does month 3 response to ranibizumab predict long-term
TRANSCRIPT

Does Month 3 Response to Ranibizumab Predict Long-term Response to Treatment in Patients With
Age-Related Macular Degeneration?
Presented at the Retina Society 53rd Annual Meeting | Virtual Presentation | September 21-22, 2020
Paul Hahn, MD, PhD1
Min Tsuboi, PharmD2; Steven Blotner, MS2; Ivaylo Stoilov, MD2
1NJRetina, Teaneck, New Jersey, USA
2Genentech, Inc., South San Francisco, California, USA.

Disclosures
• Financial disclosures:− PH: Consultant: Allergan; Consultant: Dutch Ophthalmic DORC;
Consultant/Speaker: Genentech, Inc.− MT, SB, IS: Employee: Genentech, Inc.
• Study disclosures:− This study includes research conducted on human subjects− Institutional Review Board approval was obtained prior to study initiation− Funding was provided by Genentech, Inc., a member of the Roche Group, for the study
and third-party writing assistance, which was provided by Fiona Nitsche, PhD, CMPP,of Envision Pharma Group
2

Summary
• Vision gains in patients with nAMD treated with ranibizumab in the HARBOR (NCT00891735) clinical trial were examined− Patients were categorized based on their vision response from baseline at Month 3
• At first glance, mean BCVA gains (at a population level) may appear stable across 24 months
• However, analysis of individual patient responses demonstrates considerable variation over the 24-month period
BCVA, best-corrected visual acuity; nAMD, neovascular age-related macular degeneration. 3
Month 3 vision outcomes for an individual nAMDpatient are not highly predictive of long-term outcomes

The HARBOR Trial Compared Monthly and PRN Ranibizumab in nAMD for 24 Months
BCVA, best-corrected visual acuity; CNV, choroidal neovascularization; IRF, intraretinal fluid; LD, loading dose; nAMD, neovascular age-related macular degeneration; PRN, as-needed; SD-OCT, spectral-domain optical coherence tomography; SRF, subretinal fluid.
Treatment-naïve patients withnAMD and active subfoveal CNV (N = 1097)
0.5 mgMonthly(n = 275)
0.5 mg3 LD + PRN
(n = 275)
2.0 mgMonthly(n = 274)
2.0 mg3 LD + PRN
(n = 273)
Re-treatment criteria for the PRN groups:≥ 5-letter decrease in BCVA from previous visit or any evidence of disease activity on SD-OCT (SRF, IRF, or subretinal pigment epiretinal fluid)
4

Key Clinical Question
5
Do Month 3 vision outcomes in patients with neovascular age-related macular degeneration
predict long-term outcomes?

Methods
BCVA, best-corrected visual acuity; ETDRS, Early Treatment Diabetic Retinopathy Study; nAMD, neovascular age-related macular degeneration, PRN, as-needed; RBZ, ranibizumab. 6
1057 patients with nAMD who received RBZ (0.5 mg/2.0 mg monthly/PRN) in the HARBOR trial
Treatment arms were pooled for analysis
Patients were categorized into response ‘lanes’ based on BCVA response at month 3
<5 ETDRS letters 5 to 9 ETDRS letters ≥10 ETDRS letters
• Baseline demographic and ocular characteristics were assessed for the Month 3 response groups and evaluated for between-lane differences
• Outcome measures included:• Mean change in BCVA from baseline at Months 3 and 24• Mean BCVA over time by BCVA response at Month 3• Mean change in central foveal thickness (CFT) from baseline at Months 3 and 24
• Sensitivity analyses were conducted in the ranibizumab 0.5 mg monthly and PRN arms

Response Lanes Were Determined by Month 3 Vision Improvements From Baseline
BCVA, best-corrected visual acuity; ETDRS, Early Treatment Diabetic Retinopathy Study. 7
35.6%
20.2%
44.3%
0%
5%
10%
15%
20%
25%
30%
35%
40%
45%
50%
<5 letters 5 to 9 letters ≥10 letters
Patie
nts
(%)
Mean BCVA Improvement from Baseline at Month 3 (ETDRS Letters)
n= 376/1057 213/1057 468/1057

Baseline Characteristics Were Similar Between Patients Improving <5 and 5 to 9 ETDRS Letters From Baseline at Month 3
BCVA, best-corrected visual acuity, CFT, central foveal thickness; CST, central subfield thickness; CNV, choroidal neovascularization; ETDRS, Early Treatment Diabetic Retinopathy Study. 8
Patients with ≥10 letter gain at month 3 were on average:younger, had worse BCVA, had thicker retinas, and had a smaller lesion size
<5 Letters(n = 376)
5 to 9 Letters(n = 213)
≥10 Letters(n = 468)
Age, years, mean (SD) 80.0 (8.2) 78.9 (8.2) 77.6 (8.3)
Mean BCVA (ETDRS letters) 55.1 (13.0) 55.4 (12.0) 52.5 (12.8)
Mean CFT, μm (SD) 333.3 (146.8) 326.8 (129.7) 362.0 (146.6)
Mean CST, μm (SD) 372.4 (129.9) 361.6 (105.6) 392.7 (119.3)
Total area of lesion, μm3 (SD) 3.8 (2.4) 3.4 (2.1) 2.9 (2.0)
Total area of CNV, μm3 (SD) 3.6 (2.3) 3.3 (2.06) 2.8 (2.0)

At the Population Level Patients Stay in Their Lanes
All treatment groups pooled (RBZ 0.5 mg monthly, 0.5 mg PRN, 2 mg monthly, 2 mg PRN). Mean change and 95% confidence intervals.BCVA, best-corrected visual acuity. ETDRS, Early Treatment Diabetic Retinopathy Study, PRN, as-needed. 9
-10
-5
0
5
10
15
20
0 1 2 3 4 5 6 7 8 9 10 11 12 13 14 15 16 17 18 19 20 21 22 23 24Mea
n C
hang
e in
BC
VA fr
om B
asel
ine
(ETD
RS
Lette
rs)
Month
<5 letters 5 to 9 letters ≥10 lettersMean BCVA Improvement from Baseline at Month 3 (ETDRS Letters)
7.2
-1.6
17.4
-2.6
7.1
17.4

At the Individual Patient Level There is Notable Movement Between Lanes
BCVA response shows notable movement between response groups from M3 to M24 (numbers in red text). All patients with BCVA score at both M3 and M24 included in analysis. Data from HARBOR trial. All treatment groups pooled (RBZ 0.5 mg monthly, 0.5 mg PRN, 2 mg monthly, 2 mg PRN)BCVA, best-corrected visual acuity; PRN, as-needed. 10
All Treatments Pooled Change in BCVA at Month 24
Change in BCVA at Month 3
<5 Letters 5 to 9 Letters ≥10 Letters Total
<5 Letters 62% (n=202) 17% (n=54) 21% (n=69) n=325
5 to 9 Letters 35% (n=66) 20% (n=37) 45% (n=83) n=186
≥10 Letters 11% (n=45) 9% (n=38) 80% (n=337) n=420
Total n=313 n=129 n=489 n=931
Moved up lane(s)
Stayed in lane
Moved down lane(s)

At the Individual Patient Level There is Notable Movement Between Lanes
BCVA response shows notable movement between response groups from M3 to M24 (numbers in red text). All patients with BCVA score at both M3 and M24 included in analysis. Data from HARBOR trial. All treatment groups pooled (RBZ 0.5 mg monthly, 0.5 mg PRN, 2 mg monthly, 2 mg PRN)BCVA, best-corrected visual acuity; PRN, as-needed. 11
All Treatments Pooled Change in BCVA at Month 24
Change in BCVA at Month 3
<5 Letters 5 to 9 Letters ≥10 Letters Total
<5 Letters 62% (n=202) 17% (n=54) 21% (n=69) n=325
5 to 9 Letters 35% (n=66) 20% (n=37) 45% (n=83) n=186
≥10 Letters 11% (n=45) 9% (n=38) 80% (n=337) n=420
Total n=313 n=129 n=489 n=931
Moved up lane(s)
Stayed in lane
Moved down lane(s)

At the Individual Patient Level There is Notable Movement Between Lanes
BCVA response shows notable movement between response groups from M3 to M24 (numbers in red text). All patients with BCVA score at both M3 and M24 included in analysis. Data from HARBOR trial. All treatment groups pooled (RBZ 0.5 mg monthly, 0.5 mg PRN, 2 mg monthly, 2 mg PRN)BCVA, best-corrected visual acuity; PRN, as-needed. 12
All Treatments Pooled Change in BCVA at Month 24
Change in BCVA at Month 3
<5 Letters 5 to 9 Letters ≥10 Letters Total
<5 Letters 62% (n=202) 17% (n=54) 21% (n=69) n=325
5 to 9 Letters 35% (n=66) 20% (n=37) 45% (n=83) n=186
≥10 Letters 11% (n=45) 9% (n=38) 80% (n=337) n=420
Total n=313 n=129 n=489 n=931
Moved up lane(s)
Stayed in lane
Moved down lane(s)

At the Individual Patient Level There is Notable Movement Between Lanes
BCVA response shows notable movement between response groups from M3 to M24 (numbers in red text). All patients with BCVA score at both M3 and M24 included in analysis. Data from HARBOR trial. All treatment groups pooled (RBZ 0.5 mg monthly, 0.5 mg PRN, 2 mg monthly, 2 mg PRN)BCVA, best-corrected visual acuity; PRN, as-needed. 13
All Treatments Pooled Change in BCVA at Month 24
Change in BCVA at Month 3
<5 Letters 5 to 9 Letters ≥10 Letters Total
<5 Letters 62% (n=202) 17% (n=54) 21% (n=69) n=325
5 to 9 Letters 35% (n=66) 20% (n=37) 45% (n=83) n=186
≥10 Letters 11% (n=45) 9% (n=38) 80% (n=337) n=420
Total n=313 n=129 n=489 n=931
Moved up lane(s)
Stayed in lane
Moved down lane(s)

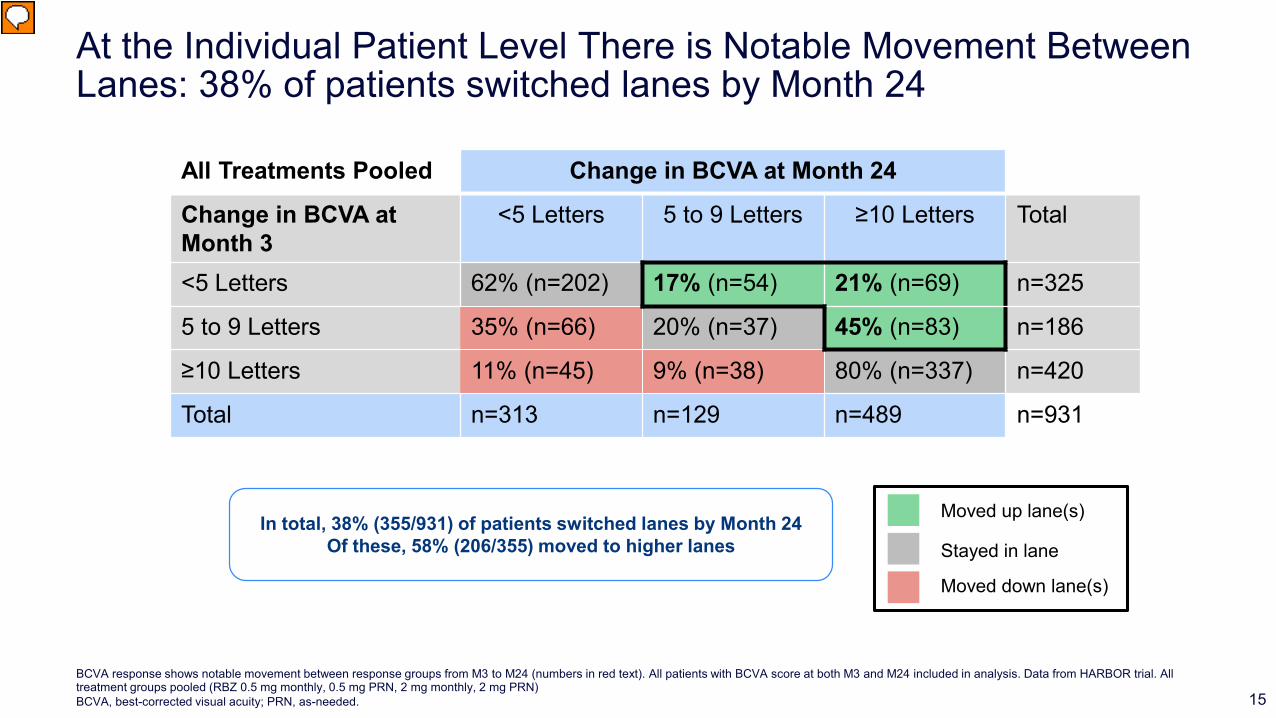
At the Individual Patient Level There is Notable Movement Between Lanes: 38% of patients switched lanes by Month 24
BCVA response shows notable movement between response groups from M3 to M24 (numbers in red text). All patients with BCVA score at both M3 and M24 included in analysis. Data from HARBOR trial. All treatment groups pooled (RBZ 0.5 mg monthly, 0.5 mg PRN, 2 mg monthly, 2 mg PRN)BCVA, best-corrected visual acuity; PRN, as-needed. 14
All Treatments Pooled Change in BCVA at Month 24
Change in BCVA at Month 3
<5 Letters 5 to 9 Letters ≥10 Letters Total
<5 Letters 62% (n=202) 17% (n=54) 21% (n=69) n=325
5 to 9 Letters 35% (n=66) 20% (n=37) 45% (n=83) n=186
≥10 Letters 11% (n=45) 9% (n=38) 80% (n=337) n=420
Total n=313 n=129 n=489 n=931
In total, 38% (355/931) of patients switched lanes by Month 24Moved up lane(s)
Stayed in lane
Moved down lane(s)
At the Individual Patient Level There is Notable Movement Between Lanes: 38% of patients switched lanes by Month 24
BCVA response shows notable movement between response groups from M3 to M24 (numbers in red text). All patients with BCVA score at both M3 and M24 included in analysis. Data from HARBOR trial. All treatment groups pooled (RBZ 0.5 mg monthly, 0.5 mg PRN, 2 mg monthly, 2 mg PRN)BCVA, best-corrected visual acuity; PRN, as-needed. 15
All Treatments Pooled Change in BCVA at Month 24
Change in BCVA at Month 3
<5 Letters 5 to 9 Letters ≥10 Letters Total
<5 Letters 62% (n=202) 17% (n=54) 21% (n=69) n=325
5 to 9 Letters 35% (n=66) 20% (n=37) 45% (n=83) n=186
≥10 Letters 11% (n=45) 9% (n=38) 80% (n=337) n=420
Total n=313 n=129 n=489 n=931
In total, 38% (355/931) of patients switched lanes by Month 24Of these, 58% (206/355) moved to higher lanes
Moved up lane(s)
Stayed in lane
Moved down lane(s)

At the Individual Patient Level There is Notable Movement Between Lanes: 38% of patients switched lanes by Month 24
BCVA response shows notable movement between response groups from M3 to M24 (numbers in red text). All patients with BCVA score at both M3 and M24 included in analysis. Data from HARBOR trial. All treatment groups pooled (RBZ 0.5 mg monthly, 0.5 mg PRN, 2 mg monthly, 2 mg PRN)BCVA, best-corrected visual acuity; PRN, as-needed. 16
All Treatments Pooled Change in BCVA at Month 24
Change in BCVA at Month 3
<5 Letters 5 to 9 Letters ≥10 Letters Total
<5 Letters 62% (n=202) 17% (n=54) 21% (n=69) n=325
5 to 9 Letters 35% (n=66) 20% (n=37) 45% (n=83) n=186
≥10 Letters 11% (n=45) 9% (n=38) 80% (n=337) n=420
Total n=313 n=129 n=489 n=931
Notably, 80% (337/420) of patients that had gained ≥10 letters at Month 3 stayed in their lane at Month 24
Moved up lane(s)
Stayed in lane
Moved down lane(s)

BCVA, best-corrected visual acuity; CFT, central foveal thickness; ETDRS, Early Treatment Diabetic Retinopathy Study. 17
Decreases in CFT From Baseline at Month 3 Were Maintained Through Month 24, Regardless of Month 3 Vision Response
-146.9
-169-182.1
-138.8 -142.8-156.7
-173.7-184.7
-191.4
-250
-200
-150
-100
-50
0M
ean
Cha
nge
From
Bas
elin
e in
CFT
(μm
)
<5 letters 5 to 9 letters ≥10 letters
Month 3 Month 12 Month 24n = 375 213 467 347 193 446 320 185 416

Findings from the Ranibizumab 0.5 mg Monthly Treatment Arm Mirrored Those of the Pooled Analysis*
*Similar trends observed in the 0.5 mg PRN treatment arm.BCVA response shows notable movement between response groups from M3 to M24 (numbers in red text). All patients with BCVA score at both M3 and M24 included in analysis.BCVA, best-corrected visual acuity; M, month; PRN, as-needed. 18
All Treatments Pooled Change in BCVA at Month 24
Change in BCVA at Month 3
<5 Letters 5-9 Letters ≥10 Letters Total
<5 Letters 60%% (n=47) 20% (n=16) 20% (n=16) n=79
5-9 Letters 29% (n=14) 31% (n=15) 40% (n=19) n=48
≥10 Letters 7% (n=7) 9% (n=9) 84% (n=83) n=99
Total n=68 n=30 n=118 n=226
In total, 36% (81/226) of patients switched lanes by Month 24Moved up lane(s)
Stayed in lane
Moved down lane(s)

Conclusions
• Patient-level data indicate that month 3 vision outcomes are not predictive of long-term nAMD outcomes− At first glance, population-level data may falsely suggest that month 3 vision outcomes are
predictive
• Nearly 40% of patients changed BCVA ‘lanes’ after month 3, with most showing vision improvement; of these, approximately 60% changed to the higher vision gain lanes
• Further biomarkers are needed to predict the long-term nAMD outcomes and optimal timing for switching to novel-mechanism treatments when available
BCVA, best-corrected visual acuity; nAMD, neovascular age-related macular degeneration. 19