does landscape diversity slow the spread of rotation-resistant western corn rootworm (coleoptera:...
TRANSCRIPT
POPULATION ECOLOGY
Does Landscape Diversity Slow the Spread of Rotation-ResistantWestern Corn Rootworm (Coleoptera: Chrysomelidae)?
D. W. ONSTAD,1, 2 D. W. CRWODER,2 S. A. ISARD,3 E. LEVINE,4 J. L. SPENCER,4 M. E. O’NEAL,5
S. T. RATCLIFFE,6 M. E. GRAY,6 L. W. BLEDSOE,7 C. D. DI FONZO,5 J. B. EISLEY,8
AND C. R. EDWARDS7
Environ. Entomol. 32(5): 992Ð1001 (2003)
ABSTRACT A behavioral change in some western corn rootworm (Diabrotica virgifera virgiferaLeConte) populations is threatening the effectiveness of crop rotation, a successful managementstrategy for controlling this pest. We created a set of simple meteorologic and behavioral models thatcan be used to predict the spread of the beetle infesting soybean (Glycine max (L.)) throughout themidwestern United States. We used data collected in Illinois, IN, MI, and Ohio to create maps ofobservations to evaluate the model. We displayed data on the maps using detection thresholds forwestern corn rootworm in soybean Þelds of 10 or 20 beetles per 100 sweeps and one or two beetlesper yellow sticky trap per day. Counts greater than a detection threshold represent populations witha lack of Þdelity to corn (Zea mays L.) and adapted to circumvent corn-soybean rotation. Some of themodels invoked a landscape-diversity function that included the proportion of noncorn, nonrotatedsoybean vegetation on farmland in each county (i.e., extra vegetation). The best model for the periodfrom 1997 to 2001 is based on heavy-storm data, with distance that beetles spread each year reducedby the proportion of extra vegetation in a county. This version is superior to a previously publishedmodel and to two newmodels that do not consider landscape diversity. Most of the models predictedspread at too high a rate between 1997 and 2001, compared with observations, but a few new modelswith rates of spread reduced by a landscape-diversity function matched the observations relativelywell. Results suggest that the conclusions based on a linearmodel using proportion of extra vegetationas the key parameter are likely to be robust. Thus, we hypothesize that as the landscape diversityrepresented by the proportion of noncorn and nonrotated soybean vegetation in a geographic regionincreases, the rate of regional spread of the rotation-resistant western corn rootworm decreases overseveral years.
KEY WORDS Diabrotica virgifera virgifera, dispersal, crop rotation, landscape ecology
THEWESTERN CORN ROOTWORM(Diabrotica virgifera vir-giferaLeConte) is themost serious insect pest of corngrown after corn (Zea mays L.) in the mid westernUnitedStates (Levine andOloumi-Sadeghi 1991).Theadults of the univoltine western corn rootworm arepresent in cornÞelds from June through frost. From
late July through September, oviposition occurs pri-marily incornÞelds; feweggs arenormally laid inothercrops. The eggs overwinter in the soil, and hatch be-gins in lateMay and early June. The larvae can surviveonly on the roots of corn and on the roots of a limitednumberof grasses (LevineandOloumi-Sadeghi 1991).Thus, growers have managed western corn rootwormby rotating corn crops with soybean crops (Glycinemax (L.)) or another noncorn crop.Themodel proposed byOnstad et al. (2001) for the
resistance of western corn rootworm to rotation em-phasizes the widespread adoption of a corn-soybeanrotationwithin a landscape that is primarily composedof these two crops. In areas of intensive corn-soybeanrotation, larvae from eggs that are oviposited into andoverwinter in soybean emerge in a cornÞeld the fol-lowing spring. Alternatively, eggs laid in cornÞeldshatch the following year in a nonhost Þeld (i.e., soy-bean). Because western corn rootworm larvae do notfeed on soybean, and eggs do not exhibit an extendeddiapause (Levine andOloumi-Sadeghi 1996, Levine et
The ideas expressed in this paper may not represent the policies ofthe USDAÐARS.
1 E-mail: [email protected] Department of Natural Resources and Environmental Sciences,
University of Illinois, Urbana, IL 61801.3 Department of Geography, University of Illinois, Urbana, IL
61801.4 Center forEconomicEntomology, IllinoisNaturalHistorySurvey,
607 E. Peabody Dr., Champaign, IL 61820.5 Department of Entomology, Michigan State University, East Lan-
sing, MI 48824.6 Department of Crop Sciences, University of Illinois, Urbana, IL
61801.7 Department of Entomology, Purdue University, West Lafayette,
IN 47907.8 Department of Entomology, Ohio State University, Columbus,
OH 43210.
0046-225X/03/0992Ð1001$04.00/0 � 2003 Entomological Society of America

al. 2002), there is selection pressure in a landscapepredominately rotatedbetweencornandsoybean thatfavors western corn rootworm that lay eggs in soy-beans. Accordingly, OÕNeal et al. (1999) found ahigher percentage of adult females in soybean Þeldsthan in cornÞelds during August, when western cornrootworms likely lay most of their eggs (Hein andTollefson 1985). As of 1997, more than 90% of thecropland in east-central Illinois is rotated corn andsoybean, and � 10% is continuously grown corn(Onstad et al. 2001). Furthermore, Onstad et al.(2001) used a model based on a single-gene locus forrotation-resistance to explain the occurrence of thisphenomenon in east-central Illinois 16 yr after thewestern corn rootworm invaded Illinois. Although ef-forts to separate rotation-resistant individuals fromthewild type have not been successful (Spencer et al.1999, Hibbard et al. 2002, OÕNeal et al. 2002), thesudden appearance and spread of injury to rotatedcorn is strong evidence for a rotation resistant popu-lation. Since the precise behavioral mechanism is notyet known, we use the expression “rotation-resistantwestern corn rootworm” to refer to populations thatcan persist in a landscape of rotated corn and soybeanthrough an expansion of their ovipositional range toinclude soybeans.Onstad et al. (1999) described the Þrst dozen years
of the geographic spread of rotation-resistant westerncorn rootworm. Model results supported the hypoth-esis that the population of western corn rootworminfesting soybean originated in Ford County, IL. Thepredictions of the simplemodel Þt an independent setof observations well on three of four fronts or direc-tions up to 1997.Onstad et al. (2001) used a population-genetics
model to show that landscape diversity in the form ofnoncorn, nonrotated soybean vegetation could slowthe development of resistance to crop rotation. Thisprocess results from the Þtness cost of the rotation-resistant, polyphagous phenotype distributing eggsrandomly to soil covered by any vegetation. In themodel, all larvae hatching outside of cornÞelds insubsequent years will die, reducing the Þtness of thephenotype. In this article, we improve the Þrst modelof Onstad et al. (1999) and use it to study hypothesesthat attempt to explain the spread of resistance beforeand after 1997. Our primary hypothesis is that in-creased landscape diversity slows the rate of regionalspread of the rotation-resistant western corn root-worm over several years.
Materials and Methods
Observations of Spread. We used data collected inIllinois, IN, MI, and Ohio to create maps of observedinfestation of soybean by western corn rootworm.Data from 1986 to 1997 were reported byOnstad et al.(1999). For the period from1998 to 2001,we collectedtrap data for Illinois, OH, and Michigan. These arePherocan AM yellow sticky trap captures (OÕNeal etal. 2001), based on at least four traps per soybean Þeld,deployed from mid July through late August to mon-
itor adult rootworm activity. For the same period forIllinois and Indiana, we alsomeasured beetle capturesin 100 sweeps of a sweep net (38-cm diameter) insoybean Þelds.Thenumberof counties sampledeachyearper state
is shown in Table 1, along with the range in the num-ber of Þelds sampled per county. Indiana had roughlythe samenumberof counties sampledeachyear,whilethe number of counties sampled in Illinois, MI, andOhio varied over the 4-yr period. Although the coun-ties of DuPage and Cook in Illinois and Marion inIndiana were within our predicted area of infestationand are surrounded by counties that exceededdetection thresholds, they were never sampled from1986 to 2001 due to the difÞculty in Þnding soybeanÞelds in the Chicago and Indianapolis metropolitanareas.We created maps showing counties with soybean
Þelds infested by western corn rootworm. We usethe highest capture value from each county to createthe maps and evaluate our model. To avoid includingspurious captures of beetles, which at low numbersmay simply represent adults straying or accidentallyblown into a Þeld and subsequently caught in a net ortrap, we used two detection thresholds when cre-ating the maps (Onstad et al. 1999). From 1979 to1982, the maximum captures of western corn root-worm beetles ranged from less than 10 to almost 16per 100 sweeps in soybean Þelds (Levine 1995).Therefore, we concluded that the detection thresh-olds should be 10Ð20 beetles per 100 sweeps (On-stad et al. 1999). Any Illinois or Ohio data based onlyon damage to corn observed before 1997 is auto-matically considered above a detection threshold(Onstad et al. 1999).We used linear regression with a computer spread-
sheet (Excel, Microsoft 2002) to relate data for thehighest average beetles/trap/d for a county(MAXATC) to data for the maximum number of bee-tles/100 sweeps for a county (MAXSC) and, thereby,determine detection thresholds based on trap cap-tures. Illinois was the only state in which both mea-surementsweremade for the samecounties and years.For the 90 matching observations during 1998 and2001, the equation and the standard errors for thecoefÞcients are
Table 1. Number of counties (range of fields per county) sam-pled for 1998-2001
YearIllinois
Indianaa Michiganb Ohiob
Traps Sweeps
1998 27 (1Ð52) 43 (1Ð7) 62 (1Ð3) 9 (1Ð5)c 59 (1Ð39)1999 25 (1Ð58) 48 (1Ð8) 62 (1Ð3) 26 (1Ð9) 61 (1Ð23)2000 35 (1Ð64) 57 (1Ð6) 61 (2Ð3) 18 (1Ð11) 31 (1Ð14)2001 9 (1Ð16) 99 (2Ð8) 62 (1Ð3) 11 (1Ð5) 19 (1Ð10)
a Only sweep-net datab Only trap datac In 1998, 18 counties (1Ð20 Þelds per county) also had sweep-net
data.
October 2003 ONSTAD ET AL: MODELING THE SPREAD OF WESTERN CORN ROOTWORM 993

MAXATC� 2.75� 0.035MAXSC
(0.53) (0.006) [1]
with an r2 � 0.27; both coefÞcients were signiÞcantlydifferent from zero (P � 0.0001). The best regressionwas obtained with the observations in 2000 (n � 31).For 2000, the regression improves to
MAXATC� 0.72� 0.062MAXSC
(0.83) (0.008) [2]
with an r2 � 0.66, and only the slope was signiÞcantlydifferent from zero (P � 0.0001). We used equationtwo to calculate the detection thresholds for averagetrap capture. The values thatmatch 10 and 20 beetles/100 sweeps are 1.34 and 1.96, respectively. We sim-pliÞed these to one and two beetles/trap/d for themaps. A county was marked as infested on the map ifeither the sweep net or sticky-trap data were abovethe detection threshold. We believe that countsgreater than a detection threshold represent popula-tions that lack Þdelity to corn and are adapted to thesoybean-corn rotation (Spencer et al. 1999).
ModelingMigratoryMovement.Beetles canßy sev-eral km using their own power and the assistance ofwind. For the period from 15 July to 31 August, 2001,we obtained data for temperature, wind speed, anddirection. We obtained these data from Bondville,Peoria, and St. Charles in Illinois (Midwestern Re-gional Climate Center, IL, State Water Survey,Champaign, IL); Columbia City, Farmland, Lafayette,and Oolitic in Indiana (Purdue Automated Agricul-tural Weather Stations Network, http://shadow.agry.purdue.edu/sc.zen-geog.html); Delaware, Mi-ami, and Northwestern in Ohio (Ohio AgriculturalResearch and Development Center, http://www.oardc.ohio-state.edu/centernet/weather.htm); andEast Lansing and Grand Junction in Michigan (Mich-igan Automated Weather Network, http://www.agweather.geo.msu.edu/mawn/). The wind speeddata were stratiÞed into 18 directional sectors, each20�. We used data recorded under the following twoconditions to represent the long-distance ßight times.First, we only used data recorded during the daybetween thehours of 0900 and1200, and1600 and1900because western corn rootworms do not ßy at nightandwere observed to have a low level of ßight activityduring the afternoon (Isard et al. 2000). Second, be-cause Witkowski et al. (1975) observed western cornrootworms ßying only between 22.2�C and 27.0 �C,weincluded only wind speed data recorded betweenthese temperatures. Based on these criteria, 1,944hourly observations were used to calculate wind sup-ported movement during a hypothetical summer.We determined from the data of Coats et al. (1986)
that sustained (migratory) ßights by beetles� 30 minoccurred during 0.8% of observation hours under op-timal ßying (i.e., ßight mill) conditions. Dividing1,944 h by the 12 weather stations gives an averagevalue of 162 h of potential ßight activity per location.Sustained ßight is expected to occur during only 0.008by 162 � 1.30 h. At the average of three km/h ßight
mill speed for sustained ßights (Coats et al. 1986), abeetle can ßy 3.9 kmwithout wind support during the1.30 h.The wave front of beetle dispersal will be deter-
mined by those ßying downwind. Although beetlesactively ßy upwind,we do not expect them to ßy as faras those assisted by the wind. Table 2 shows the num-ber of observations that have dominant vectors in the18 directions (total 1,944) and mean wind speed forthosedominant vectors. Themeanwind speeds for the18 directions ranged from 6.4 km/h to 10.3 km/h, withan overall weighted mean of 7.8 km/h. The Þnal col-umn presents the calculated distance ßownwithwindsupport. We assigned a weight of one to the directionwith the highest number of observations. The beetlesßying to the northeast between 220� and 240� areexpected to have thehighest chance of ßying 1.30 h onmigratory ßights. Other directions give beetles feweropportunities to ßy the maximum possible distance.The ratio of number of observations to the maximumnumber determines the weight for each of the direc-tions. To calculate wind supported ßight, we add3.9 km to each of the distances that the wind blowsover 1.30 h in each of 18 directions based on theaverage wind speed.
Modeling Eastward Movement by Storms.Weusedobservations of heavy rainstorms and heavy raincells(i.e., areas through which rain passes) to calculateprobability distributions for storm tracks. Huff andAngel (1992) described the orientation of 260 east-ward moving heavy storms, with mean rainfall morethan 2.54 cm, and the movement of heavy raincells inall directions, to calculate probability distributions ofstormmovement considered typical for the mid west-ern United States.Following the storm-data analysis of Onstad et al.
(1999), we used the maximum distance of 33 km to
Table 2. Wind data summarized for 12 weather stations
Sectora N WeightsbMean wind speed
km/hKm ßownin 1.3 hc
0Ð20 89 0.61 8.1 10.220Ð40 77 0.52 8.1 9.440Ð60 93 0.63 10.3 12.460Ð80 102 0.69 9.5 12.580Ð100 99 0.67 7.5 10.5100Ð120 88 0.60 7.7 9.9120Ð140 87 0.59 6.5 8.9140Ð160 131 0.89 6.4 11.3160Ð180 127 0.86 8.5 13.5180Ð200 125 0.85 7.4 12.1200Ð220 119 0.81 6.8 11.0220Ð240 147 1.00 8.0 14.3240Ð260 109 0.74 8.4 12.0260Ð280 140 0.95 8.4 14.3280Ð300 98 0.67 7.6 10.5300Ð320 89 0.61 7.7 10.0320Ð340 115 0.78 6.7 10.7340Ð360 109 0.74 6.9 10.5Totals 1944 N/A 7.8 N/A
a Degrees with 0 and 360 representing winds moving from north tosouth, 90 from east, 180 from south, and 270 from west.
b Weight equals N/147.c Km ßown is weight � speed � 1.3 h � 3.9 km (distance ßown in
1.3 hrs without wind assistance)
994 ENVIRONMENTAL ENTOMOLOGY Vol. 32, no. 5

simulate the rate of spread of the eastern wave frontor leading edge each year. This wave front rate ishypothesized to be valid for any threshold of mea-surement used to deÞne the spread of the westerncorn rootworm. The sector from 240� to 260� had thehighest number of observations based on eastwardmoving heavy storms (30%), and the sector from 240�to 270� had the highest number of observations basedon the movements of raincells (22%). Based on thesedata, we used the maximum value of 33 km to modelthe distance traveled in these sectors. The distancesfor all other sectors of the heavy storm model inTable 3were then calculated as (Z/30)� 33, inwhichZ is the percentage of storms observed for a givensector. The distances for the raincell model in Table 3were calculated as (Z/22) � 33. Only sectors withhigher movement based on storms compared withwind are presented in Table 3 and used in the mod-eling.
Modeling Movement Based on Vegetation. We ob-tained data on farmland and vegetation for eachcounty in the four states for 1997 from the USDACensus of Agriculture (USDA 1997). To determinethe total amount of land covered by vegetation thatwill not likely be rotated to cornÞelds, we used thefollowing approach. We deÞned any land planted tovegetation other than continuous corn or rotatedcorn-soybeans as extra vegetation. We deÞned “F” asacreage of farmland, “C” as acreage of corn, and “S” asacreage of soybean per county. The acreage of cornwas calculated as the total acreage of corn grown forgrain and seed plus the acreage grown for silage andgreen chop. For counties with more corn than soy-beans in a given year, we deÞned acreage of extravegetation, “E,” as F � (C � S). For counties withmore soybeans than corn in 1997, all the corn is as-sumed to be rotated, and the amount of land plantedto rotated soybeans equals the amount of land plantedto corn.We included thedifferencebetween the acre-
age of soybeans and corn as extra vegetation becausethe additional land planted to soybeans is assumed tobe not rotated with corn and, therefore, is treated asextra vegetation. Therefore, for these counties, E �(F � (C � S) � (S Ð C)) or E � (F � 2C). We thencalculated the proportion of extra vegetation percounty as EV � E/F.The calculated values of extra vegetation (i.e., pro-
portion of farmland in county) are presented in Fig. 1.Figure 1 shows the eight categories used in the stan-dard model. East central Illinois and western Indianahave the lowest levels in the region. The proportionsincrease in Ohio, MI, and northeastern and southernIndiana.
Simulation Technique. We used the observationsof Onstad et al. (1999) to determine the starting pointof our model as the one km2 grid cell 6.4 km north ofPiper City (Pella Township, Ford County, IL) and todeÞne1986asyearoneofourmodel.Wesimulated themodel for 16 yr from 1986 to 2001 using ArcGridcomputer software (ESRI 2002), calculated on a desk-top computer (Dell, Austin, TX). Each year is a timestep, and one km2 is the size of each grid cell in themodel.Each cell was assigned a value for proportion of
extra vegetation. All cells whose centers were con-tained within a given county were assigned the valuefor extra vegetation associated with that county. Be-cause of restrictions of the computer software, we hadto deÞne categories of cells. We did this because thefunction we used within the software to simulate thewave front was not designed to input a unique valuefor each cell but, instead, performed calculations onlarge groups of cells. We deÞned eight categories forproportion of extra vegetation: 0Ð0.10, 0.10Ð0.20,0.20Ð0.30, 0.30Ð0.40, 0.40Ð0.50, and 0.50Ð60, 0.60Ð0.70 and 0.70Ð1.00. For each year, each cell used as apossible source of dispersal was grouped into one ofthese categories. To simplify computations, all mapcells other than those deÞned as Lake Michigan orLake Huron can be sources for insect dispersal.Thedistances presented inTables 2 and3wereused
as maximum distances of movement for each sectorfrom 0� to 360�. We simulated the wave front based onthese radii and the value for extra vegetation of eachcell. We deÞned a linear model based on the heavystormdata presented inTable 3 as our standardmodel.This model used a linear effect to adjust the radii usedfor each cell, depending on which category of extravegetation that cell was in. For all cells within eachcategory, the maximum radius for each sector wasmultiplied by (1�MEV), whereMEV represents themean value of extra vegetation for that category. Foreach year, the ArcGrib program calculates the dis-tances traveled for each sector separately for each ofthe eight categories based on these adjusted radii. Theadjusted radii used for each category extend from thecenter of all cells included within that category. If itencompasses the center of another cell, that cell iscompletely included in the area infested for that year,and the wave front is rounded off to the nearest cell.
Table 3. Storm data used in model
Sectora Stormsb Distancec
Heavy storm model240Ð260 30% 33.0260Ð280 21% 23.1280Ð300 20% 22.0300Ð320 12% 13.2Raincell modeld
210Ð240e 16% 24.0240Ð270e 22% 33.0270Ð300e 20% 30.0300Ð330e 13% 19.5
a 0 and 360 � from north, 90 � from east, 180 � from south, 270 �from west
b Percentage of storms observed for each sector based on Tables 22and 23 in Huff and Angel (1992).
c Distance in kmdispersed each yearwith themaximumof 33 givento the sector with highest percentage and the distances for the othersequal 33 � %/max %.
d Distances used for sectors 200�Ð210� and 330�Ð340�were based onwinddata from200�Ð220�degrees and320�Ð340�degrees, respectively.
e Sectors were 30� instead of 20� based on data presented by Huffand Angel (1992).
October 2003 ONSTAD ET AL: MODELING THE SPREAD OF WESTERN CORN ROOTWORM 995

Figure 2 shows a visualization of themodel calculationof three different sectors.
Sensitivity Analysis. To test the sensitivity of ourstandard model and hypothesis, we ran multiple vari-
ations of themodel.We used the lowest value of extravegetation (LEV) for each category to reduce thedistance thewave front spreads each year. For all cellswithin each category, the maximum radius for eachsector was multiplied by (1 Ð LEV). We also ran themodel with a quadratic effect and using a power of 1.5to adjust the radii of each category. These modelsmultiplied themaximum radius of each sector by (1�MEV**2) or (1�MEV**1.5). Another variation useda threshold value of EV. As usual, 1-MEV was used toadjust the radii of all cells within categories of extravegetation �0.30, but all cells with extra vegetation�0.30 did not have the radii adjusted (multiplier of 1).
Fig. 1. Percentage of extra vegetation on farmland ineach county based on USDA Census of Agriculture data. IL,Illinois; IN, Indiana; KY, Kentucky; MI, Michigan; OH, Ohio;WI, Wisconsin.
Fig. 2. Calculation of dissemination from a one km2
source cell (shaded black). Only three of the 18, 20� sectorsare shown.All cellswith a center encompassedby anywedgeare considered infested and sources for dispersal for the nextyear.
Fig. 3. Counties with soybeans infested by western corn rootworm at 10 beetles/100 sweeps or 1.0 beetles/trap/d (a),or 20 beetles/100 sweeps or 2.0 beetles/trap/d (b), with initial year of observation indicated by color and shading. IL, Illinois;IN, Indiana; KY, Kentucky; MI, Michigan; OH, Ohio; WI, Wisconsin.
996 ENVIRONMENTAL ENTOMOLOGY Vol. 32, no. 5

Alternative Hypotheses. We tested other hypothe-ses that might explain the decrease in the rate ofspread of rotation-resistant (soybean inhabiting)western corn rootworm. First, we repeated all simu-lations described previously using the raincell stormdata rather than heavy storm data (Table 3) in themodel. Second, to test the validity of ourmodels basedonly on wind/storm data and behavioral characteris-tics of thewestern corn rootworm,we ran eachmodelwithout extra vegetation as a parameter and with nolimiting factors. These models tested the hypothesisthatwind/stormdata alonewas sufÞcient tomodel thespread of western corn rootworm populations. Third,we tested theeffectof anenvironmental factorbesideslandscape diversity that could reduce the distance ofdispersal uniformly in all directions, by running eachmodel without extra vegetation as a parameter butwith a constant limiting factor of 0.15 or 0.20. For thesemodels, the maximum radius of each sector was mul-tiplied by 0.85 or 0.80, respectively, regardless of thevalue of extra vegetation for that cell. These modelstested the hypothesis that there is another environ-mental factor besides landscape diversity that couldbetter predict the rate of spread of western corn root-worm populations.
Quantitative Comparison of Simulations. For eachyear from 1997 to 2001, we measured the area of allcounties that exceeded either of our two detectionthresholds. We focused on these years because thequantity and quality of the sampling data before 1997did not permit a formal analysis. For each model, wemeasured the area of counties over a given thresholdthatwere includedwithin thepredictedwave front forthat year (i.e., correctly predicted). We then mea-sured the area of counties included within the pre-dicted wave front for each year but which did notexceed either one or both thresholds, giving us thearea the model overpredicted. To evaluate quantita-tively each model, we used Y � (A� B)/T, where Ais area correctly predicted by model inside of wavefront, B is area overpredicted by model, and T is totalarea of counties over the detection threshold. A per-fect model would produce a Y value of 1.0.We rankedour 17models startingwith a rank of one
for the model having the highest Y. We tested ourrankingsusingaSpearmanrankcorrelationcoefÞcientand a Kendall o-test using statistical software (SASInstitute).
Results
Figure 3 presents the observed infestations of soy-bean by western corn rootworm over time in Illinois,IN, MI, and Ohio. The counties are shaded accordingto the year during which western corn rootwormadults were Þrst observed in soybean. The rootwormhas expanded its range in Illinois to the west, north,and south. The southern, eastern, and northern frontsin Indiana, OH, and Michigan, respectively, did notchange much after 1997. This result indicates thatsome factor has limited the spread of the rootwormonthese fronts. The number of counties with observa-
tions greater than the lower and higher detectionthresholds are 77 and 70 in 1997, and 99 and 91 in 2001,respectively.Examination of our observation maps using spatial
analysis tools within the ArcMap software program(ESRI 2002) showed that the rate of spread of thewestern corn rootworm variant was signiÞcantlyslower from 1998 to 2001 than from 1986 to 1997.Analysis of the counties over the higher detectionthreshold indicated that the rate of spread from 1986to 1997was�27 km/yr to the east and 8.5 km/yr to thewest. From 1998 to 2001, the rate of spread slowed to�16km/yr to theeast and7.75km/yr to thewest.Withthe lower detection threshold, the rate of spread from1986 to 1997 was�33 km/yr to the east and 8.5 km/yrto the west. From 1998 to 2001, the beetles did notsigniÞcantly spread to the east and spread to the westat a rate of 7.75 km/yr.The quantitative comparison of all the models is
presented in Tables 4 and 5. The Spearman coefÞcientbetween the ranking based off the thresholds of10 beetles/100 sweeps and 20 beetles/100 sweeps in-dicated a high degree of concordance, rs � 0.91176,andwas signiÞcantly different from zero (P � 0.0001).The Kendall o between the two thresholds also indi-cated a high degree of concordance, i.e., t � 0.77941,andwas statistically signiÞcant (P � 0.0001). Based onthese results, we determined that the rankings of ourmodels based on the two thresholds were highly cor-related and that using the average ranking betweenthe two thresholds was appropriate.
Table 4. Model comparison using normalized measures ofarea, Y, averaged over 1997-2001
Multiplierfor modela
Detectionthreshold Average for
both thresholdsOverallrankb
10 20
Heavy storm model1-MEV 0.66 0.65 0.66 11-LEV 0.67 0.64 0.65 21-MEV for EV � 0.3 0.64 0.59 0.62 31-MEV**1.5 0.63 0.59 0.61 50.80 0.58 0.63 0.61 60.85 0.56 0.59 0.57 81-MEV**2 0.60 0.54 0.57 91.0 0.51 0.41 0.46 12
Raincell model0.80 0.61 0.61 0.61 41-MEV 0.60 0.60 0.60 70.85 0.53 0.49 0.51 101-LEV 0.51 0.48 0.49 111-MEV**1.5 0.50 0.38 0.44 131-MEV for EV � 0.3 0.44 0.33 0.39 151-MEV**2 0.34 0.26 0.30 161.0 0.19 0.00 0.09 17
1999 Modelc
1.0 0.51 0.36 0.43 14
Y� (AreaCorrectly Predicted-AreaOverpredicted)/TotalArea ofCounties over Threshold.
a MEV is mean proportion of extra vegetation in a category, LEV islower value for proportion of extra vegetation in a category, and EVis the proportion of extra vegetation in a county.
b Rank based on average Y for both detection thresholds.c Based on Onstad et. al (1999).
October 2003 ONSTAD ET AL: MODELING THE SPREAD OF WESTERN CORN ROOTWORM 997

The best model for the period between 1997 and2001 is the standard model (Table 4) based on heavy-storm data, with distance that the beetle spread eachyear reduced by MEV (i.e., mean proportion of extravegetation for each of the eight categories). Thisversion is clearly superior to the old model of Onstadet al. (1999) and to the two new models that lack alandscape-diversity function (multiplier of 1.0,Table 4). Most models predicted spread at too high arate between 1997 and 2001. Therefore, they overpredicted the spread for this period, as indicated bythe Y values � 0.60 in Table 4. In general, the modelsbased on the raincell data of Table 3 did not performwell.Quantitative analysis of Table 5 indicates that the
top three models overall ranked Þfth to seventh in1997. The heavy-storm models improved over time,and the raincell models lost accuracy with time. Thus,as the rate of spread in the rotation-resistant pop-ulation declined, the heavy-storm models performedbetter than the raincell models. This trend indicatesthat a raincell model would likely continue to be lessaccurate over time. The top two models in Table 4(i.e., heavy-storm models with multipliers of 1-MEVand 1-LEV) maintained Y values greater than 0.60throughout the 5-y period. All other models had Yvalues less than 0.60 in some years (Table 5).Figure 4 shows how the results of the heavy-storm
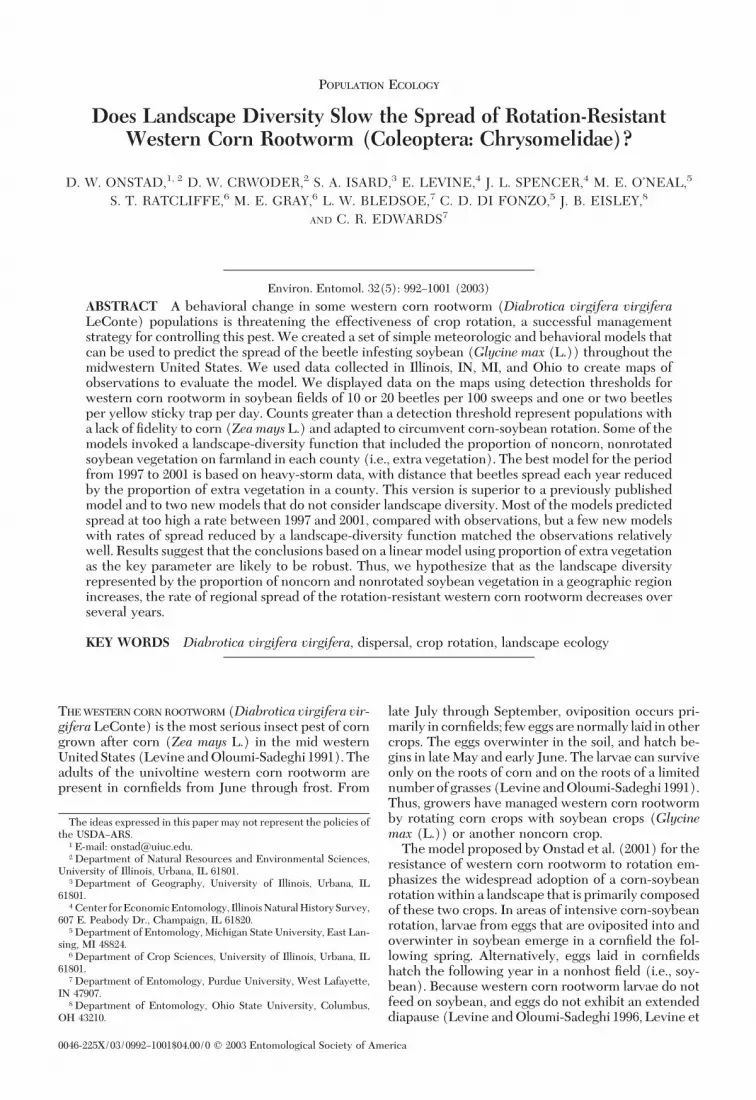
models compare with the observations. The dark con-tour lines represent the twelfth (inner line for 1997)and sixteenth (outer line for 2001) years of the modelsimulations. The standard model (Fig. 4a) performsrelatively well by 2001 but failed to predict the earlierinfestations in Ohio. Switching to a multiplier of1-LEV produced a slightly better prediction on theeastern front in Ohio andMichigan (Fig. 4b). The useof a threshold level of extra vegetation (30%) im-proved the 1997 predictions, especially in Ohio, but,by 2001, the predicted wave front is too far southeast,southwest, and even in Wisconsin (Fig. 4c). The re-sults with a multiplier of 1 � MEV**1.5 were similarto those with the 30% threshold (Fig. 4d). The modelbased on the constant reduction of 20% in distancetraveled per year (i.e., a reduction similar to values ofEV in the central part of the region [Fig. 1]), has
results for 2001 that were second only to those of thestandard model (Fig. 4e; Table 5), and were certainlybetter on the western edge.While comparing the results of the best raincell
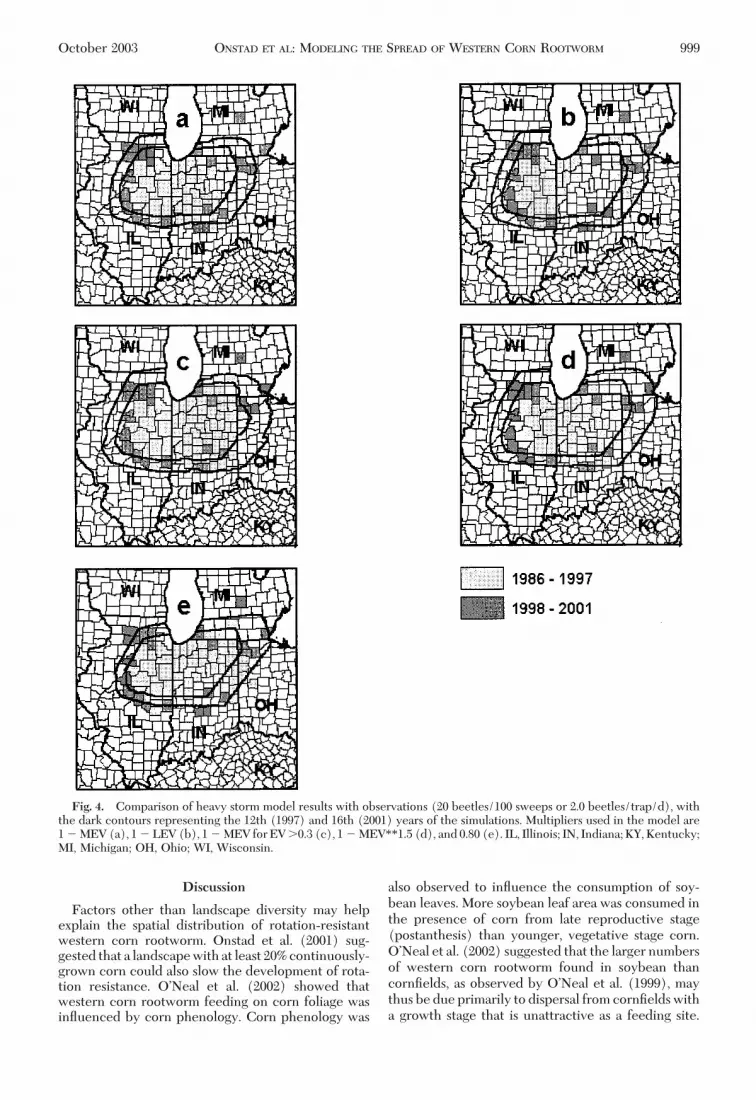
models with the observations, bothmodels performedverywell up to 1997 (Fig. 5). Themodelwith the samemultiplier (1-MEV) as our standard model over-predicts the spread into Ohio and Wisconsin in 2001(Fig. 5a). The other raincell model has a constantreduction of 20% in distance traveled each year. Itpredicts the western edge well in 2001 but pushes thenortheastern, eastern, and southern fronts much far-ther than the other top models (Fig. 5b).Raincells refer to individual convective cells or
what we conceptualize as big cumulus clouds/thun-derstorms, while heavy storms refer to the larger sys-tem (typically referred to as a front) in which manyraincells are usually embedded. Updrafts associatedwith raincells aremuchmore localized, andmay drawfewer western corn rootworms into the cells com-pared with the more extensive updrafts associatedwith the convection cells that line the front and es-sentially sweep across the central United States. Thus,one possible explanation for why the heavy stormmodels outperformed the raincell models over time inour modeling is that most of the western corn root-worms move in association with larger systems.The results shown in Tables 4 and 5, and in Figures
4 and 5 suggest that a few hypotheses are worth in-vestigating in the future. Note that changing the mul-tiplier from (1 � MEV) to (1 � LEV) had verylittle effect on the heavy-storm model results (Fig. 4;Table 4). This effect suggests that the conclusionsbased on a linear model using extra vegetation as thekey parameter are likely to be robust. Thus, we hy-pothesize that as the landscape diversity representedby the proportion of noncorn and nonrotated soybeanvegetation in a geographic region increases, the rate ofregional spread of the rotation-resistant western cornrootworm decreases over several years. We also hy-pothesize that the rotation-resistant western cornrootworm cannot persist over the long-term in smallareas with high landscape diversity. The size of thearea and the amount of vegetation must be quantiÞedin the future.
Table 5. Yearly analysis of top seven models using normalized measures of area, Y, averaged over both detection thresholds
Multiplier for model1997 1998 1999 2000 2001
Y Rank Y Rank Y Rank Y Rank Y Rank
Heavy storm model1-MEV 0.60 7 0.63 6 0.67 4 0.69 1 0.70 11-LEV 0.60 6 0.64 3 0.68 1 0.68 2 0.66 31-MEV for EV � 0.3 0.61 5 0.63 5 0.67 3 0.62 4 0.57 61-MEV**1.5 0.57 11 0.60 8 0.65 5 0.63 3 0.60 40.80 0.59 8 0.62 7 0.63 7 0.53 6 0.67 2
Raincell model0.80 0.69 2 0.71 1 0.67 2 0.45 8 0.52 91-MEV 0.70 1 0.67 2 0.65 6 0.44 9 0.57 7
Y � (Area Correctly Predicted-Area Overpredicted)/Total Area of Counties over Threshold. Ranks are overall rankings compared to all17 models in Table 4.
998 ENVIRONMENTAL ENTOMOLOGY Vol. 32, no. 5
Discussion
Factors other than landscape diversity may helpexplain the spatial distribution of rotation-resistantwestern corn rootworm. Onstad et al. (2001) sug-gested that a landscapewith at least 20%continuously-grown corn could also slow the development of rota-tion resistance. OÕNeal et al. (2002) showed thatwestern corn rootworm feeding on corn foliage wasinßuenced by corn phenology. Corn phenology was
also observed to inßuence the consumption of soy-bean leaves. More soybean leaf area was consumed inthe presence of corn from late reproductive stage(postanthesis) than younger, vegetative stage corn.OÕNeal et al. (2002) suggested that the larger numbersof western corn rootworm found in soybean thancornÞelds, as observed by OÕNeal et al. (1999), maythus be due primarily to dispersal from cornÞeldswitha growth stage that is unattractive as a feeding site.
Fig. 4. Comparison of heavy storm model results with observations (20 beetles/100 sweeps or 2.0 beetles/trap/d), withthe dark contours representing the 12th (1997) and 16th (2001) years of the simulations. Multipliers used in the model are1�MEV(a), 1� LEV(b), 1�MEVforEV�0.3 (c), 1�MEV**1.5 (d), and 0.80 (e). IL, Illinois; IN, Indiana;KY,Kentucky;MI, Michigan; OH, Ohio; WI, Wisconsin.
October 2003 ONSTAD ET AL: MODELING THE SPREAD OF WESTERN CORN ROOTWORM 999
Future modeling should attempt to clarify corn phe-nology and the proportion of continuously growncornÞelds in each county, but this would require ex-tensive data collection.It is noteworthy that the modeled maximum rate of
spread of 33 km/yr is less than the 44Ð125 km/yr,observed during the original west to east invasion ofwestern corn rootworm into such states as Illinois, IN,MI, andOhio during the 1970s (Ruppel 1975, Clementet al. 1979,Metcalf 1983,Onstadet al. 1999).Of course,the early invasion did not involve a major Þtness costassociated with oviposition outside of cornÞelds.Our best models did not predict the infestation of
counties in centralMichigan, but this lack of accuracymay be explained by the following observations. In1999 and again in 2001 in Clinton County, centralMichigan, we observed high numbers of westerncorn rootworm in a soybean Þeld but did not observesigniÞcant root injury, or large numbers of adultsemerging from this Þeld when it was rotated to cornthe following year. Thus, it is difÞcult to determinewhether this is a rotation-resistant population. Bor-dering this particular soybeanÞeldwas corn grown forsilage, which can be chopped in August, as was thecase in 1999. In ClintonCounty, 30% of the farms raisecattle; nearly a third are dairy farms. This result con-trastswithBerrienCounty, southwesternMichigan, inwhich large numbers of beetles have been trapped. InBerrienCounty, only 9% of the farms raise cattle, withonly 25 dairy farms (less 2% of the total number offarms in the county). None of the soybean Þeldsmon-itored in Berrien County were bordered by silagecorn.Our analysis was limited by the resolution of our
observations and the scale at which we could feasiblyrepresent these data. Five teams, each consisting ofone to three scientists, havecollected theobservationsin the past. This process is probably adequate to studya large-scale phenomenon. However, only three toÞve Þelds could typically be sampled in each county.Because of the resolution of the samples and the coun-ty-level reporting ofUSDACensus ofAgriculture data
(for extra vegetation), we chose to analyze the ob-servations and model results using a county as ourbasic spatial unit. A more sophisticated geographicinformation system would use maps of farmland,parks, and forests to represent vegetation better. Amore systematic collection of samples, perhaps basedon a grid, could be used in the future to measure therotation-resistant beetle population.However, in bothcases,more time,money, and laborwouldbe required.Because of the limitations in our data described
previously, we decided not to reÞne the models fur-ther. We did try to Þnd the best-Þtting model bysystematically varying exponents and thresholds forMEV or LEV. We did not try to Þnd a better variablethan either of these. A constant multiplier other than0.80 and 0.85 may have been better, but we believethat the models should not be considered precisetools. We emphasize their qualitative characteristicsand ecological relevance.Two aspects of climate should be investigated in the
future. Future modeling work could limit ßight hoursto times at which wind speed greater than the canopy(1.0Ð1.5 m) is �1.5Ð2.0 m/s. Van Woerkom et al.(1983) and Isard et al. (1999) observe little or no ßightactivity greater than these wind-speed thresholds.However, wind speed is rarely recorded at theseheights at weather stations. Furthermore, Isard et al.(1999)observedßight activitybelow22.2�Candabove27.0�C. Thus, future modeling could explore the con-sequences of relaxing the limits used in the currentmodeling effort.
Acknowledgments
We gratefully acknowledge the assistance of Ronald L.Blackwell and John L. Obermeyer in Indiana during thecollection of much of the Þeld data. We also thank MarkJoselyn for his assistance. This project was funded by theIllinois Council onFood andAgricultural Research (C-FAR)through a Sentinel grant, the Illinois Soybean Program Op-erating Board (ISPOB), the USDA-ARS through the CornRootworm Areawide Management Program via speciÞc co-
Fig. 5. Comparison of raincell model results with observations (20 beetles/100 sweeps or 2.0 beetles/trap/d), with thedark contours representing the 12th (1997) and 16th (2001) years of the simulations.Multipliers used in themodel are 1-MEV(a) and 0.80 (b). IL, Illinois; IN, Indiana; KY, Kentucky; MI, Michigan; OH, Ohio; WI, Wisconsin.
1000 ENVIRONMENTAL ENTOMOLOGY Vol. 32, no. 5

operative agreement number 58Ð5447-0-304, and severalHatch projects.
References Cited
Clement, S. L., G. Szatmari-Goodman, and B. M. Drees.1979. The status and control of Ohio corn rootworms.Ohio Rep. Res. Dev. Agric. Home Econ. Nat. Resour.,Ohio Agric. Res. Devel. Ctr., Wooster 64: 8Ð10.
Coats, S. A., J. J. Tollefson, and J. A. Mutchmor. 1986. Studyof migratory ßight in the western corn rootworm (Co-leoptera: Chrysomelidae). Environ. Entomol. 15: 620Ð625.
ESRI. 2002. ArcInfo Grid, version 8.2 ed. ESRI, Redlands,CA.
Hein, G. L., and J. J. Tollefson. 1985. Seasonal oviposition ofnorthern and western corn rootworms (Coleoptera:Chrysomelidae) in continuous cornÞelds. J. Econ. Ento-mol. 78: 1238Ð1241.
Hibbard, B. E., E. Levine, D. P. Duran, N. M. Gruenhagen,and J. L. Spencer. 2002. Electroantennogram responseof twowestern corn rootworm (Coleoptera: Chrysomeli-dae) adult populations to corn and soybean volatiles.J. Entomol. Sci. 37: 69Ð76.
Huff, F. A., and J. R. Angel. 1992. Rainfall Frequency Atlasof the Midwest. Illinois State Water Survey, Champaign.Bull. 71: 37.
Isard, S. A., M. A. Nasser, J. L. Spencer, and E. Levine. 1999.The inßuence of weather on western corn rootwormßight activity at the borders of a soybean Þeld in eastcentral Illinois. Aerobiologia 15: 95Ð104.
Isard, S. A., J. L. Spencer, M. A. Nasser, and E. Levine. 2000.Aerialmovementofwesterncorn rootworm(Coleoptera:Chrysomelidae): diel periodicity of ßight activity in soy-bean Þelds. Environ. Entomol. 29: 226Ð234.
Levine, E. 1995. Rootworm problems in Þrst-year corn: Anincreasing problem?, pp. 133Ð135. In 1995 Illinois Agri-cultural Pesticides Conference: Cooperative ExtensionService, University of Illinois at Urbana-Champaign, IL.
Levine, E., and H. Oloumi-Sadeghi. 1991. Management ofdiabroticite rootworms in corn. Annu. Rev. Entomol. 36:229Ð255.
Levine, E., and H. Oloumi-Sadeghi. 1996. Western cornrootworm (Coleoptera: Chrysomelidae) larval injury tocorn grown for seed production following soybeansgrown for seed production. J. Econ. Entomol. 89: 1010Ð1016.
Levine, E., J. L. Spencer, S. A. Isard, D. W. Onstad, and M. E.Gray. 2002. Adaptationof thewestern corn rootworm tocrop rotation: Evolution of a new strain in response to amanagement practice. Am. Entomol. 48: 94Ð107.
Metcalf, R. L. 1983. Implications andprognosis of resistanceto insecticides, pp. 703Ð733. In G. P. Georghiou andT. Saito (eds.), Pest Resistance to Pesticides, Plenum,New York, NY.
Microsoft. 2002. Excel, version. Microsoft Corp., XP Profes-sional, Seattle, WA.
O’Neal, M. E., C. DiFonzo, and D. Landis. 2002. Westerncorn rootworm (Coleoptera: Chrysomelidae) feeding oncorn and soybean leaves affected by corn phenology.Environ. Entomol. 31: 285Ð292.
O’Neal,M.E.,M.E.Gray, S.Ratcliffe, andK.L. Steffey. 2001.Predicting western corn rootworm (Coleoptera: Chry-somelidae) larval injury to rotated corn with PheroconAM traps in soybeans. J. Econ. Entomol. 94: 98Ð104.
O’Neal, M. E., M. E. Gray, and C. Smyth. 1999. Populationcharacteristics of a western corn rootworm (Coleoptera:Chrysomelidae) strain in east-central Illinois corn andsoybean Þelds. J. Econ. Entomol. 92: 1301Ð1310.
Onstad, D. W., M. G. Joselyn, S. A. Isard, E. Levine, J. L.Spencer, L. W. Bledsoe, C. R. Edwards, C. D. Di Fonzo,and H. Willson. 1999. Modeling the spread of westerncorn rootworm (Coleoptera: Chrysomelidae) popula-tions adapting to soybean-corn rotation. Environ. Ento-mol. 28: 188Ð194.
Onstad, D. W., J. L. Spencer, C. A. Guse, S. A. Isard, andE. Levine. 2001. Modeling evolution of behavioral resis-tance by an insect to crop rotation. Entomol. Expt. Appl.100: 195Ð201.
Ruppel, R. F. 1975. Dispersal of western corn rootworm,Diabrotica virgifera Le Conte, in Michigan (Coleoptera:Chrysomelidae). J. Kansas Entomol. Soc. 48: 291Ð296.
SAS Institute. 2002. SAS, version 8.2 ed. SAS Institute, Cary,NC.
Spencer, J. L., S. A. Isard, and E. Levine. 1999. Free ßight ofwestern corn rootworm (Coleoptera: Chrysomelidae) tocorn and soybeanplants in awalk-inwind tunnel. J. Econ.Entomol. 92: 146Ð155.
[USDA] U.S. Dept of Agriculture. 1997. National Agricul-tural Statistics Service. 1997 Census of Agriculture, vol. 1.Washington, D.C., Geographic Area Series. State andCounty Data.
VanWoerkom, G. J., F. T. Turpin, and J. R. Barret, Jr. 1983.Wind effect on western corn rootworm (Coleoptera:Chrysomelidae) ßight behavior. Environ. Entomol. 12:196Ð200.
Witkowski, J. F., J. C. Owens, and J. J. Tollefson. 1975. Dielactivity and vertical ßight distribution of adult westerncorn rootworms in Iowa cornÞelds. J. Econ. Entomol. 68:351Ð352.
Received for publication 11 October 2002; accepted 4 June2003.
October 2003 ONSTAD ET AL: MODELING THE SPREAD OF WESTERN CORN ROOTWORM 1001