corn processing coproducts from ethanol production
TRANSCRIPT
DRAFT – April 6, 2007
Corn Processing Coproducts from Ethanol Production
Kent D. Rausch1, *, Ronald L. Belyea2, Vijay Singh1 and M. E. Tumbleson1
1Agricultural and Biological Engineering, University of Illinois at Urbana-Champaign
2Animal Sciences, University of Missouri, Columbia, MO 65211 *Corresponding author, 1304 W. Pennsylvania Avenue, Urbana, IL 61801;
phone: (217) 265-0697, email: [email protected]
Abstract Increase in demand for ethanol as a fuel additive has resulted in growth in ethanol
production. Ethanol is produced from corn by either wet milling or dry grind processing. In wet
milling, the corn kernel is fractionated into different components, resulting in several coproducts.
Wet mill plants are capital intensive because of equipment requirements and typically are
corporate owned. In dry grind processing, the corn kernel is not fractionated and only one
coproduct, distillers dried grains with solubles (DDGS), is generated. Dry grind plants require
less equipment and capital than wet mills. They typically are producer owned and add direct
benefits to rural economies. Most of the increase in ethanol production during the past decade is
attributed to growth in the dry grind industry.
The marketing of coproducts provides income to offset processing costs. For dry grind
plants, this is especially important, because only one coproduct is available. Several issues affect
DDGS marketing. The increasing volume of DDGS accompanying ethanol production could
reduce market value; high phosphorus content could limit use of DDGS, because of animal waste
disposal issues. Technologies to remove germ and fiber from DDGS could produce a coproduct
suitable for feeding to nonruminants; this would expand the markets for DDGS. Reducing
phosphorus in DDGS would sustain markets for conventional DDGS. New technologies could
contribute to long term stability of dry grind plants.

Rausch, Belyea, Singh and Tumbleson: Corn Processing Coproducts from Ethanol Production p. 2 DRAFT
I. Introduction Much of the fuel ethanol production capacity in the US is concentrated in Midwestern
states, which have large inventories of corn. Corn is converted into ethanol primarily by two
processes, wet milling and dry grinding. In wet milling, the corn kernel is fractionated into
primary components (germ, fiber and starch); this results in several process streams and
coproducts. Wet mills are equipment and capital intensive; they generate large volumes of
ethanol and are corporate owned. In dry grind processing, the corn kernel is not fractionated and
only one coproduct is produced, distillers dried grains with solubles (DDGS). Dry grind plants
require less equipment and are less capital intensive. They produce smaller volumes of ethanol,
are producer owned and contribute significantly to rural economies. Traditionally, most ethanol
has been produced by wet milling; however, in the past ten years, dry grind capacity has
increased rapidly and now accounts for 70% of ethanol production (RFA 2007).
Recent growth trends in the dry grind ethanol industry are expected to continue and will
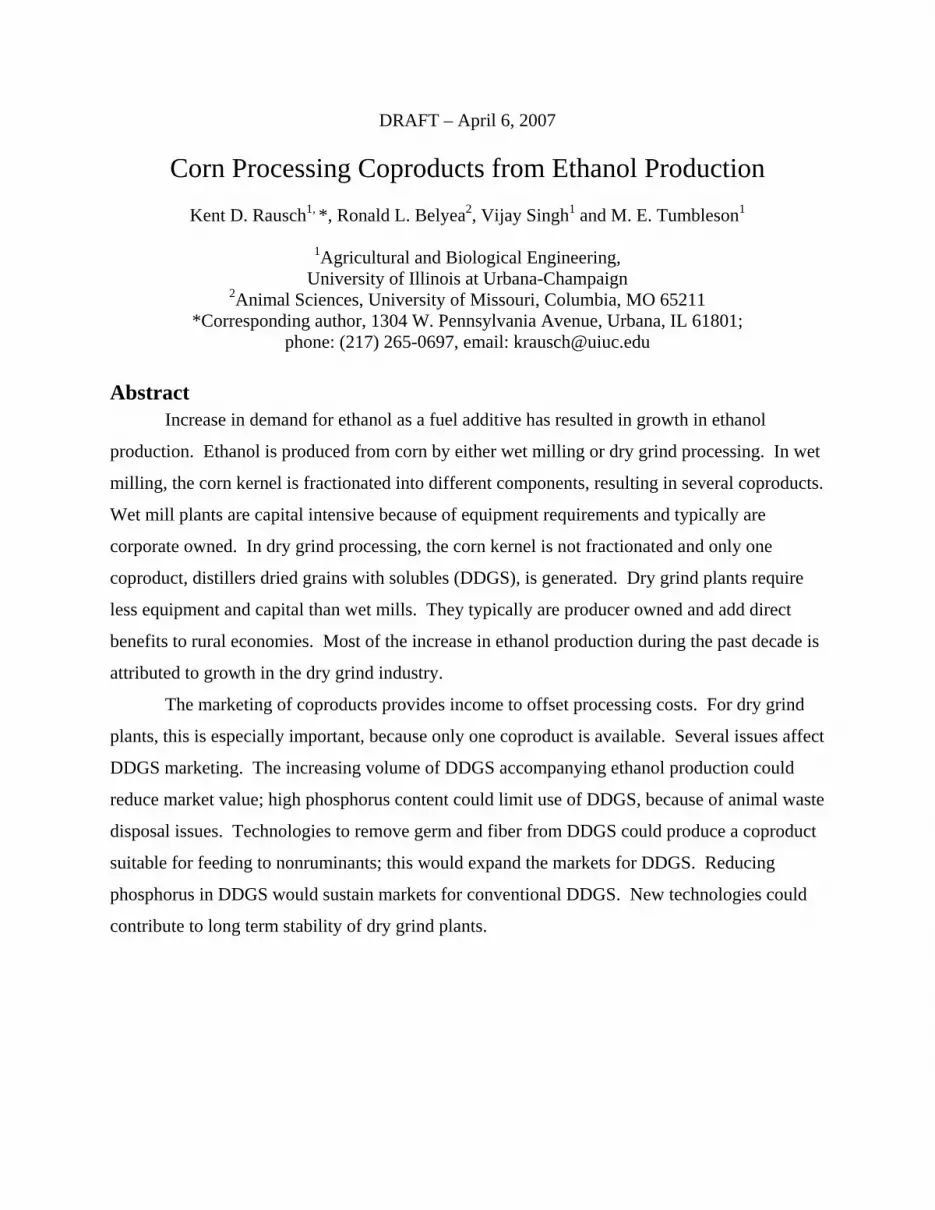
increase the volume of DDGS to be marketed. DDGS is desirable to animal producers because
of high protein content; however, they also have high fiber content, which limits their use
primarily to ruminant diets. It is not clear if the ruminant market for DDGS is becoming
saturated; that depends on the cost and supply of competitive animal foods (ie, corn and soybean
meal). However, there has been a general downward trend in the market price of DDGS during
the past two decades (Figure 1).
Many technological improvements have been made in the fermentation and distillation
steps of ethanol processing. These changes have increased the efficiency of energy use for
ethanol production. Shapouri et al (1995, 2002, 2003) suggest a 67% net energy gain from corn
production to the finished product. However, little attention has been given to addressing issues
related to quality and marketing of coproducts. For both wet milling and dry grind processing,
ethanol will be considered a primary product; other materials will be considered to be
coproducts. Marketing of coproducts is important for dry grind ethanol plants; their economic
sustainability could be strengthened if existing markets could be expanded or new markets could
be developed.
There are several impediments to be overcome if new markets are to be developed or
existing markets expanded. These include high concentrations of fiber and phosphorus,

Rausch, Belyea, Singh and Tumbleson: Corn Processing Coproducts from Ethanol Production p. 3 DRAFT
variability in composition and high cost of water removal (Rausch and Belyea 2006). High fiber
content limits use of ethanol coproducts mainly to ruminant diets. Reducing fiber concentrations
would create a new coproduct(s) that could be used in nonruminant diets. High phosphorus
concentrations of coproducts will pose important waste disposal challenges for many ruminant
producers. Variability in composition of coproducts reduces quality because it results in
inaccurate diet formulation. Reducing variability will increase the quality and market value of
coproducts. Water removal is a costly and difficult process that can affect coproduct quality;
identifying less costly and more effective approaches for removing water will increase
processing efficiency and decrease processing costs.
Technologies (Wang et al 2005, Wang et al 2007) to address these issues could contribute
to greater economic stability of ethanol processing plants by increasing markets, increasing
quality and reducing processing costs. Research efforts are needed to develop new technologies
or to modify existing technologies to produce a greater variety of coproducts, improve coproduct
quality/value and expand markets.
II. Processes for Converting Corn into Ethanol Corn is converted into ethanol by two commercial processes: wet milling (Figure 2) and
dry grinding (Figure 3). A third process, often confused with dry grinding, is dry milling. Each
process has unique equipment and technologies that impact the characteristics of the resulting
processing streams and coproducts (Table 1). The dry grind corn process is designed to subject
the entire corn kernel to fermentation. The production of fuel ethanol emphasizes maximum
yield of ethanol and conservation of process energy. The fuel ethanol process evolved from the
process to produce beverage ethanol. However, the beverage ethanol industry is less sensitive to
ethanol yield and energy efficiency. Fuel ethanol prices are subject to more commodity pressure
compared to higher valued beverage ethanol. Because of processing differences, composition of
DDGS from the fuel ethanol industry may differ from that of the beverage ethanol industry.
Dry grind corn processing has lower capital costs than corn wet milling but, unlike wet
milling, has only one major coproduct to market besides ethanol. A dry grind facility processing
40,000 bu/day and producing 40 mmgy ethanol will cost $60 million to construct in the US.
Basic steps in the dry grind corn process are grinding, cooking, liquefaction, simultaneous
saccharification and fermentation, distillation of ethanol and removal of water from stillage to

Rausch, Belyea, Singh and Tumbleson: Corn Processing Coproducts from Ethanol Production p. 4 DRAFT
form DDGS. In the dry grind process, the whole kernel is ground with mills to facilitate water
penetration during the subsequent cooking process. Two types of mills are used: (1)
hammermills, in which rotating hammers reduce corn particle size and (2) roller mills, in which a
pair of corrugated rolls rotating at different speeds exert compressive and shearing forces to
affect particle size reduction (Naidu et al 2007, Rausch et al 2005a).
The ground corn is mixed with water, resulting in a slurry which is cooked and mixed
with amylase. After the slurry has been liquefied, glucoamylase and yeast are added to the mash
and allowed to ferment. At the completion of fermentation, the resulting material (beer) consists
of ethanol, water and solids that were not fermented. Beer is released to atmospheric pressure
conditions to separate the carbon dioxide and transferred to a holding tank called a beer well.
The beer is fed to a recovery system consisting of two distillation columns and a stripping
column. The water-ethanol stream is transferred to a molecular sieve where all remaining water
is removed using adsorption technology. Purified ethanol is mixed with a small amount of
gasoline to produce fuel grade ethanol (Meredith 2003).
Whole stillage is withdrawn from the bottom of the distillation unit and is centrifuged to
produce wet grains and thin stillage. Using an evaporator, thin stillage is concentrated to form
condensed distillers solubles (called syrup in the industry). This is added to the wet grains
process stream and dried to form DDGS. Dry grind processing results in several potential
marketable coproducts: ethanol, wet grains, syrup, DDGS and carbon dioxide. The primary
market materials for most dry grind processing plants are ethanol and DDGS, although small
amounts of wet grains and syrup are marketed. A few processing plants capture and market the
carbon dioxide produced from fermentation.
III. Characteristics and Utilization of Coproducts The methods (wet milling and dry grind) for converting corn into ethanol and other useful
products use different equipment and processing conditions; these result in processing streams
that are different in composition. These processes yield coproducts that differ in quantity and in
economic value (Table 2). Coproducts that result from these streams differ in composition
(Table 3). It is important to know the unique nutritional characteristics of each coproduct so that
possible strategies can be developed to improve market value for use in animal diets.

Rausch, Belyea, Singh and Tumbleson: Corn Processing Coproducts from Ethanol Production p. 5 DRAFT
DDGS is the only coproduct from the dry grind processing of corn into ethanol. Because
the corn kernel is not fractionated, DDGS from dry grind processing contains a mixture of crude
fat, fiber, protein and elements in relatively high (3 times the levels in corn) concentrations
(Table 3). High fiber content limits use of DDGS to ruminant diets; however, because of high
protein and fat (energy) contents, DDGS is used widely as a dietary ingredient for ruminants
with large demand for nutrients (eg, lactating or growing animals). DDGS protein is
characterized by a small soluble fraction (33 g/100 g db) and a large fraction (67 g/100 g db)
slowly degraded in the rumen (Krishnamoorthy et al 1982). Consequently, DDGS often are used
to increase the ruminally undegradable protein fraction of ruminant production diets; this gives
DDGS a distinct advantage over other coproducts, such as CGF. Similar to CGF, high
phosphorus content of DDGS (0.71 g P/100 g db; Table 3) is a concern, because it increases the
phosphorus content of diets and animal wastes, which can lead to disposal challenges. The
sulfur content of DDGS based on published data is not high (0.33 g S/100 g db; Table 3).
However, the sulfur content of DDGS from dry grind plants appears to be higher than published
data. Shurson et al (2001) reported the mean concentration of sulfur in 118 samples of DDGS
from dry grind plants was 0.51 g S/100 g db, with a range of 0.33 to 0.68 g S/100 g db. We
(Clevenger et al 2004) have limited data that corroborate the data of Shurson et al (2001).
Phosphorus and sulfur can also be issues in coproducts from wet milling, because these elements
are concentrated in coproducts (Rausch et al 2005b, 2007).
Ruminants readily consume diets containing DDGS (Schingoethe et al 1983). The high
fat content of DDGS (10.3 g/100 g db) can impose intake limits under certain conditions. DDGS
are not pelleted, but the meal form is easy to handle in mechanical systems. While some of the
DDGS is sold in wet form, most is dried prior to marketing. DDGS in wet form is prone to
deterioration, especially in warmer weather; consequently, use of wet DDGS is limited to
producers located close to the dry grind plant.
While DDGS is the main coproduct that dry grind plants market, they occasionally
market syrup (condensed distillers solubles; Figure 3). Because syrup is difficult to produce as a
free flowing powder, it is handled in liquid form and added directly to diets as a liquid dietary
ingredient. Because of high water content, its use is limited to local producers. Syrup typically
contains 25 to 35% dry matter; solids contain 40 g protein, 15 g ash, 20 g fat and 25 g other
material/100 g (Table 3). Concentrations of many elements, such as Na, K and phosphorus are

Rausch, Belyea, Singh and Tumbleson: Corn Processing Coproducts from Ethanol Production p. 6 DRAFT
high; presence of elements in high concentrations raises questions about physiological effects on
animals consuming diets containing syrup and on waste disposal issues (Belyea et al 2006).
Wet grains sometimes are marketed by processors for use primarily in ruminant animal
diets due to high crude fiber content. There are limited data on nutritional profiles of wet grains.
Wet grains were characterized by NRC (1980) as containing 43% nondetergent fiber (NDF),
23% protein, 12.1% crude fiber, 9.8% fat and 2.4% ash. It is not clear what the source of
sample(s) was for these data; it is unlikely it is representative of modern dry grind processing.
Limited data from our laboratory is suggestive that wet grains have lower fiber and higher
protein (30%) and higher fat (13%) than wet grains data reported in NRC (1980). Mineral
concentrations of wet grains appear to be low (eg, 0.11% Ca, 0.43% P, 0.18% K; NRC 1980).
IV. Coproduct Utilization and Marketing Issues In ethanol production, coproducts are marketed to add value to processing. For dry grind
plants, income from the marketing of DDGS offsets much of the cost of ethanol production; this
is an important economic contribution that must be sustained. Marketing reflects the interests of
ethanol processor and end user (animal producer). Because ethanol is a primary product, plant
managers often devote most of their time and resources to manage the processes and equipment
used to convert corn into ethanol. They often do not have time nor resources to address some
issues associated with coproduct quality. This is complicated by lack of basic information
needed to address certain problems. For example, DDGS composition can have large
fluctuations. Causes of the variation are not well documented; this impairs development of
management strategies to control variation as well as other quality issues.
Because it is difficult for processors to control quality issues, such as variation, the market
value of DDGS is reduced; if the protein content were high and consistent, DDGS would be
viewed by end users as a more competitive and more valuable ingredient. However, animal
producers usually have available a wide variety of ingredients from a number of sources that can
be considered for diet formulation. These include coproducts from the processing of corn,
soybeans, cotton and rice as well as other conventional materials. Producers are able to select
the most economical dietary ingredient(s). This places pressure on the marketing of ethanol
coproducts.

Rausch, Belyea, Singh and Tumbleson: Corn Processing Coproducts from Ethanol Production p. 7 DRAFT
The chemical composition of many coproducts can vary markedly; this has been
documented (Arosemena et al 1995, Belyea et al 1989, Belyea et al 2004, Rausch et al 2003,
Shurson et al 2001). Most nutrients are affected, but protein probably is the most important
because of economic and biological implications. Protein content of coproducts can vary several
percentage units from batch to batch; for example, the protein content of DDGS can vary from
25 to 35% (Rausch, unpublished data; Belyea et al 2004). DDGS typically is marketed with a
conservative estimate of protein content (ie, 25%) so that label specifications are attained.
However, because of variation, protein content of a given batch of DDGS could be 5 to 10%
units higher than the guaranteed minimum specification. Unless the purchaser analyzed the
shipment of DDGS and made appropriate adjustments, diets containing DDGS would contain
excess protein. It would be possible for ruminants consuming the resulting diet to consume 0.5
to 1.0 lb excess protein per animal per day. This wastes resources and contributes to excess
nitrogen in animal waste. High protein also can increase concentrations of body urea, which can
have adverse physiological effects. From a marketing standpoint, it also means that about one
fourth of DDGS protein is under valued and represents unrealized income. Variation in fiber and
energy content is similar in magnitude to that associated with protein, with similar effects on diet
quality.
Variation is not limited to protein or fiber. Concentrations of most elements also vary.
Coefficients of variation ranged from 10 to 30% for many elements among coproducts (Belyea et
al 1989). Clevenger et al (2004) measured element concentrations of DDGS from different dry
grind plants; for many elements, the variation among plants was more than 50%. Others
(Arosemena et al 1995, Shurson et al 2001) reported similar variations. Such variations can lead
to adverse effects on animal health and production. Mineral imbalances are especially difficult
to resolve, because adverse effects can be subtle, latent and confounded. The problem of
variation in composition of coproducts is complicated by disagreement of published data with
contemporary data. Several groups (Arosemena et al 1995, Belyea et al 1989, Belyea et al 2004,
Clevenger et al 2004 and Shurson et al 2001) have shown the contemporary analytical data for
many coproducts differ substantially from published sources, such as NRC (1980).
Eutrophication is the process in which bodies of water naturally age; it is caused by
presence of nutrients and is characterized by growth of algae and reduced oxygen levels. Bodies
of water are classified as eutrophic if the phosphorus concentration is 31 μg P/L or higher

Rausch, Belyea, Singh and Tumbleson: Corn Processing Coproducts from Ethanol Production p. 8 DRAFT
(Belyea et al 2006). High phosphorus concentration is the primary cause of eutrophication;
runoff from agricultural land is a major source of phosphorus entering surface waters. Animal
waste can contain 1,000,000 μg P/L; it does not take much waste to increase the phosphorus
concentration of bodies of water. Reducing phosphorus in animal wastes and controlling
application of animal wastes to land are needed to reduce pollution of surface waters.
Managing the phosphorus content of diets is one aspect of reducing the phosphorus in
animal wastes. Phosphorus contents of most corn processing coproducts range from 5.4 to 8.2 g
P/kg db, which is high relative to common grains and to requirements of most ruminants (Table
3). High phosphorus in diets can increase phosphorus in animal wastes (Morse et al 1992).
Regulations for disposal of animal wastes are becoming increasingly stringent and are based, at
least partially, on phosphorus content. Most ruminant diets have adequate or nearly adequate
phosphorus concentrations. Adding high phosphorus ingredients to typical ruminant diets will
increase dietary phosphorus concentrations and phosphorus content of wastes (Dou et al 2001,
Rotz et al 2002, Spears et al 2003, Tamminga 1992, Van Horn et al 1996). High phosphorus
wastes may cause disposal difficulties for some producers because land application of animal
wastes is based primarily on phosphorus loading of soil. Some producers may have to forego
using DDGS or CGF, because of lack of sufficient land for waste disposal.
V. New Technologies to Modify the Dry Grind Process Processes have been developed to address the issue of coproduct value. In modified dry
grind corn processes called quick germ (QG), quick germ quick fiber (QGQF) and enzymatic dry
grind, whole corn is soaked in water and lightly ground in a conventional disk attrition mill
(Singh et al 2005). Enzymes are incubated with the ground slurry in each process to increase the
specific gravity prior to germ and/or fiber separation. These processes offer varying levels of
sophistication, initial capital investment and potential coproduct value. In the QG process, only
germ is recovered; in QGQF, germ and pericarp fiber are recovered; in enzymatic dry grind,
germ, pericarp fiber and endosperm fiber are recovered.
These processes separate germ (Singh and Eckhoff 1996, 1997), pericarp fiber (Singh et
al 2000, Wahjudi et al 2000) and endosperm fiber (Singh et al 2005) using principles of density
difference, hydrodynamics and particle size. Using conventional hydrocyclone systems used in
the wet milling industry, germ and pericarp fiber can be recovered. Using wedge bar screening

Rausch, Belyea, Singh and Tumbleson: Corn Processing Coproducts from Ethanol Production p. 9 DRAFT
systems, endosperm fiber can be removed. Thus, established process methodologies from wet
milling and conventional dry grind processes were joined to obtain more and higher valued
coproducts concurrently with ethanol production.
A further modification to the dry grind process was to add a protease during the
incubation step of QGQF. In the enzymatic dry grind process, protease is added along with
amylase (Figure 4), allowing endosperm fiber removal using a sieving step. When this was used,
the endosperm matrix was altered so that endosperm fiber was recovered using a sieving step
(Johnston and Singh 2001, 2004). Removal of this fiber component, in addition to germ and
fiber removal, increased protein and decreased fiber contents of DDGS from enzymatic dry grind
(Singh et al 2005).
Additional costs of retrofitting a 40,000 bu/day dry grind corn processing plant with the
enzymatic dry grind process were estimated at $2 million, or $11 million additional cost relative
to a conventional dry grind facility of similar capacity. Enhancements made with enzymatic dry
grind require a minimal additional investment relative to QGQF, but result in a DDGS that has
nutrient composition approaching those of CGM and soybean meal.
DDGS produced by the modified dry grind processes is changed from DDGS produced
by the conventional dry grind process (Singh et al 2005). Relative to the conventional dry grind
process, protein content of DDGS is increased from 28 to 58% protein (db) for enzymatic dry
grind (Table 5). Break even prices of DDGS are increased from $136/ton for the conventional
dry grind process to $216/ton for enzymatic dry grind, using methods to estimate nutritional
value (Howard and Shaver 1997).
The germ fraction recovered from enzymatic dry grind has quality that can be used for oil
extraction and contain 35 to 40% oil (db), similar to oil content found in germ recovered using
wet milling. The value of germ recovered by the enzymatic dry grind process is estimated to be
$211/ton (Table 2; Johnston et al 2005); no germ is recovered in the conventional dry grind
process.
The method to recover germ from various processes has been shown to change
composition of the germ, especially crude fat (oil) content (Johnston et al 2005). This ability to
recover high purity germ alleviates a problem with germ recovered by other processes, such as
dry milling. Because oil extraction is a capital intensive process, economy of scale for extraction
facilities is large. A germ coproduct that does not contain high oil concentrations (ie, 35 to 40%

Rausch, Belyea, Singh and Tumbleson: Corn Processing Coproducts from Ethanol Production p. 10 DRAFT
db oil) will not be accepted at large extraction facilities, reducing the market value of the lower
purity coproduct. In the wet milling process, germ recovered will have a value of $242/ton. In
dry milling, recovered germ will be worth $116 to 137/ton, which is similar to the historical
value of DDGS in the conventional dry grind process ($105/ton). Therefore, there is little
economic incentive for dry grind processors to recover germ using a dry milling germ recovery
technique. Recovery of high quality germ as a coproduct is a distinct and important objective of
modified dry grind corn processes.
VI. Conclusions Coproducts are an inherent part of corn processing and historically have not received the
same attention in development as primary products. As a result, these coproducts have low
value, high processing costs and typically are marketed as animal food ingredients, especially for
ruminant diets. Growth in corn processing, due to recent increases in ethanol production, has
caused a proportional growth in coproduct output.
Several factors have placed pressure on the value of coproducts, including issues of
supply and demand, compositional variation, nutritional value for ruminant and nonruminant
animal diets and environmental issues raised with adding coproducts to animal diets. Additional
issues facing the processor include the cost of producing coproducts so they can be handled and
stored safely and efficiently and increased awareness of the consequences of high phosphorus
content. For long term profitability and sustainability, processors need to identify and develop
technologies that will address these issues. Some advancements have been made to improve
processing methods that enhance coproduct value and improve economic feasibility of ethanol
production in rural communities. With rapid changes in the ethanol industry expected in the next
5 to 10 years, additional work is needed to develop ethanol production methodologies that
mutually meet economic, nutritional and environmental concerns.

Rausch, Belyea, Singh and Tumbleson: Corn Processing Coproducts from Ethanol Production p. 11 DRAFT
VII. References Alexander, R.J. 1987. Corn dry milling: processes, products and applications. In: Corn:
Chemistry and Technology. pp. 351-375. 1st ed. (Watson, S.A. and Ramstad, P.E., eds.).
American Association of Cereal Chemists, St. Paul, MN.
Arosemena, A., DePeters, E. J. and Fadel, J. G. 1995. Extent of variability in nutrient
composition within selected by-product feedstuffs. Anim. Feed Sci. Technol. 54:103-120.
Belyea, R.L., Clevenger, T.E., Singh, V., Tumbleson, M.E. and Rausch, K.D. 2006. Element
concentrations of dry grind corn processing streams. Appl. Biochem. Biotechnol. 134:113-
128.
Belyea, R.L., Rausch, K.D., Tumbleson, M.E. and Murthy, G.S. 2007. Sources of variation in
dry grind processing streams. In: Intl. Starch Technol. Conf. (Rausch, K.D., Singh, V. and
Tumbleson, M.E., eds.). pp. In Press. Urbana, IL.
Belyea, R.L., Rausch, K.D. and Tumbleson, M.E. 2004. Composition of corn and distillers
dried grains with solubles in dry grind ethanol processing. Biores. Technol. 94:293-298.
Belyea, R.L., Steevens, B.J., Restrepo, R.R. and Clubb, A.P. 1989. Variation in composition of
by-product feeds. J. Dairy Sci. 72:2339-2345.
Belyea, R.L., Wallig, M.A., Eckhoff, S.R. and Tumbleson, M.E. 1998. Variability in the
nutritional quality of distillers solubles. Biores. Technol. 66:207-212.
BFBB. 2003. Byproduct Feed Bulletin Board. Depts. of Agric. Econ. and Anim. Sci., Univ.
Missouri, Columbia, MO.
Brekke, O.L. 1970. Corn dry milling industry. In: Corn: Culture, Processing Products. pp.
262-291. (Inglett, G.E., ed.). AVI Publishing, Westport, CT.
Clevenger, T.E., Singh, V., Belyea, R.L., Johnston, D.B., Tumbleson, M.E. and Rausch, K.D.
2004. Element concentrations in dry grind corn processing streams. In: Proc. Corn Util.
Technol. Conf. (Tumbleson, M.E., ed.) (Abstr. no. 24). NCGA, St. Louis, MO.
Dou, Z., Galligan, D.T and Ramberg, Jr., C.F. 2001. A survey of dairy farming in Pennsylvania:
nutrient management practices and implications. J. Dairy Sci. 84:966-973.
Duensing, W.J., Roskens, A.B. and Alexander, R.J. 2003. Corn dry milling: processes, products
and applications. In: Corn: Chemistry and Technology. pp. 407-448. 2nd ed. (White, P.J.
and Johnson, L.A., eds.). American Association of Cereal Chemists. St. Paul, MN.

Rausch, Belyea, Singh and Tumbleson: Corn Processing Coproducts from Ethanol Production p. 12 DRAFT
ERS. 2007. Feed grains data delivery system. Economic Research Service, USDA.
www.ers.usda.gov/Data/feedgrains/FeedGrainsQueriable.aspx. March 26.
Howard, W.T. and Shaver, R.D. 1997. FEEDVAL: Comparative values calculated from crude
protein, TDN, Ca and P. Reference feeds used to calculate value of nutrients. Univ.
Wisconsin, Madison, WI.
Johnson, L.A. and May, J.B. 2003. Wet milling: the basis for corn biorefineries. In: Corn:
Chemistry and Technology. pp. 449-494. 2nd ed. (White, P.J. and Johnson, L.A., eds.).
American Association of Cereal Chemists. St. Paul, MN.
Johnston, D.B. and Singh, V. 2001. Use of proteases to reduce steep time and SO2 requirements
in a corn wet-milling process. Cereal Chem. 78:405-411.
Johnston, D.B. and Singh, V. 2004. Enzymatic milling of corn: optimization of soaking,
grinding, and enzyme incubation steps. Cereal Chem. 81:626-632.
Johnston, D.B., McAloon, A.J., Moreau, R.A., Hicks, K.B. and Singh, V. 2005. Composition
and economic comparison of germ fractions derived from modified corn processing
technologies. J. Am. Oil Chem. Soc. 82:603-608.
Krishnamoorthy, U., Sniffen, C.J. and Van Soest, P.J. 1982. Nitrogen fractionation in ruminant
feedstuffs for feed evaluation. Proc. Cornell Nutr. Conf. Syracuse, NY.
Loy, D.D. and Wright, K.N. 2003. Nutritional properties and feeding value of corn and its by-
products. In: Corn: Chemistry and Technology. pp. 571-603. 2nd ed. (White, P.J. and
Johnson, L.A., eds.). American Association of Cereal Chemists. St. Paul, MN.
Maisch, W.F. 2003. Fermentation processes and products. In: Corn: Chemistry and
Technology. pp. 695-721. 2nd ed. (White, P.J. and Johnson, L.A., eds.). American
Association of Cereal Chemists. St. Paul, MN.
Meredith, J. 2003. Dryhouse design: focusing on reliability and return on investment. In: The
Alcohol Textbook (Jacques, K.A., Lyons, T.P. and Kelsall, D.R. eds.). pp. 363-375. 4th ed.
Nottingham University Press, Nottingham, UK.
Morse, D., Head, H.H., Wilcox, C.J., Van Horn, H.H., Hissem, C.D. and Harris, Jr., B. 1992.
Effects of concentration of dietary phosphorus on amount and route of excretion. J. Dairy
Sci. 75:3039-3049.

Rausch, Belyea, Singh and Tumbleson: Corn Processing Coproducts from Ethanol Production p. 13 DRAFT
Naidu, K., Singh, V., Johnston, D.B., Rausch, K.D. and Tumbleson, M.E. 2007. Effects of
ground corn particle size on ethanol yield and thin stillage soluble solids. Cereal Chem.
84:6-9.
NRC. 1980. Mineral tolerances of domestic animals. Nat. Res. Council. Nat. Acad. Sci.
Washington, DC.
Rausch, K.D. and Belyea, R.L. 2006. The future of coproducts from corn processing. Appl.
Biochem. Biotech. 128:47-86.
Rausch, K.D., Belyea, R.L., Ellersieck, M., Singh, V., Johnston, D.B. and Tumbleson, M.E.
2005a. Particle size distributions of ground corn and DDGS from dry grind processing.
Trans. ASAE 48:273-277.
Rausch, K.D., Raskin, L.M., Belyea, R.L., Agbisit, R.M., Daugherty, B.J., Clevenger, T.E. and
Tumbleson, M.E. 2005b. Phosphorus concentrations and flow in corn wet milling streams.
Cereal Chem. 82:431-435.
Rausch, K.D., Raskin, L., Belyea, R.L., Clevenger, T.E. and Tumbleson, M.E. 2007. Nitrogen
and sulfur concentrations and flow rates of corn wet milling streams. Cereal Chem. In Press.
Rausch, K.D., Thompson, C.I., Belyea, R.L. and Tumbleson, M.E. 2003. Characterization of
light gluten and light steep water from a wet milling plant. Biores. Technol. 90:49-54.
RFA. 2007. Industry statistics. www.ethanolrfa.org. Renewable Fuels Association.
Washington, DC. February.
Rotz, C.A., Sharpley, A.N., Satter, L.D., Gburek, W.J. and Sanderson, M.A. 2002. Production
and feeding strategies for phosphorus management on dairy farms. J. Dairy Sci. 85:3142-
3153.
Schingoethe, D.J., Clark, A.K. and Voelker, H.H. 1983. Wet corn distillers grains in lactating
dairy cow rations. J. Dairy Sci. 66:345-349.
Shapouri, H., Duffield, J.A. and Graboski, M. S. 1995. Estimating the net energy balance of
corn ethanol. AER-721. USDA Economic Research Service, Washington, DC.
Shapouri, H., Duffield, J.A. and Wang, M. 2002. The energy balance of corn ethanol: an
update. AER-814. USDA Office of the Chief Economist, Washington, DC.
Shapouri, H., Duffield, J.A. and Wang, M. 2003. The energy balance of corn ethanol revisited.
Trans ASAE 46:959-968.

Rausch, Belyea, Singh and Tumbleson: Corn Processing Coproducts from Ethanol Production p. 14 DRAFT
Shurson, J., Spiehs, M., Whitney, M., Baidoo, S., Johnston, L., Shanks, B. and Wulf, D. 2001.
The value of distillers dried grains with solubles in swine diets. 62nd Minn. Nutri. Conf. &
Minn. Corn Growers Assoc. Tech. Symp., Bloomington, MN.
Singh, V. and Eckhoff, S.R. 1996. Effect of soak time, soak temperature, and lactic acid on
germ recovery parameters. Cereal Chemistry 73:716-720.
Singh, V. and Eckhoff, S.R. 1997. Economics of germ preseparation for dry-grind ethanol
facilities. Cereal Chem. 74:462-466.
Singh, V., Johnston, D.B., Naidu, K., Rausch, K.D., Belyea, R.L. and Tumbleson, M.E. 2005.
Comparison of modified dry grind corn processes for fermentation characteristics and DDGS
composition. Cereal Chem. 82:187-190.
Singh, V., Moreau, R.A., Hicks, K.B. and Eckhoff, S.R. 2000. Effect of alternative milling
techniques on the yield and composition of corn germ oil and corn fiber oil. Cereal Chem.
78:46-49.
Spears, R.A., Young, A.J. and Kohn, R.A. 2003. Whole-farm phosphorus balance on western
dairy farms. J. Dairy Sci. 86:688-695.
Tamminga, S. 1992. Nutrition management of dairy cows as a contribution to pollution control.
J. Dairy Sci. 75:345-357.
Van Horn, H.H., Newton, G.L. and Kunkle, W.E. 1996. Ruminant nutrition from an
environmental perspective: factors affecting whole-farm nutrient balance. J. Anim. Sci.
74:3082-3102.
Wahjudi, J., Xu, L., Wang, P., Singh, V., Buriak, P., Rausch, K.D., McAloon, A.J., Tumbleson,
M.E. and Eckhoff, S.R. 2000. Quick fiber process: effect of mash temperature, dry solids
and residual germ on fiber yield and purity. Cereal Chem. 77:640-644.
Wang, P., Singh, V., Xu, L., Johnston, D.B., Rausch, K.D. and Tumbleson, M.E. 2005.
Comparison of enzymatic (E-mill) and conventional dry grind corn processes using a
granular starch hydrolyzing enzyme. Cereal Chem. 82:734-738.
Wang, P., Singh, V., Xue, H., Johnston, D.B., Rausch, K.D. and Tumbleson, M.E. 2007.
Comparison of raw starch hydrolyzing enzyme with conventional liquefaction and
saccharification enzymes in dry grind corn processing. Cereal Chem. 84:10-14.

Rausch, Belyea, Singh and Tumbleson: Corn Processing Coproducts from Ethanol Production p. 15 DRAFT
Table 1. Composition (g/100 g db) of main processing streams and coproducts from ethanol processes.
Process Coproduct Solids
(g/100 g)* Protein1 Crude Fiber NDF Fat Ash NFE
Light steepwater 10.5 46 -- -- -- 16 38 CGF 10.0 23.8 8.9 35.5 3.5 6.8 55.7
Germ meal 10.0 26 -- 4 2 5 56 Light gluten 4.5 69 1 -- 2 2 26
CGM 10.0 65 1.3 11.1 2.5 3.3 25
Wet milling2
Distillers solubles9 4.41 22.4 -- -- 12.1 11.1 -- Beer8 11.9 29.8 -- -- -- -- --
Thin stillage 7.1 33.4 -- -- -- -- -- Wet grains 32.8 33.4 13.8 43.2 7.6 2.2 0.43
Syrup 27.5 29.8 4.2 22 9.4 7.3 1.12
Dry grind
DDGS10 84.3 29.6 4.2 -- 9 -- -- Hominy feed7 13.5 11.9 6.7 4.2 2.7 0.65
Germ7 9.6 17.5 6.3 26.3 7.4 38.4 Dry milling
Bran7 10.0 3.8 17.2 -- 1.0 1.0 -- *Solids data for dry grind (beer, wet grains, syrup, DDGS), light steepwater and light gluten
from Rausch and Belyea (2006). 1N × 6.25. 2Loy and Wright (2003). 3Corn gluten feed. 4Corn gluten meal. 6Duensing et al (2003); NFE column determined as “starch by difference”. 7Alexander (1987). 8Rausch and Belyea (2006). 9Belyea et al (1998). 10Maisch (2003).

Rausch, Belyea, Singh and Tumbleson: Corn Processing Coproducts from Ethanol Production p. 16 DRAFT
Table 2. Coproduct yields and values from ethanol processes.
Process Yield,
per bu corn Yield,1
lb/ton corn Value,1
$/ton coproduct Revenue, $/ton corn
Wet milling2 2.50 gal ethanol 89 1.29 115 4.2 lb germ3 150 211 16 3.0 lb corn gluten meal 107 270 14 12.4 lb corn gluten feed 443 63 14 Coproduct subtotal 44 Total 159 Dry grind 2.75 gal ethanol 98 1.29 126 16 lb DDGS4 571 89 25 Coproduct subtotal 25 Total 151 E-Mill5 2.54 gal ethanol 91 1.29 117 3.6 lb germ3 129 211 14 4.6 lb fiber6 164 -- -- 7.8 lb DDGS7 279 216 30 Coproduct subtotal 44 Total 161
1 Yields and values for ethanol are in gal/ton and $/gal, respectively; values from ERS (2005) data for 2001 to 2005 market years except as noted.3,7
2 Wet milling yields from Johnson and May (2003). 3 7.5% yield; germ (unextracted) value calculated using method of Johnston et al (2005). E-Mill
germ yield is 85% of wet milling yield. E-Mill germ value assumed equal to WM germ value. 4 Distillers dried grains with solubles. 5 Yields from Singh et al (2005). 6 Fiber yield increased by 0.6 lb to reflect decrease in germ yield for E-Mill. 7 Value from Rausch and Belyea (2006) and calculated from Howard and Shaver (1997) and
BFBB (2003).

Rausch, Belyea, Singh and Tumbleson: Corn Processing Coproducts from Ethanol Production p. 17 DRAFT
Table 3. Comparison of the nutrient profile of ethanol coproducts to that of corn (NRC 1980).
Item1 Corn CGM CGF
Germ Meal (db) DDGS
Hominy Feed Syrup
Wet Grains
Protein (g/100 g) 10.9 67.2 25.6 22.3 25.0 11.5 19.7 33.4 EE 4.3 2.4 2.4 4.1 10.3 7.7 -- -- Ash 1.5 1.8 7.5 4.2 4.8 3.1 -- -- CW 9.0 14.0 -- -- 44.0 55.0 -- -- LC 3.0 5.0 -- -- 18.0 13.0 -- -- C Fiber 2.9 2.2 9.7 13.1 9.9 6.7 -- -- Ca 0.03 0.16 0.36 0.04 0.15 0.05 0.45 0.018K 0.37 0.03 0.64 0.31 0.44 0.65 2.32 0.54 Mg 0.14 0.06 0.36 0.34 0.18 0.26 0.69 0.18 Na 0.03 0.10 1.05 0.08 0.57 0.09 0.23 0.045P 0.29 0.50 0.82 0.34 0.71 0.57 1.52 0.54 S 0.12 0.39 0.23 0.33 0.33 0.03 0.74 0.50 Zn (mg/kg) 14.0 190.0 72.0 114.0 -- 3.0 126 105
Essential Amino Acids (g/100 g)
Arg 0.54 0.87 2.31 1.4 1.05 0.62 His 0.25 0.68 1.55 0.8 0.70 0.31 Ile 0.39 0.98 2.82 0.8 1.52 0.40 Leu 1.12 2.44 11.33 2.0 2.43 1.09 Lys 0.24 0.71 1.12 1.0 0.77 0.42 Met 0.21 0.41 1.98 0.7 0.54 0.20 Phe 0.49 0.90 4.45 1.0 1.64 0.48 Ser 0.53 0.94 3.71 1.1 1.42 --- Thr 0.39 0.87 2.46 0.2 1.01 0.44 Try 0.09 0.17 0.33 0.22 0.19 0.13 Tyr 0.43 0.81 3.54 0.8 0.76 0.44 Val 0.51 1.22 3.43 1.3 1.63 0.58
1Composition data for syrup and wet grains from unpublished data. EE = ether extract; CW = cell wall material; LC = lignocellulose.

Rausch, Belyea, Singh and Tumbleson: Corn Processing Coproducts from Ethanol Production p. 18 DRAFT
Table 4. Equivalent nutrient value ($/ton) of ethanol coproducts for various corn and soybean meal prices (BFBB 2003).
Corn SBM DDGS CGF CGM 2.50 200 157 133 246 3.00 200 165 148 242 4.00 200 180 178 232
2.50 300 211 156 376 3.00 300 218 171 372 4.00 300 234 200 362
2.50 400 264 178 507 3.00 400 272 193 502 4.00 400 288 223 493
Table 5. DDGS composition (% db, Singh et al 2005) and coproduct values for conventional dry grind and E-Mill processes.
Composition Dry Grind E-Mill CGM* SBM* Crude Protein 28.5 58.5 66.7 53.9 Crude Fat 12.7 4.5 2.8 1.1 Ash 3.6 3.2 -- -- Acid Detergent Fiber 10.8 2.0 6.9 6.0 Coproduct Value
Germ valuea ($/ton) -- 242 DDGS valuec ($/ton) 136 216 238 202
*CGM: corn gluten meal; SBM: soybean meal. aMarket value based on estimates calculated from Johnston et al (2005). bBreak even prices based on ERS values (1994-2004) of corn ($83.92/ton), 50% soybean meal ($191.16/ton) and calculations from BFBB (2003) and Howard and Shaver (1997).

Rausch, Belyea, Singh and Tumbleson: Corn Processing Coproducts from Ethanol Production p. 19 DRAFT
0
50
100
150
200
250
300
350
400
1981
1983
1985
1987
1989
1991
1993
1995
1997
1999
2001
2003
2005
2007
Val
ue ($
/ton)
.
Corn CGFCGM DDGSHominy SBM 50
Figure 1. Price of coproducts from corn processing (CGM: corn gluten meal; CGF: corn gluten feed; SBM 50: soybean meal, 50%
protein; ERS 2007).

Rausch, Belyea, Singh and Tumbleson: Corn Processing Coproducts from Ethanol Production p. 20 DRAFT
Corn
FermentationFermentation
Distillation Ethanol
Condensed Solubles
Steeping
Liquefy
Saccharify CO2
Enzyme
Enzyme
Germ Separation
Fiber Separation
Protein Separation
Starch
Steepwater
Germ
Fiber
Gluten Meal
Gluten FeedMix / DryMix / Dry
Cook
Yeast
Evaporator Water
Water
Figure 2. The corn wet milling process.
Corn Distillation Ethanol
Centrifuge
Whole Stillage Thin
Stillage
Evaporator
Distillers Wet Grains
Distillers Solubles
Distillers Dried Grains with
Solubles (DDGS)
Grind
Cook
Liquefy
Saccharify / Ferment
Saccharify / Ferment
CO2
Enzyme
EnzymeDryer
Yeast
Water
Water
Water
Figure 3. The dry grind corn process.

Rausch, Belyea, Singh and Tumbleson: Corn Processing Coproducts from Ethanol Production p. 21 DRAFT
Corn
Distillation Ethanol
Centrifugation Evaporator
Distillers Wet Grains
Distillers Solubles
Modified DDGS
Grind, Incubate
Cook
LiquefyEnzyme
Dryer
Soak
Hydrocyclone Germ and Pericarp
CO2
Saccharify / Ferment
Saccharify / Ferment
Enzyme
Yeast
Water
Water
Enzyme
Water
Sieve Endosperm Fiber
Figure 4. The enzymatic dry grind corn process.