doctor of phrlosophy - university of plymouth pearl
TRANSCRIPT
University of Plymouth
PEARL https://pearl.plymouth.ac.uk
04 University of Plymouth Research Theses 01 Research Theses Main Collection
2003
AN INVESTIGATION INTO
REINFORCED BRICKWORK BEAMS
USING QUETTA BOND
SOUTHCOMBE, COLlN
http://hdl.handle.net/10026.1/2289
University of Plymouth
All content in PEARL is protected by copyright law. Author manuscripts are made available in accordance with
publisher policies. Please cite only the published version using the details provided on the item record or
document. In the absence of an open licence (e.g. Creative Commons), permissions for further reuse of content
should be sought from the publisher or author.
AN INVESTIGATION INTO REINFORCED BRICKWORK BEAMS
USING QUETIA BOND
by
' ' COLlN SOUTH CO MBE r ·
A thesis submitted to the University of Plymouth• in partial fulfillment for the degree of
DOCTOR OF PHrLOSOPHY
School of Civil and Structural Engineering Faculty of Technology
May 2003
UNIVERSITY OF i?l .vMOUTH
llem No. Q, 0 0 ~;M\ ~ ;).o a-
UBF\f.RV STORF
ABSTRAcr
COLIN SOUTHCOMBE AN INVESTIGATION INTO REINFORCED BRICKWORK USING QUE TT A BOND
This study considered the design, development and testing of a new type of reinforced grouted cavity clay
brickwork beam, the University of Plymouth Quetta Style Beam (the "Beam"). Under experimental load,
the beam format results in asymmetric, non-linear, elastic bending and shear stress contours. This is
conttary to beam behaviour acknowledged, in the codes, for reinforced brickwork and other structural
materials. A suggested hypothesis is "evidence has been produced of excessive tensile stress beyond the
steel yield stress, which may or may not be due to brick tensile strength". This hypothesis is based on a
relatively small sample and upon the determination of the neutral axis depth which depends on the shape of
the compressive stress diagram. It is suggested that this hypothesis is worthy of further experimental
investigation and analysis. The Beam has enhanced flexural strength when compared with beams
reinforced in the bed joints and with some grouted cavity reinforced brickwork beams, studied so far. Tests
on and analysis of brickwork prisms showed that the Structmal Code for Reinforced Masoruy, BS 5628-2-
2000, recommends extremely conservative design strengths, particularly when perforated bricks are used. It
is further suggested the Code does not fully recognize the potential strength of brickwork.
In this study 54 beams were built; reinforced and unreinforced in shear. Every beam was replicated three
times and three brick types and three different spans were used. An important aspect of the Beam is the
bonding of the outer leaves of brickwork with the grouted core. Bricks in the compression zone were
loaded in their weaker directions. Vertical pockets of grout, incorporated into the Beam design, allow easy
provision of shear links. The bonding format and integrated system is not detrimental to the flexural
resistance of the Beam but produces a compressive stress diagram, at ultimate load, which does not
conform to the parabolic curve nsed in reinforced concrete and in symmetrically reinforced brickwork
beams. This is perhaps a more realistic model for reinforced clay brickwork.
Beams were analysed using elastic and limit states theories. A 30 Finite Element Analysis (FEA) showed,
possibly for the fin;t time, the complex, asymmetric, non-linear, elastic stress contours which develop in
non-traditionally bonded brickwork. Equations are proposed in this study which would enable the depth of
the Beam to be selected to resist an applied bending moment and also, if confirmed by further studies, a
method to incorporate the excess tensile force into the analysis of the section capacities and to ascertain the
neutral axis depth. The Beam was nsed on five construction sites on and off campus. These perfonned well.
It was identified that: the characteristic compressive strength of non-traditionally bonded brickwork should
be obtained by the use of prism tests, when an accurate economical design is required; significant loss of
the potential characteristic strength of perforated and solid clay brickwork is due to the use of a bonding
material whose basic strength is less than the compressive strength of the brick. A study is needed to
identify an improved bonding material for an structural brickwork.
ACKNOWLEDGEMENTS
The Author acknowledges with thanks:
The financial support given by the Science and Engineering Research Council for the study of reinforced brickwork beams using Quetta Style Bond
The support from Structural Clay Products and members of the British Masonry Society.
Gregory Regan for the extensive research studies he carried out and for agreeing that I could use his studies.
The work carried out by Colin Appleton into reinforced brick beam behaviour.
The Author thanks the following people for their contributions during the course of the research:
Dr. Y aqub Rafiq and Professor Robert Cope for their supervision, encouragement and assistance. .
The academic, technical and secretarial staff of the School of Civil and Structural Engineering, University of Plymouth. Particularly Brian Worley, Steven Edmunds, Antony Tapp and Keith Stott for their assistance with the laboratory testing.
Bradley James for his assistance with the Lusas Analysis.
Brian Martin the Bricklayer.
Westbrick Limited, Crossley Bricks and Butterley Building Materials who provided the bricks for the tests.
Last, but not least, my family and particularly my wife Beryl, son Alan, son-in-law John, daughter Lianne, daughter-in-law Mary and their families for their valuable practical help, encouragement and support.

AUTHOR'S DECLARATION
At no time during the registration for the Degree of Doctor of Philosophy has the author been registered for any other University award.
This thesis does not contain any material which has been previously submitted for any other degree or diploma in any University, and published or written by another person, except for work carried out by Gregory Regan who authorized the use of any of his work in the completion of this thesis (Letter of 20 May 1998 in the Appendices).
Signed .... < .. ~. ~. ~\--:-:.:-:- =-L
Date ......... Y .. ".'::;) ... ~. '2 .. <;?.3

GLOSSARY
Bed fare, the face of a brick laid on a mortar bed joint, (the face of a brick placed with its length and width on the mortar bed joint).
Bed joint reinforcement, small steel bars placed within a bed of continuous mortar, normally in the horizontal bed joint.
Bed, the horizontal layers of mortar on which bricks are laid
Bed joint, a mortar joint laid horizontally on which bricks or blocks are laid.
Blockwork, the art of building in concrete blocks, using mortar as the bonding material.
Bond, any interlocking or cementing force; the form of connection between bricks e.g. English Bond, Flemish Bond
Bonding, the pattern in which masonry units are laid
Bond stone, a brick whose purpose is to bind together bricks in a horizontal and/or vertical plane.
Brick, a shapoo block, most commonly rectangular in shape (the standard UK dimensions being 215mm (length) x 102.5mm (width) x 65mm (height). Bricks are normally of clay, concrete or calcium silicate. A brick may be solid, frogged (with a depression in the bed face(s)), perforatoo or hollow (with holes in the height of the brick).
Brickwork, the art of building in clay, calcium silicate, or concrete bricks, using mortar as the bonding material.
Cavity, the clear space between two brickwork wythes.
Compressive strength, the average value of the crushing strength of a sample of bricks.
Grout, a matrix of cement, fine and coarse aggregate. It has a smaller coarse aggregate than that used in concrete.
Grouted cavity, a cavity which is filloo with grout.
Header fare, the face of a brick placed at right angles to the vertical surface of a wall or beam, with its width in the horizontal direction (the end face of a standard brick).
Initial suction rate, the rate at which the bed face of a brick absorbs water, from the mortar. This relates to the transfer of water from adjacent mortar joints to the brick., as the brickwork is being laid.
Limit states: Serviceability, limits of cracking and deflection. Ultimate strength, limits of direct compression and tension, flexural bending and shear.
Masonry, the art of building in bricks, concrete blocks, natural stone etc.
Mortar, a mixture of sand, cement and /or lime.
Perpend joint, a vertical mortar joint between the vertical faces of adjoining bricks.
Quetta, (pronounced 'Kwedda'), a town in North West India where a particular brick bonding pattern, the Quetta Style Bond, was developed.
Reinforced brickwork, brickwork that is reinforced using steel or other suitable material. The reinforcement may be placed in the bedjoints or within a solid concrete or grouted core or through the hole(s) in perforated or hollow bricks.
Snap header, a brick cut in half(to form a unit 102.5 x 102.5 x 65mm) and laid as part of a single wythe.
Stretcher face, the face of a standard brick placed with its length in the horizontal direction of a wall or beam. Generally the longer face of a brick showing in the wall.
Water absorption, the percentage of water by weight absorbed by an oven dried brick (relates to water absorbed by a brick during inclement weather). It is also a measure of brick density.
Wythe, a single skin of vertical brickwork.
NOTES
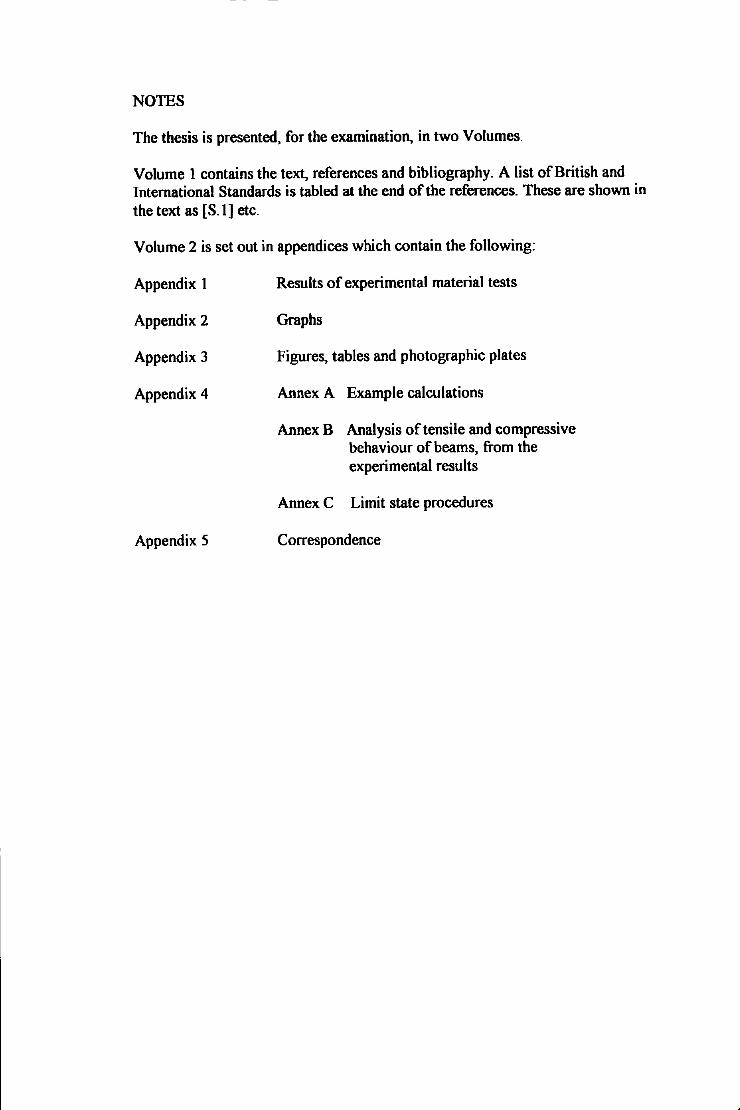
The thesis is presented, for the examination, in two Volumes.
Volume 1 contains the text, references and bibliography. A list of British and International Standards is tabled at the end of the references. These are shown in the text as [S.1] etc.
Volume 2 is set out in appendices which contain the following:
Appendix 1
Appendix 2
Appendix 3
Appendix 4
Appendix 5
Results of experimental material tests
Graphs
Figures, tables and photographic plates
Annex A Example calculations
Annex B Analysis of tensile and compressive behaviour of beams, from the experimental results
Annex C Limit state procedures
Correspondence

NOTATION
'Y partial safety factor
'Ym partial safety factor for material
'Ymb partial safety factor for compressive strength of brickwork
'Yms partial safety factor for strength of reinforcement
'Ymv partial safety factor for shear strength of brickwork
£ strain
c' maximum strain
£oo compressive strain in brickwork in bending
£ bu ultimate compressive strain in brickwork in bending
Ec compressive strain calculated during tension field analysis
£ ex experimental tensile strain
£m strain in brickwork at maximum stress
Est strain in reinforcement at yield
c. tensile strain calculated during tension field analysis
Eu strain in brickwork at failure
Ey experimental tensile strain
p reinforcement ratio= AJbd, often quoted as a percentage
cr stress
cr' maximum stress
cl> nominal diameter of reinforcing bar
cl>sv nominal diameter of shear reinforcement
a shear span
aid shear span ratio (distance between a vertical support
and the nearest load)
b width of beam section
b1 internal width of a shear link
d effective depth; depth to the centre of the reinforcing steel
d1 internal height of a shear link
d2 effective depth of2m beam
d3 effective depth of3m beam
~ effective depth of 4m beam

depth of brickwork in compression; the depth from the top of the beam to the neutral axis
depth of tension zone; the depth from the bottom of the beam to the neutral axis
fb brick unit compressive strength
fc maximum compressive stress of brickwork as calculated from the
prism stress strain plot
feu characteristic compressive strength of grout
fk characteristic compressive strength of brickwork
fk mean compressive stress ofUOP Quetta Style Beam
fm• characteristic compressive strength of brickwork unit across bed face
fmy characteristic compressive strength of brickwork unit across header
face
fmz characteristic compressive strength of brickwork unit across stretcher face
ft flexural tensile strength of brickwork
fv characteristic shear strength of brickwork
fy characteristic tensile strength of reinforcing steel
fyv characteristic tensile strength of shear reinforcing steel
h overall depth of section
k; a constant which is dependant on the shape of the compressive
stress diagram:
k1 brickwork compressive stress factor
k2 depth factor to cetre of compression from top face of beam
m modular ratio= E.n.tenat, I E....t.:naJ 2
n dcld
n. number of tension reinforcement bars
Pbc permissible compressive stress in brickwork in bending
Pst permissible tensile stress in reinforcement
r permissible radius for bending shear reinforcement
Sv spacing of shear reinforcement along member
v shear stress due to design loads
v1 shear stress at first shear failure
v2 shear stress at second failure after first failure
v2 maximum shear stress due to design loads for 2m beams
v3 maximum shear stress due to design loads for 3m beams
2
Vav
Vu]
Vu2
Ymax
z
~
A.t
Asv
Aw BM
c
E
Einitia1
Eb
Eby
Eg
Em
E.
E..cam Ewy
Elcr
Elu
FBI
Fb
Fbc
Fe
F,
FOS
H
I
maximum shear stress due to design loads for 4m beams
maximum average shear stress
shear stress due to dead load
total ultimate shear stress at first shear failure
total ultimate shear stress after first shear failure
maximum mid span deflection
lever arm
cross sectional area of unit of masonry
cross-sectional area of steel in tension
cross-sectional area of reinforcing steel resisting shear forces
cross sectional area of masonry
bending moment
number of courses
experimental compressive force
modulus of elasticity
initial tangent modulus of elasticity (E;)
modulus of elasticity of brickwork
modulus of elasticity of brick unit
modulus of elasticity of grout
modulus of elasticity of mortar
modulus of elasticity of steel
secant modulus of elasticity (E,)
modulus of elasticity of full bedded masonry
flexural rigidity of the transformed cracked section
flexural rigidity of the transformed uncracked section
additional tensile strength in the beam
theoretical tensile force within brickwork
theoretical compressive force within brickwork
total compressive force acting on brickwork
total tensile force acting in the tension reinforcement
Factor of safety: ratio of experimental value/ predicted value
height of masonry
second moment of area
3
Ib second moment of area ofbrickwork
la- second moment of area of cracked section
151 second moment of area of reinforcement in tension zone
L effective span of beam
M design bending moment
M.. applied bending moment
Mbc maximum moment of resistance based on brickwork in compression
M.nax maximum applied bending moment
M.t maximum moment of resistance based on reinforcement in tension
Mt moment due to tensile forces within the brickwork
MOR moment of resistance
NA neutral axis
1/R curvature at midspan
1/Rx curvature at point x
R. elastic design shear strength of reinforced brickwork
R u elastic design shear strength of reinforced brickwork
SX stress in the X direction
SY stress in the Y direction
SZ stress in the Z direction
Tex experimental tensile force
V shear force due to design load
V 2 maximum design shear load for 2m beams
V3 maximum design shear load for Jm beams
V 4 maximum design shear load for 4m beams
v. shear capacity of shear legs
vb shear capacity of the top of shear link
V max maximum applied shear load
VR reinforced shear capacity
Vu unreinforced shear capacity
VUE Shear failure load- Unreinforced in shear and Elastic analysis
VuL Shear failure load- Unreinforced in shear and Limit state analysis
VRE Shear failure load- Reinforced in shear and Elastic analysis
VRE Shear failure load- Reinforced in shear and Limit state analysis
W applied load
Wbc load required to generate Mbc
4
Wb2 load required to generate MJ, in a 2m beam
wb3 load required to generate MJ, in a 3m beam
wb4 load required to generate MJ, in a 4m beam
w. load required to generate M.
ws2 load required to generate M. in a 2m beam
WsJ load required to generate M. in a 3m beam
w .. load required to generate M. in a 4m beam
z elastic section modulus
5
·.--, - '- 'V ' . '
.. \ ,_. r !.
:US:F OF; €ON:IiENTilS
CHAPTER I 13
INTRODUCTION 13
l RE~ORCEDBIDCKWORKBEAMS 13
1.1 THE STUDY 13
1.2 AIMS OF THE RESEARCH 13
1.3 OBJECTIVES OF THE RESEARCH 14
1.3.1 Additional Objectives 14
1.4 BIDCKWORK 15
1.5 RESEARCH INTO RE~ORCED BIDCKWORK 18
1.6 RECENT ATTITUDES TO BIDCKWORK RESEARCH 20
1.7 RELEVANT BIDCKWORK RESEARCH AT THE UNIVERSITY OF PLYMOUTH 21
CHAPTER2 23
CLASSIFICATION OF BIDCKWORK, A CRITICAL LITERATURE REVIEW OF RESEARCH INTO UNREINFORCED AND REINFORCED BRICKWORK AND JUSTIFICATION OF THE RESEARCH STUDY 23
2 INTRODUCTION 23
2.1 CLASSIFICATION OF BRICKS AND MORTAR 23
2.1.1 Bricks 23
2.1.2 Compressive Strengths of Bricks 25
2.1.3 Measurement of Residual Stresses in Clay Fired Bricks 27
2.2 SYNOPSIS OF REINFORCED BRICKWORK BEAM RESEARCH 29
2.2.1 Brebner 1918-1923 29
2.2.2 Withey, Univenity of Wisconsin, 1932 31
2.2.3 The United Kingdom BuUding Research Station 33
2.2.4 Thomas and Simms, BuUding Research Station, 1938 35
2.2.5 Hamann and Burridge, 1939 36
2.2.6 Suter and Hendry, 1975 37
2.2.7 Suter and KeUer, Carleton University, 1976 38
2.2.8 Sinha and Foster, University of Edinburgh, 1978 39
2.2.9 Garwood and Tomlinson, Bolton Institute of Technology, 1980 39
2.2.10 Osman and Hendry, University of Edinburgh, 1982 40
2.3 CORROSION OF REINFORCEMENT WITHIN REINFORCED BmCKWORK 41
2.4 OTHER RESEARCH ON REINFORCED BRICKWORK 42
2.5 CURRENT EXPERIMENTAL INVESTIGATIONS INTO REINFORCED BmCKWORK 42
2.6 SUMMARY OF THE LITERATURE REVIEW 43
2.7 JUSTIFICATION OF THE RESEARCH STUDY 46-
CHAPTER3 49
THE UNIVERSITY OF PLYMOUTH QUETTA STYLE BEAM 49
3 INTRODUCTION 49
3.1 BRICKWORK BEAMS REINFORCED IN THE BED JOINTS 50
3.2 GROUTED CAVITY REINFORCED BRICKWORK BEAMS 51
3.2.1 Variations of Grouted Cavity Reinforced Brickwork Beams 52
3.3 TRADITIONAL BRICK BONDS 53
3.3.1 English Bond 53
3.3.2 Flemish Bond 53
2
3.3.3 Sussex or Flemish Garden Wall 54
3.3.4 Stretcher Bond 54
3.3.5 Heading and Other Brick Bonds 54
3.4 THE SPECMCATION FOR A NEW UOP BEAM FORMAT 55
3.5 DESIGN OF THE UOP BEAM 56
3.5.1 The Appropriate Brick Bond for the Test Beams 56
3.5.2 Modified English Bond 56
3.5.3 Modified Flemish Bond 56
3.5.4 Partial Use of Stretcher Bond 57
3.5.5 The UOP Quetta Style Beam 58
3.5.6 A Scorecard 58
3.6 CONSTRUCTION OF THE FIRST UOP QUETT A STYLE TEST BEAM 59
3.6.1 Construction details
3.6.2 Construction time
3.6.3 Workmanship
3. 7 UOP QUETT A STYLE BEAM MATERIALS AND TESTING
CHAPTER4
MATERIALS, PRISMS, BEAMS AND INSTRUMENTATION
4 INTRODUCTION
4.1 BRICK TYPES AND TESTING
4.2 MORTAR AND GROUT
4.2.1 Mortar
4.2.1.1 Mortar Tests
3
59
60
60
61
63
63
63
64
65
65
65
4.2.2 Cement
4.2.3 Lime
4.2.4 Sand
4.2.5 Water/cement ratio
4.2.6 Steel reinforcement
4.2.7 Grout
4.3 PRISM TESTS
4.3.1 UOP Quetta Style Beam Prism Test Specimen
4.3.2 Prism Test Results
4.4 ANALYSIS OF THE PRISM DATA
4.5 UOP QUETI A STYLE BEAM SERIES AND TESTING
4.5.1 Beam Test Series
4.5.2 Beam identification
4.6 LOADING ARRANGEMENTS
4.6.1 Loading Apparatus
4.6.2 Load application
4.7 INSTRUMENTATION
4.7.1 Measurement of Strains within the Tensile Reinforcement
4.7.1.1 ERSG Specification and Associated Instrumentation
4.7.1.2 Calibrating the ERSGs
4.7.2 Demountable Mechanical Strain Gauge (Demec)
4.7.2.1 Cracking of the Brickwork Under Load
4.7.3 Displacement Gauges
4
66
66
66
67
67
68
69
69
70
71
73
73
75
75
76
77
78
78
79
81
82
83
83
4.7.3.1 LVDT
4. 7.4 Dial Test Indicators
4.8 SAFETY PROCEDURES
4.9 FAILURE MODES OF REINFORCED BRICKWORK BEAMS
4.10 BEAM TESTS
CODES, ANALYSIS AND DESIGN
5 INTRODUCTION
5.1 CODES OF PRACTICE FOR BRICKWORK DESIGN
5.1.1 Historical background
5.2 CURRENT U.K. AND INTERNATIONAL CODES
5.2.1 U.K.
5.2.2 Australia
5.2.3 The United States of America
5.2.4 Eurocode
5.3 LIMIT STATES PHILOSOPHY AND BASIS OF DESIGN
5.3.1 Philosophy
5.3.2 Basis of Limit States Design
5.3.3 Definition of Limit States
5.3.3.1 Ultimate limit states for strength
5.3.3.2 Partial safety factors for brickwork and loads.
5.3.4 Serviceability limit states
5.4 CHARACTERISTIC MATERIAL STRENGTHS
5.4.1 Characteristic compressive strength of brickwork, fk
5
83
84
84
84
86
87
87
88
88
89
89
90
90
90
91
91
92
92
93
93
94
95
95
5.4.1.1 Research results of compression tests on brickwork 96
5.4.2 Characteristic tensile strengths of brickwork 98
5.4.2.1 Direct tensile strength 98
5.4.2.2 Characteristic nexural strength of brickwork, f~a 98
5.4.3 Characteristic shear strength of grouted cavity beam, f, 100
5.5 BEAM BEHAVIOUR AND ELASTIC ANALYSIS 100
5.6 METHODS OF ANALYSIS AND DESIGN OF JlEINFORCED BRICKWORK BEAMS 101
5.6.1 Assumptions and equations 102
5.6.2 Relevance of the elastic equations to the UOP Quetta Style Beam 103
5.7 LIMITSTATESMOMENTOFRESISTANCE 107
5.7.1 Assumptions 107
5.7.2 Stress and strain diagrams 108
5. 7.3 Limit states equations for Oexural behaviour at failure 109
5. 7 .3.1 Failure by yielding of the steel in tension 110
5.7.3.2 Failure in compression due to crushing of the concrete 110
5.8 SHEAR STRENGm IN THE UOP QUETTA STYLE BEAM 111
5.8.1 Shear behaviour Ill
5.8.2 Shear stress analysis to be used in the UOP Quetta Style Beam 114
5.8.2.1 Fundamental equations ofshear stress 115
5.9 CODE DESIGN EQUATIONS 117
5.10 DEFLECTION 118
5.10.1 Introduction 118
5.10.2 Denection calculations- Annex C [S.3) 119
6
5.11 ASSUMPTIONS 122
5.12 ANNEX 5- EQUATIONS SELECTED FOR TEST BEAM ANALYSIS 123
5.12 1 123
Bending -Elastic/permissible stress
5.12.2 Bending -ultimate limit state
5.12.4 BS 5628 Part 2 [S.3] -shear equations
5.12.5 DeOection
CHAPTER6
ANALYTICAL MODELLING USING LUSAS
6 INTRODUCTION
6.1 AIM
123
123
124
124
125
125
125
125
6.2 OBJECTIVES 126
6.3 FINITE ELEMENT MODELING 126
6.4 MODEL A- MATERIALS, GEOMETRY AND LOADING 127
6.4.1 Model A- Short test section of UOP Quetta Style Beam prism 127
6.4.1.1 Model description and applied loading
6.4.1.2 Material properties
6.5 MODEL A RESULTS
6.5.1 Model A, 440mm span, stress values
127
128
129
129
6.5.1.1 Model A, 440mm span beam, first course (2 elements high) 129
6.5.1.2 Model A, 440 mm span beam, second course (4 elements high) 130
6.5.1.3 Model A 440 mm span beam, four course (8 elements high) 130
6.5.2 Initial conclusions on the use of LUSAS 131
7
6.6 MODELS BAND C, HALF MODEL OF A UOP QUETIA STYLE BEAM AND AN EQUIVALENT REINFORCED CONCRETE BEAM 131
6.6.1 Model description 132
6.6.2 Supports 133
6.6.3 Materials 133
6.6.4 Loading 133
6. 7 ANALYSIS OF MODEL B. HALF MODEL OF UOP BEAM 134
6. 7.1 Introduction 134
6.7.3 Conclusions of the LUSAS analysis oftbe UOP Quetta Style Beam 136
6.8 MODEL C- REINFORCED CONCRETE BEAM- HALF MODEL 137
6.8.1 Results 137
6.8.1.1 Bending stress contours 137
6.8.2 Comments 139
6.8.3 Conclusions on the comparison between tbe unreinforced UOP Quetta Style Beam, Model A, and the reinforced concrete beam, Model C 139
6.9 ORTHOGONAL STRESS CONTOURS 139
6.10 CONCLUSIONS 140
CHAPTER7 141
ANALYSIS OF BEAM TESTS, PREDICTIONS AND COMPARISONS 141
7 INTRODUCTION 141
7.1 CALCULATIONS 142
7.2 TEST RESULTS 142
7.2.1 Introduction 142
7.2.2 Failure loads and failure modes 142
8
7.2.2.1 Flexural failure
7 .2.2.2 Shearfailure
7.3 ANALYSIS OF GRAPHS
7.3.1 Neutral axis
7 .3.2 DeHection
7.3.3 Strain within the longitudinal tensile reinforcement
7.3.4 Crack patterns
7.3.4.1 Crack width
7.4 PREDICTIONS AND COMPARISONS
7.4.1 Introduction
7.4.2 Elastic predictions
7 .4.3 Limit States predictions
7.4.4 Predictions and comparisons
7.4.4.1 Failure modes and factors of safety considering bending and shear
7.4.4.2 Predicted moments of resistance and experimental moments
7.4.4.3 Second moment of area and mid-span deHection
7.4.4.4 Neutral axis predictions and comparisons
7.4.4.5 Tensile steel reinforcement strains and brickwork strains
7.4.4.6 Compressive strengths- prisms and beams
7.5 CONCLUSIONS
CHAPTERS
PARAMETRIC STUDY
8 INTRODUCTION
9
143
143
144
144
145
146
147
148
149
149
149
150
151
t5r
154
156
158
158
159
161
164
164
164
8.1 AIMS AND OBJECTIVES 165
8.1.1 Aims 165
8.1.2 Objectives 165
8.2 CHARACTERISTIC AND DESIGN COMPRESSIVE STRENGmS 166
8.2.1 Bricks and brickwork compressive strengths 166
8.2.2 Prism tests 167
8.2.3 Self-weight effects 169
8.2.4 Brickwork potential 170
8.2.5 Conclusions 170
8.3 SHAPE OF THE COMPRESSIVE STRESS AND STRAIN DIAGRAMS 171
8.3.1 Conclusions 175
8.4 FORCES IN mE TENSION AND COMPRESSION ZONES AND mE NEUTRAL AXIS DEPm 175
8.4.1 Introduction 175
8.4.2 Location of the neutral axis 177
8.4.2.1 Tensile resistance using Methods 1 and 2 178
8.4.2.2 Analysis of Method 1 Results 179
8.4.2.3 Analysis of Method 2 Results 185
8.4.2.4 Relevance of UOP results and the study by Withey [30) 187
8.4.3 Neutral axis equation 187
8.4.4 Conclusions 188
8.5 MODULUS OF ELASTICITY 190
8.5.1 Conclusions 191
8.6 BEAM STIFFNESS AND DEFLECTION 191
10
8.6.2 Conclusions 195
8.7 SHEARFAILURE 195
8. 7.2 Conclusions 198
8.6 COMPARATIVE BEAM BEHAVIOUR 199
8.6.1 Conclusions 201
8. 7 DISCUSSION 202
8.7.1 Equations 203
DISCUSSION 205
9 INTRODUCTION 205
9.1 OVERVIEW OF THE UOP RESEARCH 205
9.2 OVERVIEW OF THE RESEARCH BY OTHERS 210
9.2.1 Comments on statements by others 210
9.2.2 Statements of other researchers where there is agreement 212
9.3 SUMMARY 213
CHAPTER 10 215
CONCLUSIONS 215
10 CONCLUSIONS ON THE STUDY OF THE BEHAVIOUR OF THE UOP QUETTA STYLE BEAM 215
10.1 MAIN CONCLUSIONS
10.2 OTHER CONCLUSIONS
10.2.1 Conclusions from tbe analysis oftbe tension and compression zones and neutral axis depth. Some of these require further study, as indicated in the main
215
216
conclusions 216
10.2.2 Conclusions from the analysis ofstrength 217
10.2.3 Conclusions on the analysis of stiffness and serviceability criteria 218
11
·-'
FtiRTHERSTUD:\'
U ~RJ;AS,OF FlJR'FHER S'FIJD¥
IREF·EREN€E"S
ii
119
219
'll9
221
CHAPTER I
INTRODUCTION
1 REINFORCED BRICKWORK BEAMS
Brickwork is the art of building in bricks and mortar, Figure 1.1. Reinforced brickwork
beams are constructed by placing the reinforcement in the horizontal bed joints or within a
solid core of concrete or grout, Figure 1.2.
1.1 THE STUDY
The study originated from the premtse that the strength of reinforced grouted cavity
brickwork beams would be enhanced if bricks replaced some of the core, Figure 1.2f
1.2 AIMS OF THE RESEARCH
The aims of the research for the Ph.D. thesis were: -
• to develop a new format for grouted cavity brickwork beams, reinforced to resist
flexural and shear forces. (The format to provide an integral arrangement of:
brickwork, grouted core and reinforcement).
• to analyse the performance of the new formatted reinforced brickwork beams when
subjected to in-plane loads.
13
• to develop appropriate design recommendations and practical design guidance.
1.3 OBJECTIVES OF THE RESEARCH
In order to achieve the above aims, the following objectives were set:-
• to carry out an in-depth critical review of related literature.
• to construct, using a new format, a series of full-sized simply supported reinforced
brickwork grouted cavity beams.
• to test, examine and analyse the relevant properties of the materials used to construct
the beams.
• to test, examine and analyse the flexural strength and deformation of the beams.
• to carry out a study of a range of parameters.
• to identify any limitations in the existing design theories for reinforced grouted cavity
brickwork beams.
• to develop the method of design for the new beam format, having a conjoint system
of clay bricks and grouted core.
1.3.1 Additional Objedives
Towards the end of the research study the opportunity arose to carry out a limited study using
LUSAS Finite Element Analysis (FEA) software. The University of Plymouth (UOP) has the
14
licence to use an academic version of the software. Access to a more comprehensive version
ofLUSAS was also obtained.
This provided further objectives:
• to compare the elastic bending stress contours between the reinforced grouted
cavity brickwork beam developed by the University ofPiymouth and a reinforced
concrete beam of comparable dimensions.
• to compare the elastic bending stress contours from the FEA with those from the
experimental and analytical studies of the UOP beam.
1.4 BRICKWORK
Bricks were initially used to fonn brickwork in the early Egyptian dynasties [1]. Handisyde
and Halseltine [2) state that originally bricks were hand-made from sun-dried mud and also
that fire burnt clay has been used for 5000 years or more [2].
Buildings built circa 1300 B. C. at Choga Zambil, Iran [2), provide evidence that brickwork is
an enduring and versatile material. To resist cracking early constructors sometimes
reinforced the bricks by the addition of straw (3]. The Romans developed a characteristic,
thin kiln-burnt brick using sand or clay [1]. Two advantages of the firing were increased
strength and durability [2]. Variations in appearance were also obtained through the firing, by
the use of different clays and by adding colour pigments to the base materials prior to firing.
15
The attractive appearance, versatility, compressive strength and durability of unreinforced
brickwork have been exploited in an extremely wide range of projects [2, 4 and 5], including
domestic, leisure, commerciaL industriaL religious and government sites, transportation
networks, water treatment plants, sewage and sewerage disposal systems. The structural
forms have included low rise and multi-storey/multi-bay buildings, e.g. a IS storey
residential block in Essex [29], churches, castles, museums, bridges, retaining walls and
storage tanks. Slenderness of walls and columns can be overcome by thickening these
elements or by the use of reinforced or pre-stressed systems.
Brickwork expands over its lifespan as a result of the elastic properties and creep of the
materials involved. This movement can induce tensile and shear cracking, but as Professor
Heyman has stated, "It is the natural state of brickwork to be cracked, but its strength is
unaffected by such natural and unavoidable defects" [6]. This is evidenced by the long
standing cracks, which can be seen in many old buildings. Also brickwork can crack when it
is subjected to loads, which induce bending. The cracks form when the induced tensile
stresses exceed the very limited tensile resistance of brickwork.
In the nineteenth century, the advantages of placing steel reinforcing bars within the
brickwork were identified. The ductile steel was used to prevent tensile failure and
complemented the brittle compressive strength of the brickwork. Additional benefits were the
ability to accommodate flexural deformation and the provision of increased shear strength. A
further consequence was the enhanced safety of a structure, in the case of incipient collapse.
16
In the early 1800s Sir Marc lsambard Brunei [7] became a leading proponent of reinforced
brickwork. He applied steel hoops to reinforce a brickwork chimney shaft. Two caissons
were built in 1825 for the Wapping-Rotherhithe tunnel [8]. Brunei incorporated vertical and
horizontal reinforcement into these caissons, to enhance serviceability and strength. The
mechanics of reinforced brickwork were first analysed in 1872 [9].
Paul Cottancin, a French structural engineer and contractor, included reinforced brickwork
within a number of unusual buildings in the period 1889 to 1905 [ 11 and 12]. Examples of
his work were used for a church in Sidwell Street, Exeter; a brickwork water tank in Newark
on-Trent and foundations to boilers and a pump house in Duck Island, St James's Park,
London. For the Sidwell Street church, 530mm wide cavity walls were constructed using
perforated bricks for each skin. Wire reinforcement, 4mm in diameter, was passed through
the perforations and 40mm x 9mm flat steel plates were introduced at points of stress
concentration. Circa 1930, the North West Indian town of Quetta suffered earthquake
devastation. It was rebuilt using the energy absorbing qualities of reinforced brickwork. One
of the bonding patterns used for the construction of walls became known as "Quetta Bond"
[2, 8 and 13].
Reference is made to the particular use in India and Japan of reinforced brickwork to resist
high lateral forces, particularly those induced by earthquake shocks. In 1922 Brebner wrote,
"in all, nearly 3,000,000 sq. ft (of reinforced brick masonry) have been laid in the three years
prior to 1922" [13].
17
At the end of the 19th century and beginning of the 20th century, the performance of
reinforced brickwork was used to justify the adoption of reinforced concrete [10].
1.5 RESEARCH INTO REINFORCED BRICKWORK
Prior to the twentieth century, research into unreinforced and reinforced brickwork was
limited. The main source of information for the designer was the practical and design
knowledge developed by trial and error. Brunei and Paisley initiated research into reinforced
brickwork in the early 1800s, [7 and 8]. However design information on reinforced
brickwork, by way of specific codes of practice, only became available during the second
half of the last century. In 1966 the Brick Industry Association, (BIA), [2], commented that,
"during the period 1880 to 1920 little use seems to have been made of reinforced brick
masonry and experimental investigation of this type of construction appears to have been
practically discontinued". Evidence of relevant research in the 1920s and 1930s is found in a
range of international studies [14, IS, 16, and 17]. Following the Second World War,
interest in the use of reinforced brickwork in structures declined [18]. Reinforced concrete
and structural steelwork became the preferred structural materials. There was increased
understanding and application of the behaviour of these two materials. Linked to this
knowledge were: the developments of new methods of analysis and design; increased
availability of materials; associated construction methods and assumed relative cheapness.
The brick industry, concerned with mass production, concentrated its efforts into supplying
bricks for unreinforced brickwork. The bricks were, and continue to be, manufactured as
18
solid, frogged, perforated or hollow (cellular), Figure 1.3. The main uses were as wall
cladding and load bearing walls and columns.
The advantages of the flexibility and structural integrity of reinforced brickwork in seismic
areas was widely acknowledged during the 20th century [18]. The construction format, for
appropriate structures, was adopted in Asia, the U.S.A. and New Zealand [18). The second
hat f of the 20th century is notable for the development of research, internationally, into many
aspects of brickwork. There was a significant revival in the use of and research into
reinforced brickwork in the early 1960s [ 18]. This is supported by the extensive range of
research activities and of related publications produced by the U.K. Brick Development
Association, (BDA), including a set of'Engineers' File Notes' [19]. Bell nevertheless states,
"before, however, the full potential of reinforced brickwork can be realised, the attitudes of
designers and site personnel have to be considered" [10). The author of this thesis has also
encountered reluctance by architects and building surveyors to accept reinforced brickwork
as an acceptable structural medium. The use of and research into approved analytical
methods and design philosophies have been applied to reinforced designs. Brickwork
buttressed walls of large mass have been superseded by thick, hollow diaphragm and finn
walls ofunreinforced and reinforced brickwork. Unreinforced and reinforced brickwork has
been used within high-rise buildings. Retaining walls, portal frames, bridges, beams,
columns, walls, water tanks, stairs etc. have all been constructed using reinforced brickwork
[18, 22 and 23).
19
The revival of interest into the behaviour of reinforced brickwork has been supported, as
shown from the range of references provided throughout this text, by research in the U.K.,
Canada, the USA, Australia, Switzerland and other countries. This has assisted the
production of national standards, including, in 1985, the British Standard BS5628 Part 2,
[S.l]. This was the first individual British Standard for Reinforced and Prestressed Masonry.
The formation of an international community of researchers, designers and contractors led to
a significant increase in the availability of reference material and a cross-fertilisation of
ideas. There are publications, which provide a useful review of the topic [18 and 22]. Many
research centres were established which have assisted the production of new codes, the
application of new techniques and the development of a new understanding of reinforced and
prestressed brickwork and other masonry units [24]. In the U.K., the primary establishments
have been the British Ceramic Research Association and the Building Research
Establishment {BRE). Their work has been complemented by studies in many U.K.
universities [25].
1.6 RECENT ATTITUDES TO BRICKWORK RESEARCH
New information on reinforced brickwork studies is limited. The following give an indication
of the changes that have occurred since the 1970s and 1980s.
Of note are the papers by Moore, "Masonry Activity at BRE", in 1988 [26] and by de Vekey,
"Current Masonry Research and Development at BRE", in 1992 [27]. The only reference to
reinforced masonry in these publications was related to a statement concerning a proposal for
20
a European Code for Masonry. There was no indication that the BRE were involved in
reinforced brickwork research. West in the 101h Anniversary Address to the British Masonry
Society, in 1996 (28) stated, "The development of masonry solutions for long spans should
be resurrected. This requires consideration of the whole field of reinforced and prestressed
masonry". Also of note is the absence of reference to reinforced masonry in a paper by
Hendry, "Ways forward for Masonry Construction in the U.K., 2001" (29).
l. 7 RELEVANT BRICKWORK RESEARCH AT THE UNIVERSITY OF PLYMOUTH
The work described in this thesis evolves from initial studies into the behaviour of
unreinforced and reinforced brickwork, carried out at Plymouth Polytechnic, now designated
the University of Plymouth. The first brickwork studies at the UOP, in the early 1970s, were
on single skin clay brickwork beams reinforced in the bed joints (30 and 31 ], together with
associated studies on unreinforced beams and into the properties of the individual materials
i.e. bricks and mortar. Studies were subsequently carried out on laterally loaded walls, with
and without fenestrations (21], and on reinforced brickwork portal frames (23). The focus
was on the elastic, ultimate and serviceability limit states of the structures. This background
provided a foundation for the study of reinforced brickwork grouted cavity beams.
As part of the study a critical review of the research into unreinforced and reinforced
brickwork was carried out This is shown in the following Chapter together with:-
• a statement on the need for the research.
21
· .. "·
•· a: statement why the stUdy is. Worthy. of'a: 1PhD;, which :includes: an indication of. the
oontribution·to knowledge which:has,not.beeneStablished by,preyio\Jsres~ch!
1.'.
I'
I' '
CHAPTER2
CLASSIFICATION OF BRICKWORK, A CRITICAL LITERATURE REVIEW OF RESEARCH INTO
UNREINFORCED AND REINFORCED BRICKWORK AND JUSTIFICATION OF THE RESEARCH STUDY
2 INTRODUCTION
In this Chapter the classification and properties of bricks and mortar are defined. The
literature review includes research carried out on: bricks and bed joint mortar; sand used in
the bed joint mortar; relevant unreinforced brickwork sections subjected to compressive,
tensile and shear forces and the behaviour of reinforced brickwork beams. Reference has
been made to studies on reinforced brickwork columns and walls, extracting information on
the behaviour of bricks and brickwork under load. Also discussed is the corrosion of
reinforcement within reinforced brickwork.
2.1 CLASSIFICATION OF BRICKS AND MORTAR
2.1.1 Bricks
A standard brick is a masonry unit with approximate dimensions (mm) of215 x 102.5 x 65,
Figure 1.1. It is subject to tolerances as defined in the British Standard appropriate to its base
material e.g. BS 3921 for clay units [S.4]. There are three general classifications: common,
facing and engineering.
23
Bricks are also designated according to frost resistance and maximum soluble salt content.
Neither of these properties is considered within this study.
The main properties of the brick units, which are required for load bearing brickwork design,
are the compressive strength of the brick unit, water absorption and initial suction rate. The
former has been identified as one of the most important factors which affects the behaviour
of clay brickwork subjected to compressive forces e.g. vertically loaded columns and walls
and reinforced clay brickwork subject to bending, as noted in BS 5628: Part I, Clause 23
[S.6] and BS 5628: Part 2, Clause 22.4.2.1. [S.3]. The compressive strength of the· brick unit
is obtained by applying an axial load to the bed face, Figure 1.1. The characteristic
compressive strength of brickwork (fl<) is a function of the compressive strength of the brick
unit and of the mortar designation, Tables I and 2 in BS 5628: Part I [S.6]. Other
compressive strengths, for the same brick unit, could be obtained by applying loads to the
other two faces of the brick i:e. to the stretcher and header. This aspect is discussed in the
following section. Water absorption is identified to be the controlling factor for the
characteristic flexural strength (fkx)of brick for laterally loaded clay brickwork elements e.g.
walls, subject only to bending, BS 5628 Part 1, Clause 24 [S.6]. The initial suction rate of a
brick controls the amount ofmoisture that is transferred from the mortar to the brick as the
mortar is laid and as successive brick courses compress the mortar joint.
The characteristic.compressive strength of clay bricks can vary from 5 N/mm2 to strength of,
circa, 200 N/mm2. Figure 2.1 (which is Figure 1, extracted from BS 5628Part 2 [S.J]) covers
24
a limited range of? to 100 N/mm2• The water absorption for clay bricks is in the range from
less than S% to greater than 12%, Table 3 [S.6). Retention of water in the mortar can be
achieved by initially wetting the bricks, prior to laying, and by the use of lime.
2.1.2 Compressive Strengths of Bricks
A number offactors influence the compressive strengths of bricks:
• the direction of loading. In situations where the uniaxial compressive forces within a
brickwork unit are applied to more than one face it is necessary to examine the
compressive strength of the brick when loaded separately on each of the three faces.
Biaxial forces are not considered.
• the load paths of compressive forces (these are likely to be more complex for a
perforated brick than for a solid or frogged brick).
A number of reports on studies into brickwork have been published, which have included test
results of different bricks and prisms compressed in different directions. A summary ofwork
by Robson et al [33], Rad [34), Pedreschi and Sinha [73], Garwood [36] and Powell and
Hodgkinson [37] is shown in Tables 2.1 and 2.2. The bricks, produced by different
manufacturers using different clays, were subjected to compressive loading on different
faces. The three faces are shown in Figure l.1a and are denoted as bed, stretcher and header.
The values listed are the mean of a standard sample, normally ten. The values quoted for the
25
compressive strength when loaded on the bed is indicative of the properties of the natural
clay used and the manufacturing process. In all cases the strength on the stretcher face edge
and on the header are less than the strengths on the bed face. Also the bricks in all but two
samples when loaded on the header face were shown to be weaker than those loaded on the
stretcher face. Figure 2.2 shows the plot ofthe results for a range of bricks tested. Figure 2.3
is a plot of results of 3-hole perforated bricks. The reduction in compressive strength when
comparing bed to stretcher strengths varied from 8% to 78%. The mean and standard
differentiations were 49.6% and 18.4 respectively. Between bed to header the figures were: a
reduction from 17% to 87%; a mean of61.5% and a standard deviation ofl9.8.
Three general points came from suggestions of the above researchers which would be worthy
of further examination, additional to this study [37]:
1. the smaller the loaded area the lower is the compressive strength (load/unit area).
2. the shorter the distance between load platens the higher is the compressive
strength.
3. there is a possible relationship between the number and layout of the perforations
on the load path and the positions of local stress concentration.
Also of particular significance are the results produced by Rad [34]. Tests were carried out
on core samples, taken from perforated bricks, of diameter 16.94 mm (0.667 in.) and length
approximately 33.02mm (I .3 in). Since the samples were virtually identical in size the
observations stated above, in 2. and 3., would not apply to the tests by Rad. One set of
26
samples (five cores were used for each set) followed the trend shown by other researchers
that the compressive strengths in numerical order were bed, stretcher and header. The second
set showed the numerical order to be bed, header and stretcher. Of note is the fact that by
testing cores the strength when loaded on the headers was 62% larger than the strength on
stretcher. This is significantly out of step with the results produced by other researchers,
where full sized units were used. Since all of these tests were on solid core specimens, taken
from bricks from the same manufacturing batch, then it is necessary to consider why any of
the results should be significantly different. It is necessary to examine the manufacturing
process of bricks. Clay bricks are produced by using clay extracted from the ground. This is
processed prior to mixing and blending. The final mixture: is extruded; cut to produce the
required unit size; stacked on pallets; heated to a high temperature and finally allowed to cool
slowly. It is reasonable to assume that variable tri-axial internal stresses will be developed
during the processes of extrusion, cutting, stacking, heating and cooling.
2.1.3 Measurement of Residual Stresses in Clay Fired Bricks
The presence of residual stresses in clay fired bricks was confirmed by Sassu [38]. In
carrying out the tests three different extensometer techniques were used: the complete cutting
method; the hole-drilling method and the ring core method.
27
In the discussion paper of the tests Sassu stated:
a "All three tests yield values of residual tensile stress which are quite high relative to
the material strength (in the range 1.0-1.4 N/mm2}, high enough in fact to influence
the cracking pattern and load bearing capacity of the brick itself'.
b "The cutting tests revealed a moderate dependence of the surface residual stresses on
the current state of neighbouring areas".
c "The hole drilling tests show that residual surface stresses do not depend significantly
upon the point of measurement, but samples that had undergone prior ring core
testing showed less residual stress".
d "The ring core measurements revealed significant variation m residual stresses
through the thickness of the brick, the highest value being at the surface where tensile
stresses reached a maximum and then, at a depth of only a few millimetres, the value
reverses sign".
In conclusion Sassu stated, "The measurements of residual stresses in fired clay bricks
obtained through the three different extensometer techniques revealed generally high stress
values, so high, in fact that their effect upon the load bearing capacity of the brick cannot be
considered negligible".
The tensile strengths of the bricks tested were in the range l.0-1.4 N/mm2. This clarifies the
statement 'so high' in the conclusion with respect to tension. Unfortunately there is no
reference to the compressive bed strength of the bricks used.
28
Coring bricks, to obtain test samples, is time consuming and expensive but tests on such
specimens might provide further insight into the structural properties of clay brick units.
2.2 SYNOPSIS OF REINFORCED BRICKWORK BEAM RESEARCH
This section examines research studies that have been carried out on topics related to this
thesis, i.e. on brickwork beams reinforced in the bed joints and the more complex reinforced
grouted cavity brickwork beams. Examination of test results is evaluated and, where
possible, their methods of analysis are identified. Some of the experimental data is presented
in tabular form, Tables 2.3 - 2.11. This provided the opportunity to make direct comparisons
between the historic work and the results presented for this thesis.
2.2.1 Brebner 1918-1923
Sir Alexander Brebner undertook the first recorded systematic investigation of reinforced
brickwork in India in 1918. His work was a study of reinforced brickwork slabs and beams,
reinforced in the bed joints. The results were published in 1923 [13]. Brebner carried out 282
tests on reinforced brickwork beams and slabs, simply supported, continuous and
cantilevered. Additionally he studied the behaviour of suspended brickwork walls and carried
out fire tests on various reinforced brickwork members during the period 1918-1922.
Comparative tests were performed on similar reinforced concrete and composite reinforced
brickwork and reinforced concrete beams.
29
Brebner concluded:
• reinforced brickwork slabs may be designed according to reinforced concrete theory.
In the cases of ordinary residences, offices and the barrack type building commonly
found in India, the limiting stresses in the reinforced brickwork might be taken as 138
N/mm2 for steel in tension and 2.4 N/mm2 for the brickwork in compression. The
latter is reduced to 2.1 N/mm2 in the case of bigger slabs.
• the theory accepted by the French Government, which gives the percentage 'p' of
reinforcement, required in cross-reinforced concrete slabs may be taken as applying
to cross-reinforced brick slabs.
• in cantilevers the stress in steel should not exceed 110 N/mm2. Reinforced brickwork
l:!eams may be designed according to reinforced concrete theory. The limiting stresses
should be 110 N/mm2 for steel in bond between steel and mortar, and 0.4 N/mm2 for
shear in brickwork. The value of 'm', the modular ratio of steel to brickwork, may be
taken as 40.
Considering the above it is noted that:
• the brickwork was of low strength - the compressive strength, of 2.4 N/mm2 for the
brickwork, as quoted above, is very low. This is at the bottom end of the range for
brickwork used in the U.K., as shown in BS 5628 Part 2, [S.3].
• discussion on the bond formats used in the construction of the beams was not
provided.
30
Brebner immediately applied his experience to extensive governmental construction in the
Patna (Bihar) district of India. As a result reinforced brickwork was adopted for use in many
commercial and residential buildings throughout that country. For his tests Brebner used
ordinary bricks and mild steel bars. He found that native workers became expert at laying
brickwork after 7-10 days practice. Many of these structures have been subjected to severe
earthquakes. Subsequent surveys have shown residual stability to be high.
Publication ofBrebner's work brought immediate interest from other countries. One ofwhich
was the U.S.A, where reinforced brickwork was the subject of extensive investigation and
practical construction application. Much of the work has been sponsored by the Brick
Manufacturers Association of America, which, through its National Brick Manufacturers'
Research Foundation established a Reinforced Brick Masonry Board in 1932.
2.2.2 Witbey, University of Wisconsin, 1932
Professor Withey, University of Wisconsin, 1932, presented a paper [39] describing tests on
twenty-five brick 2.44m span masonry beams, loaded at third points. Three widely differing
types of brick, the Chicago, Waupaca and Streato, were used. Varying percentages of tension
steel (0.5 to 2.3 percent) were placed in the bed joints and shear reinforcement was used.
Most failures occurred in tension or diagonal tension, with only three failures in compression
recorded. He concluded that it was possible to develop a high degree of both flexural and
shear strength in reinforced brickwork beams, provided proper attention was paid to: mortar
bond; coursing; amount and arrangement of reinforcement and filling of the joints. He further
31
stated that the formulae used for reinforced concrete design, with appropriate factors, could
be used to calculate the elastic stresses and deflections of reinforced brickwork beams.
It is interesting to note that the mortar used with a 1:3: 12 lime:cement:sand mix had an
average compressive strength of 20 N/mm2. These proportions in the U.K would not
generally achieve that strength. A 1:l/4:3 mix would have a minimum strength of20 N/mm2.
Commenting on the resistance to compressive and shear stresses Withey found:
• with the 1:3:12 lime:cement:sand mortar used in these tests, shear strengths of0.64,
0.72 and 1.00 N/mm2 were developed in the beams, which were without stirrups.
• with proper design of stirrup and longitudinal reinforcement, coefficients of
resistance, Mlbd2, in excess of 3.64 and maximum shear stress, 'v', in excess of 1.38
N/mm2, were obtained using all three varieties of brick.
• the extreme fibre compressive stress in the brickwork calculated at diagonal tension
failure in the reinforced brickwork beams built with one type of brick was over 13.8
N/mm2, whereas the ultimate strength of brickwork walls (2. 745m high and l.830m
long) built in the same brick as reported by the Bureau of Standards was about 4.5
N/mm2 on slenderness ratios between 9 and 13.5. With a stronger brick this
difference was not so marked.
• proportions of neutral axis depths were in the range of 0.33 - 0.55 from measured
strains and 0.33 - 0.53 from calculations.
32
The results of these tests are summarised in Tables 2.3b and 2.4a and b. The results were
analysed using standard reinforced concrete formula and modifying the constants for use
with brickwork. Withey stated that, "the steel stresses computed from strain are much less
than those calculated from moment due to the fact that there was considerable tension carried
by portions of the masonry at the uncracked sections, whereas in the stress computations
based on moment none is assumed to be taken by the brickwork in tension".
Within his paper Withey reported on tests carried out by Parsons, Stang and McBurney (40],
working at the Bureau of Standards. They used two types of bricks and arrived at similar
conclusions. They also varied the bond, and measured, at the same time, the ultimate strength
and elastic modulus of six trios of brickwork piers, 915mm high, and each trio representing a
different bond of the two types of brick. The tests showed that the elastic modulus varied
according to joint orientation, thus suggesting that joint orientation should be considered
when deciding on the elastic modulus for the brickwork.
2.2.3 The United Kingdom Building Research Station
The first modem masonry research in the UK was by the Building Research Station (BRS),
published in 1938 [41]. It is a summary of an investigation originally carried out for an
individual brick maker. In these tests three types of beam were tested, each containing four
bars in the lowest bed joint. Two of each type were reinforced with 6.4mm diameter rods and
tested over a l.220m span, and another pair, reinforced with 9.5mm diameter rods was tested
over a 1.830m span. The ends of the reinforcement bars were not bent up or otherwise
33
anchored and shear reinforcement was not provided. The top surface of the beam was
covered with a 12.7mm layer of mortar. In addition to the beam tests the compressive and
transverse strengths of the bricks on the flat and of mortar-bonded pairs ofbricks on edge and
on end were determined, and the bond strength in double shear and tension was measured,
Collin [ 42]. A preliminary test showed that optimum mortar bond was attained by dipping
the bricks in water before they were laid.
The BRS report stated:
• "The ultimate loads sustained by the beams and the calculated steel stresses at failure
show that in only two cases were the failing loads less than those calculated on the
basis of full development of the yield strength of the steel reinforcement. In fact, in
most cases it appears that the yield point of the steel was appreciably exceeded. A
similar result has been obtained previously with reinforced concrete beams with very
low percentages of steel.
• In one case the failing load was reduced considerably as the result of shear failure,
although the shearing stress was only about 0.4 Nlmm2. In other beams shearing
stresses of0.6 N/mm2 to 0.8 N/mm2 were developed.
• At a theoretical steel stress of 124 N/mm2 the deflections were in all cases less than
one two thousandth of the span. At ninety percent of the failing load the strains at the
top surfaces of the beams correspond to maximum stresses in the brickwork of less
than one half of the ultimate crushing strength of the bricks.
34
• at low loads the strains on the underside of the beams agreed reasonably well with
those on the top surface. After the incidence of cracking, however, the strains on the
lower surface were very variable, as would be expected. In general, failure was the
result of steel yielding. In the case of three beams considerable shear cracking
occurred at the end ofthe test.
• From the point of view of strength, the reinforced brickwork beams compared quite
well with corresponding reinforced concrete beams. It is important, however, to see
that the joints are completely filled".
2.2.4 Thomas and Simms, Building Research Station, 1938
Thomas and Simms [43] reported on the work carried out at the Building Research Station.
No attempt was made to justify test data. Thirty-eight beams were tested. In the light of
current knowledge the performance of these beams can be assessed. A sample of the results
of these tests is shown in Tables 2.Sa, b and c and Table 2.3b. Although no analysis was
performed, the report thoroughly describes the failure mechanisms of the beams. Most of the
beams failed in diagonal tension. It was noted that the presence of heavier tension steel
reduced the tension cracking at mid-span. Diagonal tension cracks appeared at 60-90% of the
failure loads near to the support. They propagated, with increasing load, until they ranged
from the support to the load points. The cracks were normally confined to mortar joints. It
was also noted that additional shear resistance was provided by diagonal compression
between the load points and supports. It was suggested that this resulted in an arching action
being generated between the supports. This enabled the load to be increased until a second
35
diagonal tension failure occurred above the first. This second failure was obtained in all cases
and continued beyond the support developing to a failure of the brick-mortar bond along the
top or bottom bed joint. The test series also showed the maximum compressive stresses
obtained from the beams were of the same order as those generated in complementary pier
tests.
2.2.5 Bamaoo and Burridge, 1939
Hamann and Burridge [32] tested a series of brickwork beams, reinforced in the bed joints,
and prism tests in 1939 for the Clay Products Technical Bureau. This investigation was
undertaken to assess the performance of reinforced brickwork beams in flexure. Medium and
high strength bricks were used in beams that were externally reinforced to prevent shear
failure. Tests were carried out on prisms representing the compression zone of the beams to
establish values for the modulus of elasticity and the compressive strength of the section.
Hamann and Burridge's tests:
• confirmed that reinforced brickwork members subjected to bending behave elastically
and that therefore the accepted theories and formulae for flexure are applicable to
reinforced brickwork.
• indicated that previous suggestions as to mechanical characteristics at working loads
of British brickwork were definitely on the conservative side and that whilst the
bricks had only very moderate strength, the suggested maximum permissible stress of
1.4 N/mm2 is reasonable for design purposes (subject to special consideration of the
36
modular ratio), with high strength bricks much higher compressive stresses (of the
order of 3.5-4.1 N/mm2) and much lower modular ratios (of the order of 15) are
desirable.
• confirmed that, in reinforced brickwork members subject to flexure, the primary
criterion is that of shear resistance, and that the ultimate compressive strength of the
brickwork only becomes a decisive factor when special provision against shear is
made.
• results suggest that at certain stages of the loading either the modular ratio or the
plastic yield undergoes change.
The results of this investigation are summarised in Tables 2.3b and 2.6. Hamann and
Burridge adopted the same methods of elastic analysis as those used by Withey. However, no
attempt was made to assess perfonnance using a parabolic stress curve.
Z.Z.6 Suter and Beodry, 1975
Suter and Hendry (45] investigated and reported on the shear strength of grouted cavity
reinforced brickwork beams. The purpose of the test was to detennine how the beam shear
resistance was influenced by the shear span to effective depth ratio and the ratio of the steel
to brickwork area (the brickwork area being the effective depth multiplied by the beam
width). Two series of beams were tested, the first consisting of five beams and the second of
seven beams. In the first series the ratio of steel to brickwork area was 0.24 and the shear
span to effective depth ratio varied from I to 3 in increments of0.5. In the second series the
37
ratio of steel to brickwork area was 1.6 and the shear span to effective depth ratio varied from
1 to 7. All the beams were 215mm wide and 327mm deep with the lengths varying according
to the chosen shear span. The beams were tested on simple supports set 150mm from each
end and the load was applied through two points set 600mm apart in the centre of the beam.
The results indicated a significant increase in ultimate shear stress with decreasing shear span
to depth ratio. This is similar to the case of reinforced concrete beams but in marked contrast
shows a virtual independence of reinforcement to cross-sectional area on ultimate shear
stress. The test data is summarised in Table 2.7.
2.2.7 Suter and Keller, Carleton University, 1976
Suter and Keller [46)], reported on tests carried out to determine shear strength of grouted
cavity reinforced brickwork beams. A total of sixteen beams were tested, eight were five
courses deep and one brick wide with two 16mm bars laid in the bottom mortar joint. The
remaining eight were grouted cavity construction 343mm deep and 305mm wide, with six
16mm bars set in the cavity. The tests were conducted using shear spans varying from one to
seven. It was concluded that the ultimate shear stress of grouted cavity beams increased
markedly with decreasing shear span ratios similar to the cases of reinforced concrete and
reinforced brickwork beams. The shear capacity of grouted cavity beams lies between that
for reinforced concrete and reinforced brickwork beams, and for the particular cross-section
under investigation was considerably greater than that of reinforced brickwork beams. The
grouted cavity beam results indicated that since composite action exists between the
brickwork wythes (two leaves) and concrete core, the shear capacity could be safely derived
38
ratio of steel to brickwork area was 1.6 and the shear span to effective depth ratio varied from
I to 7. All the beams were 215mm wide and 327mm deep with the lengths varying according
to the chosen shear span. The beams were tested on simple supports set 150mm from each
end and the load was applied through two points set 600mm apart in the centre of the beam.
The results indicated a significant increase in ultimate shear stress with decreasing shear span
to depth ratio. This is similar to the case of reinforced concrete beams but in marked contrast
shows a virtual independence of reinforcement to cross-sectional area on ultimate shear
stress. The test data is summarised in Table 2. 7.
2.2.7 Suter and KeUer, Carleton University, 1976
Suter and Keller [46)], reported on tests carried out to determine shear strength of grouted
cavity reinforced brickwork beams. A total of sixteen beams were tested, eight were five
courses deep and one brick wide with two 16rnm bars laid in the bottom mortar joint. The
remaining eight were grouted cavity construction 343mm deep and 305mm wide, with six
16mm bars set in the cavity. The tests were conducted using shear spans varying from one to
seven. It was concluded that the ultimate shear stress of grouted cavity beams increased
markedly with decreasing shear span ratios similar to the cases of reinforced concrete and
reinforced brickwork beams. The shear capacity of grouted cavity beams lies between that
for reinforced concrete and reinforced brickwork beams, and for the particular cross-section
under investigation was considerably greater than that of reinforced brickwork beams. The
grouted cavity beam results indicated that since composite action exists between the
brickwork wythes (two leaves) and concrete core, the shear capacity could be safely derived
38
from the separate shear capacities of the grout and brick sections according to their relative
widths. The test data is summarised in Tables 2.8a and b.
2.2.8 Sinha and Foster, University of Edinburgh, 1978
Sinha and Foster [47] examined the behaviour of reinforced grouted cavity beams using
different shear arm: effective depth ratios. Brick strength, mortar strength and steel
percentages were kept constant for all tests. The authors found that the calculated allowable
moments based on CP 111 [S.7] (permissible stress) were conservative whilst those based on
CP110 [S.9] (limit states) appeared more realistic. This work also described an approximate
method that favourably predicts the ultimate shear strength of the test beams. The results
from this test series are shown in Tables 2.3a and 2.9.
2.2.9 Garwood and Tomlinson, Bolton Institute of Technology, 1980
Three different beam types were investigated in this test programme [48]. The authors'
principal consideration was the inclusion of tension, shear and compression reinforcement.
The performance was examined from the points of view of safety and serviceability. The
three beam types are shown in Figure 2.4. Beam 1 failed progressively in diagonal tension.
Beam 2 had no shear reinforcement and failed suddenly in shear. The main cracks followed
the line of the tension reinforcement, indicating the presence of dowel action. Beam 3 failed
extensively in diagonal tension. Strain gauges on the shear reinforcement indicated the yield
ofthe shear steel. The test results are shown in Tables 2.3a and 2.10. The authors concluded
39
that significant flexural cracking occurred at a theoretical tensile stress ofapproximately 2.0
N/mm2. The crack widths of 0.3mm were achieved at working loads. As a consequence it
was considered that the limit state for cracking was more critical than that for deflection. The
method for determination of the design ultimate moment of resistance given in SP91 [53]
(limit states philosophy) was found to be conservative.
2.2.10 Osman and Hendry, University of Edinburgh, 1982
Osman and Hendry [49] continued the studies, of reinforced grouted cavity beams, initiated
by Sinha and Foster. The beams were examined in shear and bending but this time two brick
strengths and two steel ratios were incorporated into the eight-beam test programme. All
beams were found to fail suddenly by diagonal tension. This occurred after the formation of a
major diagonal crack across the shear span; it then spread upwards which resulted in large
rotations about the apex in the compression zone. Eventually splitting took place along the
line of the reinforcement and the beams then failed completely. The results of these tests are
summarised in Tables 2.3a and 2.11. As neither tension nor compression failure was
achieved the actual failure moment was less than the calculated ultimate flexural moment.
Ultimate flexural moments were calculated from stress blocks reported by Hognested et al.
The two parameters K1 and K2 were used as 0. 75 and 0.45 respectively, with ultimate strain
at failure of 0.0035. These figures were obtained after examining a report by Powell and
Hodgkinson [37] on the relationship between different strengths and types of brickwork
piers. Dowel shear forces and aggregate interlock forces were determined from the
experimental work described by Hamadi and Regan [SO].
40
The shear carried by the compression zone was found to vary between thirty and forty
percent of the total shear. Shear caused by aggregate interlock was relatively small at
between seven and fifteen percent It was assumed that brickwork had no interlock
resistance. The shear carried by the dowel action was found to reach fifty-five percent as the
beam approached failure. Its proportion increased rapidly at this stage, suggesting that its
role is dominant and that the failure mechanism is important It was noted that the ultimate
shear resistance of the high strength bricks was lower than the low strength bricks; this may
have been due to the surface texture of the bricks or to the effect of residual stresses in the
two types of brick.
2.3 CORROSION OF REINFORCEMENT WITHIN REINFORCED BRICKWORK
An aspect of reinforced brickwork is the possibility of corrosion of the reinforcement and its
prevention. Hamann and Burridge briefly discussed this in a paper in the Structural Engineer
in 1939 [32]. They considered that the danger of corrosion is exactly on a par with that
obtained in reinforced concrete construction when proper placing of the concrete has been
neglected. They refer to correspondence with Sir Alexander Brebner, who had pointed out
that in India where corrosion had occurred it had invariably been due to faulty workmanship.
Foster and Thomas [51] describe tests carried out in 1985 by Structural Clay Products
(SCP)Ltd.
41
The following points were made:
• increasing depth of cover-distance of steel from the exposed face increases
protection.
• steel must be completely surrounded by mortar if rusting is to be avoided.
• to be certain of preventing rusting, steel within the outermost IOOmm of brickwork
should be galvanised or have equal protection.
• dipping bars in chemical solution such as mixtures of sodium nitrate and sodium
benzoate does not afford protection against rusting.
• unprotected steel is afforded protection by embedment in a grout filled cavity.
• an increase in corrosion can be expected with a greater degree of exposure.
2.4 OTHER RESEARCH ON REINFORCED BRICKWORK
Further background to this study was obtained by the examination of other research studies.
2.5 CURRENT EXPERIMENTAL INVESTIGATIONS INTO REINFORCED BRICKWORK
According to a web search and direct contact with eminent researchers there is no evidence
of recent publications related to the experimental investigations of reinforced brickwork
grouted cavity beams. Responses from enquiries to Dr. G Edgell of the British Ceramic
Research Limited (telephone conversation), Professor Adrian Page of the University of
Newcastle, Australia (correspondence, Annex A), Professor R Drysdale, McMaster
42
University, Canada, (e-mail) indicated that work in this field has not been published since the
1980s. The main reason has been lack of funding. There were no research papers on
reinforced brickwork beams presented at the 6rn International Masonry Conference held in
London in November 2002. Three papers considered effects of bed joint reinforcement on
wallettes and walls.
2.6 SUMMARY OF THE LITERATURE REVIEW
• Reinforced brick beams can be split into two categories, namely beams reinforced in
the bed joints and reinforced grouted cavity brickwork beams.
• Bond between the brickwork and grouted core can be formed using reinforcement ties
and the reliance of the natural bond between the masonry and the grout.
• Reinforced masonry has been found to develop a reasonable degree of flexural and
shear strength provided that care and attention is given to mortar type, bond coursing
and the quantity and arrangement of reinforcement.
• Where beams failed in compression the failure stresses were of a similar magnitude to
those achieved in the related pier (prism) tests.
• Flexural cracking was found to occur at a theoretical tensile stress of approximately
2.0 N/mm2. When this cracking took place a significant load transfer to the
longitudinal reinforcement was observed.
• The majority of brickwork test beams failed in shear. The dominant shear mechanism
was that of diagonal tension crack paths that tended to follow mortar joints.
43
• On some occasions the shear performance of a test beam was enhanced by the action
of diagonal compression, this allows full arching to develop between supports.
• The shear performance of reinforced brickwork beams was found to be virtually
independent to the quantity and magnitude of longitudinal reinforcement. However,
this was not true for grouted cavity beams.
• The shear capacity of a brickwork beam was found to increase with a decreasing
shear span to effective depth ratio.
• Reinforced grouted cavity beams can be treated for analysis as a combined case of
reinforced concrete and reinforced brickwork.
• In general, calculated allowable moments based on elastic design (CP Ill) [S.4] were
found to be conservative for reinforced masonry beams.
• For grouted cavity beams calculations based on SP91 [53] were also found to be
conservative but those based on CPIIO [SS] were far more reasonable.
• The use of brickwork with complex bonding patterns will involve brick units that
have different properties in mutually perpendicular directions.
• Residual stresses in brick units from the fuing of the clay, during manufacture, are
significant.
• Absorption characteristics have a definite relationship to bond strengths developed
with various mortars.
• Low absorption bricks develop a medium bond strength when set either dry or wet.
• Medium absorption bricks develop a high bond strength when set either dry or wet.
• High absorption bricks develop a low bond strength when set dry. This is materially
increased when set wet.
44
• Docking bricks just before laying attained optimum bond strength.
• It is suggested that reinforced brickwork beams can be designed using reinforced
concrete theory with empirical limiting stresses.
• Reinforced brickwork and reinforced concrete slabs perform like homogenous beams
when loaded well past design loads.
• Intimate contact between bricks and mortar ts necessary to develop best bond
strength.
• All types of brick develop relatively high bond strength when used with grout.
• Tensile bond between mortar and brick increases with increased workability of the
mortar.
• The transverse and compresstve strengths of bricks have no relationship to the
strength of the bond.
• It is preferable to eliminate headers from heavily compressed portions of the
reinforced brickwork beams.
• When reinforced brickwork members are subject to flexure a primary criterion is
often that of shear resistance.
• Most masonry beam failures occur in tension or diagonal tension.
• Diagonal tension is not present in certain reinforced brickwork beams.
• Shear strength increases with an increase in adhesion strength.
• A high degree of flexural strength and shear strength may be developed in reinforced
brickwork beams provided proper attention to detail is made.
• The shear strength of reinforced brickwork beams depends on the water: cement ratio.
Increase of the water: cement ratio decreased shear strength.
45
• The ultimate shear stress of reinforced brickwork beams increased only slightly with
increasing amounts of tensile reinforcement.
• The ultimate shear stress of reinforced brickwork beams increases significantly with
decreasing shear span to effective depth ratios.
• The shear capacity of a grouted cavity beam is the sum of the separate shear
capacities of the grout and brick sections according to their relative width.
• The linear stress/strain relationship applies to reinforced brickwork.
• Elastic modulus varied according to joint orientation and materials.
• A modular ratio of steel to masonry may be used.
• At certain stages ofloading the modular ratio may change.
• The tensile resistance provided by the steel to reinforced brickwork beams is as high
or higher than in the case of reinforced concrete.
• Unprotected steel is afforded protection by embedment in a grouted cavity.
2.7 JUSTIFICATION OF THE RESEARCH STUDY
The literature review in this Chapter identified the varied fonnats of a range of reinforced
brickwork beams that have been the subject of experimental and theoretical investigation.
With the exception of the beams reinforced in the bed joints and those tested by Garwood
and Tomlinson [48] all of the beams tested by other researchers could be classed as
reinforced concrete beams clad on the vertical faces with unreinforced brickwork. Garwood
and Tomlinson constructed beams for their investigation where some of the bricks to the
46
outer skin were embedded into the reinforced concrete core. However the format was such
that the two vertical wythes were tied together by steel and not by bricks into the core.
The review did not identify a reinforced brickwork beam where bricks tied the concrete or
grout core to the outer brickwork. It was considered that the logic behind the aims of the
thesis was therefore confirmed. The aims of the research for the Ph. D. thesis were: -
• to develop a new format for grouted cavity brickwork beams, reinforced to resist
flexural and shear forces. (The format to provide an integral arrangement of:
brickwork; grouted core and reinforcement).
• to analyse the performance of the new formatted reinforced brickwork beams when
subjected to in-plane loads.
• to develop appropriate design recommendations and practical design guidance.
It was deduced that aspects of the study that needed to be considered in depth, with a
purpose of adding to existing knowledge were:
• the benefits of a new reinforced brickwork beam format.
• the relevance of elastic, ultimate and serviceability limit states to the new beam
format.
• the effect of the direction of loading on the faces of the brick in the compression zone
of the beam and in the analysis of the compressive strength of the reinforced beam.
• the use of finite element analysis to examine whether tensile resistance can develop in
the tension zone of the beam after cracking occurs.
47
',. l . ,'
.• the .e£fe<:t ·of varying. e·lastic :rriodllli1 .of :a b.rick unit ·in mutually perpendicular
directions,
• the effect:on'bealll behJlviour cif the non-lsotropic!beha\iiounofthe brickwork.
48
CHAPTERJ
THE UNIVERSITY OF PLYMOUTH QUE TT A STYLE BEAM
3 INTRODUCTION
This Chapter describes and examines the development ofthe University of Plymouth Quetta
Style Beam used in the research programme.
A critical examination is provided of:
• brickwork beams reinforced in the mortar bed joints.
• grouted cavity reinforced brickwork beams.
• beams where some of the grout was replaced by bricks.
From this examination and consideration of traditional bond patterns the UOP Quetta Style
Beam was developed. A scorecard was used to compare the new beam format against beams
reinforced in their bed joints and grouted cavity reinforced brickwork beams.
Whilst the UOP Quetta Style Beam format was being developed meetings took place with
members of SCP who had previously provided material and technical support to several UOP
research projects. Invited to some of their meetings were representatives from the BOA,
brick manufacturers, consultants and researchers. SCP was aware that other research centres
in the U.K. were trying to develop a new beam format. They commented on and supported
the specification for the format of the beams to be built and tested.
49
3.1 BRICKWORK BEAMS REINFORCED IN THE BED JOINTS
Unreinforced brickwork beams are brittle and therefore failure under load can be sudden. The
aim in design and construction of a reinforced brickwork beam is to produce an element
where serviceability failure (i.e. excessive deflection or cracking) occurs prior to an ultimate
ductile failure. Brittle failure can be avoided by the use of bed joint reinforcement.
It was noted, (52, 54 and 47] that the first reinforced brickwork beams and floor slabs were
constructed by placing reinforcement within the mortar bed joints, Figures l.2a- l.2e. Using
standard bricks it was only possible to use small diameter steel bars, since size was restricted
by the, normal, I 0 mm joint thickness. A 5 mm bar would have an average cover of 2. 5 mm
and initially mild steel bars were used. The main advantage of this reinforcing system is the
ease of construction. The resulting beams and floor slabs can support vertical loads. Whilst
there is significant enhancement of the flexural strength of beams reinforced in their bed
joints any additional shear strength can only be taken into account for limited circumstances.
BS 5628 Part I, Clause 7.4.1.3.I[S.6] provides guidance on the provision for shear resistance
in beams. This is discussed further in Chapter 5. Currently the manufacture of proprietary
reinforcing systems enables the bricklayer to use strips of reinforcement in the bed joint.
Two typical systems are the ladder system, which consists of drawn wires linked by welded
tie wires, providing a 'ladder', or a diagonal mesh system.
Reinforced brickwork, with bed joint reinforcement, has been successfully used for door and
window lintels and for laterally loaded masonry walls restrained along their vertical
boundaries [54 and 56]. There are, however, clear limitations in the applications of this form
50
of construction. These are span, magnitude of load that can be applied and the moment of
resistance and shear capacity of the cross-section. The size of reinforcing bar that can be
incorporated into a mortar joint is limited by the joint thickness. Using a typical ladder
system the area of steel provided in one bed course is approximately 16 mrn2 and the vertical
cover between the bar and the adjoining brick is approximately 4mm, assuming the ladder is
placed centrally in the joint, which is unlikely in some instances. There is therefore a major
restriction on bar area and cover.
3.2 GROUTED CAVITY REINFORCED BRICKWORK BEAMS
The grouted cavity reinforced brickwork beam, formed by containing reinforcement and
grout between brickwork skins, Figure 1.2f, provides improved flexural and shear strength
and additional stiffness. Specific advantages are: the size and quantity of tensile steel which
can be varied; it is possible to enhance the overall strength by the use of compression
reinforcement and shear steel, both accommodated within the cavity. All of these are
achieved without affecting the aesthetics. The principal disadvantage is that total interlocking
of the grouted core with the external brickwork leaves is dependent only upon the physical
bond between the grout in the cavity and the outer leaves of the brickwork.
There is ease of construction of a reinforced brickwork beam since face formwork is not
required. Temporary formwork is used to support the soffit and precautions have to be taken
to ensure that the grout does not leach out and consequently lose some of its constituent
51
materials. Since the soffit is formed of bricks and grout it is possible that some form of
decorative finish would be required to the underside of the beam.
In 1979 SCP 3 [57] was reprinted, in which it was stated that, "little use has been made of
the knowledge in SCP 3, first published in 1966, and the associated articles in the Structural
Engineer since publication. This is simply because their publication was much ahead of
events in the development and use of reinforced brickwork in the United Kingdom. Now the
situation has changed; there is currently much interest in reinforced and prestressed
brickwork.... ". SCP 3 describes wall beams incorporating vertical bars in a grouted cavity
and horizontal reinforcement in some bed joints.
As indicated above, for the brickwork and the grouted core to interlock and to act as one unit
it is necessary to develop full bond between these two materials. An early aim in the
development of a new beam format by the UOP was to lay the bricks in such a manner that
physical interlocking was possible by arranging for some bricks to penetrate the core.
3.2.1 Variations of Grouted Cavity Reinforced Brickwork Beams
In 1980 Garwood and Tomlinson [48) produced several alternatives to the grouted cavity
beam, Figure 2.4. Only a small amount of ceramic interlock was provided. There were an
excessive number of snap headers and steel was used to tie the leaves together. Studies by
Garwood [48) and Robson et al [33) indicated that there are ways of replacing some of the
grout with bricks. In carrying out the study for this thesis it was considered that the
52
alternatives produced by Garwood and Robson did not provide equivalent homogeneity or
easy formats for the mason to construct.
3.3 TRADffiONAL BRICK BONDS
In order to develop a new bond arrangement for a reinforced brickwork beam various
traditional brick bond patterns were examined. These bond patterns normally use standard
215 x 102.5 x 65 mm bricks with a 10 mm mortar joint. For ease of comparison and to assist
with the development of a new beam format a range of models were built using model half
sized standard bricks and dry joints.
3.3.1 English Bond
English bond consists of alternate courses of headers and stretchers, Figure 3 .l.a. One header
is placed above each stretcher. It is considered to be the strongest brick bond ofthose used
[1, 2, and 4]. This would have been the view when applied to walls. However Handyside (2]
states, "recent research has shown that bond plays a less important part in wall strength than
previously believed and either English or Flemish bond are suitable for load-bearing walls "
3.3.2 Flemish Bond
Every course alternates a header and a stretcher. As courses are laid one header is placed
centrally above each stretcher, Figure J.lb. This brick bond is considered by McKay (58] to
53
be more economical and superior in appearance to English Bond, since there are fewer
perpendicular joints. This limited number of vertical joints is however a possible reason why,
as stated above, McKay [58] considered it to be weaker than English bond.
3.3.3 Sussex or Flemish Garden Wall
For this format alternating three headers and one stretcher are laid continuously in each
course. The brick bond provides a good aesthetic finish, by using fair-faced bricks on both
sides of a one brick wide wall, Figure 3.1 c.
3.3.4 Stretcher Bond
Stretchers are used on every course. Its main use now is for the outer leaf of cavity walls, half
a brick thick.
3.3.5 Heading and Other Brick Bonds
In the heading brick bond each course is formed of headers. Typically they are used to form a
circular corner or arch.
There are other brick bond patterns, for instance diagonal and herringbone, but these are too
complex for the simple application to a beam.
54
3.4 THE SPECIFICATION FOR A NEW UOP BEAM FORMAT
It was decided, after experimenting with a variety of bonding formats, that the UOP beam
required a form where bondstones would be provided to improve the bond between the outer
skins of brickwork and the grout in the cavity. At the same time the use ofbondstones would
provide the opportunity to maximise the quantity of brickwork in the beam. The specification
produced for the beam to be built and tested required the new beam format to:
• have an aesthetically pleasing elevation and soffit.
• be suitable for a range of brick bonds.
• provide a homogeneous interaction between the outer leaves of brickwork and the
grout, using bondstones.
• blend into adjacent brickwork.
• allow easy soffit construction.
• be capable of being adapted to suit varying widths and depths.
• maximise the use of brickwork and therefore minimise the quantity of grout.
• minimise waste, by limiting the number of cut bricks.
• accommodate tension, compression and shear reinforcement.
• have high flexural and shear strengths.
• be able to accept a reasonable range of bar sizes.
• provide appropriate cover to protect the steel against corrosion.
55
3.5 DESIGN OF THE UOP BEAM
3.5.1 The Appropriate Brick Bond for the Test Beams
Having considered, in Chapter 3.3, a range of traditional brick bonds it was considered
appropriate to examine the effects of modifying the English and Flemish bonds. To avoid
cutting bricks and to allow a brick to intrude into the core the minimum width of the beam
needed to be 327.5 mm, i.e. one and a half brick thickness.
3.5.2 Modified English Bond
Figures 3.2a shows a solid beam section. Voids for both tensile and shear reinforcement
could be provided by the use of snap-headers at appropriate locations, on opposite sides of
the beam. This would increase the brickwork/grout ratio (when compared to the traditional
cavity beam), enhance the shear interlock of the brickwork and make it possible to
accommodate compression steel. Providing snap-headers could produce a Modified English
Bond. As shown in Figure 3.2 this allows easy placement of tensile steel reinforcement in the
grouted cavity. However this Modified English Bond is wasteful in material because of the
significant proportion of snap-headers. Construction time would be affected and, as occurred
in the modelling process, there was the possibility of errors in the construction process.
3.5.3 Modified Flemish Bond
As shown in Plans A-A and B-B, Figure 3.3a, there is no clear vertical path through the brick
Flemish Bond pattern. Therefore shear reinforcement could not be incorporated into the
56
beam. A Modified Flemish Bond was obtained by displacing the brick bond pattern between
the two faces by one quarter of a brick. Figure 3.3b shows that natural shear voids would be
formed. Further, as with the Modified English Bond, a void for tension steel could be formed
in the second course, by the use of snap headers. This could be repeated for compression
steel. Again snap-headers are wasteful in material and construction time. The Modified
Flemish Bond was found to be identical to the brick bond used in the construction of walls in
Quetta (Quetta Bond), Figure 3.4a, where it was used primarily in wall construction to resist
earthquake movement [56]. As shown in the plan, Figure 3.2b, vertical reinforcement could
be located in the pockets, which were fonned over the full wall height. When applied to a
beam system the Quetta Bond provided pockets for shear reinforcement along the full length
of the beam. However there was not a clear path for longitudinal reinforcement.
Consideration was given to the partial use of the stretcher brick bond.
3.5.4 Partial Use of Stretcher Bond
Stretcher Bond forms the basis of traditional grouted cavity beams with the disadvantages
already discussed. It was recognised that there was an opportunity for Stretcher Bond to be
combined with the Quetta Bond. The use of Stretcher Bond in the first two courses was
viable, Figure 3.4b. This allowed the beam soffit to the beam to be formed of symmetrical
lines of solid stretcher bricks. If the second course had stretcher courses to both outer leaves
then the centre was clear for the longitudinal reinforcement, embedded in the grout. The
Quetta Bond could be built off the second course, or on top of a third stretcher course. The
latter could accommodate additional tensile steel. This solution provided interlocking of the
57
brickwork and grouted core. Snap-headers would be required at the ends to balance courses.
The partial use of both Stretcher Bond and Quetta Bond thus formed the UOP Quetta Style
Beam. Modern masonry uses Stretcher Bond and the initial system would be easy for the
bricklayer. A stretcher course at the top of the beam allowed the provision of compression
steel. The format maximized the volume of brickwork and minimized the grout, as shown in
Table 3.1. This indicates that the UOP Quetta Style Beam clearly reduces the grout (on plan)
when compared to the other two bonds.
3.5.5 The UOP Quetta Style Beam
Comments from the members of SCP indicated that the UOP Quetta Style Beam was
probably a unique solution. In 1982, Appleton and the author of this thesis introduced the
format, at the 6th International Brick Masonry Conference in Rome, (59]. The UOP Quetta
Style Beam was adopted for the design and testing programme.
3.5.6 A Scorecard
A scorecard was completed, Table 3.2, which provides a comparison between the UOP
Quetta Style Beam and other forms of reinforced brickwork beams. The scorecard indicates
that the UOP Quetta Style Beam satisfied the majority of the requirements from the initial
specification shown in Section 3.4.
58
It is of note that the beam can also:
• have varying spans, widths and depths.
• have varying load carrying capacity.
• be incorporated into rigid jointed reinforced brickwork portal frames.
Curtin et al incorporated a Quetta Style Beam section into their publication "Design of
Reinforced and Prestressed Masonry", 1988 [60].
3.6 CONSTRUCTION OF THE FIRST UOP QUE'ITA S1YLE TEST BEAM
3.6.1 Construction details
A 2m beam was constructed off a supported horizontal timber soffit, Figure 3.5. The first
course was formed using three adjacent rows of stretcher bricks, laid to lines as normal, each
being one half brick wide and straight jointed. The outer leaves to the second course were
also laid using stretcher bricks, thereby creating a central cavity, as shown in Sections A-A,
B-B and C-C. A pre-fabricated reinforcing cage was placed, on mortar seating blocks, in the
cavity. These blocks provided the appropriate cover to the steel. The cage had steel at the
bottom (tensile). Section B-B shows that the shear links, at 169 mm centres, could be placed
in the vertical pockets of the beam. The spacing of the links satisfies the maximum spacing
permitted in BS 5628: Part 2 [S.3]. Quetta Bonded brickwork followed for a further two
courses to give a beam 290 mm deep (four courses) and 327.5 mm wide. This is the
minimum depth possible for a beam using standard size bricks and this form of construction.
59

The brickwork was cured overnight. This allowed the grouting to be placed using a mix
sufficiently workable to fill the horizontal and vertical cavities. Compaction was by hand
using a steel rod. The surface of the grout was floated flush with the top of the beam.
3.6.2 Construction time
The 2m beam took two hours to construct (later a 4m beam took two and a half hours). A
· substantial proportion of the construction time was to ensure the four corners were true (this
proportion reduced with longer beams). The grouting operation took approximately forty-five
minutes. This was inclusive of mixing but exclusive of hatching the materials. Overall
construction time was almost nineteen hours, inclusive of the overnight mortar-curing break.
This compares favourably with reported construction times of between one and six days for
other types of reinforced beams e.g. by Garwood [36] and Suter [45].
3.6.3 Workmanship
Fundamental to all brickwork construction is workmanship. BS 5628: Part 2 [S.3] requires
adequate site control to be provided during the construction of reinforced masonry. This is to
ensure a satisfactory standard. The BDA [4] recommends avoidance of certain detrimental
influences, as follows:
• incorrect proportioning and mixing of mortar. Whilst this is not a practice to be
accepted, studies have shown that their effects are not too significant.
60
• incorrect adjustment suction rates of bricks. This lack of adjustment property can
reduce the overall compressive strength by up to fifty percent.
• incorrect jointing procedures i.e. unfilled and furrowed joints. There may be up to
thirty percent reduction in strength.
• excessive bed joint thickness. Joint thickness greater than the 10 mm normal depth
creates a reduction in brickwork strength. A reduction of up to thirty percent can
result from a bed joint 16 mm to 19 mm thick.
The BDA also added that "unfortunately, in practice, it is not possible to avoid all of these
faults. Kept to a minimum, by site supervision and control procedures, their combined
detrimental effect is not significant''. The partial factor of safety of brickwork materials
provides automatic compensation for the influence of design and construction faults.
However, when supervision is provided then satisfactory workmanship can be achieved and
the final brickwork element(s) should be durable and maintenance free.
All brickwork elements built for the test programme were constructed under full supervision
and considered to be of good quality workmanship.
3.7 UOP QUETIA STYLE BEAM MATERIALS AND TESTING
Examination of the UOP Quetta Style Beam confirms that the header and stretcher faces of
bricks, in the compression zone of the beam, would be subject to internal compressive forces.
61
! '
~' .
•' ·=·
To carry out ail a.rull~sl~ o£the beam the pr6perties;of!lll1 ofthe:materhiis lncltidif1g ·,that of, the
.bnckW.or:k wouldibe:requrre<L ;;r}te;following Chapter proyidesthe'information!gainedl,
62.
. ... '•...-
CHAPTER4
MATERIALS, PRISMS, BEAMS AND INSTRUMENTATION
4 ~ODU~ON
In the previous Chapter the development of the format for the UOP Quetta Style Beam was
discussed. Information is provided in this Chapter on the materials used in the construction of
54 reinforced brickwork beams. Details are given of the properties of clay bricks, sand,
mortar, concrete grout and reinforcement. Outlined is the testing of these materials, in
accordance with the relevant British Standards, and the testing and analysis of brickwork
prisms. The importance of following approved test procedures is highlighted in the BIA
Technical Notes 39, [61], " ..... the standard methods for determining the physical properties
of both materials and masonry assemblages should be strictly followed". Further, " ..... .ifthe
prescribed methods are not adhered to, inaccurate and inconsistent test data and erroneous
conclusions can result". Test results and analysis of the compression tests of the Quetta
Bond prisms are also detailed.
Also described in this Chapter are: the referencing for the beam tests series; beam loading
procedures and the instrumentation used.
63
4.1 BRICK TYPES AND TESTING
Three different types of wire cut perforated clay brick were used. Manufacturers supporting
the study provided these bricks. The identification system was Type 1, Type 2 and Type 3
and each Type is described below.
Tests were carried out on representative samples of the bricks in accordance with BS 3921:
1985 [S.5]. Dimensional tolerance was satisfied for all three brick Types. Values of water
absorption and initial suction rate are listed in Table 4.1 and of bed, header and stretcher
compressive strengths in Table 8.3
Type 1: a buff coloured sand faced brick, 10 hole, supplied by Westbrick Limited from their
Steer Point factory in South Devon. Compressive strength, on bed,38.2 N/mm2, on stretcher
18.9N/mm2, on header 11.5 N/mm2
, water absorption 10.6%.
Type 2: a red coloured sand faced mottled Coatham brick, 3 hole, supplied by Crossley
Bricks Limited from their Eaglescliff factory in the north east of England. Compressive
strengthon bed, 32.0 N/mm2, on stretcher 12.9N/mm2
, on header 7.3 N/mm2, water
absorption 13.6%.
Type 3: a chocolate coloured Waingrove brick, 14 hole, supplied by Butterley Building
Materials Limited from their Ripley works in the Midlands. Compressive strength on bed
107.9 N/mm2, on stretcher 18.2 N/mm2 and on header 9.6 N/mm2
, water absorption 5.2%.
64

4.2 MORTAR AND GROUT
The mortar and grout, for the research, were manufactured in the laboratory. The aim was to
maintain their compressive strengths at relevant constant values, thereby reducing the
number of variables.
4.2.1 Mortar
Curtin et at, (62] state, "the strength of mortar affects the characteristic strength of the
masonry then, if all other factors are equal, the stronger the mortar the higher is the
characteristic strength of the masonry''.
In Table 1 BS 5628 Part 2 [S.3] two mortar designations are defined for reinforced
brickwork. A designation (i) mortar, the strongest, was chosen for use throughout the testing
programme. This has recommended mix proportions of 1.0: _!_ :3 of cement: lime: sand. The 4
recommended minimum compressive strength of mortar, obtained from laboratory tests at 28
days, as defined in Table 1 BS 5628 Part 1 [S.6] is quoted to be 16 N/mm2.
4.2.1.1 Mortar Tests
For each batch of mortar two 100 mm cubes were taken, water cured, before testing, and
tested in a Tonipac Compressive Testing Machine. Cylinders were taken to ascertain the
indirect tensile strength. The average 28 day compressive strength was 33 N/mm2 for all
65
experiments, with a coefficient of variation of 16.4%. This compressive stress was greater
than the minimum value of 16 N/mm2, quoted in Section 4.2.1. The mean tensile strength,
obtained from the standard cylinder test, was 2.71 N/mm2. The strengths relating to
individual experiments are listed in Section 3, of Appendix 1, Volume 2.
4.2.2 Cement
Ordinary Portland cement to BS 12 (S.10] was used for the construction of all of the
brickwork.
4.2.3 Lime
Redland, [63], states that "the addition of lime increases workability, reduces the water
requirements and slightly increases strength". Discussions with local contractors (Cooper
Construction and B. Martin Bricklaying Contractor) led to the omission of lime, since they
indicated that, in their experience, its use in mortars was not common practice. Hence a 1: 3,
cement: sand, mix by volume was used.
4.2.4 Sand
For all mortars locally obtained crushed limestone building sand was used. This was
provided by English China Clay, Moorcroft Quarry, Plymouth. This is a recognised building
66
sand in the southwest of England and had been successfully used on other studies, [30 and
31].
The grading analysis shown in Table 4.2 indicates that the sand failed to meet the
requirements ofBS 1200, Table 2, [S.11] requirements. The sand was too coarse, although,
as seen later this does not appear to have been detrimental to the performance of the mortars.
The sand was found to comply with the zone 2 requirements for use in concrete as given in
BS 882, [S.12].
4.2.5 Water/cement ratio
A decision was taken not to specify a water/cement ratio but to use the experience of the
bricklayer to produce a preferred mix to match the brick being used. This is common practice
and has been used in other studies, [30 and 31].
4.2.6 Steel reinforcement
Hot rolled high yield steel was used for the tension reinforcement in the beams. This had a
type 2, deformed surface profile to BS 4449 [S.9]. Mild steel shear links were of6 or 8mm
diameter. The size of the tension reinforcement was controlled by (a) the cavity dimensions,
resulting from the headers within the UOP Quetta Style Beam, and (b) the protective cover
required to the reinforcement. A minimum cover of 20 mm for this type of construction was
adopted. This permitted a maximum bar diameter of 25 mm. Nominal bar sizes, of 16 mm,
67
20 mm and 25 mm diameter, were selected. The tensile stress-strain characteristics for the
steel were found by testing representative specimens in an A very Universal Testing Machine.
The mean results of these are shown in Table 4.4. Further details are set out in Section 5, of
Appendix I, Volume 2.
4.2.7 Grout
Grout does not have a defined specification for the mix proportions. It has a constituency
somewhere between mortar and concrete. The infill grout was proportioned by volume, 1: 3:
2, cement: fine aggregate: coarse aggregate. The cement and the fine aggregate (sand) were
the same as used for the mortar. The water/cement ratio was specified as 0.75. The grout
produced had inadequate workability for placing in the confined cavity. To improve the
workability a super-plasticiser, I% by weight of the cement content, was added. The mix was
batched by weight for consistency.
The bar spacing of the main tensile reinforcement dictated the use of a maximum 14mm
coarse aggregate. Moorcroft Quarry, Plymouth. This provided a range of coarse aggregate
from 14mm to 5mm crushed limestone. For each batch of grout two I 00 mm cubes were
taken, water cured and tested in a Tonipac Compressive Testing Machine. Cylinders of grout
were formed and tested to ascertain the indirect tensile strength. The corresponding mean 28
day compressive strength for Series I beams was 28.3 N/mm2, with a standard deviation of
5.1 N/mm2 and a coefficient of variation of 18.1 %. This compressive strength value was
larger than the minimum strength for a mortar designation (i), as quoted in paragraph 4.2.1.
68

The corresponding mean tensile strength was 2.04 N/mm2. The strength relating to a
selection of individual tests are listed in Section 4, Appendix 1, Volume 2 (under the
heading "In-fill concrete").
4.3 PRISM TESTS
To examine and analyse the performance of the test beams it was essential to understand the
behaviour of the brickwork materials in the compression zone under axial compression.
Work carried out by other researchers was discussed in Chapter 2, by Withey [39], Thomas
and Simms [43], Hamman and Burridge (32], Powell and Hodgkinsoo [37]). The consensus
is that the stress-strain curve is parabolic, being similar in shape to that used for reinforced
concrete. It was necessary to determine the validity of the parabolic curve for the UOP
Quetta Style Beam. To quantify this, a series of prisms were built and tested. These
represented the compression zone of the UOP Quetta Style Beam bonding pattern, Figure
4.1.
4.3.1 UOP Quetta Style Beam Prism Test Specimen
Four replicates of each of the three brick Types were built. Each was capped with a steel
plate and bedded on mortar in order to provide a uniform bearing surface and to minimise the
eccentricity of the applied axial test load. The prisms were tested in an Avery/Dartec
Universal Testing Machine. Surface strains on the vertical faces of the prisms were recorded,
using a 100 mm Demec gauge (refer Section 4.7.2). Prisms were cured and tested after 28
69
days. The load was applied in equal increments and instrument readings were noted at each
stage, when movement had stabilised. Unlike the Powell and Hodgkinson test apparatus,
constant strain could not be applied [37].
4.3.2 Prism Test Results
Results of the prism tests are tabulated in Section 6, Appendix l, Volume 2. Specimen failure
was considered to have occurred at a maximum load (stress). Similar tests were carried out
by Robson, [33] and by Hodgkinson and Davies [64], all reaching the same conclusion.
The specimens failed in the following manner: -
• firstly, adhesion in some of the vertical joints of the brick/mortar interface on the
narrow face of the prism broke down. This occurred at approximately 800/o of the
ultimate failure load. Cracks were visible under very close scrutiny. It is possible that
non-visible cracks occurred at lower loads.
• following the adhesion failure, cracks appeared on the wider face of the specimens.
These propagated vertically through brick, mortar and grout. Figure 4.2 shows a
diagrammatic representation of the failure sequence. The failure mode was very
similar to concrete cubes during compression testing. Diagonal planes from the corner
were clearly identified.
• at the point of collapse, maximum load, the specimen exploded. Those of brick Type
1 were most explosive.
70
Later, this type of failure was observed on beams that failed in flexure. A reasonable
similarity between the prism specimens and the beams was therefore indicated. Figures 4.3a,
4.3b and 4.3c show the graphical plots of the measured stress-strain values for the three brick
Types, with an average and best-fit curve. Table 4.3 provides a comparison of the
compressive stresses: the mean for the brick units; the brickwork characteristic strength (fk.)
from the Code [S.3], the mean prism value, and the ratio of the prism strength to fk. Brick
Types 2 and 3 produced brickwork prism strengths quite close to the basic code characteristic
strength, fie.. However the prism strength of brick Type 1 was 72% greater than the strength
obtained from the code. There was no discernible reason why the results from this latter test
gave this, unusually, high strength brickwork prism. The testing equipment is independently
tested and hence it can be suggested that each of the individual materials in the combination,
i.e. brick, mortar and grout, had compressive strengths at the top of the range of their
individual spectrums. Further discussion of these results is included in Chapter 5.
4.4 ANALYSIS OF THE PRISM DATA
In carrying out an analysis of the prisms tested it was necessary to identify whether the
specimens should be classified as stocky or slender members under compression i.e. to
determine whether the strain reading indicated wholly axial strain or included axial
shortening due to flexure. Sinha (65] and Edgell (66] both report that a slenderness ratio
(length/minimum width) of less than six indicates a non-slender element. The ratio of the
specimens tested was 4.4 based on the actual length, indicating stocky elements. The fact that
the ends of the specimens could be treated as fixed in direction and partially restrained in
71
direction was also ignored. The actual restraint conditions prevented the development of
rotation at the ends of the prisms, i.e. at the interfuce with the loading platens, until local
crushing occurred at the ends or within the lengths of the prisms. Lateral deflection along the
length of the specimen was minimal. This implied that any axial shortening due to flexure
was slight. It was, therefore assumed that the strain readings were due to pure compressive
forces and that the change of the modulus of elasticity corresponded with the non-linear
elastic characteristics of the brickwork. As stated in Chapter 4.3.2 curves of stress against
strain were drawn for the three brick Types. Other curves of behaviour of the different
specimens of the same brick Type were drawn to a common base; using a non-dimensional
graph, see Figure 4.4. The axes represent the stress and strain at individual points divided by
the maximum stress and strain for that specimen.
The shapes of the three similar curves approximately match the parabolic curve suggested by
Powell and Hodgkinson [37]. The parabolic relationship is represented by:-
o/a· = 2(EIE') - ( EIE' )2 ... .4.1
where, a' and E. are respectively the stress and strain at the maximum point of the curve.
The initial tangent modulus was given by;
Elnitial = 2 a' I E. 4.2
The parabolic plot using equation 4.1 was superimposed on the graphs. The result may
suggest that a direct relationship exists between the test results and the above equation.
Edgell [67) states that Powell and Hodgkinson's [37] parabolic representation was good for
72
calcium silicate brickwork. However, for clay brickwork, he described it as not so well
represented by parabolas. In Figure 4.4 all curves pass through the origin and the nominal
maximum stress. Examination of figures 4.3a, 4.3b and 4.3c indicates that the measurement
of strain during the tests was terminated before the maximum strain in the brickwork was
reached. This was the situation in order to ensure safety of personnel in the event of a brittle
failure. Consequently passing the curve through the origin is acceptable but the "peak stress"
may not be the absolute true value.
4.5 UOP QUETIA SlYLE BEAM SERIES AND TESTING
Since the aim of the testing was to determine the structural characteristics of the test beam it
was necessary to gather sufficient data to enable an analysis to be executed and compared to
related design theories. The analysis is based on the theories defined in Chapter 5.
4.5.1 Beam Test Series
Three series of beam tests were carried out to examine four principal variables, namely:
• flexural behaviour
• shear span
• brick strength
• the ratio of reinforcement to ceramic area
73

• Series 1 provided the basis of information needed for the design parameters. Series 2
and 3 were supplementary to enable the hypothesis from Series 1 to be validated, or
otherwise.
Beams with shear reinforcement at only one end of the beam were constructed to determine
the unreinforced shear strength of the section. This is defined as the "partial shear"
condition. This procedure, which had been successfully used in tests on reinforcement
concrete beams, eliminated the need to observe both ends of a fully unreinforced beam,
during the loading process. The effect of shear reinforcement was successfully observed by
testing similar beams, one having full shear reinforcement, the other with partial shear
reinforcement. Two, three and four metre span beams were tested, see Figures 3.5, 4.6 and
4.7. This resulted in a sequence of eighteen beam tests for each series with a range of
different span-to-depth ratios. In the beams with partial shear reinforcement shear failure
took place at the end without stirrups.
74

4.5.2 Beam identification
There were three test series. Throughout the testing the following four number identification
code was assigned to each beam.
The first numeral, a I, 2 or 3, denotes the series.
The second numeral, a I, 2 or 3, denotes the brick Type
These are defined in section 4.1
i.e. I is brick Type I - the Westbrick
2 is brick Type 2 -the Coatham
3 is brick Type 3 -the Waingrove
The third numeral, 2, 3 or 4, represents the span, centre to centre, of supports, in metres.
The fourth numeral is either a 0 or 1, and represents the shear reinforcement
condition. Zero is used for beams with partial shear reinforcement and one where beams
have full shear reinforcement. Hence 1/140 indicates a Series l beam of brick Type l and of
4m span with partial shear reinforcement.
4.6 LOADING ARRANGEMENTS
There is a choice of three or four point loading systems. The three point system which has
two end reactions and a central point load, produces a maximum moment and a maximum
shear force at the centre of the beam. It would be considered that this would result in failure
at the centre, for each beam test. However the resulting internal stresses inducing failure
would be due to a combination of bending and shear effects. This would complicate the
analysis of beam behaviour when an aim would be to identify either bending failure, which
75
might be brittle compression or ductile tension or brittle shear failure. The selected four point
loading arrangement enabled almost pure bending to be produced, with zero shear and
combined bending, and shear effects to be studied. The ratio of the distance between the
supports and loading jacks was constant for all beams at one third of the span, as shown in
Figures 4.8 and 4.9. Strains and deflections were measured after the beam was placed on the
roller supports. The effect of the self-weight ofthe beam was discounted. This provided the
required zone of constant bending moment between the two loading jacks and end zones that
were under constant shear and variable bending moment. With this method it was possible
for bending failure to take place anywhere between the two load points and shear failure in
the end zones. Failure would take place at the weakest section.
As noted in Chapter 2, various studies of the shear strength of reinforced masonry beams
have been carried out by Osman and Hendry [49, 68], Sinha [65, 69], Suter and Hendry [45,
70] et al. An aspect that was highlighted in the studies is that the ratio of shear span to beam
depth and reinforcement percentage can have an important effect on the behaviour of a beam.
It was suggested that a ratio equal to or greater than six is necessary before flexural failure
predominates. The shortest beam in the test series, of2m, had a shear span ratio of3.47. The
three and four metre span beams had shear span ratios of5.2 and 6.94 respectively.
4.6.1 Loading Apparatus
Enerpac Limited manufactured the loading apparatus, shown in Figure 4.9, for the beam
tests. Two 230 kN hydraulic jacks applied 'point' loads to the beams. The jacks were
76
L
mounted on the inside of a suitably stiffened universal steel channel. The channel and jack
assemblies were fastened to the reaction frame by means of 'Lindaptor' connections. This
allowed total flexibility of load location. To provide a knife-edge load a universal structural
steelwork channel was used. A spigot was used to locate the channel and the ram of the jack.
A round steel bar was placed between the channel and the beam. Local crushing of the
brickwork and high local stresses were avoided by setting a steel plate at the load location,
bedded in mortar, between the steel bar and the brickwork of the beam. A similar
arrangement was used for the transverse end supports, with steel web stiffeners used to
provide additional stability to the loading rig. The system was calibrated prior to testing the
beams. As the beam deflected under load a horizontal thrust occurred at the supports, which
were of stainless steel and circular in form. Calculations indicated that the thrust would
induce a bending moment equivalent to one third of one percent of the maximum bending
moment.
4.6.2 Load application
Initially a small load was put onto the beam to allow the system to 'bed-down'. This was
then removed and the recording equipment zeroed. Loading was next applied in equal
increments from zero through to ultimate failure. The magnitude of these increments varied
according to the span. Strain and deflection readings were recorded at each load increment,
when the deflection gauges showed a virtually stable condition. Slight floating of the gauges
occurred at times due to the fluctuation of oil pressure within the Enerpak jack pumping
system. It was considered that an accurate load/time relationship was not necessary since the
77
aim was to identify, during the whole load process, the mechanics and pattern of behaviour
and the failure mode(s). The periods between load increments were generally constant but
some variation occurred since the time to map the cracks varied. To visually facilitate the
location of cracking during testing the faces of the beam were painted with white emulsion.
The extent of cracking was highlighted on the beams, using a black felt tipped pen.
4.7 INSTRUMENTATION
Instrumentation was selected to measure and record data. The main areas of interest were
flexural bending and shear, therefore methods were used to ascertain:
• the strains within the tensile reinforcement
• the brickwork surface strains
• the load/deflection relationships.
The relative recording systems used were: electrical resistance strain gauges ("ERSGs");
demountable, visual, mechanical strain gauges (the Demec gauges); an electrical linear
voltage displacement transducer (LVDT) and, visual, dial test indicators (DTis, dial gauges).
4.7.1 Measurement of Strains witbin tbe Tensile Reinforcement
Linear ERSGs were used. A universally accepted method of setting up these foil gauges was
to machine a section of the round steel reinforcing bar, producing a flat area. After careful
cleaning and degreasing of the machined areas the ERSG, with its attached leads, was glued
into position using a proprietary epoxy resin. This provided a very good bond up to yielding
78
of the steel. However when the ERSG was surrounded by wet concrete/grout it was
necessary to protect it from damage and water ingress. To achieve additional protection the
ERSG and its electrical contacts were covered with a silicone rubber sealant. A heat
shrinkage system was then used. Experience of using this method at the UOP had shown that
water ingress could still occur and the result was the short-circuiting of too many ERSGs.
A more reliable technique was adopted. In this method slots were cut at defined positions
along the length of the reinforcing bar. Each slot was cleaned and a wired ERSG placed
within the slot. A compound bonded connection was obtained by filling the slot with an
epoxy. The "slotted bar" technique had been successfully used in measuring strains, beyond
the point of failure, in structural steelwork bolts and concrete reinforcing bars. The technique
has the following advantages over the surface mounting procedure:
• the ERSG functions beyond the concrete/steel bond failure.
• the ERSG measures the direct strain induced in the reinforcement by the load.
• the reduction in cross sectional area is less than with the flat surface technique.
• bulky protection of the ERSG is not required.
• a greater level of protection to the ERSG is provided.
4. 7.1.1 ERSG Specification and Associated Instrumentation
Type PLS20 ERSGs, supplied by Techni-Measure Limited were used. These had a gauge
resistance of 120 ohms. Axial strains were recorded manually using a Wheatstone Bridge,
one active and one dummy strain ERSG per circuit ERSGs were positioned along the
79

longitudinal centre lines of the bars, providing axial tensile strain measurements. Although
the reinforcement in the beams was subject to bending, the whole of the bar was considered
to be in axial tension. The meter, generator and balancing resistors for the half bridge circuit
were incorporated within a Bruel and Kjaer direct strain reading apparatus. Dummy ERSGs
were fixed to a specimen of steel embedded in concrete, which was placed close to the beams
during testing. These unstressed dummy ERSGs compensated for temperature effects.
Similarly all leads attached to the ERSGs were approximately the same length, thus
minimising possible variations in readings due to the resistance and impedance differences
between short and long leads. The beams were set on their supports. The self-weight of the
beam induced compressive and tensile bending stresses. The bridge circuits were then re
balanced to zero in order that during the tests the circuits only measured the strains induced
by the applied four point loading system. Six circuits were used on each beam. Locations of
the active ERSGs are shown in Figure 4.10. ERSGs were fixed at third span, mid-span and
halfway between the two latter positions. A distribution of strain within the zone of constant
bending moment was thus obtained. Ninety-one percent of the strain ERSGs, 131 out of 144,
provided satisfactory strain readings. All beams had at least four ERSGs operating. Of
thirteen defective ERSGs only two were due to an open circuit. The Bruel and Kjaer
equipment provided the ability to balance both resistance and circuit capacitance. The other
eleven ERSGs were rendered defective by the inability to achieve capacitance balance.
80
4.7.1.2 Calibrating the ERSGs
To determine the effect of slotting a reinforcing bar, calibration tests were carried out using
specimens with and without slots. These tests were also used to obtain the modulus of
elasticity, yield stress and ultimate stress of the reinforcement. Three bars of each type, i.e.
with and without slots and of equal length, were tested in axial tension, using an Avery
Universal Testing Machine. Bar diameters were 6 mm, 8 mm, 16 mm, 20 and 25 mm. Strains
in the specimens without slots were measured using a de-mountable extensometer gauge, of
50mm gauge length. Two ERSGs were fixed to each slotted specimen. The ERSGs were
fixed in slots 835 mm from the mid-point of the test bar. This distance represented the
minimum dimension permitted by the slotting machine. The extensometer was also used and
positioned as with the specimens without slots. This provided a comparison with the ERSGs.
Equal incremental loading was used for both types of test specimen. The results are shown in
Section 5, Appendix I, Volume 2, with a summary in Table 4.4. The results of the calibration
tests show a minimal difference of 0.4% in the value of the yield stress and of 1 .8% in the
modulus of elasticity. The largest difference was at ultimate stress, where there was a 2%
variation. The specimens without slots gave the highest stress values. The testing team
suggested that the difference at the ultimate stress was due to fragmentation of the epoxy in
the slot. As ultimate stress in the steel approached failure of the adhesive was audible. With
adhesive fracturing there was a consequent reduction in cross section area. No allowance was
made for this in the calculations because the full extent of the fractures could not be
determined. The maximum difference between the extensometer and strain readings was
3.6%. It was considered that this small difference was not significant and that placing ESRGs
81
in the slotted bars was justified. The mean values for the bars tested are shown in Section 5,
Appendix I.
4.7.2 Demouotable Mecbaoic:al Strain Gauge (Demec)
The Demec gauge, calibrated by the Cement and Concrete Association, consists of an invar
bar with a fixed point at one end and a pivotal point at the other. The Demec
records the distance between two fixed points on a specimen as the element expands or
contracts under load. The two fixed points consist of small stainless steel discs. These were
fixed with an epoxy to a prepared surface. The latter is essential to provide parallel faces; the
surface of bricks may have lumps or hollows. Positions of the Demec discs are shown in
Figures 4. 11. Both the shape of the strain distribution across the depth of the beam and the
location of the Demec studs were important. Tests, by author of this thesis and Dasht [30],
which examined the bond strength of ladder type bed joint reinforcement, showed that the
depth of the compression zone in reinforced brickwork beams was small, when compared to
the effective depth. Hence in selecting the positions for the gauges it was assumed that the
neutral axis of the beam in flexure would fall within the top two courses. Three positions in
the depth of these courses were selected. For the tension zone in the lower portion of each
beam it was accepted that tension cracks would occur. Studs were placed at the centre of the
bottom course and at the level of the reinforcement in the course above.
82
4.7.2.1 Cracking of the Brickwork Under Load
Strong floodlights were used to assist in the identification of very fine cracks in the
brickwork. Demec readings were taken until it was considered unsafe for personnel to be in
close proximity of the beam as the load was applied. This was for a reasonable period after
cracking occurred. It was considered that subsequent readings of the Demec would provide a
method of ascertaining crack widths. Spot checks, using a crack detection microscope,
showed this to be a reasonable assumption. When the beam cracked it was assumed that all
tensile forces would be transferred to the tensile reinforcement. This is examined in the
following Chapters.
4. 7.3 Displacement Gauges
Electrical linear voltage displacement transducers and visual, dial test indicators were used to
show the vertical displacement of the beam under load. Both types were positioned at mid
span, where the greatest deflection would occur.
4.7.3.1 LVDT
The calibration of the L VDT transducer was set in order that one unit of movement on the
measuring and display unit represented 0.1 mm of vertical displacement. This allowed for
measurements of movement in the range zero to a maximum of 300 mm. The LVDT
transducer was positioned at the centre line, of the top of the beam, Figure 4.10.
83
4.7.4 Dial Test Indicators
DTis recorded vertical movement at the centre line of the underside of the beams, Figure 4.9.
Two were placed at mid-span; one was situated towards the front and the other towards the
rear of the beam. This enabled any possible torsional rotation of the beam under load to be
noted.
4.8 SAFETY PROCEDURES
Portable screens provided a restricted access of two metres minimum from the test beams.
These were used to conform to the requirements of the Health and Safety at Work Act, in
place at the times of testing. Personnel retired behind the safety screens before load
increments were applied. The precautions were justified. Test beams with no shear
reinforcement failed explosively, as shown in Plate 3. When the failure of beam 1/330
occurred a block of brickwork, approximately 0.33 m x 0.1 S m x 0. 75 m, was thrown up
about 0.2 m. It then fell out of the frame, landing one metre from the latter. Causes for such
explosive movements relate to the conversion of the strain energy developed within the
beam.
4.9 FAILURE MODES OF REINFORCED BRICKWORK BEAMS
Reinforced brickwork beams can fail due to excessive cracking, deflection, in flexure, shear
or by local crushing/bearing or bond.
84
In considering the failure of each test beam it was accepted that:
• serviceability failure would be considered to have taken place when cracking or
deflection exceeded the permissible limits (refer Chapter 5, Section 5.3.4). Cracking
failure is primarily the result of tensile forces causing the bond between the brick unit
and mortar joint to fail or the tensile resistance of the brick, mortar or grouted core to
be exceeded. Tensile force induced cracking may be due to bending and /or shear
stresses. As a result cracks may perpetrate through brick, mortar joints and grouted
core.
• ultimate ductile flexural failure will occur in the tension zone due to the yielding of
the steel reinforcement. This is the preferred collapse when compared to the brittle
(sudden) flexural crushing collapse of the brick or grout in the compression zone. In
addition to yielding of the steel, flexural failure may be due to loss or lack of bond
between the reinforcement and grout.
• shear and local crushing failure are also classed as brittle modes. Shear failure occurs
close to a reaction or load point. Crushing/bearing failure may be the result of a high
contact stress developing at a reaction or load point and internally where excessive
bearing stresses develop between the grout and the tension or shear reinforcement.
• ultimate failure of the brickwork in tension would be taken at the point when the
yield stress in the tensile reinforcement was reached; compression failure would be at
the point when the brickwork or grout in the compression zone crumbled and shear
failure would be accepted when diagonal cracks developed within a shear zone.
85
I, 'I r
,jn ChapterS
86
;:, ... -,
CHAPTERS
CODES, ANALYSIS AND DESIGN
5 INTRODUCTION
British and International Codes of Practice and Standards and analysis and design procedures
have been produced for the construction industry using the results of experimental
investigation into the behaviour of reinforced brickwork beams and the analysis of the results
and examination of new design philosophies. These Codes and Standards have been
influenced by an in-depth understanding of the subject by generations of engineers and
researchers.
Limit states analysis and design has become the internationally recognised method of
designing structures, however elastic analysis and design has an important role in the design
processes.
Incorporated within this chapter are equations from referenced sources and other well known
accepted equations. Most of the latter are contained in "Annex AS" at the end of this chapter.
87
The following, which provide the background for the analysis of the test results and the
development of the parametric study, are outlined and discussed in this Chapter:
• Codes of practice for brickwork design.
• limit states philosophy and basis for design.
• characteristic material strengths
• beam behaviour and elastic analysis
• methods of analysis and design of reinforced brickwork beams.
• shear strength of the UOP Quetta Style Beam
• Code design equations
• deflection
5.1 CODES OF PRACTICE FOR BRICKWORK DESIGN
5.1.1 Historical background
The first U.K. Draft Code of Practice (CP) was produced for Loadbearing Walls in 1946, by
the Institution of Structural Engineers on behalf of the British Standards Institution (BSI). In
1948 CP111 [S.7) was published as "Structural Recommendations for Loadbearing Walls".
It contained sections on permissible stress design of unreinforced and reinforced brickwork
walls. The latter was very limited, and based on the principles of reinforced concrete design.
Revisions ofCP111 took place in 1964 and 1970 (SI units) [S.8).
88
In 1972 The British Ceramic Research Association and the Structural Ceramics Research
Advisory Group published Special Publication (SP) 91, "A Design Guide for Reinforced and
Prestressed Clay Brickwork" [53). This was based on limit states philosophy. 1978 saw
publication ofBS 5628: Part 1 1978: British Standard Code of Practice for use of masonry,
"Structural use of unreinforced masonry" [S.6]. This was also based on limit states
philosophy.
In 1985, following a significant surge in worldwide research into reinforced and prestressed
masonry, BS 5628: 1985; British Standard Code of Practice for use of masonry, Part 2:
"Structural use of reinforced and prestressed masonry" was published [S.1]. A second
edition was published in October 1995 [S.2].
5.2 CURRENT U.K. AND INTERNATIONAL CODES
5.2.1 U.K.
The third edition of the masonry code was published in November 2000 as BS 5628: 2000;
British Standard Code of Practice for use of masonry, Part 2: "Structural use of reinforced
and prestressed masonry" [S.3). It adopts the well-known principles of limit states design
philosophy, as applied to most structural materials.
89
5.2.2 Australia
The main unreinforced and reinforced masonry standard in Australia, which is based on limit
states theory, is AS 3700 "Masonry Structures" [S.IJ].
5.2.3 The United States of America
The current code is "Building Code Requirements for Masonry Structures", ACI 530-
99/ ASCE 5 -99/TMS 402-99. The American Concrete Institute, Structural Engineering
Institute of the American Society of Civil Engineers and The Masonry Society published this
document [S.4]. The code is based on permissible stresses. A section on limit states design is
to be issued in the future.
5.2.4 Eurocode
ENV (Pre-standard) 1996-1-1, based on limit states theory, was published in 1996 as
Eurocode 6: Design of Masonry Structures - Part 1-1: General rules for buildings - Rules for
unreinforced and reinforced masonry [S.15]. Associated with this is the Draft for
Development Eurocode 6: Design of masonry structures published, by the BSI in 1996, as a
U.K. National Application Document [S.l6].
90
5.3 LIMIT STATES PHILOSOPHY AND BASIS OF DESIGN
5.3.1 Philosophy
In producing the masonry code for reinforced masonry, BS 5628 Part 2 [S.I] the philosophy
of design and many of the recommendations for reinforced concrete [S.9, 18 and 19] were
adopted. The inference of this is that there is a direct relationship between masonry and
concrete, as discussed in Chapter 2, Section 2.2.2.
A design philosophy for masonry, stated by Curtin et at [71], is that, "The main underlying
aim should always he to keep the solution simple, to see that the construction methods and
the effect of the design upon them are carefully considered, and to ensure that the design is
based upon masonry as a material in its own right, and not simply as a variation on the design
of concrete structures". Curtin et at, [71], further state, "Masonry is considered to be
analogous to concrete. As a result some engineers tend to consider them as almost identical
materials in design terms. They are not - and the analogy can be pushed too far. Unlike
concrete, masonry - brickwork particularly - is not homogenous or isotropic. Concrete
shrinks as it matures and brickwork expands, and this affects bond strength, creep losses etc.
Cracking on the tensile face of reinforced concrete members will be spread along the face,
and the cracks are likely to be minute. Cracking on the tensile face of a reinforced brickwork
member will be concentrated at the mortar joints, and the cracks may well be larger''. As
stated in Chapter 4.9 some cracking may pass through the brick and/or mortar.
91
5.3.2 Basis of Limit States Design
The requirement of design in reinforced masonry [S.J] is that it should provide an adequate
margin of safety against the ultimate limit states and further that serviceability limit states
criteria are satisfied.
The specific requirement for grouted cavity beams is that designers should consider whether
the proportion ofinfill in a given cross-section is such that the recommendations ofBS 8110
Part I (S.18) are more appropriate than the masonry code (S.J). The traditional grouted
cavity beam, shown in Figure 1.1 t: can have a cavity of virtually any width. A decision about
the width has to be made when designing a grouted cavity beam where the core cross
sectional area is 500/o of the total area. This would occur with a core 205mm wide and two
wythes of half-brick thickness, i.e. each 102.5 mm. A beam ofthis form could be considered
as a brickwork or concrete beam. In this situation a C20 to CJO concrete is likely to be used
for the core.
5.3.3 Definition of Limit States
BS 5628 Part 2 [S.J] defines the limit states for reinforced masonry as follows: -
The design should provide an adequate margin of safety against the ultimate limit states
(strength, overturning and buckling). This is achieved by ensuring that the design strength is
greater than or equal to the design load. The design should be such that serviceability limit
states criteria are met (deflection and cracking and others, where appropriate e.g. fatigue).
92
5.3.3.1 mtimate limit states for strength
BS 5628 Part 2 [S.3] states "the strength of the structure should be sufficient to withstand the
design loads". Strength refers to the design strength. Design strengths and design loads are
obtained by applying factors of safety to the characteristic strengths and characteristic loads.
5.3.3.2 Partial safety factors for brickwork and loads.
The partial factors ofsafety for materials, Ym, and for Ioad&,yr, are shown in BS 5628 Part 2,
Clause 7.5, [S.3]. The material partial safety factors for the strength of reinforced brickwork
'Ymm take into account: the variations in the quality of bricks and mortar; the differences
between site and laboratory brickwork; the category of manufacturing control of individual
brick units. For reinforced brickwork in direct compression and bending the basic reference
is specified against special (Ymm = 2.0) or normal (Yrmn = 2.3) quality ofthe manufacturing
control of the structural units. It is assumed that there is special construction control of the
elements [S.3, Clause 11.3.1].
Other ultimate limit states values for materials are: shear strength of masonry,Ymv = 2.0; bond
strength between concrete infill or mortar and steel, "fmh = 1.5; strength of steel, Yrrrs = 1.15.
To obtain the design strength of the material the characteristic strength is divided by the
appropriate partial factor, Ym.
93
The partial factor for loads, rr. varies between 0.9 and 1.6. The factors take into account:
possible unusual increases in load beyond those considered in deriving the characteristic
load; inaccurate assessment of effects of loading and unforeseen stress redistribution within
the structure and the variations in dimensional accuracy achieved in construction. The design
loads are obtained by multiplying the characteristic loads by the partial factor, Yr-
5.3.4 Serviceability limit states
The section of the Code, [S3, Clause 7.1.2.2], covering deflection and cracking states, "the
deflection of the structure or any part of it should not adversely affect the performance of the
structure or any applied finishes, particularly in respect of weather resistance''. The factored
characteristic loads used in serviceability analysis vary according to the type of load
combination. The partial safety factor for loads (Yr) varies according to the type of load. A
value of 1.0 is used for each of the loads when dead load is combined with: either the
imposed load or with the wind load. When dead, imposed and wind loads are combined the
respective individual factors which are used are l.O, 0.8 and 0.8. Consequently ye has a value
between 0.8 and 1.0. The serviceability value ofymm for masonry is 1.5 and that for steel is
1.0. To control deflection and cracking it will be necessary to use reinforcement stresses that
are lower than the characteristic strengths used for strength design. The normal controlling
limit on the final deflection of reinforced brickwork beams is span/250. This is used when it
is considered necessary to carry out deflection calculations. This value allows for the effects
of temperature, creep and shrinkage. There is a 20mm or span/500 limit when consideration
is given to the effect of beam movement on partitions and finishes.
94
The Code [S.3] states, that "fine cracking or opening up of joints can occur in reinforced
masonry structures. However cracking should not be such as to adversely affect the
appearance or durability of the structure". Roberts et al [72] suggest the maximum crack
width, which is likely to occur in reinforced masonry designed to the Code, would be 0.3mm.
Control of cracking is obtained by the limitation of span to effective depth of the beams, as
listed in Table 10 of the Code [S.3].
5.4 CHARACTERISTIC MATERIAL STRENGTHS
The Code defines the characteristic material strengths relative to compressive, tensile,
bending, shear and bearing behaviour.
5.4.1 Characteristic compressive strength of brickwork, fk
As stated in Chapter 2.1.1 the characteristic compressive strength of brickwork (fk) is
dependent on the Type, shape, orientation and compressive strength of the brick unit and on
the Type of mortar used. For a particular brick and mortar fk is obtained from Figure 2.1.
Pedreschi and Sinha [73] showed that the compressive strength of a clay masonry unit and
thus the characteristic compressive strength of masonry vary according to orientation. The
Code suggests that where doubt exists a statistical assessment of the value should be made
using a number of representative prism tests.
95
The compressive strength of a specific brick unit is nonnally obtained by applying an axial
compressive load perpendicular to the bed face of the individual unit, in accordance with BS
3921 [S.S]. The characteristic compressive strength of brickwork is determined by a series of
tests on brick prisms and is therefore dependent upon the compressive strength of the brick
and of the mortar. The Code recommendation for bricks which will be loaded in compression
on a face other than a bed face is that ti should be taken as one third of the value taken when
loaded perpendicular to the bed face [S.3 Clause 7.4.1.1.4 (a) and (b)]. There is no
differentiation in the Code between bricks loaded on the stretcher face and those loaded on
the header face. Recommendations are given in the Code, [S.3, Clause 7.4.1.1.5], for the
determination of fk when unusua1 bonding patterns are used. It is suggested values are
obtained from tests, with a limitation that fk should not be greater than the standard fk from
Table 3 in the Code.
5.4.1.1 Research results of compression tests on brickwork
Compressive stresses are induced into a structura1 element by axia1 loads and bending
moments. Compressive forces due to bending in a reinforced brickwork beam can be applied
to any of the three mutually perpendicular faces of a brick unit, depending on the bonding
pattern adopted. In the UOP Quetta Style Beam forces were applied to the header and
stretcher faces. Tables S.la and 5.2b and Figures 5.1 and 5.2, show the research results of
axial compression tests on bricks and a variety of prisms, produced by Davies et al, ed.
Edgell [74] and Regan (internal UOP). The prisms were fonned of perforated or solid bricks
using header, stretcher and combined header and stretcher bonds. Table 5.1 and Figure 5.1b
96
show: the characteristic compressive strength, f~<, of brickwork loaded on the bed face
(obtained from the compressive strength of the brick unit and the mortar designation) and the
compressive strength of brick prisms loaded on stretcher and header faces. The design
strength shows two values. For solid bricks the design strength is obtained by dividing the
characteristic brickwork compressive bed strength by the partial factor ('Ym = 2.0). For
perforated bricks the compressive strength of brickwork, loaded on combined header and
stretcher faces is also divided by the factor of 3, as discussed above, and then the material
factor of safety is applied. Hence the design strength is taken as fiJ 6.
The results indicate that:
• the calculated design strength of brickwork using perforated bricks, which is loaded
on either the header or stretcher face, shows significant reductions in strength when
compared with the prism strength of brickwork formed of header and stretcher bricks.
This is clearly identified in Figures 5.1 and 5.2. Use of these low design strengths
would lead to uneconomic oversized beams.
• for all bricks the strength of the brick is not reflected in the strength of the brickwork,
as shown in Figure 5.1.
• for all but one of the bricks the characteristic strength, fk, is significantly lower than
the brickwork for which it is used due to the effect of the bonding material.
97
5.4.2 Characteristic tensile strengths of brickwork
5.4.2.1 Direct tensile strength
BS 5628 Part 2 [S.3] suggests that tension should be ignored when detennining the resistance
moments of elements. ''The direct tensile strength, or tensile bond strength, of brickwork is
typically about 0.4N/mm2, but the variability of this figure has to be kept in mind, and it
should only be used in design with great caution" (Hendry et al, 75]. This is reinforced by
Sinha, Anderson and Held [80] and Schubert (80]. Their results indicate that brick Type,
sand grading and moisture content of the brick produce variable results and therefore the
tensile strength is uncertain. Direct tensile tests were not carried out on the bricks used in the
UOP Quetta Style Beams.
5.4.2.2 Characteristic ftexural strength of brickwork, f~a
Normally, flexural bending refers to and is used in considering the design of vertical wall
panels under lateral load. The strength of brickwork specimens subjected to flexural bending
in a plane at right angles to the bed joint is different to that parallel to the bed joints. Failure
takes place parallel or perpendicular to the bed joints, as shown in Table 3, BS 5628 Part I
[S.6]. The recommendation in the Table is, that a characteristic flexural strength range for
clay brickwork between 0.25 - 2.0 N/mm2 should be used, depending on the mortar
designation and water absorption value. The Code for unreinforced brickwork [S.6], Clause
24.1 states, "In general, no direct tension should be allowed in masonry. However at the
designer's discretion half the values given in Table 3 may be allowed in direct tension when
98
suction forces arise from wind loading on roof structures are transmitted to masonry walls, or
when the probable effects of misuse or accidental damage are considered".
The values for flexural strength of brickwork in bending (fix) shown in Table 3 of the
unreinforced masonry Code [S.3] were obtained by testing small specimenslwallettes built
of stretcher bond. A four-point line loading was applied at right angles to the filce of the
element.
Tests by lames [79] to examine the flexural tensile strength of small specimens provided the
mean and coefficient of variation values in Table 5.2. The value of interest in this Table is
the tensile strength of the prism parallel to the bed joint using a I:..!.._ :3 mortar. The stress of 4
2.29 N/mm2 would relate to the bottom courses of the UOP Quetta Style Beam under the
initial loads. Anderson [77] confirmed work by West [80] that there is a correlation between
flexural strength and moisture content, but Anderson and Sise [80] identified other factors
which included the method of preparing specimens, mortar consistency, surface texture and
joint thickness.
Clause 7.4.12 in BS 5628 Part 2 [S.3) states, " For a given masonry defined in terms of the
compressive strength of the structural units and mortar designation, the value of f. may be
taken as the characteristic compressive strength of masonry in bending". The normal stress
diagrams for reinforced brickwork beams used with elastic and ultimate stress situations are
discussed in the following sections, 5.6 and 5.7.
99

5.4.3 Characteristic shear strength of grouted cavity beam, fv
BS 5628 Part 2 Clause 7.4.1.3.1(b) [S.3] states that, "for reinforced sections where the main
reinforcement is placed in grouted cores the characteristic shear strength, fv,
may be taken as:
fv = 0.35 + 17.5p N/mm2 ... 5.1
2" where p = A,.lbd , provided fv shall not exceed 0. 7N/mm .
Enhancement of this value for simply supported beams is permitted where the ratio of the
shear span, a, to the effective depth, is six or less. The shear span, a, is the distance from the
load to the centre of the support. fv may be increased by a factor (2.5 - 0.25[ald]), where fv
cannot be greater than 1.75 N/mm2.
Hence equation 5.1 becomes:
fv = (0.35 + 17.5p) ( 2.5-0.25 [aid]) N/mm2 .... 5.2
5.5 BEAM BEHAVIOUR AND ELASTIC ANALYSIS
At any cross-section of a beam the external moment (M) and shear force (V) induces internal
forces and consequent stresses. These can be resolved into components that are normal and
transverse to the section. The theory adopted for 'homogeneous' beams of structural
steelwork and timber is that flexural bending induces tension and compression, (i.e. the
normal forces), either side of the neutral axis. The transverse force is the shear force. Elastic
100
design is based on the assumption that under working (characteristic) loads the stress/strain
relationship is linear up to the value where the stress does not exceed a defined proportion of
the yield stress of the material. Elastic stress and strain diagrams for the cross-section of a
homogeneous beam are shown in Figure 5.3 and shear stress diagram is shown in Figure 5.4.
Related equations are shown in Annex A.5.
5.6 METHODS OF ANALYSIS AND DESIGN OF REINFORCED BRICKWORK BEAMS
Both elastic and limit states principles are used to analyse and design reinforced concrete
beams and reinforced brickwork. The ultimate limit states, when applied to reinforced
brickwork beam design, are based on the stress-strain relationship developed at failure. Two
of the main differences between the two standards, BS 8110 [S.19], and BS 5628 Part 2[S.3]
are that the values used for the design strengths and the stress flow through the materials can
vary significantly. Also the stress trajectory through concrete and brickwork will be different
because of their respective formats. It is possible to carry out either elastic or limit states
analysis of reinforced brickwork structures and to design those structures using either elastic
theory or the limit states method. The latter uses elastic theory for the determination of
deflections due to elastic behaviour. However the Code only provides design equations for
strength using limit states theory. In compression, brickwork is often treated as a linear-
elastic material, despite tests by Powell and Hodgknison (37] that show the stress-strain
relationship to be parabolic, refer Figure 5.5.
101
Under normal service (characteristic load) conditions brickwork is stressed to only a portion
of its ultimate strength, therefore the assumption of a linear stress-strain relationship may be
acceptable for the calculation of normal structural deformations. Masonry is strong in
compression but weak in tension. It is therefore a requirement in the design process to
"exploit the strength and overcome the weakness", Curtin et al [62]. The ultimate limit states
when applied to reinforced brickwork design are based on the stress - strain relationship at
failure.
5.6.1 Assumptions and equations
A summary of the basic assumptions of the elastic theory, used in reinforced brickwork
design and analysis, are:
• cross-sections that are plane before bending remain plane after bending.
• both steel and grout remain totally elastic.
• brickwork and grout resist no flexural tension forces (i.e. any tensile resistance of
these materials is ignored).
• reinforcing steel and grout act in conjunction throughout, there being no movement of
the reinforcement within the grout; ensured by adequate bond between steel and
grout.
102
The permissible stress design equations for a singly reinforced brickwork beam can be
derived from Figure 5.3. They are listed as equations A5.1 to A5.12 in the Annex to this
chapter.
5.6.2 Relevance of tbe elastic equations to tbe UOP Quetta Style Beam
Equations AS. I to A5.12 were developed for beams with a high percentage ofhomogeneity
and where the beam material properties in compression and tension were assumed to be
isotropic. With respect to the UOP Quetta Style Beam the equations do not therefore take
into account the:
• anisotropic behaviour of clay brick.
• the non-homogeneity of the cross-section along the length of the beam as shown in
Figures 3.5, 4.5 and 4.6.
• the varying compressive and tensile strengths, elastic moduli and the Poisson ratio of
bricks loaded on different faces. These are of particular significance in this study.
The bricks within the UOP Quetta Style Beam are formed of an anisotropic material where
the strength, elastic modulus and Poisson's ratio will take different values along orthogonal
axes. Mortar and grout are considered to be isotropic. Asymmetrical stress trajectories are
likely to occur. Gordon [81] defines stress trajectories as, "typical paths by which the stress
is handed on from one molecule to the next". The varying tensile, compressive and shear
forces induce the stresses. These result from the changing bending moments and shear forces
along the length of the beam. The stress trajectories along a reinforced concrete beam will
103
have a reasonable degree of symmetry. It is unlikely however that they will be perfectly
symmetrical or straight. Deviations could be produced by the aggregate and the shear
reinforcing bars. Within the UOP Quetta Style Beam it is permissible to consider that the
flow of the stress trajectories will vary as they move from grout to mortar or grout to brick, to
steel etc, and vice versa. Perforations in bricks will also affect the stress tmjectories. If the
stress trajectories are compressed then stress concentmtions occur. Gordon [81] states,
"Stress trajectories are diverted just as much by an area which strains too little, such as a stiff
patch, as they are by an area which strains too much, such as a hole. Anything which is, so to
speak, elastically out-of-step with the rest of the structure will cause a stress concentmtion
and may therefore be dangerous''.
Information on the values of elastic modulus for brick units is limited. Riddington and Jukes
[82] obtained the results shown in Table 5.3. This indicated that the elastic modulus was
independent of the compressive strength, ft., of the brick unit. Expressed as a factor of the
brick unit's compressive strength, this varied from 262 fb to584 6,. The elastic moduli were
obtained using 30 x 30 x 65 mm prisms cut from the bricks, provided by different
manufacturers. In lieu of the limited number of test results and of the fact that different types
of brick (i.e. solid and perforated) were used it was not considered appropriate to suggest a
relationship between compressive strength and elastic modulus.
Curtin et al [71] indicated that the elastic modulus for brickwork is defined to fall within the
range of 0. 7 to 1.1 fk kN/mm2 BS 5628 Part 2 [S.3] suggests a short-term modulus of 0. 9ti
kN/mm2. and a long term modulus of 0.45fk kN/mm2 The paper by Riddington and Jukes
104
[82] did not indicate that compressive tests were carried out on each of the three faces or
from which part, of the original bricks units, the samples were obtained. The relief of residual
stresses, cited by Sassu [38], may be a known factor which could account for the significant
differences between the values quoted by Curtin and Riddington. A further comparison was
made; see Table 5.4, between the Riddington and Juk.es results [82] and those produced by
Powell and Hodgkinson [37]. Perforated bricks of similar compressive strengths were
compared and it is noted that both had the same relative elastic moduli, with a value of
262 fb.
Contributing to the variation in the value of the brickwork to moduli is that of the mortar.
Further in considering a grouted cavity beam the concrete modulus will vary. Structural
brickwork can be constructed from materials which individually have a wide range of
strengths. It is possible to use a designation (i) or (ii) mortar with bricks whose unit strength
can vary from 10 to in excess of 200 N/mm2. For the mortar the value for Em could fall
between 3.1 kN/mm2and 26.4 kN/ mm2. As a contrast E grout varies only within the limited
range from 24kN/mm2 to 32 kN/mm2 [S.19, Table 6], for a grout of crushing strength from
20 to 60 N/mm2. Using a mortar designation (i) Forth and Brooks [83] obtained vales for Em
of 13.8 and 14.0 kN/mm2. Brooks and Amjah [84] obtained a close relationship between
mortar cube strength and elastic modulus. Their results gave the value Em= 0.98 fm.
Shrive and Jessop [85] published results of bricks tested between bed planes in compression
and between stretcher and header planes. They considered that this simulated the actual stress
condition in a brick prism when subjected to vertical axial loading. Their results shown in
105
Table 5.5 demonstrated the degree of reduction in modulus of elasticity and the relative value
ofPoisson's ratio between stretcher and header planes. This indicates a relationship between
the elastic modulus and Poisson ratio.
These results do not take into consideration the difference in the patterns of loading of
individual bricks and prisms which are not made of a single stack bond. The stress
trajectories through a column prism will be governed by the restraints or lack of restraint on
individual faces. Consequently the results are of limited use in this study.
The development of a rational analysis for the UOP Quetta style beam depended on an
appropriate understanding and interpretation of its behaviour under load. The beam could
have been formed of reinforcing steel with an E. of205 N/mm2, grouted brickwork with the
elastic moduli Et.= 20 N/mm2, Egrout= 20 N/mm2and Em= 14 N/mm2
. In view of the wide
range of values for Et, Eg..,... and Em the permutations of these values in any calculations are
infinite. Whilst the E values for the brick and grout are assumed to be the same it does not
necessarily follow that the stresses and the strains are the same but only that their ratios are
identical.
From the design aspect the possibility of appropriate values of the second moment of area, lx,
and the elastic section modulus, Zx, of a transformed uncracked and cracked section is
problematical. For the uncracked section each of the values Eh, Eg and Em have maximum
and minimum values with values in between. The UOP Quetta Style Beam has three different
cross-sections, three of which are important from the aspect of serviceability calculations.
106
The permutations of solutions to determine the flexural stiffness El are complex. When Et,
Eg and Em are determined by test it may be possible to ascertain approximate values for lx. Zx
and El.
The following equation, produced by Brooks [86], shows that six parameters are required to
determine the elastic modulus for a full bedded mortar prism: -
1
Ewy
byCAw
H {Eby~ +E.., A,) +
lily (C + 1)
HE, 5.3
where, by = height of unit, Ewy = elastic modulus of full bedded masonry ; C = number of
courses; Aw = c.s.a. of masonry; H = height of masonry; Et,y =elastic modulus of unit; ~ =
c.s.a. of masonry unit; Em = elastic modulus of mortar; Am = cross sectional area of vertical
mortar joints and my = thickness of mortar bed joint.
To adopt this equation for the UOP Quetta Style Beam prism there would need to be terms to
include Eg and two values for both Et. and ~.
5.7 LIMIT STATES MOMENT OF RESISTANCE
5.7.1 Assumptions
The following assumptions are made in the design processes recommended in the masonry
Code [S.3]
• plane sections remain plane when considering the strain.
107
• the compressive stress distribution in the brickwork is represented by an equivalent
rectangle with an intensity taken over the whole compression zone of fk/ymm where fk
is the characteristic compressive strength and 'Ymm is the value appropriate to the limit
states being considered.
• the maximum strain in the outermost compression fibre at failure is 0.0035.
• the tensile strength of brickwork is ignored.
• the strains in the beam are directly proportional to the distances from the neutral axis .
•
5.7.2 Stress and strain diagrams
The idealised stress/strain curves that are used for unreinforced brickwork and for steel are
shown in Figures 5.6 and 5.6b. The design moment of resistance is determined by assuming
that the section is under-reinforced: an upper limit of a balanced section has been set. Thus
only a progressive or ductile collapse mechanism should occur at failure. Basic bending
equations may be derived by considering a beam of rectangular cross section of symmetric
form, reinforced in tension, and using the above assumptions. In ultimate limits states non
linear and rectangular stress blocks are considered, Figure 5. 7. The values for k1 and k2 are
defined by Kong and Evans [87], in a study of reinforced concrete.
For reinforced brickwork it was shown in Chapter 4.4 (37] that a parabola, as defined by
equation 4.1, could be represented by the stress/strain relationship:
o I a' = 2 (Eie) - (Eie' )2
where o and 1i are the maximum stress and strain at the maximum point of the curve.
108
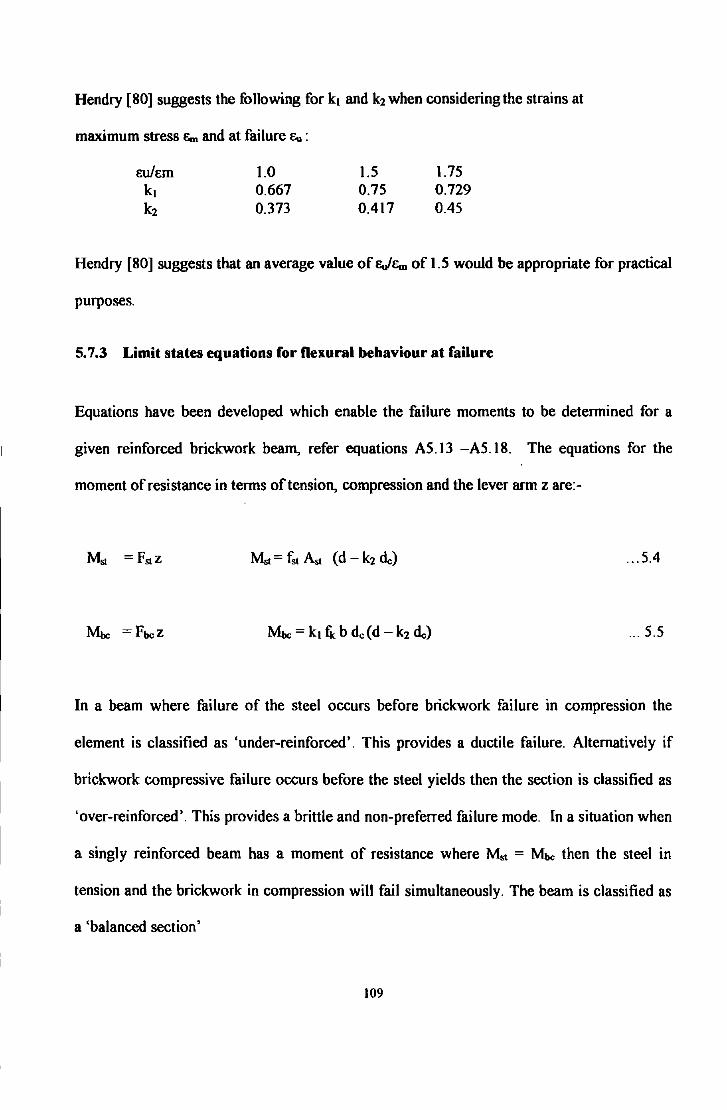
Hendry (80] suggests the following fork, and k2 when considering the strains at
maximum stress Em and at failure Eu :
1.0 0.667 0.373
1.5 0.75 0.417
1.75 0.729 0.45
Hendry (80] suggests that an average value of £,/Em of 1.5 would be appropriate for practical
purposes.
5. 7.3 Limit states equations for flexural behaviour at failure
Equations have been developed which enable the failure moments to be determined for a
given reinforced brickwork beam, refer equations A5.13 -A5.l8. The equations for the
moment of resistance in terms oftension, compression and the lever arm z are:-
... 5.4
~ =Fbcz ... 5.5
In a beam where failure of the steel occurs before brickwork failure in compression the
element is classified as 'under-reinforced'. This provides a ductile failure. Alternatively if
brickwork compressive failure occurs before the steel yields then the section is classified as
'over-reinforced'. This provides a brittle and non-preferred failure mode. In a situation when
a singly reinforced beam has a moment of resistance where Mst = ~c then the steel in
tension and the brickwork in compression will fail simultaneously. The beam is classified as
a 'balanced section'
109
5.7.3.1 Failure by yielding of the steel in tension
For failure by yielding f51 = fy. Hence the neutral axis depth, de, is given by:
de = f yA.tl (kt tk b)
The equation for the ultimate moment of resistance in tension, given in terms of the
steel yield stress is:-
5.7.3.2 Failure in compression due to crushing of the concrete
... 5.6
... 5.7
The maximum strain of brickwork in compression is taken as 0.0035. For pure compressive
failure the steel stress will be below the yield point. The actual stress will be proportional to
the steel strain e.. The equation to detennine the neutral axis depth, de, is :
ktfk.bde2 +A.t £t.uEsdc ·As EbuEsd = 0 ... 5.8
Having evaluated de the moment of resistance ofthe section, Mix,, can be determined from:
... 5.9
5.7.3.3 Moment of resistance of an unreinforced brickwork beam
The design moment of resistance (MOR) for an unreinforced brickwork beam can be
expressed as
MOR = fkx Z/ymrn ... 5.10
llO

where f~cx is a value of the flexural strength of the brickwork, shown in Table 3 of BS 5628
Part 1 [S.6]. It was noted that Table 3 was determined by testing half brick thick (102.5mm),
single skin brickwork wallettes, where all of the bricks were laid on bed in stretcher bond.
The values shown in Table 3 of the code are therefore nor relevant to the UOP Quetta Style
Beam.
5.8 SHEAR STRENGTH IN THE UOP QUEITA STYLE BEAM
5.8.1 Shear behaviour
In the examination of shear failure of reinforced brickwork it is of value to consider the
corresponding behaviour of reinforced concrete. In connection with the shear behaviour of
the latter Nilson [88] states, "Shear failure is difficult to predict. In spite of many decades of
experimental research into the use of highly sophisticated analytical tools it is not yet fully
understood". Hendry [80] states, "For beams of the same overall cross section and
reinforcement, grouted cavity beams will be intermediate between reinforced concrete and all
brickwork sections". He further states [80], when discussing cavity beams with pockets,
"there is very little experimental information as to the effectiveness of shear reinforcement".
All shear failures are of a brittle nature. The onus is thus on the designer to provide sections
strong enough to resist the applied external factored shear loads. The two basic stresses in a
beam induced by flexural bending are:
Bending,
Shear
f= Myll..a
V = V Nj/ (bloa)
Ill
... 5.11
... 5.12
Consider the two elements A, and A2 in Figure 5.8, Nawy [89], of a homogeneous, simply
supported beam, subject to vertical load. These elements are respectively in the tension and
compression zones. When basic elastic stress theory is applied the principle
stresses at A1 and A2 are defined as:-
ft(max) (ft/2) + V[(ft 12i + ~] Principal tensile stress ... 5.13
fc(max) = (fi/2) - v[[(ft /2)2 + v2] Principal compressive stress ... 5.14
Also ft(max) acts at an angle e to the horizontal,
where:- tan 28 = v/ (ft/2) ... 5.15
The Mohr's stress circles are shown in Figure 5.8. Since the tensile strength ft of brickwork is
low, when compared to its higher compressive strength, cracking will normally be induced
below the neutral axis. The form of the shear failure can be classified as:- Web Shear, Flexural
or Flexural Shear. Nawy [89] suggests a relationship between the mode of failure and the
beam slenderness category, as shown in Table 5.6.
As with reinforced concrete, shear forces applied to reinforced brickwork will induce failure
in tension, compression and in bond. The first is through the development of diagonal cracks
(diagonal tension failure). The second occurs when there is a large load close to the support.
This can induce high diagonal compression forces, resulting in a crushing of the brickwork.
The third failure is the development of flexural cracks at the bottom of the beam in areas of
high bending moment. These cracks may not initially form at the position of the highest
bending moment but at the section where the value of the moment of resistance/bending
moment ratio is the highest. The other failure can be caused by the breakdown of bond
112
between the reinforcement and the grout Web-shear, flexure-shear and flexure cracks are
shown in Figure 5.9.
Hamadi and Regan [50] and Osman and Hendry [68] have shown that the performance of
grouted cavity beams is dependent upon a number of parameters such as: shear span ratios;
percentage of reinforcement; brick and mortar strength; the effects of compression zone
transmission; shear aggregate interlock and dowel action. Hendry [80] collated results by
Suter and Keller. Shear transmission by different mechanisms is shown in Figure 5.1 0. The
cavity width was found to affect the shear strength because aggregate interlock and dowel
action can take place in the grouted cavity. Compression zone transmission occurred across
the brickwork and the grouted cavity. The limiting condition for shear was found to be:
... 5.16
or .. .5.17
These can be superimposed on design charts such as those described by Hendry, Sinha and
Davies [91].
Bittnar [90] suggests that in shear analysis a practical method for calculating shear distortion
is based on the assumption of a constant shear across the section.
113
5.8.2 Shear stress analysis to be used in the UOP Quetta Style Beam
The previous section identified some of the complexities in the shear stress analysis of
reinforced concrete. Nilson [88] and Nawy [89] both provide an in-depth discussion on shear
and diagonal tension in reinforced concrete beams. Hendry [80] provides an analysis of the
shear strength of reinforced masonry beams. In Chapter 6 a finite element analysis using the
LUSAS software identified the complex stress patterns developed by the UOP Quetta Style
Beam. There is a lack of any significant data from the tests results of the internal stress
conditions. Consideration of all of these aspects leads to a decision to only consider the
fundamental basic equations for shear in this thesis.
There are however some statements by Nilson [88] which are of note:-
• "horizontal shear stresses at the interface between components are important e.g.
composite members combining precast beams and cast in place slabs."(This is a
comment relevant to the consideration of the UOP Quetta Style Beam as a plate
element). "If the adhesion between two plates is strong enough the member will
deform as a single beam. However if the adhesion is weak the two pieces will
separate and slide.
• derivation of the principal stress throughout the beam would be beneficial, if these
could be obtained.
• diagonal cracks, in addition to vertical flexural cracks, develop at positions of high
moment and high shear and consequently high bi-axial stress. These cracks form
mostly at or near the neutral axis and propagate from that location.
114
• increasing amounts of tension reinforcement increases the shear resistance at which
diagonal cracks appear. In this situation flexural tension cracks are smaller with a
consequent increased area ofuncracked concrete to resist shear."
5.8.2.1 Fundamental equations of shear stress
As shown in Figure 5.4. the basic shear stress diagram for a homogeneous beam is parabolic.
Equation 5.12 provides the relationship for shear force and shear stress: -
V= V (AY)/( b I..,)
This indicates zero shear stress at the outer fibres and maximum stress at the neutral axis. For
design purposes the shear stress diagram is idealized and a rectangle is assumed for
homogeneous rectangular sections, Figure 5.4.b and 5.7, i.e. it is assumed that shear
throughout the depth of the section is uniform. When used with reinforced brickwork beams
equation 5.2 is expressed as:-
V= V I (b d) ... 5.18
Roberts et al (72] identified a number of component shear resistance forces in unreinforced
brickwork. These idealised components are shown in Figure 5.14.
The cross-section of the UOP Quetta Style Beam is such that at any horizontal cross section
there are different materials (brick, mortar and grout) with varying elastic and probably shear
115

moduli. It is shown in Chapter 6 that the stress distribution through the depth of the beam is
complex.
For a reinforced beam the shear resistance of a section includes contributions from the
uncracked portion, which is primarily in compression, and from the dowel action of the tensile
reinforcement and any interlock along the flexure cracks. Research by Osman [49], Suter [25]
and Sinha [65 and 69] has shown that the shear resistance of reinforced masonry depends to
some eld:ent on the compressive strength of the masonry and the percentage of the
reinforcement.
The relative importance of these effects would depend upon the form of construction of the
beam. One or more cracks may develop stepwise along mortar joints and thus aggregate
interlock is likely to be limited. In a grouted cavity beam of the type shown in Figure 1.2f
both aggregate interlock and dowel effect would develop in the grouted core. As indicated in
equation 5.1 the shear resistance of the grouted cavity reinforced brickwork beam is
influenced by the shear/ span ratio, the percentage of reinforcement and to a lesser eld:ent by
the strengths of brick and mortar, Sinha and de Vekey [69]. As the shear/span ratio decreases
to a value below six the shear strength increases quite rapidly. Figure 5.12, produced by Sinha
and de Vekey [69], shows the Code based shear strength of grouted cavity brickwork and
reinforced concrete against the shear/span ratio. The enhancement to equation 5.1, specified in
equation 5.2, cannot be used if the reinforcement is surrounded by mortar instead of concrete
or grout, due to lack of supporting evidence. When v < fvl Ymv shear reinforcement is generally
not needed, although nominal links are normally provided to take into account the suddenness
116
of possible shear failure, when v ~ fv I 'Ymv shear reinforcement is required. This can be
provided as links with a spacing Sv. In which case equation A5 .21 must be satisfied.
Spacing of stirrups is shown in Figure 5.13. In the application of truss analogy to reinforced
concrete, by Sinha and deVekey [69], it is assumed that the concrete carries the diagonal
compression, induced by the applied shear forces. Links in tension and the shear strength of
the concrete provide the resistance to balance the diagonal compression. For brickwork if
large shear forces have to be resisted it is possible that a diagonal compressive force could
cause failure. Therefore the maximum average transverse shear stress is limited to 2.0/ym
N/mm2. The normal inclination of each compression strut is taken at 45 degrees to the
longitudinal axis. To ensure that any crack is intersected by at least one link their spacing is
limited to 0. 75d.
5.9 CODE DESIGN EQUATIONS
In a design situation adjustment of the equations specified above are made. The material
factors of safety, Ymm for brickwork and Yms for steel, are used.
The depth of the stress block is assumed to be between O.SJd and 0.467d when steel strains of
0.0031 and 0.004 are used, respectively for mild steel and high yields steel.
The corresponding equations for the compressive moments of resistance take the form:-
117
The corresponding equations for the compressive moments of resistance take the form:-
For mild steel
and for high yield steel
M! = 0.39 fk b d2 I 'Ymm
M.!= 0.36 fk b d2 I 'Ymm
... 5.19
... 5.20
The corresponding stress blocks provide lever arm values for z of 0.788d and 0.805d,
respectively.
The Code, Clause 22.4.2 [S.I], adopts a conservative approach, recommending the following
equations, A5.19 and A5.20, for the design moments of resistance:
EqnA5.19
Eqn A5.20
M =A.t fy V'Yms:::; 0.4 fk b d21"(mm
z = d - 0.5 A.t fyyrrur/::; b fk 'YDlll
In using equation A5.20, z :::; 0.95 d. Compliance with equation A5.20 ensures that the
section is under-reinforced and consequently if flexural failure occurred this would be ductile
in form.
5.10 DEFLECTION
5.10.1 Introduction
General guidance on the serviceability limit states of deflection and specific details of the
load factors to be used in deflection calculations are provided earlier, in paragraph 5.4.3.2.
118
5.10.2 Deftection calculations- Annex C [S.3)
When considered necessary an estimate of the serviceability limit states of deflection of a
beam may be obtained using elastic analysis. However there are, in practice, a number of
factors that affect the reliability of the results. These are:
• assumptions of the type of restraint provided at the supports
• the nature and type of loading and its duration
• the effect of cracking
In practice it is assumed that the restraints provided by supports to beams are either simply
supported, semi-rigid or fully restrained. There will be, in the case of a simple support, some
degree of horizontal support depending on the friction that develops between the brickwork
and support. In the case of a laboratory investigation; the latter involves the use of a polished
roller, which minimises the frictional force and it is possible to identify the type of supports,
the value and duration of the loading and generally the onset of visible cracks. The latter is
the most difficult to ascertain and very fine 'invisible' hairline cracks may occur. BS 5628
Part 2 [S.J] recommends that, the following assumptions can be made:
• the section to be used for the calculation of stiffness is the gross cross-section, no
allowance being made for the reinforcement.
• plane sections remain plane.
• the reinforcement, whether in tension or compression, is elastic.
• the masonry in compression is elastic.
119
Equation A5.25 defines the maximum deflection, Ymax, of a simply supported beam of span
L, subjected to loads W at the third points:
Under short term loading the moduli of elasticity may be taken as the appropriate values
given in Clause 7.4.1.7 ofthe Code [S.J]], i.e. 0.9 fk. Consideration needs to be given as to
the appropriate value offk to be used in the analysis of the UOP Quetta Style Beam bearing
in mind the discussion in Section 5.5.1 on characteristic compressive strengths. Tests [ 47, 48
and 80] have shown that reinforced masonry beams follow a hi-linear load-deflection
relationship, with a discontinuity occurring when the masonry cracks. Initial deflections can
be calculated using an uncracked section; beyond this a cracked section must be used. No
guidance is given as to the point of discontinuity.
Numerical integration techniques can be used to determine the deflection at various points
along the length of the beam. However in the case of symmetrically loaded uniform beams
the maximum deflection, Ymax, occurs at the mid-span. The latter is also the position of
maximum bending moment. Reinforced brickwork beams have a hi-linear load deflection
relationship, Hendry [80]. The discontinuity occurs when the brickwork cracks. An
uncracked section is used to calculate the initial deflections. Post-cracking deflection is
evaluated using the second moment of area for the cracked section. Hendry [80] suggests the
following relationships for the neutral axis depth, de, and second moment of area, It>, in terms
of the modular ratio (m) and p the ratio of the steel reinforcement:
120
... 5.21
... 5.22
The term p', in equation 5.22, is the compression reinforcement ratio and would be ignored
for the UOP Quetta Style Beam. With the varying brickwork of the UOP Quetta Style Beam
format values of p, m and de could be changing along the length of the beam. Further the
effective second moment of area varies. It depends upon the extent of cracking along the
span. Tensile stresses could develop in the materials between the neutral axis and between
the cracks. This would result in a stiffening of the section. In reinforced concrete design the
effect is allowed for by assuming the elcistence of a limited tensile stress below the neutral
ax:ts.
This reduces the value of moment on the cracked section, used in determining the
deflections by an amount equal to:
[b(h - de )3 /( 3 ( d - de ))] x tensile stress in the concrete ... 5.23
In principle this could be applied to reinforced brickwork, but to date there is no
experimental verification.
121
5.11 ASSUMPTIONS
The following assumptions are made in considering the analysis and design of the UOP
Quetta Style Beam:
• the cross section is not homogeneous.
• strains at any point in the beam under load are the same at the junction of different
materials.
• consideration of the composite beam format may be required in the determination of
the second moment of area ofuncracked and cracked sections.
• the variations in the values ofE for the different materials and the changing values of
I along the length of the beam result in different stresses at the junction of the
different materials.
• the variations in the values of E for the different materials and the changing values of
I should be taken into account in the moment of resistance and deflection
calculations.
• the analysis of the test beams should involve the use of mean compressive strengths
obtained from related prism tests.
• the value of the design strength of brickwork, obtained from prism tests and the
normal partial factor, 'Ym= 2.0, can be extremely conservative.
• in-depth analysis of each individual UOP Quetta Style Beam would rely on the
selection of appropriate assumptions to minimise the number of material parameters
to be used.
122
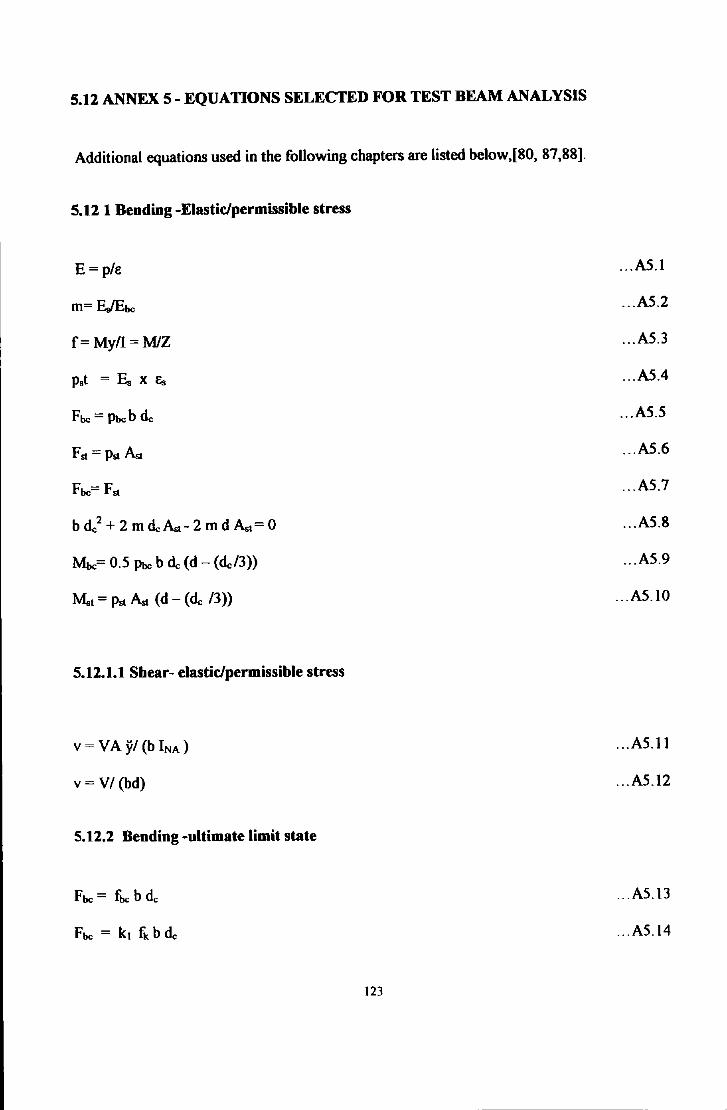
5.12 ANNEX 5- EQUATIONS SELECTED FOR TEST BEAM ANALYSIS
Additional equations used in the following chapters are listed below,[80, 87,88].
5.12 1 Bending -Elastic/permissible stress
E = p/t:.
m= E.IEbc
f= My/I=M/Z
Pst = E. X f.s
Fbc = Poob de
Fst = Pst A.t
Fbc= Fst
bde2 +2mdeA.t-2mdA.t=O
Moo= 0.5 Pbc b de (d- (dc/3))
M.t = Pst A.t (d- (de /3))
5.12.1.1 Shear- elastic/permissible stress
V = V A y/ (b INA )
V= V/ (bd)
5.12.2 Bending -ultimate limit state
Fbc = fbc b de
Fbc = k1 fk b de
123
... A5.1
... A5.2
... A5.3
... A5.4
... A5.5
... A5.6
... A5.7
... A5.8
... A5.9
... A5.10
... AS. II
... AS.l2
... AS.l3
... AS.I4
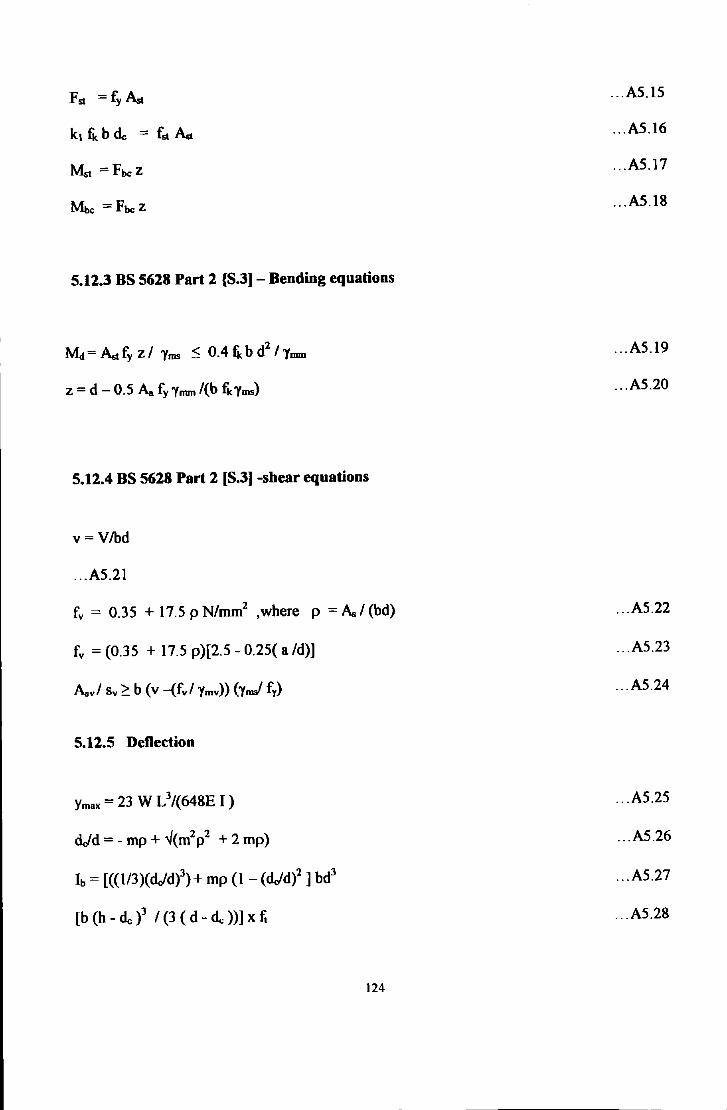
Fst = fy A.t
k, fk b de = fst A.t
M.t = Fbcz
Mt,., = Fbc z
5.12.3 BS 5628 Part 2 {S.3] -Bending equations
M.J = A.t fy Z / 'Yms :'0 0.4 fk b d2
/ 'Ymm
Z = d- 0.5 Aa fy 'Ynun /(b fk'Yms)
5.12.4 BS 5628 Part 2 [S.3] -shear equations
v= V/bd
... A5.21
fv = 0.35 + 17.5 p N/mm2 ,where p = Aa I (bd)
fv = (0.35 + 17.5 p)[2.5- 0.25( a /d)]
Aav/ Sv 2: b (v -(fv/ 'Ymv)) (yms/ fy)
5.12.5 Deflection
Ymax = 23 W L3/(648E I)
dc/d =- mp + -./(m2p2 + 2 mp)
Ib = [((I/3)(d.:ld)3)+ mp (l- (dc/d)2] bd
3
[b (h - d., )3 I (3 ( d - d., ))] X t;
124
... A5.15
... A5.16
... A5.17
... A5.18
... A5.19
... A5.20
... A5.22
... A5.23
... A5.24
... A5.25
... A5.26
... A5.27
... A5.28
CHAPTER6
ANALYTICAL MODELLING USING LUSAS
6 INTRODUCTION
In this Chapter a Finite Element Analysis of a selection of the UOP Quetta Style test beams
were modelled to provide an alternative investigative source into some aspects of the test
results. The use of FEA led to a better understanding of the behaviour of the UOP Quetta
Style Beam.
As indicated in the Abstract the opportunity to compare some of the experimental results
with those available from a LUSAS FEA programme came towards the end of the
programme of studies for this thesis. It provided a method of examining the stress contours
across transverse cut sections of the UOP Quetta Style Beam. It was decided to investigate
sections of the UOP Quetta Style Beam comparing an unreinforced and a reinforced section
with that of a reinforced concrete beam of comparable size.
6.1 AIM
The aims were to carry out investigative studies of the suitability of the FEA to:
• determine the longitudinal bending stresses, SX, stress contours for a loaded beam
constructed of the UOP Quetta Style Beam format, i.e. non-standard brickwork.
125
• provide finite element analysis results which could be compared with some aspects of
the experimental and analytical results produced in Chapters 5 and 7.
• ascertain whether, and how, the FEA could be of value, beyond this thesis, for the
analysis of brickwork constructed of non-standard bond.
6.2 OBJECTIVES
The objectives were to:
• carry out a FEA using the LUSAS software of a 440mm span, simply supported,
model of an unreinforced UOP Quetta Style Beam (Model A).
• carry out a FEA of a symmetrical half model of a 2m span, UOP Quetta Style Beam
(Model B) and to examine the SX contours with that of a comparable half model of
a reinforced concrete beam (Model C).
• examine the distribution of compressive bending stresses within the UOP Quetta
Style Beam in the longitudinal, SX, direction; the position of the neutral axis and the
magnitude of the tensile resistance in the beam.
6.3 FINITE ELEMENT MODELING
Either 20 or 30 structural systems can be analysed using FEA. The basic symmetry of both
reinforced concrete and structural steelwork beams lend themselves to 20 modelling.
126
However a more complete and better analysis of the complex format of the UOP Quetta Style
Beam can only be examined with a 3D model.
The 3D models used for the analysis of the UOP Quetta Style Beam and reinforced concrete
beams were based upon:
• the division of the beam into a series of interconnected solid continuum 3D elements.
These elements were in the form of hexahedrons, labelled by LUSAS as HX8, Figure
6.1. The eight corner nodes of each hexahedron are connected to form a 3D
rectangular prismatic mesh. There are no mid-side nodes.
6.4 MODEL A- MATERIALS, GEOMETRY AND LOADING
6.4.1 Model A- Sbort test seetion ofUOP Quetta Style Beam prism
The aim of testing a small model of a simply supported beam was to identify the SX stress
patterns which would be shown by the LUSAS software. The detail of the 'build up' of
Model A is described below and is shown in Figures 6.2a-e.
6.4.1.1 Model description and applied loading
The unreinforced UOP Quetta Style Beam model was considered to be constructed of bricks
and grouted core. In order to produce a manageable model mortar joints were merged into the
adjacent bricks and grouted core. The inclusion of all of the mortar joints would have
127
approximately doubled the number of nodes. For this merger it was necessary to assume that
the mortar joints had the same properties as the adjoining bricks and grout. By incorporating
the joints into the whole half beam element the model cross section had cross-sectional
dimensions of 330mm wide and 280 mm deep. Each element was represented by a mesh,
55 mm long x 55 mm wide x 35 mm deep. The overall dimensions selected were comparable
to those of the experimental beams. The latter were 327.5 mm wide and 290 mm deep.
Analysis of the model, which had 384 nodes, was carried out assuming simple supports on a
span of 440 mm. A uniformly distributed load of 5 N/mm2 was applied to the whole area of
the top of the beam. This provided a total load of 726 kN. The analysis was carried out as
each course of brickwork was added to the mode~ as shown in Figure 6.1. Plots of SX
bending stress contours were produced. These plots are shown in Figures 6.5 -6.8, where
maximum compressive stresses are shown in dark blue and maximum tensile stresses are
shown in dark red. The applied load induced a bending moment of 39.9kNm. This bending
moment was approximately equal to that induced in many of the experimental beams.
6.4.1.2 Material properties
The values of the material properties are listed in Table 6.1. The elastic modulus of the
brickwork was based on the compressive strength of the UOP Quetta Style prisms.
128

6.5 MODEL A RESULTS
6.5.1 Model A, 440mm span, stress values
The SX contours of the unreinforced UOP Quetta Style Beam model are shown in Figures
6.5 -6.8. The figures indicate the effects of adding additional courses. In carrying out this
initial FE study, as the model was 'built up' course by course, it was accepted that some of
the stresses produced would not reflect the actual values normally existing in any brickwork.
Due to the assumed high load and shallowness of the first course of the beam the SX stresses
were extremely high, as shown in Figure 6.5. However, since the model was analysed as
linear elastic, without any failure criteria in tension, compression, cracking or shear, then
realistic stresses would be obtained by applying a smaller load, say 0.5 N/mm2. The effect
would be to reduce the maximum and minimum stresses, in Figure 6.2, to 14.6 N/mm2 and
14.67 N/mm2·, respectively. These are acceptable values.
6.5.1.1 Model A, 440mm span beam, first course (2 elements bigb)
The first course, shown in Figure 6.5, was entirely of stretcher bond. The predicted
maximum tensile and compressive SX stresses are 148 N/mm2, based on elastic analysis, i.e.
using M = f Z. As would be expected for a uniform beam the longitudinal stress patterns are
relatively uniform. In the longitudinal direction the shape of the curves relates to the
parabolic form of the bending moment diagram.
129
6.5.1.2 Model A, 440 mm span beam, second course (4 elements high)
The effects, on the stress contours, of the addition of the second course of stretcher bond to
the outer wythes are reflected, in Figures 6.6 and 6.7. Figure 6.6 shows the SX stress
contours for the full 440mm span. Figure 6. 7 provides SX stress contours for a 220mm
length of beam, i.e. cut at the mid-span. This slide shows the variation of compressive
stresses on the end faces and the effect of the inclusion of the grouted core .
• It was clearly identified, when comparing Figures 6.5 and 6.6, that there are differences in
the SX stress contours between a beam ofuniform material and one of different materials. In
the beam with only one course the bricks were all laid in stretcher bond. In Figure 6.6 the
strength of the stiffer element, i.e. the grouted core, was shown by the development of high
compressive stresses at the top of the beam along the line of the core. There was a high
tensile stress at mid span. In Figure 6. 7 it is not possible from the quality of the slides to
identify the exact position of the neutral axis. The NA does not appear to be at a constant
depth, from the top of the beam, across the section. The listed stress contours values change
linearly. Examination of the maximum and minimum stresses which are listed show that the
equation M = f Z could be applied at the top and bottom of the beam to provide some
indication of beam behaviour.
6.5.1.3 Model A 440 mm span beam, four course (8 elements high)
Figure 6.8 shows the full size simply supported beam, cut at mid-span. The slide shows that
the stress contours are not symmetrical about the longitudinal centre line and it also gives the
130

full effect of the UOP Quetta Style Beam Bond. From Figure 6.8 the neutral axis at the
centre line of the face of the beam appears to be situated just below the mid point. The
approximate maximum bending stress in tension, at the bottom ofthe beam, is between 11.2
and 15.0 N/mm2. This is comparable to a calculated value of 12.3 N/mm2
, using M= f/Z and
assuming the neutral axis to be at mid-height. It is not possible to easily identify the
maximum compressive stress from the contours and legend. The legend, in Figure 6.8,
indicates that the tensile stress in the concrete core is 22.4 N/mm2 and that there is also an
area of relatively high compressive stress at mid depth.
6.5.2 Initial conclusions on tbe use of LUSAS
It is considered that:-
• the use of LUSAS for the analysis of the UOP Quetta Style Beam half model is
justified.
• the stress contours of the UOP Quetta Style Beam are more complex than a brickwork
beam of uniform material, Figure 6.4.
• whilst elastic analysis, in the form off =My/1, applies for some positions within the
beam it is not applicable at all locations throughout the model.
6.6 MODELS BAND C, HALF MODEL OF A UOP QUETTA STYLE BEAM AND AN EQUIVALENT REINFORCED CONCRETE BEAM
A symmetrical half model, of I m length, was set up to produce stress patterns which would
mirror a full size experimental beam, of 2m span. It was not feasible to set up a quarter
131

model, by splitting the beam longitudinally, since the UOP Quetta Style Beam had
asymmetrical cross sections throughout its length. Details of the 'build up' of the four
courses are shown in Figures 6.3a- d.
6.6.1 Model description
Dimensions were selected to produce a half model having the approximate basic sizes of the
full scale UOP Quetta Style Beam. The proportions of the hexahedron were standardized
throughout. Consequently the dimensions of each hexahedron were as shown in Figures 6.3
and 6.4. The element lengths in the x, y and z directions were respectively 50 mm, 72.5 mm
and 54.5 mm. These dimensions resulted in a half model, 1000 mm long x 290mm height x
327 mm wide (i.e. with 20 x 4 x 6 elements). Figures 6.3a and b show the longitudinal
section of the model and its front elevation. The horizontal section of the grouted core
throughout the model length was 1000 x 72.5 x 109 mm. The vertical pockets were IOOmm x
109mm in plan. Two different model sizes of brick were adopted:-
a.
b.
300 x 12.5 x 109 (bricks loaded on the header).
200 x 72.5 x 218 (bricks loaded on the stretcher).
These dimensions were selected in order to have a standard mesh throughout. Use of actual
brick sizes would have resulted in many different sizes of mesh with a significant increase in
the number of nodes. The model was formed of 480 hexahedrons and 735 nodes.
Reinforcement was provided by a single bar of equivalent cross-section to the two bars in the
experimental beam. Use of a single bar and its location were in accordance with LUSAS'
132
requirements. It was placed immediately above node 3, 1 as shown in Figure 6.12, i.e. at the
bottom of the grouted core mesh, in the centre of the second course of the beam. This made
the effective depth de= 217.5 mm i.e. an increase of 25.5 mm, when compared with the
effective depth of a 2m UOP Quetta Style Beam, which is 192mm.
6.6.2 Supports
The half beam, Figure 6.4b, had a moment restraint at the left hand end but no vertical
support. The latter occurs since a beam subject to a four point loading system has no shear in
the centre. At the right hand a roller support provides restraint in the y direction. The support
type was chosen to model the laboratory knife edge support conditions.
6.6.3 Materials
Isotropic linear properties for the beams are as detailed in Table 6.1
6.6.4 Loading
A line load of 56.6 k:N was applied to half-beam models at a distance of 650rnm from the
right hand vertical support, as shown in Figure 6.4b. On the experimental beam the load was
applied, as a line load, 667mm from the support. LUSAS requires the load to be applied to
node points. The magnitude ofthe line load induced a bending moment in the model of36.8
k:Nm, being an average value for an experimental 2m beam.
133
6.7 ANALYSIS OF MODEL 8, HALF MODEL OF UOP BEAM
6. 7.1 Introduction
The stress contours for the model of the UOP Quetta Style Beam are obtained from Figures
6.9 to 6.11. Figure 6.9 shows the SX contours on a 3D beam for the whole lm span half
model. Stresses at the node points, shown in Figure 6.12, are shown in Figure 6.10. These
values are an interpretation of the mean ofthe stresses at the mid-span, shown in Figure 6.9
and those calculated by LUSAS software at the ftrst set of nodes along the length of the
beam, i.e. at 950 mm from the right hand support. This accounts for the small differences
between the values shown in the legends in Figures 6.9 and 6.10. The stress values shown on
the stress contours have a magnitude six times larger than anticipated. This was due to the
incorrect data input for the line load. The input set the load of 56.6kN/m to be applied
between every pair of nodes rather than across the full width of the beam, as required.
However since the analysis was based on a linear elastic mode it was possible to determine
all of the stresses by dividing by six (the number of horizontal elements).
6.7.2 Results
The variations in the elastic bending stresses over the left hand face of the model are shown
in Figures 6.9 and Table 6.2. In the latter the tensile and compressive stresses are shown as
negative and positive respectively. This was instigated to produce the stress diagrams in the
form shown in Figures 6. !Ja-g in which of interest are the forms of the stress diagrams in the
tension zone. This indicates that the stress at the bottom of the grout is greater than the stress
at the bottom of the beam. The presence of the steel reinforcement, also at the extreme
134
bottom face of the grout, makes this the stiffest area of the beam cross section. Whilst these
stresses were set to the approximate failure load of the experimental beam it is noted that the
stress contours are produced using an elastic analysis. Hence if a reduced BM is produced by
dividing by a partial load factor of 1.6 the stresses are reduced accordingly. The maximum
tensile stress value is 10.51 N/mm2, at node number 4.1, as shown in Figure 6.13e. Using the
load factor of 1.6 this value is reduced to 6.5N/mm2. This would be the stress taken at
serviceability limit and it is significantly higher than the normally recognized tensile stress of
0.4 N/mm2 [75] in brickwork and ofthe flexural tensile stress, fkx.. of2.0 N/mm2 quoted in
BS 5628 Part 2 [S.6], Clause 24.
The compressive stress plots are linear between nodes. Some overall plots show a slight
parabolic form. Since a linear elastic analysis is used the stress lines between nodes are
linear. Consideration of the variations in the stress values at each column mesh, shown in
Figures 6.13a-d lead to the conclusion that since the bending moment is constant at every
cross section and the bending stress varies then the geometric property, normally taken as Z,
must also vary across the beam. The author suggests that this is the effect of the Quetta
Bonding. Twisting due to asymmetry of the stresses was not identified during the testing.
Examination of Figures 6.4a-g and Table 6.2 shows the variation in the stress plots for each
of the line of vertical nodes. The greatest proportion of the applied bending moment is
attracted to the stiffest section i.e. the central core. The average stress across the extreme top
face of the beam, 8.36 N/mm2, is obtained by averaging the compressive stresses between all
horizontal nodes i.e. from nodes 0-4 to 6-4. Correspondingly the average tensile stress at the
135
bottom of the beam is 4.36N/mm2· The average neutral axis depth is l47mm. Using all of
these figures and taking moments about the centre line of the reinforcement i.e. immediately
above node 3,1 the moment of resistance of the beam is evaluated as 36.6knm. Thls
compares extremely well with the applied experimental bending moment of36.8kNm, given
in Chapter 6.7.4.
A comparison between the experimental neutral axis depth and that used above is not made
because the experimental values are the result of tensile cracking. This latter aspect needs to
be examined as a study outside ofthls thesis.
6. 7.3 Conclusions of the LUSAS analysis of the UOP Quetta Style Beam
The conclusions from the study of the applicability of using the LUSAS software to analyse
the UOP Quetta Style Beam are that:
• the SX stress contours are complex.
• a 3D FEA is required to obtain an understanding of the complex behaviour of the
UOP Quetta Style Beam.
• a 3D FEA should be used to analyse a traditional grouted cavity beam.
• the maximum compressive and tensile stresses are concentrated within a central zone
ofthe cross section of a UOP Quetta Style Beam.
• a more accurate evaluation of the maximum compressive and tensile bending
stresses can be obtained.
136
• the compressive stress diagram for sections of the UOP Quetta Style Beam appeared
to be very slightly parabolic. However, this needs to be confirmed by closer
examination out side of this thesis.
• the tensile bending stresses of the UOP Quetta Style Beam are non-linear.
• the tensile strength of the UOP Quetta Style Beam, analysed using elastic theory,
significantly exceeds the accepted values.
• an extended in-depth study should be carried out of the UOP Quetta Style Beam and
of a grouted cavity beam, using a 3D non-linear element FEA. This is required
outside of this thesis.
6.8 MODEL C- REINFORCED CONCRETE BEAM- HALF MODEL
6.8.1 Results
The results for the LUSAS analysis ofthe lm reinforced concrete model are shown in Figure
6.14.
6.8.1.1 Bending stress contours
The predicted SX stresses were evaluated using the equation f =Myll~rans, where 1trans is the
transformed second moment of area.
137
The comparative values of the maximum compressive and tensile stresses are:
Predicted stresses
FEA stresses
Maximum Compression
7.93 N/mm2
8.90N/mm2
Maximum Tension
7.71 N/mm2
6.50N/mm2
The maximum values for the LUSAS SX stresses are estimated using the stress contours
shown in Figure 6. 14, together with the associated legend. As shown, the compressive
stresses obtained from the LUSAS analysis over-estimated the hand calculations but the
tensile stresses are under-estimated. The hand calculations are determined from a planar
cracked beam where the position of the neutral axis is evaluated using a transformed section.
The section modulus of the reinforced concrete transformed section is based on the moduli of
steel and concrete and the beam dimensions. LUSAS is based on an uncracked 30 beam and
values of both the moduli and Poisson ratios are used. The pattern ofthe SX contours shown
in Figure 6.14 is layered, as was anticipated, with relatively even layer thicknesses. Whilst
the maximum compressive stresses in the SX direction at the centre and at the load point are
virtually identical the tensile stress at the line load is 100/o lower than that at the cut face. The
bending moments at the two positions are identical and it is recommended that investigations,
outside of this thesis, should examine these differences.
138
6.8.2 Comments
The stress contours confirm the 20 approach to the analysis of reinforced concrete beams
since they are basically symmetrical across the section and longitudinally the contours follow
the form of the bending moment diagram.
6.8.3 Conclusions on tbe comparison between tbe uoreiofo~ed UOP Quetta Style Beam, Model A, and tbe reinforced concrete beam, Model C
There are clear differences between the SX contours for the unreinforced UOP Quetta Style
Beam brickwork in Model A and the reinforced concrete beam in Model C. The extremely
complex behaviour of the UOP Quetta Style Beam is highlighted in the comparisons.
6.9 ORTHOGONAL STRESS CONTOURS
Figures 6.15 -6.17 show the SY and SZ contour plots for the UOP Quetta Style Beam half
model. These are included to provide an indication of the variability of the contours in theY
and Z directions. The results are not discussed since there were no comparable figures from
the experimental results or related prediction calculations.
139
6.10 CONCLUSIONS
All of the aims and objectives ofthe investigative study of the suitability ofLUSAS FEA to
obtain an in-depth understanding ofthe behaviour of the UOP Quetta Style Beam were met.
The study proved that:
• the LUSAS FEA software produced very relevant stress contours for a loaded beam
constructed of the UOP Quetta Style Beam format, i.e. non-standard brickwork.
• results of the LUSAS software provided extremely good comparison; of the bending
moment applied to a selected experimental beam and the moment of resistance of the
be~ the tensile forces present in the UOP Quetta Style beam.
• studies, outside of this thesis should be carried out to examine: non-linear behaviour
and cracking of brickwork, orthogonal stress contours and comparison of of results of
the UOP Quetta Style Beam with other reinforced beams and an examination of the
deformed shapes i.e. considering vertical bending and twisting.
140
CHAPTER 7
ANALYSIS OF BEAM TESTS, PREDICTIONS AND COMPARISONS
7 INTRODUCTION
Tests results are shown by a series of Graphs, Figures, and Plates all shown in the
Appendices, Volume 2 . The test beams were modelled to enable comparisons of the
predictions of strength and serviceability limit states for each beam to be made. Linear
elastic and ultimate limit state equations postulated in Chapter 5 were used. Material
strengths as detailed in Chapter 4 were applied to the design equations. The basic data used
in the prediction analyses are shown in Tables 7.la, 7.lb, 7.2a and 7.2b. '
The following were reviewed:
• failure modes and location of failure; flexural and shear.
• position of the neutral axis.
• deflections.
• strain within the longitudinal tension reinforcement..
• crack patterns and crack widths.
• service and ultimate failure load and mechanism.
• predictions and comparisons
• tensile and compressive forces due to bending
141
7.1 CALCULATIONS
Typical calculations are detailed in three Annexes; refer Appendix 4, Volume 2. They are
Annex A- "Example Calculations"; Annex B - "Analysis of Tensile and Compressive
Behaviour from the Experimental Beam Results" and Annex C "Limit States Procedures".
7.2 TEST RESULTS
7.2.1 Introduction
All beams were tested in accordance with the test procedures detailed in Chapter 4 and a
typical test is shown in Plate 1, Appendix 1.
7.2.2 Failure loads and failure modes
The failure modes are designated as shear (S), bending compression (Be) or bending tension
(Bt). These were modes which could be visually identified by observation of the beam
behaviour and noting the output from the instrumentation. Failure load for each beam was
taken to be the value when a beam was deemed to have reached its maximum load carrying
capacity.
142
7.2.2.1 Flexural failure
It was observed that initially vertical cracks appeared in the first course of the vertical face, at
or near the beam centre. As the longitudinal reinforcement appeared to approach its yield
point there was an increase in the rate of deflection relative to the increase in the applied
load. The steel yield continued until failure occurred in the compression zone. Cracking,
which was a combination of cracks following the joints or passing through the bricks,
continued to rise up the beam until the brick failure occurred. The latter was usually by
longitudinal splitting, on the top face of the beam. Thus a brittle compression failure
mechanism ended what had started as a ductile failure, Plates 4 and.S. Twelve beams failed
in tension. In two beams, 3/330 and 3/341, it was not possible to clearly ascertain a specific
failure mode.
7.2.2.2 Sbear failure
Shear failure was assumed to have taken place when the maximum load was reached and a
diagonal crack developed between one of the load points and the nearest support, running at
approximately forty-five degrees. The three brick Types exhibited varying speeds of failure.
Type 1 showed progressive cracking to failure, Type 2 was slower though still progressive,
Plate 2, and Type 3 demonstrated sudden and explosive failures, Plate 3. Of the fifty-four
beams tested twenty-seven were unreinforced in shear and of these nineteen failed in shear.
Eleven of the remaining twenty-seven beams reinforced in shear, exhibited shear failure. This
was unexpected in some beams. Brick Types 1 and 3 each achieved four shear failures whilst
brick Type 2 had only three. In all cases of unexpected shear failure the collapse of the beam
143

was preceded by cracking of the top surface of the grout. This may have been caused by local
crushing of the grout under the top of the shear link.
7.3 ANALYSIS OF GRAPHS
7.3.1 Neutral axis
Surface strain readings were taken using Demec gauges positioned at the mid-span of each
beam; refer to Chapter 4 for details. The results of the strain readings were plotted against
gauge location and are shown in Graphs I - 54, Appendix 2, Volume 2. Most of the graphs
clearly show the shape of the compression strain curve and the position of the neutral axis.
However, a significant number have graphs which are of irregular form and unclear neutral
axis positions, in particular I/220, 2/220, 3/220, 1/221, 21221, 31221, 1/230, 1/231, 1/240,
3/240, 3/340 and 2/241. These twelve beams were constructed using Type 2 bricks. Scaling
each graph provided a method of estimating the position of the neutral axis. The results are
presented in Table 7.4where the results for the beams reinforced in shear are separated from
those unreinforced in shear. Some results in Table 7.4 are identified as 'R' (rejected for
neutral axis analysis). These graphs were rejected because of the inconsistencies in form.
The experimental results for a particular brick, shown in Table 7.4, do not provide consistent
results across the beam series or over the increasing shear span values. An example is the
beams of brick Type 1, which are unreinforced in shear. It is only series I and 2 beams which
indicate a decreasing neutral axis depth as the shear span increases. There is no trend for the
series 3 beams. A similar comment holds for series I, 2 and 3 for beams reinforced in shear.
144
Examination of the overall averages in Table 7.4 indicates that the neutral axis lies within the
second brick course from the top, ignoring rejects. The range of depths is from 59.6 mm to
119 mm i.e. 0.31d to 0.62d. The only restriction on the neutral axis depth, de, in BS 5628
Part 2 [S.1], Clause 8.2.4.2.1, is with respect to the lever arm distance, z. The latter is limited
to 0.95d. When used in elastic and limit states design this would result in, respectively, limits
of de= 0.15d and de= 0.1d. A link between the brick compressive strength and the neutral
axis depth was not identified, considering that brick Type 2 is significantly weaker than brick
Types I and 3.
7.3.2 Denection
Experimental deflections were obtained using techniques described in Chapter Four. The
results are shown in Graphs 55-63. Each graph presents all the data for one brick Type and
one span. The following trend was discovered:
• all curves are curvilinear.
• shear reinforced beams are stiffer than those not reinforced in shear.
The large volume of data presented in the nine Graphs 55-63 was reduced by averaging all
the experimental deflection data for each brick Type, beam series and span. Figures 7.1a-c
refers to brick Types 1- 3, respectively. Each span was represented by a distinct stiffuess
band. The lower end of each band was bounded by series 1 beams and the upper end by
series 3 beams. Series 2 beams lay in between. This provides an indication that steel ratios
145
should be taken into account in the determination of beam stiffness. Brick Types 1 and 3
generally showed each beam series to be well dispersed within the band width.
However, Type 2 beams showed two distinct trends:
• beam 3/22 was significantly less stiff than beams 1122 and 2/22 (the strain plots, in
Graphs 19-21, for all ofthese beams were irregular).
• beam 21220 has an ultimate factor of safety for the ratio of the ,
Experimental/Predicted Load, less than unity, refer Table 7.13b. Overall there appears
to be a lack of stiffness and strength in this beam.
• series 2 and 3 beams had almost identical stiffness within the two, three and four
metre spans.
The non-linearity of the deflection curves at lower loads is clearly indicated by the
intersection of the curves with the y-y axis. Limits on deflection given in BS 5628 Part 2 [SI]
are compared and discussed in Chapter 3.4.4.3.
7.3.3 Strain witbin tbe longitudinal tensile reinfon:ement
Experimental strains which excluded self weight strains were measured as described in
Chapter 4. Graphs 91-94 show the load versus strain plots. Each graph shows the measured
strain for one brick type and one span, taking positive tensile force from zero strain. The
volume of data was reduced using a similar technique to that described in Section 7.2.1 to
146
produce Figures 7.2a -7.2c. Each brick Type was represented by a different part ofthe figure.
The following trends were discovered:
• all curves were essentially linear with some initial non-linearity (this is likely to be
the result of bedding down of the beam and the characteristics of the loading
machine)
• there was no noticeable difference between beams that were shear reinforced and
those not reinforced in shear
• for a particular test series and brick Type almost identical bending moments induced
very similar strains
• a reduction in equivalent strain was noted with increasing steel ratios.
7.3.4 Crack patterns
Typical crack patterns for two, three and four metre spans are shown in Figures 7.3a-i.
Beams without and with shear reinforcement are shown, respectively at the top and bottom of
each page. Figures 7.3a-c show two metre span beams. Initial cracking was due to flexure.
Vertical cracking occurred through the bottom two courses. All the beams of this span failed
in shear except beam l/321. The three metre span beams, Figures 7.3d-f, exhibited similar
crack patterns to the two metre span beams. Diagonal shear cracks propagated from the
centre of the beam, simultaneously moving towards the top and bottom of the beam. A
comparative investigation, of the latter failure mode, with the relatively high tensile stresses
identified at the top of the first course of bricks should be carried out as a further study to this
thesis. The shear reinforced beams showed vertical flexural cracking in the bottom course.
147
There was limited step cracking with brick Types 1 and 2 before the cracks continued
vertically towards the neutral axis. Type 3 showed no signs of horizontal cracking until the
flexural cracks reached the second bed joint. None of the beams exhibited signs of shear
cracking.
Figures 7.3g-i show mainly tlexural cracking. Most of the shear reinforced four metre beams
failed in flexure. As before, the tlexure cracks propagated vertically with some minor step
cracking occurring at the first and second bed joints. The prevalent direction was vertical. All
beams exhibited tlexural cracks starting in the perpends of the bottom course. These cracks
separated the bricks and mortar indicating a mortar/brick adhesion failure, rather than a
material failure. Flexural cracks in the second and third courses did not always follow the
mortar joint and in many instances individual bricks cracked.
7 .3.4.1 Crack width
There is limited guidance on the limits of acceptable crack widths for reinforced masonry.
Clause 16.2.2.2, BS 5628: Part 2 [S.3] states "fine cracking or opening up ofjoints may occur
in reinforced masonry structures. However, cracking should not be such as to affect
adversely the appearance or durability of the structure". The figure of0.3mm as suggested by
Roberts et al [72] was adopted. The Code also provides a serviceability limit of
span/effective depth of 20 for simply supported beams. The 2m, 3m and 4m test beams had
ratios of 10.4, 15.8 and 21.3 respectively. Hence only two were within the Code limits.
148
With the exception of beam l/141 the nominal crack widths at the predicted service loads
were less than 0.3mm. The crack width for beam l/141 marginally exceeded this value, and
although this may not adversely affect the appearance it may influence the possibility of
corrosion of the reinforcement and hence the durability of the beam.
7.4 PREDICTIONS AND COMPARISONS
7.4.1 Introduction
As indicated in the introduction to this Chapter the predictions and comparisons were based
on the methods of analysis developed in Chapter 5. Tables 7.3-7.15 provide comparisons
between the experimental and analytical predictions. These tables are discussed in the
following section. Elastic and ultimate predictions are summarized in Table 7.12, for series 1,
2 and 3 beams. Elastic and ultimate predictions and comparative experimental results for
each of the three series are shown separately in Tables 13a- c.
7 .4.2 Elastic predictions
The elastic analysis failure moments, Ms and Mb, loads, w. and Wb, neutral axis depths, d:,
and second moments of area, r, were determined using equations shown in Chapter 5 and are
shown in Table 7 .I b. The behaviour of the beams was assumed to be linear up to the failure
loads. The permissible stresses in the materials which were used in the analyses were those
obtained from the material tests, Appendix 2, Volume 2 refer and Tables 7.1 a and 7.1 b. The
149
initial modulus of elasticity was used. Comparisons with ultimate and experimental values
are shown in Table 7.7.
Mid span deflections were predicted, using the equations in Chapter 5.12, assuming a fully
cracked section to the neutral axis. Calculated second moments of area and deflection values
for the cmcked sections, based on initial and secant moduli of the brickwork are shown in
Tables 7.9, 7.11a and 7.llb.
7 .4.3 Limit States predictions
The ultimate and serviceability limit states analysis for failure moments, loads, neutral axis
depths and second moments of area was carried out the using equations A5.13 - A5.18
Results are detailed in Tables 7. 7, 7.12 and 7.13a- c.
Four procedures, detailed in Annex C were processed to ascertain the depth of the neutral
axis, lever arm, second moment of area, moment of resistances at collapse and the associated
collapse load. Idealised rectangular stress blocks were assumed. Characteristic material
strengths were taken as the appropriate brickwork prism strengths and by using chamcteristic
brickwork strengths. The latter were obtained from the Code [S.3], using brick unit strengths
and mortar designation (i).
150
7.4.4 PredictioDll and comparisons
7.4.4.1 Failure modes and factors of safety considering bending and shear
Elastic and limit states predictions of the shear failure loads for unreinforced, VUE and VUL,
and reinforced, VR£ and VRL beams are summarised in Table 7.5. Table 7.14 compares
failure loads and failure modes for all beams. It was predicted by ultimate and elastic analysis
that all beams with partial shear reinforcement would fail in shear. Only 19 of the beams
tested failed by this mode. Three failed in bending tension and the same number in bending
compression with the remainder by a combination of modes. For beams fully reinforced in
shear the elastic and ultimate predictions: of shear failure were 9 and 12; of bending
compression 18 and 9; of bending tension zero and 3 and of others zero and 3 respectively.
The factors of safety for unreinforced and reinforced beams of experimentaVpredicted failure
loads were determined and are shown in Tables 7.13a- 7.13h, 7.13j- 7.13m. The results of
four of these Tables are shown in Figures 7.4 - 7.7. Figures 7.4 and 7.5 are for the
unreinforced beams and Figures 7.6 and 7. 7 for the reinforced beams.
The correlations of the ExperimentaV Prediction factors of safety were by:
• brick type as the primary parameter and beam span as the secondary parameter
(Figures 7.4 and 7.5).
• beam span as the primary parameter and brick Type as the secondary parameter
(Figures 7.6 and 7.7).
151
In considering these results concerning the Factors of Safety it is necessary to take into
account the fact that the predicted results are based on the ultimate unfactored failure loads
and material strengths. In a design situation use would be made of partial factors of safety for
loads and materials strengths based on characteristic values. The results indicated that the
ExperimentaU Prediction FOSs using elastic analysis had the largest value for all of the 27
unreinforced beams and for 25 out of the 27 reinforced beams.
The two beams where the predicted ultimate analysis had a marginally higher value than the
experimental values were beams 21131 (FOS 1.21 compared to 1.23) and 3/131 (FOS 1.43
compared to 1.47).
The average ExperimentaU Prediction FOS for all unreinforced beams was 2.29 by elastic
analysis and 1.80 by ultimate analysis, Table 7.13f and Figure 7.4. The ranges for the two
methods of analysis were 1.18 to 3.48 and 0.87 to 2.59. None of the unreinforced beams
analysed elastically had a FOS less than 1.0, whilst by ultimate analysis there was one beam
with a FOS ofless than 1.0.
The average FOS for all reinforced beams was 1.44 by elastic analysis and 1.03 by ultimate
analysis, Table 7.13e and Figure 7.5. The ranges for the two methods of analysis were 0.94 to
1.94 and 0.65 to 1.38. For the elastic analysis there were three beams with a FOS below 1.0
whilst for the ultimate analysis there were 13 (almost 500/o).
152
An examination was carried out of the three modes of failure i.e. shear (Table 7.13k and
Figure 7.9), bending tension (Table 7.131 and Figure 7.10) and bending compression (Table
7.13m and Figure 7.11). Of the 30 unreinforced and reinforced beams failing in shear the
average FOS was 2.03 for ultimate analysis and 1.60 for elastic analysis with ranges 1.01 to
3.48 and 0.73 to 2.59 respectively. The ten beams which had failed in bending tension had an
overall FOS for unreinforced and reinforced beams of 1.37 and 1.03 related to elastic and
ultimate analysis. Of these beams four had a FOS less than 1.0 when elastic analysis was
used and six when ultimate analysis was used. Ten beams also failed by bending
compression with an overall FOS of 1.58 and 1.17 for the elastic and ultimate methods. A
FOS of less than one occurred once and four times respectively where elastic and ultimate
methods were used.
Whilst brick Types 1 and 2 indicated, in Tables 7.13f and 7.13g, that the overall averages of
the FOS of the weakest brick (i.e. brick Type 2 with the lowest compressive strength) had the
lowest overall FOS there were beams of brick Type 2 which had marginally higher FOS than
those of both brick Types 1 and 3. For beams of brick Types 1 and 3 there was a general
trend that the shorter the span the higher the FOS, but this does not apply to the beams of
brick Type 2.
Whilst the FOS for beams failing in shear appears to be quite high for the elastic analysis
comparison it needs to be noted that the permissible shear stress of both brickwork and steel
stirrups were taken from the earlier, elastic based, Code of Practice CP Ill [S.8] the basic
minimum shear stress in the brickwork and tensile stress in the steel were set at 0.28 N/mm2
153
and 140 N/mm2 respectively. This compares with 0.35 N/mm2, from BS 5628 Part 2 [S.3)
and 385.5 N/mm2, steel as tested. Also the partial material factor, 'Ymv, was not used in the
elastic calculations. In a design situation, using BS 5628 Part 2 [S3], the shear resistance of
the beams reinforced in shear would be 23% lower than those predicted in the thesis. The
Code would make use of design strength for the links of217 N/mm2. For this thesis the test
yield strength with a partial material factor of 1.0 was determined by test , giving the steel
design strength as 385.5 N/mm2. The effect of these two different strengths on the
calculations for the shear resistance for a 2m span is a reduction in the predicted design
strength of 48.5 kN to a Code based value of37.7 kN. This would relate to an increase in the
Experimental/Predicted FOSs of 28%. Consequently the FOS of beam 21241, which has the
lowest FOS of0.65, would be amended to 0.92.
Overall, when considering all modes of failure, the elastic analysis provided a more accurate
method of predicting the load at failure and the failure mode. The 2m span beam, brick Type
l provides the best shear performance.
7 .4.4.2 Predicted moments of resistance and experimental moments
Comparisons of the experimental results for Grade I beams and Grade 2 -4 beams are shown
in Tables 7.6a and 7.6b. The Tables provided the overall average of beam strengths
independent of shear reinforcement status. The averages are produced in Table 7.7. The latter
provides a comparison of all moments of resistances predicted and the experimental bending
moments. The elastic analysis of the moments of resistance of brickwork in compression,
154
---------
Mt.c, and of steel in tension, M.t, provided a very close relationship with the experimental
bending moments for brick Type I on all spans. Limit state analysis compared favourably for
brick Type 1 and Jm span beams.
Factored BS 5628 Part [S.l] analysis provided conservative values for the MOR for all
beams. There was no clear relationship between experimental and ductile/brittle behaviour
analysis. The last row of Table 7.7 shows the predicted flexural strengths of the beams based
on adjusted characteristic strengths of the brickwork The adjustment incorporates a one
third multiplier to allow for the fact that the load in the UOP Quetta Style Beam is applied to
the header and stretcher faces of the bricks. A second adjustment is by the use of the normal
material factor of safety (using 'Ymm = 2.0). It was significant that the calculations from first
principle for the beams, using the adjusted brickwork strength, could not be carried out The
combination of the low brickwork design strength and the related percentage of high strength
steel meant that realistic solutions for the value of the neutral axis depth could not be
calculated. The neutral axis was calculated to be in the region of the tensile steel
Consequently it was assumed that the MOR of the section should be detennined using:-
Mt.= 0.4 fk bd2 /6 and M.= 0.75d ~ fy
The resultant moments of resistance in all cases gave the brickwork MOR to be the
minimum, controlling, parameter. The use of the modified characteristic strength, fk /6, gave
low values when compared with results by the other analytical values, with those for brick
155

---------------------------------------
Types I and 2 being very low. This proves the anomaly of using the modified characteristic
strength for bricks loaded on the header and stretcher.
7.4.4.3 S«ond moment of area and mid-span deflection
In determining the second moment of area, L for the cracked section the neutral axis for
elastic and ultimate conditions was taken from Table 7.3. The values for I are listed in Table
7.9. This table indicates that in all cases the elastic values were predicted to be lower than
those obtained from limit state calculations. The latter for each brick type and similar span
are generally comparable. In considering these differences between elastic and ultimate
results it is necessary to examine the differences in the elastic moduli. The initial value was
used for the elastic analysis and the secant for the ultimate calculations. The secant modulus
is significantly less than the initial modulus.
The deflection calculations in Table 7.11a are produced from a range of sources. The basic
equation for deflection is 23WL3/648EI. Values ofE;, E.. and I have been discussed above.
An appropriate value for the load, W, was selected from the load/deflection plots, Graphs 55-
63. A value of W which incorporated all of the curves for a particular beam span was
selected. For example using Graph 55, for beams 120 and 121, a load of 48 kN was taken to
be the appropriate value. This is the approximate maximum for 6 of the 9 curves and also
cuts the remaining 3 curves. This is shown in row 3 of Table 7.11 a. Rows 4 and 5 are the
calculated predicted deflections using the initial and secant moduli. The deflection shown in
row 6 is the value of the mean deflection for all 9 curves at the load of 48kN. The maximum
156
load identified in Graph 55, i.e. 69kN, is used to calculate the deflection listed in row 8. Row
9 shows the load, 63kN, obtained from the experimental bending moments, listed in Table
7.7. The predicted deflection for this load is shown in Row 10.
Table 7.11b, rows 1 to 6, lists a summary of the deflection calculations listed in Table 7.11a.
There are additional sets of results in this table where use was made of BS 5628 Part 2 [S.3]
analysis procedures. In considering all of the results in Table 7. llb it is noticed that the
values in rows 1 and 3 generally provide the closest relationships. Basically row I is the
prediction of deflection for values of Hi, obtained by testing prisms, and I was calculated
.from the analysis of experimental results and using an assumed value for W. Row 3 shows
measured experimental deflections at the assumed value of W. This suggests that the values
used for Ei and I were of the correct magnitude. The exceptions are the 4m span beams where
the calculated deflections significantly underestimate the actual deflections. Experimental
and predicted deflections are compared in Graphs 64-90. Each graph provides a plot of
experimental, and elastic and ultimate deflections, for each beam series, brick Type and span.
Overall the ultimate analysis predicts stiffer sections than the elastic method. Generally
elastic deflection calculations are more accurate than the ultimate. In considering the mean
experimental deflections it is necessary to consider that the loads selected from the graphs
were for most beams the maximum value recorded and would apply to a factorised load
condition. If the load was divided by a partial factor of 1.6 the respective deflections would
be reduced accordingly, as shown in Table 7.16. BS 5628 Part 2 Clause 7.1.2.2.1 states that
the maximum, allowable, deflection of a simply supported beam subject to serviceability
loads should not exceed the specified span/depth ratio of 250. The ratio varies according to
157
the type of beam i.e. simply supported, continuous etc. Comparisons of the allowable and
experimental deflections (from row 3, Table 7.1lb) are shown in Table 7.16. The factored
experimental values are seen to satisfy the Code requirements for all beams.
7.4.4.4 Neutral axis predictions and comparisons
Table 7.3 provides a comparison of neutral axis (NA) depths for elastic, ultimate and
experimental values. For brick Type 1 the NA depths are almost all less than the average
experimental depths. There is one exception. This is the Code prediction for the 4m span
beam. This indicates a possible NA depth of97mm against the measured value of85mm. For
brick Type 3 the factored Code solutions are high for the 2m and 3 m span beams. There is
no overall consistency in these results. One specific area of agreement is for the brick Type 3
beams where the predicted NA depths increase as the span increases.
7.4.4.5 Tensile steel reinforcement strains and brickwork strains
Tables 7.10 -7.10e show:
and
• in Column 13 the percentage ratio between the steel test strains at yield, Ey (Column
12), and the experimental tensile steel strains Eex (Column 11)
• in Columns 20 and 21 the percentage ratio between the experimental surface brick
strains (Column 19) and the strains deduced by ascertaining the compressive stresses
in the brickwork from the experimental tensile forces, T ex (Columns 17 and 18).
!58
The analysis procedure is fully described in Annex B, "Analysis of Tensile and Compressive
Behaviour of Beams from the Experimental Results". Tables 7.10a and 7.10b are used.
Tables 7.10c- 7.10e are ignored due to the uncertainty in obtaining accurate measured
valued of the NA depth. These latter tables were included in order to record a complete set of
data obtained from the tests. Of specific interest from Tables 7.10a and 7.10b are columns
10, 13, 15, 20 and 21. Column 10 shows that in 17 out of the 26 beams there was a tensile
force in excess of the yield stress of the steel. The average excess tensile force was 53kN,
within a range from lOkN to 89kN. Column 13 shows that the actual tensile strain/test strain
at yield had an average for all 26 beams of 1100/o within a range from 66% to 147%. Two
results of 66% and 80% relate to the 4m span over reinforced beams. These were the only 4m
beams in the table analysed. The "reserve of tensile stress" is discussed in Chapter 8. Column
20 shows that the average percentage ratio of surface strain in the brickwork to calculated
brick strain from Tex (using initial modulus) was 134% and Column 21 that the average
percentage ratio of surface strain in the brickwork to calculated brick strain from T.x (using
secant modulus) was 94%. This may be indicative that the modulus which should be used in
the calculations lies somewhere between the two values.
7 .4.4.6 Compressive strengths- prisms and beams
The collation of the compressive prism and experimental beam stresses and excess tensile
forces, as detailed in Tables 7.1 Oa and 7 .I Ob were summarised in Table 7 .I Of. The
experimental beam compressive stress, f"' evaluated from the bending moment applied to
each beam is compared to the prism test Pro or fk.
!59
It is noted that for brick Type 1 the prism stress is 25.2 N/mm2 and the comparative average
experimental compressive stress is 18.3 N/mm2, i.e. 73% of the strength. The values were
obtained on the basis that the stress diagram was triangular. However, if the stress diagram
had been rectangular-parabolic or somewhere between the latter and a triangular shape then,
the lever arm would have taken a different value. The lever arm would have decreased taking
a possible value between (d- 0.67.d.:) and (d- 0.417d.,). The effect ofthis would have been to
increase Tex and consequently the balancing compressive force C. A larger value ofC would
produce an increase in the magnitude of fb and where appropriate the reserve of tensile
strength would have increased. When a 'k' factor of0.75 is applied to the prism strength of
25.2 N/mm2 the stress used in a rectangular stress block would be 18.9 N/mm2. From Table
7.1 Of it may be possible to assume that 6 out of 13 Type 1 brick beams exceeded the prism
strength. Five of these beams had a span of 3 m, the sixth a span of 2m. Beam 2/131 which
came into this group had a combined Bt +Be failure mode. It also had an excess tensile force
of 28kN. Four of the six beams had an excess tensile force. With respect to tensile stress no
account was taken of the residual stresses discussed in Chapter 2.1.3.
For brick Type 2 the average experimental compressive stress was 10.2 N/mm2,
or possibly 13.6 N/mm2 for two beams, where the calculation indicated the use of a
rectangular stress block. This is compared to the prism strength of 8.8 N/mm2. There were
only three beams of this type accepted for this analysis, and two of these failed in bending
compression. This failure implies a high compressive stress was applied to the brickwork.
160
Brick Type 3 followed a similar pattern to the other two bricks. The analysis implied a
triangular stress block but it seems reasonable to assume the shape would be moving towards
a rectangular parabolic form. In eight out of the ten beams the anticipated prism strength was
exceeded and five beams had a reserve of tensile strength.
It is considered that these results are of particular value and that the procedure adopted
produces results within the limits of experimentation. Overall it is assumed that the
compressive stress induced in the brickwork exceeds the relevant prism stress for all beams
ofbrick Type 2 and possibly for most of the beams of brick Types 1 and 3.
7.5 CONCLUSIONS
The following conclusions result from the analyses carried out in this Chapter:
• a brittle compression failure mechanism ended what had started as a ductile
failure.
• the three brick Types exhibited varying speeds of shear failure.
• cracking of the top surface of the grout preceded all cases of unexpected shear
failure collapse .
• the experimental results for a particular brick do not provide consistent results
across the beam series or over the increasing shear span values.
• in some beams there is a decreasing neutral axis depth as the shear span
m creases.
161
• all deflection curves were curvilinear.
• series 2 and 3 beams, brick Type 2 had almost identical stiffness for all spans.
• steel ratios should be taken into account in the determination of beam stiffness.
• beam tensile reinforcement strain curves were:
o essentially linear with some initial non-linearity.
o there was no noticeable difference between beams that were reinforced in
shear and those not reinforced in shear.
o for a particular test series and brick Type almost identical bending
moments induced very similar strains.
o reduction in equivalent strain was noted with increasing steel ratios.
• initial cracking was due to flexure and not shear.
• vertical cracking occurred through the bottom two courses of the beams.
• 2 and 3m span beams exhibited similar crack patterns.
• in some cases diagonal shear cracks propagated from the centre of the beam,
simultaneously moving towards the top and bottom of the beam.
• step-cracking was limited with bricks 1 and 2.
• only one beam exceeded the nominal crack width of0.3mm.
• the FOS using elastic analysis had the largest value.
• the average FOS for all unreinforced beams was larger by elastic analysis than
by ultimate analysis.
• factored BS 5628 Part [BS 1 0] analysis provided conservative values for the
MOR for all beams.
• there was no clear relationship between experimental and ductile/brittle analysis.
162
• the predicted tlexural strengths of the beams based on characteristic strengths of
the brickwork modified for header and stretcher loading provides a very
conservative design.
• the analyses suggest the values used forE; and I was of the correct magnitude.
• the factored experimental values are seen to satisfy the code requirements for all
beams.
• in 60% of the 26 beams there was a tensile force in excess of the yield stress.
• comparison of surface strain in the brickwork with calculated brick strain
indicates the elastic modulus, which should be used in the calculations, lies
somewhere between the initial and secant values.
163
8 INTRODUCTION
CHAPTERS
PARAMETRIC STUDY
The research study was carried out in order to conceive a new form of grouted cavity beam
and to investigate the advantages of a new format. In Chapters 3 to 5 of this thesis the
development of the new form, the UOP Quetta Style Beam, was described. The results of
material and beam tests were described and evaluated. Predicted values, using elastic and
limit states theory and design procedures, were evaluated and compared with the UOP Quetta
Style Beam experimental results.
An analytical study in Chapters 6 and 7 provided the opportunity to successfully compare the
experimental and calculated results of the following parameters: compressive and tensile
stresses and strains and forces acting within the UOP Quetta Style Beam; neutral axis depth;
bending stress diagram; shear; deflection and stress contours.
164
8.1 AIMS AND OBJECTIVES
8.1.1 Aims
The aims of the parametric study were to:
• use the information from the experimental and analytical studies to ascertain the
positive benefits in the use of the UOP Quetta Style Beam.
• to make recommendations regarding the parameters to be used in the design of the
UOP Quetta Style Beam, other reinforced brickwork beams and brickwork in general.
8.1.2 Objectives
The objectives of the parametric study were to examine the effect ofthe following upon the
behaviour of the UOP Quetta Style Beam:
• bricks and brickwork compressive strength
• shape of the compressive stress/strain diagrams
• forces in the tension and compression zones and of the neutral axis depth
• modulus of elasticity
• stiffness and deflection
• shear failure
• comparative beam behaviour
165
-------- - -- ---
The results presented in Chapter 7 established that the factor of safety for the ratio of
experimental/predicted failure loads exceeded unity for a large majority of the beams tested.
In producing the results the values of the partial factors of materials for brickwork, 'Ymb , and
for stee~ 'Yms, were taken as either 'Ymb = 'Yms = 1.0 or 'Ymb = 2.0 and 'Yms = 1.15. The former
values were used when material properties were obtained by tests as part of the programme
and for the consideration of serviceability conditions. The higher values for the factors are
those specified in the Code [S.3] for normal designs.
8.2 CHARACTERISTIC AND DESIGN COMPRESSIVE STRENGTHS
8.2.1 Bricks and brickwork compressive strengths
This Chapter examines:
• the relationship between the compressive strengths of brick units tested when the
loading is applied to bed, header and stretcher faces.
• prism strength.
• recommendations for the design strength of bricks loaded on header and stretcher
faces.
• the effect of the self-weight of the beam.
• the potential of brickwork.
166
In Chapter 5.4 the determination of the characteristic compressive strength of brickwork, fk,
was discussed. It was noted that the value of fie. to be used in the design process depended, for
perforated and hollow bricks, upon the orientation of the bricks within the structural element.
Perforated bricks were used for all of the UOP Quetta Style Beams tested. Table 8.1 and
Figure 8.1 were produced using results obtained by Hodgkinson and Davies [64) and Regan
[Internal UOP Report]. The bottom curve, (Power fk /6), in Figure 8.1 defines the design
strength which would be used in limit states analysis. In accordance with Clause 7.4.1.1.4 BS
5628 Part 2 [S.3], the characteristic compressive strength from tests on bed joints is divided
by three when the bricks are perforated. The design strength is obtained by the use of a
partial material factor 'Ymb· This has a value of 2.0 or 2.3, as specified in Table 7 BS 5628
Part 2 [S.3).
Over the full range of bricks used the application of the above Clause 7.4.1.1.1 [S.3] results
in a design strength which is very low, particularly when compared to the basic unit
compressive strength.
8.2.2 Prism tests
The third curve up in Figure 8.1, defines a relationship for the unfactored brickwork test
prisms which were constructed using a combined header and stretcher bond. In a design
process the values from the middle curve would normally be divided by 'Ymb, using a value of
2.0 or 2.3. The average ratio of factored prism design strength to factored characteristic bed
strength was shown to be 3 .1, in Table 8.1. The range for this ratio is 1.8 to 6.3. Table 8.2
167
and Figures 8.2 and 8.3 provide a comparison between the UOP Quetta Style Beam prism
test strengths and the design strength fk /6. The ratios for these are in the range 3.55 to 12.6.
The wide differences between brickwork bed compressive strengths and the design strengths
can be seen in Table 8.3, Columns 2 and 3. These results show that the use of the modified fk
value as suggested in the Code is extremely conservative. All of the values shown have been
adjusted by the use of the material factor 'Ymb = 2.0. This is further supported by the
comparative results of the UOP Quetta Style Beam tests and the compressive resistance
developed by the UOP Prisms tests, as shown in Table 8.4a. The ratio of the beam to
unfactored prism compressive stresses indicate that, within the beam structure, brick Type 2
developed an additional 18% of strength whilst bricks Type 1 and 3 came, respectively,
within 25% and 7% of the prism strengths. When using the ratio of beam to factored prism
results (using 'Ymb = 2.0) the beam results indicate an over design of 150%, 236% and 186%
for the brick Types 1, 2 and 3. Conversely using factored prism stresses in a design situation
the results indicate that there would be corresponding reductions in the estimated load
carrying capacity of beams using any of the bricks. The use of fk/6 provides a compressive
design strength between 1.3 N/mm2 and 4 N/mm2, These are relatively insignificant values.
When the design strength is based on fk/3 the values are doubled. However they may still be
considered low. Using prism strength/2 or prism strength/1.5 provides enhanced design
strengths from 4 N/mm2 to 11.3 N/mm2 and 5.3 N/mm2 to 15 N/mm2 respectively. The use
of prism strength/1.5 is is recommended by the author of this thesis.
In the above analysis no allowance was made for the fact that the prism stress was the result
of the load being applied via platens to the whole bed face area. If there was perfect overall
168
contact between the platens and brickwork a unifonn stress over the whole cross section of
the prism could be assumed. In a loaded beam the compressive stress is not unifonn. The
maximum compressive stress acts at a specific distance from the neutral axis.
8.2.3 Self-weight effects
The following discussion relates to the effect of the self-weight of the beam. The test beams .
were constructed on a finn horizontal base and, after curing, they were lifted into the test rig.
Self-weight stresses would have developed throughout the beams before the testing
commenced. All instrumentation readings were set at zero when the beam was in the test rig,
i.e. after the self-weight stresses had developed. The self-weight effects were not included in
any of the previous beam calculations since the stresses induced would have been the result
of the additional self-weight bending moments. These would have been identical for both
experimental and predicted values. The effects on a range of parameters are shown in Table
8.5. The range for the linear elastic maximum compressive, fbc, and maximum tensile
stresses, fbt, is seen to be 0.25 N/mm2 to 1.07 N/mm2. The inclusion of the beam self-weight
stresses into the calculations when comparing the UOP Quetta Style Beam prism and beam
stresses is shown in Table 8.4b. All ratios increased. Of particular note was the result for
brick Type 3 beams, where prism and beam results were identical. Self-weight stresses were
included in some of the following calculations.
169
8.2.4 Brickwork potential
The waste of the full potential of brickwork was examined. Brickwork is normally
constructed of bricks which have compressive strengths within a range, from 5 N/mm2 to 200
N/mm2. When mortar is used as a bonding material the resultant effect is brickwork with a
characteristic compressive strength which is significantly less than the bed face compressive
strength of the brick unit. This is evident in Table 8.6 and Figure 8.4 where the mtios
between the compressive bed strength and the characteristic strength fk vary between 2.84
and 4.5. Nine out of the eleven results show the mtio to be greater than 3.0 i.e. equivalent to
3000/o loss of brickwork potential. When the partial material factor Ymb = 2.0 was used, the
mtio between bed and design strengths varied between 5.68 and 8.99. These figures were
examined for a mortar designation (i). Chamcteristic brickwork strengths are lower when
mortar designations (ii) and (iii) are used, as shown in Figure 1 a, of BS 5628 Part 1 [S.6].
This leads to an even greater difference between the unit strength and the characteristic
strength. There must be an environmental and structural advantage to improve the load
carrying capacity of brickwork by the use of a bonding material with better bonding
characteristics, to form a perfect composite element.
8.2.5 Conclusions
Conclusions from the study of brick and brickwork compressive strengths are that:
• very cautious guidance is given in BS 5628 Part 2 [S.3] on the selection of the
characteristic strength of brickwork loaded on their head and stretcher faces
170
• a less onerous characteristic strength, for brickwork loaded on their head and
stretcher faces, would be to use tk /1.5 or the mean prism tests result. To obtain the
design strength for the latter 'Ymb could be taken as mean prism strength/ l. 5
• the advantages of using prism tests to detennine the strength of non-standard bonding
systems needs to be highlighted in BS 5628 Part 2 [S.3].
• when prism tests are used for non-standard bonding systems the use of high partial
safety material factors can produce very conservative designs.
• a new bonding material is required in order to make good use of the natural high
compressive strength ofbricks.
8.3 SHAPE OF THE COMPRESSIVE STRESS AND STRAIN DIAGRAMS
The test data from the prism test described in Chapter 4.3.2 shows that a parabolic
relationship exists between compressive stress and compressive strain. This data was used to
derive a compressive stress diagram for the experimental beams, for each brick type.
The following assumptions were made:
• the maximum compressive strain is taken as 3500 microstrain (as specified in Clause
8.2.4.1 BS 5628 Part 2 [S.3]).
• the strain variation is linear with depth.
171
Theoretical and experimental stress diagrams were derived and are shown in Figures 8.5a-c
and 8.6a-c. The theoretical curves were derived from the best fit curves 4.3a-c and the UOP
Quetta Style beam prism tests. The experimental stress diagrams were derived using best fit
curves in Figures 4.3 a, b and c and the strain gauge plots for three beams. For the
experimental stress diagrams the beams chosen were 1/121,3/231 and 3/341, from Graphs 4,
30 and 54, Volume 2. These were selected because high strain readings had been recorded
and the strain diagrams were relatively linear in the compression zone. Although the strain
was relatively linear the value of the elastic moduli varied between the initial and secant
value as the load increased. Taking this into account the compressive stress diagrams were
developed using the elastic relationship fb = Et, x Et.. The curve for each stress diagram is
parabolic in shape. The trend lines for the points plotted are based on the following parabolic
equations, where x is the stress in N/mm2 at a distance y mm from the neutral axis:
Brick Type 1
Brick Type 2
Brick Type 3
Yt = 0.0541 Xt2 + 2.8628 Xt + 1.2891
Y2 = 1.0723 X l + 1.0899 X2 + 0.9733
YJ = 0.1992 X 32 + 1.9066 X3 + 0.2532
... 8.1
... 8.2
... 8.3
The red straight line superimposed on Figures 8.5a- c shows the form of a linear elastic
stress diagram. Maximum deviation from the linear elastic stress line is approximately 12%,
45% and 31% for brick Types I, 2 and 3 respectively. Use in design of a linear elastic
diagram to failure provides a conservative solution since a larger beam would be required to
resist the applied bending moment. It is noted that the form of the experimental stress
diagrams in Figure 8.5a-c has a different form to the theoretical stress diagrams shown in
172
Figures 8.6a-c. The latter has a more significant parabolic shape and follows the shape of the
theoretical diagrams in Figures 4.5 a, b and c. As noted above, the common parameter for
both sets of diagrams is the best fit curves in Figures 4.3 a, b and c but the alternative
parameters are the beam strains, which are used to produce Figures 8.5a-c, and the prism test
results which are used to produce Figures 8.6a-c. As can be seen each stress diagram at
failure is parabolic in form. As noted in Chapter 8.2.4 the loading within the beam
compression zone is different than the loading on the prisms. This aspect warrants further
examination beyond this thesis.
Of note is the shape of the UOP Quetta Style Beam compressive stress diagram. This does
not follow the form accepted for symmetrical beams, as shown in Figure 5.7. The latter was
based on reinforced concrete theory. Clearly the complex stress contours shown by the FEA,
Figures 6.6 and 6.14 highlights the differences between symmetrical and asymmetrical
beams. Further investigation needs to be carried out of any deviance from the "accepted"
parabolic compressive stress diagrams for other asymmetrical bonding patterns.
This divergence from a straight linear elastic stress diagram in the compressive zone is noted
in some of the diagrams produce by the LUSAS FEA, in Chapter 6, and shown in Figures 6.4
a-g. The main difference between the latter figures and those shown in Figures 8.Sa- care
the depths of the neutral axis. The LUSAS analysis indicates a value of de in excess of0.75d
compared with the values in Figures of 8.5a- c of 0.47d to 0.63d. This also compares to a
range of0.3ld to 0.62d from the experimental values, Table 7.4. The latter shows, for beams
reinforced in shear, averages of: 0.44d for brick Type I; 0.46d for brick Type 2 and 0.47d for
173
brick Type 3. The LUSAS values are based on linear elastic analysis with no cracking. The
latter causes the neutral axis to move towards the top of the beam. The curves in Figures
8.6a, b and c are seen to be similar in form to those adopted for reinforced concrete, as
discussed in Section 5.9.2.
As discussed later in Section 8.3 and shown in Figures 8.5.a-c the shape of the stress diagram
for the UOP Quetta Style Beam is parabolic. Stress plots, obtained from a LUSAS FEA are
shown in Chapter 6 and are shown in Figures 6.4 a-g. In these figures there are curves at
some locations of the beam cross-section where there is a divergence from a straight linear
plot to a slightly parabolic form. However the different moduli for the header and stretcher
bricks would result in different slopes between nodes, since the mesh height represents the
size of header and stretcher bricks. A variable trend is indicated in the surface strain pattern
as the load was applied to the experimental beams, excluding those which were rejected,
Graphs 1-54. This pattern varied between linear and linear/parabolic. It is suggested that an
in-depth examination of the stress and strain diagrams, using the LUSAS FEA software,
should be carried out beyond this study.
174

8.3.1 Conclusions
The conclusions from the study of the compressive stress block for the UOP Plymouth
Quetta Style Beam are that:
• the shape of the stress diagram derived from the measured experimental strains is, for
all brick types, parabolic in shape but of a different format to that currently adopted
for symmetrical beams.
• the quadratic equation representing the parabola is dependent upon brick Type.
• the shape of the strain diagram derived from the measured experimental surface
strains varies between linear and linear/parabolic.
• the use of a linear elastic stress diagram for all brick Types would produce a
conservative design.
• for all beams the experimental neutral axis depth varied between 0.3ld to 0.62d
whilst the values determined from material and beam properties varied between 0.47d
to 0.63d.
8.4 FORCES IN THE TENSION AND COMPRESSION ZONES AND THE NEUTRAL AXIS DEPTH
8.4.1 Introduction
In this section the neutral axis depth and the consequent overall relationship between the total
tensile and compressive forces in the experimental beams is examined. The sizes of the
175
tension and compression zones depend upon the magnitude of the bending moment, the
resistances of the brickwork, grout and reinforcement and on the extent of cracking under
load. All of these influence the neutral axis depth.
It is generally recognised by practising engineers and researchers that brickwork has little
resistance to tensile load, hence the addition of tension reinforcement. Tensile cracking
occurs when the tensile strength of the brickwork is exceeded. This effectively changes the
section dimensions by reducing the neutral axis depth. Little is known about the nature and
extent of such cracking or about the tensile strength of brickwork masonry beams. Current
design guides recognise the existence of a brickwork tension field but choose to ignore it due
to its supposed insignificance. This results in the assumption that tensile cracking extends
fully to the neutral axis. However, close examination of Tables 8.7a-d indicate that the
tensile resistance of some of the UOP Quetta Style Beams exceeded that provided by the
steel reinforcement at yield. Also the results of the LUSAS FEA in Chapter 6, Figures 6.a-g,
clearly show the presence of significant tensile stresses although the analysis is linear elastic
and therefore no allowance for cracking is made. To allow for tensile cracking a value of the
tensile stress has to be defined as part of the input data. Of interest are the tensile stresses at
the bottom of the FEA beam and those at the top of the first course of bricks. The stress at the
latter location is higher than at the bottom of the beam for the area of brickwork immediately
below the grouted core. The author assumes that this is because this is the stiffest part of the
beam.
176
Consideration is given to the source of the additional tensile strength in the experimental
study i.e. whether it is provided by the steel or the brickwork and grout. To do this it is
necessary to examine further the position of the neutral axis.
8.4.2 Location of the neutral axis
Chapter 7 compares predicted and experimental neutral axis depths. It is found to exist within
the second course of brickwork, refer Graphs 1-54 (Volume 2) and Table 7.3. The second
course of bricks lies between 0.39d and 0. 74d, equivalent to a distance from the top of the
beam of approximately 75mm to 140mm .. When compared to the elastic prediction values
the experimental results show an increase in the expected depth of the compression zone.
This also results in a reduced lever arm distance. During the early stages ofloading the UOP
Quetta Style Beam the neutral axis was seen to rise slightly and then it stabilised at the mean
values given in Table 7.3. This movement of the neutral axis can be explained if the internal
load sharing and the physical properties of the section change.
Changes can occur due to:
• the modulus of elasticity of one or more of the materials decreasing as the load
increases. This is confirmed by Zhou [94].
• variable cracking occurring in the tension zone, both on the surface and internally.
• changes in the stress paths with resultant movements of stress concentrations.
• load transfer from brickwork to the grout and/or the steel.
177
The experimental failure load and the depth of the neutral axis were used to establish the
values for the predicted compressive stress. The results of the calculations are shown in
Table 7.10b, columns 15 and 16. The calculations were dependent on the use ofthe relevant
modulus of elasticity for the brickwork i.e. initial or secant and on the shape and depth of the
compression stress diagram i.e. triangular or rectangular.
8.4.2.1 Tensile resistance using Methods 1 and 2
The tensile resistance of the UOP Quetta Style Beam is checked by two methods using the
experimental data.
Method 1 is described in Annex B. Initially the assumption is made that the brickwork did
not provide any tensile resistance after cracking. Consequently the experimental tensile force
Texis assumed to be provided by the steel reinforcement. The calculation ofT ex involves the
use of the experimental failure load, W, resultant bending moment and d.:, the measured N. A.
depth from relevant Graphs 1 -54, Volume 2. For equilibrium Tax would be balanced by Cox,
the experimental brickwork compressive force. T ex and C • ._ are calculated for the selected
Grade l beams using:
M=T.z ... 8.4
where z = d- d/3, and
Tex = Cex 8.5
178
The results for Texare shown in Table 7.10a.
Calculations for Method 2 made use of the: strains, Et.; N.A depths, de, taken from Graphs 1
-54 (Volume 2); the moduli of elasticity; and appropriate values ofEmitiai and E.ec.m obtained
from the prism tests. From these, and using a triangular stress diagram, the compressive force
in the brickwork is calculated, using :
Cioitial = 0.5 X de X b X Emitial X Et, ... 8.6
This equation is modified accordingly when E.ec.m is used to provide Csecant.
8.4.2.2 Analysis of Method I Results
The results of the Method 1 analysis for beams grade 1 are shown in Table 8.7g. It is noted
that in eleven beams of 2m span there is a tensile force in excess of the yield strength. A
further four beams had a tensile force in excess of the ultimate strength of the reinforcement.
The ratios between the ultimate and yield strength for the 16mm and 20mm bars are
respectively 1.23 and 1.26. As stated in Chapter 4 the ultimate strength, obtained from the
tensile tests of the steel, did not allow for necking of the reinforcing bar. Table 8. 7b shows
that above yield there could be an excess of steel strain, Eex- An excess ranging from 19% to
4 7% of the strain at yield is shown, with an average of 29%. This includes the self-weight
strain.
179
In Figure 8.7 the longitudinal equilibrium of the beam is equated, balancing the compressive
force, F~><:, in the brickwork with tensile forces provided by the steel, Fst, and an additional
tensile force in the steel and/or brickwork, Fat. The resulting equation is given by:
F"" = Fst +Fat ... 8.7
The additional tensile force in the steel is considered to be provided as the reinforcement is
loaded past its yield point. As indicated in Chapter 4, the yield and ultimate strengths of the
steel used in the experimental work were obtained by tensile tests on a selection of
specimens. It is also of note that if the stress diagram is assumed to be parabolic then the
lever ann, z, would have reduced and the value ofT ex would have increased.
The source of the additional tensile force is unknown. Clearly the steel beyond the yield
stress could provide additional tensile resistance. This would be accompanied by additional
tensile strain. There is no conclusive evidence from the test results to test this hypothesis.
The possibility of tensile resistance being provided by the brickwork could be agrgued by
considering:
1. Direct tensile strength
Hendry [44] states "direct tensile strength of brickwork is typically 0.4 N/mm2, but the
further variability of this figure has to be kept in mind. He suggests that the variability is
due to the grading of the mortar sand and the moisture content at the time of laying the
bricks.
180

2. Flexural resistance
As shown, in Chapter 5.4.2.2, the Code [S.6] allows flexural resistance to taken for the
design of single skin brickwork walls subjected to lateral load. This allowable flexural
strength is between 0.25 and 2.0 N/mm2. The maximum is taken for a mortar
designation (i) with a brick of water absorption~ 7%.
The UOP Quetta Style Beams were constructed using a mortar designation (i). Based on
the the water absorption of Brick Types l, 2 and 3, which were used in the tests, the
comparative flexural strengths of the two bottom courses are 1.5 N/nun2, 0.9 N/nun2
and 2.0 N/nun2 , respectively.
Consideration of tensile resistance in the brickwork is now examined.
Fat can be expressed as:
Fa1 =fey A.t+ 0.5 b (h -d.,) fbt ... 8.8
where fey= excess steel strength above yield and f bt =tensile strength of the brickwork.
From Table 8.7ga the average value ofFot for brick Type 1 beam is shown as 57 kN and the
range 37- 89 kN. For brick Type 3 the average is 53.4 kN and the range is 35-74 kN. The
force in the bar at yield for the 2m beams is shown to be 191kN. The experimental ultimate
tensile force, from the material tests, was 236 kN, i.e. the difference gives an excess of 45
kN. Seven of the eleven beams have an excess greater than 45 kN. In the extreme, for brick
Type 1, if all of the excess is taken by the brickwork then, using equation 8.8, and the
181
figures given above i.e. fat= 89 kN; d.,= 99.4 IIlll1, then fm..x = 5.43 N/mm2. For brick Type 3
using Fat= 35 kN then tmax = 2.13N/mm2. These tensile stresses are for brick Type 1 equal to
0.08 to 2.15fk, with an average of0.15fi. For brick Type 3 the comparative values are: range
0.07 to 1.79fi and average 0.09fi.
The value of 5.43 N/mm2, for brick Type 1, is high when compared to the flexural strength of
1.5 N/mm2 shown in Table 3 of the Code [S.6]. However for brick Type 3, where the water
absorption was 5.18% it could be argued that the value of 2.0 N/mm2 should be accepted.
This is very close to the figure shown above of 2.13 N/mm2•
The hypothesis that "evidence has been produced by this thesis of excessive tensile stress",
which may or may not be due to brick tensile strength, is, based on a statistically small
sample. It is also based upon the determination of the neutral axis depth which is dependent
upon the shape of the compressive stress diagram. It is suggested that this hypothesis should
be the subject of further experimental investigation and analysis.
If it could be accepted that all of the excess force is taken by the brickwork then:
Fat= 0.5 b (h -de) fbt ... 8.9
The comparison of the tension and compression forces for Grade 1 beams of 3m span are
shown in Figure 8. 7h. It is of note that 5 out of 13 beams show an additional force with one
of the five exceeding the ultimate strength of the steel. For this span all three bricks show a
182
reserve of strength. Across the range of the three bricks the tensile stresses vary from 0.43 to
5.4 N/mm2. The average is equivalent to 0.4tk. In columns 14, and 16 of Table 7.10b the
relative brickwork strengths were listed. These are derived from equating Tex to give Cex· As
shown in Column 16 four beams 2/231, 3/231, 2/330 and 2/331 have a reserve of compressive
strength i.e. in excess of the prism test strength, applying to brick Types 2 and 3.
None of the 4m span beams are included into the above analysis because they were over
reinforced. Results ofthe analyses of4m span beams are shown in Table 8.7a, d and e. Table
7.1 Of provides the compressive relationship between the prism tests results and the calculated
stresses from the bending moments and subsequently Tex and Cox. The average
underestimation for brick Types 1 and 3 is shown to be 28% and 10.6% and there is an
average overestimation of 18% for brick Type 2.
In Figures 8.5a-c there is a comparison of the compressive stress distribution usmg
experimental values against those of a basic triangle, representing linear elastic behaviour.
The differences between the areas of these two diagrams were 9.6%, 24% and 17.1% for
brick Types 1, 2 and 3 respectively. Whilst this may be a reason for some or all of the
differences between calculated and prism stresses for brick Types 1 and 3 it appears to be
unreasonable to use this proposal for brick Type 2. For all of the analyses of compressive
stress for Method 1 the dependence on the actual shape and depth of the stress diagram is
noted.
183
The main variables are the three brick types, the three spans and the three different
percentages of reinforcement. Table 8.7ga shows that there were approximately equal
average excess tensile forces in 2m span beams of brick Types 1 and 3. The averages were
respectively 53.7 kN and 53.3 kN. For the 3m span beams, shown in Figure 8.7h only one
third of brick Type l and one quarter ofbrick Type 3 had an excess tensile force. The brick
Type 3 excess tensile force was significantly less than that for brick Type 1. The ratios of the
reinforcement between the 2m, 3m and 4m span beams were respectively 1.0:1.56:2.44. The
ratio of the applied bending moments for the 2m, 3m and 4m spans was 1.0:1.50:2.0.
The presence of excess tensile force occurred: in all of the 2m span beams of brick Types 1
and 2; in some of the 3m span beams of brick Types 1 and 3 and in none of the 4m span
beams for any brick Type. As shown in Table 8.7d both of the 4m beams had steel stresses
less than the yield. Hence it is not possible, for these beams, to quantify any tensile force in
the brickwork.
8.4.2.1.1 Comments on Method l
Analysis using Method 1 shows that the development of an excess tensile force is dependent
on brick type, span and areas of reinforcement. In practice the main variables for a beam of
given span and reinforcement, where the percentage of the latter ensures an under -reinforced
beam, is brick type.
184
To maintain approximately the same percentage ratio, A.Jbd2, across beams of the same
brick and width and of increasing span would require the following beam dimensions:
Span Depth
2 290mm
3
4
365mm
590mm
It is considered that there would be an excess tensile force in beams of these dimensions
using a brick with a bed compressive strength of at least 14.2 N/mm2.
8.4.2.3 Analysis of Method 2 Results
Method 2 is the reverse of Method 1, since Cex was found and then compared to Tex- The
latter is derived using Method 1. Tables 8.7g and 8.7h, Method 2, provide the relationship
between the compressive forces Cirutiai and Csecant i.e derived from the different moduli,
assuming a triangular stress diagram. A choice of the elastic modulus, i.e. Euutiai or E..c.nt. is
made to keep the differences between Cex and Tex to a minimum. The results in Tables 8.7g
and 8.7h show a relative agreement within a range of± 10% for 9 of the 24 beams. However
there are extreme differences of up to 51%. The maximum difference between C.x initial and
Cex is 137 kN. This equated, for the beam 2/231, to an excess top surface stress of 8.6
N/mm2. The result of accepting this is that the maximum compressive strength would be 19.6
N/mm2, when combining the excess stress with the stress due to Cex (11 N/mm2
, from column
16, Table 7.10b). However if the maximum stress of 19.6 N/mm2 is accepted then the average
stress over the depth of the section to the neutral axis is 9.8 N/mm2, assuming a triangular
185
stress diagram. This is 1 N/mm2 higher than the average prism compressive strength. Prisms
were loaded over their full face.
Comparison of beams 1/120, 3/120, 1/121, 2/121, using Tables 8.7b, shows that all ofthese
beams have both excess tensile and compressive forces. As shown in Table 8.7gb. With the
exception of beam 1/120 there is a close relationship in the results for the other beams i.e.
this further enhances the finite element analysis of the possibility of enhanced tensile forces
in the UOP Quetta Style Beam.
8.4.2.3.1 Comments on Method 2
It is suggested that Method 2 is dependent on the shape and depth of the compressive stress
block, strain and elastic moduli measurements. Four variables make the accurate assessment
of compressive forces more difficult. In practice when analysing the compressive strength of
a beam the main variables are the brick type and the shape of the stress block. The latter is
related to use of either the elastic or ultimate limit states theory. The elastic modulus is used
for stiffness and deflection calculations.
8.4.2.3.2 Final comments on the adoption of tensile force equations
Examination of Table 8. 7a shows that of the eleven beams of 2m span, included in the
analysis, all had an excess tensile force. Of thirteen beams of 3m span only five had an
186
excess force, whilst no 4m span beams showed the presence of a tensile force. It is suggested
that it should be considered that an excess tensile force can develop in an under-reinforced
UOP Quetta Style Beam.
8.4.1.4 Relevance of UOP results and the study by Witbey [30)
The examination of the tension force in the UOP Quetta Style Beam, using Method 1,
confirms the presence in some beams of a force in excess of that provided by the steel at
yield and also goes some way to confirm the statement made by Withey in 1933 [30]. In his
study of brick masonry beams he states, "There was considerable tension carried by portions
of the brick masonry at uncracked sections". Withey did not identify the sources of the
additional tensile force or quantify the magnitude of the stress. As shown in the finite
element analysis it is possible that tensile resistance could be provided by the brickwork
and/or steel. This hypothesis needs to be the subject of further investigation outside of this
thesis.
8.4.3 Neutral axis equation
If the presence of an additional force in the tension zone was accepted then a new equation to
find the neutral axis depth would be required. Equation 8.7 is used to produce the following
relationship, assuming a value of 0.15 fk for the value of the additional tensile stress in the
brickwork:
187
0.5 b d.,~= Am. fy + 0.5 b (h- d.,) 0.15 fk
where fk is the prism strength.
... 8.10
This equation can be compared to the analysis when the additional tension is ignored, where
the standard equation for normal design (80] is:
x'- + 2p m x -2 p m = 0 ... 8.11
where x =d.,/ d.
The comparison between the experimental neutral axis depths, d.,, with those using equations
8.10and 8.11 is shown in Table 8.8. The N.A. is evaluated to be 78 mm. when equation 8.10
is used with brick Type 1, a 2m span un-reinforced beam, where~= 25.2 N/mm2 (i.e. the
prism strength). This compares to the average experimental neutral axis depth of77.5mm for
2m span beams, and the value of 68.8 mm from equation 8.11. The comparison between the
values from the experimental results and the proposed equation is extremely good justifying
the proposal to include a term to allow for excess tension.
8.4.4 Conclusions
Conclusions from this analysis of the tension and compression zones and neutral axis depth
are that:
• during the early stages of loading the experimental beams the neutral axis position
rose slightly and then stabilised.
188
• the increase in the neutral axis depth is much more significant for beams of the
stronger bricks where the modular ratios are smaller.
• the 2m span UOP Quetta Style Beams ofbrick Types 1 and 3 have a reserve of tensile
strength, ,which is balanced by compressive resistance and in some cases there is a
further reserve of compressive strength.
• the reserve of tensile force is in excess of that provided by the steel at yield and in
some cases at ultimate strength.
• the development of any excess tensile force IS independent of brick type but
dependent upon span and areas of reinforcement.
• the LUSAS elastic analysis identified the highest tensile forces at and around the
bottom of the grouted core, where the reinforcement is located in the analysis.
• the major problem in a design process would be to identify a relevant tensile strength
for the brickwork.
• the analysis highlights the complexities of defining the parameters associated with the
compressive strength, namely shape and depth of the stress diagram, relationship
between face strains and internal stresses, values of elastic moduli to be used in
calculations.
• the effect of using equation 8.11 or a similar equation to take into account any tensile
strength in the brickwork would have the effect of reducing all of the tensile forces in
the analyses carried out within this thesis.
• Further study is required before adoption of the equations developed in this thesis, for
the design of UOP Quetta Style Beam.
189
8.5 MODULUS OF ELASTICITY
All of the stress calculations in the study made use of the measured values of the elastic
moduli. In Chapter 5.8. 1.2 it is stated that Curtin et al [71] indicate that the elastic modulus
for brickwork is defined to fall within the range of700 to 1100fk N/mm2• Table 8.9 provides
a summary of recommendations from the British Standard [S.J], American Code [S.l4],
Eurocode [S.15], the UOP Quetta Style Beam Prism tests and the proposals by Curtin et al
[71].
The average for the UOP Quetta Style Beams is 893fk but two out of three of the values fall
outside of the range suggested by Curtin et a! [71]. The percentage difference for the UOP
Quetta Style Beam when compared with the BS 5628 Part 2 [S.J] value of 900 li vary
between - 28% to + 46%. The consequences of these variations and of those determined
using the Eurocode proposal is that in design situations stiffness and deflection calculations
could be significantly under or over-estimated depending upon the values adopted. This
further confirms the conclusion in Chapter 8.2.5, which recommends prism testing to
determine the properties of brickwork using bricks loaded on faces other than the header or
stretcher face.
The current design guide BS 5628 Part 2 [S.J] quotes the short term modulus of elasticity of
900 fk. i.e. taken as a function of the compressive strength of the brickwork when tested
across bed joints. It is in fact recommended that this value is used for clay, calcium silicate
and concrete masonry, including reinforced masonry with in-fill concrete. With respect to
clay brickwork it is therefore entirely independent of the type of brick or mortar designation.
190
The UOP results, shown in Table 8.1 0, did not substantiate this. There would be further
significant differences if the characteristic compressive strength is modified for loadings on
header and/or stretcher faces. Also the use of tk/3 for bricks loaded on header and stretcher
faces would provide a modulus of 300fir_. This value is very much smaller than the lowest
figure of 700fir_ suggested by Curt in et a1 and lower than the value of 400fir_ for the calculations
of long term deflection in Annex C of The Code [S.l]. The Code recommendations leading
to a modulus of300 fir_ results in extremely high deflections.
8.5.1 Conclusions
The conclusions for this section are that the:
• modulus of elasticity for any non-standard bonding should be obtained by the use of
prism tests.
• modulus of elasticity for standard bonding should be obtained by the use of prism
tests, when an accurate value is required.
• use of a modulus of elasticity of 300 fk. for beams constructed of bricks loaded on the
header and/or stretcher faces, is extremely unrealistic.
8.6 BEAM STIFFNESS AND DEFLECTION
Stiffness gives a measure of the forces corresponding to a set of displacements. In its
simplest form stiffness is expressed as K =Fill, where F is the applied force and !!. is the
191
displacement induced by the force. In the context of a beam element the relationship between
an applied force and the beam deflection is given by the equation A= kWL3/EI where k is a
function which depends upon the type and position of the load, beam span and type of beam
supports. The equation for the deflection of the experimental beams which were subjected to
two loads, each of magnitude W, applied at the third points is re-arranged as follows:
L 28.1711 =
El
The term LIEI allows designers to evaluate the suitability of different beams for a particular
purpose. An ideal beam has a constant stiffness, LIEI, throughout its elastic range. Constant
stiffness does not occur in reinforced concrete or reinforced brickwork beams because of
tensile cracking
Throughout the test programme deflection, load and span were accurately measured. This
allowed for the section stiffness, which depends upon reliable values of E and L to be
accurately examined. From the load/deflection curves, shown in Graphs 154-162, Volume 2,
the values of El were calculated and compared .. The deflection curves show the relationship
to be curvilinear, relatively steep at low loads, becoming almost horizontal with higher loads
indicating that the section stiffness had stabilised. Nine of the eighteen beams, which were
rejected in Chapter 5, had curves which are erratic in shape. The change in gradient may
have been due to shear and/or tensile cracking, indicating that an initial brittle failure mode
below the neutral axis had given way to a ductile mode.
192
The values of the second moment of area, Lr in UEI , for each brick Type and beam span are
obtained from the UEI graphs. la secant and Lr LIEI are compared in Table 8.11 and Figure
8.11. The ratio between these two sets of figures is shown. The range for all beams is 0.82 to
1.44 with an average of 1.09. For all spans brick Type I provides conservative predictions.
Conservative predictions are noted for six out ofthe nine series of beams. The conservatism
is most significant in the 4m span beams. It is suggested by the author that beam series and
brick Types 2 and 3 of 2m span beams have very similar low ratios. This suggests a
dependence upon span.
The evaluation of both Lr secant and the Lr LIEI are dependent on the 'assumed' value of the
modulus E, as shown in the previous section E varied across the prism results for the three
different brick Types of the UOP Quetta Style Beams. Both I and E, for the UOP Quetta
Style Beam, also varied at cross sections along their longitudinal axis due to the changing
bonding pattern.
The influence of the results for I and E are next considered by examining predicted versus
experimental beam deflections. The equation for the predicted deflection values is 1:!. = WL3
/28.11EI. Deflections for thirty beams of the same brick Type and span are summarised in
Graphs 127- 141 (Volume 2). These show the deflections for unreinforced and reinforced
beams of brick Type I, 2m span beam, series I, 2 and 3. The experimental values are
compared to the predicted ultimate analysis deflections using the neutral axis depths taken
from the strain graphs (Volume 2, Graphs I- 54). Some of the Graphs 127 -141 are related
to beams where only three curves were produced, whilst the remainder have five. The
193
former is where only one gauge per beam was used, the latter when two were used one on the
near, 'n', and the second on the far, 'f.
With the exception of beams 11130, 3/131, 3/230, 3/231, 11140 and 11141 all of the
predictions and experimental results compare extremely welL Good comparability is shown
for 800/o of the results, with 100/o above and 10% below the predicted deflection.
The deflections tabulated in Table 7.llb were used to produce Figures 8.9 and 8.10. These
compare deflection with beam span and brick Type and deflection with brick Type and beam
span. Both highlight the significant effect on the predicted deflection of using the reduced
compressive strength of the bricks on the header and stretcher (modified in accordance with
BS 5628 Part 2 [S.3]. The lowest values are for brick Type 1 and beam span of 2m. The
results for brick Types 1 and 2 with the 4m span are quite unrealistic and the plots further
highlight the anomaly of using the modified characteristic strength. Figure 8.11 was also
developed from Table 7.11b, with modifications. The serviceability deflection is obtained by
dividing the experimental Ymax at collapse by the partial load factor of 1.6. Also inserted was
the deflection based on the requirement of BS 5628 Part 2 [S.3] to limit the deflection to
span/250. There is close comparability between the experimental serviceability and span/250
for the 2m span beam. However the Code calculations underestimate the measured values for
that span. Generally as would be expected, experimental and predicted values of deflection
increased with span.
l94
8.6.2 Conclusions
The conclusions from the studies of stiffuess and deflection and the previous section are that:
• a high degree of confidence in calculations can be obtained when values of E, I and
the neutral axis depths are obtained using the experimental results.
• the use of an E value based on 900 ti, as given in BS 5628 Part 2 [S.J], does not
necessarily guarantee a dependable result, since there is no universal agreement in the
use of 900fk and the experimental results either overestimate or underestimated, in
some cases significantly, the experimental results.
• the experimental results show that the use of span/250 is proven to be an acceptable
ratio for the determination of allowable deflection.
8.7 SHEAR FAILURE
The predicted beam failure loads were ascertained using the standard Code equations, AS.21
toAS.23. From Tables 7.13k and 7.13 a-c, it is noted that 30 out of 52 beams tested failed in
shear. Elastic analysis predictions indicate that 36 beams would fail in shear and by ultimate
analysis 39 beams would fail by the same mode.
Table 8.12a, derived from Table 7.13k provides a comparison of factors of safety, for beams
reinforced in shear, based on brick Type. This clearly indicates that the bricks with the
largest bed compressive strengths, i.e. brick Types I and 3, have the largest average FOS,
being respectively 1.38 and 1.12. Brick Type 2 has an overall average FOS less than LO.
195
Two out of three, i.e. 67%, have a value less than l.O. Both beams had experimental
brickwork strain plots which were rejected. However whilst the value for brick Type 2 is not
ideal this should not be disastrous since the ultimate shear strength is the design strength.
Using a partial load factor of 1.6 the ultimate FOS is 0. 73, which is not satisfactory. The
beam would be considered unsafe but would still provide a factor of safety of 1.16 at
characteristic load.
Table 8.12b, derived from Table 7.13k, provides a comparison of factors of safety, for beams
unreinforced in shear, based on brick type. Again this clearly indicates that the bricks with
the largest bed compressive strengths, i.e. brick Types I and 3, have the largest average FOS,
being respectively 2.17 and 1. 75. Brick Type 2 also has a high overall average FOS of 1.5 I
and a FOS of l.I6 at characteristic load. Also of significance is the 2m span beam of brick
Type I where the FOS is 2.41.
The elastic predictions for all of the beams, failing in shear, indicate a FOS greater than
unity.
The above experimentaVultimate prediction results for bricks Types I and 3 indicate that the
UOP Quetta Style Beam unreinforced in shear has a high reserve of shear strength,
particularly those bricks with a high bed compressive strength. The implication from these
results is that, with one exception, beam No 2/220, the use of the Quetta Style bond in the
UOP Quetta Style Beam had enhanced the strength of the brickwork. A brittle shear failure
is unlikely to occur in beams using the Quetta Style Bond.
l96
Sinha and de Vekey [ 69] stated that the shear resistance of grouted cavity brickwork beams is
influenced by the shear span ratio and the percentage of reinforcement and to a lesser extent
by the brick and mortar strengths. Figure 8.12 and Table 8.12c confirm that the shear
capacities of the UOP Quetta Style Beams are dependent on the ratio of shear span/effective
depth. Examination of Table 8.12d shows that whilst the FOS for failure/predicted ultimate
load for beams unreinforced in shear of brick Type 1 are dependent upon the span, shear span
and percentage area of reinforcement this trend does not apply to beams of brick Types 2 and
3. Table 8.12c and d indicate that strength is the predominant controlling factor for the shear
capacity of beams of different spans, shear spans and percentage of reinforcement.
Shear reinforced beams failed prematurely. In all cases failure was preceded by cracking in
the top surface of the infill grout. The cracking occurred above and close to the shear links.
As indicated in Chapter 7 local crushing under the top of the shear links may have been the
cause. This may have been due to the fact that the beams did not carry top reinforcement;
hence the anchorage of the shear links was entirely dependent on the following factors:
• the bond strength of the shear legs.
• the bearing resistance of the grout on the bends at the upper junction of the vertical
legs and horizontal section of the shear links.
The following information would have been required to carry out an in-depth examination of
possible bond failure in the UOP Quetta Style Beams:
• the bond strength of the steel
197
• strains induced in the grout and links both in the vertical and horizontal legs and
around the radii
• elastic moduli of the grout core
• bearing resistance of the grout
The above warrants a study outside of this thesis.
The compressive stresses induced by movement of the horizontal top leg of the link cannot
be easily defined. The mode of failure described above is unlikely to occur in doubly
reinforced beams or reinforced beams where a nominal amount of top steel is present. The
width of reinforced concrete beams is normally significantly greater than grouted cavity
beams thus the surface area of the link is increased and the likelihood of exceeding the local
crushing stress reduced.
8. 7.2 Conclusions
The conclusions from the study of shear are that:
the elastic predictions for all beams failing in shear indicate a FOS greater than unity.
• the use of the UOP Quetta Style Beam with a bed compressive strength of 14.2
N/mm2 and above enhances strength above the ultimate failure load.
• the predominant factor for the shear capacity of beams of different spans, shear spans
and percentage of reinforcement is noted in the use of a brick with a bed compressive
198
strength of 25.2 N/mm2• This was not the situation when lower strength bricks are
used.
• shear reinforced beams were found to fail prematurely, failure being preceded by
cracking in the top surface of the infill grout.
8.6 COMPARATIVE BEAM BEHAVIOUR
Strength comparisons have been made of the UOP Quetta Style Beams and also between the
UOP Quetta Style Beams and beams tested by other researchers Withey, [39], Osman and
Hendry, [68], Garwood and Tomlinson, [48] and Regan, [UOP]. The common relationship
used is the value of Mlbd2 which links failure load and dimensional section properties. The
advantage of having a relationship for M/bd2 is that given a known moment, (M), for a
specific beam of selected width, (b), then the effective depth, (d)_, can be calculated. This
provides a trial section.
Tables 8.13 provide comparisons of Mlbd2 with the compressive strength of the brickwork
prisms and with the spans for the UOP Quetta Style Beams. Figure 8. 13a shows that there is
a relationship of increasing Mlbd2 value as the brickwork strength increased. The equation
for the relationship is:
y = 0.054lx+ 2.3569 ... 8.12
where x = prism brickwork compressive strength and y = Mlbd2.
199
Table 8.14 shows that the value of Mlbd2 for the UOP Quetta Style Beams increases with
span. In Table 8.15 the mean values for Mlbd2 and brickwork compression strength are
compared with results from the studies of researchers, as described in Chapter 2. Relevant
plots of the results are shown in Figures 8.13b and c. These figures incorporate the results
from 87 beams. Linear graphs indicate the basic trends.
The equation for the straight line graph is:
y = 0.0238 X+ 2.7839 ... 8.13
where x =brick bed compressive strength and y = M/bd2.
In examining these results, in order to ascertain the related behaviour of reinforced brickwork
beams, it is necessary to consider that these results were by unrelated researchers who all had
similar basic aims. Each establishment had produced different: bonding formats; section
dimensions; location and percentage of reinforcements. Of all of these beams the study of a
3.68m span beam by Garwood and Tomlinson shows the smallest Mlbd2. A comparable
University of Plymouth beam is brick Type I and 4m span. However, the latter has a
percentage reinforcement of 1.6% compared to 0.33 for the Garwood beams. As a result the
comparative Mlbd2 values are UOP 3.51 and Garwood 1.92. The three Garwood beams
failed in shear whilst UOP Quetta Style Beam failure covers shear, bending compression and
bending tension. The results from these tests were omitted in the production of Figure 8.13b.
It is considered that the low values would significantly affect the results by the other
200
researchers. Figure 8.13c excludes the UOP and the Garwood results. This figure indicates a
reducing trend for M/bd2 as the compressive strength increases.
The equation for these results is:
y = -0.0341x + 3.7712 ... 8.14
where x =prism brickwork compressive strength and y = Mlbd2. The negative trend reflects
the weakness of some of the brickwork prism formats.
Table 8.15a, obtained from equations 8.11 and 8.13, and clearly indicates that the UOP
Quetta Style Beam can provide enhanced structural strength when compared to the beams
used by the other researchers.
In considering the numbers of beams tested, the samples by the UOP and Withey were
significantly higher than those used by Osman and Hendry and Garwood and Tomlinson. It
is considered that the UOP sample of 54 beams and the relationship of the results indicate
that equation 8. 11 could be used for other UOP Quetta Style Beams.
8.6.1 Conclusions
Conclusions from this section are that:
• There is a 19% increase in Mlbd2 value as the brickwork bed compressive strength
increases from 15N/mm2 to 25 N/mm2.
201

• there is a positive related trend between Mlbd2 and prism compressive strength for
beams of identical cross section.
• Mlbd2 for the UOP Quetta Style Beam increases linearly with increasing brickwork
compressive stress, span and area of reinforcement.
• The UOP Quetta Style Beam has a greater resistance to applied bending moments
than beams with bed joint reinforcement and some other grouted cavity beams.
8.7 DISCUSSION
Conclusions have been shown at the end of each section of this parametric study and these
will be summarised in the Chapter 10. However the overall outcome is that the development
of and research into the UOP Quetta Style Beam was successful.
It has been shown that the UOP Quetta Style Beam:
• has a reserve of tensile strength in excess of the values normally anticipated in
reinforced brickwork beams.
• can have a better resistance to moment when compared with other reinforced beam
formats.
• has enhanced shear strength above the ultimate failure load when constructed with
bricks of bed compressive strength greater than 14.2 N/mm2
.
202
In addition the study identified the need, outside of this thesis, for:
• a review of the determination of the characteristic and design strength and value of
the elastic modulus of bricks loaded on header and/or stretcher faces.
• a recognition that the characteristic and design strengths and elastic modul~ for
beams to be constructed of a non-standard bonding format, should be obtained by
prism tests (or analytically in view of current techniques now available).
• a review of the method of bonding brickwork in order to maximise the potential
strength of brick units.
• further investigation of the stress profiles of reinforced brickwork beams using
LUSAS FEA software.
8. 7.1 Equations
An equation suggested for use with the UOP Quetta Style Beam is:
Moment equation:
Mlbd2 = 0.054lx +2.3569 ... 8.14
where x = compressive strength of prisms N/mm2
Further studies are suggested to investigate the adoption of two equations:
a Additional tensile force:
Fat= O.Sb (d- de) f bt where f bt = O.lSfk /ymb ... 8.7
203
I b Neutral axis!depthj
0:5 b ~ f~r.;= A.t fy+05 br(t}- d;,)!Q!:IIS f~r. ... 8.10
9 INTRODUCTION
Chapter9
DISCUSSION
This Chapter provides two overviews. The first is of research carried out for this thesis and
the second considers the results of the research by others in the light of the study of the
behaviour of the UOP Quetta Style Beam.
9.1 OVERVIEW OF THE UOP RESEARCH
It is considered that the new format for a grouted cavity beam, the UOP Quetta Style Beam,
met the aims and objectives of the research presented in this thesis. The overall result of the
developmental, experimental and analytical work identifies that the UOP Quetta Style Beam
has a reserve of tensile strength and a higher moment of resistance when compared with
many other reinforced brickwork beam formats. The study also shows an enhancement of
shear strength above the failure load.
The benefit of using the LUSAS programme in the analysis of non-traditional bonding has
been confirmed. The FEA identifies in 3D, complex elastic SX stress contours for the
unreinforced and reinforced UOP Quetta Style Beam.
The behaviour of the beam at mid-span is shown in Figures 6.4 a-g. These diagrams show
straight lines between the individual nodes, shown in Table 6.2, in the Y direction of the
205
mesh. Over the whole depth of the beam the linear elastic equation, M/1 = fly, is not valid.
However it can provide realistic figures for the SX bending stresses at the extreme top and
bottom faces of the beam, along the longitudinal centre line. This section of the study also
identified the strong influence of the grouted core.
The parametric study showed that the recommendation in BS 5628 Part 2 [S.3] for the use of
a modified characteristic compressive strength for clay brickwork, combining bricks loaded
on header and stretcher faces, gave extremely conservative design solutions. Also
examination of the basic unit strength of clay brick units and the associated characteristic
compressive strengths of brickwork show a significant loss of clay brickwork potential
strength. The considered reason by the author for this is that for structural brickwork use is
made of a bonding material whose basic strength properties are always much lower less than
the unit bed compressive strength. This is accepted by current construction practice in the
UK. The normal practice in structural design is to use medium to high strength clay bricks
with mortar, a relatively weak bonding material. An investigation into the use of a new
bonding medium is required which would provide stronger brickwork, i.e. with greater
characteristic strengths. There are also implications in the environmental conservation of clay
by making greater use of the natural strength of the raw material. Action needs to be taken to
overcome this loss of potential strength. If a significantly greater proportion of the basic
strength could be used then this would allow greater loads to be carried in certain
circumstances. It could lead to savings in the quantities of bricks used. This would have
environmental and conservation implications_
206
The compression zone of the beam of the UOP Quetta Style Beam is a combination of bricks,
stressed both parallel and perpendicular to their bed faces, and infill grout. The compressive
strength of the brickwork was determined by the use of test prisms representing the
compression zone. The tests established the stress-strain relationship and thus the modulus of
elasticity of the section. The resultant stress/strain curves were non-linear and found to fit the
Powell and Hodgkinson [37] parabolic curve. The BS 5628 Part 2 [S.3] suggests use of a
failure strain of 3500~ for all types of brickwork regardless of brick type or mortar
designation. The prism testing for the thesis showed this to be incorrect, as brick Type 1, 2
and 3 gave different failure strains, nominally 2800~, 3500~ and 3000~, respectively. The
Code also recommends a constant value for the short term modulus of elasticity of Et. =
900fk i.e. it is linked to the comprehensive strength of masonry. This is a poor approximation
of this parameter, which can be applied to masonry i.e. clay, calcium silicate and concrete
bricks This common value, of 900 fk, takes no account of brick type or mortar strength.
Internationally Et, may vary from 700fk to IIOOfk. The UOP Quetta Style Beam prism tests
gave values between 648fk and 1414fk.
The form of the compressive stress diagram, Figure 8.5, for the UOP Quetta Style Beam at
collapse is closer to a straight line than to a parabola. The latter is the form normally
accepted, Figure 5.3. This is based on reinforced concrete theory.
The inaccuracy made in the assumption of the modulus of elasticity affects the predicted
stress distribution and hence the ultimate strength of the section. The fact that the stress
strain curve is parabolic automatically means that the modulus of elasticity is non-linear.
207
Two values are normally used to describe it, the initial tangent modulus and the secant
modulus. When the full stress/strain curve is known then the modulus of elasticity may be
determined at any point on the curve. The experimental work identified the need to consider
both values when the compressive resistance of the beams was determined. The importance
of establishing a correct value for the modulus of elasticity also became apparent when
calculating theoretical deflections and the position of the neutral axis. Deflection and
stiffness plots showed the changes in section stiffness due to tensile cracking. The plots
showed that a constant stiffness was achieved before failure, indicating that the beams were
fully cracked and justifying the use of a fully cracked section when predicting deflections.
The load versus tensile reinforcement strain plot showed good linearity, thus indicating a
good bond between reinforcement and infill grout throughout testing.
The use of the measured values of the applied bending moments and of the neutral axis
positions, from the surface strain profiles, identifies the presence of tensile forces in excess of
the yield strength of the main reinforcement and in some cases in excess of the ultimate
strength of the steel. This is particularly confirmed for the 2m span beam of brick Types I
and 3, which was under-reinforced. The static equilibrium relationship was used to compare
tension and compression forces. A possible equation to represent the tensile force in the
beam is shown. The assumption is made that there is a triangular stress distribution between
the neutral axis and the bottom of the beam. This stress value at the bottom of the beam is
used, as this is supported by the stress contours produced by LUSAS software. The author of
this thesis suggests that further study is required to determine the maximum tensile stress
208
which appears to exist in the UOP Quetta Style under reinforced beams. This might be taken
as a function of the characteristic bed compressive of the brickwork e.g. 0.15tk_.
Full tensile cracking occurred before failure and thus it is considered safe to assume that the
cracked second moment of area, determined from the position ofthe neutral axis, can be used
to calculate the deflection at working or service load conditions. The Quetta Bond effect of
the brickwork and the existence of the mortar joints and the grout are ignored in the analysis
to obtain the cracked second moment of area. The analysis assumes a homogeneous
compression zone.
Use of the BS 5628 Part 2 [S.3] to determine the ultimate shear capacity ofthe UOP Quetta
Style Beams was not particularly successful. Significantly under-estimated values were
obtained for the calculations based on the Code. The theory used in the Code is analogous to
reinforced concrete theory, which relies on compression zone interlock and dowel forces.
This is logical for traditional grouted cavity beams, but not for the UOP Quetta Style Beams.
It is considered that the ability of the beams to carry dowel action is high, because of the
bonding format, but development of aggregate interlock is possibly poor, due to the transfer
of load from the underside of the UOP Quetta Style Beam Bond to the infill grout. The
benefit of the UOP Quetta Style Beam Bond is that it permits the transmission of shear by
allowing brick units to pass through the central core of the beam.
As a result of the research presented in this thesis the author considers that amendments
should be made to BS 5628 part 2 [S.3] to accommodate the design of the UOP Quetta Style
209
Beam. Overall the Code produces a cautious design. Brickwork materials and construction
methods are extremely variable and the result and behaviour of specialised structural
elements have to be designed to accommodate these variations.
Reconsideration of partial material safety factors should be sufficient to meet ultimate and
serviceability requirements. Firmer and additional recommendations are required for the use
of prism tests. This would show a cost benefit when there is repetitive use of specific beam
elements. More informed guidance should be given to designs engineers who are not familiar
with the differences between reinforced brickwork elements and reinforced concrete
elements.
9.1 OVERVIEW OF THE RESEARCH BY OTHERS
Chapter 2.6 shows the summary of the literature review and overview. Some of these are
considered in the light of the study on the UOP Quetta Style Beams.
9.2.1 Comments on statements by others
This section identifies areas where there is general disagreement with the statements by other
researchers (italicised), in relation to the performance of the UOP Quetta Style Beam:
1. Reinforced brickwork beams can be split into two categories. Namely, beams
reinforced in the bed joints and reinforced grouted cavity brickwork beams. There
needs to a third category, The UOP Quetta Style Beam.
210
2. The shear performance of reinforced brickwork beams was found to be virtually
independent to the quantity and magnitude of longitudinal reinforcement. However
this was not true for grouted cavity beams. The shear performance of the UOP Quetta
Style Beam was found to be virtually independent to the quantity and magnitude of
longitudinal reinforcement.
3. Reinforced grouted cavity beams can be treated for analysis as a combined case of
reinforced concrete and reinforced brickwork. Analysis requires parameters and
equations specific to the bonding format.
4. It is suggested that reinforced brickwork beams can be designed using reinforced
concrete theory with empirical limiting stresses. Use ofthis approach could lead to
beams of incorrect size and strength when designed using the UOP Quetta Style
Beam format.
5. It is preferable to eliminate headers from heavily compressed portions of the
reinforced brickwork beams. This was not confirmed. The use of headers and
stretchers satisfied all strength requirements.
6. The tensile resistance donated by the steel to reinforced brickwork beams is as high
as or higher than in the case of reinforced concrete. This is dependent on the
percentage of reinforcement.
211
9.2.2 Statements of other researchers where there is agreement
This section identifies areas where the UOP Quetta Style Beam study shows general
agreement with the statements by other researchers:
• at certain stages of loading the modular ratio may change.
• bond between the brickwork and grouted core can be formed using the reliance of the
natural bond between the masonry and the grout.
• reinforced masonry has been found to develop a reasonable degree of flexural and
shear strength provided that care and attention is given to mortar type, bond coursing
and the quantity and arrangement of reinforcement.
• where beams failed in compression the failure stresses are of a similar magnitude to
those achieved in the related pier (prism) tests.
• the majority of brickwork test beams failed in shear. The dominant shear mechanism
was that of diagonal tension crack paths that tended to follow mortar joints.
• the shear capacity of a brickwork beam was found to increase with a decreasing shear
span to effective depth ratio.
• the use of brickwork with complex bonding patterns will involve brick units that have
different properties in mutually perpendicular directions.
• the linear stress/strain relationship applies to reinforced brickwork.
• elastic modulus varies according to joint orientation and materials.
212
9.3 SUMMARY
The study of the behaviour of the UOP Quetta Style Beam has shown that structural benefits
accrue from the use of the UOP Quetta Style Bond. A design equation for the moment of
resistance has been proposed to be used with the beam which is a modification to the formats
of the existing equations. Also suggested as the basis for further study are beam equations
related to an excess tensile force and the neutral axis depth.
In the analyzing a cross section of a UOP Quetta Style Beam to determine its design moment
of resistance the study has disproved two and queried one of the basic statements in the
Code. BS 5628 Part 2 Clause 8.2.4. [S.J].
Statements not proven are:
• the compressive stress distribution in the masonry is represented by an equivalent
rectangle with an intensity taken over the whole compression zone of fk/'Ym-
• fk is obtained from Clause 7.4.1.2
Queried statement is:
• the tensile strength of the masonry is ignored."
In addition the study identified the need to:
• change the recommendations concerning the determination of the characteristic and
design strength ofbrickwork which is loaded on stretcher and header faces.
213
l' I , I
',
• provide a newi~nding 'mlllerilll whicbrwilll enable Jthe potential:Strengtb oftbi-icltvvorlf'
to be used.
•• The brickwork charactenStic col11pressiye st_rength fk for' bricks whose .unit 'strength is•
gr~t~r than 200N/mm2 shouldt be detetriiincil;aiid includ~ :inithe code.
CHAPTER tO
CONCLUSIONS
10 CONCLUSIONS ON THE STUDY OF THE BEHAVIOUR OF THE UOP QUETI'A STYLE BEAM
10.1 MAIN CONCLUSIONS
The main conclusions are the identification of important differences between the structural
behaviour of the UOP Quetta Style Beam and other reinforced brickwork beams and of
related brickwork strengths, namely:
l. the elastic bending and shear stresses in the UOP Beam are asymmetric whilst in
other reinforced brickwork beams these stresses are symmetric.
2. the Beam has enhanced strength when compared with Reinforced Brickwork Beams
with bed joint reinforcement and some grouted cavity beams.
3. a hypothesis that "the experimental results and the analyses identified a tensile force
in the Beam", which in some cases exceeded the tensile strength of the steel
reinforcement. A further hypothesis is that "there is tensile resistance of the
brickwork at ultimate load, possibly between cracks". It is suggested that these
hypotheses should be the subject of further experimental investigation and analysis.
4. an integrated system of brickwork and grout is not detrimental to the flexural or shear
strength of the Beam, but produces a compressive stress diagram at ultimate load
215
which does not confonn to the parabolic curve used in symmetrically reinforced brick
work beams.
5. an integrated system of brickwork and grout is not detrimental to serviceability
behaviour of the Beam
6. there should be a review of clauses in the Structural Code for Reinforced Masonry,
BS 5628-2-2000, which relate to the detennination of the characteristic and design
strengths of non-traditionally bonded brickwork , particularly when use is made of
perforated bricks. The current recommendations indicate extremely cautious
compressive strengths.
7. the characteristic compressive strength of non-standard bonding should be obtained
by the use of prism tests, when an accurate and economical design is required.
8. the above named Code does not recognise the potential strength of clay brickwork or
the full range of clay bricks available
10.2 OTHER CONCLUSIONS
10.2.1 Conclusions from the analysis of the tension and compression zones and neutral axis depth. Some of these require further study, as indicated in the main conclusions
These are that:
I. during the early stages of loading the experimental beams the neutral axis position
rose slightly and then stabilised.
2. the increase in the neutral axis depth is much more significant for beams of the
stronger bricks where the modular ratios are smaller.
216
3. the 2m span UOP Quetta Style Beams of brick Types 1 and 3 have a reserve of tensile
strength which is balanced by compressive resistance and in some case there is a
further reserve of compressive strength.
4. the reserve of tensile force is in excess of that provided by the steel at yield and in
some cases at ultimate strength.
5. the LUSAS elastic analysis identified the highest tensile forces at and around the
bottom of the grouted core, where reinforcement is located in the LUSAS
analysis.
6. the development of an excess tensile force is independent of brick type but dependent
upon span and areas of reinforcement.
7. the major problem in a design process would be to identify the source of any excess
tensile strength.
8. the analysis highlights the complexities of defining the parameters associated with the
compressive strength, namely shape and depth of the stress diagram, relationship
between face strains and internal stresses, values of elastic moduli to be used in
calculations.
10.2.2 Conclusions from tbe analysis of strengtb These are that:
1. there is a 19% increase in in the value ofM/bd2 as the brickwork bed compressive
strength increases from 15N/mm2 to 25 N/mm2.
2. There is a positive related trend between Mlbd2 and prism compressive strength for
beams of identical cross-section.
217
3. Mlbd2 for the UOP Quetta Style Beam increases linearly with increasing brickwork
compressive stress, span and area of reinforcement.
4. the elastic predictions for all 2m and 3m and all but one 4m beams failing in shear
indicated a FOS greater than unity.
5. the use ofthe UOP Quetta Style Beam with a brick bed compressive strength of 14.2
N/mm2 and above enhances the strength above the ultimate failure load.
6. the predominant factor for the shear capacity of beams of different spans, shear spans
and percentage of reinforcement is noted in the use of a brick with a bed compressive
strength of25.2 N/mm2. This is not the situation when lower strength bricks are used.
7. shear reinforced beams were found to fail prematurely, failure being preceded by
cracking in the top surface of the infill grout.
10.2.3 Conclusions on tbe analysis of stiffness and serviceability criteria
These are that:
1. a high degree of confidence in calculations can be obtained when values of E, I and
the neutral axis depths are obtained using the experimental results.
2. the use of an E value based on 900 ft. as given in BS 5628 Part 2 [S 1 ], does not
necessarily guarantee a dependable result, since there is no universal agreement in the
use of 900f~c. and the experimental results either overestimate or underestimate, in
some cases significantly, the experimental results.
3. the use of span/250 is proven to be an acceptable value.
2l8
CHAPTERll
FURTHER STUDY
ll AREASOFFURTBERSTUDY
A number of areas have been defined where there is a requirement for further study:
1. By experimental and analytical investigations to test the hypothesis that "an
excess tensile force can exist in under-reinforced Quetta Style Beams". If proven
to develop design equations which define the force and re-define the neutral axis
depth.
2. Examination of the shape of the compressive stress diagram at failure for the UOP
Quetta Style beam.
3. Application of the LUSAS FEA to traditional and non-traditional bonding
formats. This should provide analyses to produce linear and non-linear stress
contours in the x, y and z directions at various cross-sections. The effect of
cracking and deformation should be ascertained, where appropriate.
4. A data base is required of characteristic compressive strengths of bricks and
brickwork, for bricks loaded on all or a combination of the three faces. From this re
consideration needs to be given to the Code clauses [S.3 and 6] which define the
219
characteristic strength of brickwork, including those fonned with brick units of
compressive strength which have a range above IOON/mm2.
5. Application ofLUSAS FEA to compare reinforced brickwork and reinforced concrete
beams of similar proportions and material to test the proposition, reinforced
brickwork beams can be designed using reinforced concrete theory.
6. Research into a possible bonding material for brickwork. This could involve the
modification of traditional mortar and/or the development of a new material.
7. It was identified that there should be an examination of the foUowing relationships;
loaded area and compressive strength; compressive strength and distance between
testing machine load platens; layout of perforations on the load path and stress
concentrations.
220
'.
REFERENOES
221
REFERENCES
I. PAXTON, J., (Ed), "The New lllustrated Everyman's Encyclopaedia", Octopus Books Ltd, Volume I, 227, 1984.
2. HANDYSIDE, A and HASEL TINE, B.A., "Bricks and Brickwork", The Brick Development Association, London, 13, 1976.
3. NASH, W.G., "Brickwork, Volume 1", Stanley Thames (Publishers) Ltd, 11, 1986.
4. BRICK DEVELOPMENT ASSOCIATION, "Bricks Their Properties and Uses", The Construction Press Limited, 3, 1974.
5. RICHARDS, J.M., "The National Trust Book of Bridges", Jonathan Cape Ltd, London, 97 and 126, 1984.
6. HEYMAN, J., "The Masonry Arch", Ellis Horwood Ltd, London, Ill, 1982.
7. BEAMISH, R., "Chimney Shaft Reinforcement, Proposal and RB Test Beams", 1837, Memoirs of the Life of Sir M. I. Brunei, London, 1862.
8. HAMANN, C.W. and BURRIDGE, L.W., "Reinforced Brickwork", The Structural Engineer, Volume 17, No. 4,198-250, London, 1939.
9. First Published Design Formulae for Brickwork, Engineering Volume.l4, I, 44 and 73, 1872.
10. BELL, S.E., "The Construction of Reinforced and Prestressed Masonry", International Symposium on Reinforced and Prestressed Masonry, University of Edinburgh, 448- 474, 1979.
11. BERNSTEIN, D., "Some Early Reinforced Brickwork Masterpieces Revisited", Vth International Brick Masonry Conference, Session IV, Paper 2, 1979.
12. EDGELL, J.G., "The Remarkable Structures of Paul Cottancin", The Structural Engineer, Volume 63A, No. 7, July 1985.
13. BREBNER, A., "Tests, Theory and Actual Construction ofReinforced Brickwork in India". Notes on Reinforced Brickwork, Government oflndia Public Works Department. Technical Paper No.38 (2 Volumes), Government Printing Office, India 1927.
222

14. DATTA, A.K. "Tests on Comparative Strength ofReinforced and Prestressed Brickwork and a Comparison ofRB, RBC, and RC", Papers accepted for publication 1922 and 1936, Institution of Engineers, India.
15. HAMANN, C.W. and BURRIDGE, L.W., "Reinforced Brickwork", The Structural Engineer, Volumel7 No. 4, 285-295, London 1939.
16. WlTHEY, M.O., "Tests on R B Beams, Tests of Brick Masonry Beam", American Society Test Materials Procedures, 651-666, 1933.
17. COLLIN, L.P., "Canadian Research on RB", Canadian Department ofMines, Paper 766, Ottawa 1935.
18. POWELL, B., "A Review of the Literature on Reinforced Brickwork", British Ceramic Research Association, Technical Note No 283, December 1978.
19. THE BRICK DEVELOPMENT ASSOCIATION, "Engineers File Notes", January London, 1988.
20. SINHA, B.P., and HENDRY, A.W., "Compressive Strength of Axially Loaded Brick Walls Stiffened along their Vertical Edges", Proceedings of the Fifth International Brick Masonry Conference (Washington), 254-261, 1979.
21. CHONG, V.L., SOUTHCOMBE, C. and MAY, I.M., "The Behaviour ofLaterally Loaded Masonry Panels with Openings", Proceedings of the British Masonry Society, 6,178-82, 1974. 21
22. HENDRY, A.W., "Structural Masonry", Second Edition, Macmillan Press Ltd, London, 1998. 22
23. SOUTHCOMBE, C and REGAN, G.," Design and Construction of a Building using Unreinforced and Reinforced Brickwork"", Proceedings ofthe Institution of Civil Engineers Symposium on the Practical Design of Masonry Structures, London, 169-184, 1986.
24. PROCEEDINGS OF THE INSTITUTION OF CIVIL ENGINEERS SYMPOSIUM 1986, "The Practical Design of Masonry Structures", Thomas Telford, London, , 1986.
25. SOUTHCOMBE, C., Masonry Research by Educational Institutions in the UK", Masonry International, London, 51, 1989
26. MOORE J.F.A. "Masonry Activity at BRE in 1988", Journal of the British Masonry Society, MASONRY INTERNATIONAL, Volume. 2, No3, 83-86, 1988.
223
27. de VEKEY R.C., "Current Masonry Research and Development at BRE", Journal of the British Masonry Society, Masonry International, Volume. 10, No2, 69-72, 1996.
28. WEST H.W.H. lOth Anniversary Address to the British Masonry Society, The Society and Masonry in the Future, Journal of the British Masonry Society, Masonry International Volume. 10, No2 vi- x, 1996.
29. HENDRY A W.H. "Ways forward for Masonry Construction in the UK"? Journal of the British Masonry Society, Masonry International, Volume. 15, Nol, 1-4, 2001.
30. SOUTHCOMBE, C. and DASHT, AS.L., "Bond Strength ofLadder Type Bed Joint Reinforcement", Proceedings 3nt Canadian Masonry Symposium, 19/1- 19/9, 1983.
31. SOUTHCOMBE, C. and JOHNSTON, G.D. "Test on Single Reinforced Brickwork Panels and Walls with Bed joint Reinforcement", 6th International Brick Masonry Conference, 199-201, Rome 1982
32. HAMANN, C.W. and BURRIDGE, "Reinforced Brickwork", The Structural Engineer, Vol. 17. No.4 !939, London,
33. ROBSON, 1., AMBROSE, RJ., HULSE, R AND MORTON, J., "Post-tensioned Prestressed Brickwork Beams", Proceedings ofthe British Masonry Society, No. 1, November 1986, p 100-105.
34. RAD, P.F., "Inherent Compressive and Tensile Strengths ofBricks", Proceedings of the North American Masonry Conference, Colorado, 9-2 to 9-7, 1978.
35. PEDRESCHI, R.F., and SINHA, B.P., "The Shear Strength of Prestressed Brickwork Beams", Proceeding British Masonry Society, CIB Congress, Washington D. C. 114-116, 1986.
36. GARWOOD, T.G., "The Construction and Test Performance of Four Prestressed Brickwork Beams", Proceedings of the British Masonry Society, No. I, November 1986, 106-109,1986.
37. POWELL, B., and HODGKINSON, H.R., "The Determination of the Stress Strain Relationship of Brickwork", Proceedings of the 4th International Brick Masonry Conference, Brugge, 1976.
38. SASSU, M., " Residual Stress Measurement in Clay Brick Units Using Several Electro-Mechanical Techniques, Journal of the British Masonry Society, Masonry International, Vol. 13, No.2, 44-47, 2000.
39. WITHEY, M.O., "Tests on R.B. Beams", Tests of Brick Masonry Beams, Am.Soc.Test Mat. Proc., p 651 -66, 1933.
224
40. PARSONS, D.E., STANG, AH and McBURNEY, J.W., "Shear Tests of Reinforced Brick Masonry Beams", National Bureau of Standards RP504, Journal of Research 9, 1932.
41. BUH..DING RESEARCH STATION, "Building Research Station Tests on R.B. Beams", Report on the Building Research Board for 1937, H.M.S.O., p 87-89, 1938.
42. COLLIN, L.P., "Canadian Research on R.B.", Canadian Department of Mine, Paper766, Ottawa, 1935
43. THOMAS, F.G. and SIMMS, L.G. "The Shear Strength of some Reinforced Brick Masonry Beams in Bending and Shear", The Structural Engineer, Vol.17, No.7, 330-349, July 1939.
44. HAMANN, C.W. and BURRIDGE, L.W., "Reinforced Brickwork", The Structural Engineer, Vol. 17, No.4, 1939, pp285-295.
45. SUTER, G.T. and HENDRY, A.W., "Shear Strength ofReinforced Brickwork Beams", Structural Engineer, Vol 53, No.6, June 1975.
46. SUTER, G.T. and HENDRY, A.W., "Limit State Shear Design of Reinforced Masonry Beams, Proc. Br. Ceram. Soc. 24, p 191-6, 1975.
47. SINHA, B.P. and FOSTER, D, "Behaviour of Reinforced Grouted Cavity Beams", Vth International Brick Masonry Conference, Session iv, Paper 7, London, 1979.
48. GARWOOD, T.G. and TOMUNSON,A., "The Design, Construction and Test Performance of Reinforced Brickwork Beams Containing Tension and Shear Reinforcement", Proceedings ofthe British Ceramic Society, Voi.JO, 1980.
49. OSMAN, YA, and HENDRY, A W., "An investigation into the Behaviour of Reinforced Grouted Cavity Brick Beams under Bending and Shear", Proceedings of the British Ceramic Society, Volume 30 1982.
50. HAMADI, and REGAN, P.E., "Behaviour of Beams of Shear with Flexural Crack2, Magazine ofConcrete Research, 32, No. Ill, 67, 1980
51. FOSTER, D. and THOMAS, A., "Some Interim Comments on the Corrosion of Reinforcement in Brickwork", Proceedings of the Ceramic Society (24), Sept 1985.
52. ARMSTRONG, A.C. and HENDRY, A.W., "The Compressive Strength of Brickwork with Reinforced Bedjoints', British Ceramic Research Association, Technical Note (209), 1973.
225
53. Structural Ceramics Advisory Group of the Structural Ceramics Research Panel, "A Deisn Guide for Reinforced and Prestressed Clay Brickwork", Special Publication No. 91, 1977.
54. KELCH, N.W., "Some properties ofReinforced Grouted Brick Masonry", ASTM, (168), 67, 1950.
55. METHA, K.C. and FINCHER, K., "Structural Behaviour of Prestressed Masonry Beams", SffiMAC Proceedings, Edited by H.W.H. West and K.H. Speed, Stoke-onTrent, B. Ceram., 1971.
56. JOHNSON, F.B. and THOMPSON, S.N., "Correlation Tests of masonry Assemblages with Strength Characteristics ofReinforced Masonry Beams", Designing, Engineering and Constructing with Masonry Products, Edited by F.B. Johnson, Houston, Texas, GulfPublishing, 1969.
51. STRUCTURAL CLAY PRODUCTS, "Reinforced Brickwork Block beams", SCPJ (Reprinted), 1979.
58. MCKAY, W.G., "Brickwork", Thornes Publishers, 11, 1986
59. APPLETON, C. and SOUTHCOMBE, C. "A Comparison of Three Reinforced Beam Designs, Internal Report, Plymouth Polytechnic, 1982
60. CURTIN, W.G. , SHAW, G. and BECK,J.K. "Design ofReinforced and Prestresssed Masonry", Thomas Telford, London, 1988
61. Brick Institute of America, "Technical Notes on Brick Construction", Notes No. 39, Testing for Engineering Brick Masonry-Brick and Mortar, USA, January 1987
62. CURTIN, W.G., SHAW, G. and BECK,J.K., and BRAY< W.A., "Structural Masonry designers Manual", Granada, 13, 1987
63. REDLAND, "Bricks and Brickwork". Redland Publication, 1982.
64. HODGKlNSON, H.R, and DA VIES. S., "The Stress Strain Relationship of Brickwork when Stressed in Directions other than Normal to the Bed Face", Proceedings of the Sixth International Brick Masonry Conference (Rome), p 290-296.1982.
65. SINHA, B.P., "Reinforced Brickwork: Grouted Cavity Shear Tests", SCP 16. Structural Clay Products Limited, Hertford, 1978.
66. EDGELL, G.J., "Note on the Flexural Strength of 102.5 mm Thick Brickwork in Different Bonds", Masonry International, Vol.l3, No. 1, 1999.
226

67. EDGELL, G.J., "Stress Strain Curves for Brickwork and their Application in the Theory ofUnreinforced Slender Members", Proceedings of the British Ceramic Society, Vol. 30. 1983.
68. OSMAN, and HENDRY, W, A.W., "Shear Transmission in reinforced Grouted Cavity Brickwork Beams", Proceedings of the Sixth International Brick Masonry Conference (Rome), 817-830, 1982.
69. SINHA, B.P. and deVEKEY, RC., "Factors Affecting the Shear Strength of Reinforced Grouted Brickwork Beams and Slabs", Proceedings ofthe Sixth International Brick Masonry Conference, Rome 1982.
70. SUTER, G.T. and HENDRY, A.W., "Shear Strength of Reinforced Brickwork Beams", The Structural Engineer, Vol. 53, No.61, June 1975.
71. CURTIN, W., SHAW .. G., BECK., G., and BRAY, W.A," Structural Masonry Designers Manual", BSP Professional Books, Oxford, 13, 346,379,1987.
72. ROBERTS, J,J, EDGELL, G.J. and RATHBONE, A.J. " Handbook to BS 5628 Part2", Viewpoint Publication, London, 20, 1986.
73. PEDRESClll, R, and SINHA, B.P. "Compressive Strength and Some Elastic Properties of Brickwork", International Journal of Masonry Construction, 3(1 ), 1983.
74. EDGELL, G.J., "Review of the Compressive Strength ofBricks and Brickwork Loaded in Directions other than Normal to the Bed Faces of the Brick", Masonry International, Summer 2000, Vol.14, No. I, 1-4, 2000.
75. HENDRY, A.W., SINHA, B.P., and DA VIES, S.R, "Design of Masonry Structures, EFN Spon, London, 45, 1997.
76. SINHA,B.P. and de VEKEY, RC., 2Factors Affecting the Shear Strength of Reinforced Grouted Brickwork Beams and Slabs", Proceedings of 6th ffiMAC, Rome, 1986.
11. ANDERSON, C., HELD. L.C., "The Effect of Sand Grading on Mortar Properties and the Tensile Bond of Brickwork Specimens", Proceedings British Masonry Society, 1-6, 1986.
78. SCHUBERT, P., "Tensile and Flexural Stress of Masonry -Influences Test Results" Proceedings of 6th International Brick and Block Masonry Conference, Calgary, 895-907, 1994.
227
79. JAMES J.A., "An Investigation of the Lateral Load resistance of Walls of Unreinforced Brickwork without Pre-compression Built in Clay Bricks" Report W!Lat/Building Development Lab, Morley, W.Australia 75,1975.
80. HENDRY, A.W., "Structural Masonry", McMillan Press Ltd, 20, 74, 175-188, 1998.
81. GORDON, I.E., "Structures or Why Things Don't Fall Down", Penguin Books, 67, 69, 1991.
82. RIDDINGTON, J.R.and JUKES, P., "Determination of Material Properties for Use in Masonry FE Analysis2, Proceedings of 4th International Masonry Conference, London, No,7 Vol2, 314-319, !995.
83. FORTH J.P.and BROOKS, J.J. "Influence of Mortar Type on the Long Tenn Effect of Single Leaf Clay Brick Masonry", Proceedings of 4th International Masonry Conference, London 1995, No.71S7-IS9, October 1995.
84. BROOKS, J.J.and AMI AD, M.A., "Strength and Elasticity of Calcium Silicate and Concrete Masonry Test Specimens", Proceedings of 2nd International Masonry Conference, London 1990, No.4 30-33, July 1990.
85. SHRIVE, N. G. and JESSOPP, E.L., "Anisotropy in Extruded Clay Units and its effect on Masonry Behaviour'', Proceedings Second Canadian Masonry Symposium, Ottawa, 39- SO, 1980.
86. BROOKS, J.J. "Composite Models for Predicting Long Tenn Movement in Brickwork Walls", Proceedings British Masonry Society, 1986.
87. KONG, F.H. and EV ANS, F.H., "Reinforced and Prestressed Concrete" 3nl Ed, V on Nostrand Reinhold (UK), 86-89, 1987.
88. Nll..SON, A.H., "Design of Concrete Structures", International Edition, Me Graw Hill, 114, 1997.
89. NA WY, E.G., "Reinforced Concrete a Fundamental Approach" 4th Ed .. , Prentice Hall, International Series, 172, 2000
90. BITNOR and Z., SEJNOTA, "Numerical Methods in Structural Analysis", ASCE Press, Telford, London, 6, 1996.
91. SONGBO LI., FRIED and A.N., ROBERTS, I.J. "Analysis of Shear Strength of Reinforced Concrete Blockwork Beams", Proceedings of the lOth International Brick and Block Conference (Calgary}, 1021, 1994.
228
92. DA VIES, S. and HODGKINSON, H.R, " Compressive Strength and Stress-Strain Relationships of Brickwork when Stressed in Directions other than Nonnal to the Bed Face, Part 2", Masonry International, Vol.2, No. 3, 1988, p 103-106.
93. YATES, M., "Linear and Non-Linear Analysis ofReinforced Concrete Deep Beams", University ofPiymouth Internal M.Eng.(Hons) Report, Jan 2003.
94. ZHOU, G.C., "Application ofStiffhess/Strength Corrector and Cellular Automata in Predicting response ofLaterally Loaded masonry Panels", University of Plymouth, Ph.D. Thesis, January 2002.
229
REFERENCES: BRITISH AND INTERNATIONAL STANDARDS ETC.
S.l. BRITISH STANDARDS INSTITUTION, "Structural use of Reinforced and Prestressed Masonry", British Standard 5628-Part 2 1985, BSI London, 1985.
S.2. BRITISH STANDARDS INSTITUTION, "Structural use of Reinforced and Prestressed Masonry", British Standard 5628 Part 2 1995, BSI London, 1995.
S.3. BRITISH STANDARDS INSTITUTION, "Structurnl use of Reinforced and Prestressed Masonry", British Standard 5628-2-2000, BSI London, 2000.
S.4. BRITISH STANDARDS INSTITUTION, "Specification for Clay Bricks and Blocks", British Standard 3921:1985, BSI London, 1985.
S.5. BRITISH STANDARDS INSTITUTION, "Structural use ofunreinforced Masonry", British Standard 5628 Part l: 1992, BSI London, 1978.
S.6. BRITISH STANDARDS INSTITUTION, "Structural use of unreinforced Masonry'', British Standard 5628 Part 1: 1992, BSI London, 1992
S.7. BRITISH STANDARDS INSTITUTION, "Structural Recommendations for Loadbcaring Walls" British Standard CP Ill, 1971, BSI London 1948
S.8. BRITISH STANDARDS INSTITUTION, "Structurnl Recommendations for Loadbearing Walls" British Standard CP Ill, BSI London, 1971.
S.9. BRITISH STANDARDS INSTITUTION, "Code of Practice for the Structural Use of Concrete", CPllO, 1972, BSI London, 1972
S.lO. BRITISH STANDARDS INSTITUTION, "Specification for Ordinary and Rapid-Hardening Portland Cement", British Standard 12: 1978, BSI London, 1978.
S.ll. BRITISH STANDARDS INSTITUTION, ''Specification for Building sands from Natural Materials", British Standard 1199: and British Standard 1200:1976, BSI London, 1976.
S.l2. BRITISH STANDARD STANDARDS INSTITUTION, "Specification for Aggregates from Natural Sources for Concrete", British Standard 882: 1992, BSI London, 1992.
S.l3. AUSTRALIAN STANDARDS INSTITUTION, "AS 3700 Masonry Structures", 1997.
S.l4. AMERICAN CONCRETE INSTITUTE, "Building Code Requirements for Masonry Structures", (A Cl 530.1 -99/ ASCE 6/99 TMS 602 -99).
S.IS. EC6 "Design of Masonry Structures- Part 1-1, genernl rules for Buildings- Rules for Unreinforced and Reinforced masonry", 1996
S.l6 EUROCODE 6, "Design of Masonry Structures", Part 1 DD ENV 1996-1-1., September 1984
S.l7. BRITISH STANDARD STANDARDS INSTITUTION, "Specification for Aggregates from Natural Sources for Concrete", British Standard: 1992, BSI London, 1992.
230

.. '·r'
S:i8. BRITISH STANDARD STANDARDS fii!STJ,TUTION, ''Q:xle;of Pi3i:tife fotDesigii alull Construction; :t985; BS SliiO; "Structural Use ooConcri:te"; 1998, 'BSH.ilri_clon, ,J985:.
S! 19. BRITISH STANDARD ST A,N])AlU)S 1NSTfi1JTION, :"COde of Praeticdorithe Structural' Use of Concrete"; CP;llO; 1972, BSIILolil:liiit, 1972.