do users ignore spatial data quality? a decision-theoretic perspective
TRANSCRIPT
Risk Analysis, Vol. 25, No. 6, 2005 DOI: 10.1111/j.1539-6924.2005.00678.x
Do Users Ignore Spatial Data Quality? ADecision-Theoretic Perspective
P. A. J. van Oort1∗ and A. K. Bregt1
Risk analysis (RA) has been proposed as a means of assessing fitness for use of spatial databut is only rarely adopted. The proposal is that better decisions can be made by accounting forrisks due to errors in spatial data. Why is RA so rarely adopted? Most geographical informa-tion science (GISc) literature stresses educational and technical constraints. In this article wepropose, based on decision theory, a number of hypotheses for why the user would be more orless willing to spend resources on RA. The hypotheses were tested with a questionnaire, whichshowed that the willingness to spend resources on RA depends on the presence of feedbackmechanisms in the decision-making process, on how much is at stake, and to a minor extenton how well the decision-making process can be modeled.
KEY WORDS: Decision making; error propagation; GIS; risk analysis
1. INTRODUCTION
Spatial data are data about topography andspecific themes of the earth’s surface. They arean ingredient in almost all public decision making(Burrough & McDonnell, 1998; Cornelis & Brunet,2002)—a popular estimate is that 80% of the dataused by managers and decisionmakers is spatial. Manyresearchers have stressed the need to deal with is-sues of spatial data quality (SDQ), as the risk of mis-use of spatial data has greatly increased (see con-ference proceedings: Heuvelink & Lemmens, 2000;Lowell & Jaton, 2000; Mowrer & Congalton, 2000;Hunter & Lowell, 2002). Important causes of thisincreased risk of misuse are the growing availabil-ity of spatial data, greatly enhanced access to thesedata, enhanced possibilities of manipulating thesedata, and a growing group of inexperienced users(Aronoff, 1989; Morrison, 1995; Doucette & Paresi,
1 Wageningen University, Centre for Geo-Information, theNetherlands.
∗ Address correspondence to P. A. J. van Oort, WageningenUniversity, Centre for Geo-Information, PO Box 47, 6700AA Wageningen; tel: +31 317 474458; fax: +31 317 419000;[email protected].
2000). Furthermore, producers of spatial data setsprovide little information regarding the quality ofthese data sets (Jakobsson & Vauglin, 2001; Ostman,1997). Geographical information systems (GIS) havelimited functionality for visualization of SDQ (vander Wel, 2000) and limited functionality for quanti-fying error propagation (Duckham, 2002; Forier &Canters, 1996; Heuvelink, 1998). Apart from thesefactors, Openshaw (1989) noted that the traditionalresponse of both researchers and users has too of-ten been to simply ignore SDQ. Agumya and Hunter(1999) categorized users into three groups accordingto how they respond to SDQ in data:
1. Those who establish that the data are suitableprior to using the data;
2. Those who wish to choose the best among sev-eral suitable data sets;
3. Those who use data regardless of their suit-ability, either because they must use it or theychoose to ignore its SDQ.
According to Agumya and Hunter (1999), studiesabout the proportion of users in each class are scant,but there is a general belief among researchers that
1599 0272-4332/05/0100-1599$22.00/1 C© 2005 Society for Risk Analysis

1600 van Oort and Bregt
most users fall into the third class. Fitness for usecan be established in various ways: consultation withexperts, trial and error, by assessing legal or other con-straints to the use of a data set, by assessing for whichpurposes the data set is already used and for whichpurposes it is produced, to the most rigid method,which is to establish fitness for use through risk analy-sis (RA). In RA implications of errors or uncertaintieson expected outcomes of a decision-making processare quantified and data sets are only used if the risksgenerated are acceptable (Agumya & Hunter, 2002).Several authors have shown that RA can be used as ameans of assessing fitness for use; see, for example, Liet al. (2000), Crosetto and Tarantola (2001), de Bruinet al. (2001), and de Bruin and Hunter (2003). Usersare often assumed to “ignore” SDQ if they did not es-tablish fitness for use through RA prior to using spa-tial data sets (Agumya & Hunter, 1999; Openshaw,1989). Knowledge of the risks caused by SDQ cancontribute in several ways to decision making:
� It helps in finding out which level of SDQ isrequired for the decision, and this can aid inselecting the data set to be used;
� It helps in deciding how many resources needto be reserved for mitigation;
� It helps in deciding on the risk level of aninvestment;
� It helps in redesigning the decision-makingprocess to reduce sensitivity to low SDQ;
� By being candid toward stakeholders about therisks taken in a decision, it is possible to pre-serve public trust in public decision making.
Given these advantages, one may wonder whyRA is so rarely adopted as a means of establishingfitness for use. One possible explanation is the lackof time and money. More informative explanationsexplain why the costs are considered to be too highand why the benefits are considered to be too low. Afull list of hypotheses or explanations as to why usersso rarely quantify risks due to SDQ prior to usingspatial data in decision making is rarely found in ge-ographical information science (GISc) literature (butsee Openshaw, 1989). Rather, most research articlesbriefly state that risks due to SDQ are not quantifiedand that this may be a problem. The greatest part ofsuch a research article then addresses one or more ofthe following problems:
1. Lack of awareness that SDQ may cause risks;2. Lack of practical examples illustrating the
needs and benefits of RA;
3. Earlier research has been limited to errorpropagation analysis on the geographical anal-yses conducted using GIS, the outcomes ofwhich are less tangible to users than outcomesreported in terms of risks;
4. Lack of methodologies for calculating risksdue to SDQ;
5. Lack of supporting tools in current GISsoftware (for example, error buttons, visual-ization, wizards);
6. Poor documentation of SDQ.
The six problems mentioned above can be sum-marized as two classes of hypotheses as to why usersignore SDQ: educational (1 to 3) and technical (4 to6). The origin of this article lies in an effort to ad-dress the problems as listed above. In 2002, we con-ducted open interviews with GIS/spatial data users inpublic decision making to find case studies in whichthese problems could be addressed. Surprisingly, wenoted in these interviews that the users concernedwere well aware of spatial data quality issues, yetin many cases they considered quantification of im-plications of SDQ (=Risk Analysis, RA) unneces-sary or impossible. They deliberately chose to ignoreSDQ. The three problems addressed in this article are(1) that existing educational and technical explana-tions could not fully explain these users’ motivations,(2) that there is hardly any empirical research intowhy users ignore spatial data quality, and (3) thatthere appears to be an unknown discrepancy betweenresearchers and spatial data users in public decisionmaking.
The aims of this article are therefore: (1) to pro-pose new hypotheses as to why users ignore SDQ,(2) to test these hypotheses in a questionnaire, and(3) to test for differences between respondents of thequestionnaire.
2. METHODS
2.1. Definitions and Outline
Before proposing hypotheses, relevant defini-tions are given in Table I. Section 2.2 then presentshypotheses based on decision theory.
2.2. Hypotheses
Hypotheses were derived from open interviewswith users of spatial data in various government orga-nizations in the Netherlands and from a selection ofdecision-theoretic literature references. A list of hy-potheses is presented at the end of this section; below,the sources of the hypotheses are listed.

Do Users Ignore Spatial Data Quality? 1601
Table I. Definitions
Decision (making): A process consisting of five phases (from Cornelis & Brunet, 2002)1. DO: documentation and information = identification of data needs, problems, objectives, and knowledge of how these can be
achieved;2. DA: decision analysis = definition of alternative actions to achieve these objectives;3. DT: decision taking = selection of one of the alternatives;4. DI: decision implementation = implementation of the selected action; and5. DE: decision evaluation = evaluation of the outcomes of the action in terms of objective achievement.
SDQ: Spatial data quality. A general term covering all aspects that affect the quality of a spatial data set. Prominent elements of SDQ arepositional accuracy, attribute accuracy, completeness, logical consistency, and lineage.
RA: Risk analysis. Quantification of risks by multiplying potential outcomes of a decision with the probabilities of these outcomes.Probabilities of outcomes are calculated, using error propagation analysis, from probabilities of errors. Probabilities of errors are derivedfrom SDQ reports of the input data set(s). If necessary, additional information on these errors (and their correlation!) is acquired.
In the decision-making process we distinguish two types of actors:(Co-) decisionmaker: Has the power to select one of the alternatives in phase DT of the decisionStakeholder: Does not have the power to select one of the alternatives in phase DT of the decision, but does experience the consequences
in DE.
Cornelis and Brunet (2002) described the spatialdecision-making process as a sequence of five phases(see Table I). They described the various sources ofuncertainty that occur in the decision-making pro-cess and provided a policymaker point of view. Ineach phase, we distinguish in this article a feedbackmechanism that, if present, may reduce risks gener-ated by SDQ. Hypothesis 1 is that if a decisionmakerexpects that a mechanism sufficiently reduces risks,then this may reduce his or her willingness to spendresources on RA. Concrete descriptions of the feed-back mechanisms are given in Tables III and IV andin the discussion (Section 3.2).
In order to calculate risks as a result of SDQ ina decision-making process, the decision-making pro-cess needs to be described in a model. The two mostimportant modeling steps that have to be taken toallow for RA are (Jaeger et al., 2001; Morgan et al.,1990): (1) it must be possible to rank potential out-comes of the decision-making process according totheir desirability and (2) the relationship between in-put data, the alternative actions, and outcome of each{input data, action, outcome} combination must bedescribed by a set of equations. These modeling stepsare further referred to as RA modeling criteria. Oncemeeting these criteria becomes more problematic,users may start to become more concerned about howrealistic the risks calculated with such a model are.They may become more skeptical about the poten-tial benefits of RA. See van der Smagt and Lucardie(1991) for a general comment on applicability of mod-els under not-well-defined conditions. Hypothesis 2is that people will be less willing to spend resources
on RA if RA modeling criteria are more difficult tomeet.
Campbell (1991) distinguished between fourkinds of decision-making processes, which in thisarticle are reduced to two kinds: data-driven anddiscussion-driven decisions. Criteria for RA are lesslikely to be met in discussion-driven decisions: it maybe more difficult to model these processes and moredifficult to rank expected outcomes according to theirdesirability. Often, but not necessarily, a greater pub-lic interest is at stake in discussion-driven decisions.The opposite is the case in data-driven decisions: RAcriteria are more likely to be met, but less may be atstake. Thus in both the data-driven and the discussion-driven decision there is one argument in favor and oneagainst RA. It will be interesting to see if one argu-ment outweighs the other and if so, which. Hypotheses2 and 3 test whether modeling criteria and the stakesaffect the willingness to spend resources on RA; Hy-potheses 4 and 5 test whether one outweighs the otherin data- or discussion-driven decisions.
On the basis of the decision-theoretic literaturecited above, we propose the following hypotheses.People will be less willing to spend resources on RAif:
1. A feedback mechanism reduces risks due toSDQ;
2. RA modeling criteria are more difficult tomeet:
a. Criterion 1: it is difficult to rank possibleoutcomes of the decision-making processaccording to their desirability;

1602 van Oort and Bregt
Table II. Relationship Between Hypotheses and Features
Feature (see Table III)Hypothesis(see Section 2.2) 1 2 3 4 5 6 7 8 9
1. Feedback mechanism – Phase –1. DO: documentation and information x2. DA: decision analysis x3. DT: decision taking x4. DI: decision implementation x5. DE: decision evaluation x
2. RA modeling criteria Criterion1. Ranking of outcomes x2. Model as a set of equations x x x x
3. Not much at stake x x4. Data-driven x5. Discussion-driven x x
b. Criterion 2: it is difficult to cast thedecision-making process into a set ofmodel equations;
3. Not much is at stake;4. The decision is data-driven;5. The decision is discussion-driven.
2.3. Questionnaire
Trials with the hypotheses inserted directly asquestions in a questionnaire proved not to be an op-tion because they were considered to be too abstractby respondents. Therefore, they were translated into aset of features and associated arguments. The formu-lation of the hypotheses and their translation into fea-tures and arguments is the result of a learning processof the authors, fed by open interviews with GIS/spatial
Table III. Features
ftr. Feature Title
1 Stakeholders often know the area of interest very well. They are invited to inspect and criticize the spatial data to be used prior toyour decision taking.
2 Prior to implementation a field trip is organized. Data acquired during this trip may be reason to change your plans, even beforeimplementation starts.
3 The aim of the decision is to achieve an objective. The extent to which this objective is achieved can be expressed numerically.4 The decision will have implications for stakeholders. Stakeholders may hold you accountable and claim compensation for damage
caused by errors in your data.5 The decision is taken in negotiation between different parties.6 After an action to be implemented has been selected, it is implemented over the course of 10 years.7 After an action to be implemented has been selected, it is implemented. During implementation there is room for adjustment of the
selected action.8 The decision-making process is clearly described.9 The decision to be taken is a strategic one in which policymakers do their best to anticipate expected long-term developments.
data users in public decision making, experience inspatial data quality research, literature research, andtrial questionnaires.
2.3.1. Questions in the Questionnaire
The decision-theoretic hypotheses were formal-ized into nine features and 17 associated arguments,listed in Tables III and IV. Table II shows the relation-ship between the five hypotheses mentioned in Sec-tion 2.2 and the nine features in Table III. Argumentsare associated with features such that Arguments1a and 1b (Table IV) are associated with Feature 1(Table III). Their relationship with the abovehypotheses can be found through their associationwith features. The relationship between the five hy-potheses and the features and arguments will also

Do Users Ignore Spatial Data Quality? 1603
Table IV. Arguments For and Against RA, Associated with Features in Table III
arg. Argument Title†
1a Before presenting these data to them, I want to be sure that they do not contain errors. Otherwise, they could use these errorsagainst me or lose trust in me as a decisionmaker. Therefore, in my opinion there is a greater need for RA if this feature is present.
1b Stakeholders will notice errors and inform me about them. That way, risks are reduced. Therefore, in my opinion there is less needfor RA if this feature is present.
2a Field trips are expensive. If RA can contribute to reducing the number of field trips, then in my opinion there is a greater need forRA.
2b During the field trip errors in the data are detected and the right action selected. That way, risks are avoided. If risks are avoidedanyhow, then in my opinion there is less need to quantify them.
3a If the objective can be expressed numerically, then it is possible to conduct calculations. Therefore, in my opinion there is a greaterneed for RA if this feature is present.
4a I want to know if the risk is acceptable to me; for example, I want to know how many claims for compensation may be expected.Therefore, in my opinion there is a greater need for RA if this feature is present.
5a It is more difficult to model propagation of errors, as the decision-making process also depends on the negotiation behavior of theactors involved. Therefore, in my opinion there is less need for RA if this feature is present.
5b As soon as more than one party is involved, it is of importance to know how reliable each party’s information is. Therefore, in myopinion there is a greater need for RA if this feature is present.
6a Precisely because implementation takes place over such a long period of time, conscientious consideration is important. Therefore,in my opinion there is a greater need for RA if this feature is present.
6b So much changes over the course of 10 years that little may be expected of RA at the start of the period. Therefore, in my opinionthere is less need for RA if this feature is present.
7a Adjustment during implementation will require repetition of the planning phase, which will cost both time and money. If RA cancontribute to reducing these costs, then in my opinion there is a greater need for RA if this feature is present.
7b No risks occur because there is room for adjustment. Therefore, there is little use in calculating these risks. In my opinion, if thisfeature is present there is less need for RA.
8a In the case of a clear procedure I expect that the designers of the procedure have made sure that it doesn’t generate unacceptablerisks. Therefore, in my opinion there is less need for RA if this feature is present.
8b If the procedures are clear, then it is easily possible to calculate which risks are caused by SDQ. Therefore, in my opinion there is agreater need for RA if this feature is present.
9a Great interests are at stake. Therefore, in my opinion there is a greater need for RA if this feature is present.9b The uncertainty in projections of long-term developments is often greater than the uncertainty in spatial data. Therefore, in my
opinion there is less need for a calculation that shows the risks generated by uncertainty in spatial data.9c Characteristic of strategic decisions is that at the onset, it is not precisely clear which alternative actions will be considered. As a
result, it is difficult to say what the risks will be. In my opinion, therefore, there is less need for RA.
†Respondents were asked if they agreed with these arguments (see Fig. 1).
become clear in the discussion in Section 3.2.1. Thequestionnaire contained the same questions for eachfeature and for each argument (see Fig. 2):
� Feature question: “If a decision-making processhas this feature, then are you less/neutral/morewilling to spend resources on risk analysis?”
� Argument question: “Do you agree withthis argument?” (Permissible answers: dis-agree/neutral/agree).
There were three reasons for adding argumentsto the features:
� Arguments clarify the relationship betweenfeature and RA.
� The feature questions require more com-mitment from respondents than argument
questions. As a result respondents may be in-clined to answer “neutral” more frequentlyin the feature questions than in the argu-ment questions. Arguments may uncover moreinformation.
� If respondents agree with both the argumentin favor and against RA, they may fill in “neu-tral” in the feature question. In that case itwould be wrong to discard the feature as beingirrelevant.
The third aim of this article was to test fordifferences between respondents. To achieve this thequestionnaire contained a background question: fortheir current job respondents could fill in (1) pol-icymaker, (2) cartographer, (3) GIS expert, (4) re-searcher, or (5) other, namely . . . . The definition of

1604 van Oort and Bregt
policymaker given in the questionnaire was: “policy-maker: part of my job is to make decisions on howmany resources will be spent on different projects.”For the other job categories no definitions were givenbecause a trial questionnaire indicated that theirmeaning was clear to respondents.
2.3.2. Trials and Final Questionnaire
Before the final questionnaire, two trials wereconducted. From the first trial we learned two lessons:(1) it proved better not to provide information aboutthe specific context of decision-making processes and(2) it was better to apply a qualitative willingness-to-pay concept than a quantitative willingness-to-payconcept. In trials where we added context informationwe observed that respondents would make inferencesabout how much was at stake and then assign moreresources to where they thought more was at stake,without paying further attention to presence or ab-sence of other features/arguments in the context de-scriptions. Also, we found that respondents tended toanswer “neutral” or “no response” when they wereless familiar with the context of the decision-makingprocess. In trials with more quantitative willingness-to-pay concepts, we found that respondents were onlywilling to answer quantitatively if much more contextinformation was provided. Also, we found that someof the respondents do not regularly make decisionson resource spending. These respondents consideredit difficult to respond quantitatively but did have aclear qualitative opinion.
In the second trial a questionnaire was distributedat a conference organized by a GIS software com-pany attended by approximately 300 visitors. It con-tained an introductory letter stating the objective ofthe questionnaire, a simple example of RA on spa-tial data, a background question on the current jobof respondent, five feature questions, and one openquestion inviting the addition of other relevant fea-tures affecting the willingness to spend resources onRA. Two lessons were learned: (1) arguments had tobe included for clarification and (2) respondents atthe conference only partially represented the targetgroup of our questionnaire: 73% of the respondentsindicated they were GIS experts, less than 10% in-dicated they were policymakers. We observed that alarge number of GIS experts had experienced diffi-culties in responding because the questions were toofar beyond the scope of their daily work.
The final questionnaire contained an introduc-tory letter stating the objective of the questionnaire, a
simple example of RA on spatial data, a backgroundquestion on the current job of respondent, all ninefeatures and 17 arguments of Tables III and IV, andan open question inviting the addition of other rel-evant features. Special efforts were made to includein the list of respondents policymakers from variousgovernment organizations. Fig. 1 is taken from the fi-nal questionnaire; it shows the instructions for fillingin, one feature question, and two associated argumentquestions.
2.3.3. Statistical Testing
The population was defined as Dutch policymak-ers, managers, advisors, GIS experts, and researchers.Active use of a GIS was not a criterion. Respondentswere personally targeted and contacted by e-mail andtelephone and asked only to return the questionnaireif they felt willing and capable of filling it in.
Minimum sample size is calculated as a functionof desired precision of the outcomes and prior knowl-edge on the distribution of the variable of interest.Precision refers to the p-values. In this study, p-valuesless than 0.15 were considered significant. No priorknowledge of the distribution of our variables wasavailable. Based on the distribution observed fromthe first 20 questionnaires returned, it was estimatedthat a sample of 50 should be the minimum.
The statistical test used was the Fisher exact testfor ordinal data (Agresti, 1990, pp. 60–65), which testsfor differences in ranking and is an appropriate testfor small sample sizes. The null hypothesis was anequal number of responses in each category (disagree/neutral/agree or less/neutral/more). It is possible thatthe total number of responses N, divided by the num-ber of response categories (=3) does not result inan integer. We applied H0 = 17–18–17 for N = 52,H0 = 18–17–18 for N = 53, and H0 = 18–18–18 forN = 54. For example, in Table V the response for Fea-ture 1 was 22–24–8 (N = 53), so H0 = 18–18–18 andwe obtained a (one-sided) p-value of 0.052. Next, theFisher exact test for ordinal data was applied to testfor differences in ranking of responses according tothe respondent’s current job.
3. RESULTS AND DISCUSSION
3.1. Results
From the 250 respondents targeted, 55 filled inand returned the questionnaire. Table V shows theresults for all respondents, with reference to features

Do Users Ignore Spatial Data Quality? 1605
Conducting a risk-analysis costs time and money. Below, 9 features of a decision-making processare listed. I would like to know if presence of the features in the decision-making process affectsyour willingness to spend resources on risk-analysis.
Per feature arguments are shown in favour and against a larger budget for risk-analysis. Pleaseindicate whether you disagree, are neutral or agree (tick one of the boxes)The last question at each feature is whether you would spend more or less resources on risk-analysis:
if you have both an argument for and one against RA, then encircle “neutral”;if one of the arguments is decisive then encircle “more” or “less”;you are allowed to include other arguments in your judgement and describe these arguments inthe open question at the end of the questionnaire.
the risk-analysis at all times refers to the calculation of risks caused by. Thus , such as for example the chance that a
proposal receives insufficient support and hence is not chosen to be implemented.
Instructions for filling in:
Important: uncertainty inspatial data not risks caused by other factors
Feature 1: Stakeholders often know the area of interest very well. They are invited to inspectand criticise the spatial data to be used, prior to your decision taking.
neutral agreedisagreeArguments
1a. Before presenting these data to them, I want to besure that they do not contain errors. Otherwise theycould use these errors against me or lose trust inme as a decision-maker. Therefore, in my opinionthere is a need for RA if this feature ispresent.
greater
1b. Stakeholders will notice errors and inform me aboutthem. That way, risks are reduced. Therefore, in myopinion there is need for RA if this feature ispresent.
less
neutral morelessIf a decision-making process has feature 1, then I amless/neutral/more willing to spend resources on risk-analysis:(encircle what applies to you)
Fig. 1. Instructions for filling in the final questionnaire.
in Table III and arguments in Table IV. The tablesshould be read as follows: Table III, Feature 1 states:“Stakeholders often know the area of interest verywell. They are invited to inspect and criticize the spa-tial data to be used prior to your decision taking.”Table V shows that if this feature is present in adecision-making process, then a significant (p < 0.15)majority of the respondents is less willing to spendresources on RA. Arguments 1a (+, in favor of RA)and 1b (−, against RA) are associated with Feature1. Argument 1b (Table IV) states: “Stakeholders willnotice errors and inform me about them. That way,risks are reduced. Therefore, in my opinion there isless need for RA if this feature is present.” Table Vshows that a significant majority agreed with this ar-gument. Phase 1 (Table I; Cornelis & Brunet, 2002) is:“1. DO: documentation and information = identifica-tion of data needs, problems, objectives, and knowl-edge of how these can be achieved.” Recalling thedecision-theoretic hypotheses listed in Section 2.2,we conclude that in the opinion of the respondents
there is less need for RA if feedback is receivedfrom stakeholders in Phase 1 of the decision-makingprocess.
Of the respondents, 23 indicated they were pol-icymakers, 0 cartographers, 7 GIS experts, 13 re-searchers, and 12 other. The 12 indicating “other”all specified their jobs as either manager, advisor, orcoordinator. Significant differences were found be-tween all groups. The most and largest differenceswere found between researchers (N = 13) and pol-icymakers (N = 23). Table VI presents the responseof these groups, with the last column showing one-sided p-values from the test for difference in rankingbetween the two groups.
3.2. Discussion
The discussion is about the five decision-theoretichypotheses (Section 2.2), formalized as features(Table III) and arguments (Table IV). Featuresand arguments, in brackets in the text below, are
1606 van Oort and Bregt
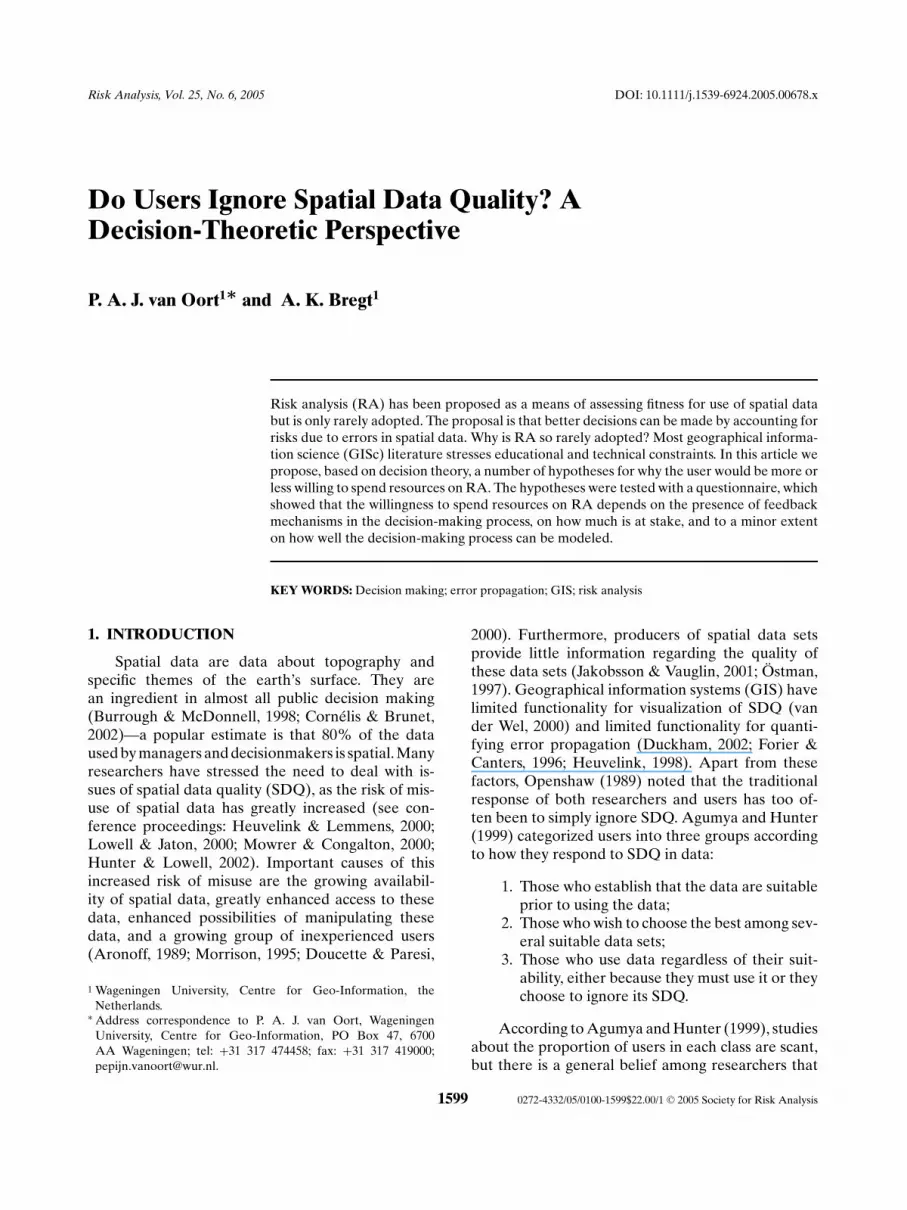
Table V. Feature and Argument Questions, All Respondents
ftr.† Less Neutral More No Response p-Value Sign.◦
1 22 24 8 1 0.052 ∗2 10 24 19 2 0.1593 7 27 20 1 0.063 ∗4 1 10 42 2 0.000 ∗5 10 24 20 1 0.131 ∗6 11 27 16 1 0.3077 16 22 16 1 0.5488 13 30 11 1 0.4499 12 19 23 1 0.108 ∗
NoArg.† fa†† Disagree Neutral Agree Response p-Value Sign.
◦
1a + 24 17 14 0 0.125 ∗1b − 14 15 26 0 0.080 ∗2a + 6 12 36 1 0.000 ∗2b − 17 16 22 0 0.2783a + 13 15 27 0 0.051 ∗4a + 3 4 46 2 0.000 ∗5a − 19 16 20 0 0.4475b + 13 16 25 1 0.084 ∗6a + 11 19 24 1 0.070 ∗6b − 22 19 14 0 0.1867a + 11 8 35 1 0.002 ∗7b − 23 11 19 2 0.3028a − 24 15 16 0 0.1738b + 19 21 14 1 0.3049a + 7 12 36 0 0.000 ∗9b − 18 9 28 0 0.114 ∗9c − 17 21 16 1 0.485
†Features: respondents were asked if presence of the featureaffected their willingness to spend resources on risk analysis(RA); Arguments: respondents were asked if they agreed withthe argument. See Tables III and IV for definition of features andarguments.††Argument is in favor (+) or against (−) RA.◦p-values smaller than 0.15 were considered significant.
significant (p-value < 0.15) unless explicitly statedotherwise.
3.2.1. Decision-Theory
Hypothesis 1 is about feedback mechanisms inPhases 1 to 5 (Table I; Cornelis & Brunet, 2002). Sig-nificant outcomes were found for the feedback mech-anisms in Phases 1, 3, and 5 of the decision-makingprocess and not in Phases 2 and 4. Phase 1 is “DO: doc-umentation and information = identification of dataneeds, problems, objectives, and knowledge of howthese can be achieved.” If feedback was received inthis phase, then respondents had the opinion that this
effectively reduced risks so that they were less willingto spend resources on RA (Table V, Feature 1, Argu-ment 1b). Phase 3 is “DT: decision taking = selectionof one of the alternatives.” In Phase 3 the majoritywas more willing to spend resources on RA (Table V,Feature 5). Note the difference between the role ofstakeholder (Phase 1) and co-decisionmaker (Phase3). Both may provide feedback on SDQ, but the co-decisionmaker has the power to influence the decisiontaken and for this reason respondents regard his orher feedback with more distrust (Table VI, Argument5b). Phase 5 is “DE: decision evaluation = evaluationof the outcomes of the action in terms of objectiveachievement.” Feedback in this phase implies that thedecisionmaker can be held accountable for damagedone due to SDQ. Respondents were more willing tospend resources on RA if this feedback mechanism ispresent (Table VI, Feature 4, Argument 4a). Epsteinet al. (1998) present a discussion on the legal aspectsof implementing this feedback mechanism. Accord-ing to them, the decisionmaker has a strong defenseagainst damage claims if he or she can prove that heor she has implemented policies to maintain productquality. Among other things, quality depends on therisks generated by SDQ. The first step, then, in main-taining product quality is to quantify it. This can bedone using RA. Other proofs of quality control are,for example, the ISO 9000 accreditation.
Phase 2 is “DA: decision analysis = definition ofalternative actions to achieve these objectives,” Phase4 is “DI: decision implementation = implementationof the selected action.” The fact that no significantmajorities were found for feedback in Phases 2 and 4(Table V, Features 2 and 7 are not significant) is alsointeresting. We had anticipated that the presence ofthese mechanisms would reduce willingness to spendresources on RA, as was the case for Feature 1. Signif-icant majorities of the respondents took into accountthat these mechanisms are expensive, and hoped thatapplying RA might contribute to reducing these ex-penses (Table V, Arguments 2a and 7a). Respondentsdiffered in their opinion as to whether or not feed-back mechanisms in Phases 2 and 4 reduced risks(Table V, Arguments 2b and 7b are not significant).Our experience is that these mechanisms certainly ex-ist in many decision-making processes and thus re-duce risks, and that respondents speculate about thenecessity of these mechanisms but do not translatethis into actively replacing them by RA. One reasonfor not doing so may be resistance from within the or-ganization, from the large workforce applying these
Do Users Ignore Spatial Data Quality? 1607
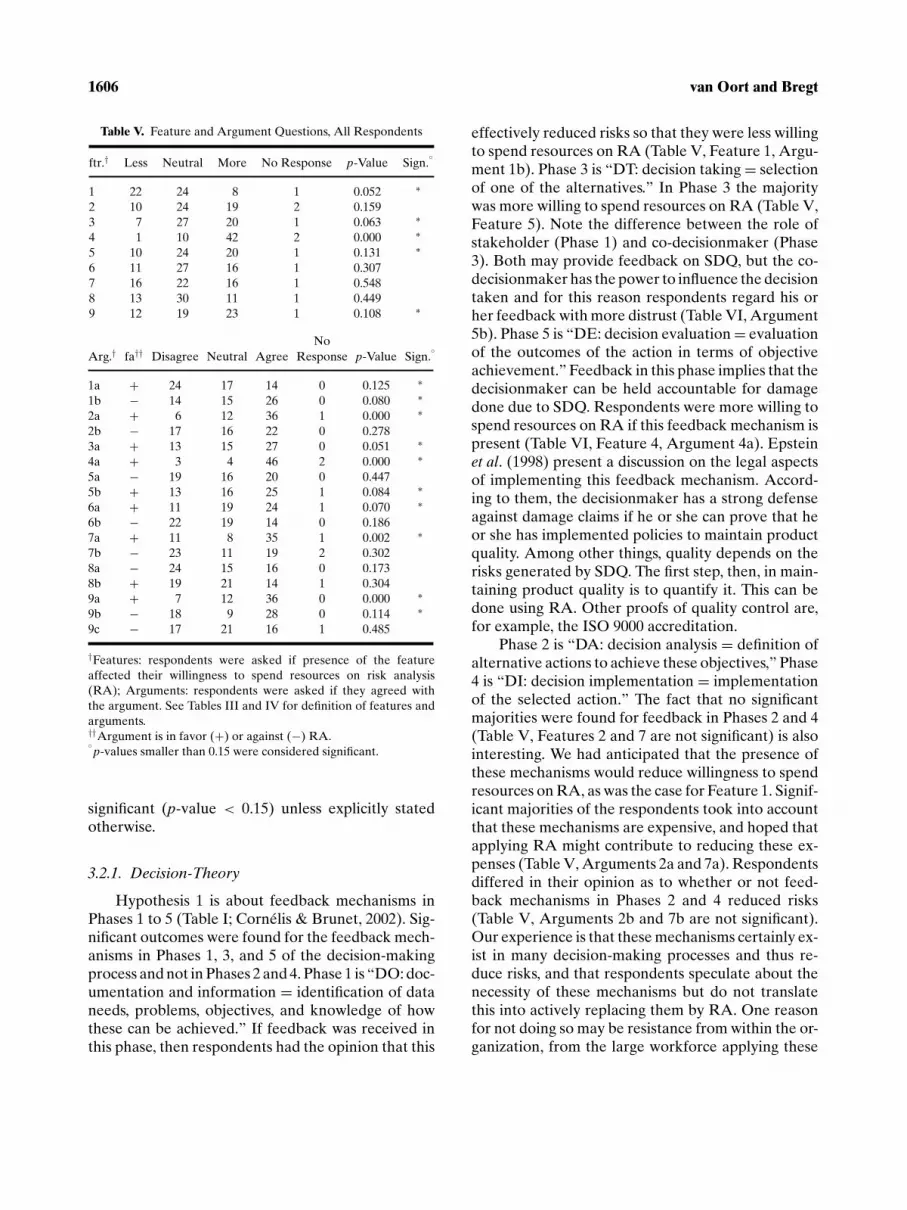
Table VI. Feature and Argument Questions, Differences Between Respondents
Researchers (N = 13) Policymakers (N = 23)
ftr.† Less Neutral More No Resp. Less Neutral More No Resp. p-Value Sign.◦
1 3 7 3 0 10 10 2 1 0.089 ∗2 3 5 5 0 4 11 6 2 0.4073 2 6 5 0 4 12 6 1 0.3114 0 3 9 1 1 4 17 1 0.5985 5 5 3 0 3 9 10 1 0.059 ∗6 2 5 6 0 6 14 2 1 0.035 ∗7 2 5 6 0 7 13 2 1 0.026 ∗8 2 7 4 0 6 13 3 1 0.149 ∗9 3 2 8 0 5 10 7 1 0.117 ∗
Arg.† Disagr. Neutral Agree No Resp. Disagr. Neutral Agree No Resp. p-Value Sign.◦
1a 4 3 6 0 9 9 5 0 0.1731b 6 2 5 0 3 8 12 0 0.079 ∗2a 2 2 9 0 1 7 15 0 0.5132b 6 1 6 0 6 9 8 0 0.4643a 3 4 6 0 7 7 9 0 0.3604a 0 2 11 0 2 2 19 0 0.4185a 7 1 5 0 6 9 8 0 0.2745b 6 2 4 1 2 9 12 0 0.031 ∗6a 4 2 7 0 4 13 5 1 0.1816b 7 5 1 0 7 7 9 0 0.040 ∗7a 3 1 9 0 4 3 16 0 0.4967b 7 2 3 1 8 7 7 1 0.1798a 7 3 3 0 11 6 6 0 0.4258b 4 4 4 1 9 11 3 0 0.2269a 3 0 10 0 3 7 13 0 0.2089b 5 3 5 0 7 3 13 0 0.2189c 7 4 2 0 5 9 8 1 0.038 ∗
†Features: respondents were asked if presence of the feature affected their willingness to spend resources on risk analysis (RA); Arguments:respondents were asked if they agreed with the argument. See Tables II and III for definition of features and arguments.◦p-values smaller than 0.15 were considered significant.
mechanisms. As one of the respondents commented,“we always do fieldwork prior to decision-taking” and“there is no tradition of conducting RA within my or-ganisation.” If feedback mechanisms in Phases 2 and4 reduce risk, be it not as cheaply as possible, a senseof urgency to replace them with RA may be lacking.
Hypothesis 2 is about RA modeling criteria. Cri-terion 1 is that it should be possible to rank expectedoutcomes of the decision according to their desirabil-ity; Criterion 2 is that the decision-making processcan be described in a model using a set of equations.Outcomes were significant for Criterion 1 (Table V,Feature 3, Argument 3a), but not significant for Cri-terion 2 (Table V, Arguments 5a, 6b, 8b). The onlyexception to this was that the majority agreed withArgument 9b, against RA if Criterion 2 is violated.
Hypothesis 3 was confirmed (Table V, Argu-ments 6a and 9a): a greater need for RA is felt if
more is at stake. Hypothesis 4 is that respondentsare less willing to spend resources on RA in data-driven decisions. The hypothesis was tested with Fea-ture 8 and neither rejected nor accepted. Hypothe-sis 5 was tested with Features 5 and 9. Results fromthe questionnaire indicate users are more willing tospend resources on RA in discussion-driven deci-sions (Table V, Features 5 and 9). Results indicatethat in discussion-driven decisions, RA is desired be-cause decisionmakers want to know how reliable co-decisionmakers’ data are (Table V, Argument 5b) andbecause more is at stake in discussion-driven deci-sions (Table V, Argument 9a). The argument thatmore is at stake can override the fact that a deci-sion may be difficult to model (RA modeling Crite-rion 2) and result in a higher willingness to spendresources on RA (Table V, Feature 9, Arguments9a, 9b).
1608 van Oort and Bregt
3.2.2. Differences Between Respondents
Table VI shows the differences in responsebetween researchers and policymakers. These differ-ences can be summarized as:
� Policymakers have more trust in feedbackmechanisms in Phases 1 and 4 of the decision-making process (Table VI, Features 1 and 7,Argument 1b);
� Policymakers are more concerned about thereliability of data from co-decisionmakers(Table VI, Feature 5, Argument 5b);
� Policymakers are less willing to spend re-sources on RA if the decision is implementedover the course of 10 years (=long term). Theyagree more with the argument that “so muchchanges over the course of 10 years that lit-tle may be expected of RA at the start of theperiod. Therefore, in my opinion there is lessneed for RA” (Table VI, Feature 6, Argument6b);
� Policymakers are less willing to spend re-sources on RA in strategic decisions. Theyagree more with the argument that “Charac-teristic of strategic decisions is that at the on-set, it is not precisely clear which alternativeactions will be considered. As a result, it is diffi-cult to say what the risks will be. In my opinion,therefore, there is less need for RA” (Table VI,Feature 9, Argument 9b).
4. CONCLUSION AND FURTHER RESEARCH
The title of this article is “Do Users Ignore Spa-tial Data Quality? A Decision Theoretic Perspective.”The word “ignore” is used in Openshaw (1989) andAgumya and Hunter (1999), where it seems to referto the phenomenon that users use spatial data withoutquantifying risks due to SDQ prior to using these data.Strictly according to this definition, we observe thatSDQ is frequently ignored. This article showed the in-appropriateness of the use of the word “ignore.” Thearticle shows that although risks are rarely quantified,this certainly does not mean that SDQ is in all thesecases ignored.
While lack of resources, awareness, skills, tools,and poor documentation of SDQ certainly explainsome of the reasons why risks due to SDQ are rarelyquantified, they do not provide the full explanation.Users of spatial data make decisions on the level ofresources spent on quantifying risks due to SDQ be-fore using a spatial data set in their decision-making
process. These decisions are based on analyzing fea-tures of the decision-making process. We found thatrespondents are less willing to spend resources on RA:
� If feedback on SDQ is received from stake-holders at the start of a decision-making pro-cess. Respondents expect that stakeholderswill detect and inform the decisionmakersabout errors in the spatial data and so reducerisks to an acceptable level.
We found that respondents are more willing tospend resources on RA:
� If the objective of the decision can be ex-pressed numerically;
� If feedback on SDQ is received from co-decisionmakers in the decision-taking phasebecause there is more concern about the re-liability of co-decisionmakers’ information;
� If feedback on SDQ is received at the end ofthe decision-making process, that is, if the de-cisionmaker can be held accountable for risksdue to SDQ;
� If more is at stake.
In cases where much is at stake or where decision-makers need to rely on each others’ data, the desirefor RA can override the fact that such decisions areat times difficult to model. This raises the question ofhow to incorporate factors that are difficult to model,such as outcomes of negotiation processes, anticipa-tion of long-term developments, or the fact that at thestart of the modeling process, it is not yet clear forwhich decision the outcomes of the spatial analysiswill be used. The answer to this question may be sce-nario analysis, in which these factors are representedas a number of scenarios and propagation of spatialerrors is modeled for each scenario.
In the questionnaire respondents were askedwhether certain feedback mechanisms reduced riskssufficiently. The results therefore refer to stakehold-ers’ perception of the effectiveness of these mech-anisms. Further research should assess the actualeffectiveness of these mechanisms and make a com-parison with respondents’ perceptions. The first mech-anism to be addressed is feedback from stakeholdersin the data-acquisition stage. The majority of the re-spondents were of the opinion that this mechanismsufficiently reduced risks. Confirmation of rejectionof this perception should be of importance to policy-makers who rely on this feedback mechanism as analternative to RA.

Do Users Ignore Spatial Data Quality? 1609
We began with an image of users using spatialdata in decision making without prior consideration ofrisks due to spatial data quality. Users failed to quan-tify risks due to constraints such as lack of tools, the-ory, and poor documentation of SDQ. What emergesfrom this article is an image of a user who assesses dif-ferent aspects of his or her decision-making processand then decides whether or not quantification of risksdue to SDQ is necessary. In view of the authors, thisarticle presents only a start to learning more aboutwhy users fail to quantify risks due to SDQ prior tousing spatial data. More empirical research into howusers handle SDQ is needed. At least one of the top-ics that deserves further research is the confrontationbetween willingness to invest (outcomes of the ques-tionnaire) and actual resource spending on RA.
ACKNOWLEDGMENTS
Dr. Sytze de Bruin is acknowledged for commentson a draft version of this article. Anonymous re-viewers are acknowledged for their comments onthe article. The work presented in this study is partof a Ph.D. project of the first author. The projectis funded by the Netherlands Geodetic Commission(NCG), the Survey Department of the Ministry ofTransport, Public Works and Water Management,Geo-Information and ICT Department (RWS-AGI),the Cadastre, Land Registry and Mapping Agency(TDK), the Netherlands Council for GeographicalInformation (Ravi), the Netherlands Institute of Ap-plied Geoscience–National Geological Survey (TNO-NITG), and the Netherlands Green World ResearchInstitute (Alterra). We wish to thank Jan Willem vanEck of ESRI for permission and support in the distri-bution of the trial questionnaire at the ESRI GISTechConference, Rotterdam, March 11, 2004. And finally,we wish to thank all the respondents without whomthis article could not have been written.
REFERENCES
Agresti, A. (1990). Categorical Data Analysis. New York: Wiley,558 p.
Agumya, A., & Hunter, G. J. (1999). Translating uncertainty in geo-graphical data into risk in decisions. In W. Shi, M. F. Goodchild,& P. F. Fisher (Eds.), Proceedings of the International Sympo-sium on Spatial Data Quality (pp. 574–584), 18–20 July 1999,Hong Kong.
Agumya, A., & Hunter, G. J. (2002). Responding to the con-sequences of uncertainty in geographical data. InternationalJournal of Geographical Information Science, 16(5), 405–417.
Aronoff, S. (1989). GIS: A Management Perspective. Ottawa: WDLPublications, 294 pp.
Burrough, P. A., & McDonnell, R. A. (1998). Principles of Geo-graphical Information Systems. Oxford, UK: Oxford Univer-sity Press, 333 pp.
Campbell, H. (1991). Organizational issues in managing geo-graphical information. In I. Masser & M. Blakemore (Eds.),Handling Geographical Information (pp. 259–282). Longman/Wiley.
Cornelis, B., & Brunet, S. (2002). A policy-maker point of view onuncertainties in spatial decisions. In W. Shi, P. F. Fisher, & M. F.Goodchild (Eds.), Spatial Data Quality (pp. 168–185). London:Taylor and Francis.
Crosetto, M., & Tarantola, S. (2001). Uncertainty and sensitivityanalysis: Tools for GIS-based model implementation. Inter-national Journal of Geographical Information Science, 15(5),415–437.
de Bruin, S., Bregt, A., & Van de Ven, M. (2001). Assessing fit-ness for use: The expected value of spatial data sets. Interna-tional Journal of Geographical Information Science, 15(5), 457–471.
de Bruin, S., & Hunter, G. J. (2003). Making the trade-off betweendecision quality and information cost. Photogrammetric Engi-neering & Remote Sensing, 69(1), 91–98.
Doucette, M., & Paresi, C. (2000). Quality management in GDI. InR. Groot & J. MacLaughlin (Eds.), Geospatial Data Infrastruc-ture: Concepts, Cases, and Good Practice (pp. 85–96). Oxford:Oxford University Press.
Duckham, M. (2002). A user-oriented perspective of error-sensitiveGIS development. Transactions in GIS, 6(2), 179–193.
Epstein, E. F., Hunter, G. J., & Agumya, A. (1998). Liability in-surance and the use of geographical information. Interna-tional Journal of Geographical Information Science, 12(3), 203–214.
Forier, F., & Canters, F. (1996). A user-friendly tool for error mod-elling and error propagation in a GIS environment. SpatialAccuracy Assessment in Natural Resources and EnvironmentalSciences: Second International Symposium (pp. 225–234), May21–23, Fort Collins, Colorado.
Heuvelink, G. B. M. (1998). Error Propagation in EnvironmentalModelling with GIS. London: Taylor & Francis, 127 pp.
Heuvelink, G. B. M., & Lemmens, M. J. P. M. (Eds.) (2000). Proceed-ings of the 4th International Symposium on Spatial AccuracyAssessment in Natural Resources and Environmental Sciences.Delft: University Press, 772 pp.
Hunter, G., & Lowell, K. (Eds.) (2002). Accuracy 2002. Proceed-ings of the 5th International Symposium on Spatial AccuracyAssessment in Natural Resources and Environmental Sciences.Melbourne, Australia, 547 pp.
Jaeger, C. C., Renn, O., Rosa, E. A., & Webler, T. (2001).Risk, Uncertainty, and Rational Action. London: Earthscan,320 pp.
Jakobsson, A., & Vauglin, F. (2001). Status of data qual-ity in European national mapping agencies. Proceeding ofthe 20th International Cartographic Conference, 4, 2875–2883.
Li, Y., Brimicombe, A. J., & Ralphs, M. P. (2000). Spatial dataquality and sensitivity analysis in GIS and environmental mod-elling: The case of coastal oil spills. Computers Environmentand Urban Systems, 24(2), 95–108.
Lowell, K., & Jaton, A. (Eds.) (2000). Spatial Accuracy Assessment:Land Information Uncertainty in Natural Resources. London:Taylor & Francis, 450 pp.
Morgan, M. G., Henrion, M., & Small, M. (1990). Uncertainty:A Guide to Dealing with Uncertainty in Quantitative Riskand Policy Analysis. Cambridge: Cambridge University Press,332 pp.
Morrison, J. L. (1995). Spatial data quality. In S. C. Guptill& J. L. Morrison (Eds.), Elements of Spatial Data Qual-ity. International Cartographic Association, Tokyo: ElsevierScience.

1610 van Oort and Bregt
Mowrer, T. H., & Congalton, R. G. (2000). Quantifying Spa-tial Uncertainty in Natural Resources: Theory and Applica-tions for GIS and Remote Sensing. London: Taylor & Francis,350 pp.
Openshaw, S. (1989). Learning to live with error in spatialdatabases. In M. F. Goodchild & S. Gopal (Eds.), Accuracyof Spatial Databases. London: Taylor & Francis.
Ostman, A. (1997). The specification and evaluation of spatialdata quality. In Proceedings of the 18th ICA International
Cartographic Conference (pp. 836–847), Sweden (Gavle:Swedish Cartographic Society).
van der Smagt, A. G. M., & Lucardie, G. L. (1991). Decision makingunder not well-defined conditions: From data processing tological modelling. Journal of Economic and Social Geography,82(4), 295–304.
van der Wel, F. J. M. (2000). Assessment and Visualisation of Un-certainty in Remote Sensing Land Cover Classifications. Ph.D.Thesis, Utrecht University, 200 pp.