do fish enhance tank mixing
TRANSCRIPT
ARTICLE IN PRESS
www.elsevier.com/locate/aqua-online
DTD 5
Aquaculture xx (2
Do fish enhance tank mixing?
Michael R. Rasmussena,T, Jesper Laursena, Steven R. Craigb, Ewen McLeanb
aAalborg University, Department of Civil Engineering, Hydraulic and Coastal Engineering,
Sohngaardsholmsvej 57, DK-9000 Aalborg, DenmarkbAquaculture Center, Virginia Polytechnic Institute and State University, Department of Fisheries and Wildlife Sciences,
Blacksburg, VA 24061, USA
Received 1 December 2004; received in revised form 31 January 2005; accepted 1 February 2005
Abstract
The design of fish rearing tanks represents a critical stage in the development of optimal aquaculture systems, especially in
the context of recirculating systems. Poor hydrodynamics can compromise water quality, waste management and the physiology
and behaviour of fish, and thence, production potential and operational profitability. The hydrodynamic performance of tanks,
therefore, represents an important parameter during the tank design process. Because there are significant complexities in
combining the rigid principles of hydrodynamics with the stochastic behaviour of fish, however, most data upon tank
hydrokinetics has been derived using tanks void of fish. Clearly, the presence of randomly moving objects, such as fish, in a
water column will influence not only tank volumes by displacing water, but due to their activity, water dynamics and associated
in-tank processes.
In order to determine the impact of fish presence upon tank hydrodynamics, Rhodamine fluorometry was employed to
examine mixing within a recirculating aquaculture system. Two different methods were compared, traditional, outlet-based
measurements and a technique that employed in-tank data acquisition. Circular tanks were employed during data collection
either in the presence or absence of experimental fish-red drum Sciaenops ocellatus (n =36; 5 kg total wet wt); and at two flow
rates. Irrespective of flow rate, the presence of fish dramatically enhanced the mixing process (P b0.001), with mixing times in
tanks with fish being one-third that for tanks without animals. In-tank dispersion coefficients and dispersion numbers also
differed (P b0.001) in the presence of fish, irrespective of flow. Presence or absence of fish had no effect upon hydraulic
residence or circulation times. Unlike measurements at the outlet, in-tank observations were more able to isolate the effects of
stochastic, fish-induced mixing, from deterministic, hydrodynamic mixing.
D 2005 Published by Elsevier B.V.
Keywords: Hydrodynamics; Tracer; Hydraulic residence time; Rhodamine; Dispersion number; Red drum
0044-8486/$ - see front matter D 2005 Published by Elsevier B.V.
doi:10.1016/j.aquaculture.2005.02.041
T Corresponding author. Fax: +45 98142555.
E-mail address: [email protected] (M.R. Rasmussen).
1. Introduction
Recirculating aquaculture systems (RAS) present
the aquaculturist with several advantages. Principal in
005) xxx–xxx
AQUA-626380; No of Pages 13

ARTICLE IN PRESS
M.R. Rasmussen et al. / Aquaculture xx (2005) xxx–xxx2
this regard is the ability to tailor production conditions
(water chemistry, photoperiod, etc.) to optimize the
performance characteristics of the cultured species
(Skjolstrup et al., 2000). Enhanced control over
production enables greater harvest flexibility that in
turn permits more precise market management which
may increase returns on investment. Additionally,
because of their reduced consumption of water and
heightened management of wastes, RAS provide
environmentally acceptable production systems
(Wheaton, 2002; Rasmussen et al., 2004). Moreover,
water reuse techniques can reduce energy and labor
costs, provide flexibility in the placement of hatch-
eries and offer a high level of biosecurity from
pollution, predator, disease and human viewpoints
(Skjblstrup et al., 1998). The major drawback of
recirculating aquaculture relates to their overall
complexity and the large capital costs required for
facility start-up. Generally, the latter is offset by
increasing stocking densities. Such strategies, how-
ever, are intrinsically dangerous since crowding may
negatively impact product quality and feed efficiency,
while occurrence of and losses due to disease intensify
(Wagner et al., 1997; Shoemaker et al., 2000).
Holding tanks are the central feature of RAS.
Tanks may be circular, oval, raceway, D-ended,
octagonal, hexagonal, square, conical, or hybrids
thereof, in form. A wide variety of materials are used
in tank construction including fiberglass, plastic,
concrete, wood, steel and their amalgams. Increas-
ingly, RAS employ barrier-based earthen ponds,
especially in shrimp production. Selection of con-
struction material for tanks is generally constrained by
size, desired shape and site characteristics. For
example, costs severely limit the use of steel whereas
large tank size restricts application of plastics and
fiberglass. The use of concrete and earthen ponds may
be impeded to a certain degree by site topography,
hydraulic permeability, soil plasticity and prevailing
height of water tables. Irrespective of size or
construction material employed, however, to achieve
maximum production potential, a prerequisite to RAS,
tanks must be optimally designed. A complete
appreciation of tank hydrodynamics represents a vital
part of the engineering process since this characteristic
may impair water quality (Burrows and Chenoweth,
1955; Burley and Klapsis, 1988). Poor water quality
reduces stocking potential, decreases growth, nega-
tively affects feed conversion, influences tank micro-
biology and elevates stress and consequently the
likelihood of losses due to disease. Poorly regulated
tank mixing can result in changes in physiology, more
pronounced aggression (Griffiths and Armstrong,
2000; Odeh et al., 2003) and the formation of social
hierarchies, a reduction in sedimentation and solid
waste removal and increased occurrence of dead
volumes (Cripps and Bergheim, 2000; Rasmussen et
al., 2004).
Several studies have examined general mixing
processes in aquaculture ponds and tanks (Burrows
and Chenoweth, 1955, 1970; Larmoyeux et al., 1973;
Burley and Klapsis, 1988; Gaikowski et al., 2004;
Rasmussen and McLean, 2004). However, because it
is extremely complex to integrate the more rigid
principles of hydrodynamics with the stochastic
behaviour of fish, most research in this field has
employed fishless tanks. In studies that have exam-
ined the effect of fish upon tank mixing processes,
results have generally been contradictory or incon-
clusive (Burley and Klapsis, 1985; Watten and Beck,
1987; Watten et al., 2000), most likely due to the
experimental and/or analytical procedures employed.
Traditionally, mixing studies estimate dispersion
numbers using tracer techniques. The principal
method employed involves inspection of dye dilution
using single-point measurements taken at the tank
outlet. However, this technique does not provide
critical detail upon in-tank hydrodynamic processes
and difficulties are encountered in assessing the
impact of fish upon the mixing process with any
degree of certainty. Due to the importance of this field
of investigation (Burley and Klapsis, 1985; Watten
and Beck, 1987; Watten et al., 2000), there remains a
clear need to intensify research upon the effect of fish
presence on tank hydraulics. An increased awareness
of these effects would assist in refining the tank
design process.
One method of enhancing the current understand-
ing of tank hydrodynamic processes might be to
undertake in-tank measurements of dye dilution. In
contrast to outlet-based methods, in-tank techniques
permit multiple determinations to be made per experi-
ment. Moreover, because in-tank measurements may
provide a more accurate evaluation of changes in
hydrodynamics over time, the effects of fish presence
upon mixing processes might be more readily
ARTICLE IN PRESS
M.R. Rasmussen et al. / Aquaculture xx (2005) xxx–xxx 3
assessed. The objective of the present study was to
compare outlet-based and in-tank methods for exam-
ining the mixing process, both in the absence and
presence of fish, and at high and low flow rates.
Circular tanks were used in preference to any other
form because these units are the most common
encountered in commercial settings while also permit-
ting acquisition of multiple measurements following
single tracer injection.
2. Materials and methods
2.1. System configuration
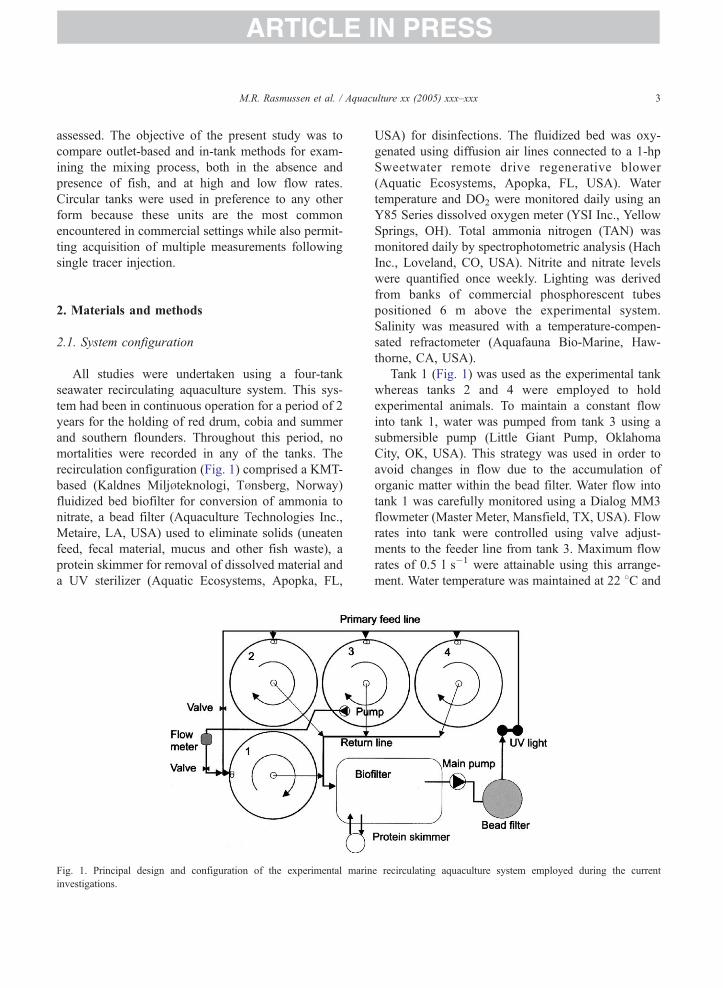
All studies were undertaken using a four-tank
seawater recirculating aquaculture system. This sys-
tem had been in continuous operation for a period of 2
years for the holding of red drum, cobia and summer
and southern flounders. Throughout this period, no
mortalities were recorded in any of the tanks. The
recirculation configuration (Fig. 1) comprised a KMT-
based (Kaldnes Miljbteknologi, Tbnsberg, Norway)
fluidized bed biofilter for conversion of ammonia to
nitrate, a bead filter (Aquaculture Technologies Inc.,
Metaire, LA, USA) used to eliminate solids (uneaten
feed, fecal material, mucus and other fish waste), a
protein skimmer for removal of dissolved material and
a UV sterilizer (Aquatic Ecosystems, Apopka, FL,
Fig. 1. Principal design and configuration of the experimental marin
investigations.
USA) for disinfections. The fluidized bed was oxy-
genated using diffusion air lines connected to a 1-hp
Sweetwater remote drive regenerative blower
(Aquatic Ecosystems, Apopka, FL, USA). Water
temperature and DO2 were monitored daily using an
Y85 Series dissolved oxygen meter (YSI Inc., Yellow
Springs, OH). Total ammonia nitrogen (TAN) was
monitored daily by spectrophotometric analysis (Hach
Inc., Loveland, CO, USA). Nitrite and nitrate levels
were quantified once weekly. Lighting was derived
from banks of commercial phosphorescent tubes
positioned 6 m above the experimental system.
Salinity was measured with a temperature-compen-
sated refractometer (Aquafauna Bio-Marine, Haw-
thorne, CA, USA).
Tank 1 (Fig. 1) was used as the experimental tank
whereas tanks 2 and 4 were employed to hold
experimental animals. To maintain a constant flow
into tank 1, water was pumped from tank 3 using a
submersible pump (Little Giant Pump, Oklahoma
City, OK, USA). This strategy was used in order to
avoid changes in flow due to the accumulation of
organic matter within the bead filter. Water flow into
tank 1 was carefully monitored using a Dialog MM3
flowmeter (Master Meter, Mansfield, TX, USA). Flow
rates into tank were controlled using valve adjust-
ments to the feeder line from tank 3. Maximum flow
rates of 0.5 l s�1 were attainable using this arrange-
ment. Water temperature was maintained at 22 8C and
e recirculating aquaculture system employed during the current
ARTICLE IN PRESS
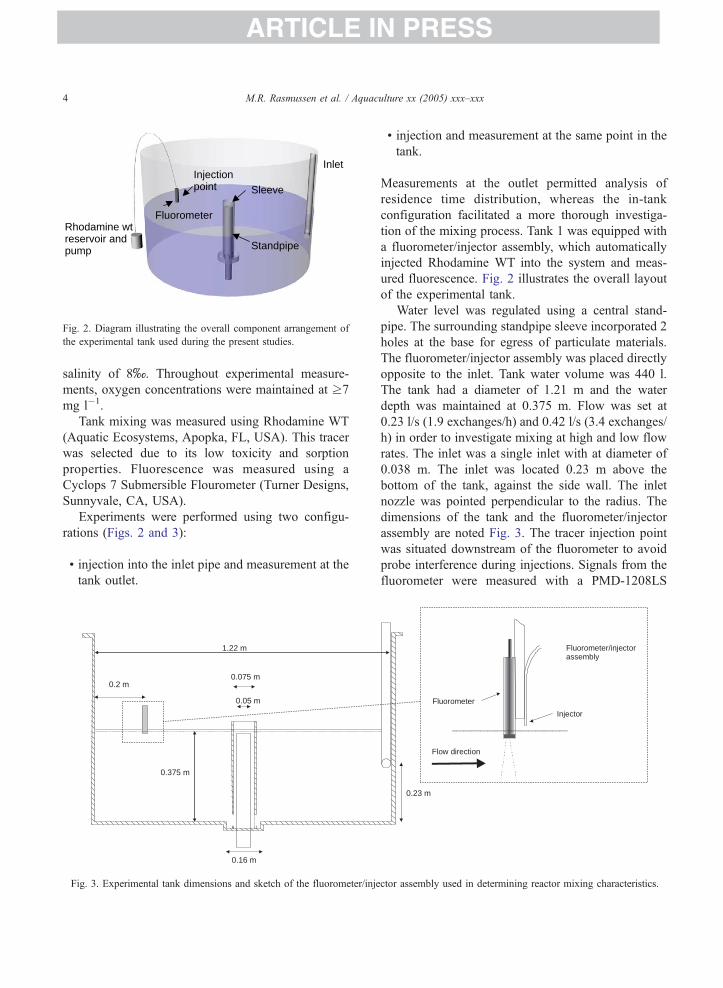
Rhodamine wt reservoir and
Fluorometer
Inlet Injection point Sleeve
Standpipe pump
Fig. 2. Diagram illustrating the overall component arrangement of
the experimental tank used during the present studies.
M.R. Rasmussen et al. / Aquaculture xx (2005) xxx–xxx4
salinity of 8x. Throughout experimental measure-
ments, oxygen concentrations were maintained at z7
mg l�1.
Tank mixing was measured using Rhodamine WT
(Aquatic Ecosystems, Apopka, FL, USA). This tracer
was selected due to its low toxicity and sorption
properties. Fluorescence was measured using a
Cyclops 7 Submersible Flourometer (Turner Designs,
Sunnyvale, CA, USA).
Experiments were performed using two configu-
rations (Figs. 2 and 3):
! injection into the inlet pipe and measurement at the
tank outlet.
0.2 m
0.375 m
0.05 m
0.075 m
1.22 m
0.16 m
Fig. 3. Experimental tank dimensions and sketch of the fluorometer/inje
! injection and measurement at the same point in the
tank.
Measurements at the outlet permitted analysis of
residence time distribution, whereas the in-tank
configuration facilitated a more thorough investiga-
tion of the mixing process. Tank 1 was equipped with
a fluorometer/injector assembly, which automatically
injected Rhodamine WT into the system and meas-
ured fluorescence. Fig. 2 illustrates the overall layout
of the experimental tank.
Water level was regulated using a central stand-
pipe. The surrounding standpipe sleeve incorporated 2
holes at the base for egress of particulate materials.
The fluorometer/injector assembly was placed directly
opposite to the inlet. Tank water volume was 440 l.
The tank had a diameter of 1.21 m and the water
depth was maintained at 0.375 m. Flow was set at
0.23 l/s (1.9 exchanges/h) and 0.42 l/s (3.4 exchanges/
h) in order to investigate mixing at high and low flow
rates. The inlet was a single inlet with at diameter of
0.038 m. The inlet was located 0.23 m above the
bottom of the tank, against the side wall. The inlet
nozzle was pointed perpendicular to the radius. The
dimensions of the tank and the fluorometer/injector
assembly are noted Fig. 3. The tracer injection point
was situated downstream of the fluorometer to avoid
probe interference during injections. Signals from the
fluorometer were measured with a PMD-1208LS
0.23 m
Fluorometer/injector assembly
Flow direction
Injector
Fluorometer
ctor assembly used in determining reactor mixing characteristics.
ARTICLE IN PRESS
M.R. Rasmussen et al. / Aquaculture xx (2005) xxx–xxx 5
analog/digital board (Measurement Computing Corpo-
ration, Middleboro, MA, USA) and stored on a PC.
Signals were sampled with a frequency of 1 Hz.
Dedicated software was developed to acquire, store and
analyze all measurements. Pump-based injection of
Rhodamine WT tracer into the experimental tank was
computer controlled. Using 4-h intervals, the software
automatically injected 3 ml of dye (100 ppm Rhod-
amine WT) into the tank. Automation of this procedure
minimized fish stress. Although the vast majority of
RhodamineWTwas removed from the systemwater by
the KMT bed and bead filter, measured background
concentrations (residual Rhodamine WT) were sub-
tracted from experimental data sets.
2.2. Methodological analysis of outlet tracer
experiments
Measurement of dye concentrations at the outlet
has traditionally been the preferred method to
determine the mixing characteristics of non-idealized
reactors. Calculation of tracer residence time allowed
quantification of mixing.
Residence time, t̄, was calculated as
t¯ ¼
Z l
0
tCdtZ l
0
Cdt
ð1Þ
where C is the concentration and t is time. Residence
time was then compared to hydraulic residence time,
th:
th ¼V
Qð2Þ
where V is the tank volume and Q is the flow through
the tank.
When the residence time is smaller than hydraulic
residence time, this implies that not all of the tank
volume participates in the process. This dead zone
volume can be calculated as
Vdead zone ¼ 1� t¯
th
� �V ð3Þ
Although difficult to identify physical positions of
dead zones, their calculated size indicates the level of
mixing occurring within a reactor or tank. Thus, it is
impossible to have residence times that exceed
hydraulic residence times.
If tank hydrodynamics resemble non-ideal plug
flow characteristics, additional variables must be
determined. It is assumed that the one-dimensional
transport-dispersion model for conservative tracers in
a stationary and uniform flow can be used.
BC
Btþ U
BC
Bx¼ D
B2C
BC2ð4Þ
where x is distance, U the mean velocity, D the
dispersion coefficient, and t is time.
Assuming that measured tracer concentration as a
function of time is proportional to the concentration as
a function of space, a simple relationship between
tracer concentration variance and the dispersion
number can be estimated (Levenspiel, 1999):
r2t
t̄ 2¼ 2
D
UL
� �ð5Þ
where rt2 is the variance calculated from the concen-
tration measured at the outlet (Eq. (6)) and L a
characteristic length. The variance is calculated as
r2t ¼
Z l
0
t � t¯� �2
CdtZ l
0
Cdt
: ð6Þ
For higher dispersion numbers (D/UL N0.01) in a
closed reactor a correction to Eq. (5) is necessary
(Levenspiel, 1999):
r2t
t̄ 2¼ 2
D
UL
� �� 2
D
UL
� �2
1� e�ULDð Þ
� �: ð7Þ
The dispersion number can be determined by
solving Eq. (7) iteratively. Variance and residence
time is calculated using a numerical trapeze integra-
tion method. The dispersion number is dimensionless
and indicates the proportion between dispersion and
convection. The dispersion number will move asymp-
totically towards infinity as tank mixing approaches
ideal mixed conditions. However, Levenspiel (1999)
advocates that this method cannot be employed when
the dispersion number exceeds 1. It should be noted
that it remains impossible to isolate the dispersion
coefficient from the dispersion number using this
method, as it is unclear which characteristic length
ARTICLE IN PRESS
0
2
4
6
8
10
12
70 75 80 85 90 95 100Time (sec )
Con
cent
ratio
n (p
pb)
Measurement
Analytical solution
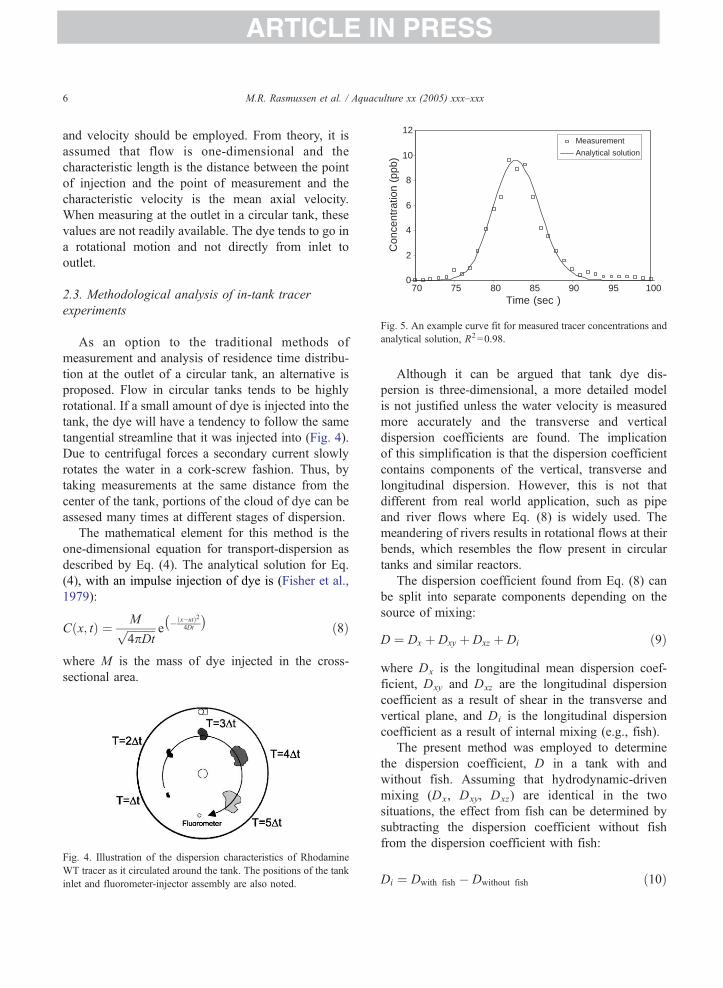
Fig. 5. An example curve fit for measured tracer concentrations and
analytical solution, R2=0.98.
M.R. Rasmussen et al. / Aquaculture xx (2005) xxx–xxx6
and velocity should be employed. From theory, it is
assumed that flow is one-dimensional and the
characteristic length is the distance between the point
of injection and the point of measurement and the
characteristic velocity is the mean axial velocity.
When measuring at the outlet in a circular tank, these
values are not readily available. The dye tends to go in
a rotational motion and not directly from inlet to
outlet.
2.3. Methodological analysis of in-tank tracer
experiments
As an option to the traditional methods of
measurement and analysis of residence time distribu-
tion at the outlet of a circular tank, an alternative is
proposed. Flow in circular tanks tends to be highly
rotational. If a small amount of dye is injected into the
tank, the dye will have a tendency to follow the same
tangential streamline that it was injected into (Fig. 4).
Due to centrifugal forces a secondary current slowly
rotates the water in a cork-screw fashion. Thus, by
taking measurements at the same distance from the
center of the tank, portions of the cloud of dye can be
assesed many times at different stages of dispersion.
The mathematical element for this method is the
one-dimensional equation for transport-dispersion as
described by Eq. (4). The analytical solution for Eq.
(4), with an impulse injection of dye is (Fisher et al.,
1979):
C x; tð Þ ¼ Mffiffiffiffiffiffiffiffiffiffi4pDt
p e � x�utð Þ24Dt
� �ð8Þ
where M is the mass of dye injected in the cross-
sectional area.
Fig. 4. Illustration of the dispersion characteristics of Rhodamine
WT tracer as it circulated around the tank. The positions of the tank
inlet and fluorometer-injector assembly are also noted.
Although it can be argued that tank dye dis-
persion is three-dimensional, a more detailed model
is not justified unless the water velocity is measured
more accurately and the transverse and vertical
dispersion coefficients are found. The implication
of this simplification is that the dispersion coefficient
contains components of the vertical, transverse and
longitudinal dispersion. However, this is not that
different from real world application, such as pipe
and river flows where Eq. (8) is widely used. The
meandering of rivers results in rotational flows at their
bends, which resembles the flow present in circular
tanks and similar reactors.
The dispersion coefficient found from Eq. (8) can
be split into separate components depending on the
source of mixing:
D ¼ Dx þ Dxy þ Dxz þ Di ð9Þ
where Dx is the longitudinal mean dispersion coef-
ficient, Dxy and Dxz are the longitudinal dispersion
coefficient as a result of shear in the transverse and
vertical plane, and Di is the longitudinal dispersion
coefficient as a result of internal mixing (e.g., fish).
The present method was employed to determine
the dispersion coefficient, D in a tank with and
without fish. Assuming that hydrodynamic-driven
mixing (Dx, Dxy, Dxz) are identical in the two
situations, the effect from fish can be determined by
subtracting the dispersion coefficient without fish
from the dispersion coefficient with fish:
Di ¼ Dwith fish � Dwithout fish ð10Þ
ARTICLE IN PRESS
0
2
4
6
8
10
12
14
0 200 400 600 800 1000Time (sec )
Con
cent
ratio
n (p
pb) Measurement
tmix
tcirc
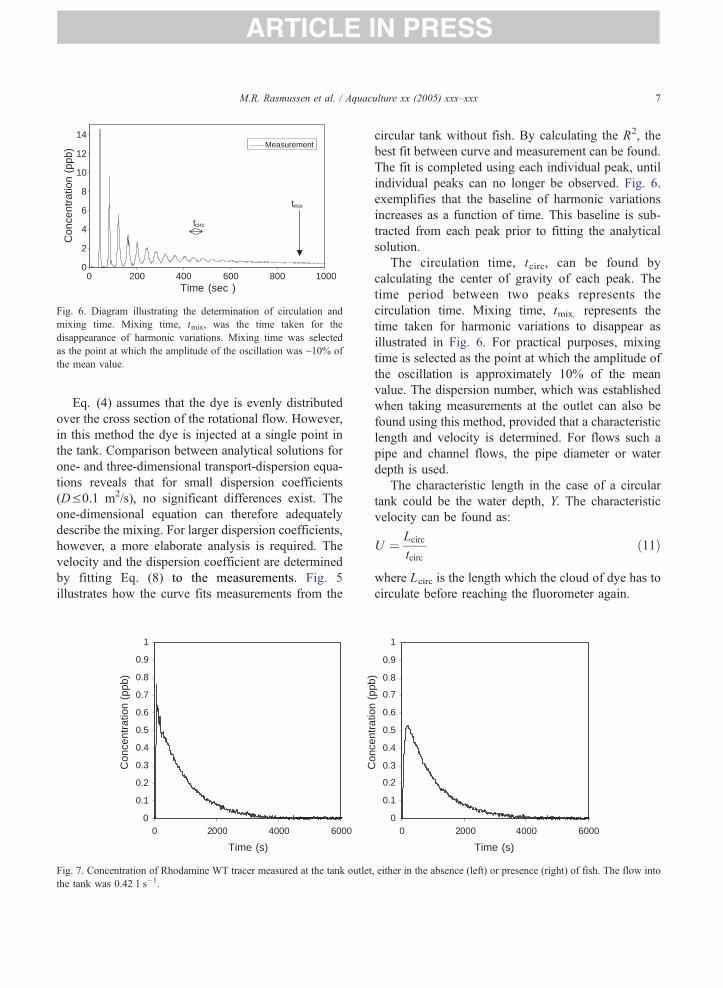
Fig. 6. Diagram illustrating the determination of circulation and
mixing time. Mixing time, tmix, was the time taken for the
disappearance of harmonic variations. Mixing time was selected
as the point at which the amplitude of the oscillation was ~10% of
the mean value.
M.R. Rasmussen et al. / Aquaculture xx (2005) xxx–xxx 7
Eq. (4) assumes that the dye is evenly distributed
over the cross section of the rotational flow. However,
in this method the dye is injected at a single point in
the tank. Comparison between analytical solutions for
one- and three-dimensional transport-dispersion equa-
tions reveals that for small dispersion coefficients
(DV0.1 m2/s), no significant differences exist. The
one-dimensional equation can therefore adequately
describe the mixing. For larger dispersion coefficients,
however, a more elaborate analysis is required. The
velocity and the dispersion coefficient are determined
by fitting Eq. (8) to the measurements. Fig. 5
illustrates how the curve fits measurements from the
0
0.1
0.2
0.3
0.4
0.5
0.6
0.7
0.8
0.9
1
0 2000 4000 6000
Time (s)
Con
cent
ratio
n (p
pb)
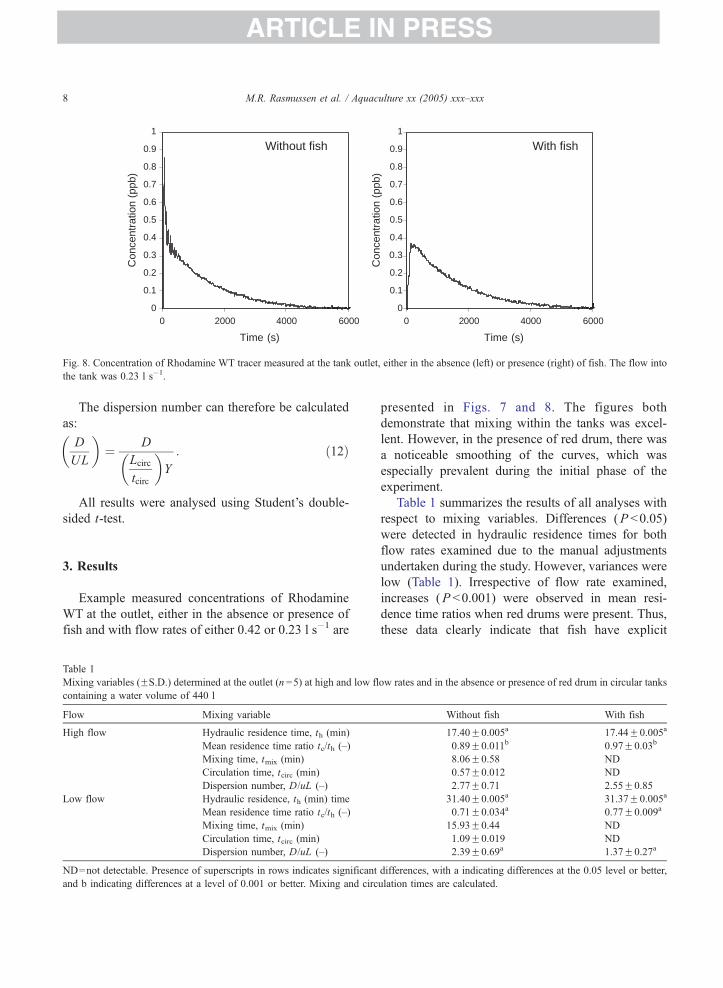
Fig. 7. Concentration of Rhodamine WT tracer measured at the tank outlet
the tank was 0.42 l s�1.
circular tank without fish. By calculating the R2, the
best fit between curve and measurement can be found.
The fit is completed using each individual peak, until
individual peaks can no longer be observed. Fig. 6.
exemplifies that the baseline of harmonic variations
increases as a function of time. This baseline is sub-
tracted from each peak prior to fitting the analytical
solution.
The circulation time, tcirc, can be found by
calculating the center of gravity of each peak. The
time period between two peaks represents the
circulation time. Mixing time, tmix, represents the
time taken for harmonic variations to disappear as
illustrated in Fig. 6. For practical purposes, mixing
time is selected as the point at which the amplitude of
the oscillation is approximately 10% of the mean
value. The dispersion number, which was established
when taking measurements at the outlet can also be
found using this method, provided that a characteristic
length and velocity is determined. For flows such a
pipe and channel flows, the pipe diameter or water
depth is used.
The characteristic length in the case of a circular
tank could be the water depth, Y. The characteristic
velocity can be found as:
U ¼ Lcirc
tcircð11Þ
where Lcirc is the length which the cloud of dye has to
circulate before reaching the fluorometer again.
0
0.1
0.2
0.3
0.4
0.5
0.6
0.7
0.8
0.9
1
0 2000 4000 6000
Time (s)
Con
cent
ratio
n (p
pb)
, either in the absence (left) or presence (right) of fish. The flow into
ARTICLE IN PRESS
0
0.1
0.2
0.3
0.4
0.5
0.6
0.7
0.8
0.9
1
0 2000 4000 6000
Time (s)
Con
cent
ratio
n (p
pb)
0
0.1
0.2
0.3
0.4
0.5
0.6
0.7
0.8
0.9
1
0 2000 4000 6000
Time (s)
Con
cent
ratio
n (p
pb)
Without fish With fish
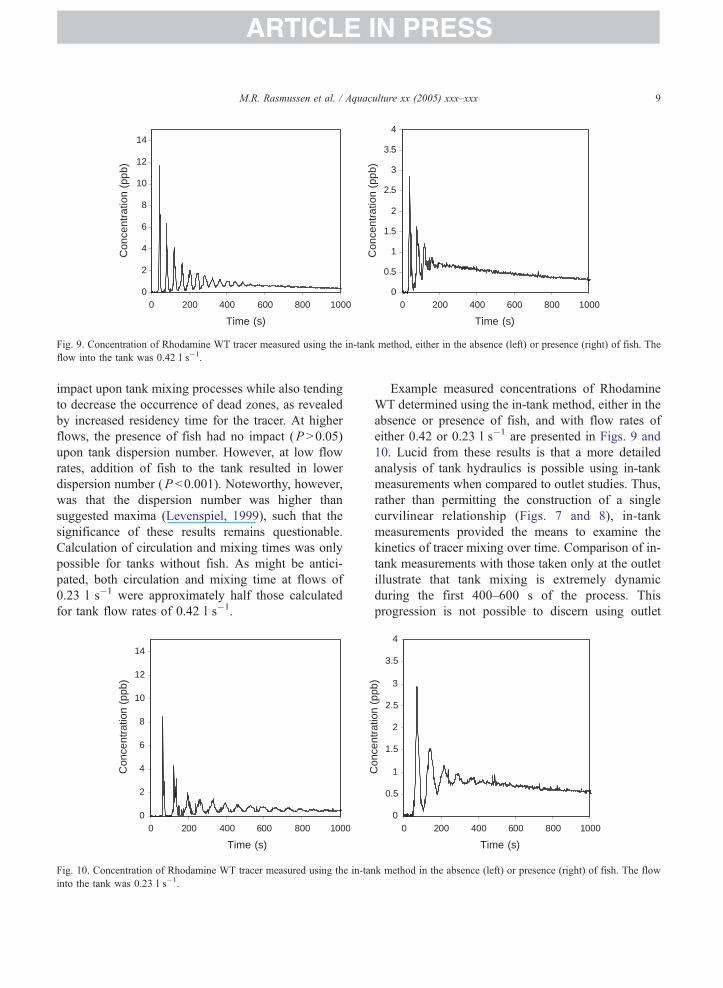
Fig. 8. Concentration of Rhodamine WT tracer measured at the tank outlet, either in the absence (left) or presence (right) of fish. The flow into
the tank was 0.23 l s�1.
M.R. Rasmussen et al. / Aquaculture xx (2005) xxx–xxx8
The dispersion number can therefore be calculated
as:
D
UL
� �¼ D
Lcirc
tcirc
� �Y
: ð12Þ
All results were analysed using Student’s double-
sided t-test.
3. Results
Example measured concentrations of Rhodamine
WT at the outlet, either in the absence or presence of
fish and with flow rates of either 0.42 or 0.23 l s�1 are
Table 1
Mixing variables (FS.D.) determined at the outlet (n =5) at high and low fl
containing a water volume of 440 l
Flow Mixing variable
High flow Hydraulic residence time, th (min)
Mean residence time ratio tc/th (–)
Mixing time, tmix (min)
Circulation time, tcirc (min)
Dispersion number, D/uL (–)
Low flow Hydraulic residence, th (min) time
Mean residence time ratio tc/th (–)
Mixing time, tmix (min)
Circulation time, tcirc (min)
Dispersion number, D/uL (–)
ND=not detectable. Presence of superscripts in rows indicates significant
and b indicating differences at a level of 0.001 or better. Mixing and circ
presented in Figs. 7 and 8. The figures both
demonstrate that mixing within the tanks was excel-
lent. However, in the presence of red drum, there was
a noticeable smoothing of the curves, which was
especially prevalent during the initial phase of the
experiment.
Table 1 summarizes the results of all analyses with
respect to mixing variables. Differences (P b0.05)
were detected in hydraulic residence times for both
flow rates examined due to the manual adjustments
undertaken during the study. However, variances were
low (Table 1). Irrespective of flow rate examined,
increases (P b0.001) were observed in mean resi-
dence time ratios when red drums were present. Thus,
these data clearly indicate that fish have explicit
ow rates and in the absence or presence of red drum in circular tanks
Without fish With fish
17.40F0.005a 17.44F0.005a
0.89F0.011b 0.97F0.03b
8.06F0.58 ND
0.57F0.012 ND
2.77F0.71 2.55F0.85
31.40F0.005a 31.37F0.005a
0.71F0.034a 0.77F0.009a
15.93F0.44 ND
1.09F0.019 ND
2.39F0.69a 1.37F0.27a
differences, with a indicating differences at the 0.05 level or better,
ulation times are calculated.
ARTICLE IN PRESS
0
2
4
6
8
10
12
14
0 200 400 600 800 1000
Time (s)
Con
cent
ratio
n (p
pb)
0
0.5
1
1.5
2
2.5
3
3.5
4
0 200 400 600 800 1000
Time (s)
Con
cent
ratio
n (p
pb)
Fig. 9. Concentration of Rhodamine WT tracer measured using the in-tank method, either in the absence (left) or presence (right) of fish. The
flow into the tank was 0.42 l s�1.
M.R. Rasmussen et al. / Aquaculture xx (2005) xxx–xxx 9
impact upon tank mixing processes while also tending
to decrease the occurrence of dead zones, as revealed
by increased residency time for the tracer. At higher
flows, the presence of fish had no impact (P N0.05)
upon tank dispersion number. However, at low flow
rates, addition of fish to the tank resulted in lower
dispersion number (P b0.001). Noteworthy, however,
was that the dispersion number was higher than
suggested maxima (Levenspiel, 1999), such that the
significance of these results remains questionable.
Calculation of circulation and mixing times was only
possible for tanks without fish. As might be antici-
pated, both circulation and mixing time at flows of
0.23 l s�1 were approximately half those calculated
for tank flow rates of 0.42 l s�1.
0
2
4
6
8
10
12
14
0 200 400 600 800 1000
Time (s)
Con
cent
ratio
n (p
pb)
Fig. 10. Concentration of Rhodamine WT tracer measured using the in-tan
into the tank was 0.23 l s�1.
Example measured concentrations of Rhodamine
WT determined using the in-tank method, either in the
absence or presence of fish, and with flow rates of
either 0.42 or 0.23 l s�1 are presented in Figs. 9 and
10. Lucid from these results is that a more detailed
analysis of tank hydraulics is possible using in-tank
measurements when compared to outlet studies. Thus,
rather than permitting the construction of a single
curvilinear relationship (Figs. 7 and 8), in-tank
measurements provided the means to examine the
kinetics of tracer mixing over time. Comparison of in-
tank measurements with those taken only at the outlet
illustrate that tank mixing is extremely dynamic
during the first 400–600 s of the process. This
progression is not possible to discern using outlet
0
0.5
1
1.5
2
2.5
3
3.5
4
0 200 400 600 800 1000
Time (s)
Con
cent
ratio
n (p
pb)
k method in the absence (left) or presence (right) of fish. The flow
ARTICLE IN PRESS
Table 2
Mixing variables (FS.D.) determined using in-tank determinations (n =6) at high and low flow rates and in the absence or presence of red drum
in circular tanks containing a water volume of 440 l
Flow Mixing variable Without fish With fish
High flow Hydraulic residence time, th (min) 17.38F0.005b 17.53F0.005b
Mixing time, tmix (min) 12.24F0.31b 4.41F0.38b
Circulation time, tcirc (min) 0.67F0.0067 0.64F0.028
Dispersion coefficient, D (m2/s) 0.0002125F0.000064 0.000975F000104b
Dispersion number, D/uL (–) 0.00133F0.00038b 0.00573F0.00059b
Low flow Hydraulic residence time, th (min) 31.25F0.005b 31.97F0.005b
Mixing time, tmix (min) 19.29F0.69b 6.35F0.59b
Circulation time, tcirc (min) 1.05F0.031 1.11F0.024
Dispersion coefficient, D (m2/s) 0.000142F000081 0.000706F0.000174b
Dispersion number, D/uL (–) 0.00139F0.00079b 0.00720F0.00186b
ND=not detectable. Presence of superscripts in rows indicates significant differences, with a indicating differences at the 0.05 level or better,
and b indicating differences at a level of 0.001 or better.
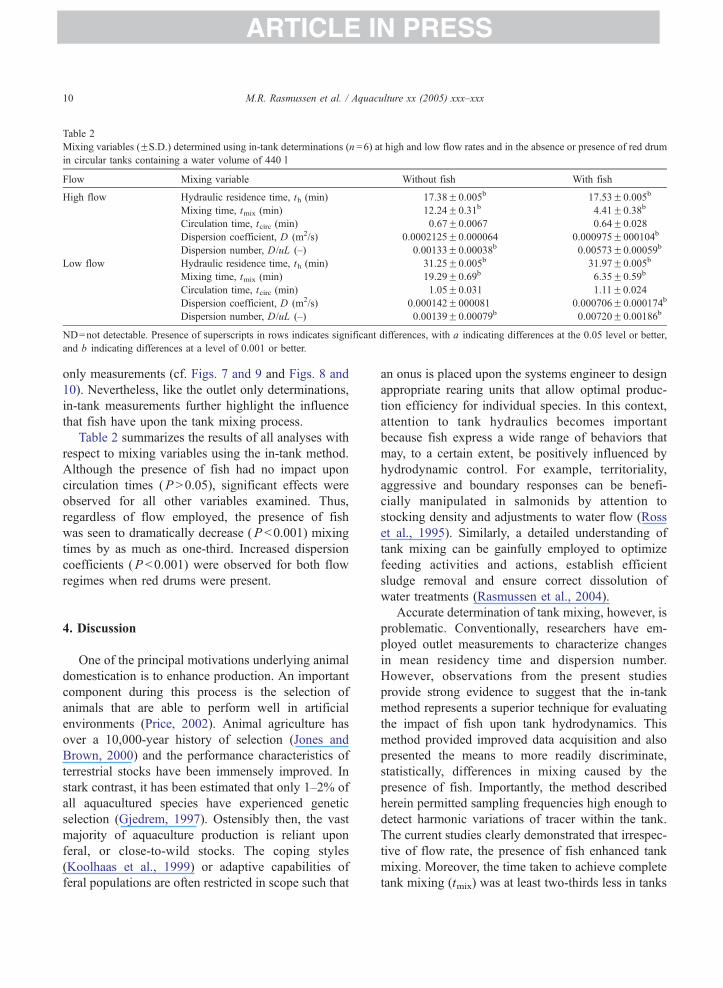
M.R. Rasmussen et al. / Aquaculture xx (2005) xxx–xxx10
only measurements (cf. Figs. 7 and 9 and Figs. 8 and
10). Nevertheless, like the outlet only determinations,
in-tank measurements further highlight the influence
that fish have upon the tank mixing process.
Table 2 summarizes the results of all analyses with
respect to mixing variables using the in-tank method.
Although the presence of fish had no impact upon
circulation times (P N0.05), significant effects were
observed for all other variables examined. Thus,
regardless of flow employed, the presence of fish
was seen to dramatically decrease (P b0.001) mixing
times by as much as one-third. Increased dispersion
coefficients (P b0.001) were observed for both flow
regimes when red drums were present.
4. Discussion
One of the principal motivations underlying animal
domestication is to enhance production. An important
component during this process is the selection of
animals that are able to perform well in artificial
environments (Price, 2002). Animal agriculture has
over a 10,000-year history of selection (Jones and
Brown, 2000) and the performance characteristics of
terrestrial stocks have been immensely improved. In
stark contrast, it has been estimated that only 1–2% of
all aquacultured species have experienced genetic
selection (Gjedrem, 1997). Ostensibly then, the vast
majority of aquaculture production is reliant upon
feral, or close-to-wild stocks. The coping styles
(Koolhaas et al., 1999) or adaptive capabilities of
feral populations are often restricted in scope such that
an onus is placed upon the systems engineer to design
appropriate rearing units that allow optimal produc-
tion efficiency for individual species. In this context,
attention to tank hydraulics becomes important
because fish express a wide range of behaviors that
may, to a certain extent, be positively influenced by
hydrodynamic control. For example, territoriality,
aggressive and boundary responses can be benefi-
cially manipulated in salmonids by attention to
stocking density and adjustments to water flow (Ross
et al., 1995). Similarly, a detailed understanding of
tank mixing can be gainfully employed to optimize
feeding activities and actions, establish efficient
sludge removal and ensure correct dissolution of
water treatments (Rasmussen et al., 2004).
Accurate determination of tank mixing, however, is
problematic. Conventionally, researchers have em-
ployed outlet measurements to characterize changes
in mean residency time and dispersion number.
However, observations from the present studies
provide strong evidence to suggest that the in-tank
method represents a superior technique for evaluating
the impact of fish upon tank hydrodynamics. This
method provided improved data acquisition and also
presented the means to more readily discriminate,
statistically, differences in mixing caused by the
presence of fish. Importantly, the method described
herein permitted sampling frequencies high enough to
detect harmonic variations of tracer within the tank.
The current studies clearly demonstrated that irrespec-
tive of flow rate, the presence of fish enhanced tank
mixing. Moreover, the time taken to achieve complete
tank mixing (tmix) was at least two-thirds less in tanks
ARTICLE IN PRESS
M.R. Rasmussen et al. / Aquaculture xx (2005) xxx–xxx 11
with fish than in tanks without. Employing in-tank
measurements determined that the presence of fish
greatly enhanced tank dispersion coefficients for both
flows examined. In contrast, at high flows and in the
presence of fish, no differences were seen in dispersion
number when measuring at the outlet only. However,
at low flows, the presence of fish caused reductions in
dispersion number. Failure to detect differences in
dispersion number using outlet measurements alone
has likewise been reported byWatten and Beck (1987),
who used circular tanks with channel catfish and
employed similar residence times to the study
described herein. Distinct to the investigations here
and to those of Watten and Beck (1987) are the
findings of Watten et al. (2000), who stated that the
presence of lake trout decreased mixing in circular
tanks. This deduction was made at even lower flow
rates than employed by the present study, using outlet
measurements only.
Comparisons of dispersion number from the
present experiments without fish illustrate that
irrespective of flow, these remained the same. This
observation fits well with theory for one-dimensional
flows where dispersion number becomes constant at
higher Reynolds numbers (Levenspiel, 1958). Intro-
duction of fish into the system, however, altered this
dynamic. Fish presence in this instance thus repre-
sents an important facet of the hydrodynamic
environment. Although outlet-based (one peak)
determination of dispersion number provided accu-
rate system evaluation, it was only with in-tank
determinations that the discrete impact of fish upon
the mixing process could be appreciated. A number
of studies suggest that through hydrodynamic sens-
ing, teleosts and other aquatic species undertake
subtle adjustments in posture, movement and posi-
tioning to facilitate favorable exploitation of varia-
tions in the hydrodynamic environment (Shtaf et al.,
1983; Anderson et al., 2001; Webb, 2002). One
benefit that arises from hydrodynamic repositioning
is a reduction in the energetic costs of locomotion.
This may be achieved through the fine-tuning of
standard metabolic rates (SMR; Pettersson and
Hedenstrom, 2000; Liao et al., 2003), or through
fish, especially when in schools, taking hydrome-
chanical advantage of vortex streets (Weihs, 1973;
Blake, 2004; Tytell and Lauder, 2004). Hydro-
mechanical adjustments and or refinement to SMR
may provide partial explanations for the beneficial
effects that have been observed to accrue following
exercise training of fish (e.g., improved: fitness,
growth homogeneity, body composition, food con-
version and muscle growth and reduced aggression;
Jbrgensen and Jobling, 1993; Hammer and Schwarz,
1994; Azuma et al., 2002). Preservation of position,
especially in higher flows necessarily involves
simultaneous use of multiple fins and body flex
(Breder, 1926) which will result in subtle adjust-
ments to swimming forces, resulting in the creation
of localized jets and vortices. Maintenance of
stability within the water column thereby demands
control of both external and self-generated alterations
to the aquatic medium. Stability control requires
precise body and fin movements which will inevi-
tably create significant, albeit confined perturbations
in the water column (Drucker and Lauder, 2003).
These movements may provide one explanation for
the enhanced tank mixing process noted when fish
were present.
Videography undertaken during the present
experiments revealed that changes in flow regimes
resulted in red drum repositioning within the water
column. At low flow, fish expressed random move-
ment and direction, whereas at high flow, animals
relocated to positions near the tank base and close to
its wall; also, animals positioned in a unidirectional
manner, swimming against the flow. Theoretically,
changes in fish station, caused by higher flow rates,
could have reduced fish-tracer interactions which in
turn might have influenced mixing time and dis-
persion coefficient. Unequivocal is that the presence
of fish greatly enhanced tank mixing. Although the
data from this study illustrates the impact that fish
have upon tank hydrodynamics, it is noteworthy that
together with stocking density, tank design will also
impact fish hydrodynamics and their overall produc-
tion efficiency. The present study illustrated that fish
presence induced measurable and enhanced mixing
in circular tanks. Moreover, in-tank data acquisition
appeared superior to outlet measurements when
taking account of the impact of fish upon the mixing
process. Clearly, different stocking densities, fish
sizes and species will impart diverse influences upon
tank mixing processes and a more precise under-
standing of such impacts will assist in the design of
optimal species-specific rearing units.
ARTICLE IN PRESS
M.R. Rasmussen et al. / Aquaculture xx (2005) xxx–xxx12
Acknowledgements
MRR gratefully acknowledges sabbatical travel
support from the Danish Technical Research Council.
References
Anderson, E.J., McGillis, W.R., Grosenbaugh, M.A., 2001. The
boundary layer of swimming fish. Journal of Experimental
Biology 204, 81–102.
Azuma, T., Noda, S., Yada, T., Ototake, M., Nagoya, H., Moriyama,
S., Yamada, H., Nakanishi, T., Iwata, M., 2002. Profiles in
growth, smoltification, immune function and swimming per-
formance of 1-year-old masu salmon Oncorhynchus masou
masou reared in water flow. Fisheries Science 68, 1282–1294.
Blake, R.W., 2004. Fish functional design and swimming perform-
ance. Journal of Fish Biology 65, 1193–1222.
Breder, C.M., 1926. The locomotion of fishes. Zoologica 4,
159–296.
Burley, R., Klapsis, A., 1985. Flow distribution studies in fish
rearing tanks: Part 2. Analysis of the hydraulic performance of 1
square m tanks. Aquacultural Engineering 4, 113–134.
Burley, R., Klapsis, A., 1988. Making the most of your flow.
IchemE Symposium (111), 211–223 (in fish rearing tanks).
Burrows, R., Chenoweth, H., 1955. Evaluation of three types of fish
rearing ponds. US Fish and Wildlife Service Research Report
#39. 29 pp.
Burrows, R., Chenoweth, H., 1970. The rectangular circulating
rearing pond. Progressive Fish-Culturist 32, 67–80.
Cripps, S.J., Bergheim, A., 2000. Solids management and removal
for intensive land-based aquaculture production systems. Aqua-
cultural Engineering 22, 33–56.
Drucker, E.G., Lauder, G.V., 2003. Function of pectoral fins in
rainbow trout: behavioural repertoire and hydrodynamic forces.
Journal of Experimental Biology 206, 813–826.
Fisher, H.B., List, E.J., Koh, R.C.Y., Imberger, J., Brooks, N.H.,
1979. Mixing in Inland and Coastal Waters. Academic Press,
New York, USA. 483 pp.
Gaikowski, M.P., Larson, W.J., Steuer, J.J., Gingerich, W.H., 2004.
Validation of two dilution models to predict chloramine-T
concentrations in aquaculture facility effluent. Aquacultural
Engineering 30, 127–140.
Gjedrem, T., 1997. Selective breeding to improve aquaculture
production. World Aquaculture 28, 22–45.
Griffiths, S.W., Armstrong, J.D., 2000. Differential responses of
kin and nonkin salmon to patterns of water flow: does
recirculation influence aggression? Animal Behaviour 59,
1019–1023.
Hammer, C., Schwarz, G., 1994. The effect of endurance swimming
on growth, body composition and calorific content of 0-group
whiting (Merlangius merlangus, Gadidae). ICES Council Meet-
ing Papers, Copenhagen, Denmark. 16 pp.
Jones, M., Brown, T., 2000. Agricultural origins: the evidence of
modern and ancient DNA. Holocene 10, 769–776.
Jbrgensen, E.H., Jobling, M., 1993. The effects of exercise on
growth, food utilization and osmoregulatory capacity of
juvenile Atlantic salmon, Salmo salar. Aquaculture 116,
233–246.
Koolhaas, J.M., Korte, S.M., De Boer, S.F., Van Der Vegt, B.J., Van
Reener, G., Hopster, H., De Jong, I.C., Ruis, M.A.W., Blokhuis,
H.J., 1999. Coping styles in animals: current status in behavior
and stress-physiology. Neuroscience and Biobehavioral Reviews
23, 925–935.
Larmoyeux, J.D., Piper, R.G., Chenoweth, H.H., 1973. Evaluation
of circular tanks for salmonid production. Progressive Fish-
Culturist 35, 122–131.
Levenspiel, O., 1958. Longitudinal mixing of fluids flowing
in circular pipes. Industrial and Engineering Chemistry 50,
343–346.
Levenspiel, O., 1999. Chemical Reaction Engineering, 3rd edition.
John Wiley and Sons, New York, USA. 668 pp.
Liao, J.C., Beal, D.N., Lauder, G.V., Triantafyllou, M.S., 2003. Fish
exploiting vortices decrease muscle activity. Science 302,
1566–1569.
Odeh, M., Schrock, R.M., Gannam, A., 2003. Comparative
hydraulics of two fishery research circular tanks and recom-
mendations for control of experimental bias. Journal of Applied
Aquaculture 14, 1–23.
Pettersson, L.B., Hedenstrom, A., 2000. Energetics, cost reduc-
tion and functional consequences of fish morphology. Pro-
ceedings of the Royal Society Biological Sciences Series B 267,
759–764.
Price, E.O., 2002. Animal Domestication and Behavior. CABI
Pub, Wallingford, Oxon, UK. 297 pp.
Rasmussen, Michael R., McLean, Ewen, 2004. Comparison of two
different methods for evaluating the hydrodynamic perform-
ance of an industrial-scale fish-rearing unit. Aquaculture 242,
397–416.
Rasmussen, M.R., Laursen, J., McLean, E., 2004. Development of
efficient sludge cones for the concentration of raceway-derived
solids in recirculating aquaculture systems. In: Rakestraw, T.T.,
Douglas, L.S., Correa, A., Flick, G.J. (Eds.), Proceedings of the
5th International Conference on Recirculating Aquaculture,
Roanoke, VA, USA, July 22–25, 2004. Virginia SeaGrant
Publication 04-08, pp. 400–410.
Ross, R.M., Watten, B.J., Krise, W.F., DiLauro, M.N., 1995.
Influence of tank design and hydraulic loading on the behavior,
growth, and metabolism of rainbow trout (Oncorhynchus
mykiss). Aquacultural Engineering 14, 29–47.
Shoemaker, C.A., Evans, J.J., Klesius, P.H., 2000. Density and
dose: factors affecting mortality of Streptococcus iniae
infected tilapia (Oreochromis niloticus). Aquaculture 188,
229–235.
Shtaf, L.G., Pavlov, D.S., Skorobogatov, M.A., Barekyan, A.Sh.,
1983. The influence of flow turbulence on fish behavior. Journal
of Ichthyology 23, 129–140.
Skjblstrup, J., Nielsen, P.H., Frier, J.O., McLean, E., 1998. Novel
design to evaluate performance characteristics of fluidised bed
biofilters for production of rainbow trout in aquaculture
recirculation systems: nitrification rates, oxygen consumption
and sludge collection. Aquacultural Engineering 18, 265–276.
ARTICLE IN PRESS
M.R. Rasmussen et al. / Aquaculture xx (2005) xxx–xxx 13
Skjolstrup, J., McLean, E., Nielsen, P.H., Frier, J.O., 2000. The
influence of dietary oxilinic acid on fluidised bed biofilter
performance in a recirculation system for rainbow trout.
Aquaculture 183, 255–268.
Tytell, E.D.T., Lauder, G.V., 2004. The hydrodynamics of eel
swimming: I. Wake structure. Journal of Experimental Biology
207, 1825–1841.
Wagner, E.J., Jeppsen, T., Arndt, R., Routledge, M.D., Bradwisch,
Q., 1997. Effects of rearing density upon cutthroat trout
hematology, hatchery performance, fin erosion, and general
health and condition. Progressive Fish-Culturist 59, 173–187.
Watten, B.J., Beck, L.T., 1987. Comparative hydraulics of a
rectangular cross-flow rearing unit. Aquacultural Engineering
6, 127–140.
Watten, B.J., Honeyfield, D.C., Schwarts, M.F., 2000. Hydraulic
characteristics of a rectangular mixed-cell rearing unit. Aqua-
cultural Engineering 24, 59–73.
Webb, P.W., 2002. Control of posture, depth, and swimming
trajectories of fishes. Integrative and Comparative Biology 42,
94–101.
Weihs, D., 1973. Hydromechanics of fish schooling. Nature 241,
290–291.
Wheaton, F., 2002. Recirculating aquaculture systems: an
overview of waste management. In: Rakestraw, T.T., Doug-
las, L.S., Flick, G.J. (Eds.), Proceedings of the 4th International
Conference on Recirculating Aquaculture, Roanoke, VA,
USA, July 18–21, 2002. Virginia SeaGrant Publication 02-11,
pp. 57–68.