district statistical handbook
TRANSCRIPT
1
DISTRICT STATISTICAL HANDBOOK
2019-20
PUDUKKOTTAI
DISTRICT STATISTICAL OFFICE
DEPARTMENT OF ECONOMICS AND STATISTICS
PUDUKKOTTAI
Tmt.P.Uma Maheshwari I.A.S.,
District Collector,
Pudukkottai.
FOREWORD
I am very glad to inform that District Statistical Office is bringing out this
District Statistical Hand Book for the year 2019- 20. It is a long time felt need to
have a comprehensive information booklet on data pertaining to this district. This
information booklet provides extensive information on all vital statistical
information about Pudukkottai District including details like District Profile,
Population, Agriculture, Irrigation, Animal husbandry, Co-operation, Education
etc.
I take this opportunity to express my sincere thanks to all officers in this
district who have furnished the required data within the prescribed time limit for
coming out with such a useful and information Booklet.
I wish to record my appreciation for the sincere efforts taken by the
team of officers who have collected and compiled this relevant information, from
various sources. I am sure that this Hand book will help all types of stakeholders
to know and understand about the district and help them to contribute to the
development of the district in the area of concern they feel.
Station : Pudukkottai District Collector,
Date : Pudukkottai
OFFICERS AND STAFF ASSOCIATED WITH THIS PUBLICATION
Overall Guidance and Advisors
JAYASHREE RAGHUNANDAN,I.A.S., Additional Chief Secretary to Government,
Planning, Development and Special Initiative Department
Thiru. ATUL ANAND,I.A.S., Commissioner,
Department of Economics and Statistics, Chennai.
Tmt. P.UMA MAHESHWARI, I.A.S., District Collector, Pudukkottai.
TECHNICAL GUIDANCE
Thiru. V.MALAIRAJ,M.Sc., M.Phil., B.Ed.,
Regional Joint Director of Statistics, MADURAI.
Thiru. K. JAYASANKAR,M.A., Deputy Director of Statistics, Pudukkottai.
DATA PROCESSING UNIT
District Statistical Office Staffs, Pudukkottai.
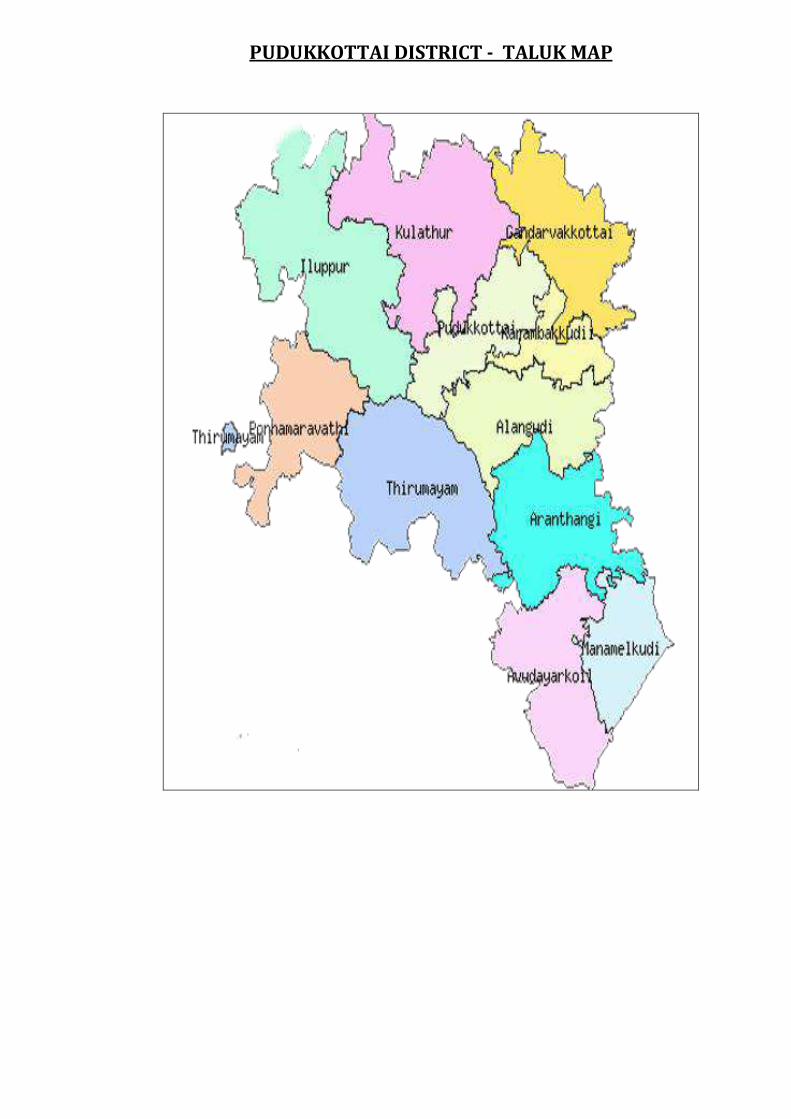
PUDUKKOTTAI DISTRICT - TALUK MAP
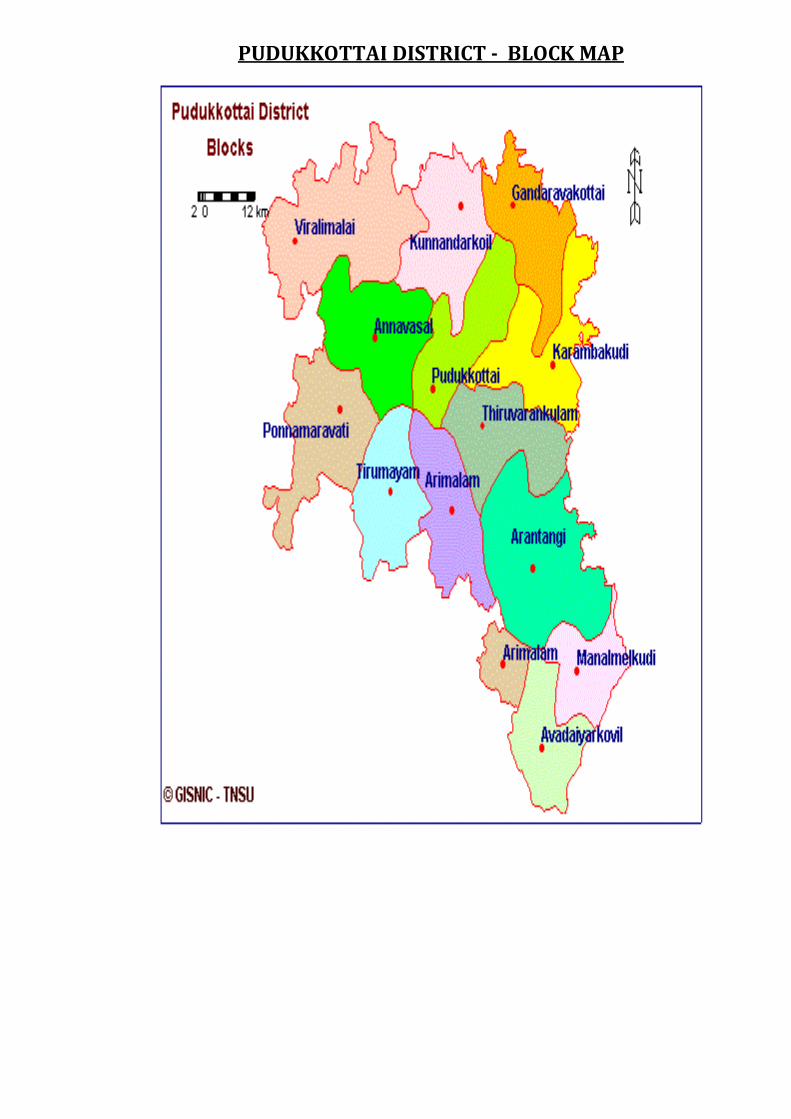
PUDUKKOTTAI DISTRICT - BLOCK MAP
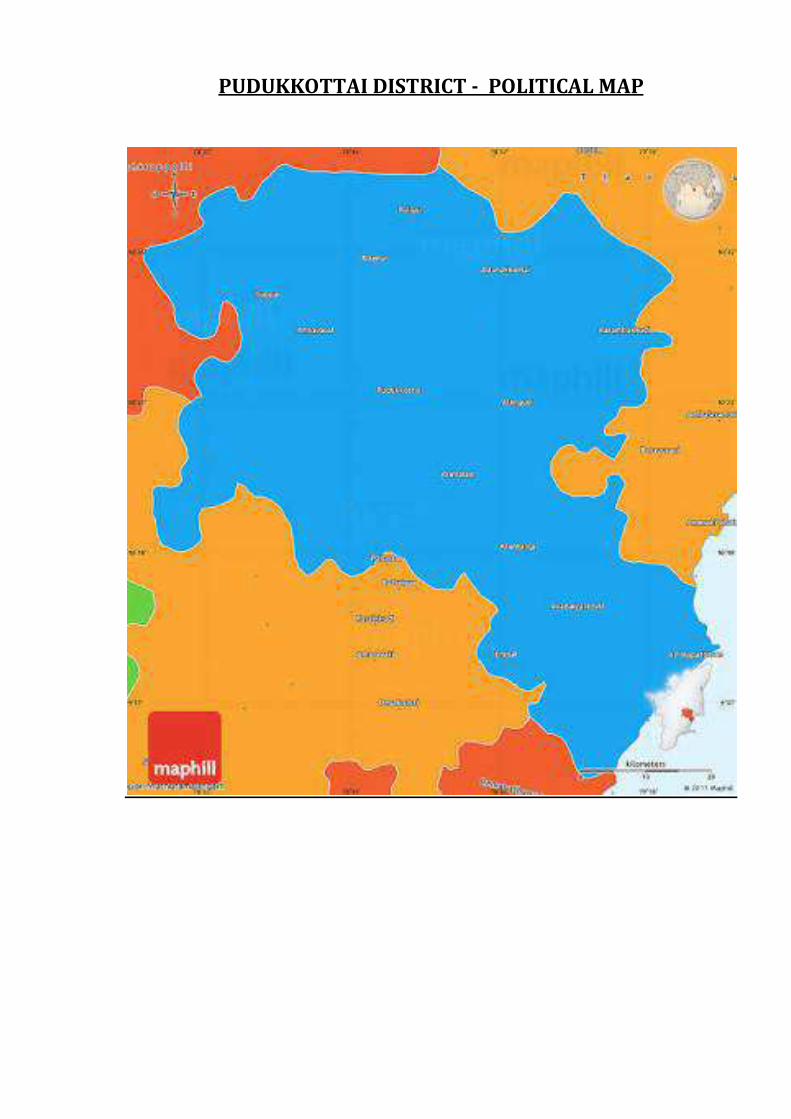
PUDUKKOTTAI DISTRICT - POLITICAL MAP
STATISTICAL TABLES
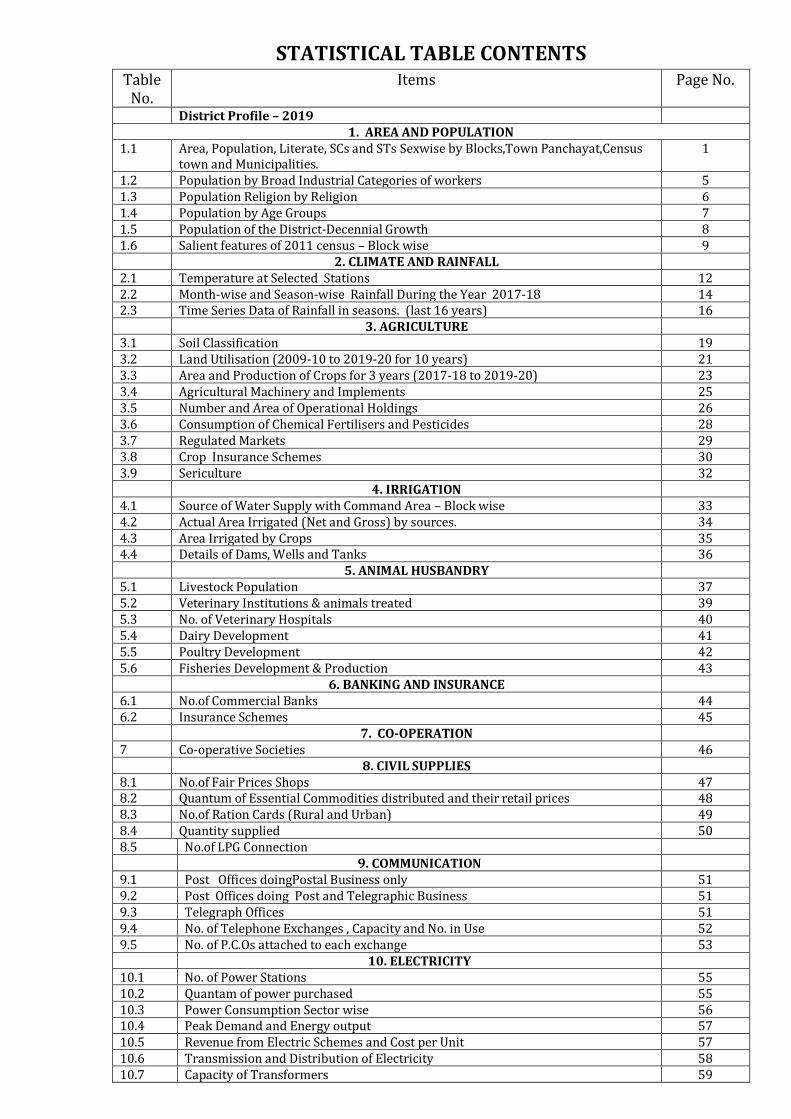
STATISTICAL TABLE CONTENTS Table
No. Items Page No.
District Profile – 2019 1. AREA AND POPULATION
1.1 Area, Population, Literate, SCs and STs Sexwise by Blocks,Town Panchayat,Census town and Municipalities.
1
1.2 Population by Broad Industrial Categories of workers 5 1.3 Population Religion by Religion 6 1.4 Population by Age Groups 7 1.5 Population of the District-Decennial Growth 8 1.6 Salient features of 2011 census – Block wise 9 2. CLIMATE AND RAINFALL 2.1 Temperature at Selected Stations 12 2.2 Month-wise and Season-wise Rainfall During the Year 2017-18 14 2.3 Time Series Data of Rainfall in seasons. (last 16 years) 16 3. AGRICULTURE 3.1 Soil Classification 19 3.2 Land Utilisation (2009-10 to 2019-20 for 10 years) 21 3.3 Area and Production of Crops for 3 years (2017-18 to 2019-20) 23 3.4 Agricultural Machinery and Implements 25 3.5 Number and Area of Operational Holdings 26 3.6 Consumption of Chemical Fertilisers and Pesticides 28 3.7 Regulated Markets 29 3.8 Crop Insurance Schemes 30 3.9 Sericulture 32 4. IRRIGATION 4.1 Source of Water Supply with Command Area – Block wise 33 4.2 Actual Area Irrigated (Net and Gross) by sources. 34 4.3 Area Irrigated by Crops 35 4.4 Details of Dams, Wells and Tanks 36 5. ANIMAL HUSBANDRY 5.1 Livestock Population 37 5.2 Veterinary Institutions & animals treated 39 5.3 No. of Veterinary Hospitals 40 5.4 Dairy Development 41 5.5 Poultry Development 42 5.6 Fisheries Development & Production 43 6. BANKING AND INSURANCE 6.1 No.of Commercial Banks 44 6.2 Insurance Schemes 45 7. CO-OPERATION 7 Co-operative Societies 46 8. CIVIL SUPPLIES 8.1 No.of Fair Prices Shops 47 8.2 Quantum of Essential Commodities distributed and their retail prices 48 8.3 No.of Ration Cards (Rural and Urban) 49 8.4 Quantity supplied 50 8.5 No.of LPG Connection 9. COMMUNICATION 9.1 Post Offices doingPostal Business only 51 9.2 Post Offices doing Post and Telegraphic Business 51 9.3 Telegraph Offices 51 9.4 No. of Telephone Exchanges , Capacity and No. in Use 52 9.5 No. of P.C.Os attached to each exchange 53 10. ELECTRICITY 10.1 No. of Power Stations 55 10.2 Quantam of power purchased 55 10.3 Power Consumption Sector wise 56 10.4 Peak Demand and Energy output 57 10.5 Revenue from Electric Schemes and Cost per Unit 57 10.6 Transmission and Distribution of Electricity 58 10.7 Capacity of Transformers 59
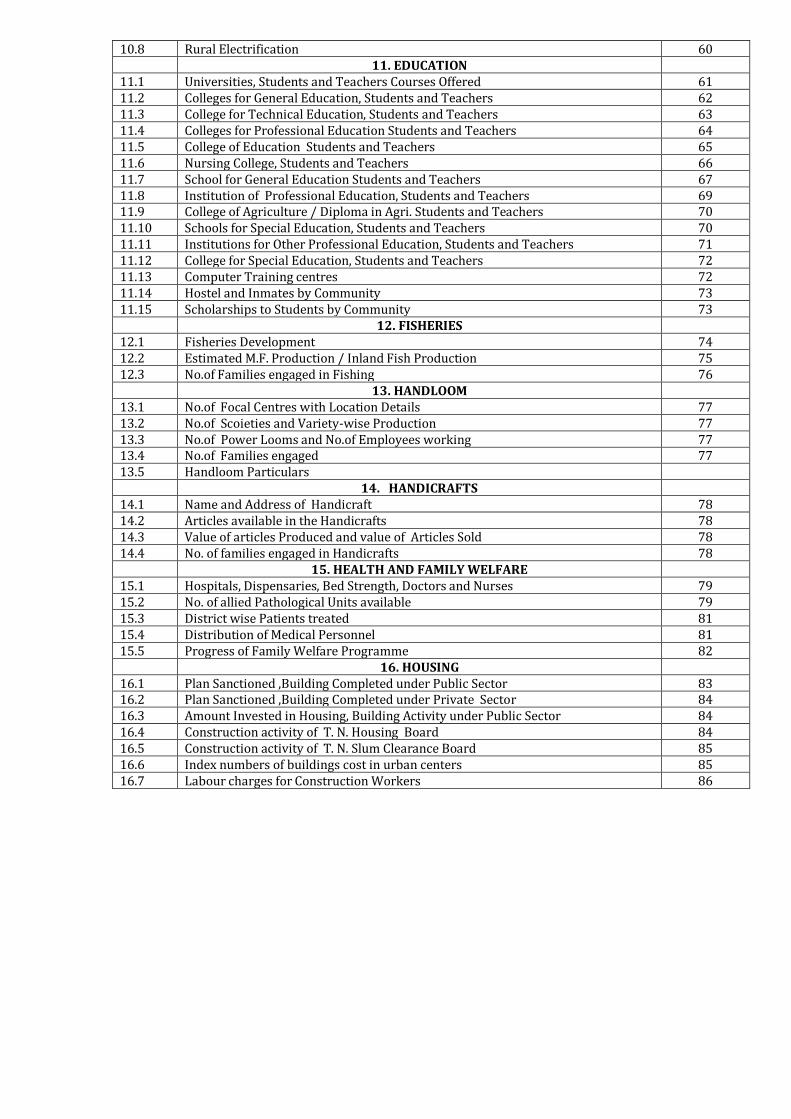
10.8 Rural Electrification 60 11. EDUCATION 11.1 Universities, Students and Teachers Courses Offered 61 11.2 Colleges for General Education, Students and Teachers 62 11.3 College for Technical Education, Students and Teachers 63 11.4 Colleges for Professional Education Students and Teachers 64 11.5 College of Education Students and Teachers 65 11.6 Nursing College, Students and Teachers 66 11.7 School for General Education Students and Teachers 67 11.8 Institution of Professional Education, Students and Teachers 69 11.9 College of Agriculture / Diploma in Agri. Students and Teachers 70 11.10 Schools for Special Education, Students and Teachers 70 11.11 Institutions for Other Professional Education, Students and Teachers 71 11.12 College for Special Education, Students and Teachers 72 11.13 Computer Training centres 72 11.14 Hostel and Inmates by Community 73 11.15 Scholarships to Students by Community 73 12. FISHERIES 12.1 Fisheries Development 74 12.2 Estimated M.F. Production / Inland Fish Production 75 12.3 No.of Families engaged in Fishing 76 13. HANDLOOM 13.1 No.of Focal Centres with Location Details 77 13.2 No.of Scoieties and Variety-wise Production 77 13.3 No.of Power Looms and No.of Employees working 77 13.4 No.of Families engaged 77 13.5 Handloom Particulars 14. HANDICRAFTS 14.1 Name and Address of Handicraft 78 14.2 Articles available in the Handicrafts 78 14.3 Value of articles Produced and value of Articles Sold 78 14.4 No. of families engaged in Handicrafts 78 15. HEALTH AND FAMILY WELFARE 15.1 Hospitals, Dispensaries, Bed Strength, Doctors and Nurses 79 15.2 No. of allied Pathological Units available 79 15.3 District wise Patients treated 81 15.4 Distribution of Medical Personnel 81 15.5 Progress of Family Welfare Programme 82 16. HOUSING 16.1 Plan Sanctioned ,Building Completed under Public Sector 83 16.2 Plan Sanctioned ,Building Completed under Private Sector 84 16.3 Amount Invested in Housing, Building Activity under Public Sector 84 16.4 Construction activity of T. N. Housing Board 84 16.5 Construction activity of T. N. Slum Clearance Board 85 16.6 Index numbers of buildings cost in urban centers 85 16.7 Labour charges for Construction Workers 86
17. INDUSTRIES 17.1 Results of Annual Survey of Industrirs 87 17.2 Estimates of Output and Value Added Manufacture Based on ASI 87 17.3 Industrial Production 87 17.4 Production of Handloom Cloth 87 17.5 Small Scale Industries 88 17.6 Khadi and Village Industries 90 17.7 No. of Photo Copy (Xerox) Centres 18. FACTORIES 18.1 Registered and Working Factories 91 18.2 Employment in Working Factories 91 18.3 Trade Unions, Industrial Disputes by Strikes, Lockout and Gheraos 92 19. LOCAL BODIES 19.1 Municipal Bodies Area and Population by Grades 93 19.2 Municipal Bodies By Taluks 93 19.3 Panchayat Union, Village, Town Panchayats 94 19.4 Revenue Divisions Taluks, Firkas and Revenue Villages 94 19.5 Tax Collected by Municipality / Panchayat Union / Town Panchayat 95 19.6 Rural Development Activities 96 20. LABOUR AND EMPLOYMENT 20.1 No.of Persons registered during the year and Total No.of Persons waiting upto the
end of the year as per Live Register 97
20.2 No. of Placements during and upto the end of the year 97 21. LEGAL SERVICE 21.1 Judicial Divisions and Original Jurisdiction 98 21.2 Results of Civil and Criminal Cases in the Court of Original Jurisdiction, Civil Suits,
Regular. 99
21.3 No. of advocates Practicing in Court 100 22. LIBRARIES 22.1 A
List of Head and Branch Libraries inthe district with details of Members, Books available and Readers
101
22.1 B No.of Libraries Branch Libraries, Village Libraries& Part time Libraries 103 22.1 C Rural Area Libraries 104 22.2 No.of Library houses in Government Building/ Rental Building 106 22.3 No. of reading rooms 107 23. MINING AND QUARRYING 23.1 No.of Mining and Quarrying units in the district. 108 23.2 Classification-wise production during the year 108 24. MANUFACTURING SECTOR 24.1 Number of Food and Allied Manucturing Units in the District 109 24.2 Number of Non Food Manucturing Units in the District 109 25. MEDICAL SERVICES 25.1 Number of Medicals Colleges in the District With Students and Teachers 110 25.2 No. of Pharmacy colleges with Students and Teachers 110 25.3 No. of Medical Stores in the District 110 25.4 Number of Veterinarycolleges in the District With Students and Teachers 110 26. MOTOR VEHICLES 26.1 No.of Motor Vehicles (Category-wise) Registered during the year and upto the end
of the year. 111
26.2 No.of Motor Vehicles (Category-wise) available for hire purpose during the year 113 26.3 No. of persons issued with Driving Licenses 113 27. NON-CONVENTIONAL ENERGY GENERATION 27.1 No of Solar Energy Generating Units in the District with Production Data 114 27.2 No of Wind Mills Generating Units with Production Data 114
28. POLICE AND PRISONS 28.1 Police Force 115 28.2 Cognizable offences under Indian Penal Code 116 28.3A Prisons and Convicts 117 28.3B Classification of Convicts 117 28.4 No.of Cases Registered under PCR 118 28.5 No. of Cases Registers against Women Harrassment and Dowry 119
29. PUBLIC HEALTH 29.1 Public Health and Medical Services rendered by Organisations and Individuals 120 29.2 No. of Primary Health Centres with sub centres 121 30. PRINTING AND PUBLICATIONS 30.1 No. of Newspapers , Weekly Magazines, Monthly Magazines etc., Published 122 30.2 No.of Puplishers in the District Otherthan Newspapers and Magazines 122 30.3 No. of. Printing Presses in the District 122 31. PRICE INDICES 31.1 Whole sale Price Index numbers- Tamilnadu 123 31.2 Consumer Price Index Numbers for Industrial Workers 125 31.3 Consumer Price Index for Rural,Urban and Combined 127 31.4A All India Consumer Price Index Numbers for Industrial Workers 129 31.4B Consumer Price Index Numbers for Selected Essential Items inRural Tamilnadu 130 31.4C Consumer Price Index Numbers for Selected Essential Items inRural Tamilnadu 131 31.4D Consumer Price Index Numbers for Selected Essential Items inRural Tamilnadu 132 31.4E Consumer Price Index Numbers for Selected Essential Items inRural Tamilnadu 133 32. QUALITY CONTROL 32.1 List of Industrial/Establishment Units having Quality Control Facilities and the
Products subjected to Quality Control 134
33. REGISTRATION 33.1 No.of Registration Offices in the district 135 33.2 Registration and Aggregate Value of properties transferred during the year 135
34. REPAIR AND SERVICES 34.1 Authorised Automobiles Repair and Service Stations 136 34.2 Authorised Electrical and Electronic goods Repair and Service Units 136 35. RESTAURANTS AND HOTELS 35.1 Restaurants, Cafes and Other Eating and Drinking Places 137 35.2 Details of Hotels 137 36. RECREATION AND CULTURAL SERVICES 36.1 List of Cinema Theatres 138 36.2 List of Clubs and Associations 139 36.3 List of Motion Picture distributors and Projection Services 139 37. SOCIAL WELFARE 37.1 Puratchi Thalaivar MGR Nutritious Meals Programme Centres 140 37.2 No.of Beneficiaries under Puratchi Thalaivar MGR Nutrious Meals 140 37.3 No.of Beneficiaries under the free supply of Text Books and Uniforms 141 37.4 No.of Beneficiaries under Old Age Pension Scheme 142 37.5 Free Houses and House sites distributed to community 142 37.6 Implementation of various Relief Measures and Pension Schemes in the District 143
38. SANITARY SERVICES 38.1 No.of Sanitary Workers engaged in Sanitation, Garbage and Sewage disposal and
other particulars. 144
38.2 No. of Vehicles engaged in Sanitary Services 144 39. SCIENTIFIC AND RESEARCH CENTRE 39 Institution and Laboratories Engaged in Research Field 145 40.STORAGE FACILITIES 40.1 List of Agricultural and Non Agricultural Storage Godowns 146 40.2 List of Cold Storage Godowns 146 41. TEXTILES 41 No.of Ginning, Spinning and Weaving Mills in the district 147 42. TRADE AND COMMERCE 42 No of Major and Minor Trade and Commercial Estate 148 43. TRANSPORT 43.1 Length of Roads 149 43.2 Road Accidents 150 43.3 Transport Corporation 151 43.4 Selected indicators of overall performance of State TransportCorporation 151 43.5 Railway Lines and Stations 152 43.6 Private Transport Operations 153 44. TOURISM 44.1 Places of Tourist Attraction 154 44.2 List of Places of Worship 155 44.3 List of Hotels and Restaurants 156 44.4 List of Travel Agents 158 44.5 Train Service Timings 159 45. VITAL STATISTICS 45.1 Birth and Death registered in the district 160 45.2 Birth , Death and Infant Mortality rates in the District 161 45.3 Death of causes 162 46. VOLUNTARY SERVICES 46 List of voluntary Services available in the district for the development of Rural and
Urban Population 163
47. WATER WORK AND SUPPLY 47.1 No.of House’s water connections, Fountains. 164 47.2 Sources of Water Supply in Municipal Areas 165 48. FOREST 48 Area and out-turn of Forest Produce 166
A PORTRAIT OF PUDUKKOTTAI DISTRICT
A Slice of History
Being home to the pre-historic man, as evidenced by the presence of a large
number of burial sites, the district is a treasure trove of antiquities, monuments, epigraphs
and archeological sites. The district teems with vestiges of the oldest habitations of man
and some of the lithic records known in the south. It finds mention in Sangam Tamil
literature with names such as Oliyamangalam (Thirumayam Taluk), Ollaiyur in
Purananuru, Ambukkovil or Alumbil in Agananuru; Avur the home of the poets Avurkilar,
Avur Mulamkilar; Erichi or Erichalur and several villages with Chola suffixes like Killi,
Sembiam, Valavan etc.
From Coins to Currency
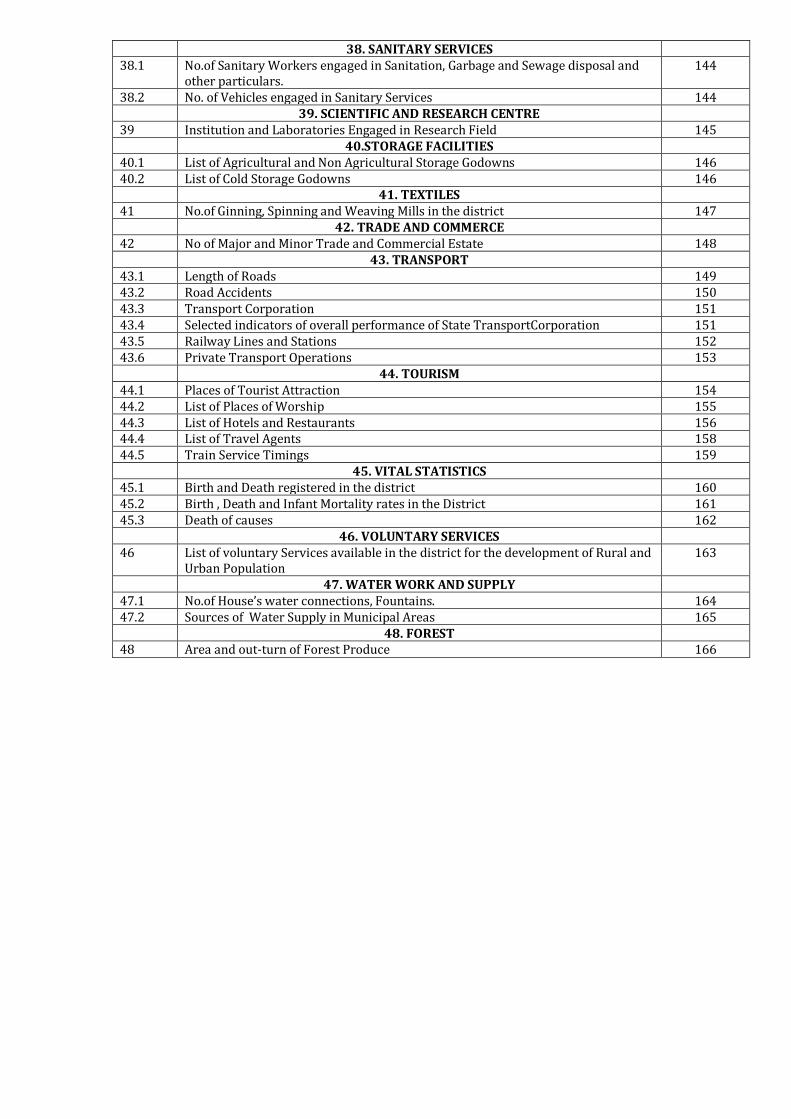
Numismatically, the district is a repository to the
flourishing prosperity of the maritime trade of the
Tamils as borne by the finds at Karukkakurichi,
which had more than 500 Imperial Roman Gold and
Silver Coins, the largest ever recorded from a single
hoard. It contained the coins issued by the Roman
emperors and their queens, successively from
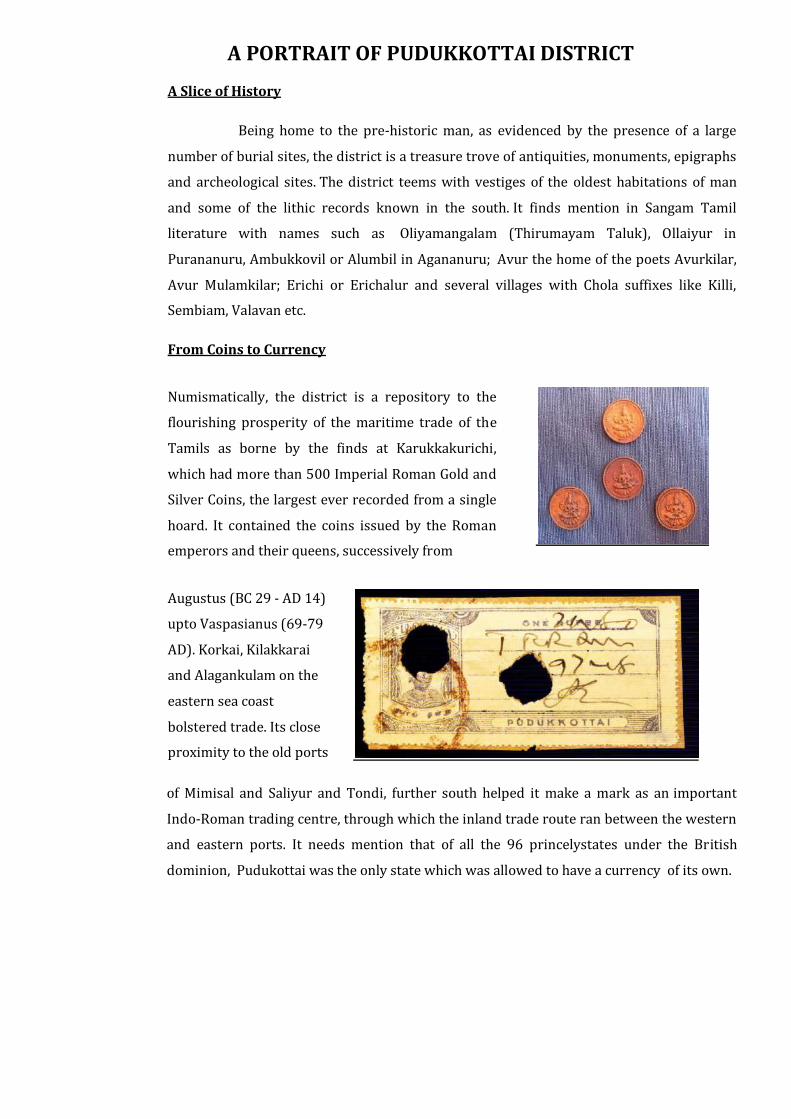
Augustus (BC 29 - AD 14)
upto Vaspasianus (69-79
AD). Korkai, Kilakkarai
and Alagankulam on the
eastern sea coast
bolstered trade. Its close
proximity to the old ports
of Mimisal and Saliyur and Tondi, further south helped it make a mark as an important
Indo-Roman trading centre, through which the inland trade route ran between the western
and eastern ports. It needs mention that of all the 96 princelystates under the British
dominion, Pudukottai was the only state which was allowed to have a currency of its own.
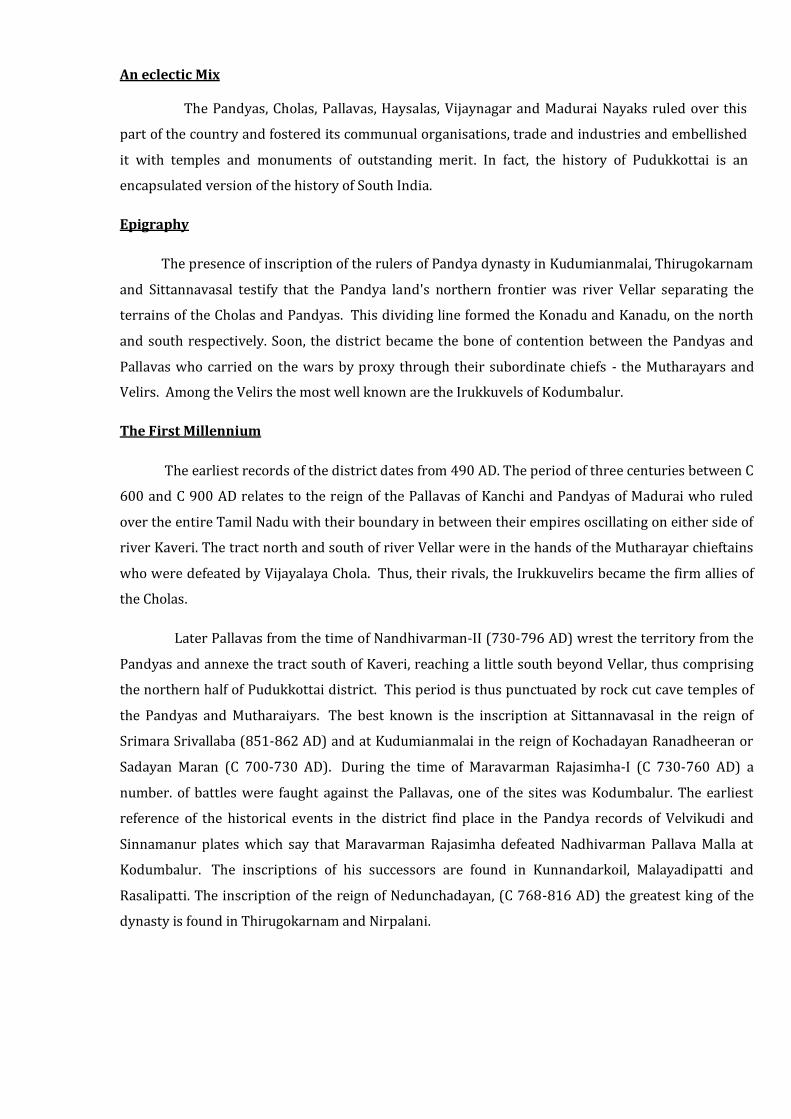
An eclectic Mix
The Pandyas, Cholas, Pallavas, Haysalas, Vijaynagar and Madurai Nayaks ruled over this
part of the country and fostered its communual organisations, trade and industries and embellished
it with temples and monuments of outstanding merit. In fact, the history of Pudukkottai is an
encapsulated version of the history of South India.
Epigraphy
The presence of inscription of the rulers of Pandya dynasty in Kudumianmalai, Thirugokarnam
and Sittannavasal testify that the Pandya land's northern frontier was river Vellar separating the
terrains of the Cholas and Pandyas. This dividing line formed the Konadu and Kanadu, on the north
and south respectively. Soon, the district became the bone of contention between the Pandyas and
Pallavas who carried on the wars by proxy through their subordinate chiefs - the Mutharayars and
Velirs. Among the Velirs the most well known are the Irukkuvels of Kodumbalur.
The First Millennium
The earliest records of the district dates from 490 AD. The period of three centuries between C
600 and C 900 AD relates to the reign of the Pallavas of Kanchi and Pandyas of Madurai who ruled
over the entire Tamil Nadu with their boundary in between their empires oscillating on either side of
river Kaveri. The tract north and south of river Vellar were in the hands of the Mutharayar chieftains
who were defeated by Vijayalaya Chola. Thus, their rivals, the Irukkuvelirs became the firm allies of
the Cholas.
Later Pallavas from the time of Nandhivarman-II (730-796 AD) wrest the territory from the
Pandyas and annexe the tract south of Kaveri, reaching a little south beyond Vellar, thus comprising
the northern half of Pudukkottai district. This period is thus punctuated by rock cut cave temples of
the Pandyas and Mutharaiyars. The best known is the inscription at Sittannavasal in the reign of
Srimara Srivallaba (851-862 AD) and at Kudumianmalai in the reign of Kochadayan Ranadheeran or
Sadayan Maran (C 700-730 AD). During the time of Maravarman Rajasimha-I (C 730-760 AD) a
number. of battles were faught against the Pallavas, one of the sites was Kodumbalur. The earliest
reference of the historical events in the district find place in the Pandya records of Velvikudi and
Sinnamanur plates which say that Maravarman Rajasimha defeated Nadhivarman Pallava Malla at
Kodumbalur. The inscriptions of his successors are found in Kunnandarkoil, Malayadipatti and
Rasalipatti. The inscription of the reign of Nedunchadayan, (C 768-816 AD) the greatest king of the
dynasty is found in Thirugokarnam and Nirpalani.
Religious History
This was the age of Tamil Bhakthi Movement. The Thevaram lists several temples in the
district. The three Nayanmars from this district were, Idangalinayanar of Kodumbalur, Perumizhalai
Kurumbanayanar associated with Devarmalai and Kulachirai Nayanar of Manamelgudi. Jainism had
flourished in Pudukkottai area up to 11th century as seen by a large number of Jaina vestiges in the
district. Buddha idols are also found in Kottaipattinam and Karur.
Administrational Acumen
The rule of Rajaraja-I is revealed through the inscriptions detailing how effectively local
administration functioned in this part of Chola Kingdom. The entire district formed part of the Chola
kingdom until the last year of Kulothunga-III (1178-1218 AD). Post the death of Rajaraja-II and the
succession of Rajadhiraja-II, the Chola power started nosediving. Towards the end of the reign of
Raja Raja-II, Kulasekara one of the two contenders for Pandya throne appealed to the Cholas for
help. His rival Parakrama sought the support of the Srilanka king and the outcome became
disastrous for the Cholas. According to Culavamsa, the Sinhalese chronicle, their army engaged itself
in the war in the parts of the district and burnt down the three storied palace at Ponnamaravathi.
Historical Inscriptions
As per the inscription of Virapandya in Kudumianmalai, the Pandya power was at its
height in the district under Jatavarman Sundra Pandya-I and Jatavaraman vira Pandya-I, the joint
rulers. During the reign of Maravarman Kulasekara-I who acceded in 1268 A.D, Marco polo the
Venetian traveler visited Pandya country. Around the fag end of Kulasekara's reign, the brothers
Jatavarman Virapandya-II and Jatavarman Sundara Pandya-II, quarreled. Malikafur the general of
Alaudeen Khilji, the Sultan of Delhi took advantage of this and invaded Pandya country. This led to
the establishment of a Sultanate at Madurai. There are two inscriptions relating to the period of the
Sultans of Madurai in the district, one at Rangiam (1332 AD) and another at Panaiyur (1344 A.D).
A mélange of rulers
The brief spell of Muslim rule by the Sultanate of Madurai lasted for about 75 years. Minor
princes ruled small territories and around 1371 AD. Kumarakampana, the Vijayanagar prince took
over Madurai and the Sultanate came to an end.
The Vijayanagar Rajas centered in Hampi took over Madurai and the whole of South India during the
13th Century. The inscriptions in the district refer to many local chiefs such as Suraikudi,Perambur,
Sendavanmangalam, Vanadaraiyar, Gangaiaraiyar and Thondaimans of Aranthangi. During the brief Tuluva
rule (1485-1505 A.D) Narasimha Raya the first Tuluva emperor, during a tour of his dominions passed
through
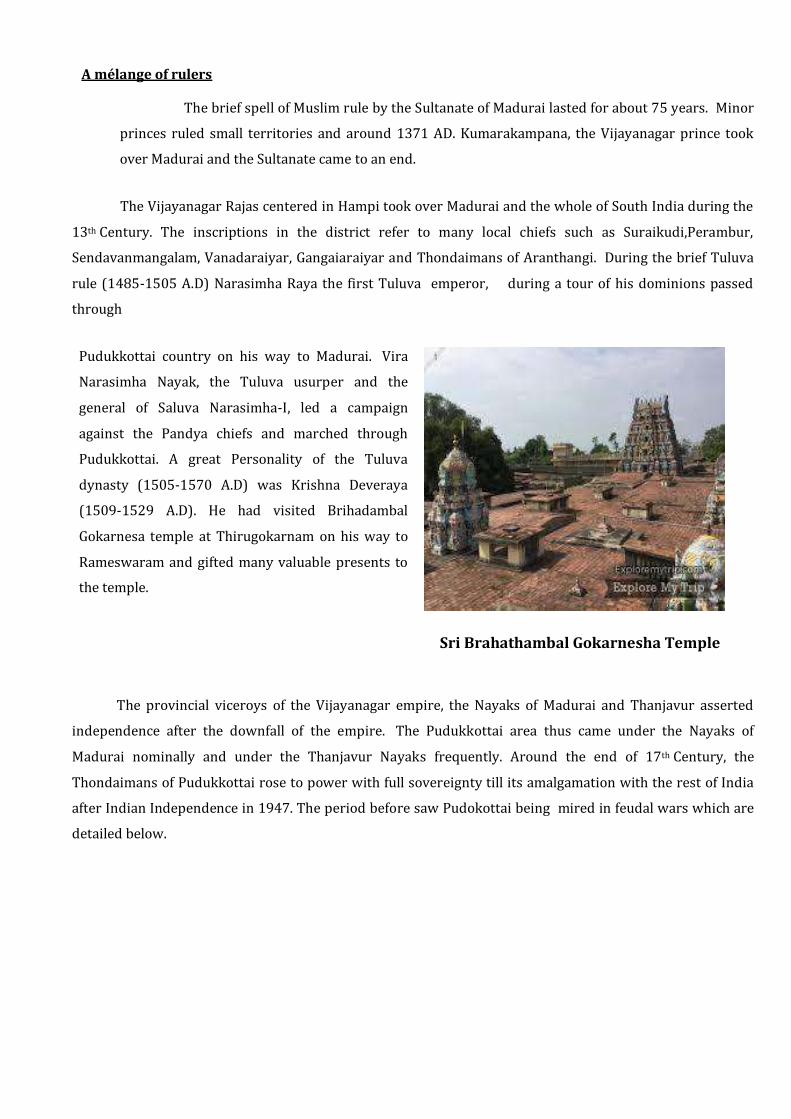
Pudukkottai country on his way to Madurai. Vira
Narasimha Nayak, the Tuluva usurper and the
general of Saluva Narasimha-I, led a campaign
against the Pandya chiefs and marched through
Pudukkottai. A great Personality of the Tuluva
dynasty (1505-1570 A.D) was Krishna Deveraya
(1509-1529 A.D). He had visited Brihadambal
Gokarnesa temple at Thirugokarnam on his way to
Rameswaram and gifted many valuable presents to
the temple.
Sri Brahathambal Gokarnesha Temple
The provincial viceroys of the Vijayanagar empire, the Nayaks of Madurai and Thanjavur asserted
independence after the downfall of the empire. The Pudukkottai area thus came under the Nayaks of
Madurai nominally and under the Thanjavur Nayaks frequently. Around the end of 17th Century, the
Thondaimans of Pudukkottai rose to power with full sovereignty till its amalgamation with the rest of India
after Indian Independence in 1947. The period before saw Pudokottai being mired in feudal wars which are
detailed below.
British Intervention
The famous war of succession to the office of Nawab of Carnatic between Mohamad Ali and
Chanda Sahib, became in due course a war of supremacy between the English and the French in South
India which resulted in the Carnatic wars. The French supported the cause of Chanda Sahib while the
English were on the side of Mohamed Ali. The war lasted for many years mainly around
Tiruchirappalli. The Thondaiman was firmly on the side of the English while the rulers like
Thanjavur Marathas wavered. At last the English emerged as the masters of this land. This firm help
of the Thondaiman to the English was rewarded by the exemption of tribute by the victorious Nawab
and later this was continued by the English.
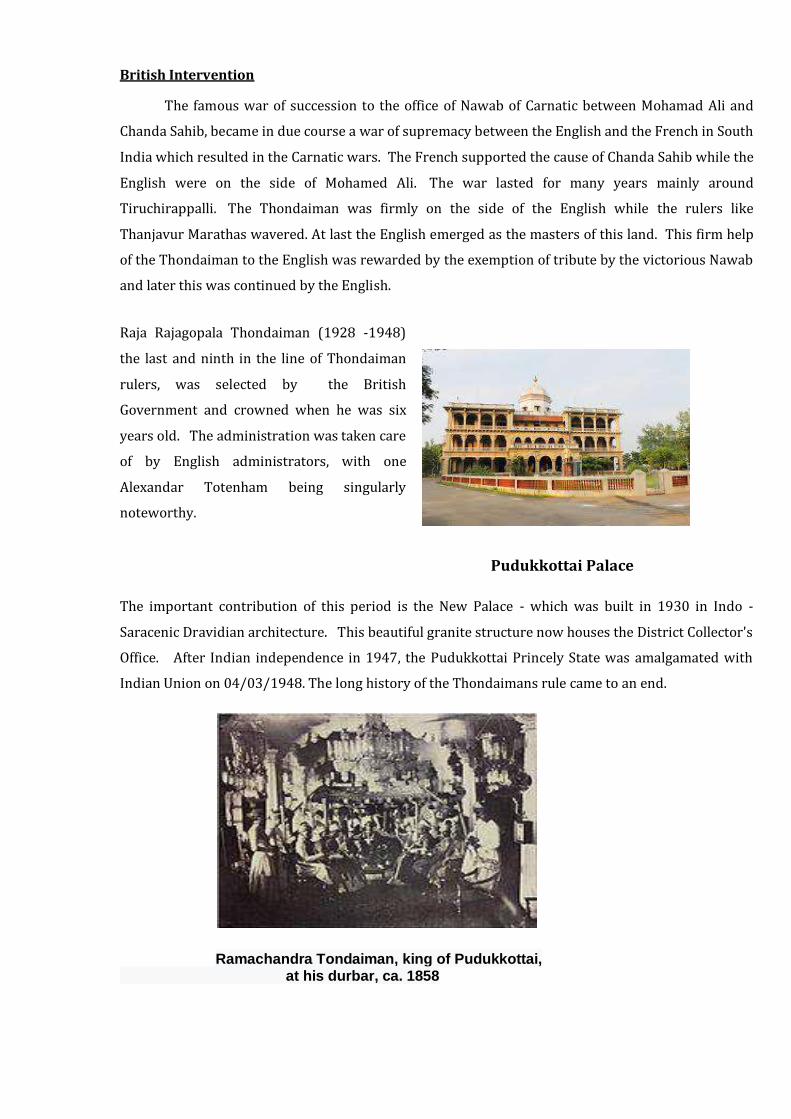
Raja Rajagopala Thondaiman (1928 -1948)
the last and ninth in the line of Thondaiman
rulers, was selected by the British
Government and crowned when he was six
years old. The administration was taken care
of by English administrators, with one
Alexandar Totenham being singularly
noteworthy.
Pudukkottai Palace
The important contribution of this period is the New Palace - which was built in 1930 in Indo -
Saracenic Dravidian architecture. This beautiful granite structure now houses the District Collector's
Office. After Indian independence in 1947, the Pudukkottai Princely State was amalgamated with
Indian Union on 04/03/1948. The long history of the Thondaimans rule came to an end.
Ramachandra Tondaiman, king of Pudukkottai, at his durbar, ca. 1858
HISTORICAL ARCHITECTURAL MONUMENTS
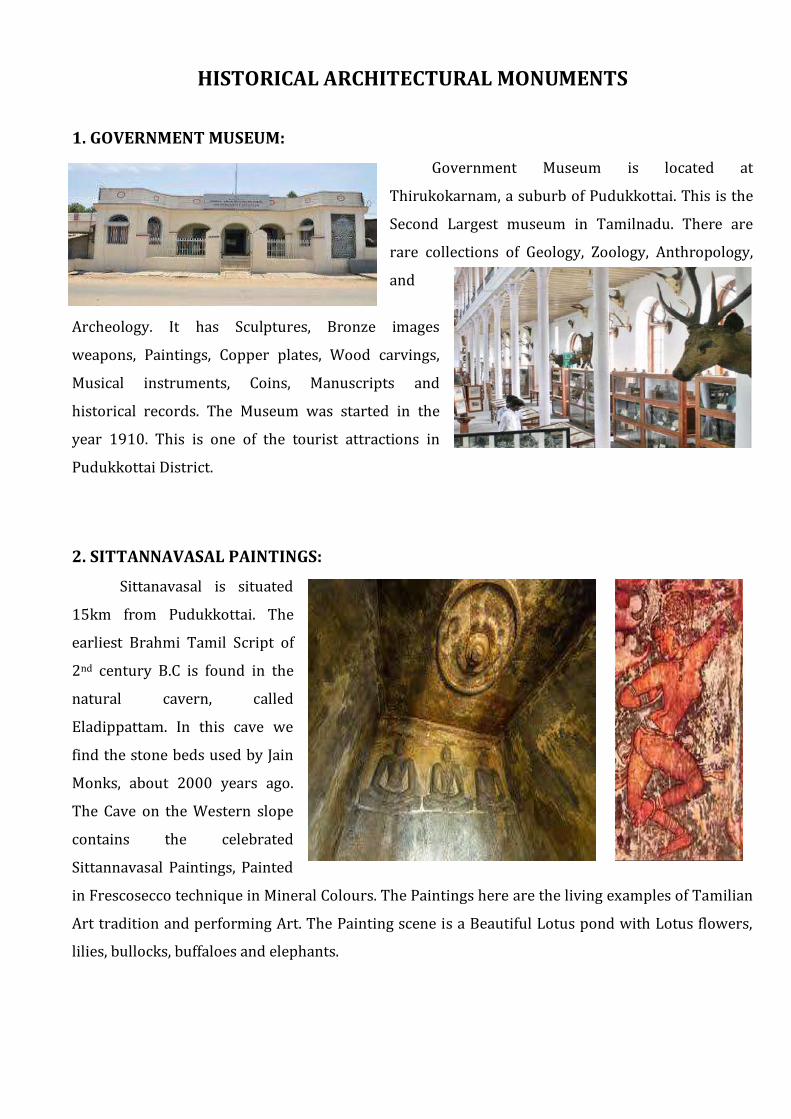
1. GOVERNMENT MUSEUM:
Government Museum is located at
Thirukokarnam, a suburb of Pudukkottai. This is the
Second Largest museum in Tamilnadu. There are
rare collections of Geology, Zoology, Anthropology,
and
Archeology. It has Sculptures, Bronze images
weapons, Paintings, Copper plates, Wood carvings,
Musical instruments, Coins, Manuscripts and
historical records. The Museum was started in the
year 1910. This is one of the tourist attractions in
Pudukkottai District.
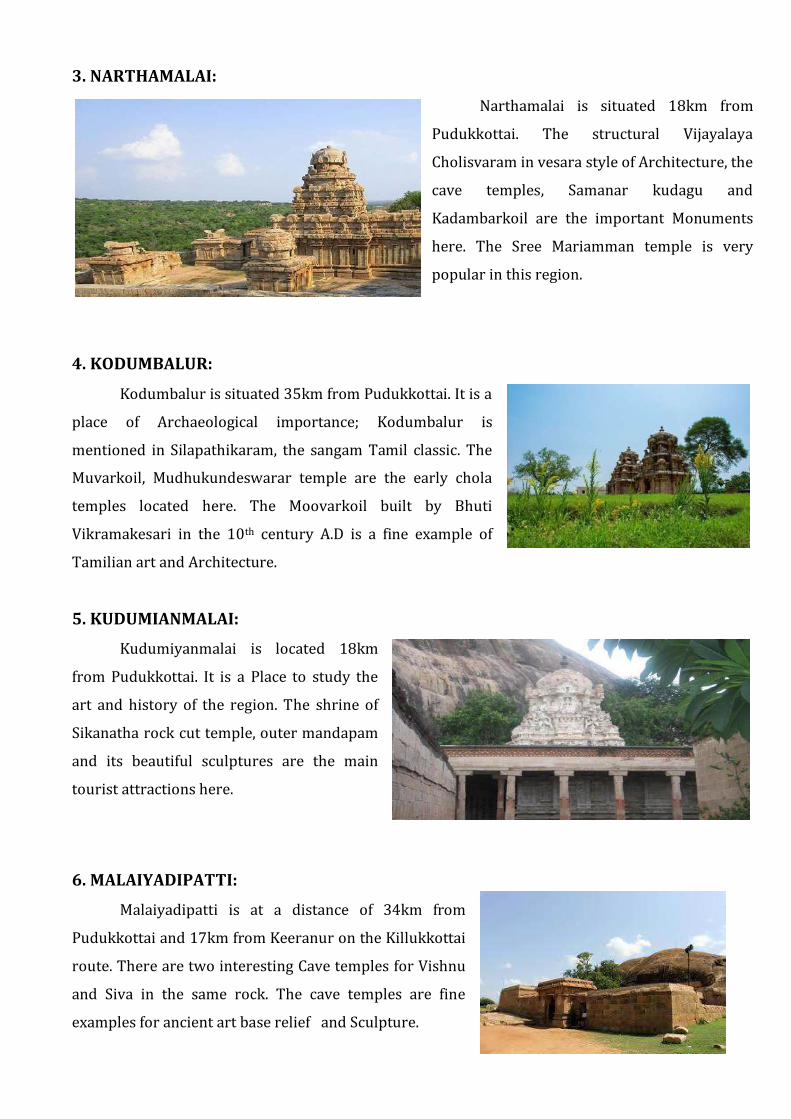
2. SITTANNAVASAL PAINTINGS:
Sittanavasal is situated
15km from Pudukkottai. The
earliest Brahmi Tamil Script of
2nd century B.C is found in the
natural cavern, called
Eladippattam. In this cave we
find the stone beds used by Jain
Monks, about 2000 years ago.
The Cave on the Western slope
contains the celebrated
Sittannavasal Paintings, Painted
in Frescosecco technique in Mineral Colours. The Paintings here are the living examples of Tamilian
Art tradition and performing Art. The Painting scene is a Beautiful Lotus pond with Lotus flowers,
lilies, bullocks, buffaloes and elephants.
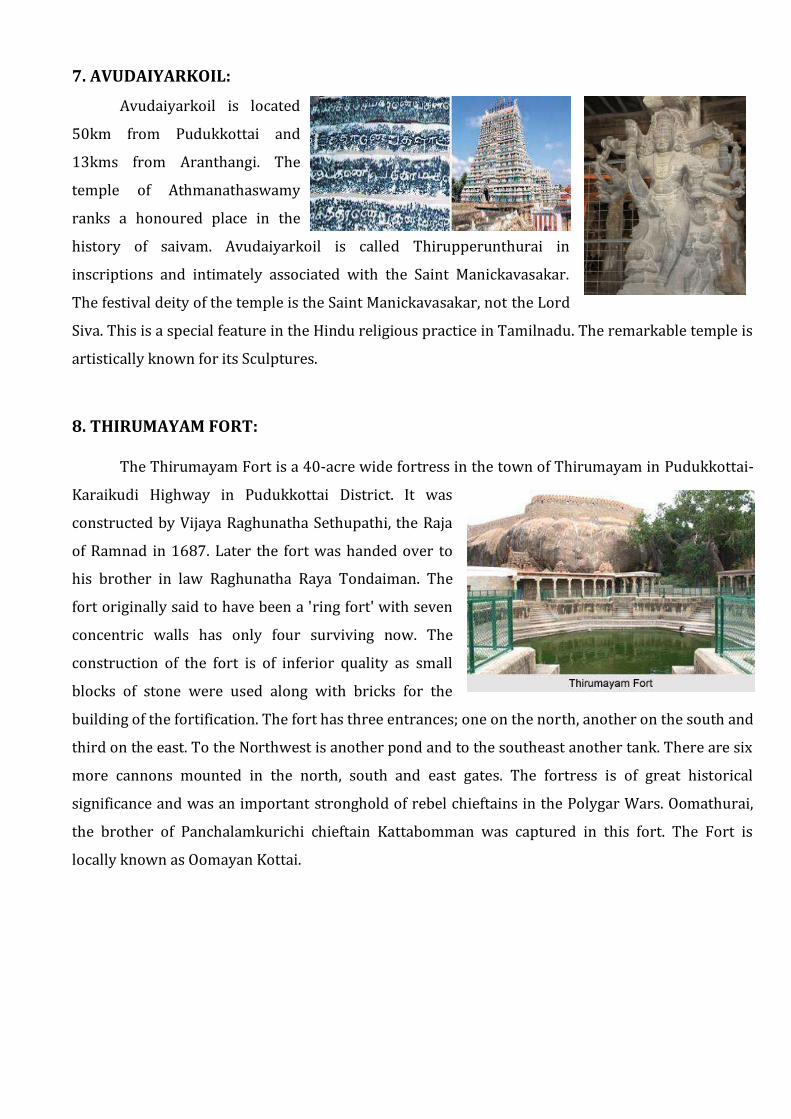
3. NARTHAMALAI:
Narthamalai is situated 18km from
Pudukkottai. The structural Vijayalaya
Cholisvaram in vesara style of Architecture, the
cave temples, Samanar kudagu and
Kadambarkoil are the important Monuments
here. The Sree Mariamman temple is very
popular in this region.
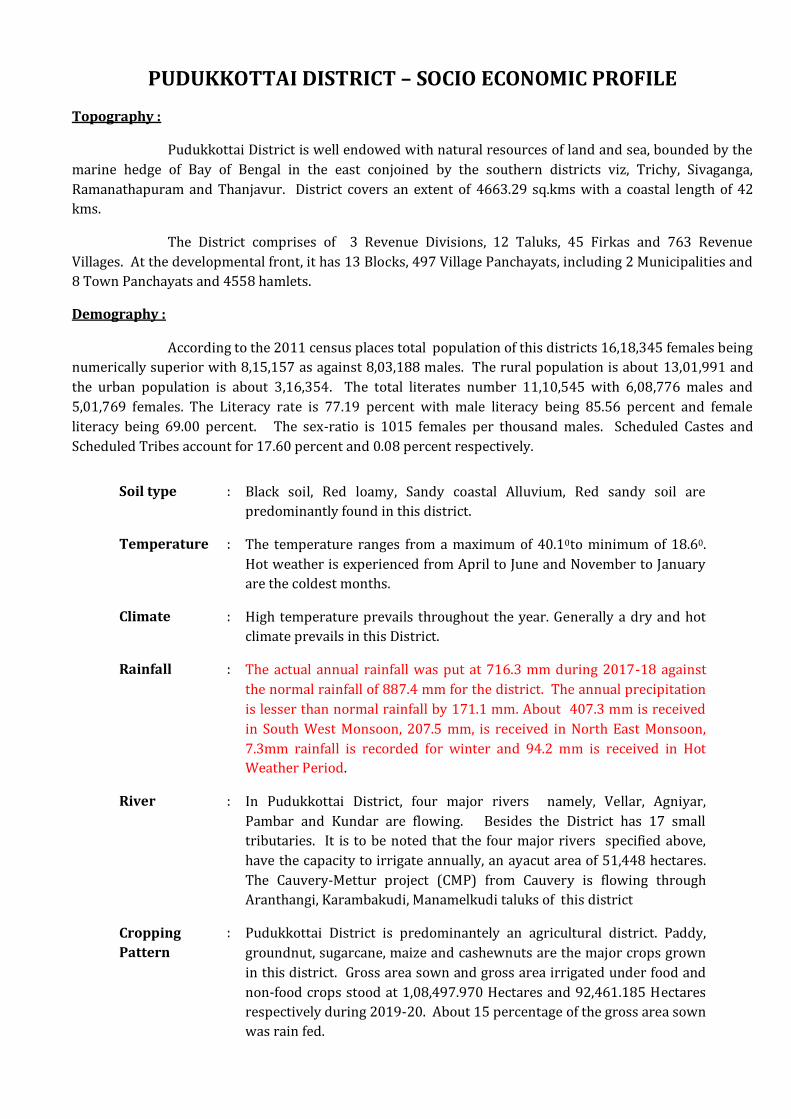
4. KODUMBALUR:
Kodumbalur is situated 35km from Pudukkottai. It is a
place of Archaeological importance; Kodumbalur is
mentioned in Silapathikaram, the sangam Tamil classic. The
Muvarkoil, Mudhukundeswarar temple are the early chola
temples located here. The Moovarkoil built by Bhuti
Vikramakesari in the 10th century A.D is a fine example of
Tamilian art and Architecture.
5. KUDUMIANMALAI:
Kudumiyanmalai is located 18km
from Pudukkottai. It is a Place to study the
art and history of the region. The shrine of
Sikanatha rock cut temple, outer mandapam
and its beautiful sculptures are the main
tourist attractions here.
6. MALAIYADIPATTI:
Malaiyadipatti is at a distance of 34km from
Pudukkottai and 17km from Keeranur on the Killukkottai
route. There are two interesting Cave temples for Vishnu
and Siva in the same rock. The cave temples are fine
examples for ancient art base relief and Sculpture.
7. AVUDAIYARKOIL:
Avudaiyarkoil is located
50km from Pudukkottai and
13kms from Aranthangi. The
temple of Athmanathaswamy
ranks a honoured place in the
history of saivam. Avudaiyarkoil is called Thirupperunthurai in
inscriptions and intimately associated with the Saint Manickavasakar.
The festival deity of the temple is the Saint Manickavasakar, not the Lord
Siva. This is a special feature in the Hindu religious practice in Tamilnadu. The remarkable temple is
artistically known for its Sculptures.
8. THIRUMAYAM FORT:
The Thirumayam Fort is a 40-acre wide fortress in the town of Thirumayam in Pudukkottai-
Karaikudi Highway in Pudukkottai District. It was
constructed by Vijaya Raghunatha Sethupathi, the Raja
of Ramnad in 1687. Later the fort was handed over to
his brother in law Raghunatha Raya Tondaiman. The
fort originally said to have been a 'ring fort' with seven
concentric walls has only four surviving now. The
construction of the fort is of inferior quality as small
blocks of stone were used along with bricks for the
building of the fortification. The fort has three entrances; one on the north, another on the south and
third on the east. To the Northwest is another pond and to the southeast another tank. There are six
more cannons mounted in the north, south and east gates. The fortress is of great historical
significance and was an important stronghold of rebel chieftains in the Polygar Wars. Oomathurai,
the brother of Panchalamkurichi chieftain Kattabomman was captured in this fort. The Fort is
locally known as Oomayan Kottai.
PUDUKKOTTAI DISTRICT – SOCIO ECONOMIC PROFILE
Topography :
Pudukkottai District is well endowed with natural resources of land and sea, bounded by the
marine hedge of Bay of Bengal in the east conjoined by the southern districts viz, Trichy, Sivaganga,
Ramanathapuram and Thanjavur. District covers an extent of 4663.29 sq.kms with a coastal length of 42
kms.
The District comprises of 3 Revenue Divisions, 12 Taluks, 45 Firkas and 763 Revenue
Villages. At the developmental front, it has 13 Blocks, 497 Village Panchayats, including 2 Municipalities and
8 Town Panchayats and 4558 hamlets.
Demography :
According to the 2011 census places total population of this districts 16,18,345 females being
numerically superior with 8,15,157 as against 8,03,188 males. The rural population is about 13,01,991 and
the urban population is about 3,16,354. The total literates number 11,10,545 with 6,08,776 males and
5,01,769 females. The Literacy rate is 77.19 percent with male literacy being 85.56 percent and female
literacy being 69.00 percent. The sex-ratio is 1015 females per thousand males. Scheduled Castes and
Scheduled Tribes account for 17.60 percent and 0.08 percent respectively.
Soil type : Black soil, Red loamy, Sandy coastal Alluvium, Red sandy soil are
predominantly found in this district.
Temperature : The temperature ranges from a maximum of 40.10to minimum of 18.60.
Hot weather is experienced from April to June and November to January
are the coldest months.
Climate : High temperature prevails throughout the year. Generally a dry and hot
climate prevails in this District.
Rainfall : The actual annual rainfall was put at 716.3 mm during 2017-18 against
the normal rainfall of 887.4 mm for the district. The annual precipitation
is lesser than normal rainfall by 171.1 mm. About 407.3 mm is received
in South West Monsoon, 207.5 mm, is received in North East Monsoon,
7.3mm rainfall is recorded for winter and 94.2 mm is received in Hot
Weather Period.
River : In Pudukkottai District, four major rivers namely, Vellar, Agniyar,
Pambar and Kundar are flowing. Besides the District has 17 small
tributaries. It is to be noted that the four major rivers specified above,
have the capacity to irrigate annually, an ayacut area of 51,448 hectares.
The Cauvery-Mettur project (CMP) from Cauvery is flowing through
Aranthangi, Karambakudi, Manamelkudi taluks of this district
Cropping
Pattern
: Pudukkottai District is predominantely an agricultural district. Paddy,
groundnut, sugarcane, maize and cashewnuts are the major crops grown
in this district. Gross area sown and gross area irrigated under food and
non-food crops stood at 1,08,497.970 Hectares and 92,461.185 Hectares
respectively during 2019-20. About 15 percentage of the gross area sown
was rain fed.
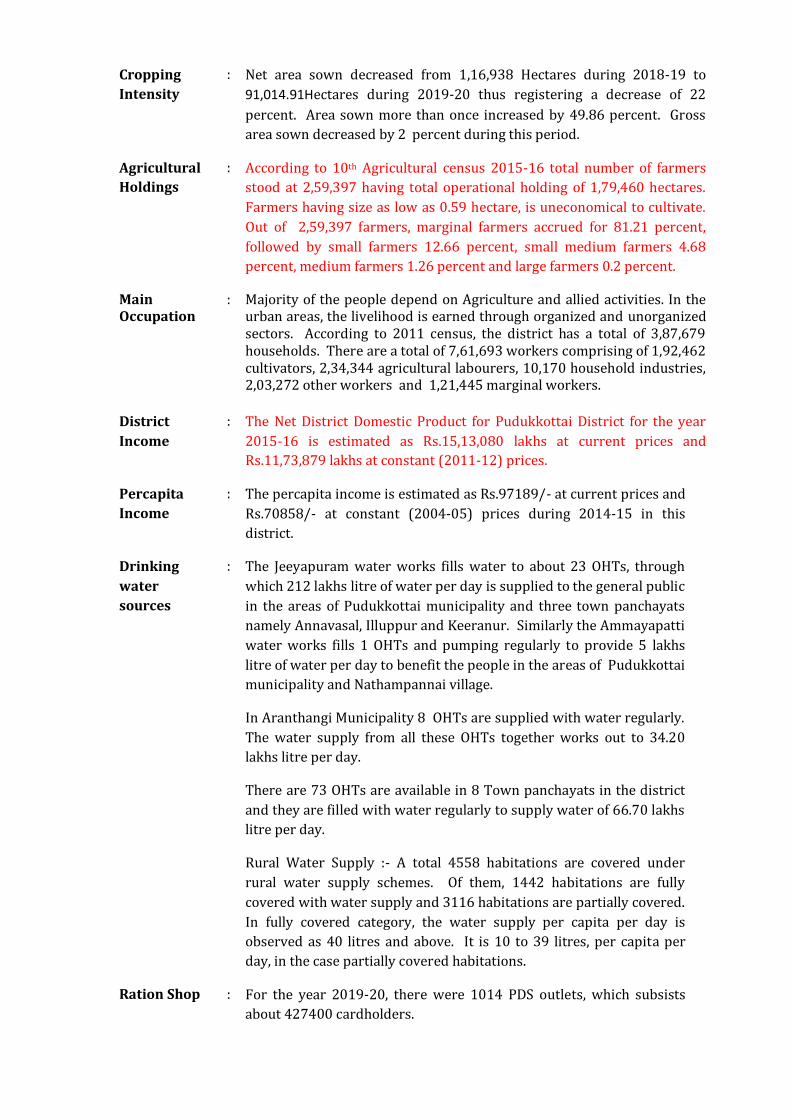
Cropping
Intensity
: Net area sown decreased from 1,16,938 Hectares during 2018-19 to
91,014.91Hectares during 2019-20 thus registering a decrease of 22
percent. Area sown more than once increased by 49.86 percent. Gross
area sown decreased by 2 percent during this period.
Agricultural
Holdings
: According to 10th Agricultural census 2015-16 total number of farmers
stood at 2,59,397 having total operational holding of 1,79,460 hectares.
Farmers having size as low as 0.59 hectare, is uneconomical to cultivate.
Out of 2,59,397 farmers, marginal farmers accrued for 81.21 percent,
followed by small farmers 12.66 percent, small medium farmers 4.68
percent, medium farmers 1.26 percent and large farmers 0.2 percent.
Main Occupation
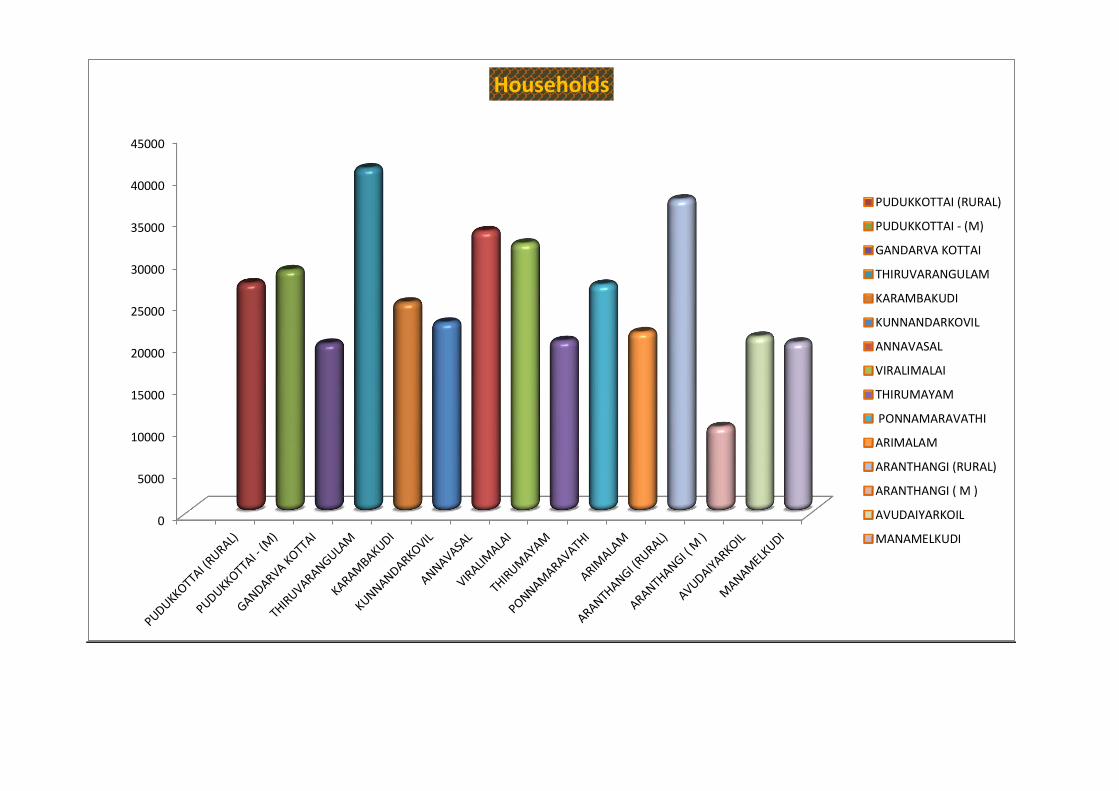
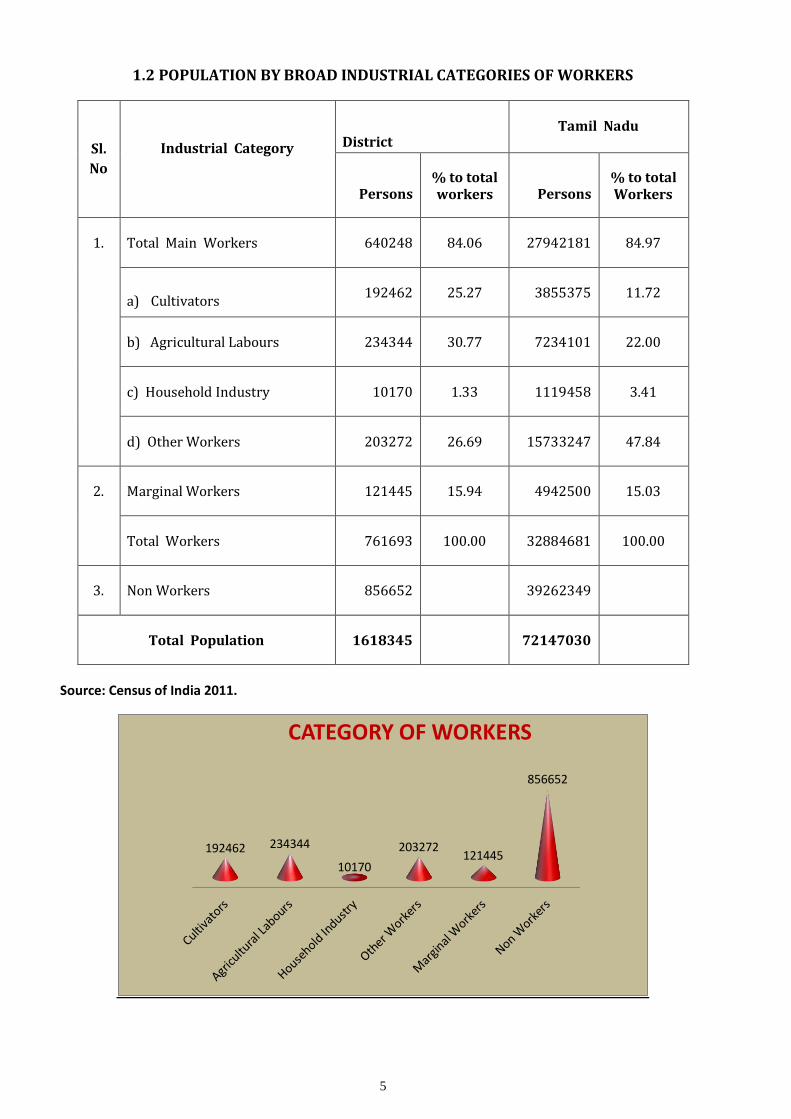
: Majority of the people depend on Agriculture and allied activities. In the urban areas, the livelihood is earned through organized and unorganized sectors. According to 2011 census, the district has a total of 3,87,679 households. There are a total of 7,61,693 workers comprising of 1,92,462 cultivators, 2,34,344 agricultural labourers, 10,170 household industries, 2,03,272 other workers and 1,21,445 marginal workers.
District
Income
: The Net District Domestic Product for Pudukkottai District for the year
2015-16 is estimated as Rs.15,13,080 lakhs at current prices and
Rs.11,73,879 lakhs at constant (2011-12) prices.
Percapita
Income
: The percapita income is estimated as Rs.97189/- at current prices and
Rs.70858/- at constant (2004-05) prices during 2014-15 in this
district.
Drinking
water
sources
: The Jeeyapuram water works fills water to about 23 OHTs, through
which 212 lakhs litre of water per day is supplied to the general public
in the areas of Pudukkottai municipality and three town panchayats
namely Annavasal, Illuppur and Keeranur. Similarly the Ammayapatti
water works fills 1 OHTs and pumping regularly to provide 5 lakhs
litre of water per day to benefit the people in the areas of Pudukkottai
municipality and Nathampannai village.
In Aranthangi Municipality 8 OHTs are supplied with water regularly.
The water supply from all these OHTs together works out to 34.20
lakhs litre per day.
There are 73 OHTs are available in 8 Town panchayats in the district
and they are filled with water regularly to supply water of 66.70 lakhs
litre per day.
Rural Water Supply :- A total 4558 habitations are covered under
rural water supply schemes. Of them, 1442 habitations are fully
covered with water supply and 3116 habitations are partially covered.
In fully covered category, the water supply per capita per day is
observed as 40 litres and above. It is 10 to 39 litres, per capita per
day, in the case partially covered habitations.
Ration Shop : For the year 2019-20, there were 1014 PDS outlets, which subsists
about 427400 cardholders.
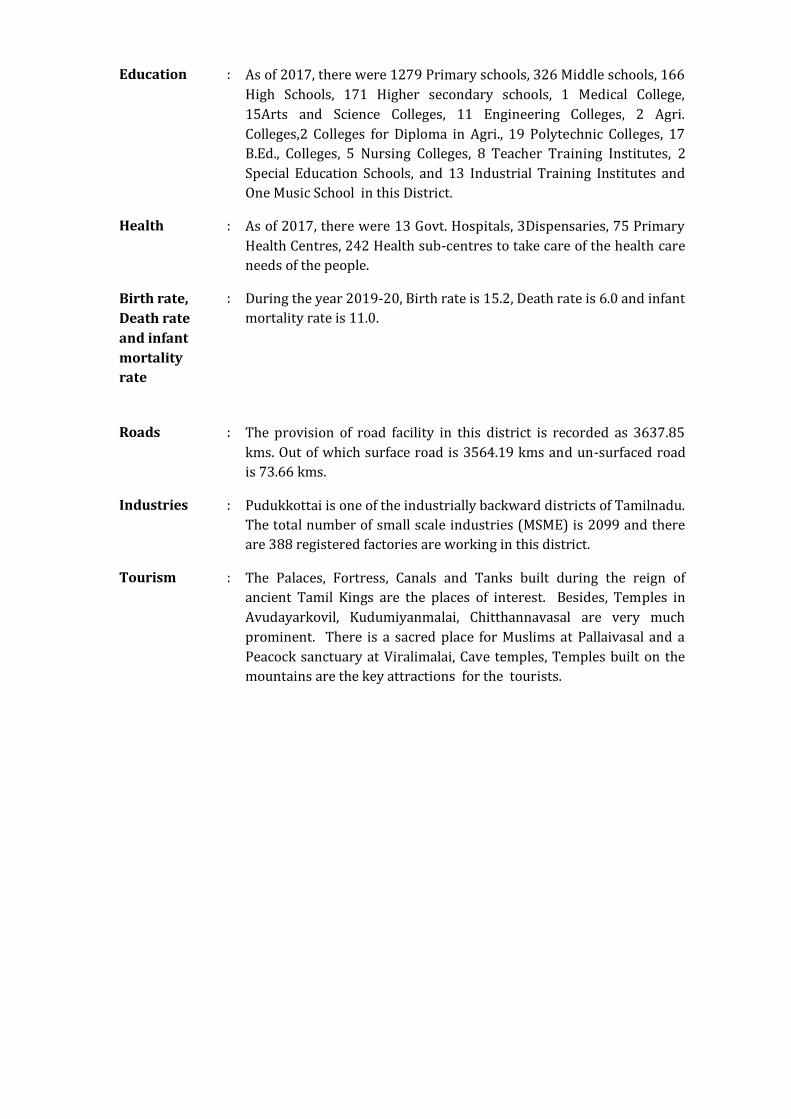
Education : As of 2017, there were 1279 Primary schools, 326 Middle schools, 166
High Schools, 171 Higher secondary schools, 1 Medical College,
15Arts and Science Colleges, 11 Engineering Colleges, 2 Agri.
Colleges,2 Colleges for Diploma in Agri., 19 Polytechnic Colleges, 17
B.Ed., Colleges, 5 Nursing Colleges, 8 Teacher Training Institutes, 2
Special Education Schools, and 13 Industrial Training Institutes and
One Music School in this District.
Health : As of 2017, there were 13 Govt. Hospitals, 3Dispensaries, 75 Primary
Health Centres, 242 Health sub-centres to take care of the health care
needs of the people.
Birth rate,
Death rate
and infant
mortality
rate
: During the year 2019-20, Birth rate is 15.2, Death rate is 6.0 and infant
mortality rate is 11.0.
Roads : The provision of road facility in this district is recorded as 3637.85
kms. Out of which surface road is 3564.19 kms and un-surfaced road
is 73.66 kms.
Industries : Pudukkottai is one of the industrially backward districts of Tamilnadu.
The total number of small scale industries (MSME) is 2099 and there
are 388 registered factories are working in this district.
Tourism : The Palaces, Fortress, Canals and Tanks built during the reign of
ancient Tamil Kings are the places of interest. Besides, Temples in
Avudayarkovil, Kudumiyanmalai, Chitthannavasal are very much
prominent. There is a sacred place for Muslims at Pallaivasal and a
Peacock sanctuary at Viralimalai, Cave temples, Temples built on the
mountains are the key attractions for the tourists.
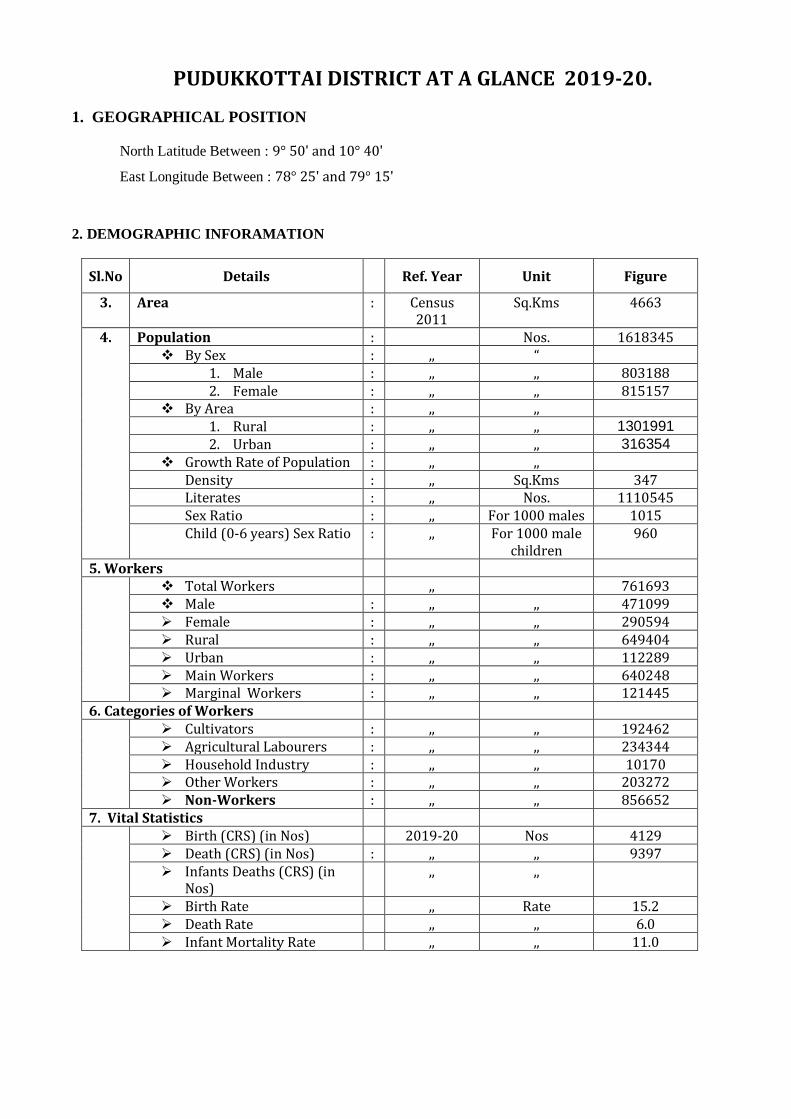
PUDUKKOTTAI DISTRICT AT A GLANCE 2019-20.
1. GEOGRAPHICAL POSITION
North Latitude Between : 9° 50' and 10° 40'
East Longitude Between : 78° 25' and 79° 15'
2. DEMOGRAPHIC INFORAMATION
Sl.No Details Ref. Year Unit Figure
3. Area : Census 2011
Sq.Kms 4663
4. Population : Nos. 1618345 By Sex : ,, “
1. Male : ,, ,, 803188 2. Female : ,, ,, 815157
By Area : ,, ,, 1. Rural : ,, ,, 1301991 2. Urban : ,, ,, 316354
Growth Rate of Population : ,, ,, Density : ,, Sq.Kms 347 Literates : ,, Nos. 1110545 Sex Ratio : ,, For 1000 males 1015 Child (0-6 years) Sex Ratio : ,, For 1000 male
children 960
5. Workers Total Workers ,, 761693
Male : ,, ,, 471099 Female : ,, ,, 290594 Rural : ,, ,, 649404 Urban : ,, ,, 112289 Main Workers : ,, ,, 640248 Marginal Workers : ,, ,, 121445
6. Categories of Workers Cultivators : ,, ,, 192462
Agricultural Labourers : ,, ,, 234344 Household Industry : ,, ,, 10170 Other Workers : ,, ,, 203272 Non-Workers : ,, ,, 856652
7. Vital Statistics Birth (CRS) (in Nos) 2019-20 Nos 4129
Death (CRS) (in Nos) : ,, ,, 9397 Infants Deaths (CRS) (in
Nos) ,, ,,
Birth Rate ,, Rate 15.2 Death Rate ,, ,, 6.0 Infant Mortality Rate ,, ,, 11.0
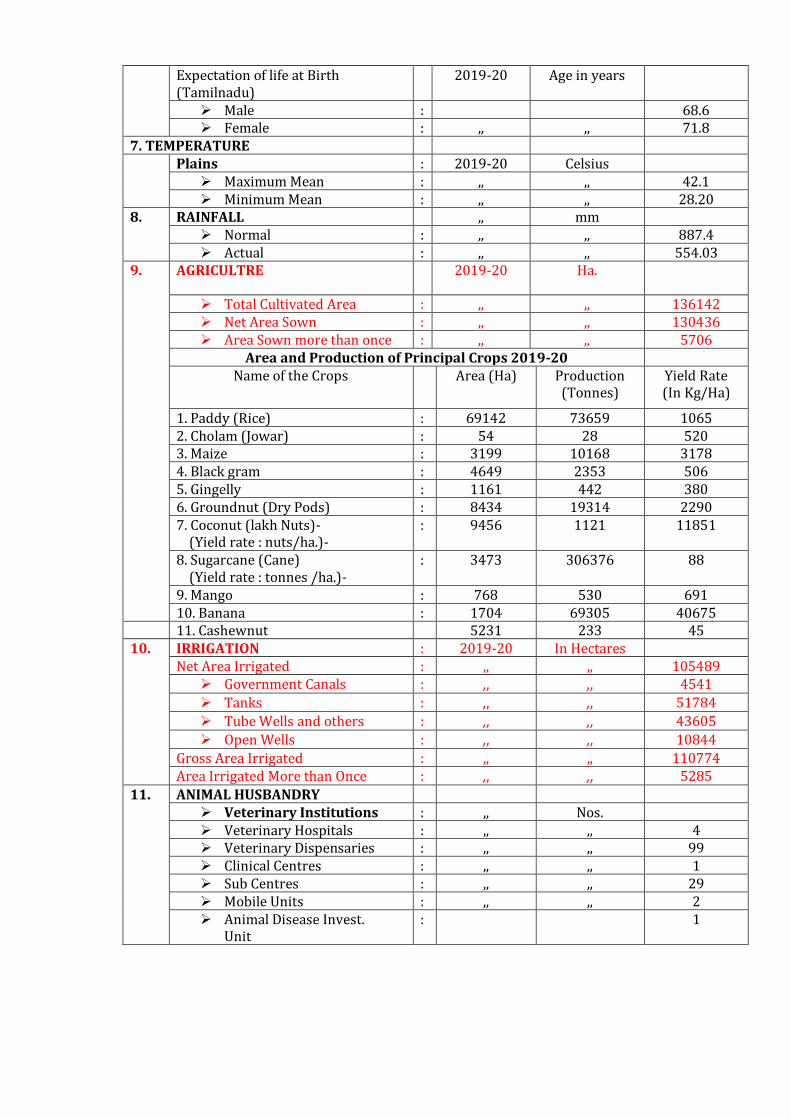
Expectation of life at Birth (Tamilnadu)
2019-20 Age in years
Male : 68.6 Female : ,, ,, 71.8
7. TEMPERATURE Plains : 2019-20 Celsius
Maximum Mean : ,, ,, 42.1 Minimum Mean : ,, ,, 28.20
8. RAINFALL ,, mm Normal : ,, ,, 887.4 Actual : ,, ,, 554.03
9. AGRICULTRE 2019-20 Ha.
Total Cultivated Area : ,, ,, 136142 Net Area Sown : ,, ,, 130436 Area Sown more than once : ,, ,, 5706
Area and Production of Principal Crops 2019-20 Name of the Crops Area (Ha) Production
(Tonnes) Yield Rate (In Kg/Ha)
1. Paddy (Rice) : 69142 73659 1065 2. Cholam (Jowar) : 54 28 520 3. Maize : 3199 10168 3178 4. Black gram : 4649 2353 506 5. Gingelly : 1161 442 380 6. Groundnut (Dry Pods) : 8434 19314 2290 7. Coconut (lakh Nuts)- (Yield rate : nuts/ha.)-
: 9456 1121 11851
8. Sugarcane (Cane) (Yield rate : tonnes /ha.)-
: 3473 306376 88
9. Mango : 768 530 691 10. Banana : 1704 69305 40675
11. Cashewnut 5231 233 45 10. IRRIGATION : 2019-20 In Hectares
Net Area Irrigated : ,, ,, 105489 Government Canals : ,, ,, 4541
Tanks : ,, ,, 51784
Tube Wells and others : ,, ,, 43605
Open Wells : ,, ,, 10844
Gross Area Irrigated : ,, ,, 110774 Area Irrigated More than Once : ,, ,, 5285
11. ANIMAL HUSBANDRY Veterinary Institutions : ,, Nos. Veterinary Hospitals : ,, ,, 4 Veterinary Dispensaries : ,, ,, 99 Clinical Centres : ,, ,, 1 Sub Centres : ,, ,, 29 Mobile Units : ,, ,, 2 Animal Disease Invest.
Unit : 1
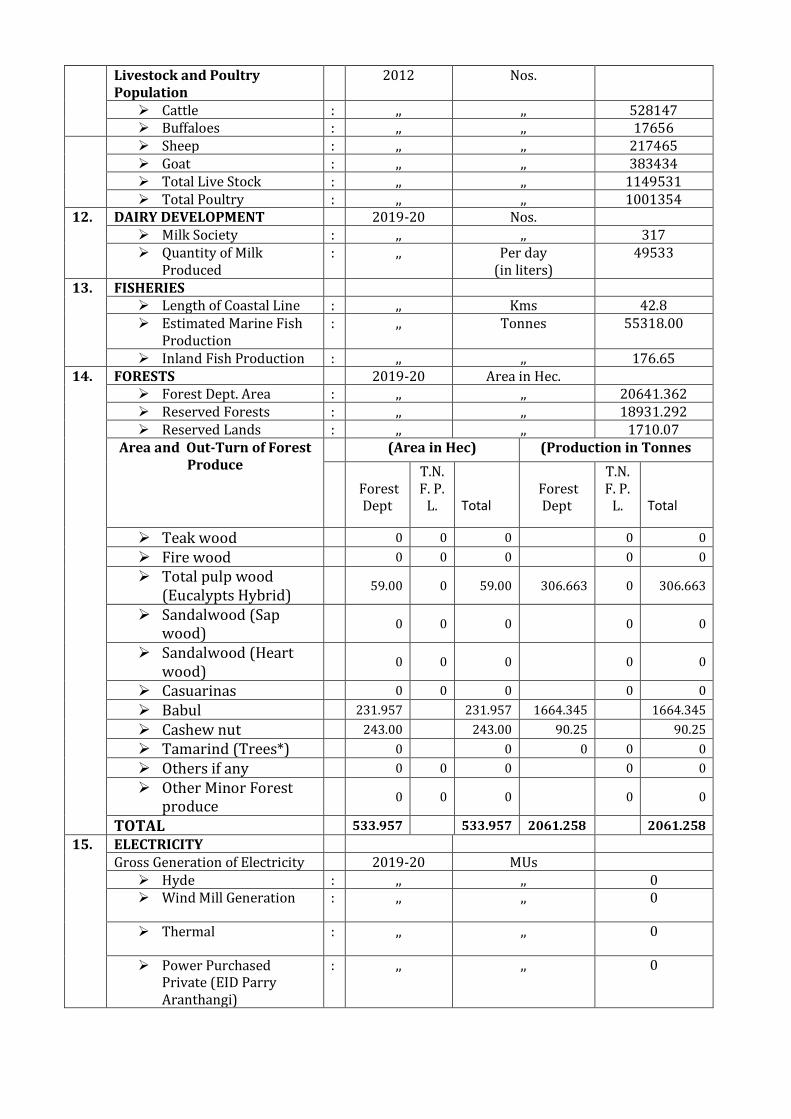
Livestock and Poultry Population
2012 Nos.
Cattle : ,, ,, 528147 Buffaloes : ,, ,, 17656
Sheep : ,, ,, 217465 Goat : ,, ,, 383434 Total Live Stock : ,, ,, 1149531 Total Poultry : ,, ,, 1001354
12. DAIRY DEVELOPMENT 2019-20 Nos. Milk Society : ,, ,, 317 Quantity of Milk
Produced : ,, Per day
(in liters) 49533
13. FISHERIES Length of Coastal Line : ,, Kms 42.8 Estimated Marine Fish
Production : ,, Tonnes 55318.00
Inland Fish Production : ,, ,, 176.65 14. FORESTS 2019-20 Area in Hec.
Forest Dept. Area : ,, ,, 20641.362 Reserved Forests : ,, ,, 18931.292 Reserved Lands : ,, ,, 1710.07
Area and Out-Turn of Forest Produce
(Area in Hec) (Production in Tonnes
Forest
Dept
T.N. F. P.
L. Total Forest
Dept
T.N. F. P.
L. Total
Teak wood 0 0 0 0 0
Fire wood 0 0 0 0 0
Total pulp wood (Eucalypts Hybrid)
59.00 0 59.00 306.663 0 306.663
Sandalwood (Sap wood)
0 0 0 0 0
Sandalwood (Heart wood)
0 0 0 0 0
Casuarinas 0 0 0 0 0
Babul 231.957 231.957 1664.345 1664.345
Cashew nut 243.00 243.00 90.25 90.25
Tamarind (Trees*) 0 0 0 0 0
Others if any 0 0 0 0 0
Other Minor Forest produce
0 0 0 0 0
TOTAL 533.957 533.957 2061.258 2061.258
15. ELECTRICITY Gross Generation of Electricity 2019-20 MUs
Hyde : ,, ,, 0 Wind Mill Generation : ,, ,, 0
Thermal : ,, ,, 0
Power Purchased Private (EID Parry Aranthangi)
: ,, ,, 0
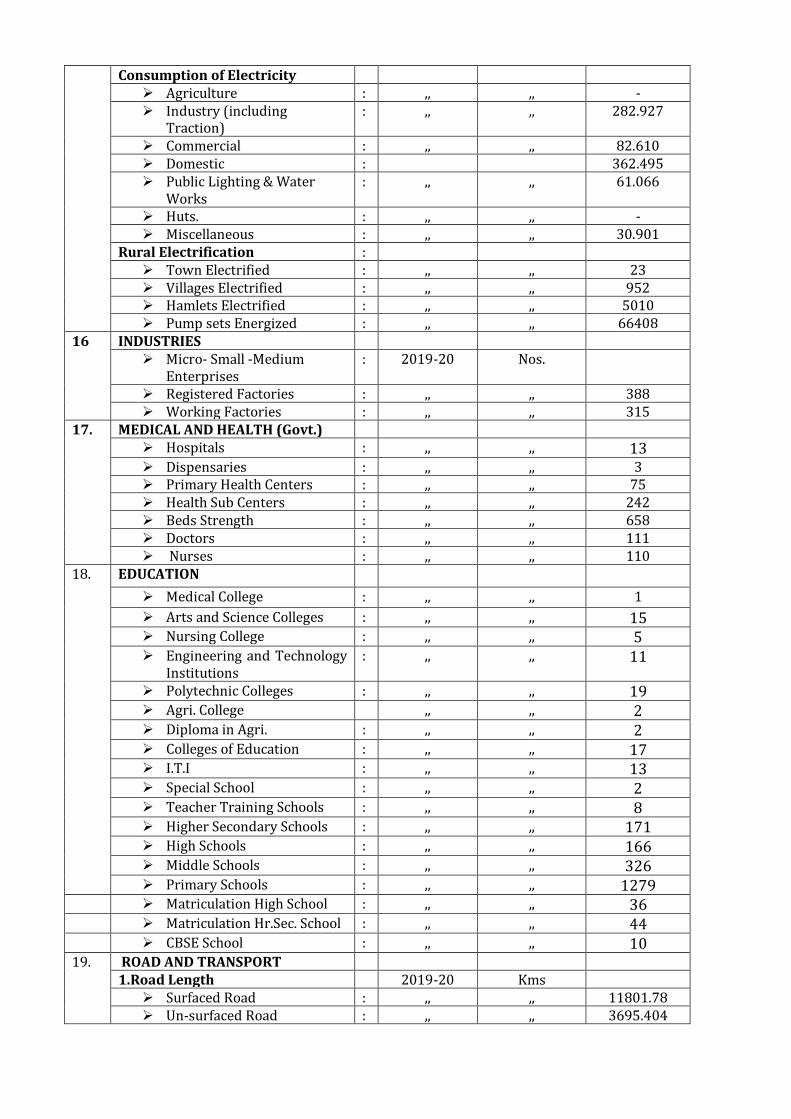
Consumption of Electricity Agriculture : ,, ,, - Industry (including
Traction) : ,, ,, 282.927
Commercial : ,, ,, 82.610 Domestic : 362.495 Public Lighting & Water
Works : ,, ,, 61.066
Huts. : ,, ,, - Miscellaneous : ,, ,, 30.901
Rural Electrification : Town Electrified : ,, ,, 23 Villages Electrified : ,, ,, 952 Hamlets Electrified : ,, ,, 5010 Pump sets Energized : ,, ,, 66408
16 INDUSTRIES Micro- Small -Medium
Enterprises : 2019-20 Nos.
Registered Factories : ,, ,, 388 Working Factories : ,, ,, 315
17. MEDICAL AND HEALTH (Govt.) Hospitals : ,, ,, 13 Dispensaries : ,, ,, 3 Primary Health Centers : ,, ,, 75 Health Sub Centers : ,, ,, 242 Beds Strength : ,, ,, 658 Doctors : ,, ,, 111 Nurses : ,, ,, 110
18. EDUCATION
Medical College : ,, ,, 1
Arts and Science Colleges : ,, ,, 15 Nursing College : ,, ,, 5 Engineering and Technology
Institutions : ,, ,, 11
Polytechnic Colleges : ,, ,, 19 Agri. College ,, ,, 2 Diploma in Agri. : ,, ,, 2 Colleges of Education : ,, ,, 17 I.T.I : ,, ,, 13 Special School : ,, ,, 2 Teacher Training Schools : ,, ,, 8 Higher Secondary Schools : ,, ,, 171 High Schools : ,, ,, 166 Middle Schools : ,, ,, 326 Primary Schools : ,, ,, 1279
Matriculation High School : ,, ,, 36 Matriculation Hr.Sec. School : ,, ,, 44 CBSE School : ,, ,, 10 19. ROAD AND TRANSPORT
1.Road Length 2019-20 Kms Surfaced Road : ,, ,, 11801.78 Un-surfaced Road : ,, ,, 3695.404
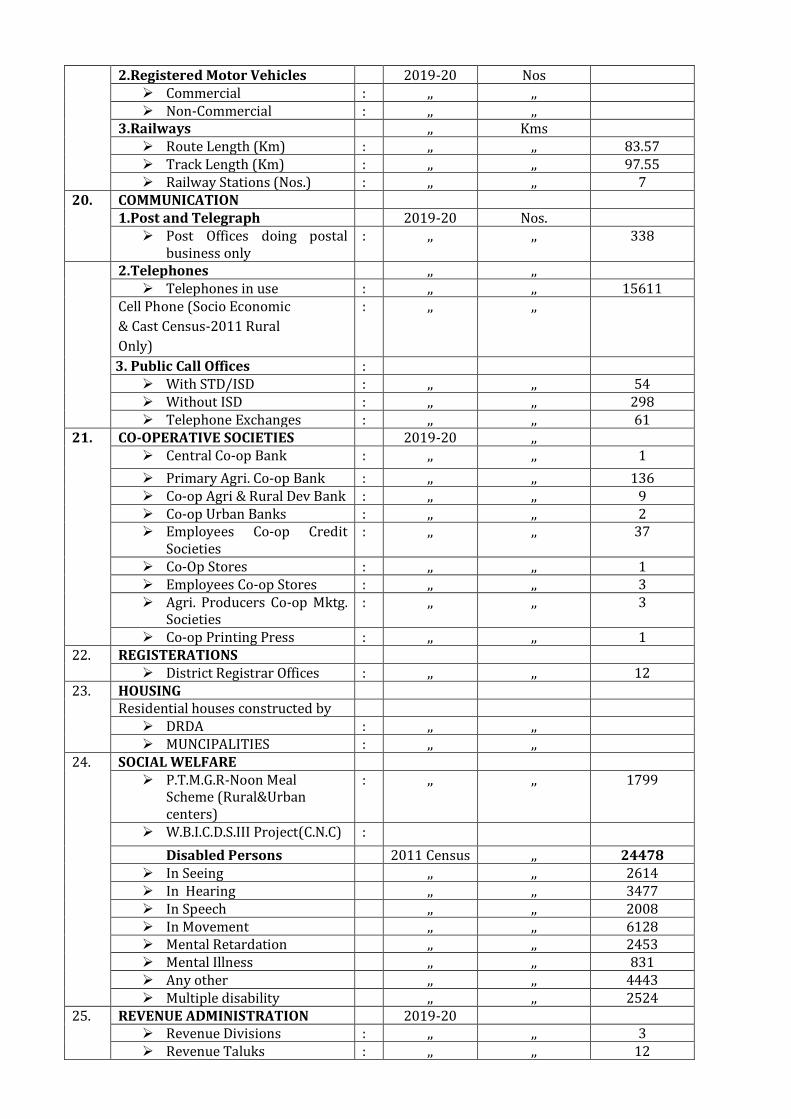
2.Registered Motor Vehicles 2019-20 Nos Commercial : ,, ,, Non-Commercial : ,, ,,
3.Railways ,, Kms Route Length (Km) : ,, ,, 83.57 Track Length (Km) : ,, ,, 97.55 Railway Stations (Nos.) : ,, ,, 7
20. COMMUNICATION 1.Post and Telegraph 2019-20 Nos.
Post Offices doing postal business only
: ,, ,, 338
2.Telephones ,, ,, Telephones in use : ,, ,, 15611
Cell Phone (Socio Economic
& Cast Census-2011 Rural
Only)
: ,, ,,
3. Public Call Offices : With STD/ISD : ,, ,, 54 Without ISD : ,, ,, 298 Telephone Exchanges : ,, ,, 61
21. CO-OPERATIVE SOCIETIES 2019-20 ,, Central Co-op Bank : ,, ,, 1
Primary Agri. Co-op Bank : ,, ,, 136 Co-op Agri & Rural Dev Bank : ,, ,, 9 Co-op Urban Banks : ,, ,, 2 Employees Co-op Credit
Societies : ,, ,, 37
Co-Op Stores : ,, ,, 1 Employees Co-op Stores : ,, ,, 3 Agri. Producers Co-op Mktg.
Societies : ,, ,, 3
Co-op Printing Press : ,, ,, 1 22. REGISTERATIONS
District Registrar Offices : ,, ,, 12 23. HOUSING
Residential houses constructed by DRDA : ,, ,, MUNCIPALITIES : ,, ,,
24. SOCIAL WELFARE P.T.M.G.R-Noon Meal
Scheme (Rural&Urban centers)
: ,, ,, 1799
W.B.I.C.D.S.III Project(C.N.C) :
Disabled Persons 2011 Census ,, 24478 In Seeing ,, ,, 2614 In Hearing ,, ,, 3477 In Speech ,, ,, 2008 In Movement ,, ,, 6128 Mental Retardation ,, ,, 2453 Mental Illness ,, ,, 831 Any other ,, ,, 4443 Multiple disability ,, ,, 2524
25. REVENUE ADMINISTRATION 2019-20 Revenue Divisions : ,, ,, 3 Revenue Taluks : ,, ,, 12
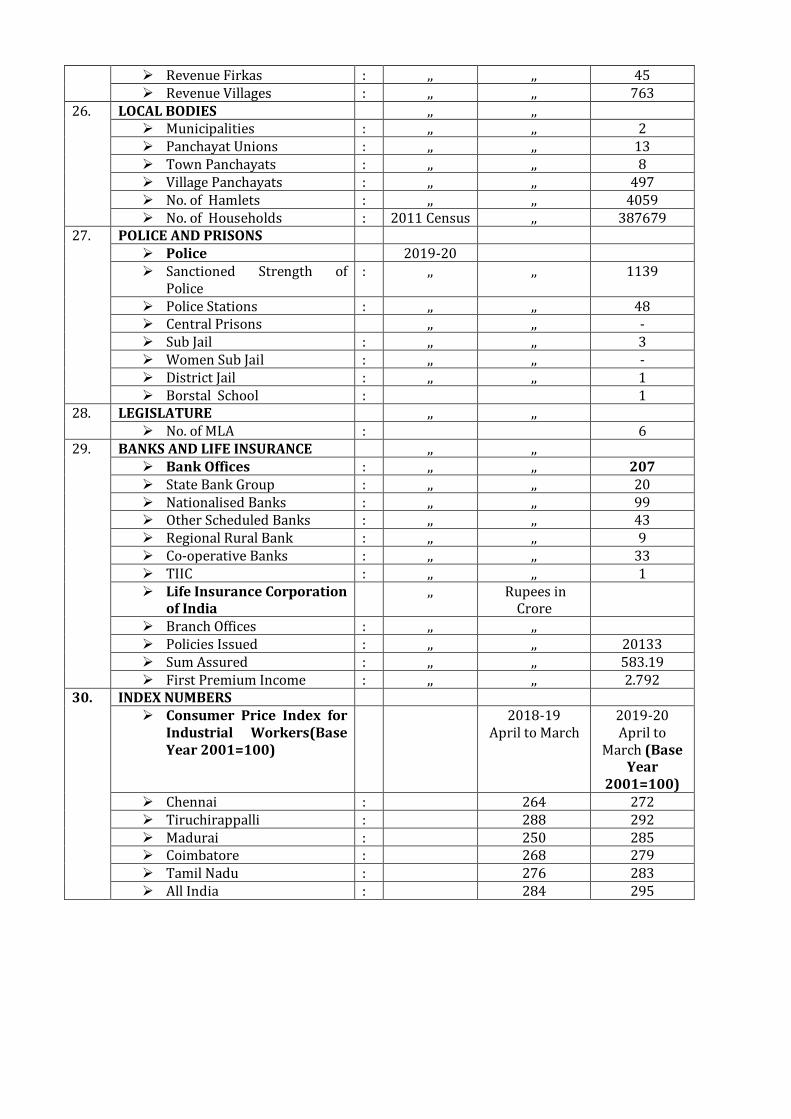
Revenue Firkas : ,, ,, 45 Revenue Villages : ,, ,, 763
26. LOCAL BODIES ,, ,, Municipalities : ,, ,, 2 Panchayat Unions : ,, ,, 13 Town Panchayats : ,, ,, 8 Village Panchayats : ,, ,, 497 No. of Hamlets : ,, ,, 4059 No. of Households : 2011 Census ,, 387679
27.
POLICE AND PRISONS Police 2019-20 Sanctioned Strength of
Police : ,, ,, 1139
Police Stations : ,, ,, 48 Central Prisons ,, ,, - Sub Jail : ,, ,, 3 Women Sub Jail : ,, ,, - District Jail : ,, ,, 1 Borstal School : 1
28. LEGISLATURE ,, ,, No. of MLA : 6
29. BANKS AND LIFE INSURANCE ,, ,, Bank Offices : ,, ,, 207 State Bank Group : ,, ,, 20 Nationalised Banks : ,, ,, 99 Other Scheduled Banks : ,, ,, 43 Regional Rural Bank : ,, ,, 9 Co-operative Banks : ,, ,, 33 TIIC : ,, ,, 1 Life Insurance Corporation
of India ,, Rupees in
Crore
Branch Offices : ,, ,, Policies Issued : ,, ,, 20133 Sum Assured : ,, ,, 583.19 First Premium Income : ,, ,, 2.792
30. INDEX NUMBERS Consumer Price Index for
Industrial Workers(Base Year 2001=100)
2018-19 April to March
2019-20 April to
March (Base Year
2001=100) Chennai : 264 272 Tiruchirappalli : 288 292 Madurai : 250 285 Coimbatore : 268 279 Tamil Nadu : 276 283 All India : 284 295
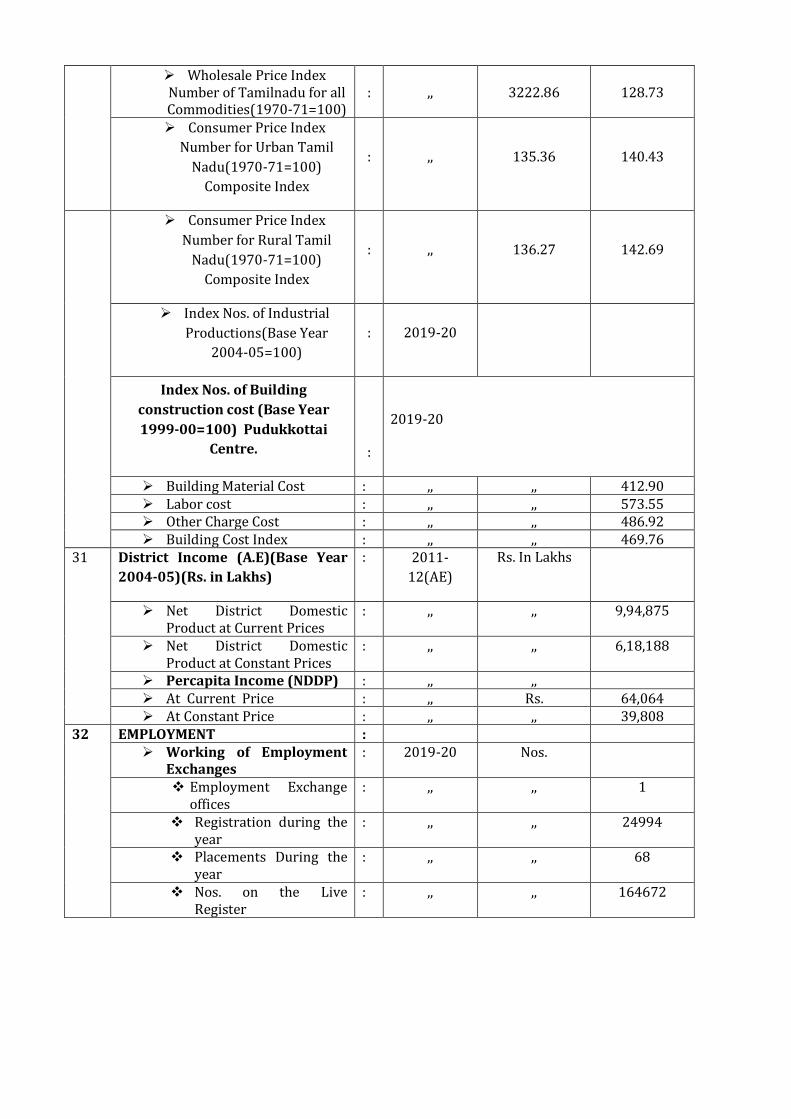
Wholesale Price Index Number of Tamilnadu for all Commodities(1970-71=100)
: ,, 3222.86 128.73
Consumer Price Index
Number for Urban Tamil
Nadu(1970-71=100)
Composite Index
: ,, 135.36 140.43
Consumer Price Index
Number for Rural Tamil
Nadu(1970-71=100)
Composite Index
: ,, 136.27 142.69
Index Nos. of Industrial
Productions(Base Year
2004-05=100)
: 2019-20
Index Nos. of Building
construction cost (Base Year
1999-00=100) Pudukkottai
Centre.
:
2019-20
Building Material Cost : ,, ,, 412.90 Labor cost : ,, ,, 573.55 Other Charge Cost : ,, ,, 486.92 Building Cost Index : ,, ,, 469.76
31 District Income (A.E)(Base Year
2004-05)(Rs. in Lakhs)
: 2011-
12(AE)
Rs. In Lakhs
Net District Domestic Product at Current Prices
: ,, ,, 9,94,875
Net District Domestic Product at Constant Prices
: ,, ,, 6,18,188
Percapita Income (NDDP) : ,, ,, At Current Price : ,, Rs. 64,064 At Constant Price : ,, ,, 39,808
32
EMPLOYMENT : Working of Employment
Exchanges : 2019-20 Nos.
Employment Exchange offices
: ,, ,, 1
Registration during the year
: ,, ,, 24994
Placements During the year
: ,, ,, 68
Nos. on the Live Register
: ,, ,, 164672

1
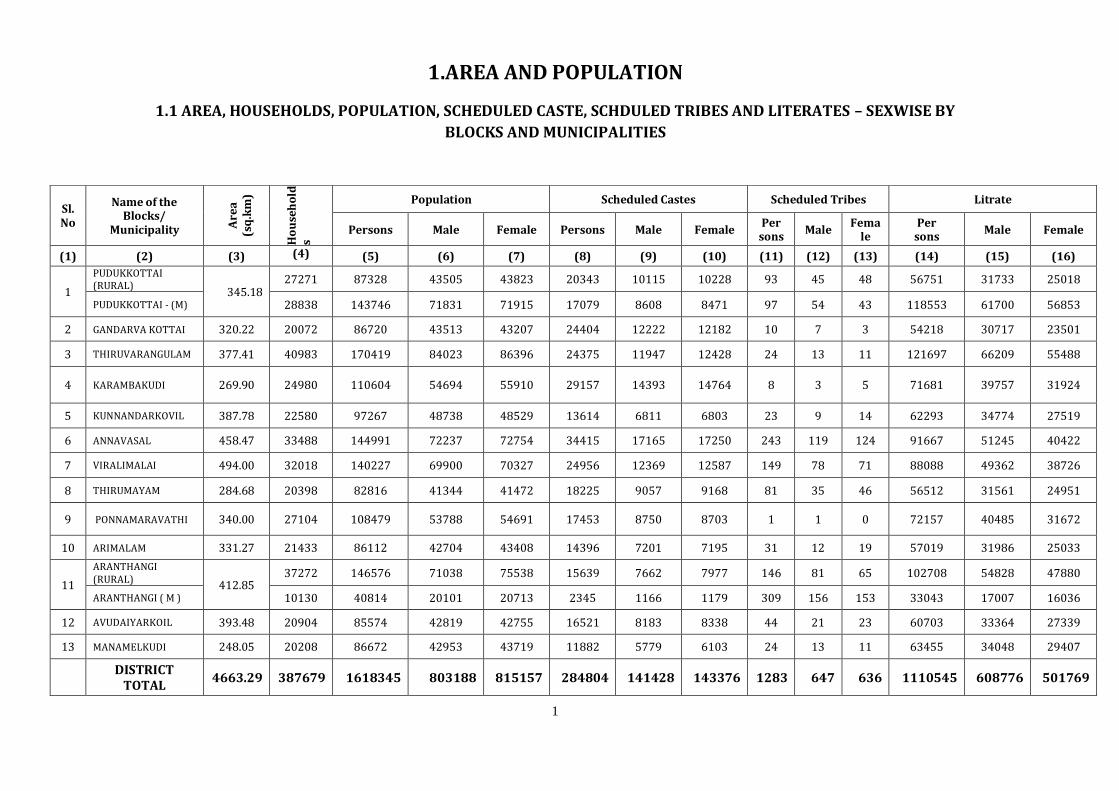
1.AREA AND POPULATION
1.1 AREA, HOUSEHOLDS, POPULATION, SCHEDULED CASTE, SCHDULED TRIBES AND LITERATES – SEXWISE BY
BLOCKS AND MUNICIPALITIES
Sl. No
Name of the Blocks/
Municipality Are
a
(sq
.km
)
Ho
use
ho
lds
Population Scheduled Castes Scheduled Tribes Litrate
Persons Male Female Persons Male Female Per
sons Male
Female
Per sons
Male Female
(1) (2) (3) (4) (5) (6) (7) (8) (9) (10) (11) (12) (13) (14) (15) (16)
1
PUDUKKOTTAI (RURAL)
345.18 27271 87328 43505 43823 20343 10115 10228 93 45 48 56751 31733 25018
PUDUKKOTTAI - (M) 28838 143746 71831 71915 17079 8608 8471 97 54 43 118553 61700 56853
2 GANDARVA KOTTAI 320.22 20072 86720 43513 43207 24404 12222 12182 10 7 3 54218 30717 23501
3 THIRUVARANGULAM 377.41 40983 170419 84023 86396 24375 11947 12428 24 13 11 121697 66209 55488
4 KARAMBAKUDI 269.90 24980 110604 54694 55910 29157 14393 14764 8 3 5 71681 39757 31924
5 KUNNANDARKOVIL 387.78 22580 97267 48738 48529 13614 6811 6803 23 9 14 62293 34774 27519
6 ANNAVASAL 458.47 33488 144991 72237 72754 34415 17165 17250 243 119 124 91667 51245 40422
7 VIRALIMALAI 494.00 32018 140227 69900 70327 24956 12369 12587 149 78 71 88088 49362 38726
8 THIRUMAYAM 284.68 20398 82816 41344 41472 18225 9057 9168 81 35 46 56512 31561 24951
9 PONNAMARAVATHI 340.00 27104 108479 53788 54691 17453 8750 8703 1 1 0 72157 40485 31672
10 ARIMALAM 331.27 21433 86112 42704 43408 14396 7201 7195 31 12 19 57019 31986 25033
11
ARANTHANGI (RURAL)
412.85 37272 146576 71038 75538 15639 7662 7977 146 81 65 102708 54828 47880
ARANTHANGI ( M ) 10130 40814 20101 20713 2345 1166 1179 309 156 153 33043 17007 16036
12 AVUDAIYARKOIL 393.48 20904 85574 42819 42755 16521 8183 8338 44 21 23 60703 33364 27339
13 MANAMELKUDI 248.05 20208 86672 42953 43719 11882 5779 6103 24 13 11 63455 34048 29407
DISTRICT
TOTAL 4663.29 387679 1618345 803188 815157 284804 141428 143376 1283 647 636 1110545 608776 501769
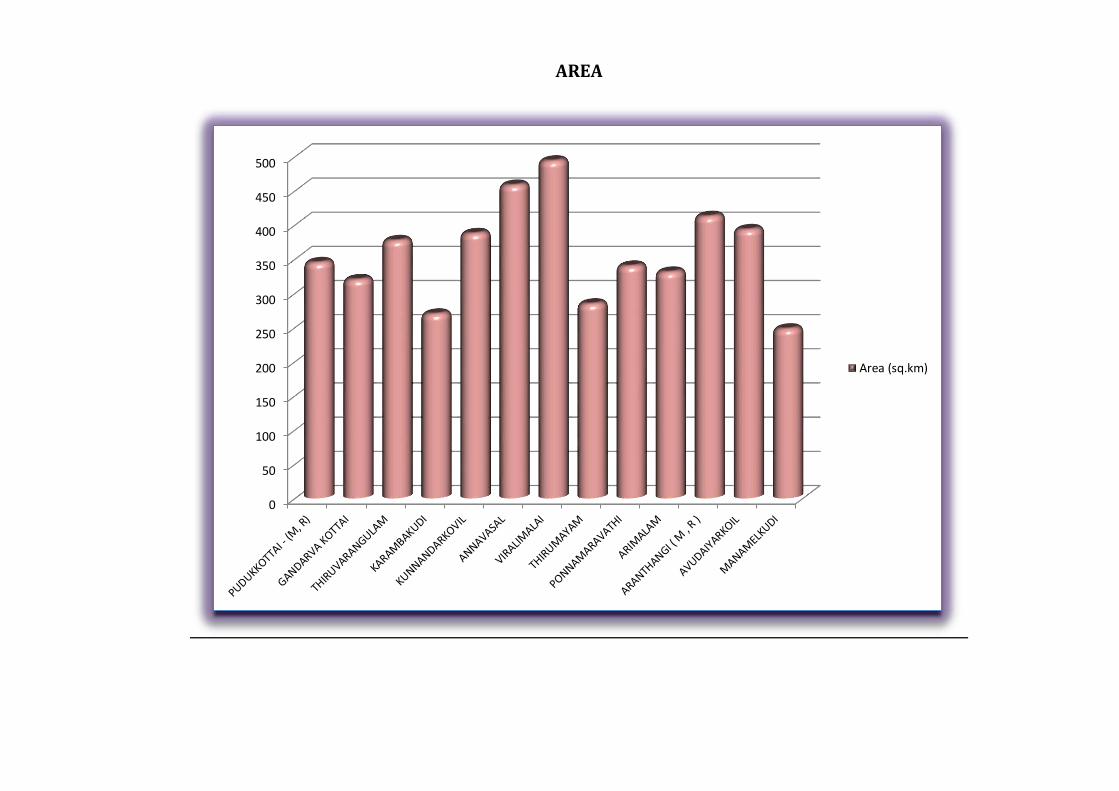
AREA
0
50
100
150
200
250
300
350
400
450
500
Area (sq.km)
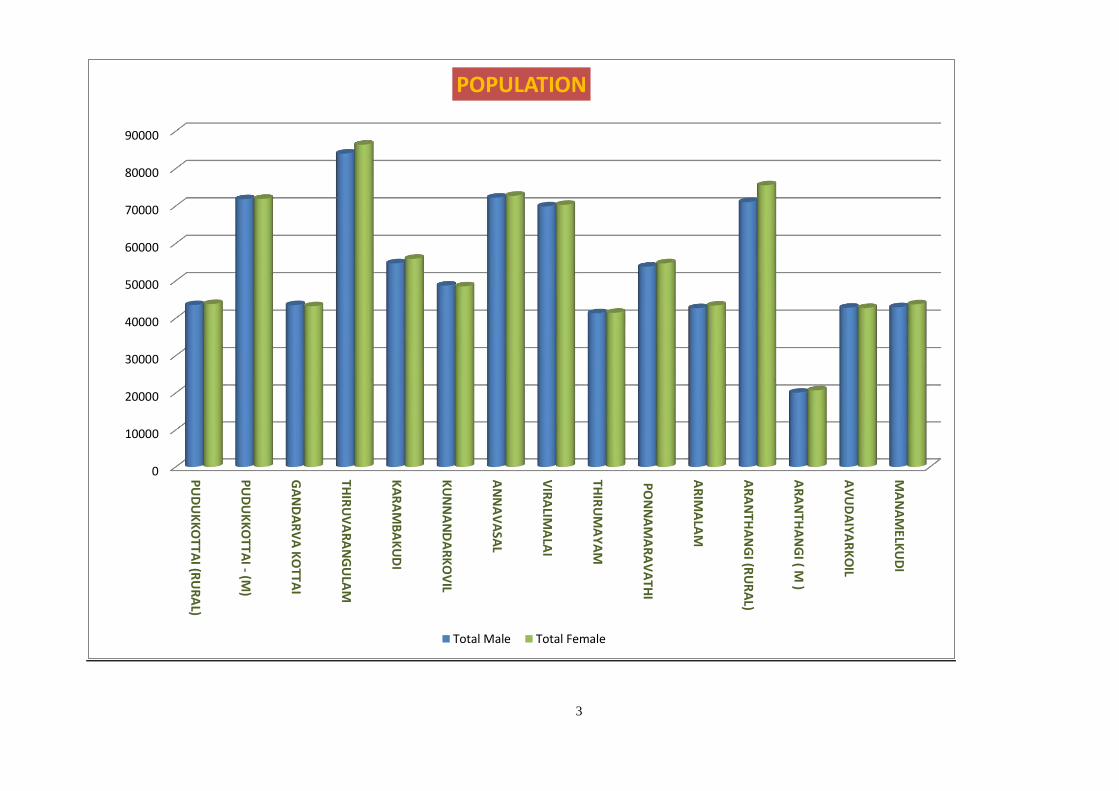
3
0
10000
20000
30000
40000
50000
60000
70000
80000
90000
PU
DU
KK
OTTA
I (RU
RA
L)
PU
DU
KK
OTTA
I - (M)
GA
ND
AR
VA
KO
TTAI
THIR
UV
AR
AN
GU
LAM
KA
RA
MB
AK
UD
I
KU
NN
AN
DA
RK
OV
IL
AN
NA
VA
SAL
VIR
ALIM
ALA
I
THIR
UM
AY
AM
PO
NN
AM
AR
AV
ATH
I
AR
IMA
LAM
AR
AN
THA
NG
I (RU
RA
L)
AR
AN
THA
NG
I ( M )
AV
UD
AIYA
RK
OIL
MA
NA
MELK
UD
I
POPULATION
Total Male Total Female
0
5000
10000
15000
20000
25000
30000
35000
40000
45000
Households
PUDUKKOTTAI (RURAL)
PUDUKKOTTAI - (M)
GANDARVA KOTTAI
THIRUVARANGULAM
KARAMBAKUDI
KUNNANDARKOVIL
ANNAVASAL
VIRALIMALAI
THIRUMAYAM
PONNAMARAVATHI
ARIMALAM
ARANTHANGI (RURAL)
ARANTHANGI ( M )
AVUDAIYARKOIL
MANAMELKUDI
5
1.2 POPULATION BY BROAD INDUSTRIAL CATEGORIES OF WORKERS
Sl.
No
Industrial Category
District Tamil Nadu
Persons % to total workers Persons
% to total Workers
1. Total Main Workers 640248 84.06 27942181 84.97
a) Cultivators 192462 25.27 3855375 11.72
b) Agricultural Labours 234344 30.77 7234101 22.00
c) Household Industry 10170 1.33 1119458 3.41
d) Other Workers 203272 26.69 15733247 47.84
2. Marginal Workers 121445 15.94 4942500 15.03
Total Workers 761693 100.00 32884681 100.00
3. Non Workers 856652 39262349
Total Population 1618345 72147030
Source: Census of India 2011.
192462 234344
10170
203272121445
856652
CATEGORY OF WORKERS
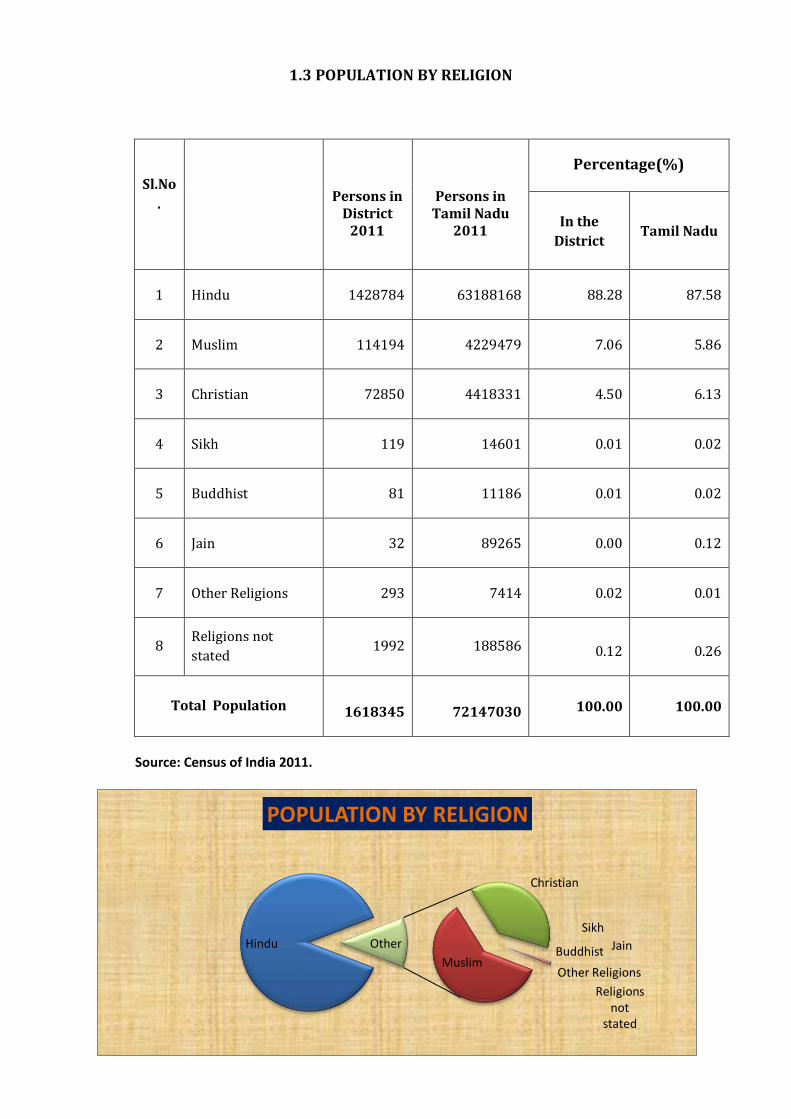
1.3 POPULATION BY RELIGION
Sl.No
.
Persons in
District 2011
Persons in
Tamil Nadu 2011
Percentage(%)
In the
District Tamil Nadu
1 Hindu 1428784 63188168 88.28 87.58
2 Muslim 114194 4229479 7.06 5.86
3 Christian 72850 4418331 4.50 6.13
4 Sikh 119 14601 0.01 0.02
5 Buddhist 81 11186 0.01 0.02
6 Jain 32 89265 0.00 0.12
7 Other Religions 293 7414 0.02 0.01
8 Religions not
stated 1992 188586 0.12 0.26
Total Population 1618345 72147030 100.00 100.00
Source: Census of India 2011.
Hindu
Muslim
Christian
Sikh
Buddhist Jain
Other Religions
Religions not
stated
Other
POPULATION BY RELIGION
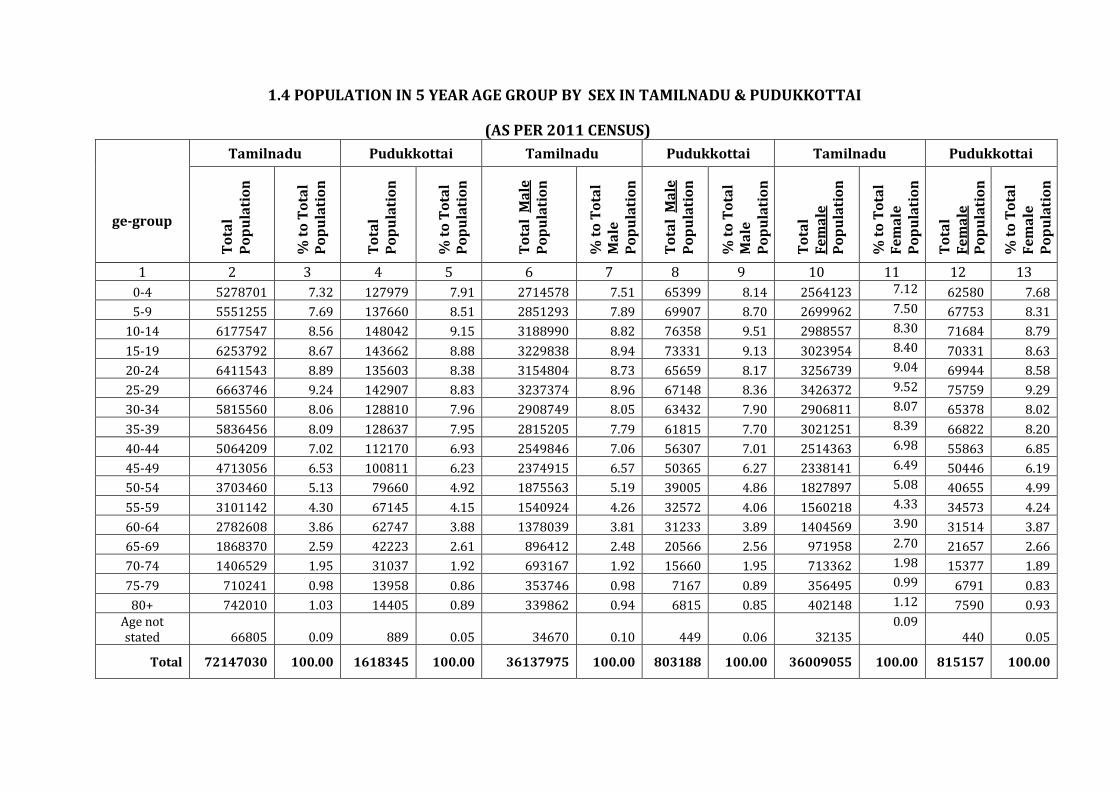
1.4 POPULATION IN 5 YEAR AGE GROUP BY SEX IN TAMILNADU & PUDUKKOTTAI
(AS PER 2011 CENSUS)
ge-group
Tamilnadu Pudukkottai Tamilnadu Pudukkottai Tamilnadu Pudukkottai
To
tal
Po
pu
lati
on
% t
o T
ota
l P
op
ula
tio
n
To
tal
P
op
ula
tio
n
% t
o T
ota
l
Po
pu
lati
on
To
tal
Ma
le
Po
pu
lati
on
% t
o T
ota
l M
ale
P
op
ula
tio
n
To
tal
Ma
le
Po
pu
lati
on
% t
o T
ota
l M
ale
P
op
ula
tio
n
To
tal
F
em
ale
P
op
ula
tio
n
% t
o T
ota
l
Fe
ma
le
Po
pu
lati
on
To
tal
F
em
ale
P
op
ula
tio
n
% t
o T
ota
l
Fe
ma
le
Po
pu
lati
on
1 2 3 4 5 6 7 8 9 10 11 12 13
0-4 5278701 7.32 127979 7.91 2714578 7.51 65399 8.14 2564123 7.12 62580 7.68
5-9 5551255 7.69 137660 8.51 2851293 7.89 69907 8.70 2699962 7.50 67753 8.31
10-14 6177547 8.56 148042 9.15 3188990 8.82 76358 9.51 2988557 8.30 71684 8.79
15-19 6253792 8.67 143662 8.88 3229838 8.94 73331 9.13 3023954 8.40 70331 8.63
20-24 6411543 8.89 135603 8.38 3154804 8.73 65659 8.17 3256739 9.04 69944 8.58
25-29 6663746 9.24 142907 8.83 3237374 8.96 67148 8.36 3426372 9.52 75759 9.29
30-34 5815560 8.06 128810 7.96 2908749 8.05 63432 7.90 2906811 8.07 65378 8.02
35-39 5836456 8.09 128637 7.95 2815205 7.79 61815 7.70 3021251 8.39 66822 8.20
40-44 5064209 7.02 112170 6.93 2549846 7.06 56307 7.01 2514363 6.98 55863 6.85
45-49 4713056 6.53 100811 6.23 2374915 6.57 50365 6.27 2338141 6.49 50446 6.19
50-54 3703460 5.13 79660 4.92 1875563 5.19 39005 4.86 1827897 5.08 40655 4.99
55-59 3101142 4.30 67145 4.15 1540924 4.26 32572 4.06 1560218 4.33 34573 4.24
60-64 2782608 3.86 62747 3.88 1378039 3.81 31233 3.89 1404569 3.90 31514 3.87
65-69 1868370 2.59 42223 2.61 896412 2.48 20566 2.56 971958 2.70 21657 2.66
70-74 1406529 1.95 31037 1.92 693167 1.92 15660 1.95 713362 1.98 15377 1.89
75-79 710241 0.98 13958 0.86 353746 0.98 7167 0.89 356495 0.99 6791 0.83
80+ 742010 1.03 14405 0.89 339862 0.94 6815 0.85 402148 1.12 7590 0.93 Age not stated 66805 0.09 889 0.05 34670 0.10 449 0.06 32135
0.09 440 0.05
Total 72147030 100.00 1618345 100.00 36137975 100.00 803188 100.00 36009055 100.00 815157 100.00
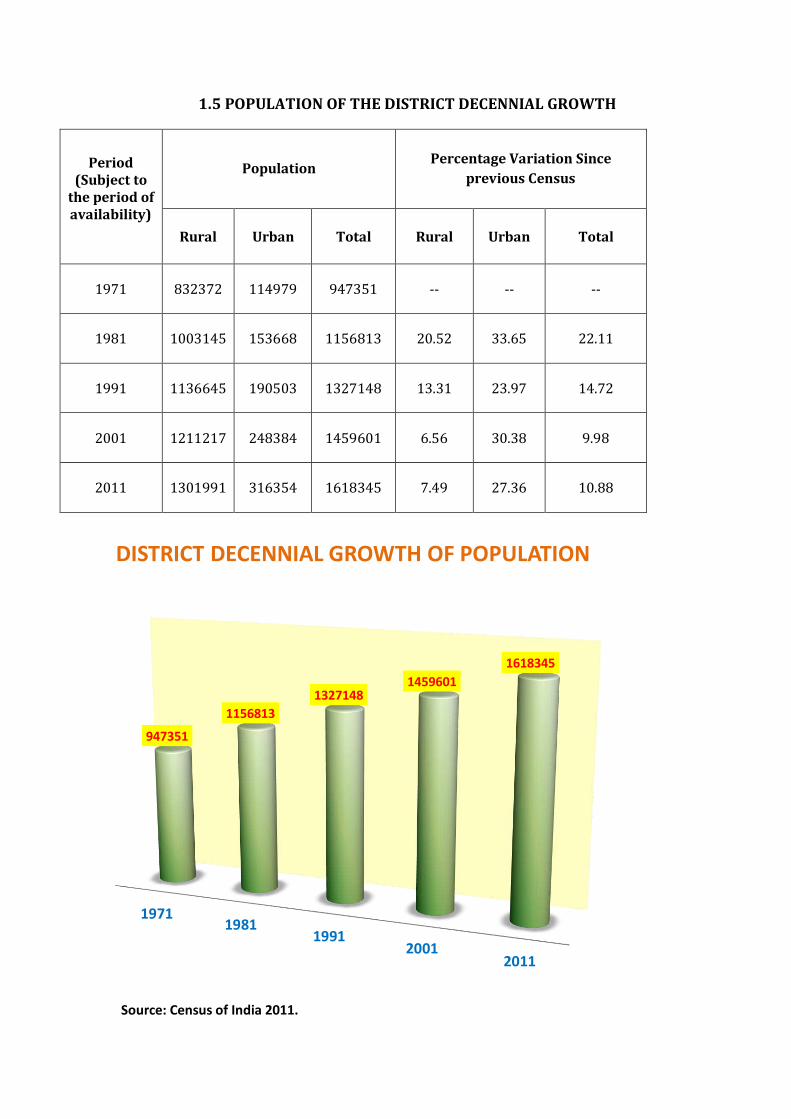
1.5 POPULATION OF THE DISTRICT DECENNIAL GROWTH
Period (Subject to
the period of availability)
Population
Percentage Variation Since
previous Census
Rural Urban Total Rural Urban Total
1971 832372 114979 947351 -- -- --
1981 1003145 153668 1156813 20.52 33.65 22.11
1991 1136645 190503 1327148 13.31 23.97 14.72
2001 1211217 248384 1459601 6.56 30.38 9.98
2011 1301991 316354 1618345 7.49 27.36 10.88
Source: Census of India 2011.
19711981
19912001
2011
947351
1156813
13271481459601
1618345
DISTRICT DECENNIAL GROWTH OF POPULATION
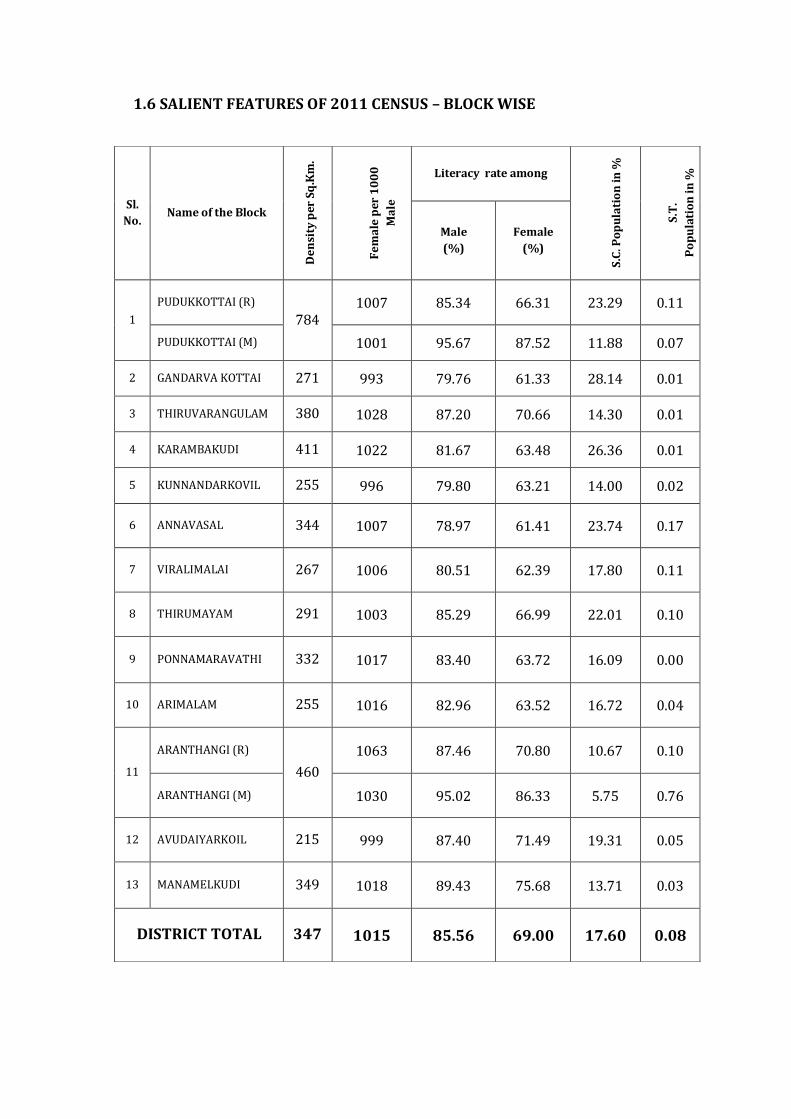
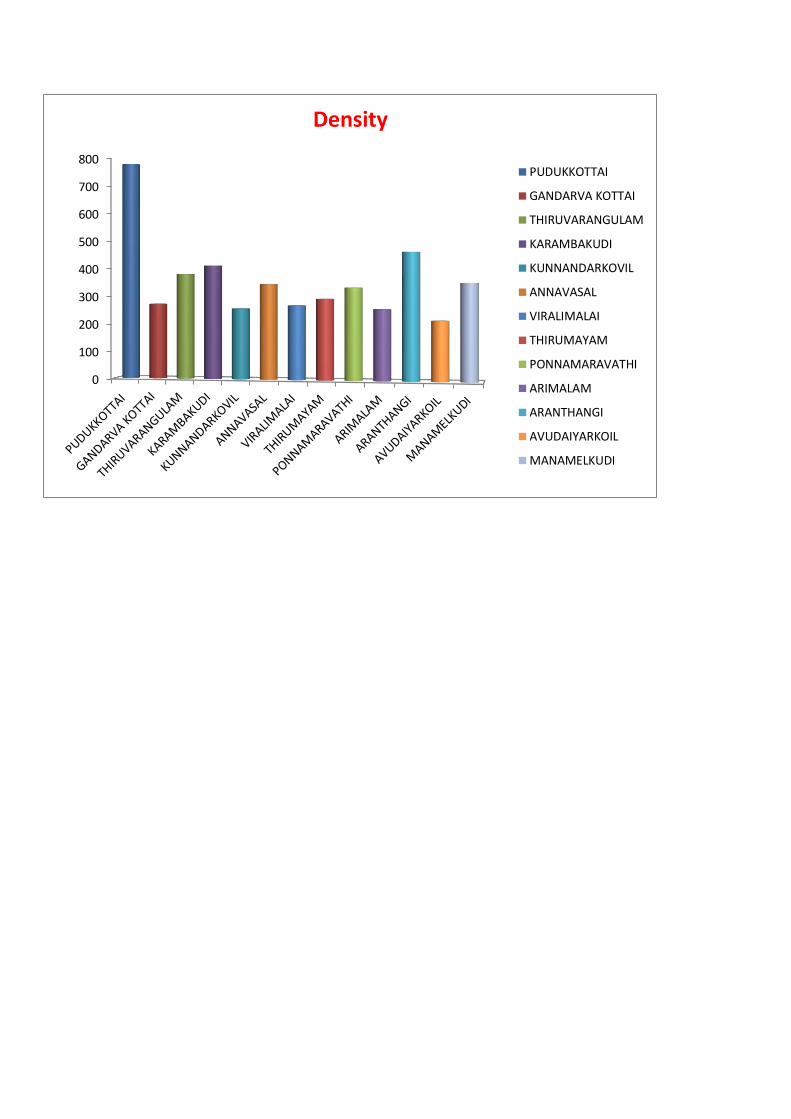
1.6 SALIENT FEATURES OF 2011 CENSUS – BLOCK WISE
Sl.
No. Name of the Block
De
nsi
ty p
er S
q.K
m.
Fe
ma
le p
er 1
00
0
Ma
le
Literacy rate among
S.C
. Po
pu
lati
on
in
%
S.T
.
Po
pu
lati
on
in
%
Male
(%)
Female
(%)
1
PUDUKKOTTAI (R)
784 1007 85.34 66.31 23.29 0.11
PUDUKKOTTAI (M) 1001 95.67 87.52 11.88 0.07
2 GANDARVA KOTTAI 271 993 79.76 61.33 28.14 0.01
3 THIRUVARANGULAM 380 1028 87.20 70.66 14.30 0.01
4 KARAMBAKUDI 411 1022 81.67 63.48 26.36 0.01
5 KUNNANDARKOVIL 255 996 79.80 63.21 14.00 0.02
6 ANNAVASAL 344 1007 78.97 61.41 23.74 0.17
7 VIRALIMALAI 267 1006 80.51 62.39 17.80 0.11
8 THIRUMAYAM 291 1003 85.29 66.99 22.01 0.10
9 PONNAMARAVATHI 332 1017 83.40 63.72 16.09 0.00
10 ARIMALAM 255 1016 82.96 63.52 16.72 0.04
11
ARANTHANGI (R)
460
1063 87.46 70.80 10.67 0.10
ARANTHANGI (M) 1030 95.02 86.33 5.75 0.76
12 AVUDAIYARKOIL 215 999 87.40 71.49 19.31 0.05
13 MANAMELKUDI 349 1018 89.43 75.68 13.71 0.03
DISTRICT TOTAL 347 1015 85.56 69.00 17.60 0.08
0
100
200
300
400
500
600
700
800
Density
PUDUKKOTTAI
GANDARVA KOTTAI
THIRUVARANGULAM
KARAMBAKUDI
KUNNANDARKOVIL
ANNAVASAL
VIRALIMALAI
THIRUMAYAM
PONNAMARAVATHI
ARIMALAM
ARANTHANGI
AVUDAIYARKOIL
MANAMELKUDI
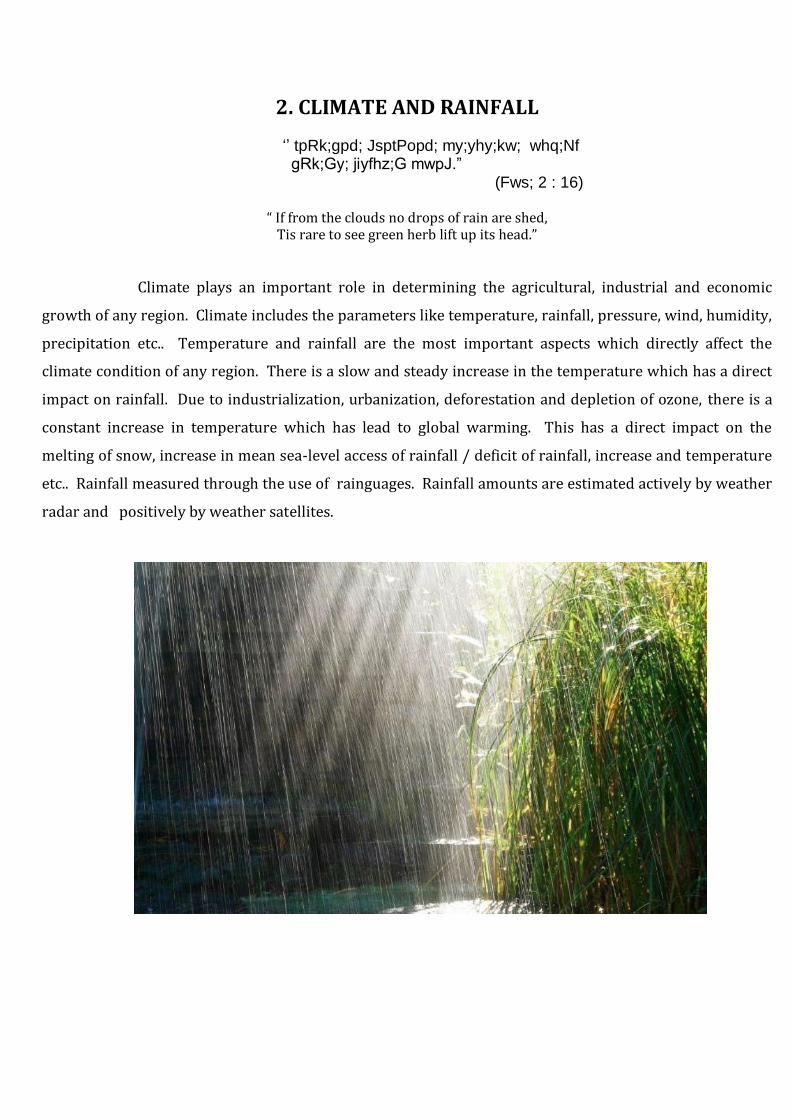
2. CLIMATE AND RAINFALL
‘’ tpRk;gpd; JsptPopd; my;yhy;kw; whq;Nf gRk;Gy; jiyfhz;G mwpJ.” (Fws; 2 : 16)
“ If from the clouds no drops of rain are shed,
Tis rare to see green herb lift up its head.”
Climate plays an important role in determining the agricultural, industrial and economic
growth of any region. Climate includes the parameters like temperature, rainfall, pressure, wind, humidity,
precipitation etc.. Temperature and rainfall are the most important aspects which directly affect the
climate condition of any region. There is a slow and steady increase in the temperature which has a direct
impact on rainfall. Due to industrialization, urbanization, deforestation and depletion of ozone, there is a
constant increase in temperature which has lead to global warming. This has a direct impact on the
melting of snow, increase in mean sea-level access of rainfall / deficit of rainfall, increase and temperature
etc.. Rainfall measured through the use of rainguages. Rainfall amounts are estimated actively by weather
radar and positively by weather satellites.
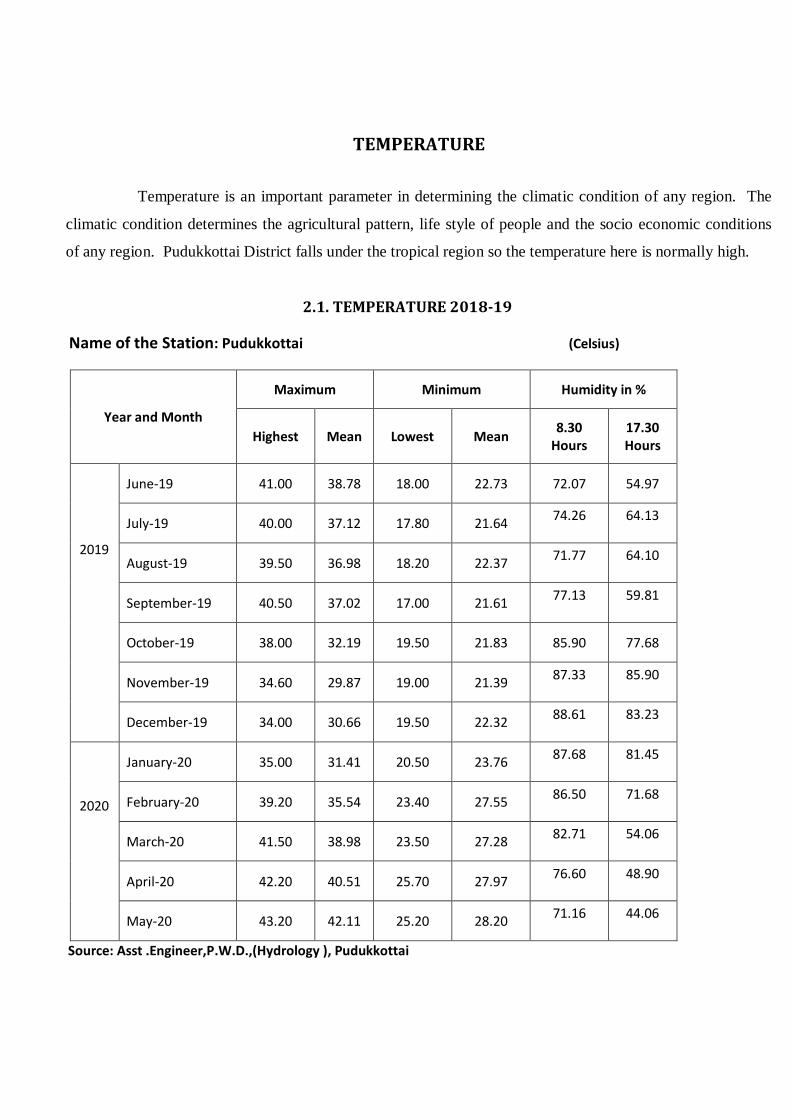
TEMPERATURE
Temperature is an important parameter in determining the climatic condition of any region. The
climatic condition determines the agricultural pattern, life style of people and the socio economic conditions
of any region. Pudukkottai District falls under the tropical region so the temperature here is normally high.
2.1. TEMPERATURE 2018-19
Name of the Station: Pudukkottai (Celsius)
Year and Month
Maximum Minimum Humidity in %
Highest Mean Lowest Mean 8.30
Hours 17.30 Hours
2019
June-19 41.00 38.78 18.00 22.73 72.07 54.97
July-19 40.00 37.12 17.80 21.64 74.26 64.13
August-19 39.50 36.98 18.20 22.37 71.77 64.10
September-19 40.50 37.02 17.00 21.61 77.13 59.81
October-19 38.00 32.19 19.50 21.83 85.90 77.68
November-19 34.60 29.87 19.00 21.39 87.33 85.90
December-19 34.00 30.66 19.50 22.32 88.61 83.23
2020
January-20 35.00 31.41 20.50 23.76 87.68 81.45
February-20 39.20 35.54 23.40 27.55 86.50 71.68
March-20 41.50 38.98 23.50 27.28 82.71 54.06
April-20 42.20 40.51 25.70 27.97 76.60 48.90
May-20 43.20 42.11 25.20 28.20 71.16 44.06
Source: Asst .Engineer,P.W.D.,(Hydrology ), Pudukkottai
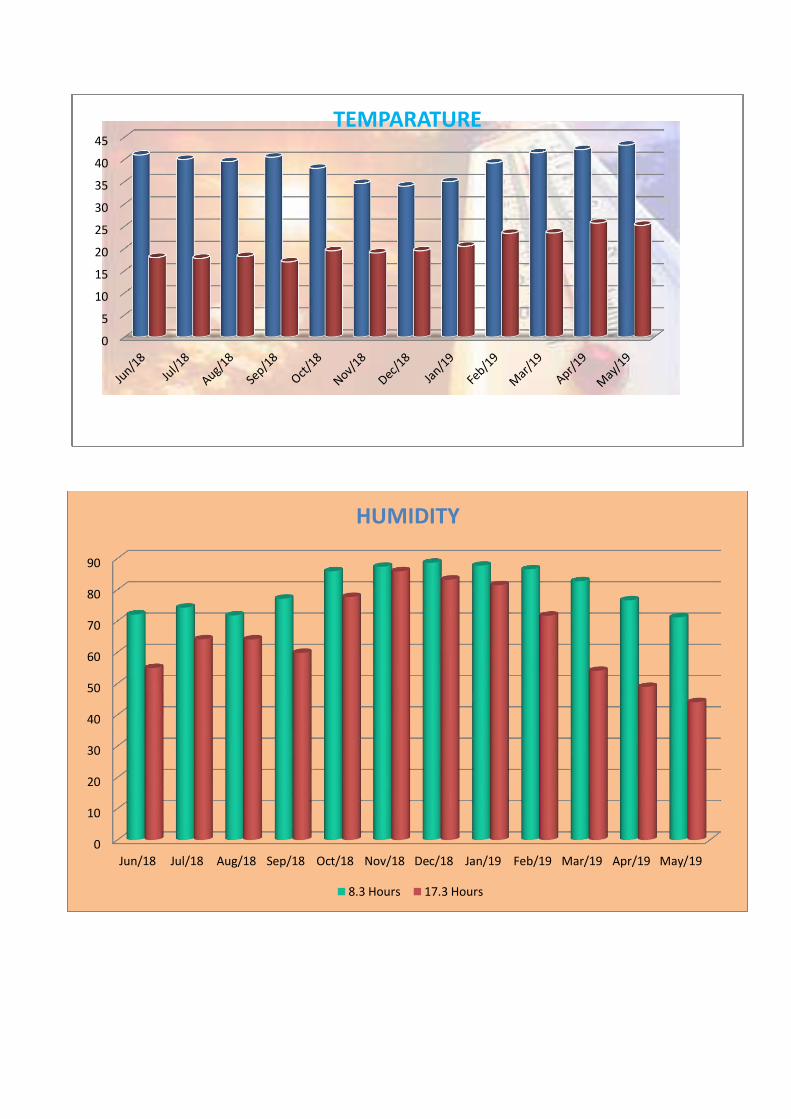
0
5
10
15
20
25
30
35
40
45
TEMPARATURE
0
10
20
30
40
50
60
70
80
90
Jun/18 Jul/18 Aug/18 Sep/18 Oct/18 Nov/18 Dec/18 Jan/19 Feb/19 Mar/19 Apr/19 May/19
HUMIDITY
8.3 Hours 17.3 Hours
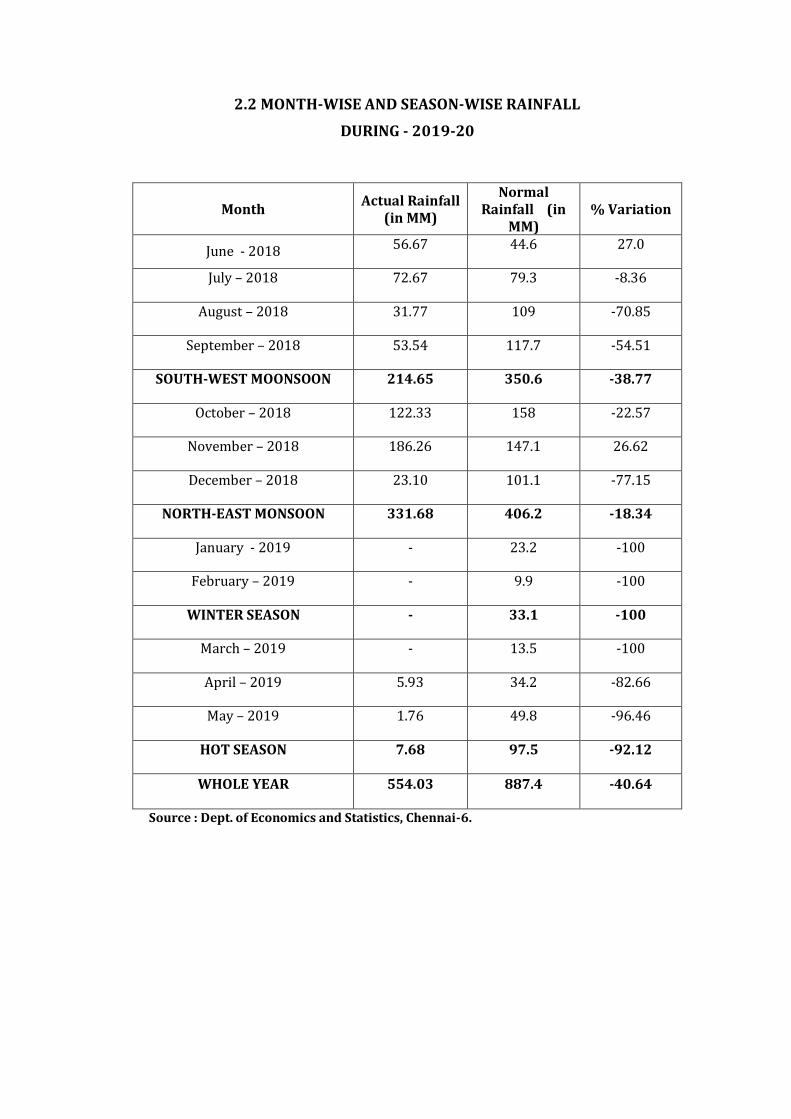
2.2 MONTH-WISE AND SEASON-WISE RAINFALL
DURING - 2019-20
Month Actual Rainfall
(in MM)
Normal Rainfall (in
MM) % Variation
June - 2018 56.67 44.6 27.0
July – 2018 72.67 79.3 -8.36
August – 2018 31.77 109 -70.85
September – 2018 53.54 117.7 -54.51
SOUTH-WEST MOONSOON 214.65 350.6 -38.77
October – 2018 122.33 158 -22.57
November – 2018 186.26 147.1 26.62
December – 2018 23.10 101.1 -77.15
NORTH-EAST MONSOON 331.68 406.2 -18.34
January - 2019 - 23.2 -100
February – 2019 - 9.9 -100
WINTER SEASON - 33.1 -100
March – 2019 - 13.5 -100
April – 2019 5.93 34.2 -82.66
May – 2019 1.76 49.8 -96.46
HOT SEASON 7.68 97.5 -92.12
WHOLE YEAR 554.03 887.4 -40.64
Source : Dept. of Economics and Statistics, Chennai-6.
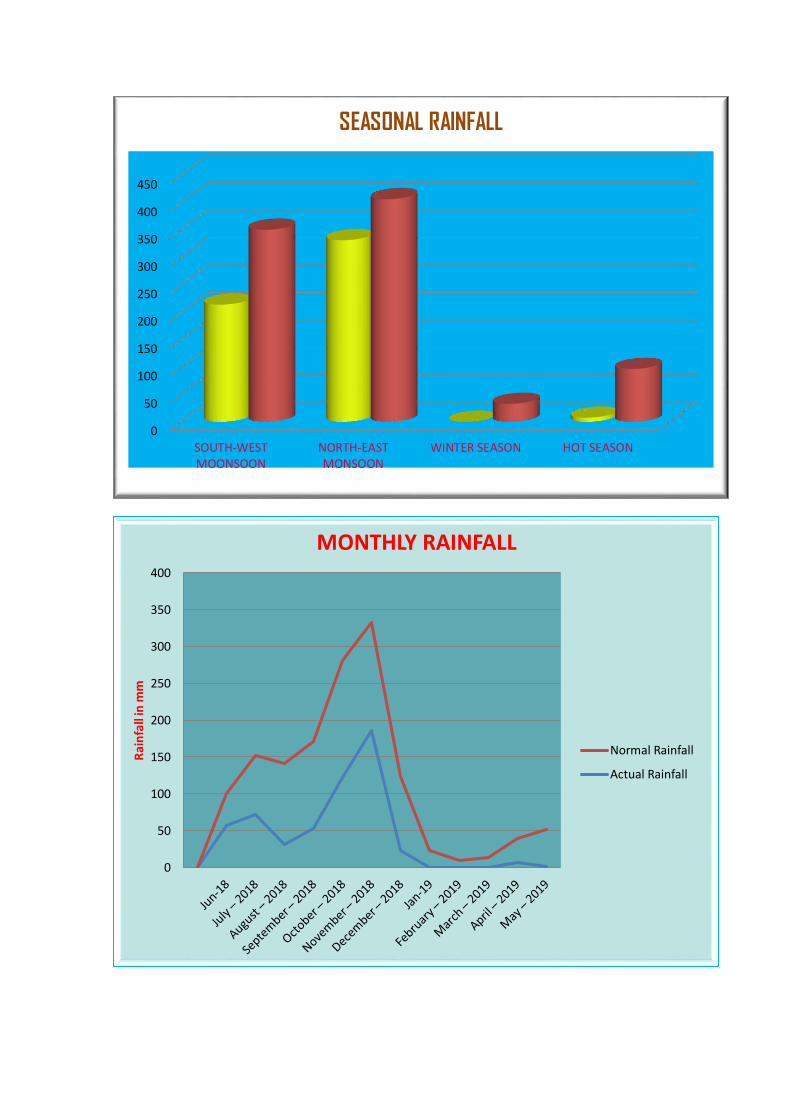
0
50
100
150
200
250
300
350
400
450
SOUTH-WESTMOONSOON
NORTH-EASTMONSOON
WINTER SEASON HOT SEASON
SEASONAL RAINFALL
0
50
100
150
200
250
300
350
400
Ra
infa
ll in
mm
MONTHLY RAINFALL
Normal Rainfall
Actual Rainfall
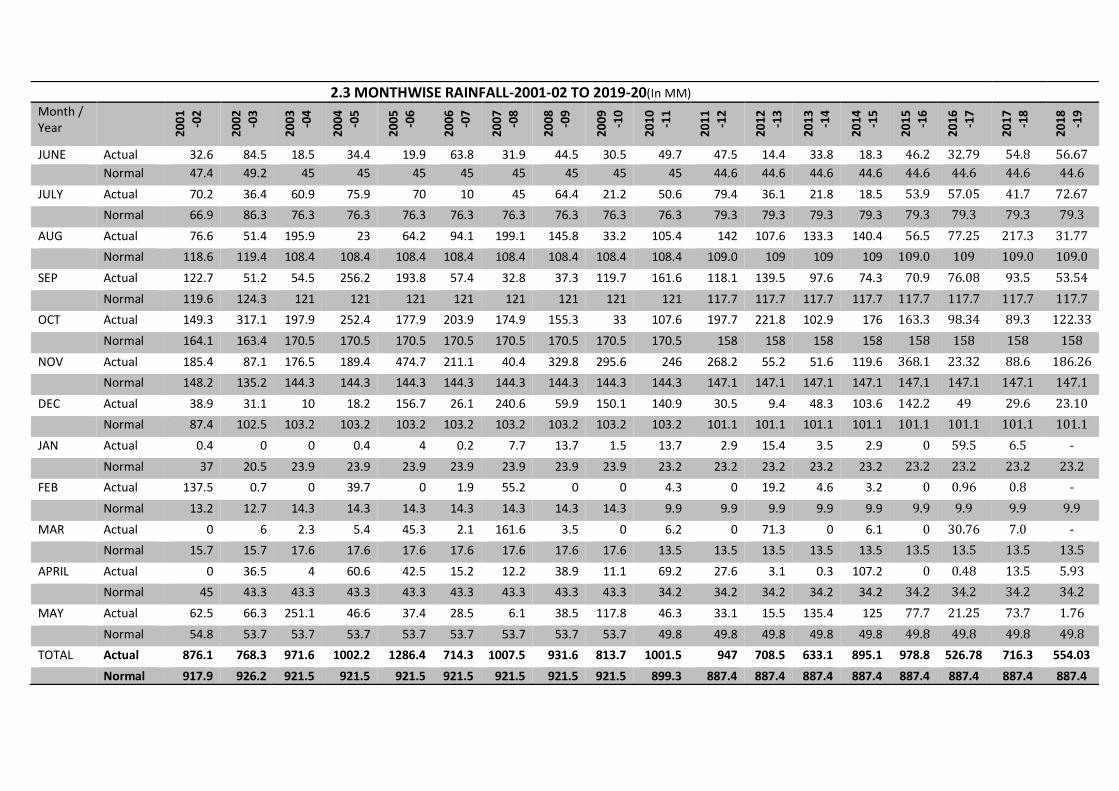
2.3 MONTHWISE RAINFALL-2001-02 TO 2019-20(In MM)
Month / Year 20
01 -02
2002 -0
3
2003 -0
4
2004 -0
5
2005 -0
6
2006 -0
7
2007 -0
8
2008 -0
9
2009 -1
0
2010 -1
1
2011 -1
2
2012 -1
3
2013 -1
4
2014 -1
5
2015 -1
6
2016 -1
7
2017 -1
8
2018 -1
9
JUNE Actual 32.6 84.5 18.5 34.4 19.9 63.8 31.9 44.5 30.5 49.7 47.5 14.4 33.8 18.3 46.2 32.79 54.8 56.67
Normal 47.4 49.2 45 45 45 45 45 45 45 45 44.6 44.6 44.6 44.6 44.6 44.6 44.6 44.6
JULY Actual 70.2 36.4 60.9 75.9 70 10 45 64.4 21.2 50.6 79.4 36.1 21.8 18.5 53.9 57.05 41.7 72.67
Normal 66.9 86.3 76.3 76.3 76.3 76.3 76.3 76.3 76.3 76.3 79.3 79.3 79.3 79.3 79.3 79.3 79.3 79.3
AUG Actual 76.6 51.4 195.9 23 64.2 94.1 199.1 145.8 33.2 105.4 142 107.6 133.3 140.4 56.5 77.25 217.3 31.77
Normal 118.6 119.4 108.4 108.4 108.4 108.4 108.4 108.4 108.4 108.4 109.0 109 109 109 109.0 109 109.0 109.0
SEP Actual 122.7 51.2 54.5 256.2 193.8 57.4 32.8 37.3 119.7 161.6 118.1 139.5 97.6 74.3 70.9 76.08 93.5 53.54
Normal 119.6 124.3 121 121 121 121 121 121 121 121 117.7 117.7 117.7 117.7 117.7 117.7 117.7 117.7
OCT Actual 149.3 317.1 197.9 252.4 177.9 203.9 174.9 155.3 33 107.6 197.7 221.8 102.9 176 163.3 98.34 89.3 122.33
Normal 164.1 163.4 170.5 170.5 170.5 170.5 170.5 170.5 170.5 170.5 158 158 158 158 158 158 158 158
NOV Actual 185.4 87.1 176.5 189.4 474.7 211.1 40.4 329.8 295.6 246 268.2 55.2 51.6 119.6 368.1 23.32 88.6 186.26
Normal 148.2 135.2 144.3 144.3 144.3 144.3 144.3 144.3 144.3 144.3 147.1 147.1 147.1 147.1 147.1 147.1 147.1 147.1
DEC Actual 38.9 31.1 10 18.2 156.7 26.1 240.6 59.9 150.1 140.9 30.5 9.4 48.3 103.6 142.2 49 29.6 23.10
Normal 87.4 102.5 103.2 103.2 103.2 103.2 103.2 103.2 103.2 103.2 101.1 101.1 101.1 101.1 101.1 101.1 101.1 101.1
JAN Actual 0.4 0 0 0.4 4 0.2 7.7 13.7 1.5 13.7 2.9 15.4 3.5 2.9 0 59.5 6.5 -
Normal 37 20.5 23.9 23.9 23.9 23.9 23.9 23.9 23.9 23.2 23.2 23.2 23.2 23.2 23.2 23.2 23.2 23.2
FEB Actual 137.5 0.7 0 39.7 0 1.9 55.2 0 0 4.3 0 19.2 4.6 3.2 0 0.96 0.8 -
Normal 13.2 12.7 14.3 14.3 14.3 14.3 14.3 14.3 14.3 9.9 9.9 9.9 9.9 9.9 9.9 9.9 9.9 9.9
MAR Actual 0 6 2.3 5.4 45.3 2.1 161.6 3.5 0 6.2 0 71.3 0 6.1 0 30.76 7.0 -
Normal 15.7 15.7 17.6 17.6 17.6 17.6 17.6 17.6 17.6 13.5 13.5 13.5 13.5 13.5 13.5 13.5 13.5 13.5
APRIL Actual 0 36.5 4 60.6 42.5 15.2 12.2 38.9 11.1 69.2 27.6 3.1 0.3 107.2 0 0.48 13.5 5.93
Normal 45 43.3 43.3 43.3 43.3 43.3 43.3 43.3 43.3 34.2 34.2 34.2 34.2 34.2 34.2 34.2 34.2 34.2
MAY Actual 62.5 66.3 251.1 46.6 37.4 28.5 6.1 38.5 117.8 46.3 33.1 15.5 135.4 125 77.7 21.25 73.7 1.76
Normal 54.8 53.7 53.7 53.7 53.7 53.7 53.7 53.7 53.7 49.8 49.8 49.8 49.8 49.8 49.8 49.8 49.8 49.8
TOTAL Actual 876.1 768.3 971.6 1002.2 1286.4 714.3 1007.5 931.6 813.7 1001.5 947 708.5 633.1 895.1 978.8 526.78 716.3 554.03
Normal 917.9 926.2 921.5 921.5 921.5 921.5 921.5 921.5 921.5 899.3 887.4 887.4 887.4 887.4 887.4 887.4 887.4 887.4

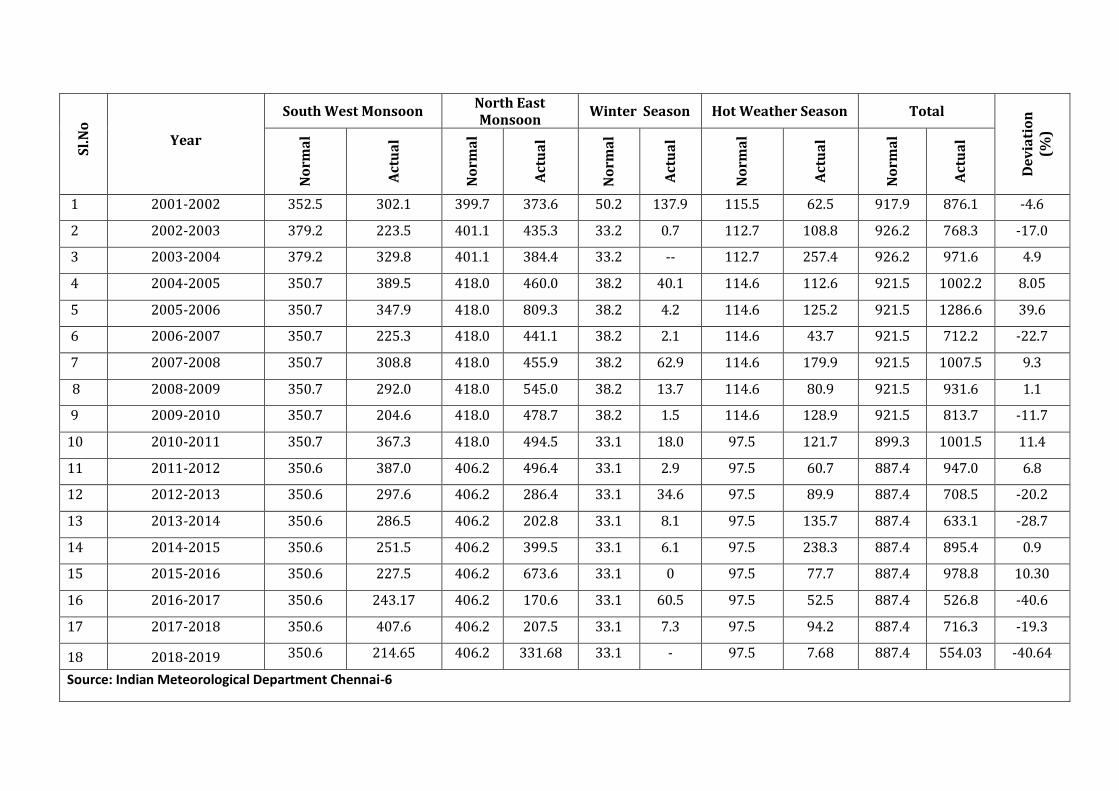
Sl.
No
Year
South West Monsoon North East Monsoon
Winter Season Hot Weather Season Total
De
via
tio
n
(%
)
No
rma
l
Act
ua
l
No
rma
l
Act
ua
l
No
rma
l
Act
ua
l
No
rma
l
Act
ua
l
No
rma
l
Act
ua
l
1 2001-2002 352.5 302.1 399.7 373.6 50.2 137.9 115.5 62.5 917.9 876.1 -4.6
2 2002-2003 379.2 223.5 401.1 435.3 33.2 0.7 112.7 108.8 926.2 768.3 -17.0
3 2003-2004 379.2 329.8 401.1 384.4 33.2 -- 112.7 257.4 926.2 971.6 4.9
4 2004-2005 350.7 389.5 418.0 460.0 38.2 40.1 114.6 112.6 921.5 1002.2 8.05
5 2005-2006 350.7 347.9 418.0 809.3 38.2 4.2 114.6 125.2 921.5 1286.6 39.6
6 2006-2007 350.7 225.3 418.0 441.1 38.2 2.1 114.6 43.7 921.5 712.2 -22.7
7 2007-2008 350.7 308.8 418.0 455.9 38.2 62.9 114.6 179.9 921.5 1007.5 9.3
8 2008-2009 350.7 292.0 418.0 545.0 38.2 13.7 114.6 80.9 921.5 931.6 1.1
9 2009-2010 350.7 204.6 418.0 478.7 38.2 1.5 114.6 128.9 921.5 813.7 -11.7
10 2010-2011 350.7 367.3 418.0 494.5 33.1 18.0 97.5 121.7 899.3 1001.5 11.4
11 2011-2012 350.6 387.0 406.2 496.4 33.1 2.9 97.5 60.7 887.4 947.0 6.8
12 2012-2013 350.6 297.6 406.2 286.4 33.1 34.6 97.5 89.9 887.4 708.5 -20.2
13 2013-2014 350.6 286.5 406.2 202.8 33.1 8.1 97.5 135.7 887.4 633.1 -28.7
14 2014-2015 350.6 251.5 406.2 399.5 33.1 6.1 97.5 238.3 887.4 895.4 0.9
15 2015-2016 350.6 227.5 406.2 673.6 33.1 0 97.5 77.7 887.4 978.8 10.30
16 2016-2017 350.6 243.17 406.2 170.6 33.1 60.5 97.5 52.5 887.4 526.8 -40.6
17 2017-2018 350.6 407.6 406.2 207.5 33.1 7.3 97.5 94.2 887.4 716.3 -19.3
18 2018-2019 350.6 214.65 406.2 331.68 33.1 - 97.5 7.68 887.4 554.03 -40.64
Source: Indian Meteorological Department Chennai-6
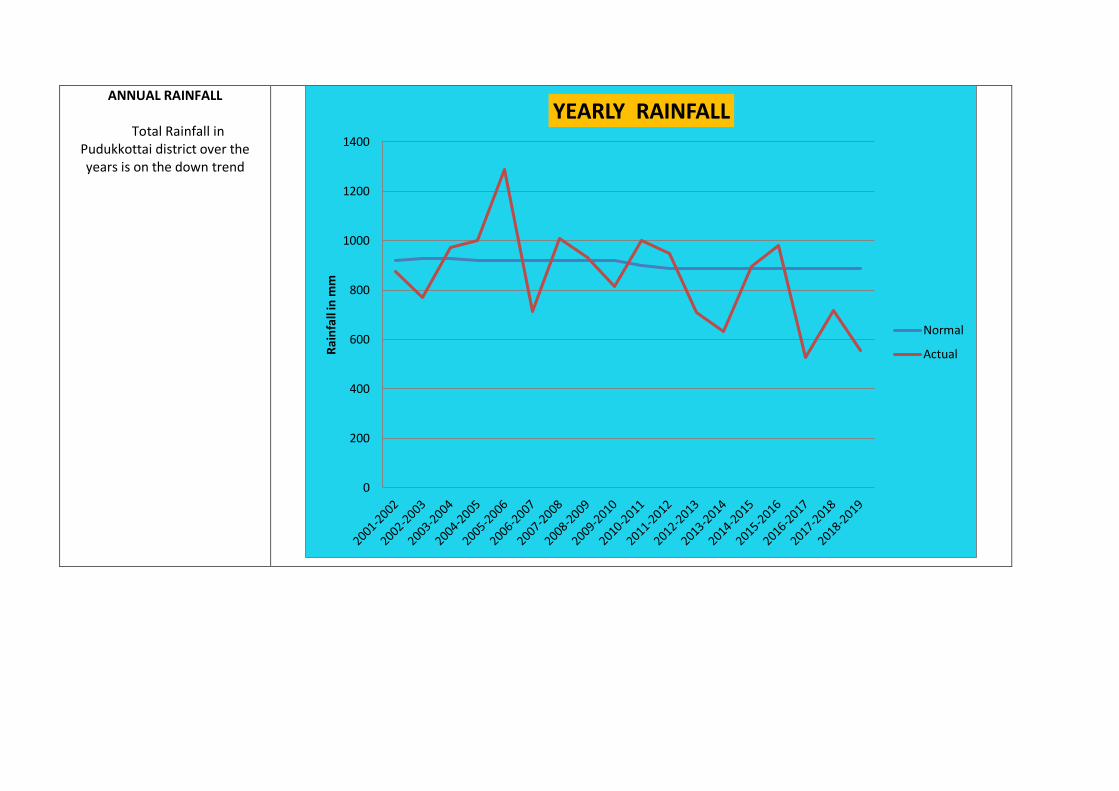
ANNUAL RAINFALL
Total Rainfall in Pudukkottai district over the years is on the down trend
0
200
400
600
800
1000
1200
1400
Rai
nfa
ll in
mm
YEARLY RAINFALL
Normal
Actual
3. AGRICULTURE
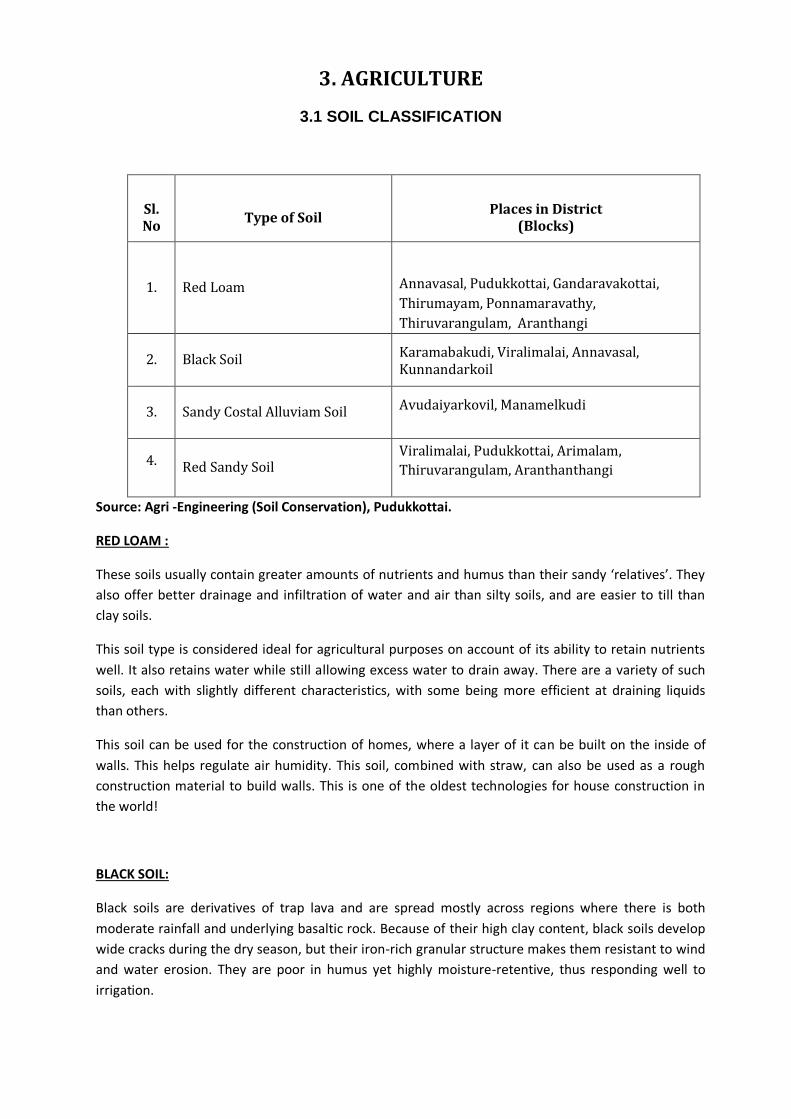
3.1 SOIL CLASSIFICATION
Sl. No
Type of Soil
Places in District
(Blocks)
1. Red Loam Annavasal, Pudukkottai, Gandaravakottai,
Thirumayam, Ponnamaravathy,
Thiruvarangulam, Aranthangi
2. Black Soil Karamabakudi, Viralimalai, Annavasal, Kunnandarkoil
3. Sandy Costal Alluviam Soil Avudaiyarkovil, Manamelkudi
4. Red Sandy Soil Viralimalai, Pudukkottai, Arimalam,
Thiruvarangulam, Aranthanthangi
Source: Agri -Engineering (Soil Conservation), Pudukkottai.
RED LOAM :
These soils usually contain greater amounts of nutrients and humus than their sandy ‘relatives’. They
also offer better drainage and infiltration of water and air than silty soils, and are easier to till than
clay soils.
This soil type is considered ideal for agricultural purposes on account of its ability to retain nutrients
well. It also retains water while still allowing excess water to drain away. There are a variety of such
soils, each with slightly different characteristics, with some being more efficient at draining liquids
than others.
This soil can be used for the construction of homes, where a layer of it can be built on the inside of
walls. This helps regulate air humidity. This soil, combined with straw, can also be used as a rough
construction material to build walls. This is one of the oldest technologies for house construction in
the world!
BLACK SOIL:
Black soils are derivatives of trap lava and are spread mostly across regions where there is both
moderate rainfall and underlying basaltic rock. Because of their high clay content, black soils develop
wide cracks during the dry season, but their iron-rich granular structure makes them resistant to wind
and water erosion. They are poor in humus yet highly moisture-retentive, thus responding well to
irrigation.
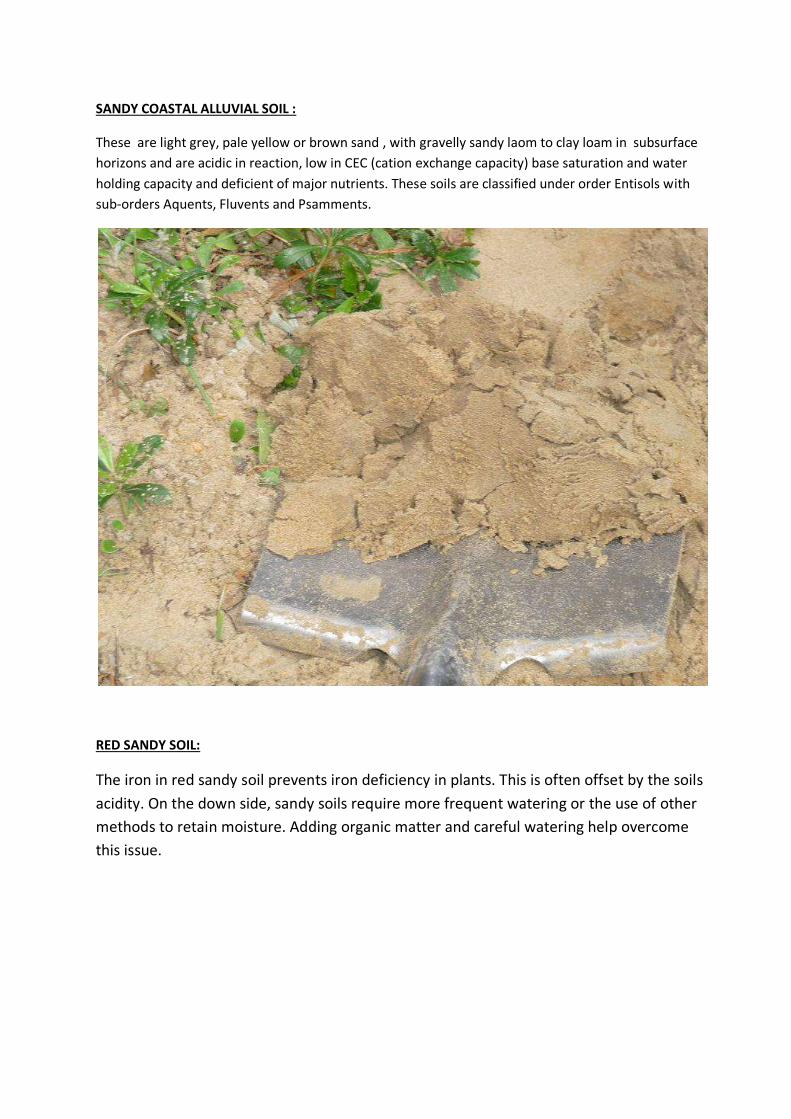
SANDY COASTAL ALLUVIAL SOIL :
These are light grey, pale yellow or brown sand , with gravelly sandy laom to clay loam in subsurface
horizons and are acidic in reaction, low in CEC (cation exchange capacity) base saturation and water
holding capacity and deficient of major nutrients. These soils are classified under order Entisols with
sub-orders Aquents, Fluvents and Psamments.
RED SANDY SOIL:
The iron in red sandy soil prevents iron deficiency in plants. This is often offset by the soils
acidity. On the down side, sandy soils require more frequent watering or the use of other
methods to retain moisture. Adding organic matter and careful watering help overcome
this issue.
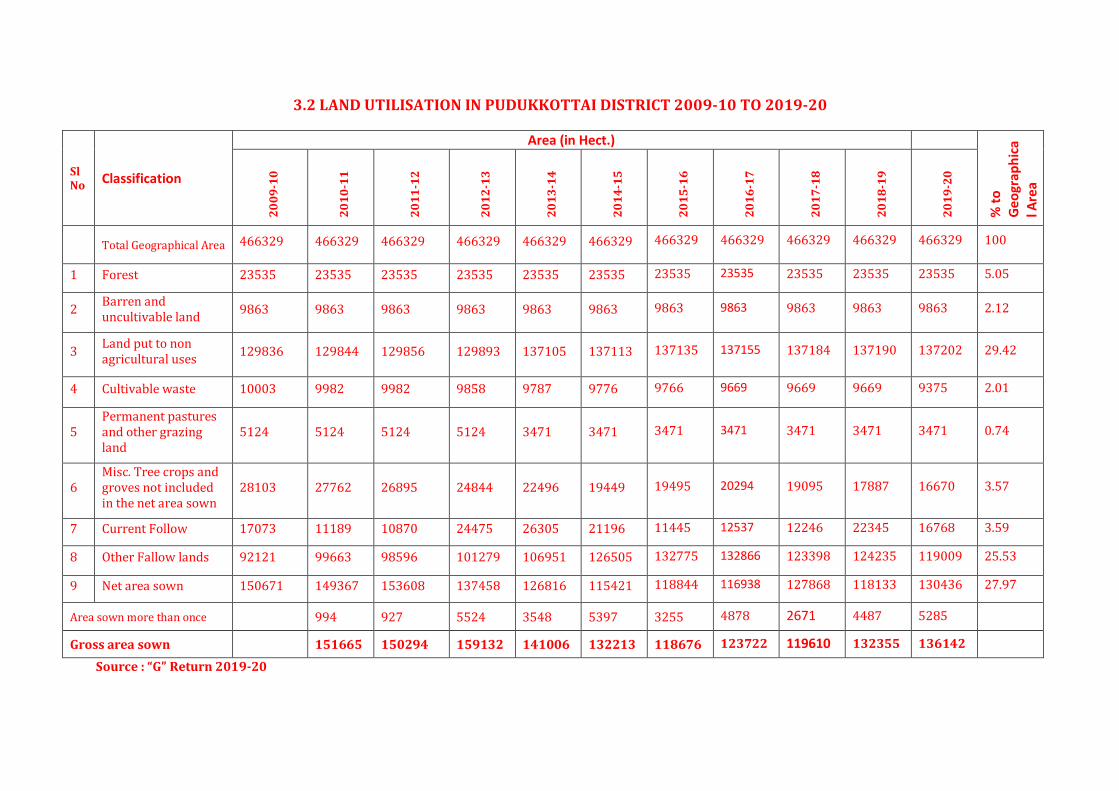
3.2 LAND UTILISATION IN PUDUKKOTTAI DISTRICT 2009-10 TO 2019-20
Sl No Classification
Area (in Hect.)
% t
o
Ge
ogr
aph
ica
l Are
a
20
09
-10
20
10
-11
20
11
-12
20
12
-13
20
13
-14
20
14
-15
20
15
-16
20
16
-17
20
17
-18
20
18
-19
20
19
-20
Total Geographical Area 466329 466329 466329 466329 466329 466329 466329 466329 466329 466329 466329 100
1 Forest 23535 23535 23535 23535 23535 23535 23535 23535 23535 23535 23535 5.05
2 Barren and uncultivable land
9863 9863 9863 9863 9863 9863 9863 9863 9863 9863 9863 2.12
3 Land put to non agricultural uses
129836 129844 129856 129893 137105 137113 137135 137155 137184 137190 137202 29.42
4 Cultivable waste 10003 9982 9982 9858 9787 9776 9766 9669 9669 9669 9375 2.01
5 Permanent pastures and other grazing land
5124 5124 5124 5124 3471 3471 3471 3471 3471 3471 3471 0.74
6 Misc. Tree crops and groves not included in the net area sown
28103 27762 26895 24844 22496 19449 19495 20294 19095 17887 16670 3.57
7 Current Follow 17073 11189 10870 24475 26305 21196 11445 12537 12246 22345 16768 3.59
8 Other Fallow lands 92121 99663 98596 101279 106951 126505 132775 132866 123398 124235 119009 25.53
9 Net area sown 150671 149367 153608 137458 126816 115421 118844 116938 127868 118133 130436 27.97
Area sown more than once
994 927 5524 3548 5397 3255 4878 2671 4487 5285
Gross area sown
151665 150294 159132 141006 132213 118676 123722 119610 132355 136142
Source : “G” Return 2019-20
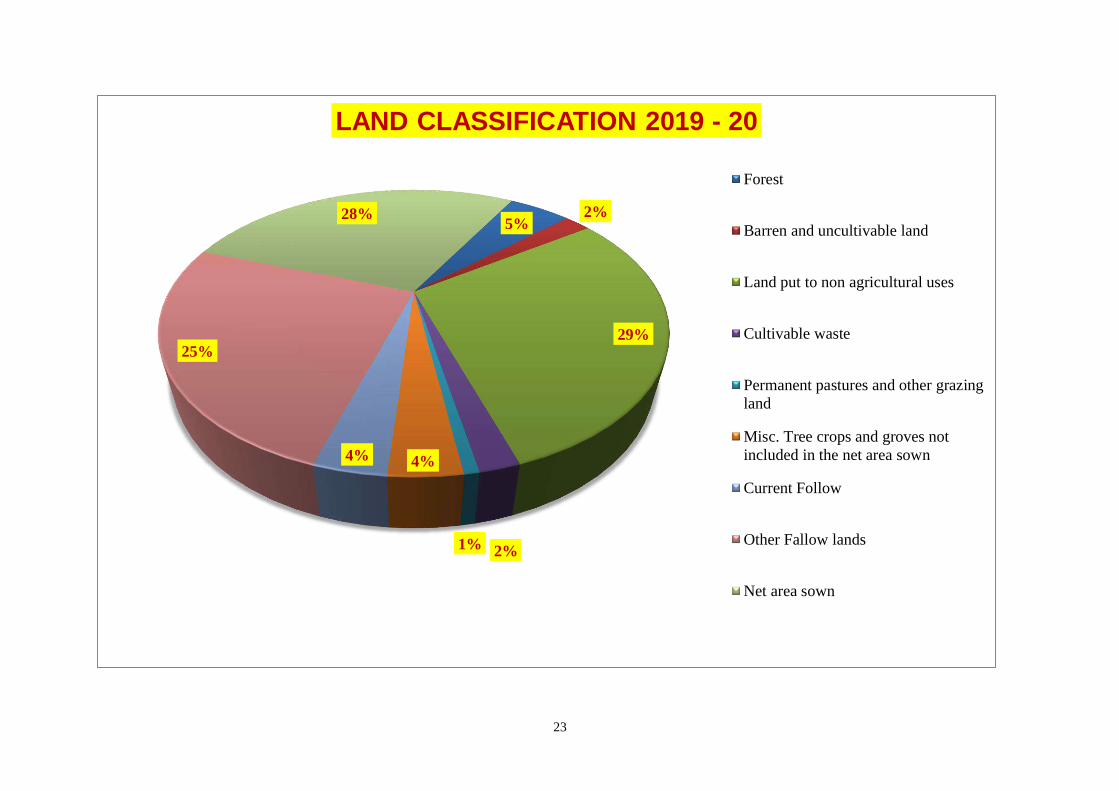
23
5%2%
29%
2%1%
4%4%
25%
28%
LAND CLASSIFICATION 2019 - 20
Forest
Barren and uncultivable land
Land put to non agricultural uses
Cultivable waste
Permanent pastures and other grazing
land
Misc. Tree crops and groves not
included in the net area sown
Current Follow
Other Fallow lands
Net area sown
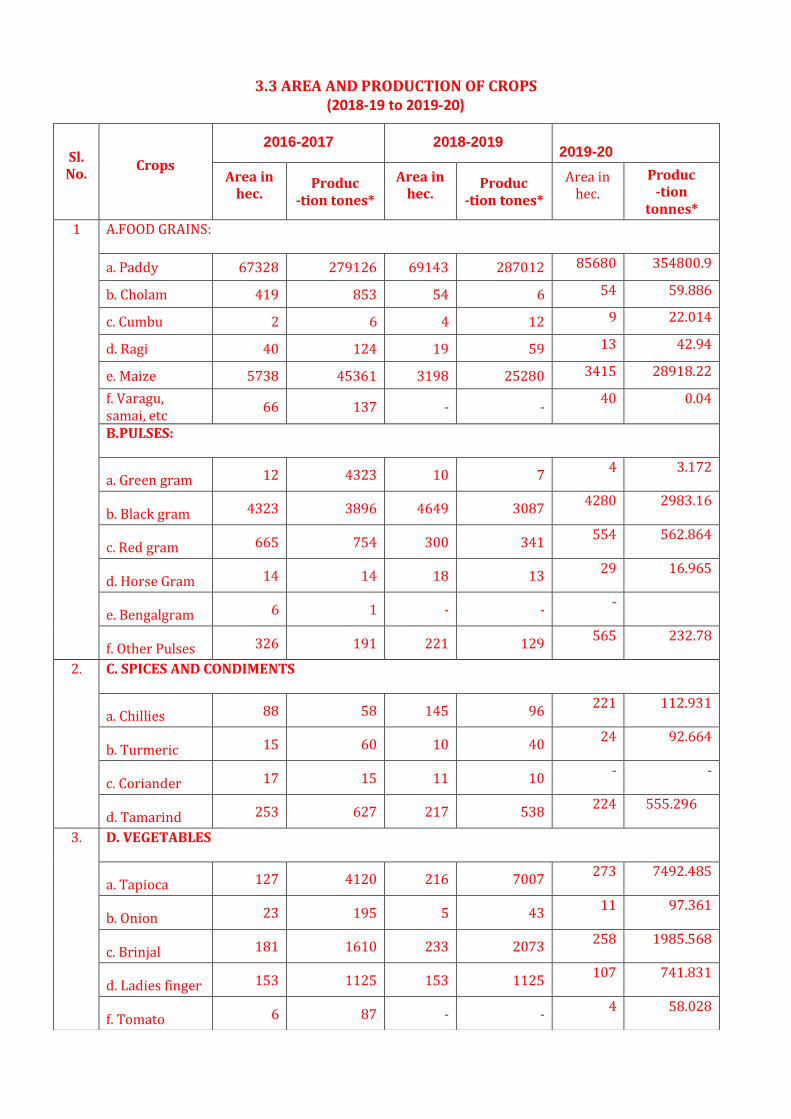
3.3 AREA AND PRODUCTION OF CROPS (2018-19 to 2019-20)
Sl. No.
Crops
2016-2017 2018-2019
2019-20
Area in hec.
Produc -tion tones*
Area in hec.
Produc -tion tones*
Area in hec.
Produc -tion
tonnes*
1
A.FOOD GRAINS:
a. Paddy 67328 279126 69143 287012 85680 354800.9
b. Cholam 419 853 54 6 54 59.886
c. Cumbu 2 6 4 12 9 22.014
d. Ragi 40 124 19 59 13 42.94
e. Maize 5738 45361 3198 25280 3415 28918.22
f. Varagu, samai, etc
66 137 - - 40 0.04
B.PULSES:
a. Green gram 12 4323 10 7 4 3.172
b. Black gram 4323 3896 4649 3087 4280 2983.16
c. Red gram 665 754 300 341 554 562.864
d. Horse Gram 14 14 18 13 29 16.965
e. Bengalgram 6 1 - - -
f. Other Pulses 326 191 221 129 565 232.78
2. C. SPICES AND CONDIMENTS
a. Chillies 88 58 145 96 221 112.931
b. Turmeric 15 60 10 40 24 92.664
c. Coriander 17 15 11 10 - -
d. Tamarind 253 627 217 538 224 555.296
3. D. VEGETABLES
a. Tapioca 127 4120 216 7007 273 7492.485
b. Onion 23 195 5 43 11 97.361
c. Brinjal 181 1610 233 2073 258 1985.568
d. Ladies finger 153 1125 153 1125 107 741.831
f. Tomato 6 87 - - 4 58.028
25
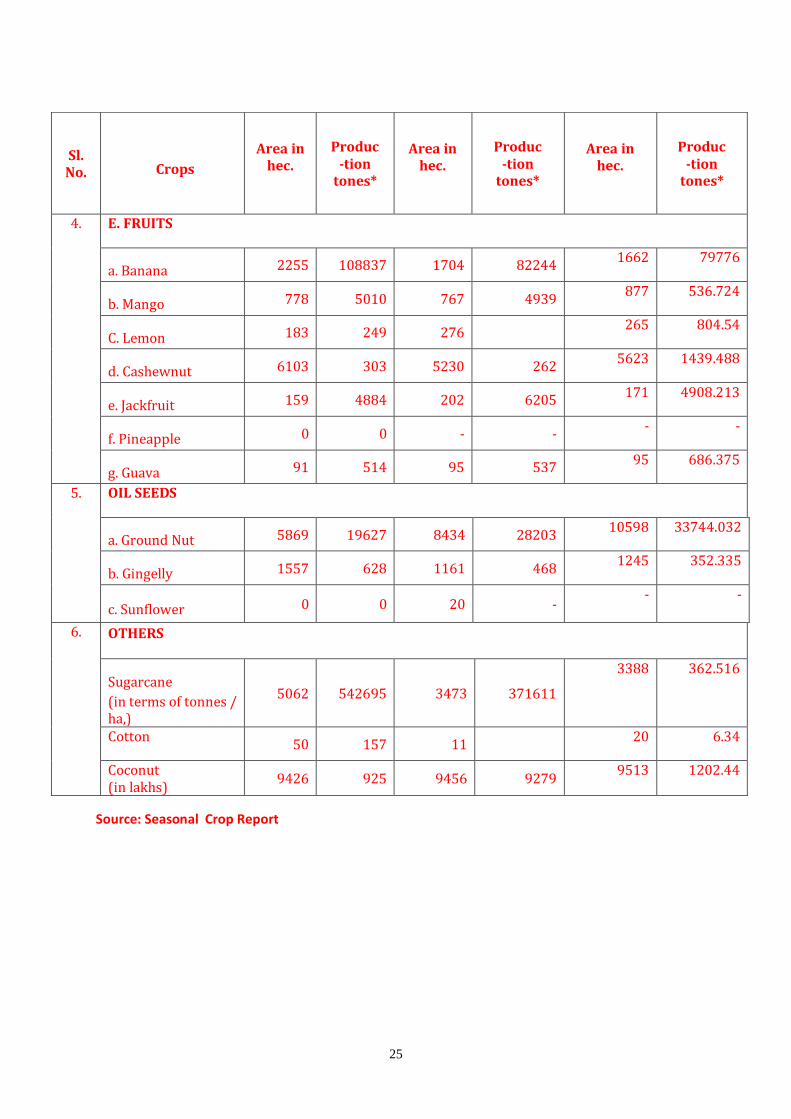
Source: Seasonal Crop Report
Sl. No.
Crops
Area in hec.
Produc -tion
tones*
Area in hec.
Produc -tion
tones*
Area in hec.
Produc -tion
tones*
4. E. FRUITS
a. Banana 2255 108837 1704 82244 1662 79776
b. Mango 778 5010 767 4939 877 536.724
C. Lemon 183 249 276 265 804.54
d. Cashewnut 6103 303 5230 262 5623 1439.488
e. Jackfruit 159 4884 202 6205 171 4908.213
f. Pineapple 0 0 - - - -
g. Guava 91 514 95 537 95 686.375
5. OIL SEEDS
a. Ground Nut 5869 19627 8434 28203 10598 33744.032
b. Gingelly 1557 628 1161 468 1245 352.335
c. Sunflower 0 0 20 - - -
6. OTHERS
Sugarcane
(in terms of tonnes / ha,)
5062 542695 3473 371611
3388 362.516
Cotton 50 157 11
20 6.34
Coconut (in lakhs)
9426 925 9456 9279 9513 1202.44
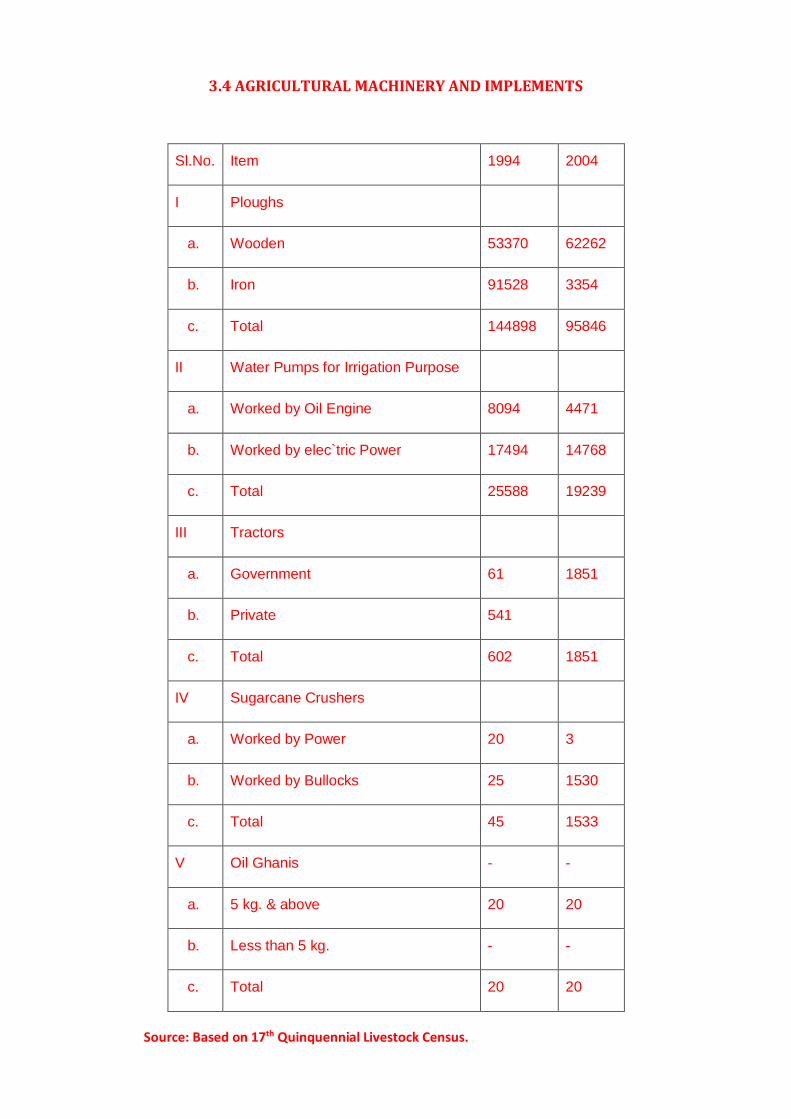
3.4 AGRICULTURAL MACHINERY AND IMPLEMENTS
Sl.No. Item 1994 2004
I Ploughs
a. Wooden 53370 62262
b. Iron 91528 3354
c. Total 144898 95846
II Water Pumps for Irrigation Purpose
a. Worked by Oil Engine 8094 4471
b. Worked by elec`tric Power 17494 14768
c. Total 25588 19239
III Tractors
a. Government 61 1851
b. Private 541
c. Total 602 1851
IV Sugarcane Crushers
a. Worked by Power 20 3
b. Worked by Bullocks 25 1530
c. Total 45 1533
V Oil Ghanis - -
a. 5 kg. & above 20 20
b. Less than 5 kg. - -
c. Total 20 20
Source: Based on 17th Quinquennial Livestock Census.
27
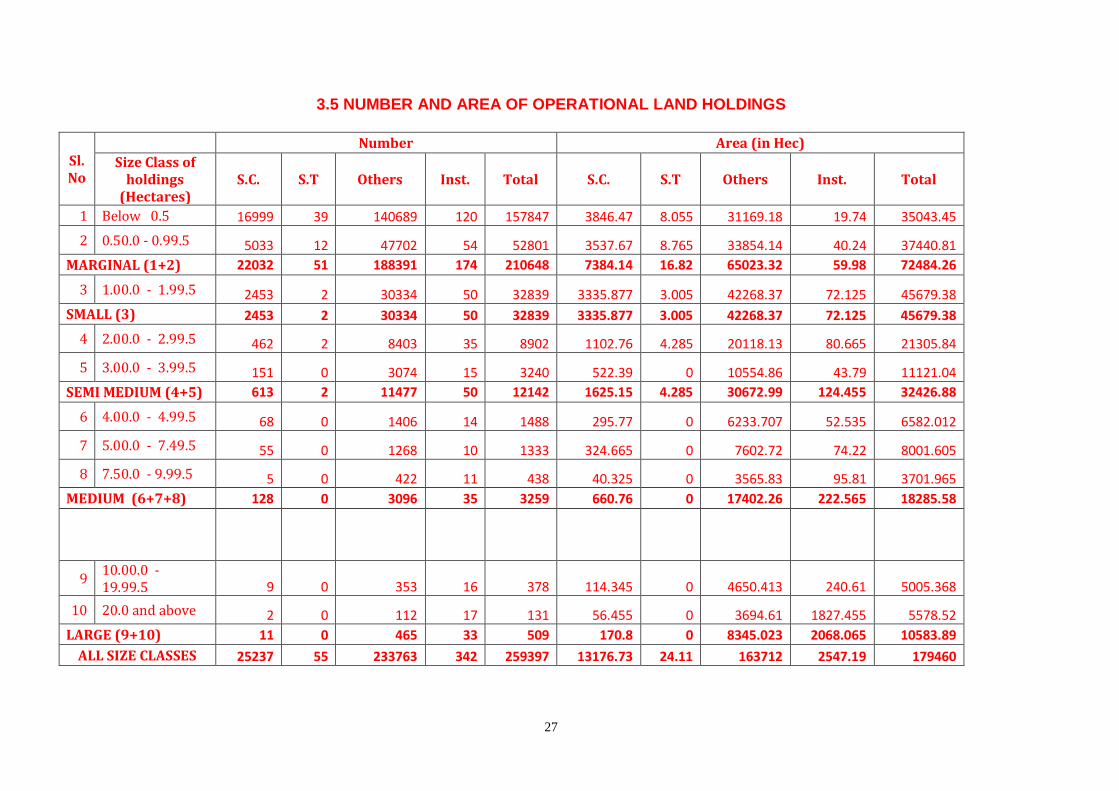
3.5 NUMBER AND AREA OF OPERATIONAL LAND HOLDINGS
Sl. No
Number Area (in Hec)
Size Class of holdings
(Hectares) S.C. S.T Others Inst. Total S.C. S.T Others Inst. Total
1 Below 0.5 16999 39 140689 120 157847 3846.47 8.055 31169.18 19.74 35043.45
2 0.50.0 - 0.99.5 5033 12 47702 54 52801 3537.67 8.765 33854.14 40.24 37440.81
MARGINAL (1+2) 22032 51 188391 174 210648 7384.14 16.82 65023.32 59.98 72484.26
3 1.00.0 - 1.99.5 2453 2 30334 50 32839 3335.877 3.005 42268.37 72.125 45679.38
SMALL (3) 2453 2 30334 50 32839 3335.877 3.005 42268.37 72.125 45679.38
4 2.00.0 - 2.99.5 462 2 8403 35 8902 1102.76 4.285 20118.13 80.665 21305.84
5 3.00.0 - 3.99.5 151 0 3074 15 3240 522.39 0 10554.86 43.79 11121.04
SEMI MEDIUM (4+5) 613 2 11477 50 12142 1625.15 4.285 30672.99 124.455 32426.88
6 4.00.0 - 4.99.5 68 0 1406 14 1488 295.77 0 6233.707 52.535 6582.012
7 5.00.0 - 7.49.5 55 0 1268 10 1333 324.665 0 7602.72 74.22 8001.605
8 7.50.0 - 9.99.5 5 0 422 11 438 40.325 0 3565.83 95.81 3701.965
MEDIUM (6+7+8) 128 0 3096 35 3259 660.76 0 17402.26 222.565 18285.58
9 10.00.0 - 19.99.5 9 0 353 16 378 114.345 0 4650.413 240.61 5005.368
10 20.0 and above 2 0 112 17 131 56.455 0 3694.61 1827.455 5578.52
LARGE (9+10) 11 0 465 33 509 170.8 0 8345.023 2068.065 10583.89
ALL SIZE CLASSES 25237 55 233763 342 259397 13176.73 24.11 163712 2547.19 179460
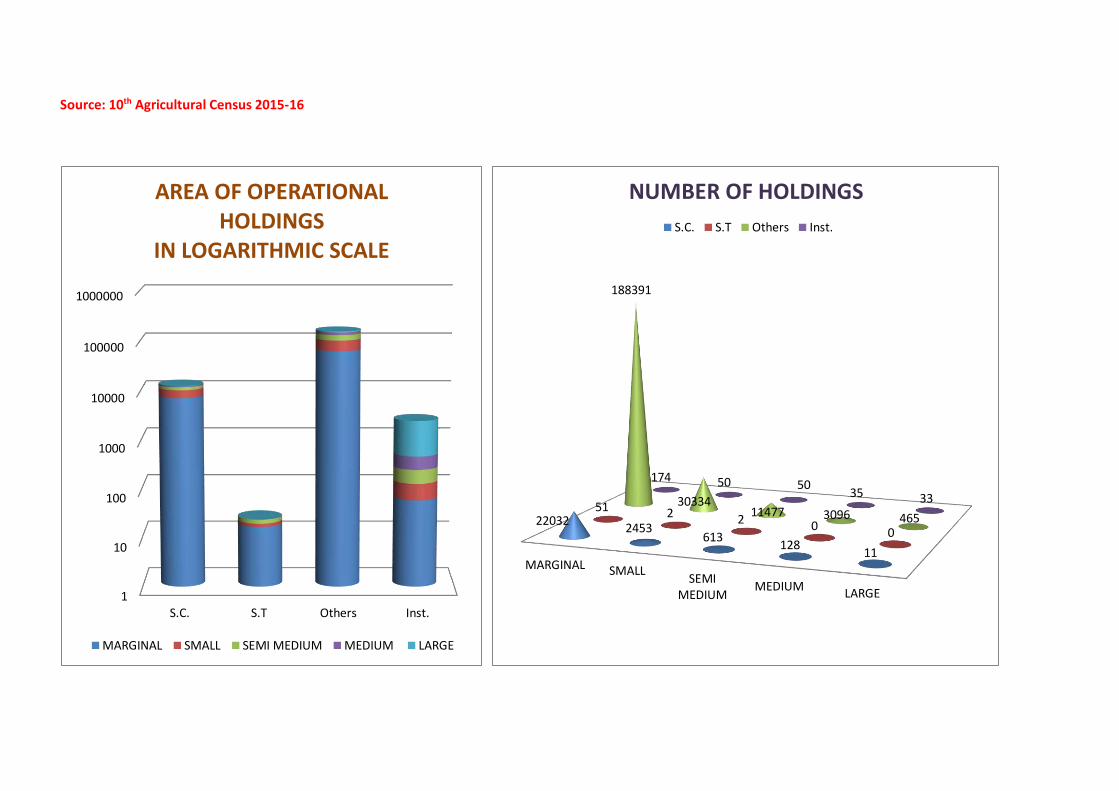
Source: 10th Agricultural Census 2015-16
1
10
100
1000
10000
100000
1000000
S.C. S.T Others Inst.
AREA OF OPERATIONAL HOLDINGS
IN LOGARITHMIC SCALE
MARGINAL SMALL SEMI MEDIUM MEDIUM LARGE
MARGINAL SMALLSEMI
MEDIUMMEDIUM
LARGE
220322453
613128
11
51 2 2 00
188391
3033411477 3096 465
174 50 5035 33
NUMBER OF HOLDINGS
S.C. S.T Others Inst.

29
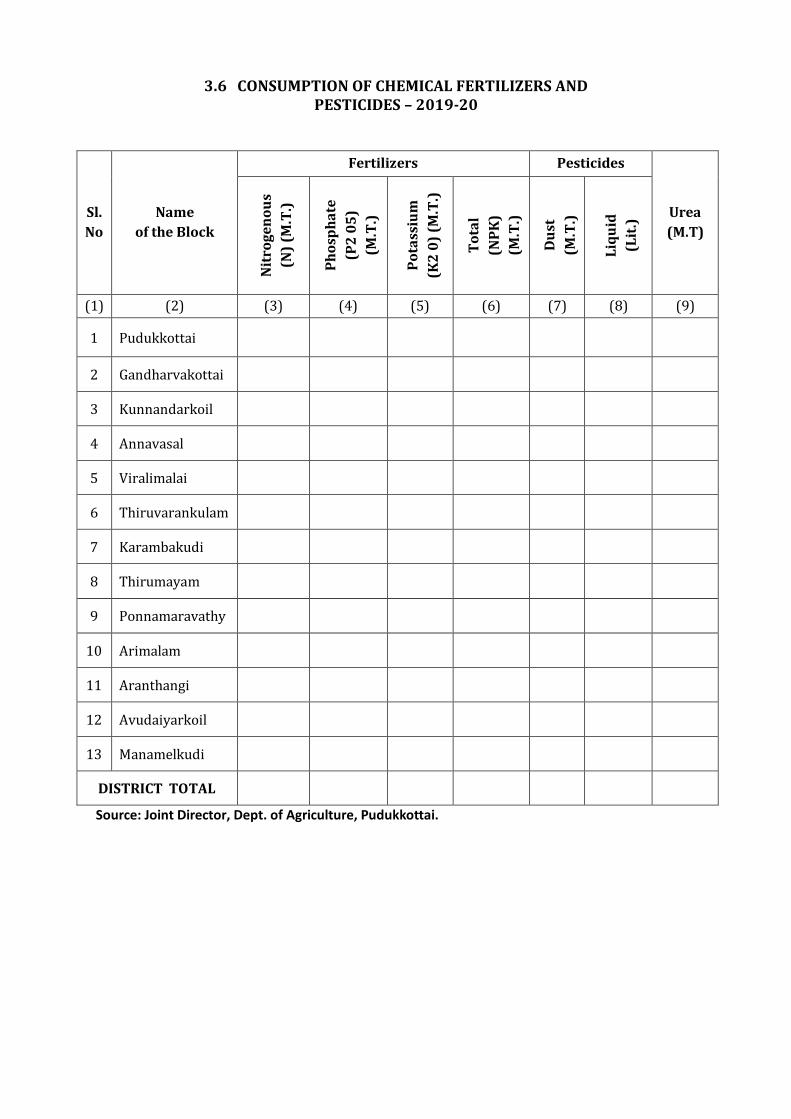
3.6 CONSUMPTION OF CHEMICAL FERTILIZERS AND PESTICIDES – 2019-20
Sl.
No
Name
of the Block
Fertilizers Pesticides
Urea
(M.T)
Nit
rog
en
ou
s
(N)
(M.T
.)
Ph
osp
ha
te
(P2
05
)
(M.T
.)
Po
tass
ium
(K2
0)
(M.T
.)
To
tal
(NP
K)
(M.T
.)
Du
st
(M.T
.)
Liq
uid
(Lit
.)
(1) (2) (3) (4) (5) (6) (7) (8) (9)
1 Pudukkottai
2 Gandharvakottai
3 Kunnandarkoil
4 Annavasal
5 Viralimalai
6 Thiruvarankulam
7 Karambakudi
8 Thirumayam
9 Ponnamaravathy
10 Arimalam
11 Aranthangi
12 Avudaiyarkoil
13 Manamelkudi
DISTRICT TOTAL
Source: Joint Director, Dept. of Agriculture, Pudukkottai.
31
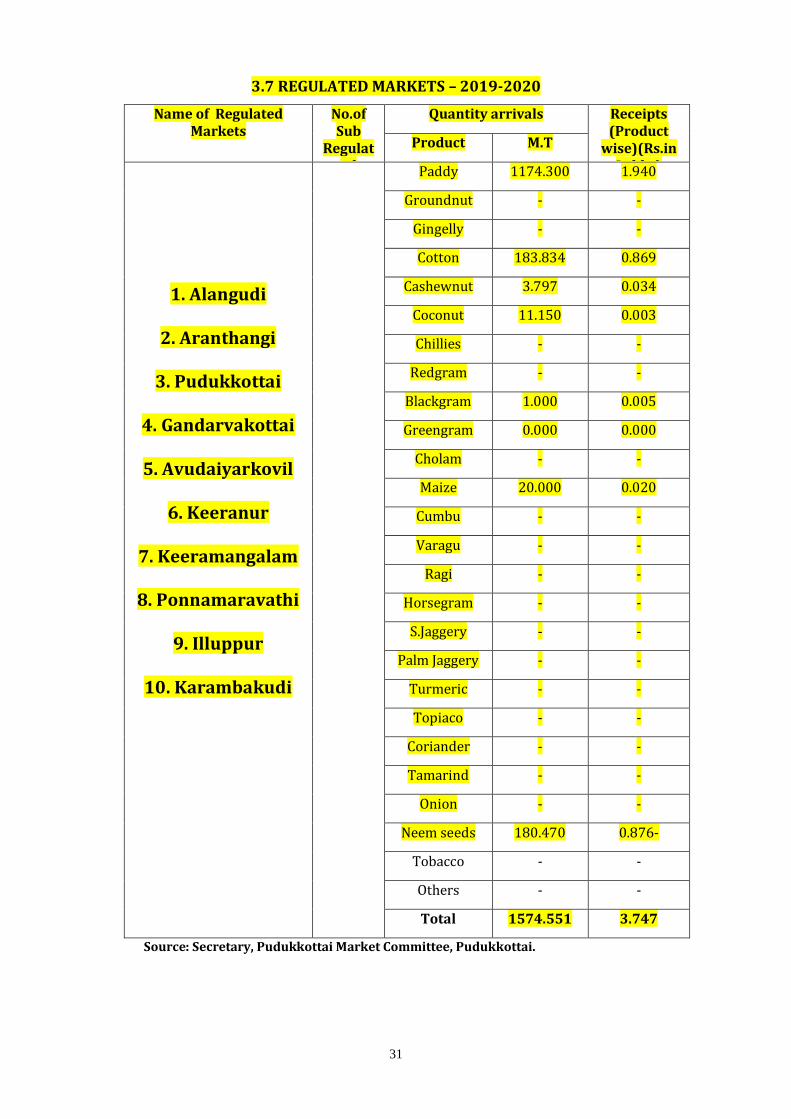
3.7 REGULATED MARKETS – 2019-2020
Name of Regulated Markets
No.of Sub
Regulated
Markets
Quantity arrivals Receipts (Product
wise)(Rs.in Lakhs)
Product M.T
1. Alangudi
2. Aranthangi
3. Pudukkottai
4. Gandarvakottai
5. Avudaiyarkovil
6. Keeranur
7. Keeramangalam
8. Ponnamaravathi
9. Illuppur
10. Karambakudi
Paddy 1174.300 1.940
Groundnut - -
Gingelly - -
Cotton 183.834 0.869
Cashewnut 3.797 0.034
Coconut 11.150 0.003
Chillies - -
Redgram - -
Blackgram 1.000 0.005
Greengram 0.000 0.000
Cholam - -
Maize 20.000 0.020
Cumbu - -
Varagu - -
Ragi - -
Horsegram - -
S.Jaggery - -
Palm Jaggery - -
Turmeric - -
Topiaco - -
Coriander - -
Tamarind - -
Onion - -
Neem seeds 180.470 0.876-
Tobacco - -
Others - -
Total 1574.551 3.747
Source: Secretary, Pudukkottai Market Committee, Pudukkottai.
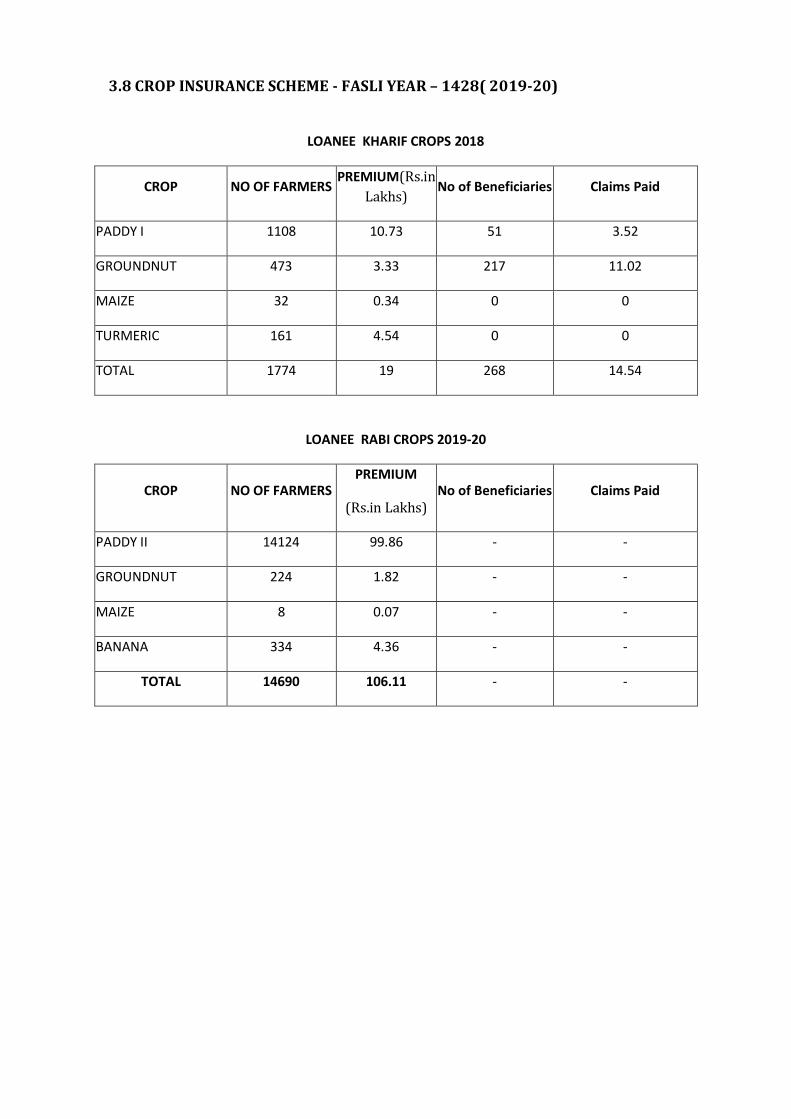
3.8 CROP INSURANCE SCHEME - FASLI YEAR – 1428( 2019-20)
LOANEE KHARIF CROPS 2018
CROP NO OF FARMERS PREMIUM(Rs.in
Lakhs) No of Beneficiaries Claims Paid
PADDY I 1108 10.73 51 3.52
GROUNDNUT 473 3.33 217 11.02
MAIZE 32 0.34 0 0
TURMERIC 161 4.54 0 0
TOTAL 1774 19 268 14.54
LOANEE RABI CROPS 2019-20
CROP NO OF FARMERS PREMIUM
(Rs.in Lakhs) No of Beneficiaries Claims Paid
PADDY II 14124 99.86 - -
GROUNDNUT 224 1.82 - -
MAIZE 8 0.07 - -
BANANA 334 4.36 - -
TOTAL 14690 106.11 - -
33
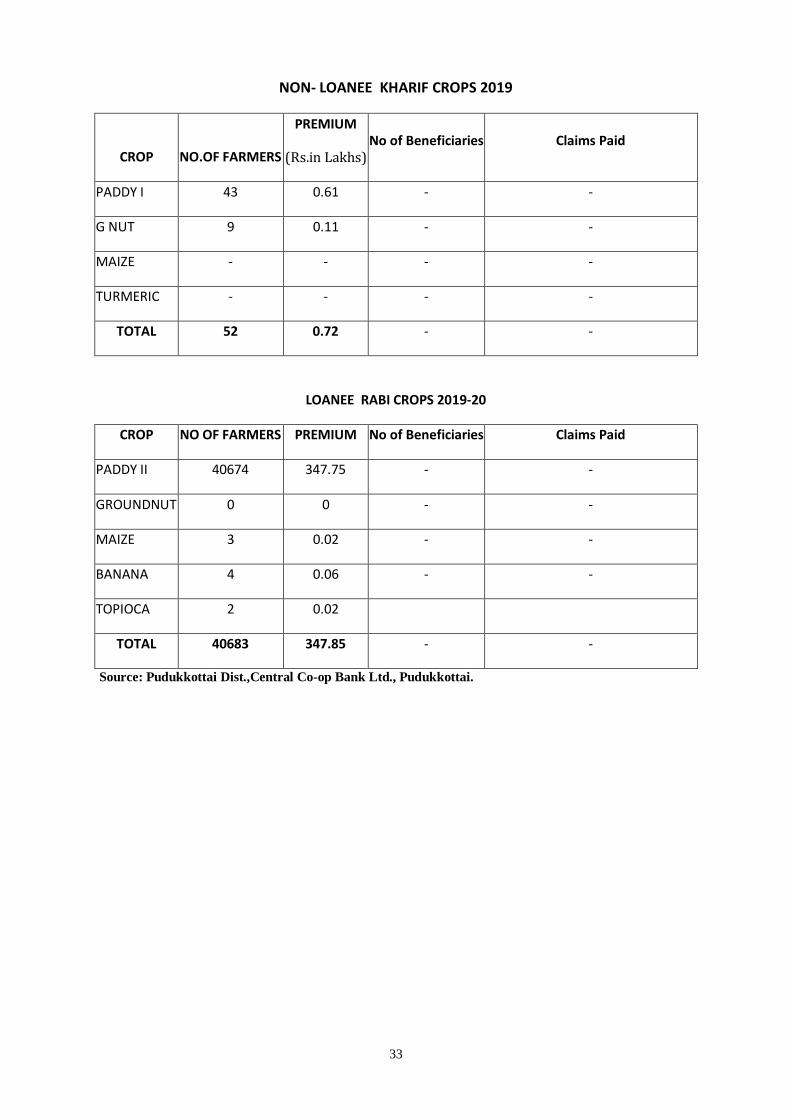
NON- LOANEE KHARIF CROPS 2019
CROP NO.OF FARMERS
PREMIUM
(Rs.in Lakhs) No of Beneficiaries Claims Paid
PADDY I 43 0.61 - -
G NUT 9 0.11 - -
MAIZE - - - -
TURMERIC - - - -
TOTAL 52 0.72 - -
LOANEE RABI CROPS 2019-20
CROP NO OF FARMERS PREMIUM No of Beneficiaries Claims Paid
PADDY II 40674 347.75 - -
GROUNDNUT 0 0 - -
MAIZE 3 0.02 - -
BANANA 4 0.06 - -
TOPIOCA 2 0.02
TOTAL 40683 347.85 - -
Source: Pudukkottai Dist.,Central Co-op Bank Ltd., Pudukkottai.
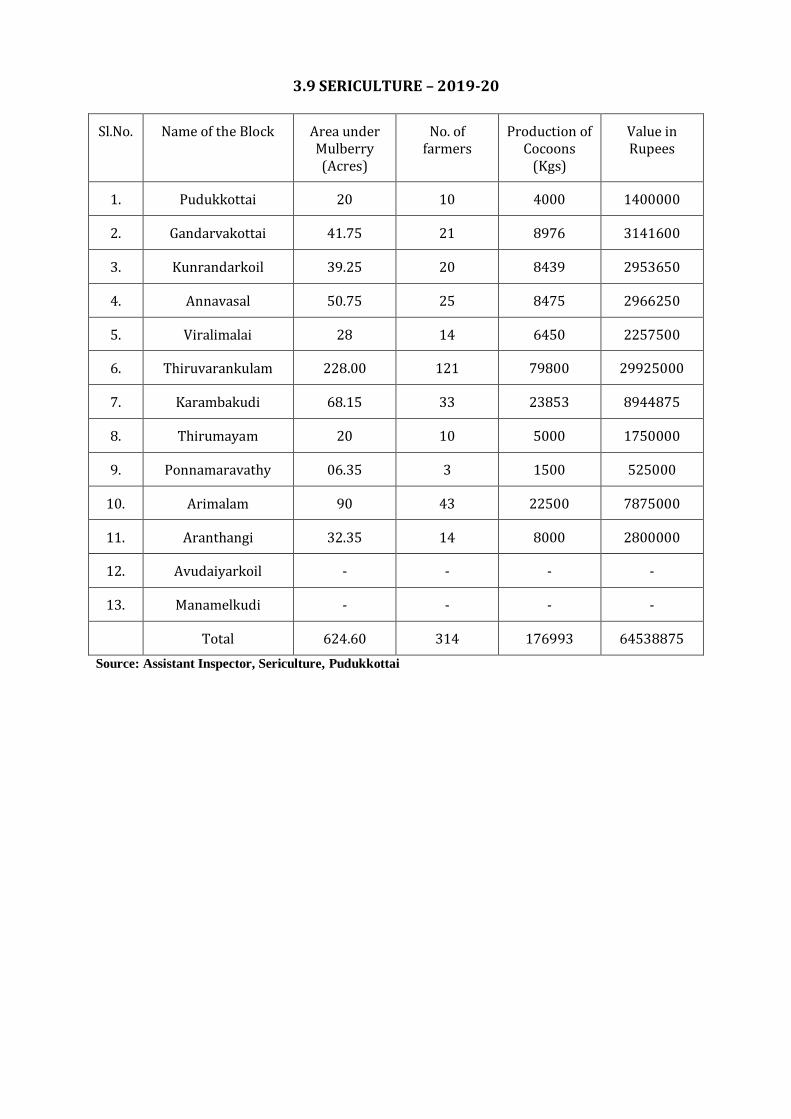
3.9 SERICULTURE – 2019-20
Sl.No. Name of the Block Area under Mulberry (Acres)
No. of farmers
Production of Cocoons
(Kgs)
Value in Rupees
1. Pudukkottai 20 10 4000 1400000
2. Gandarvakottai 41.75 21 8976 3141600
3. Kunrandarkoil 39.25 20 8439 2953650
4. Annavasal 50.75 25 8475 2966250
5. Viralimalai 28 14 6450 2257500
6. Thiruvarankulam 228.00 121 79800 29925000
7. Karambakudi 68.15 33 23853 8944875
8. Thirumayam 20 10 5000 1750000
9. Ponnamaravathy 06.35 3 1500 525000
10. Arimalam 90 43 22500 7875000
11. Aranthangi 32.35 14 8000 2800000
12. Avudaiyarkoil - - - -
13. Manamelkudi - - - -
Total 624.60 314 176993 64538875
Source: Assistant Inspector, Sericulture, Pudukkottai
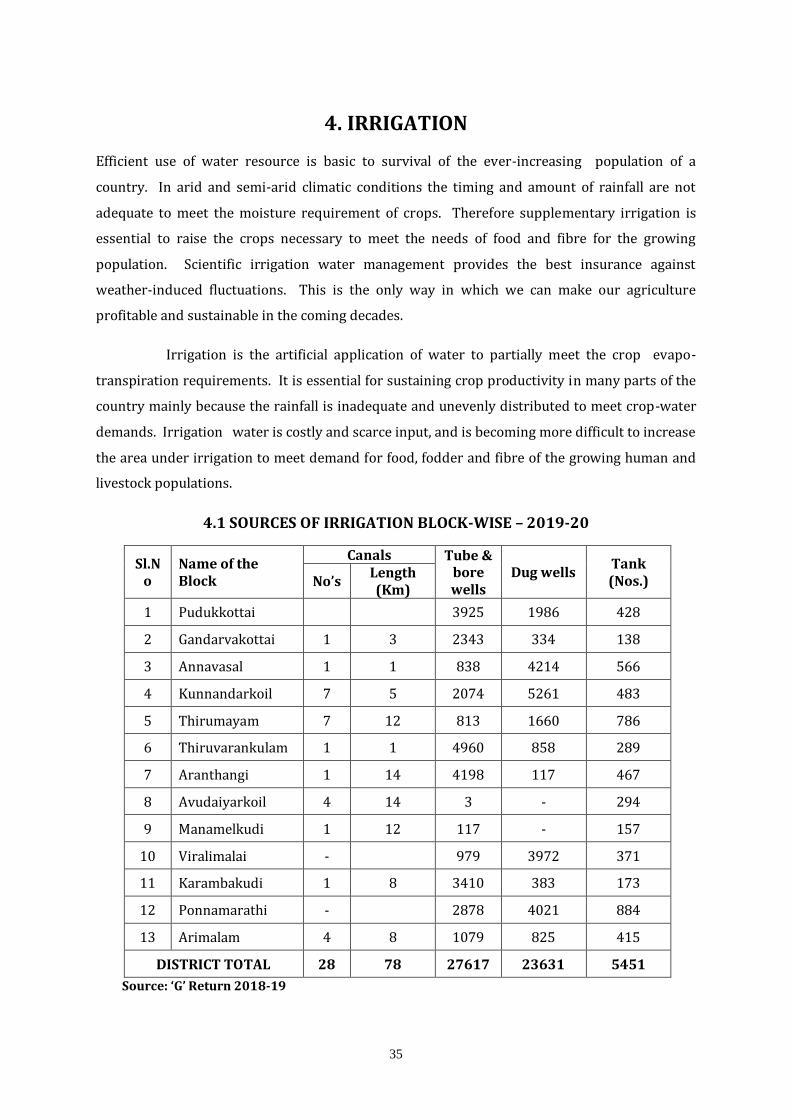
35
4. IRRIGATION
Efficient use of water resource is basic to survival of the ever-increasing population of a
country. In arid and semi-arid climatic conditions the timing and amount of rainfall are not
adequate to meet the moisture requirement of crops. Therefore supplementary irrigation is
essential to raise the crops necessary to meet the needs of food and fibre for the growing
population. Scientific irrigation water management provides the best insurance against
weather-induced fluctuations. This is the only way in which we can make our agriculture
profitable and sustainable in the coming decades.
Irrigation is the artificial application of water to partially meet the crop evapo-
transpiration requirements. It is essential for sustaining crop productivity in many parts of the
country mainly because the rainfall is inadequate and unevenly distributed to meet crop-water
demands. Irrigation water is costly and scarce input, and is becoming more difficult to increase
the area under irrigation to meet demand for food, fodder and fibre of the growing human and
livestock populations.
4.1 SOURCES OF IRRIGATION BLOCK-WISE – 2019-20
Sl.No
Name of the Block
Canals Tube & bore wells
Dug wells Tank (Nos.) No’s
Length (Km)
1 Pudukkottai
3925 1986 428
2 Gandarvakottai 1 3 2343 334 138
3 Annavasal 1 1 838 4214 566
4 Kunnandarkoil 7 5 2074 5261 483
5 Thirumayam 7 12 813 1660 786
6 Thiruvarankulam 1 1 4960 858 289
7 Aranthangi 1 14 4198 117 467
8 Avudaiyarkoil 4 14 3 - 294
9 Manamelkudi 1 12 117 - 157
10 Viralimalai -
979 3972 371
11 Karambakudi 1 8 3410 383 173
12 Ponnamarathi -
2878 4021 884
13 Arimalam 4 8 1079 825 415
DISTRICT TOTAL 28 78 27617 23631 5451
Source: ‘G’ Return 2018-19
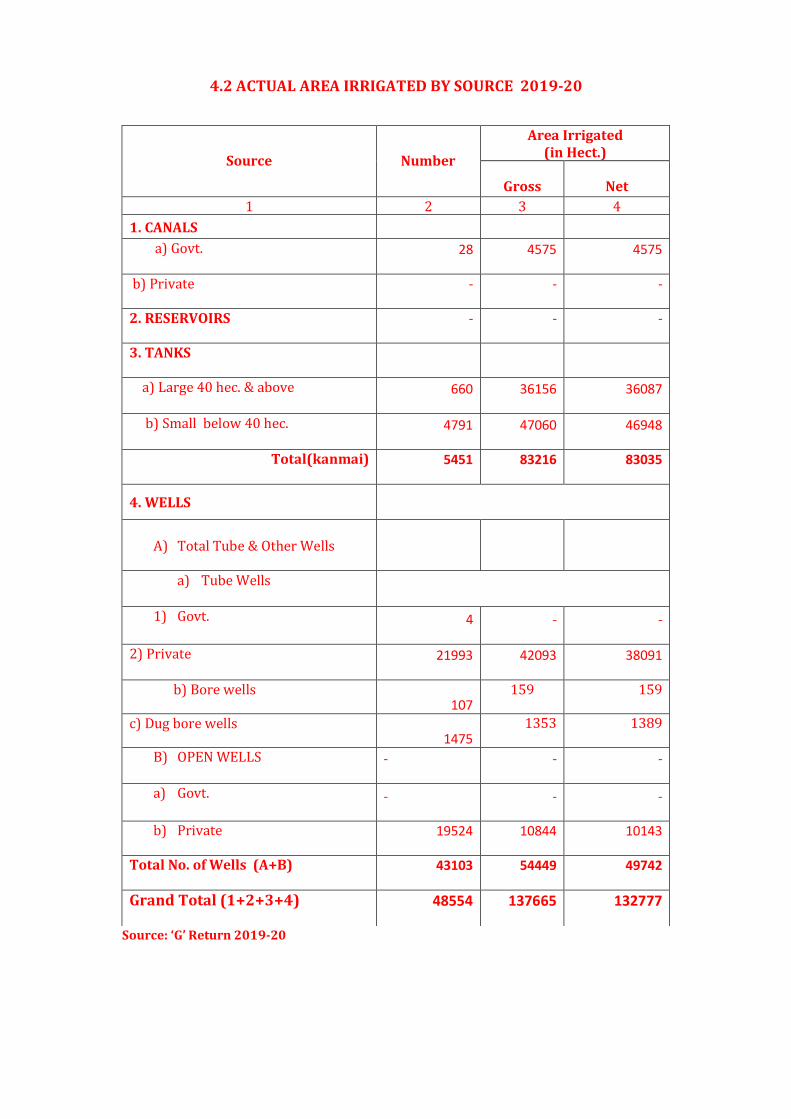
4.2 ACTUAL AREA IRRIGATED BY SOURCE 2019-20
Source: ‘G’ Return 2019-20
Source Number
Area Irrigated (in Hect.)
Gross Net
1 2 3 4
1. CANALS
a) a) Govt. 28 4575 4575
b) Private - - -
2. RESERVOIRS - - -
3. TANKS
a) Large 40 hec. & above 660 36156 36087
b) Small below 40 hec. 4791 47060 46948
Total(kanmai) 5451 83216 83035
4. WELLS
A) Total Tube & Other Wells
a) Tube Wells
1) Govt. 4 - -
2) Private 21993 42093 38091
b) Bore wells 107
159 159
c) Dug bore wells 1475
1353 1389
B) OPEN WELLS - - -
a) Govt. - - -
b) Private 19524 10844 10143
Total No. of Wells (A+B) 43103 54449 49742
Grand Total (1+2+3+4) 48554 137665 132777
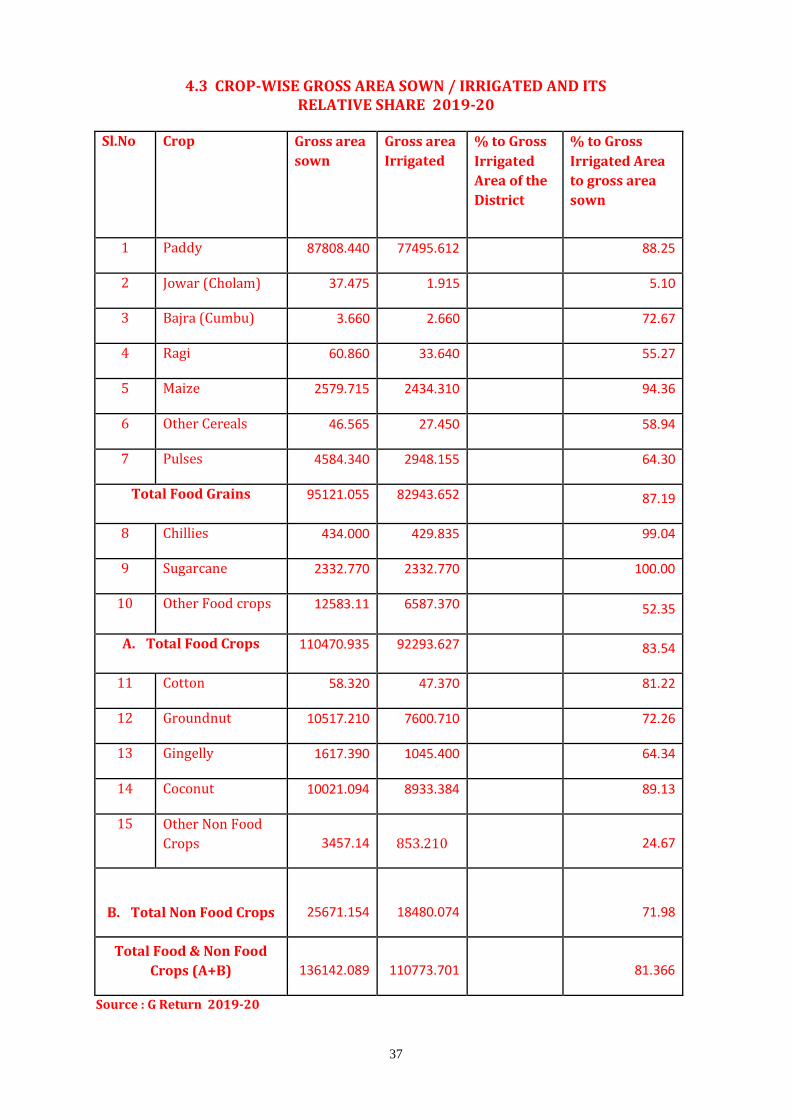
37
4.3 CROP-WISE GROSS AREA SOWN / IRRIGATED AND ITS RELATIVE SHARE 2019-20
Sl.No Crop Gross area
sown
Gross area
Irrigated
% to Gross
Irrigated
Area of the
District
% to Gross
Irrigated Area
to gross area
sown
1 Paddy 87808.440 77495.612
88.25
2 Jowar (Cholam) 37.475 1.915 5.10
3 Bajra (Cumbu) 3.660 2.660
72.67
4 Ragi 60.860 33.640
55.27
5 Maize 2579.715 2434.310
94.36
6 Other Cereals 46.565 27.450
58.94
7 Pulses 4584.340 2948.155
64.30
Total Food Grains 95121.055 82943.652
87.19
8 Chillies 434.000 429.835
99.04
9 Sugarcane 2332.770 2332.770
100.00
10 Other Food crops 12583.11 6587.370
52.35
A. Total Food Crops 110470.935 92293.627
83.54
11 Cotton 58.320 47.370
81.22
12 Groundnut 10517.210 7600.710
72.26
13 Gingelly 1617.390 1045.400
64.34
14 Coconut 10021.094 8933.384
89.13
15 Other Non Food
Crops 3457.14 853.210
24.67
B. Total Non Food Crops 25671.154 18480.074
71.98
Total Food & Non Food
Crops (A+B) 136142.089 110773.701
81.366
Source : G Return 2019-20
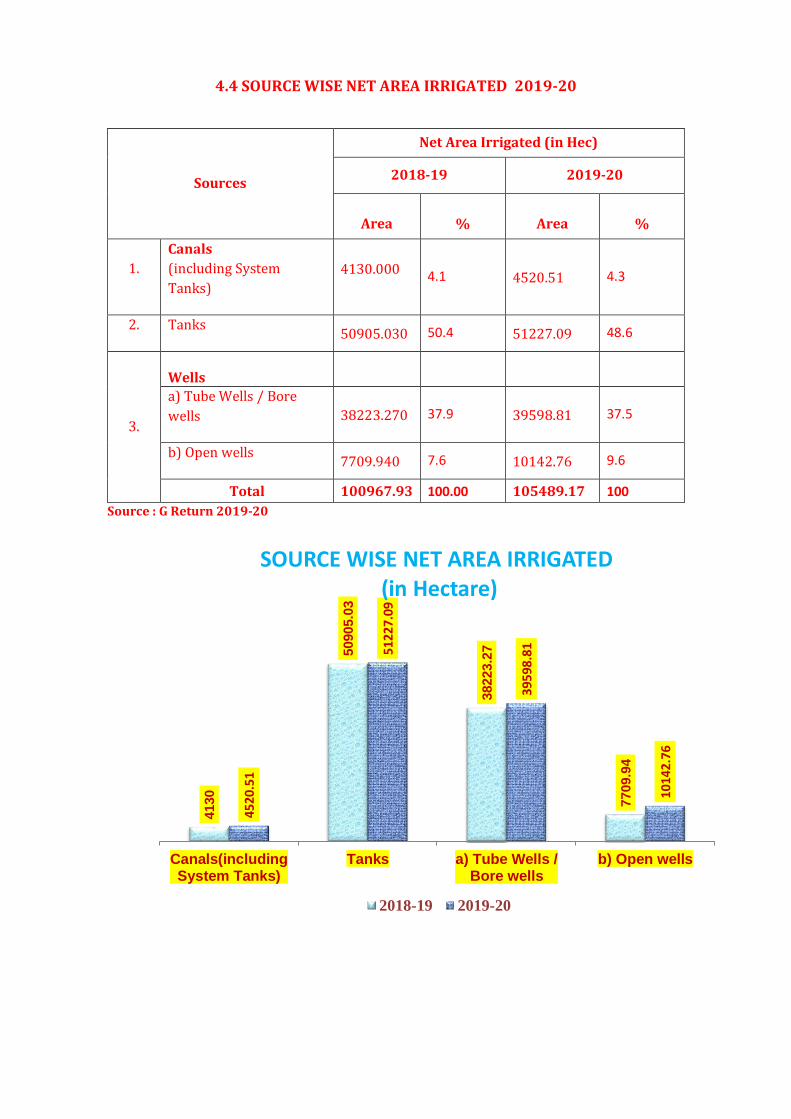
4.4 SOURCE WISE NET AREA IRRIGATED 2019-20
Sources
Net Area Irrigated (in Hec)
2018-19 2019-20
Area % Area %
1.
Canals
(including System
Tanks)
4130.000
4.1 4520.51 4.3
2. Tanks 50905.030 50.4 51227.09 48.6
3.
Wells
a) Tube Wells / Bore
wells 38223.270 37.9 39598.81 37.5
b) Open wells 7709.940 7.6 10142.76 9.6
Total 100967.93 100.00 105489.17 100
Source : G Return 2019-20
4130
50905.0
3
38223.2
7
7709.9
4
4520
.51
5122
7.09
3959
8.81
1014
2.76
Canals(includingSystem Tanks)
Tanks a) Tube Wells /Bore wells
b) Open wells
SOURCE WISE NET AREA IRRIGATED(in Hectare)
2018-19 2019-20
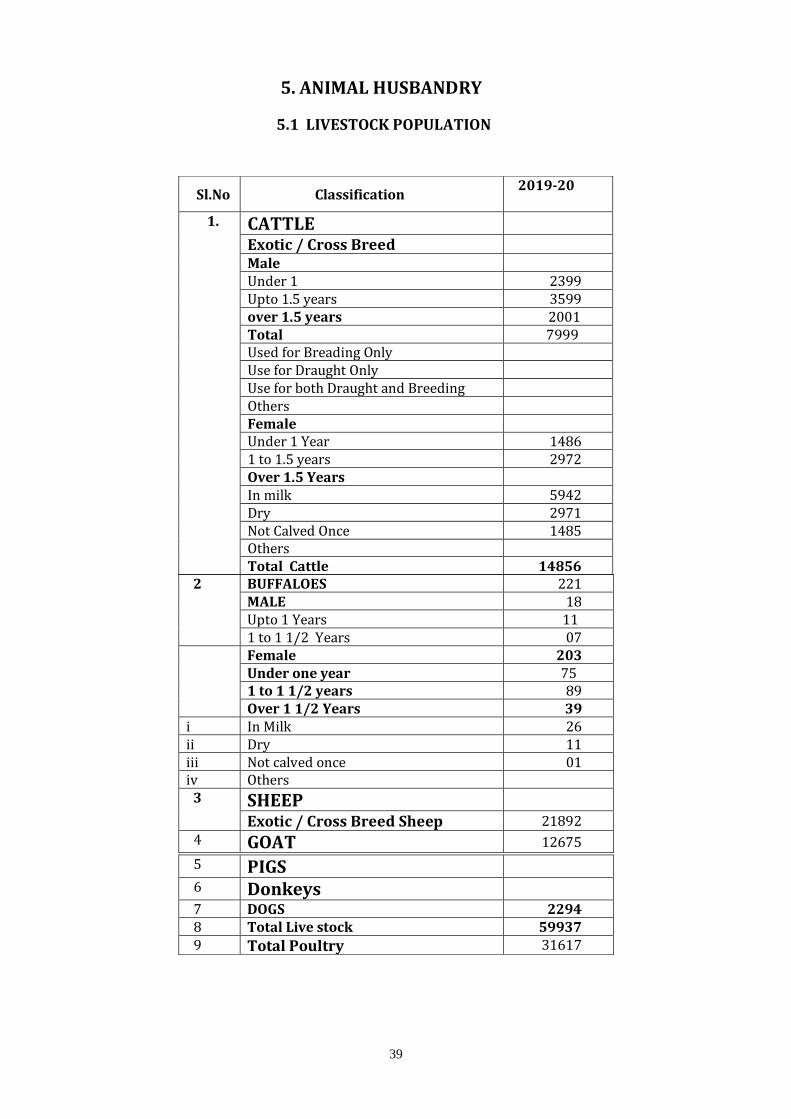
39
5. ANIMAL HUSBANDRY
5.1 LIVESTOCK POPULATION
Sl.No Classification 2019-20
1. CATTLE
Exotic / Cross Breed
Male Under 1 2399 Upto 1.5 years 3599 over 1.5 years 2001 Total 7999 Used for Breading Only Use for Draught Only Use for both Draught and Breeding Others Female Under 1 Year 1486 1 to 1.5 years 2972 Over 1.5 Years In milk 5942 Dry 2971 Not Calved Once 1485 Others Total Cattle 14856
2 BUFFALOES 221 MALE 18 Upto 1 Years 11 1 to 1 1/2 Years 07
Female 203 Under one year 75 1 to 1 1/2 years 89 Over 1 1/2 Years 39
i In Milk 26 ii Dry 11 iii Not calved once 01 iv Others
3 SHEEP
Exotic / Cross Breed Sheep 21892
4 GOAT 12675
5 PIGS
6 Donkeys
7 DOGS 2294 8 Total Live stock 59937 9 Total Poultry 31617
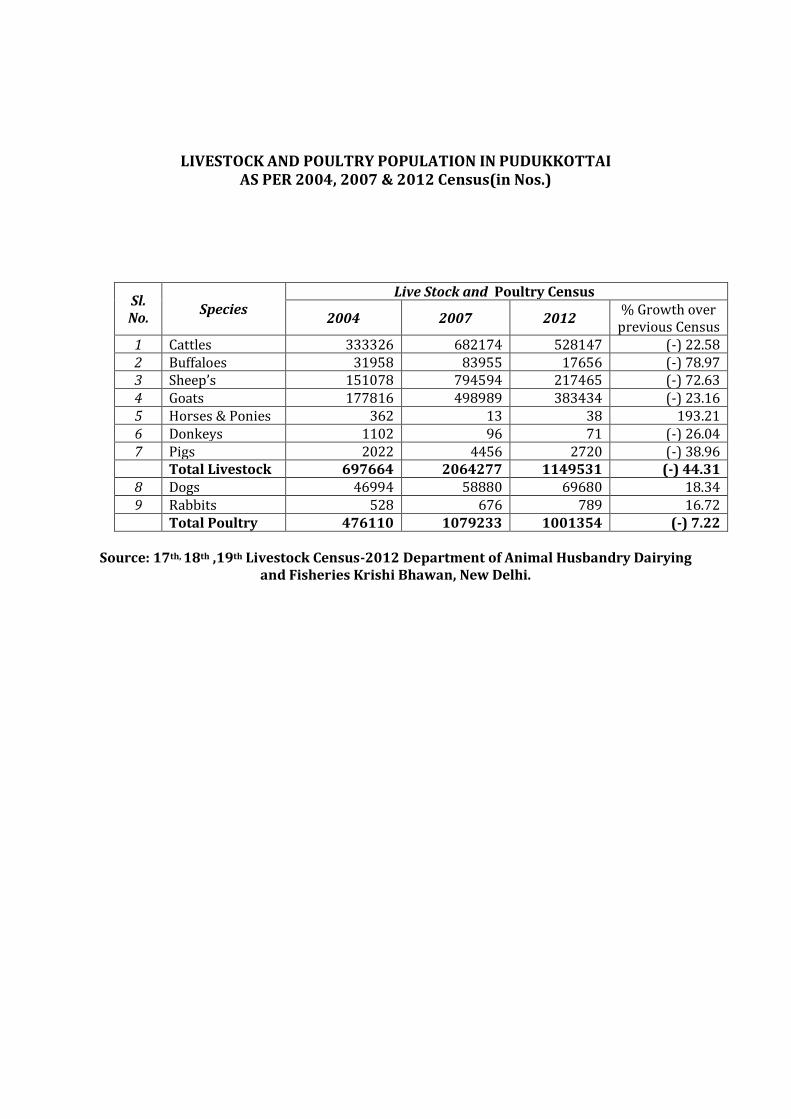
LIVESTOCK AND POULTRY POPULATION IN PUDUKKOTTAI AS PER 2004, 2007 & 2012 Census(in Nos.)
Sl. No.
Species Live Stock and Poultry Census
2004 2007 2012 % Growth over
previous Census 1 Cattles 333326 682174 528147 (-) 22.58 2 Buffaloes 31958 83955 17656 (-) 78.97 3 Sheep’s 151078 794594 217465 (-) 72.63 4 Goats 177816 498989 383434 (-) 23.16 5 Horses & Ponies 362 13 38 193.21 6 Donkeys 1102 96 71 (-) 26.04 7 Pigs 2022 4456 2720 (-) 38.96 Total Livestock 697664 2064277 1149531 (-) 44.31
8 Dogs 46994 58880 69680 18.34 9 Rabbits 528 676 789 16.72 Total Poultry 476110 1079233 1001354 (-) 7.22
Source: 17th, 18th ,19th Livestock Census-2012 Department of Animal Husbandry Dairying
and Fisheries Krishi Bhawan, New Delhi.
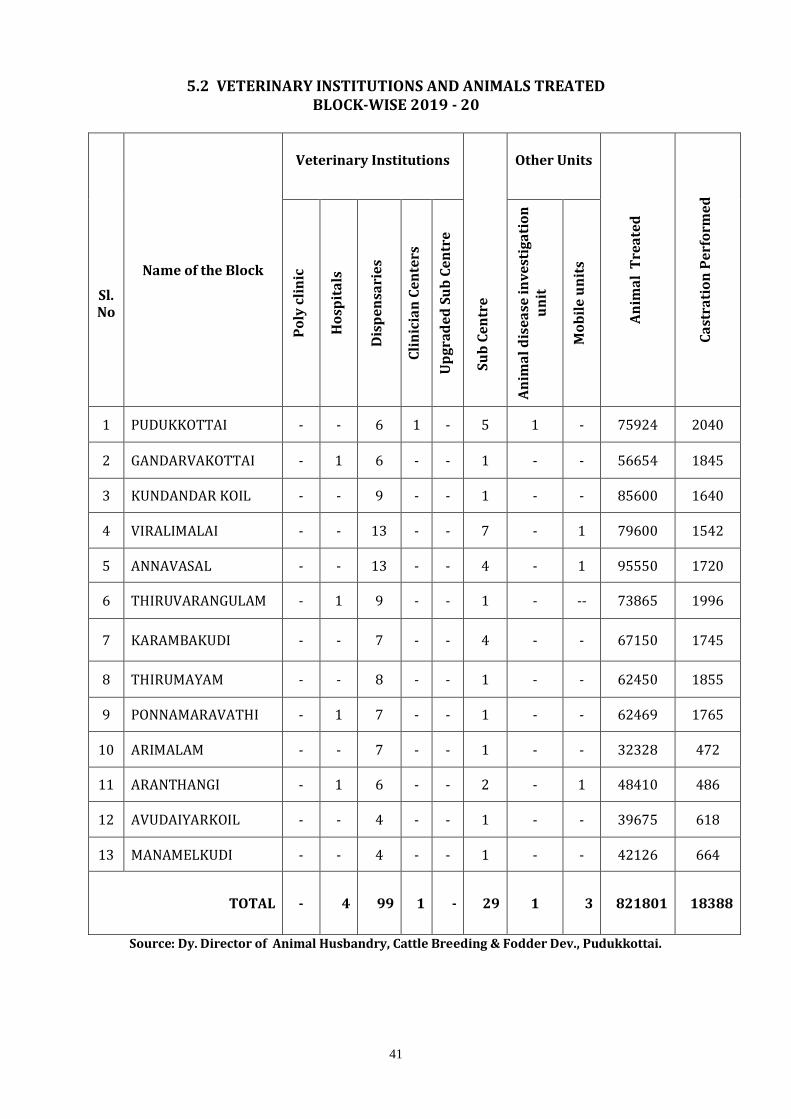
41
5.2 VETERINARY INSTITUTIONS AND ANIMALS TREATED BLOCK-WISE 2019 - 20
Source: Dy. Director of Animal Husbandry, Cattle Breeding & Fodder Dev., Pudukkottai.
Name of the Block
Veterinary Institutions
S
ub
Ce
ntr
e
Other Units
An
ima
l T
rea
ted
Ca
stra
tio
n P
erf
orm
ed
Sl. No
Po
ly c
lin
ic
Ho
spit
als
Dis
pe
nsa
rie
s
Cli
nic
ian
Ce
nte
rs
Up
gra
de
d S
ub
Ce
ntr
e
An
ima
l d
ise
ase
in
ve
stig
ati
on
u
nit
Mo
bil
e u
nit
s
1 PUDUKKOTTAI - - 6 1 - 5 1 - 75924 2040
2 GANDARVAKOTTAI - 1 6 - - 1 - - 56654 1845
3 KUNDANDAR KOIL - - 9 - - 1 - - 85600 1640
4 VIRALIMALAI - - 13 - - 7 - 1 79600 1542
5 ANNAVASAL - - 13 - - 4 - 1 95550 1720
6 THIRUVARANGULAM - 1 9 - - 1 - -- 73865 1996
7 KARAMBAKUDI - - 7 - - 4 - - 67150 1745
8 THIRUMAYAM - - 8 - - 1 - - 62450 1855
9 PONNAMARAVATHI - 1 7 - - 1 - - 62469 1765
10 ARIMALAM - - 7 - - 1 - - 32328 472
11 ARANTHANGI - 1 6 - - 2 - 1 48410 486
12 AVUDAIYARKOIL - - 4 - - 1 - - 39675 618
13 MANAMELKUDI - - 4 - - 1 - - 42126 664
TOTAL - 4 99 1 - 29 1 3 821801 18388
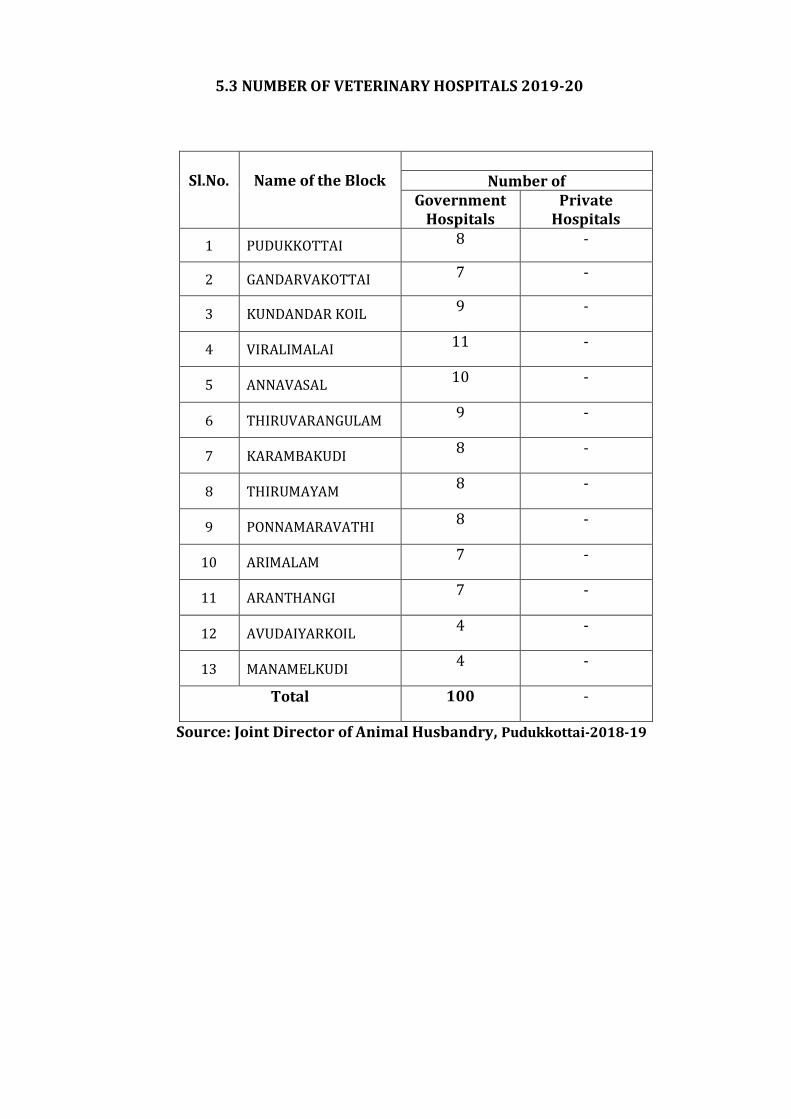
5.3 NUMBER OF VETERINARY HOSPITALS 2019-20
Sl.No.
Name of the Block
Number of
Government Hospitals
Private Hospitals
1 PUDUKKOTTAI 8 -
2 GANDARVAKOTTAI 7 -
3 KUNDANDAR KOIL 9 -
4 VIRALIMALAI 11 -
5 ANNAVASAL 10 -
6 THIRUVARANGULAM 9 -
7 KARAMBAKUDI 8 -
8 THIRUMAYAM 8 -
9 PONNAMARAVATHI 8 -
10 ARIMALAM 7 -
11 ARANTHANGI 7 -
12 AVUDAIYARKOIL 4 -
13 MANAMELKUDI 4 -
Total 100 -
Source: Joint Director of Animal Husbandry, Pudukkottai-2018-19
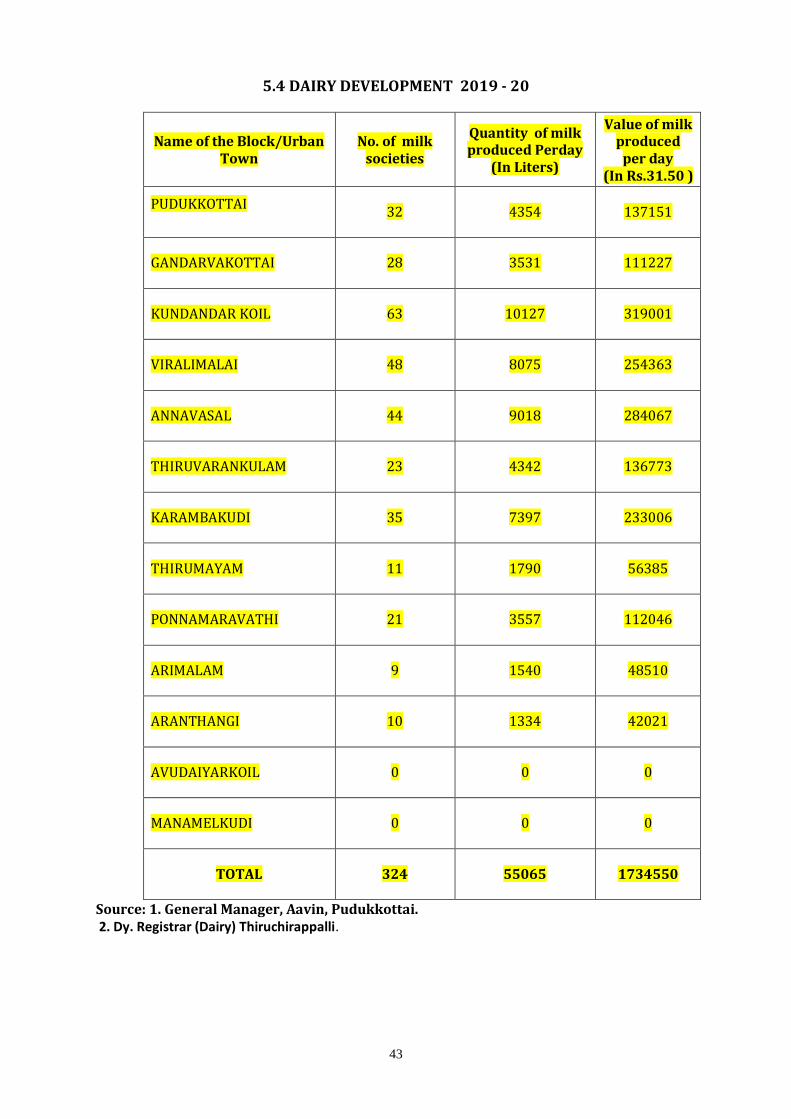
43
5.4 DAIRY DEVELOPMENT 2019 - 20
Name of the Block/Urban Town
No. of milk societies
Quantity of milk produced Perday
(In Liters)
Value of milk produced
per day (In Rs.31.50 )
PUDUKKOTTAI 32 4354 137151
GANDARVAKOTTAI 28 3531 111227
KUNDANDAR KOIL 63 10127 319001
VIRALIMALAI 48 8075 254363
ANNAVASAL 44 9018 284067
THIRUVARANKULAM 23 4342 136773
KARAMBAKUDI 35 7397 233006
THIRUMAYAM 11 1790 56385
PONNAMARAVATHI 21 3557 112046
ARIMALAM 9 1540 48510
ARANTHANGI 10 1334 42021
AVUDAIYARKOIL 0 0 0
MANAMELKUDI 0 0 0
TOTAL 324 55065 1734550
Source: 1. General Manager, Aavin, Pudukkottai. 2. Dy. Registrar (Dairy) Thiruchirappalli.
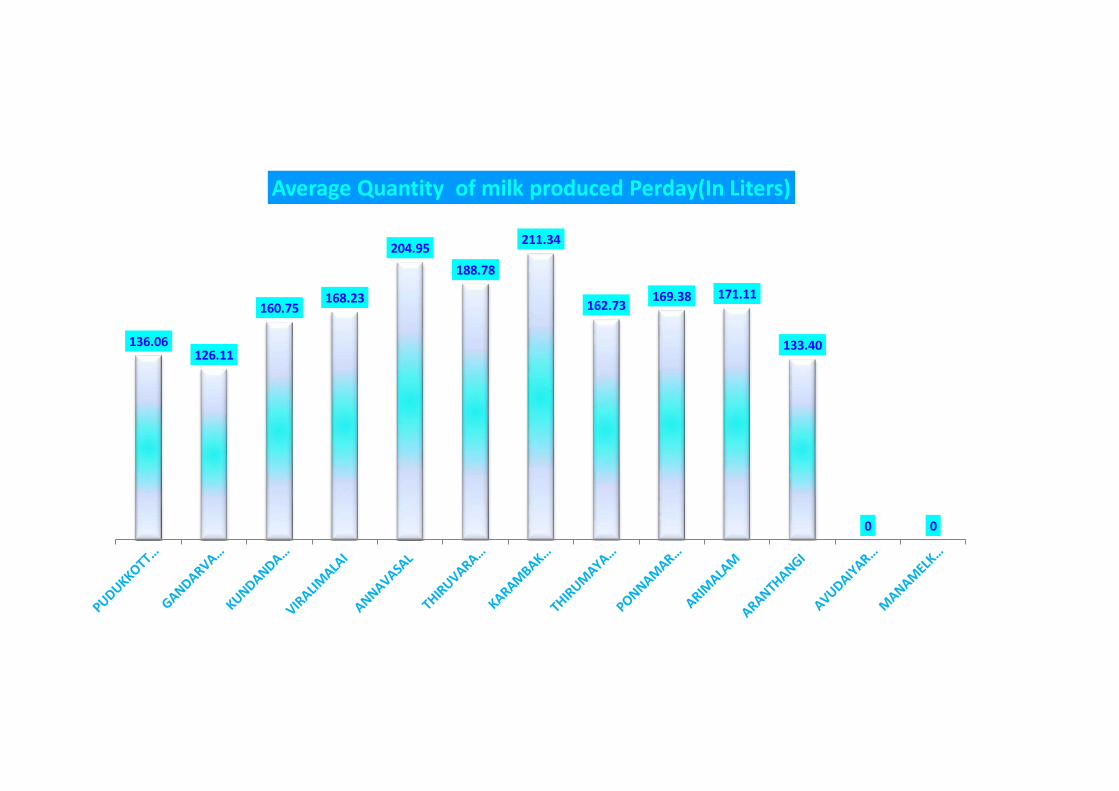
136.06126.11
160.75168.23
204.95
188.78
211.34
162.73169.38 171.11
133.40
0 0
Average Quantity of milk produced Perday(In Liters)
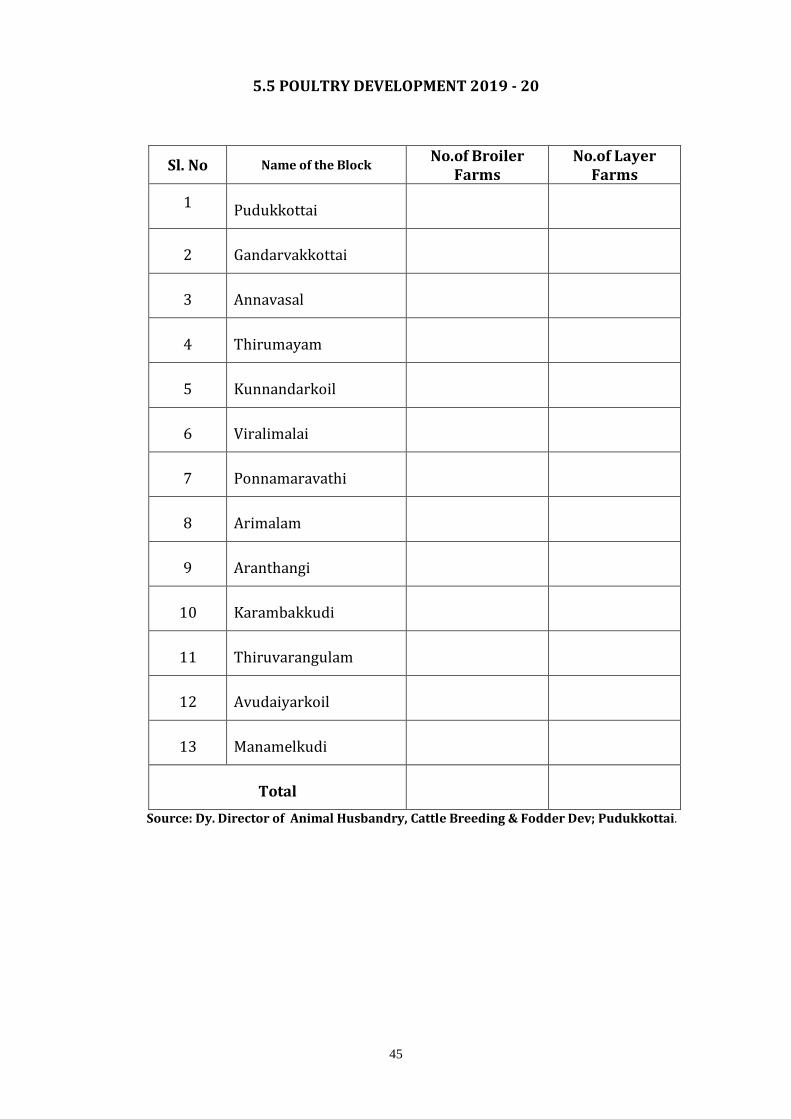
45
5.5 POULTRY DEVELOPMENT 2019 - 20
Sl. No Name of the Block No.of Broiler
Farms No.of Layer
Farms
1 Pudukkottai
2 Gandarvakkottai
3 Annavasal
4 Thirumayam
5 Kunnandarkoil
6 Viralimalai
7 Ponnamaravathi
8 Arimalam
9 Aranthangi
10 Karambakkudi
11 Thiruvarangulam
12 Avudaiyarkoil
13 Manamelkudi
Total
Source: Dy. Director of Animal Husbandry, Cattle Breeding & Fodder Dev; Pudukkottai.
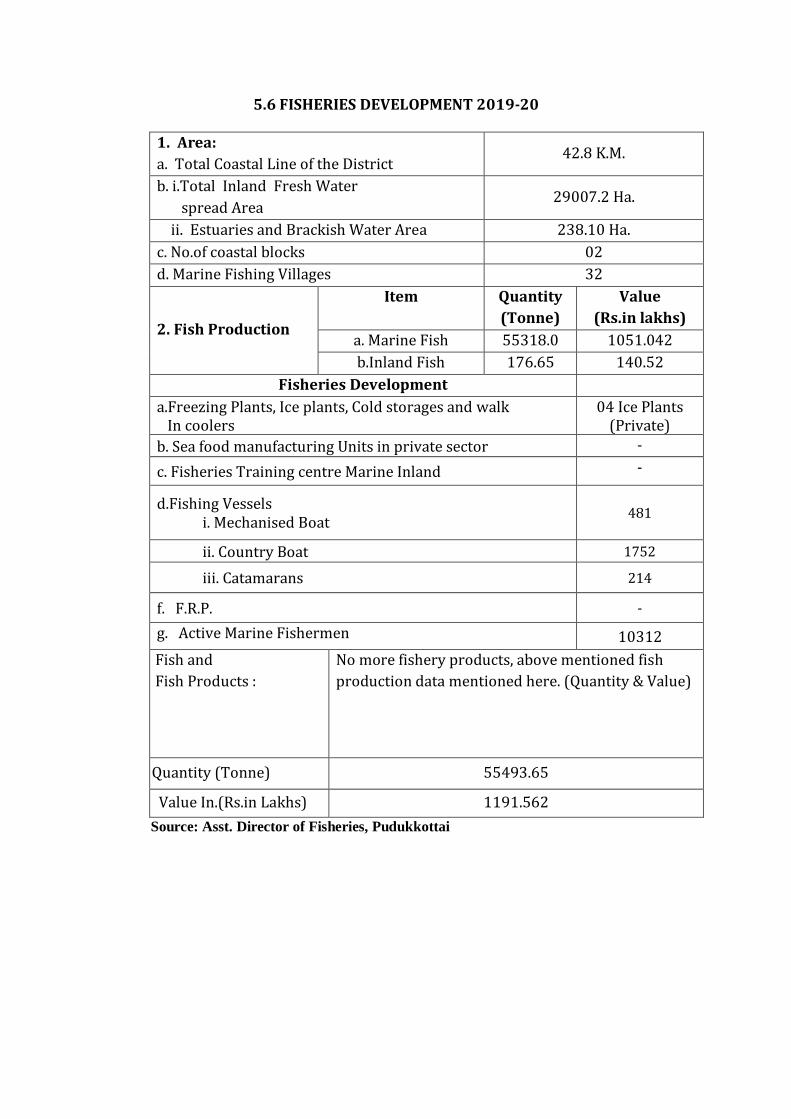
5.6 FISHERIES DEVELOPMENT 2019-20
1. Area:
a. Total Coastal Line of the District 42.8 K.M.
b. i.Total Inland Fresh Water
spread Area 29007.2 Ha.
ii. Estuaries and Brackish Water Area 238.10 Ha.
c. No.of coastal blocks 02
d. Marine Fishing Villages 32
2. Fish Production
Item Quantity
(Tonne)
Value
(Rs.in lakhs)
a. Marine Fish 55318.0 1051.042
b.Inland Fish 176.65 140.52
Fisheries Development
a.Freezing Plants, Ice plants, Cold storages and walk In coolers
04 Ice Plants (Private)
b. Sea food manufacturing Units in private sector -
c. Fisheries Training centre Marine Inland -
d.Fishing Vessels i. Mechanised Boat
481
ii. Country Boat 1752
iii. Catamarans 214
f. F.R.P. -
g. Active Marine Fishermen 10312
Fish and
Fish Products :
No more fishery products, above mentioned fish
production data mentioned here. (Quantity & Value)
Quantity (Tonne) 55493.65
Value In.(Rs.in Lakhs) 1191.562
Source: Asst. Director of Fisheries, Pudukkottai
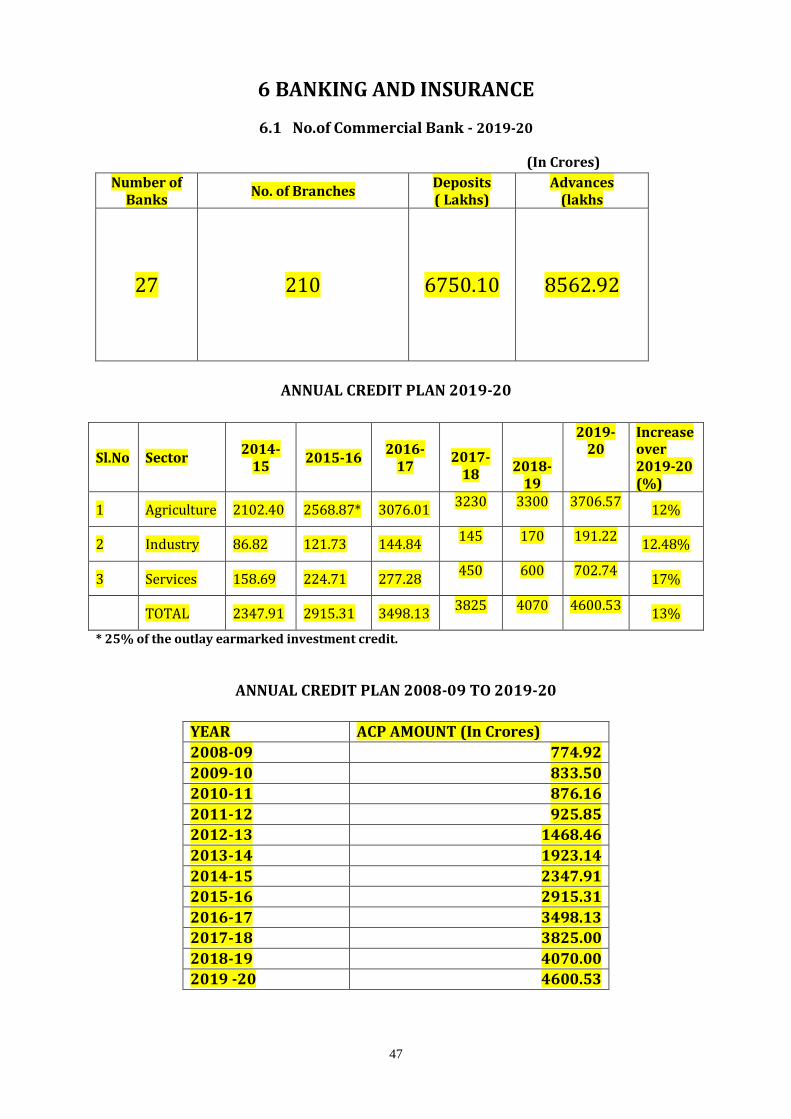
47
6 BANKING AND INSURANCE
6.1 No.of Commercial Bank - 2019-20
(In Crores) Number of
Banks No. of Branches
Deposits ( Lakhs)
Advances (lakhs
27 210 6750.10 8562.92
ANNUAL CREDIT PLAN 2019-20
Sl.No Sector 2014-
15 2015-16
2016-17
2017-
18
2018-19
2019-20
Increase over 2019-20 (%)
1 Agriculture 2102.40 2568.87* 3076.01 3230 3300 3706.57
12%
2 Industry 86.82 121.73 144.84 145 170 191.22
12.48%
3 Services 158.69 224.71 277.28 450 600 702.74
17%
TOTAL 2347.91 2915.31 3498.13 3825 4070 4600.53
13%
* 25% of the outlay earmarked investment credit.
ANNUAL CREDIT PLAN 2008-09 TO 2019-20
YEAR ACP AMOUNT (In Crores)
2008-09 774.92
2009-10 833.50
2010-11 876.16
2011-12 925.85
2012-13 1468.46
2013-14 1923.14
2014-15 2347.91
2015-16 2915.31
2016-17 3498.13
2017-18 3825.00
2018-19 4070.00
2019 -20 4600.53
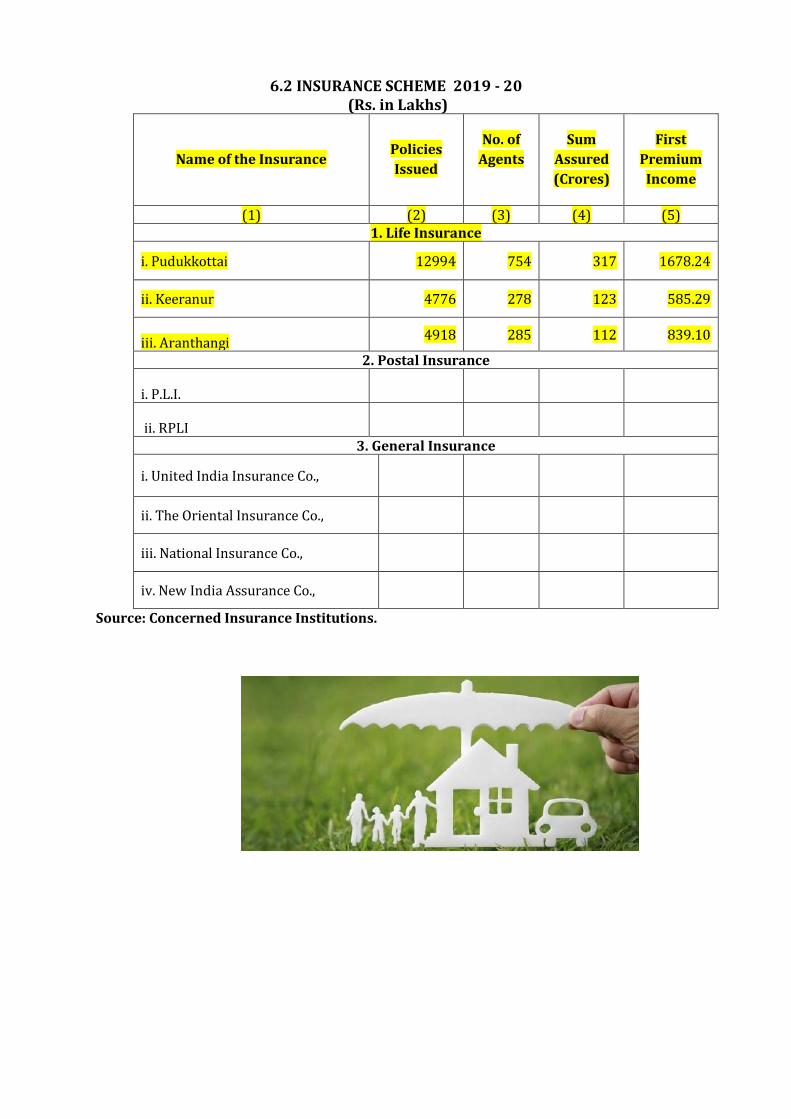
6.2 INSURANCE SCHEME 2019 - 20 (Rs. in Lakhs)
Name of the Insurance Policies
Issued
No. of
Agents
Sum
Assured
(Crores)
First
Premium
Income
(1) (2) (3) (4) (5) 1. Life Insurance
i. Pudukkottai 12994 754 317 1678.24
ii. Keeranur 4776 278 123 585.29
iii. Aranthangi 4918 285 112 839.10
2. Postal Insurance
i. P.L.I.
ii. RPLI 3. General Insurance
i. United India Insurance Co.,
ii. The Oriental Insurance Co.,
iii. National Insurance Co.,
iv. New India Assurance Co.,
Source: Concerned Insurance Institutions.
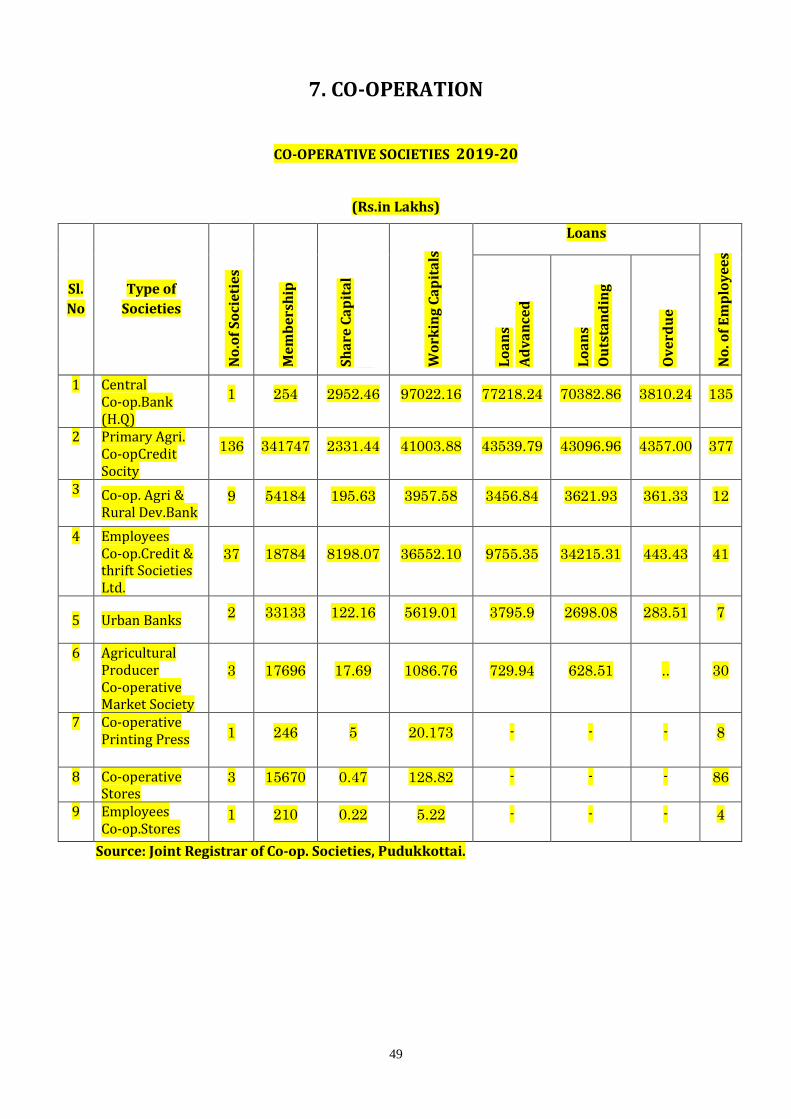
49
7. CO-OPERATION
CO-OPERATIVE SOCIETIES 2019-20
(Rs.in Lakhs)
Sl.
No
Type of
Societies
No
.of
So
cie
tie
s
Me
mb
ers
hip
Sh
are
Ca
pit
al
Wo
rkin
g C
ap
ita
ls
Loans
No
. of
Em
plo
ye
es
Lo
an
s
Ad
va
nce
d
Lo
an
s
Ou
tsta
nd
ing
Ov
erd
ue
1 Central Co-op.Bank (H.Q)
1 254 2952.46 97022.16 77218.24 70382.86 3810.24 135
2 Primary Agri. Co-opCredit Socity
136 341747 2331.44 41003.88 43539.79 43096.96 4357.00 377
3 Co-op. Agri & Rural Dev.Bank
9 54184 195.63 3957.58 3456.84 3621.93 361.33 12
4 Employees Co-op.Credit & thrift Societies Ltd.
37 18784 8198.07 36552.10 9755.35 34215.31 443.43 41
5 Urban Banks 2 33133 122.16 5619.01 3795.9 2698.08 283.51 7
6
Agricultural Producer Co-operative Market Society
3 17696 17.69 1086.76 729.94 628.51 .. 30
7
Co-operative Printing Press 1 246 5 20.173 - - - 8
8
Co-operative Stores
3 15670 0.47 128.82 - - - 86
9
Employees Co-op.Stores
1 210 0.22 5.22 - - - 4
Source: Joint Registrar of Co-op. Societies, Pudukkottai.
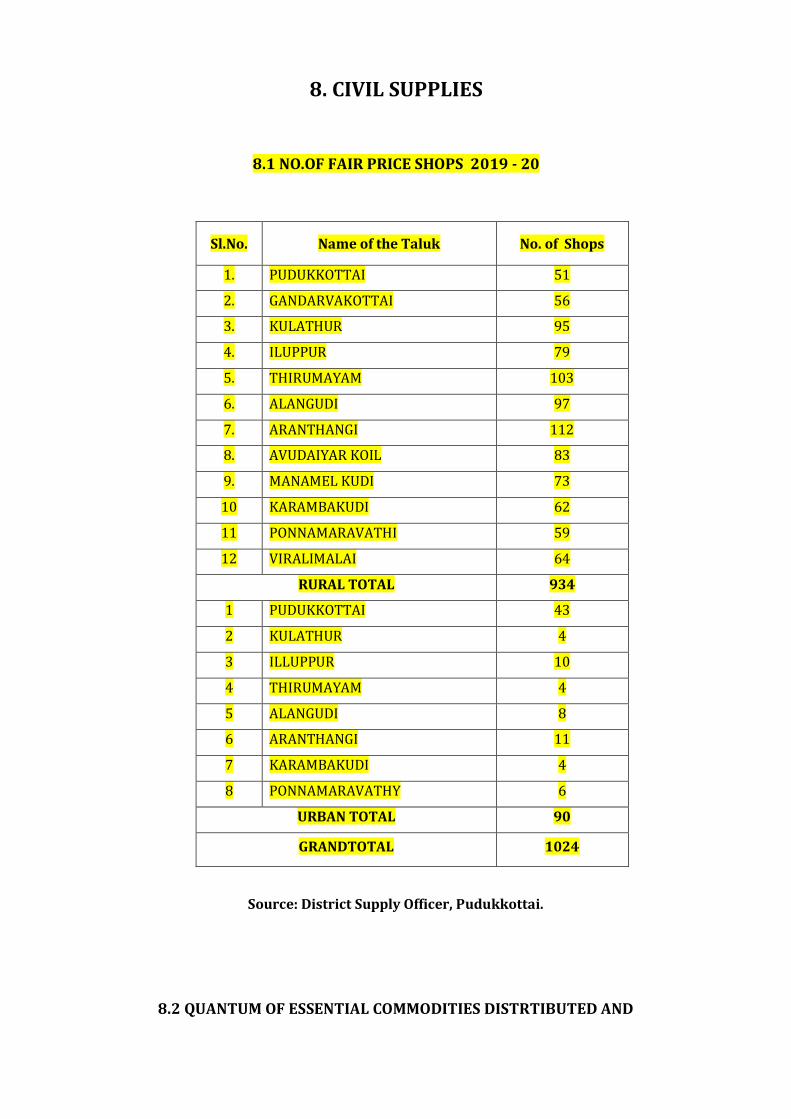
8. CIVIL SUPPLIES
8.1 NO.OF FAIR PRICE SHOPS 2019 - 20
Source: District Supply Officer, Pudukkottai.
8.2 QUANTUM OF ESSENTIAL COMMODITIES DISTRTIBUTED AND
Sl.No. Name of the Taluk No. of Shops
1. PUDUKKOTTAI 51
2. GANDARVAKOTTAI 56
3. KULATHUR 95
4. ILUPPUR 79
5. THIRUMAYAM 103
6. ALANGUDI 97
7. ARANTHANGI 112
8. AVUDAIYAR KOIL 83
9. MANAMEL KUDI 73
10 KARAMBAKUDI 62
11 PONNAMARAVATHI 59
12 VIRALIMALAI 64
RURAL TOTAL 934
1 PUDUKKOTTAI 43
2 KULATHUR 4
3 ILLUPPUR 10
4 THIRUMAYAM 4
5 ALANGUDI 8
6 ARANTHANGI 11
7 KARAMBAKUDI 4
8 PONNAMARAVATHY 6
URBAN TOTAL 90
GRANDTOTAL 1024
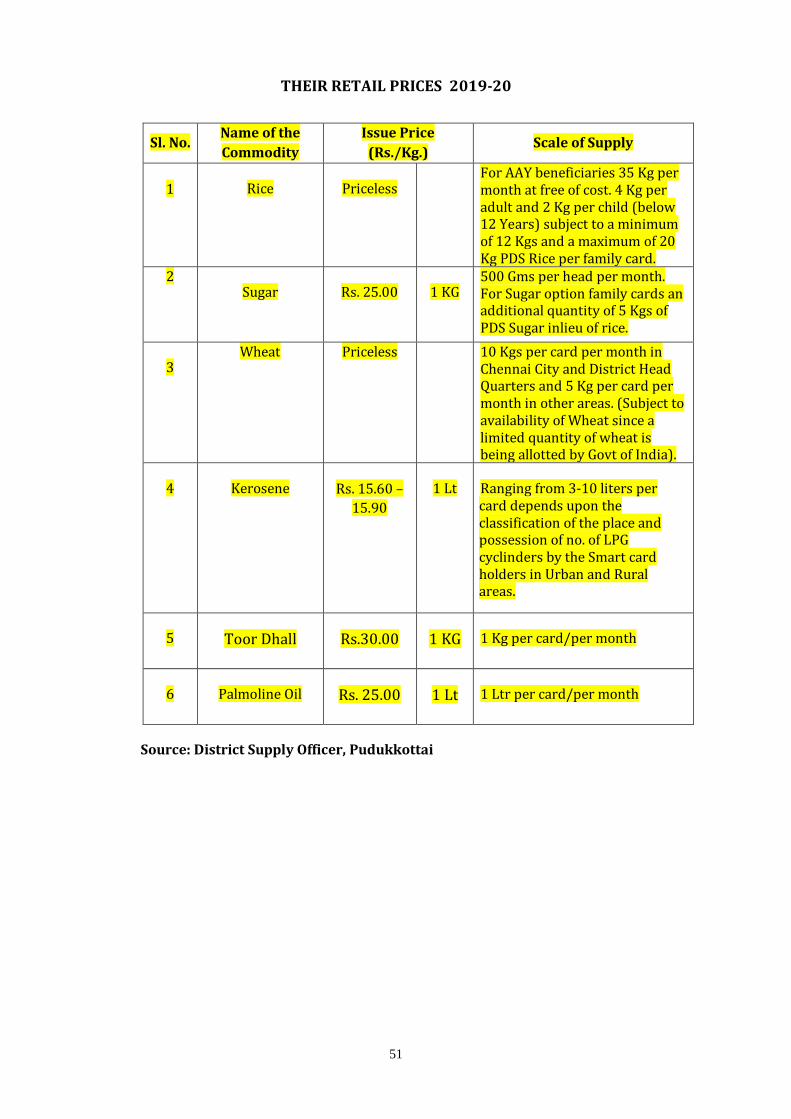
51
THEIR RETAIL PRICES 2019-20
Sl. No. Name of the
Commodity
Issue Price
(Rs./Kg.) Scale of Supply
1 Rice Priceless For AAY beneficiaries 35 Kg per month at free of cost. 4 Kg per adult and 2 Kg per child (below 12 Years) subject to a minimum of 12 Kgs and a maximum of 20 Kg PDS Rice per family card.
2 Sugar Rs. 25.00 1 KG
500 Gms per head per month. For Sugar option family cards an additional quantity of 5 Kgs of PDS Sugar inlieu of rice.
3 Wheat Priceless 10 Kgs per card per month in
Chennai City and District Head Quarters and 5 Kg per card per month in other areas. (Subject to availability of Wheat since a limited quantity of wheat is being allotted by Govt of India).
4 Kerosene Rs. 15.60 –
15.90
1 Lt Ranging from 3-10 liters per card depends upon the classification of the place and possession of no. of LPG cyclinders by the Smart card holders in Urban and Rural areas.
5 Toor Dhall Rs.30.00 1 KG 1 Kg per card/per month
6 Palmoline Oil Rs. 25.00 1 Lt 1 Ltr per card/per month
Source: District Supply Officer, Pudukkottai
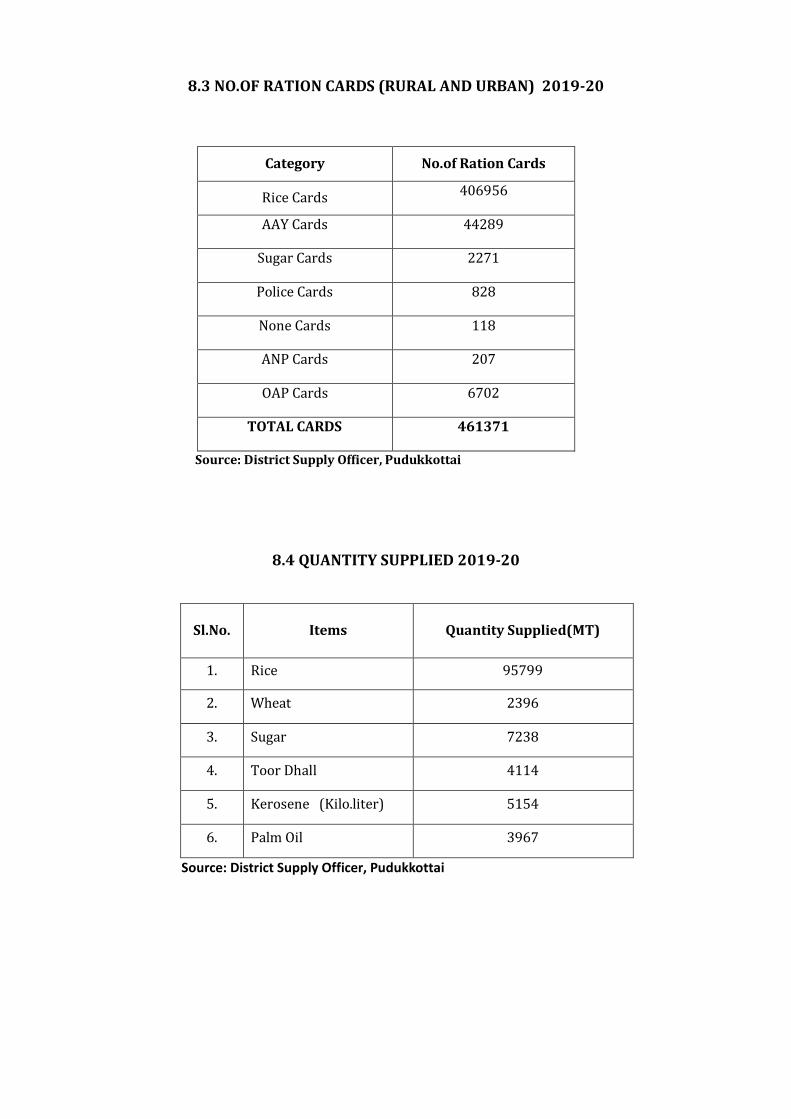
8.3 NO.OF RATION CARDS (RURAL AND URBAN) 2019-20
Category No.of Ration Cards
Rice Cards 406956
AAY Cards 44289
Sugar Cards 2271
Police Cards 828
None Cards 118
ANP Cards 207
OAP Cards 6702
TOTAL CARDS 461371
Source: District Supply Officer, Pudukkottai
8.4 QUANTITY SUPPLIED 2019-20
Sl.No. Items Quantity Supplied(MT)
1. Rice 95799
2. Wheat 2396
3. Sugar 7238
4. Toor Dhall 4114
5. Kerosene (Kilo.liter) 5154
6. Palm Oil 3967
Source: District Supply Officer, Pudukkottai
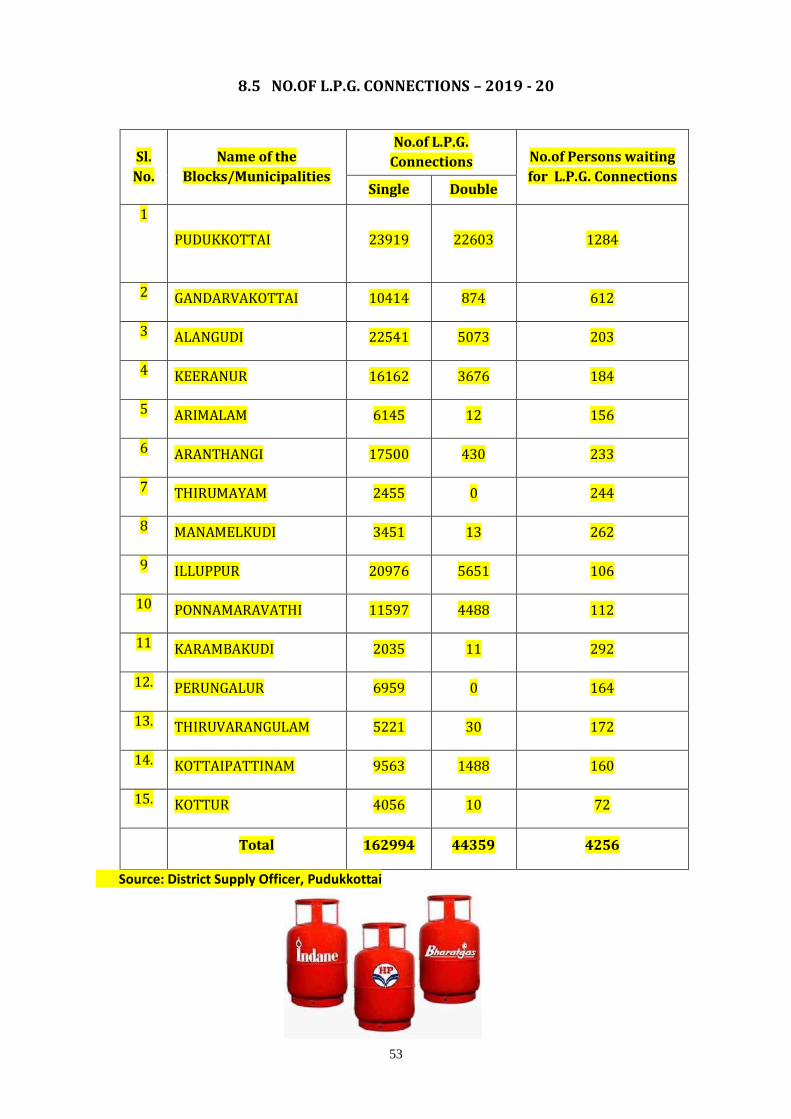
53
8.5 NO.OF L.P.G. CONNECTIONS – 2019 - 20
Sl.
No.
Name of the
Blocks/Municipalities
No.of L.P.G.
Connections No.of Persons waiting
for L.P.G. Connections Single Double
1
PUDUKKOTTAI 23919 22603
1284
2 GANDARVAKOTTAI 10414 874 612
3 ALANGUDI 22541 5073 203
4 KEERANUR 16162 3676 184
5 ARIMALAM 6145 12 156
6 ARANTHANGI 17500 430 233
7 THIRUMAYAM 2455 0 244
8 MANAMELKUDI 3451 13 262
9 ILLUPPUR 20976 5651 106
10 PONNAMARAVATHI 11597 4488 112
11 KARAMBAKUDI 2035 11 292
12. PERUNGALUR 6959 0 164
13. THIRUVARANGULAM 5221 30 172
14. KOTTAIPATTINAM 9563 1488 160
15. KOTTUR 4056 10 72
Total 162994 44359 4256
Source: District Supply Officer, Pudukkottai
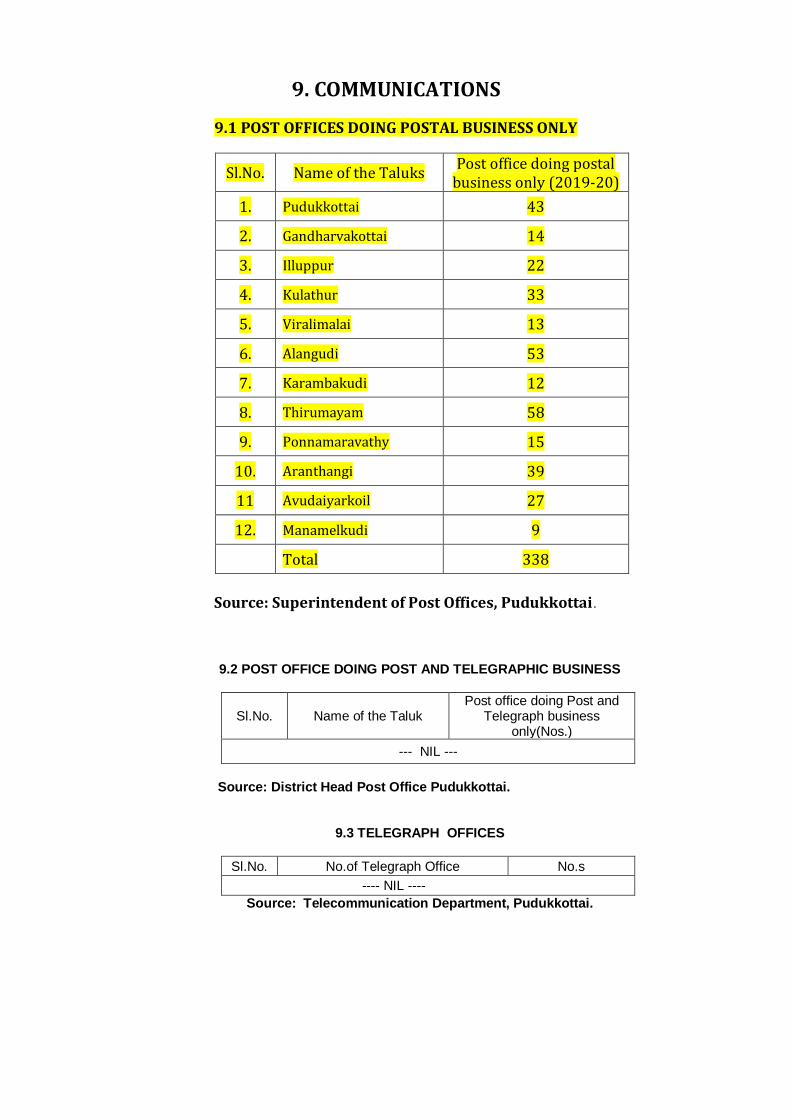
9. COMMUNICATIONS
9.1 POST OFFICES DOING POSTAL BUSINESS ONLY
Sl.No. Name of the Taluks Post office doing postal
business only (2019-20)
1. Pudukkottai 43
2. Gandharvakottai 14
3. Illuppur 22
4. Kulathur 33
5. Viralimalai 13
6. Alangudi 53
7. Karambakudi 12
8. Thirumayam 58
9. Ponnamaravathy 15
10. Aranthangi 39
11 Avudaiyarkoil 27
12. Manamelkudi 9
Total 338
Source: Superintendent of Post Offices, Pudukkottai.
9.2 POST OFFICE DOING POST AND TELEGRAPHIC BUSINESS
Sl.No. Name of the Taluk Post office doing Post and
Telegraph business only(Nos.)
--- NIL ---
Source: District Head Post Office Pudukkottai.
9.3 TELEGRAPH OFFICES
Sl.No. No.of Telegraph Office No.s
---- NIL ----
Source: Telecommunication Department, Pudukkottai.
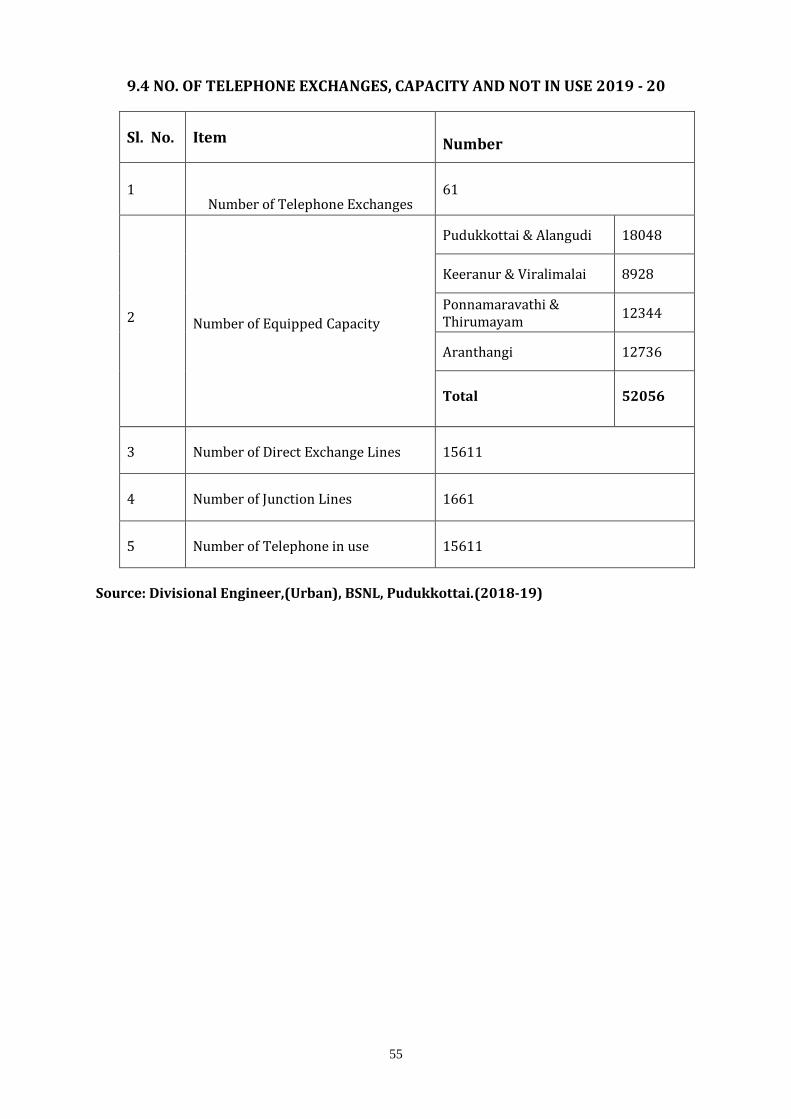
55
9.4 NO. OF TELEPHONE EXCHANGES, CAPACITY AND NOT IN USE 2019 - 20
Sl. No. Item Number
1 Number of Telephone Exchanges
61
2 Number of Equipped Capacity
Pudukkottai & Alangudi 18048
Keeranur & Viralimalai 8928
Ponnamaravathi & Thirumayam
12344
Aranthangi 12736
Total 52056
3 Number of Direct Exchange Lines 15611
4 Number of Junction Lines 1661
5 Number of Telephone in use 15611
Source: Divisional Engineer,(Urban), BSNL, Pudukkottai.(2018-19)
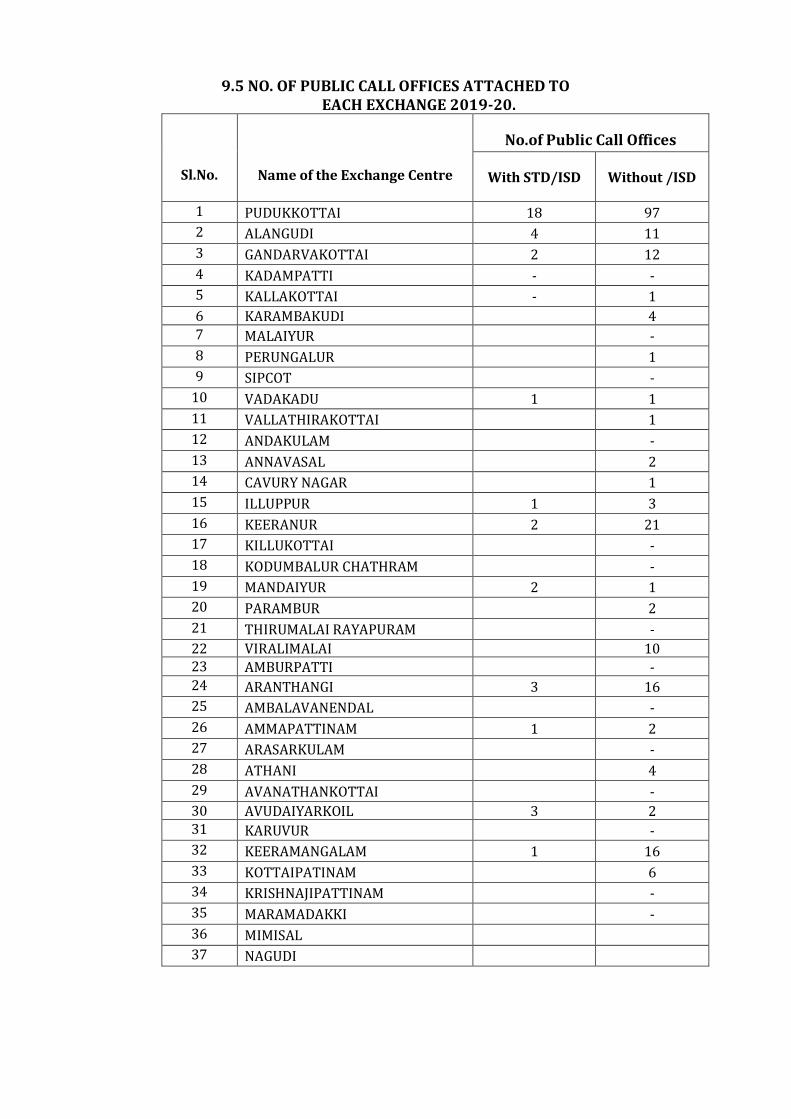
9.5 NO. OF PUBLIC CALL OFFICES ATTACHED TO EACH EXCHANGE 2019-20.
Sl.No.
Name of the Exchange Centre
No.of Public Call Offices
With STD/ISD Without /ISD
1 PUDUKKOTTAI 18 97
2 ALANGUDI 4 11
3 GANDARVAKOTTAI 2 12
4 KADAMPATTI - -
5 KALLAKOTTAI - 1
6 KARAMBAKUDI
4 7 MALAIYUR
-
8 PERUNGALUR
1
9 SIPCOT
-
10 VADAKADU 1 1
11 VALLATHIRAKOTTAI
1
12 ANDAKULAM
-
13 ANNAVASAL
2
14 CAVURY NAGAR
1
15 ILLUPPUR 1 3
16 KEERANUR 2 21
17 KILLUKOTTAI
-
18 KODUMBALUR CHATHRAM
-
19 MANDAIYUR 2 1
20 PARAMBUR
2
21 THIRUMALAI RAYAPURAM
-
22 VIRALIMALAI
10 23 AMBURPATTI
-
24 ARANTHANGI 3 16
25 AMBALAVANENDAL
-
26 AMMAPATTINAM 1 2
27 ARASARKULAM
-
28 ATHANI
4
29 AVANATHANKOTTAI
-
30 AVUDAIYARKOIL 3 2 31 KARUVUR
-
32 KEERAMANGALAM 1 16
33 KOTTAIPATINAM
6
34 KRISHNAJIPATTINAM
-
35 MARAMADAKKI
-
36 MIMISAL
37 NAGUDI
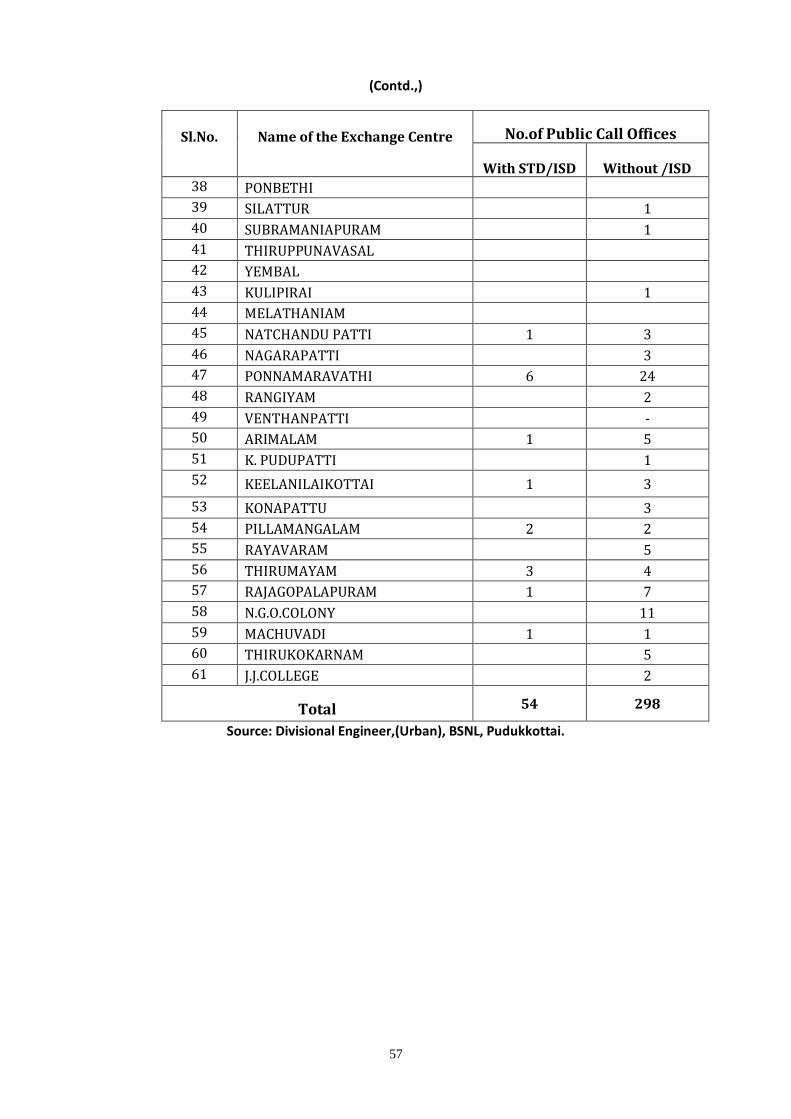
57
(Contd.,)
Sl.No.
Name of the Exchange Centre No.of Public Call Offices
With STD/ISD Without /ISD 38 PONBETHI
39 SILATTUR
1
40 SUBRAMANIAPURAM
1
41 THIRUPPUNAVASAL
42 YEMBAL
43 KULIPIRAI
1
44 MELATHANIAM
45 NATCHANDU PATTI 1 3
46 NAGARAPATTI
3
47 PONNAMARAVATHI 6 24
48 RANGIYAM
2
49 VENTHANPATTI
-
50 ARIMALAM 1 5
51 K. PUDUPATTI
1
52 KEELANILAIKOTTAI 1 3
53 KONAPATTU
3
54 PILLAMANGALAM 2 2
55 RAYAVARAM
5
56 THIRUMAYAM 3 4
57 RAJAGOPALAPURAM 1 7
58 N.G.O.COLONY
11
59 MACHUVADI 1 1
60 THIRUKOKARNAM
5
61 J.J.COLLEGE
2
Total 54 298
Source: Divisional Engineer,(Urban), BSNL, Pudukkottai.
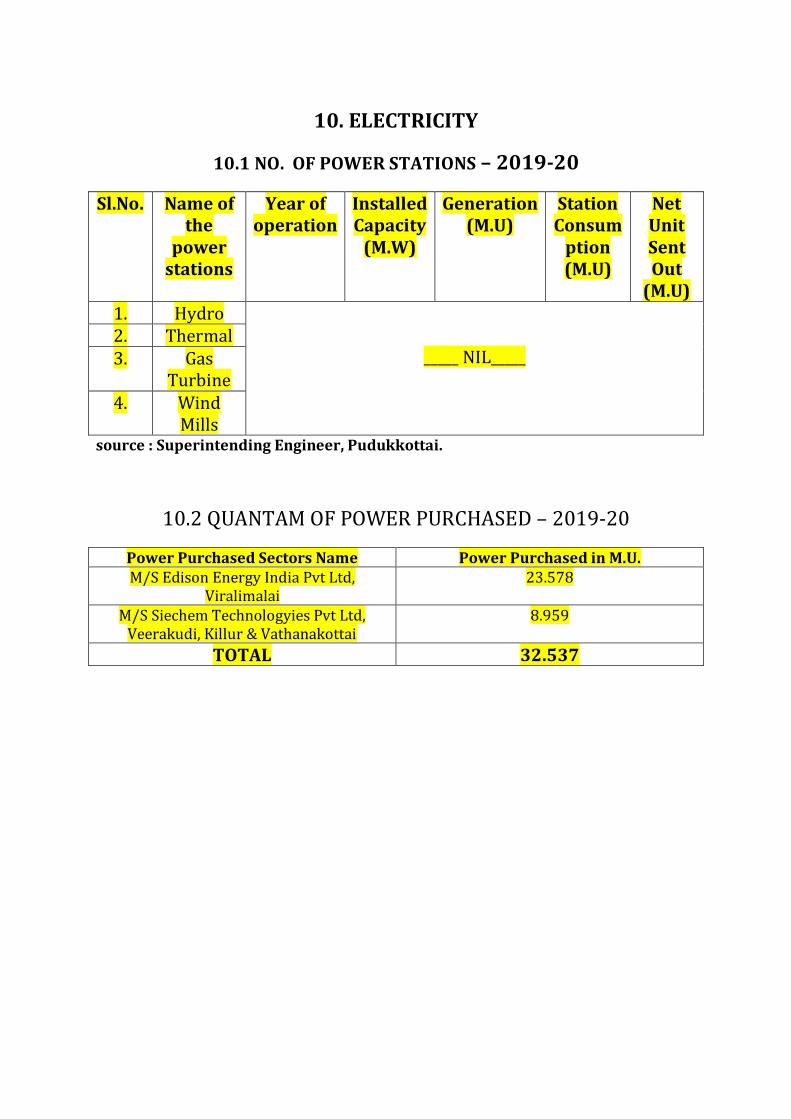
10. ELECTRICITY
10.1 NO. OF POWER STATIONS – 2019-20
Sl.No. Name of the
power stations
Year of operation
Installed Capacity
(M.W)
Generation (M.U)
Station Consum
ption (M.U)
Net Unit Sent Out
(M.U) 1. Hydro
_____ NIL_____
2. Thermal 3. Gas
Turbine 4. Wind
Mills source : Superintending Engineer, Pudukkottai.
10.2 QUANTAM OF POWER PURCHASED – 2019-20
Power Purchased Sectors Name Power Purchased in M.U. M/S Edison Energy India Pvt Ltd,
Viralimalai 23.578
M/S Siechem Technologyies Pvt Ltd, Veerakudi, Killur & Vathanakottai
8.959
TOTAL 32.537
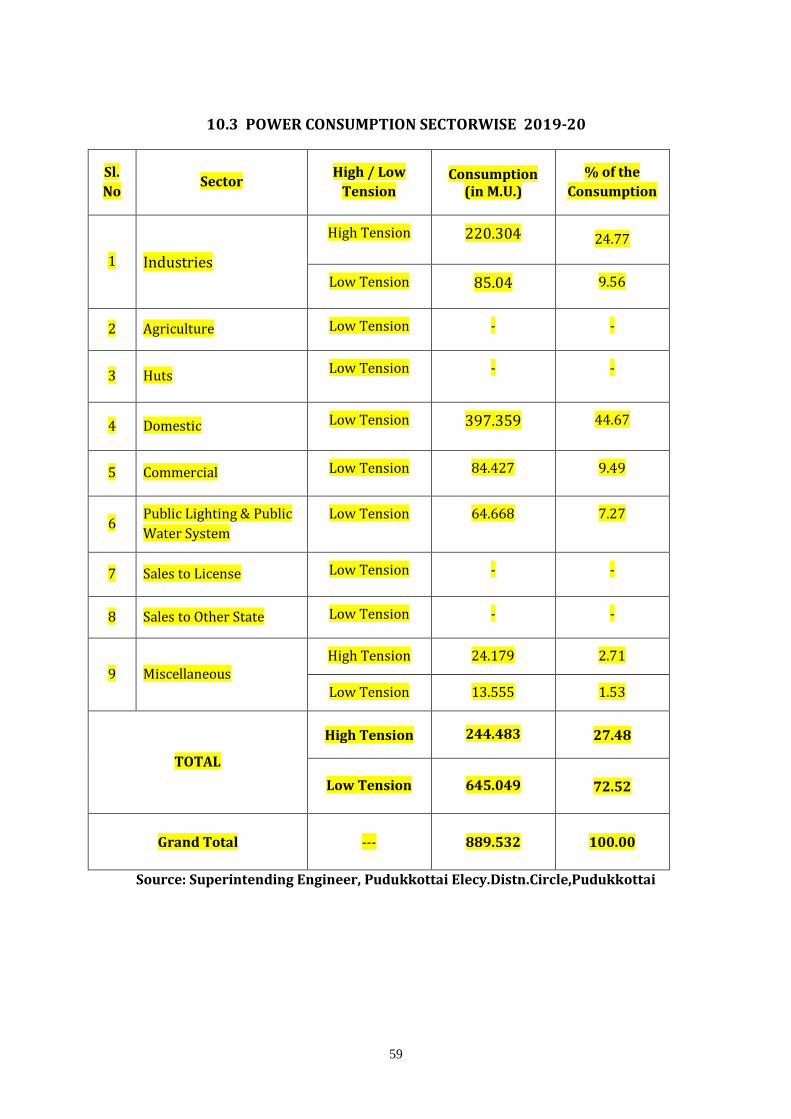
59
10.3 POWER CONSUMPTION SECTORWISE 2019-20
Sl.
No Sector
High / Low
Tension Consumption
(in M.U.)
% of the
Consumption
1 Industries
High Tension 220.304 24.77
Low Tension 85.04 9.56
2 Agriculture Low Tension - -
3 Huts Low Tension - -
4 Domestic Low Tension 397.359 44.67
5 Commercial Low Tension 84.427 9.49
6 Public Lighting & Public
Water System
Low Tension 64.668 7.27
7 Sales to License Low Tension - -
8 Sales to Other State Low Tension - -
9 Miscellaneous High Tension 24.179 2.71
Low Tension 13.555 1.53
TOTAL
High Tension 244.483 27.48
Low Tension 645.049 72.52
Grand Total --- 889.532 100.00
Source: Superintending Engineer, Pudukkottai Elecy.Distn.Circle,Pudukkottai
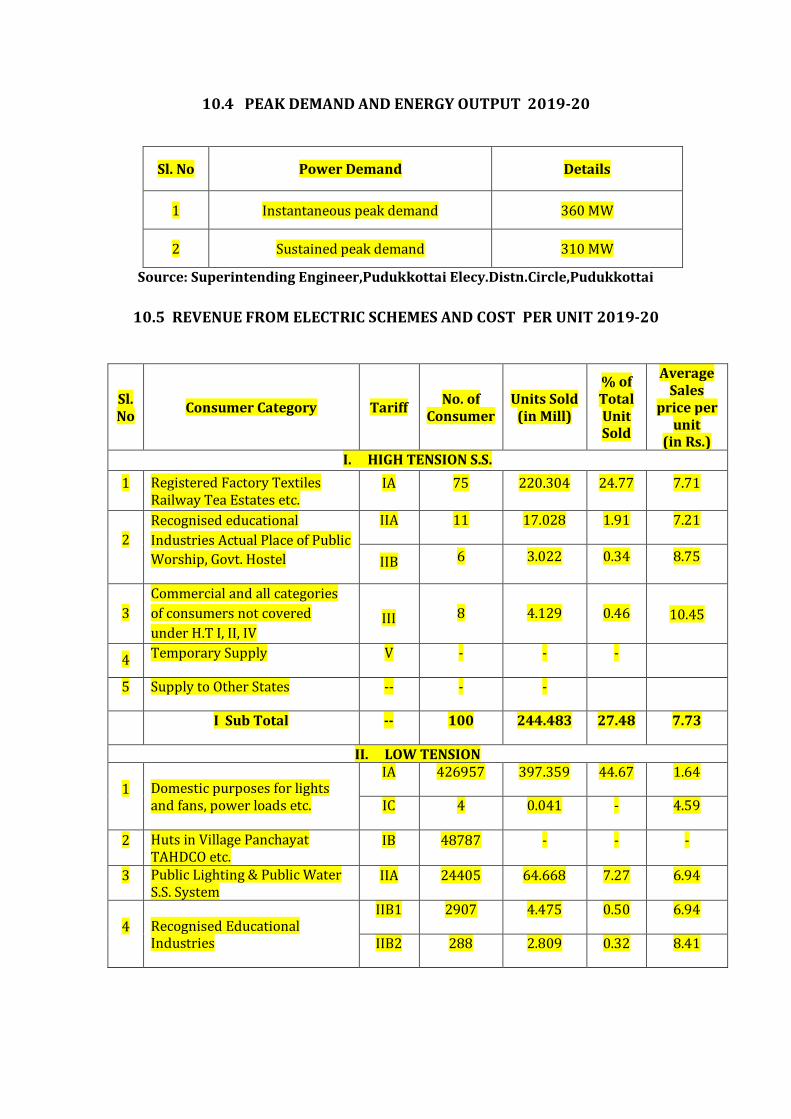
10.4 PEAK DEMAND AND ENERGY OUTPUT 2019-20
Sl. No Power Demand Details
1 Instantaneous peak demand 360 MW
2 Sustained peak demand 310 MW
Source: Superintending Engineer,Pudukkottai Elecy.Distn.Circle,Pudukkottai
10.5 REVENUE FROM ELECTRIC SCHEMES AND COST PER UNIT 2019-20
Sl. No
Consumer Category Tariff No. of
Consumer Units Sold
(in Mill)
% of Total Unit Sold
Average Sales
price per unit
(in Rs.) I. HIGH TENSION S.S.
1 Registered Factory Textiles Railway Tea Estates etc.
IA 75 220.304 24.77 7.71
2
Recognised educational
Industries Actual Place of Public
Worship, Govt. Hostel
IIA 11 17.028 1.91 7.21
IIB 6 3.022 0.34 8.75
3
Commercial and all categories
of consumers not covered
under H.T I, II, IV III 8 4.129 0.46 10.45
4 Temporary Supply V - - -
5 Supply to Other States -- - -
I Sub Total -- 100 244.483 27.48 7.73
II. LOW TENSION
1 Domestic purposes for lights and fans, power loads etc.
IA 426957 397.359 44.67 1.64
IC 4 0.041 - 4.59
2 Huts in Village Panchayat TAHDCO etc.
IB 48787 - - -
3 Public Lighting & Public Water S.S. System
IIA 24405 64.668 7.27 6.94
4 Recognised Educational Industries
IIB1 2907 4.475 0.50 6.94
IIB2 288 2.809 0.32 8.41
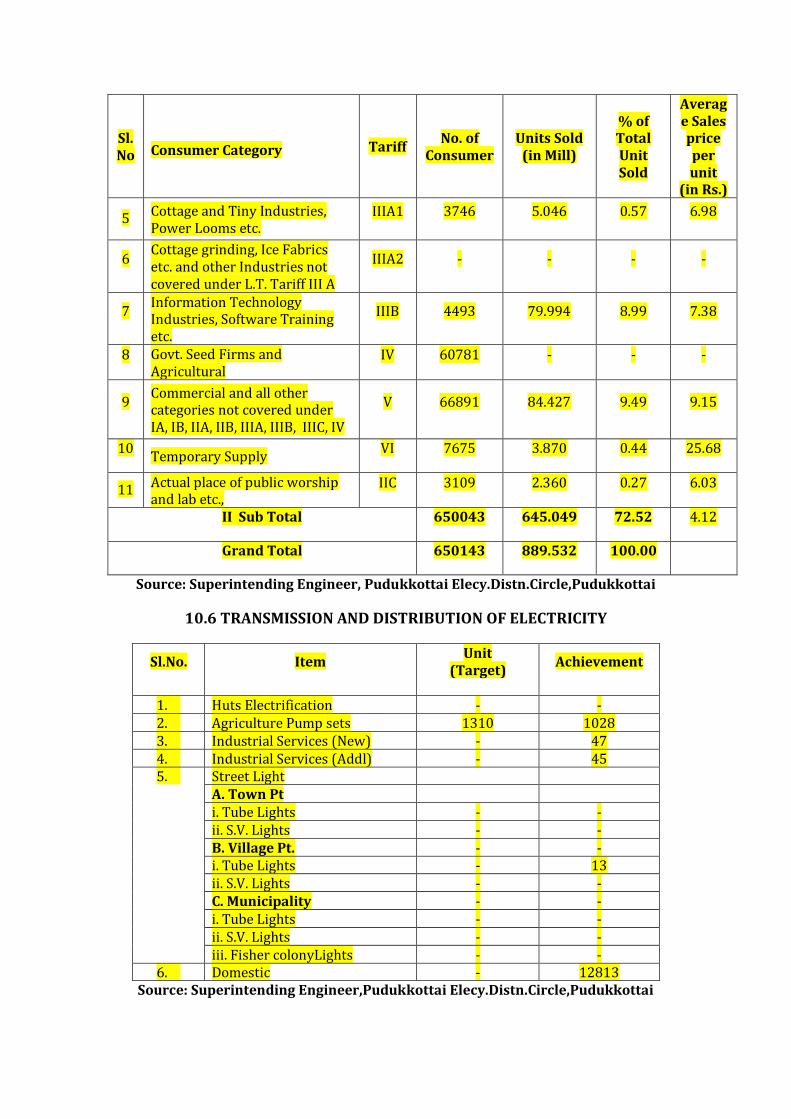
Sl. No Consumer Category Tariff
No. of Consumer
Units Sold (in Mill)
% of Total Unit Sold
Average Sales price per unit
(in Rs.)
5 Cottage and Tiny Industries, Power Looms etc.
IIIA1 3746 5.046 0.57 6.98
6 Cottage grinding, Ice Fabrics etc. and other Industries not covered under L.T. Tariff III A
IIIA2 - - - -
7 Information Technology Industries, Software Training etc.
IIIB 4493 79.994 8.99 7.38
8 Govt. Seed Firms and Agricultural
IV 60781 - - -
9 Commercial and all other categories not covered under IA, IB, IIA, IIB, IIIA, IIIB, IIIC, IV
V 66891 84.427 9.49 9.15
10 Temporary Supply
VI 7675 3.870 0.44 25.68
11 Actual place of public worship and lab etc.,
IIC 3109 2.360 0.27 6.03
II Sub Total 650043 645.049 72.52 4.12
Grand Total 650143 889.532 100.00
Source: Superintending Engineer, Pudukkottai Elecy.Distn.Circle,Pudukkottai
10.6 TRANSMISSION AND DISTRIBUTION OF ELECTRICITY
Sl.No.
Item
Unit (Target)
Achievement
1. Huts Electrification - - 2. Agriculture Pump sets 1310 1028 3. Industrial Services (New) - 47 4. Industrial Services (Addl) - 45 5. Street Light
A. Town Pt i. Tube Lights - - ii. S.V. Lights - - B. Village Pt. - - i. Tube Lights - 13 ii. S.V. Lights - - C. Municipality - - i. Tube Lights - - ii. S.V. Lights - - iii. Fisher colonyLights - -
6. Domestic - 12813 Source: Superintending Engineer,Pudukkottai Elecy.Distn.Circle,Pudukkottai
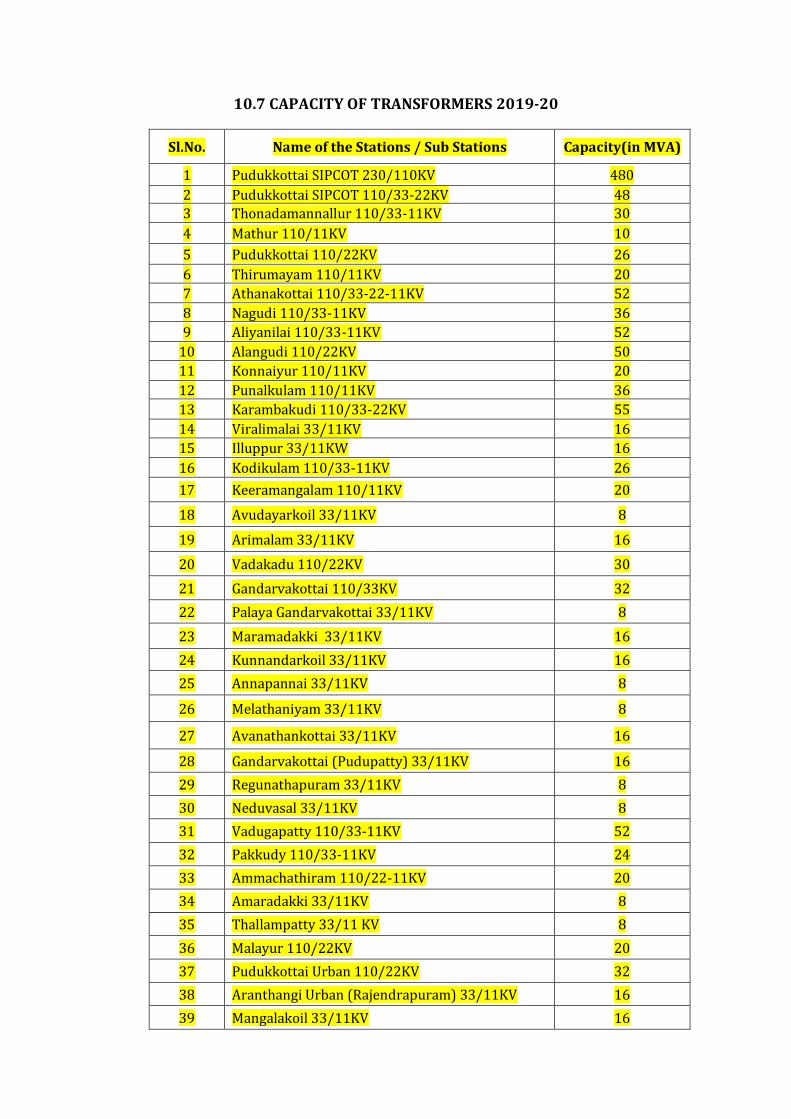
10.7 CAPACITY OF TRANSFORMERS 2019-20
Sl.No. Name of the Stations / Sub Stations Capacity(in MVA)
1 Pudukkottai SIPCOT 230/110KV 480
2 Pudukkottai SIPCOT 110/33-22KV 48
3 Thonadamannallur 110/33-11KV 30
4 Mathur 110/11KV 10
5 Pudukkottai 110/22KV 26
6 Thirumayam 110/11KV 20
7 Athanakottai 110/33-22-11KV 52
8 Nagudi 110/33-11KV 36
9 Aliyanilai 110/33-11KV 52
10 Alangudi 110/22KV 50
11 Konnaiyur 110/11KV 20
12 Punalkulam 110/11KV 36
13 Karambakudi 110/33-22KV 55
14 Viralimalai 33/11KV 16
15 Illuppur 33/11KW 16
16 Kodikulam 110/33-11KV 26
17 Keeramangalam 110/11KV 20
18 Avudayarkoil 33/11KV 8
19 Arimalam 33/11KV 16
20 Vadakadu 110/22KV 30
21 Gandarvakottai 110/33KV 32
22 Palaya Gandarvakottai 33/11KV 8
23 Maramadakki 33/11KV 16
24 Kunnandarkoil 33/11KV 16
25 Annapannai 33/11KV 8
26 Melathaniyam 33/11KV 8
27 Avanathankottai 33/11KV 16
28 Gandarvakottai (Pudupatty) 33/11KV 16
29 Regunathapuram 33/11KV 8
30 Neduvasal 33/11KV 8
31 Vadugapatty 110/33-11KV 52
32 Pakkudy 110/33-11KV 24
33 Ammachathiram 110/22-11KV 20
34 Amaradakki 33/11KV 8
35 Thallampatty 33/11 KV 8
36 Malayur 110/22KV 20
37 Pudukkottai Urban 110/22KV 32
38 Aranthangi Urban (Rajendrapuram) 33/11KV 16
39 Mangalakoil 33/11KV 16
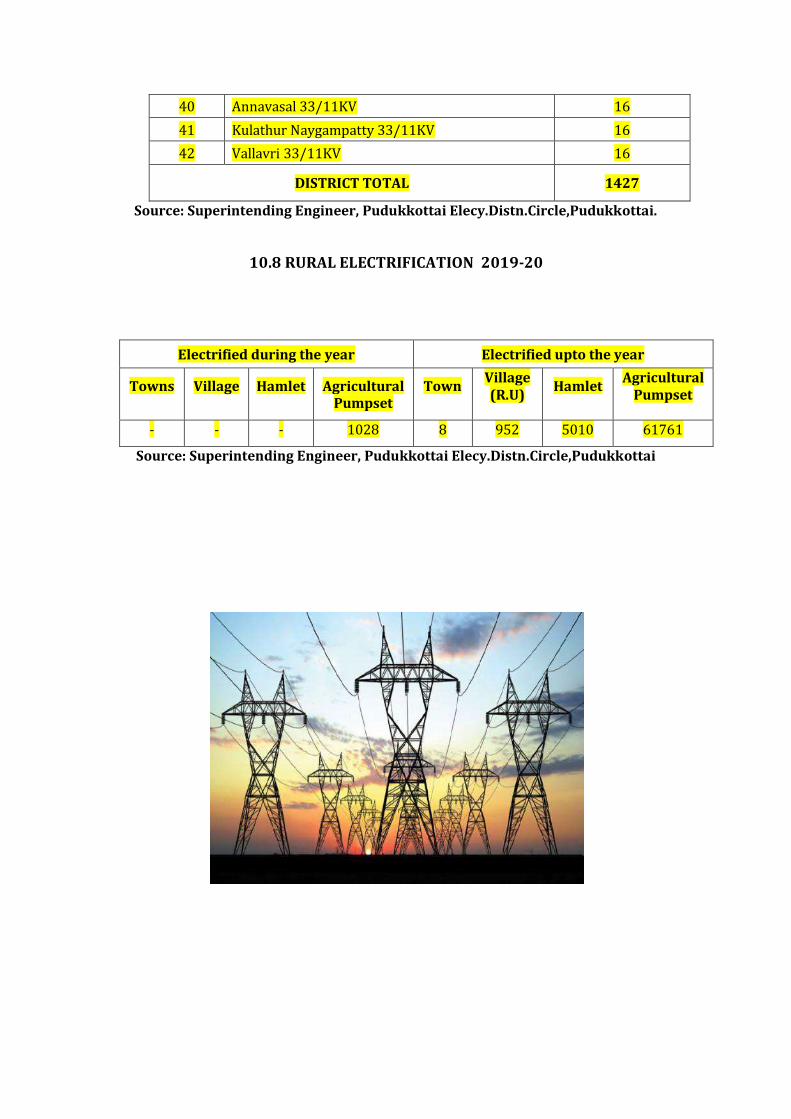
40 Annavasal 33/11KV 16
41 Kulathur Naygampatty 33/11KV 16
42 Vallavri 33/11KV 16
DISTRICT TOTAL 1427
Source: Superintending Engineer, Pudukkottai Elecy.Distn.Circle,Pudukkottai.
10.8 RURAL ELECTRIFICATION 2019-20
Electrified during the year Electrified upto the year
Towns
Village
Hamlet
Agricultural Pumpset
Town
Village (R.U)
Hamlet
Agricultural Pumpset
- - - 1028 8 952 5010 61761
Source: Superintending Engineer, Pudukkottai Elecy.Distn.Circle,Pudukkottai
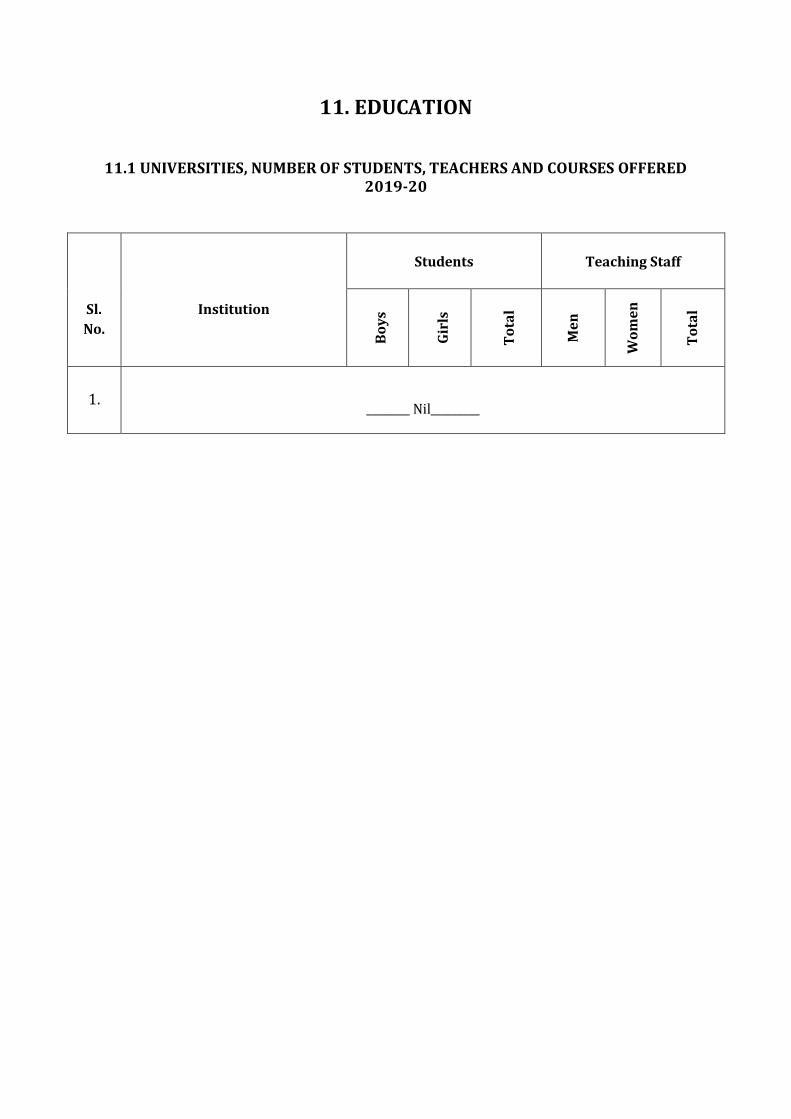
11. EDUCATION
11.1 UNIVERSITIES, NUMBER OF STUDENTS, TEACHERS AND COURSES OFFERED
2019-20
Sl.
No.
Institution
Students
Teaching Staff
Bo
ys
Gir
ls
To
tal
Me
n
Wo
me
n
To
tal
1.
________ Nil_________
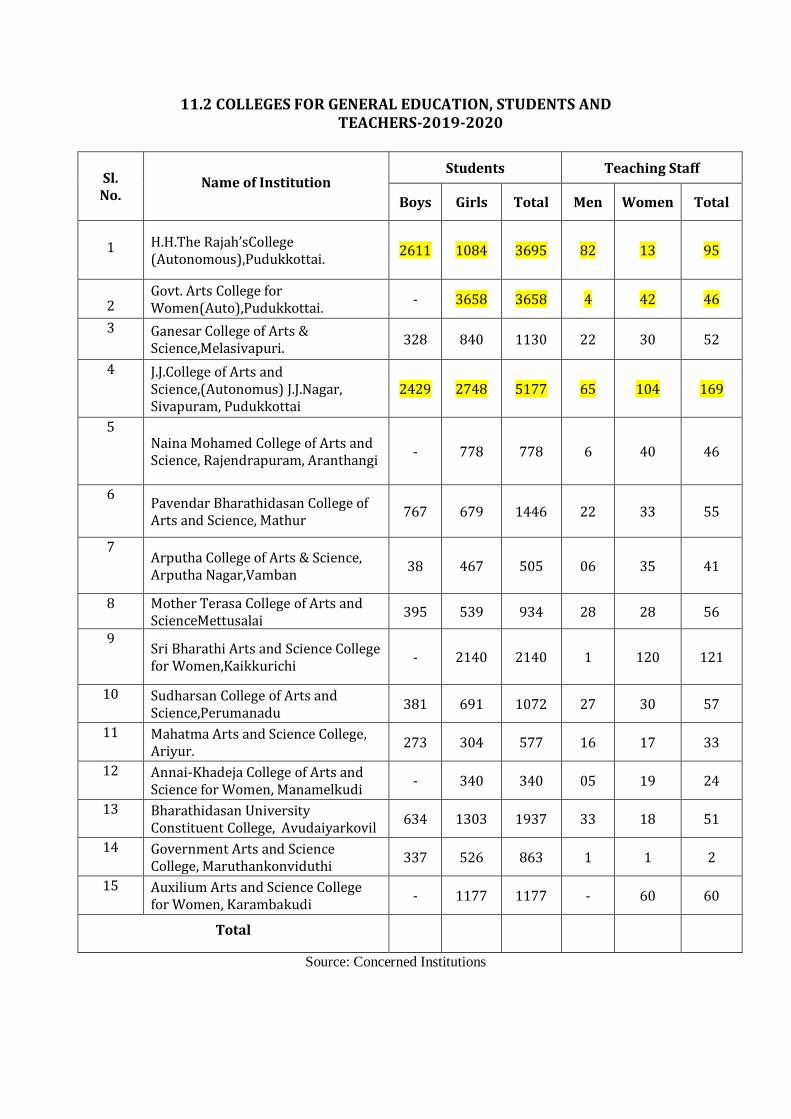
11.2 COLLEGES FOR GENERAL EDUCATION, STUDENTS AND TEACHERS-2019-2020
Sl. No.
Name of Institution Students Teaching Staff
Boys Girls Total Men Women Total
1
H.H.The Rajah’sCollege (Autonomous),Pudukkottai.
2611 1084 3695 82 13 95
2
Govt. Arts College for Women(Auto),Pudukkottai.
- 3658 3658 4 42 46
3 Ganesar College of Arts & Science,Melasivapuri.
328 840 1130 22 30 52
4
J.J.College of Arts and Science,(Autonomus) J.J.Nagar, Sivapuram, Pudukkottai
2429 2748 5177 65 104 169
5 Naina Mohamed College of Arts and Science, Rajendrapuram, Aranthangi
- 778 778 6 40 46
6
Pavendar Bharathidasan College of Arts and Science, Mathur
767 679 1446 22 33 55
7 Arputha College of Arts & Science,
Arputha Nagar,Vamban 38 467 505 06 35 41
8 Mother Terasa College of Arts and ScienceMettusalai
395 539 934 28 28 56
9
Sri Bharathi Arts and Science College for Women,Kaikkurichi
- 2140 2140 1 120 121
10 Sudharsan College of Arts and Science,Perumanadu
381 691 1072 27 30 57
11 Mahatma Arts and Science College, Ariyur.
273 304 577 16 17 33
12 Annai-Khadeja College of Arts and Science for Women, Manamelkudi
- 340 340 05 19 24
13 Bharathidasan University Constituent College, Avudaiyarkovil
634 1303 1937 33 18 51
14 Government Arts and Science College, Maruthankonviduthi
337 526 863 1 1 2
15 Auxilium Arts and Science College for Women, Karambakudi
- 1177 1177 - 60 60
Total
Source: Concerned Institutions

11.3 COLLEGE FOR TECHNICAL EDUCATION, STUDENTS AND TEACHERS – 2019 - 20
l. No.
Name of Institution
Students Teaching Staff
Bo
ys
Gir
ls
To
tal
Me
n
Wo
me
n
To
tal
1 Government Polytechnic College,Oorvani, Aranthangi.
1234 149 1383 7 1 8
2 Subramanian Polytechnic College,Rayavaram.
625 28 653 31 11 42
3 St.Joseph Polytechnic College, Thirumayam 245 34 279 26 7 33
4
Kumaran Polytechnic College,Ariyur, Annavasal
271 9 280 11 8 19
5 M.A.R. Polytechnic College, Boothakudi, Viralimalai
1624 85 1709 48 9 57
6
Mahath Amma Polytechnic College, Ariyur, Annavasal
434 85 519 18 10 28
7
Mother Teresa Polytechnic College, Mettusalai,Illuppur
785 176 961 35 24 59
8 N.M. Polytechnic College,Itchadi, Pudukkottai
closed
9 PSV Polytechnic College, Mirattunilai 265 21 286 30 13 43
10 Royal Polytechnic College, Kulathur 427 28 455 26 8 34
11 Government Polytechnic Gandarvakottai 750 28 778 26 21 47
12
Sasthaa Polytechnic College, Keelanilaikkottai
193 59 252 9 7 16
13
Sri Annai Abhirami Polytechnic College, Perungalur, Pudukkottai
172 8 180 11 5 16
14 Sri Bharathi Polytechnic College for Women Kaikuruchi.
- 191 191 2 23 25
15 Sudharsan Polytechnic College, Sathiyamangalam
294 17 311 19 13 32
16 Venkatesvara Polyechnic College, Kaikurichi.
700 8 708 50 17 67
17 Srinivasa Polytechnic College, Kalamavur 978 92 1070 57 37 94
18 SSR Polytechnic College, Arasamalai 246 45 291 15 6 21
19 MNSK Polytechnic College closed 20 Chendhuran Polytechnic College, Lena
Vilakku,Thirumayam 1276 43 1319 38 19 57
Total 10731 1119 11850 445 238 683
Source: Concerned Institutions
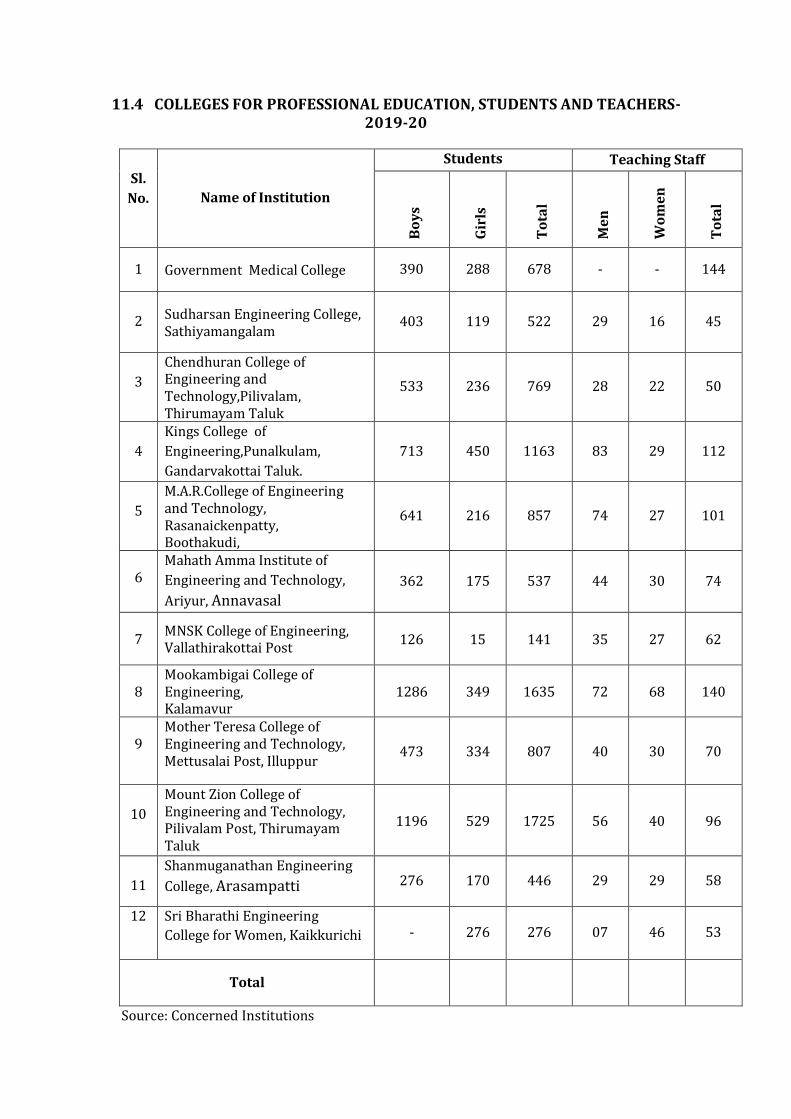
11.4 COLLEGES FOR PROFESSIONAL EDUCATION, STUDENTS AND TEACHERS-2019-20
Sl.
No. Name of Institution
Students Teaching Staff
Bo
ys
Gir
ls
To
tal
Me
n
Wo
me
n
To
tal
1 Government Medical College 390 288 678 - - 144
2 Sudharsan Engineering College, Sathiyamangalam
403 119 522 29 16 45
3
Chendhuran College of Engineering and Technology,Pilivalam, Thirumayam Taluk
533 236 769 28 22 50
4
Kings College of
Engineering,Punalkulam,
Gandarvakottai Taluk.
713 450 1163 83 29 112
5
M.A.R.College of Engineering and Technology, Rasanaickenpatty, Boothakudi,
641 216 857 74 27 101
6
Mahath Amma Institute of
Engineering and Technology,
Ariyur, Annavasal 362 175 537 44 30 74
7
MNSK College of Engineering, Vallathirakottai Post
126 15 141 35 27 62
8
Mookambigai College of Engineering, Kalamavur
1286 349 1635 72 68 140
9
Mother Teresa College of Engineering and Technology, Mettusalai Post, Illuppur
473 334 807 40 30 70
10
Mount Zion College of Engineering and Technology, Pilivalam Post, Thirumayam Taluk
1196 529 1725 56 40 96
11
Shanmuganathan Engineering
College, Arasampatti 276 170 446 29 29 58
12 Sri Bharathi Engineering
College for Women, Kaikkurichi - 276 276 07 46 53
Total
Source: Concerned Institutions
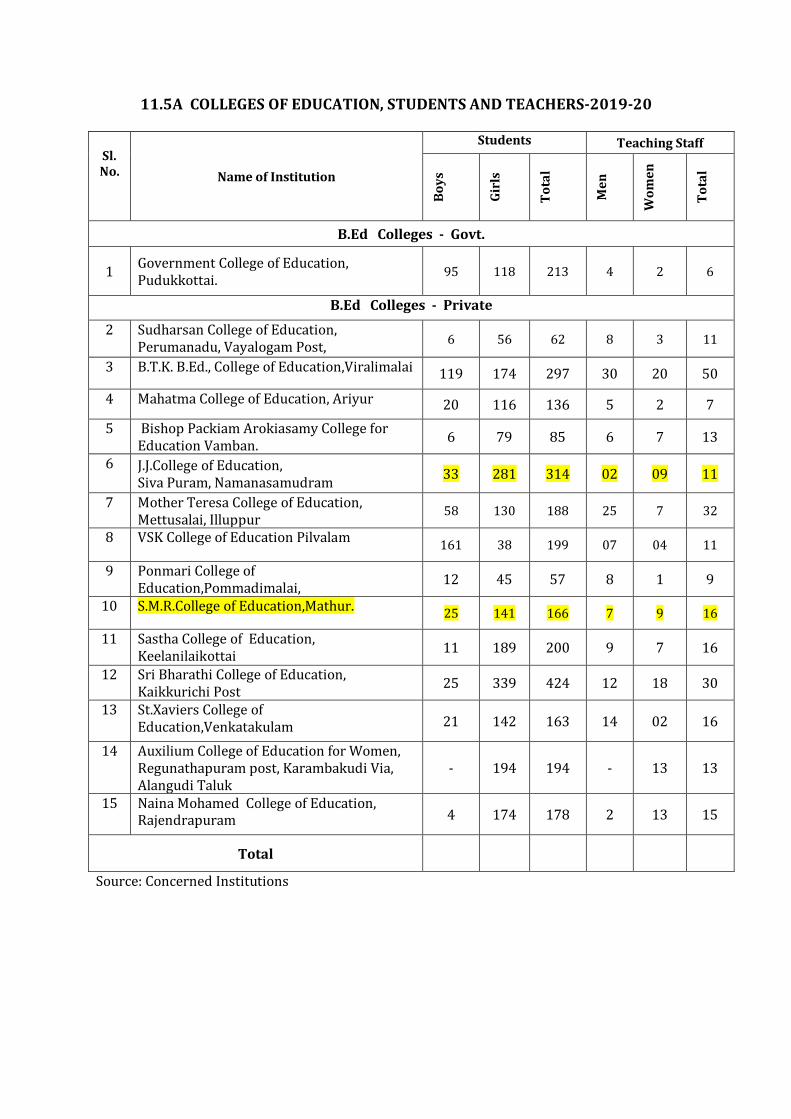
11.5A COLLEGES OF EDUCATION, STUDENTS AND TEACHERS-2019-20
Sl. No. Name of Institution
Students Teaching Staff
Bo
ys
Gir
ls
To
tal
Me
n
Wo
me
n
To
tal
B.Ed Colleges - Govt.
1 Government College of Education, Pudukkottai.
95 118 213 4 2 6
B.Ed Colleges - Private
2 Sudharsan College of Education, Perumanadu, Vayalogam Post,
6 56 62 8 3 11
3 B.T.K. B.Ed., College of Education,Viralimalai 119 174 297 30 20 50
4 Mahatma College of Education, Ariyur 20 116 136 5 2 7
5
Bishop Packiam Arokiasamy College for Education Vamban.
6 79 85 6 7 13
6
J.J.College of Education, Siva Puram, Namanasamudram
33 281 314 02 09 11
7 Mother Teresa College of Education, Mettusalai, Illuppur
58 130 188 25 7 32
8 VSK College of Education Pilvalam 161 38 199 07 04 11
9
Ponmari College of Education,Pommadimalai,
12 45 57 8 1 9
10 S.M.R.College of Education,Mathur. 25 141 166 7 9 16
11 Sastha College of Education, Keelanilaikottai
11 189 200 9 7 16
12 Sri Bharathi College of Education, Kaikkurichi Post
25 339 424 12 18 30
13 St.Xaviers College of Education,Venkatakulam 21 142 163 14 02 16
14 Auxilium College of Education for Women, Regunathapuram post, Karambakudi Via, Alangudi Taluk
- 194 194 - 13 13
15 Naina Mohamed College of Education, Rajendrapuram 4 174 178 2 13 15
Total
Source: Concerned Institutions
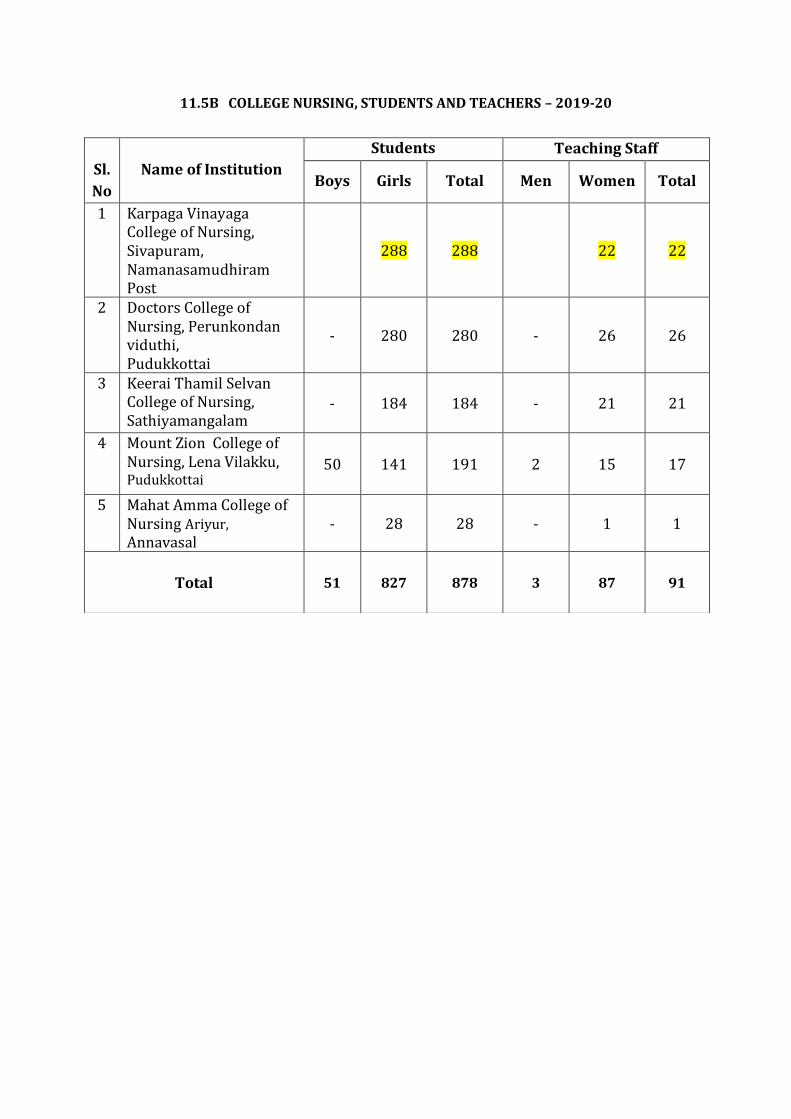
11.5B COLLEGE NURSING, STUDENTS AND TEACHERS – 2019-20
Sl.
No
Name of Institution
Students Teaching Staff
Boys Girls Total Men Women Total
1 Karpaga Vinayaga College of Nursing, Sivapuram, Namanasamudhiram Post
288 288
22 22
2 Doctors College of Nursing, Perunkondan viduthi, Pudukkottai
- 280 280 - 26 26
3
Keerai Thamil Selvan College of Nursing, Sathiyamangalam
- 184 184 - 21 21
4
Mount Zion College of Nursing, Lena Vilakku, Pudukkottai
50 141 191 2 15 17
5 Mahat Amma College of Nursing Ariyur,
Annavasal - 28 28 - 1 1
Total 51 827 878 3 87 91
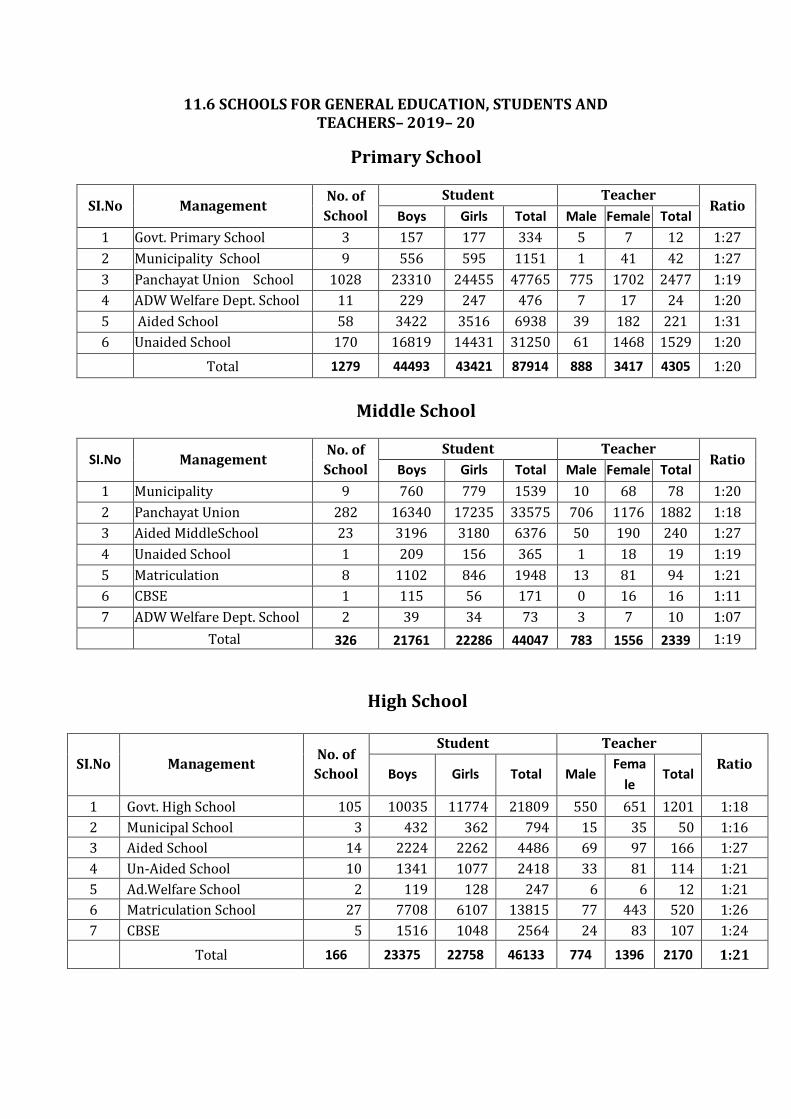
11.6 SCHOOLS FOR GENERAL EDUCATION, STUDENTS AND TEACHERS– 2019– 20
Primary School
SI.No Management No. of
School
Student Teacher Ratio
Boys Girls Total Male Female Total
1 Govt. Primary School 3 157 177 334 5 7 12 1:27
2 Municipality School 9 556 595 1151 1 41 42 1:27
3 Panchayat Union School 1028 23310 24455 47765 775 1702 2477 1:19
4 ADW Welfare Dept. School 11 229 247 476 7 17 24 1:20
5 Aided School 58 3422 3516 6938 39 182 221 1:31
6 Unaided School 170 16819 14431 31250 61 1468 1529 1:20
Total 1279 44493 43421 87914 888 3417 4305 1:20
Middle School
SI.No Management No. of
School
Student Teacher Ratio
Boys Girls Total Male Female Total
1 Municipality 9 760 779 1539 10 68 78 1:20
2 Panchayat Union 282 16340 17235 33575 706 1176 1882 1:18
3 Aided MiddleSchool 23 3196 3180 6376 50 190 240 1:27
4 Unaided School 1 209 156 365 1 18 19 1:19
5 Matriculation 8 1102 846 1948 13 81 94 1:21
6 CBSE 1 115 56 171 0 16 16 1:11
7 ADW Welfare Dept. School 2 39 34 73 3 7 10 1:07
Total 326 21761 22286 44047 783 1556 2339 1:19
High School
SI.No Management No. of
School
Student Teacher
Ratio Boys Girls Total Male
Fema
le Total
1 Govt. High School 105 10035 11774 21809 550 651 1201 1:18
2 Municipal School 3 432 362 794 15 35 50 1:16
3 Aided School 14 2224 2262 4486 69 97 166 1:27
4 Un-Aided School 10 1341 1077 2418 33 81 114 1:21
5 Ad.Welfare School 2 119 128 247 6 6 12 1:21
6 Matriculation School 27 7708 6107 13815 77 443 520 1:26
7 CBSE 5 1516 1048 2564 24 83 107 1:24
Total 166 23375 22758 46133 774 1396 2170 1:21
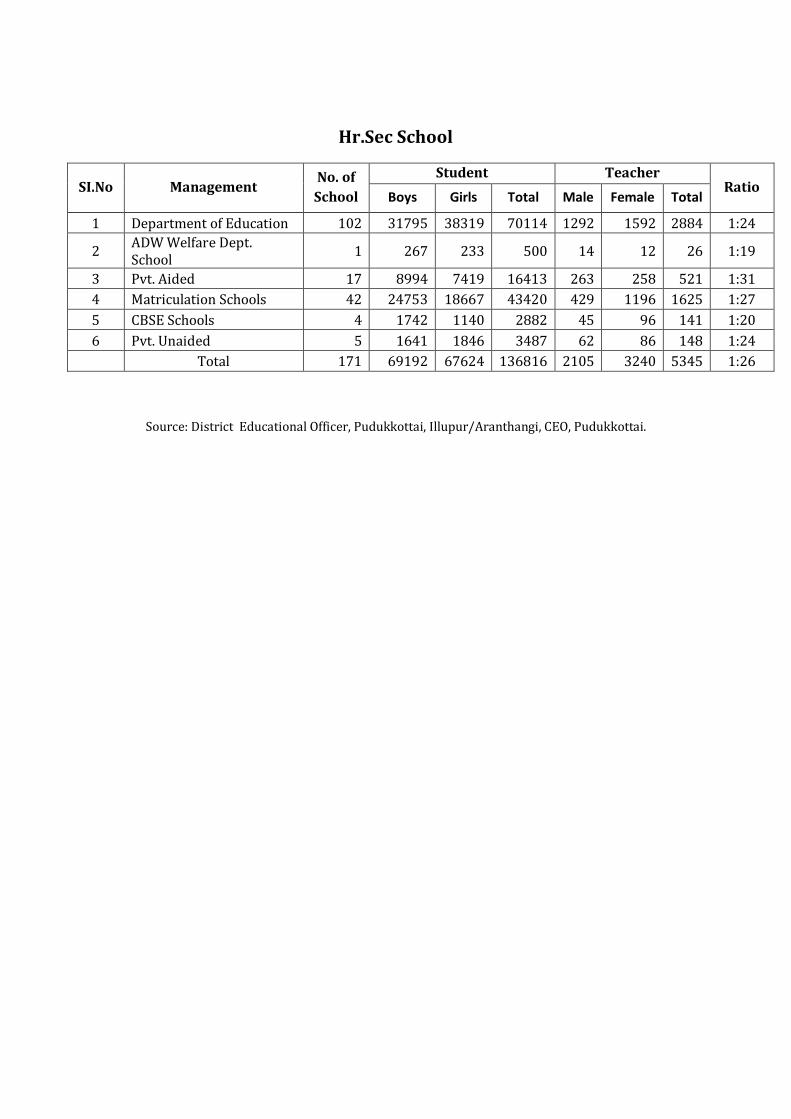
Hr.Sec School
SI.No Management No. of
School
Student Teacher Ratio
Boys Girls Total Male Female Total
1 Department of Education 102 31795 38319 70114 1292 1592 2884 1:24
2 ADW Welfare Dept. School
1 267 233 500 14 12 26 1:19
3 Pvt. Aided 17 8994 7419 16413 263 258 521 1:31
4 Matriculation Schools 42 24753 18667 43420 429 1196 1625 1:27
5 CBSE Schools 4 1742 1140 2882 45 96 141 1:20
6 Pvt. Unaided 5 1641 1846 3487 62 86 148 1:24
Total 171 69192 67624 136816 2105 3240 5345 1:26
Source: District Educational Officer, Pudukkottai, Illupur/Aranthangi, CEO, Pudukkottai.
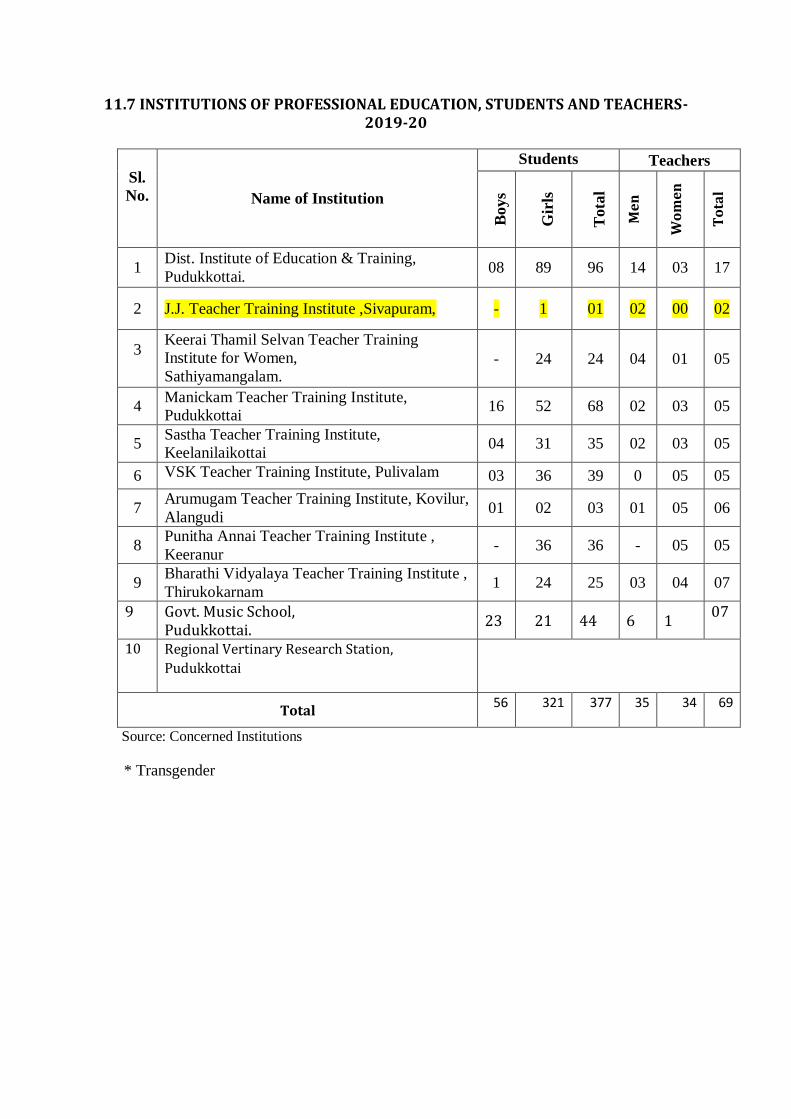
11.7 INSTITUTIONS OF PROFESSIONAL EDUCATION, STUDENTS AND TEACHERS-2019-20
Sl.
No. Name of Institution
Students Teachers
Boys
Gir
ls
Tota
l
Me
n
Wo
me
n
To
tal
1 Dist. Institute of Education & Training,
Pudukkottai. 08 89 96 14 03 17
2 J.J. Teacher Training Institute ,Sivapuram, - 1 01 02 00 02
3
Keerai Thamil Selvan Teacher Training
Institute for Women,
Sathiyamangalam. - 24 24 04 01 05
4 Manickam Teacher Training Institute,
Pudukkottai 16 52 68 02 03 05
5 Sastha Teacher Training Institute,
Keelanilaikottai 04 31 35 02 03 05
6 VSK Teacher Training Institute, Pulivalam 03 36 39 0 05 05
7 Arumugam Teacher Training Institute, Kovilur,
Alangudi 01 02 03 01 05 06
8 Punitha Annai Teacher Training Institute ,
Keeranur - 36 36 - 05 05
9 Bharathi Vidyalaya Teacher Training Institute ,
Thirukokarnam 1 24 25 03 04 07
9
Govt. Music School, Pudukkottai.
23 21 44 6 1 07
10 Regional Vertinary Research Station,
Pudukkottai
Total 56 321 377 35 34 69
Source: Concerned Institutions
* Transgender
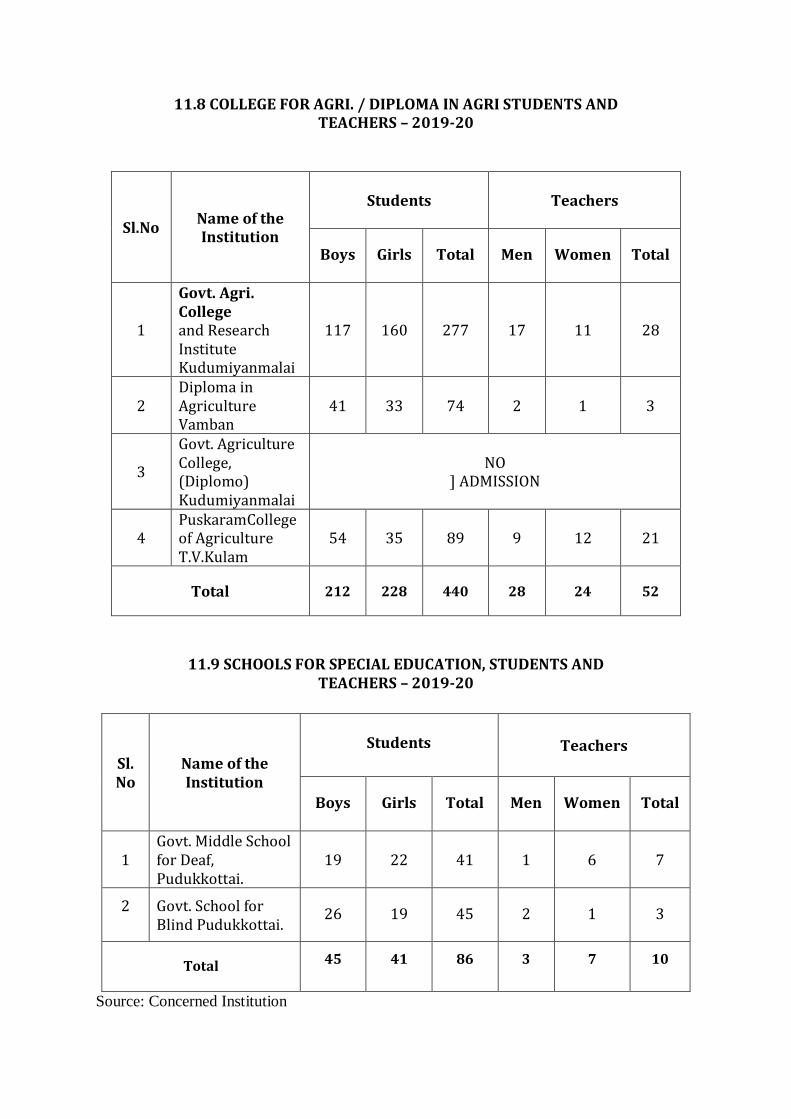
11.8 COLLEGE FOR AGRI. / DIPLOMA IN AGRI STUDENTS AND TEACHERS – 2019-20
Sl.No Name of the Institution
Students
Teachers
Boys Girls Total Men Women Total
1
Govt. Agri. College and Research Institute Kudumiyanmalai
117 160 277 17 11 28
2 Diploma in Agriculture Vamban
41 33 74 2 1 3
3
Govt. Agriculture College, (Diplomo) Kudumiyanmalai
NO ] ADMISSION
4 PuskaramCollege of Agriculture T.V.Kulam
54 35 89 9 12 21
Total 212 228 440 28 24 52
11.9 SCHOOLS FOR SPECIAL EDUCATION, STUDENTS AND TEACHERS – 2019-20
Sl. No
Name of the Institution
Students
Teachers
Boys Girls Total Men Women Total
1 Govt. Middle School for Deaf, Pudukkottai.
19 22 41 1 6 7
2
Govt. School for Blind Pudukkottai.
26 19 45 2 1 3
Total 45 41 86 3 7 10
Source: Concerned Institution
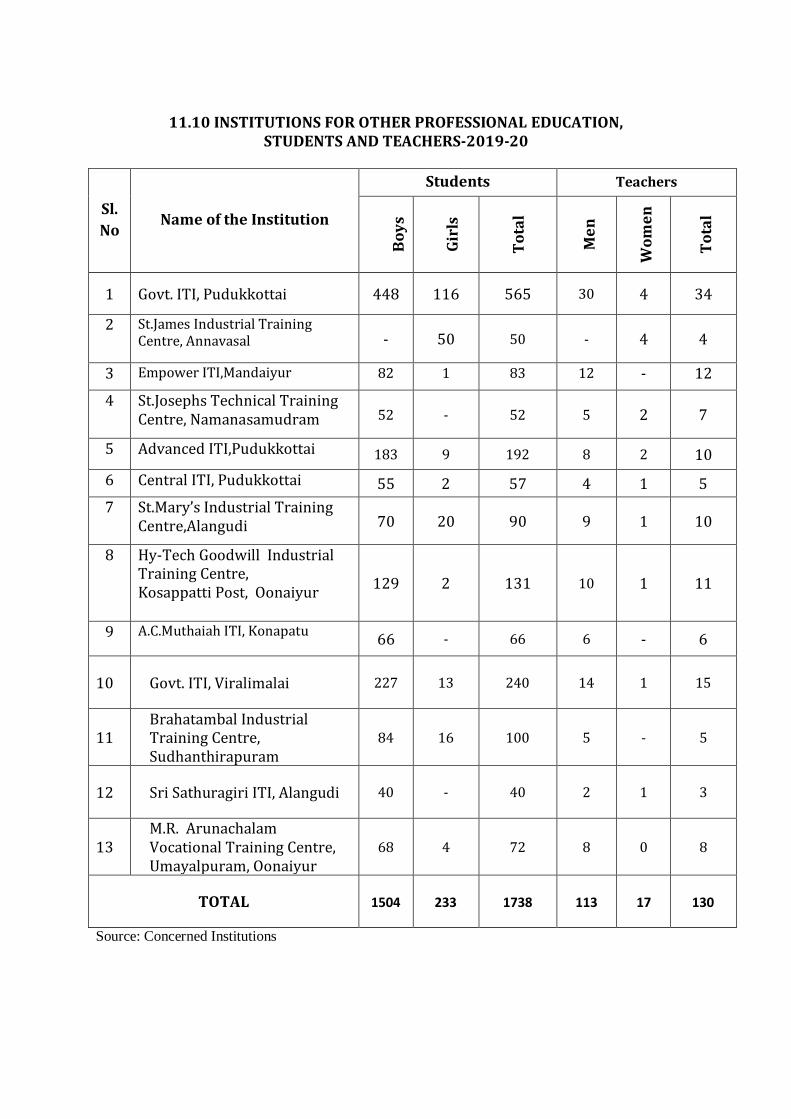
11.10 INSTITUTIONS FOR OTHER PROFESSIONAL EDUCATION, STUDENTS AND TEACHERS-2019-20
Sl.
No Name of the Institution
Students Teachers
Bo
ys
Gir
ls
To
tal
Me
n
Wo
me
n
To
tal
1 Govt. ITI, Pudukkottai 448 116 565 30 4 34
2
St.James Industrial Training Centre, Annavasal - 50 50 - 4 4
3 Empower ITI,Mandaiyur 82 1 83 12 - 12
4
St.Josephs Technical Training Centre, Namanasamudram 52 - 52 5 2 7
5 Advanced ITI,Pudukkottai 183 9 192 8 2 10
6 Central ITI, Pudukkottai 55 2 57 4 1 5
7
St.Mary’s Industrial Training Centre,Alangudi 70 20 90 9 1 10
8
Hy-Tech Goodwill Industrial Training Centre, Kosappatti Post, Oonaiyur
129 2 131 10 1 11
9 A.C.Muthaiah ITI, Konapatu 66 - 66 6 - 6
10 Govt. ITI, Viralimalai 227 13 240 14 1 15
11 Brahatambal Industrial Training Centre, Sudhanthirapuram
84 16 100 5 - 5
12 Sri Sathuragiri ITI, Alangudi 40 - 40 2 1 3
13 M.R. Arunachalam Vocational Training Centre, Umayalpuram, Oonaiyur
68 4 72 8 0 8
TOTAL 1504 233 1738 113 17 130
Source: Concerned Institutions
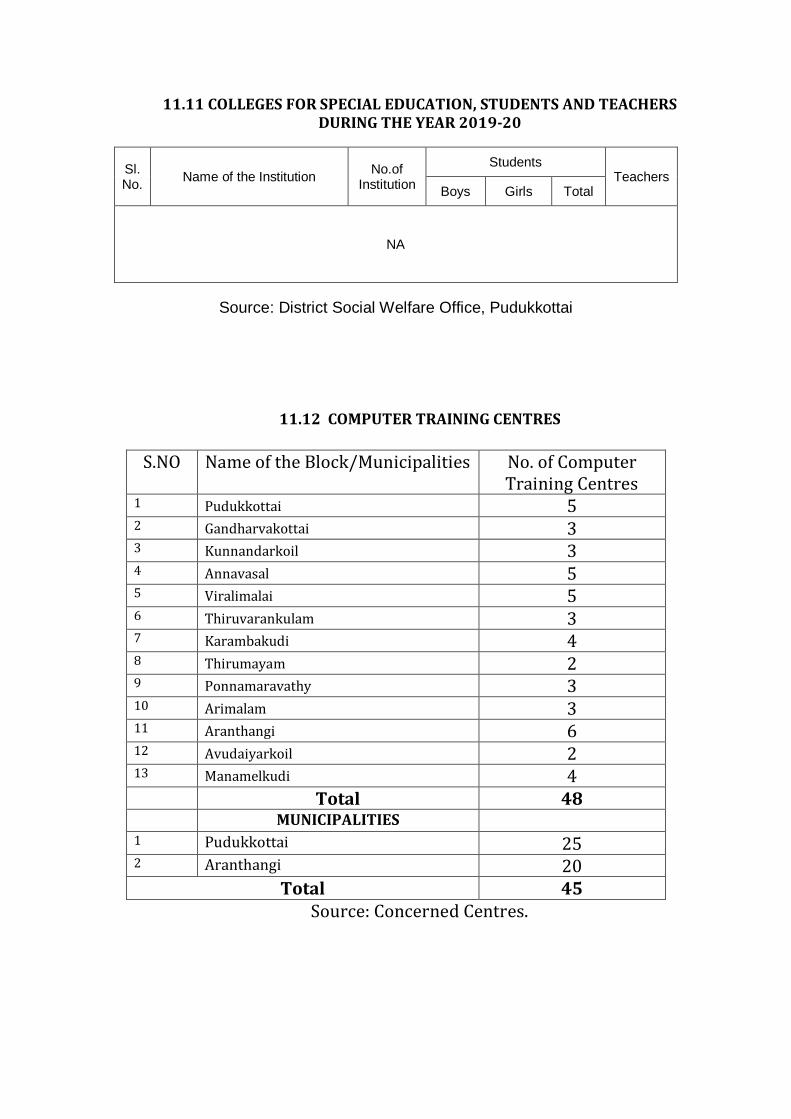
11.11 COLLEGES FOR SPECIAL EDUCATION, STUDENTS AND TEACHERS DURING THE YEAR 2019-20
Sl.No.
Name of the Institution No.of
Institution
Students Teachers
Boys Girls Total
NA
Source: District Social Welfare Office, Pudukkottai
11.12 COMPUTER TRAINING CENTRES
S.NO Name of the Block/Municipalities No. of Computer
Training Centres 1 Pudukkottai 5 2 Gandharvakottai 3 3 Kunnandarkoil 3 4 Annavasal 5 5 Viralimalai 5 6 Thiruvarankulam 3 7 Karambakudi 4 8 Thirumayam 2 9 Ponnamaravathy 3 10 Arimalam 3 11 Aranthangi 6 12 Avudaiyarkoil 2 13 Manamelkudi 4 Total 48 MUNICIPALITIES 1 Pudukkottai 25 2 Aranthangi 20
Total 45 Source: Concerned Centres.
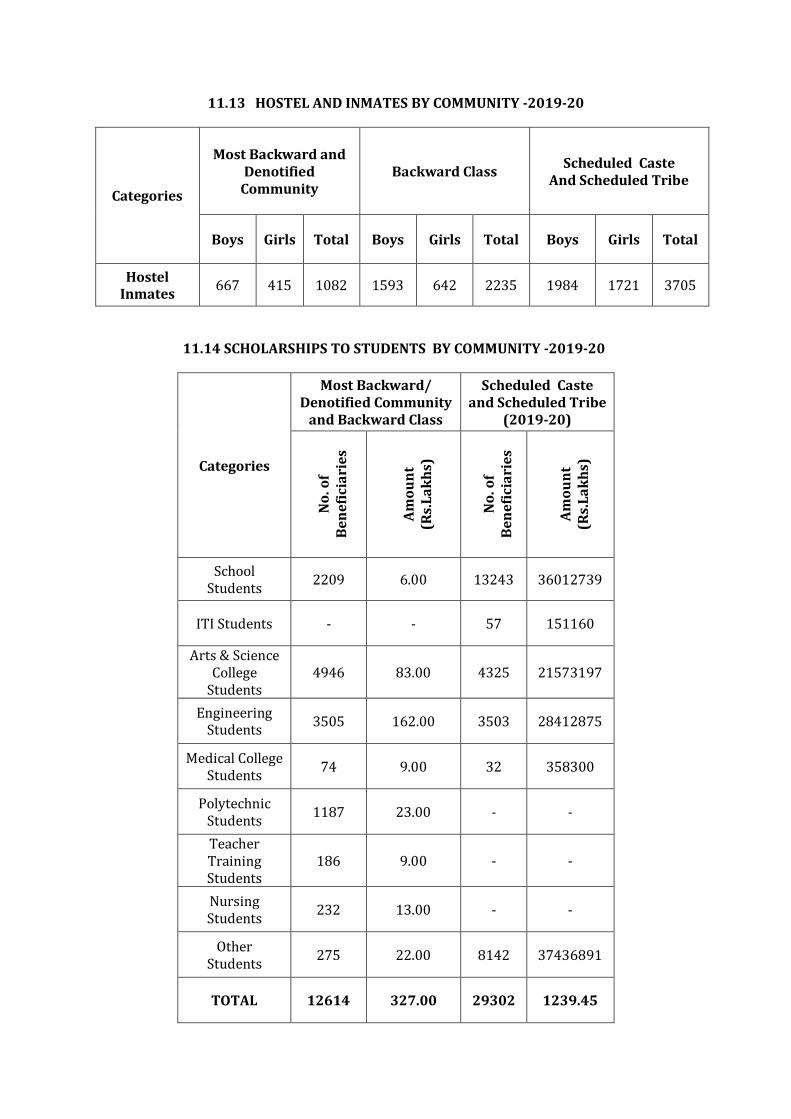
11.13 HOSTEL AND INMATES BY COMMUNITY -2019-20
Categories
Most Backward and Denotified
Community Backward Class
Scheduled Caste And Scheduled Tribe
Boys Girls Total Boys Girls Total Boys Girls Total
Hostel Inmates
667 415 1082 1593 642 2235 1984 1721 3705
11.14 SCHOLARSHIPS TO STUDENTS BY COMMUNITY -2019-20
Categories
Most Backward/ Denotified Community
and Backward Class
Scheduled Caste and Scheduled Tribe
(2019-20)
No
. of
Be
ne
fici
ari
es
Am
ou
nt
(Rs.
La
kh
s)
No
. of
Be
ne
fici
ari
es
Am
ou
nt
(Rs.
La
kh
s)
School Students
2209 6.00 13243 36012739
ITI Students - - 57 151160
Arts & Science College
Students 4946 83.00 4325 21573197
Engineering Students
3505 162.00 3503 28412875
Medical College Students
74 9.00 32 358300
Polytechnic Students
1187 23.00 - -
Teacher Training Students
186 9.00 - -
Nursing Students
232 13.00 - -
Other Students
275 22.00 8142 37436891
TOTAL 12614 327.00 29302 1239.45
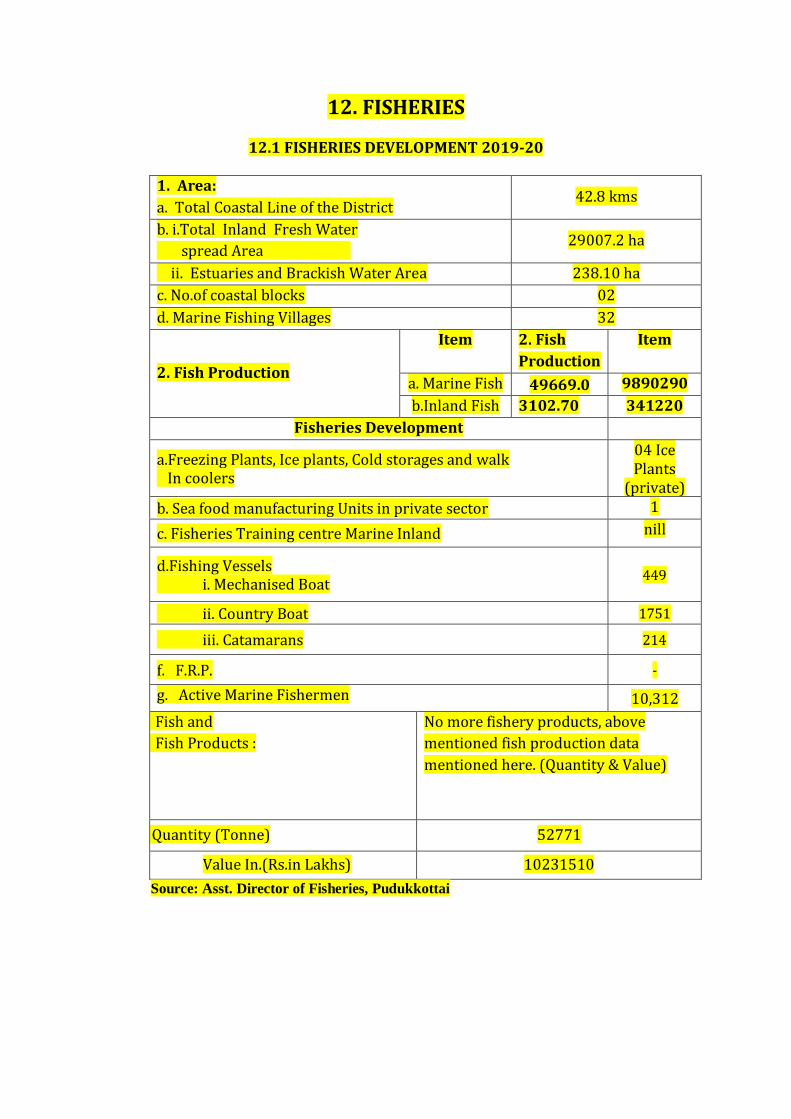
12. FISHERIES
12.1 FISHERIES DEVELOPMENT 2019-20
1. Area:
a. Total Coastal Line of the District 42.8 kms
b. i.Total Inland Fresh Water
spread Area 29007.2 ha
ii. Estuaries and Brackish Water Area 238.10 ha
c. No.of coastal blocks 02
d. Marine Fishing Villages 32
2. Fish Production
Item 2. Fish
Production
Item
a. Marine Fish 49669.0 9890290
b.Inland Fish 3102.70 341220
Fisheries Development
a.Freezing Plants, Ice plants, Cold storages and walk In coolers
04 Ice Plants
(private)
b. Sea food manufacturing Units in private sector 1
c. Fisheries Training centre Marine Inland nill
d.Fishing Vessels i. Mechanised Boat
449
ii. Country Boat 1751
iii. Catamarans 214
f. F.R.P. -
g. Active Marine Fishermen 10,312
Fish and
Fish Products :
No more fishery products, above
mentioned fish production data
mentioned here. (Quantity & Value)
Quantity (Tonne) 52771
Value In.(Rs.in Lakhs) 10231510
Source: Asst. Director of Fisheries, Pudukkottai
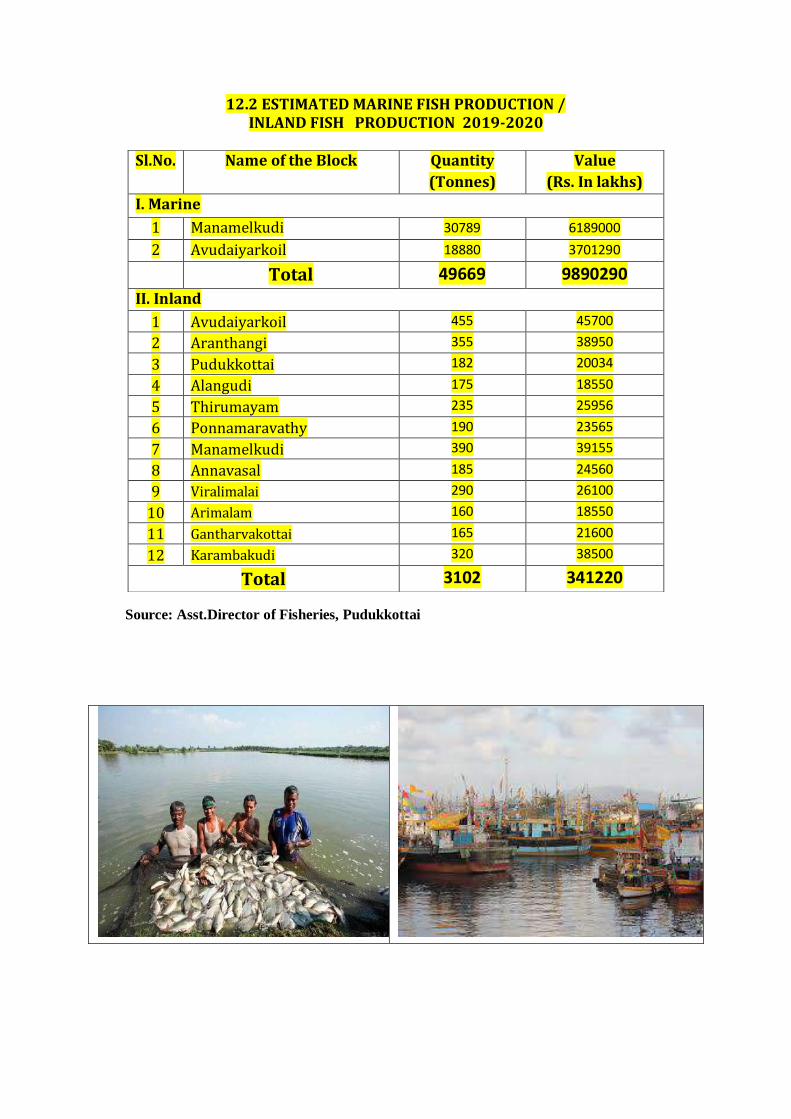
12.2 ESTIMATED MARINE FISH PRODUCTION / INLAND FISH PRODUCTION 2019-2020
Source: Asst.Director of Fisheries, Pudukkottai
Sl.No.
Name of the Block
Quantity
(Tonnes)
Value
(Rs. In lakhs)
I. Marine
1 Manamelkudi 30789 6189000
2 Avudaiyarkoil 18880 3701290
Total 49669 9890290
II. Inland
1 Avudaiyarkoil 455 45700
2 Aranthangi 355 38950
3 Pudukkottai 182 20034
4 Alangudi 175 18550
5 Thirumayam 235 25956
6 Ponnamaravathy 190 23565
7 Manamelkudi 390 39155
8 Annavasal 185 24560
9 Viralimalai 290 26100
10 Arimalam 160 18550
11 Gantharvakottai 165 21600
12 Karambakudi 320 38500
Total 3102 341220
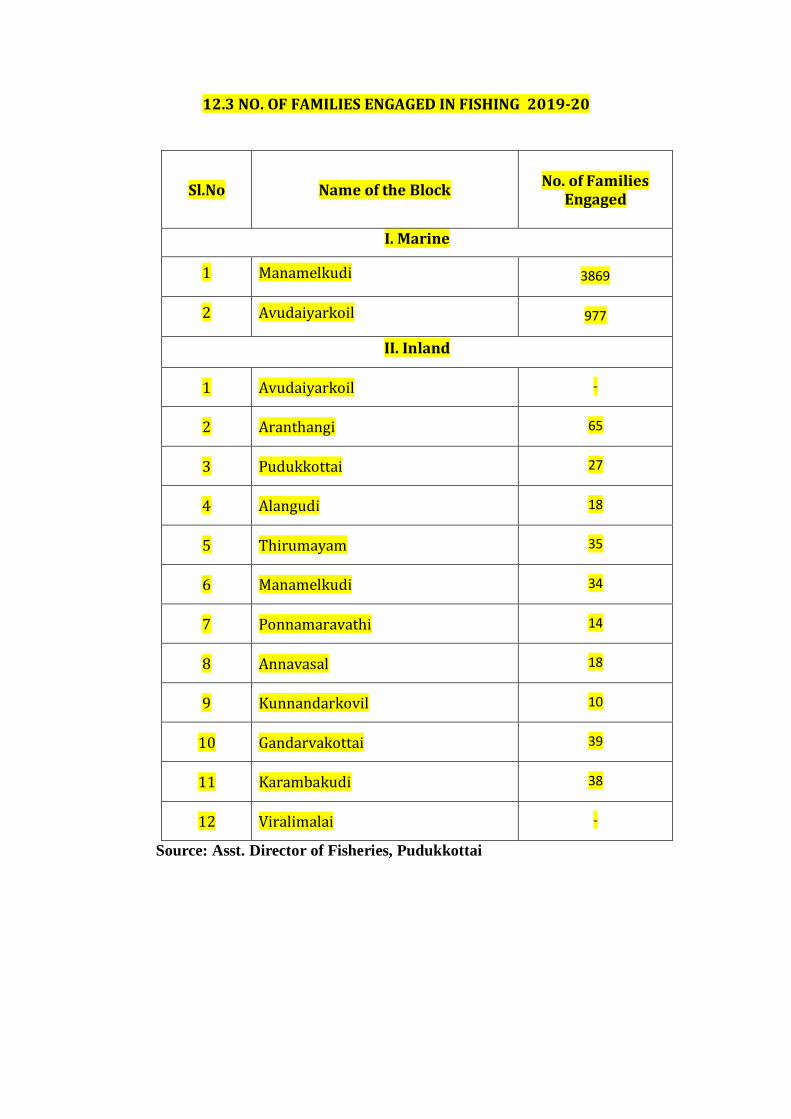
12.3 NO. OF FAMILIES ENGAGED IN FISHING 2019-20
Sl.No Name of the Block No. of Families
Engaged
I. Marine
1 Manamelkudi 3869
2 Avudaiyarkoil 977
II. Inland
1 Avudaiyarkoil -
2 Aranthangi 65
3 Pudukkottai 27
4 Alangudi 18
5 Thirumayam 35
6 Manamelkudi 34
7 Ponnamaravathi 14
8 Annavasal 18
9 Kunnandarkovil 10
10 Gandarvakottai 39
11 Karambakudi 38
12 Viralimalai -
Source: Asst. Director of Fisheries, Pudukkottai
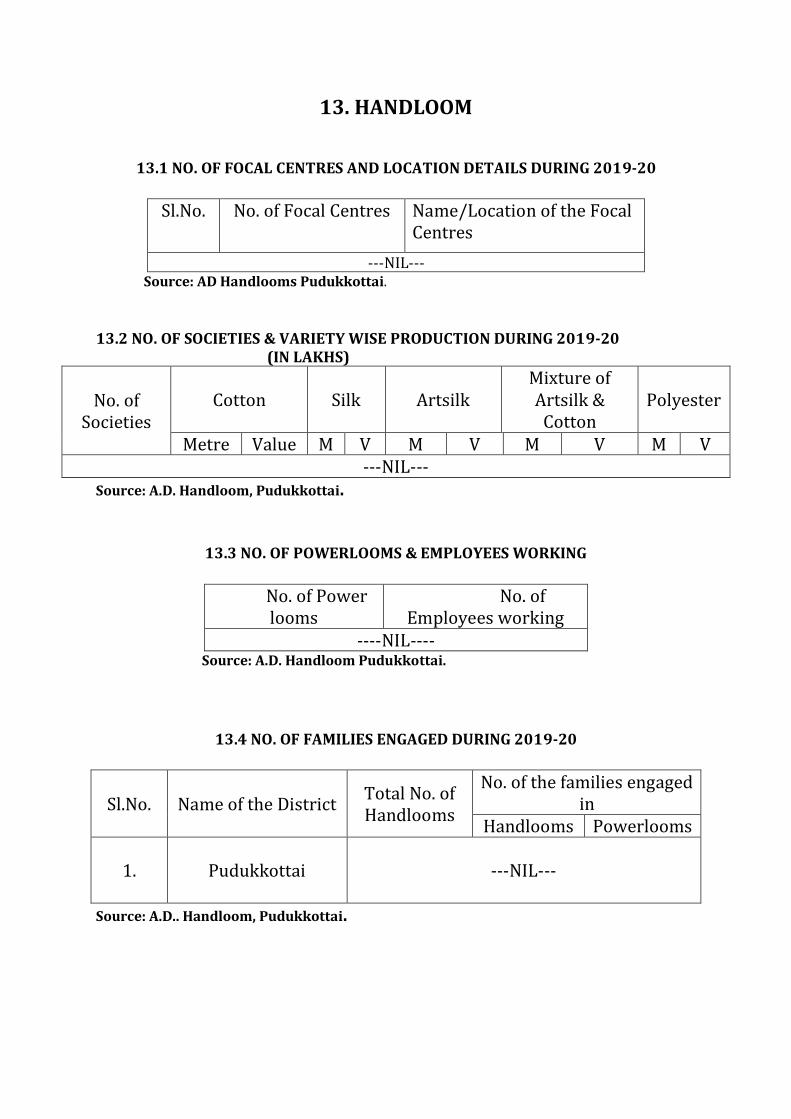
13. HANDLOOM
13.1 NO. OF FOCAL CENTRES AND LOCATION DETAILS DURING 2019-20
Sl.No. No. of Focal Centres Name/Location of the Focal
Centres
---NIL--- Source: AD Handlooms Pudukkottai.
13.2 NO. OF SOCIETIES & VARIETY WISE PRODUCTION DURING 2019-20
(IN LAKHS)
No. of Societies
Cotton Silk Artsilk Mixture of Artsilk &
Cotton Polyester
Metre Value M V M V M V M V ---NIL---
Source: A.D. Handloom, Pudukkottai.
13.3 NO. OF POWERLOOMS & EMPLOYEES WORKING
No. of Power
looms No. of
Employees working ----NIL----
Source: A.D. Handloom Pudukkottai.
13.4 NO. OF FAMILIES ENGAGED DURING 2019-20
Sl.No. Name of the District Total No. of Handlooms
No. of the families engaged in
Handlooms Powerlooms
1.
Pudukkottai ---NIL---
Source: A.D.. Handloom, Pudukkottai.
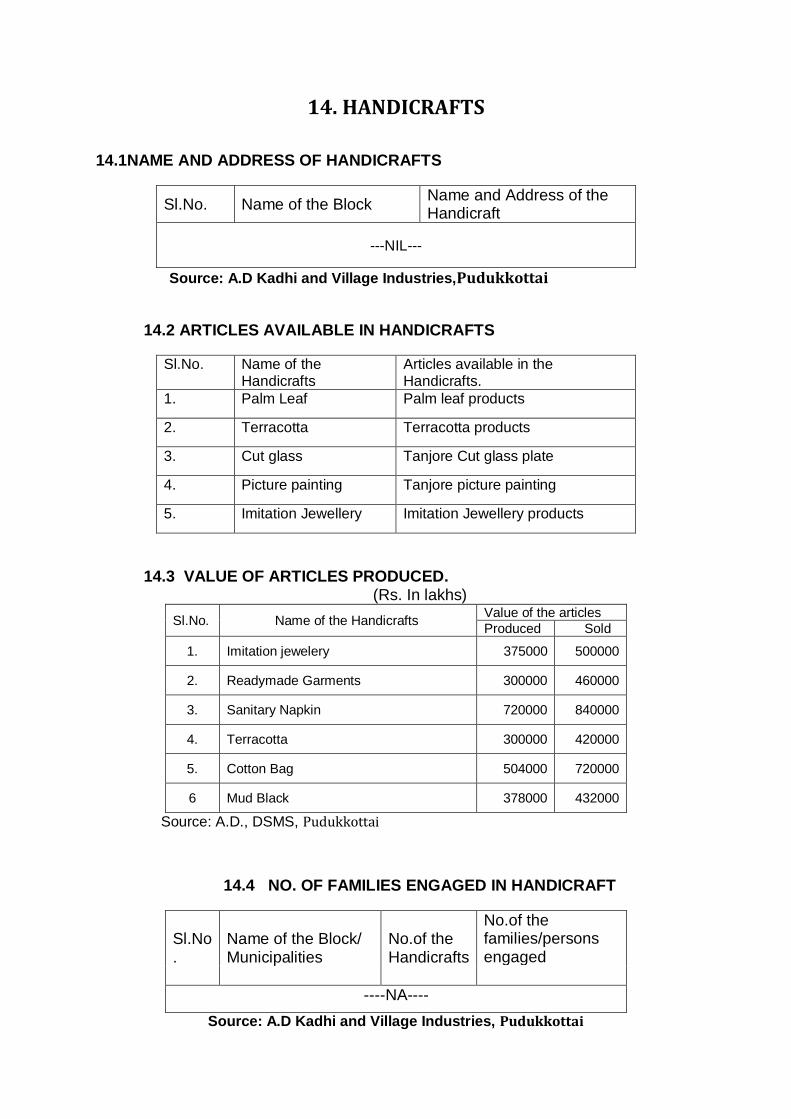
14. HANDICRAFTS
14.1NAME AND ADDRESS OF HANDICRAFTS
Sl.No. Name of the Block Name and Address of the Handicraft
---NIL---
Source: A.D Kadhi and Village Industries,Pudukkottai
14.2 ARTICLES AVAILABLE IN HANDICRAFTS
Sl.No. Name of the Handicrafts
Articles available in the Handicrafts.
1. Palm Leaf Palm leaf products
2. Terracotta Terracotta products
3. Cut glass Tanjore Cut glass plate
4. Picture painting Tanjore picture painting
5. Imitation Jewellery Imitation Jewellery products
14.3 VALUE OF ARTICLES PRODUCED.
(Rs. In lakhs)
Sl.No. Name of the Handicrafts Value of the articles
Produced Sold
1. Imitation jewelery 375000 500000
2. Readymade Garments 300000 460000
3. Sanitary Napkin 720000 840000
4. Terracotta 300000 420000
5. Cotton Bag 504000 720000
6 Mud Black 378000 432000
Source: A.D., DSMS, Pudukkottai
14.4 NO. OF FAMILIES ENGAGED IN HANDICRAFT
Sl.No.
Name of the Block/ Municipalities
No.of the Handicrafts
No.of the families/persons engaged
----NA----
Source: A.D Kadhi and Village Industries, Pudukkottai
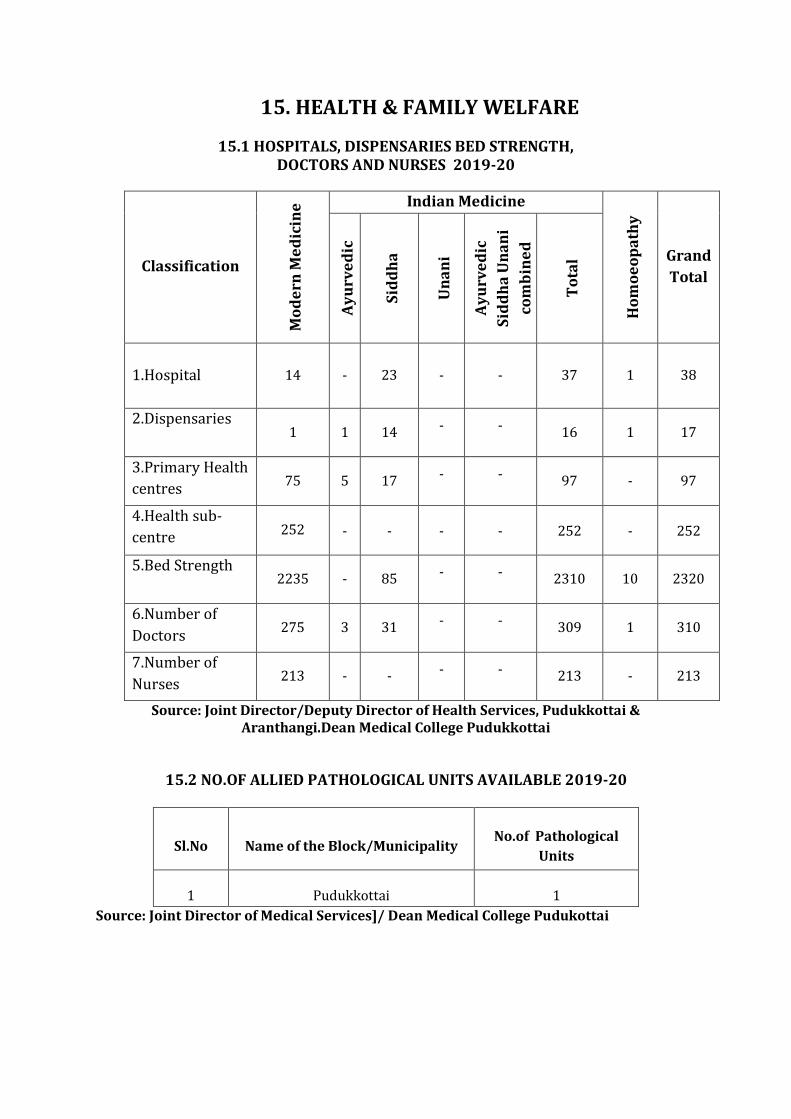
15. HEALTH & FAMILY WELFARE
15.1 HOSPITALS, DISPENSARIES BED STRENGTH, DOCTORS AND NURSES 2019-20
Classification
Mo
de
rn M
ed
icin
e Indian Medicine
Ho
mo
eo
pa
thy
Grand
Total
Ay
urv
ed
ic
Sid
dh
a
Un
an
i
Ay
urv
ed
ic
Sid
dh
a U
na
ni
com
bin
ed
To
tal
1.Hospital
14 - 23 - - 37 1 38
2.Dispensaries 1 1 14 - - 16 1 17
3.Primary Health
centres 75 5 17 - - 97 - 97
4.Health sub-
centre 252 - - - - 252 - 252
5.Bed Strength 2235 - 85 - - 2310 10 2320
6.Number of
Doctors 275 3 31 - - 309 1 310
7.Number of
Nurses 213 - - - - 213 - 213
Source: Joint Director/Deputy Director of Health Services, Pudukkottai & Aranthangi.Dean Medical College Pudukkottai
15.2 NO.OF ALLIED PATHOLOGICAL UNITS AVAILABLE 2019-20
Sl.No Name of the Block/Municipality No.of Pathological
Units
1 Pudukkottai 1
Source: Joint Director of Medical Services]/ Dean Medical College Pudukottai
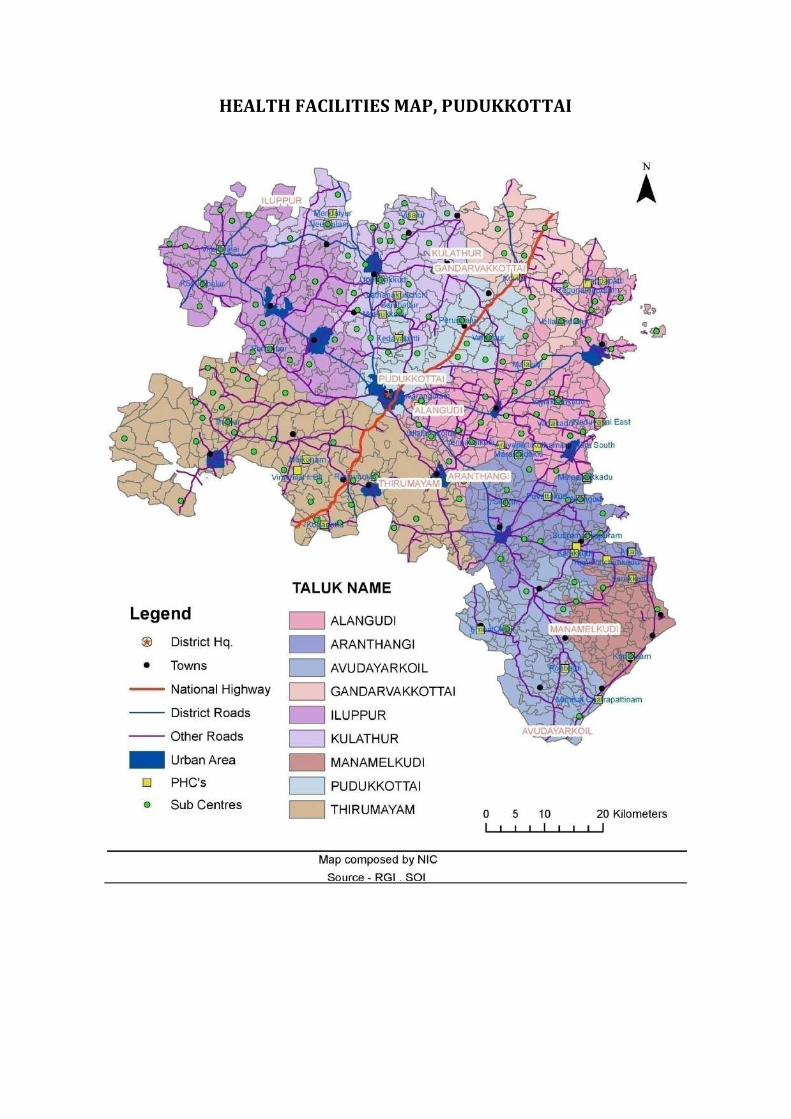
HEALTH FACILITIES MAP, PUDUKKOTTAI
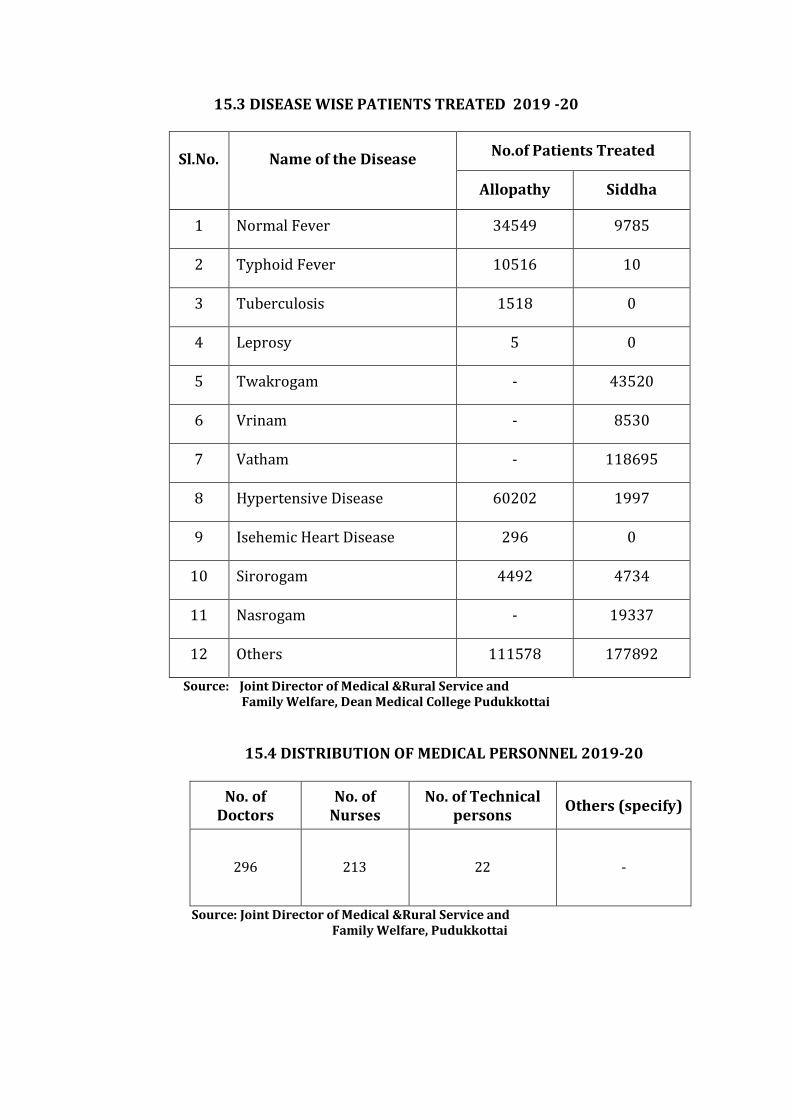
15.3 DISEASE WISE PATIENTS TREATED 2019 -20
Sl.No.
Name of the Disease
No.of Patients Treated
Allopathy Siddha
1 Normal Fever 34549 9785
2 Typhoid Fever 10516 10
3 Tuberculosis 1518 0
4 Leprosy 5 0
5 Twakrogam - 43520
6 Vrinam - 8530
7 Vatham - 118695
8 Hypertensive Disease 60202 1997
9 Isehemic Heart Disease 296 0
10 Sirorogam 4492 4734
11 Nasrogam - 19337
12 Others 111578 177892
Source: Joint Director of Medical &Rural Service and Family Welfare, Dean Medical College Pudukkottai
15.4 DISTRIBUTION OF MEDICAL PERSONNEL 2019-20
No. of Doctors
No. of Nurses
No. of Technical persons
Others (specify)
296 213 22 -
Source: Joint Director of Medical &Rural Service and Family Welfare, Pudukkottai
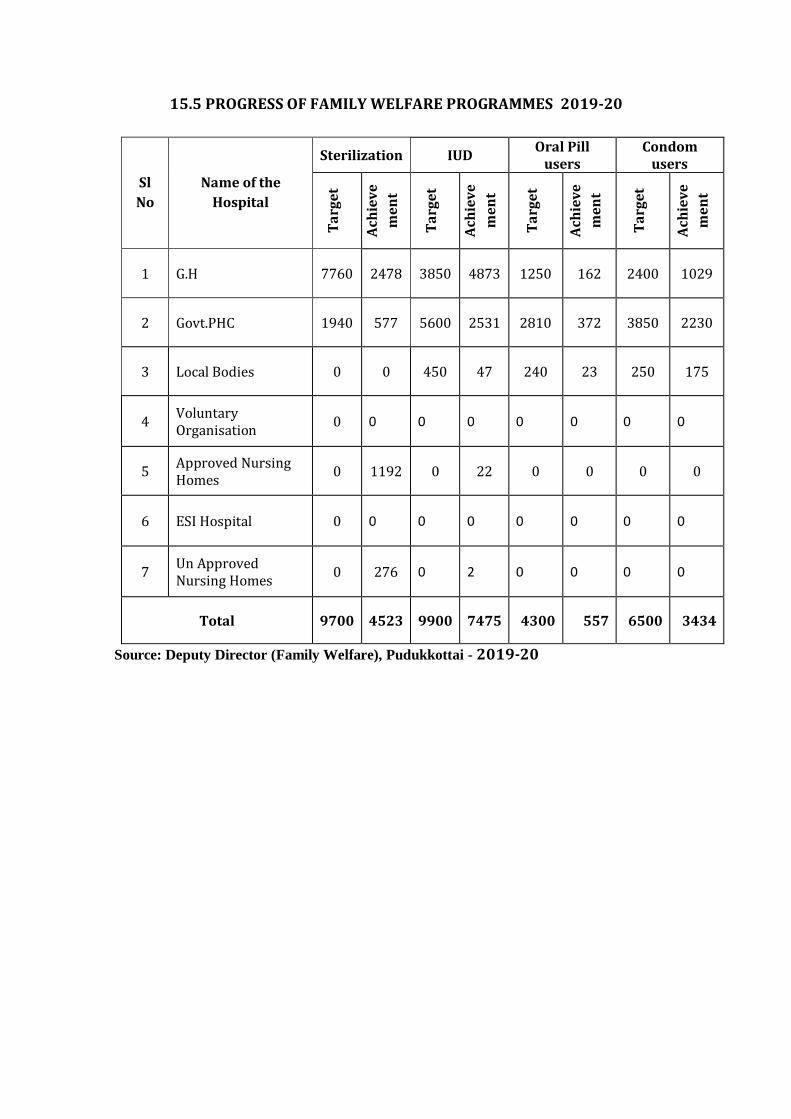
15.5 PROGRESS OF FAMILY WELFARE PROGRAMMES 2019-20
Sl
No
Name of the
Hospital
Sterilization IUD Oral Pill
users Condom
users
Ta
rge
t
Ach
iev
e
me
nt
Ta
rge
t
Ach
iev
e
me
nt
Ta
rge
t
Ach
iev
e
me
nt
Ta
rge
t
Ach
iev
e
me
nt
1 G.H 7760 2478 3850 4873 1250 162 2400 1029
2 Govt.PHC 1940 577 5600 2531 2810 372 3850 2230
3 Local Bodies 0 0 450 47 240 23 250 175
4 Voluntary Organisation
0 0 0 0 0 0 0 0
5 Approved Nursing Homes
0 1192 0 22 0 0 0 0
6 ESI Hospital 0 0 0 0 0 0 0 0
7 Un Approved Nursing Homes
0 276 0 2 0 0 0 0
Total 9700 4523 9900 7475 4300 557 6500 3434
Source: Deputy Director (Family Welfare), Pudukkottai - 2019-20
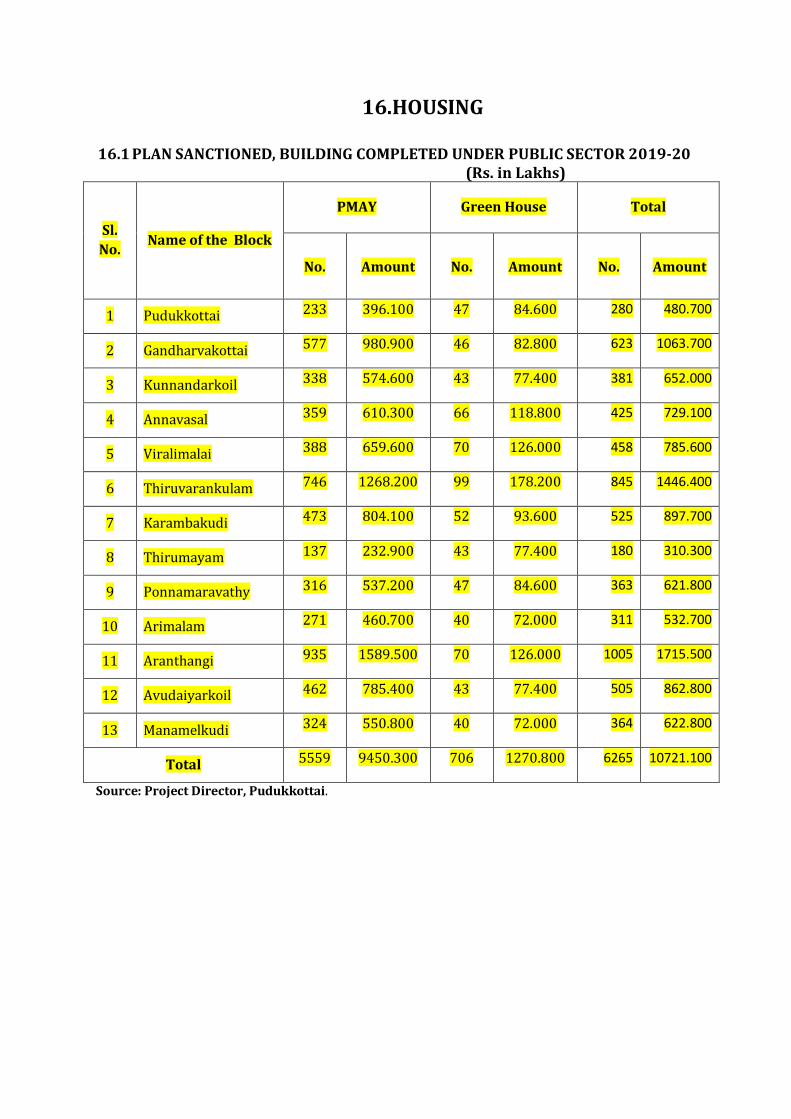
16.HOUSING
16.1 PLAN SANCTIONED, BUILDING COMPLETED UNDER PUBLIC SECTOR 2019-20 (Rs. in Lakhs)
Sl.
No. Name of the Block
PMAY Green House Total
No. Amount No. Amount No. Amount
1 Pudukkottai 233 396.100 47 84.600 280 480.700
2 Gandharvakottai 577 980.900 46 82.800 623 1063.700
3 Kunnandarkoil 338 574.600 43 77.400 381 652.000
4 Annavasal 359 610.300 66 118.800 425 729.100
5 Viralimalai 388 659.600 70 126.000 458 785.600
6 Thiruvarankulam 746 1268.200 99 178.200 845 1446.400
7 Karambakudi 473 804.100 52 93.600 525 897.700
8 Thirumayam 137 232.900 43 77.400 180 310.300
9 Ponnamaravathy 316 537.200 47 84.600 363 621.800
10 Arimalam 271 460.700 40 72.000 311 532.700
11 Aranthangi 935 1589.500 70 126.000 1005 1715.500
12 Avudaiyarkoil 462 785.400 43 77.400 505 862.800
13 Manamelkudi 324 550.800 40 72.000 364 622.800
Total 5559 9450.300 706 1270.800 6265 10721.100
Source: Project Director, Pudukkottai.
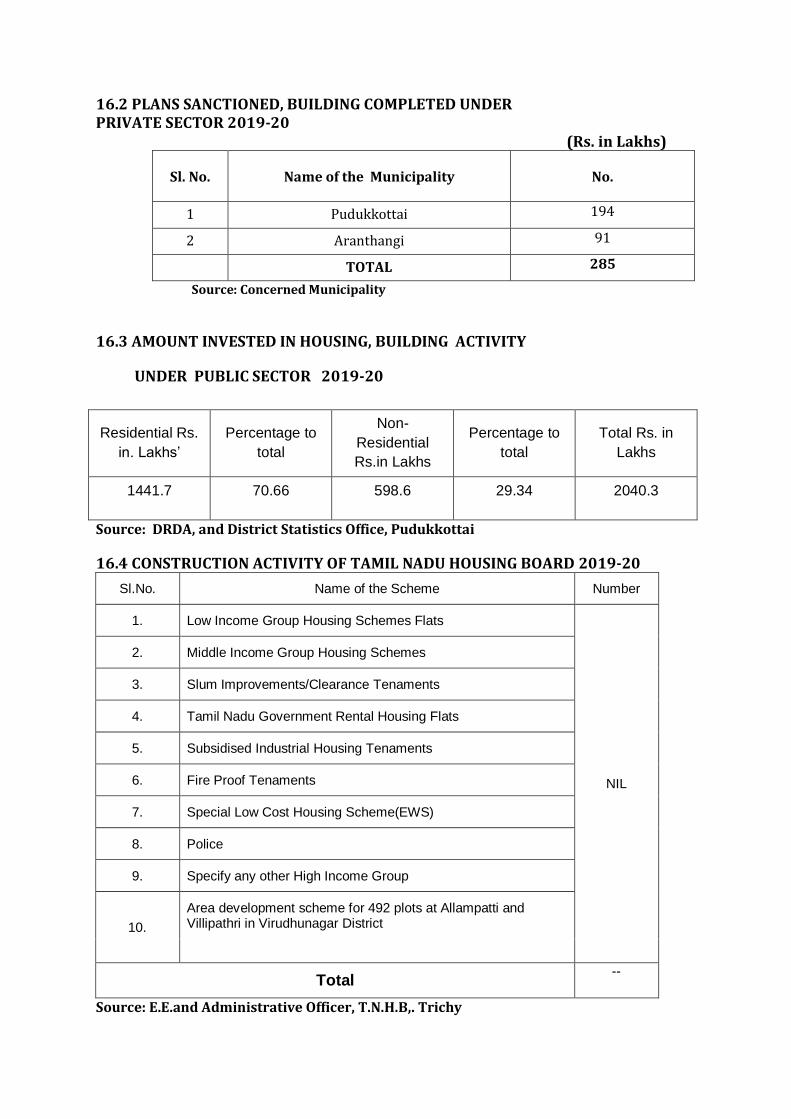
16.2 PLANS SANCTIONED, BUILDING COMPLETED UNDER PRIVATE SECTOR 2019-20
(Rs. in Lakhs)
Sl. No. Name of the Municipality No.
1 Pudukkottai 194
2 Aranthangi 91
TOTAL 285
Source: Concerned Municipality
16.3 AMOUNT INVESTED IN HOUSING, BUILDING ACTIVITY
UNDER PUBLIC SECTOR 2019-20
Residential Rs.
in. Lakhs’
Percentage to
total
Non-
Residential
Rs.in Lakhs
Percentage to
total
Total Rs. in
Lakhs
1441.7 70.66 598.6 29.34 2040.3
Source: DRDA, and District Statistics Office, Pudukkottai
16.4 CONSTRUCTION ACTIVITY OF TAMIL NADU HOUSING BOARD 2019-20
Sl.No. Name of the Scheme Number
1. Low Income Group Housing Schemes Flats
NIL
2. Middle Income Group Housing Schemes
3. Slum Improvements/Clearance Tenaments
4. Tamil Nadu Government Rental Housing Flats
5. Subsidised Industrial Housing Tenaments
6. Fire Proof Tenaments
7. Special Low Cost Housing Scheme(EWS)
8. Police
9. Specify any other High Income Group
10.
Area development scheme for 492 plots at Allampatti and Villipathri in Virudhunagar District
Total --
Source: E.E.and Administrative Officer, T.N.H.B,. Trichy
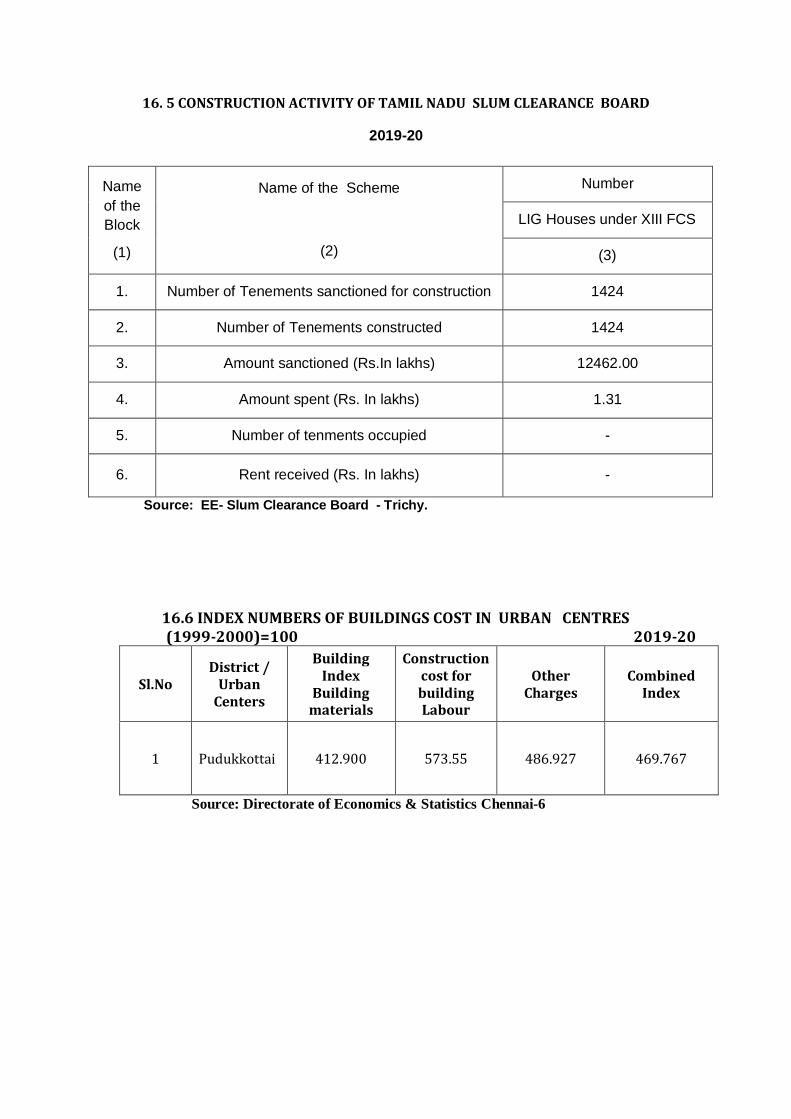
16. 5 CONSTRUCTION ACTIVITY OF TAMIL NADU SLUM CLEARANCE BOARD
2019-20
Name
of the
Block
(1)
Name of the Scheme
(2)
Number
LIG Houses under XIII FCS
(3)
1. Number of Tenements sanctioned for construction 1424
2. Number of Tenements constructed 1424
3. Amount sanctioned (Rs.In lakhs) 12462.00
4. Amount spent (Rs. In lakhs) 1.31
5. Number of tenments occupied -
6. Rent received (Rs. In lakhs) -
Source: EE- Slum Clearance Board - Trichy.
16.6 INDEX NUMBERS OF BUILDINGS COST IN URBAN CENTRES
(1999-2000)=100 2019-20
Sl.No District /
Urban Centers
Building Index
Building materials
Construction cost for building Labour
Other Charges
Combined Index
1 Pudukkottai 412.900 573.55 486.927 469.767
Source: Directorate of Economics & Statistics Chennai-6
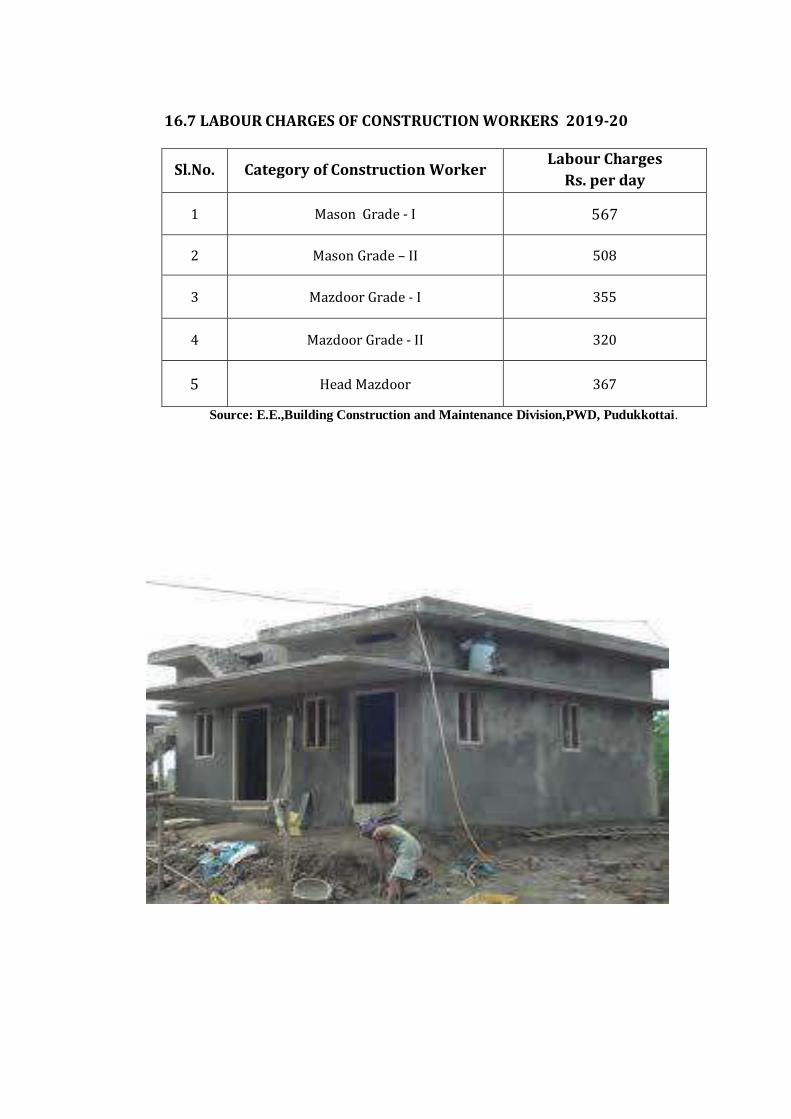
16.7 LABOUR CHARGES OF CONSTRUCTION WORKERS 2019-20
Sl.No. Category of Construction Worker Labour Charges
Rs. per day
1 Mason Grade - I 567
2 Mason Grade – II 508
3 Mazdoor Grade - I 355
4 Mazdoor Grade - II 320
5 Head Mazdoor 367
Source: E.E.,Building Construction and Maintenance Division,PWD, Pudukkottai.
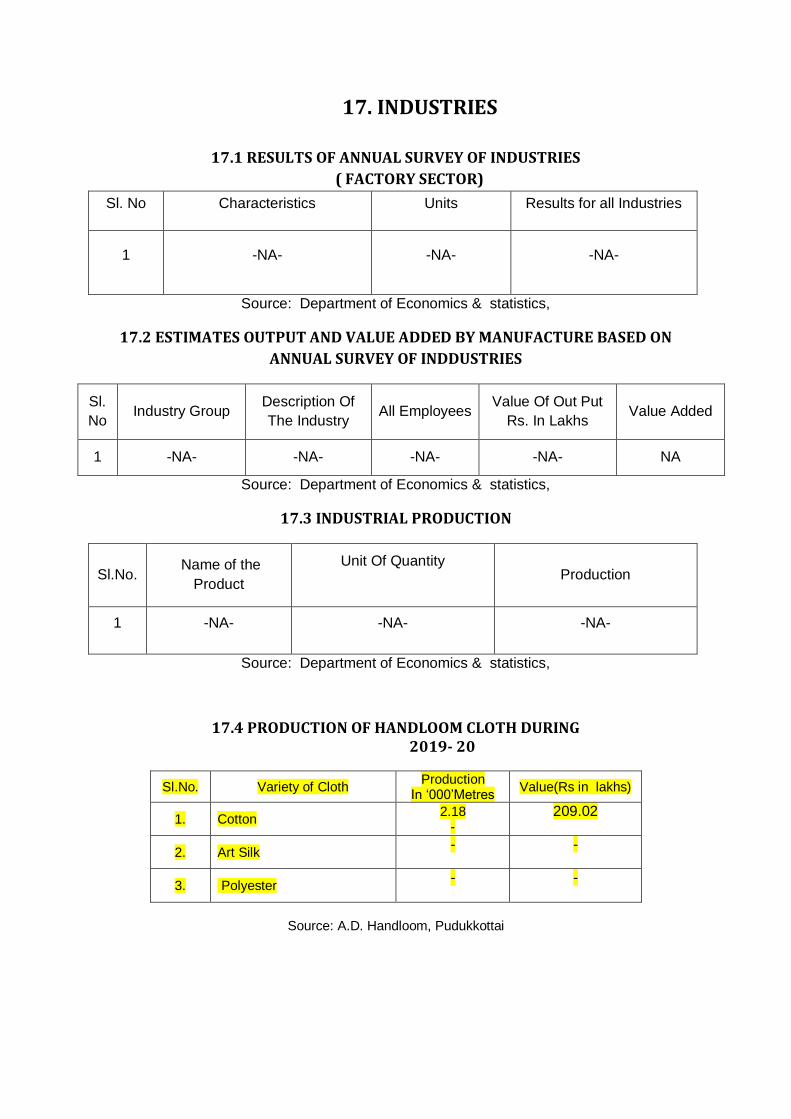
17. INDUSTRIES
17.1 RESULTS OF ANNUAL SURVEY OF INDUSTRIES
( FACTORY SECTOR)
Sl. No Characteristics Units Results for all Industries
1 -NA- -NA- -NA-
Source: Department of Economics & statistics,
17.2 ESTIMATES OUTPUT AND VALUE ADDED BY MANUFACTURE BASED ON
ANNUAL SURVEY OF INDDUSTRIES
Sl.
No Industry Group
Description Of
The Industry All Employees
Value Of Out Put
Rs. In Lakhs Value Added
1 -NA- -NA- -NA- -NA- NA
Source: Department of Economics & statistics,
17.3 INDUSTRIAL PRODUCTION
Sl.No. Name of the
Product
Unit Of Quantity
Production
1 -NA- -NA- -NA-
Source: Department of Economics & statistics,
17.4 PRODUCTION OF HANDLOOM CLOTH DURING 2019- 20
Sl.No. Variety of Cloth Production
In ‘000’Metres Value(Rs in lakhs)
1. Cotton 2.18
- 209.02
2. Art Silk - -
3. Polyester - -
Source: A.D. Handloom, Pudukkottai
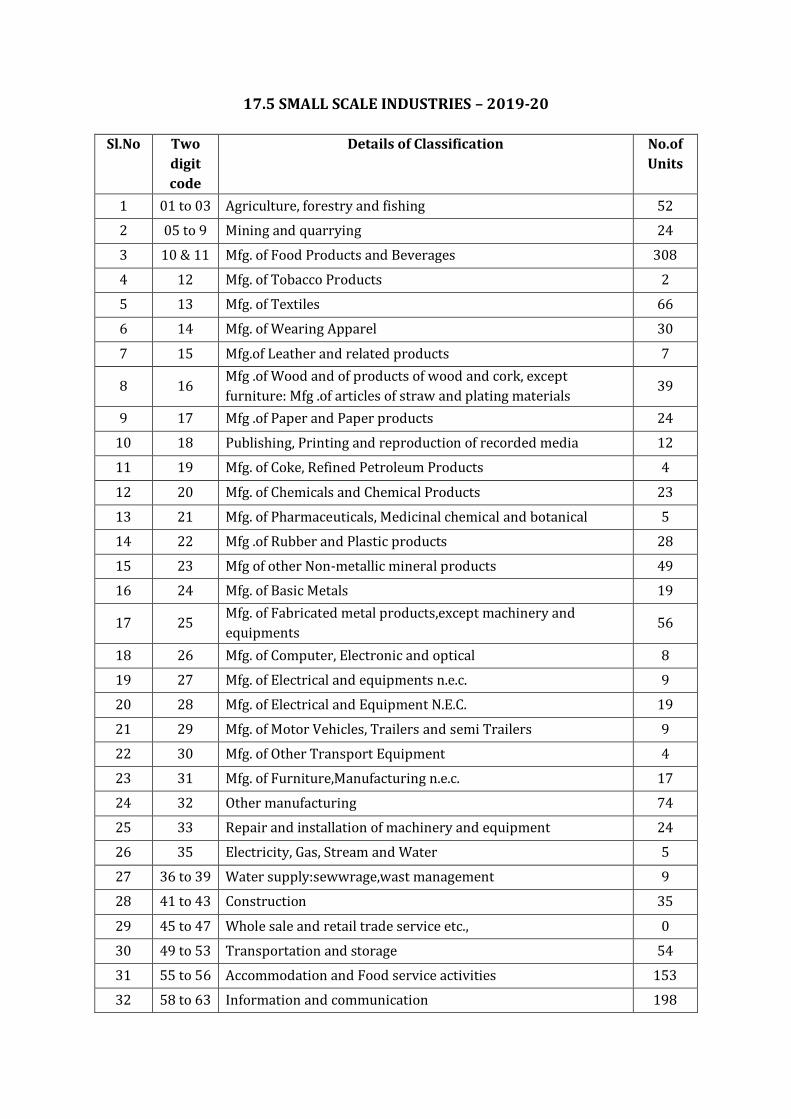
17.5 SMALL SCALE INDUSTRIES – 2019-20
Sl.No Two
digit
code
Details of Classification No.of
Units
1 01 to 03 Agriculture, forestry and fishing 52
2 05 to 9 Mining and quarrying 24
3 10 & 11 Mfg. of Food Products and Beverages 308
4 12 Mfg. of Tobacco Products 2
5 13 Mfg. of Textiles 66
6 14 Mfg. of Wearing Apparel 30
7 15 Mfg.of Leather and related products 7
8 16 Mfg .of Wood and of products of wood and cork, except
furniture: Mfg .of articles of straw and plating materials 39
9 17 Mfg .of Paper and Paper products 24
10 18 Publishing, Printing and reproduction of recorded media 12
11 19 Mfg. of Coke, Refined Petroleum Products 4
12 20 Mfg. of Chemicals and Chemical Products 23
13 21 Mfg. of Pharmaceuticals, Medicinal chemical and botanical 5
14 22 Mfg .of Rubber and Plastic products 28
15 23 Mfg of other Non-metallic mineral products 49
16 24 Mfg. of Basic Metals 19
17 25 Mfg. of Fabricated metal products,except machinery and
equipments 56
18 26 Mfg. of Computer, Electronic and optical 8
19 27 Mfg. of Electrical and equipments n.e.c. 9
20 28 Mfg. of Electrical and Equipment N.E.C. 19
21 29 Mfg. of Motor Vehicles, Trailers and semi Trailers 9
22 30 Mfg. of Other Transport Equipment 4
23 31 Mfg. of Furniture,Manufacturing n.e.c. 17
24 32 Other manufacturing 74
25 33 Repair and installation of machinery and equipment 24
26 35 Electricity, Gas, Stream and Water 5
27 36 to 39 Water supply:sewwrage,wast management 9
28 41 to 43 Construction 35
29 45 to 47 Whole sale and retail trade service etc., 0
30 49 to 53 Transportation and storage 54
31 55 to 56 Accommodation and Food service activities 153
32 58 to 63 Information and communication 198
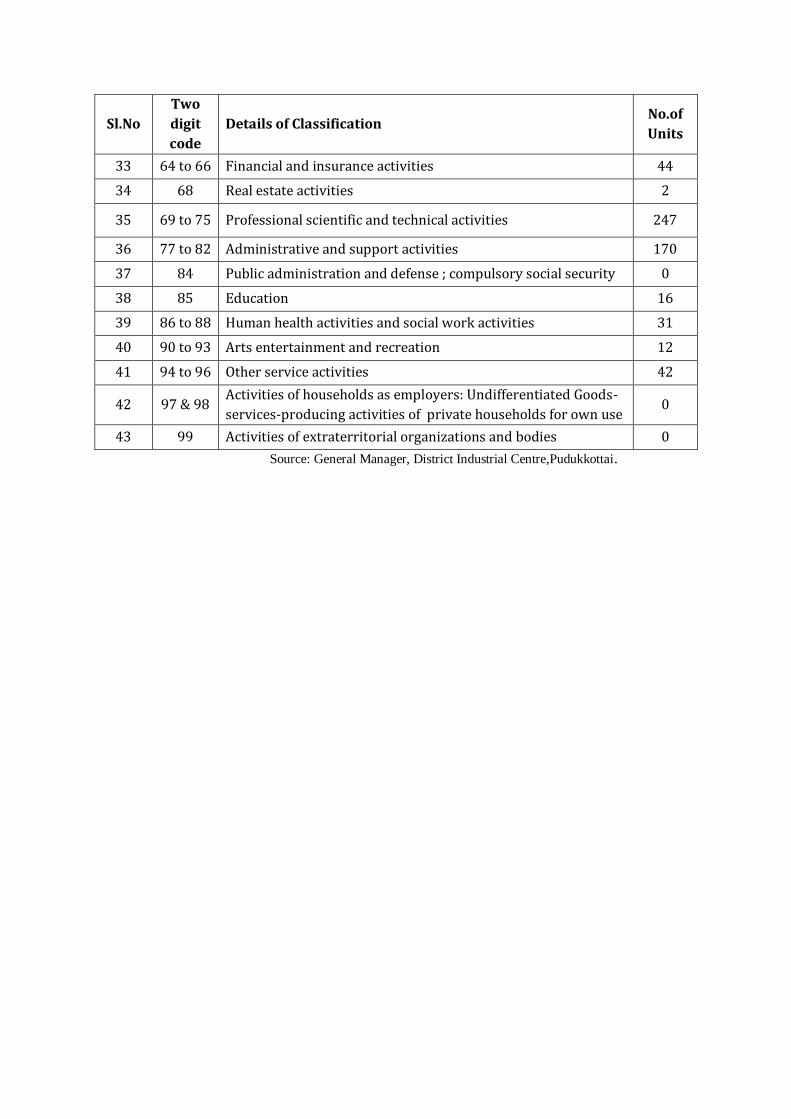
Sl.No
Two
digit
code
Details of Classification No.of
Units
33 64 to 66 Financial and insurance activities 44
34 68 Real estate activities 2
35 69 to 75 Professional scientific and technical activities 247
36 77 to 82 Administrative and support activities 170
37 84 Public administration and defense ; compulsory social security 0
38 85 Education 16
39 86 to 88 Human health activities and social work activities 31
40 90 to 93 Arts entertainment and recreation 12
41 94 to 96 Other service activities 42
42 97 & 98 Activities of households as employers: Undifferentiated Goods-
services-producing activities of private households for own use 0
43 99 Activities of extraterritorial organizations and bodies 0
Source: General Manager, District Industrial Centre,Pudukkottai.
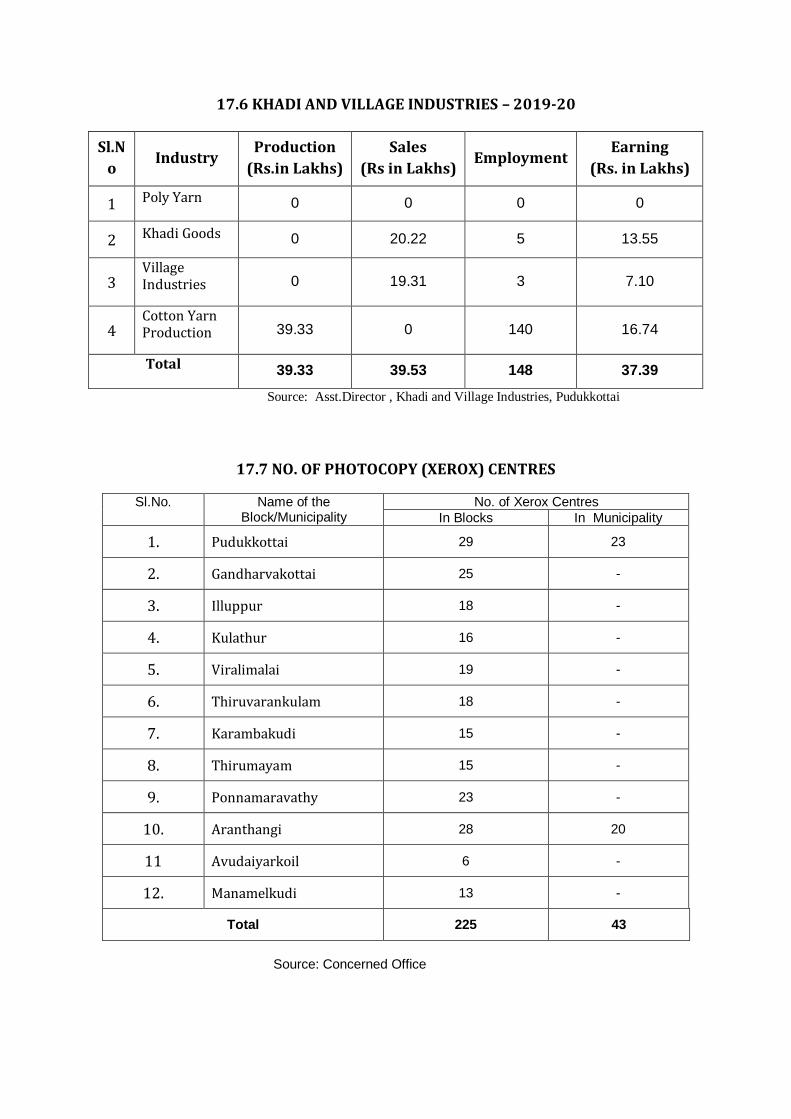
17.6 KHADI AND VILLAGE INDUSTRIES – 2019-20
Sl.N
o Industry
Production
(Rs.in Lakhs)
Sales
(Rs in Lakhs) Employment
Earning
(Rs. in Lakhs)
1 Poly Yarn 0 0 0 0
2 Khadi Goods 0 20.22 5 13.55
3 Village Industries 0 19.31 3 7.10
4 Cotton Yarn Production 39.33 0 140 16.74
Total 39.33 39.53 148 37.39
Source: Asst.Director , Khadi and Village Industries, Pudukkottai
17.7 NO. OF PHOTOCOPY (XEROX) CENTRES
Sl.No.
Name of the Block/Municipality
No. of Xerox Centres
In Blocks In Municipality
1. Pudukkottai 29 23
2. Gandharvakottai 25 -
3. Illuppur 18 -
4. Kulathur 16 -
5. Viralimalai 19 -
6. Thiruvarankulam 18 -
7. Karambakudi 15 -
8. Thirumayam 15 -
9. Ponnamaravathy 23 -
10. Aranthangi 28 20
11 Avudaiyarkoil 6 -
12. Manamelkudi 13 -
Total 225 43
Source: Concerned Office
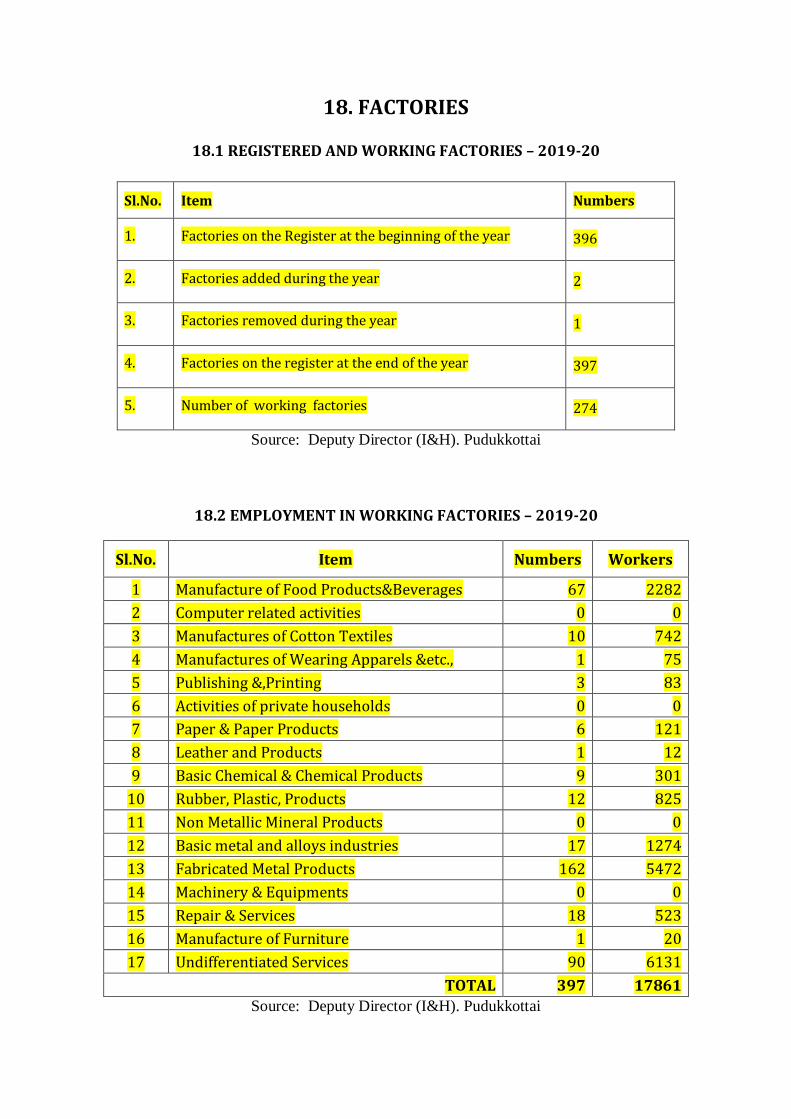
18. FACTORIES
18.1 REGISTERED AND WORKING FACTORIES – 2019-20
Sl.No. Item Numbers
1. Factories on the Register at the beginning of the year 396
2. Factories added during the year 2
3. Factories removed during the year 1
4. Factories on the register at the end of the year 397
5. Number of working factories 274
Source: Deputy Director (I&H). Pudukkottai
18.2 EMPLOYMENT IN WORKING FACTORIES – 2019-20
Sl.No. Item Numbers Workers
1 Manufacture of Food Products&Beverages 67 2282
2 Computer related activities 0 0
3 Manufactures of Cotton Textiles 10 742
4 Manufactures of Wearing Apparels &etc., 1 75
5 Publishing &,Printing 3 83
6 Activities of private households 0 0
7 Paper & Paper Products 6 121
8 Leather and Products 1 12
9 Basic Chemical & Chemical Products 9 301
10 Rubber, Plastic, Products 12 825
11 Non Metallic Mineral Products 0 0
12 Basic metal and alloys industries 17 1274
13 Fabricated Metal Products 162 5472
14 Machinery & Equipments 0 0
15 Repair & Services 18 523
16 Manufacture of Furniture 1 20
17 Undifferentiated Services 90 6131
TOTAL 397 17861
Source: Deputy Director (I&H). Pudukkottai
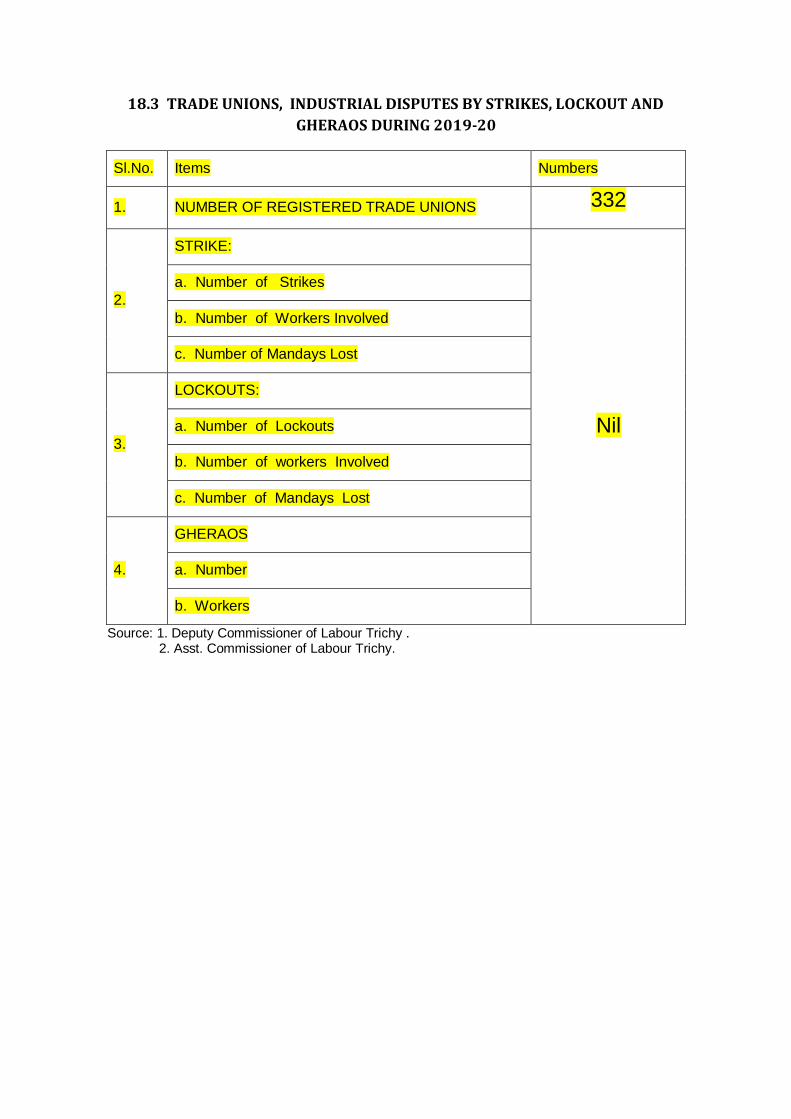
18.3 TRADE UNIONS, INDUSTRIAL DISPUTES BY STRIKES, LOCKOUT AND
GHERAOS DURING 2019-20
Sl.No. Items Numbers
1. NUMBER OF REGISTERED TRADE UNIONS 332
2.
STRIKE:
Nil
a. Number of Strikes
b. Number of Workers Involved
c. Number of Mandays Lost
3.
LOCKOUTS:
a. Number of Lockouts
b. Number of workers Involved
c. Number of Mandays Lost
4.
GHERAOS
a. Number
b. Workers
Source: 1. Deputy Commissioner of Labour Trichy . 2. Asst. Commissioner of Labour Trichy.
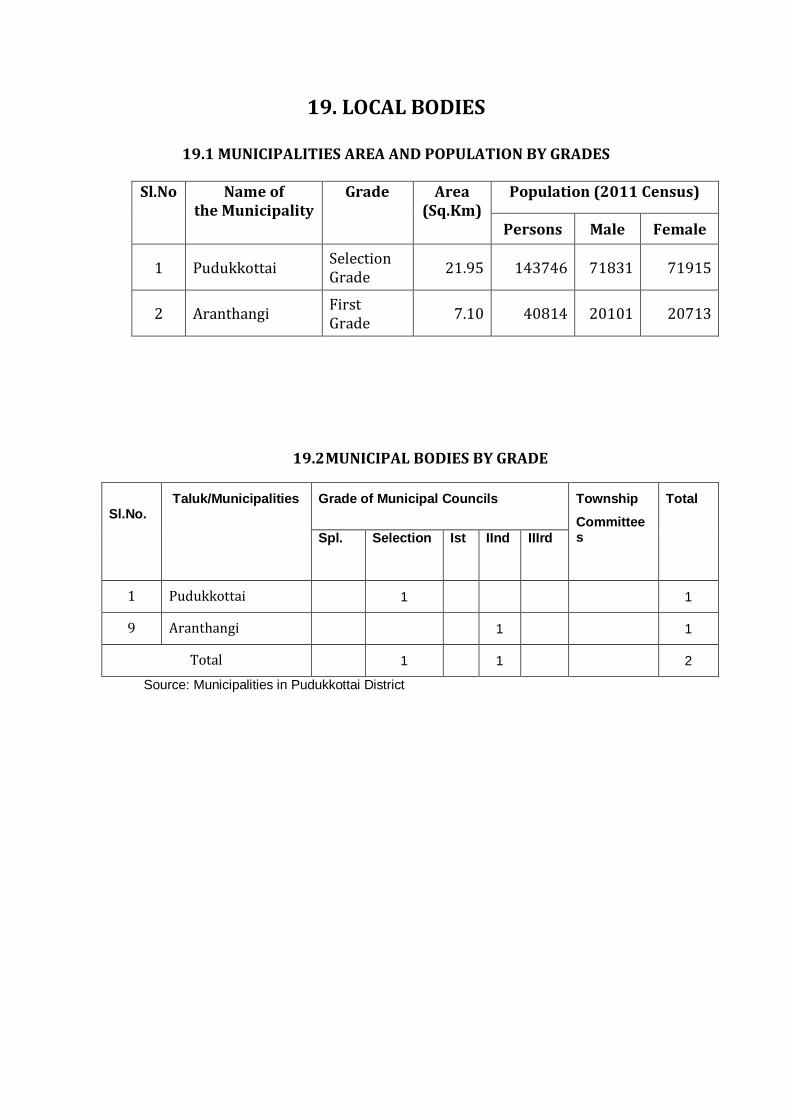
19. LOCAL BODIES
19.1 MUNICIPALITIES AREA AND POPULATION BY GRADES
Sl.No Name of the Municipality
Grade Area (Sq.Km)
Population (2011 Census)
Persons Male Female
1 Pudukkottai Selection Grade
21.95 143746 71831 71915
2 Aranthangi First Grade
7.10 40814 20101 20713
19.2 MUNICIPAL BODIES BY GRADE
Sl.No.
Taluk/Municipalities Grade of Municipal Councils
Township
Committees
Total
Spl. Selection Ist IInd IIIrd
1 Pudukkottai 1 1
9 Aranthangi 1 1
Total 1 1 2
Source: Municipalities in Pudukkottai District
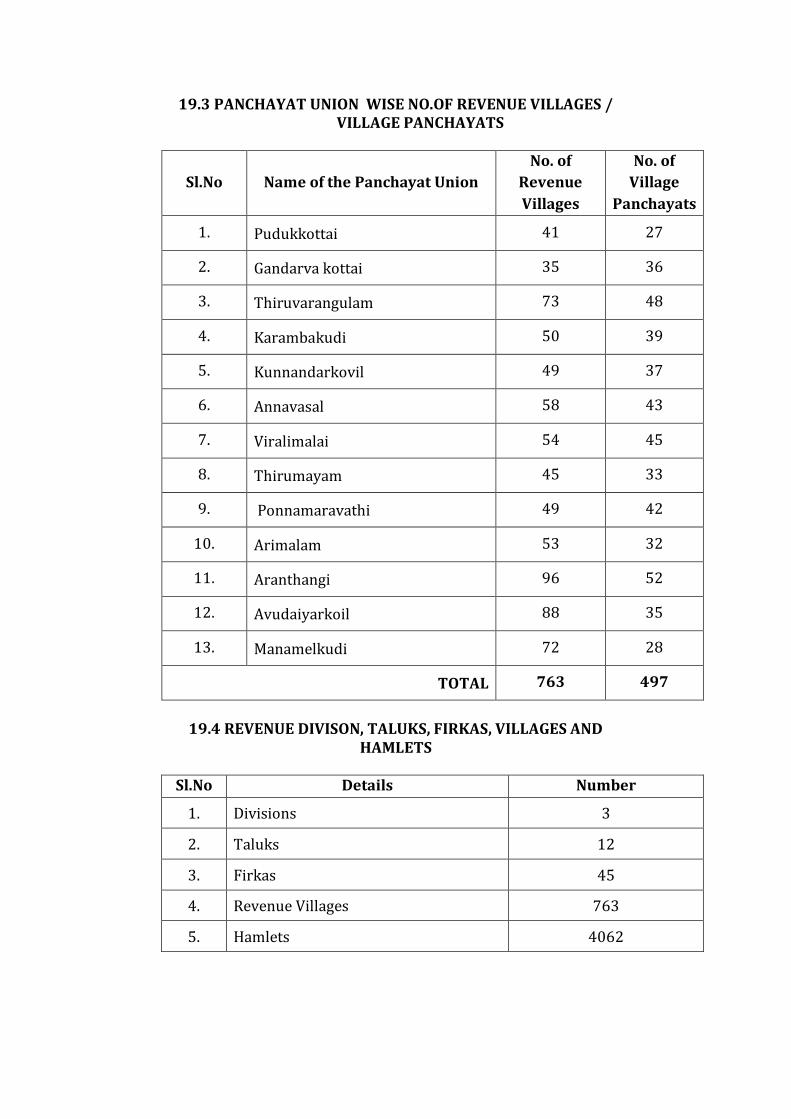
19.3 PANCHAYAT UNION WISE NO.OF REVENUE VILLAGES / VILLAGE PANCHAYATS
Sl.No Name of the Panchayat Union
No. of
Revenue
Villages
No. of
Village
Panchayats
1. Pudukkottai 41 27
2. Gandarva kottai 35 36
3. Thiruvarangulam 73 48
4. Karambakudi 50 39
5. Kunnandarkovil 49 37
6. Annavasal 58 43
7. Viralimalai 54 45
8. Thirumayam 45 33
9. Ponnamaravathi 49 42
10. Arimalam 53 32
11. Aranthangi 96 52
12. Avudaiyarkoil 88 35
13. Manamelkudi 72 28
TOTAL 763 497
19.4 REVENUE DIVISON, TALUKS, FIRKAS, VILLAGES AND HAMLETS
Sl.No Details Number
1. Divisions 3
2. Taluks 12
3. Firkas 45
4. Revenue Villages 763
5. Hamlets 4062
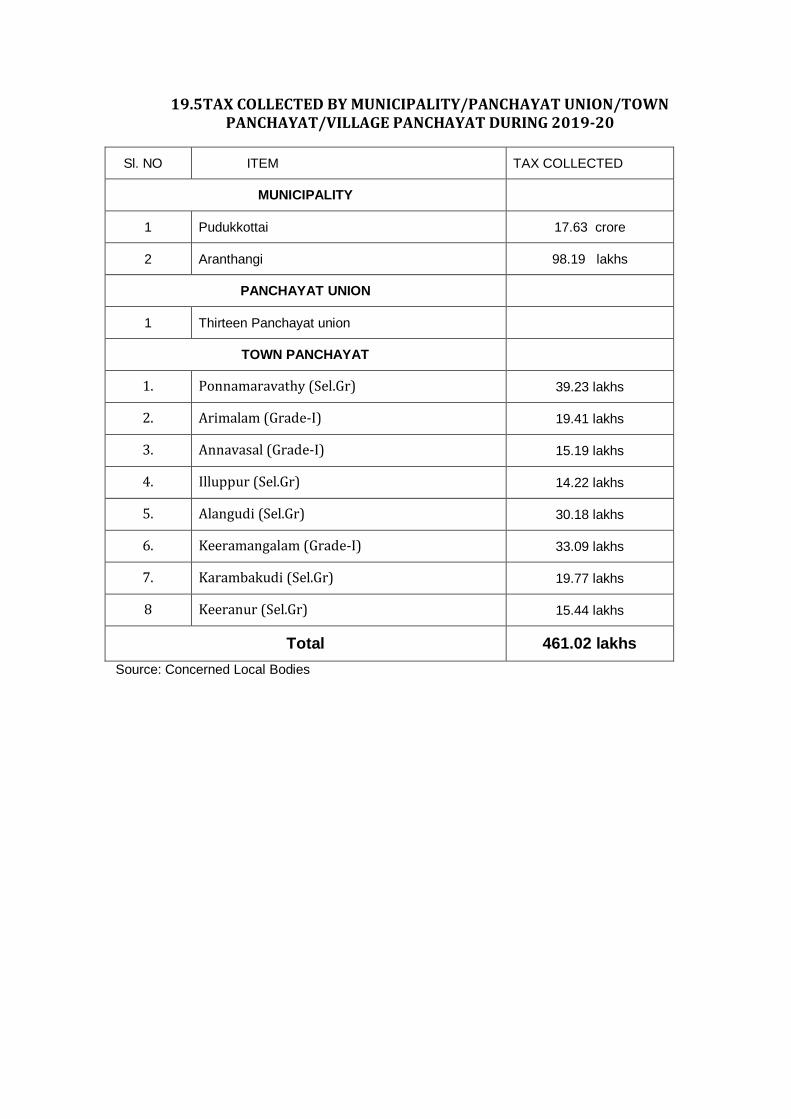
19.5TAX COLLECTED BY MUNICIPALITY/PANCHAYAT UNION/TOWN PANCHAYAT/VILLAGE PANCHAYAT DURING 2019-20
Sl. NO ITEM TAX COLLECTED
MUNICIPALITY
1 Pudukkottai 17.63 crore
2 Aranthangi 98.19 lakhs
PANCHAYAT UNION
1 Thirteen Panchayat union
TOWN PANCHAYAT
1. Ponnamaravathy (Sel.Gr) 39.23 lakhs
2. Arimalam (Grade-I) 19.41 lakhs
3. Annavasal (Grade-I) 15.19 lakhs
4. Illuppur (Sel.Gr) 14.22 lakhs
5. Alangudi (Sel.Gr) 30.18 lakhs
6. Keeramangalam (Grade-I) 33.09 lakhs
7. Karambakudi (Sel.Gr) 19.77 lakhs
8 Keeranur (Sel.Gr) 15.44 lakhs
Total 461.02 lakhs
Source: Concerned Local Bodies
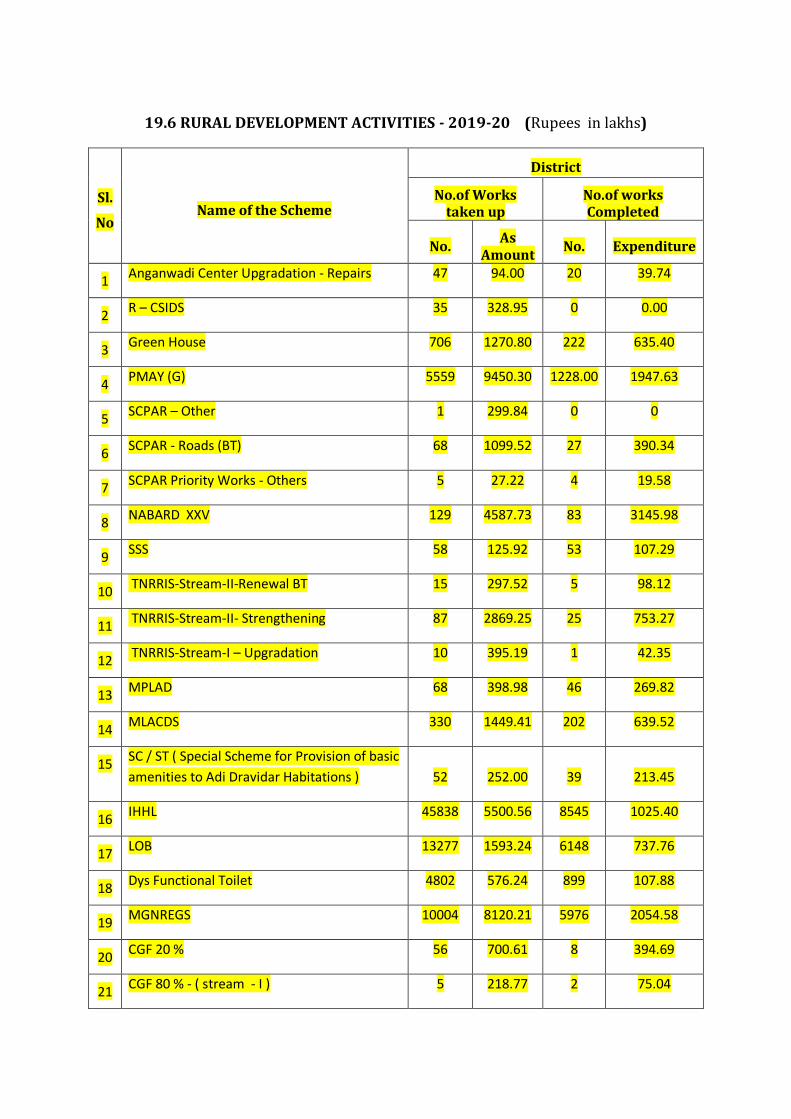
19.6 RURAL DEVELOPMENT ACTIVITIES - 2019-20 (Rupees in lakhs)
Sl.
No Name of the Scheme
District
No.of Works taken up
No.of works Completed
No. As
Amount No. Expenditure
1 Anganwadi Center Upgradation - Repairs 47 94.00 20 39.74
2 R – CSIDS 35 328.95 0 0.00
3 Green House 706 1270.80 222 635.40
4 PMAY (G) 5559 9450.30 1228.00 1947.63
5 SCPAR – Other 1 299.84 0 0
6 SCPAR - Roads (BT) 68 1099.52 27 390.34
7 SCPAR Priority Works - Others 5 27.22 4 19.58
8 NABARD XXV 129 4587.73 83 3145.98
9 SSS 58 125.92 53 107.29
10 TNRRIS-Stream-II-Renewal BT 15 297.52 5 98.12
11 TNRRIS-Stream-II- Strengthening 87 2869.25 25 753.27
12 TNRRIS-Stream-I – Upgradation 10 395.19 1 42.35
13 MPLAD 68 398.98 46 269.82
14 MLACDS 330 1449.41 202 639.52
15 SC / ST ( Special Scheme for Provision of basic
amenities to Adi Dravidar Habitations ) 52 252.00 39 213.45
16 IHHL 45838 5500.56 8545 1025.40
17 LOB 13277 1593.24 6148 737.76
18 Dys Functional Toilet 4802 576.24 899 107.88
19 MGNREGS 10004 8120.21 5976 2054.58
20 CGF 20 % 56 700.61 8 394.69
21 CGF 80 % - ( stream - I ) 5 218.77 2 75.04
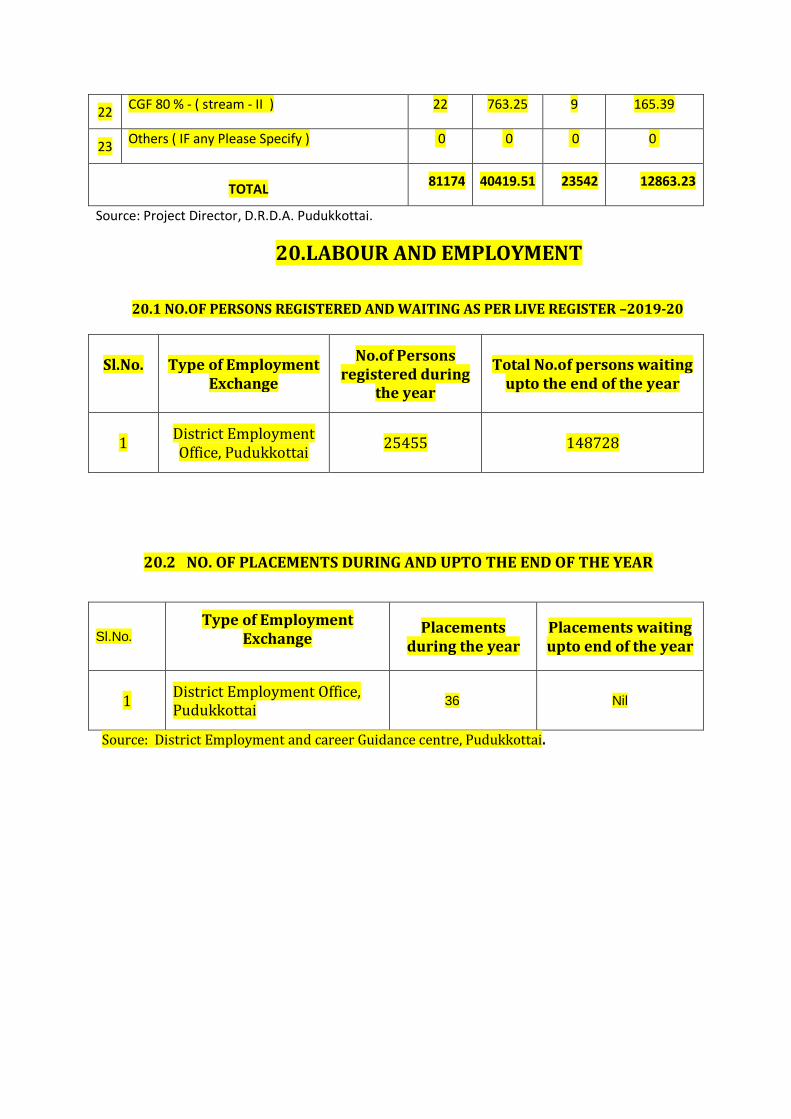
22 CGF 80 % - ( stream - II ) 22 763.25 9 165.39
23 Others ( IF any Please Specify ) 0 0 0 0
TOTAL 81174 40419.51 23542 12863.23
Source: Project Director, D.R.D.A. Pudukkottai.
20.LABOUR AND EMPLOYMENT
20.1 NO.OF PERSONS REGISTERED AND WAITING AS PER LIVE REGISTER –2019-20
Sl.No.
Type of Employment
Exchange
No.of Persons registered during
the year
Total No.of persons waiting upto the end of the year
1 District Employment Office, Pudukkottai
25455 148728
20.2 NO. OF PLACEMENTS DURING AND UPTO THE END OF THE YEAR
Sl.No.
Type of Employment Exchange
Placements during the year
Placements waiting upto end of the year
1 District Employment Office, Pudukkottai
36 Nil
Source: District Employment and career Guidance centre, Pudukkottai.
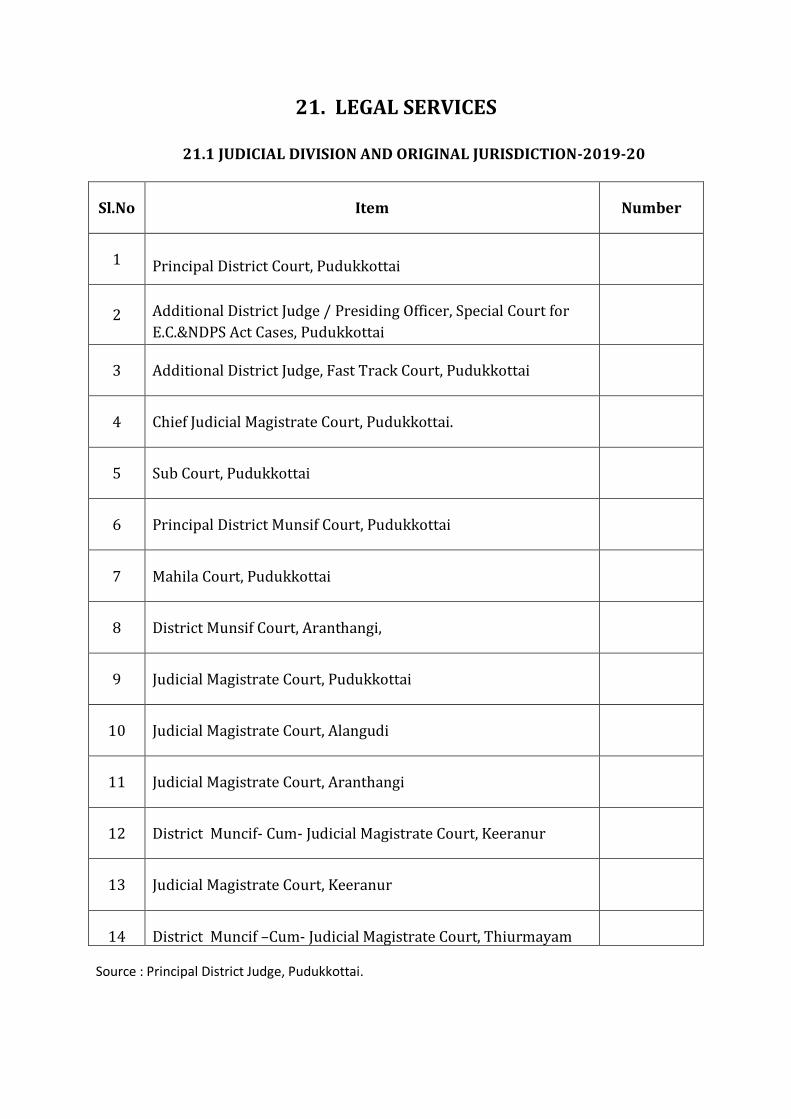
21. LEGAL SERVICES
21.1 JUDICIAL DIVISION AND ORIGINAL JURISDICTION-2019-20
Sl.No Item Number
1 Principal District Court, Pudukkottai
2 Additional District Judge / Presiding Officer, Special Court for
E.C.&NDPS Act Cases, Pudukkottai
3 Additional District Judge, Fast Track Court, Pudukkottai
4 Chief Judicial Magistrate Court, Pudukkottai.
5 Sub Court, Pudukkottai
6 Principal District Munsif Court, Pudukkottai
7 Mahila Court, Pudukkottai
8 District Munsif Court, Aranthangi,
9 Judicial Magistrate Court, Pudukkottai
10 Judicial Magistrate Court, Alangudi
11 Judicial Magistrate Court, Aranthangi
12 District Muncif- Cum- Judicial Magistrate Court, Keeranur
13 Judicial Magistrate Court, Keeranur
14 District Muncif –Cum- Judicial Magistrate Court, Thiurmayam
Source : Principal District Judge, Pudukkottai.
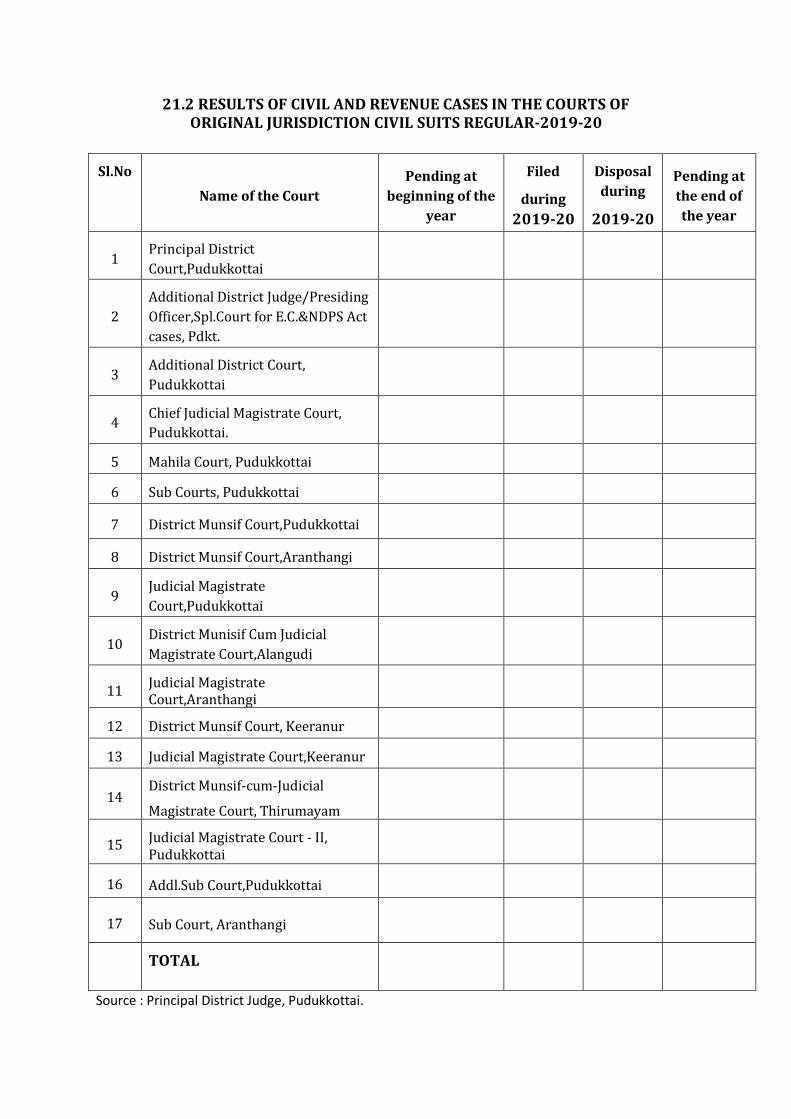
21.2 RESULTS OF CIVIL AND REVENUE CASES IN THE COURTS OF ORIGINAL JURISDICTION CIVIL SUITS REGULAR-2019-20
Sl.No
Name of the Court
Pending at
beginning of the
year
Filed
during
2019-20
Disposal
during
2019-20
Pending at
the end of
the year
1 Principal District
Court,Pudukkottai
2
Additional District Judge/Presiding
Officer,Spl.Court for E.C.&NDPS Act
cases, Pdkt.
3 Additional District Court,
Pudukkottai
4 Chief Judicial Magistrate Court,
Pudukkottai.
5 Mahila Court, Pudukkottai
6 Sub Courts, Pudukkottai
7 District Munsif Court,Pudukkottai
8 District Munsif Court,Aranthangi
9 Judicial Magistrate
Court,Pudukkottai
10 District Munisif Cum Judicial
Magistrate Court,Alangudi
11 Judicial Magistrate Court,Aranthangi
12 District Munsif Court, Keeranur
13 Judicial Magistrate Court,Keeranur
14 District Munsif-cum-Judicial
Magistrate Court, Thirumayam
15 Judicial Magistrate Court - II, Pudukkottai
16 Addl.Sub Court,Pudukkottai
17 Sub Court, Aranthangi
TOTAL
Source : Principal District Judge, Pudukkottai.
21.3 NO.OF ADVOCATES PRACTICING IN COURTS – 2019-20
Sl.No.
Name of the Court
Number of Advocates Practicing
1 Principal District Court,ADJ Court,Fast TrackCourt,CJM Court, Mahila Court,Sub Court,PDM Court, Judicial Magistrate Court, Pudukkottai
2 Judicial Magistrate Court, Disrtict Munsif Court,Aranthangi
3 District Munsif-cum-Judicial Magistrate Court,Keeranur
4 District Munsif-cum-Judicial Magistrate Court,Thirumayam
5 Judicial Magistrate Court, Alangudi
TOTAL
Source : Principal District Judge, Pudukkottai
21.3A NATURE OF FREE LEGAL AVAILABLE AND NUMBER OF BENEFICIARIES. Number of cases disposed of in LOK ADALAT during the year 2019-20
Nature of free legal available
Number of beneficiaries Number of cases disposed of in Lok Adalat
Civil Cases
Criminal cases u/s 138 NI Act
Accidents (MACOP)
H.M.O.P
TOTAL
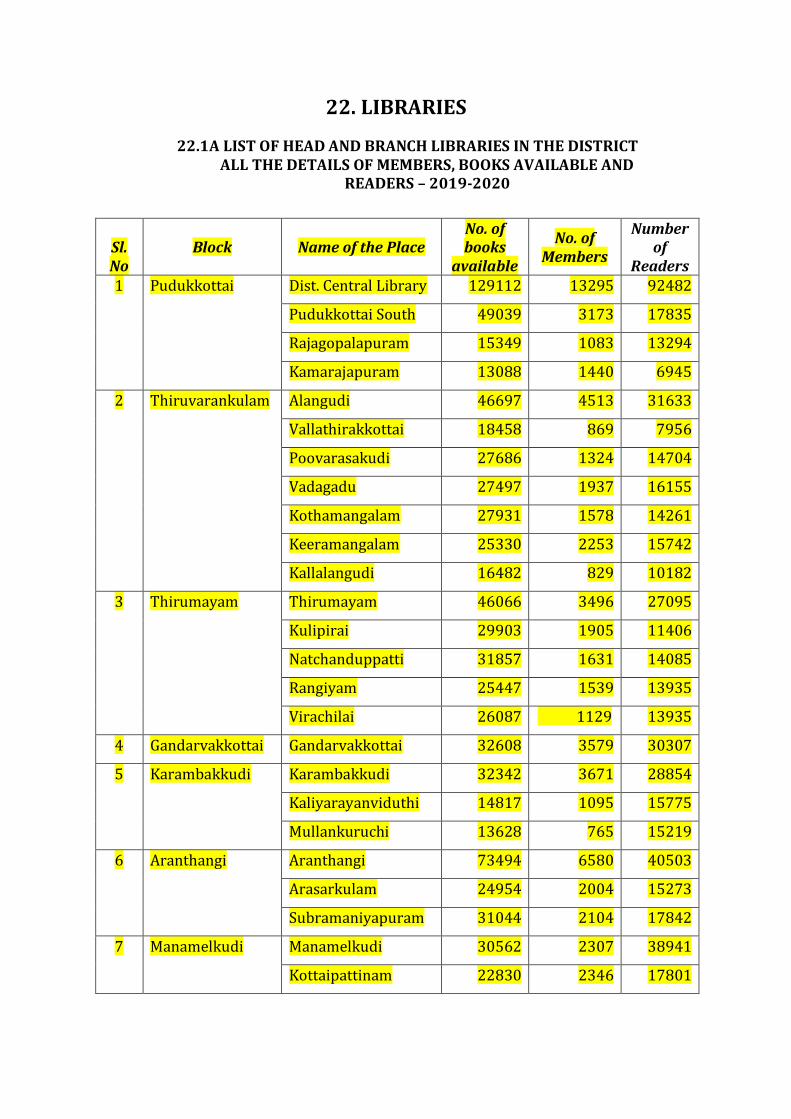
22. LIBRARIES
22.1A LIST OF HEAD AND BRANCH LIBRARIES IN THE DISTRICT ALL THE DETAILS OF MEMBERS, BOOKS AVAILABLE AND
READERS – 2019-2020
Sl. No
Block Name of the Place No. of books
available
No. of Members
Number of
Readers 1 Pudukkottai Dist. Central Library 129112 13295 92482
Pudukkottai South 49039 3173 17835
Rajagopalapuram 15349 1083 13294
Kamarajapuram 13088 1440 6945
2 Thiruvarankulam Alangudi 46697 4513 31633
Vallathirakkottai 18458 869 7956
Poovarasakudi 27686 1324 14704
Vadagadu 27497 1937 16155
Kothamangalam 27931 1578 14261
Keeramangalam 25330 2253 15742
Kallalangudi 16482 829 10182
3 Thirumayam Thirumayam 46066 3496 27095
Kulipirai 29903 1905 11406
Natchanduppatti 31857 1631 14085
Rangiyam 25447 1539 13935
Virachilai 26087 1129 13935
4 Gandarvakkottai Gandarvakkottai 32608 3579 30307
5 Karambakkudi Karambakkudi 32342 3671 28854
Kaliyarayanviduthi 14817 1095 15775
Mullankuruchi 13628 765 15219
6 Aranthangi Aranthangi 73494 6580 40503
Arasarkulam 24954 2004 15273
Subramaniyapuram 31044 2104 17842
7 Manamelkudi Manamelkudi 30562 2307 38941
Kottaipattinam 22830 2346 17801
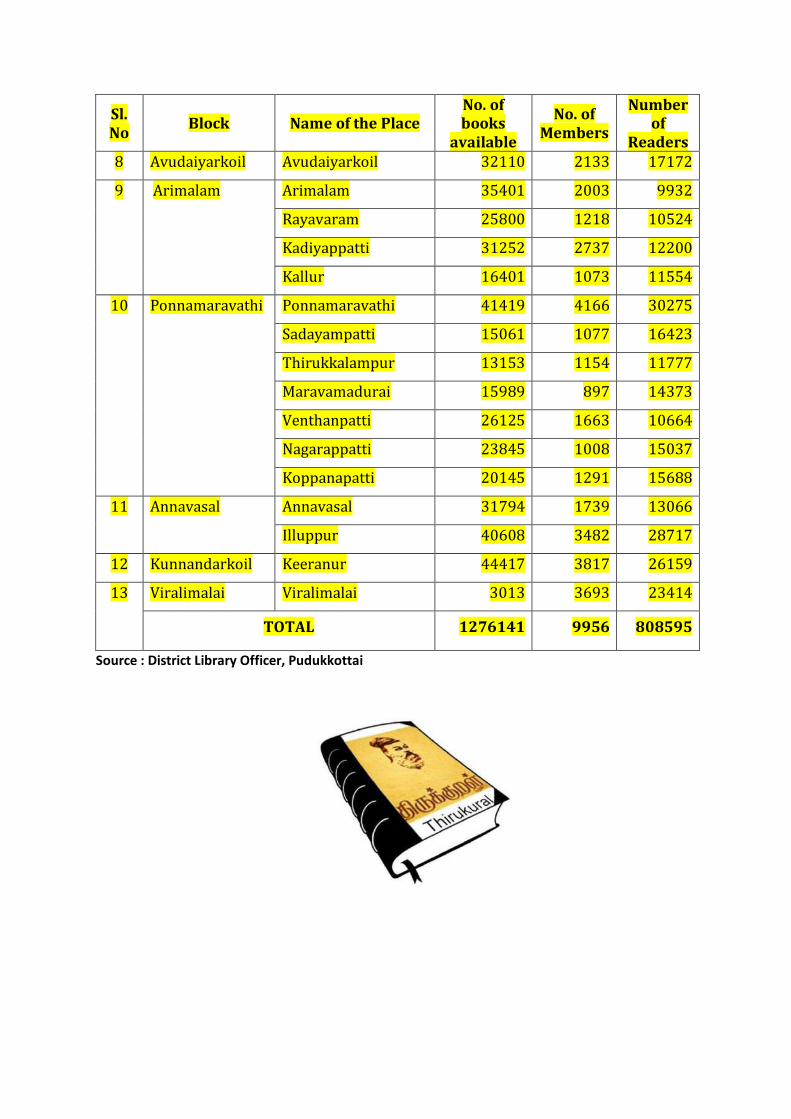
Sl. No
Block Name of the Place No. of books
available
No. of Members
Number of
Readers 8 Avudaiyarkoil Avudaiyarkoil 32110 2133 17172
9 Arimalam Arimalam 35401 2003 9932
Rayavaram 25800 1218 10524
Kadiyappatti 31252 2737 12200
Kallur 16401 1073 11554
10 Ponnamaravathi Ponnamaravathi 41419 4166 30275
Sadayampatti 15061 1077 16423
Thirukkalampur 13153 1154 11777
Maravamadurai 15989 897 14373
Venthanpatti 26125 1663 10664
Nagarappatti 23845 1008 15037
Koppanapatti 20145 1291 15688
11 Annavasal Annavasal 31794 1739 13066
Illuppur 40608 3482 28717
12 Kunnandarkoil Keeranur 44417 3817 26159
13 Viralimalai Viralimalai 3013 3693 23414
TOTAL 1276141 9956 808595
Source : District Library Officer, Pudukkottai
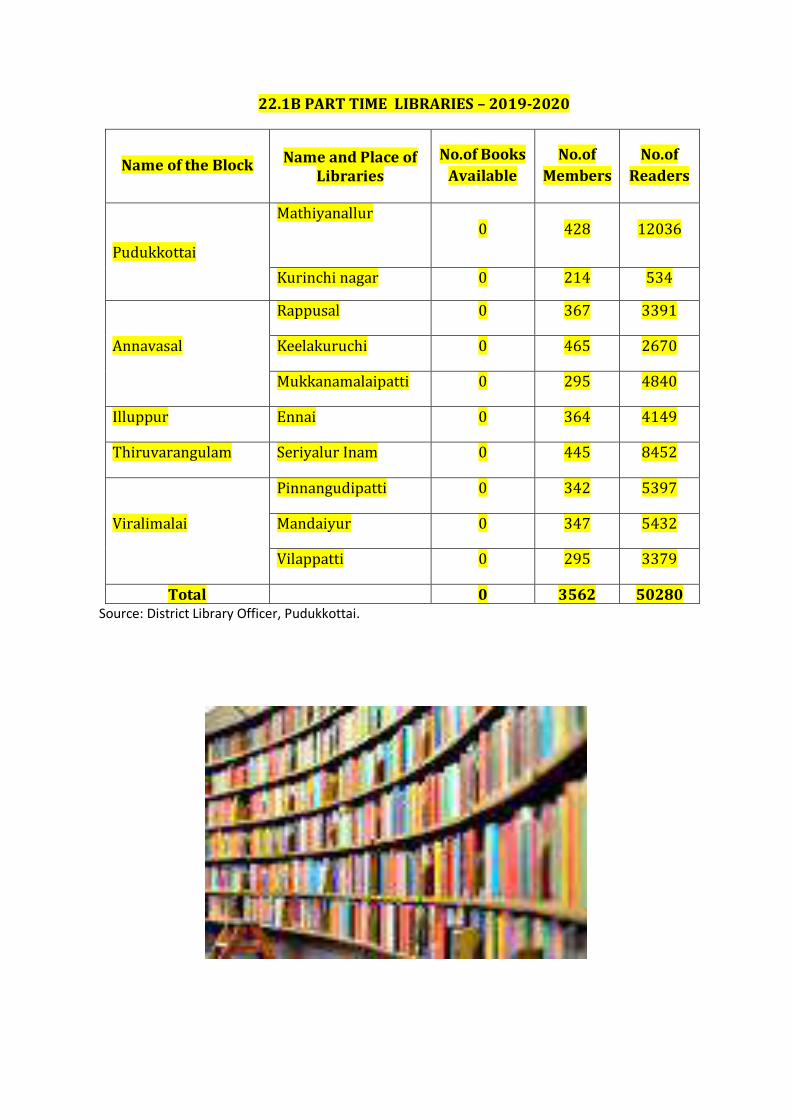
22.1B PART TIME LIBRARIES – 2019-2020
Name of the Block Name and Place of
Libraries
No.of Books
Available
No.of
Members
No.of
Readers
Pudukkottai
Mathiyanallur
0 428 12036
Kurinchi nagar 0 214 534
Annavasal
Rappusal 0 367 3391
Keelakuruchi 0 465 2670
Mukkanamalaipatti 0 295 4840
Illuppur Ennai 0 364 4149
Thiruvarangulam Seriyalur Inam 0 445 8452
Viralimalai
Pinnangudipatti 0 342 5397
Mandaiyur 0 347 5432
Vilappatti 0 295 3379
Total 0 3562 50280 Source: District Library Officer, Pudukkottai.

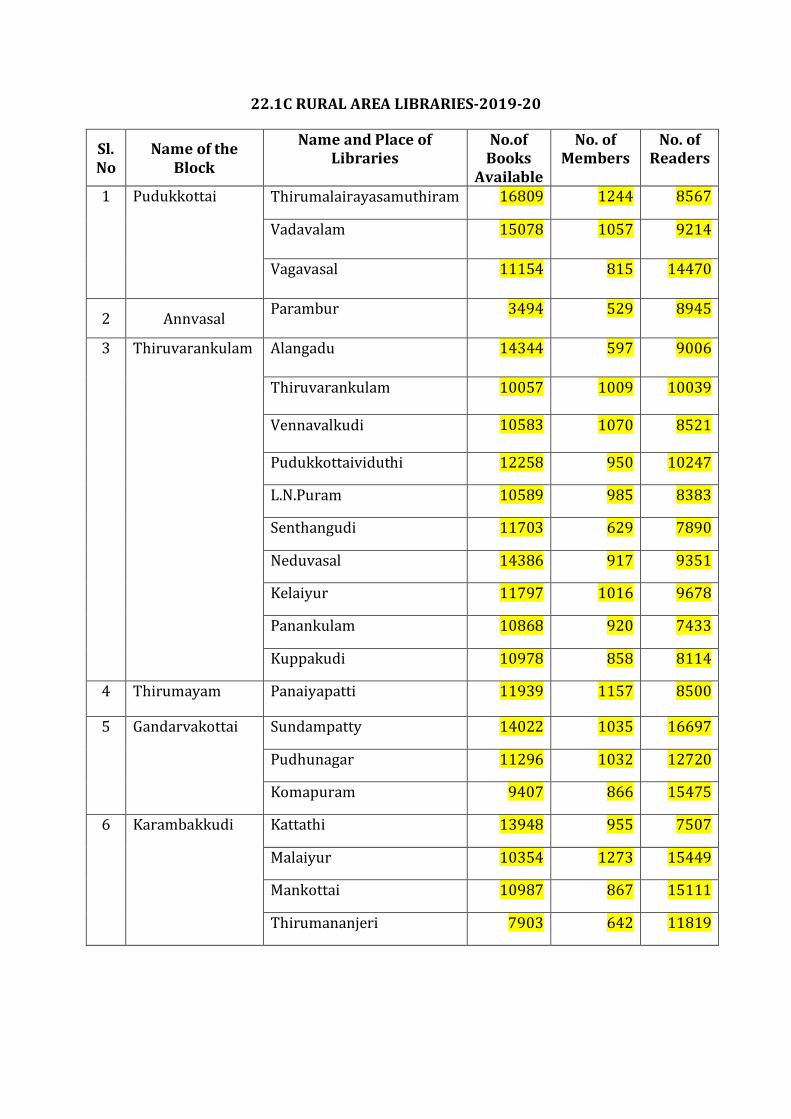
22.1C RURAL AREA LIBRARIES-2019-20
Sl. No
Name of the Block
Name and Place of Libraries
No.of Books
Available
No. of Members
No. of Readers
1 Pudukkottai Thirumalairayasamuthiram 16809 1244 8567
Vadavalam 15078 1057 9214
Vagavasal 11154 815 14470
2 Annvasal Parambur 3494 529 8945
3 Thiruvarankulam Alangadu 14344 597 9006
Thiruvarankulam 10057 1009 10039
Vennavalkudi 10583 1070 8521
Pudukkottaividuthi 12258 950 10247
L.N.Puram 10589 985 8383
Senthangudi 11703 629 7890
Neduvasal 14386 917 9351
Kelaiyur 11797 1016 9678
Panankulam 10868 920 7433
Kuppakudi 10978 858 8114
4 Thirumayam Panaiyapatti 11939 1157 8500
5 Gandarvakottai Sundampatty 14022 1035 16697
Pudhunagar 11296 1032 12720
Komapuram 9407 866 15475
6 Karambakkudi Kattathi 13948 955 7507
Malaiyur 10354 1273 15449
Mankottai 10987 867 15111
Thirumananjeri 7903 642 11819
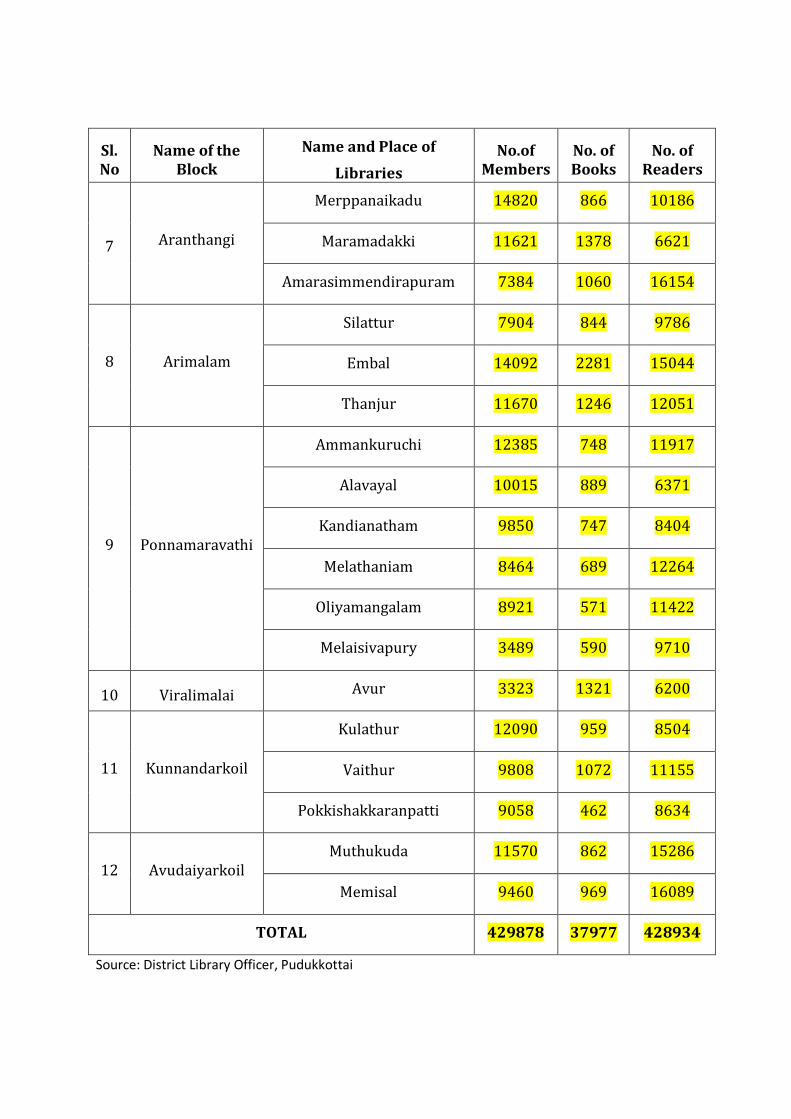
Sl. No
Name of the Block
Name and Place of
Libraries
No.of Members
No. of Books
No. of Readers
7 Aranthangi
Merppanaikadu 14820 866 10186
Maramadakki 11621 1378 6621
Amarasimmendirapuram 7384 1060 16154
8 Arimalam
Silattur 7904 844 9786
Embal 14092 2281 15044
Thanjur 11670 1246 12051
9 Ponnamaravathi
Ammankuruchi 12385 748 11917
Alavayal 10015 889 6371
Kandianatham 9850 747 8404
Melathaniam 8464 689 12264
Oliyamangalam 8921 571 11422
Melaisivapury 3489 590 9710
10 Viralimalai Avur 3323 1321 6200
11 Kunnandarkoil
Kulathur 12090 959 8504
Vaithur 9808 1072 11155
Pokkishakkaranpatti 9058 462 8634
12 Avudaiyarkoil Muthukuda 11570 862 15286
Memisal 9460 969 16089
TOTAL 429878 37977 428934
Source: District Library Officer, Pudukkottai
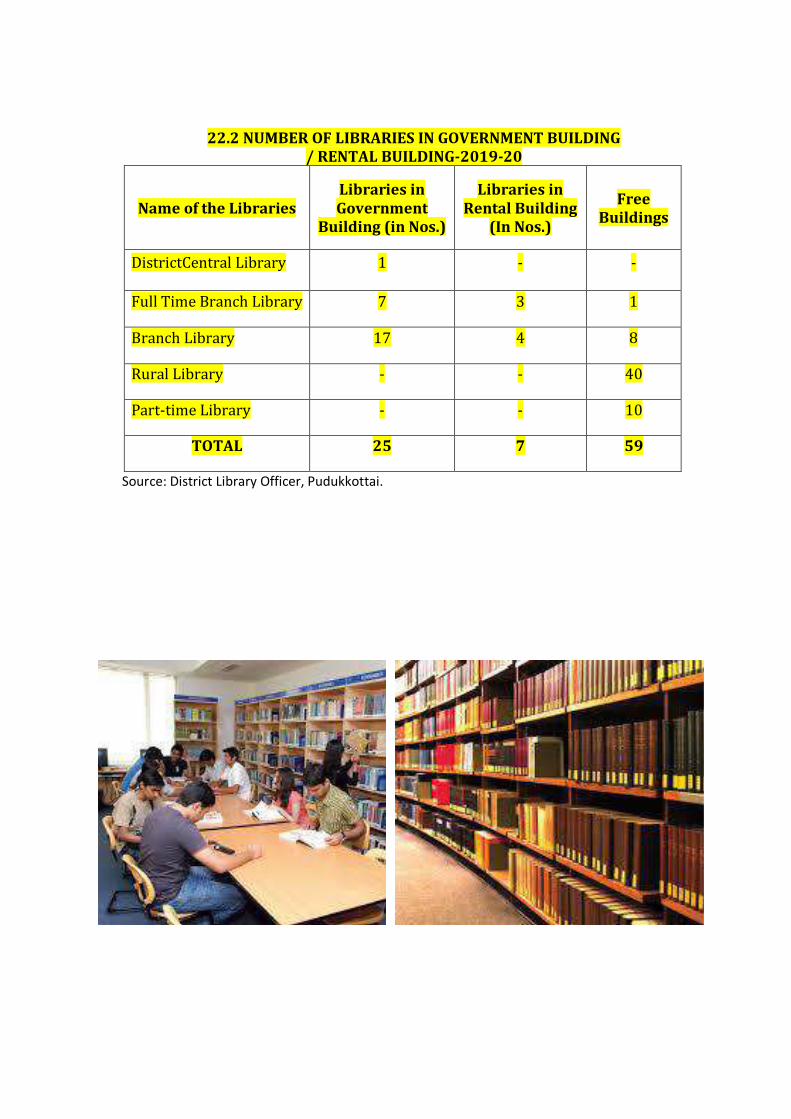
22.2 NUMBER OF LIBRARIES IN GOVERNMENT BUILDING / RENTAL BUILDING-2019-20
Name of the Libraries Libraries in Government
Building (in Nos.)
Libraries in Rental Building
(In Nos.)
Free Buildings
DistrictCentral Library 1 - -
Full Time Branch Library 7 3 1
Branch Library 17 4 8
Rural Library - - 40
Part-time Library - - 10
TOTAL 25 7 59
Source: District Library Officer, Pudukkottai.

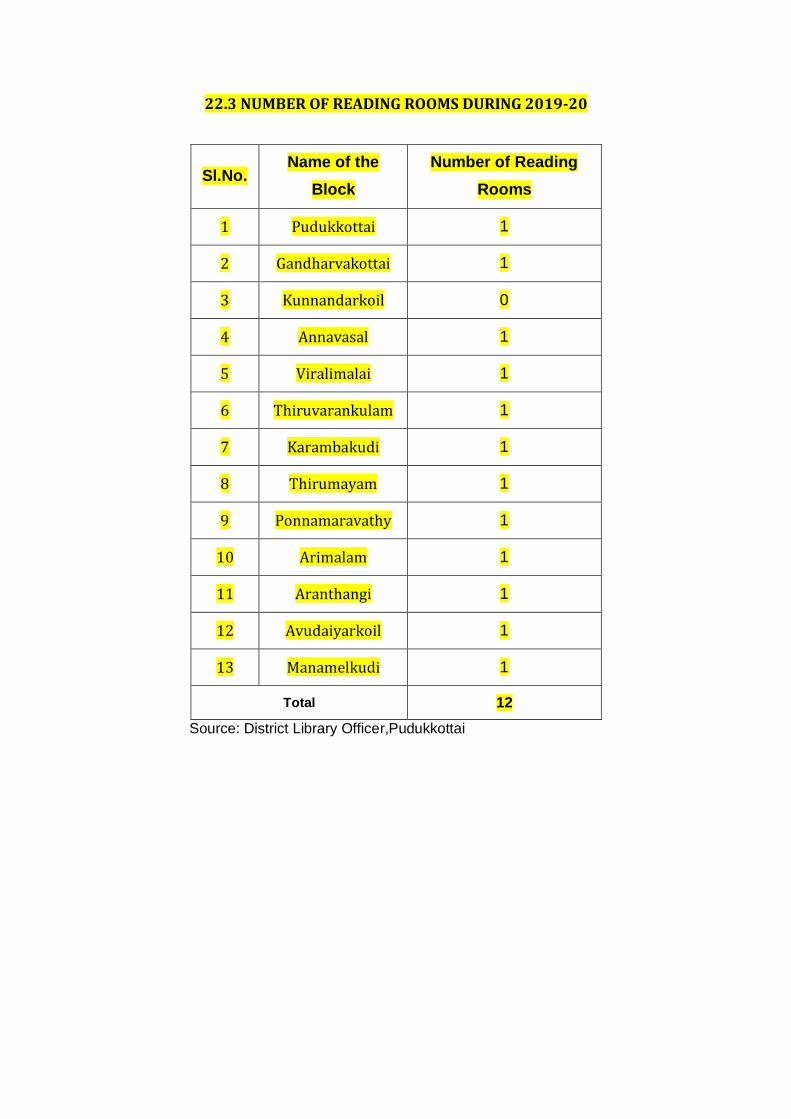
22.3 NUMBER OF READING ROOMS DURING 2019-20
Sl.No. Name of the
Block
Number of Reading
Rooms
1 Pudukkottai 1
2 Gandharvakottai 1
3 Kunnandarkoil 0
4 Annavasal 1
5 Viralimalai 1
6 Thiruvarankulam 1
7 Karambakudi 1
8 Thirumayam 1
9 Ponnamaravathy 1
10 Arimalam 1
11 Aranthangi 1
12 Avudaiyarkoil 1
13 Manamelkudi 1
Total 12
Source: District Library Officer,Pudukkottai
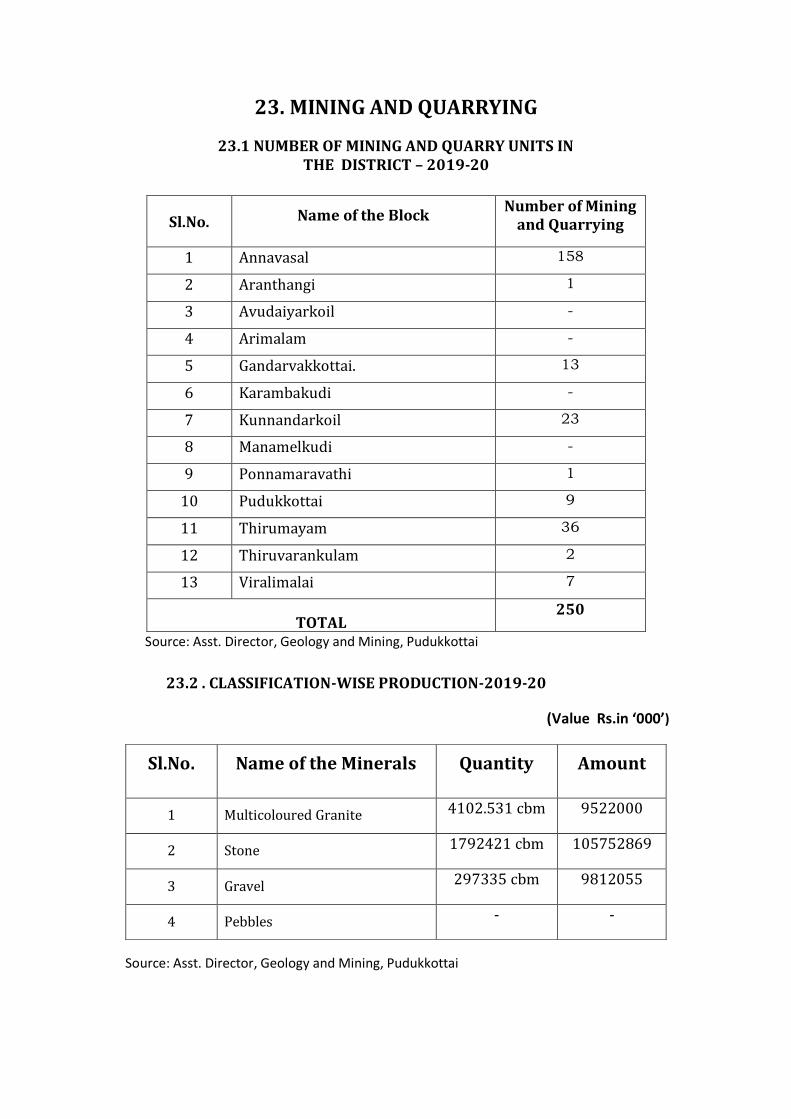
23. MINING AND QUARRYING
23.1 NUMBER OF MINING AND QUARRY UNITS IN THE DISTRICT – 2019-20
Sl.No. Name of the Block Number of Mining
and Quarrying
1 Annavasal 158
2 Aranthangi 1
3 Avudaiyarkoil -
4 Arimalam -
5 Gandarvakkottai. 13
6 Karambakudi -
7 Kunnandarkoil 23
8 Manamelkudi -
9 Ponnamaravathi 1
10 Pudukkottai 9
11 Thirumayam 36
12 Thiruvarankulam 2
13 Viralimalai 7
TOTAL 250
Source: Asst. Director, Geology and Mining, Pudukkottai
23.2 . CLASSIFICATION-WISE PRODUCTION-2019-20
(Value Rs.in ‘000’)
Source: Asst. Director, Geology and Mining, Pudukkottai
Sl.No. Name of the Minerals Quantity Amount
1 Multicoloured Granite 4102.531 cbm 9522000
2 Stone 1792421 cbm 105752869
3 Gravel 297335 cbm 9812055
4 Pebbles - -
24.MANUFACTURING SECTOR
24.1 NUMBER OF FOOD AND ALLIED MANUFACTURING UNITS IN THE DISTRICT
Industry
Group
Name of
the District
Description
of Industry
All
Empoyees
Value of
Output (Rs.in
lakhs)
Value
added
1 2 3 4 5 6
-NA- -NA- -NA- -NA- -NA- NA
Source: Department of Economics and Statistics, Chennai.
24.2 NUMBER OF NON- FOOD MANUFACTURING UNITS
IN THE DISTRICT
Industry
Group
Name of
the District
Description
of Industry
All
Empoyees
Value of
Output
(Rs.in lakhs)
Value
added
1 2 3 4 5 6
-NA- -NA- -NA- -NA- -NA- -NA-
Source: Department of Economics and Statistics, Chennai
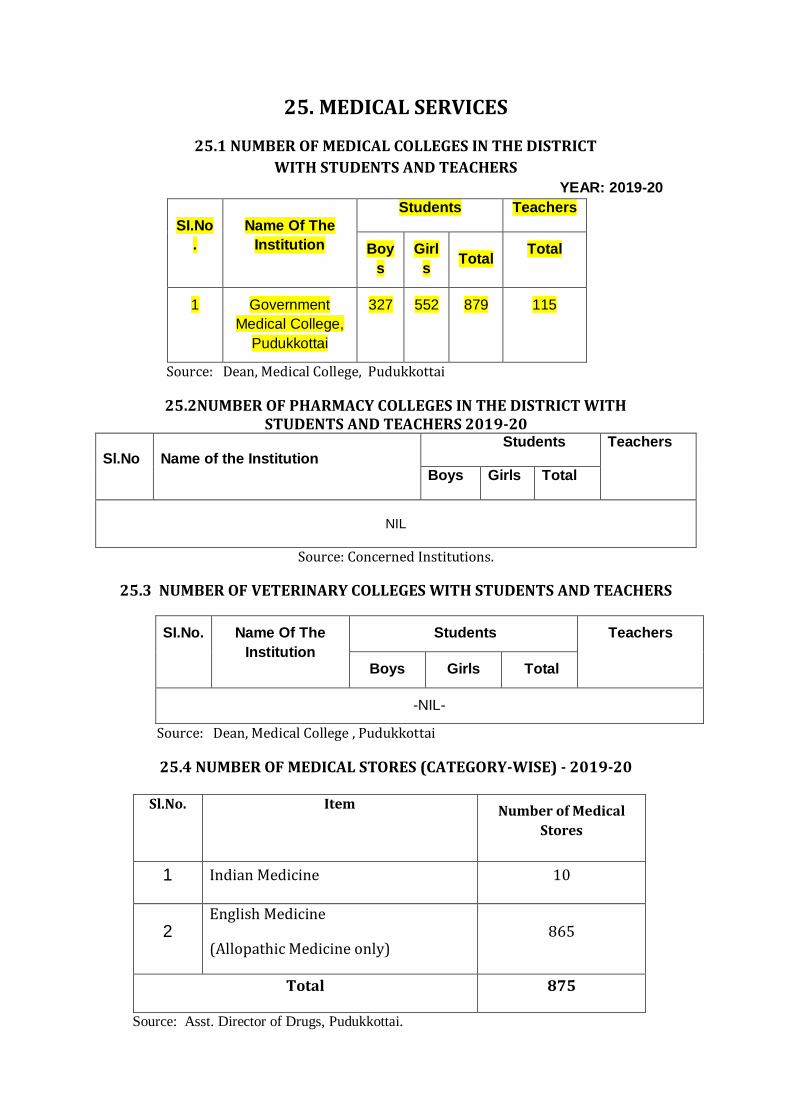
25. MEDICAL SERVICES
25.1 NUMBER OF MEDICAL COLLEGES IN THE DISTRICT
WITH STUDENTS AND TEACHERS YEAR: 2019-20
SI.No
.
Name Of The
Institution
Students Teachers
Boy
s
Girl
s Total
Total
1 Government
Medical College,
Pudukkottai
327 552 879 115
Source: Dean, Medical College, Pudukkottai
25.2NUMBER OF PHARMACY COLLEGES IN THE DISTRICT WITH STUDENTS AND TEACHERS 2019-20
Sl.No Name of the Institution Students Teachers
Boys Girls Total
NIL
Source: Concerned Institutions.
25.3 NUMBER OF VETERINARY COLLEGES WITH STUDENTS AND TEACHERS
SI.No. Name Of The
Institution
Students Teachers
Boys Girls Total
-NIL-
Source: Dean, Medical College , Pudukkottai
25.4 NUMBER OF MEDICAL STORES (CATEGORY-WISE) - 2019-20
Sl.No.
Item
Number of Medical
Stores
1 Indian Medicine 10
2 English Medicine
(Allopathic Medicine only) 865
Total 875
Source: Asst. Director of Drugs, Pudukkottai.
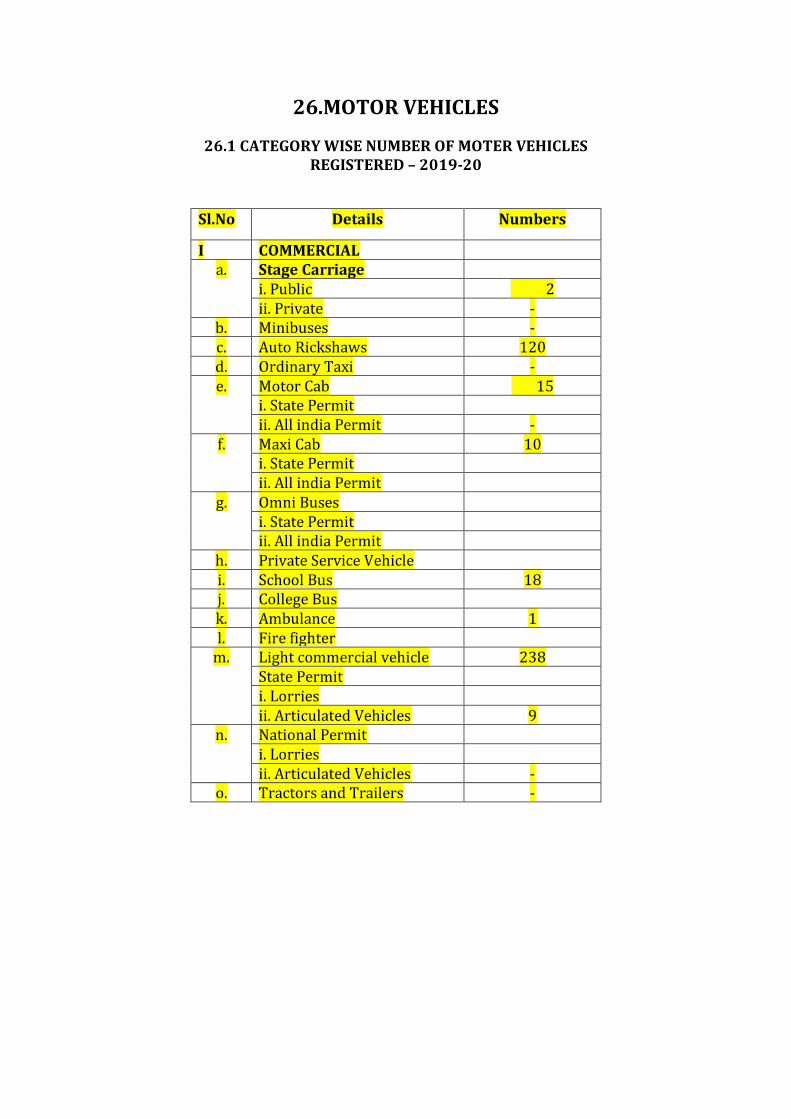
26.MOTOR VEHICLES
26.1 CATEGORY WISE NUMBER OF MOTER VEHICLES REGISTERED – 2019-20
Sl.No Details Numbers
I COMMERCIAL a. Stage Carriage
i. Public 2 ii. Private -
b. Minibuses - c. Auto Rickshaws 120 d. Ordinary Taxi - e. Motor Cab 15
i. State Permit ii. All india Permit -
f. Maxi Cab 10 i. State Permit ii. All india Permit
g. Omni Buses i. State Permit ii. All india Permit
h. Private Service Vehicle i. School Bus 18 j. College Bus k. Ambulance 1 l. Fire fighter
m. Light commercial vehicle 238 State Permit i. Lorries ii. Articulated Vehicles 9
n. National Permit i. Lorries ii. Articulated Vehicles -
o. Tractors and Trailers -
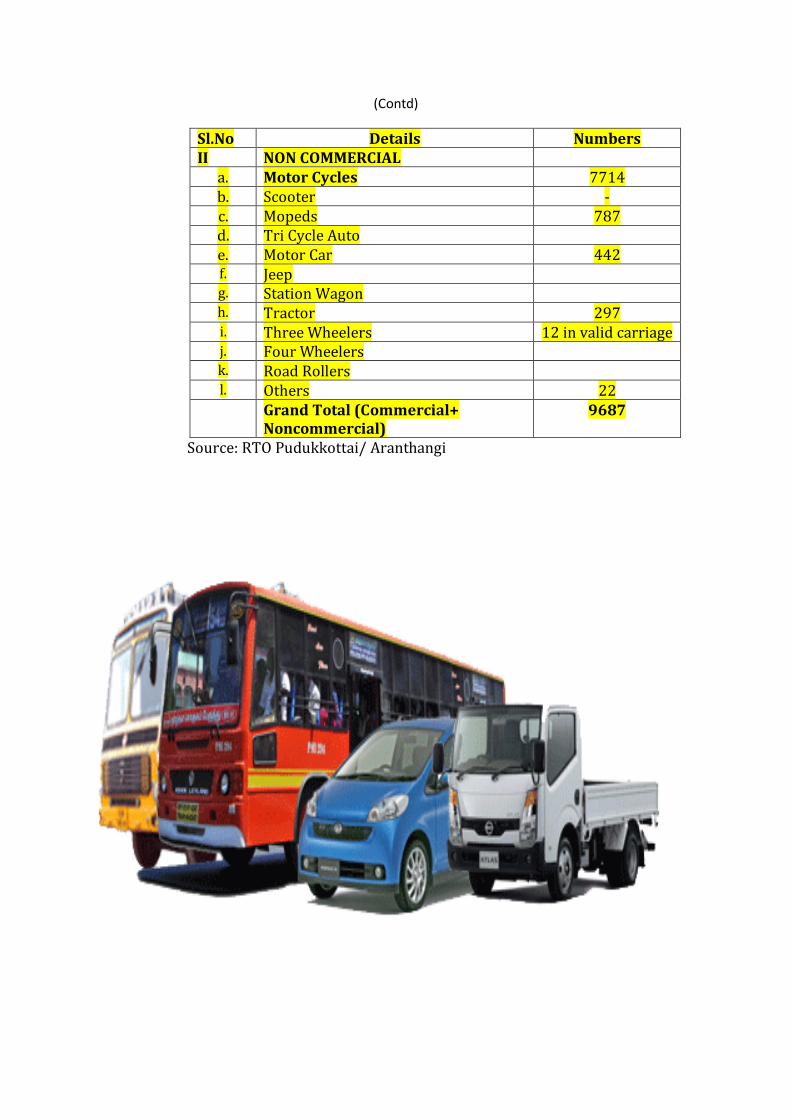
(Contd)
Sl.No Details Numbers II NON COMMERCIAL
a. Motor Cycles 7714 b. Scooter - c. Mopeds 787 d. Tri Cycle Auto e. Motor Car 442 f. Jeep g. Station Wagon h. Tractor 297 i. Three Wheelers 12 in valid carriage j. Four Wheelers k. Road Rollers l. Others 22
Grand Total (Commercial+ Noncommercial)
9687
Source: RTO Pudukkottai/ Aranthangi
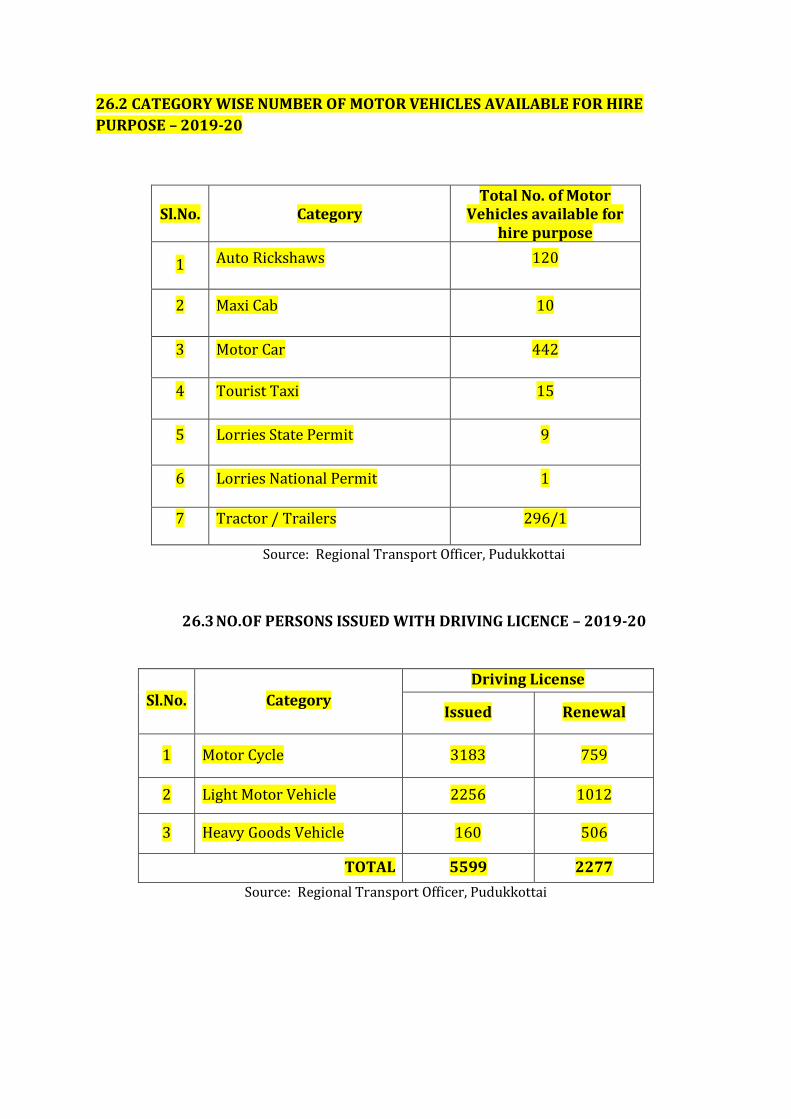
26.2 CATEGORY WISE NUMBER OF MOTOR VEHICLES AVAILABLE FOR HIRE
PURPOSE – 2019-20
Sl.No.
Category
Total No. of Motor Vehicles available for
hire purpose
1 Auto Rickshaws 120
2 Maxi Cab 10
3 Motor Car 442
4 Tourist Taxi 15
5 Lorries State Permit 9
6 Lorries National Permit 1
7 Tractor / Trailers 296/1
Source: Regional Transport Officer, Pudukkottai
26.3 NO.OF PERSONS ISSUED WITH DRIVING LICENCE – 2019-20
Sl.No.
Category
Driving License
Issued Renewal
1 Motor Cycle 3183 759
2 Light Motor Vehicle 2256 1012
3 Heavy Goods Vehicle 160 506
TOTAL 5599 2277
Source: Regional Transport Officer, Pudukkottai
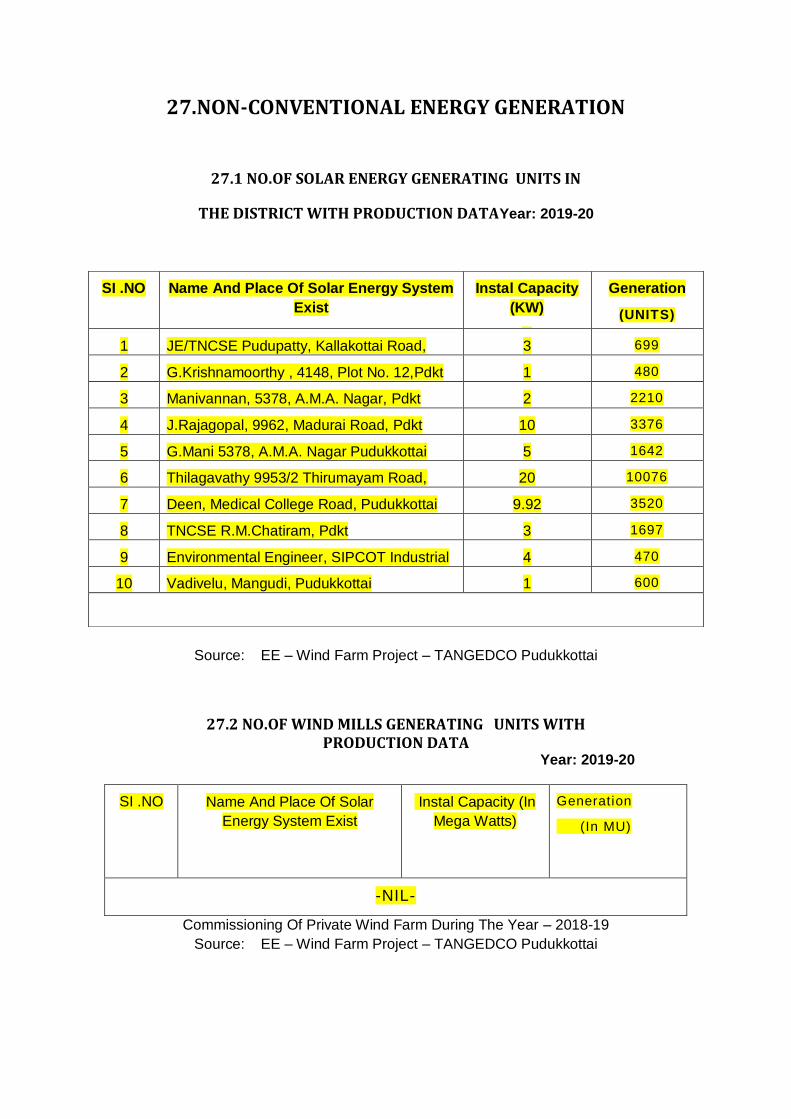
27.NON-CONVENTIONAL ENERGY GENERATION
27.1 NO.OF SOLAR ENERGY GENERATING UNITS IN
THE DISTRICT WITH PRODUCTION DATAYear: 2019-20
Source: EE – Wind Farm Project – TANGEDCO Pudukkottai
27.2 NO.OF WIND MILLS GENERATING UNITS WITH PRODUCTION DATA
Year: 2019-20
Commissioning Of Private Wind Farm During The Year – 2018-19
Source: EE – Wind Farm Project – TANGEDCO Pudukkottai
SI .NO
Name And Place Of Solar Energy System
Exist
Instal Capacity
(KW)
()
(In Mega Watts)
Generation
(UNITS)
1 JE/TNCSE Pudupatty, Kallakottai Road,
Pdkt Pudukkottai
3 699
2 G.Krishnamoorthy , 4148, Plot No. 12,Pdkt
Pon Nagar, Pudukkottai
1 480
3 Manivannan, 5378, A.M.A. Nagar, Pdkt
Pudukkottai
2 2210
4 J.Rajagopal, 9962, Madurai Road, Pdkt
Pudukkottai
10 3376
5 G.Mani 5378, A.M.A. Nagar Pudukkottai 5 1642
6 Thilagavathy 9953/2 Thirumayam Road,
Pudukkottai
20 10076
7 Deen, Medical College Road, Pudukkottai 9.92 3520
8 TNCSE R.M.Chatiram, Pdkt 3 1697
9 Environmental Engineer, SIPCOT Industrial
Estate, Pudukkottai
4 470
10 Vadivelu, Mangudi, Pudukkottai 1 600
SI .NO
Name And Place Of Solar
Energy System Exist
Instal Capacity (In
Mega Watts)
Generation
(In MU)
-NIL-
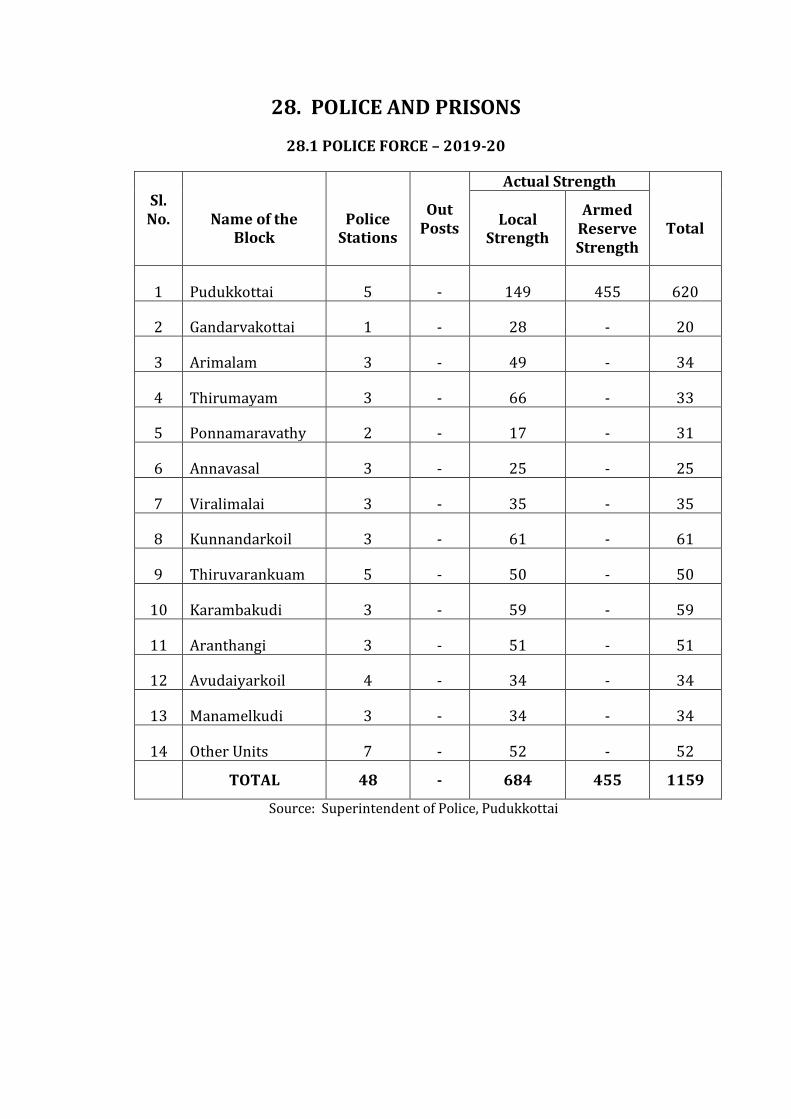
28. POLICE AND PRISONS
28.1 POLICE FORCE – 2019-20
Sl. No.
Name of the Block
Police
Stations
Out
Posts
Actual Strength
Total
Local Strength
Armed Reserve Strength
1 Pudukkottai 5 - 149 455 620
2 Gandarvakottai 1 - 28 - 20
3 Arimalam 3 - 49 - 34
4 Thirumayam 3 - 66 - 33
5 Ponnamaravathy 2 - 17 - 31
6 Annavasal 3 - 25 - 25
7 Viralimalai 3 - 35 - 35
8 Kunnandarkoil 3 - 61 - 61
9 Thiruvarankuam 5 - 50 - 50
10 Karambakudi 3 - 59 - 59
11 Aranthangi 3 - 51 - 51
12 Avudaiyarkoil 4 - 34 - 34
13 Manamelkudi 3 - 34 - 34
14 Other Units 7 - 52 - 52
TOTAL 48 - 684 455 1159
Source: Superintendent of Police, Pudukkottai
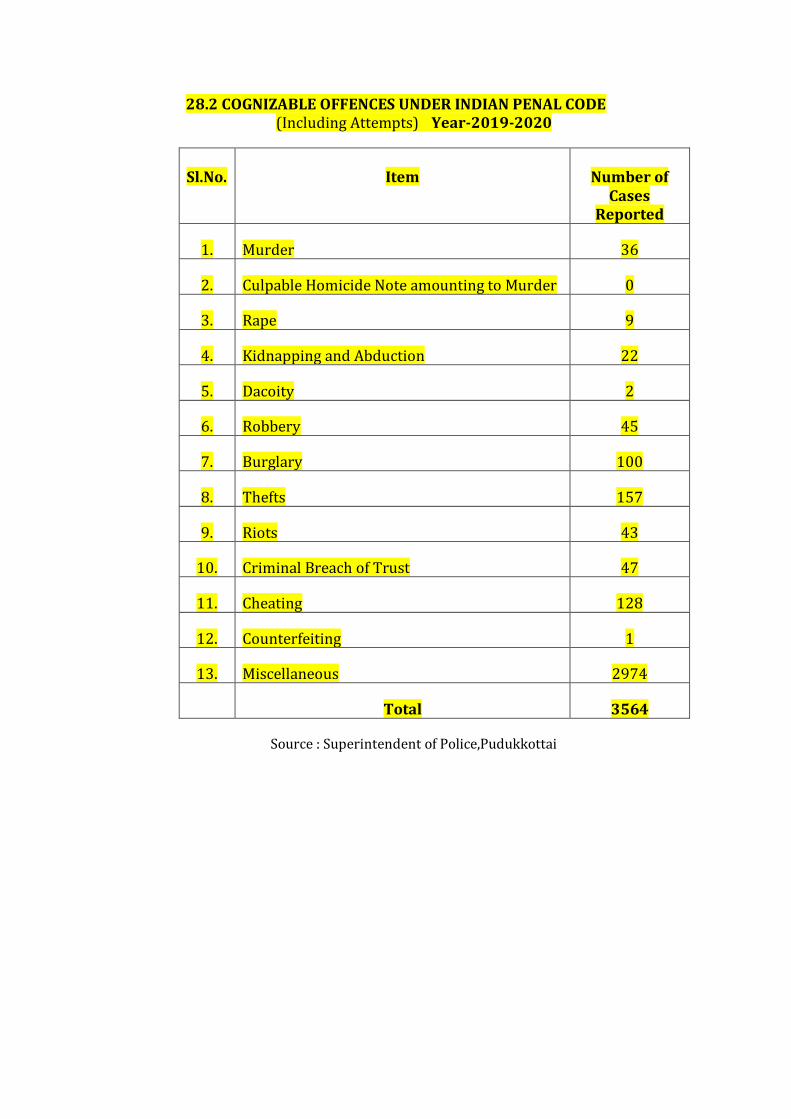
28.2 COGNIZABLE OFFENCES UNDER INDIAN PENAL CODE (Including Attempts) Year-2019-2020
Sl.No.
Item
Number of
Cases Reported
1. Murder 36
2. Culpable Homicide Note amounting to Murder 0
3. Rape 9
4. Kidnapping and Abduction 22
5. Dacoity 2
6. Robbery 45
7. Burglary 100
8. Thefts 157
9. Riots 43
10. Criminal Breach of Trust 47
11. Cheating 128
12. Counterfeiting 1
13. Miscellaneous 2974
Total 3564
Source : Superintendent of Police,Pudukkottai
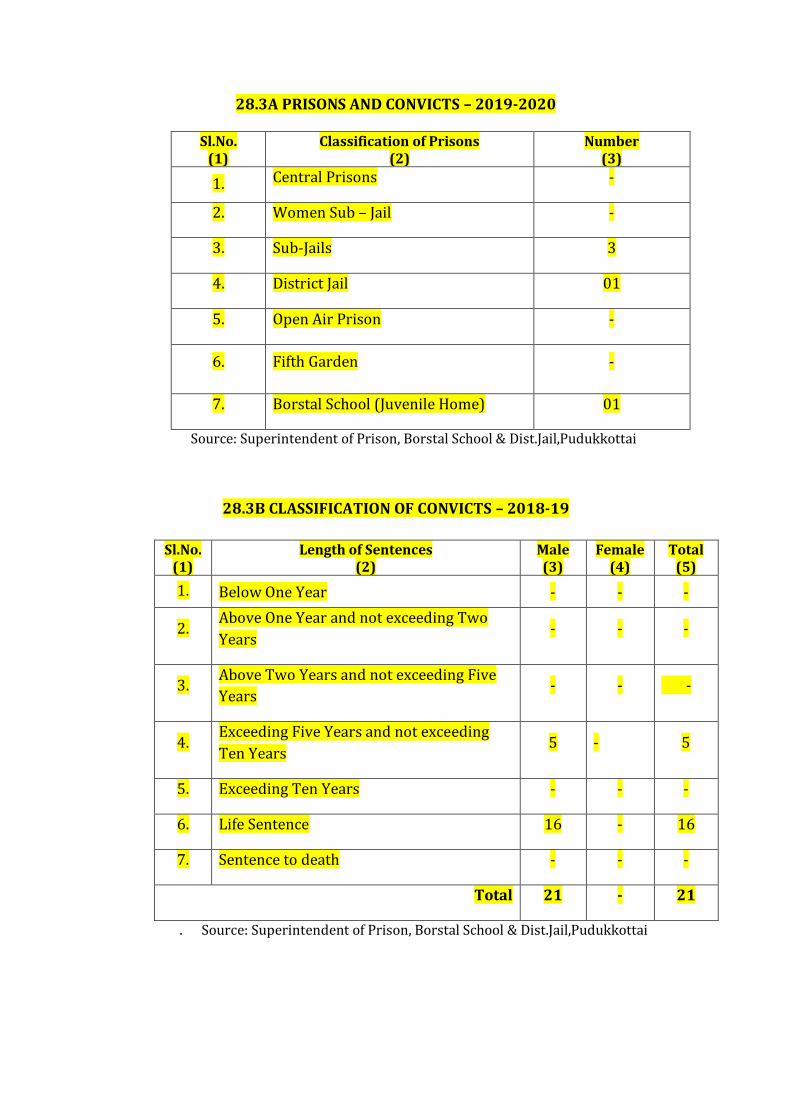
28.3A PRISONS AND CONVICTS – 2019-2020
Sl.No. (1)
Classification of Prisons (2)
Number (3)
1. Central Prisons -
2. Women Sub – Jail -
3. Sub-Jails 3
4. District Jail 01
5. Open Air Prison -
6. Fifth Garden -
7. Borstal School (Juvenile Home) 01
Source: Superintendent of Prison, Borstal School & Dist.Jail,Pudukkottai
28.3B CLASSIFICATION OF CONVICTS – 2018-19
Sl.No. (1)
Length of Sentences (2)
Male (3)
Female (4)
Total (5)
1. Below One Year - - -
2. Above One Year and not exceeding Two
Years - - -
3. Above Two Years and not exceeding Five
Years - - -
4. Exceeding Five Years and not exceeding
Ten Years 5 - 5
5. Exceeding Ten Years - - -
6. Life Sentence 16 - 16
7. Sentence to death - - -
Total 21 - 21
. Source: Superintendent of Prison, Borstal School & Dist.Jail,Pudukkottai
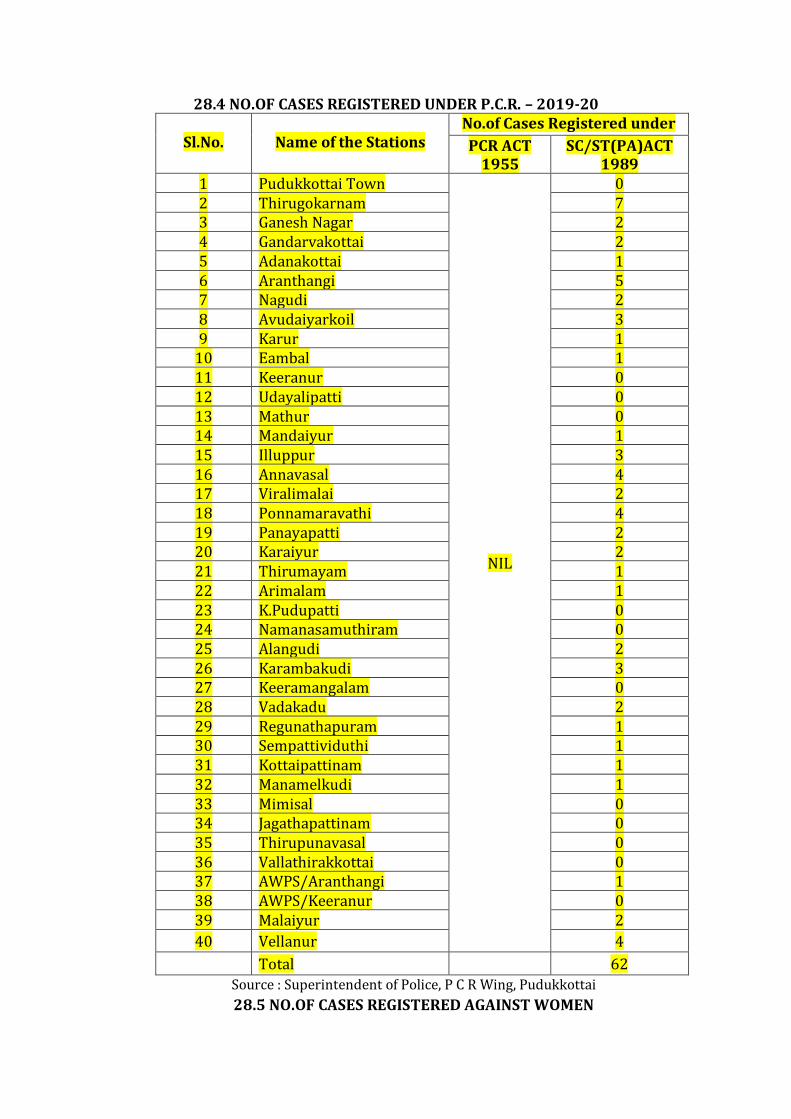
28.4 NO.OF CASES REGISTERED UNDER P.C.R. – 2019-20
Sl.No.
Name of the Stations
No.of Cases Registered under
PCR ACT 1955
SC/ST(PA)ACT 1989
1 Pudukkottai Town
NIL
0 2 Thirugokarnam 7 3 Ganesh Nagar 2 4 Gandarvakottai 2 5 Adanakottai 1 6 Aranthangi 5 7 Nagudi 2 8 Avudaiyarkoil 3 9 Karur 1
10 Eambal 1 11 Keeranur 0 12 Udayalipatti 0 13 Mathur 0 14 Mandaiyur 1 15 Illuppur 3 16 Annavasal 4 17 Viralimalai 2 18 Ponnamaravathi 4 19 Panayapatti 2 20 Karaiyur 2 21 Thirumayam 1 22 Arimalam 1 23 K.Pudupatti 0 24 Namanasamuthiram 0 25 Alangudi 2 26 Karambakudi 3 27 Keeramangalam 0 28 Vadakadu 2 29 Regunathapuram 1 30 Sempattividuthi 1 31 Kottaipattinam 1 32 Manamelkudi 1 33 Mimisal 0 34 Jagathapattinam 0 35 Thirupunavasal 0 36 Vallathirakkottai 0 37 AWPS/Aranthangi 1 38 AWPS/Keeranur 0 39 Malaiyur 2
40 Vellanur 4
Total
62
Source : Superintendent of Police, P C R Wing, Pudukkottai
28.5 NO.OF CASES REGISTERED AGAINST WOMEN
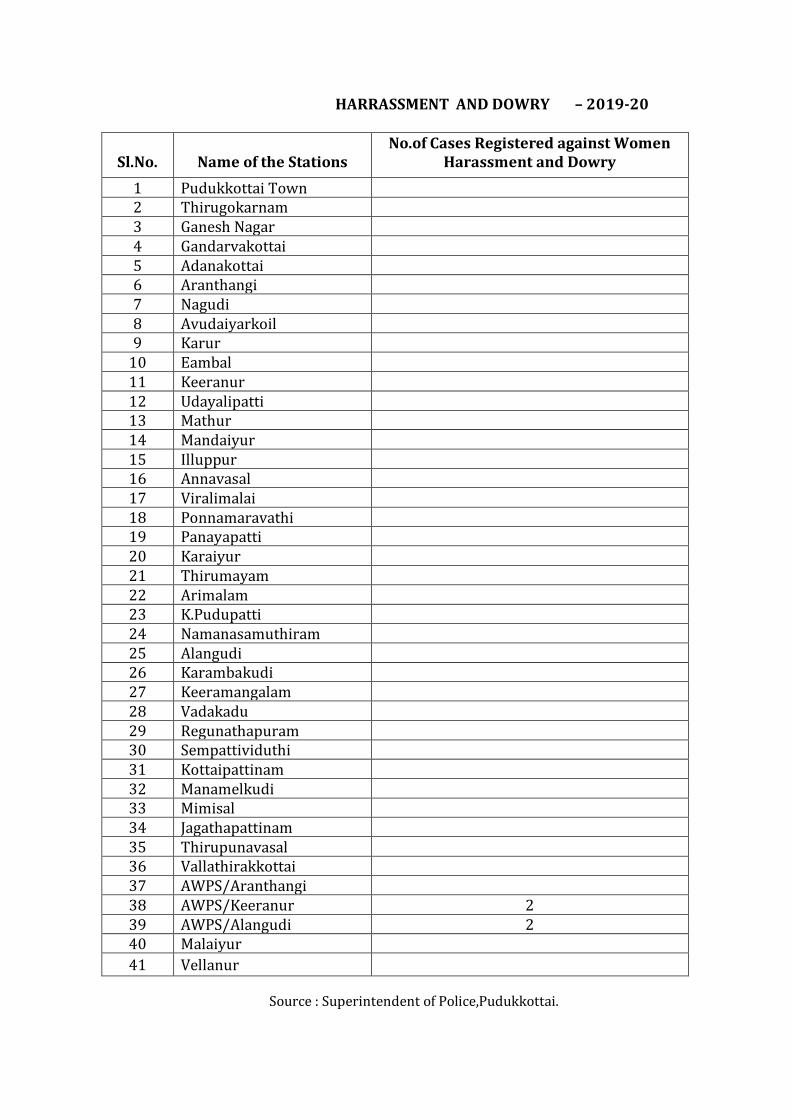
HARRASSMENT AND DOWRY – 2019-20
Sl.No.
Name of the Stations
No.of Cases Registered against Women Harassment and Dowry
1 Pudukkottai Town
2 Thirugokarnam 3 Ganesh Nagar 4 Gandarvakottai 5 Adanakottai 6 Aranthangi 7 Nagudi 8 Avudaiyarkoil 9 Karur
10 Eambal 11 Keeranur 12 Udayalipatti 13 Mathur 14 Mandaiyur 15 Illuppur 16 Annavasal 17 Viralimalai 18 Ponnamaravathi 19 Panayapatti 20 Karaiyur 21 Thirumayam 22 Arimalam 23 K.Pudupatti 24 Namanasamuthiram 25 Alangudi 26 Karambakudi 27 Keeramangalam 28 Vadakadu 29 Regunathapuram 30 Sempattividuthi 31 Kottaipattinam 32 Manamelkudi 33 Mimisal 34 Jagathapattinam 35 Thirupunavasal 36 Vallathirakkottai 37 AWPS/Aranthangi 38 AWPS/Keeranur 2 39 AWPS/Alangudi 2 40 Malaiyur
41 Vellanur
Source : Superintendent of Police,Pudukkottai.
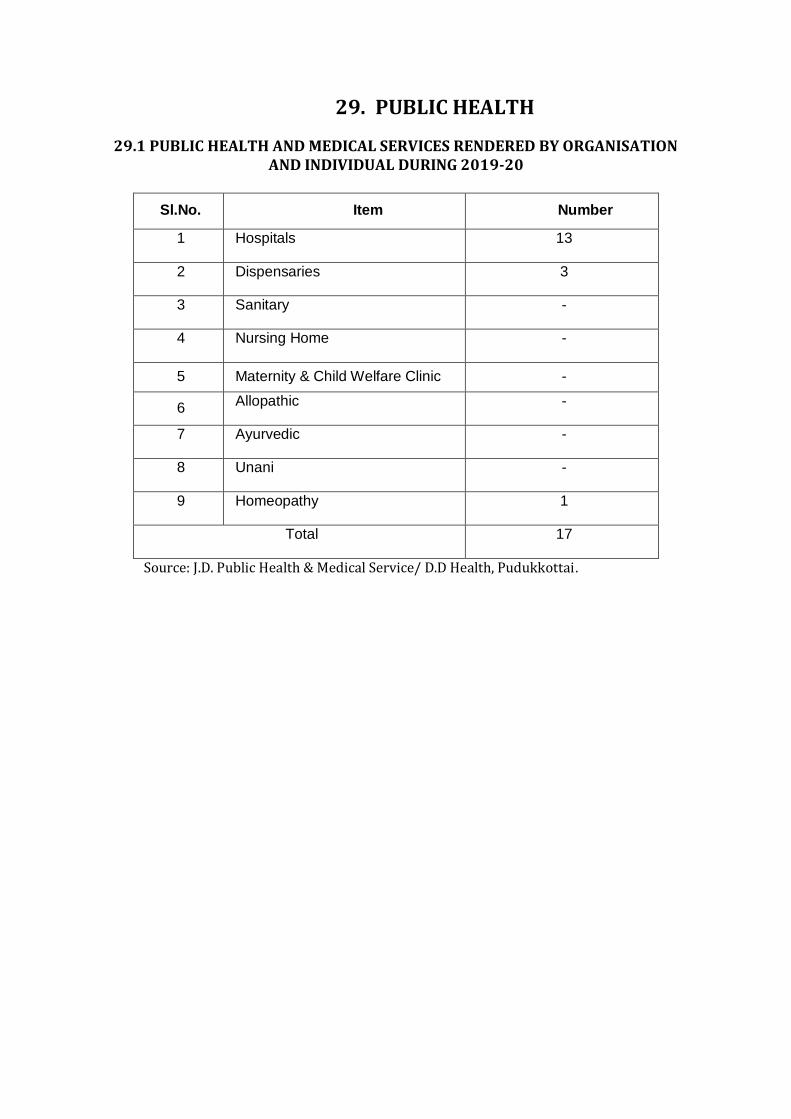
29. PUBLIC HEALTH
29.1 PUBLIC HEALTH AND MEDICAL SERVICES RENDERED BY ORGANISATION AND INDIVIDUAL DURING 2019-20
Sl.No. Item Number
1 Hospitals 13
2 Dispensaries 3
3 Sanitary -
4 Nursing Home -
5 Maternity & Child Welfare Clinic -
6 Allopathic -
7 Ayurvedic -
8 Unani -
9 Homeopathy 1
Total 17
Source: J.D. Public Health & Medical Service/ D.D Health, Pudukkottai.
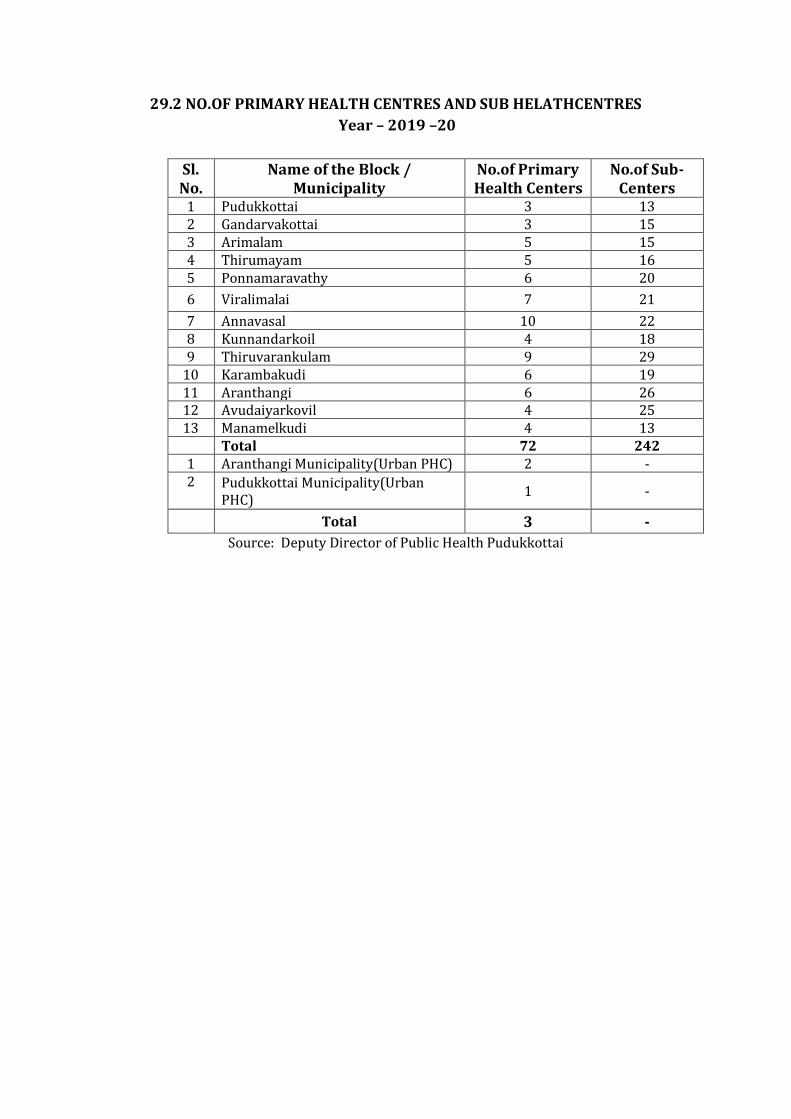
29.2 NO.OF PRIMARY HEALTH CENTRES AND SUB HELATHCENTRES
Year – 2019 –20
Sl. No.
Name of the Block / Municipality
No.of Primary Health Centers
No.of Sub-Centers
1 Pudukkottai 3 13 2 Gandarvakottai 3 15 3 Arimalam 5 15 4 Thirumayam 5 16 5 Ponnamaravathy 6 20
6 Viralimalai 7 21
7 Annavasal 10 22 8 Kunnandarkoil 4 18 9 Thiruvarankulam 9 29
10 Karambakudi 6 19 11 Aranthangi 6 26 12 Avudaiyarkovil 4 25 13 Manamelkudi 4 13
Total 72 242 1 Aranthangi Municipality(Urban PHC) 2 - 2 Pudukkottai Municipality(Urban
PHC) 1 -
Total 3 -
Source: Deputy Director of Public Health Pudukkottai
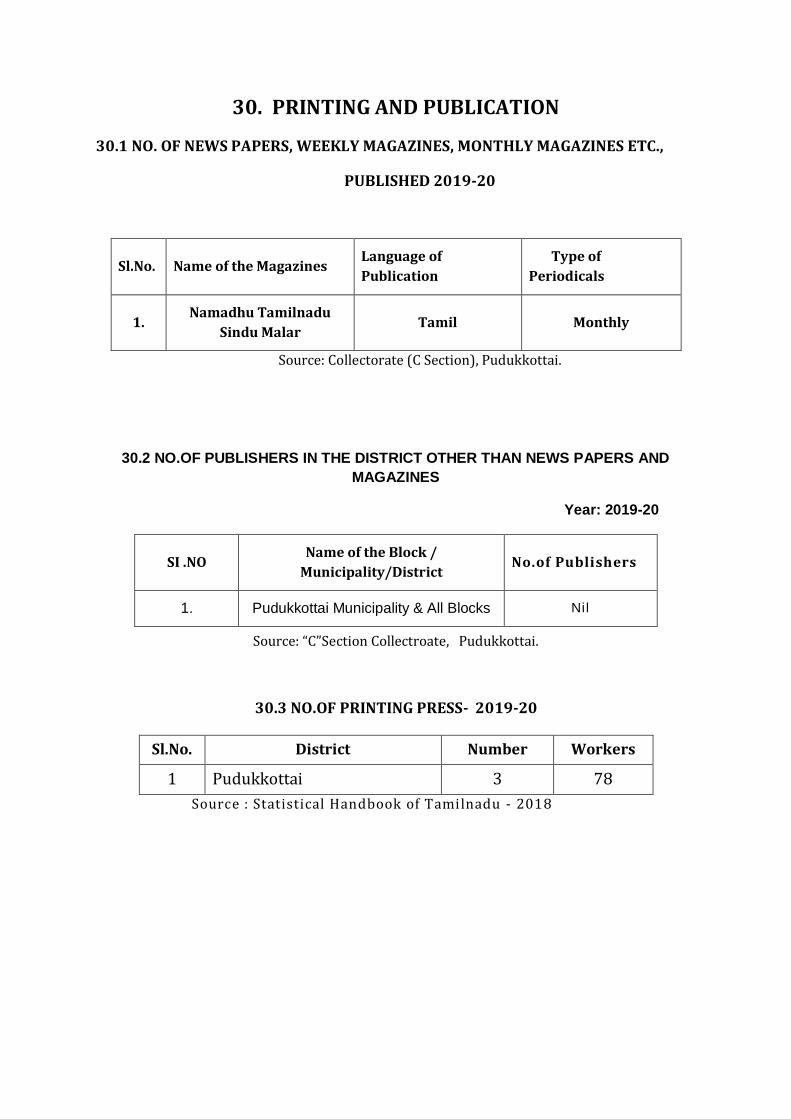
30. PRINTING AND PUBLICATION
30.1 NO. OF NEWS PAPERS, WEEKLY MAGAZINES, MONTHLY MAGAZINES ETC.,
PUBLISHED 2019-20
Sl.No. Name of the Magazines Language of
Publication
Type of
Periodicals
1. Namadhu Tamilnadu
Sindu Malar Tamil Monthly
Source: Collectorate (C Section), Pudukkottai.
30.2 NO.OF PUBLISHERS IN THE DISTRICT OTHER THAN NEWS PAPERS AND
MAGAZINES
Year: 2019-20
Source: “C”Section Collectroate, Pudukkottai.
30.3 NO.OF PRINTING PRESS- 2019-20
Sl.No. District Number Workers
1 Pudukkottai 3 78
Source : Statistical Handbook of Tamilnadu - 2018
SI .NO Name of the Block /
Municipality/District No.of Publishers
1. Pudukkottai Municipality & All Blocks Nil
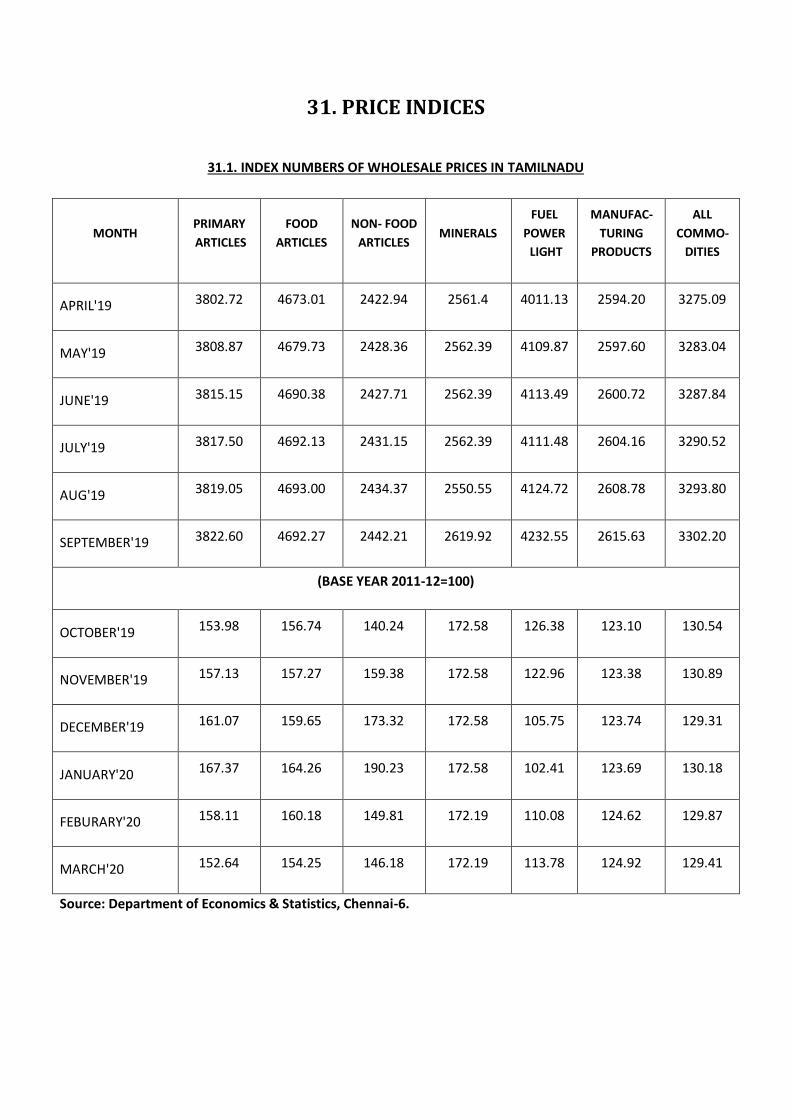
31. PRICE INDICES
31.1. INDEX NUMBERS OF WHOLESALE PRICES IN TAMILNADU
MONTH PRIMARY
ARTICLES
FOOD
ARTICLES
NON- FOOD
ARTICLES MINERALS
FUEL
POWER
LIGHT
MANUFAC-
TURING
PRODUCTS
ALL
COMMO-
DITIES
APRIL'19 3802.72 4673.01 2422.94 2561.4 4011.13 2594.20 3275.09
MAY'19 3808.87 4679.73 2428.36 2562.39 4109.87 2597.60 3283.04
JUNE'19 3815.15 4690.38 2427.71 2562.39 4113.49 2600.72 3287.84
JULY'19 3817.50 4692.13 2431.15 2562.39 4111.48 2604.16 3290.52
AUG'19 3819.05 4693.00 2434.37 2550.55 4124.72 2608.78 3293.80
SEPTEMBER'19 3822.60 4692.27 2442.21 2619.92 4232.55 2615.63 3302.20
(BASE YEAR 2011-12=100)
OCTOBER'19 153.98 156.74 140.24 172.58 126.38 123.10 130.54
NOVEMBER'19 157.13 157.27 159.38 172.58 122.96 123.38 130.89
DECEMBER'19 161.07 159.65 173.32 172.58 105.75 123.74 129.31
JANUARY'20 167.37 164.26 190.23 172.58 102.41 123.69 130.18
FEBURARY'20 158.11 160.18 149.81 172.19 110.08 124.62 129.87
MARCH'20 152.64 154.25 146.18 172.19 113.78 124.92 129.41
Source: Department of Economics & Statistics, Chennai-6.
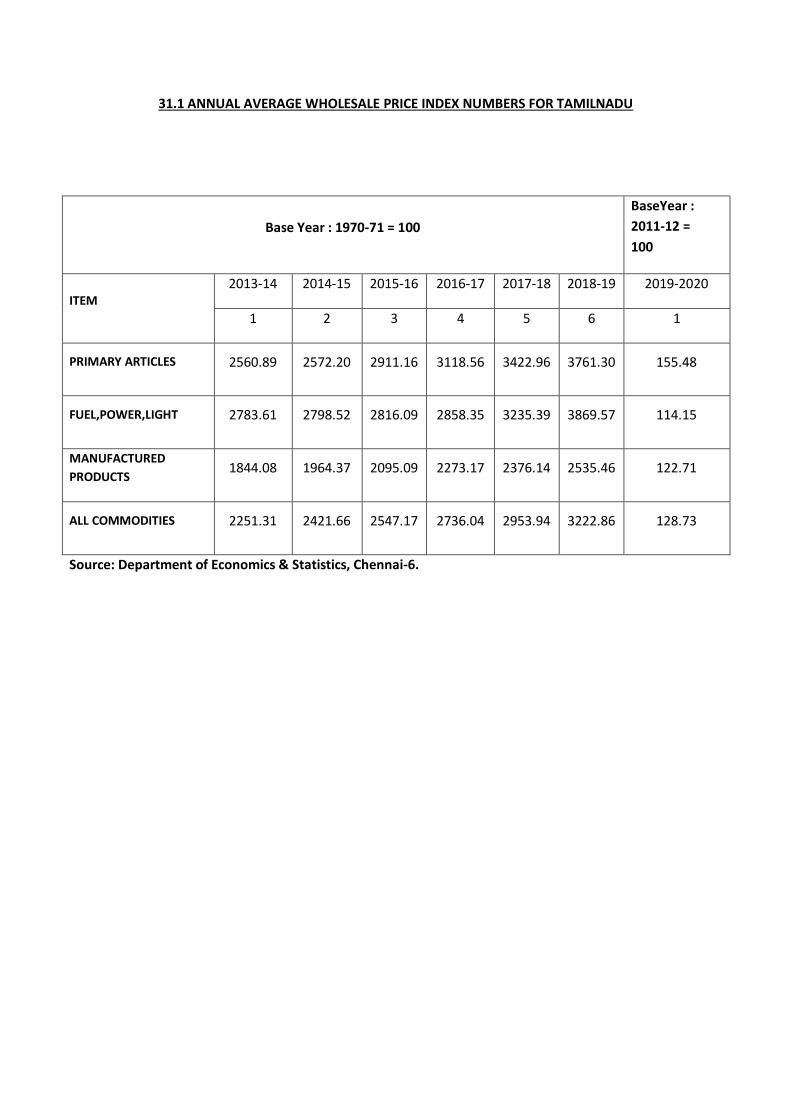
31.1 ANNUAL AVERAGE WHOLESALE PRICE INDEX NUMBERS FOR TAMILNADU
Base Year : 1970-71 = 100
BaseYear :
2011-12 =
100
ITEM 2013-14 2014-15 2015-16 2016-17 2017-18 2018-19 2019-2020
1 2 3 4 5 6 1
PRIMARY ARTICLES 2560.89 2572.20 2911.16 3118.56 3422.96 3761.30 155.48
FUEL,POWER,LIGHT 2783.61 2798.52 2816.09 2858.35 3235.39 3869.57 114.15
MANUFACTURED
PRODUCTS 1844.08 1964.37 2095.09 2273.17 2376.14 2535.46 122.71
ALL COMMODITIES 2251.31 2421.66 2547.17 2736.04 2953.94 3222.86 128.73
Source: Department of Economics & Statistics, Chennai-6.
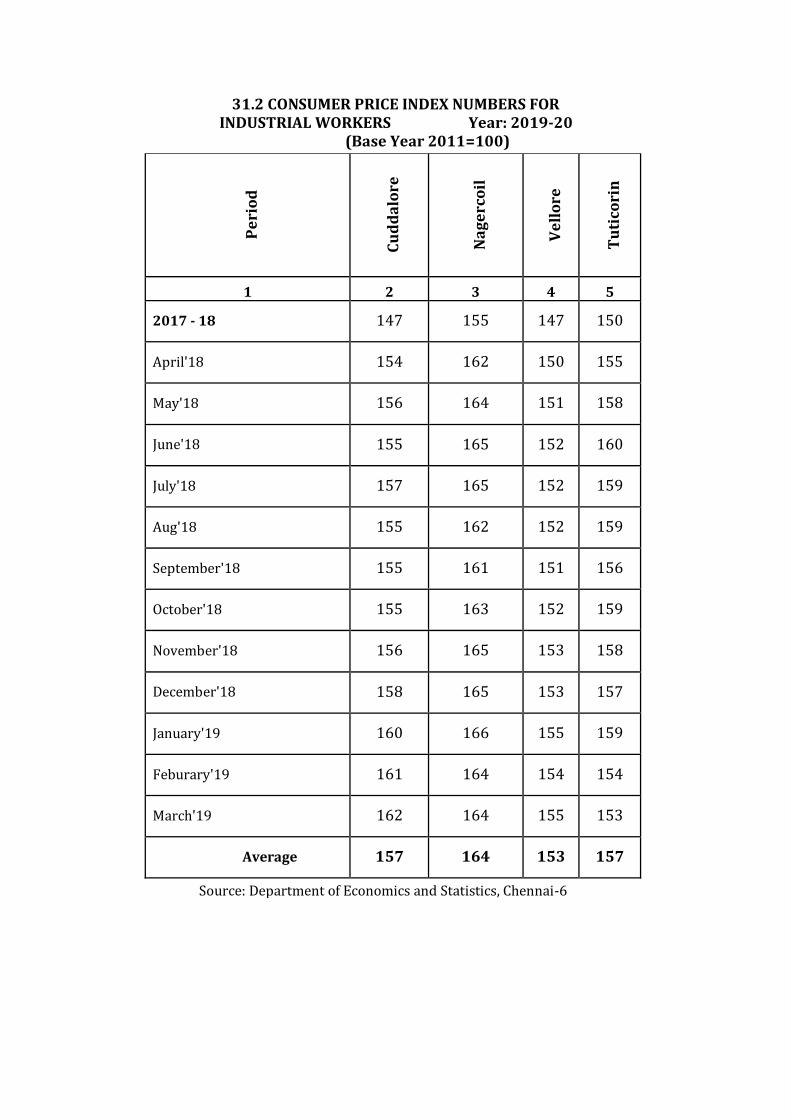
31.2 CONSUMER PRICE INDEX NUMBERS FOR INDUSTRIAL WORKERS Year: 2019-20
(Base Year 2011=100)
Pe
rio
d
Cu
dd
alo
re
Na
ge
rco
il
Ve
llo
re
Tu
tico
rin
1 2 3 4 5
2017 - 18 147 155 147 150
April'18 154 162 150 155
May'18 156 164 151 158
June'18 155 165 152 160
July'18 157 165 152 159
Aug'18 155 162 152 159
September'18 155 161 151 156
October'18 155 163 152 159
November'18 156 165 153 158
December'18 158 165 153 157
January'19 160 166 155 159
Feburary'19 161 164 154 154
March'19 162 164 155 153
Average 157 164 153 157
Source: Department of Economics and Statistics, Chennai-6
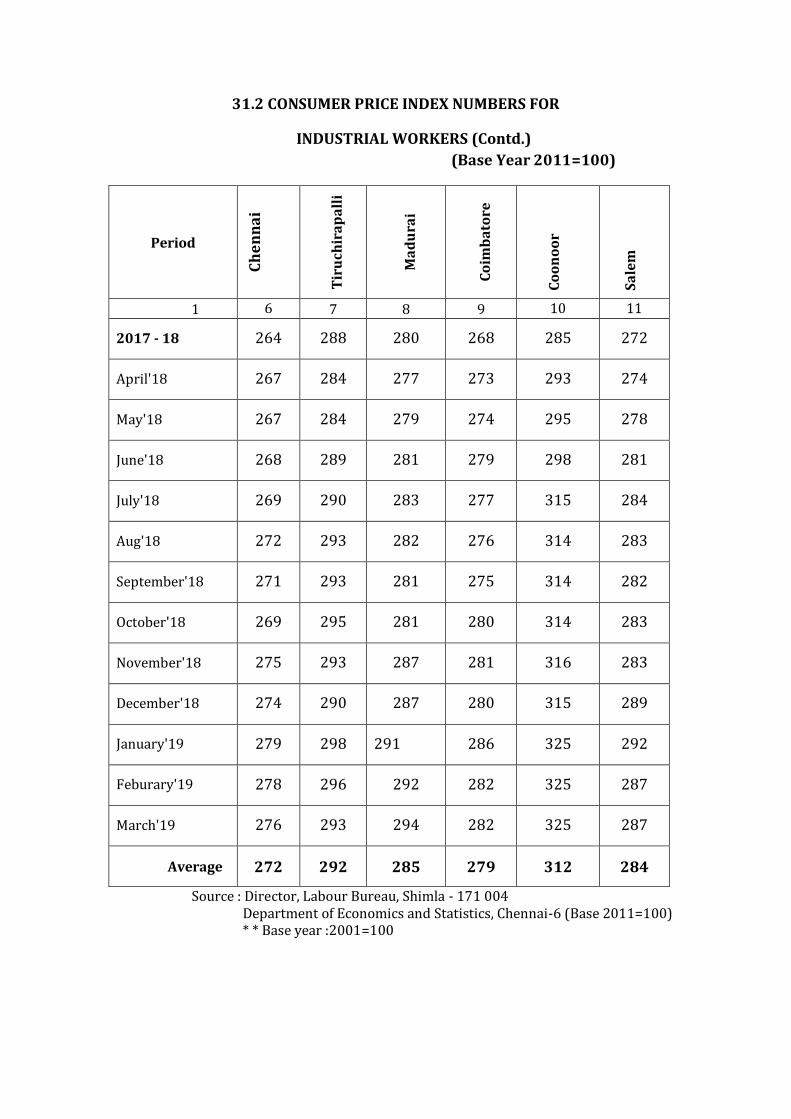
31.2 CONSUMER PRICE INDEX NUMBERS FOR
INDUSTRIAL WORKERS (Contd.)
(Base Year 2011=100)
Period C
he
nn
ai
Tir
uch
ira
pa
lli
Ma
du
rai
Co
imb
ato
re
Co
on
oo
r
Sa
lem
1 6 7 8 9 10 11
2017 - 18 264 288 280 268 285 272
April'18 267 284 277 273 293 274
May'18 267 284 279 274 295 278
June'18 268 289 281 279 298 281
July'18 269 290 283 277 315 284
Aug'18 272 293 282 276 314 283
September'18 271 293 281 275 314 282
October'18 269 295 281 280 314 283
November'18 275 293 287 281 316 283
December'18 274 290 287 280 315 289
January'19 279 298 291 286 325 292
Feburary'19 278 296 292 282 325 287
March'19 276 293 294 282 325 287
Average 272 292 285 279 312 284
Source : Director, Labour Bureau, Shimla - 171 004 Department of Economics and Statistics, Chennai-6 (Base 2011=100) * * Base year :2001=100
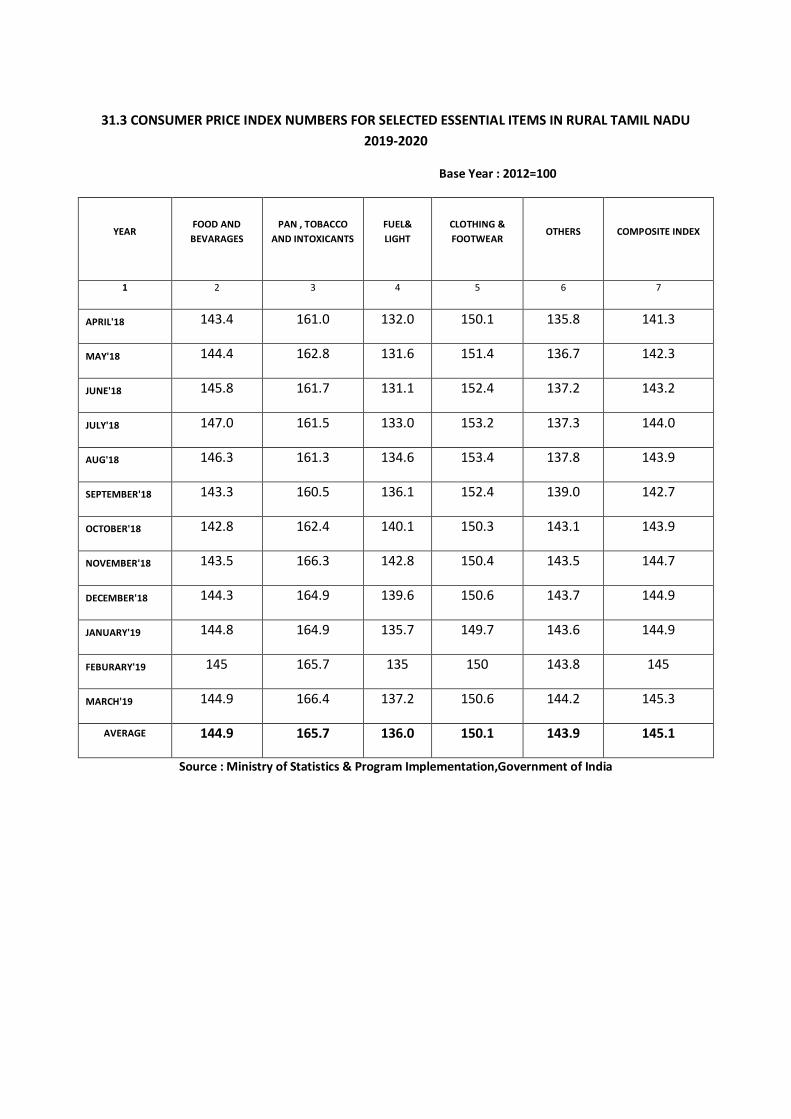
31.3 CONSUMER PRICE INDEX NUMBERS FOR SELECTED ESSENTIAL ITEMS IN RURAL TAMIL NADU
2019-2020
Base Year : 2012=100
YEAR FOOD AND
BEVARAGES
PAN , TOBACCO
AND INTOXICANTS
FUEL&
LIGHT
CLOTHING &
FOOTWEAR OTHERS COMPOSITE INDEX
1 2 3 4 5 6 7
APRIL'18 143.4 161.0 132.0 150.1 135.8 141.3
MAY'18 144.4 162.8 131.6 151.4 136.7 142.3
JUNE'18 145.8 161.7 131.1 152.4 137.2 143.2
JULY'18 147.0 161.5 133.0 153.2 137.3 144.0
AUG'18 146.3 161.3 134.6 153.4 137.8 143.9
SEPTEMBER'18 143.3 160.5 136.1 152.4 139.0 142.7
OCTOBER'18 142.8 162.4 140.1 150.3 143.1 143.9
NOVEMBER'18 143.5 166.3 142.8 150.4 143.5 144.7
DECEMBER'18 144.3 164.9 139.6 150.6 143.7 144.9
JANUARY'19 144.8 164.9 135.7 149.7 143.6 144.9
FEBURARY'19 145 165.7 135 150 143.8 145
MARCH'19 144.9 166.4 137.2 150.6 144.2 145.3
AVERAGE 144.9 165.7 136.0 150.1 143.9 145.1
Source : Ministry of Statistics & Program Implementation,Government of India
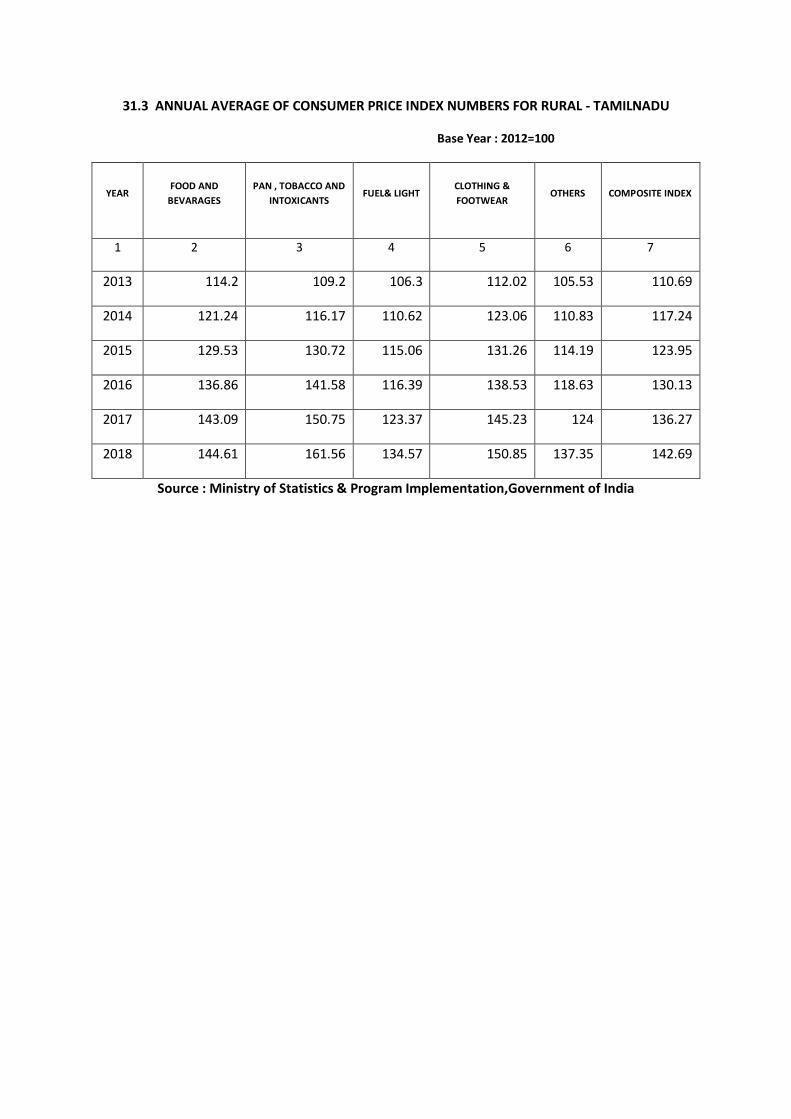
31.3 ANNUAL AVERAGE OF CONSUMER PRICE INDEX NUMBERS FOR RURAL - TAMILNADU
Base Year : 2012=100
YEAR FOOD AND
BEVARAGES
PAN , TOBACCO AND
INTOXICANTS FUEL& LIGHT
CLOTHING &
FOOTWEAR OTHERS COMPOSITE INDEX
1 2 3 4 5 6 7
2013 114.2 109.2 106.3 112.02 105.53 110.69
2014 121.24 116.17 110.62 123.06 110.83 117.24
2015 129.53 130.72 115.06 131.26 114.19 123.95
2016 136.86 141.58 116.39 138.53 118.63 130.13
2017 143.09 150.75 123.37 145.23 124 136.27
2018 144.61 161.56 134.57 150.85 137.35 142.69
Source : Ministry of Statistics & Program Implementation,Government of India
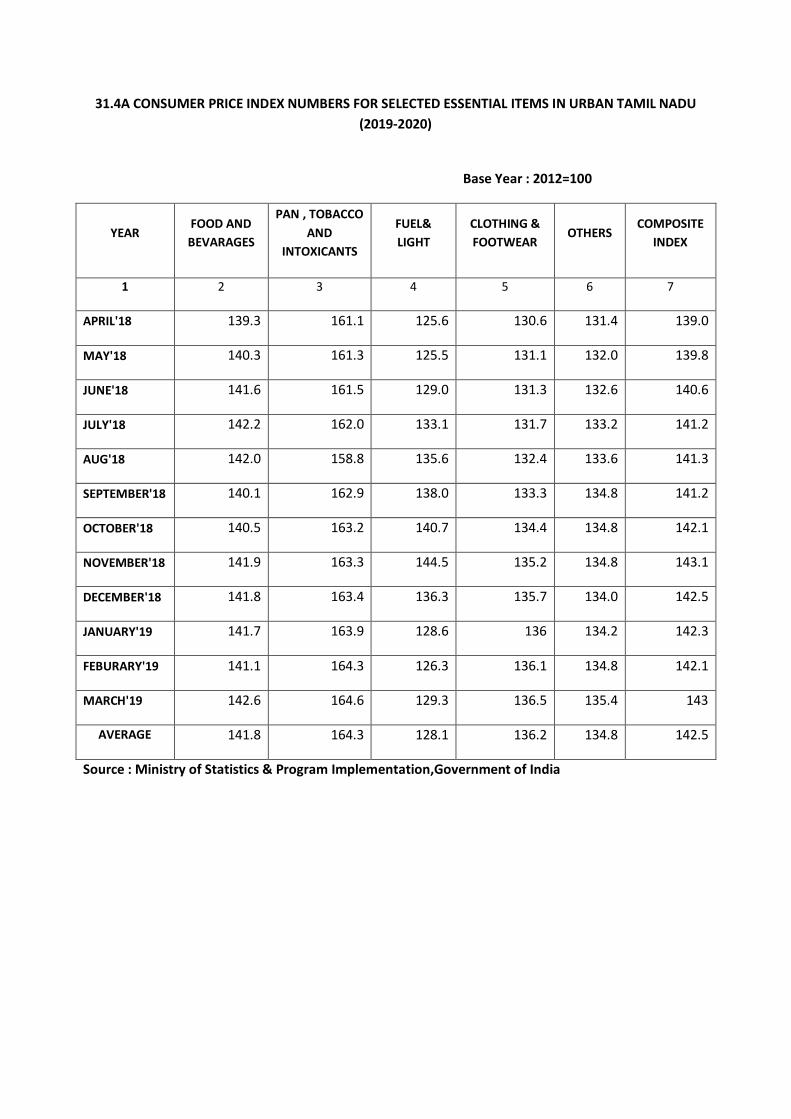
31.4A CONSUMER PRICE INDEX NUMBERS FOR SELECTED ESSENTIAL ITEMS IN URBAN TAMIL NADU
(2019-2020)
Base Year : 2012=100
YEAR FOOD AND
BEVARAGES
PAN , TOBACCO
AND
INTOXICANTS
FUEL&
LIGHT
CLOTHING &
FOOTWEAR OTHERS
COMPOSITE
INDEX
1 2 3 4 5 6 7
APRIL'18 139.3 161.1 125.6 130.6 131.4 139.0
MAY'18 140.3 161.3 125.5 131.1 132.0 139.8
JUNE'18 141.6 161.5 129.0 131.3 132.6 140.6
JULY'18 142.2 162.0 133.1 131.7 133.2 141.2
AUG'18 142.0 158.8 135.6 132.4 133.6 141.3
SEPTEMBER'18 140.1 162.9 138.0 133.3 134.8 141.2
OCTOBER'18 140.5 163.2 140.7 134.4 134.8 142.1
NOVEMBER'18 141.9 163.3 144.5 135.2 134.8 143.1
DECEMBER'18 141.8 163.4 136.3 135.7 134.0 142.5
JANUARY'19 141.7 163.9 128.6 136 134.2 142.3
FEBURARY'19 141.1 164.3 126.3 136.1 134.8 142.1
MARCH'19 142.6 164.6 129.3 136.5 135.4 143
AVERAGE 141.8 164.3 128.1 136.2 134.8 142.5
Source : Ministry of Statistics & Program Implementation,Government of India
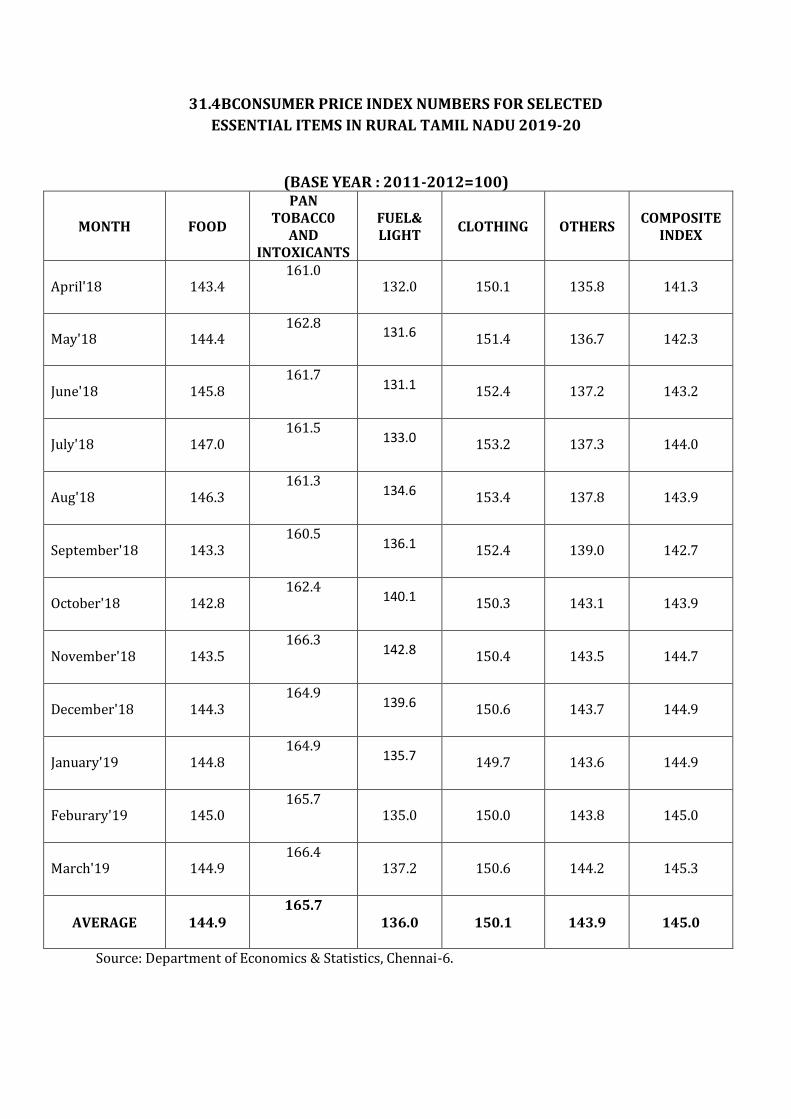
31.4BCONSUMER PRICE INDEX NUMBERS FOR SELECTED
ESSENTIAL ITEMS IN RURAL TAMIL NADU 2019-20
(BASE YEAR : 2011-2012=100)
MONTH FOOD
PAN TOBACC0
AND INTOXICANTS
FUEL& LIGHT
CLOTHING OTHERS COMPOSITE
INDEX
April'18 143.4 161.0
132.0 150.1 135.8 141.3
May'18 144.4 162.8
131.6 151.4 136.7 142.3
June'18 145.8 161.7
131.1 152.4 137.2 143.2
July'18 147.0 161.5
133.0 153.2 137.3 144.0
Aug'18 146.3 161.3
134.6 153.4 137.8 143.9
September'18 143.3 160.5
136.1 152.4 139.0 142.7
October'18 142.8 162.4
140.1 150.3 143.1 143.9
November'18 143.5 166.3
142.8 150.4 143.5 144.7
December'18 144.3 164.9
139.6 150.6 143.7 144.9
January'19 144.8 164.9
135.7 149.7 143.6 144.9
Feburary'19 145.0 165.7
135.0 150.0 143.8 145.0
March'19 144.9 166.4
137.2 150.6 144.2 145.3
AVERAGE 144.9 165.7
136.0 150.1 143.9 145.0
Source: Department of Economics & Statistics, Chennai-6.
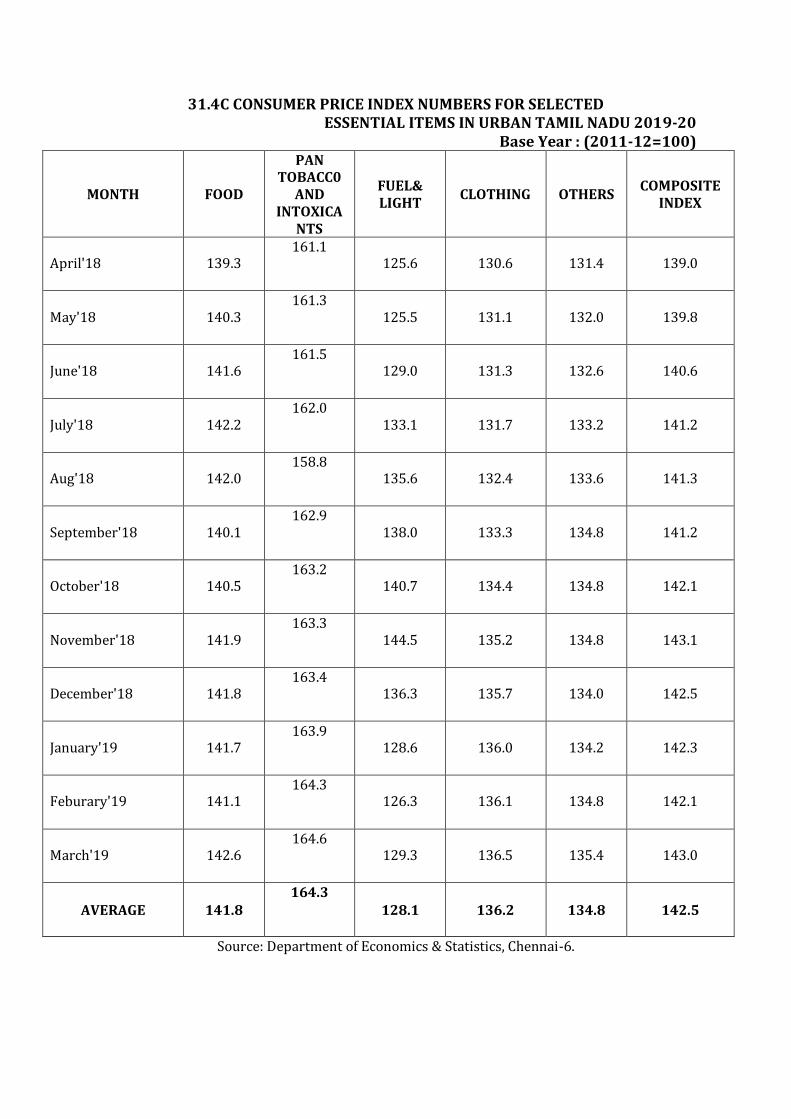
31.4C CONSUMER PRICE INDEX NUMBERS FOR SELECTED ESSENTIAL ITEMS IN URBAN TAMIL NADU 2019-20
Base Year : (2011-12=100)
MONTH FOOD
PAN TOBACC0
AND INTOXICA
NTS
FUEL& LIGHT
CLOTHING OTHERS COMPOSITE
INDEX
April'18 139.3 161.1
125.6 130.6 131.4 139.0
May'18 140.3 161.3
125.5 131.1 132.0 139.8
June'18 141.6 161.5
129.0 131.3 132.6 140.6
July'18 142.2 162.0
133.1 131.7 133.2 141.2
Aug'18 142.0 158.8
135.6 132.4 133.6 141.3
September'18 140.1 162.9
138.0 133.3 134.8 141.2
October'18 140.5 163.2
140.7 134.4 134.8 142.1
November'18 141.9 163.3
144.5 135.2 134.8 143.1
December'18 141.8 163.4
136.3 135.7 134.0 142.5
January'19 141.7 163.9
128.6 136.0 134.2 142.3
Feburary'19 141.1 164.3
126.3 136.1 134.8 142.1
March'19 142.6 164.6
129.3 136.5 135.4 143.0
AVERAGE 141.8 164.3
128.1 136.2 134.8 142.5
Source: Department of Economics & Statistics, Chennai-6.

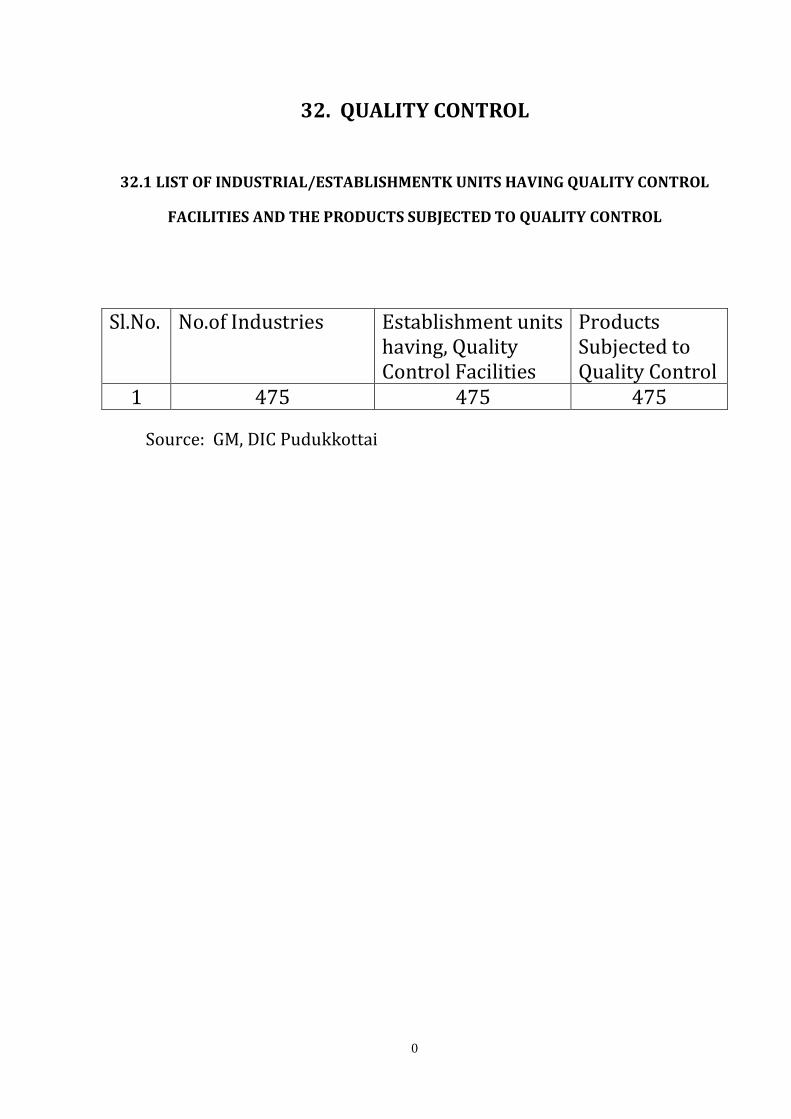
0
32. QUALITY CONTROL
32.1 LIST OF INDUSTRIAL/ESTABLISHMENTK UNITS HAVING QUALITY CONTROL
FACILITIES AND THE PRODUCTS SUBJECTED TO QUALITY CONTROL
Sl.No. No.of Industries Establishment units having, Quality Control Facilities
Products Subjected to Quality Control
1 475 475 475
Source: GM, DIC Pudukkottai
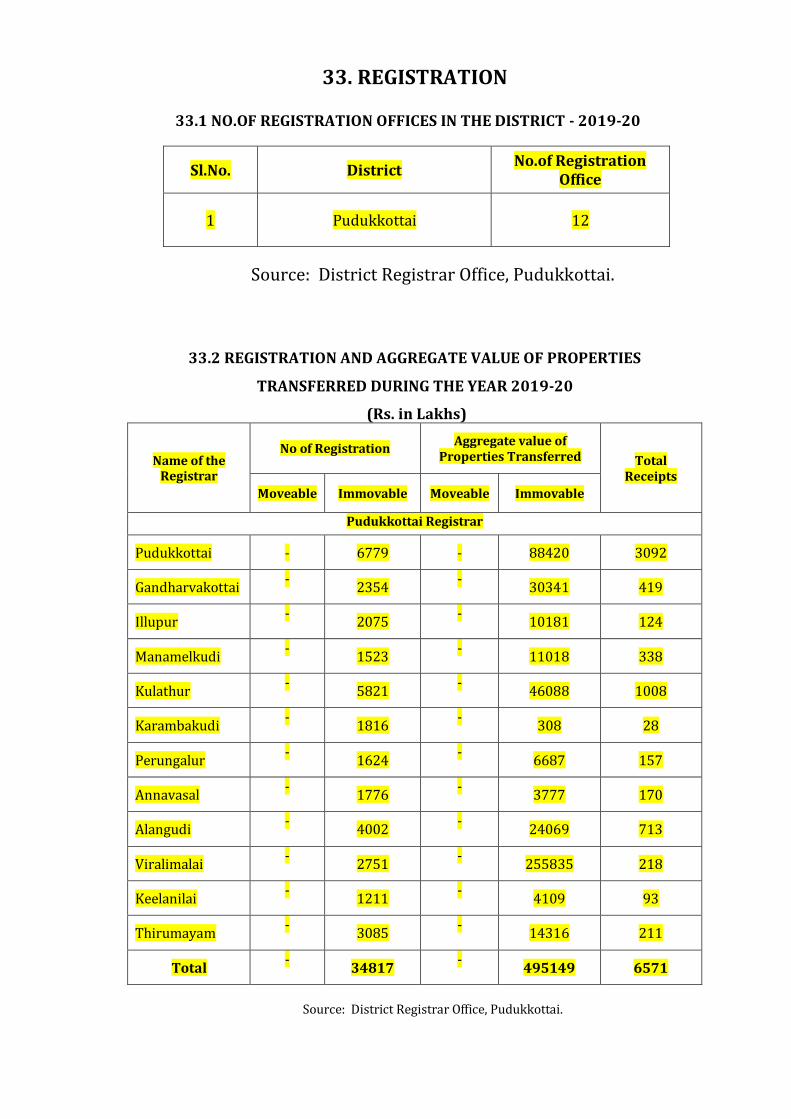
33. REGISTRATION
33.1 NO.OF REGISTRATION OFFICES IN THE DISTRICT - 2019-20
Sl.No. District No.of Registration
Office
1 Pudukkottai 12
Source: District Registrar Office, Pudukkottai.
33.2 REGISTRATION AND AGGREGATE VALUE OF PROPERTIES
TRANSFERRED DURING THE YEAR 2019-20
(Rs. in Lakhs)
Name of the Registrar
No of Registration Aggregate value of
Properties Transferred
Total Receipts
Moveable Immovable Moveable Immovable
Pudukkottai Registrar
Pudukkottai - 6779 - 88420 3092
Gandharvakottai -
2354 -
30341 419
Illupur -
2075 -
10181 124
Manamelkudi -
1523 -
11018 338
Kulathur -
5821 -
46088 1008
Karambakudi -
1816 -
308 28
Perungalur -
1624 -
6687 157
Annavasal -
1776 -
3777 170
Alangudi -
4002 -
24069 713
Viralimalai -
2751 -
255835 218
Keelanilai -
1211 -
4109 93
Thirumayam -
3085 -
14316 211
Total -
34817 -
495149 6571
Source: District Registrar Office, Pudukkottai.
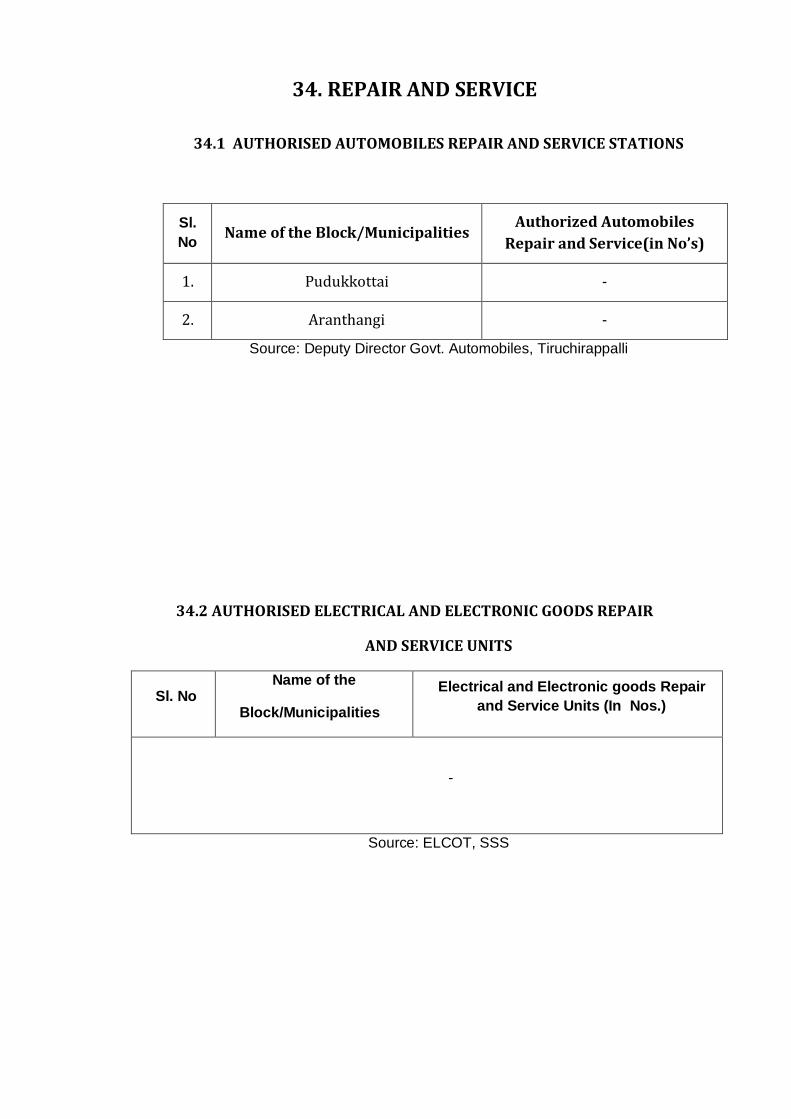
34. REPAIR AND SERVICE
34.1 AUTHORISED AUTOMOBILES REPAIR AND SERVICE STATIONS
Sl.
No Name of the Block/Municipalities
Authorized Automobiles
Repair and Service(in No’s)
1. Pudukkottai -
2. Aranthangi -
Source: Deputy Director Govt. Automobiles, Tiruchirappalli
34.2 AUTHORISED ELECTRICAL AND ELECTRONIC GOODS REPAIR
AND SERVICE UNITS
Sl. No Name of the
Block/Municipalities
Electrical and Electronic goods Repair
and Service Units (In Nos.)
-
Source: ELCOT, SSS
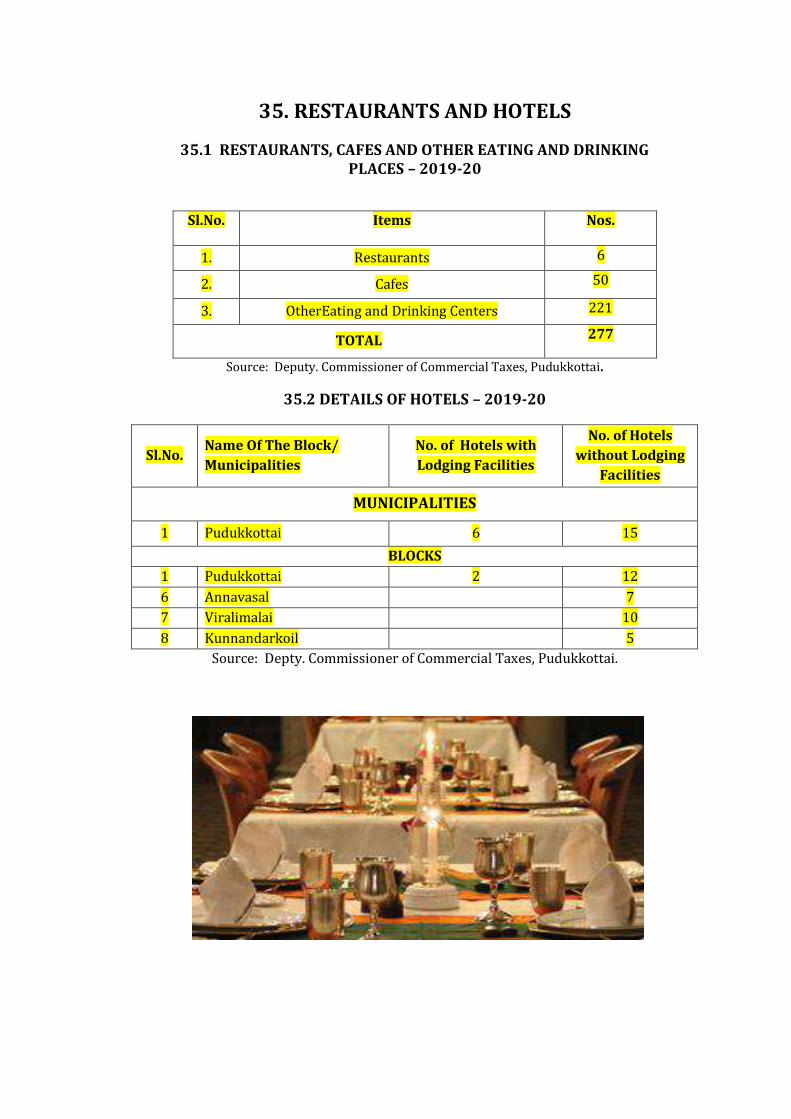
35. RESTAURANTS AND HOTELS
35.1 RESTAURANTS, CAFES AND OTHER EATING AND DRINKING PLACES – 2019-20
Sl.No.
Items
Nos.
1. Restaurants 6
2. Cafes 50
3. OtherEating and Drinking Centers 221
TOTAL 277
Source: Deputy. Commissioner of Commercial Taxes, Pudukkottai.
35.2 DETAILS OF HOTELS – 2019-20
Sl.No. Name Of The Block/
Municipalities
No. of Hotels with
Lodging Facilities
No. of Hotels
without Lodging
Facilities
MUNICIPALITIES
1 Pudukkottai 6 15
BLOCKS
1 Pudukkottai 2 12
6 Annavasal
7
7 Viralimalai
10
8 Kunnandarkoil
5
Source: Depty. Commissioner of Commercial Taxes, Pudukkottai.
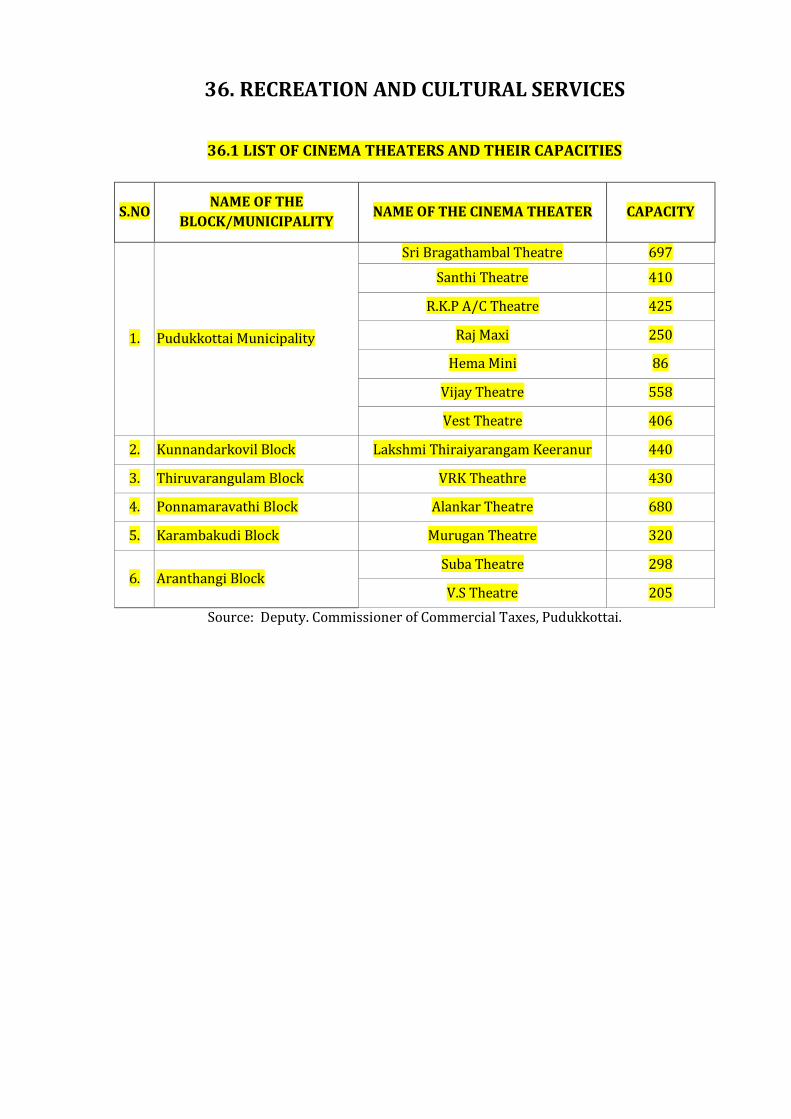
36. RECREATION AND CULTURAL SERVICES
36.1 LIST OF CINEMA THEATERS AND THEIR CAPACITIES
S.NO NAME OF THE
BLOCK/MUNICIPALITY NAME OF THE CINEMA THEATER CAPACITY
1. Pudukkottai Municipality
Sri Bragathambal Theatre 697
Santhi Theatre 410
R.K.P A/C Theatre 425
Raj Maxi 250
Hema Mini 86
Vijay Theatre 558
Vest Theatre 406
2. Kunnandarkovil Block Lakshmi Thiraiyarangam Keeranur 440
3. Thiruvarangulam Block VRK Theathre 430
4. Ponnamaravathi Block Alankar Theatre 680
5. Karambakudi Block Murugan Theatre 320
6. Aranthangi Block Suba Theatre 298
V.S Theatre 205
Source: Deputy. Commissioner of Commercial Taxes, Pudukkottai.
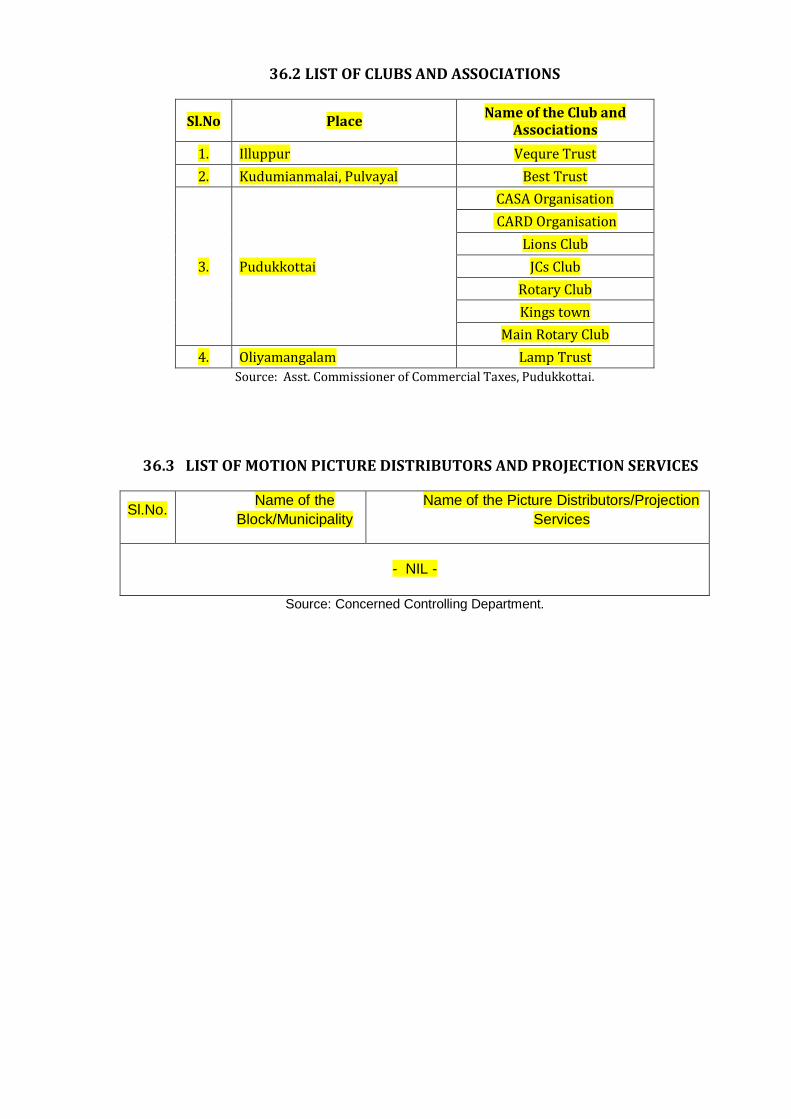
36.2 LIST OF CLUBS AND ASSOCIATIONS
Sl.No Place Name of the Club and
Associations
1. Illuppur Vequre Trust
2. Kudumianmalai, Pulvayal Best Trust
3. Pudukkottai
CASA Organisation
CARD Organisation
Lions Club
JCs Club
Rotary Club
Kings town
Main Rotary Club
4. Oliyamangalam Lamp Trust
Source: Asst. Commissioner of Commercial Taxes, Pudukkottai.
36.3 LIST OF MOTION PICTURE DISTRIBUTORS AND PROJECTION SERVICES
Sl.No. Name of the
Block/Municipality
Name of the Picture Distributors/Projection
Services
- NIL -
Source: Concerned Controlling Department.
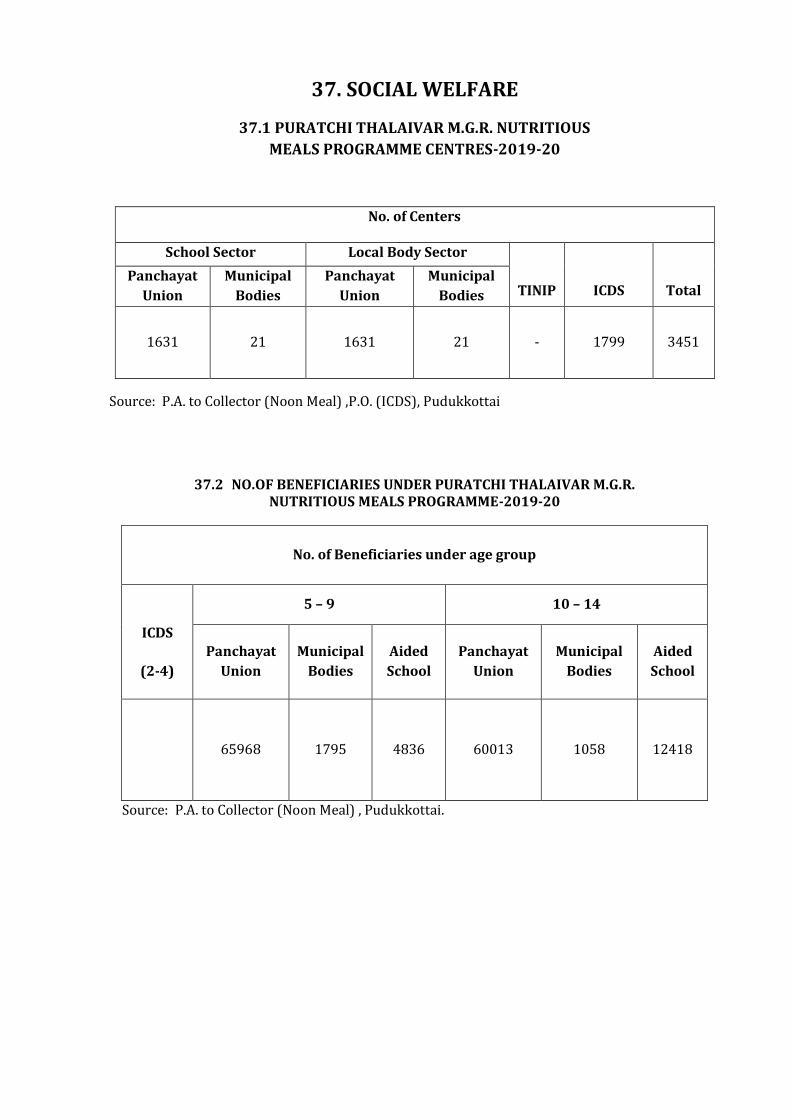
37. SOCIAL WELFARE
37.1 PURATCHI THALAIVAR M.G.R. NUTRITIOUS
MEALS PROGRAMME CENTRES-2019-20
Source: P.A. to Collector (Noon Meal) ,P.O. (ICDS), Pudukkottai
37.2 NO.OF BENEFICIARIES UNDER PURATCHI THALAIVAR M.G.R. NUTRITIOUS MEALS PROGRAMME-2019-20
No. of Beneficiaries under age group
ICDS
(2-4)
5 – 9 10 – 14
Panchayat
Union
Municipal
Bodies
Aided
School
Panchayat
Union
Municipal
Bodies
Aided
School
65968 1795 4836 60013 1058 12418
Source: P.A. to Collector (Noon Meal) , Pudukkottai.
No. of Centers
School Sector Local Body Sector
TINIP
ICDS
Total Panchayat
Union
Municipal
Bodies
Panchayat
Union
Municipal
Bodies
1631 21 1631 21 - 1799 3451
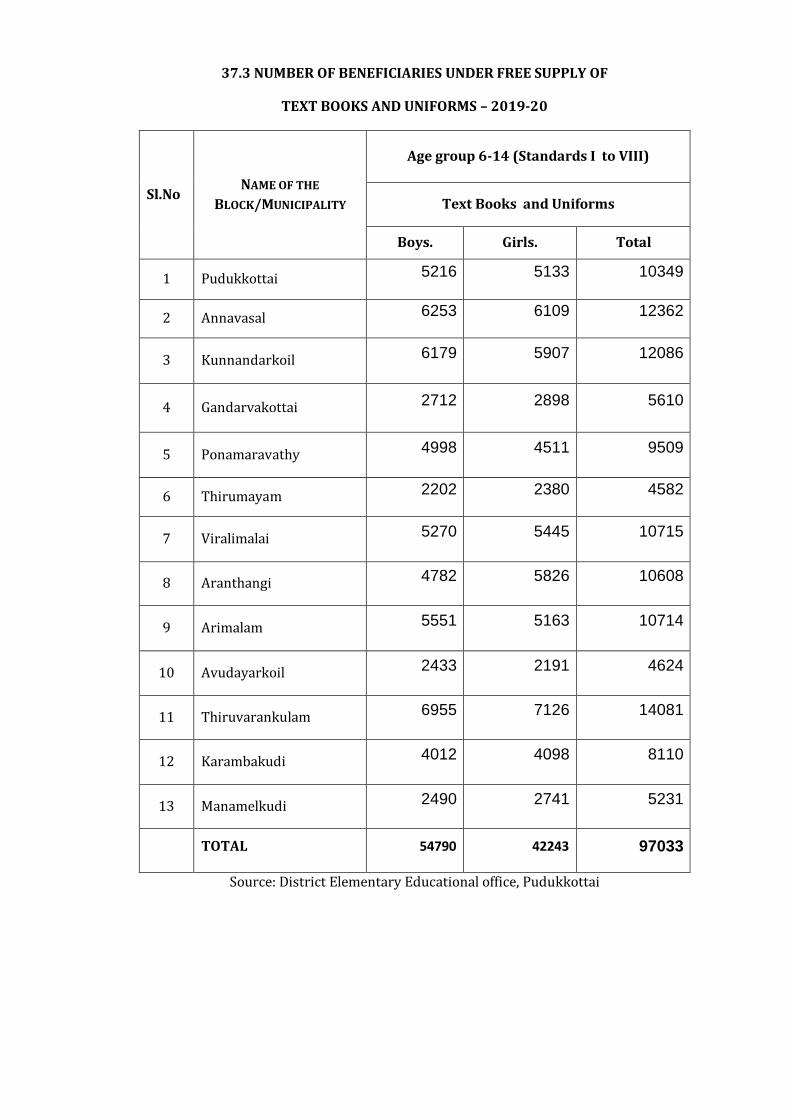
37.3 NUMBER OF BENEFICIARIES UNDER FREE SUPPLY OF
TEXT BOOKS AND UNIFORMS – 2019-20
Sl.No NAME OF THE
BLOCK/MUNICIPALITY
Age group 6-14 (Standards I to VIII)
Text Books and Uniforms
Boys. Girls. Total
1 Pudukkottai 5216 5133 10349
2 Annavasal 6253 6109 12362
3 Kunnandarkoil 6179 5907 12086
4 Gandarvakottai 2712 2898 5610
5 Ponamaravathy 4998 4511 9509
6 Thirumayam 2202 2380 4582
7 Viralimalai 5270 5445 10715
8 Aranthangi 4782 5826 10608
9 Arimalam 5551 5163 10714
10 Avudayarkoil 2433 2191 4624
11 Thiruvarankulam 6955 7126 14081
12 Karambakudi 4012 4098 8110
13 Manamelkudi 2490 2741 5231
TOTAL 54790 42243 97033
Source: District Elementary Educational office, Pudukkottai
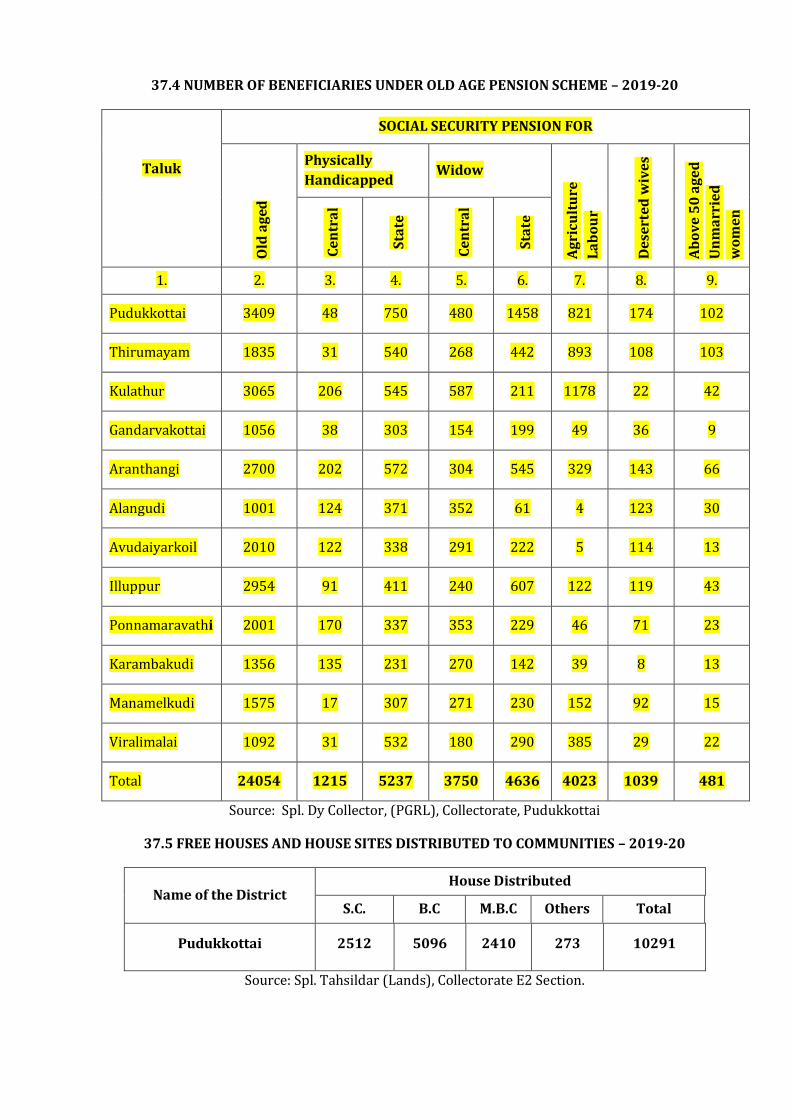
37.4 NUMBER OF BENEFICIARIES UNDER OLD AGE PENSION SCHEME – 2019-20
Taluk
SOCIAL SECURITY PENSION FOR
Old
ag
ed
Physically
Handicapped Widow
Ag
ricu
ltu
re
La
bo
ur
De
sert
ed
wiv
es
Ab
ov
e 5
0 a
ge
d
Un
ma
rrie
d
wo
me
n
Ce
ntr
al
Sta
te
Ce
ntr
al
Sta
te
1. 2. 3. 4. 5. 6. 7. 8. 9.
Pudukkottai 3409 48 750 480 1458 821 174 102
Thirumayam 1835 31 540 268 442 893 108 103
Kulathur 3065 206 545 587 211 1178 22 42
Gandarvakottai 1056 38 303 154 199 49 36 9
Aranthangi 2700 202 572 304 545 329 143 66
Alangudi 1001 124 371 352 61 4 123 30
Avudaiyarkoil 2010 122 338 291 222 5 114 13
Illuppur 2954 91 411 240 607 122 119 43
Ponnamaravathi 2001 170 337 353 229 46 71 23
Karambakudi 1356 135 231 270 142 39 8 13
Manamelkudi 1575 17 307 271 230 152 92 15
Viralimalai 1092 31 532 180 290 385 29 22
Total 24054 1215 5237 3750 4636 4023 1039 481
Source: Spl. Dy Collector, (PGRL), Collectorate, Pudukkottai
37.5 FREE HOUSES AND HOUSE SITES DISTRIBUTED TO COMMUNITIES – 2019-20
Name of the District House Distributed
S.C. B.C M.B.C Others Total
Pudukkottai 2512 5096 2410 273 10291
Source: Spl. Tahsildar (Lands), Collectorate E2 Section.
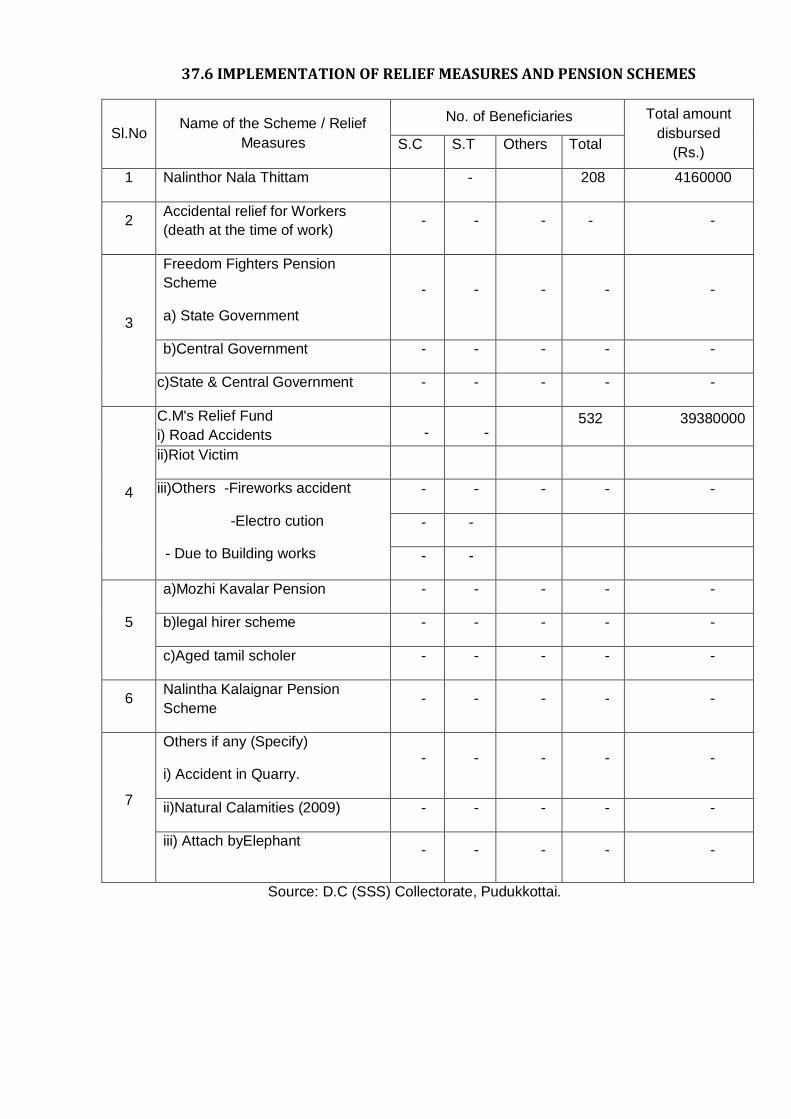
37.6 IMPLEMENTATION OF RELIEF MEASURES AND PENSION SCHEMES
Sl.No Name of the Scheme / Relief
Measures
No. of Beneficiaries Total amount
disbursed
(Rs.) S.C S.T Others Total
1 Nalinthor Nala Thittam - 208 4160000
2 Accidental relief for Workers
(death at the time of work) - - - - -
3
Freedom Fighters Pension
Scheme
a) State Government
- - - - -
b)Central Government - - - - -
c)State & Central Government - - - - -
4
C.M's Relief Fund
i) Road Accidents
-
-
532 39380000
ii)Riot Victim
iii)Others -Fireworks accident
-Electro cution
- Due to Building works
- - - - -
- -
- -
5
a)Mozhi Kavalar Pension - - - - -
b)legal hirer scheme - - - - -
c)Aged tamil scholer - - - - -
6 Nalintha Kalaignar Pension
Scheme - - - - -
7
Others if any (Specify)
i) Accident in Quarry. - - - - -
ii)Natural Calamities (2009) - - - - -
iii) Attach byElephant - - - - -
Source: D.C (SSS) Collectorate, Pudukkottai.
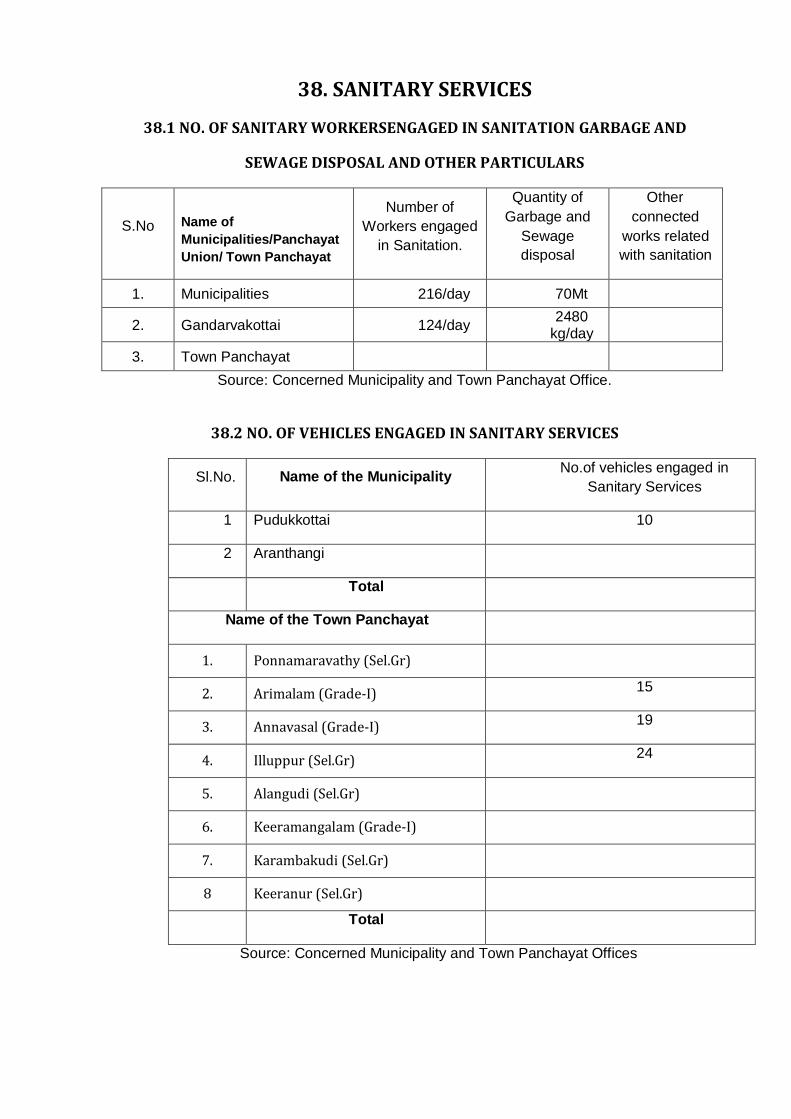
38. SANITARY SERVICES
38.1 NO. OF SANITARY WORKERSENGAGED IN SANITATION GARBAGE AND
SEWAGE DISPOSAL AND OTHER PARTICULARS
S.No Name of
Municipalities/Panchayat
Union/ Town Panchayat
Number of
Workers engaged
in Sanitation.
Quantity of
Garbage and
Sewage
disposal
Other
connected
works related
with sanitation
1. Municipalities 216/day 70Mt
2. Gandarvakottai 124/day 2480
kg/day
3. Town Panchayat
Source: Concerned Municipality and Town Panchayat Office.
38.2 NO. OF VEHICLES ENGAGED IN SANITARY SERVICES
Sl.No. Name of the Municipality No.of vehicles engaged in
Sanitary Services
1 Pudukkottai 10
2 Aranthangi
Total
Name of the Town Panchayat
1. Ponnamaravathy (Sel.Gr)
2. Arimalam (Grade-I) 15
3. Annavasal (Grade-I) 19
4. Illuppur (Sel.Gr) 24
5. Alangudi (Sel.Gr)
6. Keeramangalam (Grade-I)
7. Karambakudi (Sel.Gr)
8 Keeranur (Sel.Gr)
Total
Source: Concerned Municipality and Town Panchayat Offices
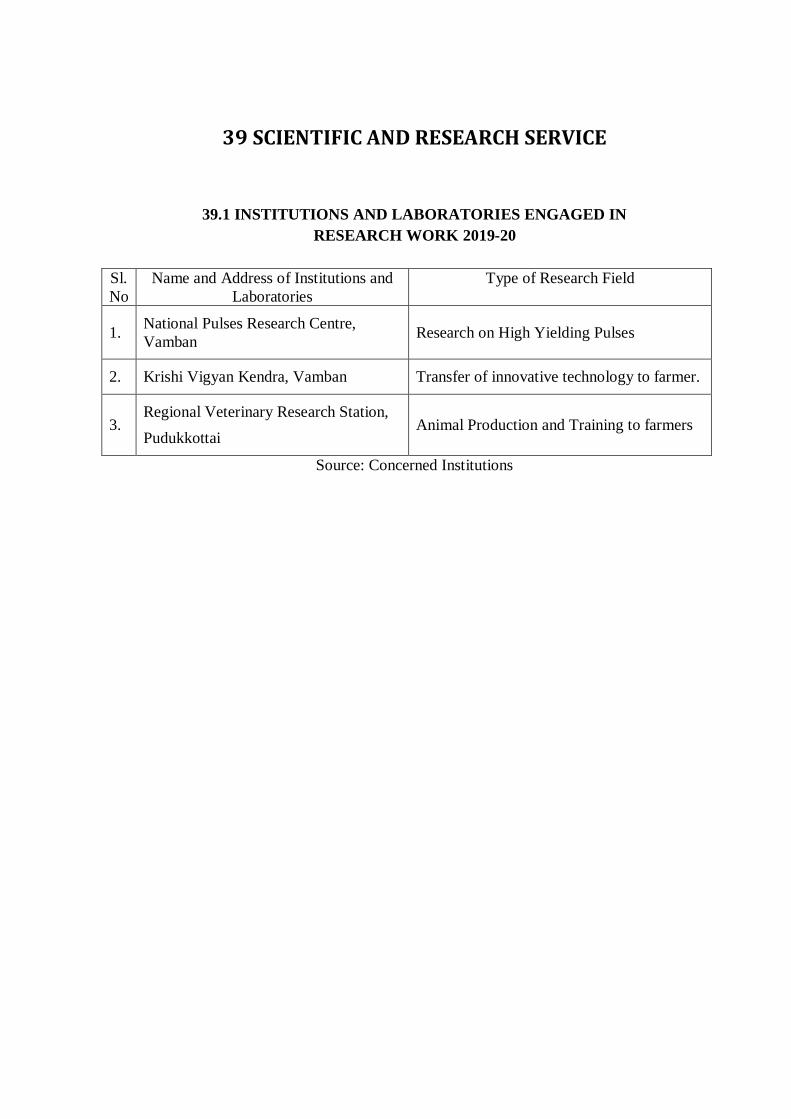
39 SCIENTIFIC AND RESEARCH SERVICE
39.1 INSTITUTIONS AND LABORATORIES ENGAGED IN
RESEARCH WORK 2019-20
Sl.
No
Name and Address of Institutions and
Laboratories
Type of Research Field
1. National Pulses Research Centre,
Vamban Research on High Yielding Pulses
2. Krishi Vigyan Kendra, Vamban Transfer of innovative technology to farmer.
3. Regional Veterinary Research Station,
Pudukkottai Animal Production and Training to farmers
Source: Concerned Institutions
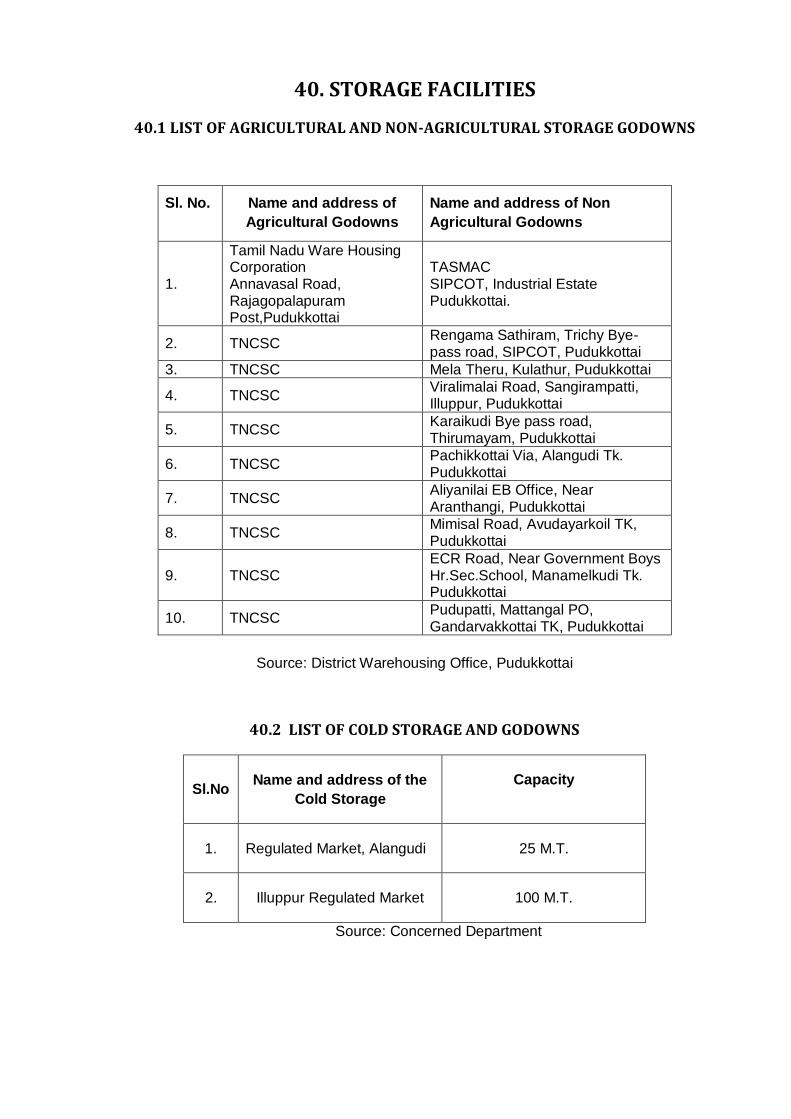
40. STORAGE FACILITIES
40.1 LIST OF AGRICULTURAL AND NON-AGRICULTURAL STORAGE GODOWNS
Sl. No. Name and address of
Agricultural Godowns
Name and address of Non
Agricultural Godowns
1.
Tamil Nadu Ware Housing Corporation Annavasal Road, Rajagopalapuram Post,Pudukkottai
TASMAC SIPCOT, Industrial Estate Pudukkottai.
2. TNCSC Rengama Sathiram, Trichy Bye-pass road, SIPCOT, Pudukkottai
3. TNCSC Mela Theru, Kulathur, Pudukkottai
4. TNCSC Viralimalai Road, Sangirampatti, Illuppur, Pudukkottai
5. TNCSC Karaikudi Bye pass road, Thirumayam, Pudukkottai
6. TNCSC Pachikkottai Via, Alangudi Tk. Pudukkottai
7. TNCSC Aliyanilai EB Office, Near Aranthangi, Pudukkottai
8. TNCSC Mimisal Road, Avudayarkoil TK, Pudukkottai
9. TNCSC ECR Road, Near Government Boys Hr.Sec.School, Manamelkudi Tk. Pudukkottai
10. TNCSC Pudupatti, Mattangal PO, Gandarvakkottai TK, Pudukkottai
Source: District Warehousing Office, Pudukkottai
40.2 LIST OF COLD STORAGE AND GODOWNS
Sl.No Name and address of the
Cold Storage
Capacity
1. Regulated Market, Alangudi 25 M.T.
2. Illuppur Regulated Market 100 M.T.
Source: Concerned Department
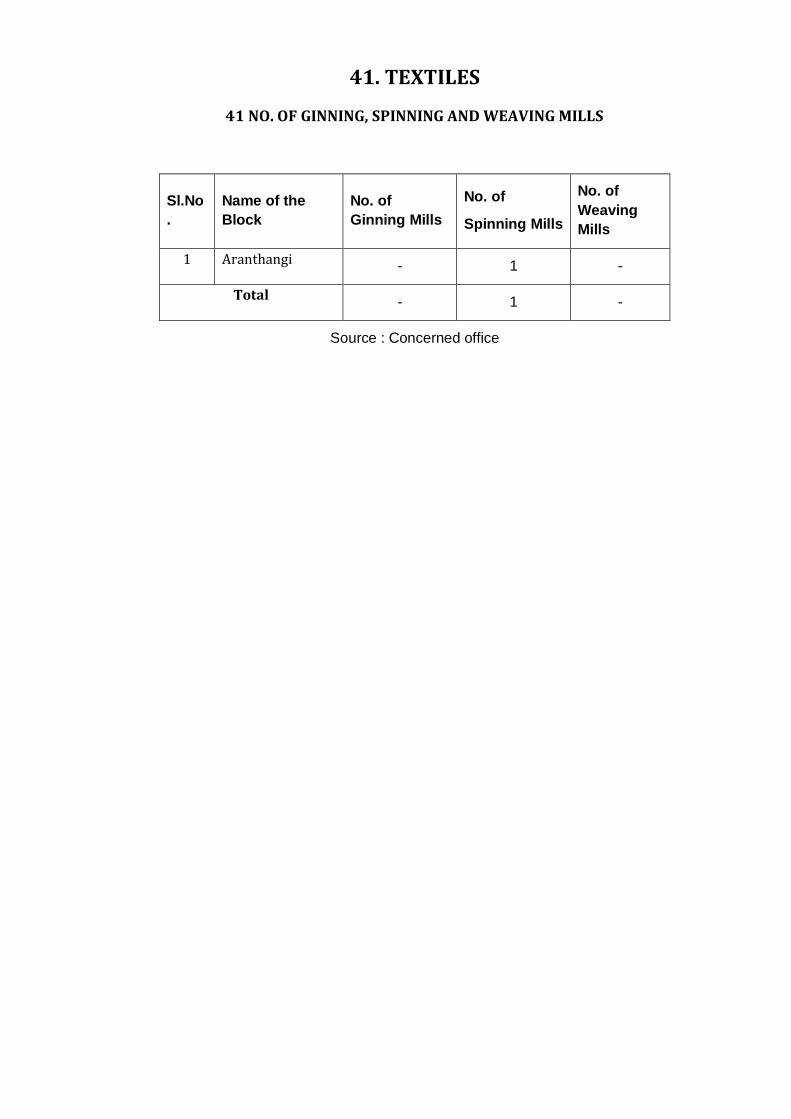
41. TEXTILES
41 NO. OF GINNING, SPINNING AND WEAVING MILLS
Sl.No
.
Name of the
Block
No. of
Ginning Mills
No. of
Spinning Mills
No. of
Weaving
Mills
1 Aranthangi - 1 -
Total - 1 -
Source : Concerned office
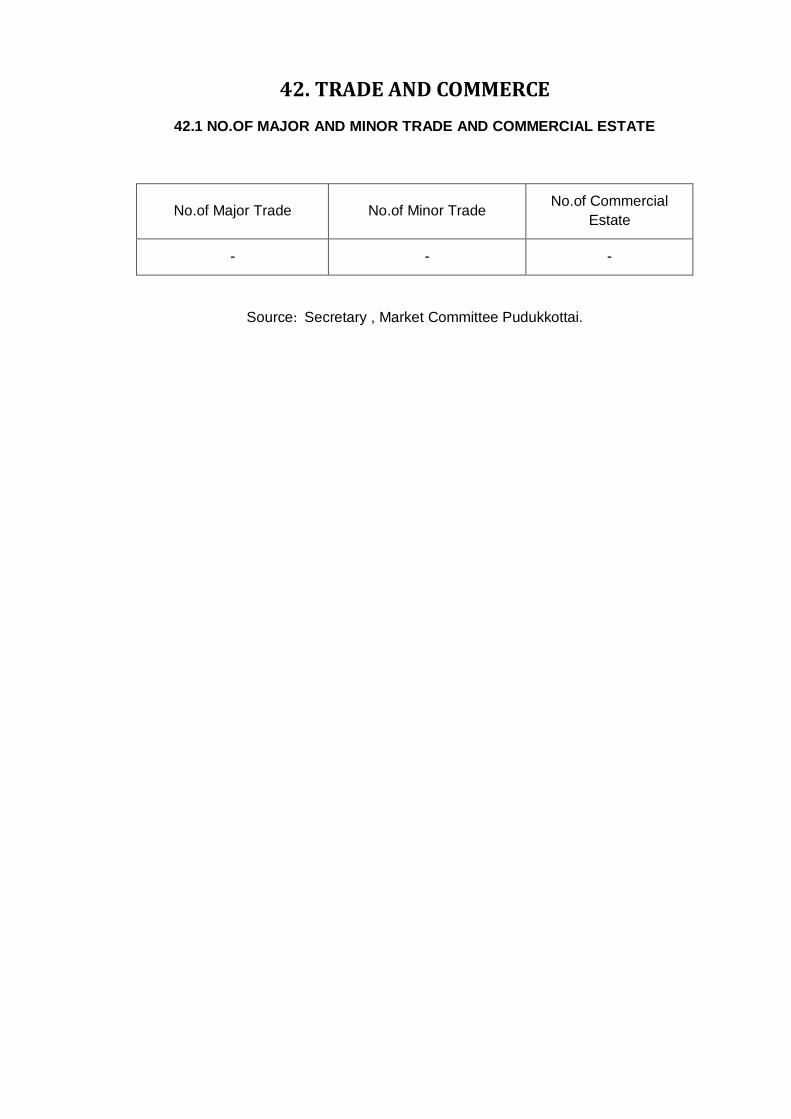
42. TRADE AND COMMERCE
42.1 NO.OF MAJOR AND MINOR TRADE AND COMMERCIAL ESTATE
No.of Major Trade No.of Minor Trade No.of Commercial
Estate
- - -
Source: Secretary , Market Committee Pudukkottai.
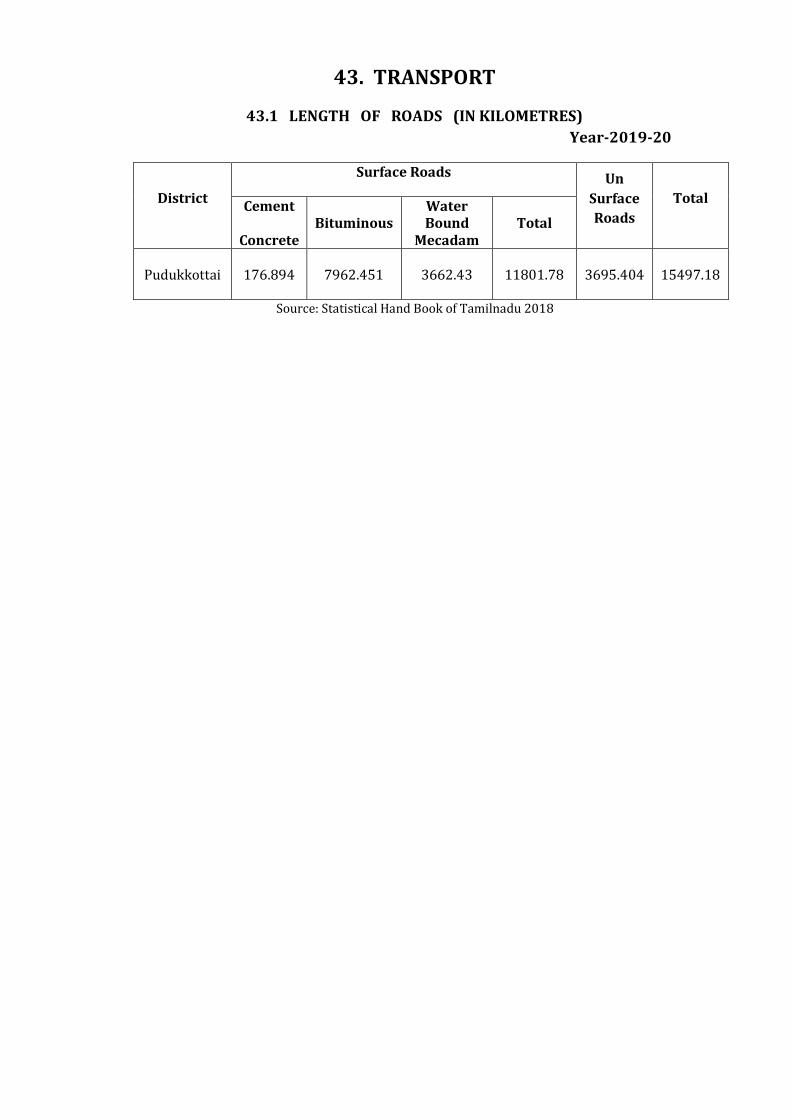
43. TRANSPORT
43.1 LENGTH OF ROADS (IN KILOMETRES)
Year-2019-20
District
Surface Roads Un
Surface
Roads
Total Cement
Concrete
Bituminous Water Bound
Mecadam Total
Pudukkottai 176.894 7962.451 3662.43 11801.78 3695.404 15497.18
Source: Statistical Hand Book of Tamilnadu 2018
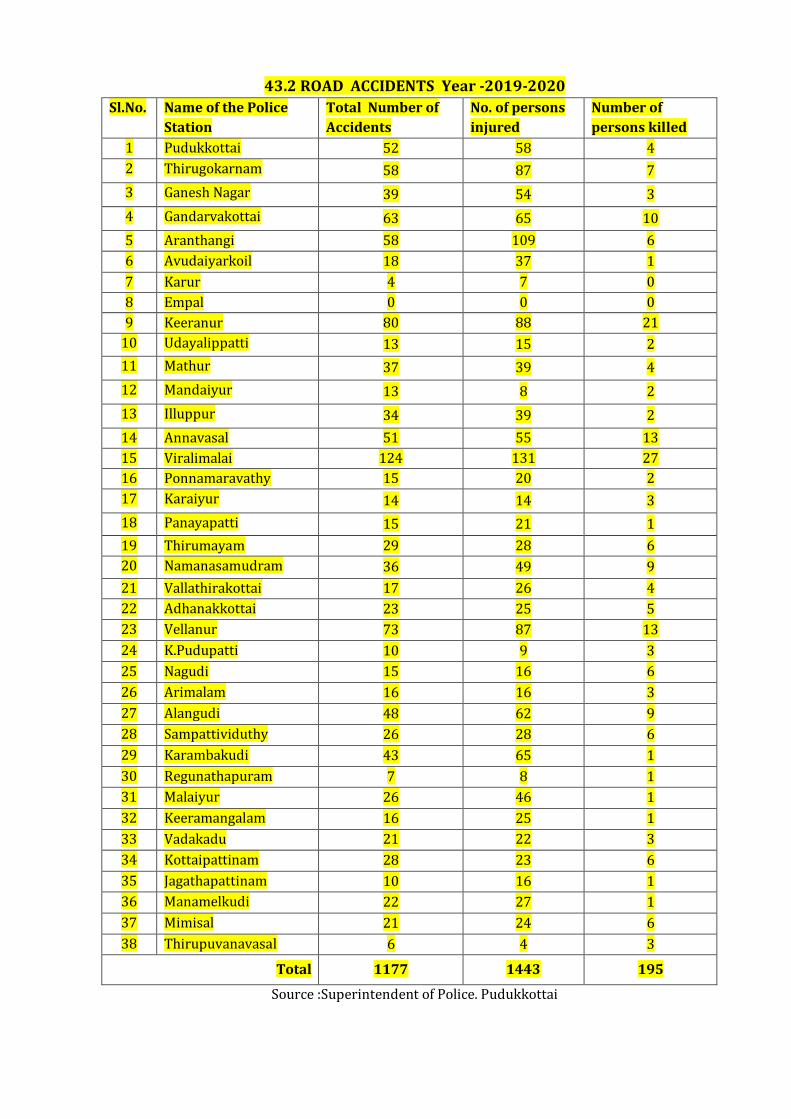
43.2 ROAD ACCIDENTS Year -2019-2020
Sl.No. Name of the Police
Station
Total Number of
Accidents
No. of persons
injured
Number of
persons killed
1 Pudukkottai 52 58 4
2 Thirugokarnam 58 87 7
3 Ganesh Nagar 39 54 3
4 Gandarvakottai 63 65 10
5 Aranthangi 58 109 6
6 Avudaiyarkoil 18 37 1
7 Karur 4 7 0
8 Empal 0 0 0
9 Keeranur 80 88 21
10 Udayalippatti 13 15 2
11 Mathur 37 39 4
12 Mandaiyur 13 8 2
13 Illuppur 34 39 2
14 Annavasal 51 55 13
15 Viralimalai 124 131 27
16 Ponnamaravathy 15 20 2
17 Karaiyur 14 14 3
18 Panayapatti 15 21 1
19 Thirumayam 29 28 6
20 Namanasamudram 36 49 9
21 Vallathirakottai 17 26 4
22 Adhanakkottai 23 25 5
23 Vellanur 73 87 13
24 K.Pudupatti 10 9 3
25 Nagudi 15 16 6
26 Arimalam 16 16 3
27 Alangudi 48 62 9
28 Sampattividuthy 26 28 6
29 Karambakudi 43 65 1
30 Regunathapuram 7 8 1
31 Malaiyur 26 46 1
32 Keeramangalam 16 25 1
33 Vadakadu 21 22 3
34 Kottaipattinam 28 23 6
35 Jagathapattinam 10 16 1
36 Manamelkudi 22 27 1
37 Mimisal 21 24 6
38 Thirupuvanavasal 6 4 3
Total 1177 1443 195
Source :Superintendent of Police. Pudukkottai
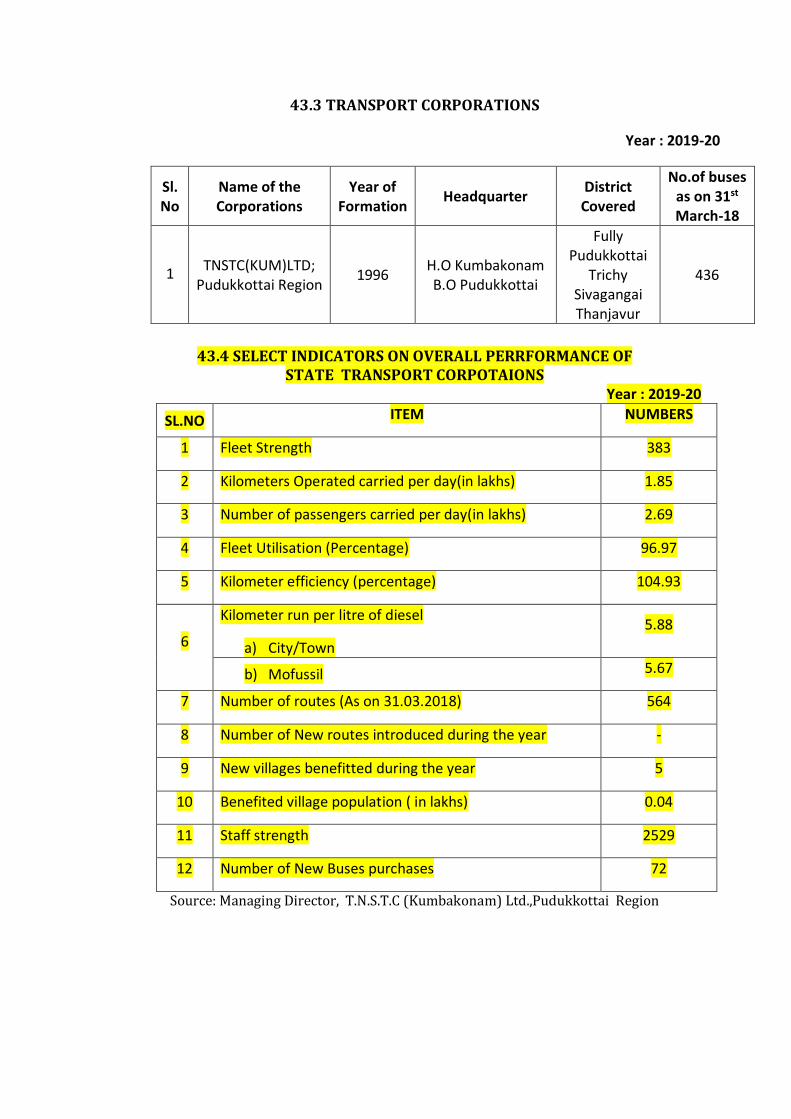
43.3 TRANSPORT CORPORATIONS
Year : 2019-20
Sl.No
Name of the Corporations
Year of Formation
Headquarter District Covered
No.of buses as on 31st March-18
1 TNSTC(KUM)LTD;
Pudukkottai Region 1996
H.O Kumbakonam B.O Pudukkottai
Fully Pudukkottai
Trichy Sivagangai Thanjavur
436
43.4 SELECT INDICATORS ON OVERALL PERRFORMANCE OF STATE TRANSPORT CORPOTAIONS
Year : 2019-20
SL.NO ITEM NUMBERS
1 Fleet Strength 383
2 Kilometers Operated carried per day(in lakhs) 1.85
3 Number of passengers carried per day(in lakhs) 2.69
4 Fleet Utilisation (Percentage) 96.97
5 Kilometer efficiency (percentage) 104.93
6
Kilometer run per litre of diesel
a) City/Town
5.88
b) Mofussil 5.67
7 Number of routes (As on 31.03.2018) 564
8 Number of New routes introduced during the year -
9 New villages benefitted during the year 5
10 Benefited village population ( in lakhs) 0.04
11 Staff strength 2529
12 Number of New Buses purchases 72
Source: Managing Director, T.N.S.T.C (Kumbakonam) Ltd.,Pudukkottai Region
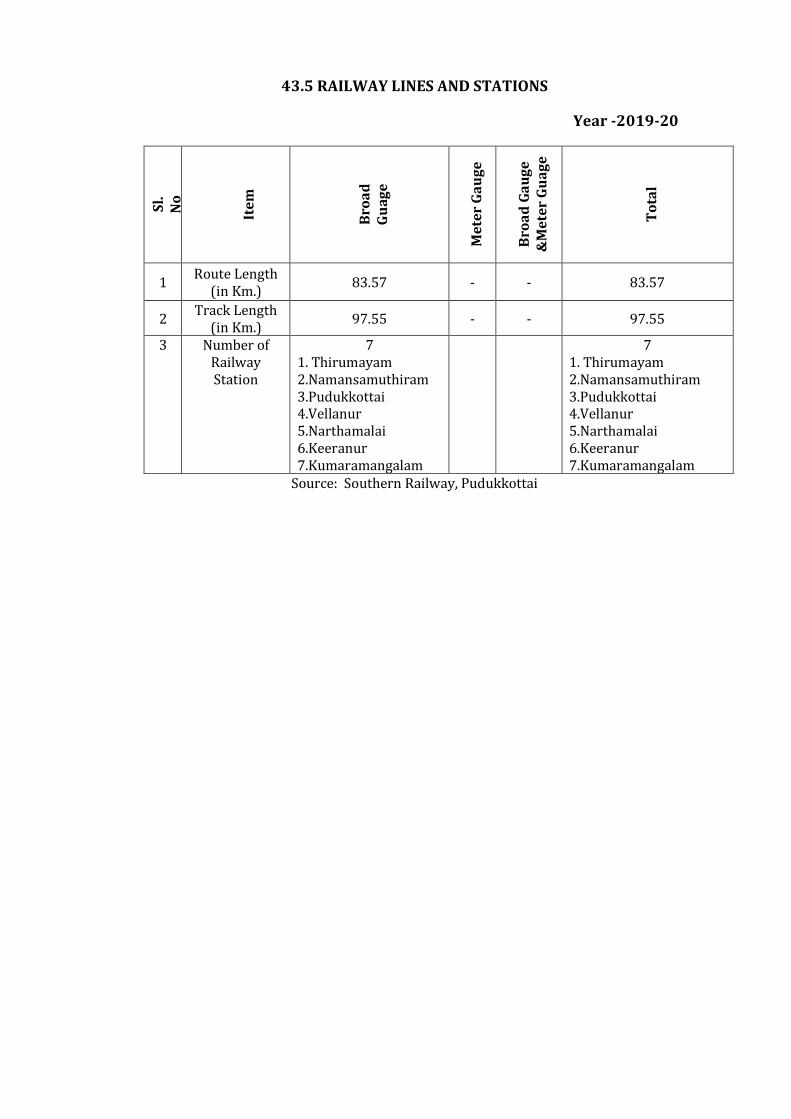
43.5 RAILWAY LINES AND STATIONS
Year -2019-20
Sl.
N
o
It
em
Bro
ad
G
ua
ge
Me
ter
Ga
ug
e
Bro
ad
Ga
ug
e
&M
ete
r G
ua
ge
To
tal
1 Route Length
(in Km.) 83.57 - - 83.57
2 Track Length
(in Km.) 97.55 - - 97.55
3 Number of Railway Station
7 1. Thirumayam 2.Namansamuthiram 3.Pudukkottai 4.Vellanur 5.Narthamalai 6.Keeranur 7.Kumaramangalam
7 1. Thirumayam 2.Namansamuthiram 3.Pudukkottai 4.Vellanur 5.Narthamalai 6.Keeranur 7.Kumaramangalam
Source: Southern Railway, Pudukkottai
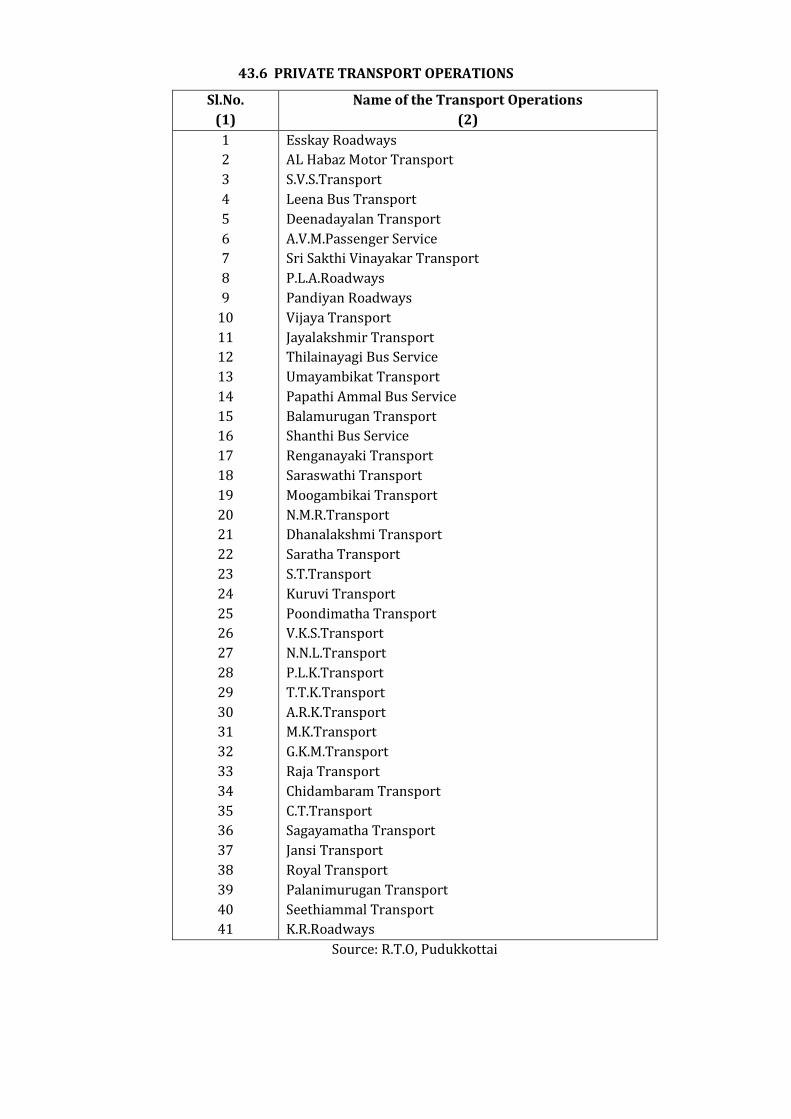
43.6 PRIVATE TRANSPORT OPERATIONS
Sl.No.
(1)
Name of the Transport Operations
(2)
1
2
3
4
5
6
7
8
9
10
11
12
13
14
15
16
17
18
19
20
21
22
23
24
25
26
27
28
29
30
31
32
33
34
35
36
37
38
39
40
41
Esskay Roadways
AL Habaz Motor Transport
S.V.S.Transport
Leena Bus Transport
Deenadayalan Transport
A.V.M.Passenger Service
Sri Sakthi Vinayakar Transport
P.L.A.Roadways
Pandiyan Roadways
Vijaya Transport
Jayalakshmir Transport
Thilainayagi Bus Service
Umayambikat Transport
Papathi Ammal Bus Service
Balamurugan Transport
Shanthi Bus Service
Renganayaki Transport
Saraswathi Transport
Moogambikai Transport
N.M.R.Transport
Dhanalakshmi Transport
Saratha Transport
S.T.Transport
Kuruvi Transport
Poondimatha Transport
V.K.S.Transport
N.N.L.Transport
P.L.K.Transport
T.T.K.Transport
A.R.K.Transport
M.K.Transport
G.K.M.Transport
Raja Transport
Chidambaram Transport
C.T.Transport
Sagayamatha Transport
Jansi Transport
Royal Transport
Palanimurugan Transport
Seethiammal Transport
K.R.Roadways
Source: R.T.O, Pudukkottai
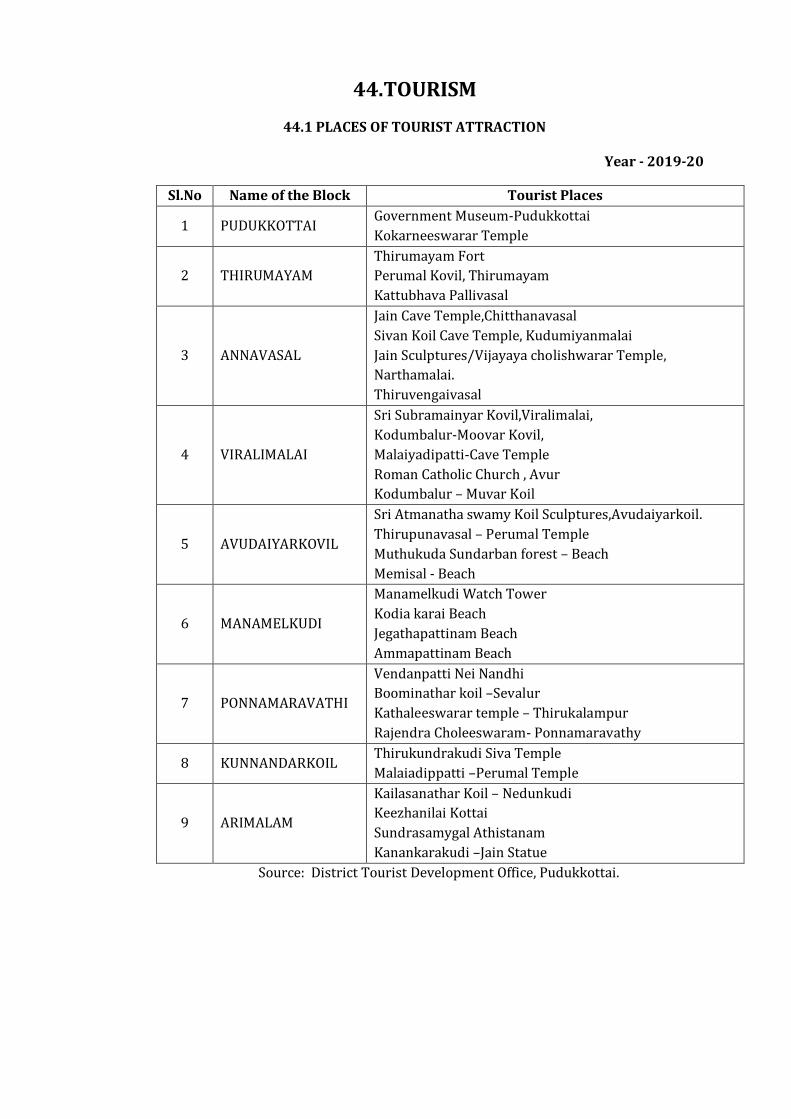
44.TOURISM
44.1 PLACES OF TOURIST ATTRACTION
Year - 2019-20
Sl.No Name of the Block Tourist Places
1 PUDUKKOTTAI Government Museum-Pudukkottai
Kokarneeswarar Temple
2 THIRUMAYAM
Thirumayam Fort
Perumal Kovil, Thirumayam
Kattubhava Pallivasal
3 ANNAVASAL
Jain Cave Temple,Chitthanavasal
Sivan Koil Cave Temple, Kudumiyanmalai
Jain Sculptures/Vijayaya cholishwarar Temple,
Narthamalai.
Thiruvengaivasal
4 VIRALIMALAI
Sri Subramainyar Kovil,Viralimalai,
Kodumbalur-Moovar Kovil,
Malaiyadipatti-Cave Temple
Roman Catholic Church , Avur
Kodumbalur – Muvar Koil
5 AVUDAIYARKOVIL
Sri Atmanatha swamy Koil Sculptures,Avudaiyarkoil.
Thirupunavasal – Perumal Temple
Muthukuda Sundarban forest – Beach
Memisal - Beach
6 MANAMELKUDI
Manamelkudi Watch Tower
Kodia karai Beach
Jegathapattinam Beach
Ammapattinam Beach
7 PONNAMARAVATHI
Vendanpatti Nei Nandhi
Boominathar koil –Sevalur
Kathaleeswarar temple – Thirukalampur
Rajendra Choleeswaram- Ponnamaravathy
8 KUNNANDARKOIL Thirukundrakudi Siva Temple
Malaiadippatti –Perumal Temple
9 ARIMALAM
Kailasanathar Koil – Nedunkudi
Keezhanilai Kottai
Sundrasamygal Athistanam
Kanankarakudi –Jain Statue
Source: District Tourist Development Office, Pudukkottai.
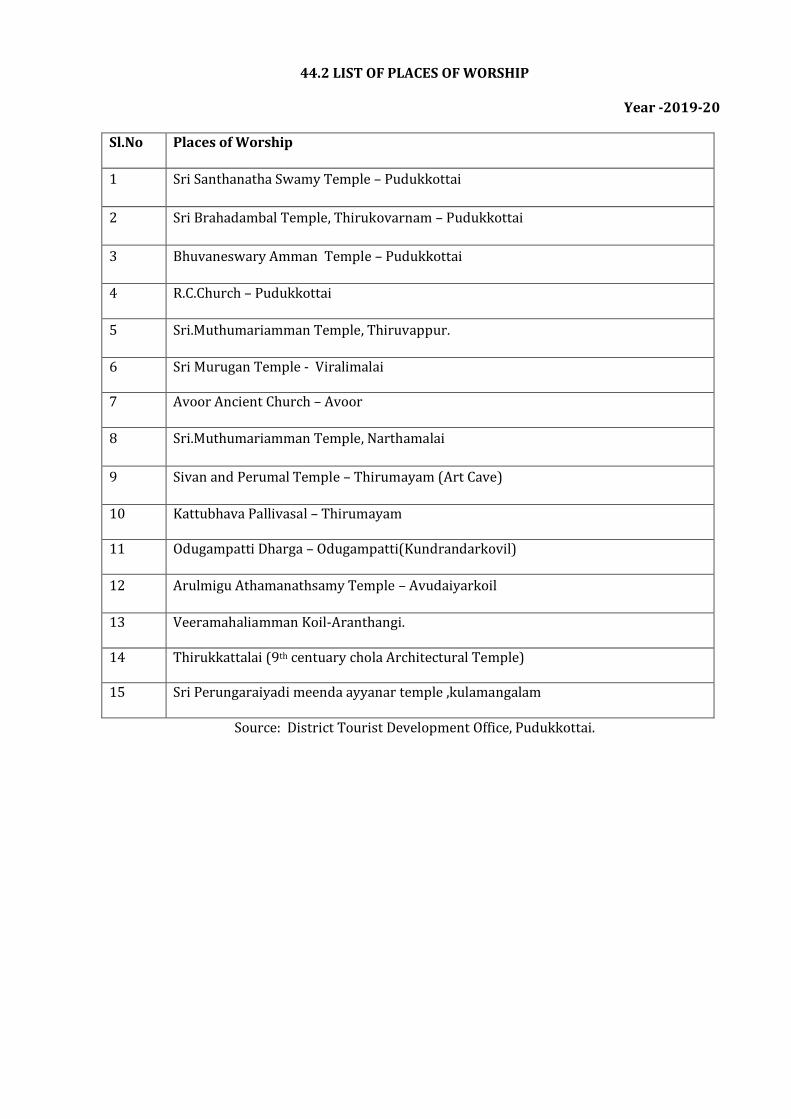
44.2 LIST OF PLACES OF WORSHIP
Year -2019-20
Sl.No Places of Worship
1 Sri Santhanatha Swamy Temple – Pudukkottai
2 Sri Brahadambal Temple, Thirukovarnam – Pudukkottai
3 Bhuvaneswary Amman Temple – Pudukkottai
4 R.C.Church – Pudukkottai
5 Sri.Muthumariamman Temple, Thiruvappur.
6 Sri Murugan Temple - Viralimalai
7 Avoor Ancient Church – Avoor
8 Sri.Muthumariamman Temple, Narthamalai
9 Sivan and Perumal Temple – Thirumayam (Art Cave)
10 Kattubhava Pallivasal – Thirumayam
11 Odugampatti Dharga – Odugampatti(Kundrandarkovil)
12 Arulmigu Athamanathsamy Temple – Avudaiyarkoil
13 Veeramahaliamman Koil-Aranthangi.
14 Thirukkattalai (9th centuary chola Architectural Temple)
15 Sri Perungaraiyadi meenda ayyanar temple ,kulamangalam
Source: District Tourist Development Office, Pudukkottai.
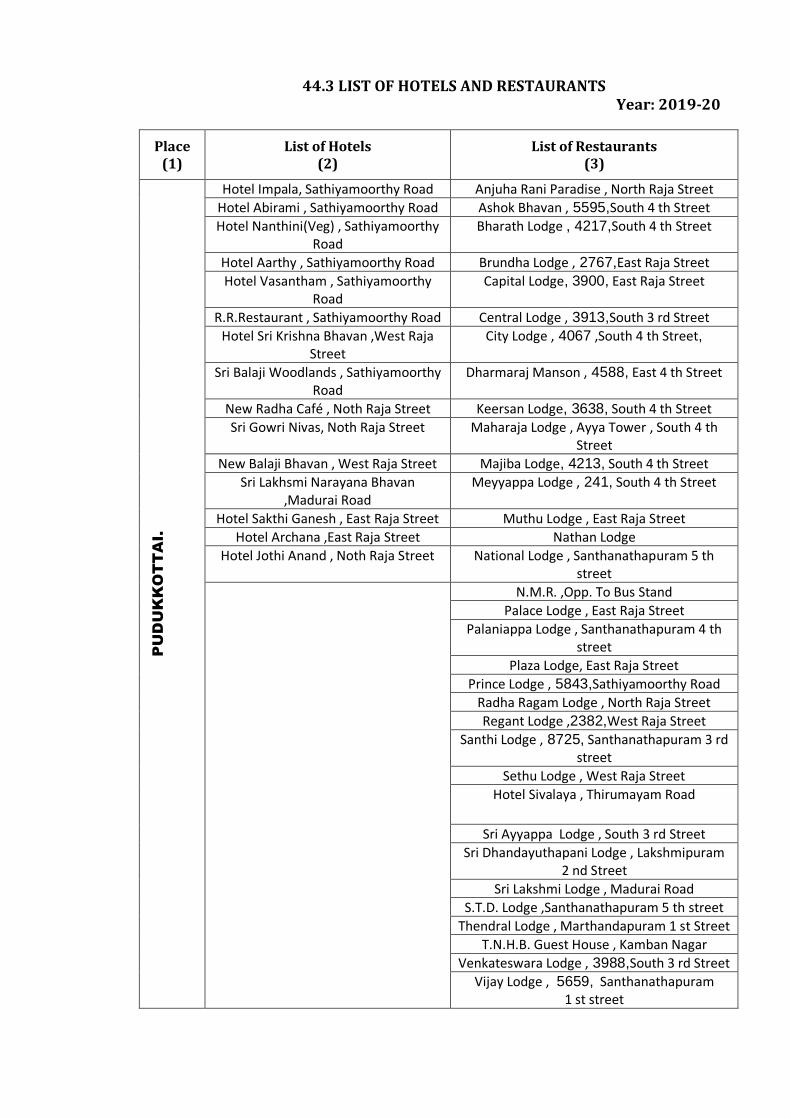
44.3 LIST OF HOTELS AND RESTAURANTS Year: 2019-20
Place (1)
List of Hotels (2)
List of Restaurants (3)
PU
DU
KK
OT
TA
I.
Hotel Impala, Sathiyamoorthy Road Anjuha Rani Paradise , North Raja Street
Hotel Abirami , Sathiyamoorthy Road Ashok Bhavan , 5595,South 4 th Street
Hotel Nanthini(Veg) , Sathiyamoorthy Road
Bharath Lodge , 4217,South 4 th Street
Hotel Aarthy , Sathiyamoorthy Road Brundha Lodge , 2767,East Raja Street
Hotel Vasantham , Sathiyamoorthy Road
Capital Lodge, 3900, East Raja Street
R.R.Restaurant , Sathiyamoorthy Road Central Lodge , 3913,South 3 rd Street
Hotel Sri Krishna Bhavan ,West Raja Street
City Lodge , 4067 ,South 4 th Street,
Sri Balaji Woodlands , Sathiyamoorthy Road
Dharmaraj Manson , 4588, East 4 th Street
New Radha Café , Noth Raja Street Keersan Lodge, 3638, South 4 th Street
Sri Gowri Nivas, Noth Raja Street Maharaja Lodge , Ayya Tower , South 4 th Street
New Balaji Bhavan , West Raja Street Majiba Lodge, 4213, South 4 th Street
Sri Lakhsmi Narayana Bhavan ,Madurai Road
Meyyappa Lodge , 241, South 4 th Street
Hotel Sakthi Ganesh , East Raja Street Muthu Lodge , East Raja Street
Hotel Archana ,East Raja Street Nathan Lodge
Hotel Jothi Anand , Noth Raja Street National Lodge , Santhanathapuram 5 th street
N.M.R. ,Opp. To Bus Stand
Palace Lodge , East Raja Street
Palaniappa Lodge , Santhanathapuram 4 th street
Plaza Lodge, East Raja Street
Prince Lodge , 5843,Sathiyamoorthy Road
Radha Ragam Lodge , North Raja Street
Regant Lodge ,2382,West Raja Street
Santhi Lodge , 8725, Santhanathapuram 3 rd street
Sethu Lodge , West Raja Street
Hotel Sivalaya , Thirumayam Road
Sri Ayyappa Lodge , South 3 rd Street
Sri Dhandayuthapani Lodge , Lakshmipuram 2 nd Street
Sri Lakshmi Lodge , Madurai Road
S.T.D. Lodge ,Santhanathapuram 5 th street
Thendral Lodge , Marthandapuram 1 st Street
T.N.H.B. Guest House , Kamban Nagar
Venkateswara Lodge , 3988,South 3 rd Street
Vijay Lodge , 5659, Santhanathapuram 1 st street
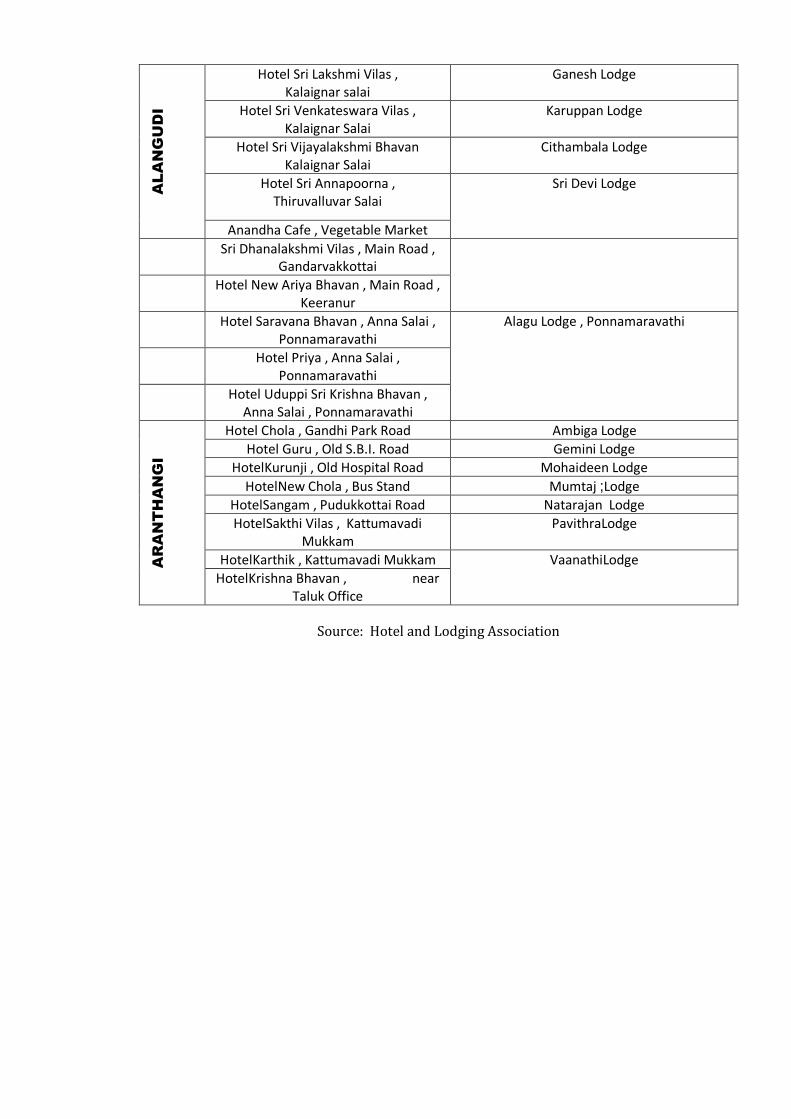
AL
AN
GU
DI
Hotel Sri Lakshmi Vilas , Kalaignar salai
Ganesh Lodge
Hotel Sri Venkateswara Vilas , Kalaignar Salai
Karuppan Lodge
Hotel Sri Vijayalakshmi Bhavan Kalaignar Salai
Cithambala Lodge
Hotel Sri Annapoorna , Thiruvalluvar Salai
Sri Devi Lodge
Anandha Cafe , Vegetable Market Sri Dhanalakshmi Vilas , Main Road ,
Gandarvakkottai
Hotel New Ariya Bhavan , Main Road , Keeranur
Hotel Saravana Bhavan , Anna Salai , Ponnamaravathi
Alagu Lodge , Ponnamaravathi
Hotel Priya , Anna Salai , Ponnamaravathi
Hotel Uduppi Sri Krishna Bhavan , Anna Salai , Ponnamaravathi
AR
AN
TH
AN
GI
Hotel Chola , Gandhi Park Road Ambiga Lodge
Hotel Guru , Old S.B.I. Road Gemini Lodge
HotelKurunji , Old Hospital Road Mohaideen Lodge
HotelNew Chola , Bus Stand Mumtaj ;Lodge
HotelSangam , Pudukkottai Road Natarajan Lodge
HotelSakthi Vilas , Kattumavadi Mukkam
PavithraLodge
HotelKarthik , Kattumavadi Mukkam VaanathiLodge
HotelKrishna Bhavan , near Taluk Office
Source: Hotel and Lodging Association
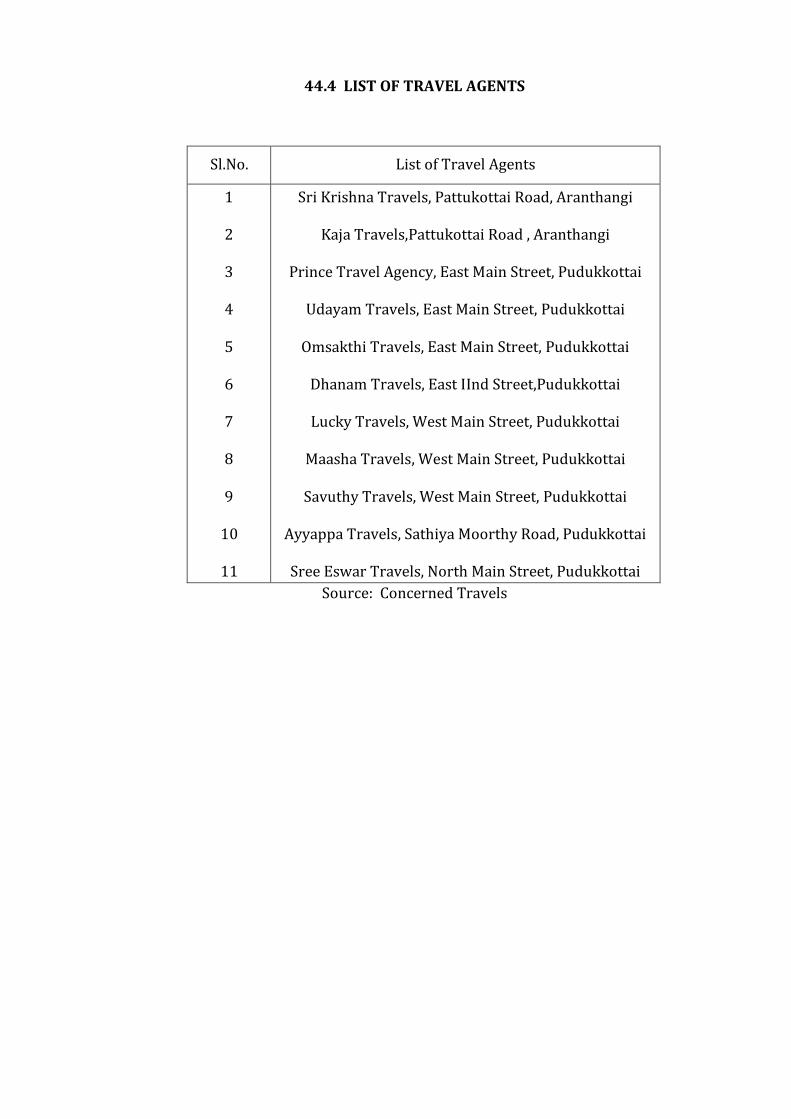
44.4 LIST OF TRAVEL AGENTS
Sl.No. List of Travel Agents
1
2
3
4
5
6
7
8
9
10
11
Sri Krishna Travels, Pattukottai Road, Aranthangi
Kaja Travels,Pattukottai Road , Aranthangi
Prince Travel Agency, East Main Street, Pudukkottai
Udayam Travels, East Main Street, Pudukkottai
Omsakthi Travels, East Main Street, Pudukkottai
Dhanam Travels, East IInd Street,Pudukkottai
Lucky Travels, West Main Street, Pudukkottai
Maasha Travels, West Main Street, Pudukkottai
Savuthy Travels, West Main Street, Pudukkottai
Ayyappa Travels, Sathiya Moorthy Road, Pudukkottai
Sree Eswar Travels, North Main Street, Pudukkottai
Source: Concerned Travels
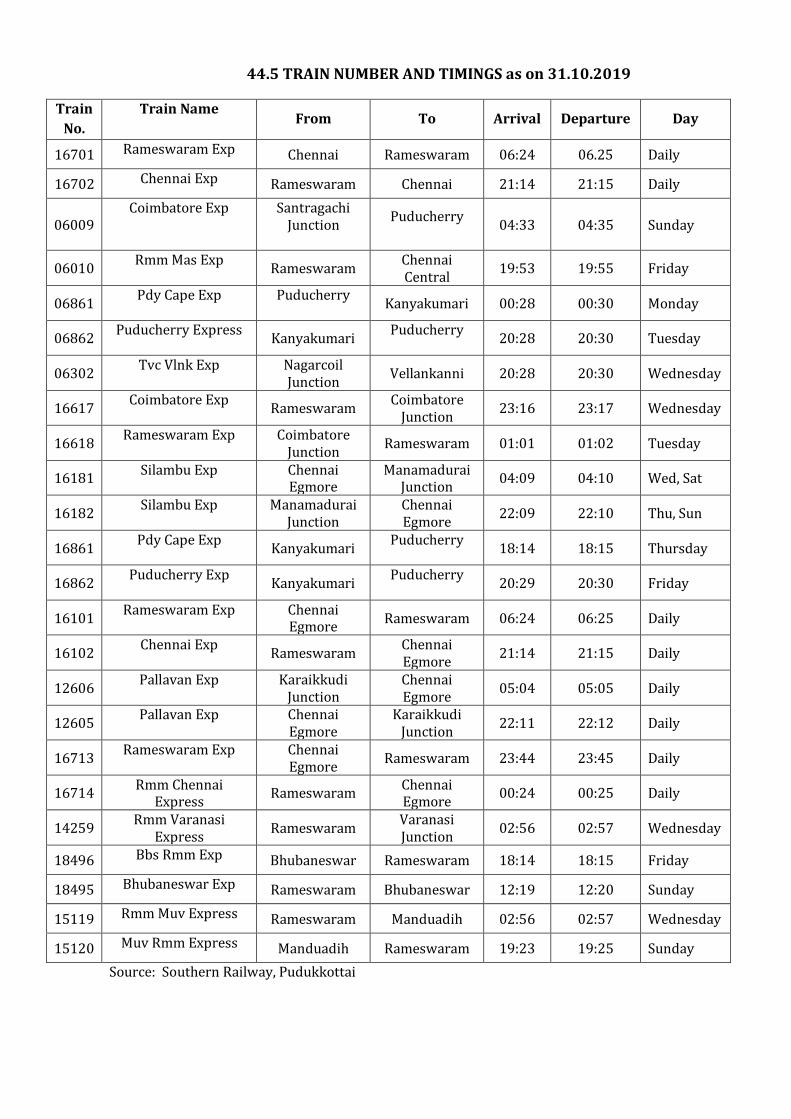
44.5 TRAIN NUMBER AND TIMINGS as on 31.10.2019
Train
No.
Train Name From To Arrival Departure Day
16701 Rameswaram Exp Chennai Rameswaram 06:24 06.25 Daily
16702 Chennai Exp Rameswaram Chennai 21:14 21:15 Daily
06009 Coimbatore Exp Santragachi
Junction
Puducherry
04:33 04:35 Sunday
06010 Rmm Mas Exp
Rameswaram Chennai Central
19:53 19:55 Friday
06861 Pdy Cape Exp Puducherry
Kanyakumari 00:28 00:30 Monday
06862 Puducherry Express
Kanyakumari Puducherry
20:28 20:30 Tuesday
06302 Tvc Vlnk Exp Nagarcoil
Junction Vellankanni 20:28 20:30 Wednesday
16617 Coimbatore Exp
Rameswaram Coimbatore
Junction 23:16 23:17 Wednesday
16618 Rameswaram Exp Coimbatore
Junction Rameswaram 01:01 01:02 Tuesday
16181 Silambu Exp Chennai
Egmore Manamadurai
Junction 04:09 04:10 Wed, Sat
16182 Silambu Exp Manamadurai
Junction Chennai Egmore
22:09 22:10 Thu, Sun
16861 Pdy Cape Exp
Kanyakumari Puducherry
18:14 18:15 Thursday
16862 Puducherry Exp
Kanyakumari Puducherry
20:29 20:30 Friday
16101 Rameswaram Exp Chennai
Egmore Rameswaram 06:24 06:25 Daily
16102 Chennai Exp
Rameswaram Chennai Egmore
21:14 21:15 Daily
12606 Pallavan Exp Karaikkudi
Junction Chennai Egmore
05:04 05:05 Daily
12605 Pallavan Exp Chennai
Egmore Karaikkudi
Junction 22:11 22:12 Daily
16713 Rameswaram Exp Chennai
Egmore Rameswaram 23:44 23:45 Daily
16714 Rmm Chennai
Express Rameswaram
Chennai Egmore
00:24 00:25 Daily
14259 Rmm Varanasi
Express Rameswaram
Varanasi Junction
02:56 02:57 Wednesday
18496 Bbs Rmm Exp Bhubaneswar Rameswaram 18:14 18:15 Friday
18495 Bhubaneswar Exp Rameswaram Bhubaneswar 12:19 12:20 Sunday
15119 Rmm Muv Express Rameswaram Manduadih 02:56 02:57 Wednesday
15120 Muv Rmm Express Manduadih Rameswaram 19:23 19:25 Sunday
Source: Southern Railway, Pudukkottai
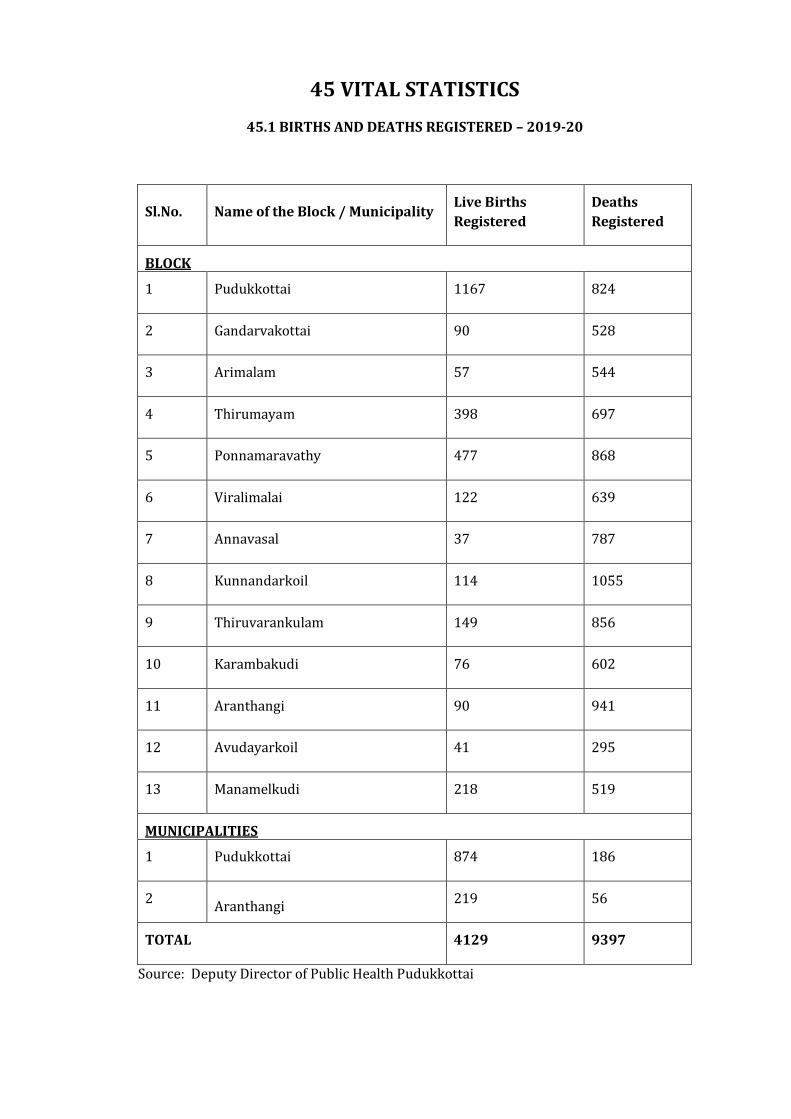
45 VITAL STATISTICS
45.1 BIRTHS AND DEATHS REGISTERED – 2019-20
Sl.No. Name of the Block / Municipality Live Births
Registered
Deaths
Registered
BLOCK
1 Pudukkottai 1167 824
2 Gandarvakottai 90 528
3 Arimalam 57 544
4 Thirumayam 398 697
5 Ponnamaravathy 477 868
6 Viralimalai 122 639
7 Annavasal 37 787
8 Kunnandarkoil 114 1055
9 Thiruvarankulam 149 856
10 Karambakudi 76 602
11 Aranthangi 90 941
12 Avudayarkoil 41 295
13 Manamelkudi 218 519
MUNICIPALITIES
1 Pudukkottai 874 186
2 Aranthangi
219 56
TOTAL 4129 9397
Source: Deputy Director of Public Health Pudukkottai
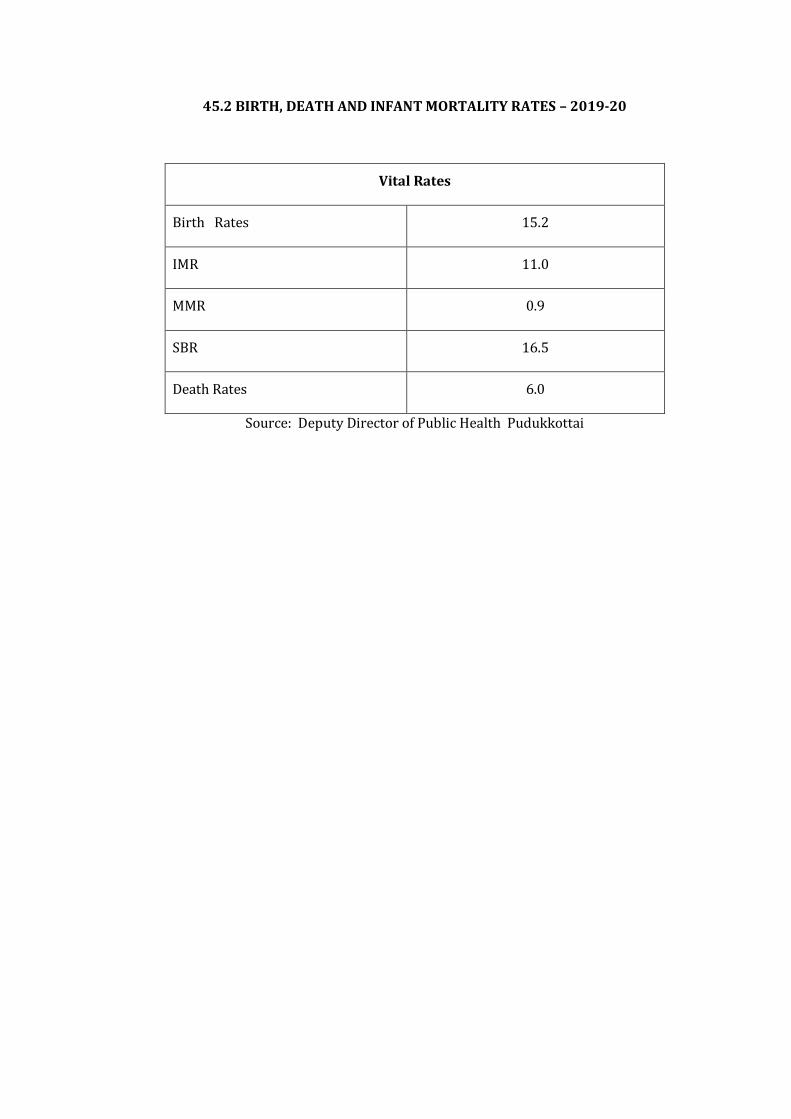
45.2 BIRTH, DEATH AND INFANT MORTALITY RATES – 2019-20
Vital Rates
Birth Rates 15.2
IMR 11.0
MMR 0.9
SBR 16.5
Death Rates 6.0
Source: Deputy Director of Public Health Pudukkottai
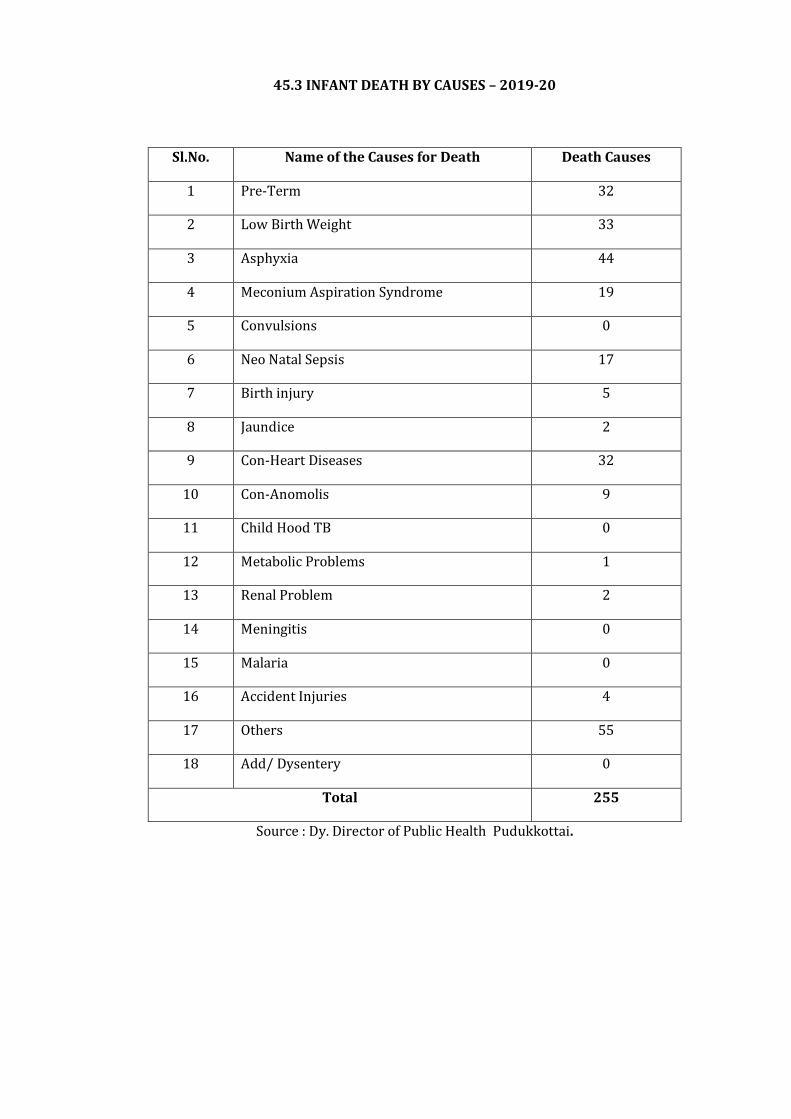
45.3 INFANT DEATH BY CAUSES – 2019-20
Sl.No. Name of the Causes for Death Death Causes
1 Pre-Term 32
2 Low Birth Weight 33
3 Asphyxia 44
4 Meconium Aspiration Syndrome 19
5 Convulsions 0
6 Neo Natal Sepsis 17
7 Birth injury 5
8 Jaundice 2
9 Con-Heart Diseases 32
10 Con-Anomolis 9
11 Child Hood TB 0
12 Metabolic Problems 1
13 Renal Problem 2
14 Meningitis 0
15 Malaria 0
16 Accident Injuries 4
17 Others 55
18 Add/ Dysentery 0
Total 255
Source : Dy. Director of Public Health Pudukkottai.
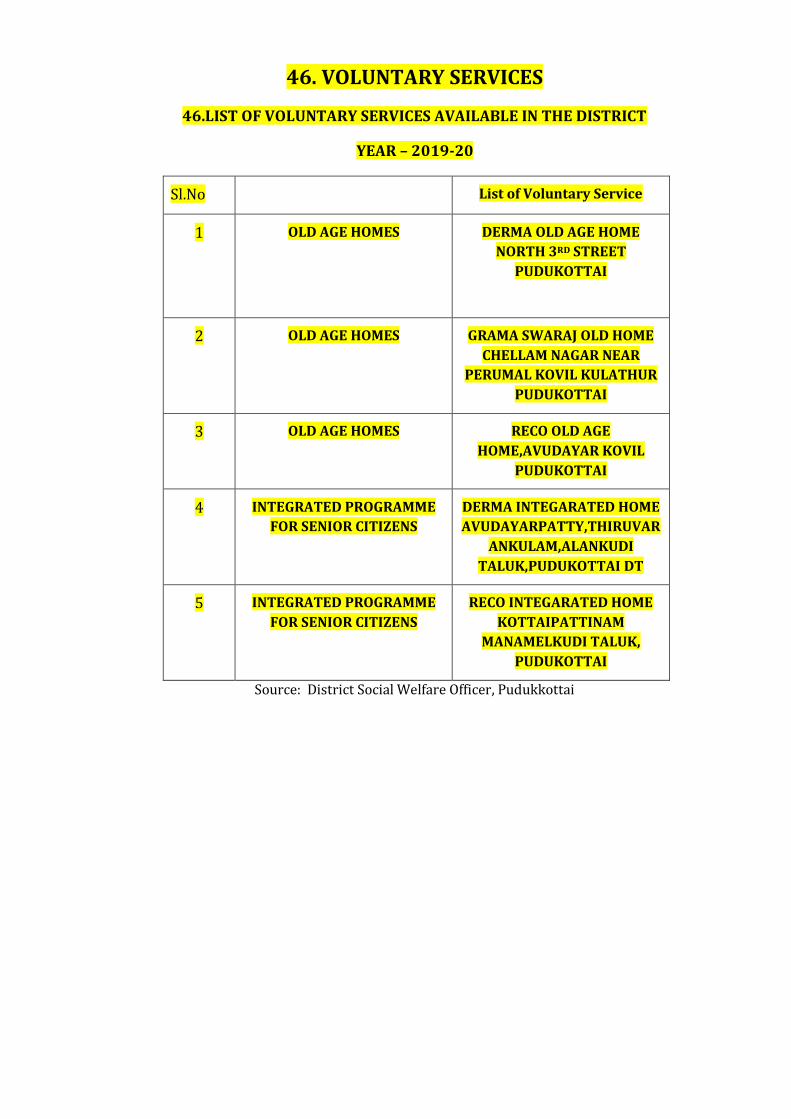
46. VOLUNTARY SERVICES
46.LIST OF VOLUNTARY SERVICES AVAILABLE IN THE DISTRICT
YEAR – 2019-20
Sl.No List of Voluntary Service
1 OLD AGE HOMES DERMA OLD AGE HOME
NORTH 3RD STREET
PUDUKOTTAI
2 OLD AGE HOMES GRAMA SWARAJ OLD HOME
CHELLAM NAGAR NEAR
PERUMAL KOVIL KULATHUR
PUDUKOTTAI
3 OLD AGE HOMES RECO OLD AGE
HOME,AVUDAYAR KOVIL
PUDUKOTTAI
4 INTEGRATED PROGRAMME
FOR SENIOR CITIZENS
DERMA INTEGARATED HOME
AVUDAYARPATTY,THIRUVAR
ANKULAM,ALANKUDI
TALUK,PUDUKOTTAI DT
5 INTEGRATED PROGRAMME
FOR SENIOR CITIZENS
RECO INTEGARATED HOME
KOTTAIPATTINAM
MANAMELKUDI TALUK,
PUDUKOTTAI
Source: District Social Welfare Officer, Pudukkottai
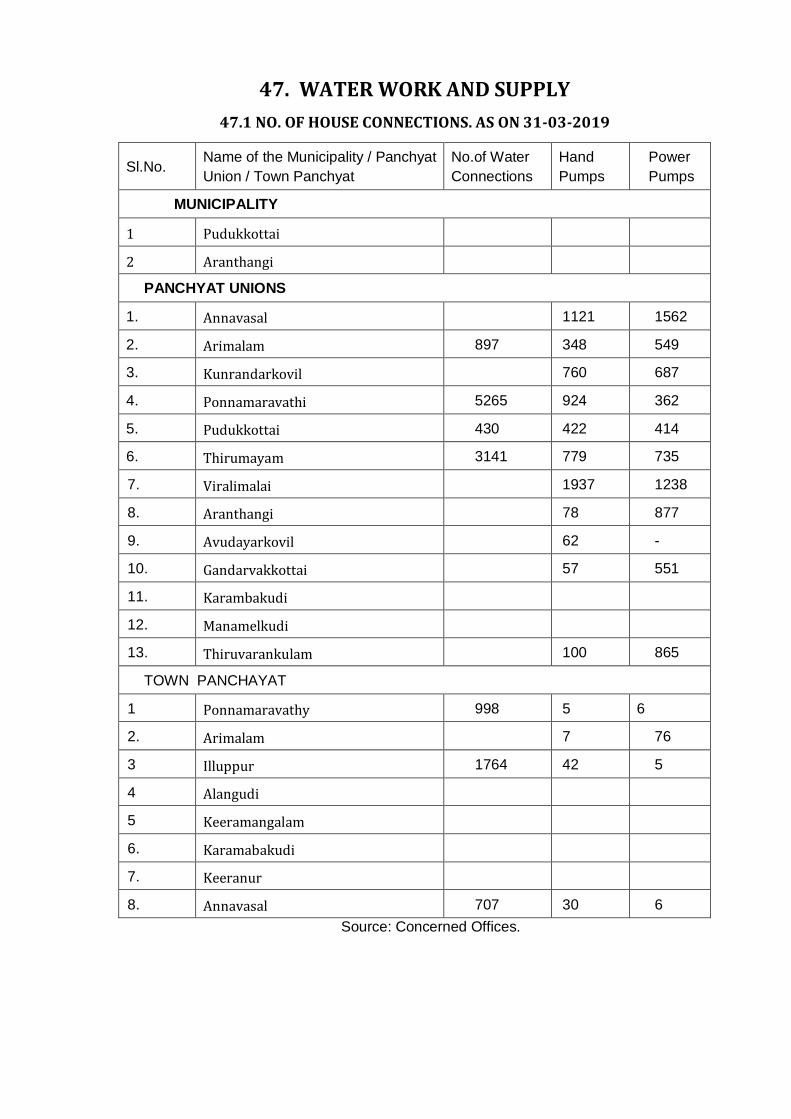
47. WATER WORK AND SUPPLY
47.1 NO. OF HOUSE CONNECTIONS. AS ON 31-03-2019
Sl.No. Name of the Municipality / Panchyat
Union / Town Panchyat
No.of Water
Connections
Hand
Pumps
Power
Pumps
MUNICIPALITY
1 Pudukkottai
2 Aranthangi
PANCHYAT UNIONS
1. Annavasal 1121 1562
2. Arimalam 897 348 549
3. Kunrandarkovil 760 687
4. Ponnamaravathi 5265 924 362
5. Pudukkottai 430 422 414
6. Thirumayam 3141 779 735
7. Viralimalai 1937 1238
8. Aranthangi 78 877
9. Avudayarkovil 62 -
10. Gandarvakkottai 57 551
11. Karambakudi
12. Manamelkudi
13. Thiruvarankulam 100 865
TOWN PANCHAYAT
1 Ponnamaravathy 998 5 6
2. Arimalam 7 76
3 Illuppur 1764 42 5
4 Alangudi
5 Keeramangalam
6. Karamabakudi
7. Keeranur
8. Annavasal 707 30 6
Source: Concerned Offices.
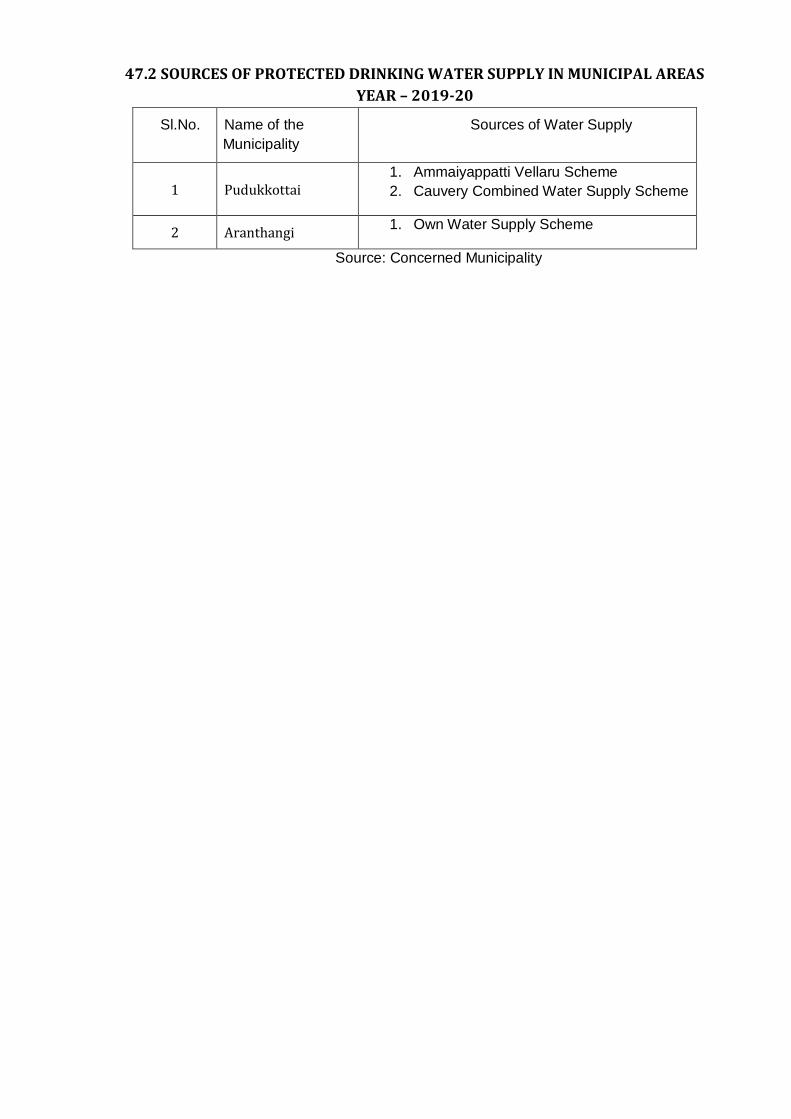
47.2 SOURCES OF PROTECTED DRINKING WATER SUPPLY IN MUNICIPAL AREAS
YEAR – 2019-20
Sl.No. Name of the
Municipality
Sources of Water Supply
1 Pudukkottai 1. Ammaiyappatti Vellaru Scheme
2. Cauvery Combined Water Supply Scheme
2 Aranthangi 1. Own Water Supply Scheme
Source: Concerned Municipality
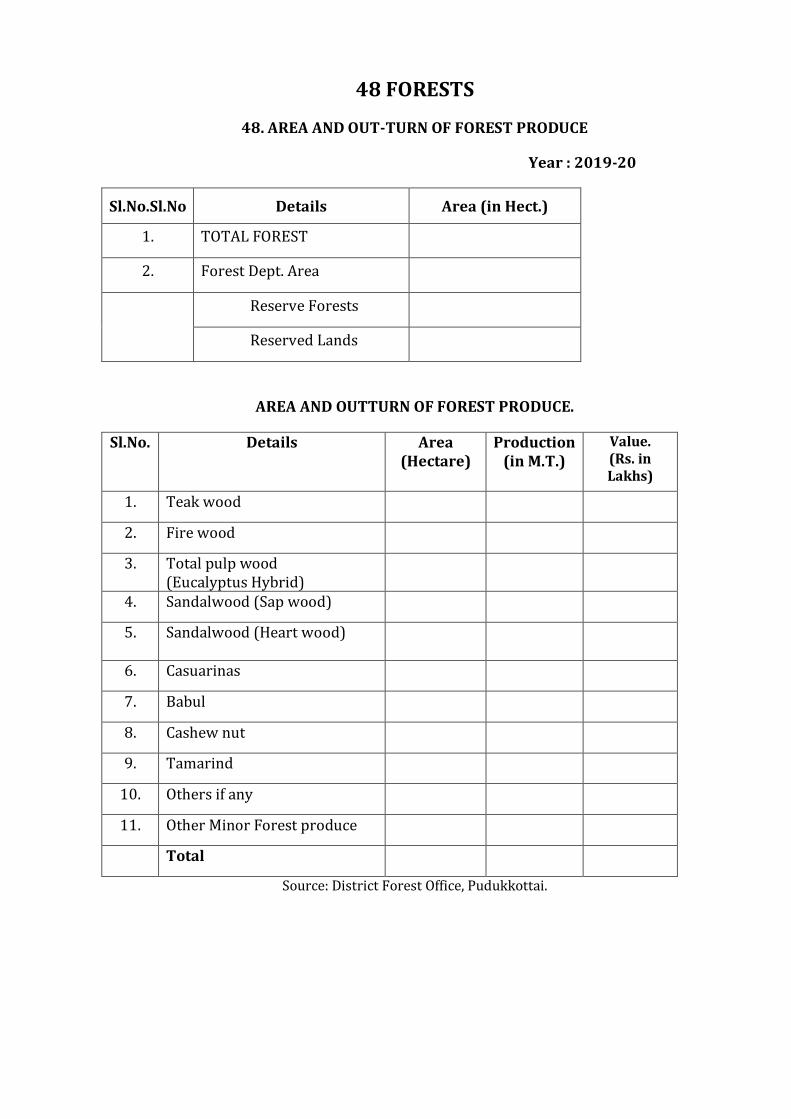
48 FORESTS
48. AREA AND OUT-TURN OF FOREST PRODUCE
Year : 2019-20
Sl.No.Sl.No Details Area (in Hect.)
1. TOTAL FOREST
2. Forest Dept. Area
Reserve Forests
Reserved Lands
AREA AND OUTTURN OF FOREST PRODUCE.
Sl.No. Details Area (Hectare)
Production (in M.T.)
Value. (Rs. in Lakhs)
1. Teak wood
2. Fire wood
3. Total pulp wood (Eucalyptus Hybrid)
4. Sandalwood (Sap wood)
5. Sandalwood (Heart wood)
6. Casuarinas
7. Babul
8. Cashew nut
9. Tamarind
10. Others if any
11. Other Minor Forest produce
Total
Source: District Forest Office, Pudukkottai.