district census handbook, wokha, part - linguistic survey of
TRANSCRIPT
CENSUS OF INDIA 2001
SERIES-14 NAGALAND
DISTRICT CENSUS HANDBOOK
Part - A & B
WOKHA DISTRICT
VILLAGE & TOWN DIRECTORY
~
VILLAGE AND TOWNWISE PRIMARY CENSUS ABSTRACT
P.G. Tenzing of the Indian Administrative Service
Director of Census Operations, Nagaland

__ -_ -. ." --
~~----c-::--- _ --- ......
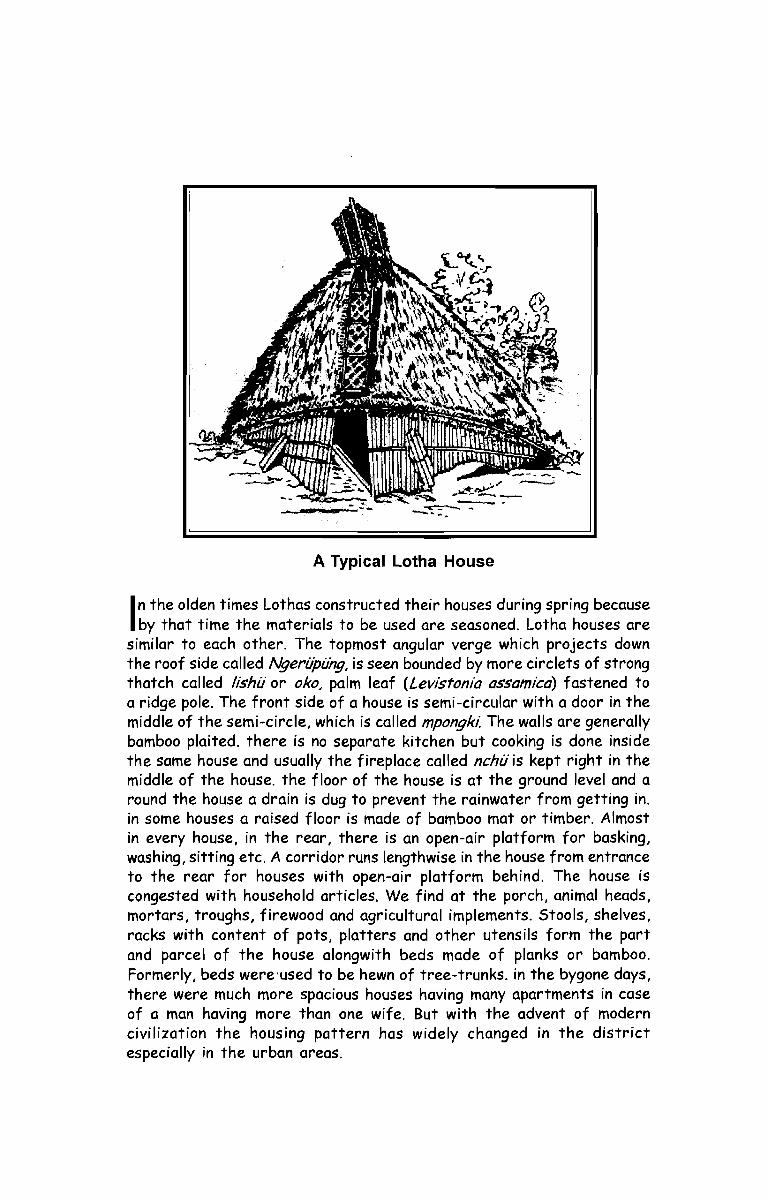
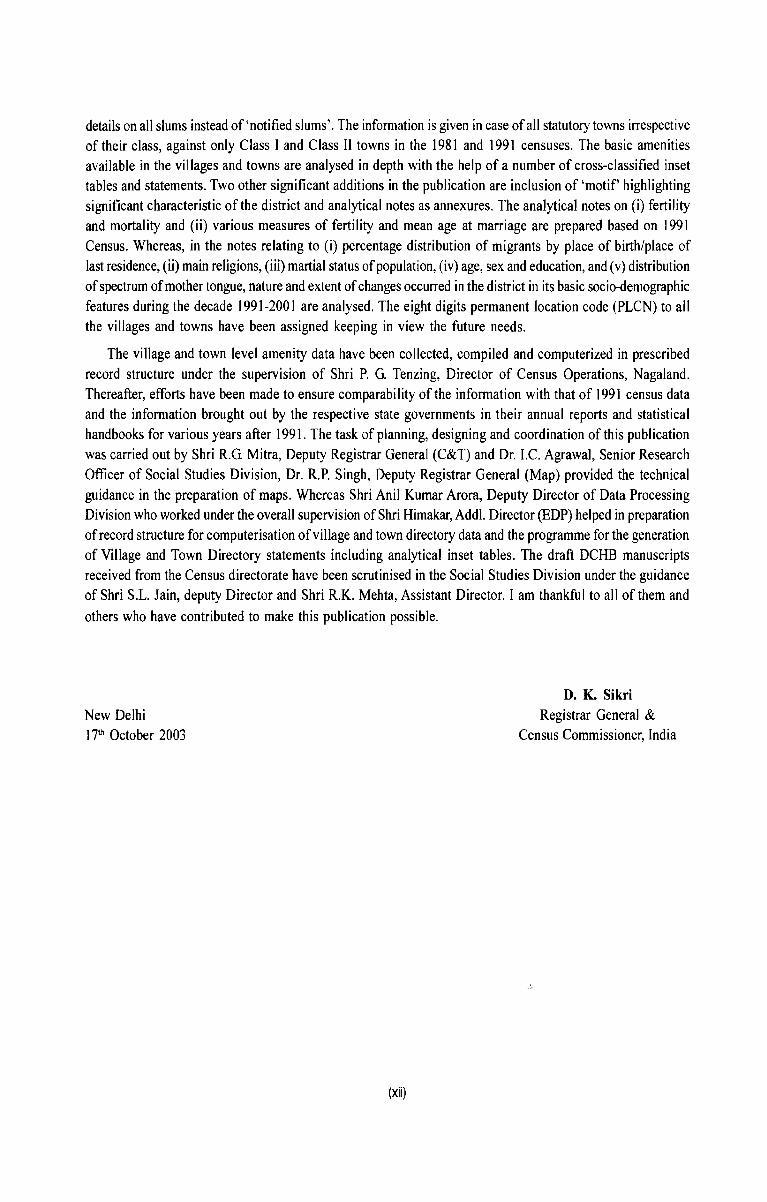
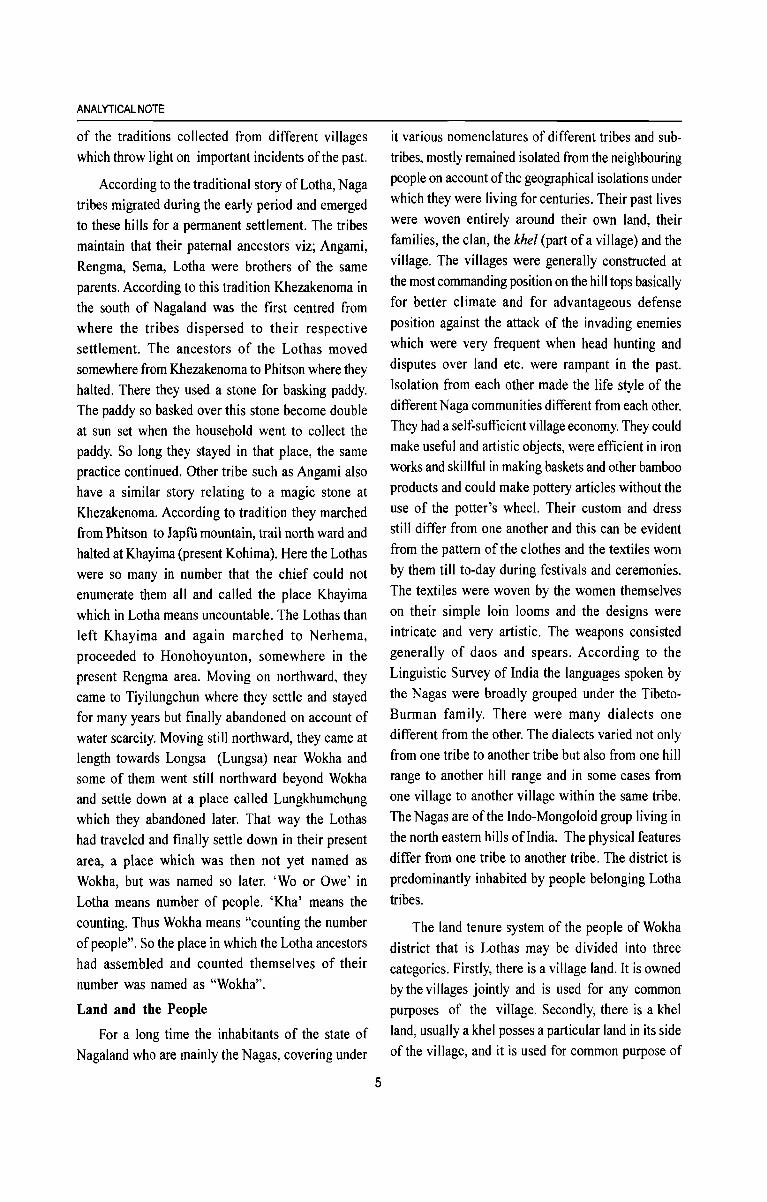
A Typical Lotha House
In the olden times Lothas constructed their houses during spring because by that time the materials to be used are seasoned. Lotha houses are
similar to each other. The topmost angular verge which projects down the roof side called Ngeriipiing, is seen bounded by more circlets of strong thatch called lishii or oko, palm leaf (Levistonia assamica) fastened to a ridge pole. The front side of a house is semi-circular with a door in the middle of the semi-circle, which is called mpongkl: The walls are generally bamboo plaited. there is no separate kitchen but cooking is done inside the same house and usually the fireplace called nchii is kept right in the middle of the house. the floor of the house is at the ground level and a round the house a drain is dug to prevent the rainwater from getting in. in some houses a raised floor is made of bamboo mat or timber. Almost in every house, in the rear, there is an open-air platform for basking, washing, sitting etc. A corridor runs lengthwise in the house from entrance to the rear for houses with open-air platform behind. The house is congested with household articles. We find at the porch, animal heads, mortars, troughs, firewood and agricultural implements. Stools, shelves, racks with content of pots, platters and other utensils form the part and parcel of the house alongwith beds made of planks or bamboo. Formerly, beds were'used to be hewn of tree-trunks. in the bygone days, there were much more spacious houses having many apartments in case of a man having more than one wife. But with the advent of modern civilization the housing pattern has widely changed in the district especially in the urban areas.

Foreword
Preface
Acknowledgements
Contents
Map of Wokha District
District Highlights - 200 1
Important Statistics of the District, 200 I
Ranking of Circle in the District
Statements 1-9
Statement 1
Statement 2
Statement 3
Statement 4
Statement 5
Statement 6
Statement 7
Statement 8
Statement 9
Analytical Note :
Name of the headquarters of District/C ire Ie, their rural-urban status and distance from District headquarters, 2001
Name of the headquarters of DistrictIRD block, their rural-urban status and distance from District headquarters, 200 1 Population of the District at each Census from 190 I to 200 I
Area, number of villages/towns and population in District and Circle, 2001
RD block wise number of villages and rural population, 200 I
Population of urban agglomerations (including constituent units! towns), 200 I
Villages with population of 5,000 and above at RD block level as per 200 I Census and amenities available
Statutory towns with population less than 5,000 as per 2001 Census and amenities available
Houseless and institutional population of Circle, rural and urban, 2001 Census
(i) History and Scope of the District Census Handbook
(ii) Brief History of the District
(iii) Administrative set-up
(iv) Physical features and Resource Physiography; Tempature & Climate; Agriculture; Animal husbandary Foresty; Power & Electricity; Horticulturer; Industry
Pages
Xl
xiii
xv
XVII
xix
xx
XXII
xxv
xxv
xxvi
xxvii
xxviii
xxviii
xxviii
xxix
xxx
3
4
6
7
(\')
(vi)
(vii)
Census concepts
Non-Census concepts
Census 2001 findings
Distribution of population in Rural and Urban areas~ Size, class and status of Towns; Population Gro\\-1h, Density and Sex Ratio; Literacy; Economic Activity; Scheduled Castes and Scheduled Tribes: Inset Tables I to 52
(viii) Major Social and Cultural events in the District - Fairs and festivals
(ix) Places of tourist interest and other important places in the district
(ix) Scope of Village and Town Directory
PART-A : VILLAGE AND TOWN DIRECTORY
Section-I: ViJlage Directory
(a) Note explaining the abbreviations used in the village directory (b) List of villages fully merged in Towns and outgrowths at 2001 Census (c) RD block wise presentation of Village Directory Data
Bhandari RD block
(i) Alphabetical List of Villages alongwith location code 1991 and 2001 (ii) Village Directory - Amenities and Land use (As in 1999)
Sanis RD block
(i) Alphabetical List of Vi II ages alongwith location code 1991 and 2001 (ii) Village Directory - Amenities and Land use (As in 1999)
Wozhuro Ralan RD block
(i) Alphabetical List of Villages alongwith location code 1991 and 2001 (ii) Village Directory - Amenities and Land use (As in 1999)
Wokha RD block
(i) Alphabetical List of Villages alongwith location ~ode 1991 and 2001 (ii) Village Directory - Amenities and Land use (As in 1999)
Chukitong RD block (i) Alphabetical List of Villages alongwith location code 1991 and 200 I (ii) Village Directory - Amenities and Land use (As in 1999)
(d) Appendixes to Village Directory Appendix - I Abstract of Educational, Medical and other amenities
in villages - RD block Level
Appendix - IA
Appendix - IB
Appendix - Ie
Appendix - n
Villages by number of Primary Schools
Villages by Primary, Middle and Secondary Schools
Villages with different sources of drinking water
facilities available
Villages with 5,000 and above population which do not
have one or more amenities
Pages
10
16
20
55
55
56
61 64 64
67 68
81
82
91
92
101 102
109 110
114
117
lIS
118
ll8
Appendix - IIA List of Census Towns which do not have one or more amenities
Appendix - III Land utilisation data in respect of Census Towns/non-municipal towns
Appendix - IV RD block wise list of inhabited villages where no amenity other than drinking water facility is available
Appendix - V Summary showing number of villages not having Scheduled Caste population
Appendix - VI Summary showing number of villages not having Scheduled Tribes population
Appendix - VIlA: List of villages according to the proportion of the Scheduled Castes to the total population by ranges
Appendix - VIIB: List of villages according to the proportion of the Scheduled Tribes to the total population by ranges
Appendix - VIII : Number of villages under each Gram Panchayat
Appendix - IX Statement showing number of girl schools in the villages
Section : II : Town Directory
(i) Note explaining the abbreviations used in the Town Directory
(ii) Town Directory Statements (I to VII)
Statement I
Statement II
Statement III
Statement IV
Statement V
Statement VI
Statement VII
Status and Growth History
Physical Aspects and Location of Towns, 1999
Municipal Finance, 1998·99
Civic and other Amenities, 1999
Medical, Educational, Recreational and Cultural Facilities, 1999
Trade, Commerce, Industry and Banking, 1999
Civic and other amenities in Slums, 1999
Pages
119
119
119
120
120
120
121
123
123
125
129
129
130
130
131
131
132
(iii) Appendix to Town Directory - Towns showing their outgrowth with population 132
PART-B : PRIMARY CENSUS ABSTRACT
Brief note on Primary Census Abstract
District Primary Census Abstract
Appendix to District Primary Abstract
Primary Census Abstract for Scheduled Tribes
Rural Development Block wise village Primary Census Abstract
Bhandari RD block
Sanis RD block
135
138
144
146
152
158
Wozhuro Ralan RD block
Wokha RD block
Chukitong RD block
Urban Primary Census Abstract
Circle-wise Village Primary Census Abstract
Changpang Circle (i) Map of Changpang Circle
(ii) Village Primary Census Abstract
Aitepyong Circle (i) Map of Aitepyong Circle
(ii) Village Primary Census Abstract
Bhandari Circle (i) Map of Bhandari Circle
(ii) Village Primary Census Abstract
Bagbty Circle (i) Map of Baghcy Circle
(ii) Village Primary Census Abstract
Sungro Circle (i) Map of Sungro Circle
(ii) Village Primary Census Abstract
Sanis Circle (i) Map of San is Circle
(ii) Village Primary Census Abstract
Lotsu Circle (i) Map of Lotsu Circle
(ii) Village Primary Census Abstract
Ralan Circle (i) Map of RaJan Circle (ii) Village Primary Census Abstract
Wozburo Circle (i) Map of Wozhuro Circle
(ii) Village Primary Census Abstract
Wokha Sadar Circle (i) Map of Wokha Sadar Circle
(ii) Village Primary Census Abstract
Chukitong Circle (i) Map of Chukitong Circle
(ii) Village Primary Census Abstract
Pages
164
170
176
182
189 192
199 202
209 212
219 222
229 232
239 242
249 252
259 262
269 272
279 282
289 292
Annexures and their write-up
Annexure-I
Annexure-II
Annexure-III
Annexure-IV
Annexure-V
Annexure-VI
Annexure-VII
Number of Villages under each Gram Panchayat
Note on Fertility, Mortality and Migrati'on,.1991
Various measures of Fertility and Mean Age at Marriage, 1991
Percentage distribution of Migrants, 1991 & 2001
Brief account of main religions in the District, 1991 & 2001
Marital status of population by age groups, 1991 & 2001
Age, Sex and Educational level in the district, 1991 & 2001
Pages
299
299
301
301
303
304
305

Foreword
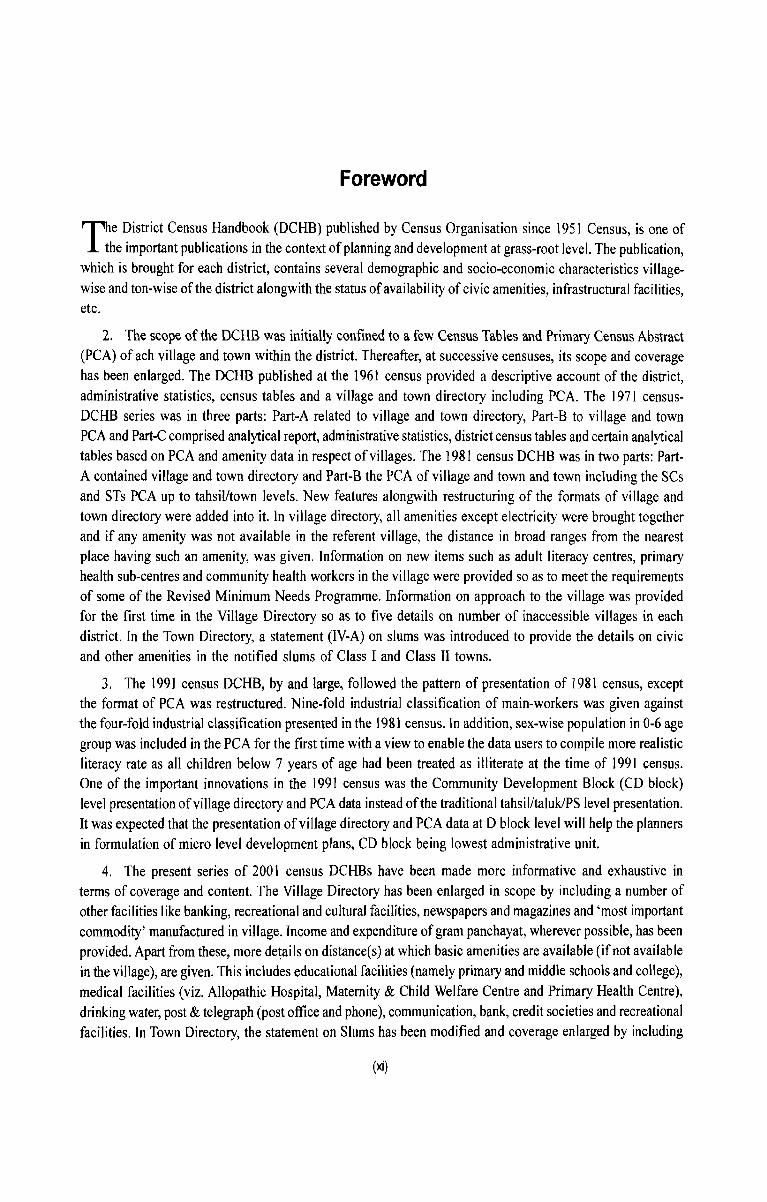
The District Census Handbook (DCHB) published by Census Organisation since 1951 Census, is one of the important publications in the context of planning and development at grass-root level. The publication,
which is brought for each district, contains several demographic and socio-economic characteristics villagewise and ton-wise of the district alongwith the status of availability of civic amenities, infrastructural facilities, etc.
2. The scope of the DCHB was initially confined to a few Census Tables and Primary Census Abstract (PCA) of ach village and town within the district. Thereafter, at successive censuses, its scope and coverage has been enlarged. The DCHB published at the 1961 census provided a descriptive account of the district, administrative statistics, census tables and a village and town directory including PCA. The 197 I censusDCHB series was in three parts: Part-A related to village and town directory, Part-B to village and town PCA and Part-C comprised analytical report, administrative statistics, district census tables and certain analytical tables based on PCA and amenity data in respect of villages. The 1981 census DCHB was in two parts: PartA contained village and town directory and Part-B the peA of village and town and town including the SCs and STs PCA up to tahsil/town levels. New features alongwith restructuring of the formats of village and town directory were added into it. In village directory, all amenities except electricity were brought together and if any amenity was not available in the referent village, the distance in broad ranges from the nearest place having such an amenity, was given. Information on new items such as adult literacy centres, primary health sub-centres and community health workers in the village were provided so as to meet the requirements of some of the Revised Minimum Needs Programme. Information on approach to the village was provided for the first time in the Village Directory so as to five details on number of inaccessible villages in each district. In the Town Directory, a statement (IV-A) on slums was introduced to provide the details on civic and other amenities in the notified slums of Class I and Class II towns.
3. The 1991 census DCHB, by and large, followed the pattern of presentation of 1981 census, except the format of PCA was restructured. Nine-fold industrial classification of main-workers was given against the four-fold industrial classification presented in the 1981 census. In addition, sex-wise population in 0-6 age group was included in the PCA for the first time with a view to enable the data users to compile more realistic literacy rate as all children below 7 years of age had been treated as illiterate at the time of 1991 census. One of the important innovations in the 1991 census was the Community Development Block (CD block) level presentation ofviIlage directory and PCA data instead of the traditional tahsil/talukiPS level presentation. It was expected that the presentation of village directory and PCA data at D block level will help the planners in formulation of micro level development plans, CD block being lowest administrative unit.
4. The present series of 200 I census DCHBs have been made more informative and exhaustive in terms of coverage and content. The Village Directory has been enlarged in scope by including a number of other facilities like banking, recreational and cultural facilities, newspapers and magazines and 'most important commodity' manufactured in village. Income and expenditure of gram panchayat, wherever possible, has been provided. Apart from these, more details on distance(s) at which basic amenities are available (if not available in the village), are given. This includes educational facilities (namely primary and middle schools and college), medical facilities (viz. Allopathic Hospital, Maternity & Child Welfare Centre and Primary Health Centre), drinking water, post & telegraph (post office and phone), communication, bank, credit societies and recreational facilities. In Town Directory, the statement on Slums has been modified and coverage enlarged by including
(xi)
details on all slums instead of 'notified slums'. The information is given in case of all statutory towns irrespective of their class, against only Class I and Class II towns in the 1981 and 1991 censuses. The basic amenities available in the villages and towns are analysed in depth with the help of a number of cross-classified inset tables and statements. Two other significant additions in the publication are inclusion of 'motif' highlighting significant characteristic of the district and analytical notes as annexures. The analytical notes on (i) fertility and mortality and (ii) various measures of fertility and mean age at marriage are prepared based on 1991 Census. Whereas, in the notes relating to (i) percentage distribution of migrants by place of birth/place of last residence, (ii) main religions, (iii) martial status of population, (iv) age, sex and education, and (v) distribution of spectrum of mother tongue, nature and extent of changes occurred in the district in its basic socio-demographic features during the decade 1991-2001 are analysed. The eight digits permanent location code (PLCN) to all the villages and towns have been assigned keeping in view the future needs.
The village and town level amenity data have been collected, compiled and computerized in prescribed record structure under the supervision of Shri P. G. Tenzing, Director of Census Operations, Nagaland. Thereafter, efforts have been made to ensure comparability of the information with that of 1991 census data and the information brought out by the respective state governments in their annual reports and statistical handbooks for various years after 1991. The task of planning, designing and coordination of this publication was carried out by Shri R.G. Mitra, Deputy Registrar General (C&T) and Dr. I.C. Agrawal, Senior Research Officer of Social Studies Division, Dr. RP. Singh, Deputy Registrar General (Map) provided the technical guidance in the preparation of maps. Whereas Shri Anil Kumar Arora, Deputy Director of Data Processing Division who worked under the overall supervision of Shri Himakar, Addl. Director (EDP) helped in preparation of record structure for computerisation of village and town directory data and the programme for the generation of Village and Town Directory statements including analytical inset tables. The draft DCHB manuscripts received from the Census directorate have been scrutinised in the Social Studies Division under the guidance of Shri S.L. Jain, deputy Director and Shri R.K. Mehta, Assistant Director. I am thankful to all of them and others who have contributed to make this publication possible.
New Delhi 17th October 2003
(xii)
D. K. Sikri
Registrar General & Census Commissioner, India
Preface
The publication of district statistics in the fonn of the District Census Handbook (DCHB) was introduced for the first time in 1951. Since then the tradition of publishing a District Census Handbook for each
district is continuing without any break while the scope of the data presented and quality of the publication have been constantly expanded and improved from Census to Census. The District Census Handbook is perhaps the most read and the most important publication brought out by the Census Organisation and it still remains the only publication that gives not only the village level, and ward level, in case of towns, demographic and economic characteristics of the population but also the various types of amenities available in the village or the town. The utility of the data presented in the DCHB to the administrators, planners, scholars and general public has so much increased over the past decades that any plan or study during the recent times without referring to the census figures appears to be incomplete and without authentication.
The District Census Handbook of 2001 Census contains general notes highlighting the history and descriptive account of the district, administrative set-up, physical features and other developmental statistics of the district in addition to the analysis of the population and tables derived from the Primary Census Abstract, Village and Town Directory and data on houses and household amenities. The District Census Handbook is divided into two parts, viz., Part-A dealing with Village and Town Directory and Part-B relating to the Primary Census Abstract. Village and Town Directory has again two sections, Section I and Section II. Section I covers the Village Directory in which the village level amenities and land use data are presented at Community/ Rural Development Block level followed by Appendices I to IX. In Section II the Town Directory consisting of seven statements are shown. In Part-B Village Primary Census Abstract for the R.D. blocks and Urban Primary Census Abstract are presented. Nine annexures are also given at the end of the chapter.
In 2001 Census, the data presented in the DCHB is the outcome of a series of high level quality checks and results of computerisation at the national and sub-national level. As a result of the continuing efforts in the office of the Registrar General of India the coverage of the data in the DCHB has been considerably improved over that of the 1991 Census. Both census and non-census definitions and concepts used have also been given for the benefit of the readers. Data in the Village Directory have been expanded in 2001 to cover new amenities regarding bank, recreational and cultural facilities, and newspapers and magazines available in the village. Infonnation on the most important commodity manufactured in the village has also been included in the Village Directory. Eight digit Permanent Location Code Number applicable for all the villages in the state running in a continuous serial number beginning from the first village in the first district to the last village in the last district has also been introduced for the first time. A number of inset tables have also been added to this publication. Another interesting addition is the inclusion of analytical notes on fertility, migration, religion, marital status, distribution of mother tongue and scheduled tribe data based on 1991 Census in annexure II to IX. It is hoped that these additional data will surely benefit the public and the planners.
l express my profound gratitude to Shri J .K.Banthia, Registrar General and Census Commissioner of India for the guidance and advice given to this Directorate at every step of the preparation of this Handbook right from drafting, quality control and final printing. The publication of this Handbook would not have been possible at all without his valuable advice. I am also equally thankful to all the officers and staff of the office of the Registrar General India for all the co-operation and assistance extended to me in the finalisation of this publication. In particular, I would like to put on record my thanks to Shri R.G.Mitra, Deputy Registrar General (Census & Tabulation), Dr.I.C.Aggrawal, Senior Research Officer (Social Studies), Mr.Himakar, Additional
(xiii)
Director (Electronic Data Processing), Dr.R.P.Singh, Deputy Registrar General (Map) and Dr.D.Roy Choudhury, Assistant Registrar General (Demography).
In the state, I express my profound indebtedness to Shri Metongmeren Ao, Ex-Director of Census Operations under whose able guidance the 2001 Census was conducted under heavy odds successfully in all the districts in the state of Nagai and. He had to leave this organisation to take up other important assignments in the State Government before this publication could be finalised. I would also like to place my sincere gratitude to all the staff of my Directorate who had worked holidays and overtime as a team against innumerable hardships to bring out this publication in time. A list of staff associated with this publication is appended herewith. The fact that only a few names have been listed in the acknowledgement should not be treated as an under-estimation of the contribution of other staff to this publication.
Kohima April 30, 2004
(xiv)
P.G. Tenzing Director of Census Operations,
Nagaland
Acknowledgement
Supervision
Shri S. Birendra Singh
Editing
Shri B. Marbaniang
Drafting and Analysis
Shri S. Birendra Singh
Shri B. Marbaniang Shri M. Peseyie
Data editing and finalisation
Shri A. laban Shri Lhovishe Chishi Shri Tinuwati Shri Imkongnungsang Shri Viyovol Chaya Shri Muyalu Kath Shri Senchulo Kath
Generation of data and computer support
Shri Imkongnungsang Shri Ranjon Changkakoty
Presentation and Layout
Shri Ranjon Changkakoty
Maps
Shri R. N. Chhipa Shri A. lahan Shri Manturaj Nath Shri Vishwanath
\
Smt. Thepfusanuo Yhome
Computer Typing
Smt. Vikiehunuo
(xv)
Deputy Director
Assistant Director
Deputy Director
Assistant Director S. I. Gr. II
S. L Gr. II S. 1. Gr. III S. 1. Gr. III Sr. Compiler Compiler Compiler Compiler
Sr. Compiler Sr. Compiler
Sr. Compiler
Research Officer (Map) S. L Gr. II Geographer Map Analysist, 0/0 Registrar General, India, New Delhi. Senior Draftsman
Senior Stenographer

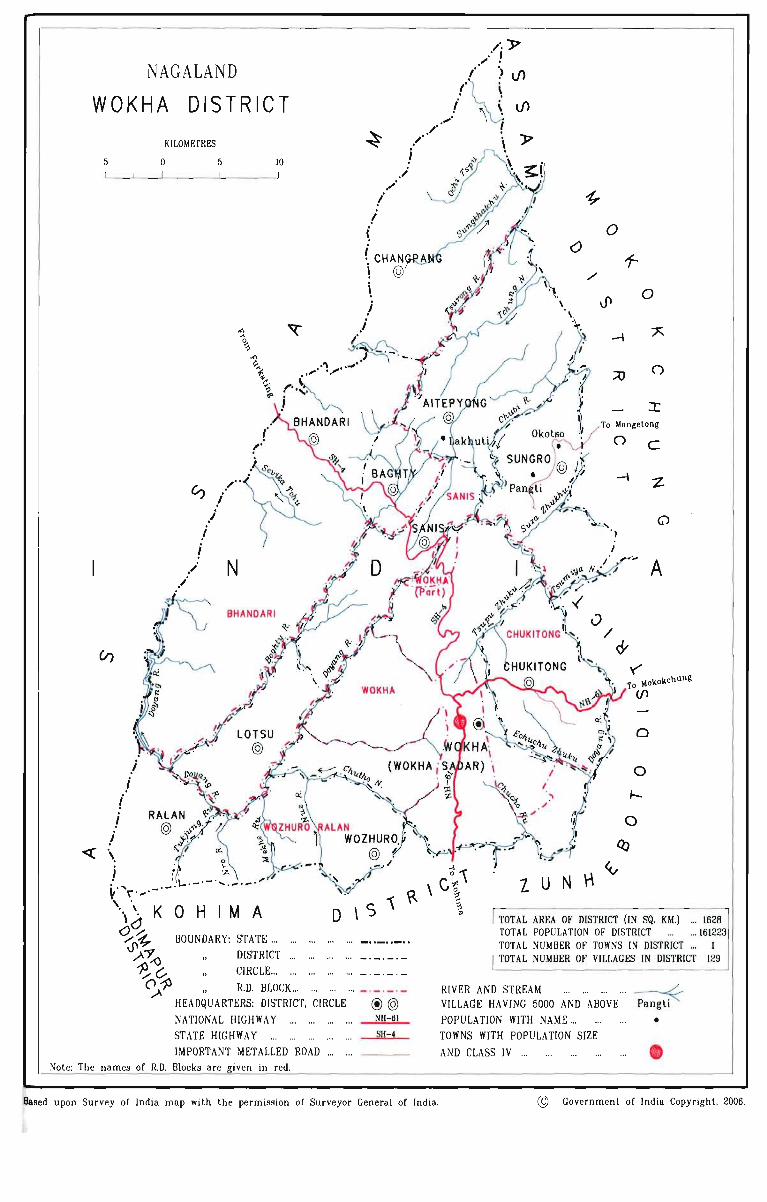
NAGALAND
WOKHA DISTRICT
KILOMETRES
5 o 5 10 j ,I
/ i (
,,,,'
( CHAN \ @ \ i
~ .i l ~-.
"".'1 ,_' _ _,'
l i i
o ,; .i
l i
,,,, ,
./ N ,/
BHANDARI
l '} « \. 0 ~ , . ~
I t· z ,/' : ~.-.- . , . -.-.' ~.",,{' ... ,-.-. "\ KOHIMA "d
r'~
'1;-'
s.~ BOUNDARY: STATE ... .). "Y-¢ DISTRICT ...
~C-0}P
CIRCLE ...
R.D. BLOCK .. . HEADQUARTERS: DISTRICT, CIRCLE
NATIONAL HIGHWAY... ... ... ... STATE HIGHWAY IMPORTANT METALLED ROAD... ...
Note: The names of R.D. Blocks are given in red.
@@ NH-61
SH- 4
/', "J::" /1
,.. ) V> ,. , , \
i '\' \ V> " \ /" (
/' "J::"
~
0 0
1-./
J' 0
-I r..
.::0 ()
J: To Mangelong
0 C
-I -z
G'>
~.. A
I U
o
o ,_
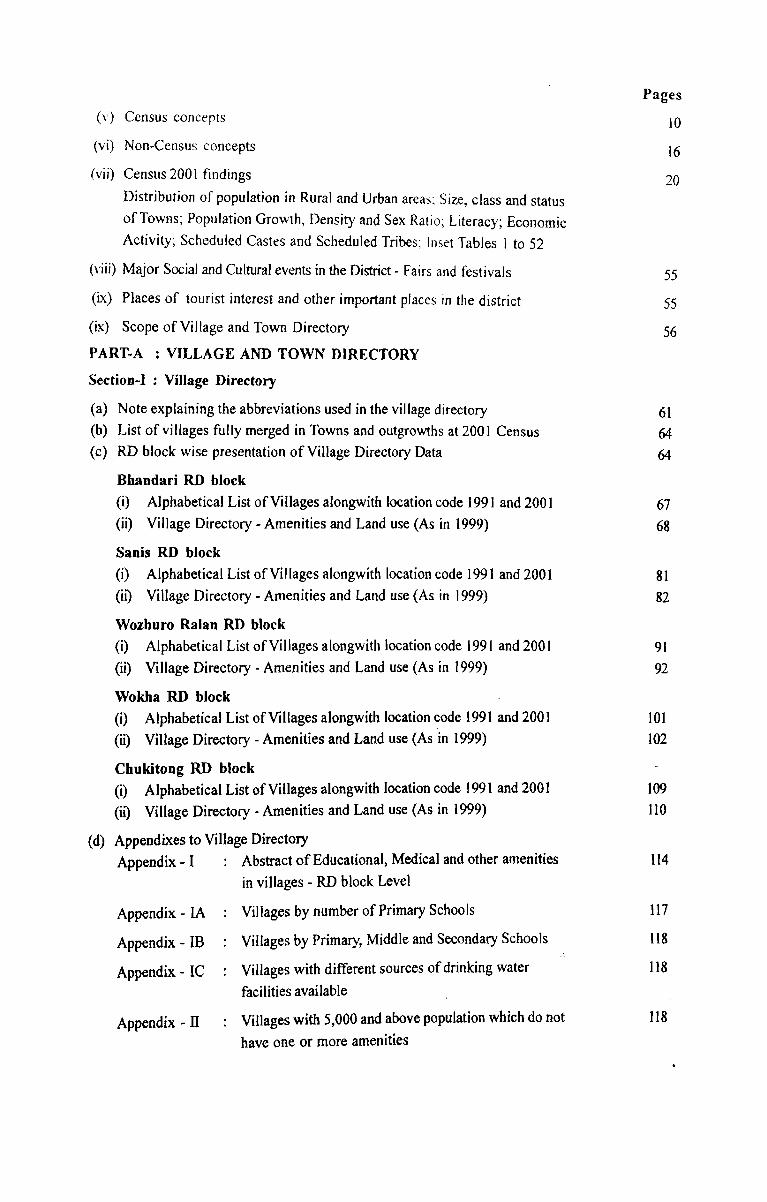
TOTAL AREA OF DISTRICT (IN SQ. KM.) ... 1628 TOTAL POPULATION OF DISTRICT ... 161223 TOTAL NUMBER OF TOWNS IN DISTRICT... 1 TOTAL NUMBER OF VILLAGES IN DISTRICT 129
RIVER AND STREAM VILLAGE HAVI NG 5000 AN D ABOVE POPULATION WITH NAME ... TOWNS WITH POPULATION SIZE
AND CLASS IV ...
~ •
• Based upon Survey of India map with the permission of Surveyor General of India. © Government of India Copyright, 2006.

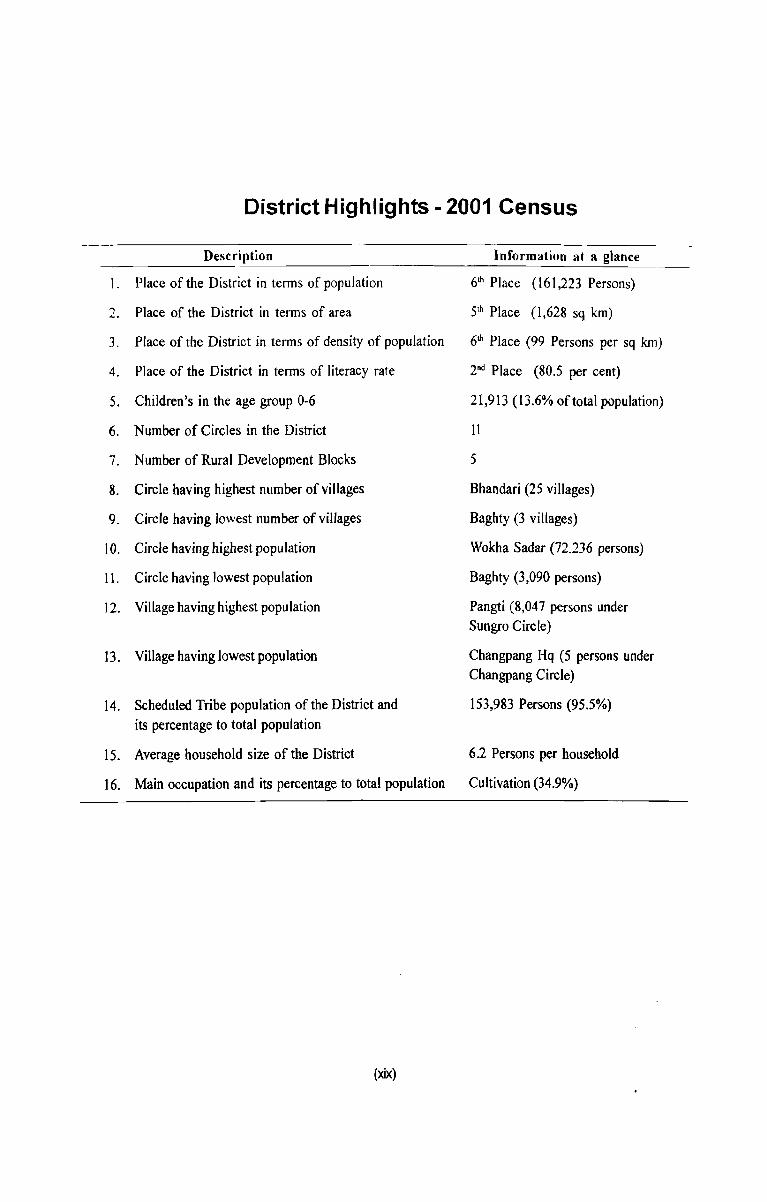
District Highlights - 2001 Census
Description Information at a glance
1. Place of the District in tenus of population 6th Place (161,223 Persons)
2. Place of the District in tenus of area 5th Place (1,628 sq km)
3. Place of the District in tenus of density of population 6th Place (99 Persons per sq km)
4. Place of the District in tenus of literacy rate 2nd Place (80.5 per cent)
5. Children's in the age group 0-6 21,913 (13.6% of total population)
6. Number of Circles in the District 11
7. Number of Rural Development Blocks 5
8. Circle having highest number of villages Bhandari (25 villages)
9. Circle having lowest number of villages Baghty (3 villages)
10. Circle having highest population Wokha Sadar (72.236 persons)
11. Circle having lowest population Baghty (3,090 persons)
12. Village having highest population Pangti (8,047 persons under Sungro Circle)
13. Village having lowest population Changpang Hq (5 persons under Changpang Circle)
14. Scheduled Tribe population of the District and 153,983 Persons (95.5%) its percentage to total population
15. Average household size of the District 6.2 Persons per household
16. Main occupation and its percentage to total population Cultivation (34.9%)
(xix)
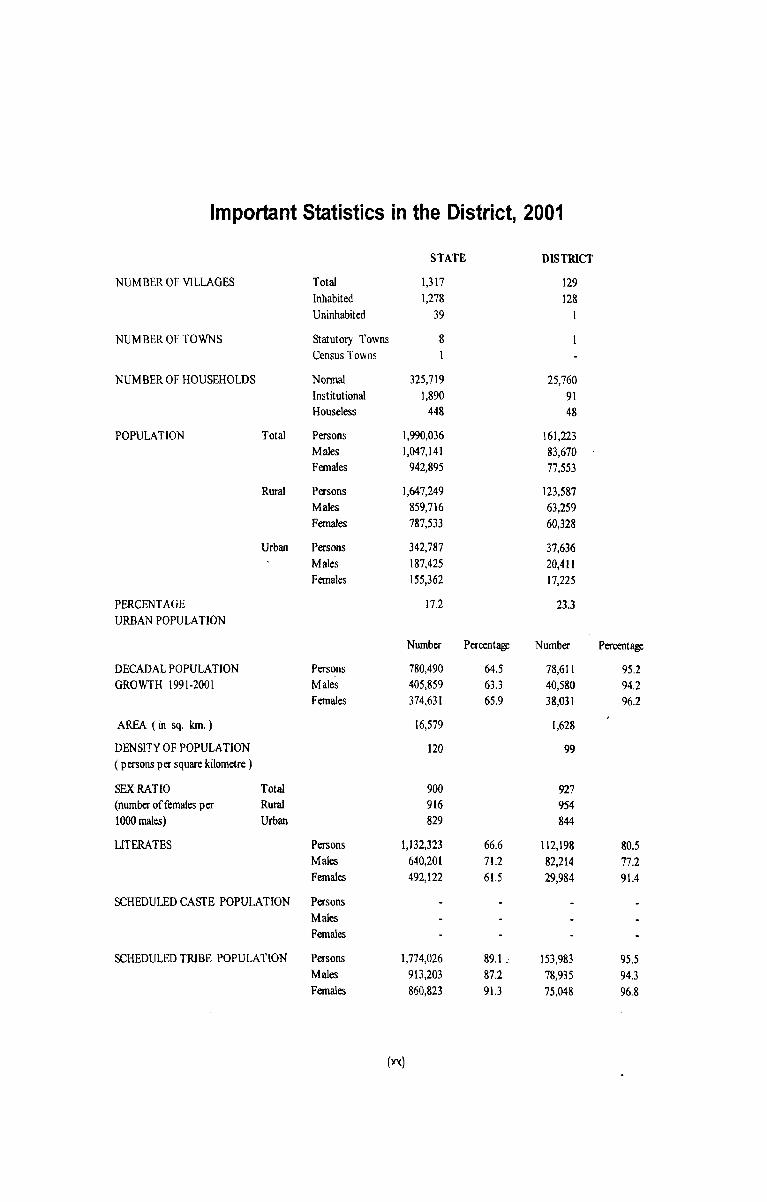
Important Statistics in the District, 2001
STATE DISTRICT
NUMBER OF VILLAGES Total 1,317 129 Inhabited 1,278 128 Uninhabited 39
NUMBER OF TOWNS Statutory Towns 8 Census Towns
NUMBER OF HOUSEHOLDS Normal 325,719 25,760 Institutional 1,890 91 Houseless 448 48
POPULATION Total Persons 1,990,036 161,223 Males 1,047,141 83,670 Females 942,895 77,553
Rural Persons 1,647,249 123,587 Males 859,716 63,259 Females 787,533 60,328
Urban Persons 342,787 37,636 Males 187,425 20,411 Females 155,362 17,225
PERCENTAGE 17.2 23.3 URBAN POPULATION
Number Percentage Number Percentage
DECADAL POPULA nON Persons 780,490 64.5 78,611 95.2 GROWfH 1991·2001 Males 405,859 63.3 40,580 94.2
Females 374,631 65.9 38,031 96.2
AREA (in sq. km.) 16,579 1,628
DENSITY OF POPULA nON 120 99 ( persons per square kilometre)
SEX RATIO Total 900 927 (number of females per Rural 916 954 1000 males) Urban 829 844
LITERATES Persons 1,132,323 66.6 112,198 80.5 Males 640,201 71.2 82,214 77.2 Females 492,122 61.5 29,984 91.4
SCHEDULED CASTE POPULA nON Persons Males Females
SCHEDULED TRIBE POPULA nON Persons 1,774,026 89.1,c 153,983 95.5 Males 913,203 87.2 78,935 94.3 Females 860,823 91.3 75,048 96.8
(Y'(l
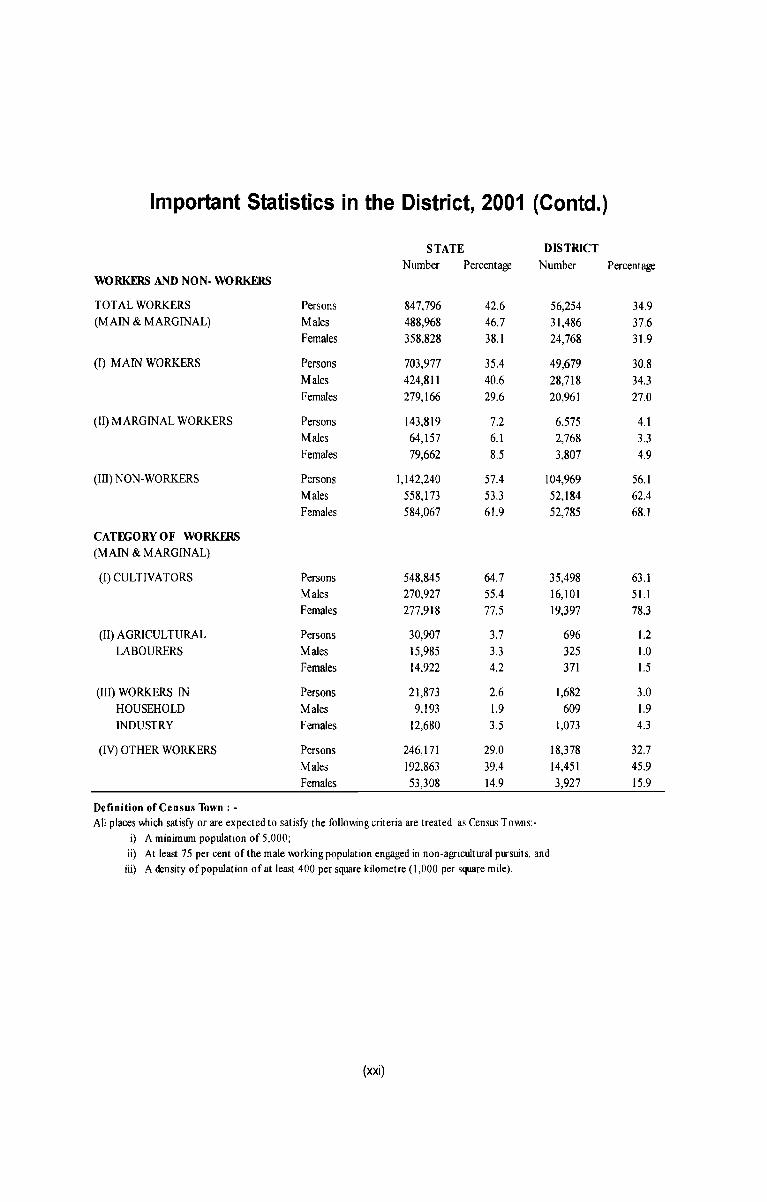
Important Statistics in the District, 2001 (Contd.)
STATE DISTRICT Number Percentage Number Percentage
WORKERS AND NON- WORKERS
TOTAL WORKERS Persons 847,796 42.6 56,254 34.9 (MAIN & MARGINAL) Males 488,968 46.7 31,486 37.6
Females 358,828 38.1 24,768 31.9
(I) MAIN WORKERS Persons 703,977 35.4 49,679 30.8 Males 424,811 40.6 28,718 34.3 Females 279,166 29.6 20,961 27.0
(II) MARGINAL WORKERS Persons 143,819 7.2 6,575 4.1 Males 64,157 6.1 2,768 3.3 Females 79,662 8.5 3,807 4.9
(III) NON-WORKERS Persons 1,142,240 57.4 104,969 56.1 Males 558,173 53.3 52,184 62.4 Females 584,067 61.9 52,785 68.1
CATEGORY OF WORKERS (MAIN & MARGINAL)
(I) CULTIVATORS Persons 548,845 64.7 35,498 63.1 Males 270,927 55.4 16,101 51.1 Females 277,918 77.5 19,397 78.3
(II) AGRICULTURAL Persons 30,907 3.7 696 1.2 LABOURERS Males 15,985 3.3 325 1.0
Females 14,922 4.2 371 1.5
(III) WORKERS IN Persons 21,873 2.6 1,682 3.0 HOUSEHOLD Males 9,193 1.9 609 1.9 INDUSTRY Females 12,680 3.5 1,073 4.3
(IV) OTHER WORKERS Persons 246,171 29.0 18,378 32.7
Males 192,863 39.4 14,451 45.9 Females 53,308 14.9 3,927 15.9
Definition of Census Town: -All places \\hich satisfy or are expected to satisfy the follomng criteria are treated as Census Towns:-
i) A minimwn population of 5,000; ii) At least 75 per cent of the male Wlrking population engaged in non-agricultural pursuits, and
iii) A density of population of at least 400 per square kilometre (1,000 per square mile).
(xxi)
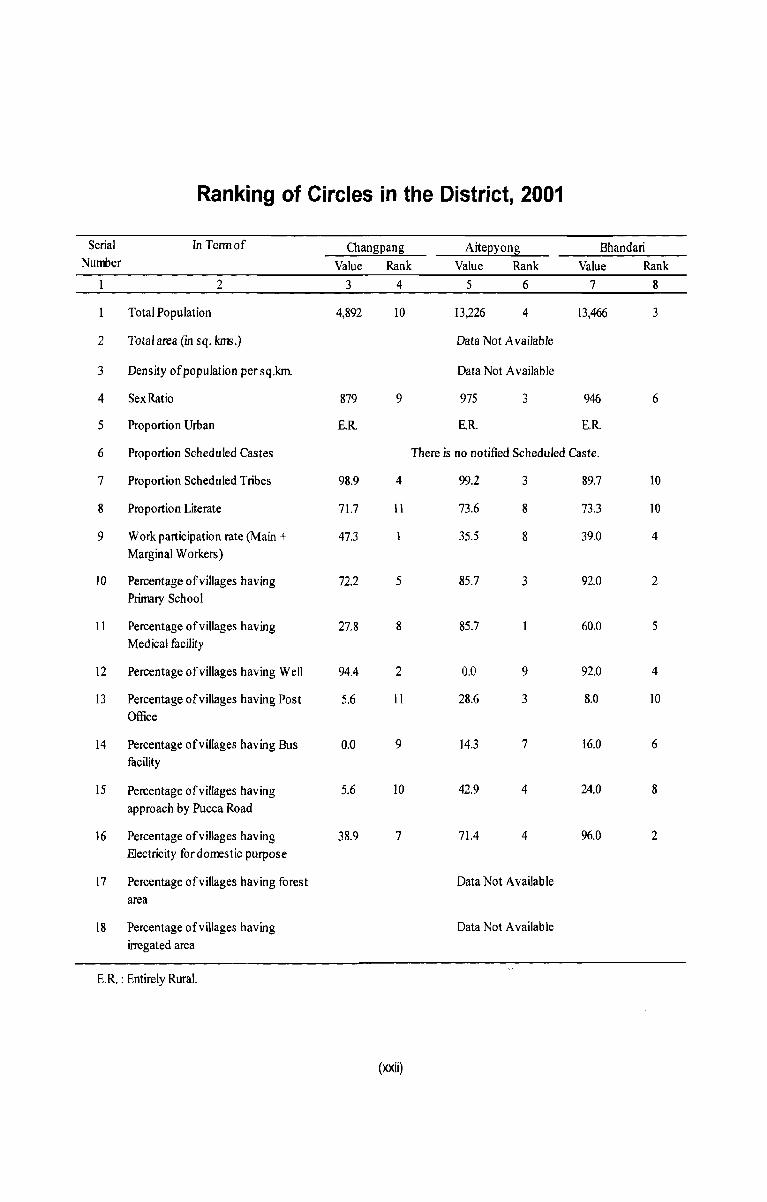
Ranking of Circles in the District, 2001
Serial In Term of Changpang Aitepyong Bhandari Number Value Rank Value Rank Value Rank
2 3 4 5 6 7 8
Total Population 4,892 10 13,226 4 13,466 3
2 Total area (in sq. kms.) Data Not Available
3 Density of population per sq.km. Data Not Available
4 Sex Ratio 879 9 975 3 946 6
5 Proportion Urban E.R E.R E.R
6 Proportion Scheduled Castes There is no notified Scheduled Caste.
7 Proportion Scheduled Tribes 98.9 4 99.2 3 89.7 10
8 Proportion Literate 71.7 11 73.6 8 73.3 10
9 Work participation rate (Main + 47.3 35.5 8 39.0 4 Marginal Workers)
IO Percentage of villages having 72.2 5 85.7 3 92.0 2 Primary School
II Percentage of villages having 27.8 8 85.7 60.0 5 Medical facility
12 Percentage of villages having Well 94.4 2 0.0 9 92.0 4
13 Percentage of villages having Post 5.6 II 28.6 3 8.0 IO Office
14 Percentage of villages having Bus 0.0 9 14.3 7 16.0 6 facility
15 Percentage of villages having 5.6 10 42.9 4 24.0 8
approach by Pucca Road
16 Percentage of villages having 38.9 7 71.4 4 96.0 2
Electricity for domestic purpose
17 Percentage of villages having forest Data Not Available
area
18 Percentage of villages having Data Not Available
irregated area
E.R. : Entirely Rural.
(xxii)
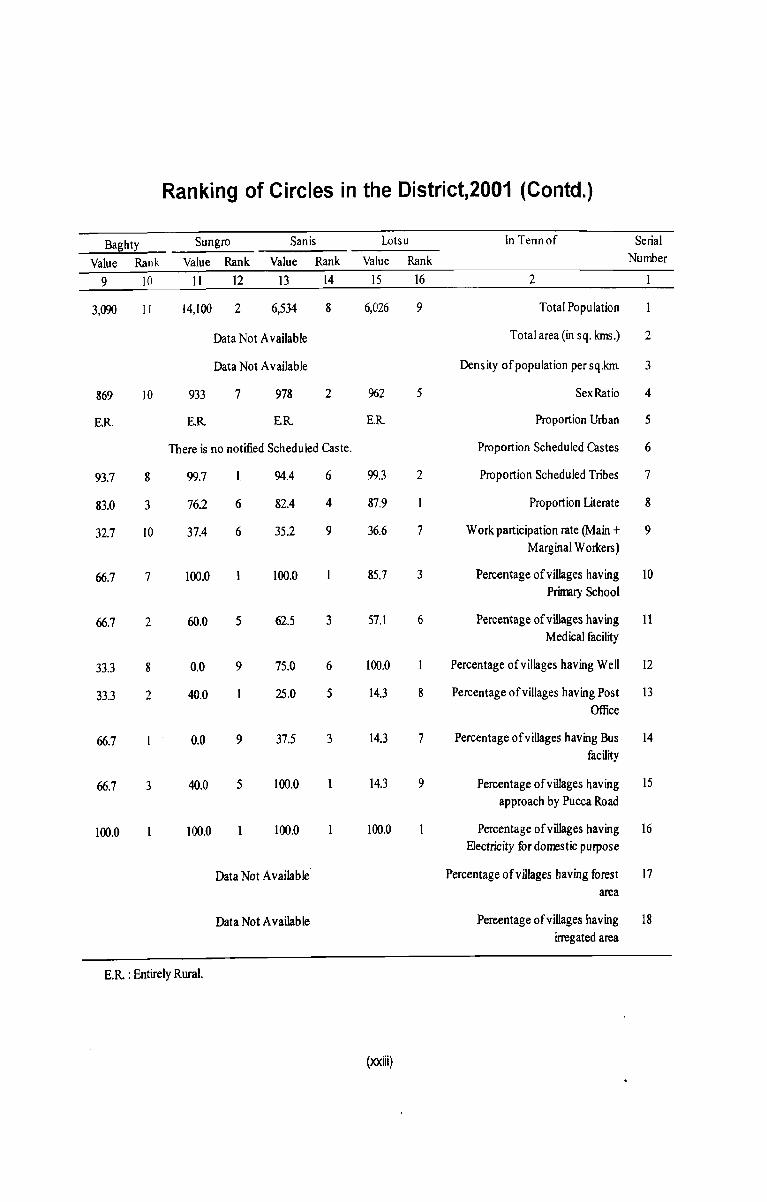
Ranking of Circles in the District,2001 (Contd.)
Baghty Sungro Sanis Lotsu In Tennof Serial
Value Rank Value Rank Value Rank Value Rank Number
9 10 11 12 13 14 15 16 2
3,090 11 14,100 2 6,534 8 6,026 9 Total Population
Data Not Available Total area (in sq. kms.) 2
Data Not Available Density of population persq.km 3
869 10 933 7 978 2 962 5 Sex Ratio 4
E.R. E.R. E.R. E.R. Proportion Urban 5
There is no notified Scheduled Caste. Proportion Scheduled Castes 6
93.7 8 99.7 94.4 6 99.3 2 Proportion Scheduled Tribes 7
83.0 3 76.2 6 82.4 4 87.9 Proportion Literate 8
32.7 10 37.4 6 35.2 9 36.6 7 Work participation rate (Main + 9 Marginal Workers)
66.7 7 100.0 100.0 85.7 3 Percentage ofviUages having 10 Prumry School
66.7 2 60.0 5 62.5 3 57.1 6 Percentage of villages having 11 Medical facility
33.3 8 0.0 9 75.0 6 100.0 Percentage ofvilJages having Well 12
33.3 2 40.0 25.0 5 14.3 8 Percentage of villages having Post 13 Office
66.7 0.0 9 37.5 3 14.3 7 Percentage of villages having Bus 14 facility
66.7 3 40.0 5 100.0 14.3 9 Percentage of villages having 15 approach by Pucca Road
100.0 100.0 100.0 100.0 Percentage ofvillages having 16 Electricity for domestic purpose
Data Not Available Percentage of villages having forest 17 area
Data Not A vailab Ie Pereentage ofviUages having 18 irregated area
E.R. : Entirely Rural.
(xxiii)
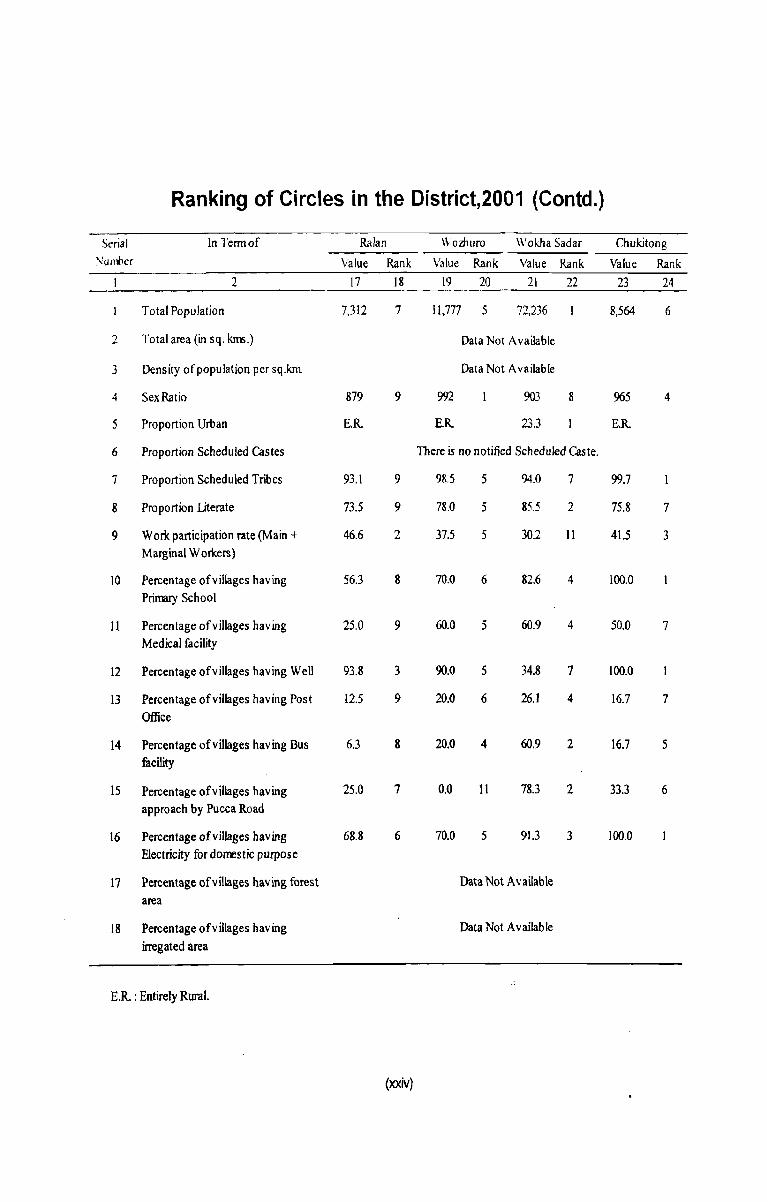
Ranking of Circles in the District,2001 (Contd.)
Serial In Tennof Ralan Wozhuro Wokha Sadar Chukitong ;--:umbcr Value Rank Value Rank Value Rank Value Rank
2 17 18 19 20 21 22 23 24
Total Population 7,312 7 11,777 5 72,236 8,564 6
2 Total area (in sq. km;.) Data Not Available
3 Density of population per sq.km Data Not Available
4 Sex Ratio 879 9 992 903 8 965 4
5 Proportion Urban E.R E.R. 23.3 E.R.
6 Proportion Scheduled Castes There is no notified Scheduled Caste.
7 Proportion Scheduled Tribes 93.1 9 98.5 5 94.0 7 99.7
8 Proportion Literate 73.5 9 78.0 5 85.5 2 75.8 7
9 Work participation rate (Main + 46.6 2 37.5 5 30.2 II 41.5 3 Marginal Workers)
10 Percentage ofvillages having 56.3 8 70.0 6 82.6 4 100.0
Primary School
II Percentage of villages having 25.0 9 60.0 5 60.9 4 50.0 7 Medical facility
12 Percentage of villages having Well 93.8 3 90.0 5 34.8 7 100.0
13 Percentage of villages having Post 12.5 9 20.0 6 26.1 4 16.7 7
Office
14 Percentage of villages having Bus 6.3 8 20.0 4 60.9 2 16.7 5 facility
15 Percentage of villages having 25.0 7 0.0 11 78.3 2 33.3 6
approach by Pucca Road
16 Percentage ofvillages having 68.8 6 70.0 5 91.3 3 100.0
Electricity for dom:stic purpose
17 Percentage ofvillages having forest Data Not Available
area
18 Percentage of villages having Data Not Available
irregated area
ER : Entirely Rural.
(xxiv)
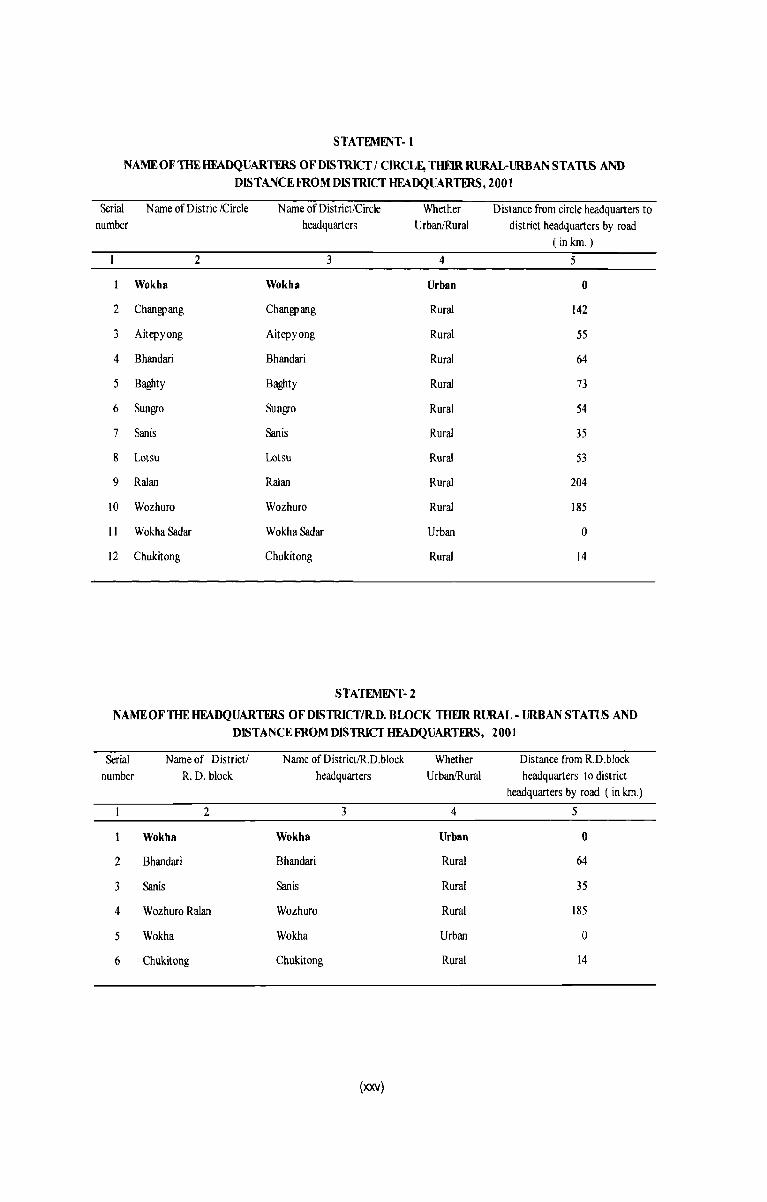
STATEMlNT-1
NAME OF THE HFADQUARTFRS OFDISTRICf {CIRCLE, THEIR RURAL-URBAN STATUS AND DISTANCE FROMDISTRICf HFADQUARnRS, 2001
Serial Name of Distric {Circle Name of District/Circle Whether Distance from circle headquarters to number headquarters UrbanlRural district headquarters by road
(in km.)
2 3 4 5
Wokha Wokha Urban 0
2 Changpang Changpang Rural 142
3 Aitepyong Aitepyong Rural 5S
4 Bhandari Bhandari Rural 64
5 Baghty Baghty Rural 73
6 Sungro Sungro Rural 54
7 Sanis San is Rural 35
8 Lotsu Lotsu Rural 53
9 Ralan Ralan Rural 204
10 Wozhuro Wozhuro Rural 185
II Wokha Sadar Wokha Sadar Urban 0
12 Chukitong Chukitong Rural 14
STATEMENT- 2
NAMEOFTHEHFADQUARTFRS OFDISTRICf/RD. BLOCK THEIR RURAL- URBAN STATUS AND DISTANCE FROM DISTRICT HFADQUARTFRS, 2001
Serial Name of District! Name of DistrictlR.D.block Whether Distance from R.D.block number R. D. block headquarters Urban/Rural headquarters to district
headquarters by road (in km.)
2 3 4 5
Wokha Wokha Urban 0
2 Bhandari Bhandari Rural 64
3 Sanis San is Rural 35
4 Wazhura Ralan Wazhura Rural 185
5 Wakha Wakha Urban 0
6 Chukitong Chukitong Rural 14
(xxv)
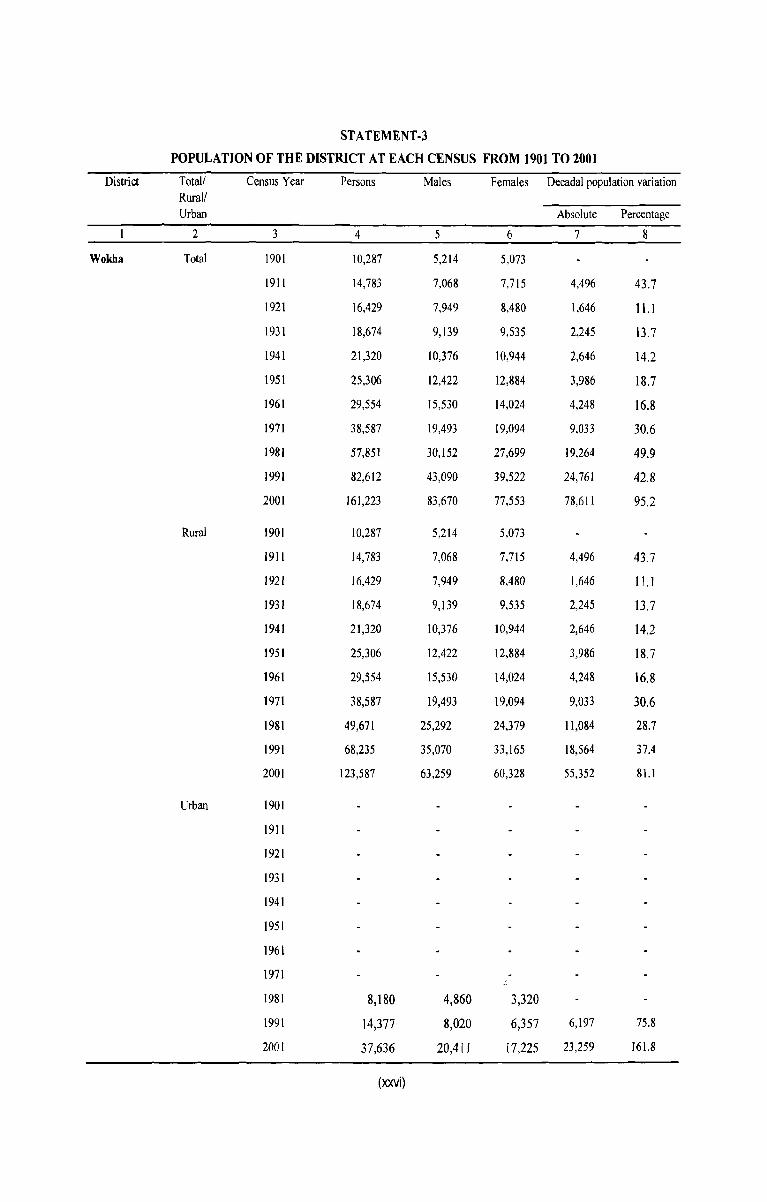
STATEMENT -3
POPULATION OF THE DISTRICT AT EACH CENSUS FROM 1901 TO 2001
District Total/ Census Year Persons Males Females Decadal population variation Rural/ Urban Absolute Percentage
2 3 4 5 6 7 8
Wokha Total 1901 10,287 5,214 5,073
1911 14,783 7,068 7.715 4,496 43.7
1921 16,429 7,949 8,480 1,646 11.1
1931 18,674 9,139 9,535 2,245 13.7
1941 21,320 10,376 10,944 2,646 14.2
1951 25,306 12,422 12,884 3,986 18.7
1961 29,554 15,530 14,024 4,248 16.8
1971 38,587 19,493 19,094 9,033 30.6
1981 57,851 30,152 27,699 19,264 49.9
1991 82,612 43,090 39,522 24,761 42.8
2001 161,223 83,670 77,553 78,611 95.2
Rural 1901 10,287 5,214 5,073
1911 14,783 7,068 7,715 4,496 43.7
1921 16,429 7,949 8,480 1,646 11.1
1931 18,674 9,139 9,535 2,245 13.7
1941 21,320 10,376 10,944 2,646 14.2
1951 25,306 12,422 12,884 3,986 18.7
1961 29,554 15,530 14,024 4,248 16.8
1971 38,587 19,493 19,094 9,033 30.6
1981 49,671 25,292 24,379 11,084 28.7
1991 68,235 35,070 33,165 18,564 37.4
2001 123,587 63,259 60,328 55,352 8l.1
Urban 1901
1911
1921
1931
1941
1951
1961
1971
1981 8,180 4,860 3,320
1991 14,377 8,020 6,357 6,197 75.8
2001 37,636 20,41 I 17,225 23,259 161.8
(xxvi)
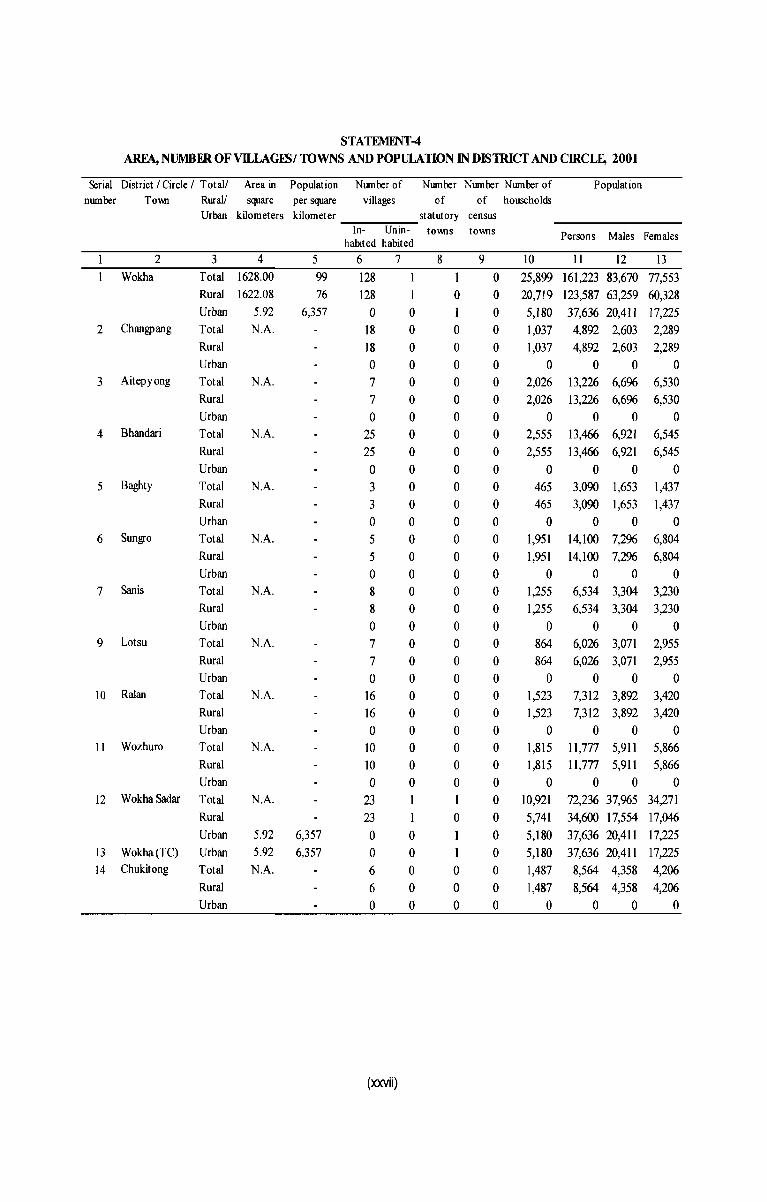
STATEMENT-4 ARFA, NUMBER OFVILLAGlSI TOWNS AND POPULATION IN DISTRICT AND CIRCLE, 2001
Serial District / Circle / Total/ Area in Population Number of Number Number Number of Population number To'Ml Rurall square per square villages of of households
Urban kilometers kilometer statutory census
2
Wokha
2 Changpang
3 Aitepyong
4 Bhandari
5 Baghty
6 Sungro
7 Sanis
9 Lotsu
3 4 Total 1628.00 Rural Urban Total Rural Urban Total Rural
Urban Total Rural
Urban Total Rural Urban Total Rural Urban Total Rural Urban Total Rural Urban
1622.08
5.92 N.A.
N.A.
N.A.
N.A.
N.A.
N.A.
N.A.
10 Ralan Total N.A. Rural Urban
II Wozhuro Total N.A.
Rural Urban
12 WokhaSadar Total N.A. Rural
5 99 76
6,357
Urban 5.92 6,357 13 Wokha(TC) Urban 5.92 6,357 14 Chukitong Total N.A.
Rural Urban
--:----:-:,...,..--In- Un in- to'MlS to'MlS Persons Males Females
habited habited
6 7
128 128
o 18 18 o 7 7 o
25 25
o 3 3
o 5 5 o 8 8
o 7 7 o
16 16 o
10 10
o 23 23 o o 6
6 o
(xxvii)
1 o o o o o o o o o o o o o o o o o o o o o o o o o o o o
1
o o o o o
8
o I o o o o o o o o o o o o o o o o o o o o o o o o o o o
o 1
o o o
9 10 11 12 13
o 25,899 161,223 83,670 77,553 o o o o o o o o o o o o o o o o o o o o o
20,719 123,587 63,259 60,328 5,180 37,636 20,411 17,225 1,037 4,892 2,603 2,289 1,037 4,892 2,603 2,289
o 0 0 0 2,026 13,226 6,696 6,530 2,026
o 13,226 6,696 6,530
o 0 0 2,555 13,466 6,921 6,545 2,555
o 465 465
o 1,951 1,951
o 1,255 1,255
o 864
13,466 6,921 6,545
o 0 0 3,090 1,653 1,437 3,090 1,653 1,437
o 0 0 14,100 7,296 6,804 14,100 7,296 6,804
o 0 0 6,534 3,304 3,230 6,534 3,304 3,230
o 0 0
6,026 3,071 2,955 o 864 6,026 3,071 2,955 o 0 0 0 0 o 1,523 7,312 3,892 3,420 o 1,523 7,312 3,892 3,420 o 0 0 0 0 o 1,815 11,777 5,911 5,866 o 1,815 11,777 5,911 5,866 o 0 0 0 0 o 10,921 72,236 37,965 34,271 o o o o o o
5,741 34,600 17,554 17,046 5,180 37,636 20,411 17,225 5,180 37,636 20,411 17,225 1,487 8,564 4,358 4,206 1,487 8,564 4,358 4,206
o 0 0 0
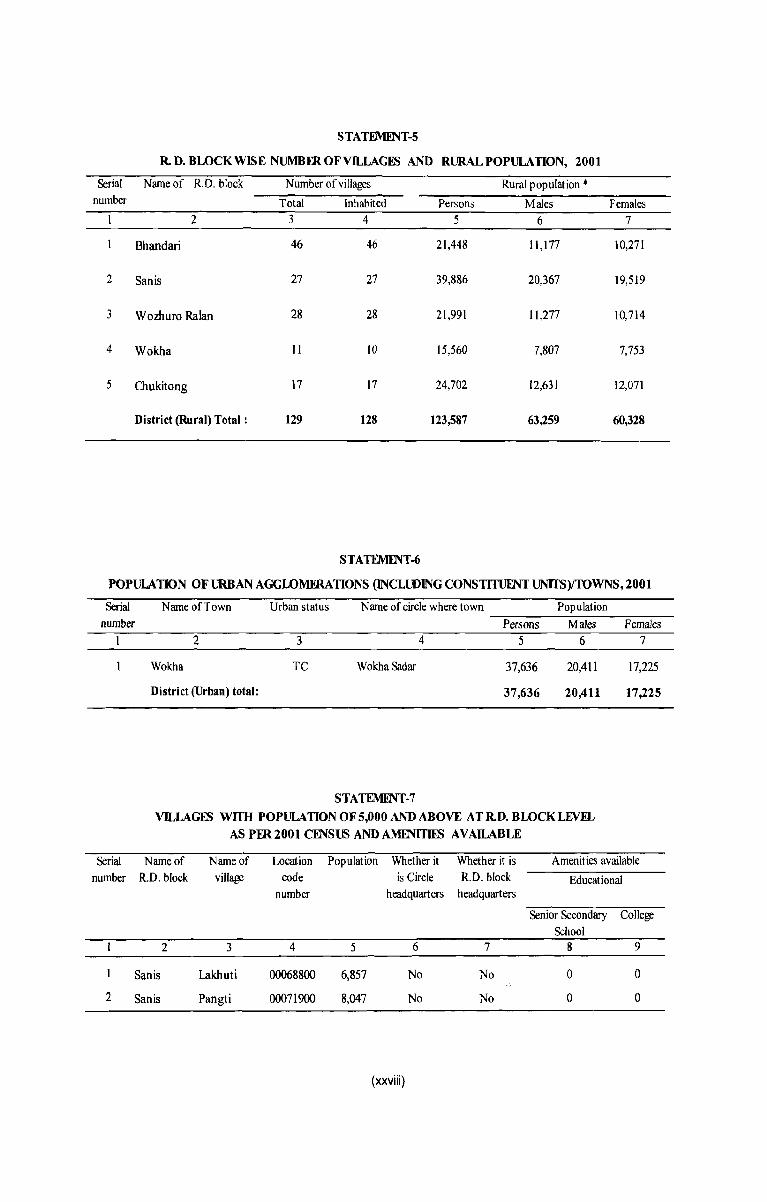
STATEMFNT-5
R. D. BLOCK WISE NUMBFROFVlLLAGES AND RURAL POPULATION, 2001
Serial Name of R.D. block Number of villages Rural population * number Total Inhabited Persons Males Females
2 3 4 5 6 7
Bhandari 46 46 21,448 11,177 10,271
2 Sanis 27 27 39,886 20,367 19,519
3 W omuro Ralan 28 28 21,991 11,277 10,714
4 Wokha II IO 15,560 7,807 7,753
5 Chukitong 17 17 24,702 12,631 12,071
District (Rural) Total: 129 128 123,587 63,259 60,328
STATEMFNT-6
POPULATION OF URBAN AGGLOMmATIONS (lNCLUDING CONSTITUENT UNITS)/IDWNS, 2001
Serial Name of Town Urban status N arne of circle where town Population number Persons Males Females
2 3 4 5 6 7
Wokha TC Wokha Sadar 37,636 20,411 17,225
District (Urban) total: 37,636 20,411 17,225
STATEMI!NT-7
VILLAGES wrm POPULATION OF 5,000 AND ABOVE AT R.D. BLOCK LEVEL AS PER 2001 CENSUS AND AMENITIES AVAILABLE
Serial Name of Name of Location Population Whether it Whether it is Amenities available number R.D. block village code is Circle R.D. block Educational
number headquarters headquarters
Senior Secondary College School
2 3 4 5 6 7 8 9
Sanis Lakhuti 00068800 6,857 No No 0 0
2 San is Pangti 00071900 8,047 No No 0 0
(xxviii)
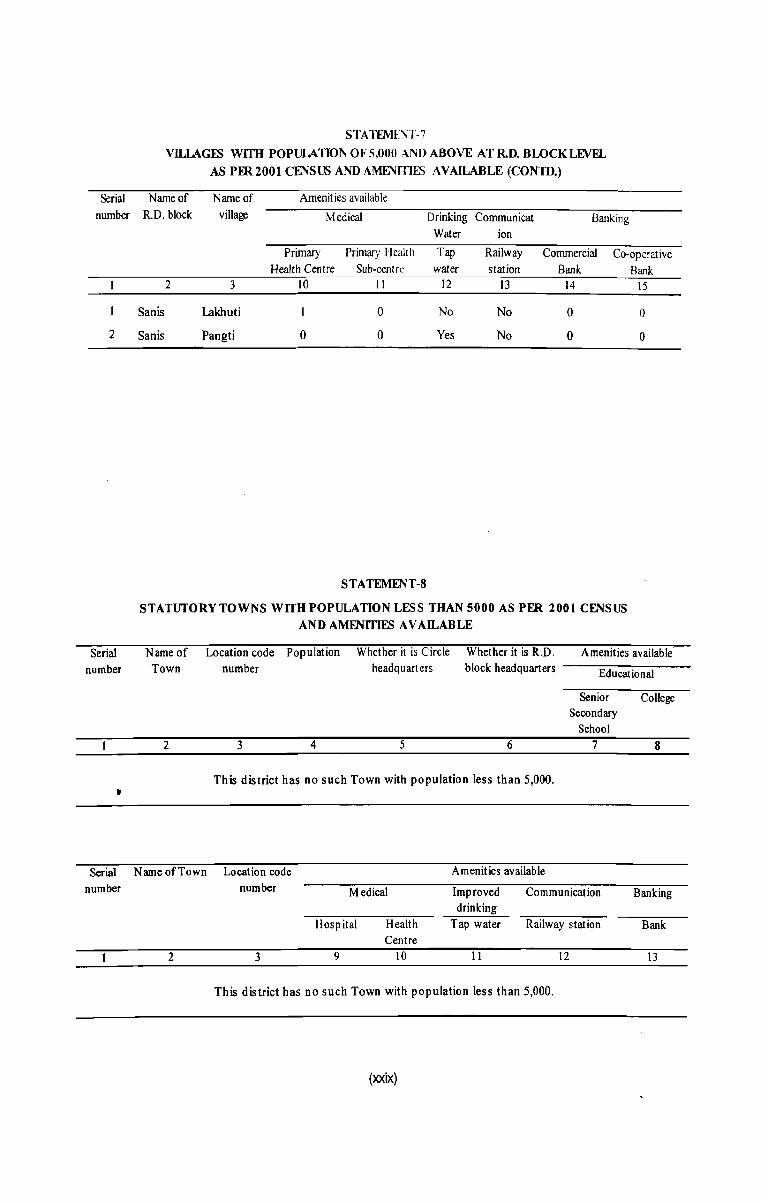
STATFME~T-7
VILLAGFS wrm POPULATION OF 5,000 AND ABOVE ATR.D.BLOCKLEVFL AS PER 2001 CENSUS AND AMENmES AVAILABLE (CONTD.)
Serial Name of number R.D. block
Name of village
Amenities available
Medical Drinking Comrnunicat Banking Water ion
Primary Primary Health Tap Railway Commercial Co-operative
2
Serial number
•
2
Sanis
San is
3
Lakhuti
Pangti
Health Centre 10
0
Sub-centre 11
0
0
STATEMENT-8
water station Bank Bank 12 13 14 15
No No 0 0
Yes No 0 0
STATUTORY TOWNS WITH POPULATION LESS THAN 5000 AS PER 2001 CENSUS AND AMENITIES AVAILABLE
Name of Location code Population Whether it is Circle Whether it is R.D. Amenities available Town number headquarters block headquarters Educational
Senior College Secondary
School 2 3 4 5 6 7 8
This district has no such Town with population less than 5,000 .
Serial Name of Town Location code Amenities available number number Medical Improved Communication Banking
drinking Hospital Health Tap water Railway station Bank
Centre 2 3 9 10 II 12 13
This district has no such Town with population less than 5,000.
(xxix)
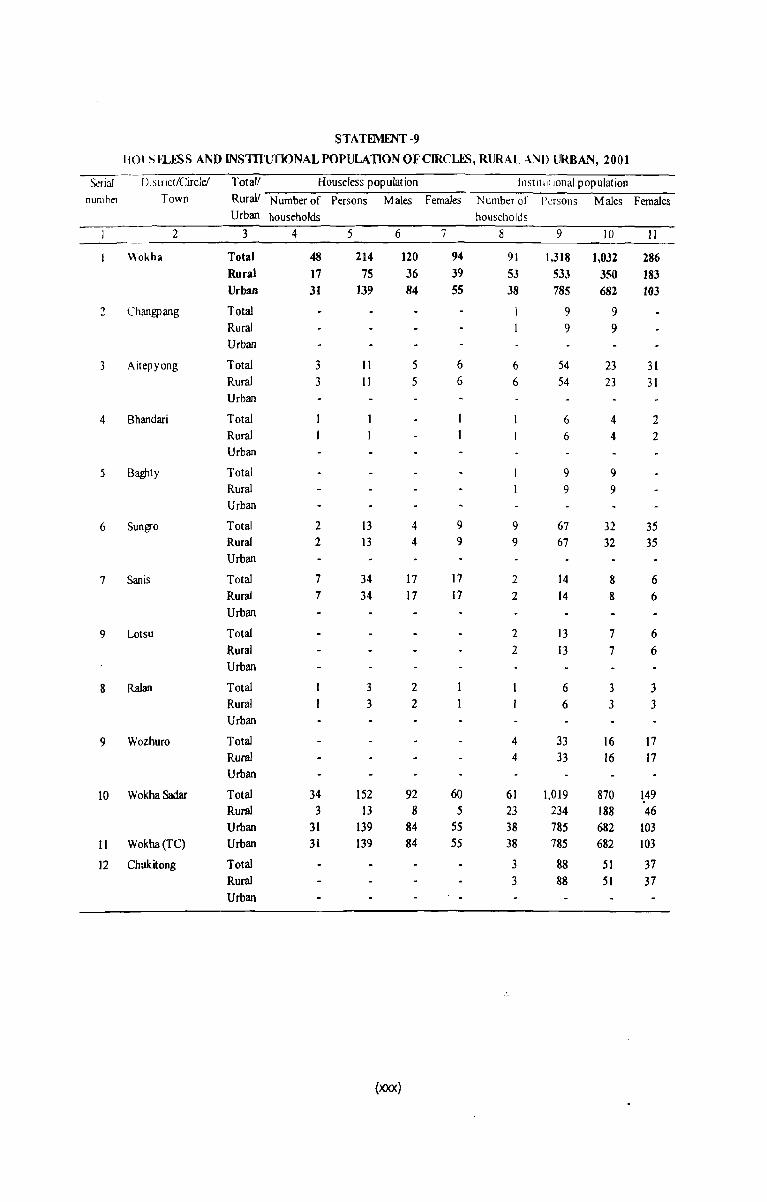
STATEMENT -9
1101 S ELESS AND INSTfI1JTIONAL POPULATION OF CIRCLES, RUR<\L AND URBAN, 2001
~riaJ [llslricl/Circlel Total! Houseless population InS!llull0nal population numhl"l Town Rural! Number of Persons Males Females Number of 1\:r500S Males Females
Urban households households 2 3 4 5 6 7 8 9 10 II
Wokha Total 48 214 120 94 91 1,318 1,032 286 Rural 17 75 36 39 53 533 3S0 183 Urban 31 139 84 55 38 785 682 t03
2 Changpang Total 9 9 Rural 9 9 Urban
3 Aitepyong Total 3 1l S 6 6 S4 23 31 Rural 3 II S 6 6 54 23 31 Urban
4 Bhandari Total 6 4 2 Rural 6 4 2 Urban
5 BagJ1ty Total 9 9 Rural 9 9 Urban
6 Sungro Total 2 13 4 9 9 67 32 35 Rural 2 13 4 9 9 67 32 35 Urban
7 Sanis Total 7 34 17 17 2 14 8 6 Rural 7 34 17 17 2 14 8 6 Urban
9 Lotsu Total 2 13 7 6 Rural 2 13 7 6 Urban
8 Ralan Total 3 2 6 3 3 Rural 3 2 6 3 3 Urban
9 Wozhuro Total 4 33 16 17 Rural 4 33 16 17 Urban
10 WokhaSadar Total 34 152 92 60 61 1,019 870 1,49 Rural 3 13 8 5 23 234 188 46 Urban 31 139 84 5S 38 785 682 103
II Wokha(TC) Urban 31 139 84 5S 38 785 682 103
12 Chukitong Total 3 88 51 37 Rural 3 88 51 37 Urban
(xxx)
ANALYTICAL NOTE

,c
Analytical Note
(i) History and Scope of District Census Handbook
The District Census Handbook has a long history and is a fascinating publication from the Census Organisation which provides details of census and noncensus data down from district to village level in rural areas and to ward level in urban areas. It, thus, has the proud privilege of being the only data source for every district at micro level.
The District Census Handbook (DCHB) was first published in 1951 in collaboration with the State Govt. But in 1951 only a few demographic and economic information at village and town level within the district were published in the District Census Handbook along with some data tables not directly related to the population count. It, however, has undergone radical changes and seen a number of improvements during the following censuses. The scope and content of DCHBs were enhanced in 1961 by incorporating more census data tables and some other administrative statistics which included information on rainfall and temperature, vital statistics, land utilization pattern and agriculture, livestock, industries, administration, public health and medical, etc. The DCHB of 1961 is therefore, considered a unique asset published by the Census Organisation. In 1971 Census, further improvements were made in the DCHB by incorporating more information on villages and towns in the form of Village and Town Directory data. The publication in 1971 had three parts, namely, Part-A presenting the Village and Town Directory data, PartB containing the village and town wise Primary Census Abstract (PCA) and Part-C dealing with the administrative aspect and other census tables based on PCA, etc. During the 1981 Census further expansion in the data coverage were made by incorporating information on literacy rates, primary health centres, etc. in addition to the information already covered in 1971. The DCHB was divided into
two parts, Part·A and Part-B. Part·A included data on Village and Town Directory and Part-B covered the village and ward-wise Primary Census Abstract data. In 1991 Census also, as in 1981, the DCHB was divided in two parts, Part-A and Part-B, Part-A presenting the Village and Town Directory and Part-B, the Primary Census Abstract. Part -A had two sections, Section I and Section II. Section I contained the alphabetical list of villages and note explaining the codes used in the Village Directory. The Village Directory had four appendices: AppendixI - Rural Development Block-wise abstract of educational and other amenities, Appendix-II - Rural Development Block-wise list of villages where no amenities are available, Appendix-III - Rural Development Block-wise list of villages according to the proportion of Scheduled Tribe population with sex break-up and Appendix-IV - Name and code of Rural Development Block with sex wise popUlation. SectionII contained the note explaining the codes used in the Town Directory, the Town Directory statements (I to IV) and appendix to the Town Directory. Part·B presented the District Primary Census Abstract at Circle, RD Block and Village level in rural areas and ward level in urban areas. In addition, the PCA had an appendix as well as annexure to the appendix. The District Primary Census Abstract of the Scheduled Castes and the Scheduled Tribes at Circle and Rural Development Block level in rural areas and town level in urban areas were also incorporated in this part of the DCHB.
In the Census of India, 200 I also the DCHB is divided into two parts, Part-A and Part-B. Part-A presents the Village Directory and Town Directory and Part-B, the Primary Census Abstract. Part-A has, like in 1991, two sections, Section-I Village Directory and Section-II Town Directory. However in 2001 a number of improvements have been made in the data presentation. Additional data on the list of villages
merged in towns and outgrowths in 2001 are new features presented in Section-I. The alphabetical list of villages shows the Permanent Location Code Numbers of the villages adopted in 2001 along with their corresponding codes of 1991. Permanent Location Code Numbers (PLCN) have been assigned to each and every village within the State in Census - 2001. PLCN is a unique eight digit location code number, the first six digits representing the code number of the village and the last two digits depicting two zeros '00' are reserved for use for coding any new village/villages that may come up between two villages in future. Unlike previous censuses, the code number of the villages are given in a continuous serial number beginning from the first village in the first district to the last village in the last district. In 1991 and the previous censuses the codes were given within each tahsil/circle. The data content has also been expanded in 200 1. Besides the four appendices of 1991, five more appendices are being added in 200 I Census. There have also been changes in the type of data shown in appendices to Section-I of Part-A. While Appendix-I displays abstract of educational, medical and other amenities in villages at RD Block level as in 1991, Appendix-II gives the list of villages with 5,000 and above population and Census Towns which do not have one or more amenities, Appendix-III presents data on land utilization pattern in Census Towns/non-municipal towns. Appendix-IV gives RD Block-wise list of villages where no amenity other than the drinking water is available. Appendix-V depicts the summary showing the number of villages without Scheduled Caste population. As no Scheduled Caste has been notified for Nagaland Appendix-V is given for information only. Appendix-VII A & B displays the summary showing the number of villages without Scheduled Tribe population. Appendix-VI
displays the same data as Appendix-III of 1991, i.e., list of villages according to the proportion of Scheduled Caste and Scheduled Tribes population to the total population. Appendix-vm shows the number of villages under each Gram Panchayat and Appendix-IX shows the number of girls school in the villages. In Section II, the Town Directory alongwith seven statements and an appendix are presented. Statement I gives status and growth history of the towns while in Statement II the physical aspects are given. Municipal finance and
4
DISTRICT CENSUS HANDBOOK: WOKHA
civic and other amenities are presented in Statement III and Statement IV respectively. Information on medical, educational, recreational and cultural activities are presented in Statement V while trade, commerce, industry and banking are given in Statement VI. Statement VII is meant for slum areas. As the district does not have any slum area no data could be presented in the statement.
In Part-B, the District Primary Census Abstract and the RD Block-wise Primary Census Abstract are presented. The District Primary Census Abstract has an Appendix showing urban enumeration block-wise figures of Scheduled Castes and Scheduled Tribes population. The Primary Census Abstracts for Scheduled Tribes are also presented in this part. For the urban area separate Primary Census Abstract at urban level is also shown. Nine Annexures are given at the end of Part-B and these annexures give information on the number of villages under each Gram Panchayat, data on fertility, mortality, migration, religion, marital status, age, sex and education, distribution of mother tongues and Scheduled Tribe population as returned in 1991 Census. As already stated the state does not have Gram Panchayat system in the villages.
(ii) Brief History of the District
The Naga Hills Tuensang Area (NHTA) by an Act No. 42 of 1957 was created to form a new Administrative Unit. Subsequently in February 1961 by the Nagaland, Nagaland attained its Statehood and Wokha the erstwhile sub-division of Mokokchung district was upgraded into a new district of Nagai and in 1973.
The district ofWokha is situated on the mid-west of the State of Nagaland and adjoins the Sibsagar plain of Assam on the west and adjoining mostly inhabited by Lotha tribe. The Lothas, like other Naga tribes have Mongoloid features. The colour of their skin is generally dark-brown and a few of them are yellowish in colour. Mojority of the Lothas have high nose, oblique eyes and straight hair. The Lothas are generally slim and moderately tall.
The early history of the Nagas is obscure, so is the early history of the Lothas. The early period, however, can be reconstructed mainly on the basis
ANALYTICAL NOTE
of the traditions collected from different villages which throw light on important incidents of the past.
According to the traditional story of Lotha, Naga tribes migrated during the early period and emerged to these hills for a permanent settlement. The tribes maintain that their paternal ancestors viz; Angami, Rengma, Serna, Lotha were brothers of the same parents. According to this tradition Khezakenoma in the south of Nagaland was the first centred from where the tribes dispersed to their respective settlement. The ancestors of the Lothas moved somewhere from Khezakenoma to Phitson where they halted. There they used a stone for basking paddy. The paddy so basked over this stone become double at sun set when the household went to collect the paddy. So long they stayed in that place, the same practice continued. Other tribe such as Angami also have a similar story relating to a magic stone at Khezakenoma. According to tradition they marched from Phitson to Japru mountain, trail north ward and halted at Khayima (present Kohima). Here the Lothas were so many in number that the chief could not enumerate them all and called the place Khayima which in Lotha means uncountable. The Lothas than left Khayima and again marched to Nerhema, proceeded to Honohoyunton, somewhere in the present Rengma area. Moving on northward, they came to Tiyilungchun where they settle and stayed for many years but finally abandoned on account of water scarcity. Moving still northward, they came at length towards Longsa (Lungsa) near Wokha and some of them went still northward beyond Wokha and settle down at a place called Lungkhumchung which they abandoned later. That way the Lothas had traveled and finally settle down in their present area, a place which was then not yet named as Wokha, but was named so later. 'Wo or Owe' in Lotha means number of people. 'Kha' means the counting. Thus Wokha means "counting the number of people". So the place in which the Lotha ancestors had assembled and counted themselves of their number was named as "Wokha".
Land and the People
For a long time the inhabitants of the state of Nagaland who are mainly the Nagas, covering under
5
it various nomenclatures of different tribes and subtribes, mostly remained isolated from the neighbouring people on account of the geographical isolations under which they were living for centuries. Their past lives were woven entirely around their own land, their families, the clan, the khel (part of a village) and the village. The villages were generally constructed at the most commanding position on the hill tops basically for better climate and for advantageous defense position against the attack of the invading enemies which were very frequent when head hunting and disputes over land etc. were rampant in the past. Isolation from each other made the life style of the different Naga communities different from each other. They had a self-sufficient village economy. They could make useful and artistic objects, were efficient in iron works and skillful in making baskets and other bamboo products and could make pottery articles without the use of the potter's wheel. Their custom and dress still differ from one another and this can be evident from the pattern of the clothes and the textiles worn by them till to-day during festivals and ceremonies. The textiles were woven by the women themselves on their simple loin looms and the designs were intricate and very artistic. The weapons consisted generally of daos and spears. According to the Linguistic Survey of India the languages spoken by the Nagas were broadly grouped under the TibetoBurman family. There were many dialects one different from the other. The dialects varied not only from one tribe to another tribe but also from one hill range to another hill range and in some cases from one village to another village within the same tribe. The Nagas are of the Indo-Mongoloid group living in the north eastern hills ofIndia. The physical features differ from one tribe to another tribe. The district is predominantly inhabited by people belonging Lotha tribes.
The land tenure system of the people of Wokha district that is Lothas may be divided into three categories. Firstly, there is a village land. It is owned by the villages jointly and is used for any common purposes of the village. Secondly, there is a khel land, usually a khel posses a particular land in its side of the village, and it is used for common purpose of
that khel. Thirdly, and the most important one is the family land. It is held jointly by the family.
All the lands belong to the villagers except a small portion of forest as Reserved and Protected by the Government. Since lands belong to the villagers there is no patta system. Individual lands may occasionally change the hands but generally remain within the Village.
(iii) Administrative set up
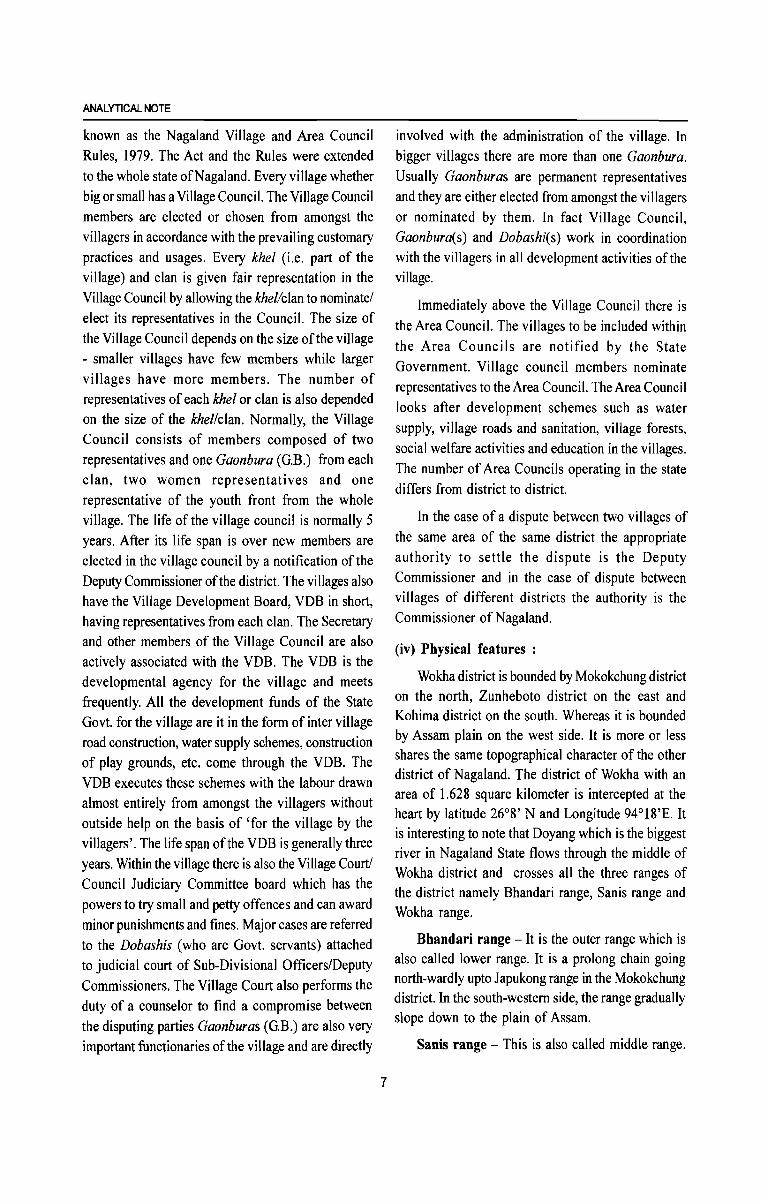
The district covers an area of 1,628 sq.km. as furnished by the Surveyor General of India which represents only 9.82 per cent of the total area of the State of Nagaland (16,579 sq.km.). In term of area the district rank to fifth position among the eight district during 1991 and 2001. The district has 11 revenue circles, 5 R.D. Block and one town during the Census of 2001. The comparative area figures of the district with respect to the other districts of the state is given below:
Serial SatelD istrict Area (in Percentage Ranking Number Sq.Km) to State of the
total districts
Nagaland 16,579 100.00
2 Mon 1,786 10.77 4
3 Tuensang 4,228 25.50 I
4 Mokokchung 1,615 9.74 6
5 Zunheboto 1,255 7.57 7
6 Wokha 1,628 9.82 5
7 Dimapur 927 5.59 8
8 Kohima 3,114 18.79 2
9 Phek 2,026 12.22 3
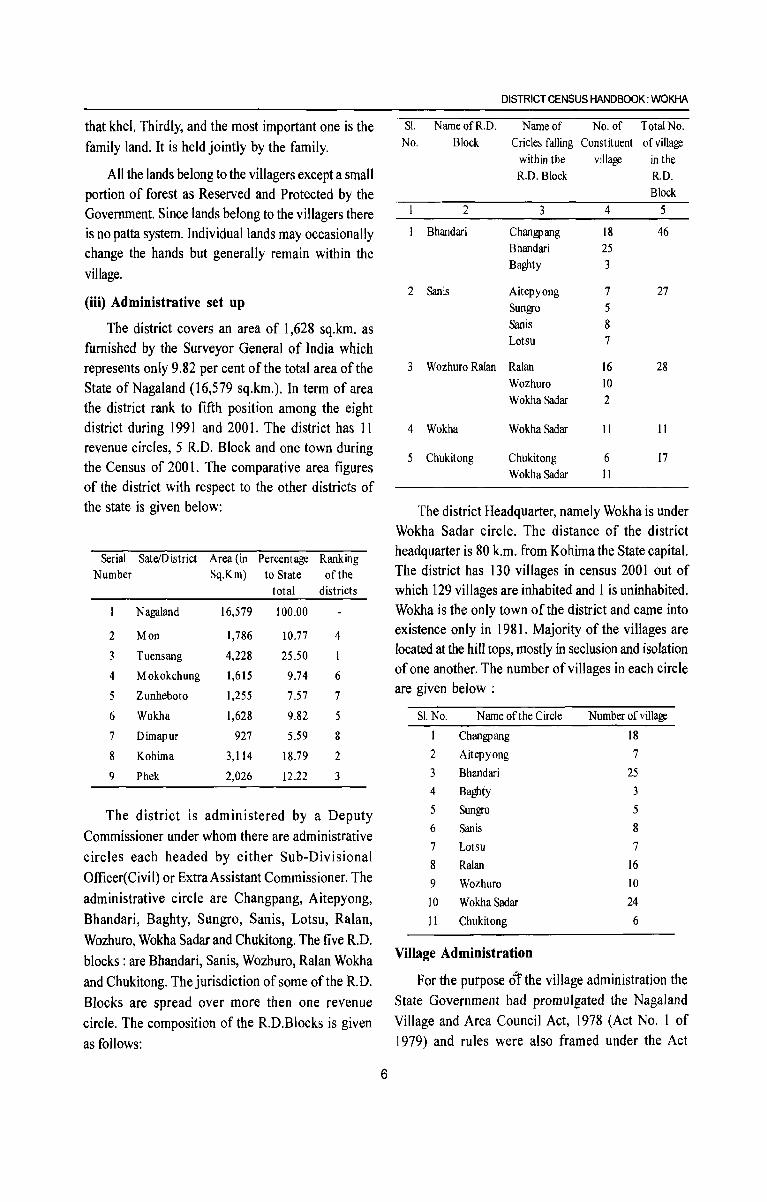
The district is administered by a Deputy Commissioner under whom there are administrative circles each headed by either Sub-Divisional Officer(Civil) or Extra Assistant Commissioner. The administrative circle are Changpang, Aitepyong, Bhandari, Baghty, Sungro, Sanis, Lotsu, Ralan, Wozhuro, Wokha Sadar and Chukitong. The five R.D. blocks: are Bhandari, Sanis, Wozhuro, Ralan Wokha and Chukitong. The jurisdiction of some of the R.D. Blocks are spread over more then one revenue circle. The composition of the R.D.Blocks is given as follows:
6
DISTRICT CENSUS HANDBOOK: WOKHA
Sl. Name ofR.D. Name of No. of Total No. No. Block Cricles falling Constituent of village
within the village in the R.D. Block R.D.
2
Bhandari
2 Sallis
3
Changpang Bhandari Baghty
Aitepyong Sungro Sanis Lotsu
3 Wozhuro Ralan Ralan Wozhuro Wokha Sadar
4 Wokha
5 Chukitong
Wokha Sadar
Chukitong Wokha Sadar
4
18 25 3
7 5 8 7
16 10 2
11
6 11
Block
5
46
27
28
11
17
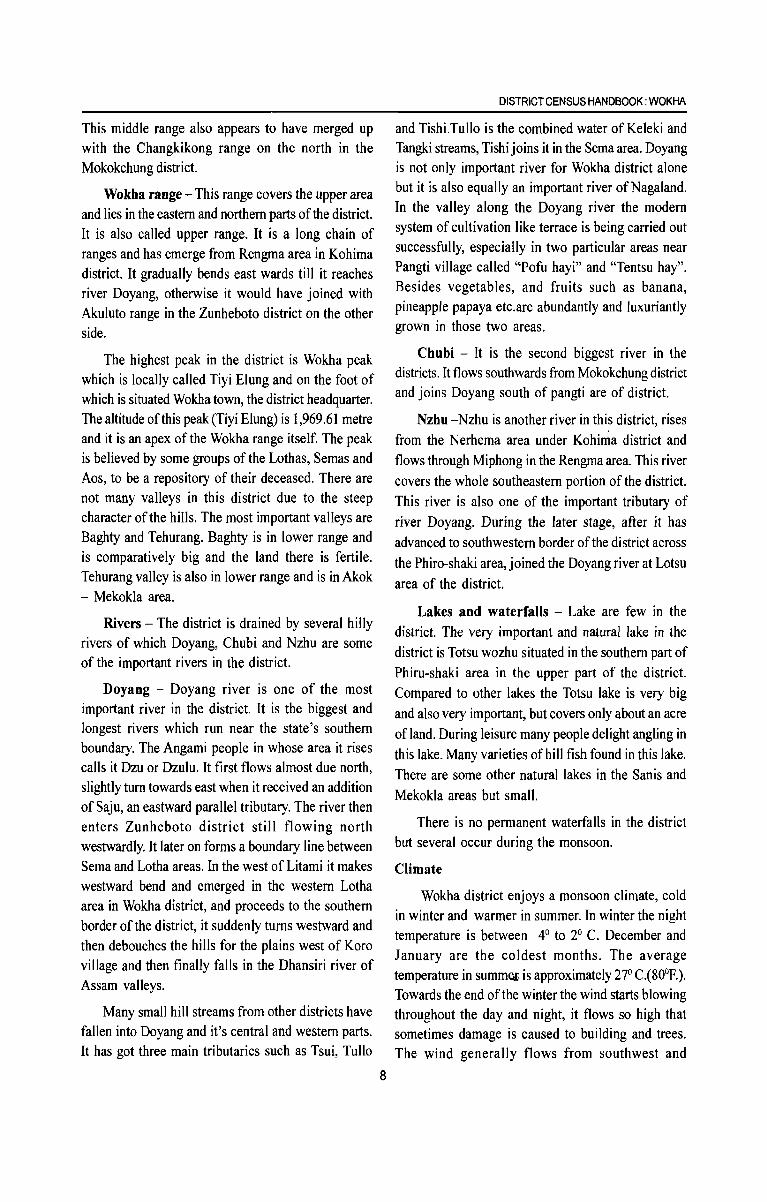
The district Headquarter, namely Wokha is under Wokha Sadar circle. The distance of the district headquarter is 80 k.m. from Kohima the State capital. The district has 130 villages in census 2001 out of which 129 villages are inhabited and 1 is uninhabited. Wokha is the only town of the district and came into existence only in 1981. Majority of the villages are located at the hill tops, mostly in seclusion and isolation of one another. The number of villages in each circle are given below ;
SI. No. Name of the Circle Number of village
I Changpang 18
2 Aitepyong 7
3 Bhandari 25
4 Baghty 3
5 Sungro 5
6 Sallis 8
7 Lotsu 7
8 Ralan 16
9 Wozhuro 10
10 Wokha Sadar 24
11 Chukitong 6
Village Administration
For the purpose oTthe village administration the State Government had promulgated the Nagaland Village and Area Council Act, 1978 (Act No. I of 1979) and rules were also framed under the Act
ANALYTICAL NOTE
known as the Nagaland Village and Area Council Rules, 1979. The Act and the Rules were extended to the whole state of Nagai and. Every village whether big or small has a Village Council. The Village Council members are elected or chosen from amongst the villagers in accordance with the prevailing customary practices and usages. Every khel (i.e. part of the village) and clan is given fair representation in the Village Council by allowing the khellclan to nominate! elect its representatives in the Council. The size of the Village Council depends on the size of the village - smaller villages have few members while larger villages have more members. The number of representatives of each khel or clan is also depended on the size of the khel/clan. Normally, the Village Council consists of members composed of two representatives and one Gaonbura (G.B.) from each clan, two women representatives and one representative of the youth front from the whole village. The life of the village council is normally 5 years. After its life span is over new members are elected in the village council by a notification of the Deputy Commissioner of the district. The villages also have the Village Development Board, VDB in short, having representatives from each clan. The Secretary and other members of the Village Council are also actively associated with the VDB. The VDB is the developmental agency for the village and meets frequently. All the development funds of the State Govt. for the village are it in the form of inter village road construction, water supply schemes, construction of play grounds, etc. come through the VDB. The VDB executes these schemes with the labour drawn almost entirely from amongst the villagers without outside help on the basis of 'for the village by the villagers'. The life span of the VDB is generally three years. Within the village there is also the Village Court!
Council Judiciary Committee board which has the powers to try small and petty offences and can award minor punishments and fines. Major cases are referred to the Dobashis (who are Govt. servants) attached to judicial court of Sub-Divisional Officers/Deputy Commissioners. The Village Court also performs the duty of a counselor to find a compromise between the disputing parties Gaonburas (G.B.) are also very important functionaries of the village and are directly
7
involved with the administration of the village. In bigger villages there are more than one Gaonbura. Usually Gaonburas are permanent representatives and they are either elected from amongst the villagers or nominated by them. In fact Village Council, Gaonbura(s) and Dobashi(s) work in coordination with the villagers in all development activities of the village.
Immediately above the Village Council there is the Area Council. The villages to be included within the Area Councils are notified by the State Government. Village council members nominate representatives to the Area Council. The Area Council looks after development schemes such as water supply, village roads and sanitation, village forests, social welfare activities and education in the villages. The number of Area Councils operating in the state differs from district to district.
In the case of a dispute between two villages of the same area of the same district the appropriate authority to settle the dispute is the Deputy Commissioner and in the case of dispute between villages of different districts the authority is the Commissioner of Nagaland.
(iv) Physical features :
Wokha district is bounded by Mokokchung district on the north, Zunheboto district on the east and Kohima district on the south. Whereas it is bounded by Assam plain on the west side. It is more or less shares the same topographical character of the other district of Nagaland. The district of Wokha with an area of 1.628 square kilometer is intercepted at the heart by latitude 26°8' N and Longitude 94°18'E. It is interesting to note that Doyang which is the biggest river in Nagaland State flows through the middle of Wokha district and crosses all the three ranges of the district namely Bhandari range, Sanis range and Wokha range.
Bhandari range - It is the outer range which is also called lower range. It is a prolong chain going north-wardly upto Japukong range in the Mokokchung district. In the south-western side, the range gradually slope down to the plain of Assam.
Sanis range - This is also called middle range.
This middle range also appears to have merged up with the Changkikong range on the north in the Mokokchung district.
Wokha range - This range covers the upper area and lies in the eastern and northern parts of the district. It is also called upper range. It is a long chain of ranges and has emerge from Rengma area in Kohima district. It gradually bends east wards till it reaches river Doyang, otherwise it would have joined with Akuluto range in the Zunheboto district on the other side.
The highest peak in the district is Wokha peak which is locally called Tiyi Elung and on the foot of which is situated Wokha town, the district headquarter. The altitude of this peak (Tiyi Elung) is 1,969.61 metre and it is an apex of the Wokha range itself. The peak is believed by some groups of the Lothas, Semas and Aos, to be a repository of their deceased. There are not many valleys in this district due to the steep character of the hills. The most important valleys are Baghty and Tehurang. Baghty is in lower range and is comparatively big and the land there is fertile. Tehurang valley is also in lower range and is in Akok - Mekokla area.
Rivers - The district is drained by several hilly rivers of which Doyang, Chubi and Nzhu are some of the important rivers in the district.
Doyang - Doyang river is one of the most important river in the district. It is the biggest and longest rivers which run near the state's southern boundary. The Angami people in whose area it rises calls it Dzu or Dzulu. It first flows almost due north, slightly turn towards east when it received an addition of Saju, an eastward parallel tributary. The river then enters Zunheboto district still flowing north westwardly. It later on forms a boundary line between Serna and Lotha areas. In the west of Litami it makes westward bend and emerged in the western Lotha area in Wokha district, and proceeds to the southern border of the district, it suddenly turns westward and then debouches the hills for the plains west of Koro village and then finally falls in the Dhansiri river of Assam valleys.
Many small hill streams from other districts have fallen into Doyang and it's central and western parts. It has got three main tributaries such as Tsui, Tullo
8
DISTRICT CENSUS HANDBOOK: WOKHA
and Tishi.Tullo is the combined water of Keleki and Tangki streams, Tishi joins it in the Serna area. Doyang is not only important river for Wokha district alone but it is also equally an important river of Nagaland. In the valley along the Doyang river the modern system of cultivation like terrace is being carried out successfully, especially in two particular areas near Pangti village called "Pofu hayi" and "Tentsu hay". Besides vegetables, and fruits such as banana, pineapple papaya etc. are abundantly and luxuriantly grown in those two areas.
Chubi - It is the second biggest river in the districts. It flows southwards from Mokokchung district and joins Doyang south of pangti are of district.
Nzhu -Nzhu is another river in this district, rises from the Nerhema area under Kohima district and flows through Miphong in the Rengma area. This river covers the whole southeastern portion of the district. This river is also one of the important tributary of river Doyang. During the later stage, after it has advanced to southwestern border of the district across the Phiro-shaki area,joined the Doyang river at Lotsu area of the district.
Lakes and waterfalls - Lake are few in the district. The very important and natural lake in the district is Totsu wozhu situated in the southern part of Phiru-shaki area in the upper part of the district. Compared to other lakes the Totsu lake is very big and also very important, but covers only about an acre of land. During leisure many people delight angling in this lake. Many varieties of hill fish found in this lake. There are some other natural lakes in the Sanis and Mekokla areas but small.
There is no permanent waterfalls in the district but several occur during the monsoon.
Climate
Wokha district enjoys a monsoon climate, cold in winter and warmer in summer. In winter the night temperature is between 4° to 2° C. December and January are the coldest months. The average temperature in summel is approximately 27° C.(80°F.). Towards the end of the winter the wind starts blowing throughout the day and night, it flows so high that sometimes damage is caused to building and trees. The wind generally flows from southwest and
ANALYTICAL NOTE
sometimes its velocity rises up to 100 Kilometers per hour. Towards the end of March the wind slowly dies out.
Southwest monsoon set in the middle of June and continues up to the middle of September. The district received average annual rainfall of 2000 mm.(803) and rains for about six months in the year with greatest concentration in July and August.
During summer the average humidity is 85%, which goes sometimes up to 95% to 100%, and as such it is very damp during monsoon.
Agriculture
Cultivation is one of the main. occupation of the people of this district. More than 80 per cent of the people depend on agriculture for their livelihood. The main type of cultivation in this district is Jhum, which mean shifting cultivation. The cultivation is done with the help of spade and hoe and not with plough of any type because the area is hilly. It has to be noted here that bullocks or buffalo drawn plough is used in Merapani plain, Doyang valley and Baghty valley where wet rice cultivation is practiced, as in the plains of Assam. The other form of cultivation is terrace, but negligible as it is seen only in a small area. But as a result of Govt. efforts, the area under terrace is increasing.
Under the system of Jhum cultivation the selected area for cultivation is cleared of its shrubs and the smaller trees are felled which big trees are preserved. This clearing work is generally done in the month of October and November. The felled trees, slashed branches and cleared shrubs etc after drying are burned in the month of February and March. Care are taken so that the fire may not engulf the uncultivated jungles. Within a day or two the field which is burnt is cleared off the un-burnt and half burnt logs are placed orderly in such a way that the loose earth is protected from being washed away by rain water.
After the land being prepared properly, the paddy is sown in the month of March and April depending on pre - monsoon showers. In spite of the practice of cultivation in monsoon, crop never fails here due to drought unlike other States ofIndia. When ever ill distribution or insufficient rainfall may sometimes
9
affect the growth of the crops adversely, but still the crop never fails totally. After a month of sowing the seeds, the weeding is done, two to three time till the plants are fully grown up. The paddy ripens and is ready for harvesting in August and September.
A Jhum field can be cultivated more than once if the same is sufficiently fertile and then it is kept for seven to ten years depending on the fertility of the land and availability of others land, after which the same land is cultivated again. Maize, millet and other crops such as taro, French beans, pumpkin, cucumber, bitter gourd etc. are grown along with the paddy in the same field.
Terrace cultivation is more advantageous than the Jhum, but due to hilly condition of the area terrace is not practiced every where in the district. In spite of this people are trying their best to find purpose of terrace cultivation water is brought from a nearby stream to the field for cultivation during the rainy season. Sometimes water from road side nalla is also channel to the terrace field. When the field is thus ready, the paddy plants are pulled out from the seed bed and planted in the field, this is done in June -July.
The water is allowed to remain in the field the whole period of the growth of the plants, and just before harvesting the water are drain out. Harvesting is done in the month of October - November. Unlike Jhum no other crops are grown along with paddy in the terrace.
Animal husbandry
Livestock rearing and animal husbandry playa very important role in the overall economy of the district. Almost every house has got a few livestock and cattle. It provide supplementary income and also generates gainful employment in the rural sector particularly small and marginal farmers and less privileged and socially disadvantaged strata of the society. The sector not only provides the basic motive power of the various agricultural operations it is also a constant source of protein and food item. Cattle, buffalo, goat, pig and dog are reared both for motive power and meat while mithun is reared in its wild form for meat only.
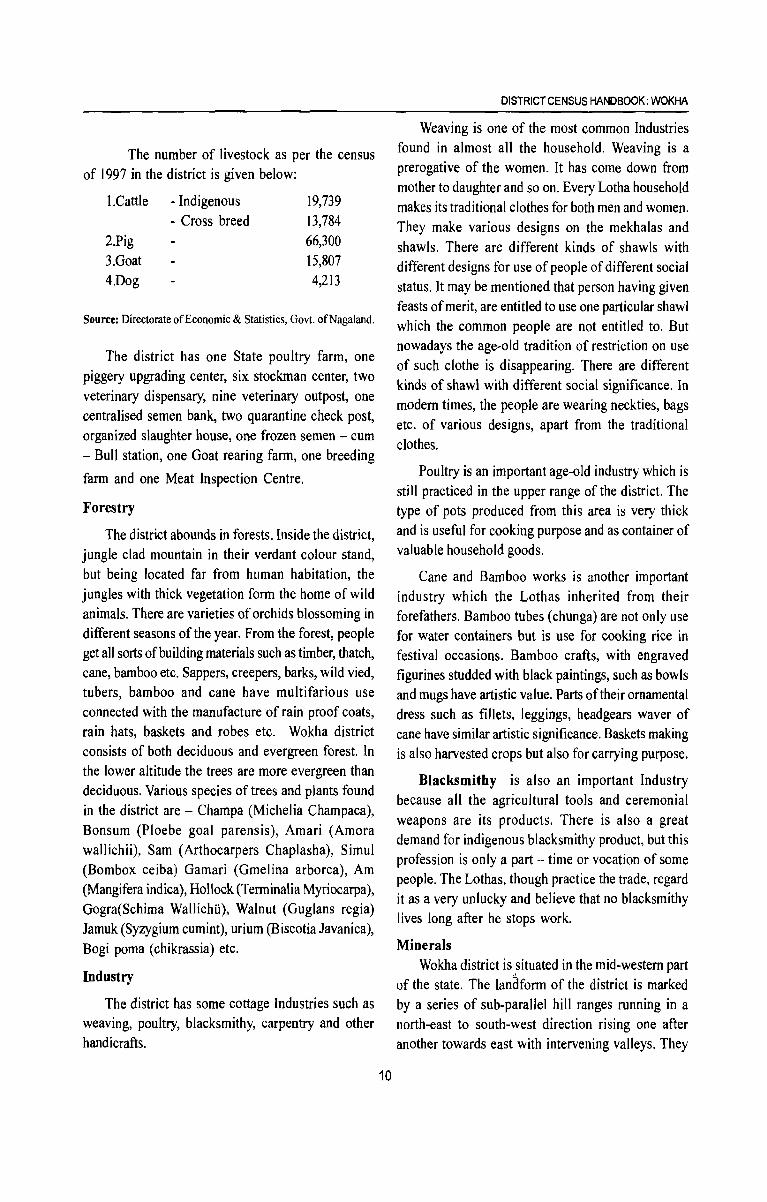
The number of livestock as per the census of 1997 in the district is given below:
I.Cattle - Indigenous
2.Pig 3.Goat 4.Dog
- Cross breed 19,739 13,784 66,300 15,807 4,213
Source: Directorate of Economic & Statistics, Govt. of NagaI and.
The district has one State poultry farm, one piggery upgrading center, six stockman center, two veterinary dispensary, nine veterinary outpost, one centralised semen bank, two quarantine check post, organized slaughter house, one frozen semen - cum - Bull station, one Goat rearing farm, one breeding
farm and one Meat Inspection Centre.
Forestry
The district abounds in forests. Inside the district, jungle clad mountain in their verdant colour stand, but being located far from human habitation, the jungles with thick vegetation form the home of wild animals. There are varieties of orchids blossoming in different seasons of the year. From the forest, people get all sorts of building materials such as timber, thatch, cane, bamboo etc. Sappers, creepers, barks, wild vied, tubers, bamboo and cane have multifarious use connected with the manufacture of rain proof coats, rain hats, baskets and robes etc. Wokha district consists of both deciduous and evergreen forest. In the lower altitude the trees are more evergreen than deciduous. Various species of trees and plants found in the district are - Champa (Michelia Champaca), Bonsum (Ploebe goal parensis), Amari (Amora wallichii), Sam (Arthocarpers Chaplasha), Simul (Bombox ceiba) Gamari (Gmelina arborca), Am (Mangifera indica), Hollock (Terminalia Myriocarpa), Gogra(Schima Wallichii), Walnut (Guglans regia) Jamuk (Syzygium cumint), urium (Biscotia Javanica), Bogi poma (chikrassia) etc.
Industry
The district has some cottage Industries such as weaving, poultry, blacksmithy, carpentry and other handicrafts.
10
DISTRICT CENSUS HANDBOOK: WOKHA
Weaving is one of the most common Industries found in almost all the household. Weaving is a prerogative of the women. It has come down from mother to daughter and so on. Every Lotha household makes its traditional clothes for both men and women. They make various designs on the mekhalas and shawls. There are different kinds of shawls with different designs for use of people of different social status. It may be mentioned that person having given feasts of merit, are entitled to use one particular shawl which the common people are not entitled to. But nowadays the age~old tradition of restriction on use of such clothe is disappearing. There are different kinds of shawl with different social significance. In modem times, the people are wearing neckties, bags etc. of various designs, apart from the traditional clothes.
Poultry is an important age-old industry which is still practiced in the upper range of the district. The type of pots produced from this area is very thick and is useful for cooking purpose and as container of valuable household goods.
Cane and Bamboo works is another important industry which the Lothas inherited from their forefathers. Bamboo tubes (chunga) are not only use for water containers but is use for cooking rice in festival occasions. Bamboo crafts, with engraved figurines studded with black paintings, such as bowls and mugs have artistic value. Parts oftheir ornamental dress such as fillets, leggings, headgears waver of cane have similar artistic significance. Baskets making is also harvested crops but also for carrying purpose.
Blacksmithy is also an important Industry because all the agricultural tools and ceremonial weapons are its products. There is also a great demand for indigenous blacksmithy product, but this profession is only a part - time or vocation of some people. The Lothas, though practice the trade, regard it as a very unlucky and believe that no blacksmithy lives long after he stops work.
Minerals Wokha district is situated in the mid-western part
of the state. The lanaform of the district is marked by a series of sub~parallel hill ranges running in a north-east to south-west direction rising one after another towards east with intervening valleys. They
ANALYTICAL NOTE
are comprised of tertiary sequence belong to an igneous and sedimentary types.
The western part of the State of Nagaland which includes Wokha district has been surveyed by Assam Oil Company, subsequently geological and geophysical surveys have been carried out by Oil and Natural Gas Corporation (ONGC). As a result of these surveys, it has been revealed that a large thickness of sedimentary rock sequence of tertiary age is exposed in this area. The boundary between Naga hills and upper Assam plain is marked by thrust fault - Naga thrust. The rocks underlying the Naga thrust are in general undisturbed. On the basis of these surveys along with laboratory analysis of the rock samples, it was assured that this part of Nagaland holds good hydrocarbon prospects, particularly within the lower tertiary sequence. Under this condition, the ONGC drilled a well in 1973 in Changpang area of this district which proved the existence of commercially exploitable hydrocarbon. On the foot hills of the district, coal deposit have been located in various places. Besides coal, sandstone suitable for, road metals also occurs in abundance in the district.
(v) Census Concepts
Building:
A 'Building' is generally a single structure on the ground. Sometimes it is made up of more than component unit which are used or likely to be used as dwellings (residences) or establishments such as shops, business houses, offices, factories, workshops, worksheds, Schools, places of entertainment, places of worship, godowns, stores etc. It is also possible that building which have component units may be used
for a combination of purposes such as shop-cumresidence, workshop-cum-residence, office-cumresidence, etc.
Usually a structure will have four walls and a roof. But in some areas the very nature of
construction of houses is such that there may not be any wall. Such is the case of conical structures where entrance is also provided but they may not have any walls. Therefore, such of the conical structures are also treated as separate buildings.
Permanent houses :
Houses, the walls and roof of which are
11
made of permanent materials. The material of walls can be anyone from the following, namely, galvanized iron sheets or other metal sheets, asbestos sheets, burnt bricks, stones or concrete. Roof may be made of from anyone of the following materials, namely, tiles, slate, galvanized iron sheets, metal sheets, asbestos sheets, bricks, stones or concrete.
Semi-permanent houses :
Houses in which either the wall or the roof is made of permanent material and the other is made of temporary material.
Temporary houses :
Houses in which both walls and roof are made of materials, which have to be replaced frequently. Walls may be made from anyone of the following temporary materials, namely, grass, thatch, bamboo, plastic, polythene, mud, unburnt bricks or wood. Roof may be made from anyone of the following temporary materials, namely, grass, thatch, bamboo, wood, mud, plastic or polythene.
Dwelling Room :
A room is treated as a dwelling room if it has walls with a doorway and a roof and should be wide and long enough for a person to sleep in, i.e. it should have a length of not less than 2 meters and a breadth of at least 1.5 meters and a height of 2 meters. A dwelling room would include living room, bedroom, dining room, drawing room, study room, servant's room and other habitable rooms. Kitchen, bathroom, latrine, store room, passageway and verandah which are not normally usable for living are not considered as dwelling rooms. A room, used for mUltipurpose such as sleeping, sitting, dining, storing, cooking, etc., is regarded as a dwelling room. In a situation where a census houses is used as a shop or office., etc., and the household also stays in it then the room is not considered as a dwelling room. But if a garage or servant quarter is used by a servant and if she/he also lives in it as a separate household then this has been considered as a dwelling room available to the servant's household. Tent or conical shaped hut if used for living by any household is also considered as dwelling room.
A dwelling room, which is shared by more than
one household, has not been counted for any of them. If two households have a dwelling room each but in addition also share a common dwelling room, then the common room has not been counted for either of the households.
Census House
A 'census house' is a building or part of a building used or recognised as a separate unit because of having a separate main entrance from the road or common courtyard or staircase, etc. It may be occupied or vacant. It may be used for residential or non- residential purpose or both.
In certain peculiar situations, the manner in which buildings and census houses were identified for numbering in the field by the enumerators is described hereunder:
Sometimes a series of different buildings are found along a street which are joined with one another by common walls on either side looking like a continuous structure. These different units are practically independent of one another and are likely to have been built at different times and owned by different persons. In such cases, though the whole structure with all the adjoining units apparently appears to be one building, each portion was treated as a separate building and its constituent units as separate census houses.
On the other hand, one may come across cases, particularly in large cities of multi-storeyed ownership flats. In these cases while the structure looks like one building, different persons own the flats. In case of such multi-storeyed structures, having a number of flats owned by different persons, the entire structure was treated as one building and each flat as a separate census house.
Ifwithin a large enclosed area, there are separate buildings owned by different persons then each such building is treated as a separate building. There can be a situation where within an enclosed compound there are separate buildings owned by an undertaking or company or even government that are actually in occupation of different persons. For example, Indian Oil Corporation colony where the buildings are owned by the Corporation but these are in occupation of their employees. Each such building was treated as a separate building. But ifin anyone of these buildings
12
DISTRICT CENSUS HANDBOOK: WOKHA
there were flats in occupation of different households, each such flat was reckoned as a separate census house.
Sometimes it becomes difficult to apply the definition of census house strictly in certain cases. For example, in an urban area, if a flat has five rooms, each room having direct entrance from the common staircase or courtyard. By definition, this has to be treated as five census houses. If all these five rooms are occupied by a single household it was not realistic to treat them as five census houses. In such a case, 'singleness' of use of these rooms along with the main house should be considered and the entire flat was treated as one census house. On the other hand, if two independent households occupy these five rooms, the first household living in three rooms and the second household occupying two rooms, then considering the use, the first three rooms together were treated as one census house and the remaining rooms as another census house. But if each room was occupied by an independent household, then each such room was treated as a separate census house.
In case of hostels, hotels, etc., even if the door of each room in which an inmate lives opens to a common verandah, staircase, courtyard or a common room, as it happens almost invariably, the entire hosteV hotel building was treated as one census house. but if such hostels/hotels have out- houses or other structures used for different purposes or the same purpose, then each such structure attached to the main hostellhotel was treated as a separate census house.
In some parts of the country, in rural areas, the pattern of habitation is such that a group of huts, located in a compound, whether enclosed or unenclosed, is occupied by one household. While the main residence may be located in one hut, other huts may be used for sleeping, as a kitchen, bath room, baithak, etc. Though each of the huts was a separate structure, they form a single housing unit and therefore, have to be treated collectively as one building and one census house. If some of the huts are used bY.,one household and the others by a second household as residence, then the two groups of huts were treated as separate census houses. However, if there were also other huts in the compound used for other purposes and not as
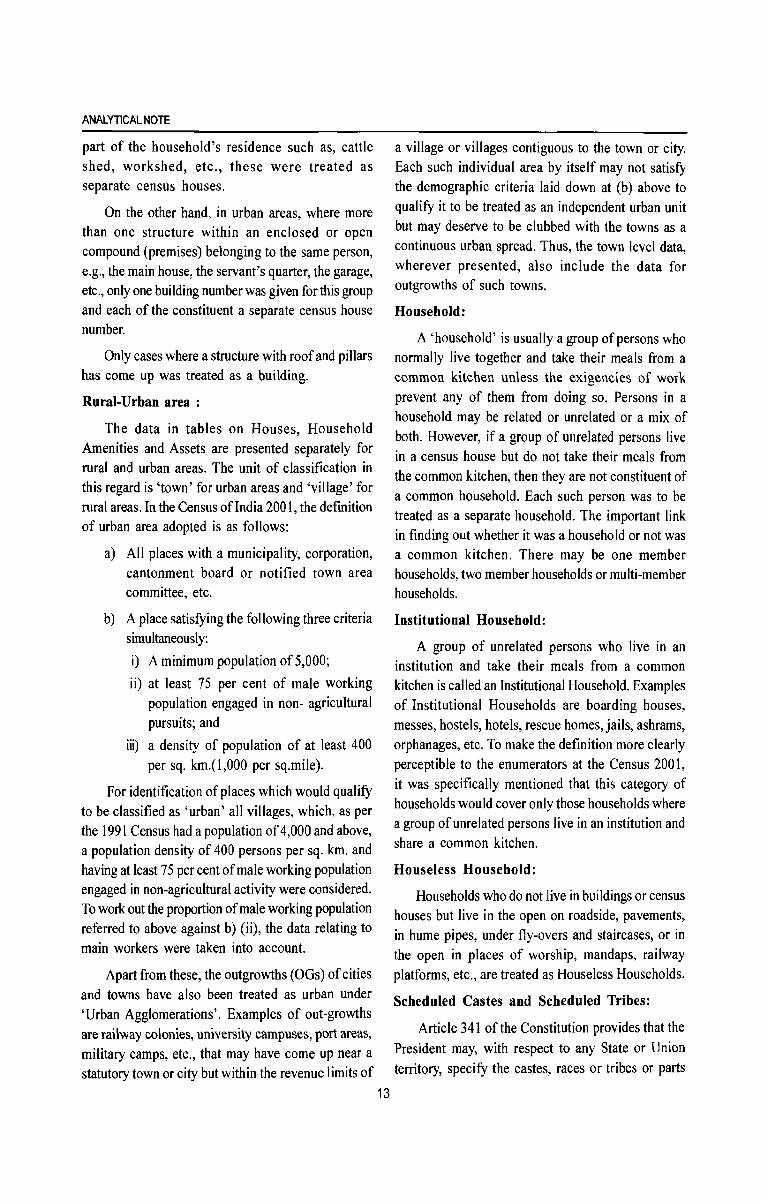
ANALYTICAL NOTE
part of the household's residence such as, cattle shed, workshed, etc., these were treated as separate census houses.
On the other hand, in urban areas, where more than one structure within an enclosed or open compound (premises) belonging to the same person, e.g., the main house, the servant's quarter, the garage, etc., only one building number was given for this group and each of the constituent a separate census house number.
Only cases where a structure with roof and pillars has come up was treated as a building.
Rural-Urban area :
The data in tables on Houses, Household Amenities and Assets are presented separately for rural and urban areas. The unit of classification in this regard is 'town' for urban areas and 'village' for rural areas. In the Census ofIndia 2001, the definition of urban area adopted is as follows:
a) All places with a municipality, corporation, cantonment board or notified town area committee, etc.
b) A place satisfying the following three criteria simultaneously:
i) A minimum population of 5,000;
ii) at least 75 per cent of male working population engaged in non- agricultural pursuits; and
iii) a density of population of at least 400 per sq. km.(l,OOO per sq. mile).
For identification of places which would qualify to be classified as 'urban' all villages, which, as per the 1991 Census had a population of 4,000 and above, a population density of 400 persons per sq. km. and having at least 75 per cent of male working population engaged in non-agricultural activity were considered. To work out the proportion of male working population referred to above against b) (ii), the data relating to main workers were taken into account.
Apart from these, the outgrowths (OGs) of cities and towns have also been treated as urban under 'Urban Agglomerations'. Examples of out-growths are railway colonies, university campuses, port areas, military camps, etc., that may have come up near a statutory town or city but within the revenue limits of
13
a village or villages contiguous to the town or city. Each such individual area by itself may not satisfy the demographic criteria laid down at (b) above to qualify it to be treated as an independent urban unit but may deserve to be clubbed with the towns as a continuous urban spread. Thus, the town level data, wherever presented, also include the data for outgrowths of such towns.
Household:
A 'household' is usually a group of persons who normally live together and take their meals from a common kitchen unless the exigencies of work prevent any of them from doing so. Persons in a household may be related or unrelated or a mix of both. However, if a group of unrelated persons live in a census house but do not take their meals from the common kitchen, then they are not constituent of a common household. Each such person was to be treated as a separate household. The important link in finding out whether it was a household or not was a common kitchen. There may be one member households, two member households or multi-member households.
Institutional Household:
A group of unrelated persons who live in an institution and take their meals from a common kitchen is called an Institutional Household. Examples of Institutional Households are boarding houses, messes, hostels, hotels, rescue homes, jails, ashrams, orphanages, etc. To make the definition more clearly perceptible to the enumerators at the Census 2001, it was specifically mentioned that this category of households would cover only those households where a group of unrelated persons live in an institution and share a common kitchen.
Houseless Household:
Households who do not live in buildings or census houses but live in the open on roadside, pavements, in hume pipes, under fly-overs and staircases, or in the open in places of worship, mandaps, railway platforms, etc., are treated as Houseless Households.
Scheduled Castes and Scheduled Tribes:
Article 341 of the Constitution provides that the President may, with respect to any State or Union territory, specify the castes, races or tribes or parts

of or groups within castes, races or tribes which shall for the purposes of the Constitution be deemed to be Scheduled Castes in relation to that State or Union territory. Article 342 similarly provides for specification of tribes or tribal communities or parts of or groups within tribes or tribal communities which are to be deemed for the purposes of the Constitution to be Scheduled Tribes in relation to the various States and Union territories. In pursuance of these provisions, the list of Scheduled Castes and / or Scheduled Tribes are notified for each State and Union territory and are valid only within the jurisdiction of that State or Union territory and not outside.
It is important to mention here that under the Constitution (Scheduled Castes) Order, 1950, no person who professed a religion different from Hinduism was deemed to be a member of a Scheduled Caste in addition to every member of the Ramdasi, Kabirpanthi, Majhabi or Sikligar caste resident in Punjab or Patiala and East Punjab States Union were in relation to that State whether they professed the Hindu or the Sikh religion. Subsequently, in September 1956, by an amendment, the Presidential Order of 1950 and in all subsequent Presidential Orders relating to Scheduled Castes, the Hindu and the Sikh religions were placed on the same footing with regard to the specification of Scheduled Castes. Later on, as per the amendment made in the Constitution (Scheduled Castes) Order 1990, the Hindu, the Sikh and the Buddhist were placed on the same footing with regard to the recognition of the Scheduled Castes.
The lists containing the names of the Scheduled Tribes applicable for the Census of India 2001 in respect of the state of Nagaland are given below:
1. Garo
2. Kachari
3. Mikir
4. Kuki
5. Naga
Among the Nagas there are as many as fourteen sub-tribes recognised by the Government of NagaI and. They are :
14
DISTRICT CENSUS HANDBOOK: WOKHA
I. Angami 2. Ao
3. Chakhesang 4. Chang
5. Khiemnungan 6. Konyak
7. Lotha 8. Phom
9. Rengma 10. Sangtam
11. Serna (Sumi) 12. Yimchungre
13. Zeliang 14. Pochuri
There are no Scheduled Castes notified in the state of Nagaland.
Language and Mother tongue :
As per the census concept, each language is a group of mother tongues. The census questionnaire collects information on the mother tongue of each person and mother tongue is defined as the language spoken in childhood by the person's mother to the person. If the mother died in infancy, the language mainly spoken in the person's home in childhood will be the mother tongue. In the case of infants and deaf mutes, the language usually spoken by the mother is considered as mother tongue. It is not necessary that the language spoken as mother tongue should have a script. The mother tongues returned by the respondents in census are classified and grouped under appropriate languages according to their linguistic characteristics.
Literate:
A person aged seven years and above who can both read and write with understanding in any language is taken as literate. A person who can only read but cannot write is not literate. It is not necessary that to be considered as literate, a person should have received any formal education or passed any minimum educational standard. Literacy could also have been achieved through adult literacy classes or through any non-formal educational system. People who are blind and can read in Braille are treated as literates.
Literacy rate :
Literacy rate of the population is defined as the percentage of literates in the age group seven years and above. For different age groups the percentage of literates in that age group gives the literacy rate.
Educational level:
The highest level of education a person has completed.
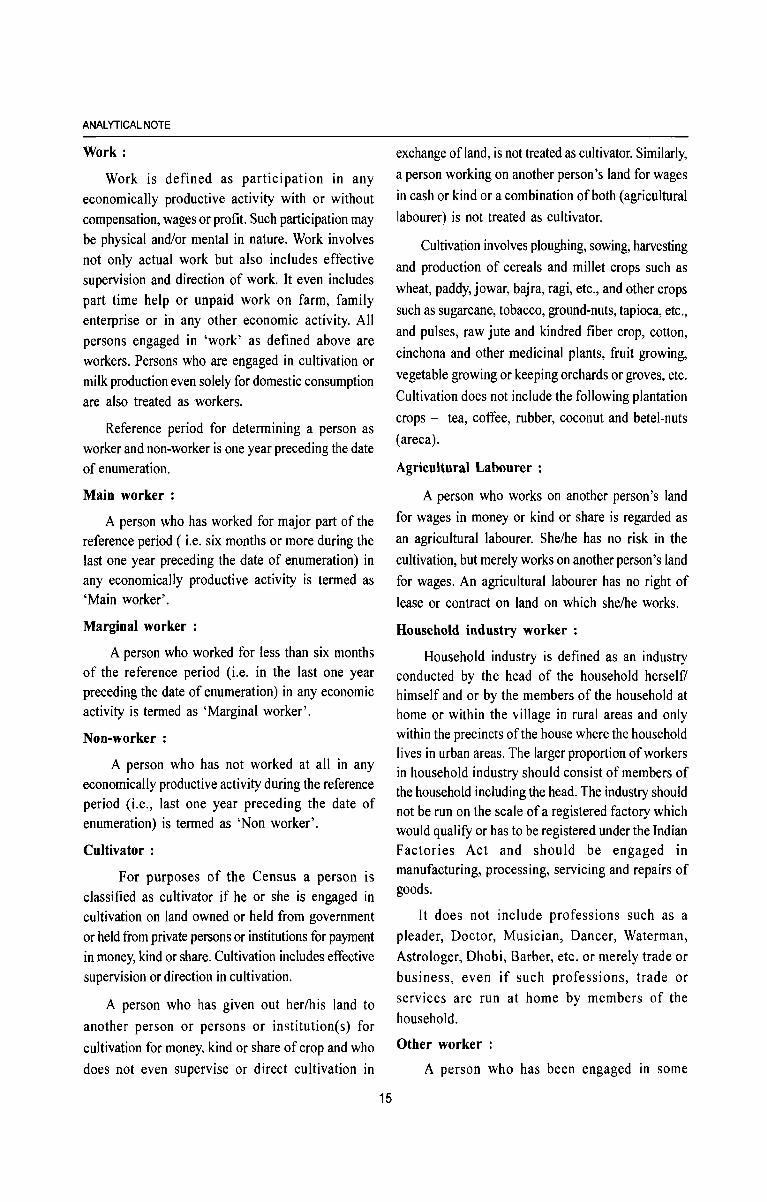
ANALYTICAL NOTE
Work:
Work is defined as participation in any economically productive activity with or without compensation, wages or profit. Such participation may be physical and/or mental in nature. Work involves not only actual work but also includes effective supervision and direction of work. It even includes part time help or unpaid work on farm, family enterprise or in any other economic activity. All persons engaged in 'work' as defined above are workers. Persons who are engaged in cultivation or milk production even solely for domestic consumption are also treated as workers.
Reference period for determining a person as worker and non-worker is one year preceding the date of enumeration.
Main worker :
A person who has worked for major part of the reference period ( i.e. six months or more during the last one year preceding the date of enumeration) in any economically productive activity is termed as 'Main worker'.
Marginal worker :
A person who worked for less than six months of the reference period (i.e. in the last one year preceding the date of enumeration) in any economic activity is termed as 'Marginal worker'.
Non-worker :
A person who has not worked at all in any economically productive activity during the reference period (i.e., last one year preceding the date of enumeration) is termed as 'Non worker'.
Cultivator :
For purposes of the Census a person is classified as cultivator if he or she is engaged in cultivation on land owned or held from government or held from private persons or institutions for payment in money, kind or share. Cultivation includes effective supervision or direction in cultivation.
A person who has given out her/his land to another person or persons or institution(s) for
cultivation for money, kind or share of crop and who
does not even supervise or direct cultivation in
15
exchange ofland, is not treated as cultivator. Similarly, a person working on another person's land for wages
in cash or kind or a combination of both (agricultural
labourer) is not treated as cultivator.
Cultivation involves ploughing, sowing, harvesting and production of cereals and millet crops such as
wheat, paddy, jowar, bajra, ragi, etc., and other crops
such as sugarcane, tobacco, ground-nuts, tapioca, etc., and pulses, raw jute and kindred fiber crop, cotton,
cinchona and other medicinal plants, fruit growing,
vegetable growing or keeping orchards or groves, etc.
Cultivation does not include the following plantation
crops - tea, coffee, rubber, coconut and betel-nuts
(areca).
Agricultural Labourer :
A person who works on another person's land for wages in money or kind or share is regarded as
an agricultural labourer. She/he has no risk in the
cultivation, but merely works on another person's land
for wages. An agricultural labourer has no right of
lease or contract on land on which she/he works.
Household industry worker :
Household industry is defined as an industry conducted by the head of the household herself/ himself and or by the members of the household at home or within the village in rural areas and only within the precincts of the house where the household lives in urban areas. The larger proportion of workers in household industry should consist of members of the household including the head. The industry should not be run on the scale of a registered factory which would qualify or has to be registered under the Indian Factories Act and should be engaged in manufacturing, processing, servicing and repairs of goods.
It does not include professions such as a pleader, Doctor, Musician, Dancer, Waterman, Astrologer, Dhobi, Barber, etc. or merely trade or business, even if such professions, trade or services are run at home by members of the household.
Other worker :
A person who has been engaged in some

economic activity during the reference period but not as a cultivator or agricultural labourer or in Household Industry is termed as an 'Other Worker (OW)'. The type of workers that come under this category of 'OW' include all government servants, municipal employees, teachers, factory workers, plantation workers, those engaged in trade, commerce, business, transport, banking, mining, construction, political or social work, priests, entertainment artists, etc. In effect, all those workers other than cultivators or agricultural labourers or household industry workers, are 'Other Workers'.
Work participation rate :
Percentage of workers (main + marginal) to total population.
Population density :
Population density is the number of persons inhabited per square kilometre of the area.
Age:
Age is measured in terms of the completed number of years
Sex-ratio:
Number of females per 1000 males in a population.
(vi) Non-Census Concept
Improved drinking water :
If the household had access to drinking water supplied from a tap, hand pump, tube well or well (protected or covered) situated within or outside the premises, it is considered as having access to improved drinking water.
It may be mentioned that such uniform definition may not be valid across all states.
System of sewerage :
Generally, a sewerage system would mean a network of mains and branches of underground conduits for the conveyance of sewerage to the point of disposal. Sewers that carry only household and industrial wastage are called separate sewers; those that carry storm water from roofs, streets and other surfaces are known as storm water
16
DISTRICT CENSUS HANDBOOK: WOKHA
drains, while those carrying both sewage and storm water are called combined sewers. However, in some towns which are not provided with such underground sewerage system, it is served by open surface drain, box drain, sylk pattern drain, etc., in these towns.
Type of latrine and Method of disposal of night
soil :
There are three prevalent systems of disposal of human wastes, viz.(i) underground sewerage, (ii) sanitary water flush latrines with individual disposal systems, like septic tank, leaching cess pool and collecting well, and (iii) dry type of latrines with manual scavengmg.
The system of underground sewerage provides for the street sewerage with which are connected the sanitary latrines constructed in the houses having water closets and fitted with flushing cistern (or hand flushing). Through this sewer the faecal matter is transported without the need for scavenging. This system generally exists in cities and big towns.
Where the streets sewer does not exist these sanitary water flush latrines are connected to a local septic tank with a sub-soil dispersion system or a leaching pit. Here the liquid wastes from the water closet is disposed of locally in leaching pit, a septic tank with a soil dispersion system is constructed. This dispersion requires an optimum travel through the pores of the soil which renders the harmful liquid bacterially innocuous by the slow process offiltration through the soil traversed.
Where the soil is impermeable, collecting wells are constructed and the sanitary water flush latrines are connected with them. These wells are cleaned at periodic intervals by a suitable device. The dry type of latrines are of service type latrines from where human excreta is removed by scavengers from house to house, in most cases carrying it on their heads or shoulders or in baskets with handle or wheel barrows. These are then collected in bullock carts or trucks or tractors and trolleys for being carried to the dumping grounds. .':_
Fertility :
In demography, the word fertility is used in relation to the actual production of children or occurrence of
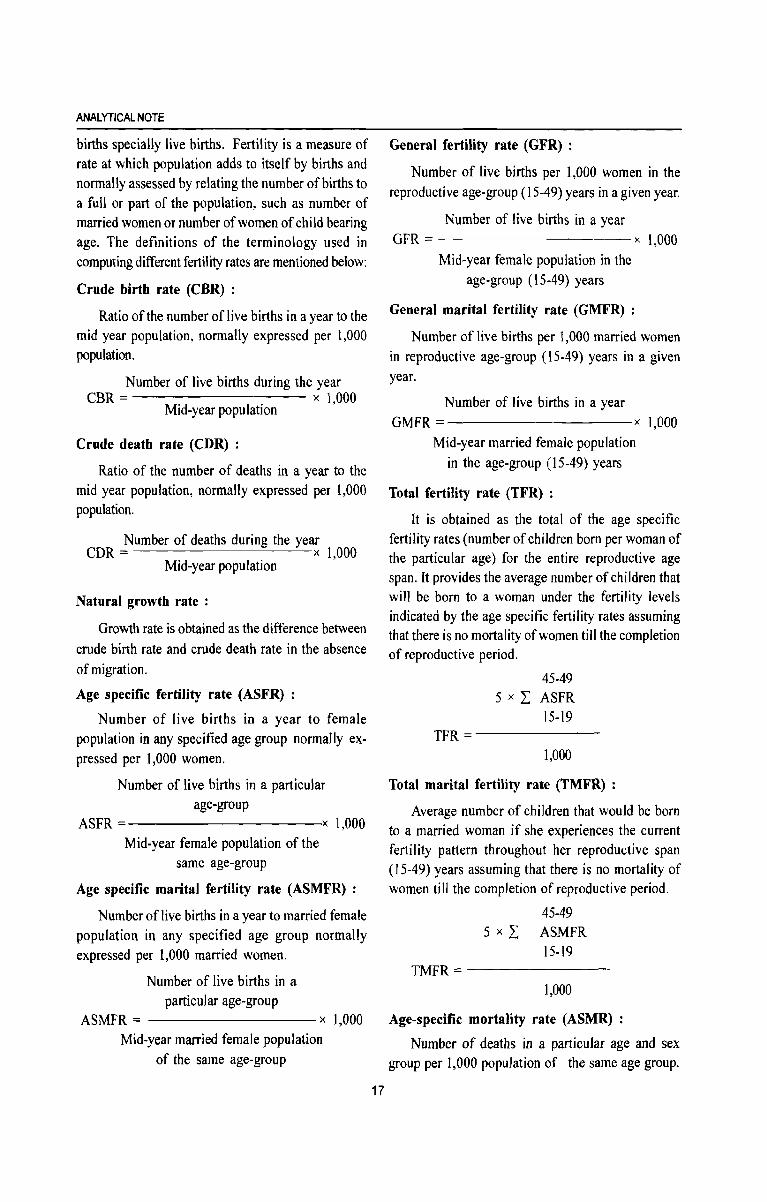
ANALYTICAL NOTE
births specially live births. Fertility is a measure of rate at which population adds to itself by births and normally assessed by relating the number of births to a full or part of the population, such as number of married women or number of women of child bearing age. The definitions of the terminology used in computing different fertility rates are mentioned below:
Crude birth rate (CBR) :
Ratio of the number of I ive births in a year to the mid year population, normally expressed per 1,000 population.
Number of live births during the year CBR = x 1,000
Mid-year population
Crude death rate (CDR) :
Ratio of the number of deaths in a year to the mid year population, normally expressed per 1,000 population.
Number of deaths during the year CDR = x 1,000
Mid-year population
Natural growth rate:
Growth rate is obtained as the difference between crude birth rate and crude death rate in the absence
of migration.
Age specific fertility rate (ASFR) :
Number of live births in a year to female population in any specified age group normally expressed per 1,000 women.
Number of live births in a particular age-group
ASFR =----------:x 1,000 Mid-year female population of the
same age-group
Age specific marital fertility rate (ASMFR) :
Number of live births in a year to married female population in any specified age group normally expressed per 1,000 married women.
Number of live births in a particular age-group
ASMFR = ---------x 1,000 Mid-year married female population
of the same age-group
17
General fertility rate (GFR) :
Number of live births per 1,000 women in the reproductive age-group (15-49) years in a given year.
Number of live births in a year GFR =----------x 1,000
Mid-year female population in the age-group (15-49) years
General marital fertility rate (GMFR) :
Number of live births per 1,000 married women in reproductive age-group (15-49) years in a given year.
Number of live births in a year GMFR = x 1,000
Mid-year married female population in the age-group (15-49) years
Total fertility rate (TFR) :
It is obtained as the total of the age specific fertility rates (number of children born per woman of the particular age) for the entire reproductive age span. It provides the average number of children that will be born to a woman under the fertility levels indicated by the age specific fertility rates assuming that there is no mortality of women till the completion of reproductive period.
45-49 5 x L ASFR
15-19 TFR = -------
1,000
Total marital fertility rate (TMFR) :
Average number of children that would be born to a married woman if she experiences the current fertility pattern throughout her reproductive span (15-49) years assuming that there is no mortality of women till the completion of reproductive period.
45-49 5 x L ASMFR
15-19 TMFR == -------
1,000
Age-specific mortality rate (ASMR) :
Number of deaths in a particular age and sex group per 1,000 population of the same age group.
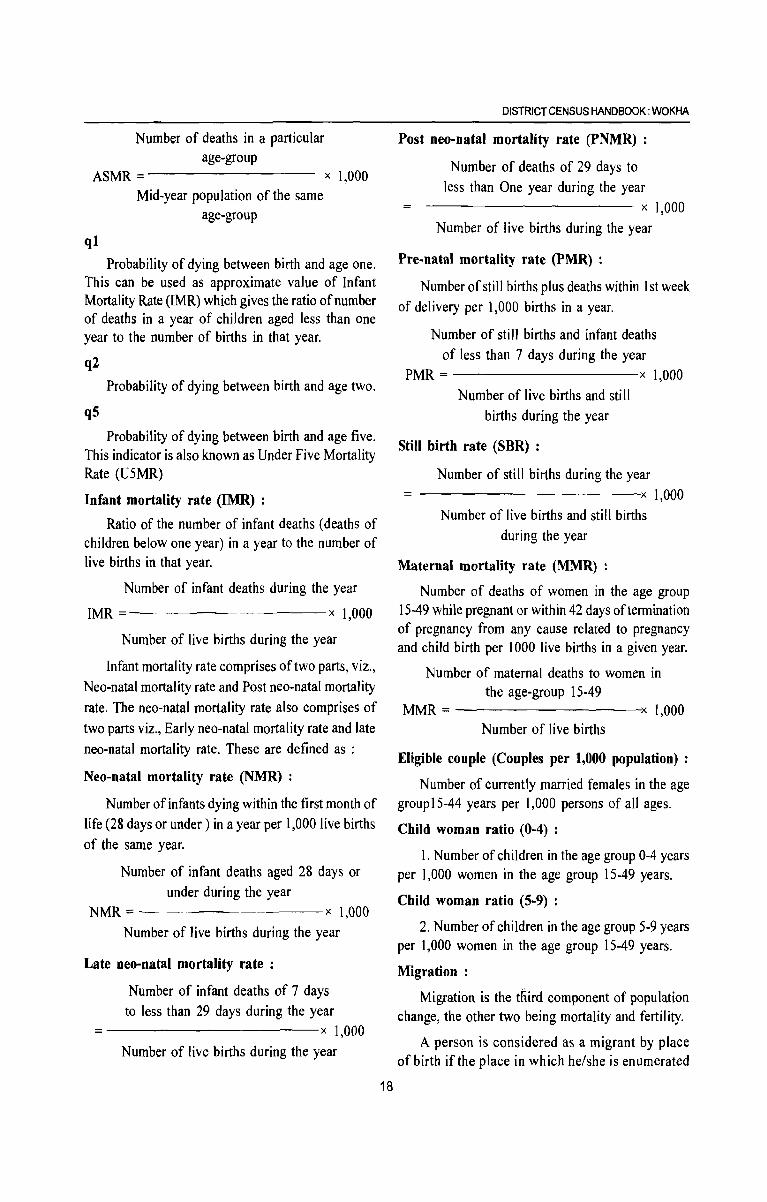
Number of deaths in a particular age-group
ASMR = x 1,000
ql
Mid-year population of the same age-group
Probability of dying between birth and age one. This can be used as approximate value of Infant Mortality Rate (IMR) which gives the ratio of number of deaths in a year of children aged less than one year to the number of births in that year.
q2
Probability of dying between birth and age two.
q5
Probability of dying between birth and age five. This indicator is also known as Under Five Mortality Rate (U5MR)
Infant mortality rate (IMR) :
Ratio of the number of infant deaths (deaths of children below one year) in a year to the number of live births in that year.
Number of infant deaths during the year
IMR = x 1,000
Number of live births during the year
Infant mortality rate comprises of two parts, viz., Neo-natal mortality rate and Post neo-natal mortality rate. The neD-natal mortality rate also comprises of two parts viz., Early neo-natal mortality rate and late neo-natal mortality rate. These are defined as :
Neo-natal mortality rate (NMR) :
Number of infants dying within the first month of life (28 days or under) in a year per 1,000 live births of the same year.
Number of infant deaths aged 28 days or under during the year
NMR=---------x 1,000 Number of live births during the year
Late neo-natal mortality rate :
Number of infant deaths of 7 days to less than 29 days during the year
= x 1,000 Number of live births during the year
18
DISTRICT CENSUS HANDBOOK: WOKHA
Post neo-natal mortality rate (PNMR) :
Number of deaths of 29 days to less than One year during the year
----------- x 1,000
Number of live births during the year
Pre-natal mortality rate (PMR) :
Number of still births plus deaths within 1 st week of delivery per 1,000 births in a year.
Number of still births and infant deaths of less than 7 days during the year
PMR = x 1,000 Number of live births and still
births during the year
Still birth rate (SBR) :
Number of still births during the year ------------x 1,000
Number of live births and still births during the year
Maternal mortality rate (MMR) :
Number of deaths of women in the age group 15-49 while pregnant or within 42 days of termination of pregnancy from any cause related to pregnancy and child birth per 1000 live births in a given year.
Number of maternal deaths to women in the age-group 15-49
MMR = -------------;x 1,000 Number of live births
Eligible couple (Couples per 1,000 population) :
Number of currently married females in the age groupl5-44 years per 1,000 persons of all ages.
Child woman ratio (0-4) :
1. Number of children in the age group 0-4 years per 1,000 women in the age group 15-49 years.
Child woman ratio (5-9) :
2. Number of children in the age group 5-9 years per 1,000 women in the age group 15-49 years.
Migration:
Migration is the ttlird component of population change, the other two being mortality and fertility.
A person is considered as a migrant by place of birth if the place in which he/she is enumerated
ANALYTICAL NOTE
during the census is other than the place of his/ her birth.
Similarly a person is considered as a migrant by place of last residence if the place in which he/she is enumerated during the census is other than his/her place of immediate last residence outside the village or town and not simply in another house or locality in the same village or town.
Certain aspects concerning temporary movement! migration of people has been explained below as these are important components concerning migration :-
(i) Migration of persons in search of job is high in the country. In many cases such migrants are only seasonal in nature. People migrate to other places for work in a particular season and come back again to their usual place of residence after three or four months. All such workers are treated as migrants. Similarly, if a person moved to any other place for attending short term vocational or educational course that lasted for only few months of a year, she/he too were considered as a migrant.
(ii) Where a person had merely gone out to another place or had been shifting from one place to another purely on tour, pilgrimage, visit to hospital for treatment or for temporary business purposes, such persons are not deemed to have had another residence different from the place where she/he or her/ his family normally resides. She/he is not considered as migrant.
(iii) A woman temporarily moves into a hospital or to her parents or other relative's house for delivery and if the hospital or the parents/ relatives houses is in a place different from usual place of residence, the place where the hospital or parents/relative's house is the place of last residence of the child but not of the mother.
A new response category' Moved after birth' was added in Census of India 2001 in the question on 'reasons for migration' to bring out additional migration patterns. Natural calamities or distress migration as a reason for migration for last residence migrants included in 1991 Census, is covered under category of 'Others'. The reason for migration has
19
been determined as applicable at the time of migration and not in reference to any point of time after that. For example, if a person had moved from the place of herlhis last residence for the purpose of education and subsequently at some point of time got employment there only, the reason for migration would be 'education' and not 'work/employment'.
Internal and International migration :
The migrational movements are of three types (i) Migration within the state itself with its components (a) Migration within the district of enumeration (intra district migration) (b) Migration from one district of state to another district of state (inter district migration), (ii) Migration from one state to another State of the country (inter-state migration), (iii) Migration from one country to another country. The first two streams together constitute internal migration, while the last type of movement is called international migration. The present name of the country, state or district and not the name by which they were known at the time of her/his birth or last residence were recorded.
Rural-Urban components of migration :
Rural or Vrban status in respect of migrants have been determined as applicable at the time of migration and not with reference to any point of time after that.
The flow of migrants consists of four streams viz. rural to rural, rural to urban, urban to rural and urban to urban.
Civic status of urban units :
Civic Status of a town/city is determined on the basis of Civic Administrative authority of the town e.g., Municipal Corporation/Corporation, Municipal Committee/Municipal Council, Municipality etc.
Size class of UAITown :
Size-class of VA/Town is based on the population
size of the VA/City/Town. VAs.lTowns with 1,00,000
and above population are classified as Class I VAs'!
Towns. These Class I VAs.!Towns are now further sub-classified into seven sub classes namely M 1 to
M7 depending on the population size of VA/City/ Town. These are M7(5,000,000 and above); M6(2,000,000 to 4,999,999); M5 (1,000,000-1,999,999)
M4 (500,000-999,999); M3(300,000-499,999), M2
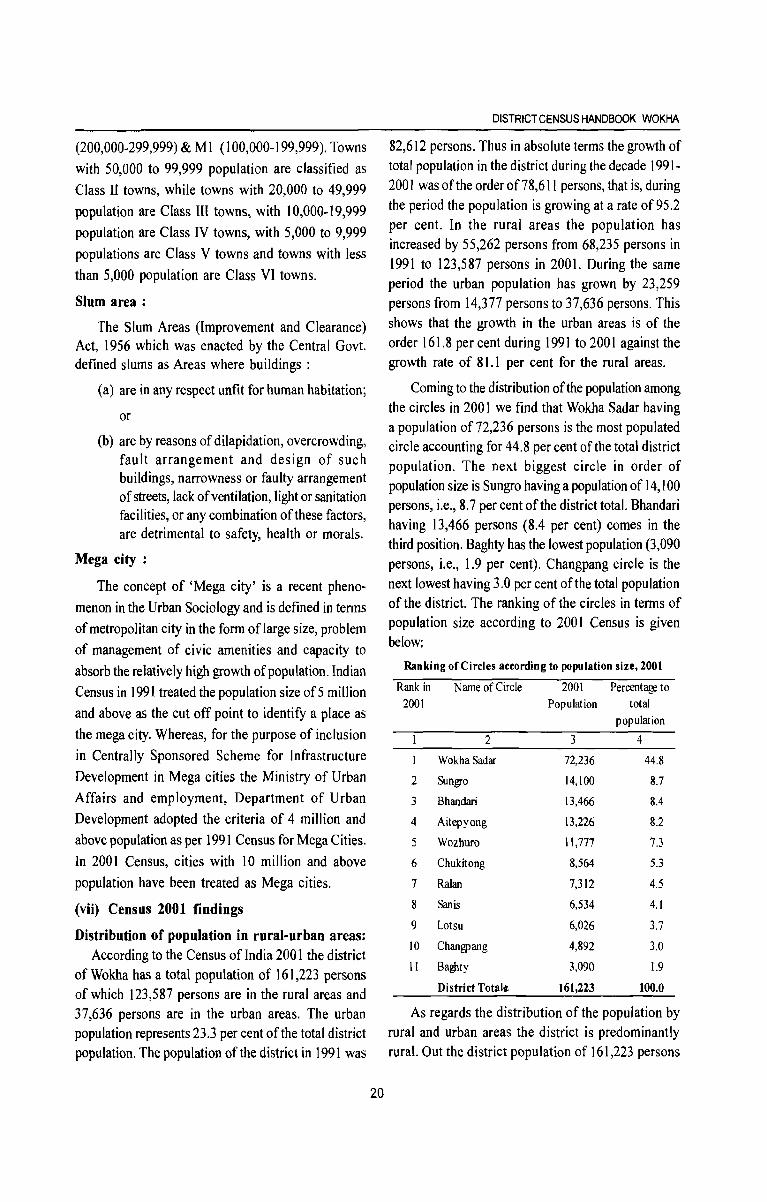
(200,000-299,999) & Ml (l 00,000-199,999). Towns
with 50,000 to 99,999 population are classified as Class IT towns, while towns with 20,000 to 49,999
population are Class III towns, with 10,000-19,999
population are Class IV towns, with 5,000 to 9,999 populations are Class V towns and towns with less
than 5,000 population are Class VI towns.
Slum area:
The Slum Areas (Improvement and Clearance) Act, 1956 which was enacted by the Central Govt. defined slums as Areas where buildings :
(a) are in any respect unfit for human habitation;
or
(b) are by reasons of dilapidation, overcrowding, fault arrangement and design of such buildings, narrowness or faulty arrangement of streets, lack of ventilation, light or sanitation facilities, or any combination of these factors, are detrimental to safety, health or morals.
Mega city:
The concept of 'Mega city' is a recent pheno
menon in the Urban Sociology and is defined in terms of metropolitan city in the form of large size, problem of management of civic amenities and capacity to
absorb the relatively high growth of population. Indian Census in 1991 treated the population size of 5 million
and above as the cut off point to identify a place as the mega city. Whereas, for the purpose of inclusion in Centrally Sponsored Scheme for Infrastructure
Development in Mega cities the Ministry of Urban Affairs and employment, Department of Urban Development adopted the criteria of 4 million and above popUlation as per 1991 Census for Mega Cities.
In 2001 Census, cities with 10 million and above
population have been treated as Mega cities.
(vii) Census 2001 findings
Distribution of population in rural-urban areas: According to the Census of India 2001 the district
of Wokha has a total population of 161,223 persons of which 123,587 persons are in the rural areas and 37,636 persons are in the urban areas. The urban population represents 23.3 per cent of the total district population. The popUlation of the district in 1991 was
20
DISTRICT CENSUS HANDBOOK. WOKHA
82,612 persons. Thus in absolute terms the growth of total popUlation in the district during the decade 1991-200 I was of the order of 78,611 persons, that is, during the period the popUlation is growing at a rate of 95.2 per cent. In the rural areas the population has increased by 55,262 persons from 68,235 persons in 1991 to 123,587 persons in 2001. During the same period the urban popUlation has grown by 23,259 persons from 14,377 persons to 37,636 persons. This shows that the growth in the urban areas is of the order 161.8 per cent during 1991 to 2001 against the growth rate of 81.1 per cent for the rural areas.
Coming to the distribution of the population among the circles in 2001 we find that Wokha Sadar having a population of 72,236 persons is the most populated circle accounting for 44.8 per cent of the total district popUlation. The next biggest circle in order of population size is Sungro having a population of 14, 100 persons, i.e., 8.7 per cent of the district total. Bhandari having l3,466 persons (8.4 per cent) comes in the third position. Baghty has the lowest population (3,090 persons, i.e., 1.9 per cent). Changpang circle is the next lowest having 3.0 per cent of the total popUlation of the district. The ranking of the circles in terms of population size according to 200 I Census is given below:
Ranking of Circles according to population size, 2001
Rank in Name of Circle 2001 Percentage to 2001 Population total
population
2 3 4
Wokha Sadar 72,236 44.8
2 Sungro 14,100 8.7
3 Bhandari 13,466 8,4
4 Aitepyong 13,226 8.2
5 Wozhuro 1l,777 7.3
6 Chukitong 8,564 5.3
7 Ralan 7,312 4.5
8 Sanis 6,534 4.1
9 Lotsu 6,026 3.7
10 Changpang 4,892 3.0
11 Baghty 3,090 1.9
District Total~ 161,223 100.0
As regards the distribution of the population by rural and urban areas the district is predominantly rural. Out the district popUlation of 161,223 persons
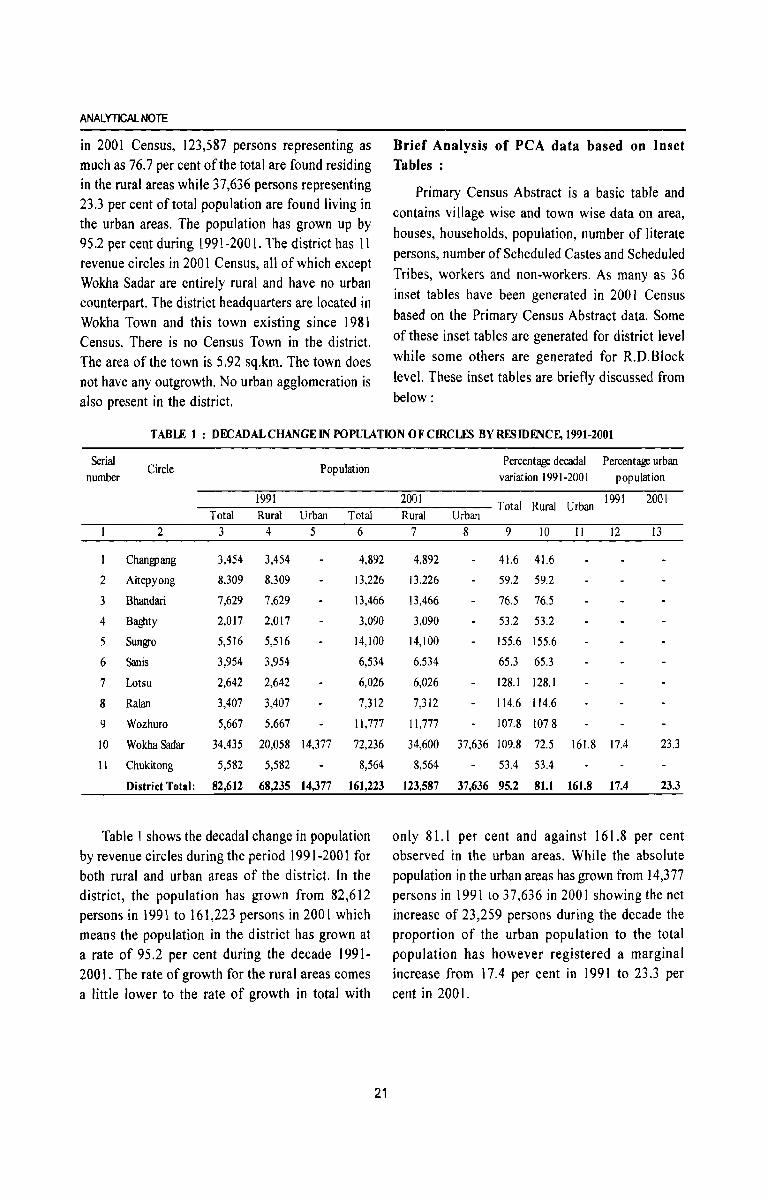
ANALYTICAL NOTE
in 2001 Census, 123,587 persons representing as much as 76.7 per cent of the total are found residing in the rural areas while 37,636 persons representing 23.3 per cent of total population are found living in the urban areas. The population has grown up by 95.2 per cent during 1991-2001. The district has 11 revenue circles in 2001 Census, all of which except Wokha Sadar are entirely rural and have no urban counterpart. The district headquarters are located in Wokha Town and this town existing since 1981 Census. There is no Census Town in the district. The area of the town is 5.92 sq.km. The town does not have any outgrowth. No urban agglomeration is also present in the district.
Brief Analysis of PCA data based on Inset Tables:
Primary Census Abstract is a basic table and contains village wise and town wise data on area, houses, households, population, number of literate persons, number of Scheduled Castes and Scheduled Tribes, workers and non-workers. As many as 36 inset tables have been generated in 200 I Census based on the Primary Census Abstract data. Some of these inset tables are generated for district level while some others are generated for R.D.Block level. These inset tables are briefly discussed from below:
TABLE 1 : DECADAL CHANGE IN POPUlATION OF CIRCLFS BY RFSIDENCE, 1991-2001
Serial number
Circle Population Percentage decadal
variation 1991-2001 Percentage urban
population
1991 2001 1991 -~-:--___ -~~~---------- Total Rural Urban
2001 Total Rural Urban Total Rural Urban
2 3 4 5 6 7 8 9 10 11 12 13
Chan!'J)ang
2 Aitepyong
3 Bhandari
4 Baghty
5 Sungro
6 Sanis
7 Lotsu
8 Ralan
9
IO
Wozhuro
Wokha Sadar
3,454 3,454
8,309 8.309
7,629 7.629
2,017 2,017
5,516 5,516
3,954 3,954
2,642 2,642
3,407 3,407
5,667
34,435
5,667
20,058 14,377
4,892
13,226
13,466
3,090
14,100
6,534
6,026
7,312
11,777
72,236
11 Chukitong 5,582 5,582 8,564
District Total: 82,612 68,235 14,377 161,223
Table 1 shows the decadal change in population by revenue circles during the period 1991-2001 for both rural and urban areas of the district. In the district, the population has grown from 82,612 persons in 1991 to 161,223 persons in 2001 which means the population in the district has grown at a rate of 95.2 per cent during the decade 1991-2001. The rate of growth for the rural areas comes a little lower to the rate of growth in total with
21
4,892
13,226
13,466
3,090
14,100
6,534
6,026
7,312
11,777
34,600
41.6 41.6
59.2 59.2
76.5 76.5
53.2 53.2
155.6 155.6
65.3 65.3
128.1 128.1
114.6 114.6
107.8 107.8
37,636 109.8 72.5 161.8 17.4
8,564 53.4 53.4
123,587 37,636 95.2 81.1 161.8 17.4
23.3
23.3
only 81.1 per cent and against 161.8 per cent observed in the urban areas. While the absolute population in the urban areas has grown from 14,377 persons in 1991 to 37,636 in 2001 showing the net increase of 23,259 persons during the decade the proportion of the urban popUlation to the total population has however registered a marginal increase from 17.4 per cent in 1991 to 23.3 per cent in 200 I.
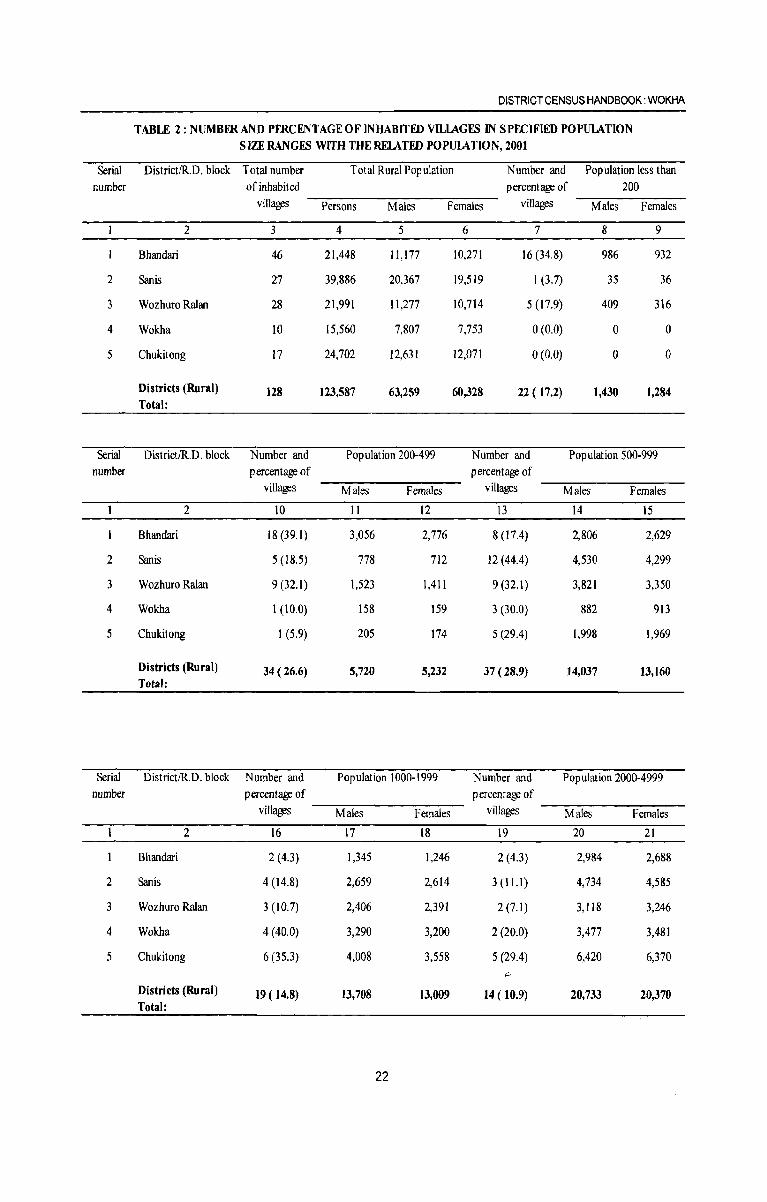
DISTRICT CENSUS HANDBOOK: WOKHA
TABLE 2: NUMBFRAND PERCENTAGE OF INHABITED VILlAGES IN SPECIFIED POPULATION SIZE RANGES WITH THE RELATED POPUlATION, 2001
Serial DistrictIR.D. block Total number Total Rural Population Number and Population less than number of inhabited percentage of 200
villages Persons Males Females villages Males Females
2 3 4 5 6 7 8 9
Bhandari 46 21,448 11,177 10,271 16 (34.8) 986 932
2 Sanis 27 39,886 20,367 19,519 1 (3.7) 3S 36
3 Wozhuro Ralan 28 21,991 11,277 10,714 5(17.9) 409 316
4 Wokha 10 15,560 7,807 7,753 0(0.0) 0 0
5 Chukitong 17 24,702 12,631 12,071 0(0.0) 0 0
Districts (Rural) 128 123,587 63,259 60,328 22 ( 17.2) 1,430 1,284 Total:
Serial DistrictIR.D. block Number and Population 200-499 Number and Population 500-999 number percentage of percentage of
villages Males Females villages Males Females
2 10 11 12 13 14 15
Bhandari 18 (39.1) 3,056 2,776 8 (17.4) 2,806 2,629
2 Sanis 5 (18.5) 778 712 12 (44.4) 4,530 4,299
3 Wozhuro Ralan 9 (32.1) 1,523 1,411 9 (32.1) 3,821 3,350
4 Wokha 1 (10.0) 158 159 3 (30.0) 882 913
5 Chukitong 1 (5.9) 205 174 5 (29.4) 1,998 1,969
Districts (Rural) 34 (26.6) 5,720 5,232 37 (28.9) 14,037 13,160 Total:
Serial DistrictIR.D. block Number and Population 1000-1999 Number and Population 2000-4999 number percentage of percentage of
villages Males Females villages Males Females
2 16 17 18 19 20 21
Bhandari 2 (4.3) 1,345 1,246 2 (4.3) 2,984 2,688
2 Sanis 4 (14.8) 2,659 2,614 3(11.1) 4,734 4,585
3 Wozhuro Ralan 3 (10.7) 2,406 2,391 2 (7.1) 3,118 3,246
4 Wokha 4 (40.0) 3,290 3,200 2 (20.0) 3,477 3,481
5 Chukitong 6 (35.3) 4,008 3,558 5 (29.4) 6,420 6,370 ,..;._,
Districts (Rural) 19 ( 14.8) 13,708 13,009 14 ( 10.9) 20,733 20,370 Total:
22
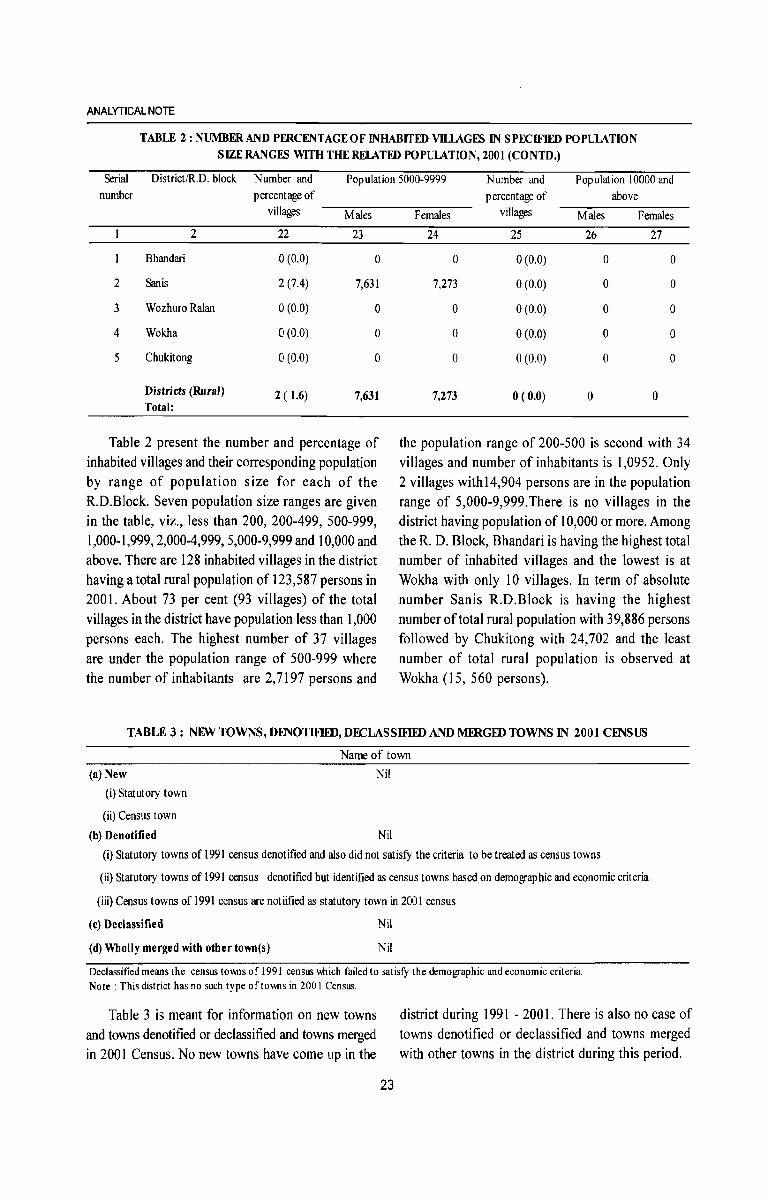
ANALYTICAL NOTE
TABLE 2: NUMBER AND PERCENTAGE OF INHABITED VILlAGES IN SPECIFIED POPUlATION SIZE RANGES WITH THE RElATED POPUlATION, 2001 (CONTD.)
Serial District/R.D. block Number and Population 5000-9999 Number and Population 10000 and number percentage of
villages Males
2 22 23
Bhandari 0(0.0) 0
2 Sanis 2 (7.4) 7,631
3 Wozhuro Ralan 0(0.0) 0
4 Wokha 0(0.0) 0
5 Chukitong 0(0.0) 0
Districts (Rural) 2 ( 1.6) 7,631 Total:
Table 2 present the number and percentage of inhabited villages and their corresponding population by range of population size for each of the R.D.Block. Seven population size ranges are given in the table, viz., less than 200, 200-499, 500-999, 1,000-1,999,2,000-4,999,5,000-9,999 and 10,000 and above. There are 128 inhabited villages in the district having a total rural population of 123,587 persons in 2001. About 73 per cent (93 villages) of the total villages in the district have population less than 1,000 persons each. The highest number of 37 villages are under the population range of 500-999 where the number of inhabitants are 2,7197 persons and
percentage of above
Females villages Males Females
24 25 26 27
0 0(0.0) 0 0
7,273 0(0.0) 0 0
0 0(0.0) 0 0
0 0(0.0) 0 0
0 o (0.0) 0 0
7,273 0(0.0) 0 0
the population range of 200-500 is second with 34 villages and number of inhabitants is 1,0952. Only 2 villages with14,904 persons are in the population range of 5,000-9,999.There is no villages in the district having population of 10,000 or more. Among the R. D. Block, Bhandari is having the highest total number of inhabited villages and the lowest is at Wokha with only 10 villages. In term of absolute number Sanis R.D.Block is having the highest number of total rural population with 39,886 persons followed by Chukitong with 24,702 and the least number of total rural population is observed at Wokha (15, 560 persons).
TABLE 3 : NEW TOWNS, DFNOTlFlED, DECLASSIFIED AND MERGED TOWNS IN 2001 CFNSUS
Name of town
(a) New
(i) Statutory town
(ii) Census town
(b) Denotified
Nil
Nil
(i) Statutory towns of 1991 census denotified and also did not satisfy the criteria to be treated as census towns
(ii) Statutory towns of 1991 census denotified but identified as census towns based on demographic and economic criteria
(iii) Census towns of 1991 census are notiified as statutory town in 2001 census
(c) Declassified
(d) Wholly merged with other town(s)
Nil
Nil
Declassified means the census towns of 1991 census \\hich failed to satisfy the demographic and economic criteria. Note: This district has no such type of towns in 2001 Census.
Table 3 is meant for information on new towns and towns denotified or declassified and towns merged in 2001 Census. No new towns have come up in the
23
district during 1991 - 2001. There is also no case of towns denotified or declassified and towns merged with other towns in the district during this period.
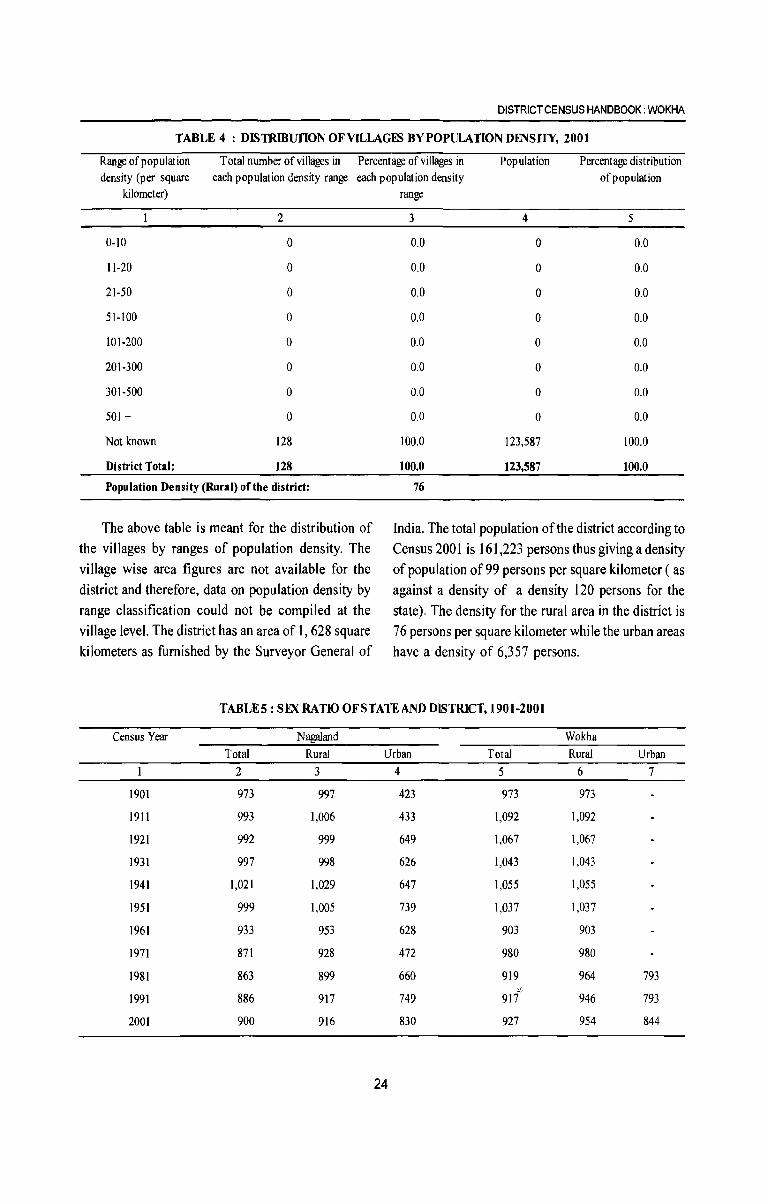
DISTRICT CENSUS HANDBOOK: WOKHA
TABLE 4 : DISTRIBUfION OF VILlAGES BY POPULATION DENSITY, 2001
Range of population Total number of villages in Percentage of villages in Population Percentage distribution density (per square each population density range each population density ofpopulation
kilometer)
2
0-10 0
11-20 0
21-50 0
51-100 0
101-200 0
201-300 0
301-500 0
501 + 0
Not known 128
District Total: 128
Population Density (Rural) of the district:
The above table is meant for the distribution of the villages by ranges of population density. The village wise area figures are not available for the district and therefore, data on population density by range classification could not be compiled at the village level. The district has an area of 1, 628 square kilometers as furnished by the Surveyor General of
range
3 4 5
0.0 0 0.0
0.0 a 0.0
0.0 a 0.0
0.0 a 0.0
0.0 0 0.0
0.0 0 0.0
0.0 a 0.0
0.0 a 0.0
100.0 123,587 100.0
100.0 123,587 100.0
76
India. The total population of the district according to Census 2001 is 161,223 persons thus giving a density of population of99 persons per square kilometer (as against a density of a density 120 persons for the state), The density for the rural area in the district is 76 persons per square kilometer while the urban areas have a density of 6,357 persons,
TABLE5: SEX RATIO OF STATE AND DISTRICT, 1901-2001
Census Year Nagaland Wokha Total Rural Urban Total Rural Urban
2 3 4 5 6 7
1901 973 997 423 973 973
1911 993 1,006 433 1,092 1,092
1921 992 999 649 1,067 1,067
1931 997 998 626 1,043 1,043
1941 1,021 1,029 647 1,055 1,055
1951 999 1,005 739 1,037 1,037
1961 933 953 628 903 903
1971 871 928 472 980 980
1981 863 899 660 919 964 793 ~
1991 886 917 749 917 946 793
2001 900 916 830 927 954 844
24
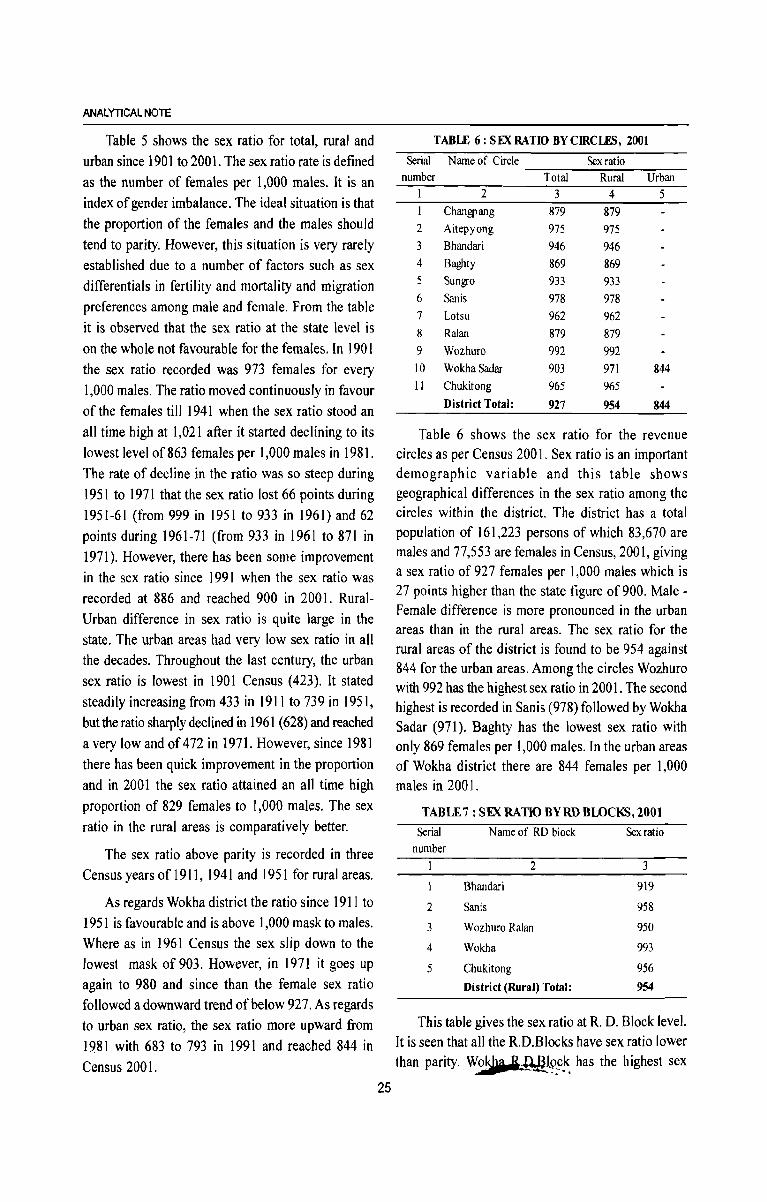
ANALYTICAL NOTE
Table 5 shows the sex ratio for total, rural and urban since 1901 to 2001. The sex ratio rate is defined as the number of females per 1,000 males. It is an index of gender imbalance. The ideal situation is that the proportion of the females and the males should tend to parity. However, this situation is very rarely established due to a number of factors such as sex differentials in fertility and mortality and migration preferences among male and female. From the table it is observed that the sex ratio at the state level is on the whole not favourable for the females. In 1901 the sex ratio recorded was 973 females for every 1,000 males. The ratio moved continuously in favour of the females till 1941 when the sex ratio stood an all time high at 1,021 after it started declining to its lowest level of 863 females per 1,000 males in 1981. The rate of decline in the ratio was so steep during 1951 to 1971 that the sex ratio lost 66 points during 1951-61 (from 999 in 1951 to 933 in 1961) and 62 points during 1961-71 (from 933 in 1961 to 871 in 1971). However, there has been some improvement in the sex ratio since 1991 when the sex ratio was recorded at 886 and reached 900 in 2001. RuralUrban difference in sex ratio is quite large in the state. The urban areas had very low sex ratio in all the decades. Throughout the last century, the urban sex ratio is lowest in 1901 Census (423). It stated steadily increasing from 433 in 1911 to 739 in 1951, but the ratio sharply declined in 1961 (628) and reached a very low and of 472 in 1971. However, since 1981 there has been quick improvement in the proportion and in 2001 the sex ratio attained an all time high proportion of 829 females to 1,000 males. The sex ratio in the rural areas is comparatively better.
The sex ratio above parity is recorded in three Census years of 1911, 1941 and 1951 for rural areas.
As regards Wokha district the ratio since 1911 to 1951 is favourable and is above 1,000 mask to males. Where as in 1961 Census the sex slip down to the lowest mask of 903. However, in 1971 it goes up again to 980 and since than the female sex ratio followed a downward trend of below 927. As regards to urban sex ratio, the sex ratio more upward from 1981 with 683 to 793 in 1991 and reached 844 in Census 200 I.
25
TABlE 6: SEX RATIO BYCmCLFS, 2001
Serial Name of Circle Sex ratio number Total Rural Urban
2 3 4 5 Changpang 879 879
2 Aitepyong 975 975 3 Bhandari 946 946 4 Baghty 869 869 5 Sungro 933 933 6 San is 978 978 7 Lotsu 962 962 8 Ralan 879 879 9 Wozhuro 992 992 10 Wolcha Sadar 903 971 844 II Chukitong 965 965
District Total: 927 954 844
Table 6 shows the sex ratio for the revenue circles as per Census 200 I. Sex ratio is an important demographic variable and this table shows geographical differences in the sex ratio among the circles within the district. The district has a total population of 161,223 persons of which 83,670 are males and 77,553 are females in Census, 2001, giving a sex ratio of 927 females per 1,000 males which is 27 points higher than the state figure of 900. Male -Female difference is more pronounced in the urban areas than in the rural areas. The sex ratio for the rural areas of the district is found to be 954 against 844 for the urban areas. Among the circles Wozhuro with 992 has the highest sex ratio in 2001. The second highest is recorded in Sanis (978) followed by Wokha Sadar (971). Baghty has the lowest sex ratio with only 869 females per 1,000 males. In the urban areas of Wokha district there are 844 females per 1,000 males in 2001.
TABLE7: SEX RATIO BYRD BLOCKS, 2001
Serial number
2
3
4
5
Name of RD block
2
Bhandari
Sanis
Wozhuro Ralan
Wokha
Chukitong
District (Rural) Total:
Sex ratio
3
919
958
950
993
956 954
This table gives the sex ratio at R. D. Block level. It is seen that all the R.D.Blocks have sex ratio lower than parity. WoHr i.Ml?:~.k. has the highest sex
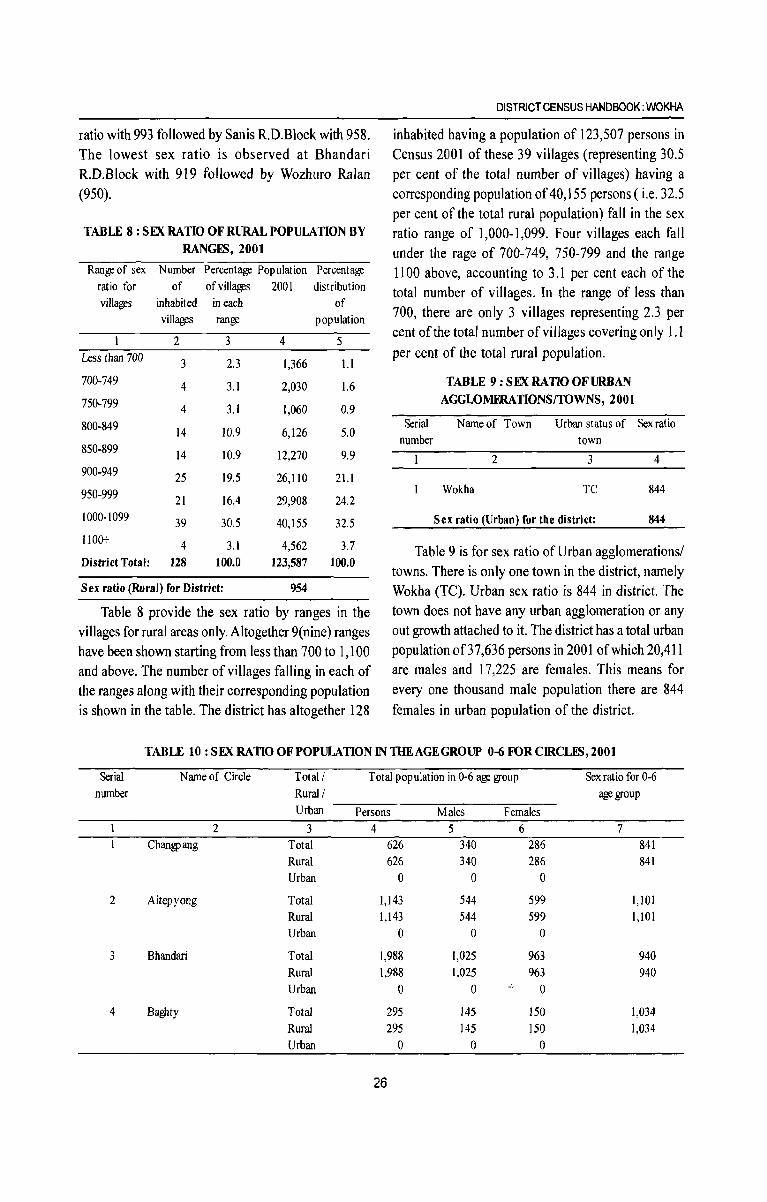
ratio with 993 followed by Sanis R.D.Block with 958. The lowest sex ratio is observed at Bhandari R.D.Block with 919 followed by Wozhuro Ralan (950).
TABLE 8: SEX RATIO OF RURAL POPULATION BY RANGES, 2001
Range of sex Number Percentage Population Percentage ratio for of of villages 2001 distribution villages inhabited in each of
villages range population
2 3 4 5 Less than 700 3 2.3 1,366 l.l 700·749 4 3.1 2,030 1.6 750·799 4 3.1 1,060 0.9 800·849 14 10.9 6,126 5.0 850-899 14 10.9 12,270 9.9 900·949 25 19.5 26,110 21.1 950·999 21 16.4 29,908 24.2 1000-1099 39 30.5 40,155 32.5 1100+ 4 3.1 4,562 3.7 District Total: 128 100.0 123,587 100.0
Sex ratio (Rural) ror District: 954
Table 8 provide the sex ratio by ranges in the villages for rural areas only. Altogether 9(nine) ranges have been shown starting from less than 700 to 1,100 and above. The number of villages falling in each of the ranges along with their corresponding population is shown in the table. The district has altogether 128
DISTRICT CENSUS HANDBOOK: WOKHA
inhabited having a population of 123,507 persons in Census 2001 of these 39 villages (representing 30.5 per cent of the total number of villages) having a corresponding population of 40, 155 persons ( i.e. 32.5 per cent of the total rural population) fall in the sex ratio range of 1,000·1,099. Four villages each fall under the rage of 700-749, 750-799 and the range 1100 above, accounting to 3.1 per cent each of the total number of villages. In the range of less than 700, there are only 3 villages representing 2.3 per cent of the total number of villages covering only 1.1 per cent of the total rural popUlation.
TABLE 9: SEX RATIO OF URBAN AGGLOMFRATIONS/TOWNS, 2001
Serial N arne of Town Urban status of Sex ratio number town
2 3 4
Wokha TC 844
Sex ratio (Urban) for the district: 844
Table 9 is for sex ratio of Urban agglomerations/ towns. There is only one town in the district, namely Wokha (TC). Urban sex ratio is 844 in district. The town does not have any urban agglomeration or any out growth attached to it. The district has a total urban population of37,636 persons in 2001 of which 20,411 are males and 17,225 are females. This means for every one thousand male population there are 844 females in urban population of the district.
TABLE 10: SEX RATIO OF POPULATION IN TIlE AGE GROUP 0-6 FORCIRCLFS, 2001
Serial N arne of Circle Total/ Total population in 0-6 age group Sex ratio for 0-6 number Rural / age group
Urban Persons Males Females 2 3 4 5 6 7
Changpang Total 626 340 286 841 Rural 626 340 286 841 Urban 0 0 0
2 Aitepyong Total 1,143 544 599 1,101 Rural 1,143 544 599 I, I 01 Urban 0 0 0
3 Bhandari Total 1,988 1,025 963 940 Rural 1,988 1,025 963 940 Urban 0 0 .' 0
4 Baghty Total 295 145 150 1,034 Rural 295 145 150 1,034 Urban 0 0 0
26
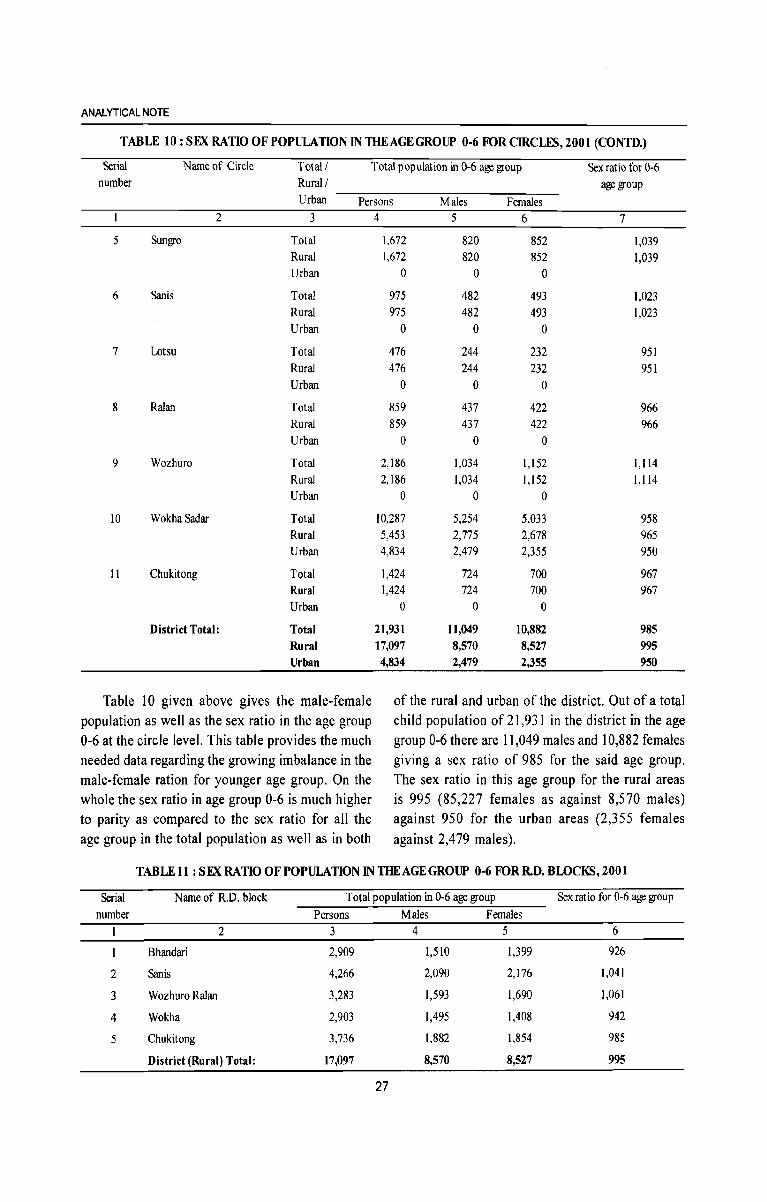
ANALYTICAL NOTE
TABLE 10: SEX RATIO OF POPULATION IN THE AGE GROUP 0-6 FORCIRCLlS,2001 (CONTD.)
Serial Name of Circle Total! Total population in 0-6 age group Sex ratio for 0-6 number Rural! age group
Urban Persons Males Females 2 3
5 Sungro Total Rural Urban
6 Sanis Total Rural Urban
7 Lotsu Total Rural Urban
8 Ralan Total Rural Urban
9 Wozhuro Total Rural Urban
10 WokhaSadar Total Rural Urban
II Chukitong Total Rural Urban
District Total: Total Rural Urban
Table 10 given above gives the male-female population as well as the sex ratio in the age group 0-6 at the circle level. This table provides the much needed data regarding the growing imbalance in the male-female ration for younger age group. On the whole the sex ratio in age group 0-6 is much higher to parity as compared to the sex ratio for all the age group in the total population as well as in both
4 5 6 7
1,672 820 852 1,039 1,672 820 852 1,039
° ° 0
975 482 493 1,023 975 482 493 1,023
0 0 0
476 244 232 951 476 244 232 951
° 0 0
859 437 422 966 859 437 422 966
0 0 ° 2,186 1,034 1,152 1,114 2,186 1,034 1,152 1,114
° 0 0
10,287 5,254 5,033 958 5,453 2,775 2,678 965 4,834 2,479 2,355 950
1,424 724 700 967 1,424 724 700 967
0 0 0
21,931 11,049 10,882 985 17,097 8,570 8,527 995 4,834 2,479 2,355 950
of the rural and urban of the district. Out of a total child population of 21 ,931 in the district in the age group 0-6 there are 11,049 males and 10,882 females giving a sex ratio of 985 for the said age group. The sex ratio in this age group for the rural areas is 995 (85,227 females as against 8,570 males) against 950 for the urban areas (2,355 females against 2,479 males).
TABLEll: SEX RATIO OF POPULATION IN THE AGE GROUP 0-6 FORR.D. BWCKS,2001
Serial number
2
3
4
5
Name of R.D. block
2
Bhandari
Sanis
Wozhuro Ralan
Wokha
Chukitong
District (Rural) Total:
Total population in 0-6 age group Sex ratio for 0-6 age group
Persons Males Females 3 4 5 6
2,909 1,510 1,399 926
4,266 2,090 2,176 1,041
3,283 1,593 1,690 1,061
2,903 1,495 1,408 942
3,736 1,882 1,854 985
17,097 8,570 8,527 995
27
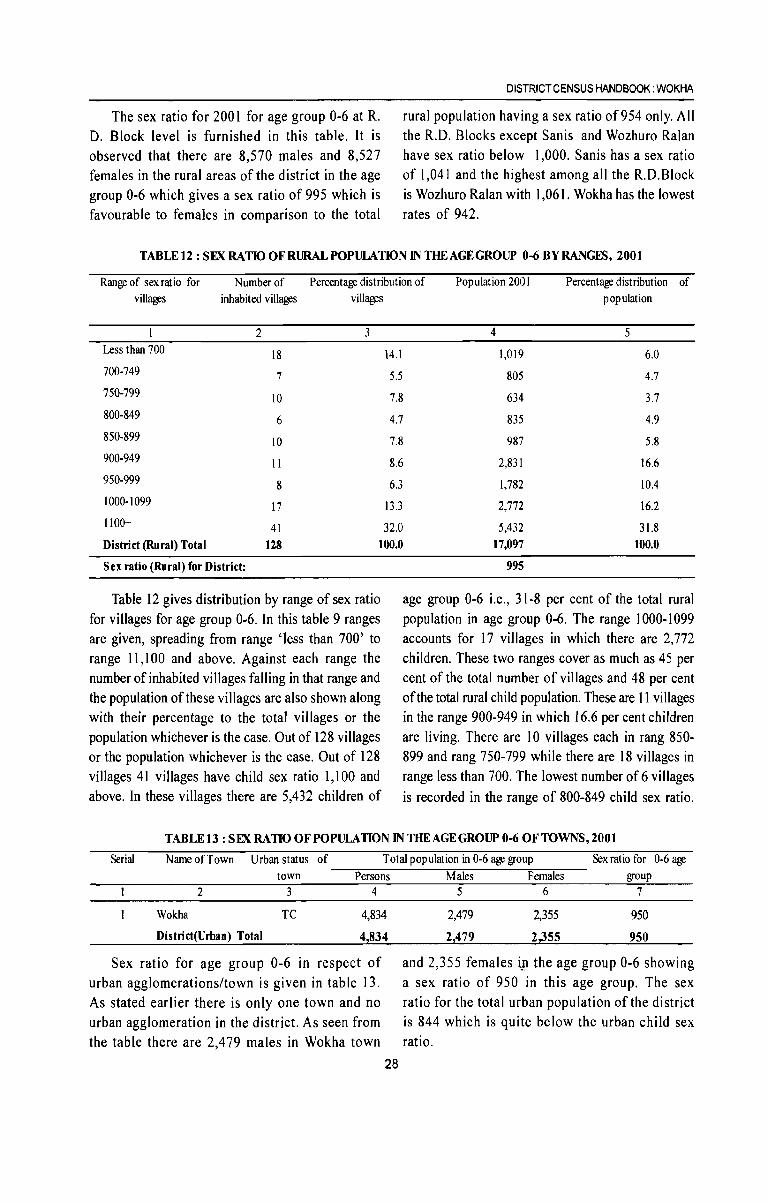
The sex ratio for 200 I for age group 0-6 at R. D. Block level is furnished in this table. It is observed that there are 8,570 males and 8,527 females in the rural areas of the district in the age group 0-6 which gives a sex ratio of 995 which is favourable to females in comparison to the total
DISTRICT CENSUS HANDBOOK: WOKHA
rural population having a sex ratio of954 only. All the R.D. Blocks except Sanis and Wozhuro Ralan have sex ratio below 1,000. Sanis has a sex ratio of 1,041 and the highest among all the R.D.Block is Wozhuro Ralan with 1,061. Wokha has the lowest rates of 942.
TABLE 12: SEX RATIO OF RURAL POPULATION IN THE AGE GROUP 0-6 BY RANGES, 2001
Range of sex ratio for Number of Percentage distribution of Population 2001 Percentage distribution of villages inhabited villages villages population
2 3 4 5 Less than 700 18 14.1 1,019 6.0 700-749 7 5.5 805 4.7 750-799 10 7.8 634 3.7 800-849 6 4.7 835 4.9 850-899 10 7.8 987 5.8 900-949 II 8.6 2,831 16.6 950-999 8 6.3 1,782 IDA 1000-1099 17 13.3 2,772 16.2 1100+ 41 32.0 5,432 31.8 District (Rural) Total 128 100.0 17,097 100.0
Sex ratio (Rural) for District:
Table 12 gives distribution by range of sex ratio for villages for age group 0-6. In this table 9 ranges are given, spreading from range 'less than 700' to range 11,100 and above. Against each range the number of inhabited villages falling in that range and the population of these villages are also shown along with their percentage to the total villages or the population whichever is the case. Out of 128 villages or the population whichever is the case. Out of 128 villages 41 villages have child sex ratio 1,100 and above. In these villages there are 5,432 children of
995
age group 0-6 i.e., 31-8 per cent of the total rural population in age group 0-6. The range 1000-1099 accounts for 17 villages in which there are 2,772 children. These two ranges cover as much as 45 per cent of the total number of villages and 48 per cent of the total rural child population. These are 11 villages in the range 900-949 in which 16.6 per cent children are living. There are 10 villages each in rang 850-899 and rang 750-799 while there are 18 villages in range less than 700. The lowest number of 6 villages is recorded in the range of 800-849 child sex ratio.
TABLE 13 : SEX RATIO OF POPULATION IN THE AGE GROUP 0-6 OF TOWNS, 2001
Serial Name of Town Urban status of Total population in 0-6 age group Sex ratio for 0-6 age town Persons
2 3 4
Wokha TC 4,834
District(Urban) Total 4,834
Sex ratio for age group 0-6 in respect of urban agglomerations/town is given in table 13. As stated earlier there is only one town and no urban agglomeration in the district. As seen from the table there are 2,479 males in Wokha town
28
Males Females group 5 6 7
2,479 2,355 950
2,479 2,355 950
and 2,355 females ill the age group 0-6 showing a sex ratio of 950 in this age group. The sex ratio for the total urban population ofthe district is 844 which is quite below the urban child sex ratio.
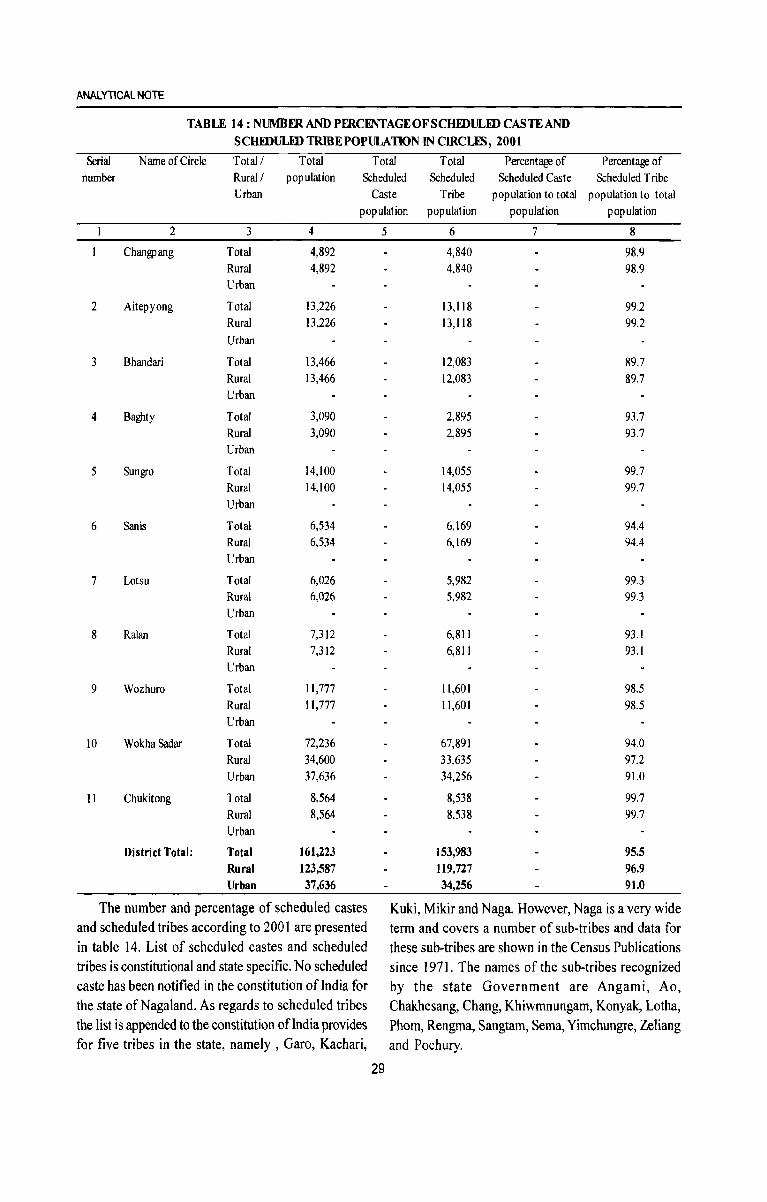
ANALYTICAL NOTE
TABLE 14: NUMBm. AND PFRCENTAGEOFSCHIDULID CASTE AND SCHIDULID TRIBE POPULATION IN CIRCUS, 2001
Serial Name of Circle Total / Total Total Total Percentage of Percentage of number Rural / population Scheduled Scheduled Scheduled Caste Scheduled Tribe
Urban Caste Tribe pop ulation to total population to total population population population population
1 2 3 4 5 6 7 8
I Changpang Total 4,892 4,840 98.9 Rural 4,892 4,840 98.9 Urban
2 Aitepyong Total 13,226 13,118 99.2 Rural 13,226 13,118 99.2 Urban
3 Bhandari Total 13,466 12,083 89.7 Rural 13,466 12,083 89.7 Urban
4 Baghty Total 3,090 2,895 93.7 Rural 3,090 2,895 93.7 Urban
5 Sungro Total 14,100 14,055 99.7 Rural 14,100 14,055 99.7 Urban
6 Sanis Total 6,534 6,169 94.4 Rural 6,534 6,169 94.4 Urban
7 Lotsu Total 6,026 5,982 99.3 Rural 6,026 5,982 99.3 Urban
8 Ralan Total 7,312 6,811 93.1 Rural 7,312 6,811 93.1 Urban
9 Wozhuro Total 11,777 11,601 98.5 Rural 1I,777 11,601 98.5 Urban
10 Wokha Sadar Total 72,236 67,891 94.0 Rural 34,600 33,635 97.2 Urban 37,636 34,256 91.0
II Chukitong Total 8,564 8,538 99.7 Rural 8,564 8,538 99.7 Urban
District Total: Total 161,223 153,983 95.5 Rural 123,587 119,727 96.9 Urban 37,636 34,256 91.0
The number and percentage of scheduled castes Kuki, Mikir and Naga. However, Naga is a very wide and scheduled tribes according to 2001 are presented term and covers a number of sub-tribes and data for in table 14. List of scheduled castes and scheduled these sub-tribes are shown in the Census Publications tribes is constitutional and state specific. No scheduled since 1971. The names of the sub-tribes recognized caste has been notified in the constitution ofIndia for by the state Government are Angami, Ao, the state of Nagaland. As regards to scheduled tribes Chakhesang, Chang, Khiwmnungam, Konyak, Lotha, the list is appended to the constitution of India provides Phorn, Rengma, Sangtarn, Serna, Yirnchungre, Zeliang for five tribes in the state, namely, Garo, Kachari, and Pochury.
29
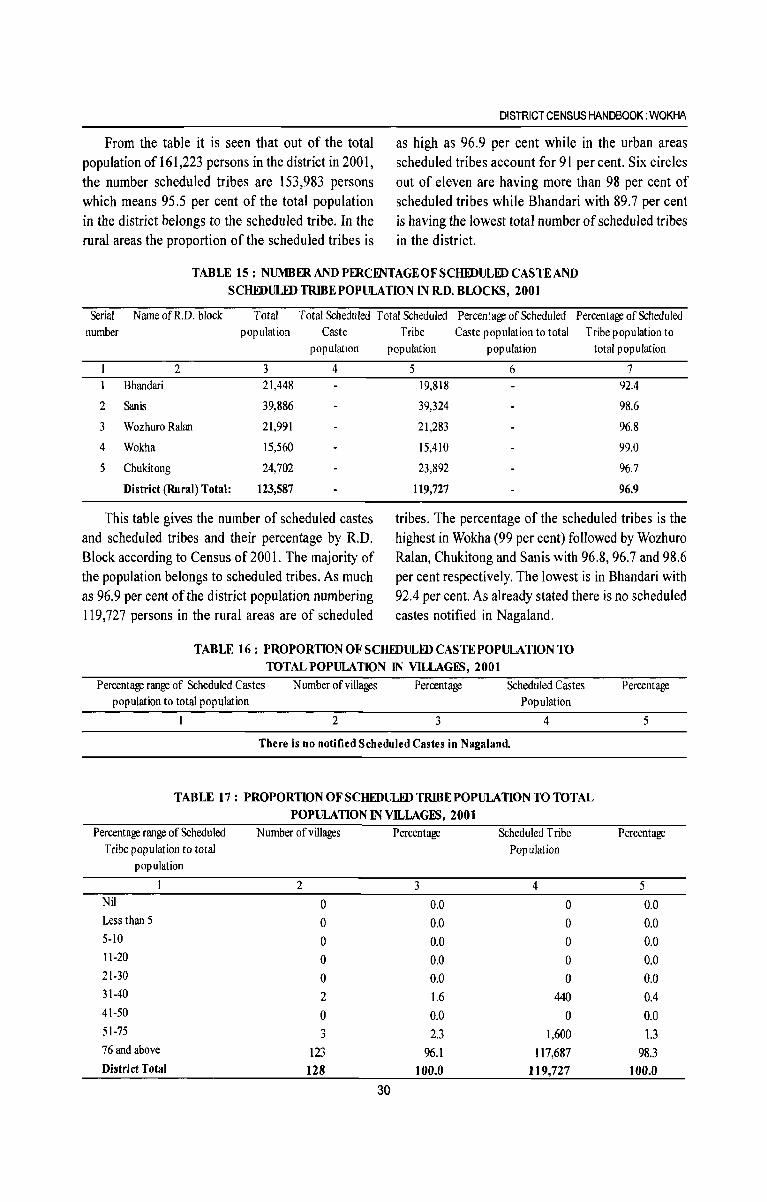
From the table it is seen that out of the total population of 161,223 persons in the district in 200 I, the number scheduled tribes are 153,983 persons which means 95.5 per cent of the total population in the district belongs to the scheduled tribe. In the rural areas the proportion of the scheduled tribes is
DISTRICT CENSUS HANDBOOK: WOKHA
as high as 96.9 per cent while in the urban areas scheduled tribes account for 91 per cent. Six circles out of eleven are having more than 98 per cent of scheduled tribes while Bhandari with 89.7 per cent is having the lowest total number of scheduled tribes in the district.
TABLE 15: NUMBER AND PERCENTAGE OF SCHEDULED CASTE AND SCHEDULID TRIBE POPULATION IN RD. BLOCKS, 2001
Serial NameofR.D. block Total Total Scheduled Total Scheduled Percentage of Scheduled Percentage of Scheduled number population Caste
popUlation
2 3 4 I Bhandari 21,448
2 Sanis 39,886
3 Wozhuro Ralan 21,991
4 Wokha 15,560
5 Chukitong 24,702
District (Rural) Total: 123,587
This table gives the number of scheduled castes and scheduled tribes and their percentage by R.D. Block according to Census of 2001. The majority of the population belongs to scheduled tribes. As much as 96.9 per cent of the district population numbering 119,727 persons in the rural areas are of scheduled
Tribe Caste pop ulation to total Tribe population to population popUlation total population
5 6 7 19,818 92.4
39,324 98.6
21,283 96.8
15,410 99.0
23,892 96.7
119,727 96.9
tribes. The percentage of the scheduled tribes is the highest in Wokha (99 per cent) followed by Wozhuro Ralan, Chukitong and Sanis with 96.8, 96.7 and 98.6 per cent respectively. The lowest is in Bhandari with 92.4 per cent. As already stated there is no scheduled castes notified in Nagaland.
TABLE 16: PROPORTION OF SCHEDULED CASTE POPULATION TO TOTAL POPULATION IN VlLLAGIS, 2001
Percentage range of Scheduled Castes popUlation to total population
Number of villages
2
Percentage
3
Scheduled Castes Population
4
There is no notitied Scheduled Castes in N agaland.
TABLE 17: PROPORTlONOFSCHEDULIDTRIBEPOPULATIONTOTOTAL
Percentage range of Scheduled Tribe population to total
population
Nil
Less than 5
5-10
11-20
21-30
31-40
41-50
51-75
76 and above
District Total
POPULATION IN VlLLAGIS, 2001 Number of villages Percentage
2 3
0 0.0
0 0.0
0 0.0
0 0.0
0 0.0
2 1.6
0 0.0
3 2.3
123 96.1 128 100.0
30
Scheduled Tribe Population
4
0
0
0
0
0
440 0
1,600
117,687 119,727
Percentage
5
Percentage
5
0.0
0.0
0.0
0.0
0.0 0.4
0.0 1.3
98.3 100.0
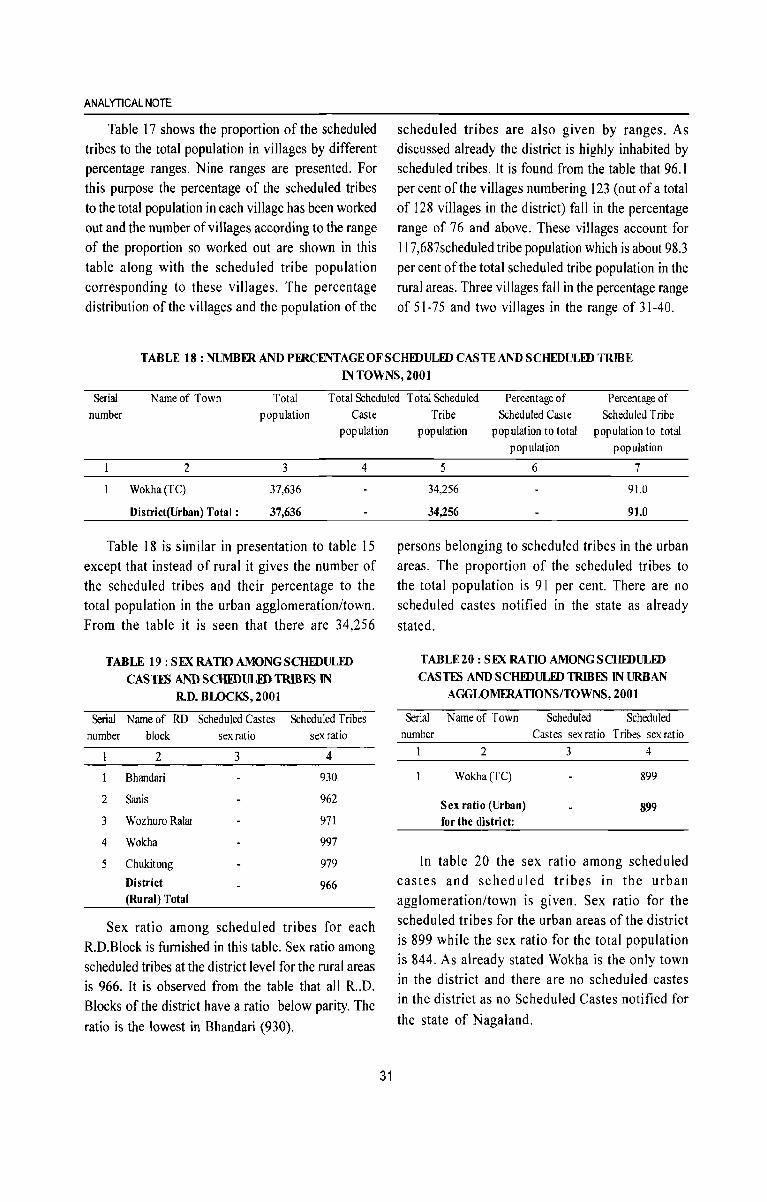
ANALYTICAL NOTE
Table 17 shows the proportion of the scheduled tribes to the total population in villages by different percentage ranges. Nine ranges are presented. For this purpose the percentage of the scheduled tribes to the total population in each village has been worked out and the number of villages according to the range of the proportion so worked out are shown in this table along with the scheduled tribe population corresponding to these villages. The percentage distribution of the villages and the population of the
scheduled tribes are also given by ranges. As discussed already the district is highly inhabited by scheduled tribes. It is found from the table that 96.1 per cent of the villages numbering 123 (out of a total of 128 villages in the district) fall in the percentage range of 76 and above. These villages account for 117,687scheduled tribe population which is about 98.3 per cent of the total scheduled tribe population in the rural areas. Three villages fall in the percentage range of 51-75 and two villages in the range of 31-40.
TABLE 18: NUMBFR AND PERCENTAGE OF SCHEDULED CASTE AND SCHEDULFDTRmE IN TOWNS, 2001
Serial Name of Town Total Total Scheduled Total Scheduled Percentage of Percentage of number population Caste
population
2 3 4
Wokha(TC) 37,636
District(Urban) Total: 37,636
Table 18 is similar in presentation to table 15 except that instead of rural it gives the number of the scheduled tribes and their percentage to the total population in the urban agglomeration/town. From the table it is seen that there are 34,256
TABLE 19: SEX RATIO AMONGSCHEDULFD CASTFS AND SCHEDULFD TRIB~ IN
RD. BWCKS, 2001
Serial Nameof RD Scheduled Castes Scheduled Tribes number block sex ratio sex ratio
2 3 4
Bhandari 930
2 Sanis 962
3 Wazhuro Ralm 971
4 Wokha 997
5 Chukitang 979
District 966 (Rural) Total
Sex ratio among scheduled tribes for each R.D.Block is furnished in this table. Sex ratio among scheduled tribes at the district level for the rural areas is 966. It is observed from the table that all R .. D. Blocks of the district have a ratio below parity. The ratio is the lowest in Bhandari (930).
31
Tribe Scheduled Caste Scheduled Tribe population population to total population to total
population population
5 6 7
34,256 91.0
34,256 91.0
persons belonging to scheduled tribes in the urban areas. The proportion of the scheduled tribes to the total popUlation is 91 per cent. There are no scheduled castes notified in the state as already
stated.
TABLE20: SEX RATIO AMONG SCHEDULED CASTES AND SCHEDULED TRmES IN URBAN
AGGWMmATIONS/TOWNS, 2001
Serial Name of Town Scheduled Scheduled number Castes sex ratio Tribes sex ratio
2 3 4
Wokha(TC) 899
Sex ratio (Urban) 899 for the district:
In table 20 the sex ratio among scheduled castes and scheduled tribes in the urban agglomeration/town is given. Sex ratio for the scheduled tribes for the urban areas of the district is 899 while the sex ratio for the total population is 844. As already stated Wokha is the only town in the district and there are no scheduled castes in the district as no Scheduled Castes notified for
the state of Nagaland.
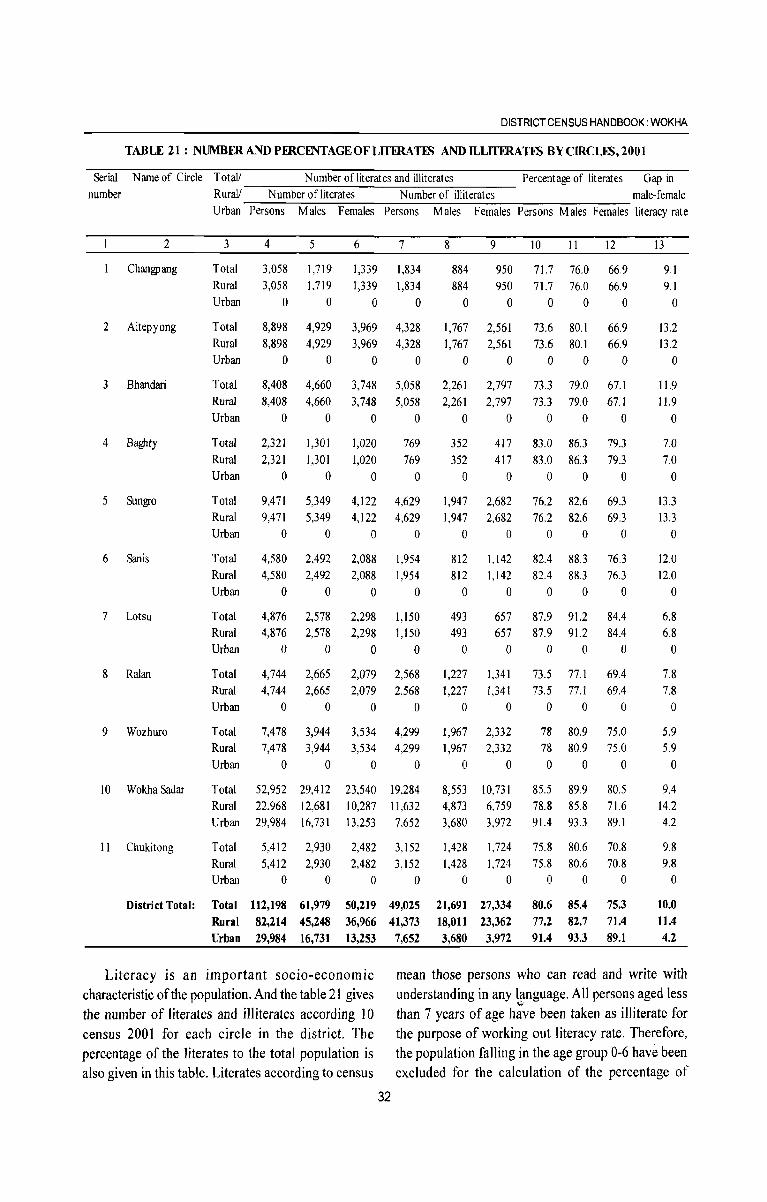
DISTRICT CENSUS HANDBOOK: WOKHA
TABLE 21: NUMBERANDPFRCENTAGEOFLITFRATE'i ANDILLITFRATE'i BY CIRCUS, 2001
Serial Name of Circle Totall Number of literates and illiterates Percentage of literates Gap in number RuraV Number of literates Number of illiterates male-female
Urban Persons Males Females Persons Males Females Persons Males Females literacy rate
2
Changpang
2 Aitepyong
3 Bhandari
4 Baghty
5 Sungro
6 Sanis
7 Lotsu
8 Ralan
9 Wozhuro
10 Wokha Sadar
11 Chukitong
District Total:
3
Total Rural Urban
Total Rural Urban
Total Rural Urban
Total Rural Urban
Total Rural Urban
Total Rural Urban
Total Rural Urban
Total Rural Urban
Total Rural Urban
Total Rural Urban
4 5 6 7
3,058 1,719 1,339 1,834 3,058 1,719 1,339 1,834
o 0 o 0
8,898 4,929 3,969 4,328 8,898 4,929 3,969 4,328
o 0 o 0
8,408 4,660 3,748 5,058 8,408 4,660 3,748 5,058
o 0 o 0
2,321 1,301 1,020 769 2,321 1,301 1,020 769
o 0 o 0
9,471 5,349 4,122 4,629 9,471 5,349 4,122 4,629
o ° o 0
4,580 2,492 2,088 1,954 4,580 2,492 2,088 1,954
o 0 o 0
4,876 2,578 2,298 1,150 4,876 2,578 2,298 1,150
o 0 o 0
4,744 2,665 2,079 2,568 4,744 2,665 2,079 2,568
o 0 o 0
7,478 3,944 3,534 4,299 7,478 3,944 3,534 4,299
o 0 o 0
52,952 29,412 23,540 19,284 22,968 12,681 10,287 11,632 29,984 16,731 13,253 7,652
8 9 IO II 12
884 884
o
950 71.7 76.0 66.9 950 71.7 76.0 66.9
o 0 0 0
1,767 2,561 1,767 2,561
o 0
2,261 2,797 2,261 2,797
o 0
352 417 352 417
o 0
1,947 2,682 1,947 2,682
o 0
812 1,142 812 1,142
o 0
493 657 493 657
o 0
1,227 1,341 1,227 1,341
o 0
1,967 2,332 1,967 2,332
o 0
8,553 10,731 4,873 6,759 3,680 3,972
73.6 80.1 66.9 73.6 80.1 66.9
o 0 0
73.3 79.0 67.1 73.3 79.0 67.1
o 0 0
83.0 86.3 79.3 83. 0 86.3 79.3
o 0 0
76.2 82.6 69.3 76.2 82.6 69.3
o 0 0
82.4 88.3 76.3 82.4 88.3 76.3
o 0 0
87.9 91.2 84.4 87.9 91.2 84.4
o 0 0
73.5 77.1 69.4 73.5 77.1 69.4
o 0 0
78 80.9 75.0 78 80.9 75.0 o 0 0
85.5 78.8 91.4
89.9 85.8 93.3
80.5 71.6 89.1
Total 5,412 2,930 2,482 3,152 1,428 1,724 75.8 80.6 70.8 Rural 5,412 2,930 2,482 3,152 Urban 0 0 0 0
Total 112,198 61,979 50,219 49,025 Rural 82,214 45,248 36,966 41,373 Urban 29,984 16,731 13,253 7,652
1,428 1,724 75.8 80.6 70.8 o 0 0 0 0
21,691 27,334 18,011 23,362 3,680 3,972
80.6 85.4 77.2 82.7 91.4 93.3
75.3 71.4 89.1
13
9.1 9.1 o
13.2 13.2
o 11.9 11.9
o 7.0 7.0 o
13.3 13.3
o
12.0 12.0
o 6.8 6.8 o
7.8 7.8 o
5.9 5.9
o 9.4
14.2 4.2
9.8 9.8
o
10.0 11.4 4.2
Literacy is an important socio-economic characteristic of the population. And the table 21 gives the number of literates and illiterates according 10 census 2001 for each circle in the district. The percentage of the literates to the total population is also given in this table. Literates according to census
mean those persons who can read and write with understanding in any language. All persons aged less
.:,
than 7 years of age have been taken as illiterate for the purpose of working out I iteracy rate. Therefore, the population falling in the age group 0-6 have been excluded for the calculation of the percentage of
32
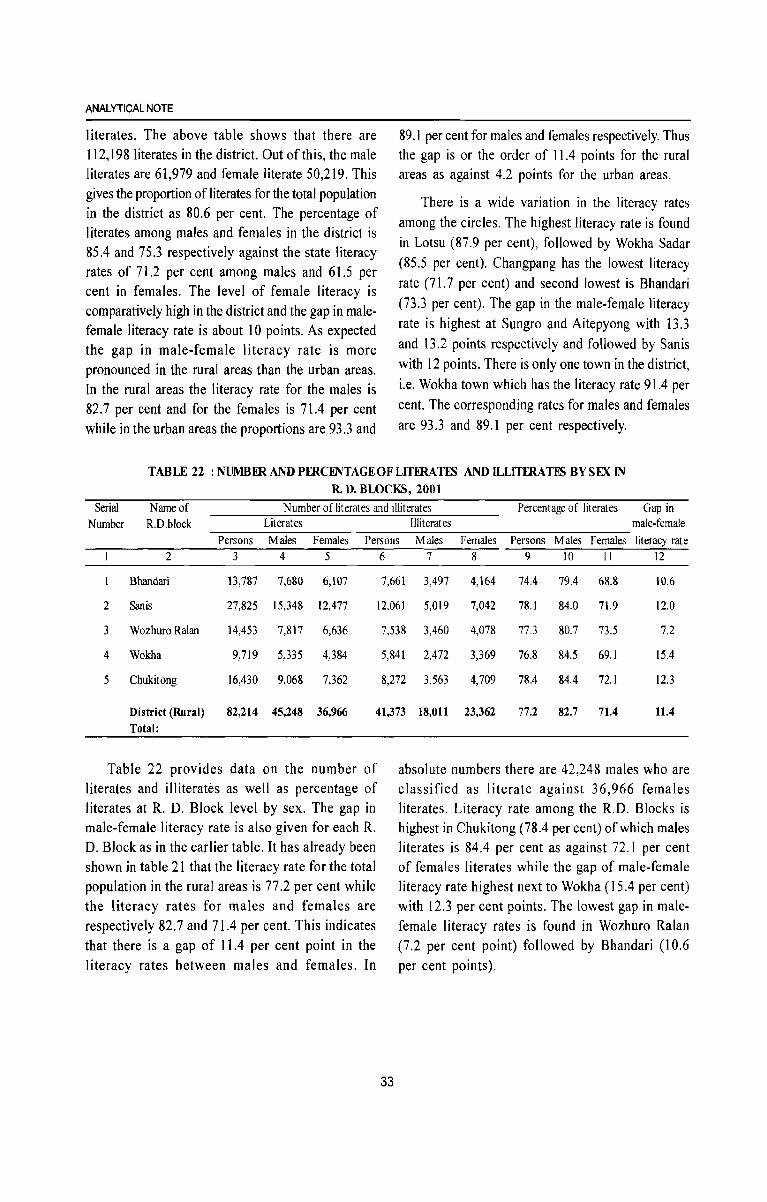
ANALYTICAL NOTE
literates. The above table shows that there are 112,198 literates in the district. Out of this, the male literates are 61,979 and female literate 50,219. This gives the proportion of literates for the total population in the district as 80.6 per cent. The percentage of literates among males and females in the district is 85.4 and 75.3 respectively against the state literacy rates of 71.2 per cent among males and 61.5 per cent in females. The level of female literacy is comparatively high in the district and the gap in malefemale literacy rate is about 10 points. As expected the gap in male-female literacy rate is more pronounced in the rural areas than the urban areas. In the rural areas the literacy rate for the males is 82.7 per cent and for the females is 71.4 per cent while in the urban areas the proportions are 93.3 and
89.1 per cent for males and females respectively. Thus the gap is or the order of 11.4 points for the rural areas as against 4.2 points for the urban areas.
There is a wide variation in the literacy rates among the circles. The highest literacy rate is found in Lotsu (87.9 per cent), followed by Wokha Sadar (85.5 per cent). Changpang has the lowest literacy rate (71. 7 per cent) and second lowest is Bhandari (73.3 per cent). The gap in the male-female literacy rate is highest at Sungro and Aitepyong with 13.3 and 13.2 points respectively and followed by Sanis with 12 points. There is only one town in the district, i.e. Wokha town which has the literacy rate 91.4 per cent. The corresponding rates for males and females are 93.3 and 89.1 per cent respectively.
TABLE 22 : NUMBER AND PERONTAGE OF LITERA -rn; AND ILLITERA m BY SEX IN R. D. BLOCKS, 2001
Serial Name of Number of literates and illiterates Percentage of literates Gap in Number R.D.block Literates lIIiterates male-female
Persons Males Females Persons Males Females Persons Males Females literacy rate 2 3 4 5 6 7 8 9 10 11 12
Bhandari 13,787 7,680 6,107 7,661 3,497 4,164 74.4 79.4 68.8 10.6
2 Sanis 27,825 15,348 12,477 12,061 5,019 7,042 78.1 84.0 71.9 12.0
3 Wozhuro Ralan 14,453 7,817 6,636 7,538 3,460 4,078 77.3 80.7 73.5 7.2
4 Wokha 9,719 5,335 4,384 5,841 2,472 3,369 76.8 84.5 69.1 15.4
5 Chukitong 16,430 9,068 7,362 8,272 3,563 4,709 78.4 84.4 72.1 12.3
District (Rural) 82,214 45,248 36,966 41,373 18,011 23,362 77.2 82.7 71.4 11.4
Total:
Table 22 provides data on the number of literates and illiterates as well as percentage of literates at R. D. Block level by sex. The gap in male-female literacy rate is also given for each R. D. Block as in the earlier table. It has already been shown in table 21 that the literacy rate for the total population in the rural areas is 77.2 per cent while the literacy rates for males and females are respectively 82.7 and 71.4 per cent. This indicates that there is a gap of 11.4 per cent point in the literacy rates between males and females. In
33
absolute numbers there are 42,248 males who are classified as literate against 36,966 females literates. Literacy rate among the R.D. Blocks is highest in Chukitong (78.4 per cent) of which males literates is 84.4 per cent as against 72.1 per cent of females literates while the gap of male-female literacy rate highest next to Wokha (15.4 per cent) with 12.3 per cent points. The lowest gap in malefemale literacy rates is found in Wozhuro Ralan (7.2 per cent point) followed by Bhandari (10.6 per cent points).
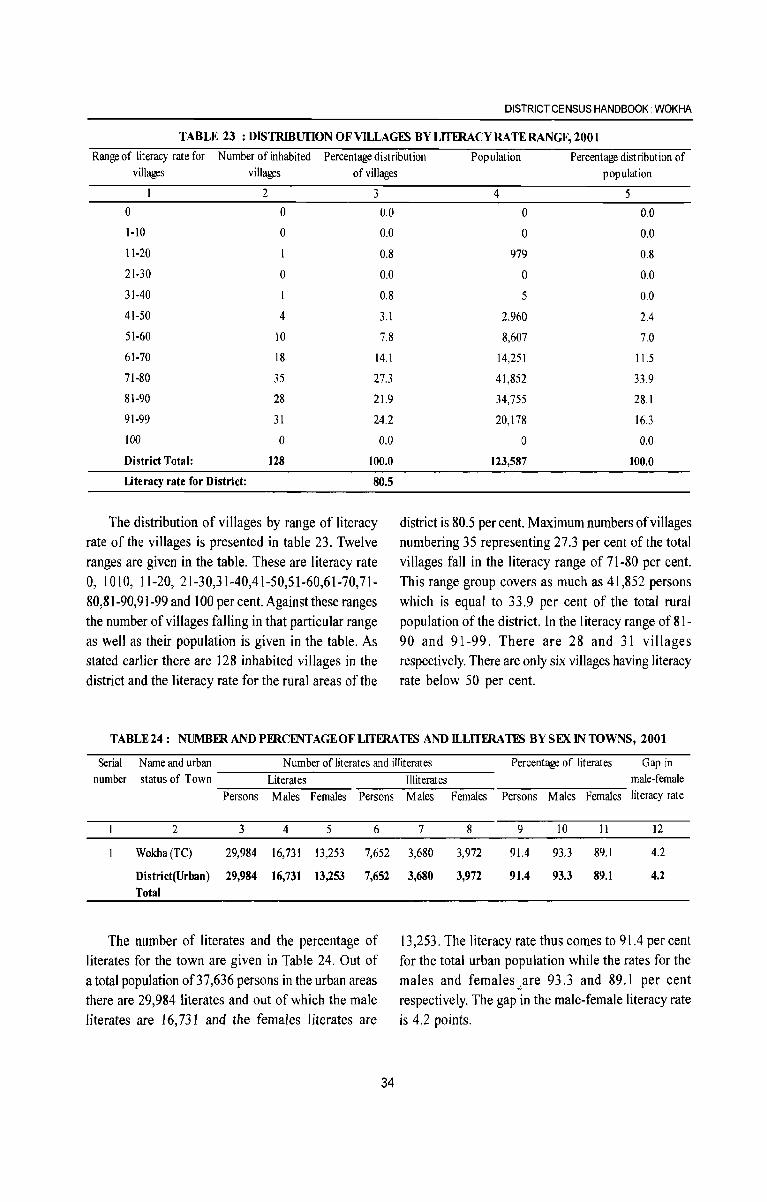
DISTRICT CENSUS HANDBOOK. WOKHA
TABLE 23 : DISTRIBUfION OF VILLAGES BY LITERACY RATE RANGE, 2001
Range of literacy rate for Number of inhabited Percentage distribution Population Percentage distribution of villages villages of villages
2
o o
o
3
0.0
0.0
0.8
0.0
0.8
3.1
7.8
o 1-10
11-20
21-30
31-40
41-50
51-60
61-70
71-80
81-90
91-99
100
4
10
18
35
28
31
14.1
27.3
21.9
24.2
0.0
District Total:
o 128 100.0
literacy rate for District: 80.5
The distribution of villages by range of literacy rate of the villages is presented in table 23. Twelve ranges are given in the table. These are literacy rate 0, 1010, 11-20, 21-30,31-40,41-50,51-60,61-70,71-80,81-90,91-99 and 100 per cent. Against these ranges the number of villages falling in that particular range as well as their population is given in the table. As stated earlier there are 128 inhabited villages in the district and the literacy rate for the rural areas of the
population
4 5
0 0.0
0 0.0
979 0.8
0 0.0
5 0.0
2,960 2.4
8,607 7.0
14,251 11.5
41,852 33.9
34,755 28.1
20,178 163
0 0.0
123,587 100.0
district is 80.5 per cent. Maximum numbers of villages numbering 35 representing 27.3 per cent of the total villages fall in the literacy range of 71-80 per cent. This range group covers as much as 41,852 persons which is equal to 33.9 per cent of the total rural population of the district. In the literacy range of 81-90 and 91-99. There are 28 and 31 villages respectively. There are only six villages having literacy rate below 50 per cent.
TABLE24: NUMBFRANDPERCENTAGEOFLITERATES AND ILLITERATES BY SEX IN TOWNS, 2001
Serial Name and urban Number of literates and illiterates Percentage of literates Gap in number status of Town Literates
Persons Males Females Persons
2 3 4 5 6
Wokha(TC) 29,984 16,731 13,253 7,652
District(Urban) 29,984 16,731 13,253 7,652 Total
The number of literates and the percentage of literates for the town are given in Table 24. Out of a total population of37,636 persons in the urban areas there are 29,984 literates and out of which the male literates are 16,731 and the females literates are
34
Illiterates male-female
Males Females Persons Males Females literacy rate
7 8 9 10 II 12
3,680 3,972 91.4 93.3 89.1 4.2
3,680 3,972 91.4 93.3 89.1 4.2
13,253. The literacy rate thus comes to 91.4 per cent for the total urban population while the rates for the males and females",are 93.3 and 89.1 per cent respectively. The gap in the male-female literacy rate is 4.2 points.
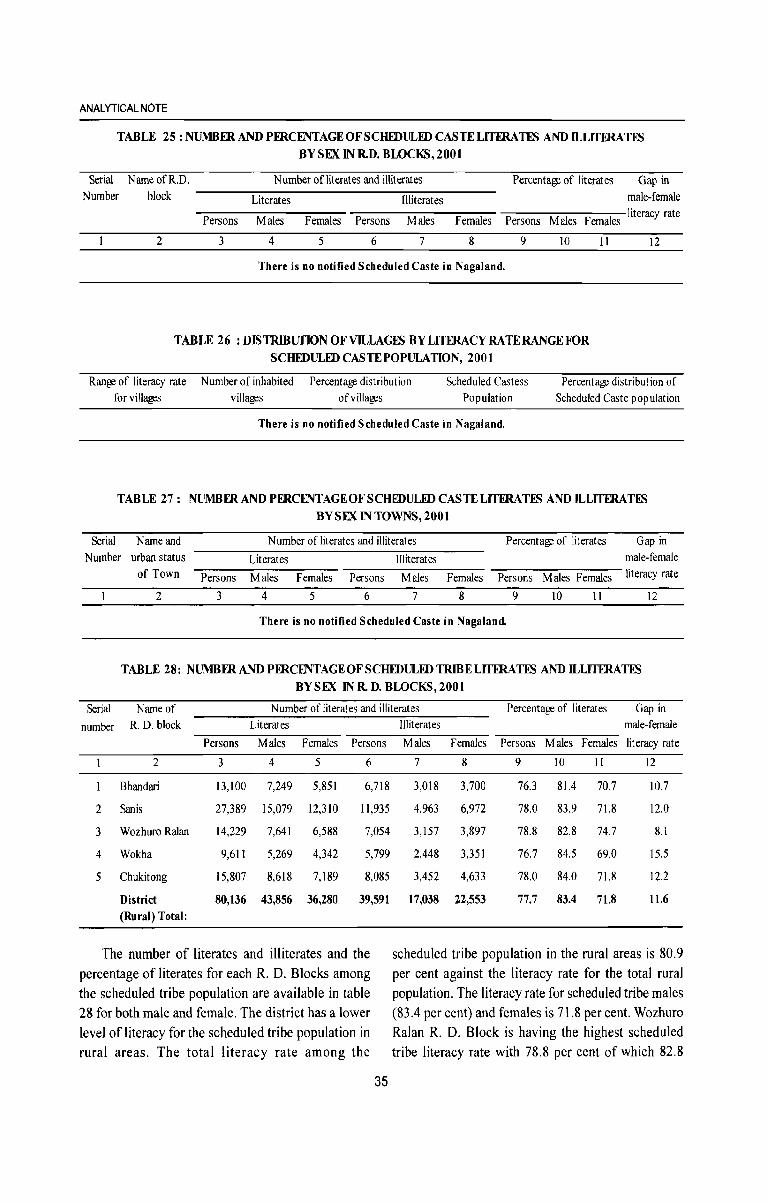
ANALYTICAL NOTE
TABLE 25 : NUMBFRAND PFRCENTAGEOFSCHIDULFD CASTE LITERATES AND ILLITERATES
BY SEX IN R.D. BWCKS, 2001
Serial Name ofR.D. Number of literates and illiterates Percentage of literates Gap in Number block Literates Illiterates male-female
2
~--~-:--:-~::---,-- -::----.,....,-.,----::---:-- -::-----,----literacy rate Persons Males Females Persons Males Females Persons Males Females
3 4 5 6 7 8 9 10
There is no notified Scheduled Caste in Nagaland.
TABLE 26 : DISTRIBUfION OF VILLAGES BY LITERACY RA TERANGE FOR SCHEDULED CASTE POPULA nON, 2001
11 12
Range of literacy rate Number of inhabited Percentage distribution of villages
Scheduled Castess Population
Percentage distribution of Scheduled Caste population for villages villages
There is no notified Scheduled Caste in Nagaland.
TABLE 27: NUMBFRAND PFRCENTAGE OF SCHEDULED CASTE LITERATES AND ILLITERATES BY SEX IN TOWNS, 2001
Serial N arne and Number of literates and illiterates Percentage of literates Gap in
Literates Illiterates male-female Number urban status of Town Persons Males Females Persons Males Females Persons Males Females literacy rate
2 3 4 5 6 7 8 9 10 11 12
There is no notified Scheduled Caste in Nagaland.
TABLE 28: NUMBFRAND PFRCENTAGEOFSCHEDULEDTRIBELITERATES AND ILLITERATES BYSEX INR.D.BWCKS,2001
Serial Name of N umber of literates and illiterates Percentage of literates Gap in
number R. D. block Literates
Persons Males Females Persons
2 3 4 5 6
Bhandari 13,100 7,249 5,851 6,718
2 Sanis 27,389 15,079 12,310 11,935
3 Wozhuro Ralan 14,229 7,641 6,588 7,054
4 Wokha 9,611 5,269 4,342 5,799
5 Chukitong 15,807 8,618 7,189 8,085
District 80,136 43,856 36,280 39,591 (Rural) Total:
The number of literates and illiterates and the percentage of literates for each R. D. Blocks among the scheduled tribe population are available in table 28 for both male and female. The district has a lower level of literacy for the scheduled tribe population in rural areas. The total literacy rate among the
35
Illiterates male-female
Males Females Persons Males Females literacy rate
7 8 9 10 II 12
3,018 3,700 76.3 81.4 70.7 10.7
4,963 6,972 78.0 83.9 71.8 12.0
3,157 3,897 78.8 82.8 74.7 8.1
2,448 3,351 76.7 84.5 69.0 15.5
3,452 4,633 78.0 84.0 71.8 12.2
17,038 22,553 77.7 83.4 71.8 11.6
scheduled tribe population in the rural areas is 80.9 per cent against the literacy rate for the total rural population. The literacy rate for scheduled tribe males (83.4 per cent) and females is 71.8 per cent. Wozhuro Ralan R. D. Block is having the highest scheduled tribe literacy rate with 78.8 per cent of which 82.8
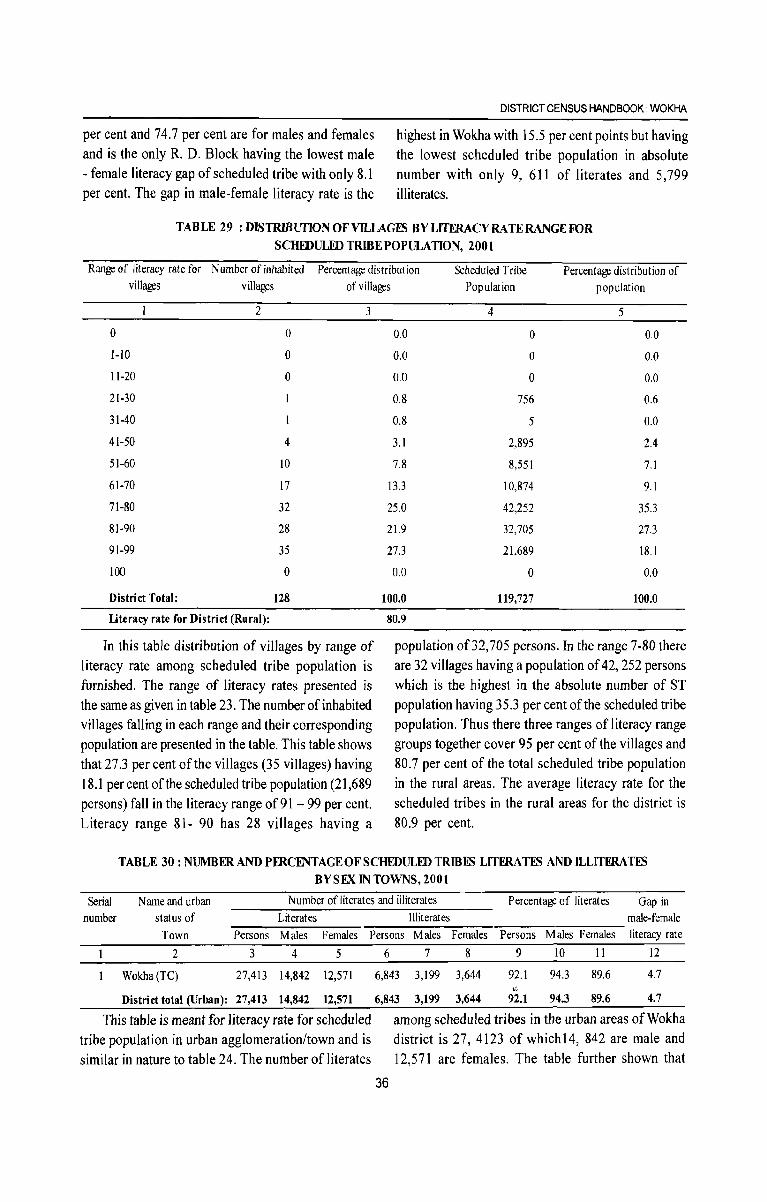
per cent and 74.7 per cent are for males and females and is the only R. D. Block having the lowest male - female literacy gap of scheduled tribe with only 8.1 per cent. The gap in male-female literacy rate is the
DISTRICT CENSUS HANDBOOK: WOKHA
highest in Wokha with 15.5 per cent points but having the lowest scheduled tribe population in absolute number with only 9, 611 of literates and 5,799 illiterates.
TABLE 29 : DlSTRIBUflONOFVILLAGRi! BY LITERACY RATE RANGE FOR SCHFDULID TRIBE POPULATION, 2001
Range of literacy rate for Number of inhabited villages villages
Percentage distribution of villages
Scheduled Tribe Percentage distribution of Population population
o l-lO
11-20
21-30
31-40
41-50
51-60
61-70
71-80
81-90
91-99
100
District Total:
2
Ute racy rate for District (Rural):
° o o
4
10
17
32
28
35
o
128
3
In this table distribution of villages by range of literacy rate among scheduled tribe population is furnished. The range of literacy rates presented is the same as given in table 23. The number of inhabited villages falling in each range and their corresponding population are presented in the table. This table shows that 27.3 per cent of the villages (35 villages) having 18.1 percent of the scheduled tribe population (21,689 persons) fall in the literacy range of 91 - 99 per cent. Literacy range 81- 90 has 28 villages having a
0.0
0.0
0.0
0,8
0.8
3.1
7.8
13.3
25,0
21.9
27.3
0,0
100.0
80.9
4
° ° ° 756
5
2,895
8,551
10,874
42,252
32,705
21,689
° 119,727
5
0,0
0,0
0,0
0,6
0.0
2.4
7,1
9.1
35.3
27.3
18.1
0,0
100.0
population of32,705 persons. In the range 7-80 there are 32 villages having a population of 42, 252 persons which is the highest in the absolute number of ST population having 35.3 per cent of the scheduled tribe population. Thus there three ranges of literacy range groups together cover 95 per cent of the villages and 80.7 per cent of the total scheduled tribe popUlation in the rural areas. The average literacy rate for the scheduled tribes in the rural areas for the district is 80.9 per cent.
TABLE 30: NUMBERANDPFRCENTAGEOFSCHEDULIDTRffiES LITERATES ANDILLITFRATES BYSEX IN TOWNS, 2001
Serial N arne and urban Number of literates and illiterates Percentage of literates Gap in number status of Literates Illiterates male-female
Town Persons Males Females Persons Males Females Persons Males Females lit eracy rate
2 3 4 5
Wokha(TC) 27,413 14,842 12,571
District total (Urban): 27,413 14,842 12,571
This table is meant for literacy rate for scheduled tribe population in urban agglomeration/town and is similar in nature to table 24. The number of literates
6 7 8 9 10 II 12
6,843 3,199 3,644 92.1 94.3 89.6 4.7 :.:'
6,843 3,199 3,644 92.1 94.3 89.6 4.7
36
among scheduled tribes in the urban areas ofWokha district is 27, 4123 of which14, 842 are male and 12,571 are females. The table further shown that
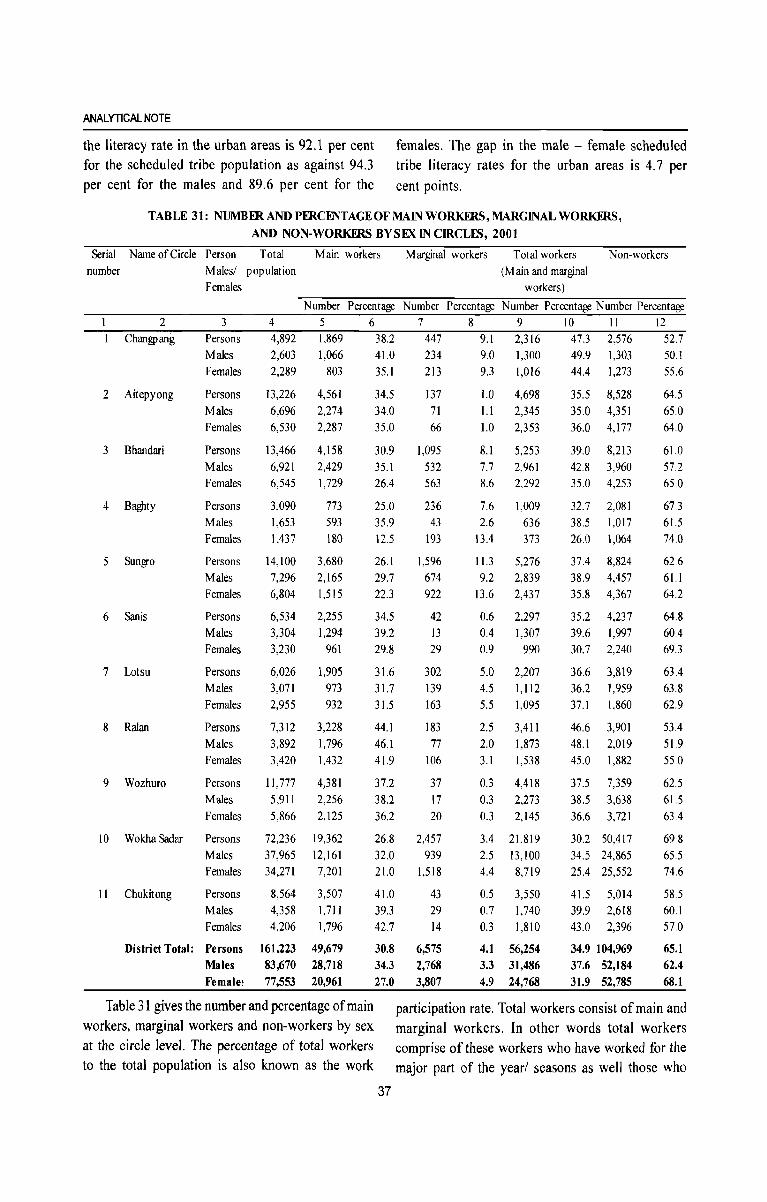
ANALYTICAL NOTE
the literacy rate in the urban areas is 92.1 per cent females. The gap in the male - female scheduled for the scheduled tribe population as against 94.3 tribe literacy rates for the urban areas is 4.7 per per cent for the males and 89.6 per cent for the cent points.
TABLE 31: NUMBER AND PERCENTAGE OF MAIN WORKERS, MARGINAL WORKERS,
AND NON-WORKERS BYSEX IN CIRCLES, 2001
Serial Name of Circle Person Total Main workers Marginal workers Total workers Non-workers number Males/ population
Females (M ain and marginal
workers)
Number Percentage Number Percentage Number Percentage N umber Percentage 2 3 4 567 8 9 10 I I 12
Changpang
2 Aitepyong
3 Bhandari
4 Baghty
5 Sungro
6 Sanis
7 Lotsu
8 Ralan
9 Wozhuro
10 Wokha Sadar
II Chukitong
Persons Males Females
Persons Males Females
Persons Males Females
Persons Males Females
Persons Males Females
Persons Males Females
Persons Males Females
Persons Males Females
Persons Males Females
Persons Males Females
Persons Males Females
District Total: Persons Males Female!
4,892 2,603 2,289
1,869 1,066
803
13,226 4,561 6,696 2,274 6,530 2,287
13,466 4,158 6,921 2,429 6,545 1,729
3,090 773 1,653 593 1,437 180
14,100 3,680 7,296 2,165 6,804 1,515
6,534 2,255 3,304 1,294 3,230 961
6,026 3,071 2,955
7,312 3,892 3,420
1l,777 5,911 5,866
72,236 37,965 34,271
1,905 973 932
3,228 1,796 1,432
4,381 2,256 2,125
19,362 12,161 7,201
8,564 3,507 4,358 1,711 4,206 1,796
161,223 49,679 83,670 28,718 77,553 20,961
Table 31 gives the number and percentage of main workers, marginal workers and non-workers by sex at the circle level. The percentage of total workers to the total population is also known as the work
38.2 41.0 35. I
447 234 213
34.5 137 34.0 71 35.0 66
30.9 1,095 35.1 532 26.4 563
25.0 236 35.9 43 12.5 193
26.1 1,596 29.7 674 22.3 922
34.5 42 39.2 13 29.8 29
31.6 31.7 31.5
44.1 46.1 41.9
37.2 38.2 36.2
26.8 32.0 21.0
41.0 39.3 42.7
30.8 34.3 27.0
302 139 163
183 77
106
37 17 20
2,457 939
1,518
43 29 14
6,575 2,768 3,807
9.1 2,316 47.3 2,576 52.7 9.0 1,300 49.9 1,303 50.1 9J 1,016 44.4 1,273 55.6
1.0 4,698 1.1 2,345 1.0 2,353
8.1 5,253 7.7 2,961 8.6 2,292
7.6 1,009 2.6 636
13.4 373
11.3 5,276 9.2 2,839
13.6 2,437
0.6 2,297 0.4 1,307 0.9 990
5.0 2,207 4.5 1,1l2 5.5 1,095
2.5 3,411 2.0 1,873 3.1 1,538
OJ 4,418 OJ 2,273 OJ 2,145
3.4 21,819 2.5 13,100 4.4 8,719
0.5 3,550 0.7 1,740 OJ 1,810
4.1 56,254 3.3 31,486 4.9 24,768
35.5 8,528 35.0 4,351 36.0 4,177
39.0 8,213 42.8 3,960 35.0 4,253
32.7 2,081 38.5 1,017 26.0 1,064
37.4 8,824 38.9 4,457 35.8 4,367
35.2 4,237 39.6 1,997 30.7 2,240
36.6 3,819 36.2 1,959 37.1 1,860
46.6 3,901 48.1 2,019 45.0 1,882
37.5 7,359 38.5 3,638 36.6 3,721
30.2 50,417 34.5 24,865 25.4 25,552
41.5 5,014 39.9 2,618 43.0 2,396
34.9 104,969 37.6 52,184 31.9 52,785
64.5 65.0 64.0
61.0 57.2 65.0
673 61.5 74.0
62.6 61.1 64.2
64.8 60.4 69J
63.4 63.8 62.9
53.4 51.9 55.0
62.5 61.5 63.4
69.8 65.5 74.6
58.5 60.1 57.0
65.1 62.4 68.1
participation rate. Total workers consist of main and marginal workers. In other words total workers comprise of these workers who have worked for the major part of the year/ seasons as well those who
37
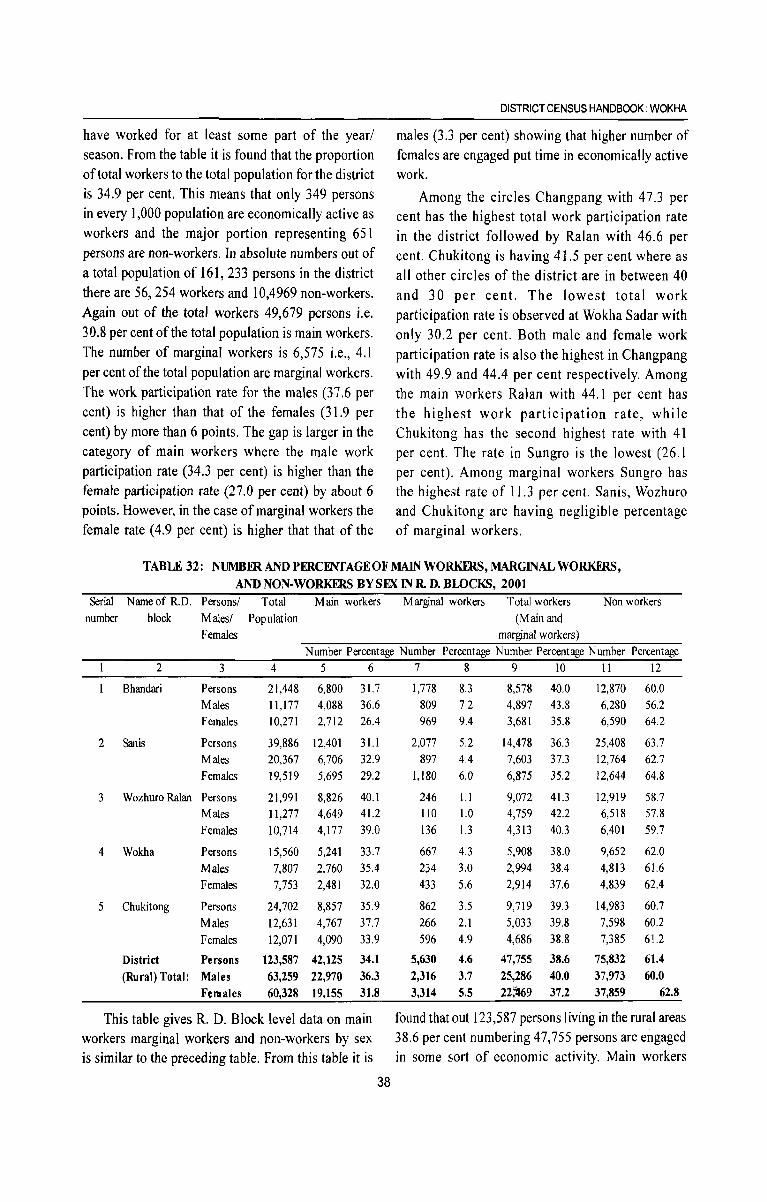
have worked for at least some part of the year/ season. From the table it is found that the proportion of total workers to the total population for the district is 34.9 per cent. This means that only 349 persons in every 1,000 population are economically active as workers and the major portion representing 651 persons are non-workers. In absolute numbers out of a total population of 161, 233 persons in the district there are 56, 254 workers and 10,4969 non-workers. Again out of the total workers 49,679 persons i.e. 30.8 per cent of the total population is main workers. The number of marginal workers is 6,575 i.e., 4.1 per cent of the total population are marginal workers. The work participation rate for the males (37.6 per cent) is higher than that of the females (31.9 per cent) by more than 6 points. The gap is larger in the category of main workers where the male work participation rate (34.3 per cent) is higher than the female participation rate (27.0 per cent) by about 6 points. However, in the case of marginal workers the female rate (4.9 per cent) is higher that that of the
DISTRICT CENSUS HANDBOOK: WOKHA
males (3.3 per cent) showing that higher number of females are engaged put time in economically active work.
Among the circles Changpang with 47.3 per cent has the highest total work participation rate in the district followed by Ralan with 46.6 per cent. Chukitong is having 41.5 per cent where as all other circles of the district are in between 40 and 30 per cent. The lowest total work participation rate is observed at Wokha Sadar with only 30.2 per cent. Both male and female work participation rate is also the highest in Changpang with 49.9 and 44.4 per cent respectively. Among the main workers Ralan with 44.1 per cent has the highest work participation rate, while Chukitong has the second highest rate with 41 per cent. The rate in Sungro is the lowest (26.1 per cent). Among marginal workers Sungro has the highest rate of 11.3 per cent. Sanis, Wozhuro and Chukitong are having negligible percentage of marginal workers.
TABLE 32: NUMBER AND PERCENTAGE OF MAIN WORKERS, MARGINAL WORKERS, AND NON-WORKERS BYSEX IN R. D. BWCKS, 2001
Serial Name of R.D. Personsl Total Main workers Marginal workers Total workers Non workers number block Malesl Population (Main and
Females marginal workers) Number Percentage Number Percentage Number Percentage Number Percentage
2 3 4 5 6 7 8 9 10 11 12
Bhandari Persons 21,448 6,800 31.7 1,778 8.3 8,578 40.0 12,870 60.0 Males 11,177 4,088 36.6 809 7.2 4,897 43.8 6,280 56.2 Females 10,271 2,712 26.4 969 9.4 3,681 35.8 6,590 64.2
2 Sanis Persons 39,886 12,401 31.1 2,077 5.2 14,478 36.3 25,408 63.7 Males 20,367 6,706 32.9 897 4.4 7,603 37.3 12,764 62.7 Females 19,519 5,695 29.2 1,180 6.0 6,875 35.2 12,644 64.8
3 Wozhuro Ralan Persons 21,991 8,826 40.1 246 1.1 9,072 41.3 12,919 58.7 Males 11,277 4,649 41.2 110 1.0 4,759 42.2 6,518 57.8 Females 10,714 4,177 39.0 136 1.3 4,313 40.3 6,401 59.7
4 Wokha Persons 15,560 5,241 33.7 667 4.3 5,908 38.0 9,652 62.0 Males 7,807 2,760 35.4 234 3.0 2,994 38.4 4,813 61.6 Females 7,753 2,481 32.0 433 5.6 2,914 37.6 4,839 62.4
5 Chukitong Persons 24,702 8,857 35.9 862 3.5 9,719 39.3 14,983 60.7
Males 12,631 4,767 37.7 266 2.1 5,033 39.8 7,598 60.2 Females 12,071 4,090 33.9 596 4.9 4,686 38.8 7,385 61.2
District Persons 123,587 42,125 34.1 5,630 4.6 47,755 38.6 75,832 61.4
(Rural) Total: Males 63,259 22,970 36.3 2,316 3.7 25,286 40.0 37,973 60.0
Females 60,328 19,155 31.8 3,314 5.5 22;-469 37.2 37,859 62.8
This table gives R. D. Block level data on main found that out 123,587 persons living in the rural areas workers marginal workers and non-workers by sex 38.6 per cent numbering 47,755 persons are engaged is similar to the preceding table. From this table it is in some sort of economic activity. Main workers
38
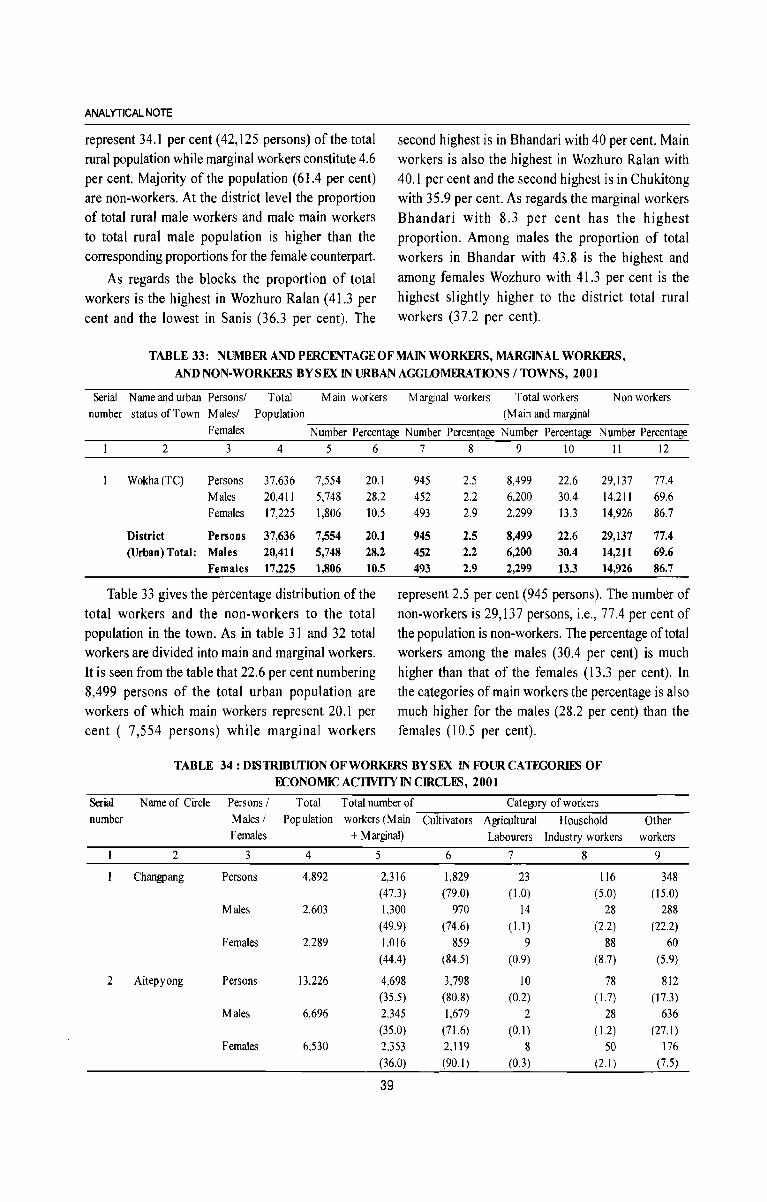
ANALYTICAL NOTE
represent 34.1 per cent (42,125 persons) of the total rural population while marginal workers constitute 4.6 per cent. Majority of the population (61.4 per cent) are non-workers. At the district level the proportion of total rural male workers and male main workers to total rural male population is higher than the corresponding proportions for the female counterpart.
As regards the blocks the proportion of total workers is the highest in Wozhuro Ralan (41.3 per cent and the lowest in Sanis (36.3 per cent). The
second highest is in Bhandari with 40 per cent. Main workers is also the highest in Wozhuro Ralan with 40.1 per cent and the second highest is in Chukitong with 35.9 per cent. As regards the marginal workers Bhandari with 8.3 per cent has the highest proportion. Among males the proportion of total workers in Bhandar with 43.8 is the highest and among females Wozh,uro with 41.3 per cent is the highest slightly higher to the district total rural workers (37.2 per cent).
TABLE 33: NUMBER AND PERCFNTAGEOF MAIN WORKmS, MARGINAL WORKERS, AND NON-WORKERS BYSEX IN URBAN AGGWMERATIONS / TOWNS, 2001
Serial Name and urban Persons/ Total Main workers Marginal workers Total workers Non workers number status of Town Males/ Population (Main and marginal
Females Number Percentage Number Percentage Number Percentage Number Percentage 2 3 4 5 6 7 8 9 10 II 12
Wokha(TC) Persons 37,636 7,554 20.1 945 2.5 8,499 22.6 29,137 77.4 Males 20,411 5,748 28.2 452 2.2 6,200 30.4 14,211 69.6 Females 17,225 1,806 10.5 493 2.9 2,299 13.3 14,926 86.7
District Persons 37,636 7,554 20.1 945 2.5 8,499 22.6 29,137 77.4 (Urban) Total: Males 20,411 5,748 28.2 452 2.2 6,200 30.4 14,211 69.6
Females 17,225 1,806 10.5 493 2.9 2,299 13.3 14,926 86.7
Table 33 gives the percentage distribution of the total workers and the non-workers to the total population in the town. As in table 31 and 32 total workers are divided into main and marginal workers. It is seen from the table that 22.6 per cent numbering 8,499 persons of the total urban population are workers of which main workers represent 20.1 per cent ( 7,554 persons) while marginal workers
represent 2.5 per cent (945 persons). The number of non-workers is 29,137 persons, i.e., 77.4 per cent of the population is non-workers. The percentage of total workers among the males (30.4 per cent) is much higher than that of the females (13.3 per cent). In the categories of main workers the percentage is also much higher for the males (28.2 per cent) than the females (10.5 per cent).
TABLE 34: DISTRlBUfION OF WORKERS BYSEX IN FOUR CATEGORIE5 OF ECONOMIC ACTIVOY IN CIRCLES, 2001
Serial Name of Circle Persons / Total Total number of Category of workers number Males / Population workers (Main Cultivators Agricultural Household Other
Females + Marginal) Labourers Industry workers workers
2 3 4 5 6 7 8 9
Changpang Persons 4,892 2,316 1,829 23 116 348 ( 47J) (79.0) (1.0) (5.0) (15.0)
Males 2,603 1,300 970 14 28 288 (49.9) (74.6) (1.1 ) (2.2) (22.2)
Females 2,289 1,016 859 9 88 60 ( 44.4) (84.5) (0.9) (8.7) (5.9)
2 Aitepyong Persons 13,226 4,698 3,798 10 78 812 (35.5) (80.8) (0.2) ( 1.7) (17.3)
Males 6,696 2,345 1,679 2 28 636 (35.0) (71.6) (0.1 ) ( 1.2) (27.1)
Females 6,530 2,353 2,119 8 50 176 (36.0) (90.1) (OJ) (2.1) (7.5)
39
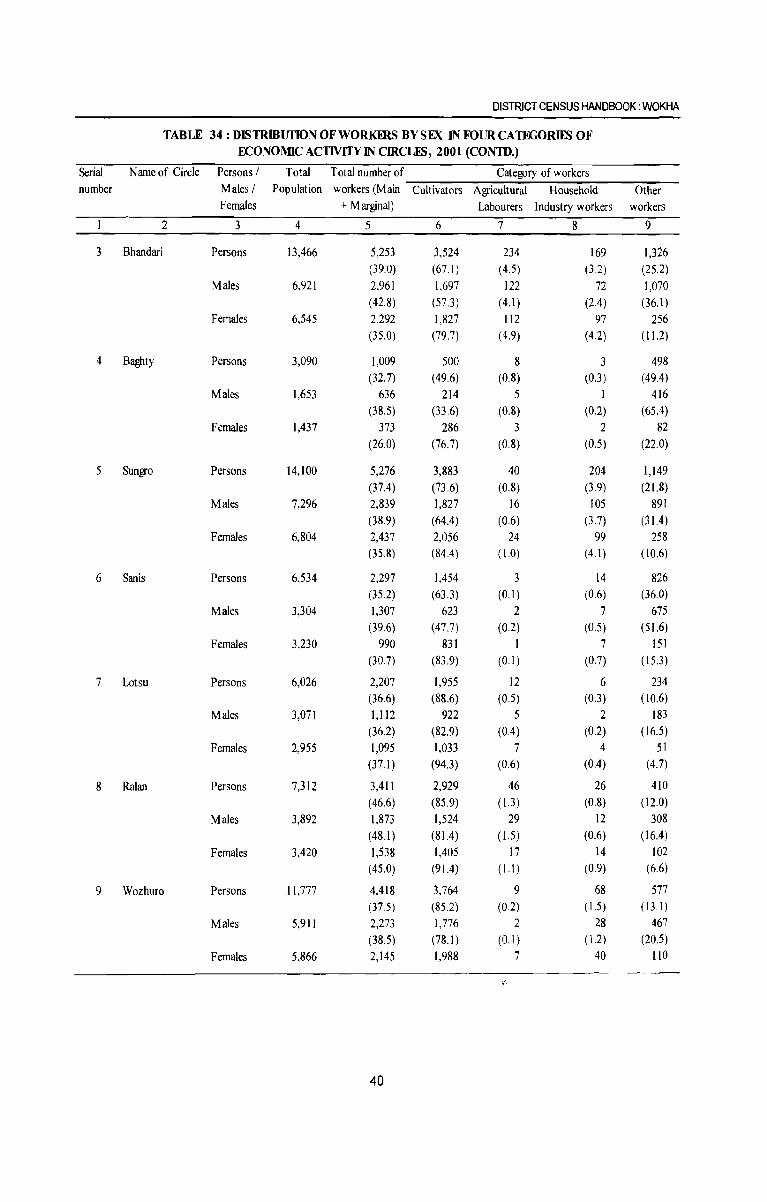
DISTRICT CENSUS HANDBOOK: WOKHA
TABLE 34: DISTRIBUITON OF WORKERS BYSEX IN FOUR CATF(X)~ OF ECONOMIC ACTIVlTYIN CIRCUS, 2001 (CONTD.)
Serial Name of Circle Persons / Total Total number of Category of workers number Males / Population workers (Main Cultivators Agricultural Household Other
Females + Marginal) Labourers Industry workers workers
2 3 4 5 6 7 8 9
3 Bhandari Persons 13,466 5,253 3,524 234 169 1,326 (39.0) (67.1) (4.5) (3.2) (25.2)
Males 6,921 2,961 1,697 122 72 1,070 (42.8) (573) (4.1) (2.4) (36.1)
Females 6,545 2,292 1,827 112 97 256 (35.0) (79.7) (4.9) (4.2) ( 11.2)
4 Baghty Persons 3,090 1,009 500 8 3 498 (32.7) (49.6) (0.8) (OJ) (49.4)
Males 1,653 636 214 5 1 416 (38.5) (336) (0.8) (0.2) (65.4)
Females 1,437 373 286 3 2 82 (26.0) (76.7) (0.8) (0.5) (22.0)
5 Sungro Persons 14,100 5,276 3,883 40 204 1,149 (37.4) (73.6) (0.8) (3.9) (21.8)
Males 7,296 2,839 1,827 16 105 891 (38.9) (64.4) (0.6) (3.7) (31.4)
Females 6,804 2,437 2,056 24 99 258 (35.8) (84.4) ( 1.0) (4.1 ) (10.6)
6 Sanis Persons 6,534 2,297 1,454 3 14 826 (35.2) (63J) (0.1) (0.6) (36.0)
Males 3,304 1,307 623 2 7 675 (39.6) (47.7) (0.2) (0.5) (51.6)
Females 3,230 990 831 I 7 151 (30.7) (83.9) (0.1 ) (0.7) (15.3)
7 Lotsu Persons 6,026 2,207 1,955 12 6 234 (36.6) (88.6) (0.5) (OJ) (10.6)
Males 3,071 1,112 922 5 2 183 (36.2) (82.9) (0.4) (0.2) (16.5)
Females 2,955 1,095 1,033 7 4 51 (37.1 ) (94.3) (0.6) (0.4) (4.7)
8 Ralan Persons 7,312 3,411 2,929 46 26 410 (46.6) (85.9) (1.3) (0.8) (12.0)
Males 3,892 1,873 1,524 29 12 308 (48.1) (81.4) ( 1.5) (0.6) (16.4)
Females 3,420 1,538 1,405 17 14 102 (45.0) (91.4) (1.1 ) (0.9) (6.6)
9 Wozhuro Persons 11,777 4.418 3,764 9 68 577 (37.5) (85.2) (0.2) ( 1.5) (13.1 )
Males 5,911 2,273 1,776 2 28 467
(38.5) (78.1) (0.1) ( 1.2) (20.5)
Females 5,866 2,145 1,988 7 40 110
-
40
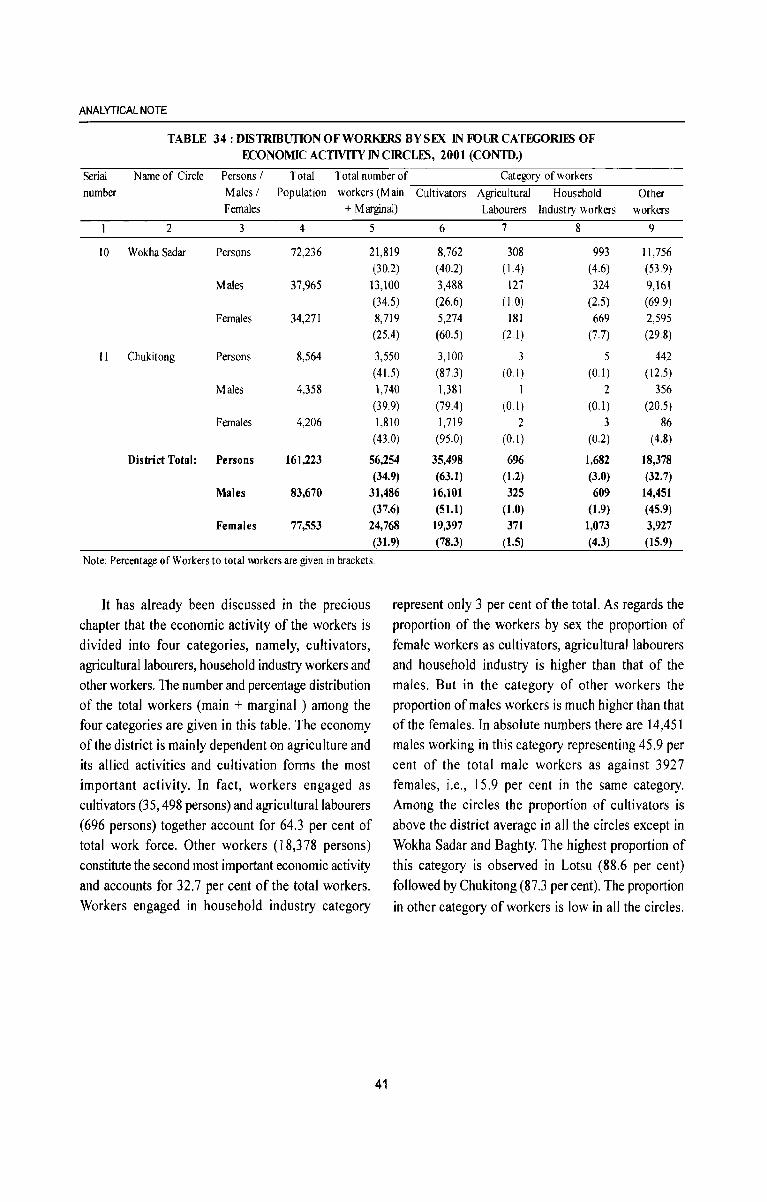
ANALYTICAL NOTE
TABLE 34: DISTRIBUflONOFWORKERS BYSEX IN FOUR CATEGORIES OF ECONOMIC ACTIVOY IN CIRCLES, 2001 (CONTD.)
Serial Name of Circle Persons / Total Total number of Category of workers number Males / Population workers (M ain Cultivators Agricultural Household Other
Females + Marginal) Labourers Industry workers workers
2 3 4 5 6 7 8 9
10 WokhaSadar Persons 72,236 21,819 8,762 308 993 11,756 (30.2) (40.2) ( 1.4) (4.6) (53.9)
Males 37,965 13,100 3,488 127 324 9,161 (34.5) (26.6) (1.0) (2.5) (69.9)
Females 34,271 8,719 5,274 181 669 2,595 (25.4) (60.5) (2.1) (7.7) (29.8)
11 Chukitong Persons 8,564 3,550 3,100 3 5 442 ( 41.5) (87.3) (0.1) (0.1) ( 12.5)
Males 4,358 1,740 1,381 I 2 356 (39.9) (79.4) (0.1) (0.1) (20.5)
Females 4,206 1,810 1,719 2 3 86 (43.0) (95.0) (0.1) (0.2) (4.8)
District Total: Persons 161,223 56,254 35,498 696 1,682 18,378 (34.9) (63.1) (1.2) (3.0) (32.7)
Males 83,670 31,486 16,101 325 609 14,451 (37.6) (51.1) (1.0) (1.9) (45.9)
Females 77,553 24,768 19,397 371 1,073 3,927 (31.9) (78.3) (1.5) (4.3) (15.9)
Note: Percentage of Workers to total oorkers are given in brackets.
It has already been discussed in the precious chapter that the economic activity of the workers is divided into four categories, namely, cultivators, agricultural labourers, household industry workers and other workers. The number and percentage distribution of the total workers (main + marginal) among the four categories are given in this table. The economy of the district is mainly dependent on agriculture and its allied activities and cultivation forms the most important activity. In fact, workers engaged as cultivators (35,498 persons) and agricultural labourers (696 persons) together account for 64.3 per cent of total work force. Other workers (18,3 78 persons) constitute the second most important economic activity and accounts for 32.7 per cent of the total workers. Workers engaged in household industry category
41
represent only 3 per cent of the total. As regards the proportion of the workers by sex the proportion of female workers as cultivators, agricultural labourers and household industry is higher than that of the males. But in the category of other workers the proportion of males workers is much higher than that of the females. In absolute numbers there are 14,451 males working in this category representing 45.9 per cent of the total male workers as against 3927 females, i.e., 15.9 per cent in the same category. Among the circles the proportion of cultivators is above the district average in all the circles except in Wokha Sadar and Baghty. The highest proportion of this category is observed in Lotsu (88.6 per cent) followed by Chukitong (87.3 per cent). The proportion
in other category of workers is low in all the circles.
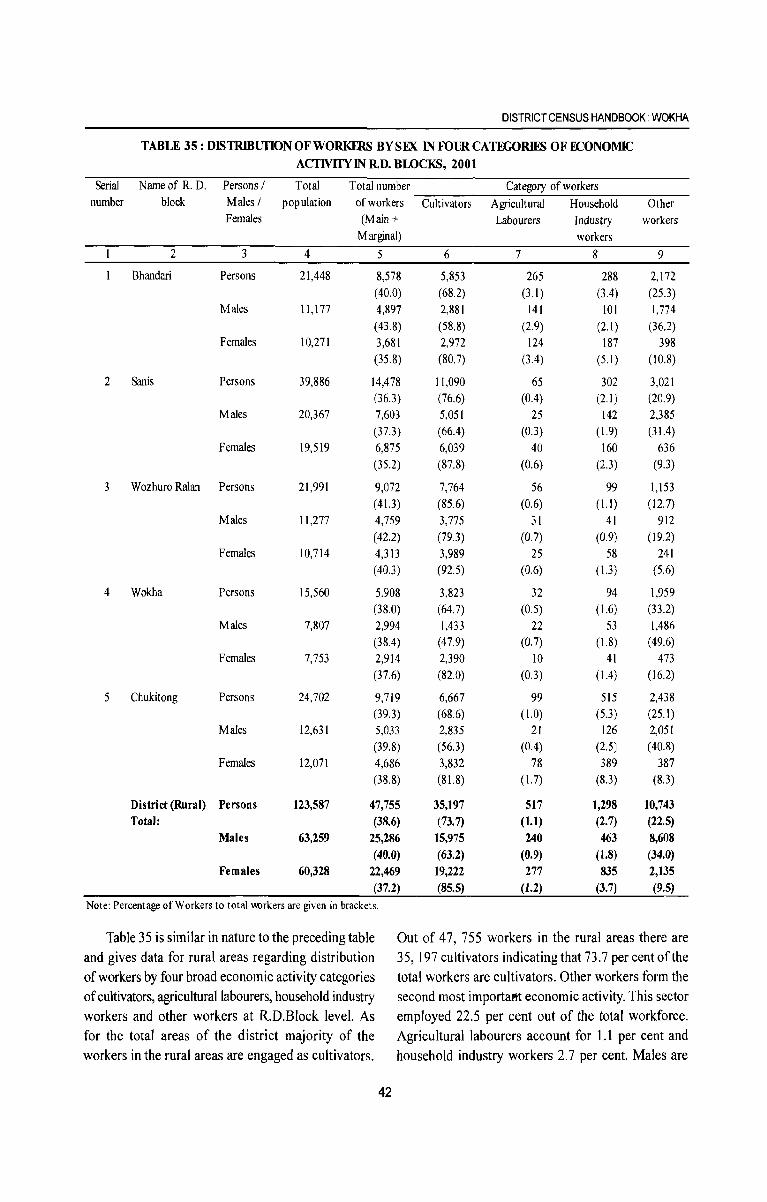
DISTRICT CENSUS HANDBOOK: WOKHA
TABLE 35: DISTRlBUfIONOFWORKERS BY SEX IN roURCATEGORIES OF ECONOMIC
ACTNITYIN R.D. BWCKS, 2001
Serial Name of R. D. Persons / Total Total number Category of workers number block Males I population of workers Cultivators Agricultural Household Other
Females (Main + Labourers Industry workers Marginal) workers
2 3 4 5 6 7 8 9
Bhandari Persons 21,448 8,578 5,853 265 288 2,172 (40.0) (68.2) (3.1 ) (3.4) (25.3)
Males 11,177 4,897 2,881 141 101 1,774 ( 43.8) (58.8) (2.9) (2.1) (36.2)
Females 10,271 3,681 2,972 124 187 398 (35.8) (80.7) (3.4) (5.1 ) (10.8)
2 Sanis Persons 39,886 14,478 11,090 65 302 3,021 (36.3) (76.6) (0.4) (2.1) (20.9)
Males 20,367 7,603 5,051 25 142 2,385 (37.3) (66.4) (0.3) (1.9) (31.4)
Females 19,519 6,875 6,039 40 160 636 (35.2) (87.8) (0.6) (2.3) (9.3)
3 Wozhuro Ralan Persons 21,991 9,072 7,764 56 99 1,153 (41.3) (85.6) (0.6) (1.1) (12.7)
Males 11,277 4,759 3,775 31 41 912 (42.2) (79.3) (0.7) (0.9) (19.2)
Females 10,714 4,313 3,989 25 58 241 (40.3) (92.5) (0.6) ( 1.3) (5.6)
4 Wokha Persons 15,560 5,908 3,823 32 94 1,959 (38.0) (64.7) (0.5) (1.6) (33.2)
Males 7,807 2,994 1,433 22 53 1,486 (38.4) (47.9) (0.7) (1.8) (49.6)
Females 7,753 2,914 2,390 10 41 473 (37.6) (82.0) (OJ) (1.4) (16.2)
5 Chukitong Persons 24,702 9,719 6,667 99 515 2,438 (39.3) (68.6) ( 1.0) (5.3) (25.1)
Males 12,631 5,033 2,835 21 126 2,051 (39.8) (56.3) (0.4) (2.5) (40.8)
Females 12,071 4,686 3,832 78 389 387 (38.8) (81.8) (1.7) (8.3) (8.3)
District (Rural) Persons 123,587 47,755 35,197 517 1,298 10,743 Total: (38.6) (73.7) (1.1) (2.7) (22.5)
Males 63,259 25,286 15,975 240 463 8,608
(40.0) (63.2) (0.9) (1.8) (34.0) Females 60,328 22,469 19,222 277 835 2,135
(37.2) (85.5) (1.2) (3.7) (9.5)
Note: Percentage of Workers to total oorkers are given in brackets.
Table 35 is similar in nature to the preceding table Out of 47, 755 workers in the rural areas there are and gives data for rural areas regarding distribution 35, 197 cultivators indicating that 73.7 per cent of the of workers by four broad economic activity categories total workers are cultivators. Other workers form the of cultivators, agricultural labourers, household industry second most importartt economic activity, This sector workers and other workers at R.D,Block level. As employed 22,5 per cent out of the total workforce. for the total areas of the district majority of the Agricultural labourers account for 1,1 per cent and workers in the rural areas are engaged as cultivators. household industry workers 2.7 per cent. Males are
42
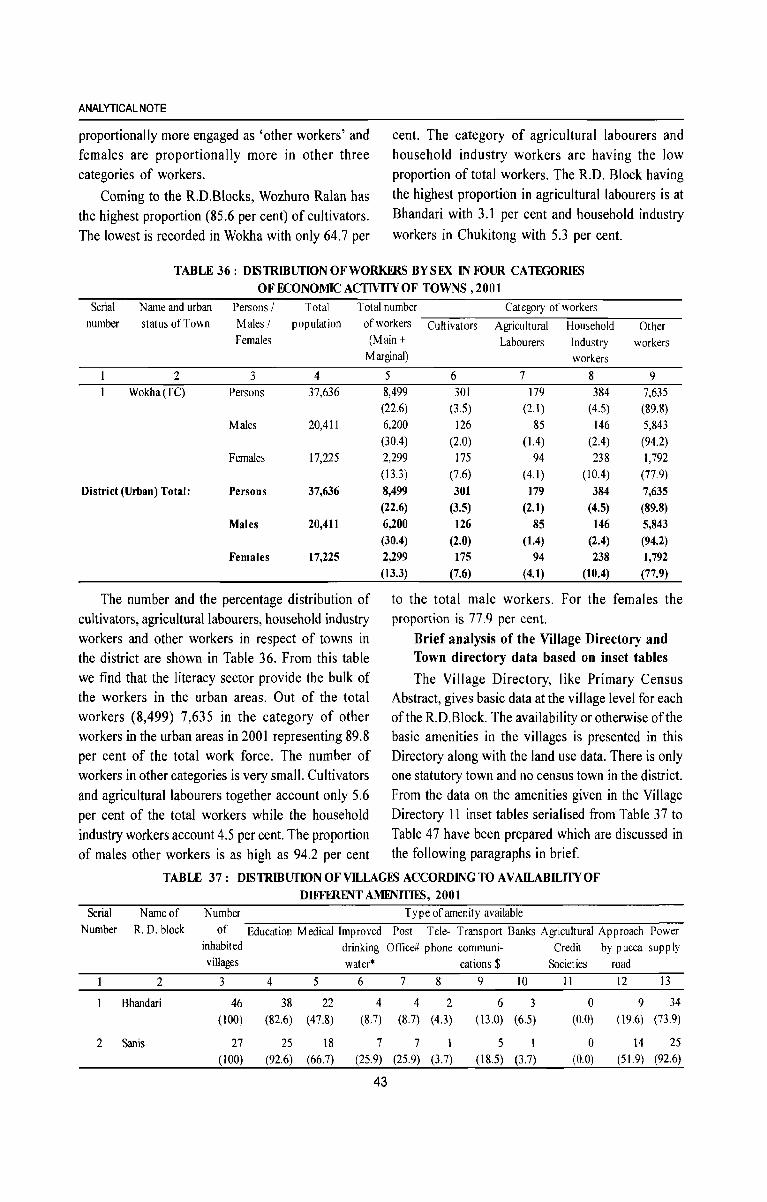
ANALYTICAL NOTE
proportionally more engaged as 'other workers' and females are proportionally more in other three categories of workers.
Coming to the R.D.Blocks, Wozhuro Ralan has the highest proportion (85.6 per cent) of cultivators. The lowest is recorded in Wokha with only 64.7 per
cent. The category of agricultural labourers and household industry workers are having the low proportion of total workers. The R.D. Block having the highest proportion in agricultural labourers is at Bhandari with 3.1 per cent and household industry
workers in Chukitong with 5.3 per cent.
TABLE 36: DISTRIBUflONOFWORKERS BYSEX. IN FOUR CATEGORIES
OF ECONOMIC ACTIVITY OF TOWNS, 2001
Serial Name and urban Persons I Total number status ofTown Males I population
Females
2 3 4 Wokha(TC) Persons 37,636
Males 20,411
Females 17,225
District (Urban) Total: Persons 37,636
Males 20,411
Females 17,225
Total number of workers (Main +
Marginal)
5 8,499 (22.6) 6,200 (30.4) 2,299 (13.3) 8,499 (22.6) 6,200 (30.4) 2,299 (13.3)
Cat egory of workers
Cultivators Agricultural Household Labourers Industry
workers
6 7 8 301 179 384
(3.5) (2.1) (4.5) 126 85 146
(2.0) (1.4) (2.4) 175 94 238
(7.6) (4.1) (10.4) 301 179 384
(3.5) (2.1) (4.5) 126 85 146
(2.0) (1.4) (2.4) 175 94 238
(7.6) (4.1) (10.4)
Other workers
9 7,635 (89.8) 5,843 (94.2) 1,792 (77.9) 7,635 (89.8) 5,843 (94.2) 1,792 (77.9)
The number and the percentage distribution of to the total male workers. For the females the cultivators, agricultural labourers, household industry proportion is 77.9 per cent. workers and other workers in respect of towns in Brief analysis of the Village Directory and the district are shown in Table 36. From this table Town directory data based on inset tables we find that the literacy sector provide the bulk of The Village Directory, like Primary Census the workers in the urban areas. Out of the total Abstract, gives basic data at the village level for each workers (8,499) 7,635 in the category of other of the R.D.Block. The availability or otherwise of the workers in the urban areas in 2001 representing 89.8 basic amenities in the villages is presented in this per cent of the total work force. The number of Directory along with the land use data. There is only workers in other categories is very small. Cultivators one statutory town and no census town in the district. and agricultural labourers together account only 5.6 From the data on the amenities given in the Village per cent of the total workers while the household Directory 11 inset tables serialised from Table 37 to industry workers account 4.5 per cent. The proportion Table 47 have been prepared which are discussed in of males other workers is as high as 94.2 per cent the following paragraphs in brief.
TABLE 37: DISTRIBUflON OF VILLAGES ACCORDING TO AV AILABILTIY OF DIFFERENT AMENlTIES, 2001
Serial Name of Number Ty pe of amenity available Number R. D. block of Education Medical Improved Post Tele- Transport Banks Agricultural Approach Power
inhabited drinking Office# phone communi- Credit by pucca supp Iy villages water* cations $ Societies road
2 3 4 5 6 7 8 9 10 11 12 13
Bhandari 46 38 22 4 4 2 6 3 0 9 34 (100) (82.6) (47.8) (8.7) (8.7) (4.3) (13.0) (6.5) (0.0) (19.6) (73.9)
2 Sanis 27 25 18 7 7 I 5 1 0 14 25 (100) (92.6) (66.7) (25.9) (25.9) (3.7) (18.5) (3.7) (0.0) (51. 9) (92.6)
43
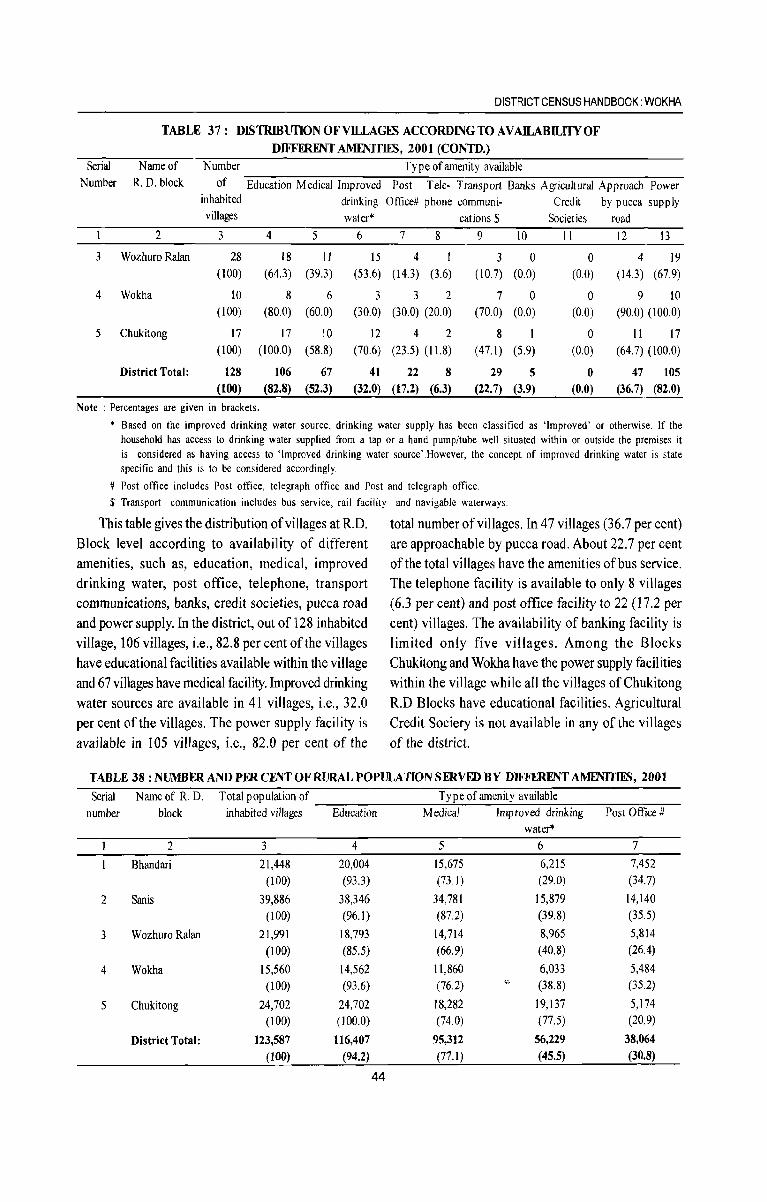
DISTRICT CENSUS HANDBOOK: WOKHA
TABLE 37: DISTRIBUTION OF VILLAGES ACCORDING TO AVAILABILITY OF DIFFERENT AMFNITIES, 2001 (CONTD.)
Serial Name of Number Type of amenity available Number R. D. block of Education Medical Improved Post Tele- Transport Banks Agricultural Approach Power
inhabited drinking Office# phone communi- Credit by pucca supply villages water* cations $ Societies road
2 3 4 5 6 7 8 9 10 II 12 13
3 Wozhuro Ralan 28 18 II 15 4 I 3 0 0 4 19 (100) (64.3) (39.3) (53.6) (14.3) (3.6) (10.7) (0.0) (0.0) (14.3 ) (67.9)
4 Wokha 10 8 6 3 3 2 7 0 0 9 10 (100) (80.0) (60.0) (30.0) (30.0) (20.0) (70.0) (0.0) (0.0) (90.0) (100.0)
5 Chukitong 17 17 10 12 4 2 8 I 0 11 17 (100) (100.0) (58.8) (70.6) (23.5) (1l.8) (47.1) (5.9) (0.0) (64.7) (100.0)
District Total: 128 106 67 41 22 8 29 5 0 47 105 (100) (82.8) (52.3) (32.0) (17.2) (6.3) (22.7) (3.9) (0.0) (36.7) (82.0)
Note : Percentages are given in brackets.
• Based on the improved drinking water source, drinking water supply has been classified as 'Improved' or otherwise. If the household has access to drinking water supplied from a tap or a hand pump/tube well situated within or outside the premises it is considered as having access to 'Improved drinking water source'.However, the concept of improved drinking water is state specific and this is to be considered accordingly.
# Post office includes Post office, telegraph office and Post and telegraph office. $ Transport communication includes bus service, rail facility and navigable waterways.
This table gives the distribution of villages at R.D. Block level according to availability of different amenities, such as, education, medical, improved drinking water, post office, telephone, transport communications, banks, credit societies, pucca road and power supply. In the district, out of 128 inhabited village, 106 villages, i.e., 82.8 per cent ofthe villages have educational facilities available within the village and 67 villages have medical facility. Improved drinking water sources are available in 41 villages, i.e., 32.0 per cent ofthe villages. The power supply facility is available in 105 villages, i.e., 82.0 per cent of the
total number of villages. In 47 villages (36.7 per cent) are approachable by pucca road. About 22.7 per cent of the total villages have the amenities of bus service. The telephone facility is available to only 8 villages (6.3 per cent) and post office facility to 22 (17.2 per cent) villages. The availability of banking facility is limited only five villages. Among the Blocks Chukitong and Wokha have the power supply facilities within the village while all the villages of Chukitong R.D Blocks have educational facilities. Agricultural Credit Sociery is not available in any of the villages of the district.
TABLE 38 : NUMBER AND PER C:mr OF RURAL POPULATION SERVFD BY DIFFERENT AMENITIES, 2001
Serial Name of R. D. Total population of Type of amenity available
number block inhabited villages Education Medical Improved drinking Post Office # water*
2 3 4 5 6 7
Bhandari 21,448 20,004 15,675 6,215 7,452 (100) (93.3) (73.1) (29.0) (34.7)
2 Sanis 39,886 38,346 34,781 15,879 14,140 (100) (96.1) (87.2) (39.8) (35.5)
3 Wozhuro Ralan 21,991 18,793 14,714 8,965 5,814
(100) (85.5) (66.9) (40.8) (26.4)
4 Wokha 15,560 14,562 11,860 6,033 5,484 (100) (93.6) (76.2) "- (38.8) (35.2)
5 Chukitong 24,702 24,702 18,282 19,137 5,174 (100) (100.0) (74.0) (77.5) (20.9)
District Total: 123,587 116,407 95,312 56,229 38,064
(100) (94.2) (77.1) (45.5) (30.8)
44
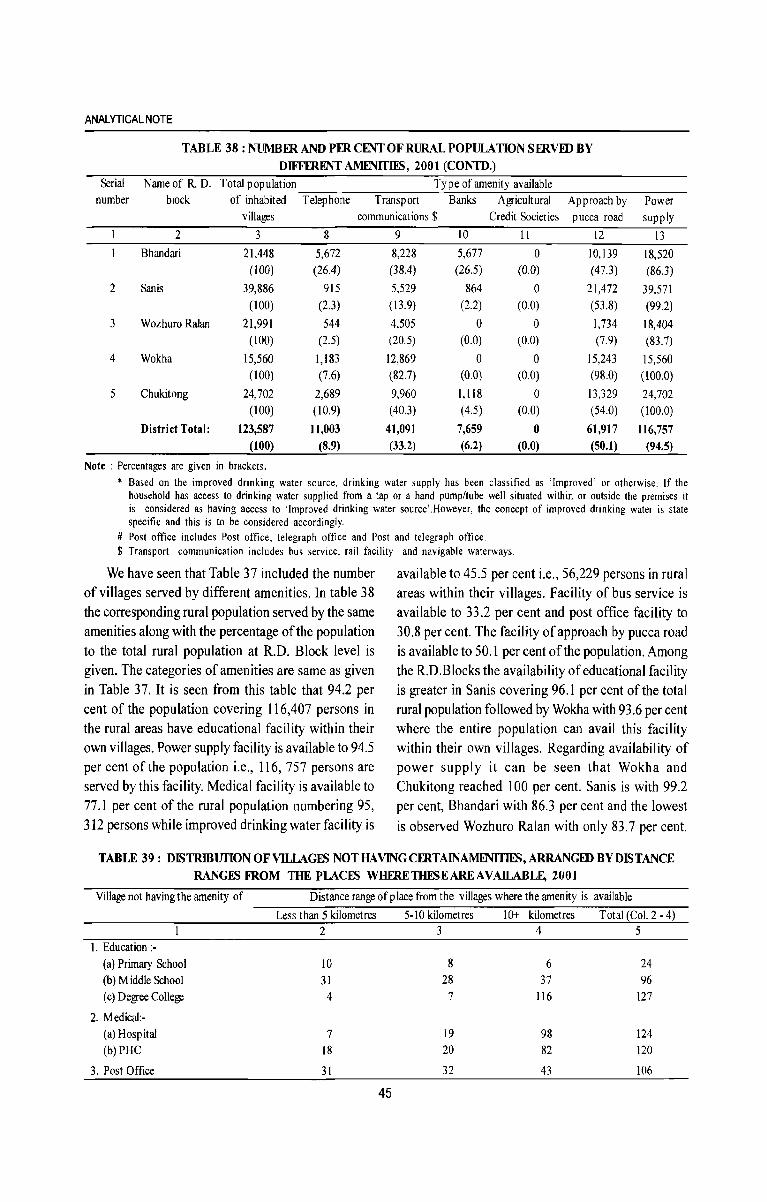
ANALYTICAL NOTE
TABLE 38: NUMBER AND PER CENT OF RURAL POPULATION SERVID BY DIFFERENT AMENlTIES, 2001 (CONTD.)
Serial Name of R. D. Total population Type of amenity available number block of inhabited Telephone Transport Banks Agricultural Approach by Power
villages communications $ Credit Societies pucca road supply
2 3 8 9 10 II 12 13
Bhandari 21,448 5,672 8,228 5,677 0 10,139 18,520 (100) (26.4) (38.4) (26.5) (0.0) (47.3) (863)
2 San is 39,886 915 5,529 864 0 21,472 39,571 (100) (2.3) (13.9) (2.2) (0.0) (53.8) (99.2)
3 Wozhuro Ralan 21,991 544 4,505 0 0 1,734 18,404 (100) (2.5) (20.5) (0.0) (0.0) (7.9) (83.7)
4 Wokha 15,560 1,183 12,869 0 0 15,243 15,560 (100) (7.6) (82.7) (0.0) (0.0) (9S.0) (100.0)
5 Chukitong 24,702 2,689 9,960 I,IIS 0 13,329 24,702 (l00) (10.9) (40.3) (4.5) (0.0) (54.0) (100.0)
District Total: 123,587 11,003 41,091 7,659 0 61,917 116,757 (100) (8.9) (33.2) (6.2) (0.0) (50.1) (94.5)
Note : Percentages are given in brackets. * Based on the improved drinking water source, drinking water supply has been classified as 'Improved' or otherwise. If the
household has access to drinking water supplied from a tap or a hand pump/tube well situated within or outside the premises it is considered as having access to 'Improved drinking water source' . However, the concept of improved drinking water is state specific and this is to be considered accordingly.
# Post office includes Post office, telegraph office and Post and telegraph office. $ Transport communication includes bus service, rail facility and navigable waterways.
We have seen that Table 37 included the number of villages served by different amenities. In table 38 the corresponding rural population served by the same amenities along with the percentage of the population to the total rural population at R.D. Block level is given. The categories of amenities are same as given in Table 37. It is seen from this table that 94.2 per cent of the population covering 116,407 persons in the rural areas have educational facility within their own villages. Power supply facility is available to 94.5 per cent of the population i.e., 116, 757 persons are served by this facility. Medical facility is available to 77.1 per cent of the rural population numbering 95, 312 persons while improved drinking water facility is
available to 45.5 per cent i.e., 56,229 persons in rural areas within their villages. Facility of bus service is available to 33.2 per cent and post office facility to 30.8 per cent. The facility of approach by pucca road is available to 50.1 per cent of the population. Among the R.D.Blocks the availability of educational facility is greater in Sanis covering 96.1 per cent of the total rural population followed by Wokha with 93.6 per cent where the entire population can avail this facility within their own villages. Regarding availability of power supply it can be seen that Wokha and Chukitong reached 100 per cent. Sanis is with 99.2 per cent, Bhandari with 86.3 per cent and the lowest is observed Wozhuro Ralan with only 83. 7 per cent.
TABLE 39: DISTRIBUTION OF VILLAGES NOT HA V1NGCERTAINAMENITIES, ARRANGED BY DISTANCE RANGES FROM THE PLACES WHERETHESEAREAVAlLABLF, 2001
Village not having the amenity of
1. Education;-(a) Primary School (b) Middle School ( c) Degree College
2. Medical:(a) Hospital (b) PHC
3. Post Office
Distance range of place from the villages where the amenity is available
Less than 5 kilometres 5-10 kilometres 10+ kilometres Total (Col. 2 - 4) 2 3 4 5
10 8 6 24 31 28 37 96 4 7 116 127
7 19 98 124 IS 20 82 120
31 32 43 106
45
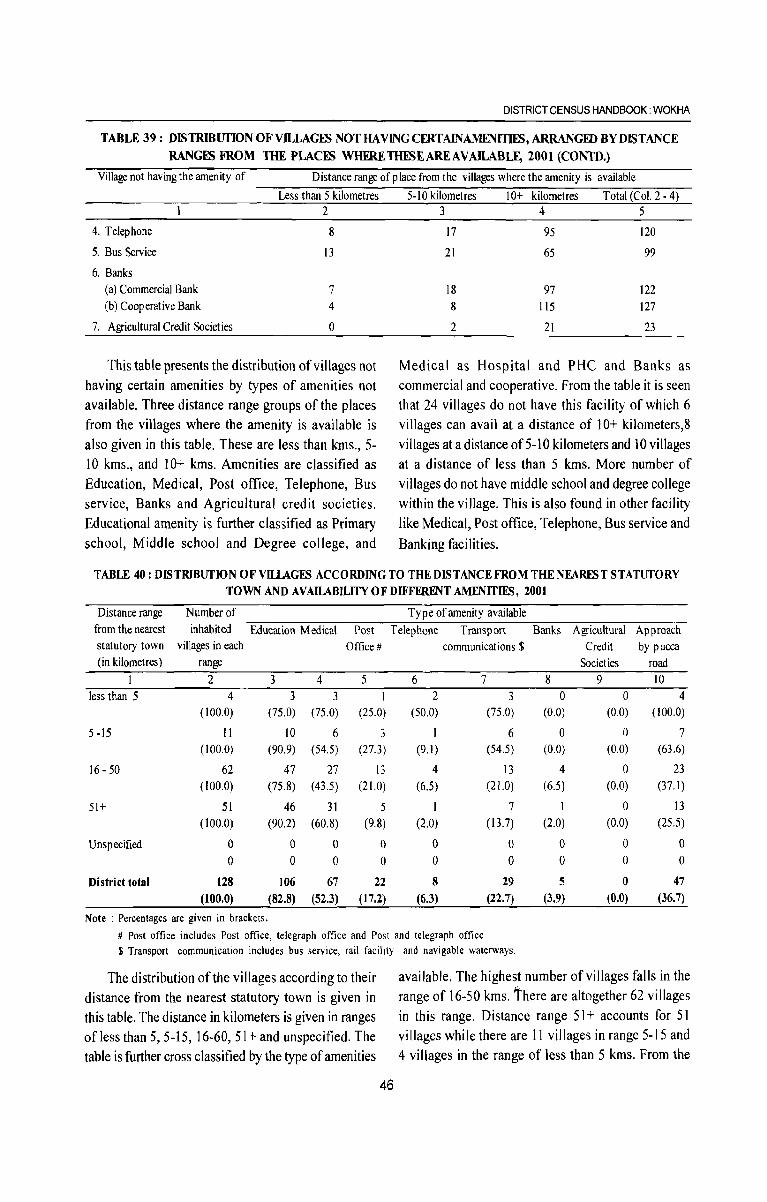
DISTRICT CENSUS HANDBOOK: WOKHA
TABLE 39: DISTRlBUfION OF VD...LAGEN NOT HAVING CERTAlNAMENlTIEN, ARRANGID BY DISTANCE
RANGES FROM THE PLACES WHFRETmSEAREAVAJLABLE, 2001 (CONTO.)
Village not having the amenity of Distance range of p lace from the villages where the amenity is available
Less than 5 kilometres 5-10 kilometres 10+ kilometres Total (Col. 2 - 4) 2 3 4 5
4. Telephone 8 17 95 120
5. Bus Service
6. Banks (a) Commercial Bank (b) Cooperative Bank
7. Agricultural Credit Societies
13
7 4
o
This table presents the distribution of villages not having certain amenities by types of amenities not available. Three distance range groups of the places from the villages where the amenity is available is also given in this table. These are less than kms., 5-10 kms., and 10+ kms. Amenities are classified as Education, Medical, Post office, Telephone, Bus service, Banks and Agricultural credit societies. Educational amenity is further classified as Primary school, Middle school and Degree college, and
21
18
8
2
65
97 115
21
99
122 127
23
Medical as Hospital and PHC and Banks as commercial and cooperative. From the table it is seen that 24 villages do not have this facility of which 6 vi lIages can avail at a distance of 10+ kilometers,8 vii lages at a distance of 5-1 0 kilometers and 10 villages at a distance of less than 5 kms. More number of villages do not have middle school and degree college within the village. This is also found in other facility like Medical, Post office, Telephone, Bus service and
Banking facilities.
TABLE 40: DISTRIBUTION OFVIl1AGES ACCORDING TO THE DISTANCE FROM THE NEAREST STATUTORY TOWN AND AVAIIABillTY OF DIFFERENT AMENITIF.S, 2001
Distance range Number of Type of amenity available from the nearest statutory town (in kilometres)
inhabited Education Medical Post Office #
Telephone Transport Banks Agricultural Approach
less than 5
5 -15
16 - 50
51+
Unspecified
District total
villages in each range
2 4
( 100.0)
II (100.0)
62 (100.0)
51 (100.0)
o o
128 (100.0)
Note : Percentages are given in brackets.
3 4 3 3
(75.0) (75.0)
10 6 (90.9) (54.5)
47 (75.8)
46 (90.2)
o o
27 (43.5)
31 (60.8)
o o
106 67
(82.8) (52.3)
5 I
(25.0)
3 (27.3)
13 (21.0)
5 (9.8)
o o
22 (17.2)
communications $
6 7 2
(50.0)
I (9.1)
4 (6.5)
I (2.0)
o o 8
(6.3)
3 (75.0)
6 (54.5)
13 (21.0)
7 (13.7)
o o
29 (22.7)
8 o
(0.0)
o (0.0)
4 (6.5)
I (2.0)
o o 5
(3.9)
Credit by pucca Societies
9 o
(0.0)
o (0.0)
o (0.0)
o (0.0)
o o o
(0.0)
road 10
4 (100.0)
7 (63.6)
23 (37.1)
13 (25.5)
o o
47 (36.7)
# Post office includes Post office, telegraph office and Post and telegraph office $ Transport communication includes bus service, rail facility and navigable waterways.
The distribution of the villages according to their distance from the nearest statutory town is given in this table. The distance in kilometers is given in ranges of less than 5, 5-15, 16-60, 51+ and unspecified. The table is further cross classified by the type of amenities
46
available. The highest number of villages falls in the range of 16-50 kms. There are altogether 62 villages in this range. Distance range 51 + accounts for 51 villages whi Ie there are 11 villages in range 5-15 and 4 villages in the range of less than 5 kms. From the
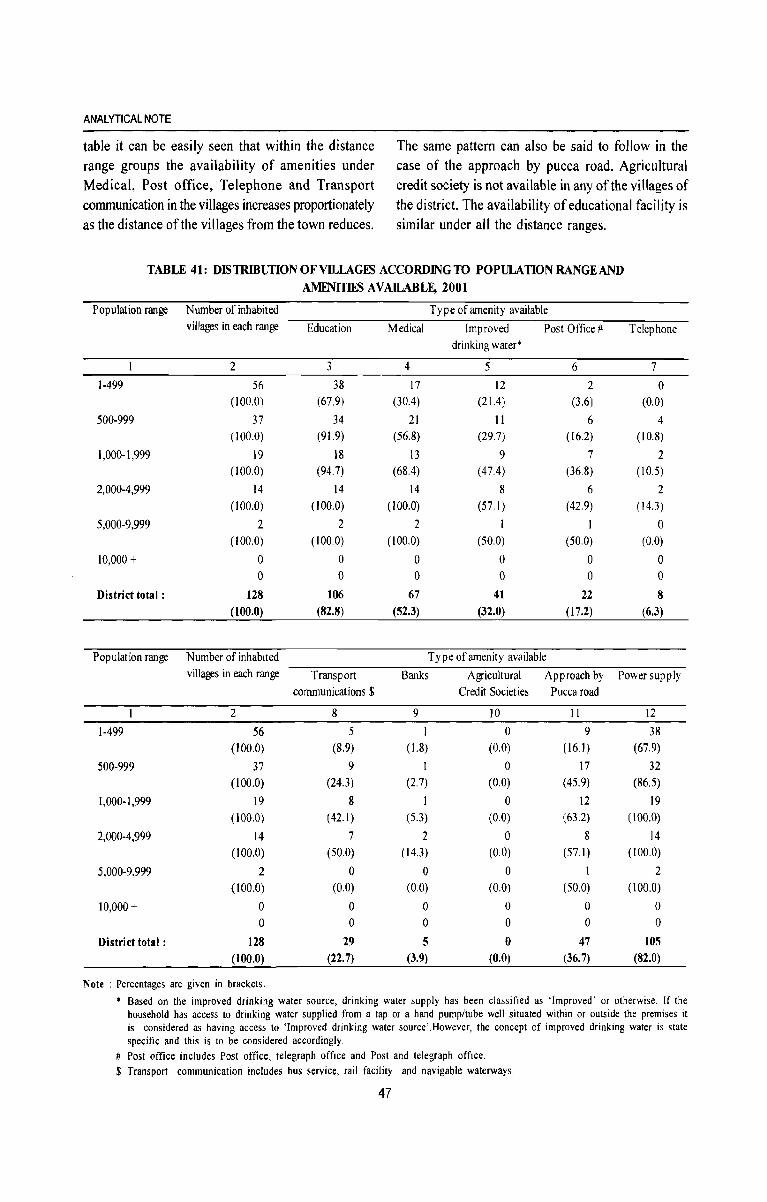
ANALYTICAL NOTE
table it can be easily seen that within the distance range groups the availability of amenities under Medical, Post office, Telephone and Transport communication in the villages increases proportionately as the distance of the villages from the town reduces.
The same pattern can also be said to follow in the case of the approach by pucca road. Agricultural credit society is not available in any of the villages of the district. The availability of educational facility is similar under all the distance ranges.
TABLE 41: DISTRIBUflONOFVILLAGES ACCORDING TO POPULATIONRANGEAND AMENITIES A V AlLABL~ 2001
PopUlation range Number of inhabited villages in each range
1-499
500-999
1,000-1,999
2,000-4,999
5,000-9,999
10,000 +
District total:
2
56 (100.0)
37 (100.0)
19 (100.0)
14 (100.0)
2 (100.0)
o o
128 (100.0)
Education
3
38 (67.9)
34 (91.9)
18 (94.7)
14 (100.0)
2 (100.0)
o o
106 (82.8)
Medical
4
17 (30.4)
21 (56.8)
13 (68.4)
14 (100.0)
2 (100.0)
o o
67 (52.3)
Type of amenity available
Improved drinking water*
Post Office #
5
12 (21.4)
11 (29.7)
9 (47.4)
8 (57.1)
I (50.0)
o o
41
(32.0)
Type of amenity available
6
2 (3.6)
6 (16.2)
7 (36.8)
6
(42.9)
1 (50.0)
o o
22 (17.2)
Telephone
7
a (0.0)
4 (10.8)
2 (10.5)
2 ( 14.3)
o (0.0)
o o 8
(6.3)
Population range Number of inhabited villages in each range Transport
communications $
Banks Agricultural Approach by Power supply
1-499
500-999
1,000-1,999
2,000-4,999
5,000-9,999
10,000 +
District total:
2
56 (100.0)
37 (100.0)
19 (100.0)
14 (100.0)
2 (100.0)
o a
128 (100.0)
Note : Percentages are given in brackets.
8
5 (8.9)
9 (24.3)
8 (42.1)
7 (50.0)
o (0.0)
o o
29 (22.7)
9
I (1.8)
1
(2.7)
I (5.3)
2 (14.3)
o (0.0)
o o 5
(3.9)
Credit Societies Pucca road
10
o (0.0)
a (0.0)
o (0.0)
o (0.0)
o (0.0)
a o o
(0.0)
II
9 (16.1)
17 (45.9)
12 (63.2)
8 (57.1)
1
(50.0)
o o
47 (36.7)
12
38 (67.9)
32 (86.5)
19 ( 100.0)
14 (100.0)
2 (100.0)
o o
105 (82.0)
* Based on the improved drinking water source, drinking water supply has been classified as 'Improved' or otherwise. If the household has access to drinking water supplied from a tap or a hand pump/tube well situated within or outside the premises it is considered as having access to 'Improved drinking water source'. However, the concept of improved drinking water is state specific and this is to be considered accordingly.
# Post office includes Post office, telegraph office and Post and telegraph office. $ Transport communication includes bus service, rail facility and navigable waterways.
47
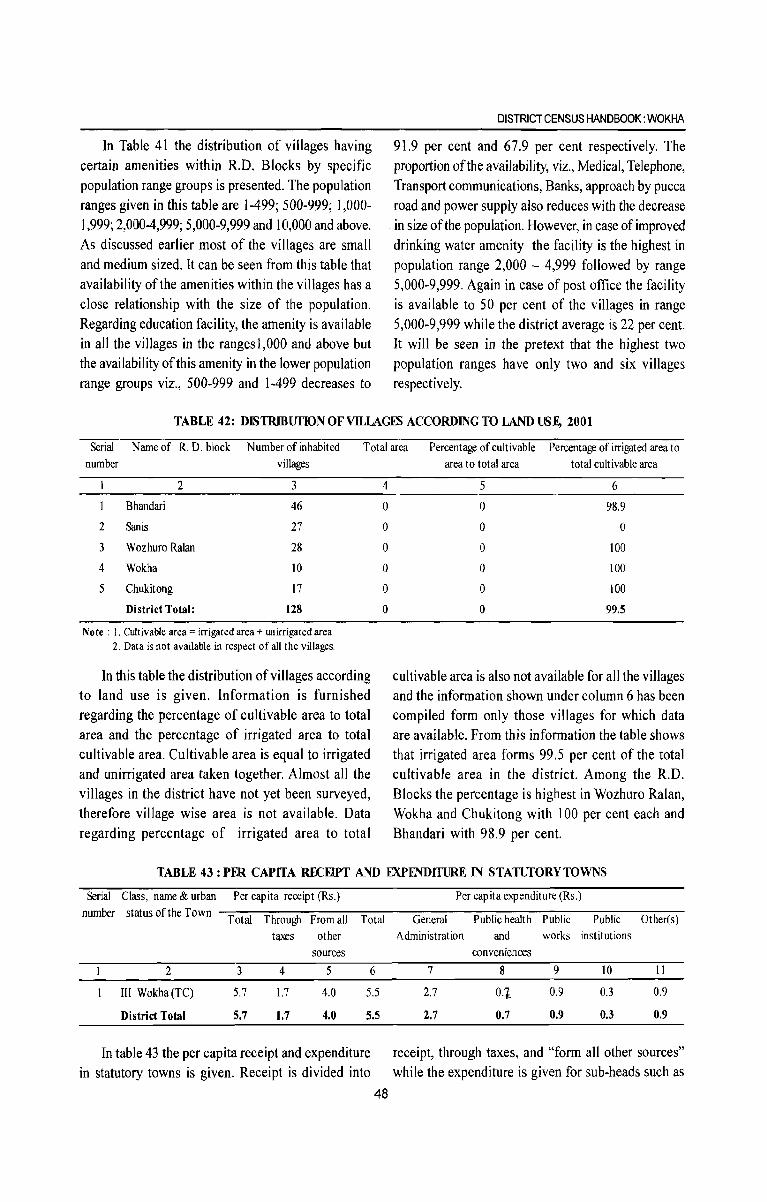
In Table 41 the distribution of villages having certain amenities within R.D. Blocks by specific population range groups is presented. The population ranges given in this table are 1-499; 500-999; 1,000-1,999; 2,000-4,999; 5,000-9,999 and 10,000 and above. As discussed earlier most of the villages are small and medium sized. It can be seen from this table that availability of the amenities within the villages has a close relationship with the size of the population. Regarding education facility, the amenity is available in all the villages in the rangesl,OOO and above but the availability of this amenity in the lower popUlation range groups viz., 500-999 and 1-499 decreases to
DISTRICT CENSUS HANDBOOK: WOKHA
91.9 per cent and 67.9 per cent respectively. The proportion of the availability, viz., Medical, Telephone, Transport communications, Banks, approach by pucca road and power supply also reduces with the decrease in size of the population. However, in case of improved drinking water amenity the facility is the highest in population range 2,000 - 4,999 followed by range 5,000-9,999. Again in case of post office the facility is available to 50 per cent of the villages in range 5,000-9,999 while the district average is 22 per cent. It will be seen in the pretext that the highest two population ranges have only two and six villages respectively.
TABLE 42: DISTRIBUTION OF VILLAGES ACCORDING TO LAND USE, 2001
Serial Name of R. D. block Number of inhabited Total area Percentage of cultivable Percentage of irrigated area to number villages
2 3
1 Bhandari 46
2 Sanis 27
3 Wozhuro Ralan 28
4 Wokha 10
5 Chukitong 17
District Total: 128
Note: 1. Cultivable area = irrigated area + unirrigated area 2. Data is not available in respect of all the villages.
In this table the distribution of villages according to land use is given. Information is furnished regarding the percentage of cultivable area to total area and the percentage of irrigated area to total cultivable area. Cultivable area is equal to irrigated and un irrigated area taken together. Almost all the villages in the district have not yet been surveyed, therefore village wise area is not available. Data regarding percentage of irrigated area to total
4
0
0
0
0
0
0
area to total area total cultivable area
5 6
0 98.9
0 a 0 100
0 100
0 100
0 99.5
cultivable area is also not available for all the villages and the information shown under column 6 has been compiled form only those villages for which data are available. From this information the table shows that irrigated area forms 99.5 per cent of the total cultivable area in the district. Among the R.D. Blocks the percentage is highest in Wozhuro Ralan, Wokha and Chukitong with 100 per cent each and Bhandari with 98.9 per cent.
TABLE 43 : PER CAPITA RECEIPT AND EXPENDITURE IN STATUfORYTOWNS
Serial Class, name & urban Per capita receipt (Rs.) Per capita expenditure (Rs.)
number status of the Town Total Through From all Total General Public health Public Public Other(s)
taxes other Administration and works institutions
sources conveniences
2 3 4 5 6 7 8 9 10 11
III Wokha (TC) 5.7 1.7 4.0 5.5 2.7 0·1 0.9 OJ 0.9
District Total 5.7 1.7 4.0 5.5 2.7 0.7 0.9 0.3 0.9
In table 43 the per capita receipt and expenditure receipt, through taxes, and "form all other sources" in statutory towns is given. Receipt is divided into while the expenditure is given for sub-heads such as
48
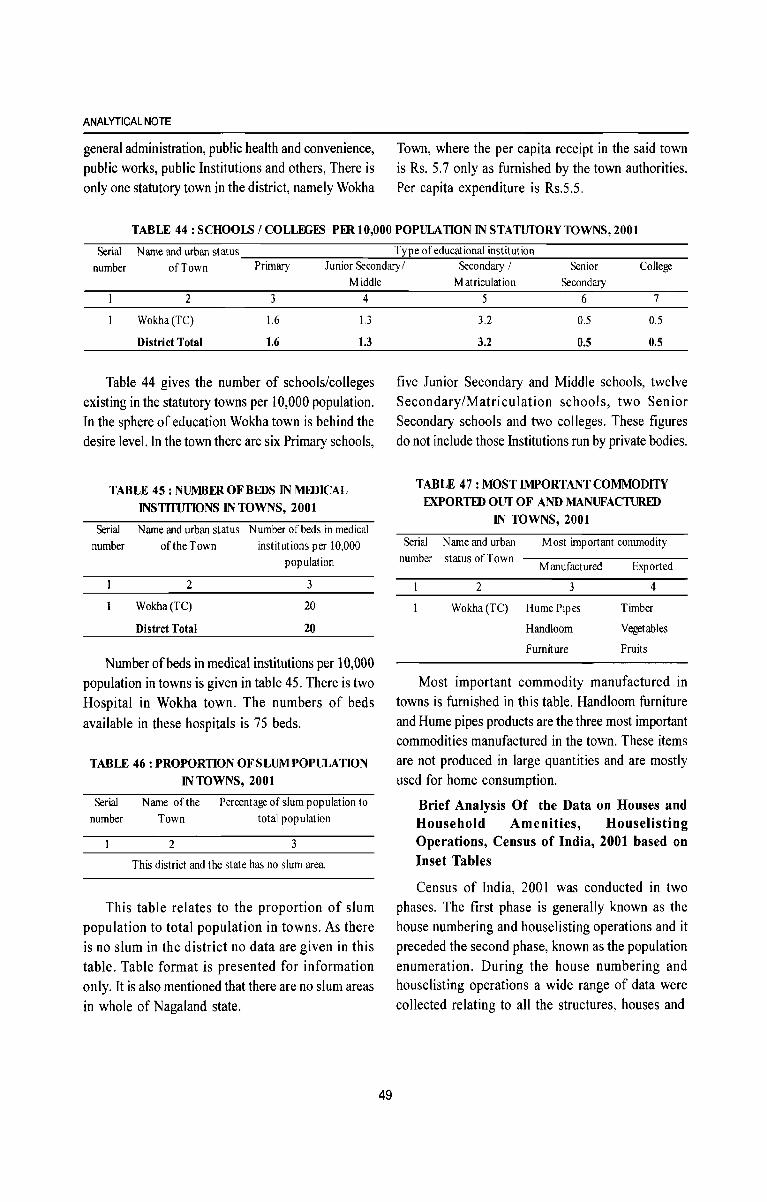
ANALYTICAL NOTE
general administration, public health and convenience, public works, public Institutions and others, There is only one statutory town in the district, namely Wokha
Town, where the per capita receipt in the said town is Rs. 5.7 only as furnished by the town authorities. Per capita expenditure is Rs.5.5.
TABLE 44 : SCHOOlS! COLLEGES PER 10,000 POPULATION IN STATUfORVmWNS, 2001
Serial Name and urban status Type of educational institution
number of Town Primary Junior Secondary ( Secondary ( Senior College Middle
2 3 4
Wokha(TC) 1.6 13
District Total 1.6 1.3
Table 44 gives the number of schools/colleges existing in the statutory towns per 10,000 population. In the sphere of education Wokha town is behind the desire level. In the town there are six Primary schools,
TABLE 45: NUMBER OF BEDS IN MIDICAL INSTITUfIONS IN TOWNS, 2001
Serial Name and urban status Number of beds in medical number of the Town institutions per 10,000
2
Wokha(TC)
Distrct Total
population
3
20
20
Number of beds in medical institutions per 10,000 population in towns is given in table 45. There is two Hospital in Wokha town. The numbers of beds available in these hospitals is 75 beds.
TABLE 46 : PROPORTION OF SLUM POPULATION IN TOWNS, 2001
Serial Name of the Percentage of slum population to number Town total population
2 3
This district and the state has no slum area
This table relates to the proportion of slum population to total population in towns. As there is no slum in the district no data are given in this table. Table format is presented for information only. It is also mentioned that there are no slum areas in whole of Nagaland state.
49
Matriculation Secondary 5 6 7
3.2 0.5 0.5
3.2 0.5 0.5
five Junior Secondary and Middle schools, twelve Secondary/Matriculation schools, two Senior Secondary schools and two colleges. These figures do not include those Institutions run by private bodies.
TABLE 47: MOST IMPORTANT COMMODITY EXPORTED our OF AND MANUFACTURED
IN mWNS, 2001
Serial Name and urban Most important commodity number status of Town
Manufactured Exported
2 3 4
Wokha(TC) HumePipes Timber
Handloom Vegetables
Furniture Fruits
Most important commodity manufactured in towns is furnished in this table. Handloom furniture and Hume pipes products are the three most important commodities manufactured in the town. These items are not produced in large quantities and are mostly used for home consumption.
Brief Analysis Of the Data on Houses and Household Amenities, Houselisting Operations, Census of India, 2001 based on Inset Tables
Census of India, 2001 was conducted in two phases. The first phase is generally known as the house numbering and house listing operations and it preceded the second phase, known as the population enumeration. During the house numbering and houselisting operations a wide range of data were collected relating to all the structures, houses and
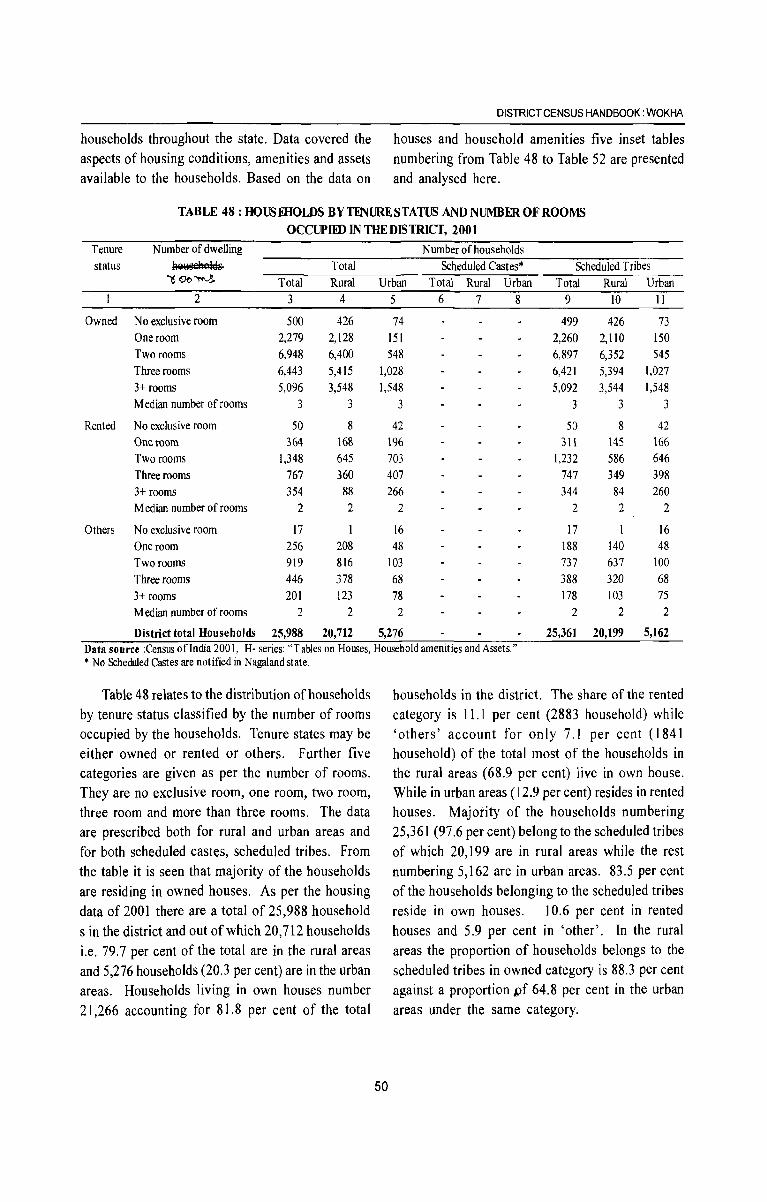
households throughout the state. Data covered the aspects of housing conditions, amenities and assets available to the households. Based on the data on
DISTRICT CENSUS HANDBOOK: WOKHA
houses and household amenities five inset tables numbering from Table 48 to Table 52 are presented and analysed here.
TABLE 48: HOUSmOLDS BY TFNURE STATUS AND NUMBER OF ROOMS OCCUPIED IN THE DISTRICT, 2001
Tenure Number of dwelling Number of households status RiltS ell ~ I=s Total Scheduled Castes· Scheduled Tribes
~o~"'r!'--!. Total Rural Urban Total Rural Urban Total Rural Urban 2 3 4 5 6 7 8 9 10 II
Owned No exclusive room 500 426 74 499 426 73 One room 2,279 2,128 151 2,260 2,110 150 Two rooms 6,948 6,400 548 6,897 6,352 545 Three rooms 6,443 5,415 1,028 6,421 5,394 1,027 3+ rooms 5,096 3,548 1,548 5,092 3,544 1,548 Median number of rooms 3 3 3 3 3 3
Rented No exclusive room 50 8 42 50 8 42 One room 364 168 196 311 145 166 Two rooms 1,348 645 703 1,232 586 646 Three rooms 767 360 407 747 349 398 3+ rooms 354 88 266 344 84 260 Median number of rooms 2 2 2 2 2 2
Others No exclusive room 17 16 17 16 One room 256 208 48 188 140 48 Two rooms 919 816 103 737 637 100 Three rooms 446 378 68 388 320 68 3+ rooms 201 123 78 178 103 75 Median number of rooms 2 2 2 2 2 2
District total Households 25,988 20,712 5,276 25,361 20,199 5,162 Data source :Census ofindia 200 I, H- series: "Tables on Houses, Household amenities and Assets." * No Scheduled Castes are notified in Nagaland state.
Table 48 relates to the distribution of households by tenure status classified by the number of rooms occupied by the households. Tenure states may be either owned or rented or others. Further five categories are given as per the number of rooms. They are no exclusive room, one room, two room, three room and more than three rooms. The data are prescribed both for rural and urban areas and for both scheduled castes, scheduled tribes. From the table it is seen that majority of the households are residing in owned houses. As per the housing data of 2001 there are a total of 25,988 household s in the district and out of which 20,712 households i.e. 79.7 per cent of the total are in the rural areas and 5,276 households (20.3 per cent) are in the urban areas. Households living in own houses number 21,266 accounting for 81.8 per cent of the total
50
households in the district. The share of the rented category is 1l.1 per cent (2883 household) while 'others' account for on Iy 7.1 per cent (1841 household) of the total most of the households in the rural areas (68.9 per cent) live in own house. While in urban areas (12.9 per cent) resides in rented houses. Majority of the households numbering 25,361 (97.6 per cent) belong to the scheduled tribes of which 20,199 are in rural areas while the rest numbering 5,162 are in urban areas. 83.5 per cent of the households belonging to the scheduled tribes reside in own houses. 10.6 per cent in rented houses and 5.9 per cent in 'other'. In the rural areas the proportion of households belongs to the scheduled tribes in owned category is 88.3 per cent against a proportion pf 64.8 per cent in the urban areas under the same category.
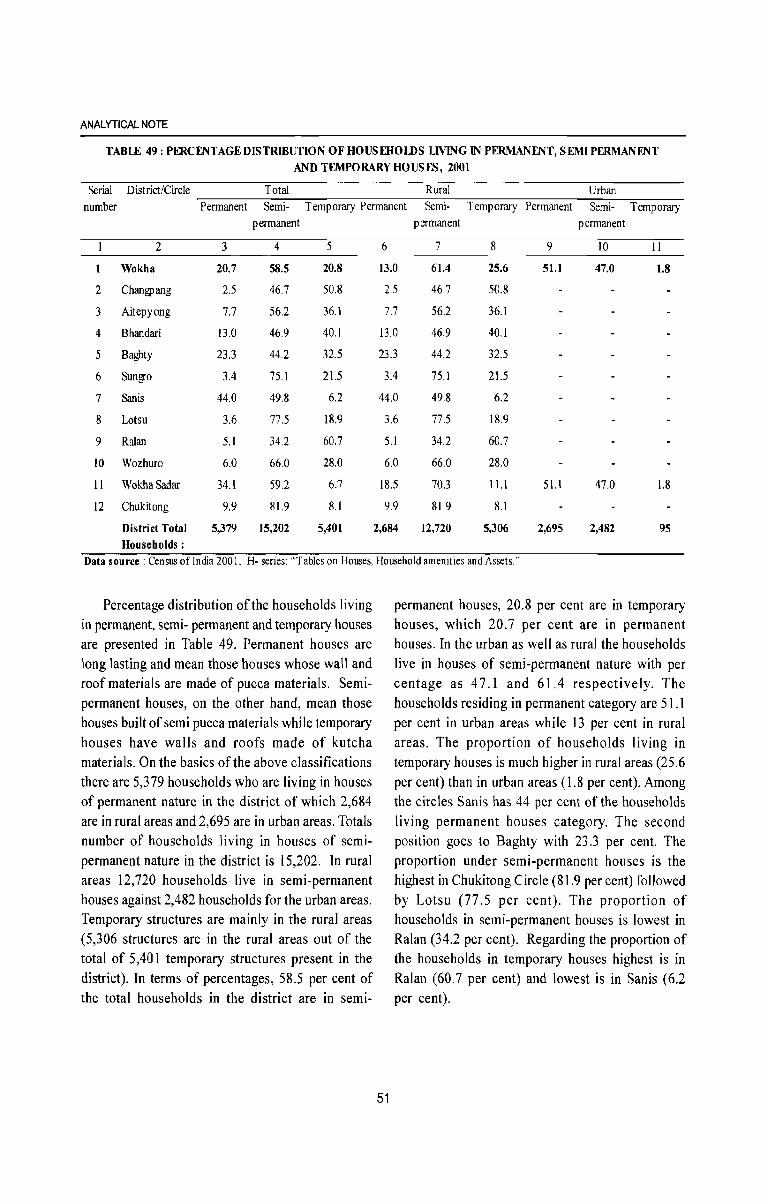
ANALYTICAL NOTE
TABLE 49: PERCENTAGE DISTRIBUTION OF HOUSEHOLDS UVING IN PERMANENT, SEMIPERMANENT AND TEMPORARY HOUSF.S, 2001
Serial District/Circle Total Rural Urban number Permanent Semi- Temp orary Permanent Semi- Temporary Permanent Semi- Temporary
permanent permanent permanent
2 3 4 5 6 7 8 9 10 II
Wokha 20.7 58.5 20.8 13.0 61.4 25.6 51.1 47.0 1.8
2 Changpang 2.5 46.7 50.8 2.5 46.7 50.8
3 Aitepyong 7.7 56.2 36.1 7.7 56.2 36.1
4 Bhandari 13.0 46.9 40.1 13.0 46.9 40.1
5 Baghty 23.3 44.2 32.5 23.3 44.2 32.5
6 Sungro 3.4 75.1 21.5 3.4 75.1 21.5
7 Sanis 44.0 49.8 6.2 44.0 49.8 6.2
8 Lotsu 3.6 77.5 18.9 3.6 77.5 18.9
9 Ralan 5.1 34.2 60.7 5.1 34.2 60.7
10 Wozhuro 6.0 66.0 28.0 6.0 66.0 28.0
11 WokhaSadar 34.1 59.2 6.7 18.5 70J 11.1 51.1 47.0 1.8
12 Chukitong 9.9 81.9 8.1 9.9 81.9 8.1
District Total 5,379 15,202 5,401 2,684 12,720 5,306 2,695 2,482 95 Households :
Data source: Census of India 200 I, H- series: "Tables on Houses, Household amenities and Assets."
Percentage distribution of the households living in permanent, semi- permanent and temporary houses are presented in Table 49. Permanent houses are long lasting and mean those houses whose wall and roof materials are made of pucca materials. Semipermanent houses, on the other hand, mean those houses built of semi pucca materials while temporary houses have walls and roofs made of kutcha materials. On the basics of the above classifications there are 5,379 households who are living in houses of permanent nature in the district of which 2,684 are in rural areas and 2,695 are in urban areas. Totals number of households living in houses of semipermanent nature in the district is 15,202. In rural areas 12,720 households live in semi-permanent houses against 2,482 households for the urban areas. Temporary structures are mainly in the rural areas (5,306 structures are in the rural areas out of the total of 5,401 temporary structures present in the district). In terms of percentages, 5S.5 per cent of the total households in the district are in semi-
51
permanent houses, 20.8 per cent are in temporary houses, which 20.7 per cent are in permanent houses. In the urban as well as rural the households live in houses of semi-permanent nature with per centage as 47.1 and 6 1.4 respectively. The households residing in permanent category are 51.1 per cent in urban areas while 13 per cent in rural areas. The proportion of households living in temporary houses is much higher in rural areas (25.6 per cent) than in urban areas (1.8 per cent). Among the circles Sanis has 44 per cent of the households living permanent houses category. The second position goes to Baghty with 23.3 per cent. The proportion under semi-permanent houses is the highest in Chukitong Circle (8 1.9 per cent) followed by Lotsu (77.5 per cent). The proportion of households in semi-permanent houses is lowest in Ralan (34.2 per cent). Regarding the proportion of the households in temporary houses highest is in Ralan (60.7 per cent) and lowest is in Sanis (6.2 per cent).
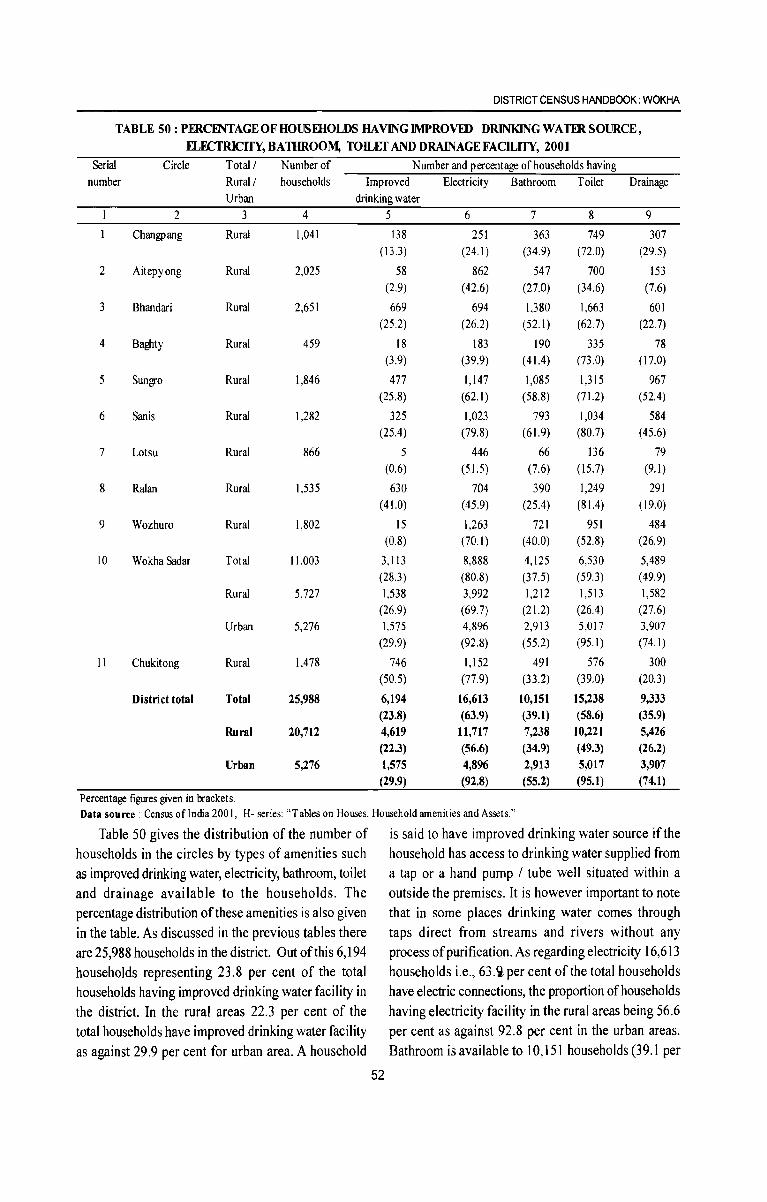
DISTRICT CENSUS HANDBOOK: WOKHA
TABLE 50: PFRCINfAGEOFHOUSmOLDS HAVING IMPROVED DRINKINGWATFRSOURCE,
ELECfRICffY,BATHROOM, TOILEr ANDDRAINAGEFACILffY, 2001
Serial Circle Total/ Number of Number and percentage of households having number Rural/ households Improved Electricity Bathroom Toilet Drainage
Urban drinking water 2 3 4 5 6 7 8 9
Changpang Rural 1,041 138 251 363 749 307 (13.3) (24.1) (34.9) (72.0) (29.5)
2 Aitepyong Rural 2,025 58 862 547 700 153 (2.9) (42.6) (27.0) (34.6) (7.6)
3 Bhandari Rural 2,651 669 694 1,380 1,663 601 (25.2) (26.2) (52.1) (62.7) (22.7)
4 Baghty Rural 459 18 183 190 335 78 (3.9) (39.9) ( 41.4) (73.0) (17.0)
5 Sungro Rural 1,846 477 1,147 1,085 1,315 967 (25.8) (62.1) (58.8) (71.2) (52.4)
6 San is Rural 1,282 325 1,023 793 1,034 584 (25.4) (79.8) (61.9) (80.7) (45.6)
7 Lotsu Rural 866 5 446 66 136 79 (0.6) (51.5) (7.6) (15.7) (9.1 )
8 Ralan Rural 1,535 630 704 390 1,249 291 (41.0) (45.9) (25.4) (81.4) (19.0)
9 Wozhuro Rural 1,802 15 1,263 721 951 484 (0.8) (70.1) (40.0) (52.8) (26.9)
10 Wokha Sadar Total 11,003 3,113 8,888 4,125 6,530 5,489 (28.3) (80.8) (37.5) (59.3) (49.9)
Rural 5,727 1,538 3,992 1,212 1,513 1,582 (26.9) (69.7) (21.2) (26.4) (27.6)
Urban 5,276 1,575 4,896 2,913 5,017 3,907 (29.9) (92.8) (55.2) (95.1) (74.1)
11 Chukitong Rural 1,478 746 1,152 491 576 300 (50.5) (77.9) (33.2) (39.0) (20.3)
District total Total 25,988 6,194 16,613 10,151 15,238 9,333 (23.8) (63.9) (39.1) (58.6) (35.9)
Rural 20,712 4,619 11,717 7,238 10,221 5,426 (22.3) (56.6) (34.9) (49.3) (26.2)
Urban 5,276 1,575 4,896 2,913 5,017 3,907 (29.9) (92.8) (55.2) (95.1) (74.1)
Percentage figures given in brackets. Data source: Census of India 200 I, H· series: "Tables on Houses, Household amenities and Assets."
Table 50 gives the distribution of the number of is said to have improved drinking water source if the households in the circles by types of amenities such household has access to drinking water supplied from as improved drinking water, electricity, bathroom, toilet a tap or a hand pump / tube well situated within a and drainage available to the households. The outside the premises. It is however important to note percentage distribution of these amenities is also given that in some places drinking water comes through in the table. As discussed in the previous tables there taps direct from streams and rivers without any are 25,988 households in the district. Out of this 6,194 process of purification. As regarding electricity 16,613 households representing 23.8 per cent of the total households i.e., 63.2 per cent of the total households households having improved drinking water facility in have electric connections, the proportion of households the district. In the rural areas 22.3 per cent of the having electricity facility in the rural areas being 56.6 total households have improved drinking water facility per cent as against 92.8 per cent in the urban areas. as against 29.9 per cent for urban area. A household Bathroom is available to 10,151 households (39.1 per
52
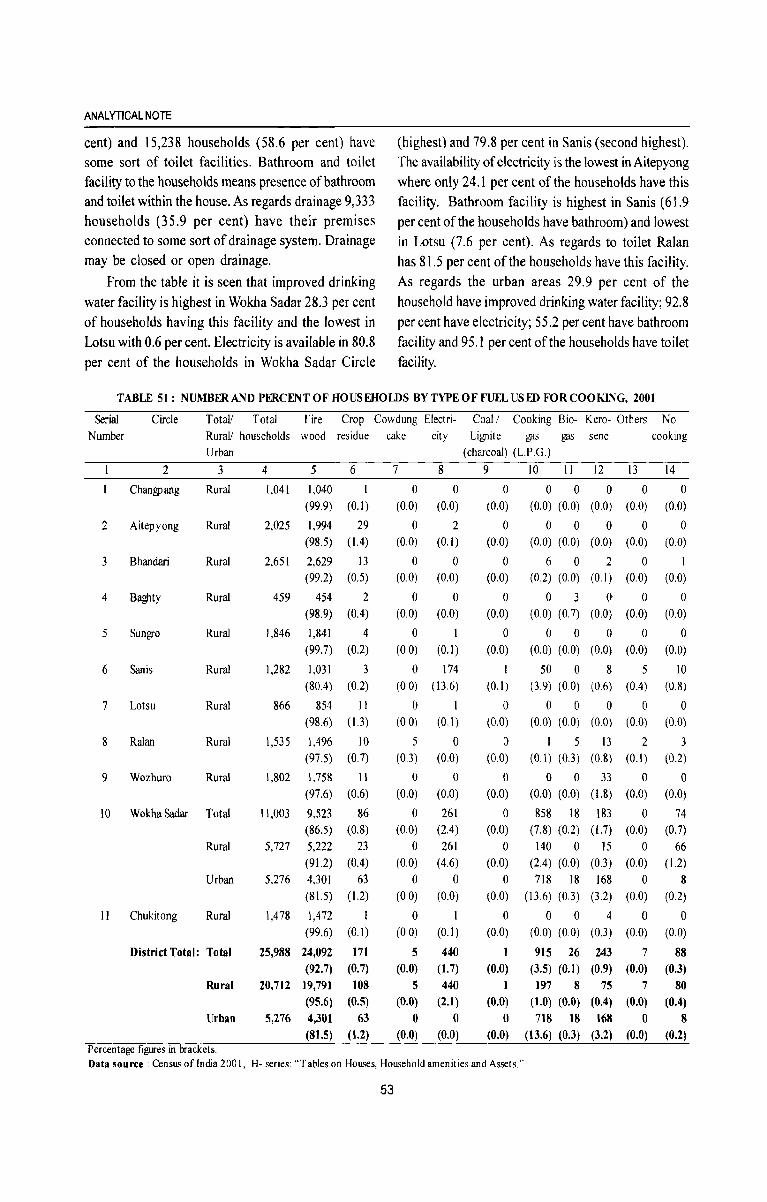
ANALYTICAL NOTE
cent) and 15,238 households (58.6 per cent) have some sort of toilet facilities. Bathroom and toilet facility to the households means presence of bathroom and toilet within the house. As regards drainage 9,333 households (35.9 per cent) have their premises connected to some sort of drainage system. Drainage may be closed or open drainage.
From the table it is seen that improved drinking water facility is highest in Wokha Sadar 28.3 per cent of households having this facility and the lowest in Lotsu with 0.6 per cent. Electricity is available in 80.8 per cent of the households in Wokha Sadar Circle
(highest) and 79.8 per cent in Sanis (second highest). The availability of electricity is the lowest in Aitepyong where only 24.1 per cent of the households have this facility. Bathroom facility is highest in Sanis (61.9 per cent of the households have bathroom) and lowest in Lotsu (7.6 per cent). As regards to toilet Ralan has 81.5 per cent of the households have this facility. As regards the urban areas 29.9 per cent of the household have improved drinking water facility; 92.8 per cent have electricity; 55.2 per cent have bathroom facility and 95.1 per cent of the households have toilet facility.
TABLE 51: NUMBER AND PERCENT OF HOUSEHOLDS BY TYPE OF FUEL USED FOR COOKING, 2001
Serial Number
Circle Total! Total Fire Rural! households wood Urban
Crop Cowdung Electri- Coal! Cooking Bio- Kero- Others No residue cake city Lignite gas gas sene cooking
(charcoal) (L.P.O.)
2 3 4 5 6 7 8 9 10 11 12 13 14
Changpang Rural
2 Aitepyong Rural
3 Bhandari Rural
4 Baghty Rural
5 Sungro Rural
6 Sanis Rural
7 Lotsu Rural
8 Ralan Rural
9 Wozhuro Rural
10 Wokha Sadar Total
Rural
Urban
11 Chukitong Rural
1,041 1,040 I
(99.9) (0.1)
2,025 1,994 29
(98.5) (1.4)
2,651 2,629 13 (99.2) (0.5)
459 454 2
(98.9) (0.4)
1,846 1,841 4
(99.7) (0.2)
1,282 1,031 3 (80.4) (0.2)
866 854 11
(98.6) (1.3)
1,535 1,496 10
(97.5) (0.7)
1,802 1.758 11
(97.6) (0.6)
11,003 9,523 86
(86.5) (0.8)
5,727 5,222 23
(91.2) (0.4)
5,276 4,301 63
(81.5) (1.2)
1,478 1,472 I (99.6) (0.1)
District Total: Total 25,988 24,092 171
(92.7) (0.7)
Rural 20,712 19,791 108
(95.6) (0.5)
Urban 5,276 4,301 63
(81.5) (1.2) Percentage figures in brackets.
o 0 o 0 0 0 0 0
(0.0) (0.0) (0.0) (0,0) (0,0) (0,0) (0.0) (0.0)
o 2 o 0 0 0 0 0
(0.0) (0.1) (0.0) (0.0) (0.0) (0.0) (0.0) (0.0)
o 0 o 6 0 2 0 I (0.0) (0.0) (0.0) (0.2) (0.0) (0.1) (0.0) (0.0)
o 0 o 0 3 0 0 0
(0.0) (0.0) (0.0) (00) (0.7) (0.0) (0.0) (0.0)
o I o 0 0 0 0 0
(0,0) (0.1) (0.0) (0,0) (0,0) (0.0) (0.0) (0.0)
o 174 1 50 0 8 5 10 (00) (13.6) (0.1) (39) (0.0) (0.6) (0.4) (0.8)
o I o 0 0 0 0 0
(0.0) (0.1) (0.0) (0.0) (0.0) (0.0) (0.0) (0.0)
5 0 o 1 5 13 2 3 (OJ) (0.0) (0.0) (0.1) (OJ) (0.8) (0.1) (0.2)
o 0 o 0 0 33 0 0
(0,0) (0.0) (0.0) (0,0) (0,0) (1.8) (0.0) (0.0)
o 261 o 858 18 183 0 74
(0.0) (2.4) (0.0) (7.8) (0.2) (1.7) (0.0) (0.7)
o 261 o 140 0 15 0 66 (0.0) (4.6) (0.0) (2.4) (0.0) (OJ) (0.0) (1.2)
o 0 o 718 18 168 0 8 (0,0) (0.0) (0.0) (13.6) (OJ) (3.2) (0.0) (0.2)
o I o 0 0 4 0 0
(0.0) (0.1) (0.0) (0.0) (0.0) (OJ) (0.0) (0.0)
5 440 I 915 26 243 7 88
(0.0) (1. 7) (0.0) (3.5) (0.1) (0.9) (0.0) (0.3)
5 440 1 197 8 75 7 80
(0.0) (2.1) (0.0) (1.0) (0.0) (0.4) (0.0) (0.4)
o 0 o 718 18 168 0 8
(0.0) (0.0) (0.0) (13.6) (0.3) (3.2) (0.0) (0.2)
Data source: Census of India 200 I, H- series: "Tables on Houses, Household amenities and Assets."
53
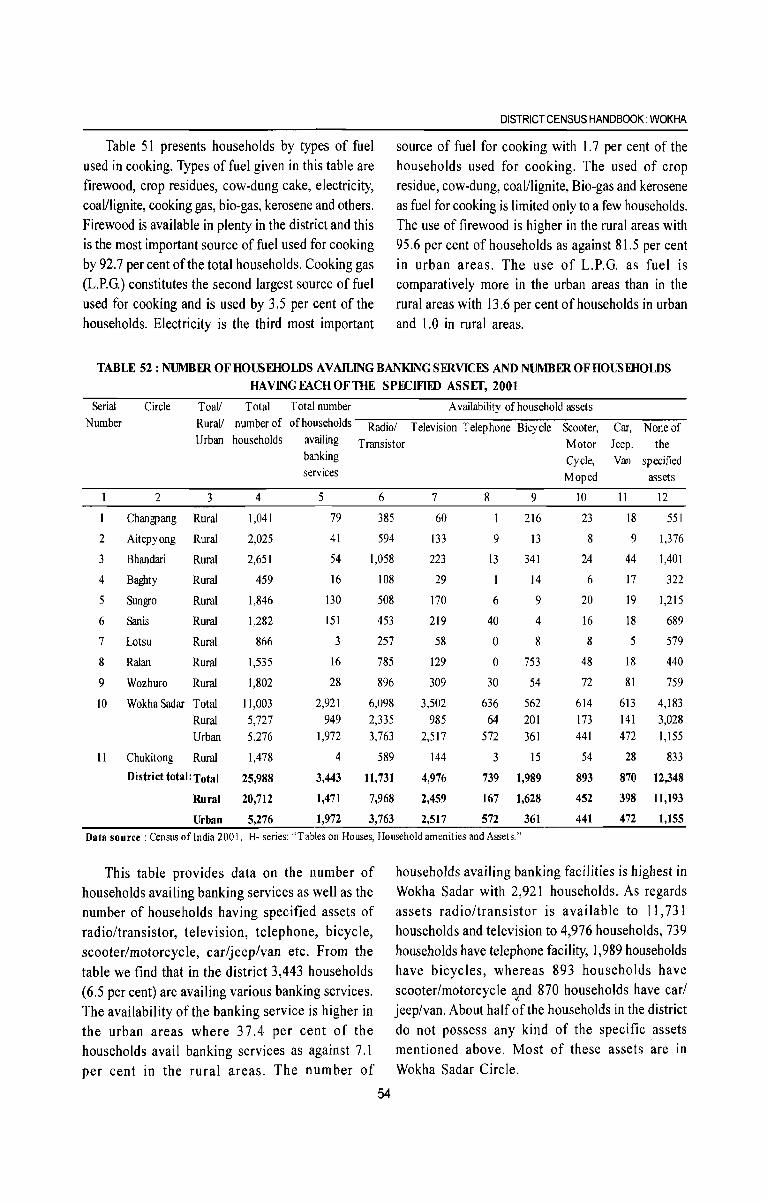
Table 51 presents households by types of fuel used in cooking. Types offuel given in this table are firewood, crop residues, cow-dung cake, electricity, coal/lignite, cooking gas, bio-gas, kerosene and others. Firewood is available in plenty in the district and this is the most important source of fuel used for cooking by 92.7 per cent of the total households. Cooking gas (L.P.G.) constitutes the second largest source of fuel used for cooking and is used by 3.5 per cent of the households. Electricity is the third most important
DISTRICT CENSUS HANDBOOK: WOKHA
source of fuel for cooking with 1.7 per cent of the households used for cooking. The used of crop residue, cow-dung, coal/lignite, Bio-gas and kerosene as fuel for cooking is limited only to a few households. The use of firewood is higher in the rural areas with 95.6 per cent of households as against 81.5 per cent in urban areas. The use of L.P.G. as fuel is comparatively more in the urban areas than in the rural areas with 13.6 per cent of households in urban and 1.0 in rural areas.
TABLE 52: NUMBmOFHOUSEHOLDS AVAILING BANKING SERVICIS AND NUMBER OF HOUSFHOLDS
HAVING FACH OF THE SPECIFIID ASSEf, 2001
Serial Number
Circle ToaV Total Total number Availability of household assets
RuraV number of of households ---:R:-a~di:-o/~r=-e-:-Ie-vi:-si'-on---:::T""'ele-p-:-ho-n-e-::B:-:'ic-y-cl:-e --::"Sc-o-ot-er-, --:C'-ar-, -N:-:-on-e-of"--
Urban households availing Transistor Motor Jeep, the banking Cycle, Van specified services Moped assets
2 3
I Changpang Rural
2 Aitepyong Rural
3 Bhandari Rural
4 Baghty Rural
5 Sungro Rural
6 Sanis Rural
7 Lotsu Rural
8 Ralan Rural
9 Wozhuro Rural
4
1,041
2,025
2,651
459
1,846
1,282
866
1,535
1,802
10 WokhaSadar Total Il,003 Rural 5,727 Urban 5,276
Il Chukitong Rural 1,478
District total: Total 25,988
Rural 20,712
Urban 5,276
5
79
41
54
16
130
151
3
16
28
6
385
594
1,058
108
508
453
257
785
896
2,921 6,098 949 2,335
1,972 3,763
4 589
3,443 11,73]
1,471 7,968
1,972 3,763
7
60
133
223
29
170
219
58
129
309
3,502
985
2,517
144
4,976
2,459
2,517
8
9
13
6
40
o o
30
9
216
13
341
14
9
4
8
753
54
636 562 64 201
572 361
3 IS
739 1,989
167 1,628
572 361
10
23
8
24
6
20
16
8
48
72
614
173 441
54
893
452
441
II 12
18 551
9 1,376
44 1,401
17 322
19 1,215
18 689
5 579
18 440
81 759
613 4,183 141 3,028 472 1,155
28 833
870 12,348
398 11,193
472 1,155
Data source: Census of India 200 I, H- series: "Tables on Houses, Household amenities and Assets."
This table provides data on the number of households availing banking services as well as the number of households having specified assets of radioltransistor, television, telephone, bicycle, scooter/motorcycle, car/jeep/van etc. From the table we find that in the district 3,443 households (6.5 per cent) are availing various banking services. The availability ofthe banking service is higher in the urban areas where 37.4 per cent of the households avail banking services as against 7.1 per cent in the rural areas. The number of
54
households availing banking facilities is highest in Wokha Sadar with 2,921 households. As regards assets radio/transistor is available to 11,731 households and television to 4,976 households, 739 households have telephone facility, 1,989 households have bicycles, whereas 893 households have scooter/motorcycle and 870 households have carl
if.-
jeep/van. About half of the households in the district do not possess any kind of the specific assets mentioned above. Most of these assets are in Wokha Sadar Circle.
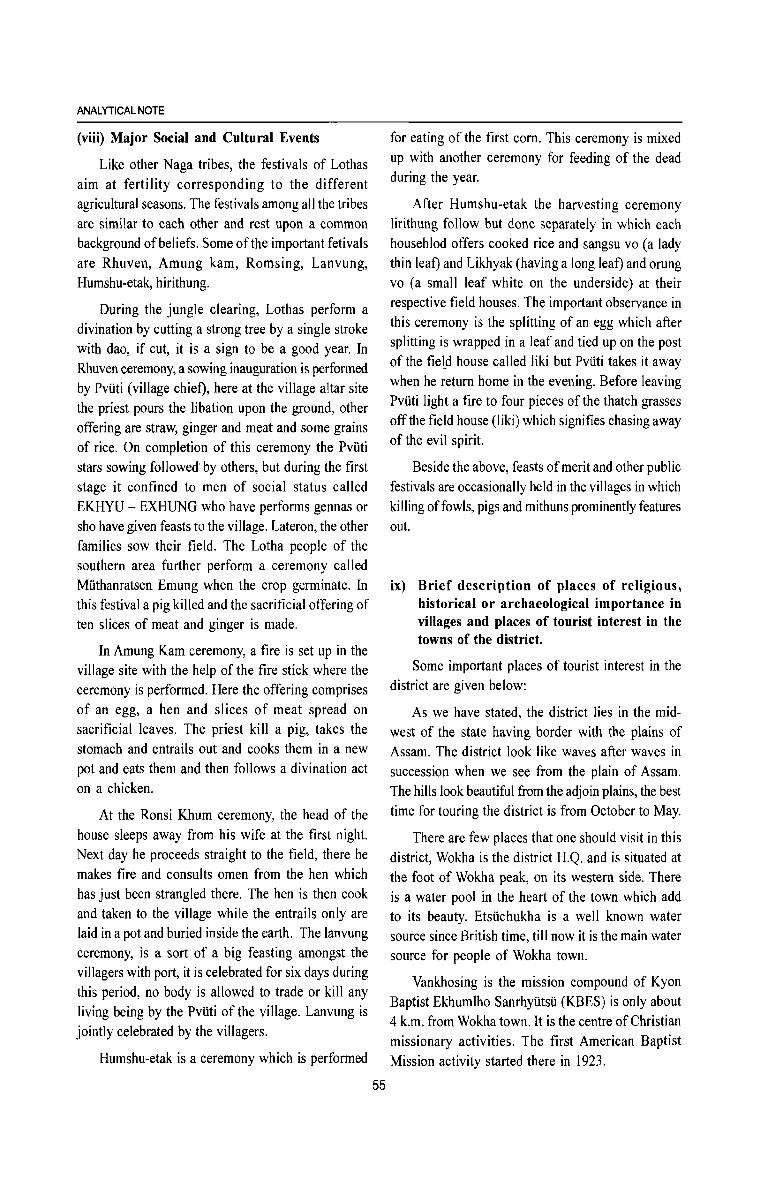
ANALYTICAL NOTE
(viii) Major Social and Cultural Events
Like other Naga tribes, the festivals of Lothas aim at fertility corresponding to the different agricultural seasons. The festivals among all the tribes are similar to each other and rest upon a common background of beliefs. Some of the important fetivals are Rhuven, Amung kam, Romsing, Lanvung, Humshu-etak, hirithung.
During the jungle clearing, Lothas perform a divination by cutting a strong tree by a single stroke with dao, if cut, it is a sign to be a good year. In Rhuven ceremony, a sowing inauguration is performed by Pviiti (village chief), here at the village altar site the priest pours the libation upon the ground, other offering are straw, ginger and meat and some grains of rice. On completion of this ceremony the Pviiti stars sowing followed' by others, but during the first stage it confined to men of social status called EKHYU - EXHUNG who have performs gennas or sho have given feasts to the village. Lateron, the other families sow their field. The Lotha people of the southern area further perform a ceremony called Miithanratsen Emung when the crop germinate. In this festival a pig killed and the sacrificial offering of ten slices of meat and ginger is made.
In Amung Kam ceremony, a fire is set up in the village site with the help of the fire stick where the ceremony is performed. Here the offering comprises of an egg, a hen and slices of meat spread on sacrificial leaves. The priest kill a pig, takes the stomach and entrails out and cooks them in a new pot and eats them and then follows a divination act on a chicken.
At the Ronsi Khum ceremony, the head of the house sleeps away from his wife at the first night. Next day he proceeds straight to the field, there he makes fire and consults omen from the hen which has just been strangled there. The hen is then cook and taken to the village while the entrails only are laid in a pot and buried inside the earth. The lanvung ceremony, is a sort of a big feasting amongst the villagers with port, it is celebrated for six days during this period, no body is allowed to trade or kill any living being by the Pviiti of the village. Lanvung is jointly celebrated by the villagers.
Humshu-etak is a ceremony which is performed
55
for eating of the first com. This ceremony is mixed up with another ceremony for feeding of the dead during the year.
After Humshu-etak the harvesting ceremony lirithung follow but done separately in which each househlod offers cooked rice and sangsu vo (a lady thin leaf) and Likhyak (having a long leaf) and orung vo (a small leaf white on the underside) at their respective field houses. The important observance in this ceremony is the splitting of an egg which after splitting is wrapped in a leaf and tied up on the post of the field house called liki but Pviiti takes it away when he return home in the evening. Before leaving Pviiti light a fire to four pieces of the thatch grasses off the field house (liki) which signifies chasing away of the evil spirit.
Beside the above, feasts of merit and other public festivals are occasionally held in the villages in which killing of fowls, pigs and mithuns prominently features out.
ix) Brief description of places of religious, historical or archaeological importance in villages and places of tourist interest in the towns of the district.
Some important places of tourist interest in the district are given below:
As we have stated, the district lies in the midwest of the state having border with the plains of Assam. The district look like waves after waves in succession when we see from the plain of Assam. The hills look beautiful from the adjoin plains, the best time for touring the district is from October to May.
There are few places that one should visit in this district, Wokha is the district H.Q. and is situated at the foot of Wokha peak, on its western side. There is a water pool in the heart of the town which add to its beauty. Etsiichukha is a well known water source since British time, till now it is the main water source for people of Wokha town.
Vankhosing is the mission compound of Kyon Baptist Ekhumlho Sanrhyiitsii (KBES) is only about 4 k.m. from Wokha town. It is the centre of Christian missionary activities. The first American Baptist Mission activity started there in 1923.
Baghty is the Administrative H.Q. ofBaghty valley and some other villages. The valley is a fertile land and plenty of vegetables and fruits are grown there, particularly pineapple and musumbi, there is also pineapple fabric plant, where from fiber is made out of pineapple leaves.
Mount Tiyi - It is situated at an altitude of 1969.61 metres above sea-level. Trekking rock climbing to the mountain top is an adventurous experience. It is then abode of the departed soul. In local folklores, it is said that there once exist an orchard, which could be traced by the lucky ones only. Colourful Rhododendrons are found on the cliffs. The peak: offers a panoramic view of the villages, hills and valleys.
Liphanyan Governor's camp - It is on the foothills and is 43 km from Dimapur and can be approached from Wokha. From here, Doyang can be seen flowing through hills and vales in a zigzag pattern. It is a splendid sight. It is an ideal spot for rafting, angling, picnics and river camping.
Doyang Hydro Project - It is a new addition to the tourist spots in Wokha district. This Hydel projects has a large quantity of water impounded in a dam. This dam is visible from many hilltop villages in the surrounding areas. Water sports can be introduced here.
(x) Scope of Village and Town Directory :
Column Heading wise explanation :
The Village Directory, as the name indicates, is a directory of villages prepared for each tahsil/circle of every district showing the population at the village level, the number of households and the availability or otherwise of a number of basic amenities within the village while the Town Directory can be stated as a
directory prepared for each town showing a number of useful information on population growth, physical aspects, municipal finance, amenities available, trade, commerce, industry, etc. relating to the town. The presentation of the Village Directory and the Town Directory started in the 1961 Census. Since then the format has been gradually expanded in the following censuses to cover a number of useful data for the planners and the scholars.
56
DISTRICT CENSUS HANDBOOK: WOKHA
The Village Directory as presented for 2001 Census has 23 columns which are briefly discussed below:
Column 1 gives serial number of the villages within each R.D.Block.
Column 2 gives the name of the villages along with their code number. Eight digit permanent location code numbers (PLCN) have been assigned to all the villages in the state in one continuous serial number starting from 00000100 of the first village of the first district to the last village of the last district. The last two digits are kept as zeros (00) for future use.
Column 3 is meant for area figures for each village. As the villages of the state are cadestrally not surveyed the area of the villages is not available. Therefore, 'NA' is given against each villages under this column.
Column 4 is meant for the total population of the village as per 2001 Census. Total population is inclusive of the institutional and houseless population also.
Column 5 presents the number of households in the village as per 2001 Census.
Data on amenities such as educational, medical, drinking water, post, telegraph and telephone, commercial and co-operative banks, agricultural, nonagricultural and other credit societies, recreational & cultural facilities and communications are presented under column 6 to 13. Amenities available within the village are shown by suitable abbrevations which are explained at the beginning of Section I under Part A.
If the amenities are not available in the village a dash (-) is shown in the column and the distance in broad ranges viz. < 5 kms, 5-10 kms and 10+ kms of the nearest place where the facility is available is given in the brackets.
Column 6 gives educational facilities available in the village such as primary school, middle school, secondary school, senior secondary school, college, industrial school, etc. Classes up to Class V are included in primary school. It also includes nursery school, kindergarten school, pre-basic/pre-primary
. .., school and junior basic school up to class V. All schools from class VI to class VIII are included in middle school whereas secondary school covers all classes from class IX to class X. Senior secondary school
ANALYTICAL NOTE
includes class XI to XII, Senior Cambridge and 10+2 schools. If there are composite schools like middle schools with primary classes or secondary schools with middle classes, these will be included in the number of primary and middle schools as well.
Column 7 presents medical facilities available in the village such as hospital, dispensary, maternity and child welfare centre, maternity home, health centre, primary health centre/sub-centre, family welfare centre, T.B. clinic, nursing home, etc. Information on registered private medical practitioner, subsidised medical practitioner and community health worker is also available in this column.
Column 8 is meant for drinking water facility available in the village. Sources of drinking water may be either from tap, well, tank, tubewell, handpump, river, canal, lake, spring or others.
Column 9 gives facility available in respect of post office, telegraph office and telephone in the village.
Column 10 is about banking facilities and furnishes data whether any commercial and/or co-operative bank is available in the village.
Column 11 - Availability of agricultural or nonagricultural or other credit societies within the village is given in this column.
Column 12 - This column is meant for recreational & cultural facilities such as cinema! video hall, sports club and stadium/auditorium present within the village.
Column 13 is for communication facilities such as availability of bus stop, railway station and waterble waterway, may be river, canal, back waterway, etc.
Column 14 provides information on the various means of approach to the village such as paved road, mud road, foot path, navigable canal/river and navigable waterway other than river or canal.
Information on nearest town and its distance in kilometres from the village is furnished in column 15.
In column 16 information is provided whether power supply is available in the village. Power supply may be either for domestic use or for agricultural use or for other purposes. It may also be for all purposes.
In column 17 availability of newspaper and . . .
magazme IS gIven.
57
In column 18 three most important commodities manufactured in the village which may be in the form of hand loom and handicraft articles,jaggery, bamboo and wood products, basket making, beri and cigarette making, etc. are provided.
Column 19 to column 23 gives data on land use i.e. area under different types of land use in hectares. Due to the prevalence of Jhum cultivation in Nagaland
state, besides information on forest, the data on land use provide information on the total area under jhum cultivation, period of rotation, main crops under jhum cultivation and area under wet rice cultivation and
area under dry rice cultivation.
The Town Directory of 2001 Census has seven statements. These are discussed below :
Statement I - This statement gives status and growth history of the towns. The statement has 22 columns. Column 1 gives serial number. Column 2 gives the name of the town, its population size class and civic status of the town. Column 3 is for location code number of the town. Location code number consists of eight digits. Name of Circle and name of R.D.block along with their respective codes are given in columns 4 and 5 respectively. Area in square kilometres is presented in column 6 while in column 7 number of households as per 2001 Census is provided. In column 8 to 18, population of the towns from 1901 to 2001 is shown along with the decadal growth rates of the town as observed in each census year. Density as per 2001 Census is given in column 19 while sex ratio for three census years of 1981, 1991 and 200 I are shown in column 20 to 22.
Statement II - It presents physical aspects and location of towns as existed in 1999. Column 1 and 2 are the same as in Statement 1. Physical aspects
are given in column 3 to 5 - rainfall in mm. in column 3 and maximum and minimum temperature in centigrade in column 4 and 5 respectively. If there is no meteorological station within the town itself the data of the nearest meteorological station is imputed for the town. Distance by road from state, district and circle headquarters measured in kilometres are presented in column 6 to 10. Names & distance of nearest cities having a population of 1 lakh and more
and 5 lakh and more are given in column 9 and 10 respectively while name & distance of the nearest
railway station is provided in column II. Distance from the nearest bus stop and navigable river/canalis shown under column 12 & 13 respectively.
Statement III - The statement gives municipal finance of the town for 1998-1999. Column 1 & 2 gives the serial number, class, name and status of the town. Receipts regarding municipal finance are given under column 3 to 9. These columns are divided into different heads such as receipts through taxes, etc.,
revenue derived from municipal properties and power other than taxation, Government grant, loan, advance and other sources. Columns for which information is not available are shown as dash ( - ) only. Columns 11 to 17 are meant for entering expenditure details under sub-heads of general administration, public safety, public health and conveniences, public works, public institutions and others.
Statement IV - Civic and other amenities as per 1999 in respect of the towns of the district are presented in this statement. Class, name civic status of the towns are given in column I & 2. Column 3 furnishes the 2001 Census population of the towns whereas under column 4 and 5 the population of the Scheduled Castes and the Scheduled Tribes are given respectively. Road length classified into pucca and kutcha is shown in column 6 and system of sewerage is recorded in column 7. Types of sewerage classified
are sewer, open surface drains, box surface drains, sylk drain, cesspool method, pit system and others. Number of latrines is presented in column 8 to 11. Separate figures are provided for latrines under water
borne, service and other categories. The method of disposal of night soil is provided in column 12 and classified as head load, basket, wheel barrow, septic tank, pit system, sewerage and others. Regarding water supply, column 13 gives source of supply such as tap, tube-well, tank & well and column 14 denotes
the system of storage with capacity in kilolitres. Information on whether any fire fighting service is
58
DISTRICT CENSUS HANDBOOK: WOKHA
present in the town is given in column 15. Number of connections under electrification are divided into subheads as domestic, industrial, commercial, road lighting
(points) and others which are given under column 17 to 20.
Statement V - This statement is meant for medical, educational, recreational and cultural facilities available in the town. Nunber of hospitals, dispensaries, health centres/primary health centres/primary health subcentres, etc. are given in column 4 and the number of beds available in these medical institutions in column 5. Educational facilities are sub-divided into arts! science/commercellaw/other colleges of degree level and above, medical colleges, engineering colleges and polytechnics and recorded in column 6 to 9. Availability of higher secondary/junior college level schools and schools of secondary/matriculation and junior secondary/middle is recorded in column 11, 12 and 13 respectively. Number of primary schools and adult literacy centres are shown in column 14 and 15 repectively. Regarding number of recreational and cultural facilities such as stadium, cinema, auditorium! drama/community halls and public libraries are given in given in column 17 to 20 while the number of working women's hostel with number of seats are provided in column 16. In addition recognised shorthand, typewriting and vocational training institutions are also reflected in column 10.
Statement VI - Information on trade, commerce, industry and banking in respect of the towns is shown in this statement. Names of three most important commodities are given under each category of 'exported' in column 3-5 and 'manufactured' in column 6-8. Number of banks, agricultural credit societies and non-agricultural credit societies are furnished under columns 9 to 11.
Statement VII - This statement is designed to give for the slum areas information on civic and other amenities almost on the same types of data as presented in Statement IV. However, as the district does not have any slum area the format is given only for the sake of information.
PART A VILLAGE AND TOWN DIRECTORY

Section I • Village Di rectory
(a) Note explaining the abbreviations used in the village directory :
The "Village Directory" is one of the traditional compilations of the Census. It gives the list of villages, their location code numbers (PLCN), their area, population, number of households, amenities such as educational, medical, drinking water, post and telegraph, commercial and co-operative banks, agricultural non-agricultural and other credit societies, recreational and cultural facilities, communication, approach to village, nearest town with distance, power supply, availability of newspapers and magazines, most important commodity manufactured and land use of each village.
Village is a statutory recognized unit having a definite boundary and separate land records. In case, a complete village is treated as an outgrowth of urban agglomeration, data on amenities for that village, have not been given in the Village Directory but shown along with the urban component. For villages which are partly merged in an outgrowth of U.A., the amenities data are shown in the Village Directory of the respective villages. The amenities data in respect of those villages which are considered as Census Towns , are shown in the Town Directory.
The 'un-inhabited' villages ( villages with no population) have been indicated as such after furnishing details in column I & 2 i.e., Serial number, Name of village & location code number and area of the village in column no. 3. The land use data if available for villages are shown in col. 19 to 23.
The Village Directory format has 23 columns and the details given under each column for the village are as follows :
Column 1 : Serial Number
Self explanatory. All the villages within the R.D. block are presented serially in the ascending order of
their location code number. This column is repeated at the last column also numbered as 1.
Column 2 : Name and Location Code Number of village.
The names and location code numbers of the villages are shown against this column. This also includes the forest and uninhabited villages. The village name is repeated in the 2nd last column also numbered as 2.
Column 3 : Area of the village
The area of the villages in hectares are given. Wherever the area figures are not furnished by the concerned department the column is shown with N.A. (Not Available).
Column 4 : Total population
The total population of the villages as per 2001 Census is given in this column.
Column 5 : Number of households
The number of households as per 2001 Census is given in this column.
Amenities:
In column 6 to 13, availability in respect of different amenities such as education, medical, drinking water, post, telegraph and telephone, banks, credit societies, recreational & cultural facilities communication, etc. in each village has been depicted with appropriate abbreviations against the column concerned. Wherever the amenities are not available in the village, a dash (-) is shown in the column and next to it in brackets the distance in broad ranges viz. <5 kms., 5-10 kms. and 10+ kms of the nearest place where the facility is available is given. Columnwise details are given below:
Column 6 : Educational
Classes upto class IV included in Primary School. This will include nursery school, kindergarten school.,
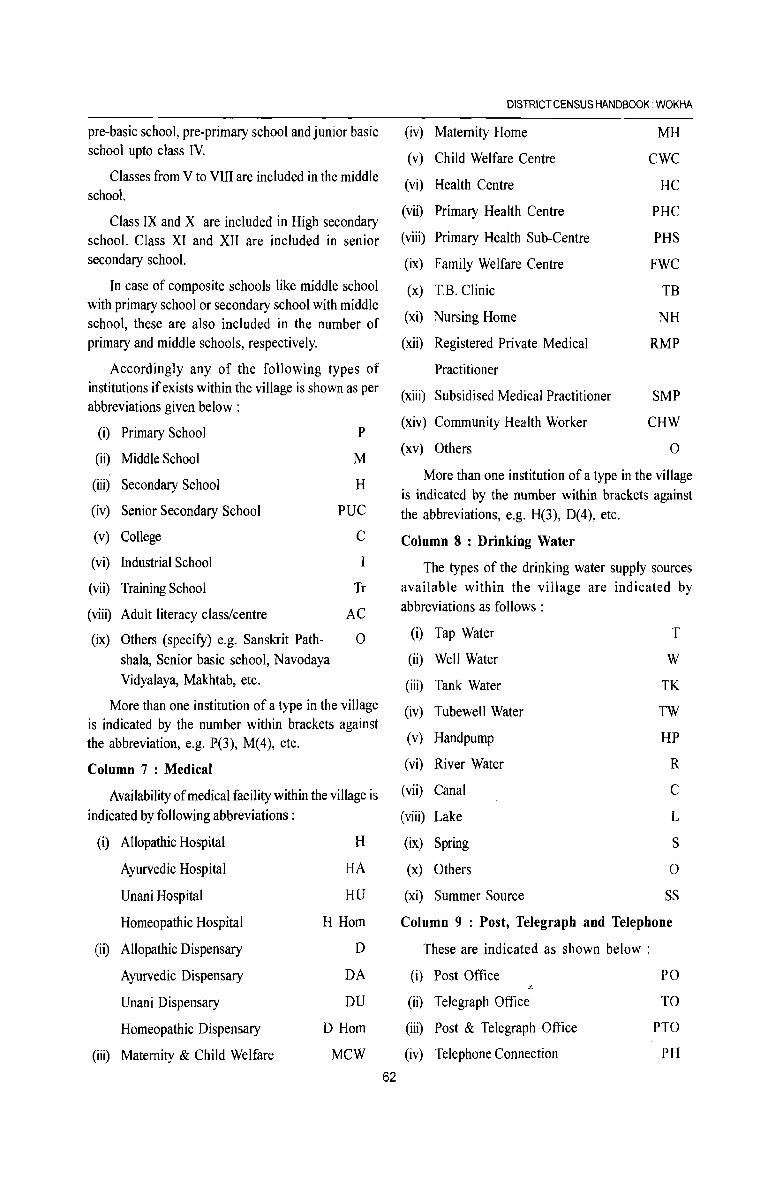
pre-basic school, pre-primary school and junior basic school upto class IV.
Classes from V to VIII are included in the middle school.
Class IX and X are included in High secondary school. Class XI and XII are included in senior secondary school.
In case of composite schools like middle school with primary school or secondary school with middle school, these are also included in the number of primary and middle schools, respectively.
Accordingly any of the following types of institutions if exists within the village is shown as per abbreviations given below:
(i) Primary School P
(ii) Middle School M
(iii) Secondary School H
(iv) Senior Secondary School PUC
(v) College C
(vi) Industrial School I
(vii) Training School Tr
(viii) Adult literacy class/centre AC
(ix) Others (specify) e.g. Sanskrit Path- 0 shala, Senior basic school, Navodaya Vidyalaya, Makhtab, etc.
More than one institution of a type in the village is indicated by the number within brackets against the abbreviation, e.g. P(3), M( 4), etc.
Column 7 : Medical
Availability of medical facility within the village is indicated by following abbreviations:
(i) Allopathic Hospital H
Ayurvedic Hospital HA
Unani Hospital HU
Homeopathic Hospital H Hom
(ii) Allopathic Dispensary D
Ayurvedic Dispensary DA
Unani Dispensary DU
Homeopathic Dispensary D Hom
(iii) Maternity & Child Welfare MCW
62
DISTRICT CENSUS HANDBOOK: WOKHA
(iv)
(v)
(vi)
(vii)
(viii)
(ix)
(x)
(xi)
(xii)
(xiii)
(xiv)
(xv)
Maternity Home
Child Welfare Centre
Health Centre
Primary Health Centre
Primary Health Sub-Centre
Family Welfare Centre
T.B. Clinic
Nursing Home
Registered Private Medical
Practitioner
Subsidised Medical Practitioner
Community Health Worker
Others
MH
CWC
HC
PHC
PHS
FWC
TB
NH
RMP
SMP
CHW
a More than one institution of a type in the village
is indicated by the number within brackets against the abbreviations, e.g. H(3), D(4), etc.
Column 8 : Drinking Water
The types of the drinking water supply sources available within the village are indicated by abbreviations as follows :
(i) Tap Water T
(ii) Well Water W
(iii) Tank Water TK
(iv) Tubewell Water TW
(v) Handpump HP
(vi) River Water R
(vii) Canal C
(viii) Lake L
(ix) Spring S
(x) Others 0
(xi) Summer Source SS
Column 9 : Post, Telegraph and Telephone
These are indicated as shown below :
(i) Post Office PO d,
(ii) Telegraph Office TO
(iii) Post & Telegraph Office PTa
(iv) Telephone Connection PH
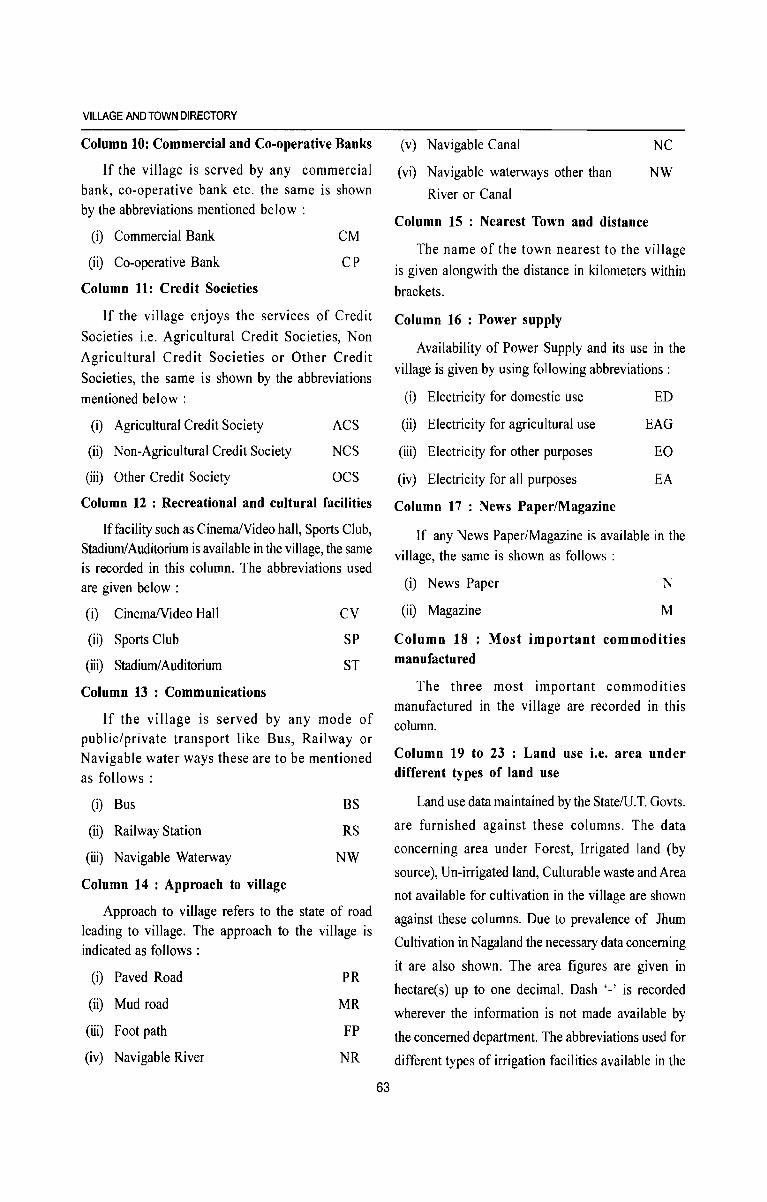
VILLAGE AND TOWN DIRECTORY
Column 10: Commercial and Co-operative Banks
If the village is served by any commercial bank, co-operative bank etc. the same is shown by the abbreviations mentioned below:
(i) Commercial Bank
(ii) Co-operative Bank
Column 11: Credit Societies
CM
CP
If the village enjoys the services of Credit
Societies i.e. Agricultural Credit Societies, Non Agricultural Credit Societies or Other Credit
Societies, the same is shown by the abbreviations mentioned below:
(i) Agricultural Credit Society ACS
(ii) Non-Agricultural Credit Society NCS
(iii) Other Credit Society OCS
Column 12 : Recreational and cultural facilities
Iffacility such as CinemalVideo hall, Sports Club, Stadium! Auditorium is available in the village, the same is recorded in this column. The abbreviations used are given below :
(i) CinemalVideo Hall
(ii) Sports Club
(iii) Stadium! Auditorium
Column 13 : Communications
CV
SP
ST
If the village is served by any mode of public/private transport like Bus, Railway or Navigable water ways these are to be mentioned as follows:
(i) Bus BS
(ii) Railway Station RS
(iii) Navigable Waterway NW
Column 14 : Approach to village
Approach to village refers to the state of road leading to village. The approach to the village is indicated as follows :
(i) Paved Road PR
(ii) Mud road MR
(iii) Foot path FP
(iv) Navigable River NR
63
(v) Navigable Canal
(vi) Navigable waterways other than
River or Canal
NC
NW
Column 15 : Nearest Town and distance
The name of the town nearest to the village
is given alongwith the distance in kilometers within
brackets.
Column 16 : Power supply
Availability of Power Supply and its use in the village is given by using following abbreviations:
(i) Electricity for domestic use ED
(ii) Electricity for agricultural use EAG
(iii) Electricity for other purposes EO
(iv) Electricity for all purposes EA
Column 17 : News PaperlMagazine
If any News Paper/Magazine is available in the village, the same is shown as follows :
(i) News Paper
(ii) Magazine
N
M
Column 18 : Most important commodities manufactured
The three most important commodities manufactured in the village are recorded in this column.
Column 19 to 23 : Land use i.e. area under different types of land use
Land use data maintained by the StatelU.T. Govts.
are furnished against these columns. The data
concerning area under Forest, Irrigated land (by
source), Un-irrigated land, Culturable waste and Area
not available for cultivation in the village are shown
against these columns. Due to prevalence of Jhum
Cultivation in Nagaland the necessary data concerning
it are also shown. The area figures are given in
hectare(s) up to one decimal. Dash '-' is recorded
wherever the information is not made available by
the concerned department. The abbreviations used for
different types of irrigation facilities available in the
village are indicated below:
(i) Government Canal GC
(ii) Private Canal PC
(iii) Well (without electricity) W
(iv) Well (with electricity) WE
(v) Tubewell (without electricity) TW
(vi) Tubewell (with electricity) TWE
(vii) Tank TK
(viii) River R
(ix) Lake L
(x) Waterfall WF
(xi) Others 0
(xii) Total T
The village directory also carries the following appendices.
Appendix-I It gives the abstract of educational, medical and other amenities available in villages at R.D. block level.
Appendix-I-A Indicates number of villages R.D. block-wise having one or more primary schools.
Appendix-I-B Indicates number of villages R.D. block-wise having primary, middle and secondary schools.
Appendix-I-C Shows number of villages R.D. block-wise with different sources of drinking water facilities.
Appendix-II Gives the list of villages with 5,000 and above population which do not have one or more amenities.
Appendix-II-A Gives the list of Census Towns which do not have one or more amenities.
Appendix-III It gives the land utilization data in
64
DISTRICT CENSUS HANDBOOK: WOKHA
respect of Census Towns/nonmunicipal Towns.
Appendix-IV R.D. block-wise list of inhabited villag~) where no amenity other than drinking water facility is available.
Appendix-V Summary showing number of villages not having Scheduled Caste population.
Appendix-VI Summary showing number of villages not having Scheduled Tribe population.
Appendix-VII A, VII B
The appendix shows the list of villages according to proportion of the Scheduled Castes and Scheduled Tribes to the total population by ranges.
Appendix-VIII Indicates R.D. block-wise number of villages under each Gram Panchayat.
Appendix-IX Shows number of different level girl's schools in a village.
(b) List of villages merged in towns and out
growths in 2001 Census.
There is no such villages in the district merged in towns in 2001 Census. There is also no outgrowth in the district.
(c) R.D. block-wise presentation of Village Directoty Data.
In Wokha district there are five R.D. blocks, viz., Bhandari R.D.Block, Sanis R.D.Block, Wozhuro Ralan R.D.Block, Wokha R.D.Block and Chukitong R.D.B1ock. R.D. block-wise Village Directory data are presented here showing map of the R.D. block; alphabetical list of villages alongwith
location code number of 1991 and 2001 Census; and amenities and land use data for all villages as in 1999.

BHANDARI RD BLOCK
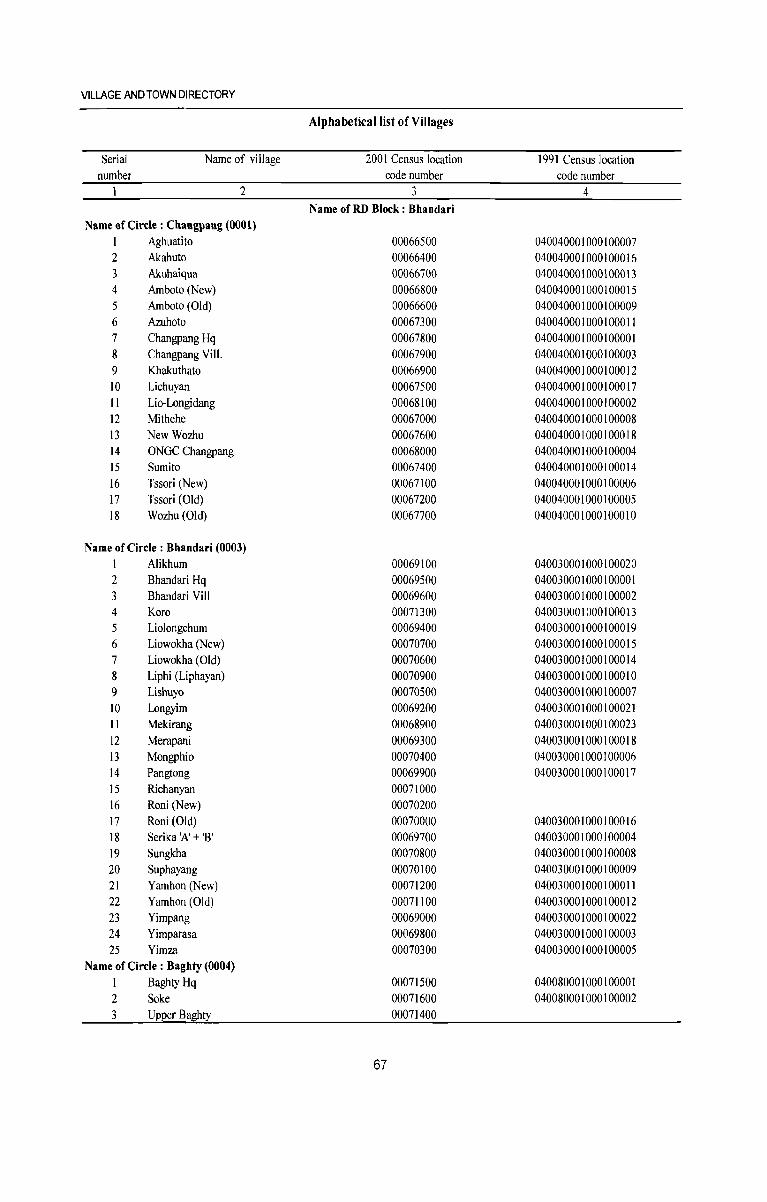
VILLAGE AND TOWN DIRECTORY
Alphabetical list of Villages
Serial Name of village 2001 Census location 1991 Census location number code number code number
I 2 3 4 Name of RD Block: Bhandari
Name of Circle : Changpang (0001) I Aghuatito 00066500 040040001000100007 2 Akahuto 00066400 040040001000100016 3 Akuhaiqua 00066700 040040001000100013 4 Arnboto (New) 00066800 040040001000100015 5 Arnhoto (Old) 00066600 040040001000100009 6 Azuhoto 00067300 040040001000100011 7 Changpang Hq 00067800 040040001000100001 8 Changpang ViiI. 00067900 040040001000100003 9 Khakuthato 00066900 040040001000100012 10 Lichuyan 00067500 040040001000100017 II Lio-Longidang 00068100 040040001000100002 12 Mithehe 00067000 040040001000100008 I3 New Wozhu 00067600 040040001000100018 14 ONGC Changpang 00068000 040040001000100004 IS Sumito 00067400 040040001000100014 16 Tssori (New) 00067100 040040001000100006 17 Tssori (Old) 00067200 040040001000100005 18 Wozhu (Old) 00067700 040040001000100010
Name of Circle : Bhandari (0003) I Alikhum 00069100 040030001000100020 2 Bhandari Hq 00069500 040030001000100001 3 Bhandari ViII 00069600 040030001000100002 4 Koro 00071300 040030001000100013 5 Liolongchum 00069400 040030001000100019 6 Liowokha (New) 00070700 040030001000100015 7 Liowokha (Old) 00070600 040030001000100014 8 Liphi (Liphayan) 00070900 040030001000100010 9 Lishuyo 00070500 040030001000100007 10 Longyim 00069200 040030001000100021 II Mekirang 00068900 040030001000100023 12 Merapani 00069300 040030001000100018 13 Mongphio 00070400 040030001000100006 14 Pangtong 00069900 040030001000100017 IS Richanyan 00071000 16 Roni (New) 00070200 17 Roni (Old) 00070000 040030001000100016 18 Serika 'A' + '8' 00069700 040030001000100004 19 Sungkha 00070800 040030001000100008 20 Suphayang 00070100 040030001000100009 21 Yamhon (New) 00071200 040030001000100011 22 Yamhon (Old) 00071100 040030001000100012 23 Yimpang 00069000 040030001000100022 24 Yimparasa 00069800 040030001000100003 25 Yimza 00070300 040030001000100005
Name of Circle: Baghty (0004) I BaghtyHq 00071500 040080001000100001 2 Soke 00071600 040080001000100002 3 Upper Baghty 00071400
67
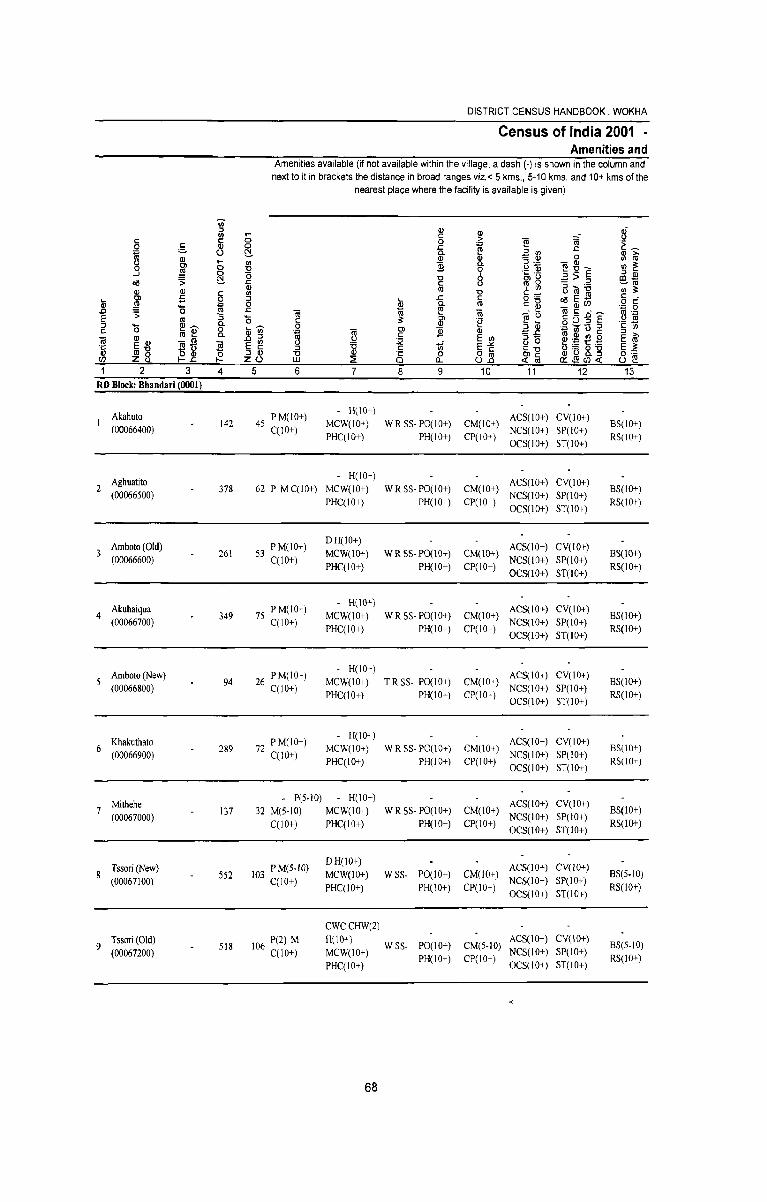
DISTRICT CENSUS HANDBOOK: WOKHA
Census of India 2001 -Amenities and
Amenities available (if not available within the village, a dash (.) is shown in the column and next to it in brackets the distance in broad ranges viz. < 5 kms., 5-10 kms. and 10+ kms of the
nearest place where the facility is available is given)
U) :> Q) Q) ~ rJ) .- e c: e 0 0 > ~ (ij
0 g Q) 0 .c ~ .c: .~ ~
~ U ~ c. :E ~ Q) >-
Q) Q) Q) 0 I/) <II 01 0 rJ) ]i c. G~ - (I)
I/) ~ 0 ~
'0 0 'i:: .~ ~~E ...J 0 '0 8 :> Q)
~ '0 0l(,J ",,>:> !D-oll .s: .c e <II 0 ~<II
Q) Q) Q) (0
'0 ' rJ) a(Q~ I/) 3:: c: rJ) 5"" e . a; Ol £i 0 ::J
~ .c c: oIlE .... o e
~ "" 0 c. (0 c:~ ~ -<II(/) .D '0 <II .c ~ ~.~ .liE
+:i 0 .s; "5 (;i (II (;i (ij (,) ~~ E <0 '0 c: 3:: 01 'e oU:> ::J .... Q)_.._ c.
Qiln 0 Q) ~ v ~ lo,~ 'c 1i) r: 0 ~ Q) 0
~ 13 Ol ]i <II "".c ::J >-
~ ~ Q)
<0 ... C. .0 ::J c: E rJ) ::J- ~E~~ E (0
~~ ~ E ~ 15 :;;; vi E""
(,J 0 E 3:: ::J e 'C "'0 g=o 8.-g Q) <0
~.21 ~ ::J Q) '0 Q) (§ 0 o c: Ole 0==
(/) Z zu w :2 Q_ u.2l 4: (0 a:.l)!(/)4: u ~ 1 2 3 4 5 6 7 8 9 10 11 12 13
RD Block: Bhandari (0001)
Akahuto 45 P M(IO+) H(10+)
AC5(1O+) CY(10+) 142 MCW(IO+) WRSS· PO(IO+) CM(IO+) BS(IO+)
(00066400) C(10+) PHC(IO+) PH(IO+) CP(10+)
NC5(10+) SP(IO+) RS(IO+)
OC5(10+) ST(10+)
Aghuatito H(10-)
AC5(10+) CY(10+) 2
(00066500) 378 62 P M C(IO+) MCW(IO+) WR 5S· PO(IO+) CM(IO+)
NC5(10+) SP(lO+) BS(IO+)
PHC(IO+) PH(IO+) CP(IO+) OC5(10+) ST(lO+)
RS(IO+)
Arnboto (Old) 53 PM(10+) D H(JO+)
AC5(10+) CY(IO+) 3
(00066600) 261
C(10+) MCW(IO+) WR SS- PO(10+) CM(IO+)
NC5(10+) SP(10+) BS(lO+)
PHC(IO+) PH(IO+) CP(10+) OC5(10+) ST(IO+)
RS(IO+)
Akuhaiqua 75 PM(IO+) • H(10"")
AC5(10+) CV(IO+) 4 349 MCW(IO+) W R 5S· PO(10+) CM(10+) BS(10+)
(00066700) C(lO+) PHC(IO+) PH(IO+) CP(IO+)
NC5(10+) SP(IO+) RS(IO+)
OC5(1O+) ST(IO+)
Arnboto (New) 26 PM(IO+) H(IO-)
AC5(1O+) CV(IO+) 94 MCW(IO+) T R S5· PO(10+) CM(IO+) BS(10+)
(00066800) C(lO+) PHC(IO+) PH(lO+) CP(IO+)
NC5(1O+) SP(IO+) RS(IO+)
OCS(IO+) ST(IO+)
Khakuthato 72 PM(IO+) • H(10+)
AC5(10+) CV(IO+) 6 289 MCW(10+) WR SS· PO(10+) CM(10+) BS(IO+)
(00066900) C(lO+) PHC(IO+) PH(IO+) CP(IO+)
NC5(10+) SP(IO+) RS(IO+)
OC5(1O+) ST(10+)
Mithehe peS-IO) H(lO'")
AC5(10+) CY(10+) 7
(00067000) 137 32 M(S·IO) MCW(10+) W R SS· PO(10+) CM(IO+)
NC5(10+) SP(IO+) BS(IO+)
C(10+) PHC(IO+) PH(IO+) CP(IO+) OC5(10+) ST(lO+)
RS(IO+)
Tssori(New) 103 PM(5-IO) D H(lO+)
ACS(10+) CV(lO+) 552 MCW(10+) WSS· PO(lO+) CM(lO+) 8S(5.10)
(00067100) C(10+) PHC(10+) PH(IO+) CP(lO+)
NC5(10+) SP(10+) RS(lO+)
OCS(IO+) ST(lO+)
CWCCHW(2)
9 Tssori (Old)
518 106 P(2) M H(lO+) WSS· PO(lO+) CM(5-10)
ACS(lO+) CV(lO+) BS(5-10)
(00067200) C(10+) MCW(IO+) PH(IO+) CP(IO+)
NCS(lO+) SP(IO+) RS(IO+)
PHC(IO+) OC5(10+) ST(10+)
"
68
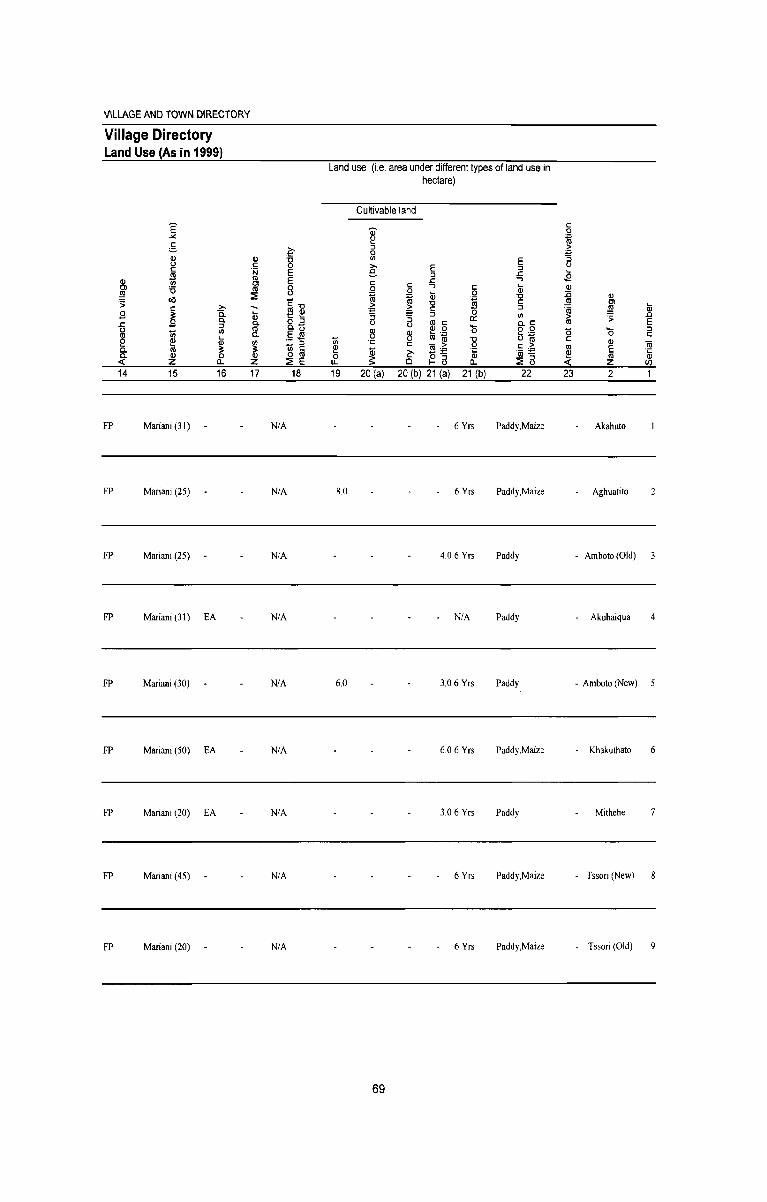
VILLAGE AND TOWN DIRECTORY
Village Directory Land Use (As in 1999)
Land use (i.e, area under different types of land use in hectare)
Cultivable land
E Q) c: ,2
.l< [:! ro c: :J > <::. ~ 0 +=> 2l Q) ii rJ) E "5 c: 0 '" E 0 c: 'N E :e. :J
~
~ :J .t:. ~ Q)
III E .t:. ..., Cl c: c: Cl ii III 8 0
..., c: (D Q)
~ :2 ~ 0 (D 0 1i
011 ~ $ -0 Q)
'S; ...
-0 c: .!l! Cl c: '" - C:-o > > c: :J Oro 4!1 (D
.9 ~ a. L.. ~ ~ +=> +=> :J 0 .0 Q) 3- "5 0:: rJ) > 'S; a. a. o :J 0 III c: o.c: III E .t:. :J U
0 iii rJ) III 0.1:) 2l 2l ~~ '0 o 0 (5 '0 :J
III a. E III b~ c: e ~ (D If) .- ..... iii ';: 15 c Q) ... :J ';: - > c:: .2=: iii a. III 3 3 If) c: ~
~ ~:E .~ III E ';:
a. Q) 0 Q) o III 0 2:- Oro :!:! ~ ro Q) « z a. z :2 E u. Cl I- a a. :2 a :;!; z (/)
14 15 16 17 18 19 20 (a) 20 (b) 21 (a) 21 (b) 22 23 2 1
FP Mariani (31) N/A 6 Yrs Paddy,Maize Akahuto
FP Mariani (25) N/A 8,0 6 Yrs Paddy, Maize Aghuatito 2
FP Mariani (25) N/A 4,06 Yrs Paddy - Arnhoto (Old)
FP Mariani (31) EA N/A N/A Paddy Akuhaiqua 4
FP Mariani (30) N/A 6,0 3.06 Yrs Paddy - Arnboto (New) 5
FP Mariani (50) EA N/A 6,06 Yrs Paddy,Maize - Khakuthato 6
FP Mariani (20) EA N/A 3.06 Yrs Paddy Mithehe
FP Mariani (45) N/A 6 Yrs PaddY,Maize - Tssori (New)
FP Mariani (20) N/A 6 Yrs PaddY,Maize - Tssori (Old) 9
69
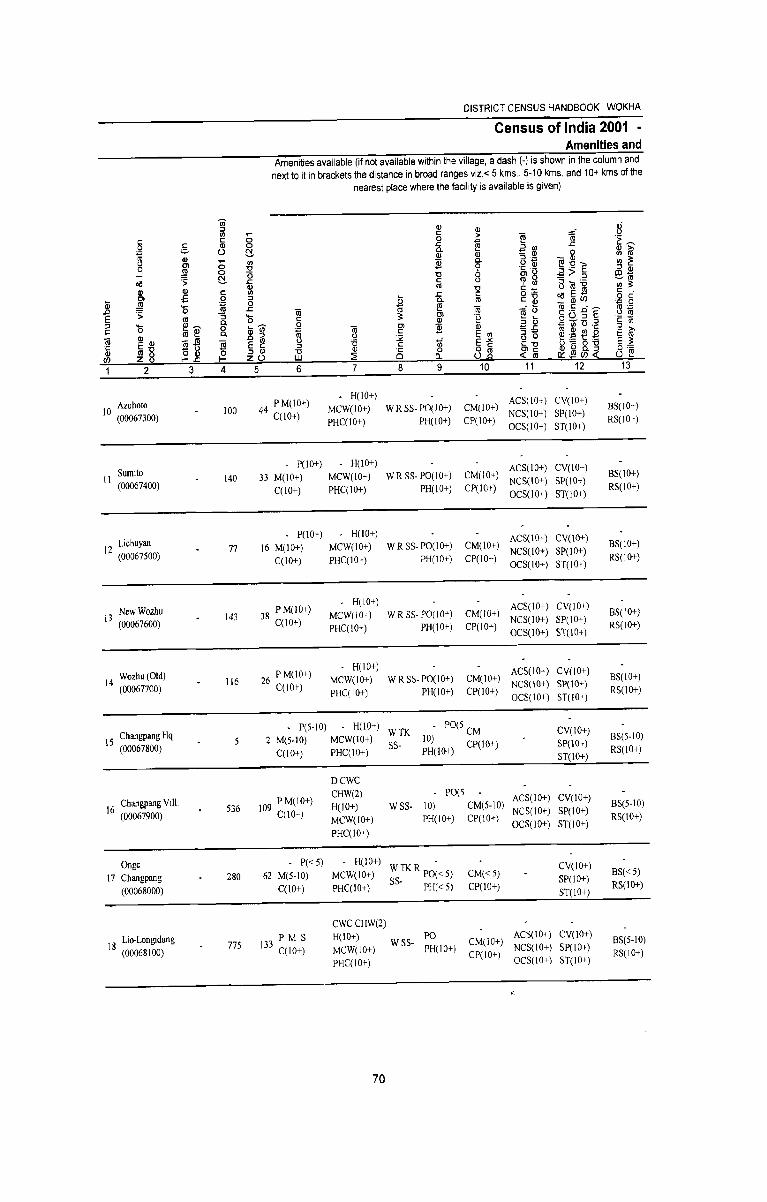
DISTRICT CENSUS HANDBOOK. WOKHA
Census of India 2001 -Amenities and
Amenities available (if not available within the village, a dash (-) is shown in the column and next to it in brackets the distance in broad ranges viz.< 5 kms., 5-10 kms. and 10+ kms of the
nearest place where the facility is available is given)
'iii :J Q) Q) 1l VI ..-- c: > T!! ~ c: e: 0 0 .~~
0 .§_ Q) 0 .c. ~ E 8J .c.
~ 0 ~ c. Q) >-
Q) Q) Q) 0 VI III
0 VI ]i C. :J ._ _ Ql
VI ~ Cl 0-0
:ll1 u ~
'C .~ ~~E ...J 0 0 Clg :J Q)
~ U ;!:>::J co-
ell .:; .c. e: <jI VI ::J ._ ~1Il
Q) Q) ro u ~~N VI 3:
Q) .s e: VI .c. c: g~ c Cl 0 ::J ]l o C
(ij ,m ~ 0 c. ro c_ ~ _Q)U)
'0 ~ :;:: 0
.a .c. lii ro iii ~.s.r:iE ~~ E .s: "3 .... 3: Ol liio
ro c. 0 e: Q) 'e :; (i) 2 ~-5.:1 'c 1ii ::J '0 ~ai' (i)~
0 c: 0
~ ~ Ol ]i Q) ~.c. ::J >-
Ql Q)
(1] ._ a. D ::J e: E VI :J- ~~~g E III
lii 3U "iii E ~ '5 S1 of E-'" ° 0 E 3: .~ Eu (5
::J Q) .~ o e: c:u ~'5 g_-g ~ 8 o Q) ::J Q) u Ci 0 Ole: 0'-:
U) f-.c. f- zO w ::2 a. 0.2 ~ III Ik:J]1C1l<X: U t'!
1 2 3 4 5 6 7 8 9 10 11 12 13
Azuhoto 44 P M(lO+) H(IO+) ACS(IO+) CV(lO+)
10 (00067300) 100 MCW(lO+) W R SS- PO(IO+) CM(IO+) BS(lO+)
C(10+) PHCCIO+) PH(IO+) CP(IO+)
NCS(IO+) SP(10+) RS(lO+) OCS(IO+) ST(10+)
Sumito P(IO+) H(!O+) ACS(IO+) CV(IO+)
11 140 33 M(lO+) MCW(IO+) W R SS- PO(IO+) CM(lO+) 8S(10+) (00067400) C(lO+) PHC(IO+) PH(IO+) CP(IO+)
NCS(lO+) SP(IO+) RS(10+)
OCS(10+) ST(IO+)
Lichuyan P(lO+) H(10+) ACS(IO+) CV(JO+)
12 (00067500) 77 16 M(lO+) MCW(IO+) WRSS-PO(IO+) CM(IO+) BS(IO+)
C(10+) PHC(IO+) PH(IO+) CP(IO+) NCS(lO+) SP(IO+) RS(lO+) OCS(IO+) ST(10+)
NewWozhu 38 P M(lO+) H(lO+) ACS(IO+) CV(IO+)
13 (00067600) 143 MCW(IO+) W R SS- PO(IO+) CM(lO+) BS(lO+)
C(lO+) PHC(IO+) PH(IO+) CP(IO+)
NCS(IO+) SP(10+) RS(IO+)
OCS(10+) ST(lO+)
14 Wozhu (Old) 26 P M(10+) H(IO+) ACS(10+) CV(IO+)
116 MCW(IO+) W R SS- PO(IO+) CM(IO+) BS(IO+) (00067700) C(10+)
PHCCIO+) PH(IO+) CP(IO+) NCS(IO+) SP(IO+)
RS(IO+) OCS(10+) ST(IO+)
Changpang Hq P(S-IO) - H(IO+)
WTK - POlS CM CV(IO+) 15 2 M(5-10) MCW(lO+) 10) BS(5-10)
(00067800) CC I 0+) PHCCIO+) SS- PH(10+) CP(IO+) SP(IO+)
RS(10+) ST(IO+)
DCWC
16 Changpang Viii. 109 PM(lO+) CHW(2) PO(S ACS(IO+) CV(JO+)
536 H(JO+) WSS- 10) CM(S-IO) BS(5-1O) (00067900) CC1O+) MCW(IO+) PH(lO+) CP(lO+)
NCS(IO+) SP(10+) RS(lO+)
PHCCIO+) OCS(lO+) ST(IO+)
Ongc P« 5) H(IO+) WTK R PO~<5) CV(lO+)
17 Changpang 280 62 M(5-10) MCW(lO+) CM«5) BS«5)
(00068000) C(1O+) PHC(1O+) SS- PH« 5) CP(IO+) SP(lO+)
RS(IO+) ST(IO+)
CWCCHW(2)
18 Lio-Longidang 775 PMS H(lO+)
WSS-PO
CM(IO+) ACS(IO+) CV(lO+) BS(5-10)
(00068100) 133 C(10+) MCW(lO+) PH(lO+) CP(IO+)
NCS(lO+) SP(IO+) RS(10+) PHC(lO+) OCS(IO+) ST(IO+)
70
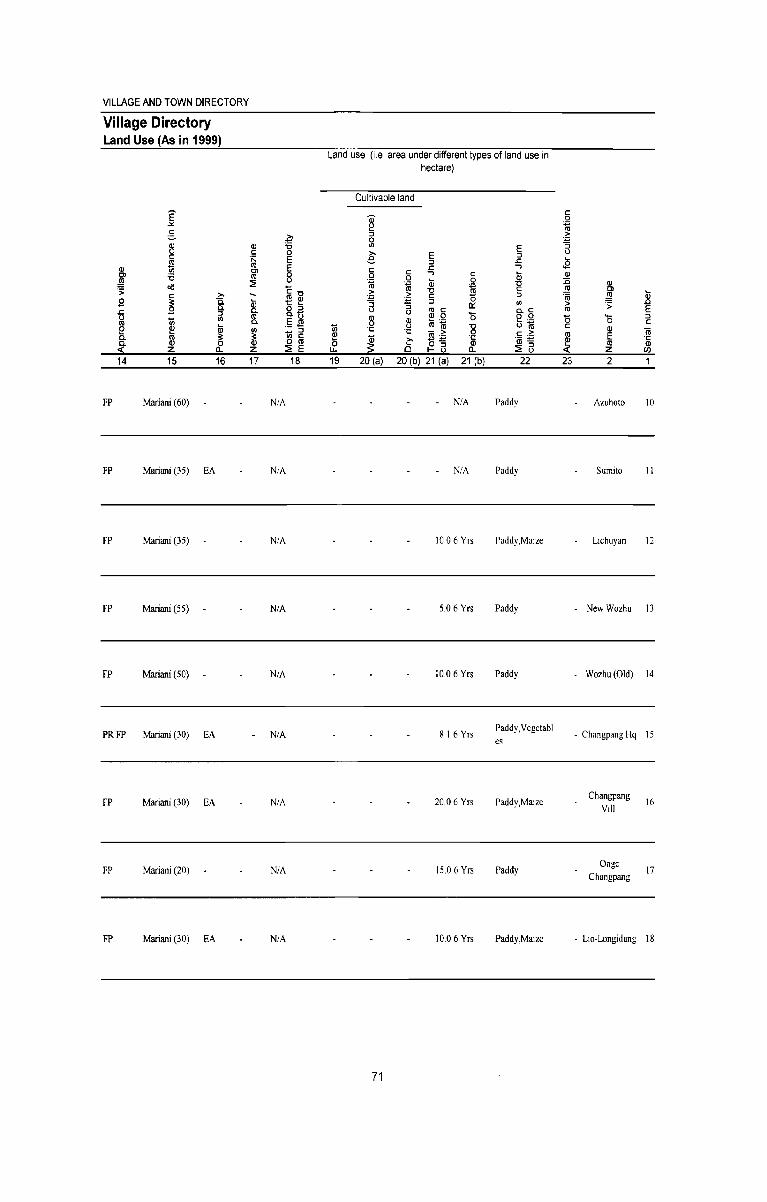
VILLAGE AND TOWN DIRECTORY
Village Directory Land Use (As in 1999)
E .>< c: :::. ~
2l Q) iJ c: 0 c: 'N E
~ Q) til E Cl
Cl iJ til 8 ~ :2 O/l ':; C"O c: >-c. til Q) B ~ ~ t:: ~
0. o OJ .s::: OJ 0.'0 u ti '" til til 0. ,s Jl! e @ (j) '" ~ OJ
~ 0. til ~ '" c: 0. OJ 0 o 11! ~ Z c.. z :2 E 14 15 16 17 18
FP Mariani (60) N/A
FP Mariani (35) EA N/A
FP Mariani (35) N/A
FP Mariani (55) N/A
FP Mariani (50) N/A
PR FP Mariani (30) EA N/A
FP Mariani (30) EA N/A
FP Mariani (20) N/A
FP Mariani (30) EA N/A
Land use (i,e, area under different types of land use in hectare)
Cultivable land
~ OJ 0
'" >- E e OJ c: .s::: c: ..., 0 0 c: ~ Qi 0
'ai ~ > "0 > c: :;::; :;::; 0 :; :; ::J Q:: U til c: u 0 8 ~~ 2l ti 'I:: "0
~ 'C: - > 0
~ ~:;::; 'C:
1:' ~~ OJ u.. Cl c.. 19 20 (a) 20 (b) 21 (a) 21 (b)
N!A
N!A
10,06 Yrs
5,06 Yrs
10.06 Yrs
8,16 Yrs
20,06 Yrs
15,06 Yrs
10,06 Yrs
71
E OJ
.s::: ..., (j) "0 c: OJ
'" o.c: o 0 o~ c: .~ '(ij~
:2 5 22
Paddy
Paddy
Paddy,Maize
Paddy
Paddy
Paddy,Yegetabl es
Paddy,Maize
Paddy
Paddy,Maize
c: 0
~ ~ :; u ~
S2 Q)
:0 ~ 'ro > til
'0 c: til @ <{
23
Q) 01 ~ Qi ':; .c
E 0 OJ
c: Q) (ij E 'ffi til z C/)
2 1
Azuhoto 10
Sumito 11
Lichuyan 12
- New Wozhu 13
- Wozhu (Old) 14
- Changpang Hq 15
Changpang Yill
Ongc
Changpang
16
17
- Lio-Longidang 18
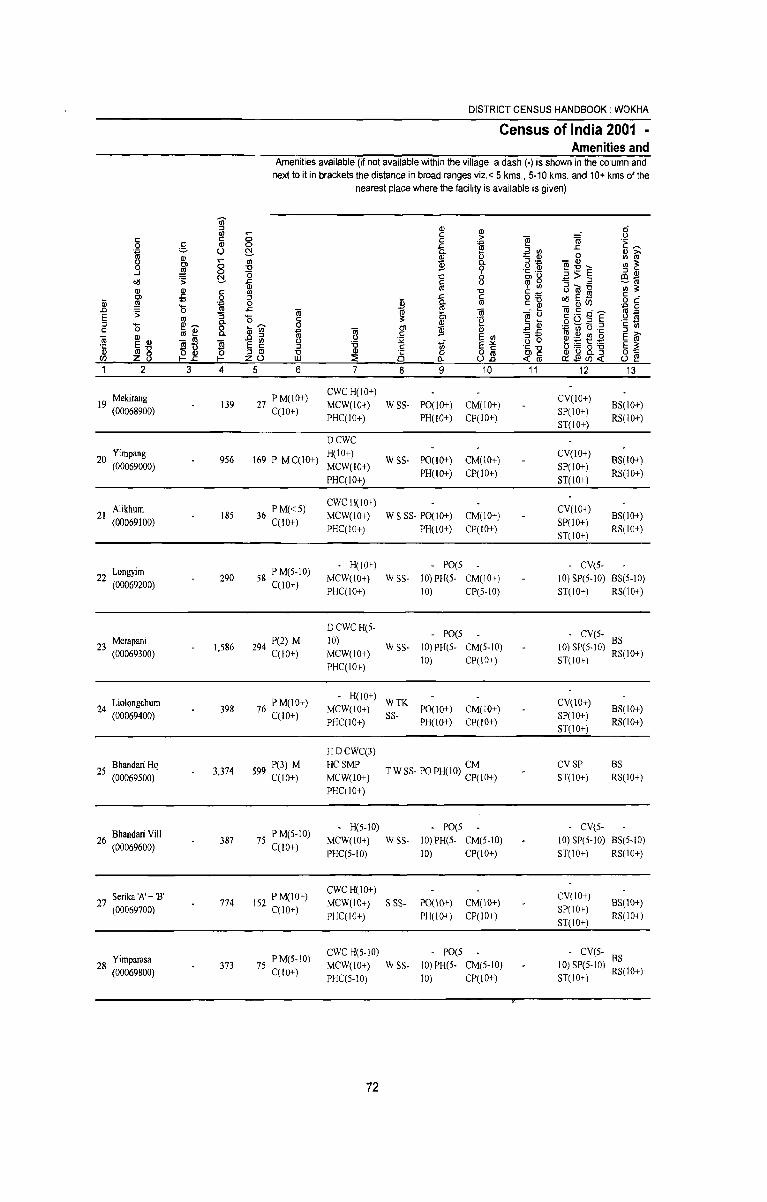
DISTRICT CENSUS HANDBOOK. WOKHA
Census of India 2001 . Amenities and
Amenities available (if not available within the village, a dash (-) is shown in the column and next to it in brackets the distance in broad ranges viz.< 5 kms., 5-10 kms. and 10+ kms of the
nearest place where the facility is available is given)
en :> <Il ID ai (/) .- c: u c e 0 0 > ~ "iii .~ ~ 0 e ID 0 a ~ ..c:
~ v 0 £:!. ~m ID >-Q) Q) 0 U) co .- (/) ]i a. 5 .~ _ Q)
U) ~ 0 C> 0 '0 0 ~:2E ..J ,lg 0 15 8 .~.~ :> Q)
£:!. '0 :2>:;, £0_ ~ ·s ...c: c: co 0 :;, .- -co
Q) Q) ro '0 ' U)
~lN U) ~ Q) e U) 6~ c _
Iii C> ;; 0 :> ,_ ...c: c o c: ~ '0 ."" 0 2 a. <'l c_ ~ _IDU) :.p 0
.0 5 ro ..c: iii (1) ~ "iii ~.!: .QE' .~ ~ E co :; 15 c :;: Ol 'e ~ ~ 0- <Il o~.=!:;, ::J '0 f!!~ 8. Q;'Ul 0 C> ]i :> Q) c (/)
c co ~ ~ ~ c: <Il :!:!..c: ~ ~ U'C E ~ Q) ID .0 ::J E U) :>- ~:e~~ iii g~ ~ u 0 ·c E'O ~ E ~ ::J 13 c: 1i E:¥. ·c U hl'G 8.'g E ;;:: III ~ 8 o Q) ::l III '0 III l§ 0 o c Ole OC::::
I/) I-..c: ZO UJ :::E 0- o2l < co 0::$1/)< (.) ~
1 2 3 4 5 6 7 8 9 10 11 12 13
Mekirang 27 P M(!O+) CWC H(lO+)
CV(IO+) 19 (00068900) 139 MCW(lO+) WSS- PO(IO+) CM(lO+) BS(lO+)
C(lO+) PHC(lO+) PH(lO+) CP(lO+)
SP(IO+) RS(lO+)
ST(lO+)
DCWC Yimpang
956 169 P MC(IO+) H(lO+)
WSS- PO(10+) CM(lO+) CV(lO+)
BS(10+) 20 (00069000) MCW(IO+) PH(IO+) CP(lO+)
SP(IO+) RS(IO+)
PHC(IO+) ST(10+)
Alikhum 36 PM«5) CWCH(IO+)
CV(10+) 21
(00069100) 185
C(IO+) MCW(IO+) W S 5S- PO(lO+) CM(IO~)
SP(lO+) BS(IO+)
PHC(IO+) PH(lO+) CP(lO+) ST(IO+)
RS(IO+)
Longyim 58 P M(5-10) H(lO+) - PO(5 - CV(S-
22 (00069200) 290 MCW(IO+) WSS- 10) PB(5- CM(IO+) 10) SP(5-10) BS(5-10)
C(lO+) PHC(IO+) 10) CP(5-10) ST(IO+) RS(IO+)
DCWCH(5-PO(5 - CV(5- BS Merapani 294 P(2) M 10)
23 (00069300) 1,586 WSS- 10) PB(5- CM(5-10) 10) SP(5·IO) RS(IO+) C(lO+) MCW(IO+)
10) CP(IO+) ST(IO+) PHC(IO+)
24 Liolongthum 76 P M(IO+) - H(IO+)
WTK CV(\O+) 398 MCW(\O+) PO(lO+) CM(IO+) BS(10+)
(00069400) C(lO+) PHC(10+)
SS-PH(lO+) CP(IO+)
SP(IO+) RS(10+)
ST(lO+)
HDCWC(3) Bhandari Hq
3,374 599 P(3) M HCSMP CM CVSP BS 25 (00069500) C(lO+) MCW(IO+) T W 5S- PO PH( 10) CPO 0+) ST(IO+) RS(lO+)
PHC(IO+)
26 Bhandari Viii 75 P M(5-10) - H(5-10) - POtS CV(S-
387 MCW(lO+) WSS- IO)PH(S- CM(5-1O) 10) SP(S-IO) BS(5-1O) (00069600) C(lO+)
PHC(S-IO) 10) CP(lO+) ST(lO+) RS(IO+)
Serika 'A' + 'B' 152 PM(IO+) ewc H(IO+)
CV(IO+) 27 (00069700) 774 MCW(IO+) S SS- PO(lO+) CM(10+) BS(10+)
C(IO+) PHC(IO+) PH(lO+) CP(IO+)
SP(IO+) RS(10+)
ST(10+)
Yimparasa 75 PM(5-10) ewe H(5-10) POtS CV(S-
BS 28 (00069800)
373 MCW(lO+) WSS- 10)PH(S- CM(5-1O) 10) SP(5-IO) RS(10+) C(IO+)
PHC(S-IO) 10) CP(IO+) ST(IO+)
72
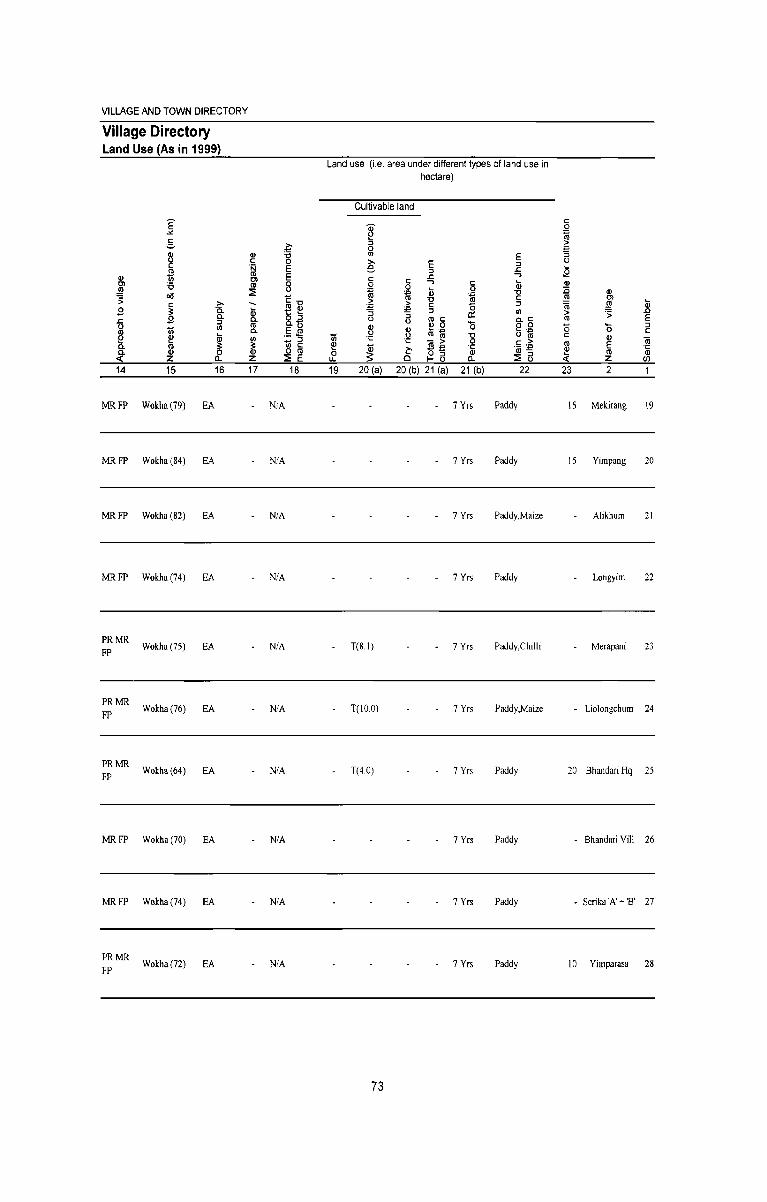
VILLAGE AND TOWN DIRECTORY
Village Directory Land Use (As in 1999)
E "" c ~
?3 C III
Q) u; Cl '0 ~ o(! .:;:
C .s ~ .l: .s l) ro u; e ~ c. ro c. Q)
~ Z 14 15
MRFP Wokha(79) EA
MR FP Wokha (84) EA
MR FP Wokha (82) EA
MR FP Wokha (74) EA
PRMR FP
PRMR FP
PRMR FP
Wokha(75)
Wokha(76)
Wokha(64)
EA
EA
EA
MR FP Wokha (70) EA
MR FP Wokha (74) EA
PRMR FP
Wokha(72) EA
>-15. C. :l rJ)
Iii ~
Q.
16
.i!' Q) '0 c 0 .j;j E III Cl E tV 8 ::i:
C"O III Q)
Q; t:: ... c. 8. 2 tV
. S .M c. rJ)
_ :J
~ rJ) C o tV
Z ::i: E 17 18
NiA
N/A
N/A
N/A
N/A
N/A
N/A
N/A
N/A
N/A
Land use (i.e. area under different types of land use in hectare)
Cultivable land c
~ 0
~ :l > 0 "" rJ) E "S >- E :l U e ~
:l .l: oS! c .l: ....,
0 c ...., c Q; Q) 0 0 :0 ~ ~ Q;
~ "0 Q)
> "0 c ~ Cl Q; > c (5 :l ·iii ~ "" :E "5 :l 0:: rJ) > :;: .Q
:l E l) l) ro c C.C tV Q) ~~ 0 o 0 0 .... :l l) ?3 o~ 0 c
u; ·c "0 C Q) "iii ~
·c - > 0 c .::: tV E ~ ~ ~E .~ 'n; :!:! ~ .~
0 ro LL Cl f- il Q. ::i: il « z (J)
19 20 (a) 20 (b) 21 (a) 21 (b) 22 23 2 1
7 Yrs Paddy 15 Mekirang 19
7 Yrs Paddy 15 Yimpang 20
7 Yrs Paddy,Maize Alikhum 21
7Yrs Paddy Longyim 22
T(8.1) 7 Yrs Paddy,Chilii Merapani 23
T(lO 0) 7 Yrs Paddy,Maize - Liolongchum 24
T(40) 7Yrs Paddy 20 Bhandari Hq 25
7 Yrs Paddy - Bhandari ViII 26
7 Yrs Paddy - Serika 'A' + '8' 27
7 Yrs Paddy 10 Yimparasa 28
73
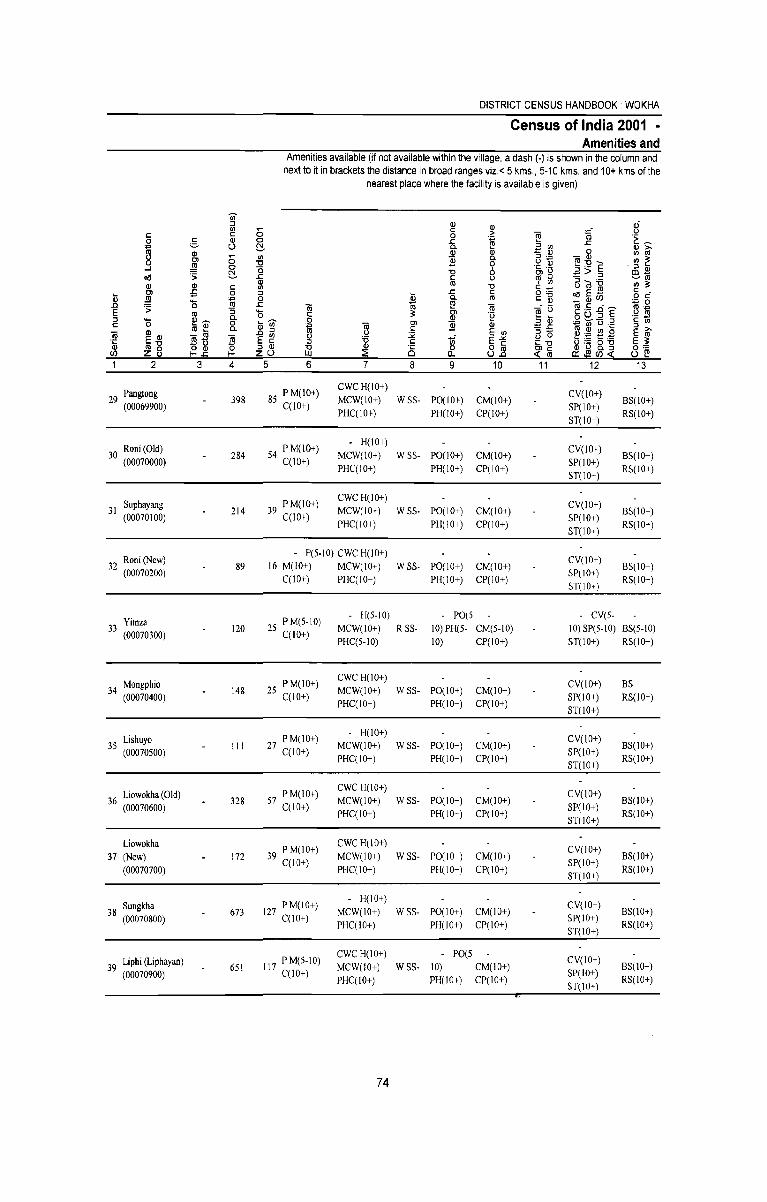
DISTRICT CENSUS HANDBOOK· WOKHA
Census of India 2001 -Amenities and
Amenities available (if not available within the village, a dash (-J is shown in the column and next to it in brackets the distance in broad ranges viz.< 5 kms., 5-10 kms. and 10+ kms of the
nearest place where the facility is available is given)
Ii) ::J (]) (]) Gi U) ;; e ()
e e 0 > ~ iii .~ ~ 0 e (]) 0 J:: . .::;
~ ;=.. l> ~ 0. ~ ~ ~
J:: (]) '" (])
~ (]) (]) 0 U) til
Ol U) ]l 0. o-"=' - (])
. ~ ~ 0 Jl1 0 -0
~ - (]) ro-o .... ...J 0 (5 -0 en 'u ii>~ al~ 011 S ~ .r:: e () ro 0 ~tIl
(]) (]) OJ ro -0 ' '" aro~ U) :;: e U) e_ oaElB e _ Ol :5 0 ::J ~ J:: c: o .-
iii Jl1 16 0 ~
0. ro t:_ ~ _OJC/) o c: '0 J:: ~ +=i 0 ..0 'iii 'iii ~ .f .ri E rl .iij E
.s; ro 3 '0 c :;: Ol .~ ~ ~ o l> :J a. (]) .- ...
::J '0 ~~ 0 iilfi) 0 Ol ]l ::J (]) :; 1"U 'E e U)
e ., ~ OJ ~J::
:J '" ro e a. ..0 ::J ~ e E U) :J-'iii (]) OJ I§~ ~ () 0 ~ ~ ~ ,.g E ro
.;: E-o ~ E g? :J ii e if E"'"' 'C "'0 ~'i3 g_-g E :;: OJ ~8 o OJ :J (]) -0 OJ 8 0 o e Ole 0=
C/) t-.r:: t- Zl> UJ ~ Cl.. l>~ ~ ro c::oI!1C/)~ l> e! 1 2 3 4 5 6 7 8 9 10 11 12 13
Pangtong 85 P M(lO+) CWCH(IO+)
CY(IO+) 29 (00069900) 398 MCW(IO+) WSS- PO(lO+) CM(IO+) BS(lO+)
C(lO+) PHCC I 0+) PH(IO+) CP(10+)
SP(lO+) RS(IO+)
ST(IO+)
Roni(Old) 54 PM(10+) - H(IO+)
CY(lO+) 30 (00070000) 284 MCW(IO+) WSS- PO(IO+) CM(lO+) BS(IO+)
C(lO+) PHCCIO+) PH(lO+) CP(IO+)
SP(IO+) RS(lO+)
ST(lO+)
Suphayang 39 PM(10+) CWCH(IO+)
CY(IO+) 31 214 MCW(IO+) WSS- PO(IO+) CM(IO+) BS(IO+)
(00070100) C(10+) PHCCI O+) PH(IO+) CP(lO+)
SP(lO+) RS(10+)
ST(IOT)
? Roni (New) P(5-10) CWCH(lO+)
CY(10+) 3_ (00070200) 89 16 M(IO+) MCW(IO+) WSS- PO(IO+) CM(lO+)
SP(IO+) BS(lO+)
C(lO+) PHCCIO+) PH(10+) CP(IO+) ST(lOT)
RS(IO+)
Yimza 25 PM(5-10) H(5-IO) PO(5 CY(5-
33 120 MCW(IO+) RSS- 10) PH(5- CM(5-10) 10) SP(5-10) BS(5-10) (00070300) C(lO+)
PHCC5-10) 10) CP(IO+) ST(IO+) RS(IO+)
Mongphio 25 PM(lO+) CWC H(IO+)
CY(lO+) BS 34 (00070400) 148 MCW(JO+) WSS- PO(JO+) CM(IO+)
C(10+) PHCCIO+) PH(JO+) CP(IO+)
SP(lO+) RS(lO+) ST(lO+)
Lishuyo 27 PM(lO+) H(IO+)
CY(IO+) 35 (00070500) III MCW(IO+) WSS- PO(JO+) CM(IO+) BS(IO+)
C(lO+) PHCCIO+) PH(IO-) CP(IO+)
SP(lO+) RS(IO+)
ST(IO+)
36 Liowokha (Old) 57 PM(lO+) CWCH(IO+)
CY(lO+) 328 MCW(lO+) WSS- PO(IO+) CM(IO+) BS(IO+)
(00070600) C(lO+) PHCCI O+) PH(IO+) CP(IO+)
SP(lO+) RS(IO+)
ST(lO+)
Liowokha 39 P M(IO+)
CWC H(lO+) CY(IO+)
37 (New) 172 MCW(IO+) WSS- PO(IO+) CM(JO+) BS(lO+)
(00070700) CCIO+)
PHC(IO+) PH(IO-) CP(IO+) SP(IO+)
RS(lO+) ST(IO+)
Sungkha 127 P M(lO+) - H(lO+)
CY(IO+) 38 (00070800) 673 MCW(10+) WSS- PO(lO+) CM(lO+)
SP(IO+) BS(lO+)
C(lO+) PHC(IO+) PH(IO+) CP(IO+) RS(IO+)
ST(lO+)
39 Liphi (Liphayan) 117 PM(5-IO) ewc H(IO+) PO(5
CY(IO+) 651 MCW(IO+) WSS- 10) CM(IO+) BS(lO+)
(00070900) C(10+) PHC(IO+) PH(10+) CP(10+)
SP(IO+) RS(lO+)
ST(IO+)
74
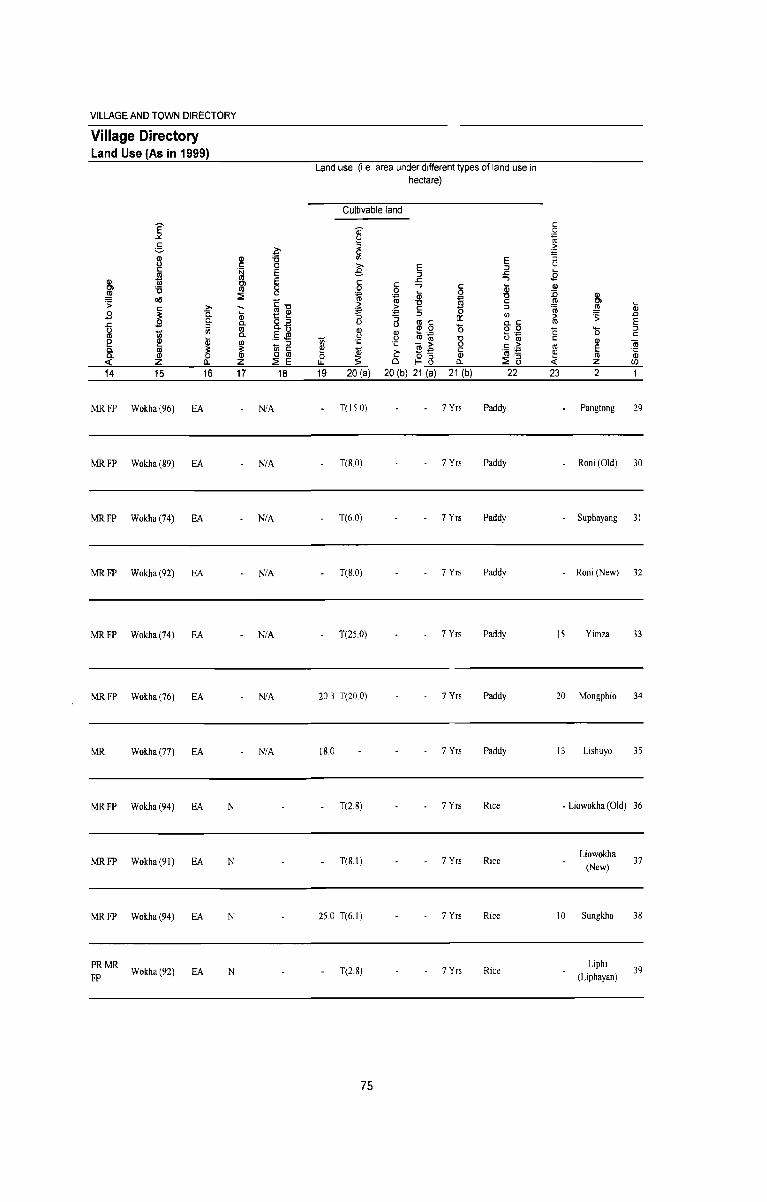
VILLAGE AND TOWN DIRECTORY
Village Directory Land Use (As in 1999)
Land use (i.e. area under different types of land use in hectare)
Cultivable land
E ~ c 0
.Y. ~ g b ::l > 0 .,
1Il Q) '6 tfJ E :; c 0 e E tJ
c 'N E ::l
~ (1l ::l .s:: S Q) 1;) (1l E c 1: -,
Cl C -, Cl '6 (1l 8 0 c iii Q)
~ 0 0
<>IS :::i: ~ iij iii jg -0 :is Q)
.:;: C-o u c .!!! 0> C >- > > C ::l 'iii ~ iii
.9 ~ c. iii III Q) B .,
::l 0 tfJ .c t ~ :; oc > :;: .9 0. 0. o ::l III C o.c III E 1: ::l 0
tJ 1;) til (1l 0.1) ~ ~~ '0 o 0 '0 ..... :J
III 0. .~ J!! ~ t;~ 0 c e !!! iii 1il ·c u c Q) til _ ::l ·c - > 0 c .~ 'iii 0. III ~ ~ til C i!! ! g~ '&3
III E .~ 0. Q) o (1l 0 c::- o ::l 'iii "" ~ III
~ Z a.. z :::i: E u. 0 f- l) a.. :::i: a z (/)
14 15 16 17 18 19 20 (a) 20 (b) 21 (a) 21 (b) 22 23 2 1
MRFP Wokha(96) EA N/A T(150) 7 Yrs Paddy Pangtong 29
MR FP Wokha (89) EA N/A T(80) 7 Yrs Paddy - Roni (Old) 30
MRFP Wokha(74) EA N/A T(60) 7 Yrs Paddy - Suphayang 31
MR FP Wokha (92) EA N/A T(S.O) 7 Yrs Paddy - Roni (New) 32
MR FP Wokha (74) EA NIA T(25 0) 7 Yrs Paddy 15 Yirnza 33
MR FP Wokha (76) EA N/A 203 T(20.0) 7 Yrs Paddy 20 Mongphio 34
MR Wokha (77) EA N/A 18.0 7 Yrs Paddy 13 Lishuyo 35
MRFP Wokba(94) EA N T(2.S) 7 Yrs Rice - Liowokha (Old) 36
MRFP Wokha(91) EA N T(8.1) 7 Yrs Rice Liowokha
37 (New)
MRFP Wokha(94) EA N 25.0 T(6.1) 7 Yrs Rice 10 Sungkha 38
PRMR Wokha(92) N T(2.g) 7 Yrs Rice
Liphi 39
FP EA (Liphayan)
75
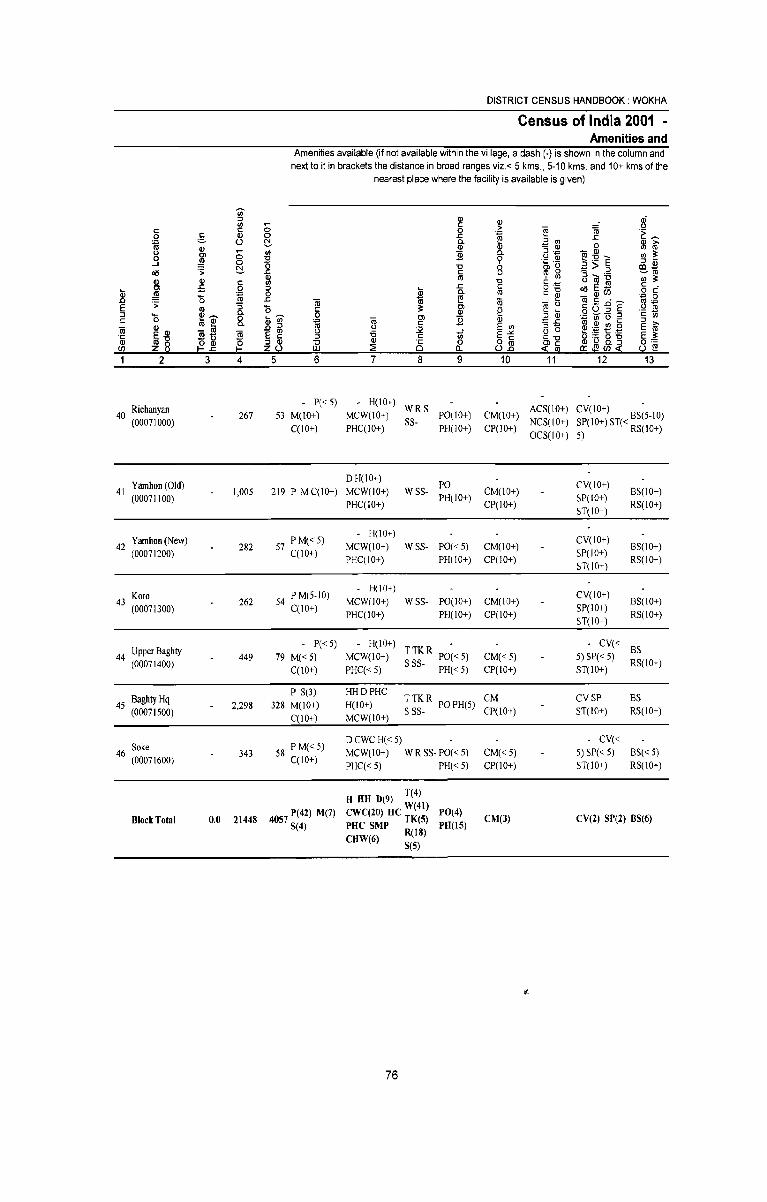
2
Richanyan 40 (00071000)
41 Yamhon (Old) (00071100)
42 Yamhon (New) (00071200)
43 Koro (00071300)
44 Upper Baghty (00071400)
45 Baghty Hq (00071500)
Soke 46 (00071600)
Block Total
3
... o o ~ c: o ~ :; Cl.
8.
~ 4
267
1,005
282
262
449
2,298
343
DISTRICT CENSUS HANDBOOK: WOKHA
Census of India 2001 -Amenities and
Amenities available (if not available within the village, a dash (-) is shown in the column and next to it in brackets the distance in broad ranges viz. < 5 kms., 5-10 kms. and 10+ kms of the
nearest place where the facility is available is given)
5
ro c: o
~ :J 1J UJ
6 7 8 9 10 11
- P«5) 53 M(IO+)
C(lO+)
- H(IO+) WRS ACS(10+) MCW(IO+) SS- PO(lO+) CM(IO+) NCS(IO+) PHC(IO+) PH(IO+) CP(lO+)
DH(lO+) 219 P MC(IO+) MCW(IO+)
PHC(JO+) WSS- ~~(IO+) CM(10+)
CP(IO+)
57 P M« 5) C(10+)
54 P M(5-10) C(IO+)
- H(lO+) MCW(IO+) PHC(IO+)
- H(IO+) MCW(IO+) PHC(IO+)
W ss- PO« 5) CM(lO+) PH(10+) CP(IO+)
W SS- PO(IO+) CM(IO+) PH(lO+) CP(lO+)
- P« 5) - H(IO+) -79 M«5) MCW(IO+) TTKR PO«5)
C(10+) PHC« 5) S SS- PH« 5) CM«5) CP(IO+)
P S(3) 328 M(lO+)
C(lO+)
58 PM«5) C(lO+)
HHDPHC H(IO+) MCW(JO+)
T TK R PO PH(5) CM S 55- CP(lO+)
D ewe H« 5) MCW(l 0+) W R SS- POe < 5) PHC« 5) PH« 5)
T(4) H HH D(9) W(41)
CM«5) CP(lO+)
OCS(IO+)
12 13
CV(IO+) SP(lO+) ST« BS(5-10) 5) RS(IO+)
CV(IO+) SP(IO+) ST(IO+)
CV(10+) SP(lO+) ST(10+)
CV(IO+) SP(lO+) ST(JO+)
BS(IO+) RS(IO+)
BS(IO+) RS(IO+)
BS(IO+) RS(IO+)
CV« BS 5) SP( < 5) RS(1 0+) ST(lO+)
CVSP ST(10+)
CV« 5) SP« 5) ST(lO+)
BS RS(lO+)
BS« 5)
RS(lO+)
4057 P(42) M(7)
0.0 21448 S(4) CWC(20) HC TK(5) PHC SMP CHW(6) R(18)
PO(4)
PU(IS) CM(3) CV(2) SP(2) BS(6)
S(5)
76
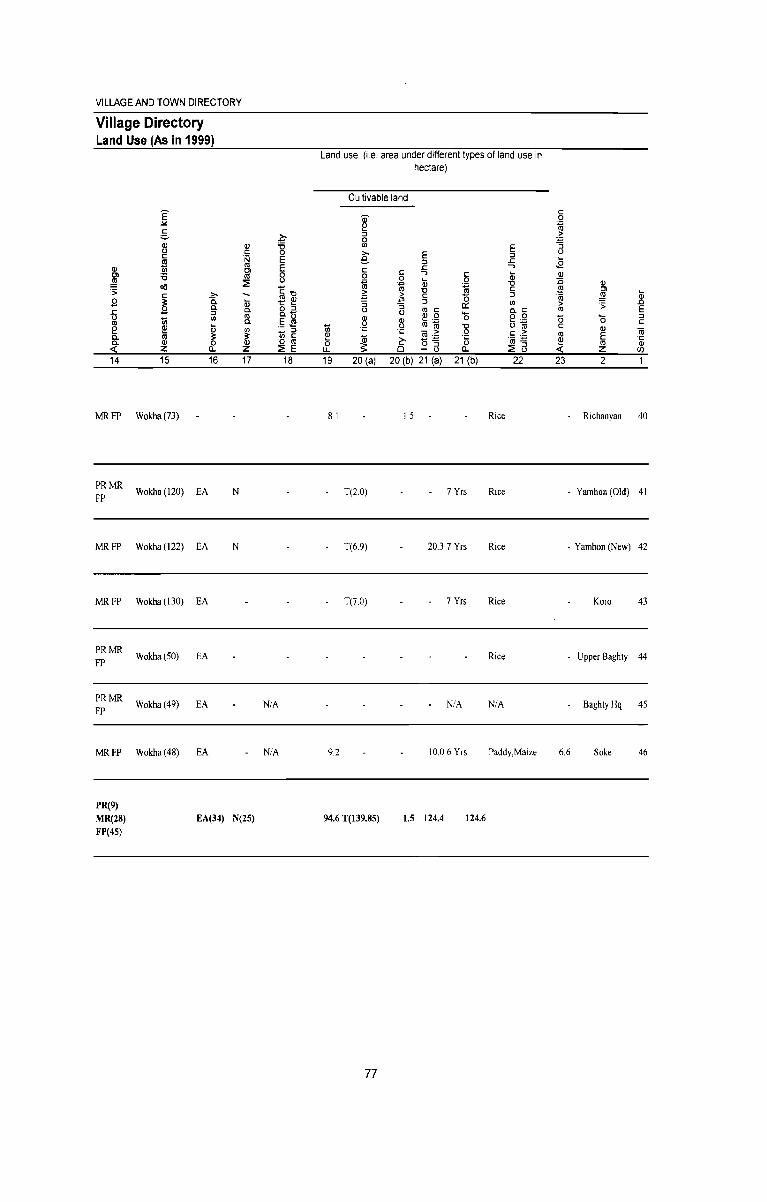
VILLAGE AND TOWN DIRECTORY
Village Directory Land Use (As in 1999)
E "" g Q) u c 1!!
Q) III CI '0 ~
"" .s; c
9 ~ .t:: U U; (Il
e ~ a. (Il a. (J)
~ z 14 15
MR FP Wokha (73)
PRMR FP
Wokha (120) EA
MR FP Wokha (122) EA
MRFP Wokha(130) EA
PRMR Wokha(50) EA
FP
PRMR Wokha(49) EA
FP
MRFP Wokha(48) EA
,., a. a. ::J III
Q; ::: 0 c.. 16
N
N
Q) c 'N (Il CI (Il
::: -~ Q) a. (Il a. III
~ z 17
PR(9) MR(28) FP(45)
EA(34) N(25)
~ '0 0 E E 8 -C'O (Il Q) t::: ~ o ::J a.t5 .~ .!'!1 _ ::J
(/) C o ro ::: E
18
N/A
N/A
Land use (ie. area under different types of land use in hectare)
Cultivable land c
~ 0
~ ::J > 0 ., III E ""5 >- E u e ::J
~
::J .t:: S .t:: ...., c c -, c ~ Q) 0 0 (J)
~ Q; 0 :n iij ~
'0 .!!!
Q)
> '0 C C> Q; .., > C ::J 'iii .!!! :;:l ::J .0 'S ""5 0:: III > .s;
U (Il C a.c ro E u
*~ ..... o 0 ::J
~ 0 (5 '0 ~ (jiij c U; ·c '0 c Q) ·c - > 0 c: .~ (ij ~ .s~ ro E
~ ~ .;::
"cu ~ i!! .;::
0 o ::J (J) (Il (J) LL 0 f- u c.. ::: a <1; z (f)
19 20 (a) 20 (b) 21 (a) 21 (b) 22 23 2 1
8.1 1.5 Rice Richanyan 40
T(2.0) 7 Yrs Rice - Yarnhon (Old) 41
T(6.9) 20.3 7Yrs Rice - Yamhon (New) 42
T(7.0) 7 Yrs Rice Koro 43
Rice - Upper Baghty 44
N/A N/A Baghty Hq 45
9.2 10.06 Yrs Paddy,Maize 6.6 Soke 46
94.6 T(139.85) 1.5 124.4 124.6
77

'-

SANIS RD BLOCK
:!,
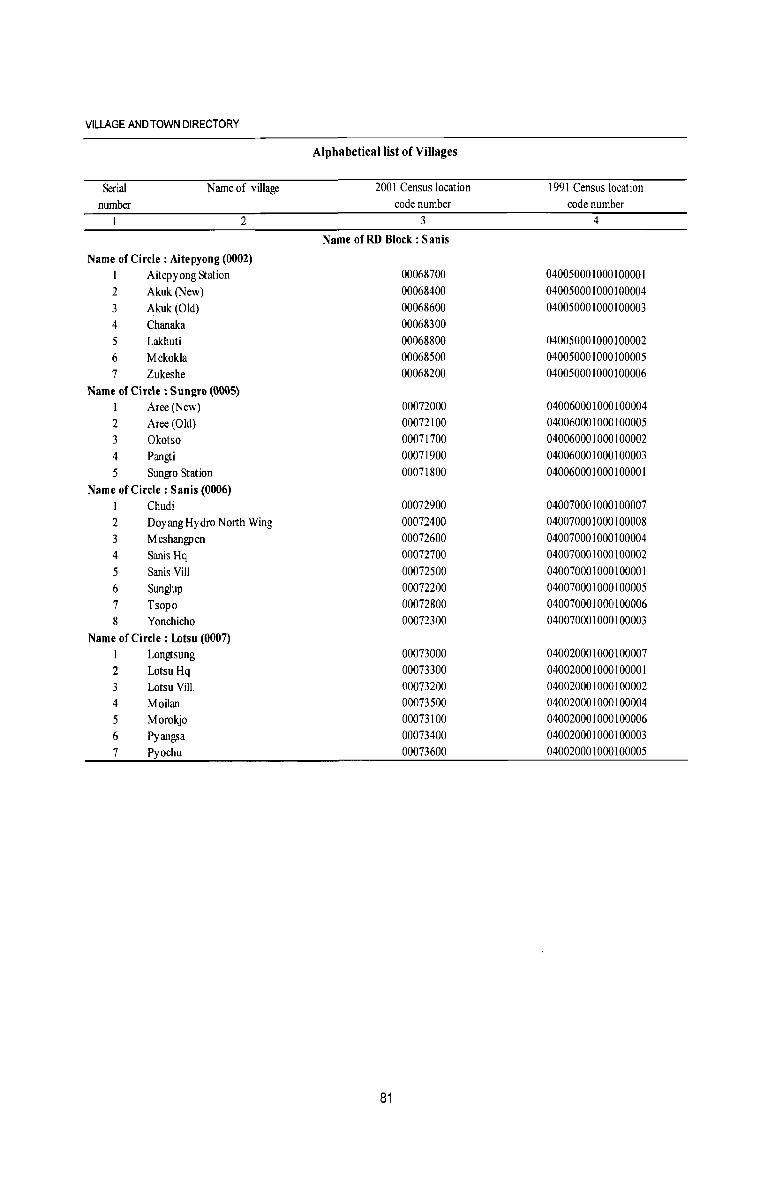
VILLAGE AND TOWN DIRECTORY
Alphabetical list of Villages
Serial Name of village 2001 Census location 1991 Census location number code number code number
2 3 4
Name ofRO Block: Sanis
Name of Circle: Aitepyong (0002) I Aitepyong Station 00068700 040050001000100001 2 Akuk (New) 00068400 040050001000100004 3 Akuk (Old) 00068600 040050001000100003 4 Chanaka 00068300 5 Lakhuti 00068800 040050001000100002 6 Mekokla 00068500 040050001000100005 7 Zukeshe 00068200 040050001000100006
Name of Circle: Sungro (0005) 1 Aree (New) 00072000 040060001000100004 2 Aree (Old) 00072100 040060001000100005 3 Okotso 00071700 040060001000100002 4 Pangti 00071900 040060001000100003 5 Sungro Station 00071800 040060001000100001
Name of Circle: Sanis (0006) 1 Chudi 00072900 040070001000100007 2 Doyang Hydro North Wing 00072400 040070001000100008 3 Meshangpen 00072600 040070001000100004 4 Sanis Hq 00072700 040070001000100002 5 Sanis ViII 00072500 040070001000100001 6 Sunglup 00072200 040070001000100005 7 Tsopo 00072800 040070001000100006 8 Yonchicho 00072300 040070001000100003
Name of Circle: Lotsu (0007) 1 Longtsung 00073000 040020001000100007 2 Lotsu Hq 00073300 040020001000100001 3 Lotsu Vill. 00073200 040020001000100002 4 Moilan 00073500 040020001000100004 5 Morokjo 00073100 040020001000100006 6 Pyang;a 00073400 040020001000100003 7 Pyochu 00073600 040020001000100005
81
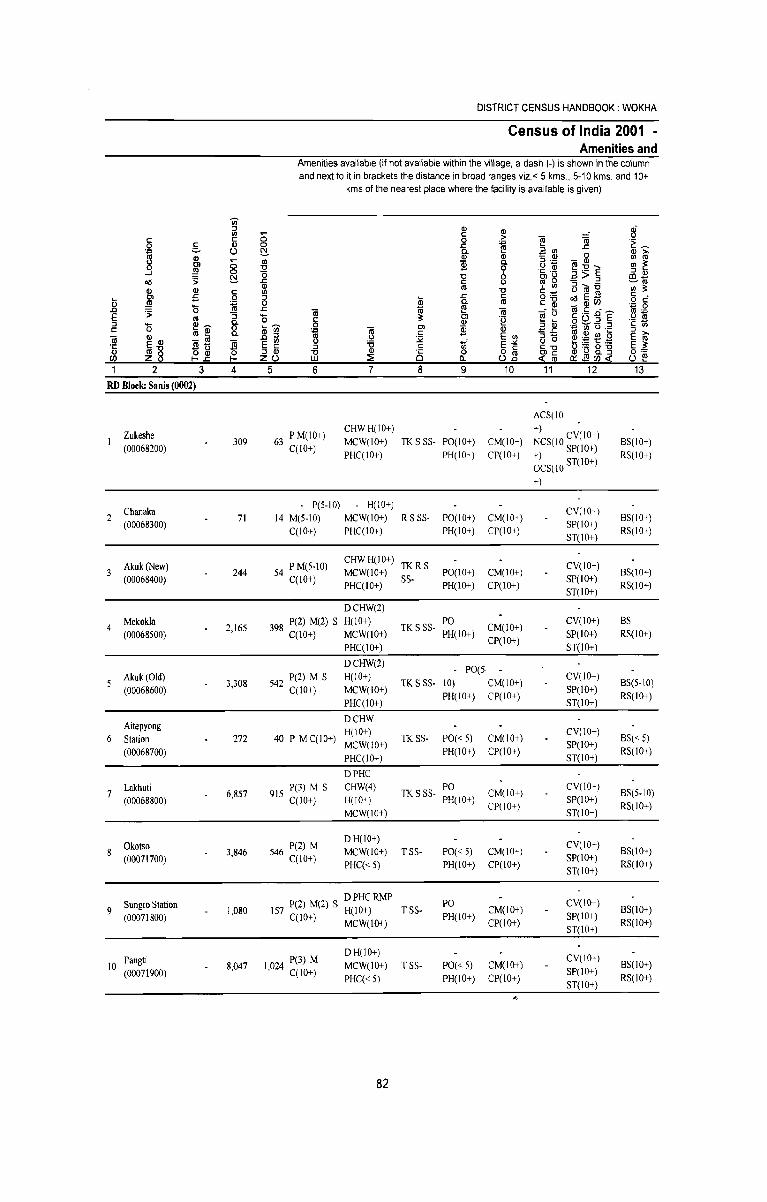
DISTRICT CENSUS HANDBOOK: WOKHA
Census of India 2001 . Amenities and
Amenities available (if not available within the village, a dash (-) is shown in the column and next to it in brackets the distance in broad ranges viz. < 5 kms , 5-10 kms. and 10+
kms of the nearest place where the facility is available is given)
Iii' :J Gl Gl e-li) ;; e: e: e: 0 > ~ iii 0 e: Gl 0 .r: "" .r: .~ ~
§ c- O ~ a. f! ~ ~ Gl >-Gl ~
Gl Gl 0 II) m Ol '" $ a. 0+=1 - Q)
II) 1: 0 U ~~E -l ~ 0 0 ~ '§' .~ :J Q) ~ U f!>:J CD ....
cIS .s; .r: e: m 0 ~m
Gl Gl Gl m U
' II) 5rn'6 '" :: e: '" e:_ Ol :5 0 :J 2
.r: e: o ._ cIS E.g e: _
iii ,m ~ 0 a. m c:~ ~ _GlCl) o e: '0 .r: f! :::; 0
.0 .s; iii m iii ~ .~ .ri E rl"" E :; .... :: Cl iii (.) m 0 e: 'e oo:J ._ j9 :J '0 I!!~ a. 0 Q) ~ (i5 e: '" e: m i!! 0 ~~ 3 ~
Cl $ Gl :!:!.r: ~ Vi "0 .~ :J >-a. e: ! ~ ~ ,g iii Q) - t1l :i: E U) ::I- E m
E Q) ]i E ~ '6 .... E-'" (.) 0
'5i .Eltl :J e: III 'i:: "'0 hl'13 g_"§ E :: mU
~~ ~ :J Q) U Q) ·c 0 o e: Ole: 0=
CI) z 8 zo w :::!: Cl o._ 02 <{ m O::~CI)<{ U ~ 1 2 3 4 5 6 7 8 g 10 11 12 13
RD Block: Sanis (0002)
ACS(lO
Zukeshe 63 PM(IO+) CHWH(IO+) +)
(00068200) 309 MCW(IO+) TK S SS- PO(IO+) CM(IO+) NCS(IO CV(lO+) 8S(10+)
C(lO+) PHC(IO+) PH(IO+) CP(IO+) +) SP(IO+) RS(IO+)
OCS(lO ST(IO+)
+)
Chanaka P(5-10) H(IO+)
CV(IO+) 2 71 14 M(5-IO) MCW(10+) R S SS- PO(10+) CM(IO+) 8S(10+)
(00068300) C(10+) PHC(IO+) PH(IO+) CP(lO+)
SP(IO+) RS(IO+)
ST(IO+)
Akuk(New) 54 PM(5-1O) CHW H(I 0+)
TKRS CV(10+) (00068400)
244 C(10+)
MCW(lO+) SS-
PO(IO+) CM(IO+) SP(10+)
8S(10+) PHC(10+) PH(lO+) CP(IO+)
ST(IO+) RS(IO+)
DCHW(2)
4 Mekokla
2,165 398 P(2) M(2) S H(IO+) TK S SS-
PO CM(10+)
CV(IO+) BS (00068500) C(10+) MCW(IO+) PH(10+)
CP(IO+) SP(lO+) RS(lO+)
PHC(IO+) ST(lO+)
DCHW(2) - PO(5
Akuk(Old) 3,308 542 P(2) M S H(IO+)
TK S SS- 10) CM(IO+) CV(10+)
8S(5-10) (00068600) C(lO+) MCW(lO+)
PH(10+) CP(IO+) SP(IO+)
RS(IO+) PHC(10+) ST(lO+)
Aitepyong DCHW
6 Station 272 40 P M C(IO+) H(IO+)
TKSS- PO« 5) CM(IO+) CV(10+)
8S« 5) (00068700)
MCW(IO+) PH(IO+) CP(IO+)
SP(lO+) RS(10+)
PHC(IO+) ST(10+)
DPHC
7 Lakhuti
6,857 915 P(3) M S CHW(4) TK S SS-
PO CM(IO+)
CV(IO+) 8S(5-IO)
(00068800) C(10+) H(IO+) PH(IO+) CP(IO+)
SP(lO+) RS(IO+)
MCW(lO+) ST(10+)
Okotso 546 P(2) M DH(IO+)
CV(lO+) 8
(00071700) 3,846
C(10+) MCW(10+) TSS- PO« 5) CM(IO+)
SP(IO+) 8S(IO+)
PHC« 5) PH(IO+) CP(IO+) ST(10+)
RS(IO+)
DPHCRMP PO CV(10+)
9 Sungro Station
1,080 157 P(2) M(2) S H(IO+) TSS- CM(IO+) 8S(10+) (00071800) C(10+) MCW(10+) PH(10+)
CP(IO+) SP(IO+)
RS(IO+) ST(lO+)
Pangti 1024 P(3) M D H(10+)
CV(IO+) 10 8,047 MCW(lO+) TSS- PO«5) CM(IO+) 8S(IO+)
(00071900) , C(IO+) PHC« 5) PH(lO+) CP(lO+)
SP(IO+) RS(lO+)
ST(IO+) •.
82
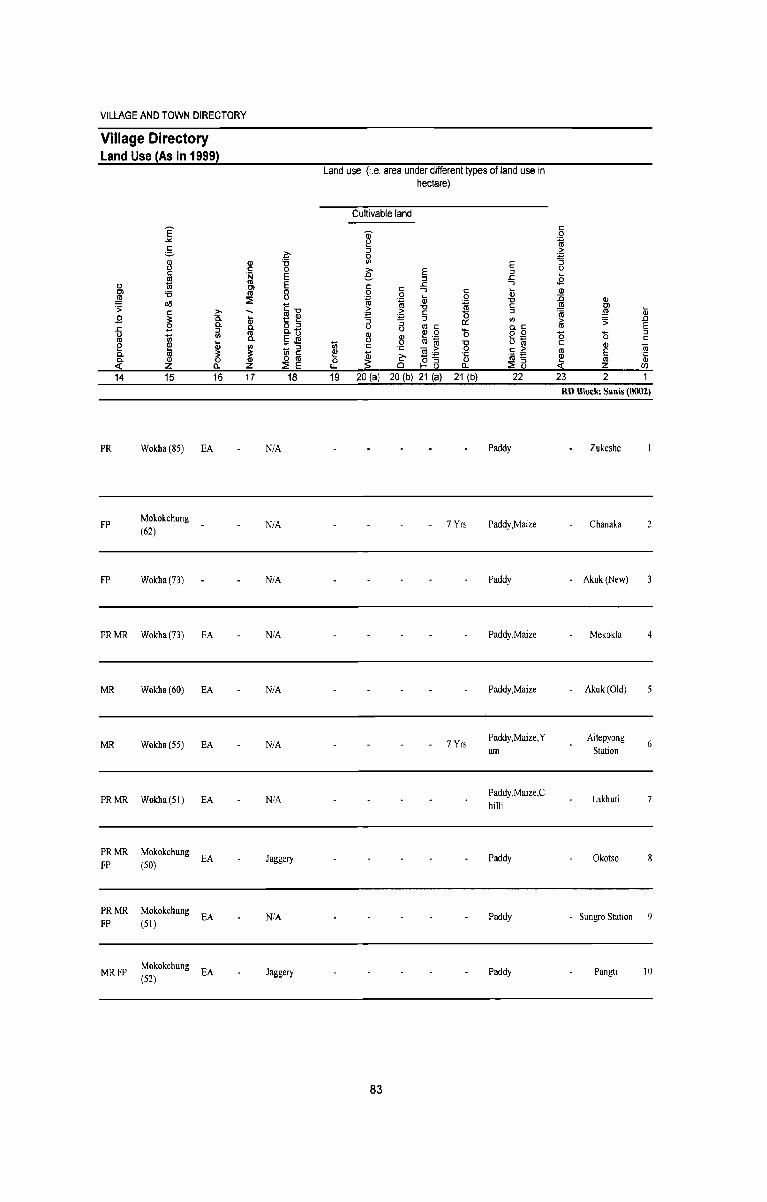
VILLAGE AND TOWN DIRECTORY
Village Directory Land Use (As in 1999)
14
PR
FP
FP
15
Wokha (85) EA
Mokokchung (62)
Wokha(73)
,., Q. c. ::l r/)
~ c.. 16
PR MR Wokha (73) EA
MR Wokha(60) EA
MR Wokha(55) EA
PRMR Wokha (51) EA
PRMR Mokokchung EA
FP (50)
PRMR Mokokchung EA
FP (51)
MRFP Mokokchung
EA (52)
17
N/A
N/A
N/A
N/A
N/A
N/A
NiA
?;-
"8 E E 8 ... <::"0 ~ ~ o ::l c.ts E til ._ -... ::l r/) C o til ~ E
18
Jaggery
NiA
Jaggery
Land use (Le. area under different types of land use in hectare)
1il ~ o
LJ...
19
Cultivable land
E ::l
.I: ..., ~ "0 <:: ::l
20 (a) 20 (b) 21 (a)
83
21 (b)
7 Yrs
7 Yrs
E ::l
.I: ..., ~ "0 C ::l r/)
c.<:: o 0 o~ c .2: 'iii :!:!
~ a 22
Paddy
Paddy,Maize
Paddy
Paddy,Maize
Paddy,Maize
Paddy,Maize, Y am
Paddy,Maize,C hilli
Paddy
Paddy
Paddy
23
Q) C)
~ .s: '0 Q)
E til Z
2 RD Block: Sanis (0002)
Zukeshe
Chanaka 2
• Akuk(New)
Mekokla 4
Akuk(Old)
Aitepyong 6
Station
Lakhuti
Okotso
- Sungro Station 9
Pangti 10
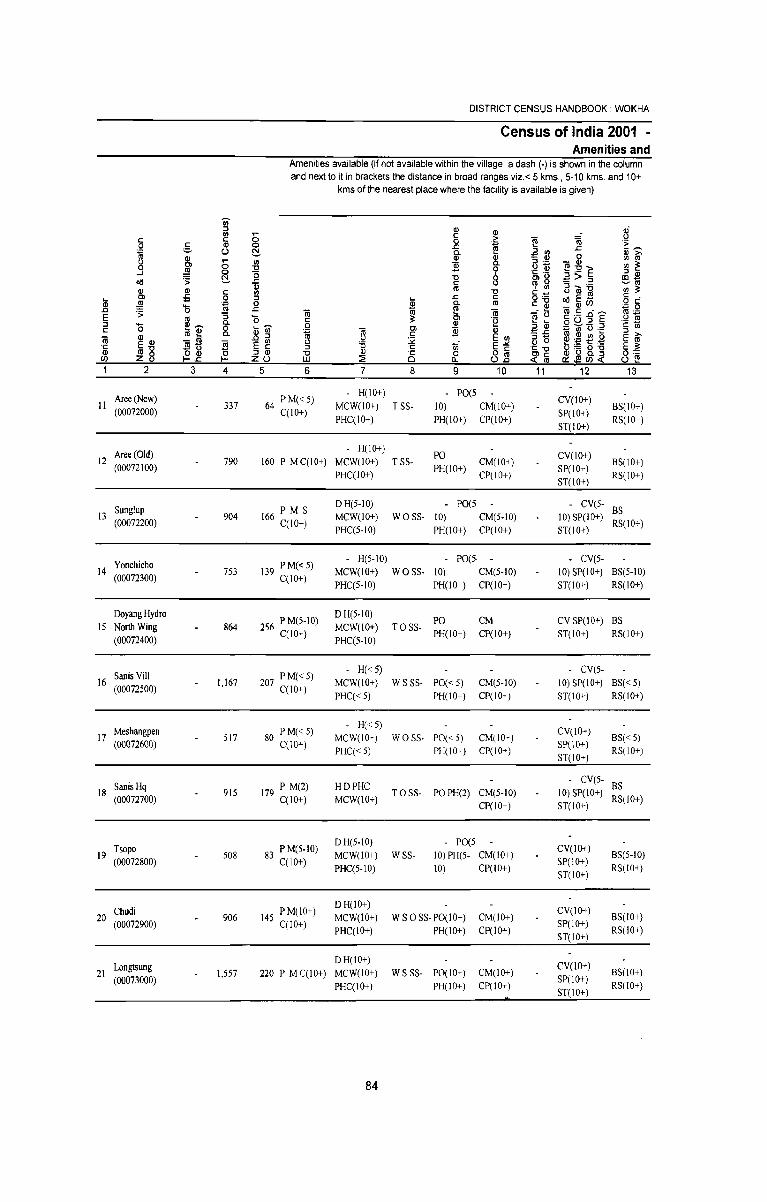
DISTRICT CENSUS HANDBOOK: WOKHA
Census of India 2001 . Amenities and
Amenities available (if not available within the village, a dash (-) is shown in the column and next to it in brackets the distance in broad ranges viz. < 5 kms., 5-10 kms. and 10+
kms of the nearest place where the facility is available is given)
Ui" :::I Q) Q) ~ 1/1 ;; e c: c: 0 > ~ til .~ ~ 0 §. Q) 0 .c ~ .c
~ U ~ a. ~ ~ Q) >-
Q) Q) Q) 0 1/1 ro ;; 1/1 a. ,Q 1i - Q) 1/1 ~ Ol ]i ~:EE 0
::\ll 1J
~ ...J 0 (5 e;, TS :::I Q) ~ 1J "'>:::1 1Il_
«I '> .c e ro 0 :::I ._ ~ro
Q) Q) ro "0 ' 1/1 ~~N 1/1 3: Q) e 1/1 6:!: Ol :5 0 :::I .c e c: _ ... ::\ll ~ 0 !i a. ro ~~ _Q)U) o e Q)
'0 .c ~ :;::; 0 .c iii ro til ro e - ~ ~~ E '> ro "5 '0 c: 3: Cl 'e ~ ~ § u.g E
:::I '0 I!!~ a. 0 Q) :::I Q) ~ 00.~ 'c t;; 0 '-~ Ol ]i Q) e ro I!! a. Q) 1/1
~ ~ e E 1/1 "'.c ~~~g
:::I >-Q) Q) ..0 :::I :::I- E ro iii -.!]I iii E ~ 15 ~ of E""" o 0
E 3: ·c
~8 .!]I 0 :::I e 'r: "'0 &lli 8. -g Q) o Q) ~ :::I Q) "C Q) 8 0 o e Ole 0:= en I-.c ZU W :2 Il.. u2 <l: ro a::roen<l: U ~ 1 2 3 4 5 6 7 8 9 10 11 12 13
Aree (New) 64 PM«5) - H(IO+) - PO(5
CV(IO+) II 337 MCW(lO+) T SS- 10) CM(IO"') BS(IO,)
(00072000) qIO+) PHC(IO+) PH(IO+) CP(lO+)
SP(IO+) RS(lO+)
ST(IO+)
Aree (Old) H(IO+)
PO CV(10+) 12
(00072100) 790 160 P M q10+) MCW(IO+) T SS-
PH(lO+) CM(IO+)
SP(IO+) BS(IO+)
PHC(10+) CP(IO+) ST(10+)
RS(IO+)
Sunglup PMS D H(5-1O) - PO(5 - CV(5-
BS 13
(00072200) 904 166 qIO+) MCW(IO+) WOSS- 10) CM(5-1O) 10) SP(IO+)
RS(lO+) PHC(5-10) PH(IO+) CP(IO+) ST(IO+)
Yonchicho 139 PM«5) - H(5-10) - PO(5 - CV(5-
14 (00072300)
753 MCW(lO+) WOSS- 10) CM(5-10) 10) SP(IO+) BS(5-10) qIO+)
PHC(5-10) PH(lO+) CP(10+) ST(10+) RS(IO+)
Doyang Hydro 256 PM(5-10)
DH(5-10) PO CM CV SP(lO+) BS
15 North Wing 864 C(10+)
MCW(IO+) TOSS-PH(IO+) CP(lO+) ST(IO+) RS(lO+)
(00072400) PHC(5-10)
Sanis Viii 207 PM«5) H« 5) - CV(5-
16 1,167 MCW(10+) WSSS- PO« 5) CM(5-10) 10) SP(IO+) BS« 5) (00072500) qIO+)
PHC« 5) PH(lO+) CP(IO+) ST(IO+) RS(10+)
Meshangpen 80 PM«5) H«5)
CV(lO+) 17 517 MCW(lO+) WOSS- PO« 5) CM(IO+) BS« 5)
(00072600) qlO+} PHq< 5) PH(IO+) CP(lO+)
SP(lO+) RS(IO+)
ST(IO+)
HDPHC - CV(5-BS
18 SanisHq
915 179 P M(2) TOSS- PO PH(2) CM(5-10) 10) SP(IO+) (00072700) C(lO+) MCW(IO+)
CP(IO+) ST(IO+) RS(10+)
Tsopo 83 PM(5-1O) DH(5-10) PO(5
CV(lO+) 19 508 MCW(IO+) WSS- 10)PH(5- CM(10+) BS(5-10)
(00072800) qIO+) PHC(S-IO) 10) CP(IO+)
SP(IO+) RS(IO+)
ST(10+)
Chudi 145 P M(10+) DH(IO+)
CV(1O+) 20 906 MCW(lO+) W SO SS- PO(lO+) CM(lO+)
SP(IO+) BS(IO+)
(00072900) C(10+) PHC(IO+) PH(lO+) CP(lO+) RS(IO+)
ST(10+)
Longtsung DH(IO+)
CV(lO+) 21 1,557 220 P M qIO+) MCW(IO+) WSSS- PO(lO+) CM(IO+) BS(IO+)
(00073000) PHqlO+) PH(IO+) CP(IO+)
SP(IO+) RS(lO+)
ST(10+)
84
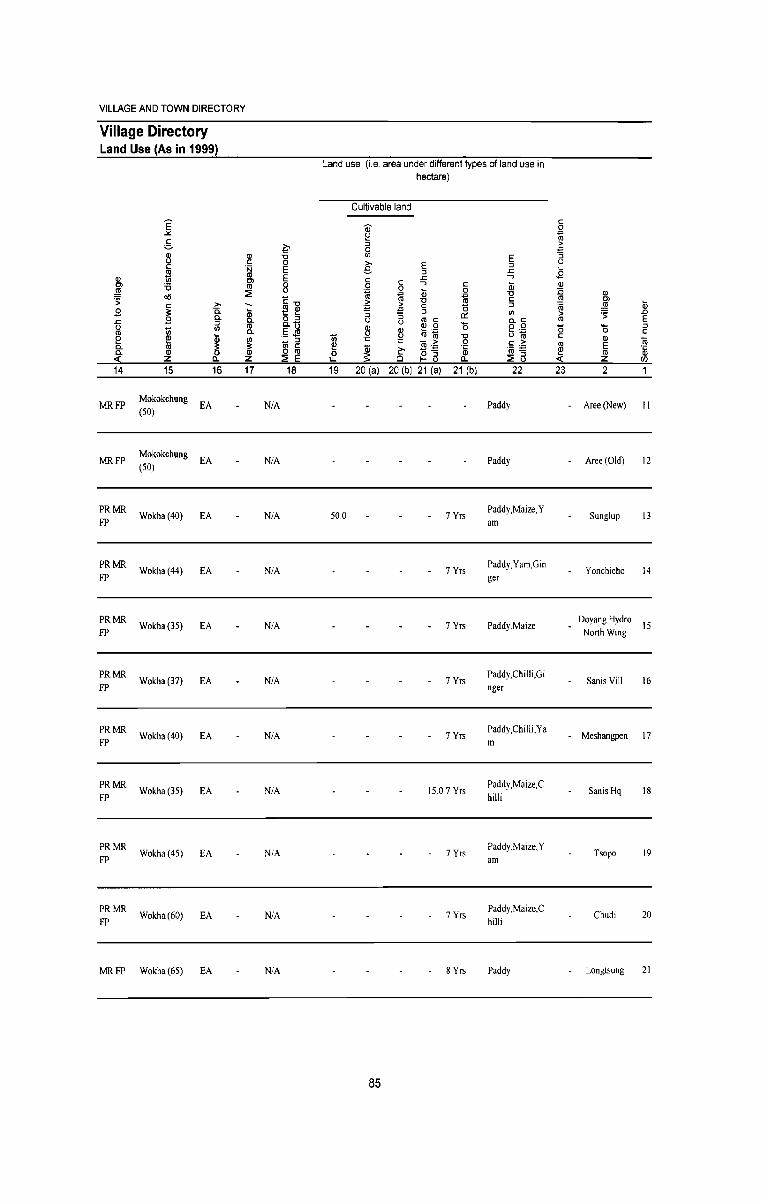
VILLAGE AND TOWN DIRECTORY
Village Directory Land Use (As in 1999)
Q) Cl ,lJl 'S: .9 .r: u <11 e 0. 0.
::J; 14
MRFP
MRFP
PRMR FP
PRMR FP
PRMR FP
PRMR FP
PRMR FP
PRMR FP
PRMR FP
PRMR FP
MRFP
E "" g ~ c
~ '6
"" C >-
~ 0. 0. :>
"' III
[I! ID ~ t1I
<Il Z a. 15 16
Mokokchung EA
(SO)
Mokokchung EA
(SO)
Wokha(40) EA
Wokha(44) EA
Wokha(3S) EA
Wokha(37) EA
Wokha(40) EA
Wokha(3S) EA
Wokha(4S) EA
Wokha(60) EA
Wokha(6S) EA
Q) c § Cl t1I
::2!
Iii 0. t1I 0. III :s: Q)
z 17
~ '6 0 E E 8 cal ~ '-o :> 0.1:5 ,5.j!! - :> III C o t1I
::2! E 18
N/A
N/A
N/A
NiA
N/A
N/A
NiA
NiA
N/A
N/A
N/A
Land use (i. e. area under different types of land use in hectare)
Cultivable land
Q) ~ :> 0 III
>- E e :> c .r: 0 c --, c ~
0 Qj 0 .~
~ > '0
"" > c
"5 .,
:> U "5 <11 C
0:: u
~ ~~ '0 ~
"' 'C '0 'C - > 0 [I! ~£; ~ ~ .~
0 LJ... 0 t- 13 a. 19 20 (a) 20 (b) 21 (a) 21 (b)
SO.O 7 Yrs
7 Yrs
7 Yrs
7 Yrs
7 Yrs
IS,O 7 Yrs
7 Yrs
7 Yrs
8 Yrs
85
E :> .r: --,
Iii "C c :> III o.C o 0 b~ c .~ 'iii :!:
::2! 13 22
Paddy
Paddy
PaddY,Maize,Y am
Paddy,Yarn,Gin ger
Paddy,Maize
Paddy,Chilli,Gi nger
Paddy,Chilli,Ya m
Paddy,Maize,C hilli
Paddy ,Maize, Y am
Paddy,Maize,C hilli
Paddy
c 0 :; ~ "5 u
.8 <Il :0 Q) ]! Cl 'iii ,lJl Qj > .0 m ':; E '0 '0 :>
c C Q) ro t1I E [I! .~ t1I
::J; z (f)
23 2 1
- Aree(New) II
Aree (Old) 12
Sunglup 13
Yonchicho 14
Doyang Hydro IS
North Wing
Sarris ViII 16
- Meshangpen 17
Sanis Hq 18
Tsopo 19
Chudi 20
Longtsung 21
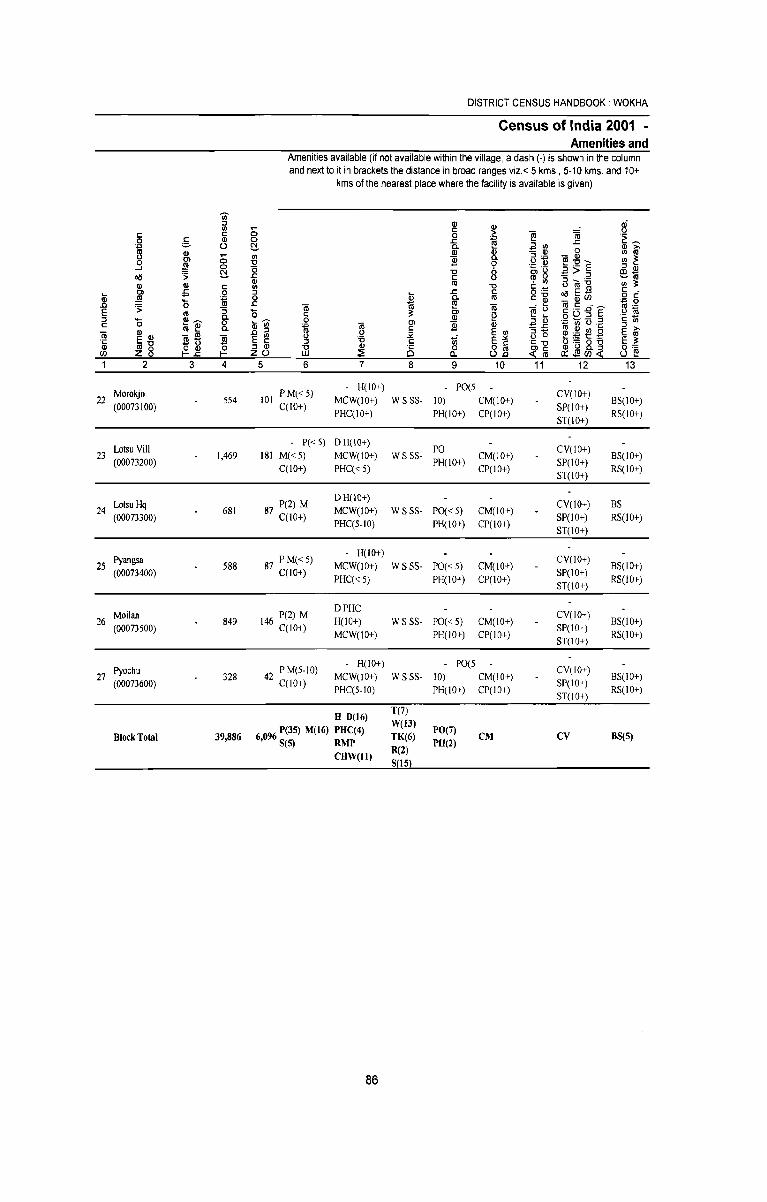
DISTRICT CENSUS HANDBOOK: WOKHA
Census of India 2001 -Amenities and
Amenities available (if not available within the village, a dash (.) is shown in the column and next to it in brackets the distance in broad ranges viz. < 5 kms, 5·10 kms. and 10+
kms of the nearest place where the facility is available is given)
Ii) :J III Q) 2i III C; c:
c: c: 0 > ~ (ij .~ ~ 0 c: CIl 0 .c: ~ .c:
~ ;::.. (.) ~ 0. ~ ~ Q) >-CIl III 8. 0 III m
0 III lJ:iJ _ Q)
III 1: Ol ]i ~:gE 0 § " ~ .~.~ -' 0 "0 :J Q)
'5 ~ " :E>:J 1Il_ oI! .c: c: 0 m 0 ~m
III Q) Q) C\l ""0
' III B-roij UI ;: c: III 5~ oI!E.E c: • en .s 0 :J
~ .c: c:
lil .!!! 16 0 0. C\l c_ ¥ _Q)U) o c: '0 +=i 0
.0 .c: m ~ (ij m c: - ~ rl+=> E .s: m :; '0 c: ;: Ol .~ ~ ~ §0-§E ._ J9
:J '0 !I!~ 0. (i;cn 0 III :J Q) ~ Ii) (3 .~ c: UI
c: 0
~ ~ Ol ]i Q) '"".c: :J >-
Q) Q) ro !I! 0. .0 :J c: E III :J- ~~~~ E m m _ ro
(ij E ~ '5 j<
iii E"" () 0 E ;: .'" E" ~ti :J c: 'C "0 ~'G g_-g Q) ~ 8 "0 :J Q) " Q) C§ 0 o c: $'lij 0'-:
(/) t-.2! t- z(.) LU :::E a. (.).:g o:.j!1U)~ (.) f! 1 2 3 4 5 6 7 8 9 10 11 12 13
Morokjo PM«5) H(lO+) . POtS
CV(IO+) 22
(00073100) SS4 101
C(lO+) MCW(IO+) WSSS- 10) CM(IO+)
SP(IO+) 8S(10+)
PHCCIO+) PH(IO+) CP(IO+) ST(IO+)
RS(lO+)
Lotsu Viii. PC< 5) DHCIO+)
PO CV(lO+) 23 1,469 181 M«S) MCW(lO+) WSSS· CM(IO+) 8S(10+)
(00073200) C(lO+) PHCC< 5)
PH(lO+) CP(IO+)
SP(lO+) RS(lO+)
ST(IO+)
Lotsu Hq 87 P(2) M DH(lO+)
CV(IO~) 8S 24 681 MCW(lO+) WSSS· PO« 5) CM(IO+)
(00073300) C(10+) PHC(5.1O) PH(IO+) CP(IO+)
SP(lO+) RS(lO+) ST(IO+)
Pyangsa 87 PM«S) H(lO+)
CV(IO+) 25 588 MCW(10+) WSSS· PO« 5) CM(lO+) 8S(10+)
(00073400) C(10+) PHCC<: 5) PH(IO+) CP(10+)
SP(IO+) RS(10+)
ST(IO+)
Moilan 146 P(2) M DPHC
CV(IO-) 26 849 H(IO+) WSSS· PO« 5) CM(lO+) 8S(IO+)
(00073500) C(10+) MCW(IO+) PH(lO+) CP(IO+)
SP(IO+) RS(lO+)
ST(IO+)
Pyochu 42 P M(5·10) H(10+) . POtS
eV(lo+) 27 328 MCW(IO+) WSSS· 10) CM(IO+) 8S(l0+)
(00073600) C(10+) PHCC5.IO) PH(IO+) CP(10+)
SP(IO+) RS(lO+)
ST(lO+)
H D(16) T(7)
6096 P(35) M(16) PHC(4) W(13)
PO(7) Block Total 39,886 TK(6) CM CV B8(5)
, S(5) RMP R(2)
PH(2) CHW(ll)
815
86
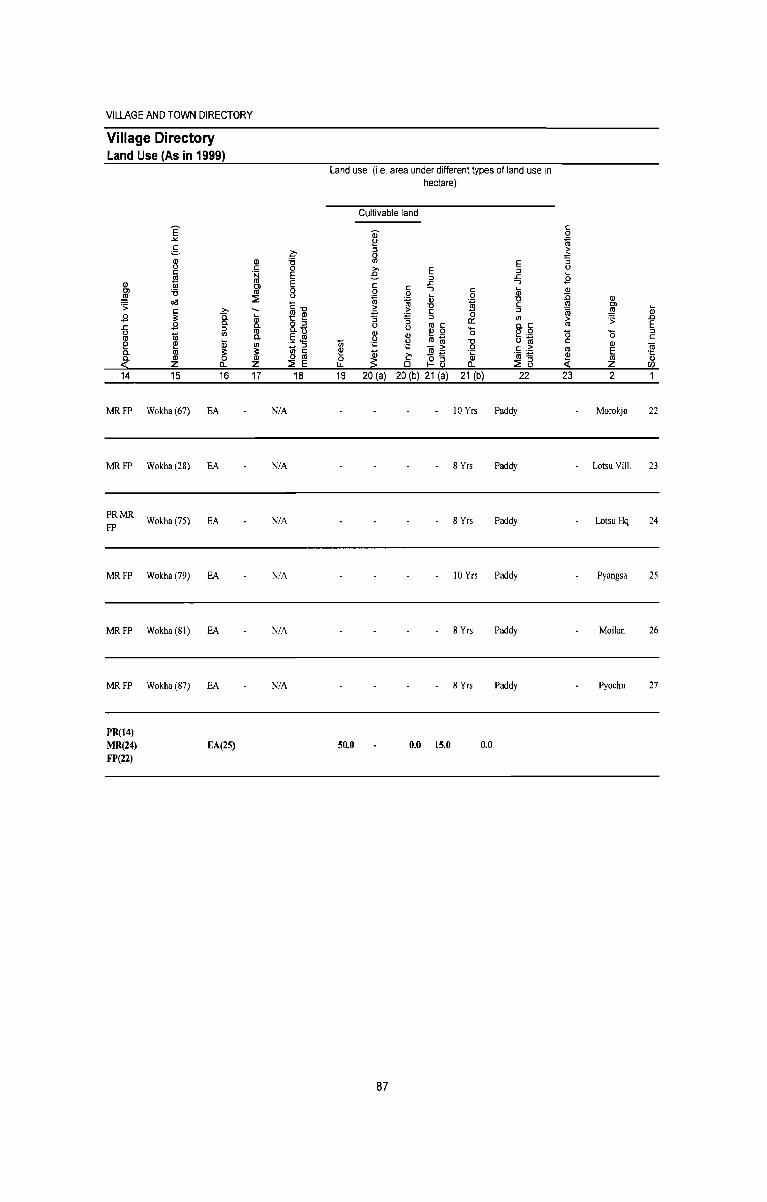
VILLAGE AND TOWN DIRECTORY
Village Directory Land Use (As in 1999)
QJ Cl
~ .;:
.9
.r:. 0 !II e a. a.
:S; 14
MRFP
MRFP
PRMR FP
MRFP
MRFP
MRFP
PR(14) MR(24) FP(22)
E .>t.
c = B c ~ '5 cIS C :;: .9 Ui ~ m Q)
Z
15
Wokha(67)
Wokba(28)
Wokha (75)
Wokha(79)
Wokha (SI)
Wokha(S7)
>-c. a. :l If)
G3 :;: 0 a. 16
EA
EA
EA
EA
EA
EA
EA(25)
QJ c ·N ro Dl ro :2
G3 a. !II a. If)
~ z 17
;:;. '5 0 E E 8 C"O !II QJ 1:: '-o :l 0.1) §$ _ :l
If) C o ro :2 E
18
N/A
N/A
N/A
N/A
N/A
N/A
Land use (i.e. area under different types of land use In hectare)
Cultivable land
Q) e :l 0 If) E >- E :l e :l .r:.
.r:. --, C 0 c --, c G3 0 0 15 ~ G3
~ "0
"0 C > > C :l :;::; :;::; "S :l If) "S 0:: 0 0 !II C o.c 8 8 ~~ '0 o 0
o~ Ui "0 .c:: .c:: ro .2: 0 C .2: !!:! ~ ?: o~ '&5 '(ij ~
0 u. 0 I- a a. :2 a 19 20 (a) 20 (b) 21 (a) 21 (b) 22
10 Yrs Paddy
8 Yrs Paddy
8 Yrs Paddy
10 Yrs Paddy
8 Yrs Paddy
8 Yrs Paddy
50.0 0.0 15.0 0.0
87
c 0
~ > .;::; "S 0 '-Q Q)
:0 Q)
E! Dl ffi :l'l G3
.0 > ;: E ro 0 '0 :l
c c Q) ro m E ~ .~
!II :S; z en 23 2 1
Morokjo 22
Lotsu ViiI. 23
Lotsu Hq 24
Pyangsa 25
Moilan 26
Pyochu 27


WOZHURO RALAN RD BLOCK
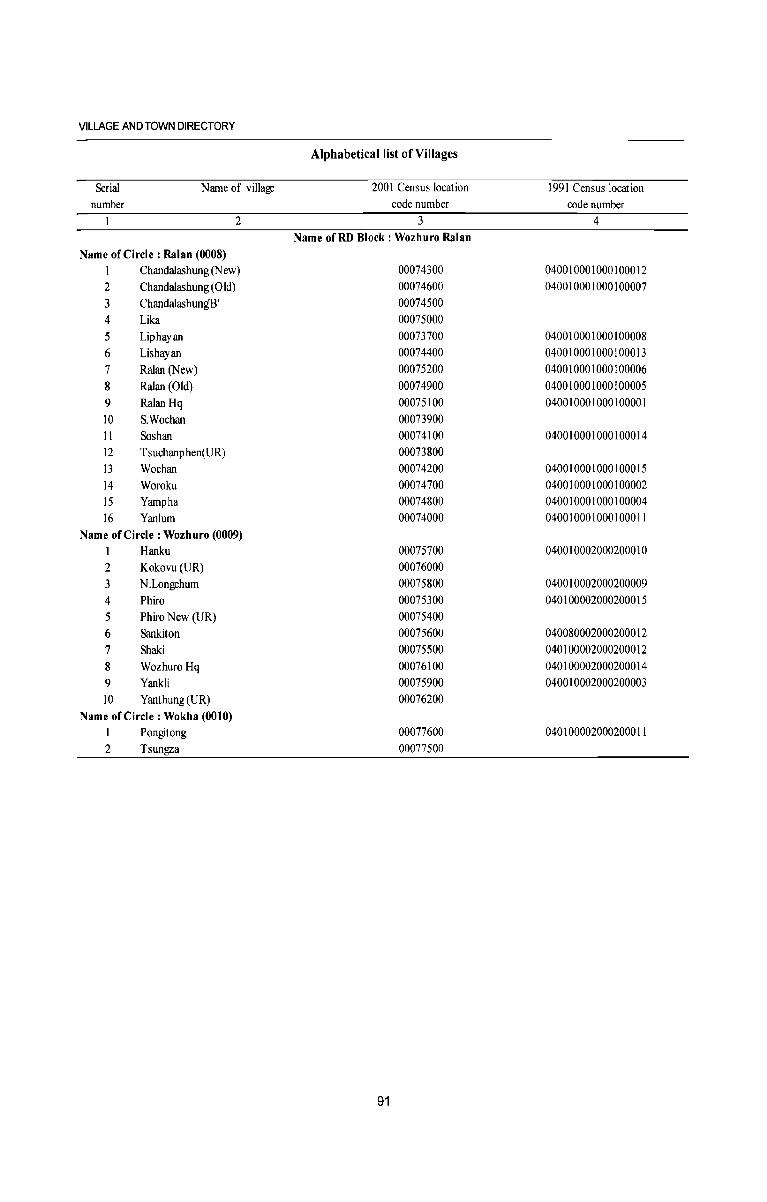
VILLAGE AND TOWN DIRECTORY
Alphabetical list of Villages
Serial Name of village 2001 Census location 1991 Census location number code number code number
2 3 4 Name ofRD Block: Wozhuro Ralan
Name of Circle : Ralan (0008) 1 Chandalashung (N ew) 00074300 040010001000100012 2 Chandalashung (Old) 00074600 040010001000100007 3 Chandaiashung'B' 00074500 4 Lika 00075000 5 Lip hay an 00073700 040010001000100008 6 Lishayan 00074400 040010001000100013 7 Ralan (New) 00075200 040010001000100006 8 Ralan (Old) 00074900 040010001000100005 9 Ralan Hq 00075100 040010001000100001 10 S.Wochan 00073900 11 Soshan 00074100 040010001000100014 12 Tsuchanphen(UR) 00073800 13 Wochan 00074200 040010001000100015 14 Woroku 00074700 040010001000100002 15 Yampha 00074800 040010001000100004 16 Yanlum 00074000 040010001000100011
Name of Circle : Wozhuro (0009) 1 Hanku 00075700 040010002000200010 2 Kokovu (UR) 00076000 3 N.Longchum 00075800 040010002000200009 4 Phiro 00075300 040100002000200015 5 Phiro New (UR) 00075400 6 Sankiton 00075600 040080002000200012 7 Shaki 00075500 040100002000200012 8 Wozhuro Hq 00076100 040100002000200014 9 Yankli 00075900 040010002000200003 10 Yanthung(UR) 00076200
Name of Circle : Wokha (0010) 1 Pongitong 00077600 040100002000200011 2 Tsungza 00077500
91
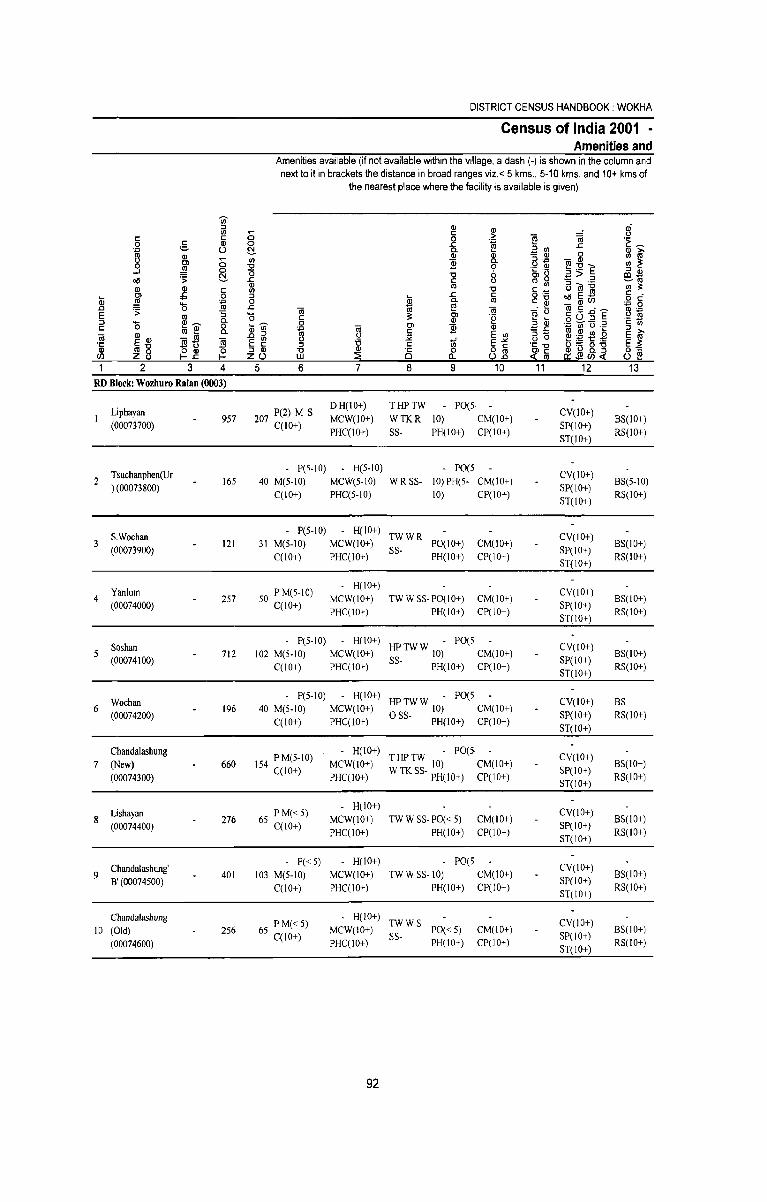
DISTRICT CENSUS HANDBOOK: WOKHA
Census of India 2001 -Amenities and
Amenities available (if not available within the village, a dash (-) is shown in the column and next to it in brackets the distance in broad ranges viz.< 5 kms., 5-10 kms. and 10+ kms of
the nearest place where the facility is available is given)
"' :J (I) (I) ~ '" 0 c: > ~ c: c: 0 ~
'iii .~ ~ 0 c: (J) 0 J:: J:: .~ '=- (..) ~ a. E ~ (I) >-
(I) (I) (I) 0 '" ro Ol
~
'" ]i a. .§ ~ - (I) Ul ~ 0
~ 0 "0 0 e!:Q"E -' 0 "5 8 0, '0 :J (I)
~ "0 ~>:J CJ ... 011 .s: J:: c: ro 0 ~ro
(I) (J) ro "0 ' '" a(ij~ '" ;;:: (I) c: '" c: ~
Ol :5 0 :J J:: c: o ._ oIIE.l'l c: _
Q; ~ .~ 0 * a. ro c:al _(1)(1) o c: .... ~
:z:; 0 .0 0 J:: OJ OJ ~- ~ ~S.riE rl~ E s: ro '5 '0 c: ;;:: Ol .~ 0(..) :J :J '0 ~~ c.
(Den 0 (I) ::J (I) +:i t1i (3 .~ 'c 1i) c: m ~ 0
~ OJ Ol ]i (I) :!::J:: ::J >-C. c: m 0) .._ (I) .0 ::J U E Ul ::J'" ~ ~ ~ . .g E ro OJ E Gl -,l]! ]i E [q is 32 iii E"" u 0 E 3: .~ .l'l u :J e 'i:: -c &l '5 8. -g ro"C o (I) ~
:J (J) "0 (I) 8 0 o c: Ole 0== (I) Z 8 f-J:: Z(..) LU :2 a. (..)~ < m 11:$(1)< (..)~
1 2 3 4 5 6 7 8 9 10 11 12 13 RD Block: Wozhuro Ralan (0003)
Liphayan 207 P(2) M S DH(IO+) THPTW - PO(5
CV(!O+) (00073700)
957 C(lO+)
MCW(lO+) WTKR 10) CM(IO+) SP(lO+)
BS(IO+) PHC(IO+) SS- PH(IO+) CP(10+)
ST(IO+) RS(lO+)
Tsuchanphen(U r - P(5-10) H(5-10) - PO(5 CV(lO+)
2 ) (00073800)
165 40 M(5-10) MCW(5-10) WRSS- 10)PH(5- CM(IO+) SP(10+)
8S(5-10) C(IO+) PHC(5-IO) 10) CP(10+)
ST(IO+) RS(lO+)
S.Wochan - P(5-10) - H(IO+) TWWR CV(IO+)
3 (00073900)
121 31 M(5-10) MCW(IO+) SS-
PO(IO+) CM(IO+) SP(IO+)
8S(l0+) C(lO+) PHC(10+) PH(IO+) CP(10+)
ST(10+) RS(10+)
Yanlum 50 P M(S-IO) H(IO+)
CV(IO+) 4
(00074000) 257
C(lO+) MCW(IO+) TW W SS-PO(IO+) CM(IO+)
SP(lO+) 8S(10+)
PHC(lO+) PH(IO+) CP(IO+) ST(IO+)
RS(IO+)
Soshan P(5-10) H(IO+) HPTWW - PO(5 CV(IO+)
5 712 102 M(5-10) MCW(10+) 10) CM(IO+) 8S(10+) (00074100)
C(IO+) PHC(IO+) SS- PH(IO+) CP(10+) SP(10+)
RS(IO+) ST(IO+)
Wochan - P(5-10) H(IO+) HPTWW - PO(5 CV(lO+) 8S
6 196 40 M(5-10) MCW(lO+) 10) CM(IO+) (00074200) o SS- PH(IO+) SP(lO+) RS(lO+)
C(IO+) PHqIO+) CP(10+) ST(lO+)
Chandalashung 154 P M(5-10)
H(IO+) THPTW - PO(5 CV(IO+) 7 (New) 660 MCW(lO+) 10) CM(lO+)
SP(IO+) 8S(l0+)
(00074300) C(lO+)
PHC(10+) W TK SS- PH(IO+) CP(IO+) RS(10+) ST(10+)
Lishayan 65 P M« 5) H(IO+)
CV(lO+) 8 276 MCW(10+) TW W SS- PO« 5) CM(10+) BS(10+)
(00074400) C(lO+) PHC(IO+) PH(lO+) CP(IO+)
SP(IO+) RS(10+)
ST(10+)
Chandalashung' - P« 5) H(lO+) - PO(5
CV(IO+) 9 401 103 M(5-10) MCW(10+) TWW SS-IO) CM(lO+) 8S(10+)
B' (00074500) C(lO+) PHC(IO+) PH(IO+) CP(10+)
SP(IO+) RS(10+)
ST(IO+)
Chandalashung 65 P M« 5)
H(lO+) TWWS CV(lO+)
10 (Old) 256 C(IO+)
MCW(IO+) SS-
PO«5) CM(IO+) SP(IO+)
8S(10+)
(00074600) PHC(IO+) PH(IO+) CP(IO+) ST(IO+)
RS(IO+)
92
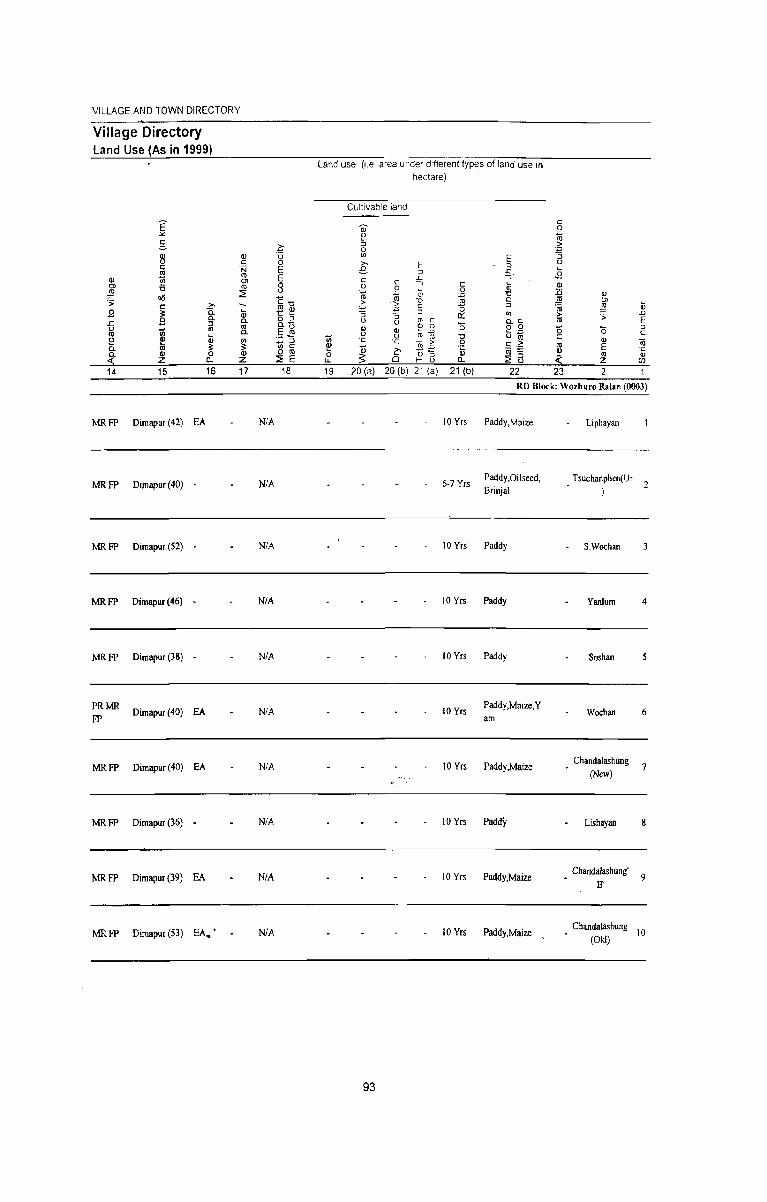
VILLAGE AND TOWN DIRECTORY
Village Directory Land Use (As in 1999)
E -"
2-~ c
QJ 2l III
0> iJ ~ oil .;;
C >-.9 ~
Q. a.
.c: ::J (.) 1ii III (1) :u 2 ~ a. III :I: a. QJ 0 <!; z a. 14 15 16
MRFP Dimapur(42) EA
MRFP Dimapur (40) -
MR FP Dimapur (52) -
MRFP Dimapur(46) -
MRFP Dimapur (38) -
PRMR FP
Dimapur (40) EA
MRFP Dimapur (40) EA
MRFP Dimapur (36) -
MRFP Dimapur (39) EA
MRFP Di!'.lapur (53) EA .. '
QJ C N ro Ol (1)
~ -L.. QJ a. (1) a. III 3: Q)
z 17
~ iJ 0 E E 8 C u (1) QJ -e L.. o ::J a.-E l;l .- .....
::J 1iic o (1)
~ E 18
N/A
N/A
N/A
NfA
N/A
N/A
N/A
N/A
N/A
N/A
land use (I.e area under different types of land use in hectare)
Cultivable land
OJ (.)
:; 0 III >-E-c:: 0
~ > .... :; (.)
Q) - (.) III ·c l!!
~ 0 LJ._
E E ::J ::J .r:
L -,' c:: -, c:: Qj 0
Q; 0 :g ~
U U c: .. > c ::J . ...
"3 ::J a::: en U ro c ... Q.C
Q) Q) 0 0 o 0 ro iU u~ (.) "0 ·c n~
0 c: ,2: ·t c:- o ::J 'iii ~ 0 f- (.) a. :2 a
19 20 (a) 20 (b) 21 (a) 21 (b) 22
c 0
~ > ., "3 (.) L..
.2 Q)
:0 ill ..!!! Ol 'iii ~ Qj > '> .D III E 0 '0 ::J
c C Q) ro nl E ·c ~ nl Q) « z (j)
23 2 1 RD Block: Wozhuro Ralao (0003)
93
10 Yrs
6-7 Yrs
Paddy,Maize
PaddY,Oilseed, Brinjal
10 Yrs Paddy
10 Yrs Paddy
10 Yrs Paddy
10 Yrs Paddy,Maize,Y am
10 Yrs Paddy,Maize
10 Yrs Paday
10 Yrs PaddY,Maize
10 Yrs PaddY,Maize <
Liphayan
Tsuchanphen(Ur 2 )
SWochan 3
Yanlum 4
Soshan 5
Wochan 6
Chandalashung 7
(New)
Lishayan
Chandalashung' 9
B'
ChandaJashung 10
(Old)
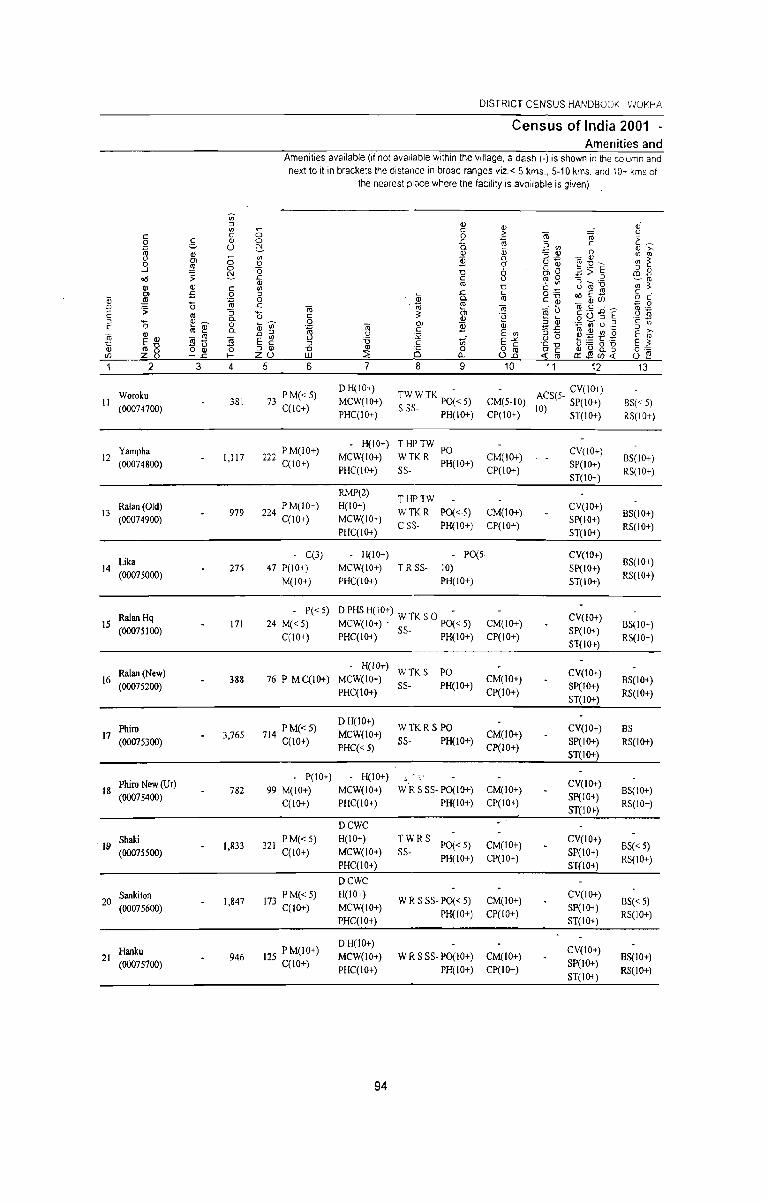
DISTRICT CENSUS HANDBOOK \NOKHA
Census of India 2001 -Amenities and
Amenities available (if not available within the village, a dash (-) is shown in the column and next to it in brackets the distance in broad ranges viz.< 5 kms., 5-10 kms. and 10+ kms of
the nearest place where the facility is available is given)
Vi' :J <1J Il> ai If) ;; e
C C 0 > ro Iii tl
0 e Il> a £ ~ ;; !/) .r:. ~~
~ ;;;. U c::!. a. a; Il> ,., Il> Il> == <1J 0 If) ro OJ ;; <1) !i a. i3~
_ <J If) ~ 0 g '0 o' ._ <1J ~:-QE ...J a '0 D 6 o,u :J Q)
c::!. ~ > :J CD~ oil :; £ C () ro 0 -ro
<1J <1J ro D
' If) 6ro u If) 3: <1J C III C _
Ol :5 0 :J Qj .r:. c a .- oIlE2 c . ~ J11 .~ 0 a. ro c-g _(IJU) o c
(5 £ . iii ~ .;:; 0
D 'iii 'iii ~t; ~ .S .ri -- 8 ~ E :; -s '0 3: Ol 0) a. e <1J "Q :J :v o U :J E c til ;0 (5 <1J~ 0 (fitn .Q "iii Ol ]i <1l ~ ~u.~ c ,__ Q)
a. ro c !:£ :J ,., III
ro ,__ .D ;0 () E !/) :J- ~ ~ ~ . .g E ro iii _ ro
0 ~ C) 0 E cv 0) - Iii E :q U e ....: E"" E 3: .~ OlD - () -0 :J QJ
!/) o e "C. "0 ~138.-g o Q) ;0 Q) D 8 0 Ole 0"= U) Z 8 1-£ I- zu w ::f Q._ ull ~ ro a:~U)<{ U ~ 1 2 3 4 5 6 7 8 9 10 11 12 13
Woroku 73 P M« 5) DH(IO+)
TW WTK Po« 5) ACS(5- CY(IO+)
II 381 MCW(IO+) CM(5-IO) 10) SP(lO+) 8S« 5) (00074700) C(10+)
PHC(IO+) S S5- PH(IO+) CP(lO+) 5T(IO+) RS(lO+)
222 PM(IO+) - H(IO+) THPTW PO
12 Yampha
1,117 MCW(IO+) ~~:K R PH(IO+) CM(IO+)
CY(IO+) 8S(10+)
(00074800) C(10+) PHC(IO+) CP(IO+)
5P(10+) RS(IO+)
5T(10+)
RMP(2) THPTW
13 Ralan(Old)
979 224 PM(IO+) H(IO+) WTKR PO«·5) CM(IO+)
CY(IO+) 85(10+)
(00074900) C(10+) MCW(IO+) C SS· PH(lO+) CPO 0-'-)
SI'(IO+) RS(IO+)
PHC(IO+) ST(lO+)
Lika C(3) - H(lO+) - PO(S CY(lO+)
14 275 47 P(lO+) MCW(IO+) T RSS- 10) SI'(IO+) BS(lO+)
(00075000) M(IO+) PHC(IO+) PH(lO+) 5T(10+)
RS(lO+)
Ralan Hq P« 5) DPHSH(IO+)WTKSO - CY(lO+)
15 171 24 M« 5) MCW(IO+) - PO« 5) CM(lO+) 8S(l0+) (00075100)
C(IO+) PHC(IO+) SS- PH(IO+) CP(IO+) SP(IO+)
RS(IO+) ST(IO+)
- H(lO+) WTKS PO CY(lO+) Ralan (New)
16 (00075200)
388 76 P MC(IO+) MCW(lO+) SS- PH(lO+)
CM(IO+) SP(IO+)
BS(IO+) PHC(IO+) CP(lO+)
ST(lO+) RS(IO+)
Phiro 714 PM«5) D H(lO+)
WTKRS PO CV(IO+) BS 17 3,765 MCW(IO+) CM(IO+)
(00075300) C(lO+) PHC«5)
SS- PH(IO+) CP(lO+)
SP(IO+) RS(IO+) ST(IO+)
P(IO+) - H{lO+) CY(lO+)
18 Phiro New (Or)
782 99 M(lO+) MCW(IO+) W R S SS- PO(IO+) CM(IO+) BS{lO+) (00075400)
C(10+) PHC(IO+) PH(IO+) CP(lO+) Sp(IO+)
RS(IO+) ST(IO+)
DCWC Shaki PM«5) H(IO+) TWRS
PO« 5) CM(IO+) CV(lO+)
. 19 (00075500)
1,833 321 C(lO+) MCW(IO+) SS- SP(IO+)
BS« 5)
PHC(IO+) PH(IO+) CP(IO+)
ST(IO+) RS(IO+)
DCWC
20 5ankiton
1,847 173 P M« 5) H(lO+) W R S SS- PO« 5) CM(IO+)
CV(lO+) BS« 5)
(00075600) C(IO+) MCW(IO+) PH(lO+) CP(IO+)
5P(10+) RS(lO+)
PHC(IO+) ST(lO+)
Hanku 125 PM(10+) D H(lO+)
CV(IO+) 21 946 MCW(lO+) W R S SS- PO(IO+) CM(IO+) B5(IO+)
(00075700) C(lO+) PHC(IO+) PH(IO+) CP(lO+)
SP(IO+) RS(IO+)
ST(IO+)
94
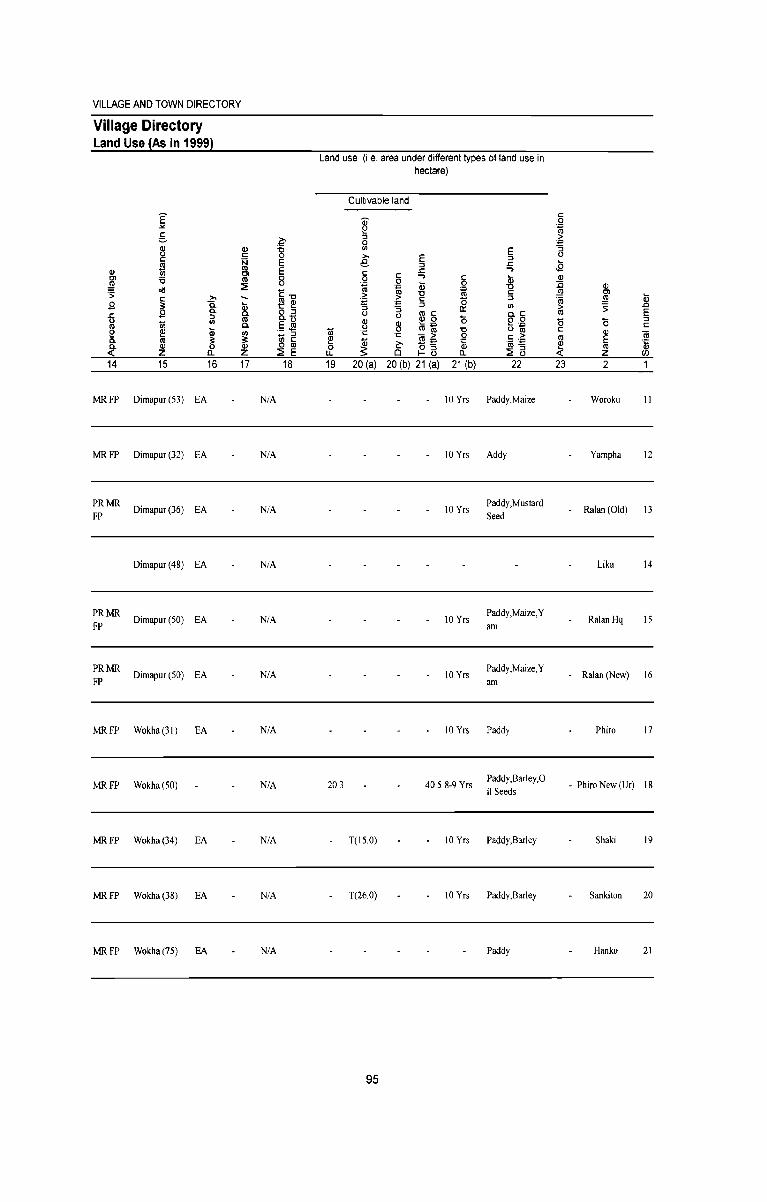
VILLAGE AND TOWN DIRECTORY
Village Directory Land Use (As in 1999)
E "" c: '=-
!!l c: g
Ql '" Cl '6 ~ 011 .>
c: >-a. .9 ~ a. .r:: ::l 0 iil '" III !:! ~ CD a. <1l ~ 0. Ql <{ Z a.. 14 15 16
MRFP Dimapur (53) EA
MRFP Dimapur (32) EA
PRMR Dimapur (36) EA
FP
Dimapur (48) EA
PRMR Dimapur (50) EA
FP
PRMR Dimapur (50) EA
FP
MRFP Wokha(31) EA
MRFP Wokha(50)
MR FP Wokha (34) EA
MR FP Wokha (38) EA
MR FP Wokha (75) EA
Ql c: ·N <1l CI <1l ::2
Qj a. <1l a. In ~ Ql
z 17
~
~ E E 8 <:"0
~ ~ o :::J 0.1)
.!:; ~ _ ::l
'" c: o III ::2 E
18
N/A
N/A
N/A
N/A
N/A
N/A
N/A
N/A
N/A
N/A
N/A
Land use (i.e. area under different types of land use in hectare)
Cultivable land
~ ::I 0
'" E >- E e :::J :::J .r:: .r:: ....,
c: 0 c: ...., c: Qj ~
0 Qj 0 ~ ~
"0 "0 c: > > c: :::J ., .,
:; :; :::J a:: '" 0 0 <1l c: a.c:
~ !!l ~~ '0 00 u~ u; .c: "0 ·c - > 0 c: .2: ~
~ <1l .- 'ffi 0 c:- 15:!:! 'ro ~
LL 0 I-G a.. ::2 G 19 20 (a) 20 (b) 21 (a) 21 (b) 22
10 Yrs Paddy,Maize
10 Yrs Addy
10 Yrs Paddy,Mustard Seed
10 Yrs Paddy,Maize,Y am
10 Yrs Paddy,Maize,Y am
10 Yrs Paddy
20.3 40.5 8-9 Yrs Paddy,Barley,O il Seeds
T(15.0) 10 Yrs Paddy,Barley
T(26.0) 10 Yrs Paddy,Barley
Paddy
95
c: 0
~ > ., :; 0 ._ $! Ql
:c Ql .!!! Cl ·iii ~ Qj > .> .c <1l E 15 '0 ::l
c: c: Ql ro III E .~ ~ III <{ z (J)
23 2 1
Woroku II
Yampha 12
Ralan(Old) 13
Lika 14
Ralan Hq 15
- Ralan(New) 16
Phiro 17
- Phiro New (Ur) 18
Shaki 19
Sankiton 20
Hanku 21
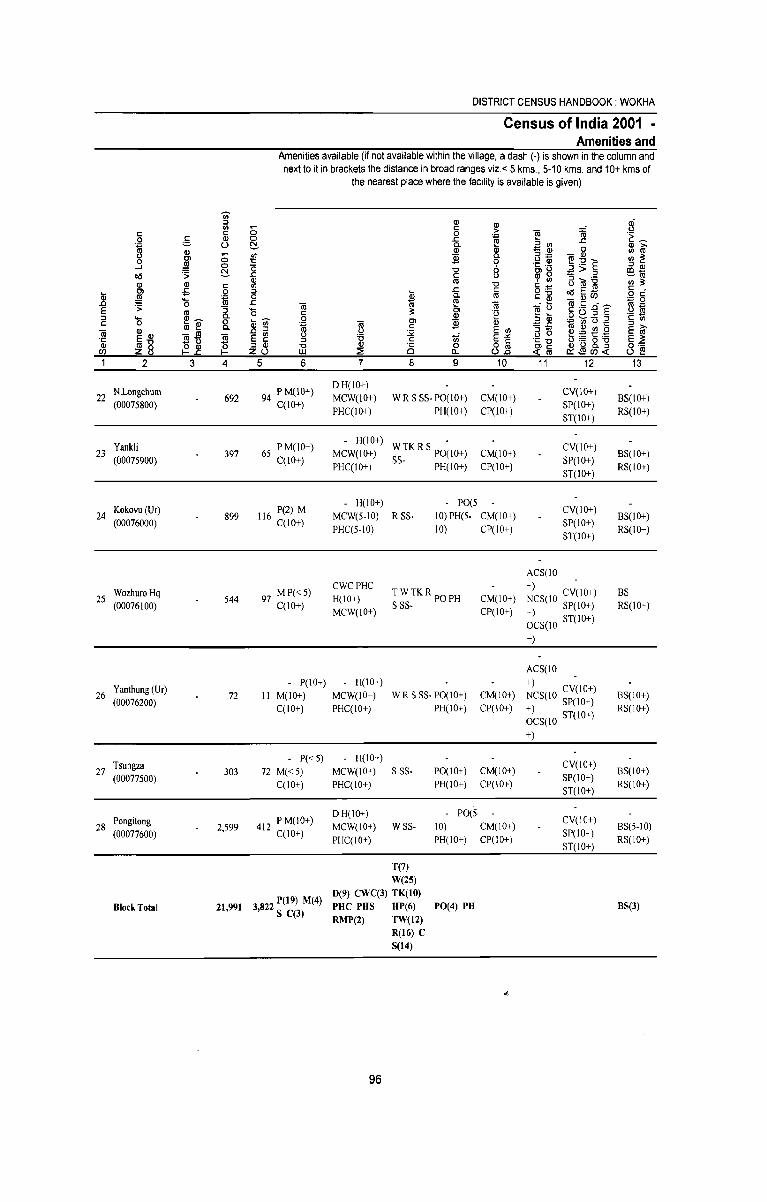
DISTRICT CENSUS HANDBOOK; WOKHA
Census of India 2001 -Amenities and
Amenities available (if not available within the village, a dash (-) is shown in the column and next to it in brackets the distance in broad ranges viz. < 5 kms., 5-10 kms. and 10+ kms of
the nearest place where the facility is available is given)
Ii) ::J Q) Q) ~ II) ~ e:
e: e: 0 0 > ~ 16 2~ g Q) 0 .c: ;;::; 0 ~ .c:
~ U ~ 0. E ~ Q) >-
Q) Q) Q) 0 In ro 0 (/)
~ a. ,Q a; _ IV In 2: 0 Ol -0
~ Ill-o_
..J :ll1 0 0 -0 0)0 ~>§ ::J IV ~
lIl_ IllS .s> .c: e: ro 0 ~ro
Cll IV III -0 ' In Gtil'5 In 3: CI) c (/) 5~ IlISE.19 e: _
Ol £; 0 ::J $ .c: c:
lii :ll1 ~ 0 0. ro c~ ~ _CI)(/) o e:
'0 ~ ;;::; 0
.0 .c: 16 ro 16 ro c: - ~ !Hl E .s> III
:; '0 e: 3: Ol 'e ~ ~ §(}-§E ::J .... e~ 0.
(i;Ch 0 Ol Q) ::J Q) :tJ (j) (3 .~ 'c ti
c 0 0
~ 13 ~ Q) "='.c: ::J >-ro e 0. .0 ::J C E In ::J- ~ ~ ~.~ E ro 16 CI) Cll _ III
~ E ~ '5 :.;;: '!if E-'" u 0 E 3: .~ E-o So ::J C ·c "C ~'[j g_-g
~8 o CI) ::J CI) -0 CI) (§ 0 o e: Ole: 0== (/) I-.c: I- ZU W ::2 CL u1l $ III C::.l!!(/)$ u ~ 1 2 3 4 5 6 7 8 9 10 11 12 13
N.Longchum 94 P M(lO+) D H(IO+)
CV(lO+) 22 692 MCW(IO+) W R S SS- PO(IO+) CM(IO+) BS(IO+)
(00075800) C(IO+) PHC(IO+) PH(lO+) CP(lO+)
SP(IO+) RS(IO+)
ST(IO+)
Yankli 65 PM(lO+) - H(IO+)
W TK R S PO~IO+) eV(lo+) 23 397 MCW(lO+) CM(lO+) BS(IO+)
(00075900) C(lO+) PHC(IO+) SS- PH(IO+) CP(lO+)
SP(IO+) RS(IO+)
ST(IO+)
Kokovu (Ur) 116 P(2) M - H(lO+) PO(5
CV(IO+) 24 899 MeW(5-IO) RSS- 10)PH(5- CM(IO+) BS(lO+)
(00076000) C(IO+) PHC(5-10) 10) CP(IO+)
SP(IO+) RS(IO+)
ST(IO+)
ACS(10
Wazhuro Hq 97 MP« 5) CWCPHC
TWTKR PO PH +)
BS 25 544 H(IO+) CM(IO+) NCS(IO eV(lo+)
(00076100) C(IO+) MCW(IO+)
S SS-CP(IO+) +) SP(IO+) RS(IO+)
OeS(1O ST(lO+)
+)
ACS(IO
Yanthung (Ur) - P(IO+) - H(lO+) +)
26 72 II M(IO+) MCW(IO+) WR S SS- PO(IO+) CM(IO+) NCS(IO eV(lo+) BS(IO+) (00076200)
C(lO+) PHC(IO+) PH(IO+) ep(lo+) +) SP(lO+) RS(IO+) OCS(IO ST(IO+)
+)
- P«5) - H(lO+) eV(lo+)
27 Tsungza
303 72 M« 5) MCW(lO+) S SS- PO(lO+) CM(IO+) BS(lO+) (00077500)
C(lO+) PHC(IO+) PH(IO+) CP(IO+) SP(lO+)
RS(IO+) ST(IO+)
Pongitong 412 P M(lO+) DH(IO+) PO(5
CV(IO+) 28 2,599 MCW(IO+) WSS- 10) CM(IO+) BS(5-IO)
(00077600) C(lO+) PHC(IO+) PH(IO+} CP(IO+)
SP(lO+) RS(lO+)
ST(lO+)
T(7) W(25)
3822 P(19) 1\-1(4) D(9) CWC(3) TK(10)
Block Total 21,991 PHC PHS HP(6) PO(4) PH BS(3) , S C(3)
RMP(2) TW(12) R(16) C S(14)
11-
96
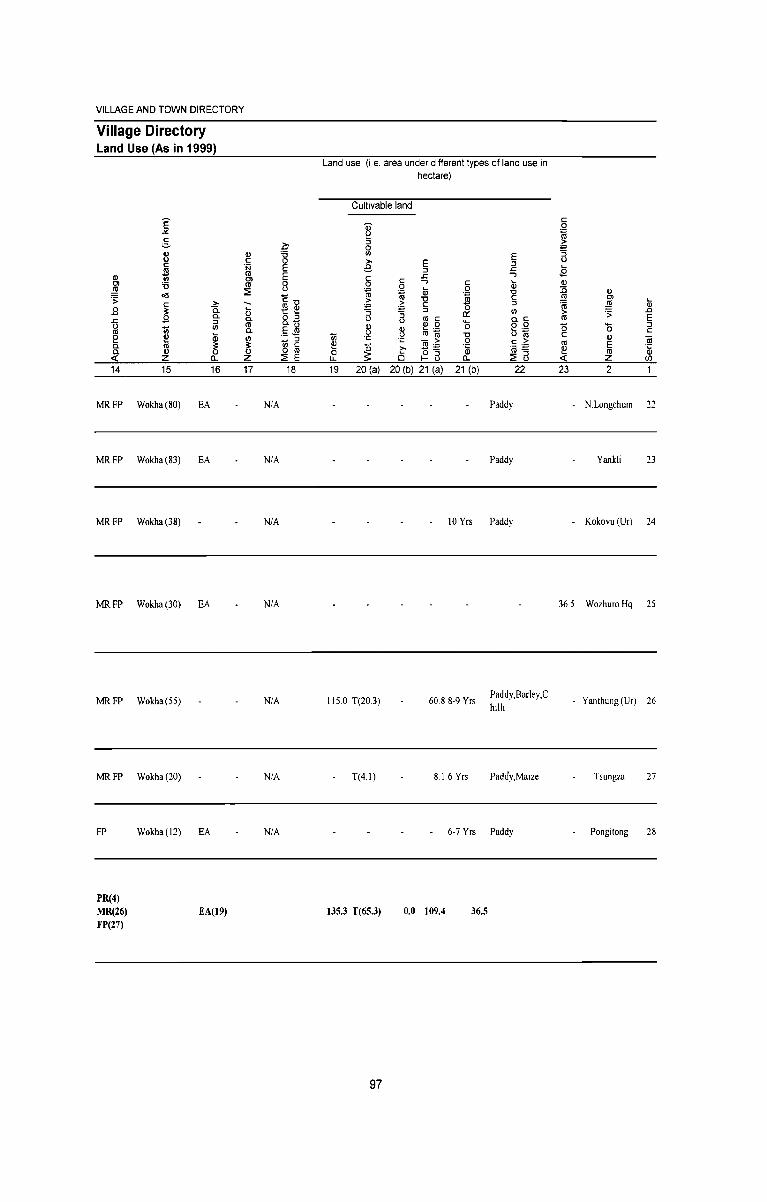
VILLAGE AND TOWN DIRECTORY
Village Directory Land Use (As in 1999)
E ~
C ;;;.
2l C
~ OJ Cl 'ti Jl1 -:;: <>IS
C >. .8 ~
Ci. .<:
a. :l
U 'lii r/) m iii e ~
a. m ~ a. Q) <{ Z a.. 14 15 16
MRFP Wokha(80) EA
MR FP Wokha (83) EA
MRFP Wokba(38)
MR FP Wokha (30) EA
MR FP Wokha (55)
MR FP Wokha (20)
FP Wokba(12) EA
PR(4) MR(26) FP(27)
EA(19)
OJ C 'N m Cl m ~
iii a. m a. r/)
~ OJ z 17
.t:-'ti 0 E E 8 1:"0
~ ~ o :l a.t)
,~ ~ _ :l
'" c o <0 ~ E
18
N/A
N/A
N/A
N/A
N/A
N/A
N/A
Land use (i e. area under different types of land use in hectare)
Cultivable land
Q) e :l o '" >. e C 0
~ > :;::; :; 0 Q)
'lii 0 'C
~ ~ 0
u. 19 20 (a)
II 5,0 T(20J)
T(41)
135,3 T(65,3)
97
E E :l :l .<:
.<: ..,
C .., C iii 0 0
~ Qj "0 "0 ~ C
> C :l :;::; :l '" :; c:: 0 <0 C a.C
~~ 0 o 0 2l h~ "0 'C - > 0 c .~ ~ -5:;:; "&j 'iii "'" Cl t- a a.. ~ a
20 (b) 21 (a) 21 (b) 22
Paddy
Paddy
10 Yrs Paddy
60.8 8-9 Yrs Paddy,Barley,C hilli
8.1 6 Yrs Paddy,Maize
6-7 Y rs Paddy
0.0 109.4 36.5
c: 0
~ > .. :; U
S OJ i5 Q)
.!!l Cl
'iii Jl1 Iii .0 > 'S: m E
'0 0 :l c
C Q) m <0 E ~ .~ <0 <{ z (J)
23 2 1
N,Longchum 22
Yankli 23
- Kokovu (Ur) 24
36,5 Wozhuro Hq 25
- Yanthung (Ur) 26
Tsungza 27
Pongitong 28

"_
WOKHA RD BLOCK

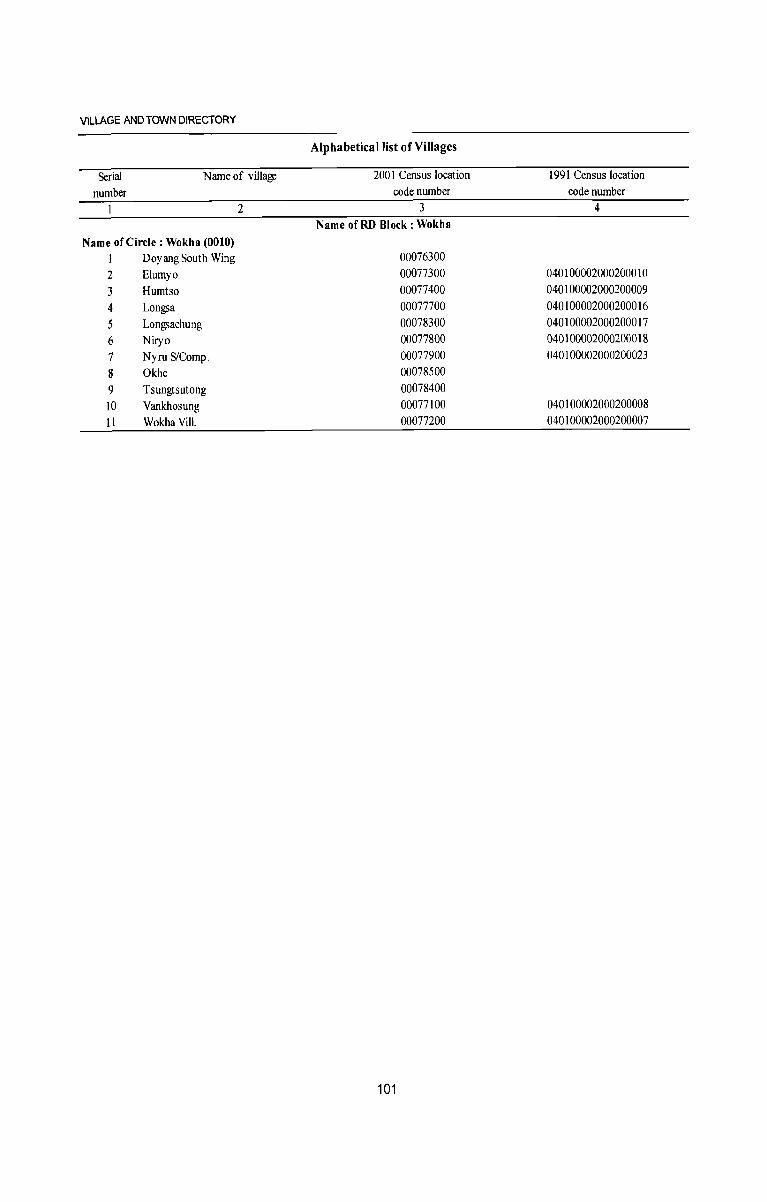
VILLAGE AND TOWN DIRECTORY
Alphabetical list of Villages
Serial Name of village 2001 Census location 1991 Census location number code number code number
I 2 3 4 Name ofRD Block: Wokha
Name of Circle : Wokha (0010) 1 Doyang South Wing 00076300
2 Elumyo 00077300 040100002000200010
3 Humtso 00077400 040100002000200009 4 Long;a 00077700 040100002000200016
5 Long;achung 00078300 040100002000200017 6 Niryo 00077800 040100002000200018
7 Nyru S/Comp. 00077900 040100002000200023
8 Okhe 00078500
9 Tsungtsutong 00078400 10 Vankhosung 00077100 040100002000200008 II WokhaVill. 00077200 040100002000200007
101
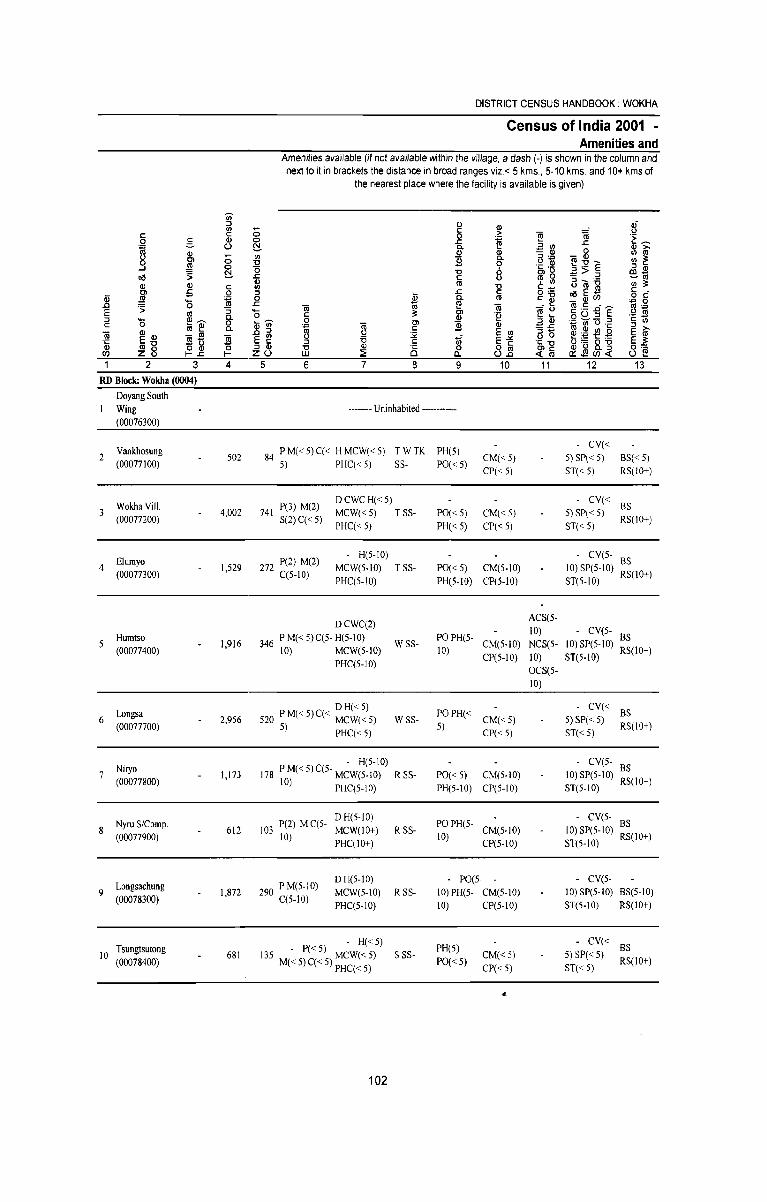
DISTRICT CENSUS HANDBOOK: WOKHA
Census of India 2001 -Amenities and
Amenities available (if not available within the village, a dash (-) is shown in the column and next to it in brackets the distance in broad ranges viz. <: 5 kms., 5-10 kms. and 10+ kms of
the nearest place where the facility is available is given)
Vi :::J OJ OJ 8 <J) ....- c
c c 0 0 > ~ 1ii .~ ~ 0 c OJ 0 .s:: :;::; .s::
~ -=- (.) ~ 0. ~ Em OJ >-Gl Gl Gl 0 III til ;; I/) 0. 5+' - Gl
III ~ 0> ]l ~:>1E 0 Jl! '0
~ .~.~ --' 0 0 :::J OJ ~ "0 ~>:::J co-
ol! :; .s:: c ro 0 GiU'6
~ro
Gl OJ ro "0 ' III <J) ;: Gl c I/) c_ O> :5 0 :::J '- .s:: c o ._ oI!E~
c _ o c--W Jl! '0 =a; 0 .$ 0. CD ':~ _Glen .. 0
.0 .s:: e! ro c -.:; '5 1ii ro 1ii ~ ~ §i:3.gE' g=a; E CD '0 c ;: 0> .~ 0. Gl ._ -:::J '0 ~~ (pen 0 :::J OJ +=i c;; "0 .~ c I/) c 0
~ ~ Ol ]l Gl :o=.s:: :::J >-CD ~ 0. c ~~~~ 1ii Gl Gl - CD
.0 :::J :.i< E I/) Bo E ro 'c E'O ~t5 2 E ~ :::J '6 c it E-'" 'C "C &l '0 8. -g E ;: OJ ~8 ~~ 0 :::J OJ "0 OJ 8 0 o c $'§ 8~ en I- z(.) UJ ::i: Q. (.)2 o::~en~ 1 2 3 4 5 6 7 8 9 10 11 12 13
RD Block: Wokha (0004)
Doyang South Wing -------- Uninhabited ------------(00076300)
Vankhosung 84 P M« 5) C« H MCW« 5) TWTK PH(5) - CV« 2 502 CM«5) 5) SP« 5) BS« 5)
(00077100) 5) PHC« 5) SS- PO«5) CP« 5) ST«5) RS(IO+)
Wokha ViiI. P(3) M(2) DCWCH«5) - CV«
BS 3
(00077200) 4,002 741
S(2) C« 5) MCW«5) TSS- PO«5) CM«5) 5) SP« 5)
RS(IO+) PHC« 5) PH« 5) CP« 5) ST«5)
Elumyo 272 P(2) M(2) H(5-IO) - CV(5- BS
4 1,529 MCW(5-IO) TSS- PO«5) CM(5-10) 10) SP(5-1O) RS(10+) (00077300) C(5-10) PHC(5-10) PH(5-10) CP(5-lO) ST(5-10)
DCWC(2) ACS(S-
Humtso 346 PM«S)C(5-H(5-10) POPH(5-10) - CV(5- BS
5 (00077400)
1,916 10) MCW(5-10)
WSS-10)
CM(5·10) NCS(S- 10) SP(5·10) RS(IO+)
PHC(5-10) CP(S-IO) 10) ST(S-IO)
OCS(S-10)
Longsa DH«5)
POPH« - CV«
BS 6 2,956 520 PM«5)C« MCW«5) WSS- CM«5) 5) SP« 5)
(00077700) 5) PHC« 5) 5) CP« 5) ST«5)
RS(lO+)
Niryo . H(5·10) - CV(5. BS
7 1,173 178 PM«S)C(S·MCW(S.IO) R SS- PO«5) CM(5.10) 10) SP(5·10) RS(IO+) (00077800) 10) PHC(S-IO) PH(5-10) CP(S-IO) ST(5-10)
103 P(2) M C(5. DH(5·1O)
POPH(5· - CV(5·
BS 8
Nyru S/Comp. 612 MCW(10+) RSS- CM(5.1O) 10) SP(5·10)
(00077900) 10) PHC(IO+)
10) CP(S-IO) ST(S-IO)
RS(IO+)
290 P M(5-10) D H(5·10) PO(5 - CV(5·
9 Longsachung
1,872 MCW(5-1O) R SS- 10) PH(5- CM(S·IO) 10) SP(S·1O) BS(5·10) (00078300) C(5-1O)
PHC(5-10) 10) CP(5-10) ST(5-10) RS(lO+)
H« 5) PH(5)
- CV« BS Tsungtsutong
681 - P« 5)
S SS· CM«5) 5) SP« 5) 10 (00078400) 135 M« 5) C« 5) MCW« 5) PO« 5) RS(lO+)
PHC« 5) CP«5) ST«5)
..
102
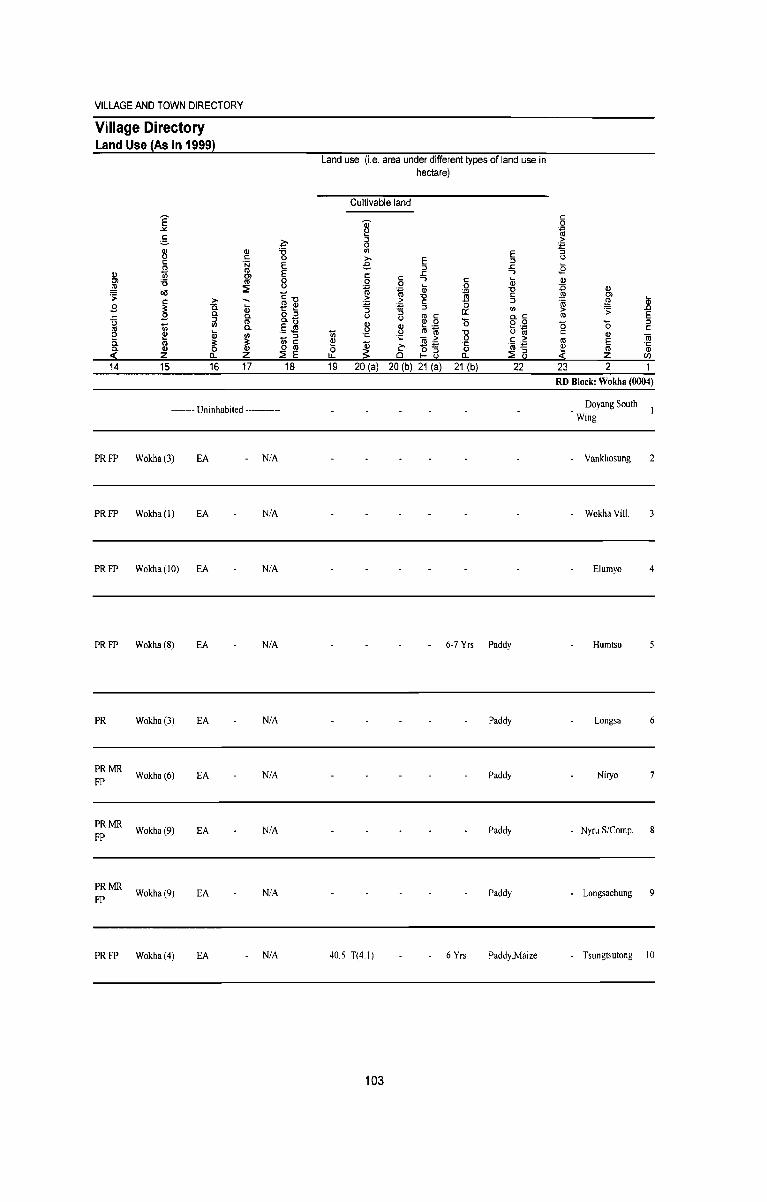
VILLAGE AND TOWN DIRECTORY
Village Directory Land Use (As in 1999)
14 15
>. is. 0. :J
'" ~
0..
16 17
------- Uninhabited ----------
PR FP Wokha (3) EA
PRFP Wokha(J) EA
PRFP Wokha(JO) EA
PR FP Wokha (8)
PR
PRMR FP
PRMR FP
PRMR FP
Wokha(3)
Wokha(6)
Wokha(9)
Wokha(9)
PRFP Wokha(4)
EA
EA
EA
EA
EA
EA
NIA
NIA
NIA
NIA
NIA
NIA
NIA
NIA
NIA
18
Land use (i.e, area under different types of land use in hectare)
~ o u. 19
Cultivable land
~ :J o '" e I: o
~ +' "5 u
1l ''''
20 (a) 20 (b) 21 (a)
40.5 T(41)
103
I: o
~ 0::
'0 '0 o .~
0..
21 (b)
E :J .c: ..., Oi '0 I: :J
'" 0.1: o 0 b~ .~ ~ :2: 5
22
6-7 Yrs Paddy
Paddy
Paddy
Paddy
Paddy
6 Yrs Paddy,Maize
23
Q) Ol
Jl1 ':;;
'0 Q)
E
'" z 2
2 E :J I:
'iii .~
(/)
RD Block: Wokha (0004)
Doyang South Wing
Vankhosung 2
- Wokha Viii, 3
Elumyo 4
Humtso 5
Longsa 6
Niryo 7
- Nyru S/Comp, 8
- Longsachung 9
- Tsungtsutong 10
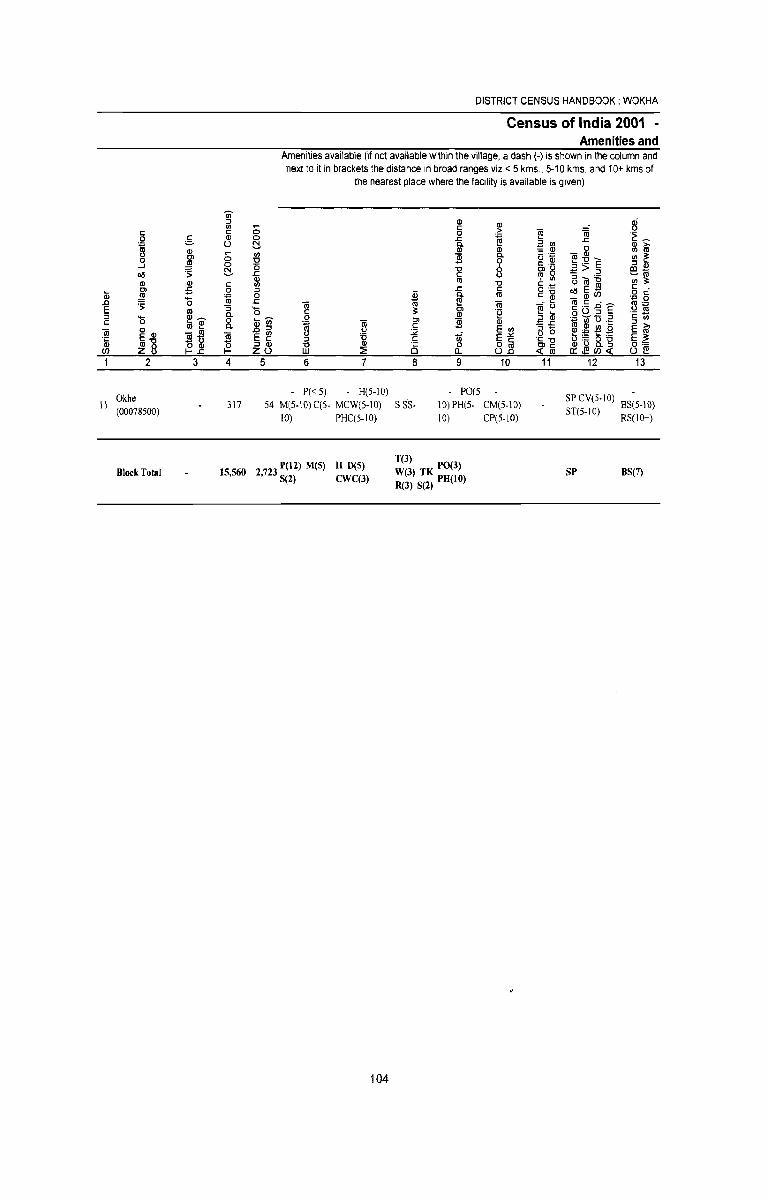
iii .0 E ::> c: 'iii 'c Q)
C/)
e: o
§ ...J
011 Q) Ol
.!!! ~
'0 Q) Q)
E-o ~8
2
11 Okhe (00078500)
Block Total
3
U> ::J II) e: Q) (.)
(; o !:::!.
4
317
(; o !:::!. II) '0 (5 ..c:
~ o .c '0 (Uti) .o::J
E ~ ::J Q) Z(.)
5
DISTRICT CENSUS HANDBOOK: WOKHA
Census of India 2001 -Amenities and
Amenities available (if not available within the village, a dash (.) is shown in the oolumn and next to it in brackets the distance in broad ranges viz.< 5 kms., 5-10 kms. and 10+ kms of
the nearest place where the facility is available is given)
6 7 B
. P«5) H(5-10)
Q) e: o ..c: a. Q)
]i -0 e: C\I
..c: a. e! g' ]i
~ a. 9
- PO(5
10
IE :@ ~ B+=' '§, ,~ til 0 , II)
§ .~ c:~ ~ 'iii u ... ... ::J Q) ::..c: ::Ju 0 'C "'0 Ole:
<J; til
11 12 13
54 M(5-IO)C(5. MCW(S·IO) S SS· 10)PH(S- CM(S-IO) 10) CP(5-10)
SP CV(5-lO) BS(5-10) ST(5-10) RS(IO+) 10) PHC(5-10)
T(3) W(3) TK PO(3) R(3) S(2) PH(tO)
15,560 2 723 P(ll) M(S) H 0(5) 'S(2) CWC(3)
SP BS(7)
104
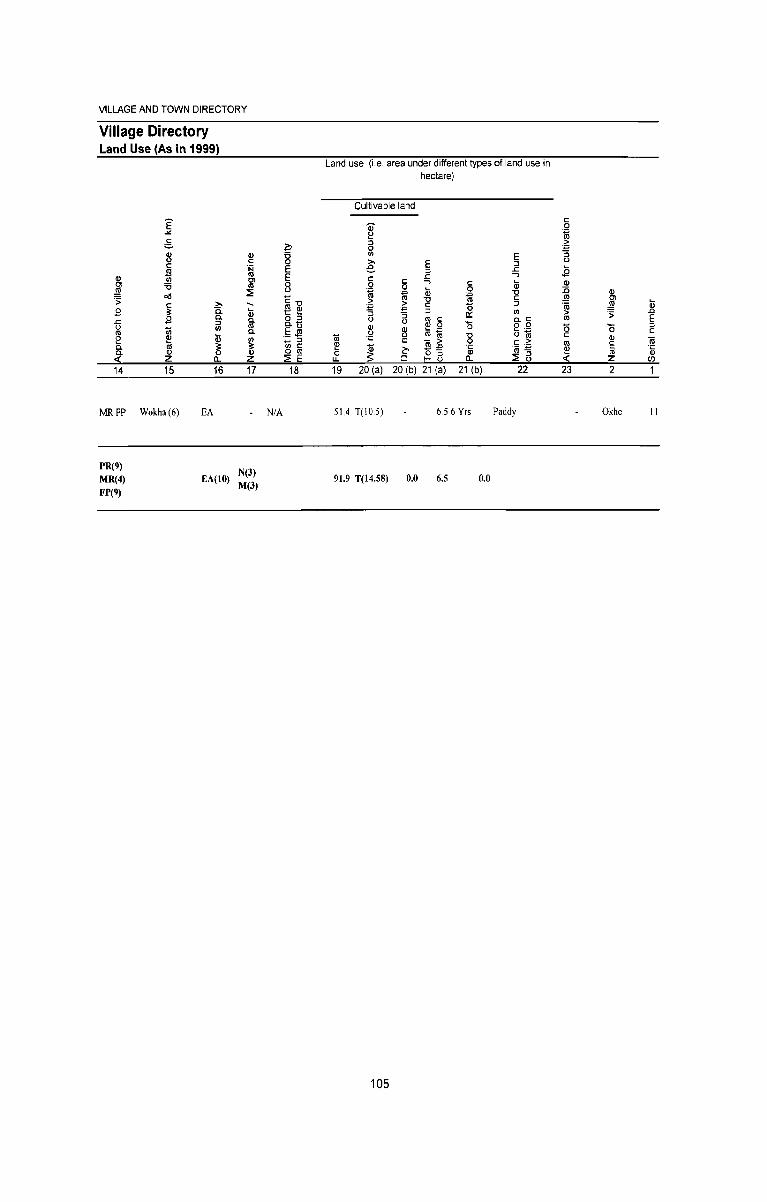
VILLAGE AND TOWN DIRECTORY
Village Directory Land Use (As in 1999)
E ~
§.
2l c: .!!!
CI) <II Cl U g 'S: 0.5
c .9 ~ .<: 0 iii m e ~ a. m a. CI)
« z 14 15
MRFP Wokha(6)
PR(9)
MR(4) FP(9)
CI) c: 'N m Cl m ::i:
:>. 0. Qj a. a. :l <II m
a. Qj <II
~ ~ Q.. Z
16 17
EA
EA(IO) N(3) M(3)
~ U 0 E E 8 C"C m CI) t::~ o :J a.u ,s $!! 'iii
:l c:
0 ro ::i: E
18
N/A
Land use (i.e, area under different types of land use in hectare)
Cultivable land
Q) !:! :l 0 <II E :>. E e :l
:l .<: .c: ....,
C c: ...., c: Qj 0 0 ~ ~ Qj 0 "C > "C ~ c:
> c: :J :;::;
"" S S :l a:: <II
0 ro c: a.c: () '0 ~ ~ ~ .Q o 0 ron; b~ iii ';: "C
';: - > 0 c: ,~ ~ £ ~:2 .~ 0 ~ o :l
'cu :!:!
u. Cl f- () Q.. ::i: 13 19 20 (a) 20 (b) 21 (a) 21 (b) 22
51.4 T(IO.5) 6,56 Yrs Paddy
91.9 T(14,58) 0.0 6.5 0.0
105
c: 0
~ > "" S 0 ~
Q CI)
:0 ~ 'ro > ro
CI) Cl
Qj g 'S: .0
E (5 c: (I)
~ «
'0 :l c:
CI) 'iii E m .~
Z (/)
23 2 1
Okhe II

CHUKITONG RD BLOCK

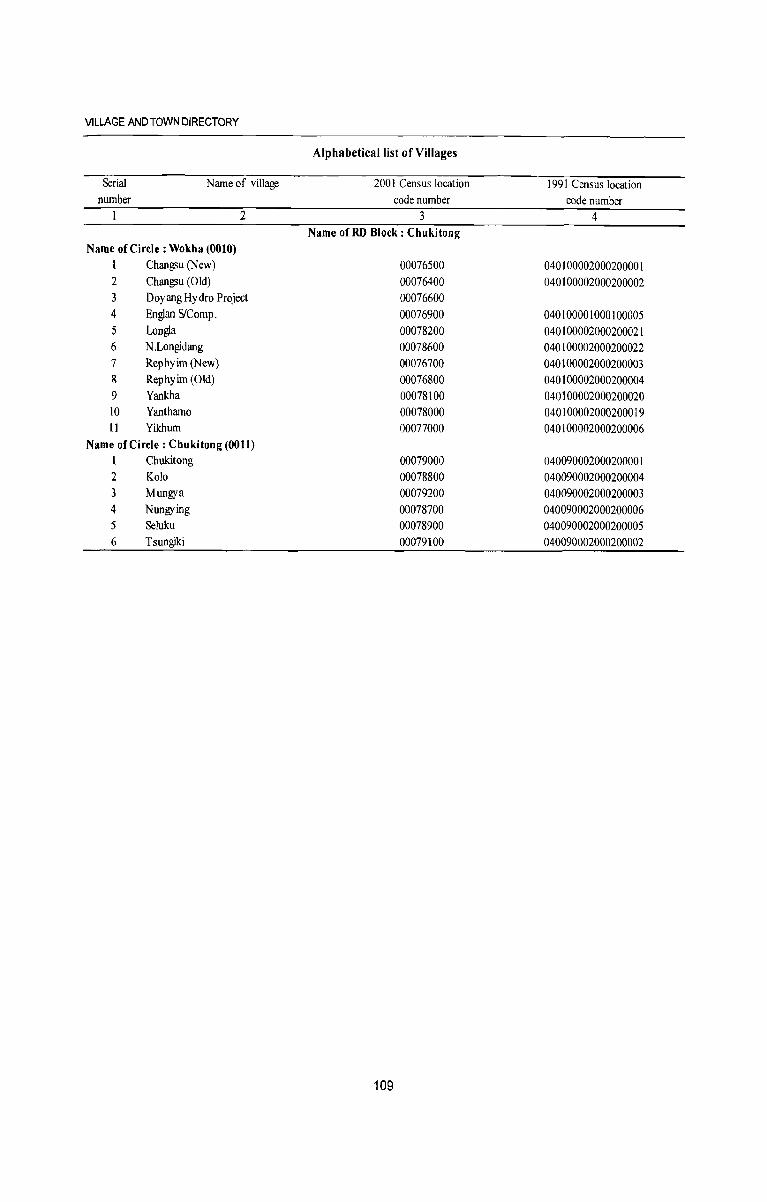
VILLAGE AND TOWN DIRECTORY
Alphabetical list of ViII ages
Serial Name of village 2001 Census location 1991 Census location number code number code number
2 3 4 Name ofRD Block: Chukitong
Name of Circle: Wokha (0010) 1 Chang>u (New) 00076500 040100002000200001 2 Chang>u (Old) 00076400 040100002000200002 3 DoyangHydro Project 00076600 4 Englan SlComp. 00076900 040100001000100005 5 Longla 00078200 040100002000200021 6 N .Longidang 00078600 040100002000200022 7 Rephyim (New) 00076700 040100002000200003 8 Rephyim (Old) 00076800 040100002000200004 9 Yankha 00078100 040100002000200020 10 Yanthamo 00078000 040100002000200019 II Yikhum 00077000 040100002000200006
Name of Circle : Chukitong (0011) 1 Chukitong 00079000 040090002000200001 2 Kolo 00078800 040090002000200004 3 Mungya 00079200 040090002000200003 4 Nungying 00078700 040090002000200006 5 Seluku 00078900 040090002000200005 6 Tsungiki 00079100 040090002000200002
109
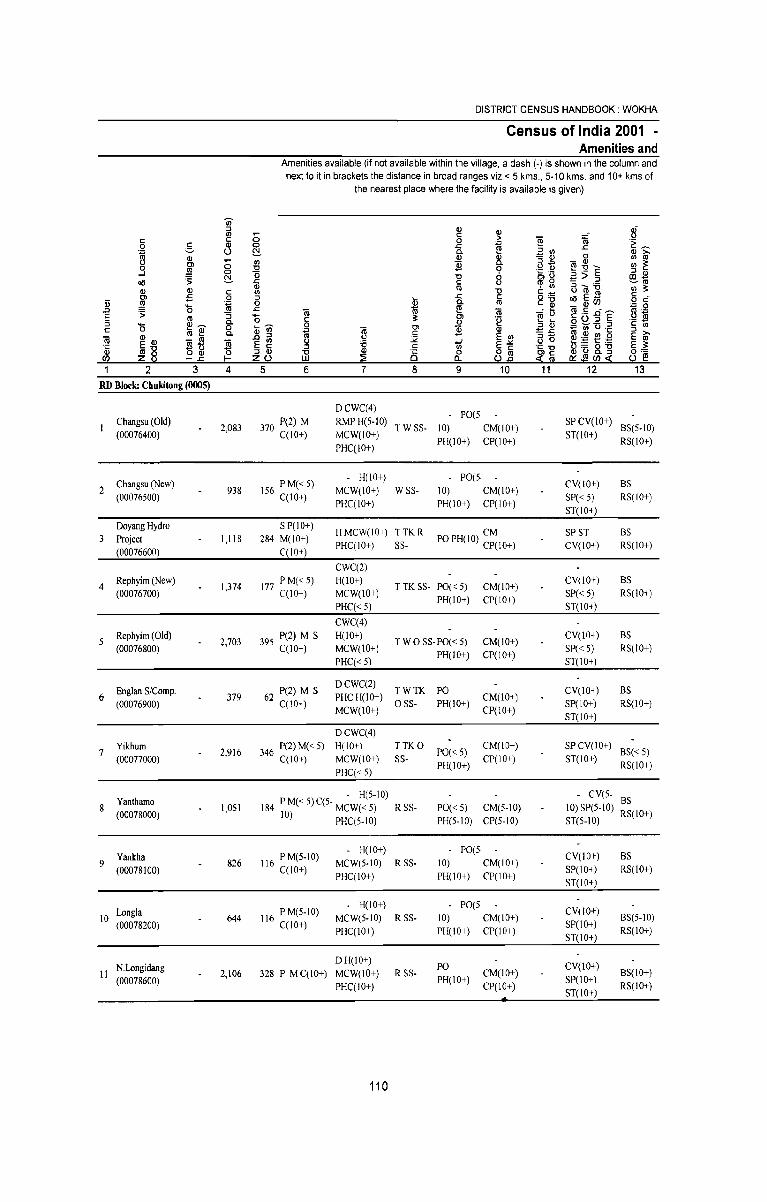
DISTRICT CENSUS HANDBOOK: WOKHA
Census of India 2001 -Amenities and
Amenities available (if not available within the village, a dash (-) is shown in the column and next to it in brackets the distance in broad ranges viz. < 5 kms., 5-10 kms. and 10+ kms of
the nearest place where the facility is available is given)
en :l CD CD ~ VJ ;; C
C C 0 > ~ tv .~ ~ 0 c CD 0 J:: ~ J::
~ c- U ~ a. :E m CD >-CD ~
CD CD 0 VJ <1l Cl VJ ]i a. 5~ - CD
I/) 1: 0 0 -0 0 ~:gE ~ 0 ._ CD
:l CD _, ~
(5 -0 6 rn '0 ~ > ::J co~ oil .s; J:: C U <1l 0 a-rn:e1
~<1l
OJ OJ <1l -0 ' VJ I/) 3; CD c If) 5 :~ o1SE.2! c _
Cl ;; 0 :l
~ J:: C o c Iii ~ ~ 0 a. <1l c~ ~ _OJen
'0 J:: ~ "" 0 .0 .s; :i tv tv ~ ~ ~ .~ .Ii E rl~ E <1l '0 c it Cl .~ :l '0 Q)~ a.
Q)Ul 0 CD :l Q) 0~.2:l 'c U) c .... OJ 0
~ ~ Cl ]i CD ~J:: :; m o,c:: :l >-
Q) OJ al .... a. .0 :l C E VJ ~o ~E~~ E <1l tv ~~ ~ E ~ '5
:.;< 'lii E'>:: E it '&i E-o :l c 't: "C ~'5 g_-g
~8 :l Q) -0 Q) 8 0 o c
~~ 0==
en f-J:: f- ZU w :2 Il. ull a:::.ll!en!'l: u ~ 1 2 3 4 5 6 7 8 9 10 11 12 13
RD Block: Chukitong (OlIOS)
DCWC(4) - PO(5
Changsu (Old) 2,083 370 P(2) M RMPH(5-1O)
TWSS- 10) CM(IO+) SPCV(IO+)
BS(5-10) (00076400) C(lO+) MCW(IO+)
PH(lO+) CP(IO+) ST(10+)
RS(lO+) PHqlO+)
Changsu (New) 156 PM«5) H(lO+) - PO(5
CV(IO+) BS 2 938 MCW(lO+) WSS- 10) CM(lO+)
(00076500) qIO+) PHqIO+) PH(lO+) CP(IO+)
SP« 5) RS(IO+) ST(IO+)
Doyang Hydro S P(lO+) HMCW(IO+) TTKR CM SP ST BS
3 Project 1,118 284 M(IO+) PHC(IO+) SS- PO PH(lO) CP(IO+) CV(IO+) RS(IO+)
(00076600) C(lO+)
CW(2) Rephyim (New)
1,374 177 P M« 5) H(lO+) T TK SS- PO« 5) CM(IO+)
CV(lO+) BS 4
(00076700) C(lO+) MCW(lO+) SP« 5) RS(IO+) PHq< 5)
PH(IO+) CP(lO+) ST(IO+)
CWC(4)
5 Rephyim (Old)
2,703 395 P(2) M S H(IO+) TWOSS-PO«5) CM(IO+)
CV(lO+) BS (00076800) C(lO+) MCW(IO+)
PH(IO+) CP(IO+) SP« 5) RS(lO+)
PHq< 5) ST(10+)
Englan S/Comp. 62 P(2) M S DCWC(2)
TWTK PO CV(lO+) BS 6
(00076900) 379
C(lO+) PHCH(lO+)
OSS- PH(lO+) CM(lO+)
SP(lO+} RS(IO+) MCW(lO+) CP(lO+)
ST(IO+)
DCWC(4)
7 Yikhum
2,916 346 P(2) M« 5) H(IO+) TTKO PO« 5)
CM(IO+) SPCY(IO+) BS«S)
(00077000) C(lO+) MCW(10+) SS-PH(IO+)
CP(IO+) ST(10+) RS(IO+)
PHC« 5)
Yanthamo - H(S-10) - CY(5- BS
8 (00078000)
1,051 184 PM«5)C(5- MCW«5) RSS- PO«S) CM(S-IO) 10) SP(S-IO) RS(IO+) 10) PHq5-10) PH(S-IO) CP(S-lO) ST(5-10)
116 P M(S-IO) H(lO+) - PO(S
CV(IO+) BS 9
Yankha 826 MCW(S-IO) RSS- 10) CM(lO+)
(00078100) C(IO+) SP(lO+) RS(lO+) PHC(IO+) PH(IO+) CP(IO+)
ST(IO+)
Longla 116 P M(S-IO) H(lO+) POtS
CV(IO+) 10 644 MCW(S-IO) RSS- 10) CM(IO+) BS(5-IO)
(00078200) C(lO+) PHC(IO+) PH(IO+) CP(IO+)
SP(10+) RS(IO+)
ST(lO+)
N.Longidang D H(10+)
PO CY(lO+) 11 2,106 328 P M qIO+) MCW(IO+) R SS- CM(IO+) BS(IO+)
(00078600) PHC(lO+)
PH(lO+) CP(IO+)
SP(lO+) RS(IO+)
ST(lO+)
110
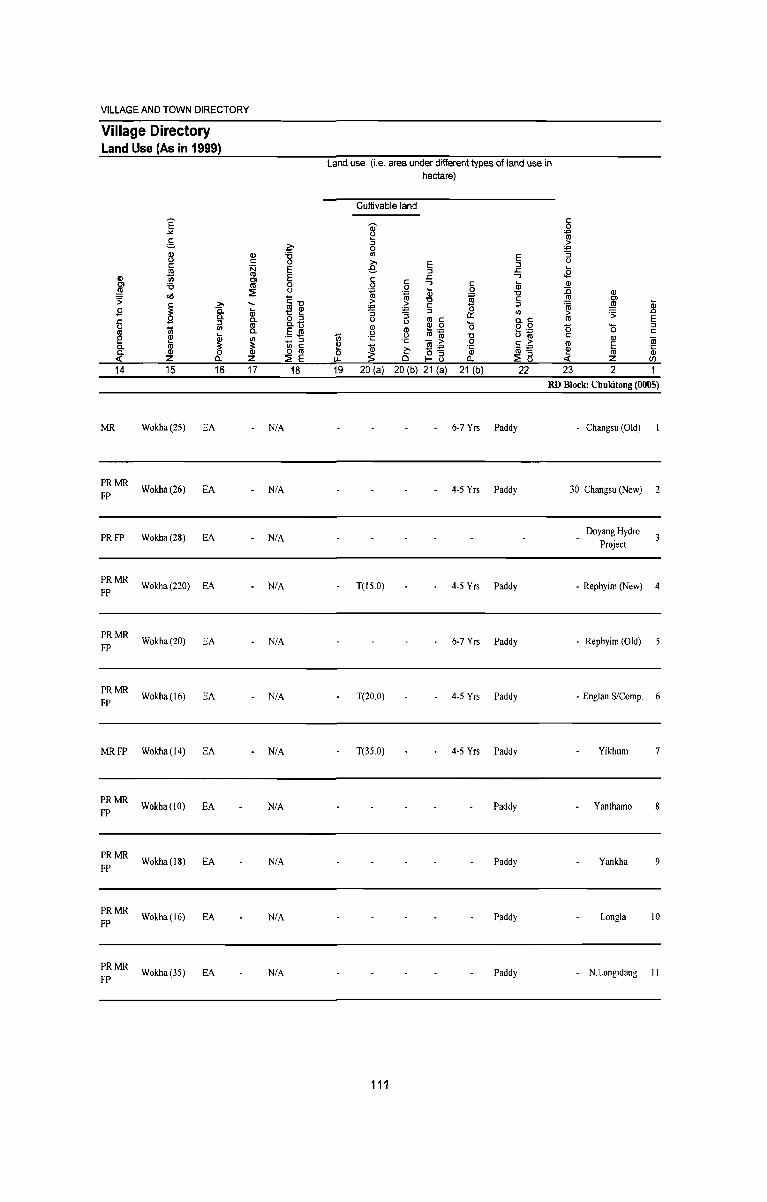
VILLAGE AND TOWN DIRECTORY
Village Directory Land Use (As in 1999)
E .>t!
c: '=-
fl c:
Ql .21 '" Cl iJ :ll! 015 .> c: '" B ~
a. .c: c.
::J u iii '" co ... e ~ Ql c. co ~ C. Ql « z 0..
14 15 16
MR Wokha(2S) EA
PRMR Wokha(26) EA
FP
PRFP Wokba(28) EA
PRMR Wokha(220) EA
FP
PRMR Wokha(20) EA
FP
PRMR Wokba(16) EA
FP
MRFP Wokha(14) EA
PRMR Wokha(IO) EA
FP
PRMR Wokha (I 8) EA
FP
PRMR Wokha(l6) EA
FP
PRMR Wokha(35) EA
FP
Ql c: ·N co Cl co
:::E
(jj c. co c.
'" ~ Ql Z
17
~ iJ 0 E E 0 u <:"tl
~ ~ o ::J c.t) s$
::J iii c: o co :::E E
18
N/A
N/A
N/A
N/A
N/A
N/A
N/A
N/A
N/A
N/A
N/A
land use (i.e. area under different types of land use in hectare)
Cultivable land
j ::J 0
'" '" :e. E
E ::J ::J .c:
c: 0
~ > +' :; U Ql u iii ·c
IE ~ 0
U-
.c: ...., c: ...., c: lii 0 (jj 0 ~ S
"tl "tl c:
> c: ::J +' ::J 0
'" :; 0:: u rn c: c.c:
*~ '0 o 0
Ql b~ U "tl ·c - > 0 c: .~ ~:;:; c:- .~ '(5 :!:!
Cl f- 13 0... :::E 13 19 20 (a) 20 (b) 21 (a) 21 (b) 22
c: 0
~ > +' :; u ... .E Ql :c Ql
..!!! Cl (jj ·ro :ll! .0 > .> rn E
0 '0 ::J c: c: Ql (ij co E
~ co .~
« z C/)
23 2 1 RD Block: Chukitong (0005)
6-7 Yrs Paddy Changsu (Old)
4-S Yrs Paddy 30 Changsu (New) 2
Doyang Hydro Project
T(IS.O) 4-S Yrs Paddy - Rephyim (New) 4
6-7 Yrs Paddy - Rephyim (Old)
T(20.0) 4-5 Yrs Paddy - Englan S/Comp. 6
T(35.0) 4-5 Yrs Paddy Yikhum 7
Paddy Yanthamo
Paddy Yankha 9
Paddy Longla 10
Paddy N.Longidang II
111
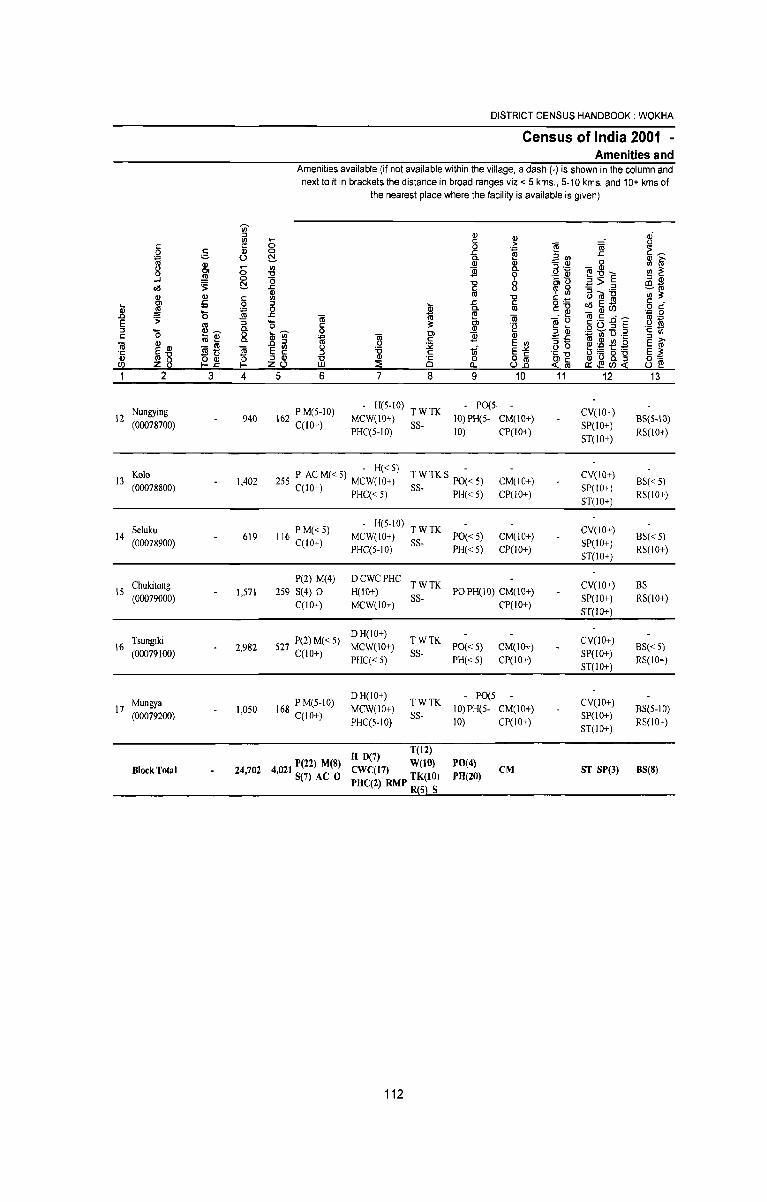
DISTRICT CENSUS HANDBOOK· WOKHA
Census of India 2001 -Amenities and
Amenities available (if not available within the village, a dash (-) is shown in the column and next to it in brackets the distance in broad ranges viz.< 5 kms., 5-10 kms. and 10+ kms of
the nearest place where the facility is available is given)
"' :::I Q) Q) ~ II) ..- c: c: c: 0 0 > e! "iii
0 §. III 0 .r; ~ J:: .~ ~
§ (.) ~ 0- :2~ Q) ,.,
III Q) 8. 0 '" CIl ..- '" "2 3:;::; - III ~ ~ 01 0 "0
~ ~:2E :ll1 .c: .~ _J 0 "0 010 co$ ~ "0 "">:::1 oil ':;; .t: c: CIl 0 ~CIl
III III III CIl "0 ' '" ~1il'5 '" ~ c: '" § :'=' oIIE.!!I c: _ ... Ol £; Q :::I $
.r:. c: o c: :ll1 0 0. m c'O -Q)(/) Q)
'0 ~ .r:. f! - i!! ~ 0 .0 ':;; m III "iii :g ,S .ri E ,~ ~ -s .... ~~ E CIl 0 c: 3: Ol 'e 0(.):::1 0- .9l :::I '0 ~~ 0 .8~
0 Cl 3 III ~lo .~ C <II C III i!! 0- ~ TI C .!! III - J:: :::I »
E '" :::1-m III III - rn
~ E ~ '5 :i2 tf E~ o 0 ~~~~ E m .~ 1:"0 .!!It) :::I C 'C: -0 ~13 a'S E 3:
~ 8 ~~ :::I III 1J Q)
0 0 Q C
~ffi 8~ (/) I- Z(.) W :E a.. (.)2 D::.J!1(/)« 1 2 3 4 5 6 7 8 g 10 11 12 13
Nungying 162 P M(5-10) - H(5-IO) - PO(5
CV(IO+) 12 940 MCW(IO+) TWTK 10) PH(S- CM(10+) BS(5-10)
(00078700) C(lO+) PHC(5-10) SS- 10) CP(IO+) 5P(10+)
RS(lO+) 5T(10+)
Kolo - H« S)
TWTKS PO~<5) CV(IO+) 13 1,402 255 P AC M« 5) MCW(lO+) CM(IO+) BS« 5)
(00078800) C(1 0+) PHC( < 5) SS- PH« 5) CP(IO+) SP(IO+)
RS(IO+) ST(IO+)
Seluku P M«5) - H(5-IO) TWTK PO« 5) CM(lO+)
CV(IO+) BS«5) 14 619 116 C(IO+) MCW(lO+)
(00078900) PHC(5-1O) SS- PH« 5) CP(lO+) SP(IO+)
RS(IO+) ST(IO+)
Chukitong P(2) M(4) DCWCPHC
TWTK CV(lO+) BS 15
(00079000) 1,571 259 S(4) 0 H(IO+)
SS-POPH(IO) CM(IO+)
5P(IO+) RS(IO+) C(lO+) MCW(IO+) CP(IO+)
ST(10+)
Tsungiki 527 P(2) M( < 5) DH(IO+)
TWTK CV(IO+) 16 2,982 MCW(IO+) PO« 5) CM(IO+) BS« 5)
(00079100) C(10+) PHC« 5)
SS-PH«5) CP(IO+)
SP(lO+) RS(lO+)
ST(IO+)
Mungya 168 PM(5-10) D H(lO+)
TWTK - POlS
CV(IO+) 17 1,050 MCW(lO+) 10) PH(5- CM(IO+) BS(5-1O)
(00079200) C(10+) PHC(5-10)
SS-10) CP(IO+)
SP(IO+) RS(IO+)
ST(IO+)
R D(7) T(l2)
Block Total 24,702 4 021 P(22) M(S) CWC(!7) W(lO) PO(4)
CM ST SP(3) BS(8) , S(7) AC 0 PRe 2) RMP TK(!O) PH(20)
( R 5 S
112
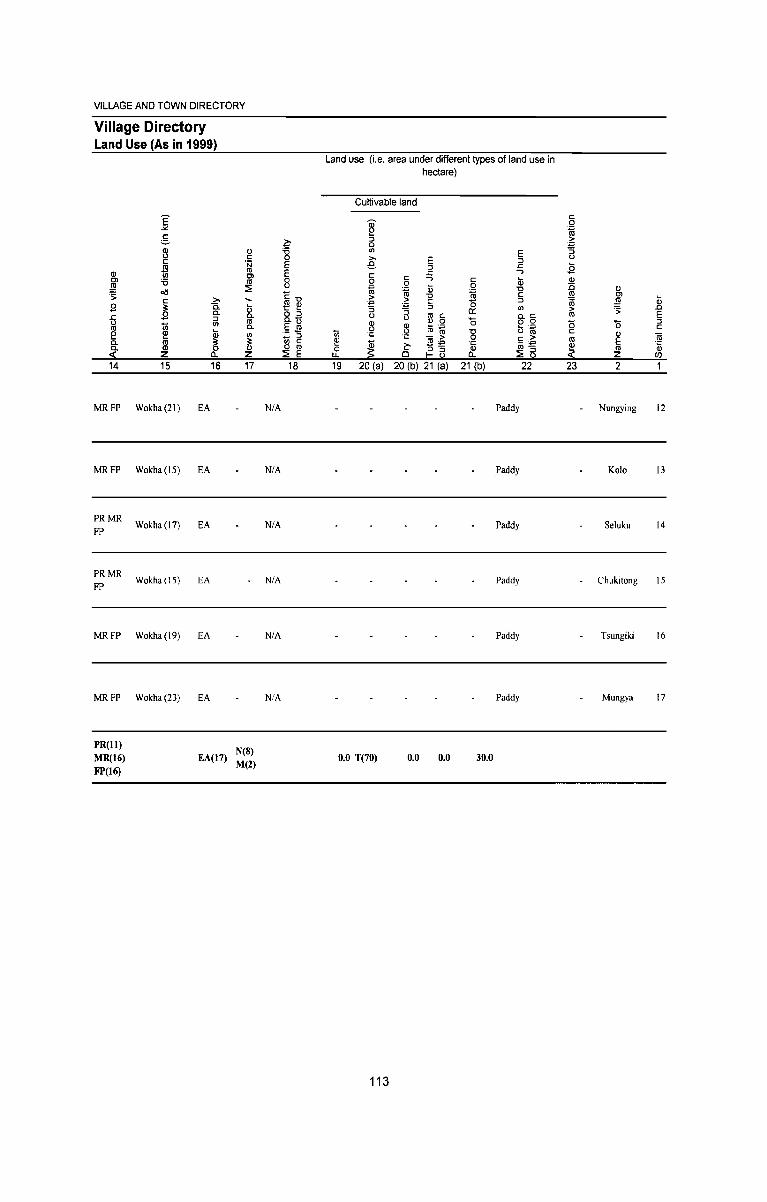
VILLAGE AND TOWN DIRECTORY
Village Directory Land Use (As in 1999)
Q) C)
Jll ;; £l .c () (1l
e 0. 0. <{
14
MRFP
MRFP
PRMR FP
PRMR FP
MRFP
MRFP
PRell) MR(16) FP(16)
E -" c
;=:;.
8 c
~ 15 ell c
~ iii !!! (1l Ql
z 15
Wokha(21)
Wokha(15)
Wokha (17)
Wokha(15)
Wokha (19)
Wokha(23)
C1l c 'N (1l C) (1l
::i: >-Ci. Q; 0. 0. OJ (1l II)
0. Q; II)
~ ~ Q_ z 16 17
EA
EA
EA
EA
EA
EA
EA(17) N(8) M(2)
~ 15 0 E E 8 1:''0
~ ~ o OJ 0.-
s~ OJ
iii c 0 (1l
::i: E 18
N/A
N/A
N/A
N/A
N/A
N/A
Land use (i,e, area under different types of land use in hectare)
Cultivable land
~ OJ 0 II) E >- E e OJ
OJ .c .c '"') c c '"') 0 c Q; 0 0
~ ~ Q;
~ '0
'0 c > > c OJ .." :; .." OJ II)
() :;
(1l c ex: o.c L1 ~ .Q '0 o 0 8 8 (1l iii u~ iii '" '0
'" - > 0 c: ,::: !!! ~
jgE .~ 0 ~ o OJ
Om .:!:
IJ.. 0 I- L1 Q_ ::i: i3 19 20 (a) 20 (b) 21 (a) 21 (b) 22
Paddy
Paddy
Paddy
Paddy
Paddy
Paddy
0.0 T(70) 0.0 0.0 30.0
113
c 0
iii :E; :; () ~
.E Ql
:c Q)
.!l! C)
iii ~ Q; > .D (1l
'): E OJ (5 '0 c
C C1l 'iii (1) E .~ !!! (1l
<{ z C/)
23 2 1
Nungying 12
Ko10 13
Seluku 14
Chukitong 15
Tsungiki 16
Mungya 17
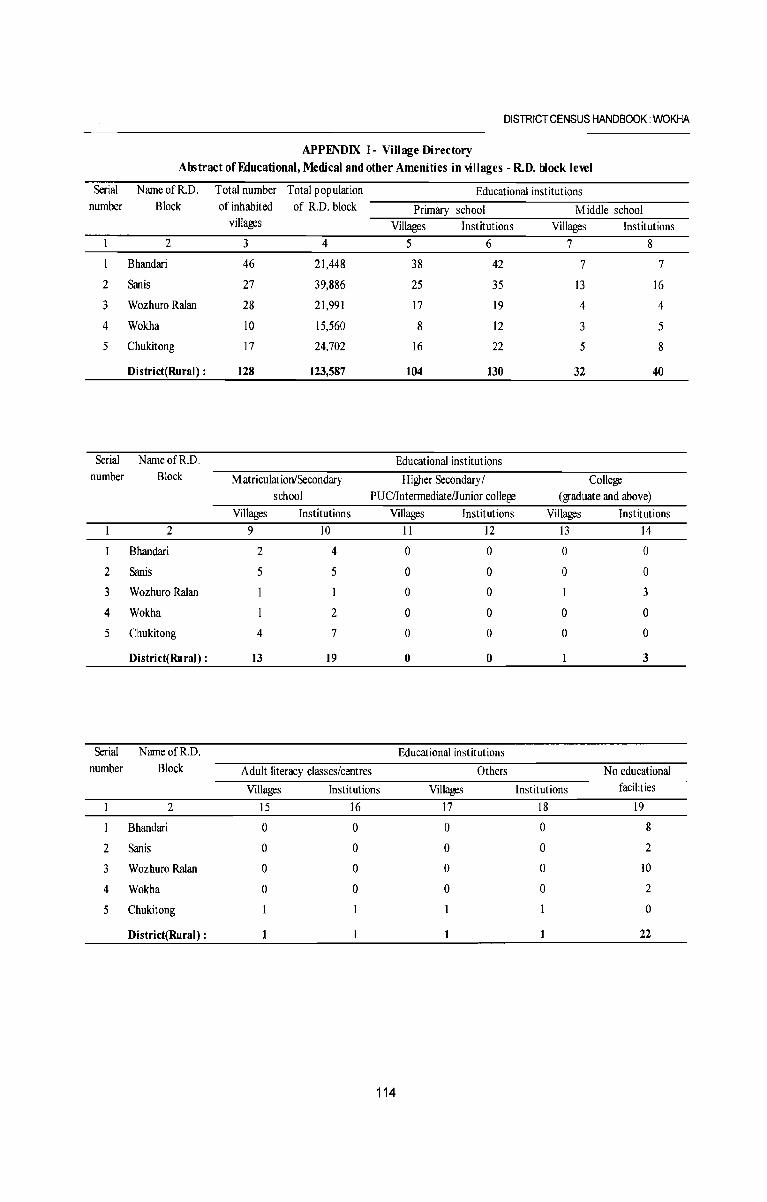
DISTRICT CENSUS HANDBOOK: WOKHA
APPENDIX I - Village Directory
Ab>tract of Educational, Medical and other Amenities in ,mages - R.D. Hock lewl
Serial NameofR.D. Total number Total population Educational institutions number Block of inhabited of R.D. block Primary school Middle school
villages Villages Institutions Villages Institutions 2 3 4 5 6 7 8
Bhandari 46 21,448 38 42 7 7
2 Sanis 27 39,886 25 35 13 16
3 Wozhuro Ralan 28 21,991 17 19 4 4
4 Wokha 10 15,560 8 12 3 5
5 Chukitong 17 24,702 16 22 5 8
District(Rural) : 128 123,587 104 130 32 40
Serial NameofR.D. Educational institutions number Block M atriculationiSecondary Higher Secondary / College
school PUClIntermediate/Junior college (graduate and above) Villages Institutions Villages Institutions Villages Institutions
2 9 10 II 12 13 14
Bhandari 2 4 0 0 0 0
2 Sanis 5 5 0 0 0 0
3 Wozhuro Ralan 0 0 3
4 Wokha 2 0 0 0 0
5 Chukitong 4 7 0 0 0 0
District(Rural) : 13 19 0 0 3
Serial NameofR.D. Educational institutions number Block Adult literacy classes/centres Others No educational
Villages Institutions Villages Institutions facilities
2 IS 16 17 18 19
I Bhandari 0 0 0 0 8
2 Sanis 0 0 0 0 2
3 Wozhuro RaIan 0 0 0 0 10
4 Wokha 0 0 0 0 2
5 Chukitong 0
District(Rural) : 1 22
114
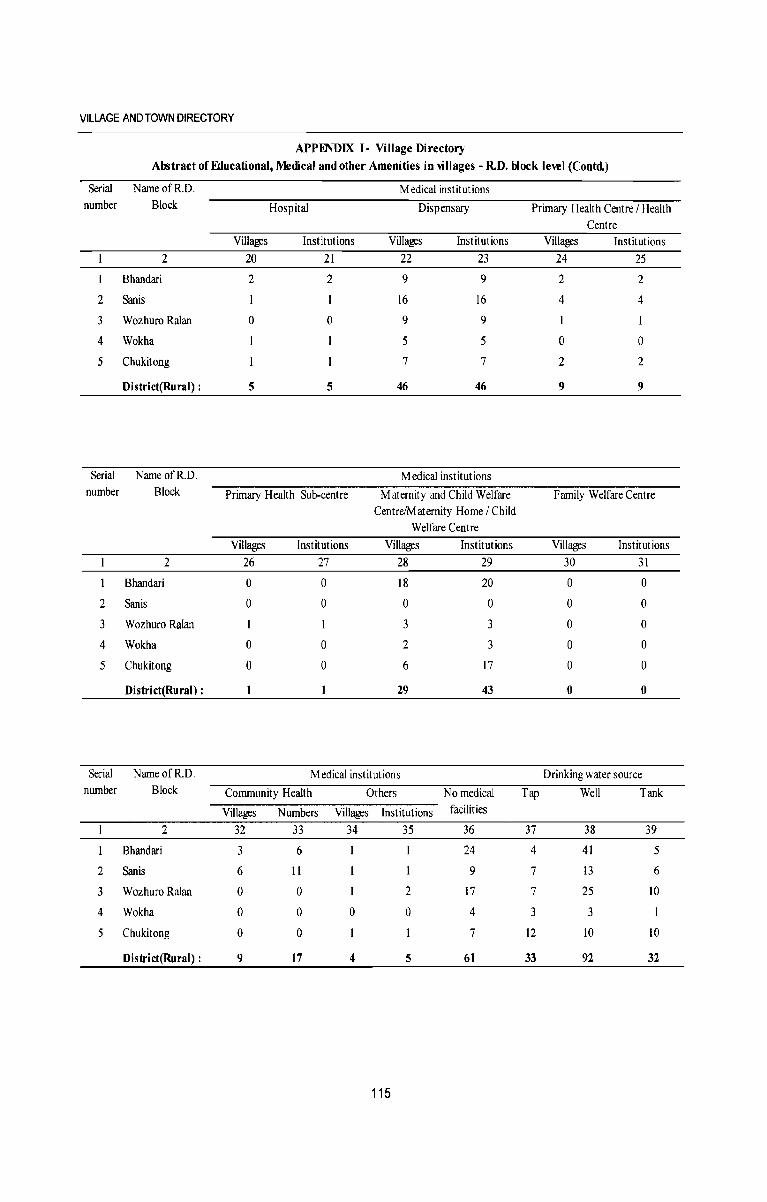
VILLAGE AND TOWN DIRECTORY
APPENDIX 1- Village Directory
Abstract of Educational, Medical and other Amenities in villages - R.D. block level (Contd)
Serial Name ofR.D. Medical institutions number Block Hospital Dispensary Primary Health Centre / Health
Centre Villages Institutions Villages Institut ions Villages Institutions
2 20 21 22 23 24 25
Bhandari 2 2 9 9 2 2
2 Sanis I 16 16 4 4
3 Wozhuro Ralan 0 0 9 9
4 Wokha 5 5 0 0
5 Chukitong 7 7 2 2
District(Rural) : 5 5 46 46 9 9
Serial Name ofR.D. Medical institutions number Block Primary Health Sub-centre Maternity and Child Welfare Family Welfare Centre
CentreJMaternity Home / Child Welfare Centre
Villages Institutions Villages Institutions Villages Institutions
2 26 27 28 29 30 31
1 Bhandari 0 0 18 20 0 0
2 Sanis 0 0 0 0 0 0
3 Wozhuro Ralan 3 3 0 0
4 Wokha 0 0 2 3 0 0
5 Chukitong 0 0 6 17 0 0
District(Rural) : 1 29 43 0 0
Serial NameofR.D. Medical institutions Drinking water source number Block Community Health Others No medical Tap Well Tank
Villages Numbers Villages Institutions facilities
2 32 33 34 35 36 37 38 39
Bhandari 3 6 I I 24 4 41 5
2 Sanis 6 11 I 9 7 13 6
3 Wozhuro Ralan 0 0 2 17 7 25 10
4 Wokha 0 0 0 0 4 3 3
5 Chukitong 0 0 7 12 10 10
District(Rural) : 9 17 4 5 61 33 92 32
115
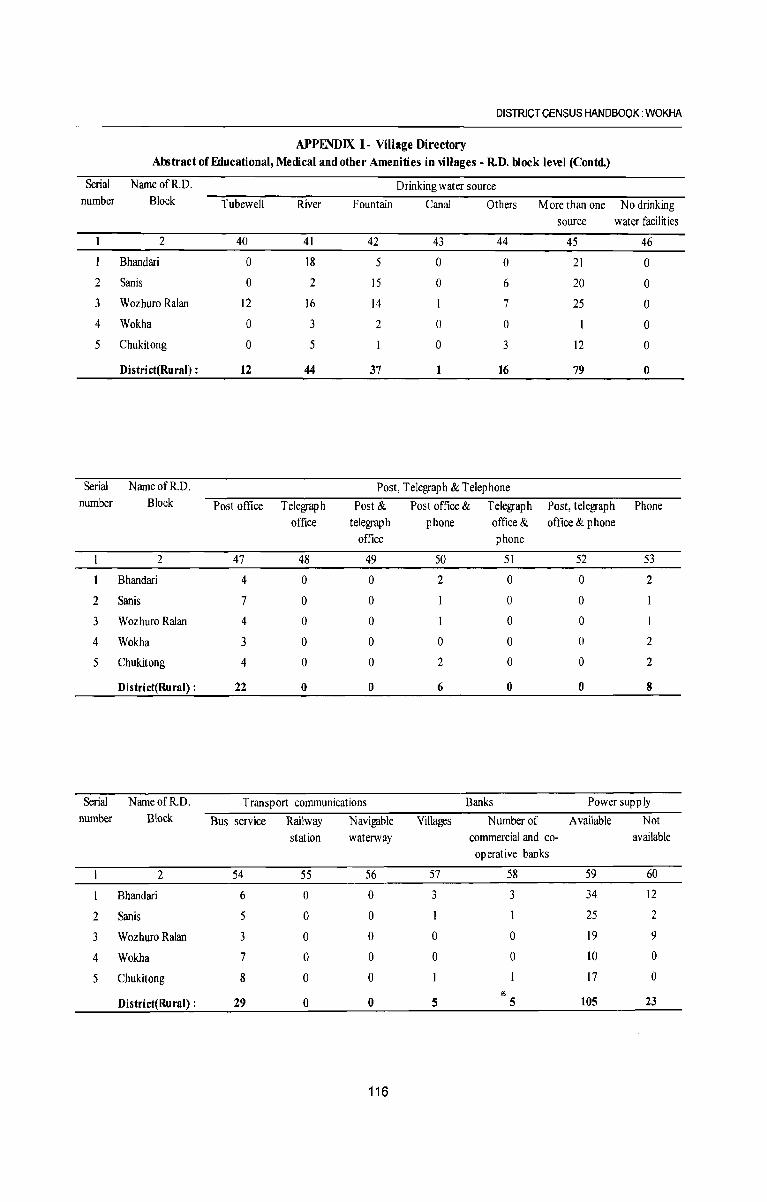
DISTRICT CENSUS HANDBOOK: WOKHA
APPENDIX I - Village Directory Abstract of Educational, Medical and other Amenities in villages - R.D. block level (Contd)
Serial NameofR.D. Drinking water source number Block Tubewell River Fountain Canal Others M ore than one No drinking
source water facilities
2 40 41 42 43 44 45 46
Bhandari 0 18 5 0 0 21 0
2 Sanis 0 2 15 0 6 20 0
3 Wozhuro Ralan 12 16 14 7 25 0
4 Wokha 0 3 2 0 0 0
5 Chukitong 0 5 0 3 12 0
District(Rural) : 12 44 37 1 16 79 0
Serial NameofR.D. Post, Telegraph & Telephone number Block Post office Telegraph Post & Post office & Telegraph Post, telegrap h Phone
office telegraph phone office & office & phone office phone
2 47 48 49 50 51 52 53
I Bhandari 4 0 0 2 0 0 2
2 Sanis 7 0 0 I 0 0
3 Wozhuro Ralan 4 0 0 0 0 I
4 Wokha 3 0 0 0 0 0 2
5 Chukitong 4 0 0 2 0 0 2
District(Rural) : 22 0 0 6 0 0 8
Serial NameofR.D. Transport communications Banks Power supply number Block Bus service Railway Navigable Villages Number of Available Not
station waterway commercial and co- available operative banks
2 54 55 56 57 58 59 60
I Bhandari 6 0 0 3 3 34 12
2 Sanis 5 0 0 25 2
3 Wozhuro Ralan 3 0 0 0 0 19 9
4 Wokha 7 0 0 0 0 10 0
5 Chukitong 8 0 0 17 0 !I..
District(Rural) : 29 0 0 5 5 105 23
116
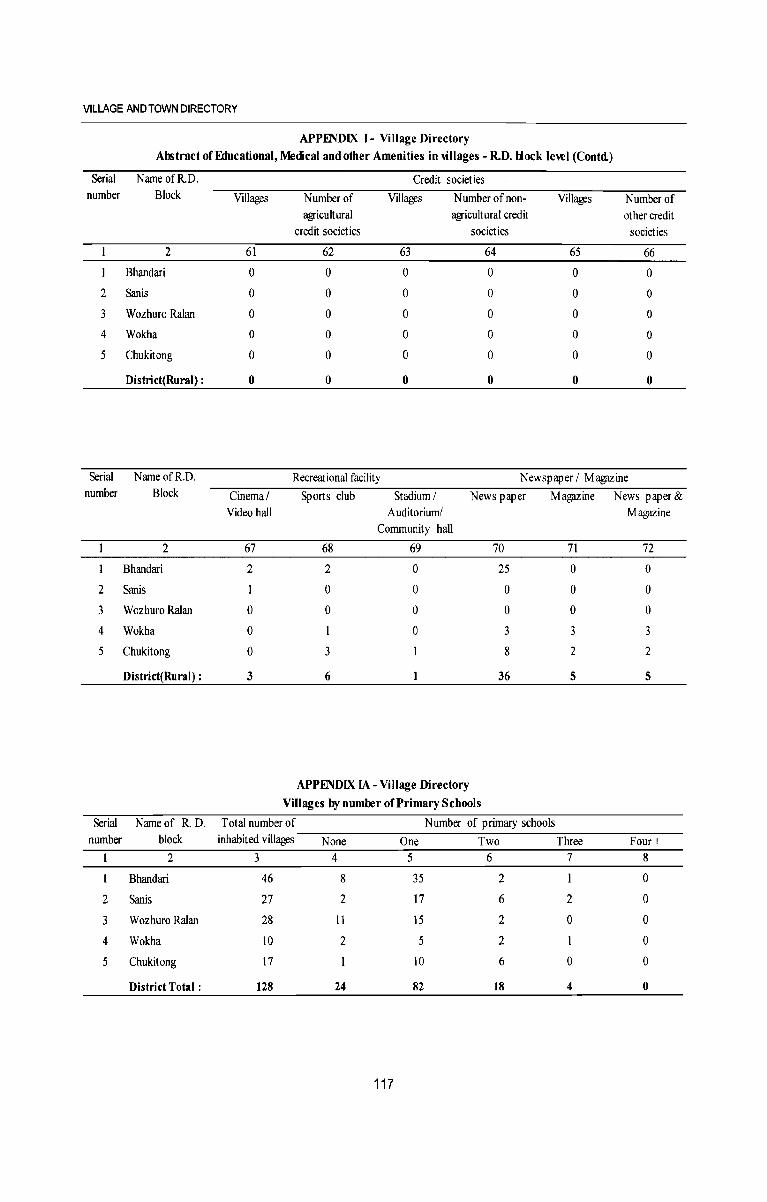
VILLAGE AND TOWN DIRECTORY
APPENDIX 1- Village Directory
Abstract of Educational, Medical and other Amenities in ,mages - R.D. block lewl (Contd)
Serial Name ofR.D. Credit societies number Block Villages Number of Villages N umber of non- Villages Number of
agricultural agricultural credit other credit credit societies societies societies
2 61 62 63 64 65 66
Bhandari 0 0 0 0 0 0
2 Sanis 0 0 0 0 0 0
3 W ozhuro Ralan 0 0 0 0 0 0
4 Wokha 0 0 0 0 0 0
5 Chukitong 0 0 0 0 0 0
District(Rural) : 0 0 0 0 0 0
Serial Name of RD. Recreational facility Newspaper / Magazine number Block Cinema/ Sports club Stadium/ News paper Magazine News paper&
Video hall Auditorium! Magazine Community hall
2 67 68 69 70 71 72
Bhandari 2 2 0 25 0 0
2 Sanis 1 0 0 0 0 0
3 Wozhuro Ralan 0 0 0 0 0 0
4 Wokha 0 I 0 3 3 3
5 Chukitong 0 3 8 2 2
District(Rural) : 3 6 36 5 5
APPENDIX IA - Village Directory
Villages by number of Primary Schools
Serial Nameof R. D. Total number of Number of primary schools number block inhabited villages None One Two Three Four +
2 3 4 5 6 7 8
Bhandari 46 8 35 2 I 0
2 Sanis 27 2 17 6 2 0
3 Wozhuro Ralan 28 11 15 2 0 0
4 Wokha 10 2 5 2 0
5 Chukitong 17 10 6 0 0
District Total: 128 24 82 18 4 0
117
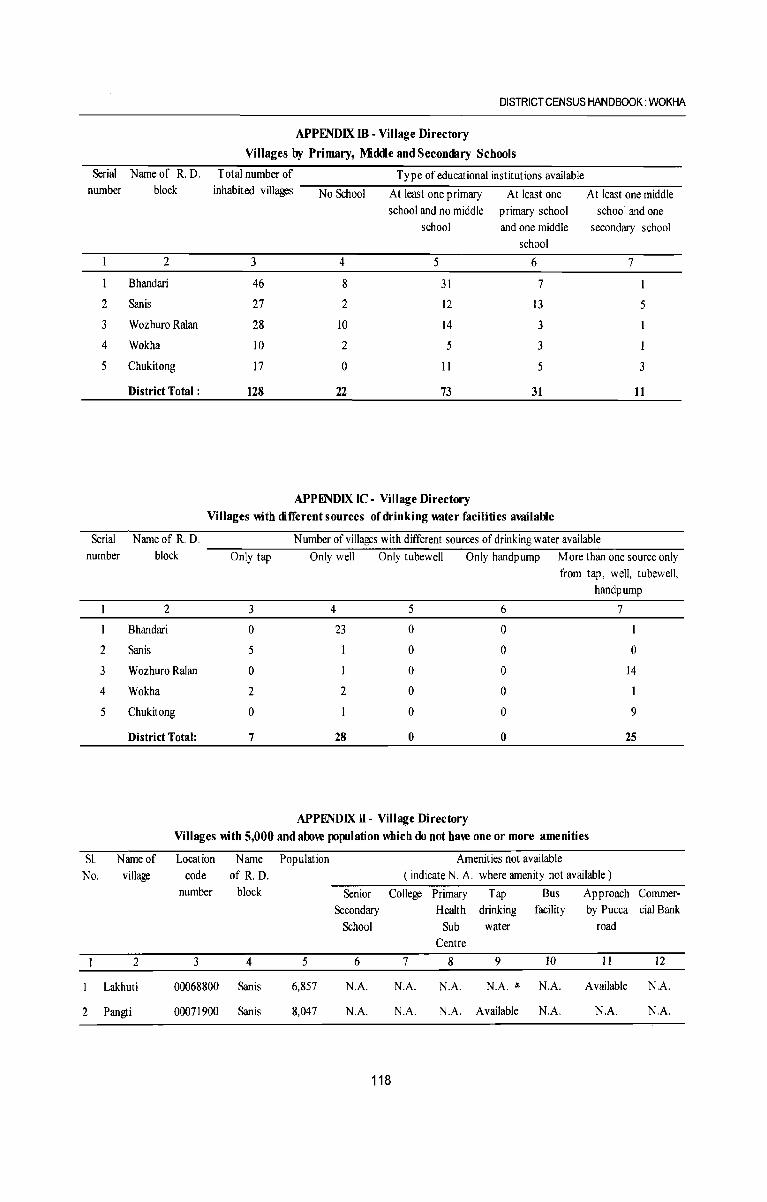
DISTRICT CENSUS HANDBOOK: WOKHA
APPENDIX m -Village Directory
Villages by Primary, Middle and Secondary Schools
Serial Nameof R.D. Total number of Type of educational institutions available number block inhabited villages No School At least one primary At least one At least one middle
school and no middle primary school school and one school and one middle secondary school
school
2 3 4 5 6 7
Bhandari 46 8 31 7
2 Sanis 27 2 12 13 5
3 Wozhuro Ralan 28 10 14 3
4 Wokha 10 2 5 3
5 Chukitong 17 0 11 5 3
District Total: 128 22 73 31 II
APPENDIX Ie - Village Directory Villages ",th different sources of drinking water facilities available
Serial Name of R. D. Number of villages with different sources of drinking water available number block Only tap Only well Only tubewell Only handpump M ore than one source only
from tap, well, tubewelL handpump
1 2 3 4 5 6 7
1 Bhandari 0 23 0 0 I
2 Sanis 5 I 0 0 0
3 Wozhuro Ralan 0 0 0 14
4 Wokha 2 2 0 0
5 Chukitong 0 0 0 9
District Total: 7 28 0 0 25
APPENDIX n - Village Di rectory
Villages ",th 5,000 and above population which do not have one or more amenities
SI. Name of Location Name Population Amenities not available No. village code of R. D. (indicate N. A. where amenity not available)
number block Senior College Primary Tap Bus Approach Commer-Secondary Health drinking facility by Pucca cial Bank
School Sub water road Centre
2 3 4 5 6 7 8 9 10 11 12
Lakhuti 00068800 Sanis 6,857 N.A. N.A. N.A. N.A. !I- N.A. Available N.A.
2 Pangti 00071900 Sanis 8,047 N.A. N.A. N.A. Available N.A. N.A. N.A.
118
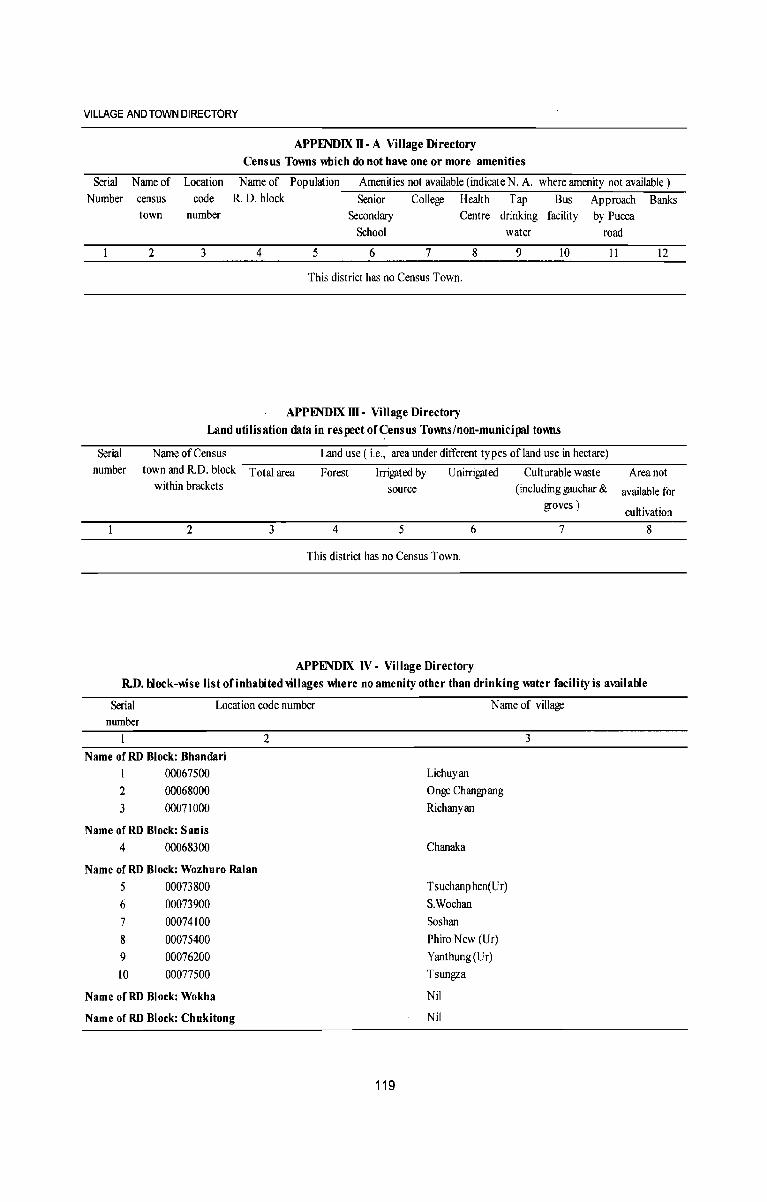
VILLAGE AND TOWN DIRECTORY
APPENDIX n -A Village Directory Census Towns which do not have one or more amenities
Serial Name of Location Name of Population Amenities not available (indicate N. A. where amenity not available) Number census code R. D. block Senior College Health Tap Bus Approach Banks
town number Secondary Centre drinking facility by Pucca School water road
2 3 4 5 6 7 8 9 10 11 12
This district has no Census Town.
APPENDIX ill - Village Directory Land utilisation data in respect of Census Towns/non-municipal towns
Serial Name of Census number town and R.D. block Total area
within brackets
2 3
Land use (i.e., area under different types of land use in hectare)
Forest Irrigated by Unirrigated Culturable waste Area not source (including gauchar & available for
groves) cultivation
4 5 6 7 8
This district has no Census Town.
APPENDIX IV - Village Directory R.D. Hock-mse list of inhabited villages where no amenity other than drinking miter facility is availaHe
Serial Location code number Name of village number
2 3 Name ofRD Block: Bhandari
I 00067500 Lichuyan
2 00068000 Onge Changpang
3 00071000 Richanyan
Name ofRD Block: Sanis
4 00068300 Chanaka
Name ofRD Block: Wozhuro Ralan
5 00073800 Tsuchanphen(Ur)
6 00073900 S.Wochan
7 00074100 Soshan
8 00075400 Phiro New (Ur)
9 00076200 Yanthung (Ur)
10 00077500 Tsungza
Name ofRD Block: Wokha Nil
Name ofRD Block: Chukitong Nil
119
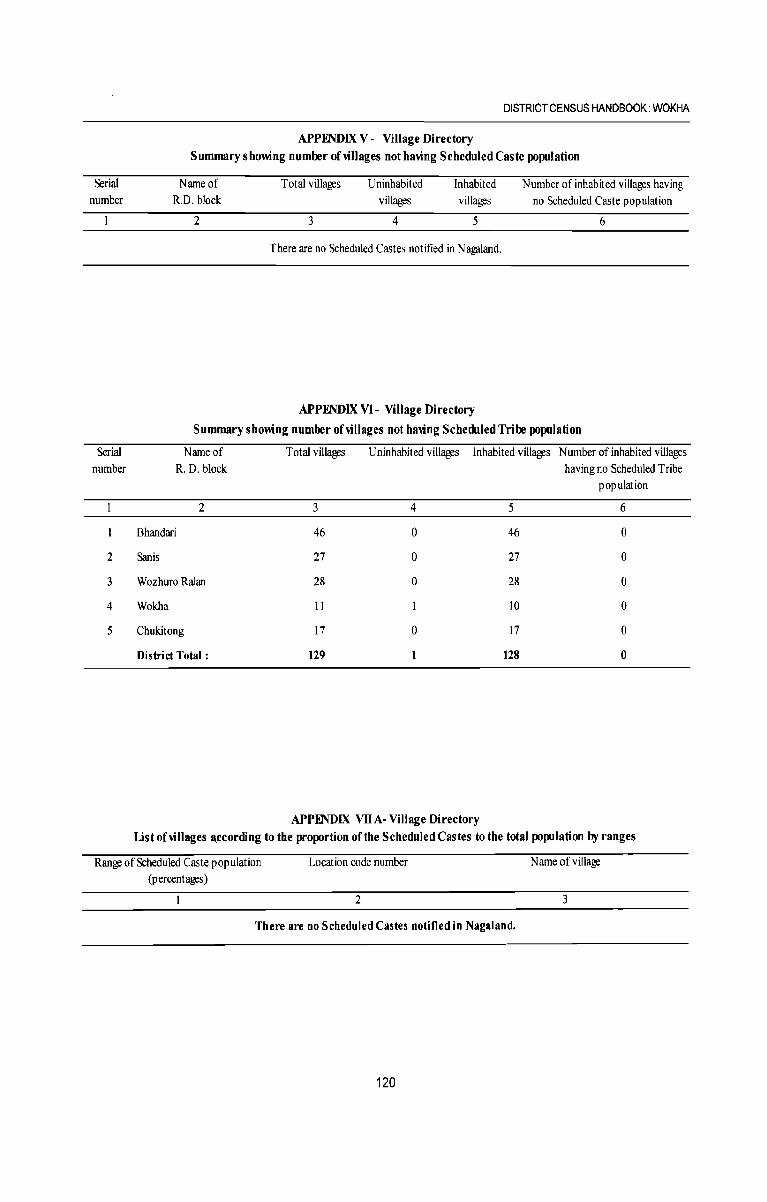
Serial number
Serial number
2
3
4
5
DISTRICT CENSUS HANDBOOK: WOKHA
APPENDIX V - Village Directory Summary sholl'ing number ohillages not having Scheduled Caste population
Name of R.D. block
2
Total villages
3
Uninhabited villages
4
Inhabited villages
5
There are no Scheduled Castes notified in N agaland.
APPENDIX VI - Village Directory
Number of inhabited villages having no Scheduled Caste population
6
Summary shomng number of villages not having Scheduled Tribe population
Name of Total villages Uninhabited villages Inhabited villages Number of inhabited villages R. D. block having no Scheduled Tribe
population
2 3 4 5 6
Bhandari 46 0 46 0
Sanis 27 0 27 0
Wozhuro Ralan 28 0 28 0
Wokha 11 10 0
Chukitong 17 0 17 0
District Total: 129 1 128 0
APPENDIX VII A- Village Directory Ust of villages I\ccording to the proportion of the Scheduled Castes to the total population by ranges
Range of Scheduled Caste population (percentages)
Location code number Name of village
2 3
There are no Scheduled Castes notified in Nagaland.
120
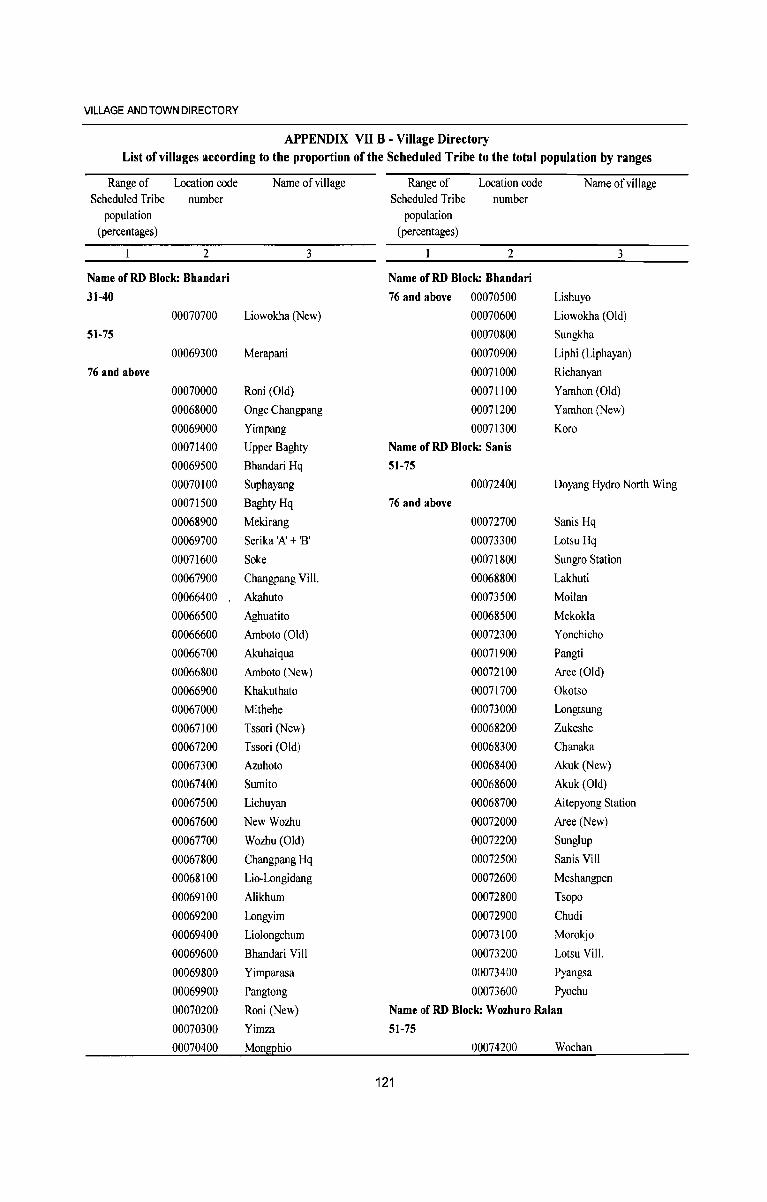
VILLAGE AND TOWN DIRECTORY
APPENDIX VII B - Village Directory List ofvillages according to the proportion of the Scheduled Tribe to the total population by ranges
Range of Location code Name of village Range of Location code Name of village Scheduled Tribe number Scheduled Tribe number
population population (percentages) (percentages)
2 3 2 3
Name of RD Block: Bhandari Name ofRD Block: Bhandari
31-40 76 and above 00070500 Lishuyo
00070700 Liowokha (New) 00070600 Liowokha (Old)
51-75 00070800 Sungkha
00069300 Merapani 00070900 Liphi (Liphayan)
76 and above 00071000 Richanyan
00070000 Roni (Old) 00071100 Yamhon (Old)
00068000 Ongc Changpang 00071200 Yamhon (New)
00069000 Yimpang 00071300 Koro
00071400 Upper Baghty Name of RD Block: Sanis
00069500 Bhandari Hq 51-75
00070100 Suphayang 00072400 Doyang Hydro North Wing
00071500 BaghtyHq 76 and above
00068900 Mekirang 00072700 Sanis Hq
00069700 Serika 'A' + 'B' 00073300 Lotsu Hq
00071600 Soke 00071800 Sungro Station
00067900 Changpang Viii. 00068800 Lakhuti
00066400 Akahuto 00073500 Moilan
00066500 Aghuatito 00068500 Mekokla
00066600 Arnboto (Old) 00072300 Yonchicho
00066700 Akuhaiqua 00071900 Pangti
00066800 Arnboto (New) 00072100 Aree (Old)
00066900 Khakuthato 00071700 Okotso
00067000 Mithehe 00073000 Longtsung
00067100 Tssori (New) 00068200 Zukeshe
00067200 Tssori (Old) 00068300 Chanaka
00067300 Azuhoto 00068400 Akuk(New)
00067400 Sumito 00068600 Akuk (Old)
00067500 Lichuyan 00068700 Aitepyong Station
00067600 New Wozhu 00072000 Aree (New)
00067700 Wozhu (Old) 00072200 Sunglup
00067800 Changpang Hq 00072500 Sanis Viii
00068100 Lio-Longidang 00072600 Meshangpen
00069100 Alikhum 00072800 Tsopo
00069200 Longyim 00072900 Chudi
00069400 Liolongchum 00073100 Morokjo
00069600 Bhandari ViII 00073200 Lotsu ViII.
00069800 Yimparasa 00073400 Pyangsa
00069900 Pangtong 00073600 Pyochu
00070200 Roni (New) Name ofRD Block: Wozhuro Ralan
00070300 Yimza 51-75
00070400 Mongphio 00074200 Wochan
121
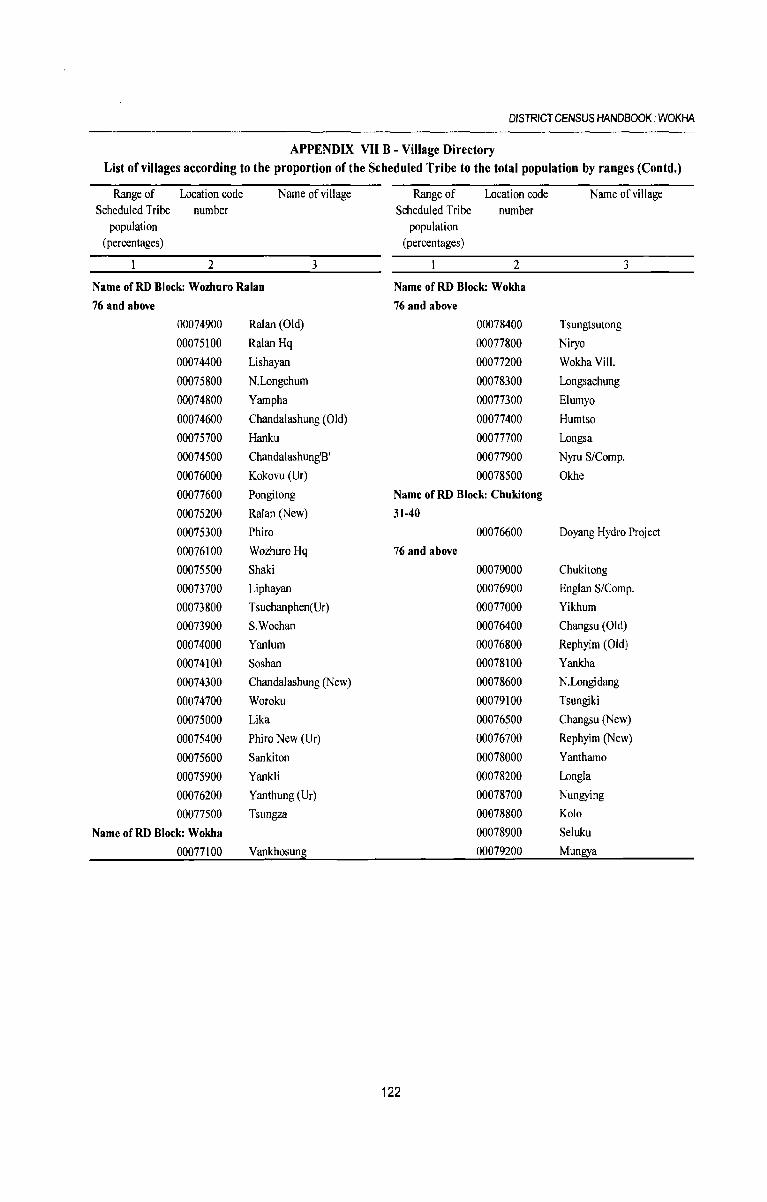
DISTRICT CENSUS HANDBOOK: WOKHA
APPENDIX VII B - Village Directory List of villages according to the proportion of the Scheduled Tribe to the total population by ranges (eontd.)
Range of Location code Name of village Range of Location code Name of village Scheduled Tribe number Scheduled Tribe number
population population (percentages) (percentages)
2 3 2 3
Name ofRD Block: Wozhuro Ralan Name ofRD Block: Wokha
76 and above 76 and above
00074900 RaJan (Old) 00078400 Tsungtsutong
00075100 RalanHq 00077800 Niryo
00074400 Lishayan 00077200 Wokha ViiI.
00075800 N.Longchum 00078300 Longsachung
00074800 Yampha 00077300 Elumyo
00074600 Chandalashung (Old) 00077400 Humtso
00075700 Hanku 00077700 Longsa
00074500 Chandalashung'8' 00077900 Nyru S/Comp.
00076000 Kokovu (Ur) 00078500 Okhe
00077600 Pongitong Name ofRD Block: Chukitong
00075200 Ralan (New) 31-40
00075300 Phiro 00076600 Doyang Hydro Project
00076100 Wozhuro Hq 76 and above
00075500 Shaki 00079000 Chukitong
00073700 Liphayan 00076900 Englan S/Comp.
00073800 Tsuchanphen(Ur) 00077000 Yikhum
00073900 S.Wochan 00076400 Changsu (Old)
00074000 Yanlum 00076800 Rephyim (Old)
00074100 Soshan 00078100 Yankha
00074300 Chandalashung (New) 00078600 N.Longidang
00074700 Woroku 00079100 Tsungiki
00075000 Lika 00076500 Changsu (New)
00075400 Phiro New (Ur) 00076700 Rephyim (New)
00075600 Sankiton 00078000 Yanthamo
00075900 Yankli 00078200 Longla
00076200 Yanthung (Ur) 00078700 Nungying
00077500 Tsungza 00078800 Kolo
Name ofRD Block: Wokha 00078900 Seluku
00077100 Vankhosung 00079200 Mungya
122
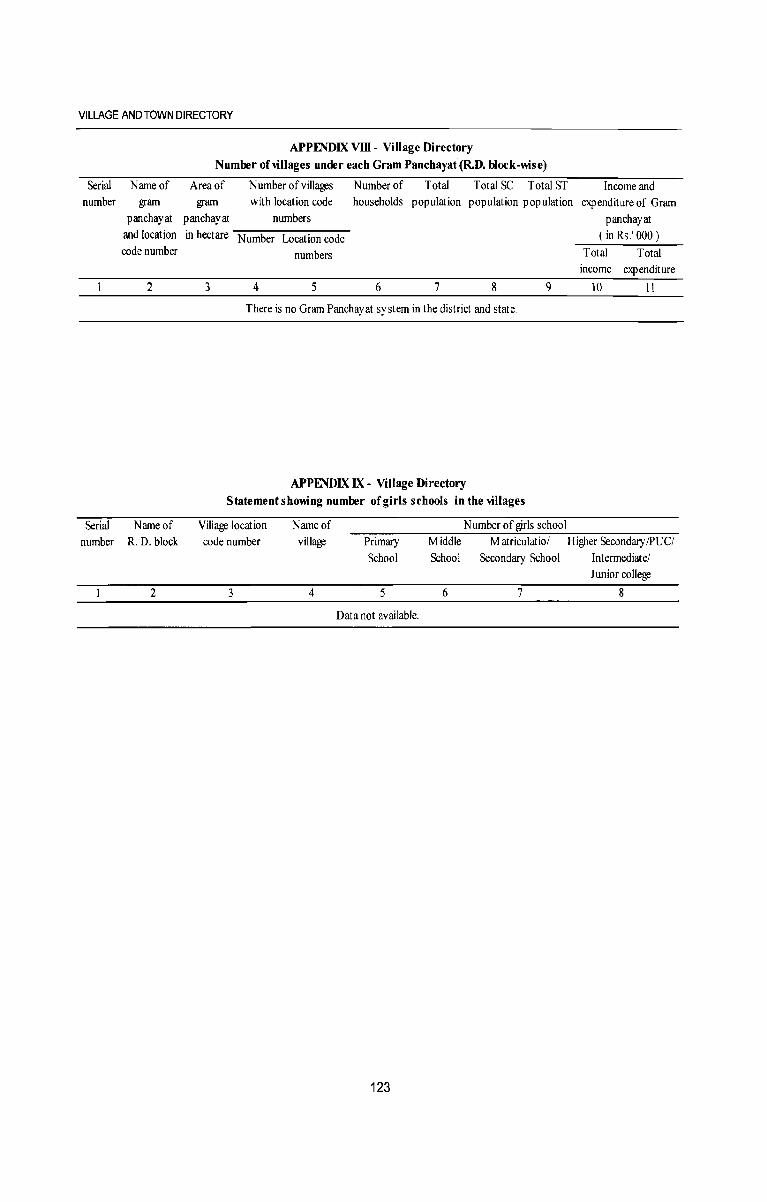
VILLAGE AND TOWN DIRECTORY
APPENDIX vm - Village Directory
Number of villages under each Gram Panchayat (RD. b1ock-mse)
Serial Name of Area of Number of villages Number of Total TotalSC TotalST number gram gram with location code households population population population
Income and expenditure of Gram
panchayat panchayat panchayat numbers
and location in hectare Number Location code ( in Rs.' 000 ) code number numbers Total Total
income expenditure
2 3 4 5 6 7 8 9 10 11
There is no Gram Panchayat sy stem in the district and state.
APPENDIX IX - Village Directory
Statement s homng number of girls schools in the villages
Serial Name of Village location Name of N umber of girls school number R. D. block code number village Primary Middle M atriculatiol Higher Secondary /PUC!
School School Secondary School Intermediate! Junior college
2 3 4 5 6 7 8
Data not available.
123

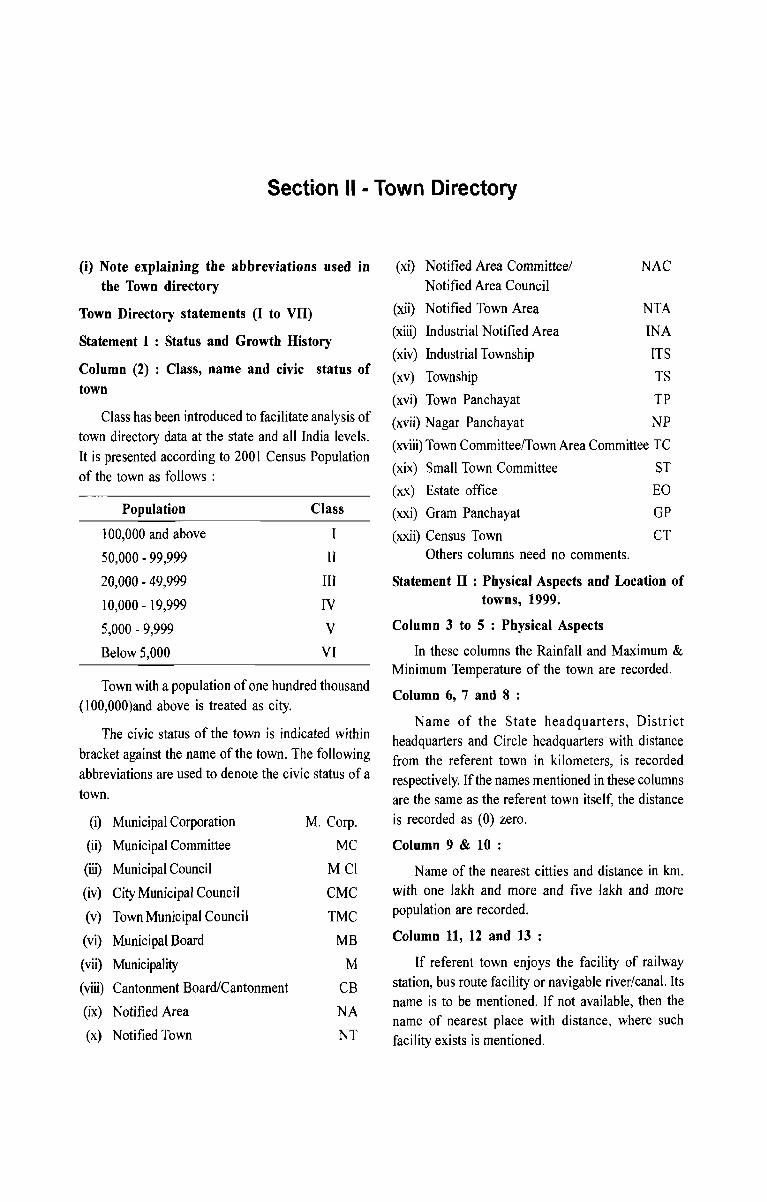
Section II - Town Directory
(i) Note explaining the abbreviations used in the Town directory
Town Directory statements (I to VII)
Statement I : Status and Growth History
Column (2) : Class, name and civic status of town
Class has been introduced to facilitate analysis of town directory data at the state and all India levels. It is presented according to 2001 Census Population of the town as follows :
Population Class
100,000 and above
50,000 - 99,999 II
20,000 - 49,999 III
10,000 - 19,999 IV
5,000 - 9,999 V
Below 5,000 VI
Town with a population of one hundred thousand (IOO,OOO)and above is treated as city.
The civic status of the town is indicated within bracket against the name of the town. The following abbreviations are used to denote the civic status of a town.
(i) Municipal Corporation M. Corp.
(ii) Municipal Committee MC
(iii) Municipal Council M CI
(iv) City Municipal Council CMC
(v) Town Municipal Council TMC
(vi) Municipal Board MB
(vii) Municipality M
(viii) Cantonment Board/Cantonment CB
(ix) Notified Area NA
(x) Notified Town NT
(xi) Notified Area Committee/ NAC Notified Area Council
(xii) Notified Town Area NTA
(xiii) Industrial Notified Area INA
(xiv) Industrial Township ITS
(xv) Township TS
(xvi) Town Panchayat TP
(xvii) Nagar Panchayat NP
(xviii) Town Committee/Town Area Committee TC
(xix) Small Town Committee ST
(xx) Estate office EO
(xxi) Gram Panchayat GP
(xxii) Census Town CT Others columns need no comments.
Statement II : Physical Aspects and Location of towns, 1999.
Column 3 to 5 : Physical Aspects
In these columns the Rainfall and Maximum & Minimum Temperature of the town are recorded.
Column 6, 7 and 8 :
Name of the State headquarters, District headquarters and Circle headquarters with distance from the referent town in kilometers, is recorded respectively. If the names mentioned in these columns are the same as the referent town itself, the distance is recorded as (0) zero.
Column 9 & 10 :
Name of the nearest citties and distance in km. with one lakh and more and five lakh and more population are recorded.
Column 11, 12 and 13 :
If referent town enjoys the facility of railway station, bus route facility or navigable river/canal. Its name is to be mentioned. If not available, then the name of nearest place with distance, where such facility exists is mentioned.
Statement III : Municipal Finance 1998-99
Item-wise amount of receipt and expenditure in thousand rupees, relating to municipal finance of the town for the year 1998-99 is recorded.
Statement IV : Civic and Other amenities, 1999
Column (1 to 5) : Self explanatory.
Column (6) : Road length (in kms.)
Information about kutchaJpucca road is to be recorded separately for the roads within the limits of the referent town.
(i) Pucca Road
(ii) Kutcha Road
Column (7) : System of Sewerage
PR
KR
Generally, sewerage system is implied by the network of mains and branches of underground conduits for the conveyance of sewerage to the point of disposal. Sewers that carry only household and industrial wastes are called separate sewers, those which carry storm water from roofs, streets and other surface are known as storm water drains, while those carrying both sewage and storm water are called combined sewers.
The codes used for different types of drainage system are as follows :
(i) Sewer S
(ii) Open Surface Drains OSD
(iii) Box Surface Drains BSD
(iv) Sylk Drains SD
(v) Cesspool method CP
(vi) Pit System Pt
(vii) Others 0
Column 8 to 11 : Number of latrines
Number of various types of latrines both Public and Private are given in these columns.
Column 12 : Method of disposal of night soil
The various prevalent methods of disposal of night soil are given below with codes :
Head Loads
Basket
Wheel Barrows
HL
B
WB
126
DISTRICT CENSUS HANDBOOK: WOKHA
Septic Tank
Pit System
Sewerage
Others o
Column 13 and 14 : Water supply
ST
Pt
S
Source and capacity of storage system. The following codes are used in these columns:
Column 13 :
(i) Tap water
(ii) Tube-well water
(iii) Tank Water
(iv) Well water
Column 14 :
T
TW
TK
W
(v) Over Head Tank OHT
(vi) Service Reservoir SR
(vii) River Infiltration Gallery RIG
(viii) Bore Well Pumping System BWP
(ix) Pressure Tank PT
The information on major source of water supply are given in column 13 and the storage capacity against each in kilo-litres (in brackets) are presented in column 14.
Column 15 : Fire Fighting Service
In case the fire fighting service is available in the referent town 'yes' is recorded. If the facility is not available within the town, the name of the nearest place having this facility with its distance from the referent town has been recorded.
Column 16 to 20 : Electrification (Number of connections)
Different types of electric connections have been shown in these columns, i.e. Domestic, Industrial, Commercial, Road lighting (points) & others.
Statement V : Medical, Educational, Recreational and Cultural Facilities, 1999
Column 1 to 3 : Stlf explanatory.
Column 4 & 5 :
The data covers all such medical institutions run by or aided by Government/Semi GovernmentlLocal
VILLAGE AND TOWN DIRECTORY
bodies and Charitable institutions or Social agencies like the Missionaries. Wherever the family planning centres are attached to hospitals or maternity and child welfare centres or Primary Health Centres, are treated as independent units and counted separately using following codes:
(i) Hospital H
(ii) Dispensary D
(iii) Health Centre HC
(iv) Family Welfare Centre FWC
(v) T.B. Clinic TB
(vi) Nursing Home NH
(vii) Others 0
In case of more than one institutions of any type, it is indicated within brackets e.g. D(3), NH(8), etc. The institutions have further been distinguished by providing additional codes within the bracket as given below:
Ayurvedic
Unani
Homoeopathic
A
U
Hom
Column 6 : College of degree level and above
The codes used for this column are as follows:
(i) Arts only A
(ii) Science only S
(iii) Commerce only C
(iv) Arts & Science only AS
(v) Arts & Commerce only AC
(vi) Combined for all categories - ASC Arts, Science and Commerce
(vii) Law L
(viii) University U
(ix) Others 0
Column 7 to 9 : Self explanatory.
Column 10 : Recognised shorthand, typewriting and vocational training institutes
"Recognised" mean recognised by some statutory authority, like education department, commerce department, labour department etc. of the government or semi government or autonomous bodies, public sector undertakings etc.
127
The following codes are used :
(i) Vocational Training Institute VT
(ii) Shorthand SH
(iii) Typewriting Type
(iv) Shorthand & Typewriting SH Type
(v) Others 0
The vocational institutions like - Applied Art!
Painting college, Pharmacy college, B. Ed. College, Teacher's Training Institute, Music/Dance School, Nursing School etc. are covered under 'Others'.
Column 11 to 14 :
Higher SecondarylIntermediate/Senior Secondary/ PUC/Junior College level, Secondary/Matriculation, Middle Schools/Junior Secondary and Primary Schools.
Schools up to class IV are treated as Primary or elementary schools. These include Nursery schools, Kindergarten schools, Pre-Primary schools, Junior Basic schools upto class IV and Primary schools upto class IV.
Schools upto VIII are considered as Middle school or Junior Secondary.
Schools upto class X are considered as Matriculation or Secondary schools.
Schools upto XI or XII classes are considered as Higher SecondarylIntermediatelPre University /Junior College etc. This would cover 10+2 classes whether held in schools or college.
If there are composite schools like middle schools with primary classes or Secondary schools with Middle classes, these are also included in the number of Primary and Middle schools, respectively. For example, if in a town, there are two Primary Schools and one Middle school with Primary classes, the number of Primary schools in the town is given as three and that of Middle schools as one though there are only three educational institutions.
If there are more institutions of a type in the town, the number is indicated within bracket along with the abbreviation, e.g. P(4), M(3).
Column 15 : Adult literacy class/centres
This column has been introduced keeping in view the Minimum Needs Programme of the Planning
Commission. Number of Adult Education Centres are included in this column.
If an educational facility is not available in the town, the name of the nearest place and its distance in kilometres from the town where the facility is available is mentioned.
Column 16 : Working Women's hostels with number of seats
The number of working women's hostel if available in the referent town is mentioned with number of seats. If the facility is not available in the town the name of nearest place with distance where the facility is available is recorded.
Column 17 to 19 : Recreational and Cultural Facilities
Stadium, Cinema, AuditoriumlDramalCommunity Hall are covered under recreational & cultural facilities. The particulars of permanent recreational facilities are considered for these columns.
Column 20 : Public Libraries & Reading Rooms Number of public libraries and reading rooms
available in the referent town are recorded in codes as follows:
(i) Public Library
(ii) Reading room
PL
RR
DISTRICT CENSUS HANDBOOK: WOKHA
Stlltement VI : Trade, Commerce, Industry and
Banking, 1999
Column 3 to 8 :
Names of three most important commodities
exported and names of three most important
commodities manufactured in the town are
recorded.
Column 9 : Number of Banks
Number of Banks available in the referent town both Commercial and Co-operative are recorded
against this column.
Column 10 & 11 : Number of Agricultural and
Non-Agricultural Credit
Societies
The total number of Agricultural Credit Societies and Non-Agricultural Credit Societies in the referent
town are recorded against these columns.
Statement VII : Civic and other Amenities in
Slums, 1999
128
This is the statement on civic and other amenities
in all slums whether notified or not and for all towns having statutory bodies, like municipality, Municipal Corporation, Town area committee etc.
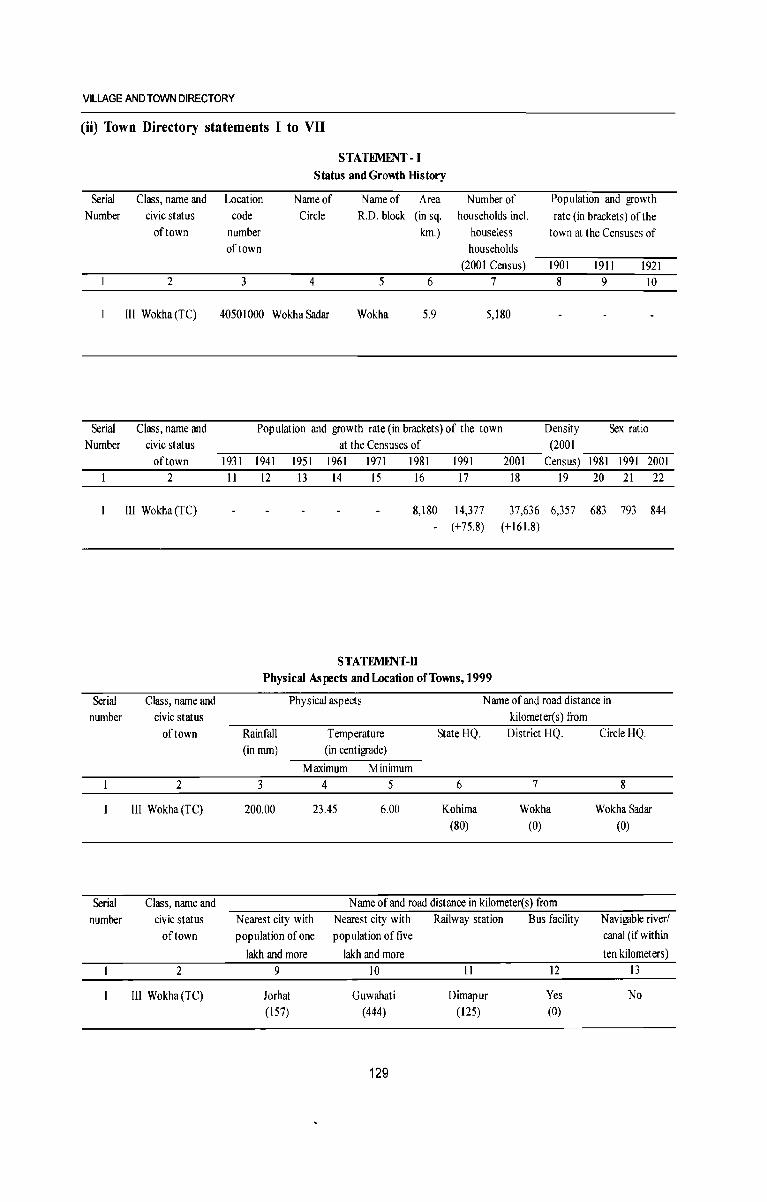
VILLAGE AND TOWN DIRECTORY
(ii) Town Directory statements I to VII
Serial Class, name and Number civic status
of town
2
III Wokha(TC)
Serial Class, name and Number civic status
of town 2
III Wokha (TC)
Serial Class, name and number civic status
of town
2
III Wokha (TC)
Serial Class, name and number civic status
of town
2
III Wokha (TC)
STATEMENT - I Status and Growth History
Location Name of Name of code Circle R.D. block
number
Area (in sq.
km.)
Number of households inc!.
houseless households
(200 I Census)
Population and growth
rate (in brackets) of the town at the Censuses of
of town 1901 1911 1921
3 4 5 6 7 8 9 10
40501000 Wokha Sadar Wokha 5.9 5,180
Population and growth rate (in brackets) of the town Density Sex ratio at the Censuses of (2001
1931 1941 1951 1961 1971 1981 1991 2001 Census) 1981 1991 2001 II 12 13 14 15 16 17 18 19 20 21 22
8,180 14,377 37,636 6,357 683 793 844
- (+75.8) (+161.8)
STATEMINf-ll Physical Aspects and Location ofToWlls, 1999
Physical aspects Name of and road distance in kilometer(s) from
Rainfall Temperature StateHQ. District HQ. Circle HQ. (inmm) (in centigrade)
Maximum Minimum 3 4 5 6 7 8
200.00 23.45 6.00 Kohima Wokha Wokha Sadar (80) (0) (0)
Name of and road distance in kilometer(s) from Nearest city with Nearest city with Railway station Bus facility Navigable river/ population of one population oftive canal (if within
lakh and more lakh and more ten kilometers) 9 10 11 12 13
Jorhat Guwahati Dimapur Yes No (157) (444) (125) (0)
129
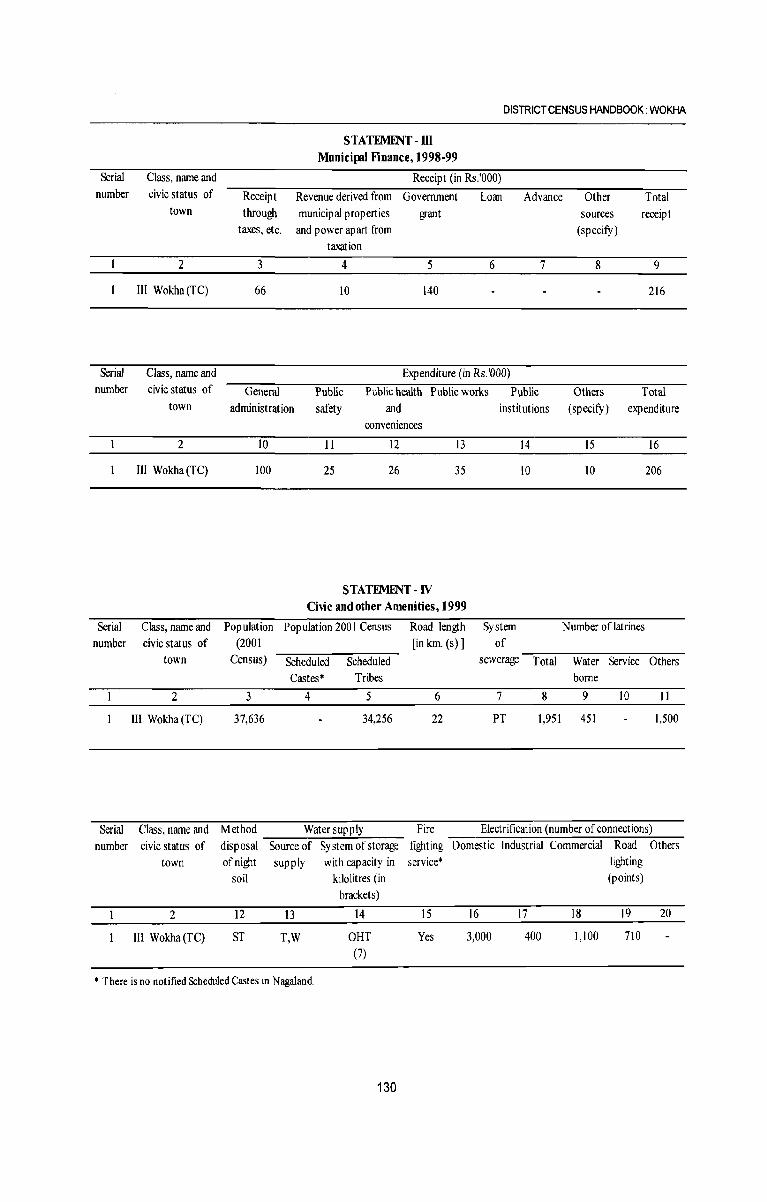
Serial Class, name and number civic status of
town
2
III Wokha (TC)
Serial Class, name and number civic status of
town
2
III Wokha (TC)
Serial Class, name and number civic status of
town
2
III Wokha (TC)
Serial Class, name and number civic status of
town
2
III Wokha (TC)
STATEMENT-m Municipll Finance, 1998-99
DISTRICT CENSUS HANDBOOK: WOKHA
Receipt (in Rs.'OOO)
Receipt Revenue derived from Government Loan Advance Other Total through municipal properties grant sources receipt
taxes, etc. and power apart from (specify ) taxation
3 4 5 6 7 8 9
66 10 140 216
Expenditure (in Rs.'OOO)
General Public Public health Public works Public Others Total administration safety and institutions (specify ) expenditure
conveniences
10 II 12 13 14 15 16
100 25 26 35 10 10 206
STATEMENT -IV Civic and other Amenities, 1999
Population Population 2001 Census Road length System Number of latrines (2001 [in km. (s)] of
Census) Scheduled Scheduled sewerage Total Water Service Others Castes· Tribes borne
3 4 5 6 7 8 9 10 11
37,636 34,256 22 PT 1,951 451 1,500
Method Water supply Fire Electrification (number of connections) disposal Source of Sy stem of storage fighting Domestic Industrial Commercial Road Others of night supply with capacity in service* lighting
soil kilolitres (in (points) brackets)
12 13 14 15 16 17 18 19 20
ST T,W OHT Yes 3,000 400 1,100 710 (7)
• There is no notified Scheduled Castes in Nagaland
130
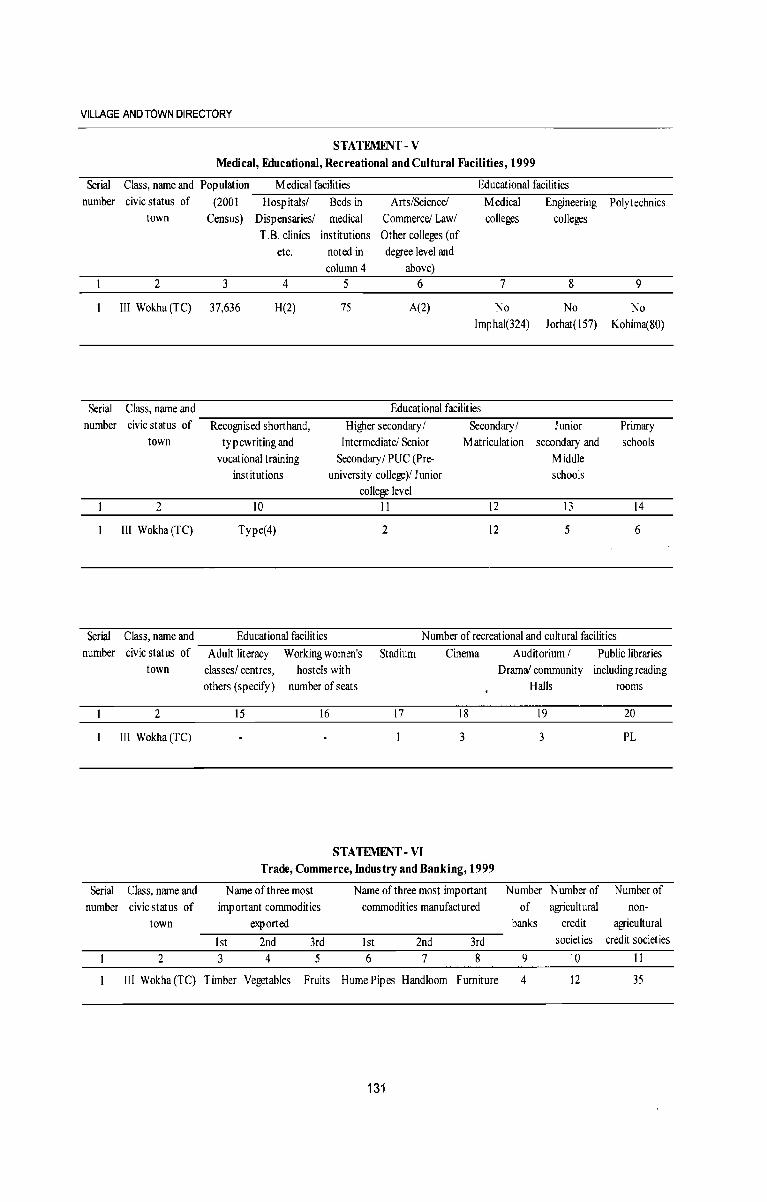
VILLAGE AND TOWN DIRECTORY
Serial number
Serial number
Serial number
Serial number
STATEMlNT-V
Medical, Educational, Recreational and Cultural Facilities, 1999
Class, name and Population Medical facilities Educational facilities civic status of
town
2
III W okha (T C)
Class, name and civic status of
town
2
III Wokha (TC)
Class, name and civic status of
town
2
III Wokha (TC)
Class, name and civic status of
town
2
III Wokha (TC)
(2001 Hospitalsl Beds in Arts/Science! Medical Engineering Polytechnics Census) Dispensaries/
T .B. clinics etc.
3 4
37,636 H(2)
Recognised shorthand, typewriting and
vocational training institutions
10
Type(4)
medical institutions
noted in column 4
5
75
Commerce! Law/ Other colleges (of degree level and
above) 6
A(2)
colleges colleges
7
No Imphal(324)
8
No Jorhat( 157)
Educational facilities
Higher secondary I Secondaryl Junior Intermediate/ Senior Matriculation secondary and
Secondary / PU C (Pre- Middle university college)/ Junior schools
college level II 12 13
2 12 5
9
No Kohima(80)
Primary schools
14
6
Educational facilities N umber of recreational and cultural facilities
Adult literacy Working women's Stadium Cinema Auditorium / Public libraries classes/ centres, hostels with Drama! community including reading others (specify) number of seats Halls rooms
15 16 17 18 19 20
3 3 PL
STATEMINT- VI Trade, Commerce, Industry and Banking, 1999
Name of three most Name of three most important Number Number of Number of important commodities commodities manufactured of agricultural non-
exported banks credit agricultural
1st 2nd 3rd 1st 2nd 3rd societies credit societies
3 4 5 6 7 8 9 10 II
Timber Vegetables Fruits Hume Pipes Handloom Furniture 4 12 35
131
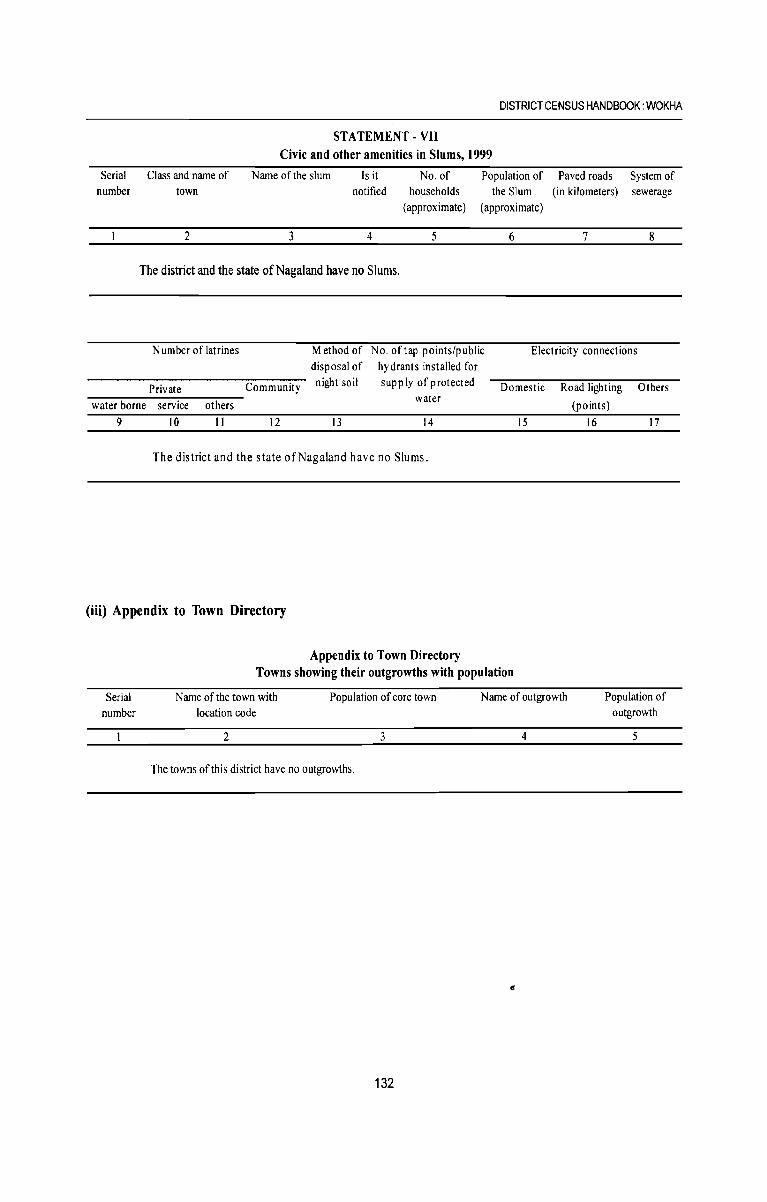
Serial number
Class and name of town
2
DISTRICT CENSUS HANDBOOK: WOKHA
ST A TEMENT - VII Civic and other amenities in Slums, 1999
Name of the slum
3
Is it notified
4
No. of households
(approximate)
5
Population of the Slum
(approximate)
6
Paved roads (in kilometers)
7
System of sewerage
8
The district and the state of Nagai and have no Slums.
N umber of latrines Method of No. of tap points/public Electricity connections disposal of hy drant s installed for
Private Community night soil supply of protected Domestic Road lighting Others
water borne service others water
(points) 9 10 II 12 13 14 15 16 17
The district and the state of Nagai and have no Slums.
(iii) Appendix to Town Directory
Serial number
Appendix to Town Directory Towns showing their outgrowths with population
Name of the town with location code
Population of core town
2 3
The towns of this district have no outgrowths.
132
Name of outgrowth
4
Population of outgrowth
5
Part B - Primary Census Abstract

Brief note on Primary Census Abstract
~e first census of the third millennium and twenty 1 first century, the Census of India, 2001 was the
14th continuous and uninterrupted Indian census since 1872. Thus, 2001 Census will provide data on population and its characteristics marking transition from one century and millennium to another.
The gigantic operations of Population Enumeration (considered by many to be the single largest and complex peace time administrative exercise in the world) was made possible due to the door to door universal canvassing of the Household Schedule by about 2 million enumerators and supervisors covering 593 districts; 5,463 subdistricts; 5,161 towns and 638,588 villages. The comprehensive Household Schedule which replaced the individual slip had three parts and two sides A and B. Part I contained the Location Particulars; Part II related to the Individual Particulars and Part III contained questions for Household engaged in Cultivation/Plantation. The part II of the Household Schedule had 39 columns and 23 questions all of which were universally canvassed and no sampling was resorted to during enumeration.
Data Processing
A quantum leap was made in the technology front while processing the Census 2001 data both for Houselisting and Population Enumeration. The Census schedules for both the phases were scanned through high speed scanners in fifteen data centres across the country and hand-written data from the schedules were converted into digitized form through Intelligent Character Reading (lCR) software for creation of ASCII records for further processing. The designing and formatting of the Household Schedule had to be done very carefully using specialized software so as to ensure uniformity, which was an essential prerequisite for scanning. The selection of appropriate state-of-art technology in data processing has made it possible to produce all the Houselisting as well as Population Enumeration tables on full count basis for the first time in the history of Census. For Census 2001, about 202 million schedules consisting of about
1,028 million records were scanned and processed within a span of only 10 months starting October, 2002.
Task Force on Quality Assurance
After the data are processed, it is expedient on the part of the data producing agency to satisfy itself about its quality before putting the same in public domain. This has to be done mainly through the process of internal consistency, comparison with .similar data in the past and also through validation with likewise data if available, from external sources. Quite often the local knowledge and perception has to be brought into play to understand both the existing and the new emerging trends of population distribution and characteristics. The other very important aspect of the data quality is to ensure complete coverage of all geographical areas especially for the population enumeration phase where the data are disseminated right upto the village level in the rural areas and the ward level in the urban areas. Thus, ensuring the complete coverage and correct geographical linkage of each enumeration block was one of the major planks of the quality control, specially for small area population statistics.
A very comprehensive check and edit mechanism was put in place to objectively examine the preliminary Census 200 I Population Enumeration results and finally clear them for use. The responsibility of the final clearance of data was with the Task Force on Quality Assurance (TFQA), headed by the Registrar General and Census Commissioner, India. The other members of the TFQA were the Heads and senior officers of the Census Division, Data Processing Division, Map Division, Demography Division and Social Studies Division. The Directors of Census Operations were co-opted as members whenever the TFQA discussed the data for their StateslUnion territories. The Directors and their senior officers were required to make detailed presentations of data for their own state both in respect to the quality and the coverage and only after the full possible cleared.
There has been a major departure in Census 2001 from the past in respect of the procedure followed for finalization of the Scheduled Caste and the Scheduled Tribe population. In the earlier censuses, the total Scheduled Caste and Scheduled Tribe population were finalized at the time of the manual compilation of the Primary Census Abstracts (PC A ) at the Regional Tabulation Offices which were specially set up for this purpose. The individual Scheduled Caste and the Scheduled Tribe population for each state was finalized much later based on manual coding done by the coders. In 200 I Census, each individual Scheduled Caste and the Scheduled Tribe have been coded directly on the computers by the Data Entry Operators through a process known as Computer Assisted Coding (CAC) and taken up along with the processing of PCA data. The CAC process involves pulling down, from the relevant dictionary of the Scheduled Castes and the Scheduled Tribes, on the computer screen and coding from the dictionary by referring to the image of the specific individual entry in the Household Schedule appearing on the screen. The CAC of the response on Religion wherever required, was also undertaken alongwith the processing ofPCA. This is because the Scheduled Caste status had to be determined in relation to the religion of the individual. Two Special Task Forces, one on Religion and the other on Scheduled Castes/ Scheduled Tribes were constituted for scrutiny and appropriate classification of these responses.
The main task of the Special Task Force on Religion was to appropriately merge or group the new responses encountered and code it into the appropriate religious community based on available literature and local knowledge. The Special Task Force on Scheduled Castes and Scheduled Tribes examined the different Scheduled Castes and Scheduled Tribes entries encountered and classified these into appropriate category of the Scheduled Castes or the Scheduled Tribes principally based on the Presidential Notification and the available literature. Thus, a very systematic and scientific mechanism was operationalised to firm up the individual religion and the individual Scheduled Castel Tribe returns. The Scheduled Caste and the Scheduled Tribe population in 2001 Census, is thus finalized by aggregating the population data for individual Scheduled Castes and the Scheduled Tribes at appropriate geographical levels.
136
DISTRICT CENSUS HANDBOOK: WOKHA
The entire work relating to the data validation and scrutiny was completed by all the StateslUnion Territories under the overall supervision and monitoring of the Census Division of the Office of the Registrar General, India with active cooperation and support of the Social Studies Division, Data Processing Division, Data Dissemination Division and Map Division.
Primary Census Abstract
The Primary Census Abstract which is another important publication on Area, Total Households, Total population, Scheduled Caste, Scheduled Tribe population, Population in the age group 0-6, Literates, Main workers and Marginal workers classified by the four broad industrial categories, namely, (i) Cultivators, (ii) Agricultural laborers, (iii) Household Industry Workers, and (iv) Other workers and also Nonworkers. The characteristics of the Total Population includes Scheduled Castes, Scheduled Tribes, Institutional and Houseless population and are presented by sex and rural-urban residence. These data are presented at different levels, namely, India, StateslUnion territories, Districts and Cities, Urban Agglomerations (Population 1,00,000 and above) in three different tables. In addition, Appendix of said publication provides Houseless and Institutional Households and their population by residence and sex for 2001 for India, State and Union territory.
Apart from the India and StatelUnion Territory volumes for Primary Census Abstract, the District Census Handbook contains District Primary Census Abstract, Appendix to District Primary Census Abstract, Primary Census Abstract for Scheduled Castes, Primary Census Abstract for Scheduled Tribes, Village Primary Census Abstract and Urban Primary Census Abstract of the concerned district in the state.
It was for the first time at the 1981 Census that the Primary Census Abstract (PC A ) was brought out for the Scheduled Castes and the Scheduled Tribes separately on the pattern of General Primary Census Abstract. This practice was continued in 1991 also. In the
~ . 1961 and 1971 Censuses, such data were made aVailable in Table C-VIII-Social and Cultural table and to some extent in the series 'Special Tables for Scheduled Castes/ Scheduled Tribes'.
PRIMARY CENSUS ABSTRACT
The fonnat of Primary Census Abstract has been restructured slightly in the 2001 Census as compared to that of 1991 Census. The nine-fold industrial classification of main workers given in the Primary Census Abstract of 1991 Census has been discontinued and its place, four-fold industrial classification of both 'main workers' and 'marginal workers' are included. In 1981 Census only main workers were presented into four categories. One of the novel features of the Primary Census Abstract of 1991 Census was the presentation
Name of the Primary Census Abstract
1. District Primary Census Abstract
of data of the population of age group 0-6 is continued in 2001 Census also. This will help the data users in better analysis and understanding of literacy data.
Level of presentation in District Census Handbooks:
The Primary Census Abstract data in different PCAs are presented at different levels. The level of presentation of Primary Census Abstracts are as under :
Level of presentation
2. Primary Census Abstract for Scheduled Castes
District/CD Block/UA/City/Town
District/CD Block/Town
District/CD Block/Town 3. Primary Census Abstract for Scheduled Tribes
4. Village Primary Census Abstract
5. Urban Primary Census Abstract
The PCA Data for villages were presented CD Block wise for the first time in 1991 Census. This practice is continued in 2001 Census also. The data for each CD Block is presented both for rural and urban areas separately. All the villages within the CD Block constitute the rural portion and the Census Towns and Outgrowths are shown under the urban portion of the CD Block. In case a CD Block is spread over two or more districts, than portion which falls within the district is presented, the data pertaining to remaining portion of the CD Block is presented in the concerned District Census Handbook. The data in the Urban Primary Census Abstract for each town as well as for town with outgrowths in the district are presented. The data for all the wards and the outgrowths of the town(s) are also presented separately below the concerned town(s).
The District Primary Census Abstract is presented in 59 columns. The Primary Census Abstract for Scheduled Castes and Primary Census Abstract for Scheduled Tribes are presented in 52 columns. The Village Primary Census Abstract and Urban Primary Census Abstract are presented in 58 columns.
The concepts and definitions used in the column headings are explained under the sub-heading 'Census Concepts' in the Analytical Note. The term 'Total Population' includes the Scheduled Castes, the Scheduled Tribes, the Institutional and the Houseless population. The explanation regarding area figures
137
CD Block/Village wise
Town/Ward level
presented at various level in the Primary Census Abstracts are as follows :
Area Figures
The area figures supplied by local revenue authorities of the district in respect ofTahsils, Police Stations and by the local bodies in respect of Towns are given in square kilometers. The area figures of the villages supplied by the Tahsildars in acres have been converted and shown in hectares. The area figures of the CD Block is the total of the village areas coming under each CD Block. The area figures for the district are the same as adopted by the Surveyor General of India to maintain unifonnity at the national level. The total area figures of all the tahsils/ CD Blocks within the district may not tally with area figures of the district because fonner represents land use area only. Similarly, the total of all the villages may not tally with the entire rural of Police Station/Tahsil. The difference may be due to the fact that while the area covered by hills, forests and rivers etc, have been accounted in the Tahsils and P.S. level the same may not be covered under the area of the villages. Apart from this it may also differ due to varying methods of computation adopted at different levels.
An appendix to District Primary Census Abstract has also been furnished showing urban enumeration block-wise particulars on Total Population, the Scheduled Caste Population and the Scheduled Tribe Population for each town.
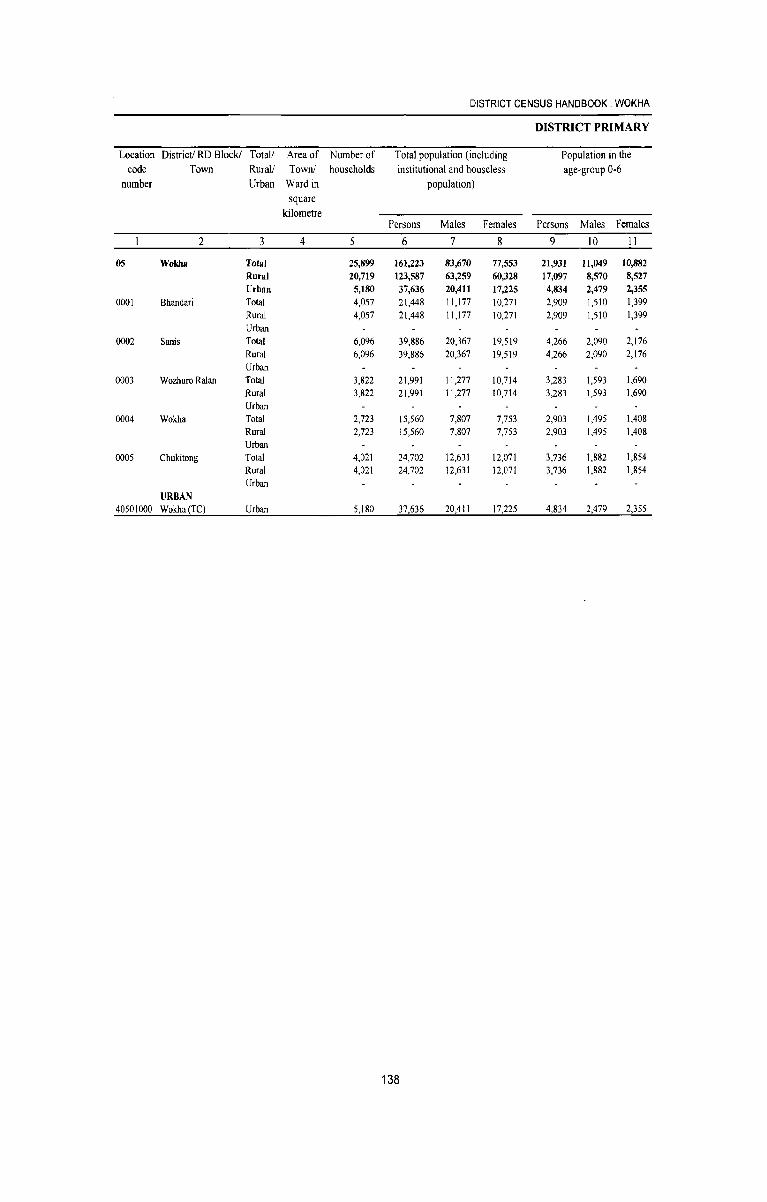
DISTRICT CENSUS HANDBOOK: WOKHA
DISTRICT PRIMARY
Location District! RD Block! Total/ Area of Number of Total population (including Population in the code Town Rural/ Town! households institutional and houseless age-group 0-6
number Urban Ward in population) square
kilometre Persons Males Females Persons Males Females
2 3 4 5 6 1 8 9 10 II
05 WoldJa Total 25,899 161,223 83,670 77,553 21,931 11,049 10,882 Rural 20,719 123,587 63,259 60,328 17,097 8,570 8,527 Urban 5,180 37,636 20,411 17,225 4,834 2,479 2,355
0001 Bhandari Total 4,057 21,448 11,177 10,271 2,909 1,510 1,399 Rural 4,057 21,448 11,177 10,271 2,909 1,510 1,399 Urban
0002 Sanis Total 6,096 39,886 20,367 19,519 4,266 2,090 2,176 Rural 6,096 39,886 20,367 19,519 4,266 2,090 2,176 Urban
0003 Wozhuro Ralan Total 3,822 21,991 11,277 10,714 3,283 1,593 1,690 Rural 3,822 21,991 11,277 10,714 3,283 1,593 1,690 Urban
0004 Wokha Total 2,723 15,560 7,807 7,753 2,903 1,495 1,408 Rural 2,723 15,560 7,807 7,753 2,903 1,495 1,408 Urban
0005 Chukitong Total 4,021 24,702 12,631 [2,071 3,736 [,882 [,854 Rural 4,021 24,702 12,631 12,071 3,736 1,882 1,854 Urban
URBAN 40501000 Wokha(TC) Urban 5,180 37,636 20,411 17,225 4,834 2,479 2,355
138
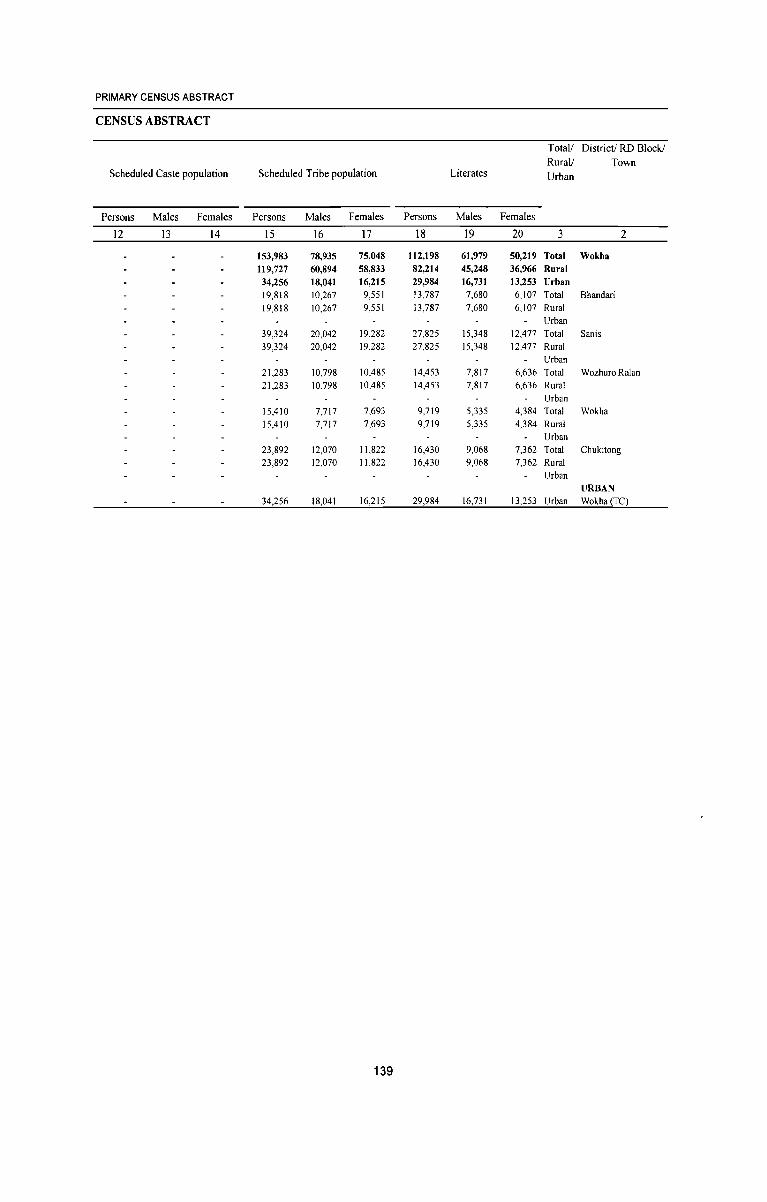
PRIMARY CENSUS ABSTRACT
CENSUS ABSTRACT
Total/ District! RD Block! Rural/ Town
Scheduled Caste population Scheduled Tribe population Literates Urban
Persons Males Females Persons Males Females Persons Males Females
12 13 14 15 16 17 18 19 20 3 2
153,983 78,935 75,048 112,198 61,979 50,219 Total Wokba 119,727 60,894 58,833 82,214 45,248 36,966 Rural 34,256 18,041 16,215 29,984 16,731 13,253 Urban 19,818 10,267 9,551 13,787 7,680 6,107 Total Bhandari 19,818 10,267 9,551 13,787 7,680 6,107 Rural
Urban 39,324 20,042 19282 27,825 15,348 12,477 Total Sanis 39,324 20,042 19282 27,825 15,348 12,477 Rural
Urban 21,283 10,798 10,485 14,453 7,817 6,636 Total Wozhuro Ralan 21,283 10,798 10,485 14,453 7,817 6,636 Rural
Urban 15,410 7,717 7,693 9,719 5,335 4,384 Total Wokha 15,410 7,717 7,693 9,719 5,335 4,384 Rural
Urban 23,892 12,070 11,822 16,430 9,068 7,362 Total Chukitong 23,892 12,070 11,822 16,430 9,068 7,362 Rural
Urban URBAN
34,256 18,041 16,215 29,984 16,731 13,253 Urban Wokha~TC)
139
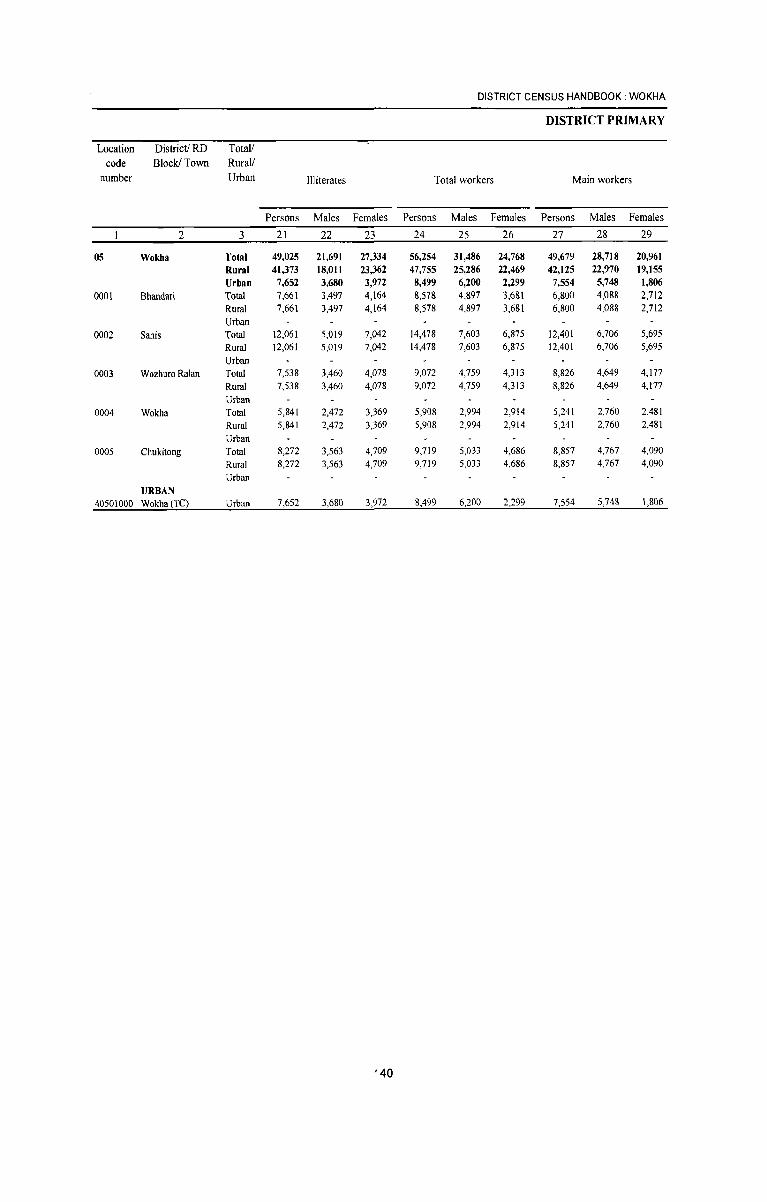
DISTRICT CENSUS HANDBOOK: WOKHA
DISTRICT PRIMARY
Location District! RD Total! code Block/Town Rural!
number Urban Illiterates Total workers Main workers
Persons Males Females Persons Males Females Persons Males Females
2 3 21 22 23 24 25 26 27 28 29
05 Wokha Total 49,025 21,691 27,334 56,254 31,486 24,768 49,679 28,718 20,961
Rural 41,373 18,011 23,362 47,755 25,286 22,469 42,125 22,970 19,155
Urban 7,652 3,680 3,972 8,499 6,200 2,299 7,554 5,748 1,806
0001 Bhandari Total 7,661 3,497 4,164 8,578 4,897 3,681 6,800 4,088 2,712
Rural 7,661 3,497 4,164 8,578 4,897 3,681 6,800 4,088 2,712
Urban 0002 Sanis Total 12,061 5,019 7,042 14,478 7,603 6,875 12,401 6,706 5,695
Rural 12,061 5,019 7,042 14,478 7,603 6,875 12,401 6,706 5,695
Urban 0003 Wozhuro Ralan Total 7,538 3,460 4,078 9,072 4,759 4,313 8,826 4,649 4,177
Rural 7,538 3,460 4,078 9,072 4,759 4,313 8,826 4,649 4,177
Urban 0004 Wokha Total 5,841 2,472 3,369 5,908 2,994 2,914 5,241 2,760 2,481
Rural 5,841 2,472 3,369 5,908 2,994 2,914 5,241 2,760 2,481
Urban 0005 Chukitong Total 8,272 3,563 4,709 9,719 5,033 4,686 8,857 4,767 4,090
Rural 8,272 3,563 4,709 9,719 5,033 4,686 8,857 4,767 4,090
Urban URBAN
40501000 Wokha(TC) Urban 7,652 3,680 3,972 8,499 6,200 2,299 7,554 5,748 1,806
140
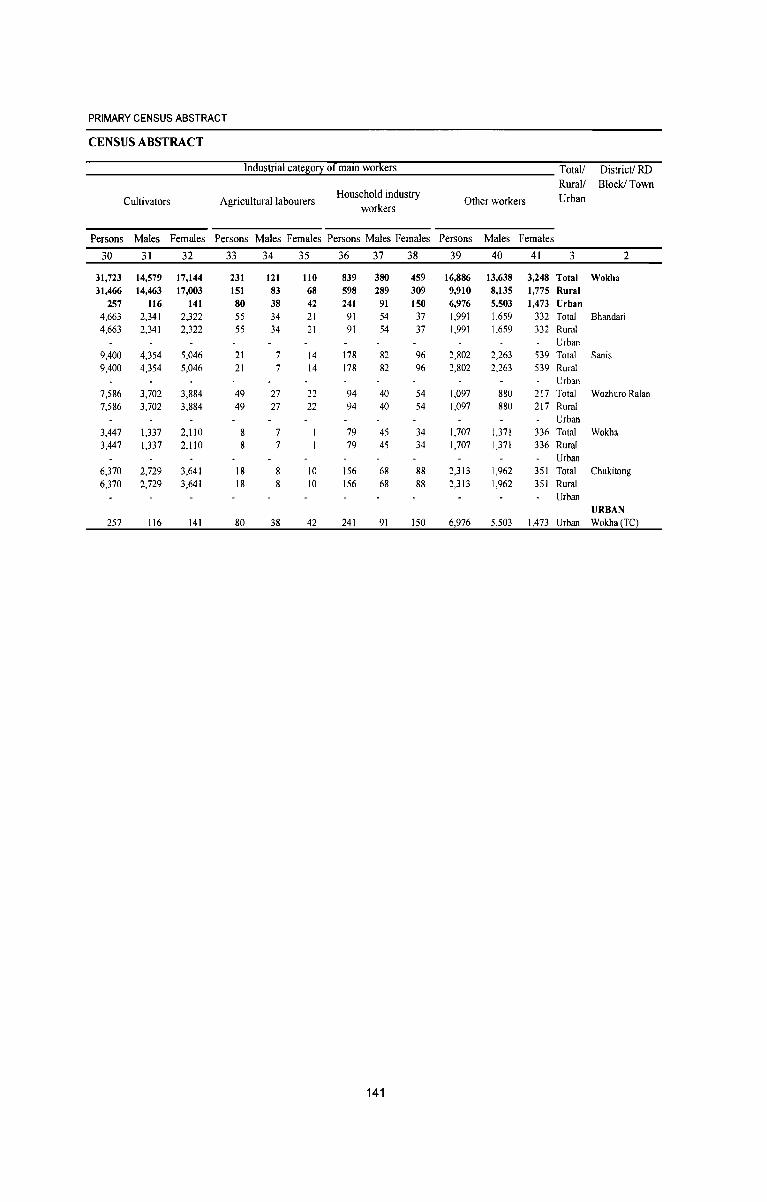
PRIMARY CENSUS ABSTRACT
CENSUS ABSTRACT
Industrial catego!): of main workers Total/ District! RD Rural/ Block/Town
Cultivators Agricultural labourers Household industry
Other workers Urban workers
Persons Males Females Persons Males Females Persons Males Females Persons Males Females
30 31 32 33 34 35 36 37 38 39 40 41 3 2
31,723 14,579 17,144 231 121 110 839 380 459 16,886 13,638 3,248 Total Wokha 31,466 14,463 17,003 151 83 68 598 289 309 9,910 8,135 1,775 Rural
257 116 141 80 38 42 241 91 150 6,976 5,503 1,473 Urban 4,663 2,341 2,322 55 34 21 91 54 37 1,991 1,659 332 Total Bhandari 4,663 2,341 2,322 55 34 21 91 54 37 1,991 1,659 332 Rural
Urban 9,400 4,354 5,046 21 7 14 178 82 96 2,802 2,263 539 Total Sanis 9,400 4,354 5,046 21 7 14 178 82 96 2,802 2,263 539 Rural
Urban 7,586 3,702 3,884 49 27 22 94 40 54 1,097 880 217 Total Wozhuro Ralan 7,586 3,702 3,884 49 27 22 94 40 54 1,097 880 217 Rural
Urban 3,447 1,337 2,110 8 7 79 45 34 1,707 1,371 336 Total Wokha 3,447 1,337 2,110 8 7 79 45 34 1,707 1,371 336 Rural
Urban 6,370 2,729 3,641 18 8 10 156 68 88 2,313 1,962 351 Total Chukitong 6,370 2,729 3,641 18 8 10 156 68 88 2,313 1,962 351 Rural
Urban URBAN
257 116 141 80 38 42 241 91 150 6,976 5,503 1,473 Urban Wokha(TC)
141
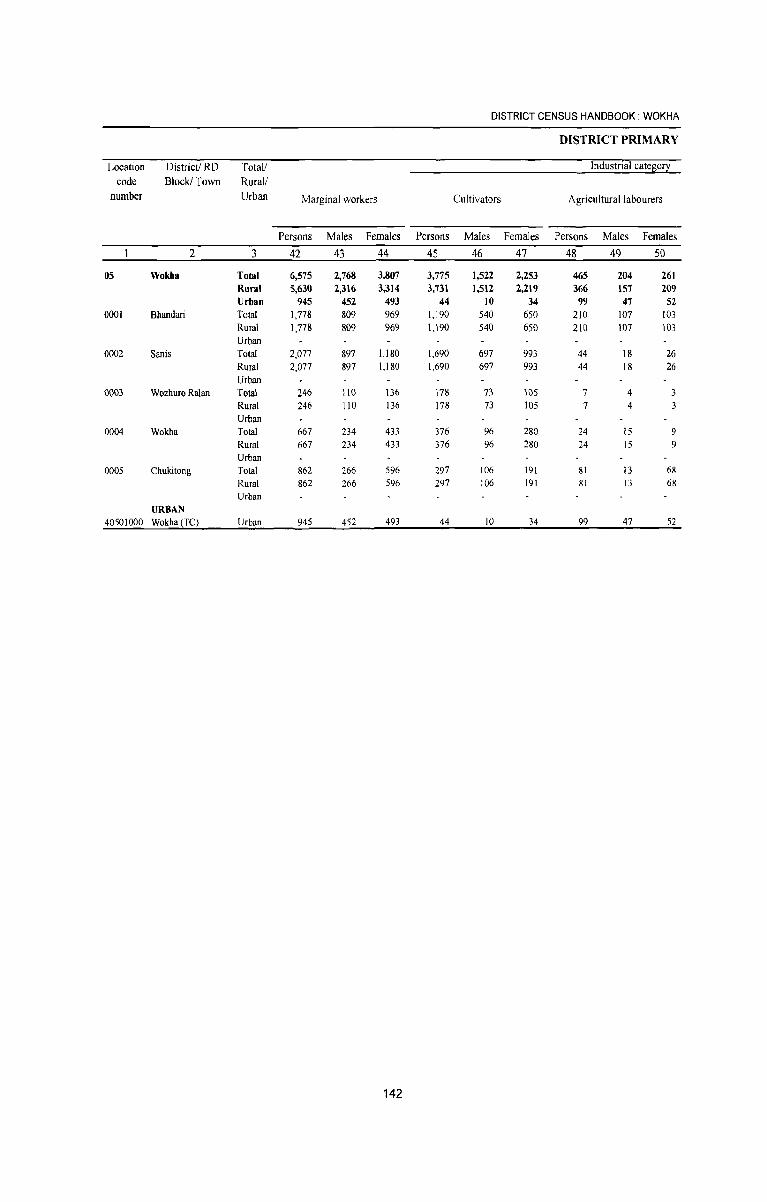
DISTRICT CENSUS HANDBOOK: WOKHA
DlSTRICT PRIMARY
Location District! RD Totall Industrial catefl0!2: code Block/Town Rurall
number Urban Marginal workers Cultivators Agricultural labourers
Persons Males Females Persons Males Females Persons Males Females
2 3 42 43 44 45 46 47 48 49 50
05 Wokha Total 6,575 2,768 3,807 3,775 1,522 2,253 465 204 261 Rural 5,630 2,316 3,314 3,731 1,512 2,219 366 157 209 Urban 945 452 493 44 10 34 99 47 52
0001 Bhandari Total 1,778 809 969 1,190 540 650 210 107 103 Rural 1,778 809 969 \,\90 540 650 210 107 103 Urban
0002 Sanis Total 2,077 897 1,180 1,690 697 993 44 18 26 Rural 2,077 897 1,180 1,690 697 993 44 18 26 Urban
0003 Wozhuro Ralan Total 246 110 \36 178 73 105 7 4 3 Rural 246 110 136 178 73 105 7 4 Urban
0004 Wokha Total 667 234 433 376 96 280 24 15 9 Rural 667 234 433 376 96 280 24 15 9 Urban
0005 Chukitong Total 862 266 596 297 106 191 81 13 68 Rural 862 266 596 297 106 191 81 13 68 Urban
URBAN 40501000 Wokha\TC) Urban 945 452 493 44 10 34 99 47 52
142
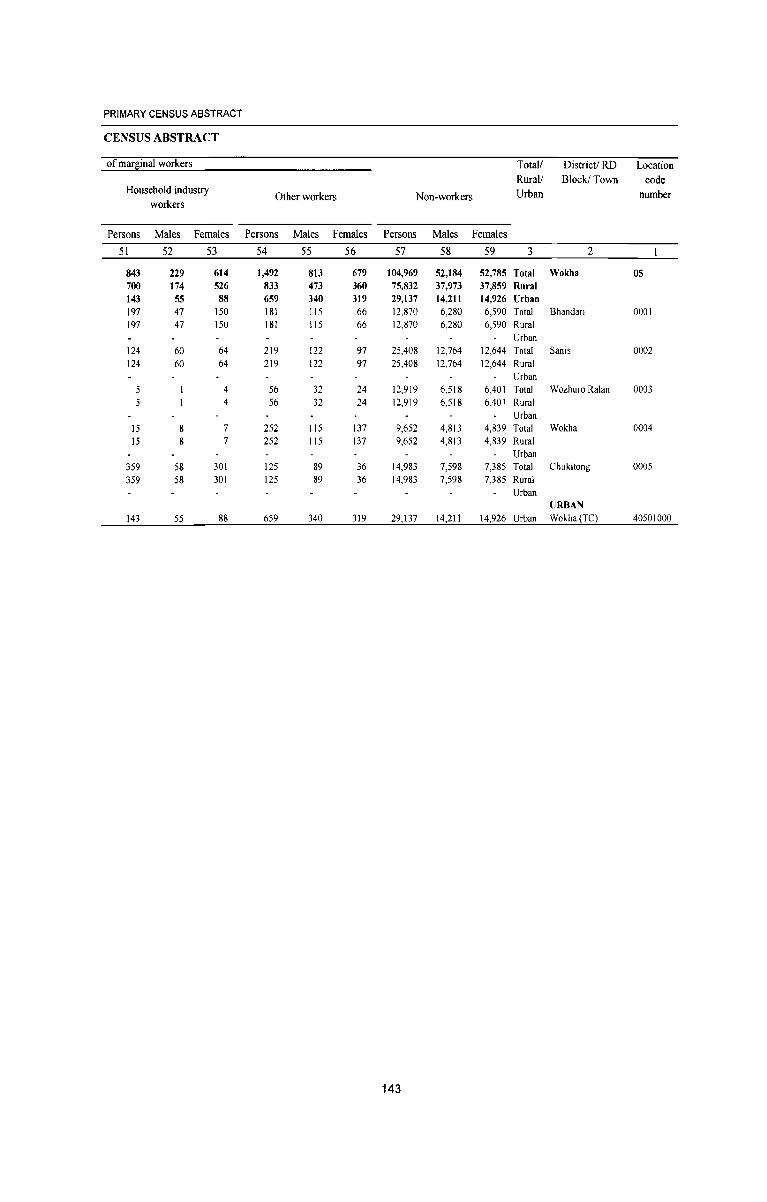
PRIMARY CENSUS ABSTRACT
CENSUS ABSTRACT
of mar~inal workers Total/ District! RD Location Rural/ Block/Town code
Household industry Other workers Non-workers Urban number
workers
Persons Males Females Persons Males Females Persons Males Females
51 52 53 54 55 56 57 58 59 3 2
843 229 614 1,492 813 679 104,969 52,184 52,785 Total Wokha 05 700 174 526 833 473 360 75,832 37,973 37,859 Rural 143 55 88 659 340 319 29,137 14,2II 14,926 Urban 197 47 ISO 181 115 66 12,870 6,280 6,590 Total Bhandari 0001 197 47 ISO 181 115 66 12,870 6,280 6,590 Rural
Urban 124 60 64 219 122 97 25,408 12,764 12,644 Total Sanis 0002 124 60 64 219 122 97 25,408 12,764 12,644 Rural
Urban 4 56 32 24 12,919 6,518 6,401 Total Wozhuro Ralan 0003 4 56 32 24 12,919 6,518 6,401 Rural
Urban IS 8 7 252 liS 137 9,652 4,813 4,839 Total Wokha 0004 15 8 7 252 115 137 9,652 4,813 4,839 Rural
Urban 359 58 301 125 89 36 14,983 7,598 7,385 Total Chukitong 0005 359 58 301 125 89 36 14,983 7,598 7,385 Rural
Urban URBAN
143 55 88 659 340 319 29,137 14,211 14,926 Urban Wokha(TC) 40501000
143
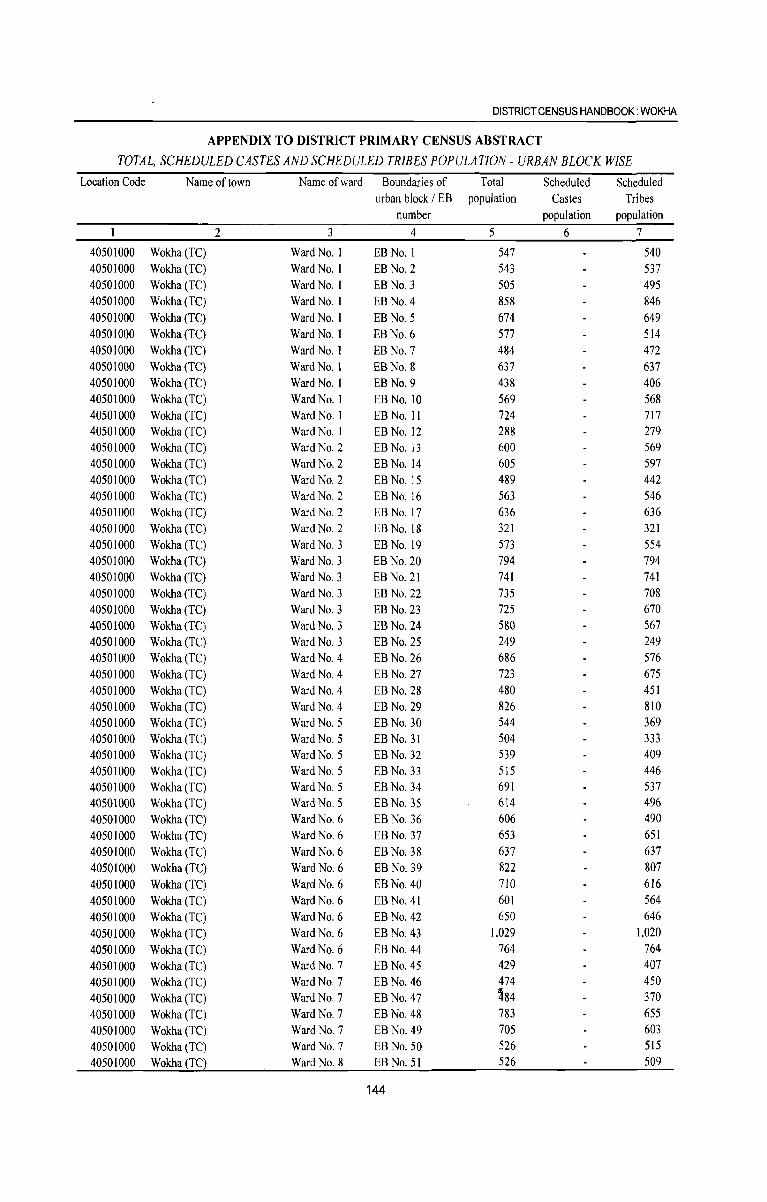
DISTRICT CENSUS HANDBOOK: WOKHA
APPENDIX TO DISTRICT PRIMARY CENSUS ABSTRACT
TOTAL, SCHEDULED CASTES AND SCHEDULED TRIBES POPULATION - URBAN BLOCK WISE
Location Code Name of town Name of ward Boundaries of Total Scheduled Scheduled urban block / EB population Castes Tribes
number population population
2 3 4 5 6 7
40501000 Wokha(TC) Ward No. I EBNo.1 547 540 40501000 Wokha(TC) Ward No. I EB No.2 543 537 40501000 Wokha(TC) Ward No. I EB No.3 505 495 40501000 Wokha(TC) Ward No. I EB No.4 858 846 40501000 Wokha(TC) Ward No. 1 EB No.5 674 649 40501000 Wokha(TC) Ward No. 1 EB No.6 577 514 40501000 Wokha(TC) Ward No. 1 EB No.7 484 472 40501000 Wokha(TC) Ward No. I EB No.8 637 637 40501000 Wokha(TC) Ward No. I EB No.9 438 406 40501000 Wokha(TC) Ward No. I EB No. 10 569 568 40501000 Wokha(TC) Ward No. I EBNo. II 724 717 40501000 Wokha(TC) Ward No. I EB No. 12 288 279 40501000 Wokha(TC) Ward No.2 EB No. 13 600 569 40501000 Wokha(TC) Ward No.2 EB No. 14 605 597 40501000 Wokha(TC) Ward No.2 EB No. 15 489 442 40501000 Wokha(TC) Ward No.2 EB No. 16 563 546 40501000 Wokha(TC) Ward No.2 EB No. 17 636 636 40501000 Wokha(TC) Ward No.2 EB No. 18 321 321 40501000 Wokha(TC) Ward No.3 EBNo.19 573 554 40501000 Wokha(TC) Ward No.3 EB No. 20 794 794 40501000 Wokha(TC) Ward No.3 EB No. 21 741 741 40501000 Wokha(TC) Ward No.3 EB No. 22 735 708 40501000 Wokha(TC) Ward No. 3 EB No. 23 725 670 40501000 Wokha(TC) Ward No. 3 EB No. 24 580 567 40501000 Wokha(TC) Ward No.3 EB No. 25 249 249 40501000 Wokha(TC) Ward No.4 EB No. 26 686 576 40501000 Wokha(TC) Ward No.4 EB No. 27 723 675 40501000 Wokha(TC) Ward No. 4 EB No. 28 480 451 40501000 Wokha(TC) Ward No. 4 EB No. 29 826 810 40501000 Wokha(TC) Ward No. 5 EB No. 30 544 369 40501000 Wokha(TC) Ward No. 5 EB No. 31 504 333 40501000 Wokha(TC) Ward No.5 EB No. 32 539 409 40501000 Wokha(TC) Ward No.5 EB No. 33 515 446 40501000 Wokha (TC) Ward No.5 EB No. 34 691 537 40501000 Wokha(TC) Ward No.5 EB No. 35 614 496 40501000 Wokha(TC) Ward No.6 EB No. 36 606 490 40501000 Wokha(TC) Ward No.6 EB No. 37 653 651
40501000 Wokha(TC) Ward No.6 EB No. 38 637 637 40501000 Wokha(TC) Ward No.6 EB No. 39 822 807 40501000 Wokha(TC) Ward No.6 EB No. 40 710 616 40501000 Wokha(TC) Ward No.6 EB No. 41 601 564
40501000 Wokha(TC) Ward No.6 EB No. 42 650 646
40501000 Wokha(TC) Ward No.6 EB No. 43 1,029 1,020
40501000 Wokha(TC) Ward No. 6 EB No. 44 764 764
40501000 Wokha(TC) Ward No.7 EB No. 45 429 407
40501000 Wokha(TC) Ward No.7 EB No. 46 474 450
40501000 Wokha(TC) Ward No.7 EB No. 47 ~84 370
40501000 Wokha(TC) Ward No.7 EB No. 48 783 655 40501000 Wokha(TC) Ward No.7 EB No. 49 705 603 40501000 Wokha(TC) Ward No.7 EB No. 50 526 515 40501000 Wokha(TC) Ward No.8 EB No. 51 526 509
144
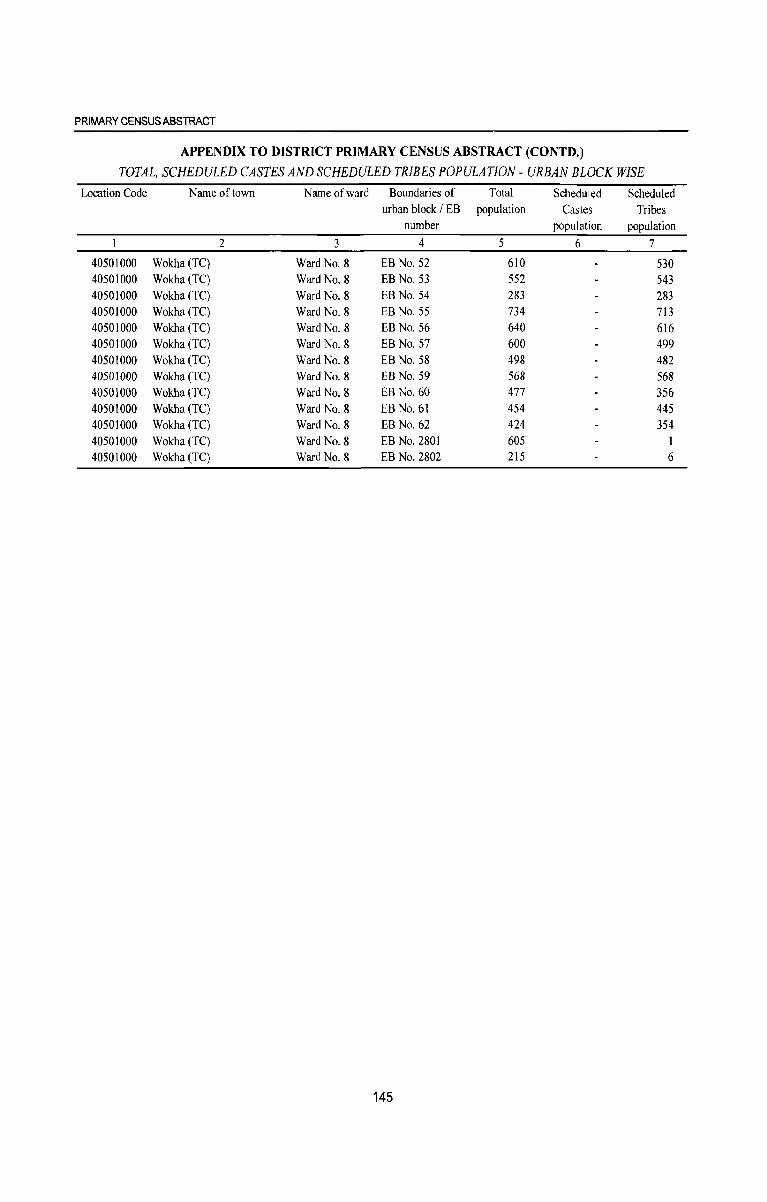
PRIMARY CENSUS ABSTRACT
APPENDIX TO DISTRICT PRIMARY CENSUS ABSTRACT (CONTD.)
TOTAL, SCHEDULED CASTES AND SCHEDULED TRIBES POPULATION - URBAN BLOCK WISE
Location Code Name of town Name of ward Boundaries of Total Scheduled Scheduled urban block / EB population Castes Tribes
number population population I 2 3 4 5 6 7
40501000 Wokha(TC) Ward No.8 EB No. 52 610 530 40501000 Wokha (TC) Ward No.8 EB No. 53 552 543 40501000 Wokha (TC) Ward No.8 EB No. 54 283 283 40501000 Wokha(TC) Ward No.8 EB No. 55 734 713 40501000 Wokha(TC) Ward No.8 EB No. 56 640 616 40501000 Wokha (TC) Ward No.8 EB No. 57 600 499 40501000 Wokha(TC) Ward No.8 EB No. 58 498 482 40501000 Wokha (TC) Ward No.8 EB No. 59 568 568 40501000 Wokha (TC) Ward No.8 EB No. 60 477 356 40501000 Wokha(TC) Ward No.8 EB No. 61 454 445 40501000 Wokha (TC) Ward No.8 EB No. 62 424 354 40501000 Wokha (TC) Ward No.8 EB No. 2801 605 I 40501000 Wokha(TC) Ward No. 8 EB No. 2802 215 6
145
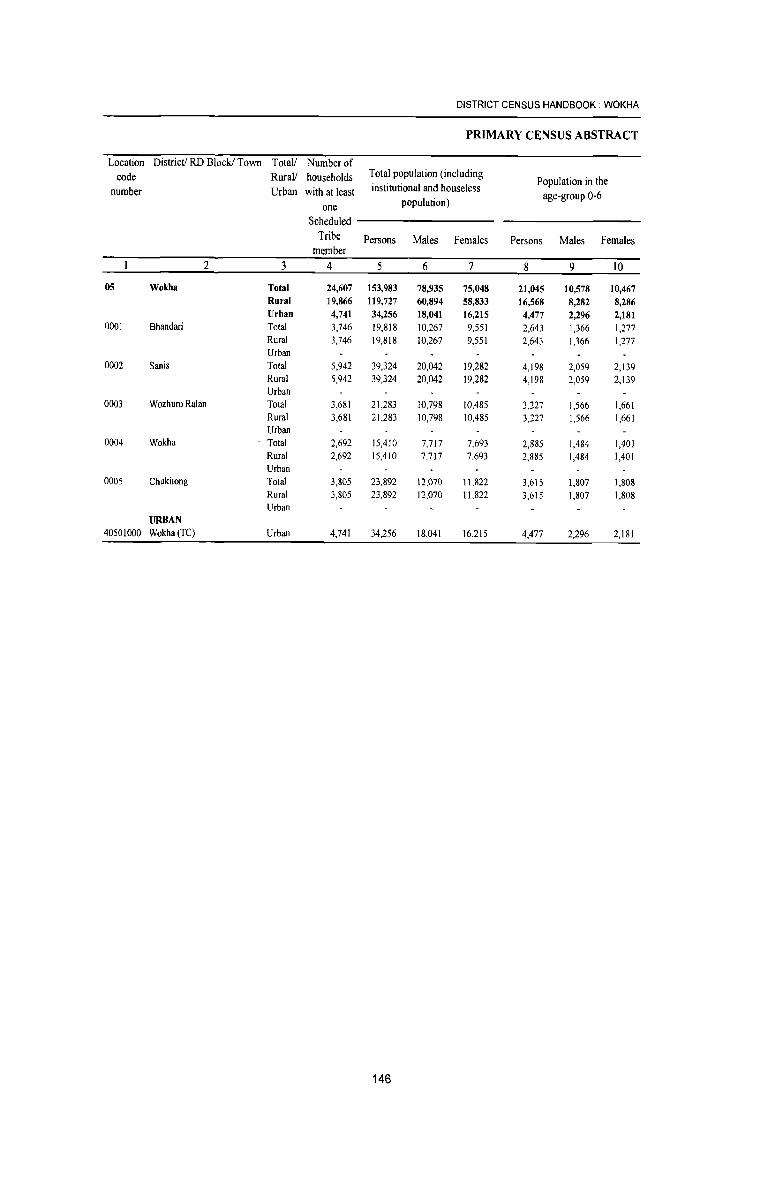
DISTRICT CENSUS HANDBOOK: WOKHA
PRIMARY CENSUS ABSTRACT
Location District! RD Block! Town Totall Number of code Rurall households Total population (including
Population in the number Urban with at least institutional and house less
age-group 0-6 one population)
Scheduled Tribe Persons Males Females Persons Males Females
member 2 3 4 5 6 7 8 9 10
05 Wokha Total 24,607 153,983 78,935 75,048 21,045 10,578 10,467 Rural 19,866 119,727 60,894 58,833 16,568 8,282 8,286 Urban 4,741 34,256 18,041 16,215 4,477 2,296 2,181
0001 Bhandari Total 3,746 19,818 10,267 9,551 2,643 1,366 1,277 Rural 3,746 19,818 10,267 9,551 2,643 1,366 1,277 Urban
0002 Sanis Total 5,942 39,324 20,042 19,282 4,198 2,059 2,139 Rural 5,942 39,324 20,042 19,282 4,198 2,059 2,139 Urban
0003 Wozhuro Ralan Total 3,681 21,283 10,798 10,485 3,227 1,566 1,661 Rural 3,681 21,283 10,798 10,485 3,227 1,566 1,661 Urban
0004 Wokha Total 2,692 15,410 7,717 7,693 2,885 1,484 1,401 Rural 2,692 15,410 7,717 7,693 2,885 1,484 1,401 Urban
0005 Chukitong Total 3,805 23,892 12,070 11,822 3,615 1,807 1,808 Rural 3,805 23,892 12,070 11,822 3,615 1,807 1,808 Urban
URBAN 40501000 Wokha(TC) Urban 4,741 34,256 18,041 16,215 4,477 2,296 2,181
146
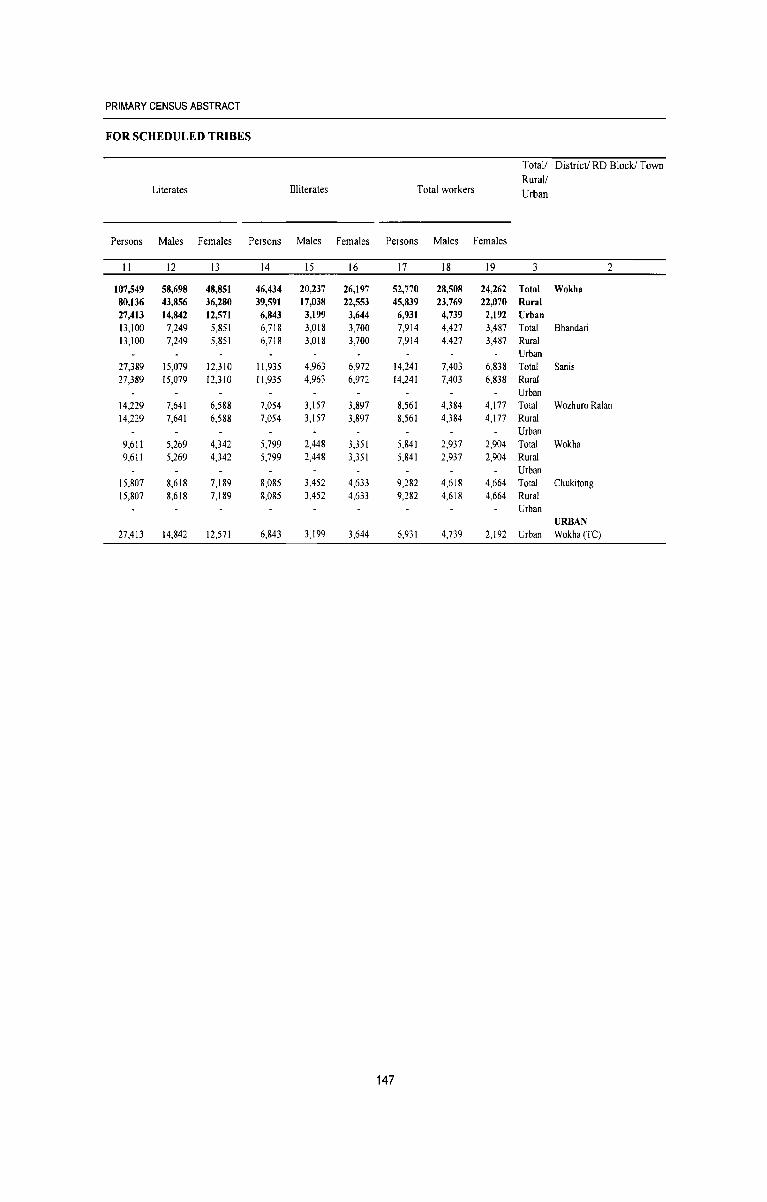
PRIMARY CENSUS ABSTRACT
FOR SCHEDULED TRIBES
Total! District! RD Block! Town Rural!
Literates Illiterates Total workers Urban
Persons Males Females Persons Males Females Persons Males Females
11 12 13 14 15 16 17 18 19 3 2
107,549 58,698 48,851 46,434 20,237 26,197 52,770 28,508 24,262 Total Wokha 80,136 43,856 36,280 39,591 17,038 22,553 45,839 23,769 22,070 Rural 27,413 14,842 12,571 6,843 3,199 3,644 6,931 4,739 2,192 Urban 13,100 7,249 5,851 6,718 3,018 3,700 7,914 4,427 3,487 Total Bhandari 13,100 7,249 5,851 6,718 3,018 3,700 7,914 4,427 3,487 Rural
Urban 27,389 15,079 12,310 11,935 4,963 6,972 14,241 7,403 6,838 Total Sanis 27,389 15,079 12,310 11,935 4,963 6,972 14,241 7,403 6,838 Rural
Urban 14,229 7,641 6,588 7,054 3,157 3,897 8,561 4,384 4,177 Total Wozhuro Ralan 14,229 7,641 6,588 7,054 3,157 3,897 8,561 4,384 4,177 Rural
Urban 9,611 5,269 4,342 5,799 2,448 3,351 5,841 2,937 2,904 Total Wokha 9,611 5,269 4,342 5,799 2,448 3,351 5,841 2,937 2,904 Rural
Urban 15,807 8,618 7,189 8,085 3,452 4,633 9,282 4,618 4,664 Total Chukitong 15,807 8,618 7,189 8,085 3,452 4,633 9,282 4,618 4,664 Rural
Urban URBAN
27,413 14,842 12,571 6,843 3,199 3,644 6,931 4,739 2,192 Urban Wokha(TC)
147
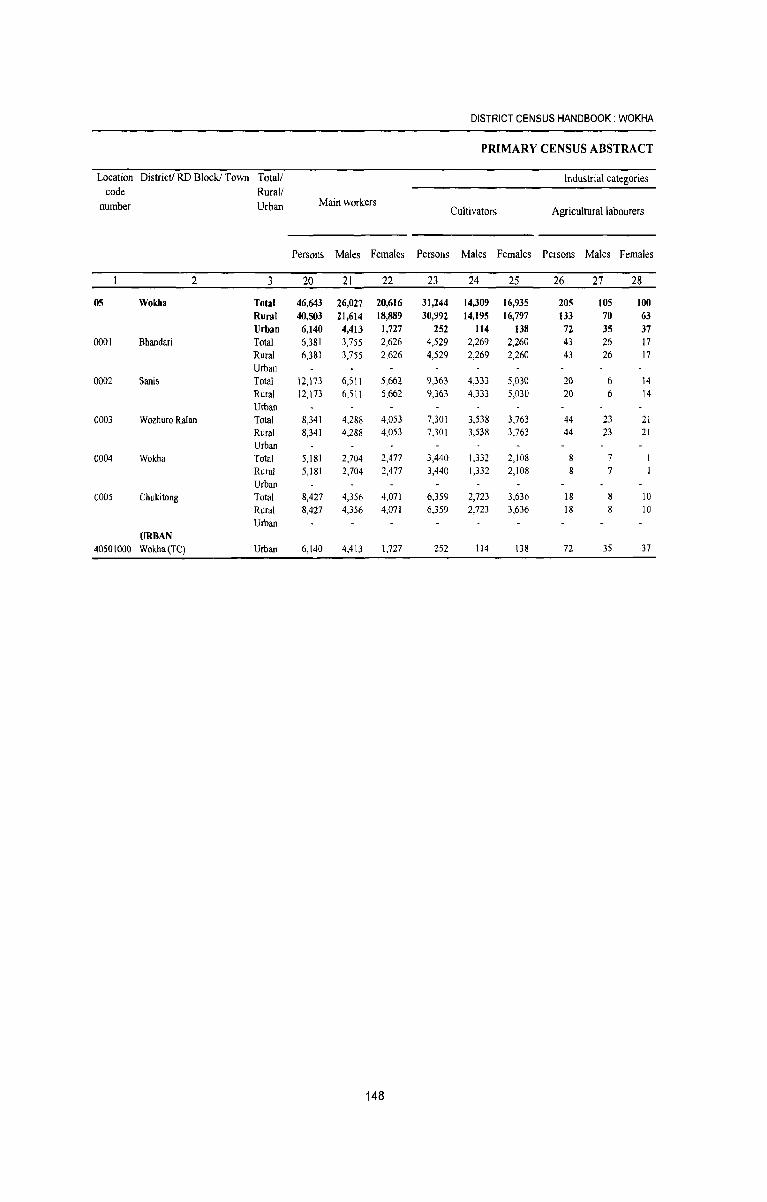
DISTRICT CENSUS HANDBOOK: WOKHA
PRIMARY CENSUS ABSTRACT
Location District! RD Block! Town Total/ Industrial categories code Rural/
number Urban Main workers Cultivators Agricultural labourers
Persons Males Females Persons Males Females Persons Males Females
2 3 20 21 22 23 24 25 26 27 28
05 Wokha Total 46,643 26,027 20,616 31,244 14,309 16,935 205 105 100 Rural 40,503 21,614 18,889 30,992 14,195 16,797 133 70 63 Urban 6,140 4,413 1,727 252 1I4 138 72 35 37
0001 Bhandari Total 6,381 3,755 2,626 4,529 2,269 2,260 43 26 17 Rural 6,381 3,755 2,626 4,529 2,269 2,260 43 26 17 Urban
0002 Sanis Total 12,173 6,511 5,662 9,363 4,333 5,030 20 6 14 Rural 12,173 6,5 II 5,662 9,363 4,333 5,030 20 6 14 Urban
0003 Wozhuro Ralan Total 8,341 4,288 4,053 7,301 3,538 3,763 44 23 21 Rural 8,341 4,288 4,053 7,301 3,538 3,763 44 23 21 Urban
0004 Wokha Total 5,181 2,704 2,477 3,440 1,332 2,108 7 Rural 5,181 2,704 2,477 3,440 1,332 2,108 7 Urban
0005 Chukitong Total 8,427 4,356 4,071 6,359 2,723 3,636 18 8 10
Rural 8,427 4,356 4,071 6,359 2,723 3,636 18 8 10 Urban
URBAN 40501000 Wokha(TC) Urban 6,140 4,413 1,727 252 114 138 72 35 37
148
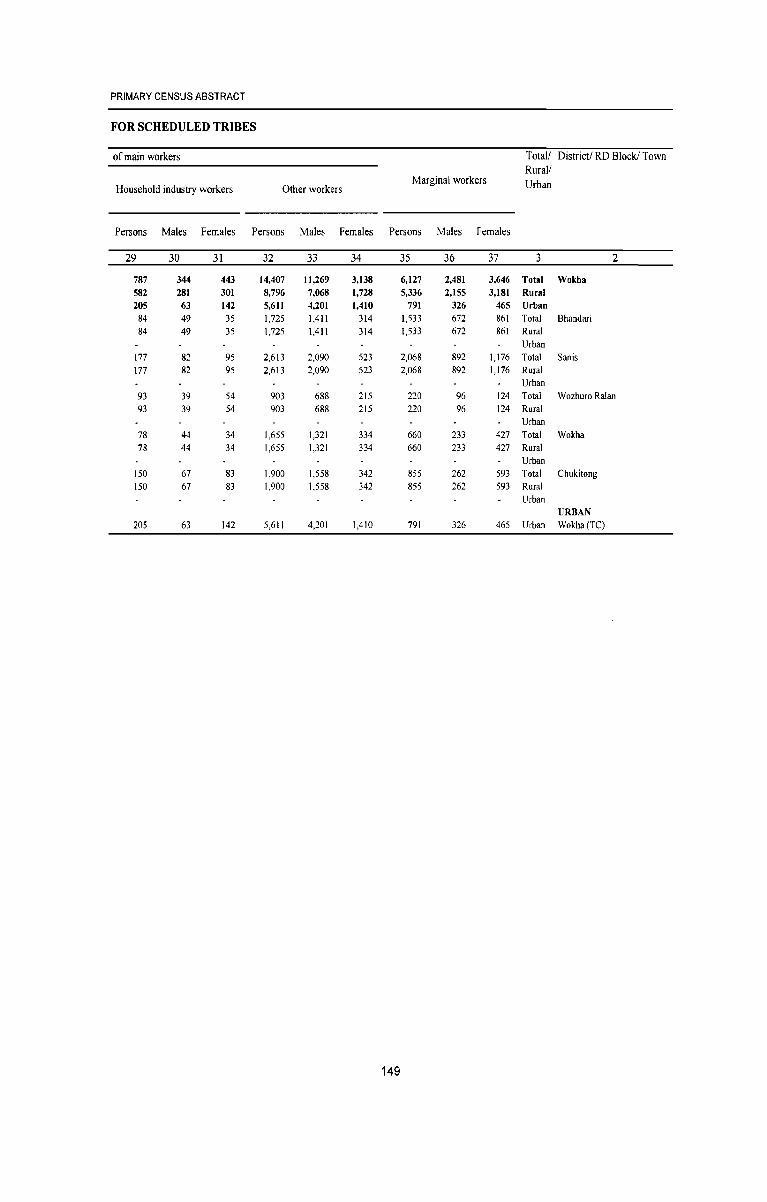
PRIMARY CENSUS ABSTRACT
FOR SCHEDULED TRIBES
of main workers Total! District! RD Block! Town Rural!
Household industry workers Other workers Marginal workers Urban
Persons Males Females Persons Males Females Persons Males Females
29 30 31 32 33 34 35 36 37 3 2
787 344 443 14,407 11,269 3,138 6,127 2,481 3,646 Total Wokha 582 281 301 8,796 7,068 1,728 5,336 2,155 3,181 Rural 205 63 142 5,611 4,201 1,410 791 326 465 Urban
84 49 35 1,725 1,411 314 1,533 672 861 Total Bhandari 84 49 35 1,725 1,411 314 1,533 672 861 Rural
Urban 177 82 95 2,613 2,090 523 2,068 892 1,176 Total Sanis 177 82 95 2,613 2,090 523 2,068 892 1,176 Rural
Urban 93 39 54 903 688 215 220 96 124 Total Wozhuro Ralan 93 39 54 903 688 215 220 96 124 Rural
Urban 78 44 34 1,655 1,321 334 660 233 427 Total Wokha 78 44 34 1,655 1,321 334 660 233 427 Rural
Urban 150 67 83 1,900 1,558 342 855 262 593 Total Chukitong 150 67 83 1,900 1,558 342 855 262 593 Rural
Urban URBAN
205 63 142 5,611 4,201 1,410 791 326 465 Urban Wokha(TC)
149
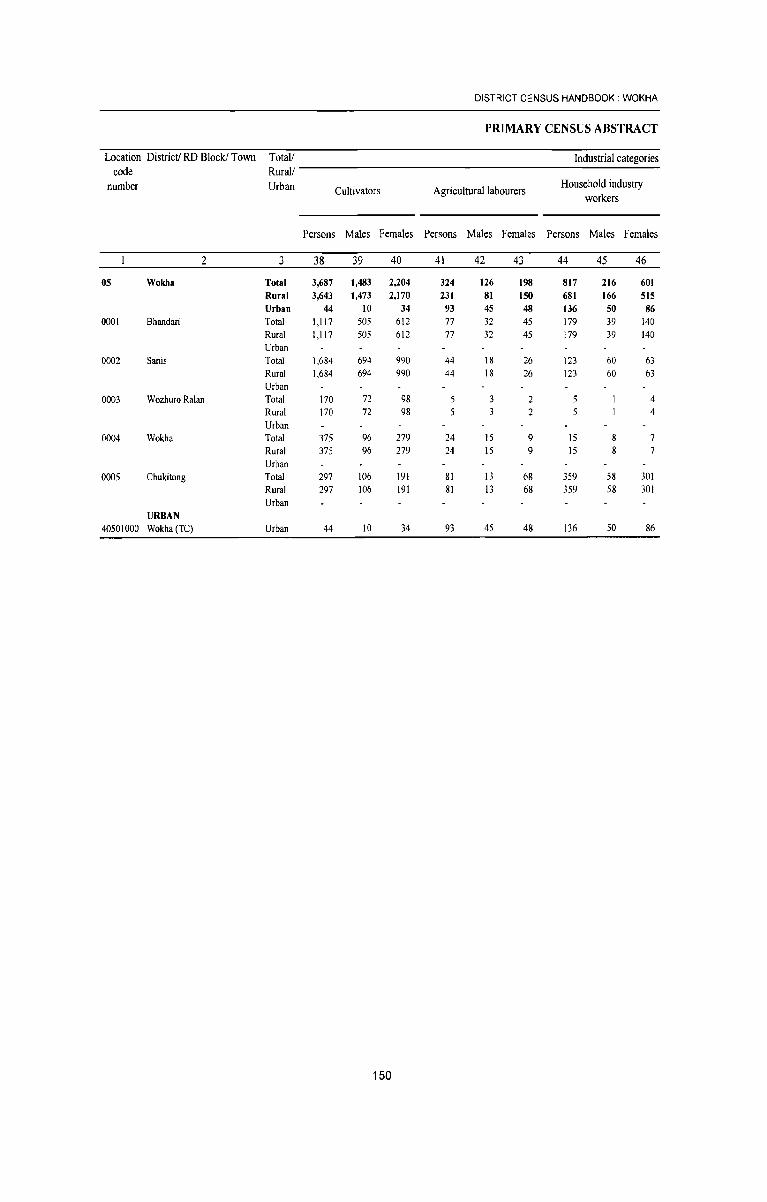
DISTRICT CENSUS HANDBOOK: WOKHA
PRIMARY CENSUS ABSTRACT
Location District! RD Block! Town Total/ Industrial categories code Rural!
number Urban Cultivators Agricultural labourers Household industry
workers
Persons Males Females Persons Males Females Persons Males Females
2 3 38 39 40 41 42 43 44 45 46
05 Wokha Total 3,687 1,483 2,204 324 126 198 817 216 60t
Rural 3,643 1,473 2,170 231 81 150 681 166 515
Urban 44 10 34 93 45 48 136 50 86 0001 Bhandari Total 1,117 505 612 77 32 45 179 39 140
Rural 1,117 505 612 77 32 45 179 39 140 Urban
0002 Sanis Total 1,684 694 990 44 18 26 123 60 63 Rural 1,684 694 990 44 18 26 123 60 63 Urban
0003 Wozhuro Ralan Total 170 72 98 2 5 4 Rural 170 72 98 2 5 4 Urban
0004 Wokha Total 375 96 279 24 15 9 15 7
Rural 375 96 279 24 15 9 15 7
Urban 0005 Chukitong Total 297 106 191 81 13 68 359 58 301
Rural 297 106 191 81 13 68 359 58 301 Urban
URBAN 40501000 Wokha(TC) Urban 44 10 34 93 45 48 136 50 86
150
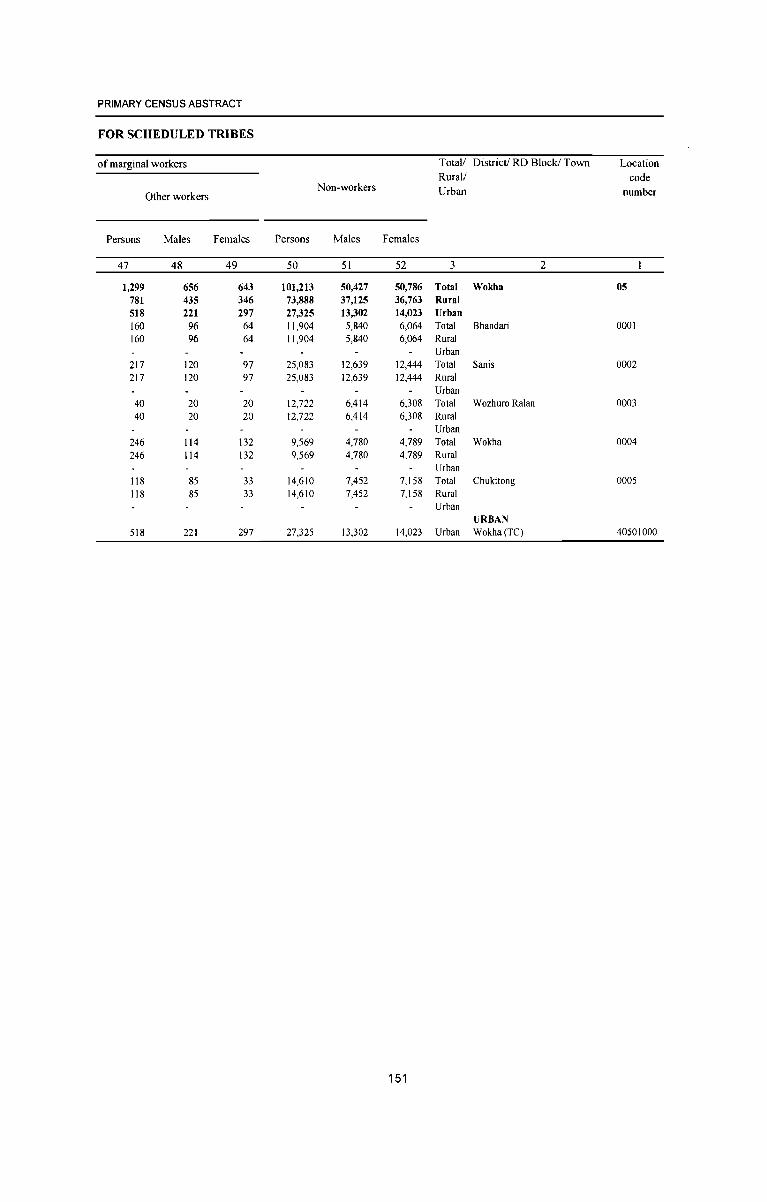
PRIMARY CENSUS ABSTRACT
FOR SCHEDULED TRIBES
of marginal workers Total/ District! RD Block! Town Location Rural! code
Non-workers Urban number Other workers
Persons Males Females Persons Males Females
47 48 49 50 51 52 3 2
1,299 656 643 101,213 50,427 50,786 Total Wokha 05 781 435 346 73,888 37,125 36,763 Rural 518 221 297 27,325 13,302 14,023 Urban 160 96 64 11,904 5,840 6,064 Total Bhandari 0001 160 96 64 11,904 5,840 6,064 Rural
Urban 217 120 97 25,083 12,639 12,444 Total Sanis 0002
217 120 97 25,083 12,639 12,444 Rural Urban
40 20 20 12,722 6,414 6,308 Total Wozhuro Ralan 0003
40 20 20 12,722 6,414 6,308 Rural Urban
246 114 132 9,569 4,780 4,789 Total Wokha 0004 246 114 132 9,569 4,780 4,789 Rural
Urban 118 85 33 14,610 7,452 7,158 Total Chukitong 0005
118 85 33 14,610 7,452 7,158 Rural Urban
URBAN 518 221 297 27,325 13,302 14,023 Urban Wokha(TC) 40501000
151
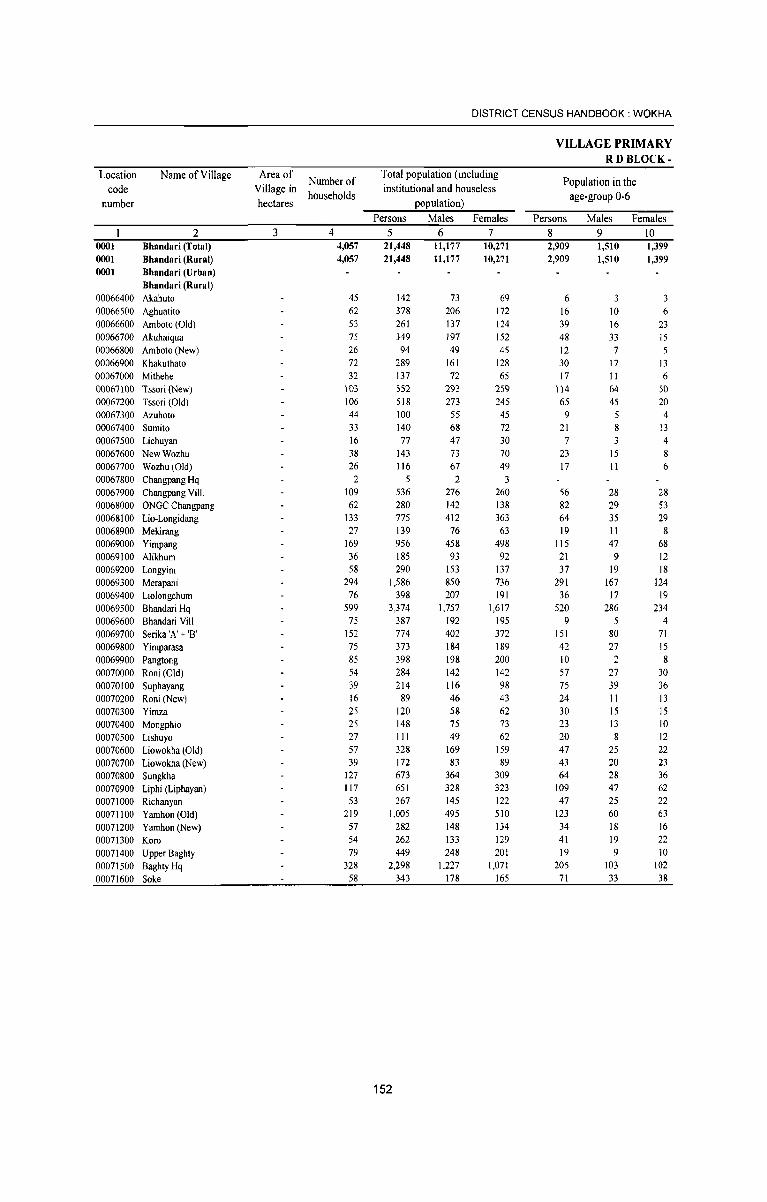
Location code
number
Name of Village
2 0001 Bhandari (Total) 0001 Bhandari (Rural) 0001 Bhandari (Urban)
Bhandari (Rural) 00066400 Akahuto 00066500 Aghuatito 00066600 Arnbolo (Old) 00066700 Akuhaiqua 00066800 Arnbolo (New) 00066900 Khakuthato 00067000 Milhehe 00067100 Tssori (New) 00067200 Tssori (Old) 00067300 Azuholo 00067400 Surnito 00067500 Lichuyan 00067600 New Wozhu 00067700 Wozhu (Old) 00067800 Changpang Hq 00067900 Changpang ViiI. 00068000 ONGC Changpang 00068100 Lio-Longidang 00068900 Mekirang 00069000 Yirnpang 00069100 Alikhurn 00069200 Longyirn 00069300 Merapani 00069400 Liolongchurn 00069500 Bhandari Hq 00069600 Bhandari ViII 00069700 Serika 'A' + '8' 00069800 Yirnparasa 00069900 Pangtong 00070000 Roni (Old) 00070100 Suphayang 00070200 Roni(New) 00070300 Yirnza 00070400 Mongphio 00070500 Lishuyo 00070600 Liowokha (Old) 00070700 Liowokha (New) 00070800 Sungkha 00070900 Liphi (Liphayan) 00071000 Richanyan 00071100 Yamhon (Old) 00071200 Yamhon (New) 00071300 Koro 00071400 Upper Baghty 00071500 Baghty Hq 00071600 Soke
Area of Number of
Village in households hectares
3 4 4,057 4,057
45 62 53 75 26 72 32
103 106 44 33 16 38 26
2 109 62
133 27
169 36 58
294 76
599 75
152 75 85 54 39 16 25 25 27 57 39
127 117 53
219 57 54 79
328 58
DISTRICT CENSUS HANDBOOK: WOKHA
Total population (including institutional and houseless
population) Persons
5 21,448 21,448
142 378 261 349 94
289 137 552 518 100 140 77
143 116
5 536 280 775 139 956 185 290
1,586 398
3,374 387 774 373 398 284 214 89
120 148 111 328 172 673 651 267
1,005 282 262 449
2,298 343
152
Males 6
11,177 11,177
73 206 137 197 49
161 72
293 273 55 68 47 73 67 2
276 142 412
76 458 93
153 850 207
1,757 192 402 184 198 142 116 46 58 75 49
169 83
364 328 145 495 148 133 248
1,227 178
Females 7
10,271 10,271
69 172 124 152 45
128 65
259 245
45 72 30 70 49 3
260 138 363
63 498
92 137 736 191
1,617 195 372 189 200 142 98 43 62 73 62
159 89
309 323 122 510 134 129 201
1,071 165
VILLAGE PRIMARY RD BLOCK-
Population in the age-group 0·6
Persons Males Females 8 2,909 2,909
6
16 39 48 12 30 17
114 65 9
21 7
23 17
56 82 64 19
115 21 37
291 36
520 9
151 42 10 57 75 24 30 23 20 47 43 64
109 47
123 34 41 19
205 71
9 1,510 1,510
3
10 16 33
7 17 11 64
45 5 8 3
15 11
28 29 35 11 47 9
19 167 17
286
80 27 2
27 39 11 15 13 8
25 20 28 47 25 60 18 19 9
103 33
10 1,399 1,399
3
6
23 15 5
13 6
50 20 4
13 4 8 6
28 53 29 8
68 12 18
124 19
234 4
71 15 8
30 36 13 15 10 12 22 23 36 62 22 63 16 22 10
102 38
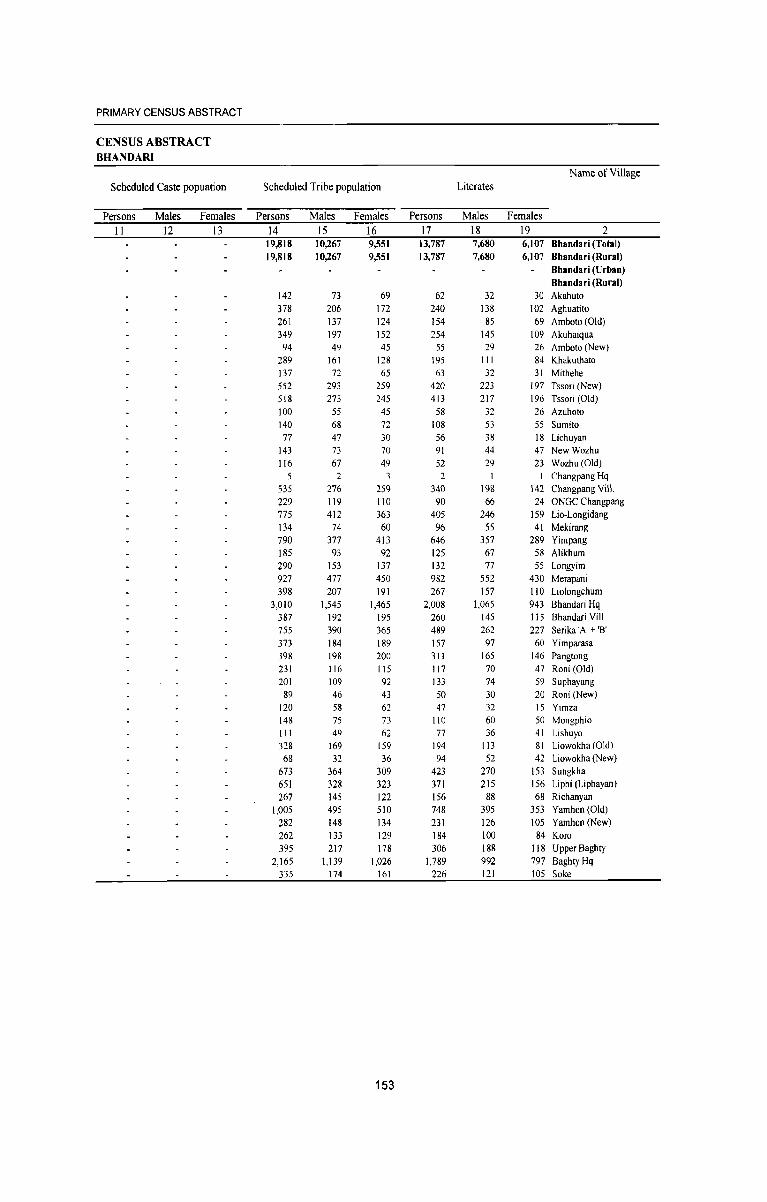
PRIMARY CENSUS ABSTRACT
CENSUS ABSTRACT BHANDARI
Name of Village Scheduled Caste popuation Scheduled Tribe population Literates
Persons Males Females Persons Males Females Persons Males Females
II 12 13 14 15 16 17 18 19 2 19,818 10,267 9,551 13,787 7,680 6,107 Bhandari (Total) 19,818 10,267 9,551 13,787 7,680 6,107 Bhandari (Rural)
Bhandari (Urban) Bhandari (Rural)
142 73 69 62 32 30 Akahulo 378 206 172 240 138 102 Aghualito 261 137 124 154 85 69 Arnholo (Old) 349 197 152 254 145 109 Akuhaiqua
94 49 45 55 29 26 Arnbolo (New) 289 161 128 195 111 84 Khakuthato 137 72 65 63 32 31 Mithehe 552 293 259 420 223 197 Tssori (New) 518 273 245 413 217 196 Tssori (Old) 100 55 45 58 32 26 Azuhoto 140 68 72 108 53 55 Surnito 77 47 30 56 38 18 Lichuyan
143 73 70 91 44 47 NewWozhu 116 67 49 52 29 23 Wozhu(Old)
5 2 3 2 1 1 Changpang Hq 535 276 259 340 198 142 Changpang ViiI. 229 119 110 90 66 24 ONGC Changpang 775 412 363 405 246 159 Lio-Longidang 134 74 60 96 55 41 Mekirang 790 377 413 646 357 289 Yirnpang 185 93 92 125 67 58 AIikhurn 290 153 137 132 77 55 Longyirn 927 477 450 982 552 430 Merapani 398 207 191 267 157 110 Liolongchurn
3,010 1,545 1,465 2,008 1,065 943 Bhandari Hq 387 192 195 260 145 I I 5 Bhandari Vill 755 390 365 489 262 227 Serika 'A' + 'B' 373 184 189 157 97 60 Yirnparasa 398 198 200 311 165 146 Pangtong 231 116 115 117 70 47 Roni (Old) 201 109 92 133 74 59 Suphayang
89 46 43 50 30 20 Roni (New) 120 58 62 47 32 15 Yirnza 148 75 73 110 60 50 Mongphio 111 49 62 77 36 41 Lishuyo 328 169 159 194 113 81 Liowokha (Old)
68 32 36 94 52 42 Liowokha (New) 673 364 309 423 270 153 Sungkha 651 328 323 371 215 156 Liphi (Liphayan) 267 145 122 156 88 68 Richanyan
1,005 495 510 748 395 353 Yarnhon (Old) 282 148 134 231 126 105 Yarnhon (New) 262 133 129 184 100 84 KoTO 395 217 178 306 188 118 Upper Baghty
2,165 1,139 1,026 1,789 992 797 Baghty Hq 335 174 161 226 121 105 Soke
153
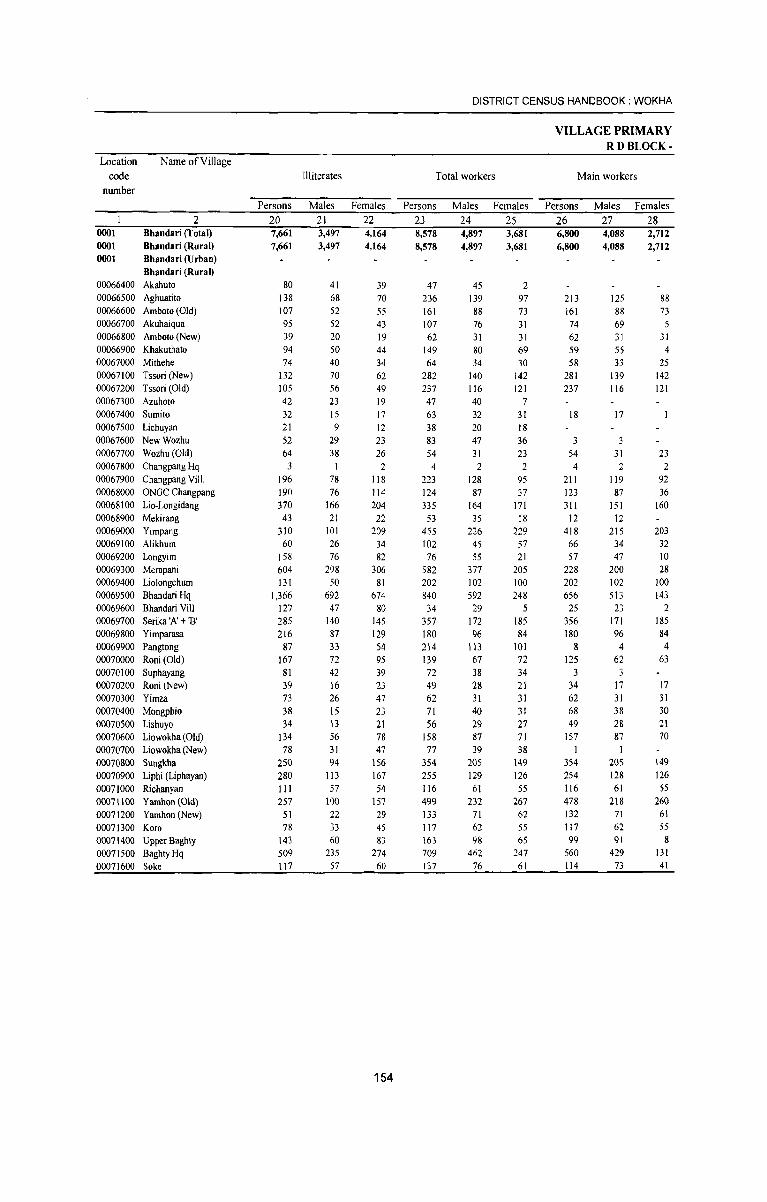
Location code
number
Name of Village
2 0001 Bhandari (Total) 0001 Bhandari (Rural) 0001 Bhandari (Urban)
Bhandari (Rural) 00066400 Akahuto 00066500 Aghuatito
00066600 Arnboto (Old) 00066700 Akuhaiqua
00066800 Arnbolo (New) 00066900 Khakuthato
00067000 Milhehe 00067100 Tssori (New)
00067200 Tssori (Old)
00067300 Azuholo 00067400 Surnilo
00067500 Lichuyan
00067600 New Wozhu 00067700 Wozhu (Old)
00067800 Changpang Hq
00067900 Changpang ViiI. 00068000 ONGC Changpang
00068100 Lio-Longidang 00068900 Mekirang
00069000 Yirnpang 00069100 Alikhurn
00069200 Longyirn 00069300 Merapani 00069400 Liolongchurn
00069500 Bhandari Hq 00069600 Bhandari ViII
00069700 Serika 'A' + B' 00069800 Yirnparasa 00069900 Pangtong 00070000 Roni (Old)
00070100 Suphayang 00070200 Roni(New)
00070300 Yirnza 00070400 Mongphio
00070500 Lishuyo 00070600 Liowokha (Old) 00070700 Liowokha (New)
00070800 Sungkha 00070900 Liphi (Liphayan)
00071000 Richanyan 00071100 Yamhon (Old)
00071200 Yamhon (New)
00071300 Koro 00071400 Upper Baghty 00071500 Baghty Hq
00071600 Soke
Persons 20 7,661
7,661
80
138 107
95 39
94 74
132 105 42
32
21
52
64 3
196 190
370 43
310 60
158 604 131
1,366 127 285 216
87 167
81 39 73
38 34
134 78
250 280
111 257
51 78
143 509 117
Illiterates
Males 21 3,497 3,497
41 68
52 52
20 50 40
70 56
23 15
9 29
38
78
76 166
21 101 26 76
298 50
692 47
140
87 33 72 42 16 26 15 13 56
31 94
113 57
100
22 33 60
235 57
Females 22 4,164 4,164
39 70
55
43 19 44
34 62 49
19
17
12 23
26 2
118
114 204
22 209
34
82 306
81 674
80 145 129 54 95 39
23 47 23
21 78
47 156 167 54
157 29
45 83
274 60
154
DISTRICT CENSUS HANDBOOK: WOKHA
Total workers
Persons 23 8,578
8,578
47
236 161
107 62
149
64 282
237 47
63
38 83
54
4 223 124 335
53 455
102 76
582 202 840 34
357
180 214 139 72 49 62 71 56
158 77
354 255 116 499 133 117 163 709 137
Males 24 4,897 4,897
45
139 88
76 31
80 34
140 116 40 32
20 47
31
2 128
87
164 35
226 45 55
377 102 592
29 172 96
113 67 38
28 31 40
29 87 39
205 129
61 232
71 62 98
462 76
Females 25 3,681
3,681
2 97
73
31 31 69 30
142 121
7
31 18 36
23 2
95
37 171 18
229 57 21
205
100 248
5 185 84
101 72 34 21 31 31 27 71 38
149 126 55
267 62
55 65
247 61
VILLAGE PRIMARY RDBLOCK-
Main workers
Persons 26 6,800 6,800
213 161 74
62 59
58 281 237
18
3 54 4
211 123 311
12 418 66 57
228 202 656
25 356 180
8 125
3 34 62 68 49
157 1
354 254 116 478 132 117 99
560 114
Males 27 4,088 4,088
125 88
69 31
55 33
139 116
17
31
2 119
87 151
12 215 34 47
200 102 513
23 171 96 4
62
17 31 38
28 87
I 205 128 61
218 71 62 91
429 73
Females 28 2,712
2,712
88 73 5
31
4 25
142
121
23
2 92 36
160
203 32 10 28
100 143
2 185 84 4
63
17 31 30 21 70
149 126 55
260 61 55 8
131 41
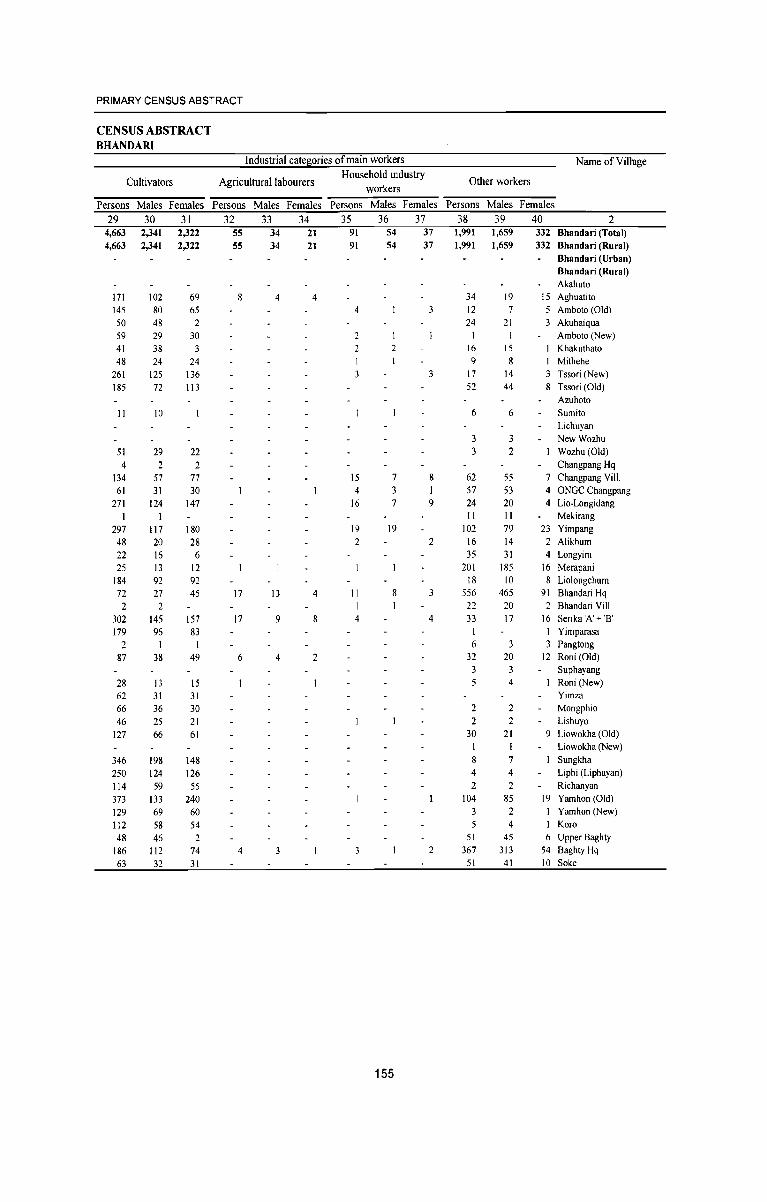
PRIMARY CENSUS ABSTRACT
CENSUS ABSTRACT BHANDARI
Industrial categories of main workers
Agricultural labourers Cultivators Household industry
workers
Name ofViUage
Other workers
Persons Males Females Persons Males Females Persons Males Females Persons Males Females 29 30 31 32 33 34 35 36 37 38 39 40 2
4,663 2,341 2,322 4,663 2,341 2,322
171 145 50 59 41 48
261 185
II
51 4
134 61
271 I
297 48 22 25
184 72 2
302 179
2 87
28 62 66 46
127
346 250 114 373 129 112 48
186 63
102 80 48 29 38 24
125 72
10
29 2
57 31
124
117 20 16 13 92 27 2
145 96
I 38
13 31 36
25 66
198 124 59
133 69 58 46
112 32
69 65 2
30 3
24 136 II3
22 2
77 30
147
180 28 6
12 92 45
157 83
I 49
15 31 30 21 61
148 126 55
240 60 54 2
74 31
55 55
8
17
17
6
4
34 34
4
13
9
4
21 21
4
4
8
2
91 91
15 4
16
19 2
II I 4
54
54
2
1
7
3 7
19
8 I
155
37 37
3
3
8
9
2
3
4
2
1,991 1,659 1,991 1,659
34 12 24
16 9
17 52
6
3 3
62 57 24 11
102 16 35
201 18
556
22 33
6 32
3 5
2 2
30 I 8 4
2 104
3 5
51 367
51
19 7
21
15 8
14 44
6
3 2
55 53 20 II 79 14 31
185 10
465 20 17
3 20
3 4
2 2
21
7
4
2 85 2 4
45 313 41
332 Bhandari (Total) 332 Bhandari (Rural)
Bhandari (Urban) Bhandari (Rural) Akahuto
15 Aghuatito 5 Amboto (Old) 3 Akuhaiqua
Amboto (New) Khakuthato Mithehe
3 Tssori (New) 8 Tssori (Old)
Azuhoto Sumito Lichuyan NewWozhu Wozhu(Old) Changpang Hq
7 Changpang ViII. 4 ONGC Changpang 4 Lio-Longidang
Mekirang 23 Yimpang 2 Alikhum 4 Longyim
16 Merapani 8 Liolongchum
91 Bhandari Hq 2 Bhandari ViII
16 Serika 'A' + 'B' I Yimparasa 3 Pangtong
12 Roni (Old) Suphayang Roni (New) Yimza Mongphio Lishuyo
9 Liowokha (Old) Liowokha (New) Sungkha Liphi (Liphayan) Richanyan
19 Yamhon (Old) Yamhon (New) Koro
6 Upper Baghty 54 Baghty Hq 10 Soke
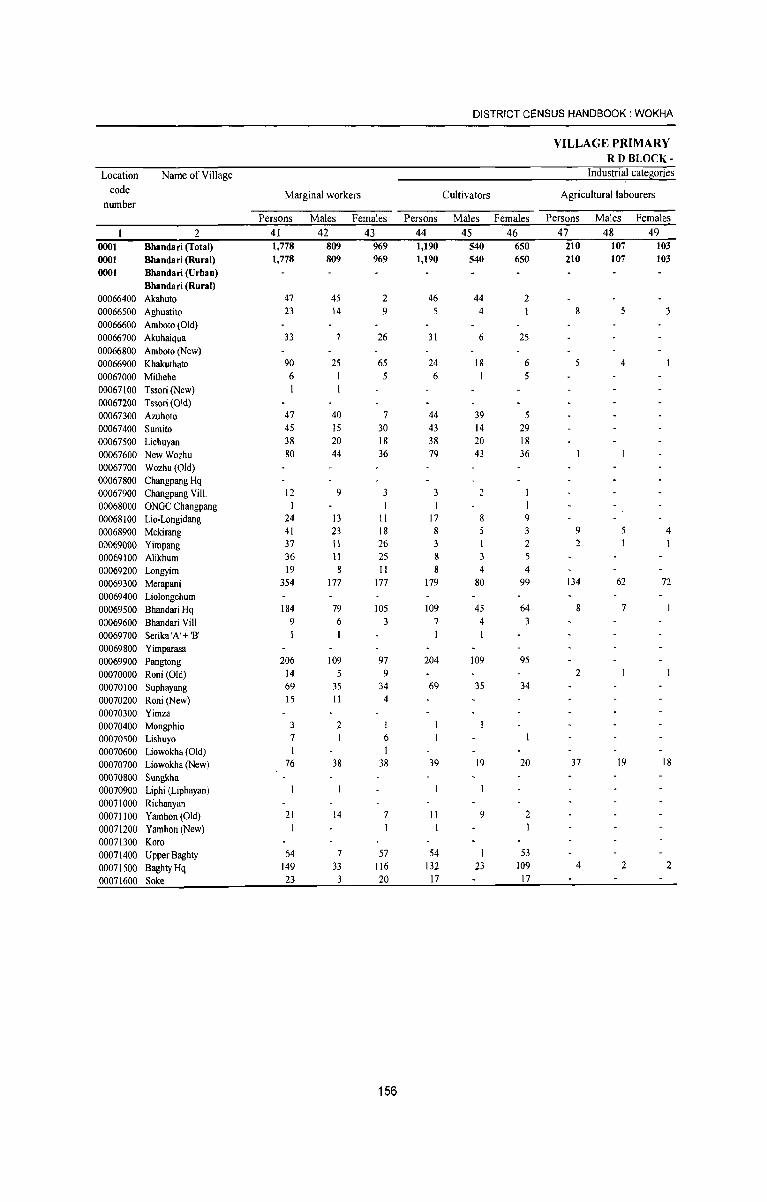
DISTRICT CENSUS HANDBOOK: WOKHA
VILLAGE PRIMARY RDBLOCK-
Location Name of Village Industrial categories
code Marginal workers Cultivators Agricultural labourers number
Persons Males Females Persons Males Females Persons Males Females
2 41 42 43 44 45 46 47 48 49 0001 Bhandari (Total) 1,778 809 969 1,190 540 650 210 107 103 0001 Bhandari (Rural) 1,778 809 969 1,190 540 650 210 107 103 0001 Bhandari (Urban)
Bhandari (Rural) 00066400 Akahulo 47 45 2 46 44 2 00066500 Aghuatito 23 14 9 5 4 8 3 00066600 Arnbolo (Old) 00066700 Akuhaiqua 33 7 26 31 6 25 00066800 Arnbolo (New) 00066900 Khakuthato 90 25 65 24 18 6 5 4
00067000 Mithehe 6 5 6 5 00067100 Tssori (New) 00067200 Tssori (Old) 00067300 Azuhoto 47 40 7 44 39 5 00067400 Sumito 45 15 30 43 14 29 00067500 Lichuyan 38 20 18 38 20 18 00067600 NewWozhu 80 44 36 79 43 36 00067700 Wozhu (Old) 00067800 Changpang Hq 00067900 Changpang ViiI. 12 9 3 3 00068000 ONGC Changpang 1 00068100 Lio-Longidang 24 13 11 17 9 00068900 Mekirang 41 23 18 8 3 9 4
00069000 Yimpang 37 11 26 3 2 2 I
00069100 Alikhum 36 II 25 8 3 5
00069200 Longyim 19 11 8 4 4
00069300 Merapani 354 177 177 179 80 99 134 62 72
00069400 Liolongchum 00069500 Bhandari Hq 184 79 105 109 45 64 8 7
00069600 Bhandari ViII 9 6 3 7 4 3
00069700 Serika 'A' + 'B' 1 00069800 Yimparasa 00069900 Pangtong 206 109 97 204 109 95
00070000 Roni (Old) 14 5 9 2
00070100 Suphayang 69 35 34 69 35 34
00070200 Roni (New) 15 11 4 00070300 Yimza 00070400 Mongphio 3 2 I
00070500 Lishuyo 7 6
00070600 Liowokha (Old) I
00070700 Liowokha (New) 76 38 38 39 19 20 37 19 18
00070800 Sungkha 00070900 Liphi (Liphayan) 00071000 Richanyan 00071100 Yamhon (Old) 21 14 7 11 9 2
00071200 Yamhon (New) I I I 00071300 Koro 00071400 Upper Baghty 64 7 57 54 53
00071500 BaghtyHq 149 33 116 132 23 109 4 2 2
00071600 Soke 23 20 17 17
156
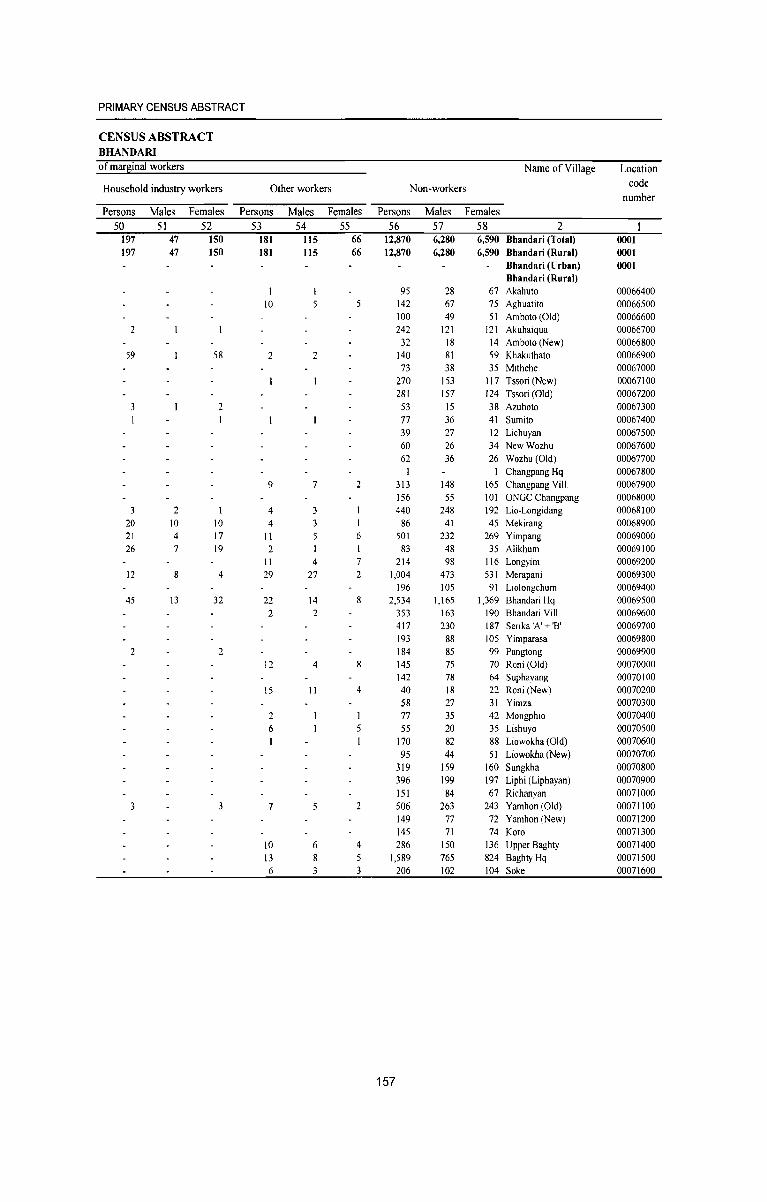
PRIMARY CENSUS ABSTRACT
CENSUS ABSTRACT BHANDARI of mar8inal workers Name of Village Location
Household industry workers Other workers Non-workers code number
Persons Males Females Persons Males Females Persons Males Females
50 51 52 53 54 55 56 57 58 2 197 47 150 181 115 66 12,870 6,280 6,590 Bhandari (Total) 0001 197 47 150 181 115 66 12,870 6,280 6,590 Bhandari (Rural) 0001
Bhandari (Urban) 0001 Bhandari (Rural)
I 95 28 67 Akahuto 00066400 10 5 142 67 75 Aghuatito 00066500
100 49 51 Arnboto (Old) 00066600 2 242 121 121 Akuhaiqua 00066700
32 18 14 Arnboto (New) 00066800 59 58 2 2 140 81 59 Khakuthato 00066900
73 38 35 Mlthehe 00067000 270 153 117 Tssori (New) 00067100 281 157 124 Tssori (Old) 00067200
2 53 15 38 Azuhoto 00067300 77 36 41 Surnito 00067400 39 27 12 Lichuyan 00067500 60 26 34 NewWozhu 00067600 62 36 26 Wozhu(Old) 00067700
Changpang Hq 00067800 9 7 2 313 148 165 Changpang Viii. 00067900
156 55 101 ONGC Changpang 00068000 2 4 3 440 248 192 Lio-Longidang 00068100
20 10 10 4 3 86 41 45 Mekirang 00068900 21 4 17 II 5 6 SOl 232 269 Yirnpang 00069000 26 7 19 2 I I 83 48 35 Alikhurn 00069100
II 4 7 214 98 116 Longyirn 00069200 12 8 4 29 27 2 1,004 473 531 Merapani 00069300
196 105 91 Liolongchurn 00069400 45 13 32 22 14 2,534 1,165 1,369 Bhandari Hq 00069500
2 2 353 163 190 Bhandari ViII 00069600 417 230 187 Serika 'A' + 'B' 00069700 193 88 105 Yirnparasa 00069800
2 2 184 85 99 Pangtong 00069900 12 4 145 75 70 Roni (Old) 00070000
142 78 64 Suphayang 00070100 15 II 4 40 18 22 Roni (New) 00070200
58 27 31 Yirnza 00070300 2 77 35 42 Mongphio 00070400 6 55 20 35 Lishuyo 00070500
170 82 88 Liowokha (Old) 00070600 95 44 51 Liowokha (New) 00070700
319 159 160 Sungkha 00070800 396 199 197 Liphi (Liphayan) 00070900 151 84 67 Richanyan 00071000
3 7 5 506 263 243 Yarnhon (Old) 00071100 149 77 72 Yarnhon (New) 00071200 145 71 74 Koro 00071300
10 6 4 286 150 136 Upper 8aghty 00071400 13 8 1,589 765 824 8aghty Hq 00071500 6 3 206 102 104 Soke 00071600
157
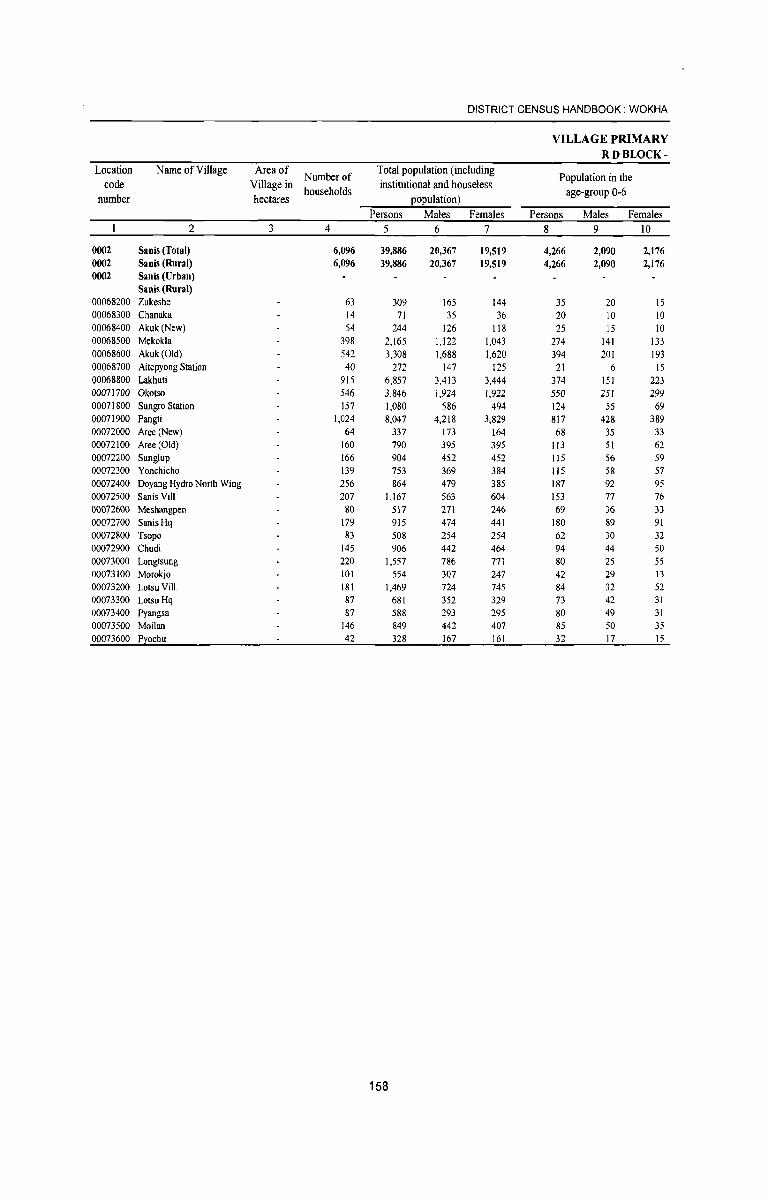
DISTRICT CENSUS HANDBOOK: WOKHA
VILLAGE PRIMARY RDBLOCK-
Location Name of Village Area of Number of
Total population (including Population in the
code Village in households
institutional and houseless age-group 0-6
number hectares population)
Persons Males Females Persons Males Females
2 3 4 5 6 7 8 9 10
0002 Sanis (Total) 6,096 39,886 20,367 19,519 4,266 2,090 2,176 0002 Sanis (Rural) 6,096 39,886 20,367 19,519 4,266 2,090 2,176 0002 Sanis (Urban)
Sanis (Rural) 00068200 Zukeshe 63 309 165 144 35 20 15 00068300 Chanaka 14 71 35 36 20 10 10 00068400 Akuk(New) 54 244 126 118 25 15 10 00068500 Mekok1a 398 2,165 1,122 1,043 274 141 133 00068600 Akuk(Old) 542 3,308 1,688 1,620 394 201 193 00068700 Aitepyong Station 40 272 147 125 21 6 15 00068800 Lakhuti 915 6,857 3,413 3,444 374 151 223 00071700 Okotso 546 3,846 1,924 1,922 550 251 299 00071800 Sungro Station 157 1,080 586 494 124 55 69 00071900 Pangti 1,024 8,047 4,218 3,829 817 428 389 00072000 Aree (New) 64 337 173 164 68 35 33 00072100 Aree (Old) 160 790 395 395 113 51 62 00072200 Sunglup 166 904 452 452 115 56 59 00072300 Yonchicho 139 753 369 384 115 58 57 00072400 Doyang Hydro North Wing 256 864 479 385 187 92 95 00072500 Sanis Viii 207 1,167 563 604 153 77 76 00072600 Meshangpen 80 517 271 246 69 36 33 00072700 SanisHq 179 915 474 441 180 89 91 00072800 Tsopo 83 508 254 254 62 30 32 00072900 Chudi 145 906 442 464 94 44 50 00073000 Longtsung 220 1,557 786 771 80 25 55 00073100 Morokjo 101 554 307 247 42 29 13 00073200 Lotsu ViII. 181 1,469 724 745 84 32 52 00073300 Lotsu Hq 87 681 352 329 73 42 31 00073400 Pyangsa 87 588 293 295 80 49 31 00073500 Moilan 146 849 442 407 85 50 35 00073600 P~ochu 42 328 167 161 32 17 15
158
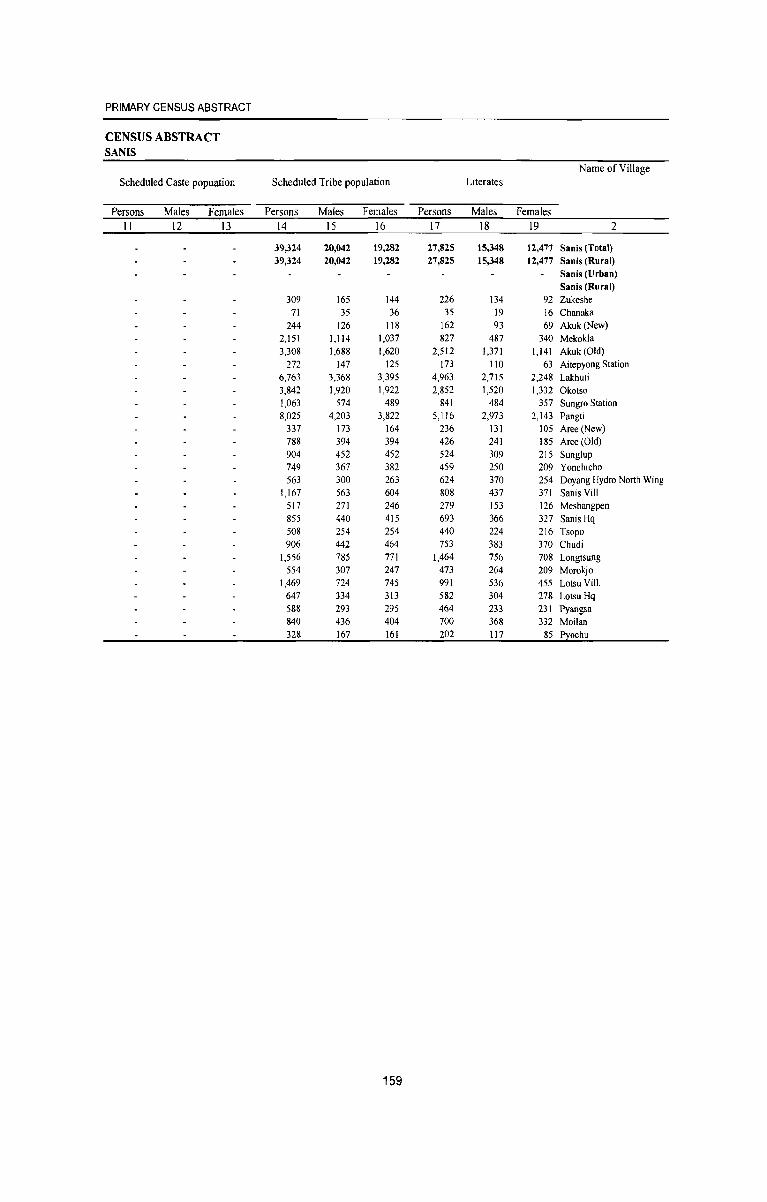
PRIMARY CENSUS ABSTRACT
CENSUS ABSTRACT SANIS
Name of Village Scheduled Caste popuation Scheduled Tribe population Literates
Persons Males Females Persons Males Females Persons Males Females
11 12 13 14 15 16 17 18 19 2
39,324 20,042 19,282 27,825 15,348 12,477 Sanis (Total) 39,324 20,042 19,282 27,825 15,348 12,477 Sanis (Rural)
Sanis (Urban) Sanis (Rural)
309 165 144 226 134 92 Zukeshe 71 35 36 35 19 16 Chanaka
244 126 118 162 93 69 Akuk(New) 2,151 1,114 1,037 827 487 340 Mekok1a 3,308 1,688 1,620 2,512 1,371 1,141 Akuk(Old)
272 147 125 173 110 63 Aitepyong Station 6,763 3,368 3,395 4,963 2,715 2,248 Lakhuti 3,842 1,920 1,922 2,852 1,520 1,332 Okotso 1,063 574 489 841 484 357 Sungro Station 8,025 4,203 3,822 5,116 2,973 2,143 Pangti
337 173 164 236 131 105 Aree(New) 788 394 394 426 241 185 Aree (Old) 904 452 452 524 309 215 Sunglup 749 367 382 459 250 209 Yonchicho 563 300 263 624 370 254 Doyang Hydro North Wing
1,167 563 604 808 437 371 Sanis Vill 517 271 246 279 153 126 Meshangpen 855 440 415 693 366 327 Sanis Hq 508 254 254 440 224 216 Tsopo 906 442 464 753 383 370 Chudi
1,556 785 771 1,464 756 708 Longtsung 554 307 247 473 264 209 Morokjo
1,469 724 745 991 536 455 Lotsu Viii. 647 334 313 582 304 278 LotsuHq 588 293 295 464 233 231 Pyangsa 840 436 404 700 368 332 Moilan 328 167 161 202 117 85 Pyochu
159
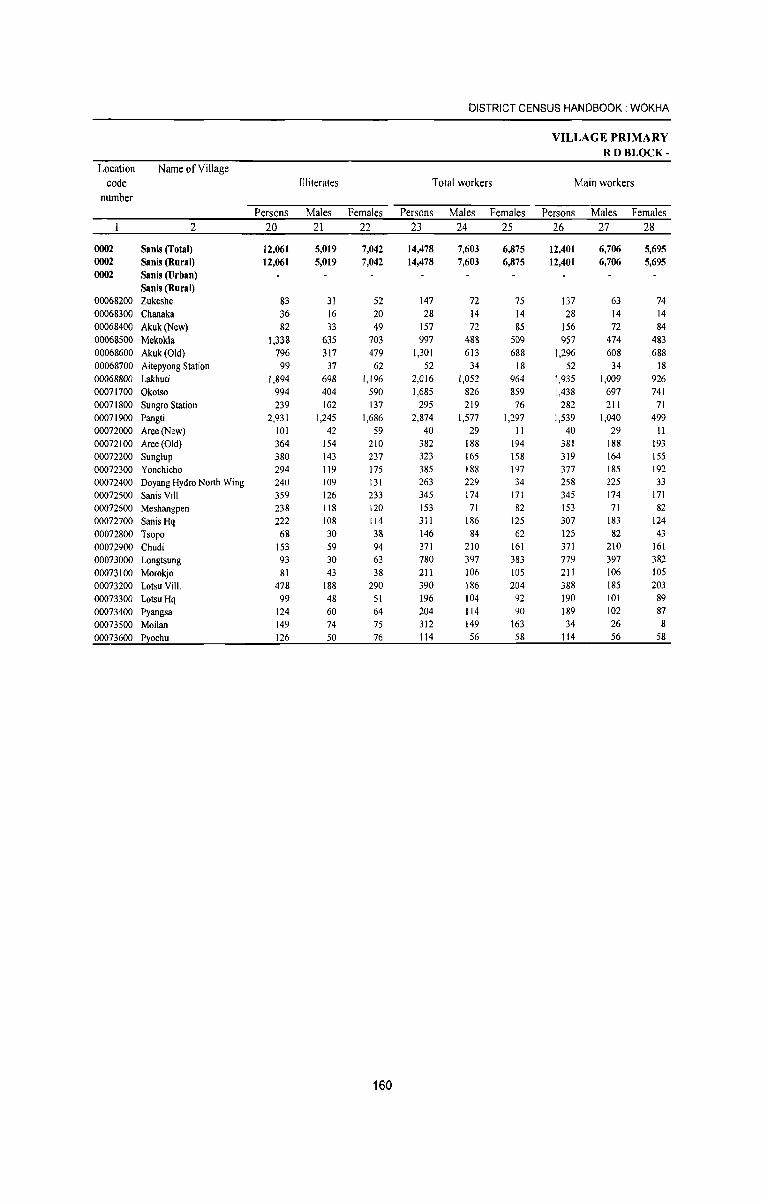
DISTRICT CENSUS HANDBOOK: WOKHA
VILLAGE PRIMARY RDBLOCK-
Location NameofViUage code Illiterates Total workers Main workers
number Persons Males Females Persons Males Females Persons Males Females
2 20 21 22 23 24 25 26 27 28
0002 Sanis (Total) 12,061 5,019 7,042 14,478 7,603 6,875 12,401 6,706 5,695 0002 Sanis (Rural) 12,061 5,019 7,042 14,478 7,603 6,875 12,401 6,706 5,695 0002 Sanis (Urban)
Sanis (Rural) 00068200 Zukeshe 83 31 52 147 72 75 137 63 74 00068300 Chanaka 36 16 20 28 14 14 28 14 14 00068400 Akuk(New) 82 33 49 157 72 85 156 72 84 00068500 Mekokla 1,338 635 703 997 488 509 957 474 483 00068600 Akuk(Old) 796 317 479 1,301 613 688 1,296 608 688 00068700 Aitepyong Station 99 37 62 52 34 18 52 34 18 00068800 Lakhuti 1,894 698 1,196 2,016 1,052 964 1,935 1,009 926 00071700 Okotso 994 404 590 1,685 826 859 1,438 697 741 00071800 Sungro Station 239 102 137 295 219 76 282 211 71 00071900 Pangti 2,931 1,245 1,686 2,874 1,577 1,297 1,539 1,040 499 00072000 Aree(New) 101 42 59 40 29 11 40 29 11 00072100 Aree(Old) 364 154 210 382 188 194 381 188 193 00072200 Sunglup 380 143 237 323 165 158 319 164 155 00072300 Yonchicho 294 119 175 385 188 197 377 185 192 00072400 Doyang Hydro North Wing 240 109 131 263 229 34 258 225 33 00072500 Sanis ViII 359 126 233 345 174 171 345 174 171 00072600 Meshangpen 238 118 120 153 71 82 153 71 82 00072700 Sanis Hq 222 108 114 311 186 125 307 183 124 00072800 Tsopo 68 30 38 146 84 62 125 82 43 00072900 Chudi 153 59 94 371 210 161 371 210 161 00073000 Longtsung 93 30 63 780 397 383 779 397 382 00073100 Morokjo 81 43 38 211 106 105 211 106 105 00073200 Lotsu ViII. 478 188 290 390 186 204 388 185 203 00073300 Lotsu Hq 99 48 51 196 104 92 190 101 89 00073400 Pyangsa 124 60 64 204 114 90 189 102 87 00073500 Moilan 149 74 75 312 149 163 34 26 8 00073600 Pyochu 126 50 76 114 56 58 114 56 58
160
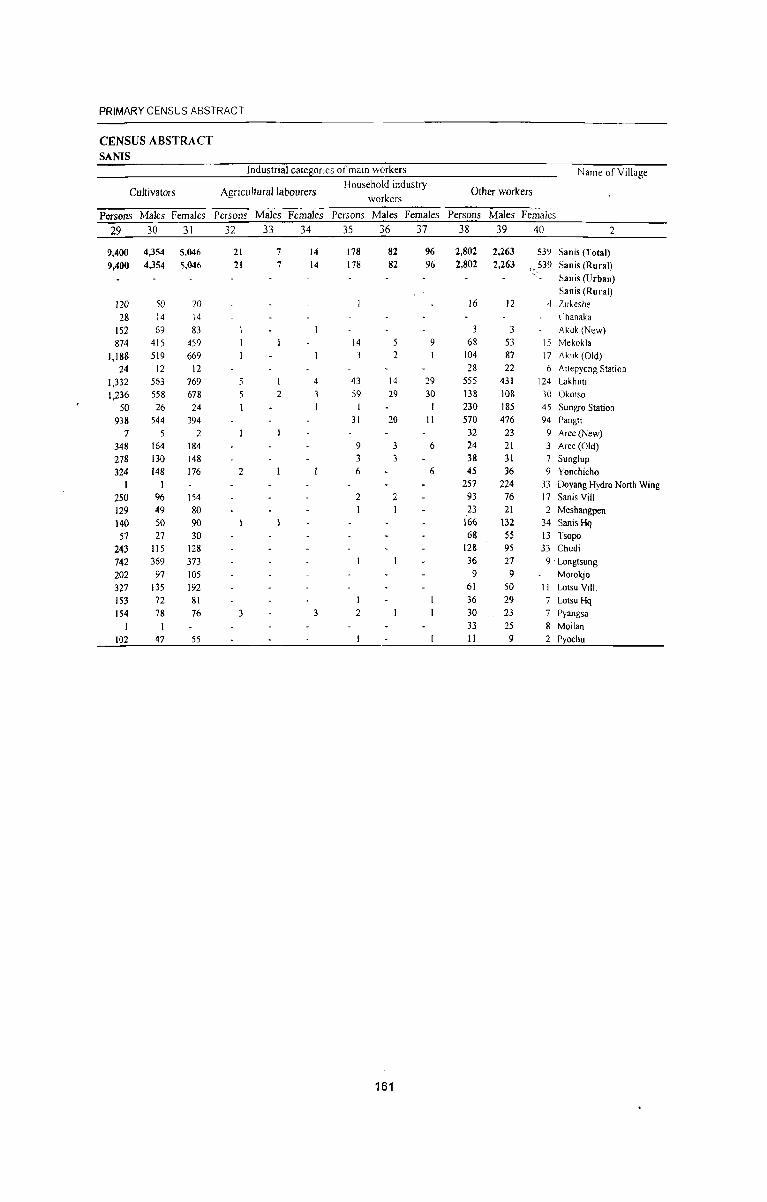
PRIMARY CENSUS ABSTRACT
CENSUS ABSTRA CT SANIS
Industrial categories of main workers Name of Village
Cultivators Agricullurallabourers Household industry
Other workers workers
Persons Males Females Persons Males Females Persons Males Females Persons Males Females
29 30 31 32 33 34 35 36 37 38 39 40 2
9,400 4,354 5,046 21 7 14 178 82 96 2,802 2,263 539 Sanis (Total) 9,400 4,354 5,046 21 7 14 178 82 96 2,802 2,263 ".539 Sanis (Rural)
Sanis (Urban) Sanis (Rural)
120 50 70 16 12 Zukeshe 28 14 14 Chanaka
152 69 83 3 3 i\kuk (New) 874 415 459 14 9 68 53 15 Mekokla
1,188 519 669 2 104 87 17 Akuk (Old) 24 12 12 28 22 6 Altepyong Station
1,332 563 769 4 43 14 29 555 431 124 Lakhuti 1,236 558 678 2 3 59 29 30 \38 108 30 Okotso
50 26 24 I 1 230 185 45 Sungro Station 938 544 394 31 20 II 570 476 94 Pangti
7 5 2 32 23 9 Aree (New) 348 164 184 9 6 24 21 3 Aree (Old) 278 130 148 3 38 31 7 Sunglup 324 148 176 2 6 6 45 36 9 Yonchicho
I I 257 224 33 Doyang Hydro North Wing 250 96 154 2 2 93 76 17 Sanis ViII 129 49 80 I 23 21 2 Meshangpen 140 SO 90 \66 \32 34 Sanis Hq 57 27 30 68 55 13 Tsopo
243 115 128 128 95 33 Chudi 742 369 373 36 27 9 . Longtsung 202 97 105 9 9 Morokjo 327 135 192 61 50 II Lotsu ViiI. \53 72 81 36 29 7 Lotsu Hq \54 78 76 3 3 2 30 23 7 Pyangsa
I 33 25 8 Moilan 102 47 55 II 9 2 Pyochu
161
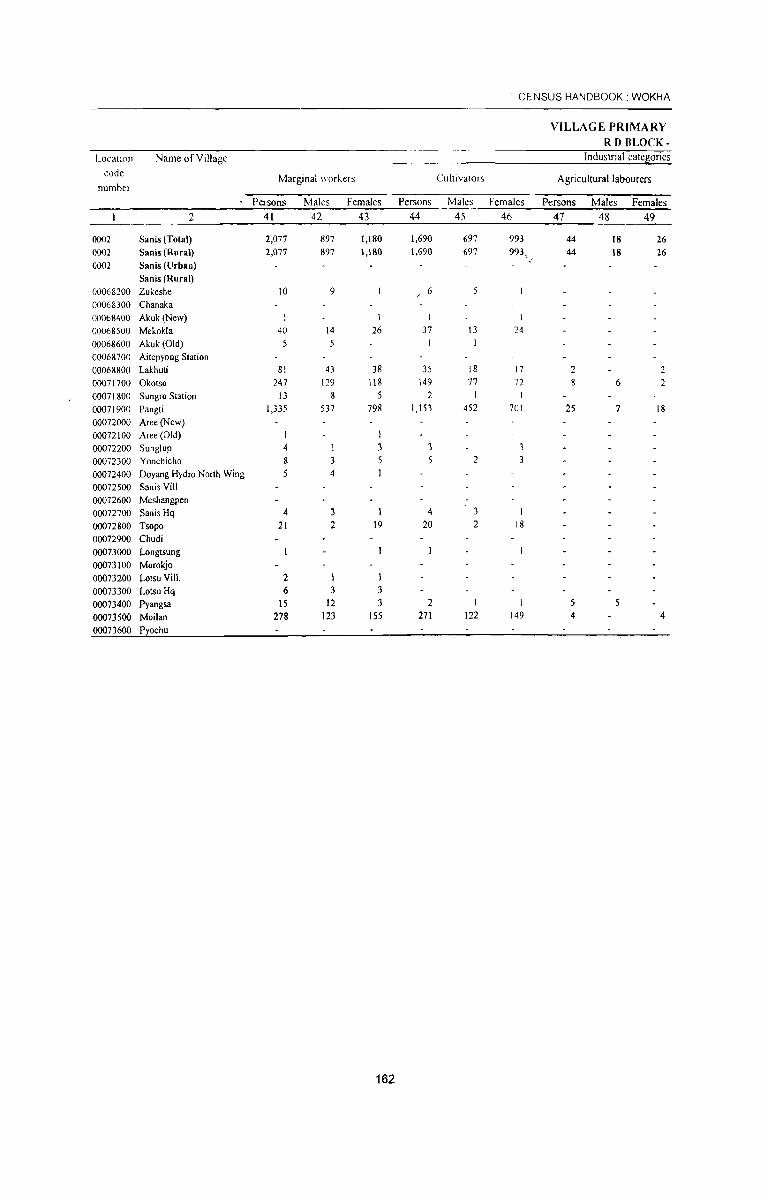
CENSUS HANDBOOK: WOKHA
VILLAGE PRIMARY RD BLOCK-
LocatIon Name ofYillage Industrial categories
code Marginal \\orkers CultIvators Agricultural labourers numbel
Persons Males Females Persons Males Females Persons Males Females
2 41 42 43 44 45 46 47 48 49
()()(J2 Sanis (Total) 2,077 897 1,[80 1,690 697 993 44 18 26 ()()(J2 Sanis (Rural) 2,077 897 1,180 1,690 697 '993, 44 18 26 ()()(J2 Sanis (Urban)
Sanis (Rural) 00068200 Zukeshe [0 9 6 5
00068300 Chanaka 00068400 Akuk(New) I I
00068500 Mekok[a 40 [4 26 37 [3 24
00068600 Akuk (Old) 5 5
00068700 Aitepyong Station 00068800 Lakhuti 81 43 38 35 18 17 2 2 00071700 Okotso 247 \29 118 149 17 72 8 6 2 0007 [800 Sungro Station [3 8 5 2 \
0007[900 Pangti [,335 537 798 1,153 452 701 25 7 18
00072000 Aree (New) 00072100 Aree (Old) I 00072200 Sunglup 4 1 3 3
00072300 Yonchicho 8 3 5 5 2
00072400 Doyang Hydro North Wing 5 4
00072500 Sanis ViII 00072600 Meshangpen 00072700 Sanis Hq 4 3 I 4 3
00072800 Tsopo 21 2 19 20 2 18
00072900 Chudi 00073000 Longtsung 00073100 Morokjo 00073200 Lotsu ViiI. 2 I 00073300 Lotsu Hq 6 3 3 00073400 Pyangsa 15 12 3 2 5 5
00073500 Moilan 278 123 155 271 122 149 4 4
00073600 P ochu
162
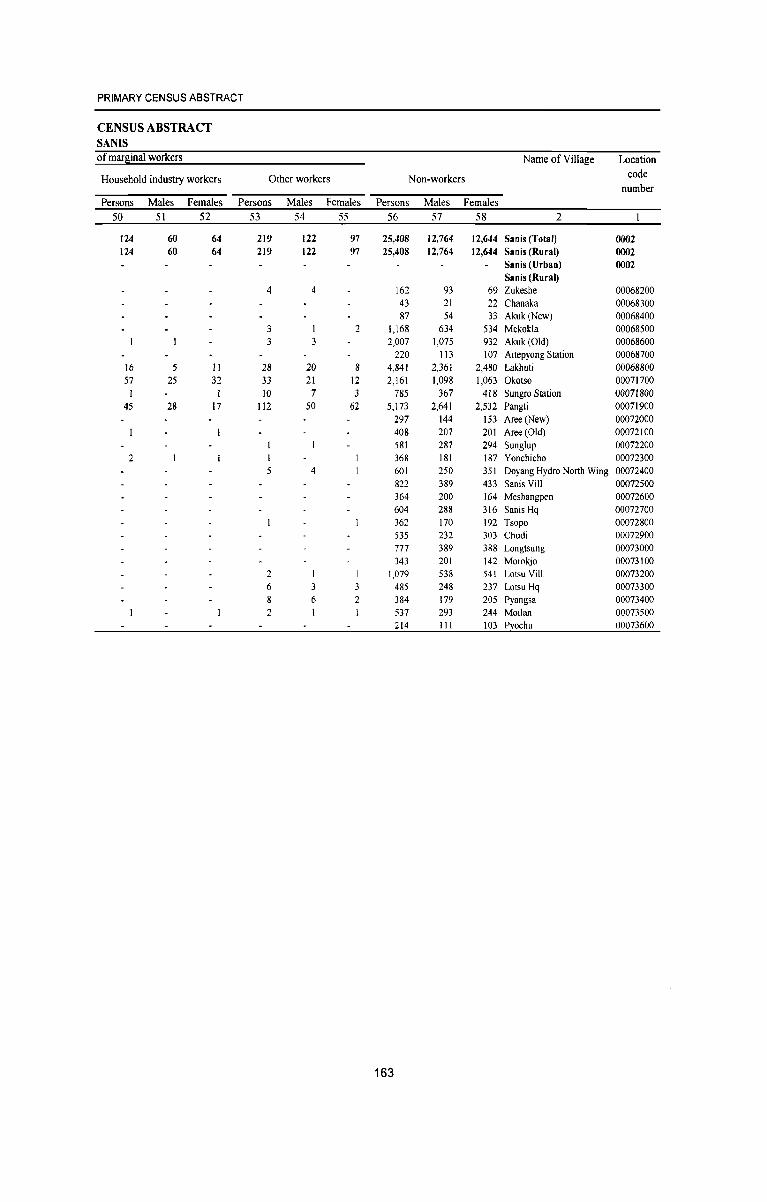
PRIMARY CENSUS ABSTRACT
CENSUS ABSTRACT SANIS of mar~inal workers Name of Village Location
Household industry workers Other workers Non-workers code number
Persons Males Females Persons Males Females Persons Males Females 50 51 52 53 54 55 56 57 58 2
124 60 64 219 122 97 25,408 12,764 12,644 Sanis (Total) 0002 124 60 64 219 122 97 25,408 12,764 12,644 Sanis (Rural) 0002
Sanis (Urban) 0002 Sanis (Rural)
4 4 162 93 69 Zukeshe 00068200 43 21 22 Chanaka 00068300 87 54 33 Akuk(New) 00068400
3 2 1,168 634 534 Mekokla 00068500 3 3 2,007 1,075 932 Akuk (Old) 00068600
220 113 107 Aitepyong Station 00068700 16 5 11 28 20 8 4,841 2,361 2,480 Lakhuti 00068800 57 25 32 33 21 12 2,161 1,098 1,063 Okotso 00071700
10 7 785 367 418 Sungro Station 00071800 45 28 17 112 50 62 5,173 2,641 2,532 Pangti 00071900
297 144 153 Aree(New) 00072000 408 207 201 Aree (Old) 00072100 581 287 294 Sunglup 00072200
2 368 181 187 Yonchicho 00072300 5 4 601 250 351 Doyang Hydro North Wing 00072400
822 389 433 Sanis Viii 00072500 364 200 164 Meshangpen 00072600 604 288 316 Sanis Hq 00072700 362 170 192 Tsopo 00072800 535 232 303 Chudi 00072900 777 389 388 Longtsung 00073000 343 201 142 Morokjo 00073100
2 1,079 538 541 Lotsu ViII. 00073200 6 3 485 248 237 Lotsu Hq 00073300 8 6 2 384 179 205 Pyangsa 00073400 2 1 537 293 244 Moilan 00073500
214 III 103 Pyochu 00073600
163
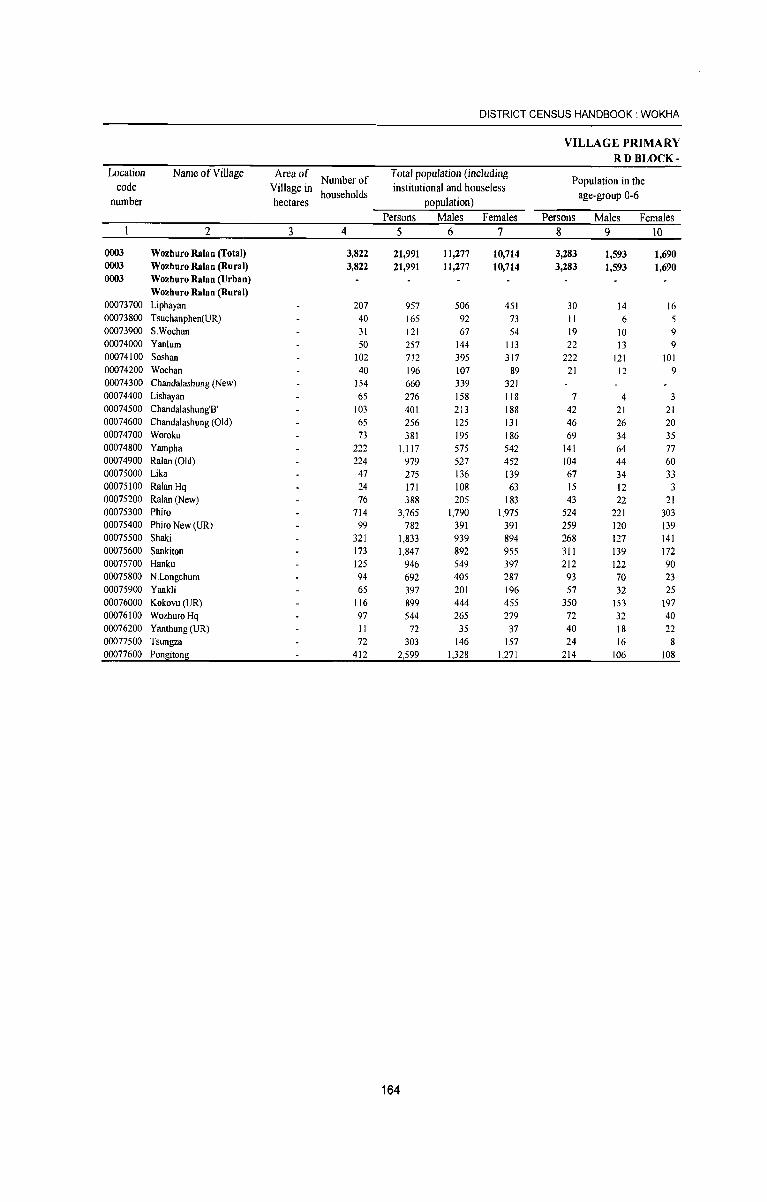
DISTRICT CENSUS HANDBOOK: WOKHA
VILLAGE PRIMARY RD BLOCK-
Location Name of Village Area of Number of
Total population (including Population in the
code Village in households
institutional and houseless age-group 0-6
number hectares population)
Persons Males Females Persons Males Females 2 3 4 5 6 7 8 9 10
0003 Wozhuro Ralan (Total) 3,822 21,991 11,277 10,714 3,283 1,593 1,690 0003 Wozhuro Ralan (Rural) 3,822 21,991 11,277 10,714 3,283 1,593 1,690 0003 Wozhuro Ralan (Urban)
Wozhuro Ralan (Rural) 00073700 Liphayan 207 957 506 451 30 14 16 00073800 Tsuchanphen(UR) 40 165 92 73 11 6 5 00073900 S.Wochan 31 121 67 54 19 10 9 00074000 Yanlum 50 257 144 113 22 13 9 00074100 Soshan 102 712 395 317 222 121 101 00074200 Wochan 40 196 107 89 21 12 9 00074300 Chandalashung (New) 154 660 339 321 00074400 Lishayan 65 276 158 118 7 4 3 00074500 Chandalashung'B' 103 401 213 188 42 21 21 00074600 Chandalashung (Old) 65 256 125 131 46 26 20 00074700 Woroku 73 381 195 186 69 34 35 00074800 Yampha 222 1,117 575 542 141 64 77 00074900 Ralan (Old) 224 979 527 452 104 44 60 00075000 Lika 47 275 136 139 67 34 33 00075100 RalanHq 24 171 108 63 15 12 3 00075200 Ralan (New) 76 388 205 183 43 22 21 00075300 Phiro 714 3,765 1,790 1,975 524 221 303 00075400 Phiro New (UR) 99 782 391 391 259 120 139 00075500 Shaki 321 1,833 939 894 268 127 141 00075600 Sankiton 173 1,847 892 955 311 139 172 00075700 Hanku 125 946 549 397 212 122 90 00075800 N.Longchum 94 692 405 287 93 70 23 00075900 Yankli 65 397 201 196 57 32 25 00076000 Kokovu (UR) 116 899 444 455 350 153 197 00076100 WozhuroHq 97 544 265 279 72 32 40 00076200 Yanthung (UR) 11 72 35 37 40 18 22 00077500 Tsungza 72 303 146 157 24 16 8 00077600 Pon~iton~ 412 2,599 1,328 1,271 214 106 108
164
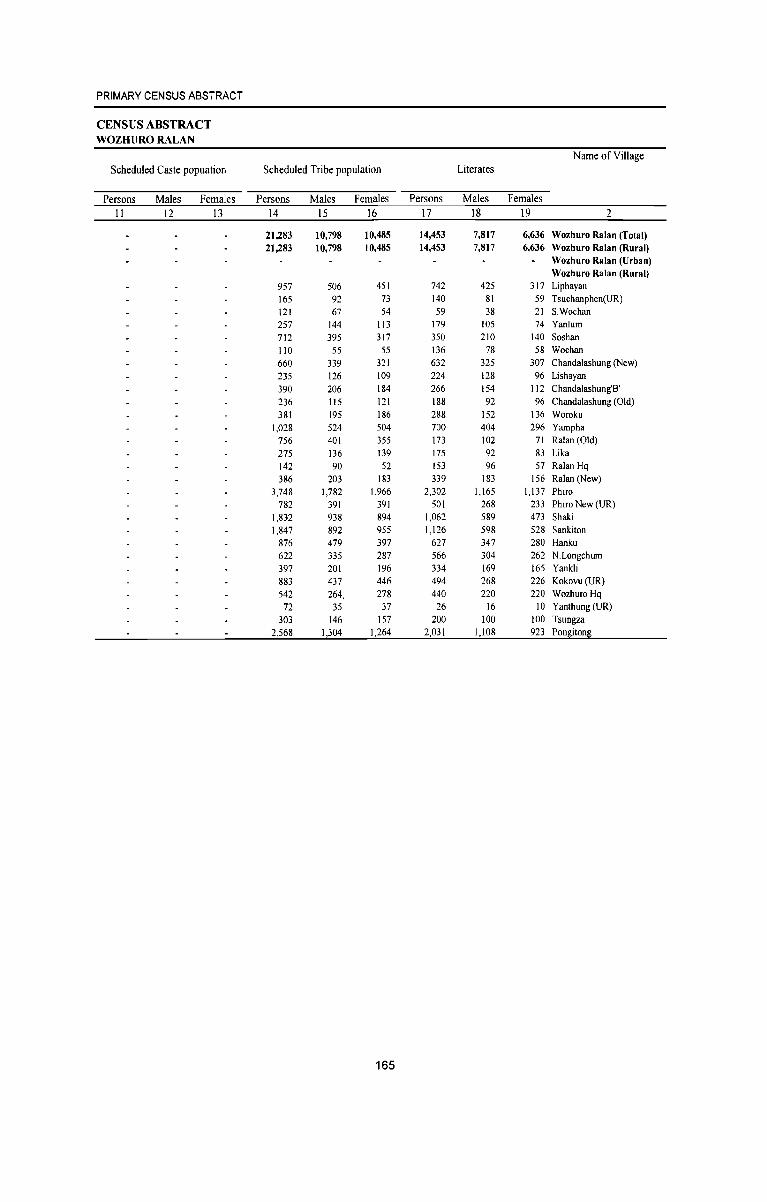
PRIMARY CENSUS ABSTRACT
CENSUS ABSTRACT WOZHURO RALAN
Name of Village Scheduled Caste popuation Scheduled Tribe population Literates
Persons Males Females Persons Males Females Persons Males Females II 12 13 14 15 16 17 18 19 2
21,283 10,798 10,485 14,453 7,817 6,636 Wozhuro Ralan (Total) 21,283 10,798 10,485 14,453 7,817 6,636 Wozhuro Ralan (Rural)
Wozhuro Ralan (Urban) Wozhuro Ralan (Rural)
957 506 451 742 425 317 Liphayan 165 92 73 140 81 59 Tsuchanphen(UR) 121 67 54 59 38 21 S.Wochan 257 144 113 179 105 74 Yanlum 712 395 317 350 210 140 Soshan 110 55 55 136 78 58 Wochan 660 339 321 632 325 307 Chandalashung (New) 235 126 109 224 128 96 Lishayan 390 206 184 266 154 112 Chandalashung'B' 236 115 121 188 92 96 Chandalashung (Old) 381 195 186 288 152 136 Woroku
1,028 524 504 700 404 296 Yampha 756 401 355 173 102 71 Ralan (Old) 275 136 139 175 92 83 Lika 142 90 52 153 96 57 Ra1an Hq 386 203 183 339 183 156 Ralan(New)
3,748 1,782 1,966 2,302 1,165 1,137 Phiro 782 391 391 501 268 233 Phiro New (UR)
1,832 938 894 1,062 589 473 Shaki 1,847 892 955 1,126 598 528 Sankiton
876 479 397 627 347 280 Hanku 622 335 287 566 304 262 N.Longchum 397 201 196 334 169 165 Yankli 883 437 446 494 268 226 Kokovu (UR) 542 264, 278 440 220 220 WozhuroHq 72 35 37 26 16 10 Yanthung (UR)
303 146 157 200 100 100 Tsungza 2,568 1,304 1,264 2,031 1,108 923 Pongitong
165
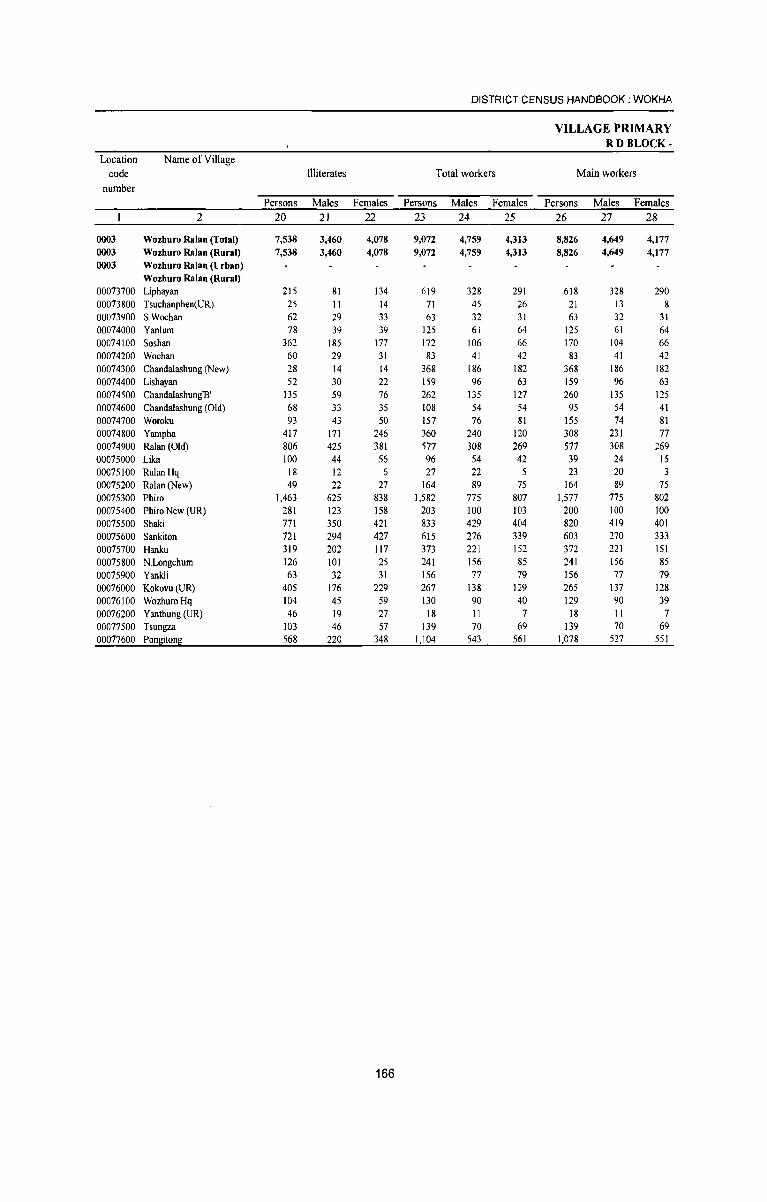
Location
code
number
Name of Village
2
0003 Wozhuro Ralan (Total) 0003 Wozhuro Ralan (Rural) 0003 Wozhuro Ralan (Urban)
Wozhuro Ralan (Rural) 00073700 Liphayan 00073800 Tsuchanphen(UR) 00073900 SWochan 00074000 Yanlum 00074100 Soshan 00014200 Wochan 00074300 Chandalashung (New) 00074400 Lishayan 00074500 Chandalashung'B' 00074600 Chandalashung (Old) 00074700 Woroku 00074800 Yampha 00074900 Ralan (Old) 00075000 Lika 00075100 Ralan Hq 00075200 Ralan (New) 00075300 Phiro 00075400 Phiro New (UR) 00075500 Shaki 00075600 Sankiton 00075700 Hanku 00075800 N.Longchum 00075900 Yankli 00076000 Kokovu (UR) 00076100 Wozhuro Hq 00076200 Yanthung (UR) 00077500 Tsungza 00077600 Pongitong
Persons
20
7,538 7,538
215 25 62 78
362 60 28 52
135 68 93
417 806 100
18 49
1,463 281 771 721 319 126 63
405 104 46
103 568
Illiterates
Males
21
3,460
3,460
81 11 29 39
185 29 14 30 59 33 43
171 425 44 12 22
625 123 350 294 202 101 32
176 45 19 46
220
Females
22
4,078 4,078
134 14 33 39
177 31 14 22 76 35 50
246 381
56 6
27 838 158 421 427 117 25 31
229 59 27 57
348
166
DISTRICT CENSUS HANDBOOK: WOKHA
Total workers
Persons
23
9,072 9,072
619 71 63
125 172 83
368 159 262 108 157 360 577 96 27
164 1,582
203 833 615 373 241 156 267 130
18 139
1,104
Males
24
4,759 4,759
328 45 32 61
106 41
186 96
135 54 76
240 308 54 22 89
775 100 429 276 221 156 77
138 90 11 70
543
Females
25
4,313
4,313
291 26 31 64 66 42
182 63
127 54 81
120 269 42 5
75 807 103 404 339 152 85 79
129 40
7 69
561
VILLAGE PRIMARY RD BLOCK-
Main workers
Persons
26
8,826 8,826
618 21 63
125 170 83
368 159 260
95 155 308 577 39 23
164 1,577
200 820 603 372 241 156 265 129
18 139
1,078
Males
27
4,649 4,649
328 13 32 61
104 41
186 96
135 54 74
231 308 24 20 89
775 100 419 270 221 156 77
137 90 11 70
527
Females
28
4,177 4,177
290 8
31 64 66 42
182 63
125 41 81 77
269 15 3
75 802 100 401 333 151 85 79
128 39
7 69
551
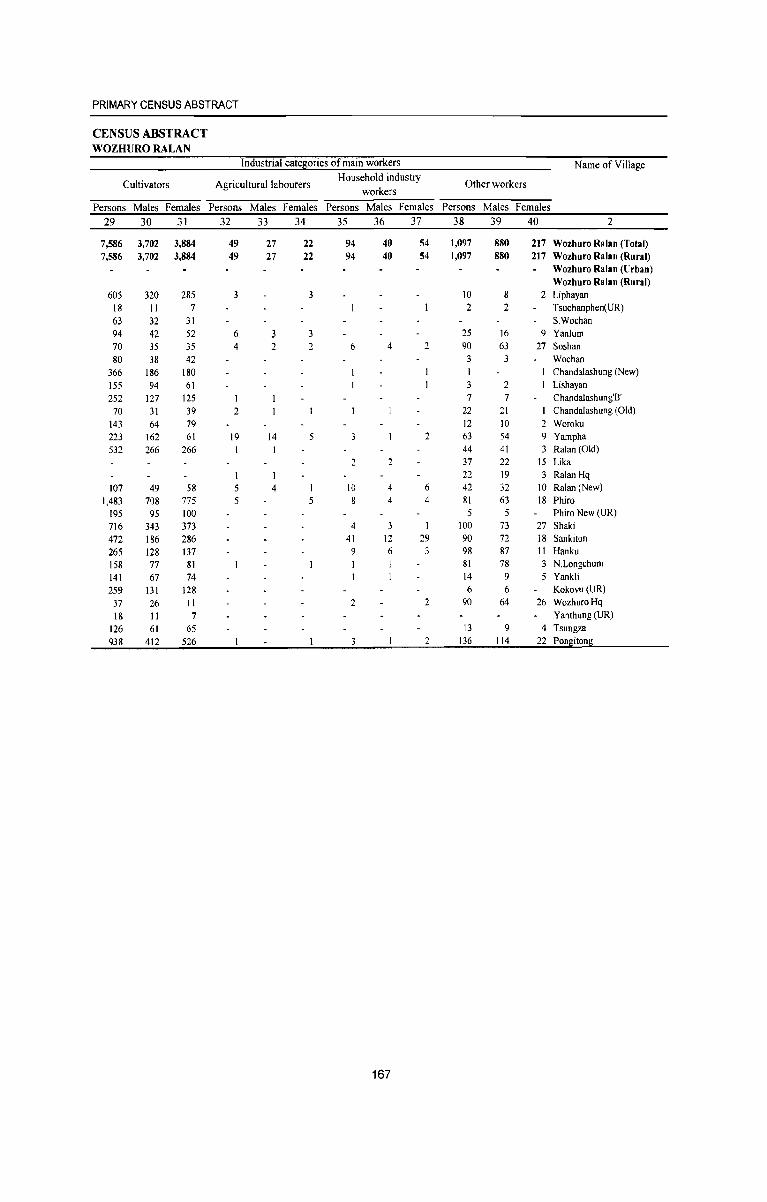
PRIMARY CENSUS ABSTRACT
CENSUS ABSTRACT WOZHURO RALAN
Industrial catesories of main workers Name of Village
Cultivators Agricultural labourers Household industry
Other workers workers
Persons Males Females Persons Males Females Persons Males Females Persons Males Females
29 30 31 32 33 34 35 36 37 38 39 40 2
7,586 3,702 3,884 49 27 22 94 40 54 1,097 880 217 Wozhuro Ralan (Total) 7,586 3,702 3,884 49 27 22 94 40 54 1,097 880 217 Wozhuro Ralan (Rural)
Wozhuro Ralan (Urban) Wozhuro Ralan (Rural)
605 320 285 3 3 10 8 2 Liphayan 18 II 7 2 2 Tsuchanphen(UR) 63 32 31 S.Wochan 94 42 52 6 3 3 25 16 9 Yanlum 70 35 35 4 2 2 6 4 2 90 63 27 Soshan 80 38 42 3 3 Wochan
366 186 180 Chandalashung (New) 155 94 61 3 2 Lishayan 252 127 125 7 7 Chandalashung'B' 70 31 39 2 22 21 Chandalashung (Old)
143 64 79 12 10 2 Woroku 223 162 61 19 14 5 2 63 54 9 Yampha 532 266 266 1 44 41 3 Ralan (Old)
2 37 22 15 Lika 22 19 3 Ralan Hq
107 49 58 5 4 10 4 6 42 32 10 Ralan (New) 1,483 708 775 5 5 8 4 4 81 63 18 Phiro
195 95 100 5 5 Phiro New (UR) 716 343 373 4 3 100 73 27 Shaki 472 186 286 41 12 29 90 72 18 Sankiton 265 128 137 9 6 98 87 11 Hanku 158 77 81 81 78 3 N.Longchum 141 67 74 14 9 5 Yankli 259 131 128 6 6 Kokovu(UR) 37 26 11 2 2 90 64 26 WozhuroHq 18 11 7 Yanthung (UR)
126 61 65 13 9 4 Tsungza 938 412 526 3 2 136 114 22 Pongitong
167
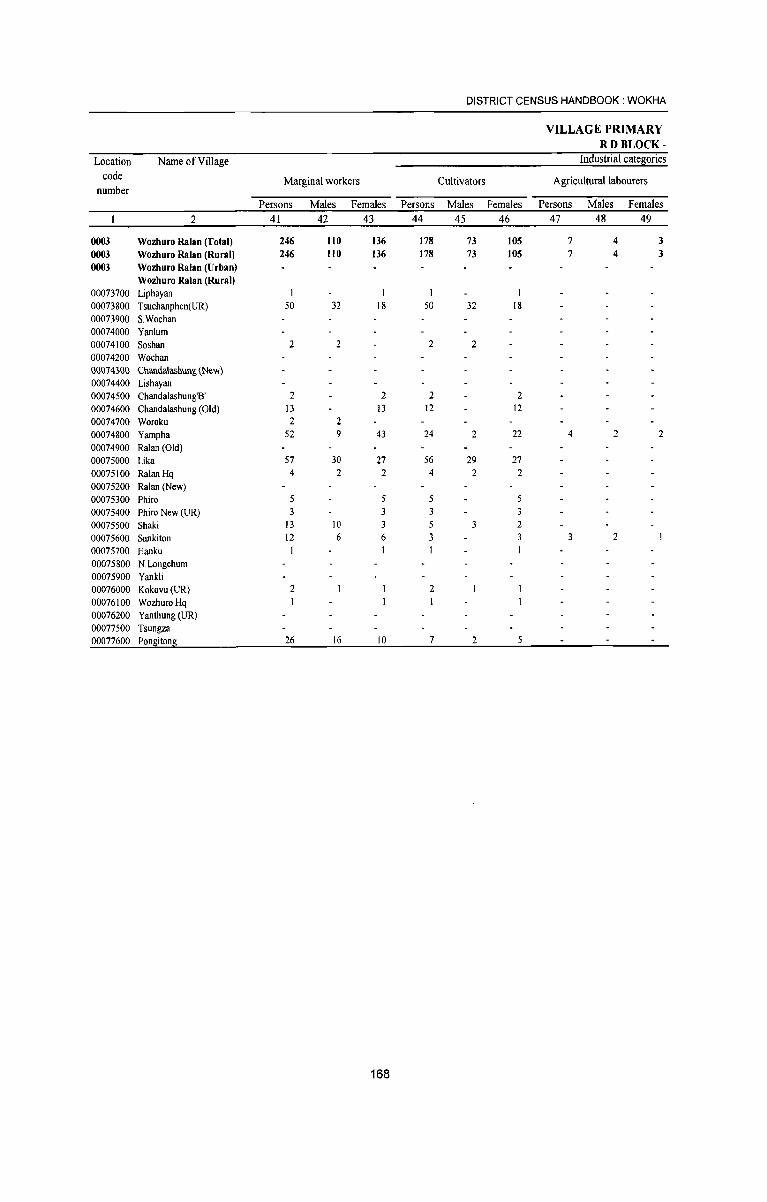
DISTRICT CENSUS HANDBOOK: WOKHA
VILLAGE PRIMARY RDBLOCK-
Location Name of Village Industrial catellories
code Marginal workers Cultivators Agricultural labourers number
Persons Males Females Persons Males Females Persons Males Females
2 41 42 43 44 45 46 47 48 49
0003 Wozhuro Ralao (Total) 246 110 136 178 73 105 7 4 3 0003 Wozhuro Ralao (Rural) 246 110 136 178 73 105 7 4 3 0003 Wozhuro Ralan (Urban)
Wozhuro Ralao (Rural) 00073700 Liphayan I 00073800 Tsuchanphen(UR) 50 32 18 50 32 18 00073900 SWochan 00074000 Yanlum 00074100 Soshan 2 2 2 2 00074200 Wochan 00074300 Chandalashung (New) 00074400 Lishayan 00074500 Chandalashung'B' 2 2 2 2 00074600 Chandalashung (Old) 13 13 12 12 00074700 Woroku 2 2 00074800 Yampha 52 9 43 24 2 22 4 2 2 00074900 Ralan (Old) 00075000 Lika 57 30 27 56 29 27 00075100 RalanHq 4 2 2 4 2 2 00075200 Ralan (New) 00075300 Phiro 5 5 5 00075400 Phiro New (UR) 3 3 3 00075500 Shaki 13 10 3 5 3 2 00075600 Sankiton 12 6 6 3 3 3 2 00075700 Hanku 00075800 N.Longchum 00075900 Yankli 00076000 Kokovu(UR) 2 2 00076100 WozhuroHq 00076200 Yanthung (UR) 00077500 Tsungza 00077600 Pon~itong 26 16 10 7 2
168
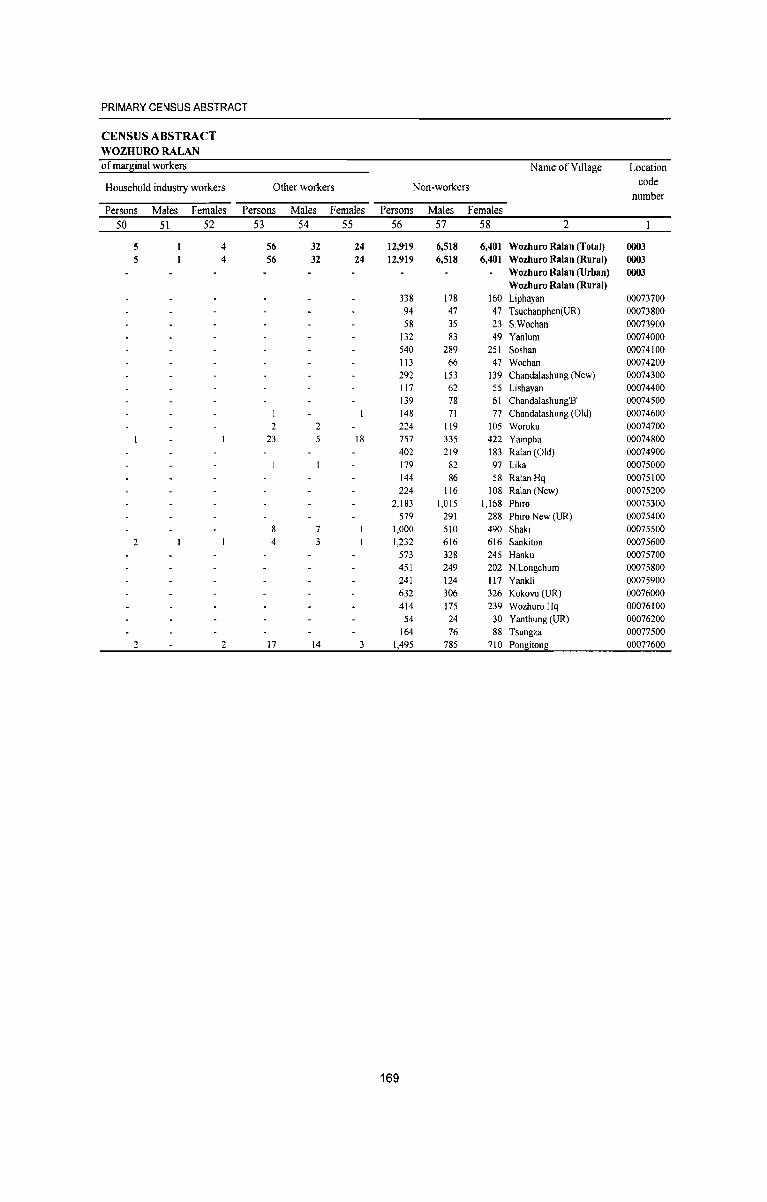
PRIMARY CENSUS ABSTRACT
CENSUS ABSTRACT WOZHURO RALAN of marginal workers Name of Village Location
Household industry workers Other workers Non-workers code number
Persons Males Females Persons Males Females Persons Males Females
50 51 52 53 54 55 56 57 58 2
5 4 56 32 24 12,'H9 6,518 6,401 Wozhuro Ralan (Total) 0003 5 4 56 32 24 12,919 6,518 6,401 Wozhuro Ralan (Rural) 0003
Wozhuro Ralan (Urban) 0003 Wozhuro Ralan (Rural)
338 178 160 Liphayan 00073700 94 47 47 Tsuchanphen(UR) 00073800 58 35 23 S.Wochan 00073900
132 83 49 Yanlum 00074000 540 289 251 Soshan 00074100 113 66 47 Wochan 00074200 292 153 139 Chandalashung (New) 00074300 117 62 55 Lishayan 00074400 139 78 61 Chandalashung'B' 00074500 148 71 77 Chandalashung (Old) 00074600
2 2 224 119 105 Woroku 00074700 23 5 18 757 335 422 Yampha 00074800
402 219 183 Ralan (Old) 00074900 179 82 97 Lika 00075000 144 86 58 Ralan Hq 00075100 224 116 108 Ralan(New) 00075200
2,183 1,015 1,168 Phiro 00075300 579 291 288 Phiro New (UR) 00075400
7 1,000 510 490 Shaki 00075500 2 4 3 1,232 616 616 Sankiton 00075600
573 328 245 Hanku 00075700 451 249 202 N.Longchum 00075800 241 124 117 Yankli 00075900 632 306 326 Kokovu(UR) 00076000 414 175 239 WozhuroHq 00076100
54 24 30 Yanthung (UR) 00076200 164 76 88 Tsungza 00077500
2 2 17 14 3 1,495 785 710 Pon~iton~ 00077600
169
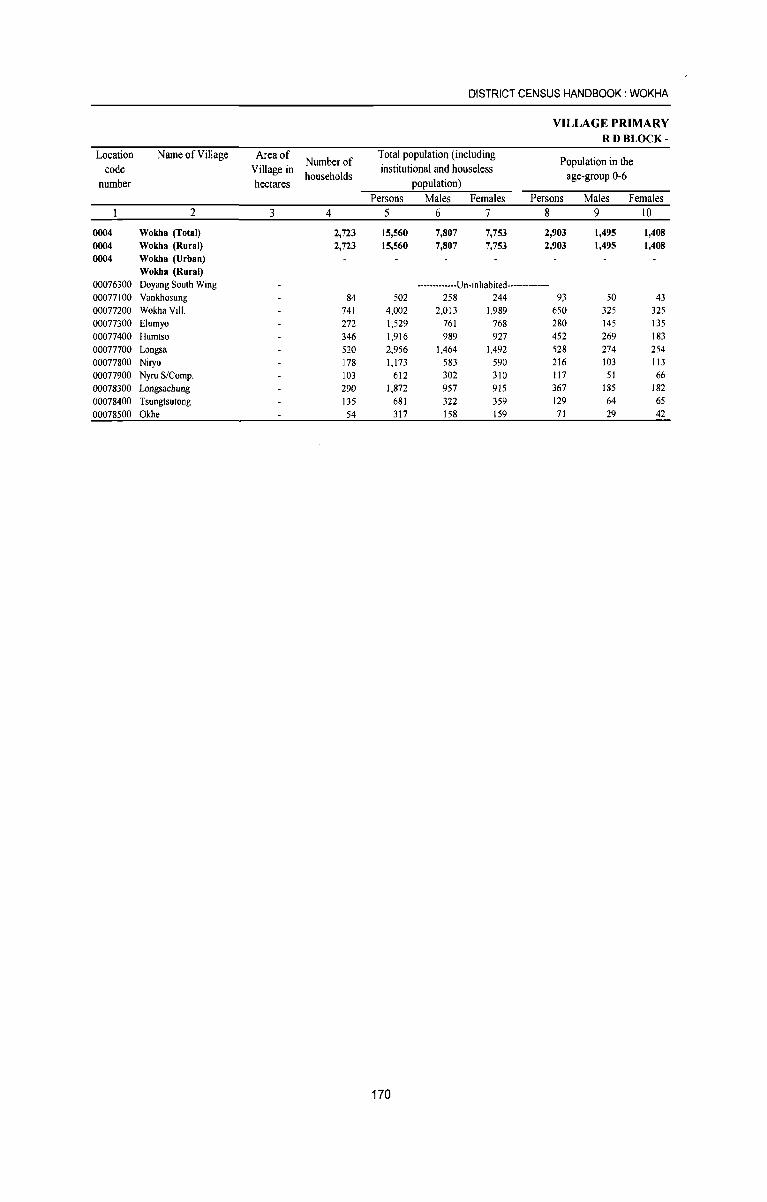
DISTRICT CENSUS HANDBOOK: WOKHA
VILLAGE PRIMARY RDBLOCK-
Location Name of Village Area of Number of
Total population (including Population in the
code Village in households
institutional and houseless age-group 0-6
number hectares population) Persons Males Females Persons Males Females
2 3 4 5 6 7 8 9 10
0004 Wokha (Total) 2,723 15,560 7,807 7,753 2,903 1,495 1,408 0004 Wokha (Rural) 2,723 15,560 7,807 7,753 2,903 1,495 1,408 0004 Wokha (Urban)
Wokha (Rural) 00076300 Doyang South Wing •.•.••.••• • •• Un.inhabited···.······.·.· 00077100 Vankhosung 84 502 258 244 93 50 43 00077200 Wokha ViII. 741 4,002 2,013 1,989 650 325 325 00077300 Elumyo 272 1,529 761 768 280 145 135 00077400 Humtso 346 1,916 989 927 452 269 183 00077700 Longsa 520 2,956 1,464 1,492 528 274 254 00077800 Niryo 178 1,173 583 590 216 103 113 00077900 Nyru S/Comp. 103 612 302 310 117 51 66 00078300 Longsachung 290 1,872 957 915 367 185 182 00078400 Tsungtsutong 135 681 322 359 129 64 65 00078500 Okhe 54 317 158 159 71 29 42
170
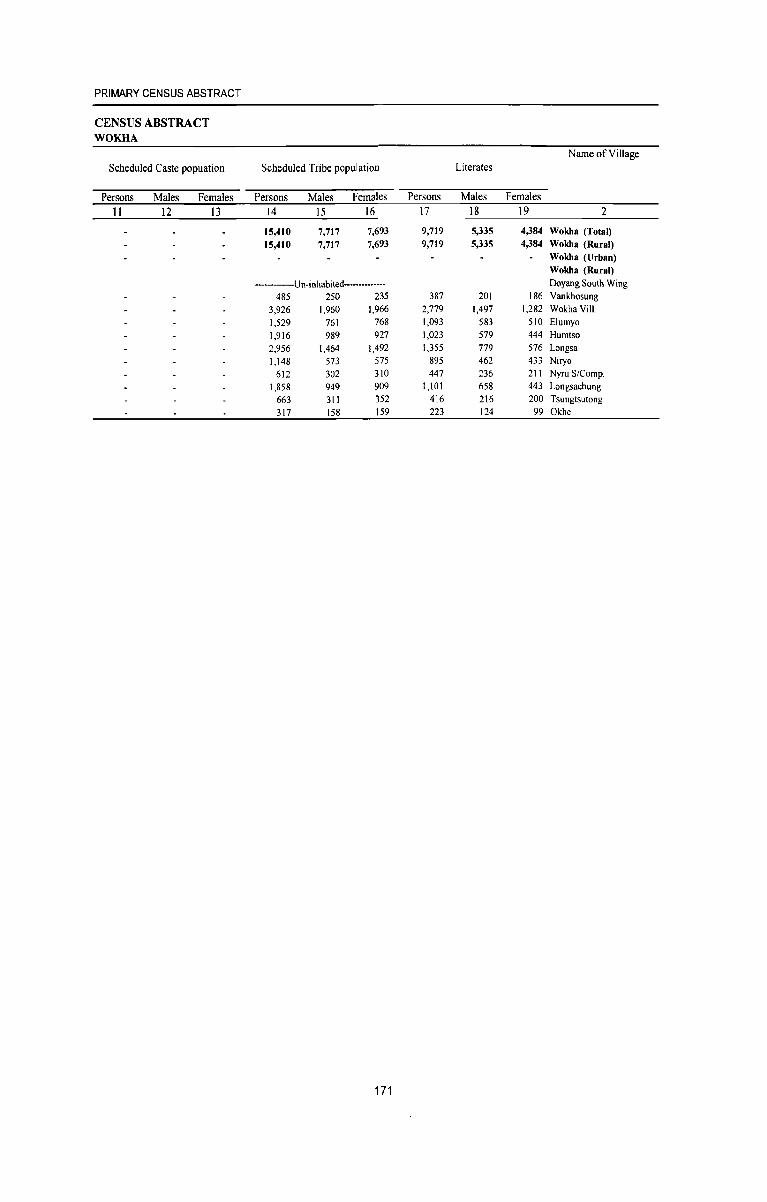
PRIMARY CENSUS ABSTRACT
CENSUS ABSTRACT WOKHA
Name of Village
Scheduled Caste popuation Scheduled Tribe population Literates
Persons Males Females Persons Males Females Persons Males Females
11 12 13 14 15 16 17 18 19 2
15,410 7,717 7,693 9,719 5,335 4,384 Wokha (Total)
15,410 7,717 7,693 9,719 5,335 4,384 Wokha (Rural) Wokha (Urban) Wokha (Rural)
------------Un-inhabited------------ Doyang South Wing
485 250 235 387 201 186 Vankhosung
3,926 1,960 1,966 2,779 1,497 1,282 Wokha ViII.
1,529 761 768 1,093 583 510 E1umyo
1,916 989 927 1,023 579 444 Humtso
2,956 1,464 1,492 1,355 779 576 Longsa
1,148 573 575 895 462 433 Niryo
612 302 310 447 236 211 Nyru S/Comp.
1,858 949 909 1,101 658 443 Longsachung
663 311 352 416 216 200 Tsungtsutong
317 158 159 223 124 99 Okhe
171
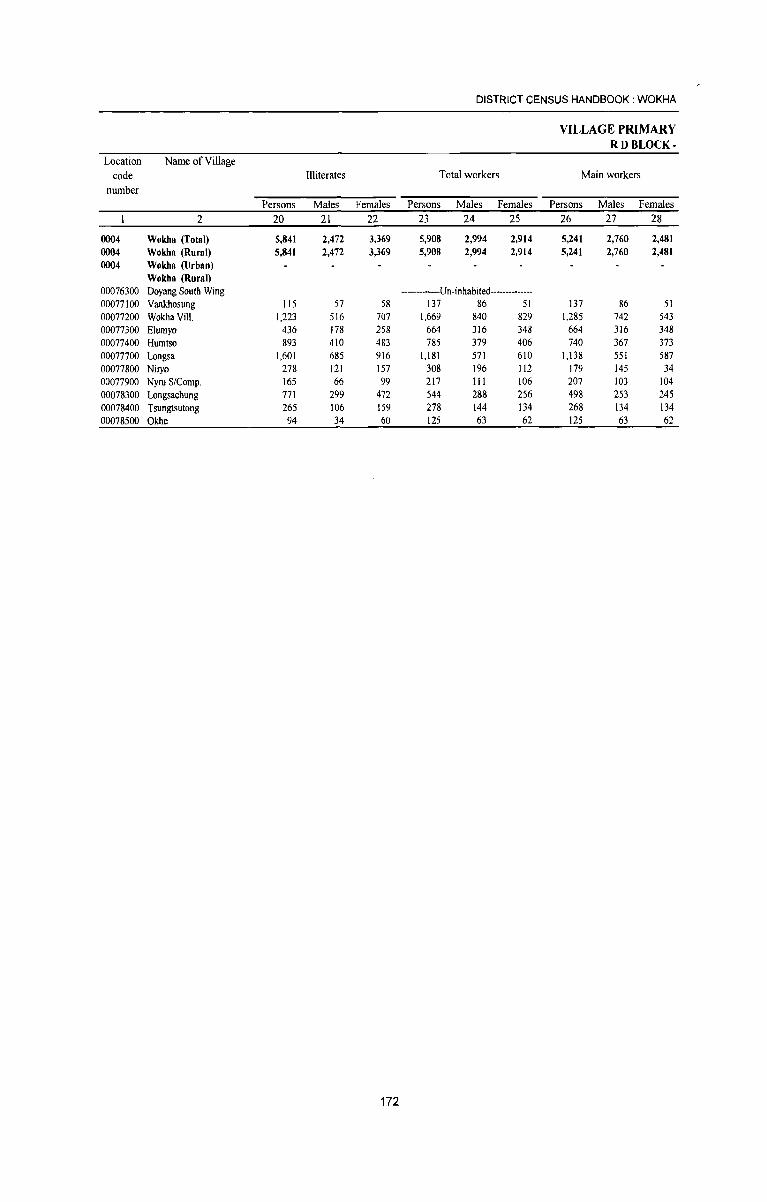
DISTRICT CENSUS HANDBOOK: WOKHA
VILLAGE PRIMARY RDBLOCK-
Location Name of Village code Illiterates Total workers Main workers
number Persons Males Females Persons Males Females Persons Males Females
2 20 21 22 23 24 2S 26 27 28
0004 Wokha (Total) 5,841 2,472 3,369 5,908 2,994 2,914 5,241 2,760 2,481 0004 Wokha (Rural) 5,841 2,472 3,369 5,908 2,994 2,914 5,241 2,760 2,481 0004 Wokha (Urban)
Wokha (Rural) 00076300 Doyang South Wing -------------Un-inhabited-------------00077100 Vankhosung 115 57 58 137 86 51 137 86 51 00077200 Wokha Viii. 1,223 516 707 1,669 840 829 1,285 742 543 00077300 Elumyo 436 178 258 664 316 348 664 316 348 00077400 Humtso 893 410 483 785 379 406 740 367 373 00077700 Longsa 1,601 685 916 1,181 571 610 1,138 551 587 00077800 Nil}'o 278 121 157 308 196 112 179 145 34 00077900 Nyru S/Comp. 165 66 99 217 111 106 207 103 104 00078300 Longsachung 771 299 472 544 288 256 498 253 245 00078400 Tsungtsutong 265 106 159 278 144 134 268 134 134 00078500 Okhe 94 34 60 125 63 62 125 63 62
172
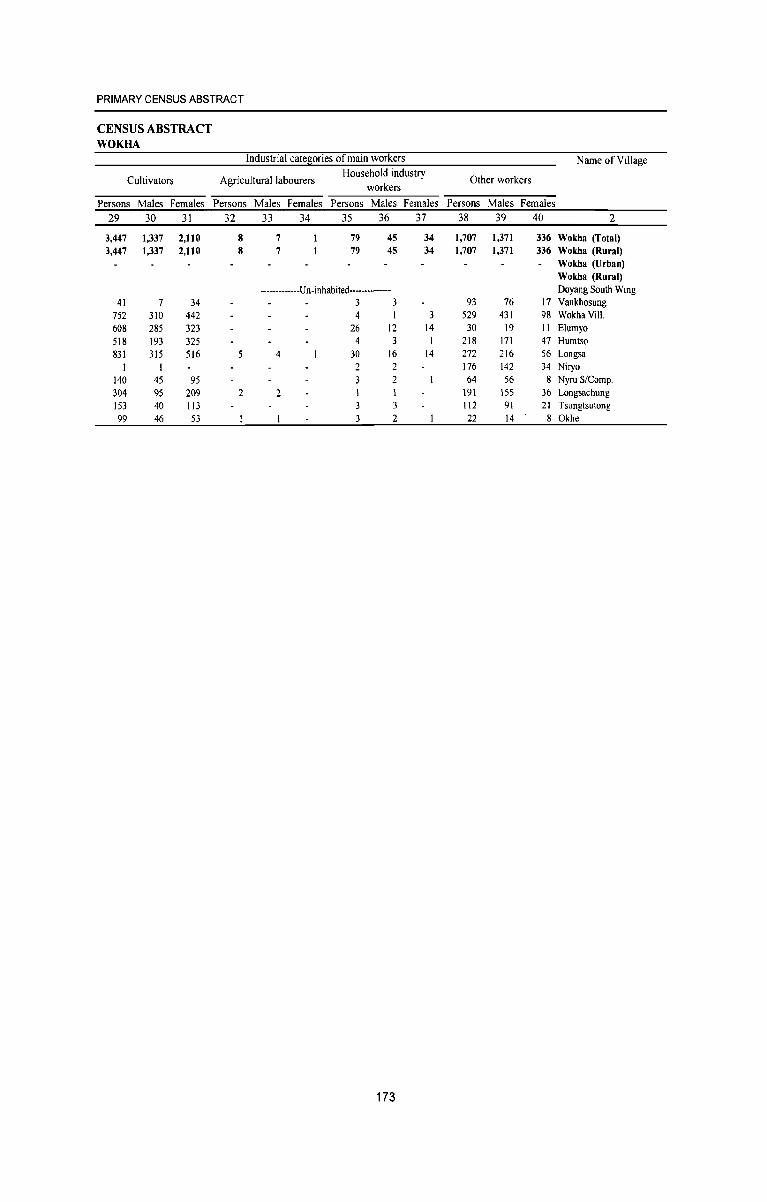
PRIMARY CENSUS ABSTRACT
CENSUS ABSTRACT WOKHA
Industrial categories of main workers Name of Village
Cultivators Agricultural labourers Household industry
Other workers workers
Persons Males Females Persons Males Females Persons Males Females Persons Males Females 29 30 31 32 33 34 35 36 37 38 39 40 2
3,447 1,337 2,110 8 7 79 45 34 1,707 1,371 336 Wokha (Total) 3,447 1,337 2,110 8 7 79 45 34 1,707 1,371 336 Wokha (Rural)
Wokha (Urban) Wokha (Rural)
------------Un-inhabited--------······ Doyang South Wing 41 7 34 3 3 93 76 17 Vankhosung
752 310 442 4 3 529 431 98 Wokha ViII. 608 285 323 26 12 14 30 19 11 Elumyo 518 193 325 4 3 218 171 47 Humtso 831 315 516 5 4 30 16 14 272 216 56 Longsa
2 2 176 142 34 Niryo 140 45 95 2 64 56 8 Nyru S/Comp. 304 95 209 2 2 \9\ \55 36 Longsachung 153 40 1\3 3 112 91 21 Tsungtsutong 99 46 53 2 22 14 8 Okhe
173
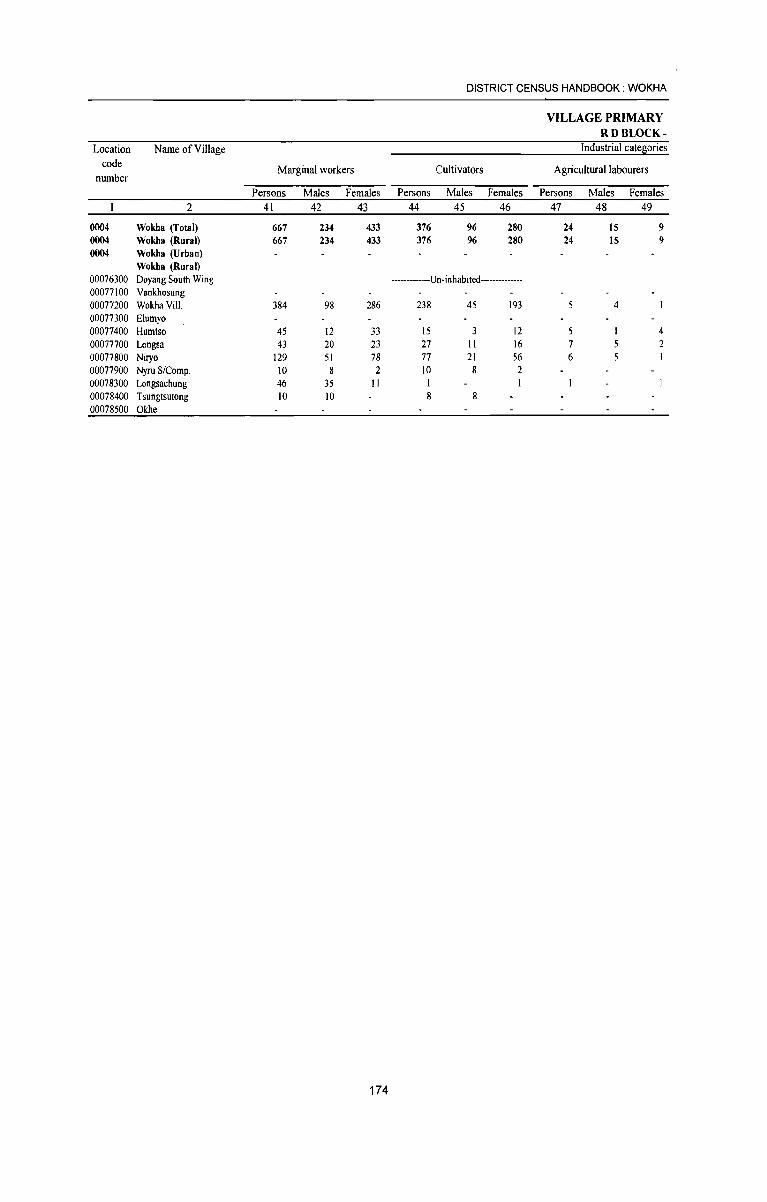
DISTRICT CENSUS HANDBOOK; WOKHA
VILLAGE PRIMARY RDBLOCK-
Location Name of Village Industrial catell:ories
code Marginal workers Cultivators Agricultural labourers number
Persons Males Females Persons Males Females Persons Males Females 2 41 42 43 44 45 46 47 48 49
0004 Wokha (Total) 667 234 433 376 96 280 24 15 9 0004 Wokha (Rural) 667 234 433 376 96 280 24 15 9 0004 Wokha (Urban)
Wokha (Rural) 00076300 Doyang South Wing -------------Un-inhabited--------------00077100 Vankhosung 00077200 Wokha ViII. 384 98 286 238 45 193 4 00077300 Elumyo 00077400 Humtso 45 12 33 15 3 12 4 00077700 Longsa 43 20 23 27 II 16 7 5 2 00077800 Niryo 129 51 78 77 21 56 6 5 00077900 Nyru S/Comp. 10 8 2 10 8 2 00078300 Longsachung 46 35 11 00078400 Tsungtsutong 10 10 8 8 00078500 Okhe
174
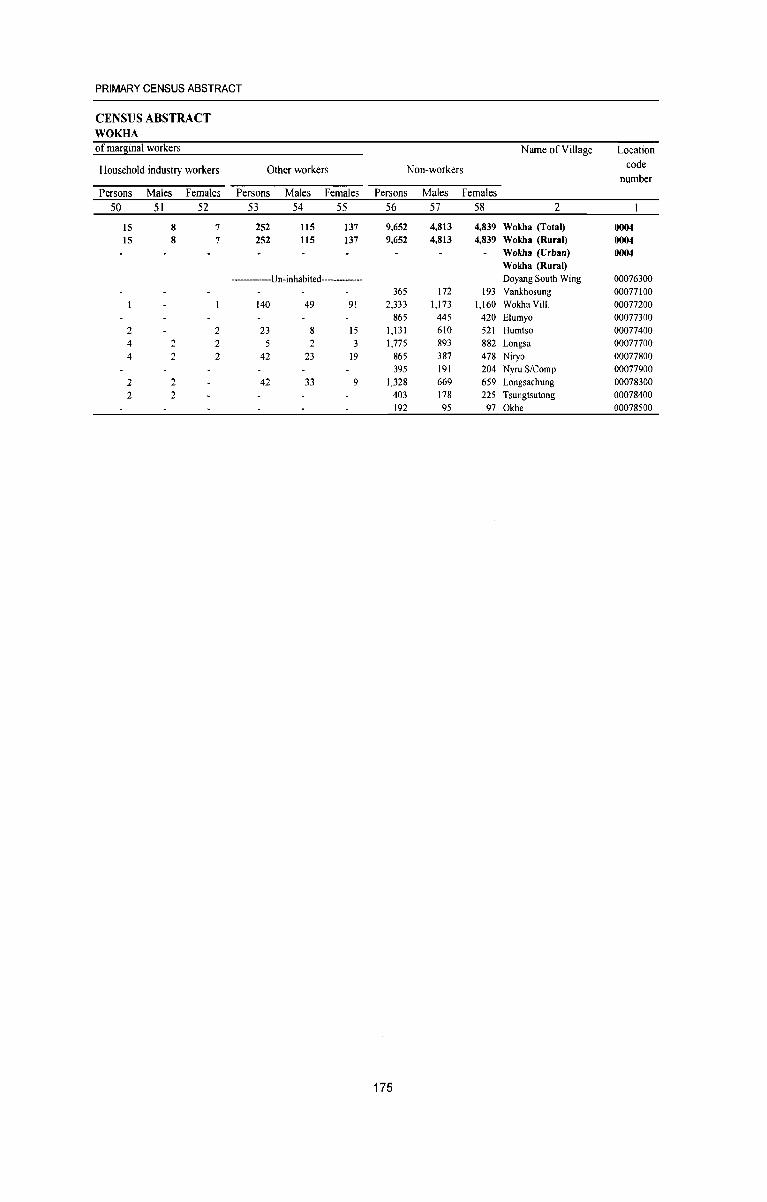
PRIMARY CENSUS ABSTRACT
CENSUS ABSTRACT WOKHA of marginal workers Name of Village Location
Household industry workers Other workers Non-workers code number
Persons Males Females Persons Males Females Persons Males Females 50 51 52 53 54 55 56 57 58 2
15 8 7 252 115 137 9,652 4,813 4,839 Wokha (Total) 0004 15 8 7 252 115 137 9,652 4,813 4,839 Wokha (Rural) 0004
Wokha (Urban) 0004 Wokha (Rural)
-------------Un-inhabited-------------- Doyang South Wing 00076300 365 172 193 Vankhosung 00077100
140 49 91 2,333 1,173 1,160 Wokha Viii 00077200 865 445 420 Elumyo 00077300
2 2 23 8 15 1,131 610 521 Humtso 00077400 4 2 2 5 2 1,775 893 882 Longsa 00077700 4 2 2 42 23 19 865 387 478 Niryo 00077800
395 191 204 Nyru S/Comp. 00077900 2 2 42 33 9 1,328 669 659 Longsachung 00078300 2 2 403 178 225 Tsungtsutong 00078400
192 95 97 Okhe 00078500
175
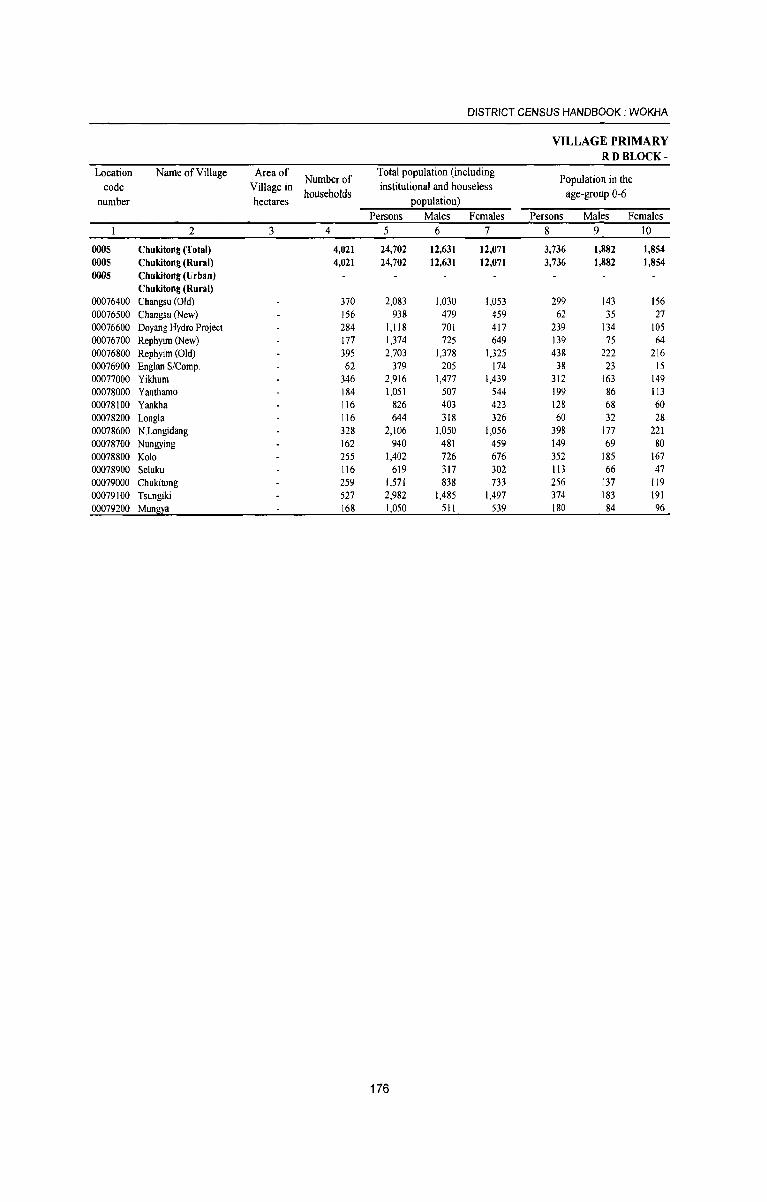
DISTRICT CENSUS HANDBOOK: WOKHA
VILLAGE PRIMARY RDBLOCK-
Location Name of Village Area of Number of
Total population (including Population in the
code Village in households
institutional and houseless age-group 0-6
number hectares population) Persons Males Females Persons Males Females
2 3 4 5 6 7 8 9 10
0005 Chukitong (Total) 4,021 24,702 12,631 12,071 3,736 1,882 1,854 0005 Chukitong (Rural) 4,021 24,702 12,631 12,071 3,736 1,882 1,854 0005 Chukitong (Urban)
Chukitong (Rural) 00076400 Changsu (Old) 370 2,083 1,030 1,053 299 143 156 00076500 Changsu (New) 156 938 479 459 62 35 27 00076600 Doyang Hydro Project 284 1,118 701 417 239 134 105 00076700 Rephyim (New) 177 1,374 725 649 139 75 64 00076800 Rephyim (Old) 395 2,703 1,378 1,325 438 222 216 00076900 Englan S/Comp. 62 379 205 174 38 23 15 00077000 Yikhum 346 2,916 1,477 1,439 312 163 149 00078000 Yanthamo 184 1,051 507 544 199 86 113 00078100 Yankha 116 826 403 423 128 68 60 00078200 Longla 116 644 318 326 60 32 28 00078600 N.Longidang 328 2,106 1,050 1,056 398 177 221 00078700 Nungying 162 940 481 459 149 69 80 00078800 Kolo 255 1,402 726 676 352 185 167 00078900 Seluku 116 619 317 302 113 66 47 00079000 Chukitong 259 1,571 838 733 256 137 119 00079100 Tsungiki 527 2,982 1,485 1,497 374 183 191 00079200 MunlQ:a 168 1,050 511 539 180 84 96
176
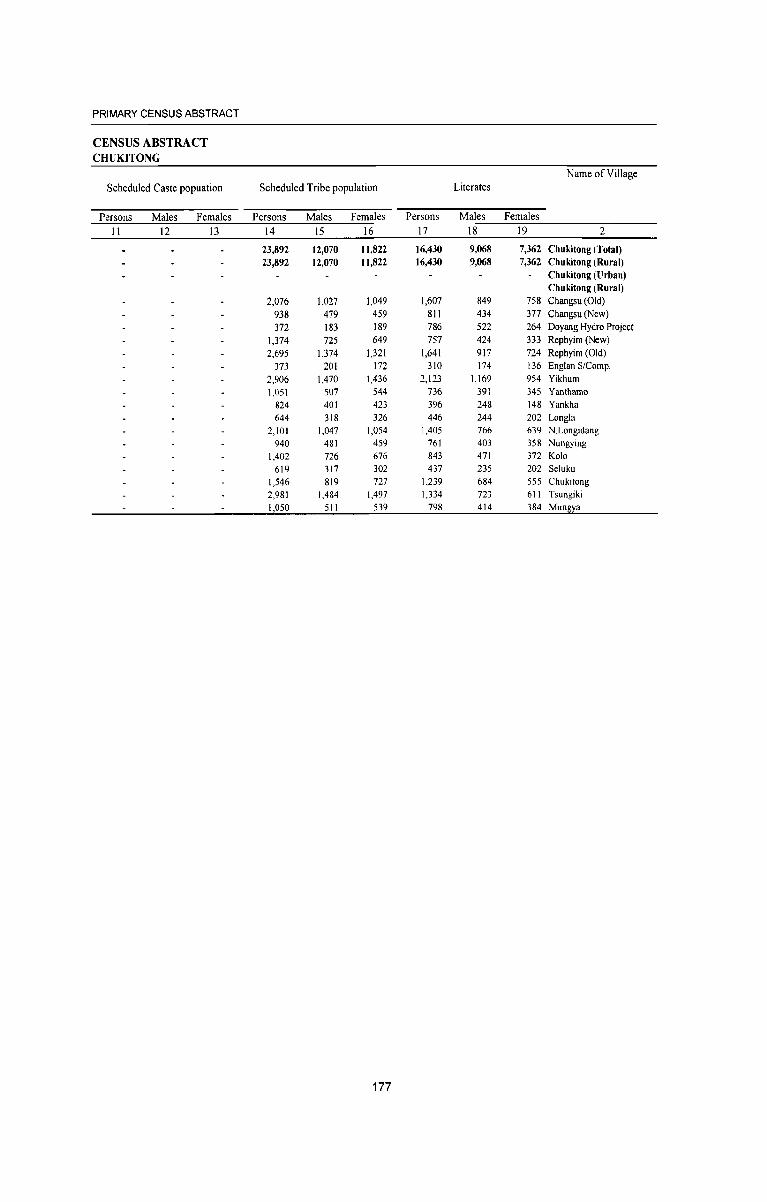
PRIMARY CENSUS ABSTRACT
CENSUS ABSTRACT CHUKITONG
Name of Village Scheduled Caste popuation Scheduled Tribe population Literates
Persons Males Females Persons Males Females Persons Males Females
II 12 13 14 15 16 17 18 19 2
23,892 12,070 11,822 16,430 9,068 7,362 Chukitong (Total) 23,892 12,070 11,822 16,430 9,068 7,362 Chukitong (Rural)
Chukitong (Urban) Chukitong (Rural)
2,076 1,027 1,049 1,607 849 758 Changsu (Old) 938 479 459 811 434 377 Changsu (New) 372 183 189 786 522 264 Doyang Hydro Project
1,374 725 649 757 424 333 Rephyim (New) 2,695 1,374 1,321 1,641 917 724 Rephyim (Old)
373 201 172 310 174 136 Englan S/Comp. 2,906 1,470 1,436 2,123 1,169 954 Yikhum 1,051 507 544 736 391 345 Yanthamo
824 401 423 396 248 148 Yankha 644 318 326 446 244 202 Longla
2,101 1,047 1,054 1,405 766 639 N.Longidang 940 481 459 761 403 358 Nungying
1,402 726 676 843 471 372 Kolo 619 317 302 437 235 202 Seluku
1,546 819 727 1,239 684 555 Chukitong 2,981 1,484 1,497 1,334 723 611 Tsungiki 1,050 511 539 798 414 384 Mungya
177
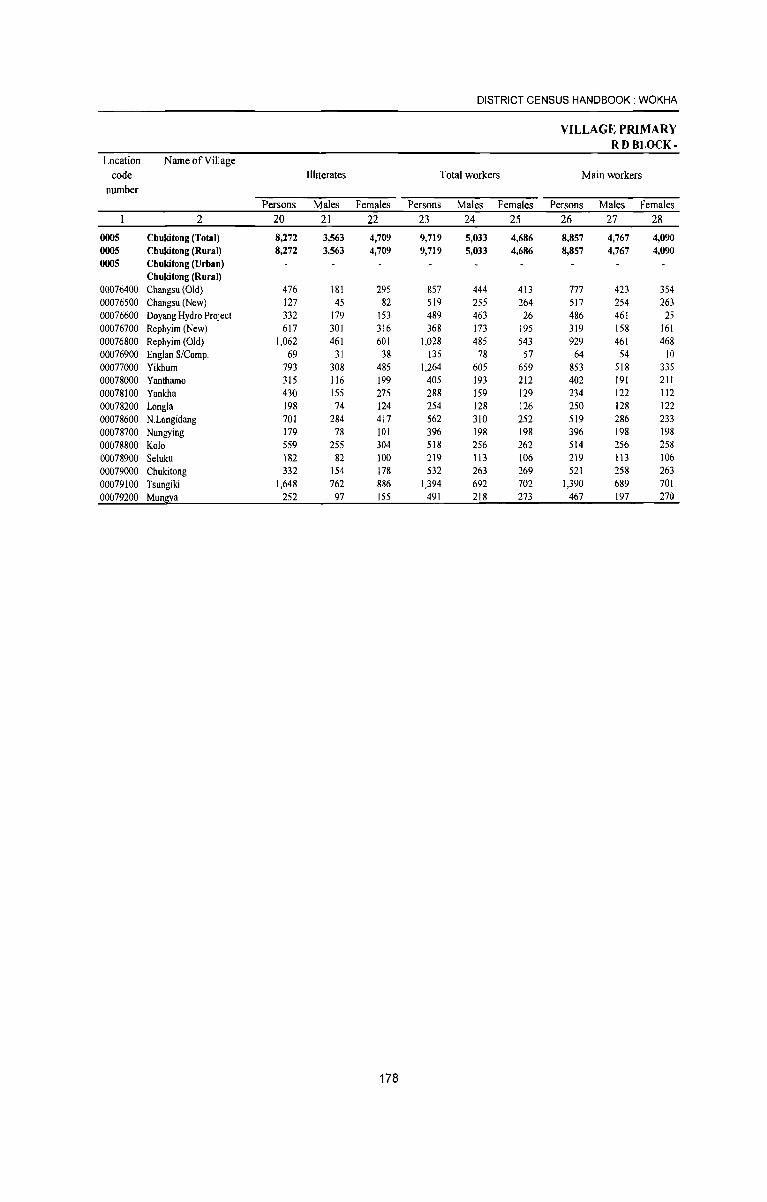
DISTRICT CENSUS HANDBOOK: WOKHA
VILLAGE PRIMARY RD BLOCK-
Location Name of Village code Illiterates Total workers Main workers
number Persons Males Females Persons Males Females Persons Males Females
2 20 21 22 23 24 25 26 27 28 0005 Chukitong (Total) 8,272 3,563 4,709 9,719 5,033 4,686 8,857 4,767 4,090 0005 Chukitong (Rural) 8,272 3,563 4,709 9,719 5,033 4,686 8,857 4,767 4,090 0005 Chukitong (Urban)
Chukitong (Rural) 00076400 Changsu (Old) 476 181 295 857 444 413 777 423 354 00076500 Changsu (New) 127 45 82 519 255 264 517 254 263 00076600 Doyang Hydro Project 332 179 153 489 463 26 486 461 25 00076700 Rephyim (New) 617 301 316 368 173 195 319 158 161 00076800 Rephyim (Old) 1,062 461 601 1,028 485 543 929 461 468 00076900 Englan S/Comp. 69 31 38 135 78 57 64 54 10 00077000 Yikhum 793 308 485 1,264 605 659 853 518 335 00078000 Yanthamo 315 116 199 405 193 212 402 191 211 00078100 Yankha 430 155 275 288 159 129 234 122 112 00078200 Longla 198 74 124 254 128 126 250 128 122 00078600 N.Longidang 701 284 417 562 310 252 519 286 233 00078700 Nungying 179 78 101 396 198 198 396 198 198 00078800 Kol0 559 255 304 518 256 262 514 256 258 00078900 Seluku 182 82 100 219 113 106 219 113 106 00079000 Chukitong 332 154 178 532 263 269 521 258 263 00079100 Tsungiki 1,648 762 886 1,394 692 702 1,390 689 701 00079200 Mun!.Q:a 252 97 155 491 218 273 467 197 270
178
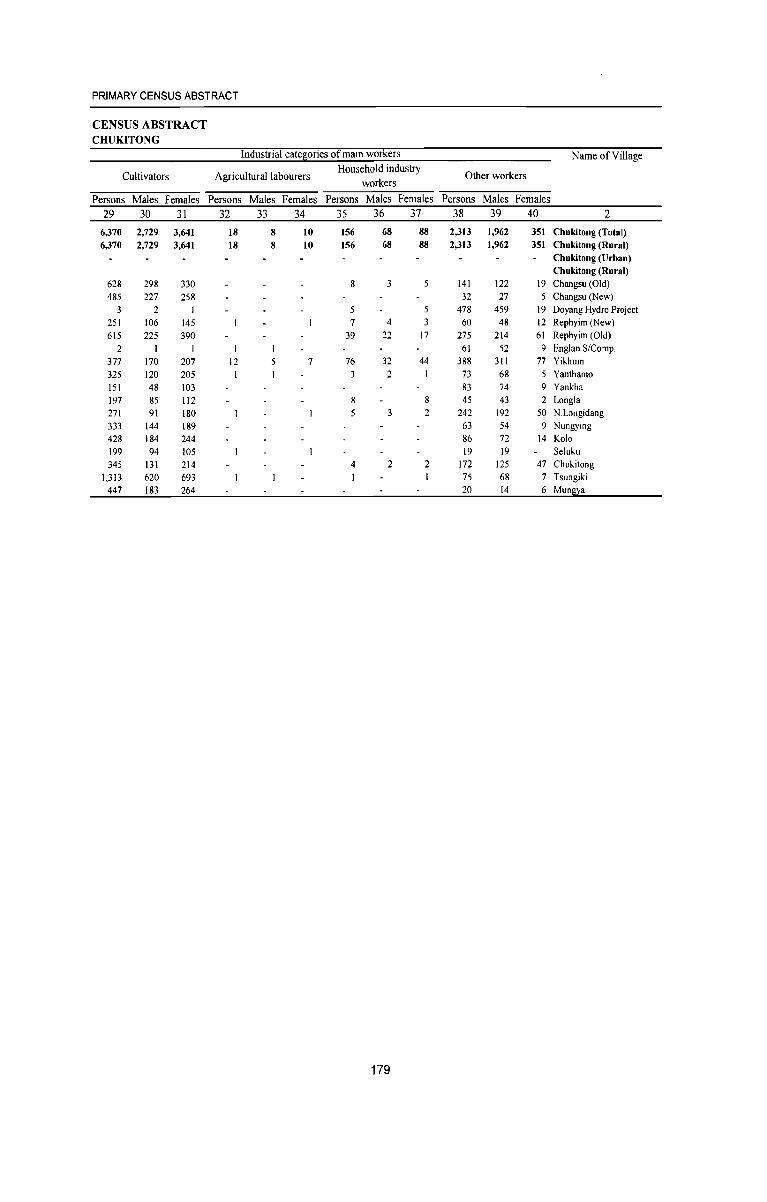
PRIMARY CENSUS ABSTRACT
CENSUS ABSTRACT CHUKITONG
Industrial categories of main workers Name of Village
Cultivators Agricultural labourers Household industry
Other workers workers
Persons Males Females Persons Males Females Persons Males Females Persons Males Females 29 30 31 32 33 34 35 36 37 38 39 40 2
6,370 2,729 3,641 18 8 10 156 68 88 2,313 1,962 351 Chukitong (Total) 6,370 2,729 3,641 18 8 10 156 68 88 2,313 1,962 351 Chukitong (Rural)
Chukitong (Urban) Chukitong (Rural)
628 298 330 8 3 5 141 122 19 Changsu (Old) 485 227 258 32 27 Changsu (New)
2 5 5 478 459 19 Doyang Hydro Project 251 106 145 7 4 3 60 48 12 Rephyim (New) 615 225 390 39 22 17 275 214 61 Rephyim (Old)
2 1 61 52 9 Englan S/Comp. 377 170 207 12 5 7 76 32 44 388 311 77 Yikhum 325 120 205 2 73 68 Yanthamo 151 48 103 83 74 9 Yankha 197 85 112 8 8 45 43 2 Longla 271 91 180 5 3 2 242 192 50 N.Longidang
333 144 189 63 54 9 Nungying 428 184 244 86 72 14 Kolo 199 94 105 19 19 Seluku 345 131 214 4 2 2 172 125 47 Chukitong
1,313 620 693 75 68 7 Tsungiki 447 183 264 20 14 6 Mungya
179
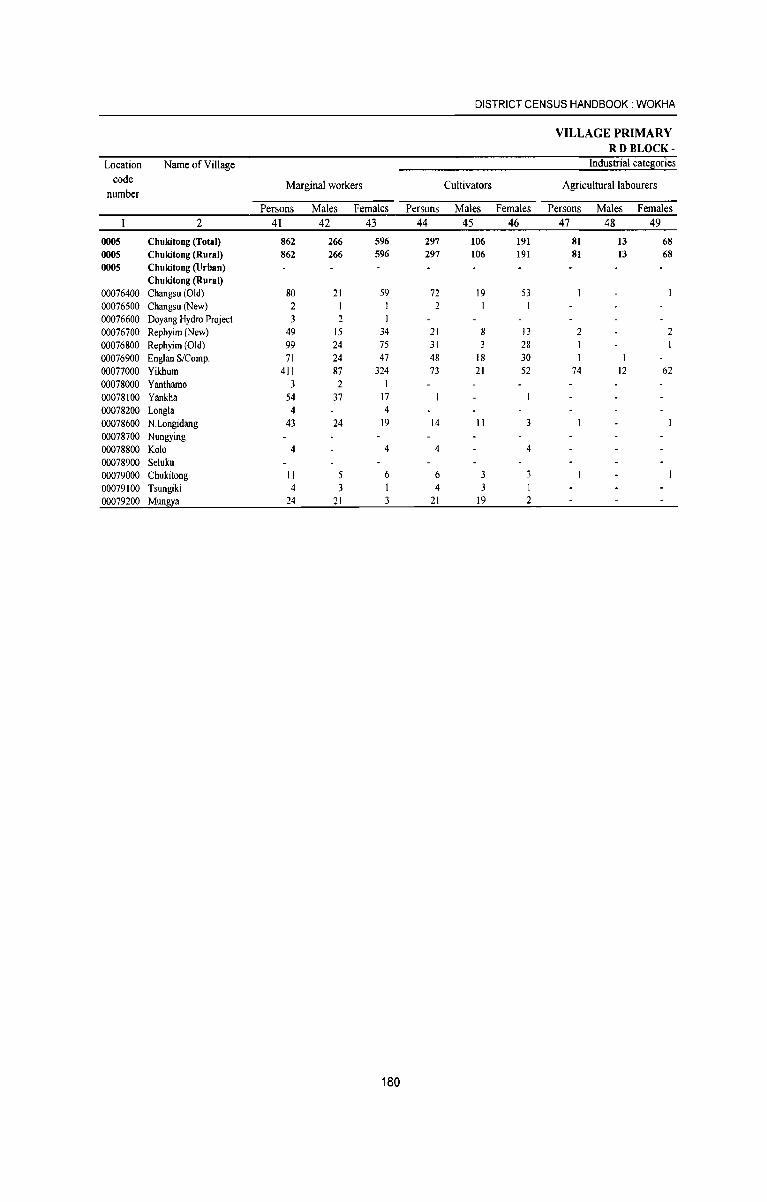
DISTRICT CENSUS HANDBOOK: WOKHA
VILLAGE PRIMARY RD BLOCK-
Location Name of Village Industrial catesories
code Marginal workers Cultivators Agricultural labourers number
Persons Males Females Persons Males Females Persons Males Females 2 41 42 43 44 45 46 47 48 49
0005 Chukitong (Total) 862 266 596 297 106 191 81 13 68 0005 Chukitong (Rural) 862 266 596 297 106 191 81 13 68 0005 Chukitong (Urban)
Chukitong (Rural) 00076400 Changsu (Old) 80 21 59 72 19 53 00076500 Changsu (New) 2 1 1 2 00076600 Doyang Hydro Project 3 2 I 00076700 Rephyim (New) 49 15 34 21 8 13 2 2 00076800 Rephyim (Old) 99 24 75 31 3 28 1 1 00076900 Englan S/Comp. 71 24 47 48 18 30 00077000 Yikhum 411 87 324 73 21 52 74 12 62 00078000 Yanthamo 3 2 00078100 Yankha 54 37 17 00078200 Longla 4 4 00078600 N.Longidang 43 24 19 14 11 3 00078700 Nungying 00078800 Kola 4 4 4 4 00078900 Seluku 00079000 Chukitong 11 5 6 6 3 3 00079100 Tsungiki 4 3 4 3 00079200 Mun~a 24 21 3 21 19 2
180
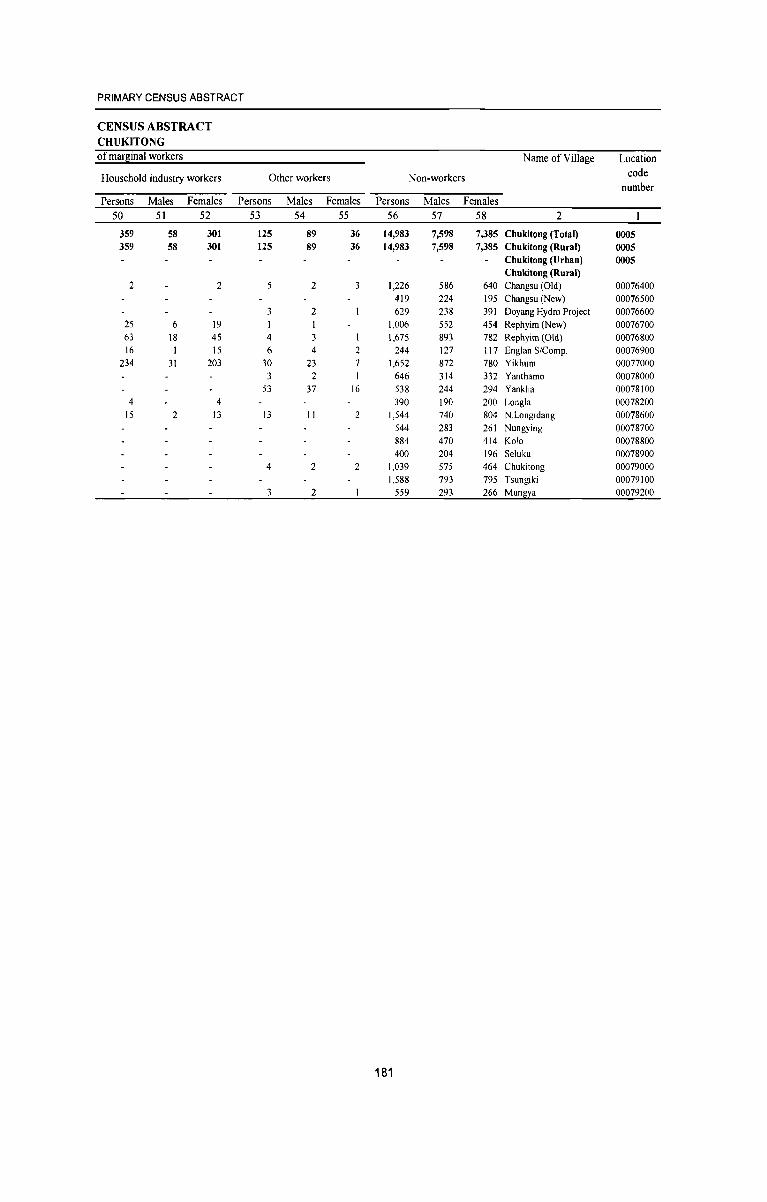
PRIMARY CENSUS ABSTRACT
CENSUS ABSTRACT CHUKITONG of marliinal workers Name of Village Location
Household industry workers Other workers Non-workers code number
Persons Males Females Persons Males Females Persons Males Females
50 51 52 53 54 55 56 57 58 2
359 58 301 125 89 36 14,983 7,598 7,385 Chukitong (Total) 0005 359 58 301 125 89 36 14,983 7,598 7,385 Chukitong (Rural) 0005
Chukitong (Urhan) 0005 Chukitong (Rural)
2 2 5 2 3 1,226 586 640 Changsu (Old) 00076400 419 224 195 Changsu (New) 00076500
3 2 629 238 391 Doyang Hydro Project 00076600 25 6 19 1,006 552 454 Rephyim (New) 00076700 63 18 45 4 3 1,675 893 782 Rephyim (Old) 00076800 16 15 6 4 244 127 117 Englan S/Comp. 00076900
234 31 203 30 23 1,652 872 780 Yikhum 00077000
3 2 646 314 332 Yanthamo 00078000 53 37 16 538 244 294 Yankha 00078100
4 4 390 190 200 Longla 00078200 15 2 13 13 II 2 1,544 740 804 N.Longidang 00078600
544 283 261 Nungying 00078700
884 470 414 Kolo 00078800 400 204 196 Seluku 00078900
4 2 2 1,039 575 464 Chukitong 00079000 1,588 793 795 Tsungiki 00079100
3 2 559 293 266 Mun~ya 00079200
181
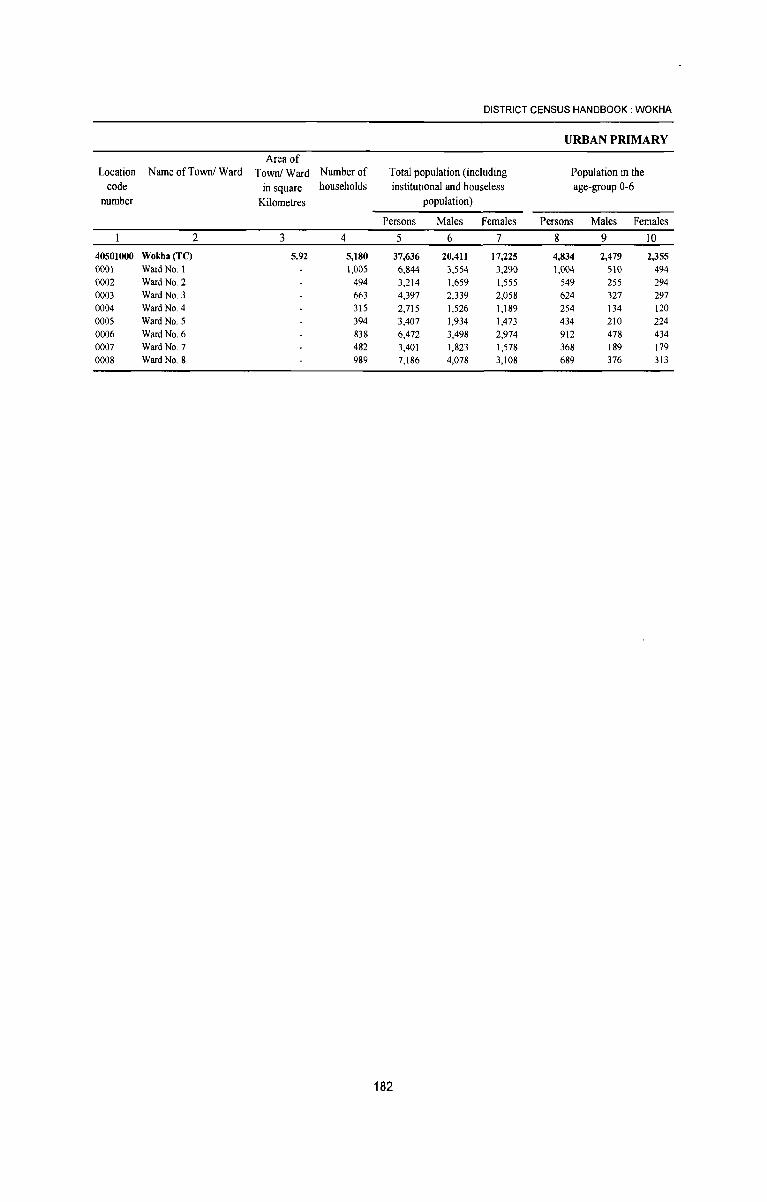
DISTRICT CENSUS HANDBOOK: WOKHA
URBAN PRIMARY
Area of Location Name ofTown/ Ward Town/Ward Number of Total population (including Population in the
code In square households institutional and houseless age-group 0-6 number Kilometres population)
Persons Males Females Persons Males Females
2 3 4 5 6 7 8 9 10
40501000 Wokba(TC) 5.92 5,180 37,636 20,411 17,225 4,834 2,479 2,355 0001 Ward No. \ 1,005 6,844 3,554 3,290 1,004 510 494
0002 Ward No. 2 494 3,214 1,659 1,555 549 255 294
0003 Ward No. 3 663 4,397 2,339 2,058 624 327 297 0004 Ward No. 4 315 2,715 1,526 1,189 254 134 120
0005 Ward No.5 394 3,407 1,934 1,473 434 210 224
0006 Ward No. 6 838 6,472 3,498 2,974 912 478 434
0007 Ward No. 7 482 3,401 1,823 1,578 368 189 179
0008 Ward No. 8 989 7,186 4,078 3,108 689 376 313
182
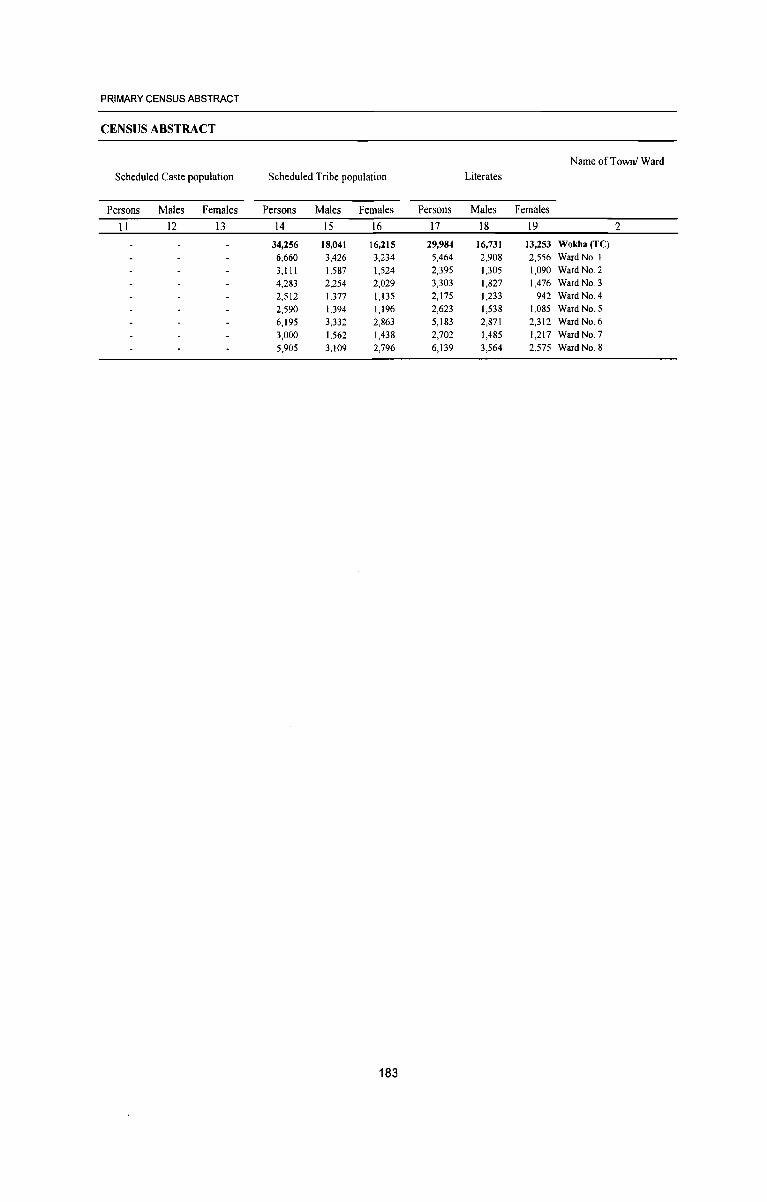
PRIMARY CENSUS ABSTRACT
CENSUS ABSTRACT
Name ofTownl Ward Scheduled Caste population Scheduled Tribe population Literates
Persons Males Females Persons Males Females Persons Males Females
II 12 13 14 15 16 17 18 19 2
34,256 Is.o41 16,215 29,984 16,731 13,253 Wokha (TC)
6,660 3,426 3,234 5,464 2,908 2,556 Ward No. I
3,111 1,587 1,524 2,395 1,305 1,090 Ward No.2
4,283 2,254 2,029 3,303 1,827 1,476 Ward No.3
2,512 1,377 1,135 2,175 1,233 942 Ward No. 4
2,590 1,394 1,196 2,623 1,538 1,085 Ward No. 5
6,195 3,332 2,863 5,183 2,871 2,312 Ward No. 6
3,000 1,562 1,438 2,702 1,485 1,217 Ward No. 7
5,905 3,109 2,796 6,139 3,564 2,575 Ward No. 8
183
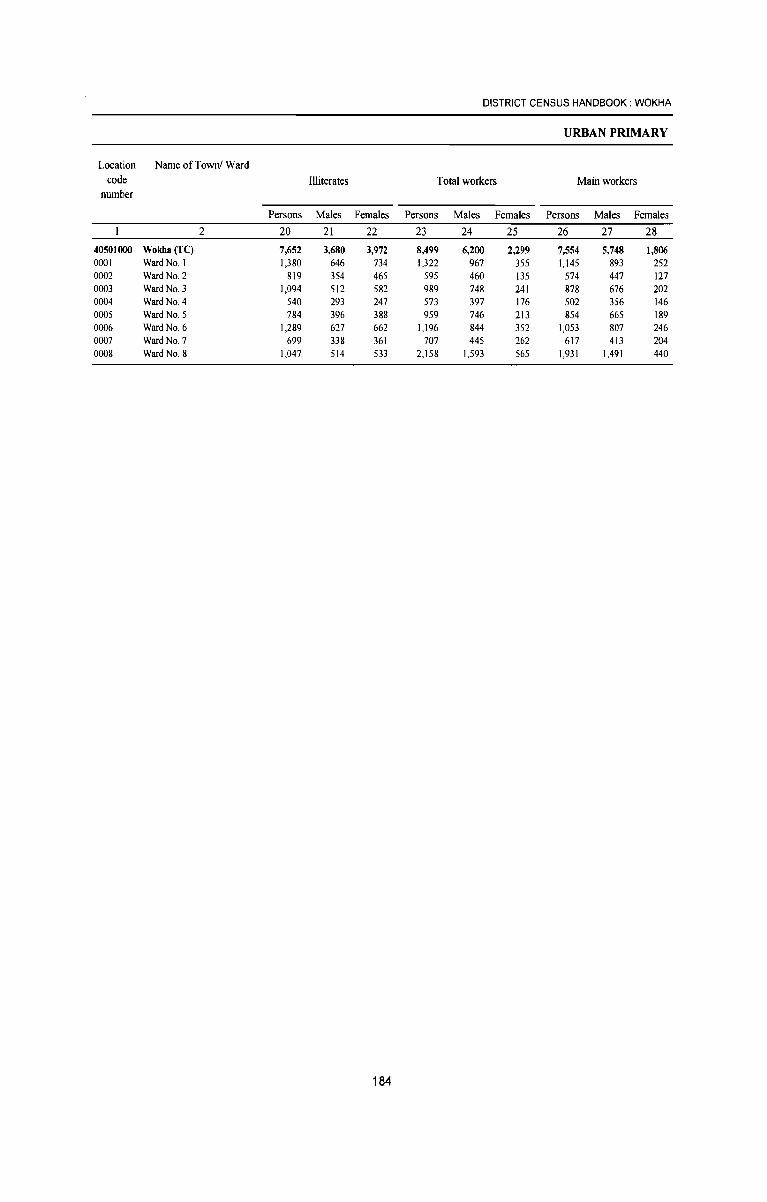
DISTRICT CENSUS HANDBOOK: WOKHA
URBAN PRIMARY
Location Name ofTowni Ward code Illiterates Total workers Main workers
number
Persons Males Females Persons Males Females Persons Males Females
2 20 21 22 23 24 25 26 27 28
40501000 Wokba(TC) 7,652 3,680 3,972 8,499 6,200 2,299 7,554 5,748 1,806 0001 Ward No, I 1,380 646 734 1,322 967 355 1,145 893 252 0002 Ward No, 2 819 354 465 595 460 135 574 447 127 0003 Ward No, 3 1,094 512 582 989 748 241 878 676 202 0004 Ward No, 4 540 293 247 573 397 176 502 356 146 0005 Ward No, 5 784 396 388 959 746 213 854 665 189 0006 Ward No, 6 1,289 627 662 1,196 844 352 1,053 807 246 0007 Ward No, 7 699 338 361 707 445 262 617 413 204 0008 Ward No, 8 1,047 514 533 2,158 1,593 565 1,931 1,491 440
184
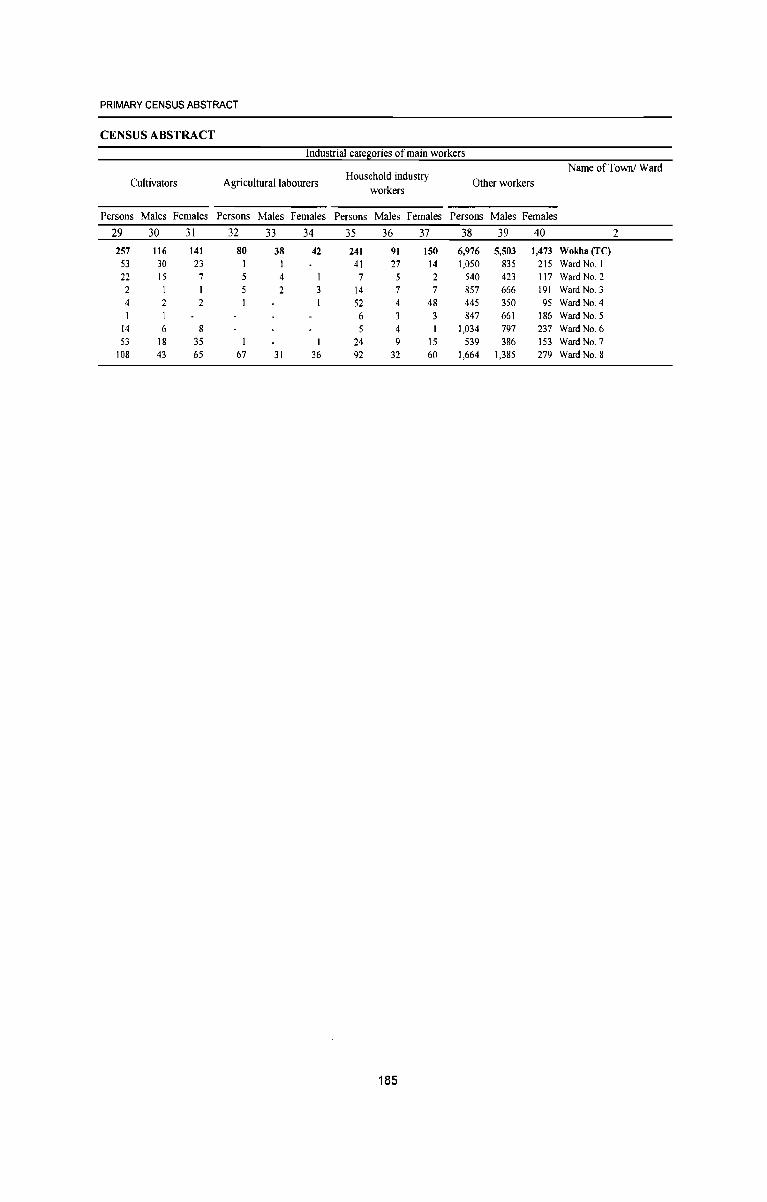
PRIMARY CENSUS ABSTRACT
CENSUS ABSTRACT
Industrial catellories of main workers Name of Town! Ward
Cultivators Agricultural labourers Household industry
Other workers workers
Persons Males Females Persons Males Females Persons Males Females Persons Males Females
29 30 31 32 33 34 35 36 37 38 39 40 2
257 116 141 80 38 42 241 91 150 6,976 5,503 1,473 Wokha(TC) 53 30 23 I I 41 27 14 1,050 835 215 Ward No.1 22 15 7 5 4 7 5 2 540 423 117 Ward No.2 2 I 5 2 3 14 7 7 857 666 191 Ward No.3 4 2 2 I 52 4 48 445 350 95 Ward No.4 I 6 3 3 847 661 186 Ward No.5
14 6 8 4 1,034 797 237 Ward No. 6 53 18 35 24 9 15 539 386 153 Ward No. 7
108 43 65 67 31 36 92 32 60 1,664 1,385 279 Ward No.8
185
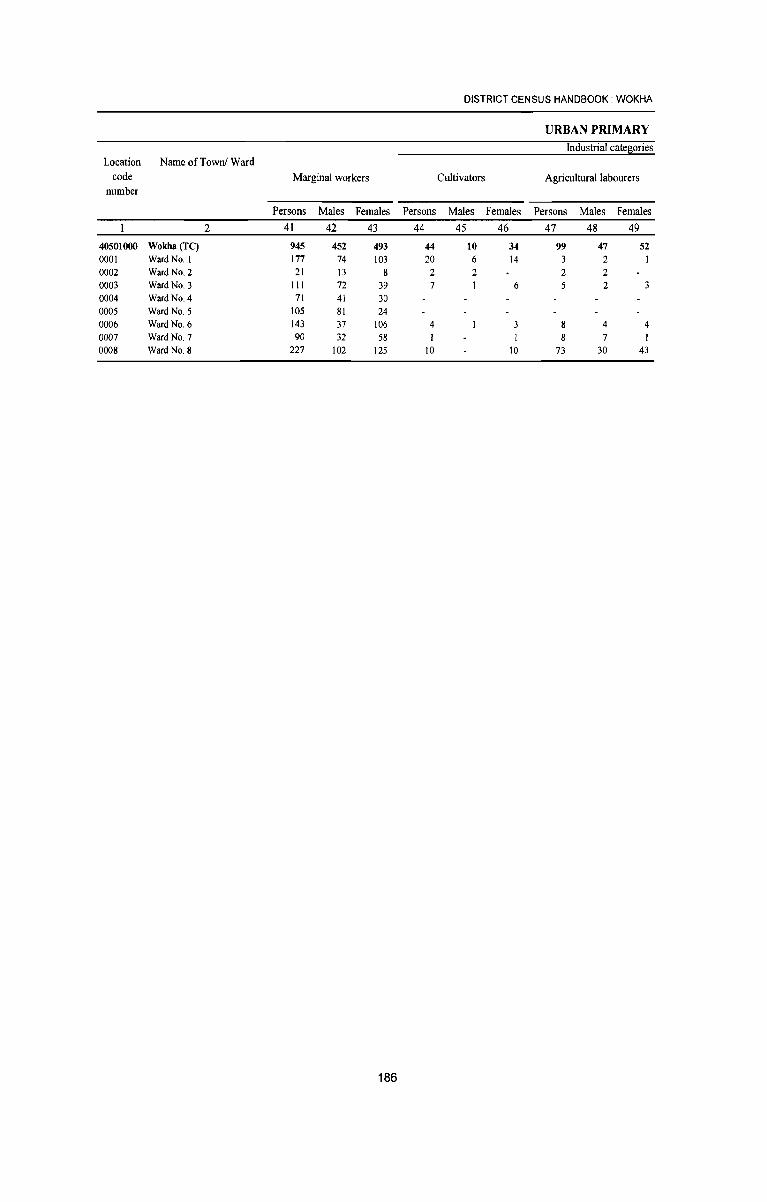
DISTRICT CENSUS HANDBOOK: WOKHA
URBAN PRIMARY Industrial cateSiories
Location Name ofTowni Ward
code Marginal workers Cultivators Agricultural labourers number
Persons Males Females Persons Males Females Persons Males Females
2 41 42 43 44 45 46 47 48 49 40501000 Wokha (TC) 945 452 493 44 10 34 99 47 52 0001 Ward No. I 177 74 103 20 6 14 3 2 0002 Ward No. 2 21 13 8 2 2 2 2 0003 Ward No. 3 111 72 39 7 6 5 2 0004 Ward No. 4 71 41 30 0005 Ward No. 5 lOS 81 24 0006 Ward No. 6 143 37 106 4 8 4 4 0007 Ward No. 7 90 32 58 8 7 0008 Ward No. 8 227 102 125 10 10 73 30 43
186
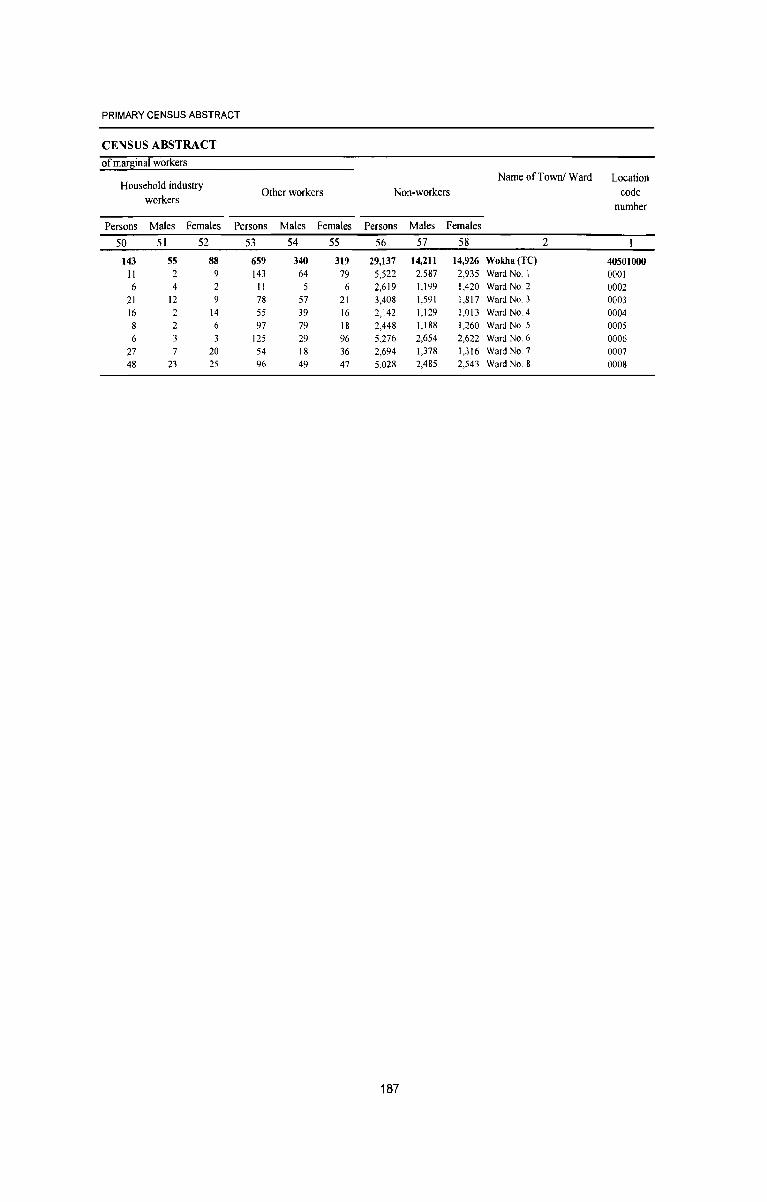
PRIMARY CENSUS ABSTRACT
CENSUS ABSTRACT
of mar~inal workers
Household industry Name of Town! Ward Location
Other workers Non-workers code workers
number
Persons Males Females Persons Males Females Persons Males Females
50 51 52 53 54 55 56 57 58 2
143 55 88 659 340 319 29,137 14,211 14,926 Wokha (Te) 40501000 11 2 9 143 64 79 5,522 2,587 2,935 Ward No. 1 0001
6 4 2 11 5 6 2,619 1,199 1,420 Ward No.2 0002
21 12 9 78 57 21 3,408 1,591 1,817 Ward No.3 0003
16 2 14 55 39 16 2,142 1,129 1,013 Ward No.4 0004
8 2 6 97 79 18 2,448 1,188 1,260 Ward NO.5 0005
6 3 3 125 29 96 5,276 2,654 2,622 Ward NO.6 0006
27 7 20 54 18 36 2,694 1,378 1,316 Ward NO.7 0007
48 23 25 96 49 47 5,028 2,485 2,543 Ward NO.8 0008
187

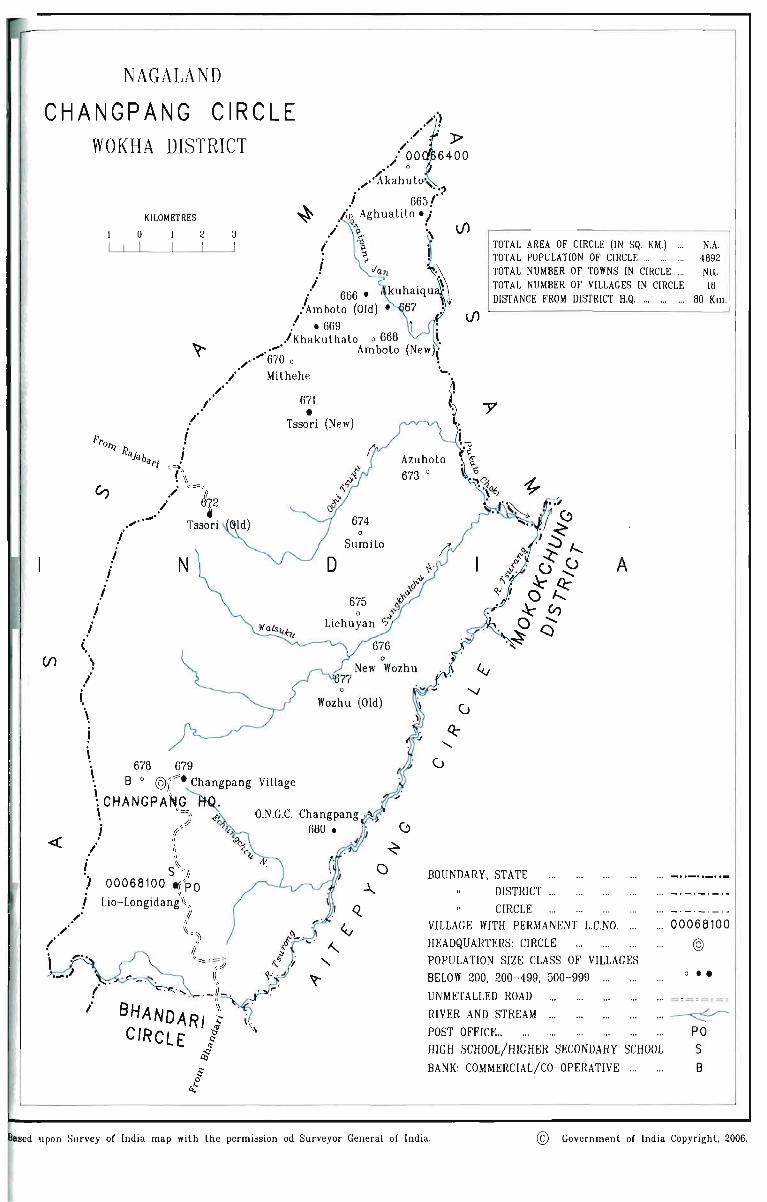
NAGALAND
CHANGPANG CIRCLE i~~~'t;'~ :;0
(/)
«
WOKHA DISTRICT ~., 0
...... · Akahuto· ... . ..')
i 665'" ~ Aghuatito .;
«>... '. f\ ./ ~. ':\ VI
(' '% i ~JIJ" •• ~
/ 666 . kUhaiqU lh /Arnboto (Old)· 67 ~ I.f)
:' • 669 1 : .IKhakuthato 0 668 \
KILOMETRES
o 2 3 TOTAL AREA OF CIRCLE (IN SQ. KM.)... N.A. TOTAL POPULATION OF CIRCLE ... 4B92 TOTAL NUMBER OF TOWNS IN CIRCLE... NIL TOTAL NUMBER OF VILLAGES IN CIRCLE IB DISTANCE FROM DISTRICT H.Q. ... ... ... 80 Km.
,........ Arnbolo (New)" ,.. ' 670 0 •
;' Mithehe ...
i ,;
,; ,;
( .~
,; i.
" j \
l ./.
_/.,
ld)
\ 678 ~79 '. B 0 @II • Chang pang
~CHANGPANG \ "="
j 1~ #
.i \\ "
; S""<r ',) 00068100 .r ~PO ! Lio- Longidang'I\",
". .f
i
"'='1) "
(f '~=-=:;;
II " " . . _ i) _ .
BHANDARI } CIRCLE !
~ s ~
4,
671 • Tssori (New)
674
Surnito
o
Azuholo 673 0
\< '
y
A
675
~'" (>>SJ
~~ <')
o ,§' Lichuyan '?
676
Wozhu (Old)
Village
BOUNDARY, STATE DISTRICT ...
CIRCLE VILLAGE WITH PERMANENT L.C.NO,
HEADQUARTERS: CIRCLE POPULATION SIZE CLASS OF VILLAGES BELOW 200, 200-499, 500-999 ...
UNMET ALLED ROAD
RIVER AN D STREAM ...
POST OFFICE ..
... 00068100
@
o ••
... ~ PO
HIGH SCHOOL/HIGHER SECONDARY SCHOOL
BANK: COMMERCIAL/CO-OPERATIVE ...
S B
ased upon Survey of India map with the permission od Surveyor General of India. © Government of India Copyrigh t, 2006.

Village Primary Census Abstract Chang pang Circle
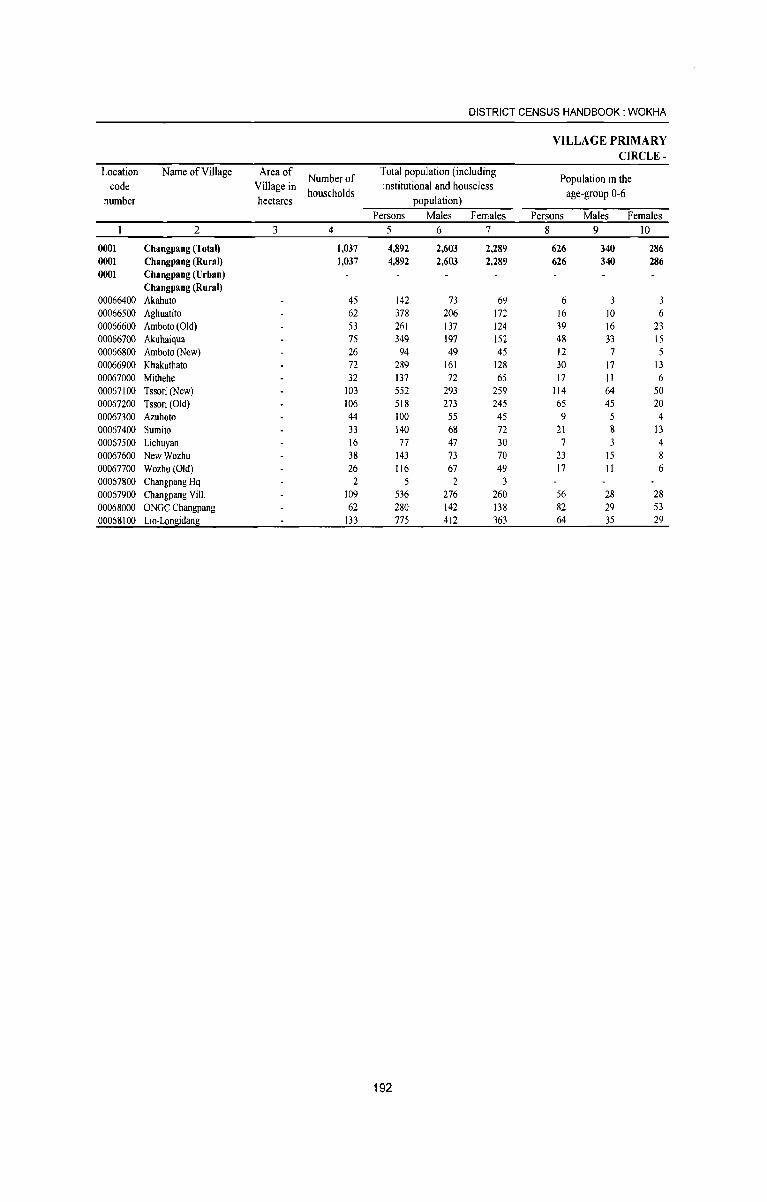
DISTRICT CENSUS HANDBOOK: WOKHA
VILLAGE PRIMARY CIRCLE-
Location Name ofViJlage Area of Number of
Total population (including Population in the
code Village in households
institutional and houseless age-group 0-6
number hectares population)
Persons Males Females Persons Males Females 2 3 4 5 6 7 8 9 10
0001 Changpang (Total) 1,037 4,892 2,603 2,289 626 340 286 0001 Changpang (Rural) 1,037 4,892 2,603 2,289 626 340 286 0001 Changpang (Urban)
Changpang (Rural) 00066400 Akahuto 45 142 73 69 6 3 00066500 Aghuatito 62 378 206 172 16 10 6 00066600 ArnbOlo (Old) 53 261 137 124 39 16 23 00066700 Akuhaiqua 75 349 197 152 48 33 15 00066800 Arnboto (New) 26 94 49 45 12 7 5 00066900 Khakuthato 72 289 161 128 30 17 13 00067000 Mithehe 32 137 72 65 17 11 6 00067100 Tssori (New) 103 552 293 259 114 64 50 00067200 Tssori (Old) 106 518 273 245 65 45 20 00067300 Azuhoto 44 100 55 45 9 5 4 00067400 Surnito 33 140 68 72 21 8 13
00067500 Lichuyan 16 77 47 30 7 3 4 00067600 NewWozhu 38 143 73 70 23 15 8 00067700 Wozhu(Old) 26 116 67 49 17 11 6 00067800 Changpang Hq 2 5 2 3 00067900 Changpang ViII. 109 536 276 260 56 28 28 00068000 ONGC Changpang 62 280 142 138 82 29 53 00068100 Lio-Lon~idang 133 775 412 363 64 35 29
192
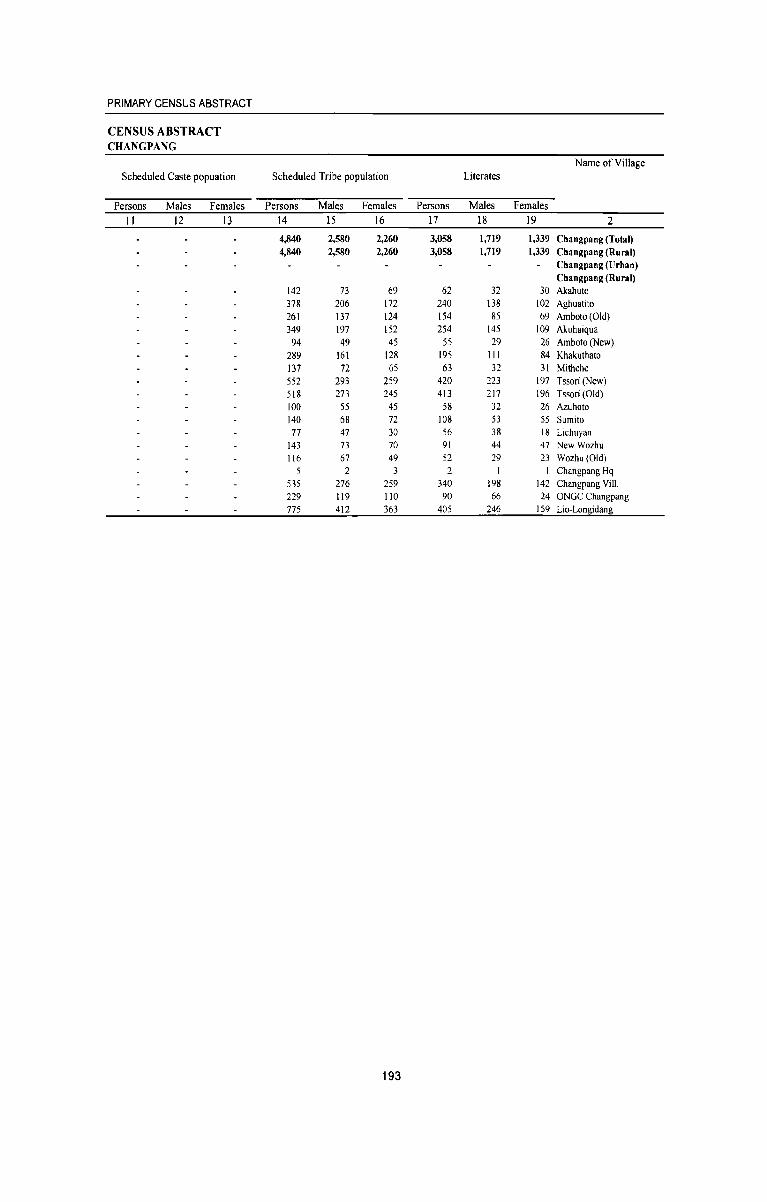
PRIMARY CENSUS ABSTRACT
CENSUS ABSTRACT CHANGPANG
Name of Village Scheduled Caste popuation Scheduled Tribe population Literates
Persons Males Females Persons Males Females Persons Males Females
11 12 13 14 15 16 17 18 19 2
4,840 2,580 2,260 3,058 1,719 1,339 Changpang (Total) 4,840 2,580 2,260 3,058 1,719 1,339 Changpang (Rural)
Changpang (Urban) Changpang (Rural)
142 73 69 62 32 30 Akahuto 378 206 172 240 138 102 Aghuatito 261 137 124 154 85 69 Arnboto (Old) 349 197 152 254 145 109 Akuhaiqua
94 49 45 55 29 26 Arnboto (New) 289 161 128 195 III 84 Khakuthato 137 72 65 63 32 31 Mithehe 552 293 259 420 223 197 Tssori (New) 518 273 245 413 217 196 Tssori (Old) 100 55 45 58 32 26 Azuhoto 140 68 72 108 53 55 Surnito 77 47 30 56 38 18 Lichuyan
143 73 70 91 44 47 New Wozhu 116 67 49 52 29 23 Wozhu(Old)
2 3 2 1 Changpang Hq 535 276 259 340 198 142 Changpang YiU. 229 119 110 90 66 24 ONGC Changpang 775 412 363 405 246 159 Lio-Longidang
193
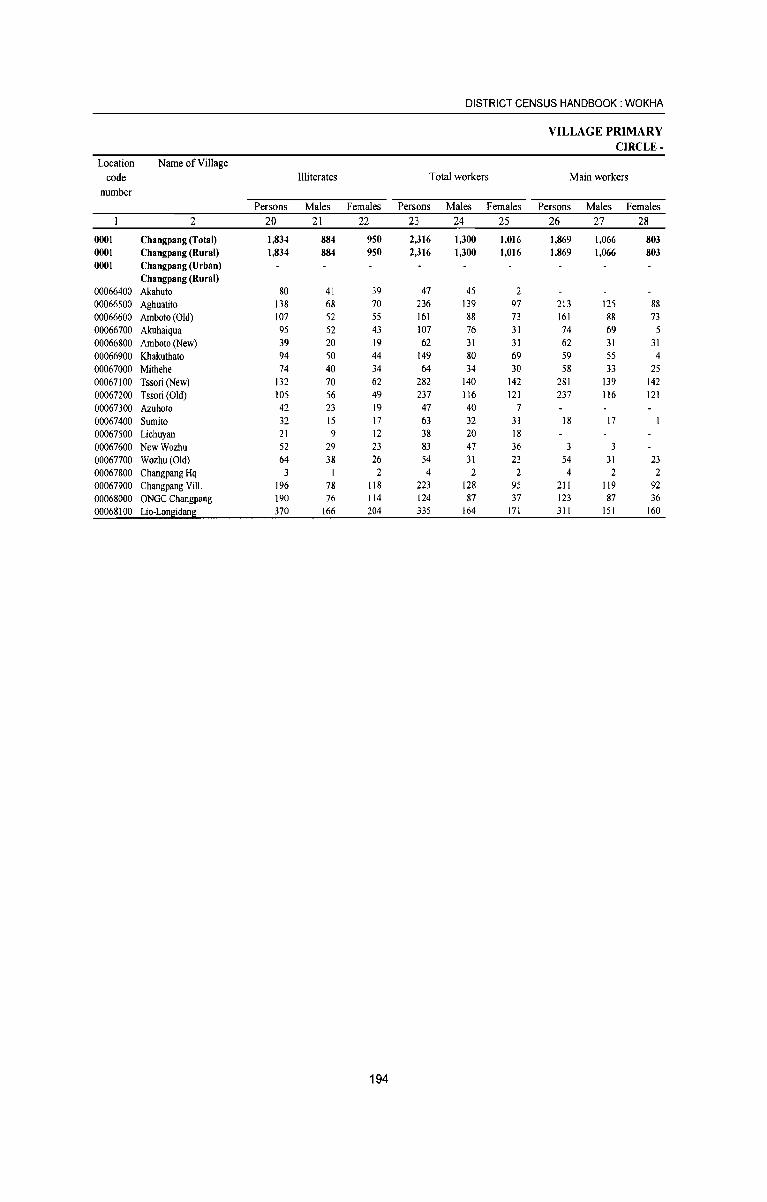
DISTRICT CENSUS HANDBOOK: WOKHA
VILLAGE PRIMARY CIRCLE-
Location Name of Village
code Illiterates Total workers Main workers
number
Persons Males Females Persons Males Females Persons Males Females
2 20 21 22 23 24 25 26 27 28
0001 Changpang (Total) 1,834 884 950 2,316 1,300 1,016 1,869 1,066 803 0001 Changpang (Rural) 1,834 884 950 2,316 1,300 1,016 1,869 1,066 803 0001 Changpang(Urban)
Changpang (Rural) 00066400 Akahuto 80 41 39 47 45 2 00066500 Aghuatito 138 68 70 236 139 97 213 125 88 00066600 Arnboto (Old) 107 52 55 161 88 73 161 88 73 00066700 Akuhaiqua 95 52 43 107 76 31 74 69 5 00066800 Arnboto (New) 39 20 19 62 31 31 62 31 31 00066900 Khakuthato 94 50 44 149 80 69 59 55 4 00067000 Mithehe 74 40 34 64 34 30 58 33 25 00067100 Tssori (New) 132 70 62 282 140 142 281 139 142 00067200 Tssori (Old) 105 56 49 237 116 121 237 116 121 00067300 Azuhoto 42 23 19 47 40 7 00067400 Surnito 32 15 17 63 32 31 18 17 00067500 Lichuyao 21 9 12 38 20 18 00067600 NewWozhu 52 29 23 83 47 36 3 00067700 Wozhu(Old) 64 38 26 54 31 23 54 31 23 00067800 Changpaog Hq 3 2 4 2 2 4 2 2 00067900 Chaogpang Vill. 196 78 118 223 128 95 211 119 92 00068000 ONGC Changpaog 190 76 114 124 87 37 123 87 36 00068100 Lio-Lonllidanll 370 166 204 335 164 171 311 151 160
194
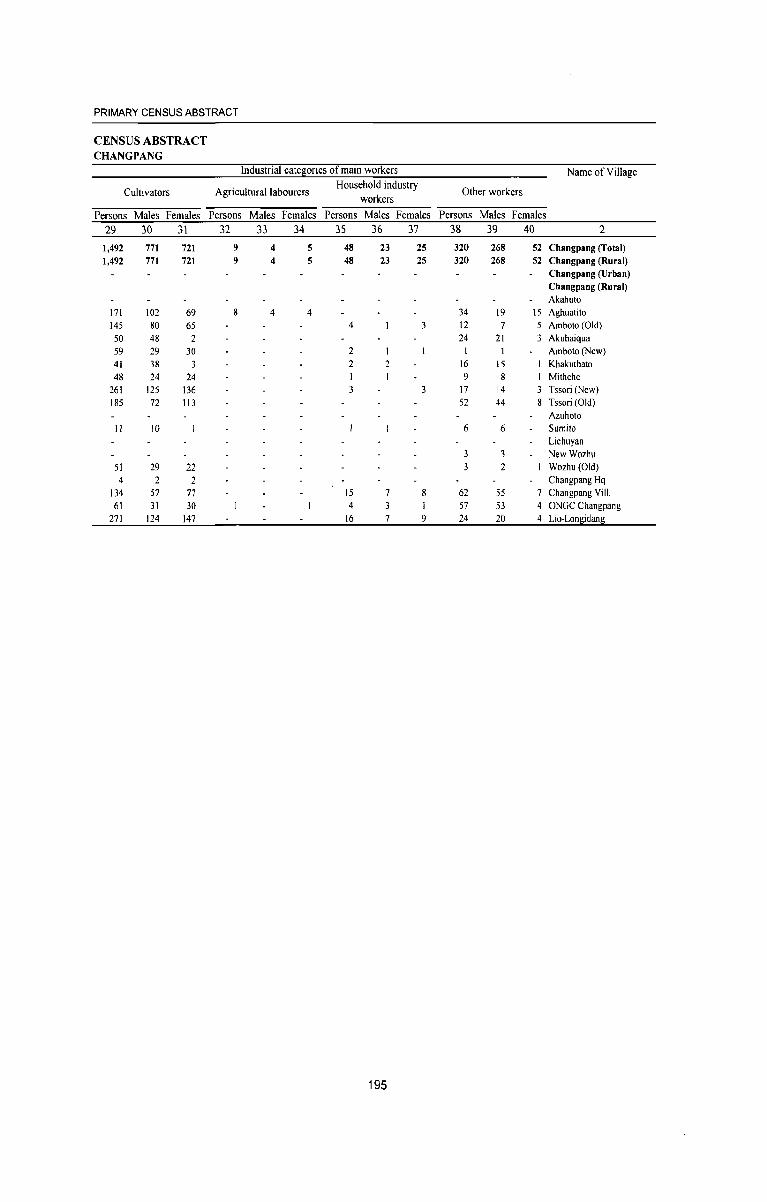
PRIMARY CENSUS ABSTRACT
CENSUS ABSTRACT CHANG PANG
Industrial categories of main workers Name of Village
Cultivators Agricultural labourers Household industry
Other workers workers
Persons Males Females Persons Males Females Persons Males Females Persons Males Females 29 30 31 32 33 34 35 36 37 38 39 40 2
1,492 771 721 9 4 5 48 23 25 320 268 52 Changpang (Total) 1,492 771 721 9 4 5 48 23 25 320 268 52 Changpang (Rural)
Changpang (Urban) Changpang (Rural) Akahuto
171 102 69 8 4 4 34 19 15 Aghuatito 145 80 65 4 3 12 7 5 Arnboto (Old) 50 48 2 24 21 3 Akuhaiqua 59 29 30 2 1 1 Arnboto (New) 41 38 3 2 2 16 15 Khakuthato 48 24 24 9 8 Mithehe
261 125 136 3 17 14 Tssori (New) 185 72 113 52 44 Tssori (Old)
Azuhoto 11 10 6 6 Surnito
Lichuyan 3 3 NewWozhu
51 29 22 3 2 Wozhu (Old) 4 2 2 Changpang Hq
134 57 77 15 7 8 62 55 7 Changpang ViiI. 61 31 30 4 3 57 53 4 ONGC Changpang
271 124 147 16 7 9 24 20 4 Lio-Longidang
195
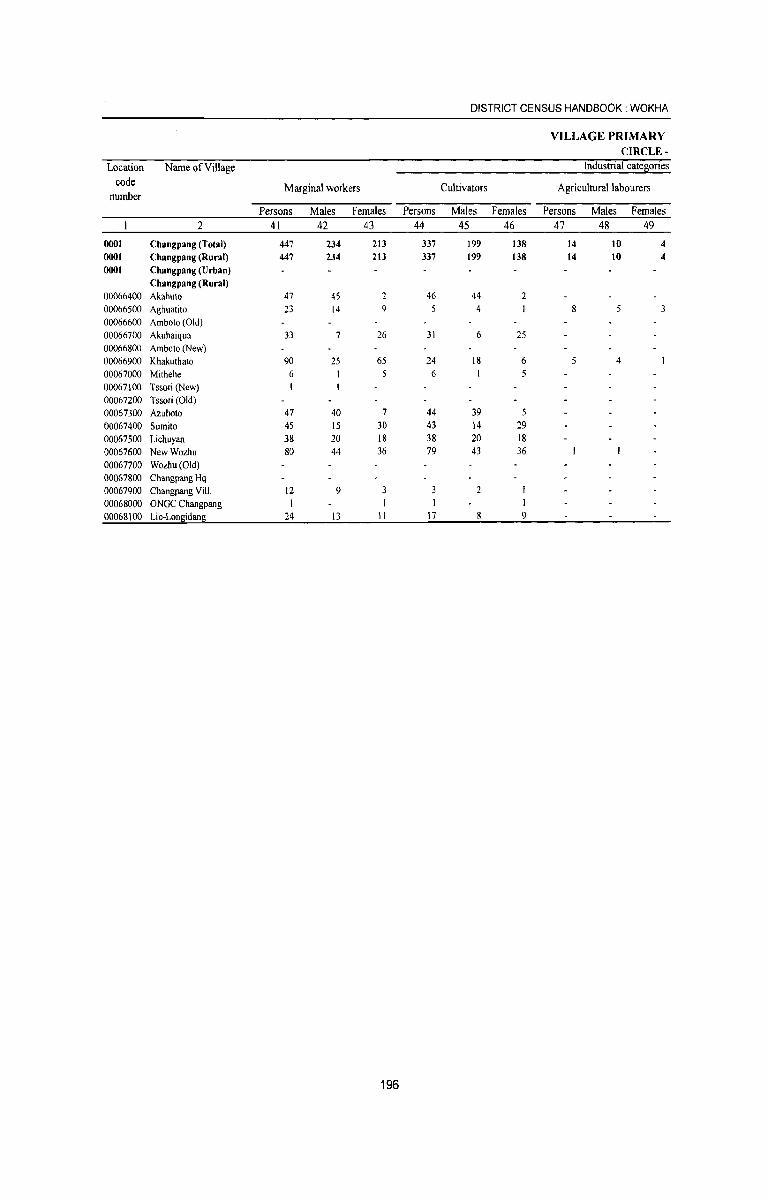
DISTRICT CENSUS HANDBOOK: WOKHA
VILLAGE PRIMARY CIRCLE-
Location Name of Village Industrial cate~ories
code Marginal workers Cultivators Agricultural labourers
number
Persons Males Females Persons Males Females Persons Males Females
2 41 42 43 44 45 46 47 48 49
0001 Changpang (Total) 447 234 213 337 199 138 14 10 4 0001 Changpang (Rural) 447 234 213 337 199 138 14 10 4 0001 Changpang (Urban)
Changpang (Rural) 00066400 Akahuto 47 45 2 46 44 2 00066500 Aghuatito 23 14 9 4 8 5 3 00066600 Arnboto (Old) 00066700 Akuhaiqua 33 7 26 31 6 25 00066800 Arnboto (New) 00066900 Khakuthato 90 25 65 24 18 6 5 4
00067000 Mithehe 6 6 5 00067100 Tssori (New) 00067200 Tssori (Old) 00067300 Azuhoto 47 40 7 44 39 5 00067400 Surnito 45 15 30 43 14 29 00067500 Lichuyan 38 20 18 38 20 18 00067600 NewWozhu 80 44 36 79 43 36 00067700 Wozhu(Old) 00067800 Changpang Hq 00067900 Changpang ViiI. 12 9 2 00068000 ONGC Changpang 00068100 Lio-Lon!lidan~ 24 13 11 17 8 9
196
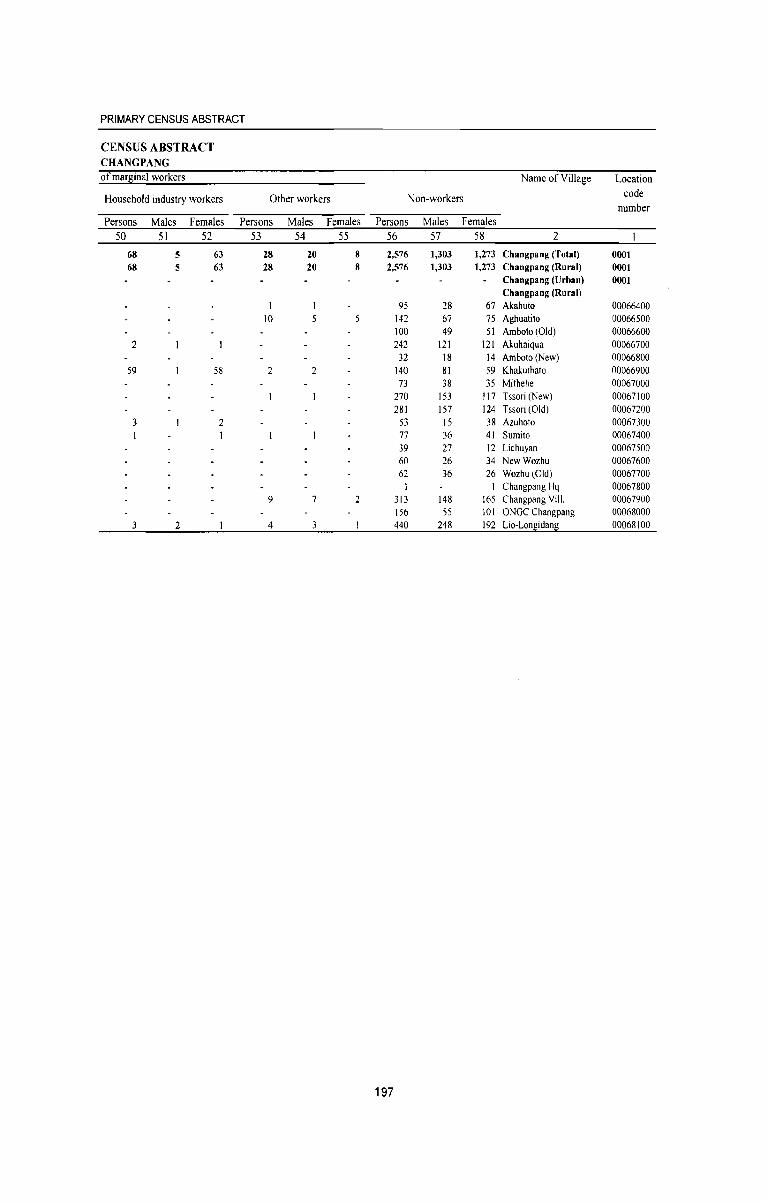
PRIMARY CENSUS ABSTRACT
CENSUS ABSTRACT CHANGPANG of marginal workers Name of Village Location
Household industry workers Other workers Non-workers code
number Persons Males Females Persons Males Females Persons Males Females
50 51 52 53 54 55 56 57 58 2
68 5 63 28 20 8 2,576 1,303 1,273 Changpang (Total) 0001 68 5 63 28 20 8 2,576 1,303 1,273 Changpang (Rural) 0001
Changpang (Urban) 0001 Changpang (Rural)
I 95 28 67 Akahuto 00066400 10 142 67 75 Aghuatilo 00066500
100 49 51 Arnbolo (Old) 00066600 2 242 121 121 Akuhaiqua 00066700
32 18 14 Arnbolo (New) 00066800 59 58 2 2 140 81 59 Khakuthalo 00066900
73 38 35 Milhehe 00067000 270 153 117 Tssori (New) 00067100 281 157 124 Tssori (Old) 00067200
3 2 53 15 38 Azuhoto 00067300 77 36 41 Surnilo 00067400 39 27 12 Lichuyan 00067500 60 26 34 NewWozhu 00067600 62 36 26 Wozhu (Old) 00067700
Changpang Hq 00067800 9 313 148 165 Changpang ViII. 00067900
156 55 101 ONGC Changpang 00068000 3 2 4 440 248 192 Lio-Lon~idanl! 00068100
197

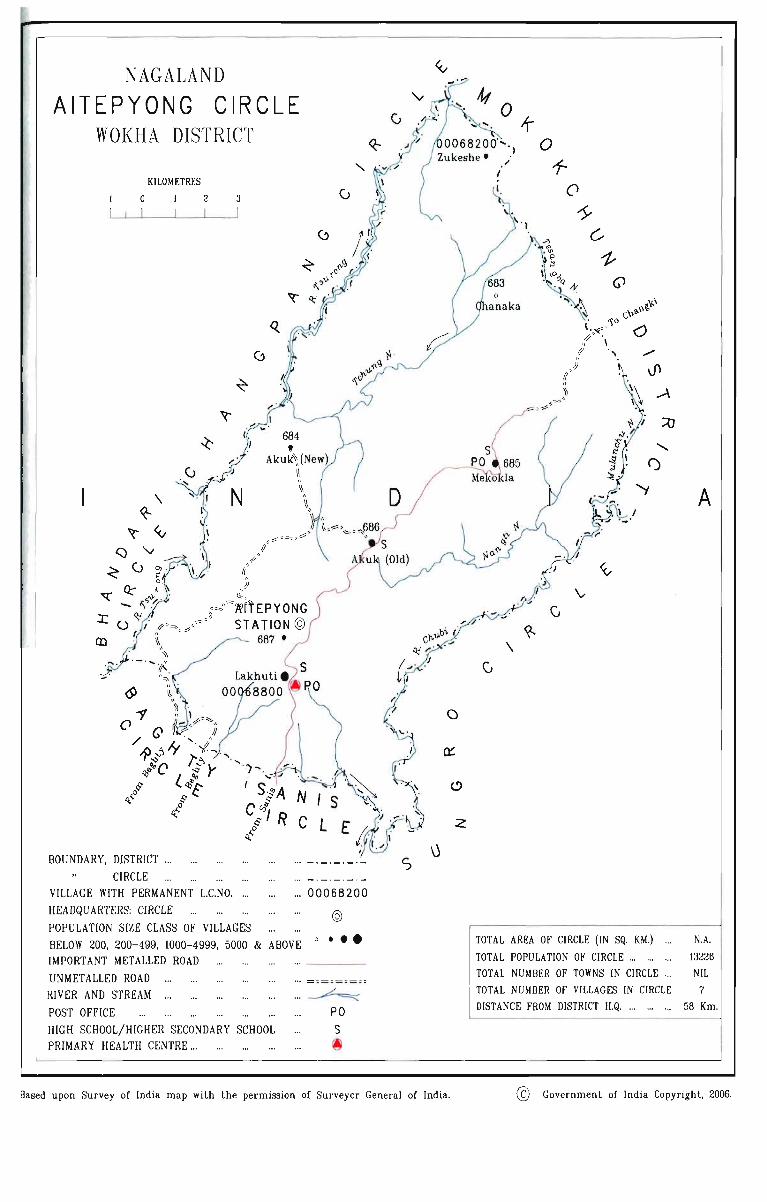
NAGALAND
AITEPYONG CIRCLE WOKHA DISTRICT
KILOMETRES
o 2
(j v.1"~
~ <\~~
~ .;
~ (.
,-~
N
BOUNDARY, DISTRICT ...
CIRCLE VILLAGE WITH PERMANENT L.C.NO. ...
HEADQU ARTERS: CIRCLE
I
POPULA nON SIZE CLASS OF VILLAGES
...
,-
684 II
Akuk'\ (New) II "
... 00068200
@
BELOW 200, 200-499, 1000-4999, 5000 & ABOVE IMPORTANT METALLED ROAD
o • • •
UNMETALLED ROAD ".
RIVER AND STREAM ". ". ~ POST OFFICE PO
HIGH SCHOOL/HIGHER SECONDARY SCHOOL S PRIMARY HEALTH CENTRE ". ~
(J
~ .
4(0 .... .... . .f-
0068200· ..... , Zukeshe· ,/
I
I
C'f','IJ,bi ;,; ~
a 1-
(J
J)
~\ ....-\
;0
........
()
'I A I
Q;;' '- ' . \
~; ' 1
(J
I'
" ()
(t:
<!>
Z
TOTAL AREA OF CIRCLE (IN SQ, KM,) '" N.A.
TOTAL POPULATION OF CIRCLE ". "" " 13226
TOTAL NUMBER OF TOWNS IN CIRCLE ". NIL
TOTAL NUMBER OF VILLAGES IN CIRCLE 7
DISTANCE FROM DISTRICT H.Q. ". ". ." 58 Km.
Based upon Survey of India map with the permission of Surveyor General of India. © Government of India Copyright, 2006,

Village Primary Census Abstract Aitepyong Circle
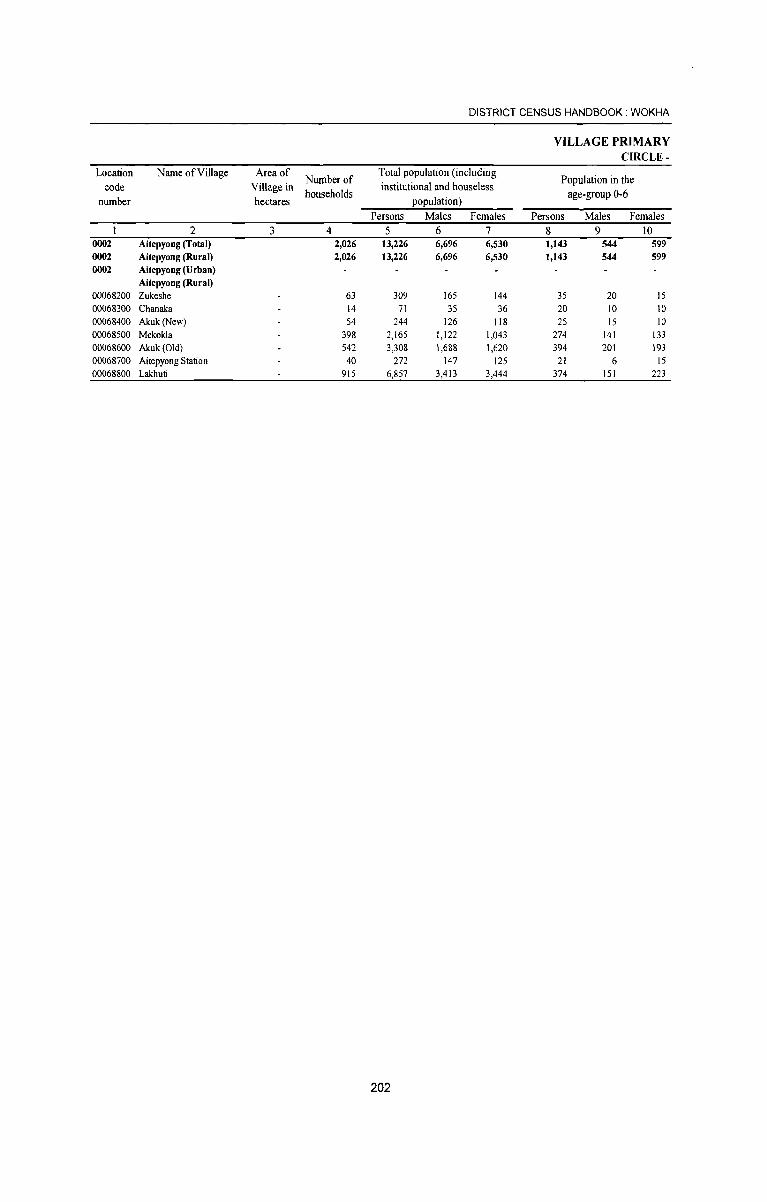
DISTRICT CENSUS HANDBOOK: WOKHA
VILLAGE PRIMARY CIRCLE-
Location Name of Village Area of Number of
Total population (including Population in the
code Village in households
institutional and houseless age-group 0-6
number hectares population) Persons Males Females Persons Males Females
2 3 4 5 6 7 8 9 10 0002 Aitepyong (Total) 2,026 13,226 6,696 6,530 1,143 544 599 0002 Aitepyong (Rural) 2,026 13,226 6,696 6,530 1,143 544 599
0002 Aitepyong (Urban) Aitepyong (Rural)
00068200 Zukeshe 63 309 165 144 35 20 15 00068300 Chanaka 14 71 35 36 20 10 10 00068400 Akuk (New) 54 244 126 118 25 15 10 00068500 Mekokla 398 2,165 1,122 1,043 274 141 133 00068600 Akuk(Old) 542 3,308 1,688 1,620 394 201 193 00068700 Aitepyong Station 40 272 147 125 21 6 15 00068800 Lakhuti 915 6,857 3,413 3,444 374 151 223
202
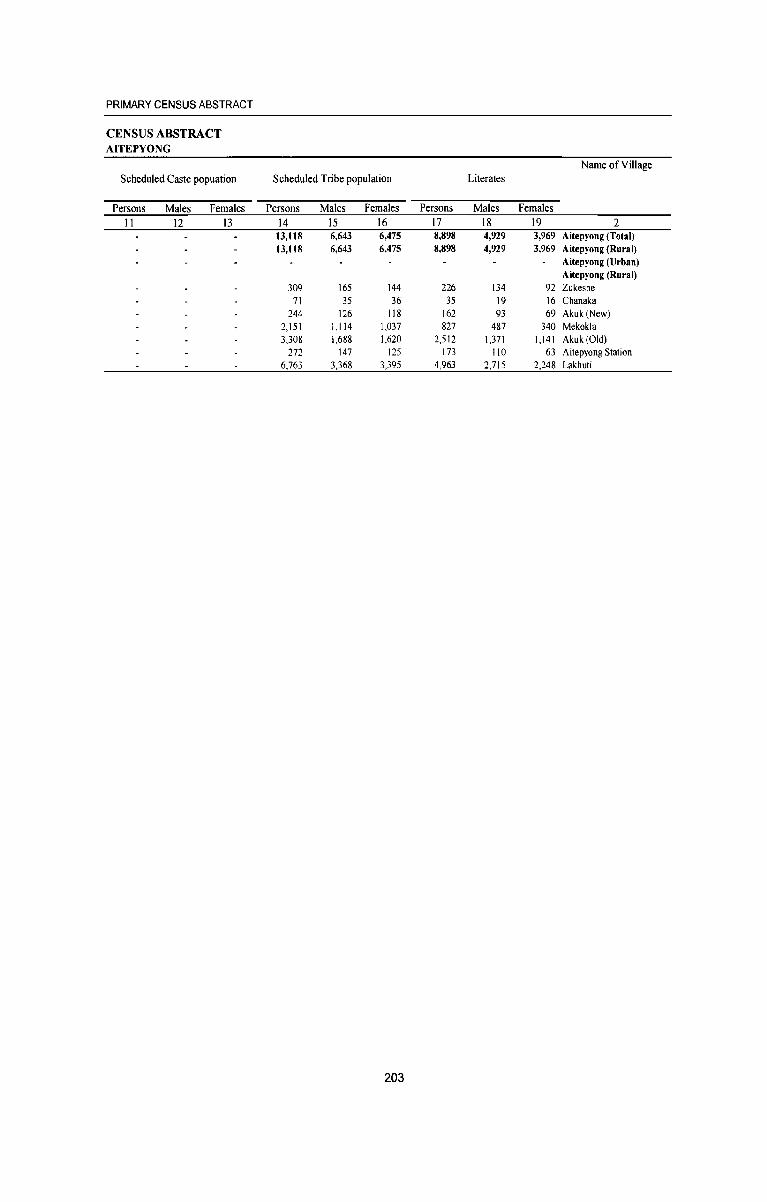
PRIMARY CENSUS ABSTRACT
CENSUS ABSTRACT AITEPYONG
Name of Village Scheduled Caste popuation Scheduled Tribe population Literates
Persons Males Females Persons Males Females Persons Males Females II 12 I3 14 15 16 17 18 19 2
13,118 6,643 6,475 8,898 4,929 3,969 Aitepyong (Total) 13,118 6,643 6,475 8,898 4,929 3,969 Aitepyong (Rural)
Aitepyong (Urban) Aitepyong (Rural)
309 165 144 226 134 92 Zukeshe 71 35 36 35 19 16 Chanaka
244 126 118 162 93 69 Akuk(New) 2,151 1,114 1,037 827 487 340 Mekok1a 3,308 1,688 1,620 2,512 1,371 1,141 Akuk(Old)
272 147 125 173 110 63 Aitepyong Station 6,763 3,368 3,395 4,963 2,715 2,248 Lakhuti
203

DISTRICT CENSUS HANDBOOK: WOKHA
VILLAGE PRIMARY CIRCLE-
Location Name of Village code Illiterates Total workers Main workers
number Persons Males Females Persons Males Females Persons Males Females
2 20 21 22 23 24 25 26 27 28 0002 Aitepyong (Total) 4,328 1,767 2,561 4,698 2,345 2,353 4,561 2,274 2,287 0002 Aitepyong (Rural) 4,328 1,767 2,561 4,698 2,345 2,353 4,561 2,274 2,287 0002 Aitepyong (Urban)
Aitepyong (Rural) 00068200 Zukeshe 83 31 52 147 72 75 137 63 74 00068300 Chanaka 36 16 20 28 14 14 28 14 14 00068400 Akuk(New) 82 33 49 157 72 85 156 72 84 00068500 Mekokla 1,338 635 703 997 488 509 957 474 483 00068600 Akuk(Old) 796 317 479 1,301 613 688 1,296 608 688 00068700 Aitepyong Station 99 37 62 52 34 18 52 34 18 00068800 Lakhuti 1,894 698 1,196 2,016 1,052 964 1,935 1,009 926
204

PRIMARY CENSUS ABSTRACT
CENSUS ABSTRACT AITEPYONG
Industrial catell,ories of main workers Name ofViUage
Cultivators Agricultural labourers Household industry
Other workers workers
Persons Males Females Persons Males Females Persons Males Females Persons Males Females 29 30 31 32 33 34 35 36 37 38 39 40 2
3,718 1,642 2,076 8 2 6 61 22 39 774 608 166 Aitepyong (Total) 3,718 1,642 2,076 8 2 6 61 22 39 774 608 166 Aitepyong (Rural)
Aitepyong (Urban) Aitepyong (Rural)
120 50 70 16 12 4 Zukeshe 28 14 14 Chanaka
152 69 83 3 AkukCNew) 874 415 459 14 9 68 53 15 Mekokla
1,188 519 669 2 104 87 17 Akuk(Old) 24 12 12 28 22 6 Aitepyong Station
1,332 563 769 5 4 43 14 29 555 431 124 Lakhuti
205
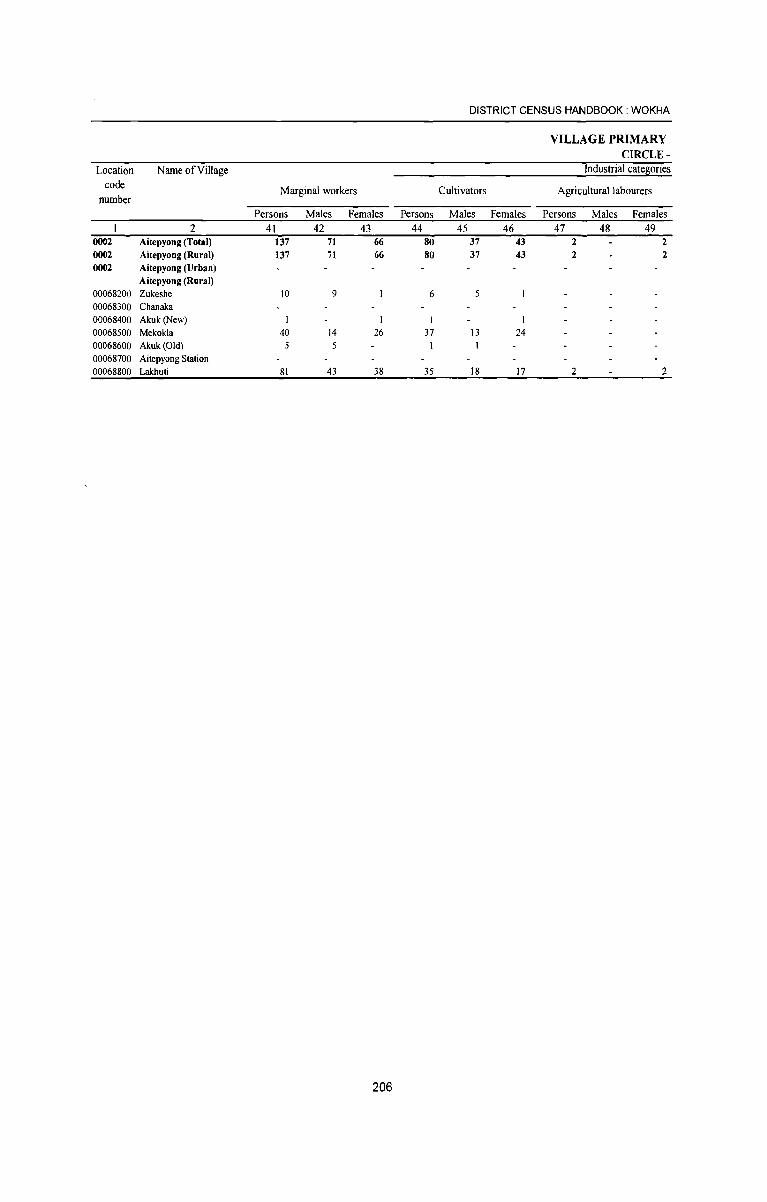
DISTRICT CENSUS HANDBOOK: WOKHA
VILLAGE PRIMARY CIRCLE-
Location Name of Village Industrial cate~ories
code Marginal workers Cultivators Agricultural labourers number
Persons Males Females Persons Males Females Persons Males Females 2 41 42 43 44 45 46 47 48 49
0002 Aitepyong (Total) 137 71 66 80 37 43 2 2 0002 Aitepyong (Rural) 137 71 66 80 37 43 2 2 0002 Aitepyong (Urban)
Aitepyong (Rural) 00068200 Zukeshe 10 9 6 00068300 Chanaka 00068400 Akuk(New) 00068500 Mekokla 40 14 26 37 13 24 00068600 Akuk(Old) 00068700 Aitepyong Station 00068800 Lakhuti 81 43 38 35 18 17 2 2
206

PRIMARY CENSUS ABSTRACT
CENSUS ABSTRACT AITEPYONG of maf!!!inal workers Name ofYillage Location
Household industry workers Other workers Non-workers code number
Persons Males Females Persons Males Females Persons Males Females 50 51 52 53 54 55 56 57 58 2
17 6 11 38 28 10 8,528 4,351 4,177 Aitepyong (Total) 0002 17 6 11 38 28 10 8,528 4,351 4,177 Aitepyong (Rural) 0002
Aitepyong (Urban) 0002 Aitepyong (Rural)
4 4 162 93 69 Zukeshe 00068200 43 21 22 Chanaka 00068300 87 54 33 Akuk(New) 00068400
3 2 1,168 634 534 Mekokla 00068500 3 3 2,007 1,075 932 Akuk (Old) 00068600
220 113 107 Aitepyong Station 00068700 16 11 28 20 8 4,841 2,361 2,480 Lakhuti 00068800
207

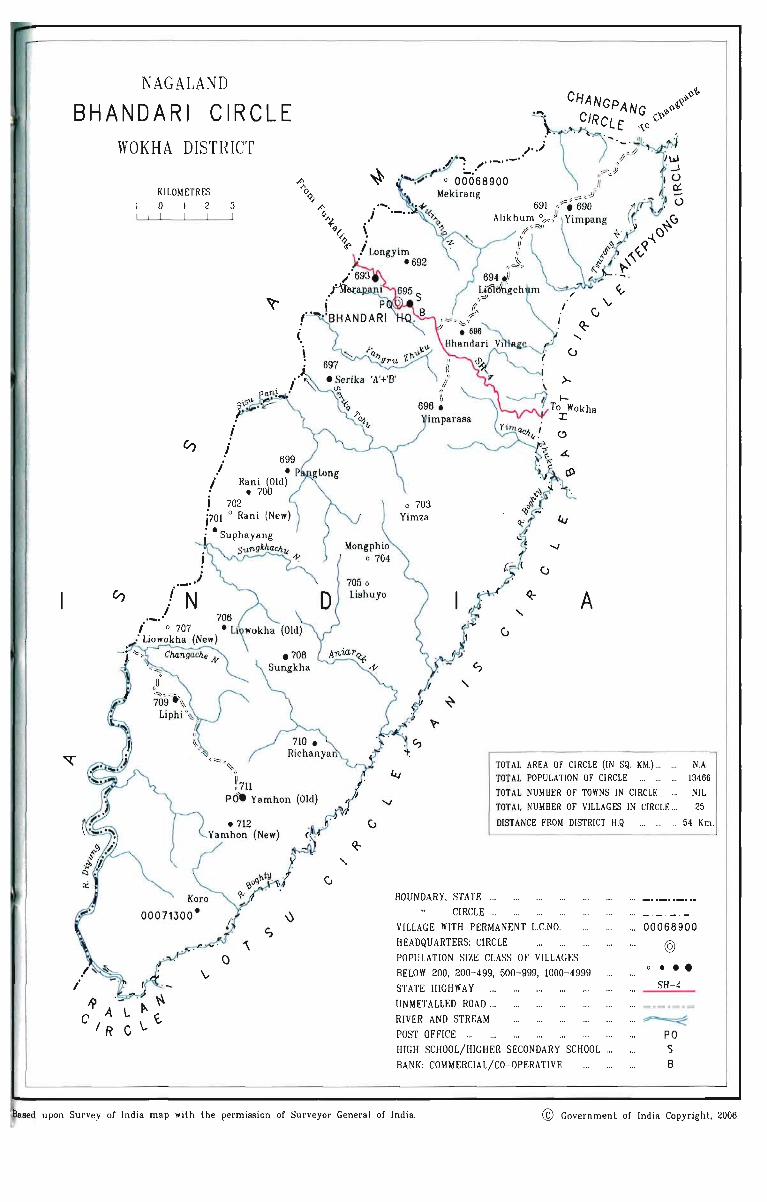
NAGALAND
BHANDARI CIRCLE WOKHA DISTRICT
KILOMETRES o 2 3
v, i i
/ /
.. _ . .i V) ! N /
!! 711
710 • Richanyan
PO" Yamhon (Old)
Koro
00071300 •
• 712 Yamhon (New)
/Longyim • ·692
0
J..
o 703 Yimza 4.J
.....,
CJ
Q;- A
TOTAL AREA OF CIRCLE (IN SQ. KM.)... N.A. TOT AL POPULATION OF CIRCLE ... ... ... 13466
TOT AL NUMBER OF TOWNS IN CIRCLE NIL TOTAL NUMBER OF VILLAGES IN CIRCLE ... 25
DISTANCE FROM DISTRICT H.Q .
BOUNDARY, STATE .. .
CIRCLE .. .
VILLAGE WITH PERMANENT L.C.NO.
HEADQUARTERS: CIRCLE
POPULATION SIZE CLASS OF VILLAGES
BELOW 200, 200-499, 500-999, 1000-4999
STATE mGnWAY
UNMETALLED ROAD ...
RIVER AND STREAM
POST OFFICE ...
HIGH SCHOOL/HIGHER SECONDARY SCHOOL ...
BANK: COMMERCIAL/CO-OPERATIVE
54 Km.
'" 00068900
@
SH- 4
". ~
PO S B
aBed upon Survey of India map with the permission of Surveyor General of India. © Government of India Copyright, 2006.

Village Primary Census Abstract Bhandari Circle
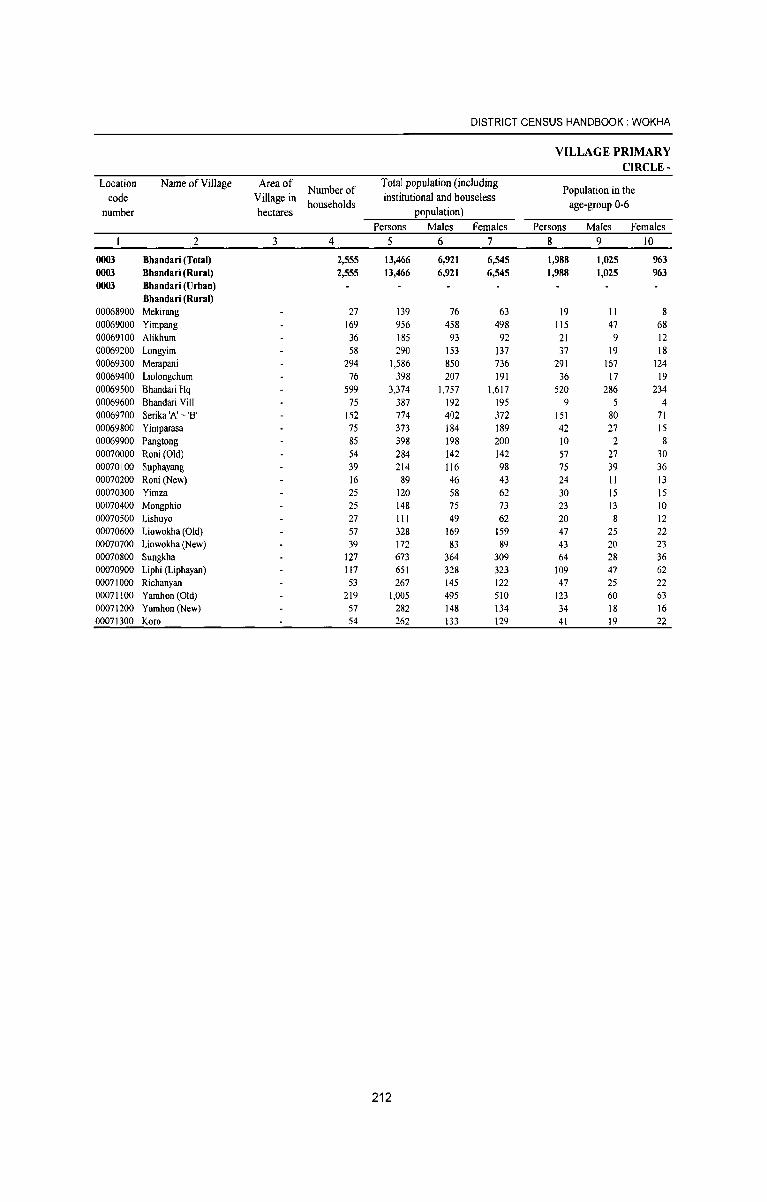
DISTRICT CENSUS HANDBOOK: WOKHA
VILLAGE PRIMARY CIRCLE -
Location Name of Village Area of Number of
Total population (including Population in the
code Village in households
institutional and houseless age-group 0-6
number hectares population) Persons Males Females Persons Males Females
2 3 4 5 6 7 8 9 10
0003 Bhandari (Total) 2,555 13,466 6,921 6,545 1,988 1,025 963 0003 Bhandari (Rural) 2,555 13,466 6,921 6,545 1,988 1,025 963 0003 Bhandari (Urhan)
Bhandari (Rural) 00068900 Mekirang 27 139 76 63 19 II 8 00069000 Yirnpang 169 956 458 498 115 47 68 00069100 Alikhurn 36 185 93 92 21 9 12 00069200 Longyirn 58 290 153 137 37 19 18 00069300 Merapani 294 1,586 850 736 291 167 124 00069400 Liolongchurn 76 398 207 191 36 17 19 00069500 Bhandari Hq 599 3,374 1,757 1,617 520 286 234 00069600 Bhandari ViII 75 387 192 195 9 5 4 00069700 Serika 'A' + 'B' 152 774 402 372 151 80 71 00069800 Yirnparasa 75 373 184 189 42 27 15 00069900 Pangtong 85 398 198 200 10 2 8 00070000 Roni(Old) 54 284 142 142 57 27 30 00070100 Suphayang 39 214 116 98 75 39 36 00070200 Roni (New) 16 89 46 43 24 II 13 00070300 Yirnza 25 120 58 62 30 15 15 00070400 Mongphio 25 148 75 73 23 13 10 00070500 Lishuyo 27 III 49 62 20 8 12 00070600 Liowokha (Old) 57 328 169 159 47 25 22 00070700 Liowokha (New) 39 172 S3 89 43 20 23 00070800 Sungkha 127 673 364 309 64 28 36 00070900 Liphi (Liphayan) 117 651 328 323 109 47 62 00071000 Richanyan 53 267 145 122 47 25 22 00071100 Yamhon (Old) 219 1,005 495 510 123 60 63 00071200 Yamhon (New) 57 282 148 134 34 18 16 00071300 Koro 54 262 133 129 41 19 22
212
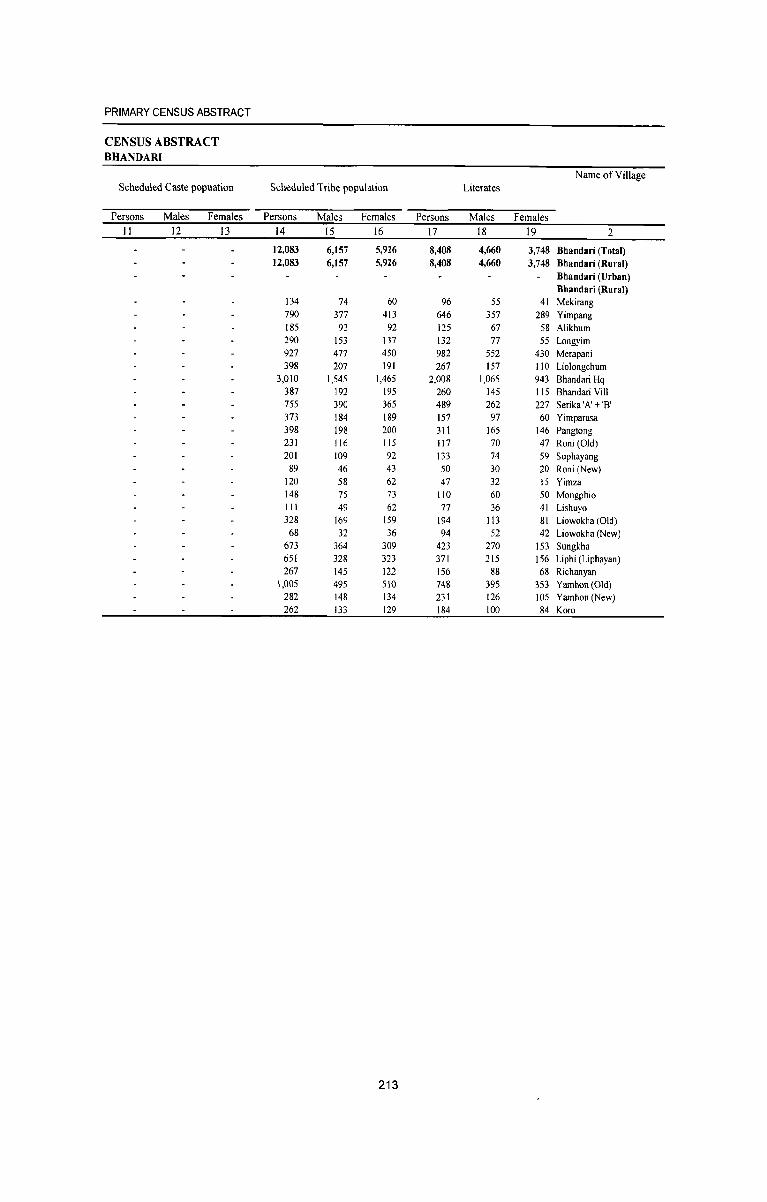
PRIMARY CENSUS ABSTRACT
CENSUS ABSTRACT BHANDARI
Name ofViJlage Scheduled Caste popuation Scheduled Tribe population Literates
Persons Males Females Persons Males Females Persons Males Females II 12 13 14 15 16 17 18 19 2
12,083 6,157 5,926 8,408 4,660 3,748 Bhandari (Total) 12,083 6,157 5,926 8,408 4,660 3,748 Bhandari (Rural)
Bhandari (Urban) Bhandari (Rural)
134 74 60 96 55 41 Mekirang 790 377 413 646 357 289 Yimpang 185 93 92 125 67 58 Alikhum 290 153 137 132 77 55 Longyim 927 477 450 982 552 430 Merapani 398 207 191 267 157 110 Lio1ongchum
3,010 1,545 1,465 2,008 1,065 943 Bhandari Hq 387 192 195 260 145 115 Bhandari ViII 755 390 365 489 262 227 Serika 'A' + 'E' 373 184 189 157 97 60 Yimparasa 398 198 200 311 165 146 Pangtong 231 116 115 117 70 47 Roni (Old) 201 109 92 133 74 59 Suphayang
89 46 43 50 30 20 Roni (New) 120 58 62 47 32 15 Yimza 148 75 73 110 60 50 Mongphio III 49 62 77 36 41 Lishuyo 328 169 159 194 113 81 Liowokha (Old) 68 32 36 94 52 42 Liowokha (New)
673 364 309 423 270 153 Sungkha 651 328 323 371 215 156 Liphi (Lipbayan) 267 145 122 156 88 68 Ricbanyan
1,005 495 SID 748 395 353 Yarnhon (Old) 282 148 134 231 126 105 Yarnbon (New) 262 133 129 184 100 84 Koro
213
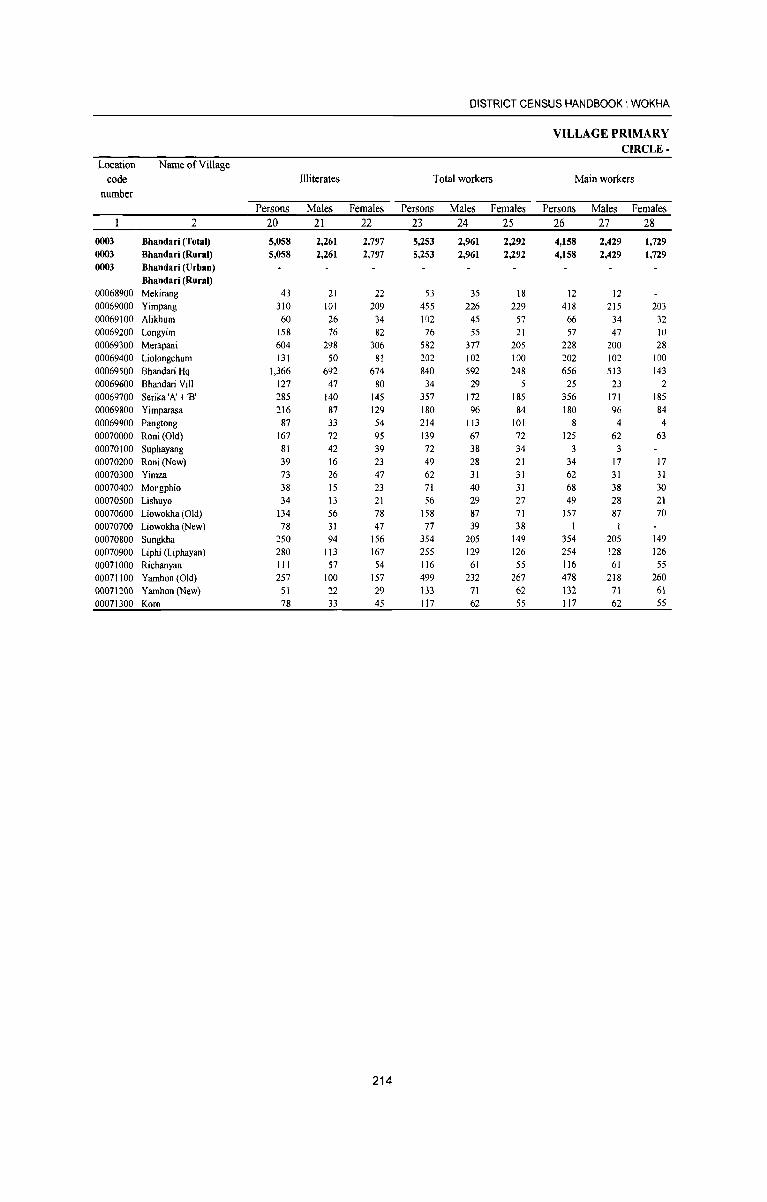
DISTRICT CENSUS HANDBOOK: WOKHA
VILLAGE PRIMARY CIRCLE -
Location Name of Village code Illiterates Total workers Main workers
number Persons Males Females Persons Males Females Persons Males Females
2 20 21 22 23 24 25 26 27 28
0003 Bhandari (Total) 5,058 2,261 2,797 5,253 2,961 2,292 4,158 2,429 1,729 0003 Bhandari (Rural) 5,058 2,261 2,797 5,253 2,961 2,292 4,158 2,429 1,729 0003 Bhandari (Urban)
Bhandari (Rural) 00068900 Mekirang 43 21 22 53 35 18 12 12 00069000 Yimpang 310 101 209 455 226 229 418 215 203 00069100 Alikhum 60 26 34 102 45 57 66 34 32 00069200 Longyim 158 76 82 76 55 21 57 47 10 00069300 Merapani 604 298 306 582 377 205 228 200 28 00069400 Liolongchum 131 50 81 202 102 100 202 102 100 00069500 Bhandari Hq 1,366 692 674 840 592 248 656 513 143 00069600 Bhandari Viii 127 47 80 34 29 25 23 2 00069700 Serika 'A' + 'B' 285 140 145 357 172 185 356 171 185 00069800 Yimparasa 216 87 129 180 96 84 180 96 84 00069900 Pangtong 87 33 54 214 113 101 8 4 4 00070000 Roni(Old) 167 72 95 139 67 72 125 62 63 00070100 Suphayang 81 42 39 72 38 34 3 3 00070200 Roni (New) 39 16 23 49 28 21 34 17 17 00070300 Yimza 73 26 47 62 31 31 62 31 31 00070400 Mongphio 38 15 23 71 40 31 68 38 30 00070500 Lishuyo 34 13 21 56 29 27 49 28 21 00070600 Liowokha (Old) 134 56 78 158 87 71 157 87 70 00070700 Liowokha (New) 78 31 47 77 39 38 I 00070800 Sungkha 250 94 156 354 205 149 354 205 149 00070900 Liphi (Liphayan) 280 113 167 255 129 126 254 128 126 00071000 Richanyan 111 57 54 116 61 55 116 61 55 00071100 Yamhon (Old) 257 100 157 499 232 267 478 218 260 00071200 Yamhon (New) SI 22 29 133 71 62 132 71 61 00071300 Koro 78 33 45 117 62 55 117 62 55
214
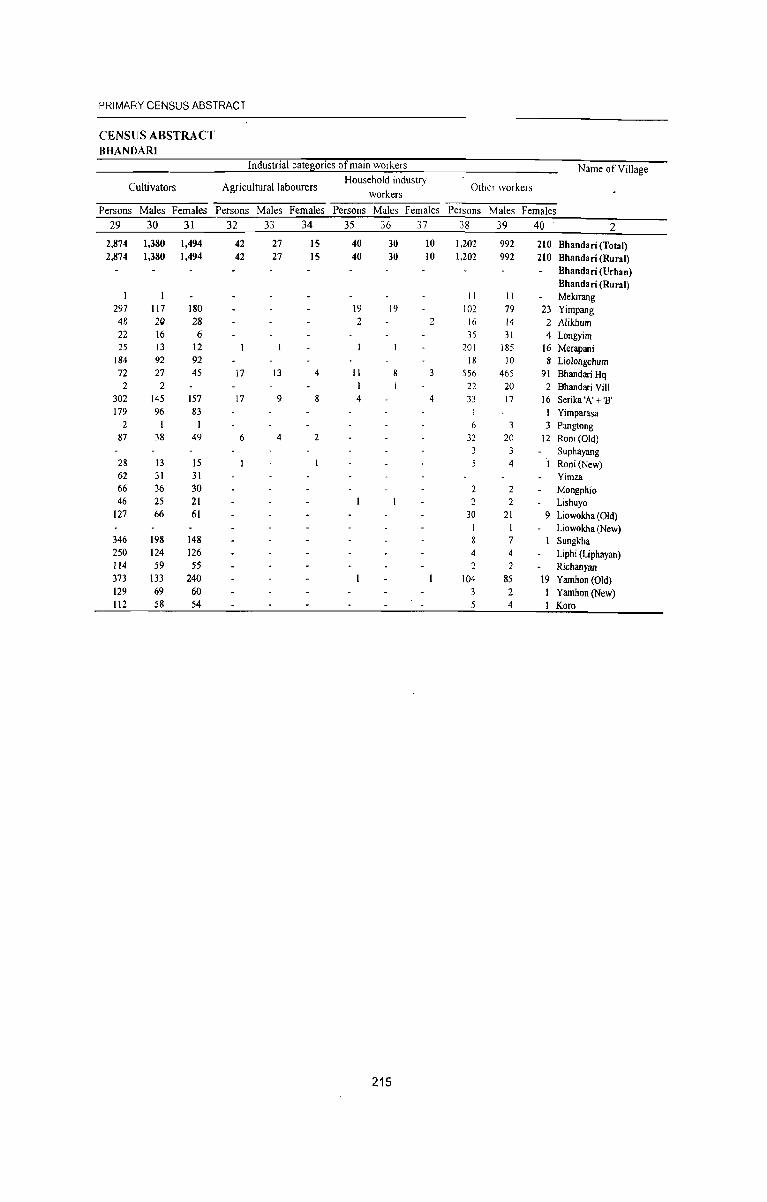
PRIMARY CENSUS ABSTRACT
CENSUS ABSTRACT BHANDARI
Industrial categories of main workers Name of Village
Cultivators Agricultural labourers Household industry
Otht'r workers workers
Persons Males Females Persons Males Females Persons Males Females Persons Males Females 29 30 31 32 33 34 35 36 37 38 39 40 2
2,874 1,380 1,494 42 27 15 40 30 10 1,202 992 210 Bhandari (Total) 2,874 1,380 1,494 42 27 15 40 30 10 1,202 992 210 Bhandari (Rural)
Bhandari (Urban) Bhandari (Rural)
I II II Mekirang 297 117 180 19 19 102 79 23 Yimpang 48 2Q 28 2 2 16 14 2 Alikhum 22 16 6 35 31 4 Longyim 25 13 12 201 185 16 Merapani
184 92 92 18 )0 8 Liolongchum 72 27 45 17 13 4 II 556 465 91 Bhandari Hq 2 2 22 20 2 Bhandari ViII
302 145 157 17 9 4 4 33 17 16 Serika 'A' + '8' 179 96 83 I Yimparasa
2 6 3 Pangtong 87 38 49 6 4 2 32 20 12 Roni (Old)
Suphayang 28 13 15 4 Roni(New) 62 31 31 Yimza 66 36 30 2 Mongphio 46 25 21 2 Lishuyo
127 66 61 30 21 9 Liowokha (Old) I Liowokha (New)
346 198 148 7 Sungkha 250 124 126 4 4 Liphi (Liphayan) 114 59 55 2 Richanyan 373 133 240 104 85 19 Yamhon (Old) 129 69 60 2 I Yamhon (New) 112 58 54 4 I Koro
215
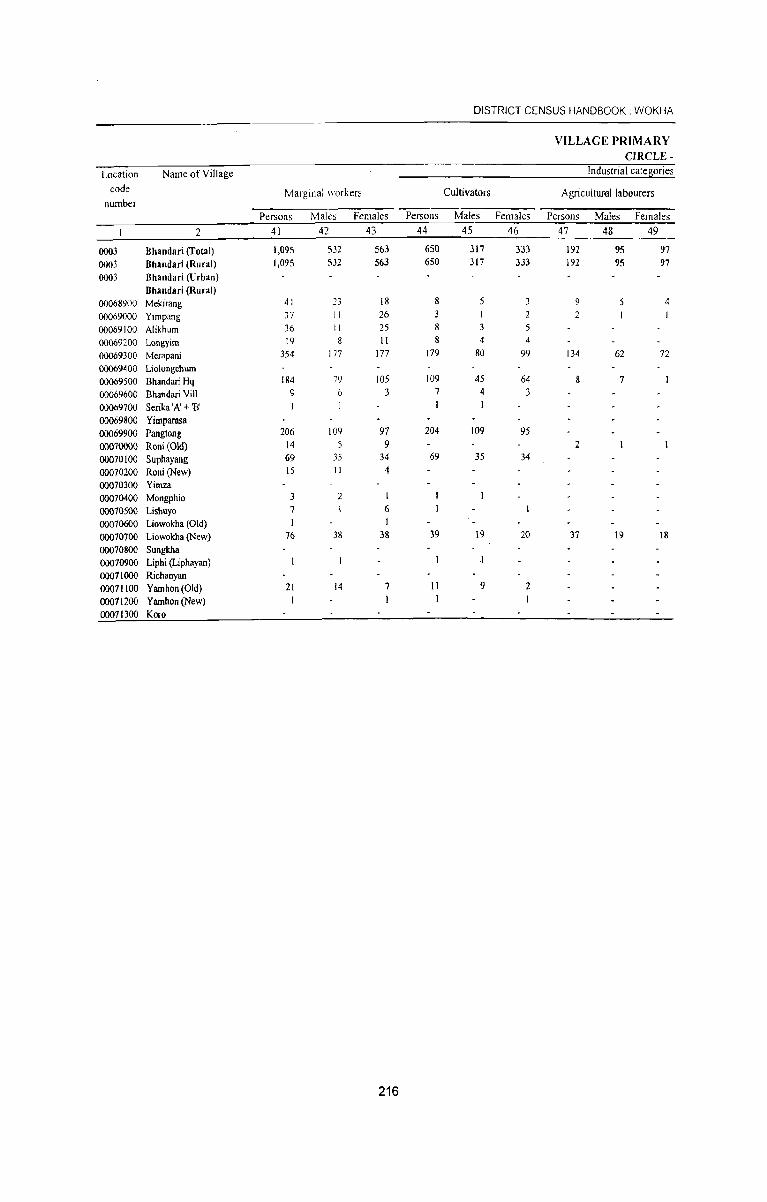
DISTRICT CENSUS HANDBOOK: WOKHA
VILLAGE PRIMARV CIRCLE -
Location Name of Village Industrial categories
code number
Marginal workers Cultivators Agricultumllabourers
Persons Males Females Persons Males Females Persons Males Females
2 41 42 43 44 45 46 47 48 49
0003 Bhandari (Total) 1,095 532 563 650 317 333 192 95 97
0003 Bhandari (Rural) 1,095 532 563 650 317 333 192 95 97
0003 Bhandari (Urban) Bhandari (Rural)
00068900 Mekirang 41 n 18 8 3 9 4
00069000 Yimpang 37 II 26 3 I 2
00069100 Alikhum 36 II 25 8 3
00069200 Longyim 19 8 II 8 4 4
00069300 Merapani 354 177 177 179 80 99 134 62 72
00069400 Liolongchum 00069500 Bhandari Hq 184 79 105 109 45 64 7
00069600 Bhandari Vilt 9 6 3 7 4 3 00069700 Serika 'A' + 'B' I
00069800 Yimparasa 00069900 Pangtong 206 109 97 204 109 95
00070000 Rani (Old) 14 5 9 2
00010100 Suphayang 69 35 34 69 35 34
00010200 Roni(New) 15 II 4
00010300 Yimza 00070400 Mongphio 3 2 I
00070500 Lishuyo 7 6
00010600 Liowokha (Old) 00070700 Liowokha (New) 76 38 38 39 19 20 37 19 18
00070800 Sungkba 00070900 Liphi (Liphayan) 00071000 Richanyan 00071100 Yamhon (Old) 21 14 7 II 9 2 00071200 Yamhon(New) I 00071300 Koro
216
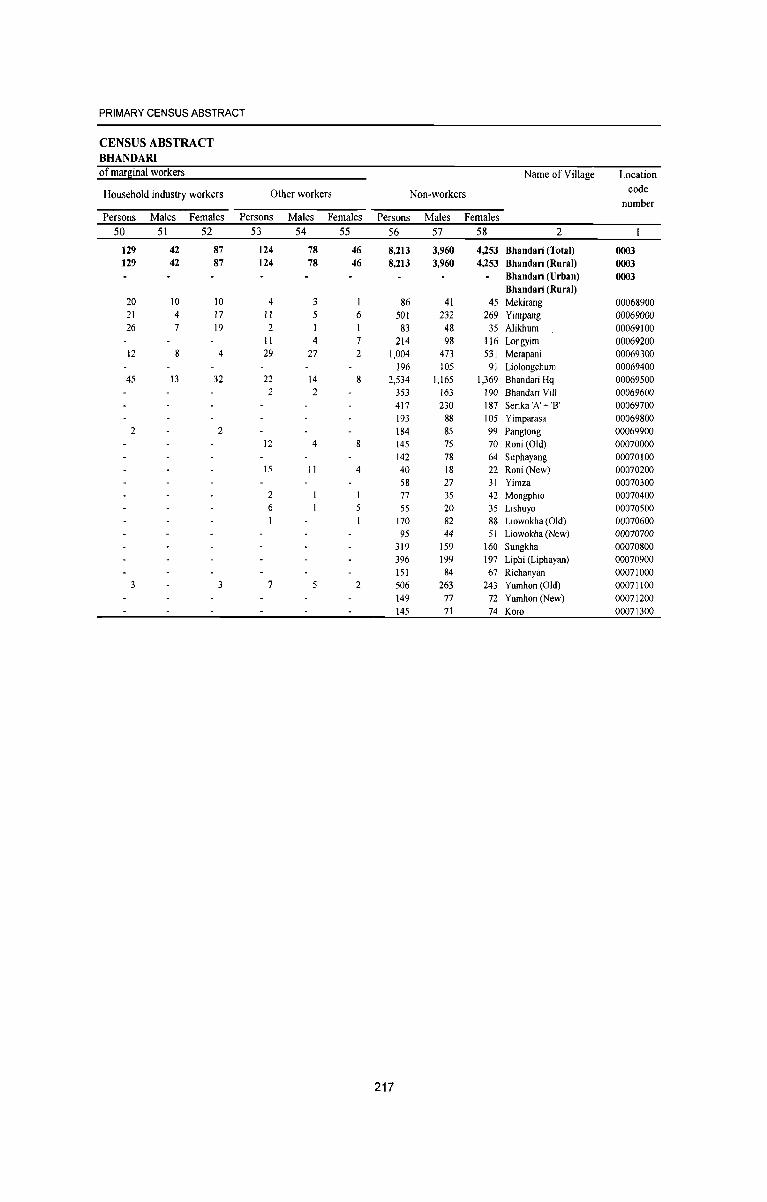
PRIMARY CENSUS ABSTRACT
CENSUS ABSTRACT BHANDARI of marginal workers Name of Village Location
Household industry workers Other workers Non-workers code number
Persons Males Females Persons Males Females Persons Males Females 50 51 52 53 54 55 56 57 58 2
129 42 87 124 78 46 8,213 3,960 4,253 Bhandari (Total) 0003 129 42 87 124 78 46 8,213 3,960 4,253 Bhandari (Rural) 0003
Bhandari (Urban) 0003 Bhandari (Rural)
20 10 10 4 3 86 41 45 Mekirang 00068900 21 4 17 II 5 6 501 232 269 Yimpang 00069000 26 7 19 2 I 83 48 35 Alikhum 00069100
II 4 7 214 98 116 Longyim 00069200 12 8 4 29 27 2 1,004 473 531 Merapani 00069300
196 105 91 Liolongchum 00069400 45 13 32 22 14 8 2,534 1,165 1,369 Bhandari Hq 00069500
2 2 353 163 190 Bhandari ViII 00069600 417 230 187 Senka 'A' + '8' 00069700 193 88 105 Yimparasa 00069800
2 2 184 85 99 Pangtong 00069900 12 4 8 145 75 70 Roni (Old) 00070000
142 78 64 Suphayang 00070100 15 11 4 40 18 22 Roni (New) 00070200
58 27 31 Yimza 00070300 2 I 77 35 42 Mongphio 00070400 6 5 55 20 35 Lishuyo 00070500 I 170 82 88 Liowokha (Old) 00070600
95 44 51 Liowokha (New) 00070700 319 159 160 Sungkha 00070800 396 199 197 Liphi (Liphayan) 00070900 151 84 67 Richanyan 00071000
3 3 7 5 2 506 263 243 Yamhon (Old) 00071100 149 77 72 Yamhon (New) 00071200 145 71 74 Koro 00071300
217

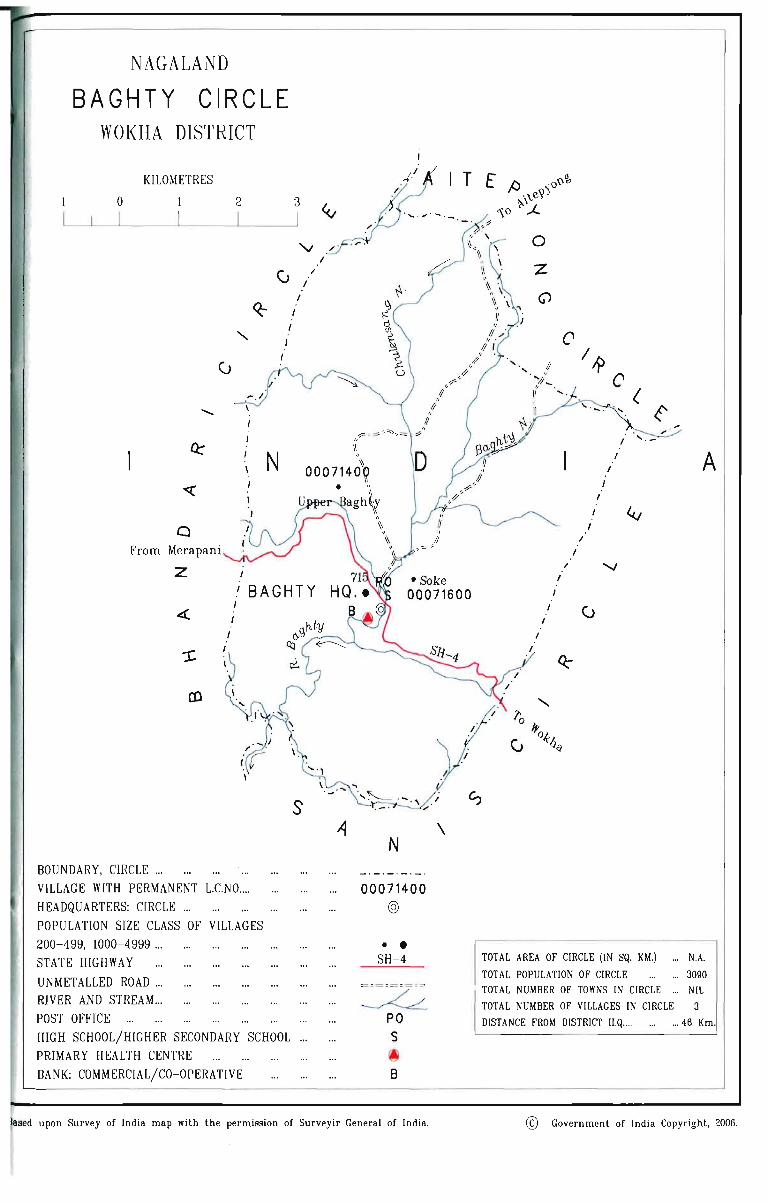
NAGALAND
BAGHTY CIRCLE WOKHA DISTRICT
KILOMETRES
o 2 3
(J I /
I
/
/
I
I
" 1/ ,; ;/ i
j' . C
,/' I;,>
C ( ;/
;/ ;;
{/~ = =:;;':::~-=:::::: 7 '/
~,_.
N \1
000714~~ 0
a From Merapani
z
co
BOUNDARY, CIRCLE ...
I
I
/
VILLAGE WITH PERMANENT L.C.NO .... HEADQUARTERS: CIRCLE ... POPULATION SIZE CLASS OF VILLAGES 200-499, 1000-4999 ...
STATE HIGHWAY
UNMETALLED ROAD .. . RIVER AND STREAM .. . POST OFFICE ...
s
HIGH SCHOOL/HIGHER SECONDARY SCHOOL ... PRIMARY HEALTH CENTRE BANK: COMMERCIAL/CO-OPERATIVE
"' .. 1
\
. "
agh ~\? " ~ \
"
• Sake 00071600
N
00071400 @
• • SH-4
~ PO S
~ 8
I
\
ased upon Survey of India map with the permission of Surveyir General of India.
....
\,. ...... "
' ._
/ A I
I ~ I
/
I " /
I
(J
/
I
TOTAL AREA OF CIRCLE (IN SQ. KM.) ... N.A.
TOTAL POPULATION OF CIRCLE ... 3090
TOTAL NUMBER OF TOWNS IN CIRCLE ... NIL
TOTAL NUMBER OF VILLAGES IN CIRCLE 3
DISTANCE FROM DISTRICT H.Q.. .. ...46 Km.
© Government of India Copyright, 2006.

Village Primary Census Abstract 8aghty Circle
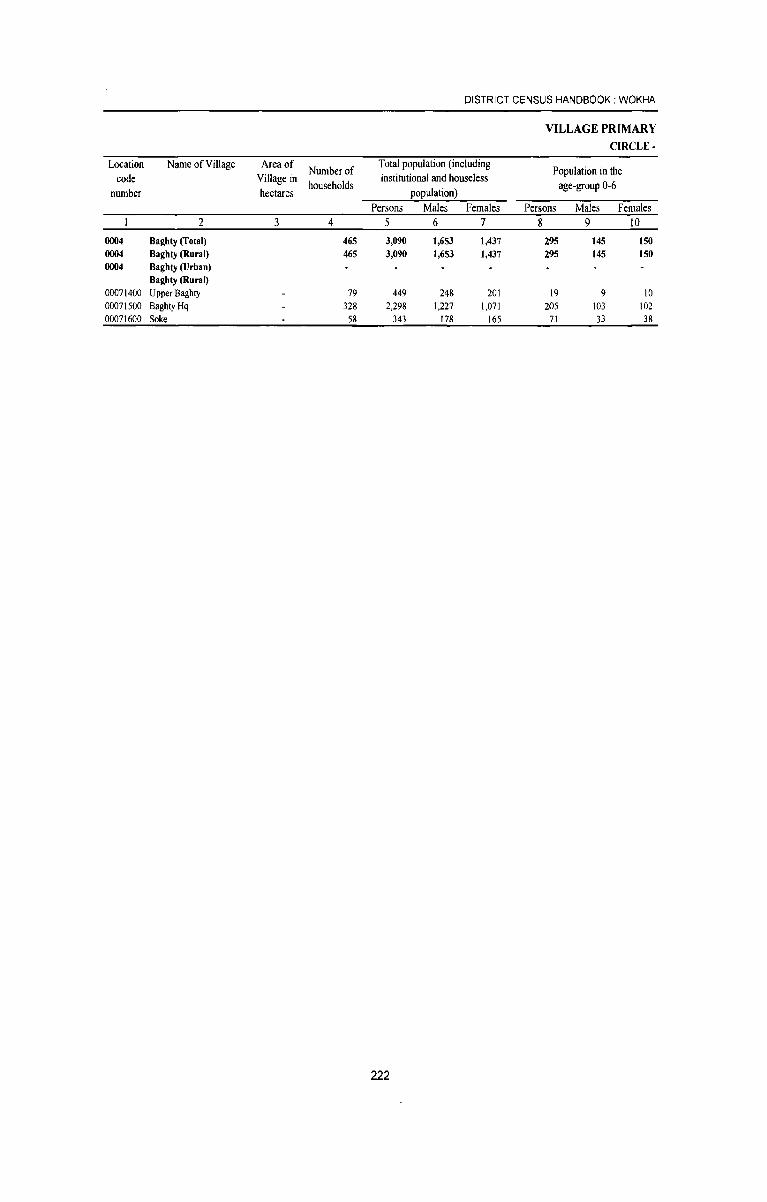
DISTRICT CENSUS HANDBOOK: WOKHA
VILLAGE PRIMARY CIRCLE-
Location Name ofViIlage Area of Number of
Total population (including Population in the
code Village in households
institutional and houseless age-group 0-6
number hectares population) Persons Males Females Persons Males Females
2 3 4 5 6 7 8 9 10
0004 Baghty (Total) 465 3,090 1,653 1,437 295 145 ISO 0004 Baghty (Rural) 465 3,090 1,653 1,437 295 145 150 0004 Baghty (Urban)
Baghty (Rural) 00071400 Upper Baghty 79 449 248 201 19 9 10 00071500 BaghtyHq 328 2,298 1,227 1,071 205 103 102 00071600 Soke 58 343 178 165 71 33 38
222
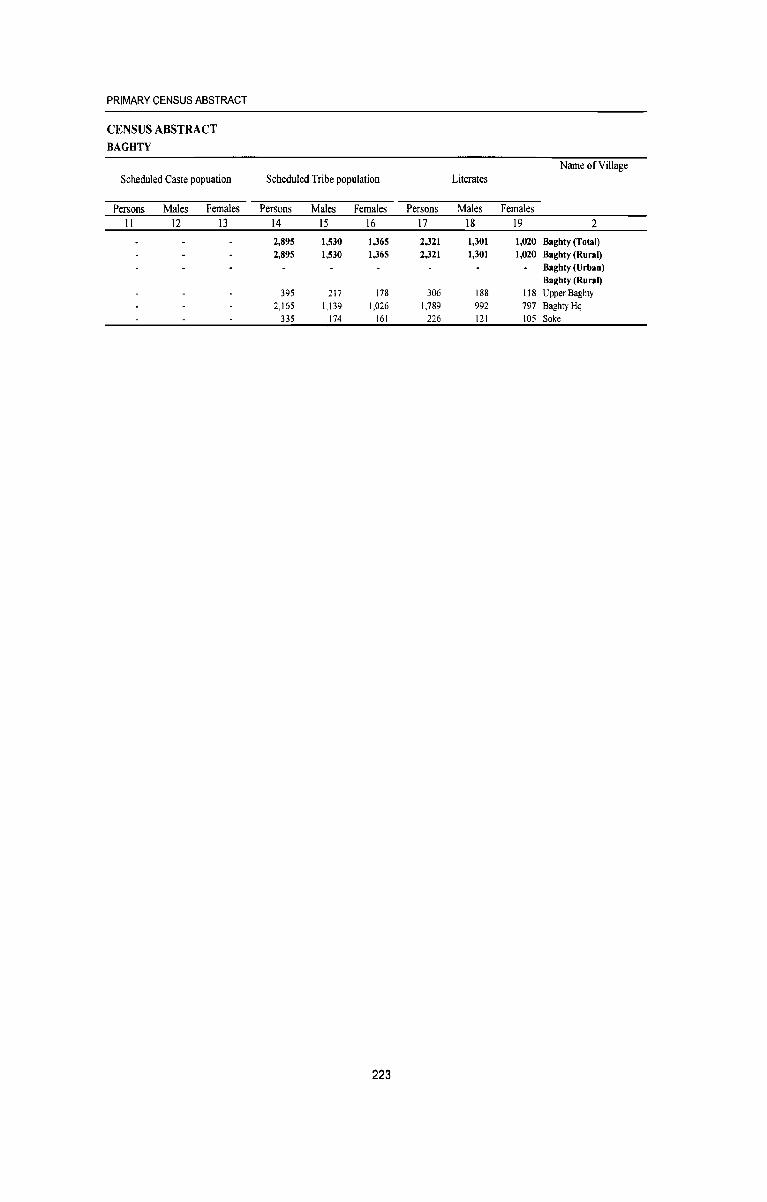
PRIMARY CENSUS ABSTRACT
CENSUS ABSTRACT BAGHTY
Name of Village Scheduled Caste popuation Scheduled Tribe population Literates
Persons Males Females Persons Males Females Persons Males Females II 12 13 14 15 16 17 18 19 2
2,895 1,530 1,365 2,321 1,301 1,020 Baghty (Total) 2,895 1,530 1,365 2,321 1,301 1,020 Baghty (Rural)
Baghty (Urban) Baghty (Rural)
395 217 178 306 188 118 Upper Baghty 2,165 1,139 1,026 1,789 992 797 Baghty Hq
335 174 161 226 121 105 Soke
223

DISTRICT CENSUS HANDBOOK; WOKHA
VILLAGE PRIMARY CIRCLE-
Location Name of Village code Illiterates Total workers Main workers
number Persons Males Females Persons Males Females Persons Males Females
2 20 21 22 23 24 25 26 27 28 0004 Baghty (Total) 769 352 417 1,009 636 373 773 593 180 0004 Baghty (Rural) 769 352 417 1,009 636 373 773 593 180 0004 Baghty (Urban)
Baghty (Rural) 00071400 Upper Baghty 143 60 83 163 98 65 99 91 8 00071500 BaghtyHq 509 235 274 709 462 247 560 429 131 00071600 Soke 117 57 60 137 76 61 114 73 41
224
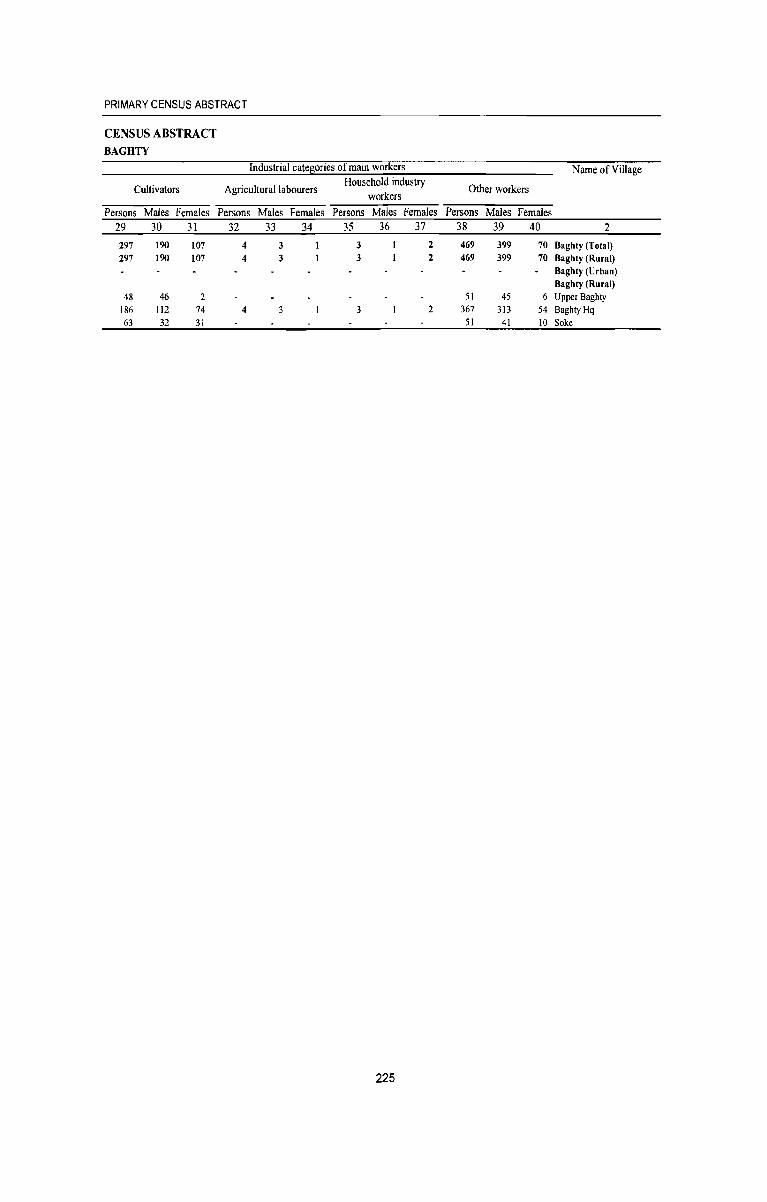
PRIMARY CENSUS ABSTRACT
CENSUS ABSTRACT BAGHTY
Industrial categories of main workers
Cultivators Agricultural labourers Household industry
workers
Persons Males Females Persons Males Females Persons Males Females 29 30 31 32 33 34 35 36 37
297 190 107 4 3 3 2
297 190 107 4 3 3 2
48 46 2 186 112 74 4 3 2 63 32 31
225
Other workers
Persons Males Females 38 39 40 469 399 70 469 399 70
51 45 6 367 313 54
51 41 10
Name of Village
2
Bagbty (Total) Bagbty (Rural) Bagbty (Urban)
Bagbty (Rural) Upper Baghty Baghty Hq Soke
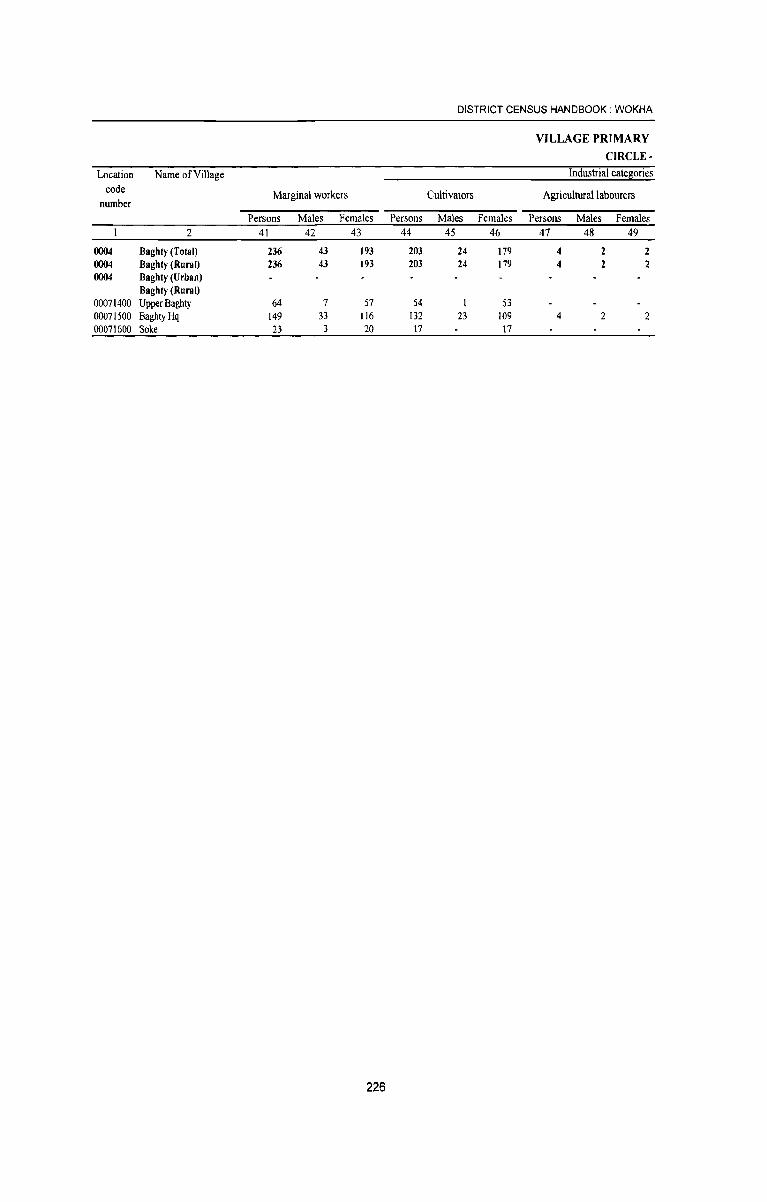
DISTRICT CENSUS HANDBOOK: WOKHA
VILLAGE PRIMARY CIRCLE·
Location Name ofViUage Industrial cate~ories code Marginal workers Cultivators Agricultural labourers
number Persons Males Females Persons Males Females Persons Males Females
2 41 42 43 44 45 46 47 48 49
0004 Baghty (Total) 236 43 193 203 24 179 4 2 0004 Baghty (Rural) 236 43 193 203 24 179 4 2 2 0004 Baghty (Urban)
Baghty (Rural) 00071400 Upper Baghty 64 7 57 54 53 00071500 BaghtyHq 149 33 116 132 23 109 4 2 2 00071600 Soke 23 3 20 17 17
226
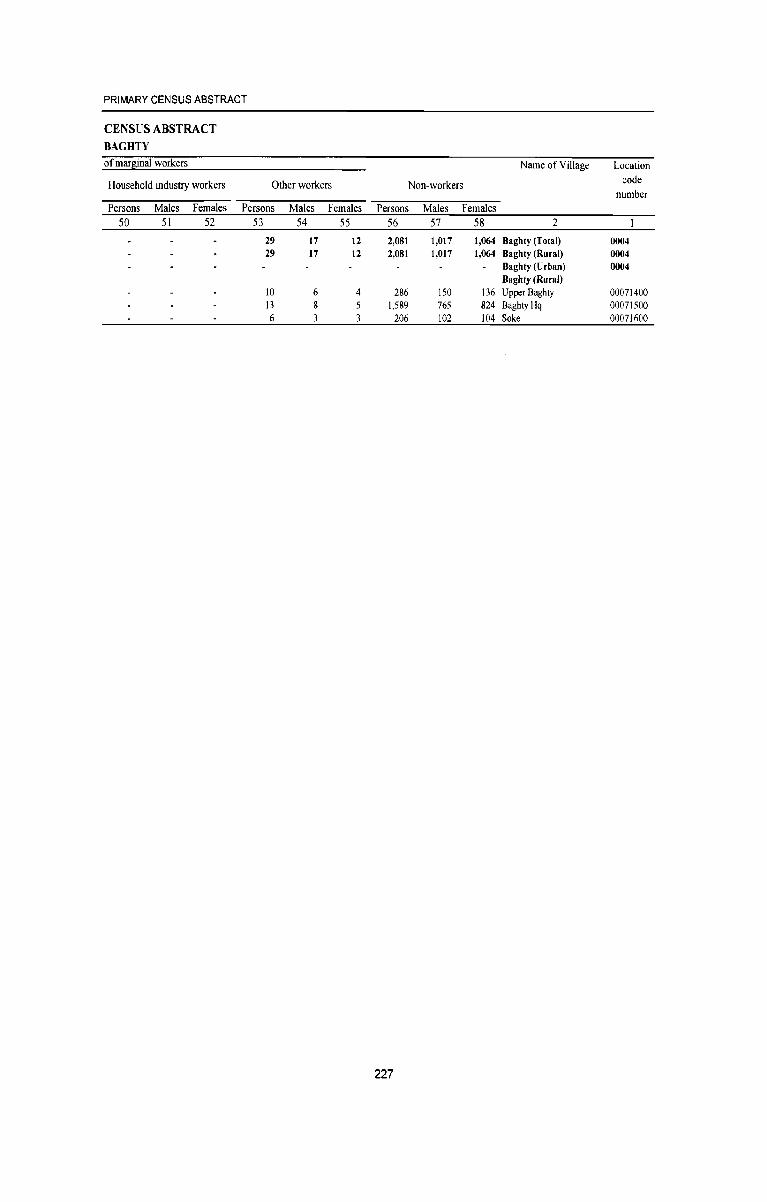
PRIMARY CENSUS ABSTRACT
CENSUS ABSTRACT BAGHTY of marsinal workers Name of Village Location
Household industry workers Other workers Non-workers code number
Persons Males Females Persons Males Females Persons Males Females 50 51 52 53 54 55 56 57 58 2
29 17 12 2,081 1,017 1,064 Baghty (Total) 0004 29 17 12 2,081 1,017 1,064 Baghty (Rural) 0004
Baghty (Urban) 0004 Baghty (Rural)
10 6 4 286 150 136 Upper Baghty 00071400 13 8 5 1,589 765 824 Baghty Hq 00071500 6 3 3 206 102 104 Soke 00071600
227

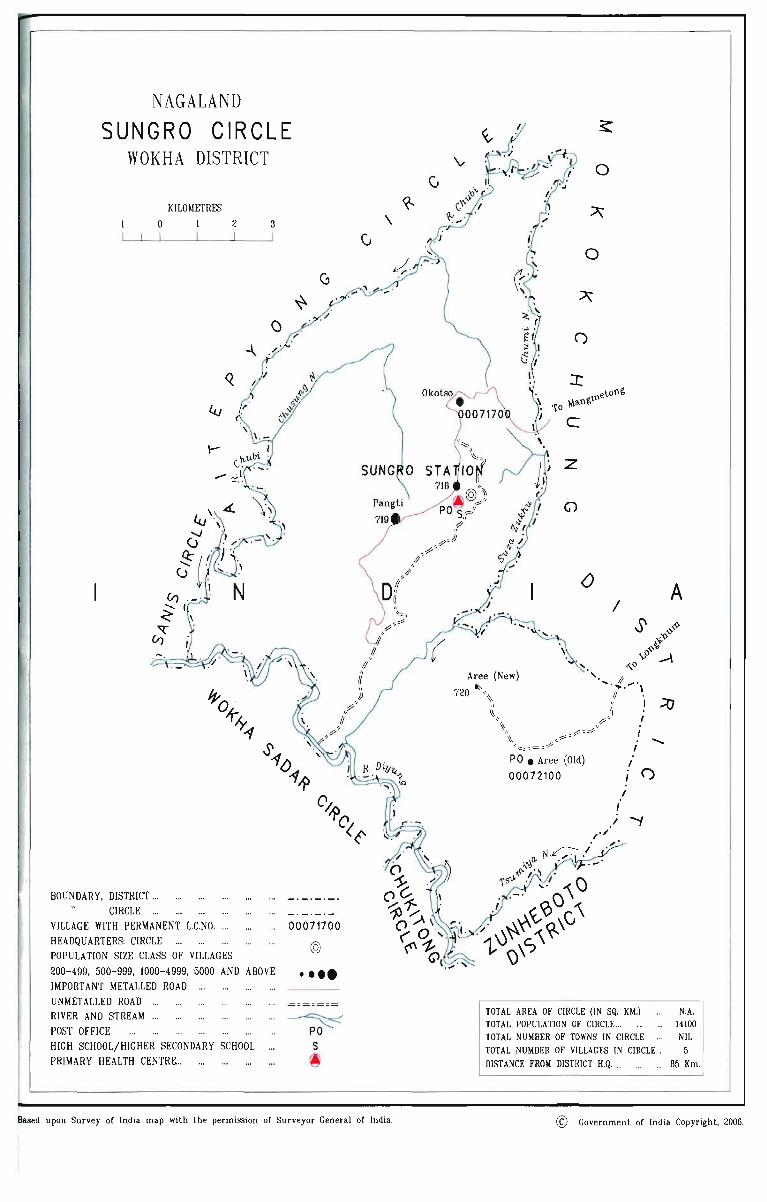
NAGALAND
SUNGRO CIRCLE WOKHA DISTRICT
KILOMETRES
o 2 3
()
BOUNDARY, DISTRICT ... CIRCLE ...
VILLAGE WITH PERMANENT L.C.NO .... ... 00071700 HEADQUARTERS: CIRCLE ... POPULATION SIZE CLASS OF VILLAGES
200-499, 500- 999, 1000-4999, 5000 AND ABOVE
IMPORTANT METALLED ROAD ...
UNMETALLED ROAD
@
•••• RIVER AND STREAM ...
POST OFFICE ... ~
PO HIGH SCHOOL/HIGHER SECONDARY SCHOOL ...
PRIMARY HEALTH CENTRE. ..
\
SUNG 0
II // " II
" r
" ~,' -?
",;-
Based upon Survey of India map with the permiSSion of Surveyor General of India.
(
I
o
o
z
()
,
PO • Aree (Old)
00072100
/
I
I
I
I ,()
TOTAL AREA OF CIRCLE (IN SQ. KM.) TOTAL POPULATION OF CIRCLE ... TOTAL NUMBER OF TOWNS IN CIRCLE
A
N.A. 14100
NIL TOTAL NUMBER OF VILLAGES IN CIRCLE... 5
DIST ANCE FROM DISTRICT H.Q. ... . . 85 Km.
© Government of Indi a Copyr ight, 2006.

Village Primary Census Abstract Sungro Circle

DISTRICT CENSUS HANDBOOK: WOKHA
VILLAGE PRIMARY CIRCLE-
Location Name of Village Area of Number of
Total population (including Population in the
code Village in households
institutional and houseless age-group 0-6
number hectares population) Persons Males Females Persons Males Females
2 3 4 5 6 7 8 9 10
0005 Sungro (Total) 1,951 14,100 7,296 6,804 1,672 820 852 0005 Sungro (Rural) 1,951 14,100 7,296 6,804 1,672 820 852 0005 Sungro (Urban)
Sungro (Rural) 00071700 Okotso 546 3,846 1,924 1,922 550 251 299 00071800 Sungro Station 157 1,080 586 494 124 55 69 00071900 Pangti 1,024 8,047 4,218 3,829 817 428 389 00072000 Aree(New) 64 337 173 164 68 35 33 00072100 Aree ~Otd) 160 790 395 395 113 51 62
232
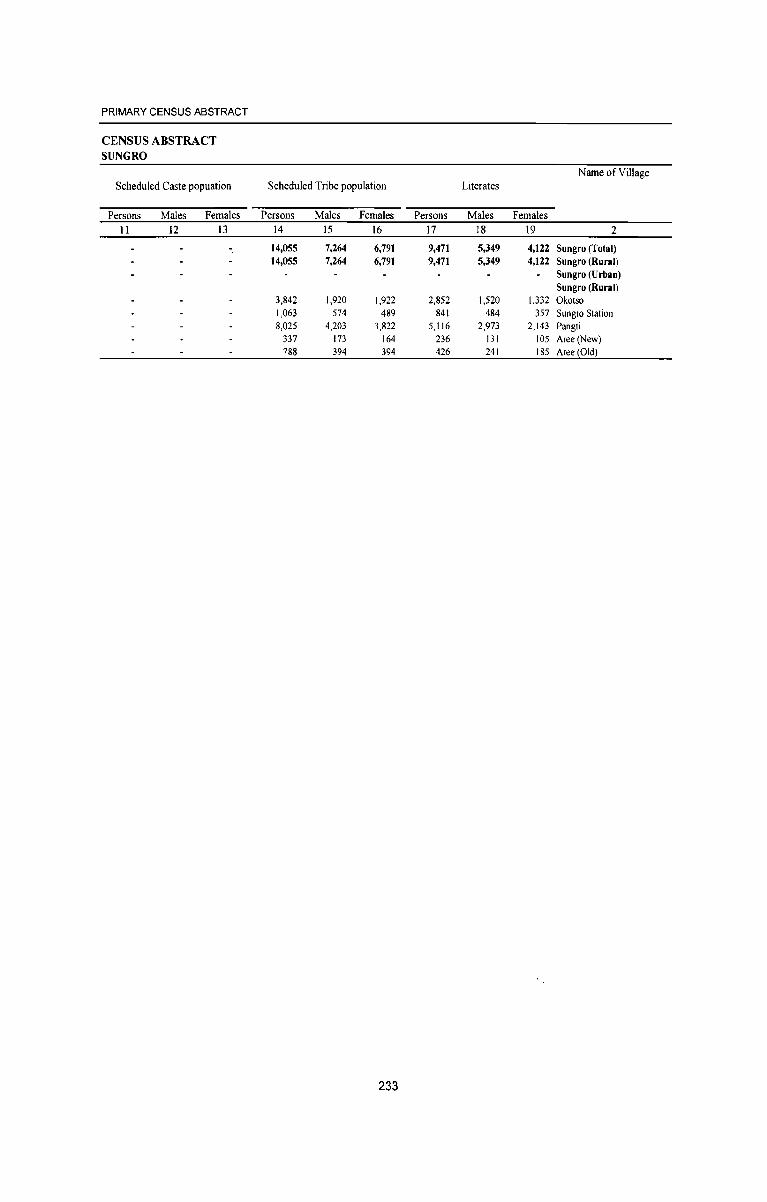
PRIMARY CENSUS ABSTRACT
CENSUS ABSTRACT SUNGRO
NameofViUage Scheduled Caste popuation Scheduled Tribe population Literates
Persons Males Females Persons Males Females Persons Males Females 11 12 13 14 15 16 17 18 19 2
14,055 7,264 6,791 9,471 5,349 4,122 Sungro (Total) 14,055 7,264 6,791 9,471 5,349 4,122 Sungro (Rural)
Sungro (Urban) Sungro (Rural)
3,842 1,920 1,922 2,852 1,520 1,332 Okotso 1,063 574 489 841 484 357 Sungro Station 8,025 4,203 3,822 5,116 2,973 2,143 Pangti
337 173 164 236 131 105 Aree(New) 788 394 394 426 241 185 Aree (Old)
233
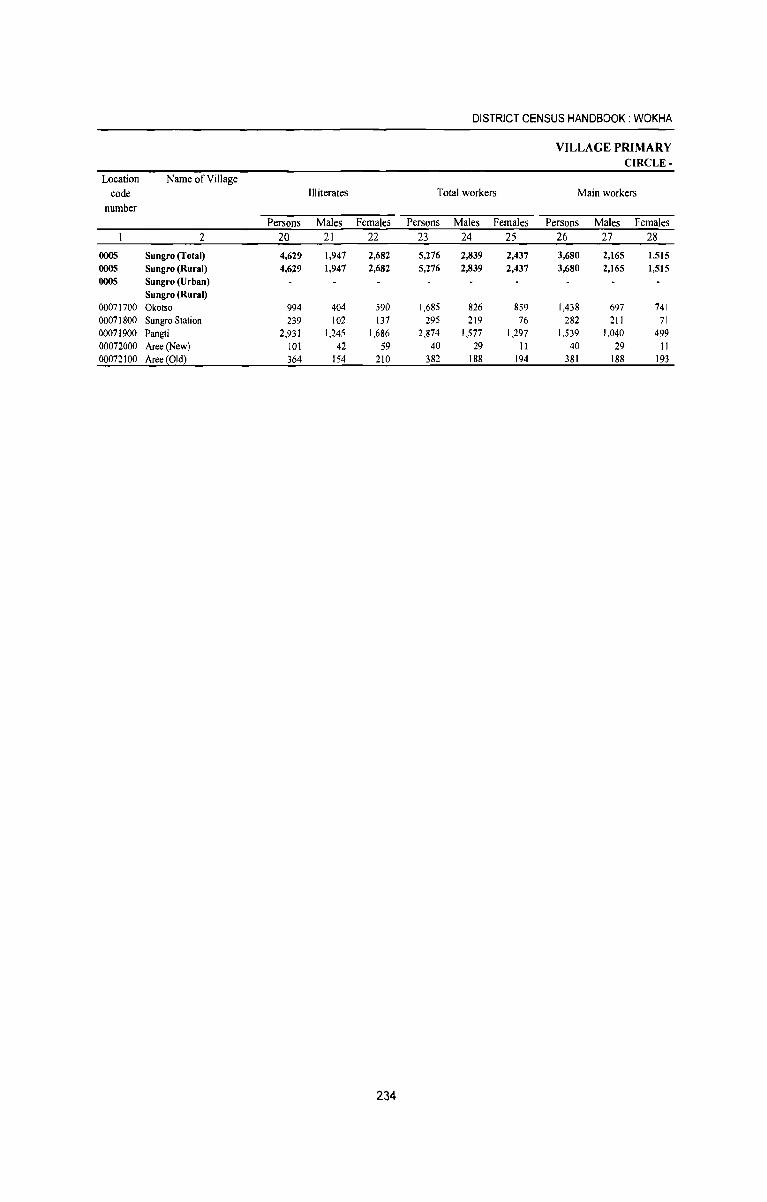
DISTRICT CENSUS HANDBOOK: WOKHA
VILLAGE PRIMARY CIRCLE-
Location Name ofYillage code llliterates Total workers Main workers
number Persons Males Females Persons Males Females Persons Males Females
2 20 21 22 23 24 25 26 27 28
0005 Sungro (Total) 4,629 1,947 2,682 5,276 2,839 2,437 3,680 2,165 1,515 0005 Sungro (Rural) 4,629 1,947 2,682 5,276 2,839 2,437 3,680 2,165 1,515 0005 Sungro (Urban)
Sungro (Rural) 00071700 Okotso 994 404 590 1,685 826 859 1,438 697 741 00071800 Sungro Station 239 102 131 295 219 76 282 211 71 00071900 Pangti 2,931 1,245 1,686 2,874 1,577 1,297 1,539 1,040 499 00072000 Aree(New) 101 42 59 40 29 II 40 29 II 00072100 Aree (Oldl 364 154 210 382 188 194 381 188 193
234

PRIMARY CENSUS ABSTRACT
CENSUS ABSTRACT SUNGRO
Industrial cateflories of main workers Name of Village
Cultivators Agricultural labourers Household industry
Other workers workers
Persons Males Females Persons Males Females Persons Males Females Persons Males Females 29 30 31 32 33 34 35 36 37 38 39 40 2
2,579 1,297 1,282 7 3 4 100 52 48 994 813 181 Sungro (Total) 2,579 1,297 1,282 7 3 4 100 52 48 994 813 181 Sungro (Rural)
Sungro (Urban) Sungro (Rural)
1,236 558 678 2 3 59 29 30 138 108 30 Okotso 50 26 24 I I 230 185 45 Sungro Station
938 544 394 31 20 11 570 476 94 Pangti 7 2 32 23 9 Aree(New)
348 164 184 9 3 6 24 21 3 Aree (Old)
235
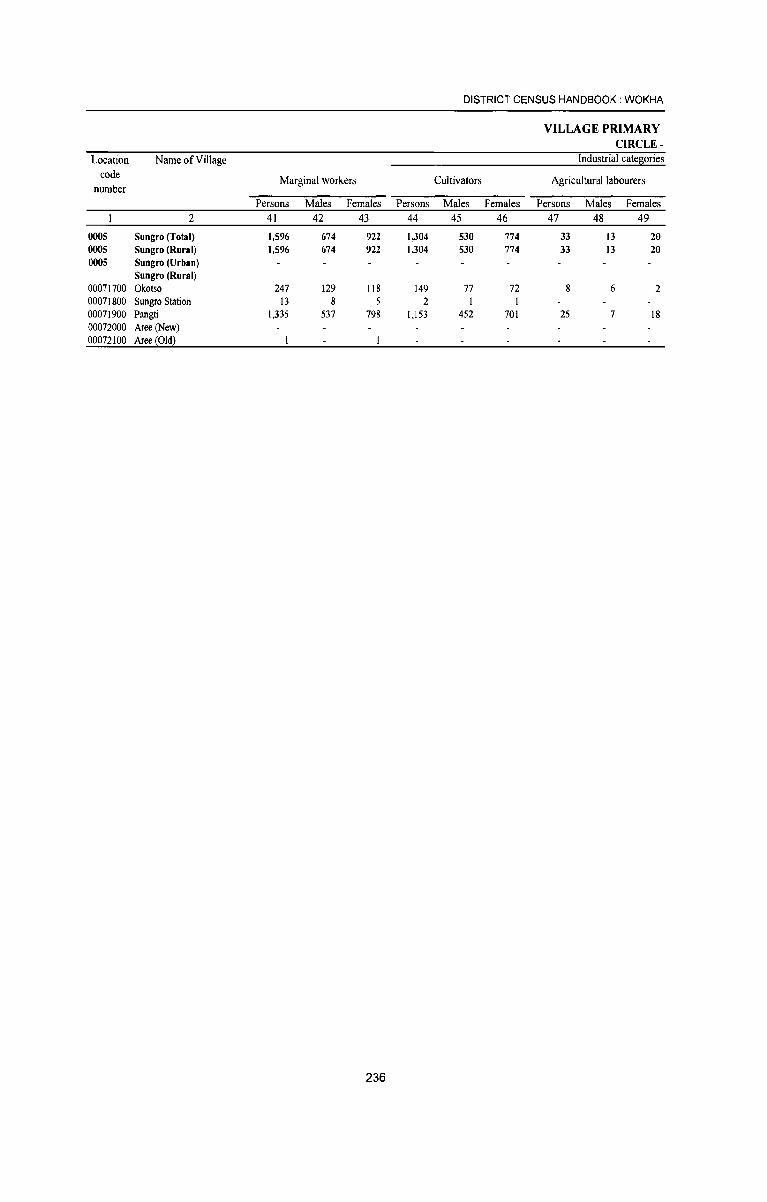
DISTRICT CENSUS HANDBOOK: WOKHA
VILLAGE PRIMARY CIRCLE -
Location Name of Village Industrial categories
code Marginal workers Cultivators Agricultural labourers number
Persons Males Females Persons Males Females Persons Males Females 2 41 42 43 44 45 46 47 48 49
0005 Sungro (Total) 1,596 674 922 1,304 530 774 33 13 20 0005 Sungro (Rural) 1,596 674 922 1,304 530 774 33 !3 20 0005 Sungro (Urban)
Sungro (Rural) 00071700 Okotso 247 129 118 149 77 72 8 6 2 00071800 Sungro Station 13 8 2 I 00071900 Pangti 1,335 537 798 1,153 452 701 25 7 18 00072000 Aree(New) 00072100 Aree(Old)
236
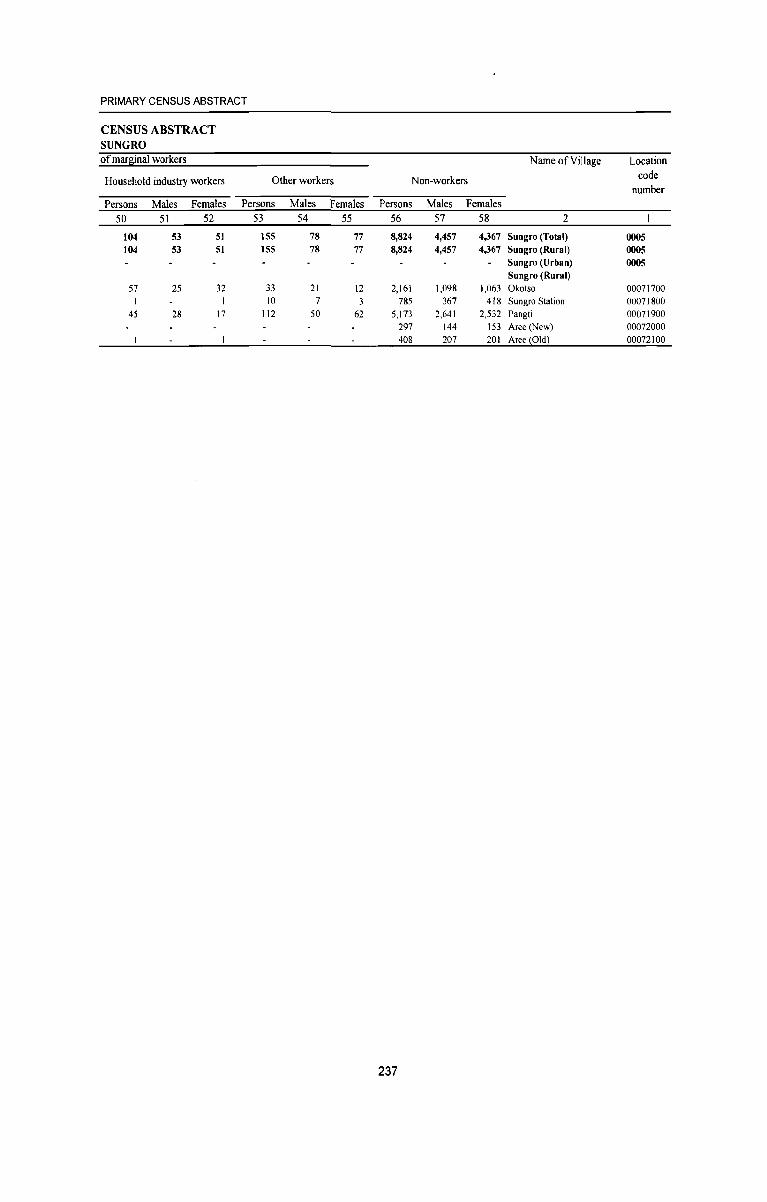
PRIMARY CENSUS ABSTRACT
CENSUS ABSTRACT SUNGRO of mar~inal workers Name of Village Location
Household industry workers Other workers Non-workers code number
Persons Males Females Persons Males Females Persons Males Females 50 51 52 53 54 55 56 57 58 2
104 53 51 155 78 77 8,824 4,457 4,367 Sungro (Total) 0005 104 53 51 155 78 77 8,824 4,457 4,367 Sungro (Rural) 0005
Sungro (Urban) 0005 Sungro (Rural)
57 25 32 33 21 12 2,161 1,098 1,063 Okotso 00071700 I 10 7 3 785 367 418 Sungro Station 00071800
45 28 17 112 50 62 5,173 2,641 2,532 Pangti 00071900 297 144 153 Aree (New) 00072000 408 207 201 Aree (Old) 00072100
237

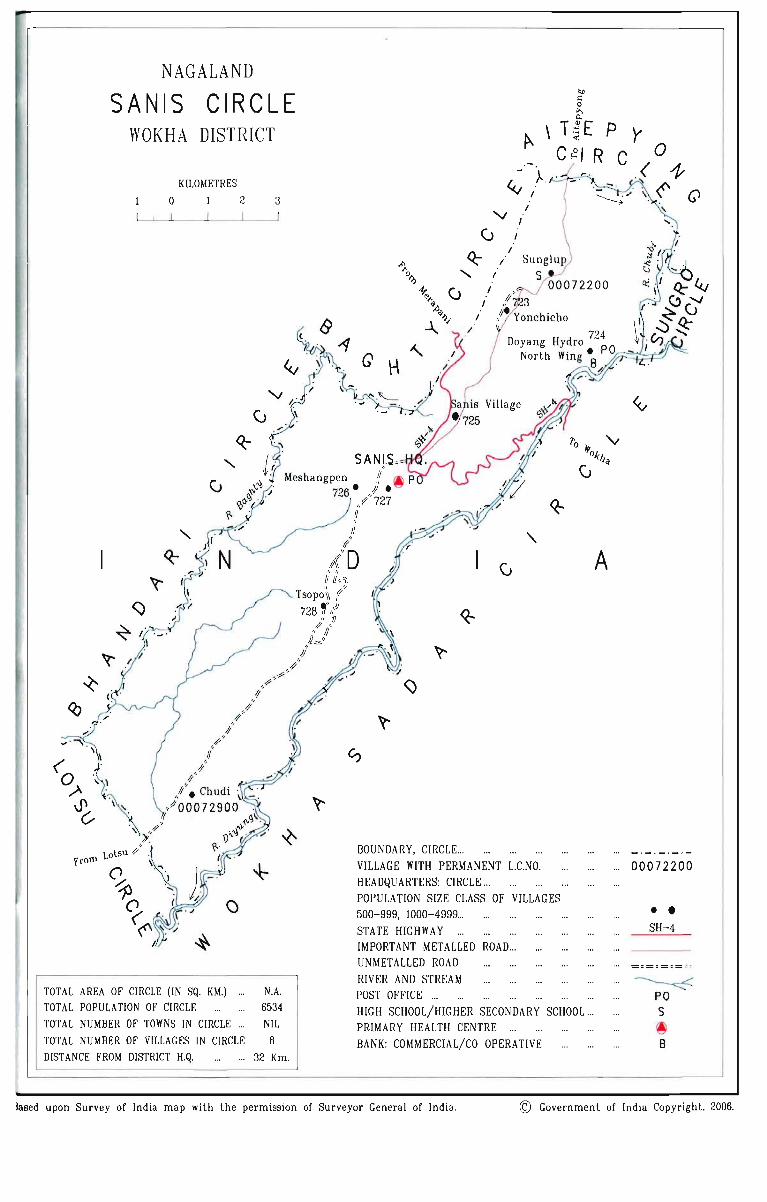
NAGALAND
SANIS CIRCLE WOKHA DISTRICT
KILOMETRES
0 2 3
()
TOTAL AREA OF CIRCLE (IN SQ. KM.) ... N.A. TOTAL POPULATION OF CIRCLE 6534 TOTAL NUMBER OF TOWNS IN CIRCLE ... NIL
TOTAL NUMBER OF VILLAGES IN CIRCLE B DIST ANCE FROM DISTRICT H.Q. . .. 32 Km.
, t
"" Q o ~
~ \ T ~ E p Y C ~ I ReO
;.~ -I'~ ' ( ~ "'V - . . ~ _,,(\ '~ .. ' '. \" Q
I V,
(J I «-/ Sunglup
" I S 00072200 I
I ,f~ 3 I /~ Yonchicho
,
724 Doyang Hydro PO
North Wing·8
""//j:::::::L;:~
BOUNDARY, CIRCLE ... VILLAGE WITH PERMANENT L.C.NO. HEADQUARTERS: CIRCLE ... POPULATION SIZE CLASS OF VILLAGES 500-999, 1000-4999 ...
STATE HIGHWAY ... IMPORTANT METALLED ROAD ... UN METALLED ROAD
RIVER AND STREAM POST OFFICE ... HIGH SCHOOL/HIGHER SECONDARY SCHOOL ... PRIMARY HEALTH CENTRE ._
BANK: COMMERCIAL/CO-OPERATIVE
A
A
00072200
• • SH-4
... ~ PO S
~ B
lased upon Survey of India map with the permission of Surveyor General of India. © Government of India Copyright, 2006.

Village Primary Census Abstract Sanis Circle

DISTRICT CENSUS HANDBOOK: WOKHA
VILLAGE PRIMARY CIRCLE -
Location Name of Village Area of Number of
Total population (including Population in the
code Village in households
institutional and houseless age-group 0-6
number hectares population) Persons Males Females Persons Males Females
2 3 4 5 6 7 8 9 10 0006 Sanis (Total) 1,255 6,534 3,304 3,230 975 482 493 0006 Sanis (Rural) 1,255 6,534 3,304 3,230 975 482 493 0006 Sanis (Urban)
Sanis (Rural) 00072200 Sunglup 166 904 452 452 115 56 59 00072300 Yonchicho 139 753 369 384 115 58 57 00072400 Doyang Hydro North Wing 256 864 479 385 187 92 95 00072500 Sanis Vill 207 1,167 563 604 153 77 76 00072600 Meshangpen 80 517 271 246 69 36 33 00072700 Sanis Hq 179 915 474 441 180 89 91 00072800 Tsopo 83 508 254 254 62 30 32 00072900 Chudi 145 906 442 464 94 44 50
242
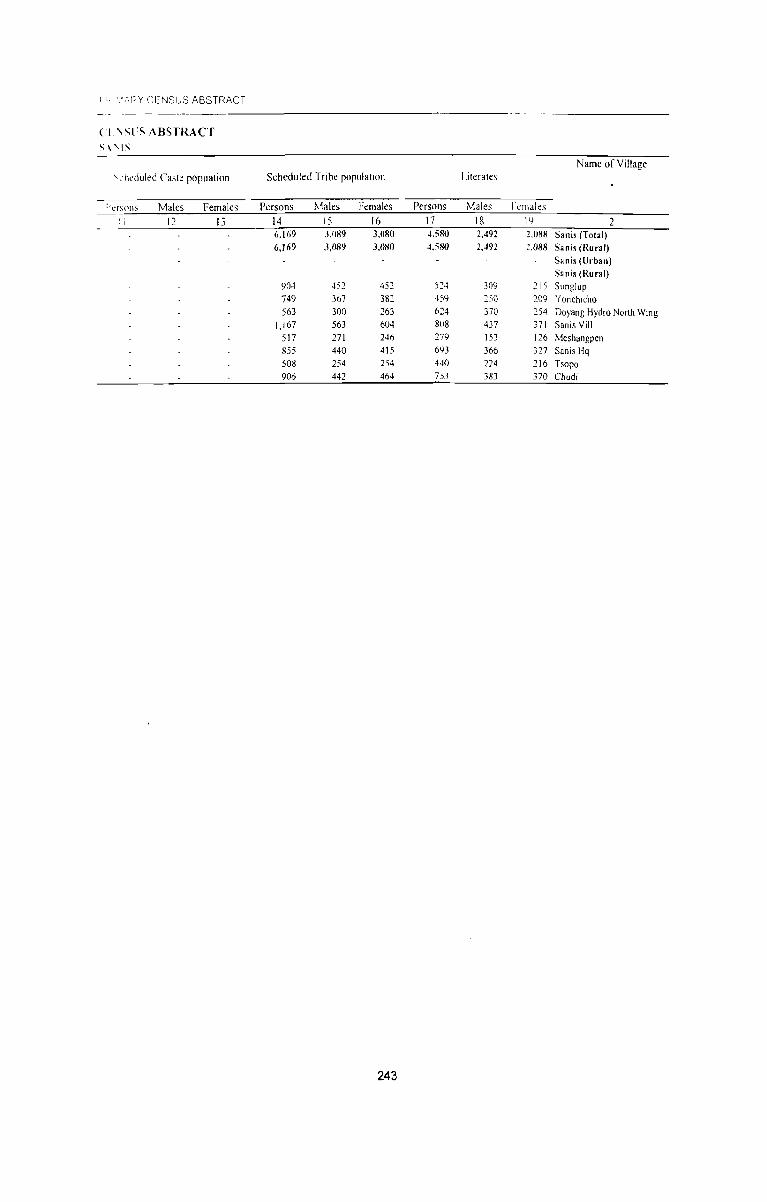
I: .. '::,I~Y CENSUS ABSTRACT ---_---
(I \SI:S ABSTRACT
" \ "I S
\, " heduled Caste popuation Scheduled Tribe populalJon
llersollS Males Female~ Persons Males Females ~ i 12 I J 14 15 16
6.169 3,(189 3,080
6.169 3,089 J,080
904 452 452 749 367 382 563 300 263
1,167 563 604 517 271 246 855 440 415 508 254 254 906 442 464
243
Literates
Persons Males 17 18 ~.5~O 2,492 ~,580 2,.J92
524 309 459 250 624 370 808 437 279 153 693 366 440 224 753 383
I <:l1laks 19 2,088
2.088
215 209 254 371 126 327 216 370
Name of Village
2 Sanis (Total)
Sanis (Rural)
Sanis (Urban) Sanis (Rural)
Sunglup Yonchlcho Doyang Hydro North Wing Sanis ViII Meshangpen Sanis Hq Tsopo Chudi
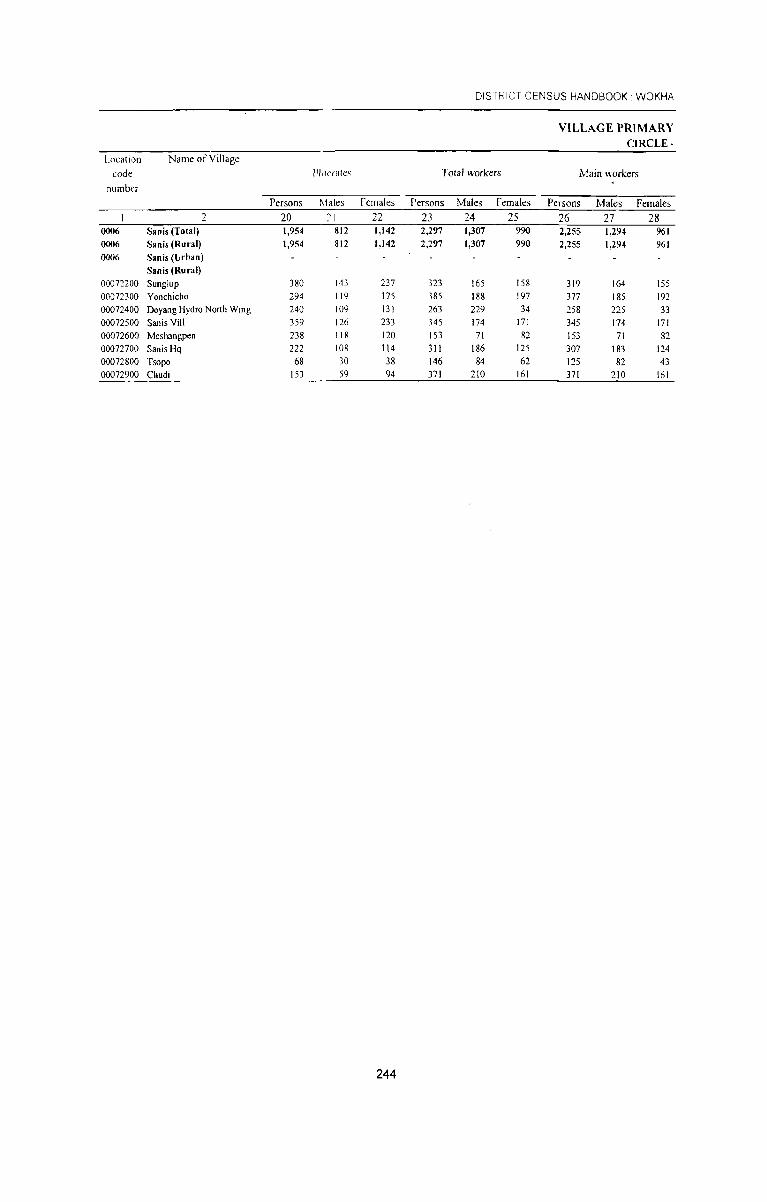
DISTRICT CENSUS HANDBOOK. WOKHA
VILLAGE PRIMARY CIRCLE-
Location Name of Village code lililaates Total workers Main workers
number Persons Males Females Persons Males Females Persons Males Females
2 20 21 22 23 24 25 26 27 28 0006 Sanis (Total) 1,954 812 1,142 2,297 1,307 990 2,255 1,294 961 0006 Sanis (Rural) 1,954 812 1,142 2,297 1,307 990 2,255 1,294 961 ()()06 Sanis (Urban)
Sanis (Rural) 00072200 Sunglup 380 143 237 323 165 158 319 164 155
00072300 Yonchicho 294 119 175 385 188 197 377 185 192
00072400 Doyang Hydro North Wing 240 109 131 263 229 34 258 225 33
00072500 Sanis Viii 359 126 233 345 174 171 345 174 171
00072600 Meshangpen 238 118 120 153 71 82 153 71 82
00072700 Sanis I-Iq 222 108 114 311 186 125 307 183 124 00072800 Tsopo 68 30 38 146 84 62 125 82 43
00072900 Chudi 153 59 94 371 210 161 371 210 161
244
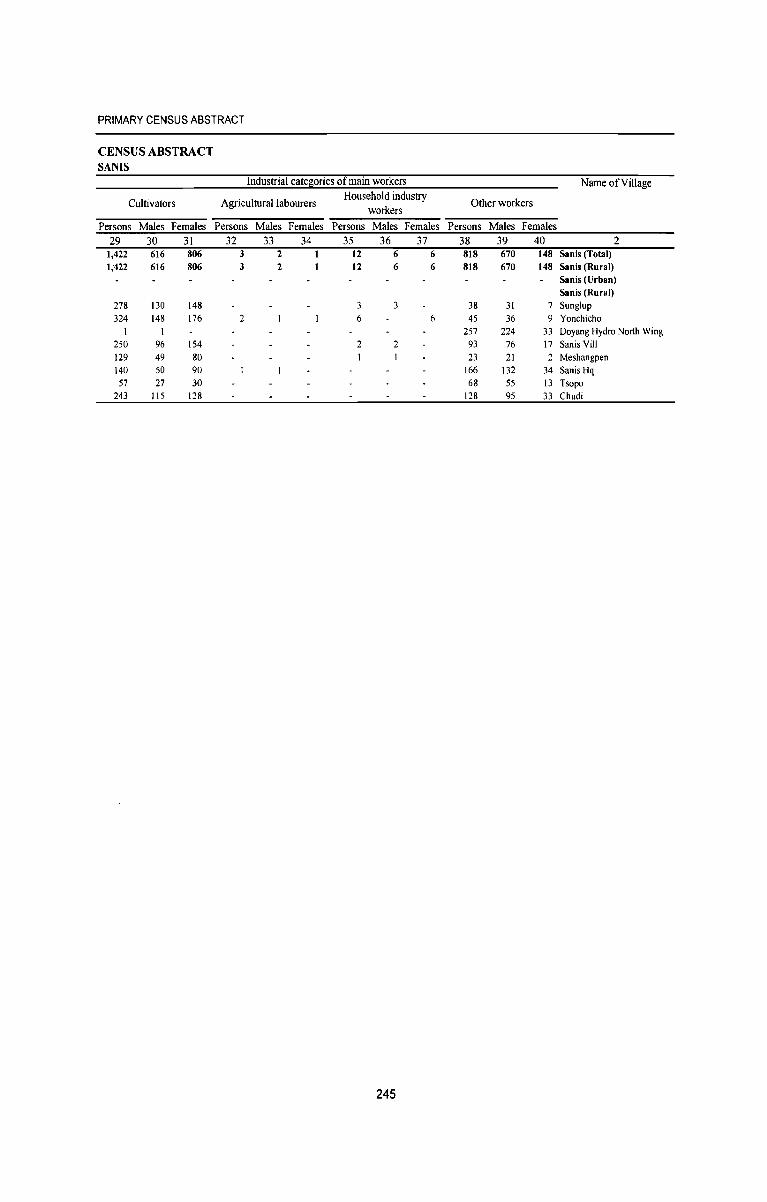
PRIMARY CENSUS ABSTRACT
CENSUS ABSTRACT SANIS
Industrial cate~ories of main workers Name ofViUage
Cultivators Agricultural labourers Household industry
Other workers workers
Persons Males Females Persons Males Females Persons Males Females Persons Males Females 29 30 31 32 33 34 35 36 37 38 39 40 2
1,422 616 806 3 2 12 6 6 818 670 148 Sanis (Total) 1,422 616 806 3 2 12 6 6 818 670 148 Sanis (Rural)
Sanis (Urban) Sanis (Rural)
278 130 148 3 3 38 31 7 Sunglup 324 148 176 2 6 6 45 36 9 Yonchicho
257 224 33 Doyang Hydro North Wing 250 96 154 2 2 93 76 17 Sanis Viii 129 49 80 23 21 2 Meshangpen 140 50 90 166 132 34 Sanis Hq 57 27 30 68 55 13 Tsopo
243 115 128 128 95 33 Chudi
245
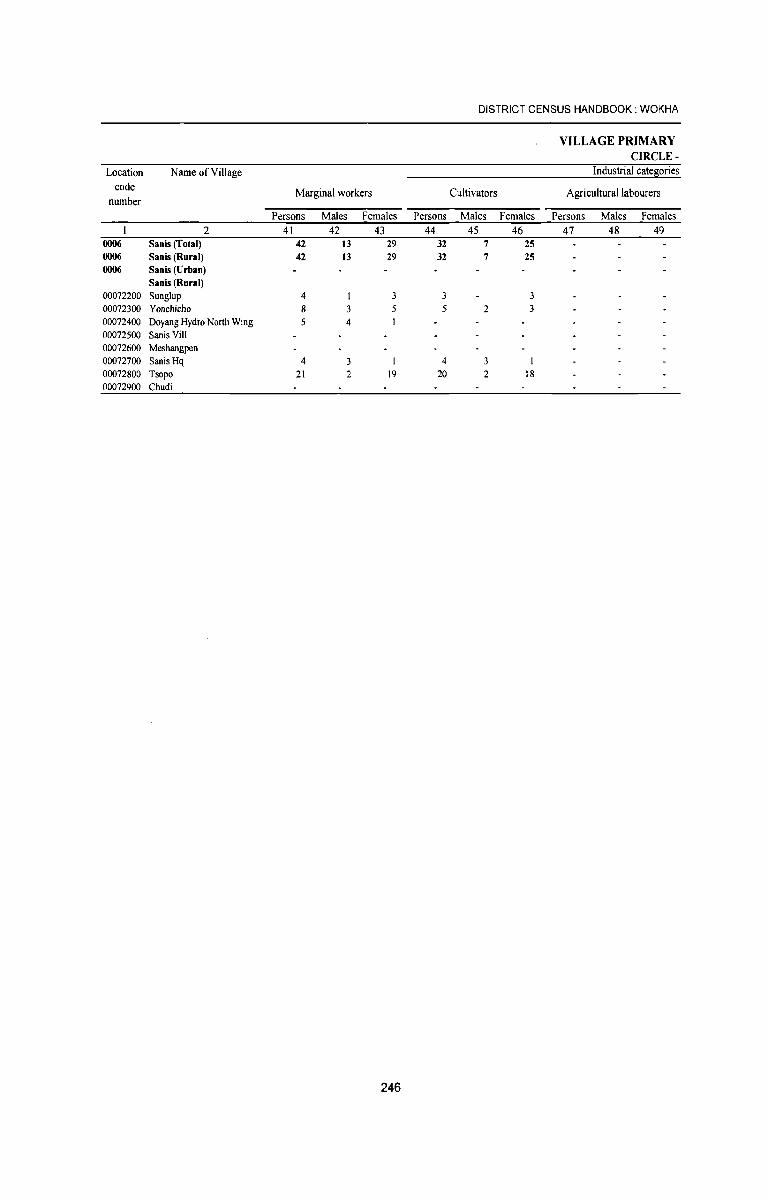
DISTRICT CENSUS HANDBOOK: WOKHA
VILLAGE PRIMARY CIRCLE-
Location Name ofViUage Industrial catesories code Marginal workers Cultivators Agricultural labourers
number Persons Males Females Persons Males Females Persons Males Females
2 41 42 43 44 45 46 47 48 49 0006 Sanis (Total) 42 13 29 32 7 25 0006 Sanis (Rural) 42 13 29 32 7 25 0006 Sanis (Urban)
Sanis (Rural) 00072200 Sunglup 4 3 3 3 00072300 Yonchicho 8 3 5 5 2 3 00072400 Doyang Hydro North Wing 5 4 00072500 Sanis ViII 00072600 Meshangpen 00072700 Sanis Hq 4 4 3 00072800 Tsopo 21 2 19 20 2 18 00072900 Chudi
246
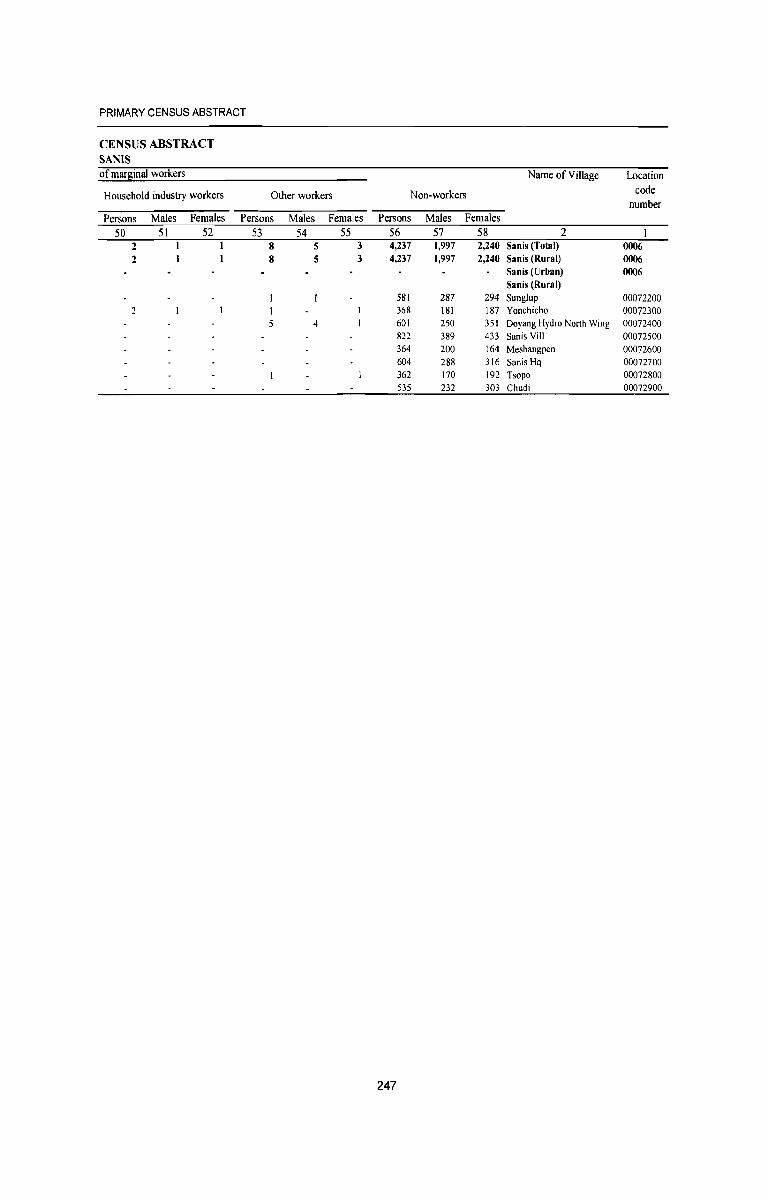
PRIMARY CENSUS ABSTRACT
CENSUS ABSTRACT SANIS of marginal workers
Household industry workers Other workers
Persons Males Females Persons Males Females 50
2 2
2
51 52 53 54 55 8 5 3 8 5 3
4
Name of Village Location
Non-workers code number
Persons Males Females 56 57 58 2 I 4,237 1,997 2,240 Sanis (Total) 0006 4,237 1,997 2,240 Sanis (Rural) 0006
Sanis (Urban) 0006 Sanis (Rural)
581 287 294 Sunglup 00072200 368 181 187 Yonchicho 00072300 601 250 351 Doyang Hydro North Wing 00072400 822 389 433 Sanis Viii 00072500 364 200 164 Meshangpen 00072600 604 288 316 Sanis Hq 00072700
362 170 192 Tsopo 00072800 535 232 303 Chudi 00072900
247

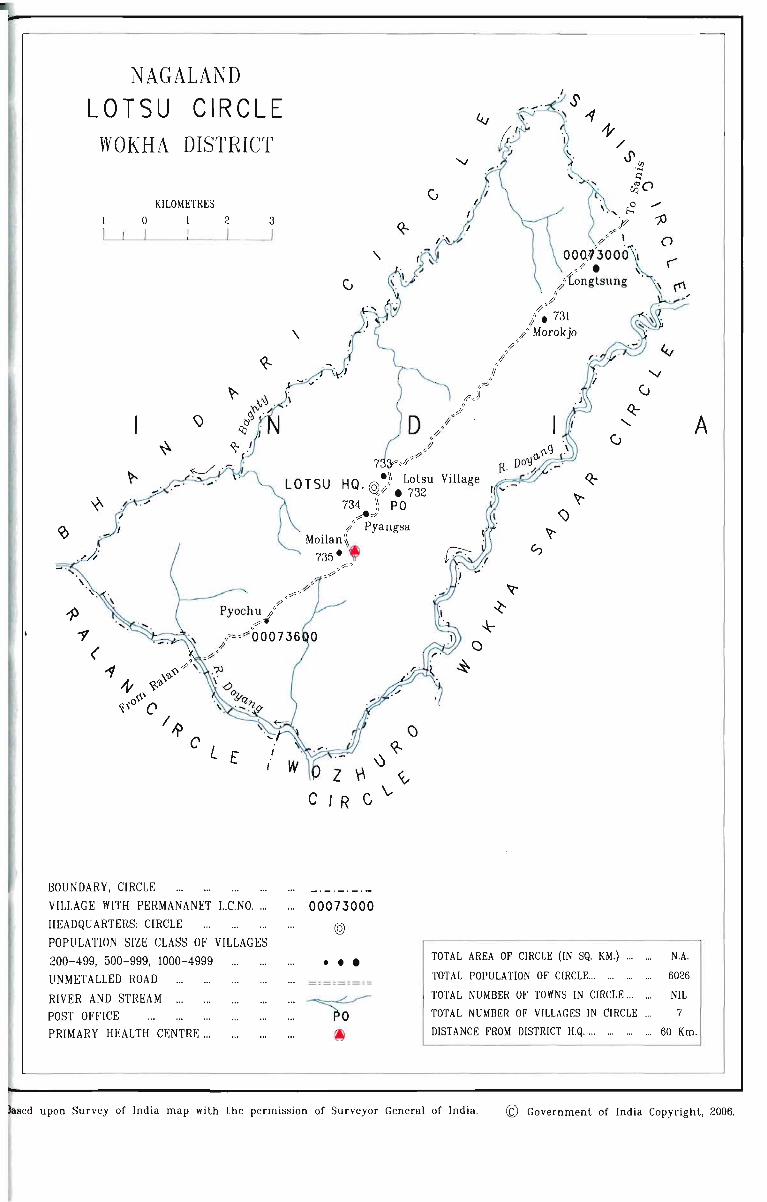
NAGALAND
LOTSU CIRCLE WOKHA DISTRICT
KILOMETRES
o 2
L E
BOUNDARY, CIRCLE
VILLAGE WITH PERMANANET L.e.NO ....
HEADQUARTER& CIRCLE
POPULATION SIZE CLASS OF VILLAGES
200-499, 500-999, 1000-4999
UNMETALLED ROAD
RIVER AND STREAM ... POST OFFICE PRIMARY HEALTH CENTRE ...
3 ~
'\ (
" (J
\
' _'",,'
()
\)~ Z r\ ~
C IRe \..
... 00073000
@
• • •
is 4; AI
~ /
~ J' <l) " .... " q
(J I C:S O /. !2 ,/ , \ . "'
I :p 1)
.p> . /. ' '/>.. ., ~. I ()
". 00Q,i'3000 " ('"
&<~ • 'I;
;- tongtsung "
A
TOTAL AREA OF CIRCLE (IN SQ. KM.)...... N.A.
TOTAL POPULATION OF CIRCLE... ... ... ... 6026
TOTAL NUMBER OF TOWNS IN CIRCLE... ... NIL
TOTAL NUMBER OF VILLAGES IN CIRCLE... 7
DISTANCE FROM DISTRICT H.Q.... ... ... ... 60 Km.
aased upon Survey of India map with lhe permission of Surveyor General of India. © Government of India Copyright, 2006.

Village Primary Census Abstract Lotsu Circle

DISTRICT CENSUS HANDBOOK: WOKHA
VILLAGE PRIMARY CIRCLE-
Location Name of Village Area of Number of
Total population (including Population in the
code Village in households
institutional and houseless age-group 0-6
number hectares population) Persons Males Females Persons Males Females
2 3 4 5 6 7 8 9 10
0007 Lotsu (Total) 864 6,026 3,071 2,955 476 244 232 0007 Lotsu (Rural) 864 6,026 3,071 2,955 476 244 232 0007 Lotsu (Urban)
Lotsu (Ru ra I) 00073000 Longtsung 220 1,557 786 771 80 25 55 00073100 Morokjo 101 554 307 247 42 29 13 00073200 Lotsu ViII. 181 1,469 724 745 84 32 52 00073300 Lotsu Hq 87 681 352 329 73 42 31 00073400 Pyangsa 87 588 293 295 80 49 31 00073500 Moilan 146 849 442 407 85 50 35 00073600 !1:ochu 42 328 167 161 32 17 15
252
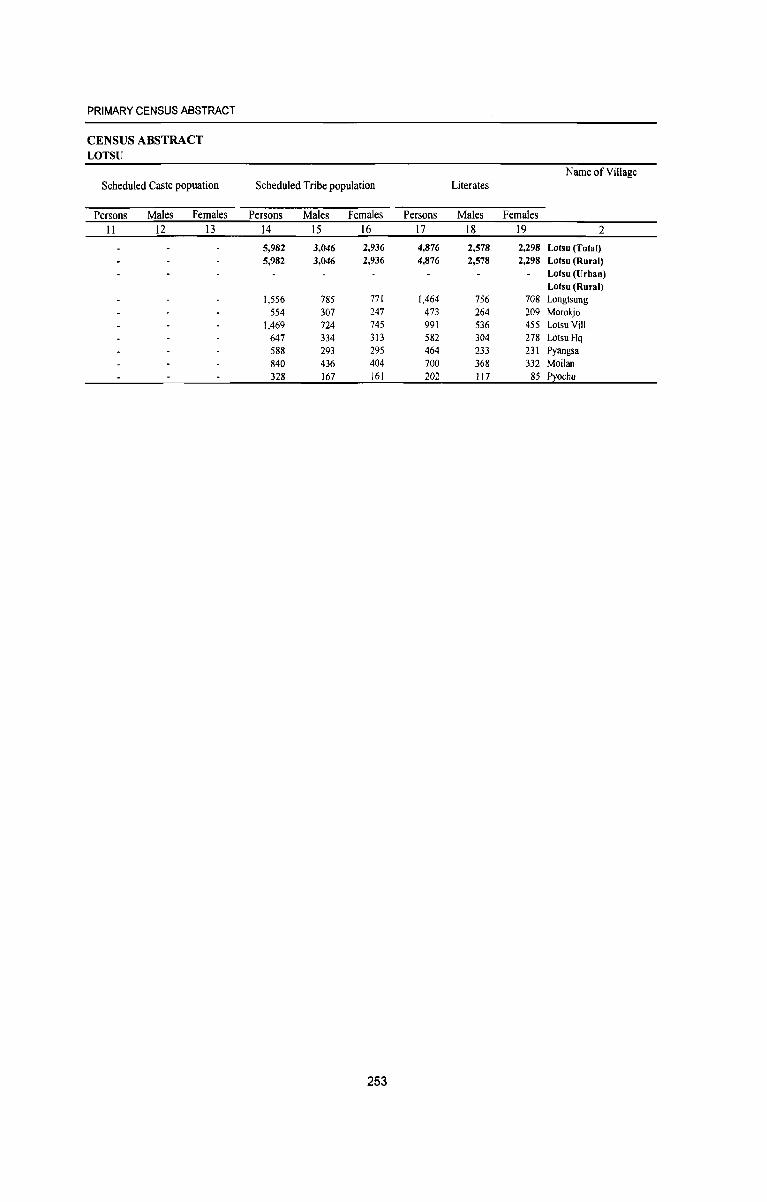
PRIMARY CENSUS ABSTRACT
CENSUS ABSTRACT LOTSU
Name of Village Scheduled Caste popuation Scheduled Tribe population Literates
Persons Males Females Persons Males Females Persons Males Females 11 12 13 14 15 16 17 18 19 2
5,982 3,046 2,936 4,876 2,578 2,298 Lotsu (Total) 5,982 3,046 2,936 4,876 2,578 2,298 Lotsu (Rural)
Lotsu (Urban) Lotsu (Rural)
1,556 785 771 1,464 756 708 Longtsung 554 307 247 473 264 209 Morokjo
1,469 724 745 991 536 455 Lotsu ViiI. 647 334 313 582 304 278 Lotsu Hq 588 293 295 464 233 231 Pyangsa 840 436 404 700 368 332 Moilan 328 167 161 202 117 85 Pyochu
253
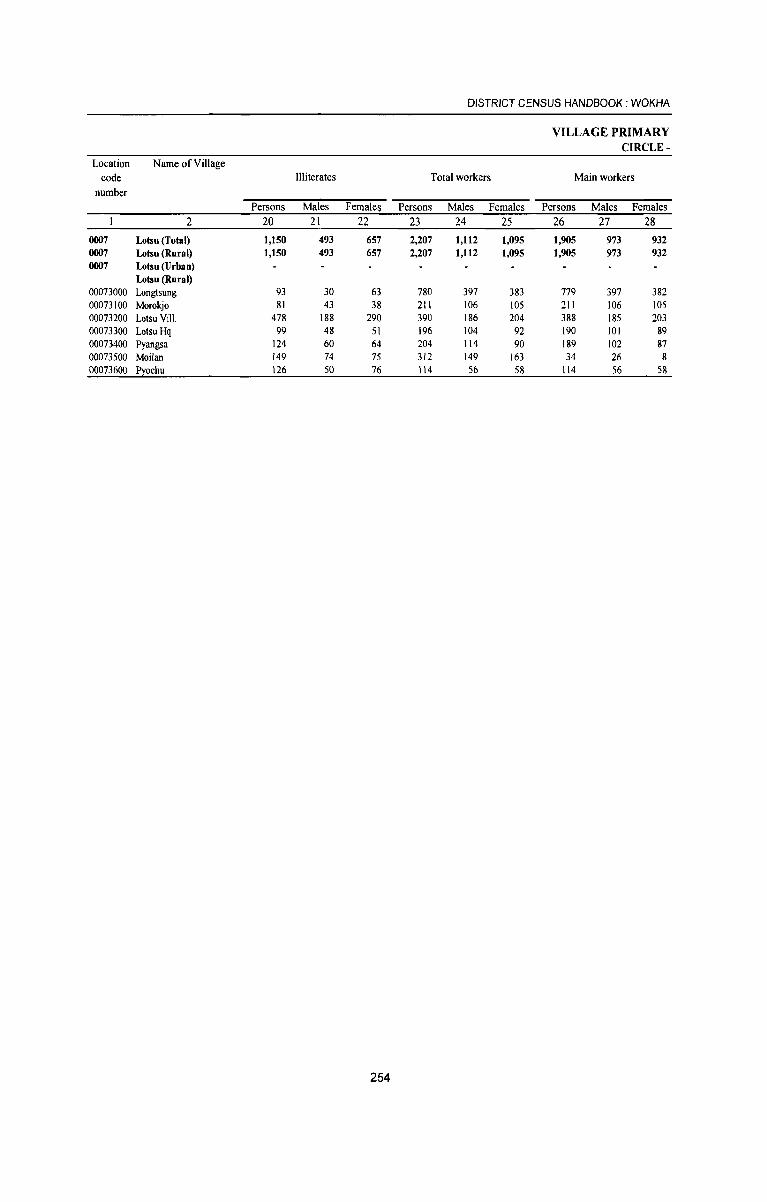
DISTRICT CENSUS HANDBOOK: WOKHA
VILLAGE PRIMARY CIRCLE-
Location Name of Village code Illiterates Total workers Main workers
number Persons Males Females Persons Males Females Persons Males Females
2 20 21 22 23 24 25 26 27 28
0007 Lotsu (Total) 1,150 493 657 2,207 1,112 1,095 1,905 973 932 0007 Lotsu (Rural) 1,150 493 657 2,207 1,112 1,095 1,905 973 932 0007 Lotsu (U rban)
Lotsu (Rural) 00073000 Longtsung 93 30 63 780 397 383 779 397 382 00073100 Morokjo 81 43 38 211 106 105 211 106 105 00073200 Lotsu ViiI. 478 188 290 390 186 204 388 185 203 00073300 Lotsu Hq 99 48 51 196 104 92 190 101 89 00073400 Pyangsa 124 60 64 204 114 90 189 102 87 00073500 Moilan 149 74 75 312 149 163 34 26 8 00073600 !J:ochu 126 50 76 114 56 58 114 56 S8
254
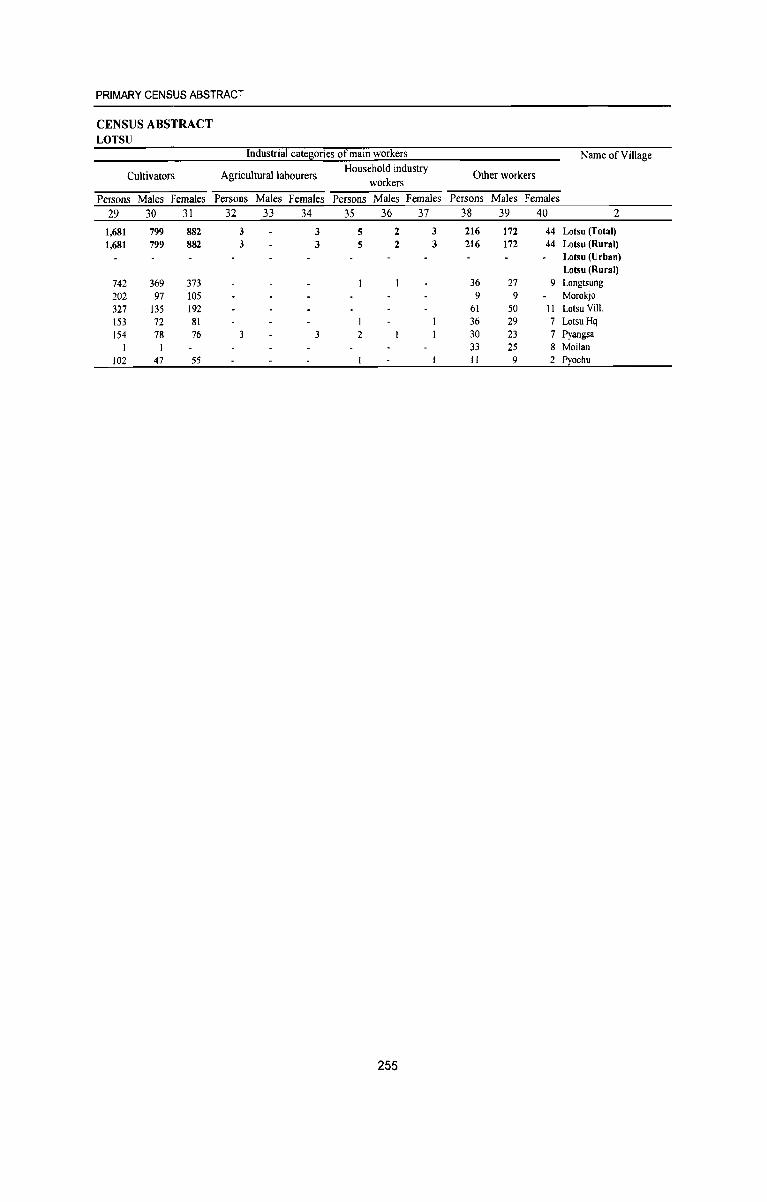
PRIMARY CENSUS ABSTRACT
CENSUS ABSTRACT LOTSU
Industrial cate~ories of main workers Name of Village
Cultivators Agricultural labourers Household industry
Other workers workers
Persons Males Females Persons Males Females Persons Males Females Persons Males Females 29 30 31 32 33 34 35 36 37 38 39 40 2
1,681 799 882 3 3 5 2 3 216 172 44 Lotsu (Total) 1,681 799 882 3 3 5 2 3 216 172 44 Lotsu (Rural)
Lotsu (Urban) Lotsu (Rural)
742 369 373 36 27 9 Longtsung 202 97 105 9 9 Morokjo 327 135 192 61 SO 11 Lotsu ViiI. 153 72 81 I 36 29 7 Lotsu Hq 154 78 76 3 2 30 23 7 Pyangsa
1 33 25 8 Moilan 102 47 55 II 9 2 Pyochu
255
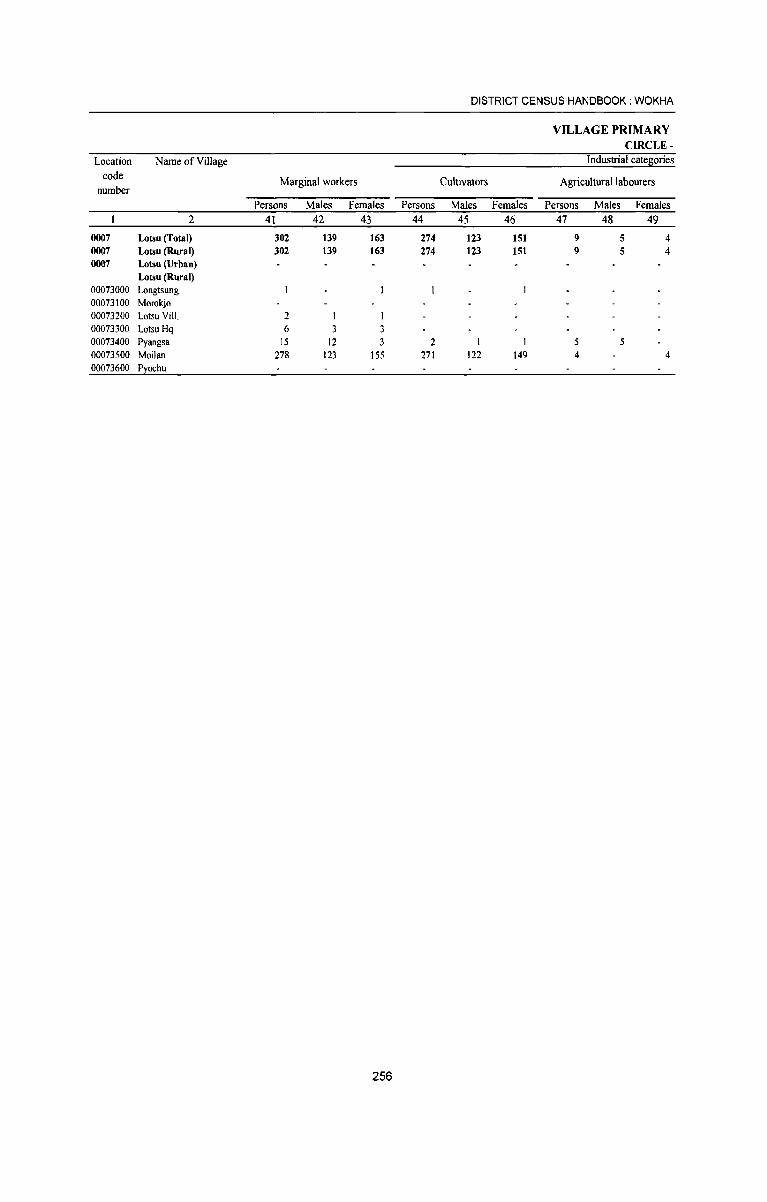
DISTRICT CENSUS HANDBOOK: WOKHA
VILLAGE PRIMARY CIRCLE -
Location Name of Village Industrial catellories
code Marginal workers Cultivators Agricultural labourers number
Persons Males Females Persons Males Females Persons Males Females 2 41 42 43 44 45 46 47 48 49
0007 Lotsu (Total) 302 139 163 274 123 151 9 5 4 0007 Lotsu (Rural) 302 139 163 274 123 151 9 5 4 0007 Lotsu (Urban)
Lotsu (Rural) 00073000 Longtsung 00073100 Morokjo 00073200 Lotsu ViII. 2 00073300 Lotsu Hq 6 3 00073400 Pyangsa 15 12 3 2 I 5 5 00073500 Moilan 278 123 155 271 122 149 4 4 00073600 !):ochu
256
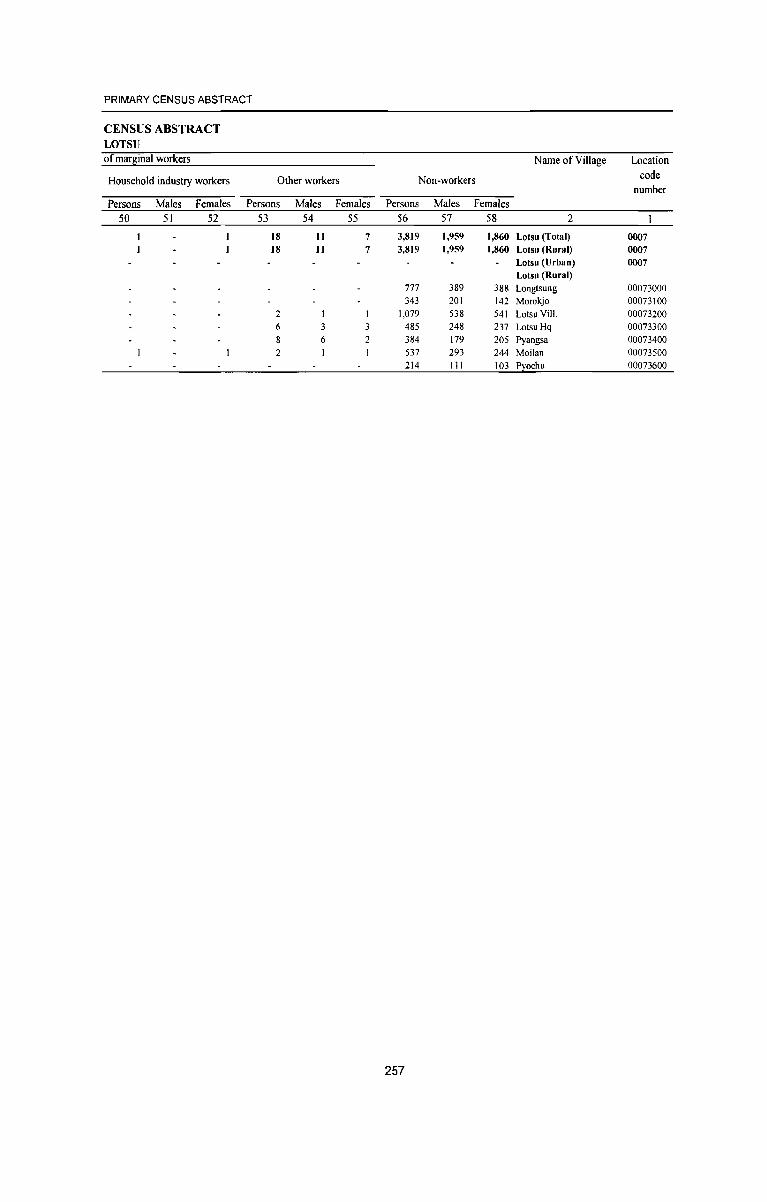
PRIMARY CENSUS ABSTRACT
CENSUS ABSTRACT LOTSU of mar!!;inal workers Name of Village Location
Household industry workers Other workers Non-workers code number
Persons Males Females Persons Males Females Persons Males Females 50 51 52 53 54 55 56 57 58 2
18 11 7 3,819 1,959 1,860 Lotsu (Total) 0007 18 11 7 3,819 1,959 1,860 Lotsu (Rural) 0007
Lotsu (Urban) 0007 Lotsu (Rural)
777 389 388 Longtsung 00073000 343 201 142 Morokjo 00073100
2 1 1,079 538 541 Lotsu Vill. 00073200 6 3 3 485 248 237 Lotsu Hq 00073300
6 2 384 179 205 Pyangsa 00073400 2 537 293 244 Moilan 00073500
214 111 103 P~ochu 00073600
257

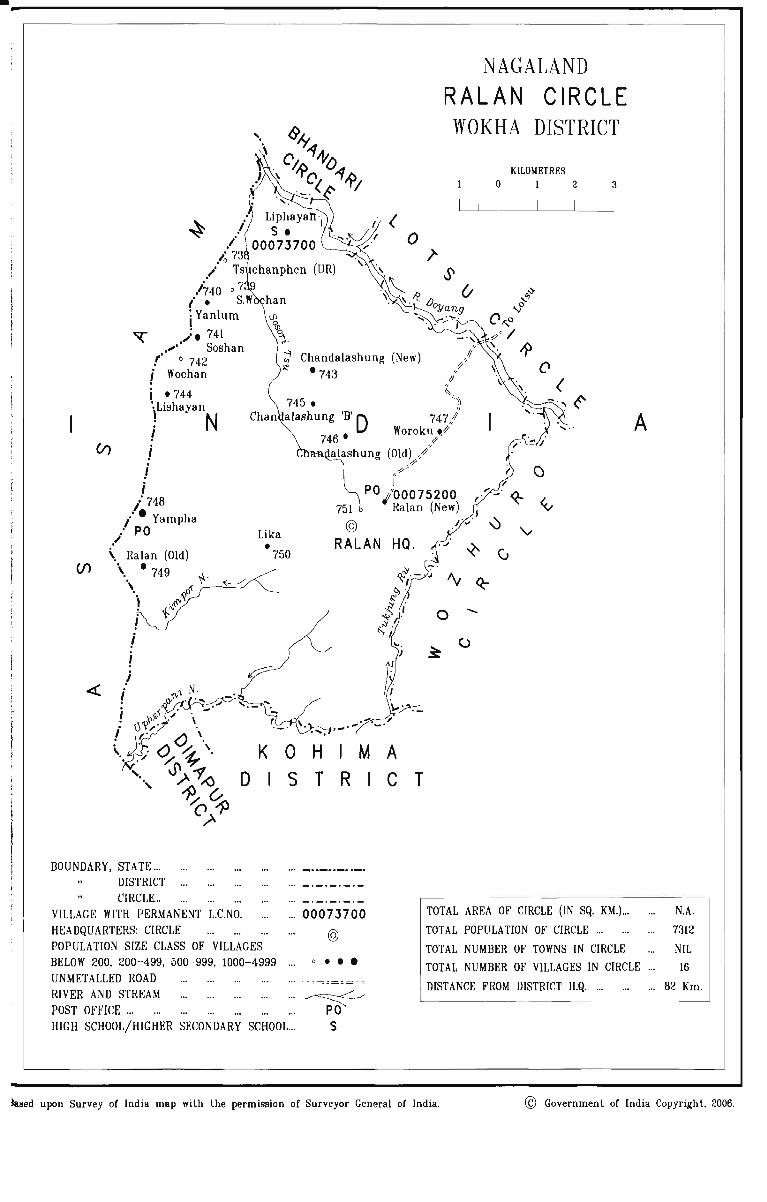
-~----------------------------------------------------------------------------------~
(/)
«
NAGALAND
RALAN CIRCLE WOKHA DISTRICT
. '" • Liphayan·, ~' .I s. o .I 00073700
I~ 73 ./ Ts chanphen (UR)
/740 07
,.. S.W i Yanlum
). 741 .;.' Soshan
t' 0 742 i Wochan
';J Chandalashung (New)
.: • 743 "
;/ ./'
;/ ~
745 • ~"\) "
i • 744 )LiShayan
N !
Chan alashung 'B'D 7471/
7 6 • Woroku "I'
i i ;
: 748 I :. Yampha
:' PO ,/ \. Ralan (Old)
\. • 749 ~. \. ~r1-
t .~ . i-'" i ! i
Lika • 750
0 S
H T
4 ,f
alashung (Old) ,/ .,y
,~-7'~
II PO i'00075200 (
751 Ralan (New) I
~ I'~
RALAN HQ .
o ....
~ )
r .....
. ". I' ...... .".
_ .
I M A R C T
KILOMETRES
o 1 2 3
i () "I'
r - ~ <v ~ v
(J
BOUNDARY, STATE ... DISTRICT CIRCLE. ..
VILLAGE WITH PERMANENT L.C.NO. HEADQUARTERS: CIRCLE
... 00073700
@
TOT AL AREA OF CIRCLE (IN SQ. KM.) ...
TOTAL POPULATION OF CIRCLE ...
TOT AL NUMBER OF TOWNS IN CIRCLE
A
N.A .
7312
NIL POPULATION SIZE CLASS OF VILLAGES BELOW 200, 200-499, 500-999, 1000-4999 UNMET ALLED ROAD
TOTAL NUMBER OF VILLAGES IN CIRCLE 16
DISTANCE FROM DISTRICT H.Q. ... 82 Km. RIVER AND STREAM ... ~ POST OFFICE ... ... PO HIGH SCHOOL/HIGHER SECONDARY SCHOOL... S
Jased upon Survey of India map with the permission of Surveyor General of India. © Government of India Copyright, 2006.

Village Primary Census Abstract Ralan Circle
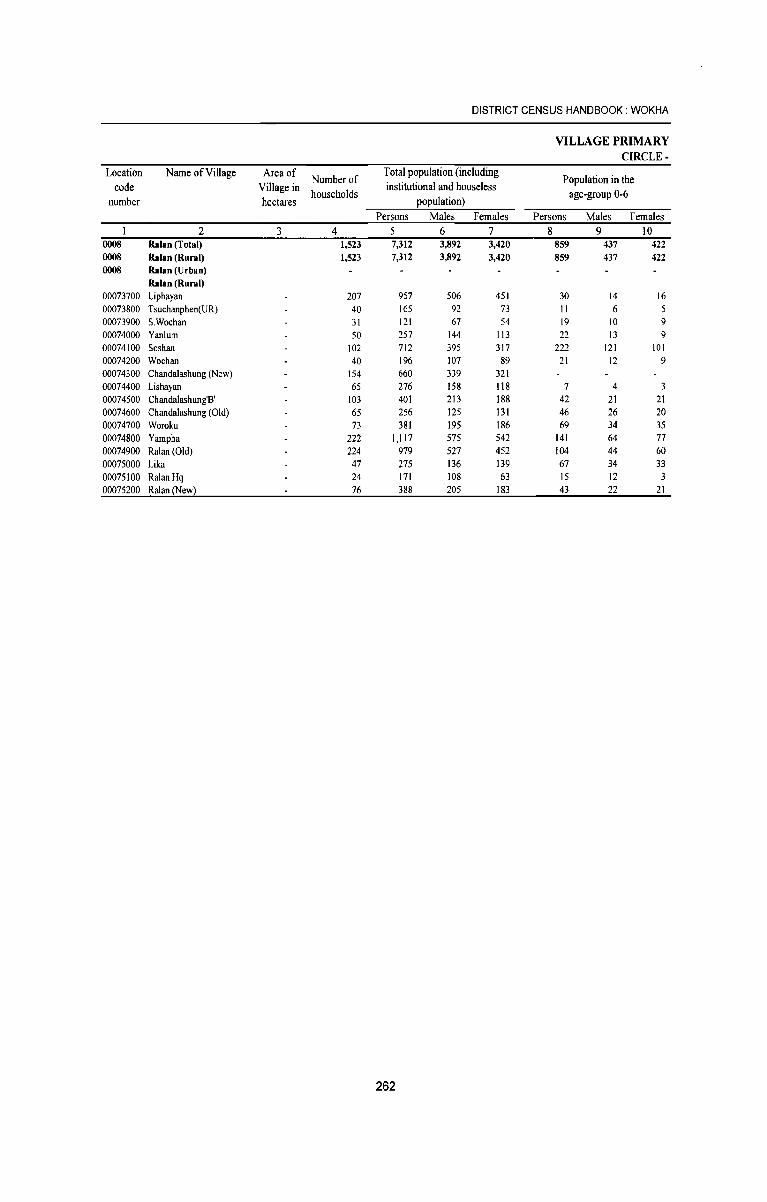
DISTRICT CENSUS HANDBOOK: WOKHA
VILLAGE PRIMARY CIRCLE·
Location Name of Village Area of Number of
Total population (including Population in the
code Village in households
institutional and houseless age-group 0-6
number hectares population)
Persons Males Females Persons Males Females
2 3 4 5 6 7 8 9 10 0008 Ralan (Total) 1,523 7,312 3,892 3,420 859 437 422 0008 Ralan (Rural) 1,523 7,312 3,892 3,420 859 437 422 0008 Ralan (Urban)
Ralan (Rural) 00073700 Liphayan 207 957 506 451 30 14 16 00073800 Tsuchanphen(UR) 40 165 92 73 11 6 5 00073900 S.Wochan 31 121 67 54 19 10 9 00074000 Yan1um 50 257 144 113 22 13 9 00074100 Soshan 102 712 395 317 222 121 101 00074200 Wochan 40 196 107 89 21 12 9 00074300 Chandalashung (New) 154 660 339 321 00074400 Lishayan 65 276 158 118 7 4 3 00074500 Chandalashung'B' 103 401 213 188 42 21 21 00074600 Chandalashung (Old) 65 256 125 131 46 26 20 00074700 Woroku 73 381 195 186 69 34 35 00074800 Yampha 222 1,117 575 542 141 64 77 00074900 Ralan (Old) 224 979 527 452 104 44 60 00075000 Lika 47 275 136 139 67 34 33 00075100 RalanHq 24 171 108 63 15 12 3 00075200 Ralan~ew~ 76 388 205 183 43 22 21
262
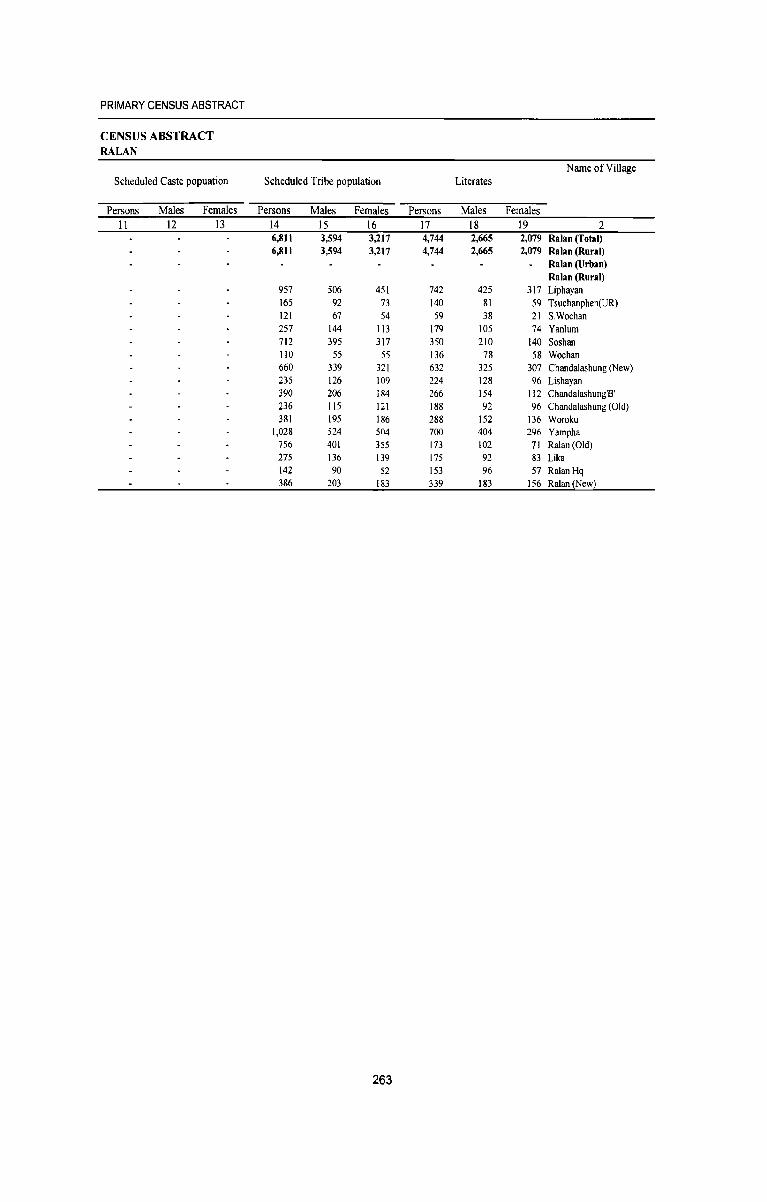
PRIMARY CENSUS ABSTRACT
CENSUS ABSTRACT RALAN
Name ofViUage Scheduled Caste popuation Scheduled Tribe population Literates
Persons Males Females Persons Males Females Persons Males Females II 12 13 14 15 16 17 18 19 2
6,811 3,594 3,217 4,744 2,665 2,079 Ralan (Total) 6,811 3,594 3,217 4,744 2,665 2,079 Ralan (Rural)
Ralan (Urban) Ralan (Rural)
957 506 451 742 425 317 Lipbayan 165 92 73 140 81 59 Tsuebanpben(UR) 121 67 54 59 38 21 S.Wochan 257 144 113 179 105 74 Yanlum 712 395 317 350 210 140 Sosban 110 55 55 136 78 58 Woehan 660 339 321 632 325 307 Chandalasbung (New) 235 126 109 224 128 96 Lisbayan 390 206 184 266 154 112 Chandalashung'B' 236 115 121 188 92 96 Chandalashung (Old) 381 195 186 288 152 136 Woroku
1,028 524 504 700 404 296 Yampha 756 401 355 173 102 71 Ralan(Old) 275 136 139 175 92 83 Lika 142 90 52 153 96 57 RalanHq 386 203 183 339 183 156 Ralan(New)
263
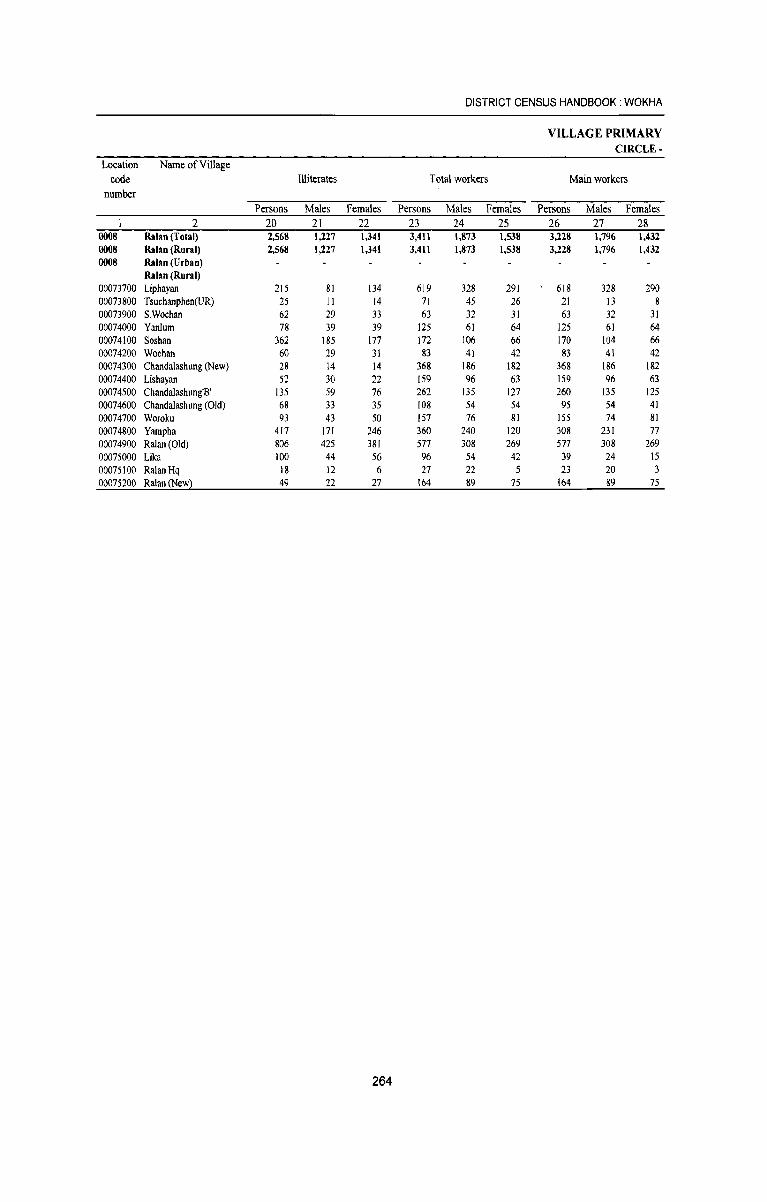
DISTRICT CENSUS HANDBOOK: WOKHA
VILLAGE PRIMARY CIRCLE·
Location Name of Village
code Illiterates Total workers Main workers
number
Persons Males Females Persons Males Females Persons Males Females
2 20 21 22 23 24 25 26 27 28 0008 Ralan (Total) 2,568 1,227 1,341 3,411 1,873 1,538 3,228 1,796 1,432 0008 Ralan (Rural) 2,568 1,227 1,341 3,411 1,873 1,538 3,228 1,796 1,432 0008 Ralan (Urban)
Ralan (Rural) 00073700 Liphayan 215 81 134 619 328 291 618 328 290 00073800 Tsuchanphen(UR) 25 11 14 71 45 26 21 13 8 00073900 SWochan 62 29 33 63 32 31 63 32 31 00074000 Yan1um 78 39 39 125 61 64 125 61 64 00074100 Soshan 362 185 177 172 106 66 170 104 66 00074200 Wochan 60 29 31 83 41 42 83 41 42 00074300 Chandalashung (New) 28 14 14 368 186 182 368 186 182 00074400 Lishayan 52 30 22 159 96 63 159 96 63 00074500 Chandalashung'B' 135 59 76 262 135 127 260 135 125 00074600 Chandalashung (Old) 68 33 35 108 54 54 95 54 41 00074700 Woroku 93 43 50 157 76 81 155 74 81 00074800 Yampha 417 171 246 360 240 120 308 231 77 00074900 Ralan(Old) 806 425 381 577 308 269 577 308 269 00075000 Lika 100 44 56 96 54 42 39 24 15 00075100 RalanHq 18 12 6 27 22 5 23 20 3 00075200 Ralan~ew} 49 22 27 164 89 75 164 89 75
264
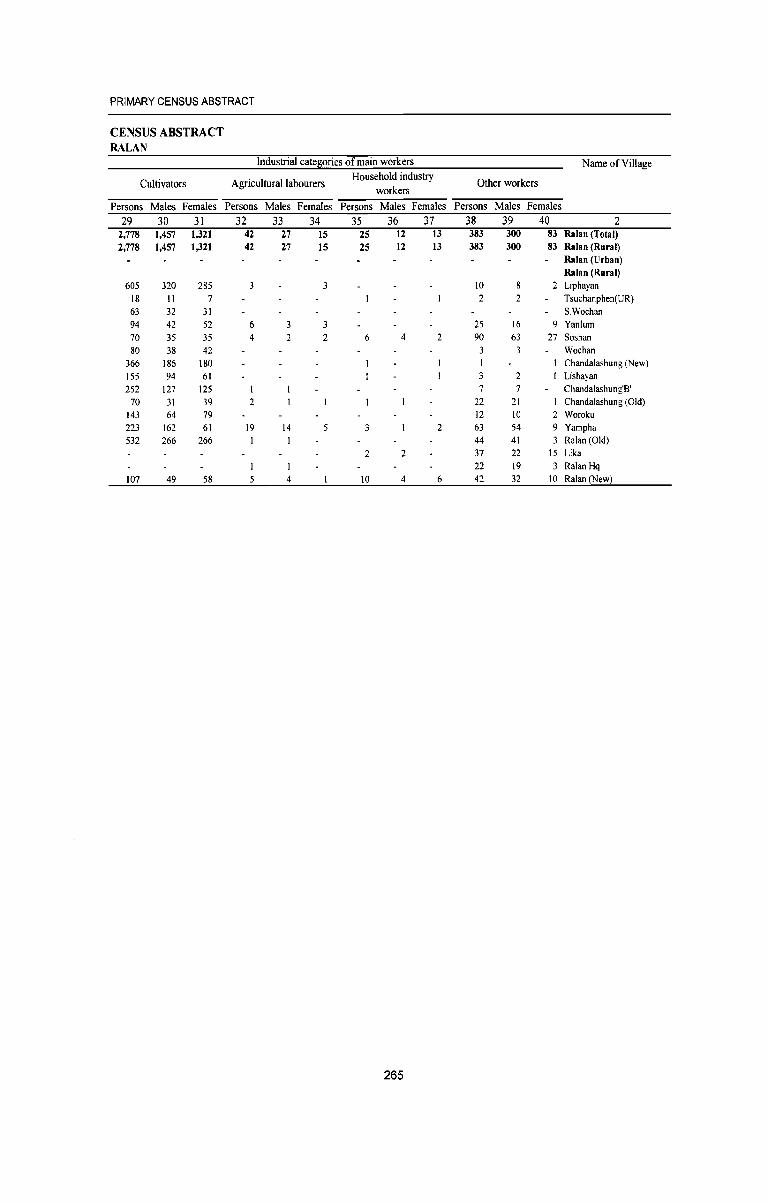
PRIMARY CENSUS ABSTRACT
CENSUS ABSTRACT RALAN
Industrial catesories of main workers Name of Village
Cultivators Agricultural labourers Household industry
Other workers workers
Persons Males Females Persons Males Females Persons Males Females Persons Males Females
29 30 31 32 33 34 35 36 37 38 39 40 2 2,778 1,457 1,321 42 27 15 25 12 13 383 300 83 Ralan (Total) 2,778 1,457 1,321 42 27 15 25 12 13 383 300 83 Ralan (Rural)
Ralan (Urban) Ralan (Rural)
605 320 285 3 10 2 Liphayan 18 11 7 2 2 Tsuchanphen(UR) 63 32 31 SWochan 94 42 52 6 3 25 16 9 Yanlum 70 35 35 4 2 2 6 4 2 90 63 27 Soshan 80 38 42 3 Wochan
366 186 180 Chandalashung (New) 155 94 61 3 2 Lishayan 252 127 125 7 7 Chandalashung'B'
70 31 39 2 22 21 I Chandaiashung (Old) 143 64 79 12 10 2 Woroku 223 162 61 19 14 5 3 2 63 54 9 Yampha 532 266 266 1 44 41 3 Ralan(Old)
2 2 37 22 15 Lika 22 19 3 RalanHq
107 49 58 4 10 4 6 42 32 10 Ralan(New)
265
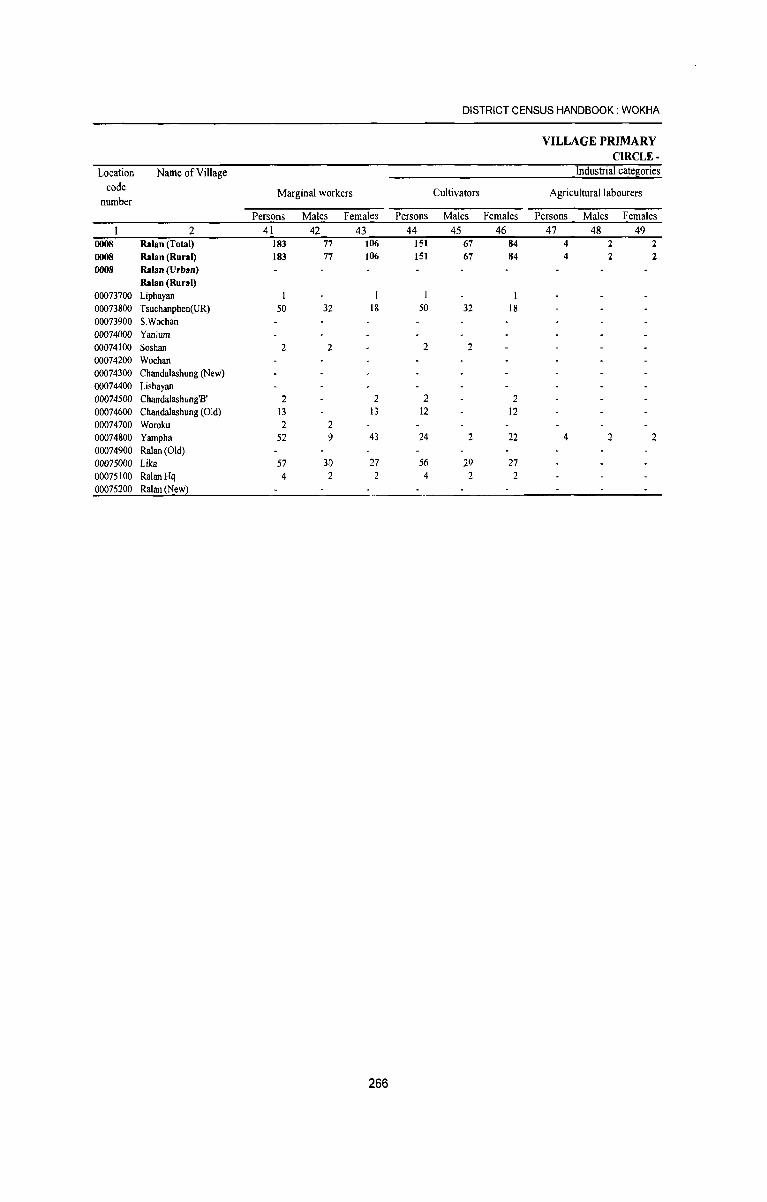
DISTRICT CENSUS HANDBOOK: WOKHA
VILLAGE PRIMARY CIRCLE·
Location Name of Village Industrial cate~ories
code Marginal workers Cultivators Agricultural labourers number
Persons Males Females Persons Males Females Persons Males Females
2 41 42 43 44 45 46 47 48 49 0008 Ralan (Total) 183 77 106 151 67 84 4 2 2 0008 Ralan (Rural) 183 77 106 151 67 84 4 2 2 0008 Ralan (Urban)
Ralan (Rural) 00073700 Liphayan 00073800 Tsuchanphen(UR) 50 32 18 50 32 18 00073900 S.Wochan 00074000 Yanlum 00074100 Soshan 2 2 2 2 00074200 Wochan 00074300 Chanda1ashung (New) 00074400 Lishayan 00074500 Chandalashung'B' 2 2 2 2 00074600 Chandalashung (Old) 13 13 12 12 00074700 Woroku 2 2 00074800 Yampha 52 9 43 24 2 22 4 2 2 00074900 Ralan (Old) 00075000 Lika 57 30 27 56 29 27 00075100 RalanHq 4 2 4 2 2 00075200 Ralan(New)
266
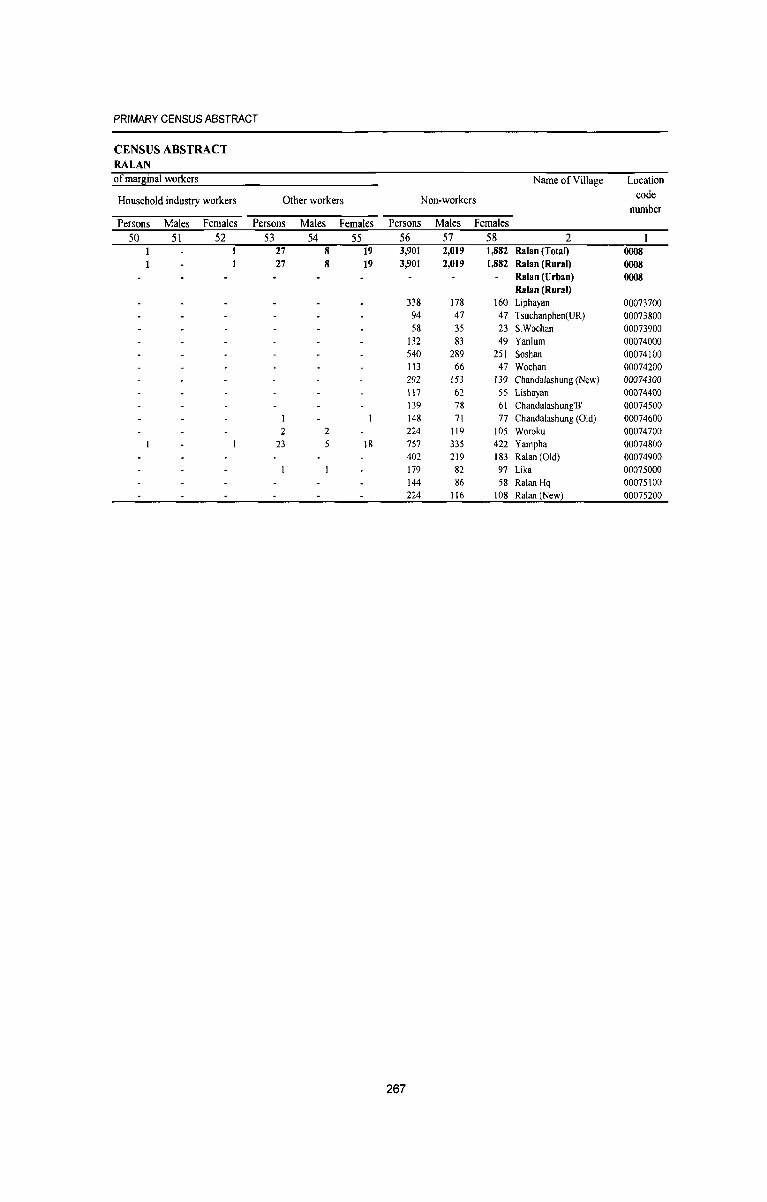
PRIMARY CENSUS ABSTRACT
CENSUS ABSTRACT RALAN of mar~inal workers Name of Village Location
Household industry workers Other workers Non-workers code number
Persons Males Females Persons Males Females Persons Males Females 50 51 52 53 54 55 56 57 58 2
27 8 19 3,901 2,019 1,882 Ralan (Total) 0008 27 8 19 3,901 2,019 1,882 Ralan (Rural) 0008
Ralan (Urban) 0008 Ralan (Rural)
338 178 160 Liphayan 00073700 94 47 47 Tsuchanphen(UR) 00073800 58 35 23 S.wochan 00073900
132 83 49 Yanlum 00074000 540 289 251 Soshan 00074100 113 66 47 Wachan 00074200 292 153 139 Chandalashung (New) 00074300 \l7 62 55 Lishayan 00074400 139 78 61 Chandalashung'B' 00074500 148 71 77 Chandalashung (Old) 00074600
2 2 224 119 105 Woroku 00074700 23 5 18 757 335 422 Yampha 00074800
402 219 183 Ralan(Old) 00074900 179 82 97 Lika 00075000 144 86 58 Ralan Hq 00075100 224 116 108 Ralan (Newl 00075200
267

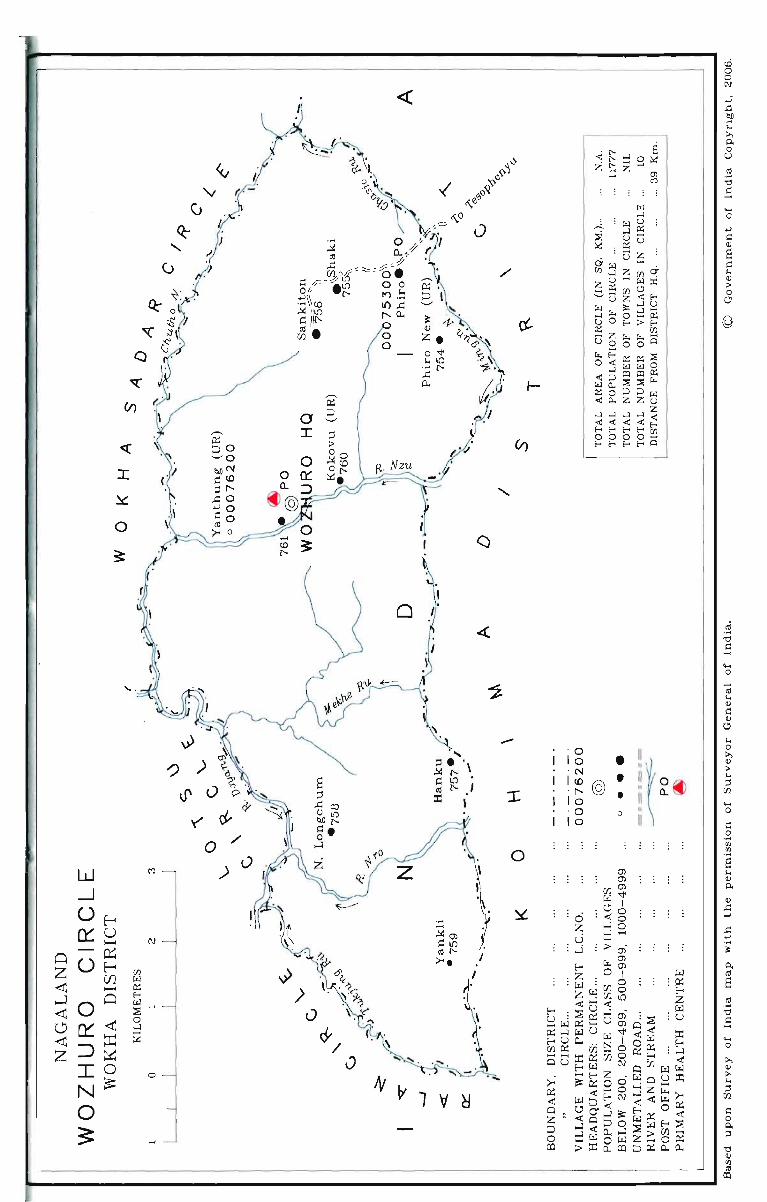
Q:-
(J
I\- ~: '" o l
:S 'I 't .::1 \
tJ· Q
""{'
(/)
« I
~
o
'-.
'v (J
l )
,I
'J
l
.) )
V
~/ J
«
«
J
./
-
o
' 0 10 'N 1<0 . r--10 ' 0 10
: : :
• II ~ • ii o ~ @ • ii n. ~
" D II
OJ • OJ • OJ
\Il"<l' !:ill
.0 0 : <t 0 ....lo ....:I .....
~==------------------------------~
~ a a N
'"' o
..... o
... o >, Q)
> ... :l
rtJ.
Q)
..c: ..-
..... o >, Q)
> .... :l
rtJ.
>:: o Q, ;:l
'0 Q) til
~

Village Primary Census Abstract Wozhuro Circle
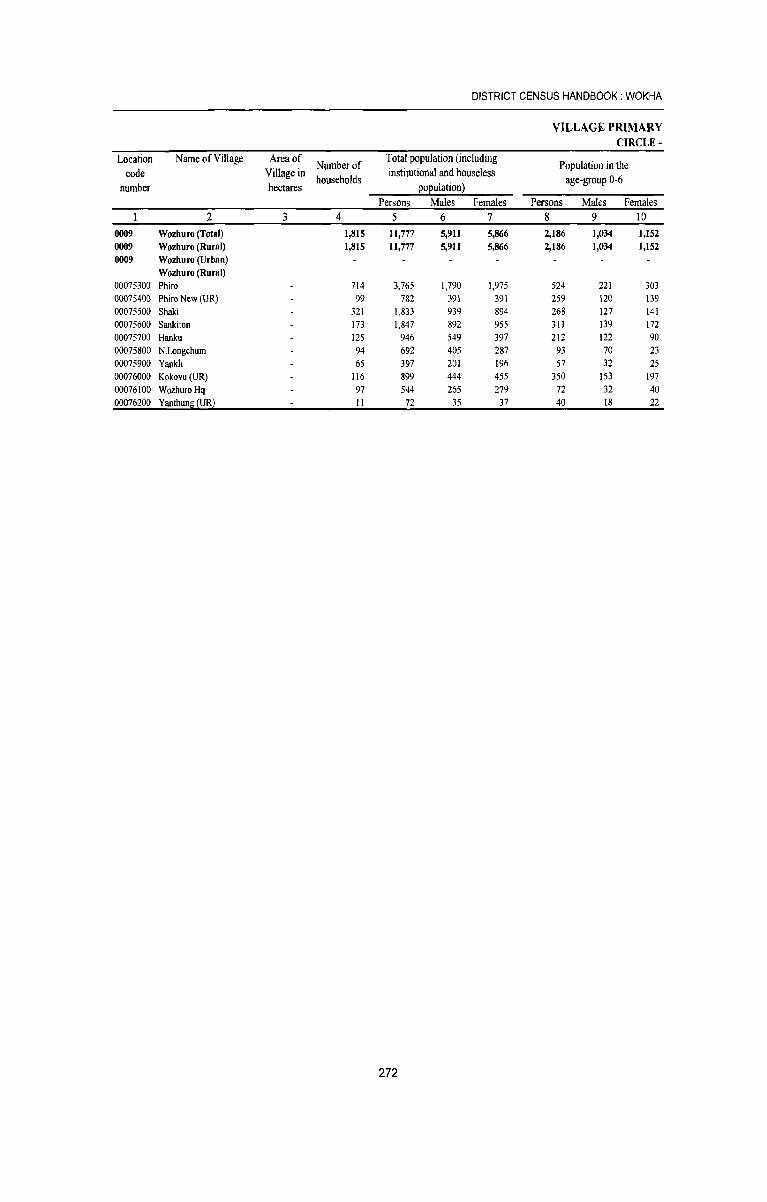
DISTRICT CENSUS HANDBOOK: WOKHA
VILLAGE PRIMARY CIRCLE-
Location Name of Village Area of Number of
Total population (including Population in the
code Village in households
institutional and houseless age-group 0-6
number hectares popUlation) Persons Males Females Persons Males Females
2 3 4 5 6 7 8 9 1D 0009 Wozhuro (Total) 1,815 11,777 5,911 5,866 2,186 1,034 1,152 0009 Wozhuro (Rural) 1,815 11,777 5,911 5,866 2,186 1,034 1,152 0009 Wozhuro (Urban)
Wozhuro (Rural) 00075300 Phiro 714 3,765 1,790 1,975 524 221 303 00075400 Phiro New (UR) 99 782 391 391 259 120 139 00075500 Shaki 321 1,833 939 894 268 127 141 00075600 Sankiton 173 1,847 892 955 311 139 172 00075700 Hanku 125 946 549 397 212 122 90 00075800 N.Longchum 94 692 405 287 93 70 23 00075900 Yankli 65 397 201 196 57 32 25 00076000 Kokovu(UR) 116 899 444 455 350 153 197 00076100 WozhuroHq 97 544 265 279 72 32 40 00076200 Yanthun~ (UR) II 72 35 37 40 18 22
272
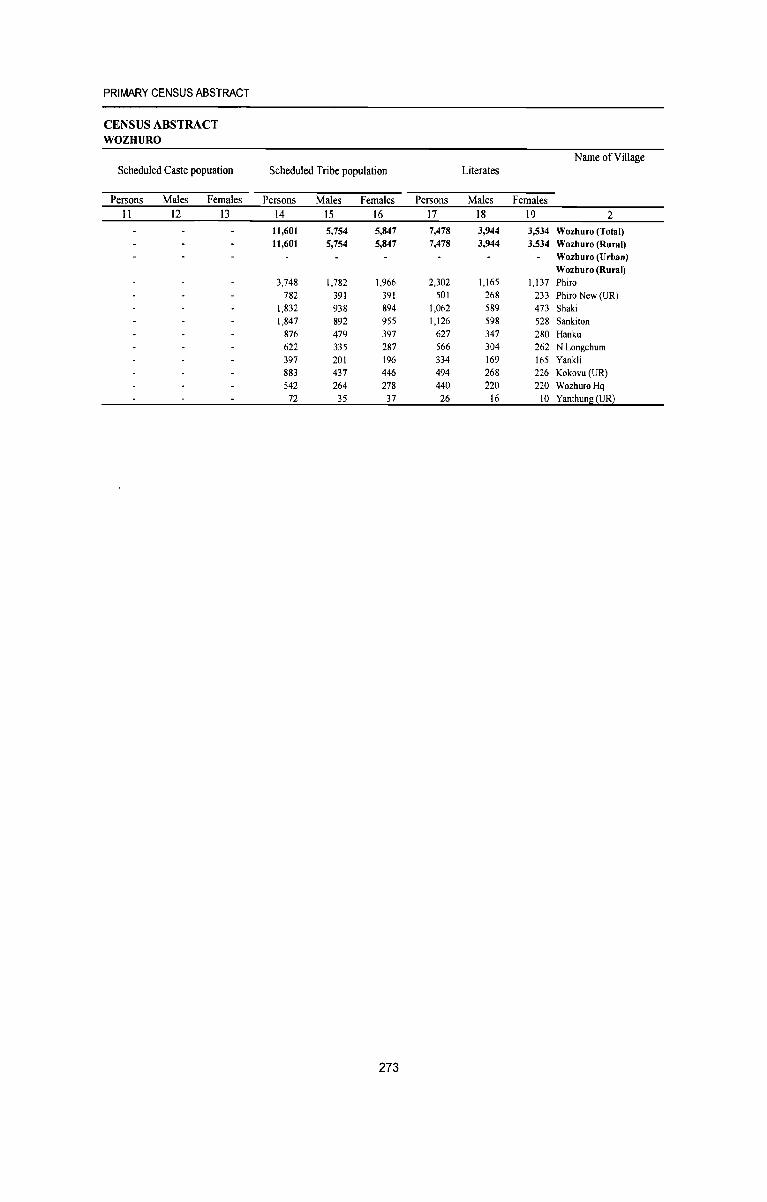
PRIMARY CENSUS ABSTRACT
CENSUS ABSTRACT WOZHURO
Name of Village Scheduled Caste popuation Scheduled Tribe population Literates
Persons Males Females Persons Males Females Persons Males Females 11 12 13 14 15 16 17 18 19 2
11,601 5,754 5,847 7,478 3,944 3,534 Wozhuro (Total) 11,601 5,754 5,847 7,478 3,944 3,534 Wozhuro (Rural)
Wozhuro (Urban) Wozhuro (Rural)
3,748 1,782 1,966 2,302 1,165 1,137 Phiro 782 391 391 501 268 233 Phiro New (UR)
1,832 938 894 1,062 589 473 Shaki 1,847 892 955 1,126 598 528 Sankiton
876 479 397 627 347 280 Hanku 622 335 287 566 304 262 N.Longchum 397 201 196 334 169 165 Yankli 883 437 446 494 268 226 Kokovu (UR) 542 264 278 440 220 220 WozhuroHq 72 35 37 26 16 10 Yanthung (UR)
273

DISTRICT CENSUS HANDBOOK: WOKHA
VILLAGE PRIMARY CIRCLE-
Location Name of Village code Illiterates Total workers Main workers
number Persons Males Females Persons Males Females Persons Males Females
2 20 21 22 23 24 25 26 27 28 0009 Wozhuro (Total) 4,299 1,967 2,332 4,418 2,273 2,145 4,381 2,256 2,125 0009 Wozhuro (Rural) 4,299 1,967 2,332 4,418 2,273 2,145 4,381 2,256 2,125 0009 Wozhuro (Urban)
Wozhuro (Rural) 00075300 Phiro 1,463 625 838 1,582 775 807 1,577 775 802 00075400 Phiro New (UR) 281 123 158 203 100 103 200 100 100 00075500 Shaki 771 350 421 833 429 404 820 419 401 00075600 Sankiton 721 294 427 615 276 339 603 270 333 00075700 Hanku 319 202 117 373 221 152 372 221 151 00075800 N.Longchum 126 101 25 241 156 85 241 156 85 00075900 Yankli 63 32 31 156 77 79 156 77 79 00076000 Kokovu(UR) 405 176 229 267 138 129 265 137 128 00076100 Wozhuro Hq 104 45 59 130 90 40 129 90 39 00076200 Yanthun~ (UR) 46 19 27 18 11 7 18 11 7
274
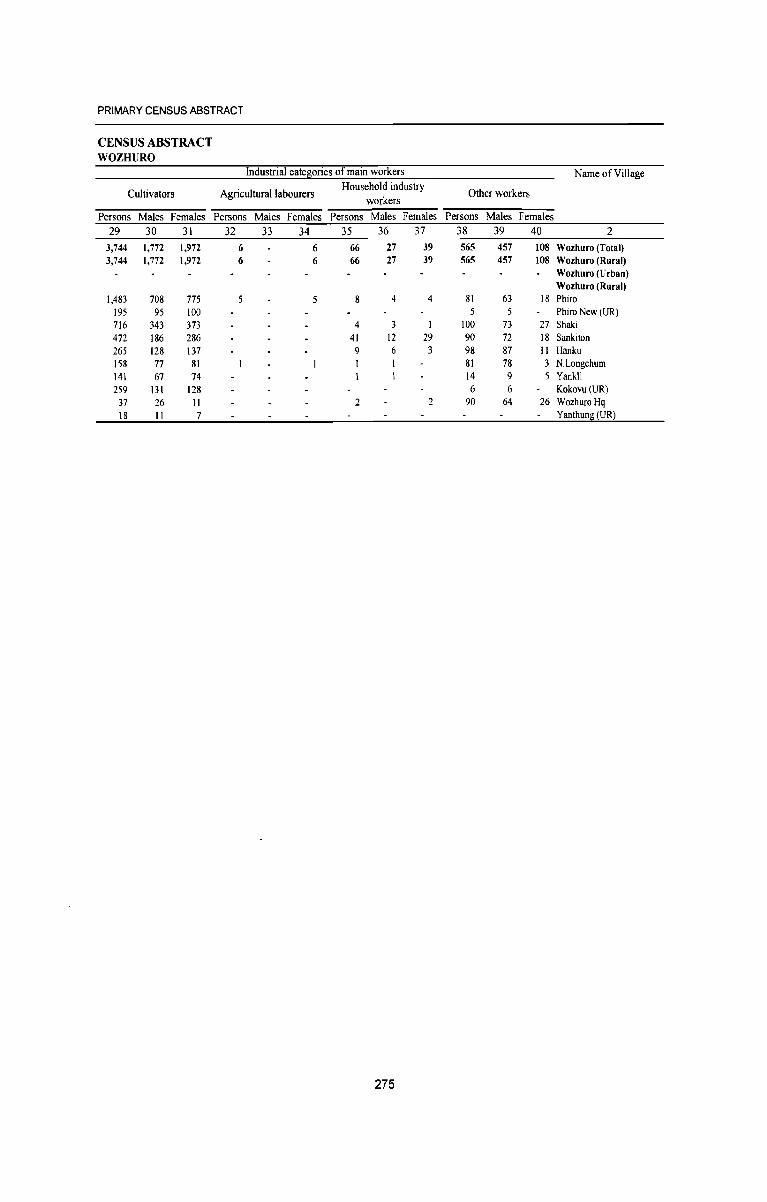
PRIMARY CENSUS ABSTRACT
CENSUS ABSTRACT WOZHURO
Industrial catesories of main workers Name of Village
Cultivators Agricultural labourers Household industry
Other workers workers
Persons Males Females Persons Males Females Persons Males Females Persons Males Females 29 30 31 32 33 34 35 36 37 38 39 40 2
3,744 1,772 1,972 6 6 66 27 39 565 457 108 Wozhuro (Total) 3,744 1,772 1,972 6 6 66 27 39 565 457 108 Wozhuro (Rural)
Wozhuro (Urban) Wozhuro (Rural)
1,483 708 775 5 8 4 4 81 63 18 Phiro 195 95 100 5 5 Phiro New (UR) 716 343 373 4 3 100 73 27 Shaki 472 186 286 41 12 29 90 72 18 Sankiton 265 128 137 9 6 3 98 87 11 Hanku 158 77 81 81 78 3 N.Longchum 141 67 74 14 9 5 Yankli 259 131 128 6 6 Kokovu(UR)
37 26 11 2 2 90 64 26 Wozhuro Hq 18 II 7 Yanthung (UR)
275
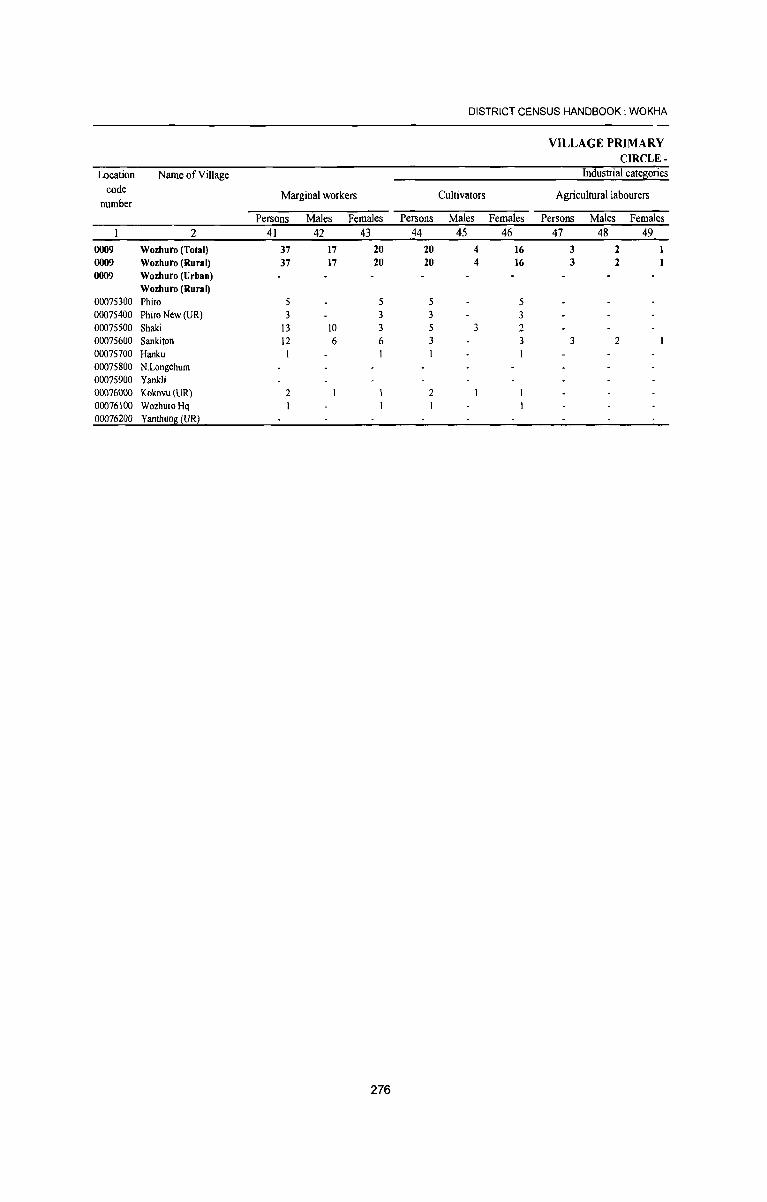
DISTRICT CENSUS HANDBOOK: WOKHA
VILLAGE PRIMARY CIRCLE-
Location Name of Village Industrial cate!!i0ries code Marginal workers
number Cultivators Agricultural labourers
Persons Males Females Persons Males Females Persons Males Females 2 41 42 43 44 45 46 47 48 49
0009 Wozhuro (Total) 37 17 20 20 4 16 3 2 0009 Wozhuro (Rural) 37 17 20 20 4 16 3 2 0009 Wozhuro (Urban)
Wozhuro (Rural) 00075300 Phiro 5 5 5 5 00075400 Phiro New (UR) 3 3 3 3 00075500 Shalei 13 10 3 5 2 00075600 Sankiton 12 6 6 3 3 3 2 00075700 Hanku 1 00075800 N.Longchum 00075900 Yankli 00076000 Kokovu (UR) 2 2 00076100 WozhuroHq 00076200 Yanthun~ (URl
276
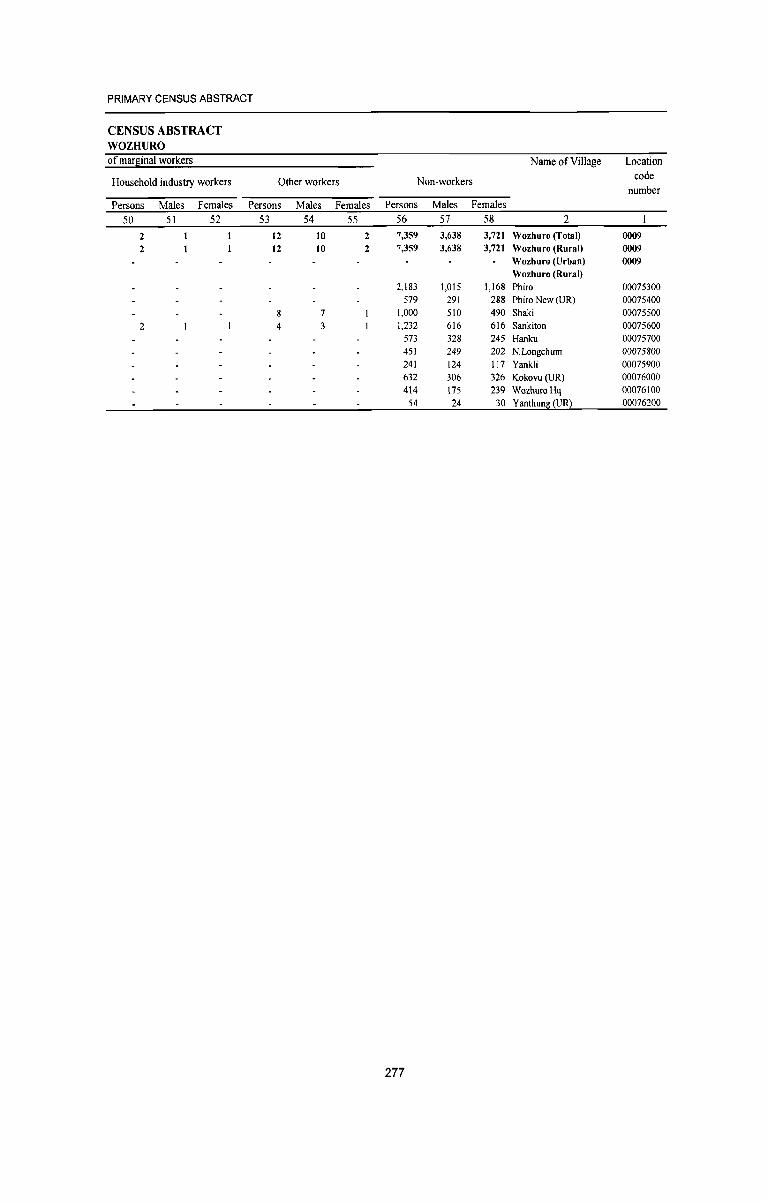
PRIMARY CENSUS ABSTRACT
CENSUS ABSTRACT WOZHURO of marj!inal workers Name ofVilJage Location
Household industry workers Other workers Non"workers code number
Persons Males Females Persons Males Females Persons Males Females
50 51 52 53 54 55 56 57 58 2
2 12 10 2 7,359 3,638 3,721 Wozhuro (Total) 0009 2 12 10 2 7,359 3,638 3,721 Wozhuro (Rural) 0009
Wozhuro (Urban) 0009 Wozhuro (Rural)
2,183 1,015 1,168 Phiro 00075300 579 291 288 Phiro New (UR) 00075400
7 1,000 510 490 Shaki 00075500 2 4 3 1,232 616 616 Sankiton 00075600
573 328 245 Hanku 00075700 451 249 202 N.Longchum 00075800 241 124 117 Yankli 00075900 632 306 326 Kokovu(UR) 00076000 414 175 239 WozhuroHq 00076100
54 24 30 Yanthun~ (URl 00076200
277

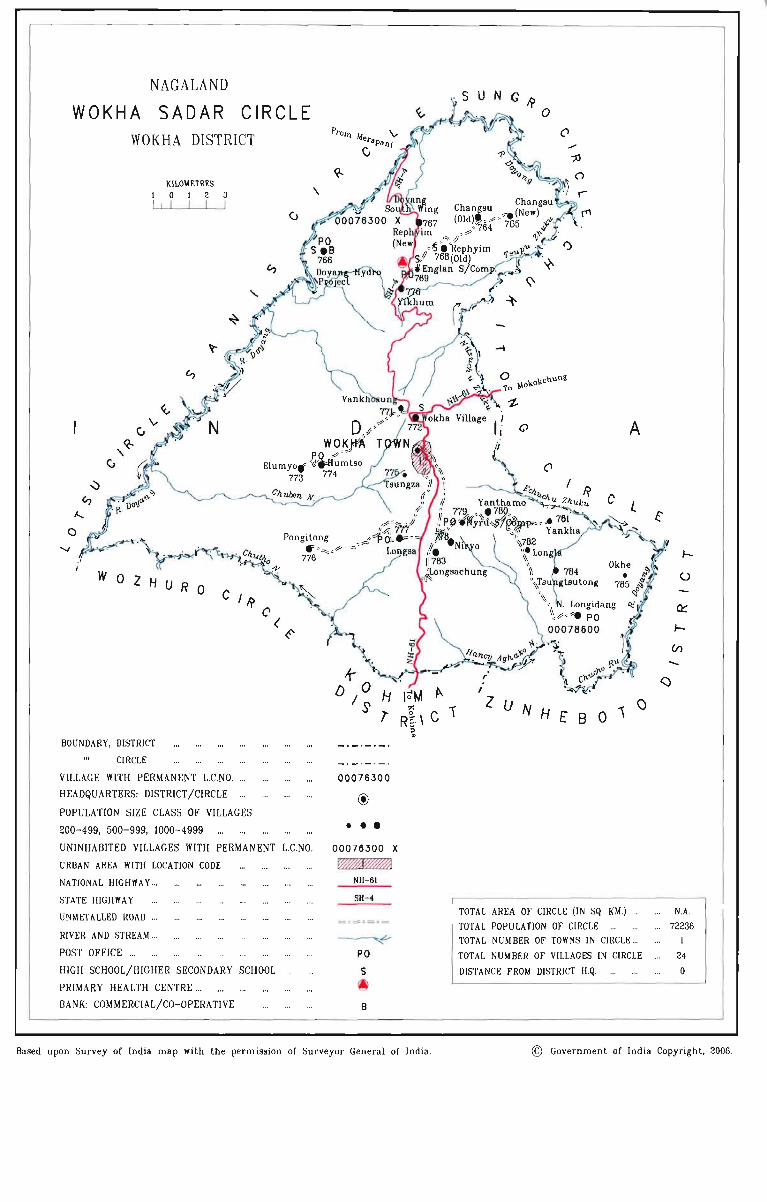
NAGALAND
WOKHA SADAR CIRCLE WOKHA DISTRICT
\, v
,~ v
0 J.....
0
" 0
BOUNDARY, DISTRICT
CIRCLE
KllOMETRES o I
~
0
o
2 3 I I
C I ~
VILLAGE WITH PERMANENT L.C.NO . .. .
HEADQUARTERS: DISTRICT/CIRCLE .. .
POPULATlON SIZE CLASS OF VILLAGES
200-499, 500-999, 1000-4999
(I (
(J
e'
UNINHABITED VILLAGES WITH PERMANENT L.e.NO.
URBAN AREA WITH LOCATION CODE
NATIONAL HIGHWAY ...
STATE HIGHWAY
UNMETALLED ROAD ...
RIVER AND STREAM ...
POST OFFICE ...
HIGH SCHOOL/HIG HER SECONDARY SCHOOL
PRIMARY HEALTH CENTRE ...
BANK: COMMERCIAL/CO-OPERATIVE .
\
r
00076300
••• 00076300 X
~ Nl1-61
SH-4
B
Based upon Survey of India map with the permission of Surveyor General of India .
N G ~ o
A
I
Z U N H £ 8 0 \ a
TOTAL AREA OF CIRCLE (IN SQ. KM.) ...
TOT AL POPULATION OF CIRCLE
TOTAL NUMBER OF TOWNS IN CIRCLE ...
TOTAL NUMBER OF VILLAGES IN CIRCLE
DISTANCE FROM DISTRICT H.Q.
-
I
()
N.A.
72236
24
o
© Government of India Copyr ighl, 2006.

Village Primary Census Abstract Wokha Sadar Circle
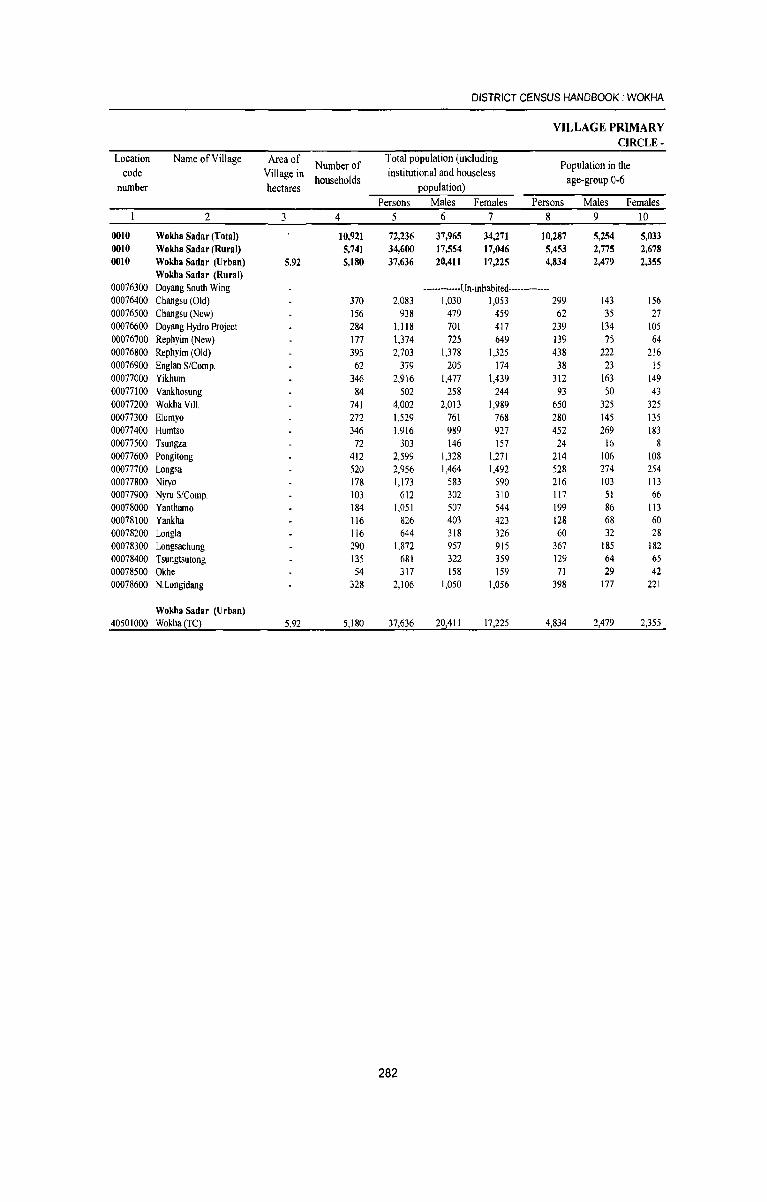
DISTRICT CENSUS HANDBOOK: WOKHA
VILLAGE PRIMARY CIRCLE-
Location Name of Village Area of Number of
Total population (including Population in the
code Village in households
institutional and houseless age-group 0-6
number hectares population)
Persons Males Females Persons Males Females
2 3 4 5 6 7 8 9 10
0010 Wokha Sadar (Total) 10,921 72,236 37,965 34,271 10,287 5,254 5,033 0010 Wokha Sadar (Rural) 5,741 34,600 17,554 17,046 5,453 2,775 2,678 0010 Wokha Sadar (Urban) 5.92 5,180 37,636 20,411 17,225 4,834 2,479 2,355
Wokha Sadar (Rural) 00076300 Doyang South Wing ------------Un-inhabited--------------00076400 Changsu (Old) 370 2.083 1,030 1,053 299 143 156 00076500 Changsu (New) 156 938 479 459 62 35 27 00076600 Doyang Hydro Project 284 1,118 701 417 239 134 105 00076700 Repbyim (New) 177 1,374 725 649 139 75 64 00076800 Repbyim (Old) 395 2,703 1,378 1,325 438 222 216 00076900 Englan S/Comp. 62 379 205 174 38 23 15 00077000 Yikhum 346 2,916 1,477 1,439 312 163 149 00077100 Vankhosung 84 502 258 244 93 50 43 00077200 WokhaVill. 741 4,002 2,013 1,989 650 325 325 00077300 E1umyo 272 1,529 761 768 280 145 135 00077400 Humtso 346 1.916 989 927 452 269 183 00077500 Tsungza 72 303 146 157 24 16 8 00077600 Pongitong 412 2.599 1,328 1,271 214 106 108 00077700 Longsa 520 2,956 1,464 1,492 528 274 254 00077800 Niryo 178 1,173 583 590 216 103 113 00077900 Nyru S/Comp. 103 612 302 310 117 51 66 00078000 Yanthamo 184 1,051 507 544 199 86 113 00078100 Yankha 116 826 403 423 128 68 60 00078200 Long1a 116 644 318 326 60 32 28 00078300 Longsachung 290 1,872 957 915 367 185 182 00078400 Tsungtsutong 135 681 322 359 129 64 65 00078500 Okhe 54 317 158 159 71 29 42 00078600 N.Longidang 328 2,106 1,050 1,056 398 177 221
Wokba Sadar (Urban) 40501000 Wokha(TC) 5.92 5,180 37,636 20,411 17,225 4,834 2,479 2,355
282
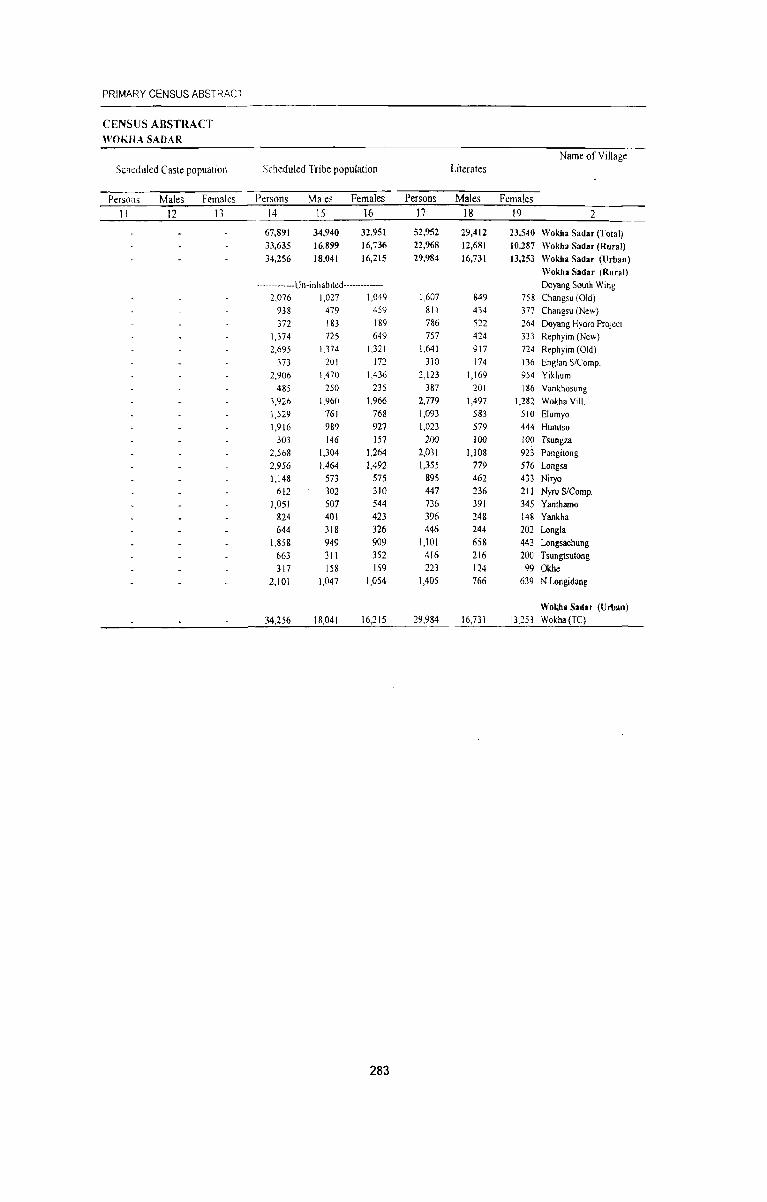
PRIMARY CENSUS ABSTRACT
CENSUS ABSTRACT WOKU.-\SADAR
Name ofYiliage Scheduled Caste popuation Scheduled Tribe population Literates
Persol1s Males Females Persons Males Females Persons Males Females 11 12 13 14 15 16 17 18 19 2
67,891 34,940 32,951 52,952 29,412 23.540 Wokha Sadar (Total) 33,635 16,899 16,736 22,968 12,681 10,287 Wokha Sadar (Rural) 34,256 18,041 16,215 29,984 16,731 13,253 Wokha Sadar (Urban)
Wokha Sadar (Rural) ------------Un-inhabtted-------------- Doyang South Wing
2,076 1,027 1,049 1,607 849 758 Changsu (Old) 938 479 459 811 4H 377 Changsu (New) 372 183 189 786 S22 264 Doyang Hydro Project
1,374 725 649 757 424 333 Rephyim (New) 2,695 1,374 1,321 1,641 917 724 Rephyim (Old)
373 201 172 310 174 136 Englan S/Comp. 2,906 1,470 1,436 2,123 1,169 954 Yikhum
485 250 235 387 201 186 Vankhosung
3.926 1,960 1,966 2,779 1,497 1,282 WokhaVill. 1,529 761 768 1,093 583 510 Elumyo 1,916 989 927 1,023 579 444 Humtso
303 146 157 200 100 100 Tsungza 2,568 1,3()4 1,264 2,031 1,108 923 Pongitong 2,956 1,464 1,492 1,355 779 576 Longsa 1,148 573 575 895 462 433 Niryo
612 302 310 447 236 211 Nyru SlComp. 1,051 507 544 736 391 345 Yantharno
824 401 423 396 248 148 Yankha 644 318 326 446 244 202 Longla
1,858 949 909 1,101 658 443 Longsachung 663 311 352 416 216 200 Tsungtsutong 317 158 159 223 124 99 Okhe
2,101 1,047 1,054 1,405 766 639 N Longidang
Woldta Sadar (Urban)
34,256 18,041 16,215 29,984 16,731 13)53 Wokha(TC)
283
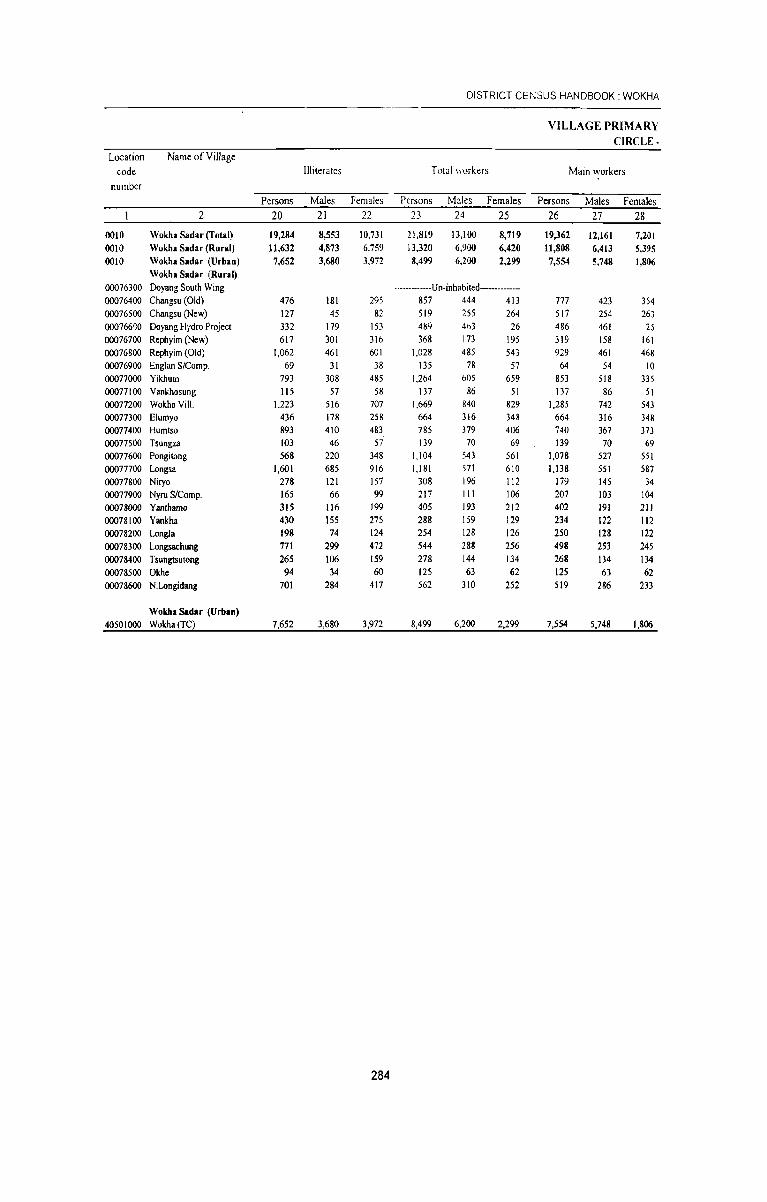
DISTRICT CENSUS HANDBOOK: WOKHA
VILLAGE PRIMARV CIRCLE-
Location Name of Village
code Illiterates Total workers Main workers
number
Persons Males Females Persons Males Females Persons Males Females 2 20 21 22 l' ~_, 24 25 26 27 28
0010 Wokha Sadn (Total) 19,284 8,553 10,731 21,819 13,100 8,719 19,362 12,161 7,201 0010 Wokha Sadar (Rural) 11,632 4,873 6,759 13,320 6,900 6,420 11,808 6,413 5,395 0010 Wokha Sadar (Urban) 7,652 3,680 3,972 8,499 6,200 2,299 7,554 5,748 1,806
Wokha Sadar (Rural) 00076300 Doyang South Wing -------------Un-inhabited----------00076400 Changsu (Old) 476 181 295 857 444 413 777 423 354 00076500 Changsu (New) 127 45 82 519 255 264 517 254 263 00076600 Doyang Hj'dro Project 332 179 153 4~9 4()3 26 486 461 25 00076700 Rephyim (New) 617 301 316 368 173 195 319 158 161 00076800 Rephyim (Old) 1,062 461 601 1,028 485 543 929 461 468 00076900 Englan S/Comp. 69 31 38 135 78 57 64 54 10 00077000 Yikhulll 793 308 485 1,264 605 659 853 518 335 00077100 Vankhosung 115 57 58 137 86 51 137 86 51 00077200 Wokha Vill_ 1,223 516 707 1,669 840 829 1,285 742 543 00077300 Elumyo 436 178 258 664 316 348 664 316 348 00077400 Humtso 893 410 483 785 379 406 740 367 373 00077500 Tsungza 103 46 57 139 70 69 139 70 69 00077600 Pongitong 568 220 348 1,104 543 561 1,078 527 551 00077700 Longsa 1,601 685 916 1,181 571 610 1,138 551 587 00077800 Niryo 278 121 157 308 196 112 179 145 34 00077900 Nyru S/Comp. 165 66 99 217 III 106 207 103 104 00078000 Yantharno 315 116 199 405 193 212 402 191 211 00078100 Yankha 430 155 275 288 159 129 234 122 112 00078200 Longla 198 74 124 254 128 126 250 128 122 00078300 Longsachung 771 299 472 544 288 256 498 253 245 00078400 Tsungtsutong 265 106 159 278 144 134 268 134 134 00078500 Okhe 94 34 60 125 63 62 125 63 62 00078600 N_Longidang 701 284 417 562 310 252 519 286 233
Wokha Sadar (Urban) 40501000 Wokha(TC) 7,652 3,680 3,972 8,499 6,200 2,299 7,554 5,748 1,806
284
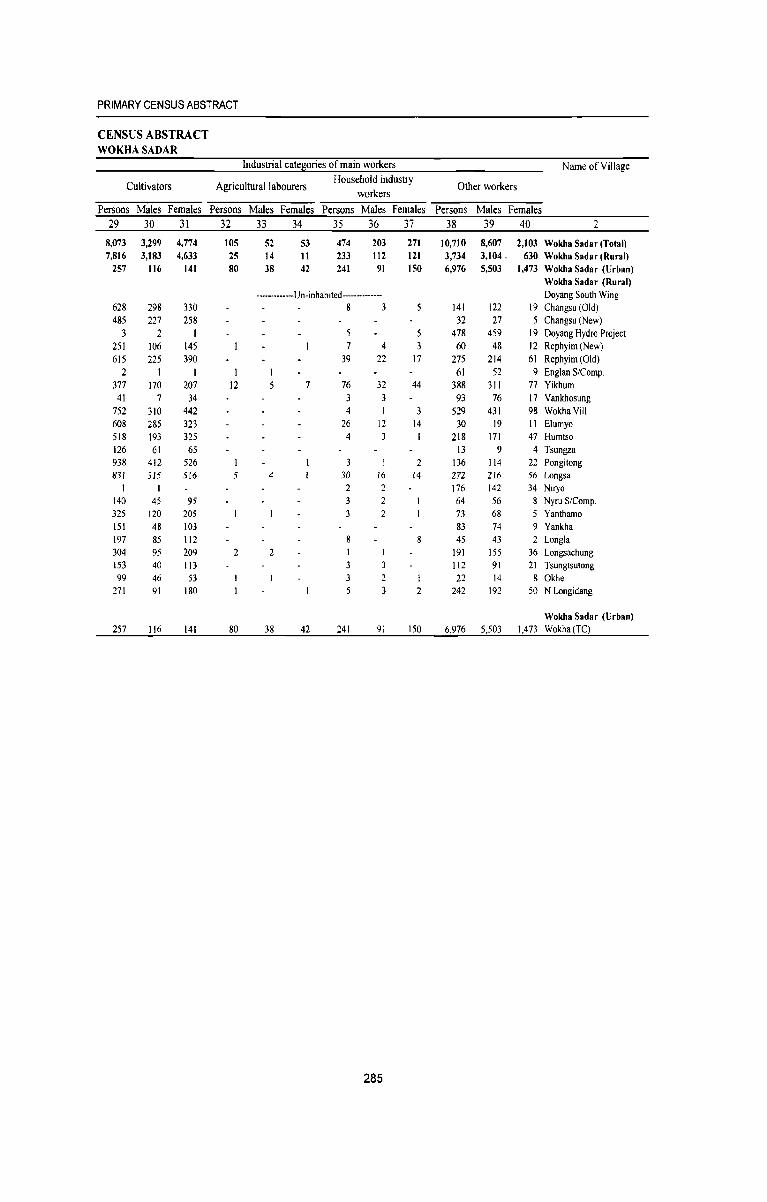
PRIMARY CENSUS ABSTRACT
CENSUS ABSTRACT WOKHASADAR
Industrial catesories of main workers Name of Village
Cultivators Agricultural labourers Household industry
Other workers workers
Persons Males Females Persons Males Females Persons Males Females Persons Males Females 29 30 31 32 33 34 35 36 37 38 39 40 2
8,073 3,299 4,774 105 52 53 474 203 271 10,710 8,607 2,103 Wokha Sadar (Total) 7,816 3,183 4,633 25 14 11 233 112 12J 3,734 3,104. 630 Wokha Sadar (Rural)
257 116 141 80 38 42 241 91 150 6,976 5,503 1,473 Wokha Sudar (Urban) Wokha Sadar (Rural)
·_·_·····-Un·inhabited·····_······· Doyang South Wing 628 298 330 8 3 141 122 19 Changsu (Old) 485 227 258 32 27 5 Changsu (New)
3 2 5 478 459 19 Doyang Hydro Project 251 106 145 7 4 3 60 48 12 Rephyim (New) 615 225 390 39 22 17 275 214 61 Rephyim (Old)
2 I 61 52 9 Englan S/Comp. 377 170 207 12 7 76 32 44 388 311 77 Yikhum
41 7 34 93 76 17 Vankhosung 752 310 442 4 3 529 431 98 WokhaVil1. 608 285 323 26 12 14 30 19 II Elumyo 518 193 325 4 218 171 47 Humtso 126 61 65 13 9 4 Tsungza 938 412 526 2 136 114 22 Pongitong 831 315 516 5 4 30 16 14 272 216 56 Longsa
1 2 2 176 142 34 Niryo 140 45 95 3 64 56 8 Nyru S/Comp. 325 120 205 3 73 68 5 Yanthamo 151 48 103 83 74 9 Yankha 197 85 112 45 43 2 Longla 304 95 209 2 2 191 155 36 Longsachung 153 40 113 112 91 21 Tsungtsutong 99 46 53 2 I 22 14 8 Okhe
271 91 180 3 2 242 192 50 N.Longidang
Wokha Sadar (Urban) 257 116 141 80 38 42 241 91 150 6,976 5,503 1,473 Wokha(TC)
285
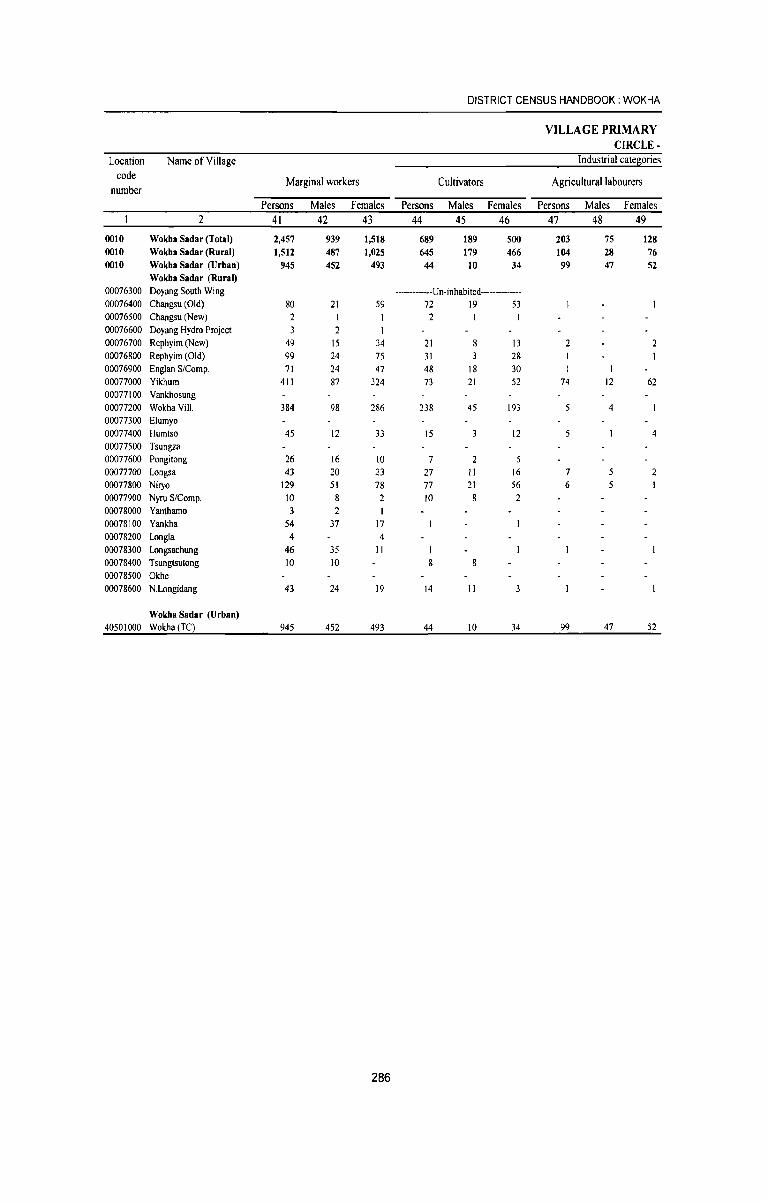
DISTRICT CENSUS HANDBOOK; WOKHA
VILLAGE PRIMARY CIRCLE-
Location Name of Village Industrial categories
code Marginal workers Cultivators Agricultural labourers
number
Persons Males Females Persons Males Females Persons Males Females 2 41 42 43 44 45 46 47 48 49
0010 Wokha Sadar (Total) 2,457 939 1,518 689 189 500 203 75 128 0010 Wokha Sadar (Rural) 1,512 487 1,025 645 179 466 104 28 76 0010 Wokha Sadar (Urban) 945 452 493 44 10 34 99 47 52
Wokha Sadar (Rural) 00076300 Doyang South Wing -------------Un-inhabited-------------00076400 Changsu (Old) 80 21 59 72 19 53 00076500 Changsu (New) 2 I I 2 00076600 Doyang Hydro Project 2 00076700 Rephyim (New) 49 15 34 21 13 2 2 00076800 Rephyim (Old) 99 24 75 31 28 00076900 Englan S/Comp. 71 24 47 48 18 30 I 00077000 Yikhum 411 87 324 73 21 52 74 12 62 00077100 Vankhosung 00077200 Wokha ViII. 384 98 286 238 45 193 4 00077300 Elumyo 00077400 Humtso 45 12 33 15 3 12 4 00077500 Tsungza 00077600 Pongitong 26 16 10 7 2 00077700 Longsa 43 20 23 27 II 16 7 5 2 00077800 Niryo 129 51 78 77 21 56 6 5 00077900 Nyru S/Comp. 10 8 2 10 2 00078000 Yanthamo 3 2 00078100 Yankha 54 37 17 00078200 Longla 4 4 00078300 Longsachung 46 35 II 00078400 Tsungtsutong 10 IO 8 00078500 Okhe 00078600 N.Longidang 43 24 19 14 II
Wokha Sadar (Urban) 40501000 Wokha(TC) 945 452 493 44 10 34 99 47 52
286
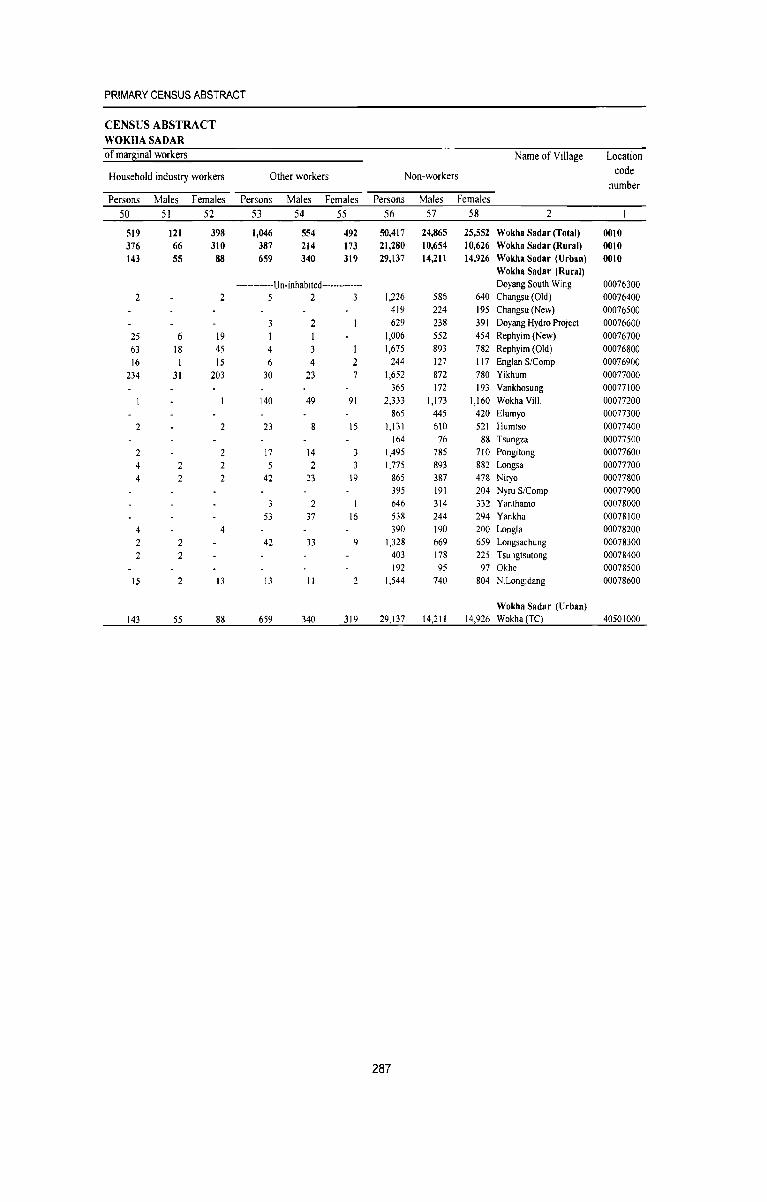
PRIMARY CENSUS ABSTRACT
CENSUS ABSTRACT WOKHASADAR o f mar~inal workers Name of Village Location
Household industry workers Other workers Non-workers code
number Persons Males Females Persons Males Females Persons Males Females
50 51 52 53 54 55 56 57 58 2
519 121 398 1,046 554 492 50,417 24,865 25,552 Wokha Sadar (Total) 0010 376 66 310 387 214 173 21,280 10,654 10,626 Wokha Sadar (Rural) 0010 143 5S 88 659 340 319 29,137 14,m 14,926 Wokha Sadar (Urban) 0010
Wokha Sadar (Rural) ------------Un-inhabtted-------------- Doyang South Wing 00076300
2 2 5 2 3 1,226 586 640 Changsu (Old) 00076400 419 224 195 Changsu (New) 00076500
3 2 629 238 391 Doyang Hydro Project 00076600 25 6 19 1 1,006 552 454 Rephyim (New) 00076700 63 18 45 4 3 1,675 893 782 Rephyim (Old) 00076800
16 15 6 4 2 244 127 117 Englan S/Comp. 00076900
234 31 203 30 23 7 1,652 872 780 Yikhum 00077000 365 172 193 Vankhosung 00077100
140 49 91 2,333 1,173 1,160 Wokha Viii. 00077200 865 445 420 Elumyo 00077300
2 2 23 8 15 1,131 610 521 Humtso 00077400 164 76 88 Tsungza 00077500
2 2 17 14 1,495 785 710 Pongitong 00077600 4 2 2 5 2 1,775 893 882 Longsa 00077700 4 2 2 42 23 19 865 387 478 Niryo 00077800
395 191 204 Nyru S/Comp 00077900 2 646 314 332 Yanthamo 00078000
53 37 16 538 244 294 Yankha 00078100 4 4 390 190 200 Longla 00078200 2 2 42 33 9 1,328 669 659 Longsachung 00078300
2 403 178 225 Tsungtsutong 00078400 192 95 97 Okhe 00078500
15 2 13 13 II 2 1,544 740 804 N. Longldang 00078600
Wokha Sadar (Urban) 143 55 88 659 340 319 29,137 14,211 14,926 Wokha(TC) 40501000
287

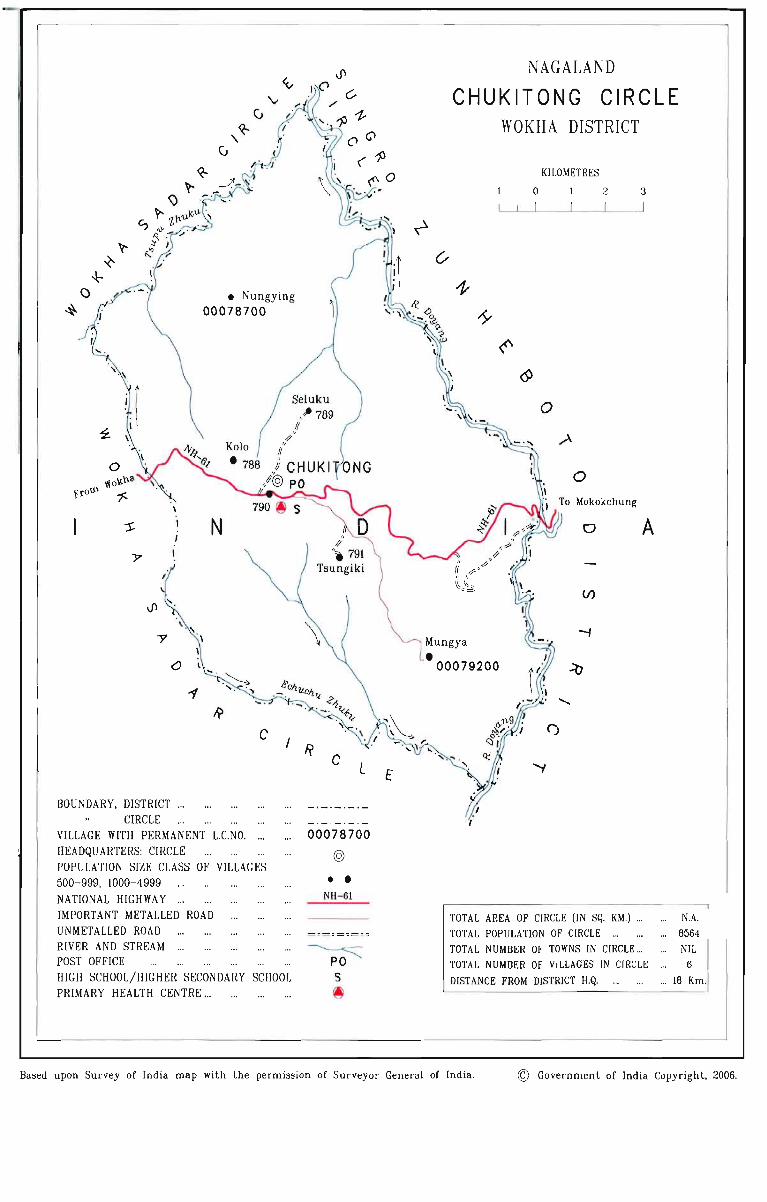
I
\
a l
BOUNDARY. DISTRICT ." CIRCLE
• Nungying
0007 8700
N
Seluku ,:~ 789
(/ ,p'1
Kolo r/' • 788 ,; CHUKI
/@ PO
c I R
c L
VILLAGE WITH PERMANENT L.e.NO. . .. HEADQU ARTERS: CIRCLE
00078700
@ POPULATION SIZE CLASS OF VILLAGES 500-999, 1000-4999
NATIONAL HIGHWAY ... IMPORTANT METALLED ROAD UNMETALLED ROAD RIVER AND STREAM ... POST OFFICE HIGH SCHOOL/HIGHI':R SECONDARY SCHOOL PRIMARY HEALTH CENTRE ...
• • NH-61
~
E
NAGALAND
CHUKITONG CIRCLE WOKHA DISTRICT
KILOMETRES
0 2 3
V
~
1--
~
6)
0
..A
0
To Mokokchung
0 A
U)
00079200
TOTAL AREA OF CIRCLE (IN SQ. KM.) ... ... N.A.
TOTAL POPULATION OF CIRCLE ... .,. 6564
TOTAL NUMBER OF TOW NS IN CIRCLE... .,. NIL
TOTAL NUMBER OF VILLAGES IN CIRCLE .,. 6
DISTANCE FROM DISTRICT H.Q. . .. ... 18 Km.
Based upon Survey of India map with the permission of Surveyor General of India. © Government of India Copyright. 2006.

Village Primary Census Abstract Chukitong Circle
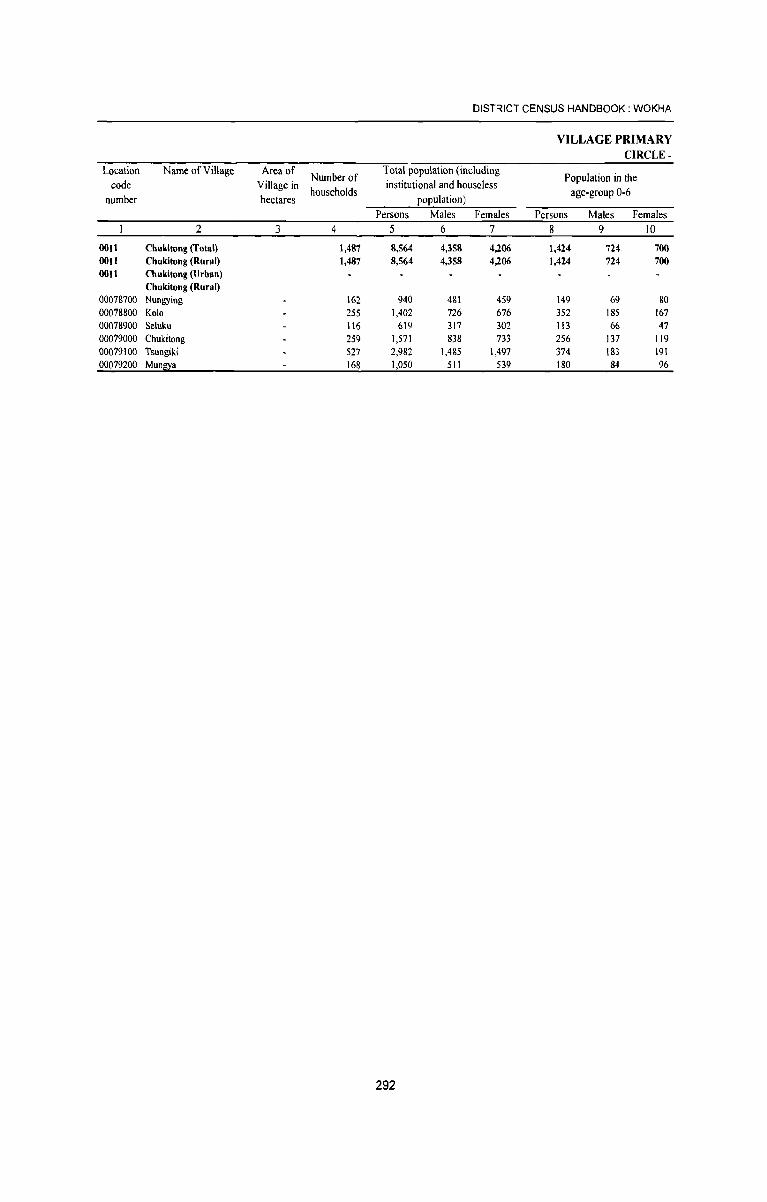
DISTRICT CENSUS HANDBOOK: WOKHA
VILLAGE PRIMARY CIRCLE -
Location Name of Village Area of Number of
Total population (including Population in the
code Village in households
institutional and houseless age-group 0-6
number hectares population) Persons Males Females Persons Males Females
2 3 4 5 6 7 8 9 10
OOll Chukitong (Total) 1,487 8,564 4,358 4,206 1,424 724 700 OOIl Chukitong (Rural) 1,487 8,564 4,358 4,206 1,424 724 700 OOll Chukitong (Urban)
Chukitong (Rural) 00078700 Nungying 162 940 481 459 149 69 80 00078800 Kolo 255 1,402 726 676 352 185 167 00078900 Selulm 116 619 317 302 113 66 47 00079000 Chukitong 259 1,571 838 733 256 137 119 00079100 Tsungiki 527 2,982 1,485 1,497 374 183 191 00079200 Mun!Q:a 168 1,050 511 539 180 84 96
292
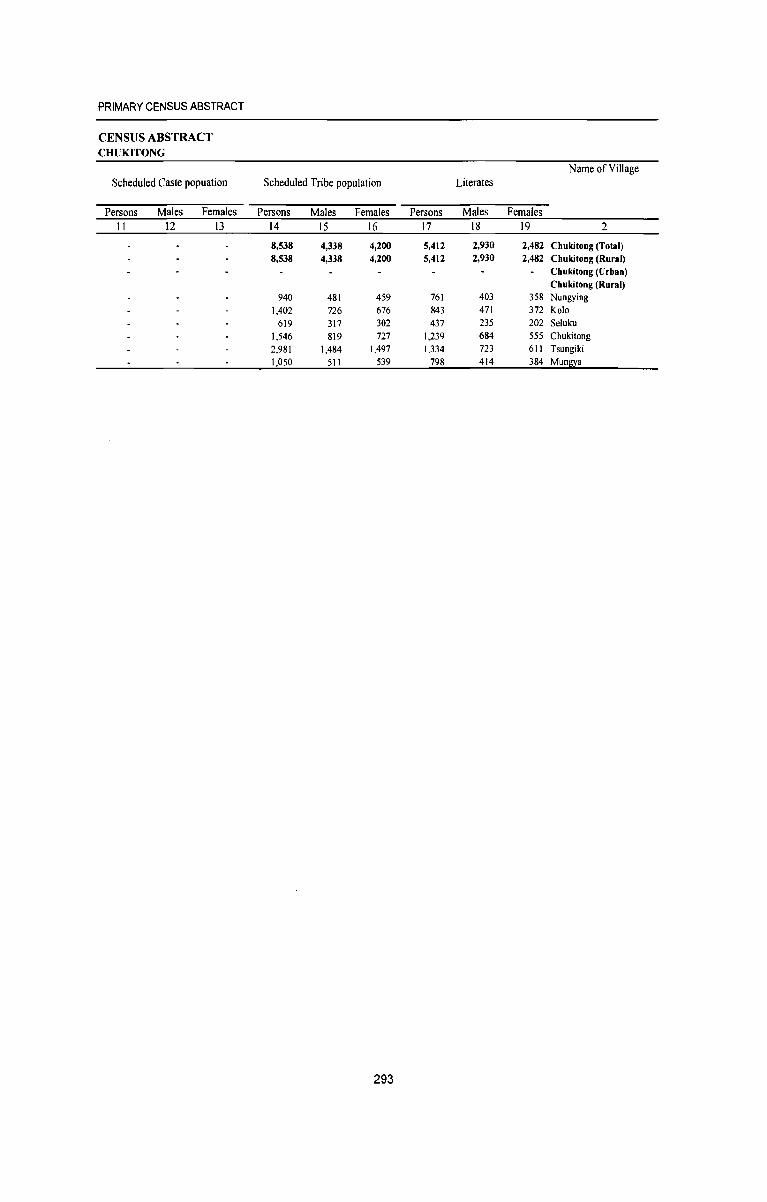
PRIMARY CENSUS ABSTRACT
CENSUS ABSTRACT CHUKITONG
Name of Village Scheduled Caste popuation Scheduled Tribe population Literates
Persons Males Females Persons Males Females Persons Males Females II 12 13 14 15 16 17 18 19 2
8,538 4,338 4,200 5,412 2,930 2,482 Chukitong (Total) 8,538 4,338 4,200 5,412 2,930 2,482 Chukitong (Rural)
Chukitong (Urban) Chukitong (Rural)
940 481 459 761 403 358 Nungying
1,402 726 676 843 471 372 Ko10
619 317 302 437 235 202 Se1uku
1,546 819 727 1,239 684 555 Chukitong
2,981 1,484 1,497 1,334 723 611 Tsungiki
1,050 511 539 798 414 384 Mungya
293
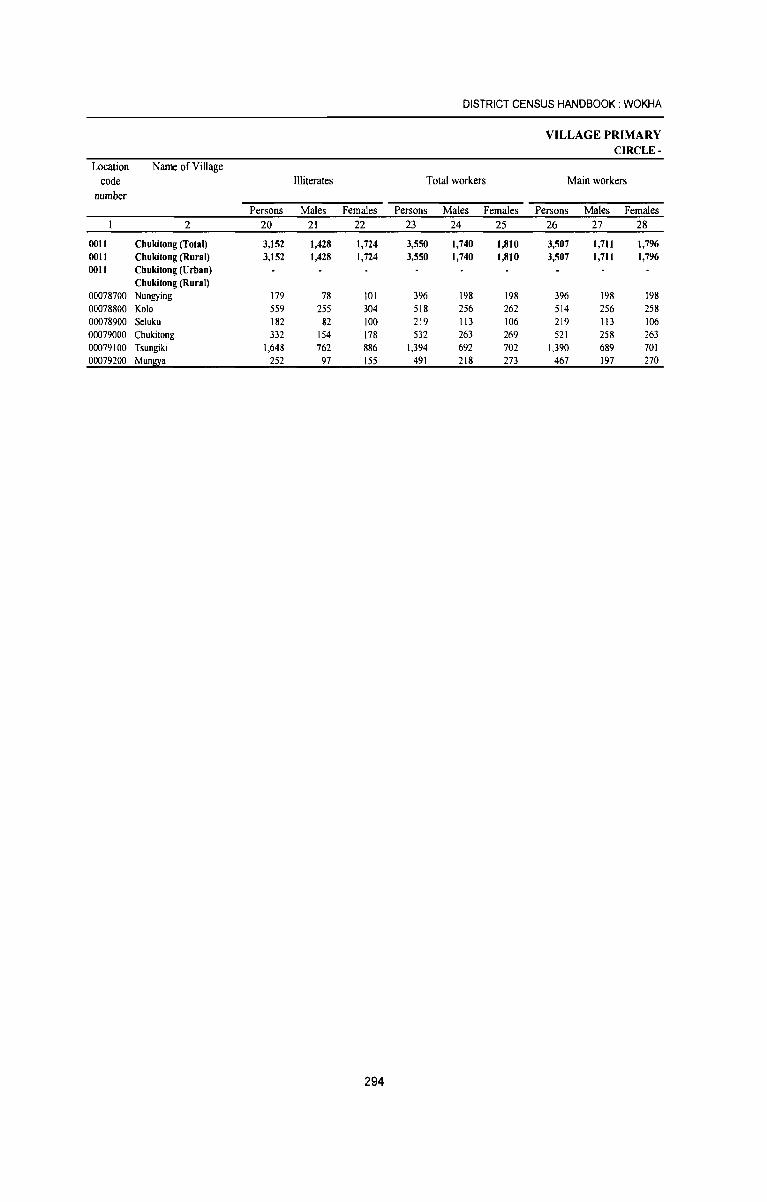
DISTRICT CENSUS HANDBOOK: WOKHA
VILLAGE PRIMARY CIRCLE-
Location Name of Village code Illiterates Total workers Main workers
number Persons Males Females Persons Males Females Persons Males Females
2 20 21 22 23 24 25 26 27 28
0011 Chukitong (Total) 3,152 1,428 1,724 3,550 1,740 1,810 3,507 1,711 1,796 0011 Chukitong (Rural) 3,152 1,428 1,724 3,550 1,740 1,810 3,507 1,711 1,796 0011 Chukitong (Urban)
Chukitong (Rural) 00078700 Nungying 179 78 101 396 198 198 396 198 198 00078800 Kolo 559 255 304 518 256 262 514 256 258 00078900 Seluku 182 82 100 219 113 106 219 113 106 00079000 Chukitong 332 154 178 532 263 269 521 258 263 00079100 Tsungiki 1,648 762 886 1,394 692 702 1,390 689 701 00079200 Mun~a 252 97 155 491 218 273 467 197 270
294
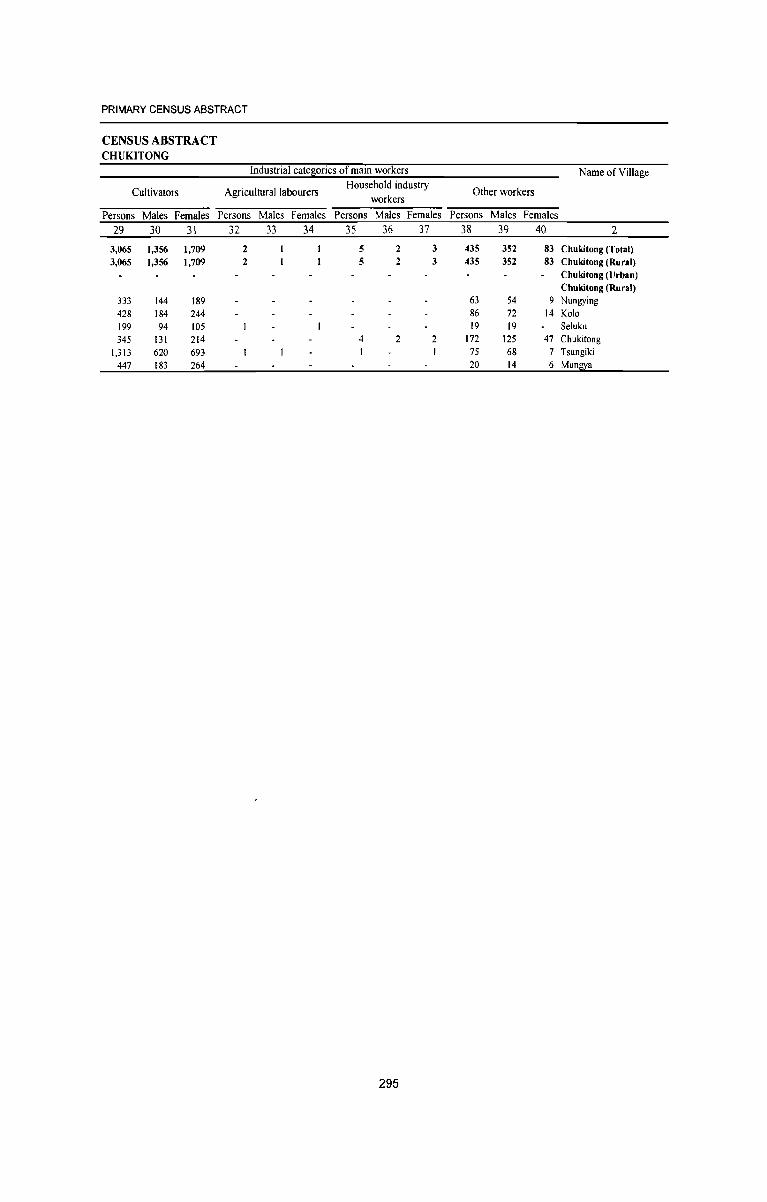
PRIMARY CENSUS ABSTRACT
CENSUS ABSTRACT CHUKITONG
Industrial catellories of main workers Name ofYillage
Cultivators Agricultural labourers Household industry
Other workers workers
Persons Males Females Persons Males Females Persons Males Females Persons Males Females 29 30 31 32 33 34 3S 36 37 38 39 40 2
3,065 1,356 1,709 2 5 2 3 435 352 83 Chukitong (Total) 3,065 1,356 1,709 2 5 2 3 435 352 83 Chukitong (Rural)
Chukitong (Urban) Chukitong (Rural)
333 144 189 63 54 9 Nungying 428 184 244 86 72 14 Kolo 199 94 105 19 19 Seluku 345 13l 214 4 2 2 172 125 47 Chukitong
1,313 620 693 1 75 68 7 Tsungiki 447 183 264 20 14 6 Mungya
295
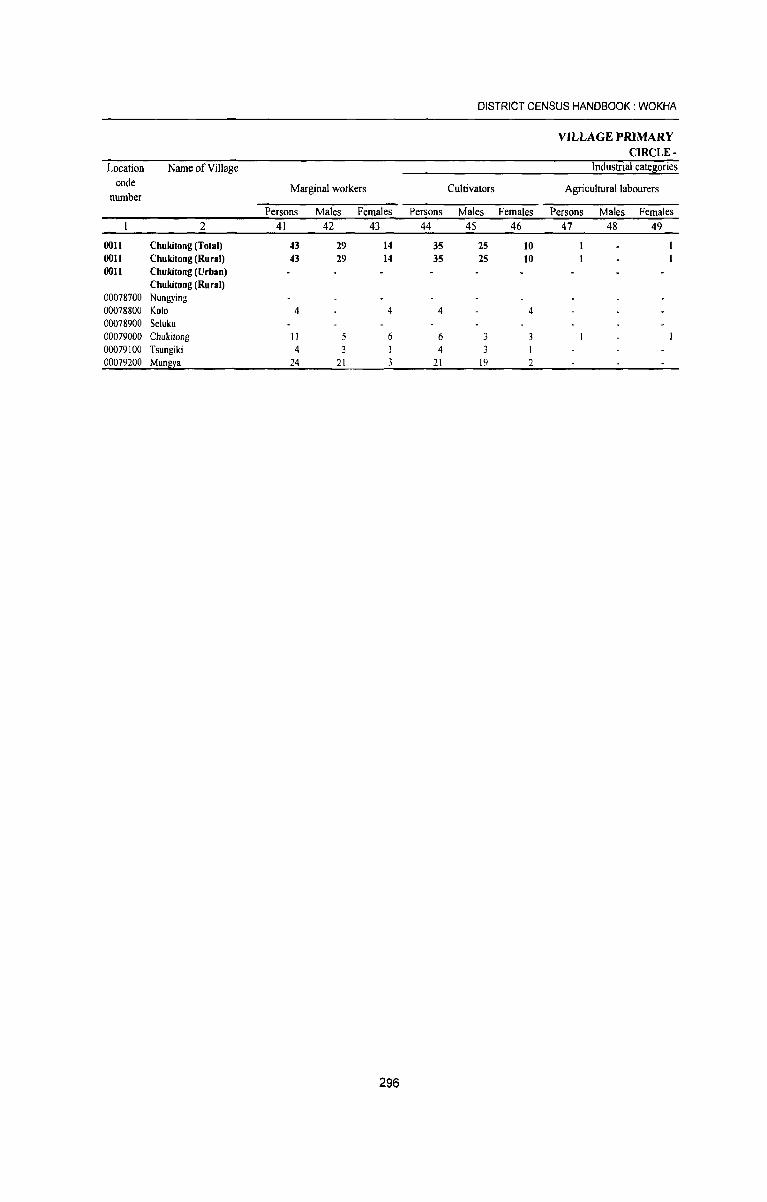
DISTRICT CENSUS HANDBOOK: WOKHA
VILLAGE PRIMARY CIRCLE-
Location Name of Village Industrial cate~ories code Marginal workers Cultivators Agricultural labourers
number Persons Males Females Persons Males Females Persons Males Females
2 41 42 43 44 45 46 47 48 49
0011 Chukitong (Total) 43 29 14 35 25 10 0011 Chukitong (Rural) 43 29 14 35 25 10 OOIl Chukitong (Urban)
Chukitong (Rural) 00078700 Nungying 00078800 Kolo 4 4 4 4 00078900 Seluku 00079000 Chukitong II 5 6 6 3 3 00079100 Tsungiki 4 3 4 3 00079200 Munlll:a 24 21 21 19 2
296
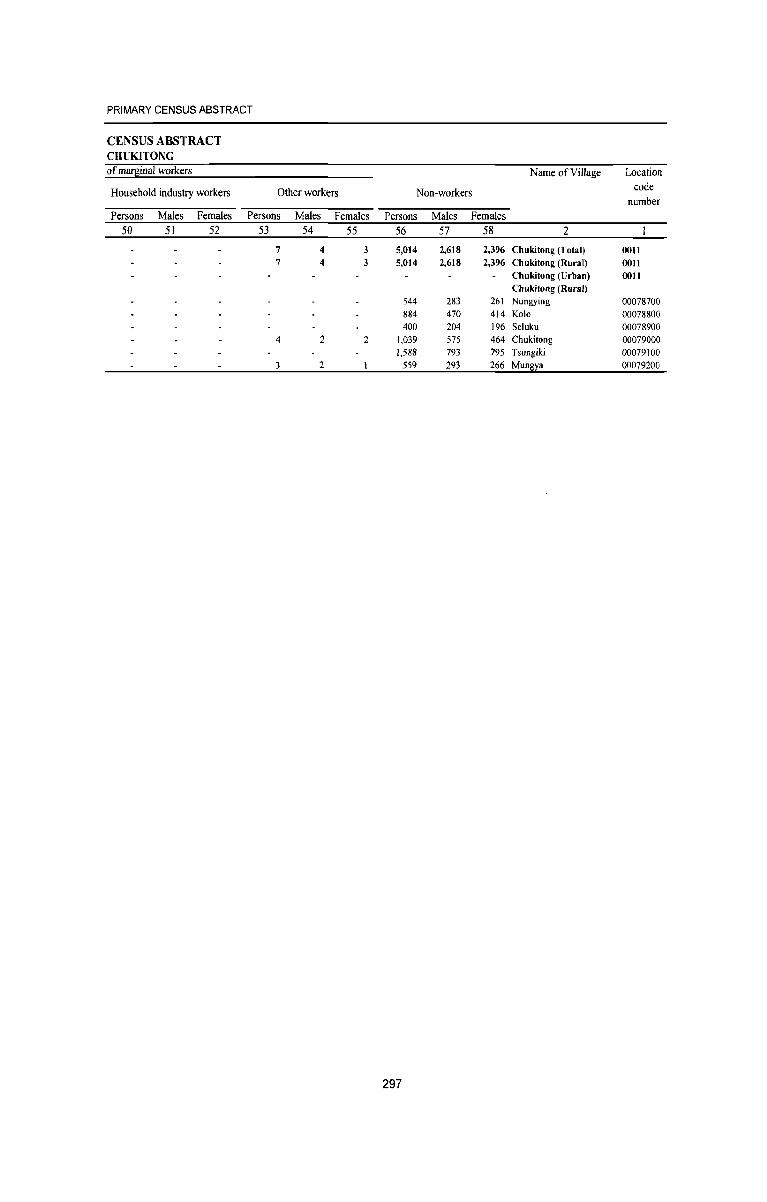
PRIMARY CENSUS ABSTRACT
CENSUS ABSTRACT CHUKITONG of maq~inal workers Name of Village Location
Household industry workers Other workers Non-workers code number
Persons Males Females Persons Males Females Persons Males Females 50 51 52 53 54 55 56 57 58 2
7 4 3 5,014 2,618 2,396 Chukitong (Total) 0011 7 4 3 5,014 2,618 2,396 Chukitong (Rural) 0011
Chukitong (Urban) 0011 Chukitong (Rural)
544 283 261 Nungying 00078700 884 470 414 Kolo 00078800 400 204 196 Seluku 00078900
4 2 2 1,039 575 464 Chukitong 00079000 1,588 793 795 Tsungiki 00079100
3 2 559 293 266 Mun~a 00079200
297

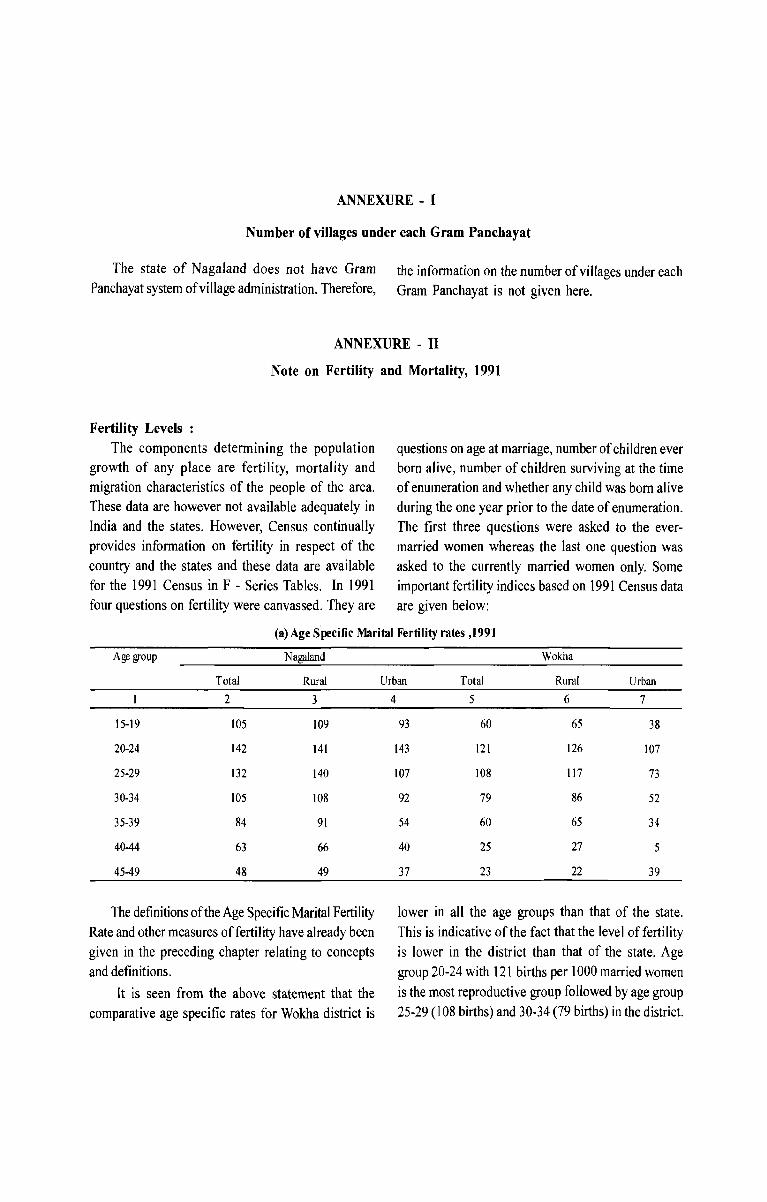
ANNEXURE - I
Number of villages under each Gram Panchayat
The state of Nagaland does not have Gram Panchayat system of village administration. Therefore,
the information on the number of villages under each Gram Panchayat is not given here.
ANNEXURE - II
Note on Fertility and Mortality, 1991
Fertility Levels :
The components determining the population growth of any place are fertility, mortality and migration characteristics of the people of the area. These data are however not available adequately in India and the states. However, Census continually provides information on fertility in respect of the country and the states and these data are available for the 1991 Census in F - Series Tables. In 1991 four questions on fertility were canvassed. They are
questions on age at marriage, number of children ever born alive, number of children surviving at the time of enumeration and whether any child was born alive during the one year prior to the date of enumeration. The first three questions were asked to the evermarried women whereas the last one question was asked to the currently married women only. Some important fertility indices based on 1991 Census data are given below:
(a) Age Specific Marital Fertility rates ,1991
Age group
15-19
20-24
25-29
30-34
35-39
40-44
45-49
Total
2
105
142
132
105
84
63
48
Nagaland
Rural
3
109
141
140
108
91
66
49
The defmitions of the Age Specific Marital Fertility Rate and other measures of fertility have already been given in the preceding chapter relating to concepts and definitions.
It is seen from the above statement that the comparative age specific rates for Wokha district is
Wokha
Urban Total Rural Urban
4 5 6 7
93 60 65 38
143 121 126 107
107 108 117 73
92 79 86 52
54 60 65 34
40 25 27 5
37 23 22 39
lower in all the age groups than that of the state. This is indicative of the fact that the level offertility is lower in the district than that of the state. Age group 20-24 with 121 births per 1000 married women is the most reproductive group followed by age group 25-29 (108 births) and 30-34 (79 births) in the district.
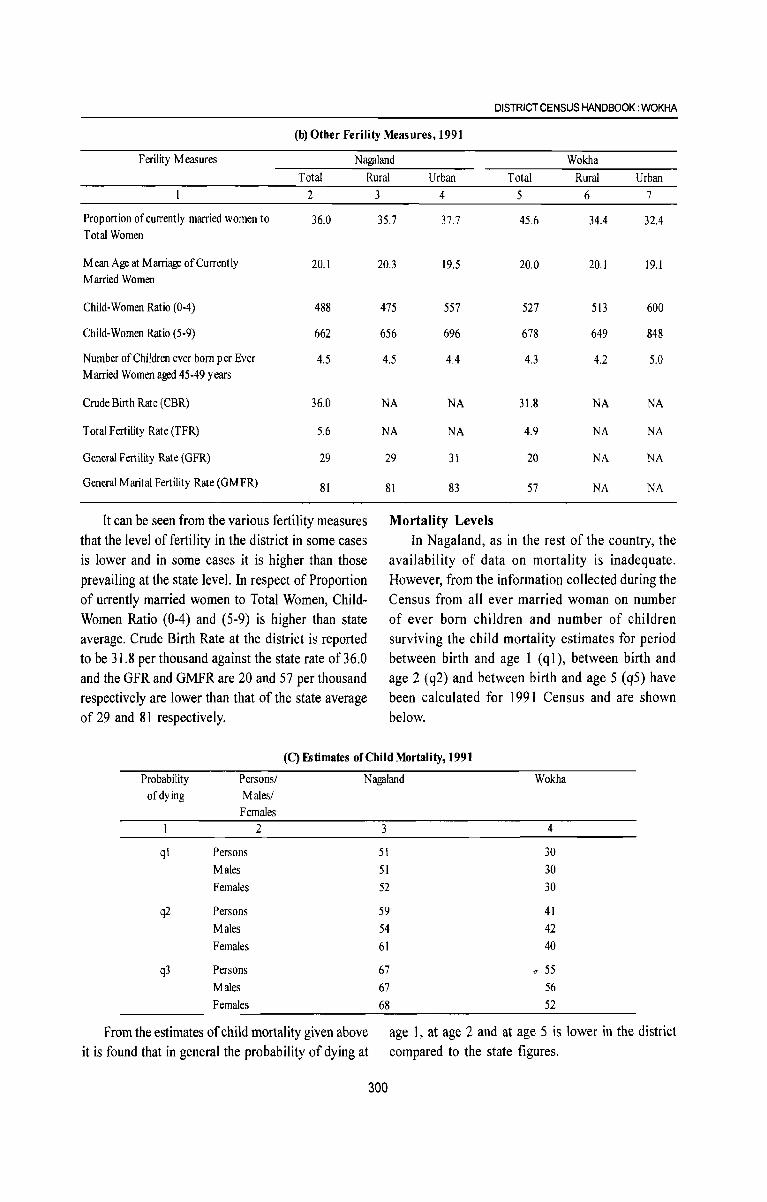
DISTRICT CENSUS HANDBOOK: WOKHA
(b) Other Ferility Measures, 1991
F erility Measures Nagaland Wokha Total Rural Urban Total Rural Urban
Proportion of currently married women to Total Women
Mean Age at Marriage of Currently Married Women
Child-Women Ratio (0-4)
Child-Women Ratio (5-9)
Number of Children ever born per Ever Married Women aged 45-49 years
Crude Birth Rate (CBR)
Total Fertility Rate (TFR)
General Fertility Rate (GFR)
General Marital Fertility Rate (GMFR)
2
36.0
20.1
488
662
4.5
36.0
5.6
29
81
It can be seen from the various fertility measures that the level of fertility in the district in some cases is lower and in some cases it is higher than those prevailing at the state level. In respect of Proportion of urrently married women to Total Women, ChildWomen Ratio (0-4) and (5-9) is higher than state average. Crude Birth Rate at the district is reported to be 31.8 per thousand against the state rate of 36.0 and the GFR and GMFR are 20 and 57 per thousand respectively are lower than that of the state average of 29 and 81 respectively.
3 4 5 6 7
35.7 37.7 45.6 34.4 32.4
20.3 19.5 20.0 20.1 19.1
475 557 527 513 600
656 696 678 649 848
4.5 4.4 4.3 4.2 5.0
NA NA 31.8 NA NA
NA NA 4.9 NA NA
29 31 20 NA NA
81 83 57 NA NA
Mortality Levels In Nagaland, as in the rest of the country, the
availability of data on mortality is inadequate. However, from the information collected during the Census from all ever married woman on number of ever born children and number of children surviving the child mortality estimates for period between birth and age 1 (q 1), between birth and age 2 (q2) and between birth and age 5 (q5) have been calculated for 1991 Census and are shown below.
(C) Fstimates of Child Mortality, 1991
Probability of dying
Persons/ Males/ Females
Nagaland Wokha
ql
q2
q3
Persons Males Females
Persons Males Females
Persons Males Females
2
From the estimates of child mortality given above it is found that in general the probability of dying at
3
51
51
52
59
54
61
67
67
68
300
4
30 30
30
41
42
40
t! 55 56
52
age 1, at age 2 and at age 5 is lower in the district compared to the state figures.
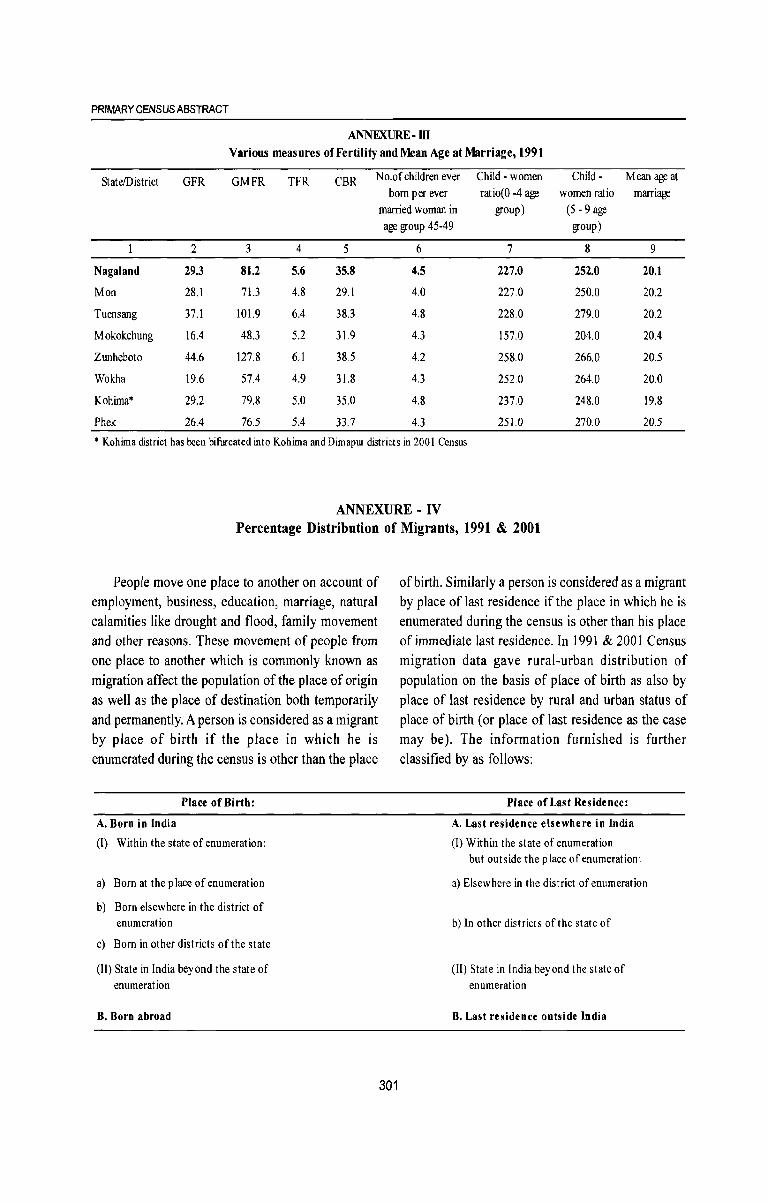
PRIMARY CENSUS ABSTRACT
ANNEXURE-m
Various measures of Fertility and Mean Age at Marriage, 1991
State!District GFR GMFR TFR CBR N o.of children ever Child - women Child - Mean age at born per ever ratio(O -4 age women ratio marriage
married woman in group) (5 - 9 age age group 45-49 group)
2 3 4 5 6 7 8 9
Nagaland 29.3 81.2 5.6 35.8 4.5 227.0 252.0 20.1
Mon 28.1 71.3 4.8 29.1 4.0 227.0 250.0 20.2
Tuensang 37.1 101.9 6.4 38.3 4.8 228.0 279.0 20.2
Mokokchung 16.4 48.3 5.2 31.9 4.3 157.0 204.0 20.4
Zunheboto 44.6 127.8 6.1 38.5 4.2 258.0 266.0 20.5
Wokha 19.6 57.4 4.9 31.8 4.3 252.0 264.0 20.0
Kohima* 29.2 79.8 5.0 35.0 4.8 237.0 248.0 19.8
Phek 26.4 76.5 5.4 33.7 4.3 251.0 270.0 20.5
* Kohima district has been bifurcated into Kohima and Dimapur districts in 2001 Census.
ANNEXURE - IV Percentage Distribution of Migrants, 1991 & 2001
People move one place to another on account of employment, business, education, marriage, natural calamities like drought and flood, family movement and other reasons. These movement of people from one place to another which is commonly known as migration affect the population of the place of origin as well as the place of destination both temporarily and permanently. A person is considered as a migrant by place of birth if the place in which he is enumerated during the census is other than the place
Place of Birth:
A. Born in India
(I) Within the state of enumeration:
a) Born at the p lace of enumeration
b) Born elsew here in the district of enumeration
c) Born in other districts of the state
(II) State in India beyond the state of enumeration
B. Born abroad
301
of birth. Similarly a person is considered as a migrant by place of last residence if the place in which he is enumerated during the census is other than his place of immediate last residence. In 1991 & 2001 Census migration data gave rural-urban distribution of population on the basis of place of birth as also by place of last residence by rural and urban status of place of birth (or place of last residence as the case may be). The information furnished is further classified by as follows:
Place of Last Residence:
A. Last residence elsewhere in India
(I) Within the state of enumeration but outside the p lace of enumeration:
a) Elsewhere in the district of enumeration
b) In other districts of the state of
(II) State in India beyond the state of enumeration
B. Last residence outside India
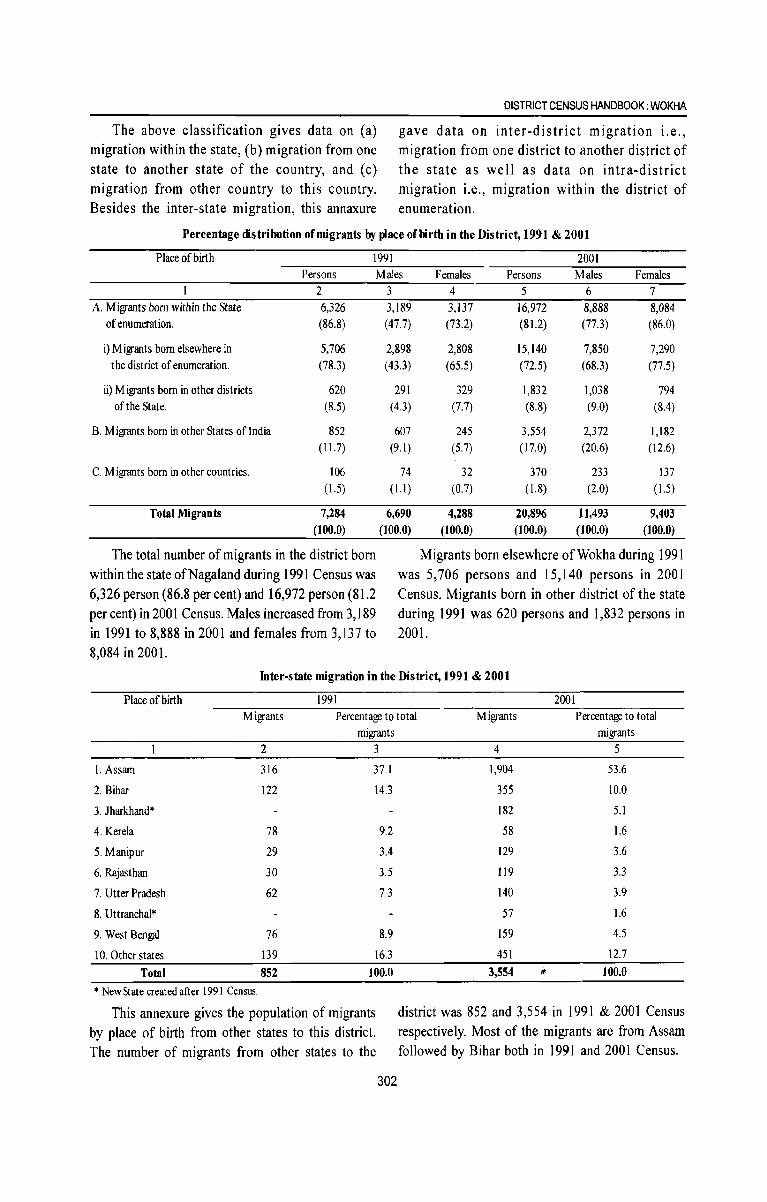
The above classification gives data on (a) migration within the state, (b) migration from one state to another state of the country, and (C) migration from other country to this country. Besides the inter-state migration, this annaxure
DISTRICT CENSUS HANDBOOK: WOKHA
gave data on inter-district migration i.e., migration from one district to another district of the state as well as data on intra-district migration i.e., migration within the district of enumeration.
Percentage distribution of migrants by place ofnrth in the District, 1991 & 2001
Place of birth 1991 2001 Persons Males Females Persons Males Females
2 3 4 5 6 7 A. Migrants born within the State 6,326 3,189 3,137 16,972 8,888 8,084
of enumeration. (86.8) (47.7) (73.2) (81.2) (77.3) (86.0)
i) Migrants born elsewhere in 5,706 2,898 2,808 15,140 7,850 7,290 the district of enumeration. (78.3) (43.3) (65.5) (72.5) (68.3) (77.5)
ii) Migrants born in other districts 620 291 329 1,832 1,038 794 of the State. (8.5) (43) (7.7) (8.8) (9.0) (8.4)
B. Migrants born in other States oflndia 852 607 245 3,554 2,372 1,182 (11.7) (9.1) (5.7) (17.0) (20.6) (12.6)
C. Migrants born in other countries. 106 74 32 370 233 137 (1.5) (l.l ) (0.7) (1.8) (2.0) (1.5)
Total Migrants 7,284 6,690 4,288 20,896 11,493 9,403 (100.0) (100.0) (100.0) (100.0) (l00.0) (100.0)
The total number of migrants in the district born Migrants born elsewhere of Wokha during 1991 within the state of Nagai and during 1991 Census was was 5,706 persons and 15,140 persons in 2001 6,326 person (86.8 per cent) and 16,972 person (81.2 Census. Migrants born in other district of the state per cent) in 2001 Census. Males increased from 3,189 during 1991 was 620 persons and 1,832 persons in in 1991 to 8,888 in 2001 and females from 3,137 to 2001. 8,084 in 2001.
Inter-state migration in the District, 1991 & 2001
Place of birth 1991 2001 Migrants Percentage to total Migrants Percentage to total
migrants 2 3
1. Assam 316 37.1
2. Bihar 122 143
3. lharkhand*
4. Kerela 78 9.2
5. Manipur 29 3.4
6. Rajasthan 30 3.5
7. Utter Pradesh 62 73
8. Uttranchal*
9. West Bengfll 76 8.9
10. Other states 139 163
Total 852 100.0
* New State created after 1991 Census.
This annexure gives the population of migrants by place of birth from other states to this district. The number of migrants from other states to the
302
migrants 4 5
1,904 53.6
355 10.0
182 5.1
58 1.6
129 3.6
119 3.3
140 3.9
57 1.6
159 4.5
451 12.7
3,554 ~ 100.0
district was 852 and 3,554 in 1991 & 2001 Census respectively. Most of the migrants are from Assam followed by Bihar both in 1991 and 2001 Census.
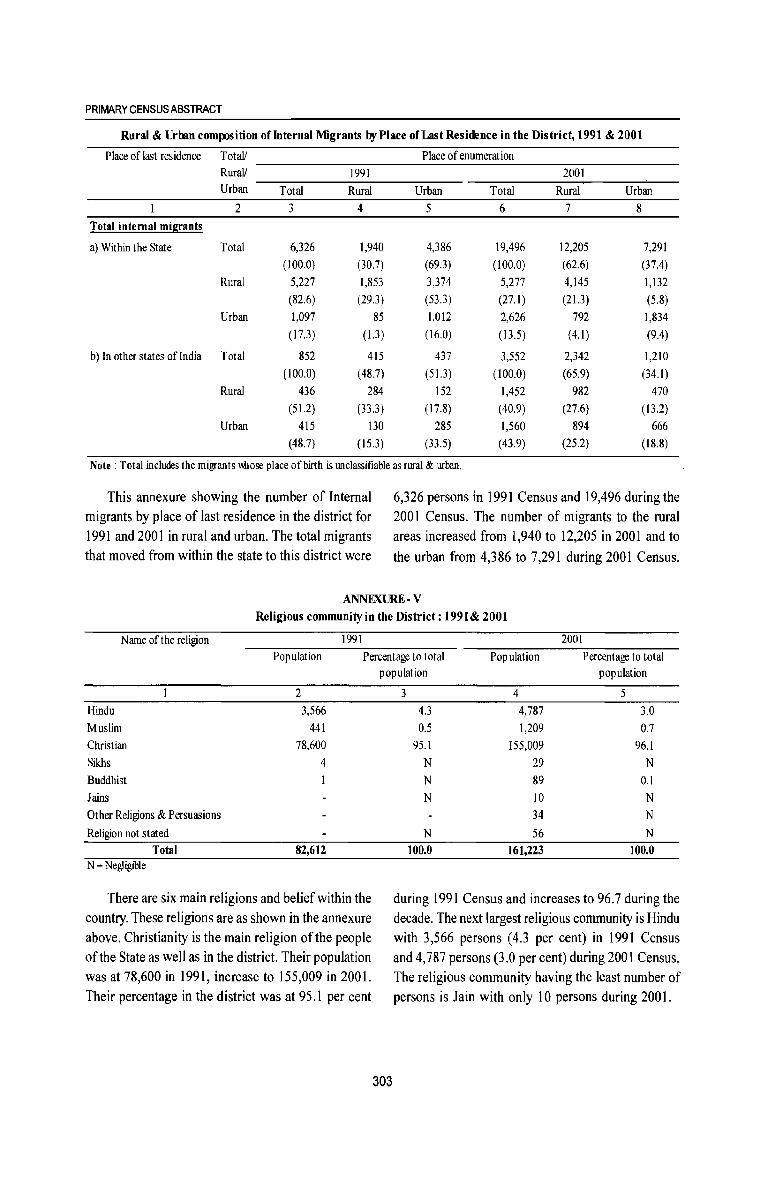
PRIMARY CENSUS ABSTRACT
Rural & Urban composition offuternal Migrants by Place of Last Residence in the District, 1991 & 2001
Place of last residence TotaV Place of enumeration RuraV 1991 2001 Urban Total Rural Urban Total Rural Urban
2 3 4 5 6 7 8
Total internal migrants
a) Within the State Total 6,326 1,940 4,386 19,496 12,205 7,291 (100.0) (30.7) (69.3) (100.0) (62.6) (37.4)
Rural 5,227 1,853 3,374 5,277 4,145 1,132 (82.6) (29.3) (53.3) (27.1) (21.3) (5.8)
Urban 1,097 85 1,012 2,626 792 1,834 (17.3) (1.3) (16.0) ( 13.5) (4.1) (9.4)
b) In other states ofIndia Total 852 415 437 3,552 2,342 1,210 (100.0) (48.7) (51.3) (100.0) (65.9) (34.1)
Rural 436 284 152 1,452 982 470 (51.2) (33.3) (17.8) (40.9) (27.6) (13.2)
Urban 415 130 285 1,560 894 666 (48.7) (15.3) (33.5) (43.9) (25.2) (18.8)
Note: Total includes the migrants \\hose place of birth is Wlclassifiable as rural & urban.
This annexure showing the number of Internal migrants by place of last residence in the district for 1991 and 2001 in rural and urban. The total migrants that moved from within the state to this district were
6,326 persons in 1991 Census and 19,496 during the 2001 Census. The number of migrants to the rural areas increased from 1,940 to 12,205 in 2001 and to
the urban from 4,386 to 7,291 during 2001 Census.
ANNEXURE - V Religious community in the District: 1991& 2001
N arne of the religion 1991 2001 Population Percentage to total Population Percentage to total
Hindu
Muslim Christian Sikhs Buddhist
Jains Other Religions & Persuasions
Religion not stated Total
N - Negligible
2
3,566 441
78,600
4
82,612
There are six main religions and belief within the country. These religions are as shown in the annexure above. Christianity is the main religion of the people of the State as well as in the district. Their population was at 78,600 in 1991, increase to 155,009 in 2001. Their percentage in the district was at 95.1 per cent
population population
303
3 4 5 4.3 4,787 3.0 0.5 1,209 0.7
95.1 155,009 96,1
N 29 N
N 89 0,1
N 10 N
34 N
N 56 N
100.0 161,223 100.0
during 1991 Census and increases to 96.7 during the decade. The next largest religious community is Hindu with 3,566 persons (4.3 per cent) in 1991 Census and 4,787 persons (3.0 per cent) during 2001 Census. The religious community having the least number of persons is Jain with only 10 persons during 2001.
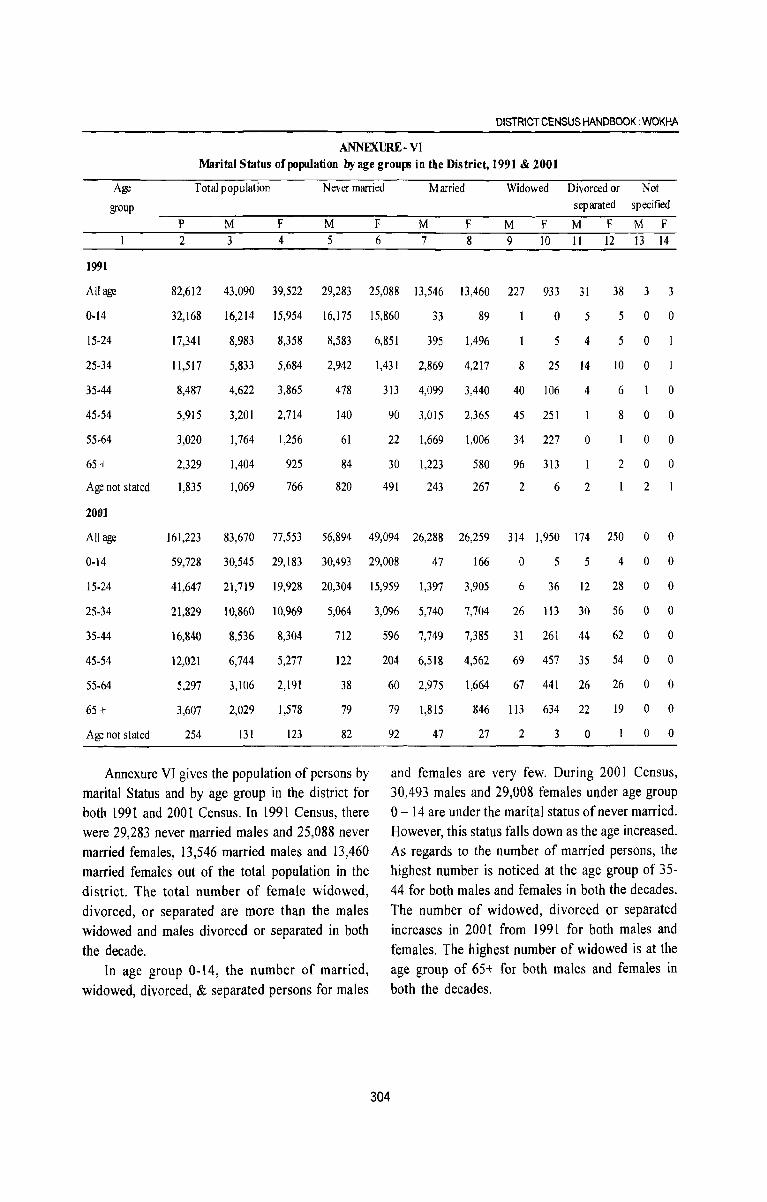
DISTRICT CENSUS HANDBOOK: WOKHA
ANNEXURE- VI Marital Status of population by age groups in the District, 1991 & 2001
Age
group
Total population Never married Married Widowed Divorced or separated
Not specified
P M F M F M F M F M F M F 2 3 4 5 6 7 8 9 10 11 12 13 14
82,612 43,090 39,522 29,283 25,088 13,546 13,460 227 933 31 38 3 3
32,168 16,214 15,954 16,175 15,860 33 89 5 0 0
1991
All age
0-14
15·24
25·34
35·44
45·54
55-64
17,341
11,517
8,487
5,915
3,020
2,329
1,835
8,983 8,358 8,583 6,851 395 1,496
o 5
5
4 5 0
65 +
Age not stated
2001
5,833 5,684
4,622 3,865
3,201 2,714
1,764 1,256
1,404
1,069
925
766
2,942
478
140
61
84
820
1,431 2,869 4,217 8 25 14 10 0
313 4,099 3,440 40 106 4 6 0
90 3,015 2,365 45 251 8 0 0
22 1,669 1,006 34 227 o 0 0
30 1,223 580 96 313 2 0 0
491 243 267 2 6 2 2
All age 161,223 83,670 77,553 56,894 49,094 26,288 26,259 3141,950 174 250 0 0
0-14 59,728 30,545 29,183 30,493 29,008 47 166 0 5 5 4 0 0
15-24 41,647 21,719 19,928 20,304 15,959 1,397 3,905 6 36 12 28 0 0
25-34 21,829 10,860 10,969 5,064 3,096 5,740 7,704 26 113 30 56 0 0
35-44 16,840 8,536 8,304 712 596 7,749 7,385 31 261 44 62 0 0
45-54 \2,021 6,744 5,277 122 204 6,518 4,562 69 457 35 54 0 0
55·64 5,297 3,106 2,191 38 60 2,975 1,664 67 441 26 26 0 0
65 + 3,607 2,029 1,578 79 79 1,815 846 113 634 22 19 0 0
Age not stated 254 131 123 82
Annexure VI gives the population of persons by marital Status and by age group in the district for both 1991 and 2001 Census. In 1991 Census, there were 29,283 never married males and 25,088 never married females, 13,546 married males and 13,460 married females out of the total population in the district. The total number of female widowed, divorced, or separated are more than the males widowed and males divorced or separated in both the decade.
In age group 0-14, the number of married, widowed, divorced, & separated persons for males
92 47 27 2 3 o o 0
304
and females are very few. During 2001 Census, 30,493 males and 29,008 females under age group o - 14 are under the marital status of never married. However, this status falls down as the age increased. As regards to the number of married persons, the highest number is noticed at the age group of 35-44 for both males and females in both the decades. The number of widowed, divorced or separated increases in 2001 from 1991 for both males and females. The highest number of widowed is at the age group of 65+ for both males and females in both the decades.
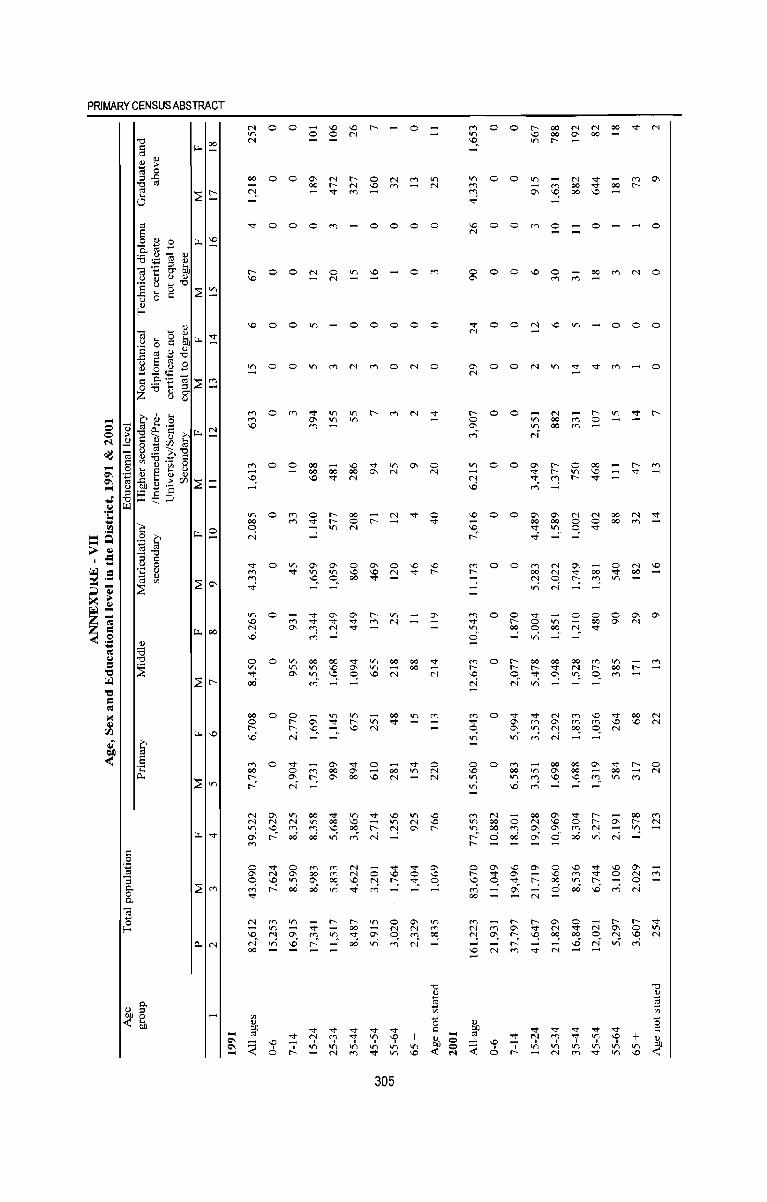
PRIMARY CENSUS ABSTRACT
Q.,N
00 0 0
N.
,. 0 0
('00 'D
'D
M M >0
on 00 o N
o
o
o
o
o
o
o
o
o
o
o
o
o
o M
NOon N
00 -00 co >0 ,.
o (' ,. ('
...... on
...:
00 co on 'D ~ ~. M
o
on on
>0 00 N
00 o N
o 'D 00
OM'" N 0\ 00 M N on a- co 'D
N
'D N 00
'f °
oQ 00 or) ..,;
,. ......
I r-
o
o N M 'D M
000
>0 0
o
...... on N
o .->0
o N r-1
o
o
on N
o N
V)
N
00
N
00 ,.
...... 00 N
o N O. M
305
o
N
00 00
on N 0\
+ on 'D
on N
o
o
c
o N
o ,.
'D ('
'D 0 0 N
000 0\
o 'D 'r: on
o
o
o
o
o
o
o
o
o
o
M N on 00 on 00 r-: d r-
o r-~ M 00
M N ~ ...... 'D
'f o
o
o
o
o
o
o
o (' 00 ......
,. ......
I ('
M 0
>0 0 M
N
>0
N 00 00
N N o N
on 00 ......
o 'D 00
d
0-N 00
N
N ,. 00 ,. 00 00 \0
on
o on r-
N o q
o ,. 00
o
o
co M
o
r- on o
00 'D ...... ,. ......
N 00 o 00 ,.
o 00 ,. '"':. on
o 0 00 0\ ,.
o
N 0
o
N 00
00 'D
aN o N
+ on >0
o
o
>0
N N
o N
Annexure VII gives the population by age, sex and education level in the district. Educational level in Census starts from the age group 7-14 onwards. Primary level is having the highest number of persons followed by Middle level in 2001 Census. Matriculation!
DISTRICT CENSUS HANDBOOK: WOKHA
secondary level is mostly under the age group 15-24. Persons having non-technical diploma and technical diploma or certificate not equal to degree are very few. Persons attained graduation and above are more in the age group 25-34 and in age group 35-44.
306
