distal chromatin structure influences local nucleosome positions and gene expression
TRANSCRIPT

Distal chromatin structure influences localnucleosome positions and gene expressionAn Jansen1,2, Elisa van der Zande1,2, Wim Meert1,2, Gerald R. Fink3,* and
Kevin J. Verstrepen1,2,*
1Laboratory for Systems Biology, VIB, Bio-Incubator, Gaston Geenslaan 1, B-3001, Leuven, Belgium,2Laboratory for Genetics and Genomics, Centre of Microbial and Plant Genetics (CMPG), KU Leuven,Kasteelpark Arenberg 22, B-3001 Leuven, Belgium and 3Whitehead Institute for Biomedical Research/M.I.T.,Nine Cambridge Center, Cambridge, MA 02142, USA
Received August 18, 2011; Revised December 18, 2011; Accepted December 21, 2011
ABSTRACT
The positions of nucleosomes across the genomeinfluence several cellular processes, includinggene transcription. However, our understanding ofthe factors dictating where nucleosomes arelocated and how this affects gene regulation is stilllimited. Here, we perform an extensive in vivo studyto investigate the influence of the neighboring chro-matin structure on local nucleosome positioningand gene expression. Using truncated versionsof the Saccharomyces cerevisiae URA3 gene, weshow that nucleosome positions in the URA3promoter are at least partly determined bythe local DNA sequence, with so-called ‘anti-nucleosomal elements’ like poly(dA:dT) tractsbeing key determinants of nucleosome positions.In addition, we show that changes in the nucleo-some positions in the URA3 promoter stronglyaffect the promoter activity. Most interestingly, inaddition to demonstrating the effect of the localDNA sequence, our study provides novel in vivoevidence that nucleosome positions are alsoaffected by the position of neighboring nucleo-somes. Nucleosome structure may therefore be animportant selective force for conservation of geneorder on a chromosome, because relocating agene to another genomic position (where the pos-itions of neighboring nucleosomes are differentfrom the original locus) can have dramatic conse-quences for the gene’s nucleosome structure andthus its expression.
INTRODUCTION
The DNA of eukaryotic cells is packaged into chromatin,a complex high-order structure consisting of DNA and itsassociated proteins. The basic repeating unit of chromatinis the nucleosome, formed when a stretch of DNA wrapsaround histone proteins (1). DNA in nucleosomes is lessaccessible than naked DNA, which influences a number ofvital biological processes including replication, recombin-ation and gene transcription (2–10). Genome functioningthus depends on the (exact and correct) positioning ofnucleosomes on the DNA.
The recent availability of genome-wide nucleosomemaps has greatly improved our understanding of in vivonucleosome organization in the model eukaryoteSaccharomyces cerevisiae (11–17). These studies revealedthat the majority of nucleosomes are well-positioned,meaning that they occur at the same locations inmost cells of a population. Positioned nucleosomesare separated by short fragments of linker DNA, theaverage linker length being �18 bp in S. cerevisiae.Interestingly, specific patterns of nucleosome organizationoccur at the 50-ends of genes. Here, a nucleosome-depletedregion of �150 bp (generally referred to as the 50
nucleosome-free region or 50 NFR) is surrounded by thehighly positioned �1 and+1 nucleosomes. The 50 NFR islocated just upstream of the transcription start site (TSS),and many functional cis-regulatory sequences such astranscription factor binding sites reside in the 50 NFR,where binding of transcription factors is not obstructedby the presence of nucleosomes (11–13,16–22).
Whereas the organization of nucleosomes in yeast isdirected by a wide range of trans factors such as chromatinremodeling enzymes, the local DNA sequence is alsoa major determinant of nucleosome positioning (23).
*To whom correspondence should be addressed. Tel: +32 (0)16 751393; Email: [email protected] may also be addressed to Gerald R. Fink. Tel: +1 617 258 5215; Email: [email protected]
3870–3885 Nucleic Acids Research, 2012, Vol. 40, No. 9 Published online 12 January 2012doi:10.1093/nar/gkr1311
� The Author(s) 2012. Published by Oxford University Press.This is an Open Access article distributed under the terms of the Creative Commons Attribution Non-Commercial License (http://creativecommons.org/licenses/by-nc/3.0), which permits unrestricted non-commercial use, distribution, and reproduction in any medium, provided the original work is properly cited.

AT content is a good predictor of nucleosome occupancy,and high AT content correlates with low nucleosome oc-cupancy (24,25). Typically, one or more homopolymericruns of polyA, referred to as poly(dA:dT) sequences,occur in the 5’ NFR where they act as nucleosome-excluding sequences (11,12,15,19,26). Elegant experimentsby Roy et al. (27) and Struhl and coworkers (28) showedthat the poly(dA:dT) elements in promoters contribute togene expression. In addition, �20% of yeast promoterscontain stretches of tandem repeats that are often ex-tremely AT-rich and act as nucleosome-excluding se-quences (29). It is unclear how AT-rich sequencesfunction as antinucleosomal elements, but studies suggestthat poly(dA:dT) tracts have unusual structural and mech-anical properties that likely prevent incorporation intonucleosomes (30).
It has been proposed that antinucleosomal AT-rich se-quences drive sequence-directed nucleosome positioningby forming boundaries against which nucleosomes arepositioned (13,31). NFRs established by poly(dA:dT)tracts tend to be surrounded by well-positioned nucleo-somes (11,13). In turn, these highly localized nucleosomesmight dictate the position of neighboring nucleosomesbecause adjacent nucleosomes appear to impose packingconstraints on each other, much like beads on a string(13,32–34). This model for sequence-directed organizationof nucleosomes throughout the genome is called the ‘stat-istical positioning’ or ‘barrier’ model (13,31). Althoughthe barrier model was proposed more than two decadesago (31,35), it has only recently been applied for nucleo-some positioning around nucleosome-depleted promoterregions (11,13). Here, the +1 nucleosomes and to alesser extent the �1 nucleosomes seem to form barriersthat direct the positioning of other nucleosomes as far as1 kb away (13). Several recent physical modeling studieshave confirmed the barrier model for nucleosome organ-ization surrounding 50 NFRs (36–39). However, recentin vivo evidence suggests nucleosome organization at the50-ends of genes is aided by a non-statistical ATP-dependent nucleosome packing mechanism (40).Unraveling the contribution and importance of (long-range) statistical positioning on local nucleosome struc-ture therefore requires further in vivo experiments.
This study provides novel in vivo evidence showing thatnucleosome positions in promoters are strongly influencedby the surrounding chromatin context. We use the URA3gene, a well-studied sequence with a known nucleosomestructure, to measure changes in nucleosome positioningand determine the consequences of an altered chromatinenvironment on URA3 expression. Inserting the sameURA3 construct at its native locus as well as differentgenomic locations alters the chromatin structure of thepromoter, as well as URA3 activity. Our results confirmthat poly(dA:dT) sequences shield stretches of DNA fromeach other’s influence on nucleosome positioning. In theabsence of a poly(dA:dT) barrier, local nucleosome pos-itioning is influenced by the surrounding chromatincontext, as well as local DNA sequence. These experi-ments show that adjacent chromatin structure is acontributing factor in conserving chromosomal gene
order—transpositions to new sites risk loss of genefunction despite the presence of intact coding sequences.
MATERIALS AND METHODS
Yeast strains and media
Strains, plasmids and primers used in this study are listedin Supplementary Tables SI, SII and SIII, respectively.Yeast strains are derived from S288C strain BY4741(41). Strain construction strategies are described in theSupplementary Materials and Methods. Standard yeastmedia were prepared as described (42).
Growth conditions
Yeast cultures were grown overnight in 5ml of YPD at30�C in a rotating wheel unless otherwise noted. For theplate assays, YPD liquid cultures were grown overnight,diluted to OD600 0.15, and grown to OD600 0.8–1.2.Culture densities were adjusted to equivalence, seriallydiluted 4-fold, and spotted onto YPD, SC-ura and5-FOA plates. Plates were incubated at 30�C for 3 days.Growth in liquid YPD and SC-ura medium was assayedusing the Bioscreen C (Oy Growth Curves Ab Ltd.). YPDcultures were grown overnight, cells were collected,washed and resuspended in water. Bioscreen microtiterplates (Honeycomb II) were inoculated with 1� 106 cellsin YPD or SC-ura medium to a final volume of 300ml perwell. Plates were placed in the Bioscreen, and incubated at30�C with constant shaking. Optical density was measuredevery 15min for 24 h using a 600 nm filter. OD values werelog transformed and plotted against measurementtime-points. A regression line was fitted to the linearrange of the plot, corresponding to exponential growth.The doubling time was defined as the inverse of the slopeof the regression line. Each condition was assayed intriplicate.
Flow cytometry
Yeast cultures were grown overnight in a 96-well platewith each well containing 100 ml YPD. Overnightcultures were diluted into another 96-well plate containing100 ml fresh YPD or SC-ura media and grown for 5 h. Allplates were grown at 30�C while shaking. Cells were col-lected by centrifugation, and shortly before analysis resus-pended in PBS buffer. The OD600 of each plate wasmeasured, and for a number of representative samplesthe number of cells/ml was counted using a hemocytom-eter. All samples contained between 8� 106 and 2� 107
cells/ml. Samples were analyzed using a BD Influx cellsorter (BD Biosciences). Fluorescent intensities wereexamined using a 488 nm excitation and a 530±40nmemission wavelength filter to detect YFP-tagged cells.Results were analyzed using FlowJo software (TreestarInc.). For all fluorescence measurements the cellularautofluorescence was measured using strain AJY248without fluorescent reporters. For all experiments per-formed, a strain carrying an integrated copy of pTDH3-YFP was used as a positive control to account for anychanges in illumination intensity. These fluctuations were
Nucleic Acids Research, 2012, Vol. 40, No. 9 3871

small, <10% of the expression level. All population-averaged fluorescence measurements were corrected forautofluorescence by substracting the population-averagedfluorescence measured for strain AJY248. After correctingfor autofluorescence, all population-averaged fluores-cence measurements were normalized by the population-averaged fluorescence measurements for strain AJY631(Ura3-YFP with wild-type URA3 promoter at the nativeURA3 locus).
Quantitative PCR
YPD liquid cultures were grown overnight, diluted 1:200in 50ml YPD and grown for 5 h. Similarly, SC-uracultures were diluted 1:100 in 50ml SC-ura and grownfor 6 h. Samples were collected and washed once withice-cold water and then stored at �80�C. RNA was ex-tracted from yeast cells by first spheroplasting cells for 1 hat 37�C using Solution A [Zymolyase (1mg/ml; MPBiomedicals), 0.9M sorbitol, 0.1 M EDTA pH 7.5,14mM b-mercaptoethanol)] and then using an ABI 6100Nucleic Acid Prep Station and reagents (AppliedBiosystems). Total RNA was reverse transcribed(Transcriptor First Strand cDNA Synthesis Kit, Roche),and qPCR was performed with Power SYBR GreenPCR Master Mix (Applied Biosystems) on an AppliedBiosystems Step One Plus system using a two-stepprogram (15 s melting at 95�C and 60 s annealing-extension at 60�C). URA3 levels were normalized toACT1. URA3 and ACT1 were amplified using primersKV2478�KV2479 and KV36�KV37, respectively.
Nucleosome positioning
Mononucleosomal DNA was prepared as described (11).Nucleosomal DNA was analyzed using primer pairs tilingthe length of the URA3 promoter region and surroundingsequences (about 1 kb in total). Primer pairs are listed inSupplementary Table SIV, and the primer combinationsused for each strain are listed in Supplementary Table SV.Each primer pair generates 97–103 bp products, centered15–30 bp away from the neighboring primer pair. Theposition at the center of the PCR products was used asthe value for plotting points in nucleosome positioningmaps. Quantification was performed using qPCR asdescribed above. The nucleosomal DNA enrichment wascalculated as the log ratio of nucleosomal DNA to that oftotal genomic DNA. Each 96-well plate contained aprimer pair targeting the PHO5 promoter as a normaliza-tion control for plate-to-plate variation. Biological repli-cates of each sample were analyzed.The nucleosomal DNA enrichment was plotted against
genomic coordinate. Plots were smoothed using a movingaverage of three adjacent values and normalized to thetallest peak within the promoter. Peaks of PCR signalrepresent enrichment of DNA segments protected by nu-cleosomes from micrococcal nuclease digestion, andvalleys represent nucleosome-free segments. Peak pos-itions correspond to nucleosome positions, while peakheight is a measure for nucleosome occupancy. Peak pos-itions and height were determined using the multi-peakfitting tool of the IGOR Pro 6 data analysis software
(WaveMetrics Inc.). Highly reproducible nucleosomeposition maps were obtained for a control region (thePHO5 promoter). However, as noted by other researchersusing this method (8), we were unable to rigorously estab-lish a linear relationship between nucleosome occupancyand protection from micrococcal nuclease. Therefore,peak heights should be viewed merely qualitatively, andthe interpretation of this data is limited to the deductionof nucleosome positions. Each experiment was performedin duplicate. Measured peak positions in Table 1 andSupplementary Tables SVI and SVII are averages of thevalues obtained in both experiments.
Pearson correlation coefficients were calculated toexamine the dependence between variables. We alsocalculated the Spearman correlation coefficients (datanot shown), which in most cases were similar to thePearson correlation coefficients, except for the correlationbetween nucleosome positions and URA3 expression inthe lys2::URA3 mutants containing construct URA3-163.Here, the Pearson correlation coefficient is skewed becauseexpression at position 721 is exceptionally high; therefore,the reported correlation coefficients do not take intoaccount the values measured for this strain. P-valueswere calculated using the Student’s t-test.
RESULTS
URA3 as a reporter of local chromatin structure
To investigate the influence of chromatin context on localnucleosome positioning, we inserted the URA3 gene atvarious locations in the S. cerevisiae genome andexplored the consequences for URA3 nucleosome distri-bution. URA3 was chosen because the nucleosome struc-ture of this gene is well characterized and reflects thenucleosome pattern of a typical yeast gene, containing a50 NFR that is surrounded by two highly localized nucleo-somes (Figure 1A, 2A) (27,32,43). Moreover, expressionof URA3 can be easily estimated by growth on two differ-ent substrates: SC-ura, a growth medium lacking uraciland allowing growth only if URA3 is induced, and5-FOA, allowing growth in the absence of basal URA3transcription (44,45).
The URA3 promoter contains a poly(dA:dT) barriersequence (Figure 1A). To determine whether thissequence shields the URA3 gene from the influence of sur-rounding chromatin, we created a series of truncatedURA3 constructs in which the URA3 promoter includingthe poly(dA:dT) tract, is progressively deleted (50–30). Theintergenic region between the URA3 START site and theSTOP codon of the first gene upstream (GEA2) is 366 bplong (Figure 1A), and progressive deletions resulted intruncated URA3 constructs with between 265 bp and100 bp of promoter sequence proximal to the URA3START codon remaining. The corresponding mutantsare referred to by the length of the remaining truncatedURA3 promoter (e.g. ‘mutant 163’ or ‘strain 163’ only hasthe 163 bp most proximal to its START codon remaining,see Figure 1).
3872 Nucleic Acids Research, 2012, Vol. 40, No. 9
Progressive 50–30 deletion of the URA3 promoter resultsin a gradual decrease in URA3 expression and aperturbed nucleosome pattern
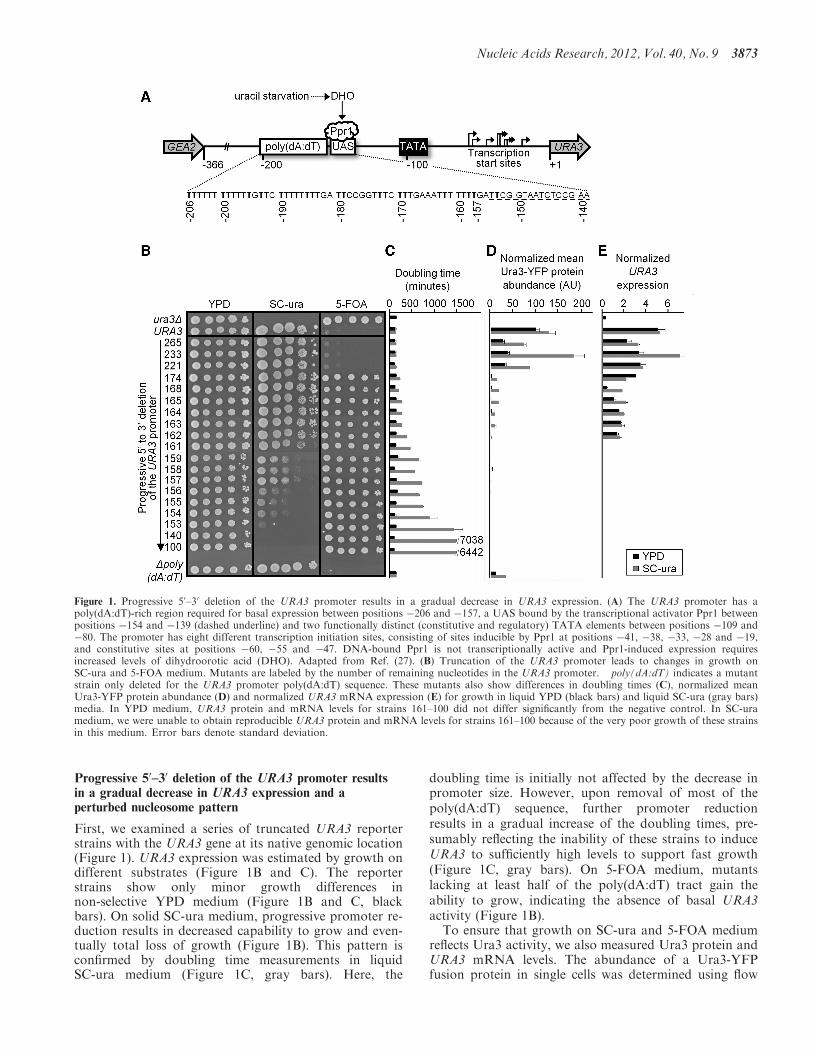
First, we examined a series of truncated URA3 reporterstrains with the URA3 gene at its native genomic location(Figure 1). URA3 expression was estimated by growth ondifferent substrates (Figure 1B and C). The reporterstrains show only minor growth differences innon-selective YPD medium (Figure 1B and C, blackbars). On solid SC-ura medium, progressive promoter re-duction results in decreased capability to grow and even-tually total loss of growth (Figure 1B). This pattern isconfirmed by doubling time measurements in liquidSC-ura medium (Figure 1C, gray bars). Here, the
doubling time is initially not affected by the decrease inpromoter size. However, upon removal of most of thepoly(dA:dT) sequence, further promoter reductionresults in a gradual increase of the doubling times, pre-sumably reflecting the inability of these strains to induceURA3 to sufficiently high levels to support fast growth(Figure 1C, gray bars). On 5-FOA medium, mutantslacking at least half of the poly(dA:dT) tract gain theability to grow, indicating the absence of basal URA3activity (Figure 1B).To ensure that growth on SC-ura and 5-FOA medium
reflects Ura3 activity, we also measured Ura3 protein andURA3 mRNA levels. The abundance of a Ura3-YFPfusion protein in single cells was determined using flow
Figure 1. Progressive 50–30 deletion of the URA3 promoter results in a gradual decrease in URA3 expression. (A) The URA3 promoter has apoly(dA:dT)-rich region required for basal expression between positions �206 and �157, a UAS bound by the transcriptional activator Ppr1 betweenpositions �154 and �139 (dashed underline) and two functionally distinct (constitutive and regulatory) TATA elements between positions �109 and�80. The promoter has eight different transcription initiation sites, consisting of sites inducible by Ppr1 at positions �41, �38, �33, �28 and �19,and constitutive sites at positions �60, �55 and �47. DNA-bound Ppr1 is not transcriptionally active and Ppr1-induced expression requiresincreased levels of dihydroorotic acid (DHO). Adapted from Ref. (27). (B) Truncation of the URA3 promoter leads to changes in growth onSC-ura and 5-FOA medium. Mutants are labeled by the number of remaining nucleotides in the URA3 promoter. �poly(dA:dT) indicates a mutantstrain only deleted for the URA3 promoter poly(dA:dT) sequence. These mutants also show differences in doubling times (C), normalized meanUra3-YFP protein abundance (D) and normalized URA3 mRNA expression (E) for growth in liquid YPD (black bars) and liquid SC-ura (gray bars)media. In YPD medium, URA3 protein and mRNA levels for strains 161–100 did not differ significantly from the negative control. In SC-uramedium, we were unable to obtain reproducible URA3 protein and mRNA levels for strains 161–100 because of the very poor growth of these strainsin this medium. Error bars denote standard deviation.
Nucleic Acids Research, 2012, Vol. 40, No. 9 3873
cytometry (Figure 1D). URA3 mRNA levels weremeasured using quantitative PCR (qPCR) (Figure 1E).The data obtained with both methods are stronglycorrelated (R=0.86, P< 0.1 in YPD and R=0.99,P< 0.05 in SC-ura). In YPD medium, Ura3 levels aregenerally low, and no protein or mRNA is measured inthe mutants that have lost basal URA3 expression, whichagrees with their ability to grow on 5-FOA medium(Figure 1B and D, black bars). Higher Ura3 levels arefound when cells were grown in SC-ura medium. Inkeeping with the growth assays on SC-ura, URA3 expres-sion decreases gradually with decreasing promoter length(Figure 1C and D, gray bars). Taken together, progressive50–30 deletion of the URA3 promoter causes gradualchanges in URA3 expression.Next, we examined nucleosome positioning in the
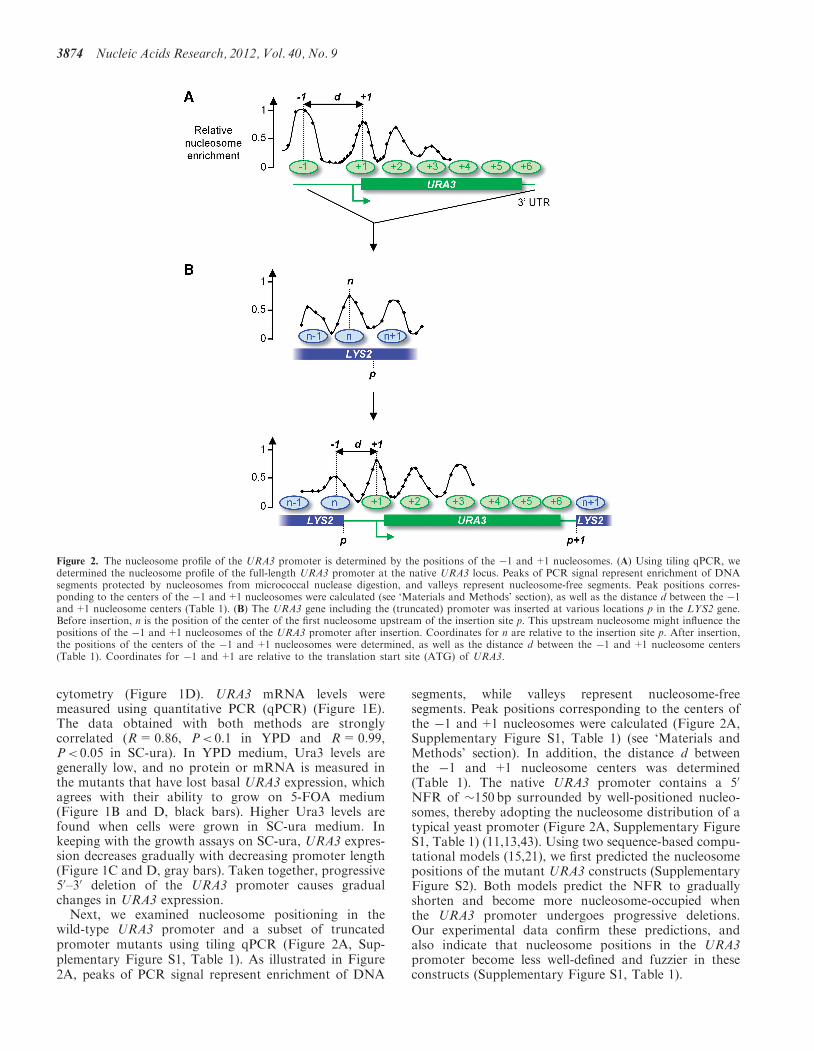
wild-type URA3 promoter and a subset of truncatedpromoter mutants using tiling qPCR (Figure 2A, Sup-plementary Figure S1, Table 1). As illustrated in Figure2A, peaks of PCR signal represent enrichment of DNA
segments, while valleys represent nucleosome-freesegments. Peak positions corresponding to the centers ofthe �1 and+1 nucleosomes were calculated (Figure 2A,Supplementary Figure S1, Table 1) (see ‘Materials andMethods’ section). In addition, the distance d betweenthe �1 and +1 nucleosome centers was determined(Table 1). The native URA3 promoter contains a 50
NFR of �150 bp surrounded by well-positioned nucleo-somes, thereby adopting the nucleosome distribution of atypical yeast promoter (Figure 2A, Supplementary FigureS1, Table 1) (11,13,43). Using two sequence-based compu-tational models (15,21), we first predicted the nucleosomepositions of the mutant URA3 constructs (SupplementaryFigure S2). Both models predict the NFR to graduallyshorten and become more nucleosome-occupied whenthe URA3 promoter undergoes progressive deletions.Our experimental data confirm these predictions, andalso indicate that nucleosome positions in the URA3promoter become less well-defined and fuzzier in theseconstructs (Supplementary Figure S1, Table 1).
Figure 2. The nucleosome profile of the URA3 promoter is determined by the positions of the �1 and+1 nucleosomes. (A) Using tiling qPCR, wedetermined the nucleosome profile of the full-length URA3 promoter at the native URA3 locus. Peaks of PCR signal represent enrichment of DNAsegments protected by nucleosomes from micrococcal nuclease digestion, and valleys represent nucleosome-free segments. Peak positions corres-ponding to the centers of the �1 and+1 nucleosomes were calculated (see ‘Materials and Methods’ section), as well as the distance d between the �1and+1 nucleosome centers (Table 1). (B) The URA3 gene including the (truncated) promoter was inserted at various locations p in the LYS2 gene.Before insertion, n is the position of the center of the first nucleosome upstream of the insertion site p. This upstream nucleosome might influence thepositions of the �1 and+1 nucleosomes of the URA3 promoter after insertion. Coordinates for n are relative to the insertion site p. After insertion,the positions of the centers of the �1 and +1 nucleosomes were determined, as well as the distance d between the �1 and +1 nucleosome centers(Table 1). Coordinates for �1 and +1 are relative to the translation start site (ATG) of URA3.
3874 Nucleic Acids Research, 2012, Vol. 40, No. 9

Poly(dA:dT) functions as a border element for nucleosomepositioning and is required for high basal and inducedURA3 expression
The previous results show that in mutants with progres-sive truncations of the URA3 promoter, URA3 expres-sion and promoter nucleosome positions were onlyaffected after the poly(dA:dT) element was at leastpartly deleted. To investigate directly the role of thepoly(dA:dT) tract in the URA3 promoter, we constructeda mutant in which the 50 bp poly(dA:dT) tract wasremoved (without removing any other URA3 promotersequences). Deleting the poly(dA:dT) tract causes a largedecrease in URA3 expression. However, the cells stillmanage to induce URA3 transcription to sufficient levelsto allow growth on medium lacking uracil (SC-ura), andbasal expression is still too high to allow growth on5-FOA medium (Figure 1B, D and E). An identicalpoly(dA:dT) deletion was constructed in a strain contain-ing the URA3 gene at another genomic location, and theresults obtained for this strain were similar to the resultsreported for the native URA3 locus (Figure 3A and C,bottom row).
To investigate whether changes in chromatin structuremight explain the observed change in URA3 activity,we determined the nucleosome positions over the URA3
promoter in the �poly(dA:dT) mutants (SupplementaryFigure S1E, Figure 4L, Table 1). Deletion of thepoly(dA:dT) tract greatly reduces the NFR. The �1 and+1 nucleosomes have moved towards each other, leavingonly a short linker region in which the UAS is located,presumably leaving this site accessible. The two TATAboxes and the different TSSs are now covered by the+1nucleosome, presumably making them less accessible.Thus, the poly(dA:dT) tract appears to help the formationof the NFR and for maintaining the accessibility of severalcis regulatory elements of the URA3 promoter. Theseresults confirm that the poly(dA:dT) tract functions asan important border element for directing nucleosomepositions in the URA3 promoter, which in turn affectsexpression of the URA3 gene.Although removal of the poly(dA:dT) tract causes
important shifts in nucleosome positioning, the URA3promoter still has highly localized nucleosomes, indicatingthat other elements also contribute to the formation ofthese nucleosomes. The presence of highly localizednucleosomes after deletion of the poly(dA:dT) element isalso predicted by sequence-based computational models(Supplementary Figure S2), indicating that the signals toposition these nucleosomes may be encoded in the localDNA sequence.
Table 1. Positions of the URA3-1 and +1 nucleosomes
Insertion sitea Promoter lengthb Position �1 nucleosomec Position +1 nucleosomec Distanced
native 366 �303.12±2.50 �5.59±/-9.75 297.53+/-12.25native 163 Noisy Noisy n/anative 162 Noisy Noisy n/anative 161 Noisy Noisy n/anative �poly(dA:dT) �244.88±0.04 �59.81±3.42 185.07±3.46LYS2-721 366 �472.83±3.26 �1.95±1.49 470.88±4.74LYS2-721 221 �272.97±2.91 �33.01±2.43 239.96±5.33LYS2-721 174 �290.38±3.03 Noisy n/aLYS2-721 168 �277.97±3.14 �44.13±4.08 233.84±7.22LYS2-721 167 �270.31±3.41 �58.70±8.63 211.61±12.04LYS2-721 165 �276.00±1.82 �59.65±2.23 216.35±4.05LYS2-721 164 �282.89±3.30 �48.15±3.22 234.74±6.52LYS2-721 163 �259.29±2.26 �34.51±2.16 224.78±4.42LYS2-721 162 �266.41±5.22 Noisy n/aLYS2-721 161 �270.91±4.95 Noisy n/aLYS2-721 �poly(dA:dT) �404.02±16.43 �69.57±1.23 334.45±15.20LYS2-450 163 �196.27±3.14 �38.50±10.12 157.76±13.26LYS2-500 163 �233.22±3.15 �46.22±1.53 187.00±4.68LYS2-540 163 �284.30±4.23 �57.64±1.11 226.66±5.34LYS2-575 163 Noisy Noisy n/aLYS2-721 163 �259.29±2.26 �34.51±2.16 224.78±4.42LYS2-770 163 Noisy �24.56±9.38 n/aLYS2-800 163 �229.08±6.38 �30.11±3.80 198.97±10.18LYS2-860 163 �284.38±4.24 �24.98±1.69 259.40±5.93LYS2-865 163 �270.06±3.63 �46.28±3.25 223.77±6.88LYS2-1950 163 �261.42±3.01 �24.98±5.86 236.44±8.87LYS2-2200 163 �209.71±11.58 �45.93±5.75 163.78±17.33LYS2-3050 163 �223.66±2.97 �41.43±1.32 182.24±4.29
a Insertion site of the URA3 reporter gene, at the native URA3 locus (‘native’) or at the LYS2 gene (e.g. ‘LYS2-721’ indicates aninsertion site is located 721 bp downstream of the LYS2 START site).b Length of the remaining truncated URA3 promoter (e.g. ‘162’ indicates the promoter has the 162 bp most proximal to itsSTART codon remaining). �poly(dA:dT) indicates the deletion of the poly(dA:dT) sequence only.c Position of the nucleosome center relative to the URA3 START site.d Distance between the �1 and +1 nucleosome centers (Figure 2). The NFR width can be calculated by subtracting 147 bpfrom the distance.
Nucleic Acids Research, 2012, Vol. 40, No. 9 3875

Expression of truncated URA3 constructs depends ongenomic location
To investigate if the expression profile and nucleosomestructure of the various truncated URA3 reportersdepend on the surrounding chromatin context, werelocated the reporters to a different genomic location.The URA3 constructs were inserted into the LYS2 gene,721 bp downstream of the LYS2 START codon. TheLYS2 ORF was chosen as an insertion site because itshows a gradual change from well-positioned nucleosomesnear the START codon to more fuzzy, less-positioned nu-cleosomes further downstream, offering multiple ‘chroma-tin environments’ in which the URA3 constructs canbe inserted (see further). To exclude the possibility thatLYS2 transcription affects URA3 expression and the nu-cleosome profile of the URA3 promoter, we examinedthese phenotypes in a lys2::URA3 mutant in which theLYS2 promoter was deleted and LYS2 transcription wasabolished (Supplementary Figure S3, SupplementaryTable SVI).We examined the growth profiles of 20 different
truncated URA3 promoter mutants integrated atposition 721 of the LYS2 gene (Figure 3A and B). Allstrains display similar growth patterns in non-selectiveYPD medium (Figure 3A and B, black bars). Based ontheir growth on selective media, the mutants can bedivided into three groups: (i) mutants 265-163 grow onSC-ura medium but not on 5-FOA medium, indicating
URA3 is being induced as well as basally expressed,(ii) mutants 162-153 grow on SC-ura medium and gainthe ability to grow on 5-FOA medium, indicating a reduc-tion in basal URA3 expression and (iii) mutants 151-100fail to grow on SC-ura medium while displaying growthon 5-FOA medium, indicating the absence of both basaland induced URA3 expression (Figure 3A). Interestingly,growth on SC-ura for the constructs at this ectopiclocation differs from the growth observed at the nativelocus (Figure 1B and C and Figure 3A and B). Insteadof a gradual increase, the doubling time remains fairly con-stant in the mutants of the first group, only to increaseslightly in the mutants of the second group. Abrupt tran-sition from growth to no growth distinguishes the secondand the third group of mutants (Figure 3A and B).
We chose to investigate URA3 expression by measuringUra3 protein concentrations using flow cytometry ratherthan by determining mRNA levels. We already showedthat Ura3 protein and URA3 mRNA measurementsstrongly correlate (R between 0.86 and 0.99, see above),and we found that protein measurements are more robustin strains that express URA3 at extremely low concentra-tions. Moreover, determining protein levels on a single cellbasis allows us to examine differences between individualcells in a population (so-called expression noise, seebelow).
The growth patterns of the different mutants correlatewith their intracellular Ura3 protein levels (Figure 3C). In
Figure 3. Growth and URA3 expression in the lys2::URA3 promoter mutants. The truncated URA3 constructs were inserted into the LYS2 gene,721 bp downstream of the LYS2 translational start site (ATG). 50 to 30 progressive deletion mutants are labeled by the number of remainingnucleotides in the URA3 promoter. �poly(dA:dT) indicates a mutant strain only deleted for the URA3 promoter poly(dA:dT) sequence.(A) Growth on solid YPD, SC-ura and 5-FOA media. (B) Doubling times, and (C) normalized mean Ura3-YFP protein abundance for growthin liquid YPD (black bars) and liquid SC-ura (gray bars) media. Error bars denote standard deviation.
3876 Nucleic Acids Research, 2012, Vol. 40, No. 9

non-selective YPD medium and in inducing SC-medium,we observe the same general trend. First, Ura3-YFP levelsdrop more or less gradually (mutants 366–167), afterwhich they increase again (mutants 165–163). Mutantswith even shorter URA3 promoters (mutants 162–100)show a dramatic drop in Ura3-YFP levels (Figure 3C).Interestingly, in a number of mutants (e.g. strains 167and 162–160), URA3 gene expression in YPD is almostthe same, but these strains show markedly differentgrowth on 5-FOA medium (Figure 3A and C). This indi-cates that a narrow difference in URA3 expression(leading to different Ura3 levels) may distinguish strainsgrowing on 5-FOA medium from strains not growing on5-FOA medium. In addition, it is possible that theobserved ability to grow on 5-FOA medium is a resultof an increased variation in Ura3 levels between individualcells within a population [so-called expression noise, (46)].Such an increase in expression noise could result in asubset of the cells no longer basally expressing URA3(allowing growth on 5-FOA medium), whereas othersstill show basal expression, explaining the significantlevels of Ura3 present in YPD medium. However, theintracellular Ura3-YFP signals do not show a differencebetween noise levels in the strains with shorter promoters(162 and shorter) compared to those with longer pro-moters (163 and up) (see Supplementary Figure S4).
Nucleosome positions of truncated URA3 constructsdepend on genomic location
To investigate if the chromatin structure of the variousmutants depends on the genomic location of the URA3marker, we determined the nucleosome positions ofvarious truncated URA3 promoters when inserted at nu-cleotide 721 of the LYS2 locus (Figure 4, Table 1). For thefull-length URA3 promoter (mutant 366), we find a NFRsurrounded by two well-positioned nucleosomes. Due tothe altered genomic context upstream of the URA3promoter, the position of the �1 nucleosome changes,but the position of the+1 nucleosome remains the same.As a consequence, the NFR doubles in size (Figure 4B,Table 1). However, this does not affect URA3 expression(Figure 3), presumably because the accessibility of thefunctional cis elements in the URA3 promoter is notaffected.
The experimentally determined nucleosome positionsfor the full-length URA3 promoter are consistent withthe predictions of the computational models, althoughthe experimentally determined NFR is smaller than whatis predicted (Supplementary Figure S5) (15,21). For thetruncated URA3 constructs inserted at the LYS2 locus,the models predict a gradual shrinking of the 50 NFRassociated with the progressive deletion of the URA3promoter (Supplementary Figure S5). Although weobserve a similar trend in our qPCR data, the actualplacing of the predicted nucleosomes is not identical tothe positions that were experimentally determined inthis study. We believe that at least part of this discrepancymay be explained by differences in methodology anddata analysis (experimental differences, e.g. in MNase
digestion; quantitative PCR data versus next generationsequencing).The predictions made by the models are similar (but not
identical) to the predictions made for the mutants at thenative URA3 locus (Supplementary Figure S2 and S5).In the Kaplan et al. model, the �1 and+1 nucleosomescan be clearly identified and the predictions show that the�1 nucleosome gradually moves inward while the positionof the +1 nucleosome does not alter (SupplementaryFigure S5A–H). In the predictions made by the Fieldet al. model, individual nucleosomes are more difficult todistinguish, especially in the strains with short URA3 pro-moters, which appear to be characterized by a high overallnucleosome occupancy (Supplementary Figure S5I–P).Experimental examination of the nucleosome profile
shows the presence of a highly positioned �1 nucleosomein all of the strains (Figure 4, Table 1). Interestingly,the �1 nucleosomes occupy similar (but not identical) pos-itions relative to the URA3 translation start site (ATG) inall of the mutants. The positions occupied by the �1 nu-cleosomes in the truncated promoter mutants are shifteddownstream relative to the position occupied by the �1nucleosome in the native, full-length URA3 promoter(average downstream shift is 29 nt; Figure 4, Table 1).It should be noted that the sequences incorporated inthe �1 nucleosome are different in each of the mutants;indeed, as the URA3 promoter shortens, the �1 nucleo-some gradually moves upstream further into the LYS2gene, and as a result, the position of this nucleosomerelative to the URA3 translation start site remainssimilar. Thus, it appears that the position of this nucleo-some is not determined by the upstream LYS2 sequence,but rather by the URA3 sequence, downstream URA3nucleosomes, and/or upstream LYS2 nucleosomes. Inaddition, the size of the truncated promoter or thepresence of a (partial) poly(dA:dT) element do not affectthe position of the �1 nucleosome.In most strains, a clearly positioned+1 nucleosome can
also be detected (Figure 4, Table 1). However, in themutants with very short URA3 promoters (strains 162and 161), the region normally occupied by the+1 nucleo-some shows relatively low nucleosome occupancy. Thus, itappears that the gradual shortening of the URA3promoter eventually results in the loss of a (positioned)+1 nucleosome. In addition, we could not detect thepresence of a +1 nucleosome in mutant 174 (Figure 4,Table 1). Where a positioned +1 nucleosome is present,our data show that it has shifted upstream towards the �1nucleosome (Figure 4, Table 1).Thus, insertion of the various URA3 mutants in a non-
native genomic location causes shifts in the nucleosomepattern compared to the pattern observed when thesemutants are located at the nativeURA3 site. Gradual trun-cation of the URA3 promoter at the non-native LYS2 sitecauses relocation of the �1 and+1 nucleosomes, resultingin the shortening of the 50 NFR (Figure 4, Table 1).
Nucleosome positions of truncated URA3 constructsdetermine URA3 expression
Do the nucleosome profiles explain URA3 expressionpatterns and the corresponding Ura3 protein levels? In
Nucleic Acids Research, 2012, Vol. 40, No. 9 3877

Figure 4. Nucleosome positions of the native URA3 promoter and selected lys2::URA3 promoter mutants. Using tiling qPCR, we determined thenucleosome positions of (A) the wild-type URA3 promoter at its native locus (same as Figure 2A). In addition, we determined the nucleosome profileof selected lys2::URA3 promoter mutants, i.e. mutants (B) 366, (C) 221, (D) 174, (E) 168, (F) 167, (G) 165, (H) 164, (I) 163, (J) 162, (K) 161 and(L) �poly(dA:dT). Peak positions corresponding to nucleosome positions were measured (Table 1). Red dotted lines mark the positions of the �1and +1 nucleosomes in the wild-type URA3 promoter at its native locus.
3878 Nucleic Acids Research, 2012, Vol. 40, No. 9

the strains with a positioned +1 nucleosome, there is astrong correlation between the position of this nucleo-some, as measured in non-selective YPD medium, andURA3 expression in YPD medium. The more this nucleo-some shifts upstream, the lower URA3 expression.(R=0.80, P< 0.0005) (Figure 3C, Table 1). This is mostlikely the result of an altered accessibility of the TSSs. Inthe native URA3 promoter, the TSSs reside inside butclose to the border of the +1 nucleosome. However, inthe truncated URA3 constructs, the +1 nucleosomeshifts upstream and the TSSs become incorporated inthe +1 nucleosome, presumably resulting in a decreasedaccessibility. In the strains that lack a (positioned)+1 nu-cleosome, and specifically in those strains with the shortestpromoters (mutants 162 and 161), only very low URA3expression can be measured, both in non-selective (YPD)and selective (SC-ura) media (Figure 3C, Table 1). Inaddition, these strains have gained the ability to grow on5-FOA medium, indicating the absence of basal URA3expression (Figure 3A). These data indicate that thepresence of a positioned +1 nucleosome is required forefficient URA3 expression.
Our data also show a moderate correlation between theposition of the �1 nucleosome and URA3 expression,both measured in YPD medium (R=�0.57, P< 10�5)(Figure 3C, Table 1). The positions of the �1 nucleosomeonly vary modestly in the different truncated constructs,and overall, the distance to the URA3 translation startremains similar (Table 1). Therefore, in contrast to the+1 nucleosome, minor changes in the position of the �1nucleosome are not expected to exert large effects onURA3 expression.
In strains containing a truncated URA3 construct with apositioned +1 nucleosome, the distance between the �1and +1 nucleosomes is similar, with a clear NFRin-between the �1 and +1 nucleosomes (Table 1).Although this NFR is only about half the size of theNFR of the full-length URA3 promoter at the nativelocus, the Ppr1 binding site and the TATA boxes areaccessible in all strains with a positioned+1 nucleosome.The size of the NFR is comparable in all mutant strains,and the width of the distance between the �1 and +1nucleosomes also shows a moderate correlation withURA3 expression (R=0.62, P< 10�4).
For a selection of mutants, we determined the URA3promoter nucleosome positions under different inducing(SC-ura) and non-inducing (YPD, 5-FOA) conditions(Supplementary Figure S6, Supplementary Table SVII).These data show that the �1 and +1 nucleosomes areorganized independent of URA3 promoter induction.This is not entirely unexpected because the transcriptionalactivator Ppr1 is always bound to the URA3 promoter(induction occurs when DNA-bound Ppr1 is activatedby dihydroorotic acid, see Figure 1A). These resultsconfirm the results obtained in rich (YPD) medium andfurther indicate that a positioned+1 nucleosome as well asa clear NFR are required for efficient URA3 expression.
Together, these results show that URA3 expression cor-relates with the nucleosome organization of the promoter.The environment around position 721 of the LYS2 ORFinfluences nucleosome positioning in the truncated URA3
inserts, suggesting that long-range effects play a role indetermining nucleosome positioning and gene expression.
Genomic locus determines growth and expression patternsof lys2::URA3 reporter strains
The previous results show that progressive deletion of theURA3 promoter alters URA3 expression and chromatinstructure, and that these changes are different when URA3is present in its native genomic location, or when it isinserted ectopically at position 721 of the LYS2 gene.To further investigate the influence of the genomic en-
vironment on local URA3 activity and chromatin struc-ture, we inserted a truncated URA3 promoter into twelvedifferent locations within the LYS2 gene (Figure 5A).Construct URA3-163 (i.e. the 163 bp most proximal tothe START codon remain, see Figure 1A) was usedbecause our previous results indicate that this constructis sensitive to the surrounding chromatin in which it isembedded. In parallel, the same experiments were per-formed with construct URA3-162 (see SupplementaryFigures S7, S9, S10 and S13 and Table SVI).The insertion sites were chosen based on the published
nucleosome positions in the LYS2 gene (12) and con-firmed in this study using tiling qPCR (Figure 5A).More specifically, we inserted the reporter constructs insites occupied by positioned nucleosomes, sites at theedges of or in between positioned nucleosomes, and sitesdepleted for nucleosomes. Nine sites (450–865) are locatedwithin 1 kb from the well-positioned+1 nucleosome thatborders the 50 NFR in the LYS2 promoter. The nucleo-somes in this region are highly localized. At sites 450, 860and 865 the URA3 gene is inserted at a nucleosome ‘peak’,indicating that a nucleosome is positioned here. Sites 540,721 and 770 on the other hand are located in a ‘valley’, alinker region where no nucleosome is present. The othersites (500, 575 and 800) are located at the transitionbetween a peak and a valley, and indicate a siteoccupied by a nucleosome, but close to one of the nucleo-some borders. A final group of insertion sites (1950, 2200and 3051) are located well beyond 1 kb from the highlylocalized+1 nucleosome in a region with low nucleosomeoccupancy, likely containing delocalized or fuzzy nucleo-somes, i.e. nucleosomes occupying different locations inthe genomes of the cells in a population (Figure 5A).For each insertion site, we characterized growth of the
resulting strains (Figure 5B and C). All mutants growsimilarly on (non-selective) YPD medium, althoughsmall variations in doubling time can be observed(Figure 5B and C, black bars). In SC-ura medium (select-ing for induction of URA3), several strains exhibit adoubling time comparable to the doubling timemeasured in YPD medium, whereas other strains showmoderately increased doubling times (Figure 5B,C, greybars). Whereas growth differences in SC-ura medium aresubtle, two strains exhibit very different growth patternson 5-FOA medium, a measure for basal URA3 expression(Figure 5B). Strains that exhibit the longest doublingtimes on SC-ura medium are able to grow on 5-FOAmedium (Figure 5B anC, grey bars). Ura3 protein levels(Figure 5D) agree with the observed growth patterns. As
Nucleic Acids Research, 2012, Vol. 40, No. 9 3879

expected, the strains that are able to grow on 5-FOAmedium show very low Ura3-YFP protein abundance(Figure 5B and D). Taken together, for each reporter con-struct (URA3-163 and URA3-162, see SupplementaryFigure S7), the growth and URA3 expression phenotypesvary greatly between the different insertion sites.
Nucleosome organization in the lys2::URA3 reporterstrains correlates with expression
To determine whether the genomic location of the URA3reporter constructs influences the nucleosome positions inthe URA3 promoter, and if these differences correlate withthe differences in URA3 expression, we ascertained thenucleosome positions of all the lys2::URA3 mutantsdescribed in the previous section (Supplementary FigureS8, Table 1). The majority of mutants have highlylocalized nucleosomes occupying the URA3 promoter,although some have fuzzy �1 (loci 575, 770) and/or +1
(locus 575) nucleosomes. When we compare the positionsof the localized �1 and +1 nucleosomes relative totheir positions in the full-length URA3 promoter at itsnative locus, we observe a shift of both nucleosomestowards the NFR.
Can URA3 expression levels in the different lys2::URA3mutants be explained by the altered nucleosome positions?The position of the+1 nucleosome correlates poorly withURA3 expression (R=0.40, P< 10�9), while the positionof the �1 nucleosome has a moderate impact (R=�0.67,P< 5� 10�8). However, our data shows that URA3 ex-pression is most strongly affected by the width of theNRF (R=0.80, P< 5� 10�8). To further explore the cor-relation between nucleosome positioning and URA3 ex-pression, we investigated another series of mutants,which contain the URA3-162 inserted at 12 different lociin the LYS2 gene (Supplementary Figures S7, S9,Supplementary Table SVI). Here, we obtain highly
Figure 5. Expression of a truncated URA3 gene depends on the genomic context. A truncated URA3 construct in which 163 bp of the URA3promoter remain (URA3-163), was inserted at various locations in the LYS2 gene. (A) Different insertion sites of the truncated URA3-163 constructwithin the LYS2 ORF. The nucleosome profile for regions of the LYS2 gene as it was experimentally determined by tiling qPCR is shown. Dottedlines indicate insertion sites which are labeled by their location inside the LYS2 ORF (coordinates refer to the position relative to the LYS2translation start). (B) Different insertion sites lead to different growth patterns on SC-ura and 5-FOA medium. Mutants are labeled by theirlocation inside the LYS2 ORF. These mutants also show differences in doubling times (C), and normalized mean Ura3-YFP protein abundance(D) for growth in liquid YPD (black bars) and liquid SC-ura (gray bars) media. Error bars denote standard deviation.
3880 Nucleic Acids Research, 2012, Vol. 40, No. 9

similar data, confirming that URA3 expression correlatespoorly with the position of the+1 nucleosome (R=0.33,P< 10�8), moderately with the position of the �1 nucleo-some (R=�0.59, P< 5� 10�8) and strongly with the sizeof the NFR (R=0.77, P< 5� 10�7). Hence, for the dif-ferent insertion sites in LYS2, the width of the NFR is themajor determinant of URA3 expression, while the positionof the+1 nucleosome has only a small impact.
These results are different from the data we obtained forthe progressively truncated URA3 constructs at locus 721(see above). At locus 721, we found that URA3 expressionwas most strongly influenced by the position of the +1nucleosome. When we take a closer look at the data inTable 1, we notice that the extent of variation in theposition of the+1 nucleosome is similar in both series ofmutants (i.e. LYS2-721 and URA3-163). In contrast, thewidth of the NFR varies greatly depending on the inser-tion site, while at locus 721, the NFR size remains fairlystable (Table 1). This might explain why NFR width onlymoderately affects expression at locus 721, while having alarge impact at other loci. Together, the data obtained forthe mutants at locus 721 and the mutants at the differentinsertion sites indicate that the size of the NFR executes alarger effect on URA3 expression than the position of the+1 nucleosome.
We also examined whether the nucleosome positions ofthe URA3-163 and URA3-162 lys2::URA3 constructscould be predicted by the existing computational models(Supplementary Figure S10; 15,21). Here, it is hard tocompare the overall nucleosome occupancy predicted bythe models with the exact nucleosome positions determinedin our analysis. However, by comparing NFR width, itbecomes clear that the models often fail to accuratelypredict a nucleosome-depleted region that is comparablein size to the NFRs measured in this study. This disparitymight indicate that the experimentally determined (in vivo)nucleosome positions may be influenced by trans factorsthat are not accounted for in the computational models.However, we did not find any evidence for changes intrans-factor binding sites that may be created or deletedin the in the URA3-162 and URA3-163 constructs(Supplementary text, Supplementary Figures S11, S12,Supplementary Tables SVI, SVIII).
Nucleosome organization in the lys2::URA3 reporterstrains depends on chromatin context
Finally, we examined whether the chromatin context ofthe insertion site determines the positions of the �1 and+1 nucleosomes in the lys2::URA3 reporter strains. Twoparameters were used to study the effects of chromatincontext. The first parameter is the position of nucleosomen, the nucleosome immediately upstream of each insertionsite before insertion of the URA3 gene (Figure 2B). Thisnucleosome acts as the �1 nucleosome of the URA3promoter after insertion. Our data show that there is agood correlation between the position of the -1 nucleo-some after insertion and the position of nucleosome nbefore insertion (R=�0.74, P< 5� 10�5) (Figure 6A).This result may suggest that the position of nucleosomen does not change upon insertion of URA3. However,
when URA3 is inserted at or close to the center of nucleo-some n, this nucleosome moves upstream, away from theURA3 promoter. On the other hand, when URA3 isinserted close to the nucleosome border or in a regiondevoid of nucleosomes, nucleosome n shifts downstream,towards the URA3 promoter.In addition, nucleosome n sometimes also affects the
position of the URA3 +1 nucleosome, even though theeffect is relatively weak (but statistically significant,R=0.38, P< 5� 10�4) (Figure 6B). Finally, the distancebetween the �1 and+1 nucleosomes is strongly influencedby the position of nucleosome n (R=0.82, P< 0.005)(Figure 6C). The same analysis was performed forURA3-162 and similar but (slightly) weaker correlationcoefficients were obtained (Supplementary FigureS13A–C).Second, we investigated whether the AT content at the
junction between the upstream LYS2 sequence and theURA3 promoter after insertion of the URA3 gene correl-ates with nucleosome positioning. For each of the inser-tion sites, we calculated the %AT content at the junctionbetween the upstream LYS2 sequence and the truncatedURA3 promoter (Table 2). We also checked whether anew, long poly(dA:dT) tract was formed at the junction,but this was not the case. We found large variations in%AT content, between 56% and 80%, and we plotted%AT content against the NFR size and the positions ofthe �1 and +1 nucleosomes after insertion of thetruncated URA3-162 promoter at various locations ofthe LYS2 gene (Figure 6D–F). The results show that ATcontent has a mild effect on the position of the �1 and+1nucleosomes, and the distance between the �1 and +1nucleosomes (R=�0.33, P< 5� 10�10, R=�0.28,P< 10�9 and R=0.25, P< 5� 10�7, respectively)(Figure 6D–F). Stronger correlations were obtained forconstruct URA3-162, with the exception of nucleosome+1 (Supplementary Figure S13D–F).
DISCUSSION
In this study, we used truncated versions of theS. cerevisiae URA3 gene to investigate the influence ofthe neighboring chromatin structure on local nucleosomepositioning and gene expression. Our results show thatprogressive 50–30 truncation of the URA3 promoter in-creases the sensitivity of the promoter to the influence ofsurrounding chromatin. In these strains, the nucleosomepositions change and become dependent on the genomiclocation. In turn, the altered nucleosome positions affectURA3 activity.When the poly(dA:dT) tract is removed without
removing any up- or downstream sequence, the NFR inthe URA3 promoter is no longer present and URA3 ex-pression decreases dramatically. This indicates that thepoly(dA:dT) tract helps to establish the NFR andoptimal URA3 expression. Although this result agreeswith previous findings (5,28), we find that the URA3promoter in the Dpoly(dA:dT) strain still retains highlylocalized nucleosomes. Thus, although the poly(dA:dT)tract directs the formation of the NFR, other elements
Nucleic Acids Research, 2012, Vol. 40, No. 9 3881

in the URA3 promoter must also help in establishing nu-cleosome organization.Truncations of the URA3 promoter that remove both
the poly(dA:dT) tract and the upstream region of the
URA3 promoter show more dramatic differences in nu-cleosome organization than mutants in which only thepoly(dA:dT) tract was removed. Moreover, when thepromoter is truncated beyond a certain point, expression
Figure 6. Genomic context influences the positions of the �1 and +1 nucleosomes of a truncated URA3 promoter. The genomic context of eachinsertion site was quantified by measuring the position of the first nucleosome n upstream of each insertion site before insertion of the URA3 gene(Figure 2B) and %AT content at the junction between the upstream LYS2 sequence and the URA3 promoter. The positions of the �1 nucleosome(A), the positions of +1 nucleosome (B) and the distance between the �1 and+1 nucleosomes (C) of the URA3-163 promoter after insertion intovarious locations of the LYS2 gene are plotted against the position of nucleosome n before insertion. The positions of the �1 nucleosome (D), thepositions of +1 nucleosome (E) and the distance between the �1 and +1 nucleosomes (F) of the URA3-163 promoter after insertion into variouslocations of the LYS2 gene are plotted against %AT content at the junction between the upstream LYS2 sequence and the URA3 promoter. Foreach plot, the Pearson correlation coefficient was calculated.
Table 2. AT content of the junction sequence
Mutant Junction sequence (40 nt upstream and 10 nt downstream) % AT Length ofpoly(dA:dT) >75% purity (nt)
native URA3poly(dA:dT)
TTTTTTTTTTTTGTTCTTTTTTTTGATTCCGGTTTCTTTGAAATTTTTTT 82 50
LYS2-450 GTTCCGTTTGGCCTTTTTGGAAAACCAAGATTTCAAATTATTTTTTTGATT 72 14LYS2-500 AGCATCATTTAGTGGACTTTGCTTTGAATTTGGATACCAGTTTTTTTGATT 70 11LYS2-540 TAATAATGCGCATGTTTTGAACTTAATTTATAACAGCTTATTTTTTTGATT 78 14LYS2-575 GCTTACTGTATTCGAATGAAAGAGTAACCATTGTTGCGGATTTTTTTGATT 68 11LYS2-721 TAAGAACTTGGGCTGGTGCGATTTCGTGGGGTGTATTCACTTTTTTTGATT 58 11LYS2-770 AGGACAATGCTGAAGCCTTCCCAGAGAGAACCTGTGTTGTTTTTTTTGATT 60 17LYS2-800 CCTGTGTTGTGGAGACTCCAACACTAAATTCCGACAAGTCTTTTTTTGATT 62 13LYS2-860 ACATCAACCGCACTTCTAACATAGTTGCCCATTATTTGATTTTTTTTGATT 70 17LYS2-865 AACCGCACTTCTAACATAGTTGCCCATTATTTGATTAAAATTTTTTTGATT 74 11LYS2-1950 AGAATTGAATAAAGAAAAATTTGTGAACAACTGGTTTGTTTTTTTTTGATT 80 17LYS2-2200 CATCCATTGGTAAGAGAAAACATTACTTTAGTTCGCAAAATTTTTTTGATT 70 11LYS2-3050 CCCACGTCAGGGCCAAGGATGAAGAAGCTGCATTTGCAAGTTTTTTTGATT 56 11
3882 Nucleic Acids Research, 2012, Vol. 40, No. 9

and nucleosome positions become sensitive to the genomiccontext. More specifically, our data indicate that thepositions of the upstream nucleosomes influence theposition of the �1 nucleosome and the width ofthe NFR (i.e. the distance between the �1 and+1 nucleo-somes). Interestingly, the position of the+1 nucleosome isin some cases also influenced by the (distal) chromatincontext of the insertion site, indicating that nucleosomepositions can influence each other over longer distances.However, the effect is relatively weak (R=0.38;P< 5� 10�4). This could be due to (a combination of)several factors. The local DNA sequence at the positionof this nucleosome may play a primary role in positioningthis nucleosome, and in addition, it is possible thattrans factors such as ATP-dependent nucleosome re-modeling proteins also contribute to the positioning ofthe key +1 nucleosome, as recently shown by Pugh andcoworkers (40).
Changes in the URA3 nucleosome pattern arecorrelated with URA3 expression and URA3-dependentgrowth phenotypes. Our data show that URA3 activityis largely determined by the extent of the NFR and thepresence and exact position of the +1 and �1 nucleo-somes. A narrow NFR results in decreased URA3 expres-sion, most likely due to decreased accessibility of the Ppr1binding site and/or the TATA boxes that are located in theNFR. This effect appears to influence both basal andinduced expression. In addition, the induction of differentURA3 promoters results in little change in nucleosomepositioning but large changes in expression (Supple-mentary Figure S6). Thus, in this case, it appears thatchromatin architecture solely sets accessibility, and theTF increases expression without gross modifications tothe nucleosomal positions. Finally, we also observe thatan upstream shift of the+1 nucleosome results in a reduc-tion of URA3 expression. The TSSs, normally located atthe border of this nucleosome, gradually become coveredby the+1 nucleosome as this nucleosome moves upstream.
In summary, our data indicate that nucleosome barrierssuch as poly(dA:dT) sequences are crucial for obtaining anaccurate promoter nucleosome organization and correctgene expression. In addition, we provide novel in vivoevidence that the positions of neighboring nucleosomesin the genomic surroundings can also influence the localpromoter nucleosome positioning, even though the effectis relatively weak. Thus, our data agrees with a thermo-dynamic model for nucleosome positioning, as proposedby the barrier model. However, other studies have convin-cingly shown that trans factors, such as chromatin re-modeling factors, also play a key role. In fact, the datain Figure 5 and Supplementary Figure S7, when comparedwith each other, argue for a second layer of nucleosomeorganization in addition to statistical positioning. Here,two constructs that differ by only one nucleotide areinserted at various locations in the LYS2 gene. Wheninserted at the same locus, these constructs sometimesshow large differences in growth and URA3 activity.This difference is most apparent for locus 721, and iscaused by strikingly different nucleosome patterns inboth constructs (Figure 4, Table 1). Because both con-structs differ by only one nucleotide, and a different
nucleosome pattern is not predicted by thermodynamicmodels (Supplementary Figure S10), this might indicatethat trans factors are at play (although we did not findany evidence for the involvement of a trans factor).One of the most intriguing properties of (eukaryotic)
genomes is the relative high degree of conservation ofgene synteny. Multiple selective forces act on synteny,and our study shows that nucleosome organization mayplay an important role. Relocating a gene to anothergenomic position may have dramatic consequences forits nucleosome structure, which in turn influences its ex-pression. Nucleosome positioning may therefore be alimiting factor in natural recombination processes wheregenes may be deregulated after they are relocated to dif-ferent parts of the genome. Moreover, in genetic engineer-ing applications, the insertion site of a construct can be acrucial factor to obtain optimal expression and regulationof an ectopic sequence. This necessitates investigatingmultiple independent transformants to account for pheno-typic differences caused by the different positions ofinserts, rather than the function of the insert, or to findmutants that have the most optimal expression pattern.Our results indicate that the use of longer constructsthat contain strong nucleosome boundary elements mayhelp to reduce the influence of the chromosomal locationon the expression of ectopic constructs.
SUPPLEMENTARY DATA
Supplementary Data are available at NAR Online:Supplementary Materials and Methods, SupplementaryFigures 1–13, Supplementary Tables I–VIII andSupplementary references (47–58).
ACKNOWLEDGEMENTS
The authors wish to thank T. Snoek and K. Voordeckersfor critique of the manuscript, and Verstrepen and Finklab members for fruitful discussions about this research.
FUNDING
European Molecular Biology Organization (EMBO)Young Investigator Program, Human Frontier ScienceProgram (HFSP; grant number RGY79/2007); EuropeanResearch Council (ERC) Young Investigator Grant (grantnumber 241426); Flemisch Institute for Biotechnology(VIB); University of Leuven (KU Leuven); ResearchFoundation – Flanders (FWO-Vlaanderen); FWO-Odysseus program; Agency for Innovation by Scienceand Technology (IWT); AB InBev Baillet-LatourFoundation (to K.J.V.); by the National Institutes ofHealth (NIH; grant numbers GM040266 and GM035010to G.F.R.); University of Leuven (KU Leuven) BOF-BDBFellowship (to A.J.). Funding for open access charge:VIB.
Conflict of interest statement. None declared.
Nucleic Acids Research, 2012, Vol. 40, No. 9 3883

REFERENCES
1. Kornberg,R.D. (1974) Chromatin structure: a repeating unit ofhistones and DNA. Science, 184, 868–871.
2. Wu,T.C. and Lichten,M. (1994) Meiosis-induced double-strandbreak sites determined by yeast chromatin structure. Science, 263,515–518.
3. Zhang,Z., Shibahara,K. and Stillman,B. (2000) PCNA connectsDNA replication to epigenetic inheritance in yeast. Nature, 408,221–225.
4. Lipford,J.R. and Bell,S.P. (2001) Nucleosomes positioned byORC facilitate the initiation of DNA replication. Mol. Cell, 7,21–30.
5. Sekinger,E.A., Moqtaderi,Z. and Struhl,K. (2005) Intrinsichistone-DNA interactions and low nucleosome density areimportant for preferential accessibility of promoter regions inyeast. Mol. Cell, 18, 735–748.
6. Guffanti,E., Percudani,R., Harismendy,O., Soutourina,J.,Werner,M., Iacovella,M.G., Negri,R. and Dieci,G. (2006)Nucleosome depletion activates poised RNA polymerase III atunconventional transcription sites in Saccharomyces cerevisiae.J. Biol. Chem., 281, 29155–29164.
7. Field,Y., Fondufe-Mittendorf,Y., Moore,I.K., Mieczkowski,P.,Kaplan,N., Lubling,Y., Lieb,J.D., Widom,J. and Segal,E. (2009)Gene expression divergence in yeast is coupled to evolution ofDNA-encoded nucleosome organization. Nat. Genet., 41, 438–445.
8. Lam,F.H., Steger,D.J. and O’Shea,E.K. (2008) Chromatindecouples promoter threshold from dynamic range. Nature, 453,246–250.
9. Han,M. and Grunstein,M. (1988) Nucleosome loss activates yeastdownstream promoters in vivo. Cell, 55, 1137–1145.
10. Han,M., Kim,U.J., Kayne,P. and Grunstein,M. (1988) Depletionof histone H4 and nucleosomes activates the PHO5 gene inSaccharomyces cerevisiae. EMBO J., 7, 2221–2228.
11. Yuan,G.C., Liu,Y.J., Dion,M.F., Slack,M.D., Wu,L.F.,Altschuler,S.J. and Rando,O.J. (2005) Genome-scale identificationof nucleosome positions in S. cerevisiae. Science, 309, 626–630.
12. Lee,W., Tillo,D., Bray,N., Morse,R.H., Davis,R.W., Hughes,T.R.and Nislow,C. (2007) A high-resolution atlas of nucleosomeoccupancy in yeast. Nat. Genet., 39, 1235–1244.
13. Mavrich,T.N., Ioshikhes,I.P., Venters,B.J., Jiang,C., Tomsho,L.P.,Qi,J., Schuster,S.C., Albert,I. and Pugh,B.F. (2008) A barriernucleosome model for statistical positioning of nucleosomesthroughout the yeast genome. Genome Res., 18, 1073–1083.
14. Shivaswamy,S., Bhinge,A., Zhao,Y., Jones,S., Hirst,M. andIyer,V.R. (2008) Dynamic remodeling of individual nucleosomesacross a eukaryotic genome in response to transcriptionalperturbation. PLoS Biol., 6, e65.
15. Field,Y., Kaplan,N., Fondufe-Mittendorf,Y., Moore,I.K.,Sharon,E., Lubling,Y., Widom,J. and Segal,E. (2008) Distinctmodes of regulation by chromatin encoded through nucleosomepositioning signals. PLoS Comput. Biol., 4, e1000216.
16. Jiang,C. and Pugh,B.F. (2009) A compiled and systematicreference map of nucleosome positions across the Saccharomycescerevisiae genome. Genome Biol., 10, R109.
17. Whitehouse,I., Rando,O.J., Delrow,J. and Tsukiyama,T. (2007)Chromatin remodelling at promoters suppresses antisensetranscription. Nature, 450, 1031–1035.
18. Lee,C.K., Shibata,Y., Rao,B., Strahl,B.D. and Lieb,J.D. (2004)Evidence for nucleosome depletion at active regulatory regionsgenome-wide. Nat. Genet., 36, 900–905.
19. Struhl,K. (1985) Naturally occurring poly(dA-dT) sequences areupstream promoter elements for constitutive transcription inyeast. Proc. Natl Acad. Sci. USA, 82, 8419–8423.
20. Albert,I., Mavrich,T.N., Tomsho,L.P., Qi,J., Zanton,S.J.,Schuster,S.C. and Pugh,B.F. (2007) Translational and rotationalsettings of H2A.Z nucleosomes across the Saccharomycescerevisiae genome. Nature, 446, 572–576.
21. Kaplan,N., Moore,I.K., Fondufe-Mittendorf,Y., Gossett,A.J.,Tillo,D., Field,Y., LeProust,E.M., Hughes,T.R., Lieb,J.D.,Widom,J. et al. (2009) The DNA-encoded nucleosomeorganization of a eukaryotic genome. Nature, 458, 362–366.
22. Bai,L., Charvin,G., Siggia,E.D. and Cross,F.R. (2010)Nucleosome-depleted regions in cell-cycle-regulated promoters
ensure reliable gene expression in every cell cycle. Dev. Cell, 18,544–555.
23. Jansen,A. and Verstrepen,K.J. (2011) Nucleosome positioning in.Saccharomyces cerevisiae. Microbiol. Mol. Biol. Rev., 75, 301–320.
24. Tillo,D. and Hughes,T.R. (2009) G+C content dominates intrinsicnucleosome occupancy. BMC Bioinformatics, 10, 442.
25. Hughes,A. and Rando,O. (2009) Chromatin ’programming’ bysequence - is there more to the nucleosome code than %GC?J. Biol., 8, 96.
26. Anderson,J.D. and Widom,J. (2001) Poly(dA-dT) promoterelements increase the equilibrium accessibility of nucleosomalDNA target sites. Mol. Cell Biol., 21, 3830–3839.
27. Roy,A., Exinger,F. and Losson,R. (1990) cis- and trans-actingregulatory elements of the yeast URA3 promoter. Mol. Cell Biol.,10, 5257–5270.
28. Iyer,V. and Struhl,K. (1995) Poly(dA:dT), a ubiquitous promoterelement that stimulates transcription via its intrinsic DNAstructure. EMBO J., 14, 2570–2579.
29. Vinces,M.D., Legendre,M., Caldara,M., Hagihara,M. andVerstrepen,K.J. (2009) Unstable tandem repeats in promotersconfer transcriptional evolvability. Science, 324, 1213–1216.
30. Segal,E. and Widom,J. (2009) Poly(dA:dT) tracts: majordeterminants of nucleosome organization. Curr. Opin. Struct.Biol., 19, 65–71.
31. Kornberg,R.D. and Stryer,L. (1988) Statistical distributions ofnucleosomes: nonrandom locations by a stochastic mechanism.Nucleic Acids Res., 16, 6677–6690.
32. Bernardi,F., Zatchej,M. and Thoma,F. (1992) Species specificprotein–DNA interactions may determine the chromatin units ofgenes in S.cerevisiae and in S.pombe. EMBO J., 11, 1177–1185.
33. Thoma,F. and Simpson,R.T. (1985) Local protein-DNAinteractions may determine nucleosome positions on yeastplasmids. Nature, 315, 250–252.
34. Thoma,F. and Zatchej,M. (1988) Chromatin folding modulatesnucleosome positioning in yeast minichromosomes. Cell, 55,945–953.
35. Fedor,M.J., Lue,N.F. and Kornberg,R.D. (1988) Statisticalpositioning of nucleosomes by specific protein-binding to anupstream activating sequence in yeast. J. Mol. Biol., 204,109–127.
36. Milani,P., Chevereau,G., Vaillant,C., Audit,B., Haftek-Terreau,Z.,Marilley,M., Bouvet,P., Argoul,F. and Arneodo,A. (2009)Nucleosome positioning by genomic excluding-energy barriers.Proc. Natl Acad. Sci. USA, 106, 22257–22262.
37. Vaillant,C., Palmeira,L., Chevereau,G., Audit,B., d’Aubenton-Carafa,Y., Thermes,C. and Arneodo,A. (2010) A novel strategyof transcription regulation by intragenic nucleosome ordering.Genome Res., 20, 59–67.
38. Mobius,W. and Gerland,U. (2010) Quantitative test of thebarrier nucleosome model for statistical positioning ofnucleosomes up- and downstream of transcription start sites.PLoS Comput. Biol., 6
39. Chevereau,G., Palmeira,L., Thermes,C., Arneodo,A. andVaillant,C. (2009) Thermodynamics of intragenic nucleosomeordering. Phys. Rev. Lett., 103, 188103.
40. Zhang,Z., Wippo,C.J., Wal,M., Ward,E., Korber,P. andPugh,B.F. (2011) A packing mechanism for nucleosomeorganization reconstituted across a eukaryotic genome. Science,332, 977–980.
41. Brachmann,C.B., Davies,A., Cost,G.J., Caputo,E., Li,J., Hieter,P.and Boeke,J.D. (1998) Designer deletion strains derived fromSaccharomyces cerevisiae S288C: a useful set of strains andplasmids for PCR-mediated gene disruption and otherapplications. Yeast, 14, 115–132.
42. Guthrie,C. and Fink,G.R. (1991) Guide to yeast genetics andmolecular biology. Academic Press, San Diego, California.
43. Tanaka,S., Livingstone-Zatchej,M. and Thoma,F. (1996)Chromatin structure of the yeast URA3 gene at high resolutionprovides insight into structure and positioning of nucleosomesin the chromosomal context. J. Mol. Biol., 257, 919–934.
44. Boeke,J.D., LaCroute,F. and Fink,G.R. (1984) A positiveselection for mutants lacking orotidine-5’-phosphate decarboxylaseactivity in yeast: 5-fluoro-orotic acid resistance. Mol. Gen. Genet.,197, 345–346.
3884 Nucleic Acids Research, 2012, Vol. 40, No. 9

45. Gottschling,D.E., Aparicio,O.M., Billington,B.L. and Zakian,V.A.(1990) Position effect at S. cerevisiae telomeres: reversiblerepression of Pol II transcription. Cell, 63, 751–762.
46. Raser,J.M. and O’Shea,E.K. (2005) Noise in gene expression:origins, consequences, and control. Science, 309, 2010–2013.
47. Ausubel,F.M. (1987) Current Protocols in Molecular Biology.Greene Pub. Associates and Wiley-Interscience: J. Wiley, NewYork.
48. Gietz,R.D., Schiestl,R.H., Willems,A.R. and Woods,R.A. (1995)Studies on the transformation of intact yeast cells by the LiAc/SS-DNA/PEG procedure. Yeast, 11, 355–360.
49. Sherman,F., Fink,G.R. and Hicks,J. (1991) Methods in yeastgenetics. Cold Spring Harbor Laboratory Press, Cold SpringHarbor, NY.
50. Storici,F., Lewis,L.K. and Resnick,M.A. (2001) In vivosite-directed mutagenesis using oligonucleotides. Nat. Biotechnol.,19, 773–776.
51. Chattoo,B.B., Sherman,F., Azubalis,D.A., Fjellstedt,T.A.,Mehnert,D. and Ogur,M. (1979) Selection of lys2 mutants of theyeast Saccharomyces cerevisiae by the utilization ofalpha-aminoadipate. Genetics, 93, 51–65.
52. Zaret,K.S. and Sherman,F. (1985) alpha-Aminoadipate as aprimary nitrogen source for Saccharomyces cerevisiae mutants.J. Bacteriol., 162, 579–583.
53. Sheff,M.A. and Thorn,K.S. (2004) Optimized cassettes forfluorescent protein tagging in Saccharomyces cerevisiae. Yeast, 21,661–670.
54. Pernambuco,M.B., Winderickx,J., Crauwels,M., Griffioen,G.,Mager,W.H. and Thevelein,J.M. (1996) Glucose-triggeredsignalling in Saccharomyces cerevisiae: different requirements forsugar phosphorylation between cells grown on glucose and thosegrown on non-fermentable carbon sources. Microbiology, 142,1775–1782.
55. Sambrook,J., Fritsch,E.F. and Maniatis,T. (1989) MolecularCloning: A Laboratory Manual., 2 edn. Cold Spring HarborLaboratory Press, Plainview, NY.
56. Newburger,D.E. and Bulyk,M.L. (2009) UniPROBE: an onlinedatabase of protein binding microarray data on protein-DNAinteractions. Nucleic Acids Res, 37, D77–D82.
57. Berger,M.F., Philippakis,A.A., Qureshi,A.M., He,F.S.,Estep,P.W. III and Bulyk,M.L. (2006) Compact, universal DNAmicroarrays to comprehensively determine transcription-factorbinding site specificities. Nat. Biotechnol., 24, 1429–1435.
58. Zhu,C., Byers,K.J., McCord,R.P., Shi,Z., Berger,M.F.,Newburger,D.E., Saulrieta,K., Smith,Z., Shah,M.V.,Radhakrishnan,M. et al. (2009) High-resolution DNA-bindingspecificity analysis of yeast transcription factors. Genome Res., 19,556–566.
Nucleic Acids Research, 2012, Vol. 40, No. 9 3885