dissertation indoor hockey officials' noise
TRANSCRIPT
DISSERTATION
INDOOR HOCKEY OFFICIALS’ NOISE EXPOSURE, TEMPORARY HEARING LOSS,
AND EFFECT OF HELMET VISOR LENGTH ON EXPOSURE TO WHISTLE NOISE
Submitted by
Karin L. Adams
Department of Environmental and Radiological Health Sciences
In partial fulfillment of the requirements
For the Degree of Doctor of Philosophy
Colorado State University
Fort Collins, Colorado
Fall 2016
Doctoral Committee: Advisor: William Brazile Stephen Reynolds
Jennifer Peel Marie Legare Tiffany Lipsey
Copyright by Karin Lynn Adams 2016
All Rights Reserved
ii
ABSTRACT
INDOOR HOCKEY OFFICIALS’ NOISE EXPOSURE, TEMPORARY HEARING LOSS,
AND EFFECT OF HELMET VISOR LENGTH ON EXPOSURE TO WHISTLE NOISE
Noise is one of the most common occupational hazards and noise exposure in non-
occupational environments is a growing concern. Generally, sporting events are a source of non-
occupational noise for spectators and employees, in which minimal research has been conducted
or published. In particular, hockey officials’ noise exposures during competitions have not thus
far been studied. More than 23,000 hockey officials are registered with USA Hockey, the
governing body of amateur hockey in the United States. Many officials are not registered,
constructing a population of more than tens of thousands of hockey officials that may be at high
risk of hearing loss. In addition, many officials begin officiating competitions as early as ten
years of age, placing them at risk of an earlier onset of symptoms of hearing loss. The hockey
officials of the Western States Hockey League (WSHL) officiate indoor competitions for elite
amateur players ranging in age from 16 to 20 in fan-driven markets providing development
opportunities for players, coaches and officials. Similarly, the officials in the American
Collegiate Hockey Association (ACHA) preside over indoor collegiate competitions for college
hockey programs that do not desire to compete within the National Collegiate Athletic
Association structure. Noise exposure and hearing thresholds of indoor hockey officials of the
WSHL and ACHA were measured to assess the impact of noise during hockey games on hearing
sensitivity. The research was conducted in northern Colorado during a pilot study in the 2013-
2014 hockey season and a main study in southeastern Wyoming during the 2014-2105 hockey
season.
iii
The pilot and main studies included noise dosimetry and pre- and post-game pure-tone
audiometric testing of participants who officiated junior and/or collegiate level hockey
competitions. Personal noise dosimetry was conducted to determine if officials were exposed to
hazardous levels of noise averaged over the duration of the game, which would result in an
equivalent sound pressure level (Leq) ≥ 85 dBA. Hearing thresholds were measured with pure-
tone audiometry before and after participants officiated hockey games to determine if a 10 dB or
greater temporary threshold shift in hearing occurred during the competition. Audiometric
testing was conducted in both ears at 500, 1000, 2000, 3000, 4000, 6000 and 8000 Hz.
The pilot study population included 23 hockey officials who officiated collegiate and
junior league hockey competitions in two arenas in northern Colorado. All of the participants
were exposed to an Leq ≥ 85 dBA over an average hockey game time of two hours and 42
minutes. The mean Leq and mean peak sound pressure level (Lpeak) were 90 dBA (SD=2.13) and
133 dB (SD=5.49), respectively. None of the officials were overexposed to noise based on the
OSHA noise criteria, yet 65 % were overexposed to noise based on ACGIH recommendations.
The audiometry portion of the pilot study included 18 hockey officials who officiated at one
indoor hockey arena in northern Colorado. Ten of eighteen (56%) sampled officials
demonstrated a ≥ 10 dB increase in hearing threshold after officiating a competition. Temporary
threshold shifts were identified in more than one ear and/or frequency in seven of the ten (70%)
participants. Two of the ten (20%) participants who experienced a threshold shift exhibited an
increase in hearing threshold of 15 dB or greater. The results of the pilot study suggested that
hockey officials were exposed to hazardous levels of noise and may be at an increased risk for
hearing loss, thus warranting further research.
iv
The main study included similar methodology to that of the pilot study. The study
population included 29 hockey officials who officiated Tier II Junior A hockey competitions in
an arena in southeastern Wyoming. All of the participants in the main study were exposed to an
Leq ≥ 85 dBA over an average hockey game time of two hours and 48 minutes. The average Leq,
maximum sound pressure level (Lmax), and Lpeak were 93 dBA (SD= 2.2), 116 dBA (SD=2.8) and
134 dB (SD=5.0), respectively. Hearing threshold shifts of 10 dB or greater were observed in
86.2% (25/29) of officials, with 36% (9/25) of those individuals exhibiting threshold shifts of 15
dB or greater. The largest proportion of hearing threshold shifts occurred at 4000 Hz, including
35.7% (10/28) of right ear shifts and 31.8% (7/22) of left ear shifts. The exhibited threshold
shifts between the pre- and post-game audiometry were statistically significant in the left ear at
500 (p=.019), 2000 (p=.0009), 3000 (p<.0001), and 4000 Hz (p=.0002) and in the right ear at
2000 (p=.0001), 3000 (p=.0001), and 4000 Hz (p<.0001), based on Wilcoxon-ranked sum
analysis. Although not statistically significant (p>0.05), with each increase of one dB of
equivalent sound pressure measured from personal noise dosimetry, the odds of a ≥ 10 dB TTS
were increased in the left ear at 500 (OR=1.33, 95% CI 0.73-2.45), 3000 (OR=1.02, 95% CI
0.68-1.51), 4000 (OR=1.26, 95% CI 0.93-1.71) and 8000 Hz (OR=1.22, 95% CI 0.76-1.94) and
in the right ear at 6000 (OR=1.03, 95% CI 0.14-7.84) and 8000 Hz (OR=1.29, 95% CI 0.12-
13.83). The findings in the main study supported those of the pilot study that indicated indoor
hockey officials were exposed to hazardous levels of noise and exhibited temporary hearing loss
after officiating games. More information is required on the noise exposure of indoor hockey
officials. However, based on the current study results, it is recommended that the hockey
officials be enrolled in a hearing conservation program including annual audiometric exams and
the use of hearing protection. Further temporary threshold shift research has the potential to
v
identify officials of other sporting events that experience temporary threshold shifts and may be
at an increased risk of noise-induced hearing loss.
Personal protective equipment (PPE) is intended to protect the body from injury or
illness. Indoor hockey officials wear specialized equipment including a league-approved helmet
with half-face visor of varying lengths for head, face, and eye protection. During competitions,
officials signal penalties and infractions using a mouth-blown whistle. The effect of the helmet
visor length on the level of whistle-generated noise to which hockey officials are exposed was
evaluated in an effort to determine if the visors introduced a reflective plane for the whistle
noise, resulting in increased noise exposure.
A Knowles Electronic Manikin for Acoustic Research (KEMAR) head and torso
assembly with a left ear microphone, in conjunction with the Larson Davis 824 Sound Level
Meter (SLM)/Octave Band Analyzer (OBA), was used to measure the peak sound pressure levels
from the noise generated from simulated whistle blowing. The KEMAR was equipped with a
Bauer 4500 hockey helmet and three different helmet/visor configurations for the study: no
visor, a 2.75” long visor, and a 4.0” long visor (as measured at the middle of the visor). A Fox
40® Super Force® finger grip pea whistle was mounted adjacent to the left side of the manikin’s
mouth in an orientation similar to that of officials observed in the pilot and main studies.
Whistle noise was generated with a short blast of air from a portable air compressor to produce
approximately 115 dB of whistle noise. The generated whistle noise was measured in an empty
indoor ice hockey arena in northern Colorado. The KEMAR assembly was positioned on the ice
to replicate the positions of the hockey official’s head and torso in five face-off spots located in
the rink. The face-off spots included the two spots in the end zone, two at the end of the neutral
zone, and one in the center of the rink. Short bursts of whistle noise were generated and
vi
measured in the left ear of the KEMAR five times in each of the five locations, with a total of 25
samples for each of the three different helmet/visor configurations.
Peak noise levels measured in the manikin ear were significantly different between the
helmet/visor configuration equipped with the long (4.0”) visor and the other two configurations.
The difference between the mean Lpeak between the long and no visor, long and short visor, and
short and no visor helmet configurations were 3.96 dBA (p<.0001, 95% CI 3.52-4.40), 3.64 dBA
(p<.0001, 95% CI 3.20-4.08), and 0.32 dBA (p=0.1558, 95% CI -0.76-0.12), respectively. These
results indicate that officials wearing helmets equipped with longer visors are likely experiencing
greater exposure to sound pressure levels of noise from their mouth-blown whistles. The longer
helmet visors offer more face and eye protection but may also act as a reflective plane for whistle
noise and increase hockey officials’ noise exposure from their mouth-blown whistles. A finding
that longer visors may increase the officials’ noise exposure from whistle noise may perhaps
provide insight for better design of helmet visors in the future.
Ultimately, the results of this study provide important preliminary data supporting further
research into the noise exposure and temporary hearing loss of officials at sporting events, as part
of the implementation of a comprehensive hearing conservation program to reduce the risk of
NIHL. In addition, further research is warranted to investigate the contribution of the visor
length to the hockey officials’ exposure to mouth-blown whistle noise. The results of this study
support that the hearing health and safety impacts of the visor length should be considered in the
assessment and design of helmet visors in the future.
vii
ACKNOWLEDGEMENTS
The entirety of my gratefulness for my advisor, committee members, colleagues and
family cannot be expressed adequately within this document. I would like to begin by thanking
my advisor Dr. William Brazile for his support, encouragement, and patience while I developed
as a scholar. I am grateful for the numerous opportunities he has given me to pursue my dream
and to advance my practice as an industrial hygienist.
I would also like to thank my committee members, Dr. Marie Legare, Professor Tiffany
Lipsey, Dr. Jennifer Peel, and Dr. Stephen Reynolds for their advice and insight. I would like to
especially thank Dr. Jennifer Peel for her patience and time during the data interpretation phase
of my dissertation. I also appreciate the contributions of Dr. Anne Hess, Dan Van Arsdall,
G.R.A.S., Ammon Langley and Kate Johnesee in one or more aspect of this research project.
I am grateful for the financial and scholarly support I received from the Mountain and
Plains Education and Research Center (MAP ERC) grant number T42OH009229. I am also
grateful for the Colorado State University OSHA Consultation Program that allowed my use of
their equipment and assisted with the purchase of new equipment necessary for the success of
my research. Without their generosity, this project would not have been possible.
Most importantly, my gratitude extends to my family. I am thankful for the work ethic
that my mother and late father instilled in me and the continued love and support of my mother.
I am thankful for the hugs and kisses from my two sons, Camden and Keaton, who remind me
daily of the love they have for me no matter how many late hours or weekends were spent away
from them. Lastly, and certainly not least, I would like to thank my husband and best friend,
Colby. I am grateful for his love, support, and understanding throughout this process. His
viii
countless sacrifices, editorial assistance, coverage of parenting responsibilities, and gentle words
of encouragement allowed me to pursue my dream of a terminal degree.
.
ix
DEDICATION
For Camden and Keaton. You are my sunshine.
x
TABLE OF CONTENTS
ABSTRACT .................................................................................................................................... ii
ACKNOWLEDGEMENTS .......................................................................................................... vii
DEDICATION ............................................................................................................................... ix
TABLE OF CONTENTS .................................................................................................................x
LIST OF TABLES ....................................................................................................................... xiii
LIST OF FIGURES ..................................................................................................................... xiv
LIST OF ACRONYMS .................................................................................................................xv
CHAPTER 1 INTRODUCTION ....................................................................................................1
CHAPTER 2 LITERATURE REVIEW .........................................................................................6
Sound and Noise ..........................................................................................................................6
Sound Propagation .......................................................................................................................8
Noise Exposure Regulations and Recommendations ................................................................12
Non-Occupational Noise Exposure............................................................................................13
Noise Measurement ...................................................................................................................15
Overview of the Auditory System .............................................................................................16
Health Effects of Noise Exposure ..............................................................................................17
Auditory Effects: .............................................................................................................................. 17
Non-Auditory Effects ...................................................................................................................... 21
Audiometry ................................................................................................................................22
Knowles Electronic Manikin for Acoustic Research (KEMAR) ...............................................24
CHAPTER 3 “NOISE EXPOSURE AND TEMPORARY HEARING LOSS OF INDOOR HOCKEY OFFICIALS: A PILOT STUDY” ................................................................................28
Summary ....................................................................................................................................28
Introduction ................................................................................................................................29
Methods......................................................................................................................................31
Audiometry ....................................................................................................................................... 31
Personal Noise Dosimetry ............................................................................................................... 32
Statistical Analysis ........................................................................................................................... 33
xi
Results ........................................................................................................................................33
Audiometry ....................................................................................................................................... 33
Personal Noise Dosimetry ............................................................................................................... 34
Discussion ..................................................................................................................................36
Audiometry ....................................................................................................................................... 36
Noise Dosimetry ............................................................................................................................... 38
Conclusions ................................................................................................................................40
CHAPTER 4 “A FACEOFF WITH HAZARDOUS NOISE: NOISE EXPOSURE AND HEARING THRESHOLD SHIFTS OF INDOOR HOCKEY OFFICIALS” ...............................41
Summary ....................................................................................................................................41
Introduction ................................................................................................................................42
Methods......................................................................................................................................46
Audiometry ....................................................................................................................................... 47
Personal Noise Dosimetry ............................................................................................................... 49
Statistical Analysis ........................................................................................................................... 50
Results ........................................................................................................................................51
Audiometry ....................................................................................................................................... 51
Personal Noise Dosimetry ............................................................................................................... 54
Discussion ..................................................................................................................................56
Audiometry ....................................................................................................................................... 57
Noise Dosimetry ............................................................................................................................... 60
Conclusions ................................................................................................................................61
CHAPTER 5 “A SIMULATION OF HOCKEY OFFICIAL WHISTLE NOISE AND USE OF KEMAR TO EVALUATE THE EFFECT OF HELMET VISOR LENGTH ON EXPOSURE TO WHISTLE NOISE” .......................................................................................................................64
Summary ....................................................................................................................................64
Introduction ................................................................................................................................65
Methods......................................................................................................................................70
Manikin .............................................................................................................................................. 70
Whistle-blowing Apparatus .......................................................................................................72
Helmet Configurations..................................................................................................................... 74
xii
Statistical Analysis ........................................................................................................................... 76
Results ........................................................................................................................................77
Discussion ..................................................................................................................................78
Limitations ........................................................................................................................................ 82
Conclusions ................................................................................................................................83
CHAPTER 6 SUMMARY .............................................................................................................85
Major Findings ...........................................................................................................................85
Specific Aim 1 .................................................................................................................................. 85
Specific Aim 2 .................................................................................................................................. 86
Specific Aim 3 .................................................................................................................................. 88
Limitations .................................................................................................................................89
Contribution to the Field ............................................................................................................92
Future Research Opportunities ..................................................................................................93
Conclusions ................................................................................................................................95
REFERENCES ..............................................................................................................................97
APPENDIX A ..............................................................................................................................106
APPENDIX B ..............................................................................................................................108
APPENDIX C ..............................................................................................................................109
APPENDIX D ..........................................................................................................................11010
APPENDIX E ..............................................................................................................................112
APPENDIX F...............................................................................................................................113
APPENDIX G ..............................................................................................................................115
APPENDIX H ..............................................................................................................................118
APPENDIX I ...............................................................................................................................119
xiii
LIST OF TABLES
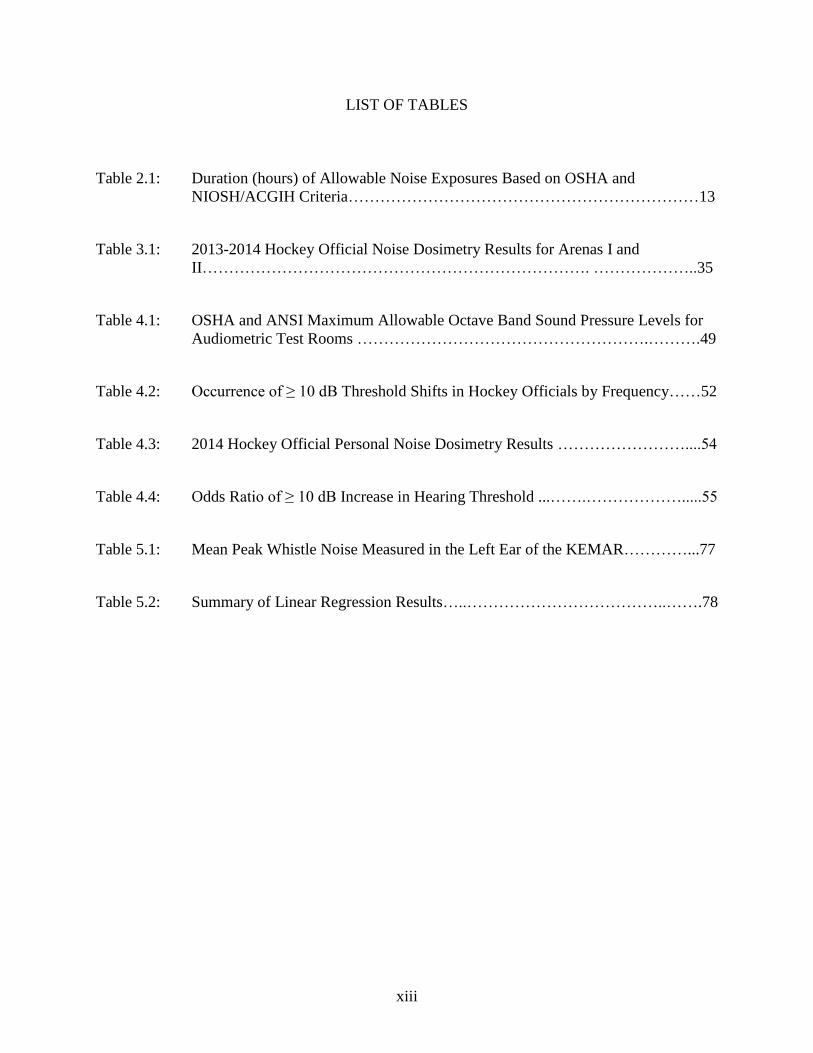
Table 2.1: Duration (hours) of Allowable Noise Exposures Based on OSHA and NIOSH/ACGIH Criteria…………………………………………………………13
Table 3.1: 2013-2014 Hockey Official Noise Dosimetry Results for Arenas I and II………………………………………………………………. ………………..35
Table 4.1: OSHA and ANSI Maximum Allowable Octave Band Sound Pressure Levels for Audiometric Test Rooms ……………………………………………….……….49
Table 4.2: Occurrence of ≥ 10 dB Threshold Shifts in Hockey Officials by Frequency……52
Table 4.3: 2014 Hockey Official Personal Noise Dosimetry Results ……………………....54
Table 4.4: Odds Ratio of ≥ 10 dB Increase in Hearing Threshold ...…….……………….....55
Table 5.1: Mean Peak Whistle Noise Measured in the Left Ear of the KEMAR…………...77
Table 5.2: Summary of Linear Regression Results…..………………………………..…….78
xiv
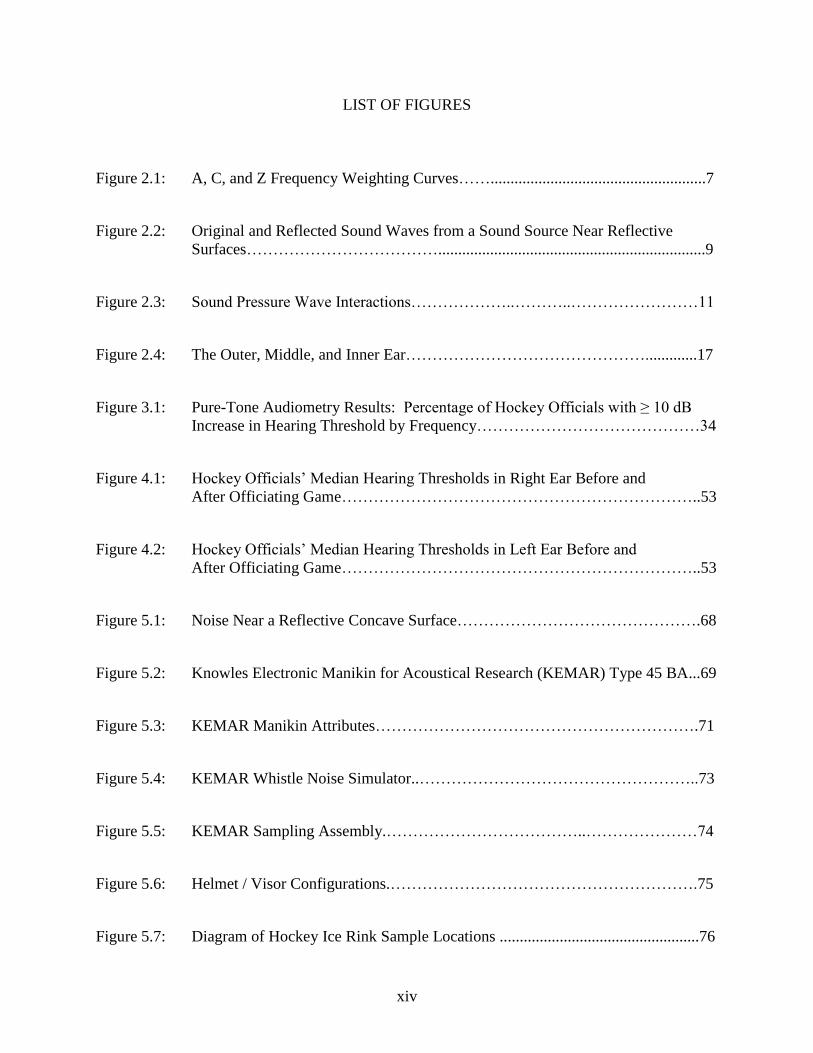
LIST OF FIGURES Figure 2.1: A, C, and Z Frequency Weighting Curves……......................................................7
Figure 2.2: Original and Reflected Sound Waves from a Sound Source Near Reflective Surfaces………………………………...................................................................9
Figure 2.3: Sound Pressure Wave Interactions………………..………..……………………11
Figure 2.4: The Outer, Middle, and Inner Ear……………………………………….............17
Figure 3.1: Pure-Tone Audiometry Results: Percentage of Hockey Officials with ≥ 10 dB Increase in Hearing Threshold by Frequency……………………………………34
Figure 4.1: Hockey Officials’ Median Hearing Thresholds in Right Ear Before and After Officiating Game…………………………………………………………..53
Figure 4.2: Hockey Officials’ Median Hearing Thresholds in Left Ear Before and After Officiating Game…………………………………………………………..53
Figure 5.1: Noise Near a Reflective Concave Surface……………………………………….68
Figure 5.2: Knowles Electronic Manikin for Acoustical Research (KEMAR) Type 45 BA...69
Figure 5.3: KEMAR Manikin Attributes…………………………………………………….71
Figure 5.4: KEMAR Whistle Noise Simulator..……………………………………………..73
Figure 5.5: KEMAR Sampling Assembly.………………………………..…………………74
Figure 5.6: Helmet / Visor Configurations.………………………………………………….75
Figure 5.7: Diagram of Hockey Ice Rink Sample Locations ..................................................76
xv
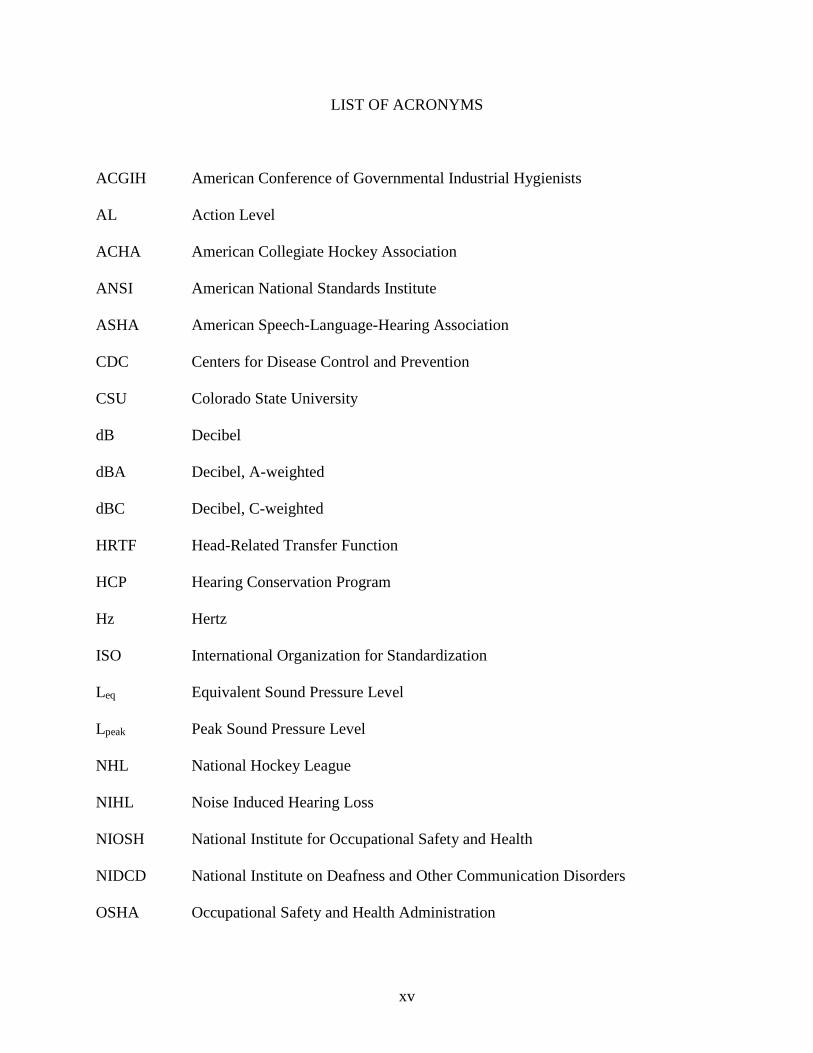
LIST OF ACRONYMS ACGIH American Conference of Governmental Industrial Hygienists
AL Action Level
ACHA American Collegiate Hockey Association
ANSI American National Standards Institute
ASHA American Speech-Language-Hearing Association
CDC Centers for Disease Control and Prevention
CSU Colorado State University
dB Decibel
dBA Decibel, A-weighted
dBC Decibel, C-weighted
HRTF Head-Related Transfer Function
HCP Hearing Conservation Program
Hz Hertz
ISO International Organization for Standardization
Leq Equivalent Sound Pressure Level
Lpeak Peak Sound Pressure Level
NHL National Hockey League
NIHL Noise Induced Hearing Loss
NIOSH National Institute for Occupational Safety and Health
NIDCD National Institute on Deafness and Other Communication Disorders
OSHA Occupational Safety and Health Administration
xvi
PEL Permissible Exposure Limit
PPE Personal Protective Equipment
SLM Sound Level Meter
SPL Sound Pressure Level
TTS Temporary Threshold Shift
TLV Threshold Limit Value
TWA Time-Weighted Average
WHO World Health Organization
WSHL Western States Hockey League
1
CHAPTER 1
INTRODUCTION
Noise is ubiquitous, and exposure to hazardous levels of noise may cause irreversible
noise-induced hearing loss (NIHL). Several researchers have established that the severity of
hearing loss is dependent on noise intensity and duration of exposure, and that susceptibility to
noise-induced hearing loss (NIHL) varies among individuals.(1-3) The National Institute on
Deafness and other Communication Disorders (NIDCD) and the American Speech-Language-
Hearing Association (ASLHA) state that exposure to sounds at or above 85 decibels (dB) is
considered hazardous noise and may increase the risk of permanent hearing loss.(4, 5) Exposure
to hazardous levels of noise may be detrimental to hearing, and may also cause stress and affect
one’s health, sleep, communication, safety, and quality of life. Exposure to hazardous levels of
noise may result in a temporary hearing loss, or temporary threshold shift (TTS).(4) Symptoms of
a TTS include a temporary hearing loss and may also include ringing in the ears (tinnitus) and/or
a feeling of fullness in the head. The hearing threshold recovery time varies, with full recovery
typically occurring within 48 hours.(6) Repeated TTSs have been found to be a risk indicator for
permanent NIHL that may occur if exposure to hazardous noise continues.(3)
NIHL is one of the most common occupational diseases and is entirely preventable.(7) It
has been reported that 15% of Americans between the ages of 20 and 69 years old have
permanent hearing loss,(4) and 16% of worldwide hearing losses are attributed to occupational
noise exposure,(8) with over $242 million spent annually on workers’ compensation for hearing
loss disability in the United States.(9) Excessive noise exposures from recreational settings and
their contribution to NIHL has been a growing concern of the World Health Organization
2
(WHO).(10) Reducing recreational noise exposures is important as occupational exposure limits
(OEL) for noise are based on occupational exposure duration and noise levels with the
assumption that exposure to non-occupational noise levels are low enough to allow the ear to
recover. It is also important to recognize that occupational and recreational noise exposures
resulting in a TTS at an early age may produce early onset of permanent cochlear nerve
degeneration.(1, 11)
Occupational noise exposure has been studied extensively since the mid-nineteenth
century, but research in the effects of non-occupational, or recreational noise sources has been
minimal. Some research on noise levels at concerts, discotheques, and live sporting events has
been conducted,(12-15) with only a few of those studies assessing the noise exposure of spectators
and employees at sporting events.(16-18) A comprehensive review of the relevant literature
indicated that research on the health and safety of sports officials is lacking with only one
published study investigating noise exposures of collegiate basketball referees.(19)
Hockey officials are a population of individuals who may be at a high risk for NIHL
because their exposures have not been evaluated and they are exposed to numerous
uncontrollable noise sources (e.g., crowd, whistle, puck-to-glass, music, public address system)
in an enclosed, indoor space with multiple noise reflective surfaces (e.g., plexiglas®, ice).
Hockey officials’ noise exposure was of particular interest because individuals may begin
officiating as early as ten years of age,(20) and in many cases noise exposure from hockey games
is supplemental to any noise exposure experienced during the other hours of the officials’ day
(e.g. work, music concerts). There are tens of thousands of amateur and professional hockey
officials in the United States alone, with over 23,000 hockey officials registered with USA
3
Hockey. These individuals’ noise exposures from officiating indoor hockey competitions have
not been investigated.
A plethora of research supports the relationship between exposure to hazardous levels of
noise and TTSs and NIHL. Therefore, researchers were interested in determining if hockey
officials experienced a TTS after officiating a game. A change in hearing sensitivity usually
occurs incrementally over time and may go unnoticed. Pure-tone audiometry is one method used
to measure the hearing acuity for each ear at different frequencies and loudness. The
audiometric test measures individual’s hearing sensitivity in dB relative to the quietest sounds
that a young healthy individual should be able to hear. The inner-ear hair cells that respond to
4000 Hz sound energy are particularly vulnerable to damage because the outer and middle ear
transmit the energy of sound frequencies near 4 kHz very efficiently. The characteristic decrease
in hearing acuity due to NIHL produces an audiometric threshold pattern termed the 4000 Hz
“notch” (4K notch). NIHL is typically indicated on an audiogram by a decrease in an
individual’s hearing sensitivity (threshold shift) at 4 kHz or 6 kHz. Continued hazardous noise
exposure may widen the notch observed on the audiogram into adjacent frequencies.
Spectators, participants, and employees of sporting events may be exposed to numerous
noise sources at the event. The noise exposure of an official is unique due to the use of the
mouth-blown whistle in close proximity to the ear. Researchers have investigated the noise
levels generated from mouth-blown whistles and postulated that sports officials may be at an
increased risk of NIHL.(19, 21) The number of times the whistle is signaled in a game is dependent
on the officials’ management of the game (e.g., infractions, timeouts, goals). The determination
of hockey officials’ exposure to mouth-blown whistle noise may be influenced by different
configurations of reflective or absorptive surfaces in close proximity to the whistle. In particular,
4
the official’s helmet visor may act as a reflective surface for the whistle noise,(22) increasing the
hockey official’s exposure to whistle noise. Utilizing a manikin equipped with an in-ear
microphone to assess if the visor of the hockey official’s helmet introduces a reflective plan for
the whistle noise may be the preliminary step in future design and production of visors. The goal
of the current research is to measure the noise exposure and any changes in hearing thresholds of
a population of individuals who, so far, have been overlooked. The goals of the research are
summarized below with three specific aims.
Specific Aim 1: Determine the noise exposure levels of Western States Hockey League
(WSHL) and American Collegiate Hockey Association (ACHA) indoor hockey officials who
officiated in ice hockey venues in northern Colorado and southeastern Wyoming. The approach
was to use a personal noise dosimeter to measure the noise exposure level of the indoor hockey
officials for the duration of the game. The data from the noise dosimeter were analyzed to
determine the proportion of hockey officials exposed to an equivalent sound pressure level (Leq)
equal to or greater than 85 dBA.
Specific Aim 2: Determine the proportion of WSHL and ACHA indoor hockey officials
that experience a decrease in hearing sensitivity (temporary threshold shift) after officiating a
game. The approach was to administer a hearing history questionnaire and otoscopic exam to
each official prior to the pre-game audiometric test. The pre- and post-game audiometric test
results were compared to determine the proportion of officials who experienced a 10 dB or
greater decrease in hearing sensitivity at 500, 1000, 2000, 3000, 4000, 6000, and 8000 Hz. The
data were also evaluated to determine if a significant relationship between the officials’ noise
exposure (Leq) and the presence of a ≥10 dB temporary threshold shift in hearing occurred at the
tested frequencies.
5
The pilot and main studies used similar noise monitoring and audiometric testing
methodologies from specific aims one and two, and were conducted in the 2013-2014 and 2014-
2015 hockey seasons, respectively. The results of the pilot study are presented in Chapter 3 in a
version of the manuscript entitled, “Noise Exposure and Temporary Hearing Loss of Indoor
Hockey Officials: A Pilot Study.” The manuscript is in press for November 2016 publication in
the Journal of Environmental Health. The results of the main study are presented in Chapter 4 in
a version of the manuscript entitled, “A Faceoff with Hazardous Noise: Noise Exposure and
Hearing Threshold Shifts of Indoor Hockey Officials.” The manuscript is in press for February
2017 publication in the Journal of Occupational and Environmental Hygiene.
Specific Aim 3: Measure the whistle noise in the ear of a KEMAR manikin wearing
three different helmet/visor configurations: no visor, 2.75” long visor, and 4.0” long visor. The
approach simulated a hockey official’s exposure to whistle noise generated adjacent to the mouth
of the KEMAR manikin equipped with an in-ear microphone. The peak sound pressure level
(Lpeak) from the whistle was measured at the manikin’s ear for each of the helmet configurations.
The results of this study are presented in Chapter 5 in a version of the manuscript entitled, “A
Simulation of Hockey Official Whistle Noise and Use of KEMAR to Evaluate the Effect of
Helmet Visor Length on Exposure to Whistle Noise.” The manuscript is planned for submission
to the Journal of Occupational and Environmental Hygiene in 2017.
6
CHAPTER 2
LITERATURE REVIEW Sound and Noise
A sound source causes rapid variations in energy, or vibrations, that disturb particles in
the surrounding medium, in an outward-moving, wavelike pattern. The sound wave is the
pattern of the disturbed medium caused by the movement of energy as it propagates away from
the source of the sound. The frequency of a sound wave, or the pitch, is the number of vibrations
per second, measured in hertz (Hz). The average range of audible frequencies for a healthy
young person is between 20 and 20,000 Hz, but varies considerably among individuals.(23, 24) A
pure-tone sound consists of a single frequency whereas most of the sounds created in everyday
environments are multi-tonal, or multi-frequency. The intensity of sound, or sound pressure
level, is measured in decibels (dB). The decibel represents the ratio of the sound pressure level
of the source sound in relation to the pressure level of the threshold of human hearing. The
upper end of sound pressure levels of sources detected by human hearing is approximately ten
million times that of the lower end, or human hearing threshold, sound pressure level.(24)
Consequently, the decibel scale is logarithmic and compresses the range of ratios of sound
pressure levels that are audible to the human ear into a more manageable scale.
The human ear does not transmit sound energies in all frequencies equally. To account
for this variation, the measurement of sound frequency has become internationally standardized
to the A, C, and Z weighting networks.(10, 25-27) The A-weighted sound pressure level
measurements model the frequency-related variability of human hearing, therefore due to
attenuation of low frequency sound by the ear, the sound pressure levels of lower frequencies
7
with the A-weighting are reported as lower than if they were measured without the weighting.
The A-weighted sound pressure levels have been adopted by governmental agencies as well as
hearing conservation professionals internationally for use in identifying noise with damaging
effects on human hearing.(27-29) The C-weighted sound level scale minimally attenuates the
lower frequencies and is often used to characterize low frequency sound that may induce
vibration in buildings or the human body. The Z-weighted scale has zero weighting and is the
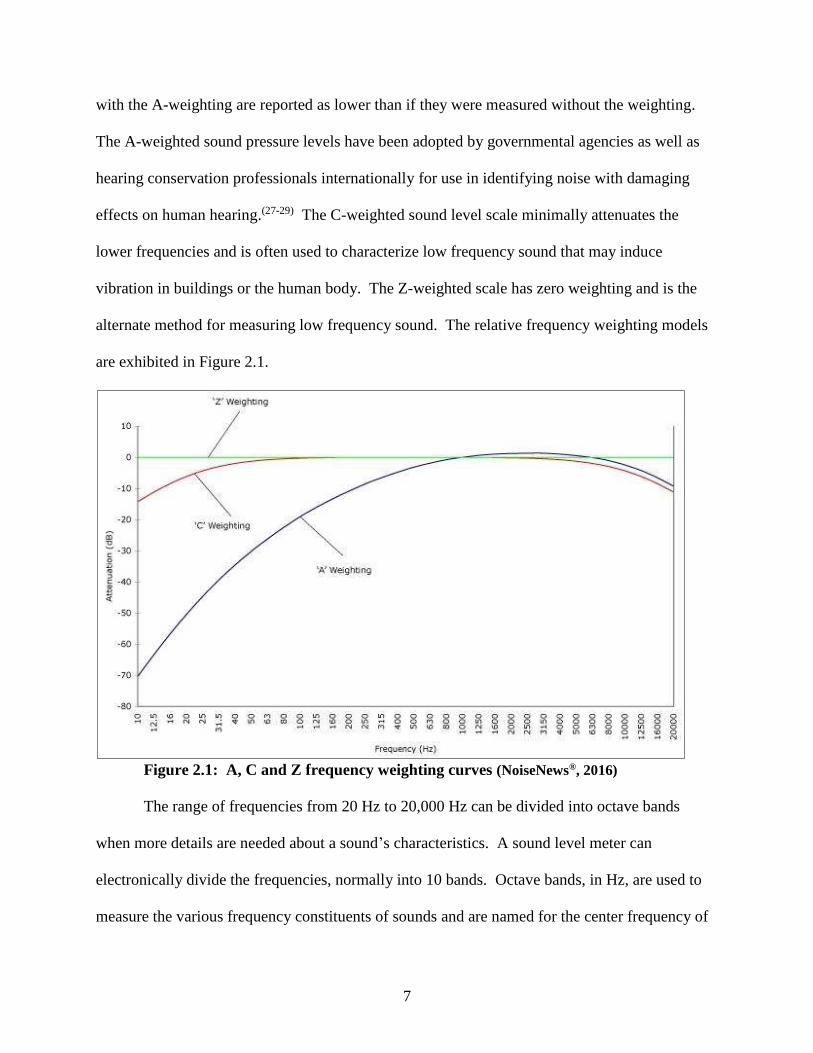
alternate method for measuring low frequency sound. The relative frequency weighting models
are exhibited in Figure 2.1.
Figure 2.1: A, C and Z frequency weighting curves (NoiseNews®, 2016)
The range of frequencies from 20 Hz to 20,000 Hz can be divided into octave bands
when more details are needed about a sound’s characteristics. A sound level meter can
electronically divide the frequencies, normally into 10 bands. Octave bands, in Hz, are used to
measure the various frequency constituents of sounds and are named for the center frequency of
8
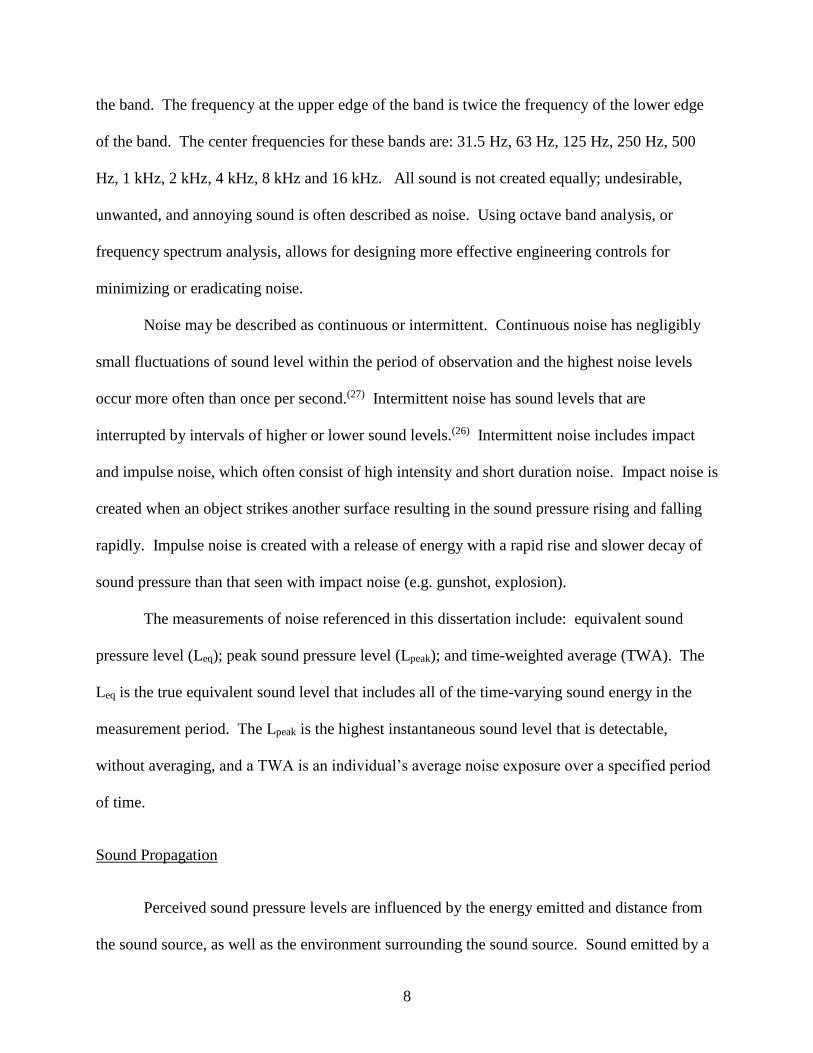
the band. The frequency at the upper edge of the band is twice the frequency of the lower edge
of the band. The center frequencies for these bands are: 31.5 Hz, 63 Hz, 125 Hz, 250 Hz, 500
Hz, 1 kHz, 2 kHz, 4 kHz, 8 kHz and 16 kHz. All sound is not created equally; undesirable,
unwanted, and annoying sound is often described as noise. Using octave band analysis, or
frequency spectrum analysis, allows for designing more effective engineering controls for
minimizing or eradicating noise.
Noise may be described as continuous or intermittent. Continuous noise has negligibly
small fluctuations of sound level within the period of observation and the highest noise levels
occur more often than once per second.(27) Intermittent noise has sound levels that are
interrupted by intervals of higher or lower sound levels.(26) Intermittent noise includes impact
and impulse noise, which often consist of high intensity and short duration noise. Impact noise is
created when an object strikes another surface resulting in the sound pressure rising and falling
rapidly. Impulse noise is created with a release of energy with a rapid rise and slower decay of
sound pressure than that seen with impact noise (e.g. gunshot, explosion).
The measurements of noise referenced in this dissertation include: equivalent sound
pressure level (Leq); peak sound pressure level (Lpeak); and time-weighted average (TWA). The
Leq is the true equivalent sound level that includes all of the time-varying sound energy in the
measurement period. The Lpeak is the highest instantaneous sound level that is detectable,
without averaging, and a TWA is an individual’s average noise exposure over a specified period
of time.
Sound Propagation
Perceived sound pressure levels are influenced by the energy emitted and distance from
the sound source, as well as the environment surrounding the sound source. Sound emitted by a
9
source in a free field is one that propagates energy uniformly in all directions, with no reflected
sound waves.(24) The sound pressure levels produced by the source are the same in every
direction and equivalent equidistant from the source. The physics of sound propagation follows
the inverse-square law, such that each time the distance from the point source of noise is
doubled, the intensity of the sound decreases to a fourth of the source intensity. Within the
decibel measurement scale for sound, this reduction of intensity is equivalent to a sound pressure
level decrease of six dB.(24)
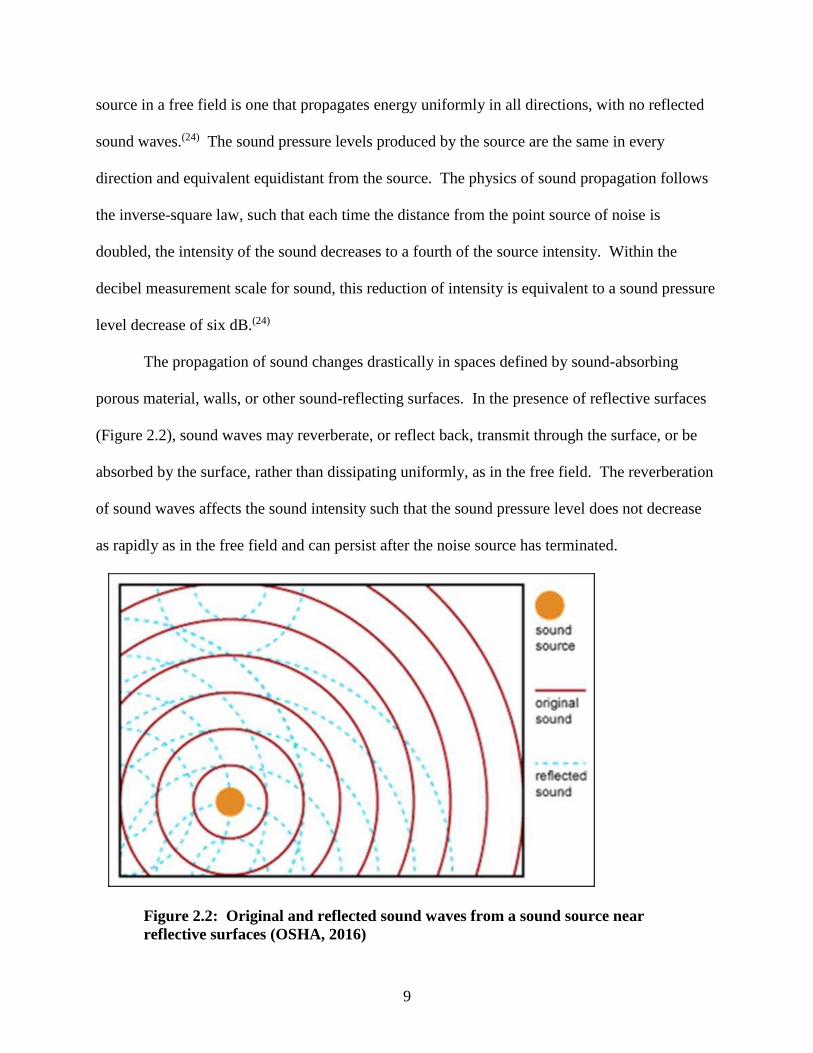
The propagation of sound changes drastically in spaces defined by sound-absorbing
porous material, walls, or other sound-reflecting surfaces. In the presence of reflective surfaces
(Figure 2.2), sound waves may reverberate, or reflect back, transmit through the surface, or be
absorbed by the surface, rather than dissipating uniformly, as in the free field. The reverberation
of sound waves affects the sound intensity such that the sound pressure level does not decrease
as rapidly as in the free field and can persist after the noise source has terminated.
Figure 2.2: Original and reflected sound waves from a sound source near reflective surfaces (OSHA, 2016)
10
A reflective surface that is located close to a noise source will affect the measured intensity of
the source noise radiated as well as the directional properties of the source noise. At a constant
distance, the addition of each reflective surface will concentrate the sound and increase the
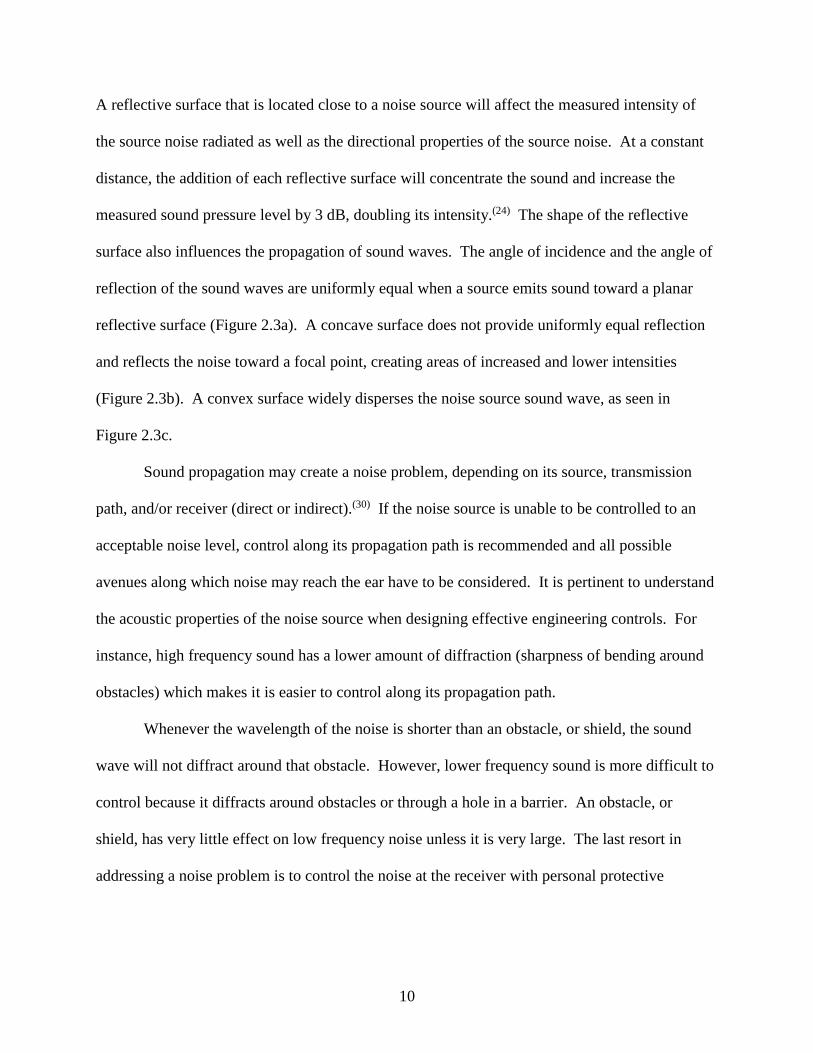
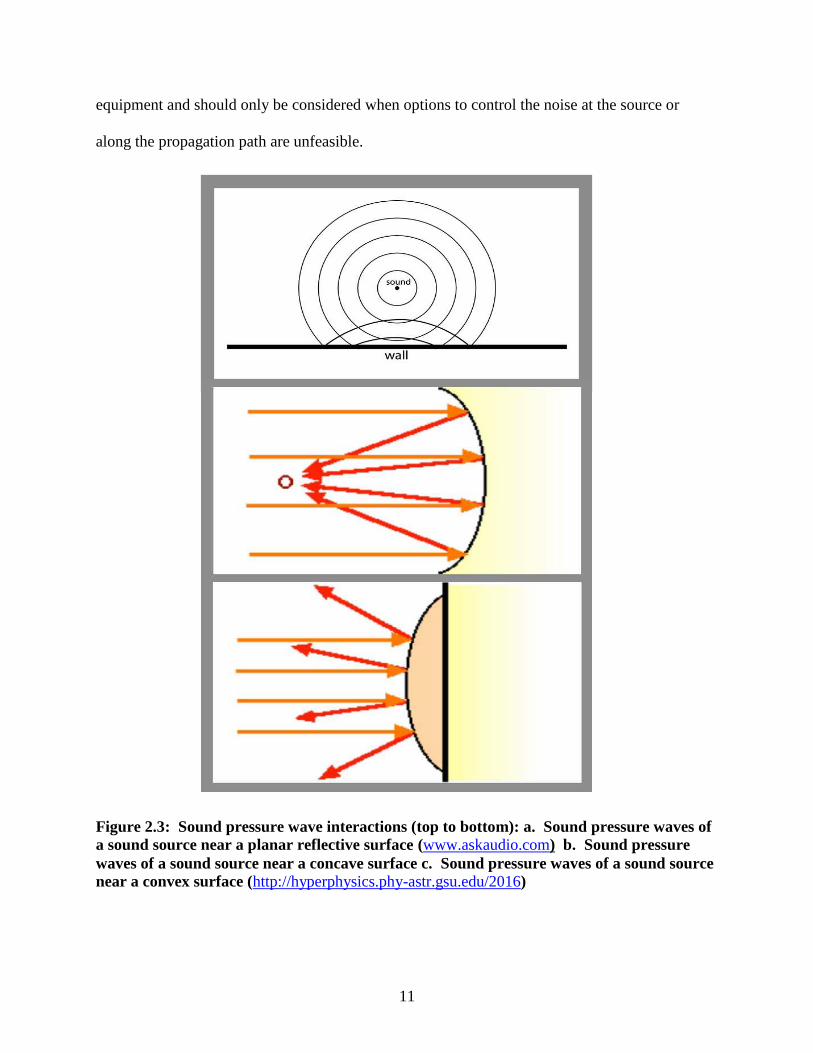
measured sound pressure level by 3 dB, doubling its intensity.(24) The shape of the reflective
surface also influences the propagation of sound waves. The angle of incidence and the angle of
reflection of the sound waves are uniformly equal when a source emits sound toward a planar
reflective surface (Figure 2.3a). A concave surface does not provide uniformly equal reflection
and reflects the noise toward a focal point, creating areas of increased and lower intensities
(Figure 2.3b). A convex surface widely disperses the noise source sound wave, as seen in
Figure 2.3c.
Sound propagation may create a noise problem, depending on its source, transmission
path, and/or receiver (direct or indirect).(30) If the noise source is unable to be controlled to an
acceptable noise level, control along its propagation path is recommended and all possible
avenues along which noise may reach the ear have to be considered. It is pertinent to understand
the acoustic properties of the noise source when designing effective engineering controls. For
instance, high frequency sound has a lower amount of diffraction (sharpness of bending around
obstacles) which makes it is easier to control along its propagation path.
Whenever the wavelength of the noise is shorter than an obstacle, or shield, the sound
wave will not diffract around that obstacle. However, lower frequency sound is more difficult to
control because it diffracts around obstacles or through a hole in a barrier. An obstacle, or
shield, has very little effect on low frequency noise unless it is very large. The last resort in
addressing a noise problem is to control the noise at the receiver with personal protective
11
equipment and should only be considered when options to control the noise at the source or
along the propagation path are unfeasible.
Figure 2.3: Sound pressure wave interactions (top to bottom): a. Sound pressure waves of a sound source near a planar reflective surface (www.askaudio.com) b. Sound pressure waves of a sound source near a concave surface c. Sound pressure waves of a sound source near a convex surface (http://hyperphysics.phy-astr.gsu.edu/2016)
12
Noise Exposure Regulations and Recommendations
The Occupational Safety and Health Administration (OSHA) is the regulatory agency
responsible for ensuring safe working conditions in the United States.(31) Occupational noise
exposure is regulated by OSHA’s noise standard 29 CFR 1910.95. The National Institute for
Occupational Safety and Health (NIOSH) and the American Conference of Governmental
Industrial Hygienists (ACGIH) have also established exposure guidelines for occupational
exposure to noise. These hearing damage-risk criteria provide the basis for recommending noise
exposure limits based on noise level and exposure duration. Standards and recommendations are
based on average risk and do not account for individual variance in susceptibility.
Occupational exposure limits (OELs) for noise are based on exposure duration and noise
level, assuming non-occupational noise levels are low enough to allow the ear to recover. OSHA
permits an 8-hour time-weighted average (TWA) exposure to 90 dBA (permissible exposure
limit (PEL)) and requires a 5 dB exchange rate. An exchange rate is also called a doubling rate.
For instance, for every 5 dB increase in noise level, the allowable exposure time is reduced by
half; and for every 5 dB decrease in noise level, the allowable exposure time is doubled.(32)
OSHA also states that employee exposure to impulsive or impact noise may not exceed a 140 dB
peak sound pressure level at any time. Those employees exposed to an 8-hour TWA of 85 dB or
greater must be enrolled in a hearing conservation program which mandates controls for
hazardous noise and hearing exams for workers. The NIOSH recommended exposure limit
(REL) and ACGIH threshold limit value (TLV) recommend an 8-hour TWA sound level of 85
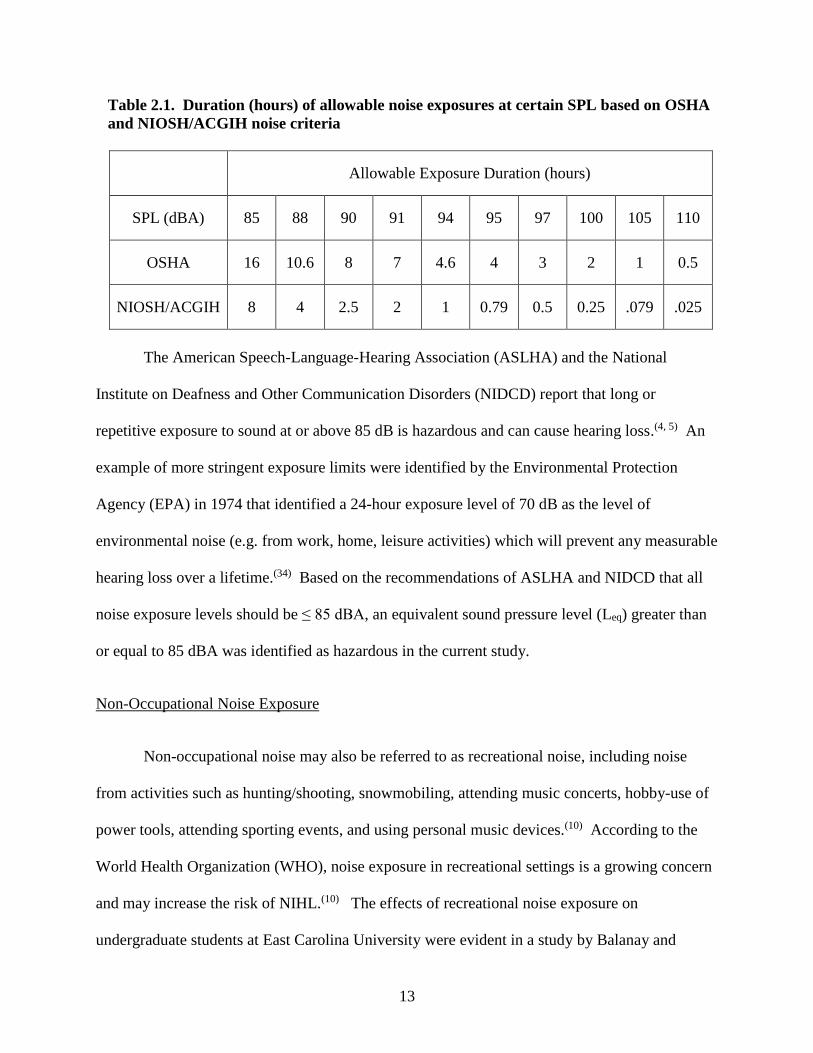
dBA and require a 3 dB exchange rate.(7, 33) The OSHA, NIOSH, and ACGIH allowable noise
duration criteria are displayed in Table 2.1, with time allowed at each dBA assumed to have
equal risk.
13
Table 2.1. Duration (hours) of allowable noise exposures at certain SPL based on OSHA and NIOSH/ACGIH noise criteria
Allowable Exposure Duration (hours)
SPL (dBA) 85 88 90 91 94 95 97 100 105 110
OSHA 16 10.6 8 7 4.6 4 3 2 1 0.5
NIOSH/ACGIH 8 4 2.5 2 1 0.79 0.5 0.25 .079 .025
The American Speech-Language-Hearing Association (ASLHA) and the National
Institute on Deafness and Other Communication Disorders (NIDCD) report that long or
repetitive exposure to sound at or above 85 dB is hazardous and can cause hearing loss.(4, 5) An
example of more stringent exposure limits were identified by the Environmental Protection
Agency (EPA) in 1974 that identified a 24-hour exposure level of 70 dB as the level of
environmental noise (e.g. from work, home, leisure activities) which will prevent any measurable
hearing loss over a lifetime.(34) Based on the recommendations of ASLHA and NIDCD that all
noise exposure levels should be ≤ 85 dBA, an equivalent sound pressure level (Leq) greater than
or equal to 85 dBA was identified as hazardous in the current study.
Non-Occupational Noise Exposure
Non-occupational noise may also be referred to as recreational noise, including noise
from activities such as hunting/shooting, snowmobiling, attending music concerts, hobby-use of
power tools, attending sporting events, and using personal music devices.(10) According to the
World Health Organization (WHO), noise exposure in recreational settings is a growing concern
and may increase the risk of NIHL.(10) The effects of recreational noise exposure on
undergraduate students at East Carolina University were evident in a study by Balanay and
14
Kearney.(35) The investigators found that the highest percentages of students with self-reported
ear pain, hearing loss, permanent tinnitus and noise sensitivity also attended sporting events.(35)
Noise exposure and temporary hearing loss have been assessed in several recreational
environments, including concerts, discotheques and live sporting events.(12-15) A cross-sectional
survey of 1,432 individuals in Australia, aged 11 to 35 years old, was conducted by Williams,
Carter, and Seeto. The researchers examined the relationship between self-reported historical
work and leisure noise exposures and pure-tone audiometry test results. The audiometry and
historical exposure data were used to estimate a cumulative lifetime noise exposure.(36) Contrary
to the findings of those researchers mentioned above, Williams et al. did not find a correlation
between cumulative lifetime noise exposure and pure-tone audiometry test results.(36)
A limited number of noise exposure studies have been conducted on spectators and
employees in sports venues.(16-18) Cranston et al. studied the noise exposures of fans and ushers
at two indoor hockey arenas and found that fans and ushers at collegiate and semi-professional
hockey games exceeded ACGIH noise exposure criteria.(17) Investigators who assessed the noise
exposures of fans and workers at various sized football stadiums found that 96% of workers and
96% of fans were overexposed according to the ACGIH recommendations.(16) According to the
literature reviewed, only two studies have been published regarding noise exposures and hearing
threshold shifts at sports venues. Hodgetts and Liu performed a small study during the 2006
Stanley Cup and found that the average noise exposure levels were above 101 dB and the hearing
thresholds of two subjects deteriorated by 5 to 10 dB for most frequencies.(14) More recently,
England et al. studied the intensity of noise exposure and hearing thresholds of attendees during
collegiate basketball games at Utah State University and found that the hearing thresholds of the
attendees deteriorated by 4.43 dB.(18)
15
Noise Measurement
The two most commonly used instruments for noise measurement include the sound level
meter (SLM) and personal noise dosimeter. The SLM is an instrument that samples the intensity
of sound for a very short period of time, which requires numerous measurements at different
times of the day to estimate a noise exposure over a certain time period (e.g. workday).(23) The
SLM is predominantly used to measure noise levels in an area. A SLM may be positioned within
the immediate vicinity of the exposed individual to obtain an estimate of personal exposure, if
the individual is relatively stationary. To collect a measurement, the microphone of the SLM is
positioned near the individual’s head, and may be moved in conjunction with minimal
movements of the individual. If noise levels fluctuate, the amount of time the noise occurs at
each of the various measured levels must be determined, which may be difficult to do without a
time-integrating SLM.
The SLM measures sound pressure levels in dB and the responses are frequency-
weighted to represent A, C and/or Z scales. The SLM uses a continuous averaging process that
weighs current and past data differently. The SLM response varies based on a fast or slow
exponential averaging process, with fast corresponding to a 125-millisecond (ms) time-constant
and slow corresponding to a 1-second time-constant.(26) The OSHA noise standard requires the
use of the A-weighted, slow exponential average when measuring typical occupational noise to
provide an estimate of the damaging effects on human hearing.(7, 23) The Z- or C-weighted scales
on the SLM are often used to characterize low frequency sound that may induce vibration. The
SLM paired with an octave band analyzer (OBA) filter may also be used for frequency spectrum
analysis to identify the sound pressure levels within the octave bands.
16
When individuals are mobile or when the noise intensity tends to fluctuate over time,
personal noise dosimetry is the more accurate choice of noise measurement.(23) A dosimeter is
similar to a SLM except that it stores sound level measurements and integrates the measurements
over time, reporting an average noise exposure and percent noise dose for a given time period,
such as a workday. Proper positioning of the dosimeter microphone is necessary to obtain
accurate measurements. The upright microphone is placed in the hearing zone, an approximately
two-foot diameter sphere around the head, and attached to the lapel or shoulder of the
individual’s clothing.(24) The personal dosimeter measures the noise levels to which an employee
is exposed as the employee travels to different locations. After the designated sampling period,
the average exposure measurement is retrieved from the instrument. The noise sampling
methodology used in this research is found in Appendix A.
Overview of the Auditory System
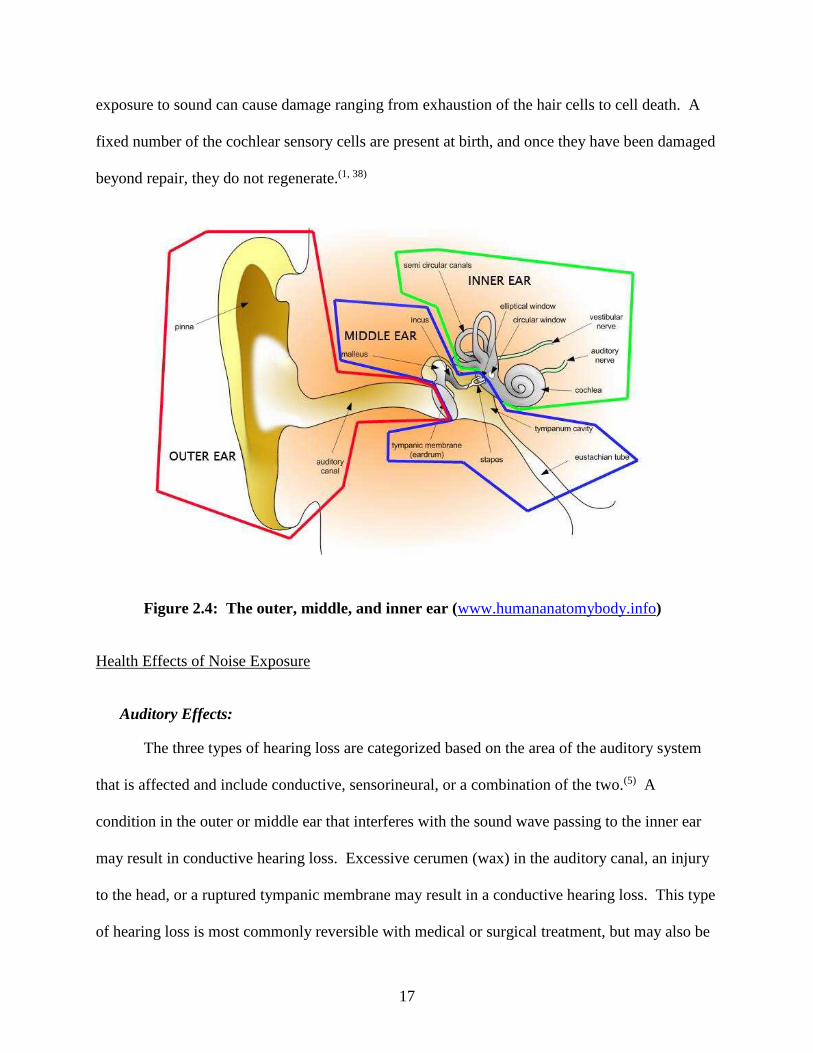
The human auditory system includes the outer, middle and inner ear (Figure 2.4). The
pinna, or outer ear, funnels sound waves and directs the variations in air pressure through the
meatus to the tympanic membrane, or eardrum.(37) The variations in air pressure cause the
eardrum to vibrate. These vibrations are amplified and transmitted by the small bones, or
ossicles, located in the middle ear. The ossicles include the malleus, incus and stapes bones and
they transmit the sound pressure/vibrations experienced by the eardrum to the inner ear. The
amplified vibrations are transmitted mechanically to the membrane of the oval window, inducing
waves in the fluid-filled inner ear. The inner ear contains the cochlea, which consists of sensory
cells, called inner and outer hair cells. The outer hair cells amplify and increase the stimuli
delivered to the inner hair cells, which respond to the movement of the basilar membrane and
send electrical impulses along the auditory nerve to the brain. Excessive sound levels or lengthy
17
exposure to sound can cause damage ranging from exhaustion of the hair cells to cell death. A
fixed number of the cochlear sensory cells are present at birth, and once they have been damaged
beyond repair, they do not regenerate.(1, 38)
Figure 2.4: The outer, middle, and inner ear (www.humananatomybody.info)
Health Effects of Noise Exposure
Auditory Effects:
The three types of hearing loss are categorized based on the area of the auditory system
that is affected and include conductive, sensorineural, or a combination of the two.(5) A
condition in the outer or middle ear that interferes with the sound wave passing to the inner ear
may result in conductive hearing loss. Excessive cerumen (wax) in the auditory canal, an injury
to the head, or a ruptured tympanic membrane may result in a conductive hearing loss. This type
of hearing loss is most commonly reversible with medical or surgical treatment, but may also be
18
irreversible.(39) Sensorineural hearing loss is associated with irreversible damage to the inner ear
and is usually not medically or surgically treatable. Excessive noise exposure and aging are the
most noteworthy causes of sensorineural hearing loss.
NIHL is the result of exposure to sound levels or exposure durations that damage the hair
cells of the cochlea and may be temporary or permanent. The NIHL depends upon a number of
factors, including, but not limited to: the intensity level, or sound pressure level (SPL) of the
noise; the spectrum, or frequency, of the noise; the duration of the noise exposure; the temporal
pattern of the noise exposure; the genetic predisposition of the individual; and the hearing
sensitivity of the exposed individual.(3, 40-42) As noise exposure increases, the inner and outer hair
cells may inflame, fatigue, and eventually disintegrate.(25) Long exposure to sounds at or above
85 dBA may cause hearing loss, whereas exposures to sounds of less than 75 dBA are not likely
to cause hearing loss.(43) Researchers have found that exposures to sounds at or above 85 dB are
hazardous, increase risk of hearing loss, and may cause permanent hearing loss.(4, 5)
Long-term exposure to excessive levels of noise, physical trauma to the head, or other
physiological conditions may cause tinnitus, a condition in the inner ear that the brain interprets
as sound or noise. Tinnitus is described as a ring, hum, whistle, buzz or roar in the ear and may
be temporary or permanent. Repeated exposure to hazardous noise levels may initially result in a
temporary threshold shift (TTS) in hearing, with symptoms including tinnitus and/or a feeling of
fullness in the head, with full recovery usually within 48 hours.(4, 6) A TTS may be defined as a
temporary decrease in hearing sensitivity as a result of noise exposure and may be a risk
indicator of possible permanent NIHL if exposure to hazardous noise continues.(3) Research by
Lawton concludes that noise exposures of 80 dBA produce a temporary threshold shift from
which subjects recover within minutes of removal of noise exposure, yet recovery from a TTS
19
may be prolonged when noise exposure is from high-intensity, high-frequency intermittent
noise.(6)
Sense of hearing has played an important role in safety and survival for tens of thousands
of years; providing alerts of dangers while hunting and gathering to protecting from an
impending attack. Hazards abound at work, home, and leisure activities and hearing allows
identification of these dangers in order to avoid injury. Driving, working in construction,
manufacturing, and officiating a hockey game can all be dangerous. Auditory warning signals
alert individuals of unsafe conditions. Deleterious auditory effects from noise exposure can
make the signals unnoticeable to individuals and possibly negatively affect those people in
danger.
Several researchers have investigated the effect of noise exposure on occupational
injuries.(44-48) A retrospective study investigating the association between occupational noise
exposure at the time of hearing tests, permanent NIHL, and work-related injuries was conducted
by Picard et al. The study utilized the Quebec National Institute of Public Health registry to
identify male workers, aged 16-64 years, who had known noise exposure ≥ 80 dBA on a daily
basis and whose hearing was measured at least once between 1983 and 1996.(44) The study
included 52,982 workers and the researchers concluded that a combination of an 8-hour exposure
to Leq ≥90 dB and NIHL contributed to 12.2% of accidents. The results also showed an
association between accident risk and hearing sensitivity, with several limitations.(44) For
instance, the researchers identified that the very large database had incomplete frames of
reference used in the accident analysis (e.g. task, tool design, individual characteristics that affect
job safety) and the findings are most likely exclusive to the particular set of industrial sectors
included in the study.(44)
20
A study by Choi et al. investigated self-reported hearing impairment and the risk of
injuries in agriculture. The study population included 150 farmers from an Iowa Certified Safe
Farm study that completed annual pure-tone audiometry from 1998 to 2002, and telephone
interviews at two- to five-month intervals.(46) The researchers found that hearing asymmetry
determined by audiometric testing (RR=1.67) and self -reported fair/poor hearing (RR=1.96)
were significantly associated with the risk of agricultural injuries.(46) Based on the results of the
study, the self-reported hearing impairment was a significant risk factor and had a stronger
association with injuries than the hearing characteristics measured with pure-tone audiometry.(46)
Cordeiro et al. conducted a population-based case-control study that utilized self-reported
hearing status to determine the risk for occupational injuries. The study was conducted in Brazil
from May to October 2002 and investigated whether or not exposure to occupational noise is a
risk factor for work-related injuries. The cases were identified as workers who had suffered
work-related injuries within 90 days of the study date, and controls were randomly selected, non-
injured workers from the same population. The self-reported hearing levels were based on
normal speaking volume and were given dummy variables of a) always or b) sometimes exposed
to high noise levels if they could not hear coworkers speaking.(48) The researchers reported that
the relative risk of having an injury for those workers who were sometimes exposed to high
levels of noise was 3.7 (95% CI 1.8-7.4; p=0.0003), and 5.0 (95% CI 2.8-8.7; p<0.001) for those
always exposed to high levels of noise.(48)
A longitudinal analysis of audiometric data during a four-year period by Leensen and
Dreschler attempted to provide insight into the development of NIHL as a function of noise
exposure and age during the first decade of noise exposure.(49) After reviewing audiometry data
of 3,111 construction workers who received three hearing tests throughout the four-year period,
21
researchers found that the annual rate of change in hearing loss was positively associated with
both age (F[1,12,253] = 123.73, p< 0.001) and noise exposure level (F[1,12,253] = 11.51,
p<0.001).(49) However, Leensen and Dreschler also found that the later follow-up hearing
thresholds were better than the baseline hearing thresholds at the lower frequencies and the
resulting development of NIHL during the first decade of noise exposure was inconclusive.
It is also important to recognize that occupational and recreational noise exposures
resulting in a TTS at an early age may result in cochlear nerve degeneration, which results in
permanent, age-related hearing loss at an earlier age than expected.(1, 11) For instance, the effects
of recreational noise exposure on young adults were evident in the study by Balanay et al., who
investigated the effects of recreational noise exposure on 2,151 undergraduate students, aged 17
years and above, at East Carolina University. The researchers found that the highest percentages
of students with self-reported ear pain, hearing loss, permanent tinnitus and noise sensitivity
participated in sporting events.(35)
Non-Auditory Effects
Over the years, researchers have found that exposure to noise may induce numerous non-
auditory health effects, including but not limited to: interference with communication, sleep
disturbance, hypertension, ischemic heart disease, disrupted development of fetus, upset
stomach, and decreased performance.(5, 25, 50-54) Noise-induced, stress-related cardiovascular
disorders, hormone and immune system effects, and reproduction and development effects have
also been identified, but individual susceptibility varies.(25, 50) Some examples of the
psychological consequences of excessive noise exposure may include a sense of isolation,
decreased morale, depression, and annoyance.(23)
22
The Committee on Noise and Health from the Health Council of the Netherlands
concludes that there are epidemiological data that support a possible relationship between noise
exposure and development of cardiovascular disease.(50) An investigation into the cardiovascular
effects of noise in children was conducted by Belojevic et al. The researchers found that systolic
pressure was significantly higher (5 mm Hg on average) among children from noisy residences
and kindergarten classrooms compared to the quiet versions of each (p = 0.001), but diastolic
pressure and mean arterial pressure were similar between the groups.(51) They also found that the
heart rate in children from noisy residences was significantly higher (2 beats/min on average)
than that of children from quiet residences (p < 0.05).(51)
Audiometry
Audiometric exams are used to evaluate an individual’s hearing function. There are
several tests that may be used to identify a hearing loss, including: pure-tone audiometry,
tympanometry, brainstem auditory evoked response (BAER), electrocochleography (ECOG),
and otoacoustic emissions (OAEs).(5) The review of literature indicated that pure-tone
audiometry and distortion product otoacoustic emissions (DPOAE) were the most common and
feasible hearing tests administered by hearing conservationists that were not formally trained in
audiology. DPOAE testing requires instrumentation that generates otoacoustic emissions from
the cochlea while simultaneously stimulating the cochlea by two pure-tone frequencies whose
ratio is between 1.1 to 1.3.(5) Although DPOAE and pure-tone audiometry have both been used
to evaluate hearing function, pure-tone audiometric testing was found to be the most common
method used by NIHL researchers.(13, 14, 18, 55-61)
NIHL usually occurs incrementally and may go unnoticed until a substantial deficit in
hearing sensitivity is reached.(4) Hearing sensitivity is determined with audiometry, the
23
measurement of hearing acuity for each ear at different frequencies and levels of loudness. The
test is administered by requiring an individual to indicate hearing of pure-tone sound at 500,
1000, 2000, 3000, 4000, 6000, and 8000 Hz in each ear at different loudness levels. The
audiogram is the numerical or graphical record of how well an individual hears at a given time,
place and under given conditions.(5)
The characteristic audiometric pattern for hearing loss resulting from exposure to
hazardous levels of noise is the 4000 Hz “notch” (4K notch). Regardless of the frequency
spectrum of the noise exposure, individuals exposed to hazardous levels of noise will develop
hearing loss in the 3000 to 6000 Hz frequency range.(1, 62) The 4K notch is the consequence of
increased sensitivity of human hearing between 1000 and 5000 Hz and that sound in the 4000 Hz
region resonates in the external auditory canal.(5) The audiometric 4K notch has been found by
several researchers who used pure-tone audiometry to identify the presence of a TTS after
exposure to loud music.(13, 61, 63) For instance, Sadhra et al. measured the noise exposure and
hearing thresholds of employees in a noisy environment and found that the correlation between
TTS and personal noise exposure was higher at 4000 Hz.(13) Le Prell et al. also found the
characteristic 4K notch after young adult college student volunteers listened to pop or rock music
from digital music players.(61) Research results from the past few decades have reported that full
recovery from a TTS may take anywhere from a few minutes up to 48 hours after the noise
exposure ceases.(4, 56, 64, 65) Several researchers who have conducted follow-up hearing tests
within 48 hours after the noise exposure found that the TTS recovery was essentially complete
with the first four hours.(13, 18, 61)
The effects of analgesic use on hearing have been investigated and research has shown
that analgesic use may increase the risk of hearing loss. Acetaminophen, aspirin and ibuprofen, a
24
nonsteroidal anti-inflammatory drug (NSAID), are the three most commonly used drugs in the
United States,(66) and research has shown that analgesic use may increase the risk of hearing
loss.(67, 68) Curhan et al. investigated the relation between the frequency of analgesic use and risk
of hearing loss among men and women in two different studies.(67, 68) The results of both
prospective studies indicate that regular use of analgesics (two or more times per week) increases
the risk of hearing loss. Among men using NSAIDs and acetaminophen, the risk increased with
longer duration and regular use.(67) The multivariate hazard ratios were adjusted for age, body
mass index, alcohol, physical activity, folate, smoking, hypertension, diabetes, profession, race,
and other analgesics.(67) The magnitude of the association was substantially higher for men
younger than 50 years old and increased from 1.12 (95% CI, 1.04-1.20) to 1.33 (95% CI, 1.03-
1.72) for regular aspirin use, from 1.21 (95% CI, 1.11-1.33) to 1.61 (95%CI, 1.15-2.26) for
NSAIDs use, and from 1.22 (95% CI, 1.07-1.39) to 1.99 (95% CI, 1.34-2.95 for acetaminophen
use.(67) Among women, the researchers found that the ibuprofen and acetaminophen use were
independently associated with increased risk of hearing loss, but aspirin was not.(68)
Knowles Electronic Manikin for Acoustic Research (KEMAR)
The sound pressure levels to which an individual is exposed may be measured by placing
a noise dosimeter or SLM microphone in the hearing zone. Exceptional circumstances (e.g.,
extremely high or low temperatures) may not allow for the use of the noise dosimeter or SLM
and the conditions must be simulated. The Knowles Electronic Manikin for Acoustic Research,
KEMAR, was designed in 1972 as the first anthropometric head and torso simulator for acoustic
research. It was designed to simulate a human head and torso and similarly affect sound waves
as they would interact (diffract and reflect) with the human ear.(69) Early applications included
its use in laboratories to perform simulated in-situ measurements of hearing aids. The KEMAR
25
is recognized as an industry standard for researchers in the fields of telecommunications, hearing
conservation, sound recording, sound quality evaluation, and noise abatement.(69)
Prior to the KEMAR, the ability of the human ear to localize sound in the vertical plane
was investigated by Roffler and Butler. The experiment involved extensive auditory stimulus
generating equipment and listeners wearing an uncomfortable plexiglas® headband to flatten the
pinnae against the head such that the sound was only able to go directly into the external auditory
canal.(37) The results of the study indicated that pinnae were required for a listener to localize an
auditory stimuli.(37) Chung et al. used a KEMAR to investigate the effects of directional
microphones on the ability of hearing aid users to localize speech. The manikin pinnae were
fitted with bilateral in-the-ear hearing aids including microphones with adjustable directivity.(70)
The researchers found that matched directional microphones worn bilaterally do not have a
negative effect on the ability to localize speech.(70)
The KEMAR has been utilized to measure the listening volume of headsets in order to
estimate the users’ noise exposure. For example, Patel and Broughton conducted a study in call
centers in Britain to determine if the headsets were damaging the employees’ hearing. The study
included 150 call center operators that represented 15 call centers in financial services, shopping,
and telecommunications. The researchers used the KEMAR fitted with small pinnae because
they were representative of the size of the ears of the majority of the study population.(71) The
headsets were removed from ten operators per workstation during normal operation and placed
on the KEMAR for a 15-minute period.(71) The researchers concluded that the noise exposure of
the call operators was less than 85 dBA and the risk of hearing loss was low.(71)
According to the American Speech-Language-Hearing Association (ASLHA) and the
National Institute on Deafness and Other Communication Disorders (NIDCD), long or repetitive
26
exposure to sound at or above 85 dB is hazardous and can cause hearing loss.(4, 5) The output
level of earphones for portable media players (PMPs) and its role in noise-induced hearing loss
(NIHL) has been an increasing concern,(10, 72-76) and the KEMAR has been a useful tool in
measuring the earphone output level for several researchers.(72, 73, 75, 76) In 1987, Rice, Rossi, and
Olina used the KEMAR to measure the preferred listening volume of over 60 PMP users.(77, 78)
The researchers found that approximately five percent of the PMP users preferred to listen at a
nearly 90 dBA equivalent sound pressure level,(77, 78) possibly increasing their risk of NIHL.(4, 5)
The sound level output of headphones of several commercially available compact disc players
was measured by Fligor et al.(72) The KEMAR was used to measure the output levels of multiple
types of headphones and the researchers determined the supra-aural headphones, resting on the
ears, would reach the maximum allowable noise dose within approximately one hour of listening
at 70% the maximum output level.(72)
The left ear of the KEMAR 45 BA with IEC60711 coupler was used by Kahari et al. to
measure 60 seconds of the PMP listening level of those passing through Stockholm Central
Station.(76) The researchers spent 12 hours at the station, made 41 sound level measurements on
the KEMAR, and found that ear buds were the preferred type of earphone. Based on the study
results of Kahari et al., the KEMAR estimated that 71% of the subjects chose a listening level ≥
85 dB, 46% chose a listening level ≥ 90 dB, and 17% chose a listening level ≥ 95 dB.(76)
Portnuff, Fligor, and Arehart used a KEMAR to investigate the relationship between
volume control settings and output levels of multiple portable listening devices (PLDs). Five
PLDs’ and five earphones’ output levels were investigated while playing five music genres.(73)
The KEMAR was fitted with a hard rubber right pinna and a soft, silicone rubber left pinna and
the researchers found that the softer pinna achieved a better fit during measurements.(73) The
27
output levels of the earphones were measured in the right and left ear of the KEMAR
simultaneously and a one-way ANOVA identified a significant difference among the maximum
output levels of the earphones when all music genres were considered (F (4, 124) = 85.3,
p<0.001).(73) The use of the KEMAR enabled Portnuff et al. to suggest that the PLDs could
reach output levels that may increase the listener’s risk of music-related hearing loss.
The KEMAR is not the only option for measuring noise exposure levels at the ear.
Kennedy et al. compared on-road motorcycle helmet noise measured at the ear to results using an
at-ear microphone on a polystyrene mannequin head in a wind tunnel simulation.(79) A
significant difference was found between the flow conditions in the wind tunnel compared to the
atmospheric flow conditions during the on-road measurements.(79) Discrepancies between the
simulated and on-road results were explained by wind speed during the on-road testing, but
simulation was successful in identifying the contributors (i.e. engine, windscreen, and helmet) to
the at-ear sound sources.(79)
After extensive review of the literature, the researchers concluded that the KEMAR is
commonly used for researching in-ear sound levels, mainly for headphone use. It is also evident
that this research operating the KEMAR with multiple helmet configurations to determine if the
hockey helmet’s visor length affects measured peak sound pressure levels from the whistle noise
is innovative.
28
CHAPTER 3
“NOISE EXPOSURE AND TEMPORARY HEARING LOSS OF INDOOR HOCKEY
OFFICIALS: A PILOT STUDY”1
Summary
Indoor hockey officials may be at high risk of hearing loss at an earlier age because their
noise exposures have not been evaluated and officiating may begin as early as 10 years of age.
Officials of junior and collegiate hockey leagues in northern Colorado participated in noise
dosimetry and pre and postgame pure-tone audiometry to determine if a ≥10 decibels (dB)
decrease in hearing sensitivity resulted from noise exposures during the game. All of the officials
(n = 23) were exposed to equivalent sound pressure levels ≥85 A-weighted decibels (dBA) and
65% were overexposed based on noise criteria set by the American Conference of Governmental
Industrial Hygienists. Of the sampled officials, 10 of 18 demonstrated a ≥10 dB increase in
hearing threshold, seven of whom included shifts in more than one ear and/or frequency and two
of whom demonstrated a 15 dB shift. The results of this study suggest exposure to hazardous
levels of noise and a possible increased risk for hearing loss among hockey officials.
1Adams, K.L., A. Langley, and W. J. Brazile: Noise Exposure and Temporary Hearing Loss of Indoor Hockey Officials: A Pilot Study. Journal of Environmental Health 79(4): (2016). Reprinted with permission from the Journal of Environmental Health and the National Environmental Health Association.
29
Introduction
Exposure to hazardous levels of noise may cause hearing damage and may affect one’s
health, communication, and quality of life. Prolonged exposures to sounds of less than 75
decibels (dB) are not likely to cause hearing loss, yet repetitive exposures to sounds at or above
85 dB are hazardous, increase risk of hearing loss, and may cause permanent hearing loss.(5, 43)
Researchers have found that repeated exposure to hazardous noise levels eventually results in a
temporary threshold shift (TTS) in hearing (e.g. tinnitus, fullness in head),(6) and repeated TTSs
may cause permanent shifts.(3)
Damage-risk criteria provide the basis for recommending occupational noise exposure
limits based on noise level and exposure duration, assuming non-occupational noise levels are
low enough to allow the ear to recover. The Occupational Safety and Health Administration
(OSHA) permits an eight-hour time-weighted average (TWA) sound level of 90 dBA with a 5
dB exchange rate,(32) whereas the American Conference of Governmental Industrial Hygienists
(ACGIH) recommend an eight-hour TWA sound level of 85 dBA with a 3 dB exchange rate.(7, 33)
Various noise exposure studies have been conducted on the spectators and employees at
sporting events.(16-18) Researchers studying noise exposures of fans and ushers at two indoor
hockey arenas found that fans and ushers at collegiate and semi-professional hockey games
exceeded ACGIH noise exposure criteria.(17) Investigators who assessed the noise exposures of
fans and workers at various sized football stadiums found that 96% of workers and 96% of fans
were considered overexposed, according to the ACGIH recommendations.(16)
There have been a limited number of temporary threshold shift studies for sports venues.
Researchers performed a pure-tone audiometry study during the 2006 Stanley Cup and found the
average noise exposure levels for each game above 101 dB and hearing thresholds of two
30
subjects deteriorated by 5 to 10 dB for most frequencies.(14) Recently, researchers studied the
intensity of noise exposure and hearing thresholds of attendees during basketball games at Utah
State University and found that the hearing thresholds of the attendees deteriorated by 4.43
dB.(18)
Although spectators of various sports have been evaluated for noise exposure and
temporary threshold shifts, sports officials have not been assessed, possibly to the detriment of
their hearing. A review of the literature revealed that indoor hockey officials’ noise exposure
levels and temporary hearing losses have not been previously studied. This population of over
23,000 registered hockey officials, not including non-registered officials, is unique for various
reasons: officiating may begin as early as 10 years of age,(20) noise exposures include sources on
and off the ice (e.g. whistle, crowd noise), and the hockey game noise exposure is supplemental
to any noise exposure experienced during the official’s normal work day. The purpose of this
pilot study was to determine if indoor hockey officials are exposed to hazardous levels of noise
and whether or not they experienced a temporary hearing loss.
The pilot study was conducted at two small indoor hockey arenas in northern Colorado
with less than 200 spectators in attendance. Investigators monitored the noise exposures of
indoor hockey officials of the American Collegiate Hockey Association (ACHA) and the
Western States Hockey League (WSHL) that officiated collegiate and junior league hockey
games. Pre- and post-game audiometric tests were administered in areas adjacent to the ice
arena. The results of this study may identify a population that may be at an increased risk of
noise induced hearing loss (NIHL) at an early age and may reduce the future NIHL cases of
hockey officials and officials of other sporting events.
31
Methods
Study participants included indoor hockey officials of the WSHL and ACHA who
officiated junior and collegiate hockey games in two northern Colorado ice arenas during the
2013-2014 hockey season. All study participants were male and 21 years of age or older. All
aspects of this study were conducted in compliance with a human subjects study protocol
approved by Colorado State University’s Institutional Review Board.
Audiometry
Audiometric tests were conducted on 18 hockey officials and administered November
2013 through January 2014. All officials completed a hearing history questionnaire and received
an otoscopic exam prior to each pre-game hearing test. The questionnaire was used to determine
the length of time since the last excessive noise exposure and non-occupational noise exposures
(e.g. music, firearms). The otoscopic examination was conducted to identify conditions that
could exclude the official from participation in the study (e.g. excessive cerumen, ruptured
tympanic membrane). Areas used for audiometric testing were selected to best achieve
acceptable background noise levels, as per Table D-1 of OSHA 1910.95 Appendix D. An
exercise room, adjacent to the ice in arena I, and the stairwell closest to the officials’ locker room
in arena II were used for administering hearing tests. The background octave band sound
pressure levels (SPLs) were measured at 500, 1000, 2000, 4000 and 8000 Hz, before and after
the pre- and post-game hearing tests. Background ambient noise levels were measured using a
CEL 383 sound level meter/octave band analyzer (SLM/OBA) (Milford, NH), which was pre-
and post-calibrated with the CEL 282 calibrator at 114 dB to assure calibration was maintained.
32
Audiometric tests were performed by a Council of Accreditation in Occupational Hearing
Conservation (CAOHC) certified researcher using an Earscan 3 ES3S pure-tone audiometer
(Micro Audiometrics, Murphy, NC). A functional, “look and listen” calibration of the
audiometer was performed prior to the first hearing test of each sampling day. The modified
Hughson-Westlake Technique was used to manually test the threshold for each ear at 500, 1000,
2000, 3000, 4000, 6000 and 8000 Hz. The descending (10 dB) and ascending (5 dB) process
was repeated until the official responded at a specific intensity at least 50% of the time at each of
the frequencies. Post-game audiometry was conducted after the official’s departure from the ice.
Personal Noise Dosimetry
Personal noise dosimetry was conducted on twenty-three officials in January and
February 2014. Each official was fitted with a Larson Davis, Model 706 RC (Provo, UT) noise
dosimeter. The dosimeters were calibrated before and after sampling using a Larson Davis CAL
150 at 94 and 114 dB, and collected data was downloaded with the 2014 version J Blaze®
software (Larson Davis, Provo, Utah). Noise sampling was performed in accordance with the
OSHA Technical Manual (OTM), Section III, Chapter 5. The dosimeter was secured to each
official before the start of the game. The microphone (including windscreen) was attached to the
official’s shoulder or lapel on the dominant side (opposite the whistle hand). The microphone
and cable were secured with adhesive tape in order to keep the microphone upright and the cable
from snagging on players’ hockey sticks. Each official was instructed to not remove, tap or yell
into the microphone and operating conditions of the dosimeter and microphone were confirmed
and adjusted, if necessary, at each of the intermissions. The dosimeter was stopped and removed
from the official after he exited the ice at the end of the game.
33
Statistical Analysis
SAS version 9.4 (SAS Institute, Cary, NC) was used to perform statistical analysis.
Descriptive statistics were used to express the proportion of officials exceeding the 85 dB Leq
and the OSHA noise regulations and ACGIH recommendations. The proportion of officials who
experienced a 10 dB or greater decrease in hearing sensitivity was determined. The non-
parametric Wilcoxon signed-rank test was conducted on the pre- and post-game audiometric data
at 500, 1000, 2000, 3000, 4000, 6000 and 8000 Hz to determine if there were statistically
significant differences between the pre- and post-game audiometry data.
Results
Audiometry
A total of 18 questionnaires were completed by the officials prior to the pre-game hearing
test. The study participants were male and ranged from 21 to 65 years of age, with an average of
12.9 years (range 4-37 years) of officiating experience. When asked to report the source of their
most recent noise exposure, 27.8% (5/18) reported hockey, and 11.1% (2/18) reported music.
No recent noise exposure was reported by 61.1% (11/18) of officials.
Audiometric tests were conducted in the most feasible space adjacent to the ice rink in
each arena. The background SPLs for each testing area were under the maximum allowable
SPLs for audiometric test rooms for 2000, 4000 and 8000 Hz but exceeded the allowable limit at
500 and 1000 Hz.
Eighteen pre- and post-game hearing tests were conducted on 15 different officials. One
official was sampled three times and another was sampled twice. An increase in hearing
threshold of 10 dB or greater was exhibited in more than half (55.6%) of the sampled officials.
Of those officials with the ≥10 dB decrease in hearing sensitivity, 70.0% experienced a threshold
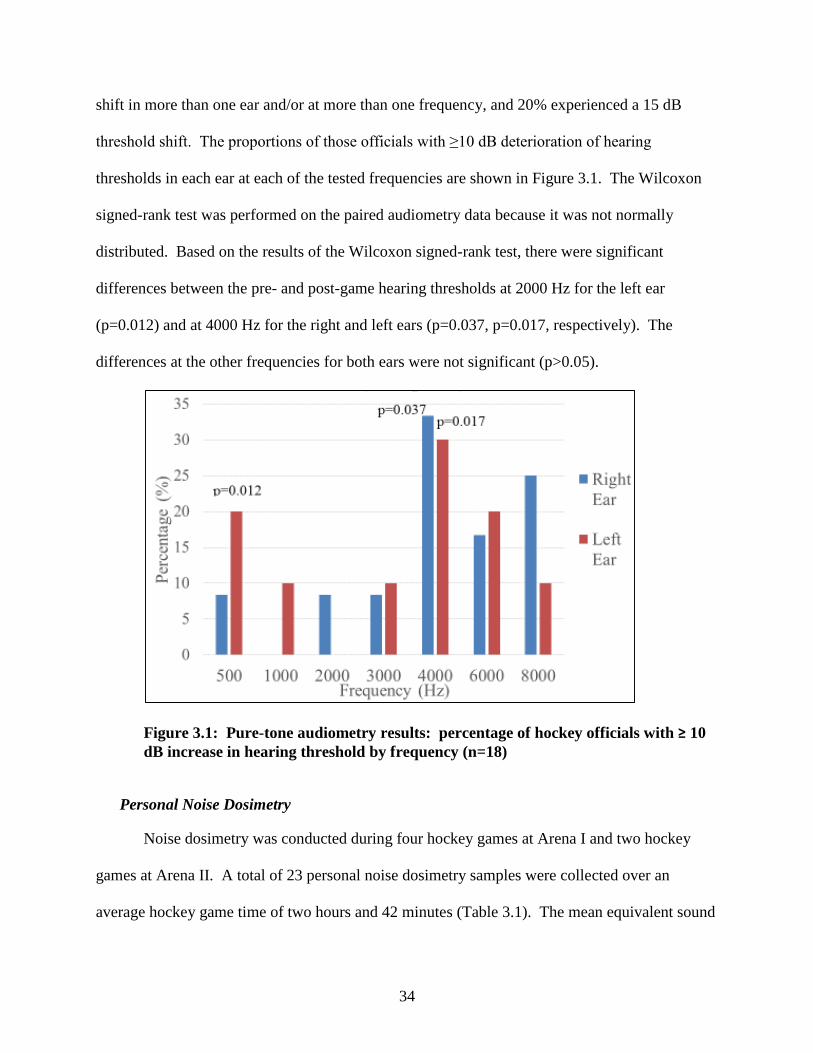
34
shift in more than one ear and/or at more than one frequency, and 20% experienced a 15 dB
threshold shift. The proportions of those officials with ≥10 dB deterioration of hearing
thresholds in each ear at each of the tested frequencies are shown in Figure 3.1. The Wilcoxon
signed-rank test was performed on the paired audiometry data because it was not normally
distributed. Based on the results of the Wilcoxon signed-rank test, there were significant
differences between the pre- and post-game hearing thresholds at 2000 Hz for the left ear
(p=0.012) and at 4000 Hz for the right and left ears (p=0.037, p=0.017, respectively). The
differences at the other frequencies for both ears were not significant (p>0.05).
Figure 3.1: Pure-tone audiometry results: percentage of hockey officials with ≥ 10 dB increase in hearing threshold by frequency (n=18)
Personal Noise Dosimetry
Noise dosimetry was conducted during four hockey games at Arena I and two hockey
games at Arena II. A total of 23 personal noise dosimetry samples were collected over an
average hockey game time of two hours and 42 minutes (Table 3.1). The mean equivalent sound
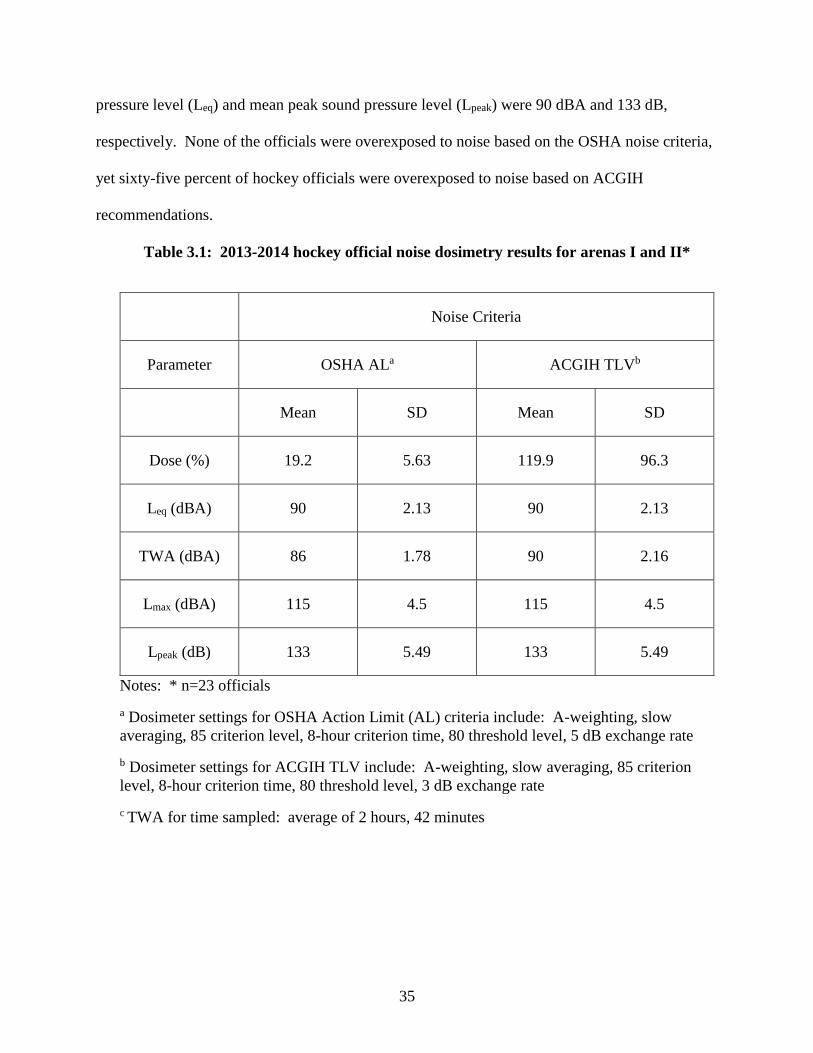
35
pressure level (Leq) and mean peak sound pressure level (Lpeak) were 90 dBA and 133 dB,
respectively. None of the officials were overexposed to noise based on the OSHA noise criteria,
yet sixty-five percent of hockey officials were overexposed to noise based on ACGIH
recommendations.
Table 3.1: 2013-2014 hockey official noise dosimetry results for arenas I and II*
Noise Criteria
Parameter OSHA ALa ACGIH TLVb
Mean SD Mean SD
Dose (%) 19.2 5.63 119.9 96.3
Leq (dBA) 90 2.13 90 2.13
TWA (dBA) 86 1.78 90 2.16
Lmax (dBA) 115 4.5 115 4.5
Lpeak (dB) 133 5.49 133 5.49
Notes: * n=23 officials
a Dosimeter settings for OSHA Action Limit (AL) criteria include: A-weighting, slow averaging, 85 criterion level, 8-hour criterion time, 80 threshold level, 5 dB exchange rate
b Dosimeter settings for ACGIH TLV include: A-weighting, slow averaging, 85 criterion level, 8-hour criterion time, 80 threshold level, 3 dB exchange rate
c TWA for time sampled: average of 2 hours, 42 minutes
36
Discussion
Audiometry
The hearing history questionnaire was used to determine the length of time since the
officials’ last excessive noise exposure. Of the 18 officials queried, 11 (61%) reported no recent
noise exposure, whereas five (28%) reported a previous hockey game as a noise exposure. In
retrospect, it may have been more appropriate to ask the source and duration of the noise
exposure within the last 48 hours, including sports officiating. Officiating more hockey games
than documented or the increased background noise levels in the audiometric testing rooms may
explain a higher pre-game hearing threshold (≥ 25 dB) found in 10 (56%) of the officials. The
questionnaire should have included a question regarding the presence of TTS symptoms prior to
and after the hockey game, similar to that done by researchers investigating the hearing loss
associated with loud music exposure.(13) Although the noise exposures from the officials’ non-
occupational/leisure noise exposures were not measured in this study, they are likely contributing
to the official’s overall noise exposure and associated symptoms, as supported in the literature
review of noise exposures from leisure activities by Clark.(80)
Pure-tone threshold shifts of 10 dB or greater were identified at all of the tested
frequencies in one or both ears, with the largest percentage of shifts occurring at 4000 Hz. These
results are similar to those found by Hodgetts and Liu during a Stanley Cup game.(14) The
researchers found a pure-tone shift of 5-10 dB for most of the tested frequencies, with one
subject experiencing a 20 dB shift in one ear. However, the audiometric testing only occurred on
two spectators in the Hodgetts and Liu study and the results may not be representative. The
current study results are also consistent with those of several researchers who have used pure-
tone audiometry to identify the presence of a TTS after exposure to loud music.(13, 61) In
37
particular, the results and design of the Sadhra et al. study are similar to the current study in that
it measured the noise exposure and hearing thresholds of employees in a noisy environment, not
just the spectators/attendees. Sadhra et al. found that the correlation between TTS and personal
exposure was higher at 4000 Hz and Le Prell et al. found the 4000 Hz “notch” that is typical of
NIHL, after noise exposure from digital music players.
The differences between pre- and post-game hearing thresholds were significantly
different at 4000 Hz in both ears and at 2000 Hz in the left ear. The Wilcoxon signed-rank test
results were less powerful due to the small sample size and sampling officials multiple times
occurred because only a small pool of 28-32 officials work the hockey games in northern
Colorado. England et al. used t-tests with Bonferroni adjustments and found significant
differences between pre- and post-game pure-tone audiometry at basketball games at all tested
frequencies in both ears, except for the left ear at 1000 Hz and right ear at 6000 Hz. The
inconsistency in results with the current study may be explained by the unfavorable audiometric
testing conditions in the current study.
Background noise levels of audiometric testing areas did not meet the acceptable levels
for 500 and 1000 Hz and the results at those frequencies may not be indicative of actual hearing
thresholds since 61% of officials had pre-game hearing thresholds ≥ 25 dB at those frequencies.
Limited funding, time, and instrumentation did not allow for optional testing environments or
continual background noise measurements. The inconsistencies may also be due to several of
the post-game hearing tests being conducted after more than 30 minutes after the game’s end,
possibly underestimating the number of hearing threshold shifts. Ideally, the audiometric testing
would occur in an audiometric testing booth that meets or exceeds the requirements outlined in
38
OSHA’s Appendix D and within less time after the game since the ear begins to heal from a TTS
in as little as a few minutes after removal of the noise source.(41, 81, 82)
Previous researchers(13, 18, 61) included a follow-up hearing test within 48 hours of the
noise exposure and found that the TTS recovery was essentially complete with the first four
hours after exposure. Unlike previous studies, the researchers were unable to coordinate a
follow-up hearing test and assumed that the threshold shifts were only temporary. The study
participants were notified to contact a physician if symptoms persisted for more than 48 hours.
Noise Dosimetry
All of the hockey officials that participated in this study were exposed to an Leq greater
than 85 dBA, with a mean Leq of 90 dBA. The mean Leq of 90 dBA in this study was similar to
the mean Leq of 85 dBA found by England et al. in basketball arenas, and within the Leq range
found by area monitoring at two indoor hockey venues by Cranston et al. During National
Hockey League (NHL) playoff games, researchers found an Leq range from 101 to 104 dBA
(Hodgetts and Liu, 2006), which were greater than the Leq found in the current study. The
previous study had more attendees, as would be expected for a NHL Stanley Cup playoff, and
crowd noise was most likely a contributing factor.(83)
The researchers measured a mean Lpeak of 133 dB in the current study that is consistent
with the Lpeak range (130-146 dB) found by Engard et al., yet higher than the area monitoring
Lpeak range of 105-124 dB at Venue 1 and 110-117 dB at Venue 2 found by Cranston et al. The
variations between personal and area monitoring may explain the difference in results. Area
sampling in the current study may have been beneficial in assessing the frequency spectra of the
noise in various locations in the hockey arenas.
39
The researcher’s findings that 65% of officials exceeded the ACGIH noise exposure
criteria are consistent with the findings of Cranston et al. The researchers of the current and
previous study concur in that none of the study participants exceeded the OSHA noise criteria.
The Engard et al. study results support the current study’s findings based on the ACGIH criteria,
yet those researchers found that 20% of fans exceeded the OSHA PEL of 90 dBA. These
differences may be the result of different arena/stadium acoustics, location of personal sampling
and number of people in attendance.
For example, the current study included less than 200 spectators while the Engard et al.
study included a range of 19,721 to 75,703 spectators. The larger crowd may have produced
more noise, which may have increased the noise exposure levels in the Engard study.(83) It is
also possible that the results from the smaller venue with fewer spectators underestimated the
noise exposures of officials in larger arenas.
The hockey officials in the study often use officiating as supplementary income to their
primary employment. Personal noise dosimetry data was only collected for the duration of the
hockey game but the occupational noise criteria are based on an 8-hour work day. The
researchers chose not to report results that compared to the OSHA or ACGHI 8-hour TWA
because the calculations would have assumed that the officials’ remaining noise exposure for the
day was less than the threshold dB value, which is unlikely. For instance, other common noise
sources integrated in a daily noise exposure may include noise from another job or occupation,
music, hunting, power tools, and other sporting events, as is supported by Clark’s review of
literature of noise exposures from leisure activities.(80)
40
Conclusions
This pilot study was the first step in evaluating the noise exposure and temporary hearing
loss of indoor hockey officials. Preliminary surveys indicate engineering controls are not
feasible and officials do not wear hearing protection. Exposure to hazardous levels of noise
increases the risk of repetitive TTSs, which may increase the risk of permanent hearing loss.
Based on the results of this study, indoor hockey officials are exposed to levels of noise that may
result in repetitive TTSs and further research is warranted.
Future research should include noise monitoring at a larger venue, audiometric testing in
a room with allowable background noise levels, and post-game audiometry within minutes of the
game’s end. Additional research has the potential to identify officials of other sporting events,
regionally and nationally, who may be at an increased risk of NIHL. In an effort to reduce noise
exposure, hockey officials should consider wearing hearing protection while officiating games.
41
CHAPTER 4
“A FACEOFF WITH HAZARDOUS NOISE: NOISE EXPOSURE AND HEARING
THRESHOLD SHIFTS OF INDOOR HOCKEY OFFICIALS”2
Summary
Noise exposure and hearing thresholds of indoor hockey officials of the Western States
Hockey League were measured to assess the impact of hockey game noise on hearing sensitivity.
Twenty-nine hockey officials who officiated the league in an arena in southeastern Wyoming in
October, November and December 2014 participated in the study. Personal noise dosimetry was
conducted to determine if officials were exposed to an equivalent sound pressure level greater
than 85 dBA. Hearing thresholds were measured before and after officiating hockey games to
determine if a 10 dB or greater temporary threshold shift in hearing occurred. Pure-tone
audiometry was conducted in both ears at 500, 1000, 2000, 3000, 4000, 6000 and 8000 Hz. All
of the participants were exposed to an Leq ≥ 85 dBA over an average hockey game time of two
hours and 48 minutes. The average Leq, maximum sound pressure level (Lmax), and Lpeak were 93
dBA (SD= 2.2), 116 dBA (SD=2.8) and 134 dB (SD=5.0), respectively. Hearing threshold shifts
of 10 dB or greater were observed in 86.2% (25/29) of officials, with 36% (9/25) of those
2Adams, K. L. and W. J. Brazile: A Faceoff with Hazardous Noise: Noise Exposure and Hearing Threshold Shifts of Indoor Hockey Officials. Journal of Occupational and Environmental Hygiene. DOI: 10.1080/15459624.2016.1225158 (2017). Reprinted by permission from the Journal of Occupational and Environmental Hygiene and the American Industrial Hygiene Association.
42
individuals experiencing threshold shifts that were 15 dB or greater. The largest proportion of
hearing threshold shifts occurred at 4000 Hz, supporting the characteristic 4K notch of NIHL.
The 4K notch was exhibited in 35.7% of the right ear shifts and 31.8% of the left ear shifts. The
threshold shifts between the pre- and post-game audiometry were statistically significant in the
left ear at 500 (p=.019), 2000 (p=.0009), 3000 (p<.0001), and 4000 Hz (p=.0002), and in the
right ear at 2000 (p=.0001), 3000 (p=.0001), and 4000 Hz (p<.0001), based on Wilcoxon-ranked
sum analysis. Although not statistically significant at alpha = 0.05, logistic regression indicated
that with each increase of one dB of equivalent sound pressure measured from personal noise
dosimetry, the odds of a ≥ 10 dB TTS were increased in the left ear at 500 (OR=1.33, 95% CI
0.73-2.45), 3000 (OR=1.02, 95% CI 0.68-1.51), 4000 (OR=1.26, 95% CI 0.93-1.71) and 8000
Hz (OR=1.22, 95% CI 0.76-1.94) and in the right ear at 6000 (OR=1.03, 95% CI 0.14-7.84) and
8000 Hz (OR=1.29, 95% CI 0.12-13.83). The officials blew their whistles on the left side of the
mouth which may contribute to the findings that the left ear had more identifiable TTSs than the
right ear. These findings suggest that indoor hockey officials are exposed to hazardous levels of
noise and experience temporary hearing loss after officiating games, and a hearing conservation
program is warranted. Further temporary threshold shift research has the potential to identify
officials of other sporting events that are at an increased risk of noise-induced hearing loss.
Introduction
Noise is ubiquitous and, in excessive levels, may cause irreversible sensorineural hearing
loss. Several researchers have established that the severity of hearing loss is dependent on noise
intensity and duration of exposure, and the susceptibility to noise-induced hearing loss (NIHL)
varies among individuals.(1-3) It has been reported that 15% of Americans between the ages of 20
and 69 years old have permanent hearing loss and 16% of worldwide hearing losses are
43
attributed to occupational noise exposure.(4, 8) Noise exposure may also be detrimental to quality
of life and cause stress, disruption of sleep, hypertension, and/or fatigue. NIHL may contribute
to communication difficulties later in life, the inability to hear environmental sounds, and
possibly increase the occurrences of safety-related injuries and illnesses.
In addition, excessive noise exposures from recreational environments may cause NIHL.
According to the World Health Organization (WHO), noise exposure in recreational settings is a
growing concern.(10) Noise exposure has been assessed in several recreational environments,
including concerts, discotheques and live sporting events.(12-15) Exposure to sounds ≤ 75 dBA
have not been found to be detrimental to hearing thresholds, yet exposure to sounds ≥ 80 dBA
for longer durations have been found to cause a decrease in hearing sensitivity.(84) Occupational
exposure limits (OEL) for noise are based on exposure duration and noise level, assuming non-
occupational noise levels are low enough to allow the ear to recover. The more conservative
OEL of an eight-hour time-weighted average (TWA) sound level of 85 dBA with a 3 dB
exchange rate is recommended by the National Institute for Occupational Safety and Health
(NIOSH) and the American Conference of Governmental Industrial Hygienists (ACGIH).(7, 33)
However, researchers have found that exposures to sounds at or above 85 dB are hazardous,
increase risk of hearing loss, and may cause permanent hearing loss. (4, 5)
Investigators have also found that repeated exposure to hazardous noise levels may result
in a temporary threshold shift (TTS) in hearing, with symptoms including ringing in the ears
(tinnitus) and/or a feeling of fullness in the head, with full recovery within 48 hours.(4, 6) TTSs
have been found to be a risk indicator that permanent NIHL may occur if exposure to hazardous
noise continues.(3) It is also important to recognize that occupational and recreational noise
exposures resulting in a TTS at an early age may result in cochlear nerve degeneration, which
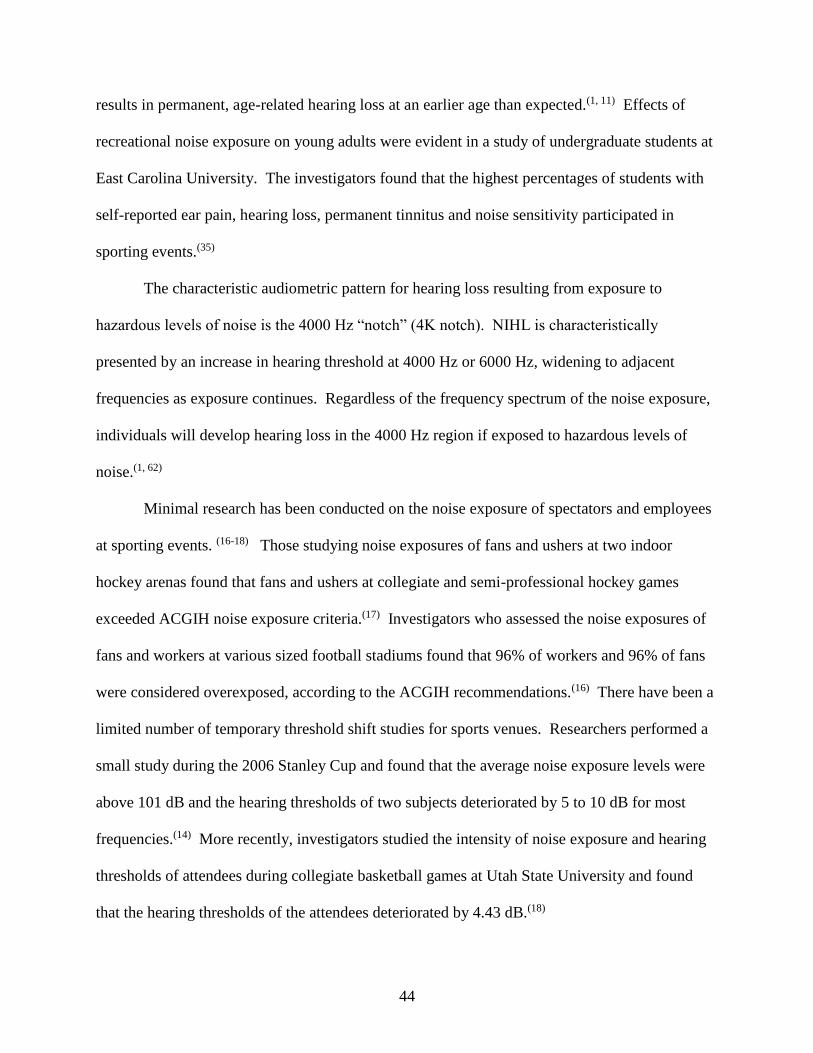
44
results in permanent, age-related hearing loss at an earlier age than expected.(1, 11) Effects of
recreational noise exposure on young adults were evident in a study of undergraduate students at
East Carolina University. The investigators found that the highest percentages of students with
self-reported ear pain, hearing loss, permanent tinnitus and noise sensitivity participated in
sporting events.(35)
The characteristic audiometric pattern for hearing loss resulting from exposure to
hazardous levels of noise is the 4000 Hz “notch” (4K notch). NIHL is characteristically
presented by an increase in hearing threshold at 4000 Hz or 6000 Hz, widening to adjacent
frequencies as exposure continues. Regardless of the frequency spectrum of the noise exposure,
individuals will develop hearing loss in the 4000 Hz region if exposed to hazardous levels of
noise.(1, 62)
Minimal research has been conducted on the noise exposure of spectators and employees
at sporting events. (16-18) Those studying noise exposures of fans and ushers at two indoor
hockey arenas found that fans and ushers at collegiate and semi-professional hockey games
exceeded ACGIH noise exposure criteria.(17) Investigators who assessed the noise exposures of
fans and workers at various sized football stadiums found that 96% of workers and 96% of fans
were considered overexposed, according to the ACGIH recommendations.(16) There have been a
limited number of temporary threshold shift studies for sports venues. Researchers performed a
small study during the 2006 Stanley Cup and found that the average noise exposure levels were
above 101 dB and the hearing thresholds of two subjects deteriorated by 5 to 10 dB for most
frequencies.(14) More recently, investigators studied the intensity of noise exposure and hearing
thresholds of attendees during collegiate basketball games at Utah State University and found
that the hearing thresholds of the attendees deteriorated by 4.43 dB.(18)
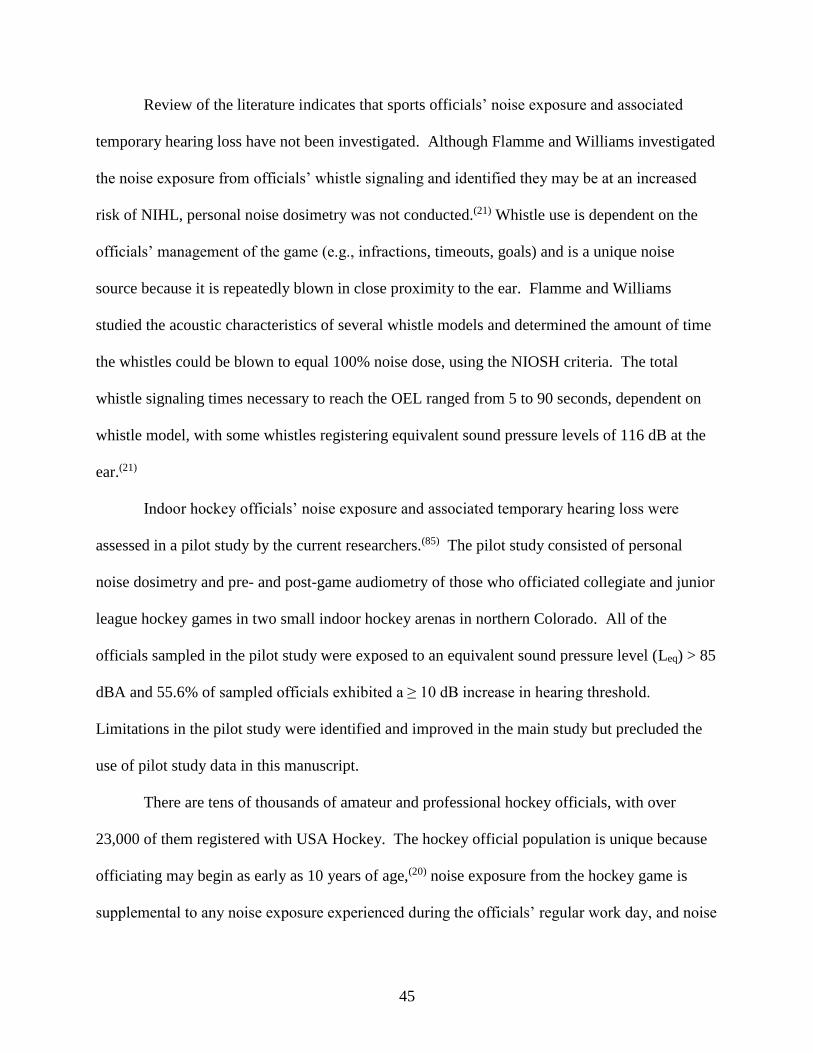
45
Review of the literature indicates that sports officials’ noise exposure and associated
temporary hearing loss have not been investigated. Although Flamme and Williams investigated
the noise exposure from officials’ whistle signaling and identified they may be at an increased
risk of NIHL, personal noise dosimetry was not conducted.(21) Whistle use is dependent on the
officials’ management of the game (e.g., infractions, timeouts, goals) and is a unique noise
source because it is repeatedly blown in close proximity to the ear. Flamme and Williams
studied the acoustic characteristics of several whistle models and determined the amount of time
the whistles could be blown to equal 100% noise dose, using the NIOSH criteria. The total
whistle signaling times necessary to reach the OEL ranged from 5 to 90 seconds, dependent on
whistle model, with some whistles registering equivalent sound pressure levels of 116 dB at the
ear.(21)
Indoor hockey officials’ noise exposure and associated temporary hearing loss were
assessed in a pilot study by the current researchers.(85) The pilot study consisted of personal
noise dosimetry and pre- and post-game audiometry of those who officiated collegiate and junior
league hockey games in two small indoor hockey arenas in northern Colorado. All of the
officials sampled in the pilot study were exposed to an equivalent sound pressure level (Leq) > 85
dBA and 55.6% of sampled officials exhibited a ≥ 10 dB increase in hearing threshold.
Limitations in the pilot study were identified and improved in the main study but precluded the
use of pilot study data in this manuscript.
There are tens of thousands of amateur and professional hockey officials, with over
23,000 of them registered with USA Hockey. The hockey official population is unique because
officiating may begin as early as 10 years of age,(20) noise exposure from the hockey game is
supplemental to any noise exposure experienced during the officials’ regular work day, and noise
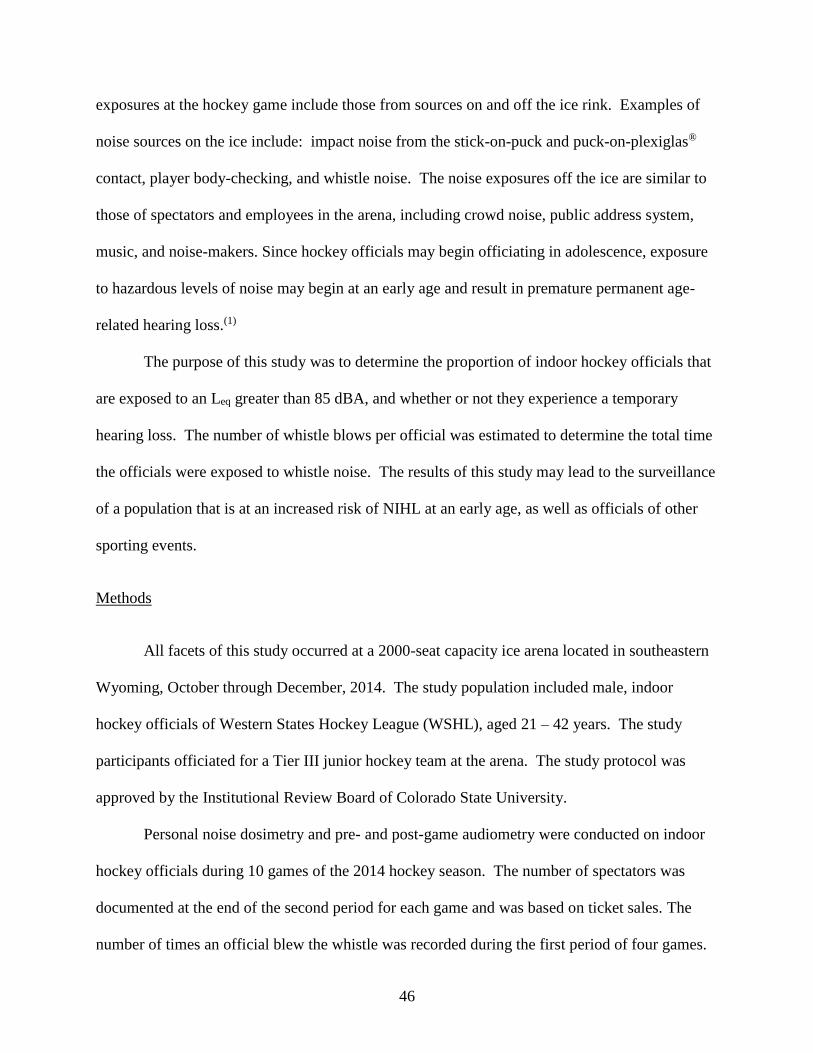
46
exposures at the hockey game include those from sources on and off the ice rink. Examples of
noise sources on the ice include: impact noise from the stick-on-puck and puck-on-plexiglas®
contact, player body-checking, and whistle noise. The noise exposures off the ice are similar to
those of spectators and employees in the arena, including crowd noise, public address system,
music, and noise-makers. Since hockey officials may begin officiating in adolescence, exposure
to hazardous levels of noise may begin at an early age and result in premature permanent age-
related hearing loss.(1)
The purpose of this study was to determine the proportion of indoor hockey officials that
are exposed to an Leq greater than 85 dBA, and whether or not they experience a temporary
hearing loss. The number of whistle blows per official was estimated to determine the total time
the officials were exposed to whistle noise. The results of this study may lead to the surveillance
of a population that is at an increased risk of NIHL at an early age, as well as officials of other
sporting events.
Methods
All facets of this study occurred at a 2000-seat capacity ice arena located in southeastern
Wyoming, October through December, 2014. The study population included male, indoor
hockey officials of Western States Hockey League (WSHL), aged 21 – 42 years. The study
participants officiated for a Tier III junior hockey team at the arena. The study protocol was
approved by the Institutional Review Board of Colorado State University.
Personal noise dosimetry and pre- and post-game audiometry were conducted on indoor
hockey officials during 10 games of the 2014 hockey season. The number of spectators was
documented at the end of the second period for each game and was based on ticket sales. The
number of times an official blew the whistle was recorded during the first period of four games.
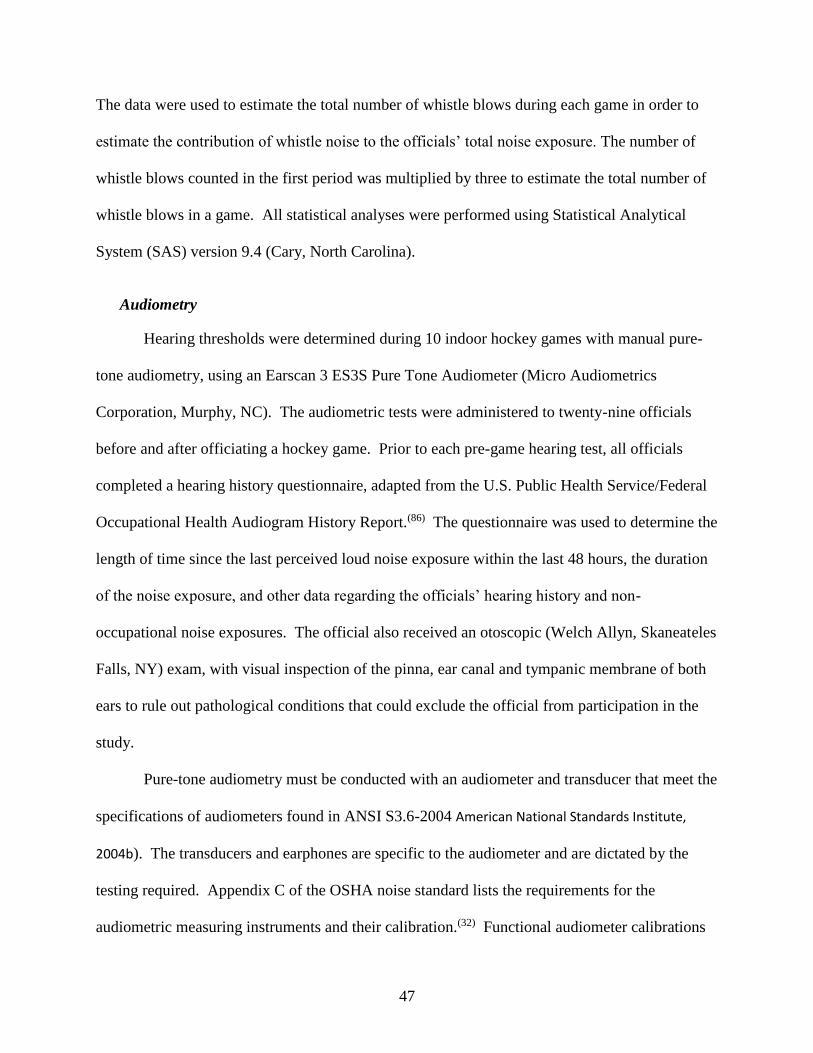
47
The data were used to estimate the total number of whistle blows during each game in order to
estimate the contribution of whistle noise to the officials’ total noise exposure. The number of
whistle blows counted in the first period was multiplied by three to estimate the total number of
whistle blows in a game. All statistical analyses were performed using Statistical Analytical
System (SAS) version 9.4 (Cary, North Carolina).
Audiometry
Hearing thresholds were determined during 10 indoor hockey games with manual pure-
tone audiometry, using an Earscan 3 ES3S Pure Tone Audiometer (Micro Audiometrics
Corporation, Murphy, NC). The audiometric tests were administered to twenty-nine officials
before and after officiating a hockey game. Prior to each pre-game hearing test, all officials
completed a hearing history questionnaire, adapted from the U.S. Public Health Service/Federal
Occupational Health Audiogram History Report.(86) The questionnaire was used to determine the
length of time since the last perceived loud noise exposure within the last 48 hours, the duration
of the noise exposure, and other data regarding the officials’ hearing history and non-
occupational noise exposures. The official also received an otoscopic (Welch Allyn, Skaneateles
Falls, NY) exam, with visual inspection of the pinna, ear canal and tympanic membrane of both
ears to rule out pathological conditions that could exclude the official from participation in the
study.
Pure-tone audiometry must be conducted with an audiometer and transducer that meet the
specifications of audiometers found in ANSI S3.6-2004 American National Standards Institute,
2004b). The transducers and earphones are specific to the audiometer and are dictated by the
testing required. Appendix C of the OSHA noise standard lists the requirements for the
audiometric measuring instruments and their calibration.(32) Functional audiometer calibrations
48
must be conducted each day before administering a hearing test. An example of the functional
calibration that was conducted on the audiometer used in this study before each day of use is
found in Appendix B. An acoustic calibration consisting of intensity, linearity, and frequency
checks is required in alternating years with the exhaustive calibration, which is a more extensive
evaluation of the instrumentation.(87) A pure-tone audiometer with circumaural earphones having
an accuracy of +/- 1 dB (88) was used in accordance with the instrumentation requirements
mentioned above.(27)
A researcher certified by the Council of Accreditation in Occupational Hearing
Conservation administered the otoscopic exam and audiometric tests. The modified Hughson-
Westlake Technique was used to manually test the hearing threshold for each ear at 500, 1000,
2000, 3000, 4000, 6000, and 8000 Hz. A 10 dB tone was presented through the circumaural
headphones at each frequency and the 5 dB ascending and 10 dB descending process was
repeated until the official responded to the lowest decibel level at least one half of the time. At a
minimum, two out of three responses at a single decibel level were required to identify a
threshold of hearing. Audiometric exams were conducted before the game and within
approximately twenty minutes after the official’s departure from the ice. The hearing test
instructions for the study participants and the methodology used to administer the hearing tests
are found in Appendices C and D, respectively.
An accurate hearing test requires that the background noise level in the testing booth or
room be less than or equal to the maximum allowable octave-band sound pressure levels for
audiometric test rooms as stated in Appendix D-1 of the OSHA noise standard or the ANSI S3.1
2008 standard,(32) as seen in Table 4.1. The ANSI S3.1 permissible ambient noise levels are
more stringent than those of the OSHA noise standard for audiometric test rooms. This research
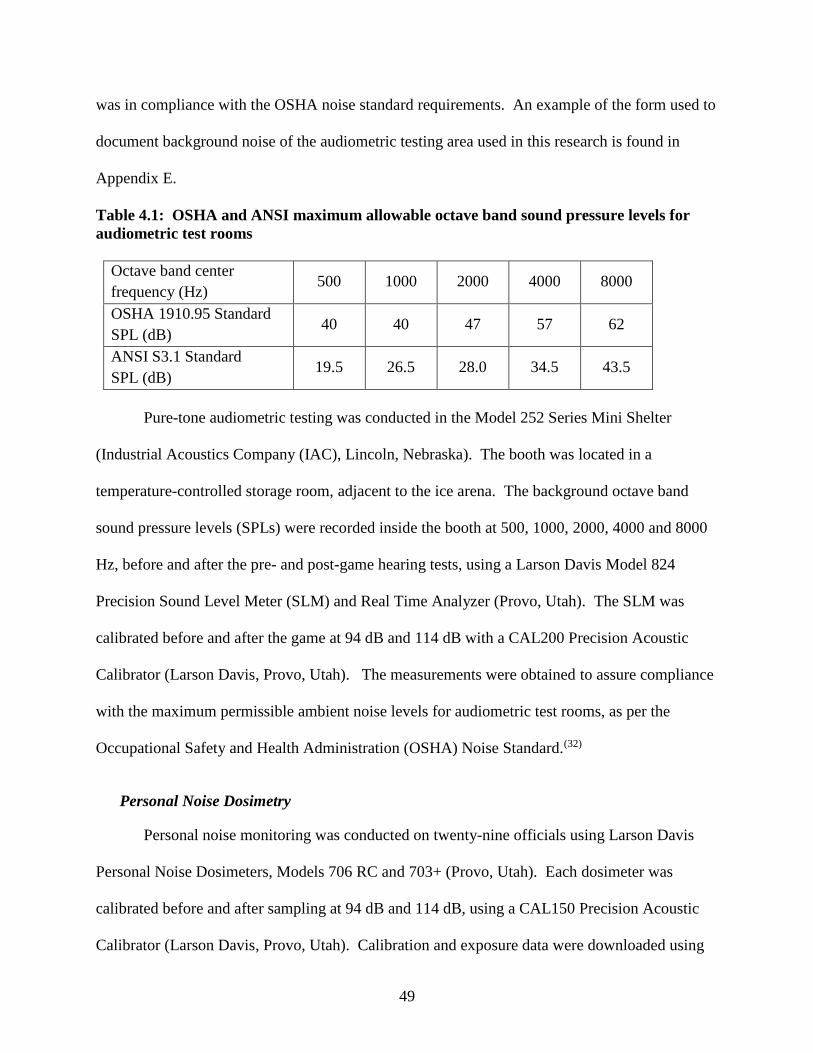
49
was in compliance with the OSHA noise standard requirements. An example of the form used to
document background noise of the audiometric testing area used in this research is found in
Appendix E.
Table 4.1: OSHA and ANSI maximum allowable octave band sound pressure levels for audiometric test rooms
Octave band center frequency (Hz)
500 1000 2000 4000 8000
OSHA 1910.95 Standard SPL (dB)
40 40 47 57 62
ANSI S3.1 Standard SPL (dB)
19.5 26.5 28.0 34.5 43.5
Pure-tone audiometric testing was conducted in the Model 252 Series Mini Shelter
(Industrial Acoustics Company (IAC), Lincoln, Nebraska). The booth was located in a
temperature-controlled storage room, adjacent to the ice arena. The background octave band
sound pressure levels (SPLs) were recorded inside the booth at 500, 1000, 2000, 4000 and 8000
Hz, before and after the pre- and post-game hearing tests, using a Larson Davis Model 824
Precision Sound Level Meter (SLM) and Real Time Analyzer (Provo, Utah). The SLM was
calibrated before and after the game at 94 dB and 114 dB with a CAL200 Precision Acoustic
Calibrator (Larson Davis, Provo, Utah). The measurements were obtained to assure compliance
with the maximum permissible ambient noise levels for audiometric test rooms, as per the
Occupational Safety and Health Administration (OSHA) Noise Standard.(32)
Personal Noise Dosimetry
Personal noise monitoring was conducted on twenty-nine officials using Larson Davis
Personal Noise Dosimeters, Models 706 RC and 703+ (Provo, Utah). Each dosimeter was
calibrated before and after sampling at 94 dB and 114 dB, using a CAL150 Precision Acoustic
Calibrator (Larson Davis, Provo, Utah). Calibration and exposure data were downloaded using
50
2014 version J Blaze® software (Larson Davis, Provo, Utah). Noise measurements were
conducted in accordance with the OSHA Technical Manual (OTM), Section III, Chapter 5. The
dosimeter was secured to each official prior to the start of the game and removed at the game’s
end. The microphone with attached windscreen was secured on the shoulder or lapel of the
official’s jersey on the dominant side, opposite the side with the hand holding the whistle. The
researcher instructed each official to not remove, tap or yell into the microphone and checked
functionality of the dosimeter and microphone placement at each intermission.
Personal noise dosimetry data were collected for the duration of the hockey game. The
researchers chose not to compare the noise dosimetry results of this study to the 8-hour
occupational noise criteria because the calculations would have assumed that the official’s
remaining noise exposure for the day was less than the threshold dB value, which is unlikely.
Although each dosimeter collected simultaneous dose measurements with the OSHA action limit
(AL) and ACGIH threshold limit value (TLV) parameters, with 5 dB and 3 dB exchange rates,
respectively, the researchers chose to report Leq.
Statistical Analysis
SAS version 9.4 (SAS Institute, Cary, NC) was used to perform statistical analysis.
Descriptive statistics were used to express the proportion of officials exceeding the 85 dB Leq
and the OSHA noise regulations and ACGIH recommendations. The proportion of officials who
experienced a 10 dB or greater decrease in hearing sensitivity was determined. The paired pre-
and post-game audiometry data did not meet the parametric requirements and the Wilcoxon
signed-rank test was conducted to determine if there were statistically significant differences
between the pre- and post-game audiometry data.
51
Logistic regression was used to evaluate the association between noise level and change
in hearing sensitivity of ≥10 dB. The association was examined in separate logistic regression
models at 500, 1000, 2000, 3000, 4000, 6000 and 8000 Hz. Repeated measures within person
were accounted for and the small sample size and low power inhibited the examination of effect
modifiers.
Results
The attendance for the 10 hockey games ranged from 237 to 589 spectators, with an
average of 446 (SD=117.8). Study participants ranged from 21 to 42 years of age, with an
average of 8.9 years of officiating experience (ranging from 4 to 21 years). None of the officials
were excluded upon otoscopic exam. Forty-five percent (13/29) of the study participants
reported excessive noise exposures within the last 48 hours, ranging from 15 minutes to nine
hours in duration. Of those who reported an excessive noise exposure, five (38.5 percent)
reported music, and five (38.5 percent) reported hockey as the source of noise. A history of
firearm use was reported by five officials and no officials self-reported a history of hearing loss.
The estimated number of whistle blows in a game ranged from 150 to 210 times in the four
games sampled, with an average of 180 (SD=25) blows. A statistically significant association
was not found between average whistle blows and average Leq in the first four games.
Audiometry
The SPLs were measured at 500, 1000, 2000, 4000 and 8000 Hz inside the audiometric
testing booth before and after the pre- and post-game hearing tests. All SPLs were below the
maximum allowable SPLs for audiometric test rooms, as outlined in the OSHA noise
standard.(32)
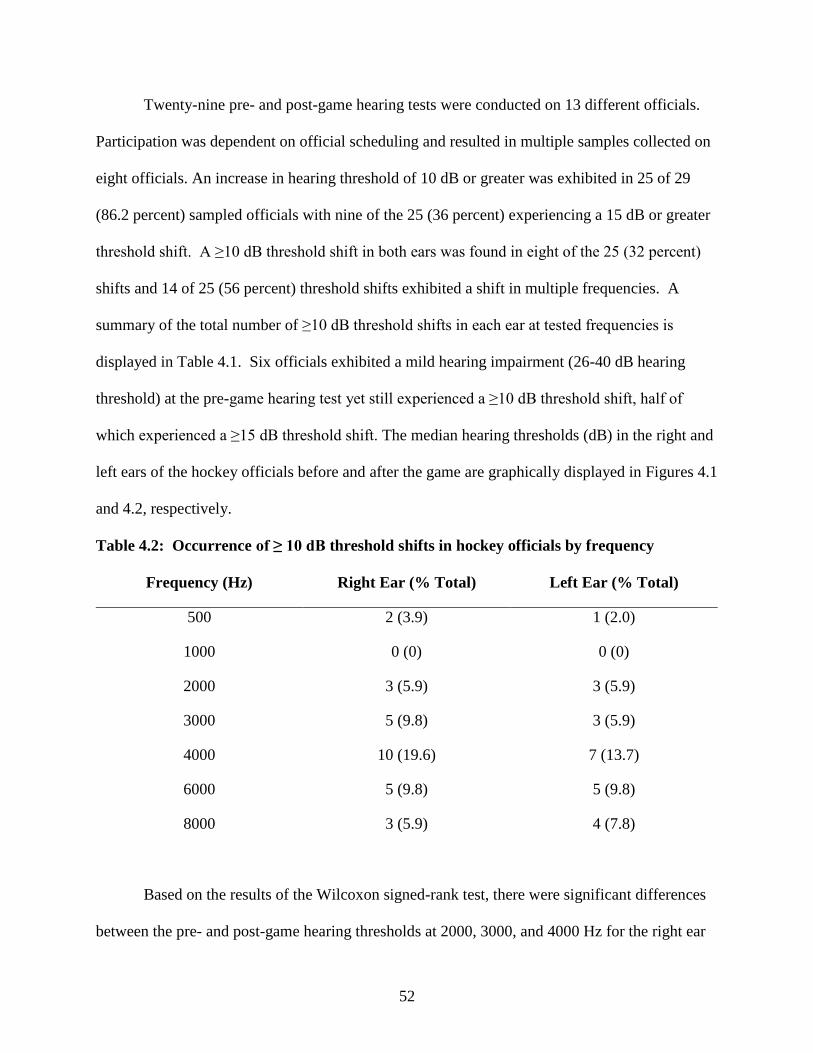
52
Twenty-nine pre- and post-game hearing tests were conducted on 13 different officials.
Participation was dependent on official scheduling and resulted in multiple samples collected on
eight officials. An increase in hearing threshold of 10 dB or greater was exhibited in 25 of 29
(86.2 percent) sampled officials with nine of the 25 (36 percent) experiencing a 15 dB or greater
threshold shift. A ≥10 dB threshold shift in both ears was found in eight of the 25 (32 percent)
shifts and 14 of 25 (56 percent) threshold shifts exhibited a shift in multiple frequencies. A
summary of the total number of ≥10 dB threshold shifts in each ear at tested frequencies is
displayed in Table 4.1. Six officials exhibited a mild hearing impairment (26-40 dB hearing
threshold) at the pre-game hearing test yet still experienced a ≥10 dB threshold shift, half of
which experienced a ≥15 dB threshold shift. The median hearing thresholds (dB) in the right and
left ears of the hockey officials before and after the game are graphically displayed in Figures 4.1
and 4.2, respectively.
Table 4.2: Occurrence of ≥ 10 dB threshold shifts in hockey officials by frequency
Frequency (Hz) Right Ear (% Total) Left Ear (% Total)
500 2 (3.9) 1 (2.0)
1000 0 (0) 0 (0)
2000 3 (5.9) 3 (5.9)
3000 5 (9.8) 3 (5.9)
4000 10 (19.6) 7 (13.7)
6000 5 (9.8) 5 (9.8)
8000 3 (5.9) 4 (7.8)
Based on the results of the Wilcoxon signed-rank test, there were significant differences
between the pre- and post-game hearing thresholds at 2000, 3000, and 4000 Hz for the right ear
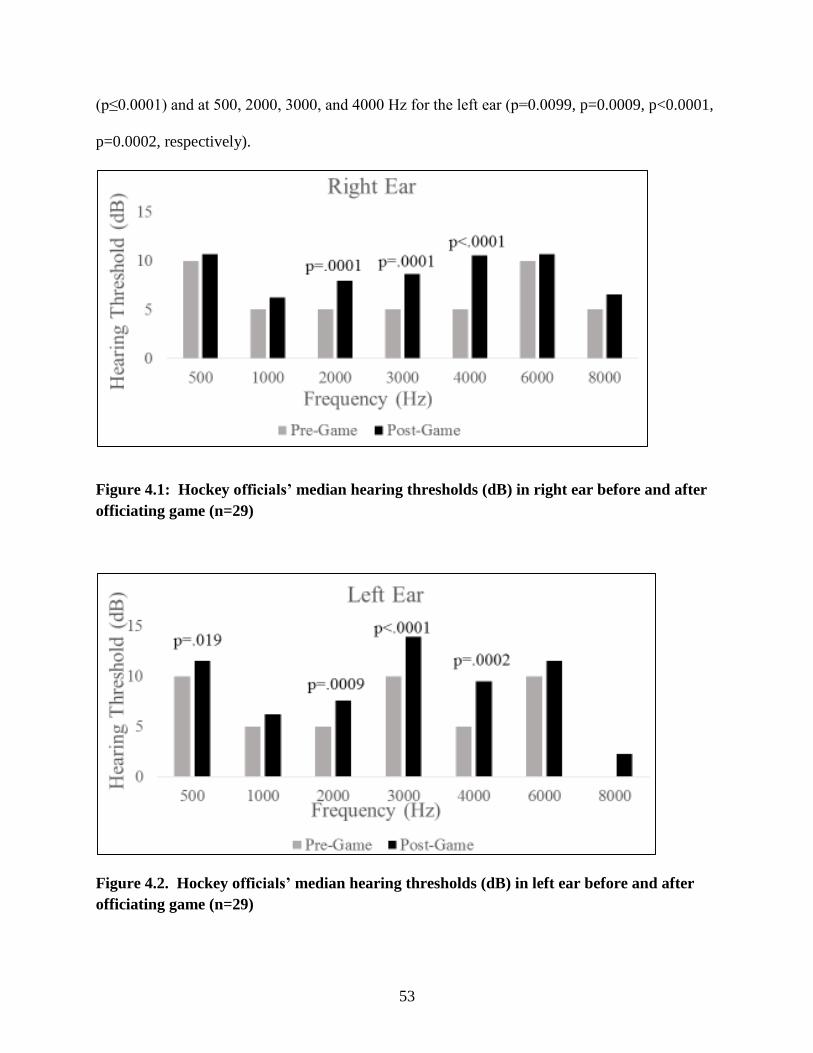
53
(p≤0.0001) and at 500, 2000, 3000, and 4000 Hz for the left ear (p=0.0099, p=0.0009, p<0.0001,
p=0.0002, respectively).
Figure 4.1: Hockey officials’ median hearing thresholds (dB) in right ear before and after officiating game (n=29)
Figure 4.2. Hockey officials’ median hearing thresholds (dB) in left ear before and after officiating game (n=29)
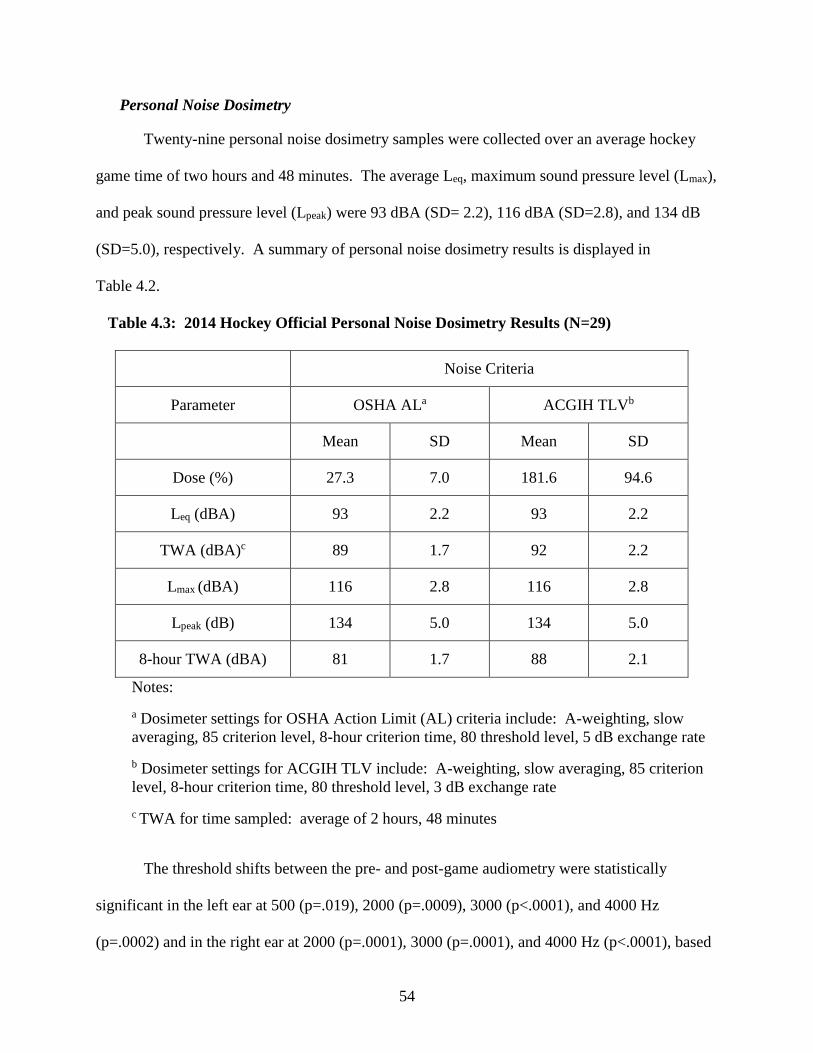
54
Personal Noise Dosimetry
Twenty-nine personal noise dosimetry samples were collected over an average hockey
game time of two hours and 48 minutes. The average Leq, maximum sound pressure level (Lmax),
and peak sound pressure level (Lpeak) were 93 dBA (SD= 2.2), 116 dBA (SD=2.8), and 134 dB
(SD=5.0), respectively. A summary of personal noise dosimetry results is displayed in
Table 4.2.
Table 4.3: 2014 Hockey Official Personal Noise Dosimetry Results (N=29)
Noise Criteria
Parameter OSHA ALa ACGIH TLVb
Mean SD Mean SD
Dose (%) 27.3 7.0 181.6 94.6
Leq (dBA) 93 2.2 93 2.2
TWA (dBA)c 89 1.7 92 2.2
Lmax (dBA) 116 2.8 116 2.8
Lpeak (dB) 134 5.0 134 5.0
8-hour TWA (dBA) 81 1.7 88 2.1
Notes:
a Dosimeter settings for OSHA Action Limit (AL) criteria include: A-weighting, slow averaging, 85 criterion level, 8-hour criterion time, 80 threshold level, 5 dB exchange rate
b Dosimeter settings for ACGIH TLV include: A-weighting, slow averaging, 85 criterion level, 8-hour criterion time, 80 threshold level, 3 dB exchange rate
c TWA for time sampled: average of 2 hours, 48 minutes
The threshold shifts between the pre- and post-game audiometry were statistically
significant in the left ear at 500 (p=.019), 2000 (p=.0009), 3000 (p<.0001), and 4000 Hz
(p=.0002) and in the right ear at 2000 (p=.0001), 3000 (p=.0001), and 4000 Hz (p<.0001), based
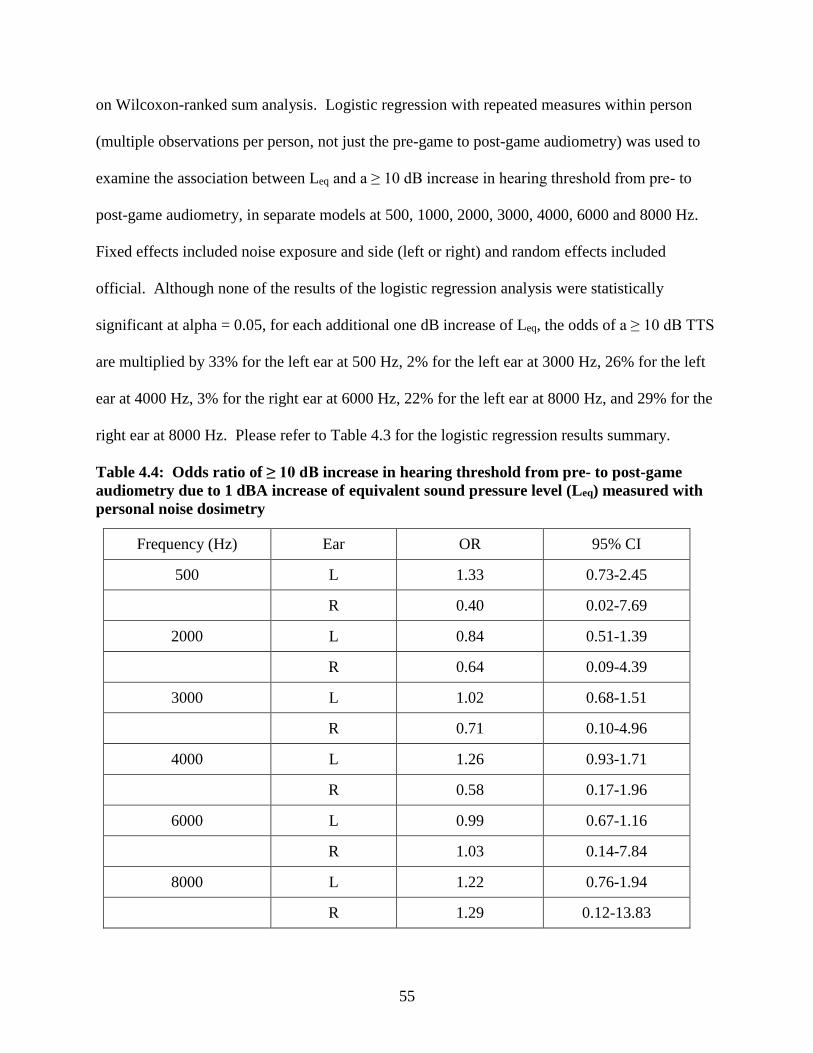
55
on Wilcoxon-ranked sum analysis. Logistic regression with repeated measures within person
(multiple observations per person, not just the pre-game to post-game audiometry) was used to
examine the association between Leq and a ≥ 10 dB increase in hearing threshold from pre- to
post-game audiometry, in separate models at 500, 1000, 2000, 3000, 4000, 6000 and 8000 Hz.
Fixed effects included noise exposure and side (left or right) and random effects included
official. Although none of the results of the logistic regression analysis were statistically
significant at alpha = 0.05, for each additional one dB increase of Leq, the odds of a ≥ 10 dB TTS
are multiplied by 33% for the left ear at 500 Hz, 2% for the left ear at 3000 Hz, 26% for the left
ear at 4000 Hz, 3% for the right ear at 6000 Hz, 22% for the left ear at 8000 Hz, and 29% for the
right ear at 8000 Hz. Please refer to Table 4.3 for the logistic regression results summary.
Table 4.4: Odds ratio of ≥ 10 dB increase in hearing threshold from pre- to post-game audiometry due to 1 dBA increase of equivalent sound pressure level (Leq) measured with personal noise dosimetry
Frequency (Hz) Ear OR 95% CI
500 L 1.33 0.73-2.45
R 0.40 0.02-7.69
2000 L 0.84 0.51-1.39
R 0.64 0.09-4.39
3000 L 1.02 0.68-1.51
R 0.71 0.10-4.96
4000 L 1.26 0.93-1.71
R 0.58 0.17-1.96
6000 L 0.99 0.67-1.16
R 1.03 0.14-7.84
8000 L 1.22 0.76-1.94
R 1.29 0.12-13.83
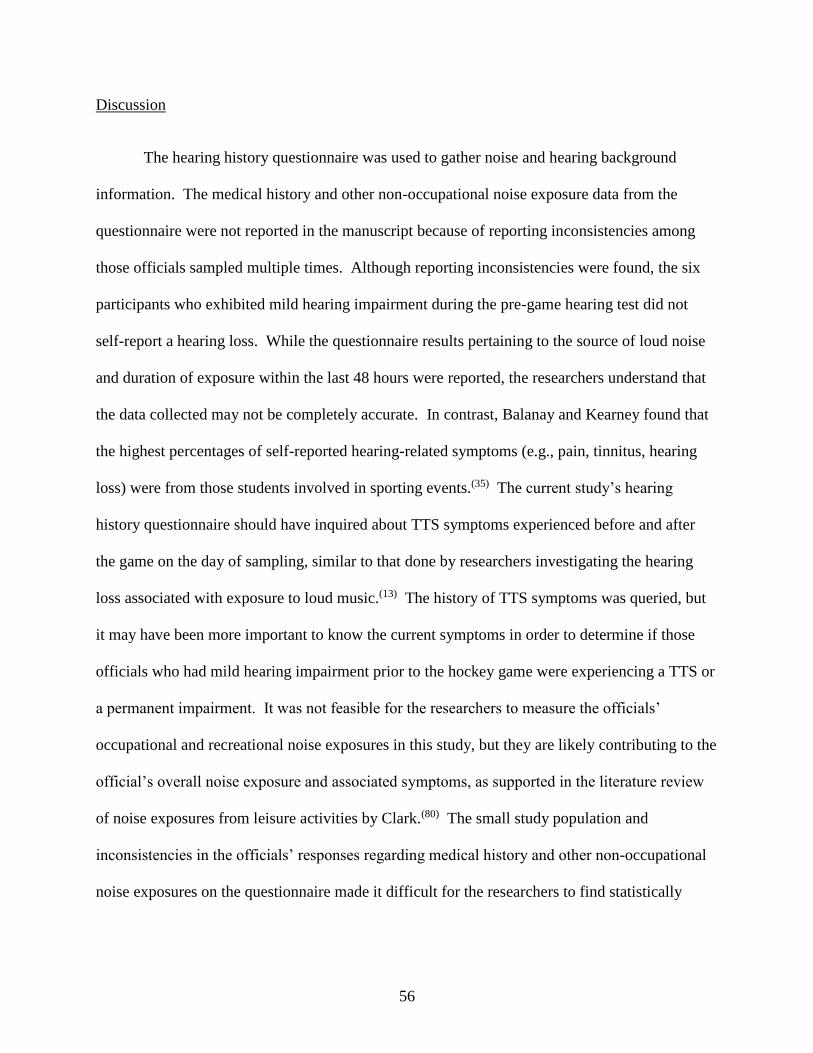
56
Discussion
The hearing history questionnaire was used to gather noise and hearing background
information. The medical history and other non-occupational noise exposure data from the
questionnaire were not reported in the manuscript because of reporting inconsistencies among
those officials sampled multiple times. Although reporting inconsistencies were found, the six
participants who exhibited mild hearing impairment during the pre-game hearing test did not
self-report a hearing loss. While the questionnaire results pertaining to the source of loud noise
and duration of exposure within the last 48 hours were reported, the researchers understand that
the data collected may not be completely accurate. In contrast, Balanay and Kearney found that
the highest percentages of self-reported hearing-related symptoms (e.g., pain, tinnitus, hearing
loss) were from those students involved in sporting events.(35) The current study’s hearing
history questionnaire should have inquired about TTS symptoms experienced before and after
the game on the day of sampling, similar to that done by researchers investigating the hearing
loss associated with exposure to loud music.(13) The history of TTS symptoms was queried, but
it may have been more important to know the current symptoms in order to determine if those
officials who had mild hearing impairment prior to the hockey game were experiencing a TTS or
a permanent impairment. It was not feasible for the researchers to measure the officials’
occupational and recreational noise exposures in this study, but they are likely contributing to the
official’s overall noise exposure and associated symptoms, as supported in the literature review
of noise exposures from leisure activities by Clark.(80) The small study population and
inconsistencies in the officials’ responses regarding medical history and other non-occupational
noise exposures on the questionnaire made it difficult for the researchers to find statistically
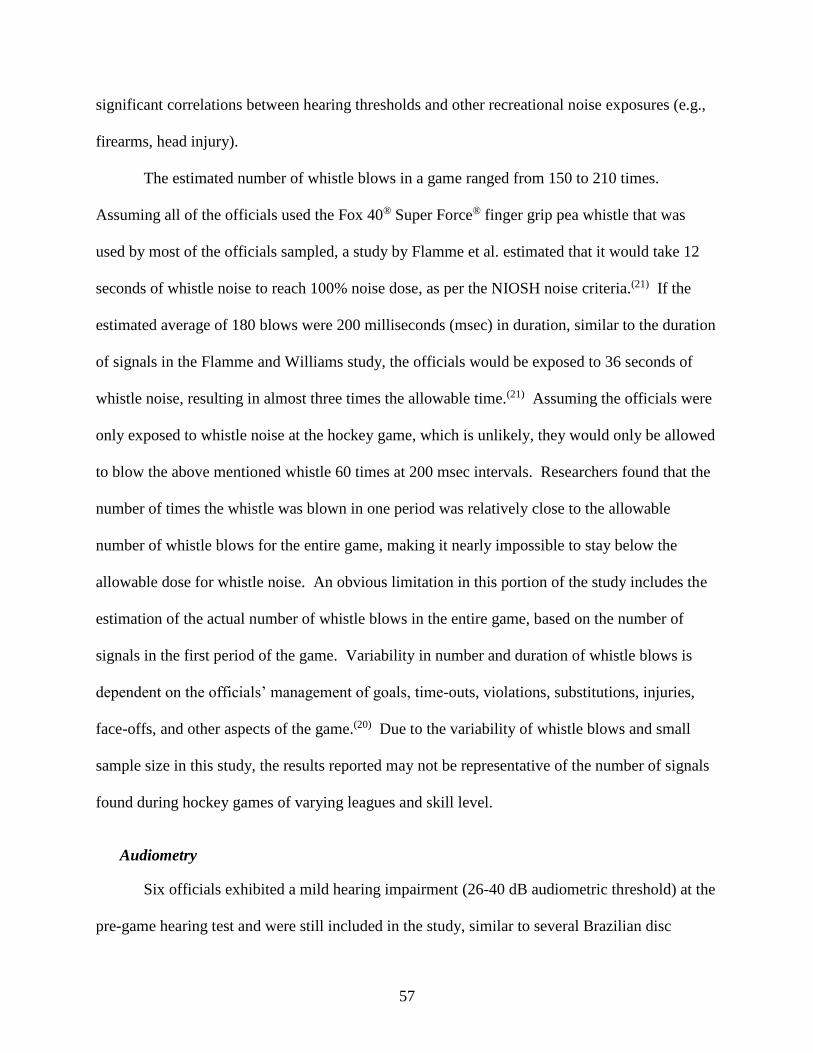
57
significant correlations between hearing thresholds and other recreational noise exposures (e.g.,
firearms, head injury).
The estimated number of whistle blows in a game ranged from 150 to 210 times.
Assuming all of the officials used the Fox 40® Super Force® finger grip pea whistle that was
used by most of the officials sampled, a study by Flamme et al. estimated that it would take 12
seconds of whistle noise to reach 100% noise dose, as per the NIOSH noise criteria.(21) If the
estimated average of 180 blows were 200 milliseconds (msec) in duration, similar to the duration
of signals in the Flamme and Williams study, the officials would be exposed to 36 seconds of
whistle noise, resulting in almost three times the allowable time.(21) Assuming the officials were
only exposed to whistle noise at the hockey game, which is unlikely, they would only be allowed
to blow the above mentioned whistle 60 times at 200 msec intervals. Researchers found that the
number of times the whistle was blown in one period was relatively close to the allowable
number of whistle blows for the entire game, making it nearly impossible to stay below the
allowable dose for whistle noise. An obvious limitation in this portion of the study includes the
estimation of the actual number of whistle blows in the entire game, based on the number of
signals in the first period of the game. Variability in number and duration of whistle blows is
dependent on the officials’ management of goals, time-outs, violations, substitutions, injuries,
face-offs, and other aspects of the game.(20) Due to the variability of whistle blows and small
sample size in this study, the results reported may not be representative of the number of signals
found during hockey games of varying leagues and skill level.
Audiometry
Six officials exhibited a mild hearing impairment (26-40 dB audiometric threshold) at the
pre-game hearing test and were still included in the study, similar to several Brazilian disc
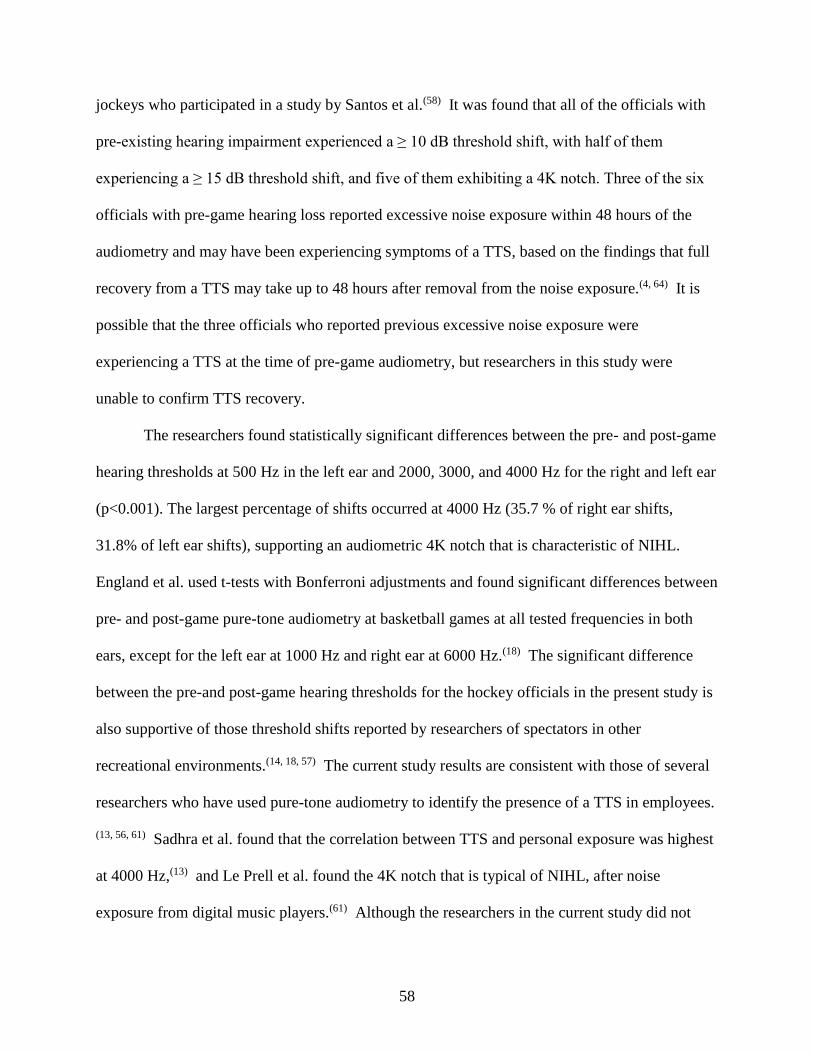
58
jockeys who participated in a study by Santos et al.(58) It was found that all of the officials with
pre-existing hearing impairment experienced a ≥ 10 dB threshold shift, with half of them
experiencing a ≥ 15 dB threshold shift, and five of them exhibiting a 4K notch. Three of the six
officials with pre-game hearing loss reported excessive noise exposure within 48 hours of the
audiometry and may have been experiencing symptoms of a TTS, based on the findings that full
recovery from a TTS may take up to 48 hours after removal from the noise exposure.(4, 64) It is
possible that the three officials who reported previous excessive noise exposure were
experiencing a TTS at the time of pre-game audiometry, but researchers in this study were
unable to confirm TTS recovery.
The researchers found statistically significant differences between the pre- and post-game
hearing thresholds at 500 Hz in the left ear and 2000, 3000, and 4000 Hz for the right and left ear
(p<0.001). The largest percentage of shifts occurred at 4000 Hz (35.7 % of right ear shifts,
31.8% of left ear shifts), supporting an audiometric 4K notch that is characteristic of NIHL.
England et al. used t-tests with Bonferroni adjustments and found significant differences between
pre- and post-game pure-tone audiometry at basketball games at all tested frequencies in both
ears, except for the left ear at 1000 Hz and right ear at 6000 Hz.(18) The significant difference
between the pre-and post-game hearing thresholds for the hockey officials in the present study is
also supportive of those threshold shifts reported by researchers of spectators in other
recreational environments.(14, 18, 57) The current study results are consistent with those of several
researchers who have used pure-tone audiometry to identify the presence of a TTS in employees.
(13, 56, 61) Sadhra et al. found that the correlation between TTS and personal exposure was highest
at 4000 Hz,(13) and Le Prell et al. found the 4K notch that is typical of NIHL, after noise
exposure from digital music players.(61) Although the researchers in the current study did not
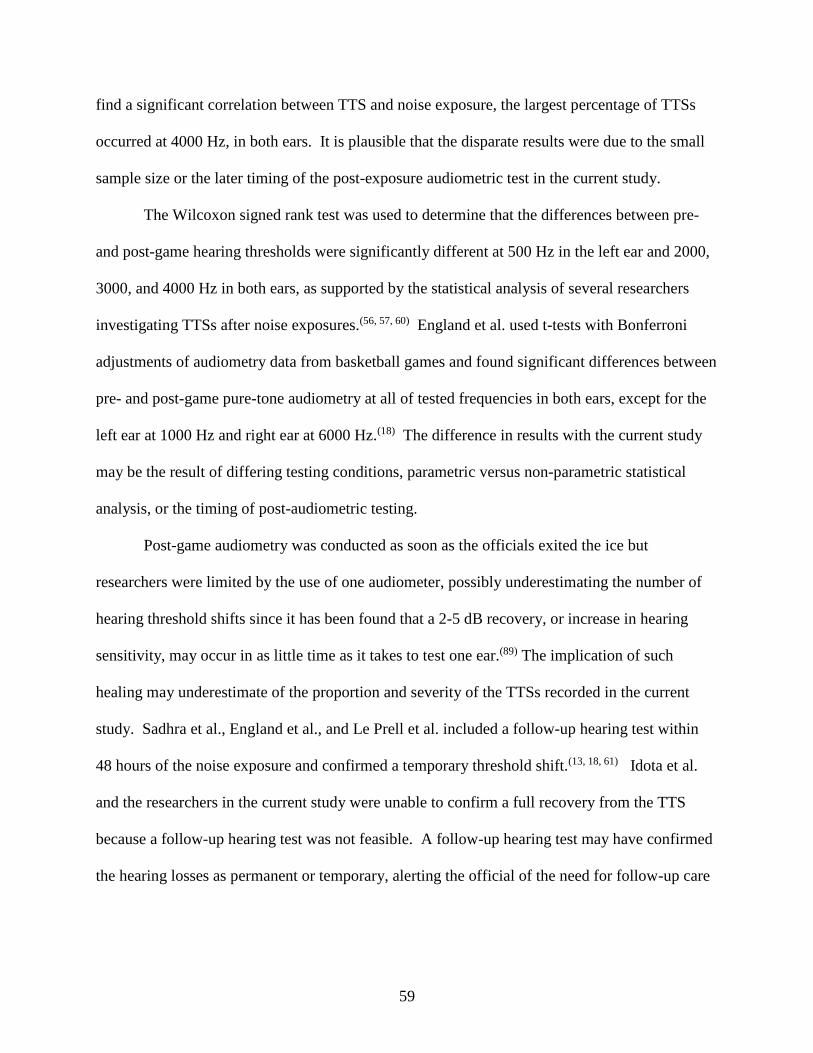
59
find a significant correlation between TTS and noise exposure, the largest percentage of TTSs
occurred at 4000 Hz, in both ears. It is plausible that the disparate results were due to the small
sample size or the later timing of the post-exposure audiometric test in the current study.
The Wilcoxon signed rank test was used to determine that the differences between pre-
and post-game hearing thresholds were significantly different at 500 Hz in the left ear and 2000,
3000, and 4000 Hz in both ears, as supported by the statistical analysis of several researchers
investigating TTSs after noise exposures.(56, 57, 60) England et al. used t-tests with Bonferroni
adjustments of audiometry data from basketball games and found significant differences between
pre- and post-game pure-tone audiometry at all of tested frequencies in both ears, except for the
left ear at 1000 Hz and right ear at 6000 Hz.(18) The difference in results with the current study
may be the result of differing testing conditions, parametric versus non-parametric statistical
analysis, or the timing of post-audiometric testing.
Post-game audiometry was conducted as soon as the officials exited the ice but
researchers were limited by the use of one audiometer, possibly underestimating the number of
hearing threshold shifts since it has been found that a 2-5 dB recovery, or increase in hearing
sensitivity, may occur in as little time as it takes to test one ear.(89) The implication of such
healing may underestimate of the proportion and severity of the TTSs recorded in the current
study. Sadhra et al., England et al., and Le Prell et al. included a follow-up hearing test within
48 hours of the noise exposure and confirmed a temporary threshold shift.(13, 18, 61) Idota et al.
and the researchers in the current study were unable to confirm a full recovery from the TTS
because a follow-up hearing test was not feasible. A follow-up hearing test may have confirmed
the hearing losses as permanent or temporary, alerting the official of the need for follow-up care
60
with a physician. The study participants in the current study were notified to contact a physician
if TTS symptoms persisted for more than 48 hours.
Noise Dosimetry
Personal noise monitoring was conducted for the duration of the hockey game, averaging
two hours and 48 minutes. Within the sampling time, hockey officials received an average of
approximately 20% of their daily noise dose, according to OSHA criteria. All of the officials
were exposed to an Leq > 85 dBA (88 dBA – 97 dBA), with a mean Leq of 93 dBA (SD=2.2),
which support the mean Leq of 90 dBA found in the pilot study by Adams et al.(85) Researchers
have found similar personal noise exposure levels in other recreational venues with music as the
primary source of exposure. For instance, Sadhra et al. monitored part-time student bar and
security staff in three areas used for musical entertainment and found an average Leq of 90 dBA
and Lpeak of 113 dB among bar staff and an average Leq of 94 dBA and Lpeak of 124dB among
security staff, concurring with the current study. Idota et al. monitored twelve employees who
wore earphones to communicate in facilities containing pinball and slot machines and found a
mean personal exposure Leq of 92.1 dBA, very similar to the Leq of the current study.(56)
Similar noise exposure levels have been found by researchers of other sports venues. For
instance, Engard et al. found that the Leq ranged from 91 to 95 dBA for workers and fans in
football stadiums, Ramma et al. found the Leq ranged from 85.3 to 98.9 dBA for spectators of
two South African Premier Soccer League (PSL) matches, and Swanepoel and Hall found the
mean Leq was 100.5 dBA for spectators of a South African PSL match at a FIFA training
stadium. (16, 59, 60) England and Larsen conducted personal noise monitoring on attendees at 10
intercollegiate basketball games, finding an average Leq of 84.6 dBA, which is lower than the
current study’s average Leq of 93 dBA. The discrepancy between the current and previous
61
studies’ findings may be due to differing noise sources and sampling periods. For instance, an
average basketball game time (1:59) is typically less than the average hockey game time (2:48).
The mean Lpeak of 134 dB (SD=5.0) in the current study is also consistent with the Lpeak range of
130 to 146 dB found by Engard et al., and the range of 130.6 to 143.1 dB found by England and
Larson.(16, 18)
The relatively small variations in the noise dosimetry among the studies may be the result
of different noise sources, arena/stadium acoustics, location of personal sampling and number of
people in attendance. The current study recorded attendance of hockey games with 237 to 589
spectators while the Engard et al. study included a range of 19,721 to 75,703 spectators. The
larger crowd may have generated more noise, which may have increased the noise exposure
levels in the Engard study. It is also possible that the results from the smaller venue with fewer
spectators underestimated the noise exposures of officials in larger arenas.
The current study was conducted during three months of a Tier III junior hockey team
season at one ice arena and the population was limited to those officials in the WSHL. The
results of this study may not be representative of noise exposures and associated hearing loss of
hockey officials in arenas of differing hockey leagues, attendance, spectator characteristics, and
acoustics. A larger study population, including officials exposed to < 85 dBA, may have
exhibited a statistically significant relationship between the officials’ noise exposure (Leq) and
the presence of a ≥10 dB temporary threshold shift in hearing.
Conclusions
The researchers in this and the pilot study were the first to evaluate the noise exposure
and temporary hearing loss of indoor hockey officials. All of the hockey officials were exposed
to a Leq > 85 dBA, with an average Leq of 93 dBA (SD= 2.2) and 86.2% of the officials
62
experienced a ≥ 10 dB increase in hearing threshold after officiating the game, with 36% of the
threshold shifts equaling 15 dB or greater. A ≥10 dB threshold shift was found in both ears of
32% of the officials and at multiple frequencies in 56% of the officials. The largest percentage
of hearing threshold shifts occurred at 4000 Hz, supporting the characteristic audiometric 4K
notch of NIHL. The hockey official blew the whistle an estimated average of 180 times and it
would only take a total of 12 seconds of whistle noise to reach 100% noise dose, according to the
results of the Flamme and Williams study.(21)
Based on the results of this study, indoor hockey officials are exposed to levels of noise
that result in TTSs, which may increase their risk of permanent NIHL and further research is
warranted. The noise exposure from the hockey game is supplemental to any noise exposure
experienced during the officials’ regular work day and should be included when determining the
total noise exposure of the official. The noise dosimetry results, based on the ACGIH criteria,
indicate that the officials may already be exceeding their daily allowable noise dose (181.6%)
from exposure to the noise levels during the hockey game. In an effort to reduce noise exposure,
hockey officials are encouraged to wear hearing protection that offers protection from the noise
sources and allows for communication while officiating games. Future research should include
noise monitoring and pre- and post-game audiometry on hockey officials at larger venues,
particularly those hosting semi-professional and professional hockey games. Follow-up
audiometry should be conducted after 48 hours of officiating to confirm if identified hearing loss
is temporary.
Further research has the potential to identify amateur and professional officials of other
sporting events, regionally and nationally, that are at an increased risk of NIHL. Although the
63
results of this study are unable to recover or repair the hearing loss that has already occurred in
hockey officials, it will hopefully thwart further or future hearing damage.
64
CHAPTER 5
“A SIMULATION OF HOCKEY OFFICIAL WHISTLE NOISE AND USE OF KEMAR TO
EVALUATE THE EFFECT OF HELMET VISOR LENGTH ON EXPOSURE TO WHISTLE
NOISE”3
Summary
The effect of the helmet visor length on the sound pressure level of whistle noise to
which hockey officials are exposed was evaluated to determine if visors may introduce a
reflective plane for the whistle noise, resulting in increased noise exposure. A Knowles
Electronic Manikin for Acoustic Research (KEMAR) head and torso assembly with a left ear
microphone, in conjunction with the Larson Davis Sound Level Meter (SLM)/Octave Band
Analyzer (OBA), was used to measure the peak sound pressure levels from the noise generated
from whistle blowing. The KEMAR was equipped with a Bauer 4500 hockey helmet and three
visor configurations for the study: no visor, 2.75” visor, and 4.0” visor. A Fox 40® Super
Force® finger grip pea whistle was mounted adjacent to the manikin’s mouth and attached to a
portable air compressor to produce approximately 115 dB of whistle noise. The whistle noise
was measured in an empty indoor ice arena in northern Colorado and the KEMAR assembly was
placed on the ice in the five, face-off spots. The whistle was blown five times in each location
with a total of 25 samples for each helmet configuration. Measured peak noise levels in the
3Adams, K. L. and W. J. Brazile: A Simulation of Hockey Official Whistle Noise and Use of KEMAR to Evaluate the Effect of Helmet Visor Length on Exposure to Whistle Noise. (2016). Unpublished Manuscript.
65
manikin ear were significantly different between the helmet/visor configuration with the long
(4.0”) visor and the other configurations (p<0.05). The measured peak noise levels were not
significantly different between the helmet without a visor and with the shorter, 2.75” visor
(p>0.05). Results suggest that longer helmet visors may act as a reflective plane for whistle
noise and increase hockey officials’ noise exposure. Understanding that longer visors may
increase the officials’ noise exposure from whistle noise may provide insight for better design of
helmet visors in the future.
As the researchers were collecting data only on the relative sound levels among
helmet/visor configurations, the head-related transfer function (HRTF) was not applied.
Researchers utilizing the KEMAR to estimate personal noise exposure levels must apply the
HRTF to data in adherence to ISO 11904-2:2004 for the determination of sound emission from
sound sources placed close to the ear.(90)
Introduction
USA Hockey is the governing body for organized amateur ice hockey in the United
States and the National Hockey League (NHL) is the governing body for professional ice hockey
in the United States and Canada. For the purpose of this study, the authors will refer to the
recommendations and rules set forth by USA Hockey and followed by the officials of the
Western States Hockey League (WSHL), unless otherwise noted. There are over 23,000 officials
registered with USA Hockey, however registration is not required. Additionally, ice hockey
officials may begin officiating as early as ten years of age, depending on state child labor
laws.(20)
Ice hockey has inherent hazards and risks for the players as well as the officials. It is an
intensely physical sport with the probability of contact among players and contact with hockey
66
sticks, pucks, boards, and skate blades.(91, 92) The hazards of ice hockey are numerous, with the
most common injuries associated with the head, eyes, and face. It has been reported that a higher
incidence of injury occurs during competition, rather than practice,(92, 93) which is when the
hockey officials are on the ice to enforce the rules of the game and maintain order.
Several studies have been conducted regarding injuries in sports, with more focus placed
on head and neck injuries in ice hockey.(92, 94-96) More specifically, the review of literature
revealed that research of ice hockey-related injuries has been primarily concerned with
concussions, brain injuries, and spinal injuries.(94, 95, 97, 98) In 2000, more than 42,000 sport or
recreation-related eye injuries were reported,(99) yet only a limited number of researchers have
investigated eye and face injuries in ice hockey.(92, 94, 95)
Personal protective equipment (PPE) has been developed to protect an individual against
injury and other adverse effects occurring at, or away from, work. The purpose of PPE in ice
hockey is to protect against hazards, yet not interfere with the game or cause injuries.(95, 100)
Beginning in 2013-2014, all players with less than 25 games of NHL experience are required to
wear a helmet with a visor, yet officials are only required to wear a league-approved helmet.(101)
Per USA Hockey rules, the officials’ PPE includes a black hockey helmet with a half-shield visor
properly attached, and a chin strap properly fastened.(102) Although the visor is required for the
officials’ eye and face protection, only one study was found that investigated the effect of a
hockey visor and sports goggles on field of vision.(103)
Occupational noise exposures have been studied in industries such as construction,(104)
mining,(105) and steel fabrication,(106) but noise exposure studies of sporting events are limited.
Noise exposures of spectators and employees outside the game area have been studied by several
researchers,(16, 17, 59, 60) yet the referees and officials on the playing surface have only been studied
67
by Adams et al., and Masullo et al.(19) It is important to recognize the difference in noise
exposures of the spectators and officials because of the close proximity of the official to the
whistle, a point source of noise.
Noise from a point source in a free-field is considered non-directional and radiates noise
equally in a spherical pattern.(24) However, a noise source is typically in proximity to various
reflective surfaces, (e.g. walls, floors) which will concentrate the noise pressure waves in
particular directions rather than allow radiation uniformly in all directions. The noise source
location in relation to the reflecting surfaces, and the directionality of the noise source itself must
both be considered when assessing the sound pressure levels associated with the noise. A
directivity factor is assigned to the pattern of noise radiation based on the various surfaces
surrounding the noise source.(24) For those surfaces surrounding the noise source, intensity of the
sound pressure level (SPL) doubles, or adds 3 dB for every surface added.
Noise from a point source near a concave surface may cause noise reflections to be
concentrated in one area, or focal point, rather than being dispersed (Figure 5.1).(24) An
increased sound pressure level of noise is experienced by listeners located in the focal point of
the reflected noise. Reflected noise may also reflect along a concave surface, conveying delayed
reflected noise around a room. The point source in the current study is the official’s whistle.
The helmet visor, when attached to the helmet, introduces a concave, reflective surface near the
whistle. The researchers studied the effect of the reflective surface of the visor on the resulting
noise exposure at the ear produced by blowing a whistle.
Hockey officials are responsible for enforcing the rules of the game and use their hands
and a whistle as signaling devices. The pea whistle is the type of whistle most commonly sold to
those officials registered with USA Hockey.(20) Specifically, the Fox40 Finger grip with a
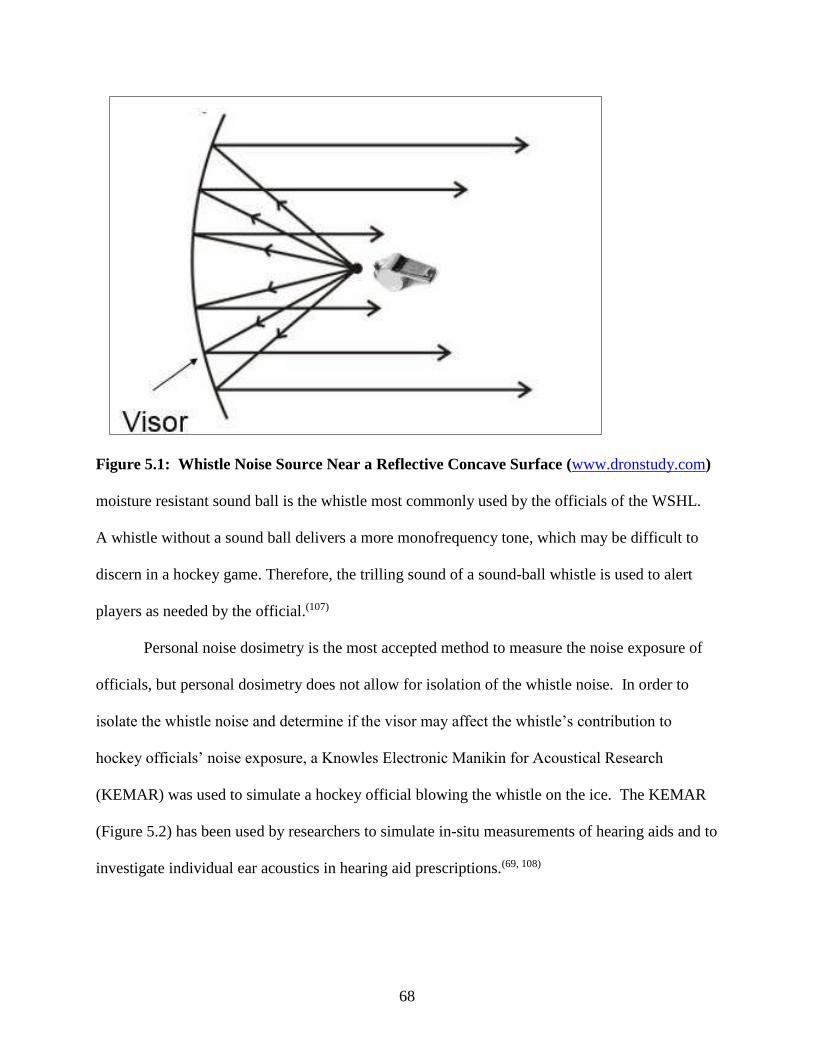
68
Figure 5.1: Whistle Noise Source Near a Reflective Concave Surface (www.dronstudy.com)
moisture resistant sound ball is the whistle most commonly used by the officials of the WSHL.
A whistle without a sound ball delivers a more monofrequency tone, which may be difficult to
discern in a hockey game. Therefore, the trilling sound of a sound-ball whistle is used to alert
players as needed by the official.(107)
Personal noise dosimetry is the most accepted method to measure the noise exposure of
officials, but personal dosimetry does not allow for isolation of the whistle noise. In order to
isolate the whistle noise and determine if the visor may affect the whistle’s contribution to
hockey officials’ noise exposure, a Knowles Electronic Manikin for Acoustical Research
(KEMAR) was used to simulate a hockey official blowing the whistle on the ice. The KEMAR
(Figure 5.2) has been used by researchers to simulate in-situ measurements of hearing aids and to
investigate individual ear acoustics in hearing aid prescriptions.(69, 108)
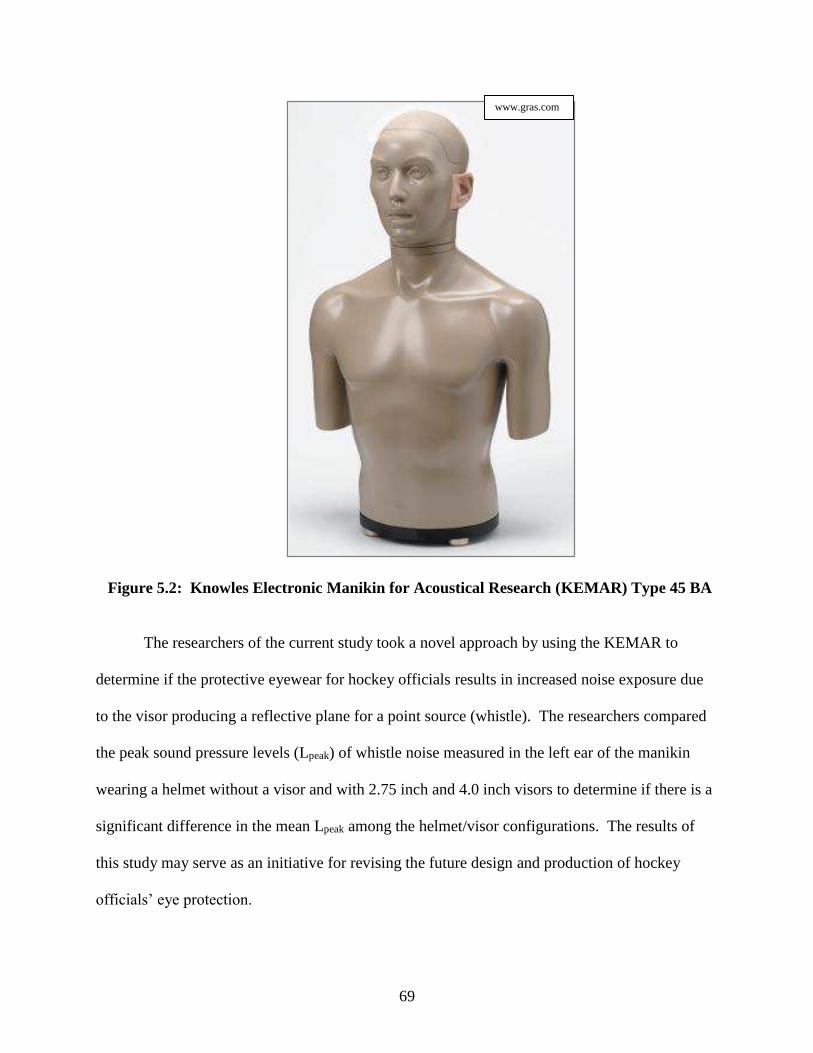
69
Figure 5.2: Knowles Electronic Manikin for Acoustical Research (KEMAR) Type 45 BA
The researchers of the current study took a novel approach by using the KEMAR to
determine if the protective eyewear for hockey officials results in increased noise exposure due
to the visor producing a reflective plane for a point source (whistle). The researchers compared
the peak sound pressure levels (Lpeak) of whistle noise measured in the left ear of the manikin
wearing a helmet without a visor and with 2.75 inch and 4.0 inch visors to determine if there is a
significant difference in the mean Lpeak among the helmet/visor configurations. The results of
this study may serve as an initiative for revising the future design and production of hockey
officials’ eye protection.
www.gras.com
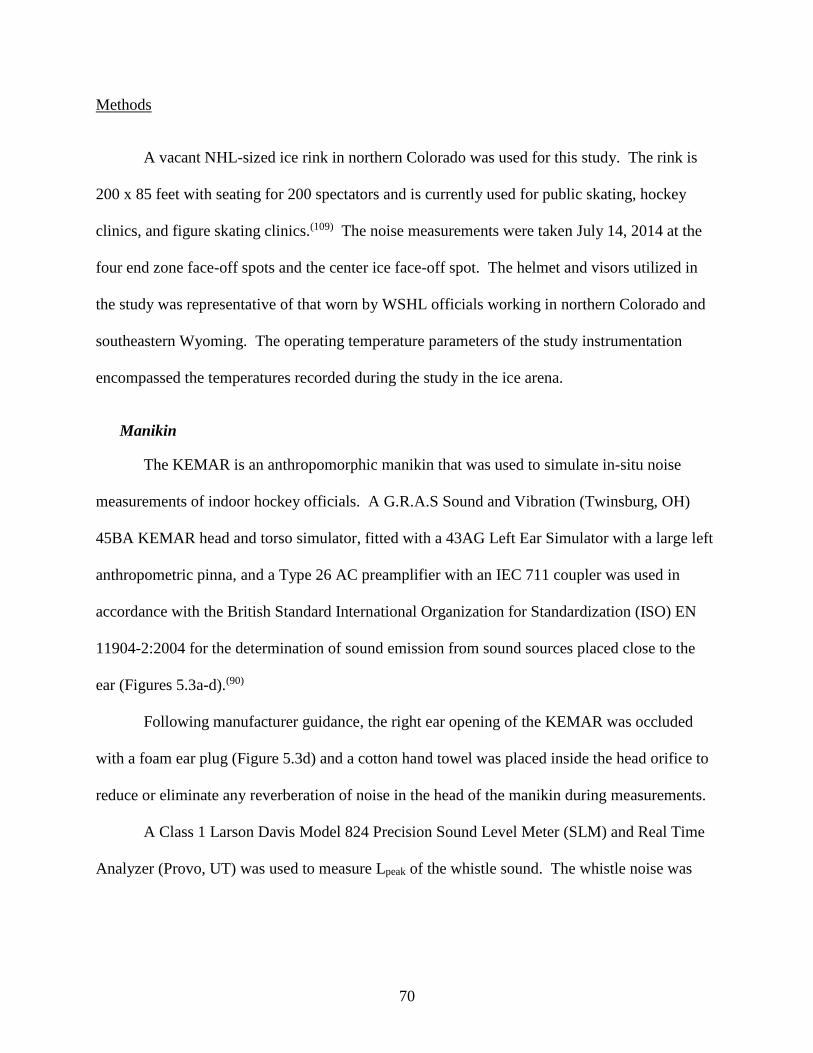
70
Methods
A vacant NHL-sized ice rink in northern Colorado was used for this study. The rink is
200 x 85 feet with seating for 200 spectators and is currently used for public skating, hockey
clinics, and figure skating clinics.(109) The noise measurements were taken July 14, 2014 at the
four end zone face-off spots and the center ice face-off spot. The helmet and visors utilized in
the study was representative of that worn by WSHL officials working in northern Colorado and
southeastern Wyoming. The operating temperature parameters of the study instrumentation
encompassed the temperatures recorded during the study in the ice arena.
Manikin
The KEMAR is an anthropomorphic manikin that was used to simulate in-situ noise
measurements of indoor hockey officials. A G.R.A.S Sound and Vibration (Twinsburg, OH)
45BA KEMAR head and torso simulator, fitted with a 43AG Left Ear Simulator with a large left
anthropometric pinna, and a Type 26 AC preamplifier with an IEC 711 coupler was used in
accordance with the British Standard International Organization for Standardization (ISO) EN
11904-2:2004 for the determination of sound emission from sound sources placed close to the
ear (Figures 5.3a-d).(90)
Following manufacturer guidance, the right ear opening of the KEMAR was occluded
with a foam ear plug (Figure 5.3d) and a cotton hand towel was placed inside the head orifice to
reduce or eliminate any reverberation of noise in the head of the manikin during measurements.
A Class 1 Larson Davis Model 824 Precision Sound Level Meter (SLM) and Real Time
Analyzer (Provo, UT) was used to measure Lpeak of the whistle sound. The whistle noise was
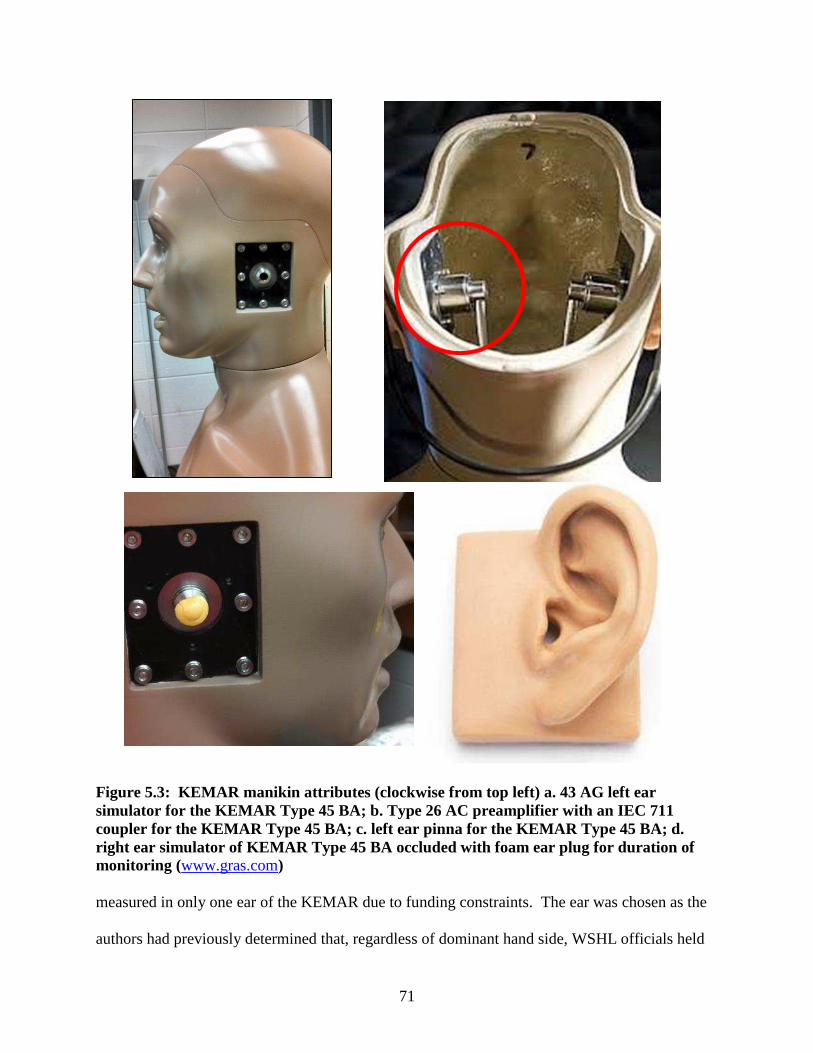
71
Figure 5.3: KEMAR manikin a ttr ibutes (clockwise from top left) a. 43 AG left ear simulator for the KEMAR Type 45 BA; b. Type 26 AC preamplifier with an IEC 711 coupler for the KEMAR Type 45 BA; c. left ear pinna for the KEMAR Type 45 BA; d. right ear simulator of KEMAR Type 45 BA occluded with foam ear plug for duration of monitoring (www.gras.com) measured in only one ear of the KEMAR due to funding constraints. The ear was chosen as the
authors had previously determined that, regardless of dominant hand side, WSHL officials held
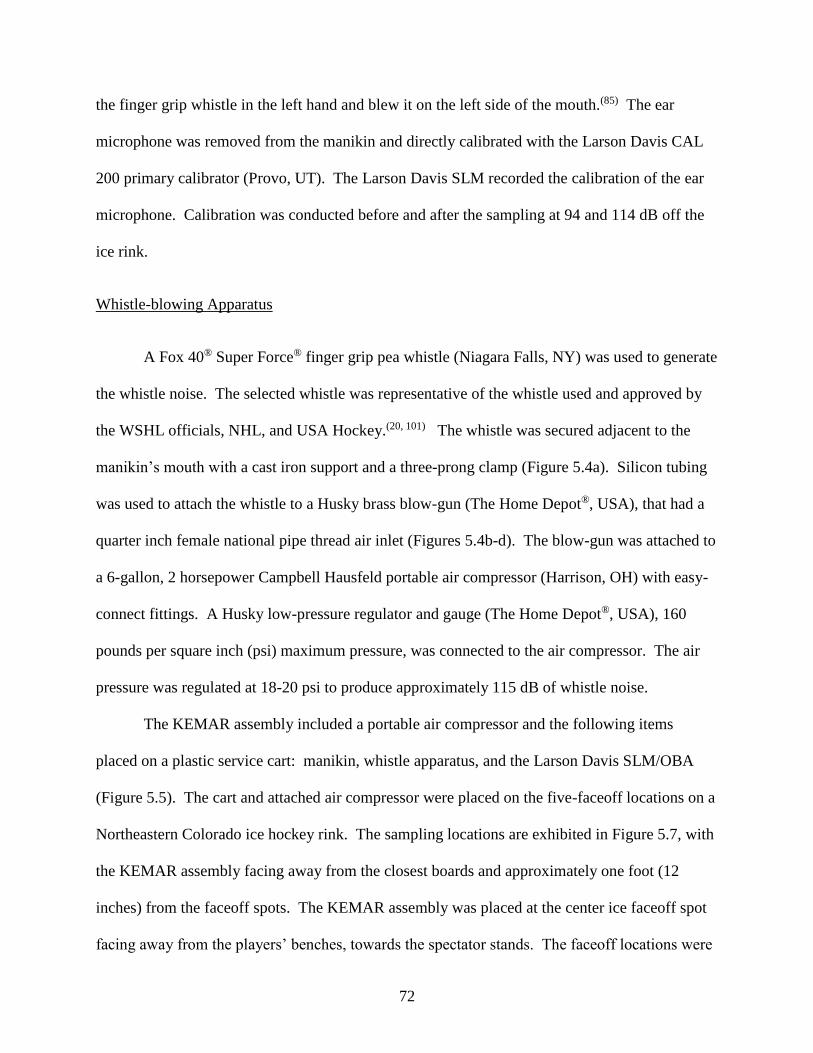
72
the finger grip whistle in the left hand and blew it on the left side of the mouth.(85) The ear
microphone was removed from the manikin and directly calibrated with the Larson Davis CAL
200 primary calibrator (Provo, UT). The Larson Davis SLM recorded the calibration of the ear
microphone. Calibration was conducted before and after the sampling at 94 and 114 dB off the
ice rink.
Whistle-blowing Apparatus
A Fox 40® Super Force® finger grip pea whistle (Niagara Falls, NY) was used to generate
the whistle noise. The selected whistle was representative of the whistle used and approved by
the WSHL officials, NHL, and USA Hockey.(20, 101) The whistle was secured adjacent to the
manikin’s mouth with a cast iron support and a three-prong clamp (Figure 5.4a). Silicon tubing
was used to attach the whistle to a Husky brass blow-gun (The Home Depot®, USA), that had a
quarter inch female national pipe thread air inlet (Figures 5.4b-d). The blow-gun was attached to
a 6-gallon, 2 horsepower Campbell Hausfeld portable air compressor (Harrison, OH) with easy-
connect fittings. A Husky low-pressure regulator and gauge (The Home Depot®, USA), 160
pounds per square inch (psi) maximum pressure, was connected to the air compressor. The air
pressure was regulated at 18-20 psi to produce approximately 115 dB of whistle noise.
The KEMAR assembly included a portable air compressor and the following items
placed on a plastic service cart: manikin, whistle apparatus, and the Larson Davis SLM/OBA
(Figure 5.5). The cart and attached air compressor were placed on the five-faceoff locations on a
Northeastern Colorado ice hockey rink. The sampling locations are exhibited in Figure 5.7, with
the KEMAR assembly facing away from the closest boards and approximately one foot (12
inches) from the faceoff spots. The KEMAR assembly was placed at the center ice faceoff spot
facing away from the players’ benches, towards the spectator stands. The faceoff locations were
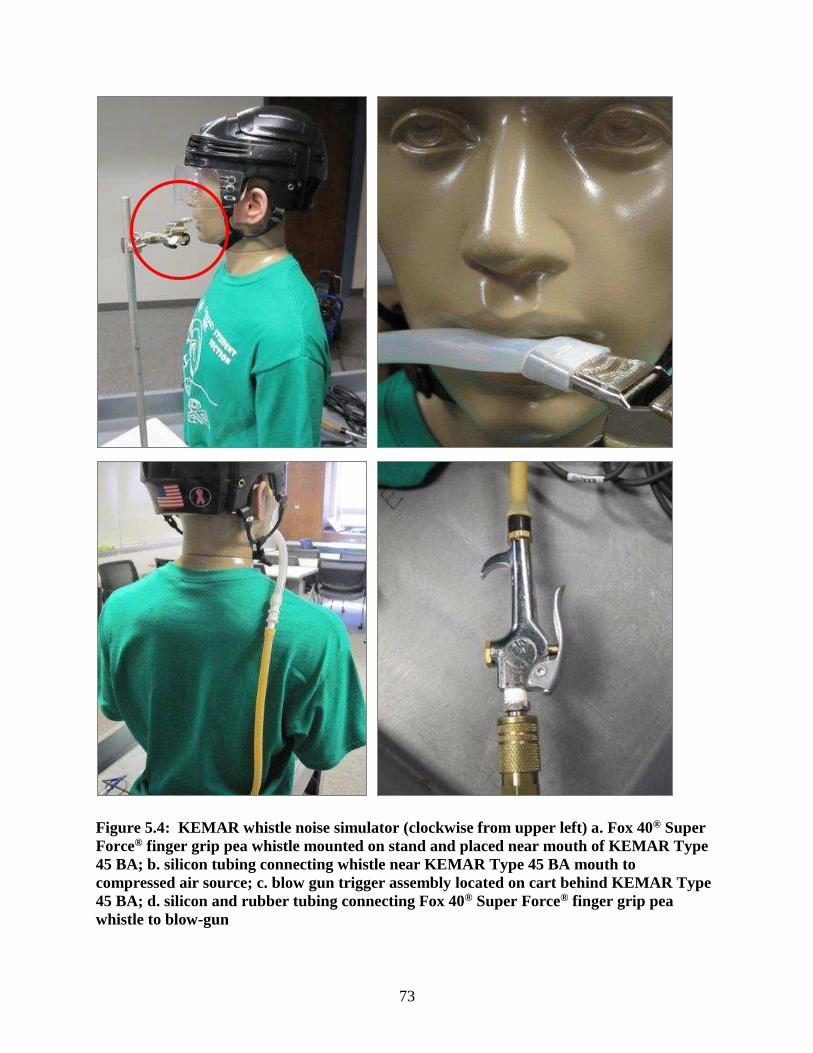
73
Figure 5.4: KEMAR whistle noise simulator (clockwise from upper left) a. Fox 40® Super Force® finger grip pea whistle mounted on stand and placed near mouth of KEMAR Type 45 BA; b. silicon tubing connecting whistle near KEMAR Type 45 BA mouth to compressed air source; c. blow gun trigger assembly located on cart behind KEMAR Type 45 BA; d. silicon and rubber tubing connecting Fox 40® Super Force® finger grip pea whistle to blow-gun
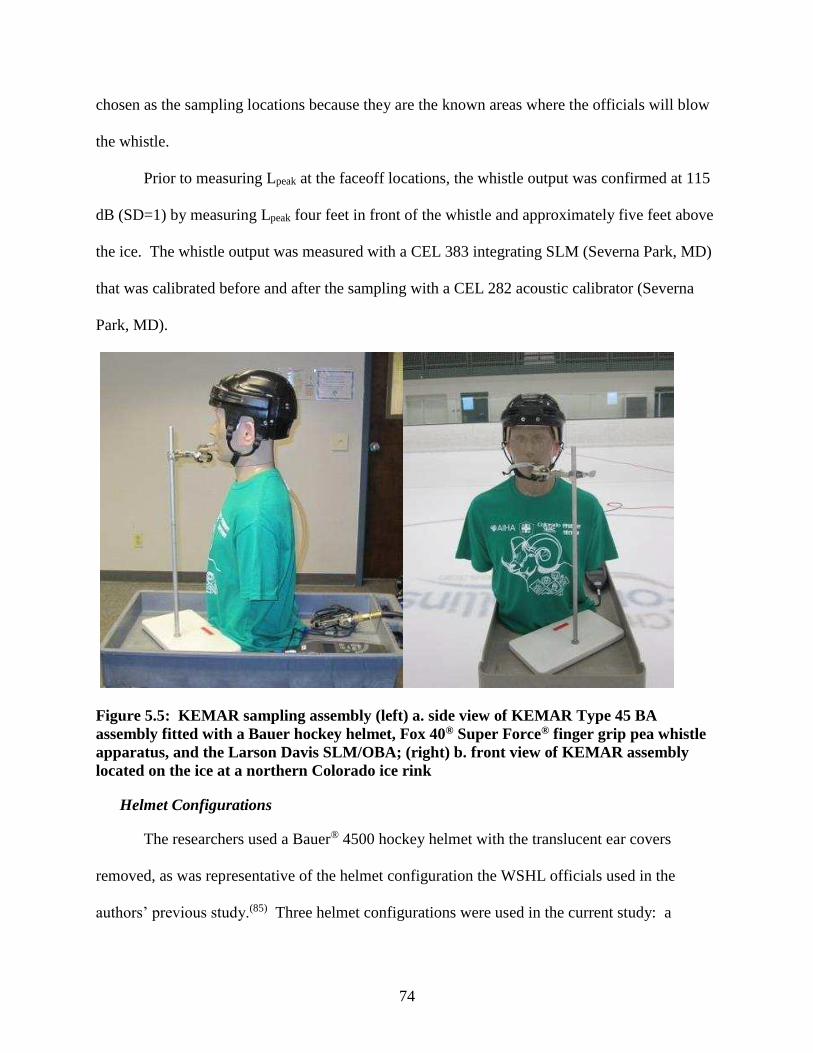
74
chosen as the sampling locations because they are the known areas where the officials will blow
the whistle.
Prior to measuring Lpeak at the faceoff locations, the whistle output was confirmed at 115
dB (SD=1) by measuring Lpeak four feet in front of the whistle and approximately five feet above
the ice. The whistle output was measured with a CEL 383 integrating SLM (Severna Park, MD)
that was calibrated before and after the sampling with a CEL 282 acoustic calibrator (Severna
Park, MD).
Figure 5.5: KEMAR sampling assembly (left) a. side view of KEMAR Type 45 BA assembly fitted with a Bauer hockey helmet, Fox 40® Super Force® finger grip pea whistle apparatus, and the Larson Davis SLM/OBA; (right) b. front view of KEMAR assembly located on the ice at a northern Colorado ice rink
Helmet Configurations
The researchers used a Bauer® 4500 hockey helmet with the translucent ear covers
removed, as was representative of the helmet configuration the WSHL officials used in the
authors’ previous study.(85) Three helmet configurations were used in the current study: a
75
helmet without a visor (Figure 5.6a), with a 2.75” Oakley (Allen, TX) VR904 modified straight
small visor with slots (Figure 5.6b), and with a 4.0” Oakley (Allen, TX) VR924 CLE pro straight
with vents visor (Figure 5.6c). A random number generator was used to determine the order of
helmet configurations and face-off spot locations. One helmet configuration was sampled at
each of the randomly selected five face-off spots (Figure 5.7) prior to changing the helmet
configuration. The Fox 40® Super Force® finger grip pea whistle was blown for a duration
between 250 and 350 milliseconds (msec), a total of five times in each location, with a total of 25
samples for each helmet configuration.
Figure 5.6: Hockey helmet configurations (left to right): a. Bauer® 4500 hockey helmet without a visor; b. Bauer® 4500 hockey helmet with a 2.75” Oakley® VR904 modified straight small visor with slots; c. Bauer® 4500 hockey helmet with a 4.0” Oakley® VR924 CLE pro straight visor with vents
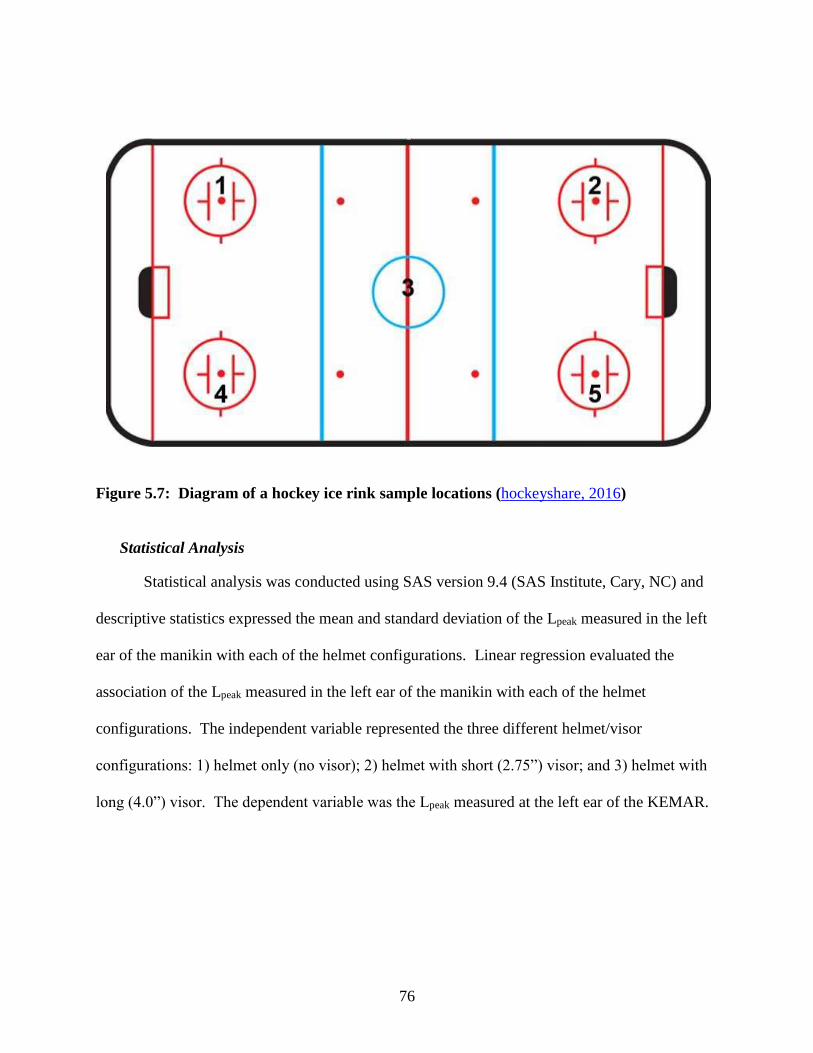
76
Figure 5.7: Diagram of a hockey ice rink sample locations (hockeyshare, 2016)
Statistical Analysis
Statistical analysis was conducted using SAS version 9.4 (SAS Institute, Cary, NC) and
descriptive statistics expressed the mean and standard deviation of the Lpeak measured in the left
ear of the manikin with each of the helmet configurations. Linear regression evaluated the
association of the Lpeak measured in the left ear of the manikin with each of the helmet
configurations. The independent variable represented the three different helmet/visor
configurations: 1) helmet only (no visor); 2) helmet with short (2.75”) visor; and 3) helmet with
long (4.0”) visor. The dependent variable was the Lpeak measured at the left ear of the KEMAR.
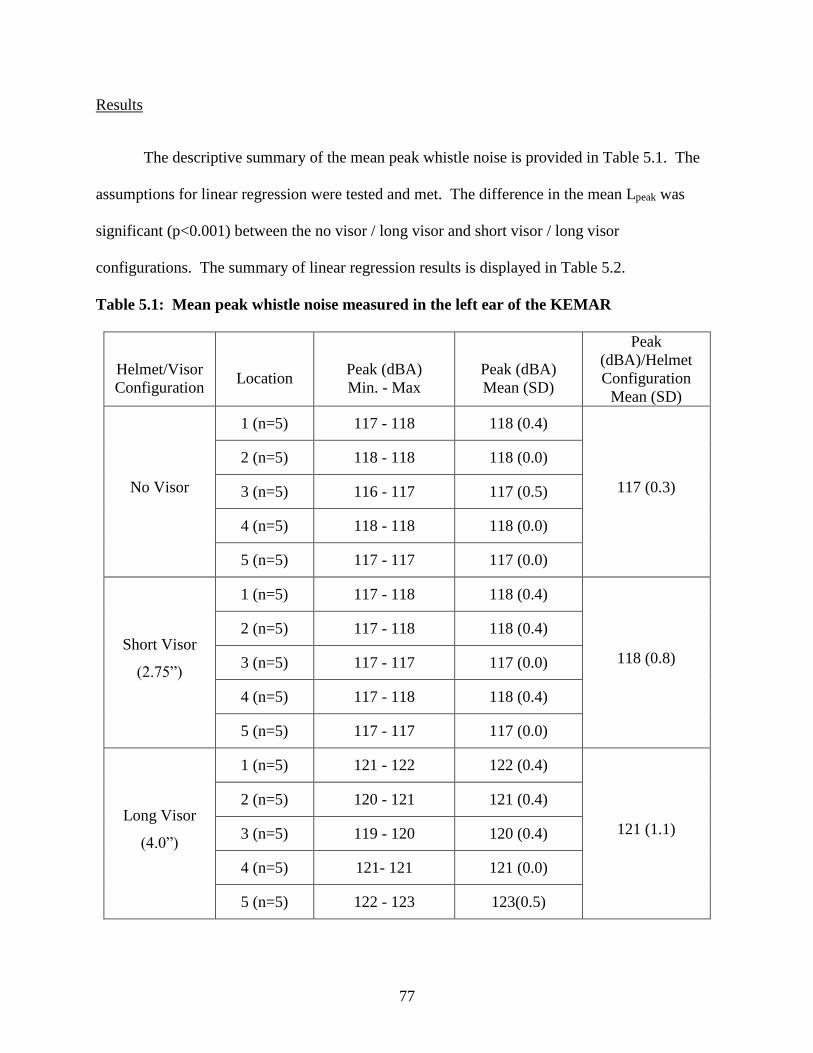
77
Results
The descriptive summary of the mean peak whistle noise is provided in Table 5.1. The
assumptions for linear regression were tested and met. The difference in the mean Lpeak was
significant (p<0.001) between the no visor / long visor and short visor / long visor
configurations. The summary of linear regression results is displayed in Table 5.2.
Table 5.1: Mean peak whistle noise measured in the left ear of the KEMAR
Helmet/Visor Configuration
Location
Peak (dBA) Min. - Max
Peak (dBA) Mean (SD)
Peak (dBA)/Helmet Configuration
Mean (SD)
No Visor
1 (n=5) 117 - 118 118 (0.4)
117 (0.3)
2 (n=5) 118 - 118 118 (0.0)
3 (n=5) 116 - 117 117 (0.5)
4 (n=5) 118 - 118 118 (0.0)
5 (n=5) 117 - 117 117 (0.0)
Short Visor
(2.75”)
1 (n=5) 117 - 118 118 (0.4)
118 (0.8)
2 (n=5) 117 - 118 118 (0.4)
3 (n=5) 117 - 117 117 (0.0)
4 (n=5) 117 - 118 118 (0.4)
5 (n=5) 117 - 117 117 (0.0)
Long Visor
(4.0”)
1 (n=5) 121 - 122 122 (0.4)
121 (1.1)
2 (n=5) 120 - 121 121 (0.4)
3 (n=5) 119 - 120 120 (0.4)
4 (n=5) 121- 121 121 (0.0)
5 (n=5) 122 - 123 123(0.5)
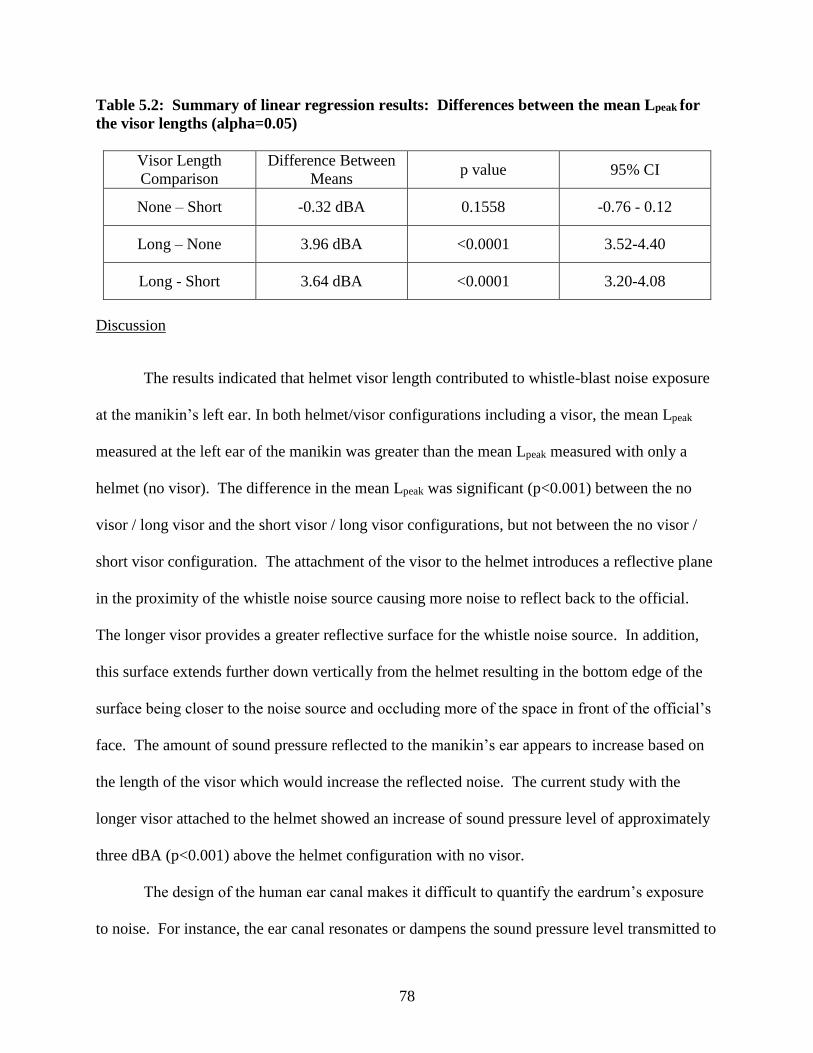
78
Table 5.2: Summary of linear regression results: Differences between the mean Lpeak for the visor lengths (alpha=0.05)
Visor Length Comparison
Difference Between Means
p value 95% CI
None – Short -0.32 dBA 0.1558 -0.76 - 0.12
Long – None 3.96 dBA <0.0001 3.52-4.40
Long - Short 3.64 dBA <0.0001 3.20-4.08
Discussion
The results indicated that helmet visor length contributed to whistle-blast noise exposure
at the manikin’s left ear. In both helmet/visor configurations including a visor, the mean Lpeak
measured at the left ear of the manikin was greater than the mean Lpeak measured with only a
helmet (no visor). The difference in the mean Lpeak was significant (p<0.001) between the no
visor / long visor and the short visor / long visor configurations, but not between the no visor /
short visor configuration. The attachment of the visor to the helmet introduces a reflective plane
in the proximity of the whistle noise source causing more noise to reflect back to the official.
The longer visor provides a greater reflective surface for the whistle noise source. In addition,
this surface extends further down vertically from the helmet resulting in the bottom edge of the
surface being closer to the noise source and occluding more of the space in front of the official’s
face. The amount of sound pressure reflected to the manikin’s ear appears to increase based on
the length of the visor which would increase the reflected noise. The current study with the
longer visor attached to the helmet showed an increase of sound pressure level of approximately
three dBA (p<0.001) above the helmet configuration with no visor.
The design of the human ear canal makes it difficult to quantify the eardrum’s exposure
to noise. For instance, the ear canal resonates or dampens the sound pressure level transmitted to
79
the eardrum, depending the frequency.(24) In the 1960’s, researchers Shaw and Teranishi began
to experiment with simulated human ear anatomy to measure the eardrum’s receipt of the sound
pressure from a point source.(110) They used a probe microphone to measure the sound pressure
levels at varying frequencies in a rubber replica of the human ear canal and compared it to the
measurements in six human ears(110). The results of the study indicated that the ear replica was
representative of the sound pressure level received at the human ear in the frequency range of
1000 to 7000 Hz, but the data were not supported statistically(110) and further development of
head and ear simulation was conducted.
More recently, Kennedy et al. compared on-road motorcycle helmet noise measured at
the ear to results using an at-ear microphone on a polystyrene mannequin head in a wind tunnel
simulation.(79) A significant difference was found between the flow conditions in the wind
tunnel compared to the atmospheric flow conditions during the on-road measurements.(79)
Discrepancies between the simulated and on-road results were explained by wind speed during
the on-road testing, but simulation was successful in identifying the contributors (i.e. engine,
windscreen, and helmet) to the at-ear sound sources.(79) If the researchers in the current study
were using the KEMAR to measure simulated noise exposure levels of hockey officials, similar
discrepancies due to wind noise would likely occur because of the rapid movement of the
officials on the ice. However, the authors were only investigating the contribution of the helmet
visor length on exposure to whistle noise.(22, 24)
Multiple head and torso simulators are available, but the acoustical properties and facial
features similar to the average human made the KEMAR appropriate for the researchers in the
current study. The KEMAR was the first anthropometric head and torso simulator designed
specifically for acoustic research in 1972 and was primarily used to determine the efficacy of
80
hearing aids.(69) While the KEMAR manikin has ear canals that approximate the average adult
ear canal, Saunders and Morgan(111) found that the individual ear canal acoustics may result in as
much as a 40 dB difference among individuals, thus supporting the earlier findings of Shaw and
Teranishi.(110) The KEMAR is designed to simulate the sound waves as they pass around a
human head and torso, such as the diffraction and reflection of sound waves around each ear.(69)
The KEMAR allowed the authors to simulate a hockey official on the ice, isolate the whistle
noise, and determine the effect of the visor length on the official’s exposure to whistle noise.
In 2008, Chung et al. used a KEMAR to investigate the effects of directional
microphones on the ability of hearing aid users to localize speech. The manikin was fitted with
bilateral in-the-ear hearing aids including microphones with adjustable directivity.(70) The
researchers found that matched directional microphones worn bilaterally do not have a negative
effect on the ability to localize speech.(70)
Researchers have also had to rely on the KEMAR to measure the listening volume of
headsets, or earphones, and estimate the users’ noise exposure. Patel and Broughton conducted a
study in call centers in Britain to determine if the headsets were damaging the employees’
hearing. The study included 150 call center employees that represented 15 call centers in
financial services, shopping, and telecommunications. The researchers used the KEMAR fitted
with the small pinnae, because they were representative of the size of the ears of the majority of
the study population.(71) The headsets were removed from ten operators per workstation during
normal operation and placed on the KEMAR.(71) Noise measurements were taken for a 15-
minute period with the use of a splitter, to not interrupt the work of the operator. Similar to the
current study methodology, measurements were only made at the left ear and the right ear was
sealed to prevent sound from reaching the microphone.
81
According to the American Speech-Language-Hearing Association (ASLHA) and the
National Institute on Deafness and Other Communication Disorders (NIDCD), long or repetitive
exposure to sound at or above 85 dB is hazardous and can cause hearing loss.(4, 5) The output
level of earphones for portable media players (PMPs) and its role in noise-induced hearing loss
(NIHL) has been an increasing concern.(72-76) The KEMAR has been a useful tool in measuring
the earphone output level for several researchers.(72, 73, 75, 76) For instance, in 1987 the KEMAR
was used by Rice, Rossi and Olina to measure the preferred listening volume of over 60 PMP
users.(77, 78) The researchers found that approximately five percent of the PMP users preferred to
listen at a nearly 90 dBA equivalent sound pressure level,(77, 78) possibly increasing their risk of
NIHL. (4, 5)
Fligor et al. measured the sound level output of headphones of several commercially
available compact disc players.(72) The researchers used the KEMAR to measure the output
levels of multiple types of headphones and determined that the smaller the headphones, the
higher the sound level for a given volume setting.(72) Noting that supra-aural headphones rest on,
but do not fully envelope the ear, Fligor et al. estimated that an individual using supra-aural
headphones would reach the maximum allowable noise dose within approximately one hour of
listening at 70% the maximum output level.(72)
A KEMAR was used by Portnuff et al. to investigate the relationship between volume
control settings and output levels of multiple portable listening devices (PLDs). Five PLDs’ and
five earphones’ output levels were investigated while playing five music genres.(73) The
KEMAR was fitted with a hard rubber right pinna and a soft, silicone rubber left pinna.(73) The
output levels of the earphones were measured in the right and left ear of the KEMAR
simultaneously, but the researchers found that the softer, silicone rubber pinna achieved a better
82
fit during measurements.(73) A one-way ANOVA identified a significant difference among the
maximum output levels of the earphones when all music genres were considered (F (4, 124) =
85.3, p<0.001). The researchers conducted the Scheffe post hoc test that revealed significant
differences among all but two pairs of earphones.(73) The KEMAR enabled Portnuff et al. to
suggest that the PLDs could reach output levels that may increase the listener’s risk of music-
related hearing loss.(73)
Flamme and Williams reported that sound pressure levels produced by officials’ whistles
ranged between 104 and 116 dBA, corresponding to total allowable exposure times of 90 and
five seconds, respectively.(21) The authors’ reproduction of 115 dBA whistle noise for a 250 to
350 msec duration was based, in part, on the sound pressure levels and durations reported in the
Flamme and Williams study. The researchers asked 321 officials from basketball, football,
volleyball, wresting, soccer, ice hockey, and lacrosse to self-report whistle noise exposure and
symptoms of tinnitus or hearing loss. The researchers found that approximately 50% of sports
officials reported symptoms of tinnitus after officiating, and the Spearman’s correlation between
self-reported hearing status and the frequency of reported tinnitus was significant (p<0.0005).(21)
The current study’s results of linear regression support Flamme and Williams’ conclusion that
whistle noise may contribute to hearing loss among sports officials. The results of the current
study suggest that the use of a longer visor may increase the contribution of the mouth-blown
whistle noise by approximately three dB (p<0.0001), doubling the intensity of the noise
exposure.(21)
Limitations
The researchers used a Fox 40® Super Force® finger grip pea whistle and two Oakley®
visors in the current study. While, multiple options for whistles and visors are available,
83
selection for this study was based on league regulations, personal preference of the officials, and
the sport being officiated. The warbling sound of a pea whistle is produced when movement of
the small ball (pea) is enclosed in the whistle’s air chamber. The sound of a whistle without a
pea is produced when turbulent air travels through the chambers of the whistle. The frequency
of the sound is dependent on the length of the whistle, with longer whistles producing lower
frequency sound.(107) The differing whistle designs suggest that the use of one whistle in the
current study is not representative of all whistles and a larger selection of whistles should be used
in future research. The use of only one design of visor of each length (2.75” and 4.0”) in the
current study also limits any findings. Investigation into a larger sample of various lengths and
designs of visors should be continued.
Data were collected on Lpeak for five whistle blows in each face-off spot with a total of 25
samples for each helmet configuration. As seen in Table 1, there was more variability in the
whistle noise measurements at the ear of the KEMAR wearing the 4.0’ visor (SD=1.1). A larger
sample set would likely decrease the standard deviation in the mean Lpeak and increase the power
and robustness of the statistical significance. A larger-scale study including multiple whistles
and visor lengths could better frame any issues that would require further investigation into the
contribution of reflected sound pressure provided by differing visor lengths attached to hockey
officials’ helmets.
Conclusions
The World Health Organization (WHO) reports that 1.1 billion young adults are at risk of
hearing loss due to exposure to damaging levels of noise at entertainment venues such as
sporting events and music concerts.(10) Since hockey officials may begin officiating in
84
adolescence, exposure to hazardous levels of whistle noise may begin at an earlier age for this
population resulting in increased risk of premature hearing loss.
The researchers of the current study instituted a novel approach by using the KEMAR to
evaluate the noise effects introduced by protective eyewear for hockey officials. The protective
visors attached to the helmets appeared to act as a reflective plane for the whistle-blast noise,
resulting in an increased sound pressure level at the manikin’s ear. The Lpeak data from this
simulation does not necessarily represent the actual Lpeak noise exposures of hockey officials.
However, the researchers found the measured Lpeak was significantly higher when the helmet was
configured with a 4.0” long visor (p< 0.05) than the Lpeak when the helmet was configured
without a visor or with the 2.75” long visor. Based on these findings, it is possible that the
longer visor increases the overall noise exposure of hockey officials that is experienced only
from whistle-blast noise.
The results of this study suggest that the longer visor may introduce a reflective plane and
possibly increase the hockey officials’exposure to whistle noise by approximately three dB.
These results serve as an initiative for further research that may provide insight toward an
improved design of helmet visors in the future – those that would continue to provide protection
of the eyes and face of the hockey official, but not at the expense of their hearing.
85
CHAPTER 6
SUMMARY
Major Findings
This research was the first to investigate noise exposures of indoor hockey officials
experienced during competitions. The investigation included personal noise dosimetry to
determine the noise levels to which the hockey officials were exposed during a game and
audiometric testing before and after the game to determine if a TTS occurred after officiating the
game. The hockey official has many sources of noise exposure while officiating, and this
research used the KEMAR in an innovative way to assess the effect of helmet visor length on the
officials’ in-ear exposure to whistle noise generated by the official.
Specific Aim 1
One aim of this research was to determine the noise exposure levels of indoor hockey
officials in the ACHA and WSHL while officiating collegiate and junior league hockey
competitions, respectively, in arenas located in northern Colorado and southeastern Wyoming.
The hockey officials wore a personal noise dosimeter for the duration of the game and the noise
exposure data were analyzed to determine if the hockey officials were exposed to an equivalent
sound pressure level (Leq ) ≥ 85 dBA, which may increase the risk of NIHL.(4, 5) Hockey
officials’ noise exposures were also assessed against the OSHA Permissible Exposure Limit
(PEL) and the ACGIH Threshold Limit Value (TLV).
86
Pilot Study Results
According to the NIDCD and ASLHA, all of the study participants were exposed to
hazardous levels of noise, an average Leq greater than 85 dBA, that may increase their risk of
permanent hearing loss.(4, 5) Exposure to hazardous levels of noise may be detrimental to
hearing, and may also cause stress and affect one’s health, sleep, communication, safety, and
quality of life. . Noise dosimetry was conducted during six hockey games of the 2013-2014
hockey season. A total of 23 personal noise dosimetry samples were collected during an average
hockey game time of two hours and 42 minutes. The mean Leq and mean Lpeak of the officials’
noise exposures were 90 dBA and 133 dB, respectively. None of the officials were overexposed
to noise based on the OSHA noise criteria, yet 65% of hockey officials were overexposed to
noise based on ACGIH recommendations.
Main Study Results
Twenty-nine personal noise dosimetry samples were collected during an average hockey
game time of two hours and 48 minutes. As was found in the pilot study, 100% of the hockey
officials were exposed to an average equivalent sound pressure level (Leq) greater than 85 dBA.
The average Leq, maximum sound pressure level (Lmax) and peak sound pressure level (Lpeak) of
the officials’ noise exposures were 93 dBA (SD= 2.2), 116 dBA (SD=2.8) and 134 dB (SD=5.0),
respectively. In support of the findings in the pilot study, none of the officials were overexposed
to noise based on the OSHA noise criteria, and 89% were overexposed based on the ACGIH
recommendations.
Specific Aim 2
Another objective of this research was to determine if the indoor hockey officials
experienced a temporary threshold shift, or temporary decrease in hearing sensitivity, after
87
officiating a hockey game. The hockey officials were given a hearing history questionnaire and
otoscopic examination before the game to identify any preexisting medical conditions that may
have disqualified them from participation in the hearing test. A pure-tone audiometric test was
administered in each ear before and after officiating the hockey game and hearing thresholds
were determined at 500, 1000. 2000, 3000, 4000, 6000, and 8000 Hz. The pre- and post-game
results were compared to determine if a 10 dB or greater decrease in hearing sensitivity occurred
after the game at any of the tested frequencies.
Pilot Study Results
Eighteen pre- and post-game audiometric tests were administered. An increase in hearing
threshold of 10 dB or greater was exhibited in more than half (55.6%) of the sampled officials.
Of those officials with the ≥10 dB decrease in hearing sensitivity, 70% experienced a threshold
shift in more than one ear and/or at more than one frequency, and 20% experienced a 15 dB
threshold shift. Significant differences between the pre- and post-game hearing thresholds were
found at 2000 Hz for the left ear (p=0.012) and at 4000 Hz for the right and left ears (p=0.037,
p=0.017, respectively) based on the Wilcoxon signed-rank test.
Main Study Results
A 10 dB or greater increase in hearing threshold after officiating a hockey game was
identified in 25 of 29 (86.2%) study participants, with nine of the 25 (36%) experiencing a 15 dB
or greater threshold shift. A ≥10 dB threshold shift in both ears was found in 8 of the 25 (32%)
individuals with threshold shifts and 14 of 25 (56%) individuals with threshold shifts exhibited a
shift in multiple frequencies. Six officials presented a mild hearing impairment (26-40 dB
hearing threshold) at the pre-game hearing test yet still experienced a ≥10 dB threshold shift after
officiating a game, and half of these officials experienced a ≥15 dB threshold shift. There were
88
significant differences between the pre- and post-game hearing thresholds at 2000, 3000, and
4000 Hz for the right ear (p≤0.0001) and at 500, 2000, 3000, and 4000 Hz for the left ear
(p=0.0099, p=0.0009, p<0.0001, p=0.0002, respectively) based on the Wilcoxon signed-rank
test.
Logistic regression (with repeated measures used to account for multiple observations per
subject) was used to examine the association between the equivalent sound pressure level from
personal noise dosimetry (Leq) and a ≥ 10 dB increase (shift) in hearing threshold from pre- to
post-game audiometry, in separate models at 500, 1000, 2000, 3000, 4000, 6000 and 8000 Hz.
Fixed effects in the analysis included personal noise exposure and side (left or right ear) and
random effects included the individual official. Although none of the results of the logistic
regression analysis were statistically significant at alpha = 0.05, for each additional one dB
increase of Leq, the odds of a ≥ 10 dB TTS were increased by 33% for the left ear at 500 Hz, 2%
for the left ear at 3000 Hz, 26% for the left ear at 4000 Hz, 3% for the right ear at 6000 Hz, 22%
for the left ear at 8000 Hz, and 29% for the right ear at 8000 Hz.
Specific Aim 3
A model was developed using the KEMAR and whistle apparatus to simulate hockey
officials’ noise exposure from a whistle while wearing different configurations of a helmet and
visor. The aim of this portion of the research was to measure and compare the whistle-generated
noise levels at the ear of the KEMAR in order to determine if the different protective visor
lengths affected the level of noise measured at the ear, possibly due to the visor acting as a
reflective surface for the whistle noise. The study was conducted in an empty northern Colorado
ice rink. One helmet configuration was sampled at each of the randomly selected five face-off
spots on the ice prior to changing the helmet configuration. The Fox 40® Super Force® finger
89
grip pea whistle was blown five times in each location for intervals of 250 to 350 milliseconds
(msec), with a total of 25 samples for each helmet configuration.
The results indicated that helmet visor length contributed to whistle-blast noise exposure
measured at the manikin’s left ear. In helmet/visor configurations including a long visor, the
mean Lpeak measured at the left ear of the manikin was approximately three dBA greater than the
mean Lpeak measured with the short visor or only a helmet (no visor). The difference in the mean
Lpeak was significant (p<0.001) between the no visor / long visor and the short visor / long visor
configurations, but not between the no visor / short visor configuration.
The attachment of the visor to the helmet introduces a reflective plane in the proximity of
the whistle noise source causing more noise to reflect back to the official. The longer visor
provided a greater reflective surface for the whistle noise source. In addition, this surface
extends further down vertically from the helmet resulting in the bottom edge of the surface being
closer to the noise source and occluding more of the space in front of the official’s face. The
amount of sound pressure reflected to the manikin’s ear appears to increase based on the length
of the visor, which would increase the reflected noise. In this study, the longer visor attached to
the helmet resulted in an increase of sound pressure level of approximately three dBA (p<0.001)
above the helmet configurations with a short visor and without a visor.
Limitations
This study’s population was limited to the number of WSHL and ACHA officials who
officiated hockey games in northern Colorado and southeastern Wyoming on the pre-selected
sampling dates, covering approximately half of the hockey seasons of 2013 and 2014. This
study was also limited by the acoustical design, size, and capacity of the ice arenas chosen for
the study, which may have affected the noise levels and may not be representative of all hockey
90
arenas. Ideally, collecting data on more of the potential pool of hockey officials would have
resulted in a larger sample size and would have reduced or eliminated the need for repeated
measures on individual officials. In addition, lost sampling data (due to equipment malfunction
and/or excessive background noise during audiometry) resulted in more noise dosimetry samples
than pre- and post-game audiometry exams precluding uniform pairing of the two sample types.
A limitation specific to the pilot study included the undesirable and non-compliant
audiometric testing environment. The maximum allowable octave-band SPLs for audiometric
test rooms listed in Appendix D-1 of the OSHA noise standard were unattainable in several of
the tested frequencies throughout the testing period. Although the background noise levels were
documented, systematic adjustments to the measured audiometric hearing thresholds were not
possible due to the variability of the background noise in the testing environment. Continuous
ambient noise monitoring would have been necessary to make compensations for background
noise to the measured hearing thresholds, but was not available during the study. Instead, it was
assumed that the audiometry data collected in the pilot study were weak estimates of the actual
hearing threshold shifts and the audiometric testing environment was addressed in the next phase
of the research.
A TTS in hearing is transient, as the ear begins to heal almost immediately once the
exposure to hazardous levels of noise ceases. However, the healing process for individuals may
take up to 48 hours.(5, 6) Due to resource and scheduling constraints, additional audiometric
exams to confirm a full recovery of the TTS within 48 hours were not conducted and it was
assumed that the identified hearing loss was temporary. Six officials in the main study exhibited
a mild hearing impairment prior to officiating the game and were still included in the study. All
of the officials with pre-existing hearing impairment experienced a ≥10 dB threshold shift, with
91
half of them experiencing a ≥15 dB threshold shift. Three of the six officials with pre-game
hearing loss reported excessive noise exposure within 48 hours of the hearing test. It is possible
that the three officials had permanent or temporary hearing loss at the time of pre-game
audiometry but the scope of this study did not include follow-up audiometry to confirm recovery.
The instrumentation utilized for the visor study included the delicate, highly-specialized,
and expensive KEMAR, in-ear microphone, and Larson Davis SLM/OBA. The cost and
required knowledge base of the instrumentation may deter other researchers from using this
methodology in future research. The instrumentation was paired with one whistle (Fox 40®
Super Force® finger grip pea whistle) and two Oakley® visors (2.75” VR904 modified straight
small visor with slots and 4.0” VR924 CLE pro straight visor with vents) in this study. Multiple
options for whistles and visors are available, but the researchers’ selection was based on the USA
Hockey league regulations and the personal preference of the WSHL and ACHA officials. The
whistle and visor options were limited in this research. The use of one whistle and only one
company’s style of visor in two different lengths in the current study did not encompass the wide
variety of equipment available for hockey officials but were representative of the products used
by officials in the study.
KEMAR noise measurements occurred when the ice rink was vacant and when the
whistle noise would not disrupt occupants of adjacent ice rinks. Hence, the availability of the ice
rink was limited to the two hours prior to the ice arena’s opening. The time constraints dictated
that randomization of the helmet configurations and face-off spots was not feasible. Instead, one
helmet configuration was sampled five times at each of the five, randomly selected face-off spots
prior to changing the helmet configuration.
92
More variability was found in the whistle noise measurements at the ear of the KEMAR
wearing the 4.0” long visor (SD=1.1), and collecting more measurements would have decreased
the standard deviation and increased the power and robustness of the statistical significance. A
larger-scale study including multiple whistles and visor lengths would better support a
recommendation to further investigate the contribution of the visor length on the officials’ noise
exposure.
Contribution to the Field
This research identified a unique population of individuals whose supplemental
employment included recreational noise exposure. The officials’ noise exposure during the
hockey game is additional to the noise exposures of the day, whether it be from work or other
recreational activities (music concerts, motorcycle riding, etc.). The recreational noise
associated with hockey competitions may be placing the hockey officials at an increased risk of
exposure to hazardous levels of noise and potential hearing loss. The noise exposure and hearing
thresholds of a population that has not been previously studied were evaluated and it was
concluded that the ACHA and WSHL hockey officials are exposed to hazardous levels of noise
(Leq ≥ 85 dBA) and experience a TTS within the 2 to 3-hour duration of a hockey game. The
identification of hockey officials as a population potentially overexposed to noise and at an
increased risk of hearing loss will alert health and safety professionals around the world to
consider this group in future health and safety surveillance.
This research using the KEMAR with multiple helmet configurations to determine if the
hockey helmet’s visor affects the in-ear peak sound pressure levels from the noise generated
from simulated whistle blowing involved a novel approach with this instrumentation. The
KEMAR is typically used to assess the efficacy of communication devices or the listening output
93
of earphones, but the study design and whistle apparatus employed in this research is original
and easily reproducible for additional applications. Knowledge regarding the reflective effect of
the longer visor on the whistle noise may provide insight for an improved design of helmet visors
in the future.
Future Research Opportunities
The results from this research potentially identify a population of individuals that
highlight the impact of recreational noise exposure on NIHL. Combining noise dosimetry and
audiometry to determine noise exposure and related effects on hearing sensitivity is not a novel
approach. However, this noise exposure study of indoor hockey officials focuses on a new
population that may have additional NIHL risks from occupational sources and may have been
exposed at an early age (some officials perform as early as age 10). Further research is needed to
determine if the effects found in this study are transferable to the group of hockey officials at
large. Additional hockey official NIHL research has the potential to identify officials regionally,
nationally and world-wide that have an increased risk of NIHL. Research should include a larger
sample of hockey officials from various sized venues, both amateur and professional. A larger
study population would provide more hearing history questionnaire data (e.g. length of time
officiating, hobbies, analgesic use) that may be used in predicting audiometric outcomes. More
comprehensive data collection could include characterizing additional sources of hazardous noise
exposure for hockey officials. Follow-up audiograms would also help determine when or if
recovery from the TTS occurs.
The use of multiple testing stations for simultaneous administration of hearing tests
would allow more accurate identification of the number and severity of temporary threshold
shifts. The current research was limited to only one audiometric testing area, creating a delay for
94
some officials that possibly contributed to underestimating the number and severity of hearing
shifts. Simultaneous audiometric testing would allow immediate testing of all of the officials
and not permit any of them more time than others to begin healing from a TTS, if present. On
those officials exhibiting a TTS at the end of the competition, conducting follow-up audiometry
48 hours after officiating would confirm the hearing threshold shift is temporary.
Although the hockey officials were not overexposed to noise according to the OSHA
regulations, in an effort to reduce noise exposure and risk of NIHL, it is recommended that they
receive training, annual audiometric testing and hearing protection in accordance with the
requirements of the OSHA noise standard. A pilot study offering disposable, reusable and
custom-molded hearing protection options to a representative sample of indoor hockey officials
would potentially identify hearing protective devices that could have application to hockey
officials worldwide. The pilot study would include hearing protection selection based on the
following criteria: attenuation of high frequency noise that still allows for communication;
comfort; ability to be disinfected (if not disposable); cost-effectiveness; secure placement in the
ear during physical activity; and ability to be tethered to the helmet in case of accidental
dislodgment on ice. The pilot study participants’ feedback should be reviewed and analyzed
before recommending hearing protection options to other leagues. The components of the pilot
study should not only include a selection of appropriate hearing protection options for the hockey
officials, but also training regarding the fitting, use, and care of the hearing protection.
Further research into the effects of visor length on the officials’ exposure to whistle noise
is also warranted. The results of this study suggest that longer visors may act as a reflective
surface and increase the officials’ exposure to whistle noise. Studies into different materials and
configurations of visors could provide insight for design of helmet visors that would reduce the
95
reflective characteristics. Further KEMAR studies employing a larger selection of whistle
designs (with and without pea) and orientations and visor styles and manufacturers are
recommended to better support the possible changes. The design of a different visor is a
comprehensive task that requires the input and support of hockey officials’ and national
leadership organizations for long-term acceptance. The KEMAR methodology used in this
research has potential applicability for testing existing or new visors in the future.
Conclusions
More than 25,000 hockey officials in the United States may be at increased risk of NIHL.
This population is exposed during a recreational activity, during which they do not wear hearing
protection. In addition, this population is at risk of suffering NIHL at an earlier age as many
begin officiating in adolescence. Within this research, all included officials were exposed to
hazardous levels of noise and most experienced temporary hearing loss after officiating a game
(86% in the main study, 55.6% in the pilot study). Officials of other sports also operate under
similar conditions (crowd noise, public announcement noise, etc.) and may also be at risk for
temporary or permanent hearing loss.
The researchers’ investigation into the effects of the official’s helmet visor length on
exposure levels from whistle noise using the KEMAR suggest that longer helmet visors increase
noise exposure at the ear compared to no/shorter visors. This effect may be due to the longer
visor acting as a reflective plane for whistle noise potentially focusing and increasing sound
pressure levels from mouth-blown whistles. This finding may potentially create a difficult
choice for officials as the longer visor that is more protective of the hockey officials’ eyes and
face may also be more damaging to their hearing.
96
The identification of hockey officials as a population potentially overexposed to noise
and at an increased risk of hearing loss alerts health and safety professionals around the world to
consider this group in future health and safety surveillance. Although the results of this study are
unable to recover or repair the hearing loss that has already occurred in hockey officials, it has
the potential to reduce effects in the future and identify officials of other sporting events that may
be at an increased risk of NIHL.
97
REFERENCES
1 Hong, O.S., M. Kerr, G.L. Poling, and S. Dhar: Understanding and preventing noise-
induced hearing loss. Dis Mon 59(4): 110-118 (2013). 2 Thorne, P.R., S.N. Ameratunga, J. Stewart, N. Reid, W. Williams, S. Purdy et al.:
Epidemiology of noise induced hearing loss in New Zealand. New Zealand Medical Journal 121(1280): 33-44 (2008).
3 Kirchner, D.B., E. Evenson, R.A. Dobie, P. Rabinowitz, J. Crawford, R. Kopke et
al.: Occupational Noise-Induced Hearing Loss: ACOEM Task Force on Occupational Hearing Loss. J Occup Environ Med 54(1): 106-108 (2012).
4 National Institute on Deafness and Other Communication Disorders (NIDCD):
Noise-Induced Hearing Loss. National Institute of Health (NIH). Bethesda, MD. Accessed from http://www.nidcd.nih.gov/health/hearing/pages/noise.aspx#5, (2014).
5 American Speech-Language-Hearing Association: Noise. Rockville, MD. Accessed
from http://www.asha.org/public/hearing/Noise/, 1997). 6 Ward, W.D.: Temporary threshold shift and damage-risk criteria for intermittent noise
exposures. J Acoust Soc Am 48(2): 561-574 (1970). 7 National Institute for Occupational Safety and Health (NIOSH): "Criteria for a
Recommended Standard: Occupational Noise Exposure". Cincinnati, Ohio: U.S. Department of Health and Human Services, 1998.
8 Nelson, D.I., R.Y. Nelson, M. Concha-Barrientos, and M. Fingerhut: The global burden of occupational noise‐induced hearing loss. Am J Ind Med 48(6): 446-458 (2005).
9 National Institute for Occupational Safety and Health (NIOSH): "Noise and Heaing
Loss Prevention." Cincinnati, OH. Accessed from http://www.cdc.gov/niosh/topics/noise/, 2014).
10 World Health Organization (WHO): Hearing loss due to recreational exposure to loud
sounds: A review: ISBN 978 92 4 150851 3. 1-32 (2015). 11 Kujawa, S., and M.C. Liberman: Adding insult to injury: cochlear nerve degeneration
after "temporary" noise-induced hearing loss. J Neurosci 29(45): 14077-14085 (2009). 12 Axelsson, A., and D. Prasher: Tinnitus induced by occupational and leisure noise. Noise
Health 2(8): 47-54 (2000).
98
13 Sadhra, S., T. Ryder, C.A. Jackson, and M.J. Brown: Noise exposure and hearing loss among student employees working in university entertainment venues. Ann Occup Hyg 46(5): 455-463 (2002).
14 Hodgetts, W., and R. Liu: Can hockey playoffs harm your hearing? Can Med Assoc J
175(12): 1541-1542 (2006). 15 Derebery, M.J., A. Vermiglio, K. Berliner, M. Potthoff, and K. Holguin: Facing the
music: pre- and postconcert assessment of hearing in teenagers. Audiol Neuro-otol 33(7): 1136-1141 (2012).
16 Engard, D.J., D.R. Sandfort, R.W. Gotshall, and W.J. Brazile: Noise exposure,
characterization, and comparison of three football stadiums. J Occup Environ Hyg 7(11): 616-621 (2010).
17 Cranston, C.J., W.J. Brazile, D.R. Sandfort, and R.W. Gotshall: Occupational and
recreational noise exposure from indoor arena hockey games. J Occup Environ Hyg 10(1): 11-16 (2013).
18 England, B., and J.B. Larsen: Noise Levels Among Spectators at an Intercollegiate
Sporting Event. Am J Audiol 23: 71-78 (2014). 19 Masullo, M., P. Lenzuni, L. Maffei, P. Nataletti, G. Ciaburro, D. Annesi et al.:
Assessment of noise exposure for basketball sports referees. J Occup Environ Hyg: 1-45 (2016).
20 USA Hockey: "USA Hockey." Accessed from www.usahockey.com, (2016). 21 Flamme, G.A., and N. Williams: Sports officials’ hearing status: whistle use as a factor
contributing to hearing trouble. J Occup Environ Hyg 10(1): 1 (2013). 22 Bell, L., and D. Bell: Industrial Noise Control. New York: Marcel Dekker, Inc. (1994). 23 Occupational Safety and Health Administration (OSHA): OSHA Technical Manual
(OTM). Section III: Chapter 5; TED 1-0.15A). Occupational Safety and Health Administration. Washington, D.C. Accessed from https://www.osha.gov/dts/osta/otm/new_noise/, (1999).
24 Berger, E.H., L.H. Royster, J.D. Royster, D.P. Driscoll, M. Layne: The Noise
Manual. American Industrial Hygiene Association. pp. 338-342: (2003). 25 Passchier-Vermeer, W., and W.F. Passchier: Noise exposure and public health.
Environ Health Perspect 108(Suppl 1): 123-131 (2000).
99
26 National Institute for Occupational Safety and Health (NIOSH): "Preventing occupational hearing loss - a practical guide." Cincinnati, OH. Accessed from http://www.cdc.gov/niosh/docs/96-110/, (2014).
27 Mine Safety and Health Aministration (MSHA): Health standards for occupational
noise exposure. Washington, D.C . Federal Register pp. 49548-49634 (1999). 28 World Health Organization: "Occupational Exposure to Noise: Evaluation, Prevention
and Control", C.H. Berenice Goelzer, Gustav Sehrndt (ed.) (1995). 29 American Conference of Governmental Industrial Hygienists (ACGIH): TLVs and
BEIs: Threshold Limit Values for Chemical Substances and Physical Agents and Biological Exposure Indicies. Cincinnati, OH. ACGIH (2014).
30 United States Department of Labor, OSHA: Noise Control: A guide for workers and
employers: OSHA. Washington, D.C. (1980). 31 Mintz, B.W.: OSHA: History, Law, and Policy: BNA, (1984). 32 Occupational Safety and Health Administration (OSHA): Occupational Noise
Exposure. Code of Federal Regulations Title 29, Part 1910.95 (1999). 33 American Conference of Governmental Industrial Hygienists (ACGIH): TLV/BEI
guidelines. Cincinnati, OH. Accessed from www.acgih.org, (2016). 34 Environmental Protection Agency (EPA): Protective Noise Levels Appendix J.
Washington, D.C. Accessed from www.denvergov.org/Portals/746/documents/HIA/Appendix%20J%20-%20EPA%20Protective%20Noise%20Levels.pdf, (1974).
35 Balanay, J., and G. Kearney: Attitudes toward noise, perceived hearing symptoms, and
reported use of hearing protection among college students: Influence of youth culture. Noise Health 17(79): 394-405 (2015).
36 Williams, W., L. Carter, and M. Seeto: Pure tone hearing thresholds and leisure noise:
Is there a relationship? Noise Health 17(78): 358-363 (2015). 37 Roffler, S.K., and R.A. Butler: Factors that influence the Llcalization of sound in the
vertical plane. J Acoust Soc Am 43(6): 1255-1259 (1968). 38 Kujawa, S., and M.C. Liberman: Acceleration of age-related hearing loss by early
noise exposure: evidence of a misspent youth. J Neurosci 26(7): 2115-2123 (2006). 39 Raveh, E., W. Hu, B.C. Papsin, and V. Forte: Congenital conductive hearing loss. The
Journal of Laryngology & Otology 116(02): 92-96 (2002).
100
40 Glorig, A., A. Summerfield, and W.D. Ward: Observations on temporary auditory threshold shift resulting from noise-exposure. Ann Otol Rhinol Laryngol 67(3): 824-847 (1958).
41 Melnick, W.: Human temporary threshold shift (TTS) and damage risk. J Acoust Soc Am
90(1): 147 (1991). 42 McRobert, H., and W.D. Ward: Damage-risk criteria: the trading relation between
intensity and the number of nonreverberant impulses. J Acoust Soc Am 53(5): 1297-1300 (1973).
43 National Institute on Deafness and Other Communication Disorders (NIDCD):
Hearing, Ear Infections and Deafness. National Institutes of Health (NIH). Accessed from https://www.nidcd.nih.gov/health/hearing-ear-infections-deafness, (2014).
44 Picard, M., S.A. Girard, M. Simard, R. Larocque, T. Leroux, and F. Turcotte:
Association of work-related accidents with noise exposure in the workplace and noise-induced hearing loss based on the experience of some 240,000 person-years of observation. Accident Analysis & Prevention 40(5): 1644-1652 (2008).
45 Girard, S.A., M. Picard, A.C. Davis, M. Simard, R. Larocque, T. Leroux et al.:
Multiple Work-Related Accidents: Tracing the Role of Hearing Status and Noise Exposure. Occup Environ Med 66(5): 319-324 (2009).
46 Choi, S.-W., C. Peek-Asa, N.L. Sprince, R.H. Rautiainen, K.J. Donham, G.A.
Flamme et al.: Hearing loss as a risk factor for agricultural injuries. Am J Ind Med 48(4): 293-301 (2005).
47 Amjad-Sardrudi, H., A. Dormohammadi, R. Golmohammadi, and J. Poorolajal:
Effect of noise exposure on occupational injuries: A cross-sectional study. J Res Health Sci 12(2): 101-104 (2012).
48 Cordeiro, R., A.P. Clemente, C.S. Diniz, and A. Dias: Occupational noise as a risk
factor for work-related injuries. Rev Saude Publica 39(3): 461-466 (2005). 49 Leensen, M., and W. Dreschler: Longitudinal changes in hearing threshold levels of
noise-exposed construction workers. International Archives of Occupational & Environmental Health 88(1): 45-60 (2015).
50 Health Council of the Netherlands: Committee on Noise and Health. Noise and Health
(1994). 51 Belojevic, G., B. Jakovljevic, V. Stojanov, K. Paunovic, and J. Ilic: Urban road-traffic
noise and blood pressure and heart rate in preschool children. Environment International 34(2): 226-231 (2008).
101
52 Lusk, S.L., B. Gillespie, B.M. Hagerty, and R.A. Ziemba: Acute effects of noise on blood pressure and heart rate. Archives of Environmental Health: An International Journal 59(8): 392-399 (2004).
53 Stansfeld, S.A., and M.P. Matheson: Noise pollution: non-auditory effects on health.
British Medical Bulletin 68(1): 243-257 (2003). 54 Mrak, M., and M. Bilban: Non-auditory effects of noise. Zdravniški Vestnik 83(4): 329-
341 (2014). 55 Tambs, K., H.J. Hoffman, H.M. Borchgrevink, J. Holmen, and S.O. Samuelsen:
Hearing loss induced by noise, ear infections, and head injuries: results from the Nord-Trondelag Hearing Loss Study. Int J Audiol 42(2): 89-105 (2003).
56 Idota, N., S. Horie, T. Tsutsui, and J. Inoue: Temporary threshold shifts at 1500 and
2000 Hz induced by loud voice signals communicated through earphones in the pinball industry. Ann Occup Hyg 54(7): 842-849 (2010).
57 Schmuziger, N., J. Patscheke, and R. Probst: An assessment of threshold shifts in
nonprofessional pop/rock musicians using conventional and extended high-frequency audiometry. Ear Hear 28(5): 643-648 (2007).
58 Santos, L., T. Morata, L. Jacob, E. Albizu, J. Marques, and M. Paini: Music
exposure and audiological findings in Brazilian disc jockeys (DJs). Int J Audiol 46(5): 223-231 (2007).
59 Swanepoel, D., and J.W. Hall: Football match spectator sound exposure and effect on
hearing: A pretest - post-test study. S Afr Med J 100(4): 239-242 (2010). 60 Ramma, L., L. Petersen, and S. Singh: Vuvuzelas at South African Soccer Matches:
Risks for spectators' hearing. Noise Health (13): 71-75 (2011). 61 Le Prell, C., S. Dell, B. Hensley, J. Hall, K.C.M. Campbell, P. Antonelli et al.: Digital
music exposure reliably induces temporary threshold shift in normal-hearing human subjects. Ear Hear 33(6): 44-58 (2012).
62 Pierson, L.L.: Relationship between outer ear resonance and permanent noise-induced
hearing loss. Am J Otolaryngol 15(1): 37 (1994). 63 Axelsson, A.: Diagnosis and treatment of occupational noise-induced hearing loss. Acta
Otolaryngol Suppl 360: 86-87 (1979). 64 Ward, W.D.: Recovery from high values of temporary threshold shift. J Acoust Soc Am
32(4): 497 (1960).
102
65 Keppler, H., I. Dhooge, L. Maes, and et al.: Short-term auditory effects of listening to an mp3 player. Archives of Otolaryngology–Head & Neck Surgery 136(6): 538-548 (2010).
66 Kaufman, D.W., J.P. Kelly, L. Rosenberg, T.E. Anderson, and A.A. Mitchell: Recent
patterns of medication use in the ambulatory adult population of the united states: The slone survey. JAMA 287(3): 337-344 (2002).
67 Curhan, S.G., R. Eavey, J. Shargorodsky, and G.C. Curhan: Analgesic use and the
risk of hearing loss in men. The American Journal of Medicine 123(3): 231-237 (2010). 68 Curhan, S.G., J. Shargorodsky, R. Eavey, and G.C. Curhan: Analgesic use and the
risk of hearing loss in women. American Journal of Epidemiology 176(6): 544-554 (2012).
69 G.R.A.S. Sound & Vibration: Head and Torso Simulators. Accessed from
http://www.gras.dk/products/head-torso-simulators-kemar.html, (2013). 70 Chung, K., A.C. Neuman, and M. Higgins: Effects of in-the-ear microphone
directionality on sound direction identification. J Acoust Soc Am 123(4): 2264-2275 (2008).
71 Patel, J.A., and K. Broughton: Assessment of the noise exposure of call centre
operators. Annals of Occupational Hygiene 46(8): 653-661 (2002). 72 Fligor, B.J., and L. Cox: Output levels of commercially available portable compact disc
players and the potential risk to hearing. Ear Hear 25: 513-527 (2004). 73 Portnuff, C., B.J. Fligor, and K. Arehart: Teenage Use of Portable Listening Devices:
A Hazard to Hearing? J Am Acad Audiol 22: 663 - 677 (2011). 74 Henderson, E., M.A. Testa, and C. Hartnick: Prevalence of noise-induced hearing-
threshold shifts and hearing loss among US youths. Pediatrics 127(1): e39-e46 (2011). 75 Autenrieth, D.A.: Occupational exposures to noise resulting from the workplace use of
personal media players at a manufacturing facility. J Occup Environ Hyg 9(10): 592 (2012).
76 Kahari, K.R., T. Aslund, J. Olsson, K. Kähäri, and T. Åslund: Preferred sound levels
of portable music players and listening habits among adults: A field study. Noise Health 13(50): 9 (2011).
77 Skrainar, S.F., L.H. Royster, E.H. Berger, and R.G. Pearson: The contribution of
personal radios to the noise exposure of employees at one industrial facility. Am Ind Hyg Assoc J 48(4): 390-395 (1987).
103
78 Rice, C.G., G. Rossi, and M. Olina: Damage risk from personal cassette players. Br J Audiol 21(4): 279-288 (1987).
79 Kennedy, J.: On-road and wind-tunnel measurement of motorcycle helmet noise. J
Acoust Soc Am 134(3): 2004 (2013). 80 Clark, W.W.: Noise exposure from leisure activities: A review. J Acoust Soc Am 90(1):
175-181 (1991). 81 Mills, J.H.: Temporary threshold shifts produced by wideband noise. J Acoust Soc Am
70(2): 390 (1981). 82 Ward, W.D.: Effects of impulse noise on hearing. Summary and overview. Scand Audiol
Suppl (Suppl 12): 339-348 (1980). 83 Maffei, L., G. Iannace, M. Masullo, and P. Nataletti: Noise exposure in school
gymnasia and swimming pools. Noise Control Engineering Journal 57(6): 603-612 (2009).
84 Lawton, B.: "A noise exposure threshold value for hearing conservation". Brussels:
CONCAWE (2001). 85 Adams, K., A. Langley, and W.J. Brazile: Noise exposure and temporary hearing loss
of indoor hockey officials: A pilot study. J Environ Health 79(4): (2016). 86 Occupational Safety and Health Administration (OSHA): "U.S. Public Health
Service/Federal Occupational Health Audiogram History Report." Accessed from https://www.osha.gov/OshDoc/Directive_pdf/PER_04-00-004_appA.pdf, (1999).
87 Precision Hearing Conservation: Occupational Noise Exposure and Hearing
Conservation. Texas (2013). 88 Micro Audiometrics Corporation: Earscan 3 Manual: Pure Tone Audiometer User's
Guide (2002). 89 Hirsh, I.J., and W.D. Ward: Recovery of the Auditory Threshold after Strong Acoustic
Stimulation. J Acoust Soc Am 24(2): 131-141 (1952). 90 British Standard International Organization for Standardization EN ISO 11904-
2:2004: Acoustics-Determination of Sound Immission From Sound Sources Placed Close to the Ear. Part 2: Technique Using a Manikin (2004).
91 Sim, F.H., W.T. Simonet, L.J. Melton, 3rd, and T.A. Lehn: Ice hockey injuries. Am J
Sports Med 15(1): 30-40 (1987).
104
92 Tegner, Y., and R. Lorentzon: Ice hockey injuries: incidence, nature and causes. British Journal of Sports Medicine 25(2): 87-89 (1991).
93 Matic, G.T., M.F. Sommerfeldt, T.M. Best, C.L. Collins, R.D. Comstock, and D.C.
Flanigan: Ice hockey injuries among United States high school athletes from 2008/2009–2012/2013. The Physician and Sportsmedicine 43(2): 119-125 (2015).
94 Benson, B.W., N.H. Mohtadi, M. Rose, and W.H. Meeuwisse: Head and neck injuries
among ice hockey players wearing full face shields vs half face shields. JAMA 282(24): 2328-2332 (1999).
95 Biasca, N., S. Wirth, and Y. Tegner: The avoidability of head and neck injuries in ice
hockey: an historical review. British Journal of Sports Medicine 36(6): 410-427 (2002). 96 Echlin, P.S., R.E.G. Upshur, D.M. Peck, and E.N. Skopelja: Craniomaxillofacial
injury in sport: a review of prevention research. British Journal of Sports Medicine 39(5): 254-263 (2005).
97 Stevens, S.T., M. Lassonde, L. de Beaumont, and J.P. Keenan: The effect of visors on
head and facial injury in National Hockey League players. Journal of Science and Medicine in Sport 9(3): 238-242 (2006).
98 Honey, C.R. and D. Phil: Brain injury in ice hockey. Clinical journal of sport medicine
(1998). 99 American Academy of Pediatrics Committee on Sports Medicine and Fitness:
Protective eyewear for young athletes. Pediatrics 113: 619-622 (2004). 100 Turbert, D.: "Eye health in sports and recreation." Accessed from
http://www.aao.org/eye-health/tips-prevention/injuries, (2016). 101 National Hockey League: "National Hockey League Official Rules 2015-2016."
Accessed from http://www.nhl.com/nhl/en/v3/ext/rules/2015-2016-Interactive-rulebook.pdf, (2015).
102 USA Hockey: "2013-2017 Official Rules of Hockey." Accessed from
http://assets.ngin.com/attachments/document/0042/4244/2013-17_USAH_Rulebook.pdf, (2013).
103 Ing, E., T. Ing, and S. Ing: The effect of a hockey visor and sports goggles on visual
function. Canadian Journal of Ophthalmology / Journal Canadien d'Ophtalmologie 37(3): 161-167 (2002).
104 Neitzel, R., N. Seixas, B. Goldman, and W. Daniell: Contributions of non-occupational
activities to total noise exposure of construction workers. Annals of occupational hygiene 48(5): 463-473 (2004).
105
105 Joy, G.J. and P.J. Middendorf: Noise exposure and hearing conservation in U.S. coal mines - A surveillance report. J Occup Environ Hyg 4(1): 26-35 (2007).
106 Ahmed, H.O., J.H. Dennis, O. Badran, M. Ismail, S.G. Ballal, A. Ashoor et al.:
Occupational noise exposure and hearing loss of workers in two plants in eastern Saudi Arabia. Ann Occup Hyg 45(5): 371-380 (2001).
107 Fox 40® International: "Super Force CMG Fingergrip " Accessed from
http://www.fox40world.com/index.cfm?id=56322, (2016). 108 Fikret-Pasa, S., and L.J. Revit: Individualized correction factors in the preselection of
hearing aids. Journal of Speech, Language, and Hearing Research 35(2): 384-400 (1992).
109 City of Fort Collins Edora Pool and Ice Center: "EPIC Ice Arena." Accessed from
http://mids2012.main.fortcollinsfsc.org/edora-pool-ice-center-epic, (2012). 110 Shaw, E.A.G., and R. Teranishi: Sound pressure generated in an external‐ear replica
and real human ears by a nearby point source. J Acoust Soc Am 44(1): 240-249 (1968). 111 Saunders, G.H., and D.E. Morgan: Impact on hearing aid targets of measuring
thresholds in dB HL versus dB SPL. International Jounal of Audiology (42): 319-326 (2003).
106
APPENDIX A
METHODOLOGY FOR CONDUCTING NOISE DOSIMETRY
Before Noise Dosimetry Sampling
Calibrate noise equipment and document calibration for SLM, noise dosimeters, and OBA
Documentation includes:
o Calibration date and time
o Serial number of instrumentation
o Date of last calibration and/or calibration due date
Explain who you are, why you are there, and the purpose of the dosimeter
o Emphasize that the dosimeter does not record speech, just dB levels
Document the dosimeter SN, name of official, and date on sampling sheet
Clip the dosimeter on the back waistband or ask the official if he would like to secure it in a zippered pocket
Clip the microphone to the official’s jersey at the shoulder, close to the hearing zone
o Should be placed in accordance with manufacturer’s instructions
o Secure the cable under the outer jersey and or with tape.
o Place the microphone on the officials’ dominant side
Ask the official if it feels all right, confirm nothing will bother the official during his activities and them not to remove, tap or yell into the microphone
Notify the official that you will be checking on them at each intermission and for them to tell you right away if there is a problem with the microphone, cord or dosimeter
o Explain you will be checking the dosimeter and microphone at intermissions to
ensure that the microphone is oriented and functioning properly
107
Notify them that YOU will remove the dosimeter once they come off of the ice at the conclusion of the game
Turn on the dosimeter and record the time
After Noise Dosimetry Sampling
As the official exits the ice or enter the locker room, remove the dosimeter and record the time
Ask if there were any problems during the game (e.g. hit with a puck, fell down)
Thank them for participating and ask them to go directly to the audiometric testing room/booth
Post-calibrate the noise equipment and fully document the calibration, as before
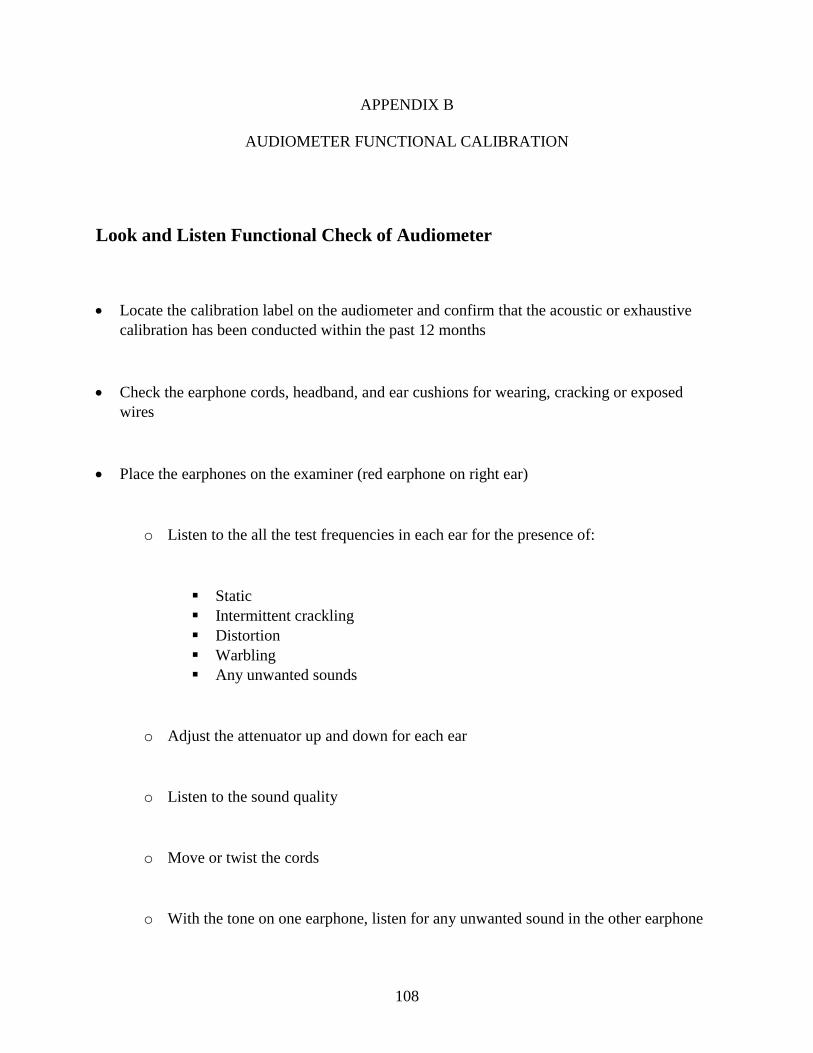
108
APPENDIX B
AUDIOMETER FUNCTIONAL CALIBRATION
Look and Listen Functional Check of Audiometer
Locate the calibration label on the audiometer and confirm that the acoustic or exhaustive calibration has been conducted within the past 12 months
Check the earphone cords, headband, and ear cushions for wearing, cracking or exposed wires
Place the earphones on the examiner (red earphone on right ear)
o Listen to the all the test frequencies in each ear for the presence of:
Static Intermittent crackling Distortion Warbling Any unwanted sounds
o Adjust the attenuator up and down for each ear
o Listen to the sound quality
o Move or twist the cords
o With the tone on one earphone, listen for any unwanted sound in the other earphone
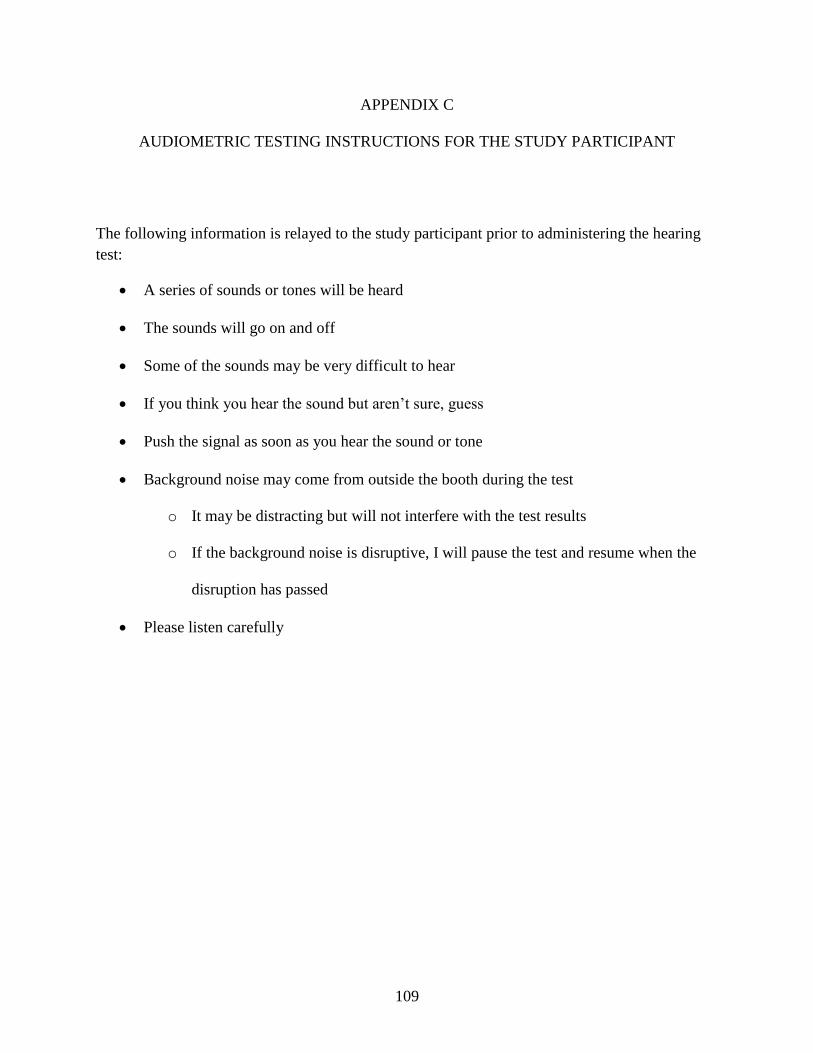
109
APPENDIX C
AUDIOMETRIC TESTING INSTRUCTIONS FOR THE STUDY PARTICIPANT
The following information is relayed to the study participant prior to administering the hearing test:
A series of sounds or tones will be heard
The sounds will go on and off
Some of the sounds may be very difficult to hear
If you think you hear the sound but aren’t sure, guess
Push the signal as soon as you hear the sound or tone
Background noise may come from outside the booth during the test
o It may be distracting but will not interfere with the test results
o If the background noise is disruptive, I will pause the test and resume when the
disruption has passed
Please listen carefully
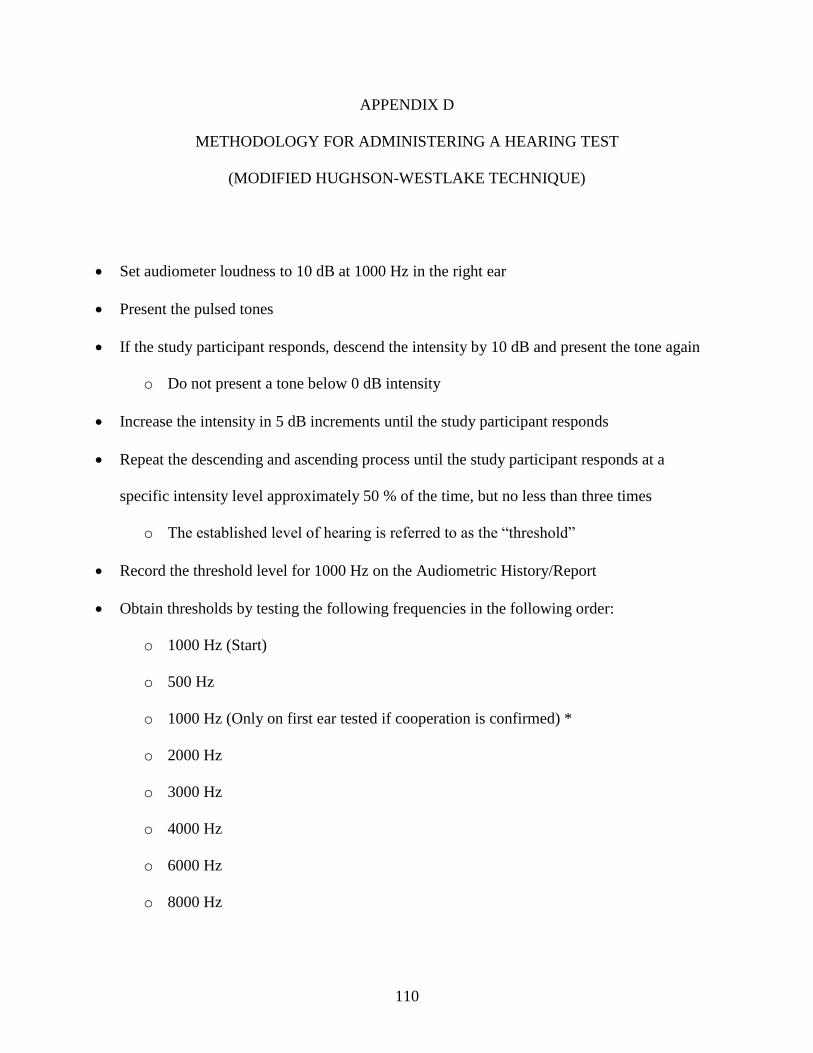
110
APPENDIX D
METHODOLOGY FOR ADMINISTERING A HEARING TEST
(MODIFIED HUGHSON-WESTLAKE TECHNIQUE)
Set audiometer loudness to 10 dB at 1000 Hz in the right ear
Present the pulsed tones
If the study participant responds, descend the intensity by 10 dB and present the tone again
o Do not present a tone below 0 dB intensity
Increase the intensity in 5 dB increments until the study participant responds
Repeat the descending and ascending process until the study participant responds at a
specific intensity level approximately 50 % of the time, but no less than three times
o The established level of hearing is referred to as the “threshold”
Record the threshold level for 1000 Hz on the Audiometric History/Report
Obtain thresholds by testing the following frequencies in the following order:
o 1000 Hz (Start)
o 500 Hz
o 1000 Hz (Only on first ear tested if cooperation is confirmed) *
o 2000 Hz
o 3000 Hz
o 4000 Hz
o 6000 Hz
o 8000 Hz
111
* Repeat the testing of 1000 Hz for only the first ear tested to determine if the study participant is
cooperating and understands the instructions. It is not necessary to retest the 1000 Hz for the
second ear tested
After retesting 1000 Hz, thresholds must be within +/- 10 dB. Record the better of the two
thresholds.
o If a > 10 dB difference is observed or the study participant seems uncooperative,
reinstruct, reschedule or refer to an audiologist
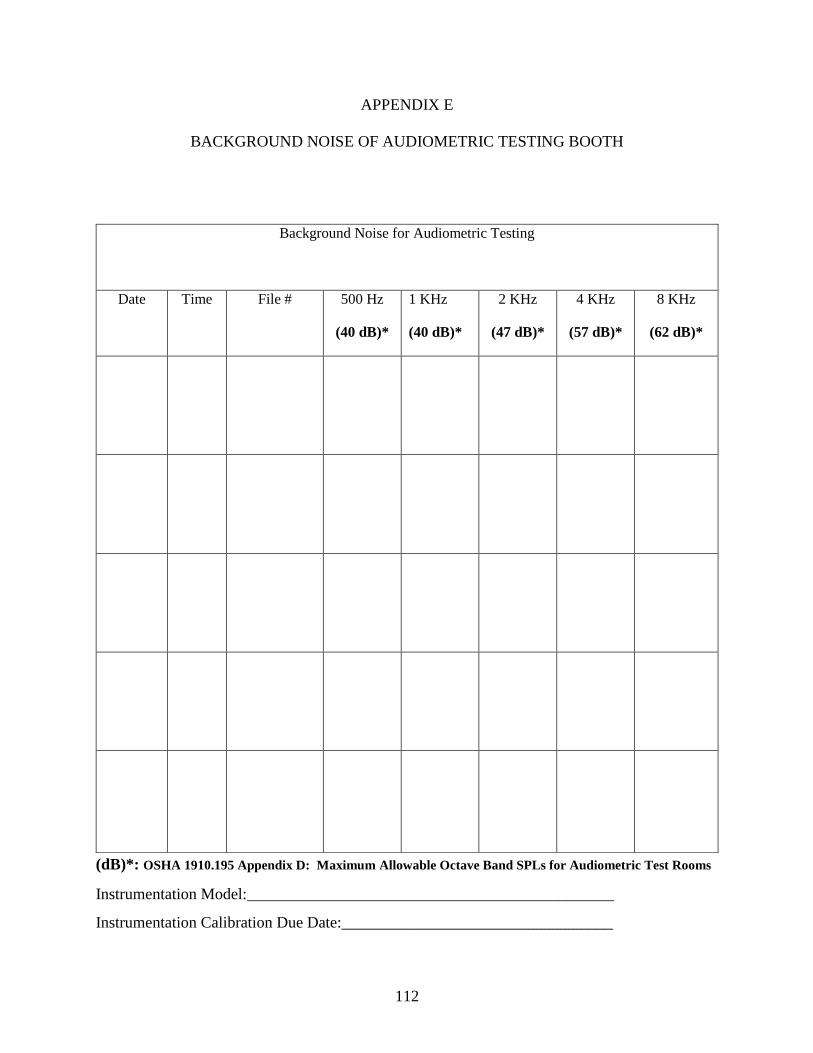
112
APPENDIX E
BACKGROUND NOISE OF AUDIOMETRIC TESTING BOOTH
Background Noise for Audiometric Testing
Date Time File # 500 Hz
(40 dB)*
1 KHz
(40 dB)*
2 KHz
(47 dB)*
4 KHz
(57 dB)*
8 KHz
(62 dB)*
(dB)*: OSHA 1910.195 Appendix D: Maximum Allowable Octave Band SPLs for Audiometric Test Rooms
Instrumentation Model:______________________________________________
Instrumentation Calibration Due Date:__________________________________
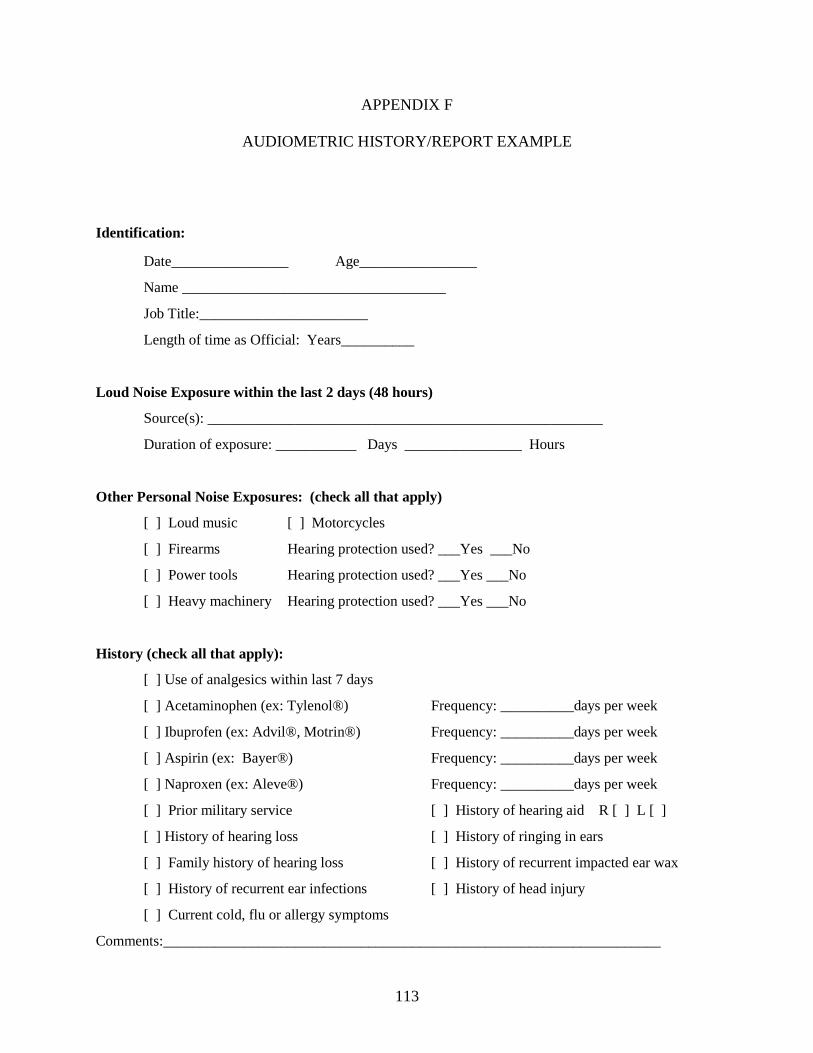
113
APPENDIX F
AUDIOMETRIC HISTORY/REPORT EXAMPLE
Identification:
Date________________ Age________________
Name ____________________________________
Job Title:_______________________
Length of time as Official: Years__________
Loud Noise Exposure within the last 2 days (48 hours)
Source(s): ______________________________________________________
Duration of exposure: ___________ Days ________________ Hours
Other Personal Noise Exposures: (check all that apply)
[ ] Loud music [ ] Motorcycles
[ ] Firearms Hearing protection used? ___Yes ___No
[ ] Power tools Hearing protection used? ___Yes ___No
[ ] Heavy machinery Hearing protection used? ___Yes ___No
History (check all that apply):
[ ] Use of analgesics within last 7 days
[ ] Acetaminophen (ex: Tylenol®) Frequency: __________days per week
[ ] Ibuprofen (ex: Advil®, Motrin®) Frequency: __________days per week
[ ] Aspirin (ex: Bayer®) Frequency: __________days per week
[ ] Naproxen (ex: Aleve®) Frequency: __________days per week
[ ] Prior military service [ ] History of hearing aid R [ ] L [ ]
[ ] History of hearing loss [ ] History of ringing in ears
[ ] Family history of hearing loss [ ] History of recurrent impacted ear wax
[ ] History of recurrent ear infections [ ] History of head injury
[ ] Current cold, flu or allergy symptoms
Comments:____________________________________________________________________
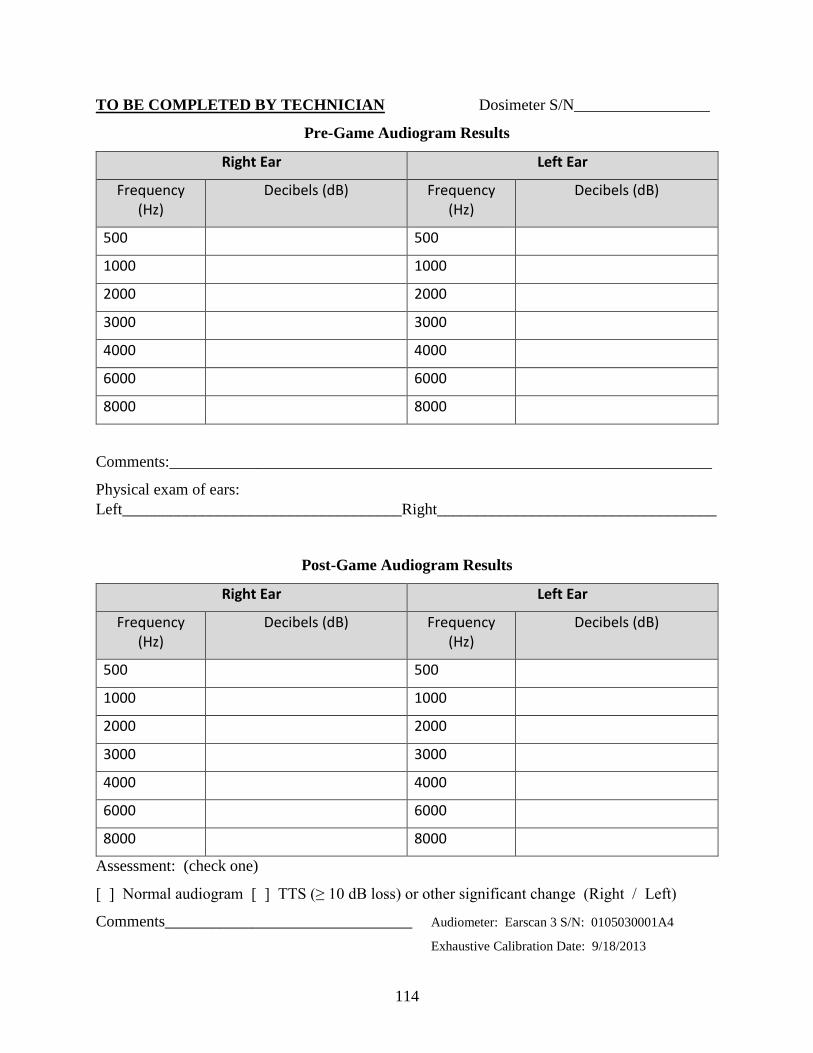
114
TO BE COMPLETED BY TECHNICIAN Dosimeter S/N_________________
Pre-Game Audiogram Results
Right Ear Left Ear
Frequency
(Hz)
Decibels (dB) Frequency
(Hz)
Decibels (dB)
500 500
1000 1000
2000 2000
3000 3000
4000 4000
6000 6000
8000 8000
Comments:____________________________________________________________________
Physical exam of ears: Left___________________________________Right___________________________________
Post-Game Audiogram Results
Right Ear Left Ear
Frequency
(Hz)
Decibels (dB) Frequency
(Hz)
Decibels (dB)
500 500
1000 1000
2000 2000
3000 3000
4000 4000
6000 6000
8000 8000
Assessment: (check one)
[ ] Normal audiogram [ ] TTS (≥ 10 dB loss) or other significant change (Right / Left)
Comments_______________________________ Audiometer: Earscan 3 S/N: 0105030001A4
Exhaustive Calibration Date: 9/18/2013
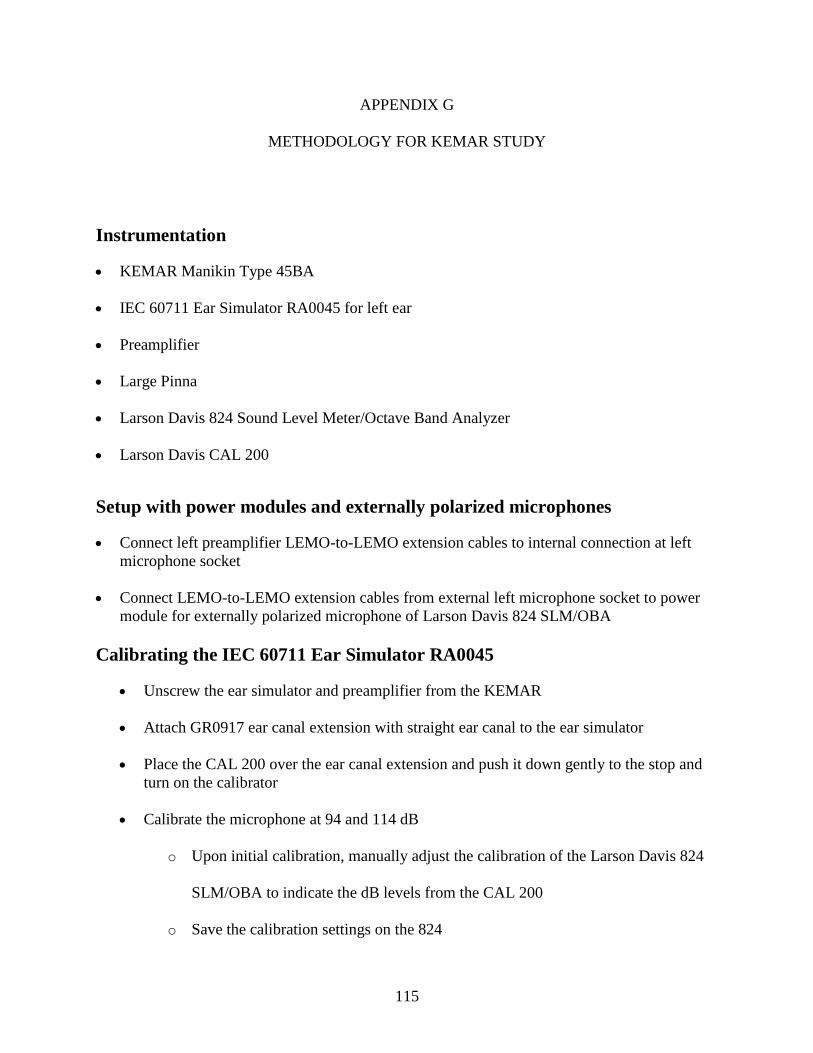
115
APPENDIX G
METHODOLOGY FOR KEMAR STUDY
Instrumentation
KEMAR Manikin Type 45BA
IEC 60711 Ear Simulator RA0045 for left ear
Preamplifier
Large Pinna
Larson Davis 824 Sound Level Meter/Octave Band Analyzer
Larson Davis CAL 200
Setup with power modules and externally polarized microphones
Connect left preamplifier LEMO-to-LEMO extension cables to internal connection at left microphone socket
Connect LEMO-to-LEMO extension cables from external left microphone socket to power module for externally polarized microphone of Larson Davis 824 SLM/OBA
Calibrating the IEC 60711 Ear Simulator RA0045
Unscrew the ear simulator and preamplifier from the KEMAR
Attach GR0917 ear canal extension with straight ear canal to the ear simulator
Place the CAL 200 over the ear canal extension and push it down gently to the stop and turn on the calibrator
Calibrate the microphone at 94 and 114 dB
o Upon initial calibration, manually adjust the calibration of the Larson Davis 824
SLM/OBA to indicate the dB levels from the CAL 200
o Save the calibration settings on the 824
116
Calibration documentation includes:
o Calibration date and time
o Serial numbers of instrumentation
o Date of last calibration and/or calibration due date
Remove the CAL 200 and GR0917 ear canal extension from the ear simulator
Attach the ear simulator and preamplifier to the left ear mounting plate
Tighten the preamplifier to face upwards, toward the top of the head, with the 2.5 mm Allen key if necessary Insert foam ear plug into the right ear mounting plate and allow it to expand
Loosely place a hand towel inside the cavity of the KEMAR head, ensuring that the preamplifier faces upwards
Attach the right pinna on the mounting plate, making sure the studs on the mounting plate align with the holes in the pinna
Attach back plate and skull cap of the KEMAR
Peak Noise Measurement
Place KEMAR, whistle apparatus, and SLM/OBA on cart Find a power source for the air compressor
Place the KEMAR assembly on the randomized five face-off spots, with the manikin positioned on the outer boundary of the face-off spot, facing toward the ice
Attach left pinna to ear simulator mounting plate, making sure the studs on the mounting plate align with the holes in the pinna
Place helmet on KEMAR head and tighten the chin strap, ensuring that the pinna is positioned in the designated ear space of the helmet
Attach tubing and blow gun to air compressor and pressurize to 18-20 psi Place air compressor as far as possible behind the KEMAR assembly
117
Once pressure has been achieved, stand behind the KEMAR, press the record button on the SLM/OBA, squeeze the blow-gun completely and release, stop the recording on the SLM/OBA and save the data file
Press the record button on the SLM/OBA, squeeze the blow-gun completely and release, stop the recording on the SLM/OBA, and save the data file four more times, with a total of 5 samples per location
Document the face-off spot location and file names and move Move to the next randomly selected face-off spot and collect 5 samples at each location After each of the 5 face-off spots have been sampled, remove the hockey helmet and
attach the visor of interest Post calibrate the ear simulator according to instructions listed above
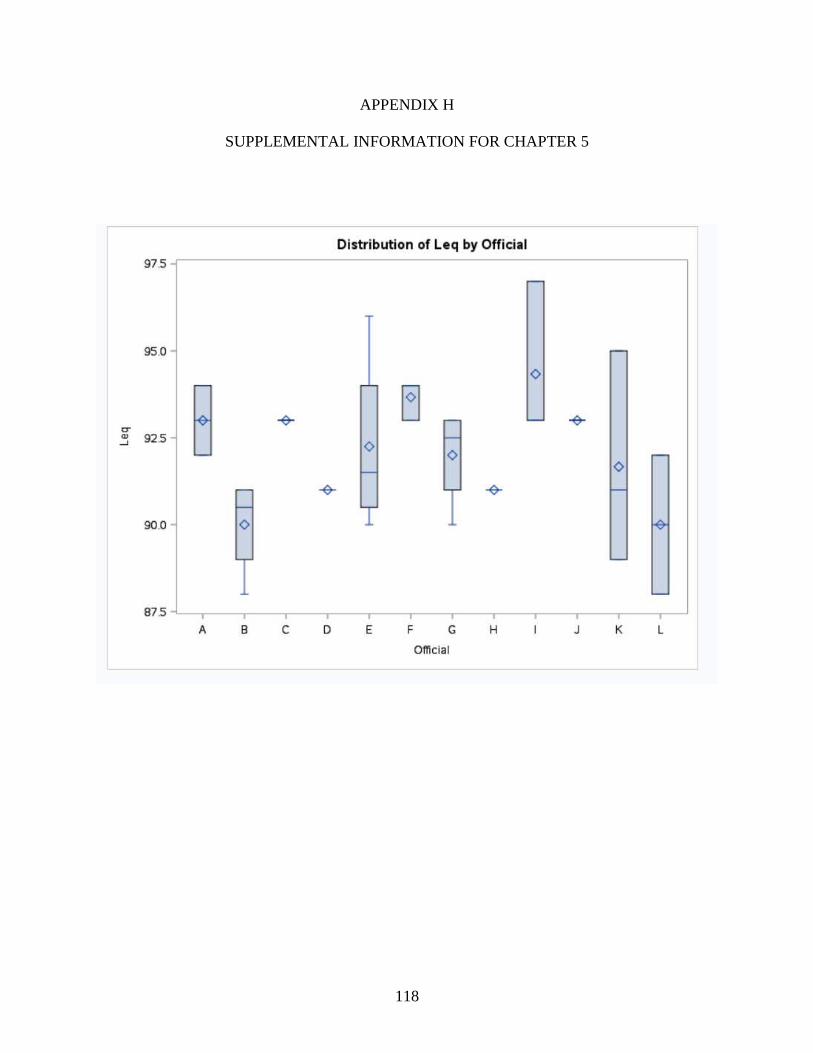
118
APPENDIX H
SUPPLEMENTAL INFORMATION FOR CHAPTER 5
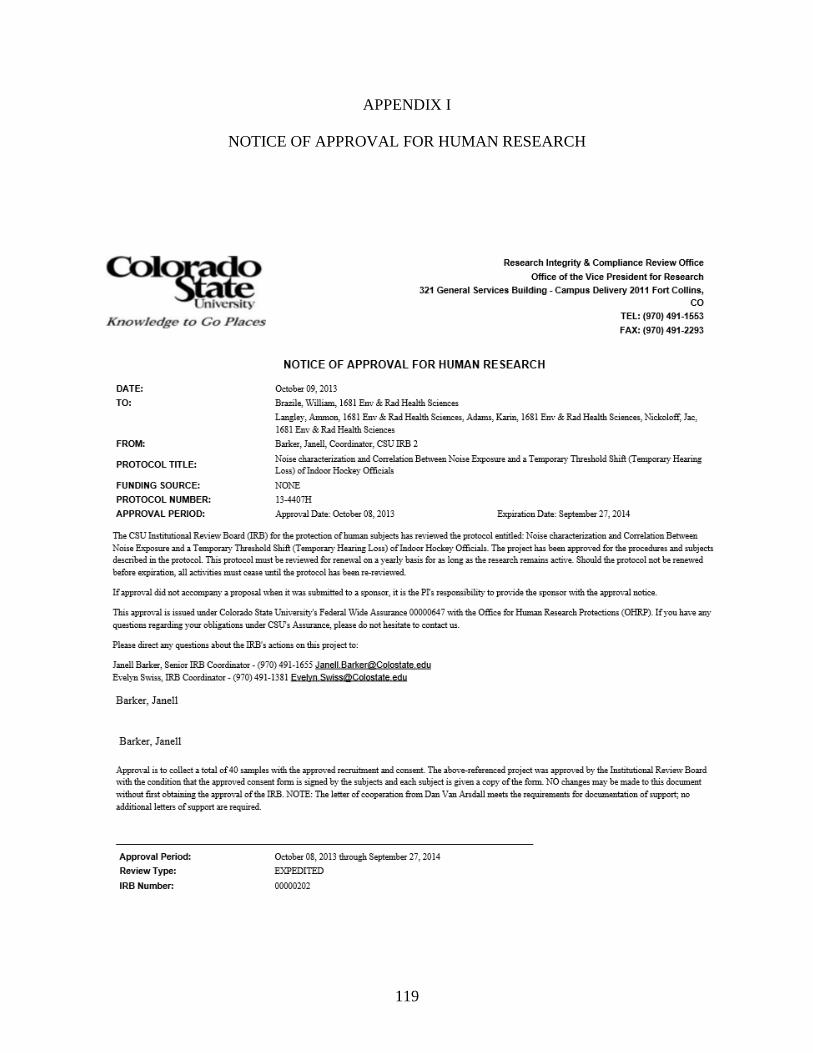
119
APPENDIX I
NOTICE OF APPROVAL FOR HUMAN RESEARCH