discrimination of cancerous from benign pigmented skin
TRANSCRIPT

Discrimination of cancerous from benign pigmentedskin lesions based on multispectral autofluorescencelifetime imaging dermoscopy and machine learning
Priyanka Vasanthakumari,a Renan A. Romano,b Ramon G. T. Rosa,b
Ana G. Salvio,c Vladislav Yakovlev,a Cristina Kurachi,b
Jason M. Hirshburg,d and Javier A. Joe,*aTexas A&M University, Department of Biomedical Engineering,
College Station, Texas, United StatesbUniversity of São Paulo, São Carlos Institute of Physics, São Paulo, Brazil
cSkin Department of Amaral Carvalho Hospital, São Paulo, BrazildUniversity of Oklahoma Health Science Center, Department of Dermatology,
Oklahoma City, Oklahoma, United StateseUniversity of Oklahoma, School of Electrical and Computer Engineering,
Norman, Oklahoma, United States
Abstract
Significance: Accurate early diagnosis of malignant skin lesions is critical in providing ade-quate and timely treatment; unfortunately, initial clinical evaluation of similar-looking benignand malignant skin lesions can result in missed diagnosis of malignant lesions and unnecessarybiopsy of benign ones.
Aim: To develop and validate a label-free and objective image-guided strategy for the clinicalevaluation of suspicious pigmented skin lesions based on multispectral autofluorescence lifetimeimaging (maFLIM) dermoscopy.
Approach: We tested the hypothesis that maFLIM-derived autofluorescence global featurescan be used in machine-learning (ML) models to discriminate malignant from benign pigmentedskin lesions. Clinical widefield maFLIM dermoscopy imaging of 41 benign and 19 malignantpigmented skin lesions from 30 patients were acquired prior to tissue biopsy sampling. Threedifferent pools of global image-level maFLIM features were extracted: multispectral intensity,time-domain biexponential, and frequency-domain phasor features. The classification potentialof each feature pool to discriminate benign versus malignant pigmented skin lesions was evalu-ated by training quadratic discriminant analysis (QDA) classification models and applying aleave-one-patient-out cross-validation strategy.
Results: Classification performance estimates obtained after unbiased feature selection were asfollows: 68% sensitivity and 80% specificity with the phasor feature pool, 84% sensitivity, and71% specificity with the biexponential feature pool, and 84% sensitivity and 32% specificitywith the intensity feature pool. Ensemble combinations of QDA models trained with phasorand biexponential features yielded sensitivity of 84% and specificity of 90%, outperforming allother models considered.
Conclusions: Simple classification ML models based on time-resolved (biexponential andphasor) autofluorescence global features extracted from maFLIM dermoscopy images havethe potential to provide objective discrimination of malignant from benign pigmented lesions.ML-assisted maFLIM dermoscopy could potentially assist with the clinical evaluation ofsuspicious lesions and the identification of those patients benefiting the most from biopsyexamination.
© The Authors. Published by SPIE under a Creative Commons Attribution 4.0 International License.Distribution or reproduction of this work in whole or in part requires full attribution of the originalpublication, including its DOI. [DOI: 10.1117/1.JBO.27.6.066002]
*Address all correspondence to Javier A. Jo, [email protected]
Journal of Biomedical Optics 066002-1 June 2022 • Vol. 27(6)
Downloaded From: https://www.spiedigitallibrary.org/journals/Journal-of-Biomedical-Optics on 20 Jun 2022Terms of Use: https://www.spiedigitallibrary.org/terms-of-use

Keywords: skin cancer; autofluorescence; fluorescence lifetime imaging; feature selection;machine learning; computer-aided diagnosis.
Paper 220022GRR received Jan. 29, 2022; accepted for publication May 23, 2022; publishedonline Jun. 14, 2022.
1 Introduction
Skin cancer is the most common type of cancer in the United States, with melanoma being thefifth most prevalent among men and women.1 The 5-year survival rate of patients with early-stage skin melanoma is ∼94%; however, ∼13% of skin melanoma patients are diagnosed withlesions already at intermediate or advance stages,1 which are associated with 5-year survivalrates of ∼61% and ∼27%, respectively. The most common diagnosis strategy for skin canceris clinical evaluation of suspicious lesions followed by biopsy for histopathological evaluation toconfirm diagnosis and tissue staging. One major drawback of this practice is the inability toclinically distinguish between similar lesions; in particular, melanoma is often mistaken for otherbenign pigmented lesions such as seborrheic keratosis (pSK). In addition, it is known that theaccuracy of melanoma diagnosis with unaided eye is only about 60%.2 Therefore, clinical toolsthat could provide objective, in situ, and accurate noninvasive discrimination between malig-nant and benign skin lesions during clinical examination could significantly improve earlydetection of skin cancer, reduce the risk of adverse events, and lead to improved cost-consciouspatient care.
One of the most common tools used by physicians to diagnose skin cancer lesions is thedermoscope2–4 which helps the unaided eye by magnifying the features on the skin. This allowsdoctors to examine the morphological features of concerning lesions at a significantly moredetailed level. Although dermoscopy is known to improve the diagnostic sensitivity of skinlesions by ∼10% to 30%, its performance largely depends on both the level of experienceof the dermatologist and the type of lesions.2 The highly subjective nature and poor reproduc-ibility of this method have led to the emergence of several proposed computer-aided diagnostic(CAD) systems.3,5–7
CAD systems are becoming largely popular in both diagnosis and prognosis of variousdiseases as they allow automated and noninvasive analysis of the tissue conditions. Table 1summarizes some of the published works that reports the diagnosis and classification of pig-mented skin lesions. Most of the works used dermoscopic images that were either collected bythe authors or from publicly available datasets (e.g., ISIC archive, ISBI, Atlas, HAM10000, orPH2). Celebi and Zornberg8 explored the clinically significant colors in dermoscopic imagesusing K-means clustering and employed symbolic regression to classify the lesions. Ramlakhanand Shang9 designed a melanoma recognition system using smart phone photographs that areclassified using k-nearest neighbor (kNN) algorithm. Satheesha et al.10 examined computerizedthree-dimensional (3D) dermoscopy features of skin cancer lesions to develop multiclass clas-sifiers using Adaboost, bag of features (BoF), and support vector machine (SVM) techniques.Khristoforova et al.11 used logistic regression to classify benign and malignant skin lesions usingspectral features from Raman and autofluorescence spectroscopy measurements.
Classification of dermoscopy images of benign and malignant skin lesions using differentdeep learning approaches has also been reported. Harangi13 used an ensemble of different con-volutional neural network (CNN) classifiers, while Romero Lopez et al.14 used transfer learningwith pretrained VGGNet CNN architecture. Majtner et al.15 combined CNN with SVM classifierusing handcrafted RSurf features and local binary patterns to classify melanomas from otherbenign skin lesions. Lee et al.16 developed the WonDerm pipeline that segments the skin cancerdermoscopic images using neural network architectures and classifies it using an ensembleapproach. Amin et al.17 extracted features using pretrained AlexNet and VGG16 deep learningarchitectures, performed feature selection using principal component analysis, and applied tradi-tional machine learning models including SVM, kNN, and discriminant analysis. Jojoa Acostaet al.18 utilized transfer learning with ResNet-152 architecture to classify benign and malignantskin lesions using dermoscopic images.
Vasanthakumari et al.: Discrimination of cancerous from benign pigmented skin lesions. . .
Journal of Biomedical Optics 066002-2 June 2022 • Vol. 27(6)
Downloaded From: https://www.spiedigitallibrary.org/journals/Journal-of-Biomedical-Optics on 20 Jun 2022Terms of Use: https://www.spiedigitallibrary.org/terms-of-use

Tab
le1
Sum
maryof
prev
ious
lyrepo
rted
works
onpigm
entedskin
lesion
clas
sification.
Imag
ingmod
ality
Distributionof
patie
nts
orim
ages
Class
ifica
tiontask
Algorith
mPerform
ance
Validationor
testing
tech
niqu
eReferen
ce
Dermos
copy
Total
imag
es:91
4Melan
oma:
272
Bluene
vi:28
Dys
plas
ticne
vi:40
5Con
genitaln
evi:17
Dermal
nevi:33
Dermatofibroma:
20Ree
d/Spitz
nevi:79
Seb
orrheicke
ratose
s:47
Ben
ignve
rsus
maligna
ntK-m
eans
clus
terin
gan
dsy
mbo
licregres
sion
Sen
sitivity:62
%Spe
cificity:76
%Train-tes
tse
tsCeleb
iand
Zornb
erg8
Smartph
one
photog
raph
Ben
ign:
37Maligna
nt:46
Ben
ignve
rsus
maligna
ntkN
NAccurac
y:66
.7%
Sen
sitivity:60
.7%
Spe
cificity:80
.5%
Train-tes
tse
tsRam
lakh
anan
dSha
ng9
Com
puteriz
edde
rmos
copy
(3D)
PH2da
tase
tTotal
imag
es:20
0Melan
oma
Insitu
melan
oma
Atypica
lnev
usCom
mon
nevu
s
Multiclass
clas
sifie
r(PH2:
4clas
sesan
dATLA
S:8clas
ses)
SVM,Ada
Boo
st,BoF
PH2da
tase
tSen
sitivity:96
%Spe
cificity:97
%
Leav
e-on
e-ou
tcros
s-va
lidation
Sathe
esha
etal.10
ATLA
Sda
tase
tTotal
imag
es:63
Melan
oma
Insitu
melan
oma
BCC
Bluene
vus
Dermatofibroma
Hae
man
giom
apS
KNormal
mole
ATLA
Sda
tase
tSen
sitivity:98
%Spe
cificity:99
%
Vasanthakumari et al.: Discrimination of cancerous from benign pigmented skin lesions. . .
Journal of Biomedical Optics 066002-3 June 2022 • Vol. 27(6)
Downloaded From: https://www.spiedigitallibrary.org/journals/Journal-of-Biomedical-Optics on 20 Jun 2022Terms of Use: https://www.spiedigitallibrary.org/terms-of-use

Tab
le1(C
ontin
ued).
Imag
ingmod
ality
Distributionof
patie
nts
orim
ages
Class
ifica
tiontask
Algorith
mPerform
ance
Validationor
testing
tech
niqu
eReferen
ce
Ram
anan
dau
toflu
ores
cenc
esp
ectros
copy
Total
patie
nts:
56Melan
oma:
19BCC:18
Ben
ign:
19
Ben
ignve
rsus
maligna
ntBinarylogistic
regres
sion
Accurac
y:87
%Sen
sitivity:84
%Spe
cificity:89
%
Noinde
pend
ent
validation
Khristoforova
etal.11
FLIM
Melan
oma:
43BCC:28
SCC:67
Early-stage
canc
erve
rsus
adva
nced
-stage
canc
erRF,kN
N,SVM,LD
AAccurac
y:84
.62%
AUC:1
Boo
tstrap
ping
Yan
get
al.12
Dermos
copy
Total
imag
es:20
00Nev
us:13
72Melan
oma:
374
Seb
orrheicke
ratosis:
254
Three
clas
ses:
nevu
s,melan
oma,
sebo
rrhe
icke
ratosis
Ens
embleof
CNNs
AUC:0.89
1Training,
validation,
andtest
sets
Haran
gi13
Dermos
copy
ISBI20
16da
taba
seTrainingim
ages
:90
0Tes
tim
ages
:37
9
Ben
ignve
rsus
maligna
ntCNN
Accurac
y:81
.33%
Sen
sitivity:78
.6%
Precision
:79
.74%
Train-tes
tse
tsRom
eroLo
pezet
al.14
Dermos
copy
ISIC
databa
seTrainingim
ages
:90
0Ben
ign:
727
Melan
oma:
173
Tes
tim
ages
:37
9Ben
ign:
304
Melan
oma:
75
Ben
ignve
rsus
maligna
ntCNN
+SVM
Accurac
y:80
.5%
Sen
sitivity:53
.3%
Spe
cificity:87
.2%
Train-tes
tse
tsMajtner
etal.15
Dermos
copy
HAM10
000da
tase
tTrainingim
ages
:10
,015
Validationim
ages
:19
3Tes
tim
ages
:15
12
Sev
enclas
ses:
melan
oma,
melan
ocytic
nevu
s,BCC,
actin
icke
ratosis,
Bow
ens
dise
ase,
benign
keratosis,
derm
atofibroma,
vascular
lesion
Won
Derm
Fine-tune
dne
ural
networks
(Ens
emble)
Validationac
curacy
:89
.9%
Tes
tac
curacy
:78
.5%
Training,
validation,
andtest
sets
Leeet
al.16
Vasanthakumari et al.: Discrimination of cancerous from benign pigmented skin lesions. . .
Journal of Biomedical Optics 066002-4 June 2022 • Vol. 27(6)
Downloaded From: https://www.spiedigitallibrary.org/journals/Journal-of-Biomedical-Optics on 20 Jun 2022Terms of Use: https://www.spiedigitallibrary.org/terms-of-use

Tab
le1(C
ontin
ued).
Imag
ingmod
ality
Distributionof
patie
nts
orim
ages
Class
ifica
tiontask
Algorith
mPerform
ance
Validationor
testing
tech
niqu
eReferen
ce
Dermos
copy
ISBIan
dPH2da
tase
tsBen
ign:
3319
Melan
oma:
830
Ben
ignve
rsus
melan
oma
Fea
ture
extrac
tionus
ing
AlexN
etan
dVGG16
Class
ifica
tion:
ense
mble
ofkN
N,discrim
inan
tan
alysis,
SVM,an
dtree
Accurac
y:99
.0%
Sen
sitivity:99
.52%
Spe
cificity:98
.59%
FivefoldCV
and
0.5ho
ldou
tCV
Amin
etal.17
Dermos
copy
ISIC
datase
tMaligna
nt:11
7Ben
ign:
481
Ben
ignve
rsus
maligna
ntCNN:Res
Net
152
Accurac
y:90
.4%
Sen
sitivity:82
.0%
Spe
cificity:92
.5%
Train-tes
tse
tsJo
JoaAco
staet
al.18
CNN,c
onvo
lutio
naln
euraln
etwork;
RF,ran
dom
forests;
LDA,linea
rdiscrim
inan
tana
lysis;
SVM,s
uppo
rtve
ctor
mac
hine
;kNN,k
-nea
rest
neighb
or;F
LIM,fluores
cenc
elifetim
eim
aging;
AUC,a
rea
unde
rthecu
rve;
CV,cros
s-va
lidation;
BCC,ba
salc
ellc
arcino
ma.
Vasanthakumari et al.: Discrimination of cancerous from benign pigmented skin lesions. . .
Journal of Biomedical Optics 066002-5 June 2022 • Vol. 27(6)
Downloaded From: https://www.spiedigitallibrary.org/journals/Journal-of-Biomedical-Optics on 20 Jun 2022Terms of Use: https://www.spiedigitallibrary.org/terms-of-use
It has been widely established that autofluorescence responses of intrinsic fluorophores varysignificantly between normal and neoplastic tissues.19–23 Neoplastic progressions in the epi-thelial tissue are associated with morphological, biochemical, and functional alterations whichcan cause changes in the autofluorescence responses from the tissue.22–24 The skin has severalintrinsic fluorophores, such as nicotinamide adenine dinucleotide (NADH), flavin adenine dinu-cleotide (FAD), collagen, elastin, keratin, melanin, and porphyrins.19,25–27 The levels of two met-abolic cofactors and endogenous fluorophores in the epidermis, the reduced-form NADH andFAD, can change as skin cancer develops.19,24 The optical redox ratio, typically defined as theratio of fluorescence intensity of NADH to FAD, is sensitive to changes in the cellular metabolicrate. Increased cellular metabolic activity, a hallmark of neoplastic cell transformation, is usuallyattributed to a decrease in the optical redox ratio. In addition, the fluorescence lifetimes of thesemetabolic cofactors are sensitive to protein binding, thus to cellular metabolic pathways involv-ing NADH and FAD. As a result, carcinogenesis process has been shown to cause changes inboth NADH and FAD fluorescence lifetimes. Finally, cancer development also leads to extrac-ellular matrix remodeling occurring within the dermis, which together with concurring epidermisthickening, result in a decrease in connective tissue autofluorescence that can be measured.Therefore, interrogation of NADH, FAD, and collagen autofluorescence could provide opticalbiomarkers of skin epithelial cancer.
Preferential excitation of these endogenous fluorophores in the tissue by multiple excitationsources could shed light on the biochemical changes in the target lesion area.28 The broad emis-sion spectral bandwidth of the fluorescence intensity signal has an intrinsic disadvantage in thatit is difficult to differentiate between the intensities of overlapping emissions from multiple flu-orophores. Time-resolved technique such as multispectral autofluorescence lifetime imaging(maFLIM) overcomes this challenge by quantifying the fluorescence lifetime in addition to theemission spectrum. Alex et al.29 demonstrated fluorescence lifetime-based imaging of minipigskin and human skin to specifically target the endogenous fluorophores: keratin, NADH, mela-nin, elastin, and collagen under 725-nm multiphoton excitation. The capability of such opticalbiopsy techniques to serve as promising tools for dermatological research to facilitate preclinicaland clinical translation is also highlighted. Huck et al.30 demonstrated the effectiveness of thecombined modality, multiphoton-based intravital tomography and fluorescence lifetime imagingto monitor the progression of inflammatory skin diseases. The two modalities studied the bio-chemical changes induced by the redistribution of mitochondria at different stages of inflam-matory skin conditions.
Several animal and human tissue studies have been published on the autofluorescence prop-erties of skin cancer lesions.31–35 Pastore et al.36 conducted experiments with mouse models tostudy the autofluorescence response from melanoma skin lesions using multiphoton excitation at740 and 900 nm and emission spectral bands at 447 and 540 nm. A significant difference in thebound and free NADH ratio between cancerous and noncancerous sites was observed, while thefluorescence decay obtained from targeting FAD remained almost the same between the tworegions. It was also mentioned that the presence of melanin in the deeper layers of the skintissue could interfere with the overall fluorescence response from the lesions. Miller et al.32
studied the autofluorescence emission properties between squamous cell carcinoma (SCC) bear-ing and normal mice skin under 480-nm excitation, and a decrease in the short lifetime com-ponent for SCC in comparison to normal skin was observed for 535-nm emission band. Drakakiet al.37 studied the autofluorescence responses from mouse, chicken, and pig skins under ultra-violet (UV) excitation, and the structural differences and the variations in tissue constituentswere investigated between the different animal species for an emission spectral band between340 and 950 nm. De Beule et al.34 investigated the autofluorescence response from ex vivobiopsy skin lesions under 355- and 440-nm excitations, and the average fluorescence lifetimewas found to be useful in discriminating basal cell carcinoma (BCC) from normal skin tissues atthe emission band between 390 and 600 nm. Galletly et al.31 imaged unstained human biopsysamples using maFLIM under a 355-nm pulsed laser excitation, and significant differences in themean fluorescence lifetimes for the emission wavelengths 375 and 455 nm were observedbetween the autofluorescence responses from BCC skin lesions and healthy skin. Lohmann andBodeker38 analyzed the fluorescence intensities at the emission wavelength 470 nm, from humanskin with melanoma, nevi, and dysplastic nevi lesions under 365-nm excitation, and a significant
Vasanthakumari et al.: Discrimination of cancerous from benign pigmented skin lesions. . .
Journal of Biomedical Optics 066002-6 June 2022 • Vol. 27(6)
Downloaded From: https://www.spiedigitallibrary.org/journals/Journal-of-Biomedical-Optics on 20 Jun 2022Terms of Use: https://www.spiedigitallibrary.org/terms-of-use

difference in fluorescence intensities was observed for melanoma and nevi lesions, while mela-noma and dysplastic nevi lesions did not show much difference. Fast et al.39 investigated theautofluorescence response from human skin at 780-nm frequency doubled excitation and twoemission channels at 535 and 720 nm corresponding to red and green channels. Red channelcollects fluorescence emission from melanin, while the green channel collects emission fromkeratin, NAD(P)H, FAD, and elastin.
In this work, we developed and validated a label-free and objective image-guided strategyfor the clinical evaluation of suspicious pigmented skin lesions based on maFLIM dermoscopy.In addition, a computationally efficient frequency-domain deconvolution of maFLIM data isexplored, and three different pools of global image-level maFLIM features were evaluated formachine-learning (ML)-based objective discrimination between malignant and benign pigmentedskin lesions.
2 Methods
A summary of the complete methodology performed in this study is shown in Fig. 1.
2.1 maFLIM Dermoscopy Imaging of Skin Lesions
A total of 30 patients (npatients ¼ 30) from the Dermatology Department of the Amaral CarvalhoCancer Hospital (Jahu, Sao Paulo, Brazil) were recruited for this study, following a human studyprotocol approved by the Internal Review Board of that institution (CAAE: 71208817.5.00005434).Only patients presenting at least one pigmented skin lesion undergoing biopsy examination forskin cancer diagnosis were recruited. The pigmented skin lesions considered in this work are solarlentigo, pSK, pigmented superficial BCC, pigmented nodular BCC, and melanoma.
maFLIM images were obtained from clinically suspicious lesions using an in-house devel-oped time-domain maFLIM dermoscope previously described.40 With this maFLIM dermo-scope, skin tissue autofluorescence is simultaneously imaged at three emission bands (390� 20,452� 22.5, and >496 nm, preferentially targeting collagen, NADH, and FAD autofluorescenceemission, respectively) with a temporal resolution of 0.4 ns, field-of-view (FOV) of 8.65 ⋅8.65 mm2, and lateral resolution of 120 μm. For the rest of the paper, the emission wavelengthsat the three spectral channels will be more conveniently referred to as 390, 452, and 500 nm.After signing the corresponding written informed consent form, each patient underwent thefollowing imaging protocol right before the scheduled biopsy examination procedure. First, thelesion was gently cleaned with a gauze soaked in a saline solution. Then, the tip of the maFLIM
Fig. 1 Summary of methodology showing maFLIM image acquisition, preprocessing, featureextraction, and classification. maFLIM, multispectral autofluorescence lifetime imaging.
Vasanthakumari et al.: Discrimination of cancerous from benign pigmented skin lesions. . .
Journal of Biomedical Optics 066002-7 June 2022 • Vol. 27(6)
Downloaded From: https://www.spiedigitallibrary.org/journals/Journal-of-Biomedical-Optics on 20 Jun 2022Terms of Use: https://www.spiedigitallibrary.org/terms-of-use

dermoscope, previously disinfected using a gauze soaked in 70% ethanol, was placed in contactwith the lesion, and an maFLIM image was acquired. The imaging site was selected so regionswithin and outside the visible lesion were present within the FOVof the maFLIM dermoscope.Right after maFLIM imaging, lesion tissue biopsy was performed following standard proce-dures. Each maFLIM image was labeled based on the histopathological evaluation of the lesionbiopsy, which was considered the gold standard in this study. All images were acquired with alaser excitation at 355 nm and average excitation power of 10 mWmeasured at the sample, 140 ×140 pixels per image, and at a pixel rate of 10 kHz. These image acquisition parameters cor-responded to an acquisition time of 1.96 s per image and an excitation energy exposure of 1.96mJ at the sample, which is significantly lower than the maximum permissible exposure levelsfor skin based on guidelines from the American National Standards Institute – ANSI.41 The totalnumber of lesions imaged from the 30 patients was 60 (i.e., nlesions ¼ 60). An instrumentresponse function (IRF) was measured by acquiring the reflection of excitation pulse by placinga mirror at the sample end.
2.2 maFLIM Data Preprocessing
Pixel-level preprocessing: The maFLIM data measured at each image pixel ðp; qÞ are composedof three fluorescence intensity temporal decay signals ym;λðp; q; tÞmeasured at the three targetedemission spectral bands (λ). The preprocessing steps applied to each pixel maFLIM temporalsignal is shown in Fig. 2(a). First, offset subtraction was applied to the raw maFLIM signal,ym;λðp; q; tÞ, followed by spatial averaging (order 5 × 5) to increase the signal-to-noise ratio(SNR) of the time-dependent signal. The offset was estimated by fitting a straight line on thefirst and last five time points in each channel. The baseline was then subtracted from the entiretime vector to obtain the corrected signal. Since the background fluorescence was significantlylower than the sample fluorescence, the background correction of the signals was not performed.Second, the duration of the temporal decay signals for all emission bands was adjusted to thelength of the longest signal among the three emission channels, which is 149 temporal samples(59.6 ns) by applying zero padding to the short signals. Finally, the signals from the threeemission channels, yλðp; q; tÞ, are concatenated to form yðp; q; tÞ as shown in Eq. (1). Signalconcatenation is essential for cluster analysis in image level preprocessing, explained later inthis section, as well as for frequency-domain deconvolution explained in Sec. 2.3.2. The con-catenated signal at each pixel location can be represented as
EQ-TARGET;temp:intralink-;e001;116;338yðp; q; tÞ ¼X2n¼0
yλnþ1ðp; q; ðt −M:nÞÞ; (1)
Fig. 2 (a) Transformations in a single pixel multispectral maFLIM data during pixel-level prepro-cessing. (b) Example maFLIM image with K -means cluster mask and the two separated regions.The images map the total integrated intensity of the maFLIM signals at each pixel location.maFLIM, multispectral autofluorescence lifetime imaging.
Vasanthakumari et al.: Discrimination of cancerous from benign pigmented skin lesions. . .
Journal of Biomedical Optics 066002-8 June 2022 • Vol. 27(6)
Downloaded From: https://www.spiedigitallibrary.org/journals/Journal-of-Biomedical-Optics on 20 Jun 2022Terms of Use: https://www.spiedigitallibrary.org/terms-of-use

where yðp; q; tÞ is the preprocessed concatenated maFLIM decay signal; yλ1ðp; q; tÞ, yλ2ðp; q; tÞ,and yλ3ðp; q; tÞ are the preprocessed maFLIM decay signals from each of the three spectral chan-nels, λ1 ¼ 390 nm, λ2 ¼ 452 nm, and λ3 ¼ 500 nm; M is the temporal spacing between thesignals from the three channels; ðp; qÞ indicates the pixel locations. The value of M is equalto 149, which is the length of the fluorescence emission decays in each channel.
Image-level preprocessing: Pixels presenting either signal saturation or low SNR (<15 dB)were detected and masked. The majority of the acquired maFLIM images contain pixels fromwithin and outside the skin lesion region; thus, cluster analysis was performed to group pixelsbased on their region of origin. The concatenated signal yðp; q; tÞ is used as the feature vectorfor cluster analysis at each pixel location to simultaneously include the information from thethree emission channels. The steps for cluster analysis are as follows: First, an unsupervisedK-means clustering algorithm was applied to generate two cluster masks. Then, each clustermask is applied to the maFLIM image to define two regions within the FOV of the maFLIMimage. It should be noted that since the K-means clustering algorithm involves random initial-ization of cluster centroids, it is difficult to identify which cluster mask belongs to within oroutside the skin lesion region; thus, the identified regions were taken as two arbitrary regions:region-1 and region-2. Figure 2(b) shows an example of the cluster mask and the two separatedregions generated from a representative maFLIM image.
2.3 Feature Extraction
2.3.1 Features based on time-domain deconvolution parameter estimation
In the context of time-domain maFLIM data analysis, the fluorescence decay yλðp; q; tÞ mea-sured at each emission spectral band (λ) and spatial location ðp; qÞ can be modeled42 as theconvolution of the fluorescence impulse response (FIR) hλðp; q; tÞ of the sample and the mea-sured IRF uλðtÞ:
EQ-TARGET;temp:intralink-;e002;116;409yλðp; q; tÞ ¼ uλðtÞ � hλðp; q; tÞ: (2)
The standard method for time-domain maFLIM data analysis proceeds by first deconvolvingthe IRF of each spectral band (uλðtÞ) from the corresponding measured time-resolved fluores-cence signal yλðp; q; tÞ to estimate the sample FIR for each image pixel, hλðp; q; t),39 which isusually modeled as a multiexponential decay. The model order (number of exponential compo-nents) can be selected by analyzing the model-fitting mean squares error (MSE) as a function ofthe model order. For the maFLIM data of this study, a model order of two was selected, since theaddition of a third component did not reduce the MSE. The variations in error for one, two, andthree exponential components during fitting is shown in Fig. S1 in the Supplemental Material.The FIR was modeled as
EQ-TARGET;temp:intralink-;e003;116;269hλðp; q; tÞ ¼ αfast;λe−t
τfast;λðp;qÞ þ αslow;λe−t
τslow;λðp;qÞ; (3)
where τfast;λ and τslow;λ represent the time-constant (lifetime) of the fast and slow decay com-ponents, respectively; while αfast;λ and αslow;λ represent the contribution of the fast and slowdecay components, respectively. The average fluorescence lifetime for each spectral band at eachpixel location is computed as
EQ-TARGET;temp:intralink-;e004;116;185τavg;λðp; qÞ ¼Rthλðp; q; tÞdtRhλðp; q; tÞdt
: (4)
The parameters of the biexponential decay model are estimated for each pixel by nonlinearleast squares iterative reconvolution.42 After deconvolution, the biexponential parameters esti-mated at each pixel can be used as features representing the temporal dynamics of the fluores-cence decays at each emission spectral band: αfast;λðp; qÞ, αslow;λðp; qÞ, τfast;λðp; qÞ, τslow;λðp; qÞ,and τavg;λðp; qÞ. Since the sum of αfast;λðp; qÞ and αslow;λðp; qÞ is equal to one, only one of themis kept as a feature.
Vasanthakumari et al.: Discrimination of cancerous from benign pigmented skin lesions. . .
Journal of Biomedical Optics 066002-9 June 2022 • Vol. 27(6)
Downloaded From: https://www.spiedigitallibrary.org/journals/Journal-of-Biomedical-Optics on 20 Jun 2022Terms of Use: https://www.spiedigitallibrary.org/terms-of-use
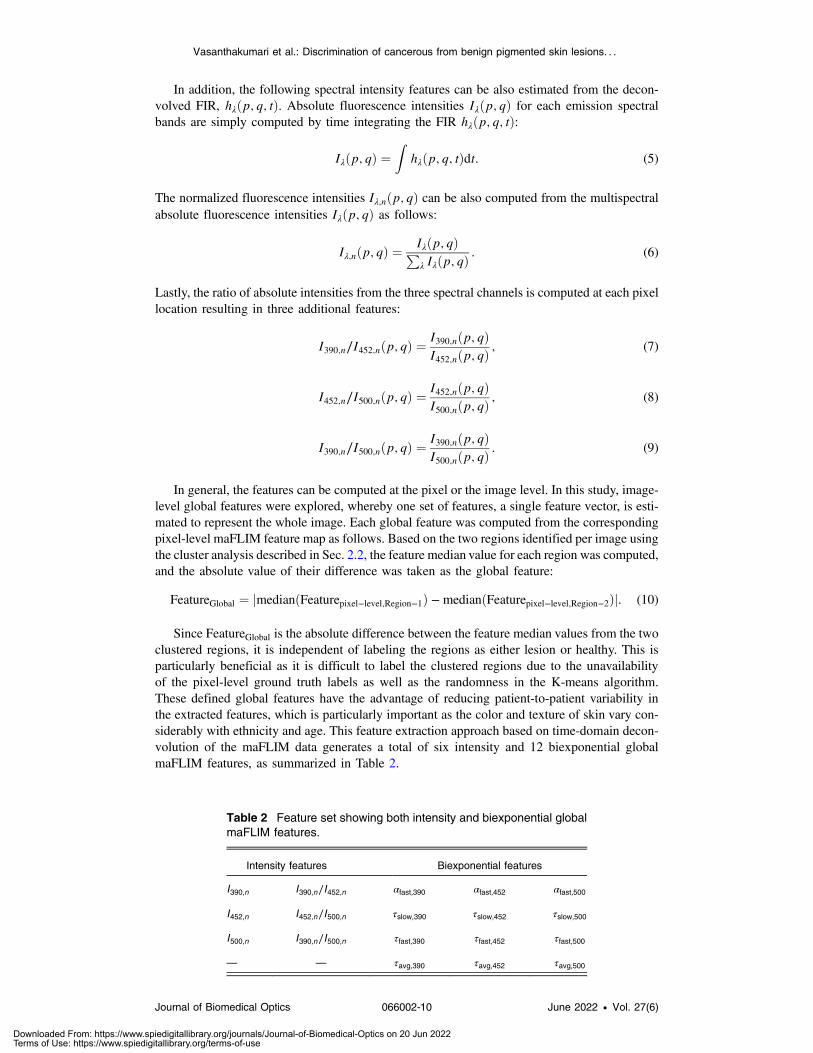
In addition, the following spectral intensity features can be also estimated from the decon-volved FIR, hλðp; q; tÞ. Absolute fluorescence intensities Iλðp; qÞ for each emission spectralbands are simply computed by time integrating the FIR hλðp; q; tÞ:
EQ-TARGET;temp:intralink-;e005;116;699Iλðp; qÞ ¼Z
hλðp; q; tÞdt: (5)
The normalized fluorescence intensities Iλ;nðp; qÞ can be also computed from the multispectralabsolute fluorescence intensities Iλðp; qÞ as follows:
EQ-TARGET;temp:intralink-;e006;116;632Iλ;nðp; qÞ ¼Iλðp; qÞPλ Iλðp; qÞ
: (6)
Lastly, the ratio of absolute intensities from the three spectral channels is computed at each pixellocation resulting in three additional features:
EQ-TARGET;temp:intralink-;e007;116;563I390;n∕I452;nðp; qÞ ¼I390;nðp; qÞI452;nðp; qÞ
; (7)
EQ-TARGET;temp:intralink-;e008;116;506I452;n∕I500;nðp; qÞ ¼I452;nðp; qÞI500;nðp; qÞ
; (8)
EQ-TARGET;temp:intralink-;e009;116;470I390;n∕I500;nðp; qÞ ¼I390;nðp; qÞI500;nðp; qÞ
: (9)
In general, the features can be computed at the pixel or the image level. In this study, image-level global features were explored, whereby one set of features, a single feature vector, is esti-mated to represent the whole image. Each global feature was computed from the correspondingpixel-level maFLIM feature map as follows. Based on the two regions identified per image usingthe cluster analysis described in Sec. 2.2, the feature median value for each region was computed,and the absolute value of their difference was taken as the global feature:
EQ-TARGET;temp:intralink-;e010;116;373FeatureGlobal ¼ jmedianðFeaturepixel−level;Region−1Þ −medianðFeaturepixel−level;Region−2Þj: (10)
Since FeatureGlobal is the absolute difference between the feature median values from the twoclustered regions, it is independent of labeling the regions as either lesion or healthy. This isparticularly beneficial as it is difficult to label the clustered regions due to the unavailabilityof the pixel-level ground truth labels as well as the randomness in the K-means algorithm.These defined global features have the advantage of reducing patient-to-patient variability inthe extracted features, which is particularly important as the color and texture of skin vary con-siderably with ethnicity and age. This feature extraction approach based on time-domain decon-volution of the maFLIM data generates a total of six intensity and 12 biexponential globalmaFLIM features, as summarized in Table 2.
Table 2 Feature set showing both intensity and biexponential globalmaFLIM features.
Intensity features Biexponential features
I390;n I390;n∕I452;n αfast;390 αfast;452 αfast;500
I452;n I452;n∕I500;n τslow;390 τslow;452 τslow;500
I500;n I390;n∕I500;n τfast;390 τfast;452 τfast;500
— — τavg;390 τavg;452 τavg;500
Vasanthakumari et al.: Discrimination of cancerous from benign pigmented skin lesions. . .
Journal of Biomedical Optics 066002-10 June 2022 • Vol. 27(6)
Downloaded From: https://www.spiedigitallibrary.org/journals/Journal-of-Biomedical-Optics on 20 Jun 2022Terms of Use: https://www.spiedigitallibrary.org/terms-of-use

2.3.2 Phasor-based features from frequency-domain deconvolved signals
As mentioned in Sec. 2.3.1, the parameters of the biexponential decay model are estimated foreach pixel by nonlinear least squares iterative reconvolution, which is computationally expensiveand time consuming. This brings about the need to develop a much simpler algorithm forextracting maFLIM features with comparatively similar discriminative capability. An alternatefitting-free strategy explored in this work is inspired by Campos-Delgado et al.,43 where a model-free representation of maFLIM data was developed utilizing the frequency-domain properties ofthe phasor representations. Here, we aim to replace the iterative time-domain deconvolutionprocess by a simple division operation in the frequency domain.44 The computational overloadis further reduced by processing the fluorescence decays of all the three spectral channelstogether, unlike in the traditional method where the maFLIM signal for each spectral channelmust be processed separately. Subsequently, several features can be extracted from the fre-quency-domain phasor representation of the maFLIM data.45,46 The presented method proceedsin three steps: (1) performing frequency-domain deconvolution of the instrument response fromthe concatenated pre-processed fluorescence decays from all the three spectral channels, (2) con-structing phasor plots for the maFLIM data, and (3) extracting global features from the phasorplots representing each maFLIM image. A detailed description of this method is presented asfollows.
In this approach, the preprocessed and concatenated maFLIM signals at each pixel location,yðp; q; tÞ are normalized to sum one for further processing and feature extraction. Similar to theconcatenated, preprocessed signal, yðp; q; tÞ, the concatenated IRF from all the three spectralchannels can be mathematically represented as
EQ-TARGET;temp:intralink-;e011;116;465uðtÞ ¼X2n¼0
uλnþ1ðt −M:nÞ; (11)
where uðtÞ is the concatenated IRF; uλ1ðtÞ, uλ2ðtÞ, and uλ3ðtÞ are the IRF signals from the threespectral channels; M is the temporal spacing between the signals from the three channels; andðp; qÞ indicates the pixel positions.
The first step of the algorithm is to compute the Fourier transform (FT) of both the prepro-cessed concatenated signal and the concatenated IRF. The FT of the signals yðp; q; tÞ and uðtÞcan be represented as Yðp; q;ωÞ and UðωÞ, respectively, where ω is the angular frequency:
EQ-TARGET;temp:intralink-;e012;116;342Yðp; q;ωÞ ¼ FTfyðp; q; tÞg; (12)
EQ-TARGET;temp:intralink-;e013;116;299UðωÞ ¼ FTfuðtÞg: (13)
If the effective FIR from all the three fluorescence emission channels is denoted as hðp; q; tÞ, theeffective fluorescence frequency response Hðp; q;ωÞ is obtained from the FT of hðp; q; tÞ as
EQ-TARGET;temp:intralink-;e014;116;265Hðp; q;ωÞ ¼ FTfhðp; q; tÞg: (14)
Therefore, the convolution in Eq. (1) can be represented as a multiplication in the frequencydomain as
EQ-TARGET;temp:intralink-;e015;116;210Yðp; q;ωÞ ¼ Hðp; q;ωÞUðωÞ: (15)
To uniformly scale all the frequency components of Yðp; q;ωÞ, the normalization with respect tothe DC response Yðp; q; 0Þ can be applied as follows:
EQ-TARGET;temp:intralink-;e016;116;155
Yðp; q;ωÞYðp; q; 0Þ ¼ Hðp; q;ωÞUðωÞ
Hðp; q; 0ÞUð0Þ : (16)
Subsequently, the normalized fluorescence frequency response Pðp; q;ωÞ can be estimated as
Vasanthakumari et al.: Discrimination of cancerous from benign pigmented skin lesions. . .
Journal of Biomedical Optics 066002-11 June 2022 • Vol. 27(6)
Downloaded From: https://www.spiedigitallibrary.org/journals/Journal-of-Biomedical-Optics on 20 Jun 2022Terms of Use: https://www.spiedigitallibrary.org/terms-of-use

EQ-TARGET;temp:intralink-;e017;116;526Pðp; q;ωÞ ¼ Hðp; q;ωÞHðp; q; 0Þ ¼ Yðp; q;ωÞUð0Þ
UðωÞYðp; q; 0Þ : (17)
A phasor representation for the normalized frequency response Pðp; q;ωÞ at specific valuesof the frequency ω can be generated by plotting the real Re½Pðp; q;ωÞ� versus the imaginaryIm½Pðp; q;ωÞ� components of Pðp; q;ωÞ. Therefore, each pixel of the maFLIM image ismapped to a point in the corresponding phasor plot generated for a specific frequency. Thistransformation is shown in Fig. 3, where a representative maFLIM image is mapped to its cor-responding phasor plot for an arbitrary frequency. Region-1 and region-2 marked on themaFLIM image represent the regions obtained after clustering. The pixels of each region aremapped into a two-dimensional (2D)-histogram distribution on the phasor plot, as shownin Fig. 3.
From the phasor representations of the maFLIM images at specific frequency components,ω ¼ 2πf, the following features were computed as follows. First, a bivariate Gaussian functionwas fitted to the phasor distribution of each region (region-1 and region-2) of a given maFLIMimage: f1 ¼ Nðμ1;Σ1Þ, f2 ¼ Nðμ2;Σ2Þ (Fig. 4). The “distance” between the phasor distribu-tions of the two regions was then estimated as the magnitude of the difference of the distributionmeans: d ¼ jμ1 − μ2j [Fig. 4(a)]. The determinant of the covariance matrix jΣj from the fittedGaussian distribution provides a measure of the “spread” of the distribution. The difference inspread of the phasor distributions of the two regions was thus estimated as: ΔΣ ¼ jΣ1 − Σ2j[Fig. 4(b)]. The “angle” θ between major axes of the phasor distributions of the two regionswas estimated as the acute angle between the eigenvectors of maximum variance of the multi-variate Gaussian distributions (Fig. 4(b)). Finally, the “symmetry” of the Gaussian distribution
can be quantified as the ratio of the variances along the orthogonal directions, s ¼ σ2pσ2q[Fig. 4(c)].
The difference in symmetry of the phasor distributions of the two regions was thus estimatedas: Δs ¼ js1 − s2j.
The fluorescence frequency response Hðp; q;ωÞ is bandlimited with a bandwidth of∼60 MHz. To cover the bandwidth of Hðp; q;ωÞ, only the first nine frequency componentsof Hðp; q;ωÞ were selected, corresponding to the frequencies 5.6, 11.2, 16.8, 22.4, 28,33.6, 39.2, 44.8, and 50.4 MHz. These frequency values are the first nine harmonics of the signalFourier spectrum, which was calculated at a frequency resolution of 5.6 MHz (sampling fre-quency/#samples ¼ 2.5 GHz∕ð3 × 149Þ). For each of these frequency components, the fourphasor features were computed, resulting in a total of 36 phasor features.
2.4 Feature Selection
For maFLIM dermoscopy-based automated classification of benign versus malignant skinlesions, a simple quadratic discriminant analysis (QDA) model was explored with the global
Fig. 3 Transition of a sample maFLIM image to the corresponding 2D histogram distribution on thephasor plot. Figure also shows the transformation of pixels from both regions 1 and 2 on themaFLIM image into corresponding points on the phasor plot computed at an arbitrary frequencycomponent.
Vasanthakumari et al.: Discrimination of cancerous from benign pigmented skin lesions. . .
Journal of Biomedical Optics 066002-12 June 2022 • Vol. 27(6)
Downloaded From: https://www.spiedigitallibrary.org/journals/Journal-of-Biomedical-Optics on 20 Jun 2022Terms of Use: https://www.spiedigitallibrary.org/terms-of-use

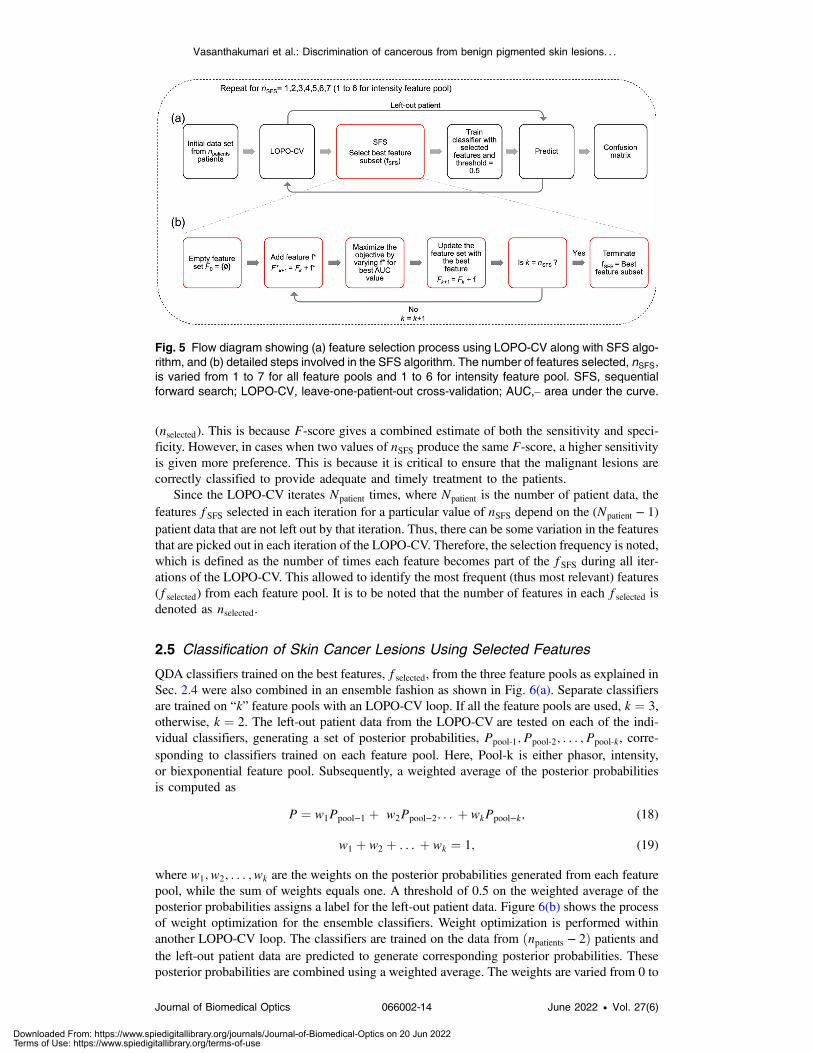
features described in Sec. 2.3. Three different pools of global features were considered: (1) inten-sity (nfeatures ¼ 6), (2) biexponential (nfeatures ¼ 12), and (3) phasor (nfeatures ¼ 36) features,where nfeatures is the number of features in each feature pool. In addition to these individualfeature pools, different combinations of the feature pools were also considered: phasor ∪biexponential (nfeatures ¼ 48), phasor ∪ intensity (nfeatures ¼ 42), intensity ∪ biexponential(nfeatures ¼ 18), and phasor ∪ biexponential ∪ intensity (nfeatures ¼ 54). Feature selection usingsequential forward search (SFS)47 was performed on each feature pool independently using aleave-one-patient-out cross-validation (LOPO-CV) strategy, whereby the data of one patient areleft out at each fold [Fig. 5(a)]. This assures that the left-out patient data are not used for featureselection and model training. Unlike exhaustive search where every possible combination offeatures is examined, SFS is computationally simpler and provides an efficient strategy to inves-tigate the importance of the available features. The steps involved in the SFS feature selectionprocess are shown in Fig. 5(b). The feature subset yielding the highest area under the curve(AUC) value in receiver operator characteristics (ROC) analysis was selected (fSFS) at each iter-ation of the LOPO-CV. Subsequently, the QDA classifier is retrained using fSFS at each LOPO-CV iteration and then tested using the left-out patient data. A threshold of 0.5 on the generatedposterior probability classifies the left-out patient data into either benign or malignant. Uponaccomplishing all folds, each patient data had been used as test, and a confusion matrix wasconstructed to estimate the classification model performance. The number of features selectedduring SFS (nSFS) is kept constant in each fold of the LOPO-CV. Therefore, to determine thenumber of features that can produce the best classifier, the experiments are repeated for differentvalues of nSFS, varying from 1 to 7 (1 to 6 for intensity feature pool). The maximum number offeatures in the feature set is chosen based on Hua et al.,48 where the optimal number of featuresfor feature sets with some degree of correlation is
ffiffiffiffiffiffiffiffiffindata
p, where ndata is the number of data
points. In this case, the maximum number of features is chosen as the closest and lower integervalue to
ffiffiffiffiffiffiffiffiffiffiffiffiffinlesions
p ¼ ffiffiffiffiffi60
p ¼ 7.75 ∼ 7. The value of nSFS that produced the best F-score computedfrom the final confusion matrix was then chosen as the number of features in the final feature set
Fig. 4 (a) 2D histogram phasor distributions from the pixels corresponding to the two regions in anmaFLIM image. The distance between the distributions is indicated by “d .” (b) Phasor distributionscatter plots with bivariate Gaussian fits on regions 1 and 2. The covariance matrices Σ1 and Σ2
give a measure of spread of the two regions and θ represents the angle between their major axes.(c) Phasor distribution scatter plot showing the variances σ2p and σ2q along the major axes. The ratioof the variances indicates the symmetry of the distribution.
Vasanthakumari et al.: Discrimination of cancerous from benign pigmented skin lesions. . .
Journal of Biomedical Optics 066002-13 June 2022 • Vol. 27(6)
Downloaded From: https://www.spiedigitallibrary.org/journals/Journal-of-Biomedical-Optics on 20 Jun 2022Terms of Use: https://www.spiedigitallibrary.org/terms-of-use
(nselected). This is because F-score gives a combined estimate of both the sensitivity and speci-ficity. However, in cases when two values of nSFS produce the same F-score, a higher sensitivityis given more preference. This is because it is critical to ensure that the malignant lesions arecorrectly classified to provide adequate and timely treatment to the patients.
Since the LOPO-CV iterates Npatient times, where Npatient is the number of patient data, thefeatures fSFS selected in each iteration for a particular value of nSFS depend on the (Npatient − 1)patient data that are not left out by that iteration. Thus, there can be some variation in the featuresthat are picked out in each iteration of the LOPO-CV. Therefore, the selection frequency is noted,which is defined as the number of times each feature becomes part of the fSFS during all iter-ations of the LOPO-CV. This allowed to identify the most frequent (thus most relevant) features(fselected) from each feature pool. It is to be noted that the number of features in each fselected isdenoted as nselected.
2.5 Classification of Skin Cancer Lesions Using Selected Features
QDA classifiers trained on the best features, fselected, from the three feature pools as explained inSec. 2.4 were also combined in an ensemble fashion as shown in Fig. 6(a). Separate classifiersare trained on “k” feature pools with an LOPO-CV loop. If all the feature pools are used, k ¼ 3,otherwise, k ¼ 2. The left-out patient data from the LOPO-CV are tested on each of the indi-vidual classifiers, generating a set of posterior probabilities, Ppool-1; Ppool-2; : : : ; Ppool-k, corre-sponding to classifiers trained on each feature pool. Here, Pool-k is either phasor, intensity,or biexponential feature pool. Subsequently, a weighted average of the posterior probabilitiesis computed as
EQ-TARGET;temp:intralink-;e018;116;198P ¼ w1Ppool−1 þ w2Ppool−2: : : þ wkPpool−k; (18)
EQ-TARGET;temp:intralink-;e019;116;154w1 þ w2 þ : : : þ wk ¼ 1; (19)
where w1; w2; : : : ; wk are the weights on the posterior probabilities generated from each featurepool, while the sum of weights equals one. A threshold of 0.5 on the weighted average of theposterior probabilities assigns a label for the left-out patient data. Figure 6(b) shows the processof weight optimization for the ensemble classifiers. Weight optimization is performed withinanother LOPO-CV loop. The classifiers are trained on the data from ðnpatients − 2Þ patients andthe left-out patient data are predicted to generate corresponding posterior probabilities. Theseposterior probabilities are combined using a weighted average. The weights are varied from 0 to
Fig. 5 Flow diagram showing (a) feature selection process using LOPO-CV along with SFS algo-rithm, and (b) detailed steps involved in the SFS algorithm. The number of features selected, nSFS,is varied from 1 to 7 for all feature pools and 1 to 6 for intensity feature pool. SFS, sequentialforward search; LOPO-CV, leave-one-patient-out cross-validation; AUC,– area under the curve.
Vasanthakumari et al.: Discrimination of cancerous from benign pigmented skin lesions. . .
Journal of Biomedical Optics 066002-14 June 2022 • Vol. 27(6)
Downloaded From: https://www.spiedigitallibrary.org/journals/Journal-of-Biomedical-Optics on 20 Jun 2022Terms of Use: https://www.spiedigitallibrary.org/terms-of-use

1 in steps of 0.1. The corresponding sensitivities and specificities are obtained using a thresholdof 0.5 on the weighted-average probability. An ROC curve is constructed on these weights, andthe weight closest to the ideal point ([0,1]) is selected.
3 Results
3.1 maFLIM Dermoscopy Clinical Imaging of Skin Lesions
The distribution of patients (npatients ¼ 30) and lesions (nlesions ¼ 60) imaged in this study show-ing benign and malignant conditions is provided in Table 3. Benign lesions included solar lentigoand pSK, while malignant lesions included pigmented superficial BCC, pigmented nodularBCC, and melanoma.
Figure 7(a) shows a handheld maFLIM dermoscope imaging the forearm of a patient. Theclinical photograph of a sample melanoma skin lesion is shown in Fig. 7(b), and its correspond-ing maFLIM feature maps are shown in Fig. 7(c). The scales of the feature maps across thethree spectral wavelengths are kept the same for comparison purposes. Most of the feature maps(including αfast;390, αfast;452, τfast;452, τfast;500, τslow;390, τslow;452, τslow;500, τavg;390, τavg;452 τavg;500,
Fig. 6 (a) Schematic of classification of skin lesions. The posterior probabilities from the individualclassifiers are combined in an ensemble fashion. (b) Weight optimization for the ensemble clas-sifier. The optimum weight is selected from the ROC curve. LOPO-CV, leave-one-patient-outcross-validation; QDA, quadratic discriminant analysis; ROC, receiver operator characteristics.
Table 3 Distribution of imaged benign and malignant lesions.
Type No. patients No. lesions
Benign Solar lentigo 2 10
Pigmented seborrheic keratosis 15 31
Malignant Pigmented superficial BCC 2 6
Pigmented nodular BCC 5 5
Melanoma 6 8
Vasanthakumari et al.: Discrimination of cancerous from benign pigmented skin lesions. . .
Journal of Biomedical Optics 066002-15 June 2022 • Vol. 27(6)
Downloaded From: https://www.spiedigitallibrary.org/journals/Journal-of-Biomedical-Optics on 20 Jun 2022Terms of Use: https://www.spiedigitallibrary.org/terms-of-use

Fig. 7 (a) Handheld maFLIM dermoscope imaging the forearm of a patient. (b) Clinical photographof a melanoma lesion. (c) Time-domain maFLIM feature maps of a melanoma lesion. The columnsshow the feature maps corresponding to the three emission channels. First row shows the weightof the fast decay. Second row shows the fast lifetime maps, while the third row shows the slowlifetime maps. Average lifetime maps are shown in the fourth row. Fifth row shows the integratedintensity maps of each spectral emission channel, and the ratio of the intensities are shown in thesixth row. The last row shows the cluster mask generated for the lesion and the integrated inten-sities from all the channels for the clustered regions 1 and 2. The horizontal strip in the images isdue to the presence of hair on the skin during imaging.
Vasanthakumari et al.: Discrimination of cancerous from benign pigmented skin lesions. . .
Journal of Biomedical Optics 066002-16 June 2022 • Vol. 27(6)
Downloaded From: https://www.spiedigitallibrary.org/journals/Journal-of-Biomedical-Optics on 20 Jun 2022Terms of Use: https://www.spiedigitallibrary.org/terms-of-use

In;452, In;500, I452;n∕I500;n and I390;n∕I500;n) clearly show two distinguishable regions: the centerand the surrounding regions. The cluster masks for this sample image are also shown in the lastrow of Fig. 7(c). The maps showing the two clustered regions: region-1 and region-2 are plottedusing the normalized integrated intensities (IIntegrated) from the three spectral emission channels.
The relative contributions of fast lifetime (αfast) for the spectral channels 390 and 452 nmexhibit a higher value in the central region compared with the surrounding regions. Fast lifetime(τfast) values for the spectral channels 452 and 500 nm are lower in the central region than thesurrounding. Slow lifetime (τslow) values for all the three spectral channels are higher in thecenter than the surrounding regions. The average lifetimes (τavg) of the pixels from the centralregion are higher than the surrounding parts. The relative intensity (In) values for spectral chan-nel 452 nm is lower in the center compared to the surrounding, while that for the spectral channel500 nm is higher in the center compared with the surrounding. The ratios of the intensities,I452;n∕I500;n and I390;n∕I500;n, are lower in the central region compared with the surroundingregions.
3.2 Feature Selection
As explained in the feature selection process in Sec. 2.4, the multiple lesions from a singlepatient constitute the left-out data in each iteration; thus, the number of lesions that are testedin each iteration varies depending on the number of lesions that are imaged for the left-outpatient. In this way, every patient becomes part of the testing, and a confusion matrix is gen-erated after all LOPO-CV iterations are completed. As mentioned in Sec. 2.4, the number offeatures nSFS was varied from 1 to 6 for intensity feature pool, and 1 to 7 for phasor and biex-ponential feature pools. The optimum number of features nselected is chosen based on the highestF-score. Table 4 shows values of accuracy, sensitivity (Sn), specificity (Sp), and F-score
Table 4 Performance metrics and confusion matrices obtained during feature selection withphasor, biexponential, and intensity feature pools.
Feature pool (total no.of features) nSelected
Accuracy(%)
Sn(%)
Sp(%)
F score(%)
Confusion matrices
True
Predicted
Benign Malignant
Phasor (36) 6 76.67 68.42 80.49 65.00 Benign 33 8
Malignant 6 13
Bi-exponential (12) 5 75.00 84.21 70.73 68.09 Benign 29 12
Malignant 3 16
Intensity (6) 1 48.33 84.21 31.71 50.79 Benign 13 28
Malignant 3 16
Phasor ∪ biexponential (48) 4 56.67 63.17 56.10 48.98 Benign 23 18
Malignant 7 12
Phasor ∪ intensity (42) 6 53.33 63.16 48.79 46.15 Benign 20 21
Malignant 7 12
Biexponential ∪ intensity (18) 7 63.33 63.16 63.41 52.17 Benign 26 15
Malignant 7 12
Phasor ∪ biexponential ∪intensity (54)
6 61.67 47.37 68.29 43.90 Benign 28 13
Malignant 10 9
Vasanthakumari et al.: Discrimination of cancerous from benign pigmented skin lesions. . .
Journal of Biomedical Optics 066002-17 June 2022 • Vol. 27(6)
Downloaded From: https://www.spiedigitallibrary.org/journals/Journal-of-Biomedical-Optics on 20 Jun 2022Terms of Use: https://www.spiedigitallibrary.org/terms-of-use
obtained when classifying benign and malignant skin lesions trained individually on the threefeature pools (phasor, biexponential, and intensity). The table shows the results for nselectednumber of features in each feature pool. Results obtained during feature selection for all thevalues of nSFS is given in Tables S1–S3 in the Supplemental Material. QDA models trained onfive biexponential features yielded the best performance with 75% accuracy, 84.21% sensitivity,70.73% specificity, and 68.09% F-score. QDA models trained on six phasor features yieldedthe next best performance with 76.67% accuracy, 68.42% sensitivity, 80.49% specificity, and65% F-score. QDA models trained on the intensity feature pool resulted in 84.21% sensitivity,but only 31.71% specificity.
The results from the combined feature pools show poor performance with low sensitivitiesand specificities. This is because the features selected by the SFS algorithm in the earlier iter-ations may not be the best when combined with those selected in the later iterations. From theseresults, it can be inferred that the five biexponential features and the six phasor features havepotential in classifying benign and malignant skin lesions. The confusion matrices of the clas-sifiers are also shown in Table 4.
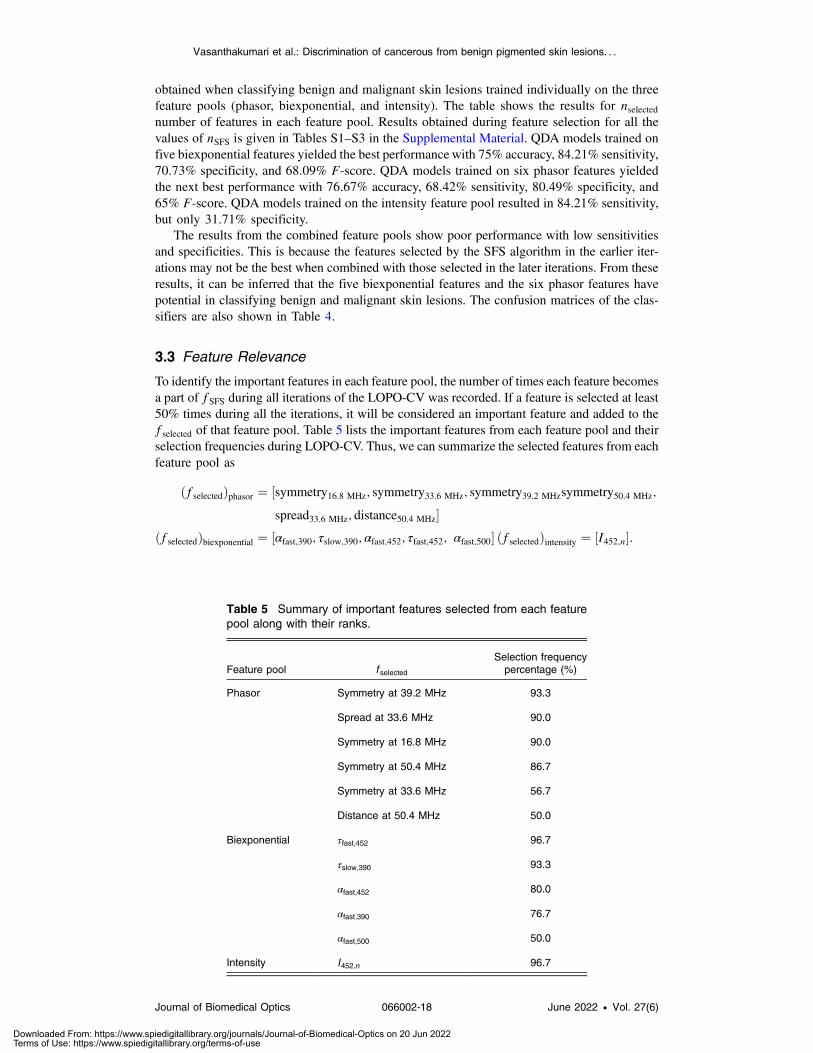
3.3 Feature Relevance
To identify the important features in each feature pool, the number of times each feature becomesa part of fSFS during all iterations of the LOPO-CV was recorded. If a feature is selected at least50% times during all the iterations, it will be considered an important feature and added to thefselected of that feature pool. Table 5 lists the important features from each feature pool and theirselection frequencies during LOPO-CV. Thus, we can summarize the selected features from eachfeature pool asEQ-TARGET;temp:intralink-;sec3.3;116;447 ðfselectedÞphasor ¼ ½symmetry16.8 MHz; symmetry33.6 MHz; symmetry39.2 MHzsymmetry50.4 MHz;
spread33.6 MHz; distance50.4 MHz�ðfselectedÞbiexponential ¼ ½αfast;390; τslow;390; αfast;452; τfast;452; αfast;500� ðfselectedÞintensity ¼ ½I452;n�:
Table 5 Summary of important features selected from each featurepool along with their ranks.
Feature pool f selectedSelection frequencypercentage (%)
Phasor Symmetry at 39.2 MHz 93.3
Spread at 33.6 MHz 90.0
Symmetry at 16.8 MHz 90.0
Symmetry at 50.4 MHz 86.7
Symmetry at 33.6 MHz 56.7
Distance at 50.4 MHz 50.0
Biexponential τfast;452 96.7
τslow;390 93.3
αfast;452 80.0
αfast;390 76.7
αfast;500 50.0
Intensity I452;n 96.7
Vasanthakumari et al.: Discrimination of cancerous from benign pigmented skin lesions. . .
Journal of Biomedical Optics 066002-18 June 2022 • Vol. 27(6)
Downloaded From: https://www.spiedigitallibrary.org/journals/Journal-of-Biomedical-Optics on 20 Jun 2022Terms of Use: https://www.spiedigitallibrary.org/terms-of-use

3.4 Classification of Skin Cancer Lesions Using Selected Features
The methodology of classifying skin lesions using the selected features is explained in Sec. 2.5.As shown in Fig. 6, “k” QDA classifiers trained separately on the fselected features from “k”feature pools are combined in an ensemble fashion. Four different combinations of feature poolsare used for constructing ensemble classifiers, as shown in Table 6. A weighted average of theposterior probabilities generated from the “k”QDA classifiers is calculated to predict the label ofthe left-out patient data. Since the weights are optimized within an LOPO-CV loop, there can besome variation in the weights selected during the npatients iterations.
Figure 8 shows the histograms of the weights obtained during all the iterations for the ensem-ble classifiers using the four feature pool combinations. Since the sum of weights of “k” featurepools is one, it is sufficient to show the weights of (k − 1) feature pools. It can be seen from
Table 6 Performance metrics of ensemble classifiers trained with multiple combinations of fea-ture pools.
Feature sets for ensembleAccuracy
(%)Sn(%)
Sp(%)
F -score(%)
Confusion matrices
True
Predicted
Benign Malignant
ðf selectedÞbiexponential þ ðf selectedÞintensity 71.67 84.21 65.85 65.31 Benign 27 14
Malignant 3 16
ðf selectedÞphasor þ ðf selectedÞbiexponential 88.33 84.21 90.24 82.05 Benign 37 4
Malignant 3 16
ðf selectedÞphasor þ ðf selectedÞintensity 86.67 78.95 90.24 78.95 Benign 37 4
Malignant 4 15
ðf selectedÞphasor þ ðf selectedÞbiexponential þðf selectedÞintensity
88.33 84.21 90.24 82.05 Benign 37 4
Malignant 3 16
Fig. 8 Histogram of weights on one of the feature pools, when combined in an ensemble fashionfor (a) phasor-intensity, (b) biexponential-intensity, (c) phasor-biexponential, and (d) phasor-biexponential-intensity feature pools.
Vasanthakumari et al.: Discrimination of cancerous from benign pigmented skin lesions. . .
Journal of Biomedical Optics 066002-19 June 2022 • Vol. 27(6)
Downloaded From: https://www.spiedigitallibrary.org/journals/Journal-of-Biomedical-Optics on 20 Jun 2022Terms of Use: https://www.spiedigitallibrary.org/terms-of-use

Table 6 that the ensemble combination of QDA classifiers trained on phasor and biexponentialfeatures as well as the ensemble combination of all the three feature pools, produced the bestperformance with 88.33% accuracy, 84.21% sensitivity, 90.24% specificity, and F-score of82.05%. The next best performance is obtained by the ensemble combination of phasor andintensity feature pools with an accuracy of 86.67%, sensitivity of 78.95, specificity of 90.4%,and an F-score of 78.95%. Ensemble combination of intensity and biexponential features pro-duced an accuracy of 71.67%, sensitivity of 84.21%, specificity of 65.85%, and F-score of65.31%. Table 6 also shows the confusion matrices for all the classifiers. While analyzing theweights on the feature pools during the ensemble combination, it can be seen in Figs. 8(a) and8(b) that intensity features have a higher weightage when combined with phasor features. Whenphasor and biexponential features are combined, both the feature pools have similar weightage asshown in Fig. 8(c). Similarly, when biexponential and intensity feature pools are combined, boththe pools have comparable weightage. When all the feature pools are combined, it can be seenfrom Fig. 8(d) that the phasor and biexponential features pools have similar weight distributionin the range [0.1, 0.5]. The weights on the intensity feature pool are widely dispersed in the range[0, 0.8].
4 Discussion
In this study, clinical widefield autofluorescence imaging of benign and malignant pigmentedskin lesions was successfully performed in 30 patients using a recently developed maFLIMdermoscope.40 The resulting maFLIM images from 60 pigmented lesions enabled exploringsteady-state (intensity) and time-resolved (biexponential, phasor) autofluorescence global fea-tures. Results based on rigorous cross-validation methods demonstrate that simple ML classi-fication models (QDA) based on selected time-resolved autofluorescence global features havethe potential to provide discrimination of malignant from benign pigmented skin lesions.
To the best of our knowledge, only one published work has reported the use of machinelearning models based on autofluorescence lifetime imaging features for the classification ofpigmented skin lesions.12 In that study, however, only skin melanoma lesions were imaged, andthe classification task was restricted to discriminate early-stage from advanced-stage skin mela-noma. In contrast, a more comprehensive set of pigmented skin lesions were imaged in this work(two benign and three malignant lesion categories). Moreover, the classification task focused ondiscriminating malignant from benign pigmented lesions, which might be clinically more rel-evant for early detection of skin cancer.
In multidimensional imaging data, such as in maFLIM, image features can be extracted atthe pixel or the image level. We have recently explored pixel-level maFLIM features for theclassification of oral dysplasia and early-stage cancer.49 Pixel-level features, however, requirethe labeling of each pixel which is generally impractical. In this work, the maFLIM data werelabeled at the lesion level based on the histopathology diagnosis obtained from the lesion biopsysamples; therefore, an image-level global feature extraction strategy was preferred. As shown inFig. 7, two regions were frequently observed in the maFLIM images, corresponding to pixelseither within or outside the lesion extension. In an attempt to reduce interpatient variability, theexplored relative features were defined in terms of difference in autofluorescence propertiesbetween the two regions identified in each lesion maFLIM image. This strategy of using global(image-level) and relative features can find applications in many other classification tasks basedon optical imaging data.
The performance of ML classification models needs to be carefully estimated when trainedon limited sample size. To minimize overfitting and avoid overoptimistic performance estima-tions, a rigorous strategy was adopted for feature selection, model training, and performanceestimation. First, the maximum number of features allowed (seven) was limited based on thesample size.48 Second, a simple nonlinear classification model (QDA) was adopted. Third, cross-validation was applied at the patient-level (LOPO-CV) to ensure that data from the same patientis not used for both training and validation. Fourth, feature selection was performed togetherwith model training to make sure that the validation data are not used during neither featureselection nor model training. It should be noted that at each fold of the cross-validation strategy,
Vasanthakumari et al.: Discrimination of cancerous from benign pigmented skin lesions. . .
Journal of Biomedical Optics 066002-20 June 2022 • Vol. 27(6)
Downloaded From: https://www.spiedigitallibrary.org/journals/Journal-of-Biomedical-Optics on 20 Jun 2022Terms of Use: https://www.spiedigitallibrary.org/terms-of-use

a different classification model (with different selected features and model parameters) is appliedto the validation set. Thus, although a single optimal model is not necessarily defined, thisapproach still enables identifying relevant features and providing unbiased classification perfor-mance estimation.
Classification performance was dependent of the feature pool used in the model. The mostfrequently selected intensity feature was I452;n which is associated to NADH fluorescence con-tribution. Although the classification models using intensity features showed good sensitivity(∼84%), their specificity was poor (∼31%). This means that steady state intensity features arenot sufficient to minimize false positives while discriminating benign and malignant lesions.Classification models using biexponential features showed similar sensitivity (∼84%) than thosewith intensity features, but significantly higher specificity (∼70%). These results indicate thattime-resolved properties of pigmented skin lesion autofluorescence could represent biomarkersof skin cancer. While examining the selected features from the biexponential feature pool, it canbe seen from Table 5 that the most frequently selected features were associated to NADH(τfast;452, αfast;452) and collagen (τslow;390, αfast;390) fluorescence temporal dynamics. The fast life-time component of NADH (τfast;452, αfast;452) is associated with the free state of the molecule,19
suggesting that metabolic pathway changes induced by malignant transformations alter themicroenvironment of NADH molecules. Unlike NADH or FAD, the collagen is not involvedin cellular respiration and is not part of metabolic pathways. Changes in collagen autofluores-cence response can occur in benign and malignant lesions as they mostly correspond to skinthickening, extracellular matrix remodeling, and texture changes.23 Therefore, the selectedfeatures corresponding to collagen autofluorescence (τslow;390, αfast;390) can provide high sensi-tivity but may not contribute to high specificity leading to several false positives as can be seenin Table 4.
The phasor representation of fluorescence lifetime imaging data analysis is a noniterative,model-free, fast approach to visualize the lifetime components (and their distributions) of thefluorescence emission of a sample.50–53 In this work, a modified version of this method wasapplied to the clinical multispectral maFLIM data, and a set of global image features wereextracted from the corresponding phasor representation of the two regions present in each lesionmaFLIM image (Fig. 4). The processing times taken for computing phasor and biexponentialfeatures from one sample lesion using a computer with an i7 Intel core processor and 48 GBRAM were found to be 10.5 and 251.8 s, respectively. Therefore, phasor-based features aresimpler and ∼25 times faster than traditional time resolved biexponential features. Unlike biex-ponential maFLIM features, the phasor features explored cannot be directly interpreted in termsof the skin autofluorescent constituents. Nevertheless, the classification models using phasorfeatures showed superior specificity (∼80%) than those using biexponential features, suggestingthat these two different pools of time-resolved maFLIM features might be complementary.Phasor-based features are computed from the concatenated signal and contain information fromall three emission channels. It is challenging to develop solid reasoning for the high specificityobtained from these features; however, since every phasor-based feature contains informationfrom all three channels, each channel’s contribution is not quantifiable.
Feature selection starting with combinations of feature pools were also explored, although theresulting models showed lower classification performance overall (Table 4). On the other hand,ensemble classifiers based on models using the most frequently selected features of each pooloutperformed any other models (Table 5). In particular, the ensemble classifier combining themodels based on the most frequently selected biexponential and phasor features resulted in thebest performance overall (∼84% sensitivity and ∼90% specificity). Moreover, the optimumweights identified for these ensemble models indicate that both the phasor and biexponentialfeatures contribute equally to the weighted probability [Fig. 8(c)]. These results further indicatethat these two maFLIM feature pools might be complementary, as biexponential features seem tocontribute to higher sensitivity, while phasor features to higher specificity.
Some of the studies summarized in Table 1 produced superior classification performancescompared with that reported in this work. However, those studies employed complex machinelearning and deep learning algorithms, such as Adaboost,10 BoF,10 and CNN’s for classifica-tion,18 and feature extraction.17 This work uses a simple QDAmachine learning model to analyzethe performance with different feature pools. It is plausible that more complex machine learning
Vasanthakumari et al.: Discrimination of cancerous from benign pigmented skin lesions. . .
Journal of Biomedical Optics 066002-21 June 2022 • Vol. 27(6)
Downloaded From: https://www.spiedigitallibrary.org/journals/Journal-of-Biomedical-Optics on 20 Jun 2022Terms of Use: https://www.spiedigitallibrary.org/terms-of-use

classification models, such as neural networks, might provide superior performance. Given thelimited data available for training and validation, however, a simple QDA model was selected, asit still enables nonlinear decision boundaries while reducing the chances of overfitting. In addi-tion, by choosing a simple classification method, it is possible to analyze other aspects of clas-sification model, such as the feature pools, number of features, and ensemble combinations of thefeature pools.
Recent advances in artificial intelligence (AI) are allowing the development of CAD systemsfor discriminating benign from malignant skin lesions based on digital dermoscopy data.Although these CAD systems have not been translated yet to the clinic, preliminary validationstudies demonstrate their potential to discriminate typical benign from malignant lesions.Dermoscopy data, however, provide information limited to the visual appearance of the lesions;thus, AI-assisted digital dermoscopy is less suitable for the discrimination of visually similarbenign and malignant skin lesions. maFLIM dermoscopy data, on the other hand, can captureautofluorescence-based biochemical and metabolic biomarkers of skin malignant transforma-tion, which is independent of lesion visual appearance. This property is especially importantin distinguishing visually similar benign and malignant lesions, thus minimizing the numberof false positives and, in turn, reducing the number of unnecessary biopsies. In particular, thelesion types included in this work—pSK and melanoma, are visually similar benign and malig-nant lesions, which can be easily misdiagnosed during dermoscopic evaluation. Therefore,maFLIM dermoscopy has the potential to complement digital dermoscopy by providing superiorperformance in the discrimination of visually similar benign and malignant skin lesions.
4.1 Study Limitations
Although this preliminary clinical study demonstrates the potential of maFLIM-derived auto-fluorescence features to discriminate malignant from benign pigmented skin lesions, a numberof limitations are recognized. First, the database of maFLIM images is limited in both the typeof benign and malignant skin conditions, and the number of samples per condition. A morecomprehensive and larger database will be needed to fully develop accurate enough classificationmethods for skin lesion discrimination and to rigorously quantify their performance in prospec-tive studies. Second, the lack of histopathology-based assessment of the maFLIM imaging dataat the pixel-level prevented to specifically quantify the capabilities of maFLIM dermoscopy asa tool for not only detecting malignant skin lesions but also determining their true extension andmargins. Third, the current maFLIM dermoscopy system provides nonspecific excitation andspectral detection of skin autofluorescence component emission. Finally, the current implemen-tation of the ML classification models does not allow for real-time processing of maFLIM data.Ongoing research efforts aiming to overcome these limitations include collecting maFLIM der-moscopy images from a plurality of nonpigmented and pigmented skin lesions from patientsof various skin tones, performing accurate pixel-level registration between the lesion maFLIMimaging data and histopathology tissue sections, developing improved maFLIM dermoscopesystems with multiwavelength excitation and narrow-band emission detection capabilities, andimplementing optimized CAD using field programmable gate arrays and graphics processingunits technologies for real-time maFLIM data processing, pixel-level classification, and tissuemapping visualization.
4.2 Clinical Perspective
The incidence of skin cancer including melanoma continues to increase yet most providers isforced to rely on their own visual recognition skills and experience to identify concerninglesions. In addition, many patients do not have access to a trained dermatologist which can placethem in a potentially precarious situation since early detection of skin cancer leads to bettersurvival rates. The importance of early detection cannot be understated, as it not only saveslives but also reduces the invasiveness of the treatment patients undergo and conserves preciousmedical resources, leading to quality, cost-conscious care. A noninvasive, label-free, fast, accu-rate, and objective tool capable of discriminating most common malignant from benign skinlesions would improve the clinical management of patients. Currently, there is no objective
Vasanthakumari et al.: Discrimination of cancerous from benign pigmented skin lesions. . .
Journal of Biomedical Optics 066002-22 June 2022 • Vol. 27(6)
Downloaded From: https://www.spiedigitallibrary.org/journals/Journal-of-Biomedical-Optics on 20 Jun 2022Terms of Use: https://www.spiedigitallibrary.org/terms-of-use

device providers can use to independently identify cancerous skin lesions. In the hand of primarycare physicians, such a tool will enable the early identification of patients in need of referral to adermatologist. In addition, the dermatologists could use such tool to identify lesions in need of abiopsy, thus reducing the rate of unnecessary biopsies and adverse events such as pain, infection,and scarring. Such a tool would also assist with monitoring cancer recurrence without the need ofregular and frequent biopsies. This work demonstrates that maFLIM dermoscopy aided by MLmodels could potentially have the capabilities of such tool, thus impacting the clinical manage-ment of skin cancer patients for the better.
5 Conclusion
The results of this study demonstrate the capabilities of maFLIM dermoscopy to clinically imagea plurality of autofluorescence biomarkers of malignant skin pigmented lesions. Moreover, someof these autofluorescence biomarkers were identified as promising for malignant lesion identi-fication, particularly those quantifying the time-resolved fluorescence characteristics of skinlesions. In addition, these relevant autofluorescence biomarkers were successfully used as fea-tures in ML models trained to discriminate malignant from benign pigmented skin lesions withpromising accuracy (∼84% sensitivity and ∼90% specificity). Further developments in maFLIMinstrumentation and image analysis methods could result in clinical tools for noninvasive, label-free, accurate, and objective in situ detection of malignant from benign skin lesions, with thepotential to impact the clinical management of skin cancer patients.
Disclosures
The authors have no relevant financial interests in the paper and no other potential conflicts ofinterest to disclose.
Acknowledgements
This study was supported by the National Institutes of Health (NIH/NCI Grant No.1R01CA218739) and the Cancer Prevention and Research Institute of Texas (CPRIT Grant No.RP180588). This study was also supported by the following Brazilian funding agencies:Coordenação de Aperfeiçoamento de Pessoal de Nível Superior - Brasil (CAPES) – FinanceCode 001; CNPq-PVE (401150/2014-3 and 314533/2014-1); CNPq-PQ (305795/2016-3) andSão Paulo Research Foundation (FAPESP) Grant Nos: 2013/07276-1 (CEPOF) and 2014/50857-8 (INCT).
References
1. R. L. Siegel et al., “Cancer statistics, 2021,” CA: A Cancer J. Clin. 71(1), 7–33 (2021).2. H. Kittler et al., “Diagnostic accuracy of dermoscopy,” Lancet Oncol. 3(3), 159–165 (2002).3. A.Masood and A. A. Al-Jumaily, “Computer aided diagnostic support system for skin cancer:
a review of techniques and algorithms,” Int. J. Biomed. Imaging 2013, 323268 (2013).4. R. M. Bakos et al., “Noninvasive imaging tools in the diagnosis and treatment of skin
cancers,” Am. J. Clin. Dermatol. 19(s1), 3–14 (2018).5. D. A. Shoieb, S. M. Youssef, and W. M. Aly, “Computer-aided model for skin diagnosis
using deep learning,” J. Image Graphics 4, 122–129 (2016).6. B. Rosado et al., “Accuracy of computer diagnosis of melanoma: a quantitative meta-
analysis,” Arch. Dermatol. 139(3), 361–367 (2003).7. D. Adla et al., “Deep learning-based computer aided diagnosis model for skin cancer detec-
tion and classification,” in Distributed and Parallel Databases, Springer (2021).8. M. E. Celebi and A. Zornberg, “Automated quantification of clinically significant colors
in dermoscopy images and its application to skin lesion classification,” IEEE Syst. J. 8(3),980–984 (2014).
Vasanthakumari et al.: Discrimination of cancerous from benign pigmented skin lesions. . .
Journal of Biomedical Optics 066002-23 June 2022 • Vol. 27(6)
Downloaded From: https://www.spiedigitallibrary.org/journals/Journal-of-Biomedical-Optics on 20 Jun 2022Terms of Use: https://www.spiedigitallibrary.org/terms-of-use

9. K. Ramlakhan and Y. Shang, “A mobile automated skin lesion classification system,” inIEEE 23rd Int. Conf. Tools with Artif. Intell., IEEE, pp. 138–141 (2011).
10. T. Y. Satheesha et al., “Melanoma is skin deep: a 3D reconstruction technique for comput-erized dermoscopic skin lesion classification,” IEEE J. Transl. Eng. Health Med. 5(Dec.2016), 1–17 (2017).
11. Y. A. Khristoforova et al., “Optical diagnostics of malignant and benign skin neoplasms,”Proc. Eng. 201, 141–147 (2017).
12. Q. Yang et al., “Classification of skin cancer based on fluorescence lifetime imaging andmachine learning,” Proc. SPIE 11553, 115531Y (2020).
13. B. Harangi, “Skin lesion classification with ensembles of deep convolutional neural net-works,” J. Biomed. Inf. 86, 25–32 (2018).
14. A. Romero Lopez et al., “Skin lesion classification from dermoscopic images using deeplearning techniques,” in 13th IASTED Int. Conf. Biomed. Eng. (BioMed), IEEE, Interna-tional Association of Science and Technology for Development—IASTED, pp. 49–54(2017).
15. T. Majtner, S. Yildirim-Yayilgan, and J. Y. Hardeberg, “Combining deep learning and hand-crafted features for skin lesion classification,” in 6th Int. Conf. Image Process. Theory, Toolsand Appl., IPTA IEEE, IEEE, pp. 1–6 (2016).
16. Y. C. Lee, S.-H. Jung, and H.-H. Won, “WonDerM: skin lesion classification with fine-tunedneural networks,” arXiv:1808.03426 (2018).
17. J. Amin et al., “Integrated design of deep features fusion for localization and classification ofskin cancer,” Pattern Recognit. Lett. 131, 63–70 (2020).
18. M. F. Jojoa Acosta et al., “Melanoma diagnosis using deep learning techniques on dermato-scopic images,” BMC Med. Imaging 21(1), 6 (2021).
19. M. C. Skala et al., “In vivo multiphoton microscopy of NADH and FAD redox states, fluo-rescence lifetimes, and cellular morphology in precancerous epithelia,” Proc. Natl. Acad.Sci. U. S. A. 104(49), 19494–19499 (2007).
20. P. Diagaradjane et al., “Autofluorescence characterization for the early diagnosis of neoplas-tic changes in DMBA/TPA-induced mouse skin carcinogenesis,” Lasers Surg. Med. 37(5),382–395 (2005).
21. Y. Yuan et al., “Autofluorescence of NADH is a new biomarker for sorting and character-izing cancer stem cells in human glioma,” Stem Cell Res. Ther. 10(1), 330 (2019).
22. K. Awasthi et al., “Sensitive detection of intracellular environment of normal and cancercells by autofluorescence lifetime imaging,” J. Photochem. Photobiol. B: Biol. 165,256–265 (2016).
23. E. Duran-Sierra et al., “Clinical label-free biochemical and metabolic fluorescence lifetimeendoscopic imaging of precancerous and cancerous oral lesions,” Oral Oncol. 105, 104635(2020).
24. O. I. Kolenc and K. P. Quinn, “Evaluating cell metabolism through autofluorescenceimaging of NAD(P)H and FAD,” Antioxid. Redox Signaling 30(6), 875–889 (2019).
25. I. Giovannacci et al., “Which are the main fluorophores in skin and oral mucosa? A reviewwith emphasis on clinical applications of tissue autofluorescence,” Arch. Oral Biol. 105,89–98 (2019).
26. R. Na et al., “Autofluorescence spectrum of skin: component bands and body site varia-tions,” Skin Res. Technol. 6, 112–117 (2000).
27. E. A. Shirshin et al., “Label-free sensing of cells with fluorescence lifetime imaging: thequest for metabolic heterogeneity,” Proc. Natl. Acad. Sci. U. S. A. 119, e2118241119(2022).
28. Y. Wu and J. Y. Qu, “Autofluorescence spectroscopy of epithelial tissues,” J. Biomed. Opt.11(5), 054023 (2006).
29. A. Alex et al., “In vivo characterization of minipig skin as a model for dermatologicalresearch using multiphoton microscopy,” Exp. Dermatol. 29(10), 953–960 (2020).
30. V. Huck et al., “From morphology to biochemical state - intravital multiphoton fluorescencelifetime imaging of inflamed human skin,” Sci. Rep. 6, 22789 (2016).
31. N. P. Galletly et al., “Fluorescence lifetime imaging distinguishes basal cell carcinomafrom surrounding uninvolved skin,” Br. J. Dermatol. 159(1), 152–161 (2008).
Vasanthakumari et al.: Discrimination of cancerous from benign pigmented skin lesions. . .
Journal of Biomedical Optics 066002-24 June 2022 • Vol. 27(6)
Downloaded From: https://www.spiedigitallibrary.org/journals/Journal-of-Biomedical-Optics on 20 Jun 2022Terms of Use: https://www.spiedigitallibrary.org/terms-of-use

32. J. P. Miller et al., “Multimodal fluorescence molecular imaging for in vivo characterizationof skin cancer using endogenous and exogenous fluorophores,” J. Biomed. Opt. 22(6),066007 (2017).
33. E. G. Borisova et al., “Autofluorescence spectroscopy of cutaneous neoplasia under ultra-violet, visible and near infrared excitation,” Proc. SPIE 11363, 113630Z (2020).
34. P. A. A. de Beule et al., “A hyperspectral fluorescence lifetime probe for skin cancer diag-nosis,” Rev. Sci. Instrum. 78(12), 123101 (2007).
35. H. Zeng et al., “Autofluorescence properties of skin and applications in dermatology,” Proc.SPIE 4224, 366–373 (2000).
36. M. N. Pastore et al., “Non-invasive metabolic imaging of melanoma progression,” Exp.Dermatol. 26(7), 607–614 (2017).
37. E. Drakaki et al., “Laser induced autofluorescence studies of animal skin used in modelingof human cutaneous tissue spectroscopic measurements,” Skin Res. Technol. 13(4), 350–359(2007).
38. W. Lohmann and R. H. Bodeker, “In situ differentiation between nevi and malignant mela-nomas by fluorescence measurements,” Naturwissenschaften 78, 456–457 (1991).
39. A. Fast et al., “Fast, large area multiphoton exoscope (FLAME) for macroscopic imagingwith microscopic resolution of human skin,” Sci. Rep. 10, 18093 (2020).
40. R. A. Romano et al., “Multispectral autofluorescence dermoscope for skin lesion assess-ment,” Photodiagn. Photodyn. Ther. 30, 101704 (2020).
41. R. Henderson and K. Schulmeister, “Laser safety,” J. Chem. Inf. Model. 53(9), 97–131(2004).
42. J. R. Lakowicz, Principles of Fluorescence Spectroscopy, Springer (2006).43. D. U. Campos-Delgado et al., “Extended output phasor representation of multi-spectral
fluorescence lifetime imaging microscopy,” Biomed. Opt. Express 6(6), 2088 (2015).44. P. Vasanthakumari et al., “Classification of skin-cancer lesions based on fluorescence life-
time imaging,” Proc. SPIE 11317, 113170Z (2020).45. D. Kim et al., “Phasor plot analysis using low pass filter for high-speed FLIM,” Proc. SPIE
10884, 108840P (2019).46. T. Luo et al., “Phasor-FLIM as a screening tool for the differential diagnosis of actinic kera-
tosis, Bowen’s disease, and basal cell carcinoma,” Anal. Chem. 89(15), 8104–8111 (2017).47. P. Pudil, J. Novovicová, and J. Kittler, “Floating search methods in feature selection,”
Pattern Recognit. Lett. 15(11), 1119–1125 (1994).48. J. Hua et al., “Optimal number of features as a function of sample size for various classi-
fication rules,” Bioinformatics 21(8), 1509–1515 (2005).49. E. Duran-Sierra et al., “Machine-learning assisted discrimination of precancerous and can-
cerous from healthy oral tissue based on multispectral autofluorescence lifetime imagingendoscopy,” Cancers (Basel) 13(19), 4751 (2021).
50. M. A. Digman et al., “The phasor approach to fluorescence lifetime imaging analysis,”Biophys. J. 94(2), L14–L16 (2008).
51. B. K. Wright et al., “Phasor-flim analysis of NADH distribution and localization in thenucleus of live progenitor myoblast cells,” Microsc. Res. Tech. 75(12), 1717–1722 (2012).
52. N. Ma et al., “Measurements of absolute concentrations of NADH in cells using the phasorFLIM method,” Biomed. Opt. Express 7(7), 2441 (2016).
53. F. Fereidouni, A. N. Bader, and H. C. Gerritsen, “Spectral phasor analysis allows rapid andreliable unmixing of fluorescence microscopy spectral images,” Opt. Express 20(12),12729–12741 (2012).
Priyanka Vasanthakumari received her PhD from the Department of Biomedical Engineering,Texas A&M University. She received her MS degree in biomedical engineering from the IndianInstitute of Technology Madras in 2016 and her BTech degree in applied electronics and instru-mentation engineering in 2013. Her current research interests include applications of machinelearning and deep learning algorithms in medical sciences. She is a member of SPIE.
Vladislav Yakovlev is a full professor in Department of Biomedical Engineering at Texas A&MUniversity. He has more than 180 research publications in leading scientific journals. He is a
Vasanthakumari et al.: Discrimination of cancerous from benign pigmented skin lesions. . .
Journal of Biomedical Optics 066002-25 June 2022 • Vol. 27(6)
Downloaded From: https://www.spiedigitallibrary.org/journals/Journal-of-Biomedical-Optics on 20 Jun 2022Terms of Use: https://www.spiedigitallibrary.org/terms-of-use

fellow of OSA, AIMBE, APS, and SPIE. He is a member of the editorial board of Optica,Journal of Biomedical Optics, and Applied Sciences. His research interests are in a broad areaof spectroscopy and imaging. He received the 2021 SPIE Harold E. Edgerton Award.
Cristina Kurachi, PhD, is an associate professor at the São Carlos Institute of Physics,University of São Paulo (Brazil), working on biophotonics with main expertise in photodynamictherapy and optical diagnosis. His main interests lie in the development of new protocols andinstrumentation for medical applications in cancer and infectious diseases, from proof-of-conceptvalidation at preclinical studies, up to the clinical translation of the photonic technologies.
Jason M. Hirshburg MD, PhD, is currently the medical director for dermatology at theUniversity of Oklahoma Health Sciences Center in Oklahoma City, Oklahoma, where he splitshis time between patient care in general dermatology and Mohs micrographic surgery, residenteducation, and research. Prior to his clinical practice, he received his PhD in biomedical engi-neering before his medical training in general dermatology and a Mohs Micrographic Surgeryand Dermatologic Oncology fellowship.
Javier A. Jo is a biomedical scientist and a professor in electrical and computer engineering(University of Oklahoma). He has pioneered the integration of optical imaging technologies withmachine learning to develop smart imaging systems, which are facilitating precision medicine byconverting imaging big data into more effective, personalized clinical decisions. He is a fellow ofthe international society for optics and photonics (SPIE) and the American Institute for Medicaland Biological Engineering (AIMBE).
Biographies of the other authors are not available.
Vasanthakumari et al.: Discrimination of cancerous from benign pigmented skin lesions. . .
Journal of Biomedical Optics 066002-26 June 2022 • Vol. 27(6)
Downloaded From: https://www.spiedigitallibrary.org/journals/Journal-of-Biomedical-Optics on 20 Jun 2022Terms of Use: https://www.spiedigitallibrary.org/terms-of-use