discounting disentangled - london school of economics
TRANSCRIPT
Discounting disentangled
Moritz Drupp, Mark Freeman,
Ben Groom and Frikk Nesje
November 2015
Centre for Climate Change Economics and Policy
Working Paper No. 195
Grantham Research Institute on Climate Change and
the Environment
Working Paper No. 172

The Centre for Climate Change Economics and Policy (CCCEP) was established by the University of Leeds and the London School of Economics and Political Science in 2008 to advance public and private action on climate change through innovative, rigorous research. The Centre is funded by the UK Economic and Social Research Council. Its second phase started in 2013 and there are five integrated research themes:
1. Understanding green growth and climate-compatible development 2. Advancing climate finance and investment 3. Evaluating the performance of climate policies 4. Managing climate risks and uncertainties and strengthening climate services 5. Enabling rapid transitions in mitigation and adaptation
More information about the Centre for Climate Change Economics and Policy can be found at: http://www.cccep.ac.uk. The Grantham Research Institute on Climate Change and the Environment was established by the London School of Economics and Political Science in 2008 to bring together international expertise on economics, finance, geography, the environment, international development and political economy to create a world-leading centre for policy-relevant research and training. The Institute is funded by the Grantham Foundation for the Protection of the Environment and the Global Green Growth Institute. It has nine research programmes:
1. Adaptation and development 2. Carbon trading and finance 3. Ecosystems, resources and the natural environment 4. Energy, technology and trade 5. Future generations and social justice 6. Growth and the economy 7. International environmental negotiations 8. Modelling and decision making 9. Private sector adaptation, risk and insurance
More information about the Grantham Research Institute on Climate Change and the Environment can be found at: http://www.lse.ac.uk/grantham. This working paper is intended to stimulate discussion within the research community and among users of research, and its content may have been submitted for publication in academic journals. It has been reviewed by at least one internal referee before publication. The views expressed in this paper represent those of the author(s) and do not necessarily represent those of the host institutions or funders.
Discounting Disentangled
Moritz A. Drupp1, Mark C. Freeman2,
Ben Groom3 and Frikk Nesje4∗
As the most important driver of long-term project evaluation, from climate
change policy to infrastructure investments, the social discount rate (SDR) has been
subject to heated debate among economists. To uncover the extent and sources of
disagreement, we report the results of a survey of over 200 experts that disentangles
the long-term SDR into its component parts: the pure rate of time preference, the
wealth effect, and the real risk-free interest rate. The mean recommended SDR is
2.27 percent, with a range from 0 to 10 percent. Despite disagreement on point
values, more than three-quarters of experts are comfortable with the median SDR of
2 percent, and over 90 percent find an SDR in the range of 1 to 3 percent acceptable.
Our disentangled data reveal that only a minority of responses are consistent with
the Ramsey Rule, the theoretical framework dominating discounting policy. Instead,
experts recommend that governmental discounting guidance should be updated to
deal with uncertainty, relative prices, and alternative ethical approaches.
Keywords: Social discount rate, project appraisal, expert opinions, disagreement.
JEL codes: H43, D61, Q58.
∗1Department of Economics, University of Kiel, Germany; mail: [email protected] 2 School of Business and Economics, Loughborough University, United Kingdom; mail:[email protected]. 3 Department of Geography and Environment, London School of Eco-nomics, United Kingdom; mail: [email protected]. 4 Department of Economics and ESOP, Uni-versity of Oslo, Norway; mail: [email protected]. We would like to express our deepestgratitude to our many survey respondents for their time and thoughts. We further thank JuliusAndersson, Geir Asheim, Stefan Baumgartner, Wolfgang Buchholz, Simon Dietz, Bard Harstad,Cameron Hepburn, Svenn Jensen, Antony Millner, Kian Mintz-Woo, Paolo Piacquadio, MartinQuaas, Thomas Sterner, Gernot Wagner and Marty Weitzman as well as seminar audiences atBergen, Berlin, Camp Reinsehlen, EAERE 2015, Edinburgh, EEA 2015, EnvEcon 2015, Geneva,Gothenburg, Hamburg, Kiel, Oslo, Ulvon 2015 and ZEW for helpful discussions. We thank theLSE Research Seed Fund for financial support and Natalia Grinberg for research assistance. Druppis grateful for financial support from the German National Academic Foundation, the DAAD, andthe BMBF under grant 01LA1104C. Author for correspondence: Ben Groom.
1
1. Introduction
We report the results of a survey of experts on the appropriate long-term real
social discount rate (SDR). The sample contains over 200 academics who are defined
as experts on social discounting by virtue of their publications. We elicit responses,
both quantitative and qualitative, on each expert’s approach to intergenerational
discounting. A key innovation of our survey is that we elicit the recommended values
for the individual components of the Ramsey Rule. Together with the recommended
point value of the SDR and its acceptable range, the responses allow us to disentangle
the sources of disagreement on the SDR. Our findings lead us to the conclusion that
current policy guidance concerning social discounting and the evaluation of long-
term public projects requires significant revision.
The opinions of experts who are “genuine specialists” play an important role in
public policy. One need only look at the Stern Review and the numerous expert
panels held in recent years to see that social discounting is no exception. Govern-
ments listen to what experts say on this matter.1 Yet, to date, there is no detailed
survey of expert opinion on discounting. This is a serious omission since discounting
the distant future has been described as “one of the most critical problems in all
of economics” (Weitzman 2001: 260). Views on discounting differ substantially and
over the past decades economists have found themselves either stumbling around in
the “dark jungles of the second best” in pursuit of an answer or accused of “stoking
the dying embers of the British Empire” if they claim to find one (Baumol 1968:
789; Nordhaus 2007: 691). Despite this, we have little understanding of the source
or extent of this disagreement. In this context, the Ramsey Rule has been a constant
presence as the workhorse representation of the SDR, serving as a “useful conceptual
framework for examining intergenerational discounting issues” (Arrow et al. 2012:
3). Policy guidelines on cost-benefit analysis across the world are testament to this
view (HMT 2003; IPCC 2014; Lebegue 2005). However, the exact role that the Ram-
sey Rule should play is controversial, as are the appropriate values for its individual
parameters (Dasgupta 2008; Nordhaus 2007; Stern 2007; Weitzman 2007).
Disagreement typically stems from the three different representations of the rule,
and the normative-positive content of its parameters (Arrow et al., 1996). Originally,
1Since the Stern Review, expert advice on social discounting has been sought from specialistsin the field by the United States Environmental Protection Agency (US EPA), and the Norwegian,French, UK and Dutch governments.
2

it was presented as an optimality condition for the savings decisions of a representa-
tive agent (Ramsey 1928). On the optimal path the marginal productivity of capital,
r, equals the Social Rate of Time Preference (SRTP), defined as the right hand side
of Equation 1:2
r = SDR = δ + ηg. (1)
The SRTP is composed of the rate of pure time preference or utility discount rate
(δ), and the interaction of the expected real growth rate of per-capita consumption
(g) and the elasticity of marginal utility of consumption (η). Another interpretation
of the Ramsey Rule associates the SDR solely with the SRTP: SDR = δ + ηg.
This approach focuses on the trajectory of consumption while ignoring that of the
capital stock on the production side. It is typically considered to be the normative or
prescriptive approach to determining the SDR, and is the interpretation followed by
Her Majesty’s Treasury in the United Kingdom (HMT 2003), for instance. Finally,
there is the opportunity cost of capital approach: SDR = r. Here the focus is on the
trajectory of the capital stock, while that of consumption is ignored. This approach
is informed by anchoring the SDR in an observable rate of return in the market
place, such as the yield on government bonds. This is the positive or descriptive
approach followed by the US EPA (2010), among others.
Without explicitly referencing the Ramsey Rule, our survey seeks the opinions
of experts not only on the SDR itself, but also on the values of its components and
determinants (r, δ, η, and g). This allows us to disentangle expert disagreement on
the SDR into some of its fundamental constituent parts.
The responses make for interesting reading. The mean (median) recommended
SDR of our experts is 2.27 percent (2 percent). This is substantially lower than
the mean (median) values 3.96 percent (3 percent) reported in the seminal survey
by Weitzman (2001), yet the modal value of 2 percent is the same. We also find
that there remains substantial disagreement between experts over this value, with
individual recommendations ranging between 0 and 10 percent. Despite this, 92
percent of experts report that they would be comfortable with a SDR somewhere in
the interval of 1 percent to 3 percent, and over three-quarters find a SDR value of 2
percent acceptable.
2The First Welfare Theorem applies in the equivalent perfectly competitive economy, so theoptimality condition in Equation 1 can be thought of as an equilibrium condition.
3
Looking at the empirical distributions of the individual determinants of the dis-
count rate, we find that expert opinion is particularly varied on the appropriate rate
of pure time preference. The modal value is zero, in line with many prominent opin-
ions, including Ramsey (1928) himself. But with a mean (median) of 1.1 percent (0.5
percent), the results do not confirm the IPCC’s (2014: 229) conclusion that “a broad
consensus for a zero or near-zero pure rate of time preference” exists. Also, while
we find that experts, on average, recommend placing greater weight on normative
than positive issues when determining the SDR, most believe that the SDR should
be informed by both.
An unambiguous result of our survey is that the prominence of the simple Ramsey
Rule in public policy needs to be revisited. When we use the Ramsey Rule to
impute an individual SDR for each expert, we find that there are wide discrepancies
between this value and their recommended SDR. Both the average SRTP and the
forecasted risk-free interest rate are higher than the average recommended SDR.
The rich body of qualitative responses provided by our experts further stresses the
need for policy on long-term public decision-making to depart from the confines
of the simple Ramsey Rule. Accounting for a more comprehensive set of technical
issues, such as uncertainty and relative prices of non-marketed goods, was one set
of recommended departures. Ensuring that decision-making on long-term public
policies is participatory and takes a more procedural approach, was another. A
third set of recommendations stressed the importance of different societal criteria
which embody broader notions of intergenerational equity and sustainability.
There are good arguments for a more “democratic” approach to informing gov-
ernmental guidance on social discounting (Dasgupta 2008: 158). Yet, because the
questions raised by long-term discounting are highly complex, there are also strong
reasons for so-called “genuine specialists” (Pindyck 2015; Sunstein 2014: 550) to
play an active role. Precisely because discounting policy is so often influenced by
experts who are specialists in the field, it is imperative to obtain a more complete
picture of the range of opinions they hold. By presenting the responses of a large
number of experts on the determinants of the long-term SDR, this paper contributes
to the ongoing academic debate over improving conceptual approaches to intergen-
erational decision-making. It also provides detailed information for the discounting
policy revisions taking place in several countries.
4
2. Survey Design and Expert Selection
2.1. The Survey Questions
The survey asked respondents about the SDR and its determinants within the
setting of the Ramsey Rule. The questionnaire began with the following contextual
preamble:
Imagine that you are asked for advice by an international governmental
organization that needs to determine the appropriate real social discount
rate for calculating the present value of certainty-equivalent cash flows of
public projects with intergenerational consequences.
For its calculations, the organization needs single values for the compo-
nents of the real social discount rate. While this does not capture all
of the important complexities of social discounting, it does reflect most
existing policy guidance on the matter. Your answers will therefore help
to improve the current state of decision-making for public investments.
Specifically, you are asked to provide your recommendations on the single
number, global average and long-term (>100 years) values of the follow-
ing determinants of the social discount rate:
This was followed by seven brief quantitative questions and an optional comments
section for qualitative responses. The full survey text is presented in the Appendix.3
Questions 1–3 elicited responses on the three individual parameter values that
underlie the Ramsey Rule’s SRTP approach; δ, η and g. Question 4 asked for a fore-
cast of the long-term global average real interest rate, r. Question 6 asked for the
point-value of the SDR that should be recommended for evaluating the certainty-
equivalent cash flows of a generic global public project with intergenerational con-
sequences.4 Having a separate question on the SDR meant that respondents could
deviate from both the real risk-free interest rate and the SRTP if they so wished,
3We had previously piloted different potential versions of the survey with selected discountingexperts, economists from different fields, and students to find the best trade-off between complete-ness and parsimony.
4For reasons of parsimony, the survey was not designed to elicit opinions on the treatment ofuncertain future benefits in intergenerational cost-benefit analysis.
5
and allowed more complex issues in social discounting to be manifested in their rec-
ommended SDR. The survey did not refer to the Ramsey Rule explicitly to avoid
providing a cue to respondents that they should conform to it. As a result, the
survey did not include a direct mechanism to extract the rationales for deviating
from the Ramsey Rule. However, the open comments section, Question 8, allowed
for feedback on the survey, where respondents could, and often did, point towards
various deviations from the Ramsey Rule.
Question 5 elicited information about each respondent’s approach to discount-
ing by asking for the relative weight that the governmental body should place on
normative versus positive approaches to determining the SDR. Responses were mea-
sured on a sliding scale from 0 to 100 percent. This question intended not only
to highlight potential heterogeneity in responses, but also to explore the disagree-
ment in rationales that has been evident at least since Arrow et al. (1996): whether
normative issues, involving intergenerational ethics and justice, or positive issues,
involving forecasted future returns to financial assets, or a mixture of both should
determine the SDR. Importantly, the sliding scale admits many interpretations of
normative and positive other than those associated with the Ramsey Rule. For in-
stance, responses could reflect the relative weight that respondents place on different
consequentialist or deontological ethical frameworks. In Question 7 we asked for the
minimum and maximum values of the SDR that respondents would be comfortable
with recommending, in order to elicit an ‘agreeable range’.
2.2. Expert Selection and Survey Dissemination
Because our survey aimed at disentangling the determinants of the long-term
SDR, we restricted our sample to scholars who have been involved with these complex
issues and hence can be considered genuine specialists. For the purposes of this
paper, an individual is deemed to be an “expert” if he or she is a (co-)author of
at least one pertinent publication in the field of (social) discounting in a leading
economics journal. A journal was classified as “leading” if, according to the ranking
of 600 economics journals by Combes and Linnenmer (2010, Table 15), it is rated A
or higher, together with the highly relevant Review of Environmental Economics and
Policy. This amounts to 103 peer-reviewed journals. A publication is deemed to be
“pertinent” if it was published between January 2000 and March 2014 and, according
to the Google Scholar engine, included at least one of the terms ‘social discounting’,
6
‘social discount rate’ or ‘social discount factor’. We further performed an EconLit
abstract-based search for the broader term ‘discount rate’ within the same journals.
Correcting for scholars with multiple publications, and also discarding papers that
did not pass a weak relevancy test (see Supplementary material A), our sample of
potential experts includes 627 scholars.
There are some limitations to this selection strategy. First, by restricting the
search to publications since the year 2000 to only capture scholars active in the
current debate on social discounting, we potentially miss some relevant earlier con-
tributors. Second, by selecting experts based on their publications, we necessarily
include co-authors of relevant papers who are not themselves experts on discounting.
Third, due to the rather generous weak relevancy test, we include a number of schol-
ars who might not regard themselves as true experts on the issue. Fourth, we do
not pick up relevant publications in the field that have used other terms to discuss
discounting. Finally, we miss potentially relevant articles in lower-ranked journals.
This may introduce a geographical bias into our sample by under-representing those
from developing nations.
Despite these possible short-comings, the definition of expert that we deploy here
is close to the one frequently used by policy makers, both in general policy contexts
and in relation to social discounting.
Starting in May 2014, we sent out a link to the online survey (implemented in
SurveyMonkey) via e-mail to all potential experts, and used three general rounds of
reminders, each time slightly varying the subject line and motivation for answering
the survey (Supplementary material B provides the initial e-mail text). In later
rounds, we offered the option of completing the survey in a Word document or the
e-mail itself to increase flexibility.
3. Survey Results
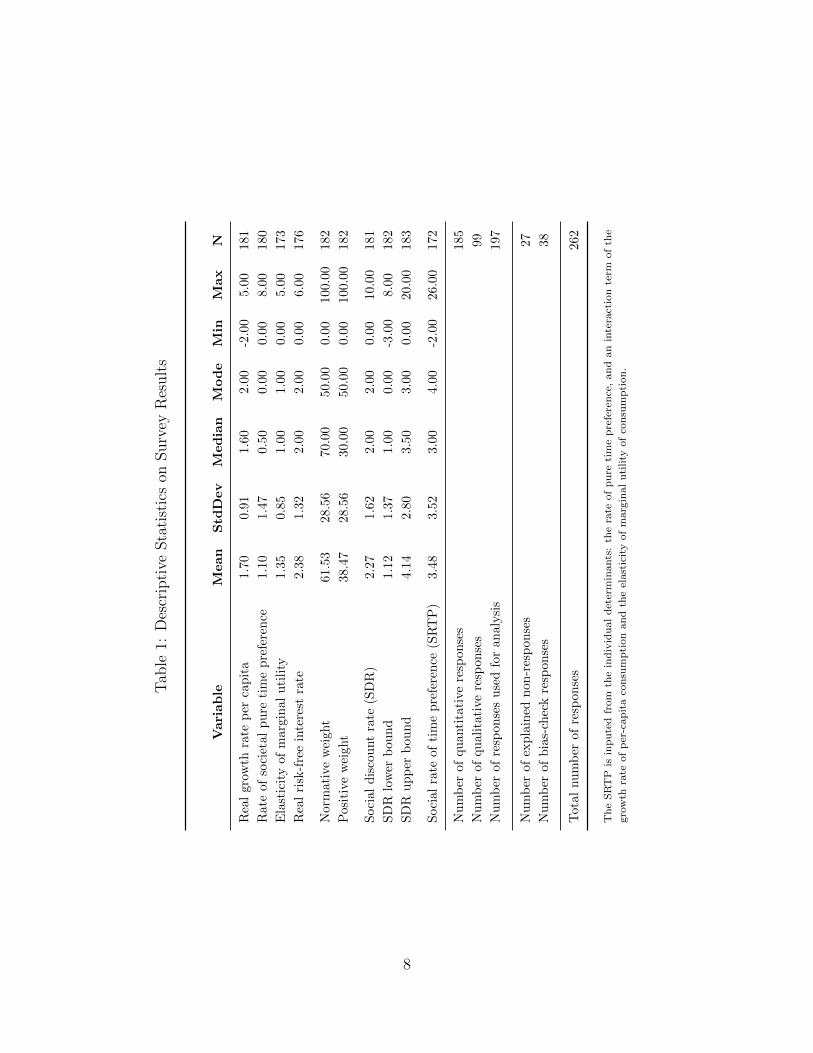
Table 1 provides summary statistics for each quantitative question in the survey
as well as the imputed SRTP for each expert.
By November 2014 we had received quantitative and qualitative responses from
197 experts, including 12 who solely provided qualitative feedback containing im-
portant insights. We also received replies from 27 scholars explaining why they did
not answer the survey and whose answer did not warrant inclusion as a qualitative
7
Tab
le1:
Des
crip
tive
Sta
tist
ics
onSurv
eyR
esult
s
Variable
Mean
Std
Dev
Median
Mode
Min
Max
N
Rea
lgr
owth
rate
per
cap
ita
1.7
00.9
11.6
02.0
0-2
.00
5.0
0181
Rat
eof
soci
etal
pu
reti
me
pre
fere
nce
1.1
01.4
70.5
00.0
00.0
08.0
0180
Ela
stic
ity
ofm
argi
nal
uti
lity
1.3
50.8
51.0
01.0
00.0
05.0
0173
Rea
lri
sk-f
ree
inte
rest
rate
2.3
81.3
22.0
02.0
00.0
06.0
0176
Nor
mat
ive
wei
ght
61.5
328.5
670.0
050.0
00.0
0100.0
0182
Pos
itiv
ew
eigh
t38.4
728.5
630.0
050.0
00.0
0100.0
0182
Soci
ald
isco
unt
rate
(SD
R)
2.2
71.6
22.0
02.0
00.0
010.0
0181
SD
Rlo
wer
bou
nd
1.1
21.3
71.0
00.0
0-3
.00
8.0
0182
SD
Ru
pp
erb
oun
d4.1
42.8
03.5
03.0
00.0
020.0
0183
Soci
alra
teof
tim
ep
refe
ren
ce(S
RT
P)
3.4
83.5
23.0
04.0
0-2
.00
26.0
0172
Nu
mb
erof
qu
anti
tati
vere
spon
ses
185
Nu
mb
erof
qu
alit
ativ
ere
spon
ses
99
Nu
mb
erof
resp
onse
su
sed
for
an
aly
sis
197
Nu
mb
erof
exp
lain
edn
on-r
esp
on
ses
27
Nu
mb
erof
bia
s-ch
eck
resp
onse
s38
Tot
alnu
mb
erof
resp
onse
s262
Th
eS
RT
Pis
inp
ute
dfr
om
the
ind
ivid
ual
det
erm
inants
:th
era
teof
pu
reti
me
pre
fere
nce
,an
dan
inte
ract
ion
term
of
the
gro
wth
rate
of
per
-cap
ita
con
sum
pti
on
an
dth
eel
ast
icit
yof
marg
inal
uti
lity
of
con
sum
pti
on
.
8
response. The most common reason for such non-response was self-reported insuffi-
cient expertise, but it also included simply not having enough time or being unable
to respond due to reasons of central bank confidentiality. Responses were also ob-
tained after the survey closed from 38 previous non-respondents. This group is used
to check for non-response bias.
Overall, we elicited 262 responses out of a pool of 627 potential experts. The
response rate is 30 percent if we only consider the 185 quantitative responses. If we
include all responses, the rate rises to 42 percent. Each is in line with comparable
online surveys with economists (Necker 2014). Besides this, the sampling strategy
was successful in obtaining responses from “blue ribbon” academic leaders on social
discounting including 12 of the 13 experts of the Arrow et al. (2012) panel who
advised the US EPA on this matter.
3.1. Quantitative Responses
3.1.1 Recommended Long-Term Social Discount Rate
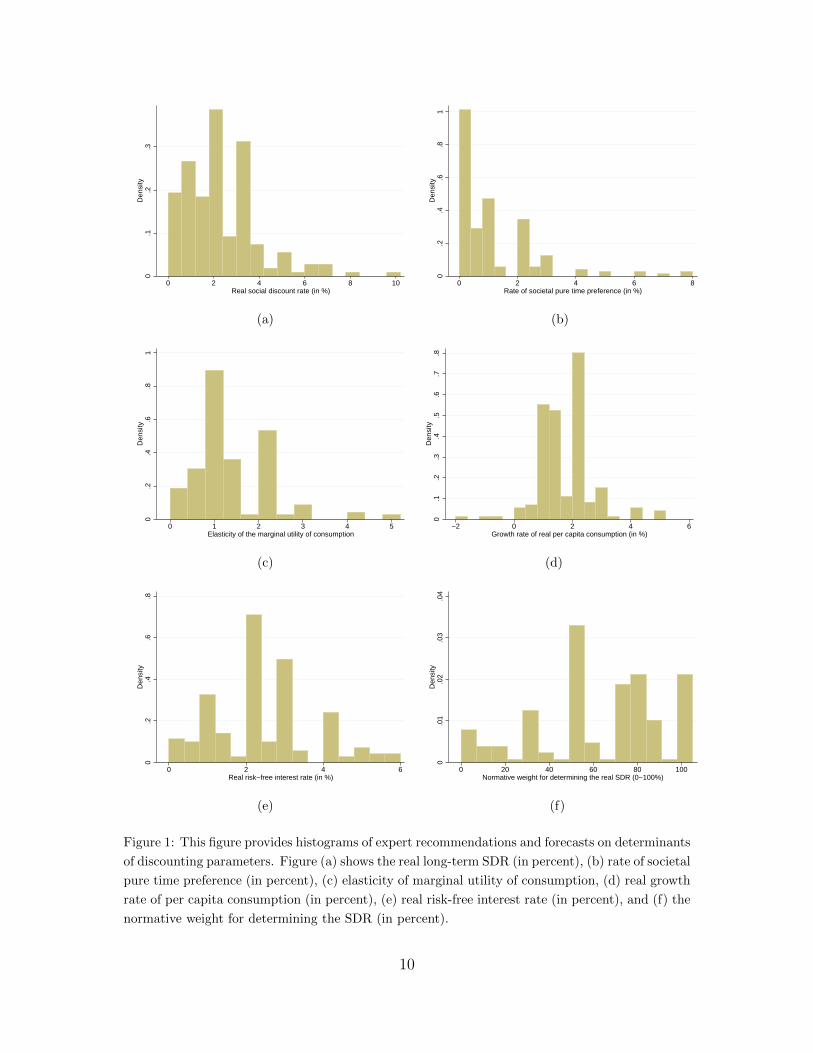
In recent years, prominent experts such as Gollier (2012), Nordhaus (2008),
Stern (2007) and Weitzman (2007) have proposed very different SDRs. Figure 1
(a) illustrates the extent of disagreement on the SDR for discounting real certainty-
equivalent cash flows of a global public project with intergenerational consequences.
The lowest recommendation is 0 and the highest 10 percent. However, the vast ma-
jority of experts provide point recommendations in the range of 0 to 4 percent, while
the interval of 1 to 3 percent contains the point SDR recommendations of 68 per-
cent of experts. The mean (median) value of the recommended SDR are 2.27 percent
(2 percent), which are much lower than the corresponding values from Weitzman’s
(2001) survey of economists of 3.96 percent (3 percent). Yet the most common single
value recommended in these two different surveys is 2 percent. These results deviate
significantly from the discount rates recommended in important recent guidelines,
including the IPCC Fifth Assessment Report (IPCC 2014: 230).5
9
0.1
.2.3
Den
sity
0 2 4 6 8 10Real social discount rate (in %)
(a)
0.2
.4.6
.81
Den
sity
0 2 4 6 8Rate of societal pure time preference (in %)
(b)
0.2
.4.6
.81
Den
sity
0 1 2 3 4 5Elasticity of the marginal utility of consumption
(c)
0.1
.2.3
.4.5
.6.7
.8D
ensi
ty
−2 0 2 4 6Growth rate of real per capita consumption (in %)
(d)
0.2
.4.6
.8D
ensi
ty
0 2 4 6Real risk−free interest rate (in %)
(e)
0.0
1.0
2.0
3.0
4D
ensi
ty
0 20 40 60 80 100Normative weight for determining the real SDR (0−100%)
(f)
Figure 1: This figure provides histograms of expert recommendations and forecasts on determinants
of discounting parameters. Figure (a) shows the real long-term SDR (in percent), (b) rate of societal
pure time preference (in percent), (c) elasticity of marginal utility of consumption, (d) real growth
rate of per capita consumption (in percent), (e) real risk-free interest rate (in percent), and (f) the
normative weight for determining the SDR (in percent).
10
3.1.2 Rate of Societal Pure Time Preference
Positions on the rate of societal pure time preference, δ, have historically been the
subject of intense disagreement. Luminaries of economics, such as Pigou, Ramsey
and Harrod, believed that the well-being of each generation ought to be weighted
equally, and so pure time preference should be zero. This view stems from their
classical impartial Utilitarian philosophy. Disagreement surfaced again more recently
with the publication of the Stern Review (Stern 2007), which took the same classical
Utilitarian stance. Many alternative arguments exist for the use of a positive rate
of societal pure time preference (e.g. Arrow 1999; Koopmans 1960; Nordhaus 2007).
Figure 1 (b) shows substantial disagreement among experts on their chosen value for
this parameter. As the modal value, a rate of zero is a focal point, and, if we include
those responses that lie in the range of 0 to 0.1 percent, 38 percent take what might
be called the Ramsey-Stern view. Yet, the distribution of responses is substantially
right skewed with a median of 0.50 percent, a mean of 1.10 percent and a maximum
recommendation of 8 percent. Based on these results, we cannot confirm the IPCC’s
(2014: 229) conclusion that “a broad consensus for a zero or near-zero pure rate of
time preference” exists among experts.
3.1.3 Elasticity of the Marginal Utility of Consumption
Settling on a value of the elasticity of the marginal utility of consumption, η, is an
intricate affair. The reason is that it might capture vastly different concepts and thus
lend itself to different interpretations. These are not only divided along the lines of
normative (e.g., issues of distribution) and positive (e.g., preferences for consump-
tion smoothing) determinants, but might also capture the inverse of the elasticity
of intertemporal substitution or societal preferences for the aversion of consumption
inequalities across space, time and also states of nature. All these rationales could
have been used by different experts to inform their response, although the survey
setting might reasonably have led respondents to primarily consider interpretations
relating to an intertemporal context. Previous discussions in the literature point
towards a range of 0.5 to 4 (Cowell and Gardiner 1999; Dasgupta 2008). The re-
5The results are closer to recent findings by Giglio et al. (2015) for long-term discount ratesestimated from the housing market in Singapore and the UK, which imply risk-free discount ratesof around 1 percent for 100-year claims on leaseholds.
11
sulting expert recommendations for elasticity of the marginal utility of consumption
as presented in Figure 1 (c) are indeed widely dispersed, with a mean of 1.35 and
a median and mode of 1. These values provide some support to the often made
assumption of logarithmic utility.
3.1.4 Growth Rate of Real Per-Capita Consumption
Figure 1 (d) presents the results of our respondents’ forecasts of the growth rate
of real per-capita consumption, g. The overwhelming majority forecast a positive
growth rate, with a mean of 1.7 percent and a median of 1.6 percent (cf. Table 1).
This is close to the 2 percent growth rate of consumption per-capita in the western
world for the last two centuries (Gollier 2012) and the 1.6 percent growth rate in
GDP per-capita over the period 1900 to 2000 in non-OECD countries (Boltho and
Toniolo 1999). Three experts project a negative growth rate, and 55 respondents
forecast a lower growth rate than the IPCC’s (2000) lower bound projection of 1.3
percent for the period from 1990 to 2100. 28 experts forecast a growth rate larger
than 2 percent.
3.1.5 Real Risk-Free Interest Rate
Over the period 1900–2010, the global average real risk-free rate, r, was ap-
proximately 1 percent for bills and 2 percent for bonds (Dimson et al. 2011). For
individual countries the rates are 1.1 percent for bills and 1.9 percent for bonds for
the US, 0.8 percent and 2.0 percent for the UK and -0.5 percent and -0.6 percent for
Japan (Dimson et al. 2011; see also Gollier 2012 for similar figures). The average
response to our survey was 2.38 percent, with a standard deviation of 1.32 percent-
age points and a median value of 2 percent. The maximum forecast is 6 percent,
while the minimum value, forecasted by three experts, is 0. The forecasted long-term
global real risk-free interest rate according to our sample of experts is thus slightly
higher than the estimated world average real risk-free rate of return on bonds over
the past century.
12
3.1.6 Normative versus Positive Approaches
A central point of disagreement on the SDR concerns the question of whether
normative issues, involving justice towards future generations, or positive issues, in-
volving forecast average future returns to financial assets, or a mix of the two should
determine the SDR (Arrow et al. 1996, 2014). Not everyone agrees that discounted
utilitarianism is the correct ethical basis for intergenerational decision-making in the
first place. For instance, some prefer deontological ethics which emphasize duties,
while others prefer rights-based approaches. In line with this history of disagree-
ment on the SDR, our intention for Question 5 is to establish the extent to which
recommendations on the SDR are influenced by “positive predictions and ethical
judgments” (Ricketts and Shoesmith 1992: 210–211). A clear finding from our data
is that a large majority of experts (80 percent) think that both dimensions are
relevant (see Figure 1 (f)). However, they generally recommend that governmental
institutions should place greater weight on normative issues in determining the SDR;
this has a mean (median) weighting of 61.53 percent (70 percent). When considering
extreme weights, 14 percent (5 percent) of experts placed 0 (100 percent) weight
on positive considerations, while 42 experts were divided equally between the two
rationales; making this the modal response. These findings emphasize that setting
the SDR requires both forecasts and value judgments.
3.2. Qualitative Responses
More than half of our respondents provided comments ranging from short re-
marks, such as “risk matters”, to explanations over multiple pages. The qualitative
observations provide a rich body of evidence which shed light on various complex-
ities of the theory and practice of social discounting. We group these individual
comments into four main categories that address (i) individual survey questions Q1-
Q5, (ii) technical issues, (iii) methodological issues, and (iv) concerns about limited
expertise. Each category has multiple subcategories.
Table 2 provides an overview of the most common issues raised, including the
number of experts that commented upon the respective issue and an example quote,
sometimes edited for brevity. The five most often raised are: ‘declining discount
rates and time-horizon’, ‘uncertainty’, ‘substitutability and environmental scarcity’,
‘heterogeneity and aggregation’, and ‘comparison to the Ramsey Rule’.
13
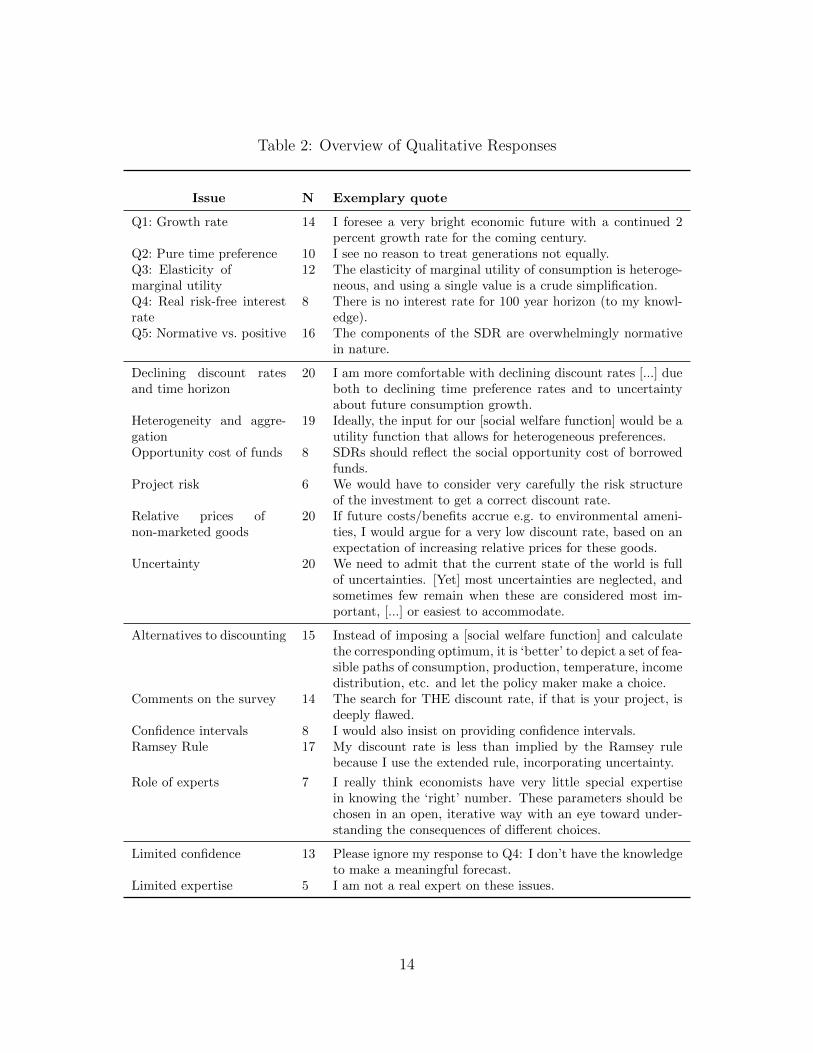
Table 2: Overview of Qualitative Responses
Issue N Exemplary quote
Q1: Growth rate 14 I foresee a very bright economic future with a continued 2percent growth rate for the coming century.
Q2: Pure time preference 10 I see no reason to treat generations not equally.Q3: Elasticity ofmarginal utility
12 The elasticity of marginal utility of consumption is heteroge-neous, and using a single value is a crude simplification.
Q4: Real risk-free interestrate
8 There is no interest rate for 100 year horizon (to my knowl-edge).
Q5: Normative vs. positive 16 The components of the SDR are overwhelmingly normativein nature.
Declining discount ratesand time horizon
20 I am more comfortable with declining discount rates [...] dueboth to declining time preference rates and to uncertaintyabout future consumption growth.
Heterogeneity and aggre-gation
19 Ideally, the input for our [social welfare function] would be autility function that allows for heterogeneous preferences.
Opportunity cost of funds 8 SDRs should reflect the social opportunity cost of borrowedfunds.
Project risk 6 We would have to consider very carefully the risk structureof the investment to get a correct discount rate.
Relative prices ofnon-marketed goods
20 If future costs/benefits accrue e.g. to environmental ameni-ties, I would argue for a very low discount rate, based on anexpectation of increasing relative prices for these goods.
Uncertainty 20 We need to admit that the current state of the world is fullof uncertainties. [Yet] most uncertainties are neglected, andsometimes few remain when these are considered most im-portant, [...] or easiest to accommodate.
Alternatives to discounting 15 Instead of imposing a [social welfare function] and calculatethe corresponding optimum, it is ‘better’ to depict a set of fea-sible paths of consumption, production, temperature, incomedistribution, etc. and let the policy maker make a choice.
Comments on the survey 14 The search for THE discount rate, if that is your project, isdeeply flawed.
Confidence intervals 8 I would also insist on providing confidence intervals.Ramsey Rule 17 My discount rate is less than implied by the Ramsey rule
because I use the extended rule, incorporating uncertainty.
Role of experts 7 I really think economists have very little special expertisein knowing the ‘right’ number. These parameters should bechosen in an open, iterative way with an eye toward under-standing the consequences of different choices.
Limited confidence 13 Please ignore my response to Q4: I don’t have the knowledgeto make a meaningful forecast.
Limited expertise 5 I am not a real expert on these issues.
14
3.3. Non-Response Bias and Representativeness
We followed several standard procedures to test for the existence of non-response
bias. First, from December 2014 to April 2015 we contacted via e-mail and telephone
60 randomly selected non-respondents. This allowed us to obtain a further 38 re-
sponses, with 14 of these experts providing qualitative data and 24 giving reasons
for their initial non-responses.6
Second, our sample includes quantitative responses from 11 of the 13 “blue rib-
bon” experts on social discounting from the Arrow et al. (2012) panel that advised
the US EPA.7
Third, we divide the sample between early and late responses (Dalecki et al. 1993,
Necker 2014), defined by the subsample of 58 experts that directly responded to the
first e-mail and those that answered a reminder e-mail. Potential non-response bias
is checked for by comparison of the mean and median responses of each of these
groups, which are reported in Table 3. While there are differences regarding some
of the discounting determinants, we find that there are no statistically significant
differences in the mean and median SDR values between different groups.
A further common measure for potential non-response bias is to consider groups
by gender and location (Necker 2014).8 We find that male experts selected into
responding to our survey relative to the non-response group (91 percent versus 81
percent). The proportions of respondents and non-respondents are balanced in terms
of characteristics such as being a full Professor (49 percent versus 48 percent) and
average year of Ph.D. completion (1993.6 versus 1993.7). Experts currently based in
Europe selected into responding (49 percent of respondents versus 32 percent of non-
respondent), which provides some indicative evidence for a potential geographical
6Reasons include having insufficient time (11 times) or expertise (10 times). The high proportionof respondents stating to be no expert suggests self-selection of true experts into responding to theinitial survey.
7A twelfth panel member initially provided qualitative evidence only, but stated after the surveywas completed that he would “follow the view of the median panelist.”
8Personal data are obtained, where possible, from the experts’ own web pages. We collectinformation on current continental location, gender, whether of not they have a professorial title,and year of Ph.D. graduation as a proxy for (academic) age. We are able to identify 89 respondentsfrom Europe, 80 from the Americas and 16 from the Rest of the World (RoW), who work exclusivelyfrom Asia and Oceania. We have 167 male respondents, while only 16 women gave quantitativeanswers to our questionnaire. Approximately half our sample are professors and the mean year ofPh.D. graduation is 1994.
15
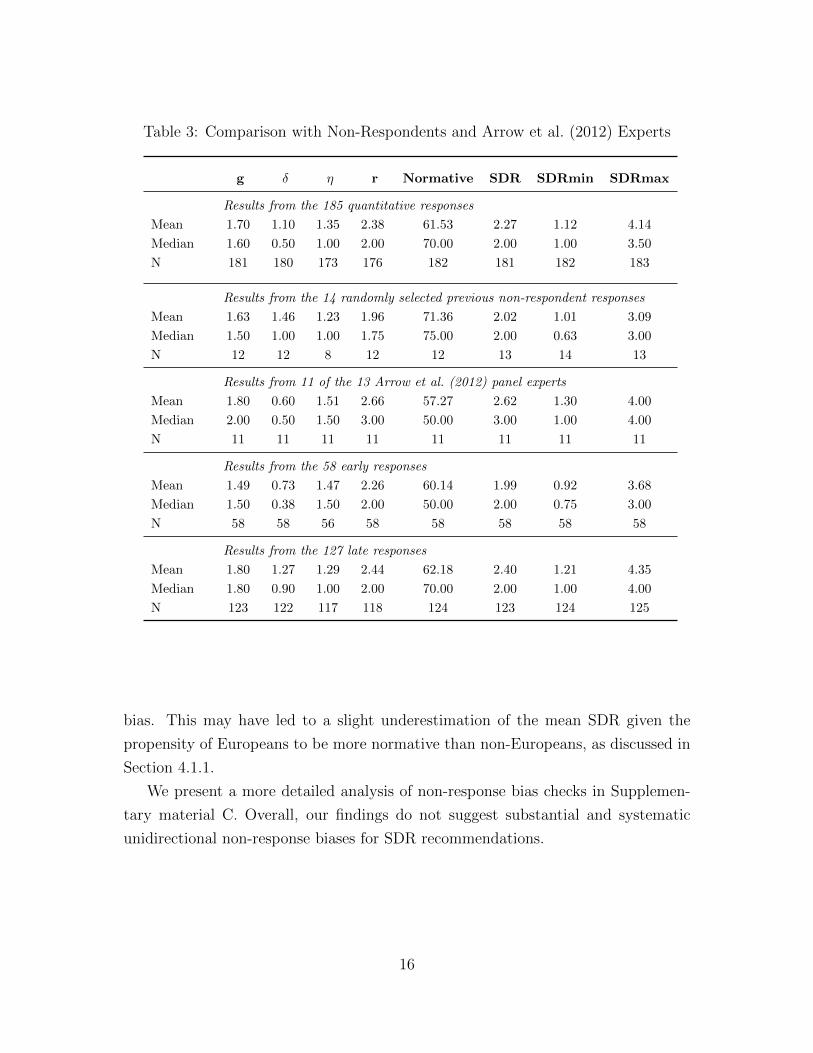
Table 3: Comparison with Non-Respondents and Arrow et al. (2012) Experts
g δ η r Normative SDR SDRmin SDRmax
Results from the 185 quantitative responses
Mean 1.70 1.10 1.35 2.38 61.53 2.27 1.12 4.14
Median 1.60 0.50 1.00 2.00 70.00 2.00 1.00 3.50
N 181 180 173 176 182 181 182 183
Results from the 14 randomly selected previous non-respondent responses
Mean 1.63 1.46 1.23 1.96 71.36 2.02 1.01 3.09
Median 1.50 1.00 1.00 1.75 75.00 2.00 0.63 3.00
N 12 12 8 12 12 13 14 13
Results from 11 of the 13 Arrow et al. (2012) panel experts
Mean 1.80 0.60 1.51 2.66 57.27 2.62 1.30 4.00
Median 2.00 0.50 1.50 3.00 50.00 3.00 1.00 4.00
N 11 11 11 11 11 11 11 11
Results from the 58 early responses
Mean 1.49 0.73 1.47 2.26 60.14 1.99 0.92 3.68
Median 1.50 0.38 1.50 2.00 50.00 2.00 0.75 3.00
N 58 58 56 58 58 58 58 58
Results from the 127 late responses
Mean 1.80 1.27 1.29 2.44 62.18 2.40 1.21 4.35
Median 1.80 0.90 1.00 2.00 70.00 2.00 1.00 4.00
N 123 122 117 118 124 123 124 125
bias. This may have led to a slight underestimation of the mean SDR given the
propensity of Europeans to be more normative than non-Europeans, as discussed in
Section 4.1.1.
We present a more detailed analysis of non-response bias checks in Supplemen-
tary material C. Overall, our findings do not suggest substantial and systematic
unidirectional non-response biases for SDR recommendations.
16
4. Analysis
4.1. The Determinants of Expert Responses
We now examine factors which can be used to explain each expert’s recommended
SDR. In addition to the quantitative and qualitative answers provided in the survey,
we also consider expert’s personal characteristics.
4.1.1 Associations between the SDR and its Determinants
We start by considering pairwise correlation coefficients between different quan-
titative variables and personal characteristics. Consistent with the Ramsey Rule,
the recommended SDR is positively associated with δ, g, and the imputed SRTP.9
However, in absolute terms, the correlation with the SRTP is surprisingly low at
35 percent, and lower than the 42 percent correlation between the SDR and the
risk-free interest rate response. There is a -43 percent correlation between the SDR
and the weight placed on normative considerations, strongly suggesting that those
who place more emphasis on market-based rates of return recommend higher SDRs.
A number of other interesting features emerge. Consistent with the strict optimality
Ramsey Rule, the risk-free interest rate is highly positively correlated with forecasts
of future growth and, to a slightly lesser extent, the rate of pure time preference.
The correlation between the SRTP and both the risk-free interest rate and the SDR
is very similar at just over 30 percent. Those who place greater weight on normative
considerations are associated with lower rates of pure time preference. These nor-
matively inclined experts are also more likely to be pessimistic about our economic
future and forecast lower future interest rates.
In terms of the relationship between the recommended SDR and the personal
characteristics of the respondent, there are clear negative correlations between SDR
recommendations and experts who are currently located in Europe as well as expert’s
academic age as proxied by year of Ph.D. completion.10
9The correlation between the SDR and η is small and statistically insignificant.10The 88 experts currently located in Europe had a mean (median) SDR recommendation of 1.91
percent (2 percent), compared to 2.56 percent (2 percent) for the 77 currently based in the Americasand 2.79 percent (2.5 percent) for the 14 in Asia and Oceania. The 50 experts we identified with aPh.D. completion date after 2001 had a mean (median) SDR recommendation of 1.84 percent (1.75percent), compared with 2.29 percent (2.05 percent) for the 45 experts who graduated between1991 and 2001 and 2.23 percent (2 percent) for the 43 finishing their Ph.D. before 1991. This
17
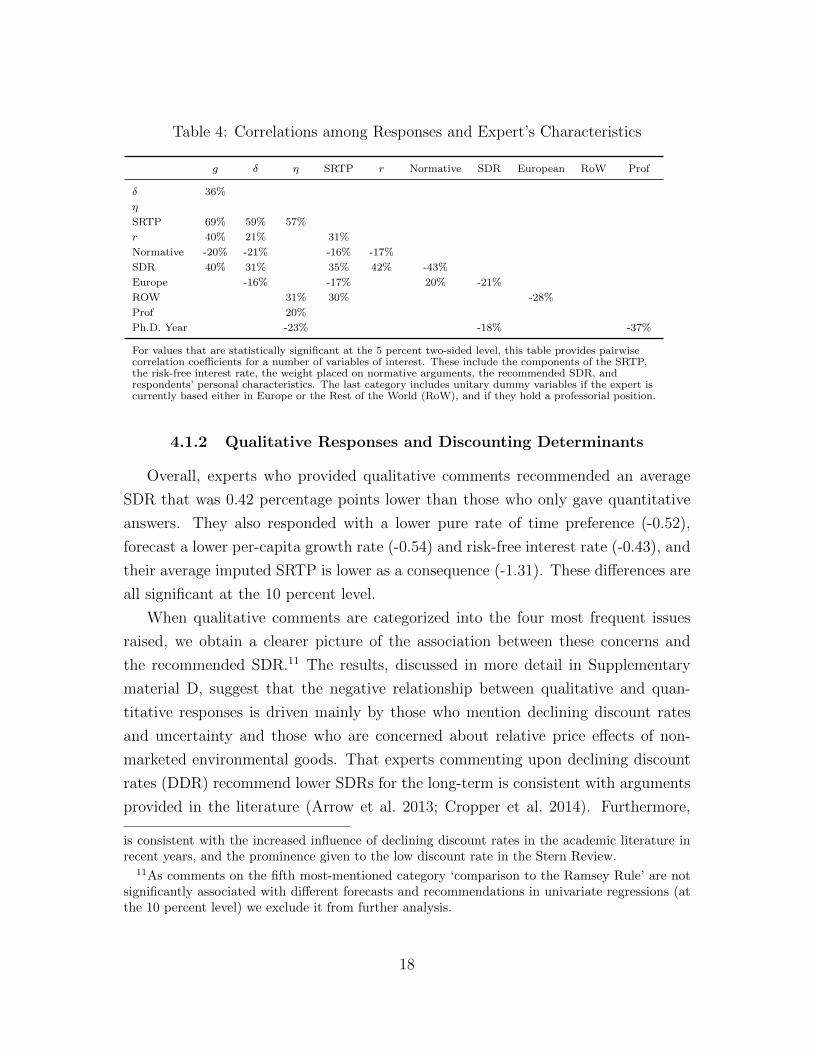
Table 4: Correlations among Responses and Expert’s Characteristics
g δ η SRTP r Normative SDR European RoW Prof
δ 36%
η
SRTP 69% 59% 57%
r 40% 21% 31%
Normative -20% -21% -16% -17%
SDR 40% 31% 35% 42% -43%
Europe -16% -17% 20% -21%
ROW 31% 30% -28%
Prof 20%
Ph.D. Year -23% -18% -37%
For values that are statistically significant at the 5 percent two-sided level, this table provides pairwisecorrelation coefficients for a number of variables of interest. These include the components of the SRTP,the risk-free interest rate, the weight placed on normative arguments, the recommended SDR, andrespondents’ personal characteristics. The last category includes unitary dummy variables if the expert iscurrently based either in Europe or the Rest of the World (RoW), and if they hold a professorial position.
4.1.2 Qualitative Responses and Discounting Determinants
Overall, experts who provided qualitative comments recommended an average
SDR that was 0.42 percentage points lower than those who only gave quantitative
answers. They also responded with a lower pure rate of time preference (-0.52),
forecast a lower per-capita growth rate (-0.54) and risk-free interest rate (-0.43), and
their average imputed SRTP is lower as a consequence (-1.31). These differences are
all significant at the 10 percent level.
When qualitative comments are categorized into the four most frequent issues
raised, we obtain a clearer picture of the association between these concerns and
the recommended SDR.11 The results, discussed in more detail in Supplementary
material D, suggest that the negative relationship between qualitative and quan-
titative responses is driven mainly by those who mention declining discount rates
and uncertainty and those who are concerned about relative price effects of non-
marketed environmental goods. That experts commenting upon declining discount
rates (DDR) recommend lower SDRs for the long-term is consistent with arguments
provided in the literature (Arrow et al. 2013; Cropper et al. 2014). Furthermore,
is consistent with the increased influence of declining discount rates in the academic literature inrecent years, and the prominence given to the low discount rate in the Stern Review.
11As comments on the fifth most-mentioned category ‘comparison to the Ramsey Rule’ are notsignificantly associated with different forecasts and recommendations in univariate regressions (atthe 10 percent level) we exclude it from further analysis.
18
that those who comment on uncertainty recommend lower SDRs is consistent with
the view that uncertainty tends to lower the appropriate SDR (Gollier 2008; Traeger
2009; Weitzman 1998; Weitzman and Gollier 2010). For those experts commenting
on relative price effects, we not only find lower recommended SDR values and rates
of pure time preference, but also lower forecasted growth and interest rates. While
lower SDRs and pessimism about future growth can be traced back to the literature
on dual discounting and the relative price effects of non-marketed environmental
goods (Gollier 2010; Sterner and Persson 2008; Traeger 2011), this seems to be
coupled with a strong concern for intergenerational equity.
4.1.3 Multivariate Analysis of Discounting Determinants
Finally, we report the results of multivariate analysis of the determinants of the
SDR to disentangle the relative importance of some of the characteristics that were
analyzed on a pairwise basis above. Table 5 presents the results of a number of ordi-
nary least squares (OLS) regressions with the recommended SDR as the dependent
variable, and various potential explanatory factors.
The most robust determinant of the SDR is the ‘normative weight’. This effect
is negative, and statistically significant at the 1 percent level in all the models. Each
additional normative percentage-point reduces the recommended SDR by approxi-
mately 0.02 percentage points, implying that a pure ‘positivist’ (normative scale = 0)
would have a SDR 2 percentage points higher than a pure ‘normativist’ (normative
scale = 100 percent). Although regression (1) shows a sizeable negative ‘European
effect’, this seems to be an artifact of a European tendency to be more normative,
and the fact that the European respondents were academically younger (2). While it
appears that having raised comments has predictive power on recommend SDRs (3),
this effect disappears once we control again for academic age (4). Further, we find
that the presence of the four most frequently raised comments (see section 4.1.2) has
no additional statistically significant explanatory power for the recommended SDR
as long as the normative weight is accounted for (5).
With adjusted R-squared never more than 20 percent, it is clear that specifica-
tions (1) to (5) only capture some of the determinants of the SDR. It seems likely
that contained within our normative-positive measure is a variety of unexplained
and unobserved normative positions. Variation could also reflect differences within
the positive school stemming from, for instance, differences or asymmetries in the
19
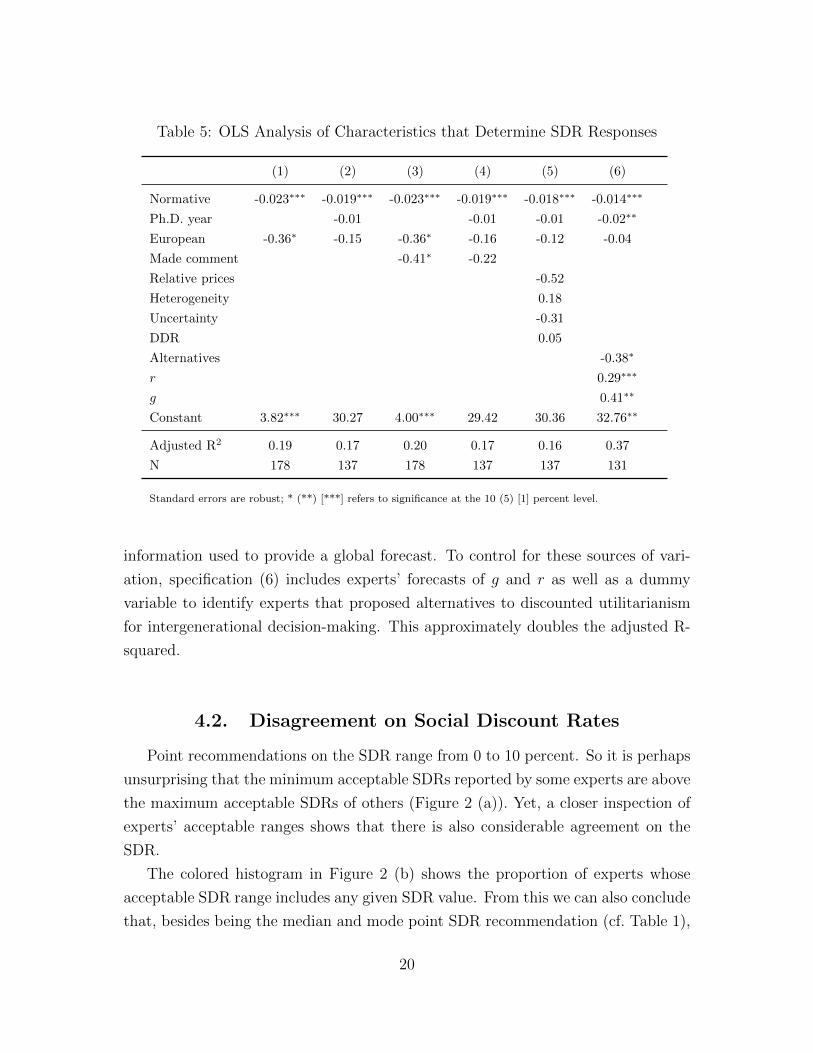
Table 5: OLS Analysis of Characteristics that Determine SDR Responses
(1) (2) (3) (4) (5) (6)
Normative -0.023∗∗∗ -0.019∗∗∗ -0.023∗∗∗ -0.019∗∗∗ -0.018∗∗∗ -0.014∗∗∗
Ph.D. year -0.01 -0.01 -0.01 -0.02∗∗
European -0.36∗ -0.15 -0.36∗ -0.16 -0.12 -0.04
Made comment -0.41∗ -0.22
Relative prices -0.52
Heterogeneity 0.18
Uncertainty -0.31
DDR 0.05
Alternatives -0.38∗
r 0.29∗∗∗
g 0.41∗∗
Constant 3.82∗∗∗ 30.27 4.00∗∗∗ 29.42 30.36 32.76∗∗
Adjusted R2 0.19 0.17 0.20 0.17 0.16 0.37
N 178 137 178 137 137 131
Standard errors are robust; * (**) [***] refers to significance at the 10 (5) [1] percent level.
information used to provide a global forecast. To control for these sources of vari-
ation, specification (6) includes experts’ forecasts of g and r as well as a dummy
variable to identify experts that proposed alternatives to discounted utilitarianism
for intergenerational decision-making. This approximately doubles the adjusted R-
squared.
4.2. Disagreement on Social Discount Rates
Point recommendations on the SDR range from 0 to 10 percent. So it is perhaps
unsurprising that the minimum acceptable SDRs reported by some experts are above
the maximum acceptable SDRs of others (Figure 2 (a)). Yet, a closer inspection of
experts’ acceptable ranges shows that there is also considerable agreement on the
SDR.
The colored histogram in Figure 2 (b) shows the proportion of experts whose
acceptable SDR range includes any given SDR value. From this we can also conclude
that, besides being the median and mode point SDR recommendation (cf. Table 1),
20
0.1
.2.3
.4D
ensi
ty
0 10 20
Maximum comfortable SDR Minimum comfortable SDR
(a)
0.2
.4.6
.81
Per
cent
−5 0 5 10 15Lower Bound of Interval
2% SDR interval 0% SDR interval (single value)
(b)
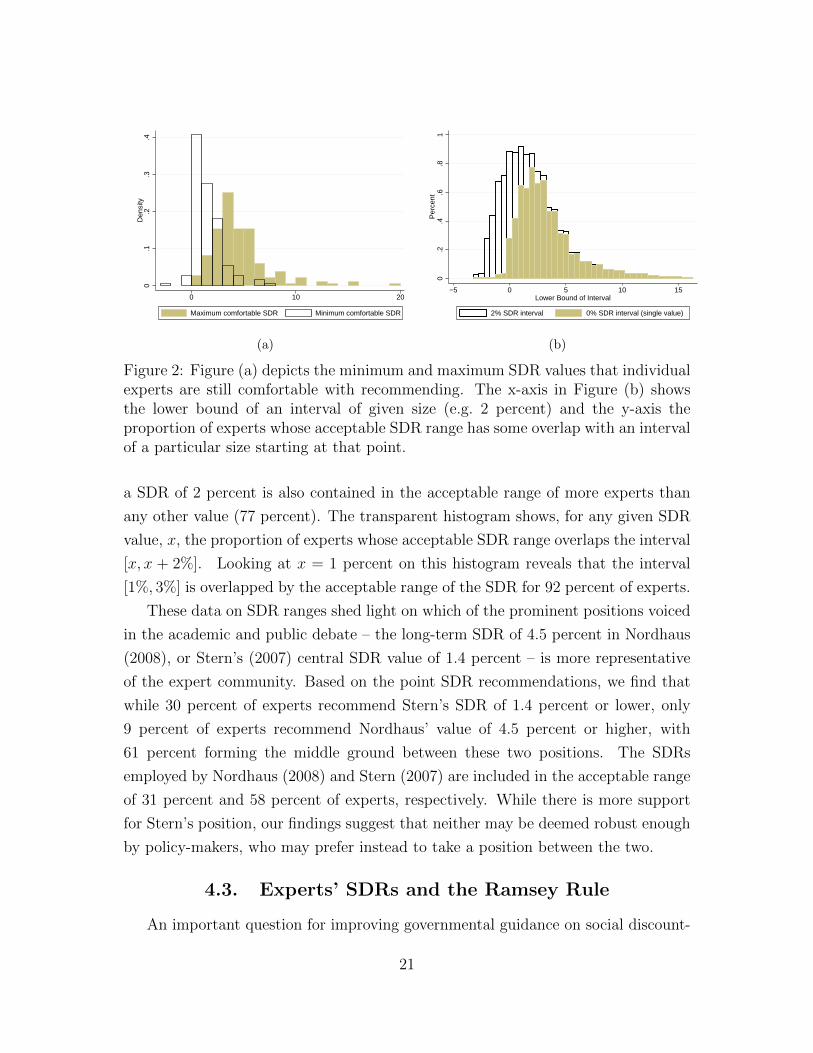
Figure 2: Figure (a) depicts the minimum and maximum SDR values that individualexperts are still comfortable with recommending. The x-axis in Figure (b) showsthe lower bound of an interval of given size (e.g. 2 percent) and the y-axis theproportion of experts whose acceptable SDR range has some overlap with an intervalof a particular size starting at that point.
a SDR of 2 percent is also contained in the acceptable range of more experts than
any other value (77 percent). The transparent histogram shows, for any given SDR
value, x, the proportion of experts whose acceptable SDR range overlaps the interval
[x, x + 2%]. Looking at x = 1 percent on this histogram reveals that the interval
[1%, 3%] is overlapped by the acceptable range of the SDR for 92 percent of experts.
These data on SDR ranges shed light on which of the prominent positions voiced
in the academic and public debate – the long-term SDR of 4.5 percent in Nordhaus
(2008), or Stern’s (2007) central SDR value of 1.4 percent – is more representative
of the expert community. Based on the point SDR recommendations, we find that
while 30 percent of experts recommend Stern’s SDR of 1.4 percent or lower, only
9 percent of experts recommend Nordhaus’ value of 4.5 percent or higher, with
61 percent forming the middle ground between these two positions. The SDRs
employed by Nordhaus (2008) and Stern (2007) are included in the acceptable range
of 31 percent and 58 percent of experts, respectively. While there is more support
for Stern’s position, our findings suggest that neither may be deemed robust enough
by policy-makers, who may prefer instead to take a position between the two.
4.3. Experts’ SDRs and the Ramsey Rule
An important question for improving governmental guidance on social discount-
21
ing is whether experts’ SDR recommendations are determined by the Ramsey Rule.
We examine all three possible representation of this as outlined in the Introduction;
the strict optimality form (r = SDR = SRTP ), the consumption (SDR = SRTP ),
and the production (SDR = r), side approaches.
We first impute the Ramsey Rule’s SRTP using responses on its individual com-
ponents from each expert. The mean value is 3.48 percent and the median is 3
percent (see Table 1). The mean SRTP is thus 1.21 percentage points higher than
the mean SDR. The risk-free interest rate is closer on average to the reported SDR
in our sample with the mean difference between the two being only 0.11 percentage
points, but this hides a great deal of heterogeneity.
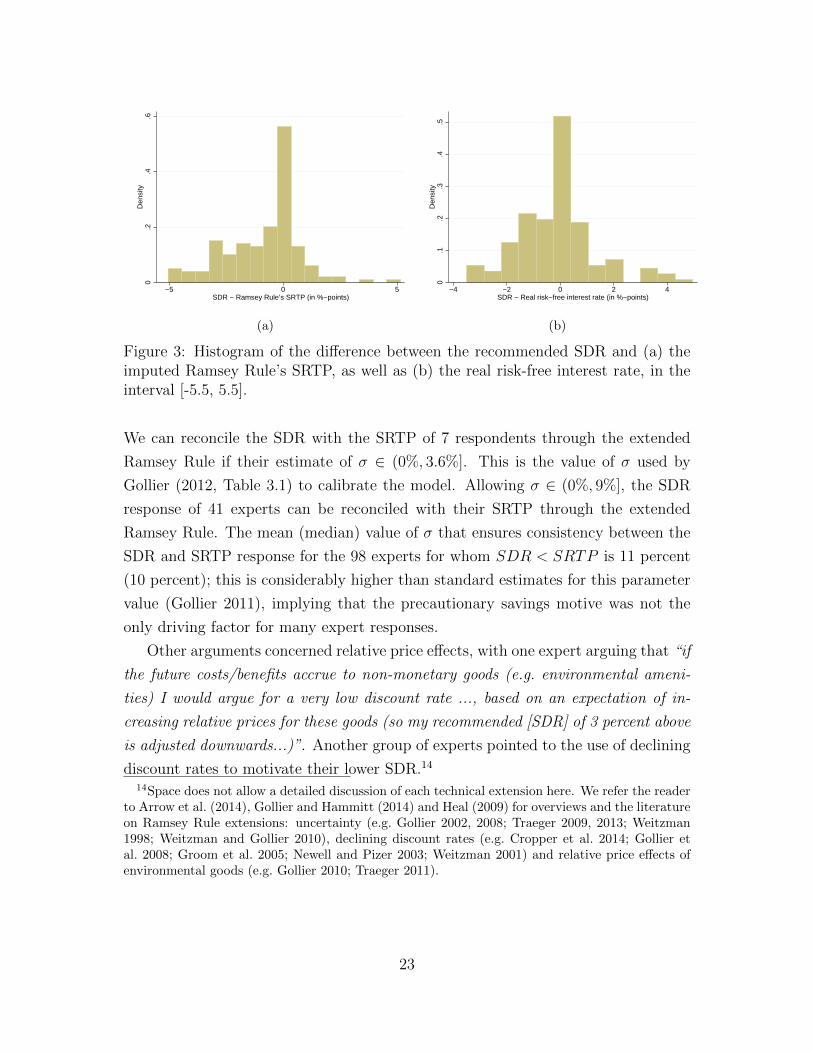
Figures 3 (a) and (b) display the cross-sectional histograms of SDR − SRTP
and SDR− r, excluding five and two outliers, respectively. The SDR coincides with
the SRTP (real risk-free interest rate) for only 36 (47) respondents. For 18 of these
experts, less than 10 percent of the sample, the Ramsey Rule holds in its strict
optimality form. Overall, the responses of only 35 percent of respondents can be
reconciled with any of the representations of the Ramsey Rule.12 Analysis of the
response time does not suggest that these discrepancies are due to errors made in
haste. The root cause of the discrepancies between an expert’s implied SRTP, or r,
and their SDR varies from one expert to another for reasons often revealed by their
qualitative responses.
SDR < SRTP A typical reason for why experts reported SDR < SRTP con-
cerned uncertainty of growth.13 This concept was captured by one expert as: “my
discount rate is less than implied by the Ramsey rule because I use the extended
rule, incorporating uncertainty about long term growth”. In this extended version
of the Ramsey Rule, the precautionary savings motive results in SRTP − SDR
= 0.5η (η + 1)σ2, where σ2 is the volatility of real per-capita consumption growth
(Gollier 2002, 2011). While we do not elicit forecasts of σ, we can infer the value of
this parameter that makes the SRTP consistent with the SDR for any given expert.
12We also examine whether experts may have used a mixed interest rate-SRTP approach weightedby their recommended positive and normative weight to determine the SDR: SDR = wr + (1 −w)(δ + η g), where w ∈ [0, 1] is the weight to be put on positive issues. We find that the SDR ofonly 9 experts coincides with this mixed interest rate-SRTP approach in addition to the 18 expertsfor whom the Ramsey Rule holds in its strict optimality form.
13Recall that the survey instrument referred to certainty-equivalent costs and benefits, but saidnothing about the certainty, or otherwise, of future growth.
22
0.2
.4.6
Den
sity
−5 0 5SDR − Ramsey Rule’s SRTP (in %−points)
(a)
0.1
.2.3
.4.5
Den
sity
−4 −2 0 2 4SDR − Real risk−free interest rate (in %−points)
(b)
Figure 3: Histogram of the difference between the recommended SDR and (a) theimputed Ramsey Rule’s SRTP, as well as (b) the real risk-free interest rate, in theinterval [-5.5, 5.5].
We can reconcile the SDR with the SRTP of 7 respondents through the extended
Ramsey Rule if their estimate of σ ∈ (0%, 3.6%]. This is the value of σ used by
Gollier (2012, Table 3.1) to calibrate the model. Allowing σ ∈ (0%, 9%], the SDR
response of 41 experts can be reconciled with their SRTP through the extended
Ramsey Rule. The mean (median) value of σ that ensures consistency between the
SDR and SRTP response for the 98 experts for whom SDR < SRTP is 11 percent
(10 percent); this is considerably higher than standard estimates for this parameter
value (Gollier 2011), implying that the precautionary savings motive was not the
only driving factor for many expert responses.
Other arguments concerned relative price effects, with one expert arguing that “if
the future costs/benefits accrue to non-monetary goods (e.g. environmental ameni-
ties) I would argue for a very low discount rate ..., based on an expectation of in-
creasing relative prices for these goods (so my recommended [SDR] of 3 percent above
is adjusted downwards...)”. Another group of experts pointed to the use of declining
discount rates to motivate their lower SDR.14
14Space does not allow a detailed discussion of each technical extension here. We refer the readerto Arrow et al. (2014), Gollier and Hammitt (2014) and Heal (2009) for overviews and the literatureon Ramsey Rule extensions: uncertainty (e.g. Gollier 2002, 2008; Traeger 2009, 2013; Weitzman1998; Weitzman and Gollier 2010), declining discount rates (e.g. Cropper et al. 2014; Gollier etal. 2008; Groom et al. 2005; Newell and Pizer 2003; Weitzman 2001) and relative price effects ofenvironmental goods (e.g. Gollier 2010; Traeger 2011).
23
SDR > SRTP Figure 3(a) also shows that many experts recommended SDRs that
are higher than their imputed SRTP. Such positions were typically motivated by
opportunity cost arguments. One expert, for whom SDR > r > SRTP stated “no
mention is made here of the opportunity cost of government funds”. Another stated:
“You need one rate to weed out public projects that are dominated by the private
sector and another to evaluate which of the remaining projects pass the social present
value test”. Both comments indicate the need to evaluate intergenerational projects
using the social opportunity cost of capital, rather than the SRTP, and the idea that
the former will typically be higher. Indeed, those experts for whom SDR > SRTP
place a substantially greater weight on positive issues for determining the SDR than
those for whom SDR < SRTP (50 percent positive compared to 38 percent on
average).
SDR and the risk-free interest rate A few experts also highlighted the relation
of their SDR recommendation to their forecasted real risk-free interest rate. For
instance, one expert explicitly stated that “the real social discount rate should be
the risk-free interest rate”, while others remarked that “incomplete futures markets
justify social discount rates lower than real market rates”. Moreover, experts who
commented upon the opportunity cost of funds recommended SDRs higher than the
risk-free interest rate, while those commenting upon declining discount rates tended
to recommend SDRs below their forecasted risk-free interest rate.
Beyond the Ramsey Rule Beyond the above technical arguments, which largely
require extensions to the Ramsey Rule, further criticism focused on the need for al-
ternative approaches to inform intergenerational decision-making. Experts recorded
doubts about whether “a representative agent model with a standard Ramsey social
welfare function is adequate in either descriptive or normative terms”. They also
point towards “richer ways of framing questions of intergenerational justice than
simply tweaking the discount rate” by developing alternative criteria for intergener-
ational decision-making (see Asheim (2010) and Botzen and van den Bergh (2014)
for overviews). Such approaches might “set limits in physical terms to the future
development that must not be exceeded for reasons of intra- and intergenerational
justice... Then use a discounted utilitarian approach to optimize development only
within these limits”.
24
This analysis demonstrates two things. First, the qualitative evidence suggests
that individual responses are theoretically motivated and display internal consis-
tency. Second, within the expert community there are several distinct schools of
thought on discounting intergenerational projects which are more nuanced than the
standard normative-positive dichotomy. Overall, our findings highlight that many
experts are sceptical about the central role of the Ramsey Rule in determining policy
recommendations on long-term public projects.
5. Discussion
5.1. Comparison to the Weitzman (2001) Survey
A natural reference comparison for our results is the seminal survey of Weitzman
(2001), who asked more than 2000 Ph.D.-level economists to report a single ap-
propriate “real discount rate” or “rate of interest” with which to discount projects
aimed at mitigating climate change. The key difference between the response data
of Weitzman (2001) and our results is that we find a substantially lower mean (me-
dian) SDR recommendation, with 2.27 percent (2 percent) compared to 3.96 percent
(3 percent). Furthermore, we find a much lower standard deviation of the SDR re-
sponses of 1.62 percent compared to the 2.94 percent of Weitzman’s (2001) respon-
dents, and the range of point recommendations on the SDR is much more condensed
(0 to 10 percent compared to -3 percent to 27 percent).15 The modal recommended
value for the SDR of 2 percent, however, is the same in both surveys.
We can point to at least three potential explanations for these differences. First,
experts who have graduated from their Ph.D.s since Weitzman’s survey was con-
ducted generally recommend lower SDRs than those who have been in the profes-
sion for longer. Second, the literature that has influenced this new generation of
academics — for example, on declining discount rates and the arguments articu-
lated in the Stern Review — may have led more established scholars to reduce their
SDR recommendations during their careers. Third, Weitzman’s pool of potential
respondents is a general economics audience, while we select only those scholars
15The standard deviation, minimum and maximum of the imputed SRTPs (3.52%, -2% and 26%respectively) are, by contrast, similar to the values reported in Weitzman (2001).
25
who have published directly on discounting and can be considered specialists in this
sense.16
5.2. What SDR Should a Government Use?
In this section we provide advice on determining the appropriate SDR from the
survey evidence. This involves answering two important questions. First, what role
should experts play in providing the raw materials for the SDR? Second, how should
uncertainty (of forecasts) and disagreement (on value judgments) be treated when
calculating the appropriate SDR for long-term public policy making?
The first question has itself been a source of disagreement (Dasgupta 2008; Weitz-
man 2001). One typical criticism is that guidance on social discounting should be
informed via more “democratic” means (Dasgupta 2008: 158). It is often claimed
that economists do not command any special expertise in matters of ethics. Yet
some discussants explicitly advocate an active role for “genuine specialists” to steer
the process of setting SDRs (Pindyck 2015; Sunstein 2014: 550). This comes as no
surprise, as the questions raised by intergenerational discounting are highly complex.
Compared to members of the general population, experts will have spent consider-
ably more time considering the intricate issues that arise. We also note that govern-
mental guidance on social discounting is generally influenced by expert opinion, as
are other areas of policy as evidenced by, for example, membership of Monetary Pol-
icy Committees. There is also a distinction to be drawn within economics between
genuine specialists and general economists. Monetary Policy Committee members
typically fall into the former category, as do those who have provided recent advice
to international governments on social discounting. Therefore, while there are good
arguments for more inclusive approaches, it is also imperative that advice is heard
from genuine experts on the determinants of the long-term SDR.
Based on the heterogeneous responses to this survey, a decision-maker might rea-
16That real growth and interest rates in many countries are now below the rates that prevailed atthe start of the Century is unlikely to be a core driving factor. The mean real risk-free interest rateresponse of 2.38 percent does not closely correspond to current real bond yields in major economiesand is above the 2 percent long-term global average for bonds reported by Dimson et al. (2011).Similarly, the mean forecasted growth rate of real per-capita consumption of 1.7 percent is onlyslightly lower than the historical global average. Finally, if low current interest rates are driving thelower SDRs we would expect those who put the highest weight on positive issues for determiningthe SDR to be influenced more by current yields. Yet these experts tend to recommend higherSDRs.
26
sonably then ask which single rate to use when discounting the certainty-equivalent
cash flows from an intergenerational project. Deciding how best to adjudicate be-
tween conflicting opinions, and aggregate different forecasts, is a contentious issue
to which there is no single accepted answer. A number of proposals do exist though.
In relation to the pure rate of time preference, Heal and Millner (2014b) provide two
possible resolutions to disagreement. The efficient solution is to use a declining term
structure of pure time preference rates, but this introduces time inconsistent behav-
ior. The alternative is to imagine a voting mechanism. Median voter arguments
then recommend the median pure time preference, which is deemed democratic and
avoids time inconsistency, but is inefficient. When experts disagree, choosing the
representative agent is a matter of choosing one’s poison: time inconsistency or
inefficiency (Jackson and Yariv 2015).
An approach which relates to the SDR directly is to calculate the discount factor
for each respondent, and then construct the social discount factor as a weighted
average of the individual discount factors. This is the approach taken by Weitzman
(2001) and leads to a declining term structure of SDRs. The difficulty with applying
this approach to survey data is that it is not clear what weights to assign to each of
the expert discount factors. While Weitzman (2001) gives each response equal im-
portance, this has been a controversial choice (Freeman and Groom 2015; Heal and
Millner 2014a,b; Jouini et al. 2010; Weitzman and Gollier 2010; Gollier and Zeck-
hauser 2005). In particular, Freeman and Groom (2015) show that the appropriate
weighting depends on whether responses reflect disagreement on value judgments or
uncertainty about forecasts. The theory of aggregation is very different in each case,
and leads to vastly different outcomes. The current literature does not advise us on
what weights to apply to each individual’s discount factor in the present case, since
some responses to the survey are purely positive, others are purely normative, yet
the majority are a blend of the two.
Given the lack of clear theoretical guidance on how to aggregate individual expert
responses, what remains is to rely on a data-driven approach. Fortunately, this
points towards a rather clear recommendation: a long term SDR of 2 percent is not
only the modal and median recommendation but also the SDR value that is included
in the acceptable ranges of most experts (77 percent). Interestingly, this clear long-
run SDR recommendation of 2 percent is lower than the equivalent recommendations
of the UK, French and US governments.
27
6. Conclusion
We have presented evidence from a survey of over 200 experts on the determinants
of the long-term real social discount rate (SDR). This is, perhaps, the single most
important driver of any cost-benefit analysis evaluating long-term public projects.
We find that the mean (median) recommended SDR of our experts is 2.27 percent
(2 percent). While there is considerable disagreement between respondents on point
recommendations, which range from 0 to 10 percent, more than three-quarters of
those surveyed would find a SDR of 2 percent acceptable. More than 90 percent are
comfortable with a SDR somewhere in the interval of 1 percent to 3 percent.
A key innovation of our survey is that we not only elicit responses on the appro-
priate SDR itself, but also on individual discounting determinants: recommendations
on the rate of pure time preference and the elasticity of marginal utility of consump-
tion, as well as predictions of long-term per-capita consumption growth and the
average real risk-free rate of interest.
Based on this disentangled data, we show that the simple Ramsey Rule, which
is widely accepted as a “useful conceptual framework for examining intergenera-
tional discounting issues” (Arrow et al. 2012: 3) and can be found in governmental
guidelines on cost-benefit analysis across the world, cannot explain the responses
of the majority of our experts. The conclusion that more complex models for so-
cial discounting are required is supported by the rich body of qualitative responses
we received. Many of our respondents provided comments relating to a number
of extension and alternatives to the simple Ramsey Rule approach. These include
issues such as uncertainty, heterogeneity, relative prices of non-marketed goods as
well as other societal evaluation approaches that policy guidance on social discount-
ing should consider to ensure efficient and equitable decisions on long-term public
projects.
Further inspection of the data on individual discounting determinants yields
findings that transcend their value as potential inputs to governmental discounting
guidelines. First, we find that the modal value of the pure rate of time preference
is zero, but with a mean (median) of 1.1 percent (0.5 percent), our results cannot
confirm the IPCC’s (2014: 229) conclusion that “a broad consensus for a zero or near-
zero pure rate of time preference” exists among experts. Second, our data suggest
that the IPCC should consider lower growth scenarios in future assessments. Third
28
the median and mode recommended elasticity of marginal utility of consumption of
1 provides some support for the often made assumption of logarithmic utility. Lastly,
we find that there exists considerable disagreement between experts on the relative
importance of normative and positive approaches to discounting. Most report that
the SDR should reflect both, highlighting that these previously accepted categories
overly polarize more nuanced expert views. Engaging with both disagreement about
values and uncertainty over forecasts is therefore an essential task for informing
decision-making on long-term public projects.
Overall, our findings lead us to the conclusion that the prominence of the Ram-
sey Rule needs to be revisited and that current policy guidance concerning social
discounting and the evaluation of long-term public projects needs to be updated.
While not uncontentious, our survey points to a long-term global SDR for certainty-
equivalent cash flows of 2 percent.
29
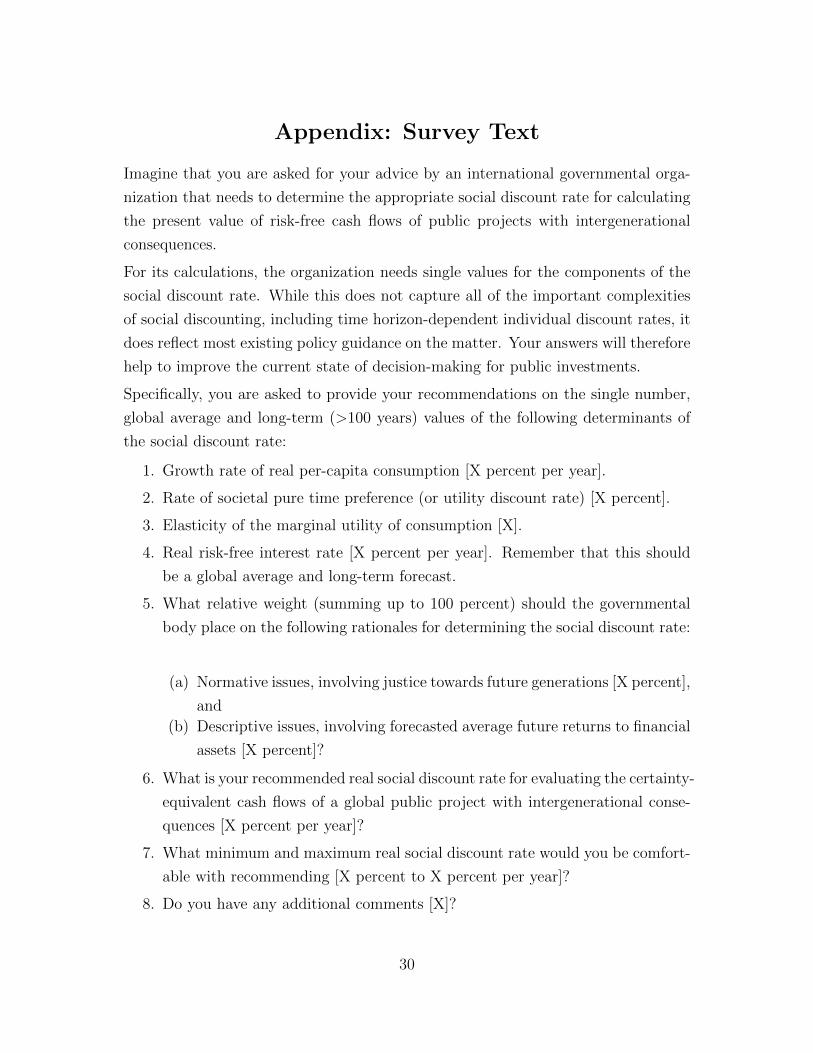
Appendix: Survey Text
Imagine that you are asked for your advice by an international governmental orga-
nization that needs to determine the appropriate social discount rate for calculating
the present value of risk-free cash flows of public projects with intergenerational
consequences.
For its calculations, the organization needs single values for the components of the
social discount rate. While this does not capture all of the important complexities
of social discounting, including time horizon-dependent individual discount rates, it
does reflect most existing policy guidance on the matter. Your answers will therefore
help to improve the current state of decision-making for public investments.
Specifically, you are asked to provide your recommendations on the single number,
global average and long-term (>100 years) values of the following determinants of
the social discount rate:
1. Growth rate of real per-capita consumption [X percent per year].
2. Rate of societal pure time preference (or utility discount rate) [X percent].
3. Elasticity of the marginal utility of consumption [X].
4. Real risk-free interest rate [X percent per year]. Remember that this should
be a global average and long-term forecast.
5. What relative weight (summing up to 100 percent) should the governmental
body place on the following rationales for determining the social discount rate:
(a) Normative issues, involving justice towards future generations [X percent],
and
(b) Descriptive issues, involving forecasted average future returns to financial
assets [X percent]?
6. What is your recommended real social discount rate for evaluating the certainty-
equivalent cash flows of a global public project with intergenerational conse-
quences [X percent per year]?
7. What minimum and maximum real social discount rate would you be comfort-
able with recommending [X percent to X percent per year]?
8. Do you have any additional comments [X]?
30
References
Arrow, K.J. (1999), Discounting, Morality, and Gaming. In: Discounting and
Intergenerational Equity, edited by Portney, P.R., and J.P. Weyant. Washington,
D.C.: Resources for the Future.
Arrow, K.J., Cline, W., Maler, K.G., Munasinghe, M., Squitieri, R., and J. Stiglitz
(1996), Intertemporal Equity, Discounting, and Economic Efficiency. In: Cli-
mate Change: Economic and Social Dimensions of Climate Change, Contribution
of Working Group III to the Second Assessment Report of the Intergovernmen-
tal Panel on Climate Change, edited by Bruce, J.P., Lee, H., and E.F. Haites.
Cambridge: Cambridge University Press.
Arrow, K.J., Cropper, M.L., Gollier, C., Groom, B., Heal, G., Newell, R., Nord-
haus, W.D., Pindyck, R., Pizer, W., Portney, P., Sterner, T., Tol, R.S.J., and
M.L. Weitzman (2012), How Should Benefits and Costs Be Discounted in an In-
tergenerational Context? The Views of an Expert Panel, RFF Discussion Paper
12(53), Resources for the Future.
Arrow, K.J., Cropper, M.L., Gollier, C., Groom, B., Heal, G., Newell, R., Nordhaus,
W.D., Pindyck, R., Pizer, W., Portney, P., Sterner, T., Tol, R.S.J., and M.L.
Weitzman (2013), Determining Benefits and Costs for Future Generations, Science
341(6144): 349–350.
Arrow, K.J., Cropper, M.L., Gollier, C., Groom, B., Heal, G., Newell, R., Nordhaus,
W.D., Pindyck, R., Pizer, W., Portney, P., Sterner, T., Tol, R.S.J., and M.L.
Weitzman (2014), Should Governments Use a Declining Discount Rate in Project
Analysis?, Review of Environmental Economics and Policy 8(2): 145–163.
Asheim, G.B. (2010), Intergenerational Equity, Annual Review of Economics 2(1):
197–222.
Baumol, W.J. (1968), On the Social Rate of Discount, American Economic Review
57: 788–802.
Boltho, A., and G. Toniolo (1999), The Assessment: The Twentieth Century -
Achievements, Failures, Lessons, Oxford Review of Economic Policy 4: 1–17.
31
Botzen, W.W., and J.C. van den Bergh (2014), Specifications of Social Welfare
in Economic Studies of Climate Policy: Overview of Criteria and Related Policy
Insights, Environmental and Resource Economics 58(1): 1–33.
Combes, P.P., and L. Linnemer (2010), Inferring Missing Citations: A Quantitative
Multi-Criteria Ranking of all Journals in Economics, GREQAM Working Paper
2010-25.
Cowell, F.A., and K. Gardiner (1999), Welfare Weights, OFT Economic Research
Paper 202, STICERD, London School of Economics.
Cropper, M.L., Freeman, M.C., Groom, B., and W. Pizer (2014), Declining Discount
Rates, American Economic Review: Papers and Proceedings 104(5): 538–543.
Dalecki, M.G., Whitehead, J.C., and G.C. Blomquist (1993), Sample Non-Response
Bias and Aggregate Benefits in Contingent Valuation: An Examination of Early,
Late and Non-Respondents, Journal of Environmental Management 38(2): 133–
143.
Dasgupta, P. (2008), Discounting Climate Change, Journal of Risk and Uncertainty
37(2): 141–169.
Dimson, E., Marsh, P., and M. Staunton (2011), Equity Premia Around the World,
SSRN Working Paper, available at: http://ssrn.com/abstract=1940165.
Freeman, M. C., and B. Groom (2015), Positively Gamma Discounting: Combining
the Opinions of Experts on the Social Discount Rate, The Economic Journal,
125(585): 1015-1024.
Giglio, S., Maggiori, M., and J. Stroebel (2015), Very Long-Run Discount Rates,
Quarterly Journal of Economics, 130(1): 1-53.
Gollier, C. (2002), Time Horizon and the Discount Rate, Journal of Economic
Theory 107: 463–473.
Gollier, C. (2008), Discounting with Fat-Tailed Economic Growth, Journal of Risk
and Uncertainty 37(2-3): 171–186.
Gollier, C. (2010), Ecological Discounting, Journal of Economic Theory 145: 812–
829.
32
Gollier, C. (2011), On the Underestimation of the Precautionary Effect in Discount-
ing, The Geneva Risk and Insurance Review 36(2): 95–111.
Gollier, C. (2012), Pricing the Future: The Economics of Discounting in an Uncer-
tain World, Princeton: Princeton Press.
Gollier, C., and J.K. Hammitt (2014), The Long-Run Discount Rate Controversy,
Annual Review of Resource Economics 6: 273–95.
Gollier, C., Koundouri, P., and T. Pantelidis (2008), Declining Discount Rates:
Economic Justifications and Implications for Long-Run Policy, Economic Policy
56: 757–795.
Gollier, C., and R. Zeckhauser (2005), Aggregation of Heterogeneous Time Prefer-
ences, Journal of Political Economy 113(4): 878–896.
Groom, B., Hepburn, C., Koundouri, P., and D. Pearce (2005), Declining Discount
Rates: The Long and the Short of it, Environmental and Resource Economics
32(4): 445–493.
Heal, G. (2009), The Economics of Climate Change: A Post-Stern Perspective,
Climatic Change 96: 275–297.
Heal, G., and A. Millner (2014a), Agreeing to Disagree on Climate Policy, Proceed-
ings of the National Academy of Sciences 111(10): 3695–3698.
Heal, G., and A. Millner (2014b), Resolving Intertemporal Conflicts: Economics vs
Politics, NBER Working Paper 20705.
[HMT 2003] Her Majesty’s Treasury (2003), The Green Book: Appraisal and Eval-
uation in Central Government, London: UK Treasury.
[IPCC 2000] Intergovernmental Panel on Climate Change (2000), The IPCC Special
Report on Emissions Scenarios (SRES), Geneva: IPCC.
[IPCC 2014] Kolstad, C. et al. (2014), Social, Economic and Ethical Concepts and
Methods. In: Mitigation of Climate Change. Contribution of Working Group
III to the Fifth Assessment Report of the Intergovernmental Panel on Climate
Change, edited by Edenhofer, O. et al. Cambridge and New York: Cambridge
University Press.
33
Jackson, M.O., and L. Yariv (2015), Collective Dynamic Choice: The Necessity
of Time Inconsistency, Forthcoming in: American Economic Journal: Microeco-
nomics.
Jouini, E., Marin, J.M., and C. Napp (2010), Discounting and Divergence of Opinion,
Journal of Economic Theory 145: 830–59.
Koopmans, T.C. (1960), Stationary Ordinal Utility and Impatience, Econometrica
28(2): 287–309.
Lebegue, D. (2005), Revision du Taux d’Actualisation des Investissements Publics,
available at: http://catalogue.polytechnique.fr/site.php?id=324&fileid=2389.
Necker, S. (2014), Scientific Misbehavior in Economics, Research Policy 43: 1747–
1759.
Newell, R., and W. Pizer (2003), Discounting the Distant Future: How Much Do
Uncertain Rates Increase Valuations?, Journal of Environmental Economics and
Management 46(1): 52–71.
Nordhaus, W.D. (2007), The Stern Review on the Economics of Climate Change,
Journal of Economic Literature 45(3): 686–702.
Nordhaus, W.D. (2008), A Question of Balance: Economic Modeling of Global
Warming, Yale University Press, New Haven, USA.
Pindyck, R.S. (2015), The Use and Misuse of Models for Climate Policy, NBER
Working Paper No. 21097.
Ramsey, F.P. (1928), A Mathematical Theory of Saving, The Economic Journal
38(152): 543–559.
Ricketts, M., and E. Shoesmith (1992), British Economic Opinion: Positive Science
or Normative Judgment?, American Economic Review: Papers and Proceedings
82(2): 210–215.
Stern, N. (2007), The Economics of Climate Change: The Stern Review, Cambridge
and New York: Cambridge University Press.
34
Sterner, T., and M. Persson (2008), An Even Sterner Review: Introducing Relative
Prices into the Discounting Debate, Review of Environmental Economics and
Policy 2(1): 61–76.
Sunstein, C.R. (2014), On Not Revisiting Official Discount Rates: Institutional
Inertia and the Social Cost of Carbon, American Economic Review: Papers and
Proceedings 104(5): 547–551.
Traeger, C.P. (2009), Recent Developments in the Intertemporal Modeling of Un-
certainty, Annual Review of Resource Economics 1: 261–285.
Traeger, C.P. (2011), Sustainability, Limited substitutability, and Non-Constant
Social Discount Rates, Journal of Environmental Economics and Management
62(2): 215–228.
Traeger, C.P. (2013), Discounting Under Uncertainty: Disentangling the Weitzman
and the Gollier Effect, Journal of Environmental Economics and Management
66(3): 573–582.
[US EPA 2010] United States Environmental Protection Agency (2010), Guidelines
for Preparing Economic Analyses, Washington D.C.: EPA 240-R-10-001
Weitzman, M.L. (1998), Why the Far-Distant Future Should Be Discounted at Its
Lowest Possible Rate, Journal of Environmental Economics and Management
36(3): 201–208.
Weitzman, M.L. (2001), Gamma Discounting, American Economic Review 91(1):
260–271.
Weitzman, M.L. (2007), A Review of The Stern Review on the Economics of Climate
Change, Journal of Economic Literature 45: 703–724.
Weitzman, M.L., and C. Gollier (2010), How Should the Distant Future be Dis-
counted When Discount Rates are Uncertain?, Economic Letters 107(3): 350–353.
35
Supplementary Material
A Further Detail on the Selection of Experts
Based on full-text analysis in the Google scholar engine, we searched the 102 lead-
ing economics journals (according to the ranking of Combes and Linnenmer 2010)
plus the Review of Environmental Economics and Policy for publications since the
year 2000 including the terms ‘social discounting’, ‘social discount rate’ or ‘social
discount factor’ (in March/April 2014). As a result, we identified 778 potential ex-
perts. As not all pertinent contributions to the field use the term ‘social discount
rate’, but often ‘real discount rate’ or simply ‘discount rate’, we further performed
an EconLit search for the term ‘discount rate’ (in April 2014). To avoid picking up a
large number of papers that only mention a ‘discount rate’ in passing somewhere in
the paper, we limited the scope to a within-abstract search. This search yielded an
additional 241 potential experts. We thus identified a total of 1019 unique potential
experts. We then manually discarded – using a weak relevancy test – publications
that are clearly not of direct relevance for our study. The criteria used to judge
whether a publication is not relevant are listed below:
• If the search phrases do not appear in the article itself, but only in the refer-
ence list.
• If the publication is a book review or another non-original contribution.
• If a value for the SDR is simply applied in an analysis without reference to the
literature.
• If one of the phrases is mentioned but not elaborated on.
• If the publication relies on a discount rate that is clearly not relevant to long-
term social discounting by governmental bodies, such as discounting of profits
or university fees.
A publication is labeled irrelevant if it meets at least one of the listed criteria. If
at least one of the publications of a scholar is regarded to be relevant (i.e. passes
this weak relevancy test), he or she is considered to be an expert. As a result of the
above relevancy test, we exclude 365 scholars from the pool of potential experts, thus
being left with 654 potential experts. For 27 of these scholars we could not obtain
an e-mail address because, for example, they have left academia or are deceased.
Our final population of potential experts thus contains 627 experts.1
1Although potential experts have published in leading economics journals, a small number ofthem do not have a Ph.D. in economics but come from diverse fields, including law and the naturalsciences.
36
B E-mail Text
This Appendix provides the text of the initial e-mail introducing experts to the
online survey.
Dear [Personal identifier],
We are targeting a select group of academics with expertise in social discounting.
The objective is to elicit recommendations on fundamental issues of discounting to
inform long-term public investment decision-making.
We would be most grateful if you could find the time to complete the very short
survey appended below.
https://www.surveymonkey.com/s/discounting-survey
Your individual response will be held in the strictest confidence.
Many thanks for your time and cooperation,
Ben Groom (LSE), Moritz Drupp (Kiel, LSE),
Frikk Nesje (Oslo, LSE), Mark Freeman (Loughborough)
37
C Further Checks of Non-Response Bias
We carried out a series of robustness checks to test for potential non-response
bias (see Johnson and Wislar (2012) and Necker (2014) for discussions of different
testing strategies).
In the main body of the paper, we first compare our 185 quantitative responses
with a random sample of 60 potential experts who had not replied by November 2014.
Second, we compare our 185 quantitative responses with the sub-sample responses
of the Resources for the Future (RFF) Arrow et al. (2012) panel on intergenera-
tional decision-making. Third, we consider differences in observable characteristics
– academic age, location and gender – among respondents and non-respondents. A
related check is to test for selection of environmental economists into responding.2
Indeed, we observe that environmental economists self-select into responding: 48%
of respondents are environmental economists, while only 33% of the non-respondents
are environmental economists. Yet, we find that environmental economists do not
recommend significantly (at the at the 10 percent level) different mean and median
SDRs to non-environmental economists.
Lastly, we consider differences between experts who responded to the initial
wave, and those who responded to a reminder. In Table 3 we report the results of a
comparison of these early and late respondents to obtain a further indirect measure
of potentially biasing participation. At the 10 percent level of significance only the
mean forecasted per-capita growth rate and recommended social rate of pure time
preference are different between the samples of early and late respondents. The
mean forecasted per-capita growth rate and recommended social rate of pure time
preference are higher for the sub-sample of respondents that required a reminder.
On the other hand, the median recommendation on the elasticity of marginal utility
is the only median response significantly different between the subsamples, with the
median of those responding immediately being higher. As a robustness check, we
also divided early and late respondents into equal sized groups and found that the
results were similar. The results of this additional exercise are reported in Table
2We regard an expert to be an environmental economist if the publication that led us to selecther or him as a potential expert is in either American Journal of Agricultural Economics, EcologicalEconomics, Energy Journal, Environmental and Resource Economics, Journal of EnvironmentalEconomics and Management, Land Economics, Resource and Energy Economics, or Review ofEnvironmental Economics and Policy.
38
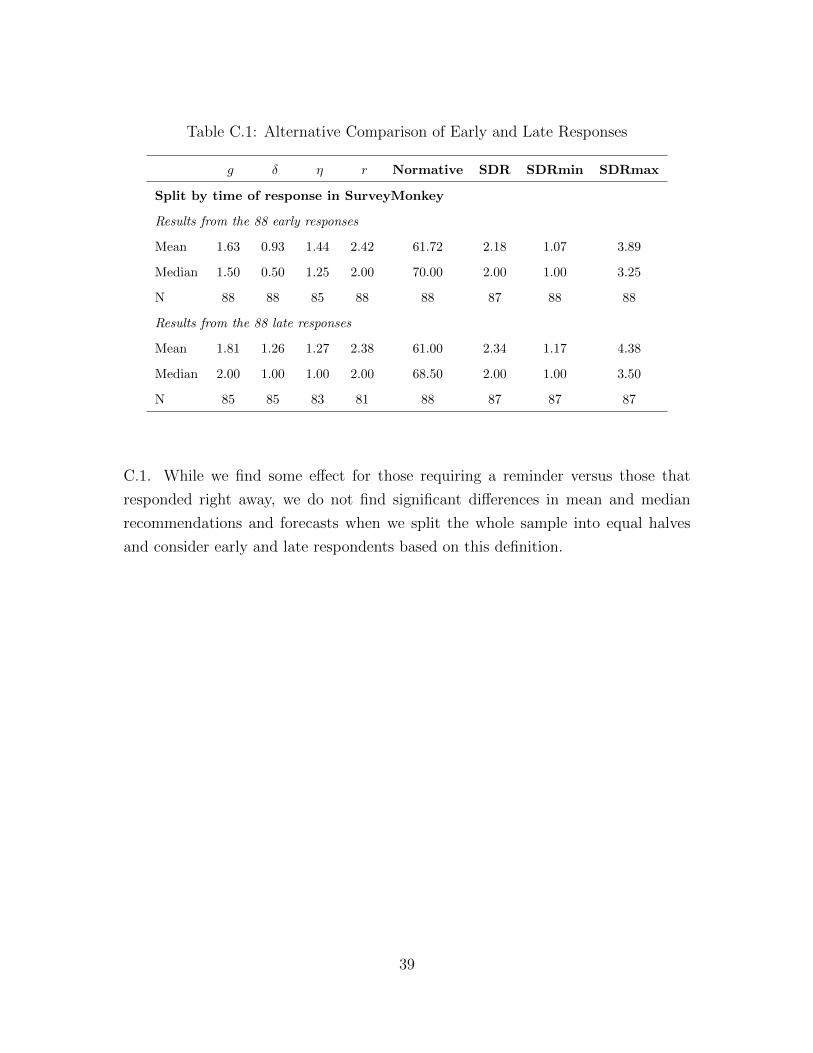
Table C.1: Alternative Comparison of Early and Late Responses
g δ η r Normative SDR SDRmin SDRmax
Split by time of response in SurveyMonkey
Results from the 88 early responses
Mean 1.63 0.93 1.44 2.42 61.72 2.18 1.07 3.89
Median 1.50 0.50 1.25 2.00 70.00 2.00 1.00 3.25
N 88 88 85 88 88 87 88 88
Results from the 88 late responses
Mean 1.81 1.26 1.27 2.38 61.00 2.34 1.17 4.38
Median 2.00 1.00 1.00 2.00 68.50 2.00 1.00 3.50
N 85 85 83 81 88 87 87 87
C.1. While we find some effect for those requiring a reminder versus those that
responded right away, we do not find significant differences in mean and median
recommendations and forecasts when we split the whole sample into equal halves
and consider early and late respondents based on this definition.
39
D Further Analysis of Qualitative Responses
As reported in the main paper, about half of our respondents provided qualita-
tive responses alongside their quantitative responses. Here, we analyse how raising
different issues is related to the quantitative responses received. Difference in means
statistically significant at the 10 percent level between those who commented and
those that did not are reported in Table D.1.
We find that experts who have provided comments responded with a lower pure
rate of time preference, forecast a lower per-capita growth rate and risk-free interest
rate, and recommended a lower SDR and minimum value of the SDR. As is further
illustrated in Table D.1, the implied SRTP is lower as a consequence. These results
are qualitatively similar if the subsample of experts raising issues of limited expertise
is excluded from the analysis.3
When qualitative comments are categorised into the five most frequent issues
raised, we obtain a clearer picture of the association between these concerns and
the quantitative responses.4 Experts raising the issue of ‘DDRs and time-horizon’
forecast a lower growth rate per-capita, recommended a more normative foundation
for the SDR and a lower point value of the SDR, and would be comfortable with a
lower minimum value of the SDR. Experts that raised the importance of ‘uncertainty’
tend to recommend lower values of the minimum acceptable value of the SDR and
the SDR itself. Experts raising the issue of ‘substitutability and environmental
scarcity’ recommended lower rates of pure time preference and forecast lower per-
capita growth rates and risk-free interest rates. These experts also recommended
that normative considerations should receive more weight, while recommending a
lower SDR and lower minimum and maximum values of the SDR. Their implied
SRTP is also lower. Finally, experts commenting on the importance of ‘heterogeneity
and aggregation’ recommended a lower rate of pure time preference and that the SDR
should have a more normative foundation.5
3Although not shown in Table D.1 only the forecast per-capita growth rate differs statisticallysignificantly between the subsample of experts stating limited expertise and the subsample ofexperts that did not raise this issue.
4Raising a comment on the ‘Ramsey Rule’ is not significantly associated with different forecastsand recommendations (at the 10 percent level); it is excluded from Table D.1.
5In light of the variety of heterogeneities mentioned by experts, there is no straightforwardexpectation on how heterogeneities impact SDR recommendations. While some respondents simply
40
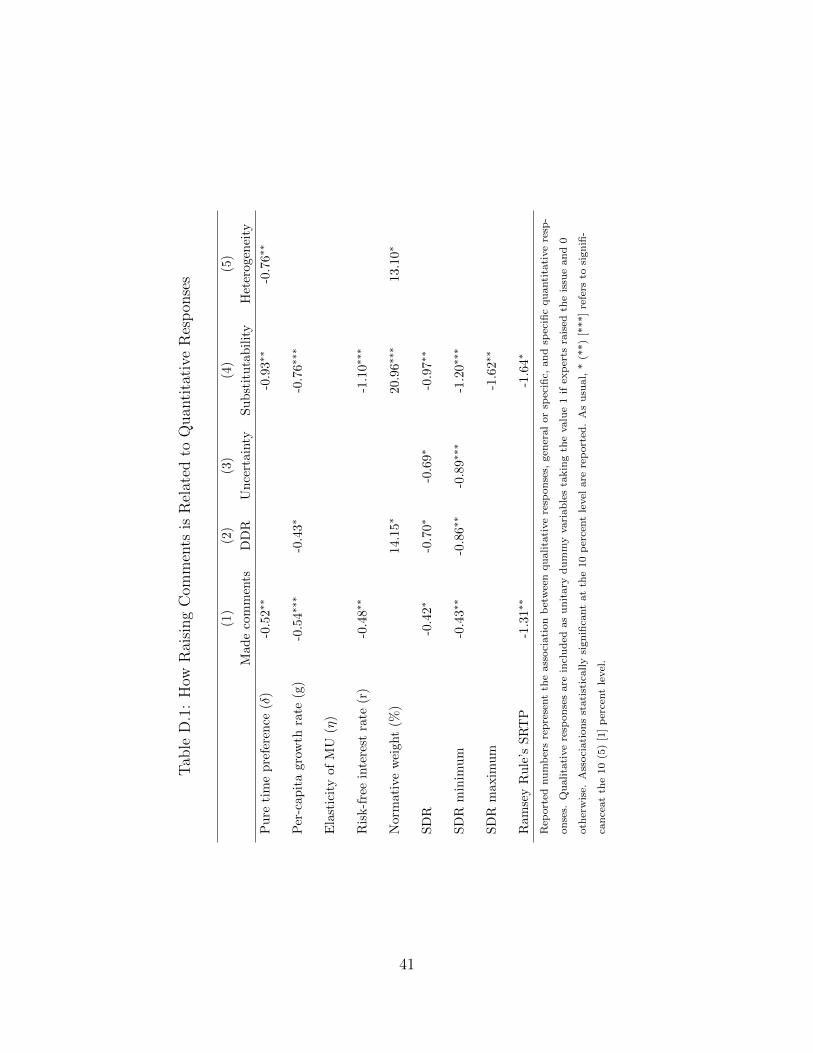
Tab
leD
.1:
How
Rai
sing
Com
men
tsis
Rel
ated
toQ
uan
tita
tive
Res
pon
ses
(1)
(2)
(3)
(4)
(5)
Mad
eco
mm
ents
DD
RU
nce
rtain
tyS
ub
stit
uta
bil
ity
Het
erogen
eity
Pu
reti
me
pre
fere
nce
(δ)
-0.5
2∗∗
-0.9
3∗∗
-0.7
6∗∗
Per
-cap
ita
grow
thra
te(g
)-0
.54∗
∗∗-0
.43∗
-0.7
6∗∗∗
Ela
stic
ity
ofM
U(η
)
Ris
k-f
ree
inte
rest
rate
(r)
-0.4
8∗∗
-1.1
0∗∗∗
Nor
mat
ive
wei
ght
(%)
14.1
5∗20.9
6∗∗∗
13.1
0∗
SD
R-0
.42∗
-0.7
0∗-0
.69∗
-0.9
7∗∗
SD
Rm
inim
um
-0.4
3∗∗
-0.8
6∗∗
-0.8
9∗∗
∗-1
.20∗
∗∗
SD
Rm
axim
um
-1.6
2∗∗
Ram
sey
Ru
le’s
SR
TP
-1.3
1∗∗
-1.6
4∗
Rep
ort
ednu
mb
ers
rep
rese
nt
the
ass
oci
ati
on
bet
wee
nqu
alita
tive
resp
on
ses,
gen
eral
or
spec
ific,
an
dsp
ecifi
cqu
anti
tati
ve
resp
-
on
ses.
Qu
alita
tive
resp
on
ses
are
incl
ud
edas
un
itary
du
mm
yvari
ab
les
takin
gth
evalu
e1
ifex
per
tsra
ised
the
issu
ean
d0
oth
erw
ise.
Ass
oci
ati
on
sst
ati
stic
ally
sign
ifica
nt
at
the
10
per
cent
level
are
rep
ort
ed.
As
usu
al,
*(*
*)
[***]
refe
rsto
sign
ifi-
can
ceat
the
10
(5)
[1]
per
cent
level
.
41
Taken as a whole, these results suggest a negative relationship between qual-
itative and quantitative responses. This is driven mainly by those who mention
declining discount rates and uncertainty and those who are concerned about sus-
tainability and environmental scarcity.
References
Arrow, K.J., Cropper, M.L., Gollier, C., Groom, B., Heal, G., Newell, R., Nord-
haus, W.D., Pindyck, R., Pizer, W., Portney, P., Sterner, T., Tol, R.S.J., and
M.L. Weitzman (2012), How Should Benefits and Costs Be Discounted in an In-
tergenerational Context? The Views of an Expert Panel, RFF Discussion Paper
12(53), Resources for the Future.
Combes, P.P., and L. Linnemer (2010), Inferring Missing Citations: A Quantitative
Multi-Criteria Ranking of all Journals in Economics, GREQAM Working Paper
2010-25.
Johnson, T.P. and J.S. Wislar (2012), Response Rates and Nonresponse Errors in
Surveys, The Journal of the American Medical Association 307(17): 1805–1806.
Necker, S. (2014), Scientific Misbehavior in Economics, Research Policy 43: 1747–
1759.
state that one must take the distributional effect for those “affected by the project” into account,other respondents are more specific in stating that “the discount rate should be negative if richpeople pay today for poor people in the future”.
42