direct observations of aerosol radiative forcing over the tropical indian ocean during the...
TRANSCRIPT

JOURNAL OF GEOPHYSICAL RESEARCH, VOL. 103, NO. D12, PAGES 13,827-13,836, JUNE 27, 1998
Direct observations of aerosol radiative forcing over the tropical Indian Ocean during the January-February 1996 pre-INDOEX cruise A. Jayaraman, • D. Lubin,: S. Ramachandran, • V. Ramanathan,: E. Woodbridge, :,3 W. D. Collins, TM and K. S. Zalpuri s
Abstract. Simultaneous measurements of aerosol optical depth, size distribution, and incoming solar radiation flux were conducted with spectral and broadband radiometers over the coastal Indian region, Arabian Sea, and Indian Ocean in January-February 1996. Columnar aerosol optical depth, 8a, at visible wavelengths was found to be 0.2-0.5 over the Arabian Sea and <0.1 over the equatorial Indian Ocean. Aerosol mass concentration decreased from about 80 bcg/m 3 near the coast to just a few bcg/m 3 over the interior ocean. The sub-micron-size particles showed more than an order of magnitude increase in number concentration near the coast versus the interior ocean. This large gradient in particle concentration was consistent with a corresponding large increase in the Sun- photometer-derived Angstrom exponent, which increased from 0.2 over the Indian Ocean to about 1.4 near the coast. The change in surface-reaching solar flux with 8a was obtained for both the direct and the global solar flux in the visible spectral region. The solar-zenith-angle-normalized global and diffuse fluxes vary almost linearly with normalized •a. The direct visible (<780 nm) solar flux decreases by about 42 +_ 4 Wm -2 and the diffuse sky radiation increases by about 30 _+ 3 Wm -2 with every 0.1 increase in 8a, for solar zenith angles smaller than 60 ø . For the same extinction optical depth the radiative forcing of the coastal aerosols is larger than the open ocean aerosol forcing by a factor of 2 or larger.
1. Introduction
One of the largest sources of uncertainty in validating model predictions of climate change is the role of aerosols in the radiation budget. While "greenhouse gases" are known to de- crease the outgoing long wave radiation and contribute to global warming (positive forcing), aerosols can either increase or decrease the outgoing solar radiation by scattering or ab- sorption (direct effect) or by changing the microphysical prop- erties of the clouds (indirect effect). The change (between now and the early 20th century) in the reflected solar flux (the direct effect) due to anthropogenic sulfate averaged over the northern hemisphere is estimated as -1.1 Wm -2 [Charlson et al., 1991] which is roughly 50% (but opposite sign) of the radiative forcing due to anthropogenic CO2 [Intergovernmental Panel on Climate Change (IPCC), 1995]. However, because of their short residence times, aerosols with varying optical prop- erties are not uniformly mixed around the globe, and conse- quently, their radiative forcing is subject to significant regional variations [Kiehl and Briegleb, 1993].
The primary objective of this study is to examine through direct observations the microphysical and radiative forcing of anthropogenic aerosols over oceans influenced by continental air. In particular, we wish to understand how the continental
•Physical Research Laboratory, Ahmedabad, India. 2Scripps Institute of Oceanography, UCSD, La Jolla, California. 3Now at Thermotrex Corporation, San Diego, California. 4Now at National Center for Atmospheric Research, Boulder, Colo-
rado.
SNational Physical Laboratory, New Delhi, India.
Copyright 1998 by the American Geophysical Union.
Paper number 98JD00559. 0148-0227/98/98JD-00559509.00
aerosols infiltrate over clean ocean areas hundreds and thou-
sands of kilometers away from the source. The focus of the study is the Arabian Sea, which is surrounded by arid and semiarid regions producing wind-blown dust particles into the atmosphere in addition to the anthropogenically produced sul- fate and carbonaceous particles. We know very little about these aerosol effects on the Indian Ocean. The ideal period to examine this aspect of the aerosol-climate problem, is the wintertime northeast monsoon period. The prevailing low- level wind during the winter season is the northeasterly wind from the Indian subcontinent toward the Arabian Sea and the
tropical Indian Ocean. This flow pattern can transport large amounts of continental aerosols over the Arabian Sea and the
adjoining Indian Ocean. Thus the Arabian Sea and the tropical Indian Ocean provide ideal conditions during winter to study the transport of continental aerosols and formation of new particles over the ocean surface and their radiative forcing.
2. Experiment A comprehensive international field experiment, the Indian
Ocean Experiment (INDOEX) campaign [Ramanathan et al., 1995, 1996], is being planned to study the aerosol-chemical- microphysical-radiative interactions. A series of pre-INDOEX cruises on ships-of-opportunity are being conducted before the main field phase. The first of these was conducted on the NOAA Baldridge [Rhoads et al., 1997] in January 1995 in which vertical profiles of ozone, water vapor, and chemical analyses of aerosols were observed. The results reported in this study were obtained from the cruise conducted in 1996.
The cruise was conducted during January 5 to February 4, 1996, over the Arabian Sea and the Indian Ocean using the Indian research vessel ORV Sagar Kanya. Research groups
13,827

13,828 JAYARAMAN ET AL.: AEROSOL RADIATIVE FORCING OVER THE INDIAN OCEAN
ORV Sagar Kanya Pre-INDOEX Cr•xise, Jan 5 - Feb 4, 25
20 - •5 •um•i . •Bomboy)
• •'' 6 52 Z 10- o • 31
• 9 8 20_ 21•2 • 5-
• lo 0 18
• o- 11 17 16
15
12 14 -5- -
-10 .... •0 s• 7• • 90
Longitude (øE)
Figure ]. Track of ORV 5•r K•y•, the pre-[NDOEX dian Ocean Experiment) cruise made on Janua• 5 to Febma• 4, ]PPS. The Julian day numbers (Janua• ], ]PP5 as ]) are marked alon• the ship track.
from India and the United States participated in the cruise, and the data collected included aerosol filter samples, aerosol optical depth, mass concentration, size distribution, concentra- tion of trace gases, and spectral to broadband solar fluxes at the sea surface. Since radiometric observations (optical depths and solar fluxes) are difficult to make from a ship, we ensured adequate redundancy in our instrument sets. For example, as described below, we used two independent radiometers (with different types of detectors) for solar fluxes. This study uses a subset of the data collected during the cruise.
Figure 1 shows the ship's track. The research vessel left Goa (in the western coast of south India) on January 4, 1996, sailed in the Arabian Sea and the Indian Ocean down to 5 ø south and
returned to Bombay on February 4. The ship's position on each day at 1200 UT is marked in the figure. The January to Feb- ruary time period is part of the NE monsoon during which clear to broken low-cloud conditions prevail north of about 4øN, and the Intertropical Convergence Zone (ITCZ) is lo- cated at or south of the equator. As reported by the scientists onboard (coauthors SR and KSZ), the sky was nearly cloud free north of about 4øN, during both the initial and the final phases of the cruise. The sky was, however, cloudy, and deep convective clouds were seen over the equator during January 20-31. No optical measurement was possible during this pe- riod. The above onboard reports are consistent with the sky conditions that we inferred from polar orbiting NOAA satellite data, described below.
Plate 1 is a map of the average infrared brightness temper- ature (IRBT) during the cruise. The brightness temperature is obtained from the 11 /am channel of the advanced very high resolution radiometer (AVHRR) instruments onboard the NOAA 12 and NOAA 14 polar satellites. Regions where the IRBT exceeds 290 K are either cloud free or populated by low-altitude clouds possibly mixed with thin cirrus. Regions where the IRBT is below 270 K are associated with clouds in
the middle and upper troposphere. The map shows that the meteorological conditions during the first phase of the cruise
were characterized by clear skies with scattered low clouds. The cloud cover derived from the AVHRR imagery using spatial coherence analysis [Coakley and Baldwin, 1984] indi- cates that the area mean-cloud cover between the start of the
cruise and 8øN ranged between 10 and 25%, with the cloud tops well within the boundary layer. The Sagar Kanya sailed into the ITCZ, south of the equator. The IRBT in this portion of the cruise is below 240 K. This range of IRBTs is typical of upper troposphere clouds generated by deep convection. The ship sailed north out of the ITCZ into relatively undisturbed conditions and then returned to the ITCZ during the latter phase of the cruise. At the end of the final leg the Sagar Kanya reentered a region of predominantly clear skies off the western coast of India.
Table 1 gives a list of observations and instruments used in this study. The columnar optical depth measurements were made using (1) a manually operated hand-held Sun photome- ter at five wavelength bands selected by interference filters centered at 399, 497, 667, 848, and 1051 nm and having band widths (full width at half maximum) 19, 13, 14, and 25 nm, respectively, and (2) an automated Sun photometer (by Space Physics Laboratory, Trivandrum) whose results were consistent with those used in this study. The filter's transmission charac- teristics are known accurately by calibrating them periodically in the laboratory using a spectrophotometer, and the effective central wavelength of the filters (transmission weighted by photodiode response and the solar spectral intensity) are used in converting the measured radiation intensity into optical depths. The photometer is manually aimed at the Sun with the help of a Sun guider, and the peak voltage is recorded during clear sky condition and for solar zenith angles up to 70 ø . The total field of view of the photometer is kept as 8 ø for opera- tional convenience of pointing the photometer toward the Sun from ship deck.
The total optical depth /3 is calculated from the measured voltage V and the air mass factor 1//a, where/a = cos 0 and 0 is the solar zenith angle at the time of measurement. The instrument constant Vo, the voltage for "no atmosphere" con- dition, is obtained using the Langley plot technique, from pe- riodic measurements made at Mount Abu (25øN), a hill station about 1.7 km above the mean sea level. For the cruise period the Vo values for individual channels are corrected for the mean Sun-Earth distance for the day.
There are essentially two sources of measurement uncertain- ties in the optical depth measurements: (1) radiometric uncer- tainties, i.e., instrumental error (due to bias and precision). This is about +5%. (2) The optical depth is inferred from the direct solar flux by invoking Beer's law. This procedure ignores the contribution from "forward" scattering to the measured flux. It is estimated that the forward scattered radiation within
the field of view of the photometer tends to decrease the measured aerosol optical depth by not more than 8% at 399 nm and less than 4% at 1051 nm. The overall uncertainty in the inferred optical depth from these two sources is less than +_ 15%.
Aerosol optical depth/3a is obtained from/3, after subtract- ing the optical depths due to Rayleigh scattering (/3Ray) and molecular absorptions (/3oz and /3H20 ) wherever applicable. An average air column density value of 2.16 x 1025 molecules/ cm 2 [Sasi and Sengupta, 1986] is used in estimating/3Ray. The annual variation in the air column density inclusive of seasonal dispersion from January to December over the equatorial re- gion is found to be less than 2% [Sasi and Sengupta, 1986] and is not considered in this study. In the absence of independent

JAYARAMAN ET AL.: AEROSOL RADIATIVE FORCING OVER THE INDIAN OCEAN 13,829
AVHRR IRBT Jan. 5- Feb. 2, 1996
Sagar Kanya Cruise 109
0 . ' 0
'
-20 " ':' " . -20 -
• .
o
, , _
$o 7o 8o Longitude
240. 245. 250. 255. 260. 265. 270. 275. 280. 285. 290. 295. 300. (K)
Plate 1. Map of the time-mean 11 tam infrared brightness temperatures (IRBT) from the AVHRR instru- ments onboard NOAA 12 and 14. IRBTs are averaged over the period from January 5 to February 2, 1996. The cruise track is shown by the thick white line.
ozone column measurements, &oz is computed from the Dob- son ozone data available over Ahmedabad (23øN) for over 30 years [Angreji, 1989]. The computed &oz values are 0.01 and 0.017 for the 497 and 667 nm channels (weighted for the entire band width), respectively. The seasonal variation in the column concentration of ozone, which is about 4% [Angregi, 1989], is not considered. The •iH20 is computed from a model surface water vapor density value of 17 g/m 3 applicable for the Arabian Sea and Indian Ocean for the months of January and February
[Sarkar et al., 1982]. The computed •iH20 values are 0.035 and 0.018 for the 667 and 1051 channels, respectively. NO 2 absorp- tion at 399 and 497 nm channels are not considered, which are however much less than the values mentioned above. The
cumulative effect of these assumptions in the retrieved aerosol optical depths is expected to be less than 15%.
The quartz crystal microbalance (QCM) cascade impactor (model PC-2, California Measurements Inc.) was used for the measurements of mass concentration and size distribution of

13,830 JAYARAMAN ET AL.: AEROSOL RADIATIVE FORCING OVER THE INDIAN OCEAN
Table 1. Data From the Following Observations Made in the ORV Sagar Kanya Cruise 109 During January 5 to February 4, 1996, Used in This Study
Parameters Measured Instruments Used Responsibility
Aerosol optical depths at 399, 497, 667, 848, hand-held Sun photometer and 1051 nm
Aerosol mass concentration and size quartz crystal microbalance (QCM) distribution (0.025, 0.05, 0.1, 0.2, 0.4, 0.8, cascade impactor, California 1.6, 3.2, 6.25, 12.5 mm radii) Measurements Inc.
Direct solar flux, W/m 2 broadband pyrheliometer with filter wheel (normal (280-2800 nm) and NIR (780-2800 nm) incidence), Eppley Laboratory Inc., USA
Global flux, W/m 2 broadband (280-2800 nm) pyranometers (2 Nos.) Eppley and NIR (780-2800 nm) Laboratory Inc., USA
Spectral global flux, W/m 2 (305, 320, 380 photodiode radiometer, Biospherical (10 nm FWHM) and PAR (400-700 nm) Instruments Inc., USA
Physical Research Laboratory, Ahmedabad, India
Physical Research Laboratory, Ahmedabad, India
Physical Research Laboratory, Ahmedabad, India
Center for Clouds, Chemistry and Climate, Scripps Institute of Oceanography, San Diego, California
Center for Clouds, Chemistry and Climate, Scripps Institute of Oceanography, San Diego, California
particles. The cascade impactor operates at a flow rate of 240 mL/min, and the samples are segregated into 10 stages with 50% efficiency cutoff radii at 0.025, 0.05, 0.1, 0.2, 0.4, 0.8, 1.6, 3.2, 6.25, and 12.5/am diameter. A pair of sampling and ref- erence quartz crystal sensors are used in each stage to provide real-time mass data for the sampling period. The impactor and the other gas-measuring equipment were kept together inside the ship's cabin. Air samples were brought through a duct at a reasonably high flow rate, from a location optimized for draw- ing a representative air sample, at a height of about 11 m from the sea level, to an air plenum. The impactor and other instru- ments were made to draw sample from the plenum, to ensure that all instruments get samples from the same source. On aver- age, four measurements were made each day, and a total of 120 size distribution profiles and mass concentrations were obtained during the entire cruise. The typical sampling time for each mea- surement was kept as 10 min (2.41 of air sample) near the coastal regions and was increased to about 30 min over the interior "clean" ocean region to get sufficient aerosol mass in each stage. In the absence of the quoted uncertainty from the manufacturer we estimated an uncertainty of about 25% (maximum limit for all the 10 stages) by operating the instrument simultaneously with other similar sampling instruments such as Anderson Im- pactor. A more rigorous intercomparison is under way.
Direct solar radiation measurements were made using cali- brated Eppley's normal incidence pyrheliometers. The main quantity of interest for this study is the solar radiative forcing of aerosols in the wavelength regions smaller than about 800 nm. The aerosol forcing (at the surface) at wavelengths larger than 800 nm are overlapped by the significant absorption by H20. As a result, vertical water vapor distribution is required to interpret the data, which was unavailable for this cruise. Thus for the radiative fluxes we focus primarily on wavelengths less than 800 nm.
The pyrheliometer was configured for a total field of view of 5.5 ø , determined by the aperture angle. Radiation intensities were measured in two wavelength regions, namely 280-2800 nm and 780-2800 nm using a filter wheel. The difference between the two data is referred to as the direct "visible"
ra. diation and used in the present work. The radiometric un- certainty in the total (280-2800 nm) solar pyrheliometer is less than 1%. The filtered instrument (780-2800 nm) has a larger uncertainty of about 3%. Assuming the two errors to be un- correlated, the error in the visible pyrheliometer flux is antic- ipated to be less than 4%.
We have two independent estimates for the surface global
solar flux for X <800 nm. We deployed a Biospherical Instru- ments Inc. (San Diego, California) model GUV-531 mul- tichannel solar ultraviolet/visible radiometer system, hereinaf- ter referred to as the "photodiode radiometer." The channel of interest here is the so-called photosynthetically active radiation (PAR) channel, which covers the wavelength range 400-700 nm. The GUV-531 measures downwelling irradiance by means of an optimized Teflon diffuser (cosine collector optic) and selected filter and photodiode combinations for each channel. The 400-700 nm channel is established by means of a silicon photodiode and a hot-mirror-type filter combined with color balance filters to ensure a flat wavelength response across the entire spectral interval. Because the instrument was originally designed for applications in photobiology the wavelength re- sponse of the PAR channel is designed to be flat in the quan- tum (photon counting) domain rather than in the energy (watts per square meter) domain. This introduces one uncertainty related to the spectral composition of the incident radiation, which will depend on both atmospheric turbidity and solar zenith angle and which could be different from the spectral characteristics of the calibration source. Radiative transfer cal-
culations, for clear skies, for a variety of aerosol models, and for the range of solar zenith angles considered in this study, show that this uncertainty will affect the slope and intercept of the empirical relationship between downwelling flux and aero- sol optical depth (the primary objective of this study) by less than _+5%.
To ensure stability, the photodiode radiometer optics are maintained above ambient temperature, at 40øC, by a temper- ature controller. The photodiode voltages are digitized within the temperature-stabilized optical unit before being sent along the data cables to the data logger to eliminate transmission line uncertainties. Because of the high stability achieved by tem- perature regulation the precision of the channel is only limited by the precision of the analog-digital converter. Under tropical solar illumination this precision is one part in 12 bits over a voltage range 625 mV to 1 V, which is effectively _+0.15%. Radiometric calibration is established by periodic reference to NIST-traceable irradiance standards and is estimated at
+2.5%. The two radiometric calibration checks that bracket
this field experiment were done on December 2, 1994 and July 16, 1996. The linear calibration constant changed by only + 1.3% between these two calibration checks, while the dark offset remained the same. This photodiode radiometer was deployed in a gimbal on the forecastle of ORV Sagar Kanya. The overall uncertainty (20-range) in the photodiode fluxes is

JAYARAMAN ET AL.: AEROSOL RADIATIVE FORCING OVER THE INDIAN OCEAN 13,831
estimated to be less than _+10% or +2 W m -2, whichever is greater.
Secondly, a pair of Eppley PSP pyranometers were deployed for the measurements of global solar flux in the 280 to 2800 nm and the other in the 780 to 2800 nm wavelength regions. The difference between the two is used as an estimate of the 280 to
780 nm flux. Like the photodiode radiometer, the pyranom- eters were also mounted on gimbals to balance out the ship motion. The individual pyranometer data are accurate to about 3% (or 15 Wm -2, whichever is more). The difference between the two pyranometers can have an uncertainty as large as 4 to 5%. Russell and Livingston [1984] estimate an uncertainty of _+2 W m -2 for flux measured by tower-mounted pyranometers, whereas Saunders et al. [1992] estimate +_8 Wm -2 for airborne pyranometers.
On the basis of our experience in this and other cruises we rely more on the photodiode radiometer data for our interpre- tation. The pyranometer data are used for consistency checks. Our strategy for interpreting the data involves examining con- sistencies between the various instruments. For example, we try to correlate the optical depths from the Sun photometer with the direct solar flux from the pyrheliometer, since the two should be strongly correlated from theoretical considerations. Likewise, we compare the size distribution obtained from the QCM cascade impactor with the spectral dependence of the optical depth inferred from the Sun photometer, since aerosol size distribution is one of the important parameters governing the spectral variations in the optical depth.
Data corresponding to solar zenith angle greater than 60 ø are not included in the analysis. Both the pyranometer and the photodiode radiometer global flux measurements were made continuously and 10 s average values were used.
3. Results and Discussions
3.1. Aerosol Optical Depth
A total of about 530 data points were obtained for aerosol optical depths at the five wavelength channels during the entire cruise (Figure 1). The aerosol optical depths 15a were found to vary from about 0.6 at 399 nm to about 0.18 at 1051 nm near the coast and from about 0.08 at 399 nm to about 0.06 at 1051
nm over the interior ocean regions (Figure 2). The decrease in 15a from the coast to the interior ocean region was found to be more rapid in the visible and shorter wavelength regions. Par- ticles in the size range from 0.1 to 0.4 •m radius, which con- tribute significantly to 8a in the visible and shorter-wavelength
0.8
0.6
•.. 0.4
0.2
0 10 20 30
Julian Day, 1996 4O
o 399 nm
/x 497 nm
[] 667 nm
½ 848 nm
.• 1051 nm
Figure 2. Average aerosol optical depths obtained each day along the cruise track for the wavelengths shown. Intermittent data gaps are due to cloudy sky.
0.6
•'• (a) . 0.4
0.2
300 500 700 900 1100
Wavelength (nm)
.5(1.31) --•- 6 (1.26) + 11 (0.87)
•19 (0.14)
+22 (1.17) .32 (1.33) .•- 33 (1.43) • 35 (1.46)
,,
Figure 3. Spectral variation of the aerosol optical depths at selected locations along the cruise track. The day number and the value of the fitted Angstrom parameter a (within paren- theses) for each measurement day are shown. Figure 3a is for the days when the ship was sailing away from the coast, and Figure 3b is for the days when the ship was approaching the coast.
region, are likely to be non-sea-salt sulfate and other submi- cron particles of continental origin (due to the northeasterly low-level flow). The increase in 15a at 1051 nm channel (Figure 2), seen near the coastal locations, is probably due to the coarse mineral particles of land origin. The average aerosol optical depth for the midvisible wavelength region (497 nm channel in the present case) was in the range of 0.3 to 0.4 near the western coast of India and in the range of 0.1 to 0.2 over the tropical Indian Ocean, around 5øS and 70øE, the farthest region from the coast visited in the present cruise.
For comparison, the aerosol optical depth reported for the Atlantic Ocean ranged from 0.04 to 0.25 [Hoppel et al., 1990]. Similar variations in 15a have been reported by l/illevalde et al. [1994] over the Pacific and North Atlantic based on Sun pho- tometer measurements made in early 1989. The 15a measured over the Arabian Sea (this work) is however higher than the reported values for other ocean regions with an exemption of the tropical zone of the Atlantic Ocean affected by the Sahara dust. The high 15a values obtained over the Arabian Sea are most likely due to the combined effect of the influx of wind- blown dust particles from the surrounding arid and semiarid regions as well as the anthropogenic aerosols from the Indian subcontinent transported by the low-level flow.
The measured aerosol optical depth spectra could be repre- sented by the usual Angstrom power law, 8a(X) = /3X -•. The a values are estimated for an individual data set (a set of five optical depths at five wavelengths) by least squares fitting 15a against wavelength on a log-log plot. This parameter is partic- ularly useful in studying the spatial variation in aerosol size distribution as well as in comparing the data with other pub- lished results for different regions. Figures 3a and 3b show the spectral variation of 15a at few selected locations. The esti-

13,832 JAYARAMAN ET AL.' AEROSOL RADIATIVE FORCING OVER THE INDIAN OCEAN
1 oo
• 80
E 03 60
o
.B
E 40
• 20
Aerosol Mass Concentration
0 10 20 30 40
Julian Day, 1996
Figure 4. Total mass concentration of aerosols measured along the cruise track during the period from January 5 to February 4, 1996.
mated a values are shown within parentheses along the day number of the measurements. Refer to ship track in Figure 1 for the locations. While the mean a value for the entire region of measurements is 1.2 ___ 0.3, the mean a values for the Arabian Sea and Indian Ocean individually are 1.4 ___ 0.1 and 0.8 _+ 0.3, respectively. The present Indian Ocean a value of 0.8 is higher than the earlier value of 0.6 reported by Tomasi and Prodi [1982] obtained over the equatorial Indian Ocean, northeast of the Seychelles islands in January-February 1979. Similarly, the mean a value for the Arabian Sea is also higher than the values reported for other regions. For example, the a value over the trans-Atlantic region was found to be 1.03 based on the measurements made in March-April 1983 [Hoppel et al. 1990]. Over the Pacific Ocean it was in the range of 0.26-0.86 and over North Atlantic in the range of 0.61-1.37 [VillevaMe et al. 1994].
Either an increase in the number of smaller particles or a decrease in the number of bigger particles can cause an in- crease in the value of a. In the present case, the increase in the a value observed over the Arabian Sea with a corresponding increase in the aerosol optical depth show that it is the increase in the number of smaller particles which caused the observed increase in a. Independent aerosol mass concentration mea- surements made onboard the ship and discussed in the follow- ing chapter, showed a steep increase in the concentration of smaller size particles as the ship cruised from the interior ocean toward the coastal region.
3.2. Aerosol Mass Concentration and Size Distribution
Figure 4 shows the aerosol mass concentration, i.e., inte- grated total values of mass collected at all the 10 radii stages of the QCM (Table 1) as a function of day number in 1996, from January 5 to February 4. A systematic decrease is seen in the mass values as the ship sailed away from the coast toward the interior ocean and a similar increase as the ship approached the coast during its final leg. The values are in the range of 40 to 80/.tg/m 3 near the coastal India, decreases to a range of 20 to 40 /.tg/m 3 over the Arabian Sea and decreasing still further to the lowest values of less than 20 /.tg/m 3 over the Indian Ocean. The coastal values are typical of the aerosol mass found in polluted continental regions such as the northeastern United States [Leaitch et al., 1992]. As the aerosols of conti- nental origin are carried over the ocean surface in the low-level
flow, there is a systematic removal of bigger particles due to gravitational settling.
Figure 5 shows the average of aerosol mass size distribution profiles obtained over the three regions, namely, the Arabian Sea (January 5-8 data), the Indian Ocean (January 18-22 data), and the coastal India (January 31 to February 4 data). A systematic decrease in mass is seen in all size ranges from coastal India toward the interior Indian Ocean region. The data are grouped such that the mass distribution remained more or less constant over the averaging period. This is how- ever in contrast to the coastal data, where a systematic increase is seen as the ship sailed along the coast, toward north. About 15 to 20 profiles are averaged in each case, and the mean values are shown. It should be noted that the particles can "swell" according to the humidity of the ambient air. Hanel [1976] has studied the swelling factor (r/ro) for various relative humidity (RH) and particle size. The factor is 1.1 at RH 50% which increases to 1.6 at RH 90% for particles of radius <0.5 /am and to about 2.4 for particles of radius > 1.5/am, which are mainly the sea spray aerosols. The RH values during the aero- sol measurements were found to be within a range of 60 to 85%. Changes (if any) in the aerosol size distribution induced by the humidity change is not explored in the present work.
The collected aerosol mass is found to decrease, in general, in all stages from the coast to the interior ocean (Indian Ocean) region. The coastal data are marked by two prominent peaks in the mass distribution, one in the coarse particle size range (6.25/am radius and above) and the other in the submi- cron size range (around 0.05/am radius). The coarse particles, mostly of land origin, are (as expected) confined largely to the coastal region. Their residence time in the atmosphere is of the order of few hours and less. In addition, the submicron size particles are also larger in number over the coastal regions, perhaps indicating the production of new particles from the polluted air close to the coast. In contrast, the intermediate size ranges (0.1 to 1 /am) do not show much asymmetry be- tween the coast and the interior ocean.
In order to bring out the correlation between the mass con- centration and the measured aerosol optical depth, the mass values are converted into number density distributions for the
lOO
E lO E
._
E
1
0.1
2.5 3.2 .8 .2 .05 6.25 1.6 .4 .1 .025
Radius (micrometer)
ß Coastal India
[] Arabian Sea
[] Indian Ocean
Figure 5. Average aerosol size distribution over the three different regions obtained during January 5-8 (Arabian Sea), during January 12-17 (Indian Ocean), and January 31 to Feb- ruary 4 (Coastal India).

JAYARAMAN ET AL.: AEROSOL RADIATIVE FORCING OVER THE INDIAN OCEAN 13,833
three cases and are shown in Figure 6. For the sake of clarity, data for size less than 10/xm radius (last eight stages data) are only shown. Furthermore, these are the particles which signif- icantly contribute to the aerosol optical depth in the visible part of the solar spectrum. The derived values fall within the urban and remote continental model number size distributions
of Jaenicke [1993]. The size of the aerosol particles is a dynamic parameter which depends, in addition to large-scale transport, on different microphysical processes such as condensational growth and coagulation. From a series of aerosol size distri- bution measurements made in the marine boundary layer over the Atlantic Ocean, Hoppel et al. [1990] conclude that as the continental air moves off the coast, in the absence of clouds or precipitation (as in the present case) there is a rapid decay of small particles (r < 0.5 /•m) due to both coagulation and condensational growth, and the size distribution evolves with a strong peak in the 0.05-0.08 /xm radius range (accumulation mode). The size distributions obtained for coastal India and the Arabian Sea are consistent with that explanation. As the residence time of these particles is of the order of a day, the "background aerosol" particles found in the remote ocean (Indian Ocean in the present case) could be the result of in situ production of new particles from mostly sulfur-bearing gases such as SO2, OCS of land origin, and dimethyl sulfide of ocean origin [Andreae and Raemdonck, 1983]. Particles larger than about 0.3 /xm radius found over oceans are mainly sea-salt particles generated at the sea surface, and hence "no appre- ciable change" in their concentration is observed for the three regions. The large increase seen in the aerosol number con- centration, by an order of magnitude or more, of particle size less than about 0.08 /xm as one approaches the coast clearly shows the influence of the continental air. This increase in the
amount of smaller particles near the coast is the reason for the observed increase in the measured aerosol optical depth at lower wavelengths over the Arabian Sea and near the coast (Figures 3a and 3b), which is indicated by the increase in the estimated Angstrom parameter a.
3.3. Aerosol Radiative Forcing
Aerosol properties measured by the above techniques are correlated with the independent radiative flux measurements made simultaneously. In Figures 7a, 7b, and 7c the direct visible (<780 nm) solar fluxes are compared with the instan- taneous aerosol optical depth (for 497 nm channel) corrected for the air mass factor (1//x). Normalization of the aerosol optical depth with/x (=cos 0) is found necessary as the slant air column length increases with increasing solar zenith angle 0. The direct solar flux represents here the solar flux at the sur- face, normal to the angle of incidence, within a cone of about 5.5 ø (determined by the aperture angle of the pyrheliometer) with the Sun at the center. The 497 nm channel aerosol optical depth data are used throughout this work for comparison with the visible radiative flux measurement, because 500 nm (550 nm in other studies) is used as a representative wavelength for expressing midvisible aerosol optical depth. By restricting 13a/ix within 0.8, (excluding the data for solar zenith angle larger than 60 ø) a straight line could be fitted with a negative slope of 421 W m -2 per unit aerosol optical depth. Table 2 gives the regression analysis statistics.
Some of the scatter of the data in Figure 7 (as well as in other figures to follow) could be from the Rayleigh optical depth variations resulting from its zenith angle dependence. The fitted slopes in the figures, however, are dominated by
1.0E+06
1.0E+04
• 1.0E+02 E
o
• 1.0E+00
. Coastal India
e Arabian Sea .o
1.0E-02 'v Indian Ocean v - - daenicke's Urban ß
-Jaenicke's Remote Continental
1.0E-04 • I I I IIIII I I I I IIIII I I I I IIII
0.01 0.1 1 10
Radius (micron)
Figure 6. Aerosol number density derived from the data shown in Figure 5 for a size less than 10 /xm radius and by assuming a constant density of 2 g/cm 3. For comparison, aero- sol number size distributions for urban and remote continental
models [Jaenicke, 1993] are shown.
variations in (Sa, since •3a/ix varies by more than a factor of 10 (see Figures 3 and 7) compared with (SRay//x which can only vary by factors less than 2. We discuss our results in terms of the change in the sea surface solar forcing to a 0.1 increase in the aerosol optical depth. From Figure 7a, for a 0.1 increase within the prescribed columnar aerosol optical depth ((Sa < 0.4 and/x within 0.5-1) the direct visible solar flux decreases by about 42 W m -2. This value could still be higher (by about 10%) because the direct radiation also includes the forward scattered radiation. The linear relation is however not valid for
higher aerosol optical depth, higher than 0.4, because an ex- ponential fit will be more appropriate as per the Beer Lambert law.
Figures 7b and 7c separate the coastal aerosol radiative forcing from that of the interior ocean. The coastal data rep- resent the data obtained on February 1 and 2, when the ship was sailing off the western coast of India, and the interior ocean data represent the rest of the data obtained on January 5, 6, 8, 11, 12, 15, 19, and 22. Furthermore, a total of three data points collected between January 12 and 15 had to be removed because they were contaminated by clouds in the vicinity of the ITCZ (e.g., see the location of the ITCZ clouds in Plate 1 and the location of the ship during January 12 to 15). The results of the regression analysis are given in Table 2. A better correla- tion is seen in the coastal data (Figure 7b), presumably due to cloud-free conditions throughout the measurement period. The extinction of the direct solar radiation is about the same
for the coastal aerosols (-49 W m -2 for 0.1 increase in /3a
13,834 JAYARAMAN ET AL.' AEROSOL RADIATIVE FORCING OVER THE INDIAN OCEAN
60C
5OO
4OO
3O0
2OO
(a) e ' "-}' '"" '<P'• O 0.2 0.4 0.6
Aerosol Optical depth (497nm)/u 0.8
6OO
5OO
4OO
30O
2OO
(b)
I Coastal Data, Slope = -(491+/-12) I
i i i i
0.2 0.4 0.6 0.8
Aerosol Optical Depth(497nm)/u
600
5OO
400
3OO
200
ata, SloPe = _-(_4_25_+_/__-__]___o._)___1
eo •".. -•.• '"' '":;:• '
(c) •* e i i i i i i i
0.2 0.4 0.6 0.8
Aerosol Optical Depth(497nrn)/u
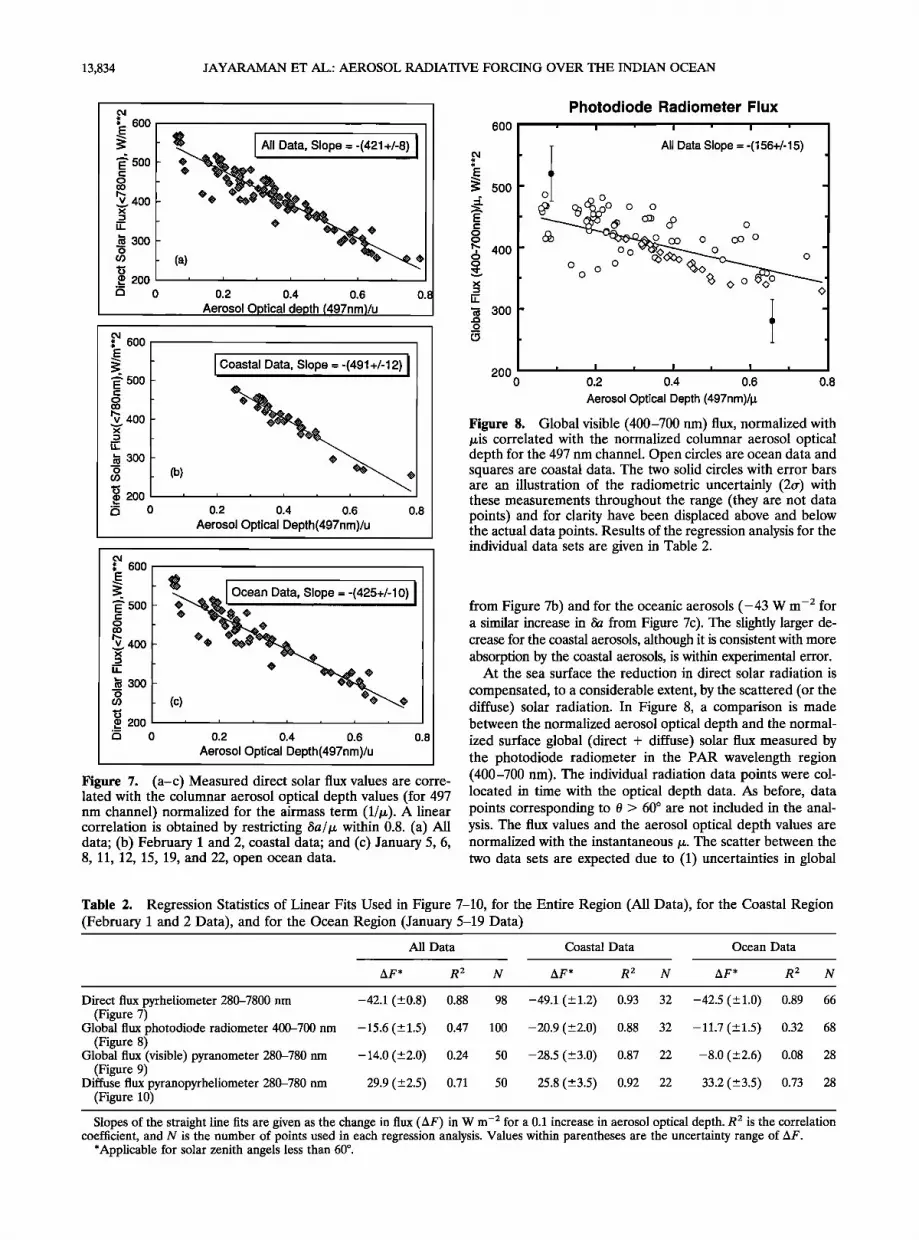
Figure 7. (a-c) Measured direct solar flux values are corre- lated with the columnar aerosol optical depth values (for 497 nm channel) normalized for the airmass term (l/Ix). A linear correlation is obtained by restricting &a/ix within 0.8. (a) All data; (b) February 1 and 2, coastal data; and (c) January 5, 6, 8, 11, 12, 15, 19, and 22, open ocean data.
6OO
E
• 500
E
i,;., 400
• 300 o
2OO 0
Figure 8.
Photodiode Radiometer Flux
ß I ' I ' I ' I
I All Data Slope =-(156+/-15) el _• o /
0 0 0 o oO o o ooo I
0.2 0.4 0.6 0.8
Aerosol Optical Depth (497nm)/•
Global visible (400-700 nm) flux, normalized with Ixis correlated with the normalized columnar aerosol optical depth for the 497 nm channel. Open circles are ocean data and squares are coastal data. The two solid circles with error bars are an illustration of the radiometric uncertainly (20-) with these measurements throughout the range (they are not data points) and for clarity have been displaced above and below the actual data points. Results of the regression analysis for the individual data sets are given in Table 2.
from Figure 7b) and for the oceanic aerosols (-43 W m -2 for a similar increase in • from Figure 7c). The slightly larger de- crease for the coastal aerosols, although it is consistent with more absorption by the coastal aerosols, is within experimental error.
At the sea surface the reduction in direct solar radiation is
compensated, to a considerable extent, by the scattered (or the diffuse) solar radiation. In Figure 8, a comparison is made between the normalized aerosol optical depth and the normal- ized surface global (direct + diffuse) solar flux measured by the photodiode radiometer in the PAR wavelength region (400-700 nm). The individual radiation data points were col- located in time with the optical depth data. As before, data points corresponding to 0 > 60 ø are not included in the anal- ysis. The flux values and the aerosol optical depth values are normalized with the instantaneous Ix. The scatter between the two data sets are expected due to (1) uncertainties in global
Table 2. Regression Statistics of Linear Fits Used in Figure 7-10, for the Entire Region (All Data), for the Coastal Region (February 1 and 2 Data), and for the Ocean Region (January 5-19 Data)
All Data Coastal Data Ocean Data
AF* R 2 N AF* R 2 N AF* R 2 N
Direct flux pyrheliometer 280-7800 nm (Figure 7)
Global flux photodiode radiometer 400-700 nm (Figure 8)
Global flux (visible) pyranometer 280-780 nm (Figure 9)
Diffuse flux pyranopyrheliometer 280-780 nm (Figure 10)
-42.1 (_+0.8) 0.88 98 -49.1 (+_ 1.2) 0.93 32 -42.5 (___ 1.0) 0.89 66
-15.6 (_+1.5) 0.47 100 -20.9 (_+2.0) 0.88 32 -11.7 (_+1.5) 0.32 68
-14.0 (_+2.0) 0.24 50 -28.5 (_+3.0) 0.87 22 -8.0 (_+2.6) 0.08 28
29.9 (+_2.5) 0.71 50 25.8 (_+3.5) 0.92 22 33.2 (_+3.5) 0.73 28
Slopes of the straight line fits are given as the change in flux (AF) in W m -2 for a 0.1 increase in aerosol optical depth. R 2 is the correlation coefficient, and N is the number of points used in each regression analysis. Values within parentheses are the uncertainty range of AF.
*Applicable for solar zenith angels less than 60 ø .

JAYARAMAN ET AL.: AEROSOL RADIATIVE FORCING OVER THE INDIAN OCEAN 13,835
flux radiometers, (2) contamination of the global fluxes by broken and optically thin clouds, and (3) other spatial inho- mogeneity of the atmosphere within the hemisphere. The data points corresponding to the coastal and the oceanic regions are represented by different symbols in the figure. The regression analysis is made for all the data points taken together. Results of individual fits for the coastal and ocean data are however
given in Table 2. A consistent decrease is seen in the global flux values with increase in 8a. On average, the flux is found to decrease by about 16 W m -2 for every 0.1 increase in 8a. However, the decrease is higher, about 21 W m -2 near the coast and is about 12 W m -2 over the ocean region (Table 2).
Remarkably (in view of the large uncertainty in flux mea- surements), a similar analysis done for the pyranometer data also shows a feature (Figure 9). Unlike the photodiode radi- ometer data, which are direct measurements, the pyranometer visible data are obtained by subtracting data from two different instruments. This could be responsible for the larger spread in the data and a poorer correlation coefficient (Table 2), when compared with the photodiode radiometer data. In addition, because of a software timing error, the data logger collected the pyranometer date only during the afternoon hours, and hence the number of pyranometer data points is only half that of the photodiode radiometer. In spite of these limitations, the limited pyranometer data points also show a more or less similar average decrease in the visible flux by about 14 W m -2. Individual analysis for the coastal and ocean data show a de- crease of 28 W m -2 over the coast and 8 W m -2 over the
ocean. Note that the pyranometer "visible" flux also includes wavelengths less than 400 nm (down to about 280 nm), whereas the photodiode radiometer measures from 400 to 700 nm.
The only other comparable observational study is that due to Dutton et al [1994], who reported changes in the surface- reaching global flux over Mauna Loa, Hawaii, after the E1 Chichon and Mount Pinatubo eruptions. For a 12 hour aver- aging period they reported a decrease of about 13 W m -2 for a 0.1 increase in 8a (500 nm) which is not very different from those shown in Figures 8 and 9. The close agreement, however, may be fortuitous since the present study is for tropospheric aerosols (of land origin), and the other study is for sulfate aerosols of volcanic origin.
75O
• 65o
o eo 550
v
x
u_ 450
o
350
Pyranometer Flux
_ All Data Slope = -(140+/- 18) l o
- O0 • 0
0
o Ocean ß Coastal
0 0.2 0.4 0.6 0.8
Aerosol Optical Depth(497nm)/u
Figure 9. Global visible (<780 nm) flux normalized with • is correlated with the normalized columnar aerosol optical depth for the 497 nm channel. Open circles are ocean data and shaded squares are coastal data. Results of the regression analysis for the individual data sets are given in Table 2.
35O
250
150
5O
o
• o ø
o o
All Data Slope = 299 +/-14 i I I I
0 0.2 0.4 0.6 0.8
Aerosol Optical Depth(497nm) / u
Figure 10. Diffuse flux, defined as (global flux - direct flux •) and normalized with •, is correlated with the normalized columnar aerosol optical depth for the 497 nm channel. Open circles are ocean data and shaded squares are coastal data. Results of the regression analysis for the individual data sets are given in Table 2.
The direct solar radiation flux reaching the surface is atten- uated by both scattering and absorption (if any). In the case of global radiation flux, a part of the radiation energy removed from the direct beam by scattering reappears as diffuse sky radiation which depends, in part, on parameters such as single- scattering albedo and aerosol-scattering phase function. It is of interest to see how the diffuse component changes with aerosol optical depth over our region of interest. The best way to make these measurements is through a so-called shadow band radi- ometer, which shadows the direct solar radiation. Such a radi- ometer was not deployed during this cruise. In order to get a crude understanding of this problem, the diffuse flux, deter- mined from the difference between the global and the direct solar flux (global flux-direct flux •) and normalized with • is correlated with normalized 8a in Figure 10. A linear fit shows an average increase of about 30 W m -2 for every 0.1 increase in 8a. Individual fits for the coastal and the ocean regions show an increase of 26 W m -2 over the coast, whereas the increase is about 33 W m -2 over the ocean.
To summarize, of the approximately 42 W m -2 energy re- moved from the direct visible (<780 nm) solar radiation by a 0.1 increase in 8a (taking • as 1), about 30 W m -2 is compen- sated by the increase in the diffuse sky radiation, leaving a net loss of about -14 W m -2 in the visible solar radiation at the
surface. We define an effective scattering efficiency e by letting e = increase in diffuse radiation/decrease in direct solar flux.
From the results shown here (Figures 7-10 and Table 2), e varies from about 0.5 for the coast to about 0.77 for the interior
ocean, perhaps indicating the presence of more absorbing aerosols over the coast. For example, for conservative aerosol scattering, e (for 0 < 60 ø) is about 0.85 [Braslau and Dave, 1973], whereas for absorbing aerosols like mineral dust over Jerusalem, the Joseph and Wolfson [1975] radiometric mea- surements suggest that e can range from 0.3 to 0.6.
In spite of the consistency between the present and the published data sets, further interpretation of our data on the low scattering efficiency found near the coastal India must await confirmation from future cruises.

13,836 JAYARAM• ET AL.: AEROSOL RADIATIVE FORCING OVER THE INDIAN OCEAN
4. Conclusion
A "closure" experiment involving simultaneous measure- ments of aerosol optical depth, size distribution, and the in- coming solar radiation flux was carried out over the Arabian Sea and the Indian Ocean during a pre-INDOEX cruise con- ducted from January 5 to February 4, 1996. Columnar aerosol optical depth in the visible wavelength region was found to be as high as 0.5 near the western coast of India, and in the range of 0.2-0.4 over the Arabian Sea, and was 0.1 and below over the Indian Ocean region. The spectral exponent a showed a systematic decrease from about 1.4 near the Indian coast to about 0.2 over the Indian Ocean. The mean a value for the
Indian Ocean, adjacent to the Arabian Sea, was 0.8, which was higher than the values reported for the Pacific and Atlantic Oceans. Aerosol mass concentration also showed a systematic decrease with increasing distance from the coastline, from a high of about 80/_•g/m 3 near the coast of Bombay to a low of few/_•g/m 3 over the interior ocean region. The aerosol number concentration obtained from the mass density data show about an order of magnitude increase in the number of submicron size particles of radius less than 0.! /_•m over the coast com- pared to interior ocean data, indicating an increase in the amount of anthropogenically produced aerosols.
A regression analysis made between the direct solar flux at the surface and the aerosol optical depth reveals that the flux decreases by about 42 W m -2 (between solar zenith angles of 0 ø and 60 ø) with every 0.1 increase in optical depth. The global flux decreases by about 16 W m -2 for every 0.1 increase in the aerosol optical depth. The above relationships are however valid only for aerosol optical depths below 0.4 and solar zenith angle less than 60 ø .
One picture that consistently emerges from the various in- strumental results reported here is that coastal aerosols may be more absorbing than those over the interior oceans. Air sam- pling of the particle imaginary refractive index is needed to confirm this finding. The next step is to undertake aerosol- radiation modeling of this region to compare with the data.
These aerosol- and radiative-forcing results, the first of this kind obtained over the Arabian Sea and the adjoining Indian Ocean, illustrate the persistence of aerosol-radiative-forcing effects over a large geographic region and provide validity to global radiative-forcing studies involving aerosols [e.g., Kiehl and Briegleb, 1993]. These results thus set the stage for the main INDOEX campaign scheduled for the 1998-1999 period.
Acknowledgments. The authors thank A.P. Mitra (the Indian co- ordinator for INDOEX), the National Institute of Oceanography, Goa, and the Department of Ocean Development, Government of India for making the Sagar Kanya pre-INDOEX cruise possible. One of the authors (AJ) would like to thank the Indian Space Research Organization's Geosphere Biosphere Program Office for funding the Physical Research Laboratory's participation in the cruise experiment. The U.S. coauthors thank the National Science Foundation for fund-
ing this study through the Center for Clouds, Chemistry and Climate, La Jolla, CA. The photodiode radiometer used in this study was pur- chased under National Science Foundation grant OPP93-22700. This is INDOEX publication 5.
References
Andreae, M. O., and H. Raemdonck, Dimethylsulfide in the surface ocean and the marine atmosphere: A global view, Science, 221, 744-747, 1983.
Angreji, P. D., Revaluation of total ozone measurements with Dobson spectrophotometer at Mt. Abu/Ahmedabad during 1951-1985, Sci.
Rep. ISRO-PRL-SR-34-89, 34 pp., Indian Space Res. Organ. Ahmed- abad, India, 1989.
Braslau, N. and J. V. Dave, Effect of aerosols on the transfer of solar energy through realistic model atmospheres, I Nonabsorbing aero- sols, J. Appl. Meteorol. 12, 601-615, 1973.
Charlson, R. J., J. Langner, H. Rohde, C. B. Leovy and S. G. Warren, Perturbation of northern hemisphere radiative balance by backscat- tering from anthropogenic sulfate aerosols, Tellus, 43, 152-163, 1991.
Coakley J. A,, and D. G. Baldwin, Towards the objective analysis of clouds from satellite imagery data, J. Clin. Appl. Meteorol., 23, 1065- 1099, 1984.
Dutton, G. E., P. Reddy, S. Ryan, and J. J. DeLuisi, Features and effects of aerosol optical depth observed at Mauna Loa, Hawaii: 1982-1992, J. Geophys. Res., 99, 8295-8306, 1994.
Hanel, G., The properties of atmospheric aerosol particles as functions of relative humidity at thermodynamic equilibrium with the sur- rounding moist air, Adv. Geophys., 19, 77-188, 1976.
Hoppel, W. A., J. W. Fitzgerald, G. M. Frick, and R. E. Larson, Aerosol size distribution and optical properties found in the marine boundary layer over the Atlantic Ocean, J. Geophys. Res., 95, 3659-3686, 1990.
Intergovernmental Panel on Climate Change (IPCC), Climate Change, 1994: Radiative Forcing of Climate Change and an Evaluation of IPCC IS92 Emission Scenarios, edited by John T. Houghton, 339 pp., Cambridge Univ. Press, New York, 1995.
Jaenicke R., Tropospheric aerosol in Aerosol Cloud Climate Interac- tions, edited by P.V. Hobbs, Academic, San Diego, Calif., 1993.
Joseph, J. H. and N. Wolfson, The ratio of absorption to backscatter of solar radiation on by aerosols during Khamsin conditions and effects on the radiation balance, J. Appl. Meteorol., 14, 1389-1396, 1975.
Kiehl, J. T., and B. P. Briegleb, The radiative roles of sulfate aerosols and greenhouse gases in climate forcing, Science, 260, 311-314, 1993.
Leaitch, W. R., G. A. Isaac, J. W. Strapp, C. M. Banic, and H. A. Wiebe, The relationship between cloud droplet number concentra- tions and anthropogenic pollution: Observations and climatic impli- cations, J. Geophys. Res., 97, 2463-2474, 1992.
Ramanathan. V., et al., Indian Ocean Experiment (INDOEX) White Paper, C 4, Scripps Inst. of Oceanogr., UCSD, La Jolla, Calif. 1995.
Ramanathan, V., et al., Indian Ocean Experiment (INTDOEX), A multi-agency proposal for a field experiment in the Indian Ocean, C 4, 83 pp., Scripps Inst. of Oceanogr., UCSD, La Jolla, Calif. 1996.
Rhoads K. P., P. Kelley, R. R. Dickerson, T. P. Carsey, M. Farmer, D. L. Savoie, and J. M. Prospero, The composition of the tropo- sphere over the Indian Ocean during the monsoonal transition, J. Geophys. Res., 102, 18,981-18,995, 1997.
Russell, P. B. and J. M. Livingston, Slant-lidar aerosol extinction mea- surements and their relation to measured and calculated albedo
changes, J. Clin. Appl. Meteorol., 23, 1204-1221, 1984. Sarkar, S. K., H. N. Dutta, P. K. Pasricha, and B. M. Reddy, Atlas of
Troposhereic Water Vapour Over the Indian Subcontinent, 164 pp., Nat. Phys. Lab., New Delhi, 1982.
Sasi, M. N., and Sengupta, A reference atmosphere for Indian equa- torial zone from surface to 80 km, Sci. Rep., SPL:SRO06:85, Vikram Sarabhai Space Centr., Thumba, India, 1986.
Saunders, R. W., G. Brogniez, J. C. Buriez, R. Meerkotter, and P. Wendling, A comparison of measured and modeled broadband fluxes from aircraft data during the ICE'89 field experiments, J. Atmos. Oceanic Technol., 7, 391-406 1992.
Tomasi, C., and F. Prodi, Measurements of atmospheric turbidity and vertical mass loading of particulate matter in marine environments, J. Geophys. Res., 87, 1279-1286, 1982.
Villevalde, Y. V., A. V. Smirnov, N. T. O'Neill, S. P. Smyshlyaev, and V. V. Yakovlev, Measurement of aerosol optical depth in the Pacific Ocean and the North Atlantic, J. Geophy Res., 99, 20,983-20,988, 1994.
W. D. Collins, D. Lubin, and V. Ramanathan (corresponding au- thors), Center for Clouds, Chemistry and Climate & Center for At- mospheric Sciences, Scripps Institution of Oceanography, UCSD, 9500 Gilman Drive #0221, La Jolla CA 92093. (e-mail: [email protected])
A. Jayaraman (corresponding author) and S. Ramachandran, Plan- etary Atmospheric Sciences Division Physical Research Laboratory, Ahmedabad 380 009, India. (e-mail: jraman@prl'ernet'in)
E. Woodbridge, Thermotrex Corporation, San Diego, CA 92121. K. S. Zalpuri, National Physical Laboratory, New Delhi, India.
(Received April 23, 1997; revised November 22, 1997; accepted February 12, 1998.)