direct cancer tissue proteomics: a method to identify candidate cancer biomarkers from...
TRANSCRIPT
ORIGINAL ARTICLE
Direct cancer tissue proteomics: a method to identify candidate cancer
biomarkers from formalin-fixed paraffin-embedded archival tissues
S-I Hwang1,4, J Thumar1,4, DH Lundgren1, K Rezaul1, V Mayya1, L Wu1, J Eng2, ME Wright3 andDK Han1
1Department of Cell Biology, Center for Vascular Biology, University of Connecticut School of Medicine, Farmington, CT, USA;2Fred Hutchinson Cancer Research Center, Seattle, WA, USA and 3University of California Davis Genome Center, Davis, CA, USA
Successful treatment of multiple cancer types requiresearly detection and identification of reliable biomarkerspresent in specific cancer tissues. To test the feasibility ofidentifying proteins from archival cancer tissues, we havedeveloped a methodology, termed direct tissue proteomics(DTP), which can be used to identify proteins directlyfrom formalin-fixed paraffin-embedded prostate cancertissue samples. Using minute prostate biopsy sections, wedemonstrate the identification of 428 prostate-expressedproteins using the shotgun method. Because the DTPmethod is not quantitative, we employed the absolutequantification method and demonstrate picogram levelquantification of prostate-specific antigen. In depthbioinformatics analysis of these expressed proteins affordsthe categorization of metabolic pathways that may beimportant for distinct stages of prostate carcinogenesis.Furthermore, we validate Wnt-3 as an upregulated proteinin cancerous prostate cells by immunohistochemistry. Wepropose that this general strategy provides a roadmap forsuccessful identification of critical molecular targets ofmultiple cancer types.Oncogene (2007) 26, 65–76. doi:10.1038/sj.onc.1209755;published online 26 June 2006
Keywords: direct tissue proteomics (DTP); LC-MS/MS;prostate cancer; Wnt; formalin-fixed paraffin-embeddedtissues; prostate-specific antigen (PSA)
Introduction
One of the most important challenges in the fight againstcancer is the ability to detect cancer cells early in thedisease (Parnes et al., 2005; Posadas et al., 2005; Smithet al., 2005; Wardwell and Massion, 2005). To achievethis overall goal, new and innovative technologies thatwill allow detection of early stages of cancer cells
sensitively and accurately are needed (Parnes et al.,2005; Posadas et al., 2005; Smith et al., 2005; Wardwelland Massion, 2005). This goal is central to reducingmost cancer-associated deaths as the available cancerdrugs and treatment procedures can lengthen thelifespan of most cancer patients if the disease is detectedearly (Posadas et al., 2005; Wardwell and Massion,2005). A major shortcoming associated with the earlydetection and treatment of cancer is the lack of sensitiveand robust technology to detect the signatures of cancercells from minute quantities of available tissues orserum. The lack of technological platform has signifi-cantly slowed the identification of reliable biomarkers toaccurately diagnose most types of cancers (Zangar et al.,2004; Posadas et al., 2005; Sweat, 2005; Tarro et al.,2005; Wardwell and Massion, 2005; Wright et al., 2005).
Defining the molecular mechanisms that give rise tothe cancer phenotype is also believed to represent acritical step in developing an effective therapeuticregimen for cancer patients (Tanneberger, 1977;Sawyers, 2002; Raben and Helfrich, 2004; Zangar et al.,2004; Meyerson and Carbone, 2005). Thus, effectivetreatment will require specific genotyping of expressedgenes or proteins in the cancerous tissue. Once theexpression profile associated with the underlying patho-genesis of the cancer is determined, one can presumablyselect a treatment regimen that is best suited for aspecific type of cancer (Tanneberger, 1977; Sawyers,2002; Raben and Helfrich, 2004; Zangar et al., 2004;Meyerson and Carbone, 2005).
A number of large-scale expression studies character-izing both the levels of mRNA and proteins expressed innormal and cancerous tissue have been undertaken withthe goal of identifying unique expression signaturesassociated with the cancer phenotype (Sawyers, 2002;Zangar et al., 2004; Meyerson and Carbone, 2005;Parnes et al., 2005). Although a wealth of informationexists on the expression signature of mRNAs expressedby a specific type of cancer, very little data are availableabout the protein expression signatures that exist innormal and cancerous prostate tissue (Gygi et al., 1999;Nelson et al., 2000; Griffin et al., 2003; Wright et al.,2005).
Although proteomic technology has been proposed asa general tool for the discovery of cancer biomarkers
Received 9 December 2005; revised 7 April 2006; accepted 24 April 2006;published online 26 June 2006
Correspondence: Dr DK Han, Department of Cell Biology, Center forVascular Biology, University of Connecticut School of Medicine, 263Farmington Avenue, Farmington, CT 06030, USA.E-mail: [email protected] authors contributed equally to this work.
Oncogene (2007) 26, 65–76& 2007 Nature Publishing Group All rights reserved 0950-9232/07 $30.00
www.nature.com/onc
that will lead to new diagnostic and therapeutic targetsof cancer, the promise has not been fully realized to date(Wilson, 2004; Wright et al., 2005). For example, theproteomic methods referred to as surface-enhanced laserdesorption ionization mass spectrometry (SELDI-MS)and matrix-assisted laser desorption ionization time-of-flight mass spectrometry (MALDI–TOF-MS) have beenused to identify protein expression patterns directlyfrom cancer tissues or serum (Petricoin et al., 2002).Although these methods can provide potential proteinpeak patterns that are statistically correlated with cancerphenotype, the exact chemical identity of proteinbiomarkers is never routinely identified. Additionalprotein enrichment and identification steps are necessaryto unambiguously identify potential biomarkers ortherapeutic targets. Once these biomarkers are conclu-sively identified, a more sensitive immunological orenzyme-based assay can be developed to accuratelydetermine and measure the molecule of interest innormal and disease samples (Patterson, 2004; Zangaret al., 2004; Wright et al., 2005). Thus, deciphering thechemical identity of protein biomarkers is necessary ifmore robust and sensitive tests are to be developed todetect, monitor and possibly target these new proteinbiomarkers in cancer (Patterson, 2004; Zangar et al.,2004; Wright et al., 2005).
In this report, we have employed a shotgun proteo-mics approach, which provides the chemical identity ofproteins in cells, tissues and fluids. We have coined thisstrategy as direct tissue proteomics (DTP), as directprotein identification by tandem mass spectrometry(MS/MS) from tissues, we presumed, would allowdetection of diagnostic biomarkers and therapeutictargets (Wolters et al., 2001; Cantin and Yates, 2004).Using this strategy, we have tested whether potentialdiagnostic biomarkers and/or therapeutic targets can bedirectly identified from the prostate cancer tissues. Thismethod utilizes the advantages of shotgun proteomicsand combines with a new protein extraction procedurethat disrupts the crosslinked proteins from the pre-viously formaldehyde-fixed paraffin-embedded tissuesamples. This analysis led to the identification of over400 proteins from prostate cancer biopsies, in whichprostate-specific antigen (PSA) was quantified at pico-gram (pg) levels. We also detected expression of Wnt-3as a possible regulator of prostate cancer cell prolifera-tion. We discuss the broad utility of applying the DTPmethod to preventive medicine and the early detectionof prostate cancer.
Results
Development of DTP technologyThe overall goal of this study is to determine if proteinscan be conclusively identified from small quantities ofbiopsy tissue samples from clinically relevant prostatecancers. This study addressed three main questions: (1)how many proteins can be conclusively identified insmall quantities of prostate cancer biopsy tissues using
the shotgun proteomic method?, (2) can a currentprostate cancer protein biomarker, such as PSA, berobustly identified using this approach? and (3) canadditional proteins involved in prostate tumorigenesisalso be detected using this method? More importantly,we asked whether a general methodology could bedeveloped that would allow for robust protein identifi-cation directly from archival tissue samples that werepreviously formaldehyde-fixed and paraffin-embedded.We believe that the DTP methodology provides anopportunity for investigators to further interrogate theexpression levels of disease-associated proteins in largevolumes of archived tissues that represent various stagesof pathological conditions. This ability to conclusivelyidentify proteins from archival tissues will clearly be animportant technological advancement to identify newdiagnostic and prognostic proteins biomarkers.
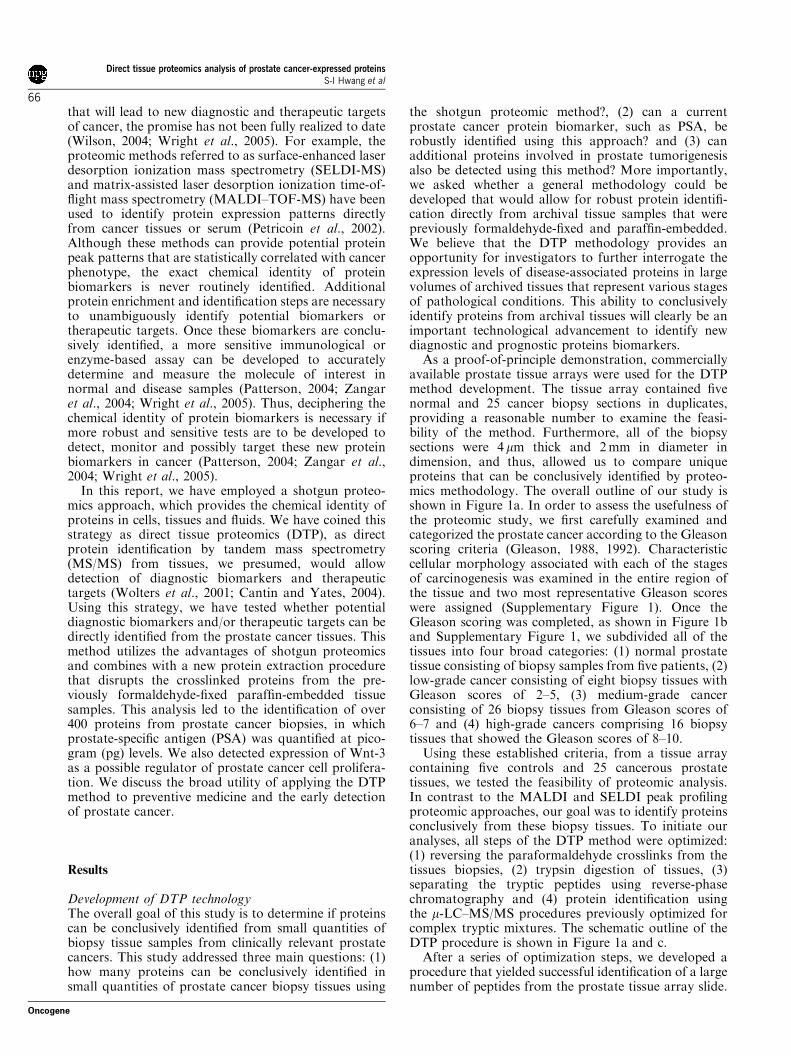
As a proof-of-principle demonstration, commerciallyavailable prostate tissue arrays were used for the DTPmethod development. The tissue array contained fivenormal and 25 cancer biopsy sections in duplicates,providing a reasonable number to examine the feasi-bility of the method. Furthermore, all of the biopsysections were 4 mm thick and 2 mm in diameter indimension, and thus, allowed us to compare uniqueproteins that can be conclusively identified by proteo-mics methodology. The overall outline of our study isshown in Figure 1a. In order to assess the usefulness ofthe proteomic study, we first carefully examined andcategorized the prostate cancer according to the Gleasonscoring criteria (Gleason, 1988, 1992). Characteristiccellular morphology associated with each of the stagesof carcinogenesis was examined in the entire region ofthe tissue and two most representative Gleason scoreswere assigned (Supplementary Figure 1). Once theGleason scoring was completed, as shown in Figure 1band Supplementary Figure 1, we subdivided all of thetissues into four broad categories: (1) normal prostatetissue consisting of biopsy samples from five patients, (2)low-grade cancer consisting of eight biopsy tissues withGleason scores of 2–5, (3) medium-grade cancerconsisting of 26 biopsy tissues from Gleason scores of6–7 and (4) high-grade cancers comprising 16 biopsytissues that showed the Gleason scores of 8–10.
Using these established criteria, from a tissue arraycontaining five controls and 25 cancerous prostatetissues, we tested the feasibility of proteomic analysis.In contrast to the MALDI and SELDI peak profilingproteomic approaches, our goal was to identify proteinsconclusively from these biopsy tissues. To initiate ouranalyses, all steps of the DTP method were optimized:(1) reversing the paraformaldehyde crosslinks from thetissues biopsies, (2) trypsin digestion of tissues, (3)separating the tryptic peptides using reverse-phasechromatography and (4) protein identification usingthe m-LC–MS/MS procedures previously optimized forcomplex tryptic mixtures. The schematic outline of theDTP procedure is shown in Figure 1a and c.
After a series of optimization steps, we developed aprocedure that yielded successful identification of a largenumber of peptides from the prostate tissue array slide.
Direct tissue proteomics analysis of prostate cancer-expressed proteinsS-I Hwang et al
66
Oncogene
Details describing optimization of the DTP method arecontained in the Materials and methods. Two tissuearrays processed in replicate led to the generation ofthousands of MS/MS spectra. Database searching of allof these spectra using the SEQUEST followed bystringent data filtering coupled with a decoy databasesearch to establish low false-positive identificationsresulted in the successful identification of 12 631peptides. Subsequent data analysis grouping the pep-tides into unique proteins using a suite of bioinformaticssoftware tools resulted in a list of 428 unique proteinswith high confidence identification.
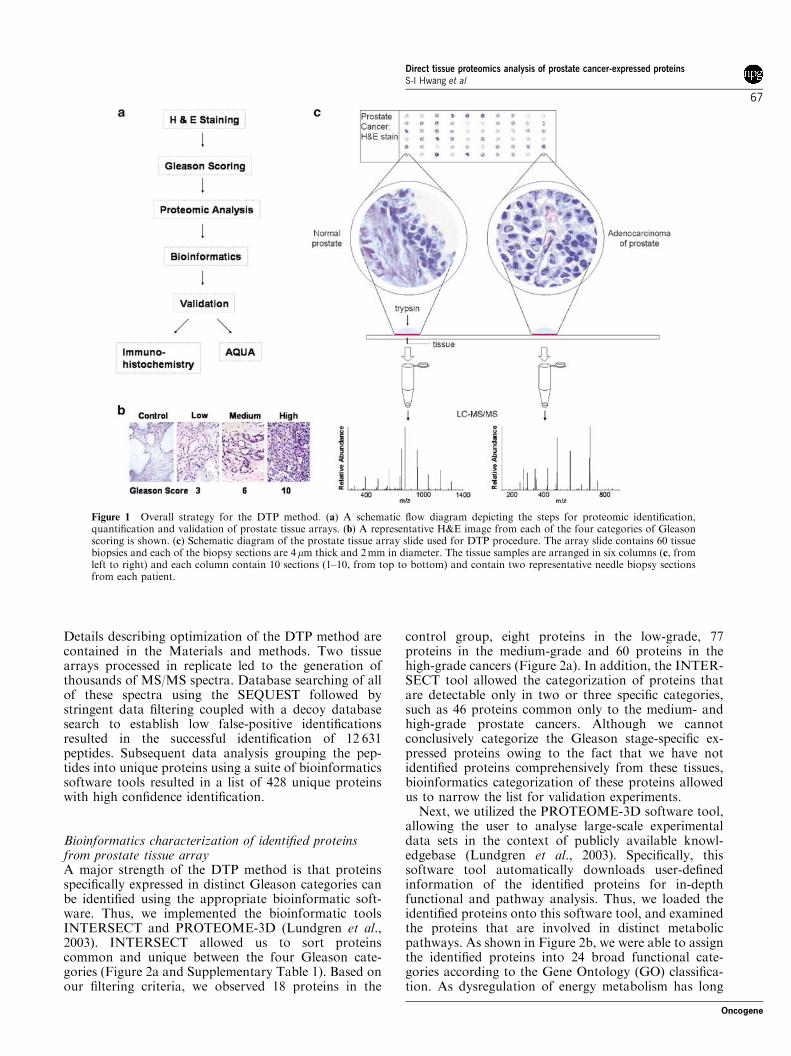
Bioinformatics characterization of identified proteinsfrom prostate tissue arrayA major strength of the DTP method is that proteinsspecifically expressed in distinct Gleason categories canbe identified using the appropriate bioinformatic soft-ware. Thus, we implemented the bioinformatic toolsINTERSECT and PROTEOME-3D (Lundgren et al.,2003). INTERSECT allowed us to sort proteinscommon and unique between the four Gleason cate-gories (Figure 2a and Supplementary Table 1). Based onour filtering criteria, we observed 18 proteins in the
control group, eight proteins in the low-grade, 77proteins in the medium-grade and 60 proteins in thehigh-grade cancers (Figure 2a). In addition, the INTER-SECT tool allowed the categorization of proteins thatare detectable only in two or three specific categories,such as 46 proteins common only to the medium- andhigh-grade prostate cancers. Although we cannotconclusively categorize the Gleason stage-specific ex-pressed proteins owing to the fact that we have notidentified proteins comprehensively from these tissues,bioinformatics categorization of these proteins allowedus to narrow the list for validation experiments.
Next, we utilized the PROTEOME-3D software tool,allowing the user to analyse large-scale experimentaldata sets in the context of publicly available knowl-edgebase (Lundgren et al., 2003). Specifically, thissoftware tool automatically downloads user-definedinformation of the identified proteins for in-depthfunctional and pathway analysis. Thus, we loaded theidentified proteins onto this software tool, and examinedthe proteins that are involved in distinct metabolicpathways. As shown in Figure 2b, we were able to assignthe identified proteins into 24 broad functional cate-gories according to the Gene Ontology (GO) classifica-tion. As dysregulation of energy metabolism has long
Figure 1 Overall strategy for the DTP method. (a) A schematic flow diagram depicting the steps for proteomic identification,quantification and validation of prostate tissue arrays. (b) A representative H&E image from each of the four categories of Gleasonscoring is shown. (c) Schematic diagram of the prostate tissue array slide used for DTP procedure. The array slide contains 60 tissuebiopsies and each of the biopsy sections are 4 mm thick and 2 mm in diameter. The tissue samples are arranged in six columns (c, fromleft to right) and each column contain 10 sections (1–10, from top to bottom) and contain two representative needle biopsy sectionsfrom each patient.
Direct tissue proteomics analysis of prostate cancer-expressed proteinsS-I Hwang et al
67
Oncogene
been implicated in the pathogenesis of prostate cancer,we next grouped the identified proteins into energy-generating metabolic pathways. From these analyses,key enzymes from five major pathways were found to beassociated with cancer cells (Figure 2c). For example,among the six pathways that were analysed, preferentialidentification of enzymes that are critical for gluconeo-genesis were detected in the low- and medium-stageprostate cancers (Figure 2c). In addition, metabolicenzymes associated with the tricarboxylic acid cyclewere detected in multiple stages of the prostate cancers(Figure 2c). In contrast, a large majority of theglycolysis enzymes were found in normal tissue as wellas in the cancerous prostate tissues. However, phos-phoglucose isomerase, phosphoglycerate kinase andphosphogylceromutase enzymes were detected in theprostate cancers.
Detection of known markers of prostate cancer cellsincluding the PSA and the measure of its relativeabundanceWe next examined whether the most widely usedprostate antigen, PSA, can be detected by the DTPmethod. We carefully examined the presence of trypticpeptides from PSA in the 1.5 million spectra generatedfrom the fragmentation of mass spectrometry peaks.
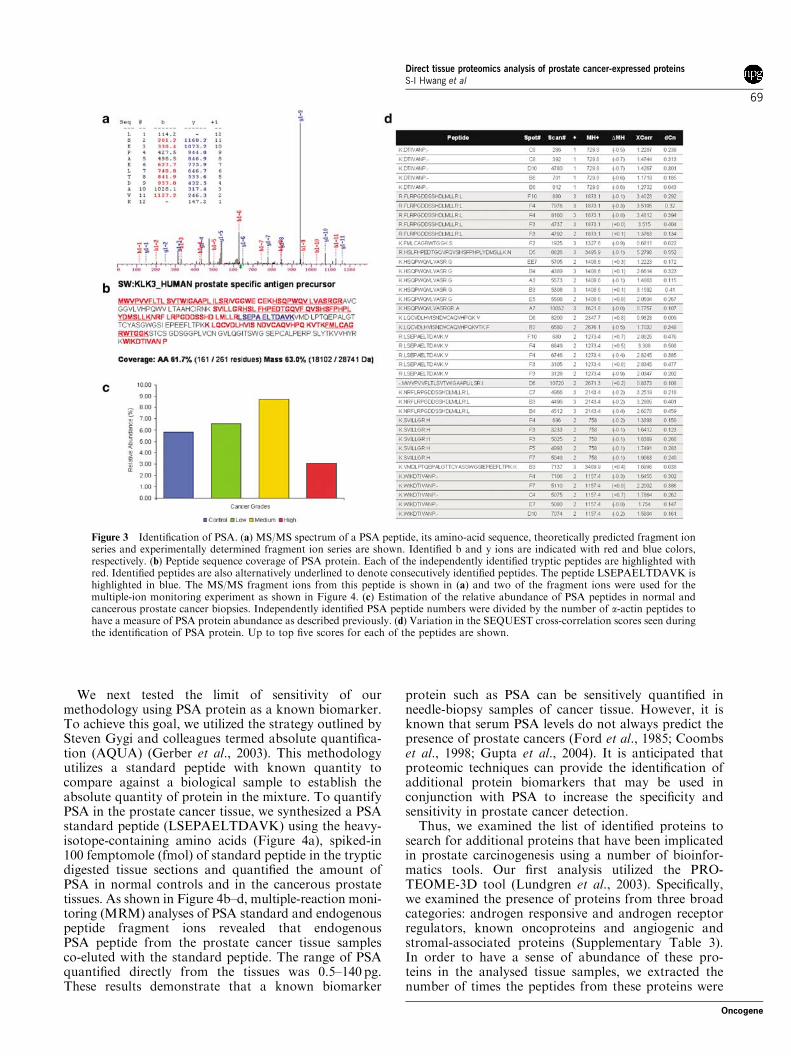
Towards this goal, we made use of the INTERACTsoftware tool, which allows the sorting of one proteinfrom a large number of MS/MS spectra generated fromover 120 LC–MS/MS analyses. Sorting for theKLK3_HUMAN (Kallikrein 3/p-30 antigen/PSA pre-cursor) resulted in the identification of 214 trypticpeptides from the PSA with up to 61% peptide coverageof the protein (Figure 3a and b). MS/MS analyses andthe resulting SEQUEST scores revealed that approxi-mately half of the identified peptides were above thecutoff scores (Figure 3d; please see Materials andmethods).
Consistent with the known expression of PSA innormal prostate and cancerous prostate tissue, we wereable to identify tryptic PSA peptides in all four states ofthe prostate tissues. In order to get a sense of relativeabundance of PSA in these samples, we analysed thenumber of independent identifications in each of thestages of the prostate tissue. As shown in Figure 3c,normalizing the number of independent identificationsof PSA as a measure of abundance revealed that thehighest level of PSA was detected in the medium-stageprostate cancers (Materials and methods). These resultsestablish that the DTP strategy can conclusively identifythe most well-established diagnostic marker fromminute quantities of previously formalin-fixed paraffin-embedded tissues.
Figure 2 Bioinformatics characterization of identified proteins from the prostate tissue arrays. (a) Venn diagram showing the numberof identified proteins from each of the four Gleason categories. Proteins common to some categories are not shown in the figure:control and high-grade prostate cancers, 10; medium and low-grade, 6. (b) Functional characterization of identified proteins into 24GO categories. (c) Classification of identified proteins in energy-generating metabolic pathways. The classification table is shown in theright panel. Identified metabolic enzymes are highlighted in blue and marked with the classification number.
Direct tissue proteomics analysis of prostate cancer-expressed proteinsS-I Hwang et al
68
Oncogene
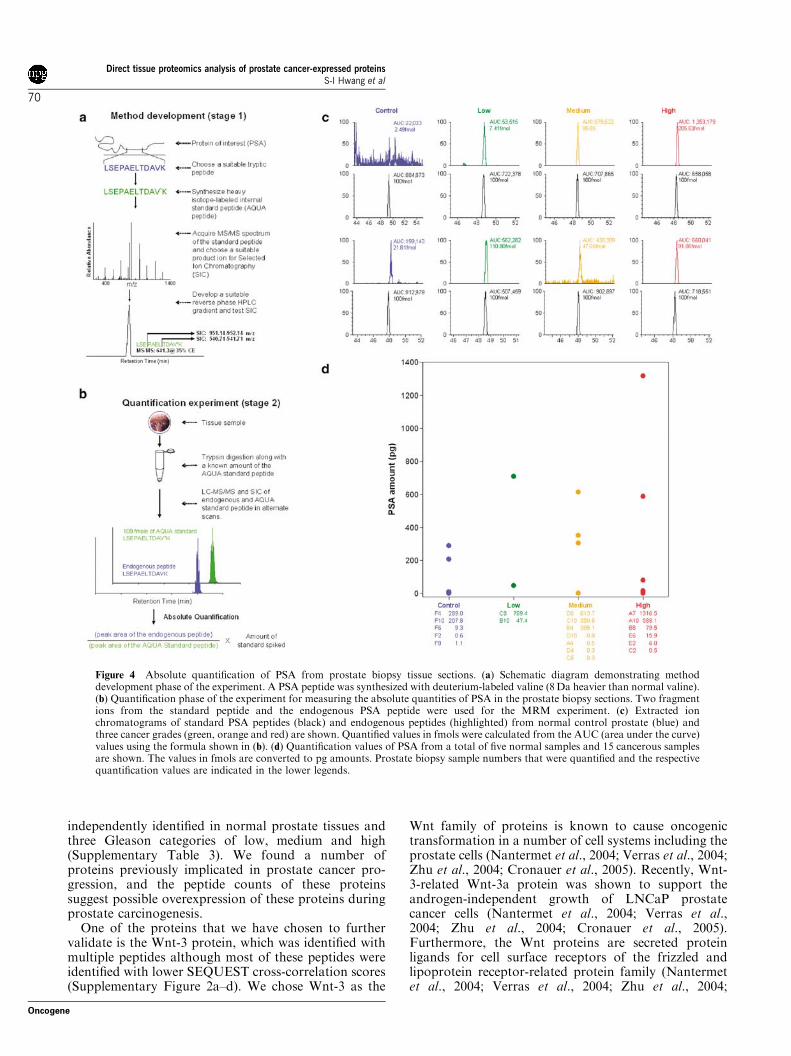
We next tested the limit of sensitivity of ourmethodology using PSA protein as a known biomarker.To achieve this goal, we utilized the strategy outlined bySteven Gygi and colleagues termed absolute quantifica-tion (AQUA) (Gerber et al., 2003). This methodologyutilizes a standard peptide with known quantity tocompare against a biological sample to establish theabsolute quantity of protein in the mixture. To quantifyPSA in the prostate cancer tissue, we synthesized a PSAstandard peptide (LSEPAELTDAVK) using the heavy-isotope-containing amino acids (Figure 4a), spiked-in100 femptomole (fmol) of standard peptide in the trypticdigested tissue sections and quantified the amount ofPSA in normal controls and in the cancerous prostatetissues. As shown in Figure 4b–d, multiple-reaction moni-toring (MRM) analyses of PSA standard and endogenouspeptide fragment ions revealed that endogenousPSA peptide from the prostate cancer tissue samplesco-eluted with the standard peptide. The range of PSAquantified directly from the tissues was 0.5–140 pg.These results demonstrate that a known biomarker
protein such as PSA can be sensitively quantified inneedle-biopsy samples of cancer tissue. However, it isknown that serum PSA levels do not always predict thepresence of prostate cancers (Ford et al., 1985; Coombset al., 1998; Gupta et al., 2004). It is anticipated thatproteomic techniques can provide the identification ofadditional protein biomarkers that may be used inconjunction with PSA to increase the specificity andsensitivity in prostate cancer detection.
Thus, we examined the list of identified proteins tosearch for additional proteins that have been implicatedin prostate carcinogenesis using a number of bioinfor-matics tools. Our first analysis utilized the PRO-TEOME-3D tool (Lundgren et al., 2003). Specifically,we examined the presence of proteins from three broadcategories: androgen responsive and androgen receptorregulators, known oncoproteins and angiogenic andstromal-associated proteins (Supplementary Table 3).In order to have a sense of abundance of these pro-teins in the analysed tissue samples, we extracted thenumber of times the peptides from these proteins were
Figure 3 Identification of PSA. (a) MS/MS spectrum of a PSA peptide, its amino-acid sequence, theoretically predicted fragment ionseries and experimentally determined fragment ion series are shown. Identified b and y ions are indicated with red and blue colors,respectively. (b) Peptide sequence coverage of PSA protein. Each of the independently identified tryptic peptides are highlighted withred. Identified peptides are also alternatively underlined to denote consecutively identified peptides. The peptide LSEPAELTDAVK ishighlighted in blue. The MS/MS fragment ions from this peptide is shown in (a) and two of the fragment ions were used for themultiple-ion monitoring experiment as shown in Figure 4. (c) Estimation of the relative abundance of PSA peptides in normal andcancerous prostate cancer biopsies. Independently identified PSA peptide numbers were divided by the number of a-actin peptides tohave a measure of PSA protein abundance as described previously. (d) Variation in the SEQUEST cross-correlation scores seen duringthe identification of PSA protein. Up to top five scores for each of the peptides are shown.
Direct tissue proteomics analysis of prostate cancer-expressed proteinsS-I Hwang et al
69
Oncogene
independently identified in normal prostate tissues andthree Gleason categories of low, medium and high(Supplementary Table 3). We found a number ofproteins previously implicated in prostate cancer pro-gression, and the peptide counts of these proteinssuggest possible overexpression of these proteins duringprostate carcinogenesis.
One of the proteins that we have chosen to furthervalidate is the Wnt-3 protein, which was identified withmultiple peptides although most of these peptides wereidentified with lower SEQUEST cross-correlation scores(Supplementary Figure 2a–d). We chose Wnt-3 as the
Wnt family of proteins is known to cause oncogenictransformation in a number of cell systems including theprostate cells (Nantermet et al., 2004; Verras et al., 2004;Zhu et al., 2004; Cronauer et al., 2005). Recently, Wnt-3-related Wnt-3a protein was shown to support theandrogen-independent growth of LNCaP prostatecancer cells (Nantermet et al., 2004; Verras et al.,2004; Zhu et al., 2004; Cronauer et al., 2005).Furthermore, the Wnt proteins are secreted proteinligands for cell surface receptors of the frizzled andlipoprotein receptor-related protein family (Nantermetet al., 2004; Verras et al., 2004; Zhu et al., 2004;
Figure 4 Absolute quantification of PSA from prostate biopsy tissue sections. (a) Schematic diagram demonstrating methoddevelopment phase of the experiment. A PSA peptide was synthesized with deuterium-labeled valine (8 Da heavier than normal valine).(b) Quantification phase of the experiment for measuring the absolute quantities of PSA in the prostate biopsy sections. Two fragmentions from the standard peptide and the endogenous PSA peptide were used for the MRM experiment. (c) Extracted ionchromatograms of standard PSA peptides (black) and endogenous peptides (highlighted) from normal control prostate (blue) andthree cancer grades (green, orange and red) are shown. Quantified values in fmols were calculated from the AUC (area under the curve)values using the formula shown in (b). (d) Quantification values of PSA from a total of five normal samples and 15 cancerous samplesare shown. The values in fmols are converted to pg amounts. Prostate biopsy sample numbers that were quantified and the respectivequantification values are indicated in the lower legends.
Direct tissue proteomics analysis of prostate cancer-expressed proteinsS-I Hwang et al
70
Oncogene
Cronauer et al., 2005). Thus, the possibility that theseproteins might be detectable in serum as a diagnosticmarker along with PSA becomes a strong possibility.Thus, Wnt-3 protein was further validated usingimmunohistochemistry on the prostate cancer tissuearrays.
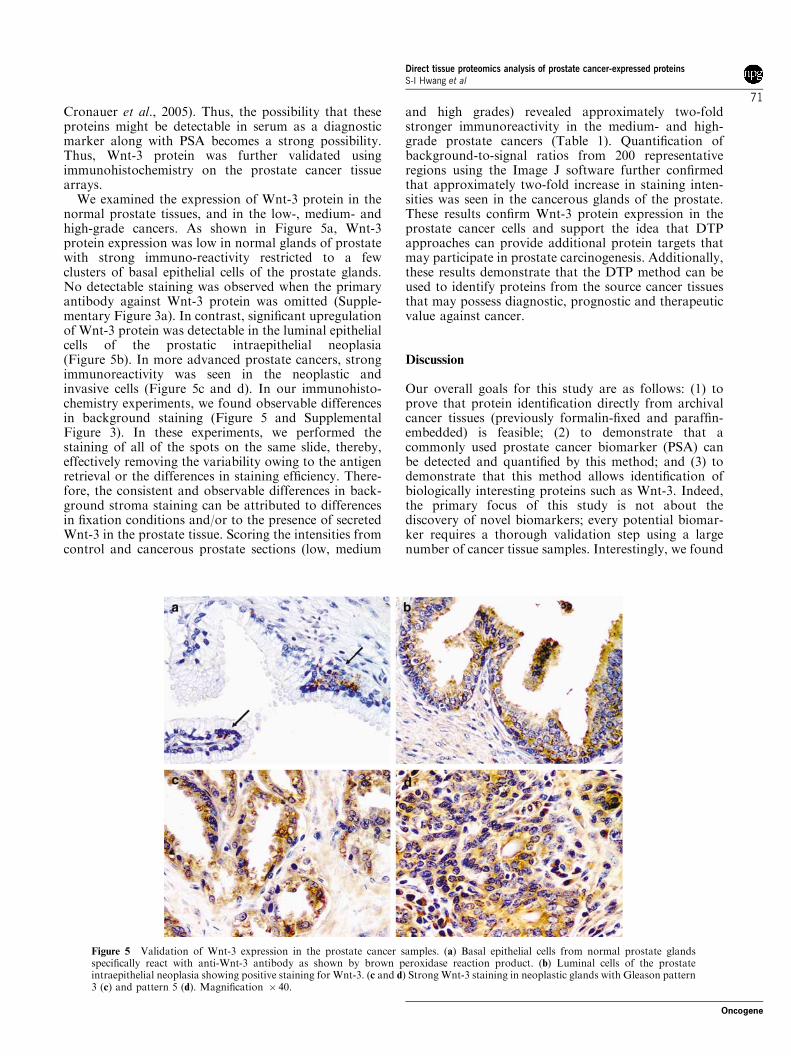
We examined the expression of Wnt-3 protein in thenormal prostate tissues, and in the low-, medium- andhigh-grade cancers. As shown in Figure 5a, Wnt-3protein expression was low in normal glands of prostatewith strong immuno-reactivity restricted to a fewclusters of basal epithelial cells of the prostate glands.No detectable staining was observed when the primaryantibody against Wnt-3 protein was omitted (Supple-mentary Figure 3a). In contrast, significant upregulationof Wnt-3 protein was detectable in the luminal epithelialcells of the prostatic intraepithelial neoplasia(Figure 5b). In more advanced prostate cancers, strongimmunoreactivity was seen in the neoplastic andinvasive cells (Figure 5c and d). In our immunohisto-chemistry experiments, we found observable differencesin background staining (Figure 5 and SupplementalFigure 3). In these experiments, we performed thestaining of all of the spots on the same slide, thereby,effectively removing the variability owing to the antigenretrieval or the differences in staining efficiency. There-fore, the consistent and observable differences in back-ground stroma staining can be attributed to differencesin fixation conditions and/or to the presence of secretedWnt-3 in the prostate tissue. Scoring the intensities fromcontrol and cancerous prostate sections (low, medium
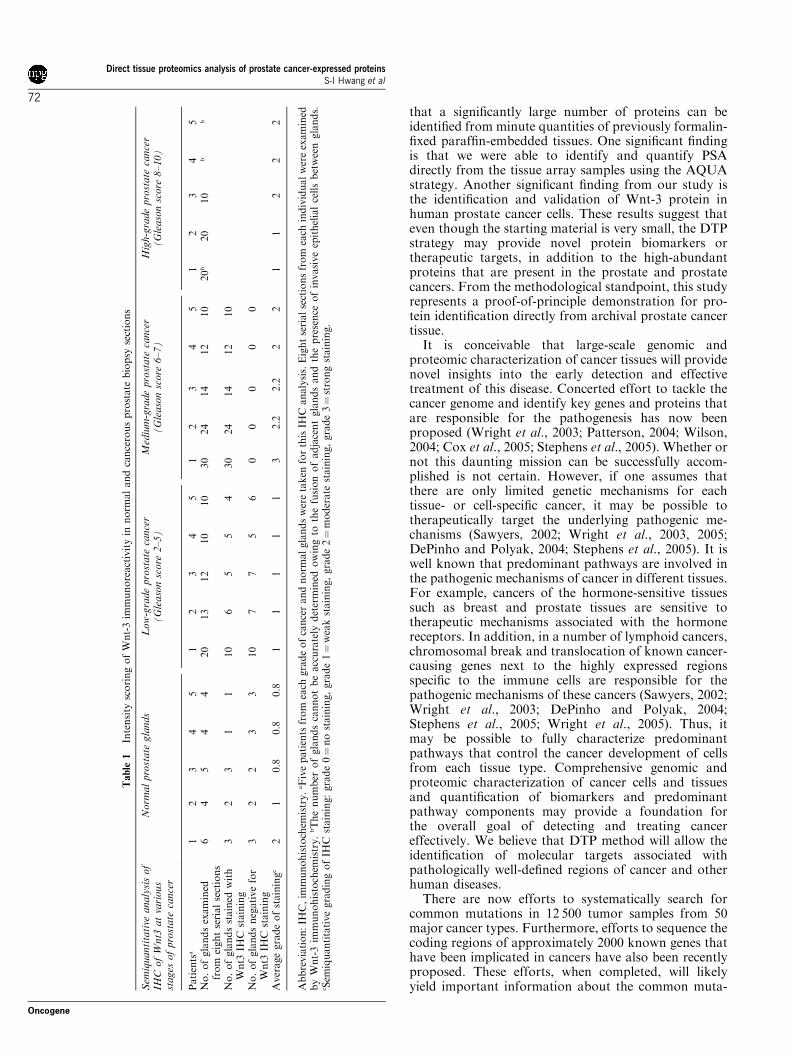
and high grades) revealed approximately two-foldstronger immunoreactivity in the medium- and high-grade prostate cancers (Table 1). Quantification ofbackground-to-signal ratios from 200 representativeregions using the Image J software further confirmedthat approximately two-fold increase in staining inten-sities was seen in the cancerous glands of the prostate.These results confirm Wnt-3 protein expression in theprostate cancer cells and support the idea that DTPapproaches can provide additional protein targets thatmay participate in prostate carcinogenesis. Additionally,these results demonstrate that the DTP method can beused to identify proteins from the source cancer tissuesthat may possess diagnostic, prognostic and therapeuticvalue against cancer.
Discussion
Our overall goals for this study are as follows: (1) toprove that protein identification directly from archivalcancer tissues (previously formalin-fixed and paraffin-embedded) is feasible; (2) to demonstrate that acommonly used prostate cancer biomarker (PSA) canbe detected and quantified by this method; and (3) todemonstrate that this method allows identification ofbiologically interesting proteins such as Wnt-3. Indeed,the primary focus of this study is not about thediscovery of novel biomarkers; every potential biomar-ker requires a thorough validation step using a largenumber of cancer tissue samples. Interestingly, we found
Figure 5 Validation of Wnt-3 expression in the prostate cancer samples. (a) Basal epithelial cells from normal prostate glandsspecifically react with anti-Wnt-3 antibody as shown by brown peroxidase reaction product. (b) Luminal cells of the prostateintraepithelial neoplasia showing positive staining for Wnt-3. (c and d) Strong Wnt-3 staining in neoplastic glands with Gleason pattern3 (c) and pattern 5 (d). Magnification � 40.
Direct tissue proteomics analysis of prostate cancer-expressed proteinsS-I Hwang et al
71
Oncogene
that a significantly large number of proteins can beidentified from minute quantities of previously formalin-fixed paraffin-embedded tissues. One significant findingis that we were able to identify and quantify PSAdirectly from the tissue array samples using the AQUAstrategy. Another significant finding from our study isthe identification and validation of Wnt-3 protein inhuman prostate cancer cells. These results suggest thateven though the starting material is very small, the DTPstrategy may provide novel protein biomarkers ortherapeutic targets, in addition to the high-abundantproteins that are present in the prostate and prostatecancers. From the methodological standpoint, this studyrepresents a proof-of-principle demonstration for pro-tein identification directly from archival prostate cancertissue.
It is conceivable that large-scale genomic andproteomic characterization of cancer tissues will providenovel insights into the early detection and effectivetreatment of this disease. Concerted effort to tackle thecancer genome and identify key genes and proteins thatare responsible for the pathogenesis has now beenproposed (Wright et al., 2003; Patterson, 2004; Wilson,2004; Cox et al., 2005; Stephens et al., 2005). Whether ornot this daunting mission can be successfully accom-plished is not certain. However, if one assumes thatthere are only limited genetic mechanisms for eachtissue- or cell-specific cancer, it may be possible totherapeutically target the underlying pathogenic me-chanisms (Sawyers, 2002; Wright et al., 2003, 2005;DePinho and Polyak, 2004; Stephens et al., 2005). It iswell known that predominant pathways are involved inthe pathogenic mechanisms of cancer in different tissues.For example, cancers of the hormone-sensitive tissuessuch as breast and prostate tissues are sensitive totherapeutic mechanisms associated with the hormonereceptors. In addition, in a number of lymphoid cancers,chromosomal break and translocation of known cancer-causing genes next to the highly expressed regionsspecific to the immune cells are responsible for thepathogenic mechanisms of these cancers (Sawyers, 2002;Wright et al., 2003; DePinho and Polyak, 2004;Stephens et al., 2005; Wright et al., 2005). Thus, itmay be possible to fully characterize predominantpathways that control the cancer development of cellsfrom each tissue type. Comprehensive genomic andproteomic characterization of cancer cells and tissuesand quantification of biomarkers and predominantpathway components may provide a foundation forthe overall goal of detecting and treating cancereffectively. We believe that DTP method will allow theidentification of molecular targets associated withpathologically well-defined regions of cancer and otherhuman diseases.
There are now efforts to systematically search forcommon mutations in 12 500 tumor samples from 50major cancer types. Furthermore, efforts to sequence thecoding regions of approximately 2000 known genes thathave been implicated in cancers have also been recentlyproposed. These efforts, when completed, will likelyyield important information about the common muta-
Table
1In
ten
sity
sco
rin
go
fW
nt-
3im
mu
no
react
ivit
yin
no
rmal
an
dca
nce
rou
sp
rost
ate
bio
psy
sect
ion
s
Sem
iquantitative
analysisof
IHC
ofWnt3
atvarious
stages
ofprostate
cancer
Norm
alprostate
glands
Low-gradeprostate
cancer
(Gleasonscore
2–5)
Medium-gradeprostate
cancer
(Gleasonscore
6–7)
High-gradeprostate
cancer
(Gleasonscore
8–10)
Pati
ents
a1
23
45
12
34
51
23
45
12
34
5N
o.
of
gla
nd
sex
am
ined
fro
mei
gh
tse
rial
sect
ion
s6
45
44
20
13
12
10
10
30
24
14
12
10
20
b20
10
bb
No
.o
fgla
nd
sst
ain
edw
ith
Wn
t3IH
Cst
ain
ing
32
31
110
65
54
30
24
14
12
10
No
.o
fgla
nd
sn
egati
ve
for
Wn
t3IH
Cst
ain
ing
32
23
310
77
56
00
00
0
Aver
age
gra
de
of
stain
ing
c2
10.8
0.8
0.8
11
11
13
2.2
2.2
22
11
22
2
Ab
bre
via
tio
n:
IHC
,im
mu
no
his
toch
emis
try.
aF
ive
pati
ents
fro
mea
chgra
de
of
can
cer
an
dn
orm
al
gla
nd
sw
ere
tak
enfo
rth
isIH
Can
aly
sis.
Eig
ht
seri
al
sect
ion
sfr
om
each
ind
ivid
ual
wer
eex
am
ined
by
Wn
t-3
imm
un
oh
isto
chem
istr
y.
bT
he
nu
mb
ero
fgla
nd
sca
nn
ot
be
acc
ura
tely
det
erm
ined
ow
ing
toth
efu
sio
no
fad
jace
nt
gla
nd
san
dth
ep
rese
nce
of
invasi
ve
epit
hel
ial
cells
bet
wee
ngla
nd
s.cS
emiq
uan
tita
tive
gra
din
go
fIH
Cst
ain
ing:
gra
de
0¼
no
stain
ing,
gra
de
1¼
wea
kst
ain
ing,
gra
de
2¼
mo
der
ate
stain
ing,
gra
de
3¼
stro
ng
stain
ing.
Direct tissue proteomics analysis of prostate cancer-expressed proteinsS-I Hwang et al
72
Oncogene
tions that are present in major cancer types and mayprovide insights into the underlying mechanisms foreach of the cancer types (Sharpless and DePinho, 2005;Tonon et al., 2005).
Complementing this effort will be the characterizationof the proteome complement of these cancer types, asthe proteome from each of the cancer types will provideadditional mechanistic insights into the consequences ofgenetic mutations. For example, mutations in oncogenesor tumor suppressor genes may cause dominant-positiveor -negative effects (George, 2002; Sawyers, 2002;Raben and Helfrich, 2004; Cox et al., 2005; Meyersonand Carbone, 2005; Sharpless and DePinho, 2005).These effects may be exhibited by compensatory up- ordownregulation of key proteins. Thus, proteomicidentification of these proteins may help explain keypathways that are activated in each cancer type andDTP method will be useful in this regard. Furthermore,some proteins that are activated as a consequence ofgene activation/inactivation may be used as surrogatebiomarkers for early cancer detection (Wilson, 2004;Wright et al., 2005). We have systematically comparedthe identified protein list from this study with a numberof published cDNA microarray data sets (Velasco et al.,2004) and found very little overlap between theregulated mRNAs and identified proteins. These resultssuggest that more comprehensive characterization ofproteomes and mRNAs from normal and cancerousprostates is required for meaningful comparative efforts.Compounding this effort is also the fact that cancertissues are heterogeneous in nature and their cellular tostroma ratios can be very different in distinct areas.Thus, comparing two normal or tissue samples may notbe meaningful unless careful efforts are made tonormalize the cells and matrix components. In addition,most proteomic shotgun proteomic experiments sufferfrom under-sampling of the expressed proteins, as thecomplexity of the expressed proteins, especially fromtissue samples, is huge. Moreover, the duty cycle of the
latest mass spectrometers are still relatively slow, andthus, cannot identify most of the expressed proteins thatare detectable by the mass spectrometer. Thus, com-parative or subtractive proteomics techniques are quitelimited and at the present form, could not providecomprehensive list of expressed proteins.
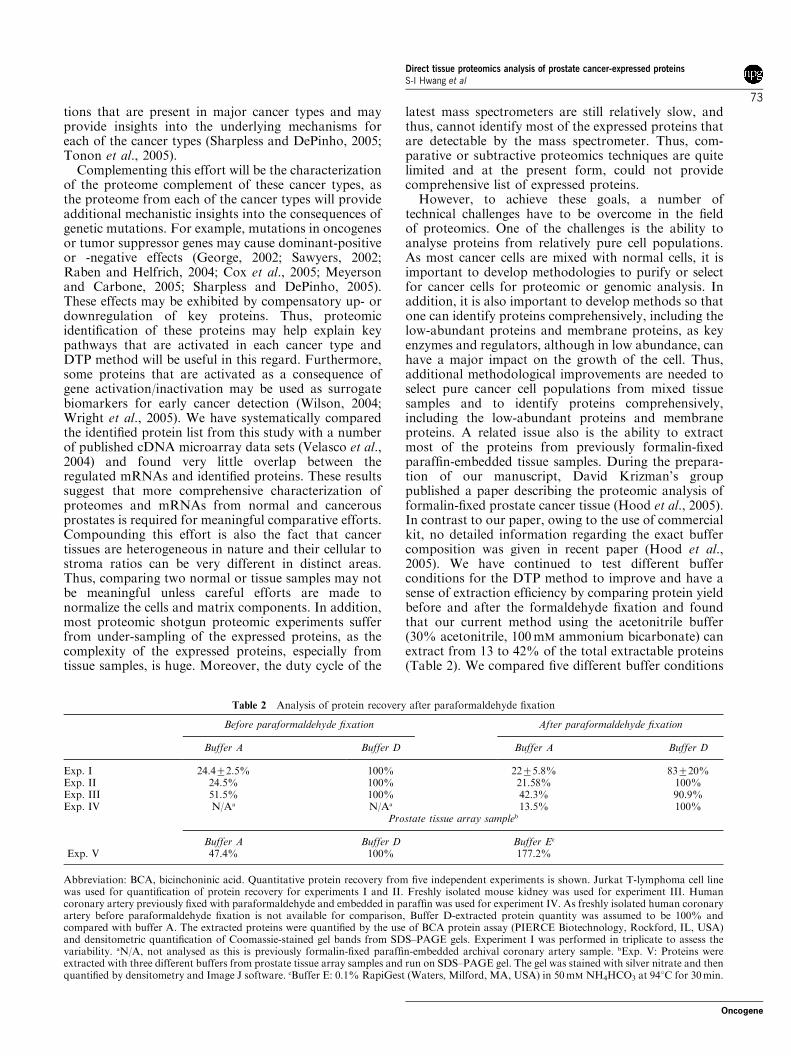
However, to achieve these goals, a number oftechnical challenges have to be overcome in the fieldof proteomics. One of the challenges is the ability toanalyse proteins from relatively pure cell populations.As most cancer cells are mixed with normal cells, it isimportant to develop methodologies to purify or selectfor cancer cells for proteomic or genomic analysis. Inaddition, it is also important to develop methods so thatone can identify proteins comprehensively, including thelow-abundant proteins and membrane proteins, as keyenzymes and regulators, although in low abundance, canhave a major impact on the growth of the cell. Thus,additional methodological improvements are needed toselect pure cancer cell populations from mixed tissuesamples and to identify proteins comprehensively,including the low-abundant proteins and membraneproteins. A related issue also is the ability to extractmost of the proteins from previously formalin-fixedparaffin-embedded tissue samples. During the prepara-tion of our manuscript, David Krizman’s grouppublished a paper describing the proteomic analysis offormalin-fixed prostate cancer tissue (Hood et al., 2005).In contrast to our paper, owing to the use of commercialkit, no detailed information regarding the exact buffercomposition was given in recent paper (Hood et al.,2005). We have continued to test different bufferconditions for the DTP method to improve and have asense of extraction efficiency by comparing protein yieldbefore and after the formaldehyde fixation and foundthat our current method using the acetonitrile buffer(30% acetonitrile, 100 mM ammonium bicarbonate) canextract from 13 to 42% of the total extractable proteins(Table 2). We compared five different buffer conditions
Table 2 Analysis of protein recovery after paraformaldehyde fixation
Before paraformaldehyde fixation After paraformaldehyde fixation
Buffer A Buffer D Buffer A Buffer D
Exp. I 24.472.5% 100% 2275.8% 83720%Exp. II 24.5% 100% 21.58% 100%Exp. III 51.5% 100% 42.3% 90.9%Exp. IV N/Aa N/Aa 13.5% 100%
Prostate tissue array sampleb
Buffer A Buffer D Buffer Ec
Exp. V 47.4% 100% 177.2%
Abbreviation: BCA, bicinchoninic acid. Quantitative protein recovery from five independent experiments is shown. Jurkat T-lymphoma cell linewas used for quantification of protein recovery for experiments I and II. Freshly isolated mouse kidney was used for experiment III. Humancoronary artery previously fixed with paraformaldehyde and embedded in paraffin was used for experiment IV. As freshly isolated human coronaryartery before paraformaldehyde fixation is not available for comparison, Buffer D-extracted protein quantity was assumed to be 100% andcompared with buffer A. The extracted proteins were quantified by the use of BCA protein assay (PIERCE Biotechnology, Rockford, IL, USA)and densitometric quantification of Coomassie-stained gel bands from SDS–PAGE gels. Experiment I was performed in triplicate to assess thevariability. aN/A, not analysed as this is previously formalin-fixed paraffin-embedded archival coronary artery sample. bExp. V: Proteins wereextracted with three different buffers from prostate tissue array samples and run on SDS–PAGE gel. The gel was stained with silver nitrate and thenquantified by densitometry and Image J software. cBuffer E: 0.1% RapiGest (Waters, Milford, MA, USA) in 50 mM NH4HCO3 at 941C for 30 min.
Direct tissue proteomics analysis of prostate cancer-expressed proteinsS-I Hwang et al
73
Oncogene
and found an optimal buffer and extraction conditionsfor Buffer D: 2% sodium dodecyl sulfate (SDS)-containing radioimmunoprecipitation assay (RIPA)buffer (150 mM NaCl, 10 mM Tris-HCl pH 7.2, 2%SDS, 1% Triton X-100, 1% deoxycholate, 5 mM
ethylenediamenetetraacetic acid (EDTA) at 941C for30 min and at 601C for 3 h). As shown in Table 2,comparison of freshly isolated cell line or mouse tissuewith or without the paraformaldehyde fixation, followedby extraction with either Buffer A (acetonitrile buffer)or Buffer D revealed that 80–100% of the proteins canbe extracted by Buffer D. We have used acetonitrilebuffer in this study as this buffer is compatible withtrypsin digestion and direct LC–MS/MS analysis. Thispoint is critical especially for minute quantities ofclinically relevant sample analysis such as thin sectionsof needle biopsy tissue. However, if larger quantities oftissue samples are available, we recommend the use of2% SDS-containing RIPA buffer for the DTP methodfor increased protein yield. Furthermore, we tested theextraction efficiency with another detergent, RapiGest(Waters, Milford, MA, USA), which is compatible withmass spectrometry (Table 2). The extraction efficiency of0.1% RapiGest in 50 mM NH4HCO3 was found to beB77% higher than Buffer D by densitometric quanti-fication of silver-stained gel.
Once the comprehensive information regarding thegene mutation and proteome library is achieved fromcancer cells, it will be useful to reconstruct the pathwaysthat are likely amplified or inactivated, and correlate themechanistic data with the clinical outcome and respon-siveness to therapy. It is also conceivable that theidentified protein targets that participate in the under-lying pathogenic mechanisms will be targeted forpatient- and cancer-specific therapeutic strategies toachieve the most beneficial outcome. We believe DTPmethod will help establish proteomic libraries of majorcancer types. This information will be useful for betterunderstanding of the disease pathogenic mechanisms, aswell as for successful prevention and treatment ofcancer.
Materials and methods
Prostate cancer tissue characterizationTissue array sections stained with hematoxylin and eosin(H&E) were carefully examined under the light microscope forthe presence of cancerous cells according to the Gleasoncriteria (Gleason, 1988, 1992). The tissue array containedprostate tissues from five normal individuals and 25 cancerpatients. The H&E-stained tissue sections from each of thepatients consist of two separate regions of the biopsy tissue,each 4mm thick and 2 mm in diameter. A combined total of 60sections were carefully examined under the light microscope,given the representative scores and subdivided into four broadcategories: (1) normal prostate tissue, (2) low-grade cancerscomprising Gleason scores from 2 to 5, (3) medium-gradecancers comprising Gleason scores from 6 to 7 and (4) high-grade cancers comprising Gleason scores from 8 to 10. Thisscoring scheme, first reported by Gleason, and since thenchanged to a new scoring scheme, was chosen, as this outdated
categorization was most suitable for our sample size.Characteristic gland types from each of the sections wereexamined and two predominant scores were given andcombined to generate the final Gleason scores. Two of themost representative regions from each of the sections andcorresponding Gleason scores are shown (SupplementaryFigure 1).
Optimization of protein extraction from paraformaldehyde-fixedparaffin-embedded prostate cancer tissue arrays Our first goalwas to isolate and identify proteins from previously formalde-hyde-fixed paraffin-embedded tissues. Paraffin-embedded tis-sue arrays were de-waxed by heating for 1 h at 651C followedby the removal of paraffin by three 5-min extractions in 100%toluene at room temperature. Residual toluene was removedfrom the slides by immersion in 100% ethanol and air-dried inthe fume hood for 5 min. We have used the tissue size as anormalization factor as virtually all of these sections were core-biopsy samples with identical dimensions (2 mm rings with4mm thickness). Estimation of cell numbers on each spot bymanual counting of defined microscopic fields revealedB40 000–60 000 cells/sample. Estimation of protein quantitiesby pooling two batches of five spots each in Buffer A, followedby protein quantification using the bicinchoninic acid kitrevealed that each spot contained 0.63–0.74 mg of extractableproteins. As the sample quantities are limited, fearing sampleloss from sub-fractionation using the strong cation exchangemethod, we have chosen to analyse them directly by liquidchromatography–tandem mass spectrometry (LC–MS/MS)procedure. We typically find that repeated sequencing of thesame sample resulted in 70–80% overlap in protein identifica-tion between two analyses, whereas much wider overlap is seenwhen different samples are compared (50–85%).
We next tested and optimized a method for successfulprotein identification directly from the prostate cancer tissuearrays. We chose a buffer system that was optimal to break theformaldehyde crosslinks, re-hydrate the proteins from thetissue arrays, digest the proteins directly by sequencing-grademodified trypsin and directly analyse digested tissues by them-capillary-LC–MS/MS. Conditions to optimally extract paraf-fin-embedded proteins and identify them using the shotgunproteomics approach were determined empirically. In short,the following steps were performed: (1) tissue sections wereextracted from the glass slides using a razor blade andtransferred to a 0.5 ml GenAmp microfuge tube (AppliedBiosystems, Foster City, CA, USA); (2) 60ml Buffer A(100 mM ammonium bicarbonate and 30% acetonitrile) orBuffer D (150 mM NaCl, 10 mM Tris-HCl, pH 7.2, 2% SDS,1% Triton X-100, 1% deoxycholate, 5 mM EDTA) was addedto each tube and heated to 941C for 30 min followed by 601Cfor 3 h to rehydrate proteins and hydrolyse the formaldehydecrosslinks; (3) samples were then incubated with 1 mg ofsequencing-grade modified trypsin for 18 h at 371C (1:20dilution of Buffer D is required for efficient digestion) and (4)samples were then lyophilized and re-suspended in 12 ml ofBuffer B (5% acetonitrile, 0.5% acetic acid, 0.005% hepta-fluorobuteric acid) and analysed on a Finnigan LTQ-linearion-trap mass spectrometer coupled to the nano-electrospraysource.
Data-dependent mass spectrometry analysis The digestedtissue samples were loaded onto a self-pack C18 microcapillaryusing the Famos autosampler coupled in-line to a 1100Hewlett Packard binary pump connected to the mass spectro-meter. Peptide mixtures were eluted into the mass spectrometerover 106 min using an acetonitrile gradient. The details of the
Direct tissue proteomics analysis of prostate cancer-expressed proteinsS-I Hwang et al
74
Oncogene
methods for the mass spectrometer data acquisition,termed ‘top 6 method’, are described elsewhere (Mayyaet al., 2005). Using 60 biopsy tissue spots and performingtwo independent analyses from two array slides, thousands ofMS/MS attempts were performed. The generated data in.RAW format were submitted for database searching using theSEQUEST algorithm (Eng et al., 1994). Identified proteinswere filtered, sorted and analysed by a suite of bioinformaticsoftware tools as described below (Han et al., 2001; Rezaulet al., 2005).
Data analysis and interpretation Each of the MS/MS spectragenerated from fragmentation of the peptides was searchedagainst the locally installed human protein database with over120 000 entries. Each of the top 10 matches was then listed inthe output files. SEQUEST search parameters include theoption to identify some post-translational modifications onpeptides such as the methionine oxidation (þ 16), phosphor-ylation on serine, threonine and tyrosine residues (þ 80) andthe presence of both tryptic ends allowing one missed cleavage.The resulting output data files were grouped into fourcategories based on the Gleason scoring criteria as describedabove. All the output files in each of the four categories werefurther filtered using the INTERACT software tool (Hanet al., 2001; Rezaul et al., 2005). In brief, a set of commonlyaccepted stringent SEQUEST scoring criteria was used to filterthe output: Xcorr of 1.9 for þ 1 peptides, 2.8 for þ 2 peptidesand 3.7 for þ 3 peptides, and DCn of 0.1 or above. In additionto the SEQUEST scores, protein identification was confirmedby manual inspection of the spectra. Furthermore, statisticalsignificance of peptide and protein identification was assessedusing the PeptideProphet and ProteinProphet Software toolsas described previously (Han et al., 2001; Keller et al., 2002;Nesvizhskii et al., 2003; Rezaul et al., 2005). In addition, weused the decoy-database searching approach to estimate thelevel of false-positive peptide assignments (Peng et al., 2003).We used reasonably stringent criteria to eliminate most of thefalse-positive identifications and we are reporting the list ofproteins with approximately 1.1% false-positive rates formultiple peptide containing proteins. Furthermore, we manu-ally validated the single hit proteins. Using these stringentcriteria, we identified 428 unique proteins derived form the listof 12 631 identified peptides. Among the proteins that wereidentified, 361 proteins were identified with multiple peptidesand 67 proteins with single peptides. The identified proteinswere analysed by the use of PROTEOME-3D software(Lundgren et al., 2003). This tool allows the categorizationof proteins into defined metabolic pathways, oncogenes/tumorsuppressor genes, function groups, subcellular location andcategorization according to the GO terminology. Finally, astage-specific prostate expression library was generated by theuse of INTERSECT software tool (DH Lundgren et al.,unpublished data). This tool also allows the selection ofcandidate prognostic and diagnostic proteins that are ex-pressed in different stages of the cancer tissues for additionalvalidation experiments.
Immunohistochemical validation of Wnt-3 expression in prostatecancer cells Briefly, prostate tissue arrays were de-paraffi-nized with toluene, re-hydrated with graded alcohol washesand subjected to antigen retrieval in a steamer for 30 min insodium citrate buffer (pH 6.0). The tissue slides were thenblocked for the endogenous peroxidase activity using hydrogenperoxide. The slides were then blocked for nonspecific bindingusing normal goat serum (1:20 dilution in phosphate-bufferedsaline (PBS), pH 7.4), followed by blocking for endogenous
biotin by using the Victor kit (Burlingame, CA, USA). Slideswere then incubated for 1 h with the following primaryantibodies diluted in PBS: goat anti-human Wnt-3 antibody(Santa Cruz Biotechnology, Santa Cruz, CA, USA, C-15antibody catalog No. SC-5210 diluted 1:50), anti-humanb-catenin antibody (Santa Cruz Biotechnology, Santa Cruz,CA, USA, C-18 antibody catalog No. SC-1496 diluted 1:50).Cell proliferation status and stromal cell composition of theprostate tissue sections were also examined by immunostainingwith anti-proliferating cell nuclear antigen antibody and anti-smooth muscle a actin antibody (Sigma, St Louis, MO, USA).Each of the immunostaining experiments was carried outtogether with negative control staining by omission of primaryantibody. Slides were then washed, incubated with biotinylatedanti-mouse or anti-goat secondary antibody for 30 min atroom temperature and incubated with the preformed avidin–biotin–horseradish peroxidase complex. The slides were thendeveloped with the horseradish peroxidase substrate, diami-nobenzidine, counter stained with hematoxylin, dehydratedand mounted.
Absolute quantification of PSA in normal and cancerousprostate tissues In order to quantify the absolute amountsof PSA in the prostate cancer tissues, we made use of atechnique termed AQUA (24). In brief, a tryptic peptidebetween positions 126 and 137 of PSA (LSEPAELTDAVK)was chosen. The synthetic peptide contained an octa-deuter-ated valine (Isotec, St Louis, MO, USA) at position 136 and is8 Da heavier than the endogenous peptide. Accurate quantityof the standard peptide in a suspended solution was measuredby quantitative amino-acid analysis. The peptide synthesis andamino-acid analysis were carried out by Molecular BiologyResource Facility at the University of Oklahoma HealthScience Center. Optimization steps include acetonitrile gradi-ent for peptide elution and selecting the MRM ions forreproducible quantification (Figure 4). Finally, 100 fmol ofstandard PSA peptide was combined with the tissue digest,and the mixture was loaded onto a C18 reverse-phasemicro-column. The mass spectrometer is operated in theMRM mode to fragment and detect the PSA standard peptide(641.3 m/z) and the endogenous PSA peptide (637.3 m/z).Two of the fragment ions from the standard peptide andthe endogenous peptides were used for the MRMexperiment. Absolute quantity of PSA is obtained bycomputing the quantity of endogenous PSA peptide with thestandard peptide (Figure 4). Five normal prostate tissuesamples and 15 cancerous tissue samples were quantified usingthis approach.
Abbreviations
DTP, direct tissue proteomic; fmol, femptomole; pg, picogram;LC–MS/MS, liquid chromatography–tandem mass spectro-metry; TCA cycle, tricarboxylic acid cycle; MALDI–TOF-MS,matrix-assisted laser desorption ionization-time-of-flight massspectrometry; SELDI–TOF, surface-enhanced laser deso-rption ionization mass spectrometry.
Acknowledgements
We thank Michael Fong for his expert assistance in graphicsand tables, and members of Han Lab for helpful discussion.This work was supported by R01 HL 67569, P01 HL70694,RR019436, funds from Neag Comprehensive Cancer Centerand UConn Cancer Golf Proceeds.
Direct tissue proteomics analysis of prostate cancer-expressed proteinsS-I Hwang et al
75
Oncogene
References
Cantin GT, Yates III JR. (2004). J Chromatogr A 1053: 7–14.Coombs GS, Bergstrom RC, Pellequer JL, Baker SI, Navre M,
Smith MM et al. (1998). Chem Biol 5: 475–488.Cox C, Bignell G, Greenman C, Stabenau A, Warren W,
Stephens P et al. (2005). Proc Natl Acad Sci USA 102:4542–4547.
Cronauer MV, Schulz WA, Ackermann R, Burchardt M.(2005). Int J Oncol 26: 1033–1040.
DePinho RA, Polyak K. (2004). Nat Genet 36: 932–934.Eng JK, McCormack AL, Yates III JR. (1994). J Am Soc
Mass Spectrom 5: 976–989.Ford TF, Butcher DN, Masters JR, Parkinson MC. (1985). Br
J Urol 57: 50–55.George DJ. (2002). Urology 60: 115–121; discussion 122.Gerber SA, Rush J, Stemman O, Kirschner MW, Gygi SP.
(2003). Proc Natl Acad Sci USA 100: 6940–6945.Gleason DF. (1988). NCI Monogr 7: 15–18.Gleason DF. (1992). Hum Pathol 23: 273–279.Griffin TJ, Lock CM, Li XJ, Patel A, Chervetsova I, Lee Het al. (2003). Anal Chem 75: 867–874.
Gupta A, Roehrborn C, Aragaki C. (2004). J Urol 171:2384–2385 (author reply 2385).
Gygi SP, Rochon Y, Franza BR, Aebersold R. (1999). MolCell Biol 19: 1720–1730.
Han DK, Eng J, Zhou H, Aebersold R. (2001). Nat Biotechnol19: 946–951.
Hood BL, Darfler MM, Guiel TG, Furusato B, Lucas DA,Ringeisen BR et al. (2005). Mol Cell Proteomics 4:1741–1753.
Keller A, Nesvizhskii AI, Kolker E, Aebersold R. (2002). AnalChem 74: 5383–5392.
Lundgren DH, Eng J, Wright ME, Han DK. (2003). Mol CellProteomics 2: 1164–1176.
Mayya V, Rezaul K, Cong YS, Han D. (2005). Mol CellProteomics 4: 214–223.
Meyerson M, Carbone D. (2005). J Clin Oncol 23: 3219–3226.
Nantermet PV, Xu J, Yu Y, Hodor P, Holder D, Adamski Set al. (2004). J Biol Chem 279: 1310–1322.
Nelson PS, Han D, Rochon Y, Corthals GL, Lin B, MonsonA et al. (2000). Electrophoresis 21: 1823–1831.
Nesvizhskii AI, Keller A, Kolker E, Aebersold R. (2003). AnalChem 75: 4646–4658.
Parnes HL, Thompson IM, Ford LG. (2005). J Clin Oncol 23:368–377.
Patterson SD. (2004). Arthritis Rheum 50: 3741–3744.Peng J, Elias JE, Thoreen CC, Licklider LJ, Gygi SP. (2003).
J Proteome Res 2: 43–50.Petricoin EF, Zoon KC, Kohn EC, Barrett JC, Liotta LA.
(2002). Nat Rev Drug Discov 1: 683–695.Posadas EM, Simpkins F, Liotta LA, MacDonald C, Kohn
EC. (2005). Ann Oncol 16: 16–22.Raben D, Helfrich B. (2004). Clin Lung Cancer 6: 48–57.Rezaul K, Wu L, Mayya V, Hwang SI, Han D. (2005). Mol
Cell Proteomics 4: 169–181.Sawyers CL. (2002). Curr Opin Genet Dev 12: 111–115.Sharpless NE, DePinho RA. (2005). Nature 436: 636–637.Smith RA, Cokkinides V, Eyre HJ. (2005). CA Cancer J Clin
55: 31–44; quiz 55–56.Stephens P, Edkins S, Davies H, Greenman C, Cox C, Hunter
C et al. (2005). Nat Genet 37: 590–592.Sweat GT. (2005). Postgrad Med 117: 45–50.Tanneberger S. (1977). Arch Geschwulstforsch 47: 755–765.Tarro G, Perna A, Esposito C. (2005). J Cell Physiol 203: 1–5.Tonon G, Wong KK, Maulik G, Brennan C, Feng B, Zhang Yet al. (2005). Proc Natl Acad Sci USA 102: 9625–9630.
Velasco AM, Gillis KA, Li Y, Brown EL, Sadler TM,Achilleos M et al. (2004). Endocrinology 145: 3913–3924.
Verras M, Brown J, Li X, Nusse R, Sun Z. (2004). Cancer Res64: 8860–8866.
Wardwell NR, Massion PP. (2005). Semin Oncol 32: 259–268.Wilson JF. (2004). Ann Intern Med 140: 317–319.Wolters DA, Washburn MP, Yates III JR. (2001). Anal Chem
73: 5683–5690.Wright ME, Eng J, Sherman J, Hockenbery DM, Nelson PS,
Galitski T et al. (2003). Genome Biol 5: R4.Wright ME, Han DK, Aebersold R. (2005). Mol Cell
Proteomics 4: 545–554.Zangar RC, Varnum SM, Covington CY, Smith RD. (2004).
Dis Markers 20: 135–148.Zhu H, Mazor M, Kawano Y, Walker MM, Leung HY,
Armstrong K et al. (2004). Cancer Res 64: 7918–7926.
Supplementary Information accompanies the paper on the Oncogene website (http://www.nature.com/onc)
Direct tissue proteomics analysis of prostate cancer-expressed proteinsS-I Hwang et al
76
Oncogene