dietary sources of energy and macronutrient intakes among flemish preschoolers
TRANSCRIPT
RESEARCH Open Access
Dietary sources of energy and macronutrientintakes among Flemish preschoolersWillem De Keyzer1,2*, Yi Lin2, Carine Vereecken2, Lea Maes2, Herman Van Oyen3, Erika Vanhauwaert4,Guy De Backer2, Stefaan De Henauw1,2 and Inge Huybrechts2
Abstract
This study aims to identify major food sources of energy and macronutrients among Flemish preschoolers as abasis for evaluating dietary guidelines. Three-day estimated diet records were collected from a representativesample of 696 Flemish preschoolers (2.5-6.5 years old; participation response rate: 50%). For 11 dietary constituents,the contribution of 57 food groups was computed by summing the amount provided by the food group for allindividuals divided by the total intake of the respective nutrient for all individuals. Bread (12%), sweet snacks (12%),milk (6%), flavoured milk drinks (9%), and meat products (6%) were the top five energy contributors. Sweet snackswere among the top contributors to energy, total fat, all fatty acids, cholesterol, and complex and simplecarbohydrates. Fruit juices and flavoured milk drinks are the main contributors to simple carbohydrates(respectively 14% and 18%). All principal food groups like water, bread and cereals, vegetables, fruit, milk andspreadable fats were under-consumed by more than 30% of the population, while the food groups that wereover-consumed consisted only of low nutritious and high energy dense foods (sweet snacks, sugared drinks, friedpotatoes, sauces and sweet spreads). From the major food sources and gaps in nutrient and food intakes, somerecommendations to pursue the nutritional goals could be drawn: the intake of sweet snacks and sugar-rich drinks(incl. fruit juices) should be discouraged, while consumption of fruits, vegetables, water, bread and margarine onbread should be encouraged.
IntroductionThe diet in childhood is not only of great importancefor the well-being and growth of the child, it is also apotential determinant of adult morbidity and mortality[1,2]. However, some important gaps in the diet ofFlemish preschoolers have been identified in the pastand have already been discussed in depth by comparingnutrient and food intakes of Flemish preschoolers withrespectively the Belgian age-specific recommended diet-ary allowances (RDA) for nutrients [3] and the Flemishfood-based dietary guidelines (FBDG) for preschoolersin Flanders [4]. In summary, more than half of the chil-dren did not comply with the water recommendation.Furthermore, intakes of saturated fatty acid (SFA),mono-unsaturated fatty acid (MUFA) and poly-unsatu-rated fatty acid (PUFA) were not in line with the recom-mendations at population level. Therefore, the diet of
Flemish preschoolers can be an important target formodifying the risk for cardiovascular disease (CVD) inlater life [3]. When comparing the food group intakesamong preschoolers in Flanders with the Flemish FBDG(Table 1), we found that for almost all food groupsmore than half of the children did not reach the mini-mum recommendations. However, the consumption ofmeat products and sugar and fat-rich products like softdrinks and biscuits exceeded the upper levels of therecommendations [4].The relative contribution of specific foods and food
groups to total nutrient intakes has been studied sincethe early eighties, when a new concept of ‘important’nutrient sources was introduced in addition to the con-cept of ‘rich’ nutrient sources [5]. Whereas rich sourceswere foods with the greatest concentration of a nutrient,important sources were foods that contributed most toa population’s intake. Important sources of nutrientscan be strongly influenced by ‘nutrient density’ of thefood, its ‘frequency of consumption’ and the quantityconsumed. Knowledge of such sources, combined with
* Correspondence: [email protected] of Nutrition and dietetics, University College Ghent, Gent,BelgiumFull list of author information is available at the end of the article
De Keyzer et al. Archives of Public Health 2011, 69:5http://www.archpublichealth.com/content/69/1/5 ARCHIVES OF PUBLIC HEALTH
© 2011 De Keyzer et al; licensee BioMed Central Ltd. This is an Open Access article distributed under the terms of the CreativeCommons Attribution License (http://creativecommons.org/licenses/by/2.0), which permits unrestricted use, distribution, andreproduction in any medium, provided the original work is properly cited.

information about the degree to which people meetrecommended nutrient intakes, is not only useful forrecommending changes in food intakes to pursue nutri-tional goals [6], but also for the conceptualisation ofnew/revised dietary guidelines and dietary intake assess-ment instruments [7-9].To date, no comprehensive analysis has been underta-
ken to identify energy and macronutrient sources inFlemish preschoolers. Therefore the current paperincludes two important study aims. Firstly, it investigatesthe major food sources of macronutrients and energyamong preschoolers in Flanders. Secondly, it investigateshow changes in food intakes (while taking into accounttheir nutrient contributions) could induce changes innutrient intakes. Based upon those results, age-specificsuggestions in the context of FBDG can be made in orderto increase compliance of nutrient recommendations.
MethodsThe present study used data of the Flanders preschooldietary survey (data collected from October 2002 untilFebruary 2003), in which usual dietary intake was esti-mated from 3-day estimated dietary records (3d EDR),completed by the parents. To ensure that all days of the
week would be equally covered in the dietary records,the days to be registered were determined beforehand.The sampling design and methods have been describedin detail previously [10]. In brief, a random cluster sam-pling design at the level of schools, stratified by provinceand age was used (the age range for the target popula-tion were preschool children 2.5-6.5 years old). Also, theresponse rate and the representativeness of the studysample were discussed before (50% response rate and49% after data-cleaning) [10]. Comparison of the studysample with the Flemish population confirmed gooddemographic representativeness of our study sample.Data on educational level of parents showed that, com-pared to the Flemish population, participants werehigher educated. This was definitely true for those parti-cipants with good quality food diaries. The school head-masters, teachers and parents were informed about thestudy objectives, aims and dietary assessment methodsduring a school meeting. Oral and written instructionswere provided for the recording of foods and drinksconsumed by children. Portion sizes were described asnatural units (like fruit), known amounts in grams orml, or using household measures like ‘a small glass’ or‘half a plate’. Teachers were asked to report what the
Table 1 Flemish Food Based Dietary Guidelines for preschoolers [23]
Food group Children 1 - 3 years Children 3 - 6 years
Water
Liquids 0.5 - 1 litre 1.5 litre
Cereal and potatoes
Bread 1-3 slices (30-100 g) 3-5 slices (100-150 g)
Potatoes 1-2 pieces (50-100 g) 1-4 pieces (50-200 g)
Vegetables
Cooked vegetables should be alternated with raw vegetables 1-2 vegetable spoons (50-100 g) 2-3 vegetable spoons (100-150 g)
Fruit 1-2 pieces (100-200 g) 1-2 pieces (100-200 g)
Dairy and calcium enriched soy drinks
Milk (whole fat milk up to the age of 4 years) 4 beakers (500 ml) 4 beakers (500 ml)
Cheese 1/2 slice (10 g) 1/2-1 slice (10-20 g)
Meat, fish, eggs and meat substitutes (e.g. tofu)
Meat, meat products (cold cuts), poultry, fish (raw weight) 30-50 g 50-75 g
OR
Meat substitute (tofu, tempe, mycoproteins) 30-50 g 50-75 g
OR
Mushrooms (cooked weight) 50 g 100 g
OR
Eggs 1 per week 1 per week
OR
Legumes (dry weight) 1 tablespoon (15 g) 2 tablespoons (30 g)
Legumes (cooked weight) 3 tablespoons (50 g) 6 tablespoons (100 g)
Fat (baking & spreadable)
On bread 5 g per slice of bread 5 g per slice of bread
Oil or baking fat ≤ 15 g ≤ 15 g
Residual group (e.g. soft drinks, candy, etc.) discouraged discouraged
De Keyzer et al. Archives of Public Health 2011, 69:5http://www.archpublichealth.com/content/69/1/5
Page 2 of 11
children consumed at school so that the parents/proxiescould include it in the diaries. For the current analysesdiaries containing insufficiently detailed descriptions ofthe food products and portion sizes consumed (e.g.when the parents did not include descriptors like ‘lowfat’ or ‘whole grain’ in their diaries or when they did notinclude portion sizes (no standard units or grams)) wereexcluded. Thus, only good quality food diaries, includingthree completed record days were included (n = 696;66% of collected diaries). Two dietitians, with long-standing experience in nutritional epidemiological field-work, performed this exclusion procedure of the EDR.The percentage of underreporters was already
described in depth in a previous paper and was shownto be low (< 2% of the children when using Goldbergcut-offs adapted for children) [3]. Underreporters havenot been excluded from the study sample that was usedfor the present analyses.The food composition data for calculating nutrients
were based on the following tables: the Belgian foodcomposition table NUBEL [11], the Dutch food compo-sition database NEVO [12], the food composition tableof the Belgian Institute Paul Lambin [13], and McCanceand Widdowson’s UK food composition table [14].In this paper, energy and ten nutrients (nine macronu-
trients and cholesterol), that have public health signifi-cance in terms of meeting either nutrient requirementsor dietary guidance, are reported. In total 936 foods andcomposite dishes were encoded in the original database.All recipes that were described in detail as ingredientsin the diaries were encoded as ingredients in the originaldatabase. However, in order to classify foods easily intofood groups of the Flemish FBDG, eight extra compositedishes had to be disaggregated (nasi goreng, nasi gorengwith egg, spaghetti bolognaise, chicken ragout, turkeyragout, lasagna, macaroni ham/cheese sauce, and stew).Spaghetti bolognaise for instance was disaggregated intopasta, minced meat, onions, tomatoes, carrots and mar-garine (the source used for recipe description was therecipe list of the Flemish EPIC-soft version 2004) [15].In addition to those recipes that needed to be disaggre-gated, the authors sometimes had to aggregate ingredi-ents into their original mixed/complex food in order toallow comparison with the FBDG. For instance whenparents reported the ingredients of homemade bread,this had to be aggregated into bread in order to facilitatecomparison with the food groups of the FBDG. In total116 food items were recomposed. After the aggregationand disaggregating procedures, food items were dividedinto 57 food groups of similar nutrient content, basedon the classification of the Flemish FBDG and theexpert opinion of the investigators (see food groupslisted in tables 2 and 3). In the Flemish FBDG, productswithin a food group have been categorised into three
groups: food items that are to be preferred – the ‘prefer-ence group’ (e.g. fresh fruit), food items that should beconsumed with moderation – the ‘moderate group’ (e.g.fruit juice) and food items that should be avoided – the‘residual group’ (e.g. confectionery, soft drinks, ...).The Ethical Committee of the Ghent University Hos-
pital (Belgium) granted ethical approval for the study.Signed informed consent was obtained from the parentsof all the children participating in the Flanders pre-school dietary survey.
Statistical analysesStatistical analyses were performed with the StatisticalPackage for the Social Sciences for Windows version 14(SPSS Inc., Chicago, IL, USA). The population propor-tion formula was used to determine the percentage con-tribution of each of the 57 food groups to the intake ofeach dietary component. This was done by summing theamount of the component provided by the food for allindividuals divided by the total intake of that compo-nent from all foods for the entire study population[7,16,17].Since the average of a small number of days does not
adequately reflect an individual’s usual intake, statisticalmodelling of dietary intakes is needed [18]. In order tocorrect for day-to-day variability in the 3d EDR, meanand median ‘usual’ intakes of the population and theproportion below or above defined cut-offs were calcu-lated using statistical modelling (the NUSSER method,developed at Iowa State University) [19,20]. When usingconsecutive days, at least three days are required to esti-mate usual dietary intakes by means of the NUSSERmethod [19,20]. The programme used to calculate usualintakes was the Software for Intake Distribution Estima-tion (C-side) [21]. The proportion of the variance onnutrient intakes explained by schools and classes waslow (< 5%) in the present study, so clustering effectswere not addressed during analysis. Because of the highnumber of non-consumers in some of the detailed food(group)s, adjusted mean intakes could not be calculatedfor those food(group)s. However, to give an impressionof the magnitude of intakes of the different food(group)sin order to help interpreting the contributions, unad-justed mean and median intakes were added to thetables (tables 2 and 3). The Belgian recommended diet-ary allowances were used as reference values for thenutrient intakes [22], age-specific Food Based DietaryGuidelines (FBDG) were used as reference for food(group) intakes [23].
ResultsEnergy and macronutrientsTables 2 &3 show that bread, sweet snacks (cakes/cookies/candy...), milk, and flavoured milk drinks belong
De Keyzer et al. Archives of Public Health 2011, 69:5http://www.archpublichealth.com/content/69/1/5
Page 3 of 11

Table 2 Contribution from all food groups to energy, fat, fatty acids and cholesterol (n = 696)
Nutrients and dietary constituents
Food intakef Energy Total Fat SFA MUFA PUFA Cholest
Food Group Mean Median (SD) % order % order % order % order % order % order
Beverages (incl. juices but no drinksfrom restgroup)
486,2 5,2 0,5 0,3 0,4 0,4 0,3
Water 224,2 150,0 (226.4) 0,0 0,0 0,0 0,0 0,0 0,0
Light beverages 23,1 0,0 (90.1) 0,0 0,0 0,0 0,0 0,0 0,0
Tea and coffee without sugar 8,2 0,0 (43.5) 0,0 0,0 0,0 0,0 0,0 0,0
Fruit juice 172,8 150,0 (209.3) 4,5 6 0,0 0,0 0,0 0,0 0,0
Vegetable juice 0,2 0,0 (6.0) 0,0 0,0 0,0 0,0 0,0 0,0
Soup/bouillon 57,7 0,0 (101.7) 0,6 0,4 0,3 0,4 0,4 0,3
Bread and cereals 86,7 16,4 6,5 6,4 6,3 10,1 15,0
Bread/rolls/crackers/rice cakes 70,3 62,5 (46.8) 12,4 1 4,5 8 4,0 8 4,8 10 8,3 4 12,1 2
Sugared bread 7,5 0,0 (22.5) 1,7 1,5 1,9 1,1 0,8 2,9
Breakfast cereals (ready-to-eat/hot) 8,9 0,0 (20.0) 2,3 0,5 0,5 0,4 1,0 0,0
Potatoes and grains 86,7 5,4 1,6 1,2 1,5 2,6 1,1
Pasta/noodles 15,4 0,0 (41.0) 1,1 0,2 0,1 0,1 0,4 0,0
Rice 6,3 0,0 (25.5) 0,6 0,1 0,0 0,0 0,1 0,0
Potatoes 65,0 50,0 (69.3) 3,7 7 1,4 1,1 1,4 2,0 1,1
Vegetables 66,5 1,1 0,3 0,3 0,1 0,5 0,1
Cooked vegetables 53,7 40,0 (60.1) 1,0 0,3 0,3 0,1 0,5 0,1
Raw vegetables 12,8 0,0 (38.3) 0,1 0,0 0,0 0,0 0,0 0,0
Fruits (sweetened/unsweetened) 109,9 4,4 0,1 0,1 0,1 0,3 0,0
Fresh fruit 94,0 68,8 (102.7) 3,6 8 0,1 0,1 0,0 0,3 0,0
Canned fruit 15,4 0,0 (45.4) 0,7 0,0 0,0 0,0 0,0 0,0
Dried fruit 0,4 0,0 (3.7) 0,1 0,0 0,0 0,0 0,0 0,0
Olives 0,1 0,0 (1.5) 0,0 0,0 0,0 0,0 0,0 0,0
Milk, milk products and calciumenriched soy milk
439,9 19,9 15,7 22,0 12,1 6,6 12,1
Milka 179,0 125,0 (218.5) 6,2 4 7,1 5 10,1 2 5,4 7 1,0 5,7 8
Flavoured milk drinks (e.g. Fristi,chocolate milk,...)
188,3 145,0 (226.8) 8,9 3 4,4 9 6,2 6 3,5 1,9 3,2 9
Yoghurt 4,5 0,0 (25.3) 0,2 0,1 0,2 0,1 0,0 0,1
Sugared or aromatised yoghurt 14,2 0,0 (46.9) 0,9 0,4 0,7 0,2 0,0 0,4
Soy drinks 15,7 0,0 (82.5) 0,6 0,7 0,3 0,5 2,6 0,0
Milk desserts 19,9 0,0 (56.2) 1,7 1,5 2,3 1,1 0,3 1,3
Desserts on the basis of soy 2,3 0,0 (19.1) 0,1 0,1 0,0 0,1 0,3 0,0
Probiotics (e.g. actimel, yakult, ...) 0,7 0,0 (7.4) 0,0 0,0 0,0 0,0 0,0 0,0
White (fresh) cheese 15,3 0,0 (43.3) 1,4 1,5 2,2 1,3 0,4 1,4
Cheese 14,5 3,5 8,2 11,6 6,7 1,5 8,2
Hard cheeseb 11,8 0,0 (22.6) 3,0 6,9 6 9,8 3 5,7 6 1,2 7,0 7
Cheese spread 2,7 0,0 (8.8) 0,5 1,2 1,8 1,0 0,3 1,3
Fat & oilc 8,6 3,3 10,5 8,9 9,3 20,6 2,4
Butter/margarine 8,3 6,0 (9.5) 3,1 9,9 3 8,7 5 8,3 4 19,8 1 2,4
Oil 0,3 0,0 (1.4) 0,2 0,5 0,2 0,9 0,7 0,0
Frying oil 0,0 0,0 (0.6) 0,0 0,1 0,0 0,1 0,1 0,0
Meat/poultry/fish/egg/meatalternates
90,3 13,5 23,2 18,4 27,3 22,5 43,3
Meat, game and meat products 37,2 20,0 (46.1) 6,0 5 10,6 2 9,4 4 12,9 1 6,6 6 12,5 1
Chicken/turkey 15,9 0,0 (34.7) 1,9 2,0 1,3 2,5 2,7 10 9,1 5
Fish/shellfish 8,5 0,0 (28.7) 0,9 1,1 0,5 1,1 2,9 9 3,0 10
Cold cuts (from meat poducts) 20,7 6,8 (30.2) 3,5 9 7,2 4 6,0 7 8,3 3 6,4 7 7,9 6
De Keyzer et al. Archives of Public Health 2011, 69:5http://www.archpublichealth.com/content/69/1/5
Page 4 of 11
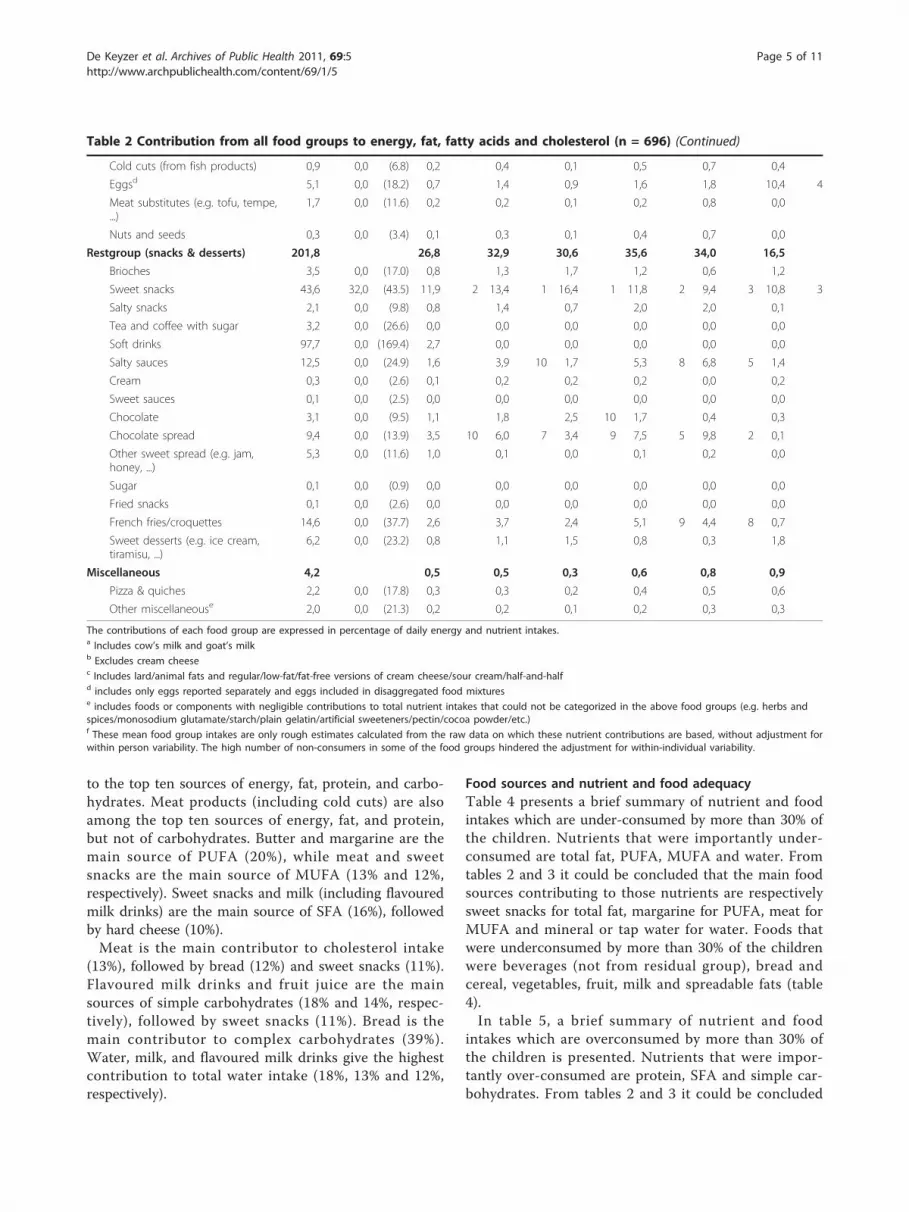
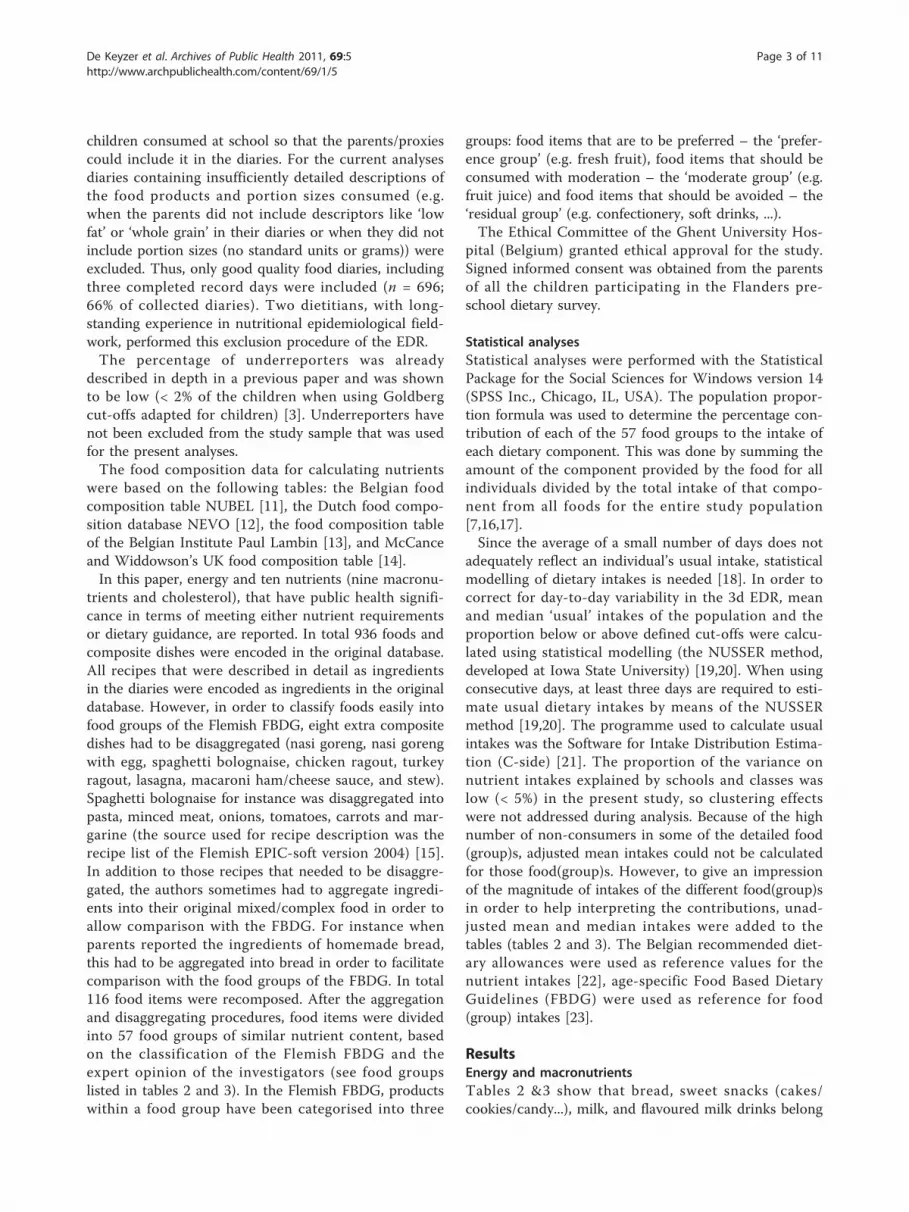
to the top ten sources of energy, fat, protein, and carbo-hydrates. Meat products (including cold cuts) are alsoamong the top ten sources of energy, fat, and protein,but not of carbohydrates. Butter and margarine are themain source of PUFA (20%), while meat and sweetsnacks are the main source of MUFA (13% and 12%,respectively). Sweet snacks and milk (including flavouredmilk drinks) are the main source of SFA (16%), followedby hard cheese (10%).Meat is the main contributor to cholesterol intake
(13%), followed by bread (12%) and sweet snacks (11%).Flavoured milk drinks and fruit juice are the mainsources of simple carbohydrates (18% and 14%, respec-tively), followed by sweet snacks (11%). Bread is themain contributor to complex carbohydrates (39%).Water, milk, and flavoured milk drinks give the highestcontribution to total water intake (18%, 13% and 12%,respectively).
Food sources and nutrient and food adequacyTable 4 presents a brief summary of nutrient and foodintakes which are under-consumed by more than 30% ofthe children. Nutrients that were importantly under-consumed are total fat, PUFA, MUFA and water. Fromtables 2 and 3 it could be concluded that the main foodsources contributing to those nutrients are respectivelysweet snacks for total fat, margarine for PUFA, meat forMUFA and mineral or tap water for water. Foods thatwere underconsumed by more than 30% of the childrenwere beverages (not from residual group), bread andcereal, vegetables, fruit, milk and spreadable fats (table4).In table 5, a brief summary of nutrient and food
intakes which are overconsumed by more than 30% ofthe children is presented. Nutrients that were impor-tantly over-consumed are protein, SFA and simple car-bohydrates. From tables 2 and 3 it could be concluded
Table 2 Contribution from all food groups to energy, fat, fatty acids and cholesterol (n = 696) (Continued)
Cold cuts (from fish products) 0,9 0,0 (6.8) 0,2 0,4 0,1 0,5 0,7 0,4
Eggsd 5,1 0,0 (18.2) 0,7 1,4 0,9 1,6 1,8 10,4 4
Meat substitutes (e.g. tofu, tempe,...)
1,7 0,0 (11.6) 0,2 0,2 0,1 0,2 0,8 0,0
Nuts and seeds 0,3 0,0 (3.4) 0,1 0,3 0,1 0,4 0,7 0,0
Restgroup (snacks & desserts) 201,8 26,8 32,9 30,6 35,6 34,0 16,5
Brioches 3,5 0,0 (17.0) 0,8 1,3 1,7 1,2 0,6 1,2
Sweet snacks 43,6 32,0 (43.5) 11,9 2 13,4 1 16,4 1 11,8 2 9,4 3 10,8 3
Salty snacks 2,1 0,0 (9.8) 0,8 1,4 0,7 2,0 2,0 0,1
Tea and coffee with sugar 3,2 0,0 (26.6) 0,0 0,0 0,0 0,0 0,0 0,0
Soft drinks 97,7 0,0 (169.4) 2,7 0,0 0,0 0,0 0,0 0,0
Salty sauces 12,5 0,0 (24.9) 1,6 3,9 10 1,7 5,3 8 6,8 5 1,4
Cream 0,3 0,0 (2.6) 0,1 0,2 0,2 0,2 0,0 0,2
Sweet sauces 0,1 0,0 (2.5) 0,0 0,0 0,0 0,0 0,0 0,0
Chocolate 3,1 0,0 (9.5) 1,1 1,8 2,5 10 1,7 0,4 0,3
Chocolate spread 9,4 0,0 (13.9) 3,5 10 6,0 7 3,4 9 7,5 5 9,8 2 0,1
Other sweet spread (e.g. jam,honey, ...)
5,3 0,0 (11.6) 1,0 0,1 0,0 0,1 0,2 0,0
Sugar 0,1 0,0 (0.9) 0,0 0,0 0,0 0,0 0,0 0,0
Fried snacks 0,1 0,0 (2.6) 0,0 0,0 0,0 0,0 0,0 0,0
French fries/croquettes 14,6 0,0 (37.7) 2,6 3,7 2,4 5,1 9 4,4 8 0,7
Sweet desserts (e.g. ice cream,tiramisu, ...)
6,2 0,0 (23.2) 0,8 1,1 1,5 0,8 0,3 1,8
Miscellaneous 4,2 0,5 0,5 0,3 0,6 0,8 0,9
Pizza & quiches 2,2 0,0 (17.8) 0,3 0,3 0,2 0,4 0,5 0,6
Other miscellaneouse 2,0 0,0 (21.3) 0,2 0,2 0,1 0,2 0,3 0,3
The contributions of each food group are expressed in percentage of daily energy and nutrient intakes.a Includes cow’s milk and goat’s milkb Excludes cream cheesec Includes lard/animal fats and regular/low-fat/fat-free versions of cream cheese/sour cream/half-and-halfd includes only eggs reported separately and eggs included in disaggregated food mixturese includes foods or components with negligible contributions to total nutrient intakes that could not be categorized in the above food groups (e.g. herbs andspices/monosodium glutamate/starch/plain gelatin/artificial sweeteners/pectin/cocoa powder/etc.)f These mean food group intakes are only rough estimates calculated from the raw data on which these nutrient contributions are based, without adjustment forwithin person variability. The high number of non-consumers in some of the food groups hindered the adjustment for within-individual variability.
De Keyzer et al. Archives of Public Health 2011, 69:5http://www.archpublichealth.com/content/69/1/5
Page 5 of 11
Table 3 Contribution from all food groups to protein, carbohydrates and water (n = 696)
Nutrients and dietary constituents
Food intakef Protein CH Simp. CH Comp. CH Water
Food Group Mean Median (SD) % order % order % order % order % order
Beverages (incl. juices but no drinks fromrestgroup)
486,2 2,0 8,8 14,8 1,2 36,6
Water 224,2 150,0 (226.4) 0,0 0,0 0,0 0,0 17,7 1
Light beverages 23,1 0,0 (90.1) 0,0 0,1 0,1 0,0 1,8
Tea and coffee without sugar 8,2 0,0 (43.5) 0,0 0,0 0,0 0,0 0,6
Fruit juice 172,8 150,0 (209.3) 1,2 8,1 4 14,4 2 0,0 12,1 4
Vegetable juice 0,2 0,0 (6.0) 0,0 0,0 0,0 0,0 0,0
Soup/bouillon 57,7 0,0 (101.7) 0,7 0,7 0,3 1,2 4,3 7
Bread and cereals 86,7 12,9 23,2 3,7 48,7 2,0
Bread/rolls/crackers/rice cakes 70,3 62,5 (46.8) 10,3 4 17,7 1 1,1 39,3 1 1,8 10
Sugared bread 7,5 0,0 (22.5) 1,4 1,8 0,3 3,8 6 0,2
Breakfast cereals (ready-to-eat/hot) 8,9 0,0 (20.0) 1,1 3,7 9 2,3 5,6 4 0,0
Potatoes and grains 86,7 3,9 8,0 1,0 17,4 5,1
Pasta/noodles 15,4 0,0 (41.0) 0,9 1,6 0,3 3,4 7 0,9
Rice 6,3 0,0 (25.5) 0,4 1,1 0,0 2,5 8 0,3
Potatoes 65,0 50,0 (69.3) 2,6 10 5,4 6 0,7 11,4 3 3,9 8
Vegetables 66,5 2,0 1,4 1,8 0,8 4,8
Cooked vegetables 53,7 40,0 (60.1) 1,8 1,1 1,4 0,8 3,8 9
Raw vegetables 12,8 0,0 (38.3) 0,2 0,2 0,3 0,1 1,0
Fruits (sweetened/unsweetened) 109,9 1,3 7,8 13,2 0,9 7,2
Fresh fruit 94,0 68,8 (102.7) 1,2 6,4 5 10,7 4 10 0,9 6,2 6
Canned fruit 15,4 0,0 (45.4) 0,1 1,3 2,3 0,0 1,0
Dried fruit 0,4 0,0 (3.7) 0,0 0,1 0,3 0,0 0,0
Olives 0,1 0,0 (1.5) 0,0 0,0 0,0 0,0 0,0
Milk, milk products and calcium enriched soymilk
439,9 27,3 20,4 33,7 2,8 29,5
Milka 179,0 125,0 (218.5) 11,3 2 4,3 8 7,6 6 0,0 12,6 2
Flavoured milk drinks (e.g. Fristi, chocolatemilk,...)
188,3 145,0 (226.8) 10,5 3 11,1 3 18,4 1 1,7 9 12,4 3
Yoghurt 4,5 0,0 (25.3) 0,4 0,1 0,3 0,0 0,3
Sugared or aromatised yoghurt 14,2 0,0 (46.9) 1,0 1,1 2,0 0,0 0,9
Soy drinks 15,7 0,0 (82.5) 1,0 0,4 0,5 0,1 1,1
Milk desserts 19,9 0,0 (56.2) 1,4 1,9 2,6 9 0,9 1,1
Desserts on the basis of soy 2,3 0,0 (19.1) 0,1 0,2 0,2 0,1 0,2
Probiotics (e.g. actimel, yakult, ...) 0,7 0,0 (7.4) 0,0 0,1 0,1 0,0 0,0
White (fresh) cheese 15,3 0,0 (43.3) 1,6 1,2 1,9 0,0 0,9
Cheese 14,5 5,9 0,1 0,1 0,0 0,5
Hard cheeseb 11,8 0,0 (22.6) 5,2 7 0,0 0,0 0,0 0,4
Cheese spread 2,7 0,0 (8.8) 0,7 0,0 0,1 0,0 0,1
Fat & oilc 8,6 0,1 0,0 0,0 0,0 0,3
Butter/margarine 8,3 6,0 (9.5) 0,1 0,0 0,0 0,0 0,3
Oil 0,3 0,0 (1.4) 0,0 0,0 0,0 0,0 0,0
Frying oil 0,0 0,0 (0.6) 0,0 0,0 0,0 0,0 0,0
Meat/poultry/fish/egg/meat alternates 90,3 35,1 1,3 0,2 2,7 4,3
Meat, game and meat products 37,2 20,0 (46.1) 15,6 1 0,7 0,0 1,6 10 1,7
Chicken/turkey 15,9 0,0 (34.7) 8,0 5 0,1 0,0 0,1 0,8
Fish/shellfish 8,5 0,0 (28.7) 3,0 9 0,2 0,0 0,4 0,5
Cold cuts (from meat poducts) 20,7 6,8 (30.2) 6,5 6 0,2 0,1 0,3 1,0
Cold cuts (from fish products) 0,9 0,0 (6.8) 0,3 0,0 0,0 0,0 0,0
Eggsd 5,1 0,0 (18.2) 1,3 0,0 0,0 0,0 0,3
De Keyzer et al. Archives of Public Health 2011, 69:5http://www.archpublichealth.com/content/69/1/5
Page 6 of 11
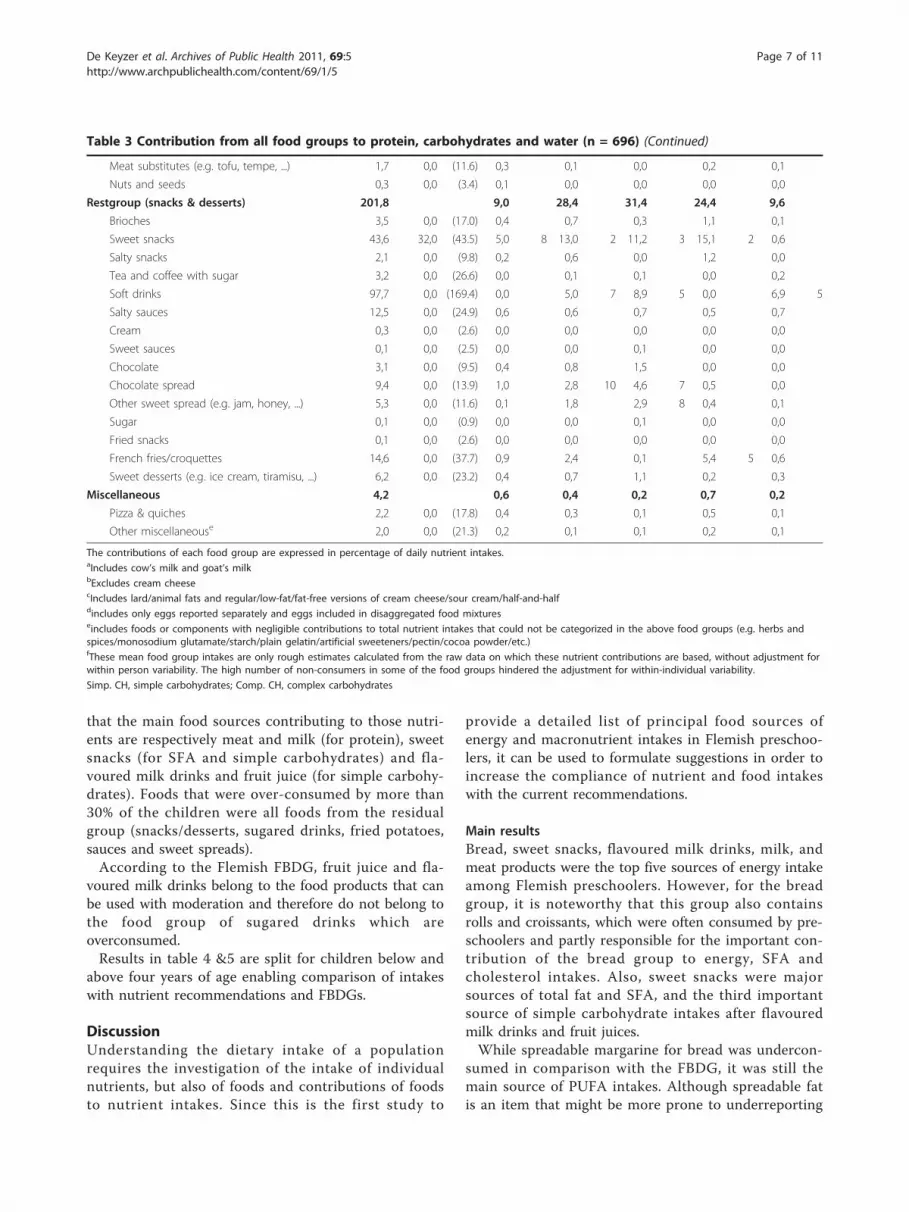
that the main food sources contributing to those nutri-ents are respectively meat and milk (for protein), sweetsnacks (for SFA and simple carbohydrates) and fla-voured milk drinks and fruit juice (for simple carbohy-drates). Foods that were over-consumed by more than30% of the children were all foods from the residualgroup (snacks/desserts, sugared drinks, fried potatoes,sauces and sweet spreads).According to the Flemish FBDG, fruit juice and fla-
voured milk drinks belong to the food products that canbe used with moderation and therefore do not belong tothe food group of sugared drinks which areoverconsumed.Results in table 4 &5 are split for children below and
above four years of age enabling comparison of intakeswith nutrient recommendations and FBDGs.
DiscussionUnderstanding the dietary intake of a populationrequires the investigation of the intake of individualnutrients, but also of foods and contributions of foodsto nutrient intakes. Since this is the first study to
provide a detailed list of principal food sources ofenergy and macronutrient intakes in Flemish preschoo-lers, it can be used to formulate suggestions in order toincrease the compliance of nutrient and food intakeswith the current recommendations.
Main resultsBread, sweet snacks, flavoured milk drinks, milk, andmeat products were the top five sources of energy intakeamong Flemish preschoolers. However, for the breadgroup, it is noteworthy that this group also containsrolls and croissants, which were often consumed by pre-schoolers and partly responsible for the important con-tribution of the bread group to energy, SFA andcholesterol intakes. Also, sweet snacks were majorsources of total fat and SFA, and the third importantsource of simple carbohydrate intakes after flavouredmilk drinks and fruit juices.While spreadable margarine for bread was undercon-
sumed in comparison with the FBDG, it was still themain source of PUFA intakes. Although spreadable fatis an item that might be more prone to underreporting
Table 3 Contribution from all food groups to protein, carbohydrates and water (n = 696) (Continued)
Meat substitutes (e.g. tofu, tempe, ...) 1,7 0,0 (11.6) 0,3 0,1 0,0 0,2 0,1
Nuts and seeds 0,3 0,0 (3.4) 0,1 0,0 0,0 0,0 0,0
Restgroup (snacks & desserts) 201,8 9,0 28,4 31,4 24,4 9,6
Brioches 3,5 0,0 (17.0) 0,4 0,7 0,3 1,1 0,1
Sweet snacks 43,6 32,0 (43.5) 5,0 8 13,0 2 11,2 3 15,1 2 0,6
Salty snacks 2,1 0,0 (9.8) 0,2 0,6 0,0 1,2 0,0
Tea and coffee with sugar 3,2 0,0 (26.6) 0,0 0,1 0,1 0,0 0,2
Soft drinks 97,7 0,0 (169.4) 0,0 5,0 7 8,9 5 0,0 6,9 5
Salty sauces 12,5 0,0 (24.9) 0,6 0,6 0,7 0,5 0,7
Cream 0,3 0,0 (2.6) 0,0 0,0 0,0 0,0 0,0
Sweet sauces 0,1 0,0 (2.5) 0,0 0,0 0,1 0,0 0,0
Chocolate 3,1 0,0 (9.5) 0,4 0,8 1,5 0,0 0,0
Chocolate spread 9,4 0,0 (13.9) 1,0 2,8 10 4,6 7 0,5 0,0
Other sweet spread (e.g. jam, honey, ...) 5,3 0,0 (11.6) 0,1 1,8 2,9 8 0,4 0,1
Sugar 0,1 0,0 (0.9) 0,0 0,0 0,1 0,0 0,0
Fried snacks 0,1 0,0 (2.6) 0,0 0,0 0,0 0,0 0,0
French fries/croquettes 14,6 0,0 (37.7) 0,9 2,4 0,1 5,4 5 0,6
Sweet desserts (e.g. ice cream, tiramisu, ...) 6,2 0,0 (23.2) 0,4 0,7 1,1 0,2 0,3
Miscellaneous 4,2 0,6 0,4 0,2 0,7 0,2
Pizza & quiches 2,2 0,0 (17.8) 0,4 0,3 0,1 0,5 0,1
Other miscellaneouse 2,0 0,0 (21.3) 0,2 0,1 0,1 0,2 0,1
The contributions of each food group are expressed in percentage of daily nutrient intakes.aIncludes cow’s milk and goat’s milkbExcludes cream cheesecIncludes lard/animal fats and regular/low-fat/fat-free versions of cream cheese/sour cream/half-and-halfdincludes only eggs reported separately and eggs included in disaggregated food mixtureseincludes foods or components with negligible contributions to total nutrient intakes that could not be categorized in the above food groups (e.g. herbs andspices/monosodium glutamate/starch/plain gelatin/artificial sweeteners/pectin/cocoa powder/etc.)fThese mean food group intakes are only rough estimates calculated from the raw data on which these nutrient contributions are based, without adjustment forwithin person variability. The high number of non-consumers in some of the food groups hindered the adjustment for within-individual variability.
Simp. CH, simple carbohydrates; Comp. CH, complex carbohydrates
De Keyzer et al. Archives of Public Health 2011, 69:5http://www.archpublichealth.com/content/69/1/5
Page 7 of 11
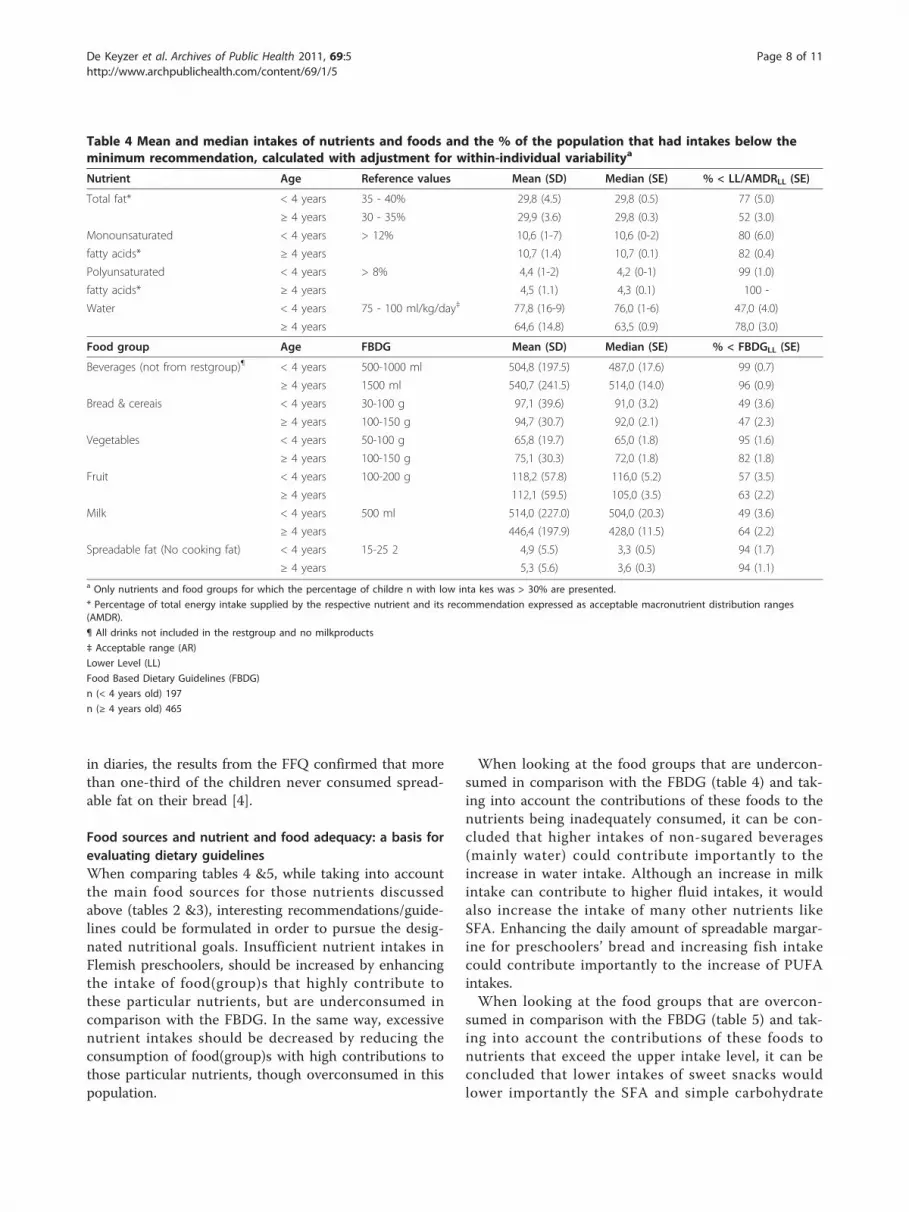
in diaries, the results from the FFQ confirmed that morethan one-third of the children never consumed spread-able fat on their bread [4].
Food sources and nutrient and food adequacy: a basis forevaluating dietary guidelinesWhen comparing tables 4 &5, while taking into accountthe main food sources for those nutrients discussedabove (tables 2 &3), interesting recommendations/guide-lines could be formulated in order to pursue the desig-nated nutritional goals. Insufficient nutrient intakes inFlemish preschoolers, should be increased by enhancingthe intake of food(group)s that highly contribute tothese particular nutrients, but are underconsumed incomparison with the FBDG. In the same way, excessivenutrient intakes should be decreased by reducing theconsumption of food(group)s with high contributions tothose particular nutrients, though overconsumed in thispopulation.
When looking at the food groups that are undercon-sumed in comparison with the FBDG (table 4) and tak-ing into account the contributions of these foods to thenutrients being inadequately consumed, it can be con-cluded that higher intakes of non-sugared beverages(mainly water) could contribute importantly to theincrease in water intake. Although an increase in milkintake can contribute to higher fluid intakes, it wouldalso increase the intake of many other nutrients likeSFA. Enhancing the daily amount of spreadable margar-ine for preschoolers’ bread and increasing fish intakecould contribute importantly to the increase of PUFAintakes.When looking at the food groups that are overcon-
sumed in comparison with the FBDG (table 5) and tak-ing into account the contributions of these foods tonutrients that exceed the upper intake level, it can beconcluded that lower intakes of sweet snacks wouldlower importantly the SFA and simple carbohydrate
Table 4 Mean and median intakes of nutrients and foods and the % of the population that had intakes below theminimum recommendation, calculated with adjustment for within-individual variabilitya
Nutrient Age Reference values Mean (SD) Median (SE) % < LL/AMDRLL (SE)
Total fat* < 4 years 35 - 40% 29,8 (4.5) 29,8 (0.5) 77 (5.0)
≥ 4 years 30 - 35% 29,9 (3.6) 29,8 (0.3) 52 (3.0)
Monounsaturated < 4 years > 12% 10,6 (1-7) 10,6 (0-2) 80 (6.0)
fatty acids* ≥ 4 years 10,7 (1.4) 10,7 (0.1) 82 (0.4)
Polyunsaturated < 4 years > 8% 4,4 (1-2) 4,2 (0-1) 99 (1.0)
fatty acids* ≥ 4 years 4,5 (1.1) 4,3 (0.1) 100 -
Water < 4 years 75 - 100 ml/kg/day‡ 77,8 (16-9) 76,0 (1-6) 47,0 (4.0)
≥ 4 years 64,6 (14.8) 63,5 (0.9) 78,0 (3.0)
Food group Age FBDG Mean (SD) Median (SE) % < FBDGLL (SE)
Beverages (not from restgroup)¶ < 4 years 500-1000 ml 504,8 (197.5) 487,0 (17.6) 99 (0.7)
≥ 4 years 1500 ml 540,7 (241.5) 514,0 (14.0) 96 (0.9)
Bread & cereais < 4 years 30-100 g 97,1 (39.6) 91,0 (3.2) 49 (3.6)
≥ 4 years 100-150 g 94,7 (30.7) 92,0 (2.1) 47 (2.3)
Vegetables < 4 years 50-100 g 65,8 (19.7) 65,0 (1.8) 95 (1.6)
≥ 4 years 100-150 g 75,1 (30.3) 72,0 (1.8) 82 (1.8)
Fruit < 4 years 100-200 g 118,2 (57.8) 116,0 (5.2) 57 (3.5)
≥ 4 years 112,1 (59.5) 105,0 (3.5) 63 (2.2)
Milk < 4 years 500 ml 514,0 (227.0) 504,0 (20.3) 49 (3.6)
≥ 4 years 446,4 (197.9) 428,0 (11.5) 64 (2.2)
Spreadable fat (No cooking fat) < 4 years 15-25 2 4,9 (5.5) 3,3 (0.5) 94 (1.7)
≥ 4 years 5,3 (5.6) 3,6 (0.3) 94 (1.1)a Only nutrients and food groups for which the percentage of childre n with low inta kes was > 30% are presented.
* Percentage of total energy intake supplied by the respective nutrient and its recommendation expressed as acceptable macronutrient distribution ranges(AMDR).
¶ All drinks not included in the restgroup and no milkproducts
‡ Acceptable range (AR)
Lower Level (LL)
Food Based Dietary Guidelines (FBDG)
n (< 4 years old) 197
n (≥ 4 years old) 465
De Keyzer et al. Archives of Public Health 2011, 69:5http://www.archpublichealth.com/content/69/1/5
Page 8 of 11
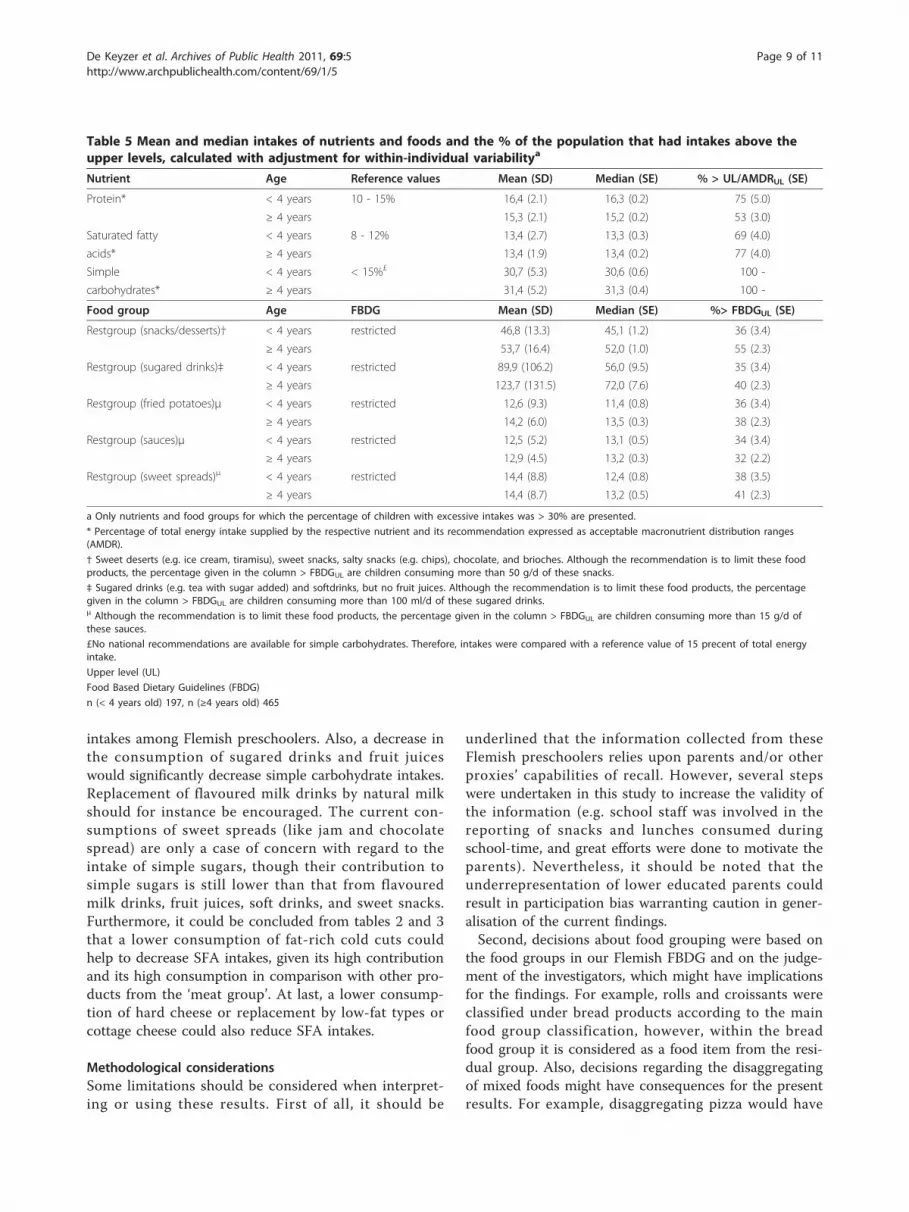
intakes among Flemish preschoolers. Also, a decrease inthe consumption of sugared drinks and fruit juiceswould significantly decrease simple carbohydrate intakes.Replacement of flavoured milk drinks by natural milkshould for instance be encouraged. The current con-sumptions of sweet spreads (like jam and chocolatespread) are only a case of concern with regard to theintake of simple sugars, though their contribution tosimple sugars is still lower than that from flavouredmilk drinks, fruit juices, soft drinks, and sweet snacks.Furthermore, it could be concluded from tables 2 and 3that a lower consumption of fat-rich cold cuts couldhelp to decrease SFA intakes, given its high contributionand its high consumption in comparison with other pro-ducts from the ‘meat group’. At last, a lower consump-tion of hard cheese or replacement by low-fat types orcottage cheese could also reduce SFA intakes.
Methodological considerationsSome limitations should be considered when interpret-ing or using these results. First of all, it should be
underlined that the information collected from theseFlemish preschoolers relies upon parents and/or otherproxies’ capabilities of recall. However, several stepswere undertaken in this study to increase the validity ofthe information (e.g. school staff was involved in thereporting of snacks and lunches consumed duringschool-time, and great efforts were done to motivate theparents). Nevertheless, it should be noted that theunderrepresentation of lower educated parents couldresult in participation bias warranting caution in gener-alisation of the current findings.Second, decisions about food grouping were based on
the food groups in our Flemish FBDG and on the judge-ment of the investigators, which might have implicationsfor the findings. For example, rolls and croissants wereclassified under bread products according to the mainfood group classification, however, within the breadfood group it is considered as a food item from the resi-dual group. Also, decisions regarding the disaggregatingof mixed foods might have consequences for the presentresults. For example, disaggregating pizza would have
Table 5 Mean and median intakes of nutrients and foods and the % of the population that had intakes above theupper levels, calculated with adjustment for within-individual variabilitya
Nutrient Age Reference values Mean (SD) Median (SE) % > UL/AMDRUL (SE)
Protein* < 4 years 10 - 15% 16,4 (2.1) 16,3 (0.2) 75 (5.0)
≥ 4 years 15,3 (2.1) 15,2 (0.2) 53 (3.0)
Saturated fatty < 4 years 8 - 12% 13,4 (2.7) 13,3 (0.3) 69 (4.0)
acids* ≥ 4 years 13,4 (1.9) 13,4 (0.2) 77 (4.0)
Simple < 4 years < 15%£ 30,7 (5.3) 30,6 (0.6) 100 -
carbohydrates* ≥ 4 years 31,4 (5.2) 31,3 (0.4) 100 -
Food group Age FBDG Mean (SD) Median (SE) %> FBDGUL (SE)
Restgroup (snacks/desserts)† < 4 years restricted 46,8 (13.3) 45,1 (1.2) 36 (3.4)
≥ 4 years 53,7 (16.4) 52,0 (1.0) 55 (2.3)
Restgroup (sugared drinks)‡ < 4 years restricted 89,9 (106.2) 56,0 (9.5) 35 (3.4)
≥ 4 years 123,7 (131.5) 72,0 (7.6) 40 (2.3)
Restgroup (fried potatoes)μ < 4 years restricted 12,6 (9.3) 11,4 (0.8) 36 (3.4)
≥ 4 years 14,2 (6.0) 13,5 (0.3) 38 (2.3)
Restgroup (sauces)μ < 4 years restricted 12,5 (5.2) 13,1 (0.5) 34 (3.4)
≥ 4 years 12,9 (4.5) 13,2 (0.3) 32 (2.2)
Restgroup (sweet spreads)μ < 4 years restricted 14,4 (8.8) 12,4 (0.8) 38 (3.5)
≥ 4 years 14,4 (8.7) 13,2 (0.5) 41 (2.3)
a Only nutrients and food groups for which the percentage of children with excessive intakes was > 30% are presented.
* Percentage of total energy intake supplied by the respective nutrient and its recommendation expressed as acceptable macronutrient distribution ranges(AMDR).
† Sweet deserts (e.g. ice cream, tiramisu), sweet snacks, salty snacks (e.g. chips), chocolate, and brioches. Although the recommendation is to limit these foodproducts, the percentage given in the column > FBDGUL are children consuming more than 50 g/d of these snacks.
‡ Sugared drinks (e.g. tea with sugar added) and softdrinks, but no fruit juices. Although the recommendation is to limit these food products, the percentagegiven in the column > FBDGUL are children consuming more than 100 ml/d of these sugared drinks.μ Although the recommendation is to limit these food products, the percentage given in the column > FBDGUL are children consuming more than 15 g/d ofthese sauces.
£No national recommendations are available for simple carbohydrates. Therefore, intakes were compared with a reference value of 15 precent of total energyintake.
Upper level (UL)
Food Based Dietary Guidelines (FBDG)
n (< 4 years old) 197, n (≥4 years old) 465
De Keyzer et al. Archives of Public Health 2011, 69:5http://www.archpublichealth.com/content/69/1/5
Page 9 of 11
given a more realistic estimate of how cheese contri-butes to nutrient intakes but does not allow for knowinghow pizza itself contributes.Since all days of the week were included in the study,
the effect of day of the week could be removed. Unfor-tunately, it was impossible to correct for seasonal varia-tions, because data was collected during autumn andwintertime. However, in the Belgian National Food Con-sumption Survey performed in 2004, it was concludedthat seasonal variation was limited for nutrient intakes[15]. A possible explanation might be the widespreadavailability of most foods all year round.Differences in methodology and ways of grouping
foods hamper comparisons with other studies. However,an essential finding that was comparable with other stu-dies investigating the major sources of energy and nutri-ent intakes among children was the importantcontribution of fortified foods to children’s diets [7,24].Finally, caution is necessary when interpreting these
results since food composition data do not consider bio-availability of nutrient sources.
Suggestions for future dietary guidelines and policiesFrom previous studies investigating nutrient and foodgroup adequacies in Flemish preschoolers [3,4], it couldbe concluded that preschoolers in Flanders should berecommended a different dietary pattern in order topursue the designated nutritional goals. More specifi-cally, fibre, iron and vitamin D intakes were well belowrecommendations, while sodium and saturated fatty acidintakes exceeded tolerable upper intake levels [3].Furthermore, the percentage of children complying withFBDGs was for most food groups extremely low (ran-ging from 4% for fluids and vegetables up to 99% forpotato intakes) [4]. The current study investigatingnutrient sources, additionally revealed some importantrecommendations in order to increase nutrient and foodintake compliances with the current recommendations.However, this study also raised concern about some ofthe current dietary guidelines, which are discussedbelow.Given the fact that whole fat milk is still recom-
mended for children younger than four years old andconsidering the high SFA contributions of milk pro-ducts, it could be suggested to replace whole fat milk byhalf-fat varieties in FBDG for preschoolers. Supply offat-soluble vitamins could then be compensated by useof margarine on children’s bread, which is currentlybeing underconsumed in comparison with the recom-mendations and which, at the same time, would contri-bute to higher PUFA intakes. Accordingly, nutritionalpolicies targeted at replacing whole fat milk withanother low-fat (e.g. semi-skimmed) variety, should be
implemented as key strategy for achieving recommendedSFA intake levels in this age group [25,26].Furthermore, it should be noted that excessive con-
sumption of fruit juice in infants and children has typi-cally been related to carbohydrate malabsorption [27],dental caries, and gastrointestinal symptoms such asbloating, diarrhoea, and cramping [28]. More recently,fruit juices have also been blamed as possible contribu-tors to the current childhood obesity epidemic in theUS where fruit juices were seen as healthy and conveni-ent replacements of fresh fruits [29]. Therefore, itshould be stressed to parents and caregivers that fruitjuices should not be used as a replacement for freshfruits. More importantly, FBDG compilers should re-evaluate fruit juice’s grouping as a food that can be con-sumed with moderation. In the present study, fruit juiceconsumption is the second highest contributor of simplecarbohydrate intakes in preschoolers, therefore, fruitjuice should be categorised as a food item from the resi-dual group.The high intake of fortified biscuits seen in Flemish
preschoolers results in an increase of energy, SFA, andsimple carbohydrates, all counteradvised in the preven-tion of certain chronic diseases. Furthermore, a ‘habit’ ofeating biscuits/cakes that is formed during childhood islikely to continue into adulthood [30,31]. Therefore,children should be recommended to replace sweetsnacks by more healthy foods like bread with margarine(combined with low-fat cold cuts or cottage cheese),fruits or certain vegetables (e.g. baby carrots) in order todecrease SFA and simple carbohydrate intakes.Since this study includes the first comprehensive
examination of food sources of nutrients in Flemish pre-schoolers, it can be used for establishing/revising guide-lines for Flemish preschoolers. Though, as the foodsupply changes, these data will need to be continuallyupdated.
ConclusionSome guidelines to improve Flemish preschoolers’ diet-ary habits could be derived from this study. The intakeof sweet snacks and sugar rich drinks (like soft drinksor fruit juices) should be discouraged, while the con-sumption of fruits, vegetables, water, bread, and margar-ine on bread should be encouraged. Replacement of fat-rich foods from the SFA-rich food groups ‘meat pro-ducts’ and ‘dairy’ by lean or low-fat alternatives shouldbe recommended. Furthermore it should be emphasisedthat selection of a variety of foods is the best way toprovide a desirable balance, without excessive intakes ofmacronutrients, micronutrients, and other componentsof foods, and should be recommended above the con-sumption of fortified foods.
De Keyzer et al. Archives of Public Health 2011, 69:5http://www.archpublichealth.com/content/69/1/5
Page 10 of 11
AcknowledgementsWe thank Mia Bellemans and Mieke De Maeyer, the dietitians of our team,for the data input and for performing the exclusion procedure of the EDRs.We are also extremely grateful to all the parents and teachers whoparticipated in this project and generously volunteered their time andknowledge.
Author details1Department of Nutrition and dietetics, University College Ghent, Gent,Belgium. 2Department of Public Health, Ghent University, Ghent, Belgium.3Unit of Epidemiology, Scientific Institute of Public Health, Brussels, Belgium.4Flemish Institute for Health Promotion and disease prevention, Brussels,Belgium.
Authors’ contributionsIH, YL and WDK were responsible for the analyses. WDK and IH drafted themanuscript. All other authors helped in the evaluation of the results andcommented on the manuscript. Moreover, IH and SDH were reponsible forthe study protocol and the fieldwork. All authors have read and approvedthe manuscript as submitted.
Competing interestsThe authors declare that there are no competing interests. Carine Vereeckenis postdoctoral researcher funded by the FWO-Flanders.
Received: 25 April 2011 Accepted: 1 November 2011Published: 1 November 2011
References1. Birch LL: Development of food acceptance patterns in the first years of
life. Proc Nutr Soc 1998, 57(4):617-24.2. Berenson GS, Srinivasan SR, Nicklas TA: Atherosclerosis: a nutritional
disease of childhood. Am J Cardiol 1998, 82(10B):22T-9T.3. Huybrechts I, De Henauw S: Energy and nutrient intakes by pre-school
children in Flanders-Belgium. British Journal of Nutrition 2007, 98(3):600-10.4. Huybrechts I, Matthys C, Vereecken C, Maes L, Temme EH, Van Oyen H,
et al: Food intakes by preschool children in Flanders compared withdietary guidelines. Int J Environ Res Public Health 2008, 5(4):243-57.
5. Batcher O, Nichols J: Identifying Important Food Sources of Nutrients.Journal of Nutrition Education 1984, 16:177-81.
6. Thompson FE, Sowers MF, Frongillo EA Jr, Parpia BJ: Sources of fiber andfat in diets of US women aged 19 to 50: implications for nutritioneducation and policy. Am J Public Health 1992, 82(5):695-702.
7. Royo-Bordonada MA, Gorgojo L, de Oya M, Garces C, Rodriguez-Artalejo F,Rubio R, et al: Food sources of nutrients in the diet of Spanish children:the Four Provinces Study. Br J Nutr 2003, 89(1):105-14.
8. Block G, Dresser CM, Hartman AM, Carroll MD: Nutrient sources in theAmerican diet: quantitative data from the NHANES II survey. I. Vitaminsand minerals. Am J Epidemiol 1985, 122(1):13-26.
9. Block G, Dresser CM, Hartman AM, Carroll MD: Nutrient sources in theAmerican diet: quantitative data from the NHANES II survey. II.Macronutrients and fats. Am J Epidemiol 1985, 122(1):27-40.
10. Huybrechts I, Matthys C, Pynaert I, De Maeyer M, Bellemans M, DeGeeter H, et al: Flanders preschool dietary survey: rationale, aims, design,methodology and population characteristics. The Archives of Public Health2008, 66:5-25.
11. NUBEL: Belgian Food Composition Table. Brussels: Ministry of PublicHealth (in Dutch);, 4 2004.
12. NEVO: NEVO-Table, Dutch Food Composition Table 2001. Zeist: NEVOfoundation (in Dutch); 2001.
13. Intstitut Paul Lambin (IPL): Table de Composition des Aliments 2004.Bruxelles: Institut Paul Lambin; 2004.
14. Food Standards Agency (FSA): McCance and Widdowson’s TheCompostition of Foods. Cambridge: Royal Society of Chemistry;, 6 2002.
15. De Vriese S, Huybrechts I, Moreau M, Van Oyen H: The Belgian FoodConsumption Survey 1 - 2004: Report (Enquête de consommationalimentaire Belge 1 - 2004: Rapport). 2006, Contract No.: Report No.: D/2006/2505/16.
16. Fox MK, Reidy K, Novak T, Ziegler P: Sources of energy and nutrients inthe diets of infants and toddlers. Journal of the American DieteticAssociation 2006, 106(1 Suppl 1):S28-42.
17. Krebs-Smith SM, Kott PS, Guenther PM: Mean proportion and populationproportion: two answers to the same question? J Am Diet Assoc 1989,89(5):671-6.
18. Dodd KW, Guenther PM, Freedman LS, Subar AF, Kipnis V, Midthune D,et al: Statistical methods for estimating usual intake of nutrients andfoods: a review of the theory. J Am Diet Assoc 2006, 106(10):1640-50.
19. Guenther PM, Kott PS, Carriquiry AL: Development of an approach forestimating usual nutrient intake distributions at the population level. JNutr 1997, 127(6):1106-12.
20. Nusser SM, Carriquiry AL, Dodd KW, Fuller WA: A semiparametrictransformation approach to estimating usual daily intake distributions. JAm Stat Assoc 1996, 91:1440-9.
21. Iowa State University: 1997, C-side. Software for Intake DistributionEstimation. 1.02 ed .
22. Brussel: Hoge Gezondheidsraad; 2009, Hoge Gezondheidsraad. Dietaryrecommendations for Belgium (Voedingsaanbevelingen voor België).Revised version 2009 .
23. Brussels: Kind & Gezin; 2011, Kind & Gezin. Aan tafel! Alles over eten enleren eten. 2011 ed. .
24. Subar AF, Krebs-Smith SM, Cook A, Kahle LL: Dietary sources of nutrientsamong US children, 1989-1991. Pediatrics 1998, 102(4 Pt 1):913-23.
25. Gibbons KL: The role of fats in the lifecycle stages: the primary schoolyears. Med J Aust 2002, 176(Suppl):S115-6.
26. Basch CE, Shea S, Zybert P: Food sources, dietary behavior, and thesaturated fat intake of Latino children. Am J Public Health 1992,82(6):810-5.
27. Smith MM, Davis M, Chasalow FI, Lifshitz F: Carbohydrate absorption fromfruit juice in young children. Pediatrics 1995, 95(3):340-4.
28. Newby PK: Introduction: moving forward the discussion on childhoodobesity. J Law Med Ethics 2007, 35(1):7-9.
29. Lustig RH: The ‘skinny’ on childhood obesity: how our westernenvironment starves kids’ brains. Pediatr Ann 2006, 35(12):898-902, 5-7.
30. BMA. Preventing childhood obesity: London: BMA publications unit; 2005.31. Boulton TJ, Magarey AM, Cockington RA: Tracking of serum lipids and
dietary energy, fat and calcium intake from 1 to 15 years. Acta Paediatr1995, 84(9):1050-5.
doi:10.1186/0778-7367-69-5Cite this article as: De Keyzer et al.: Dietary sources of energy andmacronutrient intakes among Flemish preschoolers. Archives of PublicHealth 2011 69:5.
Submit your next manuscript to BioMed Centraland take full advantage of:
• Convenient online submission
• Thorough peer review
• No space constraints or color figure charges
• Immediate publication on acceptance
• Inclusion in PubMed, CAS, Scopus and Google Scholar
• Research which is freely available for redistribution
Submit your manuscript at www.biomedcentral.com/submit
De Keyzer et al. Archives of Public Health 2011, 69:5http://www.archpublichealth.com/content/69/1/5
Page 11 of 11