dietary quality and encephalization in platyrrhine primates
TRANSCRIPT
Proc. R. Soc. B (2012) 279, 715–721
* Autho
Electron10.1098
doi:10.1098/rspb.2011.1311
Published online 10 August 2011
ReceivedAccepted
Dietary quality and encephalizationin platyrrhine primatesKari L. Allen* and Richard F. Kay
Department of Evolutionary Anthropology, Duke University, Durham, NC 27708, USA
The high energetic costs of building and maintaining large brains are thought to constrain encephaliza-
tion. The ‘expensive-tissue hypothesis’ (ETH) proposes that primates (especially humans) overcame
this constraint through reduction of another metabolically expensive tissue, the gastrointestinal tract.
Small guts characterize animals specializing on easily digestible diets. Thus, the hypothesis may be
tested via the relationship between brain size and diet quality. Platyrrhine primates present an interesting
test case, as they are more variably encephalized than other extant primate clades (excluding Hominoidea).
We find a high degree of phylogenetic signal in the data for diet quality, endocranial volume and body size.
Controlling for phylogenetic effects, we find no significant correlation between relative diet quality and
relative endocranial volume. Thus, diet quality fails to account for differences in platyrrhine encephaliza-
tion. One taxon, in particular, Brachyteles, violates predictions made by ETH in having a large brain and
low-quality diet. Dietary reconstructions of stem platyrrhines further indicate that a relatively high-quality
diet was probably in place prior to increases in encephalization. Therefore, it is unlikely that a shift in diet
quality was a primary constraint release for encephalization in platyrrhines and, by extrapolation, humans.
Keywords: expensive tissue; New World monkeys; human brain size evolution; phylogenetic
comparative methods
1. INTRODUCTIONPrimates are notable among mammals for having rela-
tively large brains. A number of selective mechanisms
have been proposed to explain primate encephalization
and to account for variation in encephalization within
the order. These hypotheses centre upon benefits for cog-
nitive and social strategies [1–7], or on the demands of
obtaining various dietary components [8–14]. More
proximate adaptive scenarios involve diurnal living [3]
and accompanying changes in visual acuity [15,16].
Diet quality has long been suspected to play a role in
brain size evolution, as species consuming higher levels
of fruit or animal matter often have larger brains than
those whose diets require more digestive processing (e.g.
diets high in structural carbohydrates) [9,17,18]. While
many researchers have focused on the challenges of locat-
ing, choosing and extracting food as driving selective
mechanisms for encephalization [8,19], others have
focused on mechanisms that have ameliorated metabolic
constraints on brain size [20–26]. Aiello & Wheeler’s
‘expensive-tissue hypothesis’ (ETH) proposes that ence-
phalization was enabled via the release of energetic
constraints on brain tissue growth [20–22].
Large brains are metabolically expensive, and primates
expend a larger percentage of their energy budget in
growing and maintaining brain function than do most
other mammals [13,22,27,28]. Paradoxically, this incre-
mental metabolic cost has not resulted in a markedly
higher resting metabolic rate (BMR) [13]. ETH was pro-
posed to explain the marked encephalization of humans
r for correspondence ([email protected]).
ic supplementary material is available at http://dx.doi.org//rspb.2011.1311 or via http://rspb.royalsocietypublishing.org.
22 June 201121 July 2011 715
in the absence of elevated BMRs. Aiello & Wheeler [22]
propose that an increase in brain tissue is compensated
for by the reduction of another metabolically expensive
tissue, the digestive tract [20–22]. It has recently been
emphasized that tissue reduction is just one possible
energy trade-off mechanism for encephalization. The
broader ‘expensive brain hypothesis’ emphasizes that the
energetic costs of encephalization may be offset by
energy allocation to ‘maintenance’ (expensive tissues
including the gut but also of musculature) or ‘production’
(growth and reproduction) [23–25].
Gut size reduction appears to have been a plausible
constraint release in human encephalization, especially
when coupled with the use of cooking to enhance digesti-
bility [20–22,29], however, the extent to which it explains
interspecific variation in primate brain size has not been
widely explored. Direct testing of the hypothesis in non-
human primates has been hampered by a paucity of
high-quality data on gut mass. The predictions of ETH
may be tested in another way by analysing the relationship
between diet quality and brain size [18]. The hypothesis
posits that a small gastrointestinal tract is a proxy for
a relatively high diet quality ([22], p. 207). Small guts
are characteristic of animals with a high-energy diet,
one low in structural carbohydrates and high in fat,
protein, and simple carbohydrates [30–32]. ETH
predicts that a high-quality diet releases metabolic con-
straints on brain size, when encephalization is selected
by other factors. The predictions of ETH across primates
would be supported if the following criteria are met:
(i) relatively large-brained species should exhibit corre-
spondingly high-quality diets and (ii) species with
low-quality diets should be energetically constrained from
marked encephalization. Notably, however, a species with
a high-quality diet need not necessarily be encephalized,
This journal is q 2011 The Royal Society
716 K. L. Allen & R. F. Kay Diet quality in platyrrhines
because ETH is formulated as a releasing mechanism, not
a driving factor in encephalization.
Sailer et al. [33] devised a method for quantification of
dietary quality (DQ) by weighting percentages of dietary
composition by their relative volume, nutrient density and
digestibility. Conversion of categorical percentages (per
cent of consumed leaves, fruit and animal matter) from
the comparative literature of primate ecology into a
measure of energy input allows broad comparisons of
diet quality with body size and brain size. Fish & Lock-
wood [18] report a significant positive correlation
between relative brain size and DQ in a broad sample of
primates after controlling for allometric and phylogenetic
effects. Their results broadly support ETH, but their
dataset crosses several clades of differing overall encepha-
lization. It remains to be seen whether the correlation is
significant within a densely sampled taxon—a limitation
we address here with a more phylogenetically constrained
and extensively documented clade, the New World
monkeys (Platyrrhini).
Extant platyrrhines are an ideal focus group for such a
study. Platyrrhini is a diverse group of 16 genera and more
than 100 species. The phylogeny is tightly constrained by
molecular data at the genus and in most cases, species
level. Moreover, the range of relative endocranial
volume (ECV) exceeds that of any other clade of extant
primates, excluding Hominoidea [34]. Finally, platyr-
rhine diets are extensively documented from long-term
field studies in a variety of habitats and seasons.
2. MATERIAL AND METHODS(a) Variables
Species mean brain size is taken from published ECVs from Isler
et al. [34]. The Isler et al. dataset include associated body masses
(BM1) for many of the measured crania. For those species that
did not have associated body weights, published mass estimates
were supplemented from other sources [35–37]. A second
independent source for platyrrhine body masses (BM2) was
taken from Smith & Jungers [38]. Species body mass estimates
were calculated as the average between the reported male and
female weights (data in the electronic supplementary material).
The raw data for DQ calculations were gathered from diet com-
position, reported in the literature. DQ was calculated following
the equation proposed by Sailer et al. [33]:
DQ ¼ sþ 2r þ 3:5a;
where s is the percentage of structural plant parts (leaves and
stems), r is the percentage of reproductive plant parts (fruits,
seeds, flowers, nectar and gums) and a is the percentage of
animal matter in the diet, and s þ r þ a¼ 100%. The constants
2 and 3.5 reflect the assumed relative energetic values per unit
mass of these three dietary categories. Measured in this way,
DQ scores range from 100 to 350. Higher DQ values represent
a higher ‘quality’ (e.g. more energetically rich and more easily
digestible) diet. DQ was calculated for 16 genera and 37 species
of platyrrhines, from 67 published sources (see electronic sup-
plementary material). The mean DQ for each species was
calculated as the average of reported scores from all sites
recorded in the literature.
(b) Analysis
All raw variables were log transformed (base 10) prior to analy-
sis. Previous studies suggest that DQ is correlated to body size,
Proc. R. Soc. B (2012)
such that larger bodied primates tend to be folivorous (low-
quality diet), while small-bodied primates gain their protein
from insectivory (higher diet quality) [18,33,39]. ECV is
known to scale with negative allometry [34,40–43]. Both
ECV and DQ were size-adjusted through the use of residuals.
Statistics computed on biological data run the risk of non-
independence of data points, owing to the similarity in species
characteristics as a result of common ancestry [44,45]. The
parameter l is a measure of phylogenetic signal in the data,
where l ranges from 0 to 1, with 1 indicating a strong phylo-
genetic signal [46]. A phylogenetic generalized least-squares
(PGLS) analysis where l ¼ 0 is analogous to a non-phyloge-
netic least-squares regression. Raw variables used in this
analysis (logECV, logBM1, logBM2 and logDQ) produce l
values that do not differ significantly from 1, indicating a
strong underlying phylogenetic signal in the data. Thus, to
control for the effects of phylogenetic signal in the data,
residual ECV and residual DQ are calculated from PGLS
regressions of each variable on BM1 or BM2, in the ‘caper’
package of the software program ‘R’ [47,48]. Residuals them-
selves also contain phylogenetic signal, and as such the
relationship between residual ECV and residual DQ was sub-
sequently examined using PGLS. For comparison of our
results, we also present non-phylogenetic least-squares
regression analyses in the electronic supplementary material.
When performing a correlation analysis of two residuals, the
use of the same control variable in the calculation of both
residuals may lead to an increase in type I error rates
[49,50]. One way to account for this problem is to use inde-
pendent sources for the control variable, in this case body
mass [51]. For this analysis, we used species average body
mass estimates from the Isler et al. [34] database (BM1) to cal-
culate ECV residuals, and mean body masses from the Smith
& Jungers [38] (BM2) database to calculate the DQ residuals.
Independent estimates of body mass were not available for two
species (Cacajao calvus and Brachyteles arachnoides). The Smith
& Jungers [38] estimate was used in both residuals for these
species. We also calculated ECV residuals using the Smith &
Jungers dataset, and compared the results with those obtained
from the independent body mass estimates.
Published molecular phylogenies of platyrrhines are in
general agreement. They differ, however, in the phylogenetic
placement of Pitheciidae (sister to all other platyrrhines
versus sister to Atelidae) and the genus Aotus (sister to
Cebus/Saimiri versus sister to Callitrichinae) [52–56]. To
test the effects of these phylogenetic uncertainties on the
results of the PGLS analysis, all analyses were run on three
separate trees, reflecting variation in opinions about pitheciid
and Aotus affinities (electronic supplementary material,
figure 1). Trees 1 and 2 use genus-level divergence dates
from Opazo et al.’s [53] maximum-parsimony tree and
maximum-likelihood tree, respectively. Resolution of the
tree at the species level was achieved from a consensus view
of evidence from morphological intrageneric studies
[54,57–61]. Tree 3 is taken directly from Perelman et al.
[54], which is resolved to the species level with associated
branch lengths. The availability of diet composition data
has resulted in over-representation of some genera (in
terms of number of species) and under-representation of
others. As such, data were analysed at both the species and
genus levels. Maximum-likelihood-based ancestral character
states were reconstructed for non-phylogenetically derived
relative ECV and raw DQ values, using the ‘APE’ package
in ‘R’ [62].
–0.2 –0.1 0 0.1
resi
dual
EC
V
residual DQ –0.2 –0.1 0 0.1
–0.2
–0.1
0
0.1
0.2(a) (b)
residual DQ
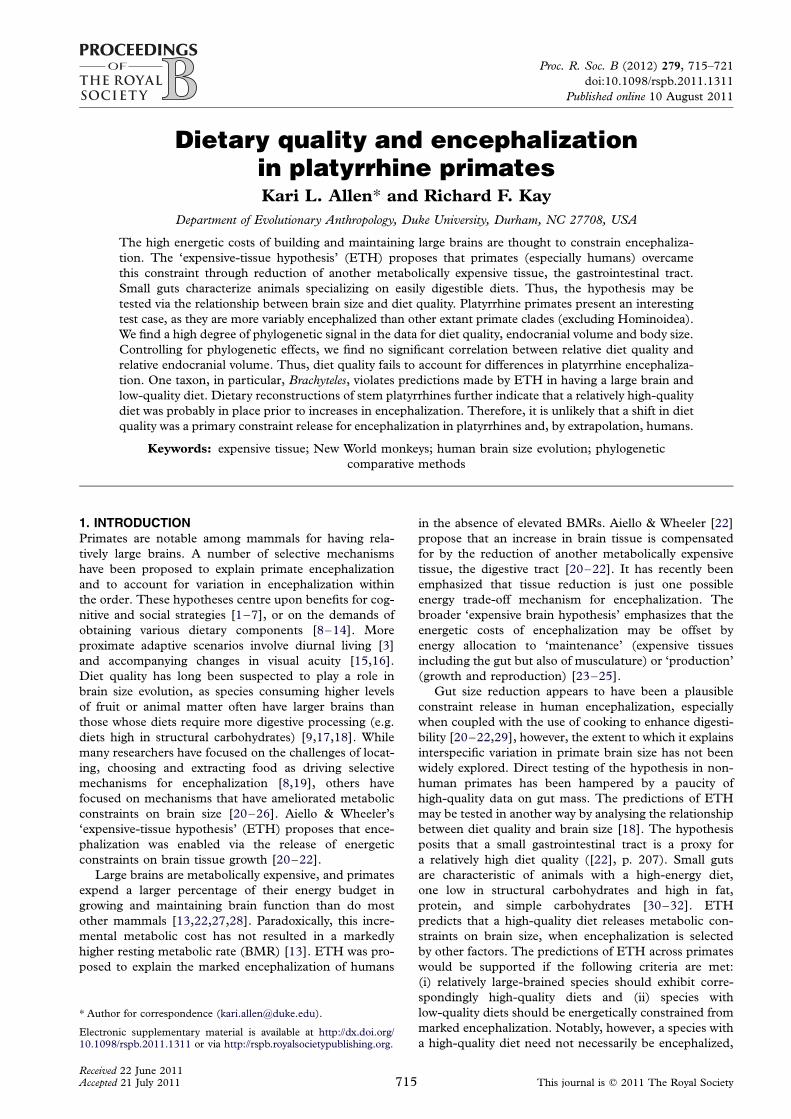
Figure 1. Phylogenetic generalized least-squares (PGLS) regression of residual endocranial volume (ECV) versus residual dietquality (DQ) at the (a) species and (b) genus level.
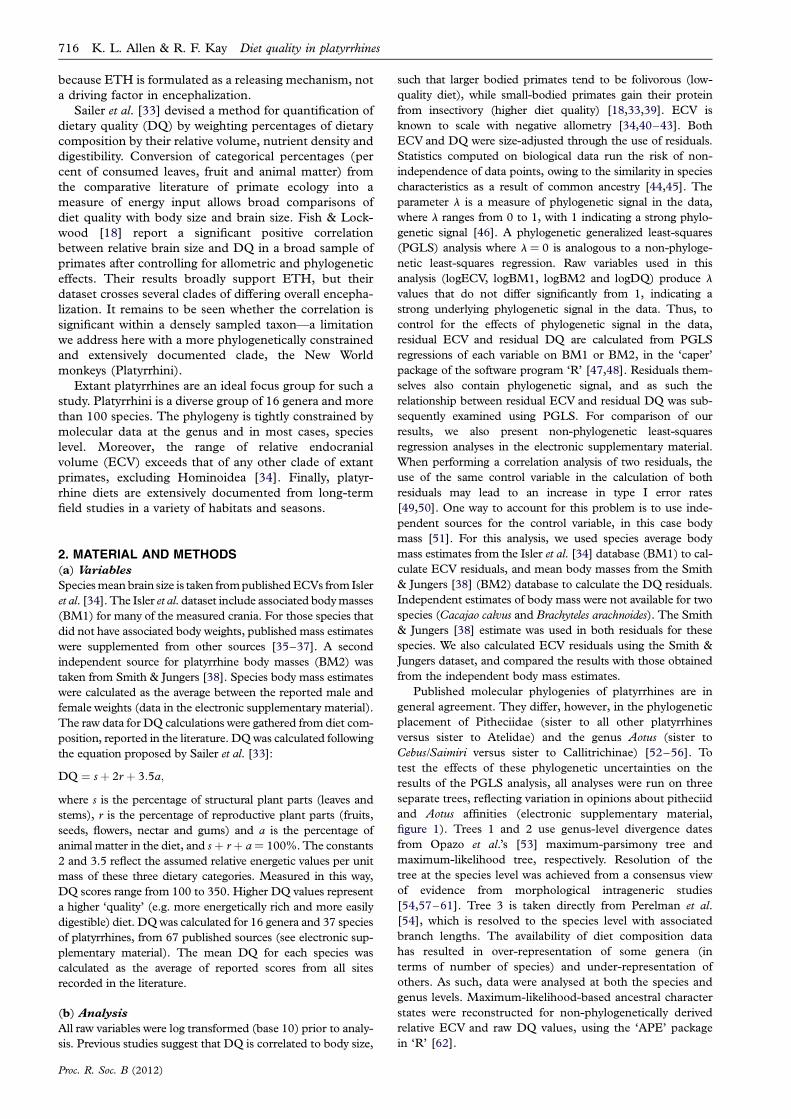
Table 1. Results for phylogenetic generalized least-squares (PGLS) regressions of brain size, body size and diet quality.
level of analysis slope intercept r2 p-value
logECV versus logBM1 species (n ¼ 37) 0.66 20.65 0.74 ,0.01genus (n ¼ 16) 0.75 20.91 0.94 ,0.01
logDQ versus logBM2 species (n ¼ 37) 20.06 2.47 0.05 0.19genus (n ¼ 16) 20.10 2.62 0.44 ,0.01
residual ECV versus residual DQ species (n ¼ 37) 0.29 0 0.03 0.26genus (n ¼ 16) 0.73 0 0.02 0.08
Diet quality in platyrrhines K. L. Allen & R. F. Kay 717
3. RESULTSResults for the PGLS analyses are the same irrespective of
which among the three platyrrhine phylogenies is used.
Therefore, we present the results from tree 1 only,
which places pitheciids as sister to other platyrrhine
families and Aotus as sister to Cebus/Saimiri. Preference
is given to this phylogeny owing to its concordance with
genetic ‘Alu’ data, which demonstrate low risk of homo-
plasy [63]. Results for trees 2 and 3, as well as the
raw data and residuals are presented in the electronic
supplementary material.
PGLS regression results are presented in table 1 and
figure 1. As expected from previous work, logECV and
logBM1 are strongly correlated with a negatively allometric
slope of 0.66 for the species-level and 0.75 for the genus-
level data. In general, diet quality declines with increasing
body mass, however, a significant but weak correlation
between logDQ and logBM2 occurs only at the genus
level (slope ¼ 20.10, p ¼ 0.0048, r2 ¼ 0.44). Notably,
we do not find a significant correlation between residual
ECV and residual DQ at either the genus (p ¼ 0.08) or
species level (p ¼ 0.26). Use of residuals for ECV and
DQ computed from the same control variable (BM2
from Smith & Jungers [38]) resulted in slightly different
p-values, but did not create any ‘false positives’ when com-
pared with analyses using independent control variables.
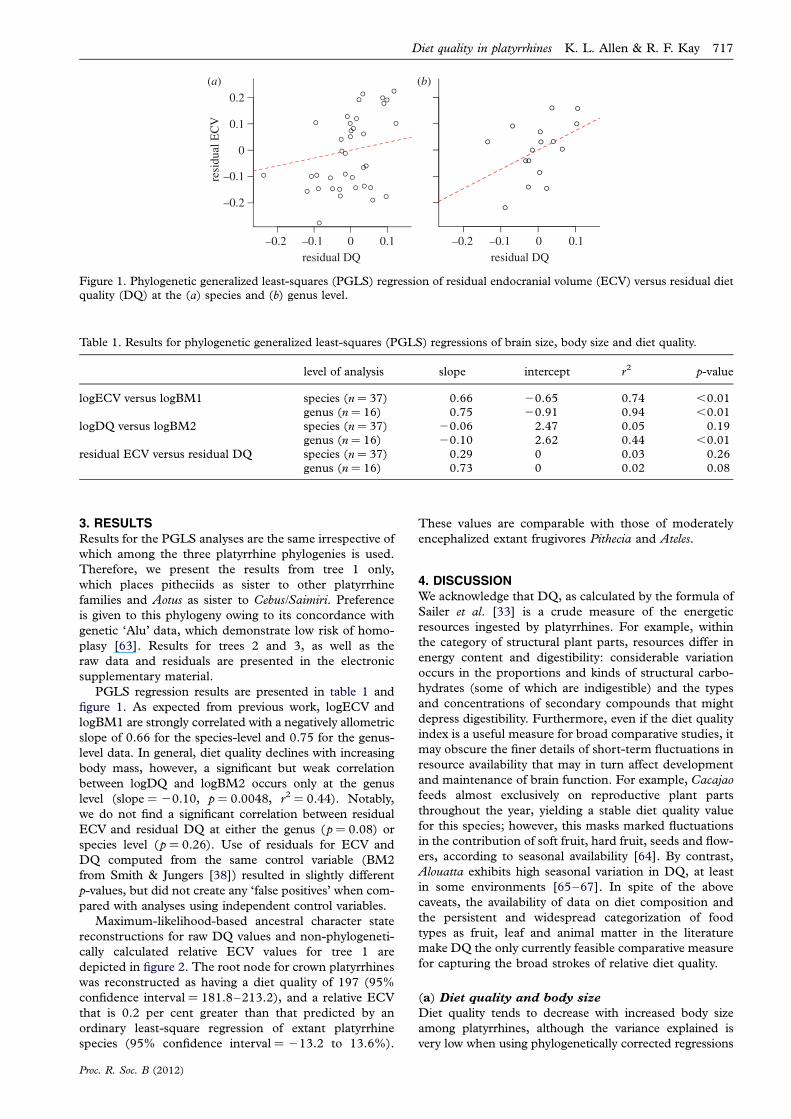
Maximum-likelihood-based ancestral character state
reconstructions for raw DQ values and non-phylogeneti-
cally calculated relative ECV values for tree 1 are
depicted in figure 2. The root node for crown platyrrhines
was reconstructed as having a diet quality of 197 (95%
confidence interval ¼ 181.8–213.2), and a relative ECV
that is 0.2 per cent greater than that predicted by an
ordinary least-square regression of extant platyrrhine
species (95% confidence interval ¼ 213.2 to 13.6%).
Proc. R. Soc. B (2012)
These values are comparable with those of moderately
encephalized extant frugivores Pithecia and Ateles.
4. DISCUSSIONWe acknowledge that DQ, as calculated by the formula of
Sailer et al. [33] is a crude measure of the energetic
resources ingested by platyrrhines. For example, within
the category of structural plant parts, resources differ in
energy content and digestibility: considerable variation
occurs in the proportions and kinds of structural carbo-
hydrates (some of which are indigestible) and the types
and concentrations of secondary compounds that might
depress digestibility. Furthermore, even if the diet quality
index is a useful measure for broad comparative studies, it
may obscure the finer details of short-term fluctuations in
resource availability that may in turn affect development
and maintenance of brain function. For example, Cacajao
feeds almost exclusively on reproductive plant parts
throughout the year, yielding a stable diet quality value
for this species; however, this masks marked fluctuations
in the contribution of soft fruit, hard fruit, seeds and flow-
ers, according to seasonal availability [64]. By contrast,
Alouatta exhibits high seasonal variation in DQ, at least
in some environments [65–67]. In spite of the above
caveats, the availability of data on diet composition and
the persistent and widespread categorization of food
types as fruit, leaf and animal matter in the literature
make DQ the only currently feasible comparative measure
for capturing the broad strokes of relative diet quality.
(a) Diet quality and body size
Diet quality tends to decrease with increased body size
among platyrrhines, although the variance explained is
very low when using phylogenetically corrected regressions
Callicebus
Pithecia
Cacajao
Chiropotes
Alouatta
Ateles
Brachyteles
Lagothrix
Aotus
Saimiri
Cebus
Saguinus
Leontopithecus
Callimico
Cebuella
Callithrix
DQ residual ECV170–179 –10 to –4.9
–5 to –0.10–4.95–9.9
10–14.915+
180–189190–199200–209210–219220–229
Figure 2. Phylogenetic tree of New World monkeys with a heat map of maximum-likelihood-based ancestral root node recon-structions for DQ and residual ECV. The magnitude of the DQ reconstruction is depicted in solid colours on the upper
hemisphere, while the residual ECV is coloured in stripes in the bottom hemisphere of each node.
718 K. L. Allen & R. F. Kay Diet quality in platyrrhines
and conceals more than it reveals: several taxa of fairly uni-
form size, like the atelids (spider, woolly, woolly spider and
howling monkeys) and callitrichines (marmosets and
tamarins) evince considerable variance in diet quality.
This may reflect the lability of this behavioural trait and/
or a range of adaptive options available to animals of
small to moderate body size. Among platyrrhines, the
inclusion of animal and insect matter into the diet tends
to decrease with increasing body size [33,68,69]. The
protein demands of animals below 500 g require the
inclusion of insects into the diet, while those platyrrhines
above 500 g more often obtain their protein from plants
[70]; however, even those in the below 500 g range include
varying rates of insectivory. For example, animal matter
comprises only 11 per cent of the diet in the small-
bodied Cebuella, but 74 per cent in Saguinus tripartitus,
an animal nearly four times larger with a relatively smaller
brain [71]. The relative low use of faunal resources
reported for Cebuella results in its placement as a slight out-
lier in the regression of relative brain size and relative diet
quality. Platyrrhines have been previously noted to display
a broad variability in diet quality within body size cat-
egories [37,72]. Ford & Davis [37] hypothesize that this
diversity could be the result of body size convergence
among groups with differing adaptive histories.
(b) Tests of the ETH
The principal prediction of ETH is that species with rela-
tively large brains also have correspondingly high diet
quality in the absence of some other energetic compensa-
tory mechanism. Our findings do not conform to this
expectation. Instead, we find no significant correlation
between diet quality and relative brain size in extant
platyrrhines, when phylogenetic effects are controlled
Proc. R. Soc. B (2012)
for. This indicates that any association which may
exist between these two variables is overshadowed by
the pervasive effects of similarity owing to common
descent.
When phylogeny is not taken into account, it is appar-
ent that the most encephalized platyrrhines tend to have
high-quality diets (e.g. Cebus, Saimiri), while those with
relatively small brains have the lowest quality diets (e.g.
Alouatta), consistent with the traditional perceptions
that diet and brain size are linked in these animals
[11,18,20,32]; however, these extremes appear to drive
the correlation and the overall explained variance is
quite low (see the electronic supplementary material).
At this level of explanatory power, DQ is not highly pre-
dictive of encephalization. Any predictive power that may
exist is lost when phylogenetic controls are applied. This
result emphasizes the importance of using phylogenetic
control in analysing these traits.
ETH proposes gut reduction as a release mechanism
on the metabolic constraints limiting encephalization,
rather than a prime selective force for brain enlargement
[20–22]. Consequently, brain size and diet quality may
be asymmetrically associated. On the one hand, the pres-
ence of a relatively small-brained species with a high diet
quality should not be considered as evidence against
the hypothesis. For example, while tamarins (Saguinus)
have a relative brain size on par with the empirical platyr-
rhine average, this group has a diet quality above that
expected by the model, owing to the large contribution of
insects to its diet. Under ETH, tamarins do not count
as an exception: they may have the potential resources
to invest in a large brain but may not have been selected
to do so.
On the other hand, energetic constraints should miti-
gate against increased encephalization in species with
Diet quality in platyrrhines K. L. Allen & R. F. Kay 719
low-quality diets and lacking some other compensatory
mechanism [23,25]. ETH is inconsistent with our finding
of highly encephalized species with low diet quality.
Brachyteles arachnoides is one such species that presents
a significant problem for the hypothesis. Brachyteles is a
large-bodied platyrrhine that has dental and gastric adap-
tations for folivory [69,73,74]. Ecological studies have
confirmed this species as predominantly folivorous
[75,76] and it is aligned with the howling monkey,
Alouatta, in possessing one of the lowest diet qualities
within the Platyrrhini. Contrary to the expectations of
ETH, Brachyteles possesses a relatively large brain, com-
parable to its more frugivorous and phylogenetically
closer relatives Ateles and Lagothrix. It is possible that Bra-
chyteles supports its large brain by reducing energy costs
through the reduction of other expensive tissues rather
than those associated with the gastrointestinal tract, i.e.
via the ‘expensive brain hypothesis’, which emphasizes
energy offsets by allocation to ‘maintenance’ or ‘pro-
duction’. Brachyteles does not appear to have a
reduction in limb musculature when compared with
Ateles and Lagothrix [77]. However, Brachyteles does
demonstrate a ‘slower’ reproductive pace, at least com-
pared with the equally folivorous Alouatta [19,78–84].
Thus, it is possible that increased interbirth intervals
and slowed maturational processes are the trade-offs
being used by this animal to ‘afford’ such a metabolically
expensive brain. Its reproductive similarities to frugivor-
ous atelines may indicate that Brachyteles evolved from a
‘brainy’ frugivorous ancestor, or alternatively, that the
driving mechanisms for encephalization were strong
enough to force the exploration of alternative avenues
for constraint release. Interestingly, Brachyteles has been
found to display dramatic intrageneric variation in diet
composition, day ranges and activity levels. In areas
with greater fruit availability, Brachyteles is more frugivor-
ous, with larger day ranges compared with groups living
in fruit-scarce regions [85].
(c) Diet quality and the evolution of anthropoid
encephalization
Our ancestral character state reconstructions suggest the
last common ancestor of crown platyrrhines had a degree
of encephalization on par with that of modern Pithecia or
Ateles, both frugivorous, moderately encephalized platyr-
rhines. Stem platyrrhine taxa from the Early Miocene of
South America (Homunculus, Dolichocebus and Tremacebus)
had diets very similar to those of extant platyrrhines—
mixed frugivorory/insectivory or frugivory/folivory, not
unlike the extant medium-sized platyrrhine Callicebus
[86]. However, these stem taxa were substantially less
encephalized than living platyrrhines [87–89]. Thus, the
modern level of encephalization in platyrrhines appears to
have been achieved without any shift to a more energy-
rich diet. Given the relatively high-quality diets of extant
and fossil platyrrhines, it is unlikely that diet quality con-
strained encephalization in the presence of a persistent
selective pressure; instead, it is more likely that the abun-
dance of high-quality diet niches available to Neotropical
primates allowed encephalization to occur freely, once
initiated later by other driving mechanisms.
We thank C. L. Nunn, R. Mundy, L. C. Aiello, E. C. Kirk,A. Barr and E. L. MacLean for helpful discussions.
Proc. R. Soc. B (2012)
For training in phylogenetic comparative methods, wethank the AnthroTree Workshop which is supported by theNSF (BCS-0923791) and the National EvolutionarySynthesis Center (NSF grant EF-0905606). Furtherfunding was provided from NSF BNS 0824546 to R.F.K.
REFERENCES1 Dunbar, R. 1992 Neocortex size as a constraint on group
size in primates. J. Hum. Evol. 20, 469–493. (doi:10.1016/0047-2484(92)90081-J)
2 Dunbar, R. 1998 The social brain hypothesis. Evol.Anthropol. 6, 178–190. (doi:10.1002/(SICI)1520-6505
(1998)6:5,178::AID-EVAN5.3.0.CO;2-8)3 Barton, R. A. 1996 Neocortex size and behavioural ecol-
ogy in primates. Proc. R. Soc. Lond. B 263, 173–177.(doi:10.1098/rspb.1996.0028)
4 Marino, L. 2002 Convergence of complex cognitive abil-ities in cetaceans and primates. Brain Behav. Evol. 59,21–32. (doi:10.1159/000063731)
5 Byrne, R. & Whiten, A. 1988 Machiavellian intelligence:social expertise and the evolution of intellect in monkeys,apes, and humans. Oxford, UK: Claredon Press.
6 Barton, R. & Dunbar, R. 1997 Evolution of the socialbrain. In Machiavellian intelligence II: extensions and evalu-ations (eds A. Whiten & R. Byrne), pp. 240–263.Cambridge, UK: Cambridge University Press.
7 Byrne, R. 1997 Machiavellian intelligence. Evol. Anthro-pol. 5, 172–180. (doi:10.1002/(SICI)1520-6505(1996)5:5,172::AID-EVAN6.3.0.CO;2-H)
8 Gibson, K. R. 1986 Cognition, brain size and the extractionof embedded food resources. In Primate ontogeny, cognition,and social behaviour (eds J. G. Else & P. C. Lee), pp. 93–105.Cambridge, UK: Cambridge University Press.
9 Clutton-Brock, T. & Harvey, P. 1980 Primates, brains,and ecology. J. Zool. 190, 309–323. (doi:10.1111/j.
1469-7998.1980.tb01430)10 Milton, K. 1981 Food choice and digestive strategies of
two sympatric primate species. Am. Nat. 117, 496–505.(doi:10.1086/283730)
11 Milton, K. 1988 Foraging behavior and the evolution of
primate intelligence. In Machiavellian intelligence: socialexpertise and the evolution of intellect in monkeys, apes andhumans (eds A. Whiten & R. Byrne), pp. 285–305.Oxford, UK: Oxford University Press.
12 Milton, K. 1992 Diet and primate evolution. Sci. Am.269, 86–93. (doi:10.1038/scientificamerican0606-22sp)
13 McNab, B. K. & Eisenberg, J. F. 1989 Brain size and itsrelation to the rate of metabolism in mammals. Am. Nat.133, 157–167. (doi:10.1086/284907)
14 Parker, S. & Gibson, K. 1979 A developmental model forthe evolution of language and intelligence in early homi-nids. Behav. Brain Sci. 2, 367–408. (doi:10.1017/S0140525X0006307X)
15 Kirk, C. 2006 Visual influences on primate encephaliza-tion. J. Hum. Evol. 51, 76–90. (doi:10.1016/j.jhevol.
2006.01.005)16 Barton, R. A. 1998 Visual specialization and brain evol-
ution in primates. Proc. R. Soc. Lond. B 265, 1933–1937. (doi:10.1098/rspb.1998.0523)
17 MacLean, E. L., Barrickman, N. L., Johnson, E. M. &Wall, C. E. 2009 Sociality, ecology, and relative brainsize in lemurs. J. Hum. Evol. 56, 471–478. (doi:10.1016/j.jhevol.2008.12.005)
18 Fish, J. L. & Lockwood, C. A. 2003 Dietary constraints
on encephalization in primates. Am. J. Phys. Anthropol.120, 171–181. (doi:10.1002/Ajpa.10136)
19 Milton, K. 1981 Estimates of reproductive parametersfor free-ranging Ateles geoffroyi. Primates 22, 574–579.(doi:10.1007/BF02381250)
720 K. L. Allen & R. F. Kay Diet quality in platyrrhines
20 Aiello, L. C. 1997 Brains and guts in human evolution:the expensive tissue hypothesis. Braz. J. Genet. 20,141–148. (doi:10.1590/S0100-84551997000100023)
21 Aiello, L. C., Bates, N. & Joffe, T. 2000 In defense of theexpensive tissue hypothesis. In Evolutionary anatomy ofthe primate cerebral cortex (eds D. Falk & K. R. Gibson),pp. 57–78. Cambridge, UK: Cambridge University Press.
22 Aiello, L. C. & Wheeler, P. 1995 The expensive-tissue
hypothesis: the brain and the digestive-system in humanand primate evolution. Curr. Anthropol. 36, 199–221.(doi:10.1086/204350)
23 Isler, K. & Van Schaik, C. 2006 Costs of encephalization:
the energy trade-off hypothesis tested on birds. J. Hum.Evol. 51, 228–243. (doi:10.1016/j.jhevol.2006.03.006)
24 Isler, K. & Van Schaik, C. P. 2006 Metabolic costs ofbrain size evolution. Biol. Lett. 2, 557–560. (doi:10.1098/rsbl.2006.0538)
25 Isler, K. & Van Schaik, C. P. 2009 The expensive brain: aframework for explaining evolutionary changes in brainsize. J. Hum. Evol. 57, 392–400. (doi:10.1016/j.jhevol.2009.04.009)
26 Barrickman, N. L., Bastian, M. L., Iser, K. & Van
Schaik, C. P. 2008 Life history costs and benefits of ence-phalization: a comparative test using data from long-termstudies of primates in the wild. J. Hum. Evol. 54, 568–590. (doi:10.1016/j.jhevol.2007.08.012)
27 Armstrong, E. 1983 Relative brain size and metabolism
in mammals. Science 220, 1302–1304. (doi:10.1126/science.6407108)
28 Roth, G. & Dicke, U. 2005 Evolution of the brain andintelligence. Trends Cogn. Sci. 9, 251–257. (doi:10.
1016/j.tics.2005.03.005)29 Wrangham, R. 2009 Catching fire: how cooking made us
human, p. 309. New York, NY: Basic Books (PersusBook Group).
30 Chivers, D. J. 1994 Functional anatomy of the gastrointes-
tinal tract. In Colobine monkeys: their ecology, behaviour, andevolution (eds A. G. Davies & J. F. Oates), pp. 205–228.Cambridge, UK: Cambridge University Press.
31 Chivers, D. J. & Hladik, C. M. 1980 Morphology of thegastrointestinal tract in primates: comparisons with other
mammals in relation to diet. J. Morphol. 166, 337–386.(doi:10.1002/jmor.1051660306)
32 Milton, K. 1987 Primate diets and gut morphology:implications for hominid evolution. In Food and evolution:toward a theory of human food habits (eds M. Harris &
E. B. Ross), pp. 93–116. Philadelphia, PA: TempleUniversity Press.
33 Sailer, L. D., Gaulin, S. J. C., Boster, J. S. & Kurland,J. A. 1985 Measuring the relationship between dietaryquality and body size in primates. Primates 26, 14–27.(doi:10.1007/BF02389044)
34 Isler, K., Kirk, E. C., Miller, J. M. A., Albrecht, G. A.,Gelvin, B. R. & Martin, R. D. 2008 Endocranial volumesof primate species: scaling analyses using a comprehen-
sive and reliable data set. J. Hum. Evol. 55, 967–978.(doi:10.1016/j.jhevol.2008.08.004)
35 Smithsonian National Museum of Natural History:Division of Mammals Collections Database 2011 Infor-mation provided with the permission of the NationalMuseum of Natural History, Smithsonian Institution, 10thand Constitution Avenue northwest Washington, DC, 2June. See http://www.nmnh.si.edu/.
36 Glander, K. E. 2006 Average body weight for mantledhowling monkeys (Alouatta palliata): an assessment of
average values and variability. In New perspectives inthe study of mesoamerican primates: distribution, ecology,behavior, and conservation (eds A. Estrada, P. A. Garber,M. Pavelka & L. Luecke), pp. 247–263. Boston, MA:Springer.
Proc. R. Soc. B (2012)
37 Ford, S. M. & Davis, L. C. 1992 Systematics and bodysize: implications for feeding adaptations in New-Worldmonkeys. Am. J. Phys. Anthropol. 88, 415–468. (doi:10.
1002/ajpa.1330880403)38 Smith, R. J. & Jungers, W. L. 1997 Body mass in com-
parative primatology. J. Hum. Evol. 32, 523–559.(doi:10.1006/jhev.1996.0122)
39 Leonard, W. R. & Robertson, M. L. 1994 Evolutionary
perspectives on human nutrition. Am. J. Hum. Biol. 6,77–88. (doi:10.1002/ajhb.1310060111)
40 Gould, S. J. 1966 Allometry and size in ontogeny andphylogeny. Biol. Rev. 41, 587–640. (doi:10.1111/j.
1469-185X.1966.tb01624.x)41 Jerison, H. J. 1955 Brain to body ratios and the evolution
of intelligence. Science 121, 447–449. (doi:10.1126/science.121.3144.447)
42 Gould, S. J. 1975 Allometry in primates, with special
emphasis on scaling and the evolution of the brain. Con-trib. Primatol. 5, 244–292.
43 Jerison, H. J. 1961 Quantitative analysis of evolution ofthe brain in mammals. Science 133, 1012–1014.(doi:10.1126/science.133.3457.1012)
44 Felsenstein, J. 1985 Phylogenies and the comparativemethod. Am. Nat. 125, 1–15. (doi:10.1086/284325)
45 Nunn, C. L. & Barton, R. A. 2001 Comparative methodsfor studying primate adaptation and allometry. Evol.Anthropol. 10, 81–98. (doi:10.1002/evan.1019)
46 Pagel, M. 1999 Inferring the historical patterns of bio-logical evolution. Nature 401, 877–884. (doi:10.1038/44766)
47 R Development Core Team 2009 R: a language andenvironment for statistical computing. Vienna, Austria: RFoundation for Statistical Computing. See http://www.R-project.org.
48 Orme, D., Freckleton, R., Thomas, G., Petzoldt, T., Fritz,S. & Isaac, N. 2010 caper: comparative analyses of phyloge-netics and evolution in R. R package version 0.4/r71. Seehttp://www.R-Forge.R-project.org/projects/caper/.
49 Freckleton, R. P. 2002 On the misuse of residuals in ecol-ogy: regression of residuals vs. multiple regression.J. Anim. Ecol. 71, 542–545. (doi:10.1046/j.1365-2656.
2002.00618.x)50 Darlington, R. B. & Smulders, T. V. 2001 Problems with
residual analysis. Anim. Behav. 62, 599–602. (doi:10.1006/anbe.2001.1806)
51 Mundry, R., Nunn, C. L. & Barton, R. In preparation.
Controlling for confounding variables and the economosproblem: a simulation study.
52 Wildman, D. E., Jameson, N. M., Opazo, J. C. & Yi, S. V.2009 A fully resolved genus level phylogeny of neo-
tropical primates (Platyrrhini). Mol. Phylogenet. Evol.53, 694–702. (doi:10.1016/j.ympev.2009.07.019)
53 Opazo, J. C., Wildman, D. E., Prychitko, T., Johnson,R. M. & Goodman, M. 2006 Phylogenetic relationshipsand divergence times among New World monkeys (Pla-
tyrrhini, Primates). Mol. Phylogenet. Evol. 40, 274–280.(doi:10.1016/J.Ympev.2005.11.015)
54 Perelman, P. et al. 2011 A molecular phylogeny ofliving primates. PLOS Genet. 7, e1001342. (doi:10.1371/journal.pgen.1001342)
55 Disotell, T. R. 2008 Primate phylogenetics. In Encyclopediaof life sciences. New York, NY: John Wiley and Sons, Ltd.
56 Schrago, C. G. 2007 On the time scale of New Worldprimate diversification. Am. J. Phys. Anthropol. 132,344–354. (doi:10.1002/ajpa.20459)
57 Cortes-Ortiz, L., Bermingham, E., Rico, C., Rodriguez-Luna, E., Sampaio, I. & Ruiz-Garcia, M. 2003 Molecularsystematics and biogeography of the Neotropical monkeygenus Alouatta. Mol. Phylogenet. Evol. 26, 64–81.(doi:1055-7903(02)00308-1)
Diet quality in platyrrhines K. L. Allen & R. F. Kay 721
58 Cropp, S. J., Larson, A. & Cheverud, J. M. 1999 Histori-cal biogeography of tamarins, genus Saguinus: themolecular phylogenetic evidence. Am. J. Phys. Anthropol.108, 65–89. (doi:10.1002/(SICI)1096-8644(199901)108:1,65::AID-AJPA4.3.0.CO;2-4)
59 Kobayashi, S. 1995 A phylogenetic study of titi monkeys,genus Callicebus, based on cranial measurements.I. Phyletic groups of Callicebus. Primates 36, 101–120.
(doi:10.1007/BF02381918)60 Natori, M. & Hanihara, T. 1988 An analysis of interspecific
relationships of Saguinus based on cranial measurements.Primates 29, 255–262. (doi:10.1007/BF02381127)
61 Alfaro, J. L. et al. In press. Explosive Pleistocene rangeexpansion leads to widespread Amazonian sympatrybetween robust and gracile capuchin monkeys. J. Biogeogr.
62 Paradis, E., Claude, J. & Strimmer, K. 2004 APE: analysisof phylogenetics and evolution in R language. Bioinformatics20, 289–290. (doi:10.1093/bioinformatics/btg412)
63 Ray, D. A. et al. 2005 Alu insertion loci and platyrrhineprimate phylogeny. Mol. Phylogenet. Evol. 35, 117–126.(doi:10.1016/j.ympev.2004.10.023)
64 Boubli, J. P. 1999 Feeding ecology of black-headed
uacaris (Cacajao melanocephalus melanocephalus) in Picoda Neblina National Park, Brazil. Int. J. Primatol. 20,719–749. (doi:10.1023/A:1020704819367)
65 deSouza, L. L., Ferrari, S. F., daCosta, M. L. & Kern,D. C. 2002 Geophagy as a correlate of folivory in red-
handed howler monkeys (Alouatta belzebul). East. Braz.Amazonia J. Chem. Ecol. 28, 1613–1631. (doi:10.1023/A:1019928529879)
66 Pavelka, M. S. M. & Knopff, K. H. 2004 Diet and
activity in black howler monkeys (Alouatta pigra) insouthern Belize: does degree of frugivory influenceactivity level? Primates 45, 105–111. (doi:10.1007/s10329-003-0072-6)
67 Ludwig, G., Aguiar, L. M., Svoboda, W. K., Hilst, C. L. S.,
Navarro, I. T., Vitule, J. R. S. & Passos, F. C. 2008 Com-parison of the diet of Alouatta caraya (Primates: Atelidae)between a riparian island and mainland on the UpperParana River, southern Brazil. Rev. Bras. Zool. 25,419–426. (doi:10.1590/S0101-81752008000300006)
68 Kay, R. 1984 On the use of anatomical features to inferforaging behavior in extinct primates. In Adaptations forforaging in nonhuman primates (eds P. Rodman & J. Cant),pp. 21–53. New York, NY: Columbia University Press.
69 Gaulin, S. 1979 A Jarman/Bell model of primate feeding
niches. Hum. Ecol. 7, 1–20. (doi:10.1007/BF00889349)70 Kay, R. F. 1973 Mastication, molar tooth structure and diet.
New Haven, CT: Yale University Press.71 Youlatos, D. 2004 Multivariate analysis of organismal
and habitat parameters in two neotropical primate com-munities. Am. J. Phys. Anthropol. 123, 181–194.(doi:10.1002/ajpa.10307)
72 Terborgh, J. 1985 The ecology of Amazonian primates.In Key environments in amazonia (eds G. Prance &
T. Lovejoy), pp. 284–304. New York, NY: PergamonPress.
73 Hill, W. 1962 Primates: comparative anatomy and taxon-omy. V: Cebidae, Part B. New York, NY: IntersciencePublications.
Proc. R. Soc. B (2012)
74 Zingeser, M. R. 1973 Dentition of Brachyteles arachnoideswith reference to alouattine and ateline affinities. FoliaPrimatol. 20, 351–390. (doi:10.1159/000155586)
75 Milton, K. 1984 Habitat, diet, and activity patterns of free-ranging woolly spider monkeys (Brachyteles arachnoides,E. Geoffroy 1806). Int. J. Primatol. 5, 491–514. (doi:10.1007/BF02692271)
76 Strier, K. 1991 Diet in one group of woolly spider
monkeys, or muriquis (Brachyteles arachnoides). Am. J.Primatol. 23, 113–126. (doi:10.1002/ajp.1350230205)
77 Hill, W. C. O. 1962 Primates: comparative anatomy andtaxonomy. New York, NY: Interscience Publishers, Inc.
78 Fedigan, L. M. & Rose, L. M. 1995 Interbirth interval vari-ation in three sympatric species of neotropical monkey.Am. J. Primatol. 37, 9–24. (doi:10.1002/ajp.1350370103)
79 Chapman, C. A. & Chapman, L. J. 1990 Reproductive-biology of captive and free-ranging spider monkeys.
Zoo. Biol. 9, 1–9. (doi:10.1002/zoo.1430090102)80 Glander, K. E. 1980 Reproduction and population-
growth in free-ranging mantled howling monkeys.Am. J. Phys. Anthropol. 53, 25–36. (doi:10.1002/ajpa.1330530106)
81 Martins, W. P. & Strier, K. B. 2004 Age at first repro-duction in philopatric female muriquis (Brachyteleshypoxanthus). Primates 45, 63–67. (doi:10.1007/s10329-003-0057-5)
82 Strier, K. B. 1991 Demography and conservation of an
endangered primate. Brachyteles arachnoides. Conserv. Biol.5, 214–218. (doi:10.1111/j.1523-1739.1991.tb00126.x)
83 Strier, K. B., Mendes, S. L. & Santos, R. R. 2001 Timingof births in sympatric brown howler monkeys (Alouattafusca clamitans) and northern muriquis (Brachytelesarachnoides hypoxanthus). Am. J. Primatol. 55, 87–100.(doi:10.1002/ajp.1042)
84 Strier, K. B. & Ziegler, T. E. 1994 Insights into ovarianfunction in wild muriqui monkeys (Brachyteles ara-chnoides). Am. J. Primatol. 32, 31–40. (doi:10.1002/ajp.1350320104)
85 deCarvalho, O., Ferrari, S. F. & Strier, K. B. 2004 Diet ina muriqui group (Brachyteles arachnoides) in continuousprimary forest. Primates 45, 201–204. (doi:10.1007/
s10329-004-0079-7)86 Fleagle, J. G., Kay, R. F. & Anthony, M. R. L. Fossil New
World monkeys. In Vertebrate paleontology in the Neotropics:the Miocene fauna of La Venta, Colombia (eds R. F. Kay,R. H. Madden, R. L. Cifelli & J. J. Flynn), pp. 473–
496. Washington, DC: Smithsonian Institution Press.87 Sears, K. E., Finarelli, J. A., Flynn, J. J. & Wyss, A. R.
2008 Estimating body mass in New World ‘monkeys’(Platyrrhini, Primates), with a consideration of the Mio-
cene platyrrhine. Chilecebus carrascoensis. Am. MuseumNovitates 3617, 1–29. (doi:10.1206/627.1)
88 Kay, R. F. & Kirk, E. C. 2008 New data on encephalizationin Miocene New World monkeys: implications for anthro-poid brain evolution. J. Vertebr. Paleontol. 28, 151A.
89 Kay, R. F., Kirk, E. C., Malinzak, M. & Colbert, M. W.2006 Brain size, activity pattern, and visual acuity inHomunculus patagonicus, an early Miocene stem platyrrhine:the mosaic evolution of brain size and visual acuity inAnthropoidea. J. Vertebr. Paleontol. 26, 83A–84A.