dietary overlap between frugivorous birds and bats in the peruvian amazon
TRANSCRIPT

Wiley and Nordic Society Oikos are collaborating with JSTOR to digitize, preserve and extend access to Oikos.
http://www.jstor.org
Nordic Society Oikos
Dietary Overlap between Frugivorous Birds and Bats in the Peruvian Amazon Author(s): David L. Gorchov, Fernando Cornejo, Cesar F. Ascorra and Margarita Jaramillo Source: Oikos, Vol. 74, No. 2 (Nov., 1995), pp. 235-250Published by: on behalf of Wiley Nordic Society OikosStable URL: http://www.jstor.org/stable/3545653Accessed: 30-03-2015 14:46 UTC
REFERENCESLinked references are available on JSTOR for this article:
http://www.jstor.org/stable/3545653?seq=1&cid=pdf-reference#references_tab_contents
You may need to log in to JSTOR to access the linked references.
Your use of the JSTOR archive indicates your acceptance of the Terms & Conditions of Use, available at http://www.jstor.org/page/info/about/policies/terms.jsp
JSTOR is a not-for-profit service that helps scholars, researchers, and students discover, use, and build upon a wide range of contentin a trusted digital archive. We use information technology and tools to increase productivity and facilitate new forms of scholarship.For more information about JSTOR, please contact [email protected].
This content downloaded from 134.53.245.11 on Mon, 30 Mar 2015 14:46:47 UTCAll use subject to JSTOR Terms and Conditions
OIKOS 74: 235-250. Copenhagen 1995
Dietary overlap between frugivorous birds and bats in the Peruvian Amazon
David L. Gorchov, Fernando Cornejo, Cesar F. Ascorra and Margarita Jaramillo
Gorchov, D. L., Cornejo, E, Ascorra, C. F. and Jaramillo, M. 1995. Dietary overlap between frugivorous birds and bats in the Peruvian Amazon. - Oikos 74: 235-250.
To assess the potential for competition between fruit-eating birds and bats, we quanti- fied overlap in their use of fruit in a matrix of disturbed and undisturbed tropical forest. Seeds were obtained from 897 bats (31 species) and 200 birds (29 species) mist-netted over 2.5 yr. We calculated pairwise overlap in fruit diet by the simplified Morisita index for those frugivore species with the most diet data ( 1 bats and 7 birds). Overlap was 0 for 70% of the bird-bat species pairs, and less than 0.05 for the remainder. Two tanagers, Tachyphonus surinamus and Tangara schrankii, had greater dietary overlap with bats than did other bird species. Cluster analysis based on diet overlap separated birds and bats into different clusters. Correspondence analysis was used to reduce the dimensionality of the frugivore x fruit diet matrix. The first axis separated bats and the fruits on which they primarily fed from birds and their major fruits and was related to fruit length, type, and color. The second axis separated the frugivorous bats by size and was correlated with fruit length and plant growth form. Six fruits were eaten by both bats and birds: Phytolacca rivinoides, Marcgravia sp., Souroubea guianensis, Philo- dendron cuneatum, Coussapoa villosa, and Havetiopsis flavida. As a group, these shared fruits comprised a minor fraction (< 4%) of most bat diets, but a larger fraction (> 10%) of most bird diets. These shared fruits were morphologically similar to those eaten by birds (arillate or berry-like, brightly colored exterior or aril), suggesting bats may be sampling "bird fruits".
D. L. Gorchov, Dept of Botany, Miami Univ., Oxford, OH 45056, USA. - E Cornejo, Casilla 11, Chaclacayo, Lima 8, Peru. - C. F Ascorra, Departamento de Mastozoolo- gia, Museo de Historia Natural, Ap. 140434, Lima 14, Peru. - M. Jaramillo, Uni- versidad Nacional de la Amazonla Peruana, Iquitos, Peru.
Competitive relationships among unrelated animal taxa are prevalent but are not frequently studied (American Zoologist vol. 19). The finding that large number of tropical birds and bats depend on fruit for most of their diet has raised the question of whether these unrelated taxa compete for fruit (Fleming 1979, Fleming et al. 1987, Palmeirim et al. 1989). A first step in examining the potential for competition is to assess the extent of dietary overlap. Although distinct "syndromes" of fruits adapted for bird- and bat-dispersal have been described (e.g., van der Pijl 1982, Howe and Westley 1986), fruits of some plant species are avidly eaten by both taxa (e.g.
Cecropia obtusifolia (Estrada et al. 1984a) and Muntingia calabura (Fleming et al. 1985)). Most quantitative analy- ses of the dietary overlap between frugivorous birds and bats have consisted of comparisons of lists of fruit species or genera eaten by birds and bats compiled by different investigators (Fleming 1979, Fleming et al. 1987). In each case one of the lists encompasses a broader geo- graphic area, a longer sampling period, or a cruder taxo- nomic level than the other. The comparison least affected by such problems of scale is for montane forest in Monte- verde, Costa Rica, where bats ate 13 of 169 species of
Accepted 29 March 1995 Copyright (? OIKOS 1995 ISSN 0030-1299 Printed in Denmark - all rights reserved
OIKOS 74:2 (1995) 235
This content downloaded from 134.53.245.11 on Mon, 30 Mar 2015 14:46:47 UTCAll use subject to JSTOR Terms and Conditions

fruits eaten by birds (Wheelwright et al. 1984, Dinerstein 1986, Fleming et al. 1987).
Because fruiting patterns and frugivore diets change within and between years, simultaneous studies are necessary to quantify the overlap on fruits between birds and bats. A community level study in an early succes- sional tropical wet habitat at La Selva, Costa Rica re- vealed that six fruit species were eaten by both birds and bats (of 59 eaten by either taxon), and dietary overlap (simplified Morisita index; Horn 1966) between pairs of bird and bat species ranged from 0 to 0.08 (Palmeirim et al. 1989). However, the brevity (5 weeks) and early successional context of that study makes extrapolation speculative.
We studied the diets of fruit-eating birds and bats over 2.5 yr in a matrix of primary tropical rain forest and disturbed areas in the Peruvian Amazon, in order to quantify trophic relationships. These data were collected as part of a larger study to determine the role of seed dispersal by birds and bats in the natural regeneration of forest after strip-cutting (Gorchov et al. 1993).
Study area and methods Study site Our study site was the Centro de Investigaciones Jenaro Herrera (CIJH) (4055'S, 73045'W), operated by the In- stituto de Investigaciones de la Amazonia Peruana (IIAP) and located 2.5 km east of the Ucayali River and 140 km SSW of Iquitos in the Province of Requena, Department of Loreto, Peru. Rainfall averages 2521 mm/yr with a drier season usually extending from June to September (Spichiger et al. 1989). Temperature averages 260C and elevation averages 130 m. The primary forest in this area is evergreen tropical rain forest, with a canopy of 25-30 m.
Capture of animals We captured birds and bats with nylon mist nets in pri- mary forest, secondary forest, and logged strips. In pri- mary forest nets were set along (for birds and bats) or across (for bats) small trails or along narrow lanes opened for this purpose. The secondary forest was about 18 yr old and located along an abandoned forest extraction road bordered by primary forest. Two logged strips were cleared by the strip-cut system (Hartshorn 1989) and surrounded by primary forest. Strips were 30 x 150 m and 140 m apart. Netting was done along the edge of the strips over the first two yr after clearing, during which time the vegetation underwent succession from relatively open, with scattered small trees, to a dense stand of small trees. The trees were primarily Cecropia distachya, many of which reached 7 m in height. Strip 1 was cleared April-May 1989 and Strip 2 was cleared October-No-
vember 1989. In addition, bats were netted in open areas around buildings at CIJH and in tree plantations.
Most nets were set at ground level (0.5-3 m) but about 20% were set at greater heights in the forest and strips. Along the edge of the strips the nets were set up to 20 m by attaching them to ropes secured to high branches.
During the period May 1989 to October 1991 birds and bats were netted during 18 months in primary forest and in Strip 1, during 16 months in Strip 2, and during 7 months in secondary forest. In addition, bats were netted during 6 months in open areas. Monthly netting effort for bats generally consisted of 1 to 3 nights per habitat, with 8 to 12 nets for a total at least 30 net-hours per habitat. For birds, monthly netting effort in each forest habitat consisted of 2 to 4 d with 2 8 nets open for 2 150 net- hours; in each strip for 3 to 4 d with ?8 nets for ?400 net-hours.
Nets were checked every 30 min, and all animals captured were held in cloth bags to collect fecal samples, identified, and released. Reference specimens of birds and bats from these sites are deposited in the Museo Nacional de Historia Natural de la Universidad Nacional Mayor de San Marcos (MUSM) in Lima, Peru.
Determination of diets With the exceptions of the sanguinivorous bat, Desmodus rotundus (N = 100), and hummingbirds (N = 231), nearly every captured animal was kept in a cloth bag for at least one h before being identified and released. Each bag was inspected for fecal material; fecal material was carefully inspected for arthropod parts and intact seeds. Seeds found in feces were identified with the aid of a reference collection of seeds from ripe fruits collected in the forest and disturbed areas. Plants were identified by F. Comejo and Rodolfo Vasquez. Voucher specimens are deposited at the Universidad Nacional Agraria - La Molina in Lima.
The presence of one or more seeds of a plant species in the feces or regurgitate of an animal was considered a "seed record". If seeds from two or more species were found in the feces of the same individual, they were treated as separate seed records.
Fruit dietary overlap between pairs of frugivore species was calculated from these seed records using the simpli- fied Morisita index, C (Horn 1966).
C = 21xjyIl(ZX2 + ly,2)
where xi = the proportion of the seed records of animal species x made up of food item i and yi = the proportion of the seed records of animal species y made up of food item i. This index ranges from 0 (no overlap) to 1 (complete overlap) and, because it combines diet choices multipli- catively, it is an appropriate measure of the overlap in resource exploitation between species in the same habitat (Horn 1966).
236 OIKOS 74:2 (1995)
This content downloaded from 134.53.245.11 on Mon, 30 Mar 2015 14:46:47 UTCAll use subject to JSTOR Terms and Conditions

Table 1. Principal frugivorous bat and bird species, species abbreviations, mean and standard deviation of mass (in g), number of captures with diet samples of arthropods and seeds (percent of total captures in parentheses) and number of seed records.
Species Abbrev. Mass No. of captures (%) Seed (s.d.) records
w. arth. w. seeds
Birds Catharus ustulatus CUST 26 (3) 3 (20) 8 (53) 9 Machaeropterus regulus MREG 12 (1) 8 (42) 14 (74) 15 Manacus manacus MMAN 16 (2) 3 (23) 7 (54) 10 Pipra coronata PCOR 10 (2) 10 (25) 25 (62) 28 Pipra pipra PPIP 12 (3) 33 (27) 72 (59) 93 Tachyphonus surinamus TSUR 21 (4) 22 (69) 18 (56) 22 Tangara schrankii TSCH 19 (1) 4 (40) 8 (80) 11 Bats Artibeus gnomus AGNO 11 (3) 3 (10) 11 (35) 13 A. jamaicensis AJAM 52 (14) 4 (3) 26 (21) 28 A. lituratus ALIT 79 (10) 5 (3) 35 (20) 35 A. obscurus AOBS 37 (6) 0 (0) 21 (30) 21 Carollia brevicauda CBRE 16 (4) 38 (11) 189 (54) 235 C. castanea CCAS 12 (4) 6 (10) 34 (54) 48 C. perspicillata CPER 18 (3) 61 (10) 382 (63) 448 Phyllostomus hastatus PHAS 93 (14) 45 (29) 98 (64) 111 Rhinophylla pumilio RPUM 12 (4) 3 (4) 37 (51) 40 Sturnira lilium SLIL 22 (3) 2 (9) 10 (43) 11 Uroderma bilobatum UBIL 21 (6) 4 (12) 13 (38) 13
Frugivore diets were clustered by the average linkage algorithm (CLUSTER procedure, AVERAGE option, SAS Version 6) using 1-C as a measure of distance between frugivore species.
We assigned species to trophic guilds following Gard- ner (1977) for phyllostomid bats, Wilson (1973) for non- phyllostomids (by genus), and Terborgh et al. (1990) for birds, except where our data differed from and were more complete than data in those references (see Appendix). Species not listed in Gardner (1977) or Terborgh et al. (1990) were assigned to a guild based on our data or information given for its congeners. Bird species in genera not included in Terborgh et al. (1990) were as- signed to guilds based on Hilty and Brown (1986), Johns (1991), Karr et al. (1990), and Snow (1962).
Correspondence analysis of diet matrix To find the best simultaneous representation of the matrix of diet records (with frugivore species as rows and fruit species as columns) we used Correspondence analysis (CA, also called Reciprocal averaging). CA involves the derivation of new axes that maximally account for the structure of the points in a multi-dimensional space, making possible the reduction of dimensionality (Gauch 1982, Pielou 1984). These new axes maximize the corre- spondence between row and column categories (frugi- vores and fruits) so that species with similar diets are positioned close to each other, as are fruits eaten by similar sets of animal species. CA was done using the CORRESP procedure in SAS version 6.
We included in the CA all plant operational taxonomic
units (OTUs, see Results) that made up 2 10% of the seed records of any of the 18 major frugivorous animal species or that were present in the diet of more than one of these species.
Several plant genera were represented by several spe- cies; these typically had similar fruit and might be ex- pected to be functionally equivalent, with differences in patterns of consumption by frugivores due to sampling error. To explore whether differences between congeneric plants were contributing strongly to the representation of trophic structure by CA, we also carried out CA after grouping plant taxa by genus. All genera that met either of the criteria in the previous paragraph were included, resulting in the addition of a few observations. It is possible that a few of the taxa that could not be classified to genus actually belonged to one of the genera included in the analysis, but they were considered separate entities in our analysis.
Relationship of fruit characteristics to CA axes and dispersal mode For nearly all of the fruit species eaten by birds or bats that were identified with the reference collection, we recorded growth form (epiphyte, liana, tree (>5i m), or "shrub" (incl. terrestrial herbs and treelets < 5 m), fruit type (capsule with arillate seeds, 1- or 2-seeded drupace- ous fruit, multi-seeded (2 3) berry-like fruit, or multiple fruit), color (of aril in arillate fruits, otherwise of ex- terior), and seed length and width (in mm). For more than half of these species we also measured fruit length in cm.
Relationships between CA scores and fruit and seed
OIKOS 74:2 (1995) 237
This content downloaded from 134.53.245.11 on Mon, 30 Mar 2015 14:46:47 UTCAll use subject to JSTOR Terms and Conditions
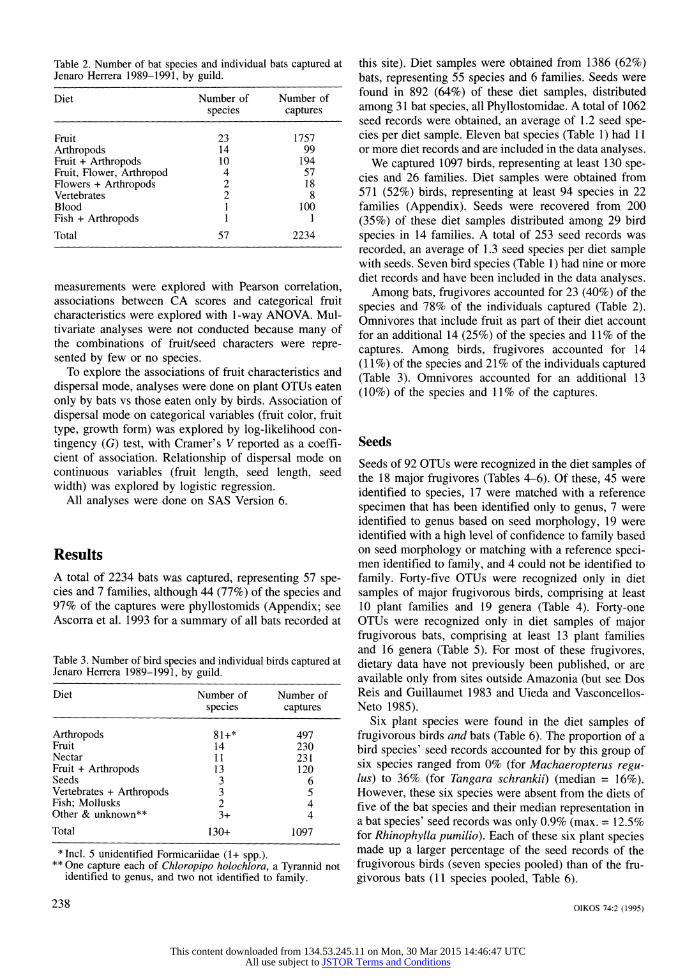
Table 2. Number of bat species and individual bats captured at Jenaro Herrera 1989-1991, by guild.
Diet Number of Number of species captures
Fruit 23 1757 Arthropods 14 99 Fruit + Arthropods 10 194 Fruit, Flower, Arthropod 4 57 Flowers + Arthropods 2 18 Vertebrates 2 8 Blood 1 100 Fish + Arthropods 1 I Total 57 2234
measurements were explored with Pearson correlation, associations between CA scores and categorical fruit characteristics were explored with 1-way ANOVA. Mul- tivariate analyses were not conducted because many of the combinations of fruit/seed characters were repre- sented by few or no species.
To explore the associations of fruit characteristics and dispersal mode, analyses were done on plant OTUs eaten only by bats vs those eaten only by birds. Association of dispersal mode on categorical variables (fruit color, fruit type, growth form) was explored by log-likelihood con- tingency (G) test, with Cramer's V reported as a coeffi- cient of association. Relationship of dispersal mode on continuous variables (fruit length, seed length, seed width) was explored by logistic regression.
All analyses were done on SAS Version 6.
Results A total of 2234 bats was captured, representing 57 spe- cies and 7 families, although 44 (77%) of the species and 97% of the captures were phyllostomids (Appendix; see Ascorra et al. 1993 for a summary of all bats recorded at
Table 3. Number of bird species and individual birds captured at Jenaro Herrera 1989-1991, by guild.
Diet Number of Number of species captures
Arthropods 81+* 497 Fruit 14 230 Nectar 11 231 Fruit + Arthropods 13 120 Seeds 3 6 Vertebrates + Arthropods 3 5 Fish; Mollusks 2 4 Other & unknown** 3+ 4 Total 130+ 1097
* Incl. 5 unidentified Formicariidae (1+ spp.). ** One capture each of Chloropipo holochlora, a Tyrannid not
identified to genus, and two not identified to family.
this site). Diet samples were obtained from 1386 (62%) bats, representing 55 species and 6 families. Seeds were found in 892 (64%) of these diet samples, distributed among 31 bat species, all Phyllostomidae. A total of 1062 seed records were obtained, an average of 1.2 seed spe- cies per diet sample. Eleven bat species (Table 1) had 11 or more diet records and are included in the data analyses.
We captured 1097 birds, representing at least 130 spe- cies and 26 families. Diet samples were obtained from 571 (52%) birds, representing at least 94 species in 22 families (Appendix). Seeds were recovered from 200 (35%) of these diet samples distributed among 29 bird species in 14 families. A total of 253 seed records was recorded, an average of 1.3 seed species per diet sample with seeds. Seven bird species (Table 1) had nine or more diet records and have been included in the data analyses.
Among bats, frugivores accounted for 23 (40%) of the species and 78% of the individuals captured (Table 2). Omnivores that include fruit as part of their diet account for an additional 14 (25%) of the species and 11% of the captures. Among birds, frugivores accounted for 14 (11%) of the species and 21% of the individuals captured (Table 3). Omnivores accounted for an additional 13 (10%) of the species and 11% of the captures.
Seeds Seeds of 92 OTUs were recognized in the diet samples of the 18 major frugivores (Tables 4-6). Of these, 45 were identified to species, 17 were matched with a reference specimen that has been identified only to genus, 7 were identified to genus based on seed morphology, 19 were identified with a high level of confidence to family based on seed morphology or matching with a reference speci- men identified to family, and 4 could not be identified to family. Forty-five OTUs were recognized only in diet samples of major frugivorous birds, comprising at least 10 plant families and 19 genera (Table 4). Forty-one OTUs were recognized only in diet samples of major frugivorous bats, comprising at least 13 plant families and 16 genera (Table 5). For most of these frugivores, dietary data have not previously been published, or are available only from sites outside Amazonia (but see Dos Reis and Guillaumet 1983 and Uieda and Vasconcellos- Neto 1985).
Six plant species were found in the diet samples of frugivorous birds and bats (Table 6). The proportion of a bird species' seed records accounted for by this group of six species ranged from 0% (for Machaeropterus regu- lus) to 36% (for Tangara schrankii) (median = 16%). However, these six species were absent from the diets of five of the bat species and their median representation in a bat species' seed records was only 0.9% (max. = 12.5% for Rhinophylla pumilio). Each of these six plant species made up a larger percentage of the seed records of the frugivorous birds (seven species pooled) than of the fru- givorous bats (11 species pooled, Table 6).
238 OIKOS 74:2 (1995)
This content downloaded from 134.53.245.11 on Mon, 30 Mar 2015 14:46:47 UTCAll use subject to JSTOR Terms and Conditions

Table 4. Plant species eaten only by birds and the number of seed records of each in the diet of each of the major frugivorous bird species (abbreviations follow Table 1). See Table 6 for species eaten by both birds and bats. Names for plant codes appear below.
Bird Melastomataceae Rubiaceae Mora- Other sp. ceae families
Miconia other genera
1 2 3 4 5 6 7 1 2 3 4 5 6 7 8 9 1 2 3 4 5 1 2 3 1 2 3 4
CUST 0 0 1 0 0 0 3 0 0 1 0 0 0 0 0 0 00000 0 0 0 0 0 1 0 MREG 1 0 0 1 0 1 2 0 2 0 3 0 2 0 0 1 0 0 0 0 0 1 0 0 0 0 0 0 MMAN 0 0 0 0 0 0 4 0 0 0 1 0 0 0 1 0 0 0 0 0 1 0 0 0 0 1 1 0 PCOR 4 4 2 0 1 0 4 0 0 0 3 0 1 0 2 1 2 1 0 0 1 0 0 0 0 0 0 0 PPIP 5 6 0 4 2 2 24 0 1 1 5 2 2 2 3 3 0 2 2 2 1 1 1 0 0 1 0 2 TSUR 0 0 0 1 1 0 4 2 1 2 1 0 0 0 0 0 0 000 0 1 1 0 2 0 0 1 TSCH 0 0 0 1 0 1 0 0 0 0 0 0 0 0 0 0 0 0 0 0 0 2 0 2 0 0 0 0
Key to plant species codes: Miconia: 1 - M. minutiflora, 2 - M. ternatifolia, 3 - M. splendens, 4 - M. dolichorrhyncha, 5 - M. wittii, 6 - M. phanerostila, 7 -
M. duckei; Other Melastomataceae: 1 - unknown, 2 - Tococa discolor, 3 - Clidemia hirta, 4 - Ossaea cucullata, 5 - Clidemia japurensis var.
heterobasis, 6 - Henriettea sp. ?, 7 - Ossaea araneifera, 8 - minute-seeded taxa not identified to species, 9 - other Melastomes (1 diet record of each of the following): MREG: Tococa guianensis; PCOR: Clidemia epiphytica; PPIP: Miconia poeppigii, M. tetragona, and Loreya arborescens.
Rubiaceae: 1 - Psychotria deflexa, 2 - Psychotria alboviridula, 3 - Palicourea punicea, 4 - 2 Psychotria spp. distinct from others listed, 5 - other Rubiaceae: 3 distinct taxa, not identified to genus.
Moraceae: I - Coussapoa cf. parvifolia, 2 - Ficus americana, 3 - Coussapoa sp. See also Table 6. Other families: 1 - Clusia sp. (Guttiferae), 2 - unknown Marcgraviaceae, 3 - Euphorbiaceae (MMAN: Alchornea triplinervia;
CUST: Croton schiedianus), 4 - Araceae (PPIP: 1 each - Anthurium acaule and Unidentifed; TSUR: unid.; see also Table 6). The following taxa are not included in Table 4 but were represented by 1 diet record each: CUST: Codonanthe sp. (Gesneriaceae);
MREG: unid. Dilleniaceae; PPIP: Sorocea sp. (Moraceae), Iryanthera grandis (Myristicaceae), and unid.; TSCH: Ficus sp.
Table 5. Plant species eaten only by bats and the number of seed records of each in the diet of each of the major frugivorous bat species (abbreviations follow Table 1). See Table 6 for species eaten by both birds and bats. Names for plant codes and abbreviations appear below.
Bat Piperaceae Moraceae Hyperic. Ara- Other sp. ceae families
Piper Cecropia Ficus Vismia
1 2 3 4 5 6 7 1 2 3 4 5 6 7 1 2 3 1 2 3 1 2 1 2 3 4 5
AGNO 0 0 0 0 0 0 0 0 3 0 0 3 0 0 3 1 0 2 0 0 0 0 0 0 0 0 0 AJAM 1 0 1 0 0 0 0 2 12 1 0 0 4 1 3 0 0 1 0 0 0 0 0 0 0 0 0 ALIT 1 0 0 0 0 0 0 6 18 0 5 0 2 0 2 1 0 0 0 0 0 0 0 0 0 0 0 AOBS 0 0 0 0 0 0 0 0 19 00 020 0 0 0 0 0 0 0 0 0 0 0 0 0 CBRE 51 2 8 6 5 4 1 2 17 0 1 0 2 0 80 1 1 1 2 2 9 4 1 0 2 1 0 1 CCAS 18 1 6 0 1 1 0 0 1 0 1 0 2 0 9 3 0 1 0 1 1 0 0 0 0 0 1 CPER 127 1 17 1 9 2 2 4 29 2 2 1 3 0 152 35 1 3 1 4 13 1 1 4 0 0 9 PHAS 3 0 0 0 0 0 0 49 5 10 32 0 0 1 1 0 0 1 0 0 0 0 0 0 3 3 0 RPUM 0 0 0 0 0 0 0 2 2 0 0 0 0 0 13 3 0 0 0 1 0 0 12 0 0 0 1 SLIL 0 0 0 0 0 0 1 4 0 0 0 0 0 0 0 0 0 0 0 2 2 1 0 0 0 0 UBIL 1 0 1 0 0 0 0 0 1 0 0 0 4 2 1 0 0 0 0 0 3 0 0 0 0 0 0
Key to plant species codes: Piperaceae: 1 - Piper aduncum, 2 - Piper sp., 3 - P. arboreum, 4 - Pothomorphe peltata, 5 - Piper sp., 6 - unknown, 7 - unknown. Moraceae: 1 - Cecropia distachya, 2 - C. ficifolia, 3 - C. sciadophylla, 4 - C. membranacea, 5 - Ficus sp., 6 - Ficus sp., 7 - Ficus
sp. See also Table 6. Hypericaceae: 1 - Vismia angusta, 2 - V. macrophylla, 3 - Vismia sp. Araceae: 1 - Anthurium sp., 2 - Philodendron sp., 3 - unknown. See also Table 6. Other families: 1 - Solanum lanceolatum, 2 - Solanum sp., 3 - unknown Guttiferae, 4 - unknown Passifloraceae, 5 - Gurania
acuminata (Cucurbitaceae), 6 - unknown, 7 - Amaranthaceae? Additional records not listed in Table 5 (number of seed records in parentheses): CBRE: Solanum jamiacense (1), Physalis sp. (1),
Thoracocarpus bissectus (Cyclanthaceae) (1), Ficus "sp. 9" (1), Cactaceae (1), Curcurbid (1), unknown (8); CPER: Vismia sp. (1), Piper sp. (1), Ficus "sp. 42" (1), Passifloraceae (1), unid. Gesneriaceae (1); PHAS: unknown (2); RPUM: Marcgravia sp. (1).
OIKOS 74:2 (1995) 239
This content downloaded from 134.53.245.11 on Mon, 30 Mar 2015 14:46:47 UTCAll use subject to JSTOR Terms and Conditions

Table 6. Plant species with fruits eaten by both birds and bats, the number of seed records of each in the diet of each of the major frugivorous species (abbreviations follow Table 1). Totals are the number of records of the seed in diets of all major frugivorous birds or bats, followed by the percentage of seed records comprised by that seed.
Marcgraviaceae Moraceae Guttifer. Araceae Phytolacc.
Marcgravia Souroubea Coussapoa Havetiopsis Philodendron Phytolacca sp. 301 guianensis villosa flavida cuneatum rivinoides
Birds CUST 0 1 1 0 0 0 MREG 0 0 0 0 0 0 MMAN 0 1 0 0 0 0 PCOR 1 0 0 0 1 0 PPIP 5 1 0 5 1 3 TSUR 1 1 1 1 1 0 TSCH 2 1 0 1 0 0 Total (%) 9 (4.8) 5 (2.7) 2 (1.1) 7 (3.7) 3 (1.6) 3 (1.6)
Bats AGNO 0 0 1 0 0 0 AJAM 0 0 1 1 0 0 ALIT 0 0 0 0 0 0 AOBS 0 0 0 0 0 0 CBRE 2 1 0 2 3 0 CCAS 0 0 0 0 0 0 CPER 2 0 2 1 1 10 PHAS 0 0 1 0 0 0 RPUM 1 0 0 0 4 0 SLIL 0 0 0 0 0 0 UBIL 0 0 0 0 0 0 Total (%) 5 (0.5) 1 (0.1) 5 (0.5) 4 (0.4) 8 (0.8) 10 (1.0)
Pairwise dietary overlap Among pairs of bird species, dietary overlap, C, averaged 0.43 (sd=0.22, N=21, range 0.05 to 0.73, Table 7). Dietary overlap among pairs of bat species averaged 0.36 (sd=0.25, N=55, range 0.03 to 0.97, Table 8). Among bird - bat species pairs, dietary overlap averaged 0.004 (sd=0.009, N=77, range 0 to 0.045, Table 7). For 54 of
the 77 bird - bat species pairs, overlap was 0, for the remainder overlap averaged 0.013 (sd-0.012).
Cluster analysis Cluster analysis of frugivore diets, based on 1-C, revealed two major groups comprised of birds and bats, respec-
Table 7. Dietary overlap (Horn's (1966) modification of Morisita's index of overlap) between pairs of major frugivorous bird species and between bird and bat species. A blank indicates overlap was zero. Abbreviations follow Table 1.
CUST MREG MMAN PCOR PPIP TSUR TSCH
MREG 0.284 MMAN 0.713 0.431 PCOR 0.394 0.504 0.473 PPIP 0.642 0.553 0.731 0.700 TSUR 0.603 0.448 0.540 0.398 0.696 TSCH 0.062 0.187 0.050 0.055 0.311 0.259 AGRN 0.045 0.025 AJAM 0.019 0.012 0.020 0.017 ALIT AOBS CBRE 0.003 0.002 0.006 0.009 0.012 0.017 CCAS CPER 0.002 0.002 0.006 0.004 0.006 PHAS 0.004 0.002 RPUM 0.029 0.005 0.037 0.025 SLIL UBIL
240 OIKOS 74:2 (1995)
This content downloaded from 134.53.245.11 on Mon, 30 Mar 2015 14:46:47 UTCAll use subject to JSTOR Terms and Conditions

Table 8. Dietary overlap (see Table 7) between pairs of major frugivorous bat species. Abbreviations follow Table 1.
AGNO AJAM ALIT AOBS CBRE CCAS CPER PHAS RPUM SLIL
AJAM 0.620 ALIT 0.518 0.898 AOBS 0.408 0.759 0.819 CBRE 0.537 0.386 0.133 0.132 CCAS 0.283 0.250 0.150 0.045 0.826 CPER 0.499 0.354 0.246 0.114 0.971 0.891 PHAS 0.060 0.241 0.461 0.073 0.075 0.082 0.062 RPUM 0.446 0.267 0.203 0.086 0.608 0.323 0.567 0.107 SLIL 0.401 0.731 0.752 0.626 0.253 0.214 0.259 0.230 0.226 UBIL 0.182 0.452 0.246 0.193 0.308 0.339 0.318 0.032 0.139 0.368
tively (Fig. 1). Among the bats, the diet of Phyllostomus hastatus was the most dissimilar. The remaining bats were grouped in three clusters: the four species of Carol- linae, Uroderma bilobatum, and the three Artibeus spp. plus Sturnira lilium. Among the birds, Tangara schankii had the most dissimilar diet.
Correspondence analysis Correspondence analysis of major frugivore species and the plant OTUs in their diets separated out major guilds of frugivores. The first axis accounted for 20.8% of the variance and separated bats and plants eaten primarily by bats from birds and plants eaten primarily by birds
PHAS
ALIT
AJAM
AOBS
SLIL
AGNO
UBIL
CCAS
CPER
CBRE
RPUM
TSCH
TSUR
CUST
PPIP
MMAN
PCOR
MREG
0 0.2 0.4 0.6 0.8 1.0 1.2
Fig. 1. Cluster diagram of frugivore species based on distance matrix of 1-C (dietary overlap). Full names of frugivore species given in Table 1. X axis is normalized RMS distance.
(Fig. 2). The only plant species with intermediate values (0.0-2.0) on this axis were those eaten by both birds and bats (compare Fig. 2, Table 6). Scores of plant OTUs on this axis were negatively correlated with fruit length (r= -0.61, P=0.0009). Average axis 1 scores also differed for fruits of different colors (F5,43 = 13.7, P= 0.001) and type (F3,47 = 7.8, P = 0.0002): fruits with high scores (eaten by birds) tended to be black, purple, or red, and arillate or drupaceous.
The second axis accounted for 15.7% of the variance and separated the bat species with contrasting diets (Fig. 2). The score for the largest bat, Phyllostomus hastatus, was quite distinct from all other bats, with the four Carolliinae bats occupying the other extreme. Scores for bat species on this axis were strongly related to body weight (Fig. 3). Fruits eaten by bats were also separated on this axis, with fruits eaten primarily by P. hastatus
3 141o 0 Plants * Birds
PHAS Bats
398 349 38
2 1310
cs 7C 1 ALITU
430
AJAM. 0 0. villosa. CUSTO # AOBSI SLIL TSUu o AOBS, S~~~~~lL ~guian.o 0 UBILJ& AGNO H.flavida TSCH
0(9 R1PLM o Phi. cun. * CCASt CBRE 0 Phy. riv. C
C1 6 -1 I l I .
-1 0 1 2 3
Axisa
Fig. 2. First two axes of Correspondence analysis of matrix of fruit OTUs and frugivore species. Four-letter abbreviations refer to major frugivore species (Table 1). Numbers refer to plant species (Tables 4, 5). Abbreviated scientific names refer to those in Table 6.
OIKOS 74:2 (1995) 241
This content downloaded from 134.53.245.11 on Mon, 30 Mar 2015 14:46:47 UTCAll use subject to JSTOR Terms and Conditions

2.5 Axis 2 = -0.74 + 0.03*Wt
2.0 R2=0.86 P<0.001
1.5 ,,
La 1.0X
0.5
0.0 * .
-0.5
10 20 30 40 50 60 70 80 90 100
Weight
Fig. 3. Regression of Correspondence analysis Axis 2 (see Fig. 2) on mean weight (g) of the 11 frugivorous bat species.
(Cecropia spp., Gurania acuminata (Cucurbitaceae), and an unknown Passifloraceae) having the highest values and fruits eaten by Carollia spp. and other small frugivor- ous bats (Piper spp., Vismia spp., Solanum spp., and Araceae) having the lowest values. Axis 2 scores were positively correlated with fruit length (r = 0.76, P = 0.0001) and seed length (r=0.524, P=0.0002). In addi- tion, axis 2 scores were associated with growth form (F344= 4.3, P = 0.0099); lianas and trees averaged higher values than epiphytes and shrubs.
The third axis accounted for 8.7% of the variance and separated one tanager, Tangara schrankii, from the mana- kins and the thrush, Catharus ustulatus (Fig. 4). The other tanager, Tachyphonus surinamus, had an interme- diate value on this axis. The plant species with the most positive values on axis 3 were two epiphytic Coussapoa spp. eaten primarily by T. schrankii. Fruits with the most negative values for axis 3 were those eaten solely by Pipra coronata (Miconia splendens, Psychotria deflexa) or by Manacus manacus (Alchornea triplinervia and an unidentified Rubiaceae). None of the fruit characteristics were significantly related to axis 3, although ANOVA on fruit type approached significance (P=0.0721); drupes tended to have lower scores than other fruit types.
Grouping plant species by genus resulted in only minor changes in the first two axes of Correspondence analysis. The first axis (explaining 28.6% of the variance) again separated bats and bat-fruits from birds and bird-fruits, but the tanagers emerged somewhat intermediate be- tween the other birds and the bats (Fig. 5). Fruit genera shared by the two classes also had intermediate values on this axis. The second axis (accounting for 18.0% of the variance) again separated Phyllostomus hastatus from the Carollinae bats, but in this case it was joined by the three large Artibeus species. The third axis (accounting for 9.6% of the variance) was unrelated to axis 3 of the species-level analysis. It separated Rhinophylla pumilio and an unknown species in the Guttiferae from the other bats and bat-fruits (Fig. 5). This Guttiferae made up 30% of the seed records of R. pumilio, and R. pumilio ac-
Coussapoa sp. 0
8F-
?Plnts
7 Birds
Bats
6-
* TSCH
5
4 31
3
1019 01012
2
TSUR* 0 Sgulan. O
1 Marogravia o 0
H.tflavida 0 0 * MREG
0 C. viosa 0 - h RPlJ Phi. cuis.
? Phy. riv. ppIp *0 o
0 C:UST* a
-1 0
' MMAN PCOR*
-2 1008 0 o 261
,1 102 -3 I I
-1 0 1 2 3
Axis I
Fig. 4. Axes 1 and 3 of Correspondence analysis of matrix of fruit OTUs and frugivore species. See Fig. 2 for notes. Con- gruent with no. 1019 is no. 706 (Clusia sp.) and congruent with no. 206 is an unidentified Rubiaceae.
242 OLKOS 74:2 (1995)
This content downloaded from 134.53.245.11 on Mon, 30 Mar 2015 14:46:47 UTCAll use subject to JSTOR Terms and Conditions

o Guttiferae
o Plant genera 4* Birds
* Bats
3 * RPUM
2 C,,
X o Philodendron
1 Clusla
SLIL * 0 Marcgravia I 0 POOR
Cecropia TSUR
Vismia * TSCH j
Piper~ Do 62 0 Phytolacca 0 "- MREG Piper-,
~~~~Souroubea 0OUT A\ ~~~~~CUST Ficus * MMAN
Croton, Codonanthe 0
o Alchornea
, I , I , ' i
-1 0 1 2 3 Axis 1
Fig. 5. Axes 1 and 3 of Correspondence analysis of matrix of fruit genera and frugivore species. Four-letter abbreviations re- fer to major frugivore species (Table 1). Congruent with Alchor- nea is an unidentified Rubiaceae.
counted for 86% of the records of this plant species in the diets of the major frugivores (Table 5). There was some separation of birds and bird-fruits along this axis as well.
Characteristics of bat- vs bird-fruits Dispersal mode (bat vs bird) was significantly associated with the color, type, and length of fruit. The association was strongest with fruit color whether all seven colors were considered (G = 49.9, df= 6, P <0.001, Cramer's V= 0.81) or whether the three rarest colors (white, oran- ge, and yellow) were pooled (G = 47.0, df = 4, P < 0.001, V= 0.78). All green fruits (N= 15) were bat-dispersed; all purple fruits (N= 14) and most black and red fruits were bird-dispersed. The association of dispersal mode with fruit type (G= 24.3, df=3, P<0.001, V=0.59) was due to most multiple fruits being eaten by bats and most arillate, berry-like, and drupaceous fruits eaten by birds. Dispersal mode was not associated with growth form.
Logistic regression revealed that the probability that a plant species was bat- (vs bird-)dispersed was positively related to fruit length (Score X2= 10.3, df= 1, P= 0.0013). Dispersal mode was not related to seed length or width.
Discussion Overlap between birds and bats Dietary overlap between birds and bats was low. Only 6.5% of OTUs eaten by either class were shared, virtually identical to the 6.4% calculated for Monteverde (Wheel- wright et al. 1984, Dinerstein 1986, Fleming et al. 1987); and lower than the 10.2% in early successional habitat at La Selva (Palmeirim et al. 1989). The average dietary overlap between pairs of bird and bat species (0.004) was lower than the 0.007 found by Palmeirim et al. (1989), and an order of magnitude lower than the smallest over- laps between pairs of species in the same class. Cluster analysis separated birds as a group from bats as a group. The trophic structure of the volant frugivore community, as revealed by Correspondence analysis, was most strongly shaped by the separation of birds and bats, re- gardless of whether fruits were grouped by species or by genus.
Limitations of the analyses Our analyses of both dietary overlap and trophic structure considered only the fruit component of the diets, not arthropods and floral resources. Nectar and/or pollen were not detected by our methods, but are seasonally significant components of the diets of P. hastatus, C. perspicillata, A. jamaicensis, A. lituratus, and S. lilium (Heithaus et al. 1975, Gardner 1977). Arthropods were present in the diet of all but one (Artibeus obscures) of these "frugivores", but were encountered more frequently than seeds in the diet samples in only one species, the tanager Tachyphonus surinamus (Table 1). Although classified an "insectivore" by Terborgh et al. (1990), T. surinamus should be considered an omnivore, given that 56% of diet samples contained seeds. Two other of the major frugivorous birds (Catharus ustulatus and Tangara schrankii) are considered "omnivores" in the literature, as is the bat Phyllostomus hastatus (Appendix).
Arthropods were not included in the analyses because their remains in diet samples were not further identified, hence we could not assess whether different animal spe- cies were eating the same arthropods. However, we sus- pect birds and bats do not overlap in their use of arthro- pod resources, because they are active at different times of day and hence encounter different arthropod faunas. Unlike arthropods, fruits are available round-the-clock (once they ripen), so frugivores do not avoid dietary overlap by foraging at different times.
Our calculations of dietary overlap and trophic struc- ture are subject to certain limitations and biases in our data. Analysis of feces of captured animals probably provides the least biased non-lethal method of quanti- fying diets of frugivorous birds and bats (Wheelwright et al. 1984, Thomas 1988), but is likely to miss or under- represent fruits with large seeds that are not ingested with
OIKOS 74:2 (1995) 243
This content downloaded from 134.53.245.11 on Mon, 30 Mar 2015 14:46:47 UTCAll use subject to JSTOR Terms and Conditions
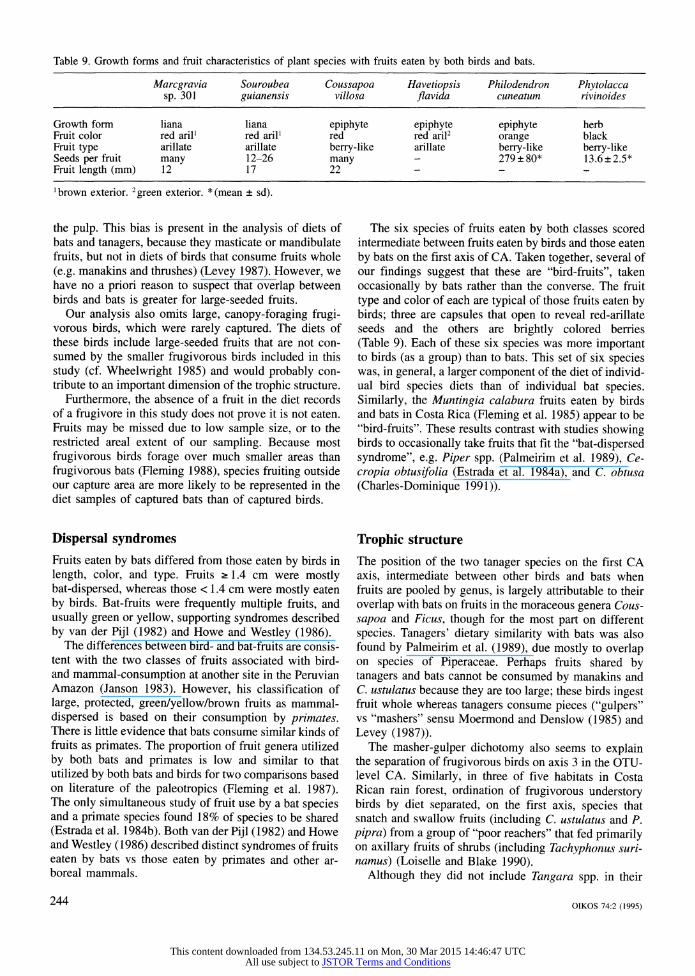
Table 9. Growth forms and fruit characteristics of plant species with fruits eaten by both birds and bats.
Marcgravia Souroubea Coussapoa Havetiopsis Philodendron Phytolacca sp. 301 guianensis villosa flavida cuneatum rivinoides
Growth form liana liana epiphyte epiphyte epiphyte herb Fruit color red aril' red aril' red red aril2 orange black Fruit type arillate arillate berry-like arillate berry-like berry-like Seeds per fruit many 12-26 many - 279?80* 13.6 ?2.5* Fruit length (mm) 12 17 22 - - -
'brown exterior. green exterior. *(mean ? sd).
the pulp. This bias is present in the analysis of diets of bats and tanagers, because they masticate or mandibulate fruits, but not in diets of birds that consume fruits whole (e.g. manakins and thrushes) (Levey 1987). However, we have no a priori reason to suspect that overlap between birds and bats is greater for large-seeded fruits.
Our analysis also omits large, canopy-foraging frugi- vorous birds, which were rarely captured. The diets of these birds include large-seeded fruits that are not con- sumed by the smaller frugivorous birds included in this study (cf. Wheelwright 1985) and would probably con- tribute to an important dimension of the trophic structure.
Furthermore, the absence of a fruit in the diet records of a frugivore in this study does not prove it is not eaten. Fruits may be missed due to low sample size, or to the restricted areal extent of our sampling. Because most frugivorous birds forage over much smaller areas than frugivorous bats (Fleming 1988), species fruiting outside our capture area are more likely to be represented in the diet samples of captured bats than of captured birds.
Dispersal syndromes Fruits eaten by bats differed from those eaten by birds in length, color, and type. Fruits ? 1.4 cm were mostly bat-dispersed, whereas those < 1.4 cm were mostly eaten by birds. Bat-fruits were frequently multiple fruits, and usually green or yellow, supporting syndromes described by van der Pijl (1982) and Howe and Westley (1986).
The differences between bird- and bat-fruits are consis- tent with the two classes of fruits associated with bird- and mammal-consumption at another site in the Peruvian Amazon (Janson 1983). However, his classification of large, protected, green/yellow/brown fruits as mammal- dispersed is based on their consumption by primates. There is little evidence that bats consume similar kinds of fruits as primates. The proportion of fruit genera utilized by both bats and primates is low and similar to that utilized by both bats and birds for two comparisons based on literature of the paleotropics (Fleming et al. 1987). The only simultaneous study of fruit use by a bat species and a primate species found 18% of species to be shared (Estrada et al. 1984b). Both van der Pijl (1982) and Howe and Westley (1986) described distinct syndromes of fruits eaten by bats vs those eaten by primates and other ar- boreal mammals.
The six species of fruits eaten by both classes scored intermediate between fruits eaten by birds and those eaten by bats on the first axis of CA. Taken together, several of our findings suggest that these are "bird-fruits", taken occasionally by bats rather than the converse. The fruit type and color of each are typical of those fruits eaten by birds; three are capsules that open to reveal red-arillate seeds and the others are brightly colored berries (Table 9). Each of these six species was more important to birds (as a group) than to bats. This set of six species was, in general, a larger component of the diet of individ- ual bird species diets than of individual bat species. Similarly, the Muntingia calabura fruits eaten by birds and bats in Costa Rica (Fleming et al. 1985) appear to be "bird-fruits". These results contrast with studies showing birds to occasionally take fruits that fit the "bat-dispersed syndrome", e.g. Piper spp. (Palmeirim et al. 1989), Ce- cropia obtusifolia (Estrada et al. 1984a), and C. obtusa (Charles-Dominique 1991)).
Trophic structure The position of the two tanager species on the first CA axis, intermediate between other birds and bats when fruits are pooled by genus, is largely attributable to their overlap with bats on fruits in the moraceous genera Cous- sapoa and Ficus, though for the most part on different species. Tanagers' dietary similarity with bats was also found by Palmeirim et al. (1989), due mostly to overlap on species of Piperaceae. Perhaps fruits shared by tanagers and bats cannot be consumed by manakins and C. ustulatus because they are too large; these birds ingest fruit whole whereas tanagers consume pieces ("gulpers" vs "mashers" sensu Moermond and Denslow (1985) and Levey (1987)).
The masher-gulper dichotomy also seems to explain the separation of frugivorous birds on axis 3 in the OTU- level CA. Similarly, in three of five habitats in Costa Rican rain forest, ordination of frugivorous understory birds by diet separated, on the first axis, species that snatch and swallow fruits (including C. ustulatus and P. pipra) from a group of "poor reachers" that fed primarily on axillary fruits of shrubs (including Tachyphonus suri- namus) (Loiselle and Blake 1990).
Although they did not include Tangara spp. in their
244 OLKOS 74:2 (1995)
This content downloaded from 134.53.245.11 on Mon, 30 Mar 2015 14:46:47 UTCAll use subject to JSTOR Terms and Conditions
ordinations, Loiselle and Blake (1990) considered them to comprise a distinct trophic group due to their consump- tion of canopy fruits. In our study, Tangara schrankii had the most dissimilar diet, due largely to the contribution of Coussapoa spp. and the reduced importance of Melasto- mataceae (25% of diet records vs 2 50% for each of the other bird spp.).
The second major factor in the trophic structure of the volant frugivore community is the separation of frugivor- ous bats by body size, which coincides with a separation of the "canopy frugivore guild" from the "understory frugivore guild" (sensu Bonaccorso 1978). This separa- tion of bats along CA axis 2 is nearly identical to that obtained at a site in Costa Rica with many of the same bat species (Palmeirim et al. 1989).
The correlation between axis 2 scores and fruit length supports Heithaus et al.'s (1975) finding of a positive correlation between body size and fruit size in frugivor- ous phyllostomid bats.
The diet of Phyllostomus hastatus is quite distinct from other frugivorous bats when analyzed at the level of plant OTUs (Figs 1, 2), but similar to that of the large Artibeus spp. at the level of plant genus, due to its consumption of fruits of different species of Cecropia. Sturnira lilium's diet diverged from those of the large Artibeus spp. due to its consumption of Solanum spp.
The four bats in subfamily Carolliinae (three Carollia spp. and Rhinophylla pumilio) differ from the stenoder- mines in the greater importance of Vismia spp. and re- duced importance of Cecropia in their diets. The diet of R. pumilio differed from that of Carollia spp. in the major contribution of an unidentified Guttiferae and absence of Piper spp. The diets of the three Carollia spp. differed (X2 = 14.9, df = 6, P < 0.05 (records pooled to Vismia spp., Piper spp., Cecropia spp., and "other")), showing a pat- tern consistent with that reported by Fleming (1991): the percentage of Piper was highest in the smallest species, C. castanea (52% of the seed records, compared to 29% for the intermediate C. brevicauda and 33% for the largest, C. perspicillata).
Conclusions The low dietary overlap between frugivorous birds and bats suggests that they do not compete for fruit. However, overlap may vary temporally, due to inter-annual and seasonal changes in the availability of fruit species. Over- lap may be greatest during periods of fruit scarcity, or during periods of fruit abundance if highly profitable or patchy fruit resources are involved (Crome 1975, Schoe- ner 1982). However, our data reveal that overlap between frugivorous birds (7 spp. pooled) and bats (11 spp. pooled) remained low year-round: dry season (June-Sep- tember) C=0.019, early wet season (October-January) C = 0.003, late wet season (February-May) C = 0.009. This suggests that dietary overlap between frugivorous
birds and bats rarely, if ever, is sufficient to permit competition for fruits.
The distinct fruit diets of Amazonian birds and bats also demonstrates that these taxa are not redundant in the seed dispersal services they provide. Both frugivorous birds and bats are essential in the regeneration of tropical rain forests.
Acknowledgements - This research was supported under Grant No. 7.228, Program in Science and Technology Cooperation, Office of the Science Advisor, U.S. Agency for International Development. We thank the Direcci6n General de Forestal y Fauna of the Ministerio de Agricultura of Peru for collecting permits. We thank the Instituto de Investigaciones de la Amazo- nia Peruana (IIAP), Jose Lopez Parodi, and Manuel Isuiza for use of the Centro de Investigaciones Jenaro Herrera. Cecilia Fox, Victor Pacheco, Jorge Palmeirim, and Rosa Arana assisted with animal captures. T. H. Fleming, M. S. Foster, C. Herrera, E. Losos, and M. Vanni provided valuable comments on an earlier draft of this manuscript.
References Ascorra, C. F, Gorchov, D. L. and Cormejo, F 1993. The bats
from Jenaro Herrera, Loreto, Peru. - Mammalia 57: 533- 552.
Bonaccorso, F. J. 1978. Foraging and reproductive ecology in a Panamanian bat community. - Bull. Fla. State Mus. Biol. Sci. 24: 359-408.
Charles-Dominique, P. 1991. Feeding strategy and activity bud- get of the frugivorous bat Carollia perspicillata (Phyllosto- midae) in French Guiana. - J. Trop. Ecol. 7: 243-256.
Crome, F H. J. 1975. The ecology of fruit pigeons in tropical northern Queensland. - Aust. Wildl. Res. 2: 155-185.
Dinerstein, E. 1986. Reproductive ecology of fruit bats and the seasonality of fruit production in a Costa Rican cloud forest. - Biotropica 18: 307-318.
Dos Reis, N. R. and Guillaumet, J.-L. 1983. Les chauves-souris frugivores de la region de Manaus et leur r6le dans la dissemination des especes vdgdtales. - Rev. Ecol. Terre Vie 38: 147-169.
Estrada, A., Coates-Estrada, R. and Vasquez-Yanes, C. 1984a. Observations on fruiting and dispersers of Cecropia ob- tusifolia at Los Tuxtlas, Mexico. - Biotropica 16: 315-318.
- , Coates-Estrada, R., Vasquez-Yanes, C. and Orozco-Sego- via, A. 1984b. Comparison of frugivory by howler monkeys (Alouatta palliate) and bats (Artibeus jamaicensis) in the tropical rain forest of Los Tuxtlas, Mexico. - Am. J. Prima- tol. 7: 3-13.
Fleming, T. H. 1979. Do tropical frugivores compete for food? - Am. Zool. 19: 1157-1172.
- 1988. The Short-tailed Fruit Bat. - Univ. of Chicago Press. - 1991. The relationship between body size, diet, and habitat
use in frugivorous bats, genus Carollia, (Phyllostomidae). - J. Mammal. 72: 493-501.
-, Williams, C. F, Bonaccorso, F J. and Herbst, L. H. 1985. Phenology, seed dispersal, and colonization in Muntingia calabura, a neotropical pioneer tree. - Am. J. Bot. 72: 383-391.
-, Breitwisch, R. and Whitesides, G. H. 1987. Patterns of tropical vertebrate frugivore diversity. - Annu. Rev. Ecol. Syst. 18: 91-109.
Gardner, A. L. 1977. Feeding habits. - In: Baker, R. J., Jones Jr., J. K. and Carter, D. C. (eds), Biology of the bats of the New World family Phyllostomidae, part II. Special Publications. Museum. Texas Tech Univ. 13, Lubbock, TX, pp. 293-350.
Gauch, H. G. 1982. Multivariate analysis in community ecology. - Cambridge Univ. Press, Cambridge.
OIKOS 74:2 (1995) 245
This content downloaded from 134.53.245.11 on Mon, 30 Mar 2015 14:46:47 UTCAll use subject to JSTOR Terms and Conditions

Gorchov, D. L., Cornejo, F, Ascorra, C. and Jaramillo, M. 1993. The role of seed dispersal in the natural regeneration of rain forest after strip-cutting in the Peruvian Amazon. - Vegeta- tio 107/108: 339-349.
Hartshorn, G. S. 1989. Application of gap theory to tropical forest management: natural regeneration on strip clear-cuts in the Peruvian Amazon. - Ecology 70: 567-569.
Heithaus, E. R., Fleming, T. H. and Opler, P. A. 1975. Foraging patterns and resource utilization in seven species of bats in a seasonal tropical forest. - Ecology 56: 841-854.
Hilty, S. L. and Brown, W. L. 1986. A guide to the birds of Colombia. - Princeton Univ. Press, Princeton, NJ.
Horn, H. S. 1966. Measurement of "overlap" in comparative ecological studies. - Am. Nat. 100: 419-424.
Howe, H. F and Westley, L. C. 1986. Ecology of pollination and seed dispersal. - In: Crawley, M. (ed.), Plant ecology. Blackwell, Oxford, pp. 185-215.
Janson, C. H. 1983. Adaptation of fruit morphology to dispersal agents in a Neotropical forest. - Science 219: 187-189.
Johns, A. D. 1991. Responses of Amazonian rain forest birds to habitat modification. - J. Trop. Ecol. 7: 417-437.
Karr, J. R., Robinson, S., Blake, J. G. and Bierregaard Jr., R. 0. 1990. Birds of four Neotropical forests. - In: Gentry, A. H. (ed.), Four Neotropical forests. Yale Univ. Press, New Haven, CT, pp. 237-269.
Levey, D. J. 1987. Seed size and fruit-handling techniques of avian frugivores. - Am. Nat. 129: 471-485.
Loiselle, B. A. and Blake, J. G. 1990. Diets of understory fruit- eating birds in Costa Rica. - Stud. Avian Biol. 13: 91-103.
Medellin, R. A. 1988. Prey of Chrotopterus auritus, with notes on feeding behavior. - J. Mammal. 69: 841-844.
Moermond, T. C. and Denslow, J. S. 1985. Neotropical frugi- vores: patterns of behavior, morphology, and nutrition with consequences for fruit selection. - In: Buckley, P. A., Foster, M. S., Morton, E. S., Ridgely, R. S. and Smith, N. G. (eds), Neotropical ornithology. Ornithological Monographs 36. AOU, Washington DC, pp. 865-897.
Palmeirim, J. M., Gorchov, D. L. and Stoleson, S. 1989. Trophic structure of a neotropical frugivore community: is there competition between birds and bats? - Oecologia 79: 403- 411.
Pielou, E.C. 1984. The interpretation of ecological data. - Wiley, New York.
Schoener, T. W. 1982. The controversy over interspecific com- petition. - Am. Sci. 70: 586-595.
Snow, D. W. 1962. A field study of the Black and White Mana- kin, Manacus manacus, in Trinidad. - Zoologica (NY) 47: 65-104.
Spichiger, L., Meroz, J., Loizeau, P.-A. and Stutz de Ortega, L. 1989. Contribuci6n a la flora de la amazonia peruana. Los arboles del arboretum Jenaro Herrera. Vol 1. - Conserva- toire et Jardin Botaniques de Geneve.
Terborgh, J., Robinson, S. K., Parker III, T. A., Munn, C. A. and Pierpont, N. 1990. - Structure and organization of an Ama- zonian forest bird community. - Ecol. Monogr. 60: 213- 238.
Thomas, D. W. 1988. Analysis of diets of plant-visiting bats. - In: Kunz, T. H. (ed.), Ecological and behavioral methods for the study of bats. Smithsonian Inst. Press, Washington DC, pp. 211-220.
Uieda, W. and Vasconcellos-Neto, J. 1985. Dispersdo de Sola- num spp. (Solanaceae) por morcegos, ne regido de Manaus, Am, Brasil. - Rev. Bras. Zool. 2: 449-458.
van der Pijl, L. 1982. Principles of dispersal in higher plants, 3rd ed. - Springer, Berlin.
Wheelwright, N. T. 1985. Fruit size, gape width, and the diets of fruit-eating birds. - Ecology 66: 808-818.
- , Haber, W. A., Murray, K. G. and Guindon, C. 1984. Tropi- cal fruit-eating birds and their food plants: a survey of Costa Rican lower montane forest. - Biotropica 16: 173-192.
Wilson, D.E. 1973. Bat faunas: a trophic comparison. - Syst. Zool. 22: 14-29.
246 OIKOS 74:2 (1995)
This content downloaded from 134.53.245.11 on Mon, 30 Mar 2015 14:46:47 UTCAll use subject to JSTOR Terms and Conditions

Appendix. Trophic guild of each bird and bat species, number of captures, number with diet samples (total, with arthropods, and with seeds), and total seed records. Some diet samples contained both arthropods and seeds. A seed record is the presence of 2a I seeds of a species in a diet sample; one diet sample can contribute > 1 seed records.
Family and Trophic Captures No. of diet samples Total species guild* seed-
Tot w/Arthr. w/Seeds records
Bats Emballonuridae Saccopteryx bilineata i10 8 8 0 0 Saccopteryx leptura i 4 4 3 0 0 Peropteryx kappleri i 2 2 2 0 0 Noctifionidae Noctilio albiventris V, 1 1 1 1 0 0 Phyllostomidae Phyllostominae Micronycteris megalotis f, i 4 3 1 1 1 Micronycteris nicefori fi2 2 2 0 0 Micronycteris schmidtorum fIi 1 1 0 0 Tonatia bidens fi5 3 2 1 1 Tonatia brasiliensis fi2 2 2 0 0 Tonatia carrikeri fIi 1 1 0 0 Tonatia silvicola fi8 7 5 1 1 Mimon crenulatum i 25 22 22 2 2 Phyllostomus discolor f, i, n 5 5 5 0 0 Phyllostomus elongatus i, na 15 12 11 0 0 Phyllostomus hastatus f, i, n 154 114 45 98 111 Phylloderma stenops f, Pb 5 3 1 2 2 Trachops cirrhosus i 2 2 2 0 0 Chrotopterus auritus VC 5 4 3 2 2 Vampyrum spectrum v 3 2 1 0 0 Glossophaginae Glossophaga soricina fi, n 18 13 4 3 3 Lonchophylla thomasi f, i, nd' 33 21 6 4 6 Anoura caudifer f, i, n 1 1 I 0 0 Choeroniscus intermedius 1, n 3 2 0 0 0 Carolliinae Carollia brevicauda f 349 247 38 186 235 Carollia castanea f 63 43 6 33 48 Carollia perspicillata f 609 465 61 374 448 Rhinophylla fischerae fe 24 13 1 8 10 Rhinophylla pumilic f 73 51 3 37 40 Stenoderminae Sturnira lilium f 23 16 2 10 11 Sturnira magna ff 10 8 0 4 4 Sturnira tildae f, ig 1 1 6 2 4 5 Uroderma bilobatum f 34 19 4 13 13 Uroderma magnirostrum fh 5 3 0 1 2 Platyrrhinus brachycephalus fi 2 2 0 2 2 Platyrrhinus hellerij f 8 3 0 2 2 Vampyressa brockii f 1 1 0 1 1 Vampyressa macconnelli f 9 5 1 0 0 Vampyressa pusilla fk 12 7 0 3 4 Chiroderma villosum f 5 3 1 1 1 Artibeus anderseni f 6 3 0 1 1 Artibeus concolor f 15 10 0 6 8 Artibeus gnomus f 31 19 3 10 13 Artibeus hartii f 3 1 0 1 1 Artibeus jamaicensis f 124 53 4 25 28 Artibeus lituratus f 277 94 5 35 35 Artibeus obscurus f 70 36 0 21 21 Desmodus rotundus b 100 7 0 0 0 Thyropteridae Thyroptera discifera i 2 2 1 0 0 Vespertilionidae Myotis nigricans i 16 5 5 0 0 Myotis riparius i 8 5 4 0 0 Myotis simus i 7 6 5 0 0 Myotis Sp. i 1 1 1 0 0 Eptesicus brasiliensis i 2 2 2 0 0 Molossidae Molossops neglectus i 4 2 2 0 0 Promops centralis i2 2 2 0 0 Molossus molossus i13 1 1 9 0 0 Taxa w. no diet samples (2 addl. 6 0 0 0 0
spp., 1 addl. genus & family) To tal 22341A 138 291I 892106
This content downloaded from 134.53.245.11 on Mon, 30 Mar 2015 14:46:47 UTCAll use subject to JSTOR Terms and Conditions

Appendix, continued.
Family and Trophic Captures No. of diet samples Total species guild* seed
Tot w/Arthr. w/Seeds records
Birds Columbidae Geotrygon montana F, T 5 3 1 0 0 Psittacidae Pionites melanocephala G, A 1 1 0 0 0 Touit purpurata g al 4 2 1 0 0 Caprimulgidae Nyctidromus albicollis I, T, S 1 1 0 0 0 Alcedinidae Chioroceryle inda Aquat 3 1 0 0 0 Galbulidae Galbula albirostris I, A, S 7 2 2 0 0 Bucconidae Bucco capensis I, A, S 2 2 1 1 1 Bucco tamatia I, A, S 2 2 2 0 0 Monasa morphoeus I, A, S 2 1 1 0 0 Nonnula rubecula I, A, S 4 3 2 0 0 Capitonidae Capito niger O, A 1 1 0 1 3 Ramphastidae Pteroglossus flavirostris F, A 2 2 1 1 1 Picidae Celeus grammicus I, B,I1 2 2 2 1 2 Celeus torquatus I, B, I 3 3 1 0 0 Dendrocolaptidae Deconychura longicauda I, A, S 7 1 1 0 0 Deconychura stictolaema I, A, S 1 1 1 0 0 Dendrocincla fuliginosa I, A, 5 13 3 3 0 0 Dendrocolaptes certhia I, A, 5 5 2 1 0 0 Glyphorhynchus sprirurus I, B, S 64 28 19 1 2 Xiphorhynchus guttatus I, B, 5 5 4 4 0 0 Xiphorhynchus obsoletus I, B, 5 3 2 2 0 0 Xiphorhynchus ocellatus I, B, S 30 21 18 2 2 Xiphorhynchus spixii I, B, S 1 1 1 0 0 Xiphorhynchus sp. I, B, S 2 2 1 0 0 Furnariidae Automolus infuscatus I, A, DL 2 2 2 0 0 Automolus ochrolaemus I, A, DL 1 1 1 0 0 Philydor ruficaudatus I, A, DL 2 2 2 0 0 Scierurus mexicanus I, T, G 3 2 2 0 0 Xenops milleri I, B, S 12 6 6 1 1 Xenops minutus I, B, S 20 13 12 0 0 Formicariidae Cercomacra nigrescens I, A, G 5 1 1 0 0 Cercomacra serva I, A, G 5 4 3 0 0 Cercomacra tyrannina I, A, G 1 1 1 0 0 Conopophaga aurita I, T, G 13 8 8 0 0 Conopophaga castaneiceps I, T, G 2 1 1 0 0 Cymbilaimus lineatus I, A, G 1 1 1 0 0 D~ichrozona cincta I, T, G 6 2 2 0 0 Formicarius colma Om 2 2 2 2 2 Gymnopithys salvini I, AF 47 29 26 0 0 Hylophylax naevia I, A, G 6 2 2 0 0 Hylophylax poecilonata I, AF 4 2 2 0 0 Hypocnemis cantator I, A, G 3 2 2 0 0 Megastictus margaritatus i, a, gfl 3 1 1 0 0 Myrmneciza hemimelaena I, A, G 15 6 6 0 0 Myrmoborus myotherinus I, T, G 5 4 4 0 0 Myrmotherula axillaris I, A, G 25 17 13 0 0 Myrmotherula haemotonota I, A, G 20 10 9 0 0 Myrmotherula leucophthalma I, A, DL 1 1 0 0 0 Myrmotherula longipennis I, A, G 8 7 5 0 0 Myrmotherula schisticolor L, A, G 1 1 1 0 0 Phiegopsis erythroptera I, AF 3 2 1 0 0 Thamnomanes ardesiacus I, A, S 15 12 9 0 0 Thamnomanes caesius I, A, 5 1 1 1 0 0 Thamnomanes saturninus I, A, 5 2 2 2 0 0 Thamnophilus aethiops I, A, G 4 3 3 0 0 Thamnophilus murinus I, A, G 3 2 2 0 0 Thamnophilus punctatus? I, A, U 1 1 1 0 0 Thamnophilus schistaceus L, A, G 1 1 1 0 0
This content downloaded from 134.53.245.11 on Mon, 30 Mar 2015 14:46:47 UTCAll use subject to JSTOR Terms and Conditions

Appendix, continued.
Family and Trophic Captures No. of diet samples Total species guild* seed
Tot w/Arthr. w/Seeds records
Pipridae Chloropipo holochlora 1 1 0 0 0 Machaeropterus regulus o,a? 19 17 8 14 15 Manacus manacus f,aP 13 12 3 7 10 Pipra chloromeros F,A 3 2 1 2 2 Pipra coronata F,A 40 35 10 25 28 Pipra erythrocephala F, A 4 4 0 4 6 Pipra pipra F,A 123 98 33 72 93 Schiffornis major F,A 1 1 0 1 2 Schiffornis turdinus F,A 9 7 3 4 5 Cotingidae Lipaugus vociferans F, A 7 6 2 4 5 Cnipodectes subbrunneus i, a, g' 10 9 8 0 0 Corythopis torquata I, T, S 9 5 5 0 0 Lophotriccus galeatus i, a, gq 8 5 5 0 0 Lophotriccus vitosus i, a, g4 1 1 0 0 0 Lophotriccus sp. i, a, g 1 1 1 0 0 Mionectes oleaginea 0, A 34 20 14 7 7 Myiobius atricaudus i, a, Sq 7 4 4 0 0 Myiornis ecaudatus I, A, S 1 1 0 0 0 Onycorhynchus coronatus I, A, S 1 1 1 0 0 Ramphotrigon ruficauda o, ar 7 4 3 2 4 Rhynchocyclus olivaceus i, a, gq 2 1 1 0 0 Terenotriccus erythrurus I, A, S 11 4 3 0 0 Tolmomyias poliocephalus I, A, S 9 5 5 0 0 Troglodytidae Microcerculus marginatus 1, T, G 13 10 10 0 0 Turdidae Catharus ustulatus OA 15 11 3 8 9 Turdus albicollis O,A 8 7 4 4 6 Turdussp. 0,A 2 2 1 2 2 Coerebidae Chlorophanes spiza O,A 1 1 0 1 1 Cyanerpes caeruleus O,A 1 1 0 1 2 Icteridae Cacicus cela O,A 1 1 0 0 0 Thraupidae Euphonia rufiventris F, A 2 1 0 1 3 Hemithraupis flavicollis I, A, G 1 1 0 1 1 Lanio versicolor I, A, S 1 1 0 0 0 Tachyphonus surinamus o, as 32 26 22 18 22 Tangara chilensis O,A 5 3 0 3 4 Tangara schankii OA 10 9 4 8 11 Fringillidae Oryzoborus angolensis g, tq 1 1 1 1 1 Not identified to genus 8 7 6 0 0 Trochilidae (6 genera, 11 spp.) N 231 2 0 0 0 Taxa with no diet records 31 0 0 0 0
(4 addl. families, 15 addl. genera, 21 addl. spp.)
Total 1097 571 361 200 253
* Trophic guilds for bats based on Gardner (1977) for phyllostomids and Wilson (1973) for non-phyllostomids, except where indicated by footnote: i = insects and other arthropods, f = fruit, n = nectar and/or pollen, v = vertebrates, incl. fish, b = blood. Trophic guilds for birds based on Terborgh et al. (1990), except where indicated by footnote: Aquat = water birds feeding on fish; F, A = arboreal frugivore; F, T = terrestrial frugivore; G,A = arboreal granivore; G, T = terrestrial granivore; I, A, DL = dead-leaf-searching arboreal insectivore; I, AF = ant-following insectivore; I, A, G = arboreal, gleaning insectivore; I, A, S = arboreal, sallying insectivore; I, B, I = bark-dwelling insectivores feeding in trunk interiors; I, B, S = bark-dwelling insectivores feeding superficially; I, T, G = gleaning terrestrial insectivore; I, T, S = sallying terrestrial insectivore; N = nectarivore; 0, A = arboreal omnivore; Lower cases letters are for genera not covered in Terborgh et al. (1990) or where our data indicate a different guild than indicated by Terborgh et al. (1990).
a Diet undescribed in literature except for pollen reported on heads (Gardner 1977). Gardner (1977) suspected that plant material as well as insects were eaten, but ours is first report of seeds (of Gurania acuminata Cucurbitaceae). Eats mostly vertebrates with some insects (Medellin 1988). Seeds in our captures (1 Piper, 1 Philododendron) may have been from prey stomachs.
dDiet undescribed in literature, but congeners feed on flowers as well as insects and fruit (Gardner 1977). Seeds found in our specimens were Cecropia spp. (N= 5) and Piper (N= 1).
OIKOS 74:2 (1995) 249
This content downloaded from 134.53.245.11 on Mon, 30 Mar 2015 14:46:47 UTCAll use subject to JSTOR Terms and Conditions

Appendix, continued.
eDiet undescribed in literature; of our seed records, 30% were an unknown Guttiferae (No. 77 in Table 5), 20% Vismia spp., and 20% Araceae. Diet undescribed in literature; half of our seed records were Solanum spp. Gardner (1977) considers this a frugivore, but one third of our diet samples contained insects. Three of our five seed records were Solanum spp. Also visits flowers, based on Gardner's observation of pollen on fur, the only published diet data; our only diet sample contained Cecropia and Ficus seeds. Formerly Vampyrops brachycephalus. Diet undescribed in literature; our two seed records were of Vismia and Ficus. Formerly Vampyrops helleri.
kConsidered frugivorous based on our limited data and Gardner (1977). Two of our four seed records were Cecropia spp. Other Vampyressa spp. considered frugivorous based on this sp. Based on Karr et al. (1990).
mI,T,G according to Terborgh et al. (1990) but all our diet samples contained seeds. nBased on Hilty and Brown (1986). O Based on Johns (1991). PBased on Snow (1962). qBased on Hilty and Brown (1986) and Karr et al. (1990). rI, A, S according to Terborgh et al. (1990) but half of our diet samples contained seeds.
I, A, G according to Terborgh et al. (1990) but 69% of our diet samples contained seeds, and arboreal-insectivore according to Johns (1991).
250 OIKOS 74:2 (1995)
This content downloaded from 134.53.245.11 on Mon, 30 Mar 2015 14:46:47 UTCAll use subject to JSTOR Terms and Conditions