dielectric constant, optical transmission, and thermal diffusivity monitoring of iodine-impregnated...
TRANSCRIPT

Dielectric Constant, Optical Transmission, and Thermal Diffusivity Monitoring of Iodine-Impregnated Polystyrene Films
N. F. LEITE, A. H. FRANZAN, A. TORRES-FILHO, and L. C . M. MIRANDA, Ministhi0 da Cikncia e Tecnobgiu, Institute de Pesqukas Espuci.uk, Laborathrio Associado de Sensores e Materiais,
Caixa Postal 515,12201-5'60 JosZ dos Campos, SP, Brazil
Synopsis
A simple method for the iodine doping of atactic polystyrene films is described. The marked changes in the physical properties of the polystyrene films, such as dielectric constant, optical absorption coefficient, and thermal diffusivity, are presented as a function of the doping time. The results show strong evidences of the onset of an order-disorder transition as a function of the doping time.
INTRODUCTION
In the past few years a considerable amount of work has been dedicated to the development of electrically conducting polymers (see, for example, Ref. l ) . 2 3 3 In general, the main polymer skeleton has a high degree of electronic delocalization and, after a doping process with electron donor or acceptor species, the material shows a drastic change in electrical conductivity,2 some- times comparable to that of metals, even at room temperat~re.~ The techno- logical applications span over a wide range of interests, going from simple flexible rubbery conductors to solar and electrochemical cells. The possibilities seem to be unlimited because of the ease with which the polymer molecules can be tailored for specific purposes. From the scientific point of view consid- erable progress has been made regarding both the development of new syn- thetic methods4 and the understanding of the basic conduction mechanism in these material^.^
Polystyrene (PS) is a well-known insulating material which can have its electrical properties changed by both chemical6 and physical7 methods. The main motivation for studying the electrical properties of doped PS is twofold. One is that PS polymers have delocalized aromatic 7 electrons which act as charge donors.' Secondly, in the case of isotactic PS, the particular arrange- ment of the aromatic rings in this material seems to set a well-defined pathway for charge transfer. Besides that, the spectroscopy of PS is well known so that any perturbation on the elecLronic configuration or molecular vibrations can be easily characterized. In this paper, we describe a simple method for the iodine impregnation of atactic PS films, and present the kinetics of the doping process as manifested by the changes in some of the
Journal of Applied Polymer Science, Vol. 39, 1361-1373 (1990) 0 1990 John Wiley & Sons, Inc. CCC 0021-8995/90/oS1361-13$04.00
1362 LEITE ET AL.
optical, electrical, and thermal properties of the PS doped samples, as a function of the doping time.
SAMPLE PREPARATION
The effect of the iodine impregnation on polystyrene was investigated using especially prepared atactic PS films. The PS resin used was manufactured by Estireno do Nordeste S.A. and was free from additives. PS is readily dissolved in carbon tetrachloride or chloroform a t room temperature. Film castings from a chloroform solution were tried a t different solution concentrations and drying temperatures. The solution is spread over a flat, clean glass substrate and the temperature is kept constant until complete evaporation of the solvent is reached. At room temperature, a 5% (w/w) solution was found optimum for producing homogeneous, pinhole-free, transparent PS films. The final film thickness can be varied from 5 up to 40 pm, depending on the solution concentration and the thickness of the initial solution layer spread over the glass substrate. A t room temperature, when a 5% chloroform solution is spread over an area of roughly 100 cm', the ratio between the thickness of the initial liquid layer and the final film thickness is roughly 3.
The resulting films undergo next the iodine (I,) doping by exposing them to iodine vapor either a t ambient conditions or under vacuum and different heating conditions. In our case, the I, doping process was carried out a t ambient temperature using a covered Petri plate in which finely divided I, pellets are placed at the center of the plate. The samples were positioned a t equal distances from the central I, pellets. For the optical transmission measurements the PS:I,-doped films were fixed between two brass rings with a central hole of 1 cm diameter. In the case of the capacitance measurements all the samples were cut in the shape of disks with 1 cm diameter. The electrodes consisted of 20 pm thick A1 foils with a 1 cm diameter. The intimate contact between the A1 disks and the PS samples was made using a very thin layer of vacuum grease between the A1 disks and the PS films. The reason for using these A1 disks and not A1 evaporated electrodes was essen- tially dictated by the need to avoid eventual I, desorption which may occur during the A1 evaporation. Care has been taken to make sure that the thin grease layer was not influencing the capacitance measurements; for the undoped samples, the measured values of the dielectric constant, loss tangent, and so on agreed very well with the known values for poly~tyrene.~
OPTICAL TRANSMISSION
To understand the iodine impregnation of PS, we initially obtained the optical transmission spectra of our samples between 190 and 900 nm using a Lambda 3 VIS-UV Perkin-Elmer spectrometer. In Figure 1 we show the transmission spectra of a 10 pm thick sample. The spectrum for the undoped PS sample shown in Figure l(a) exhibits strong absorption bands below 270 nm. These bands correspond to the known electronic transitions of PS involv- ing electronic excitation of the delocalized electrons of the aromatic rings hanging on the main polymer chain. For the PS:I,-doped sample, two new bands are apparent in the transmission spectrum shown in Figure 103). One between 580 and 420 nm with minimum transmission around 495 nm, and

IODINE-IMPREGNATED POLYSTYRENE FILMS 1363
I I 1 1 I
620.0 638.3 390.3 314.3 190.0
WAVELENGTH ( n m ) Fig. 1. Transmission spectra of 10 pm thick undoped (a) and I,-doped (b) PS films.
another, stronger one, from 420 to 270 nm with maximum absorption centered at 310 nm. These two bands are characteristic of the formation of a charge transfer complex.' The 495 nm band is the I, molecular band which in solutions with noninteracting solvents (like CC1,) is located at 520 nmlo but tends towards the blue with increasing donor concentration. The second, stronger band at 310 nm is assigned to PS-to-I, charge transfer, similarly to those observed in other systems?."
The molecular I, band at 495 nm is responsible for the deep red color of the doped PS films. For this reason we have monitored the 495 nm absorption coefficient p as a function of the I, doping time. There is yet another reason for the monitoring of this absorption band as a function of the I, doping. This band is also responsible for the Ar+-laser marking capability of these doped films.', The marking capability of these PS:I, films is evidenced as follows. Exposing, for a few seconds, the PST:I,-doped films to the beam of a CW-Ar+ laser, the interaction region changes its color from red to transpar-

1364 LEITE ET AL.
1 1 1 I
DOPINO TIME hid Fig. 2. Optical absorption coefficient of =:I,-doped, a t the 495 nm wavelength, as a function
of the I, doping time. The solid line corresponds to the data fitting to eq. (2) of the text.
ent, leaving a clear marked spot with the laser beam shape. This marking process is erasable, i.e, the film can regain its original color after exposing again to I, vapor, and was discussed in detail elsewhere." The marking time is inversely proportional to the laser beam intensity as well as to the optical absorption coefficient between 488 and 514.5 nm. In Figure 2 we present the results we got for the evolution of the 495 nm absorption as a function of the I, doping time. The data were obtained from conventional optical transmis- sion measurements at the 495 nm using Beer's law for the transmitted power, namely,
where I is the sample thickness and P (Po) is the transmitted (incident) power at the 495 nm wavelength. The solid curve in Figure 2 represents the data fitting to a theoretical expression for the doping time evolution of p. The ansatz we used was an expression of the form
p ( t ) = Po + &(I - e - t / T ) (2)
The data fitting yielded Po = 34 cm-l, p, = 120.61 cm-l, and r = 271.61 min. In eq. (2) r represents the time constant for the doping process and it turned out from the data fitting that the time for reaching the deep red color is of the order of 4.5 h of I, vapor exposure.
DIELECTRIC CONSTANT
The capacitance measurements were carried out using a Hewlett-Packard Model 4274A LCR meter in the frequency range between 100 Hz and 100 kHz. The disklike samples with diameter of 1 cm and thicknesses between 24 and 29 pm were previously exposed to I, vapor at different time intervals. After the I, vapor exposure, the A1 electrodes were then connected to the samples as described in the "Sample Preparation" section. In Figures 3 and 4 we show the dependence of the dielectric constant, c/cO, and of the electrical conduc-

IODINE-IMPREGNATED POLYSTYRENE FILMS 1365
c
0 0
2.4
0 a z 2 2 - w A
0 !!!
2.0
- - - -
- l I l I l + l
DOPINO TIME ( m i d
Fig. 3. Dielectric constant of the PS:I,-doped samples, at 1 kHz, as a function of the I, doping time. The solid line corresponds to the result of the data fitting to eq. (5) of the text.
tivity u, respectively, measured at 1 kHz, as a function of the sample doping time. The electrical conductivity was deduced from the measured values of the capacitance and loss tangent, as follows. The loss resistance RL of a capacitor is given by
R , = ( w C tan6)-' (3)
where w is the frequency, C is the capacitance, and tan 6 is the loss tangent. Equating eq. (3) to RL = l/uA, one gets
u = cotan6 (4)
Figure 3 shows that the dielectric constant remains practically constant around the value of 2.52 for the pure PS up to 2 h of I, impregnation. At
OOPlNO TlYt (nkl Fig. 4. Electrical conductivity of PS:I,-doped samples, at 1 kHz, as a function of the iodine
doping time.

1366 LEITE ET AL.
120 rnin of I, impregnation, the dielectric constant suffers a sharp decrease towards the value of 2.05 and practically remains constant a t this value for longer doping times. The same sudden change around 120 min doping time is also exhibited by the electrical conductivity as shown in Figure 4. In fact, it follows from Figure 4 that for up to 130 rnin doping time the electrical conductivity increases with increasing exposure time. At 130 rnin of impregna- tion it suffers a sharp decrease and for longer doping times it keeps increasing with increasing I, exposure time at a sharper rate. The overall change in the electrical conductivity observed during 4 h of impregnation was of the order of 15 times the value of the undoped sample. The same general behavior of both u and c / c 0 was also observed a t all the frequencies used in our measurements. The solid curve in Figure 3 is the result of the corresponding data fitting to a theoretical expression describing the sudden jump. The trial function we have used was an exponential-like function to describe the knee around 120 min. Mathematically, a knee may be described by a function of the form
where A is the knee height, to describes the knee location, and r represents its halfwidth. For the 1 kHz data shown in Figure 3, the resulting expression we got was
c / c o = 2.065 + 0.472/(1 + e(t-122.31)/7.22 ) (6)
which means that the sharp transition observed in Figure 3 is centered a t 122.31 min. For all the other frequencies used in our measurements, the data fitting yielded practically the same values for the parameters to and r describing the knee, except for small changes in both the value of the independent term in eq. (6) (it varied from 2.17 a t 100 Hz to 2.05 a t 10 kHz) and of the knee height (it varied from 0.402 a t 100 Hz to 0.486 a t 10 kHz). In the case of the electrical conductivity data shown in Figure 4, the dashed curve represents a simple interpolation between the experimental points.
The observed increase in the electrical conductivity and the decrease in the dielectric constant of the PS films with increasing doping time when using a metallic dopant are both physically reasonable and predictable. However, the sudden change in both the dielectric constant and the electrical conductivity around the 130 min doping time could not be easily anticipated. In general, a discontinuity in the dielectric constant is associated with some sort of order-disorder tran~ition.'~ Thus, from a qualitative point of view, the sudden drop in the dielectric constant observed in Figure 3 around 122 min may then be thought to mark the transition to an ordered state in which the directions of the dipoles form a regular array. The smaller value of the dielectric constant in this somewhat ordered state means that to cause the same change in the polarization of the system, one requires a stronger electric field than in the case of the disordered state; i.e, in an ordered state it is more difficult to cause a reorientation of the dipoles than in a disordered state. Furthermore, in an ordered state one would expect an enhanced electrical conductivity. Thus, this assignment of the sudden changes in both c and u, at a given doping time,

IODINE-IMPREGNATED POLYSTYRENE FILMS 1367
as being due to some kind of order-disorder transition seems, at least qualitatively, to explain the overall behavior of the data shown in Figures 3 and 4. However, if this is true, the same sudden change should also be manifested in the thermodynamic properties of the PS:I,-doped films. To check this, we have next measured the thermal diffusivity a of the PS:I,-doped films as a function of the doping time.
THERMAL DIFFUSIVITY
The thermal diffusivity a measures the rate of heat diffusion in a sample and is defined by
a = k / p c (7)
where k is the thermal conductivity, p is the density, and c is the heat capacity at constant pressure. The importance of a as a physical parameter to be monitored is due to the fact that, like the optical absorption coefficient, it is unique for each material. This can be appreciated from the tabulated values of a presented by Touloukian et al.14 for a wide range of materials, such as metals, minerals, foodstuffs, biological specimens, and polymers. Furthermore, the thermal diffusivity is extremely dependent upon the effects of composi- tional and microstructural ~ariables’~ as well as processing conditions, as in the case of glasses,lg metallic ribbons,20 and semiconductors.21
Thermal diffusivities of many materials can be accurately measured by the photoacoustic (PA) technique. The PA technique looks directly at the heat generated in a sample, due to nonradiative deexitation processes, following the absorption of light. In the conventional PA experimental arrangement a sample enclosed in an air-tight cell is exposed to a chopped light beam. As a result of the periodic heating of the sample, the pressure in the chamber oscillates at the chopping frequency and can be detected by a sensitive microphone coupled to the cell. The resulting PA signal depends not only on the amount of heat generated in the sample (i.e., on the optical absorption coefficient and the sample light-into-heat conversion efficiency), but also on how the heat diffuses through the sample. The PA measurement of the thermal diffusivity of polymers has been reported by a number of authors.’6-18’22 These papers employ different versions of the PA technique. Of the several PA techniques23 for measuring the thermal diffusivity we resorted to the recently proposed “open cell” (OPC) method described in Ref. 24, which is schematically shown in Figure 5. It consists of mounting the sample directly onto a cylindrical electret microphone. The typical design of an electret microphone consists of a metallized electret diaphragm (12 pm Teflon with a 500-1000 A thick deposited metal electrodes) and a metal back-plate separated from the diaphragm by an air gap (45 pm). The metal layer and the back-plate are connected through a resistor R. The front sound inlet is a circular hole of 2 mm diameter, and the front air chamber adjacent to the metallized face of the diaphragm is roughly 1 mm long. As a result of the periodic heating of the sample by the absorption of modulated light, the pressure in the front chamber oscillates at the chopping frequency, causing diaphragm deflections, which generates a voltage across the resistor R. That
1368 LEITE ET AL.
vacuum Groaro /
P A Chamber 1
Motallitod Eloctrot
Diaphragm
A i r Gap V
Motal
B a t k - P l a t ~
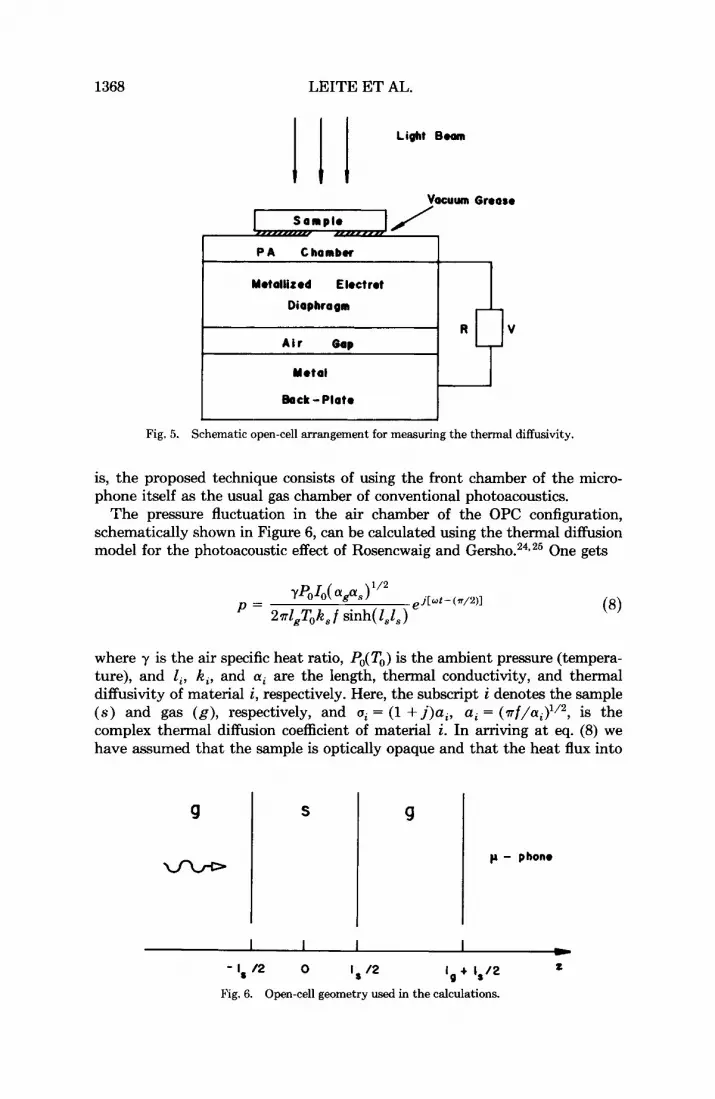
Fig. 5. Schematic open-cell arrangement for measuring the thermal diffusivity.
is, the proposed technique consists of using the front chamber of the micro- phone itself as the usual gas chamber of conventional photoacoustics.
The pressure fluctuation in the air chamber of the OPC configuration, schematically shown in Figure 6, can be calculated using the thermal diffusion model for the photoacoustic effect of Rosencwaig and G e r ~ h o . ~ ~ , ~ ~ One gets
where y is the air specific heat ratio, Po(To) is the ambient pressure (tempera- ture), and Zi, k,, and ai are the length, thermal conductivity, and thermal diffusivity of material i, respectively. Here, the subscript i denotes the sample ( s ) and gas (g), respectively, and ui = (1 + j ) u i , ai = (af/ai)’l2, is the complex thermal diffusion coefficient of material i. In arriving at eq. (8) we have assumed that the sample is optically opaque and that the heat flux into
S 9
p - phono
1 1 1 I c z - I, I2 0 I, 12 I Q + &,I2
Fig. 6. Open-cell geometry used in the calculations.

IODINE-IMPREGNATED POLYSTYRENE FILMS 1369
the surrounding air is negligible. The implicit optical opaqueness condition, meaning that all the incident radiation is fully absorbed at the surface z = -Z,/2 (cf. Fig. 6), was ensured by using a thin circular A1 foil (20 pm thick) of 8 mm diameter attached to the front side of the sample using a thin layer of vacuum grease. The thermal diffusion time d 2 / a in this A1 foil is of the order of 13.6 ps [cu(Al) = 0.92 cm2/s] so that the heat generated in the A1 foil absorber may be assumed to be instantaneously diffused towards the PS samples. For a thermally thin sample (i.e, Zsas -=z l), eq. (8) reduces to
In other words, the PA signal amplitude decreases as f - ' , 5 as one increases the modulation frequency. In contrast, at high modulation frequencies, such that the sample is thermally thick (i.e, Zsas >> l), one gets
Equation (10) means that, for a thermally thick sample, the amplitude of the PA signal decreases exponentially with the modulation frequency as (l/f )exp( - a f i ) , where a = ( T Z ; / ~ , ) ~ / ~ . The thermal diffusivity a, can then be obtained from the signal data fitting, in the high modulation frequency range, from the coefficient a = ( ~ Z z / a , ) ' / ~ in the expression
The PA thermal diffusivity measurements were carried out using a 500 W halogen lamp whose polychromatic beam was modulated using a variable speed chopper (PAR Model 192) and later focused onto the sample. The microphone voltage output was measured using a lock-in amplifier (PAR Model 124). In Figure 7 we show the PA signal amplitude as a function of the modulation frequency square root for a 30 pm thick, 8 mm diameter PS:I,- doped sample after 2 h of I, vapor exposure. The solid curve in this figure represents the fitting of the experimental data to eq. (11). The resulting value obtained for a from the data fitting was a = 0.00136 cm2/s for the 2-h PS:I,-doped sample. For the undoped PS sample, the value we got for a was 0.00084 cm2/s, which agrees very well with the known value (i.e, a = 0.00086 cm2/s) of the thermal diffusivity for atactic PS. The same procedure was repeated with all the other PST:I,-doped samples. In Figure 8 we summarize the results for the thermal diffusivity of our PS:I,-doped samples as a function of the doping time. We note that at 120 min doping time a exhibits a sudden change too, reaching a peak value of 0.00136 cm2/s, and then decreases on further increasing the doping time up to 150 min, where it reaches a minimum of the order of 0.00094 cm2/s. On further increasing the I, exposure time from 150 min, a increases, reaches another maximum around 180 min, and then decreases with increasing doping time. The overall behavior up to

1370 LEITE ET AL.
7.2 8.8 la4 FREQUENCY SQUARE ROOT ( H f l g )
Fig. 7. PA signal amplitude, as a function of the square root of the modulation frequency, for a 30 pm thick PS:I,-doped sample after 2 h of I, exposure. The solid line corresponds to the fitting of the experimental data to eq. (11) of the text.
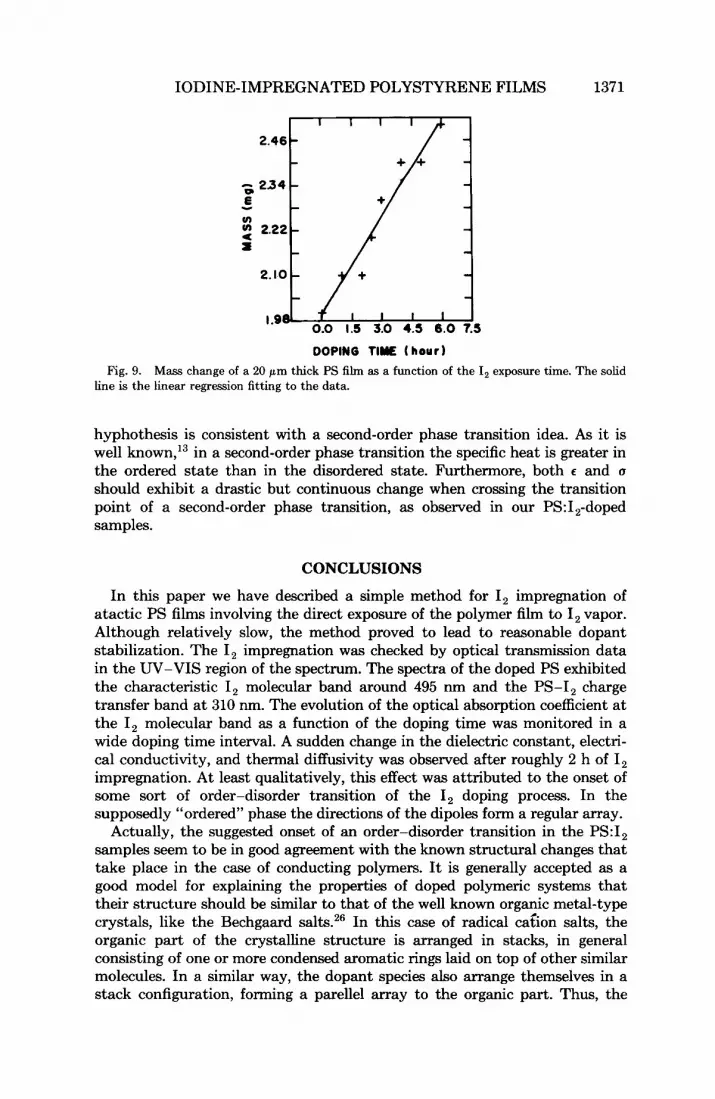
200 min doping time, exhibiting a sudden change around 120 min, is very similar to the electrical conductivity behavior and seems to support our tentative explanation that some sort of order-disorder transition is taking place after 2 hours of I, impregnation. This may be due to the metallic iodine contribution to the thermal conductivity as given by the Wiedmann-Franz law. However, above 200 min, a decreases with increasing doping time. This behavior would be expected if both the mass density and the specific heat increase with increasing doping time. The mass incorporation into our sample was monitored as a function of the I, doping time. This is shown in Figure 9 in which a 23% increase in the mass of a 20 pm thick PS sample is observed after 5 h of I, impregnation. On the other hand, between 200 and 300 min of I, impregnation the thermal diffusivity data (cf. Fig. 8) indicates that i t has decreased roughly 54%. Thus, the mass variation (increase in p ) due to the I, impregnation cannot alone account for the observed decrease in a. We then conclude that the specific heat must also increase in this region. This later
DOPING TIME ( m i d Fig. 8. Thermal diffusivity of PS:I,-doped samples as a function of the doping time.
IODINE-IMPREGNATED POLYSTYRENE FILMS 1371
DOPINO TlYE ( hour Fig. 9. Mass change of a 20 pm thick PS film as a function of the I, exposure time. The solid
line is the linear regression fitting to the data.
hyphothesis is consistent with a second-order phase transition idea. As it is well in a second-order phase transition the specific heat is greater in the ordered state than in the disordered state. Furthermore, both c and a should exhibit a drastic but continuous change when crossing the transition point of a second-order phase transition, as observed in our PS:I,-doped samples.
CONCLUSIONS
In this paper we have described a simple method for I, impregnation of atactic PS films involving the direct exposure of the polymer film to I, vapor. Although relatively slow, the method proved to lead to reasonable dopant stabilization. The I, impregnation was checked by optical transmission data in the UV-VIS region of the spectrum. The spectra of the doped PS exhibited the characteristic I, molecular band around 495 nm and the PS-I, charge transfer band at 310 nm. The evolution of the optical absorption coefficient at the I, molecular band as a function of the doping time was monitored in a wide doping time interval. A sudden change in the dielectric constant, electri- cal conductivity, and thermal diffusivity was observed after roughly 2 h of I, impregnation. A t least qualitatively, this effect was attributed to the onset of some sort of order-disorder transition of the I, doping process. In the supposedly “ordered” phase the directions of the dipoles form a regular array.
Actually, the suggested onset of an order-disorder transition in the PS:I, samples seem to be in good agreement with the known structural changes that take place in the case of conducting polymers. I t is generally accepted as a good model for explaining the properties of doped polymeric systems that their structure should be similar to that of the well known organic metal-type crystals, like the Bechgaard salts.26 In this case of radical cazion salts, the organic part of the crystalline structure is arranged in stacks, in general consisting of one or more condensed aromatic rings laid on top of other similar molecules. In a similar way, the dopant species also arrange themselves in a stack configuration, forming a parellel array to the organic part. Thus, the
1372 LEITE ET AL. ...c... 0 0
. . .
. . .
. . .
... 0
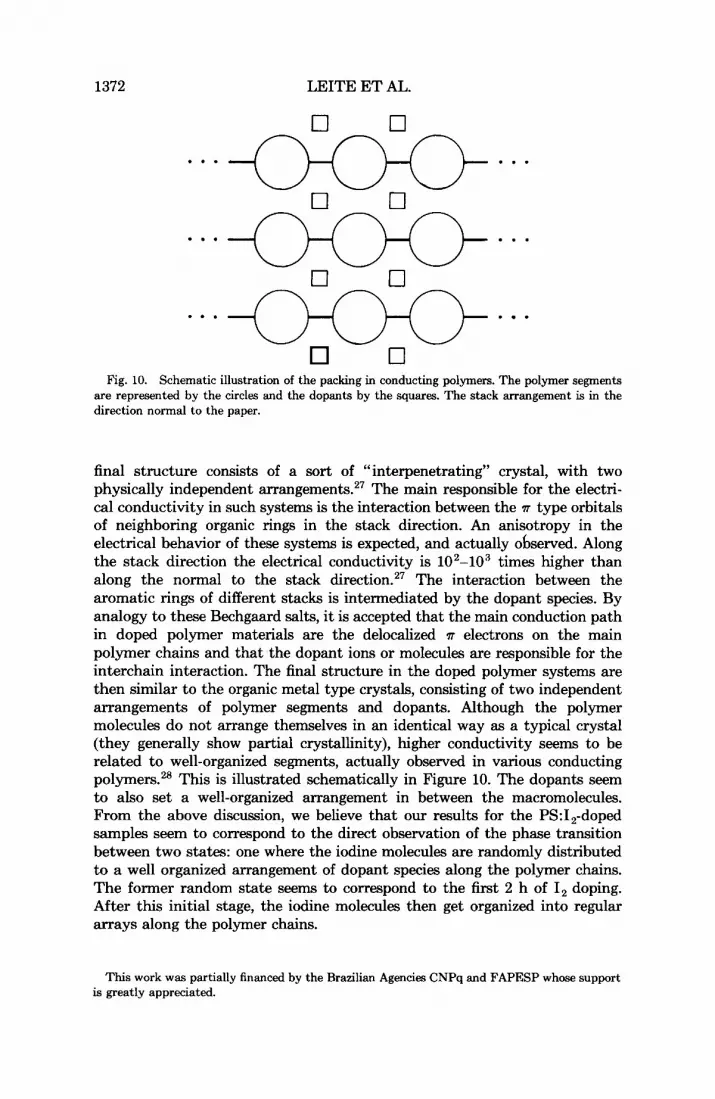
Fig. 10. Schematic illustration of the packing in conducting polymers. The polymer segments are represented by the circles and the dopants by the squares. The stack arrangement is in the direction normal to the paper.
final structure consists of a sort of “interpenetrating” crystal, with two physically independent arrangerne~~ts.~~ The main responsible for the electri- cal conductivity in such systems is the interaction between the IZ type orbitals of neighboring organic rings in the stack direction. An anisotropy in the electrical behavior of these systems is expected, and actually observed. Along the stack direction the electrical conductivity is 102-103 times higher than along the normal to the stack direction.27 The interaction between the aromatic rings of different stacks is intermediated by the dopant species. By analogy to these Bechgaard salts, it is accepted that the main conduction path in doped polymer materials are the delocalized IZ electrons on the main polymer chains and that the dopant ions or molecules are responsible for the interchain interaction. The final structure in the doped polymer systems are then similar to the organic metal type crystals, consisting of two independent arrangements of polymer segments and dopants. Although the polymer molecules do not arrange themselves in an identical way as a typical crystal (they generally show partial crystallinity), higher conductivity seems to be related to well-organized segments, actually observed in various conducting polymers.28 This is illustrated schematically in Figure 10. The dopants seem to also set a well-organized arrangement in between the macromolecules. From the above discussion, we believe that our results for the PS:I,-doped samples seem to correspond to the direct observation of the phase transition between two states: one where the iodine molecules are randomly distributed to a well organized arrangement of dopant species along the polymer chains. The former random state seems to correspond to the first 2 h of I, doping. After this initial stage, the iodine molecules then get organized into regular arrays along the polymer chains.
This work was partially financed by the Brazilian Agencies CNPq and FAPESP whose support is greatly appreciated.

IODINE-IMPREGNATED POLYSTYRENE FILMS 1373
References 1. Conducting Polymers, L. Alcacer, Ed., Riedel, Lancaster, 1987. 2. H. Shirakawa, E. J. Louis, A. G. MacDiarmid, C. R. Chiang, and A. J. Heeger, J . Chem.
3. N. Basescu, Z. X. Lin, D. Moses, A. J. Heeger, H. Naarmann, and N. Theophilou, Nature,
4. J. H. Edwards and W. J. Feast, Polymer, 21, 595 (1980). 5. W. P. Su, J. R. Schrieffer, and A. J. Heeger, Phys. Reu. Lett., 42, 1698 (1979); Phys. Rev.
6. F. Sandrolini, P. Manaresi, and G. Zappia, Chim. Znd., 58, 831 (1976). 7. Y. Segui, Bui Ai, and H. Carchano, J . Appl. Phys., 47, 140 (1976). 8. H. Benesi and J. Hildebrand, J . Am. Chem. SOC., 70, 2832 (1948). 9. Polymer Handbook, J. Bandrup and E. H. Immergut, Eds., Wiley, New York, 1975.
SOC. Chem. Commun., 578 (1977).
327, 403 (1987).
B, 22, 2099 (1980).
10. M. J. Blandmer and M. F. Fox, Chem. Reu., 70, 59 (1970). 11. R. M. Keefer and L. J. Andrews, J . Am. Chem. SOC., 77, 2164 (1955). 12. A. Torres-Filho and A. H. Franzan, J. Appl. Phys., to appear. 13. L. D. Landan and E. M. Lifshitz, Statistical Physics, Pergamon, Oxford, 1975. 14. Y. S. Touloukian, R. W. Powell, Y. C. Ho, and M. C. Nicolasu, Thermal Diffmioity,
15. G. Ziegler and D. P. H. Hasselman, J. Mater. Sci., 16, 495 (1981). 16. B. MertB, P. Korpiun, E. Luscher, and R. Tilgner, J . Phys. C, 6, 43 (1983). 17. N. F. Leite, N. Cella, H. Vargas, and L. C. M. Miranda, J . Appl. Phys., 61, 3023 (1987). 18. A. Torres Filho, L. F. Perondi, and L. C. M. Miranda, J . Appl. Polym. Sci., 35, 103 (1988). 19. A. C. Bento, H. Vargas, M. M. F. Aguiar, and.L. C. M. Miranda, Phys. Chem. Glasses, to
20. R. Kordecki, B. K. Bein, and J. Pelzl, Can. J . Phys., 64, 1204 (1986). 21. 0. Pessoa Jr., C. L. Cesar, N. A. Patel, H. Vargas, C. C. Ghizoni, and L. C. M. Miranda,
22. A. Lachaine and P. Poulet, Appl. Phys. Lett., 45, 953 (1984). 23. H. Vargas and L. C. M. Miranda, Phys. Rep., 161, 43 (1988). 24. L. F. Perondi and L. C. M. Miranda, J . Appl. Phys., 62, 2955 (1987). 25. A. Rosencwaig and A. Gersho, J . Appl. Phys., 47, 64 (1976). 26. H. P. Fritz, H. Geloaner, P. Friedrich, P. Ecker, R. A r t s , and U. Schubert, 2. Naturforch.,
B33, 498 (1978). 27. G. Wegner, in Electronic Properties of Polymers and Related Compounds, Solid State
Science Series, Vol. 63, H. Kuzmany, M. Mehring, and S. Roth, Eds., Springer-Verlag, Berlin, 1985, p. 18.
28. M. A. Druy, C. H. Tsang, N. Brown, A. J. Heeger, and A. G. MacDiarmid, J . PoZym. Sci., PoZym. Phys. Ed., 18, 429 (1980).
Plenum, New York, 1973.
appear.
J . Appl. Phys., 59, 1316 (1986).
Received April 25, 1989 Accepted April 28, 1989