dielectric behaviour of insulating papers subjected to mixed
TRANSCRIPT
Dielectric Behaviour of InsulatingPapers Subjected
to Mixed Electric Fields
Doctoral thesispresented by
Ivan Semenov
born on 19.01.1991citizen of the Russian Federation
submitted tothe Faculty of Electrical Engineering and
Information Technologyin Technische Universität Ilmenau
for the degree of Doctor of Engineering
First reviewer Prof. Dr.-Ing. habil. Jürgen PetzoldtSecond reviewer Prof. Dr. Christian FranckThird reviewer Prof. Dr.-Ing. Carsten Leu
Day of submission: 14.08.2020Day of defense: 12.05.2021
DOI: 10.22032/dbt.50393URN: nbn:de:gbv:ilm1-2021000364
This work is licensed under a Creative Commons Attribution- 4.0
International (CC BY 4.0).

Abstract
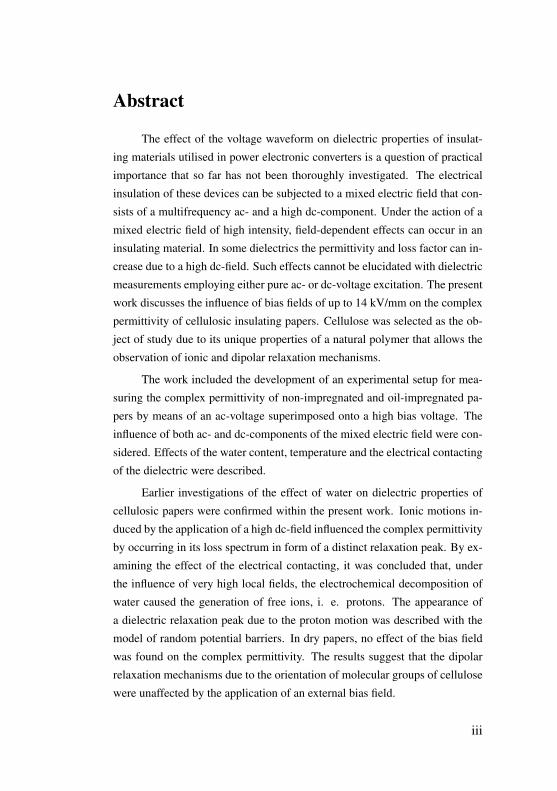
The effect of the voltage waveform on dielectric properties of insulat-
ing materials utilised in power electronic converters is a question of practical
importance that so far has not been thoroughly investigated. The electrical
insulation of these devices can be subjected to a mixed electric field that con-
sists of a multifrequency ac- and a high dc-component. Under the action of a
mixed electric field of high intensity, field-dependent effects can occur in an
insulating material. In some dielectrics the permittivity and loss factor can in-
crease due to a high dc-field. Such effects cannot be elucidated with dielectric
measurements employing either pure ac- or dc-voltage excitation. The present
work discusses the influence of bias fields of up to 14 kV/mm on the complex
permittivity of cellulosic insulating papers. Cellulose was selected as the ob-
ject of study due to its unique properties of a natural polymer that allows the
observation of ionic and dipolar relaxation mechanisms.
The work included the development of an experimental setup for mea-
suring the complex permittivity of non-impregnated and oil-impregnated pa-
pers by means of an ac-voltage superimposed onto a high bias voltage. The
influence of both ac- and dc-components of the mixed electric field were con-
sidered. Effects of the water content, temperature and the electrical contacting
of the dielectric were described.
Earlier investigations of the effect of water on dielectric properties of
cellulosic papers were confirmed within the present work. Ionic motions in-
duced by the application of a high dc-field influenced the complex permittivity
by occurring in its loss spectrum in form of a distinct relaxation peak. By ex-
amining the effect of the electrical contacting, it was concluded that, under
the influence of very high local fields, the electrochemical decomposition of
water caused the generation of free ions, i. e. protons. The appearance of
a dielectric relaxation peak due to the proton motion was described with the
model of random potential barriers. In dry papers, no effect of the bias field
was found on the complex permittivity. The results suggest that the dipolar
relaxation mechanisms due to the orientation of molecular groups of cellulose
were unaffected by the application of an external bias field.
iii
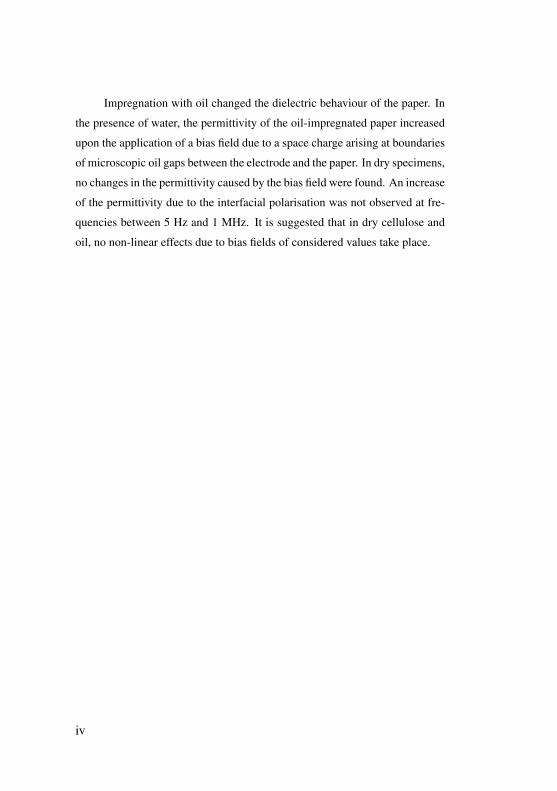
Impregnation with oil changed the dielectric behaviour of the paper. In
the presence of water, the permittivity of the oil-impregnated paper increased
upon the application of a bias field due to a space charge arising at boundaries
of microscopic oil gaps between the electrode and the paper. In dry specimens,
no changes in the permittivity caused by the bias field were found. An increase
of the permittivity due to the interfacial polarisation was not observed at fre-
quencies between 5 Hz and 1 MHz. It is suggested that in dry cellulose and
oil, no non-linear effects due to bias fields of considered values take place.
iv
Kurzfassung
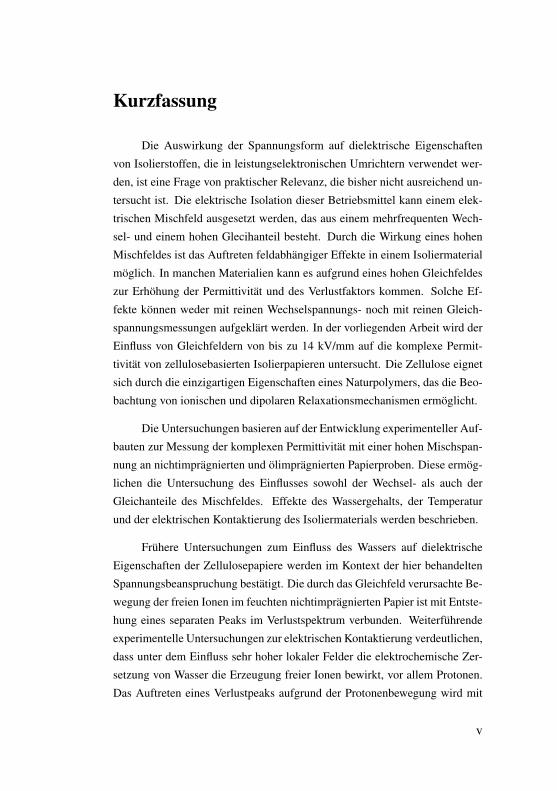
Die Auswirkung der Spannungsform auf dielektrische Eigenschaften
von Isolierstoffen, die in leistungselektronischen Umrichtern verwendet wer-
den, ist eine Frage von praktischer Relevanz, die bisher nicht ausreichend un-
tersucht ist. Die elektrische Isolation dieser Betriebsmittel kann einem elek-
trischen Mischfeld ausgesetzt werden, das aus einem mehrfrequenten Wech-
sel- und einem hohen Glecihanteil besteht. Durch die Wirkung eines hohen
Mischfeldes ist das Auftreten feldabhängiger Effekte in einem Isoliermaterial
möglich. In manchen Materialien kann es aufgrund eines hohen Gleichfeldes
zur Erhöhung der Permittivität und des Verlustfaktors kommen. Solche Ef-
fekte können weder mit reinen Wechselspannungs- noch mit reinen Gleich-
spannungsmessungen aufgeklärt werden. In der vorliegenden Arbeit wird der
Einfluss von Gleichfeldern von bis zu 14 kV/mm auf die komplexe Permit-
tivität von zellulosebasierten Isolierpapieren untersucht. Die Zellulose eignet
sich durch die einzigartigen Eigenschaften eines Naturpolymers, das die Beo-
bachtung von ionischen und dipolaren Relaxationsmechanismen ermöglicht.
Die Untersuchungen basieren auf der Entwicklung experimenteller Auf-
bauten zur Messung der komplexen Permittivität mit einer hohen Mischspan-
nung an nichtimprägnierten und ölimprägnierten Papierproben. Diese ermög-
lichen die Untersuchung des Einflusses sowohl der Wechsel- als auch der
Gleichanteile des Mischfeldes. Effekte des Wassergehalts, der Temperatur
und der elektrischen Kontaktierung des Isoliermaterials werden beschrieben.
Frühere Untersuchungen zum Einfluss des Wassers auf dielektrische
Eigenschaften der Zellulosepapiere werden im Kontext der hier behandelten
Spannungsbeanspruchung bestätigt. Die durch das Gleichfeld verursachte Be-
wegung der freien Ionen im feuchten nichtimprägnierten Papier ist mit Entste-
hung eines separaten Peaks im Verlustspektrum verbunden. Weiterführende
experimentelle Untersuchungen zur elektrischen Kontaktierung verdeutlichen,
dass unter dem Einfluss sehr hoher lokaler Felder die elektrochemische Zer-
setzung von Wasser die Erzeugung freier Ionen bewirkt, vor allem Protonen.
Das Auftreten eines Verlustpeaks aufgrund der Protonenbewegung wird mit
v

dem Modell der zufälligen Potentialbarrieren beschrieben. Im trockenen Pa-
pier wird kein Einfluss des Gleichfeldes auf die komplexe Permittivität fest-
gestellt. Dieses Ergebnis deutet darauf hin, dass die dipolaren Relaxation-
smechanismen, die auf die Orientierung der Molekülgruppen der Zellulose
zurückzuführen sind, beim Anlegen eines externen Gleichfeldes nicht beein-
flusst werden.
Die Imprägnierung mit Öl verändert das dielektrische Verhalten des Pa-
piers. In Anwesenheit von Wasser erhöht sich die Permittivität des ölimpräg-
nierten Papiers beim Anlegen eines Gleichfeldes aufgrund der Raumladung,
die an den Grenzen mikroskopischer Ölspalte zwischen der Elektrode und
dem Papier entsteht. In getrockneten Proben werden keine Änderungen der
Permittivität aufgrund des Gleichfeldes festgestellt. Eine Erhöhung der Per-
mittivität, die als Folge der Grenzflächenpolarisation zu erwarten wäre, tritt in
dem getrockneten Papier bei Frequenzen zwischen 5 Hz und 1 MHz nicht auf.
Die Messergebnisse lassen erkennen, dass sowohl in der trockenen Zellulose
als auch im trockenen Öl keine nichtlinearen Effekte durch das Anlegen eines
hohen Gleichfeldes der betrachteten Feldstärke auftreten.
vi
Erklarung
Ich versichere, dass ich die vorliegende Arbeit ohne unzulässigeHilfe Dritter und ohne Benutzung anderer als der angegebenen Hilfs-mittel angefertigt habe. Die aus anderen Quellen direkt oder indirektübernommenen Daten und Konzepte sind unter Angabe der Quellegekennzeichnet.
Bei der Auswahl und Auswertung folgenden Materials haben mirdie nachstehend aufgeführten Personen in der jeweils beschriebenenWeise unentgeltlich geholfen:
1. Dr. Carsten Leu (TU Ilmenau),
2. Dr. Andrea Knauer (TU Ilmenau) – Rasterelektronenmikroskopie.
Weitere Personen waren an der inhaltlich-materiellen Erstellungder vorliegenden Arbeit nicht beteiligt. Insbesondere habe ich hierfürnicht die entgeltliche Hilfe von Vermittlungs- bzw. Beratungsdiensten(Promotionsberater oder anderer Personen) in Anspruch genommen.Niemand hat von mir unmittelbar oder mittelbar geldwerte Leistun-gen für Arbeiten erhalten, die im Zusammenhang mit dem Inhalt dervorgelegten Dissertation stehen.
Die Arbeit wurde bisher weder im In- noch im Ausland in gle-icher oder ähnlicher Form einer Prüfungsbehörde vorgelegt.
Ich bin darauf hingewiesen worden, dass die Unrichtigkeit dervorstehenden Erklärung als Täuschungsversuch bewertet wird undgemäß § 7 Abs. 10 der Promotionsordnung den Abbruch des Pro-motionsverfahrens zur Folge hat.
Ilmenau, 14.08.2020
vii

Contents
Abstract . . . . . . . . . . . . . . . . . . iiiKurzfassung . . . . . . . . . . . . . . . . . vErklärung . . . . . . . . . . . . . . . . . . vii1 Introduction . . . . . . . . . . . . . . . 1
1.1 Effect of a High DC-Field . . . . . . . . . 31.2 High DC-Field and Dielectric Properties of Oil-Paper
Insulation . . . . . . . . . . . . . . 61.3 Objectives . . . . . . . . . . . . . . 9
2 Theoretical . . . . . . . . . . . . . . . . 102.1 AC Response Function . . . . . . . . . . 102.2 Separation of Conduction and Polarisation Losses . 12
3 Cellulose . . . . . . . . . . . . . . . . 153.1 Structure of Cellulose . . . . . . . . . . 173.2 Cellulose and Water Interaction . . . . . . . 18
4 Dielectric Relaxations in Cellulose . . . . . . . . 224.1 Ionic Transport . . . . . . . . . . . . 224.2 Relaxations in Polymers in the Glassy State . . . 284.3 Molecular Origin of Secondary Relaxations . . . 294.4 Secondary Relaxation Processes in Cellulose . . 31
4.4.1 The β -relaxation . . . . . . . . . . 324.4.2 The γ-relaxation . . . . . . . . . . 334.4.3 The βwet-relaxation . . . . . . . . . 34
4.5 Temperature Dependence of Relaxation Processes . 395 Experimental . . . . . . . . . . . . . . . 42
5.1 Test Setup for Dielectric Measurements . . . . 445.1.1 Basics . . . . . . . . . . . . . 445.1.2 Referencing . . . . . . . . . . . 465.1.3 Signal Measurement and Processing . . . 49
5.2 Specimen Preparation and Measurement . . . . 55
ix
5.2.1 Specimens . . . . . . . . . . . . 555.2.2 Test Cell. . . . . . . . . . . . . 565.2.3 Oil Conditioning . . . . . . . . . . 585.2.4 Preparation of Specimens . . . . . . . 595.2.5 Measurement of the Water Content . . . . 605.2.6 Specimen Holders . . . . . . . . . 62
5.3 Effect of the Electrode-Specimen Interface . . . 645.3.1 Conclusion . . . . . . . . . . . . 69
6 Results . . . . . . . . . . . . . . . . . 706.1 Time-Resolved Measurement . . . . . . . . 706.2 Variation of Components of the Mixed Field . . . 726.3 Effect of the Bias-Field on Frequency Spectra . . 79
6.3.1 Hidden Relaxation Peaks . . . . . . . 846.3.2 AC-Conductivity . . . . . . . . . . 86
6.4 Dielectric Behaviour of the Oil-Impregnated Paper. 886.4.1 Effect of the Bias Field . . . . . . . . 896.4.2 Properties of a Layered Oil Paper Specimen . 90
7 Discussion . . . . . . . . . . . . . . . . 947.1 Non-Impregnated Papers . . . . . . . . . 947.2 Oil-Impregnated Papers . . . . . . . . . 987.3 Application in Medium-Frequency Transformers . 98
8 Summary and Outlook . . . . . . . . . . . . 101References . . . . . . . . . . . . . . . . . . 103Acknowledgement . . . . . . . . . . . . . . . 112
x
1 Introduction
Owing to recent advancements in the power semiconductor tech-nology, high voltage power devices based on wide-band-gap semicon-ductors with blocking voltages higher than 10 kV are in development.1
As key components of isolated or non-isolated power electronic con-verters, these devices are intended to be utilised in medium voltagedistribution and traction grids, thus substituting conventional low fre-quency transformers. An isolated power electronic converter knownas "Solid-State Transformer" (SST)2, 3 or "Power Electronic Trans-former"4 is more flexible in the power flow control enabled by thepulse width modulation (PWM) and has a smaller volume and weightdue to the increased operation frequency. The galvanic isolation of anSST is provided by a medium frequency transformer (MFT) operatingat frequencies in the range of several kHz. The reduced volume of thetransformer constitutes a higher power density that results in a higheroperating temperature. Hence, the electrical insulation of an MFT, incontrast to low frequency power transformers, must safely function atelevated temperatures. The destructive effect of partial discharges at
AC
DC
u
UMVDC
UHV
UMVDC
ULVDC
MFT
DC
AC
AC
DC
DC
AC
AC
DC
DC
AC
t0
ULV
uHV-LV
0
UHV
HV
LV
ULV
CoreSST
u
UMVDC
t
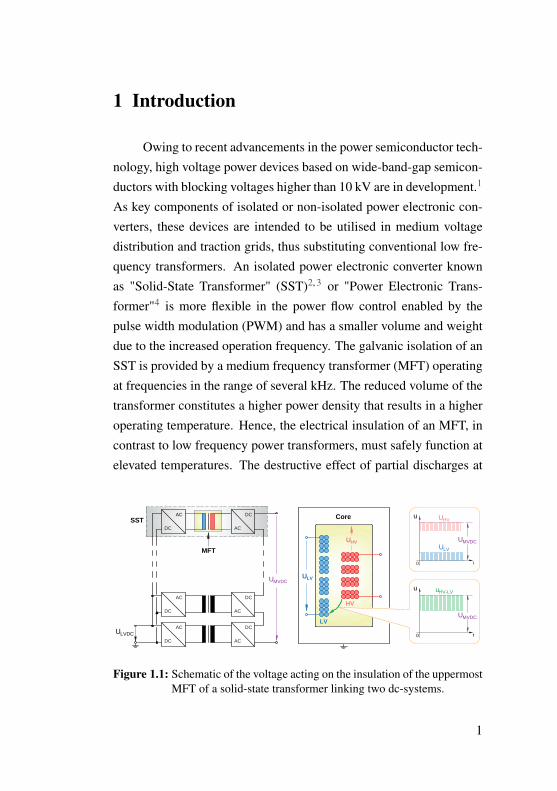
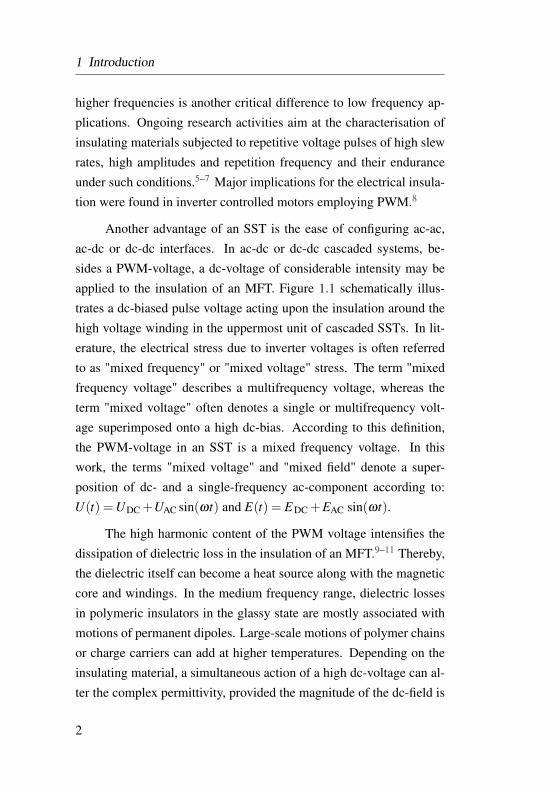
Figure 1.1: Schematic of the voltage acting on the insulation of the uppermostMFT of a solid-state transformer linking two dc-systems.
1
1 Introduction
higher frequencies is another critical difference to low frequency ap-plications. Ongoing research activities aim at the characterisation ofinsulating materials subjected to repetitive voltage pulses of high slewrates, high amplitudes and repetition frequency and their enduranceunder such conditions.5–7 Major implications for the electrical insula-tion were found in inverter controlled motors employing PWM.8
Another advantage of an SST is the ease of configuring ac-ac,ac-dc or dc-dc interfaces. In ac-dc or dc-dc cascaded systems, be-sides a PWM-voltage, a dc-voltage of considerable intensity may beapplied to the insulation of an MFT. Figure 1.1 schematically illus-trates a dc-biased pulse voltage acting upon the insulation around thehigh voltage winding in the uppermost unit of cascaded SSTs. In lit-erature, the electrical stress due to inverter voltages is often referredto as "mixed frequency" or "mixed voltage" stress. The term "mixedfrequency voltage" describes a multifrequency voltage, whereas theterm "mixed voltage" often denotes a single or multifrequency volt-age superimposed onto a high dc-bias. According to this definition,the PWM-voltage in an SST is a mixed frequency voltage. In thiswork, the terms "mixed voltage" and "mixed field" denote a super-position of dc- and a single-frequency ac-component according to:U(t) =UDC +UAC sin(ωt) and E(t) = E DC +EAC sin(ωt).
The high harmonic content of the PWM voltage intensifies thedissipation of dielectric loss in the insulation of an MFT.9–11 Thereby,the dielectric itself can become a heat source along with the magneticcore and windings. In the medium frequency range, dielectric lossesin polymeric insulators in the glassy state are mostly associated withmotions of permanent dipoles. Large-scale motions of polymer chainsor charge carriers can add at higher temperatures. Depending on theinsulating material, a simultaneous action of a high dc-voltage can al-ter the complex permittivity, provided the magnitude of the dc-field is
2
1.1 Effect of a High DC-Field
high enough to enter the non-linear region. In some dielectrics, thealteration of the complex permittivity may be associated with chargecarrier motions at relatively low dc-fields. Therefore, the analysis ofthe effect of a high static field on the complex permittivity may behelpful in assessing insulating materials. A seemingly small increaseof the permittivity within a wider range of frequencies could be an in-dication for a significant enhancement of the total dielectric loss undera multifrequency voltage excitation. In practice, the Joule heating dueto the conduction current is much lower than the dielectric heating dueto the alternating field stress.
The present work discusses the impact of a high static field ondielectric properties of cellulosic insulating papers. Oil-paper insula-tion that serves both insulating and cooling functions in oil-immersedtransformers could be utilised in high power MFTs. A liquid dielectricenables a more efficient cooling of the active part compared to solidinsulation with a lower thermal conductivity. Impregnated fibrous ma-terials enhance the electrical strength of the insulation and act as amechanical support for the transformer core and windings. Syntheticfibrous materials with superior characteristics than cellulosic papersare available. However, the advantage of cellulosic papers is a rel-atively simple manufacturing process requiring cheap raw materials.At the same time, their main drawback is a lower thermal stabilityin comparison to high-temperature synthetic fibres and a pronouncedhydrophilicity that negatively affects the dielectric properties. So far,no fundamental research has been carried out on cellulosic materialsunder the aspect of their application in power electronic converters.
1.1 Effect of a High DC-Field
In what follows, a brief account of the influence of a high staticfield on dielectric properties of typical insulating materials is given. At
3
1 Introduction
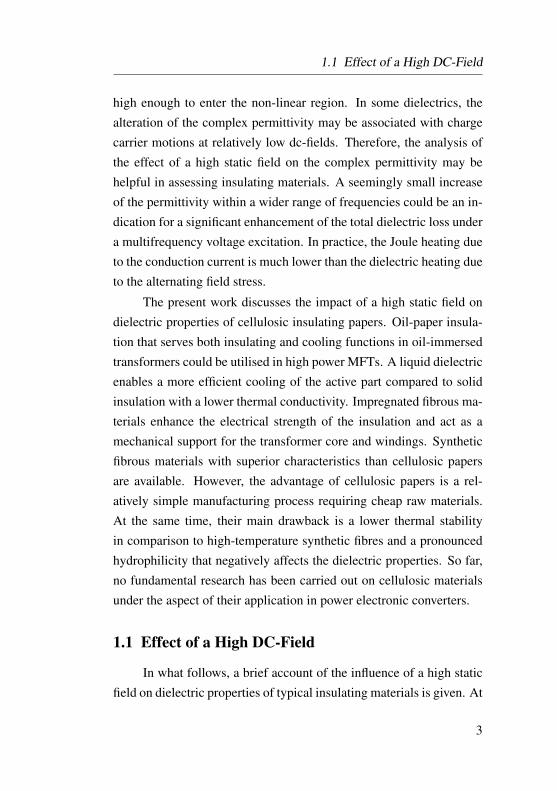
moderate intensities of the static field, the polarisation of the dielec-tric is in a linear dependence with the electric field P = χE , whereχ is the dielectric susceptibility. The dielectric susceptibility is re-lated to the permittivity through ε = χ + 1. With the increasing dc-field, depending on the dielectric, the polarisation can change non-linearly in two different ways (curves 2 and 3 in Figure 1.2). Tomeasure the effect of a high dc-field on the complex susceptibility,a low amplitude sinusoidal voltage is superimposed onto a dc-biasE(t) = E DC+EAC sin(ωt), where the oscillatory component EAC is inthe linear response region. The field dependent susceptibility is deter-mined as χ = ∂P/∂E. The following three cases illuminate the effectof a high dc-field on the dielectric susceptibility at the fundamentalfrequency that are associated with both microscopic and macroscopicphenomena, whereas the apparent increase due to the electrostrictionand electrode polarisation are disregarded. The interfacial polarisa-tion is mentioned due to its relevance in cellulosic insulating materialsexamined in this work.
1. χ remains virtually constant despite the increased bias field.Most solid polymeric insulators exhibit such behaviour. In fact,in solid dielectrics, the local electric field acting on dipoles islargely influenced by the electrostatic interaction of dipoles.Hence, the local field causing the polarisation of a dipole, maysignificantly differ from the externally applied field. The factthat the susceptibility is insensitive to the increase of the exter-nal field indicates that the local field is affected insignificantly.At extremely high fields, χ can increase due to ionisation pro-cesses followed by an imminent breakdown.
2. χ increases with the bias field. The curve P(E) bends upwardsfrom the linear regime. For example, in polar liquids, the strongelectric field can influence the chemical equilibrium of the sub-
4
1.1 Effect of a High DC-Field
Figure 1.2: Schematic dependence of the polarisation on the electric fieldadapted from Figure 1 on page 102 of reference.12
stance. The new equilibrium has a greater dipole moment sincemolecules tend to align in the field direction that results in arelative increase of permittivity in the order of 10−6 to 10−3.13
In a solid dielectric with a rigid dipolar structure, a change ofthe dipole moment under a high electric stress is rather unlikely.In electrically heterogeneous dielectrics, one can expect an in-crease of χ due to the enhancement of the Maxwell-Wagner-Sillars polarisation as the cause of a macroscopic charge accu-mulation at boundaries between regions of different conductiv-ities. Also, the hopping of ions under the influence of a staticfield in a disordered structure can be associated with a chargerelaxation that affects the dielectric susceptibility.
3. χ decreases with the bias field. This phenomenon is known asdielectric saturation12 or normal saturation14 that resembles a
5

1 Introduction
similar effect in magnetic materials. This effect was reported ina wide range of polar liquids,15 and polymer solutions.16 It is as-sumed that a strong electric field constrains the rotatory motionsof dipoles and thereby leads to a decrease of the susceptibility.Macroscopically, the blocking of free ions within a heteroge-neous dielectric can cause a substantial decrease of χ .17–20
1.2 High DC-Field and Dielectric Properties ofOil-Paper Insulation
The influence of high bias fields on dielectric properties of theoil-impregnated paper insulation has been drawing attention of sci-entists since the middle of the last century.18, 21–27 Experimental andtheoretical works were motivated primarily by the need of understand-ing of dielectric phenomena in the insulation of power devices that canbe subjected to significant bias fields, e. g. compensation capacitors orHVDC transformers. An early systematic research on the field depen-dence of the loss tangent of liquid impregnated dielectrics was carriedout by Garton.17 He investigated thin films of liquid dielectrics as amodel approximation of pores of the paper. The author suggested,that at high alternating fields of power frequency, a fraction of ionsblocked at fibre-oil boundaries cannot move with the electric field. Itelucidates the reduction of the dielectric loss tangent with the increas-ing ac field strength. This theory was employed by later researchers inthe discussion of the decrease of the loss tangent due to a high staticfield. Liebscher and Held18 concluded, that of different factors deter-mining the total dielectric loss of an oil-impregnated paper, only theloss due to the motion of ions in the liquid can decrease with the ac-field (Figure 1.3). Dipolar losses in paper and oil were assumed to beindependent on the electric field in the range of magnitudes occurring
6

1.2 High DC-Field and Dielectric Properties of Oil-Paper Insulation
in practice. The reduction of the loss tangent due to a high dc-fieldwas observed primarily on capacitors that had been in operation forseveral years, during which ionic impurities emerged in the insulatingliquid.22 The conclusion of Garton was later extended by a statement,that the increase of the loss tangent at weaker ac-fields was associatedwith space charge formation.28 Depletion of charge carriers of oil un-der the action of a high bias field was also reported by Taschner.27 Hesuggested that the accumulation of charge carriers of oil at the bound-aries of cellulose fibres restricts the motion of ions in cellulose thusdecreasing the loss tangent. The author mentioned that an oil film be-tween the electrodes and the paper led to an earlier increase of the losstangent with the bias field.
Figure 1.3: Field-dependence of loss tangent components of oil-impregnatedpaper at room temperature. Adapted from reference.18
The influence of high dc-fields on the permittivity of paper wasnot considered or assumed negligible in literature. On the one hand,the insensitivity of dielectric properties of a new oil-paper insulationto high dc-fields seems to be appropriate (see discussions on page 3)The ionic content of both solid and liquid phases are still low. Onthe other hand, it may well be anticipated that, with the progressiveageing, besides the ionic contribution of the liquid, properties of the
7
1 Introduction
deteriorated paper can be influenced by the dc-field. One of the mainconsequences of ageing of cellulosic insulation is the increase of thewater content. The hydration of cellulose significantly enhances itsdielectric loss tangent and the dc-conductivity. Water can be absorbedfrom the ambient atmosphere or appear during the depolymerisationof cellulose chains or through ageing of oil. It seems to be reasonableto separately investigate the dielectric behaviour of cellulose, sincethe relaxation processes of cellulose vastly determine the amount ofdielectric loss dissipated in an oil-impregnated paper. Attention to therole of water on dielectric processes in cellulose under the applicationof a mixed electric field should be paid.
8

1.3 Objectives
1.3 Objectives
The intention of the present work is to characterise the dielec-tric relaxation processes in cellulosic insulating papers subjected to amixed electrical stress with a high dc-component. The problem willbe addressed by completing the following steps:
• Information on the low-field dielectric relaxation processes ap-plying for cellulose will be reviewed in order to sensibly addressthe effects occurring in cellulosic papers under the influence ofa high static field. Attention will be paid to the effects of thehydration and the polymer morphology of cellulose.
• An experimental setup and a signal processing software will beestablished that enable measurements of the complex permit-tivity under a simultaneously applied dc-field. A test cell willbe assembled in which the sample preparation under vacuumas well as dielectric measurements at a controllable temperaturecan be carried out. A separate facility for drying and degassingof insulating oils will be prepared.
• Experiments will be carried out both on non-impregnated andoil-impregnated specimens with different water contents at dif-ferent temperatures. The experimental methods will includetime-resolved measurements of dielectric properties of speci-mens subjected to high static fields, the low-field dielectric spec-troscopy and scans of dielectric spectra under simultaneouslyapplied strong dc-fields.
• Analysis of the experimental data will be provided. Modelscharacterising the dielectric behaviour of cellulosic paper ma-terials will be suggested. Conclusions regarding the suitabilityof cellulosic papers for the use in medium-frequency transform-ers will be drawn.
9
2 Theoretical
Following discussions are based on the analysis of frequencyspectra of the complex permittivity and conductivity. The present sec-tion provides therefore a brief review of the ac-response theory thatincludes the essential relations, relevant for the interpretation of re-sults. Further, a method of eliminating the conductivity contributionin ε ′′(ω)-data is presented.
2.1 AC Response Function
The time-dependent polarisation of a dielectric in a time-dependentelectric field is defined in the linear regime by a response function f (t)
P(t) = ε0
∞∫0
f (t)E(t− τ)dτ . (2.1)
The response in the frequency domain is expressed by the Fouriertransform of the previous equation
P(ω) = ε0χ(ω)E(ω) , (2.2)
where χ(ω)= χ ′(ω)− iχ ′′(ω) is the complex susceptibility defined asthe Fourier transform of the response function. The real and imaginaryparts of the complex susceptibility are defined through
χ′(ω) = ε0
t∫0
f (∞)cos(ωt)dt , (2.3)
χ′′(ω) = ε0
t∫0
f (∞)sin(ωt)dt . (2.4)
10
2.1 AC Response Function
Therefore, χ ′(ω) and χ ′′(ω) cannot be independent. Since they arederived from the same function f (t), by using Kramers-Kronig rela-tions, χ ′(ω) can be determined from χ ′′(ω) and vice versa:
χ′(ω) =
2π
∞∫0
χ′′(x)
xx2−ω2 dx , (2.5)
χ′′(ω) =− 2
π
∞∫0
χ′(ω)
ω
x2−ω2 dx . (2.6)
χ(ω) is the response function of a dielectric to a harmonic ex-citation at frequency ω . It can be expressed in terms of the complexpermittivity
ε(ω) = ε′(ω)− iε ′′(ω) = ε0[1+χ
′(ω)− iχ ′′(ω)] (2.7)
or in terms of the complex conductivity
σ(ω) = σ′(ω)+ iσ ′′(ω) = ωε0ε
′′(ω)+ iωε0ε′(ω) . (2.8)
The loss tangent is determined as the relation between imaginaryand real components of the complex permittivity
tanδ (ω) =ε ′′(ω)
ε ′(ω). (2.9)
The current through the dielectric is composed from the directcurrent and the displacement current
I = σdcE +∂D/∂ t . (2.10)
The Fourier transform of this expression gives the response in frequency-
11
2 Theoretical
domain29
I(ω) = σdcE(ω)+ iωD(ω) t . (2.11)
Considering that D(ω) = [ε0(1+ χ(ω)]E(ω) and by substituting theexpression for the complex permittivity (Eq. 2.7) the Equation 2.11 ismodified into
I(ω) = [σdc +ωε0ε′′(ω)]E(ω)+ iωε0ε
′(ω)E(ω) . (2.12)
The first term of Equation 2.12 corresponds to the power loss due toconduction and polarisation mechanisms while the second term doesnot contribute to the loss. Therefore, the constant ε ′′ is accounted forthe dielectric loss.
2.2 Separation of Conduction and Polarisation Losses
It is common to analyse the dielectric data by examining the losspeaks in dielectric loss spectra ε ′′(ω,T). However, since the dielectricloss contains the contribution of the dc-conduction
ε′′(ω,T ) = ε
′′pol(ω,T )+
σdc(T )ε0ω
, (2.13)
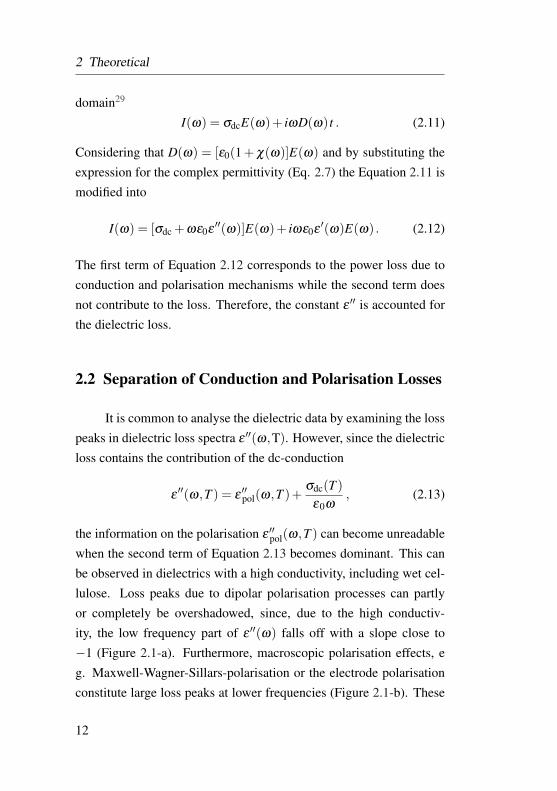
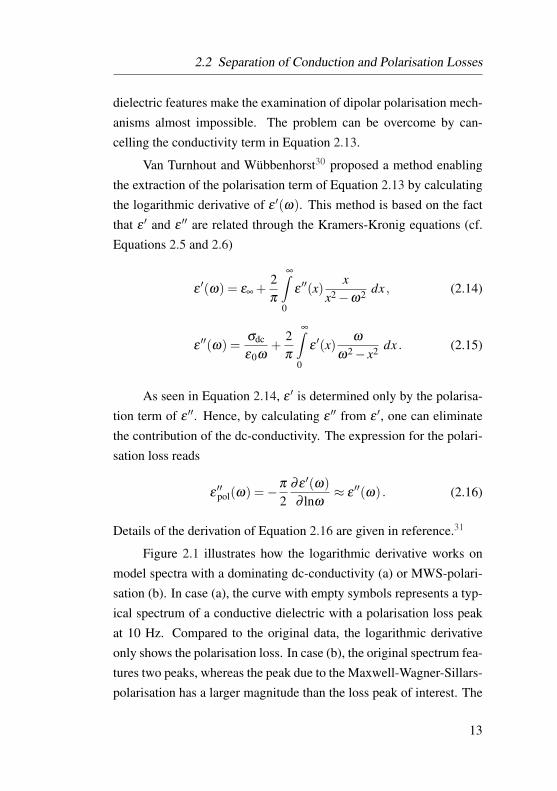
the information on the polarisation ε ′′pol(ω,T ) can become unreadablewhen the second term of Equation 2.13 becomes dominant. This canbe observed in dielectrics with a high conductivity, including wet cel-lulose. Loss peaks due to dipolar polarisation processes can partlyor completely be overshadowed, since, due to the high conductiv-ity, the low frequency part of ε ′′(ω) falls off with a slope close to−1 (Figure 2.1-a). Furthermore, macroscopic polarisation effects, eg. Maxwell-Wagner-Sillars-polarisation or the electrode polarisationconstitute large loss peaks at lower frequencies (Figure 2.1-b). These
12
2.2 Separation of Conduction and Polarisation Losses
dielectric features make the examination of dipolar polarisation mech-anisms almost impossible. The problem can be overcome by can-celling the conductivity term in Equation 2.13.
Van Turnhout and Wübbenhorst30 proposed a method enablingthe extraction of the polarisation term of Equation 2.13 by calculatingthe logarithmic derivative of ε ′(ω). This method is based on the factthat ε ′ and ε ′′ are related through the Kramers-Kronig equations (cf.Equations 2.5 and 2.6)
ε′(ω) = ε∞ +
2π
∞∫0
ε′′(x)
xx2−ω2 dx , (2.14)
ε′′(ω) =
σdc
ε0ω+
2π
∞∫0
ε′(x)
ω
ω2− x2 dx . (2.15)
As seen in Equation 2.14, ε ′ is determined only by the polarisa-tion term of ε ′′. Hence, by calculating ε ′′ from ε ′, one can eliminatethe contribution of the dc-conductivity. The expression for the polari-sation loss reads
ε′′pol(ω) =−π
2∂ε ′(ω)
∂ lnω≈ ε
′′(ω) . (2.16)
Details of the derivation of Equation 2.16 are given in reference.31
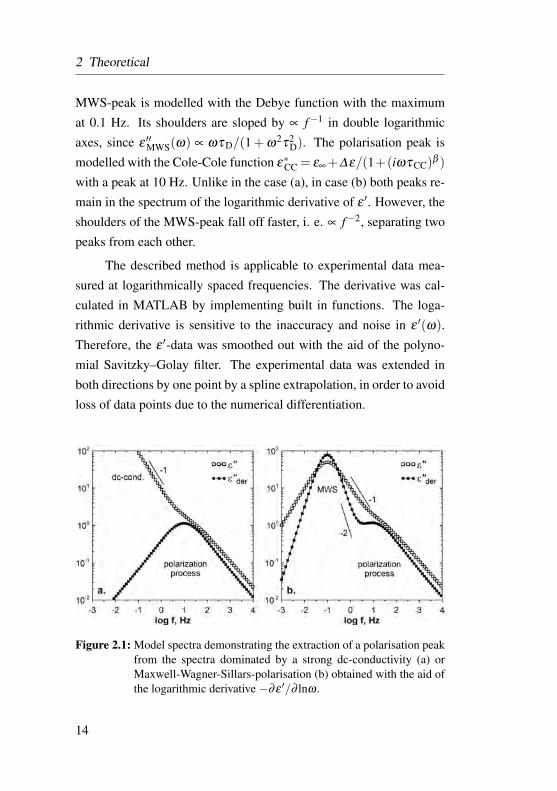
Figure 2.1 illustrates how the logarithmic derivative works onmodel spectra with a dominating dc-conductivity (a) or MWS-polari-sation (b). In case (a), the curve with empty symbols represents a typ-ical spectrum of a conductive dielectric with a polarisation loss peakat 10 Hz. Compared to the original data, the logarithmic derivativeonly shows the polarisation loss. In case (b), the original spectrum fea-tures two peaks, whereas the peak due to the Maxwell-Wagner-Sillars-polarisation has a larger magnitude than the loss peak of interest. The
13
2 Theoretical
MWS-peak is modelled with the Debye function with the maximumat 0.1 Hz. Its shoulders are sloped by ∝ f−1 in double logarithmicaxes, since ε ′′MWS(ω) ∝ ωτ D/(1+ω2τ2
D). The polarisation peak ismodelled with the Cole-Cole function ε∗CC = ε∞+∆ε/(1+(iωτ CC)
β )
with a peak at 10 Hz. Unlike in the case (a), in case (b) both peaks re-main in the spectrum of the logarithmic derivative of ε ′. However, theshoulders of the MWS-peak fall off faster, i. e. ∝ f−2, separating twopeaks from each other.
The described method is applicable to experimental data mea-sured at logarithmically spaced frequencies. The derivative was cal-culated in MATLAB by implementing built in functions. The loga-rithmic derivative is sensitive to the inaccuracy and noise in ε ′(ω).Therefore, the ε ′-data was smoothed out with the aid of the polyno-mial Savitzky–Golay filter. The experimental data was extended inboth directions by one point by a spline extrapolation, in order to avoidloss of data points due to the numerical differentiation.
Figure 2.1: Model spectra demonstrating the extraction of a polarisation peakfrom the spectra dominated by a strong dc-conductivity (a) orMaxwell-Wagner-Sillars-polarisation (b) obtained with the aid ofthe logarithmic derivative −∂ε ′/∂ lnω .
14
3 Cellulose
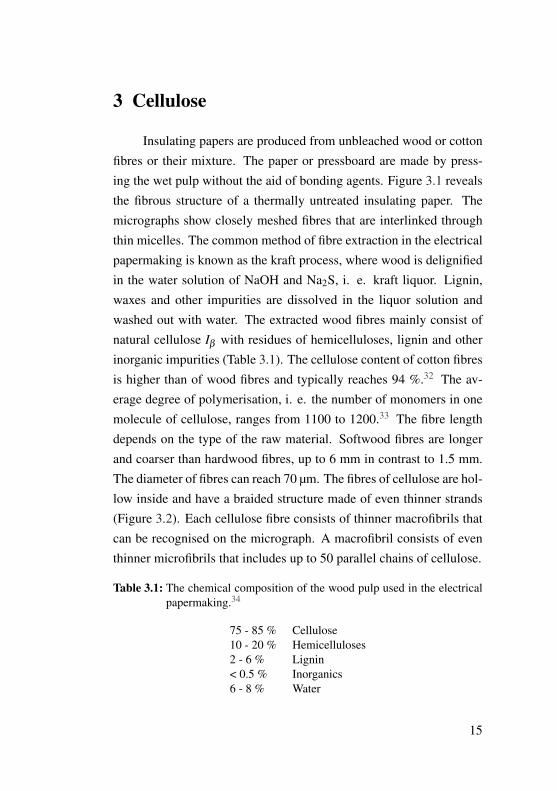
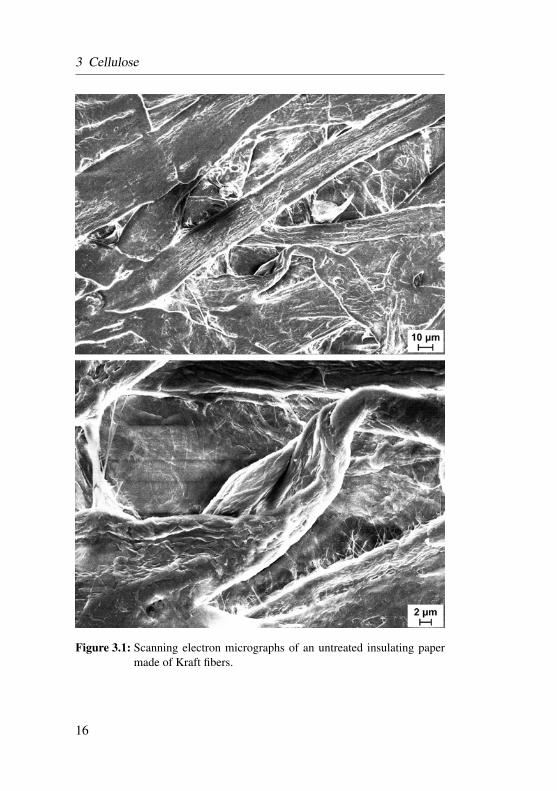
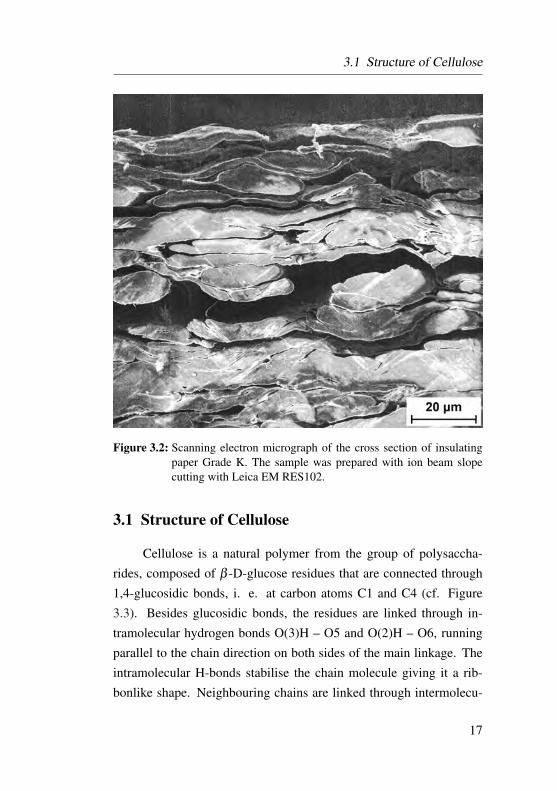
Insulating papers are produced from unbleached wood or cottonfibres or their mixture. The paper or pressboard are made by press-ing the wet pulp without the aid of bonding agents. Figure 3.1 revealsthe fibrous structure of a thermally untreated insulating paper. Themicrographs show closely meshed fibres that are interlinked throughthin micelles. The common method of fibre extraction in the electricalpapermaking is known as the kraft process, where wood is delignifiedin the water solution of NaOH and Na2S, i. e. kraft liquor. Lignin,waxes and other impurities are dissolved in the liquor solution andwashed out with water. The extracted wood fibres mainly consist ofnatural cellulose Iβ with residues of hemicelluloses, lignin and otherinorganic impurities (Table 3.1). The cellulose content of cotton fibresis higher than of wood fibres and typically reaches 94 %.32 The av-erage degree of polymerisation, i. e. the number of monomers in onemolecule of cellulose, ranges from 1100 to 1200.33 The fibre lengthdepends on the type of the raw material. Softwood fibres are longerand coarser than hardwood fibres, up to 6 mm in contrast to 1.5 mm.The diameter of fibres can reach 70 µm. The fibres of cellulose are hol-low inside and have a braided structure made of even thinner strands(Figure 3.2). Each cellulose fibre consists of thinner macrofibrils thatcan be recognised on the micrograph. A macrofibril consists of eventhinner microfibrils that includes up to 50 parallel chains of cellulose.
Table 3.1: The chemical composition of the wood pulp used in the electricalpapermaking.34
75 - 85 % Cellulose10 - 20 % Hemicelluloses2 - 6 % Lignin< 0.5 % Inorganics6 - 8 % Water
15
3 Cellulose
Figure 3.1: Scanning electron micrographs of an untreated insulating papermade of Kraft fibers.
16
3.1 Structure of Cellulose
Figure 3.2: Scanning electron micrograph of the cross section of insulatingpaper Grade K. The sample was prepared with ion beam slopecutting with Leica EM RES102.
3.1 Structure of Cellulose
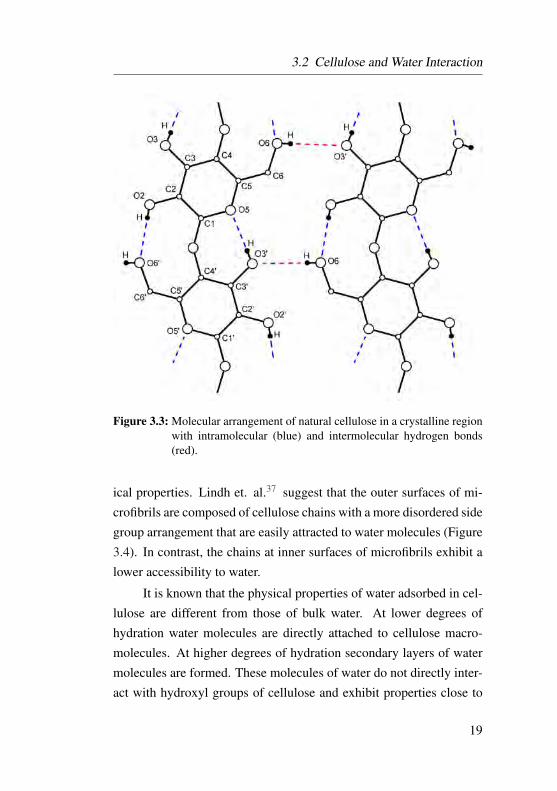
Cellulose is a natural polymer from the group of polysaccha-rides, composed of β -D-glucose residues that are connected through1,4-glucosidic bonds, i. e. at carbon atoms C1 and C4 (cf. Figure3.3). Besides glucosidic bonds, the residues are linked through in-tramolecular hydrogen bonds O(3)H – O5 and O(2)H – O6, runningparallel to the chain direction on both sides of the main linkage. Theintramolecular H-bonds stabilise the chain molecule giving it a rib-bonlike shape. Neighbouring chains are linked through intermolecu-
17
3 Cellulose
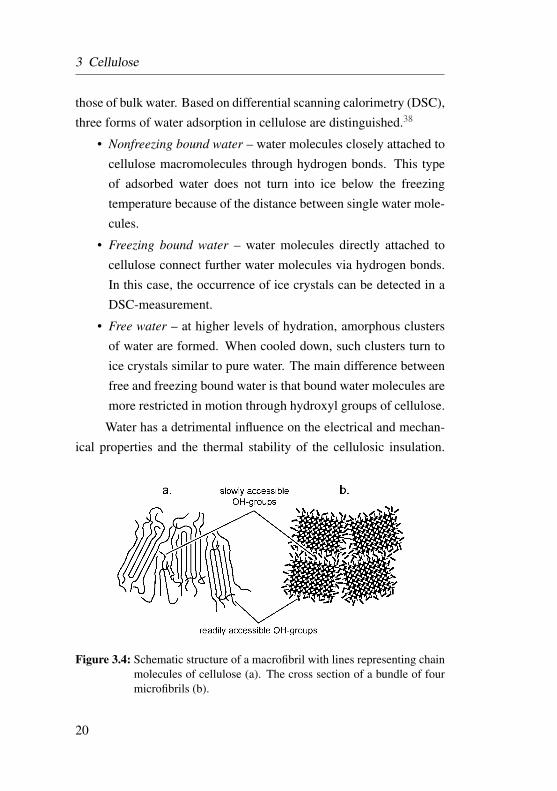
lar hydrogen bonds between O(6)H – O3, which lie in the same planeas the intramolecular hydrogen bonds. Herewith, parallel ribbonlikechains are arranged into sheets. Groups of parallel sheets form thecrystal lattice; regions with closely packed sheets are called crystal-lites. Crystallites of cellulose and chitin exhibit a particularly tightpacking compared to other polysaccharides that explains their insolu-bility in water in spite of the exceptional ratio of hydroxyl groups permonomer.35 Groups of disordered molecules are considered as amor-phous regions (Figure 3.4). The degree of crystallinity in the naturalcellulose depends on the mechanical, chemical and thermal pretreat-ment and varies from 20 to 90 %.36 The average degree of crystallinityof cellulose in the insulating kraft paper measured 80 % according tothe X-ray diffraction analysis.
3.2 Cellulose and Water Interaction
Like other polysaccharides, cellulose has a significant hydrophilic-ity, since each of the three hydroxyl groups of each monomer can binda molecule of water through hydrogen bonding. The adsorption of wa-ter onto the macromolecule of cellulose is uneven due to the unsym-metrical conformation of the polymer. The OH-group at the branchC5-C6 stands out further than two other OH groups at C2 and C3 (Fig-ure 3.3). The longer OH group has a higher chemical activity that alsoapplies for the binding of the water molecule. As mentioned earlier,the degree of crystallinity, i. e. the fraction of amorphous regions, de-termines the degree of hydration of cellulose. Under room conditionsthe insulating paper made of wood of cotton fibres adsorbs in aver-age up to 8 % wt. moisture, while wood fibres contain slightly moremoisture than cotton fibres.
The hydrophilicity of cellulose is an important morphologicalfeature that manifests itself in dielectric, mechanical and other phys-
18
3.2 Cellulose and Water Interaction
Figure 3.3: Molecular arrangement of natural cellulose in a crystalline regionwith intramolecular (blue) and intermolecular hydrogen bonds(red).
ical properties. Lindh et. al.37 suggest that the outer surfaces of mi-crofibrils are composed of cellulose chains with a more disordered sidegroup arrangement that are easily attracted to water molecules (Figure3.4). In contrast, the chains at inner surfaces of microfibrils exhibit alower accessibility to water.
It is known that the physical properties of water adsorbed in cel-lulose are different from those of bulk water. At lower degrees ofhydration water molecules are directly attached to cellulose macro-molecules. At higher degrees of hydration secondary layers of watermolecules are formed. These molecules of water do not directly inter-act with hydroxyl groups of cellulose and exhibit properties close to
19
3 Cellulose
those of bulk water. Based on differential scanning calorimetry (DSC),three forms of water adsorption in cellulose are distinguished.38
• Nonfreezing bound water – water molecules closely attached tocellulose macromolecules through hydrogen bonds. This typeof adsorbed water does not turn into ice below the freezingtemperature because of the distance between single water mole-cules.
• Freezing bound water – water molecules directly attached tocellulose connect further water molecules via hydrogen bonds.In this case, the occurrence of ice crystals can be detected in aDSC-measurement.
• Free water – at higher levels of hydration, amorphous clustersof water are formed. When cooled down, such clusters turn toice crystals similar to pure water. The main difference betweenfree and freezing bound water is that bound water molecules aremore restricted in motion through hydroxyl groups of cellulose.
Water has a detrimental influence on the electrical and mechan-ical properties and the thermal stability of the cellulosic insulation.
Figure 3.4: Schematic structure of a macrofibril with lines representing chainmolecules of cellulose (a). The cross section of a bundle of fourmicrofibrils (b).
20
3.2 Cellulose and Water Interaction
The adsorption of water accelerates the thermal ageing of cellulosethat leads to shortening of chain molecules through depolymerisation.Only under the maintenance of a high degree of dryness of the oil-paper insulation can a long-term reliability of the transformer be en-sured. The maximum permissible degree of hydration of the trans-former insulation is between 0.3 and 1 % wt.39 The higher the voltagerate of the transformer, the higher the requirement for the dryness ofthe insulation.
In the course of the operation, water is adsorbed from the atmo-sphere through parts of the insulation exposed to the moist air. It isalso produced through the chemical depolymerisation of cellulose anddecomposition of oil under the influence of high thermal and electri-cal stresses. The moisture distribution between oil and paper dependson the temperature of the insulation and ambient temperature and hu-midity. The cellulosic paper takes in the most part of water due toits greater hydrophilicity. While the mass fraction of water in cellu-lose is measured in per-cents by weight, the moisture content of oil istypically measured in parts per million. The solubility of water in oilincreases with the temperature. A more detailed account on the effectof water on dielectric properties of cellulose will be given in a separatesection.
21
4 Dielectric Relaxations in Cellulose
The following section describes the dielectric relaxation pro-cesses in cellulose including ionic and dipolar mechanisms that definethe values of ε ′ and ε ′′ in the frequency range from several mHz upto several MHz. Prior to the introduction of dipolar relaxation mecha-nisms in cellulose, a brief account of dielectric relaxations in polymersin the glassy amorphous state is given. Therewith, molecular motionsdefining the origins of dipolar relaxations in a wide range of polymersare illuminated.
4.1 Ionic Transport
The dielectric response of cellulose to an external electric field isdetermined by the polarisation of permanent dipoles and the motion offree ions. The mechanism of ionic transport in cellulose is similar tothat of ionically conducting amorphous solids, e. g. glasses. In whatfollows a brief discussion of the ionic conduction and the associateddielectric relaxation is provided.
The conductivity of cellulose is determined by the transport ofions that hop between neighbouring stable sites by surmounting po-tential energy barriers when acquiring sufficient thermal energy. Cel-lulose may contain protons that occur in an ion exchange reactionwhen the pulping chemicals are washed out with distilled water. Itcan also contain alkali metal ions remaining after the washing. Theproton transport involves two different mechanisms. The first mecha-nism implies a transition of a proton between covalent OH and hydro-gen bonds (Figure 4.1-a). A bare proton appearing at the left end of thechain, forms a positive OH+
2 ion that is transported to the right end by asequential hopping of a successive proton. After passing of the proton,the chain is again in the confirmation (b) that does not permit a transit
22
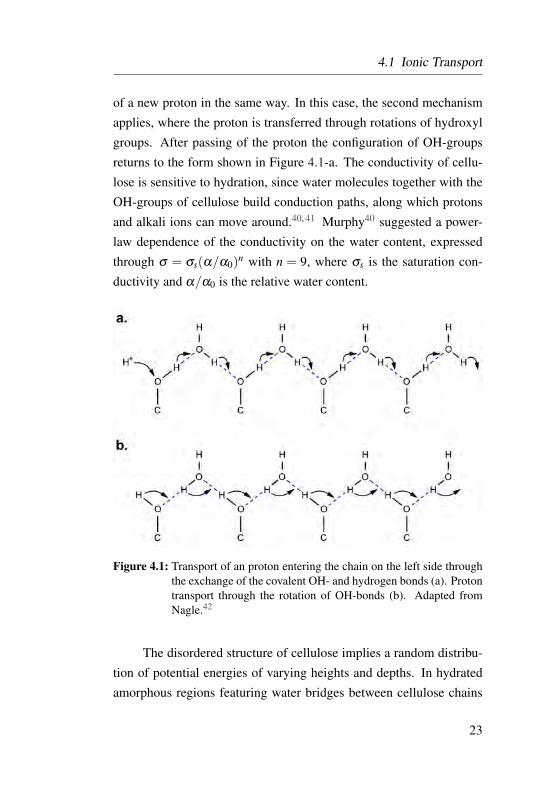
4.1 Ionic Transport
of a new proton in the same way. In this case, the second mechanismapplies, where the proton is transferred through rotations of hydroxylgroups. After passing of the proton the configuration of OH-groupsreturns to the form shown in Figure 4.1-a. The conductivity of cellu-lose is sensitive to hydration, since water molecules together with theOH-groups of cellulose build conduction paths, along which protonsand alkali ions can move around.40, 41 Murphy40 suggested a power-law dependence of the conductivity on the water content, expressedthrough σ = σs(α/α0)
n with n = 9, where σs is the saturation con-ductivity and α/α0 is the relative water content.
Figure 4.1: Transport of an proton entering the chain on the left side throughthe exchange of the covalent OH- and hydrogen bonds (a). Protontransport through the rotation of OH-bonds (b). Adapted fromNagle.42
The disordered structure of cellulose implies a random distribu-tion of potential energies of varying heights and depths. In hydratedamorphous regions featuring water bridges between cellulose chains
23
4 Dielectric Relaxations in Cellulose
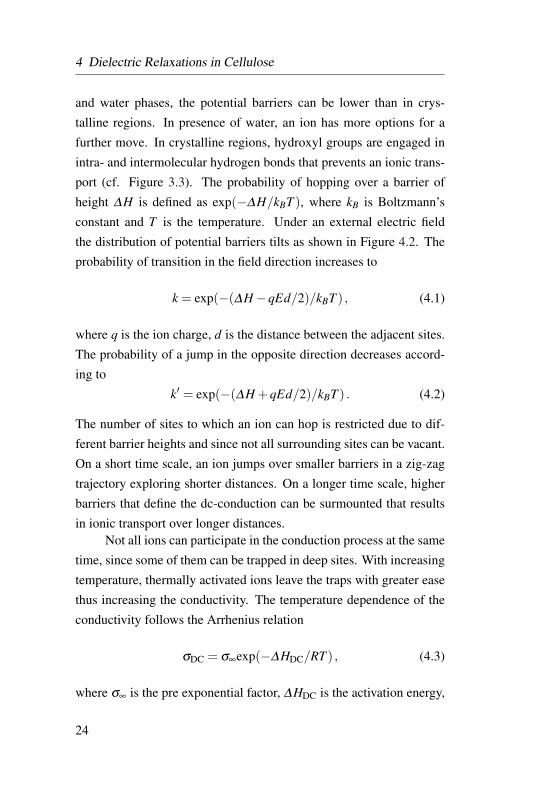
and water phases, the potential barriers can be lower than in crys-talline regions. In presence of water, an ion has more options for afurther move. In crystalline regions, hydroxyl groups are engaged inintra- and intermolecular hydrogen bonds that prevents an ionic trans-port (cf. Figure 3.3). The probability of hopping over a barrier ofheight ∆H is defined as exp(−∆H/kBT ), where kB is Boltzmann’sconstant and T is the temperature. Under an external electric fieldthe distribution of potential barriers tilts as shown in Figure 4.2. Theprobability of transition in the field direction increases to
k = exp(−(∆H−qEd/2)/kBT ) , (4.1)
where q is the ion charge, d is the distance between the adjacent sites.The probability of a jump in the opposite direction decreases accord-ing to
k′ = exp(−(∆H +qEd/2)/kBT ) . (4.2)
The number of sites to which an ion can hop is restricted due to dif-ferent barrier heights and since not all surrounding sites can be vacant.On a short time scale, an ion jumps over smaller barriers in a zig-zagtrajectory exploring shorter distances. On a longer time scale, higherbarriers that define the dc-conduction can be surmounted that resultsin ionic transport over longer distances.
Not all ions can participate in the conduction process at the sametime, since some of them can be trapped in deep sites. With increasingtemperature, thermally activated ions leave the traps with greater easethus increasing the conductivity. The temperature dependence of theconductivity follows the Arrhenius relation
σDC = σ∞exp(−∆HDC/RT ) , (4.3)
where σ∞ is the pre exponential factor, ∆HDC is the activation energy,
24
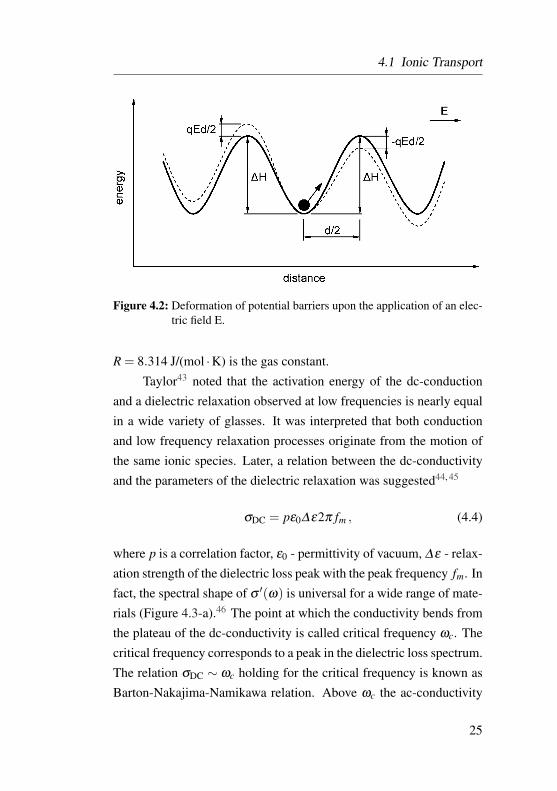
4.1 Ionic Transport
Figure 4.2: Deformation of potential barriers upon the application of an elec-tric field E.
R = 8.314 J/(mol ·K) is the gas constant.Taylor43 noted that the activation energy of the dc-conduction
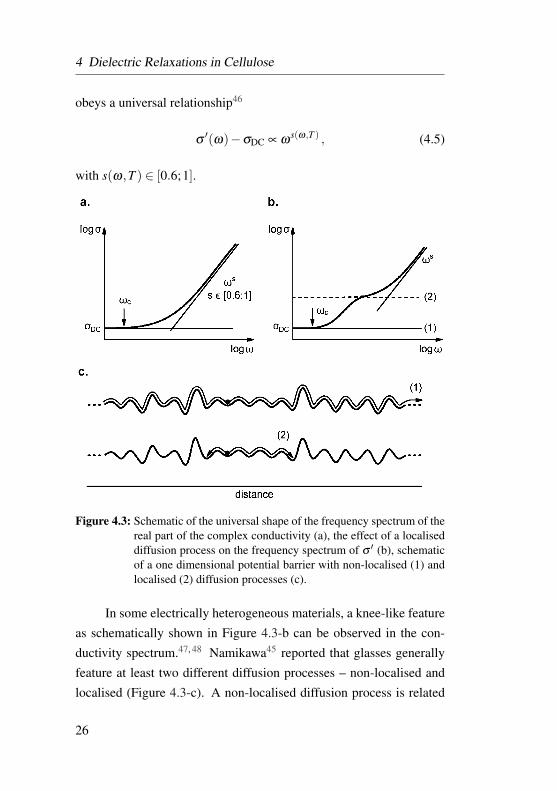
and a dielectric relaxation observed at low frequencies is nearly equalin a wide variety of glasses. It was interpreted that both conductionand low frequency relaxation processes originate from the motion ofthe same ionic species. Later, a relation between the dc-conductivityand the parameters of the dielectric relaxation was suggested44, 45
σDC = pε0∆ε2π fm , (4.4)
where p is a correlation factor, ε0 - permittivity of vacuum, ∆ε - relax-ation strength of the dielectric loss peak with the peak frequency fm. Infact, the spectral shape of σ ′(ω) is universal for a wide range of mate-rials (Figure 4.3-a).46 The point at which the conductivity bends fromthe plateau of the dc-conductivity is called critical frequency ωc. Thecritical frequency corresponds to a peak in the dielectric loss spectrum.The relation σDC ∼ ωc holding for the critical frequency is known asBarton-Nakajima-Namikawa relation. Above ωc the ac-conductivity
25
4 Dielectric Relaxations in Cellulose
obeys a universal relationship46
σ′(ω)−σDC ∝ ω
s(ω,T ) , (4.5)
with s(ω,T ) ∈ [0.6;1].
Figure 4.3: Schematic of the universal shape of the frequency spectrum of thereal part of the complex conductivity (a), the effect of a localiseddiffusion process on the frequency spectrum of σ ′ (b), schematicof a one dimensional potential barrier with non-localised (1) andlocalised (2) diffusion processes (c).
In some electrically heterogeneous materials, a knee-like featureas schematically shown in Figure 4.3-b can be observed in the con-ductivity spectrum.47, 48 Namikawa45 reported that glasses generallyfeature at least two different diffusion processes – non-localised andlocalised (Figure 4.3-c). A non-localised diffusion process is related
26
4.1 Ionic Transport
to the dc-conduction in terms of equal activation energies. It is markedby a large loss peak. In contrast, a localised diffusion process does notaffect the dc-conduction. It is associated with a loss peak in ε ′′(ω)
arising at a higher frequency and a knee-like bend in σ ′(ω) that isattributed to the Maxwell-Wagner-Sillars relaxation.49
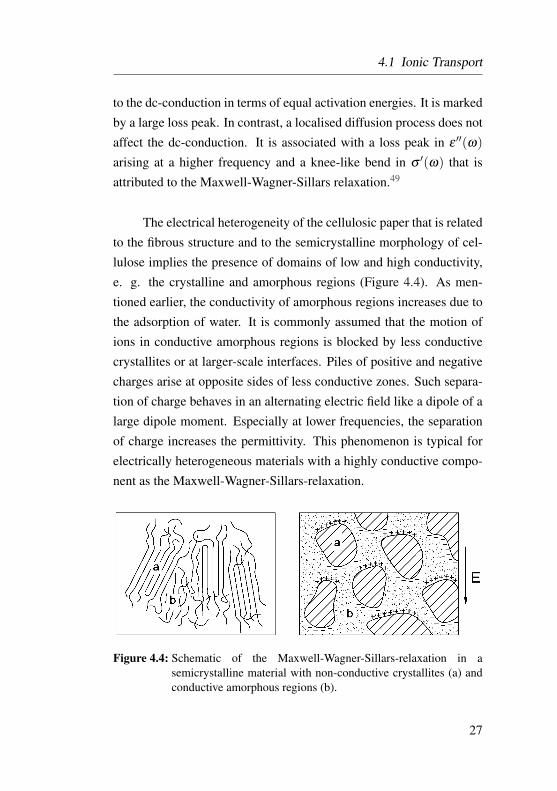
The electrical heterogeneity of the cellulosic paper that is relatedto the fibrous structure and to the semicrystalline morphology of cel-lulose implies the presence of domains of low and high conductivity,e. g. the crystalline and amorphous regions (Figure 4.4). As men-tioned earlier, the conductivity of amorphous regions increases due tothe adsorption of water. It is commonly assumed that the motion ofions in conductive amorphous regions is blocked by less conductivecrystallites or at larger-scale interfaces. Piles of positive and negativecharges arise at opposite sides of less conductive zones. Such separa-tion of charge behaves in an alternating electric field like a dipole of alarge dipole moment. Especially at lower frequencies, the separationof charge increases the permittivity. This phenomenon is typical forelectrically heterogeneous materials with a highly conductive compo-nent as the Maxwell-Wagner-Sillars-relaxation.
Figure 4.4: Schematic of the Maxwell-Wagner-Sillars-relaxation in asemicrystalline material with non-conductive crystallites (a) andconductive amorphous regions (b).
27

4 Dielectric Relaxations in Cellulose
4.2 Relaxations in Polymers in the Glassy State
There are different states, in which a polymer may exist: amor-phous or semicrystalline (glassy), viscoelastic fluid (rubber) and vis-cous fluid. The glass-rubber transition in amorphous polymers appear-ing at the temperature Tg causes major structural changes accompaniedby significant alterations of mechanical, dielectric, thermal and otherphysical properties. This transition is designated as the primary orα-relaxation. Semicrystalline polymers exhibit further structural tran-sitions due to crystalline phases. The latter are treated in detail inliterature.50
It is customary to denote the relaxation mechanisms in polymerswith Greek letters α , β , γ , etc. according to the temperature, at whichthese relaxations set in (Tα > Tβ > Tγ > Tδ ) when measuredisochronally (ω = const), or according to frequencies of loss peaks(ωα < ωβ < ωγ < ωδ ) when measured isothermally (T = const).
In the glassy state, amorphous polymers or amorphous phases ofsemicrystalline polymers possess at least one, mostly two secondaryrelaxations β and γ . In contrast to the primary relaxation, secondaryrelaxations originate from lower range molecular motions featuringbroader and lower loss peaks than the α-peak.
The temperature dependence of the β -relaxation obeys the Ar-rhenius law
ωp(T ) = ν0exp(
EkT
), (4.6)
where ωp(T ) is the frequency of the loss peak, ν0 is the relaxation ratein the high-temperature limit, E is the energy of activation.
Figure 4.5 depicts the β -peak of poly(methyl methacrylate)(PMMA) due to the motion of the ester group around the C–C bondconnecting the side group to the main chain. With increasing temper-ature, the sterical hindrance for the side group rotation ceases and the
28
4.3 Molecular Origin of Secondary Relaxations
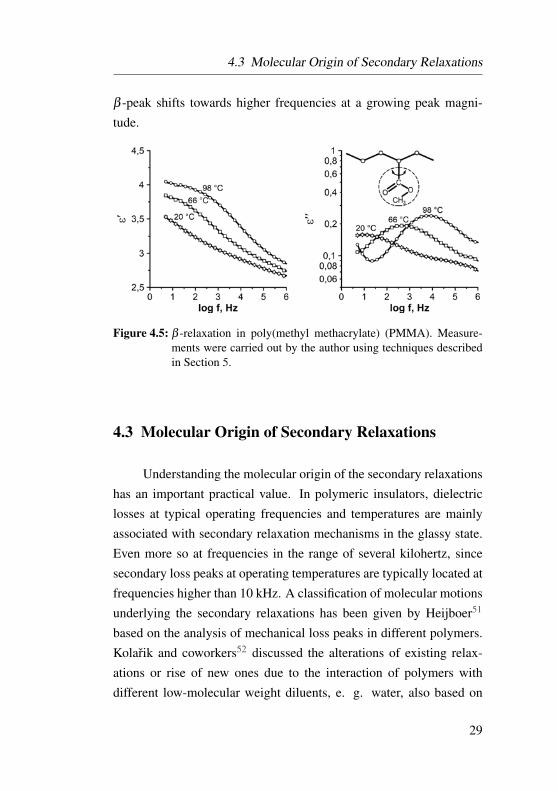
β -peak shifts towards higher frequencies at a growing peak magni-tude.
Figure 4.5: β -relaxation in poly(methyl methacrylate) (PMMA). Measure-ments were carried out by the author using techniques describedin Section 5.
4.3 Molecular Origin of Secondary Relaxations
Understanding the molecular origin of the secondary relaxationshas an important practical value. In polymeric insulators, dielectriclosses at typical operating frequencies and temperatures are mainlyassociated with secondary relaxation mechanisms in the glassy state.Even more so at frequencies in the range of several kilohertz, sincesecondary loss peaks at operating temperatures are typically located atfrequencies higher than 10 kHz. A classification of molecular motionsunderlying the secondary relaxations has been given by Heijboer51
based on the analysis of mechanical loss peaks in different polymers.Kolarik and coworkers52 discussed the alterations of existing relax-ations or rise of new ones due to the interaction of polymers withdifferent low-molecular weight diluents, e. g. water, also based on
29
4 Dielectric Relaxations in Cellulose
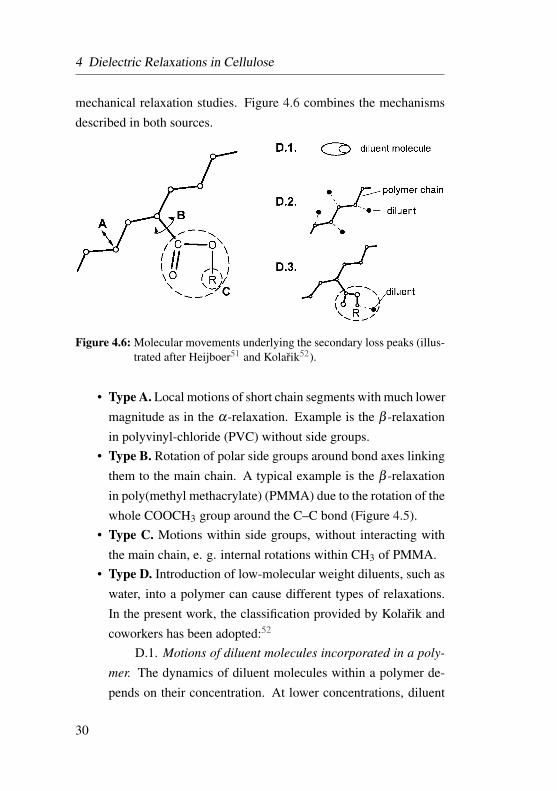
mechanical relaxation studies. Figure 4.6 combines the mechanismsdescribed in both sources.
Figure 4.6: Molecular movements underlying the secondary loss peaks (illus-trated after Heijboer51 and Kolarik52).
• Type A. Local motions of short chain segments with much lowermagnitude as in the α-relaxation. Example is the β -relaxationin polyvinyl-chloride (PVC) without side groups.
• Type B. Rotation of polar side groups around bond axes linkingthem to the main chain. A typical example is the β -relaxationin poly(methyl methacrylate) (PMMA) due to the rotation of thewhole COOCH3 group around the C–C bond (Figure 4.5).
• Type C. Motions within side groups, without interacting withthe main chain, e. g. internal rotations within CH3 of PMMA.
• Type D. Introduction of low-molecular weight diluents, such aswater, into a polymer can cause different types of relaxations.In the present work, the classification provided by Kolarik andcoworkers has been adopted:52
D.1. Motions of diluent molecules incorporated in a poly-
mer. The dynamics of diluent molecules within a polymer de-pends on their concentration. At lower concentrations, diluent
30
4.4 Secondary Relaxation Processes in Cellulose
molecules are tightly bound to the polymer. Their mobility issignificantly lower compared to the bulk liquid state; the corre-sponding relaxation peak denoted βd appears at lower frequen-cies. With increasing concentration, weaker bound networks ofdiluent molecules build up. The relaxation peak grows due tothe contribution of diluent molecules and shifts towards higherfrequencies. Studies on water dissolved in amorphous polymershave revealed a similarity to the dynamics of water within con-fining environments.53
D.2. Motions of diluent molecules with local motions of the
main chain. This type of interaction is characteristic for poly-mers without polar side chains (e. g. polyamides, poly(ethylenetherepthalate)). The local motions of polar segments of the poly-mer backbone cease with the addition of diluents. At the sametime a relaxation peak due to the motions of diluent moleculesappears.
D.3. Motions of diluent molecules with rotations inside the
side groups. Upon adding diluents, the loss peak originatingfrom side chain motions is transformed into a loss peak due tothe motions of diluent molecules.54
4.4 Secondary Relaxation Processes in Cellulose
As mentioned earlier, cellulose has a semi-crystalline structureof microfibrils with tightly packed crystallites and disordered amor-phous phases. Like in synthetic polymers, the semi-crystalline mor-phology plays an important role in molecular relaxations of cellulose.In fact, the secondary relaxations discussed below are assumed to takeplace only in amorphous regions, where the dipoles possess a greaterfreedom of motion. Similarly, dielectric processes associated with the
31
4 Dielectric Relaxations in Cellulose
hydration of cellulose are located in amorphous regions too. Below, abrief review of dielectric relaxation processes in cellulose is given.
The molecular interpretation of secondary relaxations in polysac-charides, including cellulose, has been controversial among differentauthors.55–58 In this work definitions suggested by Kaminski and hiscoworkers59 are adopted. The authors identified similarities betweenβ - and γ-relaxations of cellulose with relaxations in mono- and dis-accharides made of similar monomers as cellulose. In fact, activa-tion energies of rotatory motions determined for example in trehalose∆Hβ = 87± 1 kJ/mol, ∆Hγ = 51± 0.5 are close to values obtainedfor cellulose ∆Hβ = 85± kJ/mol, ∆Hγ = 38...43.5. This assumptionseems plausible due to the fact that the secondary relaxations of cellu-lose originate from local chain motions involving few monomers.
4.4.1 The β -relaxation
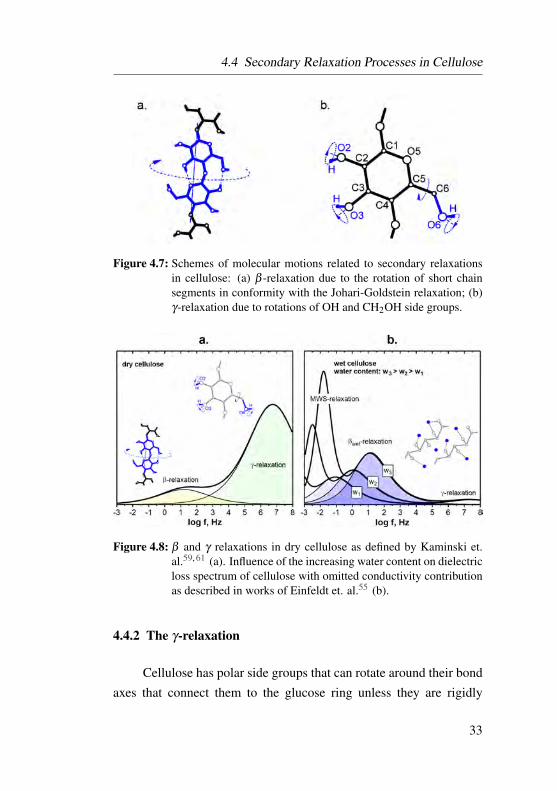
The β -relaxation is related to local rotations of several mono-mers around the longitudinal axis of the cellulose chain (Figure 4.7-a). Such type of polymer chain motions is known in literature as theJohari-Goldstein (JG) relaxation.60 This form of dielectric relaxationis observed in numerous polymers in glassy amorphous state and otherglass-forming materials. Local rotations within a chain molecule ofcellulose with rigidly attached side groups and hydrogen bonds to theneighbouring chains, require a higher activation energy than the mo-tion of side groups. As discussed earlier, this type of secondary re-laxation can be eased through adding diluent molecules that act as aplasticiser. In dielectric loss spectra of cellulose, the β -relaxation pro-cess can be identified as a broad peak of low magnitude (see Figure4.8-a). In a wet cellulose it is masked under the βwet-peak (Figure4.8-b).
32
4.4 Secondary Relaxation Processes in Cellulose
Figure 4.7: Schemes of molecular motions related to secondary relaxationsin cellulose: (a) β -relaxation due to the rotation of short chainsegments in conformity with the Johari-Goldstein relaxation; (b)γ-relaxation due to rotations of OH and CH2OH side groups.
Figure 4.8: β and γ relaxations in dry cellulose as defined by Kaminski et.al.59, 61 (a). Influence of the increasing water content on dielectricloss spectrum of cellulose with omitted conductivity contributionas described in works of Einfeldt et. al.55 (b).
4.4.2 The γ-relaxation
Cellulose has polar side groups that can rotate around their bondaxes that connect them to the glucose ring unless they are rigidly
33

4 Dielectric Relaxations in Cellulose
bonded with side groups of neighbouring chains as in the crystallinelattice. Their motion can be detected as a dipolar loss peak in ε ′′(ω) athigher frequencies. Kaminski and coworkers defined these molecularmotions as the origin of the γ-relaxation in various polysaccharides,since a similar dielectric relaxation was observed in mono- and disac-charides that have the same side groups (Figure 4.7-b). This processis characterised by a lower activation energy than the β -relaxation.The hydration increases the activation energy of the γ-process, indi-cating that the dipolar moment of OH-groups increases through theattachment of water molecules.55 The peak of the γ-relaxation in thedielectric loss spectrum appears at a higher frequency than that of theβ -relaxation because of the shorter relaxation times of side group ro-tations than the rotation of bulky chain segments. The γ-process ischaracterised by a higher and sharper peak than the β -peak. It is alsovisible in the dielectric loss spectrum of wet cellulose (Figures 4.8 and4.9).
4.4.3 The βwet-relaxation
Water incorporated in cellulose, even at lower concentrations,has a significant influence on the complex permittivity of the host poly-mer. A specific dielectric feature for cellulose and other polysaccha-rides and their derivatives, that arises as a cause of hydration, is calledβwet-relaxation. It is marked by a pronounced loss peak that arises be-tween 0 and 60°C on the right shoulder of the MWS-peak (Figure 4.9).The latter is also enhanced due to the hydration. The peak of βwet-process vanishes almost completely upon drying and reappears againwith adsorption of water. Drying the paper under vacuum removes thevast part of the water residing in amorphous regions. Dielectrically, itis associated with a permittivity decrease explained by the disappear-ance of the βwet-peak as well as the decrease of the MWS-relaxation
34
4.4 Secondary Relaxation Processes in Cellulose
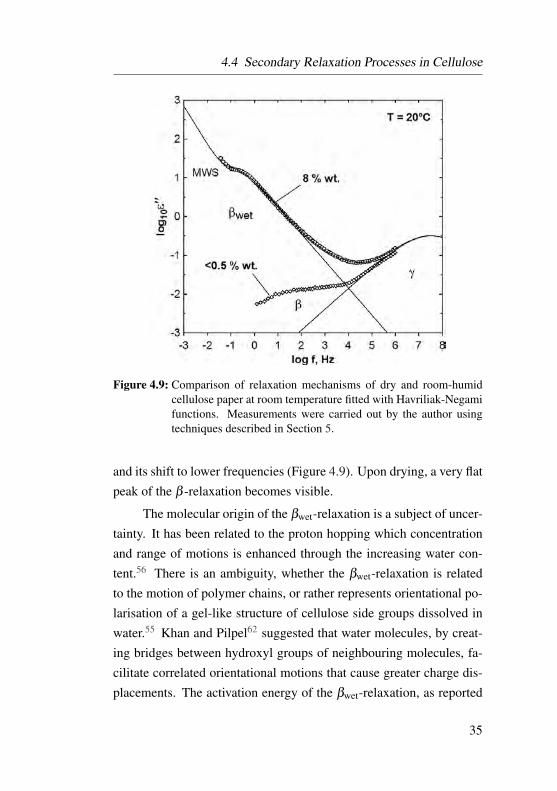
Figure 4.9: Comparison of relaxation mechanisms of dry and room-humidcellulose paper at room temperature fitted with Havriliak-Negamifunctions. Measurements were carried out by the author usingtechniques described in Section 5.
and its shift to lower frequencies (Figure 4.9). Upon drying, a very flatpeak of the β -relaxation becomes visible.
The molecular origin of the βwet-relaxation is a subject of uncer-tainty. It has been related to the proton hopping which concentrationand range of motions is enhanced through the increasing water con-tent.56 There is an ambiguity, whether the βwet-relaxation is relatedto the motion of polymer chains, or rather represents orientational po-larisation of a gel-like structure of cellulose side groups dissolved inwater.55 Khan and Pilpel62 suggested that water molecules, by creat-ing bridges between hydroxyl groups of neighbouring molecules, fa-cilitate correlated orientational motions that cause greater charge dis-placements. The activation energy of the βwet-relaxation, as reported
35
4 Dielectric Relaxations in Cellulose
in literature, measures between 63 and 70 kJ/mol.63
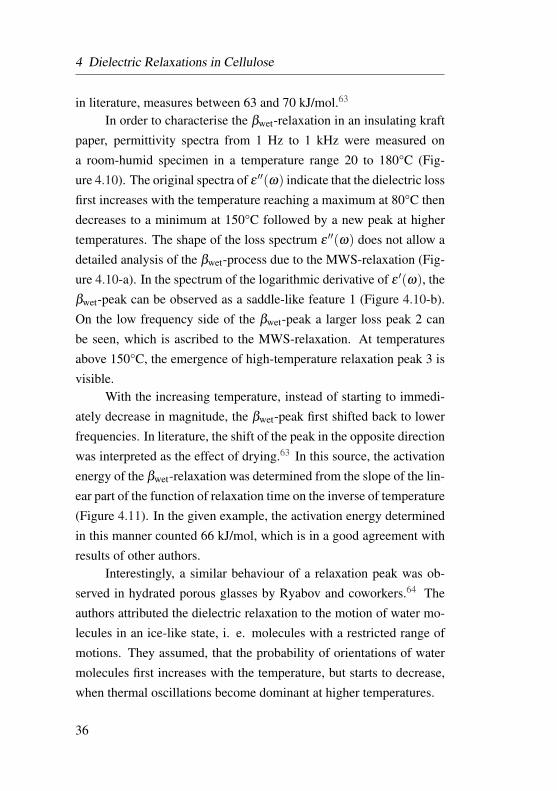
In order to characterise the βwet-relaxation in an insulating kraftpaper, permittivity spectra from 1 Hz to 1 kHz were measured ona room-humid specimen in a temperature range 20 to 180°C (Fig-ure 4.10). The original spectra of ε ′′(ω) indicate that the dielectric lossfirst increases with the temperature reaching a maximum at 80°C thendecreases to a minimum at 150°C followed by a new peak at highertemperatures. The shape of the loss spectrum ε ′′(ω) does not allow adetailed analysis of the βwet-process due to the MWS-relaxation (Fig-ure 4.10-a). In the spectrum of the logarithmic derivative of ε ′(ω), theβwet-peak can be observed as a saddle-like feature 1 (Figure 4.10-b).On the low frequency side of the βwet-peak a larger loss peak 2 canbe seen, which is ascribed to the MWS-relaxation. At temperaturesabove 150°C, the emergence of high-temperature relaxation peak 3 isvisible.
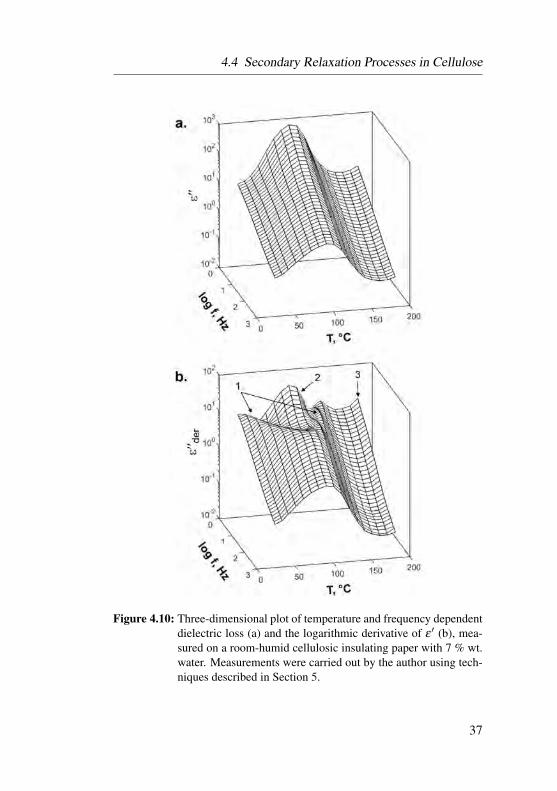
With the increasing temperature, instead of starting to immedi-ately decrease in magnitude, the βwet-peak first shifted back to lowerfrequencies. In literature, the shift of the peak in the opposite directionwas interpreted as the effect of drying.63 In this source, the activationenergy of the βwet-relaxation was determined from the slope of the lin-ear part of the function of relaxation time on the inverse of temperature(Figure 4.11). In the given example, the activation energy determinedin this manner counted 66 kJ/mol, which is in a good agreement withresults of other authors.
Interestingly, a similar behaviour of a relaxation peak was ob-served in hydrated porous glasses by Ryabov and coworkers.64 Theauthors attributed the dielectric relaxation to the motion of water mo-lecules in an ice-like state, i. e. molecules with a restricted range ofmotions. They assumed, that the probability of orientations of watermolecules first increases with the temperature, but starts to decrease,when thermal oscillations become dominant at higher temperatures.
36
4.4 Secondary Relaxation Processes in Cellulose
Figure 4.10: Three-dimensional plot of temperature and frequency dependentdielectric loss (a) and the logarithmic derivative of ε ′ (b), mea-sured on a room-humid cellulosic insulating paper with 7 % wt.water. Measurements were carried out by the author using tech-niques described in Section 5.
37
4 Dielectric Relaxations in Cellulose
Figure 4.11: Temperature dependence of the relaxation time of the βwet-process in a room-humid cellulosic insulating paper from Fig-ure 4.10.
Another explanation for the bow-like transition of the βwet-pro-cess at a maintained peak magnitude might be the migration of pro-tons. It seems reasonable that the probability of proton motions firstincreases with the temperature elevation. It shifts the relaxation peaksof βwet- and MWS-processes to higher frequencies. The reversal ofthe shift direction might be related to the increase of chaotic ther-mal motions, lowering the hopping probability of protons (Equation4.1). At further heating, the concentration of water in cellulose de-creases. Hence, conduction paths formed by water gradually disap-pear, restricting the probability of ionic hopping. The decreased con-ductivity of the amorphous regions also reduces the MWS-peak 2 andcauses its shift to lower frequencies.
It can be assumed, that the water in the paper specimen has beenremoved almost completely by the moment of reaching 150°C. How-ever, at a continued heating, the dielectric loss starts to increase again,
38
4.5 Temperature Dependence of Relaxation Processes
marking the onset of a high-temperature relaxation47 (feature 3 in Fig-ure 4.10-b).
4.5 Temperature Dependence of Relaxation Processes
Previously introduced relaxation processes in cellulose dependon temperature. As shown in the previous example, the increase oftemperature significantly alters the dielectric properties of the hydratedcellulose due to the activation and the consequent removal of water.Practically, it can be stated, that the detrimental effect of water is en-hanced by the increase of temperature within a range, where the waterstill remains in cellulose. Dipolar processes of dry cellulose are alsoaffected by the change of temperature. The relaxation times of molec-ular motions, responsible for β - and γ-processes decrease with thetemperature elevation, i. e. their peaks shift to higher temperatures.
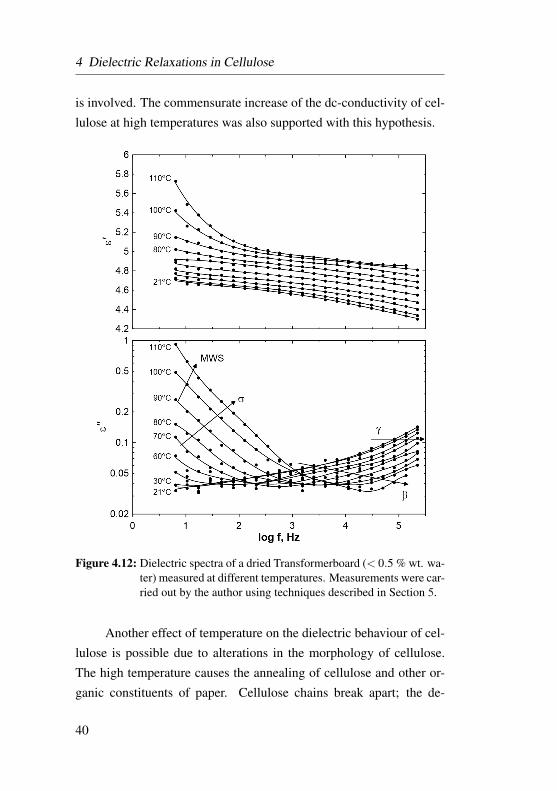
Figure 4.12 shows frequency spectra of the complex permittivityof a dry Transformerboard specimen with less than 0.5 % wt. water. Itindicates that the permittivity increases with temperature at frequen-cies below 1 kHz. In contrast, above 1 kHz the dielectric loss de-creased with temperature. This is explained by different dynamics ofcorresponding relaxation processes, i. e. their different shift rates withtemperature.
At lower frequencies, the increase of temperature enhances theMWS-relaxation and causes another process on the right shoulder ofthe MWS-peak. In literature this phenomenon is denoted σ -relaxa-tion.47 Such high-temperature relaxation was observed not only invarious polysaccharides and their derivatives but also in conductiveglasses.65 Einfeldt and coworkers suggested that a local diffusion pro-cess, different from the MWS-relaxation, causes the appearance of adielectric loss peak at higher temperatures, in which the motion of ions
39
4 Dielectric Relaxations in Cellulose
is involved. The commensurate increase of the dc-conductivity of cel-lulose at high temperatures was also supported with this hypothesis.
Figure 4.12: Dielectric spectra of a dried Transformerboard (< 0.5 % wt. wa-ter) measured at different temperatures. Measurements were car-ried out by the author using techniques described in Section 5.
Another effect of temperature on the dielectric behaviour of cel-lulose is possible due to alterations in the morphology of cellulose.The high temperature causes the annealing of cellulose and other or-ganic constituents of paper. Cellulose chains break apart; the de-
40
4.5 Temperature Dependence of Relaxation Processes
gree of crystallinity of cellulose decreases. A so-called hornificationtakes place.66, 67 With water escaping the cellulose, chain moleculesin amorphous regions are packed closer to each other. In a closer prox-imity of neighbouring molecules, a reestablishment of hydrogen bondsand other chemical linkings, earlier diminished through the adsorptionof water, is assumed. The hornification is a partially reversible pro-cess. Therefore, a paper once subjected to high temperatures adsorbsless moisture than a thermally untreated paper.
41
5 Experimental
The general idea behind the experiments was to assess the alter-ations of the complex permittivity of insulating paper materials due tosubjection to a high bias field. An experimental setup was developedby the author for the purpose of measuring the complex permittivity ata simultaneously acting high dc-voltage. In order to characterise thebehaviour of the dielectric subjected to a high bias field, the intensityof the bias field and the stress duration, as well as the magnitude andfrequency of the probing ac-voltage were varied. These experimentswere carried out at different temperatures and water contents of spec-imens. The following chapter provides detailed explanations of themeasurement methods, the design and function of the experimentalsetup and the procedure of specimen preparation.
Schemes of electric field configurations employed by the authorin the present work are illustrated in Figure 5.1.
1. Time-resolved measurement. With a time-resolved measurementof the complex permittivity it was intended to observe the di-electric behaviour of the specimen over an extended time spanafter applying a high bias field. Depending on temperature andwater content, ε ′ and tanδ of insulating papers behaved differ-ently. It is known that the polarisation of the dielectric upona step voltage application evolves according to time constantsof individual polarisation processes. By superimposing a low-amplitude ac-voltage of a fixed frequency, the influence of a biasfield on a particular polarisation process, which is addressedwith the ac-voltage, can be observed. Hence, faster dipolar pro-cesses were examined with a high frequency probing voltage,whereas slower ionic processes with a low frequency ac-voltage.
2. Variation of mixed field components. Preliminary measurementsidentified a dependence of the permittivity of paper specimens
42
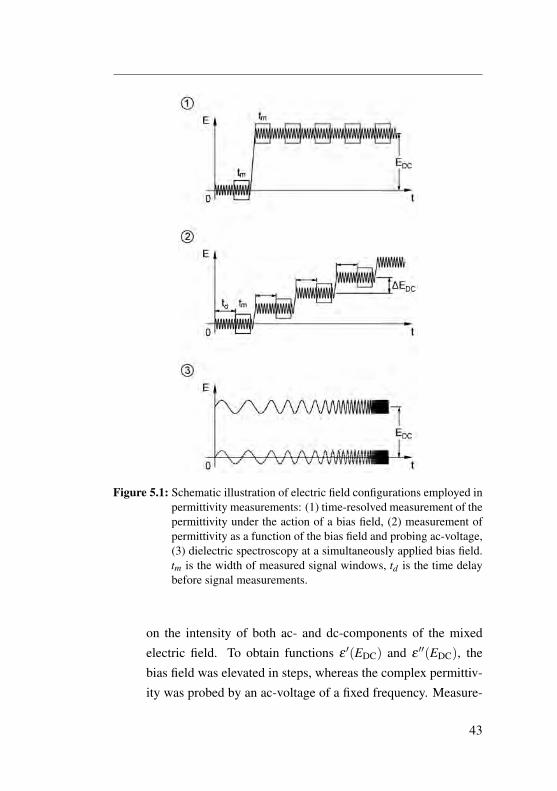
Figure 5.1: Schematic illustration of electric field configurations employed inpermittivity measurements: (1) time-resolved measurement of thepermittivity under the action of a bias field, (2) measurement ofpermittivity as a function of the bias field and probing ac-voltage,(3) dielectric spectroscopy at a simultaneously applied bias field.tm is the width of measured signal windows, td is the time delaybefore signal measurements.
on the intensity of both ac- and dc-components of the mixedelectric field. To obtain functions ε ′(EDC) and ε ′′(EDC), thebias field was elevated in steps, whereas the complex permittiv-ity was probed by an ac-voltage of a fixed frequency. Measure-
43
5 Experimental
ments were carried out also with a high amplitude ac-voltage.Upon each step-like adjustment of the bias field, the permittiv-ity was measured after a constant time delay td .
3. Dielectric spectroscopy using a biased ac-signal. Since the al-terations of ε ′ and ε ′′ due to the bias field depended on the fre-quency and amplitude of the probing voltage, it was decided toexamine the dielectric spectra in a wide range of frequenciesunder the action of a bias field. The complex permittivity andconductivity spectra were measured in a frequency range 5 Hzto 1 MHz with a low-amplitude ac-signal, and in a range 40 Hzto 500 Hz with a high-amplitude ac-signal. Measurement of onesweep from 5 Hz to 1 MHz took less than one minute. Keepingthe sweep times as short as possible was important to measureinstantaneous shapes of frequency spectra, considering time de-pendent changes of ε ′ and ε ′′ observed under dc-field. In orderto minimise perturbations caused by low-frequency voltage, fre-quency sweeps were taken from high to low frequencies.
The equipment used in permittivity measurements included acommercial LCR-meter Newtons4th PSM 1735 with an external cur-rent amplifier FEMTO DLPCA-200 for low-voltage measurementsand a home-made setup for high-voltage measurements.
5.1 Test Setup for Dielectric Measurements
5.1.1 Basics
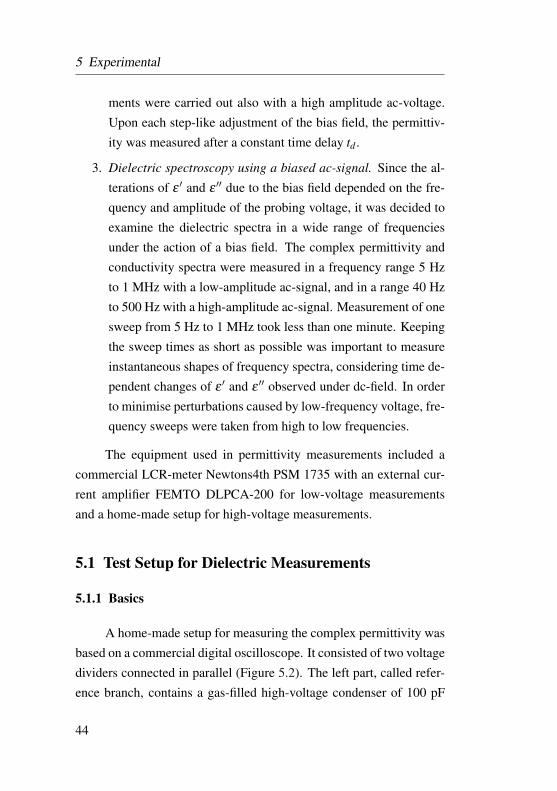
A home-made setup for measuring the complex permittivity wasbased on a commercial digital oscilloscope. It consisted of two voltagedividers connected in parallel (Figure 5.2). The left part, called refer-ence branch, contains a gas-filled high-voltage condenser of 100 pF
44
5.1 Test Setup for Dielectric Measurements
represented by an impedance Zr. The low-voltage part of the refer-ence branch ZLV 1 is a parallel connection of input elements of the os-cilloscope 1 MOhm and 20 pF, cable capacitances and a low-loss 5 nFcapacitor. The right branch is called sample branch. Its high-voltagepart includes a guarded specimen holder with an impedance Zs. Thelow-voltage side of the right branch ZLV 2 is identical with ZLV 1. Sty-roflex capacitors were employed due to their low dielectric loss andlong-term stability. Surge arresters were connected to inputs of theoscilloscope to protect against overvoltages.
Figure 5.2: Unbalanced bridge circuit for impedance measurement.
For the permittivity measurement, voltage signals were mea-sured on impedances ZLV 1 and ZLV 2 by means of a digital oscilloscope.The raw data was then transmitted to a computer. The measured sig-nal windows of sinusoidal voltages U1 and U2 were processed into thespecimen impedance Zs. The result was subsequently corrected witha referencing method (cf. section 5.1.2) in order to accurately deter-mine the magnitude and phase of the impedance Zs. Finally, from thespecimen impedance calculated from measured values, ε ′ and ε ′′ weredetermined based on the geometrical capacitance.
45
5 Experimental
5.1.2 Referencing
The accuracy of the permittivity measurement, which is particu-larly crucial for studying low-loss dielectrics, can be enhanced by per-forming reference measurements on capacitors with well-known ca-pacitances and sufficiently low losses. A brief account of this methodis given below.
According to Figure 5.2, the voltage U1 multiplied by the divid-ing ratio of the reference branch gives the total voltage
U =Zr +ZLV 1
ZLV 1U1 . (5.1)
For the impedance of the specimen, following equation holds
Zs =U s
I2=
U−U2U2
ZLV 2 . (5.2)
As seen in Equation (5.2), the expression for Zs includes thevalue of the low-voltage impedance ZLV 2 that depends on frequencyand thus contributes an error due to the measurement circuit. Thiserror can be eliminated by taking a reference measurement on a low-loss capacitor with a known impedance Z∗s , for which it holds
Z∗s =U∗sU∗2
ZLV 2 . (5.3)
A reference measurement carried out on a low-loss capacitor allows todetermine ZLV 2 under conditions close to the measurement on a lossyspecimen
ZLV 2 =U∗2U∗s
Z∗s . (5.4)
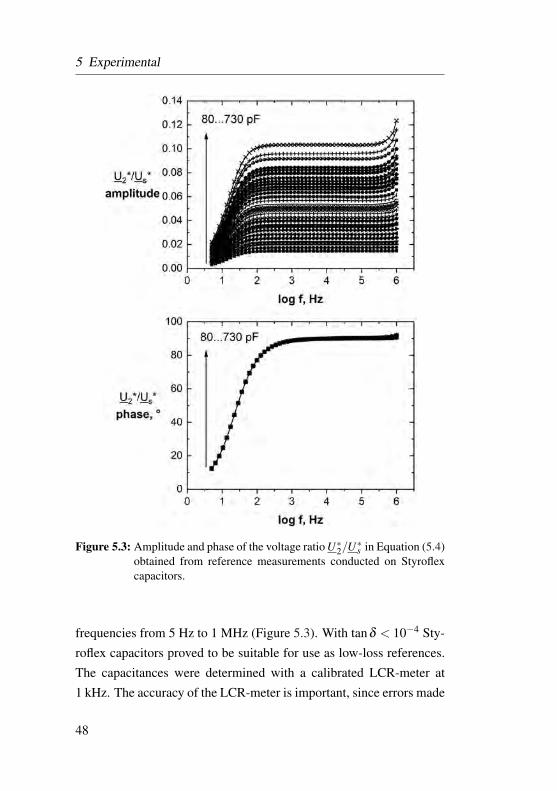
Figure 5.3 shows the voltage ratios U∗2/U∗s for low-loss Styroflexcapacitors. The ratio is not frequency independent. Below 100 Hz
46
5.1 Test Setup for Dielectric Measurements
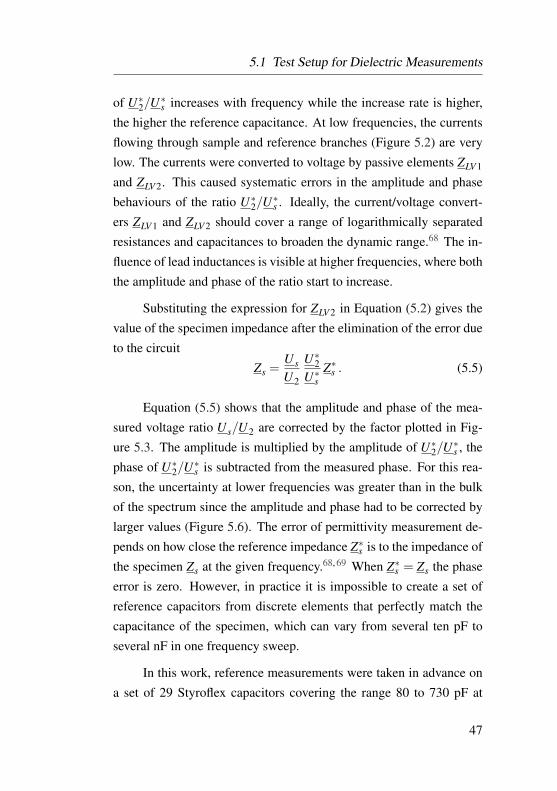
of U∗2/U∗s increases with frequency while the increase rate is higher,the higher the reference capacitance. At low frequencies, the currentsflowing through sample and reference branches (Figure 5.2) are verylow. The currents were converted to voltage by passive elements ZLV 1
and ZLV 2. This caused systematic errors in the amplitude and phasebehaviours of the ratio U∗2/U∗s . Ideally, the current/voltage convert-ers ZLV 1 and ZLV 2 should cover a range of logarithmically separatedresistances and capacitances to broaden the dynamic range.68 The in-fluence of lead inductances is visible at higher frequencies, where boththe amplitude and phase of the ratio start to increase.
Substituting the expression for ZLV 2 in Equation (5.2) gives thevalue of the specimen impedance after the elimination of the error dueto the circuit
Zs =U s
U2
U∗2U∗s
Z∗s . (5.5)
Equation (5.5) shows that the amplitude and phase of the mea-sured voltage ratio U s/U2 are corrected by the factor plotted in Fig-ure 5.3. The amplitude is multiplied by the amplitude of U∗2/U∗s , thephase of U∗2/U∗s is subtracted from the measured phase. For this rea-son, the uncertainty at lower frequencies was greater than in the bulkof the spectrum since the amplitude and phase had to be corrected bylarger values (Figure 5.6). The error of permittivity measurement de-pends on how close the reference impedance Z∗s is to the impedance ofthe specimen Zs at the given frequency.68, 69 When Z∗s = Zs the phaseerror is zero. However, in practice it is impossible to create a set ofreference capacitors from discrete elements that perfectly match thecapacitance of the specimen, which can vary from several ten pF toseveral nF in one frequency sweep.
In this work, reference measurements were taken in advance ona set of 29 Styroflex capacitors covering the range 80 to 730 pF at
47
5 Experimental
Figure 5.3: Amplitude and phase of the voltage ratio U∗2/U∗s in Equation (5.4)obtained from reference measurements conducted on Styroflexcapacitors.
frequencies from 5 Hz to 1 MHz (Figure 5.3). With tanδ < 10−4 Sty-roflex capacitors proved to be suitable for use as low-loss references.The capacitances were determined with a calibrated LCR-meter at1 kHz. The accuracy of the LCR-meter is important, since errors made
48
5.1 Test Setup for Dielectric Measurements
in measurements of reference capacitances cause later the uncertaintyin the measurement of the permittivity of the specimen. Measuring thecapacitance at 1 kHz was a compromise based on the assumption thatε ′ of the polystyrene remains constant within the considered frequencyrange. Results of reference measurements were matrices of ZLV 2 withrows corresponding to frequencies and columns corresponding to ca-pacitances. The matrices were saved in a look-up table that was usedin the post processing to implement the Equation (5.2).
5.1.3 Signal Measurement and Processing
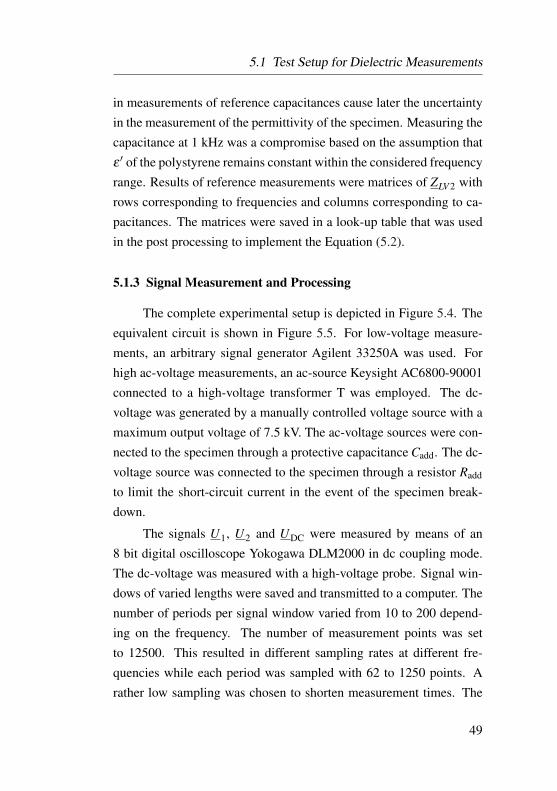
The complete experimental setup is depicted in Figure 5.4. Theequivalent circuit is shown in Figure 5.5. For low-voltage measure-ments, an arbitrary signal generator Agilent 33250A was used. Forhigh ac-voltage measurements, an ac-source Keysight AC6800-90001connected to a high-voltage transformer T was employed. The dc-voltage was generated by a manually controlled voltage source with amaximum output voltage of 7.5 kV. The ac-voltage sources were con-nected to the specimen through a protective capacitance Cadd. The dc-voltage source was connected to the specimen through a resistor Radd
to limit the short-circuit current in the event of the specimen break-down.
The signals U1, U2 and UDC were measured by means of an8 bit digital oscilloscope Yokogawa DLM2000 in dc coupling mode.The dc-voltage was measured with a high-voltage probe. Signal win-dows of varied lengths were saved and transmitted to a computer. Thenumber of periods per signal window varied from 10 to 200 depend-ing on the frequency. The number of measurement points was setto 12500. This resulted in different sampling rates at different fre-quencies while each period was sampled with 62 to 1250 points. Arather low sampling was chosen to shorten measurement times. The
49

5 Experimental
Figure 5.4: Overview of the experimental setup. (1) laptop, (2) function gen-erator, (3) digital oscilloscope, (4) test chamber, (5) high-voltageprobe PMK PHV 4002-3, (6) gas-filled capacitor, (7) high-voltagefeedthrough, (8) coupling capacitor, (9) protective resistor, (10)high-voltage transformer, (11) dc-voltage source FUG HCP 7500,(12) isolators.
measurement procedure and the signal analysis were controlled by aprogramme written in MATLAB. Amplitudes and phase angles of U1
and U2 as well as the dc-voltage UDC were determined by using theDiscrete Fourier Transformation (DFT). The DFT returns arrows ofamplitudes A( f ) and their corresponding phase angles Φ( f ) with thenumber of elements equal to the sampling rate of measured signals.
U1 = A1( f0) , ϕ1 = Φ( f0) ,
U2 = A2( f0) , ϕ2 = Φ( f0) ,
UDC = A3(1) .
(5.6)
50
5.1 Test Setup for Dielectric Measurements
Figure 5.5: The equivalent circuit used in measuring the complex permittivitywith an ac-signal superimposed onto a high dc-voltage by meansof the unbalanced bridge.
The DFT spectra exhibited a maximum at the fundamental fre-quency f0 (Figure 5.5). In conductive specimens, the signal U2 fea-tured a significant dc-bias caused by the dc-conductivity of the speci-men and the input resistance built in the oscilloscope.
From the known values of U1 and U2 and the phase angles ϕ1
and ϕ2 the specimen impedance was calculated according to Equa-tion (5.5). The real and imaginary components of the complex per-mittivity were determined from the expression applying for a series
51
5 Experimental
RC-network
Xs = Im(Zs) , Cs =1
ωXs, (5.7)
δ = arg(Zs)+π/2 , (5.8)
ε′ =
Cs
C0, (5.9)
ε′′ = ε
′ tanδ . (5.10)
The uncertainty of the sample impedance is determined by theuncertainties of ADCs of the oscilloscope and the uncertainty of theLCR-meter which was used to measure the reference capacitances.The uncertainty in the amplitude measurement of an 8 bit ADC counts0.39 %. The uncertainty of the LCR meter Newtons4th PSM1735 isspecified as 0.1 %. Calculating the combined uncertainty as the rootsquare of the linear sum of squares of each uncertainty for 3 ADCsof the oscilloscope and the LCR-meter gives 0.68 %. The dial gaugeused to measure the sample thickess has the accuracy of 4 µm, i.e.4 % uncertainty for a 100 µm thick foil. Therefore, the uncertaintyof ε ′ is mainly due to the measurement of the thickness of the spec-imen and electrode surfaces. For this reason, alterations of dielectricproperties of different specimens have been compared rather than theirabsolute values. To assess phase angle and amplitude resolutions, per-mittivity measurements were made on an air capacitor (Figure 5.6).Guarded electrodes in diameter 40 mm with an electrode separation75 µm were used. The phase angle determined for air counted lessthan 10−3 rad in the bulk of the spectrum. The deviation of the capaci-tance remained below 1 %. Due to the phase angle resolution, tanδ oflow-loss materials like polyethylene could not be sufficiently resolvedbelow 10−3.
To ensure that the application of a high bias field had no influ-
52
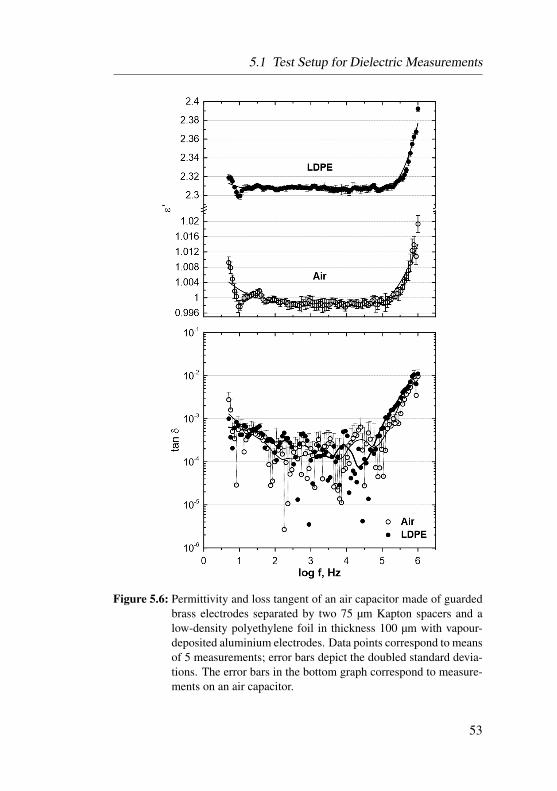
5.1 Test Setup for Dielectric Measurements
Figure 5.6: Permittivity and loss tangent of an air capacitor made of guardedbrass electrodes separated by two 75 µm Kapton spacers and alow-density polyethylene foil in thickness 100 µm with vapour-deposited aluminium electrodes. Data points correspond to meansof 5 measurements; error bars depict the doubled standard devia-tions. The error bars in the bottom graph correspond to measure-ments on an air capacitor.
53
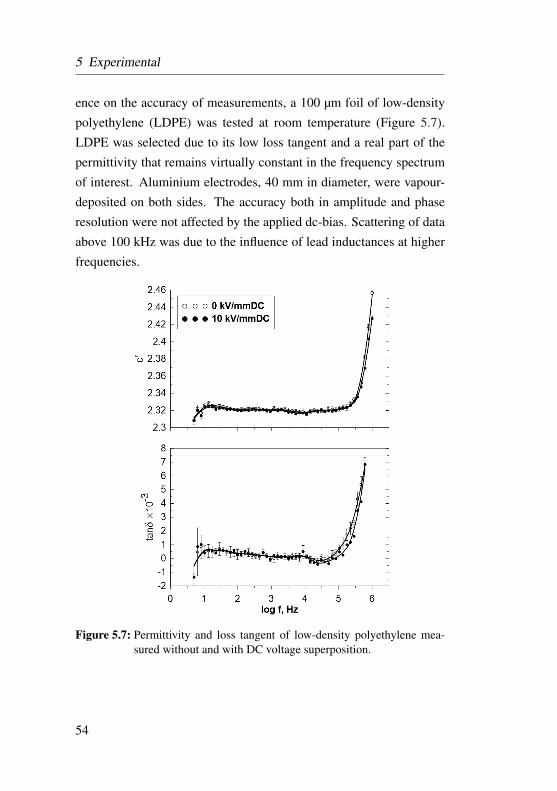
5 Experimental
ence on the accuracy of measurements, a 100 µm foil of low-densitypolyethylene (LDPE) was tested at room temperature (Figure 5.7).LDPE was selected due to its low loss tangent and a real part of thepermittivity that remains virtually constant in the frequency spectrumof interest. Aluminium electrodes, 40 mm in diameter, were vapour-deposited on both sides. The accuracy both in amplitude and phaseresolution were not affected by the applied dc-bias. Scattering of dataabove 100 kHz was due to the influence of lead inductances at higherfrequencies.
Figure 5.7: Permittivity and loss tangent of low-density polyethylene mea-sured without and with DC voltage superposition.
54
5.2 Specimen Preparation and Measurement
5.2 Specimen Preparation and Measurement
5.2.1 Specimens
Experiments were carried out on non-impregnated† and oil-imp-regnated papers and Transformerboard manufactured by WeidmannElectrical AG. These materials are widely used in oil-immersed trans-formers (Table 5.1). Papers made of 100 % cotton fibres were alsoconsidered, however the results presented in this work only includematerials listed in the table below. Non-impregnated specimens werestudied in order to exclude the effects attributable to the oil, althoughthe considered materials are utilised in practice only in combinationwith an oil impregnant.
Dielectric measurements on non-impregnated papers, especiallyunder application of high voltages, can be associated with extremelyhigh local fields that can distort the measurement through initiatingelectrical discharges at the surface. The fibrous structure of the paperand the surface roughness of metal electrodes cause a non-uniformelectrical contacting. Surface irregularities of an insulating kraft pa-per or board can reach several micrometers in depth (Figure 5.8). Incontrast, the surface roughness Ra of polished brass electrodes was inthe range of 0.05 µm. The surface roughness of lapped stainless steelelectrodes used in measurements on oil-impregnated units was lessthan 0.5 µm. At low amplitudes of probing ac-voltages, measurementswith an improper contact between the electrodes and the specimenyield a lower permittivity, since on both sides of the specimen, air ca-pacitors act in series. At higher ac-voltages, partial discharges can beinitiated causing a drastic increase of the permittivity and loss factor.This is explained through short-circuiting of air capacitors both at the
†A non-impregnated paper practically consists of air-impregnated cellulosic fibres.Therefore, in the following text, the terms "non-impregnated" and "air-impregnated"have the same meaning.
55
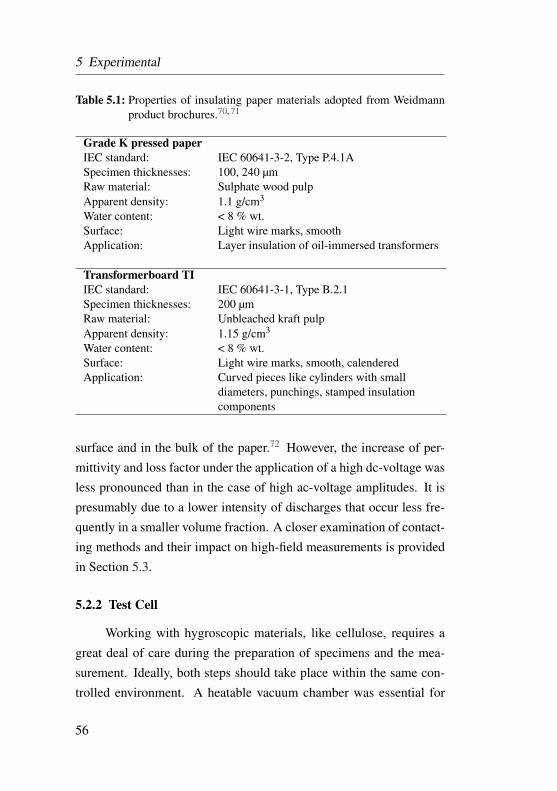
5 Experimental
Table 5.1: Properties of insulating paper materials adopted from Weidmannproduct brochures.70, 71
Grade K pressed paperIEC standard: IEC 60641-3-2, Type P.4.1ASpecimen thicknesses: 100, 240 µmRaw material: Sulphate wood pulpApparent density: 1.1 g/cm3
Water content: < 8 % wt.Surface: Light wire marks, smoothApplication: Layer insulation of oil-immersed transformers
Transformerboard TIIEC standard: IEC 60641-3-1, Type B.2.1Specimen thicknesses: 200 µmRaw material: Unbleached kraft pulpApparent density: 1.15 g/cm3
Water content: < 8 % wt.Surface: Light wire marks, smooth, calenderedApplication: Curved pieces like cylinders with small
diameters, punchings, stamped insulationcomponents
surface and in the bulk of the paper.72 However, the increase of per-mittivity and loss factor under the application of a high dc-voltage wasless pronounced than in the case of high ac-voltage amplitudes. It ispresumably due to a lower intensity of discharges that occur less fre-quently in a smaller volume fraction. A closer examination of contact-ing methods and their impact on high-field measurements is providedin Section 5.3.
5.2.2 Test Cell
Working with hygroscopic materials, like cellulose, requires agreat deal of care during the preparation of specimens and the mea-surement. Ideally, both steps should take place within the same con-trolled environment. A heatable vacuum chamber was essential for
56
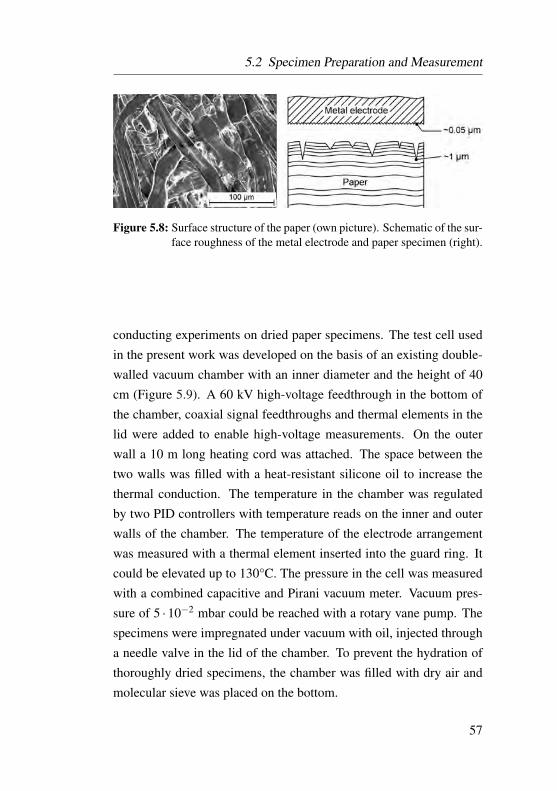
5.2 Specimen Preparation and Measurement
Figure 5.8: Surface structure of the paper (own picture). Schematic of the sur-face roughness of the metal electrode and paper specimen (right).
conducting experiments on dried paper specimens. The test cell usedin the present work was developed on the basis of an existing double-walled vacuum chamber with an inner diameter and the height of 40cm (Figure 5.9). A 60 kV high-voltage feedthrough in the bottom ofthe chamber, coaxial signal feedthroughs and thermal elements in thelid were added to enable high-voltage measurements. On the outerwall a 10 m long heating cord was attached. The space between thetwo walls was filled with a heat-resistant silicone oil to increase thethermal conduction. The temperature in the chamber was regulatedby two PID controllers with temperature reads on the inner and outerwalls of the chamber. The temperature of the electrode arrangementwas measured with a thermal element inserted into the guard ring. Itcould be elevated up to 130°C. The pressure in the cell was measuredwith a combined capacitive and Pirani vacuum meter. Vacuum pres-sure of 5 ·10−2 mbar could be reached with a rotary vane pump. Thespecimens were impregnated under vacuum with oil, injected througha needle valve in the lid of the chamber. To prevent the hydration ofthoroughly dried specimens, the chamber was filled with dry air andmolecular sieve was placed on the bottom.
57
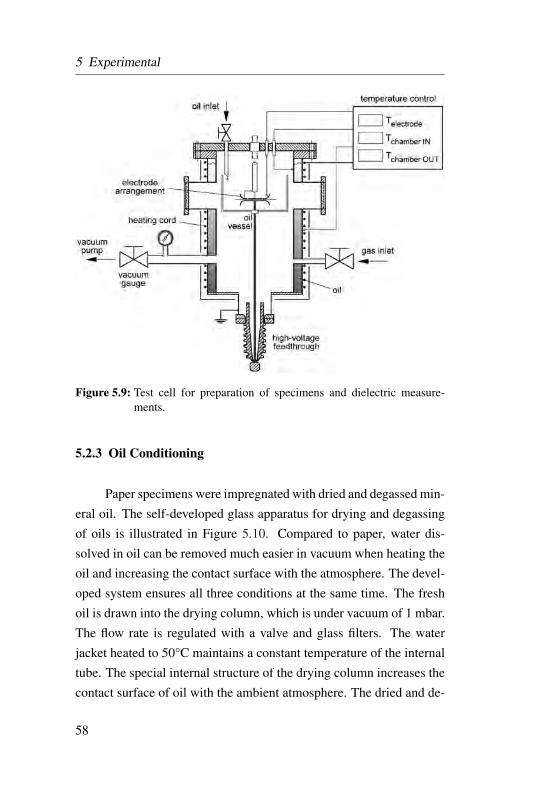
5 Experimental
Figure 5.9: Test cell for preparation of specimens and dielectric measure-ments.
5.2.3 Oil Conditioning
Paper specimens were impregnated with dried and degassed min-eral oil. The self-developed glass apparatus for drying and degassingof oils is illustrated in Figure 5.10. Compared to paper, water dis-solved in oil can be removed much easier in vacuum when heating theoil and increasing the contact surface with the atmosphere. The devel-oped system ensures all three conditions at the same time. The freshoil is drawn into the drying column, which is under vacuum of 1 mbar.The flow rate is regulated with a valve and glass filters. The waterjacket heated to 50°C maintains a constant temperature of the internaltube. The special internal structure of the drying column increases thecontact surface of oil with the ambient atmosphere. The dried and de-
58

5.2 Specimen Preparation and Measurement
gassed oil drops into a Woulff bottle. With this method, mineral oilscan be dried down to 2 ppmw.
Figure 5.10: System for drying and degassing of oil.
5.2.4 Preparation of Specimens
For non-impregnated specimens, three different degrees of hy-dration were considered: 1) untreated units with 6 – 8% wt. water,2) moderately dried units with about 4 % wt. and 3) thoroughly driedunits with less than 0.5% wt. water. Specimens with the lowest watercontent were dried under vacuum at 120°C for at least 24 hours andstored in a desiccator filled with molecular sieve. Although the spec-imens were shortly exposed to the ambient atmosphere while placingthem into the specimen holder, the water content after the measure-ment counted less than 0.5 % wt. Moderately dried units were eitherdried for 24 h in an oven at 50°C under normal atmosphere or storedin a desiccator with a little amount of desiccant for at least one week.
59
5 Experimental
Part of specimens was impregnated with vacuum treated mineral oilShell Diala S4 ZX-1. A measuring cup with specimens was placedinto the test chamber and subjected to vacuum of 5 · 10−2 mbar. Fig-ure 5.11 shows the internal of the test chamber prepared for the im-pregnation. The impregnation took place at room temperature with oilwarmed up to 40 – 45°C. The oil was drawn in through a needle valveand a silicone tube. An effective reduction of the water content of oil-impregnated specimens was achieved by adding molecular sieve intothe measuring cup. Specimens with a higher degree of hydration wereimpregnated without previous drying under vacuum.
5.2.5 Measurement of the Water Content
The water content in the paper was determined by means of aKarl-Fischer coulometry.73 A coulometer METROHM Model 652 KFwith a heating unit 707 KF oven was used. The non-impregnated spec-imens were heated to 200°C in the drying unit under N2-flow of 100ml/min. The extracted water is thereby transported into the anolyte. Inthe coulometric water determination, iodine is generated automaticallyfrom the iodide containing electrolyte through the anodic oxidation.The coulometer measures the current flowing through the anolyte andthe time required to achieve the endpoint of the titration. The electriccharge, determined as the product of the current and time, quantifiesthe amount of the consumed iodine which is directly proportional tothe amount of water added to the anolyte. The water content of oil-impregnated specimens was determined through methanol extraction.Oil-impregnated snippets were mixed in methanol with a known watercontent. The methanol-water mixture was then added directly to theanolyte.
The water content of the oil was measured with a capacitivemoisture sensor made by E+E Electronics. The sensor incorporates
60

5.2 Specimen Preparation and Measurement
Figure 5.11: Test cell arranged for impregnation of paper specimens. (1)liftable lid of the vacuum chamber, (2) electrical feedthrough,(3) coaxial feedthroughs, (4) fittings for thermal elements, (5)needle valve for oil inlet, (6) silicone tube for oil inflow, (7)measuring cup with specimens, (8) ball valve for gas inlet, (9)ventilation valve.
61
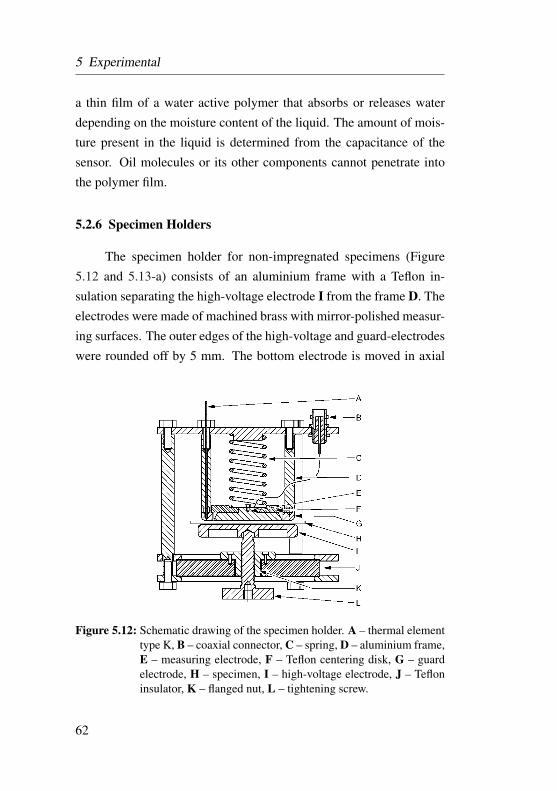
5 Experimental
a thin film of a water active polymer that absorbs or releases waterdepending on the moisture content of the liquid. The amount of mois-ture present in the liquid is determined from the capacitance of thesensor. Oil molecules or its other components cannot penetrate intothe polymer film.
5.2.6 Specimen Holders
The specimen holder for non-impregnated specimens (Figure5.12 and 5.13-a) consists of an aluminium frame with a Teflon in-sulation separating the high-voltage electrode I from the frame D. Theelectrodes were made of machined brass with mirror-polished measur-ing surfaces. The outer edges of the high-voltage and guard-electrodeswere rounded off by 5 mm. The bottom electrode is moved in axial
Figure 5.12: Schematic drawing of the specimen holder. A – thermal elementtype K, B – coaxial connector, C – spring, D – aluminium frame,E – measuring electrode, F – Teflon centering disk, G – guardelectrode, H – specimen, I – high-voltage electrode, J – Tefloninsulator, K – flanged nut, L – tightening screw.
62
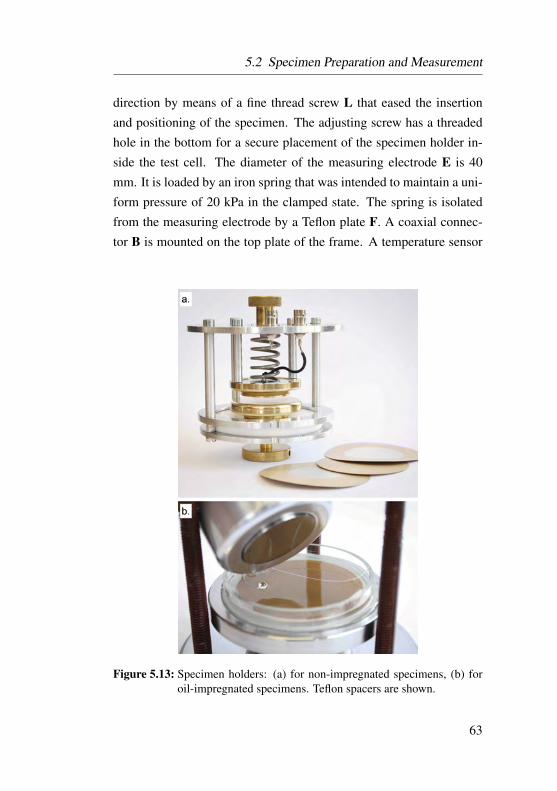
5.2 Specimen Preparation and Measurement
direction by means of a fine thread screw L that eased the insertionand positioning of the specimen. The adjusting screw has a threadedhole in the bottom for a secure placement of the specimen holder in-side the test cell. The diameter of the measuring electrode E is 40mm. It is loaded by an iron spring that was intended to maintain a uni-form pressure of 20 kPa in the clamped state. The spring is isolatedfrom the measuring electrode by a Teflon plate F. A coaxial connec-tor B is mounted on the top plate of the frame. A temperature sensor
Figure 5.13: Specimen holders: (a) for non-impregnated specimens, (b) foroil-impregnated specimens. Teflon spacers are shown.
63
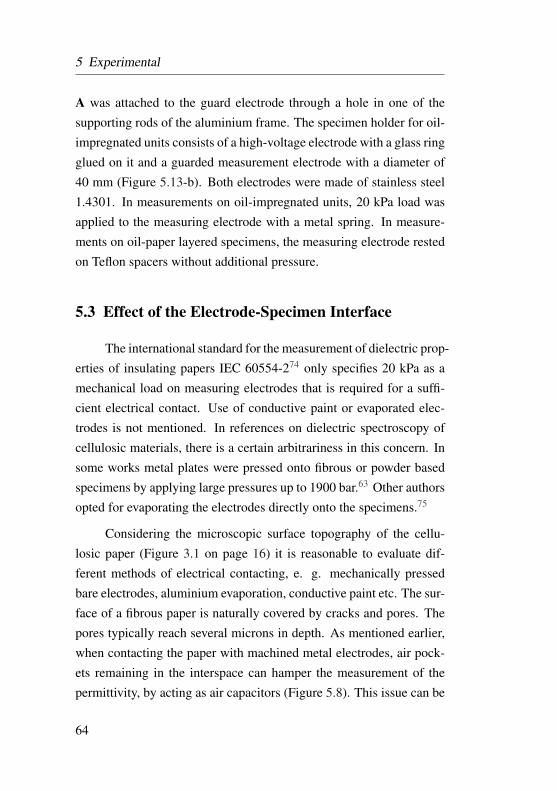
5 Experimental
A was attached to the guard electrode through a hole in one of thesupporting rods of the aluminium frame. The specimen holder for oil-impregnated units consists of a high-voltage electrode with a glass ringglued on it and a guarded measurement electrode with a diameter of40 mm (Figure 5.13-b). Both electrodes were made of stainless steel1.4301. In measurements on oil-impregnated units, 20 kPa load wasapplied to the measuring electrode with a metal spring. In measure-ments on oil-paper layered specimens, the measuring electrode restedon Teflon spacers without additional pressure.
5.3 Effect of the Electrode-Specimen Interface
The international standard for the measurement of dielectric prop-erties of insulating papers IEC 60554-274 only specifies 20 kPa as amechanical load on measuring electrodes that is required for a suffi-cient electrical contact. Use of conductive paint or evaporated elec-trodes is not mentioned. In references on dielectric spectroscopy ofcellulosic materials, there is a certain arbitrariness in this concern. Insome works metal plates were pressed onto fibrous or powder basedspecimens by applying large pressures up to 1900 bar.63 Other authorsopted for evaporating the electrodes directly onto the specimens.75
Considering the microscopic surface topography of the cellu-losic paper (Figure 3.1 on page 16) it is reasonable to evaluate dif-ferent methods of electrical contacting, e. g. mechanically pressedbare electrodes, aluminium evaporation, conductive paint etc. The sur-face of a fibrous paper is naturally covered by cracks and pores. Thepores typically reach several microns in depth. As mentioned earlier,when contacting the paper with machined metal electrodes, air pock-ets remaining in the interspace can hamper the measurement of thepermittivity, by acting as air capacitors (Figure 5.8). This issue can be
64
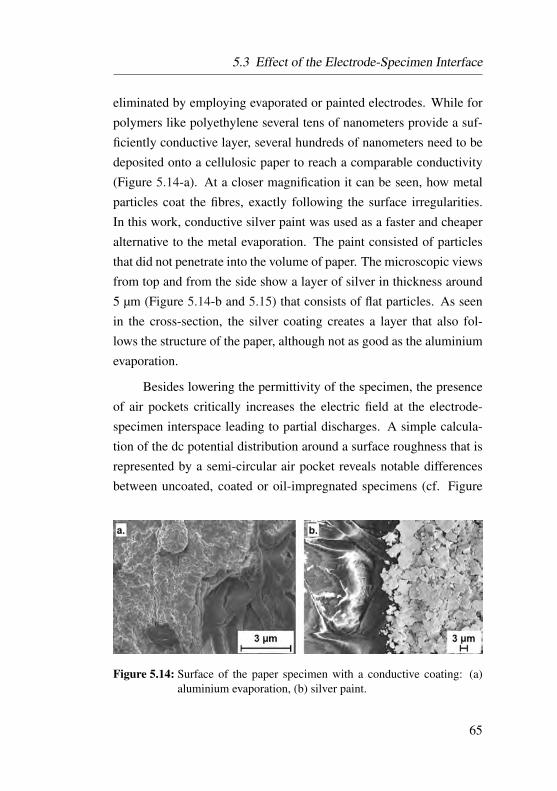
5.3 Effect of the Electrode-Specimen Interface
eliminated by employing evaporated or painted electrodes. While forpolymers like polyethylene several tens of nanometers provide a suf-ficiently conductive layer, several hundreds of nanometers need to bedeposited onto a cellulosic paper to reach a comparable conductivity(Figure 5.14-a). At a closer magnification it can be seen, how metalparticles coat the fibres, exactly following the surface irregularities.In this work, conductive silver paint was used as a faster and cheaperalternative to the metal evaporation. The paint consisted of particlesthat did not penetrate into the volume of paper. The microscopic viewsfrom top and from the side show a layer of silver in thickness around5 µm (Figure 5.14-b and 5.15) that consists of flat particles. As seenin the cross-section, the silver coating creates a layer that also fol-lows the structure of the paper, although not as good as the aluminiumevaporation.
Besides lowering the permittivity of the specimen, the presenceof air pockets critically increases the electric field at the electrode-specimen interspace leading to partial discharges. A simple calcula-tion of the dc potential distribution around a surface roughness that isrepresented by a semi-circular air pocket reveals notable differencesbetween uncoated, coated or oil-impregnated specimens (cf. Figure
Figure 5.14: Surface of the paper specimen with a conductive coating: (a)aluminium evaporation, (b) silver paint.
65
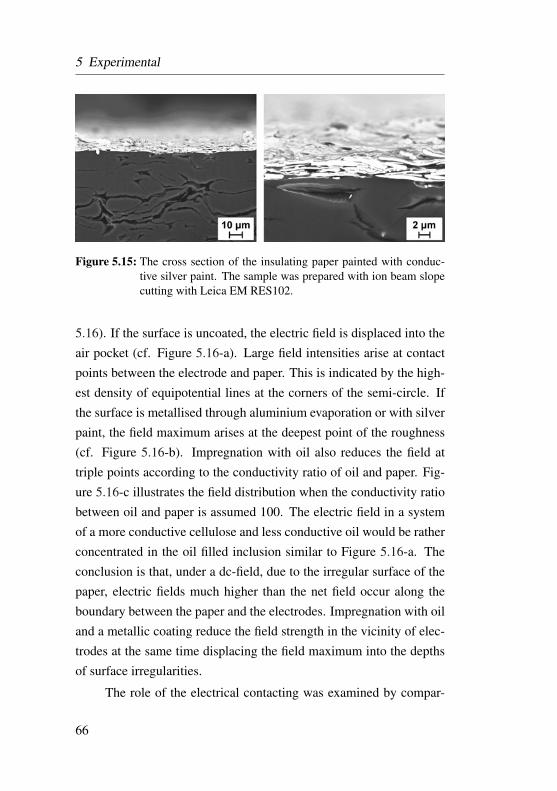
5 Experimental
Figure 5.15: The cross section of the insulating paper painted with conduc-tive silver paint. The sample was prepared with ion beam slopecutting with Leica EM RES102.
5.16). If the surface is uncoated, the electric field is displaced into theair pocket (cf. Figure 5.16-a). Large field intensities arise at contactpoints between the electrode and paper. This is indicated by the high-est density of equipotential lines at the corners of the semi-circle. Ifthe surface is metallised through aluminium evaporation or with silverpaint, the field maximum arises at the deepest point of the roughness(cf. Figure 5.16-b). Impregnation with oil also reduces the field attriple points according to the conductivity ratio of oil and paper. Fig-ure 5.16-c illustrates the field distribution when the conductivity ratiobetween oil and paper is assumed 100. The electric field in a systemof a more conductive cellulose and less conductive oil would be ratherconcentrated in the oil filled inclusion similar to Figure 5.16-a. Theconclusion is that, under a dc-field, due to the irregular surface of thepaper, electric fields much higher than the net field occur along theboundary between the paper and the electrodes. Impregnation with oiland a metallic coating reduce the field strength in the vicinity of elec-trodes at the same time displacing the field maximum into the depthsof surface irregularities.
The role of the electrical contacting was examined by compar-
66

5.3 Effect of the Electrode-Specimen Interface
Figure 5.16: Equipotential lines of the static voltage around a surface voidof paper: (a) non-impregnated paper without conductive coatingεpaper/εair = 6, (b) non-impregnated paper with conductive coat-ing, (c) oil-impregnated paper without coating, assumed relationof material parameters σoil/σpaper = 100, εoil/εpaper = 0.5.
ing the frequency spectra of tanδ measured with different contactingmethods (Figure 5.17). The spectra were measured with a low-voltageac-signal with zero bias (filled squares) and with a dc-bias of 6.75kV/mm (empty squares). The brass electrodes were pressed onto thespecimen with a constant pressure of 20 kPa. Conductive layers, in-cluding silver paint, tin, gold, or conductive rubber were applied ontothe specimen before placing it between the electrodes. A round pieceof conductive rubber of the same diameter as the measuring electrode(Figure 5.12) was placed between the brass electrode and the paper.The main differences were observed in tanδ measured at a superim-posed bias field.
Uncoated specimens featured a distinct relaxation peak arisingbetween 100 Hz and 1 kHz due to the bias field (a - c). Comparedto bare metal electrodes, a more pronounced peak was found whenusing conductive rubber (b). It seems, that the rough surface of therubber which is in contact with a similarly rough surface of the pa-per, leads to even higher microscopic electric fields than in the case ofmirror-polished metal electrodes. Almost no changes due to the biasfield were observed when coating the specimens with conductive sil-
67

5 Experimental
Figure 5.17: Loss tangent spectra of a non-impregnated Transformerboard inthickness 0.2 mm with 7.5± 0.5 % wt. moisture measured at24°C with different contacting methods. Filled squares corre-spond to an unbiased sinusoidal excitation, empty squares corre-spond to sweeps with a dc-bias of 6.75 kV/mm.
68
5.3 Effect of the Electrode-Specimen Interface
ver, tin or gold foil (d - f). Tin and gold foils were applied by meansof a thin layer of silicon grease. Interestingly, the peak in tanδ was oflower magnitude in the specimen painted with silver on one side andcontacted with a bare electrode on the other side (c). This might beexplained by the fact that the area at which high electric fields causethe ionisation is smaller than in cases (a) and (b). Silver paint elec-trodes seem to create conductive layers on the surface of the paperakin to metal evaporation (Figure 5.15). Therefore, extremely high lo-cal fields do not occur at the surface as in the case of bare electrodes.Thin layers of silicon grease, used as an adhesive for applying tin orgold foils, even up the surface of the paper and thereby prevent electricfield concentrations (cf. Figure 5.16).
5.3.1 Conclusion
Dielectric properties of non-impregnated cellulosic papers werefound to be strongly dependent on the electrical contacting. In low-field measurements, the air remaining between the specimen and elec-trodes reduces the value of ε ′ and shifts the relaxation peaks in ε ′′ tohigher frequencies (cf. curves a and d in Figure 5.17). In high-fieldmeasurements, due to the poor electrical contacting, extremely highlocal fields arise at the surface of the specimen. In the spectrum ofε ′′ or tanδ , a distinct relaxation peak occurs under the influence ofa high bias field. It is suggested, that electrical discharges at pointsof high field concentrations lead to the ionisation. The occurrence offree ions is detected with the dielectric measurement in form of a newrelaxation peak.
69
6 Results
The first part of the present chapter reports measurements carriedout on non-impregnated papers. The second part presents results ob-tained on oil-impregnated papers. The description follows the chrono-logical order in which the experiments were completed.
6.1 Time-Resolved Measurement
The time-resolved measurement of the permittivity and loss tan-gent was done to observe the possible alterations of dielectric prop-erties due to the bias field over the course of several hours. Non-impregnated Transformerboard specimens with 8 % wt. and less than0.2 % wt. moisture were studied. The specimens were not coveredwith conductive coating and were placed between metal electrodesunder a spring tension of 20 kPa. Measurements were taken at con-stant frequencies of the low-amplitude ac-voltage of 50, 500 Hz and10 kHz. It was expected that the most pronounced alterations of ε ′
and tanδ would be observed at 50 Hz in wet specimens, since theirpermittivity and loss tangent increased towards lower frequencies dueto slower relaxation mechanisms. Figure 6.1 shows relative alterationsof ε ′ and tanδ determined as
∆ tanδrel = (tanδi− tanδ0)/ tanδ0 ·100% , (6.1)
∆ε′rel = (ε ′i − ε
′0)/ε
′0 ·100% , (6.2)
where tanδ0 and ε ′0 correspond to initial values before the bias fieldapplication.76
In fact, the permittivity and loss tangent of wet specimens in-creased instantaneously upon the application of a bias field and no al-terations were found in well-dried units. However, the highest relative
70
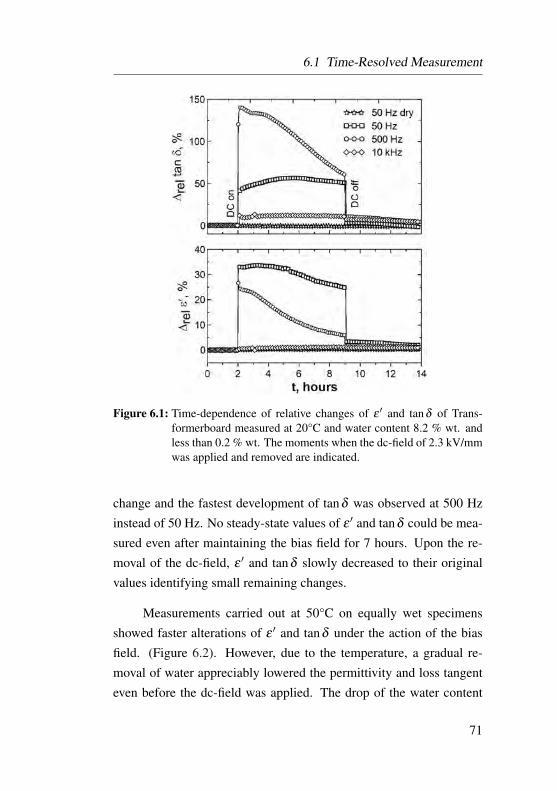
6.1 Time-Resolved Measurement
Figure 6.1: Time-dependence of relative changes of ε ′ and tanδ of Trans-formerboard measured at 20°C and water content 8.2 % wt. andless than 0.2 % wt. The moments when the dc-field of 2.3 kV/mmwas applied and removed are indicated.
change and the fastest development of tanδ was observed at 500 Hzinstead of 50 Hz. No steady-state values of ε ′ and tanδ could be mea-sured even after maintaining the bias field for 7 hours. Upon the re-moval of the dc-field, ε ′ and tanδ slowly decreased to their originalvalues identifying small remaining changes.
Measurements carried out at 50°C on equally wet specimensshowed faster alterations of ε ′ and tanδ under the action of the biasfield. (Figure 6.2). However, due to the temperature, a gradual re-moval of water appreciably lowered the permittivity and loss tangenteven before the dc-field was applied. The drop of the water content
71
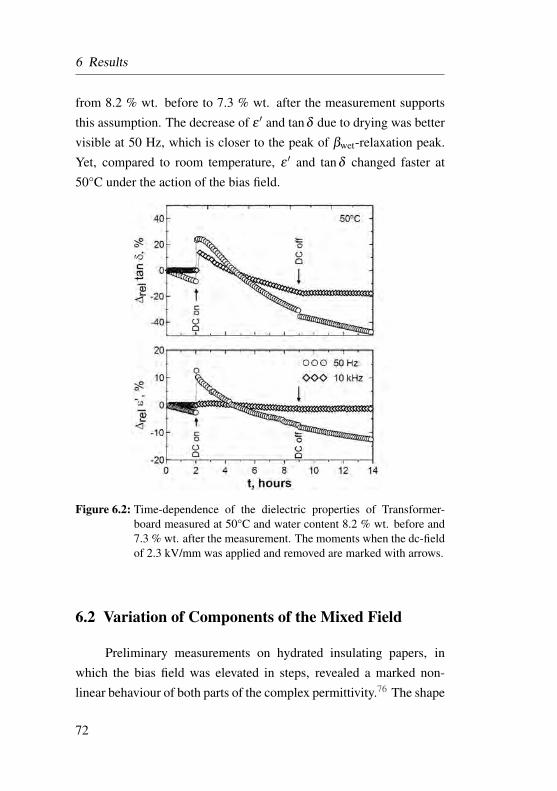
6 Results
from 8.2 % wt. before to 7.3 % wt. after the measurement supportsthis assumption. The decrease of ε ′ and tanδ due to drying was bettervisible at 50 Hz, which is closer to the peak of βwet-relaxation peak.Yet, compared to room temperature, ε ′ and tanδ changed faster at50°C under the action of the bias field.
Figure 6.2: Time-dependence of the dielectric properties of Transformer-board measured at 50°C and water content 8.2 % wt. before and7.3 % wt. after the measurement. The moments when the dc-fieldof 2.3 kV/mm was applied and removed are marked with arrows.
6.2 Variation of Components of the Mixed Field
Preliminary measurements on hydrated insulating papers, inwhich the bias field was elevated in steps, revealed a marked non-linear behaviour of both parts of the complex permittivity.76 The shape
72
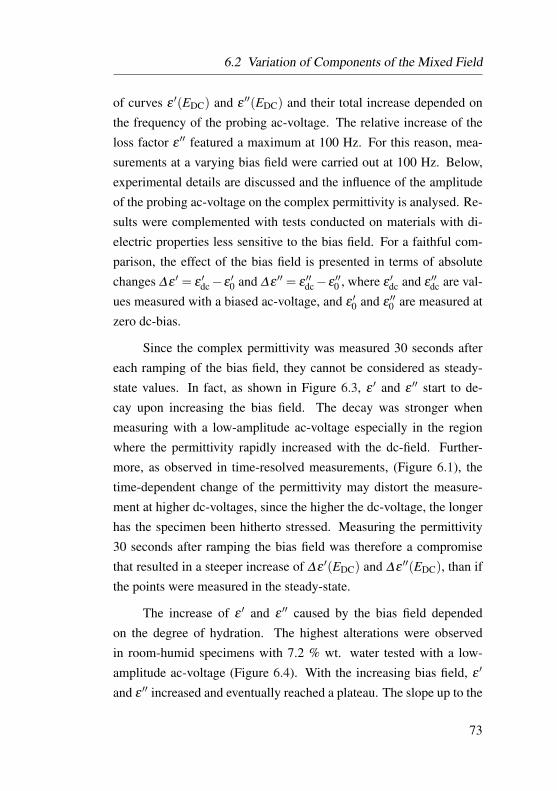
6.2 Variation of Components of the Mixed Field
of curves ε ′(EDC) and ε ′′(EDC) and their total increase depended onthe frequency of the probing ac-voltage. The relative increase of theloss factor ε ′′ featured a maximum at 100 Hz. For this reason, mea-surements at a varying bias field were carried out at 100 Hz. Below,experimental details are discussed and the influence of the amplitudeof the probing ac-voltage on the complex permittivity is analysed. Re-sults were complemented with tests conducted on materials with di-electric properties less sensitive to the bias field. For a faithful com-parison, the effect of the bias field is presented in terms of absolutechanges ∆ε ′ = ε ′dc−ε ′0 and ∆ε ′′ = ε ′′dc−ε ′′0 , where ε ′dc and ε ′′dc are val-ues measured with a biased ac-voltage, and ε ′0 and ε ′′0 are measured atzero dc-bias.
Since the complex permittivity was measured 30 seconds aftereach ramping of the bias field, they cannot be considered as steady-state values. In fact, as shown in Figure 6.3, ε ′ and ε ′′ start to de-cay upon increasing the bias field. The decay was stronger whenmeasuring with a low-amplitude ac-voltage especially in the regionwhere the permittivity rapidly increased with the dc-field. Further-more, as observed in time-resolved measurements, (Figure 6.1), thetime-dependent change of the permittivity may distort the measure-ment at higher dc-voltages, since the higher the dc-voltage, the longerhas the specimen been hitherto stressed. Measuring the permittivity30 seconds after ramping the bias field was therefore a compromisethat resulted in a steeper increase of ∆ε ′(EDC) and ∆ε ′′(EDC), than ifthe points were measured in the steady-state.
The increase of ε ′ and ε ′′ caused by the bias field dependedon the degree of hydration. The highest alterations were observedin room-humid specimens with 7.2 % wt. water tested with a low-amplitude ac-voltage (Figure 6.4). With the increasing bias field, ε ′
and ε ′′ increased and eventually reached a plateau. The slope up to the
73

6 Results
Figure 6.3: Absolute increase of ε ′ and ε ′′ of a cellulosic insulating paperGrade K in thickness 240 µm (7.2 % wt. water) due to a stepwiseelevation of the superimposed dc-bias, measured with a low andhigh amplitude ac-voltage of 100 Hz at 23°C.
plateau was lower at higher amplitudes of the probing ac-signal. Ata further elevation of the bias field, ε ′ and ε ′′ of hydrated specimensstarted to decrease, followed by an imminent breakdown. In dry spec-imens, measurable alterations were observed only in ε ′. This appliedalso for PTFE contacted with bare electrodes. On the other hand, ε ′
74
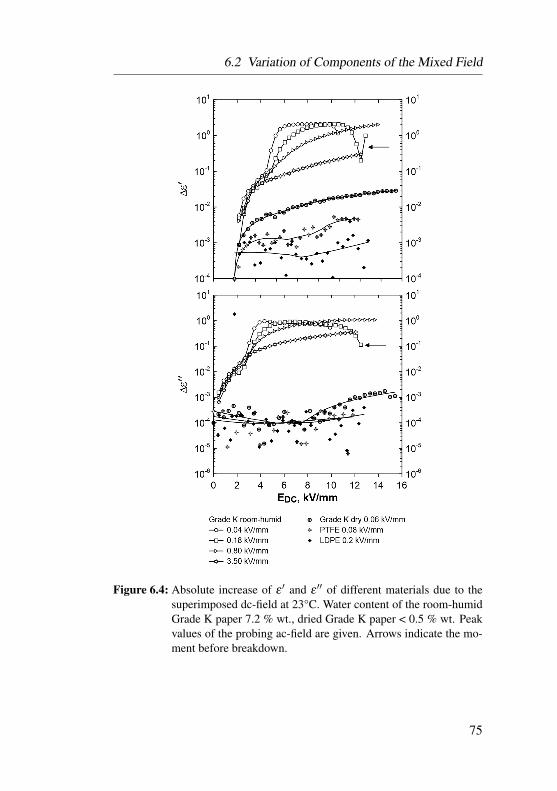
6.2 Variation of Components of the Mixed Field
Figure 6.4: Absolute increase of ε ′ and ε ′′ of different materials due to thesuperimposed dc-field at 23°C. Water content of the room-humidGrade K paper 7.2 % wt., dried Grade K paper < 0.5 % wt. Peakvalues of the probing ac-field are given. Arrows indicate the mo-ment before breakdown.
75
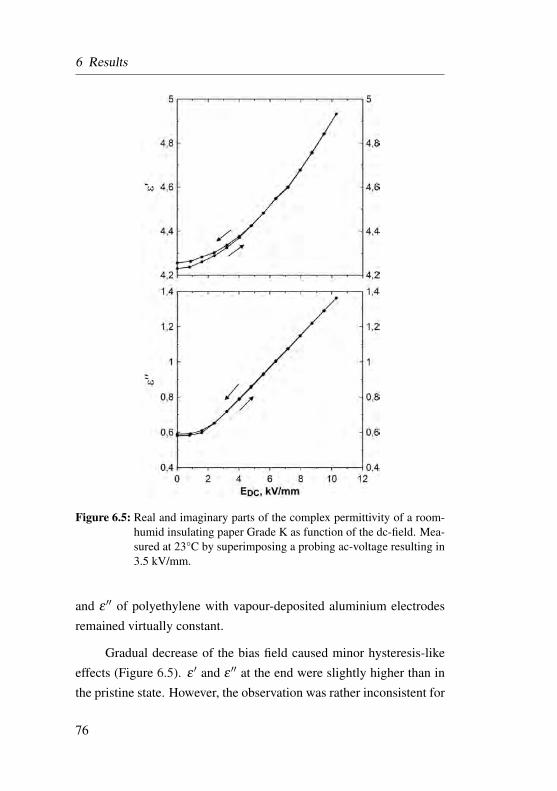
6 Results
Figure 6.5: Real and imaginary parts of the complex permittivity of a room-humid insulating paper Grade K as function of the dc-field. Mea-sured at 23°C by superimposing a probing ac-voltage resulting in3.5 kV/mm.
and ε ′′ of polyethylene with vapour-deposited aluminium electrodesremained virtually constant.
Gradual decrease of the bias field caused minor hysteresis-likeeffects (Figure 6.5). ε ′ and ε ′′ at the end were slightly higher than inthe pristine state. However, the observation was rather inconsistent for
76
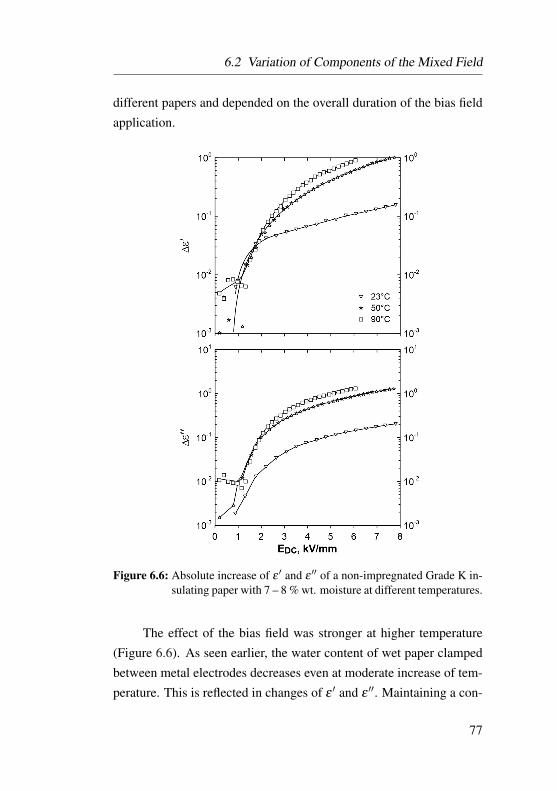
6.2 Variation of Components of the Mixed Field
different papers and depended on the overall duration of the bias fieldapplication.
Figure 6.6: Absolute increase of ε ′ and ε ′′ of a non-impregnated Grade K in-sulating paper with 7 – 8 % wt. moisture at different temperatures.
The effect of the bias field was stronger at higher temperature(Figure 6.6). As seen earlier, the water content of wet paper clampedbetween metal electrodes decreases even at moderate increase of tem-perature. This is reflected in changes of ε ′ and ε ′′. Maintaining a con-
77

6 Results
stant water content during the measurement was difficult. Thereforeresults shown in Figure 6.6 give only a qualitative comparison.
Figure 6.7: Absolute increase of ε ′ and ε ′′ of a non-impregnated Grade Kinsulating paper contacted with silver paint electrodes at differ-ent water contents. The peak value of the probing ac-field was3.5 kV/mm.
Measurements on low-loss polymers have indicated the impor-tance of a proper electrical contacting. For paper specimens, silverpaint electrodes were used as a simple alternative to metal evapora-
78

6.3 Effect of the Bias-Field on Frequency Spectra
tion. Besides silver particles the silver paint contains organic solvents.Their impact on the dielectric properties of papers was not analysed inthe present work. Painted specimens were stored in a desiccator for atleast one hour for the solvent to dry. Results obtained with silver paintelectrodes suggest that the previously mentioned anomalous increaseof dielectric properties is due to the electrical contacting (Figure 6.7).The permittivity increase of silver coated specimens was much lowercompared to uncoated units. Similar to previous results, the hydra-tion caused slightly higher ∆ε ′ and ∆ε ′′. Thoroughly dried specimenswere tested at a higher temperature. It was expected that the increaseof the ionic mobility would enhance the dielectric properties. How-ever, no substantial difference was noticed between room and hightemperature. In both measurements, the enhancement of ε ′ was in therange of 10−2 at a bias field elevation up to 10 kV/m.
6.3 Effect of the Bias-Field on Frequency Spectra
By means of dielectric spectroscopy employing a low-amplitudeac-signal superimposed onto a high bias field, it was intended to ver-ify the previous observations and to elucidate the alterations of ε ′ andε ′′ by ascribing them to relaxation mechanisms of cellulose. The ap-proach was to compare the dielectric spectra measured in the presenceof a bias field with spectra measured with an unbiased ac-signal.
The loss tangent spectra graphed in Figure 6.8 were measuredon a pristine Grade K insulating paper before applying the bias field,and once in an hour at a maintained bias field of 10 kV/mm as wellas immediately after the field removal. Measurement of one spectrumtook less than a minute. The field and time dependent changes ofdielectric properties within this time were small enough such that eachspectrum can be regarded as an instantaneous state. The effect of the
79
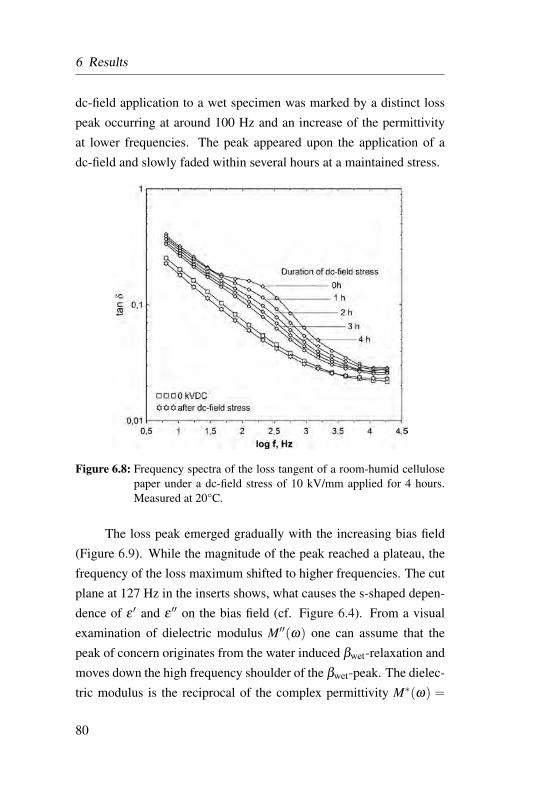
6 Results
dc-field application to a wet specimen was marked by a distinct losspeak occurring at around 100 Hz and an increase of the permittivityat lower frequencies. The peak appeared upon the application of adc-field and slowly faded within several hours at a maintained stress.
Figure 6.8: Frequency spectra of the loss tangent of a room-humid cellulosepaper under a dc-field stress of 10 kV/mm applied for 4 hours.Measured at 20°C.
The loss peak emerged gradually with the increasing bias field(Figure 6.9). While the magnitude of the peak reached a plateau, thefrequency of the loss maximum shifted to higher frequencies. The cutplane at 127 Hz in the inserts shows, what causes the s-shaped depen-dence of ε ′ and ε ′′ on the bias field (cf. Figure 6.4). From a visualexamination of dielectric modulus M′′(ω) one can assume that thepeak of concern originates from the water induced βwet-relaxation andmoves down the high frequency shoulder of the βwet-peak. The dielec-tric modulus is the reciprocal of the complex permittivity M∗(ω) =
80
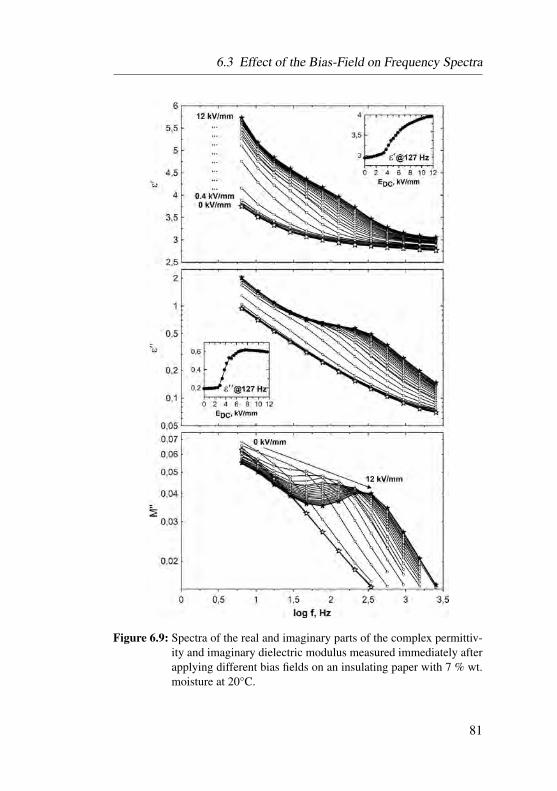
6.3 Effect of the Bias-Field on Frequency Spectra
Figure 6.9: Spectra of the real and imaginary parts of the complex permittiv-ity and imaginary dielectric modulus measured immediately afterapplying different bias fields on an insulating paper with 7 % wt.moisture at 20°C.
81

6 Results
Figure 6.10: Dielectric loss spectra of an insulating paper Grade K measuredat different water contents at 20°C. Filled symbols were mea-sured with an unbiased ac-signal, empty symbols were measuredunder a bias field of 8 kV/mm.
1/ε∗(ω). In the M′′(ω) plot, the loss peaks appear at higher frequen-cies than corresponding loss peaks of ε(ω) which is a useful feature ifthe frequency spectrum is restricted. A slope in ε ′′(ω) is transformedto a peak in modulus representation.
Variation of the water content supported the assumption, thatthe dielectric relaxation arising due to the bias field is related to theβwet-relaxation (Figure 6.10). As for results of measurements with anunbiased ac-signal, the increase of the water content was associatedwith the increase of the dielectric loss on the low-frequency side, i.
82
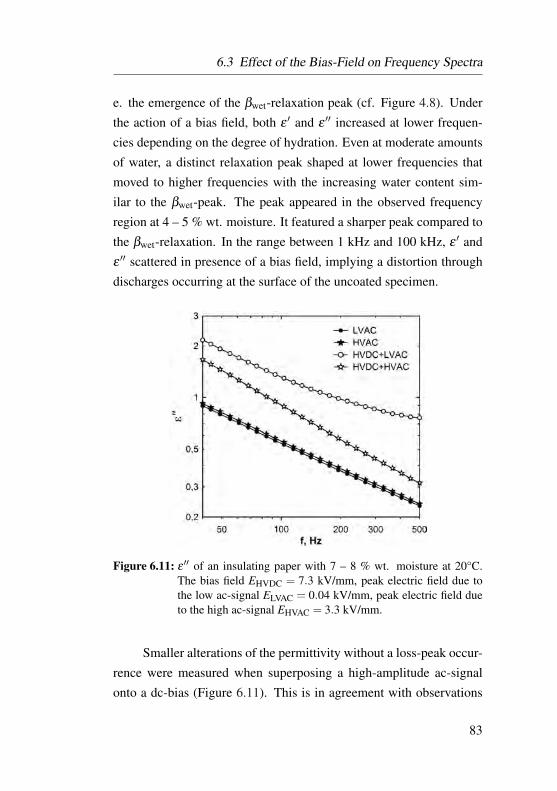
6.3 Effect of the Bias-Field on Frequency Spectra
e. the emergence of the βwet-relaxation peak (cf. Figure 4.8). Underthe action of a bias field, both ε ′ and ε ′′ increased at lower frequen-cies depending on the degree of hydration. Even at moderate amountsof water, a distinct relaxation peak shaped at lower frequencies thatmoved to higher frequencies with the increasing water content sim-ilar to the βwet-peak. The peak appeared in the observed frequencyregion at 4 – 5 % wt. moisture. It featured a sharper peak compared tothe βwet-relaxation. In the range between 1 kHz and 100 kHz, ε ′ andε ′′ scattered in presence of a bias field, implying a distortion throughdischarges occurring at the surface of the uncoated specimen.
Figure 6.11: ε ′′ of an insulating paper with 7 – 8 % wt. moisture at 20°C.The bias field EHVDC = 7.3 kV/mm, peak electric field due tothe low ac-signal ELVAC = 0.04 kV/mm, peak electric field dueto the high ac-signal EHVAC = 3.3 kV/mm.
Smaller alterations of the permittivity without a loss-peak occur-rence were measured when superposing a high-amplitude ac-signalonto a dc-bias (Figure 6.11). This is in agreement with observations
83

6 Results
from the preceding subsection (cf. Figure 6.4). Mainly the low-frequency part of the loss spectrum was influenced by the dc-fieldwhen a high ac-voltage was acting. The slope ε ′′( f ) increases uponapplying the bias field.
6.3.1 Hidden Relaxation Peaks
The logarithmic derivative ε ′′der = −∂ε ′/∂ lnω was employed toanalyse the influence of the bias field on polarisation processes by mit-igating the overshadowing effect of macroscopic mechanisms (see de-tails in Section 2.2). The raw data of ε ′ was smoothed with Savitsky-Golay filter since the derivative of the experimental data is sensitiveto small deviations. Compared to the original spectrum, the low-frequency slope of ε ′′der drops faster opening up the new relaxationpeak 1 (Figure 6.12-b). Two other features (2, 3) can be recognisedin ε ′′der at higher frequencies that seem to be independent on the biasfield.
The location and magnitude of the peak 1 was analysed by fittingthe spectra of ε ′′der with the logarithmic derivative of the Havriliak-Negami function.30 Figure 6.13 shows the relaxation strength of thepeak 1 and frequency of the maximum in dependence of the bias field.The shape of the curve ∆ε(EDC) (Figure 6.13-a) matches the shape ofthe function ε ′′(EDC) (Figure 6.4). In ε ′′(EDC), measured at a constantfrequency, a slight decrease after the plateau was noticed, that wasassociated with the shift of the peak to higher frequencies (Section6.2). The shift of the peak 1 is almost linear with the increasing biasfield (Figure 6.13-b).
The new relaxation peak is closely related to water in celluloseand occurs at the high frequency side of the βwet-process at room tem-perature (see Section 4.4.3). Since the MWS, βwet and the peak 1overlap each other, and the low-frequency end is limited by 5 Hz, it isdifficult to conclude how the peak 1 is related to the βwet-peak.
84
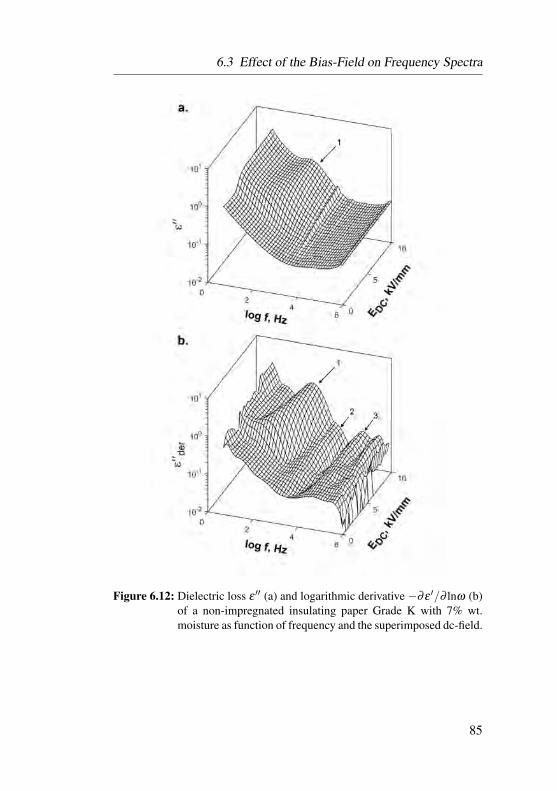
6.3 Effect of the Bias-Field on Frequency Spectra
Figure 6.12: Dielectric loss ε ′′ (a) and logarithmic derivative −∂ε ′/∂ lnω (b)of a non-impregnated insulating paper Grade K with 7% wt.moisture as function of frequency and the superimposed dc-field.
85

6 Results
Figure 6.13: The relaxation strength of the peak 1 in Figure 6.12 (a) and thefrequency corresponding to the loss peak (b) as functions of thesuperimposed dc-field.
6.3.2 AC-Conductivity
Ionic transport mechanisms underlying the dc-conductivity anda low-frequency dielectric relaxation in cellulose have been mentionedin Section 4.1. It was noted, that there is a close correlation betweenthe dc-conductivity and a low-frequency dielectric relaxation. Theuniversal shape of conductivity spectra was shown schematically inFigure 4.3. It was mentioned that a knee-like shape in σ ′(ω) indi-cates a local charge transport, that also causes the MWS-relaxation inheterogeneous materials.
Figure 6.14 compares conductivity spectra for various types ofelectrical contacting, water content and the bias field. In wet speci-mens, the begin of the transition to the dc-conductivity plateau is visi-ble at the lowest frequencies (curve 1). In contrast, in dried specimens,where the dc-conductivity is much lower, only the linear part of thespectrum was measured (curve 2). Above 100 kHz, the slope of theconductivity increase is greater than 1 which is due to the measure-ment uncertainty at high frequencies. The conductivity of specimens
86

6.3 Effect of the Bias-Field on Frequency Spectra
contacted with bare electrodes was lower than of silver painted spec-imens (cf. curves 1 and 5). What has been referred to as the localdiffusion that causes an intermediate plateau is visible in curve 4.
Figure 6.14: Frequency spectra of real part of the complex conductivity ofTransformerboard: (1) wet specimen (7 %wt.) contacted withsilver paint; (2) dried specimen contacted with silver paint (< 0.5%wt.) without dc-bias (stars); (3) dried specimen contacted withsilver paint (< 0.5 %wt.) at 13 kV/mmDC (circles); (4) wet spec-imen (7 %wt.) contacted with bare electrodes at 6.75 kV/mmDC;(5) wet specimen (7 %wt.) contacted with bare electrodes mea-sured without dc-bias.
87
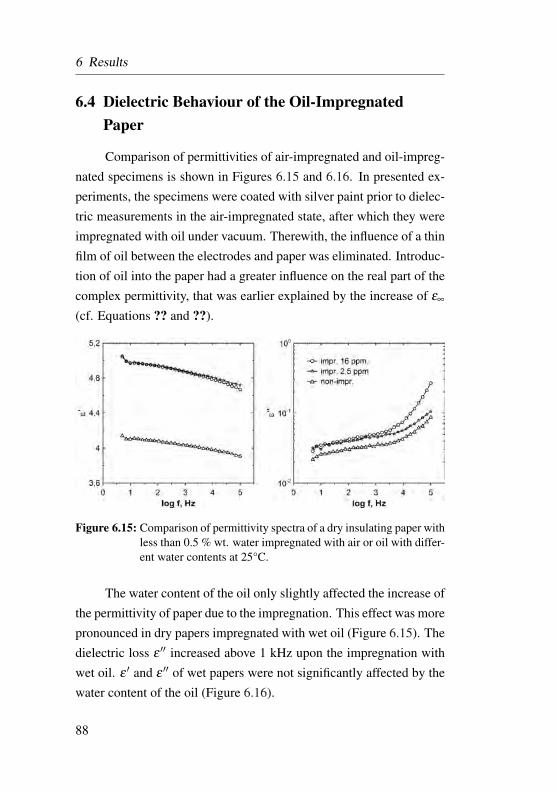
6 Results
6.4 Dielectric Behaviour of the Oil-ImpregnatedPaper
Comparison of permittivities of air-impregnated and oil-impreg-nated specimens is shown in Figures 6.15 and 6.16. In presented ex-periments, the specimens were coated with silver paint prior to dielec-tric measurements in the air-impregnated state, after which they wereimpregnated with oil under vacuum. Therewith, the influence of a thinfilm of oil between the electrodes and paper was eliminated. Introduc-tion of oil into the paper had a greater influence on the real part of thecomplex permittivity, that was earlier explained by the increase of ε∞
(cf. Equations ?? and ??).
Figure 6.15: Comparison of permittivity spectra of a dry insulating paper withless than 0.5 % wt. water impregnated with air or oil with differ-ent water contents at 25°C.
The water content of the oil only slightly affected the increase ofthe permittivity of paper due to the impregnation. This effect was morepronounced in dry papers impregnated with wet oil (Figure 6.15). Thedielectric loss ε ′′ increased above 1 kHz upon the impregnation withwet oil. ε ′ and ε ′′ of wet papers were not significantly affected by thewater content of the oil (Figure 6.16).
88
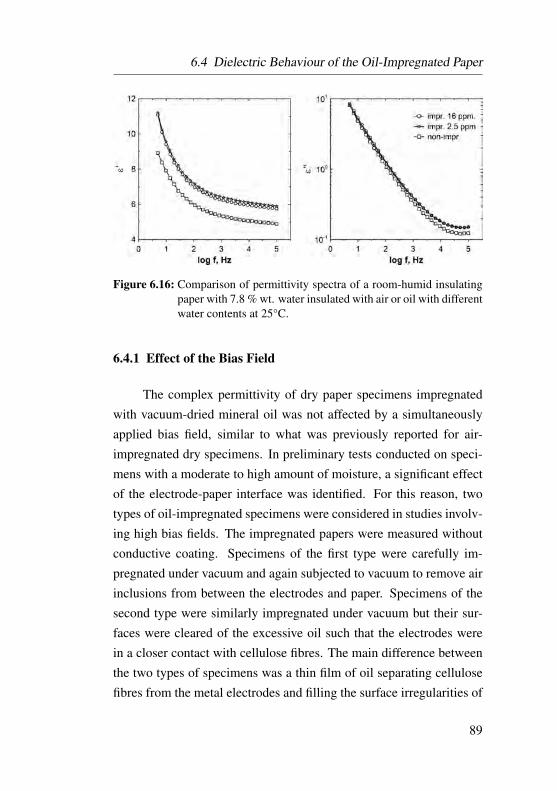
6.4 Dielectric Behaviour of the Oil-Impregnated Paper
Figure 6.16: Comparison of permittivity spectra of a room-humid insulatingpaper with 7.8 % wt. water insulated with air or oil with differentwater contents at 25°C.
6.4.1 Effect of the Bias Field
The complex permittivity of dry paper specimens impregnatedwith vacuum-dried mineral oil was not affected by a simultaneouslyapplied bias field, similar to what was previously reported for air-impregnated dry specimens. In preliminary tests conducted on speci-mens with a moderate to high amount of moisture, a significant effectof the electrode-paper interface was identified. For this reason, twotypes of oil-impregnated specimens were considered in studies involv-ing high bias fields. The impregnated papers were measured withoutconductive coating. Specimens of the first type were carefully im-pregnated under vacuum and again subjected to vacuum to remove airinclusions from between the electrodes and paper. Specimens of thesecond type were similarly impregnated under vacuum but their sur-faces were cleared of the excessive oil such that the electrodes werein a closer contact with cellulose fibres. The main difference betweenthe two types of specimens was a thin film of oil separating cellulosefibres from the metal electrodes and filling the surface irregularities of
89
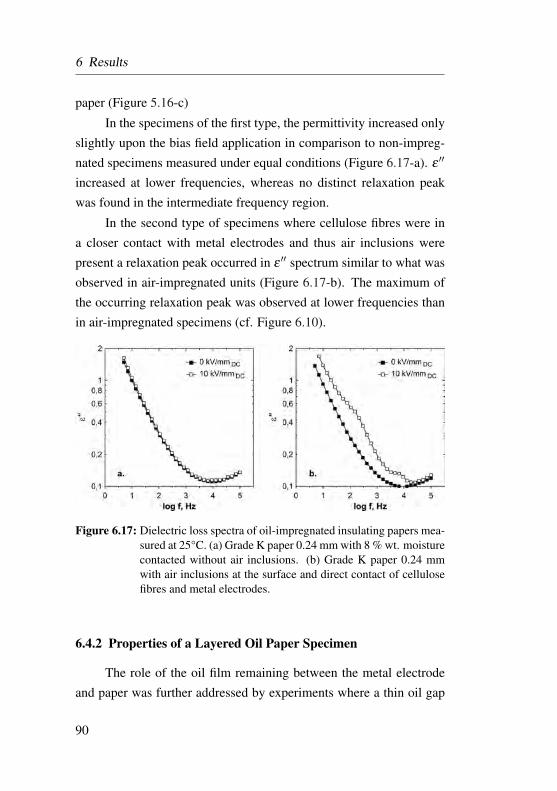
6 Results
paper (Figure 5.16-c)
In the specimens of the first type, the permittivity increased onlyslightly upon the bias field application in comparison to non-impreg-nated specimens measured under equal conditions (Figure 6.17-a). ε ′′
increased at lower frequencies, whereas no distinct relaxation peakwas found in the intermediate frequency region.
In the second type of specimens where cellulose fibres were ina closer contact with metal electrodes and thus air inclusions werepresent a relaxation peak occurred in ε ′′ spectrum similar to what wasobserved in air-impregnated units (Figure 6.17-b). The maximum ofthe occurring relaxation peak was observed at lower frequencies thanin air-impregnated specimens (cf. Figure 6.10).
Figure 6.17: Dielectric loss spectra of oil-impregnated insulating papers mea-sured at 25°C. (a) Grade K paper 0.24 mm with 8 % wt. moisturecontacted without air inclusions. (b) Grade K paper 0.24 mmwith air inclusions at the surface and direct contact of cellulosefibres and metal electrodes.
6.4.2 Properties of a Layered Oil Paper Specimen
The role of the oil film remaining between the metal electrodeand paper was further addressed by experiments where a thin oil gap
90
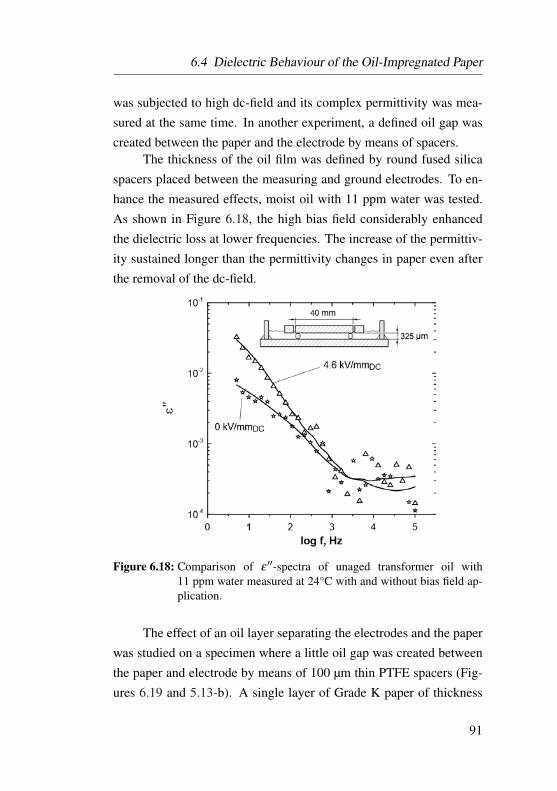
6.4 Dielectric Behaviour of the Oil-Impregnated Paper
was subjected to high dc-field and its complex permittivity was mea-sured at the same time. In another experiment, a defined oil gap wascreated between the paper and the electrode by means of spacers.
The thickness of the oil film was defined by round fused silicaspacers placed between the measuring and ground electrodes. To en-hance the measured effects, moist oil with 11 ppm water was tested.As shown in Figure 6.18, the high bias field considerably enhancedthe dielectric loss at lower frequencies. The increase of the permittiv-ity sustained longer than the permittivity changes in paper even afterthe removal of the dc-field.
Figure 6.18: Comparison of ε ′′-spectra of unaged transformer oil with11 ppm water measured at 24°C with and without bias field ap-plication.
The effect of an oil layer separating the electrodes and the paperwas studied on a specimen where a little oil gap was created betweenthe paper and electrode by means of 100 µm thin PTFE spacers (Fig-ures 6.19 and 5.13-b). A single layer of Grade K paper of thickness
91
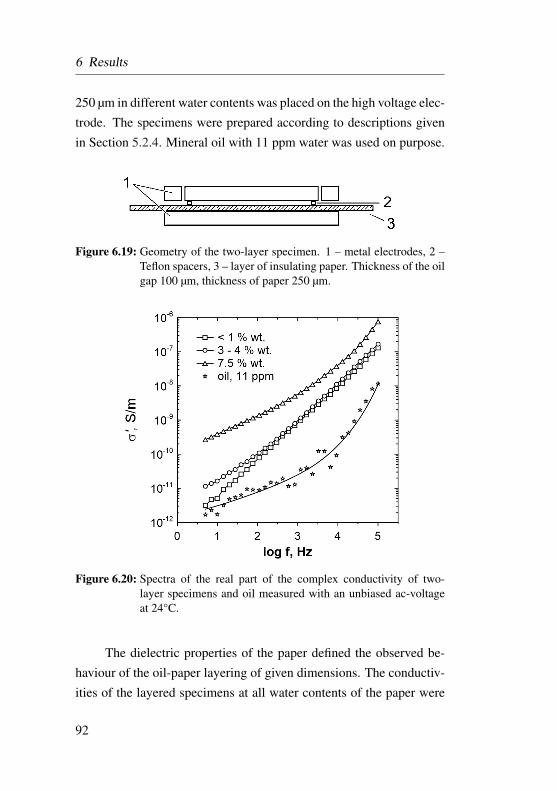
6 Results
250 µm in different water contents was placed on the high voltage elec-trode. The specimens were prepared according to descriptions givenin Section 5.2.4. Mineral oil with 11 ppm water was used on purpose.
Figure 6.19: Geometry of the two-layer specimen. 1 – metal electrodes, 2 –Teflon spacers, 3 – layer of insulating paper. Thickness of the oilgap 100 µm, thickness of paper 250 µm.
Figure 6.20: Spectra of the real part of the complex conductivity of two-layer specimens and oil measured with an unbiased ac-voltageat 24°C.
The dielectric properties of the paper defined the observed be-haviour of the oil-paper layering of given dimensions. The conductiv-ities of the layered specimens at all water contents of the paper were
92
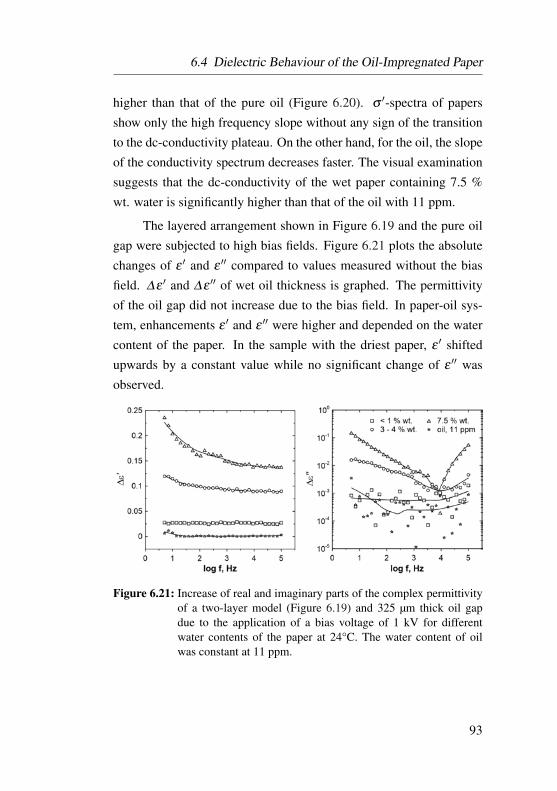
6.4 Dielectric Behaviour of the Oil-Impregnated Paper
higher than that of the pure oil (Figure 6.20). σ ′-spectra of papersshow only the high frequency slope without any sign of the transitionto the dc-conductivity plateau. On the other hand, for the oil, the slopeof the conductivity spectrum decreases faster. The visual examinationsuggests that the dc-conductivity of the wet paper containing 7.5 %wt. water is significantly higher than that of the oil with 11 ppm.
The layered arrangement shown in Figure 6.19 and the pure oilgap were subjected to high bias fields. Figure 6.21 plots the absolutechanges of ε ′ and ε ′′ compared to values measured without the biasfield. ∆ε ′ and ∆ε ′′ of wet oil thickness is graphed. The permittivityof the oil gap did not increase due to the bias field. In paper-oil sys-tem, enhancements ε ′ and ε ′′ were higher and depended on the watercontent of the paper. In the sample with the driest paper, ε ′ shiftedupwards by a constant value while no significant change of ε ′′ wasobserved.
Figure 6.21: Increase of real and imaginary parts of the complex permittivityof a two-layer model (Figure 6.19) and 325 µm thick oil gapdue to the application of a bias voltage of 1 kV for differentwater contents of the paper at 24°C. The water content of oilwas constant at 11 ppm.
93
7 Discussion
7.1 Non-Impregnated Papers
The results have shown that the effect of a superimposed high dc-voltage on the complex permittivity of paper materials is determinedby several factors related to the sample preparation and measurementconditions. These factors are discussed below separately although theyare closely related to each other and the observed effects were oftencaused by the combination of several factors.
• Water content. Water had the greatest influence on the dielec-tric behaviour of papers studied in this work. The ways in whichwater interacts with cellulose and alters its physical propertieswere described in Section 3.2. In terms of dielectric parameters,the addition of water enhances both ε ′ and ε ′′ at low and highfrequencies by affecting all known dielectric relaxation mech-anisms of cellulose. As for the dc-voltage superposition, theconsidered papers had to contain a moderate amount of wa-ter for their permittivity to be affected by the high bias field.In contrast, the permittivity of thoroughly dried papers did notchange. The enhancement of ε ′ and ε ′′ due to the high bias fieldwas observed at lower frequencies suggesting that dipolar β andγ relaxation processes, which peaks are located at higher fre-quencies, remained unaffected. Instead, a peak in the frequencyspectrum of ε ′′ of wet papers resembling a separate relaxationprocess was measured below several kHz. With the increas-ing water content the peak shifted to higher frequencies. Cel-lulose already features a relaxation peak in a similar frequencyregion known as βwet which is related to hydration. The factthat both the peak observed under the high bias field and βwet-peak are located at similar frequencies and move to higher fre-
94
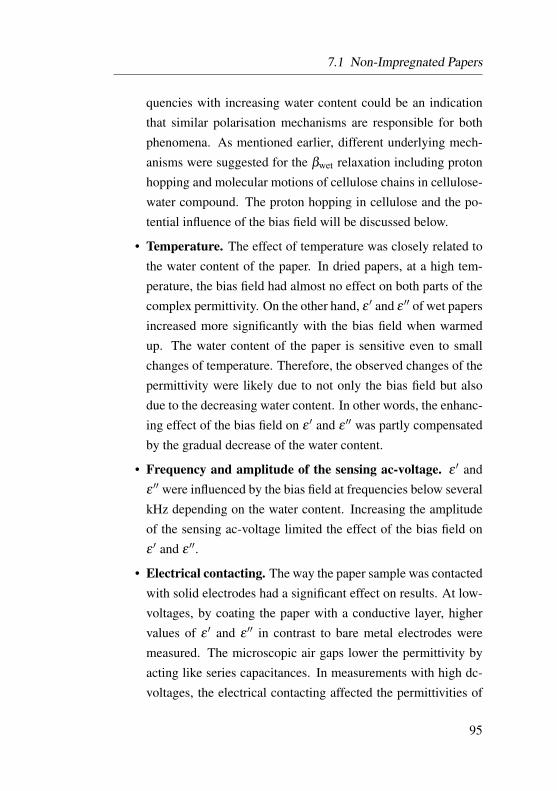
7.1 Non-Impregnated Papers
quencies with increasing water content could be an indicationthat similar polarisation mechanisms are responsible for bothphenomena. As mentioned earlier, different underlying mech-anisms were suggested for the βwet relaxation including protonhopping and molecular motions of cellulose chains in cellulose-water compound. The proton hopping in cellulose and the po-tential influence of the bias field will be discussed below.
• Temperature. The effect of temperature was closely related tothe water content of the paper. In dried papers, at a high tem-perature, the bias field had almost no effect on both parts of thecomplex permittivity. On the other hand, ε ′ and ε ′′ of wet papersincreased more significantly with the bias field when warmedup. The water content of the paper is sensitive even to smallchanges of temperature. Therefore, the observed changes of thepermittivity were likely due to not only the bias field but alsodue to the decreasing water content. In other words, the enhanc-ing effect of the bias field on ε ′ and ε ′′ was partly compensatedby the gradual decrease of the water content.
• Frequency and amplitude of the sensing ac-voltage. ε ′ andε ′′ were influenced by the bias field at frequencies below severalkHz depending on the water content. Increasing the amplitudeof the sensing ac-voltage limited the effect of the bias field onε ′ and ε ′′.
• Electrical contacting. The way the paper sample was contactedwith solid electrodes had a significant effect on results. At low-voltages, by coating the paper with a conductive layer, highervalues of ε ′ and ε ′′ in contrast to bare metal electrodes weremeasured. The microscopic air gaps lower the permittivity byacting like series capacitances. In measurements with high dc-voltages, the electrical contacting affected the permittivities of
95
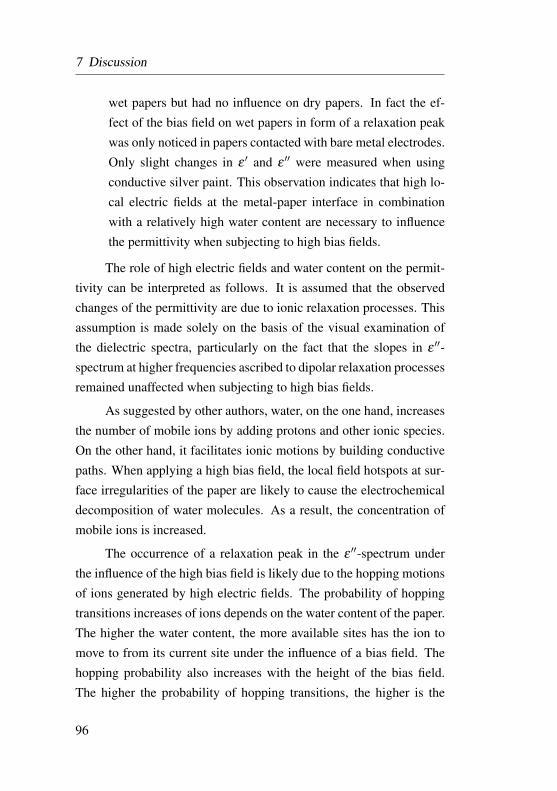
7 Discussion
wet papers but had no influence on dry papers. In fact the ef-fect of the bias field on wet papers in form of a relaxation peakwas only noticed in papers contacted with bare metal electrodes.Only slight changes in ε ′ and ε ′′ were measured when usingconductive silver paint. This observation indicates that high lo-cal electric fields at the metal-paper interface in combinationwith a relatively high water content are necessary to influencethe permittivity when subjecting to high bias fields.
The role of high electric fields and water content on the permit-tivity can be interpreted as follows. It is assumed that the observedchanges of the permittivity are due to ionic relaxation processes. Thisassumption is made solely on the basis of the visual examination ofthe dielectric spectra, particularly on the fact that the slopes in ε ′′-spectrum at higher frequencies ascribed to dipolar relaxation processesremained unaffected when subjecting to high bias fields.
As suggested by other authors, water, on the one hand, increasesthe number of mobile ions by adding protons and other ionic species.On the other hand, it facilitates ionic motions by building conductivepaths. When applying a high bias field, the local field hotspots at sur-face irregularities of the paper are likely to cause the electrochemicaldecomposition of water molecules. As a result, the concentration ofmobile ions is increased.
The occurrence of a relaxation peak in the ε ′′-spectrum underthe influence of the high bias field is likely due to the hopping motionsof ions generated by high electric fields. The probability of hoppingtransitions increases of ions depends on the water content of the paper.The higher the water content, the more available sites has the ion tomove to from its current site under the influence of a bias field. Thehopping probability also increases with the height of the bias field.The higher the probability of hopping transitions, the higher is the
96
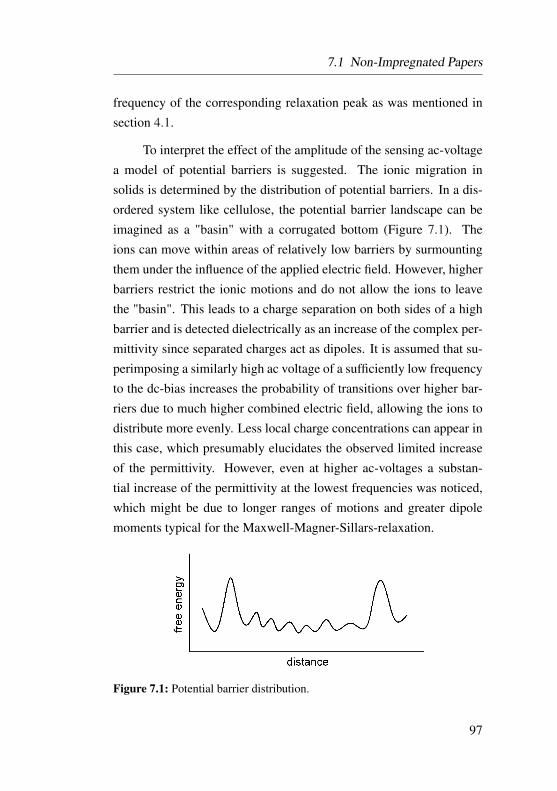
7.1 Non-Impregnated Papers
frequency of the corresponding relaxation peak as was mentioned insection 4.1.
To interpret the effect of the amplitude of the sensing ac-voltagea model of potential barriers is suggested. The ionic migration insolids is determined by the distribution of potential barriers. In a dis-ordered system like cellulose, the potential barrier landscape can beimagined as a "basin" with a corrugated bottom (Figure 7.1). Theions can move within areas of relatively low barriers by surmountingthem under the influence of the applied electric field. However, higherbarriers restrict the ionic motions and do not allow the ions to leavethe "basin". This leads to a charge separation on both sides of a highbarrier and is detected dielectrically as an increase of the complex per-mittivity since separated charges act as dipoles. It is assumed that su-perimposing a similarly high ac voltage of a sufficiently low frequencyto the dc-bias increases the probability of transitions over higher bar-riers due to much higher combined electric field, allowing the ions todistribute more evenly. Less local charge concentrations can appear inthis case, which presumably elucidates the observed limited increaseof the permittivity. However, even at higher ac-voltages a substan-tial increase of the permittivity at the lowest frequencies was noticed,which might be due to longer ranges of motions and greater dipolemoments typical for the Maxwell-Magner-Sillars-relaxation.
Figure 7.1: Potential barrier distribution.
97
7 Discussion
7.2 Oil-Impregnated Papers
Although the complex permittivity of an oil-impregnated paperis dominated by dielectric relaxation processes in cellulose, the pres-ence of oil in paper makes it to a more complex mixed dielectric thanin the air-impregnated state. The results show, that the complex per-mittivity of a well-dried paper and oil combined to a void-free dielec-tric is not affected by a strong bias field, at least not in the consideredrange of frequencies and temperatures. Only if the electric field washigh enough at the surface of the paper, did a distinct relaxation peakoccur, similar to what was seen in air-impregnated papers. Therefore,it is assumed that also in oil-impregnated specimens, the electrical de-composition of water adsorbed in cellulose is the main mechanism ex-plaining the emergence of a loss peak when applying a high bias field.The interfacial polarisation peak due to differently conductive oil andcellulose fibres seems to arise at lower frequencies, which were notobserved in this study. The decrease of the dielectric loss due to thebias field, that was reported by other authors as the cause of ionic de-pletion, could not be observed in considered specimens. At the sametime, measurements of the complex permittivity under the applicationof a bias field identified a complex set of dielectric phenomena takingplace at solid-liquid boundaries. The results suggest that under the in-fluence of the high bias field space charge is formed, whereas mobileions of both oil and paper are involved. Understanding the relation-ship between the space charge accumulation in a static electric fieldand the associated increase of the permittivity of the oil-impregnatedpaper requires further investigations.
7.3 Application in Medium-Frequency Transformers
The complex permittivity of well-dried insulating papers unaf-fected by a high bias field indicate that the molecular motions of cel-
98

7.3 Application in Medium-Frequency Transformers
lulose chains are not influenced by the bias fields of considered mag-nitudes. This is in conformity with the idea that the externally appliedelectric field is not equal to the local field acting upon dipoles. Thelatter is significantly distorted by dipolar interactions. Therewith, onlyionic polarisation mechanisms seem to be influenced by the bias field.
The PWM voltage with a fast slew rate used in medium fre-quency transformers features a high harmonic content that dependson the rise time of pulses and their repetition frequency. Under the in-fluence of such electric stress, each frequency component contributesto the total dielectric loss an amount proportional to frequency, thecorresponding dielectric loss factor and the square of the voltage
Pdiel. =12
U20 ωε
′′(ω)C0 , (7.1)
where U = U0 sin(ωt) is the sinusoidal voltage applied to a dielec-tric enclosed into a capacitor of geometric capacitance C0. The totaldielectric loss is determined as the sum of contributions of Fouriercomponents of the applied multifrequency voltage
PΣ =12
∞
∑n=1
U20,nωnε
′′(ωn)C0 . (7.2)
Hence the dielectric heating is an important factor to consider in MFTs,if the electric stress features high frequency components of high am-plitude.9–11 The total dielectric loss cannot be estimated from ε ′′ thatis known only for one frequency, e. g. 50 Hz. As seen in Figure 7.2,due to fast dipolar relaxation mechanisms of cellulose, ε ′′ of dry cel-lulose increases with the increasing frequency. As for the use of cel-lulosic papers in medium-frequency transformers, a greater dielectricloss is to be expected in the insulation than in low-frequency appli-cations. Firstly, it is associated with the higher frequency. Secondly,
99

7 Discussion
the dielectric loss factor of cellulose increases towards higher frequen-cies. Considering both factors together, the loss calculated accordingto Equation 7.2 can be anticipated to become larger than at 50 Hz.Based on the results of the present work, it can also be stated that theamount of the dielectric loss is not influenced by a simultaneously act-ing high bias field. Thoroughly dried cellulosic insulating papers ex-hibit dielectric losses not much higher than synthetic fibrous materials.However, the maintenance of a high degree of dryness of cellulosic pa-pers in oil-immersed medium-frequency transformers is imperative toensure low dielectric losses and to avoid detrimental effects of wateron the paper insulation.
Figure 7.2: Schematic of the loss spectrum of dry cellulose with indication ofrelaxation processes at temperatures around room temperature.
100
8 Summary and Outlook
Within the scope of the present work an experimental effort wasundertaken with the intention to characterise the dielectric relaxationphenomena in cellulosic insulating papers, subjected to high mixedelectric fields. Detailed conclusions can be found at the ends of corre-sponding sections as well as in the discussion.
The unique properties of cellulose, especially in the interactionwith water, make it a remarkably complex material. At the same time,it can be considered as an insightful model substance. The results ofexperiments involving high bias fields suggest that proton migrationdetermines the origin of the relaxation mechanism in cellulose asso-ciated with its hydration. The increase of proton concentration due tothe ionisation at the surface of paper specimens is assumed to causean additional dielectric relaxation in the intermediate frequency regionwith a loss peak arising at several hundred hertz at room temperature.A model of random potential barriers was employed to elucidate theorigin of the arising relaxation.
As revealed in presented experiments, dielectric properties of in-sulating papers in an unaged state were unaffected by the presence ofa high static field. It was only at higher degrees of ageing accompa-nied with an increase of the water content of cellulose and at improperelectrical contacting, where a high dc-field enhanced the complex per-mittivity. The enhancement of dielectric properties in a relatively widerange of frequencies, i. e. up to 100 kilohertz may be associated witha substantial increase of dielectric losses. However, the higher degreesof hydration which were considered in the work were rather exagger-ated. These water contents would be a sign for severe deterioration ofthe insulation of a real apparatus. The proper drying and avoidanceof gas-filled inclusions are well-known prerequisites for the reliable
101
8 Summary and Outlook
operation of the oil-impregnated insulation. Their importance was un-derlined by the presented experimental evidence. The sensitivity ofdielectric losses in the cellulosic paper to water content and tempera-ture could become a limiting factor for the use in medium-frequencymedium-voltage transformers with high requirements on thermal andelectrical properties of dielectric materials. However, further specificinvestigations including different insulating materials are needed togive a more exhaustive conclusion.
Improvements of experimental facilities combined with a researchin listed directions would supplement and verify the observations pre-sented in this work:
• Extension of the frequency range towards lower frequencieswould provide valuable information concerning the macroscopicrelaxation processes in terms of the complex permittivity andthe complex conductivity.
• Extension of measurement temperatures to lower degrees wouldbe particularly important in the observation of phenomena re-lated to hydration, since the water content of cellulose starts todecrease at around 50°C. Lower temperatures are also reason-able for the investigation of secondary relaxation mechanismsdue to the shift of the secondary loss peaks to lower frequen-cies.
• Application of dielectric spectroscopy at higher magnitudes ofthe probing ac-voltage would be another insightful way of ex-tending the knowledge obtained from low-field measurements,especially in addressing the processes due to ionic motions.
102
References
1 J. Thoma, S. Kolb, C. Salzmann, and D. Kranzer. Characterizationof high-voltage-sic-devices with 15 kv blocking voltage. In 2016
IEEE International Power Electronics and Motion Control Confer-
ence (PEMC), pages 946–951, 2016.
2 A. Q. Huang. Medium-voltage solid-state transformer: Technologyfor a smarter and resilient grid. IEEE Industrial Electronics Maga-
zine, 10(3):29–42, 2016.
3 D. Schröder and R. Marquardt. Leistungselektronische Schaltun-
gen: Funktion, Auslegung und Anwendung. Springer Berlin Heidel-berg, 2018.
4 C. Zhao, D. Dujic, A. Mester, J. K. Steinke, M. Weiss, S. Lewdeni-Schmid, T. Chaudhuri, and P. Stefanutti. Power electronic tractiontransformer—medium voltage prototype. IEEE Transactions on In-
dustrial Electronics, 61(7):3257–3268, 2014.
5 S. Candolfi, S. Blume, D. Aguglia, P. Viarouge, J. Biela, and J. Cros.Evaluation of insulation systems for the optimal design of high volt-age pulse transformers. In 2014 IEEE International Power Modula-
tor and High Voltage Conference (IPMHVC), pages 557–560, 2014.
6 T. Guillod. Modeling and Design of Medium-Frequency Transform-
ers for Future Medium-Voltage Power Electronics Interfaces. PhDthesis, ETH Zurich, Zurich, 2018.
7 R. Färber. Endurance of Polymeric Insulation under Mixed-
Frequency Medium-Voltage Stress. PhD thesis, ETH Zurich, Zurich,2019.
8 J. C. G. Wheeler. Effects of converter pulses on the electrical insula-tion in low and medium voltage motors. IEEE Electrical Insulation
Magazine, 21(2):22–29, 2005.
103
REFERENCES
9 B. Sonerud, T. Bengtsson, J. Blennow, and S. M. Gubanski. Dielec-tric heating in insulating materials subjected to voltage waveformswith high harmonic content. IEEE Transactions on Dielectrics and
Electrical Insulation, 16, 2009.
10 M. Birle and C. Leu. Dielectric heating in insulating materials athigh dc and ac voltages superimposed by high frequency high volt-ages. 2013.
11 T. Guillod, R. Färber, F. Krismer, C. M. Franck, and J. W. Ko-lar. Computation and analysis of dielectric losses in mv powerelectronic converter insulation. In 2016 IEEE Energy Conversion
Congress and Exposition (ECCE), pages 1–8, Sep. 2016.
12 R. Richert. Nonlinear Dielectric Spectroscopy. Advances in Di-electrics. Springer International Publishing, 2018.
13 J. Małecki. Non-linear dielectric behaviour and chemical equilibriain liquids. Electrochimica Acta, 33(9):1235 – 1241, 1988.
14 C.J.F. Böttcher. Theory of electric polarization: Dielectrics in static
fields. Number Bd. 1. Elsevier, 1973.
15 R. Richert. Nonlinear dielectric effects in liquids: A guided tour.Journal of Physics Condensed Matter, 29(36), 8 2017.
16 H. Block and E. F. Hayes. Dielectric behaviour of stiff polymers insolution when subjected to high voltage gradients. Trans. Faraday
Soc., 66:2512–2525, 1970.
17 C. G. Garton. Dielectric loss in thin films of insulating liquids.Journal of the Institution of Electrical Engineers - Part II: Power
Engineering, 88(2):103–120, April 1941.
18 F. Liebscher and W. Held. Kondensatoren: Dielektrikum Bemes-
sung Anwendung. Springer Berlin Heidelberg, 1968.
104
REFERENCES
19 S. Osaki, S. Uemura, and Y. Ishida. Effects of a static electricfield upon dielectric properties of poly(vinylidene fluoride) andpoly(vinyl fluoride). Journal of Polymer Science Part A-2: Poly-
mer Physics, 9(4):585–594, 1971.20 S. Uemura. Ionic contribution to the complex dielectric constant
of a polymer under dc bias. Journal of Polymer Science: Polymer
Physics Edition, 10(11):2155–2166, 1972.21 G. S. Kuchinsky. Measurement of loss tangent under simultaneous
action of d.c. and a.c. voltages. Elektrichestvo, (6):52–54, 1952.22 G. S. Kuchinsky. The behaviour of paper-oil insulation under a.c.
voltage with simultaneous d.c. component. Elektrichestvo, (10):45–49, 1955.
23 D. H. Hogle, M. M. Rutter, and T. W. Dakin. Dielectric properties ofcyanoethylcellulose. In 1957 Conference on Electrical Insulation,pages 51–52, 1957.
24 Z. Krasucki, H. F. Church, and C. G. Garton. A new explanation ofgas evolution in electrically stressed oil-impregnated paper insula-tion. Journal of The Electrochemical Society, 107(7):598, 1960.
25 C. G. Garton Z. Krasucki, H. F. Church. Factors controlling the life
of power capacitors. Cigre-Report N. 138. 1962.26 M. Rapos. The electrical properties of insulating materials under
the simultaneous action of ac and dc voltage. In Conference on
Electrical Insulation Dielectric Phenomena - Annual Report 1972,pages 98–104, Oct 1972.
27 W. Taschner. Öl- und Ölpapier bei Gleich- und Wechselspannung
insbesondere bei Überlagerung beider Spannungsarten. PhD thesis,TU Darmstadt, Darmstadt, 1972.
28 H. Shimokawa, A. Ohashi, and M. Ueda. Voltage dependence oftan δ of dielectric liquid films. Electrical Engineering in Japan,101(1):14–20, 1981.
105
REFERENCES
29 A.K. Jonscher. Dielectric Relaxation in Solids. Chelsea DielectricsPress Limited, 1983.
30 M. Wübbenhorst and J. v. Turnhout. Analysis of complexdielectric spectra. i. one-dimensional derivative techniques andthree-dimensional modelling. Journal of Non-Crystalline Solids,305(1):40 – 49, 2002.
31 P.A.M. Steeman. Interfacial phenomena in polymer systems: A di-
electric approach. Doctoral Thesis. TU Delft, 1992.32 M. Dochia, C. Sirghie, R.M. Kozłowski, and Z. Roskwitalski. 2
- cotton fibres. In R. M. Kozłowski, editor, Handbook of Natural
Fibres, volume 1 of Woodhead Publishing Series in Textiles, pages11 – 23. Woodhead Publishing, 2012.
33 T. A. Prevost and T. V. Oommen. Cellulose insulation in oil-filledpower transformers: Part i - history and development. IEEE Elec-
trical Insulation Magazine, 22(1):28–35, Jan 2006.34 H. Gasser, C. Krause, and T. Prevost. Water absorption of cellulosic
insulating materials used in power transformers. In 2007 IEEE In-
ternational Conference on Solid Dielectrics, pages 289–293, July2007.
35 E. Westhof. Water and Biological Macromolecules. Topics inMolecular and Structural Biology. Macmillan Education UK, 1993.
36 T. Hatakeyama and H. Hatakeyama. Thermal Properties of Green
Polymers and Biocomposites. Hot Topics in Thermal Analysis andCalorimetry. Springer Netherlands, 2004.
37 E. L. Lindh and L. Salmén. Surface accessibility of cellulose fibrilsstudied by hydrogen–deuterium exchange with water. Cellulose,24(1):21–33, Jan 2017.
38 K. Nakamura, T. Hatakeyama, and H. Hatakeyama. Studies onbound water of cellulose by differential scanning calorimetry. Tex-
tile Research Journal, 51(9):607–613, 1981.
106
REFERENCES
39 T. V. Oommen. Moisture equilibrium charts for transformer insu-lation drying practice. IEEE Transactions on Power Apparatus and
Systems, PAS-103(10):3062–3067, Oct 1984.40 E.J. Murphy. The dependence of the conductivity of cellulose, silk
and wool on their water content. Journal of Physics and Chemistry
of Solids, 16(1):115 – 122, 1960.41 M. Nilsson and M. Strømme. Electrodynamic investigations of con-
duction processes in humid microcrystalline cellulose tablets. The
Journal of Physical Chemistry B, 109(12):5450–5455, 2005. PMID:16851580.
42 J F Nagle and H J Morowitz. Molecular mechanisms for protontransport in membranes. Proceedings of the National Academy of
Sciences, 75(1):298–302, 1978.43 H. E. Taylor. The dielectric relaxation spectrum of glass. Trans.
Faraday Soc., 52:873–881, 1956.44 T. Nakajima. Correlation between electrical conduction and dielec-
tric polarization in inorganic glasses. In Conference on Electrical
Insulation Dielectric Phenomena - Annual Report 1971, pages 168–176, 1971.
45 H. Namikawa. Characterization of the diffusion process in oxideglasses based on the correlation between electric conduction anddielectric relaxation. Journal of Non-Crystalline Solids, 18(2):173– 195, 1975.
46 J. C. Dyre and T. B. Schrøder. Universality of ac conduction indisordered solids. Rev. Mod. Phys., 72:873–892, Jul 2000.
47 J. Einfeldt, D. Meißner, and A. Kwasniewski. Contributions to themolecular origin of the dielectric relaxation processes in polysac-charides – the high temperature range. Journal of Non-Crystalline
Solids, 320(1):40 – 55, 2003.
107
REFERENCES
48 P. Ortiz-Serna, M. Carsí, B. Redondo-Foj, and M.J. Sanchis. Elec-trical conductivity of natural rubber–cellulose ii nanocomposites.Journal of Non-Crystalline Solids, 405:180 – 187, 2014.
49 R. J. Charles. Some structural and electrical properties oflithium silicate glasses. Journal of the American Ceramic Society,46(5):235–238, 1963.
50 P. Hedvig. Dielectric spectroscopy of polymers. Wiley, 1977.51 J. Heijboer. Secondary loss peaks in glassy amorphous polymers.
International Journal of Polymeric Materials and Polymeric Bio-
materials, 6(1-2):11–37, 1977.52 J. Kolarík. Secondary relaxations in glassy polymers: Hydrophilic
polymethacrylates and polyacrylates. In Behavior of Macro-
molecules, pages 119–161, Berlin, Heidelberg, 1982. SpringerBerlin Heidelberg.
53 S. Cerveny, J. Colmenero, and Á. Alegría. Dielectric properties ofwater in amorphous mixtures of polymers and other glass formingmaterials. Journal of Non-Crystalline Solids, 353(47):4523 – 4527,2007. Dielectric Relaxation and Related Phenomena.
54 J. Kolarík and J. Janácek. Effect of low molecular weightcompounds on the relaxation behavior of poly(2-hydroxyethylmethacrylate) in the glassy state and in the transition region fromthe glassy to the rubberlike state. Journal of Polymer Science Part
A-2: Polymer Physics, 10(1):11–22, 1972.55 J. Einfeldt, D. Meißner, and A. Kwasniewski. Comparison of the
molecular dynamics of celluloses and related polysaccharides in wetand dried states by means of dielectric spectroscopy. Macromolec-
ular Chemistry and Physics, 201(15):1969–1975, 2000.56 Derek J. Crofton and Richard A. Pethrick. Dielectric studies of
proton migration and relaxation in wet cellulose and its derivatives.Polymer, 22(8):1048 – 1053, 1981.
108

REFERENCES
57 G. Jafarpour, F. Roig, E. Dantras, A. Boudet, and C. Lacabanne. In-fluence of water on localized and delocalized molecular mobility ofcellulose. Journal of Non-Crystalline Solids, 355(34):1669 – 1672,2009.
58 H. Montes, J.Y. Cavaillé, and K. Mazeau. Secondary relaxationsin amorphous cellulose. Journal of Non-Crystalline Solids, 172-174:990 – 995, 1994. Proceedings of the Second Internatinal Dis-cussion Meeting on Relaxations in Complex Systems.
59 K. Kaminski, E. Kaminska, K. L. Ngai, M. Paluch, P. Wlodarczyk,A. Kasprzycka, and W. Szeja. Identifying the origins of two sec-ondary relaxations in polysaccharides. The Journal of Physical
Chemistry B, 113(30):10088–10096, 2009.60 G. P. Johari and M. Goldstein. Viscous liquids and the glass tran-
sition. ii. secondary relaxations in glasses of rigid molecules. The
Journal of Chemical Physics, 53(6):2372–2388, 1970.61 K. Kaminski, K. Adrjanowicz, D. Zakowiecki, E. Kaminska,
P. Wlodarczyk, M. Paluch, J. Pilch, and M. Tarnacka. Dielectricstudies on molecular dynamics of two important disaccharides: Su-crose and trehalose. Molecular Pharmaceutics, 9(6):1559–1569,2012.
62 F. Khan and N. Pilpel. An investigation of moisture sorption inmicrocrystalline cellulose using sorption isotherms and dielectricresponse. Powder Technology, 50(3):237 – 241, 1987.
63 J. Einfeldt, D. Meißner, and A. Kwasniewski. Polymerdynamics ofcellulose and other polysaccharides in solid state-secondary dielec-tric relaxation processes. Progress in Polymer Science, 26(9):1419– 1472, 2001.
64 Ya. Ryabov, A. Gutina, V. Arkhipov, and Yu. Feldman. Dielectricrelaxation of water absorbed in porous glass. The Journal of Physi-
cal Chemistry B, 105(9):1845–1850, 03 2001.
109
REFERENCES
65 K. Yamamoto and H. Namikawa. Conduction current relaxation ofinhomogeneous conductor i. Japanese Journal of Applied Physics,27(Part 1, No. 10):1845–1851, oct 1988.
66 M. Chang. Folding chain model and annealing of cellulose. Jour-
nal of Polymer Science Part C: Polymer Symposia, 36(1):343–362,1971.
67 J. M. B. Fernandes Diniz, M. H. Gil, and J. A. A. M. Castro.Hornification—its origin and interpretation in wood pulps. Wood
Science and Technology, 37(6):489–494, 2004.68 R. Richert. A simple current-to-voltage interface for dielectric re-
laxation measurements in the range 1 mhz to 10 mhz. Review of
Scientific Instruments, 67(9):3217–3221, 1996.69 New integrated dielectric analyzer extends accuracy and impedance
range for material measurements. Dielectric Newsletter. Novocon-
trol.70 Electrical insulating papers. WEIDMANN Electrical AG.71 Transformerboard. Cellulosic insulation of unsurpassed quality.
WEIDMANN Electrical AG.72 F. Liebscher. Über die dielektrischen Verluste und die Kurvenform
der Ströme in geschichteten Isolierstoffen bei hohen Wechselfeld-stärken von 50 hz. Wiss. Veröff. a. d. Siemens-Werken, 12:214–248,1943.
73 E. Scholz. Karl-Fischer-Titration: Methoden zur Wasserbes-
timmung. Anleitungen für die chemische Laboratoriumspraxis.Springer Berlin Heidelberg, 2013.
74 IEC 60554-2. cellulosic papers for electrical purposes - Part 2:Methods of test, November 2001.
75 A. Rachocki, E. Markiewicz, and Jadwiga Tritt-Goc. Dielectric re-laxation in cellulose and its derivatives. Acta Physica Polonica A -
ACTA PHYS POL A, 108, 01 2006.
110
REFERENCES
76 I Semenov and C. Leu. Effect of high dc field on loss tan-gent and permittivity of non-impregnated transformer board. InBálint Németh, editor, Proceedings of the 21st International Sym-
posium on High Voltage Engineering, pages 336–346, Cham, 2020.Springer International Publishing.
111
Acknowledgement
I express my deepest gratitude to: my supervisor Dr. Carsten Leufor making this project possible, for his advice and encouragementthroughout the work; my colleagues in the research unit High-VoltageTechnologies at TU Ilmenau for excellent feedback and support overthe years; WEIDMANN Electrical AG for the financial support andproviding sample materials and valuable information; Prof. KlausHeinemann of TITK Rudolstadt for helpful advice on many questions;Dr. Andrea Knauer for making beautiful micrographs; Dr. ThomasStauden for helping me in building the test facilities; Dr. Raphael Fär-ber of ETH Zurich for valuable discussions; my family and friends fortheir continued support and friendship.
112