diabetes among inuit migrants in denmark
TRANSCRIPT

354 International Journal of Circumpolar Health 64:4 2005
ORIGINAL RESEARCH
DIABETES AMONG INUIT MIGRANTS IN DENMARK
Helene Moustgaard 1, Peter Bjerregaard 2, Knut Borch-Johnsen 1, Marit E. Jørgensen 2, the Greenland Population Study 3
1 Steno Diabetes Center, Gentofte, Denmark2 National Institute of Public Health, Copenhagen, Denmark3 Steering Group: Vibeke Backer, Ulrik Becker, Peter Bjerregaard, Knut Borch-Johnsen, Stig Andersen, Gert Mulvad.
Secretariat: National Institute of Public Health, Denmark
Received 17 January 2005, Accepted 17 June 2005
ABSTRACT
Objectives. The study aimed to estimate the prevalence of diabetes and impaired glucose intoler-
ance (IGT) among Inuit migrants living in Denmark, and to compare with findings from Green-
land. Further, we analyzed determinants for diabetes and impaired glucose metabolism.
Study design. Cross-sectional, population–based epidemiological study.
Methods. This cross-sectional study included randomly selected Inuit migrants in Denmark aged
34 years and above. Diabetes and IGT were diagnosed using the oral glucose tolerance test. Body
mass index (BMI) and waist circumference were measured, and blood samples were taken from
each subject. Socio-demographic characteristics were investigated using a questionnaire. For
comparison, data from the Greenland Population Study were used (n = 917).
Results. Of 506 eligible subjects, 256 (51%) participated. Twenty-six subjects had diabetes
(10.2%) and twenty-eight had IGT (10.9%). Of those with diabetes, 64% had not been previ-
ously diagnosed. The prevalences of diabetes and IGT were not significantly different from those
among Inuit in Greenland. Significant predictors of diabetes and impaired glucose metabolism
(IGM) were found to be age, waist circumference and physical inactivity. The association between
waist circumference and diabetes was significantly stronger among Inuit migrants in Denmark
than among Inuit in Greenland.
Conclusions. The prevalence of diabetes is high among the Inuit migrants in Denmark. However,
unlike that reported in most studies, the prevalence was not significantly higher in the migrant
population compared with the population of origin.
(Int J Circumpolar Health 2005; 64(4):354-364.)
Keywords: OGTT, oral glucose tolerance test, BMI, body mass index, IGM, impaired glucose
metabolism

355International Journal of Circumpolar Health 64:4 2005
ORIGINAL RESEARCH
INTRODUCTION
Studies of the Inuit prior to the 1980s have
reported a lower prevalence of diabetes
compared to Northern European populations
(1). However, we have recently reported a
surprisingly high prevalence of diabetes and
IGT among the Inuit of Greenland. Amomg
men, the prevalences of diabetes and IGT
among participants over 34 years old were
10.8% and 9.4%, respectively, and 8.8% and
14.1% among women (2). Thus, the Green-
landic population seems to have undergone,
or to be undergoing, a transition from low to
high prevalence of diabetes.
In our previous study, three groups of
Greenlanders living under different conditions
in Greenland were studied. One group lived in
villages in a hunting district (Uummannaq),
another in a small town (Qasigiannguit),
while a random sample of the population
living in the capital (Nuuk) comprised the
third group. The three areas were chosen to
represent increasing degrees of acculturation,
or westernization, with the hunting villages
representing the most traditional lifestyle and
the capital the most westernized lifestyle. The
assumption was that the survey would find
a geographical manifestation of the transi-
tion process, with a gradient of increasing
prevalence, going from the least, to the most
westernized subpopulations. Surprisingly,
the results did not show such a gradient – the
prevalence of diabetes proved to be highest
in the villages and lowest in the intermediate
size town (2).
One possible explanation for this finding is
that the lifestyle no longer varies sufficiently
within Greenland to yield a gradient – the
changes that have caused the transition may
have already occurred across all the subpopu-
lations studied.
Ethnic Greenlanders, including those living
in Denmark, are genetically Inuit (Eskimos),
with a substantial admixture of European,
mainly Danish, genes. They are closely related
to the Inuit and Yupik in Canada, Alaska and
Siberia. Around 7000 ethnic Greenlanders live
in Denmark. There are three major subgroups
in this population. One of these is made up of
women who have married Danes working in
Greenland. Others are themselves children of
marriages between Greenlanders and Danes,
and have moved to Denmark with their parents
at a young age. Finally, some Greenlanders
move to Denmark for educational purposes,
and may end up staying permanently. Only
20% have neither a Danish parent, nor a Danish
spouse, and there is a preponderance of women
in the Inuit population in Denmark (3).
This group of migrants is well integrated
into the Danish society, and has a lifestyle
similar to that of the general population of
a Western industrialized country. Thus, the
Inuit migrants are exposed to a lifestyle that
differs considerably from that in Greenland.
This offers a unique opportunity to study the
effects of westernization, and to study the
factors that could contribute to the transition
from low to high prevalence of glucose intoler-
ance. The aims of this study were to assess the
prevalences of IGT and diabetes among ethnic
Greenlanders living in Denmark, to compare
them with findings from Greenland, and to
identify determinants for IGT and diabetes.
Our hypothesis was that the lifestyle acquired
through migration to Denmark would increase
the risk of diabetes and, thus, cause a higher
prevalence among the migrants than among
the residents of Greenland.

356 International Journal of Circumpolar Health 64:4 2005
ORIGINAL RESEARCH
MATERIAL AND METHODS
ParticipantsGreenlanders living in Denmark were initially
identified through the Central Population
Register as those persons born in Greenland
but presently living in Denmark. A random
sample of those living in the eastern part of
Denmark was drawn from the total popula-
tion over the age of 34 years. Of the sampled
persons, only those with at least one Inuit
parent were included in the study. Data were
collected between March and September 2002.
Participants (n=506) were invited by mail.
Data from the Greenland population study
were used for comparison. The Greenland
population study was a population-based,
randomized survey carried out in Greenland
from 1999-2001. 917 persons aged 35 years
and above participated in the study in Green-
land (4).
Verbal and written consent was obtained
from all participants. Full approval for the
study was obtained from the Ethics Review
Committee in Denmark.
Survey procedureThe participants attended the clinic between
08:00 and 10:00 h, after an overnight fast. A
2-h standard 75-g oral glucose tolerance test
was performed. Height was measured and
the participants were weighed on a standard
clinical balance beam scale wearing under-
garments. BMI was calculated. The waist
circumference of the standing participant was
measured midway between the iliac crest and
the costal margin.
Blood samples were placed immediately on
ice and spun at 4°C within 30 min of sampling.
Plasma glucose was determined by the hexo-
kinase/G6P-DH method, using a Hitachi 912
system in the laboratory of the Steno Diabetes
Center.
For participants with a known history
of diabetes, fasting glucose was measured
without an OGGT.
Glucose tolerance was classified according
to World Health Organization criteria (5).
Fasting plasma glucose ≥ 7.0 mmol/l and/or
2-h plasma glucose ≥ 11.1 mmol/l were taken
to indicate diabetes, and IGT was defined as a
fasting plasma glucose level < 7.0 mmol/l and
2-h plasma glucose ≥ 7.8 and < 11.1 mmol/l.
The details of the survey procedure in
Greenland have been published elsewhere (4).
Plasma samples from Greenland and Denmark
were analyzed in the same laboratory, using
identical methods and clinical procedures.
Interviews and questionnairesData were collected by structured interviews
and self-administered questionnaires. Infor-
mation on age, sex, former places of residence
in Greenland and duration of stay in Denmark
was recorded, as were family histories of
diseases. Inuit blood quantum was estimated
from questions on the ethnicity of the four
grandparents and, if this information was
missing, of the parents. It was recorded as
full Inuit heritage (all grandparents Inuit), or
partly Inuit heritage.
Participants completed a food frequency
questionnaire including questions on the
consumption of seal, whale, fish, fresh fruit
and vegetables, egg and various dairy products.
The questionnaire also contained questions on
the consumption of alcohol. The frequency of
alcohol consumption was reported. Partici-
pants were classified as current smokers, or
non-smokers, the latter including past smokers.

357International Journal of Circumpolar Health 64:4 2005
ORIGINAL RESEARCH
Highest educational grade completed and
current employment was recorded.
Physical activity levels during leisure-
time, summer and winter were measured
using a standardised questionnaire (6), where
information on leisure-time physical activity
comprised five categories: 1) sedentary; 2)
light; 3) physical activity less than four hours
per week; 4) physical active at least four hours
per week; and 5) heavy activity several times
per week. Due to the small group sizes, it was
recoded on a three-point scale: sedentary
(1); moderate (2 and 3); and heavy physical
activity (4 and 5)
Data analysis and statisticsAnalyses were performed using SPSS 11.0 and,
for logistic regression models, SAS 8.2. The
direct method was used to age- and gender-
standardize the prevalence of diabetes among
Greenlanders and migrants, respectively, to the
total survey population. Inter-group compari-
sons were performed using Pearson’s Chi2-test
for categorical variables and Student’s t test for
continuous variables. To evaluate associations
with glucose tolerance status, two categorical
variables were produced to reflect the glucose
tolerance status as follows: 1) diabetes versus
normal glucose tolerance, and 2) Impaired
glucose metabolism (diabetes + IGT) versus
normal glucose tolerance. Multiple logistic
regression analyses were performed to assess
the association of the following risk factors with
the glucose tolerance status among migrants
and non-migrants: gender, age, waist circum-
ference, physical activity and family history
of diabetes. Waist circumference was chosen
for the measurement of obesity, because this
anthropometrical measurement is suggested
to be the best marker of intra-abdominal fat
(7). To test whether the association between
the glucose intolerance status and risk factors
differed between the two countries, we used
an interaction term between country of resi-
dence and each of the risk factors.
RESULTS
A total of 506 Inuit migrants in Denmark
were invited to participate in the study. Of
those, 256 attended the study (50.6%). The
mean age of the participants was 45 (range
34-76), compared to 49 (range 35-86) among
participants in Greenland (p = 0.0002). Of the
participants in Denmark 72.2% were women,
compared to 56.1% in Greenland (p < 0.0001).
Ninety-six percent had lived in Denmark for 3
years or more (average 28.2 years).
All participants were classified with respect
to glucose tolerance. Twenty-six subjects had
diabetes (10.2%, 95% CI 6.5-13.9%). The
age-standardized prevalence of diabetes was
10.8% among women and 7.1% among men
(p = 0.04). There was no difference in the
age- and gender-standardized prevalences of
diabetes between the two Inuit populations
(9.8% vs. 9.6%, p = 0.92).
Of those with diabetes, 16 (64%) were
not previously aware of their diabetic status
compared with 70% in Greenland (p = 0.14).
Among the migrants in Denmark, 19% with
diabetes were diagnosed solely on the basis
of fasting glucose, compared with 53% of the
diabetics in Greenland (p = 0.03), and 44%
of the migrants were diagnosed solely on the
basis of elevated 2-h glucose values compared
with 19% in Greenland (p = 0.02).
Twenty-eight subjects had IGT (10.9%,
95% CI 7.1-14.7%). The age-standardized

358 International Journal of Circumpolar Health 64:4 2005
ORIGINAL RESEARCH
prevalence of IGT was 12.4% among women
and 7.0% among men (p = 0.03). The age- and
gender-standardized prevalences of IGT were
not significantly different in the two Inuit
populations (10.1% vs. 12.2%, p = 0.51). The
prevalences of diabetes and IGT increased
with age among both men and women (p <
0.0001; figure 1).
The two population groups differed signifi-
cantly with regard to a number of biological,
behavioral and socio-economic factors (Table
I). Almost half of the migrants were of mixed
heritage. On average, the migrants had lower
mean levels of BMI and waist circumference
than the residents of Greenland. Consump-
tion of seal and fish was very low among the
migrants, while the consumption of fresh
fruit was low among the participants in
Greenland. Alcohol consumption was more
frequent among the migrants. Conversely,
there were fewer smokers among the migrants
than among the residents of Greenland.
No significant difference was found in the
distribution between categories of physical
activity. Finally, the length of school educa-
tion received was generally shorter among
the residents of Greenland than among the
migrants. In Greenland, 62% had attended
school for eight years or less, compared to
21% of the migrants.
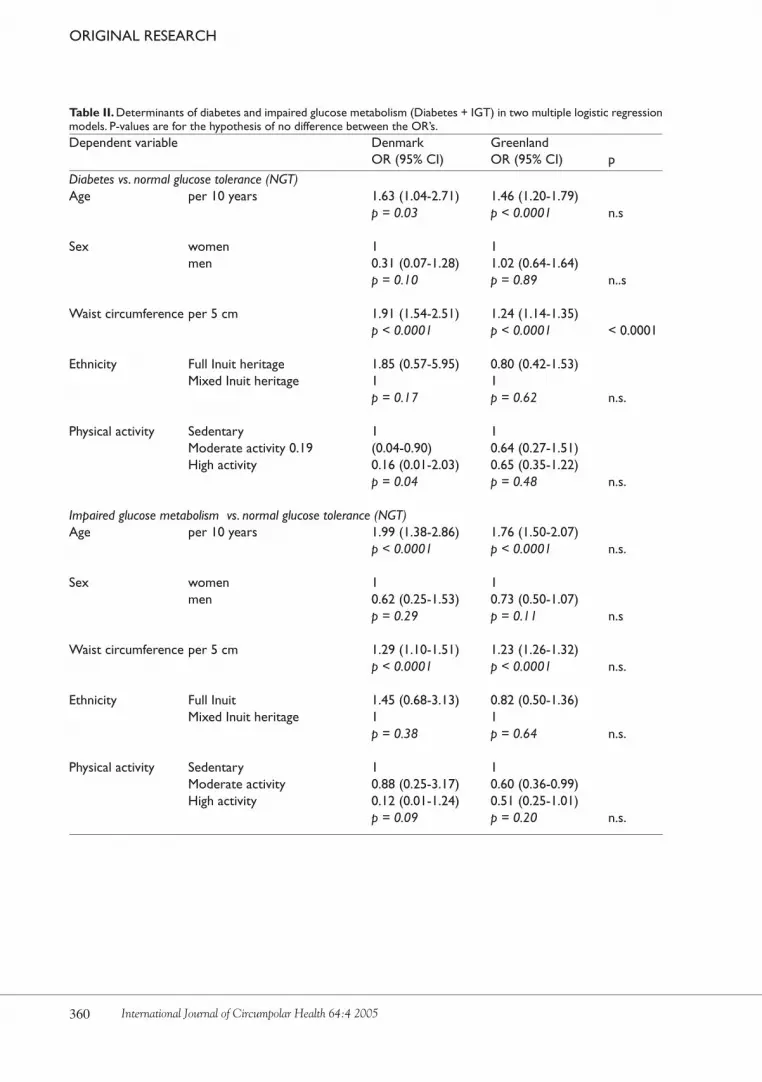
Two logistic regression models were
constructed, with diabetes and impaired
glucose metabolism as dependent variables
for each of the two countries. Gender, age,
waist circumference, physical activity and
family history of diabetes were included as
explanatory variables (Table II).
In both Denmark and Greenland, age and
waist circumference were significantly associ-
ated with diabetes. Physical activity was nega-
tively associated with diabetes, but, although
consistent, the association was not statistically
significant in Greenland. The same variables
were associated with impaired glucose metab-
olism in both countries. In the multivariate
model, gender and ethnicity were not statis-
tically significantly associated with diabetes
or impaired glucose metabolism, in either
Denmark, or Greenland. There was a signifi-
cant difference in the association between
waist circumference and diabetes in the two
countries: the association was stronger among
Figure 1. Age-specific prevalence of diabetes and impaired glucose tolerance (IGT) among migrant men and women in Denmark.

359International Journal of Circumpolar Health 64:4 2005
ORIGINAL RESEARCH
Table I. Distribution of basic variables among Inuit migrants in Denmark and Inuit in Greenland. Migrants Greenland mean (SD) mean (SD) p Continuous variables Age (years) 46 49 0.0003 BMI (kg/m2) 25.8 (4.5) 26.7 (5.2) 0.009 Waist circumference (cm) 86 (12) 90 (13) < 0.001
Categorical variables % % Gender Male 28 44 Female 72 56 < 0.001
Ethnicity 75% or less Inuit heritage 49 12 Full Inuit heritage 51 88 < 0.001
Family history of diabetes No 85 89 Yes 15 11 0.053
Physical activity Sedentary 7 12 Moderate activity 76 71 Heavy activity 17 17 0.110
Consumption of seal or fish Less than weekly 99 55 Weekly 1 45 < 0.001
Consumption of fresh fruit Less than daily 33 74 Daily 67 26 < 0.001
Smoking status Current smoker 55 66 Non-smoker 45 34 0.001
Alcohol consumption >3 times per week 25 5 1-2 times per week 30 21 1-3 times per month 20 24 Less than monthly or never 25 50 < 0.001
Education 8 years or less 21 62 9-12 years 59 34 High school or more 19 4 < 0.001
360 International Journal of Circumpolar Health 64:4 2005
ORIGINAL RESEARCH
Table II. Determinants of diabetes and impaired glucose metabolism (Diabetes + IGT) in two multiple logistic regression models. P-values are for the hypothesis of no difference between the OR’s. Dependent variable Denmark Greenland OR (95% CI) OR (95% CI) p Diabetes vs. normal glucose tolerance (NGT)Age per 10 years 1.63 (1.04-2.71) 1.46 (1.20-1.79) p = 0.03 p < 0.0001 n.s
Sex women 1 1 men 0.31 (0.07-1.28) 1.02 (0.64-1.64) p = 0.10 p = 0.89 n..s
Waist circumference per 5 cm 1.91 (1.54-2.51) 1.24 (1.14-1.35) p < 0.0001 p < 0.0001 < 0.0001
Ethnicity Full Inuit heritage 1.85 (0.57-5.95) 0.80 (0.42-1.53) Mixed Inuit heritage 1 1 p = 0.17 p = 0.62 n.s.
Physical activity Sedentary 1 1 Moderate activity 0.19 (0.04-0.90) 0.64 (0.27-1.51) High activity 0.16 (0.01-2.03) 0.65 (0.35-1.22) p = 0.04 p = 0.48 n.s.
Impaired glucose metabolism vs. normal glucose tolerance (NGT)Age per 10 years 1.99 (1.38-2.86) 1.76 (1.50-2.07) p < 0.0001 p < 0.0001 n.s.
Sex women 1 1 men 0.62 (0.25-1.53) 0.73 (0.50-1.07) p = 0.29 p = 0.11 n.s
Waist circumference per 5 cm 1.29 (1.10-1.51) 1.23 (1.26-1.32) p < 0.0001 p < 0.0001 n.s.
Ethnicity Full Inuit 1.45 (0.68-3.13) 0.82 (0.50-1.36) Mixed Inuit heritage 1 1 p = 0.38 p = 0.64 n.s.
Physical activity Sedentary 1 1 Moderate activity 0.88 (0.25-3.17) 0.60 (0.36-0.99) High activity 0.12 (0.01-1.24) 0.51 (0.25-1.01) p = 0.09 p = 0.20 n.s.

361International Journal of Circumpolar Health 64:4 2005
ORIGINAL RESEARCH
migrants in Denmark. The logistic regression
analyses were repeated using BMI instead of
waist circumference as the explanatory vari-
able (data not shown). The same variables
were associated with diabetes and impaired
glucose metabolism and, for BMI, the associ-
ation with glucose abnormalities was signifi-
cantly modified by country of residence.
DISCUSSION
The prevalence of diabetes and impaired
glucose tolerance was high among Inuit
migrants in Denmark compared with a
general Danish population (8). This study did
not find a significantly higher prevalence of
IGT or diabetes among migrants than among
residents of Greenland. A high proportion of
individuals with diabetes were unaware of
their disease.
The fact that significantly more partici-
pants in Denmark were diagnosed on the
basis of elevated 2-h glucose levels may be
attributable to a higher degree of insulin
resistance among the migrants, rather than
insulin deficiency, although controversy
continues over the relative contributions of
insulin sensitivity and insulin deficiency in
glucose intolerance (9-12).
Other migrant populations have been
studied with the aim of comparing the preva-
lence of diabetes with that in their countries
of origin. Studies of Japanese migrants in
Hawaii (13), Tokelau Polynesians in New
Zealand (14), Indian and Chinese migrants
in Mauritius (15) and Caribbean migrants
in the UK (16), all found a significantly
higher prevalence in the migrant popula-
tions, compared to the respective countries of
origin. It appears that, in many populations,
there is a marked effect of migration to more
industrialized societies. The hypothesis has
been put forth that, in populations that have
lived under “feast or famine” conditions,
individuals with a tendency towards insulin
resistance, and a consequent increased ability
to store fat, have had the best chances of
survival. This “thrifty genotype” would then
manifest itself as obesity and diabetes when
the population is exposed to the environment
of plenty in a westernized, industrialized
society (17). Considering this, our findings
might be seen as all the more surprising.
However, when looking at other aspects of
the metabolic syndrome, there is evidence
that the changes that occur with western-
ization in the Inuit population do not follow
expected patterns.
Thus, in a previously published study,
Inuit migrants in Denmark proved to be less
obese than the residents of Greenland (18).
The effect was most pronounced for women.
The results were also surprising when
studying serum lipids in relation to western-
ization and migration among the Greenland
Inuit. Female Inuit migrants in Denmark had
significantly higher HDL levels than those
living in Greenland and LDL levels similar
to those of the least westernized women in
Greenland. For male migrants, HDL levels
were similar to those of the least westernized
men in Greenland, while there was no differ-
ence for LDL (19).
It would appear that there are several
stages of westernization: early stages that
cause an increasing risk of diabetes and other
components of the metabolic syndrome, and
later stages that may cause reduction of the
risk relative to the early stages. The popula-

362 International Journal of Circumpolar Health 64:4 2005
ORIGINAL RESEARCH
tion of Greenland is known originally to have
had a low prevalence of diabetes, so a transi-
tion from low to high prevalence must have
occurred. This would then represent the early
stages of westernization. When comparing
with migrants in Denmark, we are comparing
with a population that has changed its life-
style further, i.e. become more westernized
and, apparently, these further changes do not
increase the risk of diabetes, and may even
reduce the risk of other components of the
metabolic syndrome. Other factors related to
urbanization and migration, such as higher
socio-economic status and a higher level of
education, are likely to be responsible for the
relationship observed between westernization
and components of the metabolic syndrome
in Inuit populations. Thus, it appears that
Greenland Inuit follow the pattern usually
observed in industrialized countries with the
highest risk of diabetes in the lower socio-
economic groups. However, further studies
in a larger group of migrants are needed to
allow more detailed analyses.
Due to the low response rate among the
migrants, a selection bias cannot be excluded.
Any differences between Greenland and
Denmark in the factors that made people
attend, or not, would bias results and make
comparison less valid. In Greenland, the oral
glucose tolerance test was taken as part of a
wider health examination. In Denmark, the
study was presented to potential participants
as an examination specifically to identify
diabetes and cardiovascular risk factors, and
only these aspects of health were examined.
Those who already knew they had diabetes
may have been more likely not to attend,
causing an over-sampling of non-diabetics in
the migrant population.
The surveys in Greenland and Denmark
were carried out in 1999-2001 and 2002,
respectively. Any time trend in the preva-
lence of diabetes affecting both Greenland
and Denmark would have introduced bias.
Since the global time trend for diabetes is
that of an increase, this would tend to inflate
the prevalence among the migrants relative
to that in Greenland.
Aside from bias deriving from the collec-
tion of data, migrant studies share a common
problem of interpretation, stemming from
the fact that migration itself is a selective
process. People migrate for social, economic,
or health-related reasons, among others.
Thus, the migrants do not constitute a repre-
sentative sample of the population of origin.
This means that any interpretation regarding
the effect of migration to a new environment,
based on the comparison of the two popula-
tions, must be made with caution.
Various risk factors were included as
confounders in the logistic regression
models. Age is a well-known risk factor for
diabetes and IGM, and was confirmed as
such in this study. Obesity, as measured by
waist circumference, was a risk factor for
both IGM and diabetes. However, there was
a significant difference in the effect of waist
circumference on diabetes in Denmark and
Greenland. It is well known that the associa-
tion between obesity and cardiovascular risk
factors differs across populations, a finding
that has mainly been attributed to genetic
differences (20,21). A differential impact of
obesity on diabetes in two Inuit populations
living under different conditions indicates
a significant influence of environmental
factors on the association between obesity
and cardiovascular disease.

363International Journal of Circumpolar Health 64:4 2005
ORIGINAL RESEARCH
Lack of physical activity was also a strong
predictor for the development of diabetes
and IGT in other studies (22). Physical
inactivity showed an independent associa-
tion with prevalence of IGM and diabetes,
although the association was not statistically
significant for diabetes in Greenland and
for IGM in Denmark. The lack of a statisti-
cally significant effect may be a result of the
use of a questionnaire developed and vali-
dated in a white population (6). The focus on
leisure-time physical activity, rather than total
activity, may be less useful in Inuit popula-
tions, especially in Greenland, where leisure
time and occupation time are not necessarily
clearly separated, and organized sports are
not always available. Furthermore, it is well
established that self-report data on physical
activity are less reliable and valid than direct
measures of physical activity (23). So far, no
questionnaire has been developed to assess
physical activities in Inuit communities, and
the best way to measure physical activity in
epidemiological studies in arctic populations
has yet to be determined.
One secondary aim of this study was to
extend the survey of the Greenland Inuit to
include a population with more individuals
of mixed heritage. Any effect of the quantum
of Inuit blood on the risk of IGT or diabetes
would point towards a specific genetic compo-
nent in the aetiology of these conditions in
this population. We found no such significant
effect, either in the univariate analyses, or in
the logistic regression models. However, it
may still be possible to find a genetic compo-
nent, if more precise measures of genetic Inuit
heritage, such as DNA markers, are used.
Our conclusion is that diabetes and
impaired glucose tolerance are no longer rare
conditions among the Inuit, and, contrary to
our initial hypothesis, the prevalence does not
increase with migration. Westernization and
migration are complex processes, and future
studies should focus on behavioral factors
associated with modernization, including
socio-economic factors and motivational
factors associated with migration. Our results
underline the need for increased awareness of
diabetes, and for intervention against diabetes
and similar lifestyle-related diseases in Inuit
populations.
AcknowledgementsThe Greenland population study was funded
by the Danish Medical Research Council,
the Greenland Medical Research Council,
the Commission for Scientific Research in
Greenland, the Danish Diabetes Association,
the Health Insurance Foundation, the Emil
Hertz Foundation and theKaren Elise Jensen’s
Foundation.
REFERENCES
1. Sagild U, Littauer J, Jespersen CS, Andersen S. Epide- miological studies in Greenland 1962-1964. I. Diabetes mellitus in Eskimos. Acta Med Scand 1966; 179:29-39.2. Jørgensen ME, Bjerregaard P, Borch-Johnsen K. Dia- betes and impaired glucose tolerance among the inuit population of greenland. Diabetes Care 2002; 25: 1766-1771.3. Togeby L. Greenlanders in Denmark. An overlooked minority. Aarhus, Aarhus University Press, 2002.4. Bjerregaard P, Curtis T, Borch-Johnsen K, et al. Inuit Health in Greenland: A population survey of life style and disease in Greenland and among Inuit living in Denmark. Int J Circumpolar Health 2003; 62(sup- pl.1): 1-79.5. Alberti KG, Zimmet PZ. Definition, diagnosis and classification of diabetes mellitus and its complica- tions. Part 1: diagnosis and classification of diabetes mellitus provisional report of a WHO consultation see comments COMMENT: Comment in: Diabet Med 1998 Jul;15(7):535-6. Diabet Med 1998; 15: 539- 553.

364 International Journal of Circumpolar Health 64:4 2005
ORIGINAL RESEARCH
Marit Eika JørgensenNational Institute of Public HealthSvanemøllevej 252100 CopenhagenDenmarkEmail: [email protected]
6. Saltin B, Grimby G. Physiological analysis of middle- aged and old former alhletes. Comparison with still active athletes of the same ages. Circulation 1968; 38: 1104-1115.7. Pouliot MC, Despres JP, Lemieux S, et al.Waist circum- ference and abdominal sagittal diameter: best simple an- thropometric indexes of abdominal visceral adipose tissue accumulation and related cardiovascular risk in men and women. Am J Cardiol 1994; 73:460-468.8. Glumer C, Jørgensen T, Borch-Johnsen K, Inter99 study. Prevalences of diabetes and impaired glucose regulation in a Danish population: the Inter99 study. Diabetes Care 2003; 26:2335-2340.9. Weyer C, Bogardus C, Pratley RE. Metabolic charac- teristics of individuals with impaired fasting glucose and/or impaired glucose tolerance. Diabetes 1999; 48: 2197-2203.10. Dickinson S, Colagiuri S, Faramus E, Petocz P, Brand- Miller JC. Postprandial Hyperglycemia and Insulin Sensitivity Differ among Lean Young Adults of Differ- ent Ethnicities. J Nutr 2002; 132: 2574-2579.11. Phillips DI, Clark PM, Hales CN, Osmond C. Under- standing oral glucose tolerance: comparison of glu- cose or insulin measurements during the oral glucose tolerance test with specific measurements of insulin resistance and insulin secretion. Diabet Med 1994; 11: 286-292.12. Hanefeld M, Koehler C, Fuecker K, Henkel E, Schaper F, Temelkova-Kurktschiev T. Impaired Glu- cose Tolerance for Atherosclerosis and Diabetes study: Insulin secretion and insulin sensitivity pattern is different in isolated impaired glucose tolerance and impaired fasting glucose: the risk factor in Im- paired Glucose Tolerance for Atherosclerosis and Diabetes study. Diabetes Care 2003; 26: 868-874.13. Hara H, Egusa G, Yamakido M, Kawate R. The high prevalence of diabetes mellitus and hyperinsulinemia among the Japanese-Americans living in Hawaii and Los Angeles. Diabetes Res Clin Pract 1994; 24: 37-42.14. Stanhope JM, Prior IAM. The Tokelau Island Pacific Ocean Migrant Study Prevalence and Incidence of Di- abetes Mellitus. N Z MED J 1980; 92: 417-421.
15. Dowse GK, Gareeboo H, Zimmet PZ, et al. High prevalence of NIDDM and impaired glucose toler- ance in Indian, Creole, and Chinese Mauritians. Mau- ritius Noncommunicable Disease Study Group. Dia- betes 1990; 39: 390-396.16. Mbanya JC, Cruickshank JK, Forrester T, et al. Stan- dardized comparison of glucose intolerance in west African-origin populations of rural and urban Camer- oon, Jamaica, and Caribbean migrants to Britain. Dia- betes Care 1999; 22: 434-440.17. Neel JV. Diabetes mellitus: a “thrifty” genotype ren- dered detrimental by “progress”? Am J Hum Genet 1962: 14: 353-362.18. Bjerregaard P, Jørgensen ME, Andersen S, Mulvad G, Borch-Johnsen K, The Greenland Population Study. Decreasing overweight and central fat patterning with Westernization among the Inuit in Greenland and Inuit migrants. Int J Obes Relat Metab Disord 2002; 26: 1503-1510.19. Bjerregaard P, Jørgensen ME, Borch-Johnsen K. Se- rum lipids of Greenland Inuit in relation to Inuit genet- ic heritage, westernisation and migration. Atheroscle- rosis 2004; 174: 391-398.20. Jørgensen ME, Glumer C, Bjerregaard P, Gyntelberg F, Jørgensen T, Borch-Johnsen K. Obesity and central fat pattern among Greenland Inuit and a general pop- ulation of Denmark (Inter99): Relationship to meta- bolic risk factors. Int J Obes Relat Metab Disord 2003; 27: 1507-1515.21. Valdez R, Gonzalez-Villalpando C, Mitchell BD, Haff- ner SM, Stern MP. Differential impact of obesity in related populations. Obes Res 1995; 3 (Suppl 2): 223-232.22. Helmrich SP, Ragland DR, Leung RW, Paffenbarger RS. Physical activity and reduced occurrence of non- insulin-dependent diabetes mellitus. N Engl J Med 1991; 325: 147-152.23. Wareham NJ, Rennie KL. The assessment of physical activity in individuals and populations: why try to be more precise about how physical activity is assessed? Int J Obes Relat Metab Disord 1998; 22(Suppl 2): 30-38.