development of variable attention capture (vac) haptic
TRANSCRIPT

Abstract
D evelopm ent o f Variable A tten tion C apture (VAC) H aptic Feedback System s for C onveying Inform ation at an
A ppropriate Level o f Salience
Ying Zheng
2013
As the proliferation of visual and auditory communication media push human information process
ing to its limits, many researchers turn to the haptic modality - the sense of touch - as a means
of conveying information. Presently, most haptic feedback systems are focal feedback mechanisms
designed to deliver alerting cues. However, not all tasks are urgent and require a person’s immediate
and focal attention, so these attention-capture methods may distract a user from more critical tasks.
Recently, researchers have begun to investigate ambient feedback systems tha t convey peripheral
information without distracting a user from a more im portant task. So far no efforts have been
made to combine these two separate categories to create a unified system for haptic attention cap
ture. We thus propose the development of variable attention capture (VAC) feedback methods as a
new design paradigm for fluidly modulating a user’s attention capture along a spectrum depending
on task priority. This proposed VAC feedback paradigm will allow for the development of versatile
next-generation haptic devices capable of generating both focal and ambient stimuli depending on
the task at hand.
This dissertation represents a first step in creating VAC haptic feedback systems that can con
vey information to a user at an appropriate level of attentional salience. We demonstrate th a t a
VAC haptic device is able to produce relevant stimuli without unnecessarily competing for a user’s
limited attentional resources. As with all VAC devices, this allows the haptic device to provide
important information to a user in a timely, accurate, and unobtrusive manner.
We begin the exploration of VAC haptic feedback through the specific application of seated
posture guidance. This task is a good candidate for VAC haptics as it is typically lower priority
and requires minimal cognitive bandwidth. A real-time posture sensing and feedback chair, Posture
Seat, was prototyped for this purpose. We created VAC versions of the chair with either vibration
or pressure actuators, and a non-VAC version with vibration actuators, to produce the necessary
stimuli for haptic feedback. In our initial experiments with the non-VAC Posture Seat, we measured

2
users’ ability to comply with postural guidance and their level of mental load while responding to
the feedback. We tested various haptic actuator parameters for their influence on affect and atten
tion capture, and integrated these parameters into the design of the vibrotactile and pressure-based
VAC Posture Seat versions. Finally, we used the VAC Posture Seat for an in-the-wild study to
investigate user compliance, level of mental load, attention capture, and task interference from
haptic feedback. We thus were able to assess the impact of our VAC haptic system by comparing
the VAC and non-VAC experiments.
Our results represent important findings in the development of VAC haptic systems. We demon
strated that VAC haptic actuators reduced the amount of disruption experienced by subjects com
pared to those tested on the non-VAC system. We found tha t actuation rate was the most significant
parameter for achieving VAC - i.e., higher actuation rates produced more focal haptic stimuli, while
lower actuation rates produced more ambient haptic stimuli. Thus, an increase in the bandwidth
of actuator rate resulted in a wider range of attention capture. Actuation intensity was also an
important parameter for VAC: increasing the resolution of intensities from sub-threshold to supra-
threshold of detectability leads to better VAC. Finally, we found th a t pressure feedback was more
conducive to VAC than vibrotactile feedback, potentially due to the prioritization of the activation
of different cutaneous mechanoreceptors. Interestingly many parameters had no significant contri
bution to VAC due to widely variable user preferences, and thus could be user-defined without loss
of VAC capability.
We have successfully designed, characterized, and tested a posture sensing and feedback system
employing VAC haptic feedback, including in-the-wild studies for real-time posture correction. We
demonstrate that VAC haptic feedback is both feasible and beneficial for modulating information
priority and improving task performance in our Posture Seat system, and determined the main
parameters for achieving VAC in our system. By quantifying the degree of attention capture in
our system and characterizing the necessary parameters for doing so, we lay the foundation for
a general approach in developing VAC-capable haptic systems. Our findings form the basis for
further developments in VAC haptics that will produce a richness in haptic communication through
utilizing the full range of haptic vocabulary, tone, and context.

D evelopm ent o f Variable A tten tion C apture
(VAC) H aptic Feedback System s for C onveying
Inform ation at an A ppropriate Level o f Salience
A Dissertation Presented to the Faculty of the Graduate School
ofYale University
in Candidacy for the Degree of Doctor of Philosophy
byYing Zheng
Dissertation Director: Aaron M. Dollar
December 2013

UMI Number: 3578481
All rights reserved
INFORMATION TO ALL USERS The quality of this reproduction is dependent upon the quality of the copy submitted.
In the unlikely event that the author did not send a complete manuscript and there are missing pages, these will be noted. Also, if material had to be removed,
a note will indicate the deletion.
Di!ss0?t&iori Publishing
UMI 3578481Published by ProQuest LLC 2014. Copyright in the Dissertation held by the Author.
Microform Edition © ProQuest LLC.All rights reserved. This work is protected against
unauthorized copying under Title 17, United States Code.
ProQuest LLC 789 East Eisenhower Parkway
P.O. Box 1346 Ann Arbor, Ml 48106-1346

Copyright © 2013 by Ying Zheng
All rights reserved.
C ontents
1 In tro d u ctio n 1
1.1 Haptic F e e d b a c k ........................................................................................................................ 1
1.2 Variable Attention Capture Haptics ..................................................................................... 4
1.3 Application: Seated Posture Guidance Using Variable Attention Capture Haptics . . 5
1.4 Dissertation O v erv iew ............................................................................................................... 7
2 R e la ted W ork 9
2.1 Posture sensing and fee d b a c k .................................................................................................. 9
2.2 Ambient haptic feedback sy s te m s ............................................................................................ 13
3 A V ib ro ta c tile Feedback A pproach to S ea ted P o stu re G u id a n ce 16
3.1 O v e rv ie w .................................................................................................................................... 16
3.2 System D escription..................................................................................................................... 17
3.2.1 Equipment .................................................................................................................... 17
3.2.2 Posture List and Sensor P lacem en t........................................................................... 18
3.2.3 Posture Identification A lg o r ith m .............................................................................. 20
3.2.4 Posture Feedback Algorithm .................................................................................... 20
3.3 User S t u d y .................................................................................................................................. 22
3.3.1 Part I - Posture Classification A c c u ra c y ................................................................. 22
3.3.2 Part II - Posture R e p e a ta b ility ................................................................................. 23
3.3.3 Part III - Posture F eed b ack ....................................................................................... 23
3.4 Results and Discussion.............................................................................................................. 24
3.4.1 Part I - Classification A ccuracy ................................................................................. 24
3.4.2 Part II - Posture R e p e a ta b ility ................................................................................. 25
iii
3.4.3 Part III - Posture F eedback ........................................................................................ 28
3.5 Conclusion ............................................................................................................................... 31
4 Task In terference from R esp o n d in g to V ib ro ta c tile P o stu re F eedb ack G u id an ce 33
4.1 Overview .................................................................................................................................. 33
4.2 System D escription.................................................................................................................... 34
4.2.1 E q u ip m e n t..................................................................................................................... 34
4.2.2 Posture List and Sensor P lacem en t........................................................................... 34
4.2.3 Posture Sensing and Feedback A lg o r ith m .............................................................. 35
4.2.4 Typing P r o g ra m ........................................................................................................... 36
4.3 User S t u d y ............................................................................................................................... 37
4.4 R esults......................................................................................................................................... 38
4.5 Discussion and L im ita tio n s .................................................................................................... 42
4.6 Conclusion ............................................................................................................................... 42
5 C om parison o f V isu a l and V ib ro ta c tile F eedback M e th o d s for S ea ted P o stu re
G uid an ce 44
5.1 Overview ................................................................................................................................... 44
5.2 System D escription.................................................................................................................... 44
5.2.1 Posture Specification..................................................................................................... 44
5.2.2 Prototype D evelopm ent............................................................................................... 45
5.2.3 Posture Sensing and Feedback A lg o r ith m ............................................................... 46
5.2.3.1 Vibrotactile fe e d b a c k ....................................................................................... 47
5.2.3.2 Visual feedback ............................................................................................ 48
5.3 User S tudies................................................................................................................................ 49
5.3.1 Setup and P repara tion .................................................................................................. 50
5.3.2 Posture C o m p lian ce ..................................................................................................... 50
5.3.3 Task Interference in Dual-Task S c e n a rio .................................................................. 51
5.4 R esults.......................................................................................................................................... 52
5.4.1 Compliance to the upright p o s tu r e ............................................................................ 53
5.4.2 Task interference in dual-task sc en a rio ..................................................................... 54
5.5 D iscussion................................................................................................................................... 57
iv

5.6 Conclusion 58
6 H aptic A ctu a to r D esig n P aram eters T h a t In flu en ce A ffect an d A tten tio n 59
6.1 Overview ................................................................................................................................... 59
6.2 Related Work on A f f e c t ......................................................................................................... 60
6.3 Haptic Actuator D e s ig n ............................................................................................................ 60
6.4 Affect, Attention, and Novelty I n d ic e s .................................................................................. 61
6.5 Parameter L i s t ......................................................................................................................... 61
6.6 Equipment and H a rd w a re ...................................................................................................... 65
6.7 User S t u d y ................................................................................................................................ 66
6.8 R esults......................................................................................................................................... 68
6.8.1 Parameters that significantly influence affect ........................................................ 69
6.8.2 Parameters that significantly influence a t t e n t i o n ................................................. 70
6.8.3 Parameters tha t significantly influence novelty .................................................... 70
6.8.4 Preferences for specific param eter com binations..................................................... 71
6.8.5 Correlations between affect, attention, and n o v e lty ................................................ 73
6.8.6 Correlations between pre- and post-experiment mood ......................................... 73
6.8.7 Correlations between biographical, physiological data and affect, attention,
novelty ........................................................................................................................... 74
6.8.8 A necdotes......................................................................................................................... 74
6.9 Discussion and Conclusion...................................................................................................... 75
7 D esig n and E valu ation o f P a cto rs for M a n a g in g A tten tio n C a p tu re 77
7.1 O v e rv ie w ................................................................................................................................... 77
7.2 Design of P a c to rs ......................................................................................................................... 77
7.2.1 Actuator S e lec tio n ......................................................................................................... 78
7.2.2 Pactor D esign.................................................................................................................. 79
7.3 User S t u d y ................................................................................................................................ 79
7.4 Results and Discussion............................................................................................................. 84
7.4.1 Detection threshold................. ......................................................................................... 84
7.4.2 Attention capture ......................................................................................................... 86
7.4.3 U rgency ............................................................................................................................ 87
v

7.4.4 A necdotes........................................................................................................................ 88
7.5 Conclusion ................................................................................................................................ 88
8 E valuation o f T actors and P a cto rs for V ariab le A tten tio n C a p tu re (V A C ) H ap
tics 90
8.1 O v e rv ie w ................................................................................................................................... 90
8.2 Hardware D e sc rip tio n ............................................................................................................. 91
8.3 User S t u d y ................................................................................................................................ 92
8.4 Results and Discussion............................................................................................................. 95
8.4.1 Response T im e .............................................................................................................. 95
8.4.2 Anecdotes from informal in te rv ie w ........................................................................... 98
8.5 Conclusion ................................................................................................................................ 99
9 E valuation o f T w o T y p es o f VA C H a p tic F eedback S y s te m s for S ea ted P o stu re
G uid an ce 100
9.1 O v e rv ie w ...................................................................................................................................... 100
9.2 System D escription...................................................................................................................... 101
9.2.1 E q u ip m e n t ........................................................................................................................101
9.2.2 Posture Sensing................................................................................................................. 102
9.2.2.1 Calibration mode ...........................................................................................102
9.2.2.2 Classification m o d e ........................................................................................103
9.2.2.3 Real-time sensing m o d e ................................................................................. 103
9.2.3 Posture Feedback.............................................................................................................. 103
9.3 User S t u d y ................................................................................................................................... 106
9.4 Results and Discussion................................................................................................................ 108
9.4.1 Calibration and Classification A c c u ra c y .................................................................... 108
9.4.2 Dual-task trials - typing p e rfo rm a n c e ........................................................................108
9.4.3 Dual-task trials - response time to posture g u id a n c e ..............................................110
9.4.4 A necdotes........................................................................................................................... I l l
9.5 D iscussion.......................................................................................................................................112
9.6 Conclusion ................................................................................................................................... 114
10 Sum m ary an d O u tlo o k 115
11 F uture W ork 118
11.1 Future work for the Posture Seat sy s te m ................................................................................ 118
11.2 Future work for VAC h a p t i c s ....................................................................................................120
11.3 Applications of VAC h ap tics .......................................................................................................122
A C u tan eou s S en ses 124
B P o stu re 128
C P relim in ary D esig n s for th e P o stu re S en sin g S y s tem 132
C.l Selection of posture sensing s y s te m ..........................................................................................132
C.2 Design criteria ............................................................................................................................. 132
C.3 First prototype posture sensing c h a ir .......................................................................................134
C.4 Summary and implications from the first p ro to ty p e ...............................................................136
C.5 Second and third prototypes of the Posture Seat ................................................................ 137
D P actor D esig n S e lec tio n 140
D.l Motor Selection............................................................................................................................. 140
D.2 Pactor Concept G e n e ra tio n .......................................................................................................141
D.3 Final Pactor Design ....................................................................................................................143
vii

List o f Figures
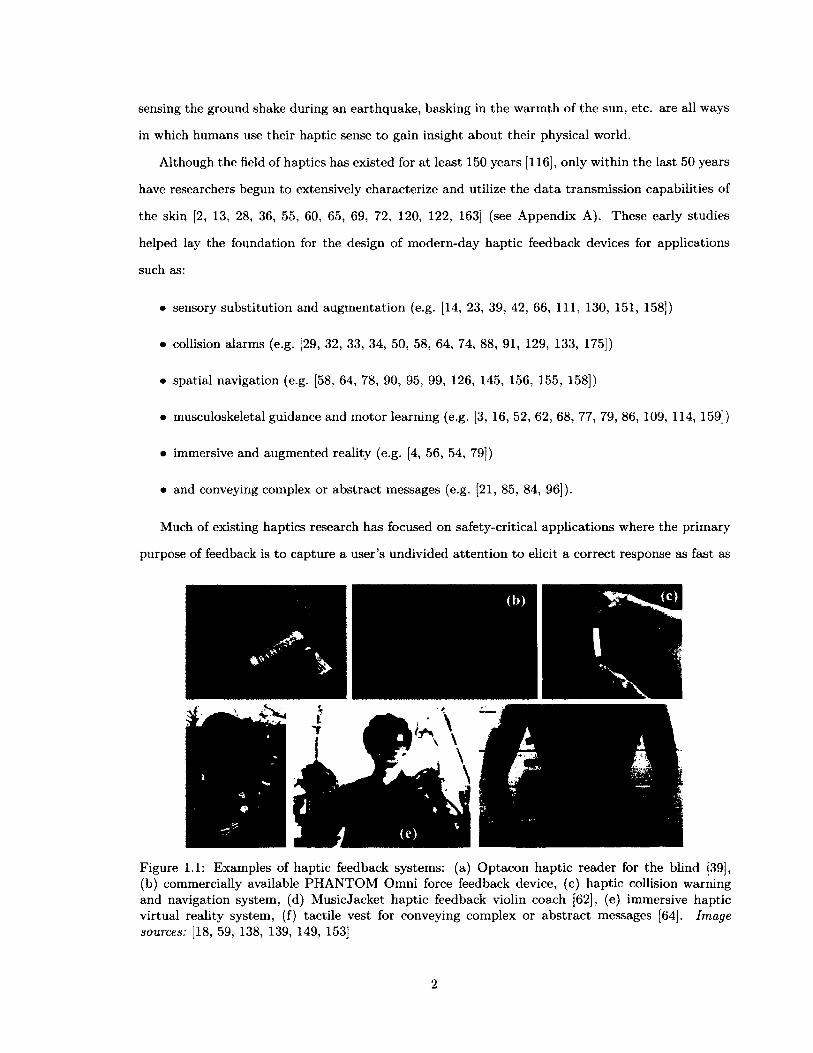
1.1 Examples of haptic feedback systems: (a) Optacon haptic reader for the blind [39], (b)
commercially available PHANTOM Omni force feedback device, (c) haptic collision
warning and navigation system, (d) MusicJacket haptic feedback violin coach [62],
(e) immersive haptic virtual reality system, (f) tactile vest for conveying complex or
abstract messages [64]. Image sources: [18, 59, 138, 139, 149, 153]................................ 2
1.2 The attention capture spectrum. We use the same terms as Matthews [89] to describe
each notification level (1-5) - ignore, change blind, make aware, interrupt, and de
mand action. VAC systems should be able to fluidly and dynamically shift along this
full spectrum................................................................................................................................. 4
2.1 A capacitative pressure measurement system developed by Rosemeyer, et. al. [124] to
measure pressure distribution on a seat by a seated subject a t various chair backrest
angles. Only the 90° and 110° backrest angles resulted in well defined pressure areas
under the ischial tuberosities (sit bones). Image source: Rosemeyer, et. al. [124]. . . 10
2.2 A method of sensing posture by attaching reflective markers and three-axis accelero
meters directly on the subject’s body to measure changes in curvature of the spinal
column. Image source: Wong and Wong [170]...................................................................... 11
2.3 The use of commercially available, high resolution Tekscan CONFORM at pressure
mats placed on the seat pan and seat back to identify sitting postures. (Left) Place
ment of Tekscan pressure mats on chair. (Middle) Pressure distribution on the seat
back. (Right) Pressure distribution on the seat cushion. Image source: Tan, et.
al. [146]........................................................................................................................................... 12
2.4 ServoTap (purple “finger”) and ServoSqueeze (black wristband) mechanism for sim
ulating human touch. Image source: Baumann, et. al. [5]................................................. 14
viii
2.5 Another researcher’s investigation of minimally disruptive posture feedback methods
subsequent to our published findings [176]. The three feedback methods used by
Haller, et. al. [44] were: (1) visual, (2) physical, (3) vibrotactile. Image source:
Haller, et. al. [44]........................................................................................................................ 15
3.1 The “Posture Seat” posture sensing and feedback system. (Left) Locations of the
7 force-sensitive resistors (FSRs) for posture sensing. (Right) Locations of the 6
vibratory tactors for posture feedback. Only 4 factors on the back of the seat are
shown. The other two are on the bottom of the seat, near the front, under each thigh. 17
3.2 Placement of FSRs on seat bottom and seat back. The edge of the FSR placed at
the rear of the seat is flush with the back edge of the chair.............................................. 17
3.3 Block diagram showing the hardware connections for the Posture Seat system. . . . 18
3.4 An example of each posture to be identified by our system: 1. upright, 2. slouching,
3. leaning forward, 4. leaning back, 5. leaning left, 6. leaning right, 7. left leg
crossed over right, 8. right leg crossed over left, 9. left leg crossed over right and
leaning right, 10. right leg crossed over left and leaning left............................................. 19
3.5 Test sequence for measuring subjects’ posture repeatability (Part I I ) ........................... 23
3.6 Test sequence for measuring posture feedback compliance (Part III) ........................... 23
3.7 (Left) Standard deviation of MSE values for each posture for all subjects combined.
Red crosses represent outliers. There was very little variability in MSE values within
each 1-minute trial suggesting tha t subjects sat very still. Subjects exhibited a large
amount of postural movement during each 1-minute trial only for the leaning back
posture. (Right) Shift in average MSE from trial to trial for each posture, all subjects
combined. Red crosses represent outliers. The MSE shift is centered around zero,
indicating that subjects were fairly repeatable in how they sat even after getting up
and walking around..................................................................................................................... 26
3.8 A representative plot from one test subject showing very minimal variation in the
mean-squared error (MSE) within each 1-minute trial. (Top) MSE calculated against
the upright calibration posture, and (bottom) MSE calculated against the slouching
calibration data. (Bottom) Sometimes there was a noticeable but insignificant shift
in MSE between trials................................................................................................................. 26
IX
3.9 Plot of mean-squared error (MSE) calculated against the leaning forward posture over
three 1-minute trials from one representative test subject. This example highlights
occasional confounding effects between MSE values, which can lead to posture mis-
identification. Notice that the upright MSE values are lower than the leaning forward
MSE values for trials 2 and 3. This results in a posture classification error as the
predicted posture corresponding to the lowest MSE is not the actual posture.............. 27
3.10 Plot of average MSE’s for each feedback mode (no feedback, feedback enabled, feed
back disabled) for all 10 subjects for both days. Low average MSE’s are more favor
able than high average MSE’s as they indicate postures closer to the desired upright
posture. In the “feedback enabled” mode, all subjects were able to successfully com
ply with postural guidance........................................................................................................ 29
4.1 (Left) Slightly modified posture sensing and feedback chair with 6 force sensitive
resistors (FSRs) and one infrared (IR) distance sensor (arrow). The FSR in the rear
of the seat (Figure 3.1) has been replaced by the IR distance sensor for better back
posture sensing accuracy. The locations of the tactors for posture feedback remain
the same (see Figure 3.1). (Right) Placement of the FSRs (black squares) and IR
distance sensor (black rectangle) on the seat back and seat bottom. Locations are
based on key anatomical features as described in [25]........................................................ 34
4.2 An example of each posture to be identified in this study: 1. upright, 2. slouching,
3. leaning forward, 4. leaning back.......................................................................................... 35
4.3 Typing environment used for the study. Test subjects had to type each passage
verbatim and the timestamp of the correct keystroke was recorded. The computer
monitor was placed 18” in front of the subject measured from the upright seated
posture........................................................................................................................................... 37
x

4.4 A representative plot of typing performance from two subjects illustrating two cate
gories of results: (left) 55% of subjects experienced statistically significant decrease
in typing speed between the single-task (pre- and post-test) trials and the dual-task
(DT) trials 1-3, although 90% of subjects experienced some amount of typing perfor
mance degradation. The plot on the left also highlights improvement across DT trials
(70% of subjects) whereas the plot on the right shows no such consistent improve
ment (remaining 30% of subjects). Bolded lines indicate pre- and post-test trials.
For all subjects, there were no statistically significant differences between their pre-
and post-test typing speed......................................................................................................... 39
4.5 An illustrative plot from one test subject showing time between keystrokes and tactor
activation level for the last minute in a five-minute test. Tactor activation level is
offset for better clarity in the plot. For this subject, as well as many others, as soon
as the tactor activated, the subject paused or stopped typing to respond to postural
guidance, and resumed typing shortly after the vibrations stopped................................. 39
5.1 Monitor occupied by typing environment and visual feedback pane. Monitor was
placed 18” in front of the subject as measured from the upright seated posture. . . . 49
5.2 One of these three icons may appear a t the top of the visual feedback pane to guide
user into that reference posture................................................................................................ 49
5.3 Comparison of average MSE between the vibrotactile and visual feedback groups
for the three different experiment modes. MSE values below the threshold (blue
dashed line, 0.08) indicates posture compliance. There were no statistically signifi
cant differences between the vibrotactile and visual feedback groups for each of the
test phases, suggesting that vibrotactile feedback was comparable in effectiveness to
visual feedback.............................................................................................................................. 53
xi
5.4 Comparison between vibrotactile and visual feedback groups of average typing speed,
in characters per minute, for all subjects for each of the phases of testing. Red
crosses indicate outliers. DT stands for Dual-task Test. In the vibrotactile feedback
group, 55% of the subjects experienced statistically significant typing performance
degradation from the single-task trials to the dual-task trials, while 43% of the people
in the visual feedback group experienced such. Additionally, 70% of the people in the
vibrotactile group experienced typing speed improvement from DT trials 1 through
3, and a comparable 67% of subjects in the visual group experienced typing speed
improvement. For both groups, there were no statistically significant differences in
typing performance between the single-task pre- and post-test trials.............................. 55
6.1 Vibration and pressure actuators (tactors and pactors, respectively) used to deliver
stimuli to the arm and back. Actuator designs vary in actuation type (vibration,
pressure), material (hard plastic - acrylic or ABS, soft rubber), and geometry (flat
surface, large radius of curvature, medium radius of curvature, and small radius of
curvature)...................................................................................................................................... 63
6.2 Dimensions of the haptic actuator contactor heads, (a) pactor - acrylic, flat; (b)
tactor - acrylic, flat; (c) tactor - rubber, flat; (d) tactor - plastic, large R; (e) tactor
and pactor - plastic, medium R; (f) pactor - rubber, medium R; (g) tactor - rubber,
small R; (h) pactor - plastic, large R; (i) pactor - rubber, large R ................................... 64
6.3 Actuation intensity and profile for the haptic feedback devices. The duration of ramp
profiles is longer than that of the step profiles. Two-second hold times apply to both
profiles............................................................................................................................................ 64
6.4 Placement of arm actuators. Actuators come in direct contact with the medial lateral
aspect of the upper arm and are secured in place by a velcro arm strap ........................ 65
6.5 Placement of back tactor on a size B Herman Miller Aeron chair approximately 8”
above the seat bottom. (Left) Back view of seat back showing placement of the
vibratory tactor. (Right) Aeron lumbar support pillow with back pactor embedded. 65
6.6 Affect survey of the haptic stimulus. This survey is completed after each stimulus
presentation, for a total of 44 trials......................................................................................... 67
xii

6.7 Matrix of haptic actuator parameters and their corresponding affect ratings. Num
bers show percent of subjects who selected a certain adjective for each combination of
test parameters. Green represents positive affect while red represents negative affect.
Most subjects had a strong negative reaction to high intensity, step profile pressure
on their back (row 15). More subjects liked the ramping pressure and vibration
profiles than the step profiles.................................................................................................... 72
6.8 Matrix of haptic actuator parameters and their corresponding attention and novelty
ratings. Numbers show percent of subjects who selected a certain adjective for each
combination of test parameters. Most people thought vibration stimuli were “insis
tent” while only the high intensity step profile pressure on the back was noted as
such. All of the vibratory stimuli were deemed “mechanical” by most of the test
subjects while pressure stimuli were considered more “organic” and “familiar.” . . . 72
6.9 A representative plot from one subject’s affect and attention data to illustrate the
direct negative correlation between affect and attention. Trial numbers for the arm
and back are displayed on the x-axes, and the affect and attention indices are plotted
on the same y-axis....................................................................................................................... 73
7.1 (Left) The final pactor (pressure actuator) design capable of 0-2.Ocm of displacement
and up to 190N of output force. (Center) Exploded view of pactor including critical
dimensions. (Right) Contactor plates for the shoulder (top), lumbar (middle), and
thigh (bottom) pactors............................................................................................................... 79
7.2 Aeron chair instrumented with pactors. (Left) The locations of tactile stimuli exerted
from the chair to a seated person. The shoulder and thigh stimulus regions are equally
spaced relative to the centerline of the chair. (Right) Pactors are attached to the
back of the chair via a custom-designed support frame....................................................... 80
7.3 Side view of the chair showing the mounting for the shoulder and lumbar pactors.
(Top inset) A view of the shoulder pactor and mating contactor plates. (Bottom
inset) A view of the lumbar pactor showing the contoured mating contactor plate. . 81
7.4 A bottom-up view of the thigh pactors and their housings sewn into the bottom of
the chair......................................................................................................................................... 81
xiii

7.5 Survey response screen presented to the subject after each trial to measure percep
tion, attention capture, and urgency. A new stimulus is delivered after the subject
clicks the Next button................................................................................................................. 82
7.6 Flowchart of the 2-down / 1-up two-alternative forced choice test method of psy
chophysical threshold testing for each body site and actuation ra te ............................... 83
7.7 A representation of the slow, medium, and fast stimulus actuation rates. Each stim
ulus has a two-second hold time. The displacement ( “stimulus intensity”) is varied
depending on each trial.............................................................................................................. 83
7.8 Displacement detection thresholds grouped by body site and actuation rate. The
red crosses represent outliers. Actual median values are given in Table 7.1. The left
and right sides of the body are balanced (i.e. there were no statistically significant
differences between the two sides), hence data is lumped together as one shoulder
group and one thigh group. The detection threshold for the slow actuation rate was
significantly different than the medium and fast rates for all three body sites, while
detection thresholds from the medium and fast actuation rates showed no statistically
significant difference.................................................................................................................... 85
7.9 Average displacement corresponding to each level of attention capture for all body
sites combined. Actual mean values are listed in Table 7.2. The current design of
pactors is capable of spanning the entire attention capture spectrum. Also, there is a
significant interaction effect between actuation rate and stimulus intensity (p < 0.001). 87
8.1 Back view of the vibration (left) and pressure (right) chairs used in this study. The
lumbar tactors and pactors axe circled.................................................................................... 91
8.2 Test procedure for this s tu d y . ................................................................................................. 92
8.3 Test subjects were instructed to click this large button to acknowledge stimulus
perception. This window spanned the entire 19” computer screen. The monitor was
placed 18” in front of the seated test subject........................................................................ 93
8.4 In the dual-task reading task, subjects were instructed to read a passage at their
normal reading pace (scrolling as necessary), and to click the button as soon as they
perceived the stimulus. The window spanned the width of the 19” monitor, which
was placed 18” in front of the subject..................................................................................... 93
xiv

8.5 In the dual-task typing task, subjects were instructed to type the passage verbatim
starting at the cursor. The typing screen refreshed with a new passage every 60
seconds to eliminate the need for scrolling with the mouse in the middle of typing
with the keyboard. The window spanned the width of the 19” monitor, and was
placed 18” in front of the test subject..................................................................................... 93
8.6 Average response time to vibration and pressure stimuli at various actuation rates
for single- and dual-task scenarios. There was a statistically significant difference in
response times between the dual-task typing task and the dual-task reading, as well as
between the dual-task typing and baseline single task for both vibration and pressure
groups. Additionally, there was a statistically significant difference in response times
between the slowest and fastest actuation rate for the vibration group, and between
the two slowest actuation rates and the fastest actuation rate for the pressure group.
Statistical findings are summarized in Table 8.3.................................................................. 96
9.1 (left) Vibration chair with tactors, (right) pressure chair with pactors used for this
study. Only the tactors and pactors on the back of the chairs are shown. The two
others are mounted on the bottom of the seat under each thigh.........................................101
9.2 Block diagram showing the hardware connections for the posture sensing and feed
back chairs....................................................................................................................................... 102
9.3 An illustrative plot from one test subject in the tactor group and one in the pactor
group showing time between keystrokes and actuator activation level from a one-
minute snapshot. As actuator activation level increased (red line), subjects’ primary
task performance were less affected by the VAC feedback; they were able to delay
responding until a more opportune time. These VAC example plots stand in contrast
from the non-VAC example in Figure 4.5 where subjects were significantly impacted
by the vibrotactile posture feedback guidance......................................................................... 109
A.l Mechanoreceptors in glabrous (top left) and hairy skin (top right). The Venn diagram
further illustrates which mechanoreceptors are present in each type of skin. Image
sources: [9, 71] ............................................................................................................................. 125
xv

A.2 Neural spike train of slowly adapting and rapidly adapting mechanoreceptors in re
sponse to a stimulus. Spikes indicate neuron activation from stimulus. Adapted from
Kandel, et. al. [6 7 ] .......................................................................................................................125
A.3 Weber’s two-point detection threshold for different body sites [163]. Image source:
Velazquez [157]................................................................................................................................127
B .l (Left) Side view and (right) front view of normal spinal alignment. The spine ex
hibits three normal curves: cervical, thoracic, and lumbar. Image source: Cleveland
Clinic [22]........................................................................................................................................ 129
B.2 Side view of pelvic bones. The ischial tuberosities (sit bones), circled in red, are
located at the base of the pelvis. Image source: Lollylegs [82].............................................130
B.3 Elements of an ideal chair for good posture. (1) adjustable height of chair, (2)
adjustable armrests (height and width), (3) adjustable chair tilt with seat pan and
backrest position fixed relative to each other, (4) proper seat pan depth, and (5)
height-adjust able backrest. Image source: Safe Work [127]................................................. 131
C .l Relative positions of the two force-sensitive resistors (FSRs) on the first prototype
of the Posture Seat......................................................................................................................... 135
C.2 The first prototype sensing chair setup. (Left) Two FSRs are taped to the surface of
the seat. (Right) Underside of the chair showing the data acquisition unit (DAQ),
circuit board, and battery pack................................................................................................... 135
C.3 Examples of each of the 5 postures to be sensed. From left to right: sitting upright,
slouching, leaning back, right leg crossed over left leg, and left leg crossed over right
leg...................................................................................................................................................... 135
C.4 Plot of all data from each of the five postures for one subject. Each posture was
maintained for 15 seconds for 3 trials each. There are distinct spatial locations for
the five postures..............................................................................................................................136
C.5 The second iteration of the Posture Seat th a t improved the sensing accuracy and
was more comfortable to sit in. Four signal enhancers were embedded between the
hard plastic base and the foam cushion of the seat corresponding to the locations of
the ischial tuberosities (sit bones) and the center of the thighs...........................................137
xvi

C.6 Prototype “signal enhancers” for the cushioned office chair to improve the FSR signal-
to-noise ratio. As the user sits on the chair, the hard rubber tip presses on the FSR
to register a force reading.............................................................................................................138
C.7 The third iteration of the Posture Seat that could identify more postures than the
first and second iterations due to the presence of bend sensors embedded behind the
elastic bands in the seat back. In the seat bottom, signal enhancers were embedded
between the hard wooden surface and foam cushion. FSRs were taped directly to
the wooden surface and the signal enhancers pressed directly onto the FSRs..................139
D.l Some initial pactor (pressure actuator) prototypes incorporating the high-torque
HS805BB servo: (a) eccentric cam with rollers, (b) slider with guiderail, (c) crankshaft,
(d) pin slider, (e) scissor linkage, (f) rack-and-pinion, and (g) plunger with leadscrew. 141
D.2 Pugh chart that aided in the pactor concept selection process........................................... 142
D.3 (From left to right) Final pactor designs, including mating contactor plates, for the
shoulders, lumbar, and thighs...................................................................................................... 143
D.4 Bottom-to-top view of thigh pactor enclosed in a wooden housing for mounting under
the seat bottom. Pactor housing is sewn into the chair mesh via the four “feet.” The
contactor plate for the thigh pactor has a larger area than the shoulder plate in order
to accommodate the variability in subject thigh sizes and positions in the seat. Also
there is no need for a mating contactor plate as the pactor plate is sewn into the
chair mesh........................................................................................................................................ 143
D.5 Prototypes of the shoulder and lumbar pactor mounting mechanisms for the Aeron
chair: (a) sewable mounts similar to the thigh pactor housing, (b) metal net and lum
bar pillow plastic mounts, (c) one-piece plywood or sheet metal backplate with slots
for adjustable pactor placement, and (d) a “claw” that allows full vertical adjustment
of pactors..........................................................................................................................................145
xvii

List o f Tables
3.1 List of postures to be identified and their d e sc r ip tio n s ..................................................... 19
3.2 Location of vibration, cause, and required motor action to properly respond to vibro
tactile feedback and successfully eliminate vibrations. Multiple tactors may vibrate
simultaneously to indicate multiple improper body orientations...................................... 21
3.3 Test sequence for measuring posture classification accuracy (Part I) ........................... 22
3.4 MSE values for all postures calculated using the upright posture calibration. The
values for each posture are distinct enough that classification errors are minimal. . . 27
4.1 Description of each of the four postures to be identified ................................................. 35
4.2 Location of vibration, cause, and required motor action to properly respond to feed
back guidance and eliminate vibrations. Unlike in Table 3.2, tactors vibrate sequen
tially depending on location of the most likely postural error. Additionally, leaning
forward and leaning back directionality is encoded through continuous and pulsing
vibrations on the shoulders........................................................................................................ 36
4.3 Test sequence for this s tu d y ..................................................................................................... 38
4.4 Median time to respond to feedback, all subjects combined. Some postures were
easier to move into than others while simultaneously typing............................................. 41
5.1 Vibrotactile feedback mapping: location of vibration, cause, and required motor action 47
5.2 Visual feedback mapping: location of indicators, cause, and required motor action.
This was designed to be a “visual equivalent” of the vibrotactile feedback mapping. . 49
5.3 Test sequence for the task interference portion of the s t u d y ........................................... 51
5.4 Test subject demographics for the posture compliance portion of the study .............. 53
5.5 Test subject demographics for the task interference part of the s tu d y ............................ 55
xviii

5.6 Important results from the dual-task interference experiment comparing vibrotactile
and visual feedback methods ................................................................................................. 56
6.1 Haptic actuator test param eters.............................................................................................. 62
6.2 Grouping of adjectives to measure affect, attention capture, and n o v e lty .................... 68
6.3 Parameters and interactions between parameters th a t result in significant changes
in affect. Actuation profile became a significant variable in the two-way interaction
analyses.......................................................................................................................................... 69
6.4 Parameters and interactions between parameters tha t result in significant changes in
a tten tion ....................................................................................................................................... 70
6.5 Parameters and interactions between parameters that result in significant changes in
novelty.......................................................................................................................................... 71
7.1 Median detection threshold values for each body site and actuation rate ....................... 85
7.2 Average displacement that corresponds to each level of attention capture (Figure 1.2). 87
8.1 Tactor and pactor actuation rates used in this study........................................................... 92
8.2 Test subject demographics........................................................................................................ 95
8.3 Statistical analysis of response time to stimuli with ST Baseline and an actuation
rate of 6.0V/s or 7.34cm/s as the basis for analysis............................................................. 96
8.4 Average stimulus intensity at detection for each actuation rate, adjusted by baseline
response time................................................................................................................................ 98
9.1 Vibration feedback mapping: location of vibration and correct action to take to
eliminate vibrations........................................................................................................................105
9.2 Pressure feedback mapping: location of pressure and correct action to take to elimi
nate p re s s u re .................................................................................................................................105
9.3 Test sequence for both vibration and pressure study g r o u p s ..............................................106
9.4 Test subject demographics........................................................................................................... 108
9.5 Comparison of aggregate typing performance between the VAC tactor and VAC
pactor groups (vibration and pressure groups, respectively). For reference, typing
performance from the non-VAC study (Chapter 5) is also presented................................. 109
xix

9.6 Comparison of average response times to posture feedback guidance between the
VAC tactor and VAC pactor groups (vibration and pressure chairs, respectively). For
reference, posture transition response times from the non-VAC study (Chapter 5) is
also presented..................................................................................................................................110
A.l Summary of basic properties of specific mechanoreceptors................................................... 126
xx

A cknow ledgem ents
I am deeply indebted to numerous mentors, colleagues, friends, and loved ones for their guidance
and support during my time at Yale. Here, I wish to recognize instrumental individuals and their
contributions to my graduate career, in a list that is by no means exhaustive.
First and foremost, I would like to thank my former advisor, John Morrell. I started graduate
school under his dedicated mentorship, which was generously poured out to me throughout his time
at Yale and even after he departed academia. John is an awe-inspiring advisor in every sense of
the word: his technical prowess, design ingenuity, cognitive bandwidth and bottomless energy make
working with him a breathtaking experience. John is a master a t dispensing fitting insights: “fail
faster to succeed sooner,” “work obeys the Ideal Gas Law: it expands to fill all available time,” and
“you cannot choose to not have problems but you can choose which problems to have” are just a
few nuggets of wisdom that have always rung true for me. I have nothing but the highest regard
for John as a wonderful mentor and friend.
My heartfelt thanks also go to the members of my thesis committee. Aaron Dollar (my current
thesis advisor), Brian“Scaz” Scassellati, and Marshall Long have always offered helpful insights and
great support during my time as a graduate student. I am especially grateful to Aaron and Scaz for
generously adopting me into their research groups after John’s departure from Yale. My academic
success has always been their priority, and this dissertation is the fruit of their commitment to me.
The interdisciplinary nature of my research afforded me the privilege of interacting with faculty
from various departments and institutions. I would like to acknowledge Yale professors Larry
Marks, Marvin Chun, and Brian Scholl for supplying me with background on psychophysics and
psychology, and for offering their guidance on experiments involving these disciplines. I would also
like to thank professors Karon MacLean (University of British Columbia), Lynette Jones (MIT), Ed
Colgate (Northwestern University), and Katherine Kuchenbecker (University of Pennsylvania), as
well as Dr. Ali Israr (Disney Research), for the helpful discussions on haptics and human perception,
which have helped drive my research direction.
Many of the greatest joys of my Yale career came from the opportunities I have had to work with
numerous graduate students, post-doctoral researchers, technical staff members, and undergraduate
students. First of all, I would like to extend my gratitude to current and former lab members Hari
Vasudevan, Arthur McClung, Cheng Xu, Kam Wasilewski, and Jonathan Awerbuch, as well as
the numerous undergraduate research assistants for their help with my research throughout the
xxi

years. I would like to especially thank Hari for the countless hours he spent in providing electrical
engineering assistance and for proofreading all my papers. Next I would like to thank members of
the Dollar Lab who not only provided me with lots of technical assistance, but also whose research
projects and side projects were a major source of inspiration and motivation for me. I would also like
to thank the members of Scaz Lab for the helpful discussions on human-computer interaction (HCI)
experiments related to haptics and for being my go-to people for programming support throughout
the years. Finally I would like to extend my sincerest gratitude to the engineering technical staff
Glenn Weston-Murphy, Nick Bernardo, and Ed Jackson for their practical engineering help and
machining assistance.
I would like to acknowledge the National Science Foundation G raduate Research Fellowship
Program (NSF GRFP) and the Yale School of Engineering and Applied Science (SEAS) for the
financial support of my research. I would like to especially thank the people in the SEAS Dean’s
OfBce, particularly Deputy Dean Vince Wilczynski, for providing me with guidance and always
ensuring I had adequate resources to complete my doctoral work after John’s departure from Yale.
I am also grateful for my time in the Advanced Graduate Leadership Program (AGLP), an initiative
of SEAS and funded by the Goizueta Foundation, which allowed me to broaden my career scope
beyond engineering R&D.
I am greatly appreciative of the numerous services at Yale, especially the Graduate Writing
Center headed by Dr. Elena Kallestinova, for helping me through the dissertation writing process.
Additionally, my thanks go to recent PhD graduates Joe Zinter, Richard Fan, and Chris Wahl, who
drew on their own doctoral experiences to help me complete mine.
My dearest friends have always been my greatest and most passionate supporters. There are too
many to name and too many to acknowledge. My love, appreciation, and gratitude go to members
of the Yale Graduate Student Christian Fellowship (YGSCF), Asian Baptist Student Koinonia
(ABSK) at MIT, and Asian Graduate Network (AGN) at Yale - who prayed for me through good
and difficult times, encouraged me to push on, and helped me maintain a healthy work-life balance.
My special thanks go to William Li, who taught me to always challenge the status quo and to
strive for greater things, and who believed in me even when I lost faith in myself; Sophia Lee, my
sounding board and listening ear at all hours of the day and night; and most of all Enping Hong,
for serving as a calming force in my life, for dutifully taking care of me, and for being the biggest
advocate of my academic pursuits. You are truly wonderful.

Last but not least, I would like to thank my parents and relatives who supported me from a
distance. They showered me with unconditional love even when I made “I told you so” mistakes
and always reminded me to keep the big picture in sight despite my everyday struggles.
I have been privileged to stand on the shoulders of giants such as these - the impact you have
had on my life and work is tremendous, and you have enabled me to reach for the stars. Thank
you all!
xxiii
C hapter 1
Introduction
The Information Age has created both significant opportunities and daunting challenges for user
interface designers. Consumers are surrounded by products and circumstances tha t demand their
attention while they simultaneously perform tasks of varying priority and complexity. Prom com
puter pop-up windows to blinking highway signs, from ringing phones to audible guidance of GPS
navigation systems, each device attem pts to create salient, appropriate communication tha t reaches
the end user in a timely manner. The brain constantly processes sensory stimuli from the environ
ment and directs an appropriate level of attention to the most im portant task. Unfortunately, the
proliferation of these visual and auditory communication media have pushed humans’ information
processing capabilities to their limits. The past few decades have seen an increase in research ex
ploring the information communication capabilities of the skin as researchers turned to haptics to
relieve overloaded visual and auditory perceptual channels.
1.1 H aptic Feedback
The word “haptics” derives from the Greek word haptikos meaning “able to touch” [116]. In
the most general sense, haptics research deals with touch and kinesthetic senses, which encompass
pressure, vibration, temperature, pain, and body forces and orientations1 [154]. Since ancient times,
humans have relied on their sense of touch to explore their immediate surroundings. Squeezing fruit
to feel freshness and ripeness, struggling with the slipperiness of fish, stepping on a sharp rock,
1Although in some literature, the term “haptics” has been synonymous with “hand,” we want to make the clarification that our use of the term “haptics” encompasses both hand and whole body sensing.
1
sensing the ground shake during an earthquake, basking in the warmth of the sun, etc. are all ways
in which humans use their haptic sense to gain insight about their physical world.
Although the field of haptics has existed for at least 150 years [116], only within the last 50 years
have researchers begun to extensively characterize and utilize the data transmission capabilities of
the skin [2, 13, 28, 36, 55, 60, 65, 69, 72, 120, 122, 163] (see Appendix A). These early studies
helped lay the foundation for the design of modern-day haptic feedback devices for applications
such as:
• sensory substitution and augmentation (e.g. [14, 23, 39, 42, 66, 111, 130, 151, 158])
• collision alarms (e.g. [29, 32, 33, 34, 50, 58, 64, 74, 88, 91, 129, 133, 175])
• spatial navigation (e.g. [58, 64, 78, 90, 95, 99, 126, 145, 156, 155, 158])
• musculoskeletal guidance and motor learning (e.g. [3, 16, 52, 62, 68, 77, 79, 86, 109, 114, 159])
• immersive and augmented reality (e.g. [4, 56, 54, 79])
• and conveying complex or abstract messages (e.g. [21, 85, 84, 96]).
Much of existing haptics research has focused on safety-critical applications where the primary
purpose of feedback is to capture a user’s undivided attention to elicit a correct response as fast as
Figure 1.1: Examples of haptic feedback systems: (a) Optacon haptic reader for the blind [39], (b) commercially available PHANTOM Omni force feedback device, (c) haptic collision warning and navigation system, (d) Music Jacket haptic feedback violin coach [62], (e) immersive haptic virtual reality system, (f) tactile vest for conveying complex or abstract messages [64]. Image sources: [18, 59, 138, 139, 149, 153]
2

possible (i.e. focal feedback). Examples include in-vehicle vibrotactile feedback systems that can
warn the driver of impending automobile collisions [29, 32, 33, 49, 50, 74, 88, 91, 133, 175], wearable
systems tha t can enhance pilot situational awareness during low visibility flying conditions [58, 64,
90, 99, 175], and a tactile vest that communicates collisions with virtual objects [79].
Haptic feedback has also been used to supplement vision, audition, and proprioception to guide
muscle movement. For example, the Haptic Radar headband [16] uses vibrotactile actuators ( “tac-
tors” ) to help the wearer detect objects near his head, TactaPack utilizes tactors to provide both
spatial and temporal information to physical therapy patients [81], HAPI Bands use wearable tac
tors to guide yoga poses [125], and in-shoe vibrotactile displays are used as a navigation aid to
guide blind people [158]. Haptic feedback has also been used to train athletes such as tennis players
and swimmers [3, 77], and musicians such as pianists and violinists [52, 62]. In all of these cases, a
user’s attention is directed towards responding to haptic feedback to complete his primary task.
While multimodal reinforcement using haptics is generally a benefit, the success of haptic warn
ings and alarms creates an associated downside. When haptic methods are used for non-critical
tasks, they may distract the user from a more im portant task (for example, we have all been
distracted by an ill-timed vibrating phone). In fact, researchers have found that humans are only
capable of handling one or two primary tasks yet can attend to multiple tasks in the periphery [164].
Some designers now recognize the need to create “calm” technology [164] and “ambient infor
mation systems” [112] for conveying less urgent information with minimal level of distraction to the
user. MacLean’s paper on ambient haptic feedback systems [83] has been influential in defining a
new path for haptics research that allows the user more choice in how he allocates attention. This
ambient, peripheral feedback allows the user to attend to his primary task or utilize the presented
information at his convenience without unnecessary interruption. For example, the low-intensity
shaking of a mechanical steering wheel linkage communicates a bumpy road without forcing the
driver to act upon this piece of information. (Other examples are discussed in Section 2.2.)
So far no efforts have been made to combine focal and ambient methods of feedback into one
unified system for haptic attention capture. Thus we propose variable attention capture (VAC)
haptics as a new design paradigm that unifies the two categories of feedback to convey information
to a user at an appropriate level of attentional salience. This allows for the development of versatile
next-generation haptic devices capable of generating both focal and ambient stimuli depending on
the task a t hand.
3
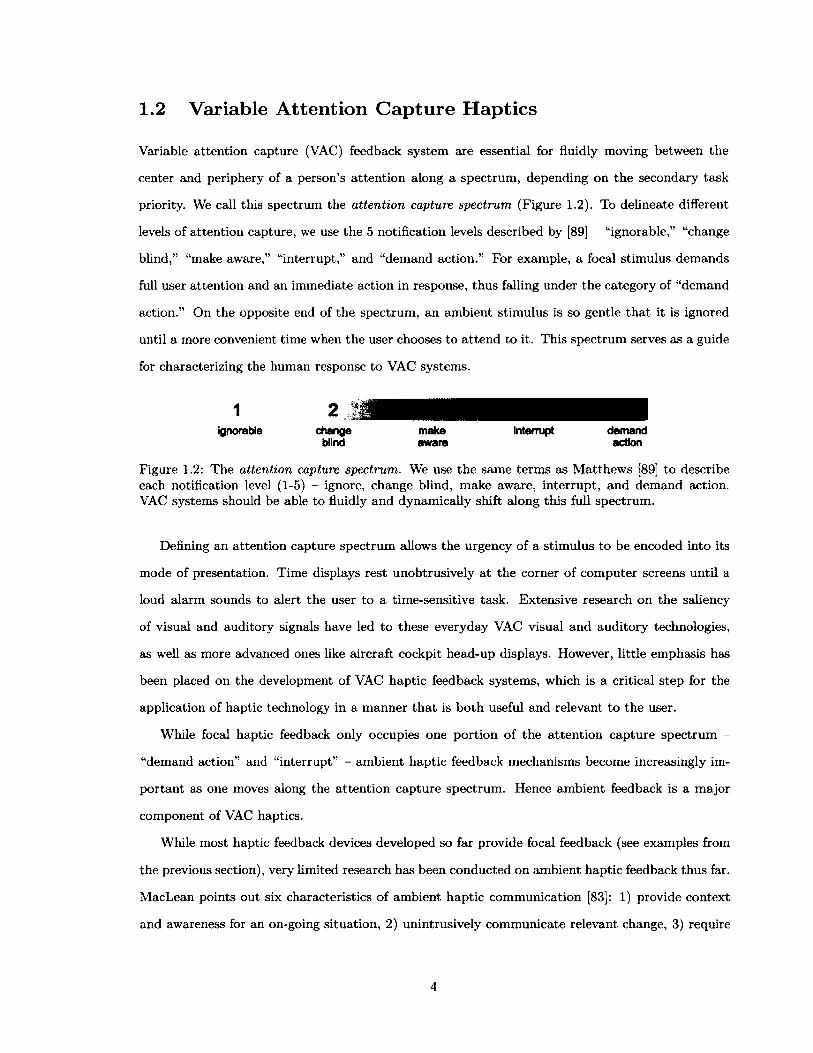
1.2 Variable A tten tion C apture H aptics
Variable attention capture (VAC) feedback system are essential for fluidly moving between the
center and periphery of a person’s attention along a spectrum, depending on the secondary task
priority. We call this spectrum the attention capture spectrum (Figure 1.2). To delineate different
levels of attention capture, we use the 5 notification levels described by [89] - “ignorable,” “change
blind,” “make aware,” “interrupt,” and “demand action.” For example, a focal stimulus demands
full user attention and an immediate action in response, thus falling under the category of “demand
action.” On the opposite end of the spectrum, an ambient stimulus is so gentle tha t it is ignored
until a more convenient time when the user chooses to attend to it. This spectrum serves as a guide
for characterizing the human response to VAC systems.
ignorable change make interrupt demandblind aware action
Figure 1.2: The attention capture spectrum. We use the same terms as Matthews [89] to describe each notification level (1-5) - ignore, change blind, make aware, interrupt, and demand action. VAC systems should be able to fluidly and dynamically shift along this full spectrum.
Defining an attention capture spectrum allows the urgency of a stimulus to be encoded into its
mode of presentation. Time displays rest unobtrusively at the corner of computer screens until a
loud alarm sounds to alert the user to a time-sensitive task. Extensive research on the saliency
of visual and auditory signals have led to these everyday VAC visual and auditory technologies,
as well as more advanced ones like aircraft cockpit head-up displays. However, little emphasis has
been placed on the development of VAC haptic feedback systems, which is a critical step for the
application of haptic technology in a manner that is both useful and relevant to the user.
While focal haptic feedback only occupies one portion of the attention capture spectrum -
“demand action” and “interrupt” - ambient haptic feedback mechanisms become increasingly im
portant as one moves along the attention capture spectrum. Hence ambient feedback is a major
component of VAC haptics.
While most haptic feedback devices developed so far provide focal feedback (see examples from
the previous section), very limited research has been conducted on ambient haptic feedback thus far.
MacLean points out six characteristics of ambient haptic communication [83]: 1) provide context
and awareness for an on-going situation, 2) unintrusively communicate relevant change, 3) require
4

low mental effort to process, 4) support automatic behavior, 5) let us follow up as needed, and 6)
act on our unconscious processes. We will incorporate MacLean’s principles of ambient feedback to
guide our development of VAC haptic feedback systems for appropriate attention management.
Our proposed VAC haptic feedback methods seek to combine both ambient and focal feedback
mechanisms to create a unified system for haptic attention capture. When properly deployed, a VAC
haptic device would be able to produce relevant stimuli without unnecessarily competing for a user’s
limited attentional resources, while simultaneously being able to convey im portant information in
a timely, accurate, and intrusive manner. Therefore, we are interested in developing actuators and
their control schemes that would allow us to modulate attention capture more intentionally over
the full attention capture spectrum. By appropriately modulating the level of attention capture,
VAC feedback systems allow the user to manage multiple tasks and interruptions while maintaining
focus on their primary work task.
The specific aims of this work are:
1. To construct novel haptic feedback devices capable of variable attention capture.
2. To characterize variable attention capture in the context of the operation of these devices.
3. To demonstrate the utility of these devices in providing information in a timely, accurate, and
unobtrusive manner.
1.3 Application: Seated P osture G uidance U sing Variable
A ttention C apture H aptics
We begin our exploration of variable attention capture (VAC) haptics through the specific applica
tion of seated posture guidance via our Posture Seat system.
Computers are now an integral part of our daily lives. In a 2007 occupational employment
and wages survey published by the National Bureau of Labor Statistics, it was found tha t over 23
million people were employed in the office and administrative support occupational group - the
largest occupational group in the US [100]. Most, if not all, of these people spend about 6 to 8
hours each day working at their computers. Unfortunately not everyone maintains good sitting
postures when working in front of their computers for so long. In fact, people will tend to slouch or
assume some other “unhealthy” sitting position after a while. Over time, these bad postures develop
5

into back pain, pressure sores, and other health issues. According to an “Ergonomic Hazards of
the Seated Posture” analysis, poor posture is the single largest factor in office injuries, and office
workers will likely suffer sometimes irreversible injuries if they do not consciously maintain correct
sitting postures [127].
The primary interventions for this issue consist of providing basic guidelines for proper work
station configuration and maintaining “proper” or “good” posture (see Appendix B). In addition
to positioning keyboards, monitors and writing surfaces at appropriate heights, ergonomic chairs
have generally been used to passively correct and/or encourage proper posture [27]. Despite these
guidelines and ergonomic adjustments, workers often have trouble maintaining these habits on their
own. Motivated by this issue, we designed a posture sensing and feedback chair to guide the user
into an appropriate posture.2
Informal interviews with ergonomics specialists and occupational therapists conveyed three im
portant ideas. First, helping patients maintain a prescribed posture when they are a t a desk would
be beneficial. Many patients either forget or cannot accurately replicate the postures tha t are
taught in therapists’ offices. Second, monitoring what patients actually do outside the therapy
environment would be helpful for therapists. At present, few therapists know whether their rec
ommendations are followed. Third, an appropriate posture is highly variable both due to human
variation as well as individual medical issues. It is therefore unlikely tha t there is a single correct
posture. In fact, therapists may want patients to change among several postures using a regime
that is customized for the individual.
We aim to correct the chronic problem of poor posture with as little disruption to the worker’s
primary task as possible. Multiple Resource Theory (MRT) suggests th a t humans should be able
to process and perform certain types of tasks in parallel as long as the tasks do not utilize the
same cognitive resource or overload a single cognitive resource [165]. For example, when a visual
perceptual channel becomes overloaded, additional information may be better perceived if delivered
through the auditory channel. Based on this theory, we assume that office workers (who rely heavily
on visual processing) would find visual feedback devices distracting and thus unacceptable. In this
research, we demonstrate that haptic feedback may be used to guide a person to a reference body
2Although there is debate over what is considered “good” posture, it is clear that some postures are more unhealthy than others. The prevalence of back pain, pressure sores, and other health issues indicate that people have trouble managing their postures. Some injuries can be traced back to people sitting in bad postures, and helping people avoid those postures would be a path towards reducing these injuries. Therefore, in our research, we do not propose what a healthy posture is (we will defer to posture experts), but rather we propose the design and development of a posture sensing and feedback chair that can guide a user towards or away from a given posture.
6

orientation, and that VAC haptic feedback will cause minimal disruption to the worker’s primary
task.
MRT may be used as a springboard to investigate how humans perceive and process non-critical
stimuli and to design systems with subtle (ambient) feedback. We rely on user’s preattention -
the idea that humans can quickly acquire peripheral sensory data without directly attending to
it [152, 171] - to simultaneously acquire multiple low-priority inputs, which can be synthesized and
acted upon at a later time.
The haptic modality remains largely unaddressed by MRT [166]. This dissertation summarizes
our exploration into VAC haptic feedback, and its effect on sensory-motor learning and cognitive
function. To that end, we designed and implemented a haptic feedback system that guides individ
uals to a reference posture using continuously variable, real-time haptic feedback.
1.4 D issertation O verview
The rest of the dissertation is organized as follows:
Chapter 2 presents a summary of related work on seated posture identification and feedback
guidance systems, as well as existing ambient haptic feedback systems.
Chapters 3-9 report on specific user studies. In Chapter 3, we present the design of a real-time
posture sensing and feedback chair system and assess its performance in a three-part user study.
The study involves posture classification accuracy, posture repeatability of the test subject, and
compliance to vibrotactile posture feedback guidance. Chapter 4 builds upon the work in Chapter 3
by conducting a user study to characterize the amount of primary task interference resulting from
responding to vibrotactile seated posture guidance. Chapter 5 extends the work from the previous
two chapters by comparing the effectiveness and level of disruption between a vibrotactile and visual
posture feedback system.
Based on the results of Chapters 3-5, it became obvious that vibrotactile feedback caused undue
disruption to a user and impaired his ability to perform a primary task. To mitigate unnecessary
disruption, in Chapters 6-8 we shift our focus towards developing variable attention capture (VAC)
haptic feedback systems that can deliver information to the user a t an appropriate notification level,
depending on secondary task priority.
In Chapter 6, we begin our investigation of VAC haptics by exploring different actuators and
actuation parameters that influence a user’s emotional affect (emotional response) and thus have
7
an impact on attention capture. Utilizing the results of tha t study, Chapter 7 presents the design
of a novel VAC haptic feedback pressure-actuated system, which we call a pactor, and the result
of a user study that measures test subjects’ pressure detection threshold and self-reported level of
attention capture using these pactors. In Chapter 8, we characterize the level of attention capture
tha t is achievable by tactors (vibration) and pactors (pressure) through a user study.
In Chapter 9, we integrate the VAC haptic actuators into our posture sensing and feedback
chair and repeat the dual-task interference study to assess the amount of performance improvement
with VAC haptics. We thus come full circle to our original problem of providing posture feedback
guidance with minimal disruption to the user’s primary task.
Chapter 10 concludes the thesis by providing a summary of my work and highlighting my
contributions to the field of haptics and to the area of seated posture guidance. The chapter ends
with an outlook for VAC haptics.
Lastly, Chapter 11 lists future research directions, including improvements to the Posture Seat
system, as well as potential areas of development for variable attention capture haptic feedback.
The appendices provide additional background information on the human’s sense of touch (Ap
pendix A), generally agreed-upon guidelines for seated posture and seating systems (Appendix B),
preliminary designs for the Posture Seat (Appendix C), and selection of pactor designs (Ap
pendix D).
Although my doctoral work was carried out in the Department of Mechanical Engineering, this
dissertation is in fact a multidisciplinary endeavor linking several disparate fields. In addition to
employing principles from mechanical engineering, electrical engineering, and computer science in
the development of our devices and control schemes, we also utilized concepts from psychology,
cognitive science, and psychophysics to inform the designs of our human subject studies. Building
on ideas from all of these fields, we were able to better understand and characterize the application
of variable attention capture haptics.
Throughout this dissertation I will frequently use the pronouns “we” and “our.” It is because
my doctoral work represents a collaboration between myself and my former advisor, John Morrell,
without whom this work would not have been possible.
8
C hapter 2
R elated W ork
In the last few decades, a number of research groups have developed posture sensing and clas
sification systems. Others have investigated the effectiveness of haptic feedback in a variety of
applications, but few have applied it to seated posture guidance or have explored ambient haptic
feedback. To our knowledge, we were the first research group to combine real-time feedback with
sensing in order to alter posture. In this chapter, we will review work related to seated posture
identification as well as research on ambient haptic feedback systems.
2.1 Posture sensing and feedback
Researchers have devised several methods to measure sitting posture, including pressure-based,
vision-based, and inertial-based systems.
In 1979, two researchers constructed a capacitative pressure measurement plate to study the
pressure forces in sitting at various backrest angles [124]. They tested backrest angles of 90°-140°
(in 10° increments) and found th a t only the 90° and 110° backrest angles displayed well defined
pressure areas under the ischial tuberosities (sit bones) (Figure 2.1). These backrest angles are
consistent with present-day guidelines for good sitting posture [22, 38].
Later, another research group [94] constructed a capacitative pressure mat (different from the
previously mentioned group [124]) to measure the distance between the points of maximum pres
sure. They determined that the mean distance between the points of maximum pressure, which
corresponded to the distance between the lower aspects of the ischial tuberosities, was on average
2.51cm greater for females than for males. They also found th a t the distance between points of
9

Figure 2.1: A capacitative pressure measurement system developed by Rosemeyer, et. al. [124] to measure pressure distribution on a seat by a seated subject a t various chair backrest angles. Only the 90° and 110° backrest angles resulted in well defined pressure areas under the ischial tuberosities (sit bones). Image source: Rosemeyer, et. al. [124].
maximum pressure decreased with forward pelvic rotation, and increased with backward pelvic
rotation. (See Appendix B for more information on posture.)
Other pressure-based posture sensing systems include the use of an XSensor pressure pad to
evaluate ergonomics of five different chair designs for mobile agricultural machinery [51], a combi
nation of the Tekscan pressure mats and the Vicon optical motion analysis system to study pelvic
movement during manual wheelchair propulsion [144], a pressure m at to identify an automobile
driver’s activity based on his seated posture [121], and a large array of individual two-pinned pres
sure triggers to identify seated posture [172].
Vision-based technology is another commonly used method of measuring posture. For example,
[45] presents a real-time body part tracking system call “Ghost” th a t uses a person’s silhouette
to determine his or her posture. In [92], a multi-camera motion capture system performing voxel
data analysis determined the posture of a seated person for “sm art” deployment of air bags. The
Optotrak motion capture system was used in [98] and [136] to sense body orientation. LED markers
were used by [31] to measure posture in the 85-110° range of motion.
Unfortunately there are numerous drawbacks to using vision systems in confined spaces to sense
postures. These drawbacks include field of view, ambient lighting, obstructions, and background
objects. Some researchers have turned to a third method of identifying postures: sensors attached
directly to the human body. In [35], a whole-body pose tracking system used inertial and magnetic
sensors to track posture. Wong and Wong [170] mounted accelerometers and reflective markers
10

\Figure 2.2: A method of sensing posture by attaching reflective markers and three-axis accelerometers directly on the subject’s body to measure changes in curvature of the spinal column. Image source: Wong and Wong [170].
along the spinal column to measure the curvature of a person’s back (Figure 2.2). Another example
involves the use of a three degree-of-freedom (3-DOF) robotic arm cupped over a child’s head to
measure postural sway [119].
Work most relevant to our current research is [146]. In 2000, Tan et. al. developed a static
posture sensing system that correlated a particular pressure distribution to a specific sitting posture.
They used commercially available pressure mats consisting of a dense array of 1024 pressure sensors
(Tekscan CONFORMat, $1500 for each mat not including software [147,168]). W ith one m at placed
on the seat cushion and one on the backrest (Figure 2.3), they were able to identify slouching, leaning
in various positions, crossing legs, and sitting upright. For 30 subjects, the overall accuracy was
96% for familiar subjects (i.e. subjects whose pressure distribution the chair had “sensed” before)
and 79% for first-time subjects. Their study indicates tha t it is plausible to correctly identify a
person’s sitting posture with the use of pressure sensors alone.
In 2007, Mutlu et. al. [97] developed an algorithm that down-sampled the sensor data from
[146] and determined the near-optimal placement of square force-sensitive resistors (FSRs) on a
Herman Miller Aeron chair. Their posture classification system achieved an accuracy of 78% using
only 19 square FSRs. The best results (87% classification accuracy) were obtained using 31 FSRs.
As in [146], the focus of this work was classification of a variety of different postures rather than
creating an analog signal for feedback.
In 2011, following our research in [176], Schrempf et. al. [131] developed a seated posture
biomechanics model and posture cost function for posture identification. Their model helped further
11

Figure 2.3: The use of commercially available, high resolution Tekscan CONFORMat pressure mats placed on the seat pan and seat back to identify sitting postures. (Left) Placement of Tekscan pressure mats on chair. (Middle) Pressure distribution on the seat back. (Right) Pressure distribution on the seat cushion. Image source: Tan, et. al. [146].
reduce the number of force transducers to four. They proposed using posture feedback for guiding
effective sitting exercises but had not yet been deployed.
Several research systems and commercial products attem pted to guide posture without ac
tively sensing posture. For example, the Prototype Multi-Posture (PM P) chair [75] and Evolution
Chair [30] require the user to actively balance on their unstable seating platform. M IT’s 5-DOF
Robotics Computer Monitor (RoCo) moved its “neck” to visually and subconsciously influence the
user into a new posture as dictated by the monitor [1].
A number of patents exist for correcting a user’s posture [37, 57, 70, 115, 132], however we
encountered only one commercially available device tha t incorporated both posture sensing and real
time feedback: the iPosture [53]. It is a small, low-cost, wearable device tha t uses an accelerometer
to sense the slouching posture through chest angle, and delivers vibrations to remind the user to sit
or stand upright. Unfortunately a recent study by Johnson et. al. [61] found that the vibrotactile
feedback from iPosture did not help users improve their posture. Other complaints aside, users
expressed frustration with the single-point vibration that merely served as a reminder to correct
the wearer’s posture but gave no indication as to how to correct their posture.
Our proposed posture sensing system is similar to Tan and Mutlu in th a t it uses pressure sensors
(specifically FSRs) affixed to the surface of an office chair. However we are able to significantly
reduce the number of FSRs used by obtaining the pressure map for each person’s postures (cali
bration) and matching his real-time posture pressure map to his calibration. Creating a low-cost,
low-complexity system was an objective. Given the variability in humans and human postures,
adjusting the system to the individual user seemed both necessary as well as desirable from a
12

cost-reduction standpoint.
Our sensing system is also similar to iPosture in tha t both rely on calibration to the user,
however our approach to haptic feedback relies on latent sensory motor instincts or reflexes and
conveys spatial and temporal information using analog signals tha t vary intensity based on the
magnitude of the error. Furthermore, our system deals with a quasi-static pose of the body rather
than a dynamic one. As such, the sensory-motor skills in our application are more biased toward
the modulation of force than the control of joint movement.
A final and important distinction in this research is our focus on pressure rather than kinematic
orientation, although the two are highly coupled. The kinematic orientation of the body is usually
observable through visual means, but the distribution of weight is not. Our FSR-based system is
sensitive to small changes in the distribution of weight that are not typically observable without
fiducial markers and an externally calibrated, high quality vision sensing system.
2.2 A m bient haptic feedback system s
The terms ambient displays, peripheral systems, and notification systems are all “labels for systems
that present information within a space through subtle changes in light, sound, or movement, which
can be processed in the background of awareness” [169]. Ambient visual and auditory displays are
relatively easy to conceive - slowly changing background scenery on a computer screen, a wilting
or blossoming flower to indicate household energy consumption, automatically pausing music or
changing background sound in response to an incoming phone call or person, crescendoing music
as a prelude to a scary movie scene, etc. [12, 83, 123, 134, 137]. However ambient haptic systems
are far less prevalent and researchers are just beginning to explore the ambient haptic sense. This
section presents existing research on ambient haptic systems.
The Aladdin doorknob described in [47, 83, 85] can act as a “haptic butler” th a t informs the
visitor of activity inside the room. It provides force, motion and therm al feedback to the visitor
who touches the doorknob and helps him decide whether or not to enter.
The Haptic Car Seat is another ambient feedback system that uses vibrotactile actuators to
deliver gentle vibrations to the driver to inform him of cars in his blindspot or cars tha t are
tailgating him [95]. The vibrations do not require the driver to take action. Instead, he can choose
to drive normally or utilize the information to influence his decision to change lanes.
The Haptic Notification System (HaNS) timing awareness wristwatch deployed at the 2012
13

Haptics Symposium (among other places) is another system that utilizes low-intensity vibrotactile
feedback to deliver gentle yet salient vibrations to the wearer. It is intended to help the speaker
keep time during oral presentations. HaNS privately reminds the person of time but does not stop
him from going overtime [143].
Similarly, haptic interactions wristwatch developed in [107] allows the user to query information
from his mobile phone without removing the phone from his pocket. The wristwatch delivers
different vibrotactile signals to convey numerical information tactually to the user for an eyes-free
interaction.
Also in 2011, a haptic wristband for bookmarking an audio track on a mobile phone was devel
oped [19, 102, 103, 104]. The device senses skin conductance to discern when the user is interrupted
by another task so that it can automatically bookmark the audiobook or podcast and pause on the
user’s behalf. The user interacts with the haptic wristband to resume playback, rewind the track,
etc. without needing to take out his phone.
A recent perceptual study by Pielot et. al. [110] on the boundaries of vibrotactile peripheral
perception proved that certain vibration patterns can be ambient: when mobile phones in test
subjects’ pockets vibrated at intensities just above their detection threshold, only 16.7% of the
stimuli were acknowledged within one minute and participants were not annoyed by the vibratory
feedback. Similarly, when [5] explored haptic feedback actuation parameters tha t would emulate
human touch through the ServoSqueeze and ServoTap wristband (Figure 2.4), they found that
symmetric pressure actuation profiles felt more pleasant and more ambient to the test subjects
than asymmetric profiles.
Figure 2.4: ServoTap (purple “finger” ) and ServoSqueeze (black wristband) mechanism for simulating human touch. Image source: Baumann, et. al. [5].
14

Subsequent to our published results [176, 177], other researchers have developed posture feed
back systems and conducted studies similar to our own. Haller et. al. [44] designed a posture
sensing and feedback chair [131] and conducted an experiment to determine which type of feedback
(visual, physical, vibrotactile, Figure 2.5) would be most effective for seated posture guidance while
simultaneously being least disruptive. They found tha t the physical object on the desk representing
the user’s seated posture was best, while vibrotactile feedback was most intrusive. Their work dif
fers from ours in that we aimed to develop variable attention capture (VAC) vibration and pressure
actuators for seated posture guidance that could intentionally modulate a user’s level of attention
across the attention capture spectrum.
The next few chapters present our research on the development of a novel real-time posture sens
ing and feedback chair as well as VAC haptic actuators for conveying information at an appropriate
level of attentional salience.
Figure 2.5: Another researcher’s investigation of minimally disruptive posture feedback methods subsequent to our published findings [176]. The three feedback methods used by Haller, et. al. [44] were: (1) visual, (2) physical, (3) vibrotactile. Image source: Haller, et. al. [44].
15

C hapter 3
A V ibrotactile Feedback A pproach
to Seated P osture G uidance
3.1 O verview
This chapter begins our investigation of vibrotactile haptic feedback for improving the performance
of a sensory-motor task, namely seated posture guidance. We present the Posture Seat system that
can actively sense and guide a person to a desired posture. We then describe the user study that
characterizes the performance of the Posture Seat system. We end with the results and implications
of this study.
As described in Section 1.3 and Appendix B, our approach to posture feedback relies on posture
guidelines proposed by the Occupational Safety and Health Administration (OSHA) [101]. We
assume that spending more time in a posture tha t is consistent with guidelines presently proposed
by OSHA would represent a significant improvement over not following such posture guidelines.
These guidelines are usually presented pictorially and may be assessed visually. Additionally, based
on the informal interviews with ergonomics experts (Section 1.3), we learned th a t a successful
system must allow users to adjust their position periodically as maintaining any one stationary
pose is fatiguing and potentially unhealthy. As mentioned in Section 1.3, we will rely on physical
therapists and posture experts to specify acceptable deviations and durations for a variety of poses.
16

Figure 3.1: The “Posture Seat” posture sensing and feedback system. (Left) Locations of the 7 force-sensitive resistors (FSRs) for posture sensing. (Right) Locations of the 6 vibratory tactors for posture feedback. Only 4 tactors on the back of the seat are shown. The other two are on the bottom of the seat, near the front, under each thigh.
0 3.75" S
Figure 3.2: Placement of FSRs on seat bottom and seat back. The edge of the FSR placed at the rear of the seat is flush with the back edge of the chair.
3.2 System D escription
3.2.1 Equipment
Our posture sensing and feedback system is a size B, fully adjustable Herman Miller Aeron chair
with lumbar support, instrumented with 7 force-senstive resistors (FSRs) for posture sensing and 6
vibrating tactors for haptic feedback (Figure 3.1). The exact placement of the FSRs on the Aeron
chair is shown in Figure 3.2. Each FSR (1.5” square Interlink 406 FSR, $8.50) is connected to a
17
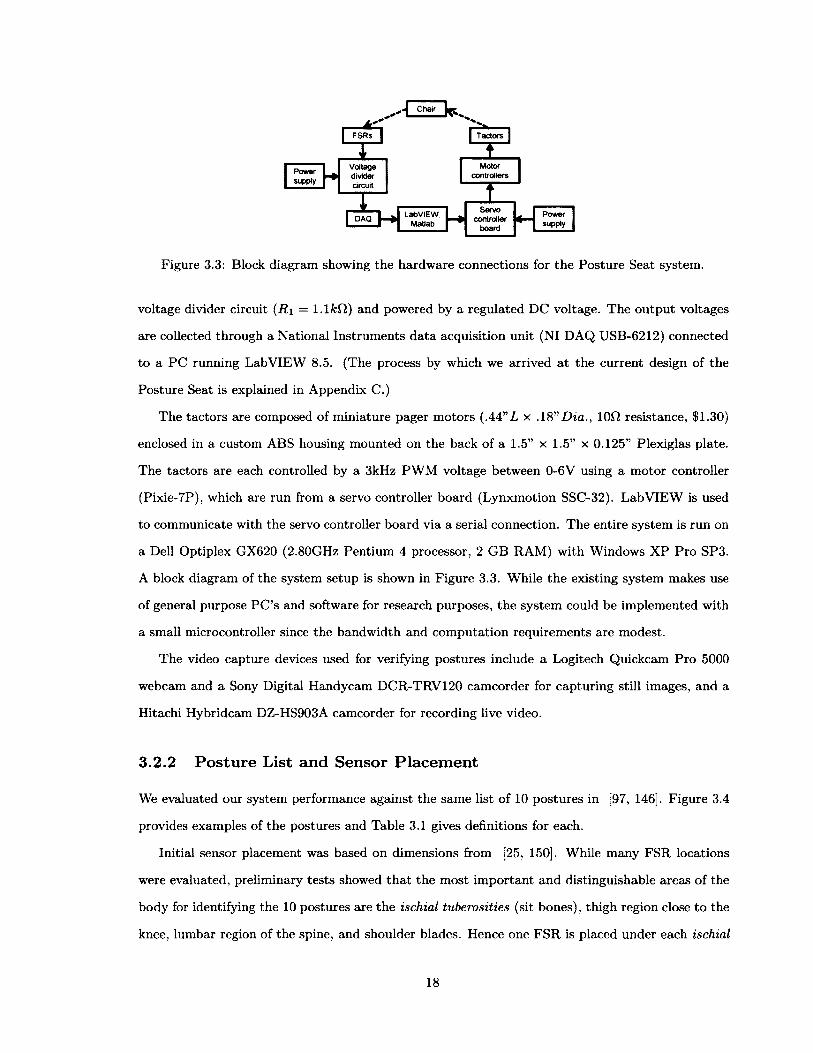
Powersupply
iVoltagedividercircuit
I Tactors I
ZELMotor
controllers
| DAQ f - »
ELabVIEW,
Matiab
Servocontroller
board
Powersupply
Figure 3.3: Block diagram showing the hardware connections for the Posture Seat system.
voltage divider circuit (R i = l.lfcfl) and powered by a regulated DC voltage. The output voltages
are collected through a National Instruments data acquisition unit (NI DAQ USB-6212) connected
to a PC running LabVIEW 8.5. (The process by which we arrived at the current design of the
Posture Seat is explained in Appendix C.)
The tactors are composed of miniature pager motors (.44”L x . 18” £>ia., 10fl resistance, $1.30)
enclosed in a custom ABS housing mounted on the back of a 1.5” x 1.5” x 0.125” Plexiglas plate.
The tactors are each controlled by a 3kHz PWM voltage between 0-6V using a motor controller
(Pixie-7P), which are run from a servo controller board (Lynxmotion SSC-32). LabVIEW is used
to communicate with the servo controller board via a serial connection. The entire system is run on
a Dell Optiplex GX620 (2.80GHz Pentium 4 processor, 2 GB RAM) with Windows XP Pro SP3.
A block diagram of the system setup is shown in Figure 3.3. While the existing system makes use
of general purpose PC’s and software for research purposes, the system could be implemented with
a small microcontroller since the bandwidth and computation requirements are modest.
The video capture devices used for verifying postures include a Logitech Quickcam Pro 5000
webcam and a Sony Digital Handycam DCR-TRV120 camcorder for capturing still images, and a
Hitachi Hybridcam DZ-HS903A camcorder for recording live video.
3.2.2 Posture List and Sensor Placem ent
We evaluated our system performance against the same list of 10 postures in [97, 146]. Figure 3.4
provides examples of the postures and Table 3.1 gives definitions for each.
Initial sensor placement was based on dimensions from [25, 150]. While many FSR locations
were evaluated, preliminary tests showed that the most im portant and distinguishable areas of the
body for identifying the 10 postures are the ischial tuberosities (sit bones), thigh region close to the
knee, lumbar region of the spine, and shoulder blades. Hence one FSR is placed under each ischial
18

Figure 3.4: An example of each posture to be identified by our system: 1. upright, 2. slouching, 3. leaning forward, 4. leaning back, 5. leaning left, 6. leaning right, 7. left leg crossed over right, 8. right leg crossed over left, 9. left leg crossed over right and leaning right, 10. right leg crossed over left and leaning left.
Table 3.1: List of postures to be identified and their descriptions
P o s t u r e D e s c r ip t i o n
1 uprigh t lo rd o tic lu m b ar cu rve , back an d th ig h a re a t a p p ro x im a te ly 90°
2 slouching k y p h o tic lu m b ar curve , h unched over
3 lean ing forw ard back s tra ig h t a n d ap p ro x im a te ly 40°-60° from v e rtica l
4 lean ing back back re s tin g on se a t back , re laxed
5 lean ing left lean in g le ft a b o u t 20° w ith left a rm re s ting on a rm re s t
6 leaning righ t lean in g r ig h t a b o u t 20° w ith r ig h t arm re s tin g on a rm re s t
7 left leg crossed over righ t
left ank le re s tin g on r ig h t knee , s i t t in g cen te red in se a t
8 rig h t leg crossed over left
r ig h t an k le re s tin g on left knee , s i t t in g cen te red in sea t
9 left leg crossed over r ig h t and lean ing r ig h t
full cross w ith left kn ee over r ig h t knee, lean ing righ t
10 rig h t leg crossed over left an d lean ing left
fu ll cross w ith r ig h t knee over le ft knee, lean ing left
tuberosity, one under each thigh, one behind the lumbar curve, and one behind the left shoulder
blade. Finally, the seventh FSR is placed in the center rear of the seat to ensure tha t the subject sits
all the way back in the seat. A dimensioned diagram of the FSR locations is shown in Figure 3.2.
19
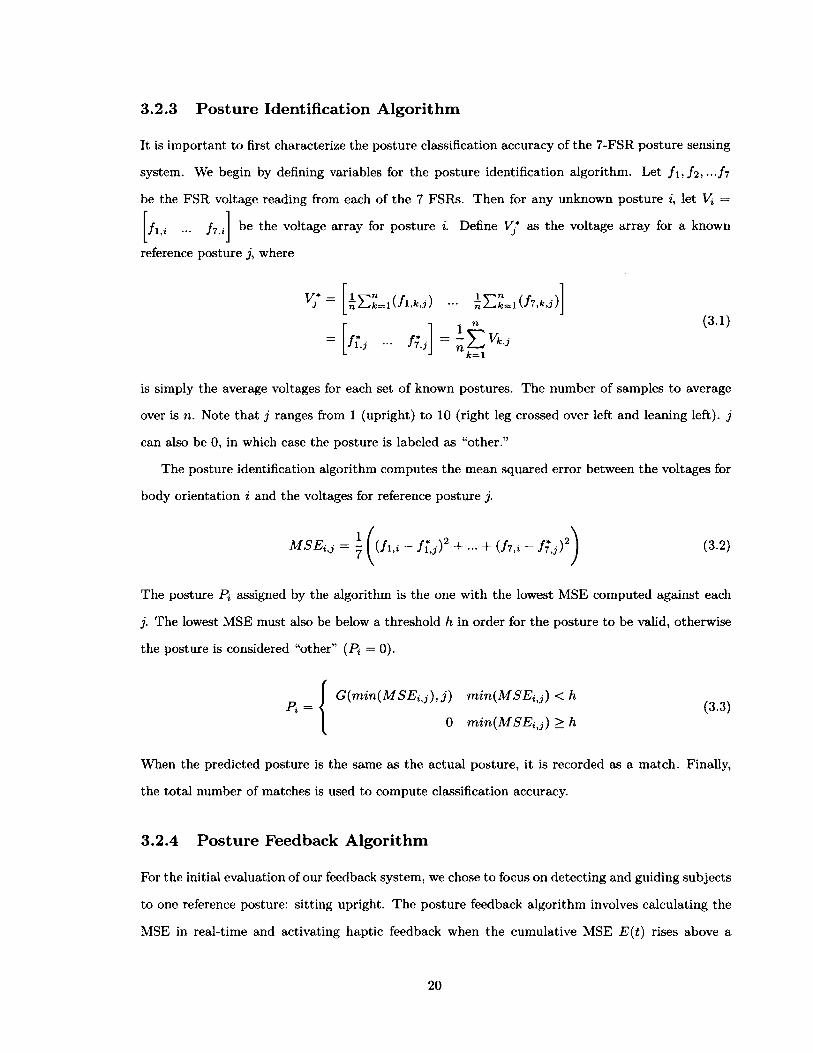
3.2.3 Posture Identification Algorithm
It is important to first characterize the posture classification accuracy of the 7-FSR posture sensing
system. We begin by defining variables for the posture identification algorithm. Let / i , / 2 , •••/?
be the FSR voltage reading from each of the 7 FSRs. Then for any unknown posture i, let V) =
fl,i /7,i be the voltage array for posture i. Define V* as the voltage array for a known
reference posture j, where
V*3
f i j f%,j
j (3-1)
— nf-ik = 1
is simply the average voltages for each set of known postures. The number of samples to average
over is n. Note tha t j ranges from 1 (upright) to 10 (right leg crossed over left and leaning left), j
can also be 0, in which case the posture is labeled as “other.”
The posture identification algorithm computes the mean squared error between the voltages for
body orientation i and the voltages for reference posture j.
M S E ij = i ^ ( / M - f l j ) 2 + ... + ( f7ii - (3.2)
The posture Pi assigned by the algorithm is the one with the lowest MSE computed against each
j. The lowest MSE must also be below a threshold h in order for the posture to be valid, otherwise
the posture is considered “other” (Pi =0) .
P =G (m in (M S E ij) , j ) m in (M S E itj) < h
(3.3)0 m in (M S E ij) > h
When the predicted posture is the same as the actual posture, it is recorded as a match. Finally,
the total number of matches is used to compute classification accuracy.
3.2.4 Posture Feedback Algorithm
For the initial evaluation of our feedback system, we chose to focus on detecting and guiding subjects
to one reference posture: sitting upright. The posture feedback algorithm involves calculating the
MSE in real-time and activating haptic feedback when the cumulative MSE E(t) rises above a
20
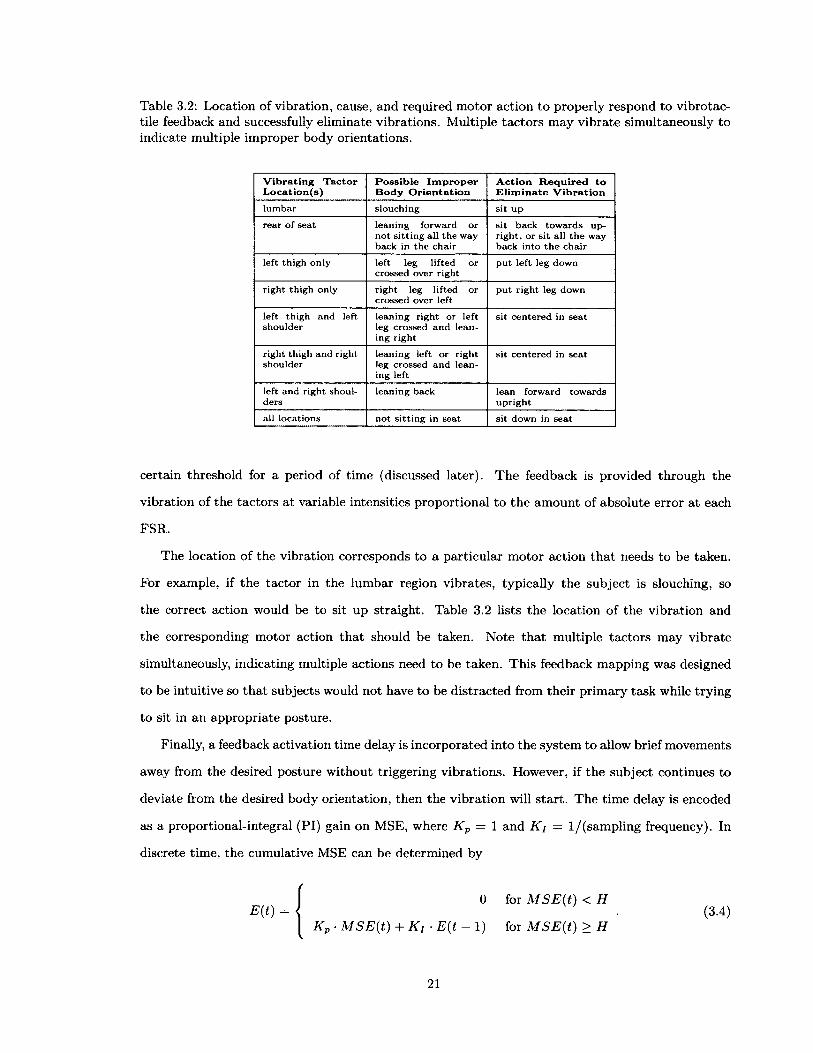
Table 3.2: Location of vibration, cause, and required motor action to properly respond to vibrotactile feedback and successfully eliminate vibrations. Multiple tactors may vibrate simultaneously to indicate multiple improper body orientations.
Vibrating Tactor Location(s)
Possible Improper Body Orientation
Action Required to Eliminate Vibration
lum bar slouch ing sit u p
rea r o f sea t lean ing fo rw ard o r n o t s i t t in g a ll th e way back in th e cha ir
s it back to w ard s u p rig h t, o r s it a ll th e way back in to th e ch a ir
left th ig h only left leg lifted o r crossed over righ t
p u t le f t leg dow n
righ t th ig h only rig h t leg lifted o r crossed over left
p u t r ig h t leg dow n
left th ig h an d left shou lder
lean ing r ig h t o r left leg crossed a n d lean ing righ t
sit c en te red in se a t
righ t th ig h an d righ t shou lder
lean ing left o r r ig h t leg crossed a n d lean ing left
sit c en te red in se a t
left and r ig h t shoulders
lean ing back lean fo rw ard tow ards u p r ig h t
all locations n o t s i t t in g in seat s it dow n in se a t
certain threshold for a period of time (discussed later). The feedback is provided through the
vibration of the tactors at variable intensities proportional to the amount of absolute error at each
FSR.
The location of the vibration corresponds to a particular motor action tha t needs to be taken.
For example, if the tactor in the lumbar region vibrates, typically the subject is slouching, so
the correct action would be to sit up straight. Table 3.2 lists the location of the vibration and
the corresponding motor action tha t should be taken. Note that multiple tactors may vibrate
simultaneously, indicating multiple actions need to be taken. This feedback mapping was designed
to be intuitive so tha t subjects would not have to be distracted from their primary task while trying
to sit in an appropriate posture.
Finally, a feedback activation time delay is incorporated into the system to allow brief movements
away from the desired posture without triggering vibrations. However, if the subject continues to
deviate from the desired body orientation, then the vibration will start. The time delay is encoded
as a proportional-integral (PI) gain on MSE, where K p — 1 and K j — l/(sam pling frequency). In
discrete time, the cumulative MSE can be determined by
0 for M S E i t ) < H E{t) = { . (3.4)
K p ■ M S E ( t ) + K i ■ E( t - 1) for M S E ( t ) > H
21
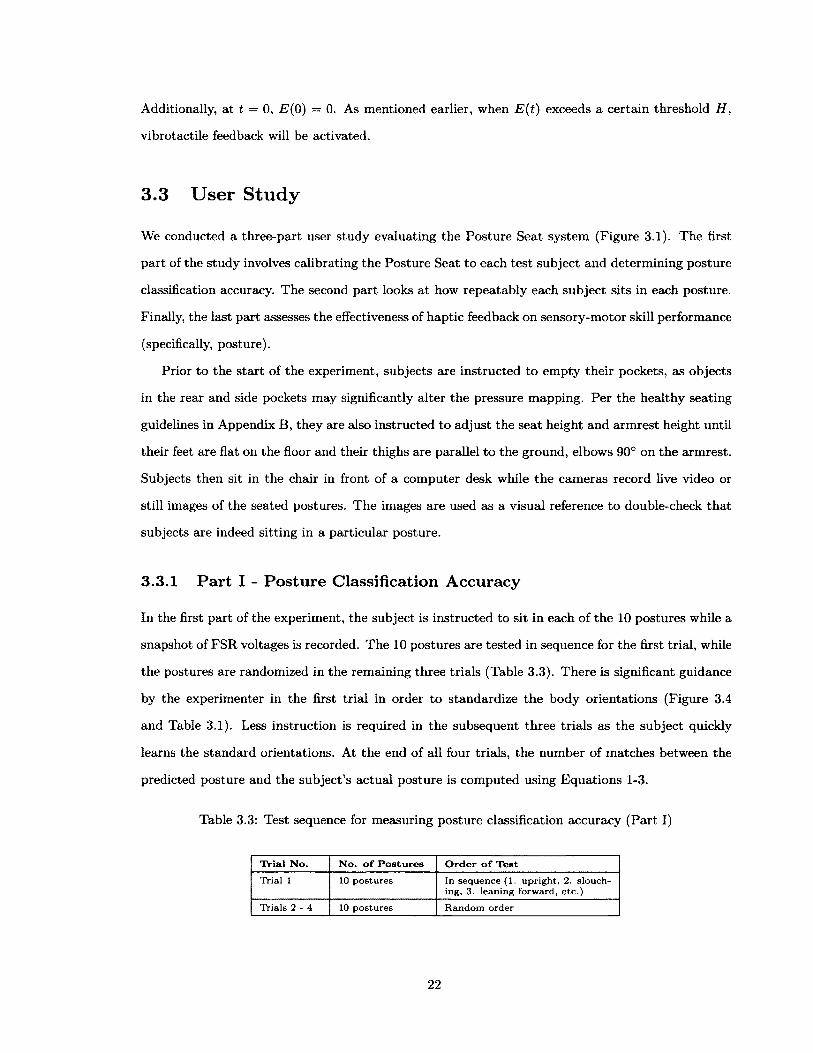
Additionally, at t = 0, E( 0) — 0. As mentioned earlier, when E{t) exceeds a certain threshold H,
vibrotactile feedback will be activated.
3.3 U ser Study
We conducted a three-part user study evaluating the Posture Seat system (Figure 3.1). The first
part of the study involves calibrating the Posture Seat to each test subject and determining posture
classification accuracy. The second part looks at how repeatably each subject sits in each posture.
Finally, the last part assesses the effectiveness of haptic feedback on sensory-motor skill performance
(specifically, posture).
Prior to the start of the experiment, subjects are instructed to empty their pockets, as objects
in the rear and side pockets may significantly alter the pressure mapping. Per the healthy seating
guidelines in Appendix B, they are also instructed to adjust the seat height and armrest height until
their feet are flat on the floor and their thighs are parallel to the ground, elbows 90° on the armrest.
Subjects then sit in the chair in front of a computer desk while the cameras record live video or
still images of the seated postures. The images are used as a visual reference to double-check that
subjects are indeed sitting in a particular posture.
3.3.1 Part I - Posture Classification Accuracy
In the first part of the experiment, the subject is instructed to sit in each of the 10 postures while a
snapshot of FSR voltages is recorded. The 10 postures are tested in sequence for the first trial, while
the postures are randomized in the remaining three trials (Table 3.3). There is significant guidance
by the experimenter in the first trial in order to standardize the body orientations (Figure 3.4
and Table 3.1). Less instruction is required in the subsequent three trials as the subject quickly
learns the standard orientations. At the end of all four trials, the number of matches between the
predicted posture and the subject’s actual posture is computed using Equations 1-3.
Table 3.3: Test sequence for measuring posture classification accuracy (Part I)
TVial N o . N o . o f P o s t u r e s O r d e r o f T e s t
T ria l 1 10 p o s tu re s In sequence (1. u p r ig h t, 2. slouching, 3. lean ing fo rw ard , e tc .)
T ria ls 2 - 4 10 p o stu res R andom o rder
22

3.3.2 Part II - Posture R epeatability
While it is important to know the posture sensing system’s accuracy, it is equally important to
understand the posture variability with a single subject over a period of time as well as when
leaving and returning to the chair in the same posture. In this part of the experiment, each
subject’s posture repeatability is evaluated by sitting in a posture for 1 minute, then getting up,
walking around, and sitting back down in the same posture, for a total of 3 trials (Figure 3.5).
FSR voltage data is collected at 10Hz during the 1-minute trials. Repeatability was evaluated for
“sitting upright” and three additional postures that were most similar to “sitting upright,” since
this is the focus of subsequent testing. Finally, an analysis of variance (ANOVA) is performed on
the data sets to assess repeatability, and the MSE threshold for the upright posture is computed.
After 3x
Sit for 1 m inute
Sit down in sam e posture
G et up, walk around for
>5 s e c
Choose posture(upright,
slouching, leaning forward, o r leaning back)
Repeat 3x
Figure 3.5: Test sequence for measuring subjects’ posture repeatability (Part II)
3.3.3 Part III - Posture Feedback
In this part of the experiment, subjects are told to sit in a comfortable working position in the
chair while doing their own work (e.g. checking email, surfing the web, etc.). When they feel the
tactors vibrate, they can move their body in such a way so th a t the vibration stops. They are also
presented with a digital knob to adjust the vibration intensity if the default setting is too weak or
too strong. The vibration locations and actions to be taken is listed in Table 3.2. For this study,
Feedback enabled Feedback disabled
No feedback, 15 min
5 min each
Figure 3.6: Test sequence for measuring posture feedback compliance (Part III)
23

only the upright posture is evaluated. However, the subject is not given prior information regarding
the target posture and is merely instructed to respond to the haptic cues. Subjects repeat this part
of the study on two separate days for a total of 2 trials.
The total test time is 45 minutes for each day. During the first 15 minutes there is no feedback
and the subject’s unguided working posture is observed ( “no feedback” mode). The FSR voltage
data is recorded at 1 Hz. At the end of the 15 minutes, haptic feedback is turned on ( “feedback
enabled” mode). If the subject is not sitting in the reference body orientation, a t least one of
the tactors will vibrate. The haptic feedback system is enabled for 5 minutes and then disabled
for 5 minutes. The “feedback disabled” mode allows subjects to relax or change postures without
triggering any feedback. This cycle is repeated 3 times for a total of 30 minutes. Figure 3.6 depicts
the test sequence. FSR voltages are recorded at 10Hz to allow sufficiently fast haptic feedback.
The MSE is recorded for the entire test and the amount of time spent in the upright posture is
computed for each phase of the test, using a threshold that is determined in Part II.
3.4 R esults and D iscussion
This section presents the results from all three parts of the experiment. Discussions will emphasize
the posture feedback portion (Part III) of the experiment.
3.4.1 Part I - Classification Accuracy
Excluding various preliminary tests, a total of 6 subjects (2 females, 4 males) were tested on the 7-
FSR posture seat system for identification accuracy. The mean age of the subjects was 24±1.0 years,
with an average height of 173±13.4cm and an average weight of 67.1±15.1kg. It was found that,
using the method of MSE’s, the posture sensing system achieved 86.4% accuracy for distinguishing
among all 10 postures, and 93.8% accuracy for distinguishing among 4 postures.
For comparison, Tan et. al. [146] was able to achieve 96% classification accuracy for distinguish
ing among a set of 10 postures for “familiar” subjects (people whose postures have been detected
on their COMFORMat posture seat system before) and 79% accuracy for first-time subjects. Each
CONFORMat consisted of a grid of 1024 pressure sensors. Mutlu et. al. [97] achieved 87% posture
classification accuracy using 31 FSRs and 78% accuracy with 19 FSRs. In the case of [146] and
[97], identification of a posture was the primary objective, rather than measuring the error relative
24

to a particular posture. It is encouraging that our “relative error” method of posture identification
allows us to reduce our sensing requirements to 7 sensors meanwhile achieving a high classification
accuracy.
Most of the incorrect matches were due to confusion between left leg crossed versus left leg
crossed and leaning right, and right leg crossed versus right leg crossed and leaning left. (A number
of test subjects were unable to fully cross their legs, resulting in “legs crossed” looking a lot like
“legs crossed and leaning.” ) Hence, by examining only postures 1-4 (see Figure 3.4), we achieved a
7.4% improvement.
The remaining 6.2% error can be mostly attributed to distinguishing between upright and leaning
forward. Some subjects were unable to lean forward by 40-50 degrees (from vertical). Therefore the
system would often predict “upright” as opposed to the correct “leaning forward” posture. However
even with these errors the posture sensing system is sufficiently robust a t 93.8% accuracy.
3.4.2 Part II - Posture R epeatability
A total of 10 subjects (2 females, 8 males) participated in the posture repeatability study, six of
whom were also participants in the posture classification accuracy part of the study. The mean age
of the 10 subjects was 23.9±1.5 years, mean height 175±11.2cm, and mean weight 71.1±13.6kg.
Figure 3.7 (left) shows the variability (e.g. seated postural sway) within each 1-minute trial for
all subjects combined. Not surprisingly, the variability was minimal, indicating th a t subjects were
able to maintain a consistent body position during each 1-minute trial. This is further evidenced
in Figure 3.8 where the subject did not substantially move around (e.g. wriggle or shift) during
each trial and hence saw very little variability in his MSE values. However from Figure 3.7, we see
that the leaning back posture exhibited considerably more variability than the other three postures,
suggesting that subjects had a harder time sitting still in the leaning back posture, even though
most of their body was supported by the chair compared to sitting in the other postures.
When comparing between trials for the same posture, there was sometimes a noticeable shift
in the mean MSE (see Figure 3.8, bottom, for an example). Figure 3.7 summarizes the MSE shift
from one trial to the next for each posture for all subjects combined. This shift was expected but
also was not significant enough to result in a posture identification error except in a few cases. In
these cases, the system confused “upright” with “leaning forward” (Figure 3.9). Therefore, it is
reassuring that subjects were fairly consistent in their postures between trials.
25

o of MSE values for each posture MSE shift from trial to trial0.06 •
g 0.05 ■ a5U 0-04 ha5g 0 03 %1| 0 02
■oe§ 0 01
upright slouching leaning forward leaning back
0.2
0 15
0.1
e*Si2
-0 .05
-0 1
-0 .15
upright slouching leaning forward leaning back
Figure 3.7: (Left) Standard deviation of MSE values for each posture for all subjects combined. Red crosses represent outliers. There was very little variability in MSE values within each 1-minute trial suggesting that subjects sat very still. Subjects exhibited a large amount of postural movement during each 1-minute trial only for the leaning back posture. (Right) Shift in average MSE from trial to trial for each posture, all subjects combined. Red crosses represent outliers. The MSE shift is centered around zero, indicating th a t subjects were fairly repeatable in how they sat even after getting up and walking around.
MSE using upright calibration da ta0.5
Trial 1 Trial 2
til
-0 .520 40 20 40 20 40 60
Time (sac)
MSE using slouching calibration data0.2
Trial 1 Trial 2 Trial 3
01uiCO2
- 0 120 40 20 40 40
Figure 3.8: A representative plot from one test subject showing very minimal variation in the mean-squared error (MSE) within each 1-minute trial. (Top) MSE calculated against the upright calibration posture, and (bottom) MSE calculated against the slouching calibration data. (Bottom) Sometimes there was a noticeable but insignificant shift in MSE between trials.
26
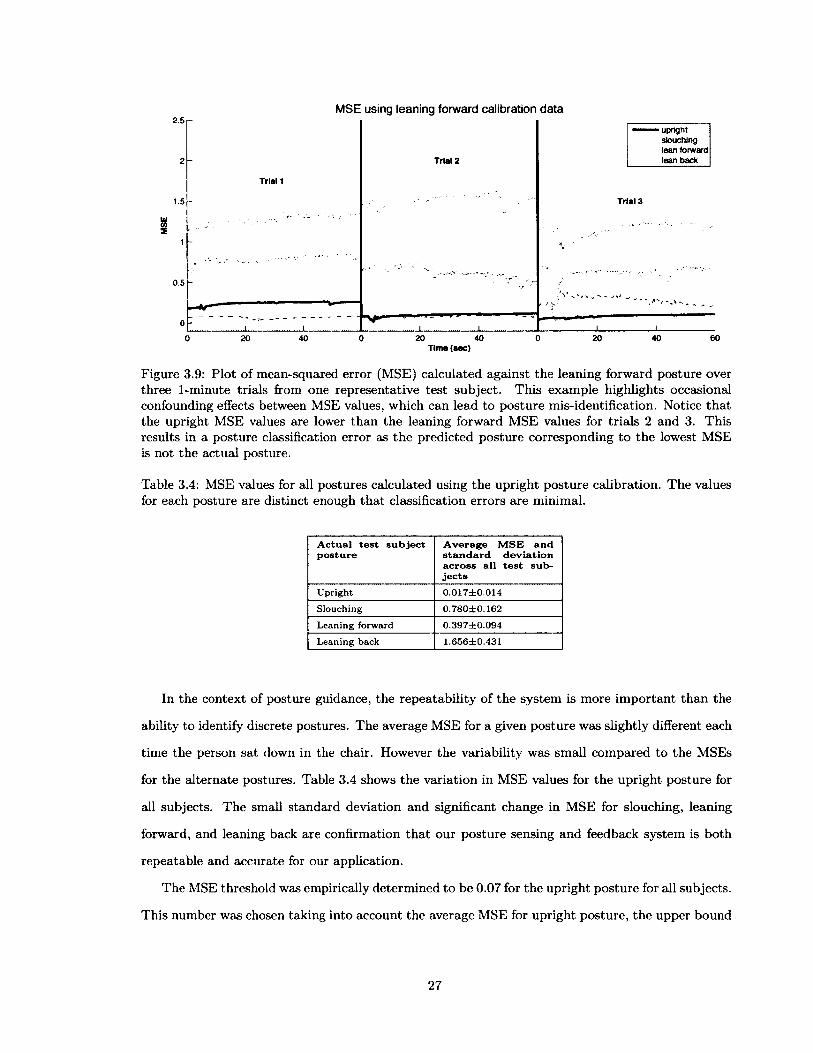
MSE using lean ing forw ard calibration d a ta2 . 5 r
Trial 2
■......... uprightslouching
- - - lean forward lean back
Trial 1
• '' / ̂ ..
-Trial 3
-
.. . . . .
, . f ' ' ~ ■/S/ ^
1 1 I I 1 13 20 40 C) 20 40 (3 20 40 e
Tlme((ac)
Figure 3.9: Plot of mean-squared error (MSE) calculated against the leaning forward posture over three 1-minute trials from one representative test subject. This example highlights occasional confounding effects between MSE values, which can lead to posture mis-identification. Notice that the upright MSE values are lower than the leaning forward MSE values for trials 2 and 3. This results in a posture classification error as the predicted posture corresponding to the lowest MSE is not the actual posture.
Table 3.4: MSE values for all postures calculated using the upright posture calibration. The values for each posture are distinct enough that classification errors are minimal.
A c tu a l t e s t s u b j e c t p o s t u r e
A v e r a g e M S E a n d s t a n d a r d d e v ia t i o n a c r o s s a l l t e s t s u b j e c t s
U prigh t 0 .017± 0 .014
Slouching 0 .780 ± 0 .1 6 2
L eaning forw ard 0.397=1:0.094
L eaning back 1.656±0.431
In the context of posture guidance, the repeatability of the system is more important than the
ability to identify discrete postures. The average MSE for a given posture was slightly different each
time the person sat down in the chair. However the variability was small compared to the MSEs
for the alternate postures. Table 3.4 shows the variation in MSE values for the upright posture for
all subjects. The small standard deviation and significant change in MSE for slouching, leaning
forward, and leaning back are confirmation that our posture sensing and feedback system is both
repeatable and accurate for our application.
The MSE threshold was empirically determined to be 0.07 for the upright posture for all subjects.
This number was chosen taking into account the average MSE for upright posture, the upper bound
27

envelope for upright posture, and any confounding effects with other postures. This threshold for
haptic feedback activation was high enough to accept all upright postures, yet low enough so that
non-upright postures could be detected and rejected.
As mentioned earlier, the focus of this study is to guide participants to a reference posture, not
to specifically identify a posture. The data described above serves to demonstrate the sensitivity
of the system to various postures with the magnitude of the MSE indicating how close the subject
is to the reference posture. The next section describes how the MSE is used to generate feedback
for the user.
3.4.3 Part III - Posture Feedback
All 10 subjects from the posture repeatability study participated in Part III of the experiment.
During the “no feedback” phase (see Figure 3.6), all of the test subjects were observed and identified
in a slouching or leaning back working posture. Over the course of two days of testing, three subjects
sat in the upright posture on average 1.2% of the time on Day 1, and only one of the subjects sat
in the upright posture on Day 2 (10.6% of the time). The remaining subjects did not sit in the
upright posture a t any time during the “no feedback” phase of the test.
During the “feedback enabled” phases, subjects responded well to the vibrotactile feedback.
Within a minute of the initial onset of the haptic feedback, subjects were able to learn the vibration
feedback mapping and adjust their body into the proper posture th a t would eliminate the vibration.
As a result, subjects spent most of their time sitting in the upright posture. Subsequent vibrotactile
feedback required only a few seconds of activation before subjects resumed the reference posture.
This shows that the current vibration feedback mapping was indeed intuitive. Some subjects were
“buzzed” more often than others, indicating tha t they relied on feedback to sit in the reference
posture. Surprisingly, none of the test subjects adjusted the vibration intensity knob; all of them
kept the knob at its default setting, leading us to believe that the feedback intensity was acceptable
to the subjects.
When the feedback was disabled without the subjects knowledge ( “feedback disabled” phases),
all of the subjects initially continued to sit in upright or near-upright postures. However, as time
progressed, most of the subjects became engrossed in their work (either on the computer or in their
textbook assignments) and assumed slouching or leaning forward postures, or sometimes leaning
left or leaning right postures. At the onset of the next “feedback enabled” phase, subjects would
28

35Average MSE per test subject, Day 1
?I 15
05
Feedback enabled Feedback disabled No feedback
4 5 6 7Subject ID number
3.5
25
ui
i ^F. «<
05
Average MSE per test subject, Day 2
Feedback enabled Feedback disabled No feedback
4 5 6 7Subject ID number
Figure 3.10: Plot of average MSE’s for each feedback mode (no feedback, feedback enabled, feedback disabled) for all 10 subjects for both days. Low average MSE’s are more favorable than high average MSE’s as they indicate postures closer to the desired upright posture. In the “feedback enabled” mode, all subjects were able to successfully comply with postural guidance.
often jolt up and then move into the desired posture according to the vibrotactile feedback.
The MSE calculated against upright posture was lowest for all test subjects for the “feedback
enabled” phases, low for the “feedback disabled” phases, and very high for the “no feedback”
phase (Figure 3.10). In the absence of any incentives to sit in a particular posture, subjects clearly
gravitated towards non-upright postures. However, with intermittent vibrotactile feedback, subjects
moved their body to respond to the feedback and sat in the desired reference posture more often.
When the feedback is disabled, subjects thought they would be buzzed if they sat in an inappropriate
posture, so they continued to sit in the reference posture until they forgot or became tired. Therefore
it is not necessary to enable feedback all the time when interm ittent feedback seems to suffice.
By the end of the test on Day 1, all of the subjects suspected tha t the only allowable posture was
the upright posture. However, when returning for the second day of feedback testing, which was at
least 24 hours after their initial test, sometimes as long as one week after their initial test, none of
the subjects assumed they were going to be guided into the same upright posture again. In fact, all
of them suspected they were going to be guided into a different posture (data informally collected
via a verbal interview). Therefore, when the tactors initially started vibrating, they actively focused
on interpreting the vibration feedback mapping to sit in the appropriate posture. However, they
quickly realized they were being guided into the same posture as Day 1.
Surprisingly, this knowledge did not encourage subjects to always sit upright, nor discourage
29

them from paying attention to the vibrotactile feedback. When doing their work, subjects often
forgot about the desired reference posture (or were tired of sitting in the same posture) and started
slouching, leaning left or right, crossing their legs, etc. When the lumbar tactor and the tactors
under their legs started vibrating, for example, they would suddenly remember to sit up straight
and put their feet flat on the ground again. For future studies, we will attem pt to guide the subject
into multiple postures, as sitting in one single posture may not be comfortable for long periods of
time. In this way, they can be guided into specific body orientations as opposed to instinctively
assuming the “upright” posture.
Also on Day 2 of the feedback testing, during the feedback disabled phases, three of the subjects
thought the feedback system was broken because they noticed they had been slouching, yet had
not received any vibrotactile feedback. These three subjects verified their suspicion by purposely
moving around in their chair (crossing legs, standing up, etc.) to try to enable the feedback. When
their suspicion was confirmed, they sat in the slouching or leaning back posture and continued with
their work before the next “feedback enabled” phase.
Only one of the test subjects voiced frustration with the upright posture. On Day 2, the subject
managed to sit in a comfortable position (leaning forward and slouching with hunched shoulders)
such that the vibrotactile feedback was not triggered. This result indicates tha t it is possible to sit in
an “MSE-acceptable” posture yet not be in the reference posture, and demonstrates the limitations
of our posture sensing system. It is therefore necessary to design a better sensing and classifica
tion system that can prevent this unwanted behavior. Simultaneously, this “cheating” behavior
highlights the importance of obtaining a reasonably comfortable primary calibration; the subject
might not have assumed the awkward posture if the primary calibration was more comfortable.
Therefore addressing this user’s attem pts to circumvent the feedback might be accomplished by
smarter sensing, or by ensuring the target posture is not too difficult or uncomfortable.
Finally, in post-testing interviews, subjects reported favorable attitudes towards the haptic
feedback. Only a few subjects reported being significantly distracted by vibrotactile feedback.
Since subjects were able to maintain the desired posture even when the system was disabled, it
should be possible to optimize the periods of feedback and minimize distraction.
In summary, over the course of two days of feedback testing, subjects spent significantly more
time sitting in the desired reference posture (upright) when there was haptic feedback than when
there was not. Even when the feedback was temporarily disabled without the subject’s knowledge,
30

subjects would continue to sit in the reference posture, or close to the reference posture. Further
more, subjects unanimously responded correctly to the haptic feedback. These results suggest that
vibrotactile feedback can be effective in guiding and altering human motor behavior, especially as
it relates to seated posture.
3.5 Conclusion
In this study, we have successfully implemented a simple, low-cost posture sensing and feedback
system using only 7 FSRs and 6 tactors. The posture sensing system is fairly robust, achieving
86.4% accuracy for distinguishing among 10 postures and 93.8% for 4 postures. Additionally, we
determined tha t test subjects sat repeatably in the four reference postures (upright, slouching,
leaning forward, and leaning back), which aided in the identification process. The subjects’ re
peatability allowed for the easy computation of the MSE threshold for the upright posture. This
threshold remained the same for all 10 test subjects, and was adequate for signaling the activation
of vibrotactile feedback.
We have also successfully shown the effectiveness of haptic feedback for coaching motor behavior
in the form of seated posture. When there was no feedback, a subject’s natural working posture
was slouching or leaning back in the chair. When the vibrotactile feedback was turned on, all
of the subjects were able to sense the feedback and correctly respond to the guidance. During
these feedback enabled phases, subjects received sporadic “buzzes” to guide them into the desired
posture. When feedback was temporarily disabled without the subject’s knowledge, they continued
to sit in the desired posture, or close to the desired posture. This leads us to conclude that only
intermittent feedback is required to cause a subject to sit for a period of time in a desired posture.
Our current study makes two contributions based on multiple resource theory and prior seat
sensing research. First, we have designed and evaluated a low-cost, low-complexity system, and
have developed a method for computing the magnitude of error from a reference pose. This method
requires a short calibration procedure, and the system uses a continuously valued error signal indi
cating the degree of match rather than a binary match. Second, we have designed and implemented
a haptic feedback system that guides individuals to a reference posture using continuously variable,
real-time feedback. The feedback is zero or very small when the errors are small and becomes more
intense when deviations are larger.
In conclusion, we have demonstrated tha t vibrotactile feedback can be an effective means of
31

communicating musculoskeletal commands to the human sensory-motor system. Furthermore, the
results of this study can be extended to apply to the domain of physical training and rehabilitation.
32

C hapter 4
Task Interference from
R esponding to V ib rotactile
P osture Feedback G uidance
4.1 O verview
This chapter investigates the level of task interference from responding to vibrotactile posture
feedback while performing standard office tasks. In the previous chapter, we have shown th a t all
subjects sat in the upright posture more often when feedback was enabled than when feedback was
disabled, demonstrating that vibrotactile feedback was effective for improving both performance
and longer term training in sensory-motor tasks.
This chapter builds on our work in Chapter 3 to refine the design of a vibrotactile posture
feedback chair. We now aim to characterize the amount of task interference tha t our feedback chair
imposes on the user. The dual-task methodology is often used to assess task interference [15]. Since
we are trying to simulate an office setting, we aim to evaluate the performance degradation of a
typing task while the user is simultaneously responding to posture guidance.
33
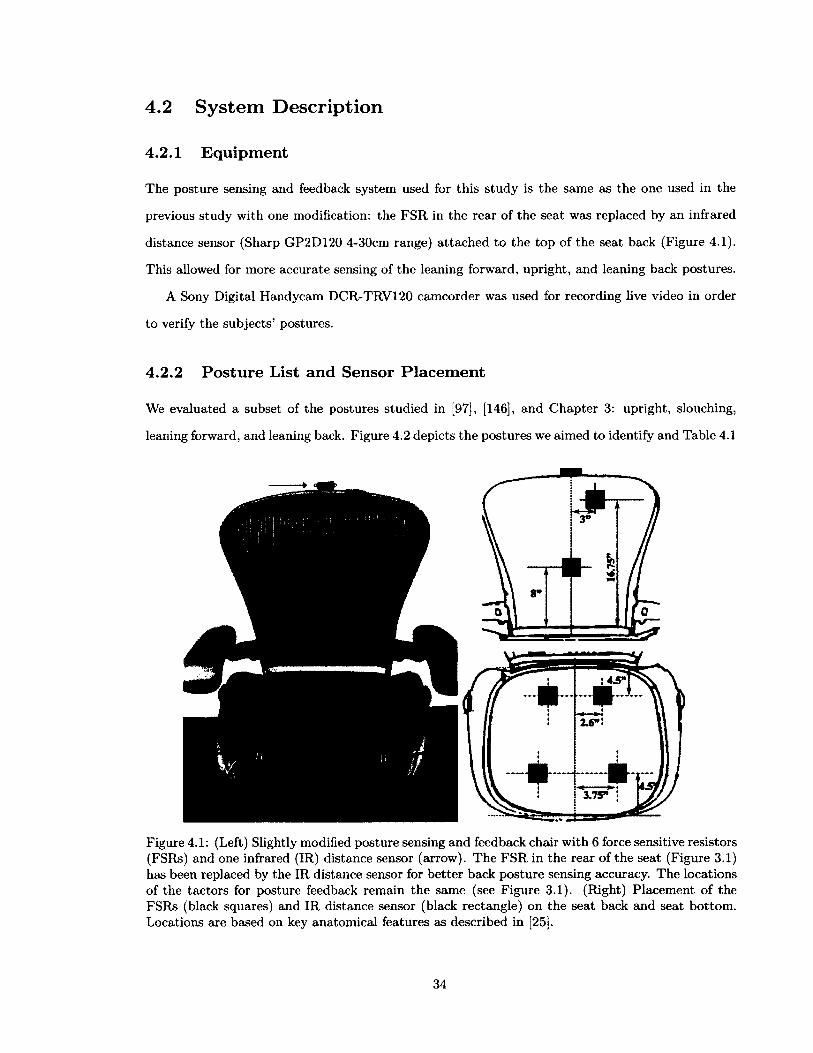
4.2 System D escription
4.2.1 Equipment
The posture sensing and feedback system used for this study is the same as the one used in the
previous study with one modification: the FSR in the rear of the seat was replaced by an infrared
distance sensor (Sharp GP2D120 4-30cm range) attached to the top of the seat back (Figure 4.1).
This allowed for more accurate sensing of the leaning forward, upright, and leaning back postures.
A Sony Digital Handycam DCR-TRV120 camcorder was used for recording live video in order
to verify the subjects’ postures.
4.2.2 Posture List and Sensor Placem ent
We evaluated a subset of the postures studied in [97], [146], and Chapter 3: upright, slouching,
leaning forward, and leaning back. Figure 4.2 depicts the postures we aimed to identify and Table 4.1
3.75” ;
Figure 4.1: (Left) Slightly modified posture sensing and feedback chair with 6 force sensitive resistors (FSRs) and one infrared (IR) distance sensor (arrow). The FSR in the rear of the seat (Figure 3.1) has been replaced by the IR distance sensor for better back posture sensing accuracy. The locations of the tactors for posture feedback remain the same (see Figure 3.1). (Right) Placement of the FSRs (black squares) and IR distance sensor (black rectangle) on the seat back and seat bottom. Locations are based on key anatomical features as described in [25].
34

Figure 4.2: An example of each posture to be identified in this study: 1. upright, 2. slouching, 3. leaning forward, 4. leaning back.
Table 4.1: Description of each of the four postures to be identified
P o s tu r e D e s c r ip t i o n
u p rig h t lo rd o tic lu m b ar cu rve , b ack an d th ig h a re a t ap p ro x im a te ly 90°
slouching k y p h o tic lu m b ar curve, h u n ch ed over
lean ing forw ard back s tra ig h t an d a p p ro x im a te ly 15°-30° from v ertica l
lean ing back back re s tin g on se a t back , re laxed
provides definitions of each posture. The choice of sensor placement is described in the previous
chapter.
4.2.3 Posture Sensing and Feedback A lgorithm
The mathematics of the posture identification algorithm is explained in the previous chapter. Even
though the seventh FSR has been replaced by a distance sensor, the same algorithm can be used
to compute the mean-squared error (MSE) from the voltage readings.
The posture feedback system guides the subject into three different postures: upright, leaning
forward, and leaning back. (Subjects are not guided into the slouching posture as it is an unhealthy
posture.) As explained in Section 3.3.3, the posture feedback algorithm calculates the MSE in
real-time and activates haptic feedback when the MSE rises above a certain threshold. A threshold
of 0.08V was selected empirically from previous experiments. Feedback is provided through the
vibration of the tactors at variable intensities proportional to the amount of error at each sensor.
At the onset of the feedback, the vibration intensity is also proportional to the elapsed time.
This creates the effect of a gradually increasing vibration intensity to “gently” notify the subject
(similar to an increasing volume alarm clock to gently wake up a person). The maximum feedback
intensity may be adjusted by each test subject based on personal preference prior to the start of
the experiments.

Table 4.2: Location of vibration, cause, and required motor action to properly respond to feedback guidance and eliminate vibrations. Unlike in Table 3.2, tactors vibrate sequentially depending on location of the most likely postural error. Additionally, leaning forward and leaning back directionality is encoded through continuous and pulsing vibrations on the shoulders.
V i b r a t i n g t a c t o r lo c a t io n ( s )
C o n t in u o u s o r p u l s a t i n g
A c t io n r e q u i r e d t o e l im in a t e v i b r a t i o n
L um bar C on tinuous S u b je c t is likely slouching, need to s it u p a n d red u ce lu m b ar c o n ta c t w ith back o f ch a ir
L eft an d righ t shou lders
C on tinuous S u b je c t is lean in g back to o m uch, need to m ove aw ay from back o f ch a ir (i.e. s it u p r ig h t o r lean forw ard)
L eft an d righ t shou lders
P u lsa tin g S u b je c t is lean in g forw ard to o m uch , need to lean back to w ard s th e back of th e c h a ir (i.e. s it u p r ig h t o r lean back)
L eft th ig h only C ontinuous L eft leg is lifted o r m oved aw ay from c e n te r o f se a t, need to p u t leg dow n or m ove to w ard s c en te r o f sea t
R ig h t th ig h only C on tinuous R ig h t leg is lifted o r m oved away from th e c e n te r of se a t, need to p u t leg dow n or m ove to w ard s c en te r o f se a t
The location of the vibration corresponds closely to the region of the body where a sensory-
motor action is needed. For example, if the tactor in the lumbar region vibrates, typically the
subject is slouching, so the correct action would be to straighten the spine, decreasing the pressure
on the lumbar sensor. Table 4.2 lists the location of the vibration and the corresponding required
motor action. The feedback mapping was designed with the intent of being intuitive so th a t subjects
would be able to quickly learn the mapping.
4.2.4 Typing Program
We developed our own typing program in order to gain access to detailed typing data. This simple
program records the timestamp of each correct keystroke (Figure 4.3). The typing program is
modeled after Typing Tutor 7. During each test, a short passage (mean 155 words, 882 characters)
is presented on the screen. Test subjects are instructed to type the passage verbatim. Only correct
keystrokes are recorded, i.e. incorrect keystrokes and backspaces do not display on the screen.
After every 60 seconds, regardless of how far the subject has typed within the passage, the screen
refreshes with a new passage. The passages refresh a total of 5 times for a 5-minute typing test.
This refresh rate is chosen to prevent scrolling during the 5-minute test. The passages are designed
to be long enough that someone typing less than 150 words per minute (wpm) will not be able
to complete the entire passage in one minute. Each test duration is chosen to be 5 minutes as a
compromise between typing fatigue and the number of feedback opportunities.
36
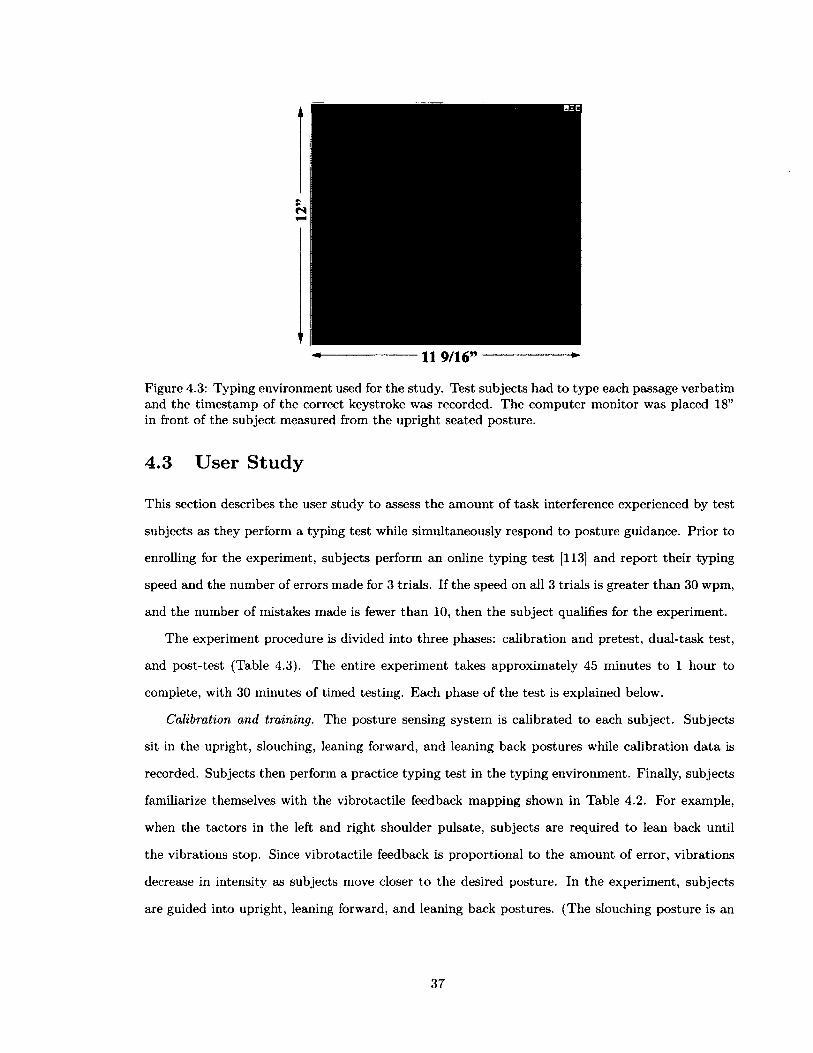
11 9/16”
Figure 4.3: Typing environment used for the study. Test subjects had to type each passage verbatim and the timestamp of the correct keystroke was recorded. The computer monitor was placed 18” in front of the subject measured from the upright seated posture.
4.3 User Study
This section describes the user study to assess the amount of task interference experienced by test
subjects as they perform a typing test while simultaneously respond to posture guidance. Prior to
enrolling for the experiment, subjects perform an online typing test [113] and report their typing
speed and the number of errors made for 3 trials. If the speed on all 3 trials is greater than 30 wpm,
and the number of mistakes made is fewer than 10, then the subject qualifies for the experiment.
The experiment procedure is divided into three phases: calibration and pretest, dual-task test,
and post-test (Table 4.3). The entire experiment takes approximately 45 minutes to 1 hour to
complete, with 30 minutes of timed testing. Each phase of the test is explained below.
Calibration and training. The posture sensing system is calibrated to each subject. Subjects
sit in the upright, slouching, leaning forward, and leaning back postures while calibration data is
recorded. Subjects then perform a practice typing test in the typing environment. Finally, subjects
familiarize themselves with the vibrotactile feedback mapping shown in Table 4.2. For example,
when the tactors in the left and right shoulder pulsate, subjects are required to lean back until
the vibrations stop. Since vibrotactile feedback is proportional to the amount of error, vibrations
decrease in intensity as subjects move closer to the desired posture. In the experiment, subjects
are guided into upright, leaning forward, and leaning back postures. (The slouching posture is an
37

Table 4.3: Test sequence for this study
P h a s e T im e L im i t T r ia ls
C a lib ra tio n a n d tra in in g 15-25 m in 1
P re te s t ( typ ing only, th e n feedback only) 5 m in each 1
D u a l- ta sk ( typ ing w ith feedback) 5 m in each 3
P o s t- te s t ( ty p in g only) 5 m in 1
unhealthy posture and subjects are not guided to it.)
Pretest. Each subject’s baseline typing speed is measured while the feedback is disabled. A
second test measures the subject’s baseline reaction time while the typing test is disabled. We
define reaction time as the time it takes the subject to respond to the feedback and turn off the
vibrations.
Dual-task test (DT). Subjects perform 3 trials of this test. In each trial, subjects type for
5 minutes while responding to vibrotactile posture feedback. The feedback guides the subject
to a randomly assigned posture (upright, leaning forward, or leaning back) approximately every
30 seconds. If within each 30-second interval the subject deviates from the desired posture, the
vibrations start again. Posture data is collected and feedback is updated four times per second.
Subjects are told to maintain their normal typing speed. Their typing speed and reaction times are
recorded.
Post-test. In this final phase, vibrotactile posture feedback is turned off and subjects’ typing
speed is measured again for a final 5-minute typing test.
Prior to the start of the experiment, subjects are instructed to empty their pockets, as objects
in the rear and side pockets may substantially alter the pressure mapping. They are also instructed
to adjust the seat height and armrest height until their feet are flat on the floor and their thighs
are parallel to the ground per the proper seating guidelines presented in Appendix B.
4.4 R esu lts
A total of 20 subjects (14 male, 6 female) participated in this study. The mean age and standard
deviation of the subjects was 25±3.2 years, with an average weight of 71.6±17.7kg and height of
172±9.3cm. Sixteen of the 20 were observed to be touch-typists, while 4 were hunt-and-peck typists.
Regardless of typing style, all test subjects were able to type faster than 35 wpm.
38

Mean typing speed and confidence interval for two categories of subjectssignificant difference in typing performance no significant difference in typing performance
pre-test
DT trial 1
DT trial 2
DT trial 3
post-test
200 300average typing speed (cpm)
150average typing speed (cpm)
250
Figure 4.4: A representative plot of typing performance from two subjects illustrating two categories of results: (left) 55% of subjects experienced statistically significant decrease in typing speed between the single-task (pre- and post-test) trials and the dual-task (DT) trials 1-3, although 90% of subjects experienced some amount of typing performance degradation. The plot on the left also highlights improvement across DT trials (70% of subjects) whereas the plot on the right shows no such consistent improvement (remaining 30% of subjects). Bolded lines indicate pre- and post-test trials. For all subjects, there were no statistically significant differences between their pre- and post-test typing speed.
S«Time betw een keystrokes and tactor activation level
- factor activation level (normalized) ■ At betw een keystrokes (3pt avg)
< 0240 250 260 270 280
elapsed time (sec)290 300
Figure 4.5: An illustrative plot from one test subject showing time between keystrokes and tactor activation level for the last minute in a five-minute test. Tactor activation level is offset for better clarity in the plot. For this subject, as well as many others, as soon as the tactor activated, the subject paused or stopped typing to respond to postural guidance, and resumed typing shortly after the vibrations stopped.
39

Typing speed. We define average typing speed as characters per minute (cpm), and instantaneous
typing speed as characters per second (cps). The timestamp of each correctly typed character was
recorded and the typing speeds were computed after the experiment
We define statistical significance as p < 0.05. We found tha t none of the subjects showed a
significant difference in mean typing speed between the pretest and post-test phases. The median
change in typing speed from pretest to post-test was +0.8cpm (+0.21%). Due to the wide variability
in typing performance from subject to subject, the median was chosen to be the more reliable
indicator.
A one-way ANOVA was performed on average typing speed for each subject, comparing pretest,
DT trials 1-3, and post-test typing speeds. We found tha t 55% of the subjects exhibited a signifi
cantly lower mean typing speed during DT trials 1-3 versus the pre- and post-tests (an example of
subjects in this category is shown in Figure 4.4, left). In total, 90% of the subjects showed some
amount of decrease in mean typing speed between the pre- and post-tests and the DT trials. The
median decrease in speed from the combined pre- and post-tests to the combined DT trials was
33.1cpm, while the median percentage speed decrease was 14.6%.
A snapshot of time between keystrokes and feedback level from one test subject is shown in
Figure 4.5. Notice that when the feedback was on, the time between keystrokes often increased.
This can be attributed to the subject focusing on adjusting his posture to stop the vibrations
at the cost of typing slowly or stopping the typing altogether. Sometimes when the subject has
successfully turned off the vibrations, his time between keystrokes may have remained high. This
was due to the fact tha t he had lost his place in the passage and needed tim e to refocus on the typing
task after the disruption. (Some subjects, such as the one whose data is shown in Figure 4.5, had
trouble maintaining the desired posture through-out the 30-second interval. Vibrotactile feedback
was triggered to guide the subject into the desired posture once again.)
We also found that 70% of the subjects exhibited a performance improvement from DT trials
1 through 3 (Figure 4.4, left). However the improvement was statistically significant for only one
of the subjects. The median speed increase for all subjects from DT trial 1 to trial 3 was 25.7cpm
(12.3%).
Finally, over half of the subjects in total exhibited a statistically significant difference in mean
typing speed when analyzed by posture (DT trials 1-3 combined). Relative to the leaning forward
posture, 20% of the subjects exhibited a significant speed increase for the upright body orientation
40

(range: +14.0% to +59.5%). Meanwhile 45% of the subjects displayed a significant speed decrease
in the leaning back posture (range: -11.5% to -34.6%). This implies that some postures could be
sat in or guided into more easily while typing than others. In fact, almost all of the test subjects
expressed difficulties in maintaining the leaning forward and leaning back postures while typing.
Reaction time. In Section 4.3, we have defined reaction time as the time it takes subjects to
respond to the feedback and turn off the vibrations. When comparing the vibration pretest with
the DT trials, we found that 30% of the subjects required significantly longer times to successfully
respond to the vibrations by shifting their postures. The median reaction time for the vibration
pretest was 3.250 seconds while the median reaction times for DT trials 1, 2, and 3 were 4.031,
4.500, 4.000 seconds, respectively. This result agrees with the prediction of faster response times in
single-task performance than dual-task performance. It is promising tha t in the dual-task scenario,
the reaction time increased by less than 2 seconds.
We expected the time required to move from one posture to another to be correlated with
the required displacement of the body. Adjusting between the leaning forward and leaning back
postures requires the largest change in body position, while adjusting between the upright and
leaning forward postures requires the smallest change. When all of the subjects da ta were grouped
together and analyzed by posture transition, we found tha t the leaning back posture resulted in the
longest transition time, meanwhile moving into the upright and lean-ing forward postures required
approximately the same amount of time. Table 4.4 lists the median transition times for each posture
for all DT trials for all subjects combined.
Even though subjects’ typing performance improved over the course of the three DT trials, we
also found no correlation (R 2 < 0.11) between reaction time and the total amount of time using
the system (vibration pretest and DT trials).
Table 4.4: Median time to respond to feedback, all subjects combined. Some postures were easier to move into than others while simultaneously typing.
Posture Transition Median Time
Leaning forw ard to u p rig h t 3.250 sec
Lean ing b ack to u p rig h t 3.750 sec
U prigh t to lean ing forw ard 3.250 sec
Lean ing back to lean in g forw ard 3.735 sec
U prigh t to lean ing back 5.250 sec
Lean ing forw ard to lean ing back 5.571 sec
41
4.5 D iscussion and L im itations
The decrease in typing performance experienced by 90% of the test subjects indicates that the
current vibrotactile posture feedback system is disruptive and takes the subject’s concentration
away from the typing task (i.e. induces a higher mental load). This also suggests that, while
subjects claim to have learned the feedback mapping during the training phase, the mapping is still
rule- or knowledge-based and has not become skill-based [117, 118]. In other words, the feedback
mapping is still unfamiliar and requires a certain amount of mental processing to respond correctly.
However it is encouraging that 70% of the subjects showed an improvement in typing performance
over the course of the 3 DT trials. This implies that, over time, the feedback mapping may become
skill-based and automatic, thus imposing lower mental workload on the user.
The disruptive nature of vibrotactile feedback points to an opportunity for context-sensitive
feedback (see Chapter 11); future work may enable a system to infer a user’s mental load and only
interrupt the user when he is not highly focused on the primary task. The perceived disruption
and annoyance of vibrotactile feedback also motivates us to evaluate other feedback mechanisms
for posture guidance (see Chapters 6 and 7). Visual displays and acoustic feed-back aside, other
possible methods include non-audible force feedback mechanisms that gently push (or pull) the users
back for posture guidance. (This mechanism may be similar to that of a massage chair.) Because
such a system delivers soft nudges (or tugs), it may cause less disruption to the user corn-pared
with vibrotactile feedback.
There was no significant correlation between reaction time and the elapsed time of the test.
This result may be attributed to the reaction time particular to each test subject, and therefore
does not necessarily increase or decrease over the course of the experiment. Additionally, in this
short experiment, subjects may not have had time to adequately internalize the feedback mapping
and therefore were at the higher bound-aries of their reaction time. A longer study over a period of
several days or weeks may be needed to see a more substantial improvement in both the subjects
reaction time as well as typing performance.
4.6 Conclusion
The goal of this study was to understand the level of task disruption that our vibrotactile posture
feedback chair imposed on the office worker. We have shown that for more than half of the test
42

subjects, responding to a change in posture command from our feedback chair imposed a statistically
significant task interference. However, over the course of three dual-task trials of typing with
vibrotactile feedback, most of the subjects showed improvement in their typing performance. Our
previous research showed that subjects were able to maintain a desired position for at least five
minutes even when the feedback system was disabled (Chapter 3). Together, these two studies
suggest that the current implementation of of vibrotactile feedback causes substantial primary task
disruption, and also initiating changes in posture too frequently is likely to be disruptive. However,
subjects can improve their compliance to a given posture over time as well as the speed with which
they can react to changes in the reference posture.
43
C hapter 5
Com parison o f V isual and
V ibrotactile Feedback M eth od s for
Seated P osture G uidance
5.1 O verview
This chapter presents an extension of our work in Chapters 3 and 4: here, we compare the effective
ness of vibrotactile and visual feedback methods for guiding seated postures. For visually dominant
office work such as typing on the computer, we presume that delivering posture feedback visually
may overload the visual sense while haptic feedback may be a viable alternative. We perform two
experiments to evaluate this assumption. The rest of the chapter describes a posture feedback
system that uses either vibrotactile or visual feedback to guide the posture of a seated typist, and
compares the effects of each type of feedback on both posture compliance and typing performance.
5.2 System D escription
5.2.1 Posture Specification
In this research, our intent was to effectively distinguish between and guide subjects to four reference
postures: upright, slouching, leaning forward, and leaning back. These were the same set of postures
44
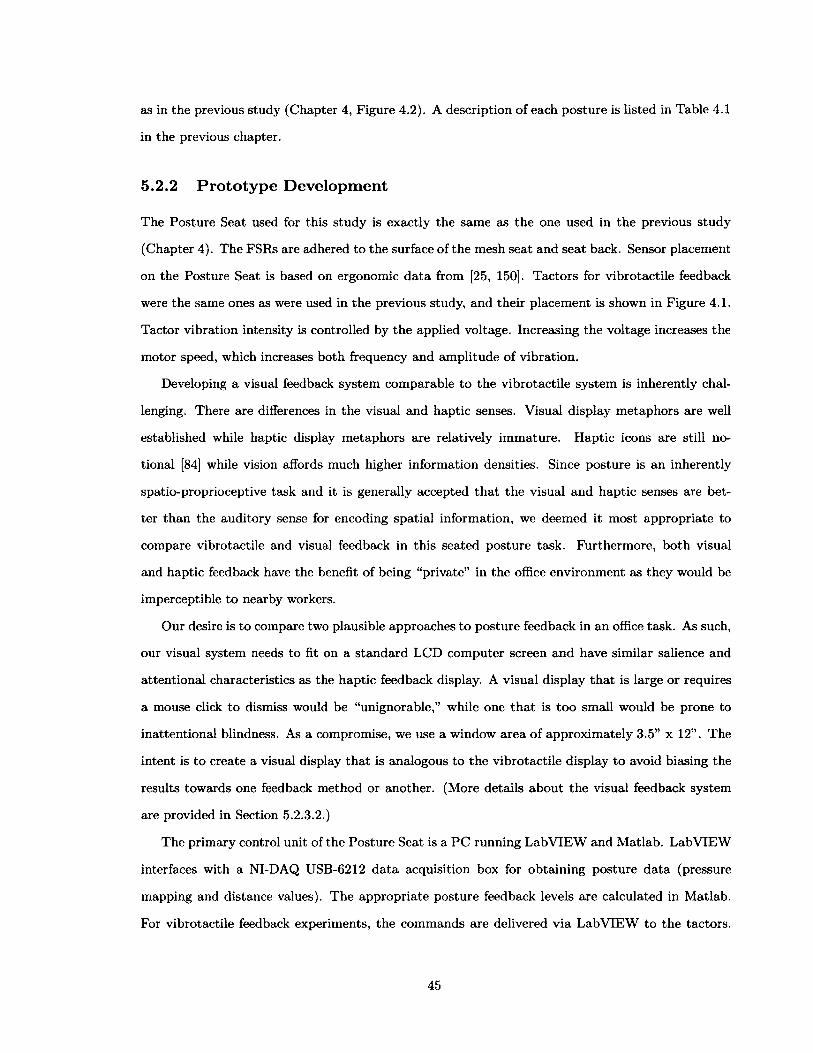
as in the previous study (Chapter 4, Figure 4.2). A description of each posture is listed in Table 4.1
in the previous chapter.
5.2.2 Prototype Developm ent
The Posture Seat used for this study is exactly the same as the one used in the previous study
(Chapter 4). The FSRs are adhered to the surface of the mesh seat and seat back. Sensor placement
on the Posture Seat is based on ergonomic data from [25, 150]. Tactors for vibrotactile feedback
were the same ones as were used in the previous study, and their placement is shown in Figure 4.1.
Tactor vibration intensity is controlled by the applied voltage. Increasing the voltage increases the
motor speed, which increases both frequency and amplitude of vibration.
Developing a visual feedback system comparable to the vibrotactile system is inherently chal
lenging. There are differences in the visual and haptic senses. Visual display metaphors are well
established while haptic display metaphors are relatively immature. Haptic icons are still no
tional [84] while vision affords much higher information densities. Since posture is an inherently
spatio-proprioceptive task and it is generally accepted tha t the visual and haptic senses are bet
ter than the auditory sense for encoding spatial information, we deemed it most appropriate to
compare vibrotactile and visual feedback in this seated posture task. Furthermore, both visual
and haptic feedback have the benefit of being “private” in the office environment as they would be
imperceptible to nearby workers.
Our desire is to compare two plausible approaches to posture feedback in an office task. As such,
our visual system needs to fit on a standard LCD computer screen and have similar salience and
attentional characteristics as the haptic feedback display. A visual display tha t is large or requires
a mouse click to dismiss would be “unignorable,” while one th a t is too small would be prone to
inattentional blindness. As a compromise, we use a window area of approximately 3.5” x 12” . The
intent is to create a visual display tha t is analogous to the vibrotactile display to avoid biasing the
results towards one feedback method or another. (More details about the visual feedback system
are provided in Section 5.2.3.2.)
The primary control unit of the Posture Seat is a PC running Lab VIEW and Matlab. Lab VIEW
interfaces with a NI-DAQ USB-6212 data acquisition box for obtaining posture data (pressure
mapping and distance values). The appropriate posture feedback levels are calculated in Matlab.
For vibrotactile feedback experiments, the commands are delivered via Lab VIEW to the tactors.
45

The tactors are each controlled by a 3kHz PWM voltage between 0-3V using a motor controller
(Castle Creations Pixie-7P), which are run from a servo controller board (Lynxmotion SSC-32). For
visual feedback experiments, feedback is displayed on a 19” LCD computer monitor approximately
18” in front of the user.
5.2.3 Posture Sensing and Feedback Algorithm
The posture identification algorithm computes the mean-squared error (MSE) between calibration
posture sensor values and real-time sensor values and generates a feedback command based on
the magnitude of the MSE. The pressure and distance data are recorded as voltages. The sensing
and feedback algorithms are the same as in Chapter 3. The posture MSE threshold, H, is chosen
heuristically to maximize identification of independent postures. In this study, H = 0.08V.
The posture feedback algorithm involves calculating the MSE in real-time and activating feed
back when the instantaneous MSE (M i j ( t ), henceforth abbreviated M{t)) rises above the threshold
H. The feedback is provided either through the tactor vibration at variable intensities proportional
to the amount of posture error, or brightening or dimming the round indicators on the visual display.
For the feedback experiments, a feedback activation time delay is incorporated into the system
to allow brief movements away from the desired posture without triggering feedback. The time
delay is encoded as a proportional-integral (PI) gain on M(t) , where K p = 1 and K] = 1 / (sampling
frequency). If the cumulative MSE Ei j ( t ) (henceforth abbreviated E(t)) rises above a threshold
g for a period of time, vibrotactile or visual feedback will be enabled (a(t)). In discrete time, the
cumulative MSE can be determined by
£(0) = 0. Therefore a(0) = 0 as well. The threshold g is empirically set to 1.00, which corresponds
to several seconds of allowable posture deviation before feedback turns on.
E(t) =0 for M(t ) < h
K pM(t ) + K j E ( t - 1) for M(t ) > h(5.1)
and whether or not feedback is active is determined by
E(t) < g
E{t) > g(5.2)
The command to the tactors and visual icons is the product of E(t) and a(t). Note tha t at t = 0,
46

5 .2 .3 .1 V ib ro ta c tile feedback
The vibrotactile feedback is designed to deliver location-specific stimuli tha t facilitates localized
adjustments in body orientation. Each of the six tactors is placed such th a t the perceived vibratory
sensation is near the region of the body that should be moved: tactors under the thigh signify thigh
movement, tactors behind the shoulder indicate upper back movement, a tactor in the lumbar
region signifies lower back movement, and a tactor in the seat rear indicates full body movement.
The vibration intensity is proportional to the amount of posture error. As the vibration “volume”
becomes softer, the user is approaching the desired reference posture. The goal state is achieved
when there is no vibration.
Table 5.1 lists the location of the vibration and the corresponding muscle motor action that
needs to be taken. For example, if the tactor in the lumbar region vibrates, typically the person
is slouching, so the correct action is to sit up straight. Similar to Chapter 4, vibrotactile feedback
is delivered sequentially based on the location of the largest postural error in order to minimize
feedback confusion.
Tactor vibration intensity may be increased or decreased but there is no inherent directionality
encoding in the vibration. Thus, we must decide how to differentiate too much pressure from too
little pressure. Anecdotally, we observed tha t some areas of our body had an instinctive repulsive
response to vibration, leading us to believe tha t moving away from vibration might be a relatively
natural response. We used this approach for all of the tactors on the back, increasing the vibration
intensity as the pressure increases above the reference value. Conversely, when the pressure was
too low, the tactors pulsed instead of vibrating continuously.
Table 5.1: Vibrotactile feedback mapping: location of vibration, cause, and required motor action
Vibrating Tactor Location(s)
Possible Improper Body Orientation
Action Required to Eliminate Vibration
lu m b ar slouching sit up
rea r o f sea t lean ing fo rw ard o r n o t s it t in g all th e way back in th e ch a ir
s it back to w ard s u p r ig h t, o r s it all th e w ay back in to th e ch a ir
left th ig h only left leg lifted o r crossed over righ t
p u t le ft leg dow n
righ t th ig h only rig h t leg lifted o r crossed over left
p u t r ig h t leg dow n
left an d r ig h t shoulders, con tinuous
lean ing back lean forw ard to w ard s u p rig h t
left an d r ig h t shoulders, p u lsa tin g
lean ing forw ard lean back to w ard s u p rig h t
47

For the leg tactors, an unexpected behavior was observed. Participants in the preliminary testing
seemed to initially press down with the leg when they felt a continuous vibration. Rather than
work against instinctive responses, we reversed the mapping for the legs, with continuous vibration
signaling too little pressure and pulsing signaling too much pressure. Although the mixture of
continuous and pulsating feedback is inconsistent for the seat bottom and seat back, it appeared to
be more natural for subjects.
5 .2 .3 .2 V isu a l feedback
The visual feedback system is comprised of an icon to signify the current desired posture and six
spatially located color changing round indicators to communicate the location and magnitude of
the posture errors. As mentioned earlier, the size and dual nature of the display was selected so as
to maintain salience while allowing the subject to continue typing.
At the top of the visual feedback window (Figure 5.1), a stick figure icon depicts the desired
posture when the feedback is active, and disappears when the subject successfully sits in that
posture. (The 3 different icons are shown in Figure 5.2.) Below the icon, six round indicators are
overlaid on the graphic corresponding to a person’s back and thighs, thus preserving the spatial
location of the tactors. The colored indicators become more grey when the error is small, and
become more red or blue when error is large. The brightness of the colored indicators is directly
proportional to the amount of posture error. Indicators on the back turn bright red when there is
too much pressure on the sensors (when guiding to upright and leaning forward postures), and they
turn bright blue when there is not enough pressure (when guiding to the leaning back posture).
Indicators on the thighs turn red when there is not enough pressure on the sensors. This mapping
mimics the vibrotactile system; based on the inconsistent mapping th a t subjects demonstrated with
the vibrotactile feedback, we chose to maintain the same directional bias with the visual system.
The visual feedback graphic occupies approximately 23% of the screen, small enough so th a t it
does not affect the available screen area for the primary typing task, yet large enough for the viewer
to notice changes. We deliberately avoid pop-up windows tha t require mousing actions since the
vibrotactile system does not require users to move their hands from the keyboard. For the same
reason, screen scrolling is disabled for the typing tasks.
The required muscle motor actions for each feedback location are shown in Table 5.2. Notice
that this mapping is similar to the vibrotactile feedback mapping in Table 5.1.
48

a r c
N |
15”
**9* §
on e o f three postu re cues
m
I *■ m
- 3- 7/ 16”
! 0 ' . 1: 1 > v. !
C i '
VISUALFEED BA CK
PA N E
Figure 5.1: Monitor occupied by typing environment and visual feedback pane. Monitor was placed 18” in front of the subject as measured from the upright seated posture.
Figure 5.2: One of these three icons may appear at the top of the visual feedback pane to guide user into that reference posture.
Table 5.2: Visual feedback mapping: location of indicators, cause, and required motor action. This was designed to be a “visual equivalent” of the vibrotactile feedback mapping.
Indicator Location(s) Color Possible Improper Body Orientation
Action Required to Dim Indicator
lu m b ar red slouching sit up
shou ld e rs , lu m b ar, an d lower back
red lean ing back lean fo rw ard aw ay from th e back o f th e cha ir
shou lders blue lean ing forw ard lean back to w ard s th e back of th e ch a ir
left th ig h only red left leg lifted o r crossed over r ig h t
p u t left leg dow n
rig h t th ig h only red r ig h t leg lifted o r crossed over left
p u t r ig h t leg dow n
5.3 U ser Studies
This section describes the procedures for two experiments th a t were performed using vibrotactile
and visual feedback for seated posture guidance. The first experiment evaluated the effectiveness
49

of each feedback method to achieve postural compliance (Section 5.3.2). The second experiment
assessed the performance effects of responding to posture feedback while simultaneously performing
a standard office task (typing) (Section 5.3.3).
5.3.1 Setup and Preparation
Prior to the start of all experiments, subjects were instructed to empty their pockets as objects
in the rear and side pockets can shift, resulting in erroneous pressure readings. They were also
asked to adjust the seat height and armrest height until their feet rested flat on the floor, their
thighs became parallel to the ground, and their forearms were approximately horizontal. Cameras
recorded live video or still images of the subjects’ seated postures. The images were used as a visual
reference to verify that subjects indeed sat in the posture recorded by the chair sensors.
5.3.2 Posture Compliance
In this experiment, we examined whether subjects sat in an upright posture while working on a
computer, both with and without posture feedback. Subjects were instructed to sit in a comfortable
working position in the chair while doing their own work (e.g. checking email, surfing the web,
etc.). The system was used to take calibration readings for 4 different postures: upright, slouching,
leaning forward, and leaning back. After calibration, participants were given practice time to learn
the feedback mapping per Table 5.1 or Table 5.2. Training ended when the user verbally confirmed
his familiarity and comfort with responding to the feedback. Subjects typically felt comfortable
with the system after 3-5 minutes of practice.
The vibrotactile feedback group performed trials on two separate days for 45 minutes each, for
a total of 2 trials. Results from the vibrotactile group showed no learning over the two-day period,
so we ran only one trial with the visual feedback group. During each 45-minute trial, the system
operated in one of 2 modes: Unguided mode and Guided mode.
When operating in the Guided mode, we aimed to provide feedback in a manner tha t would
be tolerable during extended use. Providing too much feedback is likely to be disruptive while
providing too little is likely to be ineffective.
We considered two approaches. The first approach was to set the threshold for the feedback
higher so that the system would be active less often. The second approach was to set the threshold
lower and disable the feedback periodically. This encourages subjects to assume the reference pos
50
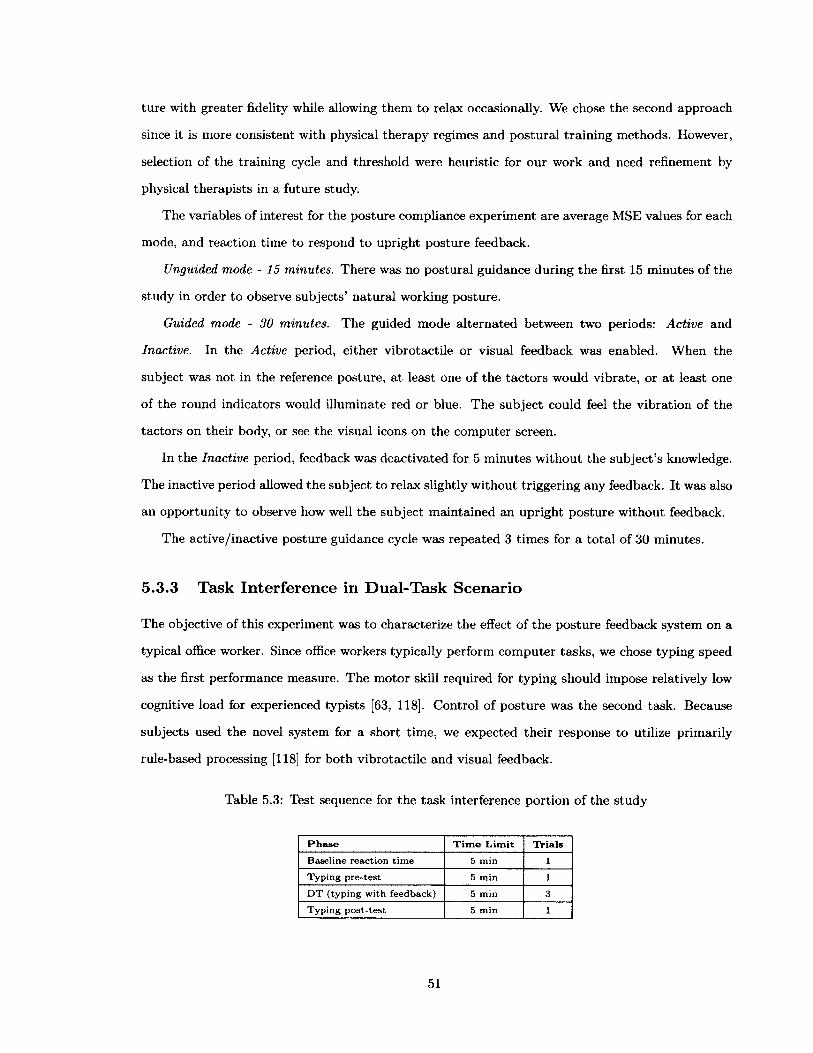
ture with greater fidelity while allowing them to relax occasionally. We chose the second approach
since it is more consistent with physical therapy regimes and postural training methods. However,
selection of the training cycle and threshold were heuristic for our work and need refinement by
physical therapists in a future study.
The variables of interest for the posture compliance experiment are average MSE values for each
mode, and reaction time to respond to upright posture feedback.
Unguided mode - 15 minutes. There was no postural guidance during the first 15 minutes of the
study in order to observe subjects’ natural working posture.
Guided mode - 30 minutes. The guided mode alternated between two periods: Active and
Inactive. In the Active period, either vibrotactile or visual feedback was enabled. When the
subject was not in the reference posture, at least one of the tactors would vibrate, or a t least one
of the round indicators would illuminate red or blue. The subject could feel the vibration of the
tactors on their body, or see the visual icons on the computer screen.
In the Inactive period, feedback was deactivated for 5 minutes without the subject’s knowledge.
The inactive period allowed the subject to relax slightly without triggering any feedback. It was also
an opportunity to observe how well the subject maintained an upright posture without feedback.
The active/inactive posture guidance cycle was repeated 3 times for a total of 30 minutes.
5.3.3 Task Interference in Dual-Task Scenario
The objective of this experiment was to characterize the effect of the posture feedback system on a
typical office worker. Since office workers typically perform computer tasks, we chose typing speed
as the first performance measure. The motor skill required for typing should impose relatively low
cognitive load for experienced typists [63, 118]. Control of posture was the second task. Because
subjects used the novel system for a short time, we expected their response to utilize primarily
rule-based processing [118] for both vibrotactile and visual feedback.
Table 5.3: Test sequence for the task interference portion of the study
P h a s e T im e L im i t TY ials
B aseline reac tio n tim e 5 m in 1
T y p ing p re -te s t 5 m in 1
D T (ty p in g w ith feedback) 5 m in 3
T y p ing p o s t- te s t 5 m in 1
51
We screened participants for an adequate level of typing proficiency through an online typing
test [113]. In order to qualify for this task interference experiment, subjects needed to demonstrate
that their average typing speed was greater than 30 wpm. Additionally, the number of mistakes
per trial of the 75-word typing test needed to be fewer than 10.
Participants performed a typing test to familiarize themselves with the typing environment.
Figure 5.1 in Section 5.2.3.2 shows the typing environment along with the visual feedback posture
guidance (this is the same typing program that was used in Chapter 4). They were also provided
a short training period to learn the vibrotactile or visual feedback mapping described in Table 5.1
or Table 5.2, respectively. Feedback was proportional to the mean-squared error from the reference
posture; vibrations or brightness of the indicators decreased in intensity as subjects moved closer
to the reference posture. In contrast to the posture compliance experiment, this experiment guided
subjects into three postures: upright, leaning forward, and leaning back.
The experimental procedure was divided into three phases: pretest, dual-task test, and post-test
(Table 5.3). The variables of interest are typing speed, time between keystrokes (interkey interval),
and posture transition reaction time.
Pretest. Baseline reaction time to respond to feedback and typing performance were measured
separately. We define reaction time as the time it takes the subject to reach the reference posture
and turn off the feedback.
Dual-task test (DT) For each trial, the subject typed a passage for 5 minutes while simultane
ously responding to vibrotactile or visual posture feedback. The feedback guided the subject to
one of three randomly assigned postures (upright, leaning forward, or leaning back) approximately
every 30 seconds. The subject was told to maintain his normal typing speed while complying with
the posture feedback.
Post-test. In the final phase, posture feedback was turned off and the subject’s typing speed
was measured again for a final 5-minute typing test. This was to measure potential typing fatigue
during the course of the experiment.
5.4 R esults
This section presents the results of the two experiments involving vibrotactile and visual feedback
posture guidance. We define statistical significance as p <0.05.
52
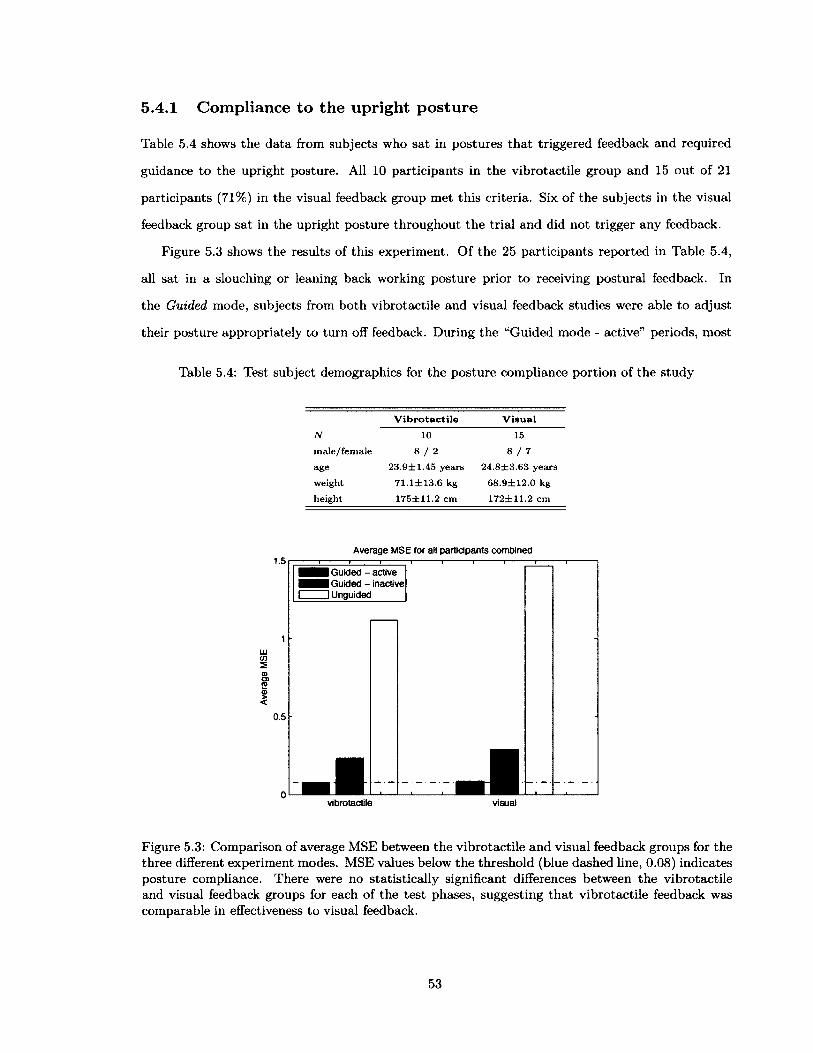
5.4.1 Compliance to the upright posture
Table 5.4 shows the data from subjects who sat in postures tha t triggered feedback and required
guidance to the upright posture. All 10 participants in the vibrotactile group and 15 out of 21
participants (71%) in the visual feedback group met this criteria. Six of the subjects in the visual
feedback group sat in the upright posture throughout the trial and did not trigger any feedback.
Figure 5.3 shows the results of this experiment. Of the 25 participants reported in Table 5.4,
all sat in a slouching or leaning back working posture prior to receiving postural feedback. In
the Guided mode, subjects from both vibrotactile and visual feedback studies were able to adjust
their posture appropriately to turn off feedback. During the “Guided mode - active” periods, most
Table 5.4: Test subject demographics for the posture compliance portion of the study
Vibrotactile Visual
N 10 15
m ale /fem ale 8 / 2 8 / 7
age 2 3 .9 ± 1 .4 5 years 2 4 .8 ± 3 .6 3 years
w eight 71.1 ± 1 3 .6 kg 6 8 .9 ± 1 2 .0 kg
heigh t 175± 11 .2 cm 172± 11 .2 cm
1.5
L Ucn
I0.5
Average MSE for all participants combined
I Guided - active I Guided - inactive ] Unguided
vibrotactile. 1
visual
Figure 5.3: Comparison of average MSE between the vibrotactile and visual feedback groups for the three different experiment modes. MSE values below the threshold (blue dashed line, 0.08) indicates posture compliance. There were no statistically significant differences between the vibrotactile and visual feedback groups for each of the test phases, suggesting tha t vibrotactile feedback was comparable in effectiveness to visual feedback.
53
subjects sat in the reference posture. Some subjects experienced feedback more often than others,
as would be expected.
When feedback was disabled without the users’ knowledge ( “Guided mode - inactive” periods),
all of the subjects initially continued to sit in upright or near-upright postures. However, as time
progressed, most subjects deviated from the upright posture.
At the onset of the next active posture correction cycle, participants in the vibrotactile feedback
study appeared startled when feedback activated and then moved into the desired posture according
to the vibrotactile feedback guidance.
All participants in the visual feedback study experienced inattentional blindness at some point
during the test and therefore did not adjust their posture until they noticed the feedback from the
visual icon. We defined inattentional blindness as not responding to feedback within 10 seconds of
activation. In one instance, one subject took about 170 seconds before reacting to visual feedback.
In post-test interviews, subjects reported th a t they did not deliberately ignore the feedback and
changed their posture as soon as they noticed the feedback.
The mean-squared error from the upright calibration posture (Equation 3.2) was lowest for all
subjects during the Guided mode and and very high for the Unguided mode (Figure 5.3). There
was no statistically significant difference between vibrotactile and visual feedback methods for the
modes (Guided - active: p—0.295, Guided - inactive: p=0.966, Unguided: p=0.193.)
In summary, both vibrotactile and visual feedback methods were equally effective in guiding
posture, although visual feedback appears to be more susceptible to inattentional blindness. In the
absence of any incentives to sit in a particular posture, subjects gravitated towards non-upright
postures. However, even with intermittent feedback, subjects spent significantly more time sitting
in the desired reference posture (upright). All participants were able to achieve each of the reference
postures, thereby turning off the feedback signals.
5.4.2 Task interference in dual-task scenario
A total of 20 people participated in the vibrotactile feedback group while 21 people participated in
the visual feedback group. All subjects were able to type faster than 35 words per minute (wpm)
based on the results of the online typing test [113]. A summary of the test subject demographics is
shown in Table 5.5.
A within-subject ANOVA followed by multiple comparisons test were performed on average
54

typing speed for each subject, comparing pretest, DT (dual-task) trials 1-3, and post-test typing
speeds. We found that 55% of the subjects in the vibrotactile study exhibited a significantly lower
mean typing speed during DT trials 1-3 versus the pre- and post-tests. In comparison, only 43% of
the visual feedback study subjects exhibited a statistically significant typing speed decrease. The
median typing speed decrease between baseline and DT trials was 14.6% for vibrotactile feedback
and 12.6% for visual feedback. There was no statistically significant difference in performance
degradation between the two feedback methods.
For both vibrotactile and visual feedback studies, typing speed improved from DT trial 1 to
trial 3 (Figure 5.4), indicating tha t there was a learning effect for postural guidance. For visual
Table 5.5: Test subject demographics for the task interference part of the study
Vibrotactile Visual
N 20 21
m ale /fem ale 1 4 / 6 10 / 11
age 2 5 .5 ± 3 .2 years 2 5 .7 ± 4 .8 years
weight 7 1 .6 ± 1 7 .7 kg 68 .7 ± 1 3 .1 kg
height 172dt9.3 cm 170± 11 .3 cm
Vibrotactile Feedback Visual Feedback500
400
300
o) 200'5.
100
DT2 DT3DT1 postpre
500
400
■=• 300
o> 200
100
DT2 DT3DT1 postpre
Figure 5.4: Comparison between vibrotactile and visual feedback groups of average typing speed, in characters per minute, for all subjects for each of the phases of testing. Red crosses indicate outliers. DT stands for Dual-task Test. In the vibrotactile feedback group, 55% of the subjects experienced statistically significant typing performance degradation from the single-task trials to the dual-task trials, while 43% of the people in the visual feedback group experienced such. Additionally, 70% of the people in the vibrotactile group experienced typing speed improvement from DT trials 1 through 3, and a comparable 67% of subjects in the visual group experienced typing speed improvement. For both groups, there were no statistically significant differences in typing performance between the single-task pre- and post-test trials.
55
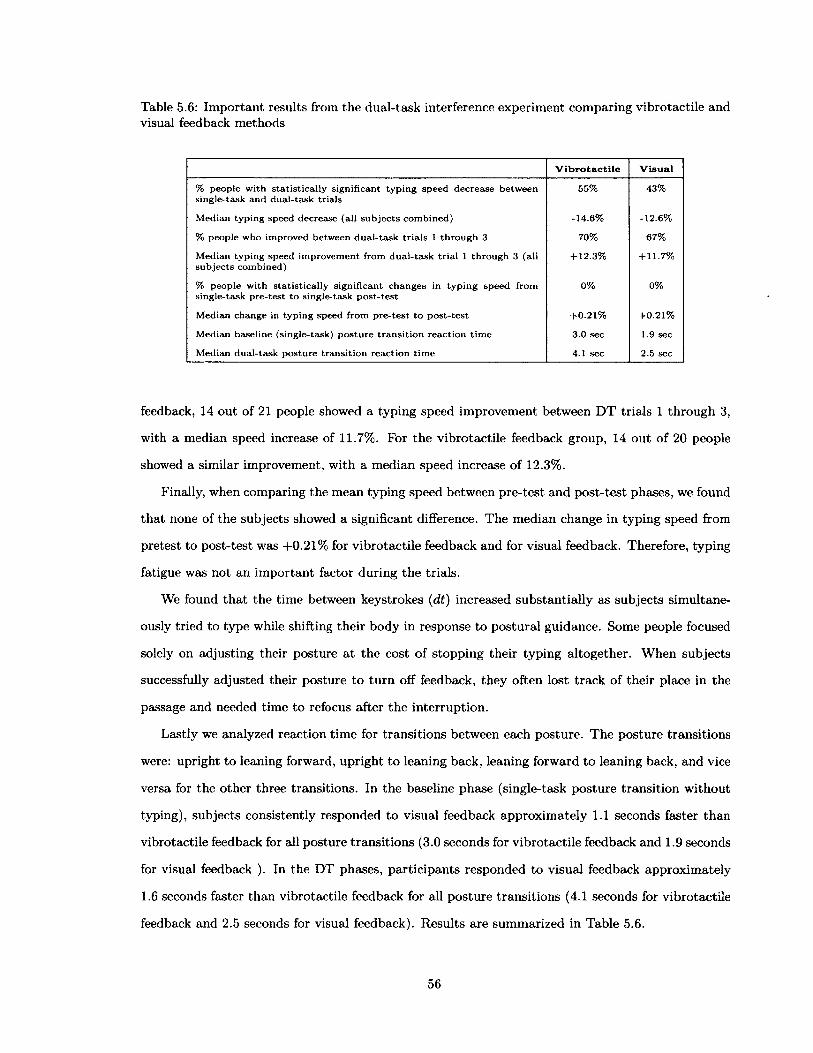
Table 5.6: Important results from the dual-task interference experiment comparing vibrotactile and visual feedback methods
Vibrotactile Visual
% people w ith s ta tis tic a lly s ign ifican t ty p in g speed d ecrease betw een sing le-task an d d u a l- ta sk tr ia ls
55% 43%
M edian ty p in g speed decrease (all su b je c ts com bined) -14.6% -12.6%
% people w ho im proved betw een d u a l- ta sk t r ia ls 1 th ro u g h 3 70% 67%
M edian ty p in g speed im provem ent from d u a l- ta sk tr ia l 1 th ro u g h 3 (all su b je c ts com bined)
+ 12.3% + 11.7%
% people w ith s ta tis tic a lly s ign ifican t ch anges in ty p in g speed from sing le-task p re -te s t to sing le-task p o s t- te s t
0% 0%
M edian change in ty p in g speed from p re -te s t to p o s t- te s t + 0 .21% + 0.21%
M edian baseline (single-task) p o s tu re tra n s i t io n reac tio n tim e 3.0 sec 1.9 sec
M edian d u a l- ta sk p o s tu re tra n s itio n reac tio n tim e 4.1 sec 2.5 sec
feedback, 14 out of 21 people showed a typing speed improvement between DT trials 1 through 3,
with a median speed increase of 11.7%. For the vibrotactile feedback group, 14 out of 20 people
showed a similar improvement, with a median speed increase of 12.3%.
Finally, when comparing the mean typing speed between pre-test and post-test phases, we found
that none of the subjects showed a significant difference. The median change in typing speed from
pretest to post-test was +0.21% for vibrotactile feedback and for visual feedback. Therefore, typing
fatigue was not an important factor during the trials.
We found that the time between keystrokes (dt) increased substantially as subjects simultane
ously tried to type while shifting their body in response to postural guidance. Some people focused
solely on adjusting their posture at the cost of stopping their typing altogether. When subjects
successfully adjusted their posture to turn off feedback, they often lost track of their place in the
passage and needed time to refocus after the interruption.
Lastly we analyzed reaction time for transitions between each posture. The posture transitions
were: upright to leaning forward, upright to leaning back, leaning forward to leaning back, and vice
versa for the other three transitions. In the baseline phase (single-task posture transition without
typing), subjects consistently responded to visual feedback approximately 1.1 seconds faster than
vibrotactile feedback for all posture transitions (3.0 seconds for vibrotactile feedback and 1.9 seconds
for visual feedback ). In the DT phases, participants responded to visual feedback approximately
1.6 seconds faster than vibrotactile feedback for all posture transitions (4.1 seconds for vibrotactile
feedback and 2.5 seconds for visual feedback). Results are summarized in Table 5.6.
56
5.5 D iscussion
We aimed to compare the level of posture compliance and mental workload when responding to vi
brotactile and visual feedback. Our results indicated tha t vibrotactile feedback and visual feedback
had similar levels of effectiveness for guiding seated postures.
There was no statistically significant difference between vibrotactile and visual feedback for
posture compliance; participants for both studies were able to attend to the feedback and sit in the
appropriate posture within a few seconds. Additionally, test subjects maintained their reference
posture even when feedback was disabled without their knowledge, suggesting tha t intermittent
feedback may suffice to achieve posture compliance although choosing an appropriate duty cycle
requires further investigation.
The task interference experiments revealed tha t both vibrotactile and visual posture feedback
methods were disruptive in the dual-task typing scenario, with vibrotactile feedback causing a
slightly greater disruption. The degradation could be due to several factors, including delayed
action selection as a result of rule-based learning [118] and overloading of the response modality,
explained as follows.
While subjects understood the feedback mapping during the training phase, the feedback map
ping had not been sufficiently internalized and required the user to think about the appropriate
motor response. However it was encouraging tha t approximately two-thirds of the subjects improved
their performance over the course of the 3 DT trials. This implied tha t the feedback mapping could
become skill-based and automatic over time, thus imposing lower mental load on the user. A study
using longer trials is needed to understand long-term training effects using both types of feedback.
It is also possible that the typing performance degradation was due to response modality over
load. While the feedback methods were different, both typing and posture adjustment required
sensory-motor control and it is possible th a t these two tasks were competing for similar mental
resources. An alternative method for determining the mental workload contribution from response
modality might involve measuring subjects’ speech rate while verbalizing a given passage. In this
manner, the output modalities for the two tasks would be separate. However, we are focused on
postural correction for office workers and as such, typing seems to be the most appropriate task.
Finally, analysis of the posture transition reaction times revealed th a t subjects responded slightly
faster and more accurately to visual cues than vibrotactile cues even though the current embodiment
of visual feedback design was susceptible to inattentional blindness. The faster response could be
57
the result of providing icons for which there was no haptic analog. However, the difference in posture
transition reaction time between visual and vibrotactile feedback was less than 2 seconds, suggesting
that the two systems were comparable in performance when considered in the context of office work
where posture changes might be recommended approximately every 20-30 minutes [22, 38].
5.6 Conclusion
Our posture guidance system using vibrotactile or visual feedback was effective for coaching posture.
Although the task interference experiments showed th a t vibrotactile feedback was slightly more
disruptive than visual feedback in a dual-task scenario, subjects’ typing performance progressively
improved over the course of the typing trials. This suggests that with enough training it is possible
to learn and internalize the vibrotactile feedback mapping so tha t the action selection process may
be more automatic.
The similar performance between vibrotactile and visual feedback should be encouraging to
designers of feedback displays. Specifically, it implies th a t designers have the flexibility of using
either feedback modality to guide whole-body sensory-motor tasks. In situations where the visual
modality may be overloaded, the haptic feedback modality may be employed, and vice versa. Im
portantly, in cases where external visual displays might not be available or desirable, vibrotactile
feedback could serve as a viable alternative. By decoupling the feedback method from the task,
vibrotactile posture guidance could be used for many jobs in which a computer is not present, such
as soldering, sewing, inspection and other seated activities.
In the informal post-experiment interviews with the test subjects, some of them reported that
vibration felt insistent and annoying. This disruptive nature of vibrotactile feedback prompts us to
investigate alternative forms of haptic feedback that can overcome these effects in two ways: first,
by designing actuators that can potentially activate more mechanoreceptors in the skin other than
those sensitive to vibration; and second, by reducing disruption to the user by reducing the negative
affect associated with our actuators and actuation parameters - we hypothesize th a t stimuli linked
to negative affect would be more attention-grabbing. Our findings from Chapters 3-5 set the stage
for the development of haptic feedback systems that can deliver information at varying levels of
attention capture.
58
C hapter 6
H aptic A ctuator D esign
Param eters T hat Influence A ffect
and A tten tion
6.1 O verview
In the last three chapters, we found that vibrotactile haptic feedback methods were successful at
guiding seated posture, albeit a t the expense of primary task performance. Thus haptic devices
that capture a user’s attention can be annoying or disruptive when the user needs to focus on
another task of higher priority. In this chapter, we undertake a comprehensive study to explore
the affective (emotional) response to several haptic actuator designs and actuation parameters
for better management of user attention. First, we design novel pressure actuators tha t reduce
actuation frequency into a region th a t can be perceived as a pure displacement instead of vibration.
Second, we characterize subjects’ emotional responses to a wide range of haptic stimuli, including
our vibration and pressure-based actuators, in order to systematically determine how we are altering
both affect and attention. This study would thus provide detailed insight into the design of VAC
haptic actuators by exploring the parameters tha t have the greatest influence on affect and attention
capture.
59
6.2 R elated W ork on A ffect
Affective design (designing for feelings or emotional responses) has been explored across many
different disciplines, ranging from marketing to nursing to robotics [1, 8, 26, 48, 108, 140, 174]. In a
simulated search-and-rescue mission, Bethel and Murphy found th a t robots with affective expression
were perceived as more friendly and attentive to simulated disaster victims [8]. Yohanan, et. al.
explored affective computing through the development of Hapticat to render a broad range of user
affect with minimal creature features [173]. Haans, et. al. investigated remote social touch mediated
by a vibrotactile vest and found tha t stimulus location on the body significantly impacted affective
response [43]. Finally, most relevant to our present study is the work by Baumann, et. al. that
found that symmetric pressure actuation profiles were more relaxing than asymmetric profiles [5].
Our current study builds upon existing knowledge on affect to investigate whether haptic actu
ator device designs can elicit positive affect and thus be capable of modulating user response along
the attention capture spectrum as explained in Section 1.2.
6.3 H aptic A ctuator D esign
Mechanoreceptors in the skin are responsive to certain types of stimuli (Appendix A). For example,
Pacinian corpuscles, Meissner corpuscles, and hair follicle receptors are sensitive to vibration while
Ruffini corpuscles and Merkle discs are sensitive to pressure. Careful design of haptic actuators
can selectively stimulate one or more mechanoreceptors to induce a desired sensation or behavioral
response. In Chapter 4, we found that vibration on the back evoked an attention-getting, “an
noyed” response that distracted the person from performing his office task. This led us to believe
that devices or signals that elicit negative affect may only fall into the “demand action” end of
the attention capture spectrum (Figure 1.2). We would like to examine whether a pure pressure
stimulus, activating different mechanoreceptors than a vibratory stimulus, might be more apt for
modulating attention across the whole spectrum.
In this study we explore the design of pressure actuators, called “pactors,” and compare them
to vibrotactile “tactors” for affective response, attention capture, and novelty of stimulus. Pactors
are comprised of high-torque servo motors attached to cam arms tha t produce linear displacements
at the “contactor head” - the part tha t comes in contact with the human. The contactor head,
which can assume any number of geometries, presses against a person’s skin at different speeds and
60
actuation profiles. Although pactors can be actuated repeatedly to produce a tapping sensation,
we will only consider simple pressure profiles in this study.
We use the same vibrotactile actuators ( “tactors” ) as the ones developed in [95]. Tactors are
comprised of eccentric mass motors mounted on an acrylic plate or rubber pad.
6.4 A ffect, A ttention , and N ovelty Indices
The primary aim of the affect study is to explore key design parameters tha t influence affect. A
secondary goal is to determine design parameters th a t influence attention capture and the perception
of novelty. We will start with a broad set of tactor and pactor parameters in the preliminary study
and reduce the size of this parameter list so tha t the affect study (Section 6.7) may be more
tractable.
We will model an “affect index” as a function of the parameters th a t influence affect:
I = f(P l,P 2 ,-P n)- (6-1)
In the simplest case, index I may be a linear combination of the individual parameters. In reality
I may also contain terms tha t capture the interaction effects of the various parameters. The
parameters ̂ may represent both discrete and continuous variables, such as material type, intensity,
radius of curvature, etc. The above equation can also be used to compute the attention and novelty
indices.
Given the inherent variability in human cognitive function and the discontinuous nature of
discrete parameter choices, it is unlikely that an absolute scale can be used for the affect, attention,
and novelty indices. Instead, we propose to measure the relative change in the indices as each
parameter is modified. In essence, we are interested in changes in parameters th a t will yield the
greatest A I.
6.5 Param eter List
We will begin by examining the effect of vibratory and pressure feedback on affect while varying body
location, stimulus intensity, actuation profile, material and geometry (see Figure 6.1 for reference).
In a preliminary test with 5 subjects, we found that subjects could only distinguish 2 levels of
61

Table 6.1: Haptic actuator test parameters
B ody S ite A ct. T y p e In ten sity P rofile M a te ria l G eo m etry
arm v ib ra tio n low ste p p las tic fia t
back pressu re high ra m p ru b b e r large R
m ed iu m R
sm a ll R
actuation intensity (low and high) and two types of actuation profile (step and ramp). Additionally,
subjects could not discern the difference between acrylic and ABS plastic for all geometries, and
between ABS and rubber for the hemisphere with the smallest radius of curvature (henceforth called
“small R”). Furthermore, the triangular geometry with sharp edges was unacceptably uncomfortable
so we omitted it from use. Finally, we found tha t subjects could only somewhat differentiate between
a flat surface and a small R for vibration on the back.
Based on the results of the preliminary test, we narrowed down the levels for each parameter
for the affect study to only the ones tha t were easily discernible, which are presented in Table 6.1.
The specific material-geometry combinations th a t were discernible during preliminary testing are
shown in Figure 6.1. The dimensions of each contactor head - the piece of the actuator tha t comes
in contact with the human body - are shown in Figure 6.2. Each of these 14 tactors and pactors
varied in actuation intensity (low and high) and actuation profile (step and ramp), for a total of 56
combinations to test in the affect study.
The representation of the intensities and profiles implemented for each haptic actuator is shown
in Figure 6.3. Vibration intensity is a function of voltage which increases both frequency and
amplitude simultaneously. We commanded the tactors a t 40% and 80% of full intensity for the low
and high intensities, respectively. The arm pactors created a displacement of 0.25” and 0.40” for
low and high intensities, and the lumbar pactors displaced the back by 0.40” and 0.75” .
The choice of body site was motivated by an evaluation of wearable and “environmental” devices
- haptic actuators that could be “built in to” the user’s existing environment as opposed to being
an additional device. We decided to use only the arm for the presentation of stimuli from a wearable
haptic device and only the back for the presentation of stimuli from a seat.
62

Tactors for Arm Vibration
rubber , f lat lastic, m ed ium
Tactors for Back Vibration
Pactors for Arm Pressure
rubber, a
Pactors for Back Pressure
r u b b e r , f la t I p l a s t i c , l a r g e R
lastic, m e d i u m R | ru b b e r , m e d i u m R
Figure 6.1: Vibration and pressure actuators (tactors and pactors, respectively) used to deliver stimuli to the arm and back. Actuator designs vary in actuation type (vibration, pressure), material (hard plastic - acrylic or ABS, soft rubber), and geometry (flat surface, large radius of curvature, medium radius of curvature, and small radius of curvature).
63

Top View
Figure 6.2: Dimensions of the haptic actuator contactor heads, (a) pactor - acrylic, flat; (b) tactor - acrylic, flat; (c) tactor - rubber, flat; (d) tactor - plastic, large R; (e) tactor and pactor - plastic, medium R; (f) pactor - rubber, medium R; (g) tactor - rubber, small R; (h) pactor - plastic, large R; (i) pactor - rubber, large R.
high * “
low - | ....
off ------- * I * -----------------------------------
0 1 2 ' ' ' 0 1 2 tim e (s e c )
high
low
off
3 00 2 4 1 2 3 4 51tim e (se c )
Figure 6.3: Actuation intensity and profile for the haptic feedback devices. The duration of ramp profiles is longer than that of the step profiles. Two-second hold times apply to both profiles.
64

6.6 Equipm ent and Hardware
Tactors were comprised of miniature pager motors enclosed in a custom ABS housing mounted on
the back of a 1.5” x 1.5” x 0.125” acrylic plate or soft rubber pad. The tactors were each controlled
by a 3kHz pulse-width modulated (PWM) voltage between 0-3V using a motor controller, which
were run from a PC-based servo controller board.
Pactors utilized Futaba S3003 and Hitec HS805BB servo motors and custom cam arms. The
cam mechanism converted rotational motion to a linear displacement of the contactor head. The
amount of displacement was controlled via position feedback inside the servo.
Figure 6.4: Placement of arm actuators. Actuators come in direct contact with the medial lateral aspect of the upper arm and are secured in place by a velcro arm strap.
Figure 6.5: Placement of back tactor on a size B Herman Miller Aeron chair approximately 8” above the seat bottom. (Left) Back view of seat back showing placement of the vibratory tactor. (Right) Aeron lumbar support pillow with back pactor embedded.
65

A set of 14 different tactors and pactors were used to stimulate the arm and back, which are
shown in Figure 6.1. Arm tactors and pactors were placed on the medial lateral aspect of the upper
arm and were secured in place by a velcro arm strap (Figure 6.4). The pressure actuators were
constrained to linear travel in order to deliver pure pressure to the skin. The back tactor was affixed
to the back of a size B Herman Miller Aeron chair approximately 8” above the seat, as shown in
Figure 6.5. The back pactor was embedded in the Aeron lumbar support pillow and was placed
approximately 8” above the seat back (Figure 6.5).
Tactors and pactors were run from the same Lynxmotion servo controller board. Lab VIEW 2010
was used to communicate with the servo controller board via a serial connection. The entire system
was run on a Dell Optiplex GX620 (2.80GHz Pentium 4 processor, 2 GB RAM) with Windows 7.
6.7 U ser Study
As stated in Section 6.5, the primary goal of this study was to measure subjects’ affective response
to various haptic feedback actuators and actuation parameters, while a secondary goal was to
determine the impact of these parameters on attention capture and perceived novelty. A total of 56
combinations of the 6 parameters listed in Table 6.1 were tested. Each stimulus was presented to
the test subject for 2-5 seconds, long enough for the subject to perceive the stimulus and formulate
a visceral reaction. However, based on feedback from preliminary testing th a t users were fatigued
after one hour of testing, each test subject was only presented a maximum of 44 combinations
(randomly selected out of the 56) so that the experiment could be completed within one hour. Test
subjects were randomly assigned into one of two groups: Group A received all of the arm stimuli
first followed by the back stimuli, while the Group B received all of the back stimuli first followed
by the arm stimuli. This was done in order to counterbalance the presentation of stimuli to the arm
and back. A randomly generated test sequence was developed for each subject in order to eliminate
ordering bias.
Test subjects were instructed to wear short-sleeve shirts since arm actuators needed to be in
direct contact with their skin.
Prior to the start of the test, subjects removed everything from their pockets as cell phone
vibrations and even phantom vibrations (e.g. perceived vibrations in the absence of real vibrations)
might alter the results of the affect study. Subjects donned noise canceling headphones playing
white noise so tha t sound from the actuators would not influence their perception of the actuators.
66

Actuator AHact Smvay Please move the slider to indicate the degree to which you feel each sensation.
PfaMMWWt
eb. The, device heb likti lalsnleeti
Happy 4 m ► Sad Insistent 4 ■ 1 > Hasitant □ pressure* 4 0 2 -2 - t o t > □ vtbratisn
□ pokeCalm i
4..... m
1 0► Excited
2Gantt# #
-2 -I 0 1>
2Vtotant □ Odd#
□ numbnessRaassurtd 4
-2 1 0> Agitated
2Mechanical *
■I 4 0 1>
2Organic □ pain
□ other:Bond 4 W M > Captivatad Foratgn * FamfUar
2 ■\ « 2 •2 4 0 1 2j
Ptaasant 4 ~~ a r > Annoyed Favonbta 4 ■ 1 ►UnfawaMa4 4 0 2 ■I 4 0 1 I
MsUke <4 *
: i
■ > Ufce2
Nagativa <•2
■ r■i • i >
Positive
Figure 6.6: Affect survey of the haptic stimulus. This survey is completed after each stimulus presentation, for a total of 44 trials.
Subjects then filled out a short pre-experiment positive and negative affect schedule (PANAS)
mood questionnaire to assess their baseline mood [160, 161]. We adopted a standard 4-point scale
PANAS questionnaire typically used in psychology experiments to assess mood [148]. Questions
include “I feel calm,” “I feel secure,” “I feel tense,” etc. Test subjects were instructed to spend only
about 2 minutes answering this survey.
Next, subjects were presented examples of pressure and vibration stimuli on the arm and back in
order to familiarize them with the sensations. The definitions of the adjectives in the affect survey
shown in Figure 6.6 were explained to the test subjects. This familiarization phase lasted less than
5 minutes.
The bulk of the experiment was the affect test. A randomized test sequence was generated
for each subject. For each trial, a haptic actuator was selected (based on the test sequence) and a
stimulus was presented to the subject’s body. When the stimulus was active, the text “Please Wait”
appeared on the screen. When the text cleared, the subject moved the sliders shown in Figure 6.6
to indicate how he felt about the stimulus. When he submitted the survey, a new stimulus was
presented. The subject repeated this process up to 44 times. At the end of the trials, or a t the end
of one hour, whichever came first, the subject answered a post-experiment PANAS questionnaire,
which was the same as the one administered in the pre-test.
We developed an affect survey tha t was modeled after the self-assessment manikin (SAM) tool [7,
67
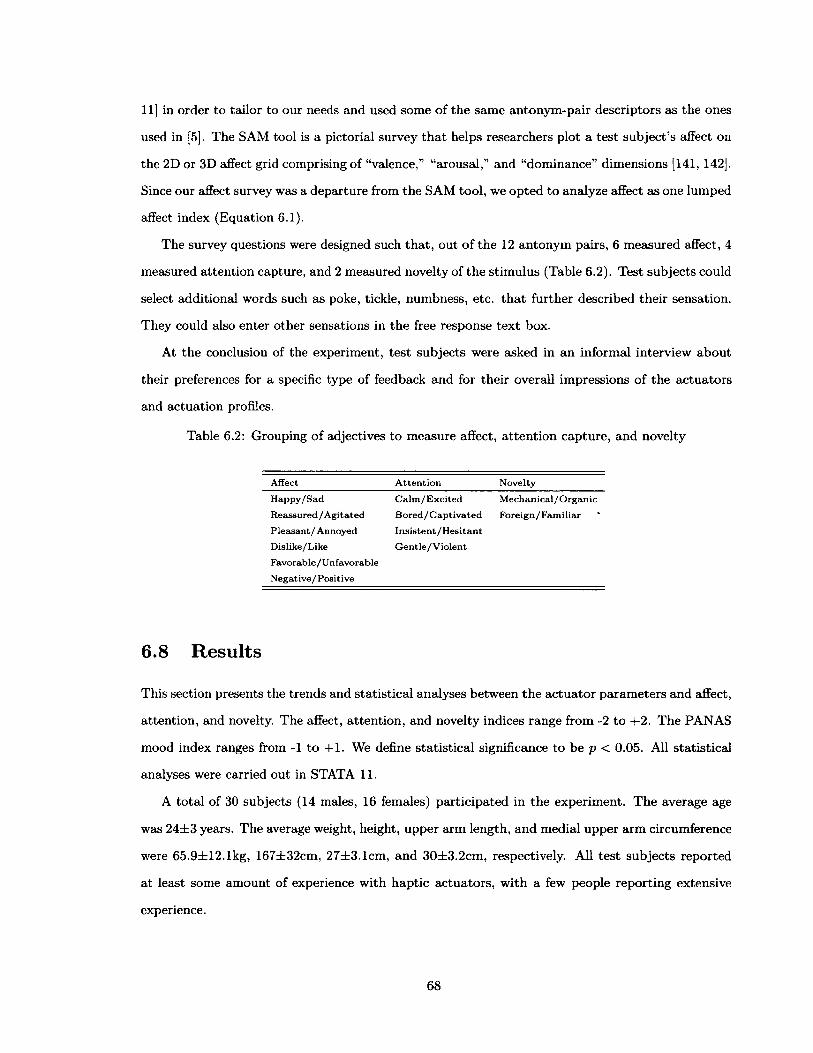
11] in order to tailor to our needs and used some of the same antonym-pair descriptors as the ones
used in [5]. The SAM tool is a pictorial survey th a t helps researchers plot a test subject’s affect on
the 2D or 3D affect grid comprising of “valence,” “arousal,” and “dominance” dimensions [141,142].
Since our affect survey was a departure from the SAM tool, we opted to analyze affect as one lumped
affect index (Equation 6.1).
The survey questions were designed such that, out of the 12 antonym pairs, 6 measured affect, 4
measured attention capture, and 2 measured novelty of the stimulus (Table 6.2). Test subjects could
select additional words such as poke, tickle, numbness, etc. that further described their sensation.
They could also enter other sensations in the free response text box.
At the conclusion of the experiment, test subjects were asked in an informal interview about
their preferences for a specific type of feedback and for their overall impressions of the actuators
and actuation profiles.
Table 6.2: Grouping of adjectives to measure affect, attention capture, and novelty
Affect A tte n tio n N ovelty
H ap p y /S ad C a lm /E x c ite d M e ch an ica l/O rg an ic
R eassu red /A g ita te d B ored / C a p t i v a ted F o re ig n /F a m ilia r
P leasan t/A n n o y ed In s is te n t/H e s ita n t
D islike/L ike G e n tle /V io le n t
Favorable / U nfavorable
N eg a tiv e /P o sitiv e
6.8 R esults
This section presents the trends and statistical analyses between the actuator parameters and affect,
attention, and novelty. The affect, attention, and novelty indices range from -2 to +2. The PANAS
mood index ranges from -1 to +1. We define statistical significance to be p < 0.05. All statistical
analyses were carried out in STATA 11.
A total of 30 subjects (14 males, 16 females) participated in the experiment. The average age
was 24±3 years. The average weight, height, upper arm length, and medial upper arm circumference
were 65.9±12.1kg, 167±32cm, 27±3.1cm, and 30±3.2cm, respectively. All test subjects reported
at least some amount of experience with haptic actuators, with a few people reporting extensive
experience.
68

Table 6.3: Parameters and interactions between parameters that result in significant changes inaffect. Actuation profile became a significant variable in the two-way interaction analyses.
S tim u lus change A Affect p-value
arm —tback -0.130 0.001
v ib ra tio n —t pressu re + 0 .187 0.000
in ten sity low—th ig h -0.158 0.000
s te p —tra m p + 0.305 0.000
p las tic—t ru b b e r + 0 .108 0.020
f la t—tsm allR + 0 .160 0.004
a rm —tback &: v ib ra t io n —tp re ssu re -0.278 0.000
a rm —tback & low—th ig h -0.269 0.001
a rm —tback & s te p —tra m p + 0.240 0.002
v ib ra tio n —tp re ssu re & s te p —tra m p + 0 .262 0.001
a rm —tback & v ib ra t io n —tp re ssu re & s te p —tra m p + 0.351 0.022
6.8.1 Parameters that significantly influence affect
Linear regression models were run on each of the parameters as well as their interactions to deter
mine their effects on affect. The statistically significant changes in the affect index from baseline
are summarized in Table 6.3. The baseline case was taken to be arm vibration at low intensity with
a step input using flat plastic, which had a baseline affect index I of -0.140.
When all of the parameters were treated as independent, then body site, actuation intensity,
actuation profile, material, and geometry exhibited a statistically significant impact on affect. Mov
ing the body site from arm to back changed the affect index by -0.130. Increasing the intensity
from low to high changed the affect index by -0.158. Changing the profile from step to ram p input
increased the affect index by 0.305, etc. (Table 6.3).
When we took into account two-way interaction effects in the linear regression analysis, we
found four instances yielding statistically significant results, and these are reported in Table 6.3.
While actuation type was not significant in the single variable analysis, it became significant in the
two-way interaction effects. As such, we included it in the table.
When we performed a linear regression with up to three-way interactions, only the interaction
among body site, actuation type, and profile was significant. The four-way interaction analysis
yielded no statistically significant results.
69

Table 6.4: Parameters and interactions between parameters tha t result in significant changes inattention
S tim ulus change A A tte n tio n p -value
a rm —t back + 0 .214 0.000
v ib ra tio n —> pressu re -0.240 0.000
in ten sity low —th ig h + 0 .325 0.000
s te p —tra m p -0.389 0.000Hat —t sm all R -0.215 0.000
a rm —tback & v ib ra tio n —tp re ssu re + 0 .315 0.000
a rm —tb a c k & low—th ig h +0.291 0.000
v ib ra tio n —tp re ssu re & low —th ig h + 0 .239 0.001
v ib ra tio n —tp re ssu re & s te p —tra m p -0.409 0.000
6.8.2 Param eters that significantly influence attention
The same set of linear regression analyses were run for attention as for affect. When all of the
parameters were treated as independent, body site, actuation type, intensity, profile, and geometry
had a statistically significant influence over attention. These are the same parameters that signifi
cantly impacted affect with the exception of actuator material.
Taking into account two-way interaction effects, we found that the interaction between body
site and actuation type, between body site and intensity, between actuation type and intensity, and
between actuation type and profile were also statistically significant. Unlike the results for affect,
the interaction between body site and actuation profile was not statistically significant in affecting
attention (p = 0.060).
The three-way and four-way interaction linear regression results did not achieve statistical sig
nificance. The variables and interactions tha t caused significant attention changes are listed in
Table 6.4. An increase in the attention index signifies greater attention capture.
6.8.3 Param eters that significantly influence novelty
The same set of linear regression analyses as affect and attention were performed for novelty. When
all of the parameters were treated as independent, body site, actuation type, intensity, profile, and
geometry showed statistically significant influences on novelty. These were the same parameters
that significantly affected attention.
Running a linear regression with interactions, we found that only the two-way interactions
between body site and actuation type, between body site and intensity, and between actuation
70

Table 6.5: Parameters and interactions between parameters tha t result in significant changes in novelty
S tim u lus change A N ovelty p-value
a rm -tb a c k + 0 .264 0.000
v ib ra tio n —t pressure -0.126 0.018
in ten sity low —thigh + 0 .164 0.000
s te p —tra m p -0.262 0.000
f la t—tsm allR -0.211 0.001
a rm —tb ack & v ib ra tio n —tp ressu re + 0 .257 0.005
a rm -tb a c k & low—th ig h + 0 .215 0.018
v ib ra tio n —tp re ssu re & low—th ig h -0.283 0.002
type and actuation profile significantly impacted the novelty index. The variables and interactions
that caused significant novelty changes are listed in Table 6.5. An increase in the novelty index
implies that the stimulus felt more unfamiliar and mechanical to the test subject.
6.8.4 Preferences for specific param eter com binations
The matrix of actuator parameters, their corresponding affect, attention capture, and novelty is
shown in Figures 6.7 and 6.8. For simplicity, the material and geometry parameters were omitted
from this matrix since subjects did not show sensitivity to material or geometry.
Looking at Figure 6.7, it is apparent tha t the m ajority of test subjects disliked the high intensity
pressure applied to the back with the step input (row 15, dark red). Over half of the subjects also
disliked the high intensity step input vibrations on the back. However, close to half of the subjects
preferred the ramp profiles for both pressure and vibration on the back, and the ramp profile for
pressure on the arm (dark green rows). About a third of the subjects found vibrations on the arm
to be pleasant while another third felt the exact opposite about arm vibrations. Generally subjects
did not feel sadness from the haptic stimuli.
Interestingly, over half of all subjects felt the haptic stimuli were insistent and mechanical (dark
orange and dark grey columns, respectively, in Figure 6.8), suggesting tha t different designs would
need to be pursued to make haptic actuators feel more organic and familiar. Finally, pressure and
vibration on the arm seemed to be more familiar and gentle than feedback on the back.
71

(+) positive affect (-) negative affect
13% 13%18%22% 17%
10%17%5% 6% 11% 12%
17%“
M% MM 18% 22% 10%11% 13% 13% 14% 12%
14% 17% 19% 2X%
wm
38% 19% 17% »% 9% 1 4
1 5
1 6
Figure 6.7: Matrix of haptic actuator parameters and their corresponding affect ratings. Numbers show percent of subjects who selected a certain adjective for each combination of test parameters. Green represents positive affect while red represents negative affect. Most subjects had a strong negative reaction to high intensity, step profile pressure on their back (row 15). More subjects liked the ramping pressure and vibration profiles than the step profiles.
(-) attention(+) attention
17% { 21% 11%! 28% 28%| le* 17% i 33% 12%{ 26%
2% 48% 26%
12% 46%11%13% 44%
7%34% «m tat19% 47%45% m13% 39% 21%
4% 28% 7% 42%
19% 39%
n.m.29% 38%12% 13%
mm 19%18% 19%
11% 9%23% 49%25%! 38%
(+] novelty (-) novelty
25%: 3% 39% i30%; 12% 38% 237%; 7% 38% 333% 16% 38% 4
42%! 23% 29%42% 36% f4H i.4 iit “ “ l® * 2 7 % 24%
4 5 % |iif .’39% 33%! 13% T f* 39%i 10% J it
4% 25% 18% 39% 8% 19%
32% 32% 12% 15% 24% 18%
Figure 6.8: Matrix of haptic actuator parameters and their corresponding attention and novelty ratings. Numbers show percent of subjects who selected a certain adjective for each combination of test parameters. Most people thought vibration stimuli were “insistent” while only the high intensity step profile pressure on the back was noted as such. All of the vibratory stimuli were deemed “mechanical” by most of the test subjects while pressure stimuli were considered more “organic” and “familiar.”
72
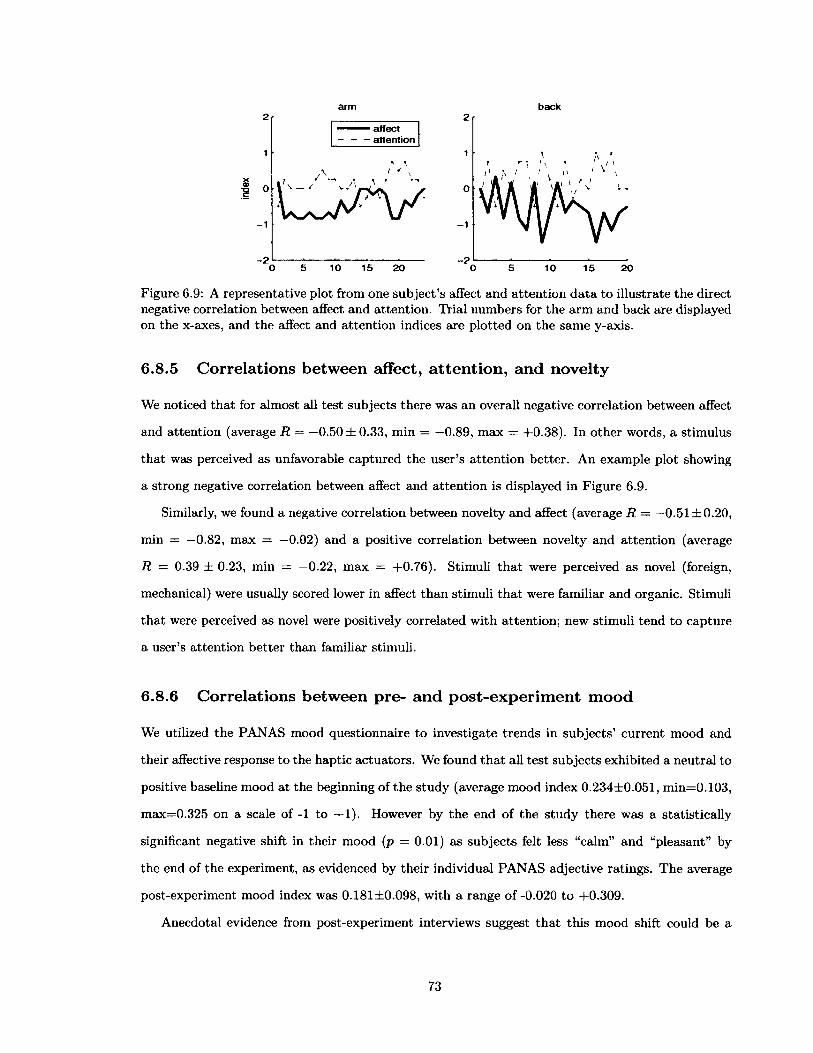
arm b a c k
affect— - attention
- 1
-210 1 5 20
- 1
-210 1 5 20
Figure 6.9: A representative plot from one subject’s affect and attention data to illustrate the direct negative correlation between affect and attention. Trial numbers for the arm and back are displayed on the x-axes, and the affect and attention indices are plotted on the same y-axis.
6.8.5 Correlations between affect, attention , and novelty
We noticed that for almost all test subjects there was an overall negative correlation between affect
and attention (average R = —0.50 ± 0.33, min = —0.89, max — +0.38). In other words, a stimulus
that was perceived as unfavorable captured the user’s attention better. An example plot showing
a strong negative correlation between affect and attention is displayed in Figure 6.9.
Similarly, we found a negative correlation between novelty and affect (average R = —0.51 + 0.20,
min = —0.82, max = —0.02) and a positive correlation between novelty and attention (average
R = 0.39 ± 0.23, min = -0.22, max = +0.76). Stimuli tha t were perceived as novel (foreign,
mechanical) were usually scored lower in affect than stimuli tha t were familiar and organic. Stimuli
that were perceived as novel were positively correlated with attention; new stimuli tend to capture
a user’s attention better than familiar stimuli.
6.8.6 Correlations between pre- and post-experim ent m ood
We utilized the PANAS mood questionnaire to investigate trends in subjects’ current mood and
their affective response to the haptic actuators. We found th a t all test subjects exhibited a neutral to
positive baseline mood at the beginning of the study (average mood index 0.234+0.051, min=0.103,
max=0.325 on a scale of -1 to +1). However by the end of the study there was a statistically
significant negative shift in their mood (p = 0.01) as subjects felt less “calm” and “pleasant” by
the end of the experiment, as evidenced by their individual PANAS adjective ratings. The average
post-experiment mood index was 0.181+0.098, with a range of -0.020 to +0.309.
Anecdotal evidence from post-experiment interviews suggest th a t this mood shift could be a
73

result of a number of reasons, such as “boredom with test” and general “dislike of listening to
white noise for an hour,” and may not necessarily be caused by the haptic actuators. This negative
mood shift is consistent with Salminen’s finding tha t test conditions (naturalistic vs. lab setting)
impacted affect, with greater negative affect derived from the lab setting [128].
6.8.7 Correlations between biographical, physiological data and affect,
attention, novelty
We collected information about each test subject’s age, gender, height, weight, arm length, and arm
circumference. When analyzed as independent variables, we found no correlation between each of
the variables and affect, attention, and novelty. We also found tha t only the interaction between
age and gender in two-way interaction analyses resulted in a statistically significant effect on affect
(p=0.004); females tended to give higher affect ratings of the devices than males.
6.8.8 Anecdotes
In the post-experiment interview, subjects shared with us their overall impressions of and prefer
ences for the haptic actuators. Sixteen out of 30 subjects preferred vibrations on the back and were
annoyed by pressure on the back. Meanwhile 7 subjects preferred just the opposite. Additionally
8 subjects liked pressure on the arm but not vibration on the arm, and 5 preferred the opposite.
We found a similar bimodal distribution for stimulus intensity and actuation profile. Five people
consistently preferred low intensity profiles while 5 consistently liked high intensity profiles. Three
subjects consistently preferred the step profile while another 3 consistently preferred the ramp
profile. The remaining subjects did not exhibit a consistent preference for intensity and profile.
Six of the test subjects mentioned that the long duration of the vibration stimuli were unfavor
able and preferred shorter duration bursts. The onset of the vibration stimuli excited or captivated
them, but the three-second or longer stimulus length was too long and “annoyed” or “agitated”
them.
Twenty-six out of 30 subjects could not consciously discern the different materials and geometries
contacting their skin. Only one person felt the edge of the flat plastic actuator against their arm.
Another subject noted a “cold” sensation from the flat plastic actuator contacting their arm. The
two others preferred the soft rubbery material to the hard plastic material.
Finally, additional words that were used to describe the haptic actuators included “poke,” “finger
74

touch,” “tap ,” and “natural” for the pactors acting on the arm and the back, and “itchy,” “insect
like,” “massage-like,” and “cell phone-like” for vibrations on the arm and back. One subject also
thought the vibrations on the back felt “friendly.”
6.9 D iscussion and C onclusion
In this study we varied six different parameters - location of stimulation, feedback actuation type,
actuation intensity, profile, material, and geometry, and measured subjects’ responses to combi
nations of these parameters. We see from Table 6.3 th a t actuation profile exhibited the greatest
change in the affect index among the independent parameters while actuator material had the small
est statistically significant change. Table 6.4 shows tha t actuation profile is also the most influential
parameter for attention capture. We are encouraged by these results because a parameter such as
material or actuation type is essentially fixed after the device is designed whereas the profile and
intensity are inherently adjustable in real time.
The statistically significant effect of actuation type on attention, where changing from vibration
to pressure decreased the attention capture index by 0.240 points, confirmed our assumption in the
posture seat task interference study (Chapter 4) tha t vibration is attention-demanding and that
pressure is less intrusive. When designing haptic devices for ambient feedback, it may be preferable
to utilize pressure rather than vibration. However, the interaction effect between actuation type
and actuation profile actually decreased the attention index by 0.409 points, suggesting tha t haptic
device designers should primarily manipulate the actuation profile param eter to achieve the desired
attentional salience.
Interestingly there was a negative correlation between affect and attention for almost all subjects,
meaning th a t devices with negative affect were better able to capture a user’s attention. This result
suggested that devices that feel more pleasant might be attended to a t the user’s convenience.
We also found a positive correlation between attention and novelty, and a weak negative cor
relation between affect and novelty. These trends implied th a t negative or unfamiliar sensations
tended to capture attention better than positive or familiar sensations. It is recommended that
haptic device designers manipulate actuation parameters to induce familiar sensations such as fin
ger poke, palm touch, or massage in order to achieve positive affect, effectively shifting towards the
“ignorable” side of the attention capture spectrum (Figure 1.2).
Finally, while test results showed parameters with consistent significant effects on affect, we
75

found inconsistencies with the subjects’ verbal interview responses. Some people preferred high
intensity vibrations on their back while others disliked them. Similarly some people preferred low
intensity pressure on the arm while others preferred high intensity pressure. While the numerical
data shows that no “volume” control is needed, anecdotal evidence shows that people have highly
variable preferences and that haptic device designers should incorporate an intensity control to
allow users to adjust to their desired intensity level.
In conclusion, the key findings from this study are the following:
• There is a negative correlation between affect and attention; devices th a t have negative affect
generate positive attention capture.
• Actuation profile most significantly impacted affect and attention. Other parameters with
statistically significant effects on affect and attention include: body site, actuation type,
actuation intensity, and actuator geometry (changing from fiat to smallR). Haptic device
designers should choose the body site and physical implementation of the actuator based
on their application constraints, and dynamically control actuation profile and intensity to
modulate affect and attention capture.
• Some of the two-way interaction effects among the parameters tested, such as the interaction
between body site and actuation intensity, were also significant. Designers should therefore
take into consideration the potential interaction effects between the parameters tha t they
choose.
• Preferences for haptic feedback intensity varied by test subject. One easy way to address this
variability is to incorporate an adjustable intensity control to allow users to customize the
feedback to their liking.
76

C hapter 7
D esign and E valuation o f P actors
for M anaging A tten tion C apture
7.1 O verview
This chapter continues our exploration of haptic actuator designs and actuation parameters for
better management of user attention. Guided by the results of the previous study, this chapter
describes our first attempts a t designing variable attention capture (VAC) pressure actuators, called
pactors, that are able to modulate the frequency of stimulation into the range tha t is perceived as
pressure rather than vibration.
7.2 D esign o f Pactors
Our design of VAC pactors is founded on our knowledge of mechanoreceptors in the human skin;
Pacinian corpuscles, Meissner corpuscles, and hair follicle receptors are sensitive to high frequency
skin displacements (e.g. vibrations) while Ruffini corpuscles and Merkel discs are sensitive to low-
frequency skin displacements (e.g. pressure). These mechanoreceptors typically act in concert
and careful design of haptic actuators can stimulate these mechanoreceptors to induce a desired
sensation or behavioral response. We know from Chapters 4 and 6 tha t high frequency vibratory
signals create negative affect and get attention quickly. Additionally, sudden on-off applications
of pressure such as an impact can also trigger high frequency skin displacements and result in an
77

insistent and unfavorable response, causing rapid attention capture [5].
Given this information, we set out to design pactors that can:
• generate a range of low frequency skin displacements
• actuate smoothly at various rates
• actuate normal to the body, as shear motions typically induce high frequency vibrations
• withstand normal and shear force overload conditions
Furthermore, we sought to create a design tha t would be compact, easy to control, and relatively
inexpensive (< $100).
We will initially implement these pactors in an office chair. Chairs provide an excellent testbed
because they have a well defined structure on which to attach devices and controllers. Additionally,
seated applications are commonplace and provide myriad opportunities for incorporating haptic
feedback mechanisms.
7.2.1 Actuator Selection
The first design task was to select actuators powerful enough to deliver forces tha t would be per
ceived as “strong” and “attention grabbing.” We conducted a preliminary evaluation to measure
the force and displacement on various parts of a person’s body tha t would be felt as “strong”
through an office chair without being painful. We found tha t all volunteers perceived forces and
displacements higher than 45N and 2cm as “very strong” and all volunteers withstood at least 55N
on their lumbar region without feeling pain. (No stimuli on the shoulder and thigh regions of the
body felt painful.) Therefore we concluded tha t our actuator should be able to output forces of
approximately 45N to ensure that the user will perceive the force on their body while avoiding
any sensations of pain. Simultaneously, our actuators must be able to advance and retract with a
frequency between 0.1Hz-2Hz to mimic a gentle nudge to a slow tap.
We evaluated a full range of available DC motors and hobby servos for these design criteria (see
Appendix D) and selected the Hitec HS-805BB sail servo for its high torque and reasonably fast
speed (2.42Nm stall torque and no-load speed of 7.48rad/sec a t 6V).
78
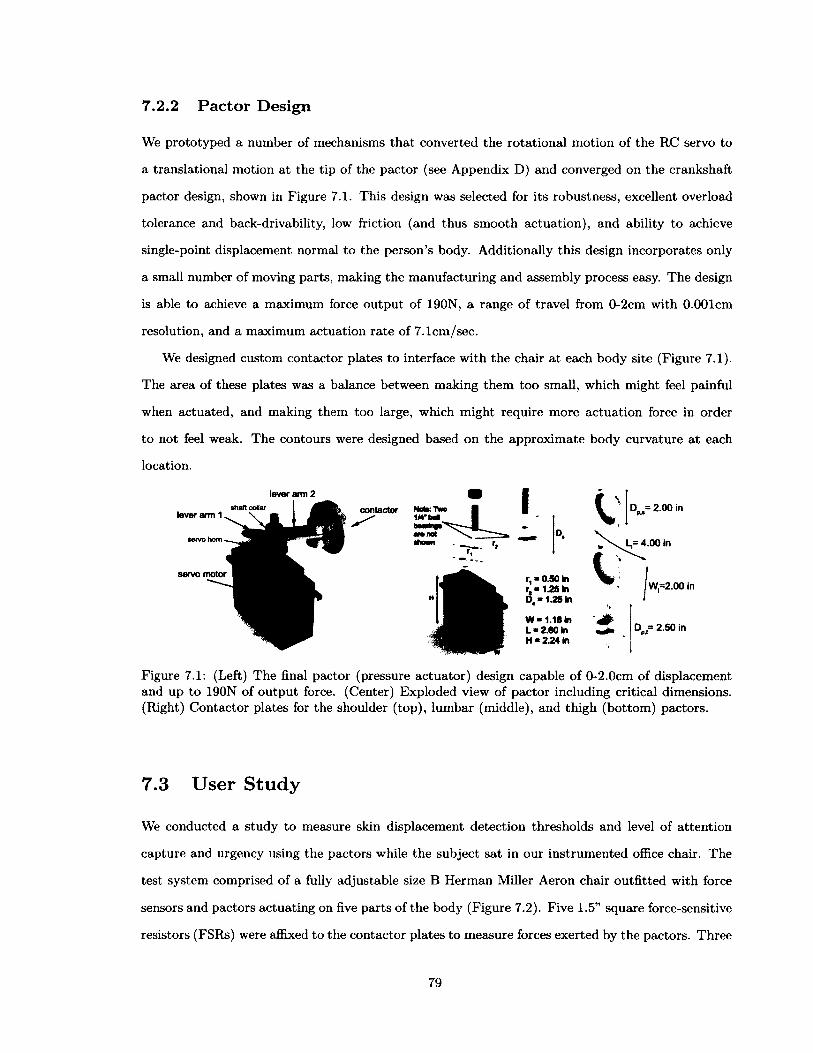
7.2.2 Pactor Design
We prototyped a number of mechanisms that converted the rotational motion of the RC servo to
a translational motion at the tip of the pactor (see Appendix D) and converged on the crankshaft
pactor design, shown in Figure 7.1. This design was selected for its robustness, excellent overload
tolerance and back-drivability, low friction (and thus smooth actuation), and ability to achieve
single-point displacement normal to the person’s body. Additionally this design incorporates only
a small number of moving parts, making the manufacturing and assembly process easy. The design
is able to achieve a maximum force output of 190N, a range of travel from 0-2cm with 0.001cm
resolution, and a maximum actuation rate of 7.1cm/sec.
We designed custom contactor plates to interface with the chair at each body site (Figure 7.1).
The area of these plates was a balance between making them too small, which might feel painful
when actuated, and making them too large, which might require more actuation force in order
to not feel weak. The contours were designed based on the approximate body curvature a t each
location.
lever arm 2contactor No* two
1M‘tlever arm 1
servo hom
servo motor
L= 4.00 in
r, * 0.50 in r,»1.28 in D - 1.25 In
W=2.00 in
0 = 2.50 in
Figure 7.1: (Left) The final pactor (pressure actuator) design capable of 0-2.0cm of displacement and up to 190N of output force. (Center) Exploded view of pactor including critical dimensions. (Right) Contactor plates for the shoulder (top), lumbar (middle), and thigh (bottom) pactors.
7.3 U ser S tudy
We conducted a study to measure skin displacement detection thresholds and level of attention
capture and urgency using the pactors while the subject sat in our instrumented office chair. The
test system comprised of a fully adjustable size B Herman Miller Aeron chair outfitted with force
sensors and pactors actuating on five parts of the body (Figure 7.2). Five 1.5” square force-sensitive
resistors (FSRs) were affixed to the contactor plates to measure forces exerted by the pactors. Three
79

Figure 7.2: Aeron chair instrumented with pactors. (Left) The locations of tactile stimuli exerted from the chair to a seated person. The shoulder and thigh stimulus regions are equally spaced relative to the centerline of the chair. (Right) Pactors are attached to the back of the chair via a custom-designed support frame.
pactors were attached to the back of the chair and actuated on the left and right shoulders and the
lower back (Figure 7.2 and 7.3). Two additional pactors were sewn under the chair and actuated
on the posterior region of the thigh (Figure 7.4). The pactors were driven via PW M signals from
a motor controller board (Lynxmotion SSC-40).
The experiment was divided into four phases: set-up, training, stimulus detection trials, post
experiment interview.
Set-up In this phase, subjects were instructed to sit in the chair with their feet flat on the ground
and their back contacting the back of the chair. The pactor support plate on the back of the chair
was adjusted until shoulder and lumbar contactor plates touched the mating plates but only lightly
enough that the FSRs registered a zero load. No additional adjustments were needed for the thigh
pactors. All participants wore noise canceling headphones playing white noise to mask potential
noise from the RC servos.
Training Subjects were presented with at least six examples of each kind of stimulus on all five
80

Figure 7.3: Side view of the chair showing the mounting for the shoulder and lumbar pactors. (Top inset) A view of the shoulder pactor and mating contactor plates. (Bottom inset) A view of the lumbar pactor showing the contoured mating contactor plate.
pactor housings pactors
Figure 7.4: A bottom-up view of the thigh pactors and their housings sewn into the bottom of the chair.
81
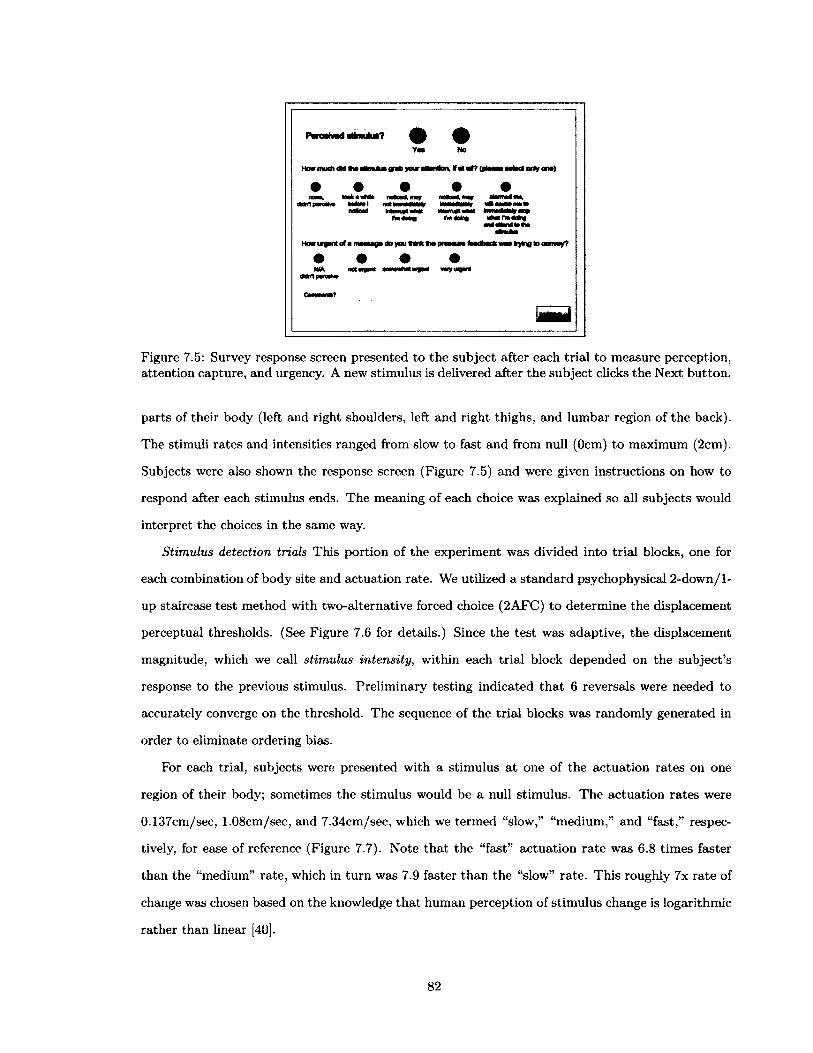
Pm iw drtm ulm ? 0 0Yn No
How much dMtwalmuluo grab your «aanbon.tf«t of? (plMMiMiocteriyono)
• • • • •nono, iBBkoiWWi noCcad.may na<B«C,iMv t tm im tim ,
d t tn p u o W i taCom I n o tiR M N W y iMRMUUy
rmtfotig «fcrtl*mdotagand Wtand to fw
How urgont of i mNoogo do you Mnk Vm pm iura foodbocfc was tyh j to convoy?
• • • •NIA noturowd somMhotwgont vwywganl
Figure 7.5: Survey response screen presented to the subject after each trial to measure perception, attention capture, and urgency. A new stimulus is delivered after the subject clicks the Next button.
parts of their body (left and right shoulders, left and right thighs, and lumbar region of the back).
The stimuli rates and intensities ranged from slow to fast and from null (Ocm) to maximum (2cm).
Subjects were also shown the response screen (Figure 7.5) and were given instructions on how to
respond after each stimulus ends. The meaning of each choice was explained so all subjects would
interpret the choices in the same way.
Stimulus detection trials This portion of the experiment was divided into trial blocks, one for
each combination of body site and actuation rate. We utilized a standard psychophysical 2-down/l-
up staircase test method with two-alternative forced choice (2AFC) to determine the displacement
perceptual thresholds. (See Figure 7.6 for details.) Since the test was adaptive, the displacement
magnitude, which we call stimulus intensity, within each trial block depended on the subject’s
response to the previous stimulus. Preliminary testing indicated tha t 6 reversals were needed to
accurately converge on the threshold. The sequence of the trial blocks was randomly generated in
order to eliminate ordering bias.
For each trial, subjects were presented with a stimulus a t one of the actuation rates on one
region of their body; sometimes the stimulus would be a null stimulus. The actuation rates were
0.137cm/sec, 1.08cm/sec, and 7.34cm/sec, which we termed “slow,” “medium,” and “fast,” respec
tively, for ease of reference (Figure 7.7). Note that the “fast” actuation rate was 6.8 times faster
than the “medium” rate, which in turn was 7.9 faster than the “slow” rate. This roughly 7x rate of
change was chosen based on the knowledge tha t human perception of stimulus change is logarithmic
rather than linear [40].
82

P r e s e n t n e w
s t i m u l u s
S t i m u l u s e n d s 1
P e r c e i v e d
s t i m u l u s ? "
P r e s e n t s a m e
s t i m u I u s
S t i m u l u s e n d s
n o" - - - - - - - - - - - - - - - - - - - - - - - - - - - - - - - - - '
I n c r e a s e s t i m u l u s
i n t e n s i t y b y S 0 %
n o
P e r c e i v e d
s t i m u l u s ? "
v « . D e c r e a s e s t i m u l u s
i n t e n s i t y b y 5 0 %
Figure 7.6: Flowchart of the 2-down / 1-up two-alternative forced choice test method of psychophysical threshold testing for each body site and actuation rate.
2 sec hofcl time
g a 2aechotdttme
&
(a) Slowv = 0.137cm/sec
(a) Mediumv = 1.08cm/8ec
(a) Fastv = 7.34cm/sec
Time
Figure 7.7: A representation of the slow, medium, and fast stimulus actuation rates. Each stimulus has a two-second hold time. The displacement ( “stimulus intensity”) is varied depending on each trial.
During each trial, the stimulus ramped up to its desired magnitude, followed by a two-second
hold time, before it ramped down at the same rate. When the stimulus ended (pactor returned to
neutral position), subjects were prompted to provide subjective feedback on their perception of the
stimulus and their level of attention capture and urgency due to the stimulus (Figure 7.5). They
were informed that some stimuli were null so not perceiving the displacement could be normal. A
new stimulus would be presented after the subject clicked the Next button. The trial proceeded
until 6 reversals had been reached. A threshold value was calculated based on the average of the
last 4 reversals.
The independent variables in this study were body site, pactor actuation rate (displacement
rate), and pactor stimulus intensity (displacement magnitude). The dependent variables were
displacement detection threshold, level of attention capture, and level of urgency.
Post-experiment interview After all the trials were completed, test subjects were asked the
following questions in an informal interview: whether or not they liked the sensations on various
83

parts of their body, out of all the stimuli which ones were most gentle and potentially least disruptive,
and which ones were most urgent and attention grabbing.
7.4 R esu lts and D iscussion
A total of 25 subjects (12 male, 13 female) were recruited from the Yale community and ranged
from 19-31 years of age, with the average age of 24±3.4 years. Participants’ heights were between
152cm-191cm, with a mean of 173cm±8.4cm. Participants weighed between 48kg-89kg with an
average weight of 70kg±11.4kg. There were no statistically significant differences due to gender for
detection threshold (p = 0.107), attention capture (p = 0.590), and urgency (p = 0.206), so both
male and female data were analyzed as one group.
7.4.1 D etection threshold
We performed an ANOVA with body site and actuation rate as the independent variables and found
tha t both were significant factors determining detection threshold (p < 0.001), but their interaction
effect was not significant (p = 0.741). Post-hoc pairwise comparisons with Bonferroni corrections
(a = 0.005) revealed no statistically significant difference in detection thresholds between the left
and right shoulders (p — 0.181), and between the left and right thighs (p = 0.692). This is consistent
with existing literature that the left and right sides of the body are balanced [69, 163]. Therefore
we present data from the left and right shoulders as one “shoulder” group and left and right thighs
as one “thigh” group.
The post-hoc analysis on actuation rate incorporating Bonferroni corrections (a = 0.0167)
showed a statistically significant difference in detection threshold between the slow and medium
actuation speeds (p < 0.001), and between the slow and fast actuation speeds (p < 0.001). However
there was no significant difference in detection threshold between the medium and fast actuation
rates (p = 0.939). This means that even though participants were able to distinguish a difference in
the two speeds (i.e. that one was fast than the other), the perceptual threshold a t these two rates
were almost the same. Therefore from a design standpoint, either the medium or fast speed - or
any speed in between - can be employed and the user’s ability to detect the stimulus will remain
relatively constant.
The median threshold displacement for each actuation rate and for each body site is presented
84

Table 7.1: Median detection threshold values for each body site and actuation rate.
Shoulders Lumbar Thighs
Slow
Medium
Fast
0.299cm
0.059cm
0.067cm
0.333cm
0.106cm
0.100cm
0.325cm
0.031cm
0.045cm
shoulder lumbar thighs
E 1
f«CD
03■oCD
I£
0.4
0.2
medium fast
0.8
0.6
0.4
0.2
slow medium fast
0.8
0.6
0.4
0.2
slow medium fast
Figure 7.8: Displacement detection thresholds grouped by body site and actuation rate. The red crosses represent outliers. Actual median values are given in Table 7.1. The left and right sides of the body are balanced (i.e. there were no statistically significant differences between the two sides), hence data is lumped together as one shoulder group and one thigh group. The detection threshold for the slow actuation rate was significantly different than the medium and fast rates for all three body sites, while detection thresholds from the medium and fast actuation rates showed no statistically significant difference.
in Table 7.1. The boxplots in Figure 7.8 show the detection thresholds as a function of actuation
rate for each body site. It can be seen tha t the detection threshold was actuation rate dependent -
the detection threshold for the slow actuation rate was much higher than that for the medium and
fast actuation rates across all body sites.
The fact tha t the medium and fast actuation rates did not yield significant differences in detec
tion thresholds, even though these two rates were approximately seven times apart, point to the
possibility that the detection threshold saturated above a certain actuation rate. It is possible that
this behavior follows a sigmoid function typically observed in psychophysical studies, in which case
we should expect to see saturation at slower rates as well.
At the slowest rate, subjects required a greater displacement before they could detect the stim
ulus. This indicates tha t a change in displacement can go unnoticed for a longer period of time if
the change is slow enough. Additionally, when the stimulus is noticed, it is detected at a higher
displacement than tha t for the faster actuation rates.
85

There was a wider spread in detection thresholds for the thigh compared to the shoulders and
lumbar region. This is likely due to the fact tha t the density of mechanoreceptors is lower in the
posterior region of the thigh than the lumbar and shoulder regions.
Finally, the spread in detection thresholds was very wide for the slow actuation rate, compared
to the very tight distribution for the medium and fast rates. The wide spread indicated tha t there
was greater uncertainty for each person and greater variability from person to person in detecting
slowly changing skin displacements.
7.4.2 A ttention capture
Table 7.2 and Figure 7.9 show the average stimulus intensity corresponding to each level of attention
capture, grouped by actuation speed. There is a positive correlation between attention capture and
skin displacement (R 2 = 0.67); overall, as the amount of displacement increases, so does the level of
attention capture. However, from the figure we see tha t as the actuation speed increases, a smaller
displacement is needed to elicit the same level of attention capture.
We performed a regression analysis with attention capture as the dependent variable and body
site, actuation speed, and stimulus intensity as the independent variables and found a significant
interaction effect between stimulus intensity and actuation speed (p < 0.001). (Body site was
not significant (p = 0.136).) The interaction effect is evident from Figure 7.9; simply reducing
the actuation speed without regard for stimulus magnitude may still elicit an attention-getting
response. Conversely a fast stimulus a t a low intensity may not capture a person’s attention.
It is also evident from the figure tha t the attention capture response curve is not linear but
possibly sigmoidal. We surmise th a t there is a plateauing effect a t the low and high ends of the
attention capture spectrum, and a steep slope between the two plateaus. This could potentially
reflect psychophysical sensory perception findings that our senses saturate a t the high intensity end
of the spectrum while fail to detect a t the low intensity end.
It is interesting to note that we did not observe saturation at the low end of the attention capture
spectrum for the slow actuation rate. It is possible th a t the curve is still sigmoidal, but in the range
that we have tested the results show more of a linear relationship. This is very encouraging because
it means that the slow actuation rate can achieve greater dynamic range for attention capture than
the medium and fast actuation rates.
Given the interaction effects between pactor displacement and actuation speed, and the po-
86

Table 7.2: Average displacement tha t corresponds to each level of attention capture (Figure 1.2).
L e v e l o f A t t e n t i o n C a p t u r e
1 2 3 4 5
S lo w
M e d iu m
F a s t
0 .202cm ±0.247cm
0 .053cm ±0.093cm
0.05 lcm ± 0 .0 8 5 cm
0.559cm ±0.490cm
0 .159cm ±0.215cm
0 .137cm ±0.161cm
0.950cm=fc0.721cm
0 .603cm ± 0.607cm
0 .436cm ± 0.449cm
1.760cm ±0.472cm
1.684cm ±0.514cm
1.508cm ± 0.547cm
1.967cm ±0.234cm
1.944cm ±0.255cm
1.855cm ±0.384cm
E 1.4 ,0 .
& 1.2
0.8
0.6
0 .4 slowmediumfast
level o f a tte n tio n c a p tu re
Figure 7.9: Average displacement corresponding to each level of attention capture for all body sites combined. Actual mean values are listed in Table 7.2. The current design of pactors is capable of spanning the entire attention capture spectrum. Also, there is a significant interaction effect between actuation rate and stimulus intensity (p < 0.001).
tentially sigmoidal response curve, we conclude that when designing for VAC, it is necessary to
consider both the stimulus intensity and actuation speed. In particular, one must choose a low
stimulus intensity as well as a slow actuation rate when designing for an ambient level of feedback.
7 .4 .3 U rg en cy
The perception of urgency was well correlated with the level of attention capture (R2 — 0.79).
A regression analysis on urgency showed the same results as attention capture: body site was
not significant (p = 0.307) and the interaction between actuation speed and displacement was
significant (p < 0.001). As actuation speed increased, urgency also increased (from “not urgent” to
“very urgent”), and as stimulus intensity increased, so did the level of urgency. Therefore haptic
87

device designers must choose appropriate levels of both actuation speed and stimulus intensity to
achieve the desired level of urgency.
7.4.4 Anecdotes
In the post-experiment interview, participants were asked to reflect on their overall impressions of
the experiment. About half of the participants thought the sensations from the pactors were pleas
ant and sometimes “massage-like.” Others neither liked nor disliked the sensations overall. However
five participants disliked the displacements under the thighs and described them as “weird,” “unfa
miliar,” “uncomfortable,” and even “inappropriate.” One participant remarked tha t pressure under
the thighs felt “ticklish.” These responses are consistent with the subjective dislike of stimuli on
thighs found by Karuei, et. al. [69]. Given these responses, it is probably not advisable to deliver
tactile feedback to the underside of thighs through a chair.
About a third of the people thought the high intensity and fast actuation rate was unpleasant
or uncomfortable and felt like a punch. Surprisingly, the slow actuation rate was annoying for half
of the participants as they waited what seemed to be “a long time” before they could perceive any
stimulus and sometimes became “paranoid” when trying to anticipate the stimulus.
7.5 C onclusion
In this chapter we have presented the design of a variable attention capture (VAC) actuator called a
pactor for delivering tactile stimuli. Our current low-cost pactor design was sufficient in delivering
low frequency skin displacements that spanned the attention capture spectrum from “ignorable” to
“demand action” (Figure 1.2).
In our evaluation of pactors, we found th a t actuation rate was a significant factor affection detec
tion threshold, attention capture, and perceived urgency. The interaction effect between actuation
rate and stimulus intensity was also significant for attention capture and urgency. Additionally,
we observed a saturation effect for detection thresholds a t the medium and fast actuation rates in
our tests (1.08cm/sec and 7.34cm/sec, respectively). Finally there were no significant differences
in detection threshold, attention capture, and perceived urgency among the body sites we tested.
These results lead us to conclude the following:
• Haptic actuators can achieve VAC by reducing actuation rate. This effectively reduces skin
88
displacement frequency to levels tha t are perceived as pure pressure, something tha t is not
easily achievable with eccentric-mass-motor vibrotactile actuators.
• The combination of actuation rate and stimulus intensity is crucial for effectively modulating
attentional salience.
• Haptic stimuli have relatively similar effects when delivered through the shoulders, lumbar,
and thighs.
In summary, we have demonstrated tha t our pactors have good potential for varying the level
of attention capture, which will allow for a greater range of applications of the haptic feedback.
89
C hapter 8
Evaluation o f Tactors and P actors
for Variable A tten tion C apture
(VAC) H aptics
8.1 O verview
In this chapter, we continue our investigation of VAC haptics by comparing the attention capture
bandwidth of two specific tactors and pactors through a user study. Specifically, we examine
how various actuation rates, coupled with different distractor tasks, can impact a user’s stimulus
detection time. In the context of tactors and pactors, we define actuation rate as the rate of change
of a stimulus intensity, e.g. V /s driving voltage for tactors tha t corresponds to a perceived rate of
change in vibration frequency and amplitude, and cm /s displacement for pactors tha t corresponds
to a perceived rate of change in pressure.
Sensing and responding to haptic stimuli, especially when conveying information of lower prior
ity, should not adversely impact a worker’s concentration or performance on his primary task. In
our within-subject experiment, we sought to measure how different vibrotactile and tactile stimuli
can modulate subjects’ attention capture (through measuring response time) while they performed
a simultaneous office task.
90

8.2 Hardware D escription
We instrumented two size B Herman Miller Aeron chairs with tactors and pactors in the lumbar
region (Figure 8.1). Tactors were off-the-shelf eccentric mass vibrotactile actuators (10mm x 3.4mm
shaftless vibration motors, Pololu #1636) affixed to the center of a 1.5”x l.5” foam pad (for noise
and vibration damping) and attached to the lumbar region of the vibration chair with self-curing
adhesive tape. Pactors were comprised of RC sail servomotors (Hitec 805BB) with an attached
linkage arm and a contactor plate tha t interfaced with the back of the chair. All actuators were
driven via PWM signals from a motor controller board (Lynxmotion SSC-40), and commands were
sent at a rate of 50Hz. Accelerometers (Pololu MMA7341L 3-axis accelerometer ± 3 /1 lg) and
force sensors (Interlink 1.5” square FSRs) affixed to the front of the chair were used for passive
monitoring of vibrations and pressures and were not used for active feedback in this study. Sensors
were connected to a 16-bit A /D data acquisition box (NI-DAQ USB-6212) and data was processed
in Lab VIEW 10.0 and Matlab R2011b.
LumbarTactor
LumbarPactor
0
Figure 8.1: Back view of the vibration (left) and pressure (right) chairs used in this study. The lumbar tactors and pactors are circled.
91
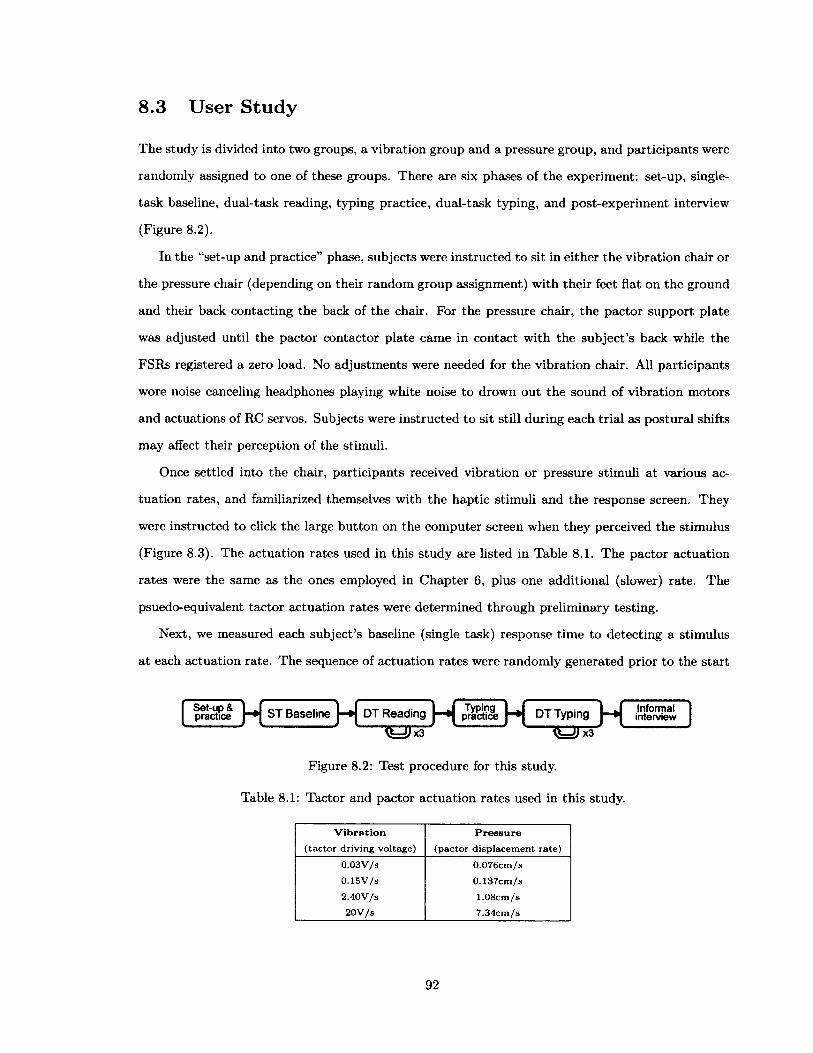
8.3 U ser S tudy
The study is divided into two groups, a vibration group and a pressure group, and participants were
randomly assigned to one of these groups. There are six phases of the experiment: set-up, single
task baseline, dual-task reading, typing practice, dual-task typing, and post-experiment interview
(Figure 8.2).
In the “set-up and practice” phase, subjects were instructed to sit in either the vibration chair or
the pressure chair (depending on their random group assignment) with their feet flat on the ground
and their back contacting the back of the chair. For the pressure chair, the pactor support plate
was adjusted until the pactor contactor plate came in contact with the subject’s back while the
FSRs registered a zero load. No adjustments were needed for the vibration chair. All participants
wore noise canceling headphones playing white noise to drown out the sound of vibration motors
and actuations of RC servos. Subjects were instructed to sit still during each trial as postural shifts
may affect their perception of the stimuli.
Once settled into the chair, participants received vibration or pressure stimuli at various ac
tuation rates, and familiarized themselves with the haptic stimuli and the response screen. They
were instructed to click the large button on the computer screen when they perceived the stimulus
(Figure 8.3). The actuation rates used in this study are listed in Table 8.1. The pactor actuation
rates were the same as the ones employed in Chapter 6, plus one additional (slower) rate. The
psuedo-equivalent tactor actuation rates were determined through preliminary testing.
Next, we measured each subject’s baseline (single task) response time to detecting a stimulus
a t each actuation rate. The sequence of actuation rates were randomly generated prior to the start
Set-up & practice ST Baseline"}—> DT R eading H practice | " * | DT Typing I n f o r m a l
in t e r v i e wigr^r ------Figure 8.2: Test procedure for this study.
Table 8.1: Tactor and pactor actuation rates used in this study.
V i b r a t i o n P r e s s u r e
( ta c to r d riv in g voltage) (p a c to r d isp lac em en t ra te )
0 .0 3 V /s 0 .0 7 6 cm /s
0 .1 5 V /s 0 .137cm /s
2 .4 0 V /s 1 .0 8 cm /s20V f s 7 .3 4 c m /s
92

Figure 8.3: Test subjects were instructed to click this laxge button to acknowledge stimulus perception. This window spanned the entire 19” computer screen. The monitor was placed 18” in front of the seated test subject.
1 Y a l e S t u d e n t ! F i n a l E s s a y G o r e V i r a l A f t r r F a t a l C a r A c c i d e n t2 I n h e r f i n a l e s a a y t o h e r c l a s s m a t e * . 2 2 - y e a r - o l d Y a l e s t u d e n t M a r i n a K e e g a n
3 p e n n e d a n o d e t o l i f e a t t h e u n i v e r s i t y s h e w a s p r e p a r i n g t o l e a v e . A t t h e t i m e ,s n o o n e k n e w I t w o u l d b e h e r f i n a l e s s a y a l t o g e t h e rs
6 O n M a y 2 6 . l u s t d a y s a f t e r g r a d u a t i n g . K e e g a n a n d h e r b o y f r i e n d M i c h a e l7 G o c k s c h w e r e d r i v i n g o n C a p e C o d . M a a s , w h e n G o r k s r h l o s t c o n t r o l o f t h e c a r ; a i t w e n t o f f t h e r o a d a n d r o l l e d a t l e a s t t w i c e . G o c k s c h w a s t a k e n t o t h e h o s p i t a l s a n d l a t e r r e l e a s e d . K e e g a n w a s d e c l a r e d d e a d a t t h e s c e n e .1011 T h e p r o m i s i n g y o u n g E n g l i s h m a j o r h a d b e e n t h e p r e s i d e n t o f t h e Y a l e Y o u n gu D e m o c r a t s a n d a n a c t i v e p a r t o f h e r c o l l e g e ' s b r a n c h o f t h e O c c u p y W a l l S t r e e t
1 3 m o v e m e n t A p r o m i s i n g w r i t e r , s h e h a d a l r e a d y p e n n e d a r t i c l e * f o r N P R a n dm T h e N e w Y o r k T i m e s a n d b l o g g e d f o r T h e N e w Y o r k e r , w h e r e s h e w a s s e t t o1 5 s t a r t w o r k a s a n a s s i s t a n t t o t h e g e n e r a l c o u n s e l i n | u n e . ’ S h e w a s s o e x c i t e d
i s s h e w a s g o i n g t o s t a r t w o r k t h e r e — t h a t ' s a U s h e t a l k e d a b o u t * h e r m o t h e r1 7 T r a c y K e e g a n t o l d t h e N e w Y o r k D a l l y N e w s ,is1 9 B u t t h e m o s t a f f e c t i n g p a r t o f K e e g a n ' s l e g a c y i s t h e e s s a y s h e w r o t e f o r a2 0 s p e c i a l e d i t i o n o f t h e Y a l e D a l l y N e w s t h a t w a s d i s t r i b u t e d a t t h e c o l l e g e ' s2 1 c o m m e n c e m e n t c e r e m o n y .222 3 T i t l e d * T h e O p p o s i t e o f L o n e l i n e s s . * — w h i c h t h e Y a l e D a i l y N e w s p u b l i s h e d
M o n l i n e f o l l o w i n g K e e g a n ' s d e a t h — i t ' s a b u o y a n t , e a r n e s t a n d h o p e f u l■Kt w untnattrtn « « H6» aaA h-uHtui « ! ! » ■ "W» Am *.'* h « w » Car th+
Figure 8.4: In the dual-task reading task, subjects were instructed to read a passage at their normal reading pace (scrolling as necessary), and to click the button as soon as they perceived the stimulus. The window spanned the width of the 19” monitor, which was placed 18” in front of the subject.
Figure 8.5: In the dual-task typing task, subjects were instructed to type the passage verbatim starting at the cursor. The typing screen refreshed with a new passage every 60 seconds to eliminate the need for scrolling with the mouse in the middle of typing with the keyboard. The window spanned the width of the 19” monitor, and was placed 18” in front of the test subject.
93

of the experiment. The four different actuation rates were repeated four times, and the first four
stimuli were discarded from data analysis as they were considered “practice” runs. During each
trial, as the stimulus constantly increased in intensity at a rate specified in Table 8.1, subjects were
instructed to click a large button as soon as they perceived the stimulus (Figure 8.3). However
they were also told tha t this was not a race against time so they should respond calmly. This “ST
Baseline” phase ended after the subject detected the last stimulus.
For the next set of three trials, subjects were given a reading task while they tried to perceive
and acknowledge haptic stimuli ( “Dual-Task Reading Trials,” or simply “DT Reading,” Figure 8.4).
A passage was randomly chosen from a pool of articles, and subjects were instructed to focus on
reading the passage verbatim. The topic of the articles ranged from current events (e.g. story of
a cancer patient) to technical writing (e.g. faculty tenure process), and were chosen to engage a
wide audience. For each trial, as subjects read the passage, a stimulus would be presented after a
random time interval between 15-30 seconds and subjects were asked to click a button on the screen
to acknowledge tha t they perceived the stimulus. The sequence of stimulus actuation rates as well
as the passages were randomly generated in order to eliminate ordering bias. The first stimulus of
each trial was eliminated from data analysis as a training sample. Each trial ended when the final
(seventh) stimulus was perceived. Subjects then answered a post-trial survey about how interesting
and engaging the passage was, as well as the line number where they stopped reading at the end of
the trial. This was repeated three times.
After the DT Reading trials, subjects practiced typing in our custom typing program (Chapter 4
for five minutes to gain familiarity with the program. After the typing practice, for the following set
of three trials, we measured subjects’ response time to detect a stimulus while performing a typing
distractor task ( “Dual-Task Typing Trials,” or simply “DT Typing”), similar to the DT Reading
trials. The sequence of stimuli and passages were again randomly generated in order to eliminate
ordering bias. Subjects were told to focus on the typing task and type at their normal speed. The
subjects’ experiment window displayed the typing program and the “click-to-acknowledge” button
(Figure 8.5). The trial ended when the last (seventh) stimulus was perceived, or when the five-
minute typing test ended, whichever came first. The first trial was eliminated from data analysis.
A post-trial survey was administered to assess how engaging the passage was.
At the end of the experiment, subjects were asked about their thoughts and feedback in an
informal interview.
94
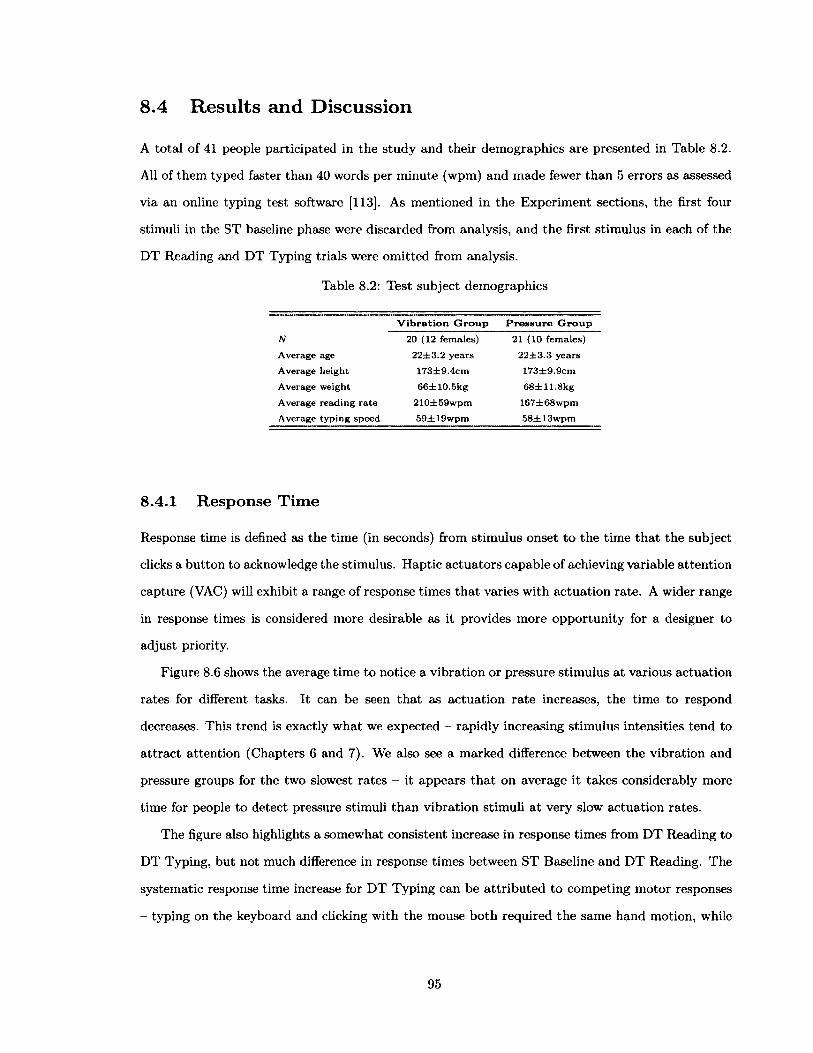
8.4 R esu lts and D iscussion
A total of 41 people participated in the study and their demographics are presented in Table 8.2.
All of them typed faster than 40 words per minute (wpm) and made fewer than 5 errors as assessed
via an online typing test software [113]. As mentioned in the Experiment sections, the first four
stimuli in the ST baseline phase were discarded from analysis, and the first stimulus in each of the
DT Reading and DT Typing trials were omitted from analysis.
Table 8.2: Test subject demographics
Vibration Group Pressure Group
N 20 (12 fem ales) 21 (10 fem ales)
A verage age 2 2 ± 3 .2 years 2 2 ± 3 .3 y ea rs
A verage heigh t 173± 9 .4cm 173± 9.9cm
A verage w eight 6 6 ± 10.5kg 6 8 ± 11.8kg
A verage read in g ra te 210± 59w pm 167± 68w pm
A verage ty p in g speed 59 ± 1 9 w p m 5 8d tl3w pm
8.4.1 Response Time
Response time is defined as the time (in seconds) from stimulus onset to the time tha t the subject
clicks a button to acknowledge the stimulus. Haptic actuators capable of achieving variable attention
capture (VAC) will exhibit a range of response times th a t varies with actuation rate. A wider range
in response times is considered more desirable as it provides more opportunity for a designer to
adjust priority.
Figure 8.6 shows the average time to notice a vibration or pressure stimulus at various actuation
rates for different tasks. It can be seen tha t as actuation rate increases, the time to respond
decreases. This trend is exactly what we expected - rapidly increasing stimulus intensities tend to
attract attention (Chapters 6 and 7). We also see a marked difference between the vibration and
pressure groups for the two slowest rates - it appears th a t on average it takes considerably more
time for people to detect pressure stimuli than vibration stimuli at very slow actuation rates.
The figure also highlights a somewhat consistent increase in response times from DT Reading to
DT Typing, but not much difference in response times between ST Baseline and DT Reading. The
systematic response time increase for DT Typing can be attributed to competing motor responses
- typing on the keyboard and clicking with the mouse both required the same hand motion, while
95
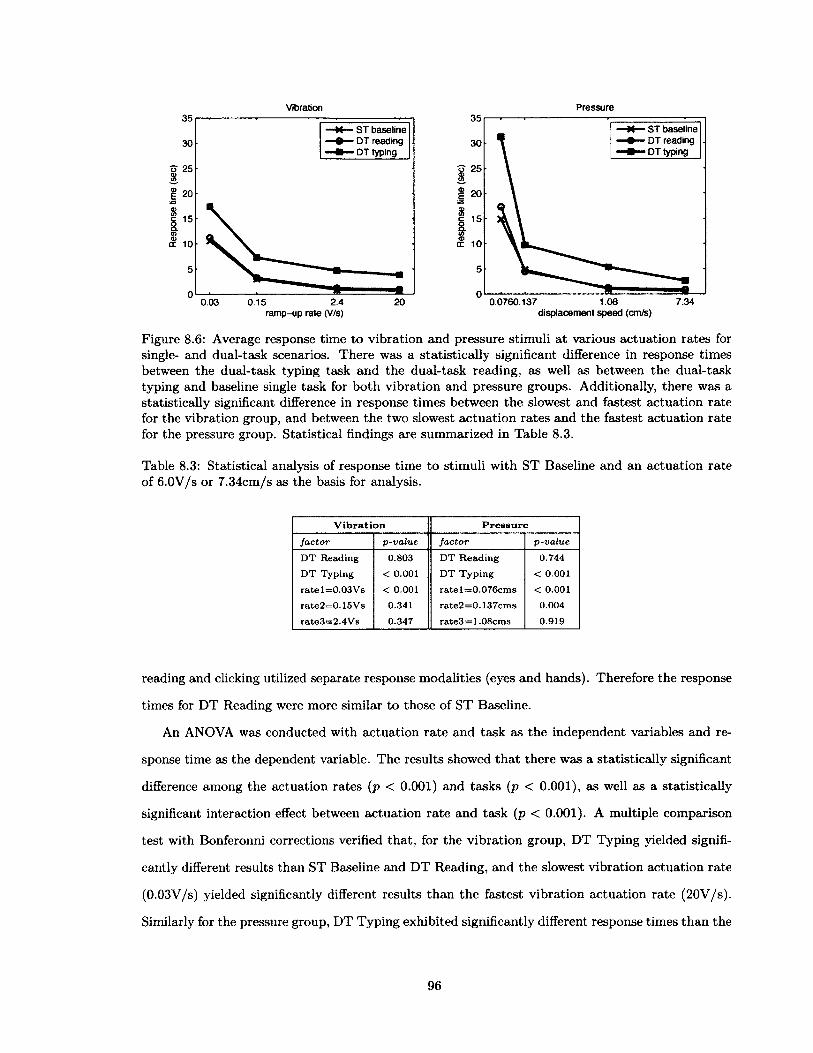
Vibration Pressure35
ST baseline DT reading DT typing
30
o 25
<CE«SS
20
S 15I©tr 10
0.0760.137 1.08 7.34
35ST baseline DT reading DT typing
30
25
20
15
10
5
02.4 200.03 0.15
ramp-up rate (V/s) displacement speed (cm/s)
Figure 8.6: Average response time to vibration and pressure stimuli a t various actuation rates for single- and dual-task scenarios. There was a statistically significant difference in response times between the dual-task typing task and the dual-task reading, as well as between the dual-task typing and baseline single task for both vibration and pressure groups. Additionally, there was a statistically significant difference in response times between the slowest and fastest actuation rate for the vibration group, and between the two slowest actuation rates and the fastest actuation rate for the pressure group. Statistical findings are summarized in Table 8.3.
Table 8.3: Statistical analysis of response time to stimuli with ST Baseline and an actuation rate of 6.0V/s or 7.34cm/s as the basis for analysis.
V i b r a t i o n P r e s s u r e
fa c to r p-va lue fa c to r p -va lu e
D T R eading
D T T yping
ra te l= 0 .0 3 V s
ra te2 = 0 .1 5 V s
ra te3 = 2 .4 V s
0.803
< 0.001
< 0.001
0.341
0.347
D T H ead in g
D T T y p in g
ra te 1 = 0 .0 7 6 cm s
ra te2 = 0 .1 3 7 cm s
ra te3 = 1 .0 8 cm s
0.744
< 0.001
< 0.001
0.004
0.919
reading and clicking utilized separate response modalities (eyes and hands). Therefore the response
times for DT Reading were more similar to those of ST Baseline.
An ANOVA was conducted with actuation rate and task as the independent variables and re
sponse time as the dependent variable. The results showed th a t there was a statistically significant
difference among the actuation rates (p < 0.001) and tasks (p < 0.001), as well as a statistically
significant interaction effect between actuation rate and task (p < 0.001). A multiple comparison
test with Bonferonni corrections verified that, for the vibration group, DT Typing yielded signifi
cantly different results than ST Baseline and DT Reading, and the slowest vibration actuation rate
(0.03V/s) yielded significantly different results than the fastest vibration actuation rate (20V/s).
Similarly for the pressure group, DT Typing exhibited significantly different response times than the
96

ST Baseline and DT Reading groups. However, the two slowest pressure actuation rates (0.076cm/s
and 0.137cm/s) were both significantly different from the fastest rate (7.34em/s). The statistical
results are summarized in Table 8.3.
For both vibration and pressure groups, we found the longest response times and greatest vari
ability for the slowest actuation rate. In the ST Baseline case, subjects waited an average of
10.6±0.17 or 14.9±0.89 seconds from the onset of the stimulus to perceive and respond to the
vibration or pressure stimulus, respectively, for the slowest actuation rate. In the DT Typing sce
nario, an average of 17.4±0.73 or 31.3±1.5 seconds elapsed before subjects reacted to the vibration
or pressure stimuli, respectively, for the slowest actuation rate. In contrast, less than 0.7±0.03 sec
onds elapsed in the ST Baseline case with the fastest actuation rate before subjects acknowledged
the stimulus. These results again suggest th a t reducing the actuation rate will reduce the time until
the signal is at a perceived level to respond to, which implies a reduction in attention capture.
We note that the response time to a vibration stimulus saturated earlier than pressure as actua
tion rate increased. We think that the vibration stimuli activated a certain set of mechanoreceptors
that tend to elicit a more attention-grabbing behavioral response. Vibration actuation rates would
need to be greatly reduced into an even lower frequency and lower amplitude domain before we
could see response times similar to the slowly actuating pressure stimuli.
Comparing the two response time curves, it seems tha t pressure feedback exhibited greater
overall attention capture dynamic range than vibration within the range of rates we tested. However
the rapid increase in response time for a small decrease in actuation rate may suggest th a t attention
capture is less controllable with pressure a t slow actuation rates. This is further suggested by the fact
that response times to pressure stimuli showed greater variability than response times to vibration
stimuli a t the slow actuation rates. While we acknowledge th a t haptic actuators could be improved
and more rates could be tested to achieve a smoother curve, these curves suggest tha t both types
of feedback are capable of modulating attention capture.
Finally, for reference, we correlated the vibration and pressure intensity level to the time of
stimulus detection. Table 8.4 shows the mean vibration and pressure detection intensity (adjusted
by each subject’s reaction time) for the three tasks and the four actuation rates. For the pressure
group, intensity is represented as a force, whereas for the vibration group, intensity is a combination
of vibration frequency and amplitude. Note tha t for the fastest actuation rates, by design, the
maximum stimulus intensity was always reached when subjects acknowledged the stimulus.
97
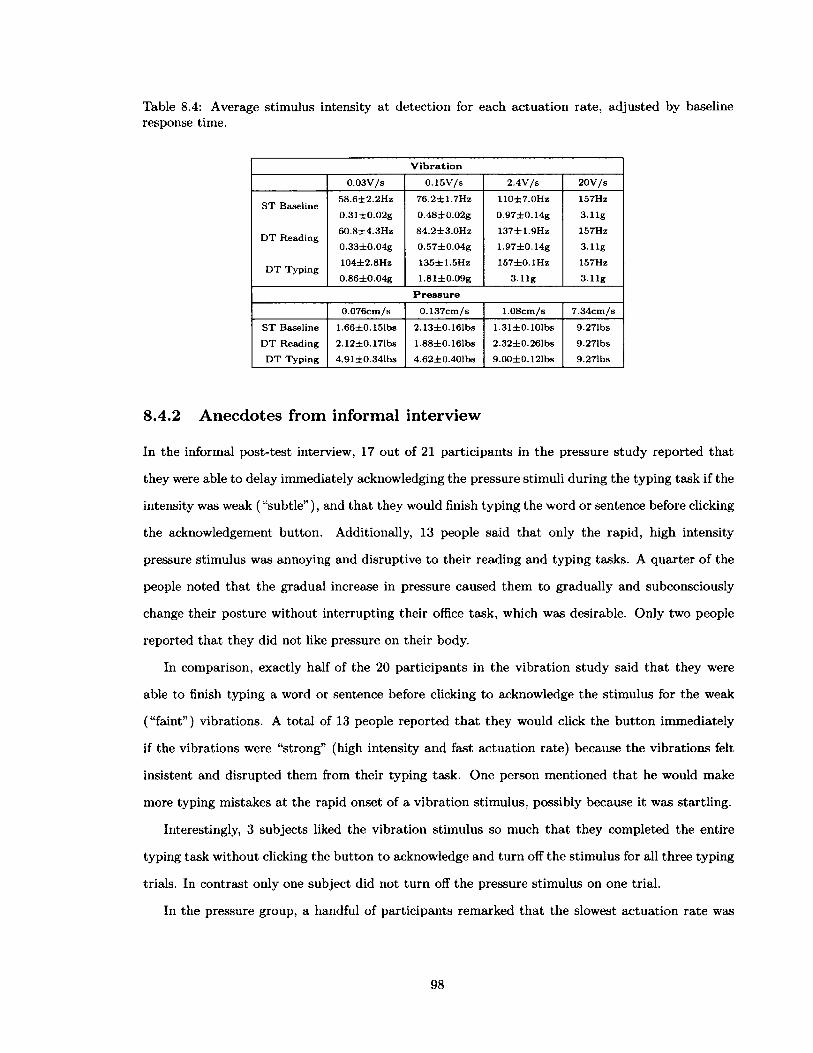
Table 8.4: Average stimulus intensity at detection for each actuation rate, adjusted by baseline response time.
V i b r a t io n
0 .0 3 V /s 0 .1 5 V /s 2.4V /S 2 0 V /s
S T Baseline
D T R ead ing
D T T yping
58 .6± 2 .2H z
0.31± 0 .02g
60 .8± 4 .3H z
0.33± 0 .04g
104±2.8H z
0.86± 0 .04g
76 .2± 1 .7H z
0 .48 ± 0 .0 2 g
84 .2 ± 3 .0 H z
0 .5 7 ± 0 .0 4 g
135± 1 .5H z
1 .81± 0 .09g
110±7.0H z
0 .97 ± 0 .1 4 g
137±1.9H z
1 .97± 0 .14g
157±0.1H z
3- l l g
157Hz
3. l l g
157Hz
3. l l g
157Hz
3 .l l g
P r e s s u r e
0 .0 7 6 cm /s 0 .1 3 7 cm /s 1 .08cm /s 7 .3 4 cm /s
S T Baseline
D T R ead ing
D T T y p ing
1.66±0.151bs
2 .12±0.171bs
4.91±0.341bs
2.13±0.161bs
1.88±0.161bs
4.62±0.401bs
1.31±0.101bs
2 .32±0.261bs
9.00±0.121bs
9.271bs
9.271bs
9.271bs
8.4.2 A necdotes from informal interview
In the informal post-test interview, 17 out of 21 participants in the pressure study reported that
they were able to delay immediately acknowledging the pressure stimuli during the typing task if the
intensity was weak ( “subtle”), and that they would finish typing the word or sentence before clicking
the acknowledgement button. Additionally, 13 people said tha t only the rapid, high intensity
pressure stimulus was annoying and disruptive to their reading and typing tasks. A quarter of the
people noted that the gradual increase in pressure caused them to gradually and subconsciously
change their posture without interrupting their office task, which was desirable. Only two people
reported tha t they did not like pressure on their body.
In comparison, exactly half of the 20 participants in the vibration study said tha t they were
able to finish typing a word or sentence before clicking to acknowledge the stimulus for the weak
( “faint” ) vibrations. A total of 13 people reported th a t they would click the button immediately
if the vibrations were “strong” (high intensity and fast actuation rate) because the vibrations felt
insistent and disrupted them from their typing task. One person mentioned tha t he would make
more typing mistakes a t the rapid onset of a vibration stimulus, possibly because it was startling.
Interestingly, 3 subjects liked the vibration stimulus so much tha t they completed the entire
typing task without clicking the button to acknowledge and turn off the stimulus for all three typing
trials. In contrast only one subject did not turn off the pressure stimulus on one trial.
In the pressure group, a handful of participants remarked that the slowest actuation rate was
98

somewhat “annoying” as they tried to anticipate the stimulus, and felt “paranoid” about whether
they were actually perceiving the stimulus. For future studies, it might be advisable to actuate
tactile stimuli faster than 0.076cm/s to avoid this “paranoia” effect.
8.5 Conclusion
This chapter examined the attention capture bandwidth of tactors and pactors as an investigation
into variable attention capture (VAC) haptics. We have shown that by modulating the actuation
rate, we can elicit different levels of attention capture with both tactors and pactors. Furthermore,
we observed tha t pressure stimuli were less noticeable and therefore less distracting a t slower actu
ation rates than vibration stimuli. However response times to pressure increased more sharply and
exhibited greater variability, making it less easy to control.
We also found tha t the distractor task - more specifically, the response modality of the distractor
task - had a significant effect on response times. If the person was typing, he will be more inclined
to ignore the slowly actuating haptic stimulus (due to response modality conflict) than if he were
reading.
In summary, we have found tha t both pactors and tactors exhibited response time curves that
are indicative of variable attention capture, each advantageous in its own way. This finding will
allow for a greater range of applications of haptic feedback, especially for conveying information of
varying priority. We hope tha t the implications of our study will also help influence the design and
control of future VAC haptic feedback systems for presenting information at an appropriate level
of attentional salience.
99
C hapter 9
Evaluation o f Tw o T yp es o f VAC
H aptic Feedback System s for
Seated P osture G uidance
9.1 O verview
In this chapter, we revisit the problem of seated posture guidance. Here, we investigate the ef
fectiveness of two different variable attention capture (VAC) haptic feedback systems for seated
posture guidance. Specifically, we are interested in learning how well users can comply with VAC
haptic feedback as well as determining how minimally disruptive VAC haptics can be. Previously,
we learned that actuation rate was most significant for achieving VAC, and th a t both pressure and
vibration feedback could be controlled to exhibit VAC characteristics. In this final experiment,
we integrate our VAC haptic actuators into office chairs and apply the lessons learned from past
studies to seated posture guidance, thus coming full circle to our problem presented in Chapter 3.
We begin with a description of the two VAC posture sensing systems, followed by a discussion
of the posture feedback algorithm. We then present the experimental design and the results of
the experiment. Additionally, we compare the results of this study to our earlier experiment with
non-VAC haptics (Chapter 3).
100

9.2 System D escription
For this study, we aim to identify the same set of four postures as in Chapters 4 and 5: upright,
slouching, leaning forward, and leaning back. (See Figure 4.2 and Table 4.1 for descriptions of each
posture.)
9.2.1 Equipment
The two Posture Seat systems used in this study are similar to the one used in Chapter 4 and 5.
The posture sensing system is a size B, fully adjustable Herman Miller Aeron chair instrumented
with 6 force-senstive resistors (FSRs) and one infrared (IR) distance sensor. The placement of the
sensors is the same as in Chapter 4 (see Figure 4.1).
There are two methods of delivering feedback: vibration and pressure. The vibration chair uses
6 vibrating tactors for haptic feedback, while the pressure chair uses 6 pactors for pressure feedback.
Each FSR (1.5” square Interlink 406) is connected to a voltage divider circuit (R\ = lfcQ). The
sensing system (FSRs and IR distance sensor) are powered by a regulated 5V DC voltage. A
National Instruments USB-6212 data acquisition unit (DAQ) is used to sense analog inputs.
Tactors for the vibration chair are composed of pancake eccentric mass motors (10mm x 3.4mm
Tactors #ShoulderPactors
LumbarPactor
Figure 9.1: (left) Vibration chair with tactors, (right) pressure chair with pactors used for this study. Only the tactors and pactors on the back of the chairs are shown. The two others are mounted on the bottom of the seat under each thigh.
101

Chair
Tactors or pactors
FSRs & IR distance sensor
Motorcontrollers
Voltagedividercircuit
Servocontroller
board
Powersupply
Figure 9.2: Block diagram showing the hardware connections for the posture sensing and feedback chairs.
shaftless vibration motors, Pololu #1636) surrounded by a 1.5”x l.5”x0.25” piece of soft polyurethane
foam. The tactors are each controlled by a 3kHz PWM voltage between 0-6V using a motor con
troller (Pixie- 7P), which are run from a servo controller board (Lynxmotion SSC-32). Lab VIEW
2010 is used to communicate with the servo controller board via a serial connection.
Pactors for the pressure chair are comprised of an RC servo motor (HS805BB), custom-designed
linkage arms, and contactor plates. (The design of the pactors is described in Chapter 7.) Pactors
are attached to the back of the Aeron chair with custom made 0.250” plywood mounting plates.
Each feedback system utilizes five tactors or five pactors. The actuators are placed directly
behind the left shoulder, lumbar, and thigh FSRs. The right shoulder actuator is located at the
same height as the left shoulder actuator, and mirrored about the centerline of the chair. Actuator
mounting locations on the back of the chair are shown in Figure 9.1. A block diagram of the entire
system is shown in Figure 9.2.
We also used a Hitachi Hybridcam DZ-HS903A camcorder for recording still images and live
videos for posture verification.
9.2.2 Posture Sensing
9 .2 .2 .1 C alib ration m od e
The posture calibration algorithm is similar to the one described in Chapter 3. In essence, the user
is directed to sit in each of the 4 postures as described in Figure 4.2 and Table 4.1. The 7 sensor
values are recorded automatically, resulting in a unique set of values for each posture for each user.
We refer to these as the “calibration values” for the “calibration postures.”
102

9 .2 .2 .2 C lassifica tion m od e
After calibration is complete, the system switches to posture-classification mode in order to verify
the classification accuracy for each user. The user sits in each of the postures from a randomized
list of postures while our sensing system records the sensor values once the users stabilize in their
posture. The mean-squared error (MSE) is computed between the sensor readings and the user’s
four sets of calibration values. If the MSE is below a threshold i f , the posture identification
algorithm assigns the posture corresponding to the lowest MSE. However, if MSE > i f , the posture
is considered “other.” When the predicted posture is the same as the actual posture, it is recorded
as a match. Finally, the total number of matches is used to compute classification accuracy. (This
is the same classification procedure as described in Chapter 3.)
Based on a preliminary evaluation of the current posture chair system, the threshold i f was
set to 0.06V for this study as a balance between natural postural sway and potential confounding
effects of other postures.
9 .2 .2 .3 R e a l-tim e sen sin g m od e
The real-time sensing mode is employed in conjunction with real-time posture feedback, which will
be discussed in the next section. In this mode, there is a target posture th a t the user must reach.
MSE is only computed between the user’s current real-time sensor values and his target posture
calibration values, as opposed to all 4 sets of calibration values. An MSE < i f indicates that the
user is sitting in the desired posture.
9.2.3 Posture Feedback
The purpose of posture feedback is to use haptic stimuli to guide the user into a specific reference
posture. The allowable postures are upright, leaning forward, and leaning back. Even though
calibration values were recorded for the slouching posture, the user will not be guided into it as it
is an unhealthy posture.
For the posture feedback algorithm, let s i,S 2 , - «7 be the voltage reading from each of the 7
sensors (6 FSRs and one IR distance sensor). Let V denote the array of instantaneous sensor values
while a user is sitting in the chair, i.e. V . Also let V* denote the array of values forS l . . . S7
each calibration posture, where p € {l=upright, 2=slouching, 3=leaning forward, 4=leaning back}.
For a given target posture p, the feedback algorithm computes the mean-squared error between the
103

current sensor values and the calibration values:
M S E P = 1 1 ( 3 ! - s * , ) 2 + ... + (a7 - s * 7)2 ). (9.1)P , 7 )
If M S E P > H, where threshold H = 0.06F, then the user is sitting in an incorrect posture and
feedback will be activated. (Otherwise feedback will remain off as the user is in the target posture.)
The location of the feedback stimulus and the corresponding action tha t the user must take to
eliminate the vibration or pressure feedback are shown in Tables 9.1 and 9.2. The feedback location
and intensity are based on the sensor location L with the greatest absolute error e/,:
eL = m ox(|si - s* . . . |s 7 - s*,7|). (9.2)
The location-specific feedback intensity I I is linearly proportional to Cl within a predetermined
error range emax:j Ermx Ell ITl j , .I I = ---------------- eL + Imin■ (9.3)
^max
Since Imin = 0, and emax was empirically determined to be 1, Equation 9.3 simplifies to
I max ' &L ^ €maxI l = < (9.4)
I f n a x i f 6L ^ 6m a x
Finally, when the user is guided to a new target posture, a time-dependent intensity filter is
applied to the feedback intensity such that
A l = <r ■ I L ■ Z for Z < l / r
(9.5)I I for Z > l / r
in discrete time, where Z is the discrete timestep and r is the actuation rate. The update rate was
50Hz and the actuation rate in discrete time was 0.01V/Z for vibration and 0.02cm/Z for pressure.
A l is the final stimulus intensity tha t is delivered to the user.
In summary, posture feedback is activated when the MSE between the user’s real-time posture
and the reference posture is greater than threshold H ( H —0.06V), indicating that he is not sitting
in the target posture. While MSE > H, the algorithm searches for the sensor “location” that
corresponds to the greatest absolute error. Once the location is determined, body-site-specific
104

Table 9.1: Vibration feedback mapping: location of vibration and correct action to take to eliminate vibrations.
L o c a t io n o f V i b r a t i o n A c t io n t o T a k e
shoulders , con tinuous
lum bar, con tinuous
legs, con tinuous
legs, pulsing
lean forw ard aw ay from back of cha ir
s it u p s tra ig h t, a rch back
lean back to w ard s back of cha ir
lean forw ard aw ay from back o f cha ir
Table 9.2: Pressure feedback mapping: location of pressure and correct action to take to eliminate pressure
L o c a t io n o f P r e s s u r e A c t io n t o T a k e
shou lders , s te ad y
lum bar, s tead y
legs, s tead y
legs, ta p p in g
lean forw ard aw ay from back o f chair
s it u p s tra ig h t, a rch back
lean back to w ard s back o f chair
lean forw ard aw ay from back o f ch a ir
feedback may be triggered. Haptic feedback intensity was controlled to be directly proportional to
amount of absolute error at the sensor location. This variable-intensity analog feedback will help
the user discern how close he is to the reference posture. Additionally, a time-dependent intensity
filter is applied to the first onset of postural feedback for guiding to a new posture. The filter is a
simple linear function that increases in intensity over time. The rate of increase ranges from 0.03V/s
to 1.2V/s for vibration feedback, and 0.076cm/s to 4.06cm/s for pressure feedback, proportional
to the amount of absolute error a t the sensor. These rates were chosen based on the results of
the study in Chapter 8 that displayed variable attention capture within these actuation rates. The
maximum driving voltage for vibration was 3V, which corresponded to a vibration intensity of
157Hz and approximately 3.11g. The maximum displacement for pressure feedback was 2.0cm,
which corresponded to approximately 45N force. When the user adjusts his posture towards the
target posture, stimulus intensity will decrease to signal he is moving in the right direction towards
the reference posture. During this phase of active adjustment, a time-dependent intensity mask is
not applied. Finally, when MSE < H, indicating the user is sitting in the target posture, feedback
turns off.
105
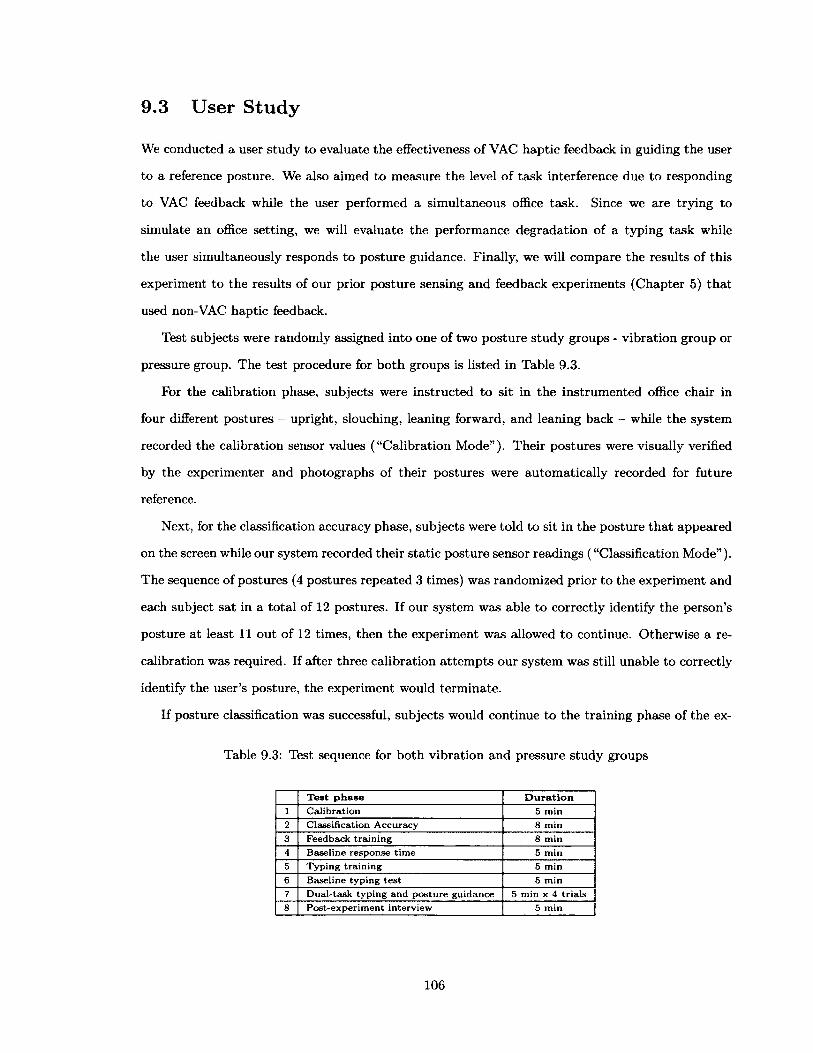
9.3 User Study
We conducted a user study to evaluate the effectiveness of VAC haptic feedback in guiding the user
to a reference posture. We also aimed to measure the level of task interference due to responding
to VAC feedback while the user performed a simultaneous office task. Since we are trying to
simulate an office setting, we will evaluate the performance degradation of a typing task while
the user simultaneously responds to posture guidance. Finally, we will compare the results of this
experiment to the results of our prior posture sensing and feedback experiments (Chapter 5) that
used non-VAC haptic feedback.
Test subjects were randomly assigned into one of two posture study groups - vibration group or
pressure group. The test procedure for both groups is listed in Table 9.3.
For the calibration phase, subjects were instructed to sit in the instrumented office chair in
four different postures - upright, slouching, leaning forward, and leaning back - while the system
recorded the calibration sensor values ( “Calibration Mode”). Their postures were visually verified
by the experimenter and photographs of their postures were automatically recorded for future
reference.
Next, for the classification accuracy phase, subjects were told to sit in the posture tha t appeared
on the screen while our system recorded their static posture sensor readings ( “Classification Mode”).
The sequence of postures (4 postures repeated 3 times) was randomized prior to the experiment and
each subject sat in a total of 12 postures. If our system was able to correctly identify the person’s
posture at least 11 out of 12 times, then the experiment was allowed to continue. Otherwise a re
calibration was required. If after three calibration attem pts our system was still unable to correctly
identify the user’s posture, the experiment would terminate.
If posture classification was successful, subjects would continue to the training phase of the ex-
Table 9.3: Test sequence for both vibration and pressure study groups
T e s t p h a s e D u r a t i o n1 C a lib ra tio n 5 m in2 C lassification A ccuracy 8 m in3 Feedback tra in in g 8 m in4 B aseline response tim e 5 m in5 T y p in g tra in in g 5 m in6 B aseline ty p in g te s t 5 m in7 D u al-task ty p in g an d p o s tu re gu id an ce 5 m in x 4 tr ia ls8 P o st-ex p e rim en t in terv iew 5 m in
106

periment. Depending on their experiment group, they would receive vibration or pressure feedback
training for guiding into the upright, leaning forward, and leaning back postures. As mentioned
before, they were not guided into the slouching posture as it is an unhealthy posture. Test subjects
were given a reference sheet with the feedback mapping and the correct action to take (Tables 9.1
and 9.2), which were also explained to them verbally. Test subjects could take as long as needed to
master their motor response to feedback, but most subjects took less than 3 minutes to correctly
respond to the feedback.
After subjects indicated their familiarity with the feedback, we measured their baseline response
time to postural feedback guidance. In this phase, subjects were guided to a randomly selected
posture at predetermined random time intervals ranging between 20-30 seconds. They were told
that feedback intensity was proportional to their postural error so moving closer to the target
posture would result in “softer” stimuli and no stimuli at all when the target posture was reached.
In total, they were guided to 15 postures, i.e. 5 times for each of the 3 acceptable postures.
Next, subjects received training on our typing environment. This is the same typing environment
as was used in Chapter 4 (Figure 4.3). Subjects were instructed to type verbatim the passage shown
on the screen. Meanwhile, the timestamp of their correct keystroke was automatically recorded.
The screen refreshed with a new passage every 60 seconds to eliminate the need for scrolling with
the mouse. Even though we allotted 5 minutes of training, all subjects expressed their comfort
and familiarity with the program after about 2 minutes. Regardless, all subjects completed the
five-minute training.
After the typing practice, we measured subjects’ baseline typing speed without posture feedback.
Finally, we combined the typing and posture feedback in the “dual-task typing and posture
guidance phase” (DT trials). Subjects were told to type the passage verbatim as before, while
simultaneously responding to vibration or pressure posture guidance. Their primary objective was
to perform the typing task and the secondary objective was to respond to posture guidance. They
performed the dual-task trials a total of 4 times. The first trial was discarded from analysis as a
“practice” trial.
At the end of the experiment, subjects were asked informal interview questions including how
disruptive the vibration or pressure stimuli was, whether or not they stopped typing due to sensing
haptic stimuli, etc. Subjects were also given the opportunity to express any other comments related
to the study. The entire study lasted approximately 1 hour and 15 minutes.
107
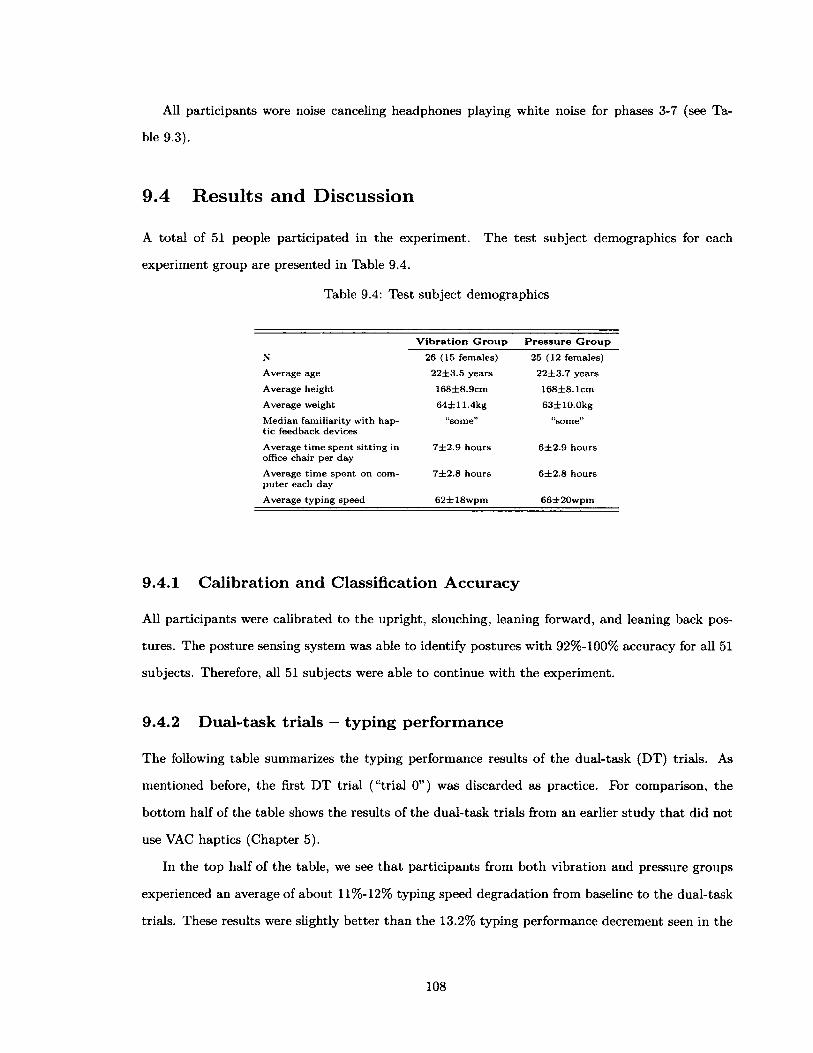
All participants wore noise canceling headphones playing white noise for phases 3-7 (see Ta
ble 9.3).
9.4 R esu lts and D iscussion
A total of 51 people participated in the experiment. The test subject demographics for each
experiment group are presented in Table 9.4.
Table 9.4: Test subject demographics
V i b r a t i o n G r o u p P r e s s u r e G r o u p
N 26 (15 fem ales) 25 (12 fem ales)
A verage age 2 2 ± 3 .5 years 2 2 ± 3 .7 years
A verage height 168±8.9cm 168± 8 .1cm
A verage w eight 6 4 ± 11.4kg 63± 1 0 .0 k g
M edian fam ilia rity w ith haptic feedback devices
“som e” “som e”
A verage tim e sp e n t s itt in g in office cha ir p er day
7 ± 2 .9 h ours 6 ± 2 .9 hou rs
A verage tim e sp e n t on com p u te r each day
7 ± 2 .8 h ours 6 ± 2 .8 hou rs
A verage ty p in g speed 62± 18w pm 66 ± 2 0 w p m
9.4.1 Calibration and Classification Accuracy
All participants were calibrated to the upright, slouching, leaning forward, and leaning back pos
tures. The posture sensing system was able to identify postures with 92%-100% accuracy for all 51
subjects. Therefore, all 51 subjects were able to continue with the experiment.
9.4.2 Dual-task trials — typing performance
The following table summarizes the typing performance results of the dual-task (DT) trials. As
mentioned before, the first DT trial ( “trial 0” ) was discarded as practice. For comparison, the
bottom half of the table shows the results of the dual-task trials from an earlier study th a t did not
use VAC haptics (Chapter 5).
In the top half of the table, we see th a t participants from both vibration and pressure groups
experienced an average of about 11%-12% typing speed degradation from baseline to the dual-task
trials. These results were slightly better than the 13.2% typing performance decrement seen in the
108

Table 9.5: Comparison of aggregate typing performance between the VAC tactor and VAC pactor groups (vibration and pressure groups, respectively). For reference, typing performance from the non-VAC study (Chapter 5) is also presented.
V i b r a t i o n (n ~ 2 6 ) P r e s s u r e (n = 2 5 )Avg. baseline ty p in g speed Avg. D T ty p in g speed Sig. diff, baseline to D T
326 cpm 287 cpm (-12.0% )
9 p eop le (35%)
345 cpm307 cp m (-11.0% )
4 p eop le (16%)
(ea rlie r stu dy , fo r reference) V i b r a t i o n (n —20)Avg. baseline ty p in g speed Avg. D T ty p in g speedSig. diff, baseline to D T
257 cpm223 cp m (-13.2% ) 11 p eop le (55%)
tactor activation level and typing performance, subject #303 pactor activation level and typing performance, subject #418z.s>
pactor activation level (normalized) At between keystrokes (3pt avg)Ic
1 2.2
1.5
03
1
Io!53
090 100 110 120
elapsed time (sec)130 140 150
tactor activation level (normalized)— —» At between keystrokes (3pt avg)J 0-9
I 0.8%0.7
§
0.3£©I
0.2
< 0.1
220 230 240elapsed time (sec)
250 260 270
Figure 9.3: An illustrative plot from one test subject in the tactor group and one in the pactor group showing time between keystrokes and actuator activation level from a one-minute snapshot. As actuator activation level increased (red line), subjects’ primary task performance were less affected by the VAC feedback; they were able to delay responding until a more opportune time. These VAC example plots stand in contrast from the non-VAC example in Figure 4.5 where subjects were significantly impacted by the vibrotactile posture feedback guidance.
earlier study, although the differences were not significant. However a closer examination of each
subject’s typing performance revealed tha t some subjects were able to delay responding to postural
guidance until a more convenient time. Figure 9.3 shows two examples of such behavior (one from
the vibrotactile group, the other from the pressure group). When the VAC haptic actuator slowly
ramped up in feedback intensity (bolded red lines), subjects continued to type normally (blue lines)
until some later point when they decided to pause typing and adjust their posture. A paired t-test
comparing typing speed during active feedback and inactive feedback (moments of sitting in the
reference posture) revealed that there was no statistically significant difference in mean typing speed
(vibrotactile feedback: p = 0.3177, pressure feedback: p = 0.4858). This supports our claim that
VAC vibration and VAC pressure feedback can be minimally disruptive to a worker’s primary task.
109
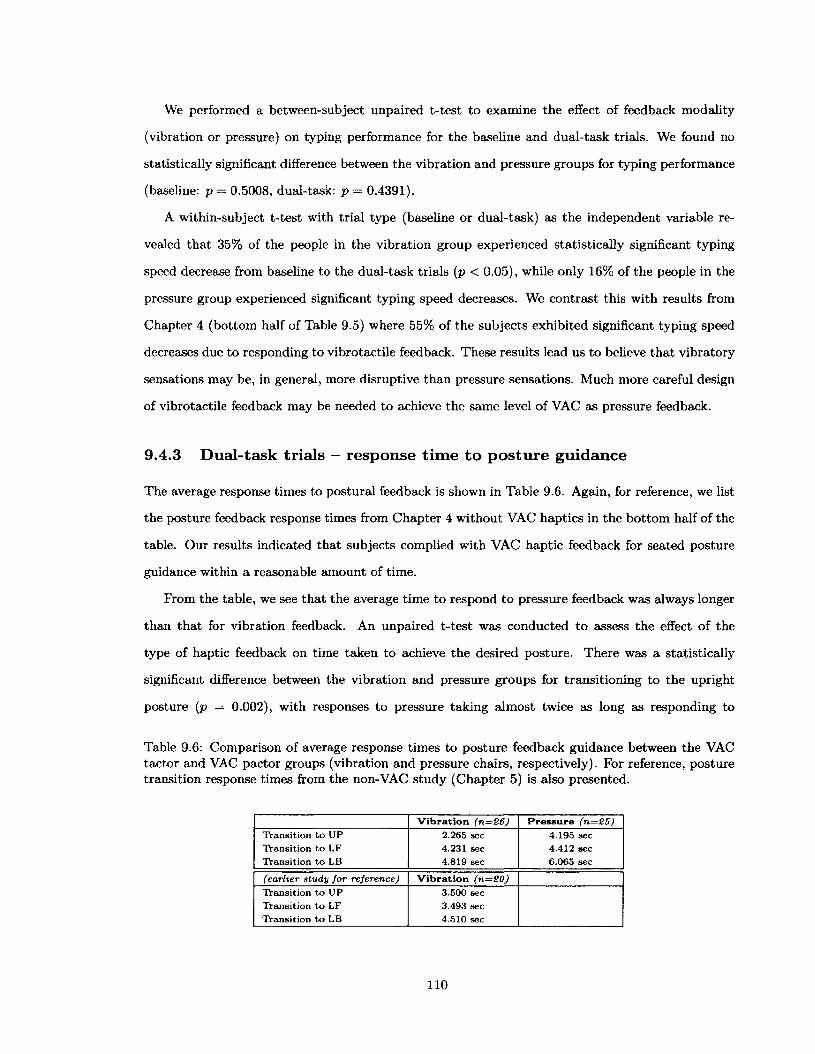
We performed a between-subject unpaired t-test to examine the effect of feedback modality
(vibration or pressure) on typing performance for the baseline and dual-task trials. We found no
statistically significant difference between the vibration and pressure groups for typing performance
(baseline: p = 0.5008, dual-task: p = 0.4391).
A within-subject t-test with trial type (baseline or dual-task) as the independent variable re
vealed that 35% of the people in the vibration group experienced statistically significant typing
speed decrease from baseline to the dual-task trials (p < 0.05), while only 16% of the people in the
pressure group experienced significant typing speed decreases. We contrast this with results from
Chapter 4 (bottom half of Table 9.5) where 55% of the subjects exhibited significant typing speed
decreases due to responding to vibrotactile feedback. These results lead us to believe that vibratory
sensations may be, in general, more disruptive than pressure sensations. Much more careful design
of vibrotactile feedback may be needed to achieve the same level of VAC as pressure feedback.
9.4.3 Dual-task trials — response tim e to posture guidance
The average response times to postural feedback is shown in Table 9.6. Again, for reference, we list
the posture feedback response times from Chapter 4 without VAC haptics in the bottom half of the
table. Our results indicated that subjects complied with VAC haptic feedback for seated posture
guidance within a reasonable amount of time.
Prom the table, we see tha t the average time to respond to pressure feedback was always longer
than tha t for vibration feedback. An unpaired t-test was conducted to assess the effect of the
type of haptic feedback on time taken to achieve the desired posture. There was a statistically
significant difference between the vibration and pressure groups for transitioning to the upright
posture (p = 0.002), with responses to pressure taking almost twice as long as responding to
Table 9.6: Comparison of average response times to posture feedback guidance between the VAC tactor and VAC pactor groups (vibration and pressure chairs, respectively). For reference, posture transition response times from the non-VAC study (Chapter 5) is also presented.
V i b r a t i o n (n = 2 6 ) P r e s s u r e (n = 2 5 )TYansition to U P 2.265 sec 4.195 secTYansition to LF 4.231 sec 4.412 secT ran s itio n to LB 4.819 sec 6.065 sec
( ea r lie r s tu d y f o r reference) V i b r a t i o n (n = 2 0 )T ran s itio n to U P 3.500 secT ran s itio n to LF 3.493 secT ran s itio n to LB 4.510 sec
1 1 0

vibration feedback. The response time difference between the vibration and pressure groups did
not reach statistical significance for transitioning to the other two postures (p > 0.05). Additionally,
transitioning to leaning forward and leaning back postures usually took longer than responding to
upright posture feedback. This is expected as more motion is required to transition to these two
“extreme” posture locations.
Comparing these results to the results obtained from Chapter 5, we see tha t the posture tran
sition response times under VAC haptic feedback were comparable - about 1-2 seconds slower - to
no VAC haptic feedback. This is very much acceptable as postural compliance is the less important
task.
9.4.4 Anecdotes
In the post-experiment informal interview, subjects had the opportunity to voice their thoughts
about the feedback. In the vibration group, 8 out of 26 people thought the vibrations were intuitive,
6 of which clarified that the back vibrations were intuitive but the leg vibrations required more
mental processing. In contrast, 12 out of 25 people expressed th a t pressure feedback was intuitive,
and that pressure feedback on the back was more intuitive than under the legs.
Six people thought vibrations in general were disruptive. Still 8 others thought tha t vibrations
themselves were not really disruptive but rather the act of changing posture was disruptive, causing
them to pause their typing even if the feedback was “quiet.” In comparison, 10 out of 25 people in
the pressure group said that the act of changing postures was disruptive while pressure itself was
not. Twelve others thought that pressure feedback was not distracting. Only one person voiced
tha t pressure feedback was annoying and disruptive.
These comments were consistent with the quantitative data that showed that more people in
the vibration group (compared to the pressure group) experienced a statistically significant typing
performance decrement while simultaneously responding to posture feedback. Furthermore, these
comments support that the act of changing postures while trying to perform another task is in itself
a taxing task and induce a non-zero performance decrement to the primary task.
A total of 9 people felt th a t vibration feedback would have been less disruptive if they had
internalized the feedback mapping through more practice (more than just the 4 trials in the exper
iment), while 8 people in the pressure group said they had learned the feedback by the end of the
last dual-task trial. A longer duration or multi-day experiment would be needed to further assess
111

the cognitive cost and learning effects of using VAC haptic feedback for seated posture guidance.
Finally, two people reported experiencing phantom vibrations, and two others thought the subtle
vibration stimuli were most disruptive since they tried to anticipate the stimuli, and would have
preferred a clearer (more intense) signal.
9.5 D iscussion
In this study, we found that all 51 subjects were able to successfully comply with vibration or
pressure feedback posture guidance. While the response times for transitioning into the upright,
leaning forward, or leaning back postures differed within each group, the response times were very
similar when compared across the vibration and pressure groups. Additionally, the transition times
under VAC haptic feedback were, on average, only 1-2 seconds slower than no VAC haptics. In
exchange for this slower response time, subjects were less hindered in their primary tying task;
fewer subjects in the VAC groups experienced significant performance degradation than the non-
VAC group. These results are encouraging; first, they suggest VAC vibration and pressure stimuli
can elicit similar behavioral responses. Second, our current implementation of VAC haptic feedback
can guide users to a desired posture in a very reasonable amount of time.
In the dual-task trials, we saw similar overall typing performance degradations for subjects in
both pressure and vibration groups. Additionally, in the informal interview, we learned tha t many
subjects did not find vibration or pressure feedback disruptive, but rather the act of adjusting their
posture was disruptive to their typing. We surmise tha t the consistent performance decrement may
be due to the nature of the simultaneous tasks - regardless of how ambient the feedback may be,
both typing and posture adjustment required sensory-motor control and perhaps these two tasks
were competing for the same mental resource. Because we see a consistent performance degradation
regardless of the haptic feedback rate or intensity, we are led to believe tha t there may be mental
resource competition between the hands and the body response modalities. However we don’t know
if the performance decrement will be generalizable to other primary tasks tha t do not involve typing,
or if any amount of whole-body movement will cause performance degradation of another task.
The decrease in typing speed in the dual-task phase could also be due to a learning effect.
Although we did not see a significant typing speed increase between dual-task trials 1-3 in this
study, subjects were clearly expending mental resources to translate the haptic stimuli into motor
responses; the responses are not yet second nature. We know from Rassmussen [118] that there
1 1 2

are skill-based, rule-based, and knowledge-based forms of learning. I t’s possible that the duration
of the experiment was not sufficient for subjects to internalize the feedback mapping into skill-
based learning and respond to the feedback automatically. Perhaps a longer study over a period of
multiple days or weeks may be needed to assess this learning effect.
The similarity in posture transition response times between the vibration and pressure groups,
with the exception of responding to upright posture feedback, suggest th a t they are comparable
in effectiveness in guiding the user to a particular posture. However, we also found tha t VAC
pressure feedback was slightly less disruptive than VAC vibration feedback. This could be due to
differences in the current implementation of our pressure and vibration feedback systems - possibly
pactors were easier to control and therefore could modulate attention capture between “ignorable”
to “demand action” more easily. Perhaps in a future study we could redesign the tactors with even
greater actuation bandwidth for VAC. However several subjects in the vibration group mentioned
that, in general, vibration stimuli were annoying to them. From Chapter 6 we know that things
that elicit negative affect tend to elicit greater attention capture, which in this case will be more
disruptive to the primary task of typing.
Finally, many subjects expressed th a t feedback from the back of the chair was more intuitive
than feedback from under the legs. This is because multiple directional encodings were assigned
to the actuators under the legs (i.e. toward or away from back of chair), while only one encoding
was mapped to the actuators in the back the chair (i.e. move away from back of chair). The dual
encoding under the legs led to a little bit of confusion, but many subjects were able to internalize
the feedback mapping and execute the correct response with a little bit of practice. Therefore,
in the future, if minimal learning curve is desirable, then it is advisable to map only one motor
response to each actuator.
When compared to the results of a prior study without VAC haptics (Chapter 4), we see tha t far
fewer subjects experienced statistically significant typing performance decrement in the presence of
VAC haptics. We are encouraged by this result th a t proves VAC haptic feedback causes less disrup
tion to a user’s primary task, while simultaneously acknowledging th a t even greater improvements
can be made to the current implementation of our two VAC haptic feedback chairs for more fluid
modulation of attention capture.
113
9.6 Conclusion
In this study, we evaluated the effectiveness of variable attention capture (VAC) haptics for seated
posture guidance, and its level of disruption to a primary (typing) task. For reference, we compared
the results of this study to an earlier study we conducted on posture sensing and feedback tha t did
not utilize VAC haptics.
We learned that VAC haptics was successful in guiding users to a desired seated posture within
a reasonable amount of time. Responding to VAC haptic feedback was less disruptive to their
typing task than responding to non-VAC haptic feedback. However subjects exhibited a consistent
typing performance degradation from responding to feedback, which could be due to competing
response modality resources and learning effects, and not necessarily due to VAC haptics. Finally,
VAC vibration feedback was slightly less preferred than VAC pressure feedback for seated posture
guidance due to the inherent “annoying” nature of vibratory stimuli.
Our current work explored the feasibility of VAC haptics for the specific application of seated
posture guidance. These results demonstrate th a t VAC haptic feedback is both feasible and ben
eficial for modulating information priority and improving task performance. This work has the
potential to extend into other areas needing different levels of feedback for tasks with differing pri
orities. We hope that our work not only helps improve office worker health with minimal disruption
to their productivity, but also provide a basis for further research into variable attention capture
(VAC) haptic feedback systems to appropriately manage user attention.
114
C hapter 10
Sum m ary and O utlook
The primary objective of this dissertation was to introduce the concept of variable attention capture
(VAC) haptic feedback as a new design paradigm in the field of haptics for conveying touch infor
mation at an appropriate level of attentional salience. The specific aims of this research were to
construct devices capable of delivering VAC haptic stimuli; characterize variable attention capture
through user studies in the context of the operation of these devices; and show th a t these devices
are useful and beneficial for providing information in a timely, accurate, and unobtrusive manner.
To that end, we successfully designed, characterized, and implemented low-cost vibration- and
pressure-based feedback systems for the application of seated posture guidance. This Posture Seat
system, utilizing only seven sensors, was capable of identifying 4 common postures - upright,
slouching, leaning forward, and leaning back - with greater than 91% accuracy, and 10 common
postures with greater than 86% accuracy. We used a continuously valued error signal to compute
the degree of match rather than a binary match, thus allowing us to provide feedback intensity
proportional to the magnitude of posture error. This system produced minimal feedback intensity
when errors were small and increased in intensity with larger deviations.
Our user studies showed that this initial non-VAC Posture Seat system was successful in guiding
subjects to a desired posture: we observed immediate posture compliance in response to vibrotactile
haptic stimuli, and test subjects were observed to sustain their target posture for a short period
even after feedback ended (Chapter 3). However, we noted that the initial implementation of vibro
tactile feedback caused considerable primary task interference (Chapter 4), while being similar in
effectiveness to visual feedback methods (Chapter 5). To overcome the disruptiveness of vibrotac-
115

tile feedback, we focused our research on determining parameters tha t most significantly impacted
attention capture in order to develop effective VAC haptic feedback systems.
In our investigation of parameters conducive to variable attention capture (Chapter 6), we found
that temporal factors - actuation rate and profile - had the greatest effect on attention capture,
followed by stimulus magnitude. Additionally, we observed a negative correlation between attention
capture and affect (stimuli with negative emotional associations increased attention capture) and
a positive correlation between attention capture and novelty (novel stimuli increased attention
capture). Other actuator and stimulus parameters such as material, geometry, location on body
exhibited less pronounced effects on attention capture. We concluded tha t actuation rate and
profile should be the primary factors modulated in the design of VAC haptic feedback systems.
Additionally, since preferences varied by subject, a haptic feedback intensity “volume” control
should be incorporated to accommodate each user’s preference.
Based on the findings from Chapter 6, we developed novel pressure-based actuators (pactors)
capable of varying actuation rate and intensity (Chapter 7). We also redesigned tactors to span
a wider range of actuation rates and intensities. Perceptual studies revealed a favorable response
time curve for both actuators, indicating th a t they were capable of modulating attention capture
across a spectrum (Chapter 8).
When VAC tactors and pactors were integrated into the Posture Seat for posture guidance, our
in-the-wild study showed that fewer test subjects experienced significant performance degradation
in their primary office task when using the VAC system compared to using the non-VAC system
(Chapter 9). We thus demonstrated tha t VAC haptic feedback is both feasible and beneficial for
modulating attentional salience and improving task performance in the context of seated posture
guidance.
Our research was the first to develop a posture sensing and haptic feedback mechanism for real
time seated posture guidance. We demonstrated the simplicity and efficacy of such a mechanism
and anticipate that this could be adapted for medically valid studies. We believe tha t this low-
cost, easy-to-use Posture Seat system would be useful as a tool for occupational therapists, posture
experts, and even everyday consumers to monitor and correct unhealthy sitting postures to help
mitigate injury.
Our work was also the first to explore VAC haptic feedback as a new design paradigm for in
tegrating focal and ambient haptic feedback systems to fluidly modulate a user’s level of attention
116
capture. Our work laid the foundation for a general approach to developing and characterizing VAC
haptic feedback systems. As our knowledge of the haptic attention capture spectrum increases, we
could further increase our ability and sophistication of encoding information in haptic stimuli. We
envision that a complete understanding of the human haptic sense may eventually result in systems
capable of a haptic “language,” synthesizing haptic vocabulary, tone, and context to produce effec
tive communication. We hope that others may build upon my doctoral work to expand and fully
utilize th a t language through the development of their own VAC haptic feedback systems tha t can
deliver information at an appropriate level of salience, thereby melding seamlessly into the user’s
environment.
117
C hapter 11
Future W ork
The user studies in this dissertation uncovered many interesting findings which serve as the basis
for future research. This chapter lists potential short-term and long-term research directions that
advance the field of haptics as a viable “language” for communication. We begin by discussing
research goals th a t can improve the capabilities of the current posture sensing and feedback system.
This is followed by a discussion on areas of future development for VAC haptics tha t help explore
the full range of the haptic “language” for more effective information communication. Lastly, we
end with our recommendations for potential applications of VAC haptics outside of seated posture
guidance.
11.1 Future work for th e P osture Seat system
Smarter posture sensing system
First, we would like to improve the posture sensing capabilities so tha t it can accurately identify 10
or more of the most common seated postures with greater than 86% classification accuracy. This
may involve developing a learning algorithm or a weighted posture cost function instead of the
current method of computing the mean-squared error (MSE) for each posture.
Additionally, we would like to develop sensors th a t could be embedded in any standard office
chair. Currently the posture sensing system works only when force-sensitive resistors (FSRs) are
affixed to the pellicle surface of the Herman Miller Aeron chair. W ith most other office chairs,
especially well-cushioned office chairs, the analog outputs from the FSRs on or inside the chairs
118
are significantly attenuated. Therefore the posture sensing system would be more versatile if the
sensors could be adapted to fit a variety of office chairs. This could be achieved, for example,
through the use of different sensors, the development of housings for the current FSRs to amplify
the signal, or the integration of signal amplification circuitry.
B etter actuators
Second, we would like to increase the bandwidth and fidelity of our VAC haptic actuators. Currently
tactors for the Posture Seat are comprised of eccentric mass motors whose frequency and amplitude
responses are a non-linear function of driving voltage with a lot of variability, rendering them hard
to control. They also have an undesirable deadband in the low frequency and low amplitude region,
the region most critical for ambient haptic feedback. Furthermore, there is variability from tactor
to tactor, making it difficult to ensure the same level of stimulation is delivered for a given driving
voltage. Therefore we seek to improve the bandwidth of VAC tactors by exploring a different
vibratory actuation technology (perhaps voice coil actuators) tha t has a lower turn-on voltage and
is capable of delivering low frequency and amplitude vibratory stimuli (close to 0.1Hz) to the human
body. The performance of such an actuator must be more repeatable than the current tactors. By
increasing the vibration resolution and controllably decreasing the vibratory intensity, we will be
better able to achieve ambient attention capture [83].
We would also like to improve the form and function of our pactors. Currently, pactors are larger
and heavier than desired, and we would like to downsize them to be more portable like tactors.
Smaller pactors will also improve their versatility, for example, for embedding into a variety of
office chairs or even for wearable haptics. Additionally, we would like to eliminate the undesirable
vibratory artifact as pactors should deliver only pressure-based stimuli.
Finally, we would like to “soundproof’ the tactors and pactors to eliminate the high frequency
buzzing noise so users need not wear noise canceling headphones, or be preemptively influenced by
noise from the actuators.
Stim ulus-response com patible feedback mapping
Our choice of feedback mapping for seated posture guidance (moving towards or away from vibration
or pressure depending on cueing location) was based on what was assumed to be the natural motor
action. However through our studies we learned that encoding two different feedback schemes on
119
one body site created confusion. Hence for future studies we will deliver only one kind of stimulus
a t each body location and investigate what is the most effective stimulus to deliver, along with the
most optimal body locations for such a stimulus.
Longer duration studies for learning and retention
Although most study subjects indicated that the haptic feedback seated posture guidance was
intuitive, the feedback still cost them non-zero performance decrement. Therefore we conclude that
internalizing the haptic feedback mapping might have required more time than was available during
our posture guidance studies. To truly transition from rule-based processing (high mental effort)
to skill-based processing (automatic, low mental effort) [117] would require more practice with the
feedback system and thus longer trials. Multiple weeks or months of using the system may be
necessary to evaluate long-term motor skill learning.
Concurrently, we would like to evaluate sensory-motor skill retention by investigating optimal
on/off feedback duty cycles in order to reduce the user’s dependence on feedback for seated posture
guidance. Furthermore, by integrating VAC haptic feedback, we hope to gain a better sense of
worker productivity over an extended period of time.
M edical efficacy - preventative and rehabilitative
Finally, we would like to collaborate with physical therapists and posture specialists to evaluate the
medical efficacy of our Posture Seat for back pain preventative care and rehabilitation. Our subject
population comprised of readily available student volunteers who represent one type of user group
and may not necessarily be the direct beneficiaries of the Posture Seat. Therefore a study utilizing
a larger population with more careful attention to selecting the population of interest, including
patients with chronic low back pain, is an appropriate next step.
11.2 Future work for VAC haptics
Quantifying th e attention capture spectrum
First and foremost, we would like to quantify each notification level along the attention capture
spectrum. Currently we draw loose connections between response time and levels of attention
capture: shorter response times indicate more focal feedback and longer response times mean more
1 2 0
ambient feedback. However there is no numerical definition associated with each of the notification
levels, or with the general terms “focal” and “ambient” feedback. Therefore, by quantifying the
notification levels along the attention capture spectrum, we will provide a more rigorous way of
characterizing how VAC haptic feedback systems modulate attention along this spectrum.
Context sensing
A crucial part of context-sensitive haptic feedback is sensing the user’s context. We wish to develop
robust methods of sensing the context of a user’s environment (such as utilizing a vision system to
detect user activity) as well as the user’s mental workload and interruptibility (such as EEG, heart
rate, or skin conductance) so that a timely and appropriate level of feedback may be delivered to
the user.
Design o f new VAC actuators
In addition to improving the existing tactors and pactors, we aim to develop a new set of VAC
haptic actuators that combines tactors and pactors into one system. This integrative unit can deliver
slowly actuating pressure stimuli to convey less urgent information and fast-actuating vibrotactile
stimuli for more urgent information. Additionally we would like to explore a combined thermal and
low frequency actuation mechanism that could better emulate human touch. According to [26],
people correlate heat and low-frequency motion with human contact. To our knowledge, so far
no research has been conducted in designing and evaluating a thermally modulated low-frequency
actuator for ambient haptic feedback.
Perceptual studies w ith VAC haptics
A largely unexplored area of haptic perception is how well people can perceive haptic stimuli on
different parts of their body while the person is in motion. Most of the haptic perceptual studies
involve detection of a stimulus when maintaining a static pose, while only a small portion of haptic
studies involve stimulus detection while moving. However many of our everyday activities involve
some sort of movement, and feedback tha t is easy to identify when stationary may become hard
to identify when in dynamic motion. Therefore it would be beneficial to investigate which haptic
feedback characteristics are most salient while a person is in motion, and to what degree we can
modulate these stimulus parameters to achieve variable attention capture.
121

Trained associations VAC vib rotactile feedback
Vibrotactile feedback often feels “unnatural” and usually elicits an attention-getting response, even
at low intensities. But can these sensations be learned to be processed in the background even
at the onset? It would be interesting to investigate whether we can “train” a peripheral haptic
sense to react to certain vibratory sensations and ignore others. Additionally, it would be inter
esting to create or reverse any ingrained negative cultural or experiential associations with certain
haptic stimuli to elicit only positive affective response and thus negative (low) attention capture.
This would be the beginnings of establishing a haptic feedback ‘Vocabulary” tha t makes formal
associations between words and haptic sensations.
11.3 A pplications o f VAC haptics
Finally, we would like to explore VAC haptics for a broad range of applications in addition to
seated posture guidance. For example, VAC haptic feedback could be integrated into the car seat
to convey variable-priority information to the driver about objects in his blindspot or a tailgating
car. (Early stages of this work is presented in [95]). These notifications are not simply binary on-off
alerts but are more subtle and fluid, allowing the driver to attend to the signals when needed.
Another area of application would be to integrate VAC haptic feedback into a variety of muscle
guidance tasks and rehabilitation devices. For example, our partial weight bearing compliance aid
for orthopedic surgery patients delivers ambient (low intensity) vibrotactile stimuli to the patient
to confirm that he has reached his partial weight bearing target load, and delivers a salient (high
amplitude and pulsing) vibratory signal to alert the patient th a t he has exceeded the safe weight
bearing range [24]. Sensory-motor guidance devices (for rehabilitation as well as sports training) can
provide continuous ambient feedback to confirm a normal or positive action, and deliver attention-
getting feedback for a negative action.
A final area of application for VAC haptics could include background activity monitoring. For
example, a VAC haptic wristwatch that ticks more intensely or rapidly can warn a presenter when
his time is about to expire (similar to [143], or when the volume of trades in a stock market increases
dramatically. Another example can be a wearable haptic display th a t monitors and conveys the
heart rate of loved one, and changes to a more urgent signal when the heart rate becomes abnormal.
These devices all aim to move fluidly between the focal and periphery of one’s attention to convey
1 2 2

timely and relevant information to the user.
In summary, variable attention capture haptics is a nascent research area within the field of
haptics. The studies presented in this thesis provide only a glimpse of what can be achieved with
VAC haptics; there are myriad opportunities for further developing VAC haptics, from perception
to application. We hope that this dissertation has put forth a framework for further research in the
area of VAC haptics to help fully characterize and utilize our rich haptic sense.
123

A ppendix A
C utaneous Senses
The skin is the largest organ in the human body and covers an area of approximately 1.8m2 [135].
Skin can be divided into two types: glabrous and hairy. Glabrous (non-hairy) skin is found only on
plantar and palmar surfaces, whereas hairy skin is found on all other parts of the body. Mechanore-
ceptors in glabrous and hairy skin sense a wealth of touch stimuli from our environment, including
pressure, vibration, temperature, and pain. They are located at different depths of the dermis
and epidermis, and come in different form factors. Figure A .l illustrates the different kinds of
mechanoreceptors classified by morphology, and lists the ones th a t are common to both glabrous
and hairy skin.
Each mechanoreceptor exhibits a specific rate of adaptation th a t allows it to sense a particular
type of stimulus, such as pressure or vibration. The types of adaptation speeds and the correspond
ing mechanoreceptor characteristics are:
• Slowly Adapting Type I (SAI) - exhibit sustained response to static stimulus, small receptive
field for “precision” sensing, sensitive to “form” and “roughness”
• Slowly Adapting Type II (SAII) - exhibit sustained response to static stimulus, large receptive
field for “gross” sensing, sensitive to “skin stretch”
• Rapidly Adapting Type I (RAI) - exhibit transient response to stimulus onset and offset,
small receptive field for “precision” sensing, sensitive to “flutter” and “slip”
• Rapidly Adapting Type II (RAII) - exhibit transient response to stimulus onset and offset,
large receptive field for “gross” sensing, sensitive to high frequency vibrations. Only Pacinian
124

Corpuscles are RAII.
Figure A.2 shows the neural spike train of slowly adapting and rapidly adapting mechanorecep-
tors in response to a stimulus. It can be seen tha t when a stimulus is held steady, neurons from the
slowly adapting mechanoreceptors continue to fire, alerting the human to a constant pressure stim
ulus. On the other hand, neurons from the rapidly adapting mechanoreceptors, which are sensitive
to vibratory stimuli, activate only when there is a change in the stimulus.
Each type of mechanoreceptor also has a specific sensitivity bandwidth. For example, Meissner
Corpuscles found in glabrous skin is sensitive to vibratory stimuli in the range of 0.4Hz to about
800Hz [10], whereas Pacinian Corpuscles are sensitive to vibrations between 150Hz - 300Hz [135].
Table A .l summarizes the basic properties of cutaneous mechanoreceptors, which are derived from
Glabrous skin Hairy skin
P ac in ian C o rp u sc le s Ruffini C o rp u sc le s
M erk le D iscs F ree N e rv e E nd ings
H air Follicle R e c e p to rs
M e issn e r C o rp u sc le s
Figure A .l: Mechanoreceptors in glabrous (top left) and hairy skin (top right). The Venn diagram further illustrates which mechanoreceptors are present in each type of skin. Image sources: [9, 71]
Neural spike train
Stimulus
Figure A.2: Neural spike train of slowly adapting and rapidly adapting mechanoreceptors in response to a stimulus. Spikes indicate neuron activation from stimulus. Adapted from Kandei, et. al. [67]
125
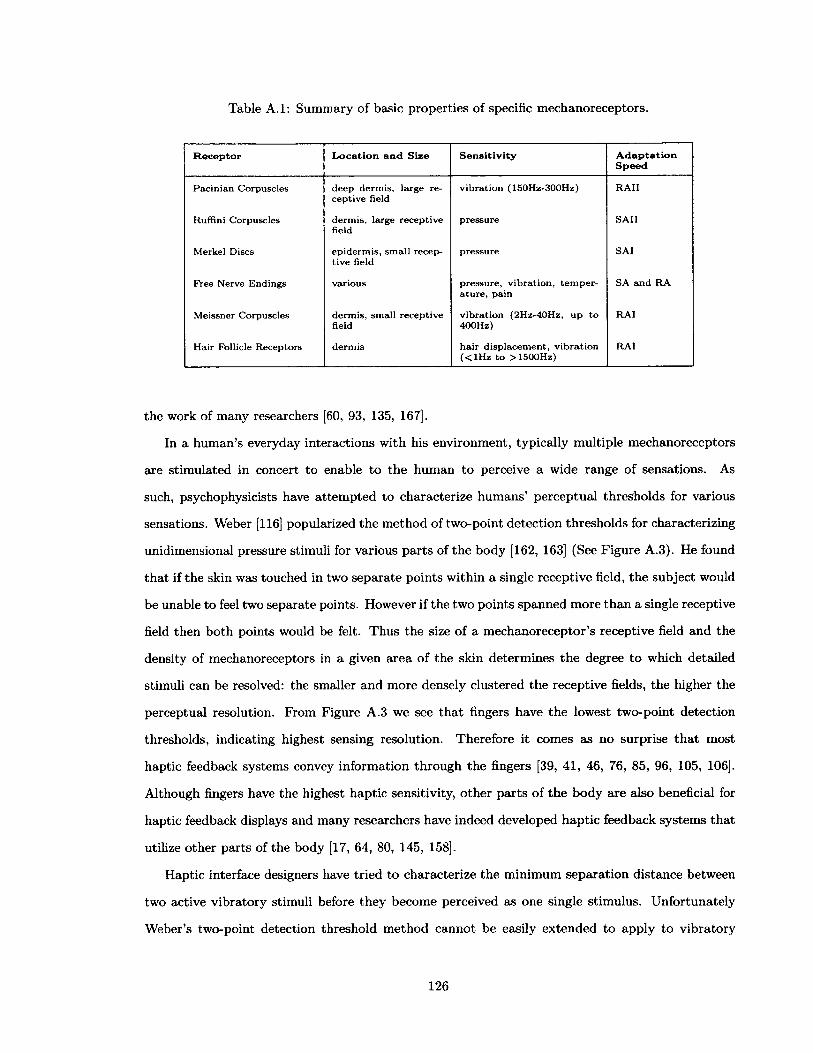
Table A .l: Summary of basic properties of specific mechanoreceptors.
Receptor Location and Size Sensitivity AdaptationSpeed
P ac in ian C orpuscles d eep derm is, la rg e re cep tiv e field
v ib ra tio n (150H z-300H z) R A II
Ruffini C orpuscles d erm is, large recep tiv e field
pressu re SA II
M erkel Discs ep id e rm is, sm a ll recep tiv e field
p ressu re SAI
Free N erve E nd ings various p ressu re , v ib ra tio n , te m p e ra tu re , pain
SA a n d RA
M eissner C orpuscles derm is, sm all recep tiv e field
v ib ra tio n (2H z-40H z, u p to 400Hz)
RA I
H air Follicle R ecep to rs derm is h a ir d isp lac em en t, v ib ra tio n ( < lH z to > 1500Hz)
RA I
the work of many researchers [60, 93, 135, 167].
In a human’s everyday interactions with his environment, typically multiple mechanoreceptors
are stimulated in concert to enable to the human to perceive a wide range of sensations. As
such, psychophysicists have attempted to characterize humans’ perceptual thresholds for various
sensations. Weber [116] popularized the method of two-point detection thresholds for characterizing
unidimensional pressure stimuli for various parts of the body [162, 163] (See Figure A.3). He found
that if the skin was touched in two separate points within a single receptive field, the subject would
be unable to feel two separate points. However if the two points spanned more than a single receptive
field then both points would be felt. Thus the size of a mechanoreceptor’s receptive field and the
density of mechanoreceptors in a given area of the skin determines the degree to which detailed
stimuli can be resolved: the smaller and more densely clustered the receptive fields, the higher the
perceptual resolution. From Figure A.3 we see tha t fingers have the lowest two-point detection
thresholds, indicating highest sensing resolution. Therefore it comes as no surprise th a t most
haptic feedback systems convey information through the fingers [39, 41, 46, 76, 85, 96, 105, 106].
Although fingers have the highest haptic sensitivity, other parts of the body are also beneficial for
haptic feedback displays and many researchers have indeed developed haptic feedback systems that
utilize other parts of the body [17, 64, 80, 145, 158].
Haptic interface designers have tried to characterize the minimum separation distance between
two active vibratory stimuli before they become perceived as one single stimulus. Unfortunately
Weber’s two-point detection threshold method cannot be easily extended to apply to vibratory
126

60
45
40
35
30
25
20
15
10
s
Figure A.3: Weber’s two-point detection threshold for different body sites [163]. Image source: Velazquez [157].
stimuli due to the complex nature of vibratory signal transmission through the skin. There is suffi
cient damping within the skin and variability between persons that vibration waves may propagate
through deep tissue for one subject (who may feel a generalized numbness or pain) but not for
another subject (who may feel only an acute localized tingle). The perception of vibration intensity
is also a function of proximity to bone structure; more acute in bony areas than fleshy areas [20].
Due to this complexity, most modern haptic perceptual studies have centered around characterizing
vibration perception [20, 23, 42, 55, 65, 69, 73, 87, 93].
EE,TJO■C»££c(002
127

A ppendix B
P osture
Good posture is important to the long-term health and well-being of the body. According to the
Cleveland Clinic [22], posture is defined as the “position in which you hold your body upright against
gravity while standing, sitting, or lying down.” Good posture will help with the following [22]:
• keep bones and joints in the correct alignment so tha t muscles can be used properly
• decrease the abnormal wearing of joint surfaces tha t could result in arthritis
• decrease the stress on the ligaments holding the joints of the spine together
• prevent the spine from becoming fixed in abnormal positions
• prevent fatigue because muscles are being used efficiently, allowing the body to use less energy
• prevent strain or overuse problems
• prevent backache and muscular pain
• contribute to good appearance
Unfortunately defining “correct” posture is often a challenge as the guidelines differ from source
to source; there is no one set of widely accepted, quantifiable guidelines. Most occupational thera
pists say a neutral posture that is 10 degrees hunched from the fully upright posture is best , while
others believe the reclined position with full back support constitutes proper posture. In this disser
tation, we adopt the definition of “good” sitting posture from the Cleveland Clinic and the Global
Spine Network. According to these sources, proper sitting posture entails the following [22, 38]:
128

Figure B .l: (Left) Side view and (right) front view of normal spinal alignment. The spine exhibits three normal curves: cervical, thoracic, and lumbar. Image source: Cleveland Clinic [22].
• Sit up with back straight and shoulders back. Buttocks should touch back of chair.
• All 3 normal back curves (cervical, thoracic, lumbar) should be present while sitting (Fig
ure B .l).
• Sit a t the end of the chair and slouch completely. Draw yourself up and accentuate the curve
of your back as far as possible. Hold for a few seconds. Release the position about 10 degrees.
This has been commonly described as a “good” neutral posture.
• Body weight should be distributed evenly on both hips.
• Knees should be bent at right angles. Knees should be even with or slightly higher than hips.
Use footstool if necessary. Do not cross legs.
• Keep feet flat on floor (or footstool).
• Avoid sitting in the same position for more than 30 minutes.
Another way to determine “correct” posture is to examine pelvic rotation. When a person
changes his sitting posture, for example, from sitting upright to slouching, he accomplishes this by
rotating his pelvis. In effect, he is using his ischial tuberosities (i.e. “sit bones”) as rockers to
reposition his body. This is consistent with the findings presented in [94].
Ischial tuberosities are rounded, bony prominences found a t the base of the pelvis [6] as shown in
Figure B.2. They take most of the person’s weight when the person is properly seated. Additionally,
129

Figure B.2: Side view of pelvic bones. The ischial tuberosities (sit bones), circled in red, are located at the base of the pelvis. Image source: Lollylegs [82].
the pelvis is at a slight anterior tilt and the thighs are supported by the seat surface. This pelvic
position promotes the normal curvature of the spine and allows the person’s head to sit directly
over the pelvis. Furthermore, the hips are a t 90° flexion.
Additionally, selecting the proper chair will aid in maintaining correct sitting postures and thus
help prevent posture-related injuries. According to [6] and [127], an ideal chair should have:
• adjustable chair height that allows knees to be bent at approximately 90° and feet to rest
flat on the floor. The chair should allow the user to operate the keyboard with elbows at
approximately 90°.
• adjustable armrests tha t should be located directly under shoulders (width adjustment) at
the level of elbows (height adjustment).
• adjustable chair tilt with seat pan and backrest position fixed relative to each other in order
to facilitate movement from one proper posture to another throughout the day.
• proper seat pan depth that is deep enough to allow approximately 1” gap behind the knees,
and shallow enough to allow user’s feet to rest flat on the floor.
• height-adjustable backrest tha t allows support of the entire back and head
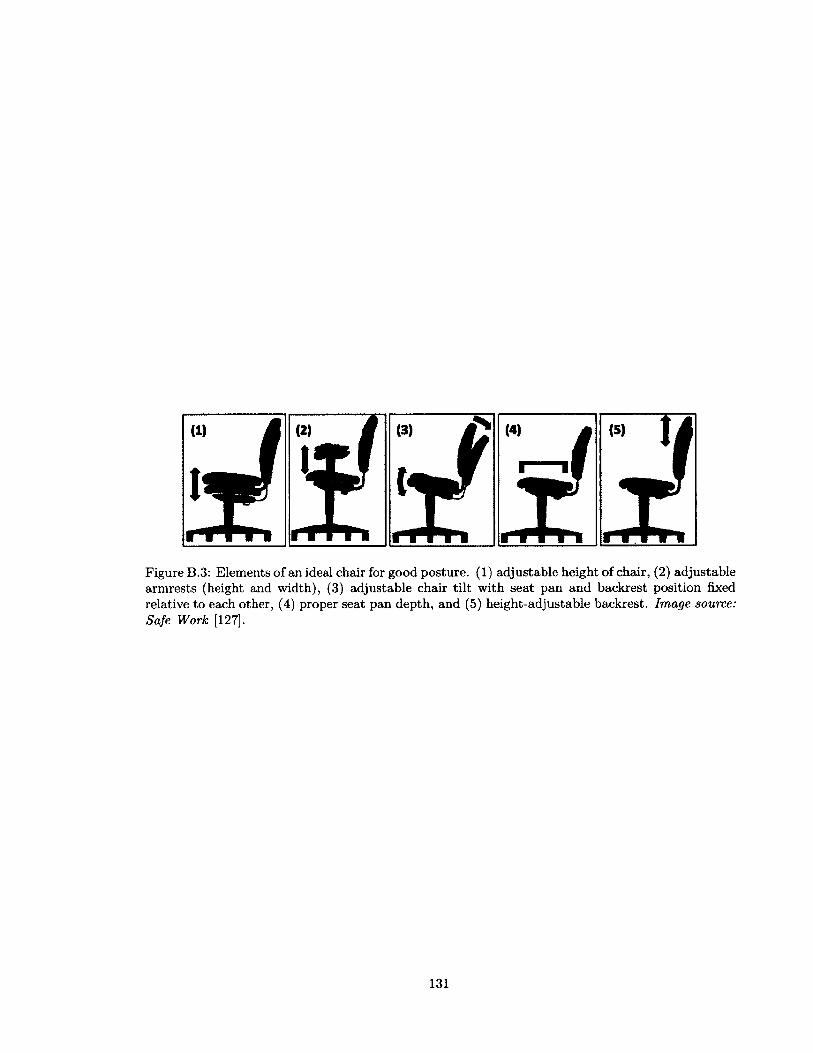
Figure B.3: Elements of an ideal chair for good posture. (1) adjustable height of chair, (2) adjustable armrests (height and width), (3) adjustable chair tilt with seat pan and backrest position fixed relative to each other, (4) proper seat pan depth, and (5) height-adjustable backrest. Image source: Safe Work [127].
131
A ppendix C
Prelim inary D esign s for th e
P osture Sensing S ystem
This chapter describes our preliminary work developing a posture sensing chair. This work ulti
mately motivated the design of our current Posture Seat system.
C .l Selection o f posture sensing system
The posture sensing chair will be used in an office setting. It is therefore necessary to take into
account the physical space occupied by the posture sensing system, the environment in which the
system is used, and the cost of the system. Of the three posture measurement methods discussed
in Related Work, the most viable measurement method to pursue is pressure distribution. This is
because pressure sensors can be packaged in relatively small spaces, such as within the seat cushion,
without encroaching on already-limited cubicle and office space. Pressure sensors are not susceptible
to the lighting limitations of the vision system and bodily contact requirements of the accelerometer
method. And pressure sensors - different from pressure mats - are relatively inexpensive.
C.2 D esign criteria
In previous work that used pressure distributions to determine posture, many researchers purchased
off-the-shelf pressure mats from Tekscan or XSensor [51, 146]. Although these commercially avail-
132

able pressure mats have very high resolution, they may be too costly to integrate into a common
office chair. For example, the Tekscan CONFORMat pressure m at alone, excluding software, is
$1500 [168]. It is thus necessary to seek a cheaper alternative to such a pressure m at system in
order for the posture-sensing chair to remain competitive with commercially available office chairs.
One such alternative is to use a small array of force-sensitive resistors (FSRs) placed at key locations
to obtain an appropriate pressure distribution. The FSRs cost on the order of $10 each. Indeed
the small array of FSRs will be used in this first concept of a posture-sensing chair.
Any discussion of sensing leads to a discussion regarding accuracy. It is im portant to note that
the approach for this research is not to accurately measure pressure, but to accurately recognize
a variety of postures. An ideal solution would be to correctly identify postures for a range of
individuals. A less perfect system might be trained to recognize postures for a single individual.
Regardless, the goal of this sensing approach is to discern postures, and small inaccuracies - to the
extent they are repeatable - are not a large concern.
After the selection of the FSRs and the construction of the chair, it is im portant to determine
the set of postures to measure. As a first concept, only five distinct postures will be measured:
sitting upright, slouching, leaning back, right leg crossed over left leg, left leg crossed over right leg.
Pressure distribution “templates” will be developed for each of these postures for each user. These
templates will aid in the matching of the real-time posture to one of the predetermined postures.
The posture-sensing chair should also be able to provide real-time feedback (haptic, auditory,
visual) about the user’s dynamic pressure distribution and posture. While the types of feedback
are undetermined at this time, the goal is to create “natural” feedback - tha t is, feedback that
corresponds to physical quantities in the system.
In summary, the first concept of a posture-sensing chair aims to achieve the following:
• dynamically sense posture and provide feedback
• use FSRs to develop pressure mappings of specific postures
• use hard, fiat seating surface, and move to a contoured cushion in the future
• develop posture templates for each individual for 5 postures: sitting upright, slouching, leaning
back, right leg crossed over left leg, left leg crossed over right leg
• match an individual’s new posture to one of five existing posture templates
133
• provide visual, haptic, and/or auditory posture feedback to encourage proper posture during
routine office tasks
C .3 F irst prototype posture sensing chair
We prototyped a posture-sensing chair th a t was constructed with a hard, flat seat surface, a cush
ioned seat back, and cushioned armrests. Two FSRs (1.5” square, Interlink) were taped to the
surface of the seat. The distance between the FSRs was 3.0” , which was optimized for the distance
between the ischial tuberosities (sit bones) of one subject. Additionally, the FSRs were placed
approximately 10.75” from the front edge of the seat, and approximately left-right centered on the
seat (Figure C .l). The battery pack, data acquisition system, and electronics were mounted on the
underside of the seat (Figure C.2). Holes were drilled in the seat to allow for connection between
the FSRs and the circuit board. The data acquisition system was connected to a computer running
Lab VIEW SignalExpress 2.5.1 and LabVIEW 8.5.
The five postures to be measured are shown in Figure C.3. Identifying the postures involved:
1. sitting directly above the FSRs, trying best to ensure that, in the upright posture, the lower
aspect of the left ischial tuberosity lies directly above the left FSR, and the lower aspect of
the right ischial tuberosity lies directly above the right FSR. When the ischial tuberosities are
aligned directly over the FSRs, the output voltage will be approximately the same for both
sensors and also a t a relative minimum.
2. clicking the “Record” button in LabVIEW SignalExpress, and then selecting the inputs to
record. Data will be recorded at 1kHz.
3. maintaining the posture for at least 15 seconds, and then clicking “Stop” to stop and save the
recording.
Overall, there seemed to be distinct characteristic voltage ranges for each of five postures mea
sured. When the voltage outputs from the left FSR were plotted against those of the right FSR,
there could be seen distinct “spatial locations” of each of the five postures (Figure C.4). Using the
combined spatial plot of the five postures as a guideline, it was possible to determine a person’s
posture solely by looking at their spatial voltage plot.
134

Figure C .l: Relative positions of the two force-sensitive resistors (FSRs) on the first prototype of the Posture Seat.
Figure C.2: The first prototype sensing chair setup. (Left) Two FSRs are taped to the surface of the seat. (Right) Underside of the chair showing the data acquisition unit (DAQ), circuit board, and battery pack.
Figure C.3: Examples of each of the 5 postures to be sensed. From left to right: sitting upright, slouching, leaning back, right leg crossed over left leg, and left leg crossed over right leg.
135

spaial plot at postuns
left leg crossed over right (eg
leaned back
right leg crossed over left leg
| u p r ig h t—«*- V islouching |
o i i » i i0 1 2 3 4 S 6
light FSR, voltage
Figure C.4: Plot of all data from each of the five postures for one subject. Each posture was maintained for 15 seconds for 3 trials each. There are distinct spatial locations for the five postures.
C .4 Sum m ary and im plications from th e first prototyp e
We discovered that even with only 2 FSRs it was possible to identify the 5 distinct postures for
one test subject. However, there were some postures tha t were identified with greater confidence
than other postures. For example, the right-leg-crossed-over-left-leg and left-leg-crossed-over-right-
leg postures were always distinguishable from the other postures. The sitting upright posture was
distinguishable from the leaning back posture. However, it was somewhat difficult to distinguish
between sitting upright and slouching, and between slouching and leaning back, since the two
postures pairs exhibited an insignificant voltage difference. Therefore, it may be necessary to
incorporate additional FSRs, potentially on the seat back, for detecting curvatures of the spine.
The current design of the posture sensing chair is unable to accommodate different people as
the system is rigid and is very sensitive to the alignment of the FSRs under the ischial tuberosities.
Even with the same test subject it is not guaranteed th a t the subject’s ischial tuberosities will
lie directly above the FSRs after the subject gets up and sits back down. Therefore, in order
for this posture-sensing system to be versatile, methods for increasing the system sensitivity to a
wider range of people and postures need to be investigated. These methods might include using
136

a compliant medium such as the chair pad to transfer the loads to the sensors when the ischial
tuberosities are not directly over the FSRs, as well as simply increasing the number of FSRs, which
we will discuss later.
C.5 Second and third p rototyp es o f th e P ostu re Seat
The second iteration of the Posture Seat sought to improve the accuracy of posture identification
as well as seating comfort. This iteration utilized a standard fabric, cushioned computer chair
to improve user comfort (Figure C.5). Four FSRs were initially adhered to the surface of the
seat. Unfortunately the contour of the seat pan and the surface deformation of the cushion from
the seated user produced erroneous pressure mappings. To improve the signal-to-noise ratio, we
developed mechanical “signal enhancers” (Figure C.6) for the FSRs and embedded them between
the seat cushion and hard plastic backing of the seat pan. This solution allowed surface forces to
be transmitted to the embedded FSRs. In a preliminary study with four subjects, the upright and
leaning with legs crossed postures were always identified correctly. Additionally, subjects expressed
comfort with sitting in this chair.
signal enhancer
Figure C.5: The second iteration of the Posture Seat tha t improved the sensing accuracy and was more comfortable to sit in. Four signal enhancers were embedded between the hard plastic base and the foam cushion of the seat corresponding to the locations of the ischial tuberosities (sit bones) and the center of the thighs.
137

PV'C n W w r r i t acrySc bate
Figure C.6: Prototype “signal enhancers” for the cushioned office chair to improve the FSR signal- to-noise ratio. As the user sits on the chair, the hard rubber tip presses on the FSR to register a force reading.
In the third iteration, we tried to expand the list of identifiable postures to 10 - the same
postures as classified by [97] and [146]. We embedded 4 FSRs in the seat pan and 3 bend sensors
in the seat back of a leather (executive) office chair (Figure C.7). The bend sensors were adhered
to the surface of custom-made flexible bow-like supports to measure deflection in the seat back.
Although this posture seat configuration was able to sense the slouching and leaning back postures
in addition to upright and leaning with legs crossed, subjects expressed discomfort with the rigid
beams in the seat back. Additionally, subjects could not ensure their ischial tuberosities were always
above the embedded FSRs and signal-to-noise ratio was low even with the “signal amplifiers.”
In the fourth and final iteration of the Posture Chair, it was discovered tha t adhering FSRs to
the surface of a Herman Miller Aeron chair produced the cleanest signal. The seat pan and seat
back of this chair are made of a pellicle mesh material held in high tension, which allowed the FSRs
to conform to the person’s body along with the chair. Additionally, subjects were able to visually
assess the location of the FSRs so tha t they may sit directly on top of them. Therefore in all of our
reported studies, we used a size B, fully adjustable Herman Miller Aeron chair.
138
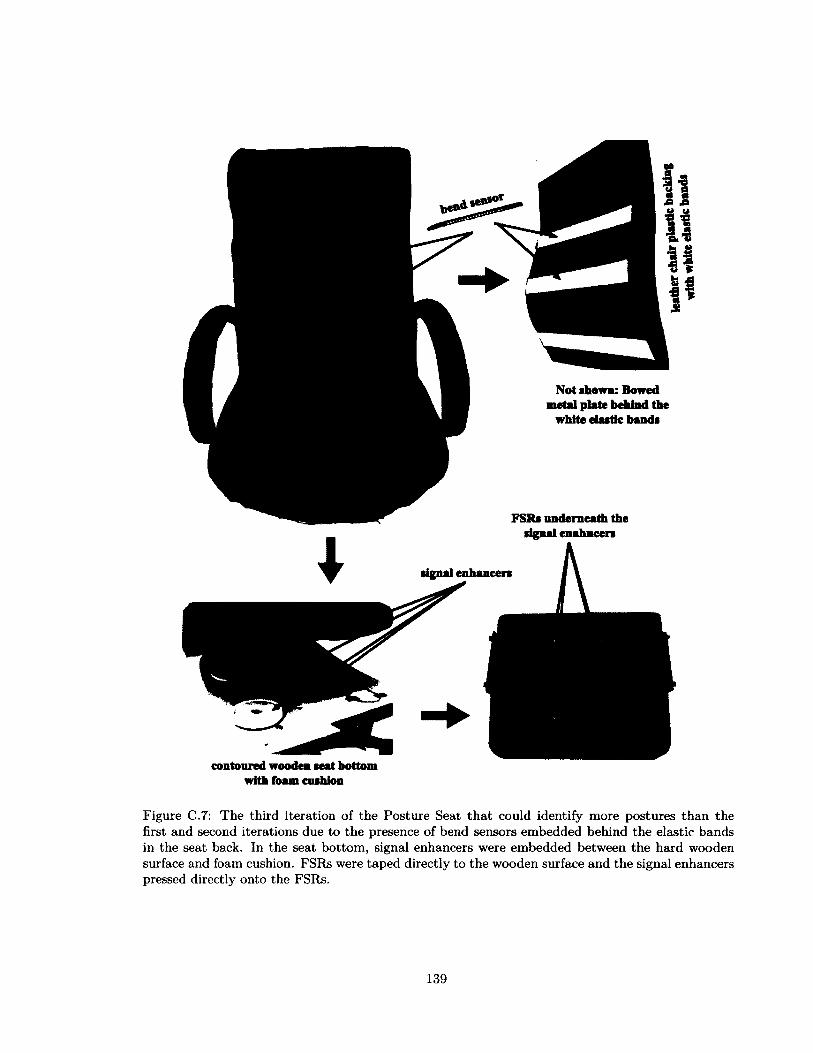
Not ahowa: Bowed metal plate behind the
white elastic bands
FSRs underneath the signal enahncers
contoured wooden seat bottom with foam cushion
Figure C.7: The third iteration of the Posture Seat th a t could identify more postures than the first and second iterations due to the presence of bend sensors embedded behind the elastic bands in the seat back. In the seat bottom, signal enhancers were embedded between the hard wooden surface and foam cushion. FSRs were taped directly to the wooden surface and the signal enhancers pressed directly onto the FSRs.
139

A ppendix D
Pactor D esign Selection
D .l M otor Selection
In the design of pactors (pressure actuators), we need to select motors with sufficient dynamic
range, i.e. motors need to be powerful enough to deliver forces tha t will be perceived as “strong”
and “attention grabbing” (the “demand action” end of the attention capture spectrum). Prelimi
nary studies indicate tha t the motor should be able to output forces of approximately 45N (which
translates to 2.25Nm of torque assuming a 0.05m lever arm) to ensure th a t the user will perceive
the force on their body and react strongly to the stimulus. Simultaneously pactors must be able to
actuate and retract with a frequency slower than 0.2Hz to a t least 2Hz to mimic a gentle nudge to
a slow tap.
The motors we considered were high-end precision DC motors such as Maxxon motors and Faul-
haber motors, position- and velocity-controlled RC servo motors, and low-cost DC hobby motors.
Precision DC motors such as Maxxon and Faulhaber motors have excellent torque and speed output
and have excellent position and speed control, but they are relatively expensive (several hundred
dollars for each motor) and require a high voltage and current source. Low-end DC hobby motors,
such as the ones sold from Pololu.com, are cost-effective (usually around $40 including encoder)
and can spin a t high speeds but have low torque output (and thus need an additional gearbox) and
sometimes require a 12V power source. RC servo motors, such as Futaba and Hitec motors, are very
easy to program and can run off a 6V power source. Some RC sail servos output sufficiently high
torque and speed, and are much more cost-effective than the high-precision DC motors. However
140
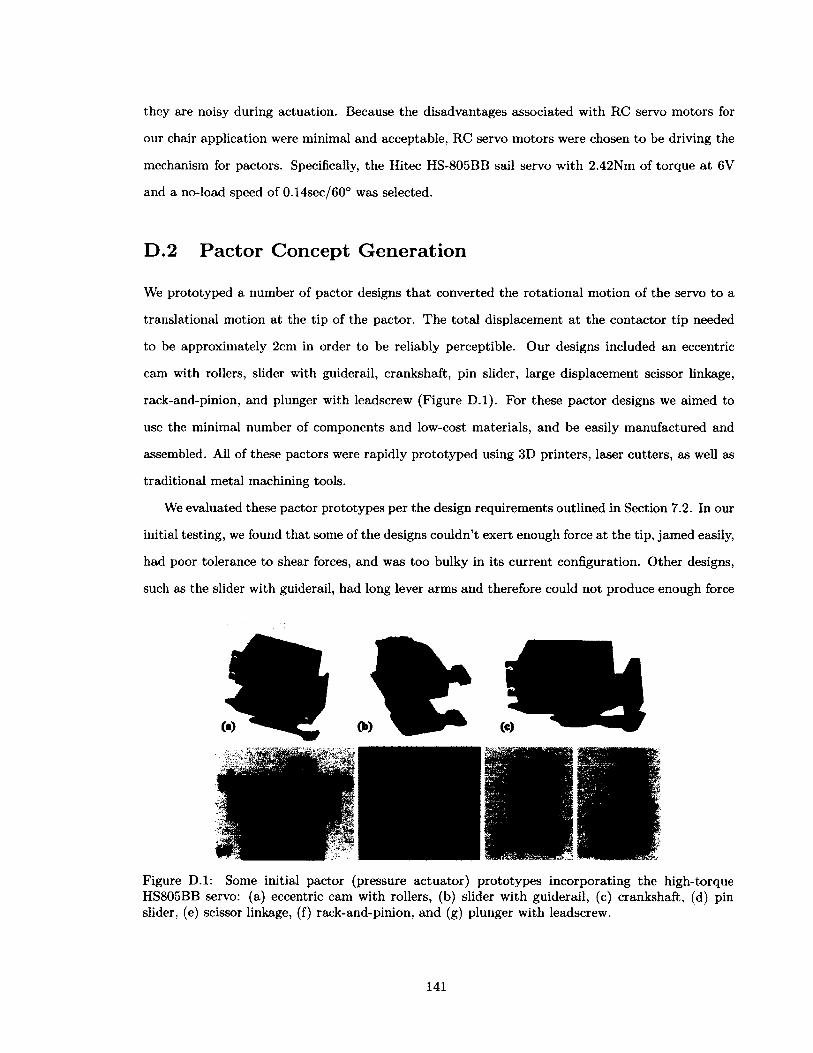
they are noisy during actuation. Because the disadvantages associated with RC servo motors for
our chair application were minimal and acceptable, RC servo motors were chosen to be driving the
mechanism for pactors. Specifically, the Hitec HS-805BB sail servo with 2.42Nm of torque at 6V
and a no-load speed of 0.14sec/60° was selected.
D .2 Pactor C oncept G eneration
We prototyped a number of pactor designs tha t converted the rotational motion of the servo to a
translational motion at the tip of the pactor. The total displacement a t the contactor tip needed
to be approximately 2cm in order to be reliably perceptible. Our designs included an eccentric
cam with rollers, slider with guiderail, crankshaft, pin slider, large displacement scissor linkage,
rack-and-pinion, and plunger with leadscrew (Figure D .l). For these pactor designs we aimed to
use the minimal number of components and low-cost materials, and be easily manufactured and
assembled. All of these pactors were rapidly prototyped using 3D printers, laser cutters, as well as
traditional metal machining tools.
We evaluated these pactor prototypes per the design requirements outlined in Section 7.2. In our
initial testing, we found that some of the designs couldn’t exert enough force a t the tip, jamed easily,
had poor tolerance to shear forces, and was too bulky in its current configuration. Other designs,
such as the slider with guiderail, had long lever arms and therefore could not produce enough force
Figure D.l: Some initial pactor (pressure actuator) prototypes incorporating the high-torque HS805BB servo: (a) eccentric cam with rollers, (b) slider with guiderail, (c) crankshaft, (d) pin slider, (e) scissor linkage, (f) rack-and-pinion, and (g) plunger with leadscrew.
141

PactorConcept
Cam * Slot with Rollers
*Guiderail mad slot
%Crankshaftm Pin SUdcr
HH
R ack*Pinion
Plunger*Leadscrew
iOntpntSpeed + + + + + +
OntpntForce + mu + + 0 + + +
CnrrentDraw - - - - - + +
Range of Motion - + + + + + +
Robustness(■■ ill ■> MHMl hm m rM + - + - - - +Survives
Shear Forces + - + - 0 + -Design
Complexity + 0 0 - - - -Hardware
Cost + 0 0 0 - - -Figure D.2: Pugh chart that aided in the pactor concept selection process.
a t the contactor tip without additional gear stages, which would add to the complexity of the
design. The cam and crankshaft designs were by far the simplest and met the output force and
speed requirements. However the eccentric cam design produced a side-to-side sensation of motion
even though the contactor plate moved normal to the contact surface. The scissor linkage design
was a challenge to manufacture and assemble as each part needed to be precision machined in
order to reduce slop in the final assembly, and there were too many parts to assemble. Finally, the
leadscrew mechanism (utilizing a continuous rotation HS805BB servo) was too slow in achieving the
desired displacement, required additional hardware for position control, and could not withstand
normal force overload conditions.
The Pugh chart in Figure D.2 summarizes the advantages and disadvantages of each of the
designs we considered. In the end the crankshaft design was selected for its robustness, excellent
overload tolerance, fast actuation speed, high output forces, ability to achieve single-point displace
ment normal to the person’s body, and reasonable manufacturing process and cost. (It also had
the fewest disadvantages out of all the designs.)
142
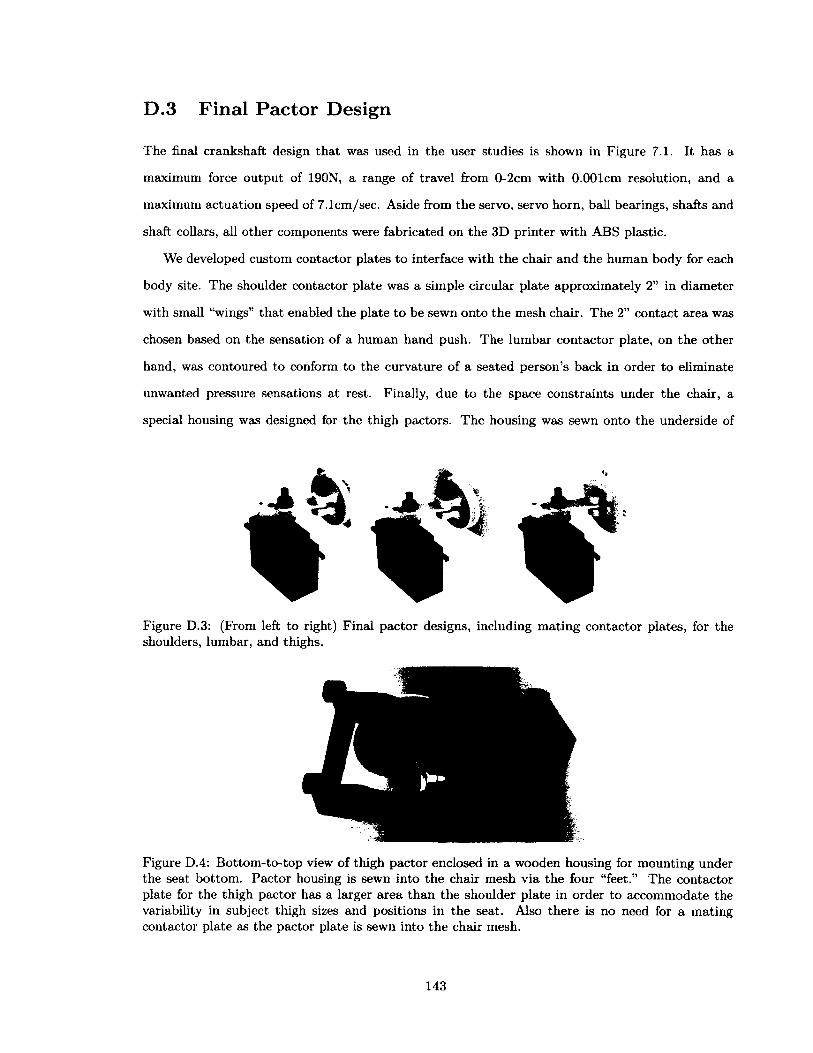
D .3 Final Pactor D esign
The final crankshaft design that was used in the user studies is shown in Figure 7.1. It has a
maximum force output of 190N, a range of travel from 0-2cm with 0.001cm resolution, and a
maximum actuation speed of 7.1cm/sec. Aside from the servo, servo horn, ball bearings, shafts and
shaft collars, all other components were fabricated on the 3D printer with ABS plastic.
We developed custom contactor plates to interface with the chair and the human body for each
body site. The shoulder contactor plate was a simple circular plate approximately 2” in diameter
with small “wings” that enabled the plate to be sewn onto the mesh chair. The 2” contact area was
chosen based on the sensation of a human hand push. The lumbar contactor plate, on the other
hand, was contoured to conform to the curvature of a seated person’s back in order to eliminate
unwanted pressure sensations at rest. Finally, due to the space constraints under the chair, a
special housing was designed for the thigh pactors. The housing was sewn onto the underside of
Figure D.3: (From left to right) Final pactor designs, including mating contactor plates, for the shoulders, lumbar, and thighs.
Figure D.4: Bottom-to-top view of thigh pactor enclosed in a wooden housing for mounting under the seat bottom. Pactor housing is sewn into the chair mesh via the four “feet.” The contactor plate for the thigh pactor has a larger area than the shoulder plate in order to accommodate the variability in subject thigh sizes and positions in the seat. Also there is no need for a mating contactor plate as the pactor plate is sewn into the chair mesh.
143

the mesh chair. As such, the thigh pactor plate always remained in contact with the bottom of
the chair, obviating the need for an additional mating plate. However the area of the contactor
plate needed to be larger than the shoulder mating plates in order to achieve the same amount of
pressure sensation under the thigh. The different contactor plates and mating plates are shown in
Figure D.3, and the special thigh pactor housing is shown in Figure D.4.
In addition to the pactors themselves, we prototyped numerous mounting mechanisms to attach
the lumbar and shoulder pactors to our Aeron office chair (Figure D.5). The mounting plate needed
to be rigid enough to withstand the high torque of the HS805BB RC servo motors. Additionally
it should be lightweight so that the center of mass and dynamic performance of the chair would
not be altered. Based on these design constraints, we arrived at our current pactor chair backplate
design which consisted of two 1/4”-inch plywood mounting plates (Figures 7.2 and 7.3). This is a
variation of the one-piece plywood backplate with slots for adjustable pactor placement. We used
this version for our pactor user studies related to posture guidance.
144

Figure D.5: Prototypes of the shoulder and lumbar pactor mounting mechanisms for the Aeron chair: (a) sewable mounts similar to the thigh pactor housing, (b) metal net and lumbar pillow plastic mounts, (c) one-piece plywood or sheet metal backplate with slots for adjustable pactor placement, and (d) a “claw” that allows full vertical adjustment of pactors.
145
Bibliography
[1] H.-i. Ahn, A. Teeters, A. Wang, C. Breazeal, and R. Picard. Stoop to conquer: Posture and
affect interact to influence computer users’ persistence. In Affective Computing and Intelligent
Interaction, pages 582-593. Springer, 2007.
[2] A. Alahakone and S. A. Senanayake. Vibrotactile feedback systems: Current trends in reha
bilitation, sports and information display. In Advanced Intelligent Mechatronics, 2009. A IM
2009. IEEE/ASM E International Conference on, pages 1148-1153. IEEE, 2009.
[3] M. Bachlin, K. Forster, and G. Troster. Swimmaster: a wearable assistant for swimmer.
Ubicomp '09: Proceedings o f the 11th International Conference on Ubiquitous Computing,
pages 215-224, 2009.
[4] A. Baijal, J. Kim, C. Branje, F. Russo, and D. I. Fels. Composing vibrotactile music: A
multi-sensory experience with the emoti-chair. In Haptics Symposium (HAPTICS), 2012
IEEE, pages 509-515. IEEE, 2012.
[5] M. A. Baumann, K. E. MacLean, T. W. Hazelton, and A. McKay. Emulating human attention-
getting practices with wearable haptics. In In Proceedings o f IEEE Haptic Symposium (HAP
TICS ’10), pages 149-156. IEEE Press, March 2010.
[6] P. Beldon. Sitting safely to prevent pressure damage. Wound Essentials, 2, 2007.
[7] C. Bethel, J. Burke, R. Murphy, and K. Salomon. Psychophysiological experimental design
for use in human-robot interaction studies. In International Symposium on Collaborative
Technologies and Systems, CTS 2007, pages 99 -105, May 2007.
[8] C. L. Bethel and R. R. Murphy. Non-facial and non-verbal affective expression for appearance-
146
constrained robots used in victim management. PALAD YN Journal o f Behavioral Robotics,
l(4):219-230, 2010.
[9] B. Biomimetics and D. M. Lab. h ttp ://bdm l.stanford.edu/tw iki/pub/H aptics/P roject
Overview/mechanoreceptors.jpg.
[10] S. J. Bolanowski Jr, G. A. Gescheider, R. T. Verrillo, and C. M. Checkosky. Four chan
nels mediate the mechanical aspects of touch. Journal o f the Acoustical Society of America,
84(5):1680-1694, 1988.
[11] M. M. Bradley and P. J. Lang. Measuring emotion: The self-assessment manikin and the
semantic differential. Journal o f Behavioral Therapy and Experimental Psychiatry, 25:49-59,
1994.
[12] E. Brazil and J. Fernstrom. Investigating ambient auditory information systems. ICAD
Proceedings. International Community for Auditory Display, Schulich School o f Music, McGill
University, Montreal, Canada, pages 326-333, 2007.
[13] S. A. Brewster, S. A. Wall, L. M. Brown, and E. E. Hoggan. Tactile displays. The Engineering
Handbook of Smart Technology for Aging, Disability, and Independence, pages 339-352, 2008.
[14] J. B. Brink, Y. Zheng, and J. B. Morrell. A haptically accurate practice carillon. In Haptics
Symposium (HAPTICS), 2012 IEEE, pages 57-64. IEEE, 2012.
[15] R. Brunken, J. L. Plass, and D. Leutner. Direct measurement of cognitive load in multimedia
learning. Educational Psychologist, 38(1):53-61, 2003.
[16] A. Cassinelli, C. Reynolds, and M. Ishikawa. Augmenting spatial awareness with Haptic
Radar, October 11 - 14 2006.
[17] A. Cassinelli, C. Reynolds, and M. Ishikawa. Haptic Radar, August 1 2006.
[18] CellularNews. http://img.cellular-news.com/story/45591/Touch.Sensitive-Steering-W heels
_Could-replaceJnCar_Navigation-Systems-l.jpg.
[19] J.-S. Chang, J. McGrenere, and K. E. MacLean. Audio stream bookmarking with a wristband
controller: Exploring the role of explicit commands in an implicit control loop. M. Sc.,
University of British Columbia, 2011.
147

[20] R. W. Cholewiak, A. A. Collins, and C. J. Brill. Spatial factors in vibrotactile pattern
perception. In Eurohaptics, 2001.
[21] K. Chung, C. Chiu, X. Xiao, and P.-Y. Chi. Stress Outsourced: A haptic social network via
crowdsourcing, 2009.
[22] ClevelandClinic. Posture for a healthy back. http://my.clevelandclinic.org/healthyJiving/
backJiealth/hic_postureJor_aJrealthy_back.aspx.
[23] J. C. Craig. Vibrotactile pattern perception: Extraordinary observers. Science,
196(4288):450-452, 1977.
[24] L. Deluke, Y. J. Zheng, R. E. Fan, M. C. Fu, J. N. Grauer, and J. B. Morrell. Design and
evaluation of partial weight-bearing sensor and haptic feedback system for lower- extremity
orthopedic patients. In IEEE Systems, Man, and Cybernetics (SM C ’13), in review, 2013.
[25] N. Diffrient, A. R. Tilley, J. Bardagjy, and H. D. Associates. Humanscale 1/2/3. MIT Press,
Cambridge, MA, 1974.
[26] K. Dobson, D. Boyd, W. Ju, J. Donath, and H. Ishii. Creating visceral personal and social
interactions in mediated spaces. In Interactive poster at conference on Human Factors and
Computing Systems (CHI ’01), 2001.
[27] W. R. Dowell, F. Yuan, and B. H. Green. Office seating behaviors: An investigation of posture,
task, and job type. Human Factors and Ergonomics Society Annual Meeting Proceedings,
45:1245-1248, 2001.
[28] K. Elleuch, R. Elleuch, and H. Zahouani. Comparison of elastic and tactile behavior of human
skin and elastomeric materials through tribological tests. Polymer Engineering & Science,
46(12):1715-1720, 2006.
[29] M. Enriquez, O. Afonin, B. Yager, and K. Maclean. A pneumatic tactile alerting system for
the driving environment, 2001.
[30] EvolutionChair. Evolution chair, http://www.evolutionchair.com.
[31] F. S. Faiks and S. M. Reinecke. Investigation of spinal curvature while changing one’s posture
during sitting. Contemporary Ergonomics, pages 113-117, 1998.
148

[32] S. Fels, R. Hausch, and A. Tang. Investigation of haptic feedback in the driver seat. Proceed
ings of the IEEE ITSC 2006 Intelligent Transportation Systems Conference, pages 584-589,
2006.
[33] G. M. Fitch, R. J. Kiefer, J. M. Hankey, and B. M. Kleiner. Toward developing an approach
for alerting drivers to the direction of a crash threat. Human Factors: The Journal o f the
Human Factors and Ergonomics Society, 49(4):710-720, 2007.
[34] G. M. Fitch, R. J. Kiefer, B. M. Kleiner, and J. M. Hankey. Identifying the pattern of
localization responses with a haptic seat intended to alert drivers to the direction of a crash
threat. Human Factors and Ergonomics Society, 51:1517-1521, 2007.
[35] A. Gallagher, Y. Matsuoka, and W.-T. Ang. An efficient real-time human posture tracking
algorithm using low-cost inertial and magnetic sensors. In Intelligent Robots and Systems,
2004-(IROS 2004)- Proceedings. 2004 IE E E /R SJ International Conference on, volume 3,
pages 2967-2972. IEEE, 2004.
[36] F. A. Geldard. Some neglected possibilities of communication. Science, 131(3413):1583-1588,
1960.
[37] A. D. Gleckler, V.-V. Ng, D. Whitworth, K. Cotner, and T. R. Hall. Providing information
related to the posture mode of a user applying pressure to a seat component, May 19 2008.
US Patent App. 12/123,239.
[38] GlobalSpineNetwork. Correct sitting technique, http://www.globalspine.net/correct-sitting
-technique.html.
[39] L. H. Goldish and H. E. Taylor. The Optacon: A valuable device for blind persons. New
Outlook for the Blind, 68(2):49-56, 1974.
[40] E. B. Goldstein. Sensation and Perception. BrooksCole Publishing Company, 1989.
[41] A. L. Guinan, N. C. Hornbaker, M. N. Montandon, A. J. Doxon, and W. R. Provancher.
Back-to-back skin stretch feedback for communicating five degree-of-freedom direction cues.
In Proceedings of 2013 World Haptics Conference, pages 13-18, 2013.
[42] E. Gunther and S. OModhrain. Cutaneous grooves: composing for the sense of touch. Journal
of New Music Research, 32(4):369-381, 2003.
149

[43] A. Haans, C. de Nood, and W. A. IJsselsteijn. Investigating response similarities between
real and mediated social touch: A first test. Proceedings o f the ACM Conference on Human
Factors in Computing Systems (2007), pages 2405-2410, 2007.
[44] M. Haller, C. Richter, P. Brandi, S. Gross, G. Schossleitner, A. Schrempf, H. Nii, M. Sugimoto,
and M. Inami. Finding the right way for interrupting people improving their sitting posture.
IN TE R A C T 11 Proceedings of the 13th International Conference on Human-Computer Inter
action, Part II, pages 1-17, 2011.
[45] I. Haritaoglu, D. Harwood, and L. S. Davis. Ghost: A human body part labeling system using
silhouettes. In Pattern Recognition, 1998. Proceedings. Fourteenth International Conference
on, volume 1, pages 77-82. IEEE, 1998.
[46] K. Hasegawa and H. Shinoda. Aerial display of vibrotactile sensation with high spatial-
temporal resolution using large-aperture airborne ultrasound phased array. In Proceedings of
the 2013 World Haptics Conference, pages 31-36, April 2013.
[47] T. W. Hazelton, I. Karuei, K. E. MacLean, M. A. Baumann, and M. Pan. Presenting a
biometrically-driven haptic interaction loop. In ACM Conference on Human Factors in Com
puting Systems (CHI ’10), Workshop on Whole Body Interaction, page 4, Atlanta, GA, April
2010. ACM.
[48] D. Heylen, M. Vissers, R. op den Akker, and A. Nijholt. Affective feedback in a tutoring
system for procedural tasks. ISCA Workshop on Affective Dialogue Systems, page 244253,
2004.
[49] C. Ho, N. Reed, and C. Spence. Multisensory in-car warning signals for collision avoidance.
Human Factors: The Journal o f the Human Factors and Ergonomics Society, 49(6):1107-
1114, 2007.
[50] C. Ho, H. Z. Tan, and C. Spence. Using spatial vibrotactile cues to direct visual attention in
driving scenes. Transportation Research Part F: Traffic Psychology and Behaviour, 8(6):397-
412, 2005.
[51] I. Hostens, G. Papaioannou, A. Spaepen, and H. Ramon. Buttock and back pressure distri
bution tests on seats of mobile agricultural machinery. Applied Ergonomics, 32(4):347-355,
2001 .
150

[52] K. Huang, E.-L. Do, and T. Starner. PianoTouch: A wearable haptic piano instruction system
for passive learning of piano skills, 2008.
[53] iPosture. http://ww w.iposture.com /.
[54] A. Israr, S.-C. Kim, J. Stec, and I. Poupyrev. Surround haptics: tactile feedback for immersive
gaming experiences. In Proceedings o f the 2012 ACM annual conference extended abstracts
on Human Factors in Computing Systems Extended Abstracts, pages 1087-1090. ACM, 2012.
[55] A. Israr and I. Poupyrev. Control space of apparent haptic motion. In World Haptics Con
ference (WHC), 2011 IEEE, pages 457-462. IEEE, 2011.
[56] A. Israr and I. Poupyrev. Tactile brush: drawing on skin with a tactile grid display. In
Proceedings o f the 2011 annual conference on Human factors in computing systems, pages
2019-2028. ACM, 2011.
[57] M. Iusim. System for improving body posture, Dec 30 2003. US Patent 6,669,286.
[58] C. Jansen, A. Wennemers, W. Vos, and E. Groen. FlyTact: A tactile display improves
a helicopter pilot’s landing performance in degraded visual environments. 6th EuroHaptics
International Conference, 5024:867-875, 2008.
[59] L. Jaskova. http://edi.firiph.uniba.sk/jaskova/IK TH/tem a06/obrazky/optacon.jpg.
[60] R. S. Johansson et al. Responses of mechanoreceptive afferent units in the glabrous skin of
the human hand to sinusoidal skin displacements. Brain research, 244(l):17-25, 1982.
[61] R. Johnson, J. van der Linden, and Y. Rogers. To buzz or not to buzz: Improving awareness
of posture through vibrotactile feedback. In CHI ’10: Proceedings o f Whole Body Interaction
Workshop. ACM, 2010.
[62] R. M. Johnson, J. van der Linden, and Y. Rogers. Musicjacket: the efficacy of real-time
vibrotactile feedback for learning to play the violin. In CHI EA ’10: Proceedings of the 28th
International Conference on Human Factors in Computing Systems, pages 3475-3480. ACM,
2010 .
[63] L. A. Jones and S. J. Lederman. Human Hand Function. Oxford University Press, 2006.
151

[64] L. A. Jones, M. Nakamura, and B. Lockyer. Development of a tactile vest. IEEE Com
puter Society 12th International Symposium on Haptic Interfaces for Virtual Environment
and Teleoperator Systems (HAPTICS 2004), pages 82-89, 2004.
[65] L. A. Jones and K. Sofia. Measuring surface wave propagation during vibrotactile stimulation.
In Haptics Symposium (HAPTICS), 2012 IEEE, pages 457-461. IEEE, 2012.
[66] K. A. Kaczmarek, J. G. Webster, P. Bach-y Rita, and W. J. Tompkins. Electrotactile and
vibrotactile displays for sensory substitution systems. Biomedical Engineering, IEEE TYans-
actions on, 38(1):1-16, 1991.
[67] E. R. Kandel, J. H. Schwartz, T. M. Jessell, et al. Principles o f neural science, volume 4.
McGraw-Hill New York, 2000.
[68] P. Kapur, S. Premakumar, S. A. Jax, L. J. Buxbaum, A. M. Dawson, and K. J. Kuchenbecker.
Vibrotactile feedback system for intuitive upper-limb rehabilitation, 2009.
[69] I. Karuei, K. E. MacLean, Z. Foley-Fisher, R. MacKenzie, S. Koch, and M. El-Zohairy.
Detecting vibrations across the body in mobile contexts. In Proceedings o f the 2011 annual
conference on Human factors in computing systems, pages 3267-3276. ACM, 2011.
[70] D. S. Kline. Posture training device, May 12 1998. US Patent 5,749,838.
[71] C. Layne. http://grants.hhp.coe.uh.edu/clayne/6397/U nit4Jiles/skin.jpg.
[72] S. Lederman and R. Klatzky. Haptic perception: A tutorial. Attention, Perception, & Psy
chophysics, 71(7):1439-1459, 2009.
[73] J. Lee and S. Choi. Evaluation of vibrotactile pattern design using vibrotactile score. In
Haptics Symposium (HAPTICS), 2012 IEEE, pages 231-238. IEEE, 2012.
[74] J. D. Lee, J. D. Hoffman, and E. Hayes. Collision warning design to mitigate driver distraction.
CHI ’04: Proceedings o f the SIGCHI conference on Human factors in computing systems,
pages 65-72, 2004.
[75] S. Legg, H. Mackie, and W. Milicich. Evaluation of a prototype multi-posture office chair.
Ergonomics, 45(2):153-163, 2002.
152
[76] K. A. Li, P. Baudisch, W. G. Griswold, and J. D. Hollan. Tapping and rubbing: exploring
new dimensions of tactile feedback with voice coil motors. In Proceedings of the 21st annual
ACM symposium on User interface software and technology, pages 181-190. ACM, 2008.
[77] J. Lieberman and C. Breazeal. Development of a wearable vibrotactile feedback suit for accel
erated human motor learning. IEEE International Conference on Robotics and Automation,
pages 4001-4006, 2007.
[78] M.-W. Lin, Y.-M. Cheng, W. Yu, and F. E. Sandnes. Investigation into the feasibility of using
tactons to provide navigation cues in pedestrian situations. OZCHI ’08: Proceedings o f the
20th Australasian Conference on Computer-Human Interaction., pages 299-302, 2008.
[79] R. W. Lindeman, R. Page, Y. Yanagida, and J. L. Sibert. Towards full-body haptic feedback:
The design and deployment of a spatialized vibrotactile feedback system, Nov 10-12 2004.
[80] R. W. Lindeman, J. L. Sibert, C. E. Lathan, and J. M. Vice. The design and deployment of a
wearable vibrotactile feedback system. In Proceedings of the Eighth International Symposium
on Wearable Computers (ISWC), 2004.
[81] R. W. Lindeman, Y. Yanagida, K. Hosaka, and S. Abe. The TactaPack: A wireless sen
sor/actuator package for physical therapy applications. In 14th Symposium on Haptic Inter
faces for Virtual Environment and Teleoperator Systems, pages 337-341, 2006.
[82] Lollylegs. http://www.lollylegs.com/injuries/ischial_tuberosity.aspx.
[83] K. E. MacLean. Putting haptics into the ambience. IEEE Transactions on Haptics, 2(3):123-
135, 2009.
[84] K. E. MacLean and M. Enriquez. Perceptual design of haptic icons. Proceedings of EuroHap-
tics, July 2003.
[85] K. E. MacLean and J. B. Roderick. Smart tangible displays in the everyday world: A haptic
door knob. Proceedings of the IE E E /A SM E Inti Conf on Advanced Intelligent Mechatronics
(A IM ’99), September 1999.
[86] M. Magaa and R. Velazquez. On-shoe tactile display. In Haptic Audio visual Environments
and Games, 2008. HAVE 2008. IEEE International Workshop on, pages 114-119. IEEE,
2008.
153
[87] S. G. Manuel, J. E. Colgate, M. A. Peshkin, and R. L. Klatzky. Perceptual collapse: The
fusion of spatially distinct tactile cues into a single percept. In Proceeings o f the 2013 World
Haptics Conference, pages 1-6, April 2013.
[88] D. C. Marshall, J. D. Lee, and P. A. Austria. Alerts for in-vehicle information systems: An
noyance, urgency, and appropriateness. Human Factors: The Journal o f the Human Factors
and Ergonomics Society, 49(1):145-157, 2007.
[89] T. Matthews, A. K. Key, J. MankofF, S. Carter, and T. Rattenbury. A toolkit for managing
user attention in peripheral displays. In Proceedings o f the 11th annual A CM symposium on
User interface Software and Technology, pages 247 - 256. ACM, 2004.
[90] B. J. McGrath, A. Estrada, M. G. Braithwaite, A. K. Raj, and A. H. Rupert. Tactile situation
awareness system flight demonstration final report. Technical Report USAARL Report 2004-
10, USAARL Report 2004-10, US Army Aeromedical Research Laboratory, 2004.
[91] N. Merat and A. H. Jamson. The effect of stimulus modality on signal detection: Implications
for assessing the safety of in-vehicle technology. Human Factors: The Journal of the Human
Factors and Ergonomics Society, 50(1):145-158, 2008.
[92] I. Mikic and M. Trivedi. Vehicle occupant posture analysis using voxel data. In Ninth World
Congress on Intelligent Transport Systems, October 2002.
[93] T. Miyaoka and T. Nakamura. Measurements of detection thresholds presenting normal and
tangential vibrations on human hairy skin. In The 22nd Annual Meeting of the International
Society for Psychophysics, volume 22, pages 229-232, 2006.
[94] N. C. Moes. Distance between the points of maximum pressure for sitting subjects. Dubrovnik,
2000.
[95] J. Morrell and K. Wasilewski. Design and evaluation of a vibrotactile seat to improve spatial
awareness while driving. IEEE Haptics Symposium, pages 281-288, March 25-26, 2010.
[96] D. Morris, H. Tan, F. Barbagli, T. Chang, and K. Salisbury. Haptic feedback enhances
force skill learning. In EuroHaptics Conference, 2007 and Symposium on Haptic Interfaces
for Virtual Environment and Teleoperator Systems. World Haptics 2007. Second Joint, pages
21-26. IEEE, 2007.
154
[97] B. Mutlu, A. Krause, J. Forlizzi, C. Guestrin, and J. Hodgins. Robust, low-cost, non-intrusive
sensing and recognition of seated postures. In ACM Symposium on User Interface Software
and Technology (UIST), October 2007.
[98] D. Nathan-Roberts, B. Chen, G. Gscheidle, and D. Rempel. Comparisons of seated postures
between office tasks. Proceedings o f the Human Factors and Ergonomics Society Annual
Meeting, 52(9):692-696, 2008.
[99] M. I. Nikolic, J. M. Orr, and N. B. Sarter. Why pilots miss the green box: How display context
undermines attention capture. International Journal o f Aviation Psychology, 14(l):39-52,
2004.
[100] N. B. of Labor Statistics. Occupational employment and wage, 2007.
http://w w w .bls.gov/oes/.
[101] OSHA. Good working positions. http://wrww.osha.gov/SLTC/etools/computerworkstations/
positions.html, April 2008.
[102] M. K. Pan, G. J.-S. Chang, G. H. Himmetoglu, A. Moon, T. W. Hazelton, K. E. MacLean, and
E. A. Croft. Galvanic skin response-derived bookmarking of an audio stream. In Proceedings
of the 2011 annual conference extended abstracts on Human factors in computing systems,
pages 1135-1140. ACM, 2011.
[103] M. K. Pan, J.-S. Chang, G. H. Himmetoglu, A. Moon, T. W. Hazelton, K. E. MacLean, and
E. A. Croft. Now where was I?: physiologically-triggered bookmarking. In Proceedings o f the
2011 annual conference on Human factors in computing systems, pages 363-372. ACM, 2011.
[104] M. K. X.-J. Pan. An exploration of a haptic affect loop through use cases. M aster’s thesis,
University of British Columbia, 2012.
[105] J. Park, W. R. Provancher, D. E. Johnson, and H. Z. Tan. Haptic contour following and
feature detection with a contact location display. In Proceedings of the 2013 World Haptics
Conference, pages 7-12, April 2013.
[106] J. Pasquero. Survey on communication through touch. Center for Intelligent Machines-McGill
University, Tech. Rep. TR-CIM, 6, 2006.
155

[107] J. Pasquero, S. J. Stobbe, and N. Stonehouse. A haptic wristwatch for eyes-free interactions.
In Proceedings of the 2011 annual conference on Human factors in computing systems, pages
3257-3266. ACM, 2011.
[108] J. Peck and J. Wiggins. It just feels good: Customers’ affective response to touch and its
influence on persuasion. Journal o f Marketing, 70(October 2006):56-59, 2006.
[109] C. Phillips, R. Koubek, and D. Hendershot. Walking while using a sensory tactile feedback
system: potential use with a functional electrical stimulation orthosis. Journal o f biomedical
engineering, 13(2):91-96, 1991.
[110] M. Pielot and R. d. Oliveira. Peripheral information displays using vibro-tactile stimuli.
In CHI’13 Extended Abstracts on Human Factors in Computing Systems, pages 1557-1562.
ACM, 2013.
[111] I. Poupyrev and S. Maruyama. Tactile interfaces for small touch screens. In Proceedings of
the 16th annual ACM symposium on User interface software and technology, pages 217-220.
ACM, 2003.
[112] Z. Pousman and J. Stasko. A taxonomy of ambient information systems: four patterns of
design. In Proceedings o f the working conference on Advanced visual interfaces, pages 67-74.
ACM, 2006.
[113] Powertyping. http://w w w .powertyping.com/typing_test/typing.test.shtml.
[114] A. A. Priplata, J. B. Niemi, J. D. Harry, L. A. Lipsitz, and J. J. Collins. Vibrating insoles
and balance control in elderly people. The Lancet, 362(9390):1123-1124, 2003.
[115] J. Prsala. Portable posture correcting apparatus, Apr 5 1988. US Patent 4,735,412.
[116] D. Prytherch and M. McLundie. So what is haptics anyway? Research Issues in A rt Design
and Media, 2, Spring 2002.
[117] J. Rasmussen. Human errors, a taxonomy for describing human malfunction in industrial
installation. Journal of Occupational Accidents, 4(2-4):311-333, 1982.
[118] J. Rasmussen. Skills, rules, and knowledge; signals, signs, and symbols, and other distinctions
in human performance models. IEEE Transactions on Systems, Man and Cybernetics, 3:257-
266, 1983.
156
[119] D. T. Reid, A. Sochaniwskyj, and M. Milner. An investigation of postural sway in sitting of
normal children and children with neurological disorders. Physical & Occupational Therapy
in Pediatrics, 11(1 ):19—36, 1991.
[120] E. Ribot-Ciscar, J. Vedel, and J. Roll. Vibration sensitivity of slowly and rapidly adapting
cutaneous mechanoreceptors in the human foot and leg. Neuroscience letters, 104(1):130—135,
1989.
[121] A. Riener and A. Ferscha. Driver activity recognition from sitting postures. In Proceedings
of the 7th Mensch und Computer Conference, Workshop Automotive User Interfaces, pages
2-5, 2007.
[122] M. A. Rinker, J. C. Craig, and L. E. Bernstein. Amplitude and period discrimination of
haptic stimuli. The Journal of the Acoustical Society of America, 104:453, 1998.
[123] D. C. Robbins, B. Lee, and R. Fernandez. Tapglance: designing a unified smartphone in
terface. In Proceedings of the 7th ACM conference on Designing interactive systems, pages
386-394. ACM, 2008.
[124] B. Rosemeyer and W. Pforringer. Measuring of pressure forces in sitting. Archives o f or
thopaedic and traumatic surgery, 95(3):167-171, 1979.
[125] M. Rotella, K. Guerin, X. He, and A. Okamura. HAPI Bands: A haptic augmented posture
interface. IEEE Haptics Symposium, pages 163-170, March 2012.
[126] E. Rukzio, M. Muller, and R. Hardy. Design, implementation and evaluation of a novel public
display for pedestrian navigation: the rotating compass. CHI ’09: Proceedings of the 27th
international conference on Human factors in computing systems., pages 113-122, 2009.
[127] Safe Work. Ergonomic hazards of the seated posture.
www.safemanitoba.com/uploads/bulletins/bltn233.pdf, July 2004.
[128] K. Salminen, V. Surakka, J. Rantala, J. Lylykangas, P. Laitinen, and R. Raisamo. Emotional
responses to haptic stimuli in laboratory versus travelling by bus contexts. Proceedings o f the
3rd International Conference on Affective Computing and Intelligent Interaction, A C II2009,
pages 387-393, September 10-12, 2009.
157

[129] Y. Salzer, T. Oron-Gilad, A. Ronen, and Y. Parmet. Vibrotactile on-thigh alerting system
in the cockpit. Human Factors: The Journal o f the Human Factors and Ergonomics Society,
53(2):118-131, 2011.
[130] P. Savage-Knepshield. Improving response to the signs of impending heart attacks. Human
Factors Bulletin, 51(3), March 2006.
[131] A. Schrempf, G. Schossleitner, T. Minarik, M. Haller, S. Gross, and W. Kurschl. PostureCare-
towards a novel system for posture monitoring and guidance. In Erscheint in 18th World
Congress of the International Federation o f Automatic Control (IFAC), 2011.
[132] A. T. Sclichter. Belt for improving posture and abdominal muscle training, Nov 14 2000. US
Patent 6,146,312.
[133] J. Scott and R. Gray. A comparison of tactile, visual, and auditory warnings for rear-end
collision prevention in simulated driving. Human Factors: The Journal o f the Human Factors
and Ergonomics Society, 50(2):264 275, 2008.
[134] X. Shen, P. Eades, S. Hong, and A. V. Moere. Intrusive and non-intrusive evaluation of
ambient displays. In Workshop at PervasiveO7 Design and Evaluating Ambient Information
Systems, 2007.
[135] C. Sherrick and R. Cholewiak. Cutaneous Sensitivity, pages 12-1 to 12-58. Wiley, New York,
1986.
[136] G. Shin and S. Hegde. User-preferred position of computer displays: effects of display size.
Human Factors: The Journal of the Human Factors and Ergonomics Society, 52(5):574-585,
2010 .
[137] C. Smith. Wilting flower, http://www.coroflot.com /, October 2009.
[138] Sophie, http://souvrsophie.blog.com/files/2009/10/20071226163320182.jpg.
[139] B. Spaller. http://bobspaller.com/images/SensAble%20PHANTOM %200mni.jpg.
[140] S. Subramanian, C. Gutwin, M. N. Sanchez, C. Power, and J. Liu. Haptic and tactile feed
back in directed movements. In Proc. o f conference on Guidelines on Tactile and Haptic
Interactions, 2005.
158

[141] C. Swindells, K. E. MacLean, K. S. Booth, and M. Meitner. Exploring affective design for
physical controls. CHI 2007 Proceedings on Emotion & Empathy, April 28-May 3, 2007.
[142] C. Swindells, K. E. MacLean, K. S. Booth, and M. Meitner. A case-study of affect measure
ment tools for physical user interface design. Proceedings o f Graphics Interface, Canadian
Human-Computer Communications Society, GI2006, June 2006.
[143] D. K. Tam. The design and field observation of a haptic notification system for timing
awareness during oral presentations. M aster’s thesis, University of British Columbia, 2012.
[144] E. W. Tam, A. F. Mak, W. N. Lam, J. H. Evans, and Y. Y. Chow. Pelvic movement and
interface pressure distribution during manual wheelchair propulsion. Archives of physical
medicine and rehabilitation, 84(10):1466-1472, 2003.
[145] H. Z. Tan, R. Gray, J. J. Young, and R. Traylor. A haptic back display for attentional and
directional cueing. Haptics-e: The Electronic Journal of Haptics Research, 3(1), 2003.
[146] H. Z. Tan, L. A. Slivovsky, and A. Pentland. A sensing chair using pressure distribution
sensors. IEEE/ASM E Transactions on Mechatronics, 6(3):261-268, September 2001.
[147] Tekscan. CONFORMat system, seating & positioning analysis,
http://www.tekscan.com/medical/system-conformat.html.
[148] TheChangeGroup. https://changegroupcounseling.com /stai/.
[149] TheMusicComputingLab. http://m cl.open.ac.uk/M usicLab/uploads/m usicjacketl.png.
[150] A. R. Tilley and H. D. Associates. The Measure of Man and Woman: Human Factors in
Design. Wiley, revised edition edition, 2002.
[151] Time. Medicine: Teletactor. http://w w w .tim e.com /tim e/m agazine/article/
0,9171,742619,OO.html, 16 November 1931.
[152] A. Treisman. Preattentive processing in vision. Computer vision, graphics, and image pro
cessing, 31(2): 156-177, 1985.
[153] Usernomics. http://www.usernomics.com/images/mit_tactile.vest.jpg.
159
[154] J. B. Van Erp, K.-U. Kyung, S. Kassner, J. Carter, S. Brewster, G. Weber, and I. Andrew.
Setting the standards for haptic and tactile interactions: ISO’s work. In Haptics: Generating
and Perceiving Tangible Sensations, pages 353-358. Springer, 2010.
[155] J. B. Van Erp and H. A. Van Veen. Vibrotactile in-vehicle navigation system. Transportation
Research Part F: Traffic Psychology and Behaviour, 7(4-5):247-256, 2004.
[156] J. B. F. van Erp. Tactile navigation display, 2000.
[157] R. Velazquez. Wearable Assistive Devices for the Blind, chapter 17, pages 331-349. Springer,
2010.
[158] R. Velazquez, O. Bazan, and M. Magaa. A shoe-integrated tactile display for directional
navigation. IE E E /R SJ International Conference on Intelligent Robots and Systems (IROS),
pages 1235-1240, 2009.
[159] C. Wall III, M. S. Weinberg, R B. Schmidt, and D. E. Krebs. Balance prosthesis based on
micromechanical sensors using vibrotactile feedback of tilt. Biomedical Engineering, IEEE
Transactions on, 48(10):1153-1161, 2001.
[160] T. A. Watson D, Clark L. Development and validation of brief measure of positive and negative
affect: The PANAS scales. Journal o f Personality and Social Psychology, 54(6):1063-1070,
1988.
[161] T. A. Watson D, Clark L. The PANAS-X manual for the positive and negative affect schedule
- expanded form, http://ir.uiowa.edu/psychology43u b s / l l / , 1999.
[162] I. B. Weiner, A. F. Healy, D. K. Freedheim, and R. W. Proctor. Handbook o f Pyschology:
Experimental Psychology, page 147. John Wiley & Sons, 2003.
[163] S. Weinstein. Intensive and extensive aspects of tactile sensitivity as a function of body part,
sex, and laterality. Charles C. Thomas, Springfield, IL, 1968.
[164] M. Weiser and J. S. Brown. Designing calm technology. PowerGrid Journal, 1, 1996.
[165] C. D. Wickens and J. G. Hollands. Engineering Psychology and Human Performance. Harper
Collins, New York, NY, 2nd edition, 1992.
[166] C. D. Wickens and J. S. McCarley. Applied Attention Theory. Taylor and Francis, 2008.
160

[167] A. WILSKA. On the vibrational sensitivity in different regions of the body surface. Acta
Physiologica Scandinavica, 31(2-3):285-289, 1954.
[168] D. Wing. Quotation, Tekscan Inc., October 2008.
[169] C. Wisneski, H. Ishii, A. Dahley, M. Gorbet, S. Brave, B. Ullmer, and P. Yarin. Ambient
displays: Turning architectural space into an interface between people and digital information.
In Cooperative buildings: Integrating information, organization, and architecture, pages 22-
32. Springer, 1998.
[170] W. Wong and M. S. Wong. Detecting spinal posture change in sitting positions with tri-axial
accelerometers. Elsevier Gait & Posture, 27(1): 168-171, 2008.
[171] D. D. Woods. The alarm problem and directed attention in dynamic fault management.
Ergonomics, 38(ll):2371-2393, November 1995.
[172] L. Xu, G. Chen, J. Wang, R. Shen, and S. Zhao. A sensing cushion using simple pressure
distribution sensors. In Multisensor Fusion and Integration for Intelligent Systems (MFI),
2012 IEEE Conference on, pages 451-456. IEEE, 2012.
[173] S. Yohanan, M. Chan, J. Hopkins, H. Sun, and K. E. MacLean. Hapticat: Exploration of
affective touch. Proceedings of the 7th International Conference on Multimodal Interfaces,
IC M I’05, pages 222-229, October 2005.
[174] S. Yohanan and K. E. MacLean. The haptic creature project: Social human-robot interaction
through affective touch. Proceedings o f the A ISB 2008 Symposium on the Reign of Catz &
Dogs: The Second AISB Symposium on the Role of Virtual Creatures in a Computerised
Society, 1:7-11, April 2008.
[175] J. J. Young, H. Z. Tan, and R. Gray. Validity of haptic cues and its effect on priming visual
spatial attention. 11th International Symposium on Haptic Interfaces for Virtual Environment
and Teleoperator Systems, pages 166-170, 2003.
[176] Y. J. Zheng and J. B. Morrell. A vibrotactile feedback approach to posture guidance. IEEE
Haptics Symposium, pages 351-358, 2010.

[177] Y. J. Zheng and J. B. Morrell. Cognitive load assessment of a vibrotactile posture feedback
chair. Proceedings o f the Human Factors and Ergonomics Society 54 th Annual Meeting, pages
1214-1218, September 2010.
162