development of solid dispersion by solvent melt method
TRANSCRIPT
Copyright© 2017, ASP Ins. This open-access article is published under the terms of the Creative Commons Attribution-NonCommercial 4.0
International License which permits Share (copy and redistribute the material in any medium or format) and Adapt (remix, transform, and build upon
the material) under the Attribution-NonCommercial terms.
Pharm Biomed Res 2017; 3(4):1
Solubility enhancement of glimperide: Development of solid
dispersion by solvent melt method, characterization and
dosage form development
Suchitra Kaushik1, Kamla Pathak1* 1Pharmacy College Saifai, Uttar Pradesh University of Medical Sciences, Etawah, 206130, India
A R T I C L E I N F O A B S T R A C T *Corresponding author:
The aim of the present work was to develop immediate release dosage form of the solid dispersion of glimperide (GLIM) for potential enhancement in the bioavailability. The solid dispersions of GLIM were prepared with PEG6000, PVP K30 and Poloxamer 188, in 1:1, 1:3 and 1:5 %w/w ratio by using solvent wetting and solvent melt method. The in vitro dissolution parameters (%DE10min, %DE30min, %DE60min, T50% and DP30) were used to select the optimized solid dispersion that was characterized by IR, PXRD, DSC and SEM. The optimized solid dispersion of GLIM (GSDSM3) was used as drug component for immediate release (IR) tablets that were evaluated for physical and pharmacopoeial parameters. The in vitro drug release studies identified G4 as the optimized tablet with a cumulative drug release (CDR) of 99.34% in 30 min in phosphate buffer, pH 7.4. The CDR was higher than the marketed tablet (91.15%, Amaryl®, Sanofiaventis), However, the f1 and f2 were 10.6 and 52 respectively, which confirmed similarity of the dissolution profile(s). Accelerated stability studies confirmed stability up to 6 months at 40°C/75% condition in the HDPE bottle pack.
Article history: Received: Sep 8, 2017 Accepted: Dec 28, 2017
Keywords: Glimperide, solid dispersion, solvent wetting method, Solvent melt method, Immediate release tablet
Citation: Pharm Biomed Res 2017;3(4):1-13. DOI: 10.18502/pbr.v3i4.84
Introduction Glimepiride is a second-generation sulfonylurea that stimulates pancreatic β cells to release insulin and used in the treatment of type 2 diabetes mellitus which is characterized by insulin resistance and progressive β cell failure (1). It is administered as monotherapy or it can also be combined with other antihyperglycemic agents, including metformin and insulin, in patients who are not adequately controlled by sulfonylurea as alone (2). Glimepiride has duration of action of up to 24 h when administered orally. Initial doses of 1 to 2 mg tablets daily may be increased if necessary, to 4 mg daily for maintenance (3). After oral administration, glimepiride is completely (100%) absorbed from the GI tract; peak plasma concentrations levels occurring within 2 to 3 h (4). It is practically insoluble in water and other aqueous media (5). The development of immediate release formulation using solid dispersion method is desirable to achieve improved therapeutic efficacy. According to Biopharmaceutical Classification System, glimperide can be classified as the class II drug. For BCS Class II compounds, dissolution is the rate limiting step to drug absorption and therefore dissolution can be used to judge the adequacy of performance with the caveat that the dissolution test used should reflect the in vivo performance (6). Therefore, efforts have been made to increase their bioavailability through enhancement of their dissolution rates. The use of solid dispersions of such drug candidate in physiologically
inert hydrophilic carriers is a potential tool to increase their dissolution rate and hence bioavailability. The solid dispersion (SD) is an established solubilization technology for poorly water soluble drugs. Since a SD is basically a drug–polymer two-component system, the drug–polymer interaction is the determining factor in its design and performance (7). Numerous studies on SDs have been published and confirmed advantageous properties of solid dispersions in improving the solubility and dissolution rate of poorly water-soluble drugs. These advantages include reducing particle size, possibly to molecular level, enhancing wettability and porosity, as well as changing drug crystalline state, preferably into amorphous state (8). The objective of the investigation was to develop and screen the SDs of poorly water soluble drug using PEG6000, PVP K30 and Poloxamer 188, as inert water soluble carriers in 1:1, 1:3 and 1:5 %w/w ratio, both by solvent wetting and solvent melt method. Further, using the best SD immediate release tablet was aimed at and to compare it with marketed tablet.
Materials and Method Glimepride was obtained as gift sample from Ranbaxy Laboratories Ltd. Gurgaon, India. PEG 6000 was procured from Clariant, Mumbai, India; poloxamer 188 from BASF India, Ltd, Mumbai, India and PVPK30 from Central Drug House, Delhi, India. Other chemicals used were ethanol from Hayman Ltd, Witham, England;
Original Article
PBR
Available online at http://pbr.mazums.ac.ir
Pharmaceutical and Biomedical Research
Kaushik et al. solid dispersion by solvent melt method
Pharm Biomed Res 2017; 3(4):2
lactose DCL11 from DMV International, Netherlands; sodium starch glycolate and microcrystalline cellulose PH102 from FMC Biopolymer, Philadelphia, USA. Solubility measurement The solubility measurements were performed (n=3) by using the method described by shake flask method (9). The excess amount of drug was added to screw capped vials containing 10.0 mL of hydrochloric acid buffer, pH 1.2; phosphate buffer, pH 6.8; phosphate buffer, pH 7.4 and purified water. The vials were shaken in shaker incubator (speed 200 ± 20 rpm) at 37 ± 0.5 ̊C for 24 h. At equilibrium after 24 h, aliquots were withdrawn, filtered through 0.45µm size (PVDF filter) and analyzed for drug content by UV spectrophotometer at specified wavelength. Likewise phase solubility studies were also conducted. Excess amount of the drug was added separately to screw capped vials containing aqueous carrier solution of PEG 6000, HPMC E5, PVP K30 and poloxamer 188 in following concentrations (1, 2, 4, 6, 8 and 10% w/v). Solid dispersion Preparation Solvent wetting method One gram of GLIM was dissolved in an appropriate quantity of ethanol depending on the weight of drug and inert polymer carrier. For PEG 6000 and PVP K30, the amount of ethanol used was 2.5 times the total weight of drug and polymer, and for poloxamer 188, the quantity of ethanol used was 1.5 times. The GLIM solution was dropped onto polymeric carriers and blended. Ethanol was removed under vacuum at 25 ± 2 ̊C. The mass was pulverized and sifted through #60 ASTM and stored in desiccator until further use (Table 1). Solvent melt method One gram of GLIM was dissolved in sufficient quantity of ethanol and mixed with the molten PEG 6000. The solvent was removed under vacuum at 25 ± 2 ̊C. The mass was pulverized, sifted through #60 ASTM and stored till further use (Table 1). Evaluation Yield The yield of solid dispersions was calculated on the basis of dry weight (drug and carrier) and the final weight of solid dispersion obtained (Eq. 1) Yield (%) = 100 Eq. 1)
Hygroscopicity The solid dispersions of GLIM were dried in a desiccator under anhydrous calcium chloride for 24 h. Then, solid dispersion (500 mg, w1) was weighed accurately and exposed to saturation humidity conditions namely, 53 ± 5% and 75 ± 5% RH at 25 ± 2 ̊C for 24 h. The SDs were weighed again (w2). The gain in the weight was
determined and the percentage moisture gained was calculated, using Eq. 2.
Moisture gained (per cent)= 100 Eq.2
The 53 ± 5% RH condition was obtained from the magnesium nitrate saturated salt solution and 75 ± 5% RH condition was obtained using sodium chloride saturated salt solution in the desiccators under vacuum at 25 ± 2 ̊C. Drug content The PMs/SDs theoretically equivalent to 2 mg for GLIM were weighed accurately and transferred to 50 mL volumetric flask, extracted with 10 mL of methanol and filtered through a 0.45 μm syringe (PVDF) filter. The stock solutions were diluted in purified water and analyzed at 229 nm. The drug content was calculated using the regression equation. In vitro dissolution The in vitro dissolution were carried out in dissolution apparatus USP type II (paddle) using purified water as dissolution medium in triplicate. The test samples used were pure GLIM, powdered SDs and PMs (equivalent to 2 mg of GLIM). The samples were added to 500 ml of dissolution medium at 37 ± 0.5 °C and stirred at 50 rpm. 5 mL aliquots were withdrawn at specified time intervals of 0, 10, 15, 20, 30, 45 and 60 min and equal volume of dissolution media was added to maintain the sink condition. The samples were filtered through a 0.45 μm syringe filter and analyzed spectrophotometerically. The in vitro dissolution data was subjected to model independent parameters to select the best solid dispersion. The magnitude of dissolution efficiency (DE) for each PM and SDs was computed as the per cent ratio of area under the dissolution curve up to time (t), to that of area of the rectangle described by 100% dissolution at the same time10 and was calculated by Eq. 3.
% DE= xty100
dt x 0
t
y 100 Eq. 3
T50, DE10%, DE30% and DE60% were calculated from the dissolution data, using DD-Solver, an MS-Excel add-in software package as reported by Zhang et al. (11), which is designed to analyse data obtained from dissolution experiments. The data analysis was carried out to understand the level of significance of factors and interactions between them to influence the responses (T50 and DE%). Based on the in vitro drug release and the calculated value of T50, DE10%, DE30% and DE60% parameters best SD was selected. Characterization of the optimized solid dispersion Infrared spectroscopy The samples were grounded and prepared as potassium bromide discs (one part of sample to two parts of KBr) for analysis. The scan range was 4000–
Kaushik et al. solid dispersion by solvent melt method
Pharm Biomed Res 2017; 3(4):3
Code Solid dispersion technique
Drug: carrier
ratio (%w/w)
Yield (%)
Change in weight (%)
mean ± S.D. (n = 3)
PEG 6000 PVP
K 30 Poloxomer 188 53 ± 5% RH 75 ± 5% RH
GSDSW1
Solvent wetting
1:1 - - 69.65 1.2± 0.57 2.4± 0.21
GSDSW2 1:3 - - 63.78 1.7± 0.25 3.4± 0.35
GSDSW3 1:5 - - 72.32 1.6± 0.21 5.2± 0.28
GSDSW4 - 1:1 - 62.33 5.2± 0.47 9.2± 0.47
GSDSW5 - 1:3 - 65.91 6.6± 0.79 10.8± 0.64
GSDSW6 - 1:5 - 69.36 7.5± 0.18 12.6± 0.79
GSDSW7 - - 1:1 71.34 2.5± 0.37 4.2± 0.51
GSDSW8 - - 1:3 76.78 2.8± 0.25 4.3± 0.58
GSDSW9 - - 1:5 72.89 3.8± 0.59 4.6± 0.67
GSDSM1
Solvent melt
1:1 - - 79.92 1.2± 0.47 2.5± 0.29
GSDSM2 1:3 - - 82.67 1.5± 0.25 3.3± 0.90
GSDSM3 1:5 - - 80.87 2.1± 0.62 4.5± 0.46
500 cm-1 at a resolution of 2 cm-1 was used to determine the infrared spectra on FTIR spectrometer paragon 1000PC, Perkin Elmer, Cleveland, US). Powder X-ray diffraction The scanning PXRD patterns of GLIM, carrier, their SDs and PMs were obtained on an X-ray diffractometer (PW 3040/60 X’pert PRO, Netherlands) under the following conditions: Ni-filtered Cu-Kα radiation; operating voltage 40 kV; operating current 40 mA; scan speed 2°/min in terms of 2θ angle. The samples were gently powdered with a pestle and mortar prior to analysis. The powder samples were then smeared onto zero-background silicon wafer sample holders and scanned over a range of 2θ values from 5 to 50 ̊, at a scan rate of 2.0 ̊/ min. Differential scanning calorimetry The DSC analysis of GLIM, carrier and optimized solid dispersion was done using DSC instrument (Perkin Elmer, Cleavland, US). Two to ten mg of sample for testing was weighed directly into an aluminium sample pan, which was then hermetically sealed. The samples were analysed in standard DSC mode. The sample chamber was purged with nitrogen gas owing at 25 mL/min. Each sample was heated from 20 to 250 ̊C at
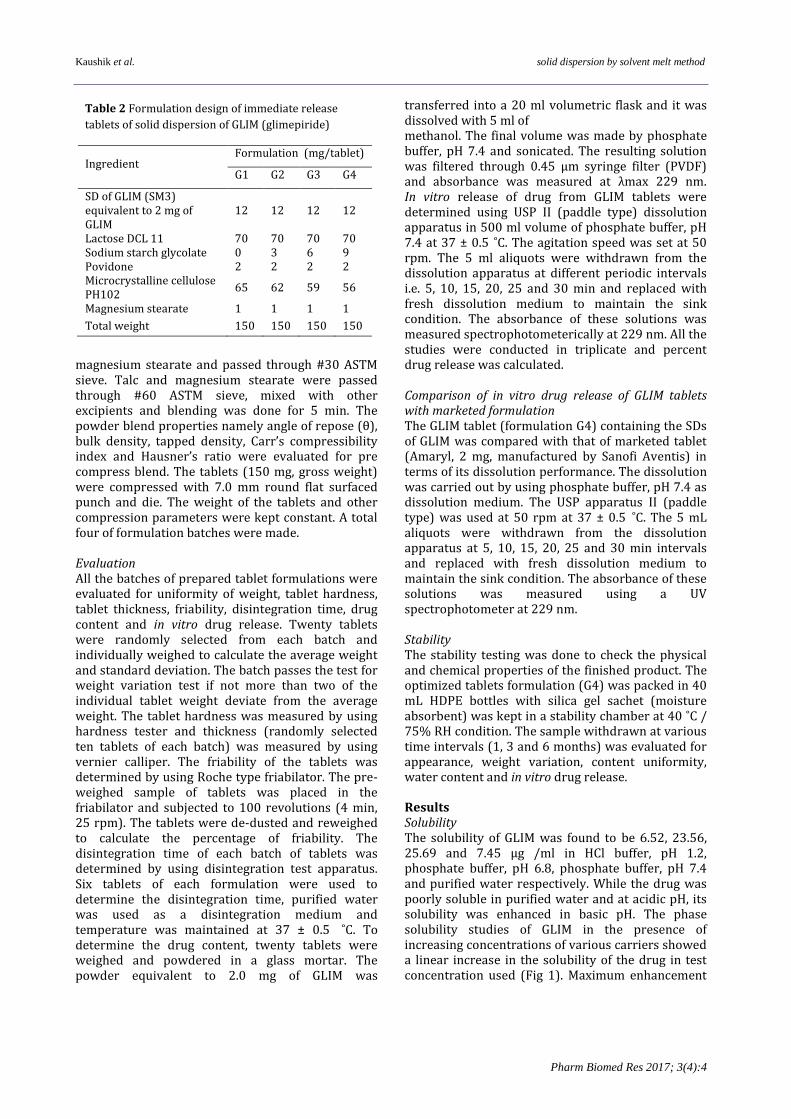
10 ̊C/min and then cooled back to 20 ̊C at the same rate. The data analysis was performed using Pyris™ 1 DSC software. An empty aluminium pan was used as reference. The instrument was calibrated using Indium (melting point, 156.61 ̊C; enthalpy of fusion, 28.71 J.g-1) prior to the experiment. Scanning electron microscopy The samples for SEM were prepared by adhering of the powder on a double sided tape stuck to aluminum stub. The stub was then coated with palladium ions and coating was done for 20 sec. Each sample was examined with a scanning electron microscope at various magnifications. Dosage form development Immediate release (IR) tablet IR tablet formulations of GLIM were prepared by combining the solid dispersions and excipients in different proportions. The GSDSM3 equivalent to 2 mg of GLIM was used as a drug component of the tablets. The tablets were prepared by direct compression technique using variable concentration of disintegrant as shown in Table 2. Solid dispersion (GSDSM3) of GLIM and all excipients were weighed, mixed properly except talc and
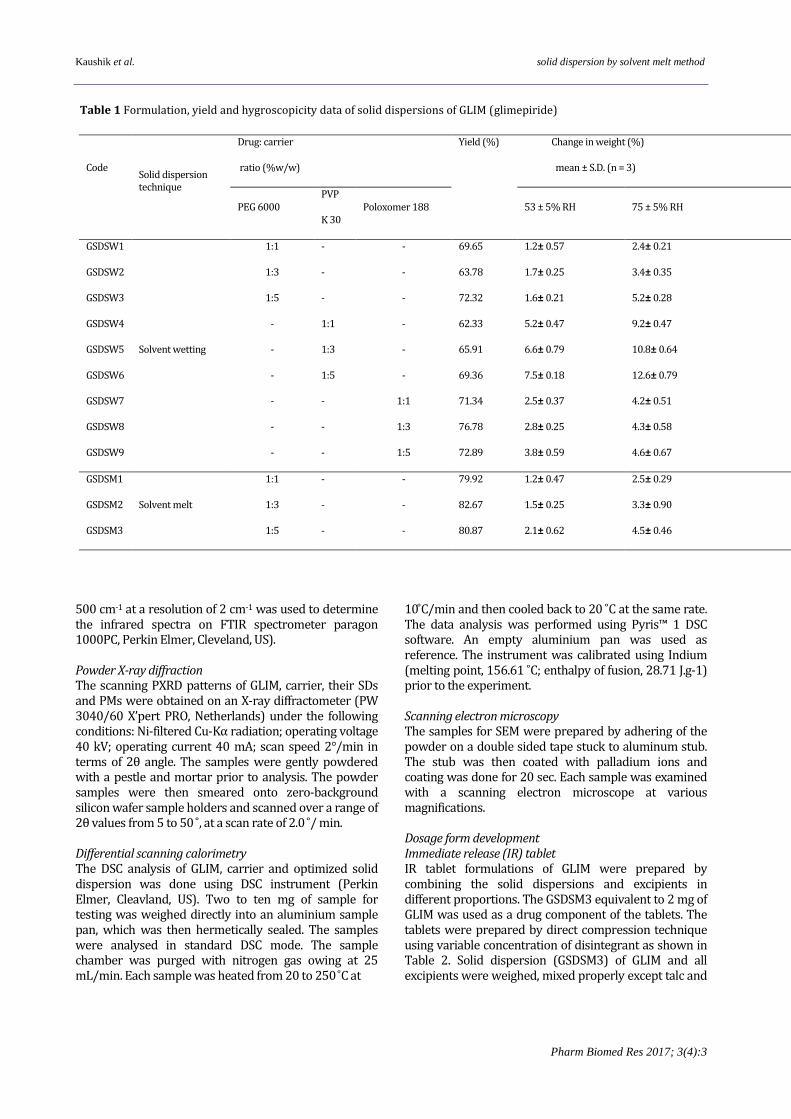
Table 1 Formulation, yield and hygroscopicity data of solid dispersions of GLIM (glimepiride)
Kaushik et al. solid dispersion by solvent melt method
Pharm Biomed Res 2017; 3(4):4
magnesium stearate and passed through #30 ASTM sieve. Talc and magnesium stearate were passed through #60 ASTM sieve, mixed with other excipients and blending was done for 5 min. The powder blend properties namely angle of repose (θ), bulk density, tapped density, Carr’s compressibility index and Hausner’s ratio were evaluated for pre compress blend. The tablets (150 mg, gross weight) were compressed with 7.0 mm round flat surfaced punch and die. The weight of the tablets and other compression parameters were kept constant. A total four of formulation batches were made. Evaluation All the batches of prepared tablet formulations were evaluated for uniformity of weight, tablet hardness, tablet thickness, friability, disintegration time, drug content and in vitro drug release. Twenty tablets were randomly selected from each batch and individually weighed to calculate the average weight and standard deviation. The batch passes the test for weight variation test if not more than two of the individual tablet weight deviate from the average weight. The tablet hardness was measured by using hardness tester and thickness (randomly selected ten tablets of each batch) was measured by using vernier calliper. The friability of the tablets was determined by using Roche type friabilator. The pre-weighed sample of tablets was placed in the friabilator and subjected to 100 revolutions (4 min, 25 rpm). The tablets were de-dusted and reweighed to calculate the percentage of friability. The disintegration time of each batch of tablets was determined by using disintegration test apparatus. Six tablets of each formulation were used to determine the disintegration time, purified water was used as a disintegration medium and temperature was maintained at 37 ± 0.5 ̊C. To determine the drug content, twenty tablets were weighed and powdered in a glass mortar. The powder equivalent to 2.0 mg of GLIM was
transferred into a 20 ml volumetric flask and it was dissolved with 5 ml of methanol. The final volume was made by phosphate buffer, pH 7.4 and sonicated. The resulting solution was filtered through 0.45 µm syringe filter (PVDF) and absorbance was measured at λmax 229 nm. In vitro release of drug from GLIM tablets were determined using USP II (paddle type) dissolution apparatus in 500 ml volume of phosphate buffer, pH 7.4 at 37 ± 0.5 ̊C. The agitation speed was set at 50 rpm. The 5 ml aliquots were withdrawn from the dissolution apparatus at different periodic intervals i.e. 5, 10, 15, 20, 25 and 30 min and replaced with fresh dissolution medium to maintain the sink condition. The absorbance of these solutions was measured spectrophotometerically at 229 nm. All the studies were conducted in triplicate and percent drug release was calculated. Comparison of in vitro drug release of GLIM tablets with marketed formulation The GLIM tablet (formulation G4) containing the SDs of GLIM was compared with that of marketed tablet (Amaryl, 2 mg, manufactured by Sanofi Aventis) in terms of its dissolution performance. The dissolution was carried out by using phosphate buffer, pH 7.4 as dissolution medium. The USP apparatus II (paddle type) was used at 50 rpm at 37 ± 0.5 ̊C. The 5 mL aliquots were withdrawn from the dissolution apparatus at 5, 10, 15, 20, 25 and 30 min intervals and replaced with fresh dissolution medium to maintain the sink condition. The absorbance of these solutions was measured using a UV spectrophotometer at 229 nm. Stability The stability testing was done to check the physical and chemical properties of the finished product. The optimized tablets formulation (G4) was packed in 40 mL HDPE bottles with silica gel sachet (moisture absorbent) was kept in a stability chamber at 40 ̊C / 75% RH condition. The sample withdrawn at various time intervals (1, 3 and 6 months) was evaluated for appearance, weight variation, content uniformity, water content and in vitro drug release.
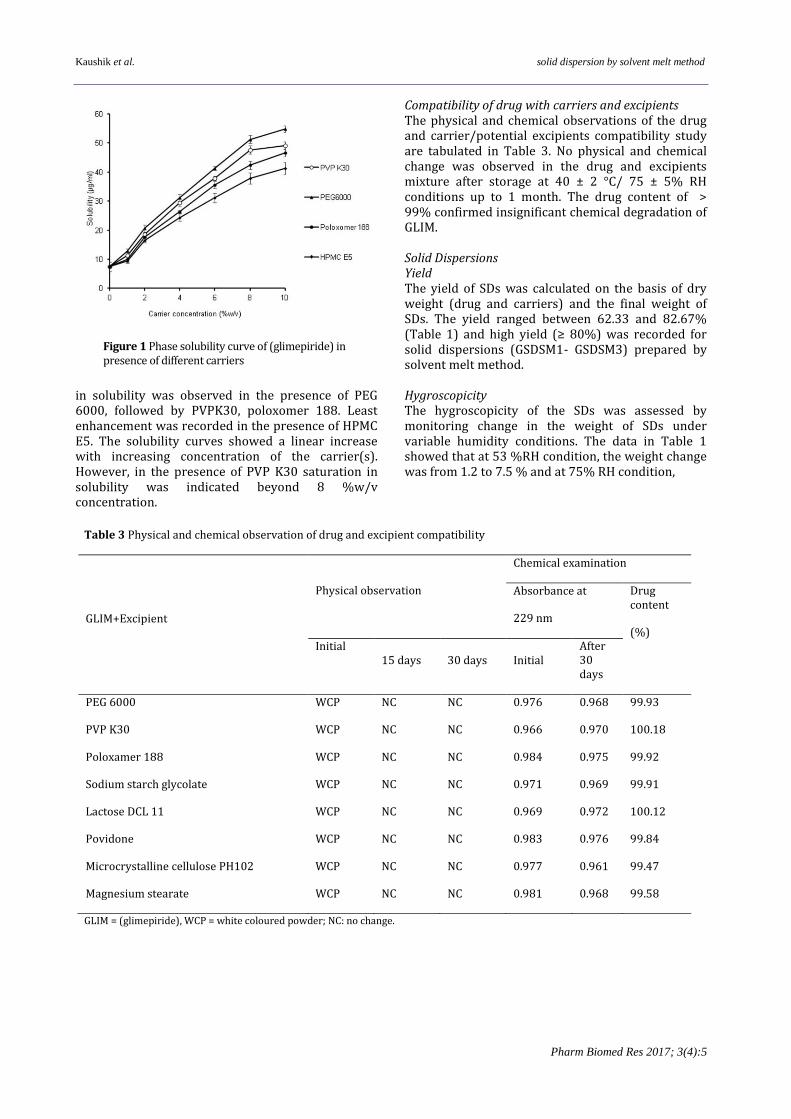
Results Solubility The solubility of GLIM was found to be 6.52, 23.56, 25.69 and 7.45 μg /ml in HCl buffer, pH 1.2, phosphate buffer, pH 6.8, phosphate buffer, pH 7.4 and purified water respectively. While the drug was poorly soluble in purified water and at acidic pH, its solubility was enhanced in basic pH. The phase solubility studies of GLIM in the presence of increasing concentrations of various carriers showed a linear increase in the solubility of the drug in test concentration used (Fig 1). Maximum enhancement
Ingredient Formulation (mg/tablet)
G1 G2 G3 G4
SD of GLIM (SM3) equivalent to 2 mg of GLIM
12 12 12 12
Lactose DCL 11 70 70 70 70 Sodium starch glycolate 0 3 6 9 Povidone 2 2 2 2 Microcrystalline cellulose PH102
65 62 59 56
Magnesium stearate 1 1 1 1
Total weight 150 150 150 150
Table 2 Formulation design of immediate release
tablets of solid dispersion of GLIM (glimepiride)
Kaushik et al. solid dispersion by solvent melt method
Pharm Biomed Res 2017; 3(4):5
Table 3 Physical and chemical observation of drug and excipient compatibility
GLIM+Excipient
Physical observation
Chemical examination
Absorbance at
229 nm
Drug content
(%) Initial
15 days 30 days Initial After 30 days
PEG 6000 WCP NC NC 0.976 0.968 99.93
PVP K30 WCP NC NC 0.966 0.970 100.18
Poloxamer 188 WCP NC NC 0.984 0.975 99.92
Sodium starch glycolate WCP NC NC 0.971 0.969 99.91
Lactose DCL 11 WCP NC NC 0.969 0.972 100.12
Povidone WCP NC NC 0.983 0.976 99.84
Microcrystalline cellulose PH102 WCP NC NC 0.977 0.961 99.47
Magnesium stearate WCP NC NC 0.981 0.968 99.58
GLIM = (glimepiride), WCP = white coloured powder; NC: no change.
in solubility was observed in the presence of PEG 6000, followed by PVPK30, poloxomer 188. Least enhancement was recorded in the presence of HPMC E5. The solubility curves showed a linear increase with increasing concentration of the carrier(s). However, in the presence of PVP K30 saturation in solubility was indicated beyond 8 %w/v concentration.
Compatibility of drug with carriers and excipients The physical and chemical observations of the drug and carrier/potential excipients compatibility study are tabulated in Table 3. No physical and chemical change was observed in the drug and excipients mixture after storage at 40 ± 2 °C/ 75 ± 5% RH conditions up to 1 month. The drug content of > 99% confirmed insignificant chemical degradation of GLIM. Solid Dispersions Yield The yield of SDs was calculated on the basis of dry weight (drug and carriers) and the final weight of SDs. The yield ranged between 62.33 and 82.67% (Table 1) and high yield (≥ 80%) was recorded for solid dispersions (GSDSM1- GSDSM3) prepared by solvent melt method. Hygroscopicity The hygroscopicity of the SDs was assessed by monitoring change in the weight of SDs under variable humidity conditions. The data in Table 1 showed that at 53 %RH condition, the weight change was from 1.2 to 7.5 % and at 75% RH condition,
Figure 1 Phase solubility curve of (glimepiride) in presence of different carriers
Kaushik et al. solid dispersion by solvent melt method
Pharm Biomed Res 2017; 3(4):6
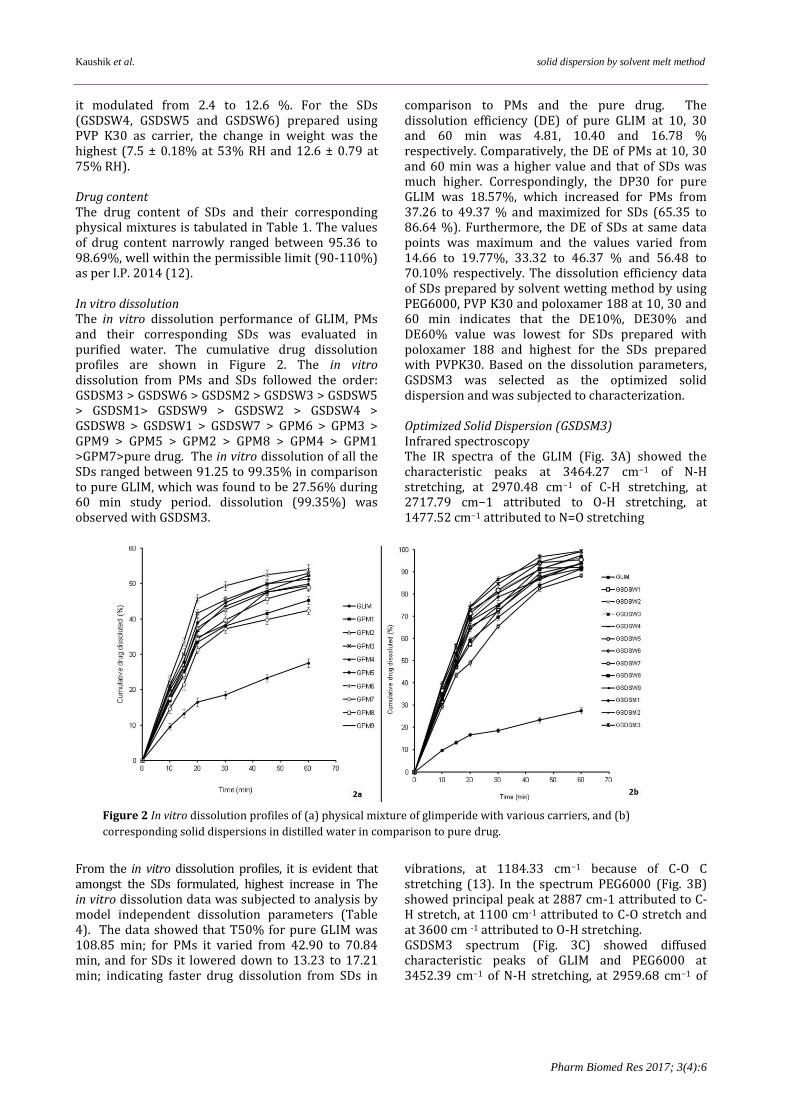
it modulated from 2.4 to 12.6 %. For the SDs (GSDSW4, GSDSW5 and GSDSW6) prepared using PVP K30 as carrier, the change in weight was the highest (7.5 ± 0.18% at 53% RH and 12.6 ± 0.79 at 75% RH). Drug content The drug content of SDs and their corresponding physical mixtures is tabulated in Table 1. The values of drug content narrowly ranged between 95.36 to 98.69%, well within the permissible limit (90-110%) as per I.P. 2014 (12). In vitro dissolution The in vitro dissolution performance of GLIM, PMs and their corresponding SDs was evaluated in purified water. The cumulative drug dissolution profiles are shown in Figure 2. The in vitro dissolution from PMs and SDs followed the order: GSDSM3 > GSDSW6 > GSDSM2 > GSDSW3 > GSDSW5 > GSDSM1> GSDSW9 > GSDSW2 > GSDSW4 > GSDSW8 > GSDSW1 > GSDSW7 > GPM6 > GPM3 > GPM9 > GPM5 > GPM2 > GPM8 > GPM4 > GPM1 >GPM7>pure drug. The in vitro dissolution of all the SDs ranged between 91.25 to 99.35% in comparison to pure GLIM, which was found to be 27.56% during 60 min study period. dissolution (99.35%) was observed with GSDSM3. From the in vitro dissolution profiles, it is evident that amongst the SDs formulated, highest increase in The in vitro dissolution data was subjected to analysis by model independent dissolution parameters (Table 4). The data showed that T50% for pure GLIM was 108.85 min; for PMs it varied from 42.90 to 70.84 min, and for SDs it lowered down to 13.23 to 17.21 min; indicating faster drug dissolution from SDs in
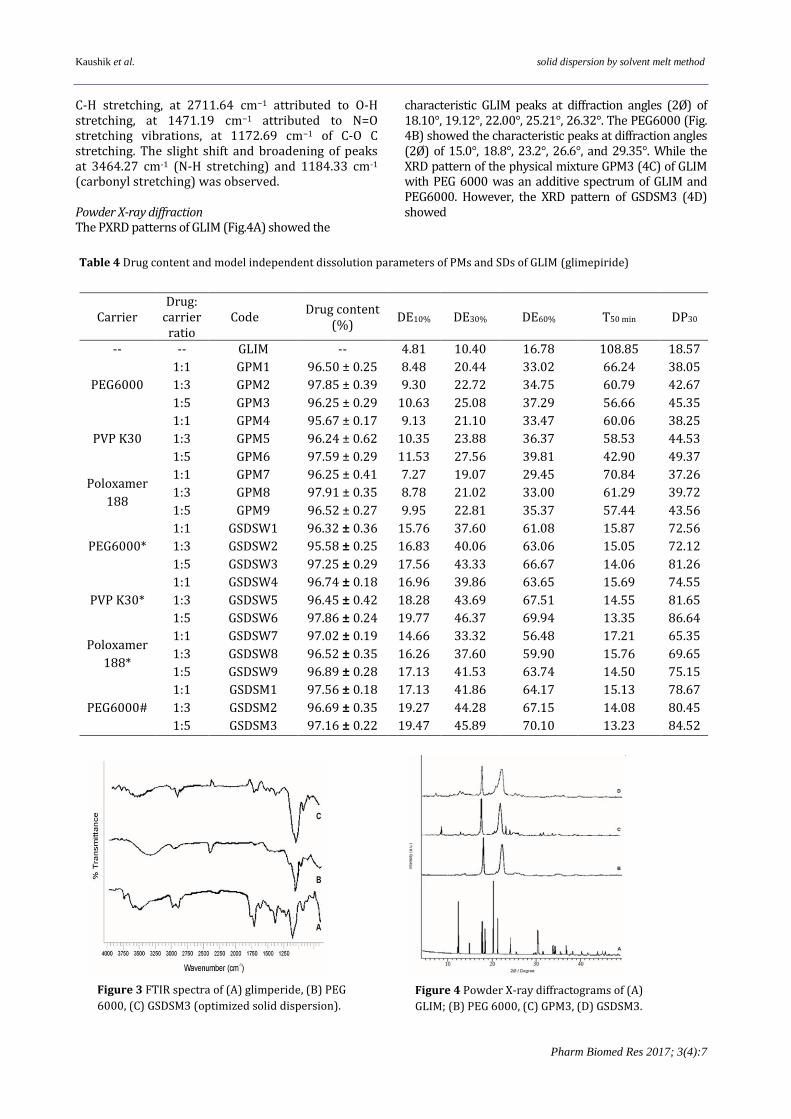
comparison to PMs and the pure drug. The dissolution efficiency (DE) of pure GLIM at 10, 30 and 60 min was 4.81, 10.40 and 16.78 % respectively. Comparatively, the DE of PMs at 10, 30 and 60 min was a higher value and that of SDs was much higher. Correspondingly, the DP30 for pure GLIM was 18.57%, which increased for PMs from 37.26 to 49.37 % and maximized for SDs (65.35 to 86.64 %). Furthermore, the DE of SDs at same data points was maximum and the values varied from 14.66 to 19.77%, 33.32 to 46.37 % and 56.48 to 70.10% respectively. The dissolution efficiency data of SDs prepared by solvent wetting method by using PEG6000, PVP K30 and poloxamer 188 at 10, 30 and 60 min indicates that the DE10%, DE30% and DE60% value was lowest for SDs prepared with poloxamer 188 and highest for the SDs prepared with PVPK30. Based on the dissolution parameters, GSDSM3 was selected as the optimized solid dispersion and was subjected to characterization. Optimized Solid Dispersion (GSDSM3) Infrared spectroscopy The IR spectra of the GLIM (Fig. 3A) showed the characteristic peaks at 3464.27 cm−1 of N-H stretching, at 2970.48 cm−1 of C-H stretching, at 2717.79 cm−1 attributed to O-H stretching, at 1477.52 cm−1 attributed to N=O stretching vibrations, at 1184.33 cm−1 because of C-O C stretching (13). In the spectrum PEG6000 (Fig. 3B) showed principal peak at 2887 cm-1 attributed to C-H stretch, at 1100 cm-1 attributed to C-O stretch and at 3600 cm -1 attributed to O-H stretching. GSDSM3 spectrum (Fig. 3C) showed diffused characteristic peaks of GLIM and PEG6000 at 3452.39 cm−1 of N-H stretching, at 2959.68 cm−1 of
Figure 2 In vitro dissolution profiles of (a) physical mixture of glimperide with various carriers, and (b)
corresponding solid dispersions in distilled water in comparison to pure drug.
Kaushik et al. solid dispersion by solvent melt method
Pharm Biomed Res 2017; 3(4):7
Carrier Drug:
carrier ratio
Code Drug content
(%) DE10% DE30% DE60% T50 min DP30
-- -- GLIM -- 4.81 10.40 16.78 108.85 18.57
PEG6000
1:1 GPM1 96.50 ± 0.25 8.48 20.44 33.02 66.24 38.05
1:3 GPM2 97.85 ± 0.39 9.30 22.72 34.75 60.79 42.67
1:5 GPM3 96.25 ± 0.29 10.63 25.08 37.29 56.66 45.35
PVP K30
1:1 GPM4 95.67 ± 0.17 9.13 21.10 33.47 60.06 38.25
1:3 GPM5 96.24 ± 0.62 10.35 23.88 36.37 58.53 44.53
1:5 GPM6 97.59 ± 0.29 11.53 27.56 39.81 42.90 49.37
Poloxamer
188
1:1 GPM7 96.25 ± 0.41 7.27 19.07 29.45 70.84 37.26
1:3 GPM8 97.91 ± 0.35 8.78 21.02 33.00 61.29 39.72
1:5 GPM9 96.52 ± 0.27 9.95 22.81 35.37 57.44 43.56
PEG6000*
1:1 GSDSW1 96.32 ± 0.36 15.76 37.60 61.08 15.87 72.56
1:3 GSDSW2 95.58 ± 0.25 16.83 40.06 63.06 15.05 72.12
1:5 GSDSW3 97.25 ± 0.29 17.56 43.33 66.67 14.06 81.26
PVP K30*
1:1 GSDSW4 96.74 ± 0.18 16.96 39.86 63.65 15.69 74.55
1:3 GSDSW5 96.45 ± 0.42 18.28 43.69 67.51 14.55 81.65
1:5 GSDSW6 97.86 ± 0.24 19.77 46.37 69.94 13.35 86.64
Poloxamer
188*
1:1 GSDSW7 97.02 ± 0.19 14.66 33.32 56.48 17.21 65.35
1:3 GSDSW8 96.52 ± 0.35 16.26 37.60 59.90 15.76 69.65
1:5 GSDSW9 96.89 ± 0.28 17.13 41.53 63.74 14.50 75.15
PEG6000#
1:1 GSDSM1 97.56 ± 0.18 17.13 41.86 64.17 15.13 78.67
1:3 GSDSM2 96.69 ± 0.35 19.27 44.28 67.15 14.08 80.45
1:5 GSDSM3 97.16 ± 0.22 19.47 45.89 70.10 13.23 84.52
Table 4 Drug content and model independent dissolution parameters of PMs and SDs of GLIM (glimepiride)
C-H stretching, at 2711.64 cm−1 attributed to O-H stretching, at 1471.19 cm−1 attributed to N=O stretching vibrations, at 1172.69 cm−1 of C-O C stretching. The slight shift and broadening of peaks at 3464.27 cm-1 (N-H stretching) and 1184.33 cm-1 (carbonyl stretching) was observed. Powder X-ray diffraction The PXRD patterns of GLIM (Fig.4A) showed the
characteristic GLIM peaks at diffraction angles (2Ø) of 18.10°, 19.12°, 22.00°, 25.21°, 26.32°. The PEG6000 (Fig. 4B) showed the characteristic peaks at diffraction angles (2Ø) of 15.0°, 18.8°, 23.2°, 26.6°, and 29.35°. While the XRD pattern of the physical mixture GPM3 (4C) of GLIM with PEG 6000 was an additive spectrum of GLIM and PEG6000. However, the XRD pattern of GSDSM3 (4D) showed
Figure 3 FTIR spectra of (A) glimperide, (B) PEG
6000, (C) GSDSM3 (optimized solid dispersion).
Figure 4 Powder X-ray diffractograms of (A)
GLIM; (B) PEG 6000, (C) GPM3, (D) GSDSM3.
Kaushik et al. solid dispersion by solvent melt method
Pharm Biomed Res 2017; 3(4):8
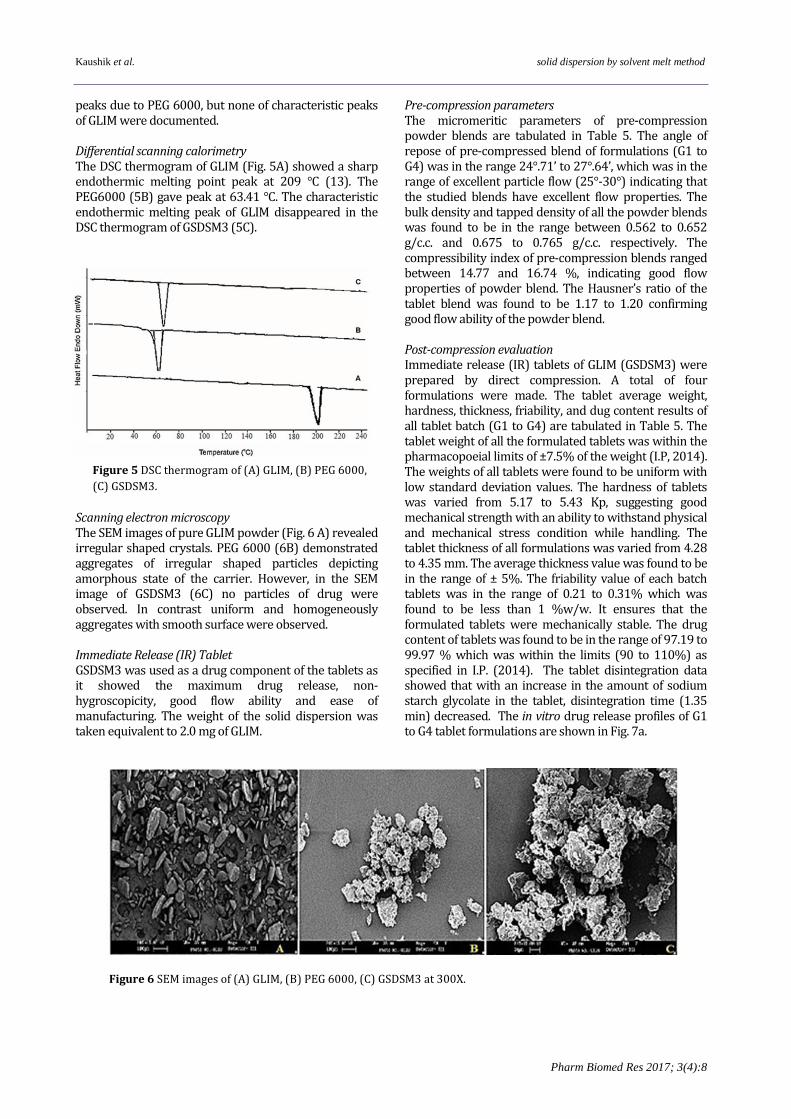
peaks due to PEG 6000, but none of characteristic peaks of GLIM were documented. Differential scanning calorimetry The DSC thermogram of GLIM (Fig. 5A) showed a sharp endothermic melting point peak at 209 °C (13). The PEG6000 (5B) gave peak at 63.41 °C. The characteristic endothermic melting peak of GLIM disappeared in the DSC thermogram of GSDSM3 (5C). Scanning electron microscopy The SEM images of pure GLIM powder (Fig. 6 A) revealed irregular shaped crystals. PEG 6000 (6B) demonstrated aggregates of irregular shaped particles depicting amorphous state of the carrier. However, in the SEM image of GSDSM3 (6C) no particles of drug were observed. In contrast uniform and homogeneously aggregates with smooth surface were observed. Immediate Release (IR) Tablet GSDSM3 was used as a drug component of the tablets as it showed the maximum drug release, non-hygroscopicity, good flow ability and ease of manufacturing. The weight of the solid dispersion was taken equivalent to 2.0 mg of GLIM.
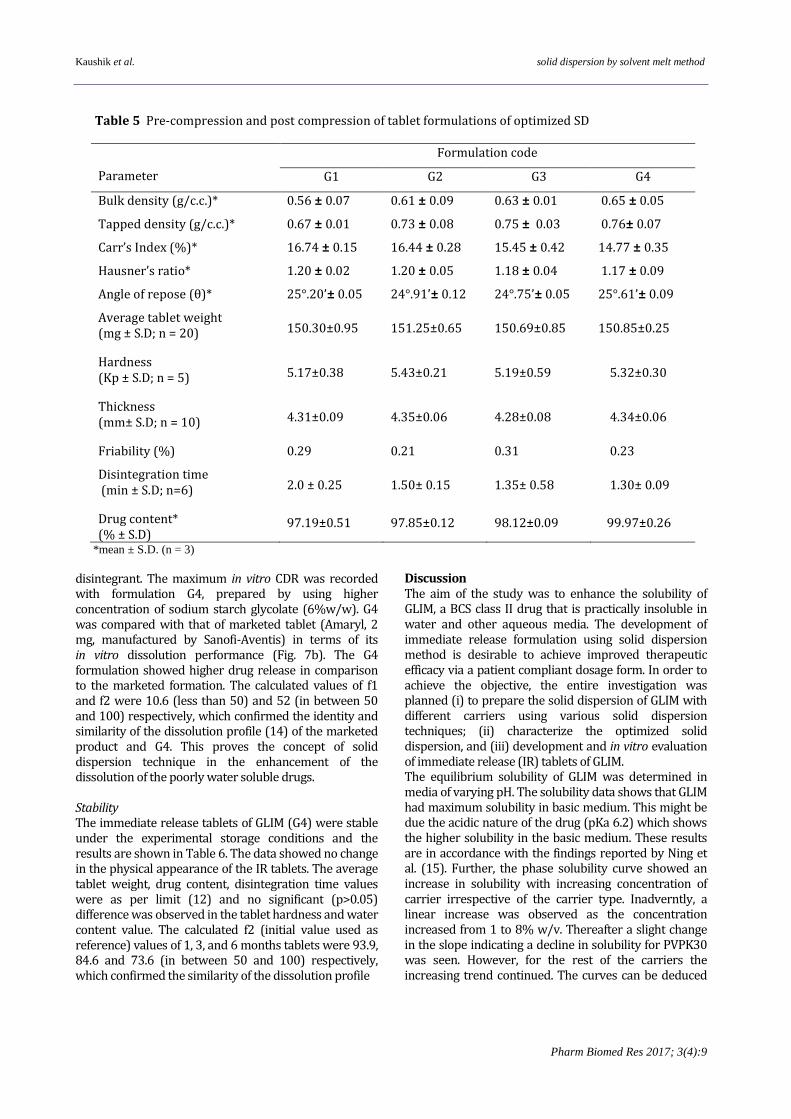
Pre-compression parameters The micromeritic parameters of pre-compression powder blends are tabulated in Table 5. The angle of repose of pre-compressed blend of formulations (G1 to G4) was in the range 24°.71’ to 27°.64’, which was in the range of excellent particle flow (25°-30°) indicating that the studied blends have excellent flow properties. The bulk density and tapped density of all the powder blends was found to be in the range between 0.562 to 0.652 g/c.c. and 0.675 to 0.765 g/c.c. respectively. The compressibility index of pre-compression blends ranged between 14.77 and 16.74 %, indicating good flow properties of powder blend. The Hausner’s ratio of the tablet blend was found to be 1.17 to 1.20 confirming good flow ability of the powder blend. Post-compression evaluation Immediate release (IR) tablets of GLIM (GSDSM3) were prepared by direct compression. A total of four formulations were made. The tablet average weight, hardness, thickness, friability, and dug content results of all tablet batch (G1 to G4) are tabulated in Table 5. The tablet weight of all the formulated tablets was within the pharmacopoeial limits of ±7.5% of the weight (I.P, 2014). The weights of all tablets were found to be uniform with low standard deviation values. The hardness of tablets was varied from 5.17 to 5.43 Kp, suggesting good mechanical strength with an ability to withstand physical and mechanical stress condition while handling. The tablet thickness of all formulations was varied from 4.28 to 4.35 mm. The average thickness value was found to be in the range of ± 5%. The friability value of each batch tablets was in the range of 0.21 to 0.31% which was found to be less than 1 %w/w. It ensures that the formulated tablets were mechanically stable. The drug content of tablets was found to be in the range of 97.19 to 99.97 % which was within the limits (90 to 110%) as specified in I.P. (2014). The tablet disintegration data showed that with an increase in the amount of sodium starch glycolate in the tablet, disintegration time (1.35 min) decreased. The in vitro drug release profiles of G1 to G4 tablet formulations are shown in Fig. 7a.
Figure 5 DSC thermogram of (A) GLIM, (B) PEG 6000,
(C) GSDSM3.
Figure 6 SEM images of (A) GLIM, (B) PEG 6000, (C) GSDSM3 at 300X.
Kaushik et al. solid dispersion by solvent melt method
Pharm Biomed Res 2017; 3(4):9
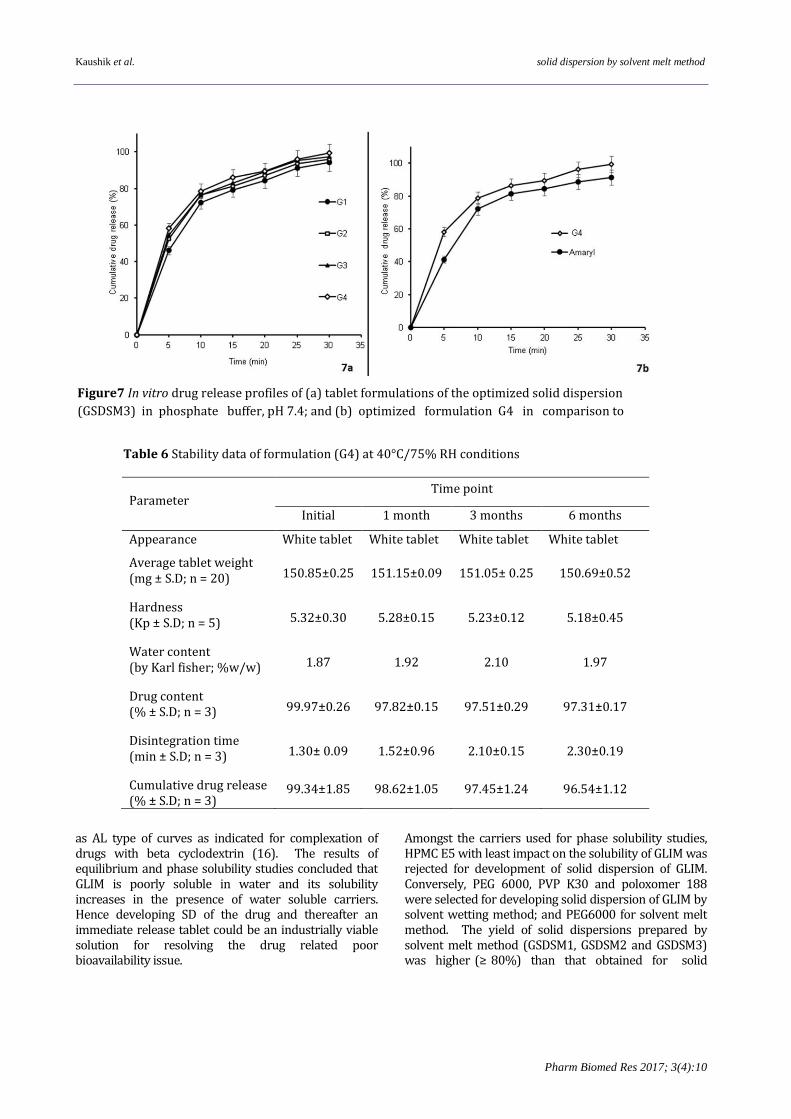
The data showed the cumulative drug release (CDR) from G1-G4 narrowly ranged between 94.26 to and 99.34% in 30 min. As anticipated, the drug release increased with the increase in the concentration of disintegrant. The maximum in vitro CDR was recorded with formulation G4, prepared by using higher concentration of sodium starch glycolate (6%w/w). G4 was compared with that of marketed tablet (Amaryl, 2 mg, manufactured by Sanofi-Aventis) in terms of its in vitro dissolution performance (Fig. 7b). The G4 formulation showed higher drug release in comparison to the marketed formation. The calculated values of f1 and f2 were 10.6 (less than 50) and 52 (in between 50 and 100) respectively, which confirmed the identity and similarity of the dissolution profile (14) of the marketed product and G4. This proves the concept of solid dispersion technique in the enhancement of the dissolution of the poorly water soluble drugs. Stability The immediate release tablets of GLIM (G4) were stable under the experimental storage conditions and the results are shown in Table 6. The data showed no change in the physical appearance of the IR tablets. The average tablet weight, drug content, disintegration time values were as per limit (12) and no significant (p>0.05) difference was observed in the tablet hardness and water content value. The calculated f2 (initial value used as reference) values of 1, 3, and 6 months tablets were 93.9, 84.6 and 73.6 (in between 50 and 100) respectively, which confirmed the similarity of the dissolution profile
up to 6 months. This shows that formulation samples were stable up to 6 months at accelerated conditions in the selected HDPE bottle pack.
Discussion The aim of the study was to enhance the solubility of GLIM, a BCS class II drug that is practically insoluble in water and other aqueous media. The development of immediate release formulation using solid dispersion method is desirable to achieve improved therapeutic efficacy via a patient compliant dosage form. In order to achieve the objective, the entire investigation was planned (i) to prepare the solid dispersion of GLIM with different carriers using various solid dispersion techniques; (ii) characterize the optimized solid dispersion, and (iii) development and in vitro evaluation of immediate release (IR) tablets of GLIM. The equilibrium solubility of GLIM was determined in media of varying pH. The solubility data shows that GLIM had maximum solubility in basic medium. This might be due the acidic nature of the drug (pKa 6.2) which shows the higher solubility in the basic medium. These results are in accordance with the findings reported by Ning et al. (15). Further, the phase solubility curve showed an increase in solubility with increasing concentration of carrier irrespective of the carrier type. Inadverntly, a linear increase was observed as the concentration increased from 1 to 8% w/v. Thereafter a slight change in the slope indicating a decline in solubility for PVPK30 was seen. However, for the rest of the carriers the increasing trend continued. The curves can be deduced
Table 5 Pre-compression and post compression of tablet formulations of optimized SD
Parameter
Formulation code
G1 G2 G3 G4
Bulk density (g/c.c.)* 0.56 ± 0.07 0.61 ± 0.09 0.63 ± 0.01 0.65 ± 0.05
Tapped density (g/c.c.)* 0.67 ± 0.01 0.73 ± 0.08 0.75 ± 0.03 0.76± 0.07
Carr’s Index (%)* 16.74 ± 0.15 16.44 ± 0.28 15.45 ± 0.42 14.77 ± 0.35
Hausner’s ratio* 1.20 ± 0.02 1.20 ± 0.05 1.18 ± 0.04 1.17 ± 0.09
Angle of repose (θ)* 25°.20’± 0.05 24°.91’± 0.12 24°.75’± 0.05 25°.61’± 0.09
Average tablet weight (mg ± S.D; n = 20) 150.30±0.95 151.25±0.65 150.69±0.85 150.85±0.25
Hardness (Kp ± S.D; n = 5) 5.17±0.38 5.43±0.21 5.19±0.59 5.32±0.30
Thickness (mm± S.D; n = 10) 4.31±0.09 4.35±0.06 4.28±0.08 4.34±0.06
Friability (%) 0.29 0.21 0.31 0.23
Disintegration time (min ± S.D; n=6) 2.0 ± 0.25 1.50± 0.15 1.35± 0.58 1.30± 0.09
Drug content* (% ± S.D)
97.19±0.51 97.85±0.12 98.12±0.09 99.97±0.26
*mean ± S.D. (n = 3)
Kaushik et al. solid dispersion by solvent melt method
Pharm Biomed Res 2017; 3(4):10
as AL type of curves as indicated for complexation of drugs with beta cyclodextrin (16). The results of equilibrium and phase solubility studies concluded that GLIM is poorly soluble in water and its solubility increases in the presence of water soluble carriers. Hence developing SD of the drug and thereafter an immediate release tablet could be an industrially viable solution for resolving the drug related poor bioavailability issue.
Amongst the carriers used for phase solubility studies, HPMC E5 with least impact on the solubility of GLIM was rejected for development of solid dispersion of GLIM. Conversely, PEG 6000, PVP K30 and poloxomer 188 were selected for developing solid dispersion of GLIM by solvent wetting method; and PEG6000 for solvent melt method. The yield of solid dispersions prepared by solvent melt method (GSDSM1, GSDSM2 and GSDSM3) was higher (≥ 80%) than that obtained for solid
Table 6 Stability data of formulation (G4) at 40°C/75% RH conditions
Parameter Time point
Initial 1 month 3 months 6 months
Appearance White tablet White tablet White tablet White tablet
Average tablet weight (mg ± S.D; n = 20) 150.85±0.25 151.15±0.09 151.05± 0.25 150.69±0.52
Hardness (Kp ± S.D; n = 5) 5.32±0.30 5.28±0.15 5.23±0.12 5.18±0.45
Water content (by Karl fisher; %w/w) 1.87 1.92 2.10 1.97
Drug content (% ± S.D; n = 3) 99.97±0.26 97.82±0.15 97.51±0.29 97.31±0.17
Disintegration time (min ± S.D; n = 3) 1.30± 0.09 1.52±0.96 2.10±0.15 2.30±0.19
Cumulative drug release (% ± S.D; n = 3)
99.34±1.85 98.62±1.05 97.45±1.24 96.54±1.12
Figure7 In vitro drug release profiles of (a) tablet formulations of the optimized solid dispersion
(GSDSM3) in phosphate buffer, pH 7.4; and (b) optimized formulation G4 in comparison to
marketed formulation.
Kaushik et al. solid dispersion by solvent melt method
Pharm Biomed Res 2017; 3(4):11
dispersions prepared by solvent wetting method. This might be due the formation of the less sticky SDs formed by the former than the latter. Consequently, less amount of SDs was lost during the process, so higher yield was documented in comparison to solvent wetting method. Furthermore, the hygroscopicity studies of SDs revealed that with PVP K30 as carrier, the hygroscopicity was the highest under both the humidity test conditions indicating highest hygroscopic character of the carrier in comparison to the rest of the carriers. Crowely and Zografi have reported the water absorption characteristics of amorphous drug PVP dispersions (17). Though the change in weight was insignificant, the order of change in weight of SDs containing various carriers under the test conditions was PVP K30 > poloxamer 188 > PEG6000. This data guided the processing and storage of the solid dispersions. Consequently, the SDs was stored under dessicated conditions until further use. The drug content values of the SDs and their corresponding physical mixtures narrowly ranged between 95.36 and 98.69%. Additionally, close values of the drug content of a given SDs when compared to the corresponding physical mixture indicated efficient processing control. The in vitro dissolution performance of GLIM, PMs and their corresponding solid dispersions was evaluated in purified water. As a thumb rule the SDs exhibited faster in vitro dissolution rates than the PMs and intact drug. For a given time point the dissolution from SDs was almost twice than that of PMs and five folds in comparison to the pure drug. The improvement in the drug dissolution via PMs could be attributed to the higher wettability and dispersibility as reported by Leuner and Dressman (18). Mixing of the drug with hydrophilic carrier’s viz. PVP K30, PEG 6000 and Poloxamer 188 results in greater wetting and increases surface availability for dissolution by reducing interfacial tension between the hydrophobic drug and the dissolution medium. Amongst the SDs formulated, highest increase (~3.6 fold) in dissolution was observed with GSDSM3 (GLIM: PEG6000; 1: 5) in comparison to the pure drug. This might be due to molecular dispersion of drug–hydrophilic carriers, increased wettability and decrease in the crystallinity to form amorphous GLIM in SDs as explained by Andrews et al. (19) and confirmed by DSC and XPRD analysis. As the dissolution profiles were very close to each other; for selection of the best SD the in vitro dissolution data was subjected to analysis by model independent dissolution parameters. T50%, that indicates the time required for 50% drug release and DE30%, DE60% that indicate per cent of drug dissolved after 30 and 60 min respectively were also computed. These parameters were selected since they provide a clear cut indication of the dissolution enhancement ability of the drug: carrier ratio and method of SDs preparation. The data showed that T50% for pure GLIM was 1.5 – 2.5 folds higher than PMs and for SDs it was higher by 6.2-8.1times signifying the advantage of SDs over simple physical mixture of drug with carriers used.
Grossly speaking the method used for preparation of solid dispersion did not demonstrate a significant effect on the T50%. However, the data indicated least value of time required for 50% dissolution for the SD (drug: carrier ratio; 1:5) made by solvent melt method probably because the molten carrier provided more homogeneous molecular matrix around the drug particles than the carrier incorporated by solvent wetting method. The order of DE10%, DE30% and DE60% of for carriers used in SDs preparation were PVP K30 > PEG6000 > Poloxamer 188. These findings are in line with the phase solubility data of the pure drug with the different concentrations of the carrier solutions. The DE was higher for SDs prepared by solvent melt method than solvent wetting method. This is due to finer dispersion of the drug and carrier at molecular level and corresponding increase in the surface area for dissolution in comparison to the SD’s prepared by solvent wetting method. The observations are analogous to those reported by Jijun et al. (20). It increased with increasing the concentration of carrier (PEG6000). The T50% of 13.23 min obtained with a GLIM: PEG6000 (1:5) and it increased to ~14.06 min when solvent wetting method was used for the preparation of SDs. The data showed that there was no significant (p > 0.05) influence of SD preparation technique on the T50%. DE60min was designated as the selection criteria and correspondingly, GSDSM3 with highest DE60min (70.10%) was selected for further characterization and development of the immediate release tablet dosage form. The infrared spectroscopy was used to check the interaction between GLIM and the carrier. The interaction between the components, if any, would be indicated by either producing additional peaks or absence of the characteristic peaks corresponding to the drug and carrier. The IR spectrum of GSDSM3 showed diffused characteristic peaks of GLIM and PEG6000. However, slight shift and broadening of 3464.27 cm-1 (N-H stretching) and 1184.33 cm-1 (carbonyl stretching) was indicative of hydrogen bonding between GLIM and PEG6000. The C=O group of PEG 6000 can potentially form hydrogen bond with the drug at molecular level in SDs. The powder X-ray diffraction was used to characterize the physical state of the drug in the solid dispersions. While the XRD pattern of the physical mixture GPM3 (4C) of GLIM with PEG 6000 was an additive spectrum of GLIM and PEG6000. However, the XRD pattern of GSDSM3 (4D) showed peaks due to PEG 6000, but none of characteristic peaks of GLIM were documented. The broadening of peaks in the SD formulations signified the amorphization of GLIM in the SD. The DSC thermogram of the SD confirmed that GLIM was amorphous state of the solid dispersion. The amorphous state in comparison to crystalline form is a high-energy state and is expected to have a high absorptivity, which might be the reason for the enhancement in the drug
Kaushik et al. solid dispersion by solvent melt method
Pharm Biomed Res 2017; 3(4):12
dissolution. The surface characteristics of drug, carrier and SDs were examined by using scanning electron microscopy. SEM images revealed that the individual surface properties of PEG 6000 and GLIM were lost during melting and solidification indicating the formation of effective SD systems and GLIM was completely dispersed with carrier at molecular level confirming that GLIM was transformed from a crystal to an amorphous form in the solid dispersion. The characterization confirmed amorphization of the drug in the said solid dispersion and was formulated as an IR tablet using solid dispersion equivalent to 2.0 mg of GLIM. The micromeritic parameters of pre-compression powder blends indicated excellent flow properties. The bulk density and tapped density did not vary widely assuring little change due to vibration effects of the manufacturing equipment and hence narrow weight variation in tablet produce. The compressibility index of pre compressed blends indicated good flow properties of powder blend that was further assured by optimal Hausner’s ratio. Post assessment of the pre-compression parameters the powder blend(s) was compressed into tablets and the formulations were screened for post compression features. The tablets were subjected to various tests and the results were compared with the compendial standards (12). The tablets were mechanically stable as indicated by the hardness and friability tests. The weight uniformity, tablet thickness and drug content of the formulation complied with the Indian Pharmacopoeial limits. The tablet disintegration time decreased with increase in the amount of sodium starch glycolate in the tablet. This may be attributed to its rapid uptake of water followed by rapid and enormous swelling. Similar finding was reported by Wan and Prasad (21). As a result of the disintegration phenomenon, the drug release increased with the increase in the concentration of disintegrant. Consequently, G4, prepared by using highest concentration (6% w/w) of sodium starch glycolate afforded maximum CDR of 99.34 ± 1.85%. This may be attributed to the highly porous structure and water wicking mechanism into porous network of sodium starch glycolate which leads to rapid drug release. The in vitro release profile of G4 was compared with that of marketed tablet (Amaryl, 2 mg of GLIM). The G4 formulation showed higher drug release (Fig. 7b) in comparison to the marketed formation. The calculated values of f1 and f2 were 10.6 (less than 50) and 52 (in between 50 and 100) respectively, which confirmed the identity and similarity of the dissolution profile of the marketed product and G4 (14). This proves the concept of solid dispersion technique in the enhancement of the dissolution of the poorly water soluble drugs. Conclusion The solid dispersions of glimperide were successfully prepared by solvent wetting method and solvent melt
method. SD prepared by solvent melt method using PEG6000 as carrier showed higher dissolution enhancement of GLIM than the SDs prepared by solvent wetting method. The selected solid dispersion when formulated as immediate release tablet showed a higher but comparable dissolution profile in comparison to the commercially available tablet. The accelerated stability studies indicated a stable formulation. Based upon the physicochemical and biopharmaceutical characteristics the drugs, immediate release tablet dosage constituting the solid dispersion of the drug can improve the therapeutic efficacy. Conflict of Interest Authors declare no conflict of interest in this study.
References
1. Basit A, Riaz M, Fawwad A. Glimepiride: evidence-based facts,
trends, and observations. Vasc Health Risk Manag 2012;8:463-72.
2. Davis SN. The role of glimepiride in the effective management of Type 2 diabetes. J Diabetes Complications 2004;18:367-76.
3. Matthews DR, Dejager S, Ahren B, Fonseca V, Ferrannini
E, Couturier A, et al. Solid Dispersion: Methods and Polymers to increase the solubility of poorly soluble drugs. J Appl Pharm Sci
2012;10:170-5.
4. www.fda.gov/ohrms/dockets/ac/06/briefing/2006-4254b_12_05_kp%20glimepiride FDAlabel112005. pdf, Accessed
on 16th July 2017.
5. Bonfilio R, Pires SA, Ferreira LMB, de Almeida AE, Doriguetto AC, de Araujo MB, et al. A discriminating dissolution method for
glimepiride polymorphs. J Pharm Sci 2012;101:794-804.
6. Cook J, Addicks W, Wu YH. Application of the biopharmaceutical classification system in clinical drug development-An industrial
view. AAPS J 2008;10:306-10.
7. Huang Y, Dai WG. Fundamental aspects of solid dispersion technology for poorly soluble drugs. Acta Pharm Sinica B
2014;4:18-25.
8. Chaturvedi M, Kumar M, Pathak K, Bhatt S, Saini V. Surface
Solid Dispersion and Solid Dispersion of Meloxicam: Comparison
and Product Development. Adv Pharm Bull 2017;7:695-775.
9. Higuchi T, Connors KA. Phase-solubility techniques. Adv Anal Chem Inst 1965;4:17- 22.
10. Khan KA. The concept of dissolution efficiency. J Pharm
Pharmacol 1975;27:48-9. 11. Z hang Y, Huo M, Zhou J, Zou A, Li W, Yao C, et al. DDSolver:
An add-in program for modeling and comparison of drug
dissolution profiles. J Am Assoc Pharm Sci 2010;12: 263-71. 12. Indian Pharmacopoeia, Government of India Ministry of Health
and Family Welfare, Indian Pharmacopoeia Commission, Ghaziabad, 2014.
13. Makar RR, Latif R, Hosni EA, El Gazayerly ON. Optimization for
glimepiride dissolution enhancement utilizing different carriers and techniques. J Pharm Invest 2013;43:115-31.
14. Moore JW, Flanner HH. Mathematical comparison of dissolution
profiles. Pharm Technol 1996;20:64-74. 15. Ning X, Sun J, Han X, Wu Y, Yan Z, Han J, et al. Strategies to
improve dissolution and oral absorption of glimepiride tablets: solid
dispersion versus micronization techniques. Drug Dev Ind Pharm 2011;37:727-36.
16. Dahiya S, Pathak K. Physicochemical characterization and
dissolution enhancement of aceclofenac–hydroxypropyl β-cyclodextrin binary systems. PDA J Pharm Sci Tech 2006;60:378-
88.
17. Crowley K J, Zografi G. Water vapor absorption into amorphous hydrophobic drug /poly (vinylpyrrolidone) dispersions. J Pharm
Sci 2002;91:2150-65.
18. Leuner C, Dressman J. Improving drug solubility for oral delivery using solid dispersions. Eur J Pharm Biopharm 2000;50:47-60.
Kaushik et al. solid dispersion by solvent melt method
Pharm Biomed Res 2017; 3(4):13
19. Andrews GP, AbuDiak OA, Jones DS. Physicochemical
characterization of hot melt extruded bicalutamide-polyvinylpyrrolidone solid dispersions. J Pharm Sci 2010; 99:1322-
35.
20. Jijun F, Lishuang X, Xiaoli W, Shu Z, Xiaoguang T, Xingna Z, Haibing H, Xing T. Nimodipine (NM) tablets with high dissolution
containing NM solid dispersions prepared by hot-melt extrusion.
Drug Dev Ind Pharm 2011:37;934-44. 21. Wan LSC, Prasad KPP. Uptake of water by excipients in tablets. Int
J Pharm 1989;50:147-53.