development of auditory phase-locked activity for music sounds
TRANSCRIPT
Seediscussions,stats,andauthorprofilesforthispublicationat:https://www.researchgate.net/publication/38043525
DevelopmentofAuditoryPhase-LockedActivityforMusicSounds
ARTICLEinJOURNALOFNEUROPHYSIOLOGY·OCTOBER2009
ImpactFactor:2.89·DOI:10.1152/jn.00402.2009·Source:PubMed
CITATIONS
29
READS
58
5AUTHORS,INCLUDING:
AntoineJShahin
UniversityofCalifornia,Davis
30PUBLICATIONS1,051CITATIONS
SEEPROFILE
LaurelTrainor
McMasterUniversity
167PUBLICATIONS6,245CITATIONS
SEEPROFILE
LarryEvanRoberts
McMasterUniversity
81PUBLICATIONS4,133CITATIONS
SEEPROFILE
Allin-textreferencesunderlinedinbluearelinkedtopublicationsonResearchGate,
lettingyouaccessandreadthemimmediately.
Availablefrom:LarryEvanRoberts
Retrievedon:04February2016
103:218-229, 2010. First published Oct 28, 2009; doi:10.1152/jn.00402.2009 J NeurophysiolLee M. Miller Antoine J. Shahin, Laurel J. Trainor, Larry E. Roberts, Kristina C. Backer and
You might find this additional information useful...
59 articles, 19 of which you can access free at: This article cites http://jn.physiology.org/cgi/content/full/103/1/218#BIBL
including high-resolution figures, can be found at: Updated information and services http://jn.physiology.org/cgi/content/full/103/1/218
can be found at: Journal of Neurophysiologyabout Additional material and information http://www.the-aps.org/publications/jn
This information is current as of May 21, 2010 .
http://www.the-aps.org/.American Physiological Society. ISSN: 0022-3077, ESSN: 1522-1598. Visit our website at (monthly) by the American Physiological Society, 9650 Rockville Pike, Bethesda MD 20814-3991. Copyright © 2005 by the
publishes original articles on the function of the nervous system. It is published 12 times a yearJournal of Neurophysiology
on May 21, 2010
jn.physiology.orgD
ownloaded from
Development of Auditory Phase-Locked Activity for Music Sounds
Antoine J. Shahin,1 Laurel J. Trainor,2 Larry E. Roberts,2 Kristina C. Backer,3 and Lee M. Miller3,4
1The Ohio State University Eye and Ear Institute and Department of Otolaryngology-Head and Neck Surgery, Columbus, Ohio;2Department of Psychology, Neuroscience and Behaviour, McMaster University, Hamilton, Ontario, Canada; and 3Center for Mindand Brain and 4Department of Neurobiology, Physiology and Behavior, University of California, Davis, California
Submitted 11 May 2009; accepted in final form 22 October 2009
Shahin AJ, Trainor LJ, Roberts LE, Backer KC, Miller LM.Development of auditory phase-locked activity for music sounds. JNeurophysiol 103: 218–229, 2010. First published October 28, 2009;doi:10.1152/jn.00402.2009. The auditory cortex undergoes functionaland anatomical development that reflects specialization for learnedsounds. In humans, auditory maturation is evident in transient audi-tory-evoked potentials (AEPs) elicited by speech or music. However,neural oscillations at specific frequencies are also known to play animportant role in perceptual processing. We hypothesized that, ifoscillatory activity in different frequency bands reflects differentaspects of sound processing, the development of phase-locking tostimulus attributes at these frequencies may have different trajectories.We examined the development of phase-locking of oscillatory re-sponses to music sounds and to pure tones matched to the fundamentalfrequency of the music sounds. Phase-locking for theta (4–8 Hz),alpha (8–14 Hz), lower-to-mid beta (14–25 Hz), and upper-beta andgamma (25–70 Hz) bands strengthened with age. Phase-locking in theupper-beta and gamma range matured later than in lower frequenciesand was stronger for music sounds than for pure tones, likely reflect-ing the maturation of neural networks that code spectral complexity.Phase-locking for theta, alpha, and lower-to-mid beta was sensitive totemporal onset (rise time) sound characteristics. The data were alsoconsistent with phase-locked oscillatory effects of acoustic (spectro-temporal) complexity and timbre familiarity. Future studies are calledfor to evaluate developmental trajectories for oscillatory activity,using stimuli selected to address hypotheses related to familiarity andspectral and temporal encoding suggested by the current findings.
I N T R O D U C T I O N
The auditory cortex undergoes developmental changes thatreflect structural and functional specialization for sound pro-cessing (Hyde et al. 2009; Moore and Guan 2001; Moore andLinthicum 2007; Picton and Taylor 2007; Shahin et al. 2004).Understanding the course of auditory maturation, in particularhighlighting milestones of functional auditory development inhealthy individuals, will likely facilitate the diagnosis of de-velopmental delays in hearing-impaired children (Ponton et al.1996; Sharma et al. 2002) and children with language deficitsand learning disabilities (Dykman et al. 1982; Lubar et al.1992; Marosi et al. 1990; Warrier et al. 2004). Auditorymaturation is influenced by the acoustical environment, includ-ing the particular sound features present and the level ofexposure during different maturational periods. Rhythmicsounds, for example, can entrain the auditory response tooscillate according to the stimulus repetition interval (Gao etal. 2009). Also, infants rats exposed to environmental noisehave delayed emergence of tonotopic maps in the primary
auditory cortex (A1) compared with infant rats exposed to themore structured pure tone stimuli (Chang and Merzenich2003). Similarly, in humans, maturation of the auditory cortexis enhanced as a result of exposure to ecologically relevantsounds; musically trained children exhibit more mature audi-tory evoked potentials (AEPs), structural enhancement (in-crease in size of gray and/or white matter), and linguisticabilities than age-matched children with no musical training(Fujioka et al. 2006; Hyde et al. 2009; Moreno et al. 2009;Shahin et al. 2004). Most of us are exposed to music through-out the period of cortical maturation, which leads to well-characterized auditory representations for these sounds.
The time course of functional and anatomical maturation forsound processing is reflected in age-related changes in thelatencies and amplitudes of the characteristic AEPs time-locked to acoustic stimuli (He et al. 2009a,b; Pang and Taylor2000; Ponton et al. 2000; Sharma et al. 1997). However,although stereotyped AEPs show changes with maturation,they do not capture some important aspects of auditory func-tioning, notably the spectral and temporal course of the oscil-latory activity of neural ensembles. EEG oscillations can begrouped into the following frequency bands: theta 4–8 Hz,alpha 8–14 Hz, beta 14–30 Hz, and gamma 30�100 Hz. Theactivity in each band may reflect different aspects of soundprocessing. For example, theta and gamma band oscillationshave been associated with processing the temporal and spectralattributes of sounds, respectively. Theta band phase patternscan track the temporal envelope of spoken sentences (Ahissaret al. 2001; Luo and Poeppel 2007). In contrast, enhancedphase-locking and power of oscillations in the gamma bandhave been associated with increased spectral complexity ofsounds (Shahin et al. 2008), memory matching in auditory(Lenz et al. 2007; Shahin et al. 2008) and visual (Herrmann etal. 2004) modalities, selective attention (Fries et al. 2001;Polley et al. 2006; Snyder et al. 2006), and long-range syn-chrony during music processing (Bhattacharya et al. 2001).
A hallmark of the early stages of normal development is thatthe power of spontaneous oscillations tends to shift from lowerto higher frequencies (Bell 1998; Clarke et al. 2001; Marshallet al. 2002; Taylor and Baldeweg 2002) as we develop; delta(2–4 Hz) and theta power decrease, whereas alpha and betapower increase with age. A decrease in the higher frequencieswith development can indicate abnormal development, as inchildren with dyslexia (Fein et al. 1986) and attention deficitdisorder (Bresnahan et al. 1999). Of particular interest is howoscillatory phase-locking develops for the different frequencybands in response to music sounds. Phase-locking, studiedhere, represents the degree of temporal alignment of auditoryresponses to stimulus characteristics. Hence it shows how well
Address for reprint requests and other correspondence: A. J. Shahin, OSUEye and Ear Inst. and Dept. of Otolaryngology-Head and Neck Surgery, 915Olentangy River Rd., Columbus, OH 43212 (E-mail: [email protected]).
J Neurophysiol 103: 218–229, 2010.First published October 28, 2009; doi:10.1152/jn.00402.2009.
218 0022-3077/10 $8.00 Copyright © 2010 The American Physiological Society www.jn.org
on May 21, 2010
jn.physiology.orgD
ownloaded from

stimulus attributes drive the neural response. Thus phase-locked oscillatory activity may index low-level aspects ofauditory processing and may differ from spontaneous or in-duced activity that can be associated with higher-order ortop-down processes (Deiber et al. 2007).
In a recent study of adult musicians and nonmusicians, thephase-locking of gamma band activity (GBA) was enhanced formusic tones compared with pure tones for both groups, consistentwith the role of GBA in processing spectral complexity. GBAphase-locking strength was also enhanced in musicians comparedwith nonmusicians, consistent with gamma’s role in auditorymemory (Shahin et al. 2008). In this study, we measured EEGduring the presentation of piano, violin, and pure tones of thesame fundamental frequency (f0) and intensity in individualsbetween 4 and 25 yr of age. Oscillatory EEG activity evoked bythese tones was subjected to phase and spectral power analyses.Phase-locking index (PLI) and spectral power were contrastedamong age groups and tone types (piano, violin, pure) for theta,alpha, beta, and gamma band activity. Finding that differentfrequency bands show distinct maturational trajectories for agiven sound would suggest that these frequency bands representdifferent aspects of sound processing. Distinct developmentaltrajectories for responses to music tones and pure tones, on theother hand, would suggest sensitive periods for processing differ-ent sound features or aspects of sound processing such as temporalvariations, spectral complexity, and/or familiarity with musicaltimbres. We also charted the developmental trajectories for thepeak amplitudes and latencies of the AEP component waves P1,N1, and P2 to compare with prior AEP developmental accounts.
M E T H O D S
Subjects
Forty-six individuals between the ages of 4 and 25 yr participatedin the study. Six were measured twice, with the second measurementoccurring 2 yr later. The subjects were categorized into the followingage groups: 4–5 (n � 10), 6–7 (n � 8), 8–9 (n � 8), 10–13 (n � 8),14–17 (n � 8), and 18–25 yr (n � 10). Subjects who were testedtwice over the span of 2 yr were included in a different age group foreach measurement. Subjects were recruited from the Hamilton com-munity and McMaster University. Before the experiment, informationabout their musical skills, listening habits, and the musical interest oftheir parents and siblings were collected. None of the subjects werepracticing musicians or had formal musical training. Subjects gavewritten informed consent in accordance with the Research EthicsBoard of McMaster University. For children under age 16, consentwas also obtained from a parent.
Stimuli
Violin, piano, and pure tones were presented over a speaker placed1 m in front of the subject at eye level. Tones were 500 ms in duration,and the interstimulus interval was fixed at 2.5 s offset to onset. Theviolin tones were taken from Kyma software and pitched to the notesA3 (f0 � 220 Hz) and C3 (f0 � 131 Hz) (American notation). Thepiano tones, also at A3 and C3 fundamental frequencies, were ob-tained from a Korg 01W synthesizer. Pure tones were created with acosine envelope and matched to the fundamental frequency of the A3and C3 music tones. The three types of tones differed in their temporalproperties, primarily the shape of the sound envelope, and spectralproperties, as reflected in different harmonic composition. For in-stance, the pure and piano tones had faster temporal onsets (�10 ms)compared with violin tones (�50 ms), whereas piano and violin tones
had a long offset compared with the pure tone. Also, violin and pianotones had a more complex spectral profile compared with pure tones.The temporal and spectral characteristics of tones are shown in Fig. 1.
Procedure
EEG was recorded from a 20-channel EEG cap (Neuromedical Quick-Cap, 10–20 system) using a Neuroscan Synamps amplifier (DC to 100Hz sampled at 1 kHz). Reference and ground were Cz and AFz,respectively. The electrode configuration included fronto-temporal chan-nels (FP1, FP2, Fz, F3, F4, F7, F8),centro-temporal channels (C3, C4, T7,T8), parietal channels (Pz, P3, P4, P7, P8), occipital channels (O3 and O4),and mastoids (M1 and M2). Electrode impedances were reduced to �10kOhms using electrogel conductant. A total of 720 tones, equally distrib-uted among type and f0, were presented in a single experimental sessionthat lasted �45 min. A passive listening protocol was followed duringwhich subjects watched a silent movie. The six tones were presented ina pseudorandom order that was identical for each subject. Sound pressurelevel was set to 70 dB for all stimuli over a noise floor of 29 dB. Stimuliwere judged to be of similar perceived loudness by psychophysicalmeasurements taken from an independent group (n � 10) of nonmusicianadult subjects before the study.
Data analysis
Using EEGLAB and in-house MATLAB code, continuous EEGfiles for each subject were average-referenced and epoched accordingto the tone type into 1,200-ms segments, which included a 500-msprestimulus baseline. Trials containing amplitudes of �200 �V orgreater in any channel were rejected. The average number of trials(mean � SD), collapsing over the three tone types for the six agegroups was 127 � 46 (age 4–5), 118 � 32 (age 6–7), 162 � 38 (age8–9), 171 � 32 (age 10–13), 199 � 33 (age 14–17), and 198 � 24(age 18–25) trials. Thus the number of trials tended to increase withage. However, trial number differences between tone types (pure,violin, piano) were much smaller—the mean difference between anytwo tone types for any age group was less than six trials. Two analyseswere carried out: time-frequency and AEP analyses. Although AEPand time-frequency techniques may analyze the same activity, theycan be differentially sensitive to, and therefore offer complementaryperspectives on, its temporal and frequency dynamics. Here, for bothanalyses, data were collapsed across A3 and C3 tones for eachstimulus type and subject to enhance the signal-to-noise ratio. Anal-yses involved all channels, but we focused on channels Fz and Cz,where auditory activity is maximally exhibited.
TIME FREQUENCY. In the time-frequency analyses, as implementedby EEGLAB (Delorme and Makeig 2004), spectrograms of intertrial
0050 ms
Stimuli: A3 notation (f0 = 220 Hz)
1
-1
Viol
in to
neP
iano
tone
0050 ms
11025
0
Hz
Pur
e to
ne
FIG. 1. The temporal profile and spectrograms of pure, violin, and pianotones matched in fundamental frequency (A3 American notation, f0 � 220).
219DEVELOPMENT OF AUDITORY RESPONSE TO MUSIC
J Neurophysiol • VOL 103 • JANUARY 2010 • www.jn.org
on May 21, 2010
jn.physiology.orgD
ownloaded from
phase coherence (ITPC) and event-related spectral perturbation(ERSP) are generated. ITPC spectrograms represent the distribution ofthe phase-locking index (PLI) across time and frequency. It should benoted that PLI is a continuous measure ranging between perfectphase-locking (PLI � 1) or phase-independence (PLI � 0), althoughthese limits are rarely reached. Enhanced phase-locking is indicativeof the degree of temporal alignment of auditory responses to soundcharacteristics and does not imply enhanced neural population activityor enhanced synchrony between populations. The latter two factorscan be indicated in the spectral power changes seen in the ERSPanalyses. ERSP spectrograms represent the spectral power differencewith respect to the time between poststimulus and prestimulus base-line activity, calculated as the log of the ratio of the two activities. Ingeneral and as specified here, ERSP refers to the average acrossspectrograms of all trials. Here, the ERSP analysis was conducted toshow whether phase-locking changes were accompanied by spectralpower changes.
Time-frequency (TF) analysis implemented by the timef.m functionof EEGLAB spanned theta (4–8 Hz), alpha (8–14 Hz), lower-to-midbeta (14–25 Hz), and upper-beta and gamma (25–30 and 30–100 Hz,respectively) frequency bands. There were no significant gamma bandeffects �70 Hz, so gamma band examination was subsequentlylimited to the 70-Hz upper limit. Activities in the upper-beta andgamma bands, and similarly theta and alpha bands, were analyzedtogether because based on preliminary inspection they exhibitedsimilar electrophysiological behavior. TF analyses used a slidingHanning-windowed sinusoidal wavelet-based discrete Fourier trans-form (DFT) of the time-domain signal with a step size of �5 ms andfrequency increments of �2 Hz. Poststimulus activity was baselinedto the prestimulus interval of �500 to �150 ms to avoid smearing ofprestimulus activity with the poststimulus activity. The sliding win-dow was 256 samples (256 ms) in size at the lowest frequency (4 Hz,1 cycle) and decreased in size, whereas number of cycles increasedlinearly with frequency, reaching 128 samples and nine cycles at thehighest frequency (70 Hz). Given the 350-ms baseline duration (�500to �150 ms), a one-cycle wavelet at the lowest frequency resulted ina floor frequency of 4 Hz (for a 256-ms window).
Peak analyses and permutation tests were used to compare agegroups and tone types. Before further analysis, the ITPC activity wascorrected for number of trials. PLIs tend to be higher for smallernumber of trials (Fisher 1993). Here, the number of trials mayespecially become an issue when comparing activity from the young-est and oldest groups, which had an average trial difference of �70trials. Effects caused by trial number can be remedied by baseliningthe poststimulus phase-locking activity to a prestimulus period equalin duration (Kolev et al. 2001) or by using the Rayleigh’s z correction(Fisher 1993). For the current data, both of these methods yieldedsimilar results, but we present the z-corrected data. To correct fornumber of trials, ITPC activity was z-transformed according to thefollowing equation: zPLI � n � PLI2, where n is the number of trialsand PLI is the phase-locking index for each time-frequency point ofthe ITPC spectrogram. Following the z-correction, the peaks of thez-corrected phase-locking index (zPLI), were obtained in four steps.1) Individual zPLI time waveforms (zPLI temporal dynamics) wereobtained for each subject by collapsing zPLI for each time pointacross all frequencies within each of the frequency bands. 2) Theindividual zPLI waveforms from step 1 were averaged across allsubjects in each of the age cohorts. 3) The zPLI peak latency from step2 was obtained for each age cohort at channel Cz. 4) The group zPLIpeak latency values from step 3 were used to obtain the zPLI peakamplitude values at these latencies for each subject, tone type, andfrequency band. This way the individual zPLI values were driven bythe age group maxima. A similar procedure was conducted for thespectral power (ERSP) analysis, with the exception that the spectralpower peak values were based on the same peak latencies of theprevious zPLI analysis. There was no need to correct for trial number
in the ERSP analysis, because it is always baselined to an averageover the same number of trials.
AEPS. Individual data for each tone type were averaged, exported toMATLAB and filtered between 0.5 and 30 Hz using a zero-phase FIRfilter. Latencies and amplitudes of the P1, N1, and P2 AEPs weremeasured at the frontal channel Fz where the P1 is known to reach itsamplitude maximum (Shahin et al. 2004) and the vertex channel Czwhere the N1 and P2 are known to reach their amplitude maxima(Shahin et al. 2003, 2004). First, each age group’s mean data wereplotted, and the peak latencies of the components of interest (P1, N1,P2) were chosen manually. These latency values were used in anautomated windowing analysis, in which the latency and amplitude ofthe local maxima (P1, P2) or minima (N1) within �20 ms wasdetermined for each individual’s mean data and tone type at channelsCz for N1 and P2 and Fz for P1.
Statistical analysis
TIME FREQUENCY. zPLI and spectral power (ERSP) peak differ-ences for each frequency band and across age and tone type wereassessed by ANOVAs (Statistica v8, Statsoft) that were Greenhouse–Geisser corrected for sphericity violations. A group (6) � tone type(3) design was implemented. Post hoc tests were based on Fisher’sleast significant difference (LSD) test.
In further analyses, permutation tests (Chau et al. 2004; Shahinet al. 2008) were used to identify time-frequency regions that showedsignificant differences between tone types for the z-corrected ITPC orERSP spectrograms. Permutation-tested spectrograms have the advan-tage of showing differences between tone types across a range offrequency and time points and not just at the peak values as in theANOVAs above. In this test, time-frequency points exceeding signif-icance denoted time-frequency points where spectral power or phase-locking index values evoked by the first tone type (e.g., “piano” in“piano � pure” tone type) exceeded that evoked by the second tonetype (depicted here with warm colors) or spectral power/zPLI evokedby the second tone type exceeded that evoked by the first tone type(cool colors). The threshold of significance was set at P � 0.005 andmaximum resampling (2n, where n equals the number of subjects inthe comparison) was used (Good 2000).
AEPS. Latency and amplitude differences of AEPs were evaluatedusing ANOVAs that were Greenhouse–Geisser corrected for spheric-ity violations. ANOVAs were conducted for each AEP component(P1, N1, P2) and included the variables age group and tone type(piano, violin, pure). Post hoc tests were based on Fisher’s LSD test.
R E S U L T S
The following analyses investigate the development of cor-tical representations for complex music tones with familiartimbres by examining the growth of oscillatory activity indifferent frequency bands between 4 yr of age and adulthood.In addition, we studied which frequency bands were sensitiveto spectral information by comparing the activity in response toeach music tone (containing many harmonics) to that of puretones. We also studied the development of temporal onsetencoding by contrasting responses to piano and pure tones,which have fast onsets, with responses to violin tones, whichhave relatively slow onsets (Fig. 1). Although the use ofrealistic music timbres precluded wide parametric control ofacoustics, the contrasts outlined above provide beginning evi-dence on developmental trajectories for encoding temporal andspectral information.
220 SHAHIN ET AL.
J Neurophysiol • VOL 103 • JANUARY 2010 • www.jn.org
on May 21, 2010
jn.physiology.orgD
ownloaded from
Phase-locking analysis
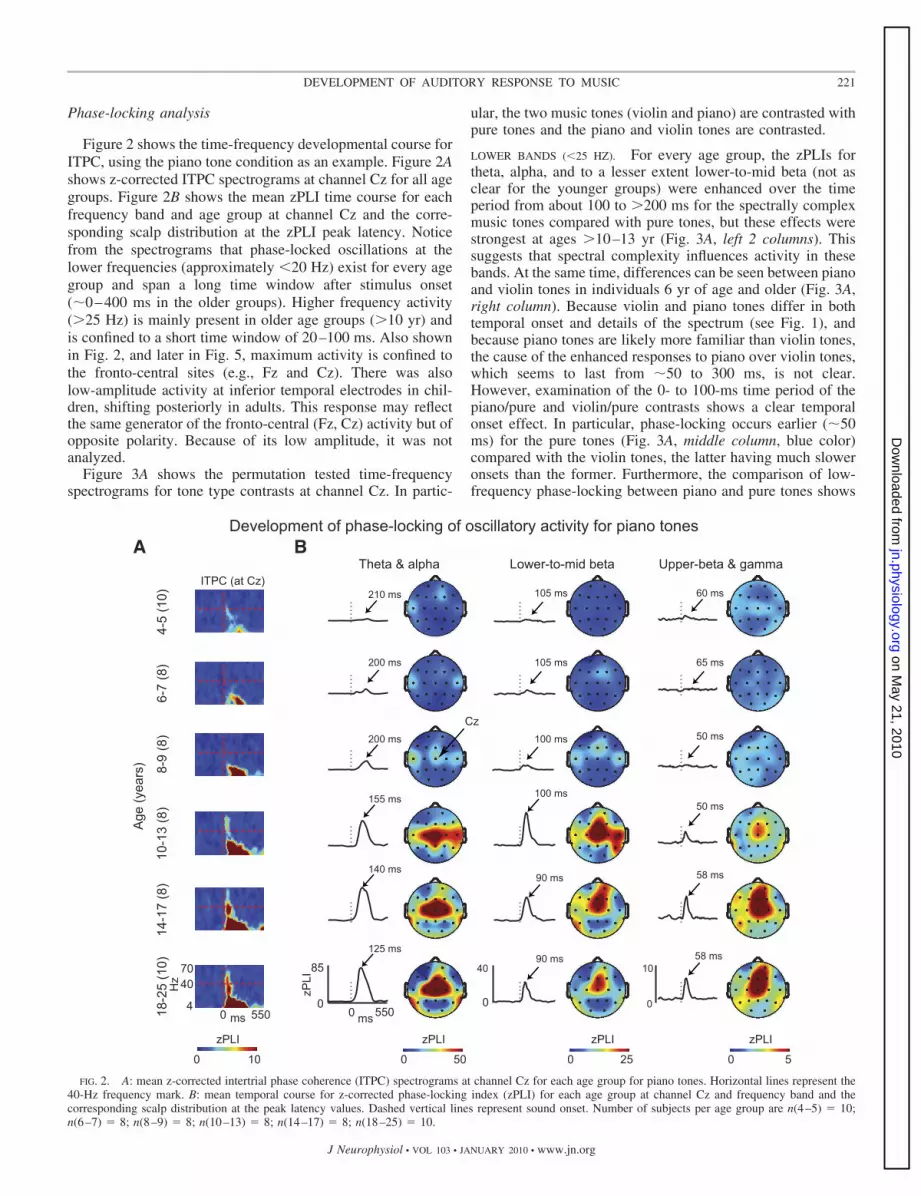
Figure 2 shows the time-frequency developmental course forITPC, using the piano tone condition as an example. Figure 2Ashows z-corrected ITPC spectrograms at channel Cz for all agegroups. Figure 2B shows the mean zPLI time course for eachfrequency band and age group at channel Cz and the corre-sponding scalp distribution at the zPLI peak latency. Noticefrom the spectrograms that phase-locked oscillations at thelower frequencies (approximately �20 Hz) exist for every agegroup and span a long time window after stimulus onset(�0–400 ms in the older groups). Higher frequency activity(�25 Hz) is mainly present in older age groups (�10 yr) andis confined to a short time window of 20–100 ms. Also shownin Fig. 2, and later in Fig. 5, maximum activity is confined tothe fronto-central sites (e.g., Fz and Cz). There was alsolow-amplitude activity at inferior temporal electrodes in chil-dren, shifting posteriorly in adults. This response may reflectthe same generator of the fronto-central (Fz, Cz) activity but ofopposite polarity. Because of its low amplitude, it was notanalyzed.
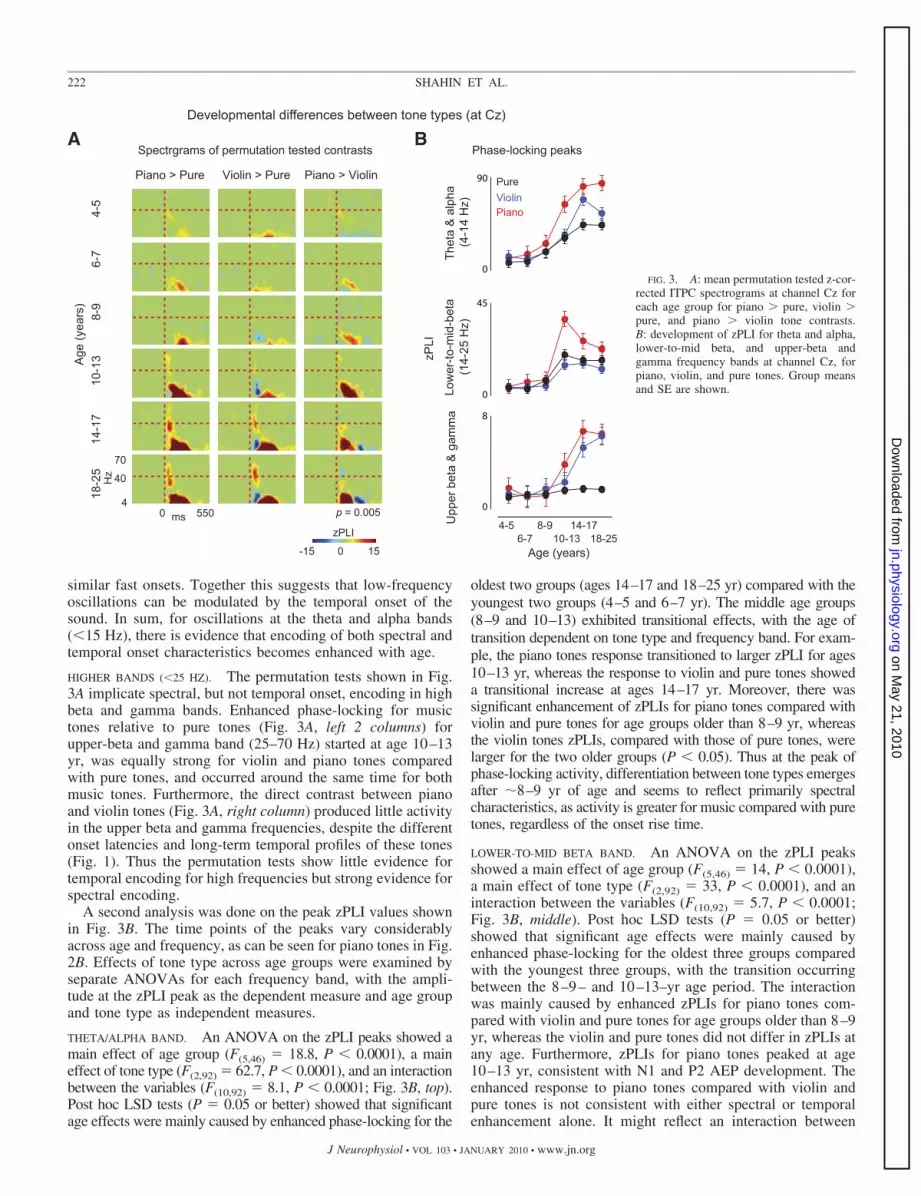
Figure 3A shows the permutation tested time-frequencyspectrograms for tone type contrasts at channel Cz. In partic-
ular, the two music tones (violin and piano) are contrasted withpure tones and the piano and violin tones are contrasted.
LOWER BANDS (�25 HZ). For every age group, the zPLIs fortheta, alpha, and to a lesser extent lower-to-mid beta (not asclear for the younger groups) were enhanced over the timeperiod from about 100 to �200 ms for the spectrally complexmusic tones compared with pure tones, but these effects werestrongest at ages �10–13 yr (Fig. 3A, left 2 columns). Thissuggests that spectral complexity influences activity in thesebands. At the same time, differences can be seen between pianoand violin tones in individuals 6 yr of age and older (Fig. 3A,right column). Because violin and piano tones differ in bothtemporal onset and details of the spectrum (see Fig. 1), andbecause piano tones are likely more familiar than violin tones,the cause of the enhanced responses to piano over violin tones,which seems to last from �50 to 300 ms, is not clear.However, examination of the 0- to 100-ms time period of thepiano/pure and violin/pure contrasts shows a clear temporalonset effect. In particular, phase-locking occurs earlier (�50ms) for the pure tones (Fig. 3A, middle column, blue color)compared with the violin tones, the latter having much sloweronsets than the former. Furthermore, the comparison of low-frequency phase-locking between piano and pure tones shows
4-5
(10)
6-7
(8)
8-9
(8)
10-1
3 (8
)14
-17
(8)
18-2
5 (1
0)
Age
(yea
rs)
0
4070
4550ms
Hz
ITPC (at Cz)
0
85
0 550
40
0
10
100
zPLI
500 50250
zPLI
ms
Development of phase-locking of oscillatory activity for piano tones
Theta & alpha Lower-to-mid beta Upper-beta & gamma
210 ms
200 ms
200 ms
155 ms
140 ms
125 ms
105 ms
105 ms
100 ms
100 ms
90 ms
90 ms
60 ms
65 ms
50 ms
50 ms
58 ms
58 ms
A B
0
ILPzILPzILPz
Cz
FIG. 2. A: mean z-corrected intertrial phase coherence (ITPC) spectrograms at channel Cz for each age group for piano tones. Horizontal lines represent the40-Hz frequency mark. B: mean temporal course for z-corrected phase-locking index (zPLI) for each age group at channel Cz and frequency band and thecorresponding scalp distribution at the peak latency values. Dashed vertical lines represent sound onset. Number of subjects per age group are n(4–5) � 10;n(6–7) � 8; n(8–9) � 8; n(10–13) � 8; n(14–17) � 8; n(18–25) � 10.
221DEVELOPMENT OF AUDITORY RESPONSE TO MUSIC
J Neurophysiol • VOL 103 • JANUARY 2010 • www.jn.org
on May 21, 2010
jn.physiology.orgD
ownloaded from
similar fast onsets. Together this suggests that low-frequencyoscillations can be modulated by the temporal onset of thesound. In sum, for oscillations at the theta and alpha bands(�15 Hz), there is evidence that encoding of both spectral andtemporal onset characteristics becomes enhanced with age.
HIGHER BANDS (�25 HZ). The permutation tests shown in Fig.3A implicate spectral, but not temporal onset, encoding in highbeta and gamma bands. Enhanced phase-locking for musictones relative to pure tones (Fig. 3A, left 2 columns) forupper-beta and gamma band (25–70 Hz) started at age 10–13yr, was equally strong for violin and piano tones comparedwith pure tones, and occurred around the same time for bothmusic tones. Furthermore, the direct contrast between pianoand violin tones (Fig. 3A, right column) produced little activityin the upper beta and gamma frequencies, despite the differentonset latencies and long-term temporal profiles of these tones(Fig. 1). Thus the permutation tests show little evidence fortemporal encoding for high frequencies but strong evidence forspectral encoding.
A second analysis was done on the peak zPLI values shownin Fig. 3B. The time points of the peaks vary considerablyacross age and frequency, as can be seen for piano tones in Fig.2B. Effects of tone type across age groups were examined byseparate ANOVAs for each frequency band, with the ampli-tude at the zPLI peak as the dependent measure and age groupand tone type as independent measures.
THETA/ALPHA BAND. An ANOVA on the zPLI peaks showed amain effect of age group (F(5,46) � 18.8, P � 0.0001), a maineffect of tone type (F(2,92) � 62.7, P � 0.0001), and an interactionbetween the variables (F(10,92) � 8.1, P � 0.0001; Fig. 3B, top).Post hoc LSD tests (P � 0.05 or better) showed that significantage effects were mainly caused by enhanced phase-locking for the
oldest two groups (ages 14–17 and 18–25 yr) compared with theyoungest two groups (4–5 and 6–7 yr). The middle age groups(8–9 and 10–13) exhibited transitional effects, with the age oftransition dependent on tone type and frequency band. For exam-ple, the piano tones response transitioned to larger zPLI for ages10–13 yr, whereas the response to violin and pure tones showeda transitional increase at ages 14–17 yr. Moreover, there wassignificant enhancement of zPLIs for piano tones compared withviolin and pure tones for age groups older than 8–9 yr, whereasthe violin tones zPLIs, compared with those of pure tones, werelarger for the two older groups (P � 0.05). Thus at the peak ofphase-locking activity, differentiation between tone types emergesafter �8–9 yr of age and seems to reflect primarily spectralcharacteristics, as activity is greater for music compared with puretones, regardless of the onset rise time.
LOWER-TO-MID BETA BAND. An ANOVA on the zPLI peaksshowed a main effect of age group (F(5,46) � 14, P � 0.0001),a main effect of tone type (F(2,92) � 33, P � 0.0001), and aninteraction between the variables (F(10,92) � 5.7, P � 0.0001;Fig. 3B, middle). Post hoc LSD tests (P � 0.05 or better)showed that significant age effects were mainly caused byenhanced phase-locking for the oldest three groups comparedwith the youngest three groups, with the transition occurringbetween the 8–9– and 10–13–yr age period. The interactionwas mainly caused by enhanced zPLIs for piano tones com-pared with violin and pure tones for age groups older than 8–9yr, whereas the violin and pure tones did not differ in zPLIs atany age. Furthermore, zPLIs for piano tones peaked at age10–13 yr, consistent with N1 and P2 AEP development. Theenhanced response to piano tones compared with violin andpure tones is not consistent with either spectral or temporalenhancement alone. It might reflect an interaction between
Piano > Pure
4-5
6-7
8-9
10-1
314
-17
18-2
5A
ge (y
ears
)
0
40
70
4550ms
Hz
Violin > Pure Piano > Violin
-15 150
zPLI
p = 0.005
Developmental differences between tone types (at Cz)
Upp
er b
eta
& g
amm
a (1
4-25
Hz)
Thet
a &
alp
ha
(4-1
4 H
z)
zPLI
BA
90
0
45
0
8
0
4-56-7
8-910-13
14-1718-25
Age (years)
ViolinPiano
Pure
Spectrgrams of permutation tested contrasts Phase-locking peaks
Low
er-to
-mid
-bet
a
FIG. 3. A: mean permutation tested z-cor-rected ITPC spectrograms at channel Cz foreach age group for piano � pure, violin �pure, and piano � violin tone contrasts.B: development of zPLI for theta and alpha,lower-to-mid beta, and upper-beta andgamma frequency bands at channel Cz, forpiano, violin, and pure tones. Group meansand SE are shown.
222 SHAHIN ET AL.
J Neurophysiol • VOL 103 • JANUARY 2010 • www.jn.org
on May 21, 2010
jn.physiology.orgD
ownloaded from

these two sound characteristics, but it also could be caused bya familiarity bias for piano tones.
UPPER-BETA AND GAMMA BANDS. An ANOVA on the zPLIpeaks showed a main effect of age group (F(5,46) � 8.4, P �0.0001), a main effect of tone type (F(2,92) � 23.6, P �0.0001), and an interaction between the variables (F(10,92) �5.7, P � 0.0001). Post hoc LSD tests (P � 0.05 or better)showed enhanced zPLIs for piano and violin tones for theoldest age groups (�14 yr) compared with the younger agegroups. The zPLIs for pure tones did not differ between anytwo age groups. The piano tones evoked larger zPLIs than puretones for the oldest three age groups for piano and the oldesttwo age groups for violin tones. The piano and violin zPLIsonly differed for the 10–13–yr age group, with piano evokinglarger zPLIs. In sum, for upper-beta and gamma bands, spectralcomplexity seems to be the main feature that is encoded afterage 8–9 yr.
Spectral power analysis
The spectral power (ERSP) of oscillatory activity was ana-lyzed at channel Cz to see whether the enhanced phase-locking
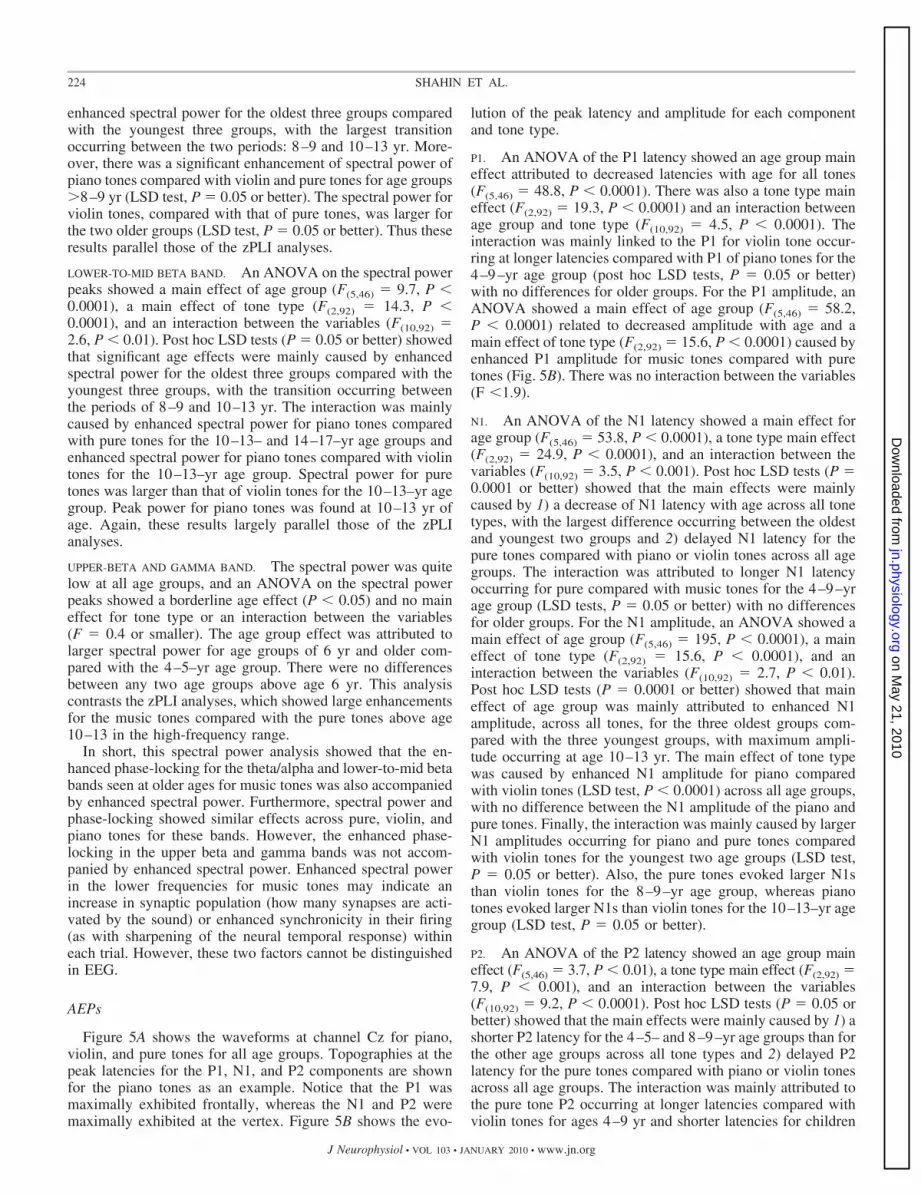
seen in the ITPC analysis was accompanied by spectral powerenhancement. Figure 4A shows the power spectrogram evolu-tion with age for piano tones as an example. Note that most ofthe activity is �25 Hz, even for the older age groups, incontrast to the phase-locking analyses shown in Fig. 2A.
Figure 4B shows the permutation contrasts between tonetypes for each age group. Notice that piano tones exhibitedlarger spectral power for theta/alpha bands, and to a lesserextent lower-to-mid beta bands, compared with pure and violintones for ages �10 yr. Violin tones exhibited larger spectralpower for theta and alpha bands compared with pure tones forages �14 yr (1 age group later than the piano � pure com-parison).
In a subsequent step, the spectral power peaks were con-trasted for each frequency band in ANOVAs, with the inde-pendent variables being age group and tone type (Fig. 4C).
THETA/ALPHA BAND. An ANOVA on the spectral power peaksshowed a main effect of age group (F(5,46) � 17.1, P �0.0001), a main effect of tone type (F(2,92) � 40.6, P �0.0001), and an interaction between the variables (F(10,92) �5.7, P � 0.0001). Post hoc LSD tests (P � 0.05 or better)showed that significant age effects were mainly caused by
p = 0.005
Development of spectral power to music tones (at Cz)
BA Piano > Pure Violin > Pure Piano > ViolinPiano
0
40
70
4550ms
Hz
4-5
6-7
8-9
10-1
314
-17
18-2
5A
ge (y
ears
)
0.35
-0.3
4
04-5
6-78-9
10-1314-17
18-25Age (years)
Upper beta & gamma (25-70 Hz)
Theta & alpha (4-14 Hz)
Spe
ctra
l Pow
er (d
B)
ViolinPiano
Pure
C
0
40
70
4550ms
Hz
4-5
6-7
8-9
10-1
314
-17
18-2
5A
GE
(yea
rs)
Spe
ctra
l pow
er (d
B)
- 2
2
0
1.7
-0.5
Lower-to-mid-beta (14-25 Hz)
FIG. 4. A: mean event-related spectralperturbation (ERSP) spectrograms at channelCz for each age group for piano tones.B: mean permutation tested ERSP spectro-grams at channel Cz for each age group forpiano � pure, violin � pure, and piano �violin tone contrasts. C: development ofpeak spectral power for theta and alpha,lower-to-mid beta, and upper-beta andgamma frequency bands at channel Cz forpure, piano, and violin tones. The peak val-ues for this analysis were taken at the samelatencies as for the zPLI analysis (Fig. 2).Group means and SE are shown.
223DEVELOPMENT OF AUDITORY RESPONSE TO MUSIC
J Neurophysiol • VOL 103 • JANUARY 2010 • www.jn.org
on May 21, 2010
jn.physiology.orgD
ownloaded from
enhanced spectral power for the oldest three groups comparedwith the youngest three groups, with the largest transitionoccurring between the two periods: 8–9 and 10–13 yr. More-over, there was a significant enhancement of spectral power ofpiano tones compared with violin and pure tones for age groups�8–9 yr (LSD test, P � 0.05 or better). The spectral power forviolin tones, compared with that of pure tones, was larger forthe two older groups (LSD test, P � 0.05 or better). Thus theseresults parallel those of the zPLI analyses.
LOWER-TO-MID BETA BAND. An ANOVA on the spectral powerpeaks showed a main effect of age group (F(5,46) � 9.7, P �0.0001), a main effect of tone type (F(2,92) � 14.3, P �0.0001), and an interaction between the variables (F(10,92) �2.6, P � 0.01). Post hoc LSD tests (P � 0.05 or better) showedthat significant age effects were mainly caused by enhancedspectral power for the oldest three groups compared with theyoungest three groups, with the transition occurring betweenthe periods of 8–9 and 10–13 yr. The interaction was mainlycaused by enhanced spectral power for piano tones comparedwith pure tones for the 10–13– and 14–17–yr age groups andenhanced spectral power for piano tones compared with violintones for the 10–13–yr age group. Spectral power for puretones was larger than that of violin tones for the 10–13–yr agegroup. Peak power for piano tones was found at 10–13 yr ofage. Again, these results largely parallel those of the zPLIanalyses.
UPPER-BETA AND GAMMA BAND. The spectral power was quitelow at all age groups, and an ANOVA on the spectral powerpeaks showed a borderline age effect (P � 0.05) and no maineffect for tone type or an interaction between the variables(F � 0.4 or smaller). The age group effect was attributed tolarger spectral power for age groups of 6 yr and older com-pared with the 4–5–yr age group. There were no differencesbetween any two age groups above age 6 yr. This analysiscontrasts the zPLI analyses, which showed large enhancementsfor the music tones compared with the pure tones above age10–13 in the high-frequency range.
In short, this spectral power analysis showed that the en-hanced phase-locking for the theta/alpha and lower-to-mid betabands seen at older ages for music tones was also accompaniedby enhanced spectral power. Furthermore, spectral power andphase-locking showed similar effects across pure, violin, andpiano tones for these bands. However, the enhanced phase-locking in the upper beta and gamma bands was not accom-panied by enhanced spectral power. Enhanced spectral powerin the lower frequencies for music tones may indicate anincrease in synaptic population (how many synapses are acti-vated by the sound) or enhanced synchronicity in their firing(as with sharpening of the neural temporal response) withineach trial. However, these two factors cannot be distinguishedin EEG.
AEPs
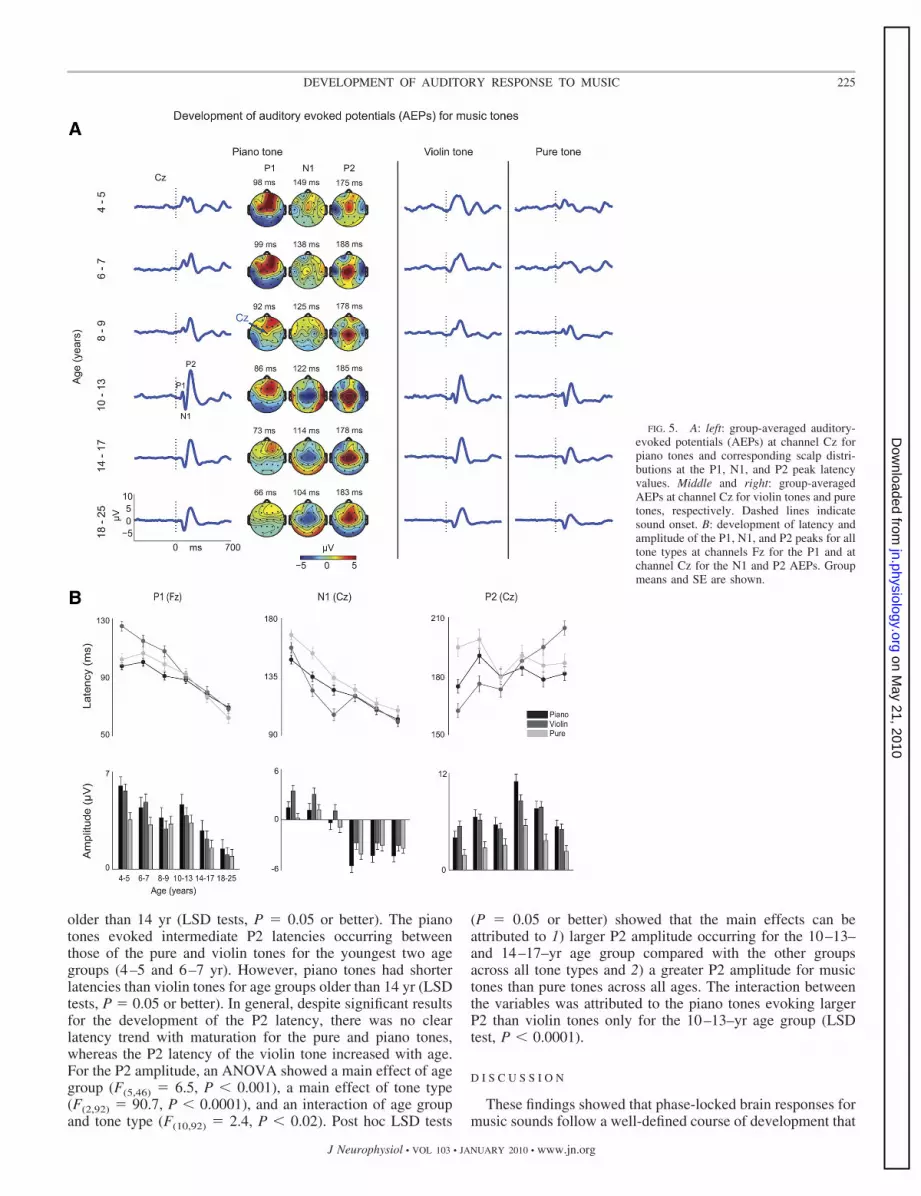
Figure 5A shows the waveforms at channel Cz for piano,violin, and pure tones for all age groups. Topographies at thepeak latencies for the P1, N1, and P2 components are shownfor the piano tones as an example. Notice that the P1 wasmaximally exhibited frontally, whereas the N1 and P2 weremaximally exhibited at the vertex. Figure 5B shows the evo-
lution of the peak latency and amplitude for each componentand tone type.
P1. An ANOVA of the P1 latency showed an age group maineffect attributed to decreased latencies with age for all tones(F(5,46) � 48.8, P � 0.0001). There was also a tone type maineffect (F(2,92) � 19.3, P � 0.0001) and an interaction betweenage group and tone type (F(10,92) � 4.5, P � 0.0001). Theinteraction was mainly linked to the P1 for violin tone occur-ring at longer latencies compared with P1 of piano tones for the4–9–yr age group (post hoc LSD tests, P � 0.05 or better)with no differences for older groups. For the P1 amplitude, anANOVA showed a main effect of age group (F(5,46) � 58.2,P � 0.0001) related to decreased amplitude with age and amain effect of tone type (F(2,92) � 15.6, P � 0.0001) caused byenhanced P1 amplitude for music tones compared with puretones (Fig. 5B). There was no interaction between the variables(F �1.9).
N1. An ANOVA of the N1 latency showed a main effect forage group (F(5,46) � 53.8, P � 0.0001), a tone type main effect(F(2,92) � 24.9, P � 0.0001), and an interaction between thevariables (F(10,92) � 3.5, P � 0.001). Post hoc LSD tests (P �0.0001 or better) showed that the main effects were mainlycaused by 1) a decrease of N1 latency with age across all tonetypes, with the largest difference occurring between the oldestand youngest two groups and 2) delayed N1 latency for thepure tones compared with piano or violin tones across all agegroups. The interaction was attributed to longer N1 latencyoccurring for pure compared with music tones for the 4–9–yrage group (LSD tests, P � 0.05 or better) with no differencesfor older groups. For the N1 amplitude, an ANOVA showed amain effect of age group (F(5,46) � 195, P � 0.0001), a maineffect of tone type (F(2,92) � 15.6, P � 0.0001), and aninteraction between the variables (F(10,92) � 2.7, P � 0.01).Post hoc LSD tests (P � 0.0001 or better) showed that maineffect of age group was mainly attributed to enhanced N1amplitude, across all tones, for the three oldest groups com-pared with the three youngest groups, with maximum ampli-tude occurring at age 10–13 yr. The main effect of tone typewas caused by enhanced N1 amplitude for piano comparedwith violin tones (LSD test, P � 0.0001) across all age groups,with no difference between the N1 amplitude of the piano andpure tones. Finally, the interaction was mainly caused by largerN1 amplitudes occurring for piano and pure tones comparedwith violin tones for the youngest two age groups (LSD test,P � 0.05 or better). Also, the pure tones evoked larger N1sthan violin tones for the 8–9–yr age group, whereas pianotones evoked larger N1s than violin tones for the 10–13–yr agegroup (LSD test, P � 0.05 or better).
P2. An ANOVA of the P2 latency showed an age group maineffect (F(5,46) � 3.7, P � 0.01), a tone type main effect (F(2,92) �7.9, P � 0.001), and an interaction between the variables(F(10,92) � 9.2, P � 0.0001). Post hoc LSD tests (P � 0.05 orbetter) showed that the main effects were mainly caused by 1) ashorter P2 latency for the 4–5– and 8–9–yr age groups than forthe other age groups across all tone types and 2) delayed P2latency for the pure tones compared with piano or violin tonesacross all age groups. The interaction was mainly attributed tothe pure tone P2 occurring at longer latencies compared withviolin tones for ages 4–9 yr and shorter latencies for children
224 SHAHIN ET AL.
J Neurophysiol • VOL 103 • JANUARY 2010 • www.jn.org
on May 21, 2010
jn.physiology.orgD
ownloaded from
older than 14 yr (LSD tests, P � 0.05 or better). The pianotones evoked intermediate P2 latencies occurring betweenthose of the pure and violin tones for the youngest two agegroups (4–5 and 6–7 yr). However, piano tones had shorterlatencies than violin tones for age groups older than 14 yr (LSDtests, P � 0.05 or better). In general, despite significant resultsfor the development of the P2 latency, there was no clearlatency trend with maturation for the pure and piano tones,whereas the P2 latency of the violin tone increased with age.For the P2 amplitude, an ANOVA showed a main effect of agegroup (F(5,46) � 6.5, P � 0.001), a main effect of tone type(F(2,92) � 90.7, P � 0.0001), and an interaction of age groupand tone type (F(10,92) � 2.4, P � 0.02). Post hoc LSD tests
(P � 0.05 or better) showed that the main effects can beattributed to 1) larger P2 amplitude occurring for the 10–13–and 14–17–yr age group compared with the other groupsacross all tone types and 2) a greater P2 amplitude for musictones than pure tones across all ages. The interaction betweenthe variables was attributed to the piano tones evoking largerP2 than violin tones only for the 10–13–yr age group (LSDtest, P � 0.0001).
D I S C U S S I O N
These findings showed that phase-locked brain responses formusic sounds follow a well-defined course of development that
FIG. 5. A: left: group-averaged auditory-evoked potentials (AEPs) at channel Cz forpiano tones and corresponding scalp distri-butions at the P1, N1, and P2 peak latencyvalues. Middle and right: group-averagedAEPs at channel Cz for violin tones and puretones, respectively. Dashed lines indicatesound onset. B: development of latency andamplitude of the P1, N1, and P2 peaks for alltone types at channels Fz for the P1 and atchannel Cz for the N1 and P2 AEPs. Groupmeans and SE are shown.
225DEVELOPMENT OF AUDITORY RESPONSE TO MUSIC
J Neurophysiol • VOL 103 • JANUARY 2010 • www.jn.org
on May 21, 2010
jn.physiology.orgD
ownloaded from

differs across oscillatory frequency bands. Across all fre-quency bands, phase-locking of oscillatory activity increasedgradually through the youngest age groups, more rapidlyacross the mid-aged groups, and either remained constant ordiminished slightly in the oldest age groups. The age ofmaximal increase was younger for the lower frequency (�25Hz) bands (8–13 yr) and older for the higher frequency (�25Hz) bands (10–17 yr). In general, the increase in phase-lockingof oscillatory activity with age was larger for music tones thanpure tones, suggesting that processing sounds with complexspectrotemporal structure becomes more refined with age.
The development of phase-locked activity followed differentdevelopmental trends in different frequency bands, likely re-flecting functional differences in the sound properties encodedin these different bands. The lower-frequency bands (�25 Hz)showed sensitivity to the temporal onset of the sounds, mani-fested during the first 100 ms after sound onset. In particular,in age groups older than 7 yr, the tones with the fastesttemporal onset slopes (piano and pure) showed earlier en-hanced phase-locking in the theta, alpha, and low-to-mid betabands compared with the tones with the slowest onset slope(violin; Fig. 3A), regardless of the sound frequency/spectralcontent. Theta’s sensitivity to processing the temporal repre-sentations of sounds is noteworthy because it has been shownthat theta band phase patterns can track the temporal outline ofspoken sentences (Ahissar et al. 2001; Luo and Poeppel 2007).After 100 ms, violin and piano tones showed enhanced pro-longed (�100–300 ms) phase-locking in the lower frequencies(�25 Hz) compared with the pure tones, and piano tonesshowed enhanced phase-locking compared with violin tones.These differences are more difficult to interpret. The enhance-ment for music tones suggests sensitivity to spectral content.However, the music tones also have more complex temporalenvelopes (intensity) over time than the pure tones (Fig. 1), andthe piano tones decay more rapidly than the violin tones. Thecontribution of temporal and spectral factors cannot be disso-ciated by the current stimuli and should be addressed paramet-rically in future studies with synthetic sounds.
Furthermore, the analyses of phase-locking peaks suggestdifferences between theta/alpha and low-to-mid beta bands.For theta/alpha in the older age groups, the greatest activity isseen for piano tones, followed by violin tones and then puretones. However, for beta, only for piano tones is phase-lockinggreater than for pure tones; violin and pure tones do not differ.Although a definitive cause of these differences cannot bemade, one possibility is that, with increasing age, lower-to-midbeta band phase-locking becomes particularly sensitive to fa-miliar timbres. Piano tones are likely more familiar than violintones. Also, although our participants were instructed to con-centrate on the silent movie, the familiarity of piano soundsmay have commanded the attention of participants to a greaterdegree than for violin or pure tones. Indeed, there is evidencethat, if subjects exercise selective attention, oscillatory activitycan become more temporally aligned to the attended stimulus(Bonte and Becker 2009; Kolev et al. 2001). For example,when individuals categorize stimuli based on type of vowel orthe voice uttering the vowel, alpha band phase-locking isenhanced (Bonte and Becker 2009). At the same time, en-hanced representations (e.g., phase-locking or spectral powerhere) in auditory memory in response to the familiar musictones can also occur without focused attention. For example,
out-of-tune or out-of-key tones can evoke a response in non-musicians with or without focused attention (Brattico et al.2006; Trainor et al. 2002), suggesting that sound cues arematched to prior representations in auditory memory evenduring passive listening.
The development of phase locked oscillatory activity for higherfrequencies (�25 Hz) followed a different trajectory than for thelower frequencies. First, compared with lower frequencies, phase-locking was much less evident in the higher bands before age10–13, suggesting different underlying mechanisms. Second,phase-locked activity in the higher frequencies only lasted for�100 ms after stimulus onset compared with 300 or 400 ms forlower frequencies. Third, phase-locking was greater for bothpiano and violin tones compared with pure tones, and there was noevidence that piano and violin tones differed. Given that violinand piano tones differ in their onset rise times and in theirextended temporal envelopes, this strongly suggests that thephase-locked oscillatory activity that emerges �25 Hz in the olderchildren is related to spectral complexity and not to tempo-ral sound characteristics. It is unclear from these resultswhether the development of this functional role is morerelated to how the sound’s spectral energy is structured(“harmonic structure”), the broadness of the frequency band-width, the presence of different frequencies in the sound, or all ofthe above. For example, there is evidence that high-frequencyoscillations seen for music sounds are related to the identificationof the “preferred” harmonic structure of the sounds. An animalstudy has shown that bat calls evoke gamma band activity in theauditory cortex that is attenuated when the calls are playedbackward in time (Medvedev and Kanwal 2008). Also, upper-betaand gamma oscillations may have been evoked by the highfrequencies present in the music but not in the pure tones.Although N1 latency is known to decrease with increasing soundfrequency, and also for music compared with pure tones (Shahinet al. 2004; Wunderlich 2001; and herein), the effects of higherfrequencies on the phase-locking level for the upper-beta andgamma band oscillations remains to be tested in further studies. Arobust evoked gamma band response is known to occur for1,000-Hz pure tones (Pantev et al. 1991; cf. with our 130- and220-Hz pure tones).
A remaining challenge is to explain the neural mechanismsthat underlie these developmental changes in electrophysiol-ogy. Auditory maturation encompasses several neurodevelop-mental processes that start prenatally and continue throughvarious periods postnatally (Marsh et al. 2008). These pro-cesses are apoptosis (programmed cell death), synaptogenesis(the formation of new synapses), cortical myelination, andsynaptic pruning. The onset and end of these processes variesbetween brain regions. Generally, apoptosis ends at about thesame age as the youngest group of this study (4–5 yr), so it isunlikely that it contributes substantially to the developmentalchanges in phase locked oscillatory activity seen in theseresults. In contrast, synaptogenesis terminates around puberty,whereas myelination continues through adolescence (Marsh etal. 2008). Toward the end of synaptogenesis, a period ofsynaptic pruning begins and extends through adolescence(Bourgeois and Rakic 1993; Zecevic and Rakic 1991). Synap-tic pruning is a process that can increase neural efficiency byeradicating “noisy” synapses that contribute to temporal jitterand synapses that are not useful.
226 SHAHIN ET AL.
J Neurophysiol • VOL 103 • JANUARY 2010 • www.jn.org
on May 21, 2010
jn.physiology.orgD
ownloaded from
The developmental trajectories seen here show the greatestincrease in phase-locking of oscillatory activity around 10–13yr of age for frequencies �25 Hz. This parallels the maturationof synaptic connections in the superficial layers of auditorycortex, which starts around age 5 and concludes at �12 yr ofage (Moore and Guan 2001; Moore and Linthicum 2007). Thisage span also corresponds with improvement in languageabilities and may indicate sensitive periods for language de-velopment (Moore and Guan 2001; Moore and Linthicum2007; Ponton et al. 2000). Effects of musical training on AEPcomponents are also greatly reduced when the training beginsafter �10–12 yr of age (Pantev et al. 1998; Trainor 2005),implying that there might also be a similar sensitive period formusical development (Trainor 2005). Enhanced phase-lockingfor the lower frequency (�25 Hz) bands in music comparedwith pure tones was accompanied by spectral power enhance-ment in older age groups (Fig. 4). Thus maturational changesin these frequency bands may also reflect functional tuning ofa neural population to familiar sound characteristics (Okamotoet al. 2007) or even structural changes leading to an enhancednumber of synapses across neural circuits (Hyde et al. 2009).Upper-beta and gamma band oscillations were less evidentbefore age 10–13 yr (Figs. 2A and 3A), suggesting that themechanisms underlying this activity are largely dependent onmaturation of the superficial auditory layers.
Previous studies of AEP development suggest that the decreasein AEP latency with age is largely a result of enhanced myelina-tion (Picton and Taylor 2007; Poulsen et al. 2007). The same maybe true of the theta and alpha bands latency shifts seen in thepresent paper (Fig. 2), because activity at these frequencies maycontribute to AEP responses. It should be noted that the latencyshifts seen in the current AEPs, mainly the P1 and N1, persistedbeyond age 18 yr. This is in contrast to the findings of Ponton etal. (2000), which show leveling off of the latency decrease aroundage 18. However, our results are in accordance with recentevidence for P1 and N1 latency shifts persisting well into middleage (Poulsen et al. 2007) and with evidence for continued myeli-nation and increased white matter density beyond the fourthdecade of life (Benes 1998; Good et al. 2001).
Whereas myelination may be responsible for decreases inlatencies of P1 and N1 with age, changes in response amplitude orthe strength of phase-locking may be more related to synaptogen-esis and synaptic pruning. In this study, the N1 amplitude wasmuch smaller in young children compared with those 10 yr andolder, including adults. In young children, the AEP complexconsisted mainly of the P1 and P2 components. A previous study(Moore and Guan 2001), summarized in Eggermont (2008),showed that layer II and III axons in the auditory cortex, whichgenerate negative scalp polarities as for the N1, were immature in5 yr olds but had matured by age 12. The axons in deeper corticallayers responsible for generating positive deflections, as in P1,were mature by age 5. Thus axonal maturation in superficial layersmay explain the P1/N1 amplitude trade-off with age. The sameprocess may contribute to enhanced phase-locking that occurredwith age in all of the frequency bands studied here, reflectingfactors such as (but not limited to) the number of synapsesactivated, spatial summation of synaptic activity, temporal syn-chronization of synapses, and how the activated neurons arealigned (Picton and Taylor 2007). Assuming that synaptic pruningremoves asynchronous or inefficient synapses (Bourgeois andRakic 1993; Zecevic and Rakic 1991), pruned neural networks
should fire more synchronously and show both increased AEPamplitude and increased phase-locking power (especially inhigher frequencies) in response to music tones. Enhancement of theN1/P2 and phase-locking for all frequency bands seen for piano andviolin tones between 8–9 and 10–13 yr may be correlates of asensitive period for this maturational neuronal efficiency.
Because AEPs can be reflected in the slow oscillatory activity,the abrupt enhancement of N1 and P2 between age 8–9 and10–13 yr may be partly attributed to the abrupt phase-lockingenhancement for the low-frequency oscillatory bands seen for thisage span. It is also noteworthy that the maturational trend of thelower-to-mid beta follows a similar trajectory as for the N1 and P2amplitudes, in which activities peak around age 10–13 yr of ageand diminish afterward. This raises the possibility that what weinterpret as phase-locking for this frequency band may reflectlower temporal jitter of the N1/P2 peaks across trials. This trendwas not clear for the other frequency bands.
Although we may attribute the development of AEPs andoscillatory activity to anatomical and functional changes in spe-cific generators along the auditory thalamo-cortical pathway (Pon-ton et al. 2000), maturation of oscillatory dynamics may alsoreflect the evolution of how auditory networks communicate.Communication between assemblies is essential to binding ofsensory information. A role in communication for upper-beta andgamma activity is favored by our finding that spectral power in theupper-beta/gamma range is not enhanced with age (Fig. 4), al-though phase-locking is (Fig. 3). Beta may be distinguished fromgamma by its role in facilitating long-range synchrony betweenneocortical regions as opposed to gamma activity, which reflectssynchrony between local assemblies (Kopell et al. 2000; Roelf-sema et al. 1997). Long-range synchrony is especially essentialduring multimodal integration. Kopell et al. (2000) noted that betaoscillations have more tolerance for large conduction delays (�10ms) than gamma band oscillations and hence may reflect im-proved synchronization between distant assemblies. Furthermore,changes in the oscillatory activity may also reflect the maturationof a hierarchical oscillatory system, in which lower frequencyphase activity modulates higher frequency amplitudes to controlneural excitability during stimulus processing (Lakatos et al.2005). It has been shown that alpha and theta phase can enhancepostsynaptic efficiency by controlling the co-occurrence of high-frequency (e.g., gamma band) spikes, thereby minimizing high-frequency adaptation (Canolty et al. 2006; Fries et al. 2001).
In summary, these findings offer strong evidence formaturational changes evoked by music sounds and suggestthat developmental trajectories are influenced by the spec-tral and temporal profile and/or familiarity of sounds. Fur-ther studies using stimuli targeted at specific hypothesesraised by these findings should be conducted to assess theinfluence of sound parameters on the development of oscil-latory brain activity.
G R A N T S
This research was supported by grants from the Canadian Institutes ofHealth Research, the Natural Sciences, Engineering Research Council ofCanada to L. J. Trainor and L. E. Roberts, and National Institute on Deafnessand Other Communication Disorders Grant R01-DC-08171 to L. M. Miller.This research was also supported by a new investigator award from theDepartment of Otolaryngology-Head and Neck Surgery of The Ohio StateUniversity College of Medicine.
227DEVELOPMENT OF AUDITORY RESPONSE TO MUSIC
J Neurophysiol • VOL 103 • JANUARY 2010 • www.jn.org
on May 21, 2010
jn.physiology.orgD
ownloaded from

R E F E R E N C E S
Ahissar E, Nagarajan S, Ahissar M, Protopapas A, Mahncke H, Mer-zenich MM. Speech comprehension is correlated with temporal responsepatterns recorded from auditory cortex. Proc Natl Acad Sci USA 98:13367–13372, 2001.
Bell MA. The ontogeny of the EEG during infancy and childhood: implica-tions for cognitive development In: Neuroimaging in Child Neuropsychiat-ric Disorders, edited by Garreau B. Berlin: Springer-Verlag, 1998, p.97–111.
Benes FM. Brain development, VII. Human brain growth spans decades. Am JPsychiatry 155: 1489, 1998.
Bhattacharya J, Petsche H, Pereda E. Long-range synchrony in the gammaband: role in music perception. J Neurosci 21: 6329–6337, 2001.
Bonte E, Becker PB. Preparation of chromatin assembly extracts frompreblastoderm Drosophila embryos. Methods Mol Biol 523: 1–10, 2009.
Bourgeois JP, Rakic P. Changes of synaptic density in the primary visualcortex of the macaque monkey from fetal to adult stage. J Neurosci 13:2801–2820, 1993.
Brattico E, Tervaniemi M, Naatanen R, Peretz I. Musical scale propertiesare automatically processed in the human auditory cortex. Brain Res 1117:162–174, 2006.
Bresnahan SM, Anderson JW, Barry RJ. Age-related changes in quantita-tive EEG in attention-deficit/hyperactivity disorder. Biol Psychiatry 46:1690–1697, 1999.
Canolty RT, Edwards E, Dalal SS, Soltani M, Nagarajan SS, Kirsch HE,Berger MS, Barbaro NM, Knight RT. High gamma power is phase-lockedto theta oscillations in human neocortex. Science 313: 1626–1628, 2006.
Chang EF, Merzenich MM. Environmental noise retards auditory corticaldevelopment. Science 300: 498–502, 2003.
Chau W, McIntosh AR, Robinson SE, Schulz M, Pantev C. Improvingpermutation test power for group analysis of spatially filtered MEG data.Neuroimage 23: 983–996, 2004.
Clarke AR, Barry RJ, McCarthy R, Selikowitz M. Age and sex effects inthe EEG: development of the normal child. Clin Neurophysiol 112: 806–814, 2001.
Deiber MP, Missonnier P, Bertrand O, Gold G, Fazio-Costa L, Ibanez V,Giannakopoulos P. Distinction between perceptual and attentional process-ing in working memory tasks: a study of phase-locked and induced oscil-latory brain dynamics. J Cogn Neurosci 19: 158–172, 2007.
Delorme A, Makeig S. EEGLAB: an open source toolbox for analysis ofsingle-trial EEG dynamics including independent component analysis.J Neurosci Methods 134: 9–21, 2004.
Dykman RA, Holcomb PJ, Oglesby DM, Ackerman PT. Electrocorticalfrequencies in hyperactive, learning-disabled, mixed, and normal children.Biol Psychiatry 17: 675–685, 1982.
Eggermont JJ. The role of sound in adult and developmental auditory corticalplasticity. Ear Hearing 29: 819–829, 2008.
Fein G, Galin D, Yingling CD, Johnstone J, Davenport L, Herron J. EEGspectra in dyslexic and control boys during resting conditions. Electroen-cephalogr Clin Neurophysiol 63: 87–97, 1986.
Fisher NI. Statistical Analysis of Circular Data. Cambridge, UK: CambridgeUniversity Press, 1993.
Fries P, Reynolds JH, Rorie AE, Desimone R. Modulation of oscillatoryneuronal synchronization by selective visual attention. Science 291: 1560–1563, 2001.
Fujioka T, Ross B, Kakigi R, Pantev C, Trainor LJ. One year of musicaltraining affects development of auditory cortical-evoked fields in youngchildren. Brain 129: 2593–2608, 2006.
Gao L, Meng X, Ye C, Zhang H, Liu C, Dan Y, Poo MM, He J, Zhang X.Entrainment of slow oscillations of auditory thalamic neurons by repetitivesound stimuli. J Neurosci 29: 6013–6021, 2009.
Good CD, Johnsrude IS, Ashburner J, Henson RN, Friston KJ, Frack-owiak RS. A voxel-based morphometric study of ageing in 465 normal adulthuman brains. Neuroimage 14: 21–36, 2001.
Good P. Permutation Tests: A Practical Guide to Resampling Methods forTesting Hypotheses. New York: Springer-Verlag, 2000.
He C, Hotson L, Trainor LJ. Development of infant mismatch responses toauditory pattern changes between 2 and 4 months old. Eur J Neurosci 29:861–867, 2009a.
He C, Hotson L, Trainor LJ. Maturation of cortical mismatch responses tooccasional pitch change in early infancy: effects of presentation rate andmagnitude of change. Neuropsychologia 47: 218–229, 2009b.
Herrmann CS, Munk MH, Engel AK. Cognitive functions of gamma-bandactivity: memory match and utilization. Trends Cogn Sci 8: 347–355, 2004.
Hyde KL, Lerch J, Norton A, Forgeard M, Winner E, Evans AC, SchlaugG. Musical training shapes structural brain development. J Neurosci 29:3019–3025, 2009.
Kolev V, Yordanova J, Schurmann M, Basar E. Increased frontal phase-locking of event-related alpha oscillations during task processing. Int J Psy-chophysiol 39: 159–165, 2001.
Kopell N, Ermentrout GB, Whittington MA, Traub RD. Gamma rhythmsand beta rhythms have different synchronization properties. Proc Natl AcadSci USA 97: 1867–1872, 2000.
Lakatos P, Shah AS, Knuth KH, Ulbert I, Karmos G, Schroeder CE. Anoscillatory hierarchy controlling neuronal excitability and stimulus process-ing in the auditory cortex. J Neurophysiol 94: 1904–1911, 2005.
Lenz D, Schadow J, Thaerig S, Busch NA, Herrmann CS. What’s thatsound? Matches with auditory long-term memory induce gamma activity inhuman EEG. Int J Psychophysiol 64: 31–38, 2007.
Lubar JF, Mann CA, Gross DM, Shively MS. Differences in semanticevent-related potentials in learning-disabled, normal, and gifted children.Biofeedback Self Regul 17: 41–57, 1992.
Luo H, Poeppel D. Phase patterns of neuronal responses reliably discriminatespeech in human auditory cortex. Neuron 54: 1001–1010, 2007.
Marosi E, Harmony T, Becker J. Brainstem evoked potentials in learningdisabled children. Int J Neurosci 50: 233–242, 1990.
Marsh R, Gerber AJ, Peterson BS. Neuroimaging studies of normal braindevelopment and their relevance for understanding childhood neuropsychi-atric disorders. J Am Acad Child Adolesc Psychiatry 47: 1233–1251, 2008.
Marshall PJ, Bar-Haim Y, Fox NA. Development of the EEG from 5 monthsto 4 years of age. Clin Neurophysiol 113: 1199–1208, 2002.
Medvedev AV, Kanwal JS. Communication call-evoked gamma-band activ-ity in the auditory cortex of awake bats is modified by complex acousticfeatures. Brain Res 1188: 76–86, 2008.
Moore JK, Guan YL. Cytoarchitectural and axonal maturation in humanauditory cortex. J Assoc Res Otolaryngol 2: 297–311, 2001.
Moore JK, Linthicum FH Jr. The human auditory system: a timeline ofdevelopment. Int J Audiol 46: 460–478, 2007.
Moreno S, Marques C, Santos A, Santos M, Castro SL, Besson M. Musicaltraining influences linguistic abilities in 8-year-old children: more evidencefor brain plasticity. Cereb Cortex 19: 712–723, 2009.
Okamoto H, Stracke H, Wolters CH, Schmael F, Pantev C. Attentionimproves population-level frequency tuning in human auditory cortex.J Neurosci 27: 10383–10390, 2007.
Pang EW, Taylor MJ. Tracking the development of the N1 from age 3 toadulthood: an examination of speech and non-speech stimuli. Clin Neuro-physiol 111: 388–397, 2000.
Pantev C, Makeig S, Hoke M, Galambos R, Hampson S, Gallen C. Humanauditory evoked gamma-band magnetic fields. Proc Natl Acad Sci 88:8996–9000, 1991.
Pantev C, Oostenveld R, Engelien A, Ross B, Roberts LE, Hoke M.Increased auditory cortical representation in musicians. Nature 392: 811–814, 1998.
Picton TW, Taylor MJ. Electrophysiological evaluation of human braindevelopment. Dev Neuropsychol 31: 249–278, 2007.
Polley DB, Steinberg EE, Merzenich MM. Perceptual learning directsauditory cortical map reorganization through top-down influences. J Neu-rosci 26: 4970–4982, 2006.
Ponton CW, Don M, Eggermont JJ, Waring MD, Masuda A. Maturation ofhuman cortical auditory function: differences between normal-hearing chil-dren and children with cochlear implants. Ear Hearing 17: 430–437, 1996.
Ponton CW, Eggermont JJ, Kwong B, Don M. Maturation of human centralauditory system activity: evidence from multi-channel evoked potentials.Clin Neurophysiol 111: 220–236, 2000.
Poulsen C, Picton TW, Paus T. Age-related changes in transient andoscillatory brain responses to auditory stimulation in healthy adults 19–45years old. Cereb Cortex 17: 1454–1467, 2007.
Roelfsema PR, Engel AK, Konig P, Singer W. Visuomotor integration isassociated with zero time-lag synchronization among cortical areas. Nature385: 157–161, 1997.
Shahin A, Bosnyak DJ, Trainor LJ, Roberts LE. Enhancement of neuro-plastic P2 and N1c auditory evoked potentials in musicians. J Neurosci 23:5545–5552, 2003.
Shahin A, Roberts LE, Trainor LJ. Enhancement of auditory corticaldevelopment by musical experience in children. Neuroreport 15: 1917–1921, 2004.
228 SHAHIN ET AL.
J Neurophysiol • VOL 103 • JANUARY 2010 • www.jn.org
on May 21, 2010
jn.physiology.orgD
ownloaded from
Shahin AJ, Roberts LE, Chau W, Trainor LJ, Miller LM. Music trainingleads to the development of timbre-specific gamma band activity. Neuro-image 41: 113–122, 2008.
Sharma A, Dorman MF, Spahr AJ. A sensitive period for the developmentof the central auditory system in children with cochlear implants: implica-tions for age of implantation. Ear Hearing 23: 532–539, 2002.
Sharma A, Kraus N, McGee TJ, Nicol TG. Developmental changes in P1and N1 central auditory responses elicited by consonant-vowel syllables.Electroencephalogr Clin Neurophysiol 104: 540–545, 1997.
Snyder JS, Alain C, Picton TW. Effects of attention on neuroelectriccorrelates of auditory stream segregation. J Cogn Neurosci 18: 1–13, 2006.
Taylor MJ, Baldeweg T. Application of EEG, ERP and intracranial record-ings to the investigation of cognitive functions in children. Dev Sci 5:318–334, 2002.
Trainor LJ. Are there critical periods for musical development? Dev Psycho-biol 46: 262–278, 2005.
Trainor LJ, McDonald KL, Alain C. Automatic and controlled processing ofmelodic contour and interval information measured by electrical brainactivity. J Cogn Neurosci 14: 430–442, 2002.
Warrier CM, Johnson KL, Hayes EA, Nicol T, Kraus N. Learning impairedchildren exhibit timing deficits and training-related improvements in audi-tory cortical responses to speech in noise. Exp Brain Res 157: 431–441,2004.
Wunderlich JL, Cone-Wesson BK. Effects of stimulus frequency and com-plexity on the mismatch negativity and other components of the corticalauditory-evoked potential. J Acoust Soc Am 109: 1526–1537, 2001.
Zecevic N, Rakic P. Synaptogenesis in monkey somatosensory cortex. CerebCortex 1: 510–523, 1991.
229DEVELOPMENT OF AUDITORY RESPONSE TO MUSIC
J Neurophysiol • VOL 103 • JANUARY 2010 • www.jn.org
on May 21, 2010
jn.physiology.orgD
ownloaded from