development of a solar-powered unmanned aerial vehicle
TRANSCRIPT
drones
Article
Development of a Solar-Powered Unmanned Aerial Vehicle forExtended Flight Endurance
Yauhei Chu †, Chunleung Ho †, Yoonjo Lee † and Boyang Li *
�����������������
Citation: Chu, Y.; Ho, C.; Lee, Y.; Li,
B. Development of a Solar-Powered
Unmanned Aerial Vehicle for
Extended Flight Endurance. Drones
2021, 5, 44. https://doi.org/
10.3390/drones5020044
Academic Editor:
Abdessattar Abdelkefi
Received: 30 April 2021
Accepted: 21 May 2021
Published: 24 May 2021
Publisher’s Note: MDPI stays neutral
with regard to jurisdictional claims in
published maps and institutional affil-
iations.
Copyright: © 2021 by the authors.
Licensee MDPI, Basel, Switzerland.
This article is an open access article
distributed under the terms and
conditions of the Creative Commons
Attribution (CC BY) license (https://
creativecommons.org/licenses/by/
4.0/).
Department of Aeronautical and Aviation Engineering, The Hong Kong Polytechnic University, Hung Hom,Kowloon, Hong Kong, China; [email protected] (Y.C.); [email protected] (C.H.);[email protected] (Y.L.)* Correspondence: [email protected]; Tel.: +852-340-082-31† Authors have contributed equally.
Abstract: Having an exciting array of applications, the scope of unmanned aerial vehicle (UAV)application could be far wider one if its flight endurance can be prolonged. Solar-powered UAV,promising notable prolongation in flight endurance, is drawing increasing attention in the industries’recent research and development. This work arose from a Bachelor’s degree capstone project at HongKong Polytechnic University. The project aims to modify a 2-metre wingspan remote-controlled (RC)UAV available in the consumer market to be powered by a combination of solar and battery-storedpower. The major objective is to greatly increase the flight endurance of the UAV by the powergenerated from the solar panels. The power system is first designed by selecting the suitable systemarchitecture and then by selecting suitable components related to solar power. The flight controlsystem is configured to conduct flight tests and validate the power system performance. Under fairexperimental conditions with desirable weather conditions, the solar power system on the aircraftresults in 22.5% savings in the use of battery-stored capacity. The decrease rate of battery voltageduring the stable level flight of the solar-powered UAV built is also much slower than the sameconfiguration without a solar-power system.
Keywords: solar-powered; UAV; endurance extension; flight experiments
1. Introduction
With widening the application scope of unmanned aerial vehicle (UAV) as the drivingforce, the development of solar-powered UAV recently has attracted more attention inacademia and commercial industries. A critical factor limiting the scope of applicationof conventional battery-powered electric UAVs is their energy storage capability. Theconventional UAV is powered by the energy stored in batteries on board to maintain thepropulsion and functioning of flight control electronics. The amount of carried electricpower limits its flight range before takeoff. Although increasing the size of the batteryor installing more batteries can increase the energy storage capacity, the weight of theaircraft also increases. In turn, more power is consumed to carry the extra weight, resultingin the flight range being not necessarily prolonged. A possible approach to overcomethis physical limit is the use of solar power as an energy source on UAV. Solar-poweredUAV, using solar cells installed onboard, captures solar energy reaching the aircraft surfaceduring daylight. Such generated power is supplied to the motor to propel the aircraft andother electronics or to recharge the battery on board. The battery supplies power when indarkness or under clouds.
This project is aimed at the development of a small fixed-wing hand-launched solar-powered UAV. A remote-controlled (RC) model glider for leisure purpose available onthe consumer market, a 759-2 Phoenix 2000 RC plane, is modified to be powered by ahybrid of solar power and battery-stored power. This project suggested key points forthe modification of an existing conventional RC plane to be solar-powered. The most
Drones 2021, 5, 44. https://doi.org/10.3390/drones5020044 https://www.mdpi.com/journal/drones
Drones 2021, 5, 44 2 of 19
significant advantage of modifying an existing plane over building a new one is the savingon development time and cost on the airframe, making solar-powered UAV available tomore users with a more straightforward design and building process. Numerous adaptivedesigns are required for such modification, for instance, modifying the power systemarchitecture to include solar cells.
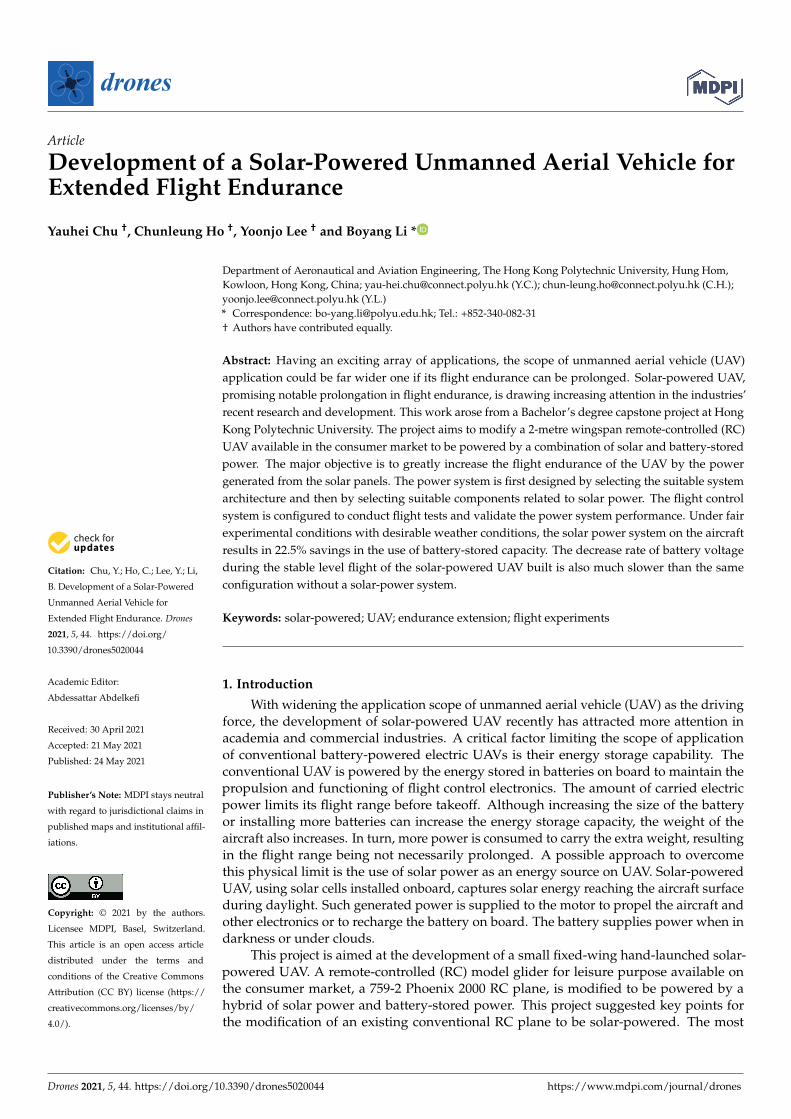
The primary objective of this work is to increase the flight duration of the UAV. Flighttests are conducted to compare the power system performance of the RC plane betweenthe manufacturer’s default version and the solar-power modified version. Objectives arealso set for the flight control system. Flight tests for determining the flight range wouldlast for an extended period. To ensure a fair comparison, the flight control system shallbe capable of flying the aircraft autonomously without human intervention. The finishedsolar-powered UAV is shown in Figure 1.
Drones 2021, 5, 44 2 of 19
modification of an existing conventional RC plane to be solar-powered. The most signifi-cant advantage of modifying an existing plane over building a new one is the saving on development time and cost on the airframe, making solar-powered UAV available to more users with a more straightforward design and building process. Numerous adaptive de-signs are required for such modification, for instance, modifying the power system archi-tecture to include solar cells.
The primary objective of this work is to increase the flight duration of the UAV. Flight tests are conducted to compare the power system performance of the RC plane between the manufacturer’s default version and the solar-power modified version. Objectives are also set for the flight control system. Flight tests for determining the flight range would last for an extended period. To ensure a fair comparison, the flight control system shall be capable of flying the aircraft autonomously without human intervention. The finished so-lar-powered UAV is shown in Figure 1.
Figure 1. The solar-powered UAV built in this project named ‘Sun’.
2. Literature Review 2.1. Examples of Solar-Powered UAV Project
The first reviewed solar-powered UAV project is AtlantikSolar, which was con-ducted by Oettershagen et al. [1] of the Autonomous Systems Lab, Swiss Federal Institute of Technology Zurich. Having completed an 81-hour continuous flight that covered a dis-tance of 2,338 km, the UAV established a new world record. It has a conventional glider configuration, having a wingspan of 5.69 m and a total mass of 6.93 kg. A new methodol-ogy was developed as a result of the project for the design of solar-powered UAVs for energetically robust perpetual flight in sub-optimal meteorological conditions. The project started with energetic system modelling to consider the variations in operating conditions and local meteorological conditions. The airframe and energy generation and storage sys-tem was designed according to the parameters obtained from the energetic system mod-elling. Power system components, such as the Maximum Power Point Trackers (MPPT) and a battery management system, were custom-made and are capable of regulating the energy flow and providing detailed energy flow information. The flight control system was designed with state-space models. With the design of aircraft systems completed, the design of the whole UAV was preliminarily verified with lab tests and short flight tests.
The second solar-powered UAV project reviewed is that conducted by Morton et al. [2] at The Centre for Distributed Robotics, University of Minnesota. A 4-metre wingspan solar UAV for the objective of low altitude aerial sensing applications was developed. The power required for level flight of that UAV was estimated to be below 46 W. It was capable of a maximum of 180 W solar power generation. The captured solar power is over 300% of the power required for level flight. The airframe design aimed at satisfying the appli-cation of low altitude aerial sensing. Then, power required for level flight was derived from the aerodynamic characteristics of the airframe. After that, the power system was
Figure 1. The solar-powered UAV built in this project named ‘Sun’.
2. Literature Review
2.1. Examples of Solar-Powered UAV Project
The first reviewed solar-powered UAV project is AtlantikSolar, which was conductedby Oettershagen et al. [1] of the Autonomous Systems Lab, Swiss Federal Institute ofTechnology Zurich. Having completed an 81-hour continuous flight that covered a distanceof 2338 km, the UAV established a new world record. It has a conventional glider configu-ration, having a wingspan of 5.69 m and a total mass of 6.93 kg. A new methodology wasdeveloped as a result of the project for the design of solar-powered UAVs for energeticallyrobust perpetual flight in sub-optimal meteorological conditions. The project started withenergetic system modelling to consider the variations in operating conditions and localmeteorological conditions. The airframe and energy generation and storage system was de-signed according to the parameters obtained from the energetic system modelling. Powersystem components, such as the Maximum Power Point Trackers (MPPT) and a batterymanagement system, were custom-made and are capable of regulating the energy flow andproviding detailed energy flow information. The flight control system was designed withstate-space models. With the design of aircraft systems completed, the design of the wholeUAV was preliminarily verified with lab tests and short flight tests.
The second solar-powered UAV project reviewed is that conducted by Morton et al. [2]at The Centre for Distributed Robotics, University of Minnesota. A 4-metre wingspansolar UAV for the objective of low altitude aerial sensing applications was developed.The power required for level flight of that UAV was estimated to be below 46 W. It wascapable of a maximum of 180 W solar power generation. The captured solar power is over300% of the power required for level flight. The airframe design aimed at satisfying theapplication of low altitude aerial sensing. Then, power required for level flight was derivedfrom the aerodynamic characteristics of the airframe. After that, the power system wasdesigned. Some power system electronics, such as the MPPT, were custom-built to satisfyproject-specific requirements. The solar power system consists of 64 SunPower C60 solar
Drones 2021, 5, 44 3 of 19
cells and a custom-built MPPT with an average efficiency of 91.59%. For the flight controlsystem, it was designed according to the mission requirements. After the design of aircraftsystems, the weight distribution of the plane was determined.
2.2. Power System Components
The primary objective of integrating a solar power system into a UAV is to increasethe range by providing an extra power source during flight. In addition to the powersystem components in conventional UAV, extra components are required. The reviewarticle about power devices for solar-powered aircraft applications by Safyanu et al. [3]is mainly referred to in understanding and determining the components needed for thesolar power system. It is also shown in reputable solar-powered UAV projects [1,2,4] thatphotovoltaic (PV) cells and Maximum Power Point Tracker (MPPT) are required for thesolar power system. The PV cells collect solar energy and convert it into electric energy; theMPPT tracks the maximum power point of the PV cells and extracts the maximum powerfrom the PV cells.
2.3. Photovoltaic (PV) Cells
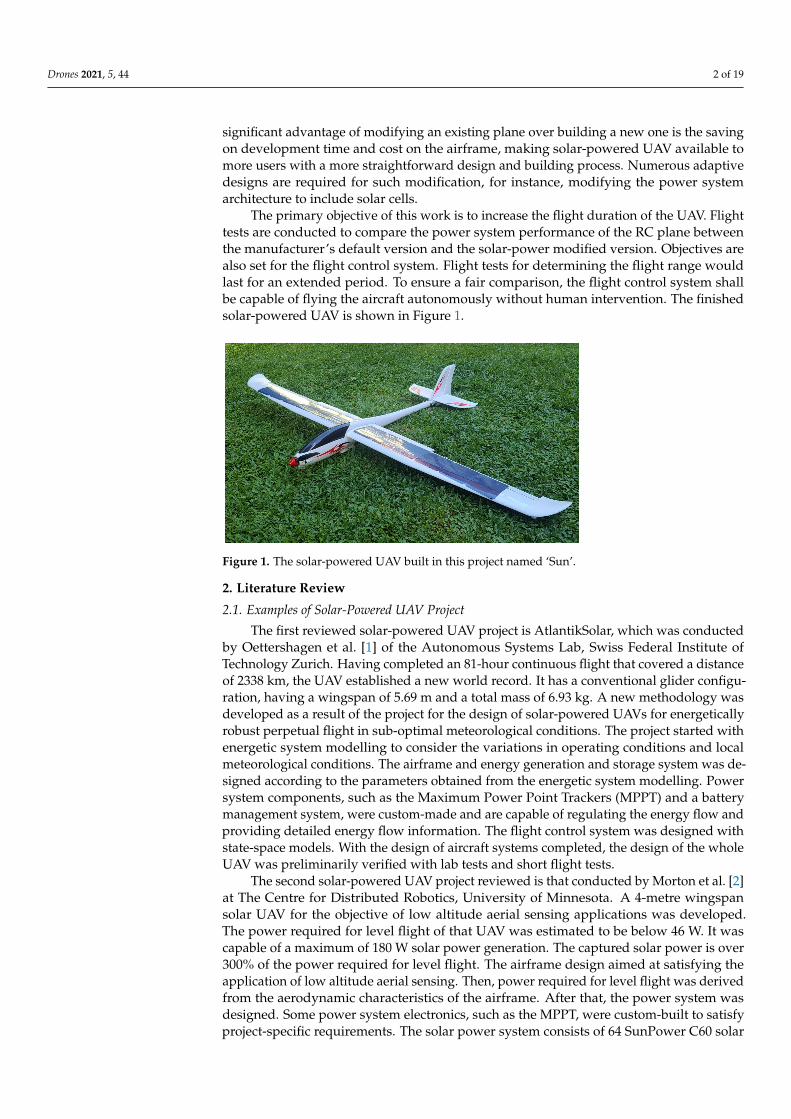
Voltage and current are produced by the PV cell when the light hits its surface. Therelationship between insolation—the amount of energy from the sun that reaches theEarth—and the amount of produced voltage and current of a PV cell is represented by anI-V curve (Current–Voltage Curve). I-V curves vary among different kinds and models ofPV cells but are mainly similar [5]. An I-V curve represents the voltage–current relationshipat particular insolation, and multiple I-V curves are included in a diagram to illustrate theperformance of a PV cell at different insolation, as shown in Figure 2.
Drones 2021, 5, 44 3 of 19
designed. Some power system electronics, such as the MPPT, were custom-built to satisfy project-specific requirements. The solar power system consists of 64 SunPower C60 solar cells and a custom-built MPPT with an average efficiency of 91.59%. For the flight control system, it was designed according to the mission requirements. After the design of aircraft systems, the weight distribution of the plane was determined.
2.2. Power System Components The primary objective of integrating a solar power system into a UAV is to increase
the range by providing an extra power source during flight. In addition to the power sys-tem components in conventional UAV, extra components are required. The review article about power devices for solar-powered aircraft applications by Safyanu et al. [3] is mainly referred to in understanding and determining the components needed for the solar power system. It is also shown in reputable solar-powered UAV projects [1,2,4] that photovoltaic (PV) cells and Maximum Power Point Tracker (MPPT) are required for the solar power system. The PV cells collect solar energy and convert it into electric energy; the MPPT tracks the maximum power point of the PV cells and extracts the maximum power from the PV cells.
2.3. Photovoltaic (PV) Cells Voltage and current are produced by the PV cell when the light hits its surface. The
relationship between insolation—the amount of energy from the sun that reaches the Earth—and the amount of produced voltage and current of a PV cell is represented by an I-V curve (Current–Voltage Curve). I-V curves vary among different kinds and models of PV cells but are mainly similar [5]. An I-V curve represents the voltage–current relation-ship at particular insolation, and multiple I-V curves are included in a diagram to illus-trate the performance of a PV cell at different insolation, as shown in Figure 2.
Figure 2. I-V curve of a typical PV cell.
Solar Cell Efficiency Tables (Version 54) created by Green et al. [6] are referenced during this project’s solar cell model selection process. The Efficiency Tables list the cur-rent PV cell models of the highest confirmed energy conversion efficiency in their respec-tive classifications. Common types of PV cells, such as silicon crystalline cells, silicon thin-film cells, gallium arsenide (GaAs) cells, and copper indium gallium selenide (CIGS) cells [7], are included in the Efficiency Tables. The highest achievable efficiency of each cate-gory of PV cell can be compared. The selection of PV cell model for this project will be discussed in detail in the following section. When multiple PV cells are connected in se-ries, they form a PV array (or solar array). The nominal total voltage of the PV array is defined by the nominal voltage per cell and the number of cells. Usually, the same model of PV cell is installed in an array, so that: PV array nominal total voltage = the nominal voltage per cell × number of cells [2].
Figure 2. I-V curve of a typical PV cell.
Solar Cell Efficiency Tables (Version 54) created by Green et al. [6] are referencedduring this project’s solar cell model selection process. The Efficiency Tables list the currentPV cell models of the highest confirmed energy conversion efficiency in their respectiveclassifications. Common types of PV cells, such as silicon crystalline cells, silicon thin-filmcells, gallium arsenide (GaAs) cells, and copper indium gallium selenide (CIGS) cells [7],are included in the Efficiency Tables. The highest achievable efficiency of each category ofPV cell can be compared. The selection of PV cell model for this project will be discussedin detail in the following section. When multiple PV cells are connected in series, theyform a PV array (or solar array). The nominal total voltage of the PV array is defined bythe nominal voltage per cell and the number of cells. Usually, the same model of PV cellis installed in an array, so that: PV array nominal total voltage = the nominal voltage percell × number of cells [2].
2.4. Maximum Power Point Tracker (MPPT)
An MPPT is to extract maximum power from the PV cells. The maximum powerpoints PMPP (PMPP = IMPP × VMPP) on I-V curves are where I = IMPP and V = VMPP. The
Drones 2021, 5, 44 4 of 19
output power of a PV array varies with insolation. As insolation changes from time totime, the MPPT is needed to continuously track the fluctuating PMP on the I-V curves ofthe respective insolation [3].
For UAV applications in which PV arrays are installed on the aircraft at differentangles, each solar array should be connected to its dedicated MPPT. PV arrays at differentangles capture different cross-sections of solar radiation and experience different levels ofinsolation, such that the PV arrays can operate on the optimal point on their respective I-Vcurve [2].
The primary performance indicator of MPPT is power conversion efficiency, whichreflects the ratio between the input power from PV cells and the output power of the MPPT.There exist many algorithms for MPPT of which the operation principles and performancevary. MPPT methods can be classified into indirect and direct methods or intelligent andconventional methods. Indirect methods obtain PV characteristics based on mathematicalrelationships, and no meteorological conditions are required; direct methods take meteo-rological conditions into account. Intelligent methods are more complex, expensive, andefficient than conventional methods [8]. Solar-powered UAV projects that are centred insuch areas and have sufficient resources and expertise in electronic engineering involvecustom-made MPPTs for optimised performance [1,2].
2.5. Power Management for Solar-Powered UAV
Research is conducted for the design of the power system of the solar-powered planeof this project. A battery, PV cells, and an MPPT, as the foregoing describes, constitute themajor components of the power system. The motor is the main consumer of power inflight,while the battery and PV cells are the power sources. It is investigated how components inthe power system should be arranged and connected to supply a combination of electricpower from that stored in the battery and that generated by the PV cells in-flight.
The research on power management for hybrid power UAV by Strele [9] is reviewed.The two categories of power management for hybrid power UAV are Passive Power Man-agement (PPM) and Active Power Management (APM). In PPM systems, the alternativepower source and the battery are directly connected in parallel. The voltage of both powersources should be roughly the same. The combined power is transmitted to the ESC, thusenabling the motor to propel the aircraft. The advantage of the PPM system is that it isweight saving, as no extra electronic components are needed to control the power flow.The demerits include compromising power system safety and efficiency, since the powerflow in the system is not controlled.
For APM systems, supervisory electronic components are employed to control powerflow. The complexity of APM systems greatly varies. In an example of a simple APM systemdesign, a relay is used to control which source (fuel cell or battery) delivers power to themotor. The switching between power sources is controlled manually by the remote operatorengaging the battery and disengaging the fuel cell during high power consumption flightphases (takeoff and initial climb), disengaging the battery and engaging the fuel cell duringlow power consumption flight phases (cruising). However, it is doubted that if this powersystem architecture can be applied to a solar-powered UAV. It requires further testing onwhether the MPPT can directly supply power to the ESC without a battery connected inthe circuit [9].
In more complex APM system designs, a microprocessor controls multiple DC-to-DCconverters that are connected to the power sources. The more electronics employed in anAPM system, the more precise the power flow can be controlled, meanwhile and the moreweight, cost, and power consumption are induced to the aircraft [9].
2.6. Unmanned Aerial System
A UAV consists of the airframe, sensors, payload, ground control station, and wire-less communication system [10]. The implementation of autopilot with support fromthe ground control station allows the aircraft to be flown autonomously or be controlled
Drones 2021, 5, 44 5 of 19
remotely. A UAV system is composed of several sub-systems in a single aircraft. Experimen-tal results show correlation between charging voltage and capacity, yet some sub-systemsare optional depending on the type of the UAV [11]. However, these sub-systems can becategorised into three main features: unmanned aircraft, communication, and GroundControl Station [12].
To receive the signal and to apply the autonomous features for the flight, an autopilotis necessary to implement on a UAV. During the flight computer selection, a UAV mustfulfil the following criteria in relation to the targeted mission: small dimensions andweight, low price, waypoint following capabilities, auto takeoff and landing capabilities,and configurable. Open-source autopilots are preferred over sophisticated commercialautopilots, as the difference in price is enormous. Figueredo [11] has shown the work ofcomparing the autopilot solutions in the market by categorising the evaluation points ofphysical specifications, sensors, and autopilot function.
Sensors provide the functionality to maintain the flight without human input. Theselection of sensors may depend on the mission required by the UAV. The greater thenumber of sensors, the greater the possibility that the UAV could gain stable control. Yet,it could increase the burden of setting up the components on the airframe and coveringthe excessive loads. The suggested sensors from André et al. [13] are a GPS receiver,gyro, acceleration, magnetic, pressure, ultrasonic sensor or sonar, infrared sensor and RGBcamera or another image sensor.
Based on the level of autonomy for flight control, the forms can be divided into threelevels. The level of autonomy may apply in relation to the UAV mission; however, inrecent days, the UAS system generally utilises part or whole autonomous to gain controlfor steady flight. Semi-autonomous is a guidance system having both ground controland autonomous feature for the flight control system. During the critical portions of thepre-flight flight, takeoff, and landing, the control input from the ground are required.
3. Power System Design
3.1. Selection of PV Cell
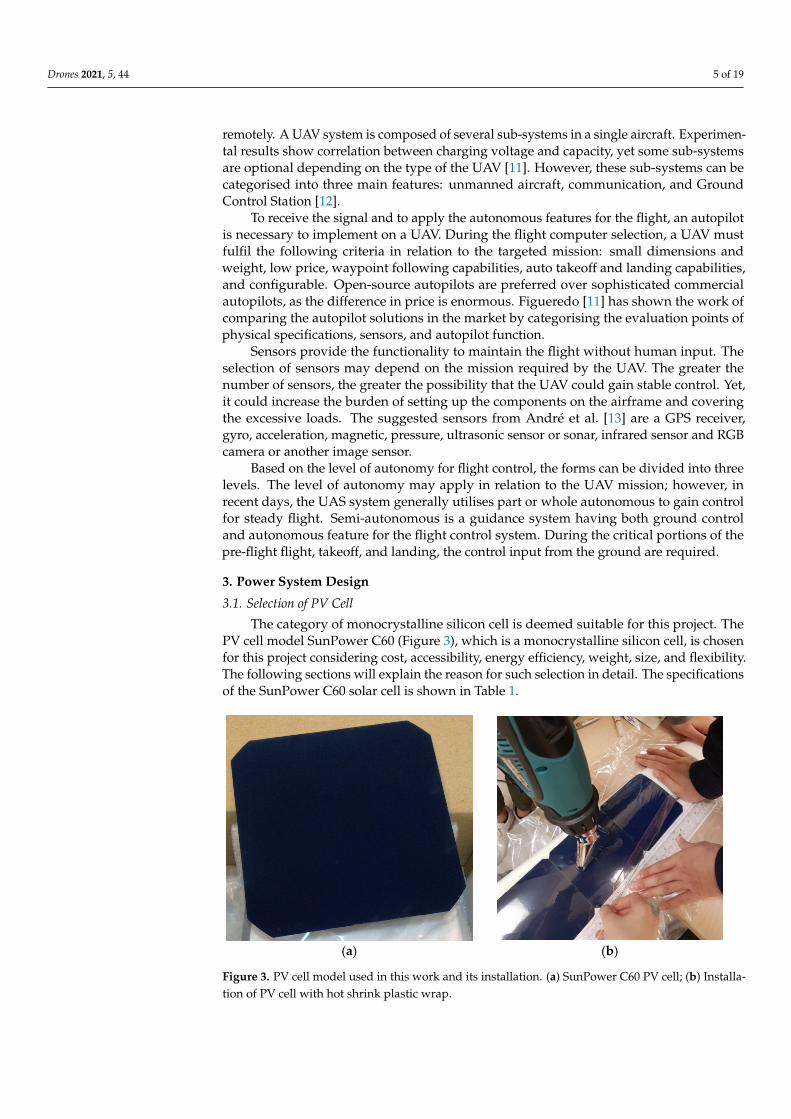
The category of monocrystalline silicon cell is deemed suitable for this project. ThePV cell model SunPower C60 (Figure 3), which is a monocrystalline silicon cell, is chosenfor this project considering cost, accessibility, energy efficiency, weight, size, and flexibility.The following sections will explain the reason for such selection in detail. The specificationsof the SunPower C60 solar cell is shown in Table 1.
Drones 2021, 5, 44 5 of 19
2.6. Unmanned Aerial System A UAV consists of the airframe, sensors, payload, ground control station, and wireless
communication system [10]. The implementation of autopilot with support from the ground control station allows the aircraft to be flown autonomously or be controlled remotely. A UAV system is composed of several sub-systems in a single aircraft. Experimental results show cor-relation between charging voltage and capacity, yet some sub-systems are optional depending on the type of the UAV [11]. However, these sub-systems can be categorised into three main features: unmanned aircraft, communication, and Ground Control Station [12].
To receive the signal and to apply the autonomous features for the flight, an autopilot is necessary to implement on a UAV. During the flight computer selection, a UAV must fulfil the following criteria in relation to the targeted mission: small dimensions and weight, low price, waypoint following capabilities, auto takeoff and landing capabilities, and configurable. Open-source autopilots are preferred over sophisticated commercial autopilots, as the differ-ence in price is enormous. Figueredo [11] has shown the work of comparing the autopilot so-lutions in the market by categorising the evaluation points of physical specifications, sensors, and autopilot function.
Sensors provide the functionality to maintain the flight without human input. The selec-tion of sensors may depend on the mission required by the UAV. The greater the number of sensors, the greater the possibility that the UAV could gain stable control. Yet, it could increase the burden of setting up the components on the airframe and covering the excessive loads. The suggested sensors from André et al. [13] are a GPS receiver, gyro, acceleration, magnetic, pressure, ultrasonic sensor or sonar, infrared sensor and RGB camera or another image sensor.
Based on the level of autonomy for flight control, the forms can be divided into three levels. The level of autonomy may apply in relation to the UAV mission; however, in recent days, the UAS system generally utilises part or whole autonomous to gain control for steady flight. Semi-autonomous is a guidance system having both ground control and autonomous feature for the flight control system. During the critical portions of the pre-flight flight, takeoff, and landing, the control input from the ground are required.
3. Power System Design 3.1. Selection of PV Cell
The category of monocrystalline silicon cell is deemed suitable for this project. The PV cell model SunPower C60 (Figure 3), which is a monocrystalline silicon cell, is chosen for this project considering cost, accessibility, energy efficiency, weight, size, and flexibil-ity. The following sections will explain the reason for such selection in detail. The specifi-cations of the SunPower C60 solar cell is shown in Table 1.
(a) (b)
Figure 3. PV cell model used in this work and its installation. (a) SunPower C60 PV cell; (b) Instal-lation of PV cell with hot shrink plastic wrap.
Figure 3. PV cell model used in this work and its installation. (a) SunPower C60 PV cell; (b) Installa-tion of PV cell with hot shrink plastic wrap.
Drones 2021, 5, 44 6 of 19
Table 1. Specifications of SunPower C60 solar cell (extracted from manufacturer datasheet).
Parameter Value
Mass 0.008 kgSize 0.125 × 0.125 m
Thickness 1.65 × 10⁻⁴ m
From the Solar Cell Efficiency Tables (Version 54) created by Green et al. [6], thesilicon crystalline cell manufactured by Kaneka has an efficiency of 26.7 ± 0.5%, whichis the second highest. The monocrystalline silicon cell is a mature technology that has atheoretical efficiency of 29% [14]. It is also easily accessible from the consumer marketat an affordable cost to this project. Silicon cells are selected widely as the PV cells forsolar-powered aircraft [15], such that the monocrystalline silicon PV cell is chosen for thisproject. The SunPower C60 solar cell has an efficiency between 21.8% and 22.5%, whichis higher than the typical efficiency of the existing monocrystalline silicon cell of 15% to20% [3].
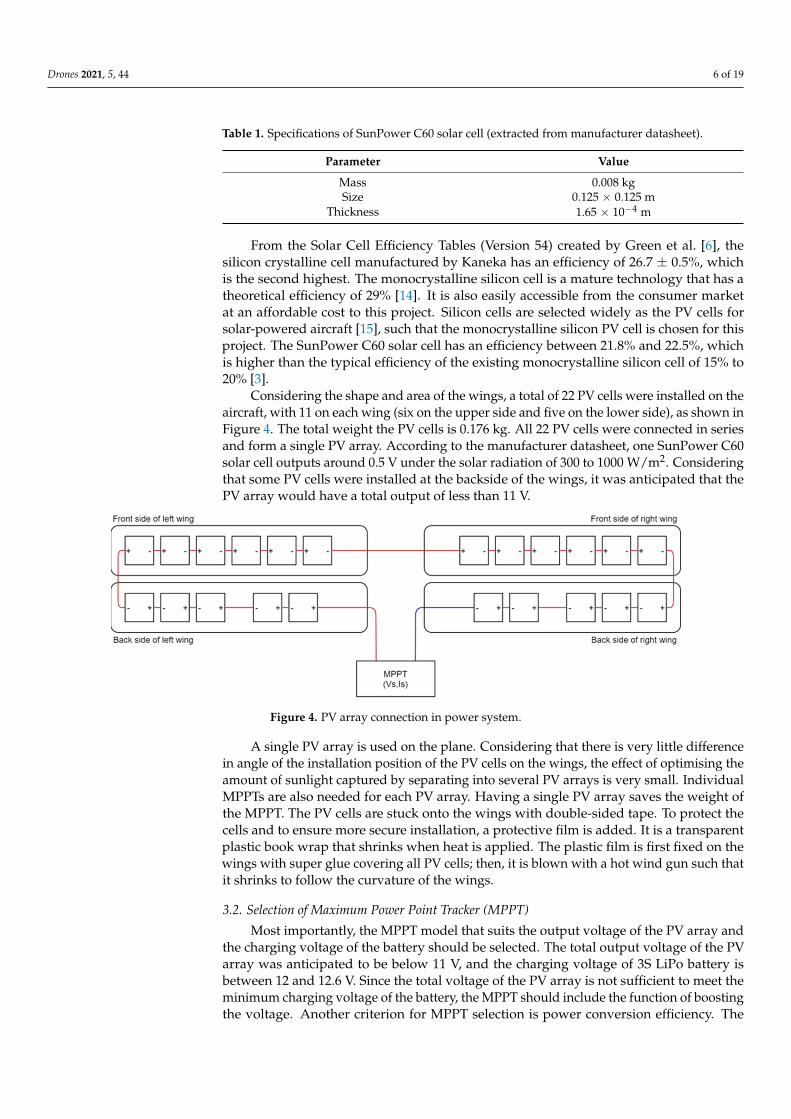
Considering the shape and area of the wings, a total of 22 PV cells were installed on theaircraft, with 11 on each wing (six on the upper side and five on the lower side), as shown inFigure 4. The total weight the PV cells is 0.176 kg. All 22 PV cells were connected in seriesand form a single PV array. According to the manufacturer datasheet, one SunPower C60solar cell outputs around 0.5 V under the solar radiation of 300 to 1000 W/m2. Consideringthat some PV cells were installed at the backside of the wings, it was anticipated that thePV array would have a total output of less than 11 V.
Drones 2021, 5, 44 6 of 19
Table 1. Specifications of SunPower C60 solar cell (extracted from manufacturer datasheet).
Parameter Value Mass 0.008 kg Size 0.125 × 0.125 m
Thickness 1.65 × 10⁻⁴ m
From the Solar Cell Efficiency Tables (Version 54) created by Green et al. [6], the sili-con crystalline cell manufactured by Kaneka has an efficiency of 26.7 ± 0.5%, which is the second highest. The monocrystalline silicon cell is a mature technology that has a theoretical efficiency of 29% [14]. It is also easily accessible from the consumer market at an affordable cost to this project. Silicon cells are selected widely as the PV cells for solar-powered aircraft [15], such that the monocrystalline silicon PV cell is chosen for this project. The SunPower C60 solar cell has an efficiency between 21.8% and 22.5%, which is higher than the typical efficiency of the existing monocrystalline silicon cell of 15% to 20% [3].
Considering the shape and area of the wings, a total of 22 PV cells were installed on the aircraft, with 11 on each wing (six on the upper side and five on the lower side), as shown in Figure 4. The total weight the PV cells is 0.176 kg. All 22 PV cells were connected in series and form a single PV array. According to the manufacturer datasheet, one Sun-Power C60 solar cell outputs around 0.5 V under the solar radiation of 300 to 1000 W/m2. Considering that some PV cells were installed at the backside of the wings, it was antici-pated that the PV array would have a total output of less than 11 V.
A single PV array is used on the plane. Considering that there is very little difference in angle of the installation position of the PV cells on the wings, the effect of optimising the amount of sunlight captured by separating into several PV arrays is very small. Indi-vidual MPPTs are also needed for each PV array. Having a single PV array saves the weight of the MPPT. The PV cells are stuck onto the wings with double-sided tape. To protect the cells and to ensure more secure installation, a protective film is added. It is a transparent plastic book wrap that shrinks when heat is applied. The plastic film is first fixed on the wings with super glue covering all PV cells; then, it is blown with a hot wind gun such that it shrinks to follow the curvature of the wings.
Figure 4. PV array connection in power system.
3.2. Selection of Maximum Power Point Tracker (MPPT) Most importantly, the MPPT model that suits the output voltage of the PV array and
the charging voltage of the battery should be selected. The total output voltage of the PV array was anticipated to be below 11 V, and the charging voltage of 3S LiPo battery is between 12 and 12.6 V. Since the total voltage of the PV array is not sufficient to meet the minimum charging voltage of the battery, the MPPT should include the function of boost-ing the voltage. Another criterion for MPPT selection is power conversion efficiency. The higher the MPPT efficiency, the more power captured by the PV array can be transferred to the power system.
Figure 4. PV array connection in power system.
A single PV array is used on the plane. Considering that there is very little differencein angle of the installation position of the PV cells on the wings, the effect of optimising theamount of sunlight captured by separating into several PV arrays is very small. IndividualMPPTs are also needed for each PV array. Having a single PV array saves the weight ofthe MPPT. The PV cells are stuck onto the wings with double-sided tape. To protect thecells and to ensure more secure installation, a protective film is added. It is a transparentplastic book wrap that shrinks when heat is applied. The plastic film is first fixed on thewings with super glue covering all PV cells; then, it is blown with a hot wind gun such thatit shrinks to follow the curvature of the wings.
3.2. Selection of Maximum Power Point Tracker (MPPT)
Most importantly, the MPPT model that suits the output voltage of the PV array andthe charging voltage of the battery should be selected. The total output voltage of the PVarray was anticipated to be below 11 V, and the charging voltage of 3S LiPo battery isbetween 12 and 12.6 V. Since the total voltage of the PV array is not sufficient to meet theminimum charging voltage of the battery, the MPPT should include the function of boostingthe voltage. Another criterion for MPPT selection is power conversion efficiency. The
Drones 2021, 5, 44 7 of 19
higher the MPPT efficiency, the more power captured by the PV array can be transferred tothe power system.
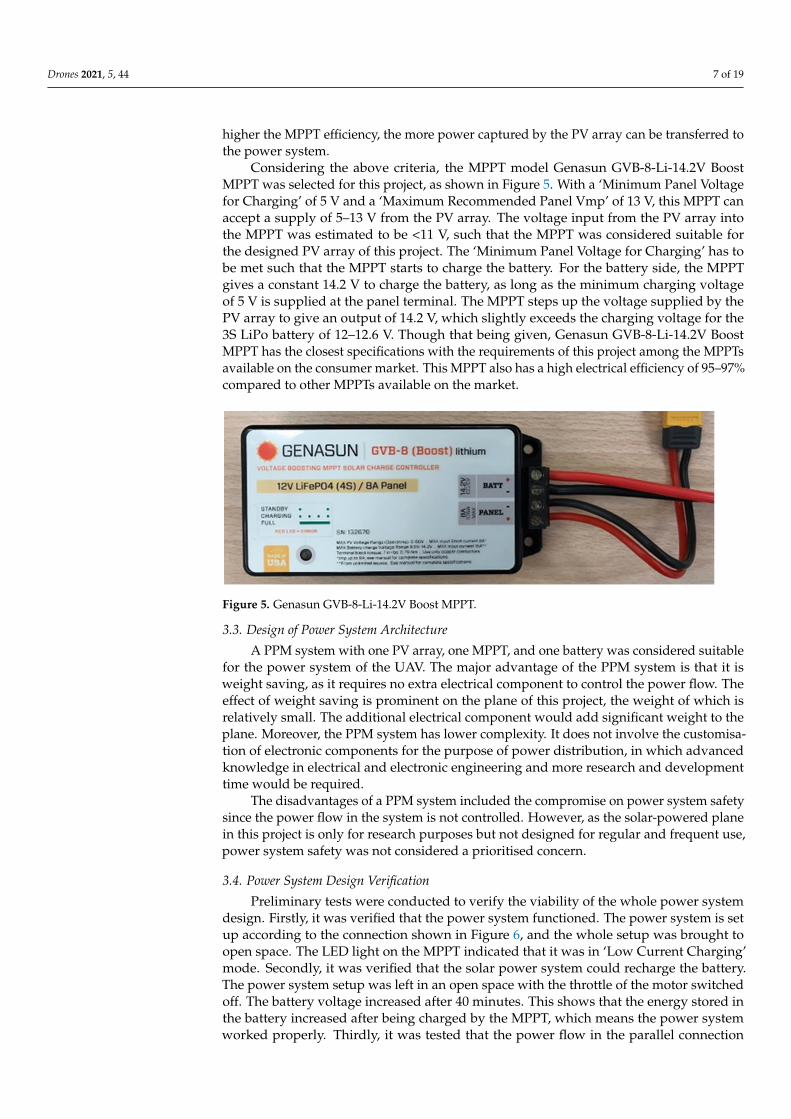
Considering the above criteria, the MPPT model Genasun GVB-8-Li-14.2V BoostMPPT was selected for this project, as shown in Figure 5. With a ‘Minimum Panel Voltagefor Charging’ of 5 V and a ‘Maximum Recommended Panel Vmp’ of 13 V, this MPPT canaccept a supply of 5–13 V from the PV array. The voltage input from the PV array intothe MPPT was estimated to be <11 V, such that the MPPT was considered suitable forthe designed PV array of this project. The ‘Minimum Panel Voltage for Charging’ has tobe met such that the MPPT starts to charge the battery. For the battery side, the MPPTgives a constant 14.2 V to charge the battery, as long as the minimum charging voltageof 5 V is supplied at the panel terminal. The MPPT steps up the voltage supplied by thePV array to give an output of 14.2 V, which slightly exceeds the charging voltage for the3S LiPo battery of 12–12.6 V. Though that being given, Genasun GVB-8-Li-14.2V BoostMPPT has the closest specifications with the requirements of this project among the MPPTsavailable on the consumer market. This MPPT also has a high electrical efficiency of 95–97%compared to other MPPTs available on the market.
Drones 2021, 5, 44 7 of 19
Considering the above criteria, the MPPT model Genasun GVB-8-Li-14.2V Boost MPPT was selected for this project, as shown in Figure 5. With a ‘Minimum Panel Voltage for Charging’ of 5 V and a ‘Maximum Recommended Panel Vmp’ of 13 V, this MPPT can accept a supply of 5–13 V from the PV array. The voltage input from the PV array into the MPPT was estimated to be < 11 V, such that the MPPT was considered suitable for the designed PV array of this project. The ‘Minimum Panel Voltage for Charging’ has to be met such that the MPPT starts to charge the battery. For the battery side, the MPPT gives a constant 14.2 V to charge the battery, as long as the minimum charging voltage of 5 V is supplied at the panel terminal. The MPPT steps up the voltage supplied by the PV array to give an output of 14.2 V, which slightly exceeds the charging voltage for the 3S LiPo battery of 12–12.6 V. Though that being given, Genasun GVB-8-Li-14.2V Boost MPPT has the closest specifications with the requirements of this project among the MPPTs available on the consumer market. This MPPT also has a high electrical efficiency of 95–97% com-pared to other MPPTs available on the market.
Figure 5. Genasun GVB-8-Li-14.2V Boost MPPT.
3.3. Design of Power System Architecture A PPM system with one PV array, one MPPT, and one battery was considered suita-
ble for the power system of the UAV. The major advantage of the PPM system is that it is weight saving, as it requires no extra electrical component to control the power flow. The effect of weight saving is prominent on the plane of this project, the weight of which is relatively small. The additional electrical component would add significant weight to the plane. Moreover, the PPM system has lower complexity. It does not involve the customi-sation of electronic components for the purpose of power distribution, in which advanced knowledge in electrical and electronic engineering and more research and development time would be required.
The disadvantages of a PPM system included the compromise on power system safety since the power flow in the system is not controlled. However, as the solar-powered plane in this project is only for research purposes but not designed for regular and fre-quent use, power system safety was not considered a prioritised concern.
3.4. Power System Design Verification Preliminary tests were conducted to verify the viability of the whole power system
design. Firstly, it was verified that the power system functioned. The power system is set up according to the connection shown in Figure 6, and the whole setup was brought to open space. The LED light on the MPPT indicated that it was in ‘Low Current Charging’ mode. Secondly, it was verified that the solar power system could recharge the battery. The power system setup was left in an open space with the throttle of the motor switched off. The battery voltage increased after 40 minutes. This shows that the energy stored in the battery increased after being charged by the MPPT, which means the power system worked properly. Thirdly, it was tested that the power flow in the parallel connection between the MPPT, the battery, and the ESC was as expected. The battery charging current is 0 with the motor switched on and is greater than 0 with the motor switched off. When
Figure 5. Genasun GVB-8-Li-14.2V Boost MPPT.
3.3. Design of Power System Architecture
A PPM system with one PV array, one MPPT, and one battery was considered suitablefor the power system of the UAV. The major advantage of the PPM system is that it isweight saving, as it requires no extra electrical component to control the power flow. Theeffect of weight saving is prominent on the plane of this project, the weight of which isrelatively small. The additional electrical component would add significant weight to theplane. Moreover, the PPM system has lower complexity. It does not involve the customisa-tion of electronic components for the purpose of power distribution, in which advancedknowledge in electrical and electronic engineering and more research and developmenttime would be required.
The disadvantages of a PPM system included the compromise on power system safetysince the power flow in the system is not controlled. However, as the solar-powered planein this project is only for research purposes but not designed for regular and frequent use,power system safety was not considered a prioritised concern.
3.4. Power System Design Verification
Preliminary tests were conducted to verify the viability of the whole power systemdesign. Firstly, it was verified that the power system functioned. The power system is setup according to the connection shown in Figure 6, and the whole setup was brought toopen space. The LED light on the MPPT indicated that it was in ‘Low Current Charging’mode. Secondly, it was verified that the solar power system could recharge the battery.The power system setup was left in an open space with the throttle of the motor switchedoff. The battery voltage increased after 40 minutes. This shows that the energy stored inthe battery increased after being charged by the MPPT, which means the power systemworked properly. Thirdly, it was tested that the power flow in the parallel connection
Drones 2021, 5, 44 8 of 19
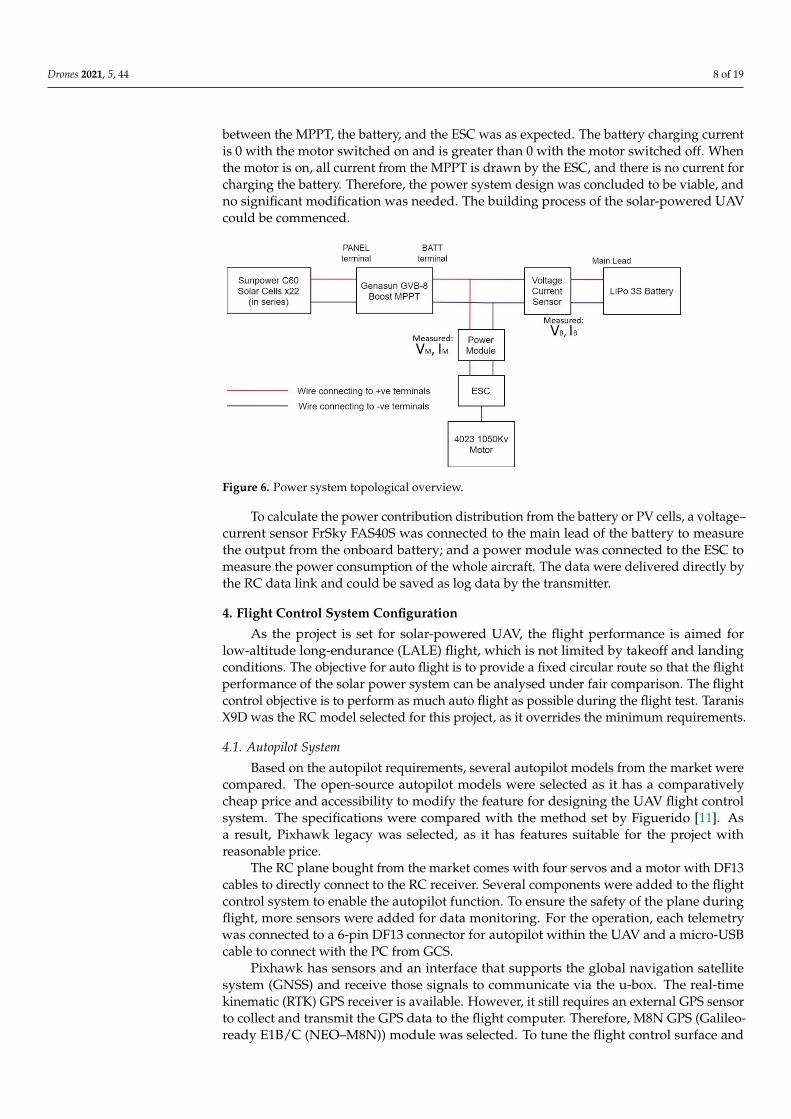
between the MPPT, the battery, and the ESC was as expected. The battery charging currentis 0 with the motor switched on and is greater than 0 with the motor switched off. Whenthe motor is on, all current from the MPPT is drawn by the ESC, and there is no current forcharging the battery. Therefore, the power system design was concluded to be viable, andno significant modification was needed. The building process of the solar-powered UAVcould be commenced.
Drones 2021, 5, 44 8 of 19
the motor is on, all current from the MPPT is drawn by the ESC, and there is no current for charging the battery. Therefore, the power system design was concluded to be viable, and no significant modification was needed. The building process of the solar-powered UAV could be commenced.
Figure 6. Power system topological overview.
To calculate the power contribution distribution from the battery or PV cells, a volt-age–current sensor FrSky FAS40S was connected to the main lead of the battery to meas-ure the output from the onboard battery; and a power module was connected to the ESC to measure the power consumption of the whole aircraft. The data were delivered directly by the RC data link and could be saved as log data by the transmitter.
4. Flight Control System Configuration As the project is set for solar-powered UAV, the flight performance is aimed for low-
altitude long-endurance (LALE) flight, which is not limited by takeoff and landing condi-tions. The objective for auto flight is to provide a fixed circular route so that the flight performance of the solar power system can be analysed under fair comparison. The flight con-trol objective is to perform as much auto flight as possible during the flight test. Taranis X9D was the RC model selected for this project, as it overrides the minimum requirements.
4.1. Autopilot System Based on the autopilot requirements, several autopilot models from the market were
compared. The open-source autopilot models were selected as it has a comparatively cheap price and accessibility to modify the feature for designing the UAV flight control system. The specifications were compared with the method set by Figuerido [11]. As a result, Pixhawk legacy was selected, as it has features suitable for the project with reason-able price.
The RC plane bought from the market comes with four servos and a motor with DF13 cables to directly connect to the RC receiver. Several components were added to the flight control system to enable the autopilot function. To ensure the safety of the plane during flight, more sensors were added for data monitoring. For the operation, each telemetry was connected to a 6-pin DF13 connector for autopilot within the UAV and a micro-USB cable to connect with the PC from GCS.
Pixhawk has sensors and an interface that supports the global navigation satellite system (GNSS) and receive those signals to communicate via the u-box. The real-time kin-ematic (RTK) GPS receiver is available. However, it still requires an external GPS sensor to collect and transmit the GPS data to the flight computer. Therefore, M8N GPS (Galileo-ready E1B/C (NEO–M8N)) module was selected. To tune the flight control surface and to ensure the safety of the actuators, a switch was added as a safety element. Whenever the UAV is powered on, the switch must be pressed to move the servos and motor. The
Figure 6. Power system topological overview.
To calculate the power contribution distribution from the battery or PV cells, a voltage–current sensor FrSky FAS40S was connected to the main lead of the battery to measurethe output from the onboard battery; and a power module was connected to the ESC tomeasure the power consumption of the whole aircraft. The data were delivered directly bythe RC data link and could be saved as log data by the transmitter.
4. Flight Control System Configuration
As the project is set for solar-powered UAV, the flight performance is aimed forlow-altitude long-endurance (LALE) flight, which is not limited by takeoff and landingconditions. The objective for auto flight is to provide a fixed circular route so that the flightperformance of the solar power system can be analysed under fair comparison. The flightcontrol objective is to perform as much auto flight as possible during the flight test. TaranisX9D was the RC model selected for this project, as it overrides the minimum requirements.
4.1. Autopilot System
Based on the autopilot requirements, several autopilot models from the market werecompared. The open-source autopilot models were selected as it has a comparativelycheap price and accessibility to modify the feature for designing the UAV flight controlsystem. The specifications were compared with the method set by Figuerido [11]. Asa result, Pixhawk legacy was selected, as it has features suitable for the project withreasonable price.
The RC plane bought from the market comes with four servos and a motor with DF13cables to directly connect to the RC receiver. Several components were added to the flightcontrol system to enable the autopilot function. To ensure the safety of the plane duringflight, more sensors were added for data monitoring. For the operation, each telemetrywas connected to a 6-pin DF13 connector for autopilot within the UAV and a micro-USBcable to connect with the PC from GCS.
Pixhawk has sensors and an interface that supports the global navigation satellitesystem (GNSS) and receive those signals to communicate via the u-box. The real-timekinematic (RTK) GPS receiver is available. However, it still requires an external GPS sensorto collect and transmit the GPS data to the flight computer. Therefore, M8N GPS (Galileo-ready E1B/C (NEO–M8N)) module was selected. To tune the flight control surface and
Drones 2021, 5, 44 9 of 19
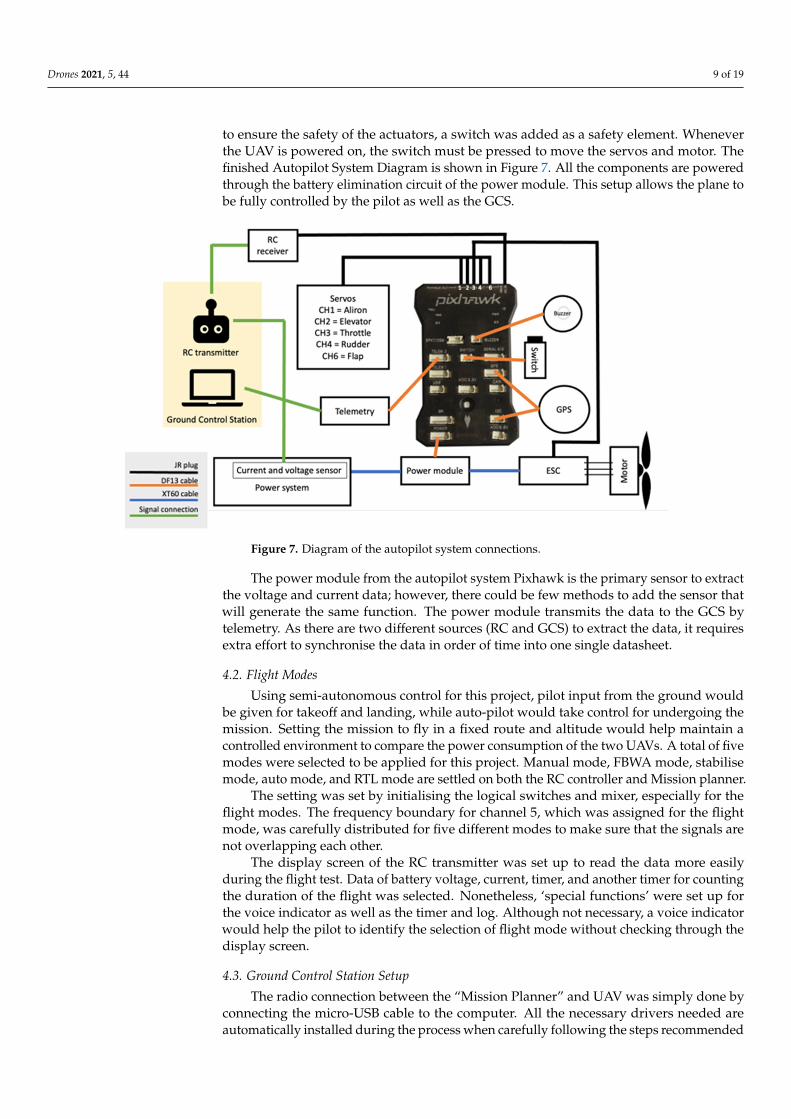
to ensure the safety of the actuators, a switch was added as a safety element. Wheneverthe UAV is powered on, the switch must be pressed to move the servos and motor. Thefinished Autopilot System Diagram is shown in Figure 7. All the components are poweredthrough the battery elimination circuit of the power module. This setup allows the plane tobe fully controlled by the pilot as well as the GCS.
Drones 2021, 5, 44 9 of 19
finished Autopilot System Diagram is shown in Figure 7. All the components are powered through the battery elimination circuit of the power module. This setup allows the plane to be fully controlled by the pilot as well as the GCS.
Figure 7. Diagram of the autopilot system connections.
The power module from the autopilot system Pixhawk is the primary sensor to ex-tract the voltage and current data; however, there could be few methods to add the sensor that will generate the same function. The power module transmits the data to the GCS by telemetry. As there are two different sources (RC and GCS) to extract the data, it requires extra effort to synchronise the data in order of time into one single datasheet.
4.2. Flight Modes Using semi-autonomous control for this project, pilot input from the ground would
be given for takeoff and landing, while auto-pilot would take control for undergoing the mission. Setting the mission to fly in a fixed route and altitude would help maintain a controlled environment to compare the power consumption of the two UAVs. A total of five modes were selected to be applied for this project. Manual mode, FBWA mode, stabilise mode, auto mode, and RTL mode are settled on both the RC controller and Mission planner.
The setting was set by initialising the logical switches and mixer, especially for the flight modes. The frequency boundary for channel 5, which was assigned for the flight mode, was carefully distributed for five different modes to make sure that the signals are not overlapping each other.
The display screen of the RC transmitter was set up to read the data more easily dur-ing the flight test. Data of battery voltage, current, timer, and another timer for counting the duration of the flight was selected. Nonetheless, ‘special functions’ were set up for the voice indicator as well as the timer and log. Although not necessary, a voice indicator would help the pilot to identify the selection of flight mode without checking through the display screen.
4.3. Ground Control Station Setup The radio connection between the “Mission Planner” and UAV was simply done by
connecting the micro-USB cable to the computer. All the necessary drivers needed are automatically installed during the process when carefully following the steps recom-mended from the Ardupilot website. With appropriate telemetry hardware, monitoring the data of vehicle status during the operation, recording, and analysing of telemetry logs and operating the vehicle in first-person view is available.
Figure 7. Diagram of the autopilot system connections.
The power module from the autopilot system Pixhawk is the primary sensor to extractthe voltage and current data; however, there could be few methods to add the sensor thatwill generate the same function. The power module transmits the data to the GCS bytelemetry. As there are two different sources (RC and GCS) to extract the data, it requiresextra effort to synchronise the data in order of time into one single datasheet.
4.2. Flight Modes
Using semi-autonomous control for this project, pilot input from the ground wouldbe given for takeoff and landing, while auto-pilot would take control for undergoing themission. Setting the mission to fly in a fixed route and altitude would help maintain acontrolled environment to compare the power consumption of the two UAVs. A total of fivemodes were selected to be applied for this project. Manual mode, FBWA mode, stabilisemode, auto mode, and RTL mode are settled on both the RC controller and Mission planner.
The setting was set by initialising the logical switches and mixer, especially for theflight modes. The frequency boundary for channel 5, which was assigned for the flightmode, was carefully distributed for five different modes to make sure that the signals arenot overlapping each other.
The display screen of the RC transmitter was set up to read the data more easilyduring the flight test. Data of battery voltage, current, timer, and another timer for countingthe duration of the flight was selected. Nonetheless, ‘special functions’ were set up forthe voice indicator as well as the timer and log. Although not necessary, a voice indicatorwould help the pilot to identify the selection of flight mode without checking through thedisplay screen.
4.3. Ground Control Station Setup
The radio connection between the “Mission Planner” and UAV was simply done byconnecting the micro-USB cable to the computer. All the necessary drivers needed areautomatically installed during the process when carefully following the steps recommended

Drones 2021, 5, 44 10 of 19
from the Ardupilot website. With appropriate telemetry hardware, monitoring the dataof vehicle status during the operation, recording, and analysing of telemetry logs andoperating the vehicle in first-person view is available.
Miscellaneous settings shall be taken care to support the flight and avoid any mis-leading errors that could result in a failsafe mode. The flight mode could be calibrated bysetting the mode allocation the same as the RC in Mission Planner. On the other hand, thecalibration shall be checked under the “Mandatory Hardware” for acceleration, compass,radio frequency, and servo output. Moreover, checking the data flow from the sensors oftelemetry, GPS, and flight data in the heads-up area from the Mission Planner main pagewere also important. These calibrations shall be checked every time before any flight testas the signal efficiency vary by weather, location, etc.
Lastly, collecting the most accurate data of power consumption, voltage, and currentmeasured by power module requires manual calibration to minimise the error. Comparingdata from different sensors (one from the power module and one from the voltage–currentsensor) and analysing the difference in data measurement could be utilised to set up amanual calibration unit.
It was determined that the RC plane has optimal flight performance at a groundspeed of 15 m/s, which is measured by the onboard GPS. It was also recommended thatsubsequent flight tests should be conducted at an altitude of around 100 m.
Figure 8 shows the maximum boundary of flight marked by overlapping the pathrecorded in Mission Planner when the ‘Sun’ UAV was flown. The boundary marked in theyellow line shows to be the safety boundary where the RC signals and GCS connections aresteady and strong. In addition, the minimum altitudes for avoiding any obstacles duringthe flight for UAV to be flown were marked as well.
Drones 2021, 5, 44 10 of 19
Miscellaneous settings shall be taken care to support the flight and avoid any mis-leading errors that could result in a failsafe mode. The flight mode could be calibrated by setting the mode allocation the same as the RC in Mission Planner. On the other hand, the calibration shall be checked under the “Mandatory Hardware” for acceleration, compass, radio frequency, and servo output. Moreover, checking the data flow from the sensors of telemetry, GPS, and flight data in the heads-up area from the Mission Planner main page were also important. These calibrations shall be checked every time before any flight test as the signal efficiency vary by weather, location, etc.
Lastly, collecting the most accurate data of power consumption, voltage, and current measured by power module requires manual calibration to minimise the error. Compar-ing data from different sensors (one from the power module and one from the voltage–current sensor) and analysing the difference in data measurement could be utilised to set up a manual calibration unit.
It was determined that the RC plane has optimal flight performance at a ground speed of 15 m/s, which is measured by the onboard GPS. It was also recommended that subsequent flight tests should be conducted at an altitude of around 100 m.
Figure 8 shows the maximum boundary of flight marked by overlapping the path recorded in Mission Planner when the ‘Sun’ UAV was flown. The boundary marked in the yellow line shows to be the safety boundary where the RC signals and GCS connec-tions are steady and strong. In addition, the minimum altitudes for avoiding any obstacles during the flight for UAV to be flown were marked as well.
Figure 8. Available airspace marked in the map.
The primary role of autopilot is to make the UAV loiter over a certain time or have a certain number of turns in the same circular route. Based on the marking of airspace in the first two flight tests, the fundamental route was set up to have control once the UAV reaches a certain altitude. The waypoints were marked on the map with desired altitudes. Based on this factor, the distance and altitude were set according to the calculated ascend-ing or descending angle between the waypoints. The waypoint radius was set to be 30 m. The UAV starts to make a turn once it reaches the waypoint boundary. The loiter radius was set as 30 m on waypoint 4.
The first waypoint was set on the right top, allowing the pilot to have 325.5 m to reach the altitude of 100 m after takeoff, as shown in Figure 9. After a big turn from waypoint (Wp) 2 to Wp 3, the UAV was assigned to have 10 loiter turns on Wp4. Wp4 was inten-tionally set away from the runway to avoid any crash with other UAV flights. Once the loitering is finished, the flight would perform a round turn over the runway and some forest area to gradually descend and to be ready for landing. When the UAV is flying parallel with the runway ay a low altitude of around 10 m, the pilot would take back control from auto mode to either FBWA, stabilise, or manual mode. The flight data related
Figure 8. Available airspace marked in the map.
The primary role of autopilot is to make the UAV loiter over a certain time or have acertain number of turns in the same circular route. Based on the marking of airspace in thefirst two flight tests, the fundamental route was set up to have control once the UAV reachesa certain altitude. The waypoints were marked on the map with desired altitudes. Basedon this factor, the distance and altitude were set according to the calculated ascending ordescending angle between the waypoints. The waypoint radius was set to be 30 m. TheUAV starts to make a turn once it reaches the waypoint boundary. The loiter radius was setas 30 m on waypoint 4.
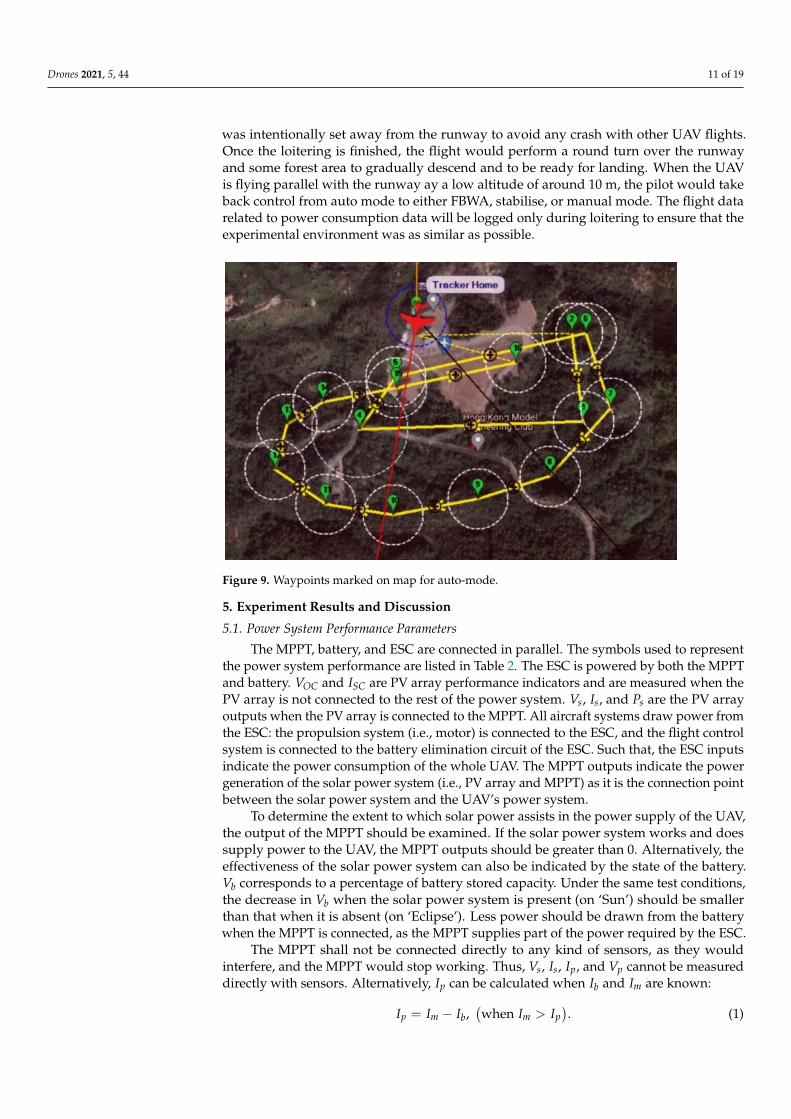
The first waypoint was set on the right top, allowing the pilot to have 325.5 m toreach the altitude of 100 m after takeoff, as shown in Figure 9. After a big turn fromwaypoint (Wp) 2 to Wp 3, the UAV was assigned to have 10 loiter turns on Wp4. Wp4
Drones 2021, 5, 44 11 of 19
was intentionally set away from the runway to avoid any crash with other UAV flights.Once the loitering is finished, the flight would perform a round turn over the runwayand some forest area to gradually descend and to be ready for landing. When the UAVis flying parallel with the runway ay a low altitude of around 10 m, the pilot would takeback control from auto mode to either FBWA, stabilise, or manual mode. The flight datarelated to power consumption data will be logged only during loitering to ensure that theexperimental environment was as similar as possible.
Drones 2021, 5, 44 11 of 19
to power consumption data will be logged only during loitering to ensure that the exper-imental environment was as similar as possible.
Figure 9. Waypoints marked on map for auto-mode.
5. Experiment Results and Discussion 5.1. Power System Performance Parameters
The MPPT, battery, and ESC are connected in parallel. The symbols used to represent the power system performance are listed in Table 2. The ESC is powered by both the MPPT and battery. and are PV array performance indicators and are measured when the PV array is not connected to the rest of the power system. , , and are the PV array outputs when the PV array is connected to the MPPT. All aircraft systems draw power from the ESC: the propulsion system (i.e., motor) is connected to the ESC, and the flight control system is connected to the battery elimination circuit of the ESC. Such that, the ESC inputs indicate the power consumption of the whole UAV. The MPPT outputs indicate the power generation of the solar power system (i.e., PV array and MPPT) as it is the connection point between the solar power system and the UAV’s power system.
Table 2. The symbol representation used in power system analysis.
Symbol Representation Voltage of PV array (or voltage input of MPPT) Current output of PV array (or voltage of MPPT) Power output of PV array (or power input of MPPT) Voltage output of MPPT Current output of MPPT Power output of MPPT Voltage of battery Current output of battery Voltage of ESC Current input of ESC Power input of ESC PV array open-circuit voltage PV array short-circuit current
To determine the extent to which solar power assists in the power supply of the UAV, the output of the MPPT should be examined. If the solar power system works and does supply power to the UAV, the MPPT outputs should be greater than 0. Alternatively, the
Figure 9. Waypoints marked on map for auto-mode.
5. Experiment Results and Discussion
5.1. Power System Performance Parameters
The MPPT, battery, and ESC are connected in parallel. The symbols used to representthe power system performance are listed in Table 2. The ESC is powered by both the MPPTand battery. VOC and ISC are PV array performance indicators and are measured when thePV array is not connected to the rest of the power system. Vs, Is, and Ps are the PV arrayoutputs when the PV array is connected to the MPPT. All aircraft systems draw power fromthe ESC: the propulsion system (i.e., motor) is connected to the ESC, and the flight controlsystem is connected to the battery elimination circuit of the ESC. Such that, the ESC inputsindicate the power consumption of the whole UAV. The MPPT outputs indicate the powergeneration of the solar power system (i.e., PV array and MPPT) as it is the connection pointbetween the solar power system and the UAV’s power system.
To determine the extent to which solar power assists in the power supply of the UAV,the output of the MPPT should be examined. If the solar power system works and doessupply power to the UAV, the MPPT outputs should be greater than 0. Alternatively, theeffectiveness of the solar power system can also be indicated by the state of the battery.Vb corresponds to a percentage of battery stored capacity. Under the same test conditions,the decrease in Vb when the solar power system is present (on ‘Sun’) should be smallerthan that when it is absent (on ‘Eclipse’). Less power should be drawn from the batterywhen the MPPT is connected, as the MPPT supplies part of the power required by the ESC.
The MPPT shall not be connected directly to any kind of sensors, as they wouldinterfere, and the MPPT would stop working. Thus, Vs, Is, Ip, and Vp cannot be measureddirectly with sensors. Alternatively, Ip can be calculated when Ib and Im are known:
Ip = Im − Ib,(when Im > Ip
). (1)
Drones 2021, 5, 44 12 of 19
Table 2. The symbol representation used in power system analysis.
Symbol Representation
Vs Voltage of PV array (or voltage input of MPPT)Is Current output of PV array (or voltage of MPPT)Ps Power output of PV array (or power input of MPPT)Vp Voltage output of MPPTIp Current output of MPPTPp Power output of MPPTVb Voltage of batteryIb Current output of battery
Vm Voltage of ESCIm Current input of ESCPm Power input of ESC
VOC PV array open-circuit voltageISC PV array short-circuit current
5.2. Power System Tests
Tests on the power system were conducted to investigate the performance of thesolar power system (i.e., PV array and MPPT) under different solar radiation levels and toinvestigate the relationship between the input and output power of the MPPT.
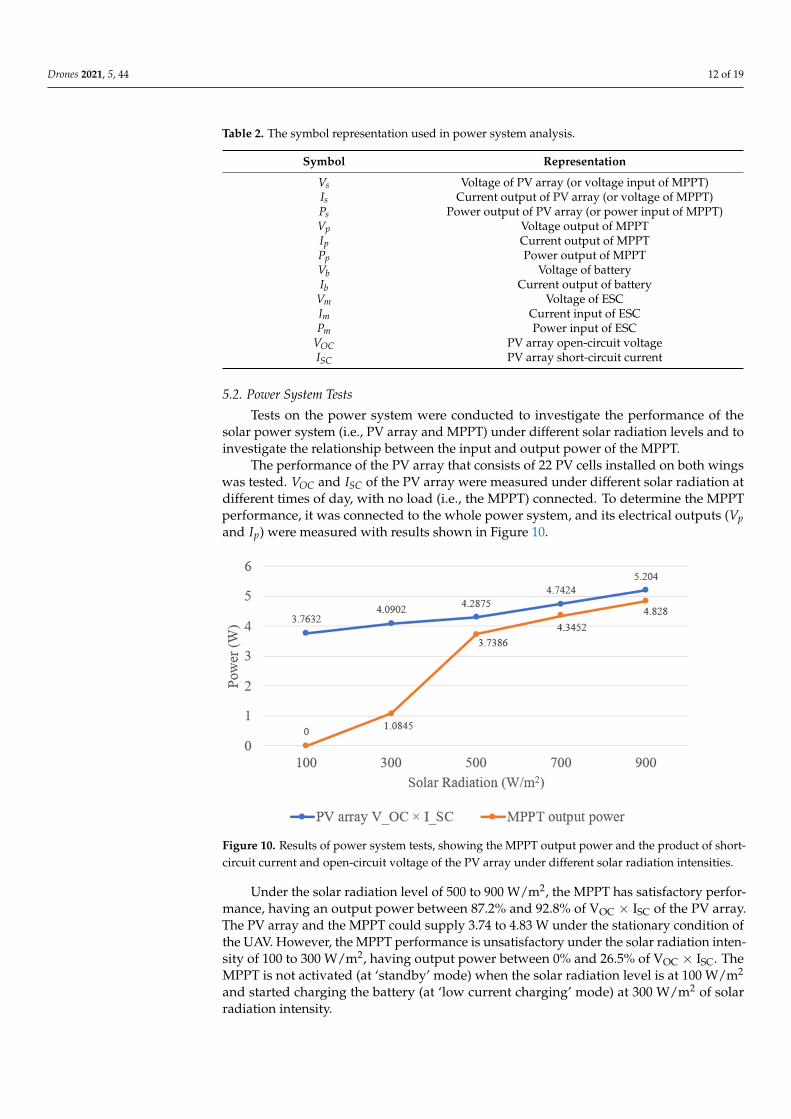
The performance of the PV array that consists of 22 PV cells installed on both wingswas tested. VOC and ISC of the PV array were measured under different solar radiation atdifferent times of day, with no load (i.e., the MPPT) connected. To determine the MPPTperformance, it was connected to the whole power system, and its electrical outputs (Vpand Ip) were measured with results shown in Figure 10.
Drones 2021, 5, 44 12 of 19
effectiveness of the solar power system can also be indicated by the state of the battery. corresponds to a percentage of battery stored capacity. Under the same test conditions,
the decrease in when the solar power system is present (on ‘Sun’) should be smaller than that when it is absent (on ‘Eclipse’). Less power should be drawn from the battery when the MPPT is connected, as the MPPT supplies part of the power required by the ESC.
The MPPT shall not be connected directly to any kind of sensors, as they would in-terfere, and the MPPT would stop working. Thus, , , , and cannot be measured directly with sensors. Alternatively, can be calculated when and are known: = − , (when ). (1)
5.2. Power System Tests Tests on the power system were conducted to investigate the performance of the solar
power system (i.e., PV array and MPPT) under different solar radiation levels and to in-vestigate the relationship between the input and output power of the MPPT.
The performance of the PV array that consists of 22 PV cells installed on both wings was tested. and of the PV array were measured under different solar radiation at different times of day, with no load (i.e., the MPPT) connected. To determine the MPPT performance, it was connected to the whole power system, and its electrical outputs ( and ) were measured with results shown in Figure 10.
Figure 10. Results of power system tests, showing the MPPT output power and the product of short-circuit current and open-circuit voltage of the PV array under different solar radiation intensities.
Under the solar radiation level of 500 to 900 W/m2, the MPPT has satisfactory perfor-mance, having an output power between 87.2% and 92.8% of VOC × ISC of the PV array. The PV array and the MPPT could supply 3.74 to 4.83 W under the stationary condition of the UAV. However, the MPPT performance is unsatisfactory under the solar radiation inten-sity of 100 to 300 W/m2, having output power between 0% and 26.5% of VOC × ISC. The MPPT is not activated (at ‘standby’ mode) when the solar radiation level is at 100 W/m2 and started charging the battery (at ‘low current charging’ mode) at 300 W/m2 of solar radiation intensity.
5.3. Flight Experiments 5.3.1. Flight Test Overview
The primary objective of this project is to increase the flight endurance of the RC plane by modifying it with a solar power system. To reduce drag and save weight, we fixed all the avionics system and sensors into the fuselage of the 759-2 Phoenix 2000 RC plane. The finished interior diagram is shown in Figure 11. To validate if the modified
Figure 10. Results of power system tests, showing the MPPT output power and the product of short-circuit current and open-circuit voltage of the PV array under different solar radiation intensities.
Under the solar radiation level of 500 to 900 W/m2, the MPPT has satisfactory perfor-mance, having an output power between 87.2% and 92.8% of VOC × ISC of the PV array.The PV array and the MPPT could supply 3.74 to 4.83 W under the stationary condition ofthe UAV. However, the MPPT performance is unsatisfactory under the solar radiation inten-sity of 100 to 300 W/m2, having output power between 0% and 26.5% of VOC × ISC. TheMPPT is not activated (at ‘standby’ mode) when the solar radiation level is at 100 W/m2
and started charging the battery (at ‘low current charging’ mode) at 300 W/m2 of solarradiation intensity.
Drones 2021, 5, 44 13 of 19
5.3. Flight Experiments
5.3.1. Flight Test Overview
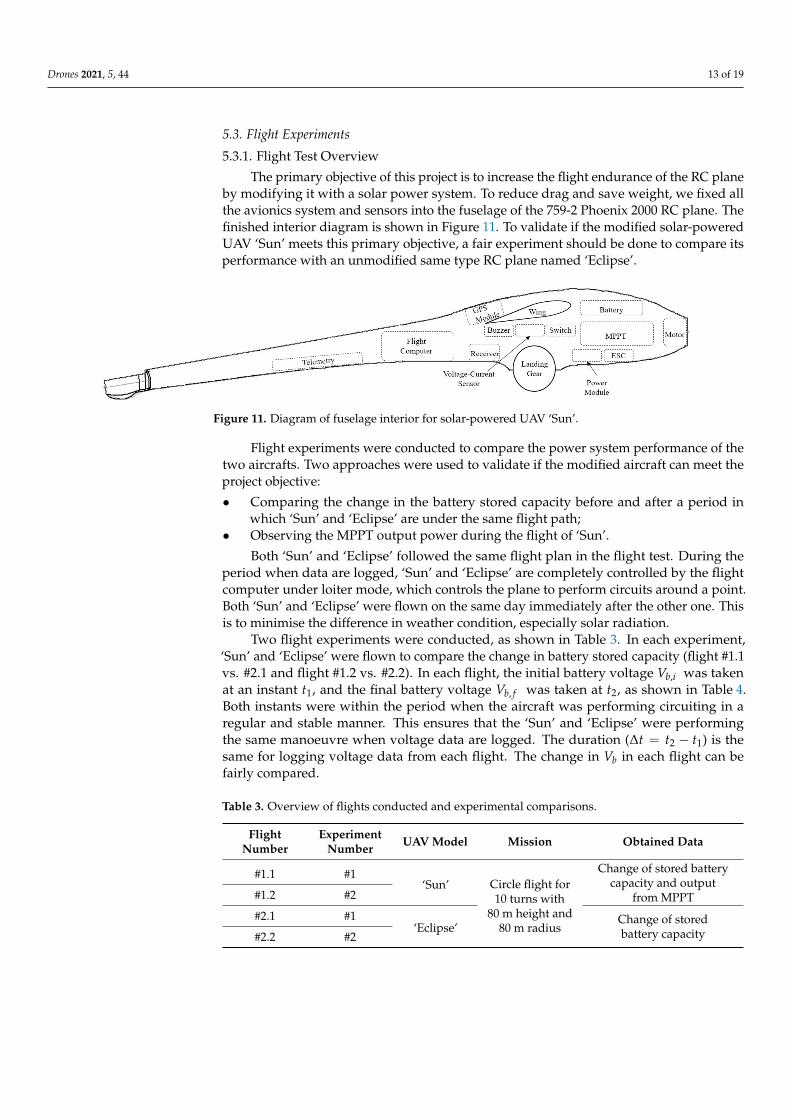
The primary objective of this project is to increase the flight endurance of the RC planeby modifying it with a solar power system. To reduce drag and save weight, we fixed allthe avionics system and sensors into the fuselage of the 759-2 Phoenix 2000 RC plane. Thefinished interior diagram is shown in Figure 11. To validate if the modified solar-poweredUAV ‘Sun’ meets this primary objective, a fair experiment should be done to compare itsperformance with an unmodified same type RC plane named ‘Eclipse’.
Drones 2021, 5, 44 13 of 19
solar-powered UAV ‘Sun’ meets this primary objective, a fair experiment should be done to compare its performance with an unmodified same type RC plane named ‘Eclipse’.
Figure 11. Diagram of fuselage interior for solar-powered UAV ‘Sun’.
Flight experiments were conducted to compare the power system performance of the two aircrafts. Two approaches were used to validate if the modified aircraft can meet the project objective: • Comparing the change in the battery stored capacity before and after a period in
which ‘Sun’ and ‘Eclipse’ are under the same flight path; • Observing the MPPT output power during the flight of ‘Sun’.
Both ‘Sun’ and ‘Eclipse’ followed the same flight plan in the flight test. During the period when data are logged, ‘Sun’ and ‘Eclipse’ are completely controlled by the flight computer under loiter mode, which controls the plane to perform circuits around a point. Both ‘Sun’ and ‘Eclipse’ were flown on the same day immediately after the other one. This is to minimise the difference in weather condition, especially solar radiation.
Two flight experiments were conducted, as shown in Table 3. In each experiment, ‘Sun’ and ‘Eclipse’ were flown to compare the change in battery stored capacity (flight #1.1 vs. #2.1 and flight #1.2 vs. #2.2). In each flight, the initial battery voltage , was taken at an instant , and the final battery voltage , was taken at , as shown in Table 4. Both instants were within the period when the aircraft was performing circuiting in a reg-ular and stable manner. This ensures that the ‘Sun’ and ‘Eclipse’ were performing the same manoeuvre when voltage data are logged. The duration (∆ = − ) is the same for logging voltage data from each flight. The change in in each flight can be fairly com-pared.
Table 3. Overview of flights conducted and experimental comparisons.
Flight Number
Experiment Number
UAV Model
Mission Obtained Data
#1.1 #1 ‘Sun’ Circle flight for 10
turns with 80 m height and 80 m ra-
dius
Change of stored bat-tery capacity and out-
put from MPPT #1.2 #2
#2.1 #1 ‘Eclipse’ Change of stored bat-
tery capacity #2.2 #2
Figure 11. Diagram of fuselage interior for solar-powered UAV ‘Sun’.
Flight experiments were conducted to compare the power system performance of thetwo aircrafts. Two approaches were used to validate if the modified aircraft can meet theproject objective:
• Comparing the change in the battery stored capacity before and after a period inwhich ‘Sun’ and ‘Eclipse’ are under the same flight path;
• Observing the MPPT output power during the flight of ‘Sun’.
Both ‘Sun’ and ‘Eclipse’ followed the same flight plan in the flight test. During theperiod when data are logged, ‘Sun’ and ‘Eclipse’ are completely controlled by the flightcomputer under loiter mode, which controls the plane to perform circuits around a point.Both ‘Sun’ and ‘Eclipse’ were flown on the same day immediately after the other one. Thisis to minimise the difference in weather condition, especially solar radiation.
Two flight experiments were conducted, as shown in Table 3. In each experiment,‘Sun’ and ‘Eclipse’ were flown to compare the change in battery stored capacity (flight #1.1vs. #2.1 and flight #1.2 vs. #2.2). In each flight, the initial battery voltage Vb,i was takenat an instant t1, and the final battery voltage Vb, f was taken at t2, as shown in Table 4.Both instants were within the period when the aircraft was performing circuiting in aregular and stable manner. This ensures that the ‘Sun’ and ‘Eclipse’ were performingthe same manoeuvre when voltage data are logged. The duration (∆t = t2 − t1) is thesame for logging voltage data from each flight. The change in Vb in each flight can befairly compared.
Table 3. Overview of flights conducted and experimental comparisons.
FlightNumber
ExperimentNumber UAV Model Mission Obtained Data
#1.1 #1‘Sun’ Circle flight for
10 turns with80 m height and
80 m radius
Change of stored batterycapacity and output
from MPPT#1.2 #2
#2.1 #1‘Eclipse’
Change of storedbattery capacity#2.2 #2
Drones 2021, 5, 44 14 of 19
Table 4. Flight plan of the UAVs for flight test.
Flight Stage Takeoff Climb Circling Descend Landing
Flight mode Stabilise Auto Loiter Auto Stabilise
Time t1 t2
Logged Data Vb,i Vb,f
The independent variable of this experiment is the solar power system and otherfactors remained unchanged or maintained as similar as possible. ‘Eclipse’ is built byuninstalling all the solar power system components from ‘Sun’. The wings with PV cellsinstalled are replaced by unmodified wings of the same model of the RC plane, and theMPPT is removed. This ensures that the two UAVs used in this experiment are identicalexcept for the presence of the solar power system.
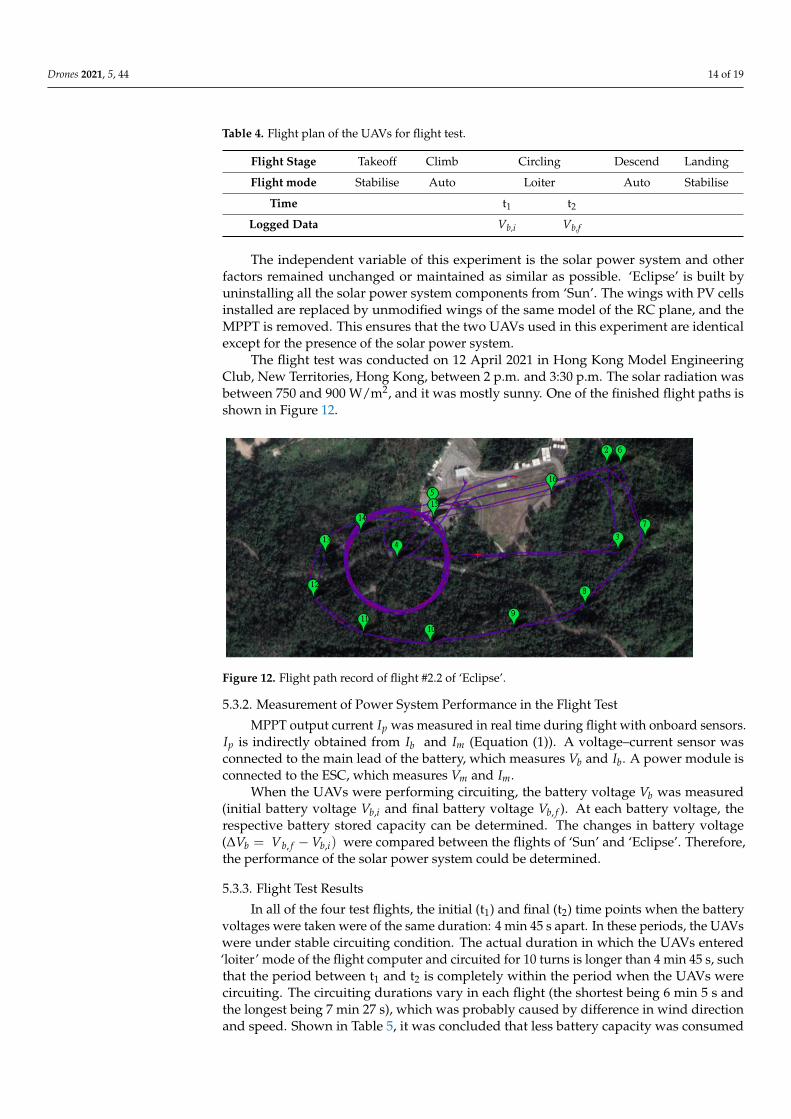
The flight test was conducted on 12 April 2021 in Hong Kong Model EngineeringClub, New Territories, Hong Kong, between 2 p.m. and 3:30 p.m. The solar radiation wasbetween 750 and 900 W/m2, and it was mostly sunny. One of the finished flight paths isshown in Figure 12.
Drones 2021, 5, 44 14 of 19
Table 4. Flight plan of the UAVs for flight test.
Flight Stage Takeoff Climb Circling Descend Landing Flight mode Stabilise Auto Loiter Auto Stabilise
Time t1 t2 Logged Data Vb,i Vb,f
The independent variable of this experiment is the solar power system and other fac-tors remained unchanged or maintained as similar as possible. ‘Eclipse’ is built by unin-stalling all the solar power system components from ‘Sun’. The wings with PV cells in-stalled are replaced by unmodified wings of the same model of the RC plane, and the MPPT is removed. This ensures that the two UAVs used in this experiment are identical except for the presence of the solar power system.
The flight test was conducted on 12 April 2021 in Hong Kong Model Engineering Club, New Territories, Hong Kong, between 2 PM and 3:30 PM. The solar radiation was between 750 and 900 W/m2, and it was mostly sunny. One of the finished flight paths is shown in Figure 12.
Figure 12. Flight path record of flight #2.2 of ‘Eclipse’.
5.3.2. Measurement of Power System Performance in the Flight Test MPPT output current was measured in real time during flight with onboard sen-
sors. is indirectly obtained from and (Equation (1)). A voltage–current sensor was connected to the main lead of the battery, which measures and . A power mod-ule is connected to the ESC, which measures and .
When the UAVs were performing circuiting, the battery voltage V was measured (initial battery voltage V , and final battery voltage V , ). At each battery voltage, the re-spective battery stored capacity can be determined. The changes in battery voltage (∆V = V , − V , ) were compared between the flights of ‘Sun’ and ‘Eclipse’. Therefore, the per-formance of the solar power system could be determined.
5.3.3. Flight Test Results In all of the four test flights, the initial (t1) and final (t2) time points when the battery
voltages were taken were of the same duration: 4 min 45 s apart. In these periods, the UAVs were under stable circuiting condition. The actual duration in which the UAVs en-tered ‘loiter’ mode of the flight computer and circuited for 10 turns is longer than 4 min 45 s, such that the period between t1 and t2 is completely within the period when the UAVs were circuiting. The circuiting durations vary in each flight (the shortest being 6 min 5 s and the longest being 7 min 27 s), which was probably caused by difference in wind di-rection and speed. Shown in Table 5, it was concluded that less battery capacity was con-sumed by ‘Sun’ with solar power system. Flight #2.1 and #2.2 of ‘Eclipse’ demonstrated that during stable circuiting without a solar power system, an average of 38% of battery-
Figure 12. Flight path record of flight #2.2 of ‘Eclipse’.
5.3.2. Measurement of Power System Performance in the Flight Test
MPPT output current Ip was measured in real time during flight with onboard sensors.Ip is indirectly obtained from Ib and Im (Equation (1)). A voltage–current sensor wasconnected to the main lead of the battery, which measures Vb and Ib. A power module isconnected to the ESC, which measures Vm and Im.
When the UAVs were performing circuiting, the battery voltage Vb was measured(initial battery voltage Vb,i and final battery voltage Vb, f ). At each battery voltage, therespective battery stored capacity can be determined. The changes in battery voltage(∆Vb = Vb, f − Vb,i) were compared between the flights of ‘Sun’ and ‘Eclipse’. Therefore,the performance of the solar power system could be determined.
5.3.3. Flight Test Results
In all of the four test flights, the initial (t1) and final (t2) time points when the batteryvoltages were taken were of the same duration: 4 min 45 s apart. In these periods, the UAVswere under stable circuiting condition. The actual duration in which the UAVs entered‘loiter’ mode of the flight computer and circuited for 10 turns is longer than 4 min 45 s, suchthat the period between t1 and t2 is completely within the period when the UAVs werecircuiting. The circuiting durations vary in each flight (the shortest being 6 min 5 s andthe longest being 7 min 27 s), which was probably caused by difference in wind directionand speed. Shown in Table 5, it was concluded that less battery capacity was consumed
Drones 2021, 5, 44 15 of 19
by ‘Sun’ with solar power system. Flight #2.1 and #2.2 of ‘Eclipse’ demonstrated thatduring stable circuiting without a solar power system, an average of 38% of battery-storedcapacity was required. Under largely similar experimental conditions, flight #1.1 and #1.2of ‘Sun’ performed the same stable circuiting, but part of the power required was suppliedby the solar power system. An average of 15.5% of battery stored capacity was required.Therefore, the solar power system is capable of saving an average of 22.5% of the batterystored capacity in 4 min 45 s of flight.
Table 5. Results of the comparison of battery stored capacity change in flights.
Parameters #1.1 ‘Sun’ #1.2 ‘Sun’ #2.1 ‘Eclipse’ #2.2 ‘Eclipse’
Initial Battery Voltage Vb,i at t1 11.81 V 11.56 V 12.02 V 11.50 VFinal Battery Voltage Vb, f at t2 11.50 V 11.42 V 11.40 V 11.04 V
Voltage Drop ∆Vb 0.31 V 0.14 V 0.62 V 0.46 V
Initial Battery PercentageCapacity at t1
68% 55% 78% 49%
Final Battery PercentageCapacity at t2
49% 43% 41% 10%
Drop in Battery PercentageCapacity 19% 12% 37% 39%
Average Drop in BatteryPercentage Capacity 15.5% 38%
Battery Percentage CapacitySaved by Solar Power System 22.5%
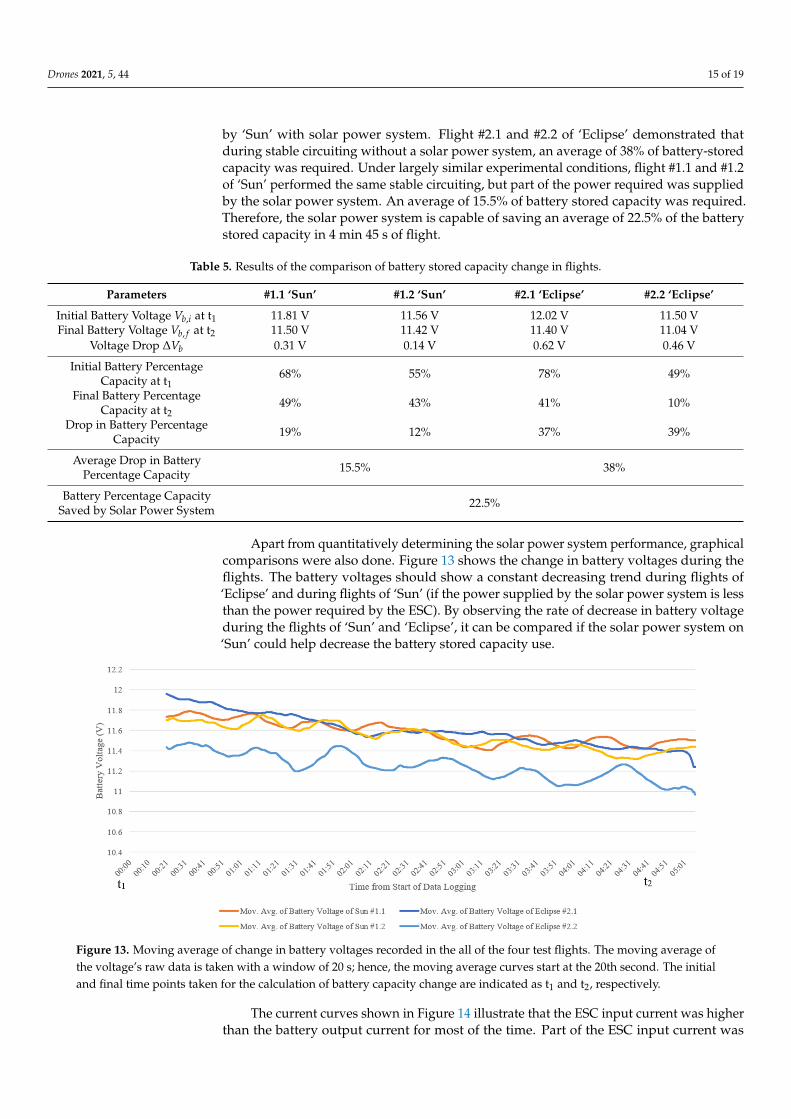
Apart from quantitatively determining the solar power system performance, graphicalcomparisons were also done. Figure 13 shows the change in battery voltages during theflights. The battery voltages should show a constant decreasing trend during flights of‘Eclipse’ and during flights of ‘Sun’ (if the power supplied by the solar power system is lessthan the power required by the ESC). By observing the rate of decrease in battery voltageduring the flights of ‘Sun’ and ‘Eclipse’, it can be compared if the solar power system on‘Sun’ could help decrease the battery stored capacity use.
Drones 2021, 5, 44 15 of 19
stored capacity was required. Under largely similar experimental conditions, flight #1.1 and #1.2 of ‘Sun’ performed the same stable circuiting, but part of the power required was supplied by the solar power system. An average of 15.5% of battery stored capacity was required. Therefore, the solar power system is capable of saving an average of 22.5% of the battery stored capacity in 4 min 45 s of flight.
Table 5. Results of the comparison of battery stored capacity change in flights.
Parameters #1.1 ‘Sun’ #1.2 ‘Sun’ #2.1 ‘Eclipse’ #2.2 ‘Eclipse’ Initial Battery Voltage , at t1 11.81 V 11.56 V 12.02 V 11.50 V Final Battery Voltage , at t2 11.50 V 11.42 V 11.40 V 11.04 V
Voltage Drop ∆ 0.31 V 0.14 V 0.62 V 0.46 V Initial Battery Percentage Capacity at t1 68% 55% 78% 49% Final Battery Percentage Capacity at t2 49% 43% 41% 10% Drop in Battery Percentage Capacity 19% 12% 37% 39%
Average Drop in Battery Percentage Capacity 15.5% 38% Battery Percentage Capacity Saved by Solar Power System 22.5%
Apart from quantitatively determining the solar power system performance, graphical comparisons were also done. Figure 13 shows the change in battery voltages during the flights. The battery voltages should show a constant decreasing trend during flights of ‘Eclipse’ and during flights of ‘Sun’ (if the power supplied by the solar power system is less than the power required by the ESC). By observing the rate of decrease in battery voltage during the flights of ‘Sun’ and ‘Eclipse’, it can be compared if the solar power system on ‘Sun’ could help decrease the battery stored capacity use.
Figure 13. Moving average of change in battery voltages recorded in the all of the four test flights. The moving average of the voltage’s raw data is taken with a window of 20 s; hence, the moving average curves start at the 20th second. The initial and final time points taken for the calculation of battery capacity change are indicated as t1 and t2, respectively.
The current curves shown in Figure 14 illustrate that the ESC input current was higher than the battery output current for most of the time. Part of the ESC input current was supplied by the MPPT. Given that the MPPT output current equals subtracting bat-tery output current from ESC input current (Equation (1)), the MPPT output current was greater than 0 most of the time in the period between t1 and t2.
Figure 13. Moving average of change in battery voltages recorded in the all of the four test flights. The moving average ofthe voltage’s raw data is taken with a window of 20 s; hence, the moving average curves start at the 20th second. The initialand final time points taken for the calculation of battery capacity change are indicated as t1 and t2, respectively.
The current curves shown in Figure 14 illustrate that the ESC input current was higherthan the battery output current for most of the time. Part of the ESC input current was
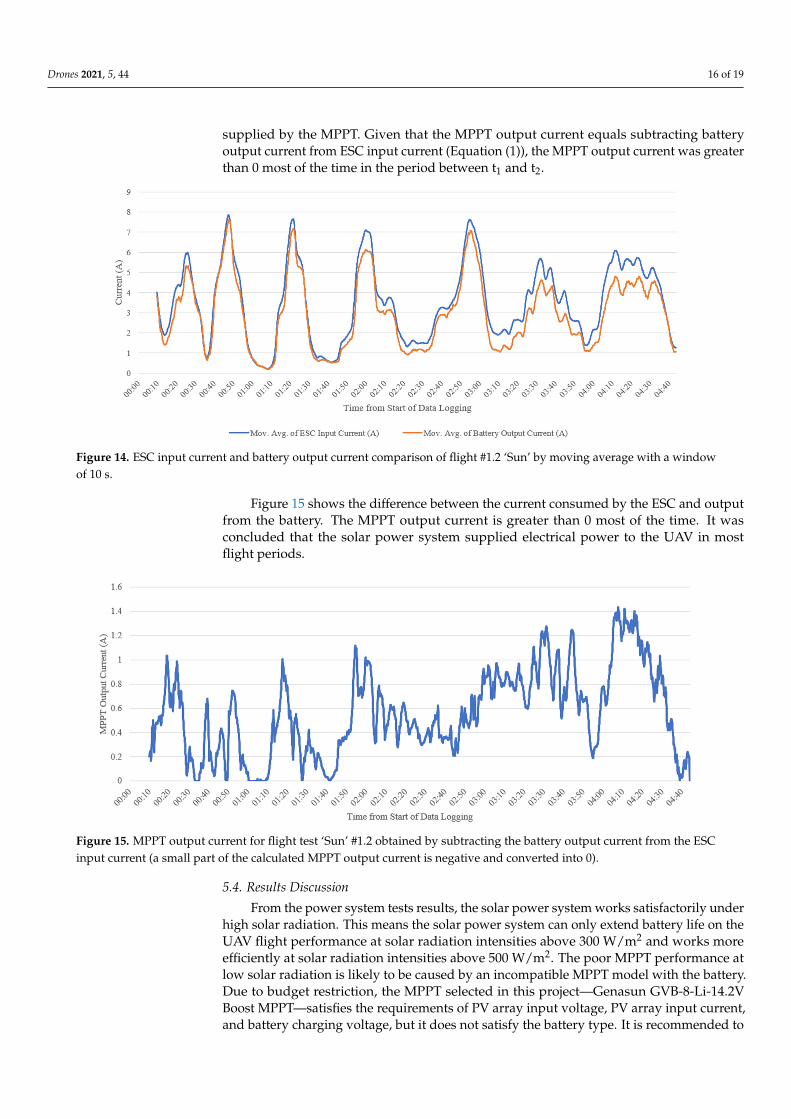
Drones 2021, 5, 44 16 of 19
supplied by the MPPT. Given that the MPPT output current equals subtracting batteryoutput current from ESC input current (Equation (1)), the MPPT output current was greaterthan 0 most of the time in the period between t1 and t2.
Drones 2021, 5, 44 16 of 19
Figure 14. ESC input current and battery output current comparison of flight #1.2 ‘Sun’ by moving average with a window of 10 s.
Figure 15 shows the difference between the current consumed by the ESC and output from the battery. The MPPT output current is greater than 0 most of the time. It was con-cluded that the solar power system supplied electrical power to the UAV in most flight periods.
Figure 15. MPPT output current for flight test ‘Sun’ #1.2 obtained by subtracting the battery output current from the ESC input current (a small part of the calculated MPPT output current is negative and converted into 0).
5.4. Results Discussion From the power system tests results, the solar power system works satisfactorily un-
der high solar radiation. This means the solar power system can only extend battery life on the UAV flight performance at solar radiation intensities above 300 W/m2 and works more efficiently at solar radiation intensities above 500 W/m2. The poor MPPT perfor-mance at low solar radiation is likely to be caused by an incompatible MPPT model with the battery. Due to budget restriction, the MPPT selected in this project—Genasun GVB-8-Li-14.2V Boost MPPT—satisfies the requirements of PV array input voltage, PV array input current, and battery charging voltage, but it does not satisfy the battery type. It is recommended to be used with a 12V 4S lithium–iron–phosphate battery, but the battery used in the power system is an 11.1V 3S lithium–polymer battery. The MPPT internal sensing algorithm may not work efficiently with an incompatible battery model.
Although the comparison of the change in battery stored capacity shows that the so-lar power system is capable of saving battery stored capacity, the values of change in bat-tery voltage determined from the two flight experiments exhibit some difference. A pos-sible explanation would be the difference in wind speed in the two flight experiments.
Figure 14. ESC input current and battery output current comparison of flight #1.2 ‘Sun’ by moving average with a windowof 10 s.
Figure 15 shows the difference between the current consumed by the ESC and outputfrom the battery. The MPPT output current is greater than 0 most of the time. It wasconcluded that the solar power system supplied electrical power to the UAV in mostflight periods.
Drones 2021, 5, 44 16 of 19
Figure 14. ESC input current and battery output current comparison of flight #1.2 ‘Sun’ by moving average with a window of 10 s.
Figure 15 shows the difference between the current consumed by the ESC and output from the battery. The MPPT output current is greater than 0 most of the time. It was con-cluded that the solar power system supplied electrical power to the UAV in most flight periods.
Figure 15. MPPT output current for flight test ‘Sun’ #1.2 obtained by subtracting the battery output current from the ESC input current (a small part of the calculated MPPT output current is negative and converted into 0).
5.4. Results Discussion From the power system tests results, the solar power system works satisfactorily un-
der high solar radiation. This means the solar power system can only extend battery life on the UAV flight performance at solar radiation intensities above 300 W/m2 and works more efficiently at solar radiation intensities above 500 W/m2. The poor MPPT perfor-mance at low solar radiation is likely to be caused by an incompatible MPPT model with the battery. Due to budget restriction, the MPPT selected in this project—Genasun GVB-8-Li-14.2V Boost MPPT—satisfies the requirements of PV array input voltage, PV array input current, and battery charging voltage, but it does not satisfy the battery type. It is recommended to be used with a 12V 4S lithium–iron–phosphate battery, but the battery used in the power system is an 11.1V 3S lithium–polymer battery. The MPPT internal sensing algorithm may not work efficiently with an incompatible battery model.
Although the comparison of the change in battery stored capacity shows that the so-lar power system is capable of saving battery stored capacity, the values of change in bat-tery voltage determined from the two flight experiments exhibit some difference. A pos-sible explanation would be the difference in wind speed in the two flight experiments.
Figure 15. MPPT output current for flight test ‘Sun’ #1.2 obtained by subtracting the battery output current from the ESCinput current (a small part of the calculated MPPT output current is negative and converted into 0).
5.4. Results Discussion
From the power system tests results, the solar power system works satisfactorily underhigh solar radiation. This means the solar power system can only extend battery life on theUAV flight performance at solar radiation intensities above 300 W/m2 and works moreefficiently at solar radiation intensities above 500 W/m2. The poor MPPT performance atlow solar radiation is likely to be caused by an incompatible MPPT model with the battery.Due to budget restriction, the MPPT selected in this project—Genasun GVB-8-Li-14.2VBoost MPPT—satisfies the requirements of PV array input voltage, PV array input current,and battery charging voltage, but it does not satisfy the battery type. It is recommended to

Drones 2021, 5, 44 17 of 19
be used with a 12V 4S lithium–iron–phosphate battery, but the battery used in the powersystem is an 11.1V 3S lithium–polymer battery. The MPPT internal sensing algorithm maynot work efficiently with an incompatible battery model.
Although the comparison of the change in battery stored capacity shows that thesolar power system is capable of saving battery stored capacity, the values of change inbattery voltage determined from the two flight experiments exhibit some difference. Apossible explanation would be the difference in wind speed in the two flight experiments.During the second flight experiment, the wind speed was higher at between 9 and 12 knots,compared to 3 to 6 knots during the first flight experiment. During circuiting in the secondflight experiment, the aircraft required more power when it flew against the wind. Asshown in Figure 13, the battery voltages fluctuated during circuiting. The periods when thevoltages increase to reach small peaks are those when the aircraft was in the section of thecircle that it faced head wind. As a result of higher windspeed, the fluctuation in batteryvoltage in the second flight experiment is greater than that in the first flight experiment.The battery voltage curves for the second flight experiment fluctuate more than those forthe first flight experiment, so that the battery voltages taken during the data logging periodcould have greater error.
In conclusion of the experimental data of changes in battery stored capacity, the useof solar power on this UAV does decrease the use of battery stored capacity during flight.From Figure 13, the battery voltage curves show that the rate of decrease in battery voltagein the test flights of ‘Sun’ is slower than that in the test flights of ‘Eclipse’. Therefore,from the graphical interpretation of battery voltage experiment data, it is concluded thatthe use of solar power system on the UAV leads to a slower rate of decrease in batteryvoltage during flights, hence extending the battery life during flights and extending theflight duration.
The MPPT electrical output values determined from the flight test are slightly largerthan those determined in the power system test. In the flight test, the MPPT output currentcan be as high as 1.2 to 1.4 A. A possible explanation would be the PV cells on the backside of the wings were exposed to more reflected sunlight when the aircraft was flyingthan they were tested on ground; hence, higher power was generated by the PV array. Therelative angles of the PV cells attached to the wing change continuously during flight. Thismay result in fluctuating MPPT electrical output.
In Table 6, the average values of the experiment raw data of ESC input current Im,battery output current Ib, and battery voltage Vb between t1 and t2 of 4 min 45 s in three ofthe test flights are calculated. Data for flight #1.1 of ‘Sun’ are not included as they exhibitsignificant anomaly—the exact same current value repeating for abnormally long period.Therefore, the average MPPT output power and average electrical power required forcircuiting during the period is obtained. The data obtained from flight #1.2 of ‘Sun’ showthat having an average MPPT output power of 6.27 W, the solar power system can supply15.4% of the electrical power required for circuiting.
Table 6. Average values of electrical parameters between t1 and t2.
Electrical Parameters #1.2 ‘Sun’ #2.2 ‘Eclipse’
Average ESC Input Current Im 3.51 A 4.34 AAverage Battery Output Current Ib 2.97 A 4.34 A
Average MPPT Voltage Vp (=Vb) 11.59 V NilAverage ESC Voltage Vm
(= Vb = Vp
)11.59 V 11.26 V
Average MPPT Output CurrentIp (=Im − Ib) 0.54 A Nil
Average MPPT Output PowerPp (= Vp × Ip) 6.27 W Nil
Average Power Required for Circuiting(= Vm × Im) 40.68 W 48.87 W
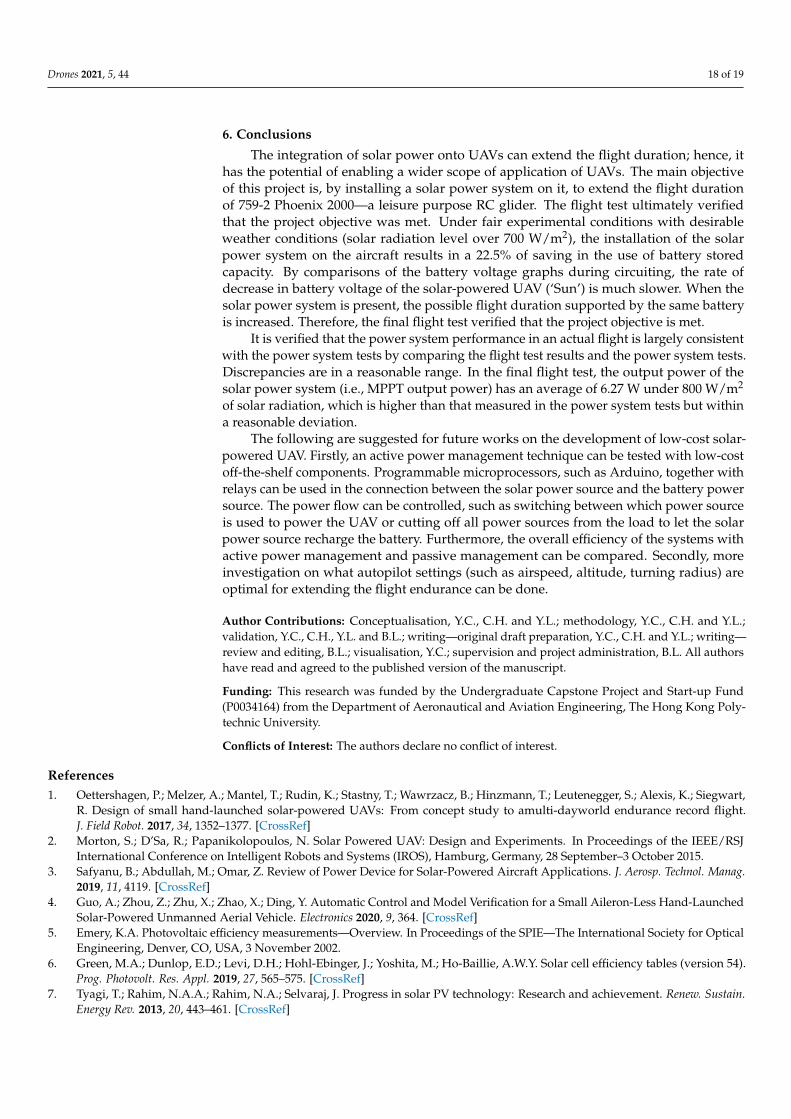
Drones 2021, 5, 44 18 of 19
6. Conclusions
The integration of solar power onto UAVs can extend the flight duration; hence, ithas the potential of enabling a wider scope of application of UAVs. The main objectiveof this project is, by installing a solar power system on it, to extend the flight durationof 759-2 Phoenix 2000—a leisure purpose RC glider. The flight test ultimately verifiedthat the project objective was met. Under fair experimental conditions with desirableweather conditions (solar radiation level over 700 W/m2), the installation of the solarpower system on the aircraft results in a 22.5% of saving in the use of battery storedcapacity. By comparisons of the battery voltage graphs during circuiting, the rate ofdecrease in battery voltage of the solar-powered UAV (‘Sun’) is much slower. When thesolar power system is present, the possible flight duration supported by the same batteryis increased. Therefore, the final flight test verified that the project objective is met.
It is verified that the power system performance in an actual flight is largely consistentwith the power system tests by comparing the flight test results and the power system tests.Discrepancies are in a reasonable range. In the final flight test, the output power of thesolar power system (i.e., MPPT output power) has an average of 6.27 W under 800 W/m2
of solar radiation, which is higher than that measured in the power system tests but withina reasonable deviation.
The following are suggested for future works on the development of low-cost solar-powered UAV. Firstly, an active power management technique can be tested with low-costoff-the-shelf components. Programmable microprocessors, such as Arduino, together withrelays can be used in the connection between the solar power source and the battery powersource. The power flow can be controlled, such as switching between which power sourceis used to power the UAV or cutting off all power sources from the load to let the solarpower source recharge the battery. Furthermore, the overall efficiency of the systems withactive power management and passive management can be compared. Secondly, moreinvestigation on what autopilot settings (such as airspeed, altitude, turning radius) areoptimal for extending the flight endurance can be done.
Author Contributions: Conceptualisation, Y.C., C.H. and Y.L.; methodology, Y.C., C.H. and Y.L.;validation, Y.C., C.H., Y.L. and B.L.; writing—original draft preparation, Y.C., C.H. and Y.L.; writing—review and editing, B.L.; visualisation, Y.C.; supervision and project administration, B.L. All authorshave read and agreed to the published version of the manuscript.
Funding: This research was funded by the Undergraduate Capstone Project and Start-up Fund(P0034164) from the Department of Aeronautical and Aviation Engineering, The Hong Kong Poly-technic University.
Conflicts of Interest: The authors declare no conflict of interest.
References1. Oettershagen, P.; Melzer, A.; Mantel, T.; Rudin, K.; Stastny, T.; Wawrzacz, B.; Hinzmann, T.; Leutenegger, S.; Alexis, K.; Siegwart,
R. Design of small hand-launched solar-powered UAVs: From concept study to amulti-dayworld endurance record flight.J. Field Robot. 2017, 34, 1352–1377. [CrossRef]
2. Morton, S.; D’Sa, R.; Papanikolopoulos, N. Solar Powered UAV: Design and Experiments. In Proceedings of the IEEE/RSJInternational Conference on Intelligent Robots and Systems (IROS), Hamburg, Germany, 28 September–3 October 2015.
3. Safyanu, B.; Abdullah, M.; Omar, Z. Review of Power Device for Solar-Powered Aircraft Applications. J. Aerosp. Technol. Manag.2019, 11, 4119. [CrossRef]
4. Guo, A.; Zhou, Z.; Zhu, X.; Zhao, X.; Ding, Y. Automatic Control and Model Verification for a Small Aileron-Less Hand-LaunchedSolar-Powered Unmanned Aerial Vehicle. Electronics 2020, 9, 364. [CrossRef]
5. Emery, K.A. Photovoltaic efficiency measurements—Overview. In Proceedings of the SPIE—The International Society for OpticalEngineering, Denver, CO, USA, 3 November 2002.
6. Green, M.A.; Dunlop, E.D.; Levi, D.H.; Hohl-Ebinger, J.; Yoshita, M.; Ho-Baillie, A.W.Y. Solar cell efficiency tables (version 54).Prog. Photovolt. Res. Appl. 2019, 27, 565–575. [CrossRef]
7. Tyagi, T.; Rahim, N.A.A.; Rahim, N.A.; Selvaraj, J. Progress in solar PV technology: Research and achievement. Renew. Sustain.Energy Rev. 2013, 20, 443–461. [CrossRef]

Drones 2021, 5, 44 19 of 19
8. Bhatnagar, P.; Nema, R.K. Maximum power point tracking control techniques: State-of-the-art in photovoltaic applications.Renew. Sustain. Energy Rev. 2013, 23, 224–241. [CrossRef]
9. Strele, T. Power Management for Fuel Cell and Battery Hybrid Unmanned Aerial Vehicle Applications; ProQuest LLC: Tucson, AZ, USA, 2016.10. Austin, R. Unmanned Aircraft System; Wiley: Hoboken, NJ, USA, 2010.11. Figueiredo, D.L. Autopilot and Ground Control Station for UAV. 2014. Available online: https://fenix.tecnico.ulisboa.pt/
downloadFile/566729524649660/DuarteFigueiredo_Thesis.pdf (accessed on 20 May 2021).12. Nagai, M.; Witayangkurn, A.; Honda, K.; Shibasaki, R. UAV-Based Sensor Web Monitoring System. Int. J. Navig. Obs. 2012, 2012, 7.
[CrossRef]13. Noth, A.; Engel, W.; Siegwart, R. Field and Service Robotics; Springer: Berlin/Heidelberg, Germany, 2006.14. Feng, S.; Li, P.; Xue, Y.; Gao, F.; Bai, Z.; Zhang, L.; Guo, Q. Characteristics and design key points of small CIGS solar UAV. In
Proceedings of the IOP Confrence Series: Earth and Environmental Science, Tianjin, China, 24–26 April 2020.15. Ghosh, K.; Guha, A.; Duttagupta, S.P. Power generation on a solar photovoltaic array integrated with lighter-than-air platform at
low altitudes. Energy Convers. Manag. 2017, 154, 286–298. [CrossRef]