development - agecon search
TRANSCRIPT
Guru Arjan Dev Institute of Development Studies
14-Preet Avenue, Majitha Road
PO Naushera, Amritsar 143008 Under the aegis of Guru Arjan Dev Institute of Development Studies Society)
Registered under the Societies Registration Act XXI of 1860
(Institute in General Consultative Status with Economic and Social Council of United Nation)
September 2016
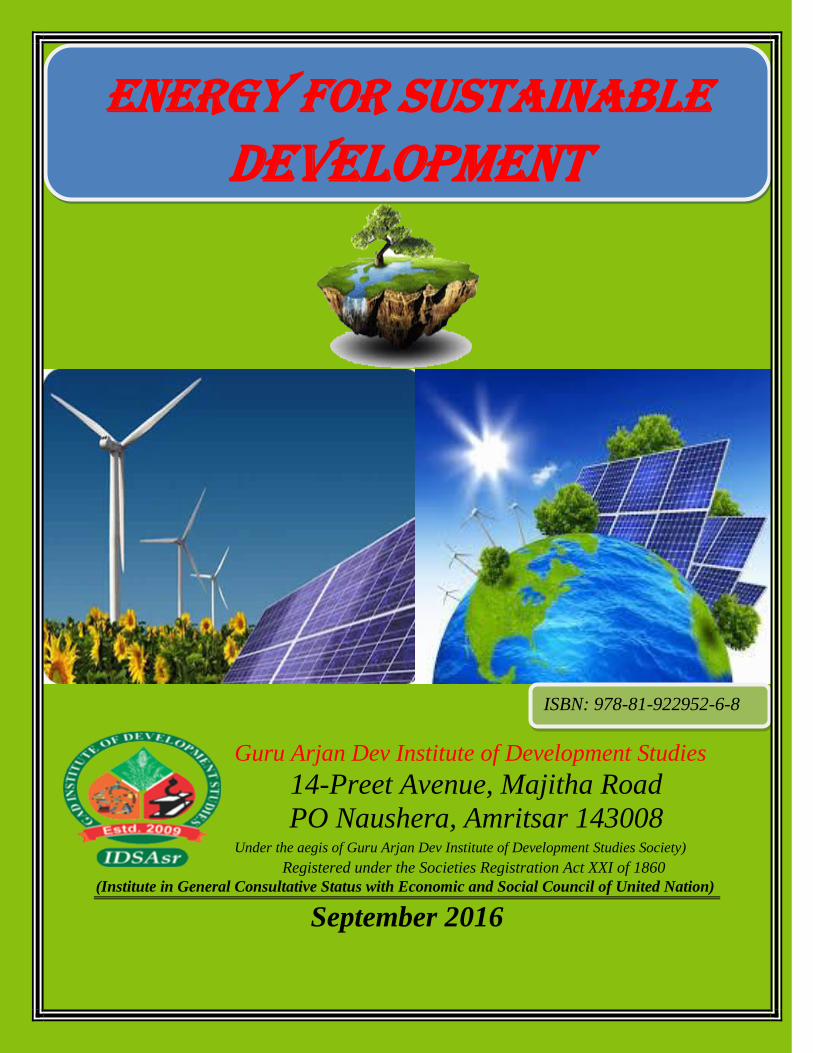
ENerGy for sustainable Development
ISBN: 978-81-922952-6-8

0
@ 2016 Guru Arjan Dev Institute of Development Studies, Amritsar (IDSAsr)
1
All rights reserved. No part of this work may be reproduced, stored, adapted or transmitted in
any form or by any means, electronic, mechanical, photocopying, microfilming recording or
otherwise, or translated in any language, without the prior written permission of the copyright
owner and the publisher.
Sections of this material may be reproduced for personal and not for profit use without the
express written permission of but with acknowledgment to IDSAsr.
The views and opinions expressed in this study are authors own and the facts reported by
authors have been verified to the expert possible and the publishers are not in any way liable for
the same.
The publication of the study is possible with the financial support of the IDSAsr. However, the
seminar was jointly sponsored by the Department of Bio technology and Ministry of earth
Science, Government of India, New Delhi.
First Published: 2016
ISBN: 978-81-922952-6-8
Price: India…… Rs. 250.00 only
Overseas……. US $ 50.00 only
Graphic Credit: Mr Navdeep Singh and Damanpreet Kaur
Typesetting under the supervision of Sh Navdeep Singh.
Printed and Published by Dr Gursharan Singh Kainth, Chief Executive Officer, Guru Arjan Dev
Institute of Development Studies Society, Amritsar-143008
Registered office: 14-Preet Avenue, Majitha Road, PO Naushera, Amritsar-143008
Phone: 0183-2426045
M. No 919914703461
Email:[email protected]
Website: idsasr.org
2

3

4
CONTENT
MESSAGES
1. India’s Energy Security: Challenges and Policy
Rajinder Singh Bawa and Gursharan Singh Kainth
2. The Energy Future and India
Neelam G. Tikkha
3. India’s Cross Border Energy Trade: A Case of Transnational Gas Pipelines
Manish Vaid and Tridivesh Singh Maini
4. Infrastructure for Renewable Energy in India: Some Policy Issues
Sanjay Tiwari
5. Oil & Gas Sector: Innovation and Sustainable Development
P K Sahoo and Surbhi Arora
6. Energy Security and Water Resource: Towards Sustainable Development
Archana Sinha and Balram Rao
7. Cattle Dung: A Suitable Substrate for Lignolytic Enzymes Production Using Coriolus
Versicolor MTCC 138
Urmila Gupta and Phutela Rekha Sharma
8. Potential of Biogas Slurry for Sustainable Agriculture in India: Evidences From Farmer’s
Participatory Action Research
Shiv Kumar, Kanika, D R Singh and K R Chadhary
9. Liquefaction and Saccharification of Rice and Wheat into Fermentable Sugars for
Production of Mixed Grain Wine
Manpreet Attri and R P Phutela
10. Role of Renewable Energy in Sustainable Development of India with Special Reference to
Solar Energy
Swami Prakash Srivstava and Surat Prakash Srivsatva
11. Briquette Fuel - An Option for Management of Mikania Micrantha
Ramesh Man Singh and Mridaney Sharma Poudel
12. Energy Conservation and Management –Towards Sustainable Development
N.V. Kavitha and Smita Asthana
13. Sustainable Use of Wind Resources for High Agricultural Production in Arid Region of
Rajasthan- A Case Study of Impact of Shelterbelt
B.L. Gajja and S.S. Ramdev
14. Fulfilling India’s Hunger for Energy
Agrim Katoch and Rohit Sinha
15. Man and Energy Resources
Surabhi Aggarwal,
5
ABSTRACT
1. Smart Oil Field: Challenges and Potential Solution
P K Sahoo and Aravinda Kumar Sikharam
2. Challenges of Energy Scenario in Asia and Pacific
Subhash Chand
3. Study on Energy Consumption Pattern and Ghgs Emission: A Case Study in Belwa Vdc,
Parsa, Nepal
Binay Sa Kanu and Jagan Nath Shrestha
4. Gas Hydrate: Recent Development for Sustainable Energy
P K Sahoo and Sambeet Mohapatra
5. Sustainable Development of Hydro-Power in India
R.K. Khanna
6. Emerging Role of Biomass Derived Biofuels as Renewable Energy Sources
D.K. Sharma
7. Energy Trade in South Asia: Role of Non-State Actors
Udai S Mehta & Gaurav Shukla
8. Review of Gas Pricing Formula by C Rangarajan Committee
Ranjan Sham, Soby Alexander, Amol Agarwal and Somya Sharma
9. Bio Fuels - Support Environmental Preservation
Gursharan Singh Kainth
10. Energy Indicators for Sustainable Development
Harinder Singh Gill
11. Electricity Consumption and Sustainable Development:Time Series Analysis for Punjab and
Haryana States
Amarjit Singh Sethi and Supreet Kaur
12. Solar Power Generation: Role of Rajasthan in Empowering the Nation
Rashpal Kaur
13. Modernization, Displacement and the Ethnic Identity: Hydro Power Projects in Undivided
Koraput District in Odisha
Sarat K Jena
14. Present Senerio of Renewable Energy Resouces In India
Anil Kumar, N. K. Tholia and Sheena Jangir
15. Short Rotation Forestry Wood Based Small Scale Gasifier System for Generation of Power
for Rural Households
Rajesh Soni, Iqbal Singh, Sanjeev K. Chauhan and Monica Sachdeva

6
Current demographic, economic, social, and technological trends – if not counterbalanced by
strong new government policies – pose major challenges to
the long-term sustainability of the global energy system. If
governments do not implement policies beyond those already
planned between now and 2030, it is projected that:
• energy consumption will increase by over half (53per
cent);
• the energy mix will remain fairly stable and dominated by
fossil fuels (80per cent share);
• energy-related CO2 emissions will increase by over half
(55per cent); and
• large populations of the world's poor will continue to lack
access to electricity (about 1.5 billion) and modern cooking
and heating services (about 2.5 billion).
In this scenario, energy consumption increases from 11 200 Mtoe (millions tons of oil
equivalent) in 2004 to 17 200 Mtoe in 2030. Over 70per cent of this growth is expected to come
from developing countries, which overtake OECD countries as energy consumers sometime
around 2014.
Nearly half of the increase in global primary energy use goes to generating electricity and one-
fifth of the increase (almost entirely in the form of oil based fuels) to meeting transport needs.
Growth in energy use and emissions is expected to be particularly marked in some sectors. The
sectoral contributors to growth in energy consumption are expected to be power generation
(35per cent), industry (15per cent), transport (12per cent) and buildings (6per cent) in
developing countries, followed by power generation (11per cent) and transport (6per cent) in
OECD countries. Improving efficiency and reducing carbon dioxide (CO2) emissions should
receive early attention in these high growth areas, because these goals are easier and cheaper to
attain at the time of new construction than at later retrofit stages. It is predicted that the global
energy mix will remain fairly stable and dominated by fossil fuels to 2030 due to the size and
inertia of the energy system and the inability to change it quickly.
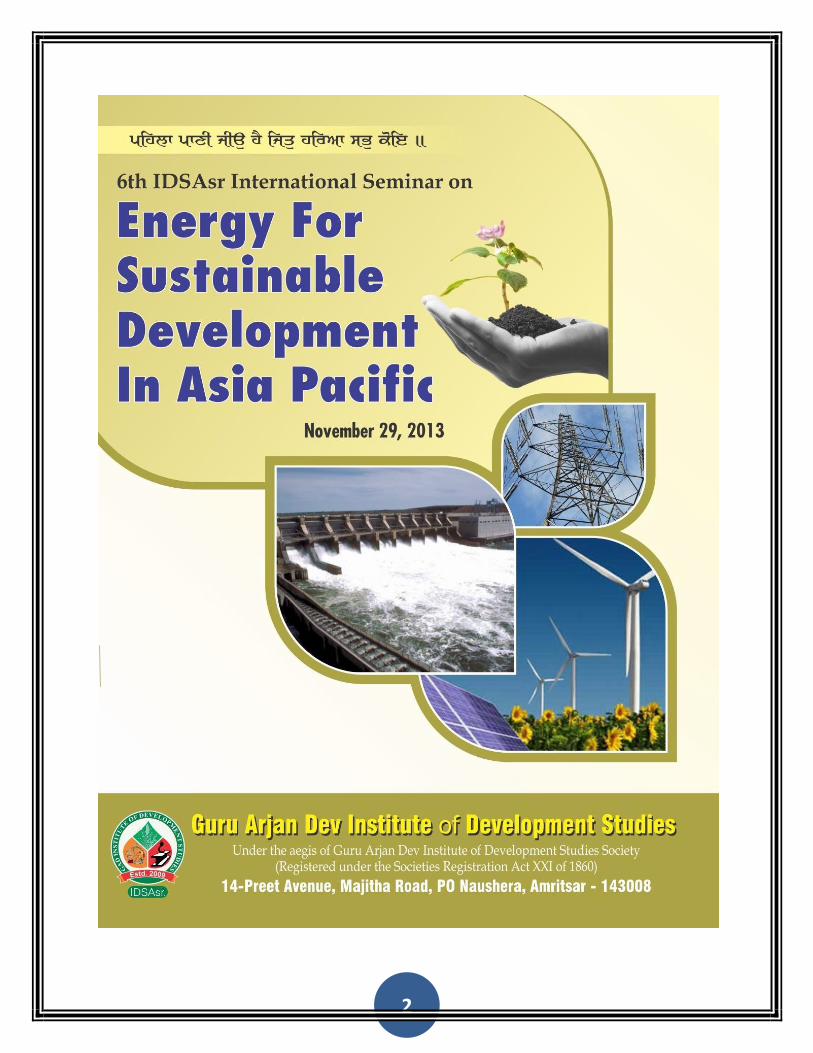
It is in the above context that Guru Arjan Dev Institute of Development Studies is organizing the
International seminar on Energy for Sustainable Development in Asia Pacific. I am sure that
the distinguished delegates and guest will enrich the understanding of this important effort for an
educated and knowledge rich India. It gives me immense pleasure to place before you this
publication (eBook) before you based on the various papers received for presentation/discussion
at the seminar.
I wish all success to the Seminar
(Prof R S Bawa)
Chairman, Research Advisory Council
Guru Arjan Dev Institute of Development Studies7
Vice Chancellor, Chandigarh University Mohali
MESSAGE
7
Hon'ble Prime Minister is happy to learn that Guru Arjun Dev Institute of Development Studies,
Amritsar is organizing a National Seminar on
―Energy for Sustainable Development in Asia
Pacific” from 29th November to 1st December.
2013.
Producing energy for sustainable development is a
big challenge of our times. The Prime Minister
hopes that the deliberations from the seminar will
focus on identifying enabling conations which will
facilitate energy production endeavours of the
government and the society.
I am happy to convey the greetings and good wishes of the Prime Minister for the success of the
Seminar.
Pankaj Pachauri
Communication Advisor
Prime Minister Office,
New Delhi
MESSAGE
8
I am pleased to know that Guru Arjan Dev Institute of Development Studies, Amritsar is
organizing 6th
International Seminar in November, 2013 on ―Energy
for Sustainable Development in Southeast Asia‖. The present energy
scenario presents many challenges. The power supply position
prevailing in the country is characterized by persistent shortage and
unreliability, and also high prices for industrial consumer. In the case
of petroleum depend to the extent of 70 per cent on imported, and this
naturally raises issues about energy security. The chosen topic for the
Seminar is therefore both relevant and timely.
India is the fourth largest consumer of energy in the world after USA,
China and Russia but it is not endowed with abundant energy
resources. It must, therefore, meet its development needs by using all available domestic
resources of coal, uranium, oil, hydro and other renewable resources and supplementing
domestic production by imports. High reliance on imported energy is costly given the prevailing
energy prices which are not likely to soften; it also impinges adversely on energy security.
Achieving an efficient configuration of the various forms of energy requires consistency in the
policies governing each sector and consistency in the pricing of different types of energy. There
is also a need for clarity in the direction in which we wish to move to in aspects like energy
security, research and development, addressing environmental concerns, energy conservation
etc.
A National Mission on Energy Efficiency (NMEE) has been launched to improve energy
efficiency in all areas of the economy including power, transport, urban housing, consumer
goods and industries. As a part of Clean Energy Mechanism, which is a global initiative, a
number of measures are being planned for improving efficiency in lighting by use of light-
emitting diodes (LEDs) and super-efficient appliances.
I have consciously raised the issues of energy efficiency, and hope that the deliberations in the
Seminar may provide some answers for energy policy design for India. I believe that policy
making is a continuous exercise that must involve all stakeholders. Our professional bodies and
academic institutions must act as pacesetters in finding new pathways foe accelerated
development of our country. I take this opportunity to congratulate the professors, teachers,
students and all other participants who have contributed to Seminar by sharing the knowledge
and learning acquired to bring change in the society.
Montek Singh Ahluwalia Deputy Chairman
Planning Commission
New Delhi
MESSAGE

9
The International Conference held in Rio de Janeiro last year to commemorate the 20th
anniversary of the Rio Earth Summit has again reiterated the need for
mainstreaming sustainability concerns in all development programmes
in Asia Pacific. Southeast Asia and sub Saharan Africa are
particularly vulnerable to the impact of adverse changes in climate.
Water and food security will be particularly endangered. In both these
cases, energy security is vital. Feeding and fueling the future are two
major challenges before us. We will have to promote energy security
without compromising the goal of food for all and forever. Energy
security will have to be achieved in such a manner that we do not
compound the problem of climate change arising from green gas
house emissions. This will call for greater attention to all renewable
sources of energy. In India, we have particularly vast untapped opportunities for mobilizing
solar and wind energy, and biomass and biogas. By developing an energy security system which
ensures adequate energy for agriculture, industry and domestic uses, we can help to promote a
better quality of life for both rural and urban communities. At the same time, we can contribute
to the UN Sustainable Development Goals which will receive attention from 2016 when the UN
Millennium Development Goals time frame for the UN goal ends.
It is in this context, that the present conference on ―Energy for Sustainable Development in
Southeast Asia‖ assumes great significance. I wish the conference great success. We owe a deep
debt of gratitude to Dr Gursharan Singh Kainth and his colleagues on this timely and important
contribution. I hope the book will be read widely by all concerned with fuel in the future.
PROF M S SWAMINATHAN
Founder Chairman and Chief Mentor
UNESCO Chair in Eco technology
M S Swaminathan Research Foundation
Third Cross Street, Taramani Institutional Area
Chennai - 600 113
MESSAGE

10
I am delighted to learn that the Guru Arjan Dev Institute of Development Studies in organizing
its 6th
International Seminar on the theme ―Energy for Sustainable
Development in Southeast Asia‖ in November, 2013. The issues that have
been dealt with in past International Seminars have all been of crucial
importance to human society and particularly to India. I am sure the
forthcoming Seminar dealing with the issue of Energy for Sustainable
Development in Southeast Asia would be equally successful.
South and Southeast Asia face some crucial challenges in the energy sector,
because with rapid growth and development the demand for energy is
increasing rapidly. Current patterns of production and consumption, which
have been borrowed largely from the developed world, are essentially
energy intensive. Consequently, there is need for innovation and fresh thinking by which
development patterns can be evolved to produce economic growth at lower intensities of energy
production and use. It is also essential to keep in mind local environmental problems associated
with the energy cycle, which have major implications for human health. These range from
outdoor air pollution as a result of growing motorized transport as well as indoor air pollution
resulting from large scale use of biomass for cooking in many countries of the region. Such
cooking often takes place with very poorly designed and inefficient cook stoves. As distinct from
the developed world, therefore, in Asia as a region it is crucially important that inefficient cook
stoves and polluting fuels be replaced with efficient cook stoves and cleaner fuels. This is a
major challenge which involves not only technological upgradation but a solution of several
institutional problems that are responsible for continuation of current patterns.
In essence, South and Southeast Asia would have to find ways by which energy can be used far
more efficiently and renewable technologies can be developed and disseminated on a large
scale. Such an approach would have benefits not only in terms of reducing the emissions of
greenhouse gases but also substantial co-benefits in the nature of improved health on account of
lower levels of air pollution, higher energy security and possibly increased employment as well.
I am sure that the 6th
International Seminar would discuss and deliberate on some of these
issues. And create knowledge by which solutions can be devised and implemented in the entire
region. I am happy to know that the papers in the Seminar will be published, because there is
clearly a need for published literature on some of these subjects, particularly if they focus on
local and country specific solutions.
I would like to convey my best wishes to the organizers of this event and the participants who I
hope will have a productive and pleasant experience at the International Seminar.
R K Pachauri Ph. D Director General
The Energy and Resource Institute
Darbari Seth block, IHC Complex
Lodhi Road
New Delhi-110003
MESSAGE
11
Over the past few years, energy security and sustainable development have become global
agenda. There are two main reasons for this: first, the impact of high
and often volatile energy prices; second, concerns over environmental
sustainability and particularly about the global climate. Both issues are
critically important for Asia and the Pacific- a region in which
impressive economic growth has boosted the demand for energy and
put corresponding strains on the environment. The existing energy
supply and demand situation means that conventional sources, such as
oil and coal, will be depleted at an alarming rate. Growing concern
about the environmental impact of the various energy resources places
restrictions on their use. The Kyoto Protocol requires participating
countries to reduce carbon emissions drastically over the next decade.
The Asia –Pacific region with its rapidly growing energy demand should utilize its abundant
natural resources to move away from heavy dependence on fossil fuels. Governments in Asia-
Pacific region have started considering sustainable energy as serious alternative to conventional
fuels. It has been estimated that investment in the sustainable energy industry would generate
more jobs per megawatt (almost 10 times) than is the case for the conventional energy industry.
This will require investment in education and training to provide the technical support and
development skills along with increased public awareness of the environmental sustainability
issues and efficient energy use strategies. If the new and emerging energy technologies are to
make a serious contribution to sustainable development in the Asia- Pacific region then
investment, intellectual effort and capacity building need to be planned for the sort and long
term.
It is matter of pleasure to know that Guru Arjan Dev Institute of Development Studies, Amritsar
is holding the 6th
International Seminar on the theme Energy for Sustainable Development in
Asia from November 29 to December 1, 2013. I am sure that the International Seminar will
provide much needed scientific exposure about energy security concerns to the young students
and researchers.
I wish the seminar all success and congratulate the organizers for this timely initiative.
Dr S Ayyappan Secretary and Director General
Government of India
Department of Agricultural Research and Education
Indian Council of Agricultural Research
Ministry of Agriculture, Krishi Bhawan,
New Delhi-110 001
MESSAGE
12
I am very happy to know that Guru Arjan Dev Institute of
Development Studies, Amritsar is organizing an International
Seminar on Energy for Sustainable Development in Asia.
It is well established that the energy consumption by a nation is
directly related to its development status. Access to sustainable
sources of clean, reliable and affordable energy has therefore, a
profound impact on human development. The affordability,
reliability and commercial viability aspects of energy are
indispensable factors for a prosperous and environmentally sustainable future. Ensuring energy
security demands diversification of types and sources of energy, energy efficiency and regional
interconnections. Greater use of clean energy obviously contributes to sustainability of the
development process, which is likely to assume great importance in the years to come.
The energy sector requires a major transformation in technology, with emphasis on mix of
energy supply sources – be it solar, wind or biomass. It is obvious that if we have to attain a
higher rate of growth of economy, the management of the energy sector will require high level of
professional competence and commitment.
I hope that the seminar will provide an intellectually rich forum for debating new research
streams and challenges and for identifying areas of success and partnership opportunities in
this important field and achieve its intended objectives.
R S Khandpur
Director General, PGSC
Pushpa Gujral Science City
Jalandhar-Kapurthala Road, Kapurthala, Punjab
MESSAGE
13
Addressing the Challenges of Energy and Food Security in the Context of Climate Change The
Case for a Multi-Partner Programme on “Energy-Smart Food for People and Climate” FAO,
May 2013
Energy is strongly linked to food security and nutrition in four ways:
Energy is needed for producing (both primary agricultural production, including production of
inputs such as fertilizer, and processing), storing, distributing, preparing and cooking food – so
at every stage of the agrifood chain
Energy prices influence the price of agricultural inputs and therefore food prices and farmers‘
income;
Biofuel development strengthens the above link and more generally influences all dimensions of
food security and nutrition;
By reducing time spent by, in particular, women on household tasks, freeing up more time for
their common role as care-givers to the most vulnerable.
1. The Agrifood Chain - Part of the Problem...
The 2011 Bonn Conference on ―The Water, Energy and Food Nexus – Solutions for a Green
Economy‖ highlighted global increasing international and national concerns about limited
access to water, sanitation, energy and food – often primarily a consequence of poor
management - and thus inequalities in distribution: Indeed today‘s situation is worrying:
About 0.9 billion people lack access to safe drinking water,
2.6 billion people lack access to adequate sanitation,
1.3 billion people lack access to electricity,
2.7 billion have no access to modern and healthy forms of cooking,
Close to 1 billion people are undernourished.
Ecosystems are already stressed, as evidenc3d for instance by the fact that 25 per cent of
agricultural land is degraded.
The planned increase in population, mainly urban and hopefully wealthy will put significant
additional pressure on energy, water and food demands with growing trade-offs among these
three development goals. This pressure might also accelerate ecosystem degradation. Water,
energy, and food sectors are interconnected in important ways, and actions in one sector may
either help or harm the other two. Disconnected approaches and silo thinking are more likely to
make matters worse (BMZ 2011). A “nexus: approach is therefore needed to address the
current and future interconnected water-energy-food security needs in an integrated way.
Globally, the agrifood chain food and agriculture consume around 30 percent of the world’s
available energy – with more than 70 percent occurring beyond the farm gate . High-GDP
countries use a greater portion of energy for processing and transport whereas in Low GDP
MESSAGE

14
countries cooking consumes the highest share. Farm and fishery production uses around one
fifth of the total agrifood energy demand but produces two thirds of the greenhouse gases
(GHG). The whole agrifood sector produces over 20per cent of total greenhouse gas emissions
(FAO, 2011). Reducing these emissions, increasing energy security, and high and volatile energy
prices are challenges for future development of the agrifood sector whilst aiming to support
sustainable development.
FAO has shown that around one third of the food we produce is lost or wasted, and with it
about 38 per cent of the energy consumed in the agrifood chain (FAO, 2011). In Low-GDP
countries most losses occur during harvest and storage whereas in High-GDP countries they
mainly occur at the retail, preparation, cooking and consumption stages of the food supply
chain.
The positive role of fossil fuel in feeding the world over the last decades is uncontested. This role
has also created a significant and increasing dependency of industrial agrifood systems on fossil
fuel. This dependency, coupled with the FAO projection that almost 90 per cent of the
projected 60per cent increased demand for food by 2050, are becoming cause for concern, as
it could have dire consequences for food security and climate change if not addressed head on.
Future increases in productivity may be constrained by the limited future availability of cheap
fossil fuel supplies. With higher and increasingly volatile fossil fuel prices foreseen in the future,
these consequences are likely to become even worse, given the close links between fossil fuel and
food prices.
At the same time, almost 3 billion people, largely in rural areas, are without access to modern
energy services for heating and cooking, and 1.4 billion are without access to electricity, which
is a fundamental barrier to their development and to the achievement of the Millennium
Development Goals. Moreover, inhaling smoke from open cooking fire kills more people than
malaria (about 1.5 Mio people per year). There is therefore a compelling need to immediately
support a transition to agri‐food systems that significantly increase access to modern energy
services through higher energy efficiency and a greater use of renewable energy.
2. But Also Part of the Solution The Vision: Energy-Smart Food for People and Climate to
simultaneously address the challenges of energy, water and food security in the context of
climate change
In green economies, new development paths are sought that put agriculture and economic equity
at the centre. The agrifood chain, the supply chain from field to the plate, can be part of the
solution. The key elements that can be varied in the system are efficiency, diversity of energy
source and integration between food production and energy production and use.
The agrifood chain uses energy at all levels from the farm to the plate. Energy inputs enter along
all stages of the chain. Food is lost and wasted across the chain, this food contains embedded
energy. Food losses are often due to lack of access to energy for adequate storage, processing,
transportation and distribution. Food wastage mainly relates to consumer behaviour. The
agrifood chain can also produce energy. Some of this energy can also be fed back into the
system, or used externally, thus improving energy access.
Energy Smart Food for People and Climate (ESF in short) is the strategy for a green economy
alternative driven from the agrifood sector. Energy smart food systems:
improve efficiency at all levels;
use diverse energy sources with an emphasis on renewable energy;
improve energy access through integrated food and energy production.
15
Amongst renewable energy types, bioenergy has a special role to play in food security because
(i) biomass is currently, and for the foreseeable future, the most important source of renewable
energy, primarily for cooking and heating, but it is often used in unsustainable ways, (ii) biomass
is present almost everywhere (iii) agri-food systems can use but also produce bioenergy, for
instance through integrated food-energy systems, but (iv) implementing bioenergy in the right
way is more complex that other types of renewable energy because, if not well managed,
bioenergy development may harm food security and the environment.
By implementing Energy Smart Food systems overall energy consumption will be reduced,
alternative energy sources will be used within the systems, and potentially the agrifood systems
will be able to produce both food and energy. This will help meet food, poverty, energy security
and access targets, and allow to identify climate smart solutions and to implement systems that
are sustainable and resilient to the ongoing climate changes.
3. What to Do – The FAO Multipartner Programme on “Energy-Smart Food for People and
Climate”
An integrated ( nexus) approach to meeting food, water, energy and climate change
requirements is essential, and this requires a multidisciplinary, multi‐partner programme to
help countries identify appropriate energy, food security and climate smart solutions and to
assist on promoting and implementing them.
Some key questions that the Energy-Smart Food “(ESF) programme addresses:
- How and to what extent can energy smart food systems contribute to energy access for the
poor?
- How much room for improvement is there through efficiency gains, loss and waste reduction
and energy source diversification?
- What alternative energy smart solutions exist, are proven and implementable?
- What is the structure of analysis and what is the baseline for the agrifood supply chain?
- Which energy smart food systems apply in which country contexts and how do they vary?
Agrifood systems have a unique link with energy in that they both consume and can produce
energy. This allows for the challenges of the ―food-energy-water-climate change nexus‖ to be
addressed from both energy used in and produced by agrifood systems by becoming more
―energy-smart through three objectives:
Higher energy efficiency through alternative practices and technological improvements (i.e.
―doing more (production) with less (inputs including energy)‖, including reducing energy
losses related to food wastage;
Energy diversification through increased use of renewable energy (RE) in the agrifood
chain;
Improved access to modern and sustainable forms of energy in rural areas, through better
integration of food and energy production.
The ESF objectives mean that this programme can be considered the major agriculture and
rural development contribution UN Sustainable Energy for All Initiative (SE4All). It will also
address key concerns related to the ―Food-Water-Energy-Climate‖ Nexus
16
As part of the ESF programme, FAO has developed a sustainable bioenergy support package1
which can help governments and operators implement bioenergy in a way that reduces risks and
harnesses opportunities.
projected 60 per cent increased demand for food by 2050, are becoming cause for concern, as
it could have dire consequences for food security and climate change if not addressed head on.
Future increases in productivity may be constrained by the limited future availability of cheap
fossil fuel supplies. With higher and increasingly volatile fossil fuel prices foreseen in the future,
these consequences are likely to become even worse, given the close links between fossil fuel and
food prices.
At the same time, almost 3 billion people, largely in rural areas, are without access to modern
energy services for heating and cooking, and 1.4 billion are without access to electricity, which
is a fundamental barrier to their development and to the achievement of the Millennium
Development Goals. Moreover, inhaling smoke from open cooking fire kills more people than
malaria (about 1.5 Mio people per year). There is therefore a compelling need to immediately
support a transition to agri‐food systems that significantly increase access to modern energy
services through higher energy efficiency and a greater use of renewable energy.
The Vision: Energy-Smart Food for People and Climate to simultaneously address the
challenges of energy, water and food security in the context of climate change.
In green economies, new development paths are sought that put agriculture and economic equity
at the centre. The agrifood chain, the supply chain from field to the plate, can be part of the
solution. The key elements that can be varied in the system are efficiency, diversity of energy
source and integration between food production and energy production and use.
The agrifood chain uses energy at all levels from the farm to the plate. Energy inputs enter along
all stages of the chain. Food is lost and wasted across the chain, this food contains embedded
energy. Food losses are often due to lack of access to energy for adequate storage, processing,
transportation and distribution. Food wastage mainly relates to consumer behaviour. The
agrifood chain can also produce energy. Some of this energy can also be fed back into the
system, or used externally, thus improving energy access.
Energy Smart Food for People and Climate (ESF in short) is the strategy for a green economy
alternative driven from the agrifood sector. Energy smart food systems:
improve efficiency at all levels;
use diverse energy sources with an emphasis on renewable energy;
improve energy access through integrated food and energy production.
Amongst renewable energy types, bioenergy has a special role to play in food security because
(i) biomass is currently, and for the foreseeable future, the most important source of renewable
energy, primarily for cooking and heating, but it is often used in unsustainable ways, (ii) biomass
is present almost everywhere (iii) agri-food systems can use but also produce bioenergy, for
instance through integrated food-energy systems, but (iv) implementing bioenergy in the right
way is more complex that other types of renewable energy because, if not well managed,
bioenergy development may harm food security and the environment.
By implementing Energy Smart Food systems overall energy consumption will be reduced,
alternative energy sources will be used within the systems, and potentially the agrifood systems
will be able to produce both food and energy. This will help meet food, poverty, energy security
and access targets, and allow to identify climate smart solutions and to implement systems that
are sustainable and resilient to the ongoing climate changes.
17
4. What to Do – The FAO Multi- partner Programme on “Energy-Smart Food for People and
Climate”
An integrated ( nexus) approach to meeting food, water, energy and climate change
requirements is essential, and this requires a multidisciplinary, multi‐partner programme to
help countries identify appropriate energy, food security and climate smart solutions and to
assist on promoting and implementing them.
Some key questions that the Energy-Smart Food “(ESF) programme addresses:
- How and to what extent can energy smart food systems contribute to energy access for the
poor?
- How much room for improvement is there through efficiency gains, loss and waste reduction
and energy source diversification?
- What alternative energy smart solutions exist, are proven and implementable?
- What is the structure of analysis and what is the baseline for the agrifood supply chain?
- Which energy smart food systems apply in which country contexts and how do they vary?
Agrifood systems have a unique link with energy in that they both consume and can produce
energy. This allows for the challenges of the ―food-energy-water-climate change nexus‖ to be
addressed from both energy used in and produced by agrifood systems; by becoming more
―energy-smart through three objectives:
Higher energy efficiency through alternative practices and technological improvements (i.e.
―doing more (production) with less (inputs including energy)‖, including reducing energy
losses related to food wastage;
Energy diversification through increased use of renewable energy (RE) in the agrifood
chain;
Improved access to modern and sustainable forms of energy in rural areas, through better
integration of food and energy production.
The ESF objectives mean that this programme can be considered the major agriculture and
rural development contribution UN Sustainable Energy for All Initiative (SE4All). It will also
address key concerns related to the ―Food-Water-Energy-Climate‖ Nexus As part of the ESF
programme, FAO has developed a sustainable bioenergy support package2 which can help
governments and operators implement bioenergy in a way that reduces risks and harnesses
opportunities.
18
On behalf of the International Crops Research Institute for the Semi-Arid Tropics (ICRISAT), allow me to
extend my warmest greetings to the Guru Arjan Dev Institute of Development
Studies on the conduct of your 6th International Seminar on Energy for
Sustainable Development in Asia Pacific on 29 Nov – 1 Dec 2013.
With a looming energy crisis and climate change at the forefront of everyone‘s
mind, there has never been a better time for alternative energy solutions to
shine. Economic, environmental and energy security concerns resulting from
excessive reliance on fossil fuels are forcing countries throughout the world to
shift to environmentally sustainable alternatives like biofuels. Nations are
investing heavily on alternative sustainable sources of bioenergy to increase
their energy security and reduce their fossil-fuel carbon emissions. Such shifts
also aim to generate employment for the rural poor and regenerate wastelands.
According to the Food and Agriculture Organization (FAO) of the United
Nations, about three billion people – or roughly half of the world‘s population – rely on unsustainable
biomass-based energy sources to meet their basic energy needs for cooking and heating, while 1.6 billion
people lack access to electricity.
In recent years, bioenergy has drawn attention as a sustainable energy source that may help cope with
the rising energy prices, address environmental concerns about greenhouse gas emissions, and offer new
income and employment to farmers and rural communities in Asia.
In ICRISAT, central to our strategy in promoting sustainable energy is the focus on biomass sources and
approaches that do not compete with, and in fact that would even enhance food production by attracting
greater investments to boost both food and Biofuel productivity.
A key part of this commitment is making bioenergy opportunities work for the poor. Sweet sorghum is a
leading example of our bioenergy strategy. Sweet sorghum produces grain for food and feed and sugary
stalks for fodder, fuel and fiber. We have been successful in our sweet sorghum production for biofuels
projects in India and China. We have tapped the power of public-private partnerships (PPP) in
developing and establishing pilot-scale centralized and decentralized value chain bio ethanol enterprise
models, and have been building seed production and delivery systems for sweet sorghum.
We therefore wish to commend the Guru Arjan Dev Institute of Development Studies for holding this
seminar focusing on the importance of energy to all aspects of development (social, economic and
environmental) with a particular focus on sustainable development and also the effect of energy on
poverty reduction efforts. We hope that this seminar provides us with some answers to the energy
challenges posed by the increasing concentration of the world's population.
At ICRISAT, we define our core value as ―Science with a human face,‖ indicating our commitment to put
people‘s welfare first when setting our priorities. We enjoin all of you to take the same path – to integrate
socioeconomic dimensions in building an energy secure world, and in attaining food security and
improving the livelihoods of millions of poor people amid the looming energy crisis and climate change.
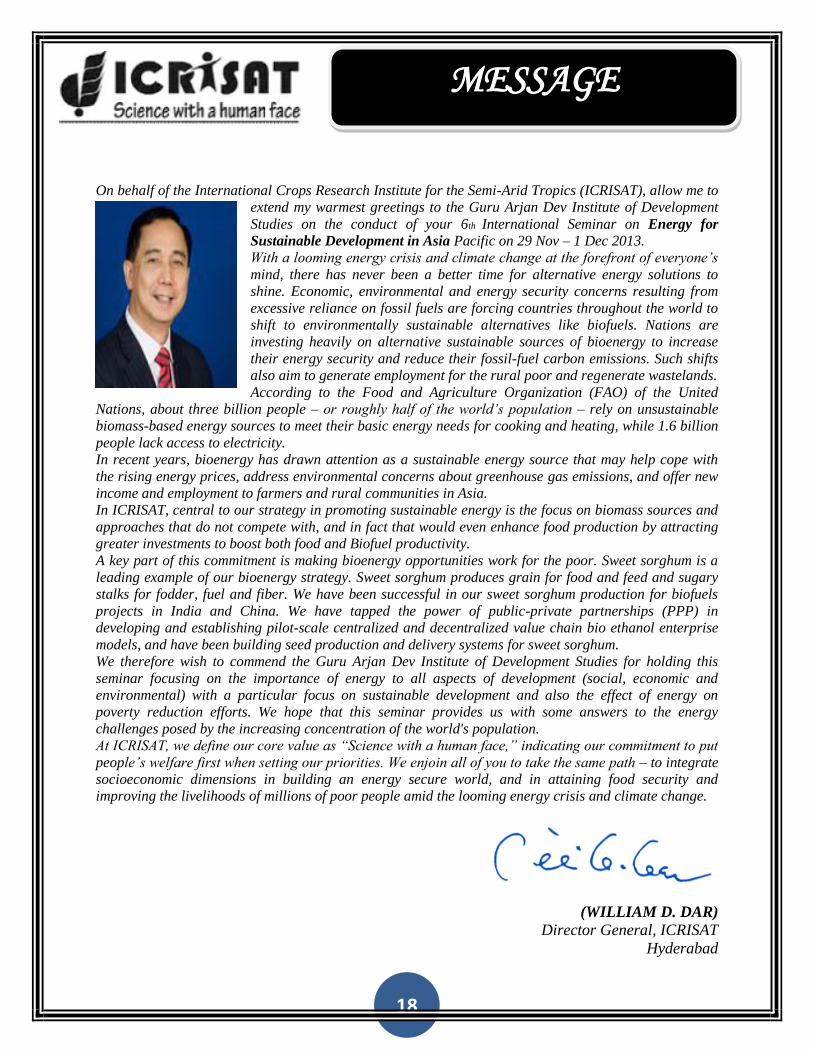
(WILLIAM D. DAR)
Director General, ICRISAT
Hyderabad
MESSAGE
19
Over the past few years, energy security and sustainable development have moved up the global
agenda. There are two main reasons for this: first, the impact of high
and often volatile energy prices; second, concerns over environmental
sustainability and particularly about the global climate. Both issues are
critically important for Asia and the Pacific—a region in which
impressive economic growth has boosted the demand for energy and
put corresponding strains on the environment. To pursue energy
security, the countries of the region will want to ensure that energy
supplies are available, sufficient, affordable and sustainable. This will
mean taking a broad range of measures: conserving and raising energy
efficiency; rationalizing pricing and taxation systems; improving
energy sector governance; and diversifying energy supplies, in
particular making greater use of alternative and renewable resources. Energy-producing and -
importing countries also need the appropriate legal frameworks, regulatory environments and
systems for pricing and taxation, along with fair and transparent processes that will encourage
public-private partnerships for developing energy infrastructure.
Access to environmentally and socially sustainable energy is essential to reduce poverty. Over
1.2 billion people are still without access to electricity worldwide, almost all of whom live in
developing countries. About 2.8 billion use solid fuels - wood, charcoal, dung, other biomass,
and coal - for cooking and heating. Every year fumes and smoke from open cooking fires kill
about 1.6 million people, mostly women and children, from respiratory diseases.
Climate change remains a critical concern. Currently, more than 80 per cent of energy
consumed comes from burning fossil fuels, which produces greenhouse gases that cause climate
change. Population, technological and economic growth is expected to drive up overall energy
demand by a third from now to 2030, with 90 per cent of new demand in developing countries.
These trends threaten to push global temperature above two degrees.
This has enormous socio-economic costs—degrading the environment, spreading disease,
increasing child mortality and weakening social services. It also restricts the opportunities for
women, who have to gather and use traditional fuels. All of these have major implications for the
Millennium Development Goals (MDGs): without better access to energy services, many of the
MDGs may be missed.
To make the leap to universal access to modern energy services by 2030, new capital investment
of about $48 billion will be needed every year. This is in addition to worldwide annual
investments of about $450 billion just to sustain energy services at current levels.
The existing energy supply and demand situation means that conventional sources, such as oil
and coal, will be depleted at an alarming rate. Growing concern about the environmental impact
of the various energy resources places restrictions on their use. The Kyoto Protocol requires
participating countries to reduce carbon emissions drastically over the next decade. To improve
the energy situation and make it sustainable, serious efforts need to be made to
advance knowledge in the following directions:
INTRODUCTORY REMARKS

20
new and energy efficient methods for recovery, power generation and distribution
energy conservation techniques,
increased utilization of renewable energy sources, and
development and utilization of emerging energy sources and techniques.
There exists a huge additional potential for conservation and reduction in energy consumption in
both industrial and domestic sectors by using energy efficient designs and products along with
improvements in energy storage and management practices. In parallel with these developments
there needs to be an awareness of the resultant social impacts and associated social
policy changes. In particular the affect of new energy source utilization on land use, food
production, transport and visual environment will need to be addressed along with technician
capacity building and public information.
Sustainable energy is regarded here as energy to meet our needs today without compromising
the ability of present and future generations to meet their energy needs and without overloading
the ecosystem. It can thus be regarded as energy for sustainable development. Sustainable
energy sources and energy management considered here for Asia and the Pacific region include:
solar, wind, geothermal, hydro, wave, biomass, energy from waste, ocean energy, and energy
efficiency. The science plan reviews the current position for each of these energy sources and
recommends priority areas for research and development.
The Asia- Pacific region with its rapidly growing energy demand should utilize its abundant
natural resources to move away from heavy dependence on fossil fuels. Governments in Asia-
Pacific region have started considering sustainable energy as serious alternative to conventional
fuels. It has been estimated that investment in the sustainable energy industry would generate
more jobs per megawatt (almost 10 times) than is the case for the conventional energy industry.
This will require investment in education and training to provide the technical support and
development skills along with increased public awareness of the environmental sustainability
issues and efficient energy use strategies. If the new and emerging energy technologies are to
make a serious contribution to sustainable development in the Asia-Pacific region then
investment, intellectual effort and capacity building need to be planned for the short and long
term. The following are a summary of the proposed areas of endeavour, identified by
ICSU regional committee for Asia Pacific to achieve this aim and should be interpreted broadly
and positively by researchers, funding agencies and governments.
Exploration assessment and Mapping of resource potential.
Improvement of existing technologies, manufacturing processes and mass
production.
Fault prediction and protection.
Use of new, improved and smart materials and techniques.
Resource and waste management.
Waste treatment technologies including biochemical.
Use of traditional technologies and best practice for low energy buildings.
Development of guidelines on low energy buildings, culture and new.
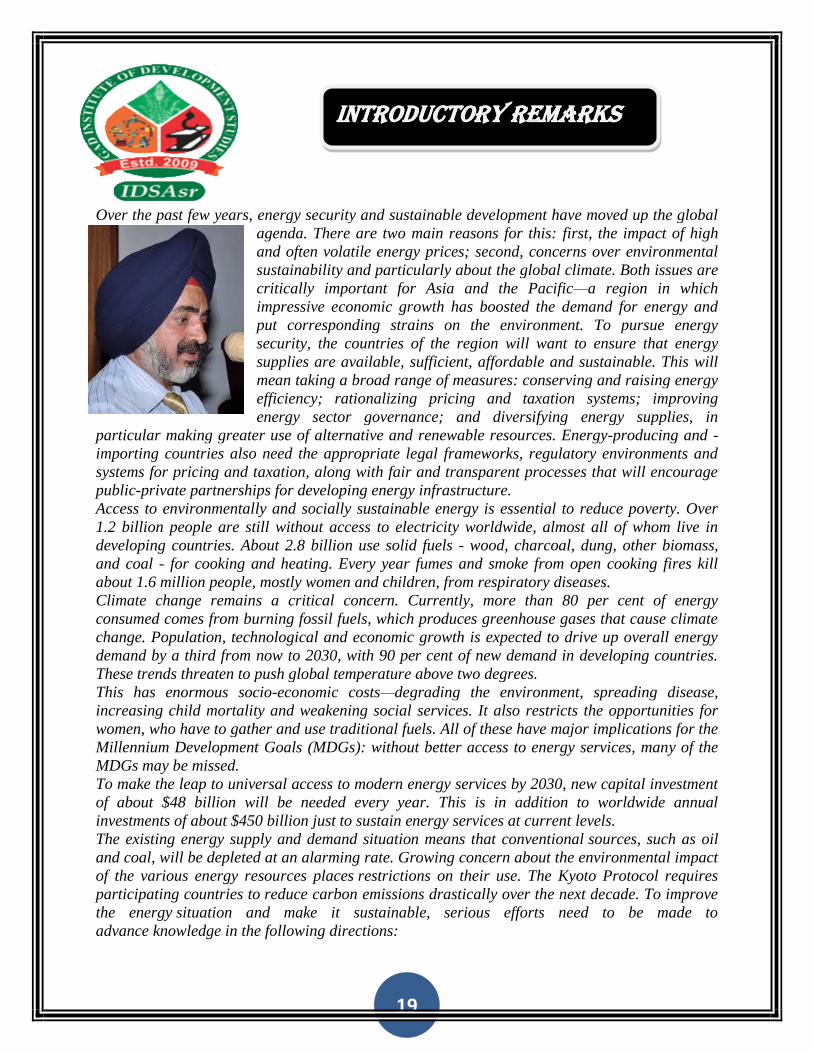
Dr Gursharan Singh Kainth
Director
Guru Arjan Dev Institute of Development Studies
14-Preet Avenue, Majitha Road
PO Naushera, Amritsar 143008
21
Committed to Excellence
Guru Arjan Dev(GAD) Institute of Development Studies is a centre for advanced research and
training in multi disciplinary areas as diverse as Agriculture and rural development; social
change and social structure; environment and resource economics; globalization and trade,
industry, labour and welfare; macro economics issues and models; population and development
and health policy research. The institute is being runs under the aegis of Guru Arjan Dev
Institute of Development Studies Society, Amritsar which is a registered national scientific and
educational society under Societies Registration Act, XXI of 1860, Chandigarh in July 2009 vide
Registration No. 77 of 2009-2010. The society was collectively conceived by a group of like-
minded peoples drawn from different disciplines and backgrounds to promote research,
publication, development, training and similar creative activities. Though the institute is at the
embryonic stage, it has got membership into various world organizations, namely, UN Global
Compact; Global Water Partnership; Coherence in Information for Agricultural Research for
Development; Forum: Science and Innovation for Sustainable Development and so on.
Objectives: The main objectives of the Institute include:
* to contribute to the understanding of the development process and problems;
* to focus on studies relating to the issue and problem of the bypassed sections and regions;
* to bring integral focus of a multi-disciplinary approach in studying and resolving some of the
critical issues and problems; and
* to provide a forum for the interested groups in starting a continuous and meaningful dialogue
on the above.
Given the nature of our concerns, the Institute is a multi-disciplinary research organization.
Much of our research is regarding the evolution of appropriate policies and action-programme.
In our endeavour to build data base and evidence for the state policy and development action,
we have been working with a wide range of national and international agencies and
collaborating with a large number of scholars across the globe. On policy front, we have been
interacting with various agencies of the Government of India as well as of Punjab Government.
And have been actively collaborating with other likeminded societies and organizations, which
are working for the development of the Indian Society. The institute provides knowledge-support
to different civil society‘s actors and functions as a resource centre for academia, government
departments, bilateral agencies, developmental NGOs and INGOs.
Mission: Our mission is to fill the lacunae in the knowledge-base pertaining to issues of development of
the Indian society. It takes cognizance of the macro environment, planning processes and
strategies including their socio-economic dimensions and attempts to make timely interventions
through research and dialogues. Particular attention is given to the study of the micro-
processes, the failure of trickledown effects of growth, direct public intervention such as through
poverty reduction and employment generation programme, and participatory efforts of voluntary
22
organizations with respect to the marginalized sections of the society. Our specific concern
relates to regional issues specially relating to Punjab.
The institute, founded by Dr. Gursharan Singh Kainth, as its director had the distinction of
having a thinker, administrator and a leading economist, Dr. Rajinder Singh Bawa as Chairman
of its Advisory Council. Currently, leading visionary and well known educationist, Sardar Amar
Singh Kanwal is the Patron-cum-Chairman of the Governing body of the institute, who is also
the President of the society. The institute is presently housed in the rent free accommodation
provided by the society treasurer. The institute is likely to grow step by step with the earnest
efforts of its dedicated team of research, library, administrative and other staff in building up an
environment conducive to research, education, development, consultancy and training activities.
Publications Books and Monographs 1.Gursharan Singh Kainth, Managing Rural Finance in India, Concept Publishing Company,
New Delhi( ISBN 978818069572) released by Dr Montek Singh Ahluwalia, Deputy Chairman,
Planning Commission,2010
2. Damanpreet Kaur and Gursharan Singh Kainth, 2011 Mobile Banking: A Boon for
Unbanked, Lambert Academic Publishing Germany (ISBN 9783845436234)
3. Gursharan Singh Kainth, Next Generation Bio fuels-The Key to India’s Sustainable Energy
Needs, Lambert, Academic Publishing Germany (ISBN 9783845470061)
4. Gursharan Singh Kainth, 2011 Sustainable Development of Forest: Some Issues; Lambert,
Academic Publishing Germany (ISBN 9783846514399)
5. Gursharan Singh Kainth and Mandeep Kaur: 2011 Adoption of Technology in Teaching of
Language: A Critical Assessment of Punjabi (Mother Tongue); Lambert Academic Publishing
Germany (ISBN 9783845420141)
6. Gursharan Singh Kainth, 2011 Aadhaar India: Brand for a Billion; Lambert Academic
Publishing Germany (ISBN 9783845428031)
7. Gursharan Singh Kainth, 2011 Climate Change, Sustainable Development and India: Need
for New Economic Thought, Lambert Academic Publishing Germany (ISBN 9783847317364)
8. Jyoti Soi and Gursharan Singh Kainth, 2013 Disclosure Practices in Indian Banking
Sector: A Comparative Study, Lambert Academic Publishing Germany (ISBN 9783659219931)
9. Gurinder Kaur and Gursharan Singh Kainth, 2013 Job Satisfaction among College
Teachers, Lambert Academic Publishing Germany (ISBN 9783659326837)
10. Gursharan Singh Kainth (2013) Indian Seed Industry: Needs Policy Incentives; Guru Arjan Dev
Institute of Development Studies, Amritsar ISBN 978819229520
11. Gursharan Singh Kainth and Rajinder Singh Bawa (2013) Productivity of Indian
Agriculture: Growth and Determinants; Guru Arjan Dev Institute of Development Studies,
Amritsar ISBN 9788192295237
23
12. Gursharan Singh Kainth and Rajinder Singh Bawa (2016) Are Productivity of Indian
Agriculture Growing; Status Constraints and Policy Implications, Guru Arjan Dev Institute of
Development Studies, Amritsar ISBN 9788192295244
13. Gursharan Singh Kainth, Rajinder Singh Bawa and Navdeep Singh (2016) Pardhan Mantri
Basal Bima Yojana: Challenges and Way Forward; Guru Arjan Dev Institute of Development
Studies, Amritsar ISBN 9788192295299
14. Gursharan Singh Kainth (2015) Right to Education Act: Its Adoption in Private Schools;
Guru Arjan Dev Institute of Development Studies, Amritsar ISBN 9788192295275
15. Anonymous (2016) Water Energy and Food Security Nexus, Guru Arjan Dev Institute of
Development Studies, Amritsar ISBN 9788192295282
16. Anonymous (2016) Energy for Sustainable Development; Guru Arjan Dev Institute of
Development Studies, Amritsar ISBN 9788192295268
17. Anonymous (2016) Water Energy and Food Security Nexus, Guru Arjan Dev Institute of
Development Studies, Amritsar ISBN 9788192295282
18. Gursharan Singh Kainth (201) Elementary Education: Needs Renewed Push; Guru Arjan
Dev Institute of Development Studies, Amritsar ISBN 9788192295
19. Gursharan Singh Kainth and Rajinder Singh Bawa and (2016) Recycling of Waste water
and Reuse System; Guru Arjan Dev Institute of Development Studies, Amritsar ISBN
9788192295244
Sponsored Research Projects: 1.Gursharan Singh Kainth, 2012 Diagnostic Analysis of Financial Inclusion in Rural
Punjab, sponsored by National bank for Agricultural and Rural Development; Punjab Regional
Office, Chandigarh
2. Gursharan Singh Kainth 2013 Diagnostic Analysis of Mid Day Meal Scheme in Rural
Punjab, Indian Council of Social Sciences Research, New Delhi under ICSSR Senior Fellowship
scheme.
3. Gursharan Singh Kainth, 2016 Diagnostic Analysis of Elementary Education in Rural
Punjab; Planning Commission, Government of India, New Delhi.
Self Sponsored Research Project: 1. Gursharan Singh Kainth, 2012: Sustainable Agriculture and Food Sustainability: The Way
Ahead, www. eurasiareview.com, July 2013
2. Rajinder Singh Bawa and Gursharan Singh Kainth, 2013: Can Punjab Mis FDI in Multi-
Brand Retail.
24
3. Gursharan Singh Kainth, 2013: Anganwadi Centres in Rural Punjab: Status, Constraints
and Policy Implications.
4. Rajinder Singh Bawa, Gursharan Singh Kainth and Manisha Sharma, 2017: Reconfiguration
of Indian Higher Education, in hand.
Seminars IDSAsr has organized since its inception following six national/international seminars, that is,
since July 2009.
1. 1st National Seminar on Food Security and Sustainability in India during November 2009
2. 2nd
National Seminar on Management of Natural Resources and Environment in
India during October 2010
3. 3rd
International seminar on Water Security and Climate Change: Challenges and
Strategies during November 2011
4. 4th
IDSAsr International seminar on The Water Energy and Food Security during February,
2013.
5. 5th
IDSAsr International seminar on Right to Education: Roadmap Ahead during March,
2013.
6. 6th
IDSAsr International seminar will be organized on Energy for Sustainable Development
in Asia Pacific with effect from November29 to December 01, 2013
7. 7th
IDSAsr national seminar will be organized on Recycling of Waste Water and Reuse
System slated with effect from November 25-26, 2016.
Policy Briefs: 1. Healthy Soil for Healthy Life
2. Better Sanitation for Batter Life: Some R & D Issues
3. Elementary Education: Needs Renewed Push
4. MPLAD Scheme Needs Amendments
5. Punjab Drug Epidemic: Dark Days Ahead
6. India’s Education Sector: Moving toward a Digital Future
7. Education for All: Some Issues
7. Continuous and Comprehensive Evaluation: A Critical Analysis
9. Universal Primary Education: Is It a Joke
10. Can Right To Education A Reality
25
Healindia’s energy security: Challenges and Policy
Dr Rajinder Singh Bawa Dr Gursharan Singh Kainth
Vice Chancellor Director
Chandigarh University Guru Arjan Dev Institute of Development Studies
Mohali Amritsar
ABSTRACT
Despite India‘s roaring economic growth over the past decade, and its citizens‘
growing belief that it is finally ready to join the league of global superpowers; the
country remains vulnerable to occasional dysfunction. Nothing typifies this better
than the blackout in July 2012 that left some 600m people without electricity.
Reforms that began in 1991 have gone some way towards improving the efficiency
of India‘s energy sector, but serious impediments to investment remain. As a
result, India‘s energy supply is constantly playing catch-up to the demands of its
burgeoning economy. Can India‘s energy sector continue to power its economy in
the long term?
Energy is the prime mover of a country‘s economic growth. Availability of
energy with required quality of supply is not only key to sustainable
development, but the commercial energy also have a parallel impact and
influence on the quality of service in the fields of education, health and, in fact,
even for food security. Growth demands energy. It is no wonder that India —
with an economy expected to grow at over 5 per cent a year for the next twenty-
five years — has developed a ravenous appetite for energy. India accounts
nearly 2.4 per cent of the annual world energy production, but on the other
hand consumes 3.3 per cent of the annual world energy supply. And this
imbalance is estimated to surpass and overtaking Japan and Russia by 2030
placing India into the third position in terms of annual energy consumption.
The most serious issue India must address is that the gap between energy
demand and energy supply is wide and growing. Two reasons for growing gap
are demographics and economics: not only is India‘s economy growing, thereby
demanding more energy and electricity, but the population is as well. There is
also massive urbanization, which is putting more pressure on energy and the
environment. India‘s electricity mix comprises 69 per cent coal, 14 per cent
hydro, 10 per cent natural gas, 4 per cent oil, 2 per cent nuclear, and 1 per
26
cent renewable (solar, wind, Biofuel, waste, etc). While the amount of off-grid
power in India is debatable, it can skew India‘s electricity growth projections
dramatically. This needs improvement through more investment both public as
well as private and more particularly from the private sector, in generation,
transmission, and distribution. While investment is beginning to occur, the
rate at which this is occurring is woefully insufficient.
GLOBAL SCENARIO:
Global primary energy consumption including commercial renewable energy
rose, by 5.6 per cent in 2010, the highest since 1973. China alone consumed
20.3 per cent of the total global energy followed closely by the US at 19 per
cent. India consumed a mere 4.4 per cent of the total with the global average
consumption (excluding China and USA) at just 0.87 per cent. It is interesting
to note that while the overall consumption of fossil fuel grew at a considerable
rate, the consumption of oil grew the least. Oil consumption increased by 3.1
per cent with the US consuming 21.1 per cent of the global production. Oil,
Coal and natural gas remain to be the highest consumed energy sources
globally. Coal consumption grew by 29.6 per cent, the highest since 1970 with
China alone consuming 48.2 per cent. This is followed by the US at 14.8 per
cent and India at 7.8 per cent. There is also a healthy trend in the renewable
sector. Global policies towards climate change and sustainability appear to
have yielded results. 2011 saw a notable 1.8 per cent growth of the overall
global renewable energy consumption. The consumption pattern of different
energy sources for the year 2011 is reproduced in Fig 1.
INDIA'S CHANGING ENERGY MIX
The Indian economy continues to grow at the rate of 7 to 8 per cent. However,
the very economic development that we strive to achieve depends heavily on
robust and reliable energy services. Ideally, energy production must not come
at a high social or environmental cost – a challenge we must face up to through
sustainable growth. Truth be told, India‘s per capita energy consumption is as
low as - 500 kgoe; far lower than the global average of 1800 kgoe. This is due in
large part, to a severe shortage of energy supply, with over 600 million Indians
having no access to electricity. Clearly, meeting this requirement itself implies
a massive up in future energy generation. The government is acutely aware of
this massive power deficit, and has a ‗power for all by 2012‘ mission, and a
planned increase in power capacity of 69 GW for the 11th Plan. Much of this
growth is expected to be based on coal, at least in the short term.
However, recognizing the potentially serious impacts of climate change, India
has ratified the UN climate deal and the Kyoto Protocol. In the follow-up to the
ratification, the government came forward with the National Action Plan on
27
Climate Change (NAPCC) in June 2008. India is determined not to exceed per-
capita emissions of developed countries, while ―meeting its development goals.
Although the mandate of development remains undiluted, NAPCC ties in
closely with the larger goals of energy security and sustainable development.
The NAPCC has eight key ‗missions‘ of which the National Solar Mission, the
National Mission on Enhanced Energy Efficiency and the National Mission on
Sustainable Habitat are flagship missions that will aim to meet key
development and energy security requirements while keeping India‘s
greenhouse gas emissions in check.
Fig 1: Energy Consumption Pattern (In Million Tonnes Oil Equivalent)
Percentage
Coal
Hydroelectricity
Renewable energy source
Gas
Nuclear
Oil
Total Capacity (MW)
State Sector
Central Sector
Private Sector
28
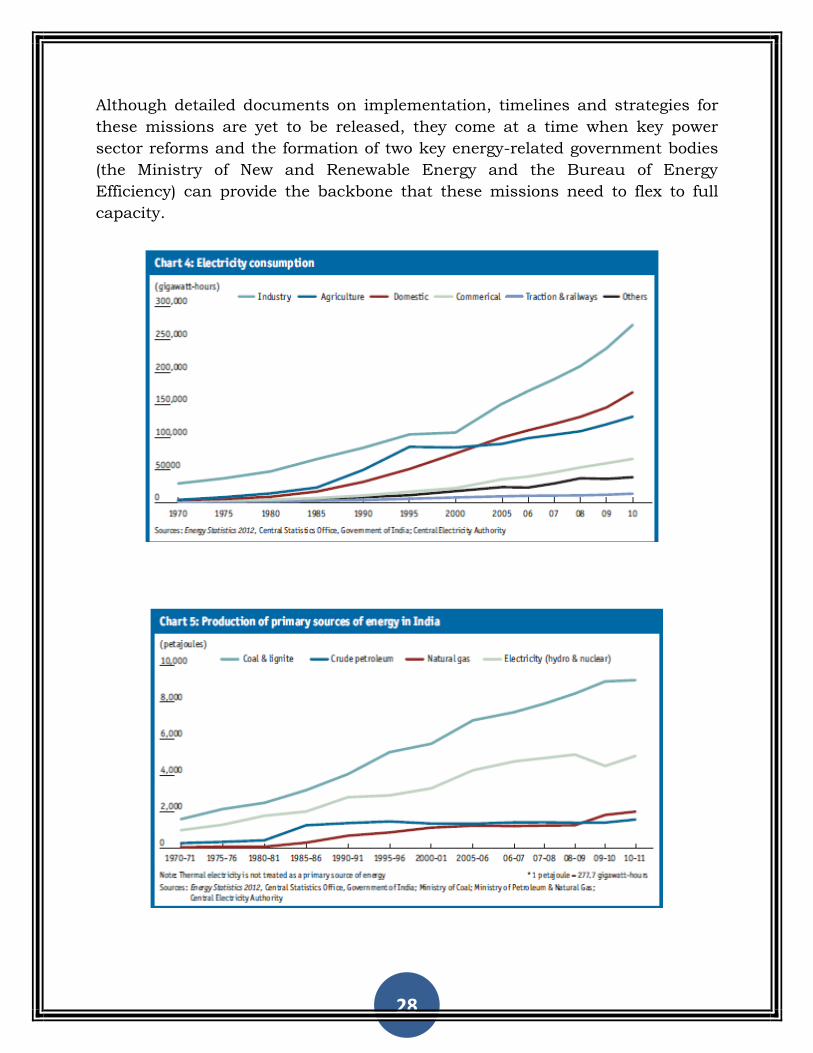
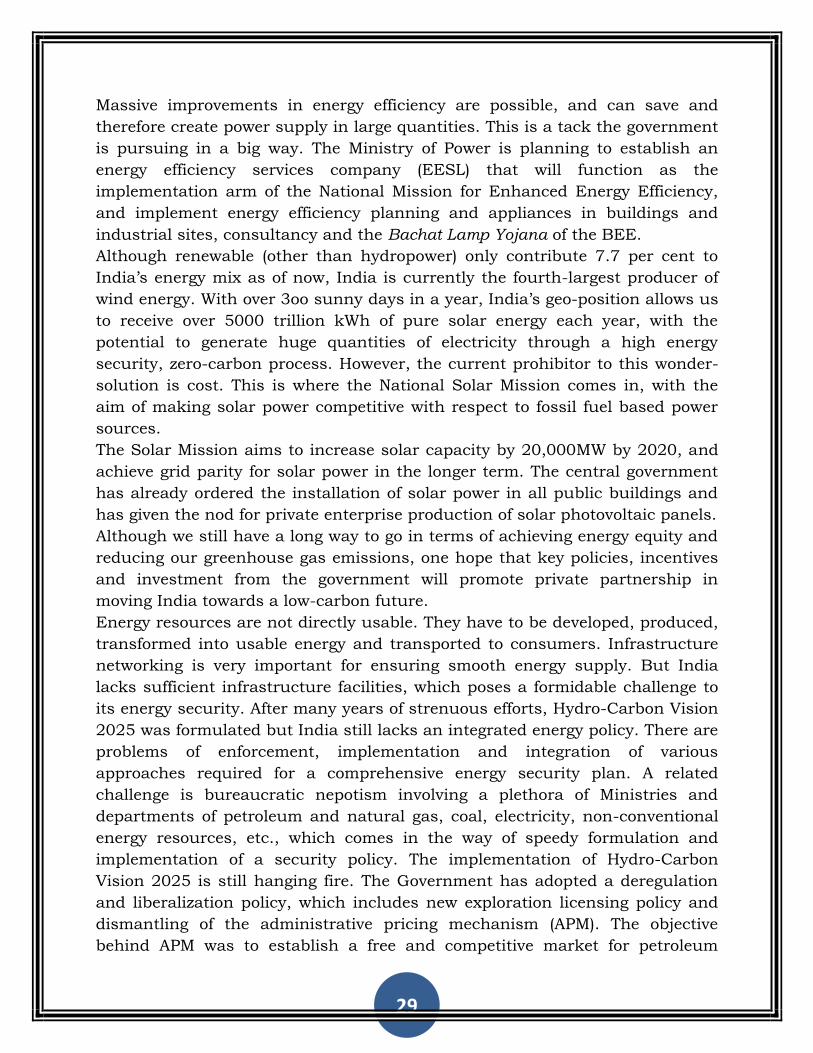
Although detailed documents on implementation, timelines and strategies for
these missions are yet to be released, they come at a time when key power
sector reforms and the formation of two key energy-related government bodies
(the Ministry of New and Renewable Energy and the Bureau of Energy
Efficiency) can provide the backbone that these missions need to flex to full
capacity.
29
Massive improvements in energy efficiency are possible, and can save and
therefore create power supply in large quantities. This is a tack the government
is pursuing in a big way. The Ministry of Power is planning to establish an
energy efficiency services company (EESL) that will function as the
implementation arm of the National Mission for Enhanced Energy Efficiency,
and implement energy efficiency planning and appliances in buildings and
industrial sites, consultancy and the Bachat Lamp Yojana of the BEE.
Although renewable (other than hydropower) only contribute 7.7 per cent to
India‘s energy mix as of now, India is currently the fourth-largest producer of
wind energy. With over 3oo sunny days in a year, India‘s geo-position allows us
to receive over 5000 trillion kWh of pure solar energy each year, with the
potential to generate huge quantities of electricity through a high energy
security, zero-carbon process. However, the current prohibitor to this wonder-
solution is cost. This is where the National Solar Mission comes in, with the
aim of making solar power competitive with respect to fossil fuel based power
sources.
The Solar Mission aims to increase solar capacity by 20,000MW by 2020, and
achieve grid parity for solar power in the longer term. The central government
has already ordered the installation of solar power in all public buildings and
has given the nod for private enterprise production of solar photovoltaic panels.
Although we still have a long way to go in terms of achieving energy equity and
reducing our greenhouse gas emissions, one hope that key policies, incentives
and investment from the government will promote private partnership in
moving India towards a low-carbon future.
Energy resources are not directly usable. They have to be developed, produced,
transformed into usable energy and transported to consumers. Infrastructure
networking is very important for ensuring smooth energy supply. But India
lacks sufficient infrastructure facilities, which poses a formidable challenge to
its energy security. After many years of strenuous efforts, Hydro-Carbon Vision
2025 was formulated but India still lacks an integrated energy policy. There are
problems of enforcement, implementation and integration of various
approaches required for a comprehensive energy security plan. A related
challenge is bureaucratic nepotism involving a plethora of Ministries and
departments of petroleum and natural gas, coal, electricity, non-conventional
energy resources, etc., which comes in the way of speedy formulation and
implementation of a security policy. The implementation of Hydro-Carbon
Vision 2025 is still hanging fire. The Government has adopted a deregulation
and liberalization policy, which includes new exploration licensing policy and
dismantling of the administrative pricing mechanism (APM). The objective
behind APM was to establish a free and competitive market for petroleum
30
products and free companies from price control. But the ground reality is that
decisions are still dictated by the Government.
India’s Electricity Mix:
Currently, India has the fifth largest electrical system in the world, with
installed electricity capacity of around 180 GW. However, more than 400
million Indians have no access to electricity, and by 2035 India‘s power
demand is expected to more than double, providing a prodigious challenge for
the country. India‘s electricity mix comprises 69 per cent coal, 14 per cent
hydro, 10 per cent natural gas, 4per cent oil, 2 per cent nuclear, and 1 per cent
renewable (solar, wind, biofuels, waste, etc). While the amount of off-grid power
in India is debatable, depending on one‘s estimates, it can skew India‘s
electricity growth projections dramatically. India‘s power deficit in 2010 at peak
load was more than 10 per cent. This needs improvement through more
investment, particularly from the private sector, in generation, transmission,
and distribution. While investment is beginning to occur, the rate at which this
is occurring is woefully insufficient.
India’s power network comprises five regions spanning the country. Tough all
girds are inter-connected with a neighboring region, there are inadequate
interregional connections through high voltage transmission lines, creating
difficulties for moving power from electricity surplus states to those in deficit.
This also creates difficulties on a seasonal basis, as power is often in short
supply during the dry season and abundant in some regions during the
monsoon but cannot be moved to help other states. An additional complication
is that India‘s investment in power transmission and distribution has not kept
up pace with generation. Thus, in some cases, new generation cannot move to
the market because of transmission bottlenecks, such as with wind power in
Tamil Nadu.
India‘s power sector is also plagued by the dual responsibility of the states and
the federal government. Power produced and sold in the same state is subject
to the oversight of the State Electricity Board and the State Electricity
Regulatory Commission, whereas power sold between states is subject to
federal oversight and regulation. As of September 2011, about 46 per cent of
generating capacity was owned by the states, 31 per cent by central
government institutions, and 23 per cent by the private sector. Complicating
this situation is that there are far too many state and federal institutions
involved in energy decision-making. In the absence of a single institution
responsible for the energy sector, comprehensive and sound policymaking is
impossible.
31
Although domestic energy supplies exist, some are limited in amount (e.g., oil)
and others (e.g., coal) are located in areas where they are geologically and
technically hard to extract. In the case of coal, although India has large
reserves, much of it is located far from demand centers or in areas where
insurgencies affect production.
These issues are further exacerbated by the country‘s policies, politics, and
infrastructure. For instance, coal resources, far from their final market, must
depend on India‘s dilapidated railroad infrastructure that is prone to delays.
Many power plants cannot get enough coal and must rely on the expensive spot
market or risk power shortages. Coal stocks at roughly 60per cent of India‘s
thermal plants were only enough for a seven-day supply. Many plants only
have a one-day supply.
In the case of oil and natural gas, the problem is pricing and infrastructure.
Because India‘s government has not created a positive climate for foreign
investors, the country‘s reserves have not benefited from the best technology
and expertise available. This hurts production. Whereas the average recovery
rate of oil in the global petroleum industry is 40per cent, in India it is only
28per cent. One way India can promote exploration and production is through
pricing reform: currently, private sector investors have no incentive to invest in
India due to poor returns on investment. Similarly, the government has not
invested enough in infrastructure: its gas pipeline network is woefully under-
connected, and although the situation is slowly improving, large parts of India‘s
south and northeast are not connected to a gas grid.
Moreover, India must also enforce regulations against energy and electricity
wastage and cheating. Often it is the wealthy landlords who waste free and
cheap electricity rather than the poor farmers it was intended to help. Bribes
are often paid to meter-readers, and many government and military buildings
and offices pay no electricity fees at all. Providing regulators with enforcement
capacity would dramatically curb consumption and increase efficiency.
One final issue is the land acquisition bill under debate in India. This bill must
be comprehensive and fair to both owners and purchasers. Most importantly,
however, it must be transparent and enforceable. While India‘s energy sector is
improving, the biggest problem for investors is that translucent regulations and
processes drive up private sector costs. A clear and egalitarian bill can
accelerate projects in the national interest while providing fair compensation
for those displaced.
If India does not embark on serious energy and electricity sector reform, it runs
the risk of a sociopolitical explosion. Given both its tremendous economic
growth fueled by energy and the equally large poverty rate, addressing these
issues is perilous. Manufacturing, industrial production, finance, and
32
commerce cannot function without energy. Similarly, energy access can provide
a lifeline and an opportunity for economic development.
India‘s energy and electricity shortages have already rattled private sector
investors. They still invest because India‘s opportunities are so expansive, but
if energy sector reform does not occur and energy provision does not become
more reliable, investment may dry up.
Moreover, any stagnation in India‘s growth rate due to energy insecurity can
have very damaging effects on the country‘s stability. Already India faces
challenges from domestic insurgencies and has tenuous borders with Pakistan,
Bangladesh, Nepal, and China. Additional insecurity due to a lack of economic
opportunity could be devastating.
MEASURES:
Foremost, the world must acknowledge that India‘s demand for commercial
energy is surging. Given the country‘s technical, economic, and political
constraints, for the next few decades this demand will be met by fossil fuels.
India and its neighbors are among the countries most at-risk from the impacts
of climate change. There are a number of measures New Delhi can take to curb
energy consumption and reduce related environmental impacts, but all will
require political courage and massive consensus-building. At the risk of
sounding like a Cassandra, India must take action on all fronts.
India, to the greatest degree possible, must liberalize all wholesale and retail
prices. As long as energy remains free or cheap, consumers have no incentive
to use it wisely, conserve, or buy energy-efficient appliances and vehicles. To
that point, India should mandate more stringent efficiency standards for
appliances, vehicles, and all new commercial, residential, and industrial
buildings, with encouragement through fiscal and other promotional polices.
The country should also enact policies that encourage energy retrofits of
existing residential and commercial buildings.
Similarly, India should move to increase the efficiency of all its power plants to
conform to international norms. Investment in a more efficient electricity grid
would do wonders for both its energy security and the environment. Rather
than building new generation facilities, most of them carbon-emitting, India
could deliver more electricity to the end consumer. Today, India‘s transmission
and distribution losses are astounding.
When widening energy access, one challenge will be deploying as much clean
energy as technically feasible. One great opportunity for rural communities in
particular—is distributed generation or isolated renewable energy installations.
India must accept the conflict that the country will be largely dependent on
fossil fuels for the foreseeable future but that the reality of climate change is
33
equally inescapable. To that end, in concert with the United States, India
should take the lead in establishing a world-class carbon capture and
sequestration research and demonstration program. This will help
commercialize a technology that addresses a fundamental reality of the world‘s
energy consumption: fossil fuels will be a staple for decades to come.
There is a tremendous opportunity, but only if a government emerges in New
Delhi that can free the Indian economy from its past ideological shackles. While
the federal government publicly embraces private sector investment, it is often
loath to give up the reins in many industries. New Delhi must allow private
investment to introduce the best technology and operational efficiencies that
are integral to building a more responsive energy sector.
Where India has made private-sector friendly reforms, the results have been
spectacular. India‘s biggest gas discovery was made by a private sector firm.
The initial public offering of Coal India raised billions in private investment for
the government. Yet for all the excitement generated, the Indian bureaucracy
still slows the implementation of reforms. In addition, as the poor are often the
most affected by changes from industry, the government must minimize the
impact of price rationalization on them. This can be done through more
targeted subsidies and better enforcement.
Centre- States Coordination:
In India, each state has authority over policy decisions governing how energy
is produced, moved, and consumed within its borders. A state can, in effect, set
prices for generation, transmission, and distribution. Generally, the prices for
the fuel itself are set by the central government or other parastatal institutions.
However, if a state wishes to subsidize these prices, which often occurs, it can
charge consumers less than it pays for the fuel. Due to this fact, almost all the
state electricity boards are bankrupt.
The central government is in charge of a number of public sector undertakings
that produce and distribute energy and electricity. However, as these
companies are forced to sell their products at subsidized rates, the government
compensates them for their ―under-recoveries,‖ which deflates the
government‘s fiscal coffers. The central government also supports the
nationally owned firms that own and build power plants. There are a host of
other government-owned and state-owned corporations that are involved in the
energy sector. The central government not only creates the rules under which
these corporations operate but also ensures that the organizations themselves
operate effectively and are responsive to the needs of India‘s citizens.
34
Regional Cooperation:
While India needs to reform its energy sector for short- and medium-term
energy security, regional cooperation will be vital in the long run. India must
avoid the trap of forming an autarchic energy policy as there are great
opportunities for energy collaboration with its neighbors, such as trading
hydroelectricity with Nepal, natural gas and coal-generated electricity with
Bangladesh, natural gas with Iran and Turkmenistan through Pakistan,
undersea gas with Oman, gas with Myanmar, and coal-generated electricity
with Pakistan. While each opportunity rises a host of geopolitical and foreign
policy issues, all must be examined seriously if India has any hope of meeting
its burgeoning energy demand.
For example, just over the border from India‘s industrial heartland in Gujarat,
the Thar Desert contains one of the largest coal deposits in the world. If
developed, Pakistan could sell the coal to India and in return India could sell
electricity back to Pakistan‘s energy-starved province of Punjab. Not only does
this make energy sense, it could start to assuage some of the region‘s existing
tensions. We must remember: India and Pakistan agreed to the Indus Water
Treaty in 1960. While not perfect, this strategy offers hope for a win-win
regional collaboration.
POLICY INITIATIVES IN INDIA
Given the bleak current energy scenario and the future prospects, the
Government of India has put in place several measures that it hopes would
lead to an easing of the shortages in the country and a more even distribution
of access to energy. Some key initiatives along these lines are listed below:
Structural and Regulatory Reforms: The oil and gas sector was one of
the first sectors in which the Government tried to introduce a much higher
level of autonomy by allowing the public sector enterprises to work as corporate
entities with their own Boards of Directors that would man-age the companies
at an arm‘s length distance from the Government. Private Sector participation
in refineries was also introduced as a result of which the private sector body
has a share of nearly 30per cent in India‘s refining capacities today. In the
exploration and production areas, the Government has progressively refined its
terms and conditions for sharing the benefits with the private sector under
various rounds of the New Exploration Licensing Policies (NELP). As a result,
there is now increasing interest on the part of the private sector to engage in
exploration and production activities in India. For example, Reliance Industries
Ltd. (RIL) – one of the largest private sector companies - has had
unprecedented success in discovering gas reserves in deep sea basins in India.
35
The Government has also unbundled the functioning of erstwhile Oil
Coordination Committee that was responsible for the complete supply planning
and procurement of oil and gas in the country, into two entities – Petrofed
which is a trade association for oil and gas and the Petroleum and Natural Gas
Authority which is an in-dependent regulator in the sector. Unfortunately, one
of the weakest points of the regulator in this sector is the fact that it does not
have a right to regulate the prices which continue to be in the domain on the
Government.
In the case of power sector, reforms were introduced in the early 1990‘s and,
through a process of learning; India has finally reached a stage where it has
enacted the Energy Conservation Act in 2001 and the Electricity Act in 2003.
The Energy Conservation Act requires the establishment of a Bureau of Energy
Efficiency as a deemed statutory autonomous body that would work towards
encouraging energy efficiency in the country. The broad objectives of BEE are
to provide a policy framework and direction to national energy conservation
and efficiency efforts and programs; to coordinate energy efficiency and
conservation policies and programs and take it to the stakeholders; to establish
systems and procedures to measure monitor and verify energy efficiency
results in individual sectors as well as at the macro level.
The Electricity Act 2003 requires the functional unbundling of erstwhile
vertically integrated state electricity boards and puts in lace regulatory
commissions both at the federal and state level. These electricity regulatory
commissions have significant powers and have the responsibility to determine
not only the tariff structures in their areas of jurisdiction but also to satisfy
quality of supply and service norms and create a competitive environment
apart from several other functions.
The coal sector, unfortunately, is one sector that has not made adequate
progress on reforms.
Enhanced Private Sector Participations: Private sector interest in
the oil and gas sector has built up and much more significantly than in the
case of electricity sector because it got an early start and because distortions in
the case of these sectors were not severe as in the case of electricity. Despite
several efforts towards encouraging private sector participation in electricity
generation and distribution the response from the private sector has been
grossly inadequate. This has largely been because of the inability of the
distribution business to generate adequate revenues to provide an adequate
return or indeed comfort that the services would be paid for! Once again,
learning from the past experiences and the need to quickly add significant
capacities, the Government of India launched the Ultra Mega Power Project
36
(UMPP) scheme that identified seven sites for setting up large-scale power
plants with each site having a capacity of 4000 MW. The attractiveness of these
projects is that it addresses the challenge of fuel supplies head on by either
linking the generation projects to captive coal fields or enabling coal imports..
Through this move, the Government found a loophole in the Legislation on Coal
that allow coal exploration and production by public sector entities alone
unless it is for captive purposes. Apart from this scheme, private sector interest
is limited to the generation segment with little or no movement in the
transmission and distribution businesses.
Universal Services: The performance of the country in providing clean
petroleum products like LPG, kerosene to the deprived rural populace of the
country has been dismal. This has continued to remain so largely because of
the reluctance to rationalize subsidies on these products and to ensure an
effective delivery system that would result in plugging leakages – it is for this
reason that nearly 90 per cent of the rural household continue to depend on
biomass energy for meeting their cooking energy needs whereas only the top 25
per cent of Indian population enjoy nearly 70per cent of the subsidies on these
products.
As far as electricity is concerned, the challenge of universal services remains
daunting for nearly 400 million people having no access to electricity supply in
the country. Under a scheme launched by the Government called the Rajiv
Gandhi Garmin Vidyutikaran Yojana (RGGVY), the Government is facilitating
the extension of electricity infrastructure to rural areas through a high capital
subsidy but linked to the establishment of franchise distribution arrangement
at the local level. This particular scheme takes advantage of a provision of the
Electricity Act 2003 that has delicensed generation and distribution of
electricity in rural areas. The attractiveness of RGVVY schemes lies in its
design where in the local level entrepreneur would be allowed to recover tariffs
from its consumers on the basis of their ability to pay and require the
distribution licensees to pro-vide electricity to such entrepreneurs at those
prices. Any loss that the distribution licensee would incur for such supplies
would be borne by the larger consumers‘ urban and industrial areas.
Transport Initiatives: Recognizing the growing role of the transport sector
in energy demand, the Government of India has started another scheme
JNNURM (Jawaharlal Nehru National Ur-ban Renewal Mission) that is
providing support to city bodies to plan their transportation and infrastructure
in the most efficient manner taking into account size, density and spread of the
city. A number of State Governments have now come up with proposals for

37
integrated urban transport system that rely heavily on the development of
public or mass transit systems.
ENERGY AND CLIMATE CHANGE
In the above energy and development scenario, it is highly unlikely that India
would commit to any quantitative emission reduction targets. However, faced
with the huge challenge of meeting its rapidly increasing energy demand, India
is focusing sharply on both energy efficiency improvements as well as tying up
energy resources at the global level – either through purchases on the
international markets or through equity investments in global assets.
India would also be keenly interested in acquiring clean and efficient energy
technologies. However, it would have to be extremely sensitive to the costs of
such technologies. The Indian consumers, specially the very large percentage
that today do not have an access to electricity, are extremely price sensitive
and the Government would need to take into account not only the ability of
such people to pay for energy ser-vices but also to its own ability to absorb the
costs of energy subsidies. Energy subsidies, especially for the deserving, are
provided by almost every country in the world – developed or developing. The
key difference for a country like India is the fact that it already suffers from the
significant fiscal deficit which only in 2007 it was able to bring down. As such,
India would be able to more readily accept those technologies that it considers
‗affordable‘ or those that may be made available at concessional terms.
The option of using the clean development mechanisms (CDM) also exists but
has thus far been focused primarily on the ―low hanging fruit‖. It would be
interesting to look at the possibility of apply the public-private-partnership
model to-wards the financing of clean technologies for a large scale energy
production and consumption in the country.
India would also be quite interested in participating in international initiatives
to further develop solar and biomass technologies given its large endowments
as well as strong technical skills that it has available within.
Energy security has a global dimension. Even with the best domestic effort our
dependence on imported energy is expected to increase. We need assured
access to imported energy supplies and also access to new energy related
technologies. This means we need sensible policies that can promote economic
partnership with countries that have energy resources and technologies.
Apparently, we need a proactive foreign policy, protecting our access to such
resources and to foreign technology.
ENERGY SECURITY FOREIGN POLICY:
On the external scene, India imports 65 per cent of its energy sources from the
Persian Gulf. But this region is volatile. Besides the Gulf region, India can get
38
energy sources from the Caspian region, South-East Asia, Australia, Africa and
Europe. But in the Caspian region, existing reserves are much lower than what
was estimated, they are land-locked and the current pipeline infrastructure is
grossly unsatisfactory. Major South-East Asian countries such as Malaysia and
Indonesia are going to turn into net oil importers by the end of this decade.
Import options from Africa and Europe are a high strategic priority as well as
an economic necessity since African and European crude oil has lower sulphur
content and is more environment-friendly. Russia is a potential energy asset to
the Asia Pacific region. However, to transport gas from there, India will need to
construct a 3,700-km long pipeline, which is not commercially feasible.
Compared to other regions, transportation of energy sources from the Gulf is
cheaper. Therefore, the possibility of diversifying the regions from which to
acquire oil and gas supplies in the near future seems somewhat remote.
In the subcontinent, Pakistan has not been cooperating with India on Indo-
Iranian energy schemes. The ambitious plan of the Russian company,
Gazprom, to connect Iranian gas to India through the Pakistani coastal areas is
yet to be initiated. Again, due to Pakistan's reluctance, the Turkmenistan
pipeline could not be connected with India and it terminated to Pakistan only
via Afghanistan. The case of Bangladesh is more frustrating. Despite
Bangladesh possessing a good reserve of natural gas and India offering a huge
market, Dhaka is reluctant to cooperate. Perhaps it views India as a regional
hegemon or its internal party politics does not allow it to take a decision in
favour of New Delhi.
Energy security has a global dimension. Even with the best domestic effort our
dependence on imported energy is expected to increase. We need assured
access to imported energy supplies and also access to new energy related
technologies. This means we need sensible policies that can promote economic
partnership with countries that have energy resources and technologies.
Ministry of External Affairs (MEA) has a division on energy security created a
few years ago with the express purpose of starting energy dialogues with a
whole range of countries that would help India explore more and varied sources
of energy across the spectrum. Its record has been patchy, at best. For
instance, India has an energy dialogue with the US, but that is conducted by
the Deputy Chairman of the Planning Commission. Other energy dialogues are
conducted by different ministries - Petroleum and Natural Gas, Power, Water
Resources and Renewable Energy, even Mines, not to speak of the Prime
Minister Office (PMO) and Department of Atomic Energy (DAE) which plays the
nuclear energy sector in total secrecy. The foreign office barely gets a word in
edgeways. Most large countries have a single ministry handling energy issues.
India has seven. The result of this plurality is there is no central approach to

39
securing energy resources or technology from overseas. It often results in one
of two things - needless duplication, or missed opportunities, particularly when
dealing with fleet-footed countries like China.
In the past five years, India has cut its energy dependence on Iran, shifting a
lot more of its oil acquisitions to Saudi Arabia and the Gulf states. However,
Iran remains a major source of energy for India, because India wants to
maintain a ―balance‖ in the Middle East - essentially between Sunni Saudi
Arabia and Shia Iran. As the Middle East and Arab world continue to be
unstable and in the throes of popular protests for the foreseeable future, India
will need to invest more heavily in understanding the nature and future of
these protests and how they might affect energy flows to the east. For instance,
Iraq should be emerging as a major oil source for India as its oil sector goes on-
stream again. Israel‘s bidding fair to becoming a gas giant and it wants to sell
to India. Can India diversify gas sources from Qatar to countries like Israel?
Central Asia too is a promising source of energy for India. Kazakhstan is a
crucial source for both fossil fuels and uranium. But transportation to India is
almost impossible. Therefore, India prefers to look at Africa and Australia.
However, India‘s quest for energy security now has to take couple of other
factors into account - first, a resource nationalism among supplier countries
particularly in Africa; and secondly security of transportation of energy. India‘s
energy security foreign policy has to be closely connected with its Indian Ocean
and South China Sea strategy as well as its Middle East policy, as well as
climate change policies. All these policies currently work in silos in the Indian
government, which does not make for anything ―proactive‖.
Ultimately, India‘s energy security challenges are internal - there are serious
challenges in ―energy governance‖, pricing of resources and power tariffs are
distorted, which means that power projects dependent on imported coal are
finding it impossible to go on stream.
The nuclear sector had brightened with the passage of the India-US nuclear
deal. But between Fukushima and a crazy nuclear liability law that is keeping
Indian and foreign nuclear companies from the Indian market, the future of
nuclear power in India has dimmed.
INDIA AND THE “PETERSBURG DECLARATION:
India is almost completely in line with the core principles of the Petersburg
action plan with a small differentiation in its approach to climate change and
sustainable development. India is clearly pursuing aggressively the path of
sustainable development which by itself has been well recognized both in the
third and fourth Assessment reports of IPCC (Intergovernmental Panel on
Climate Change) as having strong linkages with climate change.
40
While several of the policies and measures implemented by the Government of
India are aimed towards increasing the transparency and stability of the energy
markets in the country, political compulsions continue to have a dampening
effect particularly on stability of policies. This is one key reason for the
lukewarm response of the private sector to the energy sector development in
the country.
India is also strongly aligned with the principle of open, transparent and
competitive markets with the exception of coal sector. Competitive bidding
processes have been introduced in all segments of the other energy sectors.
However, a key weak point comes to the fore when such processes run into
disputes. What is required in such instances is to have strong and independent
dispute resolutions mechanisms. The Government cannot assume onto itself
this role – especially when a large part of the energy sector continues to be in
the public sector.
In a similar fashion while the dialogue between the Government and the
various stakeholders in energy developments have increased substantially as
compared to a decade ago, the challenge of informing and educating consumers
of energy products and services still remains daunting. This is apparent both in
the public consultations held by the Electricity Regulatory Commissions as well
those that are part of the Environment Impact Assessment processes in the
country.
One key principle of the Petersburg declaration that needs focused attention,
relates to the safeguarding of critical energy infrastructures. While it is easy to
identify such critical infrastructures on a point basis, India has not undertaken
any exercise to identify and prioritize critical points along its networks.
CONCLUSIONS:
The Indian Government has already undertaken or planned for several policies
and initiatives that encourage sustainable energy growth – both in terms of
improved efficiency of use and in terms of its environmental implications.
Several policies and measures have for example focused on improving energy
efficiency, enhancing renewable and clean energy forms, bringing about power
sector reforms, promoting clean coal technologies, promoting cleaner and less
carbon intensive fuels for transport, and addressing environ-mental quality.
The Indian Government has actively been pursuing a multi-pronged strategy
for the promotion of renewable energy sources. Against a target of 3,075 MW,
the country added 4,613 MW capacity based on renewable during the Tenth
Plan. During the Eleventh Plan period, the MNRE aims to have 10 per cent of
grid interactive power generation installed capacity and 4 per cent of the
electricity mix based on renewable. Setting up National Mission on Biofuel in
41
terms of exploring Jatropha curcas as a biodiesel plant and to study the
techno-commercial viability of biodiesel production from its seeds constitutes
an important step in this area.
There has been considerable improvement in commercial energy intensity
during 1986-2006, but the intensity is also likely to improve further if the
current plans and policies of the Government are implemented, revealing the
decoupling of energy and economic growth over time in the Indian economy.
Similarly, despite an absolute increase in CO2 emissions over time, the CO2
emission intensity is decreasing with more efficient and cleaner alternative
options making their way into the country‘s energy mix. In sum, energy sector
developments in India are very much aligned to the Petersburg Declaration but
any international processes that could accelerate progress, in line with national
priorities and with respect to national sovereignty issues, would be welcome.
42
The Energy Future and India
Neelam G. Tikkha
Professor MMV,
RTM Nagpur University; and
Director
CFTRA- Global
Nagpur
ABSTRACT The world is at a crucial stage where energy consumption has been rising dramatically. In Asia
itself we see people driving huge 3000cc-engine cars, to cooling rooms below 24 degrees
Celsius, and from cooking on firewood stoves, to reading under kerosene lamps, Asia and the
Pacific covers the entire gamut of energy consumption. The rapid growth has put forth a serious
energy security challenge in front of Asia Pacific region in support of its rapid economic growth.
The major question that arises is that how these energy resources can be secured, produced and
consumed in a sustainable way so that socio-economic development does not compromise the
carrying capacity of natural resources. Another major concern is the global climate change
which is being affected day by day by the various steps taken to increase production. It is
expected that total primary energy demand in Asia and the Pacific alone is expected to nearly
double between 2013 and 2033. The objective of this paper is to explore various alternative
sources of energy so that climate does not get denigrated and socio economic development does
not compromise with the carrying capacity of natural resources. The key findings are that it is
high time Research and development activities should be encouraged and alternative sources of
energy should be explored so inclusive and sustainable growth takes place.
Surprisingly, scientists have a better understanding of how many stars
there are in the galaxy than how many species there are on Earth." WRI
INTRODUCTION: The world is at a crucial stage where energy consumption has risen
dramatically and is seen ever increasing. In Asia itself we see people driving
huge 3000cc-engine cars, to cooling rooms below 24 degrees Celsius, and from
cooking on firewood stoves, to reading under kerosene lamps, Asia and the
Pacific covers the entire gamut of energy consumption. The rapid growth has
put forth a serious energy security challenge in front of Asia Pacific region in
support of its rapid economic growth. The major question that arises is that
how these energy resources can be secured, produced and consumed in a
sustainable way so that socio-economic development does not compromise the
carrying capacity of natural resources. Another major concern is the global
climate change which is being affected day by day by the various steps taken to
increase production. It is expected that total primary energy demand in Asia
and the Pacific alone is expected to nearly double between 2013 and 2033.
43
“The world today faces two main energy challenges: providing enough light, warmth, and power for every household – and at the same time shifting to cleaner energy sources to protect our increasingly fragile natural environment.” UN Secretary-General, Mr. Ban Ki-Moon launched his “Sustainable Energy for All” initiative in 2011, focusing on three major goals: improving energy access, energy efficiency, and the share of renewable sources in our energy mix.”
NAPCC also strongly advocates and states on equity ―We are convinced that
the principle of equity that must underlie the global approach must allow
each inhabitant of the earth equal entitlement to the global atmospheric
resource.‖ However there is nothing that NAPCC substantiates that
Government of India is doing to encompass this principle of unity at National
level. The report of GOI in fact puts forth the plans to increase in number of
hydro, thermal, and nuclear power plants as a measure to provide electricity
to all justifying that 56per cent rural population and 12 per cent urban
population still do not have electricity. The power plants intend to increase
their power generation capacity from present 147000 MW capacities to
800000 MW by 2032.
The research and development to tap on the alternative sources of energy is
very low. It can be substantiated by the fact that the aim of National Solar
Mission under the NAPCC is to develop just 100 MW of solar photovoltaic and
1000 MW of concentrating solar power projects by 2017. This cannot help to
achieve a comprehensive solution to protect denigration of climate. So the two
policies one of protecting environment and climate change and the other of
increasing energy output contra point at one another. Thus farfetched seems
the mission to save the Himalayan ecosystem since, the National Energy plan
talks about adding 120000 MW of hydropower by 2032, most of them in
Himalayan region which will completely destroy the Himalayan ecosystem.
The Himalayan region has rich biodiversity which should be considered as
heritage of the country. But, human activities like conversion of forest areas for
non-forestry purposes due to various necessities like electricity, irrigation and
drinking water have ruined the biodiversity. A number of dams have been
constructed in the natural forests. Moreover, roads are being constructed for
better access, power transmission lines, guest houses, dormitories, affecting or
depleting the environment and the rich biodiversity. Even the making of
trekking paths for various purposes affects the floral and faunal populations in
different ways, directly and indirectly contributing to depletion of a number of
plants and animal species.
44
Scientists believe that:
The rapid loss of species we are seeing today is
estimated by experts to be between 1,000 and 10,000 times higher than the natural extinction rate.
These experts calculate that between 0.01 and 0.1per cent of all species will become extinct each year.
If the low estimate of the number of species out there
is true - i.e. that there are around 2 million different species on our planet - then that means between 200
and 2,000 extinctions occur every year. But if the upper estimate of species numbers is true -
that there are 100 million different species co-existing
with us on our planet - then between 10,000 and
100,000 species are becoming extinct each year.
Another matter of concern should be the recent tragedy because of the
callous human activities that has resulted in devastation at such a massive
level at Kedarnath.
The world today faces two main energy challenges: providing enough light,
warmth, and power for every household – and at the same time shifting to
cleaner energy sources to protect our increasingly fragile natural environment
.Ensuring sustainable energy for all is additionally challenging in Asia and the
Pacific.
There has been a great progress and improvement in the lives of people of the
Asia-Pacific region, yet 628 million people do not have access to electricity, and
there are 1.8 billion people who still use traditional fuels such as wood,
charcoal, agricultural residues and animal waste.
Extensive energy paucity denounces billions to darkness, to morbidity and to
miss opportunities: children cannot study at night, clinics and hospitals
cannot offer quality healthcare, and large numbers of people are unable to
make use of the opportunities and information accessible through modern
technology.
This inequality must come to an end, but any effort must involve steps which
are smart and sustainable, utilizing natural resources, while preserving the
integrity of the ecosystems on which mankind depend. ―How will the Asia-
Pacific region meet this demand? How will it grow in a sustainable way that is
both equitable and efficient? How can universal energy access be achieved?
These are some of the key questions that need to be answered for sustainable
growth and protection of the environment.
Another, issue that concerns the Asia-Pacific region is that it has some of the
highest levels of carbon intensity. Our primary energy intensity is among the
highest in the world, despite rapid and significant reductions in recent
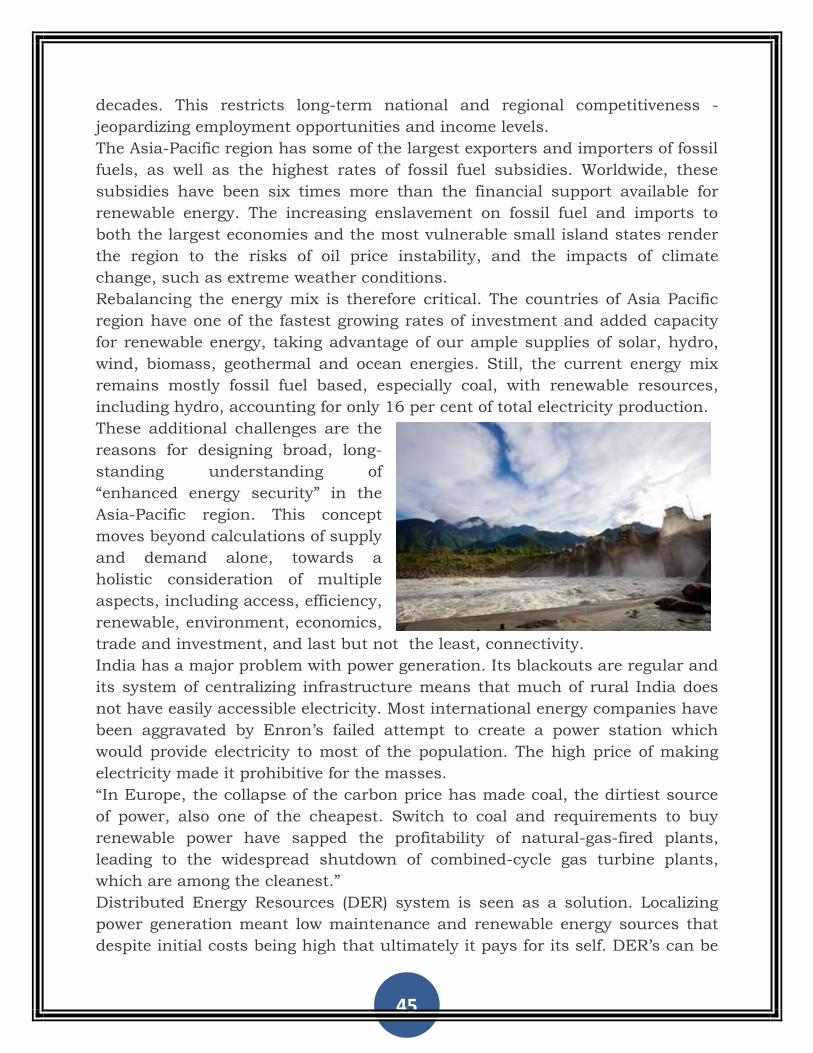
45
decades. This restricts long-term national and regional competitiveness -
jeopardizing employment opportunities and income levels.
The Asia-Pacific region has some of the largest exporters and importers of fossil
fuels, as well as the highest rates of fossil fuel subsidies. Worldwide, these
subsidies have been six times more than the financial support available for
renewable energy. The increasing enslavement on fossil fuel and imports to
both the largest economies and the most vulnerable small island states render
the region to the risks of oil price instability, and the impacts of climate
change, such as extreme weather conditions.
Rebalancing the energy mix is therefore critical. The countries of Asia Pacific
region have one of the fastest growing rates of investment and added capacity
for renewable energy, taking advantage of our ample supplies of solar, hydro,
wind, biomass, geothermal and ocean energies. Still, the current energy mix
remains mostly fossil fuel based, especially coal, with renewable resources,
including hydro, accounting for only 16 per cent of total electricity production.
These additional challenges are the
reasons for designing broad, long-
standing understanding of
―enhanced energy security‖ in the
Asia-Pacific region. This concept
moves beyond calculations of supply
and demand alone, towards a
holistic consideration of multiple
aspects, including access, efficiency,
renewable, environment, economics,
trade and investment, and last but not the least, connectivity.
India has a major problem with power generation. Its blackouts are regular and
its system of centralizing infrastructure means that much of rural India does
not have easily accessible electricity. Most international energy companies have
been aggravated by Enron‘s failed attempt to create a power station which
would provide electricity to most of the population. The high price of making
electricity made it prohibitive for the masses.
―In Europe, the collapse of the carbon price has made coal, the dirtiest source
of power, also one of the cheapest. Switch to coal and requirements to buy
renewable power have sapped the profitability of natural-gas-fired plants,
leading to the widespread shutdown of combined-cycle gas turbine plants,
which are among the cleanest.‖
Distributed Energy Resources (DER) system is seen as a solution. Localizing
power generation meant low maintenance and renewable energy sources that
despite initial costs being high that ultimately it pays for its self. DER‘s can be

46
used to provide local schools and hospitals with electricity which will ensure to
keep some of the poorest people in India healthier and better educated. DER
can also be used as Micro grids that will connect to a larger national grid. Local
generators using systems of energy trading platforms which are already in
place can then sell excess energy. This system will be monitored against
corruption online through the use of production and expected use quotas
which will be formulated by annual audits. This will go a long way to answering
some of India‘s power needs. If this system works it could end power shortages
across India and may even provide an avenue of wealth in power exportation.
The benefits of DER are quite evident since it will help bringing largely required
amenities to households across India. If implemented successfully will helps
modernize even the most rural parts of India? Districts producing localized
energy can help India‘s growth whilst helping themselves. By nurturing
innovation in generating electricity India can achieve three fold targets with one
shot, which is inclusive growth, limited centralized resources and providing a
channel for alleviating poverty.
1 Dr. Noeleen Heyzer, Shaping the Future of Sustainable Energy in Asia and the Pacific,
http://www.islandsbusiness.com/news/united-nations/3100/shaping-the-future-of-sustainable-
energy-in-asia-a/, Mon 07, Oct 2013. 1 http://planningcommission.nicin/reports/genrep/rep_intengy.pdf accessed on February , 2012.
1 http://www.eco-business.com/news/clean-energy-needs-level-playing-field-interview-adbs-
anthony-jude/ 1
WWF - How many species are we losing?,
www.panda.org/about_our_earth/biodiversity/biodiversity/ Solar and wind farms, hydropower and geothermal plants now power Asian cities with clean
energy with the help of financing and capacity building from ADB. Source: ADBV
Cartoons: https://www.google.co.in/search?q=cartoon+images+on+global+warming&tbm=isch&tbo=u&so
urce=univ&sa=X&ei=oopaUqeIBYORrQfa04DoCg&ved=0CDoQsAQ&biw=683&bih=329&dp
r=1#facrc=_&imgdii=_&imgrc=jPFQ63uOcvrUbMper cent3Aper cent3Bayy93ZNd5c 1 http://www.eco-business.com/news/europe-risks-energy-crisis-green-subsidies-ceos-say/
Bibliography:
“Stomping on Biodiversity: Humanity‟s Ecological Footprint,” published in theCommonwealth
Ministers Reference Book.
• the Science article, “Global Biodiversity: Indicators of Recent Declines” Science 328, 1164
(2010) DOI: 10.1126/science.1187512.
• report 2010 and Beyond: Rising to the Biodiversity Challenge, published by Global Footprint
Network and WWF.
• BIP‟s post-2010 strategic goals for halting biodiversity declines.
How Distant a Square meal : The Persistence of Hunger in India by Rahul Goswami , January
23,2009.

47
http;// infochangeindia.org/200901097562/agriculture analysis/ the hunger-index.html
FAO , Rome, August 2007, Energy Use in organic food system:
http://www.FAO.org/docs/eims/upoad/233069/energy-use-oa.pdf,accessedFebruary,2010.
The Financial Express , February 9, 2009, Low efficiency of resources raises concerns‟
Himachal Week , Himachal Climate Change Policy : Help or Hinderance? ,December29,2008.
http://himachal.nic.in/environment/newsevents.htm
Indian express, For carbon, Neutral Himachal , Dhumal‟s Team Draws Road Map,
January9,2009.
Mint, India Should take the lead in imposing Cap on Emission, February11, 2009.
The Hindu, Warming Ocean alters monsoon, January 21,2009.
Guy C.K.Leung , Energy policy ,China‘s Energy Security: Perception and Reality
www.elsevier.com/locate/enpol

48
india’s cross Border energy trade: A Case of Transnational Gas Pipelines
Manish Vaid Tridivesh Singh Maini
Observer Research Foundation, Jindal School of International Affairs
New Delhi Sonepat
ABSTRACT India leads the South Asian region in terms of energy trade in general and hydrocarbons in
particular. India is a case in point, because it not only imports its energy requirements including
oil, natural gas and coal from countries in Middle East, Australia, Indonesia, and now the US,
but also exports some of its petroleum products to both its neighbouring countries like Bhutan,
Nepal, Sri Lanka as well as to the countries like United Arab Emirates, Oman, Yemen, United
Kingdom, Brazil, Kenya, Nigeria, South Africa, and so on. It was since 2001-02 when India
became net exporter of petroleum products due to an increase in its refining capacity.
Given India‘s growing interest in natural gas with an eye on curbing down energy emissions,
and inability to meet its growing demand from domestic gas resources, it is making serious to
import the same through pipelines. India has pushed its diplomatic efforts to chase for gas
imports from three countries namely, Turkmenistan, Myanmar and Iran for Turkmenistan-
Afghanistan-Pakistan-India (TAPI), Myanmar-Bangladesh-India (MBI) and Iran-Pakistan-India
(IPI) gas pipelines respectively. This paper while describing India‘s existing energy scenario
would focus on its pipeline diplomacy by elaborating on the existing negotiation process going
on for each of these pipelines. Further, the paper will spell out the challenges in pursuing these
pipeline projects, providing some way forward, so that such trade can be a launch pad for other
such energy projects between these and other neighbouring countries to follow citing some
existing energy trade practices.
BACKGROUND
In South Asia, which is said to be a significant energy market for most of the
energy producing and exporting countries has witnessed significant rise in
their energy consumption in recent past, primarily because of its growth in
population, economic development and urbanisation. The existing energy crisis
in this region is putting tremendous pressure on its foreign currency as they
have to import more energy. Countries like India, Bangladesh, Pakistan, Nepal,
Bhutan, Sri Lanka are all being increasingly dependent on imported energy,
not only largely impacting their foreign reserves and fiscal deficit but also
various sectors which now have to rely on costlier imports. India, for instance,
has started to import Liquefied Natural Gas (LNG) which is more costlier than
its domestic gas production, which has seen a sharp decline, particularly due
to fall in gas production in India‘s largest discovered Reliance Industries
49
The economic and geo-political significance of pipelines has begun to be
realized in different parts of the world. Pipelines have become an engine of
economic growth and a powerful strategic weapon in gaining exporters of
hydrocarbons and geopolitical presence in regional markets. South Caucasus
region, for instance, located on the peripheries of Turkey, Iran and Russia has
historically been a ground for such pipeline diplomacy to flourish. This region
became popular post Soviet Union independence, emerging as strategic energy
supply routes. The new energy export pipelines, namely, Baku–Tbilisi–Ceyhan
(BTC) and the Baku–Tbilisi–Erzurum (BTE), which connects landlocked
Azerbaijani energy resources with international markets, marked the end of
Russia‘s monopolistic control over the energy transportation routes from the
Caspian region helping Azerbaijan and Georgia move away from Russian
sphere of influence.3 This enabled both these countries to achieve political and
economic sovereignty, with flexibility to choose its own foreign policy.4
The Indian subcontinent5 made up of India, Pakistan and Bangladesh has
started to gear up with the prospects of three natural gas pipeline entering
India after crossing territories of Pakistan and Bangladesh despite various
geopolitical and geographical challenges. Pakistan would be a party to
Turkmenistan-Afghanistan-Pakistan-India (TAPI) pipeline and Iran-Pakistan-
India (IPI) pipelines while Bangladesh could be a party to Myanmar-
Bangladesh-India gas pipeline. Off late, Bangladesh has also shown its
willingness to be a part of both TAPI6 and IPI7 pipeline due to its recent energy
crisis. There was a biggest shortfall in its natural gas reserves in the world
during 2012, which came down by 47.4 per cent since 2011, according to BP
Statistical Review of World Energy 2013. Moreover, these recoverable natural
gas reserves which at present stand at 16.36 trillion cubic feet are set to get
exhausted in 10 years, which will force Bangladesh to rely exclusively on
imported natural gas.8
The adage, „what petroleum has been for 20th century, natural gas will be
to 21st century’9, still holds true in case of many countries including India,
given its ever increasing energy thirst. India‘s increased energy demand
coupled with supply constraints due to insufficient domestic production of oil
and gas is resulting in increased imports of oil and now natural gas.

50
Emphasis is now been given on reducing costlier oil imports and efforts to
increase usage of natural gas despite the fact that India is witnessing
unprecedented fall in its production largely due to rising preference for gas as a
fuel and feedstock. Supply constraints coupled with increased demands are
dealt more and more with imported LNG both long term contracts and on spot
basis. In order to further complement costlier LNG imports, the government is
also pushing for transnational gas pipelines such as Turkmenistan-
Afghanistan-Pakistan-India (TAPI), Iran-Pakistan-India (IPI) and of late the
Myanmar-Bangladesh-India (MBI) pipelines.
Pipeline gas imports present a unique opportunity for possible cooperation
between the countries involved in pipeline projects which can significantly
bring economies of scale through policy coordination, mitigating the impact of
wide fluctuation in global oil and gas prices. But in spite of the potential
advantages, India has till date failed to implement any of the aforementioned
transnational pipeline projects, due to various bureaucratic, geopolitical and
geographical hurdles.
This paper, while elaborating the current status or progress made by these
pipeline projects will deal with the major roadblocks – political, logistical and
economic – due to which these projects are not taking off. It will also highlight
the ongoing negotiations and the deliberations between the concerned
countries, in each of these pipeline projects. The paper will further state the
advantages which will accrue to the nations concerned, thereby providing some
policy inputs in smooth functioning and kick-start of such projects.
INTRODUCTION
Gas pipeline networks bring economies of scale when imported within land lock
countries. The Integrated Energy Policy of India arguing for gas pipelines,
states that it enhances energy security provided supplying country makes a
substantial investment, given their huge stakes involved in such project. A gas
pipeline also nullifies the risk of supply disruptions as its gas cannot be easily
diverted like in the case of crude oil and LNG, imported in large tankers and
ships. There is no doubt whatsoever, that there are risks of sabotaging the
pipelines, but again the same can be mitigated by implementation of strategies
like creating interest among multiple countries through which the pipeline
would transit, encourage multiple agencies to invest in such pipeline projects
and using LNG as a buffer stock to pipeline gas.10
Therefore, supply risk arising due to fall in domestic oil and gas production,
can be dealt with increase in ability to import energy (in this case natural gas)
either through LNG imports, if it is a sea having distance of more than 2500
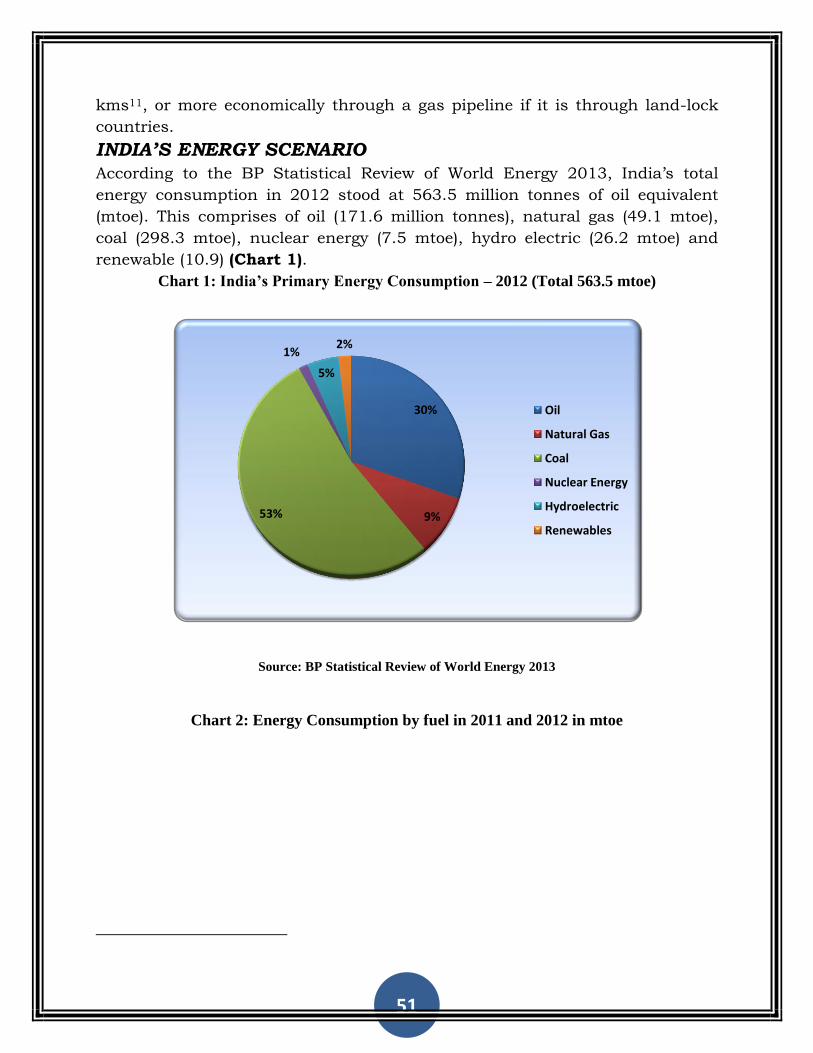
51
kms11, or more economically through a gas pipeline if it is through land-lock
countries.
INDIA’S ENERGY SCENARIO
According to the BP Statistical Review of World Energy 2013, India‘s total
energy consumption in 2012 stood at 563.5 million tonnes of oil equivalent
(mtoe). This comprises of oil (171.6 million tonnes), natural gas (49.1 mtoe),
coal (298.3 mtoe), nuclear energy (7.5 mtoe), hydro electric (26.2 mtoe) and
renewable (10.9) (Chart 1).
Chart 1:India’sPrimaryEnergyConsumption– 2012 (Total 563.5 mtoe)
Source: BP Statistical Review of World Energy 2013
Chart 2: Energy Consumption by fuel in 2011 and 2012 in mtoe
30%
9%53%
1%
5%
2%
Oil
Natural Gas
Coal
Nuclear Energy
Hydroelectric
Renewables
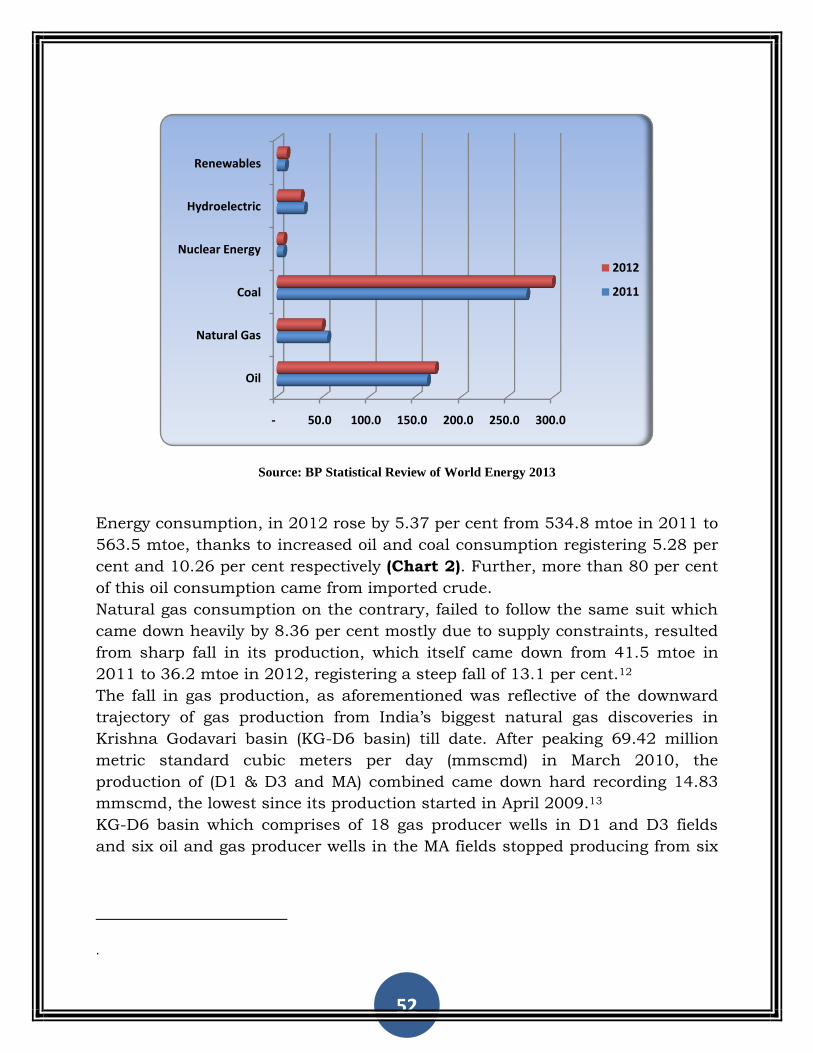
52
Source: BP Statistical Review of World Energy 2013
Energy consumption, in 2012 rose by 5.37 per cent from 534.8 mtoe in 2011 to
563.5 mtoe, thanks to increased oil and coal consumption registering 5.28 per
cent and 10.26 per cent respectively (Chart 2). Further, more than 80 per cent
of this oil consumption came from imported crude.
Natural gas consumption on the contrary, failed to follow the same suit which
came down heavily by 8.36 per cent mostly due to supply constraints, resulted
from sharp fall in its production, which itself came down from 41.5 mtoe in
2011 to 36.2 mtoe in 2012, registering a steep fall of 13.1 per cent.12
The fall in gas production, as aforementioned was reflective of the downward
trajectory of gas production from India‘s biggest natural gas discoveries in
Krishna Godavari basin (KG-D6 basin) till date. After peaking 69.42 million
metric standard cubic meters per day (mmscmd) in March 2010, the
production of (D1 & D3 and MA) combined came down hard recording 14.83
mmscmd, the lowest since its production started in April 2009.13
KG-D6 basin which comprises of 18 gas producer wells in D1 and D3 fields
and six oil and gas producer wells in the MA fields stopped producing from six
.
- 50.0 100.0 150.0 200.0 250.0 300.0
Oil
Natural Gas
Coal
Nuclear Energy
Hydroelectric
Renewables
2012
2011
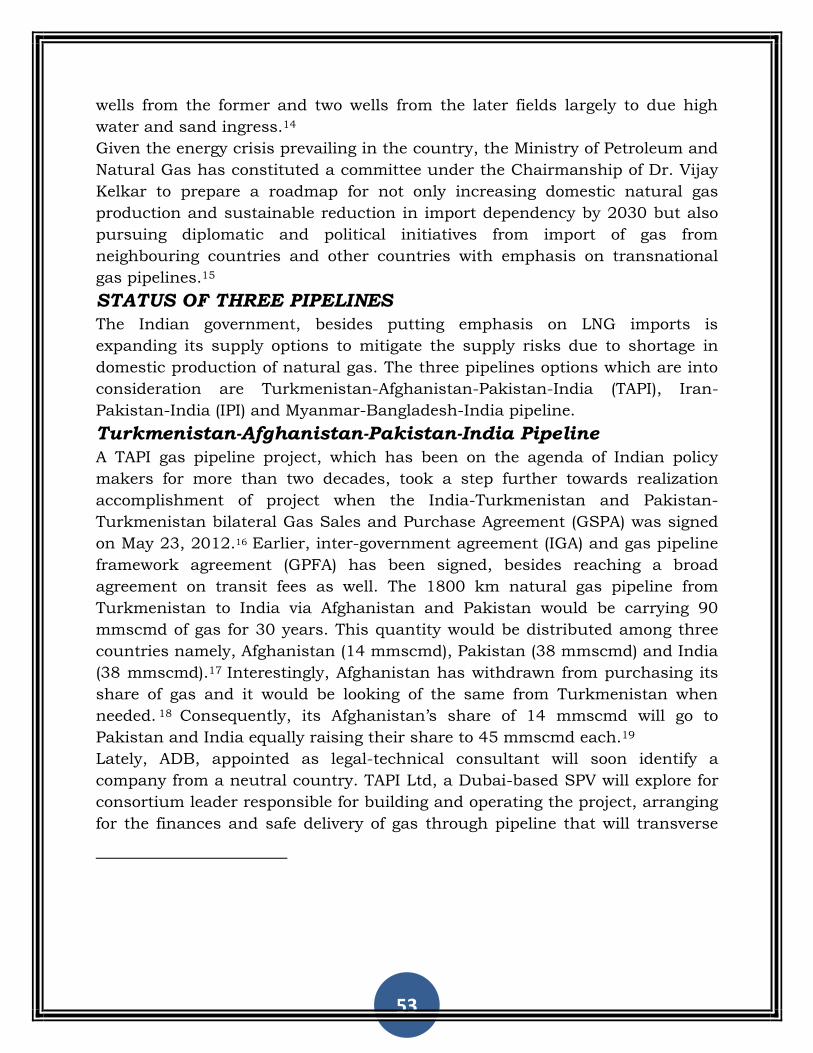
53
wells from the former and two wells from the later fields largely to due high
water and sand ingress.14
Given the energy crisis prevailing in the country, the Ministry of Petroleum and
Natural Gas has constituted a committee under the Chairmanship of Dr. Vijay
Kelkar to prepare a roadmap for not only increasing domestic natural gas
production and sustainable reduction in import dependency by 2030 but also
pursuing diplomatic and political initiatives from import of gas from
neighbouring countries and other countries with emphasis on transnational
gas pipelines.15
STATUS OF THREE PIPELINES
The Indian government, besides putting emphasis on LNG imports is
expanding its supply options to mitigate the supply risks due to shortage in
domestic production of natural gas. The three pipelines options which are into
consideration are Turkmenistan-Afghanistan-Pakistan-India (TAPI), Iran-
Pakistan-India (IPI) and Myanmar-Bangladesh-India pipeline.
Turkmenistan-Afghanistan-Pakistan-India Pipeline
A TAPI gas pipeline project, which has been on the agenda of Indian policy
makers for more than two decades, took a step further towards realization
accomplishment of project when the India-Turkmenistan and Pakistan-
Turkmenistan bilateral Gas Sales and Purchase Agreement (GSPA) was signed
on May 23, 2012.16 Earlier, inter-government agreement (IGA) and gas pipeline
framework agreement (GPFA) has been signed, besides reaching a broad
agreement on transit fees as well. The 1800 km natural gas pipeline from
Turkmenistan to India via Afghanistan and Pakistan would be carrying 90
mmscmd of gas for 30 years. This quantity would be distributed among three
countries namely, Afghanistan (14 mmscmd), Pakistan (38 mmscmd) and India
(38 mmscmd).17 Interestingly, Afghanistan has withdrawn from purchasing its
share of gas and it would be looking of the same from Turkmenistan when
needed. 18 Consequently, its Afghanistan‘s share of 14 mmscmd will go to
Pakistan and India equally raising their share to 45 mmscmd each.19
Lately, ADB, appointed as legal-technical consultant will soon identify a
company from a neutral country. TAPI Ltd, a Dubai-based SPV will explore for
consortium leader responsible for building and operating the project, arranging
for the finances and safe delivery of gas through pipeline that will transverse
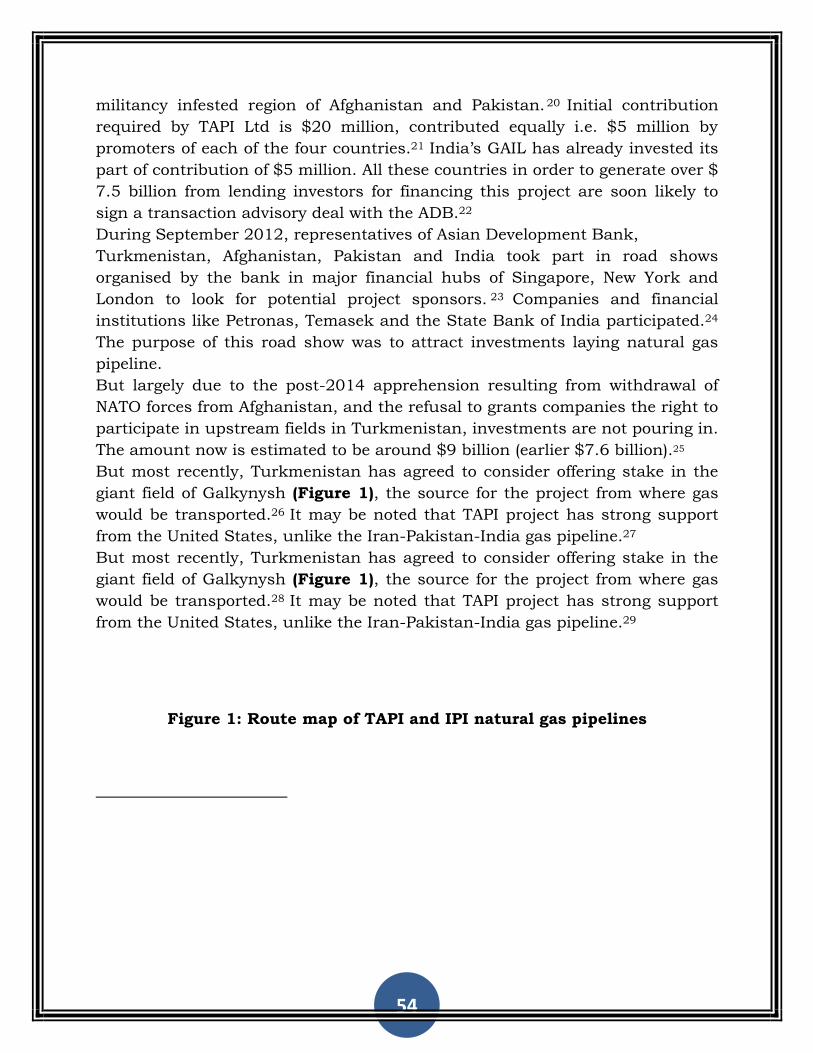
54
militancy infested region of Afghanistan and Pakistan.20 Initial contribution
required by TAPI Ltd is $20 million, contributed equally i.e. $5 million by
promoters of each of the four countries.21 India‘s GAIL has already invested its
part of contribution of $5 million. All these countries in order to generate over $
7.5 billion from lending investors for financing this project are soon likely to
sign a transaction advisory deal with the ADB.22
During September 2012, representatives of Asian Development Bank,
Turkmenistan, Afghanistan, Pakistan and India took part in road shows
organised by the bank in major financial hubs of Singapore, New York and
London to look for potential project sponsors. 23 Companies and financial
institutions like Petronas, Temasek and the State Bank of India participated.24
The purpose of this road show was to attract investments laying natural gas
pipeline.
But largely due to the post-2014 apprehension resulting from withdrawal of
NATO forces from Afghanistan, and the refusal to grants companies the right to
participate in upstream fields in Turkmenistan, investments are not pouring in.
The amount now is estimated to be around $9 billion (earlier $7.6 billion).25
But most recently, Turkmenistan has agreed to consider offering stake in the
giant field of Galkynysh (Figure 1), the source for the project from where gas
would be transported.26 It may be noted that TAPI project has strong support
from the United States, unlike the Iran-Pakistan-India gas pipeline.27
But most recently, Turkmenistan has agreed to consider offering stake in the
giant field of Galkynysh (Figure 1), the source for the project from where gas
would be transported.28 It may be noted that TAPI project has strong support
from the United States, unlike the Iran-Pakistan-India gas pipeline.29
Figure 1: Route map of TAPI and IPI natural gas pipelines
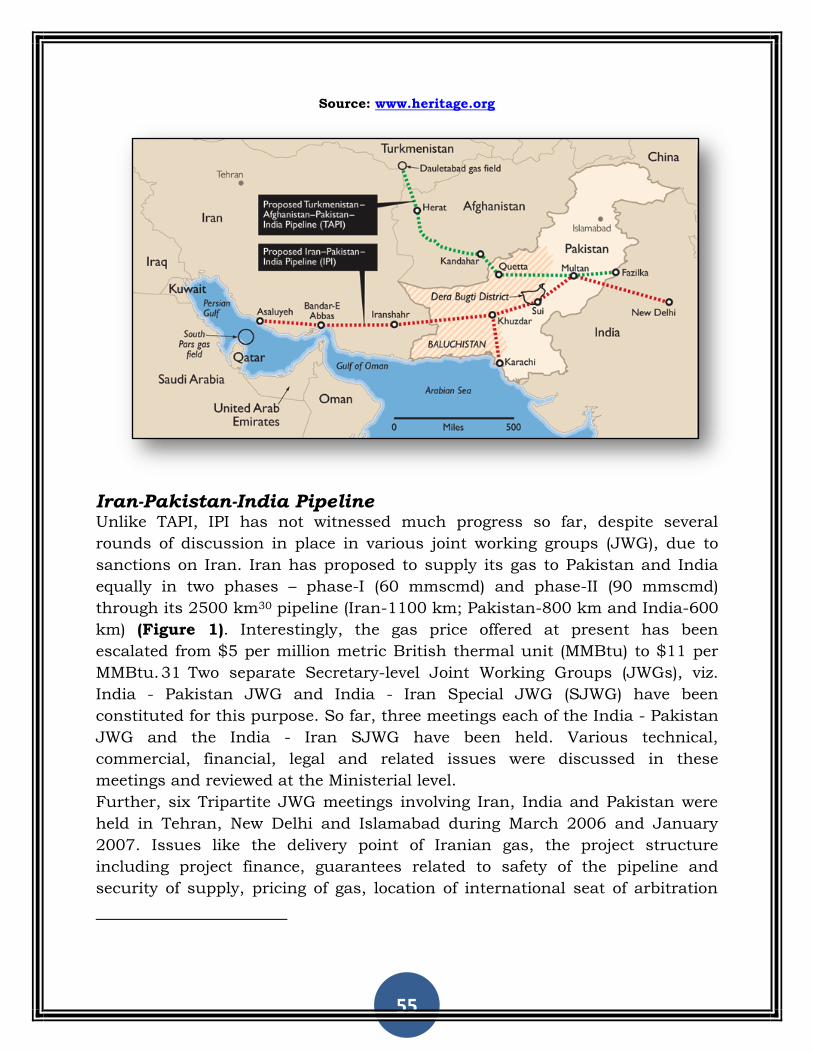
55
Source: www.heritage.org
Iran-Pakistan-India Pipeline Unlike TAPI, IPI has not witnessed much progress so far, despite several
rounds of discussion in place in various joint working groups (JWG), due to
sanctions on Iran. Iran has proposed to supply its gas to Pakistan and India
equally in two phases – phase-I (60 mmscmd) and phase-II (90 mmscmd)
through its 2500 km30 pipeline (Iran-1100 km; Pakistan-800 km and India-600
km) (Figure 1). Interestingly, the gas price offered at present has been
escalated from $5 per million metric British thermal unit (MMBtu) to $11 per
MMBtu.31 Two separate Secretary-level Joint Working Groups (JWGs), viz.
India - Pakistan JWG and India - Iran Special JWG (SJWG) have been
constituted for this purpose. So far, three meetings each of the India - Pakistan
JWG and the India - Iran SJWG have been held. Various technical,
commercial, financial, legal and related issues were discussed in these
meetings and reviewed at the Ministerial level.
Further, six Tripartite JWG meetings involving Iran, India and Pakistan were
held in Tehran, New Delhi and Islamabad during March 2006 and January
2007. Issues like the delivery point of Iranian gas, the project structure
including project finance, guarantees related to safety of the pipeline and
security of supply, pricing of gas, location of international seat of arbitration

56
were discussed in detail, but are yet to be resolved.32 India till now has made
itself available for IP gas pipeline33. With Hassan Rouhani34 at the helm of
affairs, the geopolitical equation could just ease out in India‘s favour. This
further could make the prospects of IPI gas pipeline brighter, because like
TAPI, IPI too needs a good support of the US and which will happen when Iran
settles down its nuclear tussle with International Atomic Energy Agency (IAEA).
Myanmar-Bangladesh-India Pipeline After years of isolation, the foundations have been laid for the revival of
Myanmar‘s democratic reform process and reopening of market economy. Its
president Thein Sein has already introduced a slew of political and economic
reforms. Investors are eyeing this country to pour in huge investments in
various sectors including hydrocarbon, despite the lack of data on its proven
energy reserves.35 Though, according to the CIA Fact Book, Myanmar has a
proven reserve of 283 billion cubic metres and an annual production of 12
billion cubic metres. Since, the country has not been able to sufficiently
explore its hydrocarbon resources with modern seismic technology; excitement
to explore this prospective target is developed among oil and gas companies.36
Figure 2: Expected route map of Myanmar-Bangladesh-India pipeline
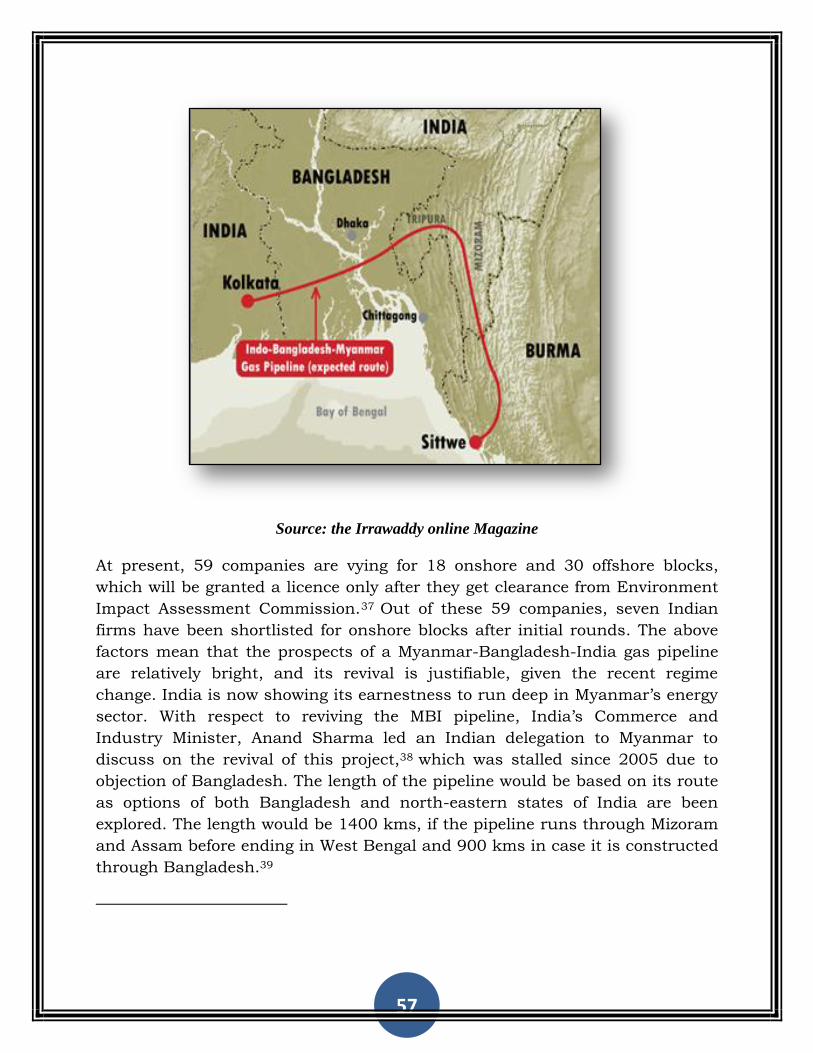
57
Source: the Irrawaddy online Magazine
At present, 59 companies are vying for 18 onshore and 30 offshore blocks,
which will be granted a licence only after they get clearance from Environment
Impact Assessment Commission.37 Out of these 59 companies, seven Indian
firms have been shortlisted for onshore blocks after initial rounds. The above
factors mean that the prospects of a Myanmar-Bangladesh-India gas pipeline
are relatively bright, and its revival is justifiable, given the recent regime
change. India is now showing its earnestness to run deep in Myanmar‘s energy
sector. With respect to reviving the MBI pipeline, India‘s Commerce and
Industry Minister, Anand Sharma led an Indian delegation to Myanmar to
discuss on the revival of this project,38 which was stalled since 2005 due to
objection of Bangladesh. The length of the pipeline would be based on its route
as options of both Bangladesh and north-eastern states of India are been
explored. The length would be 1400 kms, if the pipeline runs through Mizoram
and Assam before ending in West Bengal and 900 kms in case it is constructed
through Bangladesh.39
58
CHALLENGES AND ITS WAY OUT These three pipelines as aforementioned are in different stages of debate. But
it‘s only TAPI which has seen some substantial progress despite a danger of
security and geopolitical risks. Serious financial impediments continue to
hamper the prospects of the project, besides questions of security in the
Afghanistan-Pakistan region. Though these bottlenecks has been factored in by
making suitable provisions in the Inter-Governmental Agreement (IGA) and Gas
Pipeline Framework Agreement (GPFA), signed earlier on December 11, 201040,
it remains to be seen how coordinated efforts by the US and regional players
can deal with likely threats, mostly pertaining to miss-governance and terror
strikes.
While in case of IPI and MBI project is yet to pick up the pace. In case of former
the issue largely remains with Iran‘s problematic dealing and disclosure of its
civil nuclear program, while in case of MBI, India is re-mulling the project
particularly after serious democratic efforts made by Myanmar government,
thereby attracting investments across many sectors including in its under-
developed and yet unexplored hydrocarbon resources. Though some hope is
also visible in case of IPI gas pipeline, in which India has shown its willingness
to join current IP gas pipeline project dealt by Iran and Pakistan largely due to
Rouhani‘s becoming new Iranian President. Rouhani is regarded as a
moderator and is expected to deal with nuclear impasse with much maturity.41
Despite such hope Western countries don‘t bet much on Rouhani‘s victory as
they belief that it is Iran's Supreme Leader Ayatollah Seyed Ali Khamenei who
decides nuclear policy.42 Furthermore, despite Khamenei‘s claim that IAEA has
acknowledged that the problem with Iran‘s nuclear program been resolved,
Mark Hibbs, a senior associate in Carnegie‘s Nuclear Policy Program has
pointed out that IAEA continues to carry a list of questions it wants answer
from Iran, which though are not in public domain. 43 This shows that the
pending issues with Iran‘s nuclear program are yet to be settled completely.
Further, just like TAPI the security issue remains formidable in case of IPI gas
pipeline as well, as this pipeline will still bisect Pakistan‘s territory. For this
reason Iran is even willing to bypass Pakistan while providing its gas to India,
using sea route, after it got rattled with India‘s sharp decline of its import of
Iranian crude.44
59
In case of MBI, the challenge largely lies in multilateral negotiation of a project
as India is willing Bangladesh to be a part of this pipeline, instead of by
passing the same and routing the pipeline through north-eastern region of
India. There has been a history of mistrust between India and Bangladesh
which resulted in failure of this pipeline to fructify in 2005. Since, Bangladesh
government has shown more eagerness not only to join IPI and TAPI pipeline
but re-negotiation of MBI gas pipeline; India should consider Bangladesh‘s
participation. Given the recoverable gas reserves in Bangladesh, it would
further be prudent to further study the gas supply route from Myanmar.
Therefore despite historical record of political mistrust between India and
Bangladesh, this pipeline can just come out of a pipedream benefitting
economics and trade in Myanmar, Bangladesh and eastern and north-eastern
parts of India.
This natural gas pipeline trade between India‘s neighbouring countries would
further work as a catalyst for improving not only the existing energy trade but
also will open wider trade options beyond just hydrocarbon business. All this
will have a positive impact of strengthening infrastructure network, including
roads, highways, etc., in whole of South Asian region, helping it becoming
integrated energy hub, which will further result in stimulating economies of all
the South Asian countries.
OTHER EFFORTS TOWARDS CROSS BORDER ENERGY TRADE Indo-Pak Energy Trade:
Given the severe power crisis in Pakistan, which has been troubling its
economy now and then, India has decided to export electricity through grids as
well as petroleum products like naphtha and diesel oil and natural gas through
oil and gas pipelines. Notably, such trade has increasingly gained importance
since April 2011, after these countries resumed talks to normalize their trade
relations post 26/11 Mumbai attacks.
In June 2013, both the countries discussed on the proposals for setting up a
high voltage direct current (HDVC) transmission line connecting grid stations
from India and Pakistan to transfer 500 MW of electricity from India.
Besides, these two countries are also discussing on proposal for import of 5
mmscmd of Liquefied Natural Gas (LNG).Gas Authority of India Limited (GAIL)
and its counterpart Interstate Gas System are in an advanced stage of talk.
Under this proposal India will import LNG from the third country, which will be
regasified in one of the LNG terminals in India before pumping the same
through a gas pipeline from Jalandhar to Pakistan border via Amritsar. The
only issue which is in a process to be sorted out is the tax component of LNG
price build-up of GAIL. Therefore these energy crisis and challenge could well
60
turn into opportunities for both these countries helping them to resolve their
political issues.
Besides, above pipeline routes India and still explore possibilities of energy
trade routes through other borders like Gujarat, Rajasthan and Jammu &
Kashmir.
Amidst, all these economic measures of mutual benefit, Pakistan have to come
hard on terrorists training from their territory to completely end present day
cross border terrorism. It is only then one can be hopeful of sorting out of their
age old legacy issues, which frequently keeps coming in between any trade
negotiations.
Indo-Bangladesh Energy Trade:
In the past there have been issues with respect to Myanmar-Bangladesh-India
(MBI) natural gas pipeline costing India winning this project, the beneficiary of
which was China. Bangladesh was having a false notion of ‗floating over gas‘
during 2005, which it was thinking to export it to India itself.
While learning from its past mistakes, Bangladesh now wants to rethink the
option of MBI pipeline besides showing its interest to join TAPI45 and IPI46. This
is largely due to insufficient gas available in this country. With Bangladesh
Prime Minister, Sheikh Hasina‘s favourable stance in regarding India‘s
economic cooperation with Bangladesh, Indian public sector undertaking Oil
and Natural Gas Corporation (ONGC) stand to gain three shallow water blocks
and one gas fields in this country and Petrobangla is soon expected to invite
ONGC to sign production sharing contract by September 2013.47
Following its electricity diplomacy in Pakistan, India and Bangladesh is set to
link themselves through high-capacity transmission link between their
electricity grids. This has furthered the scope of extended energy ties between
them. Consequently, Bangladesh is now willing to pick equity stake in
hydroelectric projects in India‘s North Eastern states.48
Indo-Bhutan Energy Linkage:
Bhutan is one of the few countries in Asia which has surplus energy resources.
Others being Nepal and Tajikistan. Bhutan, which is well known for its
hydropower potential which is about 30000 MW, recently came into limelight
for reasons other than this source of energy. It was about India blockage of
.
61
petroleum products to Bhutan, a landlocked country at subsidized rates. All its
petroleum requirements are fulfilled by India through companies like Indian Oil
Corporation (IOC) and Bharat Petroleum Corporation Limited (BPCL). Products
like Liquefied Petroleum Gas (LPG), High Sulphur Diesel (HSD) and Superior
Kerosene Oil (SKO) by IOC and diesel by BPCL. Supplies to Bhutan are made at
the same price which is applicable for domestic retail customer in India
(including excise but prior to delivery charges and local taxes). Since July 1,
2013, exports of petroleum products at such subsidized rates were stopped; as
a result Bhutan was forced to buy the same at commercial rates. After a month
long hiatus the supply of petroleum products at subsidized rates were restored
with effect from August 1, 2013, giving respite to Bhutan, thereby also
restoring Indo-Bhutan energy ties.
But these two countries should now extend this energy linkage further and
Bhutan should start importing electricity from its surplus capacities. India‘s
integrated energy policy too indicates for such imports both from Bhutan and
Nepal. This would be an attempt to integrate not just these countries but the
entire South Asian region making it as a regional integrated energy hub,
thereby striving for energy security not in isolation but with each other‘s
efforts.
CONCLUSION:
In conclusion, while the gas pipelines discussed above are a win-win situation
for all, there will be numerous impediments which may slow down the pace of
the projects, escalating its project cost further and risking the feasibility of
project per se. It has been remarked in this context, that:
―.... true globalization is materializing in pipeline connectivity. However a
thorough perusal of many a proposal leads one to despair. This pessimism is
not so much about the fluctuating assessment of oil and gas reserves in the
region, nor about the real intentions of multinational companies entering into,
and withdrawing from the prospective ventures and also not entirely about the
concerned parties‘ lack of political commitment. But it is certainly about the
countries wasting their time in bickering and mutual hostility rather than
moving towards genuine globalization49.‖
62
What is required is some visionary thinking from the leaderships of the
countries involved. Two pipelines, TAPI and IPI will be heavily influenced by a
number of geo-political factors, while MBI will largely depend on the quantum
of discoveries made in new frontiers of Myanmar and political consistency in
Bangladesh while dealing with India on this. On the other hand while the US
will continue to push for TAPI, it would esist the IPI unless relations with the
newly elected Iranian President improve and current nuclear issue is resolved
by Iran and IAEA.
For all the three pipelines the common determinants in its success would be
policy coordination by various stakeholders of projects as they will be mostly
benefitted by stable gas prices, thereby reducing the risks of fluctuation in
global gas prices, which slowly is departing itself from oil-indexed pricing.
Imports through gas pipelines would necessitate strengthening of energy
security which would certainly be more than equity oil or gas, provided security
concerns are taken care and handled smartly. Though, the cost advantage of
pipeline gas import needed to be balanced against the risks of pipeline
emerging largely out of security.
Last but not the least, such natural gas imports by India from Myanmar,
Turkmenistan and Iran should always be supported by good cross-country
pipeline network within the country to reap the benefits by the country as a
63
whole. India needs huge investment in this regard too with clear set of gas
pricing policy which takes care of core (power and fertilizer) as well as non-core
sectors (city gas distribution, refinery, other industries).
Therefore, putting its house in order through establishing good gas pipeline network is needed besides exploring natural gas import options from its
neighbourhood.
1 Badalyan, Lusine. ‘Interlinked energy supply and security Challenges in the south Caucasus’, Caucasus Analytical
Digest No. 33, December 12, 2011. Accessed on July 4, 2013. http://www.css.ethz.ch/publications/pdfs/CAD-33-2-
5.pdf
1 ibid
1 "Indian subcontinent". New Oxford Dictionary of English (ISBN 0-19-860441-6) New York: Oxford University Press,
2001; p. 929: "the part of Asia south of the Himalayas which forms a peninsula extending into the Indian Ocean,
between the Arabian Sea and the Bay of Bengal. Historically forming the whole territory of Greater India, the
region is now divided between India, Pakistan, and Bangladesh."
1 Bhutta, Zafar. ‘Bangladesh decides to join TAPI gas pipeline project’, The Express Tribune, June 7, 2012. Available
online at http://tribune.com.pk/story/389966/onto-the-bandwagon-bangladesh-decides-to-join-tapi-gas-pipeline-
project/ . Accessed on July 11, 2013
1 INP, ‘Bangladesh sets eyes on Iranian gas via IPI pipeline’, Pakistan Today, May 18, 2013. Available online at
http://www.pakistantoday.com.pk/2013/05/18/news/profit/bangladesh-sets-eyes-on-iranian-gas-via-ipi-
pipeline/#sthash.YPt5EHLi.dpuf accessed on July 11, 2013
1 ‘Bangladesh's existing gas reserves to run out in 10 years: sources’, Platts, June 24, 2013. Available online at
http://www.platts.com/latest-news/natural-gas/Dhaka/Bangladeshs-existing-gas-reserves-to-run-out-26046254 .
Accessed on July 12, 2013.
1 ‘Aiyar for better Indo-Iranian ties in hydrocarbon sector’, The Hindu Business Line, December 6, 2004. Available
online at http://www.thehindubusinessline.in/2004/12/07/stories/2004120701120700.htm . Accessed on June 30,
2013.
1 Planning Commission of India, Integrated Energy Policy, August 2006, p.57. Available online at
http://planningcommission.gov.in/reports/genrep/rep_intengy.pdf , accessed on June 17, 2013. p. 61.
1 United Nations Economic Commission for Europe
1 BP Statistical Review of World Energy 2013, p. 24, 2013. (http://www.bp.com/content/dam/bp/pdf/statistical-
review/statistical_review_of_world_energy_2013.pdf)
1 PTI. ‘Reliance Industries KG-D6 output drops to below 15 mmscmd’, The Economic Times, May 31, 2013. Available
online at http://articles.economictimes.indiatimes.com/2013-05-31/news/39655779_1_gas-production-mmscmd-
sand-ingress , accessed on June 15 2013.
1 Ibid

64
1 Press Information Bureau, ‘Petroleum Minister Dr Veerappa Moily addresses National Editors’ Conference’,
March 24, 2013. Available online at http://pib.nic.in/newsite/erelease.aspx?relid=94270 , accessed on July 5, 2013.
1 Modi, Ajay. ‘Tapi agreement set to expand India's gas basket’, Business Standard, May 24, 2012.
http://www.business-standard.com/article/economy-policy/tapi-agreement-set-to-expand-india-s-gas-basket-
112052402003_1.html
1 ‘TAPI pipeline will be completed by 2017: Moily’, The Hindu Businessline, July 11, 2013. Available on
http://www.thehindubusinessline.com/economy/tapi-pipeline-will-be-completed-by-2017-
moily/article4905496.ece . Accessed on July 12, 2013.
1 ibid
1 ibid
1 Mehdudia, Sujay. ‘Company to be set up soon to execute TAPI pipeline project’, The Hindu, July 10, 2013.
Available online at http://www.thehindu.com/business/Economy/company-to-be-set-up-soon-to-execute-tapi-
pipeline-project/article4901965.ece . Accessed on July 14, 2013.
1 Ibid
1 Bhutta, Zafar. ‘Meeting in Ashgabat: ADB to generate $7.5b for financing TAPI gas pipeline’, June 21, 2013.
Available online at http://tribune.com.pk/story/566032/meeting-in-ashgabat-adb-to-generate-7-5b-for-financing-
tapi-gas-pipeline/ . Accessed on July 7 2013.
1 ibid
1 ibid
1 PTI. ‘No international pipeline firm ready to implement TAPI gas project’, The Economic Times, October 16, 2012.
http://articles.economictimes.indiatimes.com/2012-10-16/news/34498967_1_tapi-gas-turkmenistan-afghanistan-
pakistan-india-gas-pipeline
1 ‘TAPI pipeline will be completed by 2017: Moily’, The Hindu, July 11, 2013. Available online at
http://www.thehindubusinessline.com/economy/tapi-pipeline-will-be-completed-by-2017-
moily/article4905496.ece . Accessed on July 13, 2013.
1 Aziz, Hadi. ‘US supports TAPI but not Pak-Iran gas pipeline: Richard Olson’, The New Tribes, March 5, 2013.
http://www.thenewstribe.com/2013/03/05/us-supports-tapi-but-not-pak-iran-gas-pipeline-richard-olson/
1 Rasheed, Abdul. ‘India willing to join IP gas pipeline’, Business Recorder, May 9, 2013.
http://www.brecorder.com/fuel-a-energy/193/1183760/

65
1 Ibid
1 Sixteenth Report (15 Lok Sabha) of the Standing Committee on Petroleum & Natural Gas (2012-15) on 'Demands
for Grants (2013-14)' of Ministry of Petroleum & Natural Gas.
1 Zamanov, R. ‘Iran, India to begin new round of gas talks’, Trend, May 27, 2013.
http://en.trend.az/regions/iran/2154700.html
1 Knickerbocker, Brad. ‘Iran election: What does Hassan Rohani mean for the United States?’, Minn Post, June 17,
2013. http://www.minnpost.com/christian-science-monitor/2013/06/iran-election-what-does-hassan-rohani-
mean-united-states
1 ‘Myanmar—the ‘promised land’ for oil and gas explorers’, Mizzima, February 23, 2013.
http://www.mizzima.com/opinion/commentary/8957-myanmarthe-promised-land-for-oil-and-gas-explorers .
Accessed on July 5, 2013.
1 ibid
1 Gogan-Keogh, Rosie. ‘Oil block tender closes, but waiting game continues’, Mizzima, June 18, 2013.
http://www.mizzima.com/business/natural-resources/9547-oil-block-tender-closes-but-waiting-game-continues .
Accessed on July 5 2013.
1 ‘India Offers Usd 150 Million for SEZ in Sittwe Indian Banks Make Inroads in Myanmar India’s Oil Companies Get
Big Projects in the Oil Rich Myanmar Road Projects in Myanmar to Help India’s Land Locked Northeast Anand
Sharma Meets President U Thein Sein of Myanmar’, PIB, June 9, 2013.
http://www.pib.nic.in/newsite/erelease.aspx?relid=96493. Accessed on July 5, 2013.
1 Saleque, Engr. Khondkar Abdus. ‘Tri Nation Gas Pipeline: Untold Story’, Arakan Oil Watch, May 10, 2012.
http://arakanoilwatch.org/2012/05/tri-nation-gas-pipeline-untold-story/. Accessed on July 5, 2013.
1 Inter State Gas Systems (Pvt) Limited. http://www.isgs.pk/project_detail.php?project_id=8
1 ‘FM Spokesman: No Date Decided for Iran-IAEA Talks’, Fars News Agency, July 9, 2013. Available online at
http://english.farsnews.com/newstext.aspx?nn=13920418000662 . Accessed on July 13, 2013
1 ibid
1 Hibbs, Mark. ’Closing the Iran file’, Carnegie Endowment for International Peace, July 4, 2013. Available online at
http://carnegieendowment.org/2013/07/04/closing-iran-file/gdxc . Accessed on July 14, 2013.
1 PTI, ‘Iran offers oilfield, pipeline to India for raising oil import’, The Economic Times, May 27, 2013. Available
online at http://articles.economictimes.indiatimes.com/2013-05-27/news/39557218_1_oil-purchase-gas-pipeline-
iran-pakistan-india . Accessed on July 13, 2013.
1 Bhutta, Zafar. ‘Bangladesh decides to join TAPI gas pipeline project’, The Express Tribune, June 7, 2012. Available
online at http://tribune.com.pk/story/389966/onto-the-bandwagon-bangladesh-decides-to-join-tapi-gas-pipeline-
project/ . Accessed on August 5, 2013
66
1 INP. ‘Bangladesh sets eyes on Iranian gas via IPI pipeline’, Pakistan Today, May 18, 2013. Available online at
http://www.pakistantoday.com.pk/2013/05/18/news/profit/bangladesh-sets-eyes-on-iranian-gas-via-ipi-pipeline/
. Accessed online on August 5, 2013.
1 Rahman, M Azizur. ‘ConocoPhillips, ONGC Videsh set to get 3 shallow water blocks, one gas field’, The Financial
Express, August 1, 2013. Available online at http://www.thefinancialexpress-
bd.com/index.php?ref=MjBfMDhfMDFfMTNfMV8xXzE3ODU1NA== . Accessed online on August 5, 2013
1 Sasi, Anil. ‘India-Bangladesh power link to be ready by August’, The Indian Express, July 1, 2013. Available
online at http://www.indianexpress.com/news/indiabangladesh-power-link-to-be-ready-by-august/1135972/ .
Accessed on August 5, 2013.
1 Dash, PL (2008) , ‘Caspian Pipeline Politics, Energy Reserves and Regional Implications’, p. 41-42 (New Delhi:
Pentagon Press) .
Infrastructure for Renewable Energy in India: Some Policy Issues
Sanjay Tiwari Department of Management Studies;
School of Law, Governance, Public Policy & Management,
Central University of Haryana, Mahendergarh
ABSTRACT
India is facing ‗infrastructure-deficit‘ on various fronts and ‗power deficit‘ is one of them as
according to Planning Commission (2008) there exists 13.8 per cent peaking power deficit, 9.6
per cent energy shortage, 40 per cent transmission & distribution (T & D) losses and absence of
competition. Energy is very significant as the growth of agriculture, industry and service is
directly correlated with the growth of energy sector. Planning Commission projected a GDP
growth of 9 per cent for commercial energy growth of 7 per cent. There is a direct correlation
between the growth, per capita income and energy consumption (World Bank 2009 & 2010). The
countries enjoying higher per capita income are also big consumers of energy. The per capita
consumption of energy in India is one third to that of the China while the per capita income of
China is just double than India. India has the fifth largest power generation capacity in the
world. IEA (2010) reveals that India‘s frequent electricity shortages are estimated to have cost
67
the Indian economy 6per cent of gross domestic product (GDP) in financial year 2007–2008.
With a generation of 152 GW of energy, India produces about 4 percent of the global power (as
on 30.09.2009). For fuelling current growth target India requires more than 300 GW generation
capacities by the year 2017(IEA 2010). On the consumption front also India is a laggard as
average per capita electricity consumption in India stands at 704 kWh whereas US
(approx.15500 kw H) and China (approx.1800kWh) are far ahead of us and the world average is
2300 kWh (2008-09). The importance of use of non-renewable sources of energy is realized
world over as the dependence on conventional energy sources like coal, petroleum, diesel, gas,
crude oil and other natural non-renewable resource cause carbon emission and hampers the
sustainable development goal. A large portion of oil, gas, crude and petroleum is imported
which is prone to price and exchange rate volatility. Power produced through nuclear face the
challenges of environmental, ecological and health risks coupled with the cost and a long
gestation period. Environmental clearances also cause project delays as during April 2009 to
September 2012; out of 854 projects in mining, thermal and hydropower only 76 could get the
approval. The role of renewable energy in fulfilling the power-chasm becomes more crucial as
India has abundant potential of renewable resources; RE is a hedge against fossil fuel price
risks; RE can be used both for rural and urban areas; existence of conducive policy atmosphere
to promote technology, entrepreneurship and investment in RE sector and strong commitment to
adhere to carbon reduction target. The present paper is an attempt to examine the existing status
of RE scenario in India, study and analyze the policy framework and institutional interface
related to RE, discuss some emerging issues in promotion of infrastructure in RE and suggest
relevant measures to augment the investment and entrepreneurial climate for growth of RE.
KEY WORDS: Renewable energy (RE), RE infrastructure, RE investment
INTRODUCTION
As per Census 2001, about 44 per cent of the households do not have access to
electricity. Out of 207,875 MU of power produced in India, Thermal contributes
138,806 MU while Hydro, Nuclear and others generate 39,291 MU, 4780 MU
and 24,998 MU respectively (Central Electricity Authority, 2012).India's
installed grid-connected power capacity comprises 65 per cent thermal power,
21 per cent large hydro, 2.6 per cent nuclear and renewable power accounts
for around 12 per cent (26.3 GW) comprising 18 GW (68.5 per cent) from wind,
3.4 GW (13.1 per cent) from small hydro, 3.4 GW (12.9 per cent) from biomass,
and 1 GW (4 per cent) from solar (MNRE).MNRE expects renewable capacity to
double to 55 GW by 2017
Most of our energy needs are fulfilled with the energy produced through non-
renewable energy sources like coal, crude, gas and petroleum. Around 74 per
cent of coal produced in India is consumed in the power generation. If the rate
of production of coal continues at present rate then known coal reserves are
expected to last only for over 70 years. Despite various reforms measures
initiated in energy sector by the government in the past, the power deficit is
68
continuously spiraling at faster pace. According to 18th electricity Power Survey
Report (2011), by the end of the 12th Plan, the estimated peak demand will be
1, 96,398 MW while the country‘s energy requirement will stand at 1,348,515
billion units (BU). The need of the hour today is to explore the potential of
renewable energy, mapping the energy requirement, identify the infrastructure
needs of promotion of RE, cost-benefit analysis of RE sources, investment and
entrepreneurial capabilities in RE sector and seeking new trade opportunities
in RE trading.
RENEWABLE ENERGY SCENARIO IN INDIA:
Potential & Status
Renewable Energy includes; bio-energy produced from bio-mass, bio-gas, small
hydro, wind, solar, and energy from waste. There lies enormous potential for
this renewable energy sources. Twelfth Plan (2012-17) also envisages
increasing dependence on clean energy sources like nuclear, hydro and
renewable. The total potential for renewable power generation in the country as
on 31.03.12 is estimated at 89774 MW. This includes wind power potential of
49130 MW (54.73per cent), SHP (small-hydro power) potential of 15399 MW
(17.15per cent), Biomass power potential of 17,538 MW (19.54per cent) and
5000 MW (5.57per cent) from bagasse-based cogeneration in sugar mills (CSO,
Energy Statistics 2013).According to Energy Statistics, CSO (2013) combustible
renewable and waste constitute about one fourth of Indian energy use. This
share includes traditional biomass sources such as firewood and dung, which
are used by more than 800 million Indian households for cooking.
Bio-Energy Scenario in India
Biomass resources include agricultural residues; animal manure; wood wastes
from forestry and industry; residues from food and paper industries; municipal
green wastes; sewage sludge; dedicated energy crops such as short-rotation (3-
15 years) coppice (eucalyptus, poplar, willow), grasses (Miscanthus), sugar
crops (sugar cane, beet, sorghum), starch crops (corn, wheat) and oil crops
(soy, sunflower, oilseed rape, Jatropha, palm oil). Organic wastes and residues
have been the major biomass sources so far, but energy crops are gaining
importance and market share. With re-planting, biomass combustion is a
carbon-neutral process as the CO2 emitted has previously been absorbed by
the plants from the atmosphere. Residues, wastes, bagasse are primarily used
for heat & power generation. Sugar, starch and oil crops are primarily used for
fuel production. (IEA Energy Essentials, 2007)
Access to adequate, affordable and clean sources of energy, particularly
cooking fuel to a large population, living in rural areas is a serious challenge.
As per the 2011 Census, almost 85per cent of rural households are dependent
69
on traditional biomass fuels for their cooking energy requirements. National
Sample Survey 2009-10 reveals the continued dependence on firewood in rural
areas for cooking, with percentage of households depending on firewood
remaining at 76.3per cent in 2009-10 – a drop of only 2 percentage points
since 1993-94 – even though the percentage using LPG has increased from
about 2per cent to 11.5per cent over the same period. On the other hand, the
incidence of dependence on firewood for cooking in urban areas has fallen from
about 30per cent to 17.5per cent between 1993-94 and 2009-10 – a drop of
more than 12 percentage points – and the incidence of dependence on kerosene
has plunged from 23.2per cent to 6.5per cent during the same period – a 72per
cent fall, while the percentage of urban households using LPG has more than
doubled from under 30per cent to 64.5 per cent. In other words, the growth in
prevalence of use of LPG in urban areas has been balanced by a decline in use
of kerosene, in the first place, and firewood and chips, in the second. In rural
areas, the rise in LPG use has been mainly at the expense of dung cake,
followed by kerosene and ‗other‘ sources. Further, as per the NSSO Reports
(55th, 61st and 66th Rounds), there has been an increase in biomass fuel use
in terms of absolute quantity consumed over the past decade among rural
households.
Hydro Power Potential and Status
With it intricate network of rivers, substantial opportunities for generation of
hydro-power exist in India. Only 22 per cent of the 150 GW hydroelectric
potential in the country has been harnessed so far. (Economic Times 2008).
Private participation will play a key role in meeting the target requirement of an
additional 45 GW over the next 10 years. The Ministry of New and Renewable
energy Resources (MNRE), has estimated the potential of small hydro
nationally at 15 GW, mostly in the northeastern Himalayan states, best paired
with local community participation in remote and hilly areas, mixed
public/private sector and grid-connected/decentralized modes. Currently
around 4.5 GW have been set up, but MNRE expects it to reach to 7 GW by the
year 2017.These projects (between 2 MW to 25 MW) are considered
environmentally benign, particularly when compared to large hydro plants with
storage reservoirs, which can cause habitat destruction and community
displacement (IEA 2010).
Wind Energy Potential in India
India is the 4th largest country in the world in terms of installed wind energy.
(KPMG Report, November 2007).India‘s potential of wind power is pegged at
45,000 MW while its current capacity stands at only 7,660MW (Economic Times
2008). At the end of June 2010, India‘s installed wind capacity was 12,009

70
MW, representing 70per cent of India's total renewable energy capacity (IEA
2010). During the past decade (2000-10), the growth in the country‘s
renewable energy generation–especially wind- was 1250per cent (Climate Policy
Initiative).
Tax incentives, including availability of accelerated depreciation @ 80per cent
under WDV method on cost incurred on setting up of wind turbine generators
have resulted in significant private investment in this area. In the past decade,
India now has the fifth‐largest installed wind power capacity in the world, more
than three times the installed capacity of Denmark (Clean Energy Progress
Report, IEA 2011).
Solar Energy Potential in India
Despite the prevalence of an inherent advantage in the form of solar insulation,
the potential for solar energy is virtually untapped in India. India‘s installed
solar – based capacity stands at a mere 100MWcompared to its present
potential of 50,000MW. India has been ranked 7th worldwide for solar
photovoltaic (PV) cell production and secure 9th rank in solar thermal power
generation. This capacity is growing rapidly due to the entry of various private
players in manufacturing of solar energy equipment. The Indian solar energy
sector is estimated to grow at 25per cent year on year in next few years. With
this rate the global market is likely to exceed the annual production mark of 12
GW during the year 2012. Likewise, the Indian market demand is expected to
reach 200MW by the year 2012. The implementation of the three-phase plan
for solar PV capacity expansion is expected to begin this year in 2010, with the
Indian Government spending approximately US$20 billion over a 30 year
period. Based on the substantial investment opportunities that exist in this
sector, it is estimated that by 2031-32, solar power would be the single largest
source of energy, contributing 1,200 MTOE i.e. more than 30per cent of our
total expected requirements. (India Brand Equity Foundation)
Nuclear Energy Potential in India
By 2032, the government plans to raise the contribution of nuclear energy from
the current level of less than 3per cent to around 10per cent of the country's
installed capacity (Angel Broking Report).
The signing of the Indo – US nuclear deal has created significant opportunities
for several players across the entire power supply chain, with an estimated
investment opportunity of US$ 10 billion over the next five years. (JP Morgan
Estimate)
Further, India has among the world‘s largest reserves of alternative nuclear fuel
– thorium. Accordingly, substantial investment opportunities are also likely to
arise once commercial production based on thorium becomes feasible.
71
POLICY FRAMEWORK AND INSTITUTIONAL INTERFACE
The institutional structure for RE was first initiated by the establishment of a
separate Ministry named as Ministry of Non-Conventional Energy Sources in
the year 1992 which was an outcome of the conversion of Commission for
Additional Sources of Energy (CASE) in the Department of Science and
Technology, in 1981. Later on the name was changed as Ministry of New and
Renewable Energy. The functions of MNES include-promotion of renewable
energy technologies , renewable energy resource assessment, production of
biogas units, solar thermal devices, solar photovoltaic, cooks stoves, wind
energy and small hydropower units, strengthen India‘s energy security, find a
viable solution for rural electrification, administered pricing mechanism,
optimum utilization of existing assets, adoption of energy efficient technologies
in giant industries, decrease dependence on energy imports, formulation of
policy and legislation, Institutional linkages for integration of renewable energy,
identification of high focus areas, marketing outlets, R&D and specialized
institutions, International partnerships and exports, concern for the
environment, initiate efforts to minimize the demand-supply gap-especially as
population increases.
In consultation with the Planning Commission in the beginning of the Eleventh
Plan the Ministry of New and Renewable Energy (MNRE) has grouped various
programmes of the Ministry under six major programmes on the basis of the
objectives of the each programme as follows:
(i) Grid-Interactive Renewable Power
(ii) Off-Grid/Distributed Renewable Power
(iii) Renewable Energy for Rural Applications;
(iv) Renewable Energy for Urban, Industrial and Commercial Applications
(v) Research, Design and Development and
(vi) Supporting Programmes.
For ensuring energy security during last decade a series of policy documents
have been drafted by different ministries. Hydro Carbon Vision 2025 started in
2000-01 by the Ministry of Petroleum and Natural Gas; Integrated Energy
Policy announced by the Planning Commission in 2006; National Action Plan
for Climate Change (NAPCC) in the year 2008 & National Bio-Fuel Policy in
2008 under the MNRE and Jawaharlal Nehru National solar Mission (JNNSM)
in 2010 by the MNRE are the notable policy steps taken by the government in
RE sector. Along-with these policy initiatives, some regulatory provisions were
also made in the RE sector. Section 86(1) (e) of the Electricity Act, 2003, “The
State Commission shall promote co-generation and generation of
electricity from renewable sources of energy by providing suitable
72
measures for connectivity with the grid and sale of electricity to any
person, and also specify, for purchase of electricity from such sources, a
percentage of the total consumption of electricity in the area of a
distribution license”. Section 3 (1) states that “Government of India (GoI)
shall, from time to time, prepare the National Electricity Policy and Tariff Policy,
in consultation with the State Governments for developing the power system
based on optimal utilization of resources such as coal, natural gas, nuclear,
hydro, and renewable sources of energy” while Section 4 contains the
provision that GoI shall, after consultation with the State Governments, prepare
a national policy, permitting stand-alone systems (including those based on
renewable sources of energy) for rural areas”. The Indian government has also
announced plans to double the amount of clean power generated by 2017
under the next Five Year Plan, and levied an innovative coal tax of 50 rupees
(approximately$1) per metric ton to create a National Clean Energy Fund.
$90million of the current funds accrued is dedicated to clean energy
development, including transmission lines for renewable energy (NRDC). Aside
from these institutional and policy frameworks, India is also a member of Clean
Energy Ministerial (CEM), a 22member-nations forum set up in 2010 for
discussing and sorting out the energy issues related to the promotion of clean
energy and has participated actively previous four CEM including the recently
held at New Delhi. The responsibility of production and promotion of RE is
collectively owned by Planning commission, MNRE, Ministry of Coal, Ministry
of Power, Ministry of Environment and Forests, Ministry of Atomic Energy,
Ministry of Water Resources etc.
INFRASTRUCTURAL ISSUES IN PROMOTION
Success and promotion of RE depends on the infrastructure support including
institutional, investment, financial, entrepreneurial and market. Institutional
infrastructure is explained in the previous part of the paper which is basically
policy enabled organizations and institutions for development of RE sector.
Investment in Renewable Energy
Reports observe that the amount of investment in renewable is increasing
continuously. According to a World Watch report investments in renewable
energy and fuels reached 257 billion USD worldwide in 2010, with India logging
the sharpest surge of 62 per cent of total investment. The total renewable
energy investments in industrial countries in 2011 accounted for 65 per cent of
global investment, increasing 21 per cent to 168 billion USD. In contrast, 35
per cent of global new investment that went to developing countries increased
10 per cent to 89 billion USD, according to the report. China, India and Brazil
accounted for 71 billion USD in total investment. In 2011, ‗financial new

73
investment‘ in renewable energy installations (a category that excludes small-
scale projects and R&D) in industrial countries outpaced investments in the
developing world, but in 2010 investments in this category in developing
countries had surpassed those in industrial countries for the first time. A
major development in 2011 was the dominance of solar power in technology-
specific investments -- driven by a 50 per cent reduction in price over the year -
- with 147.4 billion USD invested in solar, compared with 83.8 billion USD for
wind projects and 10.6 billion USD for biomass and waste-to-energy
technology. Bio-fuels, which recently as 2006 held the second overall ranking
in renewable energy technologies, attracted the fourth highest total investment
in 2011 at 6.8 billion USD, followed by 5.8 billion USD for small hydro and 2.9
billion USD for geothermal installations (www.business-standard.com, 11
October 2012). India spent around USD 100 million between 2000 and 2008
on solar, wind, small hydro and biogas technologies RD&D but no specific
rates are officially available (IEA, 2011).
Renewable energy investment in India was the second fastest-growing among
the G-20 in 2011, with investments increasing 54 per cent to USD 10.2 billion.
Wind resources received 45 per cent of the financing (USD 4.6 billion), while 41
per cent (USD 4.2 billion) went to solar. This growth propelled the country from
the 10th to the sixth place in the G-20; it now ranks fifth in terms of five-year
investment growth (Gyan Research and Analytics 2012).
Total financial investment in clean energy in India was at INR 135 billion (USD
2.7 billion) in 2009, ranking it eighth in the world (UNEP SEFI and Bloomberg
New Energy Finance).India has been ranked by Ernst and Young as the fourth
most attractive country for renewable energy investment in the world, only
behind the United States, China, and Germany (IEA 2010).
RE Technology
The country is well endowed with abundant RE resources and high technical
potential (Reddy & Nathan 2011). The biggest challenge in RE generation is low
scale of production and high cost (Reddy & Nathan 2011). Moreover RE
technologies are promoted as one time demonstration projects and not with the
objective of commercialization (Bala chandran et al 2010).
India began participation in the Clean Development Mechanism (CDM) in 2003,
and used revenues of carbon credits to finance renewable energy projects. India
has the second largest market share of CDM projects after China; the CDM
executive board had registered 506 projects in India as of June 2010, which
amounted to more than 20per cent of all the registered projects.463 In the
initial stage of CDM development in India, biomass utilization projects, waste
gas/heat utilization projects, and other renewable energy technology projects
(largely wind and hydropower) were mainly being implemented, though India

74
also has registered CDM projects for other sectors including energy efficiency,
afforestation and reforestation, and transportation. There are also a large
number of unilateral CDM projects, approximately 422 projects as of June
2010 (IEA 2010). Technology cost of RE equipments is going down. World-wide
wind turbine prices have fallen 29per cent and PV module prices have fallen
80per cent since 2008 (Bloomberg 2013).
Financing RE in India
There are various institutions, instruments and mechanisms of financing RE
infrastructure in India. IREDA which finances up to 70per cent of project cost
with interest rates between 1.75per cent and 10.50per cent in the following
sectors; Hydro power projects; Wind energy; rebate at 0.25per cent for a period
of 2 years for projects eligible for GBI; Biomass cogeneration and industrial
cogeneration; Solar PV/solar thermal grid-connected power projects; Energy
conservation/efficiency projects and projects implemented in ESCO mode
Finances electrification of remote village projects implemented using ESCO
model: 12.75per cent with term loan up to 80per cent of project cost New
instrument: Loan against securitization of future cash flow of renewable energy
projects Implementation agency for finance scheme for off-grid projects under
JNNSM. Power Finance Corporation (PFC) provides term loans to all entities
(government and IPPs) for power generation (from conventional and renewable
energy projects), transmission, and distribution. Rural Electrification
Corporation provides loans for all entities (government and independent power
producers) for the purpose of rural electrification, irrespective of nature, size,
or source of energy and provides short-term loans and debt refinancing to state
power utilities in need of financial assistance to cover rural electrification.
NABARD has Rural Innovation Fund for all innovations and related activities in
the farm, rural non-farm, and micro-finance sectors that provide technology,
skill upgrade, inputs supply, and market support for rural entrepreneurs;
assistance is given in the form of loans, grants, or incubation funds
Environmental Promotional Assistance: scheme for eco-friendly technologies
including biogas, solar, and bio-fuels Scheme for home lighting through solar
energy. The PPP mode is also available in RE infrastructure space and these
are ; ICICI Technology Finance Group, Techno-Entrepreneurship Promotion
Program, Indian Institutes of Technology and other universities, Corporate
R&D departments, Centre for Innovation Incubation and Entrepreneurship,
The Indian Angel Network.
Banks which fund renewable projects are; Industrial Development Bank of
India (IDBI), Export-Import Bank of India, ICICI Bank, the Industrial Finance
Corporation of India (IFCI), State Bank of India, Yes Bank, and PNB. ICICI
Bank. MFIs facilitate the purchase of renewable energy systems like solar
75
cookers, solar lanterns, or small biogas plants in off-grid areas of the country.
Aside from the domestic institutional support, international financial
institutions and bilateral financial institutions are also engaged in renewable
energy financing in India, such as World Bank/IFC, KfW, Nordic Investment
Bank, United Nations Environment Programme (UNEP), ADB, USAID, and
Danish International Development Agency (DANIDA).
The mode of financing RE infra projects include; equity finance, venture
capital, low interest term loans, loan guarantees, tax credits and tax deduction
etc. Since there is low rate of returns, high gestation period, higher initial cost
of installation, dependence on imported equipments for RE infrastructure, the
companies are shying away from funding.
IMPERATIVES FOR POLICY CHANGES IN RE SPACE
According to CSO energy statistics (2013), the decadal growth of domestic
primary energy supply fell from 86 per cent in 1980s to 29 per cent in 1990s,
when growth had not accelerated, and stood at 55 per cent in the next decade
of high growth. The reasons may lie in the improved efficiencies achieved by the
cement and steel plants but the increasing dependence on import cannot be
neglected. During 1990-91 the import of coal accounted for less than five
million tonnes while it reached 110 million tonnes in 2012-13. The Integrated
Energy Policy also projects that the dependence on import in excess of 90 per
cent for crude oil, up-to 50 per cent for natural gas and 45 per cent for coal
would continue. The efforts in the direction of procuring these non-renewable
sources from domestic exploration are also negligible. In view of the above
discussion it would be pertinent to look into the following policy changes for
ensuring investment and entrepreneurship in RE:
1. Investment in bio-fuel and bio-mass should be encouraged to fulfill
transport and rural energy needs. The farmers should be motivated,
trained and incentivized to grow crops useful for mixed fuel and local
panchayats with the help of young entrepreneurs may be engaged for
these projects. Research thrust to develop technologies for commercial
production of second generation bio-fuels from cellulose rich bio-mass
and efforts be made to promote community participation and
entrepreneurship development for bio-fuel generation (Raju et al
2009).
2. For cooking purpose in rural areas, bio-gas plants are panacea for
energy shortage and community based small biogas plant should be
installed with the support of local entrepreneurs.
3. An estimated 335 million tones of agricultural waste is produced every
year as byproducts of various crops. Research and development for
76
inventing new technology for converting this huge agro-waste into
energy production may lead to reducing the energy crisis particularly
in rural areas of the country.
4. Big cities and small towns of India produce tones of waste in form of
organic and domestic solid garbage. With increase in population,
there has been an increase in solid waste and waste water output.
Systematic collection of solid waste, it‘s recycling and incineration for
recovering energy has a large potential for reducing emissions from
this sector (Planning Commission 2011).
5. In 2009, India had the fifth‐largest installed wind capacity globally,
behind only the United States, China, Germany and Spain. The total
installed wind power capacity in India amounted to 11.8 GW in March
2010, about 7per cent of the total installed generation capacity. Most
of the capacity is installed in the state Tamil Nadu (42per cent),
followed by Maharashtra (20per cent), Gujarat (16per cent) and
Karnataka (13per cent) (MNRE, 2010). The poor infrastructure of
power transmission in wind power is a serious problem in India. The
PLF of wind power plans is also very low i.e. only 17 per cent as
compared to USA, China, Spain or Germany. Therefore there is a need
to invest in R & D of wind power generation.
6. Solar capacity is still very small compared to other countries. India
had 10.2 MW grid connected photovoltaic systems and 2.5 MW
stand‐alone systems in March 2010. India also has good concentrated
solar power (CSP) potential, notably in Rajasthan, with a solar
insulation of 2400 kWh/m2 and high proportion of sunny days. The
land requirement for 100 GW is 3600 km2. Rajasthan has more than
175000 km2 of desert land. So far, no CSP plant exists in India, but
several projects with a combined capacity of 381 MW are in the
planning or construction phase in Gujarat and Rajasthan (Arora et
al., 2010). Within its solar mission, India strives to reach a CSP
capacity of 10 GW by 2022 (OECD/IEA 2011). As India is still
dependent on import of the major components of solar power, its price
also runs on a parallel line. The price of a SPV module with capacity
of one peak watt in India was Rs 225 ($ 6.25) in 1997. It came down
to Rs 140 ($ 3.50) per peak watt in 2007(Bose 2008).
7. Tariff and non tariff barriers of trade of PV (photovoltaic) cells also
impact the green energy market and hence the trade dispute should
be tackled with rationalization. Recently India has taken the US to the
WTO for providing protectionist measures to its domestic suppliers of
77
solar cells and solar modules violating TRIMS cells used in the solar
panels (Business Standard, 22nd April, 2013).
8. To discourage the usage of fossil-fuel energy sources, subsidies
should be diverted from oil, petroleum, gas to the RE-sources with
simultaneous incentives for explorers, producers and traders of the
solar, wind, waste sources producing energy.
9. Along with the diversification of sources and imports of energy,
technology collaboration and partnerships are equally important if
India is to move towards greater energy self-sufficiency.
10. The policy focus must be shifted on development of small hydro
power projects instead of large hydro projects as these are more
environment-friendly and less costly. Many OECD countries have
successfully tapped into their large hydro potential, and are now
focusing on smaller applications.
11. Increased collaboration among countries, stakeholders and
initiatives that seek to achieve the shared benefits of clean energy
technology deployment is imperative to rapidly scale‐up investment,
replicate the positive steps that are being taken, and enhance the
cost‐effectiveness and efficiency of action (Clean Energy Progress
Report, IEA 2011)
12. According to a KPMG report, India is the third most favoured
destination globally, for investments in the renewable energy sector.
The report also says that the country will be a major source of new
entrants into the sector, after the US and China. The Indian
renewable energy market has become increasingly dynamic in recent
years as a result of strong natural resources, greater accommodation
to international investments and a variety of government incentives.
13. India must drastically change its energy strategy towards one that
places the highest priority on a wide range of renewable energy
options by employing huge amount of financial resources on R & D
institutions for indigenous development of technology. Banks and
financial institutions must be encouraged to provide entrepreneurial
funding for the assembly, supply, operations and maintenance of
renewable energy systems.
14. There is a strong felt need to establish an Integrated Energy
Modelling Institution in India on the pattern of already existing
Energy Modelling and Policy Assessment in some countries like EIA in
the US, IEA in OECD, ABARE in Australia, Tyndall Centre in UK,
Energy Research Institute in China for energy information, analysis
78
and modelling the energy requirement in future (Chikkatur &
Chakravarty 2008).
15. Effective renewable energy policies, specifically targeting rural
areas, can help ensure that demand is met in a sustainable way; and
investment barriers, including administrative processes and
inadequate supporting infrastructure should be removed and a
clearer strategy is needed, both to increase India‘s renewable capacity
and to build a competitive renewable industry (IEA 2012).
CONCLUSION:
The energy policy in India to till date has been concerned about the
assessment, import and exploration of energy obtained through natural
resources like coal, oil, crude, gas and conventional resources and the trend is
likely to continue in future too. Even the two phases of reforms in energy sector
were driven by PPP, institutional restructuring, private partnership, FDI and
procurement of energy sources through import or mining of scarce natural
resources. There has been a little attention on the exploration of potential of RE
resources or clean resources in the policy frameworks and only in the year
2006 with the adoption of an Integrated Energy Policy followed by National Bio-
fuel Policy in 2008 and JNNSM in 2010, the focus shifted on the development,
trading and exploration of RE. For ensuring energy security in long run, the
policy shift is required in the direction of identifying, assessing, exploring,
modelling, mapping, trading, developing and commercializing RE. Multi-
pronged approach may be adopted to solve energy deficit in various sectors and
segments such as energy requirement in road transportation bio-energy; for
cooking needs and rural transportation in rural areas solar and bio-mass
energy; for urban municipalities‘ energy from waste and garbage; for mass
transportation natural and shale gas energy; for agriculture and industry
needs energy from mixed fuel technology; for domestic usage of energy saving
devices and for large industry nuclear based and hydro based energy and for
small scale sector the energy produced through small hydro power projects be
promoted. Simultaneous research and development, investment, trade and
entrepreneurship in unexplored area of RE-infrastructure is urgently required.
REFERENCES
1. Annual Report (2009-10), Ministry of Power, GOI
2. Arora, D.S., Sarah Busche Shannon Cowlin Dr. Tobias Engelmeier, Hanna Jaritz Anelia
Milbrandt, Shannon Wang (2010), India Renewable Energy Status Report, IEA
3. Basu, Nayanima (2013):“Now India takes US to WTO over green energy”, Business
Standard, April 24.
79
4. Bharadwaj, Anshu, Rahul Tongia & VS Arunachalam (2006) : “Whither Nuclear Power”,
Economic & Political Weekly, March25, 1203-12
5. Birol, Fatih (2005): “World Energy Prospects and Challenges”, IEA
6. Bose, Deb Kumar (2008): “Prospects of Solar Power in India under Global Warming”,
Economic & Political Weekly, Nov.22, 14-17
7. Brutsch, Christian & Hulbert, Matthew (2010): “Chindia‟s Energy Curse”, Economic &
Political Weekly, VOL XLV No. 39, Sept. 25, 15-17
8. CERC (2010): Central Electricity Regulatory Commission Terms and Conditions for
Tariff Determination from Renewable Energy Sources 2010, available at
http://cercind.gov.in/2010/ORDER/April10/Final_RE_Tariff_Order_FY2010-11 (53-
2010_Suomotu).
9. Chkkatur, Ananth & Shoibal, Chakarvarty (2008): “Need for an Integrated Energy
Modelling Institution in India”, Economic & Political Weekly, MAY 24, 64-69
10. CSO (2013): “Energy Statistics”, Central Statistics Office, Ministry of Statistics and
Programme Implementation, GOI
11. Datt, Gaurav & Ashwin Mahajan(2013). “Infrastructure in the Indian Economy”, Indian
Economy, 67th
Revised Edition, S. Chand & Co.,120-36
12. Desai, Nitin (2013) : “ How to Secure India‟s Energy”, Business Standard, April 18,P-17
13. Deshmukh, Ranjit, Ashwin Gambhir & Girish Sant (2010): “Need to Realign India‟s
National Solar Mission”, Economic & Political Weekly, VOL. XLV NO. 12, March 20,
41-50
14. Deshmukh, Ranjit, Ashwin Gambhir & Girish Sant (2011): “India‟s Solar Mission
Procurement and Auctions”, Economic & Political Weekly, VOL. XLVI NO. 28,July 9,
22-26
15. Economic Survey (2011-12): “Energy, Infrastructure and Communication”, Chapter 11,
GOI
16. Ernst & Young (2010). “Renewable Energy Country Attractiveness Indices.” p 10.
http://www.ey.com/Publication/vwLUAssets/Renewable_energy_country_attractiveness_
indices_Issue_25/$FIL E/Renewable_Energy_Issue_25.pdf. Accessed September 2010
17. Gangakhedkar, Rajesh & R.K Mishra (2012): “Public-Private Partnership in Power
Sector: A Focus on Ultra Mega Power Projects”, Journal of Infrastructure Development,
VOL. 4, NO. 1, June, Sage Publications, 27-39.
18. Ghosh, Arunabha& Ricardo Melelndez-Ortiz (2013): “Want Clean energy Avoid Trade
Disputes”, Business Standard, April16
19. GOI (2006a): “Integrated Energy Policy”, Report of the Expert Committee, Planning
Commission, Government of India.
20. GOI (2011): “Bio-Energy Road Map-An Initiative by MNRE”, Bio Energy India,
MNRE, GOI
21. GOI (2011): Strategic Plan for New and Renewable Energy Sector for the Period 2011-
17, Ministry of New and Renewable Energy, GOI
80
22. Harris-White Barbara, Sunali Rohra & Nihel Singh (2009): “Political Architecture of
India‟s Technology System for Solar Energy”, Economic & Political Weekly, VOL.
XLIV NO. 47, Nov.21, 49-60
23. IEA (2003), Creating Markets for Energy Technologies, OECD/IEA, Paris.
24. IEA (2010a), World Energy Outlook 2010, IEA/OECD, Paris.
25. IEA (2010b), Energy Technology Perspectives 2010, IEA/OECD, Paris.
26. IEA (2010c), Technology Roadmap: Solar photovoltaic energy, IEA, Paris.
27. IEA (2011), Deploying Renewables, IEA/OECD, Paris.
28. IEA (2011): “Clean Energy Progress Report”, OECD/IEA
29. IEA (2011): “Harnessing Variable Renewables A Guide to the Balancing Challenge”,
International Energy Agency
30. IEA(2011): “Interactions of Policies for Renewable Energy and Climate”, IEA, Paris
31. IEA(2012), “Pathway to a Clean Energy System” Energy Technology Perspectives 2012,
IEA, Paris
32. IEA (2012). “Understanding Energy Challenges in India-Policies, Players and Issues”,
IEA/OECD
33. IEA, OECD & World Bank (2010): The Scope for Fossil Fuel Subsidies in 2009 and a
Road map for Phasing Out Fossil Fuel Subsidies, Joint Report Prepared for G-20
Summit, Seoul
34. Kelkar, Vijay (2009): “Towards a New Natural Gas Policy”, Economic & Political
Weekly, VOL XLIV No. 36, Sept. 5, 8-10
35. Mathai, Manu V (2013): “Nuclear Power at What Cost?” Economic & Political Weekly,
VOL. XLVIII NO. 15, 17-20
36. Panagariya, Arvind (2013): “Telecommunications and Electricity-contrasting
experiences”, India The Emerging Giant, Oxford University Press, 370-95
37. Pandey, Rahul (2006): “How Can India Achieve Energy Security?”, Economic &
Political Weekly, Jan 28, 303-06
38. Planning Commission (2011): “Interim Report of the Expert Group on Low Carbon
Strategies for Inclusive Growth”, GOI
39. Planning Commission (2012): Twelfth Five Year Plan, GOI
40. Planning Commission(2010): “Monitorable Targets and Milestones for 2011-12
Infrastructure Sector” Planning Commission, GOI
41. Raju S S, P Shinoj & P K Joshi (2009): “Sustainable Development of Biofuels: Prospects
and Challenges”, Economic & Political Weekly, VOL XLIV no 52, 65-72
42. Reddy B. Sudhakar & H.S.K. Nathan (2011). “Emerging energy Insecurity The Indian
Dimention”, India Development Report 2011(Ed. D.M. Nachane), OUP, 160-75
43. Sagar, Ambuj (2002): “India‟s Energy Landscape An Assessment”, Economic & Political
Weekly, Sept. 21, 3925-34
44. Sengupta, Ramprasad (2012). “Inclusive Economic Growth and Sustainable energy
Development of India” , 155-91
81
45. Singhal, Robin & Ramprasad Gupta (2012): “Energy Security and Bio-Diesel
Implications for Land Use and Food Security”, Economic & Political Weekly, VOL
XLVII No. 40, Oct.6, 66-73
46. Sreenivas, Ashok & Shantanu Dixit (2012): “Are We Serious About Our Energy
Security?”, Economic & Political Weekly, VOL XLVII No. 20, 10-13
47. UNEP SEFI and Bloomberg New Energy Finance (2010). “Global Trends in Sustainable
Energy Investment 2010 – Analysis of Trends and Issues in the Financing of Renewable
Energy and Energy Efficiency.”; p. 8.
48. World Bank (2009) : World Development Report
49. World Bank (2010) : World Development Indicators
50. World Energy Council (2012): “India Energy Book 2012”
Oil & Gas Sector: Innovation and Sustainable Development
P K Sahoo Surbhi Arora
Student, MBA Oil & Gas Associate Professor
UPES The Global University
Dheradun Dehradun
ABSTRACT
For meeting energy demand, world is presently depending on fossil fuels i.e., coal, petroleum and natural gas, which are the major contributors to energy sources. Increase in population, advancement in technology and infrastructure, shows that the energy sources presently being used for generation of electrical energy may not be sufficient to meet the energy demand of the world in future. The use of alternative source of energy becomes the need of the hour for consistent and sustainable power supply. It is said that „there is end of easy oil‟. The major oil resources are harder to find and it is becoming difficult to sustain the present resources with the given increase in demand. Therefore, the need for clean sustainable energy is getting stronger day by day. The need of sustainability calls for innovations in hydrocarbon business that will help oil and gas sector to sustain for long period time. The objective of the proposed paper is to explore different ideas for the diversified oil and gas sector for sustainable development in hydrocarbon business. This paper will also highlight some of the innovative strategies adopted by the industry in recent times which have not
82
only helped improved their profitability but have also given a cleaner greener resource. The research methodology would mainly include literature review and the presentations at various seminars and conferences across the oil and gas sector.
KEY WORDS: Innovation, Sustainability, Oil and Gas, Hydrocarbon, Easy Oil
India is the fourth largest consumer of crude oil. Indian Oil & Gas sector
contributes around 15per cent in the total GDP. It has been observed that the
oil consumption in India has increased on CAGR of 4.3 per cent 2001-11, as
against the world CAGR of 1.2 per cent. If the trend in production of primary
energy sources in India is analyzed, the CAGR50 from 1970-71 to 2011-12 for
crude petroleum is 4.18 per cent and for natural gas is 8.6 per cent. Whereas,
if the consumption pattern is observed, the CAGR from 1970-71 to 2011-12 is
5.99 per cent and for natural gas is 10.71 per cent. This clearly shows the
energy demand from petroleum sources is increasing at a higher rate as
compared to the production rate.
In 2011-12, the consumption of crude oil in India was 211.42 MT, out of this
80per cent of oil is imported from a list of 43 countries51. In the 12th plan, it is
estimated that the domestic crude production by 2016-17 would be 41.16 MT
and for gas it would be 175 BCM. The crude production is still below 50 MT.
According to Integrated Energy Policy, it is forecasted that the total natural gas
consumption in India will reach around 600 MMSCMD by 2030.Out of total
Indian energy basket, Oil and Gas shares - 39per cent (29per cent Oil + 10per
cent Gas) of the total energy in 2012, and this is expected to increase to 45per
cent (25per cent Oil + 20per cent Gas) by 2025.This shows that there will be a
shift from Oil to Gas and the dependency on Gas will be more by the end of
2025. This highlights that natural gas will have tremendous market share in
coming decades. Hence, it is necessary to deploy resources for increasing E&P
activities in coming decades.
Fossil fuel plays an important role in Indian primary energy mix. It consists of
53per cent Coal, 39per cent oil and gas and 8per cent renewable energy source.
If we see in the context of world, energy mix consists of 13per cent renewable
energy and 87per cent fossil fuel.
50
Energy Statistics Report-2013, Ministry of Statistics and Program Implementation, Govt. of India 51
www.Indianpetro.com as on 28 October 2012
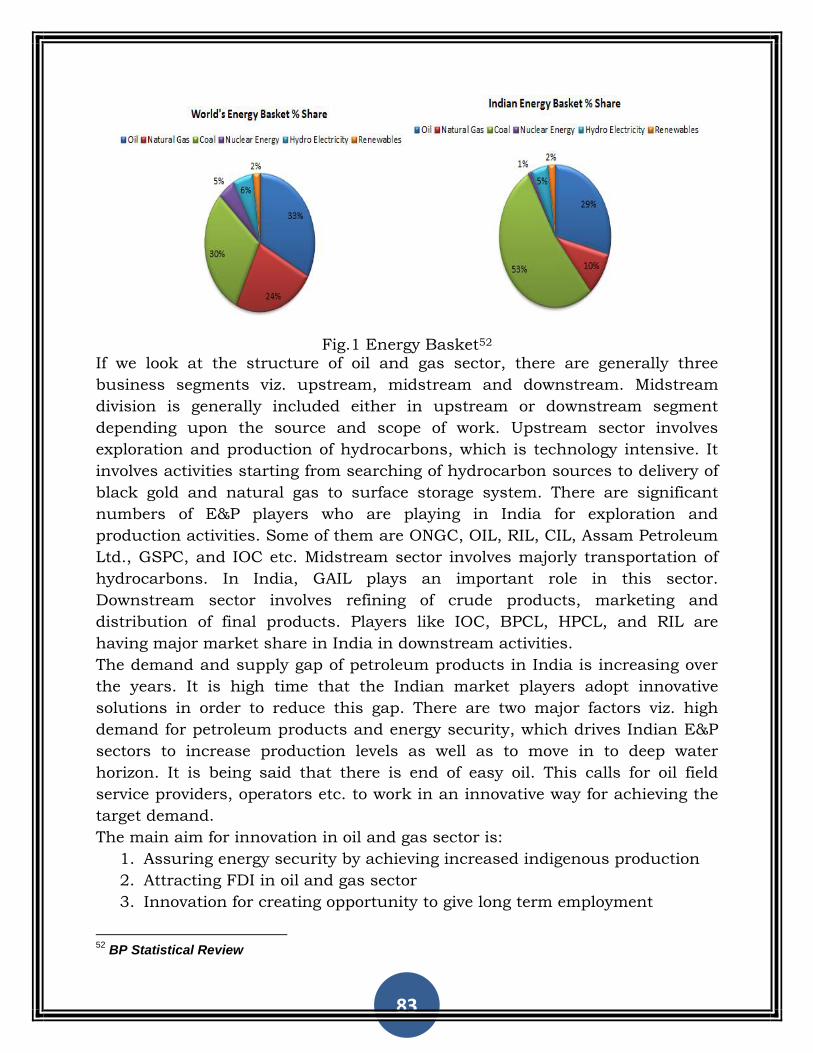
83
Fig.1 Energy Basket52 If we look at the structure of oil and gas sector, there are generally three
business segments viz. upstream, midstream and downstream. Midstream
division is generally included either in upstream or downstream segment
depending upon the source and scope of work. Upstream sector involves
exploration and production of hydrocarbons, which is technology intensive. It
involves activities starting from searching of hydrocarbon sources to delivery of
black gold and natural gas to surface storage system. There are significant
numbers of E&P players who are playing in India for exploration and
production activities. Some of them are ONGC, OIL, RIL, CIL, Assam Petroleum
Ltd., GSPC, and IOC etc. Midstream sector involves majorly transportation of
hydrocarbons. In India, GAIL plays an important role in this sector.
Downstream sector involves refining of crude products, marketing and
distribution of final products. Players like IOC, BPCL, HPCL, and RIL are
having major market share in India in downstream activities.
The demand and supply gap of petroleum products in India is increasing over
the years. It is high time that the Indian market players adopt innovative
solutions in order to reduce this gap. There are two major factors viz. high
demand for petroleum products and energy security, which drives Indian E&P
sectors to increase production levels as well as to move in to deep water
horizon. It is being said that there is end of easy oil. This calls for oil field
service providers, operators etc. to work in an innovative way for achieving the
target demand.
The main aim for innovation in oil and gas sector is:
1. Assuring energy security by achieving increased indigenous production
2. Attracting FDI in oil and gas sector
3. Innovation for creating opportunity to give long term employment
52
BP Statistical Review
84
4. Developing hydrocarbon sector with world class facility by up-gradation
and installation of new technologies
The President of India declared the decade 2011-21 as the ‗Decade of
Innovation‘ having a strong focuses on inclusive growth. To fulfill this objective,
the Prime Minister of India has taken initiation to constitute a National
Innovation Council for creating a roadmap for innovation, which focuses on key
factors like platform, drivers, ecosystem, discourse, inclusion etc.
Considering this and to focus on innovations in the oil and gas sector, Ministry
of Petroleum and Natural Gas has constituted Sectorial Innovation Council
sector to prepare a road map for implementing the key policies and initiatives
to drive innovations in the entire value chain of oil and gas sector.For a country
like India, which imports around 80 per cent of its oil and 35 per cent ofits
total energy requirements and is projected to import over 45 per cent of its total
energy needs by 2030, every drop of oil and every molecule of gas which can be
produced in India is going to make a difference.
It is well known that upstream sector activities (E&P) are technology intensive.
India is moving towards industrialization for its economic growth. This calls for
high energy demand, specifically demand for petroleum products. For meeting
this demand and for energy security, India needs to adopt new technology for
effective exploration even if from difficult offshore areas. This calls for
innovation and superior technology in upstream sector in order to explore
efficiently, quickly and enhancing recovery rate from the existing fields by
applying EOR. Let us now focus on the trends in innovation in technology that
has taken place in recent years in the upstream sector. The major oil field
service providers like Schlumberger, Halliburton, GE, Baker Hughes etc. are
putting in continuous R&D efforts to provide their services in a different way
for satisfying the production needs.
Halliburton is a major player in service and product provider in upstream oil
and gas sector. One of its business lines, Boots and Coots is developing reliable
efficient well intervention tools for vertical, horizontal, live and highly deviated
wells. They have developed Tuned Frequency and Amplitude (TFA) tool for
resolving issues while trying to stimulate reservoir for maximum production.
They have developed a complete solution for accessing inaccessible reservoir
due to low equivalent circulating density (ECD) margins. They also have
developed Mega Force TM advanced fixed cutter drill bits for drilling deeper and
longer drill bores.
Weir‘s Oil & Gas division is a major supplier of high pressure pumping
equipment to the upstream oil and gas industry. They have developed five new
products for upstream sector in order to be an innovative supplier. Products
like SPM frac pump, Destiny QWS 2800 frac pump, Dura last fluid end
85
technology, Gladiator water and slurry pump etc. have changed the traditional
exploration activities in a major way. They have developed Stampede swellable
packers which use a Weir proprietary elastomer compound. It provides
predictable swell when it is in contact with well fluids. Swell also changes with
temperature.
FMC Technologies provides innovative technologies and services for subsea
processing system. Total‘s Pazflor field is the world‘s first subsea field that uses
subsea separation producing two grades of oil (heavy and light grade).They has
also developed technology for oil and water separation in subsea field. Marlim
Field in Brazil is the first field which uses subsea system for separating heavy
oil and water in deep water. The equipment used in Marlim field also reinjects
separated water back into subsea reservoir to boost production level.
Baker Hughes, a major player in upstream sector, has developed RIS that
provides operators a new method for carrying out pipe installation and retrieval
operations. By eliminating the need for a rig, the Mastiff Rig less Intervention
System (RIS) can reduce the cost of abandonment, work over and drive pipe
pre-installation operations. Baker Hughes has recently developed METAL
MUNCHER AMT (advanced milling technology) cutters to achieve greater
efficiency and longer runs with cutting and milling systems used for casing
exits and wellbore intervention.
It is very difficult to understand the application of E&P technology in India and
it is very difficult to measure the degree of encouragement for applying these
technologies in India. There is ample number of upstream companies engaged
in Indian upstream sector, but there is no effective communication matrix to
measure the innovative technology and benefits derived from it. It is necessary
to do a SWOT analysis while going for new technology in E&P industry in India.
Hence it is advised to have a technology innovation road map in order to
understand and access technology practices in India in E&P sector.
TABLE 1: AREA OF OPERATION, CHALLENGES AND POSSIBLE TECHNOLOGIES53
Areas of
Operation Business Challenges Possible New Technology
Exploration in
frontier areas
Seismic data acquisition in
geologically complex areas and
below volcanic
New technology for seismic data
acquisition
Deepwater
exploration
Making exploratory drilling cost and
field development cost minimum
i. Direct Hydrocarbon Indication
ii. Deep water slim hole drilling
iii. Dual-gradient Drilling
iv. Subsea Processing
v. Down hole Separation
53
Report of Sectorial innovation council (December, 2012), MOPNG, Govt. Of India
86
Matured oil
field
i. Enhanced oil recovery
ii. Improve economics of marginal
fields
iii. Reduce operating cost
i. Intelligent oil field
ii. Down hole Separation
iii. 4C/4D Seismic
iv. Reservoir optimization and management
Environmental i. Reduce greenhouse gas Emission
ii. Reduce Gas Flaring
i. Gas Re-injection Technologies
ii. Decarburization Technologies
iii. GTL Technologies
Productivity
i. High Productivity
ii. Automation for Offshore Operations
iii. Effective utilization of expert human
resources
i. Broadband communication
ii. Remote real-time operation.
iii. SCADA
iv. Visualization and “Groupware”
Gas
i. Minimize processing costs
ii. Minimize cost involved in
midstream
i. LNG Technologies
ii. Gas to Liquid Technologies (GTL)
iii. Sour Gas Processing technologies
Un-
Conventional
Gas
i. Cost intensive land availability
ii. water usage
iii. Environmental issues
iv. Commercial viability
i. Original well drilling
ii. Hydro fracturing
INNOVATIONS IN UPSTREAM SECTOR As time progresses, there is need of new technology to meet the crude demand.
This can happen only when there is research and development in the area of
new technologies. This is based on innovation and plays a crucial role in
success of any company. The following table depicts areas of operation,
challenges associated within this area and possible new technology in
upstream oil and gas industry:
From the above table, the opportunity for utilizing new technology can be
observed in the following areas:
1. Enhanced seismic data acquisition
2. Enhanced oil recovery system
3. Endowment of oil and gas resources
4. Development of new and marginal field
5. Deep-water exploration
6. Accessing complex geographical location
7. Use of unconventional resources
The following list shows new technologies adopted in upstream sector during
exploration, drilling, well testing, completion etc.
Technology for Exploration54
In exploration, technology like Q Marine 3D Seismic Survey, 4D Seismic,
Micro-Seismic, Micro CT scan plays important role during initial stage of E&P
activity. For deep-water, controlled Source Electro Magnetic Surveys, Marine
87
Magneto-Telluric Surveys helps surveyor in order to map geographic
complexity. Frequency Imaging, SWPM (Single Well Predictive Model),Sequence
Stratigraphy Application to Deep Waters, Fluid Inclusion Stratigraphy & Micro
thermometry, 3DEX /RT-Scanner/ZAIT- Tri-axial induction Tool (First Time in
India), ECS/FLEX/GEM/ Eco scope -Elemental capture Spectroscopy, Sonic
Scanner/ZMAC (First Time in India), CMR/NMR/MR-Scanner for Fluid Typing,
Porosity and Hydrocarbon Saturation, Estimation (First Time in India), Dual
Packer (mini DST), Resistivity Imaging for Thin Bed Analysis (First Time in
India), Capstan (High Tension Logging) (First Time in India), Pressure While
Drilling (First Time in India),Over-Under Seismic Technology for improvised sub
basalt imaging, Multi beam Survey for exploration, Walk-away VSP in deep
waters, Surface Geochemical Exploration and Heat Flow Measurements, Sub-
basalt Imaging Techniques, Advanced processing Algorithms like, Beam
Migrations, SMRE, Anisotropic Depth Migrations, High Direct Hydrocarbon
Indicators Analysis and Joint Inversions, Interactive Interpretative Processing
etc. are successfully being used in E&P activities.
Drilling
In drilling operations, Managed pressure drilling (MPD), conversions of subsea
BOP to universal BOP stack, high performance water-base mud system-Ultra
drill, Coil tube Drilling, Slim hole drilling are among advanced technology
which are used for effective production.
Completion
In the well completion phase, following technologies are used as a part of E&P
activity:
1. Temperature Array Sensors (TAS) System
2. ICD-inflow control device used for even pressure distribution in the
production bore to increase oil production by even pressure distribution
3. Use of heated fracturing fluids for Hydro-fracturing job
4. Smart Horizontal Well Completions Single Trip Multi zone Cased Hole
Frac Pack System (MST System)
5. Free Floating Pre Perforated Liner
6. 103/4 ―Large bore Fluid Loss control Valve (FS1) in the Lower completion
7. Horizontal Xmas Tree (HXT)
8. Production of Waxy Crude
9. Hot water injection
Well Testing
In well testing, following recent techniques are adopted.
1. Multiphase Flow Meters (MPEM) for testing
2. Modular Drill Test
88
3. Down hole Gauge for real-time data
4. Subsea Pressure & Temperature
5. Permanent Rig lines
Facilities
1. Heated Insulated Pipeline for Waxy Crude evacuation
2. 7‖ horizontal subsea X-Mas Trees (XMTs)
3. Subsea Wet Gas Meters (WGMs)
4. Piggy back pipelines in deep-water
5. Subsea Isolation Valves (SSIVs) for platform protection
6. Assessment of pipe-walking and use of anchor boxes for mitigation
against pipe walking
7. Specialized umbilical termination heads (use of multibore connectors)
8. Designing and installation of vent line network for hydrate mitigation
9. Fiber optics in subsea for data transmission
10. Automated Underwater Vehicle (AUV) for pre-engineering surveys
11. Production System Simulator (PSS) for real-time monitoring and
look-ahead predictions
12. MFG Regeneration / Reclamation system consisting of pre-
treatment , vacuum distillation, salt separation and disposal
Research and Development in E&P Value Chain55
In E&P sector, oil and gas industries are injecting huge funds in research and
development field for continuous improvement in upstream activities. It is said
that there is end of easy oil and the fields are matured ones. Thus, industries
have to develop new technologies which will enhance oil production and
productivity. One of the EOR techniques is chemical technology, which is used
for improving the productivity. In Heera Field WAG injection is made. Even CO2
is used as an EOR technique. Other techniques involves MEOR, In-situ
combustion etc.
There are issues related to production too. If we take the case of KG-D6 field,
the production of gas has drastically dropped down to 14 mmscmd. In order to
mitigate production related issues, high end technology like Nanotechnology,
hydro fracturing, sand consolidation by chemical methods, effluent treatment
using microbial technique etc. are under study.
Complex Reservoirs Issues and Solution:
For complex reservoirs, innovative techniques are needed for identification and
evaluation of low resistivity low contrast reservoirs. To tap oil and gas from
unconventional reservoirs, techniques have to be developed. Following issues
89
have to be under consideration which gives an opportunity for innovation in
E&P field:
1. Field specific interpretation of NMR log data and core data in an
innovative way.
2. Estimation of permeability, residual hydrocarbon saturation (RHS) and
other reservoir parameters have to be studied in collaboration with
university and research center.
3. Interpretation of bore-hole image data and acoustic log data in an
innovative way.
4. Software for horizontal well evaluation
5. Measurement of magnetic susceptibility, cation exchange capacity,
membrane
6. potential for evaluation of low resistivity reservoirs
Drilling Issues and Solution:
1. Enhancing well bore integrity
2. Substituting OBM/SOBM as eco-friendly drilling fluid
3. Completion (drilling fluid, string design and cementation) of water flow
channels
4. Completion of HPHT wells
5. Slim hole drilling for exploratory wells
6. Cloning of low specific gravity drilling fluid
HSE: Issues and Solution
HSE is the main challenge in the fore front of E&P players. For sustainability of
unconventional gas production, management of shale gas, hydro fracturing of
tight gas etc. is a major concern of study among E&P players. How to dispose
hydro fractured water is a major challenge along with handling situation like
oil spills. For handling oil spills, there is need to development oil spill modeling
to order to check oil seepage/leakage in offshore areas. For CBM, carbon
capturing is a challenge. These factors drive success of Oil and Gas industry.
Innovation in Downstream Sector56
Downstream sector basically focuses on refining, marketing and distribution of
petro products in the market. It is known that a refinery is configured for a
particular grade of crude. Thus, in order to take a call for any grade of crude,
there is a need of advanced technology and process for configuring refinery.
This can help downstream industries and also to the whole nation for
supplying uninterrupted crude supply.
Besides, technology is needed to improve commercial value of bottom
distillates. It is a big challenge how to get clean fuel from bottom residues.
90
Innovative technology is needed for getting hydrogen from petcock, up-
gradation of FCC streams to petrochemical feedstock etc.
Continuous effort is given for the development of new additives, development of
reactor internals, separation technology, for example, progressive distillation,
divided wall column etc., development of high performance lubricant,
development of high grade fuel like Euro standard,CO2 capturing technology,
GTL,CTL technology, technology for fuel from plastics, bio refining technology
etc.
Downstream sector has ample opportunity for continuous development of
processes and for innovation to take place. In a developing country like India,
there is lot of opportunity in downstream sector for applying new technology in
refinery as the energy demand is rising and expansion of refinery is taking
place. Thus, India can think of installing new technology in order to achieve its
demand supply target.
CONCLUSION
There are many reasons for innovation of new technology to take place. One of
the main reasons is the retirement of expert human capital from hydrocarbon
business in near future. This calls for de-manning of all operation from
offshore, onshore, in refinery, in retail outlet etc. which enables industries to
think on new technology. This can help in order to have security in energy.
The world is moving towards renewable energy for its energy security. In order
to balance the energy source ratio, a call for new technology in oil and gas
industry for accessing new reserves, maximizing productivity of matured oil
field, enhancing refining processes and increasing efficiency, productivity in
downstream activities is to be addressed. Technologies used for exploration,
drilling, well testing have helped society for meeting energy demand. For
matured oil fields, enhanced oil recovery methods have significant role in
increasing productivity. Similarly, technologies used in survey methods are
having great impact in increasing probability of getting oil sources.
In downstream sector, technologies used for enhancing processing of crude,
increasing value of bottom of barrel, automation in RO, enhancing quality of
lubricant etc. have major effect on increasing energy security in present and
also for the future. The world is presently depending on fossil fuels as its
primary source of energy, but this energy has a certain life cycle. This energy
can be used in an optimized manner, if there is well advanced technology to
use it efficiently. This calls for innovation to take place and industries are
injecting huge funds in developing R&D.
91
ENERGY SECURITY AND WATER RESOURCE: TOWARDS SUSTAINABLE DEVELOPMENT
Archana Sinha Balram Rao
Department of Rural and Urban Studies Department of Humanities and Social Sciences
Indian Social Institute Indian Institute of Technology
New Delhi–110025 Roorkee-247667
ABSTRACT

92
Water and energy are intricately associated, and that measures and actions in one area more
often than not have impacts on the other. These links have always been present, but as the world
population plunges towards eight billion with increasing demands for basic services and
growing desires for higher living standards, the need for the vital resources necessary to achieve
those services and desires has become more apparent. Advances in technologies and
development offer multiple opportunities for involvement of the private sector in meeting the
world of water needs. One billion people on earth are without reliable supplies of water, and
more than 2 billion people lack basic sanitation. The Twelfth Five Year Plan envisages investing
more in space technology, metrological and agricultural use to transform the ways in which
what farmer can do and the ways in which the government can reach the poor farmers, and this
also explains the need for better inter departmental synergy between space, metrological and
agriculture department. Water is an integral part of energy development, production, and
generation; and is used directly in power generation. Water is also used extensively in energy-
resource extraction, refining, and processing, as well as for energy resource transportation.
Therefore, as global energy consumption continues to increase, to as much as fifty per cent by
2030, the demand for water supplies and resources to support this growth will also increase.
This will place the energy sector into greater competition with other water users for already
limited freshwater resources in many regions of the world. The paper addresses the challenges
in a timely way.
KEY WORDS: Water Management, Agriculture, Energy, Technology, Millennium
Development Goals, Twelfth Five Year Plan.
Water and energy are intricately linked, and that measures and actions in one
area more often than not have impacts on the other. These connections have
always been present, but as the world population plunges towards eight billion
with increasing demands for basic services and growing desires for higher
living standards, the need for the vital resources necessary to achieve those
services and desires has become more obvious. Although in many parts of the
world, economic development has been slow as has been investment in science,
there is significant potential for investment, research and development in water
technologies, systems, treatment, use and productivity. Advances in
technology, innovation and best practices are needed in order to keep pace with
the current rate of growth to be able to meet rising levels of water demand,
decreasing water availability and aging urban water infrastructure. Advances
in technologies and development offer multiple opportunities for involvement of
the private sector in meeting the world of water needs, and the potential for
public-private partnerships. Such advances will need to be integrated with
national water policies. One billion people on earth are without reliable
supplies of water, and more than 2 billion people lack basic sanitation. Water
is critical to the attainment of the United Nations Millennium Development
93
Goals whose targets are set to expire in 2015; it is already known that the
world lags far behind on the sanitation target, which is predicted to be missed
by over 1 billion people. Although real potential exists for conflict over water,
water tensions can also offer potential for cooperation between states, so long
as the underlying institutions and capacity are in place for such cooperation to
happen. The Twelfth Five Year Plan envisages investing more in space
technology, metrological and agricultural use to transform the ways in which
what farmer can do and the ways in which the government can reach the poor
farmers, and this also explains the need for better inter departmental synergy
between space, metrological and agriculture department. Also there is a need to
uplift the confidence of people in the government actions of the government
and more optimistically the Parliamentary Standing Committee would be
looked upon in this context. Indian Planning Commission envisages including a
public private partnership (PPP) section to the Rashtriya Krishi Vikas Yojana
(RKVY) for enhanced and more efficient decentralization in decision making to
accomplish preferred targets in agriculture sector.
Water security as defined in the Millennium Development Goals (MDGs) as
access to safe drinking water and sanitation, both of which have recently
become a human right. However, energy security has been defined as access to
clean, reliable and affordable energy services for heating, communications and
productive uses, at an affordable price, while respecting environment concerns;
implies that security is not so much about average availability of resources, but
has to include variability and extreme situations such as droughts and the
pliability of the poor.
Relation between Water and Energy Sectors
Water is an integral part of energy development, production, and generation.
Water is used directly in power generation. Water is also used extensively in
energy-resource extraction, refining, and processing, as well as for energy
resource transportation. Therefore, as global energy consumption continues to
increase, to as much as 50per cent by 2030, the demand for water supplies
and resources to support this growth will also increase. This will place the
energy sector into greater competition with other water users for already
limited freshwater resources in many regions of the world. This competition for
water resources will impact future energy development and could have
significant impacts on energy reliability and energy security in regions around
the globe. Improved water and energy security on a global level can be achieved
through a nexus approach – an approach that integrates management and
governance across sectors and scales. A nexus approach also helps in the
transition to a Green Economy, which intends, at resource use efficiency and
94
greater policy consistency. Given the increasing interconnectedness across
these three areas, a reduction of negative economic, social and environmental
externalities can increase overall resource use efficiency, provide additional
benefits and secure the human rights to water and food. Thus, a nexus
perspective increases the understanding of the interdependencies across the
water, energy and food sectors and influences policies in other areas of climate
concerns. The nexus perspective helps to rule out interdisciplinary solutions,
thus increasing opportunities for mutually beneficial responses between and
among all sectors. A deep understanding of the nexus approach will thus
provide the informed framework that is required to meet increasing global
demands without compromising sustainability. The nexus approach will also
consent to decision-makers to develop suitable policies, strategies, and to
identify and alleviate trade-offs among the development goals related to water,
energy and food security. Active participation by and among government
agencies, the private sector and civil society is significant to keep away from
unplanned undesirable consequences. A true nexus approach can only be
accomplished through secure partnership of all actors from all sectors.
There are substantial linkages among water, energy and food are. Water is
used for extraction, mining, processing, as well as for growing feedstock for
biofuels and for generating electricity. Water intensity varies in the energy
sector, with oil and gas production requiring much less water than oil from tar
sands or bio-fuels. Identifying biofuels for energy production should requires
prioritizing carefully, since water that has been used to grow feedstock for
biofuels could also have been used to grow food.
Many forms of energy production through fossil fuels are highly polluting in
addition to being water intensive. Further, return flows from power plants to
rivers are warmer than the water that was taken in and/or are highly polluted
and can consequently compromise other downstream usage, including
ecosystems. Conversely, energy is needed for extracting, distribution and
treatment of water. Food production is by far the largest consumer of global
fresh water supplies. Globally, agriculture is responsible for an average of 70
per cent of fresh water consumption by humans; in some countries that figure
ranges between 80-90 per cent. Agriculture is therefore also responsible for
much of fresh water over-exploitation. Food production further impacts the
water sector through land degradation, changes in runoff water, groundwater
discharge, water quality and availability of water and land for other needs. The
increased yields that have resulted from mechanization and other modern
measures have come at a high energy price, as the complete food and supply
chain accounts for approximately 30 per cent of total global energy demand.
Energy fuels land preparation, fertilizer production, irrigation and the sowing,
95
and harvesting of crops. The links between food and energy have become quite
obvious in recent years as increases in the price of oil lead very quickly to
increases in the price of food. The energy sector can have other negative
impacts on the food sector when mining for fossil fuels and deforestation for
biofuels reduce land for agriculture, and ecosystems.
While the prospects provided by the nexus perspective and the consequent
social, environmental and economic benefits are factual, implementation
necessitates the right policies and institutions that are up to the mission, as
well as frameworks that support empowerment, knowledge and research. Water
and energy are closely entangled throughout the food chain. Irrigation implies
escalating energy bills and energy is also powerfully used to make water of
good enough quality for agriculture. Energy production is linked with
significant water consumption, for instance, biofuels that can consume 20-30
tonnes of water per litre bio-fuel produces. Additionally, water can be used for
hydropower generation in many parts of the world. The interconnections
between water, food, and energy also concerns cost factor. Energy is a key
input to agriculture, thus higher energy costs obstructs agricultural
production, irrigation, and as a result food prices thus hampering food
security. Increasing energy prices also provide an incentive for replacement of
food crops with growing fuel crops. The instability of energy prices is hence
conveyed to the food price contributing to increased food security risks.
Environmental Impact of Virtual Water Trade
Virtual water among the countries and continents and within the nation is
largely due to the trade of agricultural commodity, the country which export
maximum of their agricultural product has definitely been reducing their
ground level water. Trade is a source of foreign exchange and therefore, every
nation wants to increase its per capita income by exporting maximum of their
commodity in the international market. This has totally changed the overall
production pattern of the country as land resources are scarce and it needs
greater inputs like chemical fertilizers, pesticides, etc. so the soil profile is
losing its quality with every passing day. The intensive use of pesticides is also
affecting the soil health.
According to Kampman (2007), the states like Haryana and Punjab are always
with overproduction of their agricultural products, thereby reducing their
ground water level. Hence this affects their blue and green water balance. On
the other hand, Bihar, Jharkhand, Odisha import virtual water from northern
states even though they have surplus ground water. This creates greater
imbalance between states.
96
One of the visual observations at village of Haryana revealed that the farmers
are unable to grow crops round the year. They could only grow the crop in the
rainy season because water table was low and so difficult to pump out the
ground water for irrigation purpose and even for drinking. This situation has
created only the impact of maximum exploitation of ground water for growing
water intensive crops.
Challenges and Opportunities
Growing populations, increased urban, agricultural and industrial water
demands, and a growing understanding of nature of need for water require that
we radically reform our attitude toward water and how it is managed globally.
Water needs to be on the global political agenda not only in order to feed the
projected 9 billion people that will inhabit the earth by 2050 with less
agricultural water than is available today, but also in order to address the
critical development challenge of doing so in a safe, sustainable way without
compromising water resources that are essential to ecosystem services and
functions. By addressing critical water issues, we will simultaneously address
economic and public health woes while advancing our capacity to adapt to
climate change. Addressing water security issues will create a foundation for
peace and well-being. It must be understood, however, that human interaction
with the environment is at the centre of water security. We should never forget
that nature is a silent stakeholder in all water use. The issue of water security
ultimately will only be addressed when humans can find a way to satisfy their
growing needs without compromising the ecosystem services they depend upon
to fulfill those needs, and to do so in a sustainable way so as to ensure water
and environmental security for future generations. These are immense
challenges, but they can be addressed in a timely way through innovation,
creativity, investment and cooperation.
The current trend of increasing water use in order to satisfy increasing
agriculture and energy demands to meet the needs of a growing population has
come at a cost of threatened water supply and quality levels. It is recommended
that the linking of water, agricultural and energy policies, both nationally and
globally, in order to reduce jurisdictional fragmentation that often acts as a
barrier to improved water management practices. The wastefulness of some
developed countries with respect to water and related energy use puts into
relief the challenge we face in supplying water to the 1 billion people on earth
who do not have a safe and reliable daily supply. It also speaks to the challenge
of serving the additional 2 billion people on this planet who do not have daily
access to adequate sanitation. Industry examples suggest that for every dollar
saved in water use in the developed world, as much as four dollars more is
97
saved on chemical, electricity and energy costs (Fishman, 2011). If such
savings could somehow be directed in part towards water infrastructure
development in the developing world, the improvements in human well-being
would go a long way in reducing the potential for conflict over matters of water
supply and quality in the future.
India and most of the countries in South Asia have concentrated on enhanced
production of a few food commodities like rice and wheat, which could quickly
contribute to their total food agricultural production. The rice-wheat based
cropping system, spread in the most fertile areas, is the backbone of food
security in South Asia. All the efforts in the future have to be concentrated on
breaking the yield plateau by conserving natural resources and promoting
ecological integrity of the agricultural system. Producing more with less of
inputs will be the major challenge in the next two decades. Research problems
in the rainfed unfavourable ecosystems and breaking of the current irrigated
yield ceilings are more complex and challenging. To make headway in them will
require mobilization of the best of science and the best of scientists in the
National Agricultural Research System. This needs higher investment in
agricultural research.
CONCLUSIONS:
India is the major producer and consumer of food in South Asian region and
possesses huge potential that remains highly under realized. Therefore, India
has to play a major role not only to maintain its own self-sufficiency in food
production but also to meet the additional requirement of its neighbouring
countries. The right research priorities and production strategies will promote
future growth in agriculture and ensure sustainable development.
Water is an essential resource that affects environmental, economic and social
systems. This resource, whether in the form of surface water or groundwater, is
under increasing pressure through increased demand, which is being driven by
population growth and changing lifestyles, direct anthropogenic stressors such
as agricultural, urban and industrial pollution and, in some cases, reduced
supply from ecosystems through the impacts of climate change. These facts
have led academics, politicians and the media to predict a bleak future for
societies with the prospect of conflicts triggered by water resources or massive
displacements of populations triggered by climatic hazards.
With the growing world population, particularly in urban areas, the water,
energy, and food resources will be facing budding challenges. By 2030, water
supply could face a 40 per cent shortfall, with the world's food needs growing
by as much as 50 per cent. By 2050, energy requirement will be three times
greater than it was a mere decade ago. Urban development, infrastructure
98
quality, investments in water and energy, demand and supply management
solutions possibly will all have an impact on water resources, food and energy
production.
Since an average uses of water less than half the amount of water consumed
by an average American, but still India is the world largest exporter of virtual
water by using more domestic water resources for export products than any
other country. India‘s per capita water consumption is 1,089000 litres per year,
but trade due to India‘s net virtual water export is 95,000 million cubic meters.
There is a need for more investments in research and technology along with
greater usage of natural resources in order to enhance the agriculture sector in
India. Further, it is felt, that cultivating the Influence of the Water practitioners
must find a way to help policy-makers translate effective action on public
policy related to water into long-term support. However, ultimately, water
security will require political commitment. There is a sense now of what is
ahead. Due to the recent economic meltdown, societies and governments now
find themselves in a situation in which economic recovery cannot be sustained
if climate change mitigation is pursued too rapidly. This adds yet another level
of vulnerability to the already substantial list of potential areas of conflict over
water security: the 1 billion people without access to safe, reliable water
supplies; the 2 billion people without adequate sanitation; the serious issues
related to how much water will be needed to feed growing population. To avoid
future conflict, we need to get to the root of the problem, and the goal must be
to provide water security for the poor.
REFERENCES
1. AGECC 2010. UNDP: Millennium Development Goals, Goal 7: Ensure
environmental sustainability; UN Secretary General‟s Advisory Group on Energy
and Climate Change (AGECC), Summary Report and Recommendations, 28 April
2010, p. 13
2. Asokan, S.R. 2005. “A Perspective of Contract Farming With Special Reference to
India”. Indian Journal of Agricultural Marketing, 19 (2), pp 94-106.
3. Dhan Foundation. 2006. Themes- “Rainfed Farming” –
http://www.dhan.org/rainfed.php.6k.
4. Economic Survey, 2008. Ministry of Finance, Government of India, New Delhi.
5. FAO 1996. Rome Declaration on World Food Security and World Food Summit
Plan of Action. World Food Summit 13–17 November. Rome.
6. FAO. 1991. “Sustainable Agriculture and Rural Development”. In Asia and Pacific,
Regional Document No. 2, FAO / Netherlands Conference on Agriculture and the
Environment, Hertogenbosch, The Netherlands, 15-19 April.
99
7. FAO. 1996. Rome Declaration on World Food Security and World Food Summit
Plan of Action. World Food Summit 13–17 November 1996. Rome.
8. Feder, Gershon, Just, Richard E and Zilberman, David. 1985. “Adoption of
Agricultural Innovations in Developing Countries: A Survey”, Economic
Development and Cultural Change, 33 (2): pp 255-98.
9. Fishman, C., 2011. The Big Thirst. The Secret Life and Turbulent Future of Water.
New York: Free Press.
10. George, P.S. 1996, “Public Distribution System, Food Subsidy and Production
Incentives”. Economic and Political Weekly, Volume 31, No. 39, September 28, pp
A-140-144.
11. Government of India. 2007-08. Economic Survey, Ministry of Finance, New Delhi.
12. Kumar P and Surabhi Mittal 2006. “Agricultural Productivity Trends in India:
Sustainability Issues”. AERR, Volume 19, pp 71-88.
13. Kumar P. 2001. Agricultural Performance and Productivity In Indian Agricultural
Policy at the Cross Roads eds. S.S. Acharya and D.P. Chaudhri, Rawat publications,
New Delhi, pp.353-476.
14. Kumar, P and Desai, G.M. 1995. “Fertilizer Use Pattern in India During Mid-1980s:
Micro-Level Evidence on Marginal and Small Farms”. In Strategic Issues in Future
Growth of Fertilizer Use in India. Eds. G.M. Desai and A.Vaidyanathan. Macmillan,
India.
15. Lockheed, Marlaine E, Jamison, Dean T. and Lau, Lawrence J. 1980. “Farmer
Education and Farm Efficiency: A Survey”, Economic Development and Cultural
Change, 29 (1): pp 37-76.
16. Maheswari R., K.R. Ashok and M. Prahadeeswaran 2008. “Precision Farming
Technology, Adoption Decisions and Productivity of Vegetable in Resource Poor
Environments”. AERR Volume 21, pp 415-424.
17. Mittal S. and Kumar, P. 2000. “Literacy Technology Adoption, Factor Demand and
Productivity: An Econometric Analysis”. Indian Journal of Agricultural Economics,
55 (3): pp 490-499.
18. Mittal, Surabhi 2007. Paper prepared for presentation at the seminar on “US-India
Agricultural Knowledge Initiative” organized by ICRIER and Ministry of External
Affairs, GOI on April 30, 2007 held at India Habitat Centre, New Delhi.
19. Nagaraj N., M.G. Chandrakanth, P.G.Chengappa, H.S. Roopa and Pramod M.
Chandakavate. 2008. “Contract Farming and its Implication for Input Supply,
Linkages Between Markets and Farmers in Karnataka”. AERR, Volume 21, 2008 pp
307-316.
20. Phillips, Joseph M. 1994. “Farmer Education and Farmer Efficiency: A Meta-
Analysis”. Economic Development and Cultural Change, pp 43: 149.
21. Planning Commission 2007. “Chapter 1: Agriculture”, Eleventh Five Year Plan:
2007-2012, Government of India, New Delhi.
22. Rao, C.H. Hanumantha 1997. ”Inaugural Address”, to the National Seminar on
Agricultural Development Perception for the Ninth Five Year plan, Indian Institute
of Management, Ahmedabad, Published in B.M. Desai (Ed) (1997) Agricultural
Development Paradigm for the Ninth Plan Under New Economic Environment,
Oxford & IBH Publishing Co Pvt Ltd, New Delhi.
100
23. Satyasai K.J.S., 2008. “Rural Credit Delivery in India: The Structural Constraints
and Some Corrective Measures”. AERR, Volume 21, pp.387-394.
24. Sawant S.D. 1997. „Foodgrain Output Growth: Emerging Constraints and
Perspectives for Technology Development Policies” in Bhupat Desai (Ed) (1997).
Agricultural Development Paradigm for the Ninth Plan Under New Economic
Environment, Oxford & IBH Publishing Co Pvt Ltd, New Delhi.
25. Singh, R.B., Kumar, P and Woodhead, T. 2002. “Smallholder Farmers in India:
Food Security and Agricultural Policy”. Food and Agriculture Organisation of the
United Nations, Regional Office for Asia and Pacific, Bangkok, Thailand.
26. UN Secretary General‟s Advisory Group on Energy and Climate Change (AGECC),
Summary Report and Recommendations, 28 April 2010, p. 13
27. UNDP: Millennium Development Goals, Goal 7: Ensure environmental
sustainability
28. Vaidyanathan, A. 1994. Second India Studies Revisited: Food Agriculture and
Water, Madras Institute of Development Studies, Madras.
Cattle Dung: A Suitable Substrate for Lignolytic Enzymes Production Using
Coriolus Versicolor MTCC 138
Urmila Gupta Phutela Rekha Sharma
School of Energy Studies for Agriculture, Department of Microbiology
College of Agricultural Engineering and Technology; College of Basic Sciences and Humanities
101
Punjab Agricultural University, Punjab Agricultural University
Ludhiana-141004, Ludhiana-141004,
ABSTRACT The present study reports the production of lignolytic enzymes (laccase, lignin peroxidase and
manganese peroxidase) using cattle dung as a substrate by Coriolus versicolor MTCC 138.
Traditionally cow dung has been used as a fertilizer, though today dung is collected and used to
produce biogas. This gas is rich in methane and is used in rural areas of India/Pakistan and
elsewhere to provide a renewable and stable source of electricity. Cattle dung was analysed for
proximate (total solids, volatile solids and pH), chemical (cellulose, hemicellulose, lignin and
silica) and biochemical (total proteins, laccase, lignin peroxidase and manganese peroxidase)
composition. The lignolytic enzyme profile was studied both for autoclaved as well as
unautoclaved samples. Cattle dung was inoculated with Coriolus versicolor MTCC 138 spores
and activity of lignin peroxidase, manganese peroxidase and laccase were measured for the
incubation period of 2, 4, 6 and 8 days. The unautoclaved sample have maximum production of
laccase, manganese peroxidase and lignin peroxidase as 68.0 IU/ml, 80.0 IU/ml and 216.7 IU/ml
respectively as compared to the autoclaved one which showed 53.5 IU/ml 75.9 IU/ml and 105.1
IU/ml for laccase, manganese peroxidase, lignin peroxidise respectively. Thus it shows that
sterilizing the samples does not affect the lignolytic enzyme production to much extent. All the
three activities were higher in unautoclaved samples as compared to autoclaved one, which means
that samples can be used without autoclaving, thus saving energy. So, Unautoclaved cattle dung
was found to be best suitable substrate for the lignolytic enzyme production.
KEY WORDS: Lignolytic enzyme, Lignin peroxidase, Coriolus versicolor 138, proximate and
chemical analysis, Cattle dung.
INTRODUCTION: In a country like India, where more than 70per cent of the total population
inhabits rural areas, biogas can be easily obtained by anaerobic digestion of
domestic and farm wastes, like cattle dung, as cattle dung be a good suitable
substrate for biogas production. For biogas production, cattle dung used as a
substitute for other fossil fuels, such as coal for electricity generation, two
Green House Gas sources (manure and coal combustion) can be replaced with
a less carbon-intensive source. Lignocellulolytic enzymes are very important
with reference to pretreatment of biomass, bio-pulping, bio-bleaching and soil
bioremediation (Messner and Srebotnik 1994). However, high cost of
commercial enzymes hinders their utilization. More than 50per cent of cost of
production entails to the substrate used. The cattle dung being rich in organic
matter can be utilized for enzyme production. It contains nutrients like
cellulose, hemicellulose, lignin, organic matter and potential microorganisms.
So it can be utilized for production of value added products like cellulolytic,
proteolytic and lignolytic enzymes. Lignin degrading microorganisms and their
102
enzymes are the suitable alternatives because they provide cost free and
pollution free technology for biofuel industry. Lignin after cellulose and hemi-
cellulose is the most abundant aromatic polymer on earth consisting of three
different phenyl propane units namely p-coumaryl, coniferyl, sinapyl alcohol.
Due to its complicated structure and nonhydrolysable bonds, lignin is more
difficult to break down than cellulose or hemicellulose. The major enzymes
associated with lignin-degrading ability of any microorganisms are lignin
peroxidase, manganese peroxidase and laccase. Laccase (benzenediol: oxygen
oxidoreductase, EC 1.10.3.2) belong to multicopper oxidase family. These
copper-containing enzymes catalyze the oxidation of various substrates with the
simultaneous reduction of molecular oxygen to water. Lignin peroxidases (EC
1.11.1.14) belong to the family of oxidoreductases. Lignin peroxidases (LiPs)
were first described in the basidiomycete Phanerochaete chrysosporium
Burdsall (order Corticiales) in 1983. This enzyme has been recorded for several
species of white-rot basidiomycetes and in actinomycetes. LiP is an extracellular
hemeprotein, dependent on H2O2, with an unusually high redox potential and
low optimum pH. LiP is capable of oxidizing a variety of reducing substrates
including polymeric substrates (Oyadomari et al 2003). Manganese peroxidases
(EC 1.11.1.13) also belong to the family of oxidoreductases, following the
discovery of LiP in Phanerochaete chrysosporium. Manganese peroxidase (MnP)
secreted from the same fungus was found as another lignin degrading enzyme
Filamentous fungi like Coriolus, Aspergillus, Penicilliun and Trichoderma have a
great capability for secreting a wide range of lignocellulolytic enzymes. Coriolus
versicolor degrades all three major wood components of lignin, cellulose and
hemicellulose at approximately the same rate and is considered to be one of the
most effective of the wood-rotting basidiomycetes. The system required to
breakdown the lignin polymer must be extracellular for at least the initial
stages of degradation and until the products of breakdown are able to enter the
cell for attack by intracellular enzymes
MATERIALS AND METHOD: Cattle Dung Cattle dung was procured from Dairy farm of GADVASU (Guru Angad Dev
Veterinary and Animal Science University), Ludhiana.
Chemicals All the chemicals used for proximate analysis, media and solutions preparation
were of analytical grade and were purchased from Hi-Media, SRL Sigma.
Culture Collection and Maintenance Standard culture of Coriolus vericolor MTCC 138 was procured from MTCC
(Microbial Type Culture Collection), Institute of Microbial Technology,
Chandigarh and was maintained on malt extract Blakeslee`s agar where slants

103
were maintained at 28±20C by monthly transfers. The culture was stored in
refrigerator after sub-culturing.
MALT EXTRACT BLAKESLEE’S AGAR (MEA)
Ingredients Concentration (g l-1) Malt Extract 20 Peptone 1
Agar 20
pH 6.5
Media Preparation and Sterilization For the preparation of all medium above mentioned ingredients were dissolved
in distilled water except agar and the volume was made 1000 ml. pH was
adjusted and 20g agar was added if solidified media was required.
Sterilization was accomplished by placing the media in an autoclave and
steaming it for 15-20 minutes, at 121°C at a pressure of 15 pounds (lbs) per
square inch (psi).
Proximate and Chemical Analysis of Cattle Dung
Cattle dung was analyzed for pH value; proximate (total solids and volatile
solids) and its chemical composition (cellulose, hemicelluloses, lignin and
silica) by standard methods of AOAC (2000).
Lignolytic Enzyme Profile Studies of Cattle Dung Without Inoculation of Coriolus Versicolor MTCC 138:
Twenty five grams of cattle dung was properly mixed with 25 ml of distilled
water in a flask. Sample was centrifuged at 10,000 rpm for 15 minutes at 4°C
to get clear supernatant. The supernatant was used as crude enzyme extract
and was analyzed for activities of laccase, manganese peroxides‘, lignin
peroxides by Shandilya and Munjal (1983) method and protein content by the
method of Lowry et al (1951). Enzyme activities (U/ml of sample) and protein
(mg/ml of sample) was determined spectro photo metrically using UV-VIS
Hitachi spectrophotometer 2800 model. Similarly, the experiment was
performed after autoclaving all the samples.
With Inoculation of Coriolus Versicolor MTCC 138: Ten flasks of 250 ml capacity were dispensed with 25g cattle dung and mixed
with 25 ml of water. These flasks were autoclaved at 121°C for 20 minute;
inoculated with 5 mm culture bit of C.versicolor (Fig. 3.3.2) and incubated at
28±2°C for enzyme production. After an incubation of 2, 4, 6 and 8 days flasks
were taken out from incubator and crude enzyme was extracted by
centrifugation at 10000 rpm for 15 minutes at 4° C and supernatant was
analyzed for activities of laccase, manganese peroxides‘, lignin peroxides by
Shandilya and Munjal (1983) method and protein content by Lowry et al

104
(1951). Enzyme activities (U/ml of sample) and protein content (mg/ml of
sample) was determined spectrophotometrically using UV-VIS
spectrophotometer Hitachi 2800 model.
Similar experiments were conducted with all the samples without autoclaving
and results were compared with autoclaved samples.
Fig. Culture of Coriolus versicolor MTCC 138 on slant and plate of malt extract agar
RESULTS AND DISCUSSION
Results from the Table 1 indicate that cattle dung was nearly neutral showing a
pH value of 6.98 Total solid concentration in cattle dung was much higher
(14.5per cent) . The volatile solid content in cattle dung was 79.2per cent
Cellulose and hemi-cellulose content was more than lignin in cattle dung. This
might be due to the fact that part of organic matter like cellulose and
hemicelluloses are consumed by natural consortia of microorganisms in biogas
plant for biogas production. Lignin concentration in cattle dung was observed to
be 10.2 per cent and silica content was 8.3per cent in dung.
Anonymous (2009) too reported that pH of dung was 6.85. The average total
solid concentration of the feed was reported to be 18.62 per cent and volatile
solids content was 84 per cent. Similar results were also reported by Ajit (2012)
about the chemical and proximate composition of cattle dung and cattle dung
slurry.
TABLE 1: PROXIMATE AND CHEMICAL COMPOSITION OF CATTLE DUNG
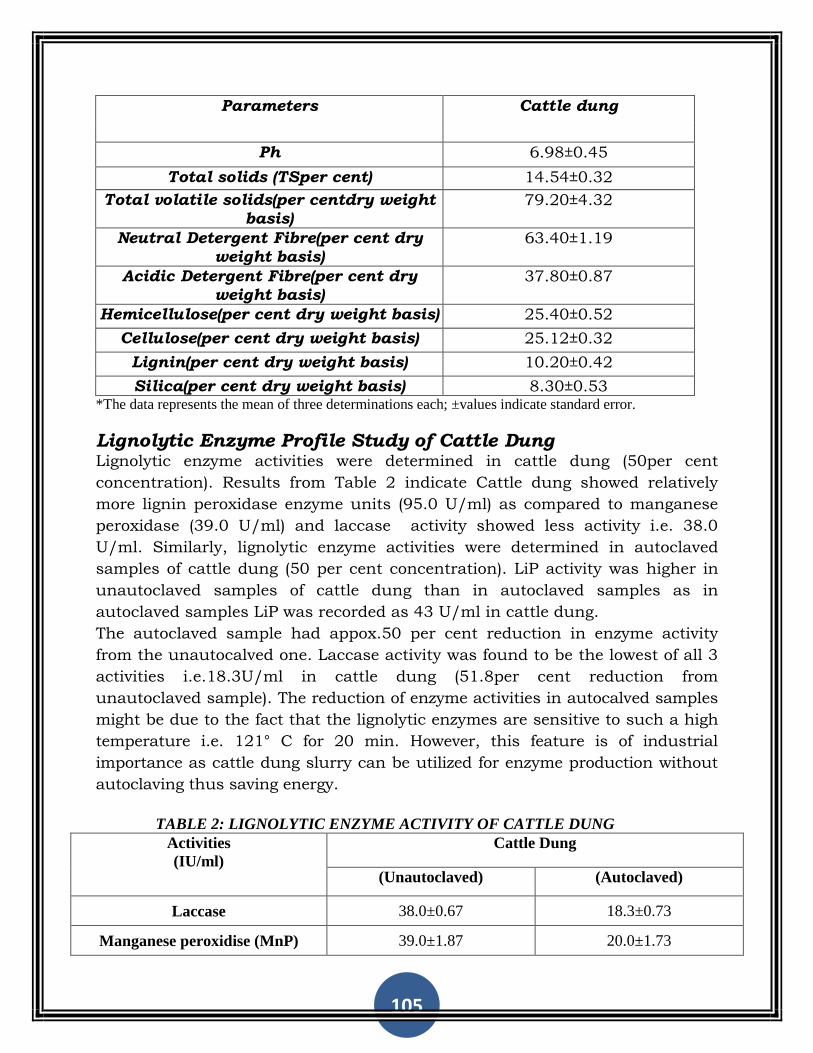
105
Parameters Cattle dung
Ph 6.98±0.45
Total solids (TSper cent) 14.54±0.32
Total volatile solids(per centdry weight basis)
79.20±4.32
Neutral Detergent Fibre(per cent dry weight basis)
63.40±1.19
Acidic Detergent Fibre(per cent dry weight basis)
37.80±0.87
Hemicellulose(per cent dry weight basis) 25.40±0.52
Cellulose(per cent dry weight basis) 25.12±0.32
Lignin(per cent dry weight basis) 10.20±0.42
Silica(per cent dry weight basis) 8.30±0.53 *The data represents the mean of three determinations each; ±values indicate standard error.
Lignolytic Enzyme Profile Study of Cattle Dung Lignolytic enzyme activities were determined in cattle dung (50per cent
concentration). Results from Table 2 indicate Cattle dung showed relatively
more lignin peroxidase enzyme units (95.0 U/ml) as compared to manganese
peroxidase (39.0 U/ml) and laccase activity showed less activity i.e. 38.0
U/ml. Similarly, lignolytic enzyme activities were determined in autoclaved
samples of cattle dung (50 per cent concentration). LiP activity was higher in
unautoclaved samples of cattle dung than in autoclaved samples as in
autoclaved samples LiP was recorded as 43 U/ml in cattle dung.
The autoclaved sample had appox.50 per cent reduction in enzyme activity
from the unautocalved one. Laccase activity was found to be the lowest of all 3
activities i.e.18.3U/ml in cattle dung (51.8per cent reduction from
unautoclaved sample). The reduction of enzyme activities in autocalved samples
might be due to the fact that the lignolytic enzymes are sensitive to such a high
temperature i.e. 121° C for 20 min. However, this feature is of industrial
importance as cattle dung slurry can be utilized for enzyme production without
autoclaving thus saving energy.
TABLE 2: LIGNOLYTIC ENZYME ACTIVITY OF CATTLE DUNG
Activities
(IU/ml)
Cattle Dung
(Unautoclaved) (Autoclaved)
Laccase 38.0±0.67 18.3±0.73
Manganese peroxidise (MnP) 39.0±1.87 20.0±1.73
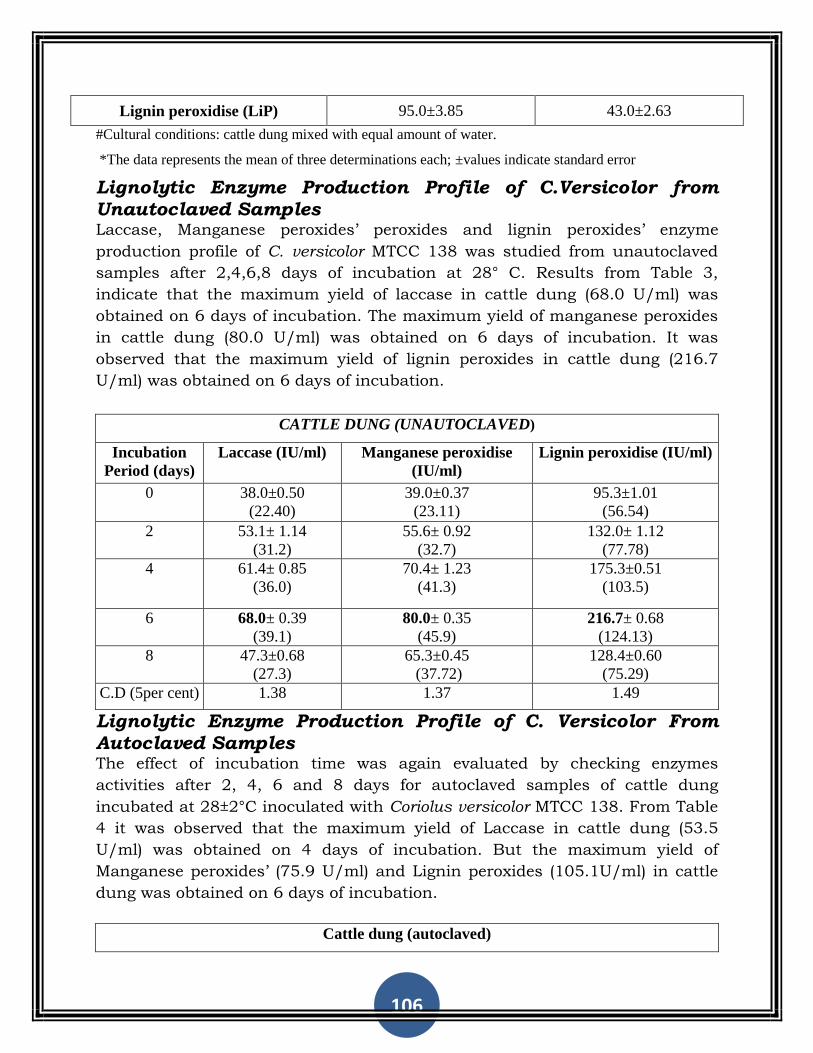
106
Lignin peroxidise (LiP) 95.0±3.85 43.0±2.63
#Cultural conditions: cattle dung mixed with equal amount of water.
*The data represents the mean of three determinations each; ±values indicate standard error
Lignolytic Enzyme Production Profile of C.Versicolor from Unautoclaved Samples Laccase, Manganese peroxides‘ peroxides and lignin peroxides‘ enzyme
production profile of C. versicolor MTCC 138 was studied from unautoclaved
samples after 2,4,6,8 days of incubation at 28° C. Results from Table 3,
indicate that the maximum yield of laccase in cattle dung (68.0 U/ml) was
obtained on 6 days of incubation. The maximum yield of manganese peroxides
in cattle dung (80.0 U/ml) was obtained on 6 days of incubation. It was
observed that the maximum yield of lignin peroxides in cattle dung (216.7
U/ml) was obtained on 6 days of incubation.
CATTLE DUNG (UNAUTOCLAVED)
Incubation
Period (days)
Laccase (IU/ml) Manganese peroxidise
(IU/ml)
Lignin peroxidise (IU/ml)
0 38.0±0.50
(22.40)
39.0±0.37
(23.11)
95.3±1.01
(56.54)
2 53.1± 1.14
(31.2)
55.6± 0.92
(32.7)
132.0± 1.12
(77.78)
4 61.4± 0.85
(36.0)
70.4± 1.23
(41.3)
175.3±0.51
(103.5)
6 68.0± 0.39
(39.1)
80.0± 0.35
(45.9)
216.7± 0.68
(124.13)
8 47.3±0.68
(27.3)
65.3±0.45
(37.72)
128.4±0.60
(75.29)
C.D (5per cent) 1.38 1.37 1.49
Lignolytic Enzyme Production Profile of C. Versicolor From Autoclaved Samples The effect of incubation time was again evaluated by checking enzymes
activities after 2, 4, 6 and 8 days for autoclaved samples of cattle dung
incubated at 28±2°C inoculated with Coriolus versicolor MTCC 138. From Table
4 it was observed that the maximum yield of Laccase in cattle dung (53.5
U/ml) was obtained on 4 days of incubation. But the maximum yield of
Manganese peroxides‘ (75.9 U/ml) and Lignin peroxides (105.1U/ml) in cattle
dung was obtained on 6 days of incubation.
Cattle dung (autoclaved)
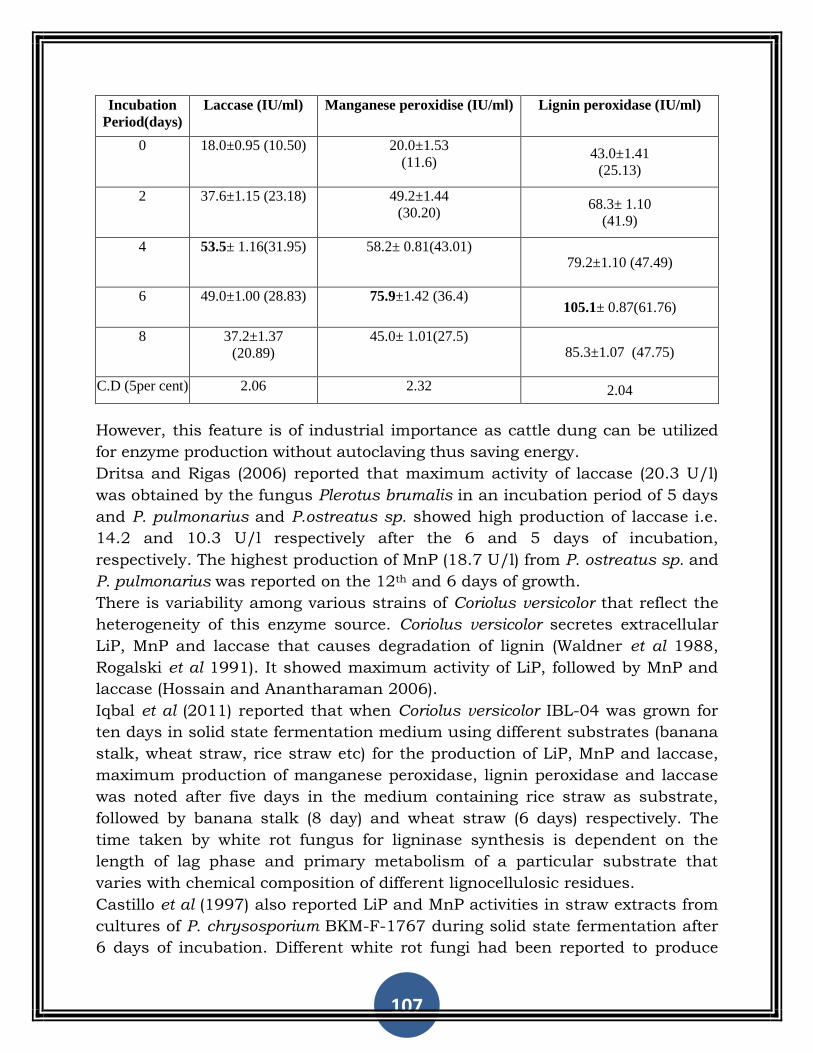
107
Incubation
Period(days)
Laccase (IU/ml) Manganese peroxidise (IU/ml) Lignin peroxidase (IU/ml)
0 18.0±0.95 (10.50) 20.0±1.53
(11.6) 43.0±1.41
(25.13)
2 37.6±1.15 (23.18) 49.2±1.44
(30.20) 68.3± 1.10
(41.9)
4 53.5± 1.16(31.95) 58.2± 0.81(43.01) 79.2±1.10 (47.49)
6 49.0±1.00 (28.83) 75.9±1.42 (36.4) 105.1± 0.87(61.76)
8 37.2±1.37
(20.89)
45.0± 1.01(27.5) 85.3±1.07 (47.75)
C.D (5per cent) 2.06 2.32 2.04
However, this feature is of industrial importance as cattle dung can be utilized
for enzyme production without autoclaving thus saving energy.
Dritsa and Rigas (2006) reported that maximum activity of laccase (20.3 U/l)
was obtained by the fungus Plerotus brumalis in an incubation period of 5 days
and P. pulmonarius and P.ostreatus sp. showed high production of laccase i.e.
14.2 and 10.3 U/l respectively after the 6 and 5 days of incubation,
respectively. The highest production of MnP (18.7 U/l) from P. ostreatus sp. and
P. pulmonarius was reported on the 12th and 6 days of growth.
There is variability among various strains of Coriolus versicolor that reflect the
heterogeneity of this enzyme source. Coriolus versicolor secretes extracellular
LiP, MnP and laccase that causes degradation of lignin (Waldner et al 1988,
Rogalski et al 1991). It showed maximum activity of LiP, followed by MnP and
laccase (Hossain and Anantharaman 2006).
Iqbal et al (2011) reported that when Coriolus versicolor IBL-04 was grown for
ten days in solid state fermentation medium using different substrates (banana
stalk, wheat straw, rice straw etc) for the production of LiP, MnP and laccase,
maximum production of manganese peroxidase, lignin peroxidase and laccase
was noted after five days in the medium containing rice straw as substrate,
followed by banana stalk (8 day) and wheat straw (6 days) respectively. The
time taken by white rot fungus for ligninase synthesis is dependent on the
length of lag phase and primary metabolism of a particular substrate that
varies with chemical composition of different lignocellulosic residues.
Castillo et al (1997) also reported LiP and MnP activities in straw extracts from
cultures of P. chrysosporium BKM-F-1767 during solid state fermentation after
6 days of incubation. Different white rot fungi had been reported to produce
108
maximum lignolytic activity after different time periods due to genetic variation
among the strain as well as in nature and composition of the substrated used
(Patel et al 2009). A white rot fungi Datronia sp. KAPI 0039 produced maximum
laccase and MnP after 4 and 8 days of incubation respectively (Vaithanomsat et
al 2010).
CONCLUSION
From above discussions, it was concluded that cattle dung contains organic
nutrients like cellulose, hemicellulose, lignin, organic matter and potential
microorganisms. It can be utilized for production of value added products like
cellulolytic, proteolytic and lignolytic enzymes. Keeping importance of cattle
dung, as a potential substrate for value added products; in the present study
production of lignin peroxides‘ from cattle dung using Coriolus versicolor MTCC
138.
Acknowledgement
The author acknowledges the financial support provided by AICRP (All India Coordinated Research Project) ICAR (Indian Council of Agricultural Research) for pursuing this project.
REFERENCES
Anonymous (2009) Workshop report of All India coordinated research project on Renewable energy
sources, Central Institute of Agricultural Engineering, Bhopal, India. CIAE/RES/2009/2.
AOAC (2000) Association of official analytical chemist, official methods of analysis. Maryland, USA.
Castillo M.P, Ander P and Stenstroem J (1997) Lignin and manganese peroxidase activity in extracts
from straw solid substrate fermentation. Biotechnol Technol 11: 701-06.
Drista V and Rigas F (2006) Influence of cultivation temperature on the ligninolytic activity of selected
fungal strains. Proc 5th WSEAS International Conference on Environment, Ecosystems and
Development, Venice, Italy, November 20-22, 2006.
Hossain S M and Anantharaman N (2006) Activity enhancement of ligninolytic enzymes of Trametes
versicolor with bagasse powder. Afri J Biotechnol 5: 189-194
Iqbal H M N, Asgher M and Bhatti H N (2011) Lignin degrading enzymes. BioResour 6: 1273-
87.
Lowry O H, Rosebrough N J, Farr A L and Randall R J(1951) Protein measurement with folin –phenol
reagent. J Biol Chem 193: 265-75.
Oyadomari M, Shinohara H, Johjima T, Wariishi H and Tanaka H (2003) Electrochemical characterization
of lignin peroxidase from the white-rot basidiomycete Phanerochaete chrysosporium. J
Molecular Catalysis B: Enzymatic 21: 291-97.
Patel H, Gupte A and Gupte S (2009) Effect of different culture conditions and inducers on production of
laccase by a basidiomycete fungal isolate Pleuotus ostreatus HP-1 under solid state fermentation.
Bioresour 4: 268-84.

109
Rogalski J, Lundell T, Leonowicz A and Hatakka A (1991) Production of laccase, lignin peroxidase and
manganese-dependent peroxidase by various strains of Trametes versicolor depending on culture
conditions. Acta Microbiologica Polonica 40: 221-34.
Shandilya J R and Munjal R L (1983) Some experiments with casing layer. Tai-wan-Yang-ku: Taiwan
Mushrooms 7: 32-38.
Vaithanomsat P, Apiwatanapiwat W, Petchoy O and Chedchant J (2010) Production of lignimolytic
enzymes by white rot fungus Datronia sp. KAPI0039 and their application for reactive dye
removal. Int J Chemical Eng Article ID 162504,6 pages,doi:1155/2010/162504.
Waldner R, Leisola M S A and Fiechter A (1988) Comparison of lignolytic activities of selected white rot
fungi. Appl Microbiol Biotechnol 29: 400-07.
110
Potential of Biogas Slurry for Sustainable Agriculture in India:
evidences from farmer’s participatory Action Research
Shiv Kumar and K R Chaudhary, Kanika
National Centre for Agricultural Economics National Research Centre on
and Policy Research Plant Biotechnology
New Delhi-110012 New Delhi- 110012
D.R. Singh
Indian Agricultural Statistics Research Institute
Pusa, New Delhi-110012
ABSTRACT The productivity enhancement through judicious use of water and energy in field crops has
recently been a great concern to agricultural researchers and policy makers. Energy is central
to sustainable development and poverty reduction efforts. It affects all aspects of development --
social, economic, and environmental – including livelihoods, access to water, agricultural
productivity, health, population levels, education, and gender-related issues. The availability of
water and energy for agricultural sector is bound to decrease also due to fierce competition from
industrial, power and domestic use in urban areas. The varied agro-climatic situations and
settings have unique difficulties and problems in water and energy management and require
different appropriate technologies to manage sustainable use of water. Biogas slurry has shown
potential to contribute significantly in enhancing the agricultural productivity per unit of land
and per drop of water.
Large numbers of farmers in semi-arid and arid areas are unable to sow their crops in the
absence of sufficient soil moisture and even if they sow, the germination of the crop remains
poor (Sidhu et.al. 2007). This technology has multiple potential benefits to farmers in three
ways: (i), to increase income of farmers through improved water and nutrient use efficiency and
increased crop yields, (ii), the farmers gain through reduced cost of cultivation in terms of fuels,
water, agro-chemicals and fertilizer savings, and lastly, (iii), the improved soil structure and
fertility will be additional advantages and reduced use of agro-chemicals and chemical
fertilizers. However, despite these potential benefits, the technology has not been used by
farmers on a large scale (Kumar et.al; 2007). With this background, it becomes essential to
carry out the specific objectives: firstly, to assess and transfer the biogas technology to the end
users; secondly, to study technical feasibility and socio-economic viability of the technology;
lastly; to enhance water and nutrient use efficiency for improved soil-health and sustainable
agricultural productivity. The knowledge emanating from this action research would help
farmers joined their hands to work in tandem and learn from one other‘s experiences,
111
researchers will keep on playing pivotal role in improving, refining and strengthening these
experiences for further spread of the technology.
INTRODUCTION The productivity enhancement through judicious use of water and energy in
field crops has recently been a great concern to agricultural researchers and
policy makers. Energy is central to sustainable development and poverty
reduction efforts. It affects all aspects of development -- social, economic, and
environmental – including livelihoods, access to water, agricultural
productivity, health, population levels, education, and gender-related issues.
The availability of water and energy for agricultural sector is bound to decrease
also due to fierce competition from industrial, power and domestic use in
urban areas. The varied agro-climatic situations and settings have unique
difficulties and problems in water and energy management and require
different appropriate technologies to manage sustainable use of water. Biogas
slurry has shown potential to contribute significantly in enhancing the
agricultural productivity per unit of land and per drop of water. Large numbers of farmers in semi-arid and arid areas are unable to sow their
crops in the absence of sufficient soil moisture and even if they sow, the
germination of the crop remains poor (Sidhu et.al. 2007). This technology has
multiple potential benefits to farmers in three ways: (i), to increase income of
farmers through improved water and nutrient use efficiency and increased crop
yields, (ii), the farmers gain through reduced cost of cultivation in terms of
fuels, water, agro-chemicals and fertilizer savings, and lastly, (iii), the improved
soil structure and fertility will be additional advantages and reduced use of
agro-chemicals and chemical fertilizers. However, despite these potential
benefits, the technology has not been used by farmers on a large scale (Kumar
et.al; 2007). With this background, it becomes essential to carry out the
specific objectives: firstly, to assess and transfer the biogas technology to the
end users; secondly, to study technical feasibility and socio-economic viability
of the technology; lastly; to enhance water and nutrient use efficiency for
improved soil-health and sustainable agricultural productivity. The knowledge
emanating from this action research would help farmers joined their hands to
work in tandem and learn from one other‘s experiences, researchers will keep
on playing pivotal role in improving, refining and strengthening these
experiences for further spread of the technology.
The ripple effect of technology will move from farmer to farmer, village to
village, district to district and finally state to state all simultaneously will
generate movement of saving water and energy through use of technology and
harvest more from each drop of water applied.
112
MATERIALS AND METHODS:
Materials:
Biogas slurry comes out from the plant in liquid form about 10-12 per cent dry
matter. In the off-season such slurry is allowed to dry for use as solid compost
for basal application at the time of field preparation. To maintain the nutrient
value of slurry, farmers were advised to keep such slurry under shade to
protect it from direct sunlight. Such solid slurry has about 25 per cent dry
matter is suitable to be used at the time of field preparation. For layout of
demonstrations, about two tone of such solid compost slurry was applied as
split dose in one acre plot in irrigated areas where fold irrigation is in practice.
In semi-arid areas of Jhunjhunu and Churu district of Rajasthan where lands
being undulated and sprinkler system is used for irrigation, full dose of three to
six tone such solid slurry was applied as basal dose at the time of field
preparation. In irrigated areas with flood irrigation system, fifty per cent of the
five to six tone slurry was used as basal and remaining fifty per cent liquid
slurry having 10 per cent dry matter, was also applied in split doses through
irrigation water of first three irrigations i.e after 20 days, 30 days and 50 days
of sowing/ transplanting. For layout of demonstrations on use of biogas slurry
in paddy, nursery was raised separately for demonstration plot and control
plot, however the variety was the same. For control plot the farmers practice in
vogue for nursery rising was flowed. In control plot nursery, farmers applied
chemical fertilizer (DAP 10-15 kg, Urea 5kg and Zinc Sulfate 2 kg per hectare
nursery) as basal dose and Urea 10 kg as tow top dressings. In nursery for
demonstration plot bio-gas slurry was used @ of 1 tonne/ha nursery as basal
application at the time of bed preparation. The nursery in demonstration plot
was healthy and comparatively free from weeds and insect infestation. The
nursery for demonstration plots was ready for transplanting about 5-10 days
earlier than nursery for control plots.
Methods:
The demonstration of potential benefits of the technology-investment is Biogas
Slurry from the perspective of savings in water, energy and other benefits is
needed. Three operational areas with different agro-ecological conditions i.e
Upper Gangetic plains (irrigated) in villages viz Kekpur, Siriyal, Chak,
Jahangirpur and Jawa of Buland Shahar district of UP; Trans-Gangetic plains
(limited irrigation) in villages Chhej Pahadipur, Malikpur and Majra Dubaldhan
of district Jhajjar of Haryana; and Western Dry region (rainfed) in villages
Ureeka, Pipli, Jharora, Tirpali badi and Gudan of districts Jhunjhunu and
Churu of Rajasthan. Farmer‘s clubs, self help group were formed in each of the
villages and participating farmers, for layout of demonstrations, were identified
113
through these groups. Necessary implements/ machinery and other critical
inputs like high yielding variety seeds were provided to farmers through these
self help group. A total of 78 ha demonstrations during four cropping seasons
(Kharif 2008 to Rabi 2009-10) in Paddy, Bajra, Pigeoonpea, Moong, Wheat,
Mustard, Chickpea, Barley, Onion and Methi in all the three operational areas.
Each demonstration was laid in an area of 1 acre to avoid disadvantages of
small plot demonstration. For each demonstration, two plots of same area were
selected, one for demonstration of technology with recommended packages and
practices and other as control plot with the package of practices in vogue in the
area. The water applied and saving in water application due to intervention of
technology was determined accordingly for different demonstrations. Besides
this, more than 40 farmers training programmes, six farmer‘s group visits from
operational areas, and 20 crop field days each involving more than 40 farmers
/ farm women were organized to educate the farmers about biogas slurry
technology in form of awareness campaign.
RESULTS AND DISCUSSION
About 2.7 billion people continue to rely on solid fuels such as traditional
biomass and coal for cooking and heating and this is expected to rise to 2.8
billion in 2030. In recent times, the major international endorsements of the
elements of sustainable development the Millennium Development Goals
(MDGs) and the World Summit on Sustainable Development (WSSD), have
recognized universal access to energy as an important goal. Similar is the case
of water productivity. Even for crops that have high water use efficiency, water
productivity could be much low resulting inefficient use of irrigation water.
With the emergence of submersible pumping technology and indiscriminate use
of water, sometimes due to free electricity policy in some states and sometimes
due to inadequate knowledge of irrigation practices, led the groundwater table
lower and pumping water for irrigation itself becomes a costly affair. In
response to save the groundwater from ―diminishing to the point at which
farmers and residents of the region have forcefully reacted‖ (Rodell et al., 2009)
in the form of landmark legislations like Punjab preservation of sub-soil water
Act, 2009 and similar Act in Haryana. These mark for necessitating
improvements in water use efficiency.
To educate the farmers regarding the economic value of water and energy and
to improve their use efficiency, capacity building of the farmers is crucial. The
demonstrations were of 1 acre size (the standard land units popular in the
operational areas). All the demonstrations were laid down in participatory
mode with active participation of the farmers based on ideas and insights
114
underlying field problems in a better way and also for better layout of the
experiments.
Environmentalists have appreciated slurry manure as well as biogas
technology as a whole. When fresh cow dung dries, approximately 30 to 50 per
cent of the nitrogen escapes within 10 days. While nitrogen escaping from
digested slurry within the same period amounts to only 10 to 15 per cent
besides the high value of slurry as fertilizer because 30 to 40 per cent of
organic carbon present in the dung is decomposed as carbon dioxide and
methane (Paul et al., 1996). The performance of a biogas plant is dependent on
the local conditions in terms of climate, soil conditions, the substrate for
digestion and building material availability. The design must respond to these
conditions. The potential of technology in varying agro-climatic situations and
in many different crops on various parameters differ significantly. Hence overall
average picture as per season wise and location wise performance of 78 ha
demonstration on use of Bio Gas Slurry in different crops is presented in Table
1. Demonstration plot farmers applied only 4 irrigations against 5 irrigations
in the control plot. Thus farmers saved 20 per cent water consequently saving
of about 35 per cent of total time for irrigation. This water saving was due to
increase in water holding capacity of the soil through incorporation of biogas
slurry in the soil. Farmers got 14 per cent higher grain yield in the
demonstration plot than the control plot. Similarly farmers also got higher
fodder yield. In semi arid area, a thin layer was formed by slurry on the soil
surface, which acted as mulch. This layer not only saved water but also
suppressed the weed germination. The crop in the demonstration plot was
healthier, free from weed infestation, and the numbers of effective tillers were
nine to fourteen in demonstration plot as against five to ten in control plot.
This may be due to cumulative effect of better availability of nutrient in
balanced form through biogas slurry and efficient use of water. If the same is
seen in monetary terms farmers got Rs 7800 /ha of total income. They saved
Rs.2600/ha on irrigation cost due to efficient water use and also saved
fertilizer/ manure cost (25 per cent) which is equivalent to Rs 756/ha. Besides
this, beneficiary farmers were able to save 14 per cent of energy which could be
used for other alternatives. Thus the technology was liked not only by the
demonstration farmers but also by other farmers who saw the difference in
performance of demonstration plot and control plot. Farmers reported not only
luster and shine of grain was better but also better rice recovery from the
paddy produced in demonstration plot. Interestingly, the farmer‘s participatory
action research program for demonstrating the usefulness of biogas technology
for sustainable agricultural productivity was successful taken up in three agro-
ecologically different operational areas. In semi arid region, symptoms of
115
nutritional deficiency are observed in almost all crops in sandy soils which
have low water holding capacity and lacks organic matter. Orobanchae weed is
a major problem in mustard crop in Rajasthan areas. Termite is a serious
problem in almost all crops, largely due to use of undecompsed farm yard
manures. Utility of biogas slurry in such environment shows the necessity and
importance of introduction of biogas technology. The technical knowhow of
maintenance of biogas plant and uses of biogas slurry was imparted to
participatory farmers by conducted on site training programs. Overall, biogas
slurry not only saves moisture and organic matter but also enhances yield and
income of farmers.
CONCLUSION:
Biogas slurry continuously coming out of plant has shown potential of
enhancing agricultural productivity of the area through improved organic
content and water holding capacity of soil along with improvement in physical,
chemical and biological parameters of soil health besides saving energy.
Moreover weed seed present in dung were destroyed during anaerobic digestion
and slurry is almost free from weeds. Appropriate capacity building for
participatory farmers was done with intent of enhancing adaptive capacity, and
compliance ability for collective group performance and also to treat water as
an ‗economic good‘. Participatory farmers of different operational areas in three
states were socialized among themselves by field visits and trainings. They
interact with each other and mutually share the advantages of the technology
with the help of information and communication technologies. This experiential
learning and sharing about innovative use of these technologies would keep on
playing pivotal role in improving, refining and strengthening these experiences
for further spread of biogas slurry. Such action research program in
participatory mode gives birth to a movement of saving water and energy
through use of technology for sustainable agriculture and harvest more from
each drop of water applied. The support of the local non-government
organizations in social mobilization can be availed as it is a challenging task to
mobilize farmers to adopt to new and innovative method/system of water and
energy management through collective action of farmers.
REFERENCES
1. Paul Jun, Michael Gibbs, and Kathryn Gaffney (1996), ―CH4 and N2O
Emissions from Livestock Manure,‖ Good Practice Guidance and
Uncertainty Management in National Greenhouse Gas Inventories and
The Revised 1996 IPCC Guidelines for National Greenhouse Gas
Inventories (IPCC Guidelines), pp. 321-346.

116
2. Kumar, S; K Chakarvarty, P Chand, JPS Dabas, 2007, ―Mode of
operation and performance of contract farming of cottonseed in
Haryana‖, Agricultural Economics Research Review 20 (1), pp.1-8.
3. Sidhu, H.S., Manpreet Singh and S. S. Ahuja (2007), ―Level Fields to
Increase Irrigation Efficiency‖, Progressive Farming, Punjab
Agricultural University, Vol. 38, No. 1, Pp. 9-12.
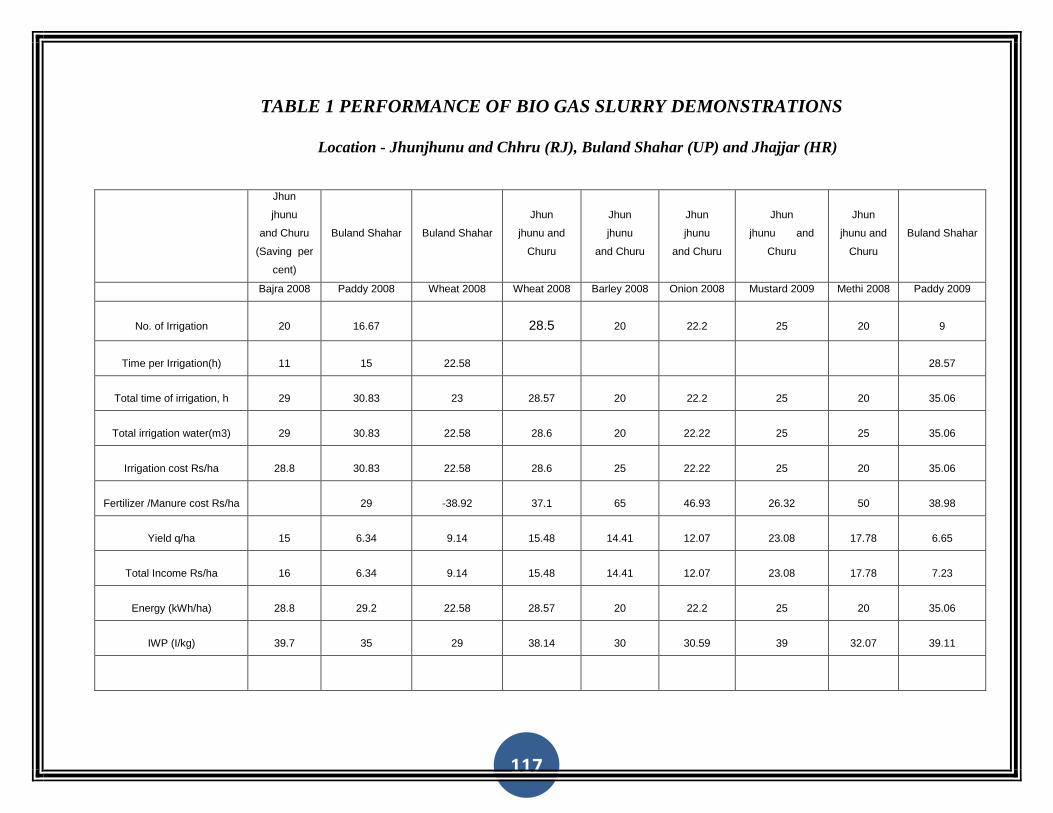
117
TABLE 1 PERFORMANCE OF BIO GAS SLURRY DEMONSTRATIONS
Location - Jhunjhunu and Chhru (RJ), Buland Shahar (UP) and Jhajjar (HR)
Jhun
jhunu
and Churu
(Saving per
cent)
Buland Shahar Buland Shahar
Jhun
jhunu and
Churu
Jhun
jhunu
and Churu
Jhun
jhunu
and Churu
Jhun
jhunu and
Churu
Jhun
jhunu and
Churu
Buland Shahar
Bajra 2008 Paddy 2008 Wheat 2008 Wheat 2008 Barley 2008 Onion 2008 Mustard 2009 Methi 2008 Paddy 2009
No. of Irrigation 20 16.67
28.5 20 22.2 25 20 9
Time per Irrigation(h) 11 15 22.58
28.57
Total time of irrigation, h 29 30.83 23 28.57 20 22.2 25 20 35.06
Total irrigation water(m3) 29 30.83 22.58 28.6 20 22.22 25 25 35.06
Irrigation cost Rs/ha 28.8 30.83 22.58 28.6 25 22.22 25 20 35.06
Fertilizer /Manure cost Rs/ha
29 -38.92 37.1 65 46.93 26.32 50 38.98
Yield q/ha 15 6.34 9.14 15.48 14.41 12.07 23.08 17.78 6.65
Total Income Rs/ha 16 6.34 9.14 15.48 14.41 12.07 23.08 17.78 7.23
Energy (kWh/ha) 28.8 29.2 22.58 28.57 20 22.2 25 20 35.06
IWP (I/kg) 39.7 35 29 38.14 30 30.59 39 32.07 39.11
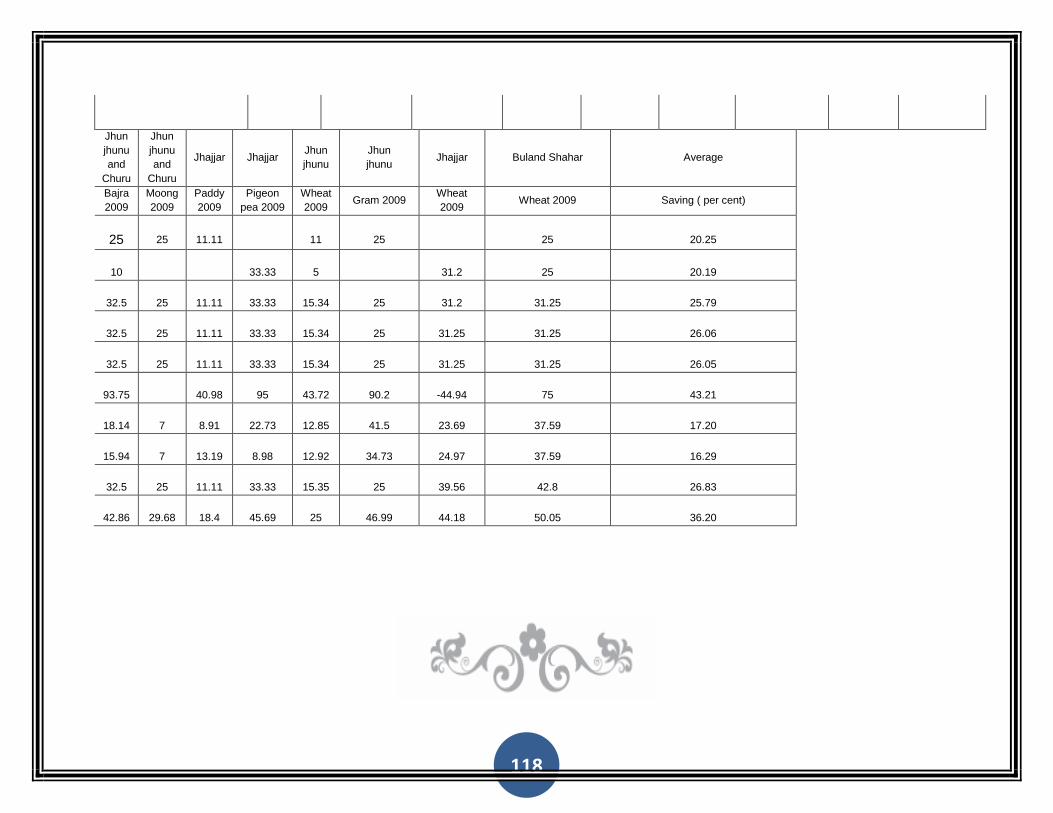
118
Jhun
jhunu
and
Churu
Jhun
jhunu
and
Churu
Jhajjar Jhajjar Jhun
jhunu
Jhun
jhunu Jhajjar Buland Shahar Average
Bajra
2009
Moong
2009
Paddy
2009
Pigeon
pea 2009
Wheat
2009 Gram 2009
Wheat
2009 Wheat 2009 Saving ( per cent)
25 25 11.11
11 25
25 20.25
10
33.33 5
31.2 25 20.19
32.5 25 11.11 33.33 15.34 25 31.2 31.25 25.79
32.5 25 11.11 33.33 15.34 25 31.25 31.25 26.06
32.5 25 11.11 33.33 15.34 25 31.25 31.25 26.05
93.75
40.98 95 43.72 90.2 -44.94 75 43.21
18.14 7 8.91 22.73 12.85 41.5 23.69 37.59 17.20
15.94 7 13.19 8.98 12.92 34.73 24.97 37.59 16.29
32.5 25 11.11 33.33 15.35 25 39.56 42.8 26.83
42.86 29.68 18.4 45.69 25 46.99 44.18 50.05 36.20
119
Liquefaction and Saccharification of Rice and Wheat into Fermentable Sugars for Production of Mixed Grain Wine
Manpreet Attri and R P Phutela
Department of Microbiology,
College of Basic Sciences and Humanities,
Punjab Agricultural University, Ludhiana-141004,
ABSTRACT Rice and wheat serve as the two major globally important crops cultivated during kharif and
rabi season respectively. The rice wine is very popular however, no such reports are available
for the wheat wine or the mixed grain wine from these two cereals. Two rice varieties PR116 and
PUSA1121 and one wheat variety PBW550 were used under the present study. The liquefaction
and saccharification of rice and wheat was studied individually and in mixtures under the action
of enzymes:-α amylase and glucoamylase (1:1). Diluted solution of each enzyme (i.e 1:20) was
added in rice, wheat and their mixtures at a concentration of 10:20:10 (gelatinization:
liquefaction: saccharification), raising the final volume upto 140ml in a flask. The results
indicate that the 16per cent concentration of rice and wheat took the minimum time of >2hours
(1.30 and 0.35 for α amylase and glucoamylase action respectively) for starch to be negative.
Hence rice (PR116) and wheat (PBW550) mixture produced better saccharification of 80.87per
cent as compare to individual crops and the fermentation of this saccharified wort was carried
out to produce mixed grain wine.
KEY WORDS: Saccharification, rice, wheat, α amylase and glucoamylase
INTRODUCTION:
India produced 89.13 million metric tonnes rice from and 80.71 million metric
tonnes wheat from 41.85 million hectares of land and28.52 million hectares
respectively in the year 2009-10. Punjab's contribution towards these cereals‘s
production has been 11 million metric tonnes rice and 15.73 million metric
tonnes wheat. Both rice and wheat are consumed everywhere as whole grain
food and less than 10 per cent enters the food processing industry including
alcoholic fermentation. Rice and wheat are the oldest crops of the world
belonging to genus Oryzae sativa and Triticum aestivum respectively. Since the
production of rice and wheat wines results from fermentation of saccharified
grains, production of cereal grain wine is a complex process involving initially
enzymatic conversion of starch into fermentable sugars like maltose and
glucose by amylolytic enzymes and secondly the fermentation of these sugars
into ethyl alcohol by the activity of yeast. Starch is composed of long and
branched chains of glucose molecules joined by glycosidic bond to one another
through α-1,4 glycosidic bonds with some additional α-1,6 linkages and these

120
have to be broken down into smaller molecule, which the yeast can transform
into alcohol. Enzymes -amylase (E.C.3.2.1.1) and glucoamylase (or
amyloglucosidase glucogenic enzyme or starch glucogenase (E.C.3.2.1.3) can
carry out this process into two stages; liquefaction and saccharification
respectively. Before the enzyme can attack the starch it must be gelatinised.
The -amylase break the starch to dextrins by a process called liquefaction.
The glucoamylase is capable of achieving the complete degradation of the
starch to fermentable sugars (glucose) by a process known as saccharification
respectively.
-amylase can be derived from several sources such as plants, animals and
microbes. The microbial enzymes meet the industrial demand as a large
number of them are available commercially and have almost replaced chemical
hydrolysis of starch processing industry (Pandey et al 2000). -amylase has
been derived from several fungi, yeasts, bacteria and actinomycetes. Fungal
species are mostly terrestrial isolates such as Aspergillus species. Rousset and
Schlich (1989) screened different species of A.niger for the synthesis of
amylolytic enzymes i.e. alpha-amylase and glucoamylase by using the
submerged fermentation. Dostaket and Haggstorm (1983) and Neves et al
(2007) reported that simultaneous saccharification of starch with an amylolytic
yeast or mold and fermentation of saccharified starch by yeast is an effective
method for direct fermentation of starch.
MATERIAL AND METHODS:
Procurement of Material
Two rice varieties PR116 and PUSA 1121 and one wheat variety PBW550 were
procured from Department of Plant Breeding and Genetics, PAU, Ludhiana, got
dehusked, milled and polished from the post harvest technology lab of the
department of the college of Agricultural Engineering, PAU, Ludhiana. The
white polished grains were used for experimentation.
Preparation of Enzyme Solution
The commercial enzyme (α amylase and glucoamylase) were diluted suitably for
their use in the saccharification mixture. The dilutions were as under:
1. α amylase : 1 ml enzyme (1.1 g) was dissolved in distilled water to final
volume 20 ml. Accordingly the enzyme units in the solution were calculated to
be 13.2 KNU/ml (Kilo Novo Units).
2. Glucoamylase : 1 ml enzyme (1.2 g) was dissolved in distilled water to final
volume 20 ml. Accordingly the enzyme units in the solution were calculated to
be 24AGU/ml (Amyloglucosidase Units).
121
Saccharification of Rice and Wheat Starch and Preparation of Wort
The saccharification mixture comprised of separate rice and wheat as well as
their mixture (1:1) in concentrations (16per cent, w/v). Rice and wheat grains
were grinded and saccharified in the solution phase using different quantities
of diluted form of commercial -amylase and glucoamylase enzymatic
preparations (as shown in result tables). The performance was analyzed for the
complete conversion of starch into sugars with iodine solution, total sugars and
TSS (Total Soluble Sugars). The rice-water and wheat-water mixture and -
amylase (enzyme 1) were taken together and allowed to undergo gelatinization
at 105º C (in autoclave at 3psi) for 10 minutes. Thereafter, more enzyme-1 was
added. Along with this, lime solution 20 mg/ml at the rate of 1 per cent was
also added and the mixture was kept in a water bath at 90° C for 60-90
minutes with constant shaking. After the liquefaction of rice and wheat grains
had been completed, the water bath was set at 60° C for the saccharification
process with the addition of glucoamylase (enzyme-2) solution and
continuously stirred. Continuous monitoring of the colour and of the mixture
with the iodine solution was done until starch tested negative.
Following pH levels were maintained: pH
At liquefaction : 6.5-7.0
At Saccharification : 4.5-5.0
ANALYTICAL TECHNIQUES
Determination of Starch Content in the Cereal Grains
The starch content in the rice and wheat grains was determined by the method
of Clegg (1956).
Reagents
1. 80 per cent alcohol
2. 70 per cent alcohol
3. 52 per cent perchloric acid
Extraction One gram of rice or wheat grain powder was added to a flask containing 20 ml
of 80 per cent alcohol. Free sugars were removed by extraction twice in boiling
alcohol in a water bath. The residues were extracted twice again with 70 per
cent alcohol. To this residue, 5ml distilled water and 6.5 ml of chilled
perchloric acid were added in a 50 ml centrifuge tube. The contents were mixed
continuously for 10 min and then intermittently for 10 min. To this 10 ml
distilled water was added and the contents were centrifuged for 20 min. at
1500 rpm. The extraction procedure was repeated with the pellet but the time
was increased to 30 min. The supernatants were pooled using distilled water to
122
50 ml and filtered using Whatmann No.1 filter paper, discarding the first 5 ml
of the filtrate.
Estimation of Starch:
The total sugars were estimated by the phenol-sulphuric acid method of
Dubois et al (1956) .The values obtained were multiplied by a factor of 0.93 to
arrive at starch concentration.
Calculations:
Starch content = Total sugars from the extract 0.93
Total Soluble Solids / Sugars formed
Per cent Saccharification = 100
Weight of substrate (g)
Reducing sugars were estimated by the method of Miller et al (1959) where as
total soluble solids (TSS) was measured by the method of (Winton and Winton
1999) and pH
RESULTS AND DISCUSSION
Liquefaction and Saccharification of Rice and Wheat into Fermentable
Sugars
The liquefaction and saccharification of rice and wheat varieties was studied
individually and as in mixture (1:1). The 1:20 diluted enzyme solution of α
amylase and glucoamylase were used in concentration of 10:20:10
(geltinization: liquefaction: saccharification) respectively, as the volume in
mixture went to 140 ml. The results present in table 1 to 3 revealed that the 16
per cent concentration of rice and wheat took the minimum time of >2hours
(1.30 and 0.35 for α amylase and glucoamylase action respectively) for starch
to be negative.
A maximum recovery of 123 ml of saccharified wort with 10.5ºBrix which
correspond to highest saccharification levels of 80.68 per cent (TSS basis) and
77.75 per cent (sugar basis) was obtained with 16 per cent concentration of
PR116. On the other hand in case of 16 per cent PUSA112, brix of saccharified
wort was 9.8ºB which gave saccharification of 73.5 and 8 per cent total sugars
in the wort exhibiting 60 per cent of saccharification with a recovery of 120ml
of saccharified wort (Table 1, Figure 1).
The saccharification of wheat, var. PBW550 at 16 per cent of wheat
concentration in the saccharification mixture revealed that the produced
saccharified wort with brix of 8.1ºB corresponded to saccharification of 59.18
with 7.56 per cent total sugars and the final recovery of saccharified wort was
117 ml (Table 2).
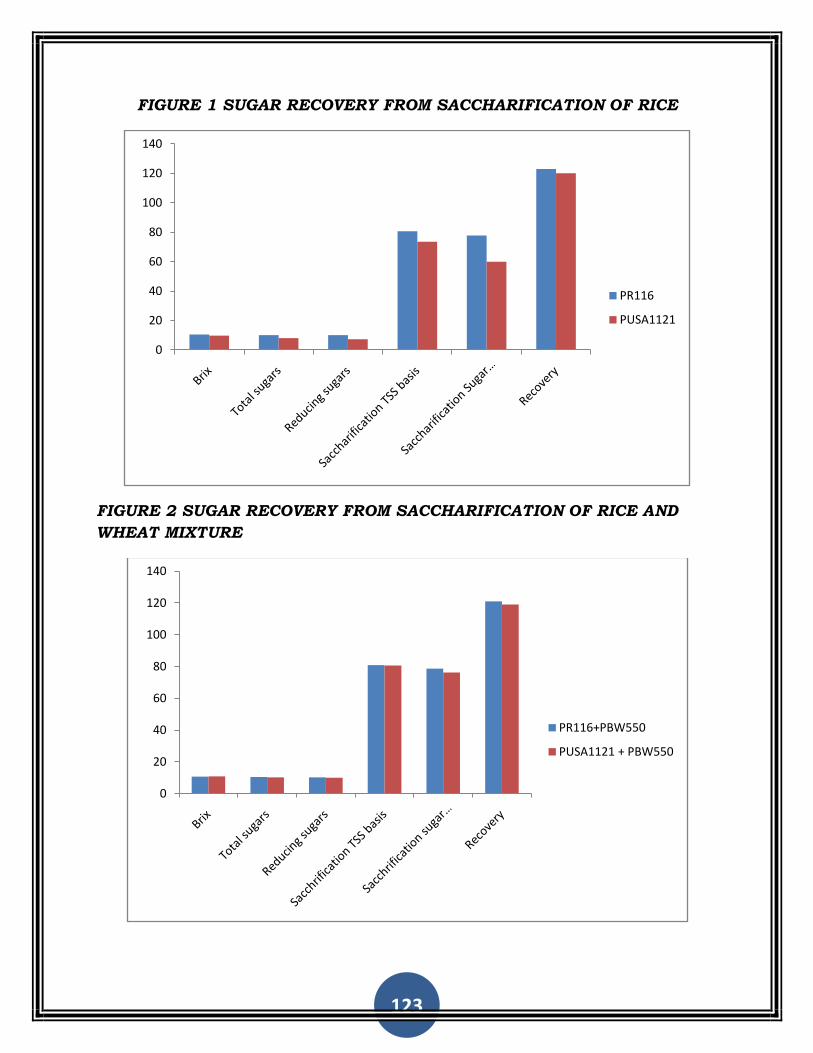
123
FIGURE 1 SUGAR RECOVERY FROM SACCHARIFICATION OF RICE
FIGURE 2 SUGAR RECOVERY FROM SACCHARIFICATION OF RICE AND
WHEAT MIXTURE
0
20
40
60
80
100
120
140
PR116
PUSA1121
0
20
40
60
80
100
120
140
PR116+PBW550
PUSA1121 + PBW550
124
The results of rice and wheat mixtures presented in Table 3 revealed that in
case of 16 per cent mixture of rice PR116and wheat, highest saccharification
level of 80.87 per cent was obtained with a final brix of 10.70ºB, total sugars of
10.4 per cent, saccharification of 78.62 per cent and the recovery of the
saccharified wort was 121 ml. In another mixture i.e PUSA1121 + wheat, there
was a rise in brix of saccharified wort i.e 10.85ºB with recovery of 119 ml
similarly there is fall in saccharification i.e 80.68 (TSS basis) and 76.18 per
cent (sugar basis) (Table 3, figure 2).The results of saccharification thus
revealed that rice (PR116) and wheat (PBW550) mixture at the rate of 16 per
cent produced a better saccharification of 80.87 per cent and one thus chosen
for further experiments.
Manikandan and Viruthagiri (2010) reported 25 per cent (w/v) solution of corn
flour as optimum for fungal α amylase (enzyme activity of 1300 IU/g) action at
pH 6.0 and temperature 70ºC for two hours using 2g enzyme to liquefy the
starch present in the flour.
Akerberg et al (2000) prepared a kinetic model describing the enzymatic
saccharification of wheat starch by a mixture of α-amylase and
amyloglucosidase. The model describes the influence of pH, glucose inhibition
and starch and enzyme concentration. The minimum rate of saccharification
due to this enzyme was found to be optimal at pH 5 and increased five folds
when the temperature was increased from 30 to 55°C. Saccharification due to
the action of amyloglucosidase was inhibited by the glucose produced and
stimulation showed that the maximum rate of saccharification decreased by 58
per cent at a starch concentration of 140g/dm3 compared to 110g/dm3 where
the effect of glucose inhibition was negligible.
Sauer et al (2000) showed that glucoamylase are inverting exo-acting starch
hydrolases releasing β-glucose from the non-reducing ends of starch and
related substrates. The majority of glucoamylases are multidomain enzymes
consisting of a catalytic domain connected to a starch binding domain by an O-
glucosylated linker region.
Thus, from the above studies it may be inferred that Rice variety PR116 +
wheat give a better saccharification efficient which can be further used for wine
production.
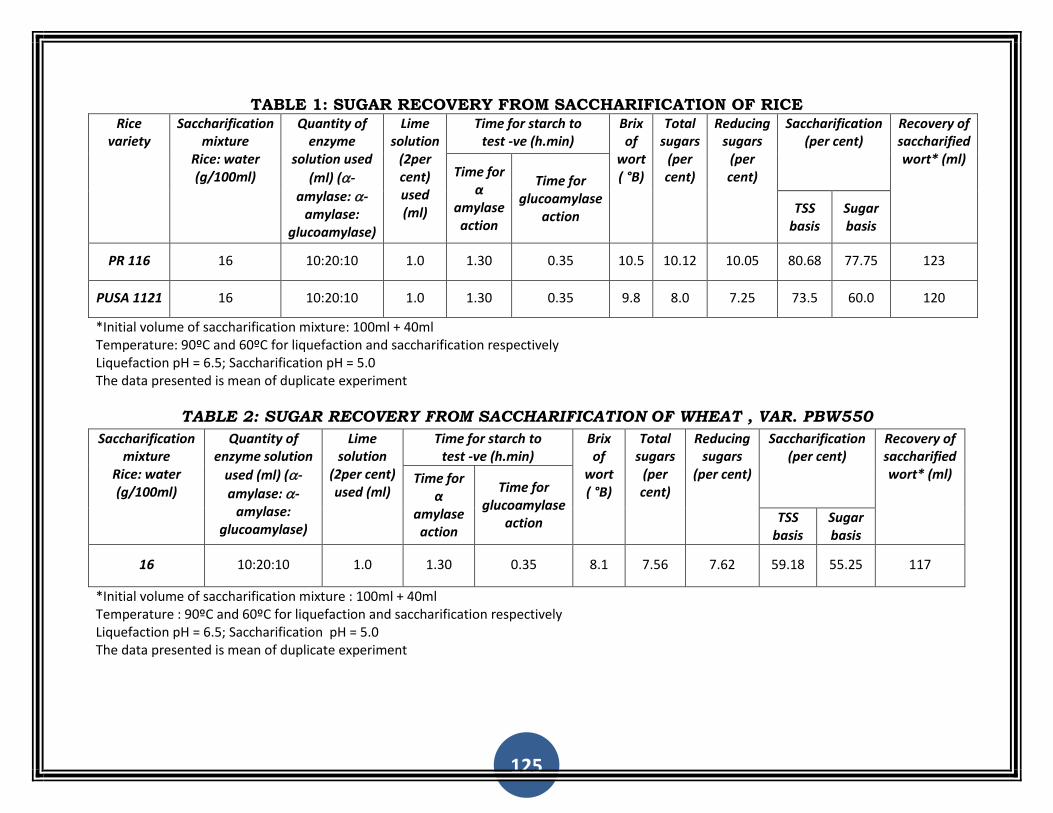
125
TABLE 1: SUGAR RECOVERY FROM SACCHARIFICATION OF RICE Rice
variety Saccharification
mixture Rice: water (g/100ml)
Quantity of enzyme
solution used
(ml) (-
amylase: -amylase:
glucoamylase)
Lime solution
(2per cent) used (ml)
Time for starch to test -ve (h.min)
Brix of
wort ( °B)
Total sugars
(per cent)
Reducing sugars
(per cent)
Saccharification (per cent)
Recovery of saccharified wort* (ml)
Time for α
amylase action
Time for glucoamylase
action TSS
basis Sugar basis
PR 116 16 10:20:10 1.0 1.30 0.35 10.5 10.12 10.05 80.68 77.75 123
PUSA 1121 16 10:20:10 1.0 1.30 0.35 9.8 8.0 7.25 73.5 60.0 120
*Initial volume of saccharification mixture: 100ml + 40ml Temperature: 90ºC and 60ºC for liquefaction and saccharification respectively Liquefaction pH = 6.5; Saccharification pH = 5.0 The data presented is mean of duplicate experiment
TABLE 2: SUGAR RECOVERY FROM SACCHARIFICATION OF WHEAT , VAR. PBW550
Saccharification mixture
Rice: water (g/100ml)
Quantity of enzyme solution
used (ml) (-
amylase: -amylase:
glucoamylase)
Lime solution
(2per cent) used (ml)
Time for starch to test -ve (h.min)
Brix of
wort ( °B)
Total sugars
(per cent)
Reducing sugars
(per cent)
Saccharification (per cent)
Recovery of saccharified wort* (ml) Time for
α amylase action
Time for glucoamylase
action TSS basis
Sugar basis
16 10:20:10 1.0 1.30 0.35 8.1 7.56 7.62 59.18 55.25 117
*Initial volume of saccharification mixture : 100ml + 40ml Temperature : 90ºC and 60ºC for liquefaction and saccharification respectively Liquefaction pH = 6.5; Saccharification pH = 5.0 The data presented is mean of duplicate experiment
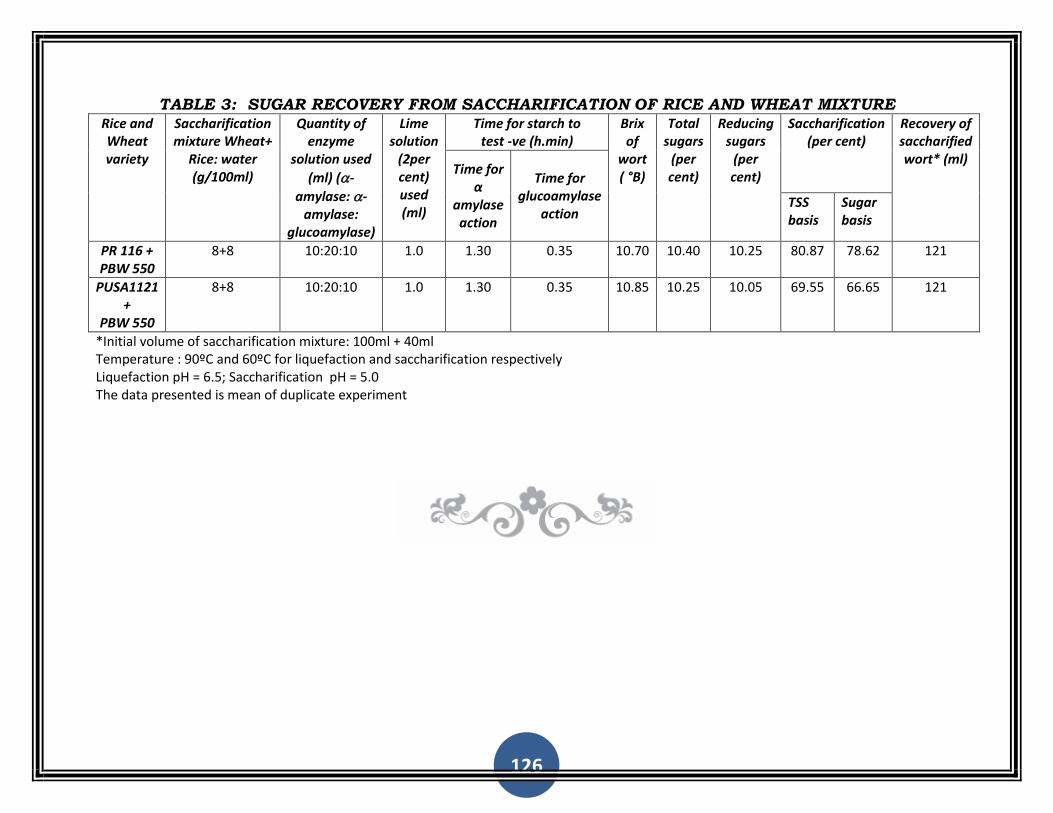
126
TABLE 3: SUGAR RECOVERY FROM SACCHARIFICATION OF RICE AND WHEAT MIXTURE Rice and Wheat variety
Saccharification mixture Wheat+
Rice: water (g/100ml)
Quantity of enzyme
solution used
(ml) (-
amylase: -amylase:
glucoamylase)
Lime solution
(2per cent) used (ml)
Time for starch to test -ve (h.min)
Brix of
wort ( °B)
Total sugars
(per cent)
Reducing sugars
(per cent)
Saccharification (per cent)
Recovery of saccharified wort* (ml)
Time for α
amylase action
Time for glucoamylase
action TSS basis
Sugar basis
PR 116 + PBW 550
8+8 10:20:10 1.0 1.30 0.35 10.70 10.40 10.25 80.87 78.62 121
PUSA1121 +
PBW 550
8+8 10:20:10 1.0 1.30 0.35 10.85 10.25 10.05 69.55 66.65 121
*Initial volume of saccharification mixture: 100ml + 40ml Temperature : 90ºC and 60ºC for liquefaction and saccharification respectively Liquefaction pH = 6.5; Saccharification pH = 5.0 The data presented is mean of duplicate experiment
127
Role of Renewable Energy in Sustainable Development of India with
Special Reference to Solar Energy
Swami Prakash Srivstava Sachin Prakash Srivsatva Associate Professor B. Tech Student
Department of Economics, Anand Engineering College
Dayalbagh Educational Institute (Deemed University) Agra-282005
Dayalbagh-Agra-282005 (U.P.)
ABSTRACT
India is facing an acute energy scarcity which is hampering its industrial growth and economic
progress. Setting up of new power plants is inevitably dependent on import of highly volatile
fossil fuels. Thus, it is essential to tackle the energy crisis through judicious utilization of
abundant the renewable energy resources, such as Biomass Energy solar Energy, Wind
Energy and Geothermal Energy. Apart from augmenting the energy supply, renewable resources
will help India in mitigating climate change. In terms of all renewable energy, currently India
is ranked fifth in the world with 15,691.4 MW grid-connected and 367.9 MW off-grid renewable
energy based power capacity. India is among top 5 destinations worldwide for solar energy
development as per Ernst & Young‘s renewable energy attractiveness index. Solar energy could
be made financially viable with government tax incentives and rebates. Most of the developed
countries are switching over to solar energy as one of the prime renewable energy source. The
current architectural designs make provision for photovoltaic cells and necessary circuitry while
making building plans. The National Solar Mission is a major initiative of the Government of
India and State Governments to promote ecologically sustainable growth while addressing
India‘s energy security challenge. It will also constitute a major contribution by India to the
global effort to meet the challenges of climate change. The objective of the National Solar
Mission is to establish India as a global leader in solar energy, by creating the policy conditions
for its diffusion across the country as quickly as possible. The immediate aim of the Mission is to
focus on setting up an enabling environment for solar technology penetration in the country both
at a centralized and decentralized level.
KEY WORDS: Photovoltaic Cells, Zero Emission, Geothermal Energy, Biomass Energy, Solar
India
Energy is an essential ingredient of socio-economic development and economic
growth. The production and consumption of energy is often linked to other
major issues in the society, including poverty alleviation, environmental
degradation and security concerns. The experience shows that there is a
128
definite correlation between access to energy on one hand and education
attainment and literacy on the other, among the rural and urban poor.
Consequently, the goals of poverty eradication, improved living standards, and
increased economic output imply increasing energy requirements. To meet its
energy demands, some of the countries in the region are heavily depending on
imported fuels. Most of the power generation is carried out by coal and mineral
oil-based power plants which contribute heavily to greenhouse gases emission.
The average per capita consumption of energy in India is around 500 W, which
is much lower than that of developed countries like USA, Europe, Australia,
Japan etc. However, this figure is expected to rise sharply due to high
economic growth and rapid industrialization. The consumption of electricity is
growing on the worldwide basis. Energy is a necessity and sustainable
renewable energy is a vital link in industrialization and development of India. A
transition from conventional energy systems to those based on renewable
resources is necessary to meet the ever-increasing demand for energy and to
address environmental concerns. India plans to double its renewable energy
capacity to 55,000 MW by 2017 as part of efforts to increase efficiency of its
energy use.
INTRODUCTION
Renewable energy sources are indigenous and can contribute towards
reduction in dependency of imported fossil fuels. Renewable energy also
provides national energy security at a time when decreasing global reserves of
fossil fuels threatens the long-term sustainability of the economy. Renewable
energy sources assume special significance in Asian Pacific region when viewed
in the context of the geographic diversity and size. Since the renewable energy
resources are diffuse and decentralized, they are appropriate as local energy
sources, meeting ever expanding and diversified energy needs. In the
perspective, they offer numerous possibilities for meeting the basic energy
needs of the rural poor. Thus the increased use of renewable energy sources
and technologies is necessitated by the inability of the conventional systems to
meet growing energy demands in an equitable and sustainable manner.
Solar Power a clean renewable resource with zero emission has got tremendous
potential of energy which can be harnessed using a variety of devices.
Originally developed for energy requirement for orbiting earth satellite – Solar
Power – have expanded in recent years for our domestic and industrial needs.
Solar power is produced by collecting sunlight and converting it into electricity.
This is done by using solar panels, which are large flat panels made up of
many individual solar cells. It is most often used in remote locations, although
it is becoming more popular in urban areas as well. With recent developments,
129
solar energy systems are easily available for industrial and domestic use with
the added advantage of minimum maintenance. Solar energy could be made
financially viable with government tax incentives and rebates. Most of the
developed countries are switching over to solar energy as one of the prime
renewable energy source. The current architectural designs make provision for
photovoltaic cells and necessary circuitry while making building plans.
Because of its location between the Tropic of Cancer and the Equator, India
has an average annual temperature that ranges from 25°C – 27.5 °C. This
means that India has huge solar potential.
REVIEW OF LITERATURE
Bajaj (2011): Friendly policies and dropping prices have brought the goal of
generating 20,000 megawatts of solar power in India by 2020 closer to reality.
CSO (2011): There is high potential for generation of renewable energy from
various sources such as wind, Solar, biomass, small hydro and cogeneration
bagasse. The total potential for renewable power generation in the country as
on 31.03.2010 is estimated at 90,313. The estimates of Ministry of New and
Renewable Energy for solar energy potential are estimated at20-30 MW per Sq.
Km. for most parts of the country.
Johnson (2009): Sunlight bathes us in far more energy than we could ever
need. We could catch enough of the 120 quadrillion watts of sunlight that
constantly falls on earth.
Kumar et al (2012): In 2001, government initiated a nationwide programme
to provide off grid , clean alternatives, mostly solar in remote areas. Solar has
now lit up more than a million homes-a 100 per cent increase since 2001-
though the programme has its share of loopholes.
Lal (2012): Wide spread energy poverty condemns millions to darkness , ill
health and to missed opportunities for education and prosperity. Renewable
energy is important for India to end this poverty.
Ramesh M (2011): Today the solar industry is how the IT industry was in
1980‘s or the telecom industry was in 1990‘s.
Solar Energy Society of India (2013): SESI, organizes its flagship event
International Congress on Renewable Energy (ICORE) annually , this years
theme is ―Renewable for Development of Rural Ares‖ to be held in November
2013.
Sunsong Chris (2013): Demand for solar photovoltaic (PV) energy across Latin
America and the Caribbean is poised for explosive growth through 2017, with a
forecasted compound annual growth rate (CAGR) of 45per cent.
SESI (2012): The eight states using solar power are Rajasthan, Punjab,
Maharashtra, Andhra Pradesh, Odisha, Tamil Nadu, Uttar Pradesh and
Karnataka.
130
Vijay Kumar (2012): Government Agency plans to deliver within two years a
state of the art solar atlas of India identifying solar hotspots where the sun‘s
radiation has the optimum intensity for power generation leading to speady
development of solar power projects.
Wang (2010): The remarkable growth and rapid urbanization have led to twin
energy challenges in the region: environmental sustainability and energy
security.
UNDP (2012): Increasing renewable energy usage in India has been
undertaken through pilot projects under Jawaharlal Nehru Mission and by
UNDP to accelerate clean energy access.
IMPORTANCE OF CLEAN OR RENEWABLE ENERGY FOR
SUSTAINABLE DEVELOPMENT IN INDIA
The future economic development trajectory for India is likely to result in rapid
and accelerated growth in energy demand, with attendant shortages and
problems. Due to the predominance of fossil fuels in the generation mix, there
are large negative environmental externalities caused by electricity generation.
The power sector alone has a 40 per cent contribution to the total carbon
emissions. In this context, it is imperative to develop and promote alternative
energy sources that can lead to sustainability of the energy–environment
system.
Renewable energy is energy that comes from resources which are continually
replenished such as sunlight, wind, tides, waves and geothermal heat. About
16 per cent of global final energy consumption comes from renewable
resources, with 10 per cent of all energy from traditional biomass, mainly used
for heating, and 3.4 per cent from hydroelectricity. New renewable (small
hydro, modern biomass, wind, solar, geothermal, and biofuels) account for
another 3 per cent and are growing very rapidly. While many renewable energy
projects are large-scale, renewable technologies are also suited to rural and
remote areas where energy is often crucial in human development. As of 2011,
small solar PV systems provide electricity to a few million households and
micro-hydro configured into mini-grids serves many more.
There is an increased need for renewable energy resources to achieve
sustainable living. Our natural resources are depleting at a faster rate and the
pollution levels have become uncontrollable due to the use of fossil fuels.
Renewable sources of energy can provide a more qualitative life to the people.
Urban houses and industrial sectors have to start using renewable energy
resources. It is possible to use solar power for water heating and to use waste
for power generation effectively in the urban areas. To have a sustainable
development the emphasis should be on the measures to integrate the use of

131
renewable energy in the mainstream uses of energy. The present trend of using
environmentally friendly or the so called green energy is the response of the
people to the problem of global climatic change resulted from environmental
pollution.
According to Development Counselors International (DCI), a United States
marketing company, India is the second best country, after China, for business
investment. United Nations Environment Programme (UNEP) has reported that
India has seen a 12per cent increase in investment in the renewable energy
sector with an investment of $3.7 billion in 2008. The largest share was asset
finance at $3.2 billion which grew by 25per cent. The clean renewable energy
includes wind, solar, biomass and small-hydro projects. The major portion of
investment has been made in wind energy sector. The investment in wind
energy sector grew at 17per cent from $2.2 billion to $2.6 billion. Proper
awareness among people about the use of clean energy and their benefits can
reduce the pressure on our natural resources and environment. The market
incentives provided by government for promoting clean or renewable energy use
make sustainable development a reality in the future.
Average per Capita Energy Consumption in India
The average per capita consumption of energy in India is around 500 W, which
is much lower than that of developed countries like USA, Europe, Australia,
Japan etc. However, this figure is expected to rise sharply due to high
economic growth and rapid industrialization. The consumption of electricity is
growing on the worldwide basis. Energy is a necessity and sustainable
renewable energy is a vital link in industrialization and development of India. A
transition from conventional energy systems to those based on renewable
resources is necessary to meet the ever-increasing demand for energy and to
address environmental concerns. India plans to double its renewable energy
capacity to 55,000 MW by 2017 as part of efforts to increase efficiency of its
energy use.
Glance at Renewable Energy Sources in India
One segment of the energy sector which acquires high priority is in the field of
renewable energy production and supply. India is one of the countries in the
world which receives the largest flow of solar energy incident on its land area.
We also have substantial wind energy potential. In addition, India produces
large quantities of agricultural waste which makes biomass an attractive option
for conversion to modern fuels both through gasification on a decentralized
basis, and possible conversion to liquid fuels on a diverse scale through
technologies that is being worked on across the world, though not adequately
in India.

132
Biomass Energy
Biomass Energy can play a major role in reducing India‘s reliance on fossil
fuels by making use of thermo-chemical conversion technologies. In addition,
the increased utilization of biomass-based fuels will be instrumental in
safeguarding the environment, creating new job opportunities, sustainable
development and health improvements in rural areas. Biomass energy could
also aid in modernizing the agricultural economy.
A large amount of energy is expended in the cultivation and processing of crops
like sugarcane, food grains, vegetables and fruits which can be recovered by
utilizing energy-rich residues for energy production. The integration of
biomass-fuelled gasifies and coal-fired energy generation would be
advantageous in terms of improved flexibility in response to fluctuations in
biomass availability with lower investment costs.
Over 44 million households use biogas made in household-scale digesters for
lighting and/or cooking and more than 166 million households rely on a new
generation of more-efficient biomass. It's a great that biotechnology has
developed powerful approaches to find cures to diseases, curb climate change
and reduce reliance on foreign oil. Synthetic biology promises to change the
world by making biology easier to engineer and enabling solutions to some of
the world‘s most difficult problems. Bio technology is to be at the forefront of
the emerging field of advanced biofuels production to develop scientific
breakthroughs to help solve the energy crisis.
Solar Energy
Solar Energy, a clean renewable resource with zero emission, has got
tremendous potential of energy which can be harnessed using a variety of
devices. With recent developments, solar energy systems are easily available for
industrial and domestic use with the added advantage of minimum
maintenance. Solar energy could be made financially viable with government
tax incentives and rebates. An exclusive solar generation system of capacity of
250 to KWh units per month would cost around Rs. 5 Lacs, with present
pricing and taxes. Most of the developed countries are switching over to solar
energy as one of the prime renewable energy source. The current architectural
designs make provision for photovoltaic cells and necessary circuitry while
making building plans. India has a very high density of population and has
high solar isolation, making it an ideal scenario for solar power in India. The
first applications for solar power has been for water pumping to replace India's
four to five million diesel powered water pumps. New projects are on the
pipeline and an area of 35,000 square km has been set aside in the Thar for
solar power projects.
133
Central Government has initiated a massive project to popularize solar energy
systems. It is estimated these projects will generate 200,000 megawatts by
2050.The government has taken steps to install small scale photovoltaic
panels, commercial scale solar plants and solar lightning systems to give
impetus to the domestic manufacturers.
Wind Energy
Wind Power is one of the most efficient alternative energy sources. There has
been good deal of development in wind turbine technology over the last decade
with many new companies joining the fray. Wind turbines have become larger,
efficiencies and availabilities have improved and wind farm concept has become
popular. It could be combined with solar, especially for a total self-
sustainability project. The economics of wind energy is already strong, despite
the relative immaturity of the industry. The downward trend in wind energy
costs is predicted to continue. As the world market in wind turbines continues
to boom, wind turbine prices will continue to fall. India now ranks as a ―wind
superpower‖ having a net potential of about 45000 MW only from 13 identified
states.
Hydro Electric Power
India has a huge hydro power potential, out of which around 20 per cent has
been realized so far. New hydro projects are facing serious resistance from
environmentalists. Resettlement of the displaced people with their lands
becomes major issue. Hydroelectric power generation in India started much
before Independence in 1897 at Darjeeling. In 1902 another power station was
set up at Siva samudram in Karnataka. Over 25 per cent of electricity produced
by India today is from hydropower. Some of the major states generating
hydroelectricity are Himachal Pradesh, Karnataka, Kerala, Jammu & Kashmir,
Meghalaya, Tripura and Sikkim.
Waste-to-Energy
Waste–to—Energy plants offer two important benefits of environmentally sound
waste management and disposal, as well as the generation of clean electric
power. Waste-to-energy facilities produce clean, renewable energy through
thermo-chemical, biochemical and physicochemical methods. Moreover, waste-
to-energy plants are highly efficient in harnessing the untapped sources of
energy from a variety of wastes.
Nuclear Power
The increasing awareness to generate power without polluting the environment
and at the same time meet the increasing demand for power due to the rapid
growth in the economy has resulted in the government shifting focus towards
nuclear power. The Department of Atomic Energy has proposed to use locally
134
available uranium resources in Pressurized Heavy Water Reactors
(PHWRs),followed by the recycling of spent fuel in Fast Breeder Reactors for
generating nuclear power. Again recycling of plutonium derived from the
reprocessing of spent fuel gives us a very large energy resource. While the
government has taken steps to increase the installed nuclear generation
capacity, the setting up of a Light Water Reactor based on imported technology
at Kudan kulam in Tamil Nadu is a step in the right direction. At BARC
technology to tap the vast thorium reserves in the country is being developed.
Others Energy Resources
Latest techniques in plant science, molecular biology and chemical engineering
has to be developed to produce affordable, sustainable, carbon-neutral fuels
identical to gasoline, diesel and jet fuel. Traditionally, most of the chemicals we
use are produced using chemical synthesis, which is the combination of simple
chemicals to form more complex ones. Enzymes can do in one step what might
take many steps using synthetic organic chemistry. Redesigning microbes (like
yeast) to be miniature chemical reactors that transform sugars into fuels. To
engineer a microbe to be a chemical factory, genes are grafted from plants and
other naturally occurring life forms into the microbe.
Once inside the cells, the genes produce enzymes that do the chemistry to
transform sugars into chemicals. Efforts are directed towards making biofuels
out of sugars. Microbes are engineered to transform sugars into energy-rich
fuels that can directly replace petroleum-derived gasoline, diesel and jet fuel
having identical properties to petroleum-based fuels. There is no need to
replace our cars, trucks or planes to use the fuels. Efforts are on ways to
extract sugar from cellulosic biomass, such as paper waste, trees that have
fallen down in the forest, the residue of crops such as corn husks and stalks -
everything but the kernel of corn - and non-food plants such as switch grass.
Because plants grow by fixing carbon dioxide from the atmosphere, burning a
fuel made from cellulosic biomass does not add extra carbon to the
atmosphere, unlike the burning of fossil fuels, which produces carbon
emissions.
IMPACT OF RENEWABLE ENERGY IN SUSTAINABLE
DEVELOPMENT OF DEVELOPING COUNTRIES ESPECIALLY
INDIA
Clean energy can also support the economic development of a
country. Promoting the use of renewable energy will cause the diversification
of power supply and will bring energy security. A country will not have to
depend on another country for its energy needs. Apart from facilitating
sustainable development and living, renewable energy can promote
135
development in the socio-economic areas. Government has to implement
integrated renewable or clean energy centers that will help to share the
technology and services to the communities which need support for harnessing
renewable sources of energy. A good energy policy by government should
ensure the adequate use of renewable sources of energy to cater to the needs of
the people in that nation. Sustainable energy production will lead to the
improvement of living standards of people.
Energy is central to sustainable development and poverty reduction efforts. It
affects all aspects of development -- social, economic, and environmental --
including livelihoods, access to water, agricultural productivity, health,
population levels, education, and gender-related issues. None of the
Millennium Development Goals (MDGs) can be met without major improvement
in the quality and quantity of energy services in developing countries. It is
estimated that approximately 1.3 billion people worldwide have no access to
electricity. Furthermore, 2.7 billion people continue to rely on solid fuels such
as traditional biomass and coal for cooking and heating and this is expected to
rise to 2.8 billion in 2030.
In recent times the two major international endorsements of the elements of
sustainable development the Millennium Development Goals (MDGs) and the
World Summit on Sustainable Development (WSSD), have recognized universal
access to energy as an important goal. India has emerged as a leader in
promoting renewable energy development and tackling global climate change.
The energy sector requires a major transformation in technology, which would
also involve changes in infrastructure as well as the mix of energy supply in the
future.
It is obvious that if India has to attain a 9 to 10 per cent growth of the
economy, the management of the energy sector and its evolution in the coming
future would need attention by the country‘s leadership and every section of
society. Access to sustainable sources of clean, reliable and affordable energy
has a profound impact on multiple aspects of human development; it relates
not only to physical infrastructure (e.g. electricity grids), but also to energy
affordability, reliability and commercial viability. In practical terms, this means
delivering energy services to households and businesses that are in line with
consumers' ability to pay. Investing in clean, efficient, affordable and reliable
energy systems is indispensable for a prosperous, environmentally sustainable
future. Ensuring energy security will require diversification of types and
sources of energy, with increasing focus on consumer needs, on indigenous
energy supplies, energy efficiency and regional interconnections. Greater use of
clean energy obviously contributes to sustainability of the development
process, and this issue will become more important in the years that lie ahead.
136
Developing countries account for 82 per cent of the world‘s population and they
use 55 per cent of the available global supply of energy. They must aim at
faster growth of their GDP to improve the living standards of their populations
and this will entail an expanded demand for energy. If they follow the
industrialized countries in meeting their energy requirements through fossil
fuel based energy, the impact on the global climate would be simply
unsustainable. This poses a global challenge. We can only meet the challenge
by responding in two ways.
(1) We must contain the total growth in energy associated with the growth of
GDP by improving energy efficiency.
(2) We can work to shift from conventional to non-conventional or clean energy.
Asia has been experiencing sustained high economic growth in the recent
years. However, there still exists substantial amount of unacceptable poverty
among the people in the region. The expressions of symptoms of such poverty
include among others inadequate educational and health attainment of the
people and lack of access to basic amenities like modern clean energy, safe
water and sanitation, which are crucial determinants of human capability
development.
Historical Growth of the Solar Power in India
The Rural Electrification Program of 2006 was the first step by the Indian
Government in recognizing the importance of solar power. It gave guidelines for
the implementation of off-grid solar applications. However, at this early stage,
only 33.8MW (as on 14-2-2012) of capacity was installed through this policy.
This primarily included solar lanterns, solar pumps, home lighting systems,
street lighting systems and solar home systems. In 2007, as a next step, India
introduced the Semiconductor Policy to encourage the electronic and IT
industries. This included the Silicon and PV manufacturing industry as well.
New manufacturers like Titan Energy Systems, Indo Solar Limited and KSK
Surya Photovoltaic Venture Private Limited took advantage of the Special
Incentive Scheme included in this policy and constructed plants for PV
modules. This move helped the manufacturing industry to grow, but a majority
of the production was still being exported. There were no PV projects being
developed in India at that stage. There was also a need for a policy to
incorporate solar power into the grid.
The Generation Based Incentive (GBI) scheme, announced in January 2008
was the first step by the government to promote grid connected solar power
plants. The scheme for the first time defined a Feed-In Tariff (FIT) for solar
power (a maximum of Rs. 15/kWh). Since the generation cost of solar power
was then still around Rs. 18/kWh, the tariff offered was unviable. Also, under
137
the GBI scheme, a developer could not install more than 5MW of solar power in
India, which limited the returns from scale. One of the main drawbacks of the
GBI scheme was that it failed to incorporate the state utilities and the
government in the project development, leaving problems like land acquisitions
and grid availability unaddressed. As a result, despite the GBI scheme,
installed capacity in India grew only marginally to 6MW by 2009. In June
2008, the Indian government announced the National Action Plan for Climate
Change (NAPCC). A part of that plan was the National Solar Mission (NSM). The
NSM guidelines indicated that the government had improved on the
shortcomings of the GBI scheme. It aimed to develop a solar industry, which
was commercially driven and based on a strong domestic industry. The extra
cost of generation of solar power was being borne by the federal government
under the GBI scheme.
Present Status and Installed Capacity of Solar Energy in India
Solar power has so far played an almost non-existent role in the Indian energy
mix. The grid-connected capacity (all PV) in India now stands at 481.48 MW as
of 31st January 2012. However, the market is set to grow significantly in the
next ten years, driven mainly by rising power demand and prices for fossil
fuels, the ambitious National Solar Mission (NSM), various state level
initiatives, renewable energy quotas including solar energy quotas for utilities
as well as by falling international technology costs.
Encouraging the spread of solar power generation (both CSP and PV) and
aiming for grid-parity (currently at around RS.5/kWh) by 2022 and parity with
coal power generation (currently at around RS.4/kWh) by 2030, is a key
element in India‘s comprehensive, long term energy supply strategy. Keeping in
view the solar annual insulation, solar power could therefore easily address
India‘s long-term power requirements. However, it has to be cost-competitive.
As of December 2011, solar power generation in India costs around
RS.10/kWh, or over 2.5 times as much as power from coal. Importantly, it is
crucial that the industry receives the right policy support to ensure that
projects are executed and performed up to the mark.
Growth of Solar Energy in India
India‘s government has begun to acknowledge the importance of solar energy to
the country‘s economic growth. Prime Minister Manmohan Singh, who has said
solar energy will transform rural India, launched a National Solar Mission in
2010. Initial growth has been dramatic, albeit from a tiny base. From less than
12 MW in 2009, solar-power generation in the country grew to 190 MW in
2011. By March 2013, it is expected to grow fivefold to 1,000 MW, but the
country has a long way to go to reach its goal of increasing solar-power
138
generation to 20 gig watts by 2020. Across India, there are still thousands of
villages with plenty of sun but not enough power.
India’s Potential of Solar Energy
India has a great potential to generate electricity from solar energy and the
Country is on course to emerge as a solar energy hub. The techno-commercial
potential of photovoltaic in India is enormous. With GDP growing in excess of
8per cent, the energy ‗gap‘ between supply and demand will only widen. Solar
PV is a renewable energy resource capable of bridging this ‗gap‘. Most parts of
India have 300 – 330 sunny days in a year, which is equivalent to over 5000
trillion kWh per year – more than India‘s total energy consumption per year.
Average solar incidence stands at a robust 4 – 7 kWh/sq. meter/day. About 66
MW of aggregate capacity is installed for various applications comprising one
million industrial PV systems – 80per cent of which is solar lanterns,
home/street lighting systems and solar water pumps, etc. The estimated
potential envisaged by the Ministry for the solar PV programme, i.e. solar
street/home lighting systems, solar lanterns is 20 MW/sq. kilometer.
The potential of the solar thermal sector in India also remains untapped. The
Ministry of Renewable Energy proposes an addition of 500 MW during the
phase 1 of JNNSM. Establishing manufacturing units at Export Oriented Units,
SEZs or under the SIPS programme presents a good opportunity for firms
which can leverage India‘s cost advantage to export solar modules at
competitive prices to markets in Europe and the United States. In terms of all
renewable energy, currently India is ranked fifth in the world with 15,691.4
MW grid-connected and 367.9 MW off-grid renewable energy based power
capacity. India is among top 5 destinations worldwide for solar energy
development as per Ernst & Young‘s renewable energy attractiveness index.
Solar power is attractive because it is abundant and offers a solution to fossil
fuel emissions and global climate change. Earth receives solar energy at the
rate of approximately 1,73,000 TW. This enormously exceeds both the current
annual global energy consumption rate of about 15 TW, and any conceivable
requirement in the future. India is both densely populated and has high solar
isolation, providing an ideal combination for solar power in India. India is
already a leader in wind power generation. In solar energy sector, some large
projects have been proposed, and a 35,000 km² area of the Thar Desert has
been set aside for solar power projects, sufficient to generate 700 to 2,100 GW.
The India Energy Portal estimates that if 10per cent of the land were used for
harnessing solar energy, the installed solar capacity would be at 8,000GW, or
around fifty times the current total installed power capacity in the country. For
example, even assuming 10per cent conversion efficiency for PV modules, it will
139
still be thousand times greater than the likely electricity demand in India by
the year 2015. Daytime production peak coincides with
peak electricity demand making solar ideal supplement to grid.
With around 300 sunny days a year nationwide, solar energy‘s potential in
India is immense. And with $10.2 billion investments in clean energy, money is
starting to follow the opportunity. India received $95 million in venture-capital
funding and over $1.1 billion in large-scale funding for solar projects in 2011,
according to a report by Mercom Capital, a clean-energy consulting firm. The
biggest funding deal was a $694 million loan raised by Maharashtra State
Power Generation Co. for its 150-MW Dhule and 125-MW Sakri solar projects.
Jawaharlal Nehru National Solar Mission
On November 23, 2009, Dr. Farooq Abdullah, Union Minister for New and
Renewable Energy in a statement in the Parliament said that ―the Government
has approved a new policy on development of solar energy in the country by
launching of the Jawaharlal Nehru National Solar Mission‖. The mission aims at
development and deployment of solar energy technologies in the country to
achieve parity with grid power tariff by 2022. The National Solar Mission is a
major initiative of the Government of India and State Governments to promote
ecologically sustainable growth while addressing India‘s energy security
challenge. It will also constitute a major contribution by India to the global
effort to meet the challenges of climate change. The objective of the National
Solar Mission is to establish India as a global leader in solar energy, by
creating the policy conditions for its diffusion across the country as quickly as
possible. The aim would be to protect Government from subsidy exposure in
case expected cost reduction does not materialize or is more rapid than
expected. The immediate aim of the Mission is to focus on setting up an
enabling environment for solar technology penetration in the country both at a
centralized and decentralized level.
The main features of the National Solar Mission are:
Make India a global leader in solar energy and the mission envisages an
installed solar generation capacity of 20,000 MW by 2022, 1,00,000 MW
by 2030 and of 2,00,000 MW by 2050.
The total expected investment required for the 30-year period will run is
from Rs. 85,000 crore to Rs. 105,000 crore.
Between 2017 and 2020, the target is to achieve tariff parity with
conventional grid power and achieve an installed capacity of 20 giga
watts (Gw) by 2020.
4-5GW of installed solar manufacturing capacity by 2017.
To deploy 20 million solar lighting systems for ru ral areas by 2022
140
Three-Phase Approach of Mission
The Mission will be adopted in a 3-phase approach
Phase I: Remaining period of the 11th Plan and first year of the 12th Plan (up
to 2012-13)
Phase II: The remaining 4 years of the 12th Plan (2013-17)
Phase III: The 13th Plan (2017-22) as Phase 3.
The target for phase I is to ramp up grid connected solar power generation to
1000MW and an additional 3000MW by the end of phase II through the
mandatory use of the renewable purchase obligation by utilities backed with a
preferential tariff. The mission also plans to promote programs for off-grid
applications, reaching 1000 MW by 2017 and 2000 MW by 2022. At the end of
each plan, and mid-term during the 12th and 13th Plans, there will be an
evaluation of progress, review of capacity and targets for subsequent phases,
based on emerging cost and technology trends, both domestic and global. The
aim would be to protect Government from subsidy exposure in case expected
cost reduction does not materialize or is more rapid than expected.
Decreasing Investment Cost of Solar in India
Prices of solar panels (per Watt) have already dropped 97.2per cent over the
past 35 years and will continue this trend. In India, solar energy generation is
now cheaper than diesel. Most of Europe will achieve grid parity (cost of solar =
cost of grid power) sooner than the US. Next decade solar will cost a fraction of
what fossil fuels energy does world over.
The cost of electricity generated by solar power cells is falling so fast, it is likely
to provide a serious alternative to the national grid within five years. Scientists
demonstrated that solar cells are now capable of converting 43 per cent of the
sunlight hitting them into electricity. However, the demonstration did not use
regular silicon-based solar cells, which are much cheaper and more likely to be
in popular use. Rather, the demonstration cells require sunlight to be split into
five different frequencies, or ‗colours‘, with each colour sent to a different cell.
In contrast, the efficiency record with regular silicon-based solar cells stands at
just 25 per cent. Significance of the new system is that, as the intensity of light
is increased, the efficiency of the demonstration cells improves.
With the cost of solar photovoltaic cells falling — prices dropped by 50per cent
last year and are now a quarter of what they were in 2008 — renewable-energy
advocates say India is ripe for a solar-power revolution. And it could use it.
More than 40per cent of the countryside is still not connected to the national
power grid, and a 2010 report by the National Renewable Energy Laboratory in
the U.S. said power demand in India trails supply by 12.7per cent. Closing this
141
gap ―will be critical for India to achieve its growth targets,‖ the report said.
Failure to meet that unsatisfied demand could hamper India‘s growth, the
World Economic Forum (WEF) said in a recent report.
Advantages and Disadvantages of Solar Power
There is, indeed, enormous amount of advantages lies with use of solar power
specially, in the context of environmental impact and self-reliance. However, a
few disadvantages such as its initial cost and the effects of weather conditions,
make us hesitant to proceed with full vigor.
Advantages of Solar power -
(1) The major advantage of solar power is that no pollution is created in the
process of generating electricity. Environmentally it is the most Clean and
Green energy. Solar Energy is clean, renewable (unlike gas, oil and coal) and
sustainable, helping to protect our environment.
(2) It does not pollute our air by releasing carbon dioxide, nitrogen oxide, sulfur
dioxide or mercury into the atmosphere like many traditional forms of electrical
generation does. Therefore Solar Energy does not contribute to global warming,
acid rain or smog. It actively contributes to the decrease of harmful green
house gas emissions.
(3) There is no on-going cost for the power it generates – as solar radiation is
free everywhere. Once installed, there are no recurring costs. It‘s generated
where it is needed. Therefore, large scale transmission cost is minimized. It is
quite economical in long run
(4) It can be flexibly applied to a variety of stationary or portable applications.
Unlike most forms of electrical generation, the panels can be made small
enough to fit pocket-size electronic devices, or sufficiently large to charge an
automobile battery or supply electricity to entire buildings.
(7) A Solar Energy system can operate entirely independently, not requiring a
connection to a power or gas grid at all. Systems can therefore be installed in
remote locations, making it more practical and cost-effective than the supply of
utility electricity to a new site.
(8) More solar panels can easily be added in the future when our family‘s needs
grow.
(9) Solar Energy supports local job and wealth creation, fuelling local
economies.
Disadvantages of Solar Power –
(1) The initial cost is the main disadvantage of installing a solar energy system,
largely because of the high cost of the semi-conducting materials used in
building solar panels.
142
(2) The cost of solar energy is also high compared to non-renewable utility-
supplied electricity. As energy shortages are becoming more common, solar
energy is becoming more price-competitive.
(3) Solar panels require quite a large area for installation to achieve a good level
of efficiency.
(4) The production of solar energy is influenced by the presence of clouds or
pollution in the air. Similarly, no solar energy will be produced during
nighttime although a battery backup system and/or net metering will solve this
problem.
(5) As far as solar powered cars go – their slower speed might not appeal to
everyone caught up in today‘s fast track movement.
Development of Solar Power under Public–Private Partnership
Agreement (PPPA)
On the import side, the biggest culprit contributing to the Current Account
Deficit(CAD) is the inelastic demand. A solution that kills many birds with one
stone is for the government to facilitate the development of solar power in a big
way under Public –Private Partnership Agreement (PPPA). This will cost next to
nothing. The government act as a credit enhancer to tie up $ 50 billion from
multilateral agencies in the US, Japan and China to import solar panels. This
will enable development of 50 giga watts(GW) of solar power. It should assure
solar developers that anyone who signs a valid power purchase agreement with
any State Electricity Board (SEB) will automatically get a low –interest rupee
loan for 70per cent of the total project cost at the same interest rate in rupees
as the Dollar interest rate at which the government has borrowed. The
government can guarantee SEB payments on the Solar PPPAs against any state
default and adjust that against disbursement to states. This will reduce the
perceived risks for early movers and investors. The Central government‘s risk
will be diversified across 28 states. It can also encourage insurers like LIC to
provide takeout financing for fully commissioned projects. This enables
recycling of equity to be deployed for the next project, and provides a steady
yield stream for insurers, ideal for their requirements.
Sun is the Limit
It should offer Rs one per kilowatt –hour (kWh) subsidy to SEB if they pay
Solar generator on time. This can be funded by the Renewable Energy fund,
already substantial built up through cess on coal production. Together, these
will enable developers to offer solar power at a rate of Rs 5per kWh, which will
fall further over time from technological enhancements. Solar is competitive
even now as it displaces peak power, generated with diesel on the margin
costing Rs 14 per kWh, while solar costs Rs 8 per kWh. The latest long-term
143
bids from thermal power plants were north of Rs 5 per kWh and will rise over
time.
The benefits of this solar initiative to the country will be enormous. It could
generate net savings of Rs 500 billion over the next 25 years, from reduced
diesel consumption. A rapid solar build up will supplemented thermal power ,
which has slowed down. A solar plant can be built in 6-9 months against 48-60
months for a thermal plant. This will work because the government borrows to
facilitate solar power development at 4per cent dollar interest cost , while the
returns in dollar terms on solar investment for the Indian economy are in
excess of 17-18per cent per year. That is because 80per cent of solar
generation happens during peak demand and will save on diesel power.
EFFORTS MADE BY CENTRAL AND STATE GOVERNMENTS TO
PROMOTE SOLAR ENERGY IN INDIA
Role of Central Government in Development of Solar Energy:
The government of India is promoting the use of solar energy through various
strategies. In the budget for 2010-11, the government has announced an
allocation of 10 billion (US$172.0 million) towards the Jawaharlal Nehru
National Solar Mission and the establishment of a clean energy fund. It is an
increase of 3.8 billion (US$65.4 million) from the previous budget. This new
budget has also encouraged private solar companies by reducing customs duty
on solar panels by 5per cent and exempting excise duty on solar photovoltaic
panels. This is expected to reduce the cost of a roof-top solar panel installation
by 15–20per cent. The budget also proposed a coal tax of US$1 per metric ton
on domestic and imported coal used for power generation. Additionally, the
government has initiated a Renewable Energy Certificate (REC) scheme, which
is designed to drive investment in low-carbon energy projects. The Ministry of
New and Renewable Energy provides 70 per cent subsidy on the installation
cost of a solar photovoltaic power plant in North-East states and 30 per
centage subsidy on other regions. The detailed outlay of the National Solar
Mission highlights various targets set by the government to increase solar
energy in the country's energy portfolio.
Role of Different States in Development of Solar Energy
India is densely populated and has high solar insolation, an ideal combination
for using solar power in India. India is already a leader in wind power
generation. In the solar energy sector, some large projects have been proposed,
and a 35,000 km2 area of the Thar Desert has been set aside for solar power
projects, sufficient to generate 700 GW to 2,100 GW. Also India's Ministry of
New and Renewable Energy has released the JNNSM Phase 2 Draft Policy, by
which the Government aims to install 10GW of Solar Power and of this 10 GW
144
target, 4 GW would fall under the central scheme and the remaining 6 GW
under various State specific schemes.
The Gujarat solar policy initiated a process of the states formulating their own
policy frameworks independent of the federal guidelines. The renewable
purchase obligations for state distribution companies, a demand-driven
scheme, further accelerated the formulation of solar policies at the state level.
These policies exist independent of each other as well as the NSM. Other states
like Karnataka, Andhra Pradesh and Rajasthan have followed suit in
developing solar power development programs. Rajasthan has implemented
land banks as well to make land acquisition easier. As more states plan to meet
their solar power obligations, new policies are expected to be offered, creating
as very vibrant set of markets across the subcontinent.
1. Production Based Subsidy by Delhi Government:
A recent Greenpeace India and Bridge to India analysis estimated that Delhi
has the potential to generate 2,557 mw of solar power using only 1.6per cent of
the city‘s roof space. If anyone generates power from a rooftop solar project, the
Delhi government will soon incentivize those efforts. A new solar policy upholds
―production based subsidy‖ which means that the government will pay any one
for the units of energy you save by using solar power. As of now, there is a
―capital subsidy‖ scheme which involves of a fixed sum on installation of solar
water heaters in Delhi. Environmentalists are excited about the new policy
because it is customer centric.
Net Metering
A mechanism was developed to credits customers who generate solar energy to
add to the grid. The utility pays the customer for the extra or unused units of
solar energy, which automatically go back to the grid. Through net metering,
we can monitor the source of the energy. Through a net metering system the
utility can monitor how much solar energy a consumer is generating at home
and if the consumer is generating more power than his requirements, then
excess power is returned to grid. Another development that is likely to push the
implementation of the policy is Central Electricity Regulatory commission‗s
guidelines on net metering. The guidelines include every detail on metering
energy accounting and how commercial transactions will be done. Any state
government can straightaway use the document to regulate net metering. The
guidelines are based on net metering systems in Germany and US. In 2012, the
Delhi Government had scrapped its previous solar policy. Delhi government
had to scrap the previous policy because solar power tariff was very high then.
Now, it‘s almost at par with conventional energy. Delhi government can
implement it now much easily. It can be adopted by any state government
145
thereafter. In 2002, Thailand became the first developing nations to have the
first net metering policy. Countries that have successfully implemented the
model are Australia, Canada, Italy, Spain, Denmark, US, Germany
2. Gujarat Solar Power Policy -2009
Gujarat is the first state to launch its own solar policy in 2009. The Gujarat
solar policy was in place a year before the NSM was announced. The initial
target is to achieve 500 MW of installed capacity by the end of this period.
Gujarat Energy Development Agency (GEDA) and Gujarat Power Corporation
Limited (GPCL) have been appointed as nodal agencies for the facilitation and
implementation of the policy. Gujarat Solar Power Policy is the only policy,
which has awarded projects with a fixed FiT, on a first-come-first serve basis.
This has resulted in the allocation of a number of projects to in-experienced or
unknown developers.
After the NSM policy was formalized in December 2009, developers moved away
from Gujarat towards the NSM. In the first phase of the Gujarat policy, only
396.5 MW worth of PPAs were signed out of 716 MW allotments, leading to a
conversion rate of 55per cent (PPAs signed as a per centage of projects allotted).
The tremendous interest from developers for NSM led to the competitive
bidding for projects and a subsequent fall in tariffs. The fall in the NSM tariff
below the levelized tariff in Gujarat suddenly made the Gujarat policy very
attractive again to developers. Further, a significantly higher feed-in-tariff in
the first 12 years in Gujarat matches investor‘s timelines, as they would look to
cover the cost of debt during this period. To ensure developer commitment,
Gujarat‘s solar policy for the second phase has been amended to include a
deposit that would be encashed, if the developers fail to sign the PPAs. Larger
available project sizes and the relative ease of land acquisition has led to larger
developers getting serious about the Gujarat policy and signing PPAs and
starting the implementation of projects. Gujarat has significantly improved the
credibility of its solar program from the first to the second phase.
India’s First Solar Park
On December 29th 2010, India‘s first solar park was inaugurated at
Charanaka in Patan district of northern Gujarat. So far, land has been allotted
in the solar park for projects worth 176MW to 16 companies from the first and
second phases. The total capacity of the solar park is 500MW with 30,000 sq.
m per MW land allotted to Solar Thermal and 20,000 sq. m per MW of land
allotted to PV projects. The solar park has been financed with over Rs. 12
billion by financial institutions like the International Finance Corporation (IFC),
the Asian Development Bank (ADB) and the Infrastructure Development
Finance Corporation (IDFC). The park tackles land procurement, water
146
availability and grid connectivity issues and offers a ―single-window‖ clearance
process. Sixteen companies, including Sun Edison Energy India (25MW), Alex
Astral Power (25MW), Roha Energy (25MW), GMR Gujarat Solar (25MW), Kiran
Energy (20MW), Emami Cement (10MW) and Azure Power (5MW) have been
allotted projects worth a total of 176MW in the park. They have all signed PPAs
with the state government.
3. Karnataka Solar Energy Policy (2011-16)
Karnataka, a south-western state of India, announced its solar policy on July
1, 2011. Under the solar policy 2011-16, the Karnataka Government proposes
to promote solar power as part of renewable energy generation policy in the
state.
It targets 350 MW worth of projects till 2016.
200 MW is to be developed for direct sale to the distribution companies
in the state (40 MW to be added each year)
100 MW under REC Mechanism
50 MW for bundling of power with thermal power from outside the state
at rates to be determined by the State Government subject to approval
of KERC.
The minimum capacity of solar PV projects is 3 MW and maximum capacity of
10 MW, while for Solar Thermal the minimum is 5MW with no cap on
maximum. The quantum of power to be procured by ESCOMs from solar
resources under purchase obligation is 0.25per cent of the total consumption
and the shortfall in procurement of solar energy by the ESCOMs can be made
good by purchase of solar specific RECs. Though the state has come up with its
own policy, it will continue to support programs like the NSM. The state has set
a combined target of 126 MW of solar power to be developed by 2013-14
through NSM and its own solar policy. The Mysore City Corporation has
decided to set up a mega solar power plant in Mysore with 50per cent
concession from the Government of India.
4. Rajasthan Solar Energy Policy -2011
On April 19th 2011, Government of Rajasthan issued Rajasthan Solar Energy
Policy, 2011 to promote solar energy in the state. The policy aims to help
Rajasthan, develop as a global hub of solar power for 10000-12000 MW
capacity over the next 10 to 12 years to meet energy requirements of Rajasthan
and other states of India.
It targets a minimum of 550MW of grid connected solar power in Phase 1
(up to 2013).
Projects will be awarded through a process of competitive bidding.
147
PV projects will be worth 300MW, out of which 100MW are reserved for
project developers and 200MW for panel manufacturers.
The minimum and maximum sizes for PV projects are 5MW and 10MW.
Module manufacturers that set up their manufacturing plant in
Rajasthan can bid for either 10MW or 20MW worth of PV projects based
on their manufacturing capacity.
A further 50MW will be allocated for rooftop PV (1MW each) and other
small solar power plants.
The DISCOMS in Rajasthan will provide PPAs for the projects. In
addition, projects worth 100MW (50MW PV and 50MW CSP) are targeted
for bundled solar power. In such projects, the developer can sell
conventional power and solar power in a ratio of 4:1 at the weighted
average tariff to the distribution utilities in Rajasthan. Varied project
sizes will attract small as well as large developers looking to invest in
projects of different scale.
5. Maharashtra Solar Energy Policy
The Maharashtra State Power Generation Company (Mahagenco) has made
plans for setting up more power plants in the state to take up total generation
up to 200 MW.
6. Tamil Nadu Solar Power Policy
Reeling under acute power crises, the Government of Tamil Nadu has recently
unveiled its new Solar Energy Policy which aims at increasing the installed
solar capacity from the current approximate of 20 MW to over 3000 MW by
2015. The policy aims at fixing a 6per cent solar energy requirement on
industries and residential buildings for which incentives in the form of tax
rebates and current tariff rebates of up to Rs. one per unit will be applicable to
those who comply with the Solar Energy Policy.
SOLAR THERMAL PROCESS
Solar thermal electricity technologies produce electric power by converting the
sun‘s energy into high-temperature heat using various mirror configurations,
which is then channeled to an on-site power plant and used to make electricity
through traditional heat-conversion technologies. The plant essentially consists
of two parts; one that collects Solar energy and converts it to heat, and another
that converts the heat energy to electricity.
Solar Cell
A solar cell is a semiconductor device that transforms sunlight into electricity.
Semiconductor material is placed between two electrodes. When sunshine
reaches the cell, free negatively charged electrons are discharged from the
material, enabling conversion to electricity. This is the so-called photovoltaic
148
effect. In theory, a solar cell made from one semiconductor material only can
convert about 30 per cent of the solar radiation energy it is exposed to into
electricity. Commercial cells today, depending on technology, typically have an
efficiency of 5 -12 per cent for thin films and 13 – 21 per cent for crystalline
silicon based cells. Efficiencies up to 25 per cent have been reached by the use
of laboratory processes. By using multiple solar cells, efficiencies above 35 per
cent have been achieved.
Solar Photovoltaic
Photovoltaic has been derived from the combination of two words, Photo means
Light and Voltaic means electricity. It is a technology that converts light
directly into electricity. Photovoltaic material, most commonly utilizing highly-
purified silicon, converts sunlight directly into electricity.
CONCENTRATION PROCESS OF SOLAR TECHNOLOGIES:
(i) Parabolic trough technologies track the sun with rows of mirrors that
heat a fluid. The fluid then produces steam to drive a turbine.
(ii) Central receiver (tower) systems use large mirrors to direct the sun to a
central tower, where fluid is heated to produce steam that drives a turbine.
Parabolic trough and tower systems can provide large-scale, bulk power with
heat storage (in the form of molten salt, or in hybrid systems that derive a
small share of their power from natural gas).
(iii) Dish systems consist of a reflecting parabolic dish mirror system that
concentrates sunlight onto a small area, where a receiver is heated and drives
a small thermal engine.
(iv) Concentrating photovoltaic systems (CPV) use moving lenses or mirrors
to track the sun and focus its light on high-efficiency silicon or multi-junction
solar cells; they are potentially a lower-cost approach to utility-scale PV power.
Dish and CPV systems are well suited for decentralized generation that is
located close to the site of demand, or can be installed in large groups for
central station power.
ROLE OF SOLAR ENERGY IN RURAL ELECTRIFICATION
Lack of electricity infrastructure is one of the main hurdles in the development
of rural India. India‘s grid system is considerably under-developed, with major
sections of its populace still surviving off-grid. As of 2004 there are about
80,000 un-electrified villages in the country. Of these villages, 18,000 could not
be electrified through extension of the conventional grid. A target for
electrifying 5,000 such villages was fixed for the Tenth National Five Year Plan
(2002–2007). As on 2004, more than 2,700 villages and hamlets had been
electrified mainly using SPV systems. Developments on cheap solar technology
are considered as a potential alternative that allows an electricity
149
infrastructure comprising of a network of local-grid clusters with distributed
electricity generation. That could allow bypassing, or at least relieving the need
of installing expensive, and lossy, long-distance centralised power delivery
systems and yet bring cheap electricity to the masses.3000 villages of Odissa
will be lighted with Solar power by 2014.
The off-grid and rooftop segments will grow exponentially as price parity with
consumer tariffs makes solar power an economically viable alternative,
particularly for urban and semi-urban consumers. Distributed generation in
rural areas and support for latent urban demand has the potential to reach 4
GW by 2020 and increase rapidly to more than 10 GW over the next three to
four years.
RECENT DEVELOPMENT IN SOLAR ENERGY IN U.S.:
A recent renewed interest in alternative energy technologies has revitalized
interest in solar thermal technology, a type of solar power that uses the sun‘s
heat rather than its light to produce electricity. Although the technology for
solar thermal has existed for more than two decades, projects have languished
while fossil fuels remained cheap. But solar thermal‘s time may now have come
— and mirrored arrays of solar thermal power plants, hopefully, will soon
bloom in many of the world‘s deserts. Large desert-based power plants
concentrate the sun‘s energy to produce high-temperature heat for industrial
processes or to convert the solar energy into electricity. It is quite interesting to
note that, as per the recent reports on Solar Power, the resource calculations
show that just seven states in the U.S. Southwest can provide more than 7
million MW of solar generating capacity, i.e., roughly 10 times that of total
electricity generating capacity of U.S. today from all sources.
In US, as per report, four more concentrating solar technologies are being
developed. Till now, parabolic trough technology (i.e., tracking the sun with
rows of mirrors that heat a fluid, which then produces steam to drive a turbine)
used to provide the best performance at a minimum cost. With this technology,
as per the report, since the mid-1980s nine plants, totaling about 354 MW,
were operating reliably in California‘s Mojave Desert. Natural gas and other
fuels provide supplementary heating when the sun is inadequate, allowing
solar power plants to generate electricity whenever it is needed. In addition, in
order to extend the operating times of solar power plants new heat-storing
technologies are being developed as well.
Realizing the advantages of solar energy and seeing the success of desert solar
power installed, several solar power plants are now being planned in the U.S.
Southwest. Renewed Governmental supports and rising fossil fuel prices
including natural gas, lead to new interest in concentrating solar power among
150
many entrepreneurs. Efficiency of concentrating solar technologies has also
been improved substantially, since then. While earlier trough plants needed a
25 per cent natural gas-fired backup, the new improved plants will require only
about 2 per cent backup. As per recent news in US, utilities in states with large
solar resources such as Arizona, California, Nevada, and New Mexico etc., are
considering installation of solar dish systems on a larger scale. As per the
latest estimation, within the next decade more than 4,000 MW of central solar
plants will be installed. It‘s quite encouraging!!
DEVELOPMENT OF SOLAR ENERGY IN DIFFERENT ASIAN
COUNTRIES
1. BANGLADESH
In Bangladesh, a number of domestic solar energy systems are in use in
houses around the country. The use of solar energy on this scale is highly
potential and advantageous as more than 60per cent of areas in the country do
not have access to main grid electricity. The World Bank is backing a program
of making solar energy available to wider population in Bangladesh, as part of
the Rural Electrification and Renewable Energy Development Project
(REREDP), which subsidizes solar energy systems. A typical 'solar home
system' can power two to eight 'low energy' lights, plus a socket for TV, radio or
battery recharging, and a mobile telephone charging unit, too. Each system
consists of a solar photovoltaic panel, mounted on the house roof. Depending
on its size, this provides between 40W and 135W of electricity in full sunlight
(the most common being 50W).
Role of Grameen Shakti in Rural Based Solar Home System:
Grameen Shakti is the largest organization installing rural based Solar Home
System (SHS) in Bangladesh. Other companies working on similar solar energy
based SHS are Rural Services Foundation (RSF), Brac, Hilfulfujal and so on.
The model of micro finance based SHS is now being copied in other parts of the
world as a successful business model. Rahimafrooz is a major supplier of high
quality solar batteries and other solar components for the program.
Rahimafrooz Renewable Energy Ltd (RRE) has been the pioneer in installing
solar powered centralized systems, water pumps for irrigation and pure
drinking water, water heaters, street lights, and solar-powered telecom
solutions to various organizations. They are working closely with pertinent
government organizations in installing solar powered medical refrigerator that
provides emergency live saving medicines in the off-grid rural areas. A company
named Digital Technology is doing research and development of solar PV
products like solar billboard lighting, mini grid system for irrigation etc.
151
2. CHINA
China will intensify effort and adopt ambitious plans to plant enough forest to
cover an area the size of Norway and use 15 per cent of its energy from
renewable sources within a decade. China has become a world leader in the
manufacture of solar photovoltaic technology, with its six biggest solar
companies having a combined value of over $ 15 billion. Around 820
megawatts of solar PV were produced in China in 2007, second only to Japan.
Suntech Power Holdings Co based in Jiangsu, is the world's third- biggest
supplier of solar cells. In China there are now six factories producing at least 2
GW/year each of mono-crystalline, poly-crystalline and non-
crystalline Photovoltaic cells. These factories include the LDK Solar Co, Wuxi
Suntech Solar Energy Co., Ltd., which produces approximately 50 MW/year of
solar cells and photovoltaic modules; the Yunnan Semi-conductor Parts Plant,
which manufactures approximately 2 MW/year of mono-crystalline cells; the
Baoding Yingli Solar Energy Modules Plant, which manufactures approximately
6 MW/year of polycrystalline cells and modules; the Shanghai Jiaoda Guofei
Solar Energy Battery Factory, which produces approximately 1 MW/year of
modules; and the Shanghai PV Science and Technology Co., Ltd., which
produces approximately 5 MW/year of modules. According to some studies, the
demand in China for new solar modules could be as high as 232 MW each
year. The government has announced plans to expand the installed capacity to
1,800 MW by 2020. If Chinese companies manage to develop low cost, reliable
solar modules, then the sky is the limit for a country that is desperate to
reduce its dependence on coal and oil imports as well as the pressure on its
environment by using renewable energy.
Under the ―Golden Sun" stimulus program, the Ministry of Finance will
subsidize half of the total construction costs of an on-grid solar power plant,
including transmission expenses. The Ministry of Finance will also pay
subsidies of up to 70 per cent to develop independent photovoltaic power
generating systems in remote regions. The strong handed move by the
Government is meant to encourage more solar projects to increase the current
solar power capacity. As the Government targets to increase China‘s solar
power capacity up to 20GW by 2020 this will provide significant opportunities
for solar cell and module manufacturers. Many of the solar industry players
therefore will expect for chances to be benefited from the government programs
especially the solar cell manufacturers.
3. INDIA
India is both densely populated and has high solar insolation, providing an
ideal combination for solar power in India. Much of the country does not have
152
an electrical grid, so one of the first applications of solar power has been for
water pumping; to begin replacing India's four to five million diesel powered
water pumps, each consuming about 3.5 kilowatts, and off-grid lighting. Some
large projects have been proposed, and a 35,000 km² area of the Thar
Desert has been set aside for solar power projects, sufficient to generate 700 to
2,100 gig watts. The Indian Solar Loan Programme, supported by the United
Nations Environment Programme has won the prestigious Energy Globe World
award for Sustainability for helping to establish a consumer financing program
for solar home power systems. Over the span of three years more than 16,000
solar home systems have been financed through 2,000 bank branches,
particularly in rural areas of South India where the electricity grid does not yet
extend. Launched in 2003, the Indian Solar Loan Programme was a four-year
partnership between UNEP, the UNEP Risoe Centre, and two of India's largest
banks, the Canara Bank and Syndicate Bank.
4. SOUTH KOREA
In 2008, Korea came 4th in the list of installed PV capacity according to EPIA
statistics as a result of the favorable feed-in tariff system with a cap of 500MW
in 2008. According to Display bank, the new ―PV Market Creation Plan‖
announced in 2009 is expected to boost the Korean PV installment market to
increase to 200MW by 2012. The government further announced plans to
increase more than double its financing for renewable R&D projects to 3.5
trillion won ($2.9/£1.9bn) by 2013. The government also plans to expand its
system of tax breaks to cover new technologies in solar such as wind and
thermal power, low-emission vehicles and rechargeable batteries etc
5. PHILIPPINES
The Philippine government sees the growth of the renewable energy sector
essential for national energy security. The Philippines' fossil fuel sector is
unsustainable, being dependent on the import of nonrenewable fuel, including
petroleum, but has significant potential in the renewable energy sector. Based
on a report of an Australian consulting firm, International Energy Consultants,
the Philippines has the highest electricity rate in Asia, followed by Japan.
Transmitting power and transporting fuel throughout the Philippine
archipelago is problematic due to very high cost. The Philippines could be
considered a world leader in renewable energy, with 30 per cent of its power
generation being powered by the renewable energy sector. The Philippines is
the world's second largest genarator of geothermal energy and was the
first Southeast Asian nation to invest in large-scale solar and wind
technologies.
153
ROLE OF UNEP TO STIMULATE RENEWABLE ENERGY
RESOURCES IN DEVELOPING COUNTRIES
UNEP has developed a loan programme to stimulate renewable energy
market forces with attractive return rates, buffer initial deployment costs and
entice consumers to consider and purchase renewable technology. After a
successful solar loan program sponsored by UNEP that helped 100,000 people
finance solar power systems in developing countries like India, UNEP started
similar schemes in other parts of developing world like Africa -
Tunisia, Morocco, Kenya projects are already functional and many projects in
other African nations are in the pipeline. In Africa, UNEP assistance to Ghana,
Kenya and Namibia has resulted in the adoption of draft National Climate
Awareness Plans, publications in local languages, radio programmes and
seminars. The Rural Energy Enterprise Development (REED) initiative is
another flagship UNEP effort focused on enterprise development and seed
financing for clean energy entrepreneurs in developing countries of West and
Southern Africa. The Government of South Africa has set up the South African
Renewables Initiative (SARI) to develop a financing arrangement that would
enable a critical mass of renewables to be developed in South Africa, through a
combination of international loans and grants, as well as domestic funding.
APPLICATION OF SOLAR ENERGY AS CLEAN ENERGY
Solar energy reaching the earth from the sun dwarfs all other forms of energy
used by humans. Solar energy is underutilized as an energy source. It is clean,
plentiful, renewable and depending on the site, easy to access.
Solar Lamps and Lighting:
By 2012, 46, 00,000 solar lanterns and 861,654 solar powered home lights
have been installed. These typically replace kerosene lamps and can be
purchased for the cost of a few months worth of kerosene through a small loan.
The Ministry of New and Renewable Energy is offering a 30per cent to 40per
cent subsidy for the cost of lanterns, home lights and small systems up to 210
WP. 20 million solar lamps are expected by 2022.
Agricultural Support:
Solar PV water pumping systems are used for irrigation and drinking water.
The majority of the pumps are fitted with a 200–3,000 watt motor that are
powered with 1,800 Wp PV arrays which can deliver about 140,000 liters of
water per day from a total head of 10 metres. By 30 September 2006, a total of
7,068 solar PV water pumping systems had been installed, and by March 2012,
7,771 had been installed. Solar driers are used to dry harvests before storage.
Solar Water Heaters: Bangalore has the largest deployment of rooftop
solar water heaters in India. These heaters generate an energy equivalent of

154
200 MW. Bangalore is also the first city in the country to put in place an
incentive mechanism by providing a rebate of 50 on monthly electricity bills
for residents using roof-top thermal systems. These systems are now
mandatory for all new structures. Pune, another city in the western part of
India, has also recently made installation of solar water heaters in new
buildings mandatory. Three methods of capturing and using solar energy for
heating are as follows:
(i). Solar Water Heating: It is used for domestic or commercial water use
where significant hot water is loaded i.e., pools, showers etc.
(ii). Solar Air Heating: It is used for space heating; any building with a south-
facing wall and a requirement for ventilation; industrial facility, operations
building, retail shops etc.
(iii) Passive Solar Heating: It is used for space heating, residential,
commercial, institutional etc.
FUTURE GROWTH TRENDS OF SOLAR ENERGY IN INDIA
The solar industry's structure will rapidly evolve as solar reaches grid parity
with conventional power between 2016 and 2018. Solar will be seen more as a
viable energy source, not just as an alternative to other renewable sources but
also to a significant proportion of conventional grid power. The testing and
refinement of off-grid and rooftop solar models in the seed phase will help lead
to the explosive growth of this segment in the growth phase.
Global prices for photovoltaic (PV) modules are dropping, reducing the overall
cost of generating solar power. In India, this led to a steep decline in the
winning bids for JNNSM projects. With average prices of 15 to 17 cents per
kilowatt hour (kWh), solar costs in India are already among the world's lowest.
Given overcapacity in the module industry, prices will likely continue falling
over the next four years before leveling off. By 2016, the cost of solar power
could be as much as 15 per cent lower than that of the most expensive grid-
connected conventional energy suppliers. The capacity of those suppliers alone,
nearly 8 GW in conventional terms, corresponds to solar equivalent generation
capacity potential of 25 to 30 GW. Due to implementation challenges, however,
it's unlikely that all of this potential will be realized by 2016. Grid parity will be
an inflection point, leading to two major shifts in the solar market. First,
thanks to favorable project economics, grid-connected capacity will rise at a
much faster rate than before, and second, regulations and policy measures will
be refined to promote off-grid generation.
According to one estimates, the combination of electricity demand growth,
fossil fuel cost and availability challenges, and supportive environmental
regulations could increase solar power capacity to more than 50 GW by 2022.

155
The market will see a significant change after 2016. Lower solar costs
combined with rising prices of grid power will convince off takers (including
distribution companies, private firms using open access, and firms putting up
their own captive capacity) that solar power is economically viable. This shift
will signal the start of the growth phase, during which grid-connected solar
capacity will rise rapidly to about 35 GW by 2020 as developers build capacity
to meet both RPO requirements and demand from off takers seeking cost-
efficient alternatives to conventional power.
Factors that will Make India Solar Power
Solar Energy in India is poised to take off in a exponential manner because of a
unique confluence of favorable Supply and Demand factors. Here is a list of
factors that will make Solar Power one of the fastest growing energy sectors in
the world
India has very high isolation (solar radiation in layman language)
which makes solar energy much cheaper to produce solar power in
India compared to countries like Germany, Denmark etc.
India has a huge electricity demand supply gap – Large parts of
India regularly face blackouts for lack of electricity supply leading to
huge monetary losses.
Lack of power grid availability – Solar Energy is ideally suited for
providing power to those areas which don‘t have power lines connecting
it. Large parts of India don‘t have electricity grid connectivity and it is
cheaper to power them through solar energy rather than extending power
lines
Increasing expensive and unreliable electricity supply - The rates of
electricity prices are going up rapidly each year due to a combination of
factors like higher costs of fossil fuels, increasing capital expenditure by
utilities and privatization of power.
Solar Energy approaching Grid Parity – The costs of Solar Energy has
been decreasing rapidly over the last 2 years and has reached retail price
grid parity in countries like Italy, Hawaii.
Strong Support from the Government – The Indian government
through the Jawaharlal Nehru National Solar Mission has provided
strong support to the growth of this industry. The government has set
a target of 20 GW by 2022.
CHALLENGES AND CONSTRAINTS
1. Land Scarcity:
Per capita land availability is a scarce resource in India. Dedication of land
area for exclusive installation of solar cells might have to compete with other
156
necessities that require land. The amount of land required for utility-scale solar
power plants — currently approximately 1 km² for every 20–60 megawatts
(MW) generated could pose a strain on India‘s available land resource. The
architecture more suitable for most of India would be a highly distributed,
individual rooftop power generation systems, all connected via a local grid.
However, erecting - such an infrastructure which doesn‘t enjoy the economies
of scale possible in mass utility-scale solar panel deployment — needs the
market price of solar technology deployment to substantially decline so that it
attracts the individual and average family size household consumer. That
might be possible in the future, since PV is projected to continue its current
cost reductions for the next decades and be able to compete with fossil fuel.
2. Slow Progress
While the world has progressed substantially in production of basic silicon
mono-crystalline photovoltaic cells, India has fallen short to achieve the
worldwide momentum. India is now in 7th place worldwide in Solar
Photovoltaic (PV) Cell production and 9th place in Solar Thermal Systems with
nations like Japan, China, and the US currently ranked far ahead. Globally,
solar is the fastest growing source of energy (though from a very small base)
with an annual average growth of 35per cent, as seen during the past few
years.
3. Latent Potential
Some noted think-tanks recommend that India should adopt a policy of
developing solar power as a dominant component of the renewable energy mix,
since being a densely populated region in the sunny tropical belt; the
subcontinent has the ideal combination of both high solar insolation and a big
potential consumer base density. In one of the analyzed scenarios , while
reining on its long-term carbon emissions without compromising its economic
growth potential, India can make renewable resources like solar the backbone
of its economy by 2050.
4. Government Support
The government of India is promoting the use of solar energy through various
strategies. In the budget proposal for 2010-11, the government has announced
an allocation of Rs.10 billion towards the Jawaharlal Nehru National Solar
Mission and the establishment of a Clean Energy Fund. It‘s an increase of Rs.
3.8 billion from the previous budget. Also budget has also encouraged private
solar companies by reducing customs duty on solar panels by 5 per cent and
exempting excise duty on solar photovoltaic panels. This is expected to reduce
the roof-top solar panel installation by 15- 20 per cent.

157
PROBLEMS AND SUGGESTIONS
PROBLEMS
1. Stand alone EPC Players will cater to ISPPS and
Corporations: The above scenario will increase demand for Engineering
Procurement, and Construction (EPC) players, as developers opt to outsource
turnkey projects due to a lack of internal expertise. EPC players can look
forward to $3 billion in annual sector revenues by 2017, thanks to a wide client
base of utilities, small independents, and niche players.
2. EPC Market will remain Fragmented: With project sizes typically
ranging from 10 to 25 MW, small and medium-sized players will have few
constraints competing against larger national and international ones. Scale-
driven procurement efficiencies will diminish as rapidly declining costs and
improving technology options inhibit the long-term framework agreements that
characterize conventional-energy procurement structures.
3. Manufacturing Space will e Dominated by Imports: One area
of the solar market won't be dominated by small local companies:
manufacturing of modules. Given global overcapacity in this segment, module-
manufacturing facilities likely will not be built in India unless mandated by
local regulations. If that happens, the lower-cost economics of Indian
manufacturers could delay grid parity by two to three years. Nonetheless,
global players have already started setting up bases for balance of systems
(BoS) in India, a trend that is likely to continue.
SUGGESTIONS
Global procurement is unlikely to remain a differentiator as more players
achieve scale and become adept at it. Creating value in the Indian market,
therefore, requires efficient execution, financing, and localization and an open
market.
1. Execution
Given the substantial front-end costs of solar projects, delays can wreak havoc
on profitability. Even under the most suitable conditions, managing power
projects in India is tough—projects are often slowed by infrastructure issues
and unreliable local vendors. In addition, stakeholder management at the
national, state, and local levels often stands in the way of ensuring efficient
project execution and sustained operation. Therefore, building a team of
talented project managers and experienced troubleshooters will be crucial.
2. Financing
Innovative means of financing will create win-win situations for all
stakeholders and drive significant upfront value for project developers.
158
Differentiated models could include teaming with technology providers from
low-cost financing countries—Japan, for example—or with consumers seeking
sustainability benefits or tax credits. A pool of low-cost project equity developed
from retail or other cost sources can add up to a distinct advantage.
3. Localization
Local design and engineering will play a major role in India's solar market.
Inverter and balance-of-system designs that incorporate local requirements and
eliminate unnecessary elements that are geared more toward global markets
can generate significant benefits. Eventually, global players will see the benefits
of manufacturing locally and specifically for the Indian market. Competition
from local players could further drive down systems costs.
4. An Open Market
Although India's solar market appears well suited for local players, it's
currently open to global players as well. Indeed, global firms that tailor their
broad expertise to serve unique local needs in a frugal way could actually
extract significant value. At the same time, local players can bridge capability
gaps by striking appropriate alliances, or by recruiting strong teams or
individuals. A partnership of foreign technology and local EPC can help both
parties climb up the steep learning curve fast, but mechanisms will need to be
put in place to ensure that the risks and upsides are shared equally. Both
parties involved will need a long-term view of the market, with lessons learned
from initial projects built into subsequent ones.
CONCLUSION
Solar power technology is improving consistently over time, as people begin to
understand the benefits offered by this incredible technology. As our oil
reserves decline, it is important for us to turn to alternative sources for energy.
Therefore, it would be better that converting some of the world‘s energy
requirements to solar power are in the best interest of the worldwide economy
and the environment. Since we all are aware of the power of the sun and the
benefits we could get from it. Now, the cost of solar power is quite high. In fact,
for solar energy to achieve its potential, desert solar power plant construction
costs will have to be further reduced via technology improvements, economies
of scale, and streamlined assembly techniques. Development of economic
storage technologies can also lower costs significantly. According to renewable
energy department, a desert solar power plant covering 10 square miles of
desert has potential to produce as much power as the Hoover Dam of US
produces. Thus, desert-based power plants can provide a large share of the
nation‘s commercial energy needs. While some players have already begun
preparing, most have yet to place a bet on solar, given the uncertainties within
159
the sector. Success in solar energy will require a long-term commitment and a
sound understanding of local dynamics.
REFERENCES
1. TERI(2011): Towards Energy Security, 10 January, accessed on 15 Jan
2011(www.teri.in.org)
2. Singh Manmohan(2010): To create solar Village, Jan, Solar Energy Review, New
Delhi
3. Chatterjee, Pramita(2010): For Clean Green Energy, Economic Times, October 1st,
pp-7
4. Delhi International Renewable Energy Conference(DIREC-2010): accessed on 12
Dec, 2010 (http:/www.direc2010.gov.in/)
5. US-India Energy Partnership Summit, Washington DC(2010); Solar Energy Review,
New Delhi-India
6. The Times of India, August 18, 2013, pp-12
7. The Economic Times, August 19, 2013, pp 11
8. The Times of India, August 19, 2013, pp-4
9. Down to Earth, July 16-31, 2013, pp- 12, 16-17
10. Indian J. Environmental Protection, Vol.32, No. 12, Dec 2012, pp1006-1007
11. The Economic Times, August 31, 2013, pp-6
12. Business Standard, August 27, 2013, pp-4
13. http://www.energymile.com
14. http://www.worldenergyoutlook .org/
15. www.pcra.org
27. http://www.communityenergy
28. http://en.wikipedia.org
29. www.safenvironment.wordpress.com
160
Briquette Fuel - An Option for Management of Mikania Micrantha
Ramesh Man Singh and Mridaney Sharma Poudel
Center for Energy and Environment Nepal (CEEN),
Bhote Bahal-224, Kathmandu-11, Nepal
ABSTRACT
Mikania micrantha, mile- a-minute in English, is assessed as one of the six high risks posed IAS
in terrestrial ecosystem in Nepal and is considered second biggest threat after deforestation to
biodiversity conservation. It is becoming pervasive and estimated to have covered over 20per
cent of the Chitwan National Park. A survey was conducted jointly with NTNC, TCN and NAST
to establish the estimates of available Mikania biomass raw material. After being cut, Mikania
can even regenerate by old rootstocks, runners and suckers. M. micrantha does not have much
use after manual removal. So using dried biomass material for briquetting to get fuel may be an
option for its utilization. Different types of briquettes using biomass as well as char were made
from the M. micrantha raw materials. Various physical and fuel characteristics of the briquette
fuels and combustion tests were performed and studied as an alternative fuel. Different test
results show that the use of forest weed M. micrantha to produce briquette fuel will generate a
potential source of alternative energy and will also help in conserving biodiversity in long run.
KEY WORDS: Mikania micrantha, biomass briquetting, carbonization
INTRODUCTION Biological invasion and climate change are the two hottest topics of ecology these
days. Mikania micrantha (Mile-a-minute in English), one of the worst invasive
weeds in the world, is a plant of Neotropical origin and threatening to the
ecosystem of most countries within the moist tropical zones of South-East Asia
(Sapkota 2006). M. micrantha the name honors the Czech botanist Johann
Christian Mikan. A native of Central and South America, M. micrantha was
introduced into India after the Second World War to camouflage airfields and
into Nepal through Ilam from Kajiranga National Park in Assam through India.
The M. micrantha is a fast growing plant capable of climbing over other plants
to gain more sunshine. It is also known as plant killer as it spreads appallingly
fast, blocking sun light for other plants and strangles many plants, which
wither as a result. Its shoot has been reported to grow 27mm a day. It is also
reported that a single plant may cover over 25 sq. meters within a few months.
A single plant releases over 40,000 viable seeds every year (www. issg.org). It
161
also reproduces by old rootstocks, runners, and suckers. Due to its spatial
spread from east to west it now occurs in some 15 eastern and central lowland
Terai districts of Nepal between 72 to 1200 m altitudinal ranges (Tiwari 2005).
Manual uprooting of M. micrantha is the most feasible method but possible
only in the early stage. Burning is not viable as it is fairly deep rooted and is
almost impossible to burn out the roots to exterminate the plant and prevent it
from regenerating. Well established areas pose serious problems because new
plants can grow even from the tiniest stem fragments (IUCN 2005). Mechanical
methods are expensive, labour intensive and provide only short term control.
Herbicides like glycophosphate and 2, 4-D are used before flowering while
contact herbicides such as paraquat is used in seedling stage. Chemical
methods are expensive, environmentally damaging and is not in practice in
Nepal. As the plant does not have any economic value or food value for
herbivores, using this biomass for production of fuel briquettes could be one
alternative method to manage the proliferation problem and also to reduce
dependency on fuel wood and deforestation.
METHODOLOGY 1. M. micrantha was collected from the Chitwan National park (CNP) and used
as the raw materials for this research work. The stem, leaves, branches and
tendril of M. micrantha biomass was collected for total three times in the
months of July, August and October respectively from the buffer zone area
of Chitwan National Park. The material was first sun dried and part of it was
used to make charcoal and the rest was ground in a grinder to get powder
form for making direct biomass briquettes.
2. During the research period, a study for the estimation of M. micrantha
biomass in Chitwan National Park was carried out jointly with National
Trust for Nature Conservation (NTNC), Timber Corporation of Nepal (TCN)
and Nepal Academy of Science and Technology (NAST) with the researchers
to establish the amount of Mikania biomass, which could be available for
briquetting.
3. Proximate analysis and calorific values was determined using Bomb
calorimeter for both the biomass and charcoal using Japanese Industrial
Standards (JIS) 8813 and 8814. The charred material was used to make
beehive briquettes using an ordinary manual mold with 19 holes, whereas
the biomass was used in a screw extruder machine Bangladeshi type in
NAST to obtain biomass briquettes.
4. The briquette fuels (both biomass and charred briquettes) were then tested
using the standard water boiling tests for their performance as fuel. Water
Boiling Test was performed as per VITA or Apprevecho methodology with
some modification.
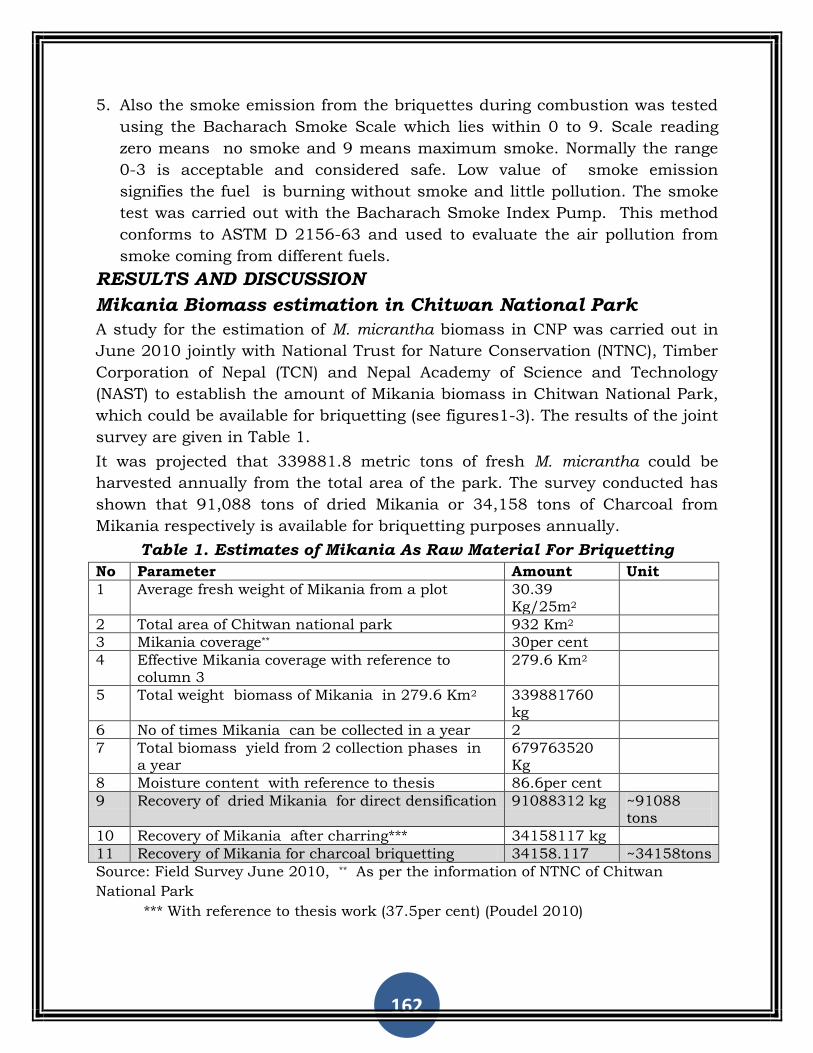
162
5. Also the smoke emission from the briquettes during combustion was tested
using the Bacharach Smoke Scale which lies within 0 to 9. Scale reading
zero means no smoke and 9 means maximum smoke. Normally the range
0-3 is acceptable and considered safe. Low value of smoke emission
signifies the fuel is burning without smoke and little pollution. The smoke
test was carried out with the Bacharach Smoke Index Pump. This method
conforms to ASTM D 2156-63 and used to evaluate the air pollution from
smoke coming from different fuels.
RESULTS AND DISCUSSION
Mikania Biomass estimation in Chitwan National Park
A study for the estimation of M. micrantha biomass in CNP was carried out in
June 2010 jointly with National Trust for Nature Conservation (NTNC), Timber
Corporation of Nepal (TCN) and Nepal Academy of Science and Technology
(NAST) to establish the amount of Mikania biomass in Chitwan National Park,
which could be available for briquetting (see figures1-3). The results of the joint
survey are given in Table 1.
It was projected that 339881.8 metric tons of fresh M. micrantha could be
harvested annually from the total area of the park. The survey conducted has
shown that 91,088 tons of dried Mikania or 34,158 tons of Charcoal from
Mikania respectively is available for briquetting purposes annually.
Table 1. Estimates of Mikania As Raw Material For Briquetting
No Parameter Amount Unit
1 Average fresh weight of Mikania from a plot 30.39 Kg/25m2
2 Total area of Chitwan national park 932 Km2
3 Mikania coverage** 30per cent
4 Effective Mikania coverage with reference to column 3
279.6 Km2
5 Total weight biomass of Mikania in 279.6 Km2 339881760 kg
6 No of times Mikania can be collected in a year 2
7 Total biomass yield from 2 collection phases in a year
679763520 Kg
8 Moisture content with reference to thesis 86.6per cent
9 Recovery of dried Mikania for direct densification 91088312 kg ~91088 tons
10 Recovery of Mikania after charring*** 34158117 kg
11 Recovery of Mikania for charcoal briquetting 34158.117 ~34158tons
Source: Field Survey June 2010, ** As per the information of NTNC of Chitwan
National Park
*** With reference to thesis work (37.5per cent) (Poudel 2010)

163
Mikania has infested many other places such as the Koshi Tappu, Parsa Wild
life Reserve, etc. It has been established that more than 20 districts in the
Terai region has been infested with Mikania (Banko Jankari 2007). Therefore,
the potentials of Mikania as one raw material for briquetting in these areas are
quite large.
Fig 1. Collection of Mikania Fig. 2. Weighing the biomass Fig 3. Team of NTNC, TCN & NAST
Briquette Production The dried Mikania biomass was ground to powder form in a disc mill and was
then run through a screw extruder briquetting machine at 300oC die
temperature to obtain log type briquettes. Some portion of the powder was
compressed in a tablet making machine to obtain biomass pellets as well.
Other remaining biomass was charred in a charring drum to obtain charcoal
which, after grinding, was mixed with 30per cent clay binder and water to
obtain a thick paste, which was then molded into a manual beehive briquette
mold to obtain circular cylindrical briquettes with 19 holes. Some hand pressed
pellets were also made for some tests. Some photos of different briquettes from
Mikania micrantha are given in figures 4-6 below.
Fig 4. Log type briquettes Fig 5. Beehive briquette Fig 6. Charcoal pellets
Proximate Analysis
The highest moisture content 14.77per cent was found to be in char sample
while M. micrantha biomass had 6.8per cent. Similarly moisture content of
beehive briquette (BHB) was found to be 5.26per cent. The highest moisture
content in the char (drum) may be due to the humid weather during the day of
test. Normally, charcoal when standing has the tendency to absorb a lot of
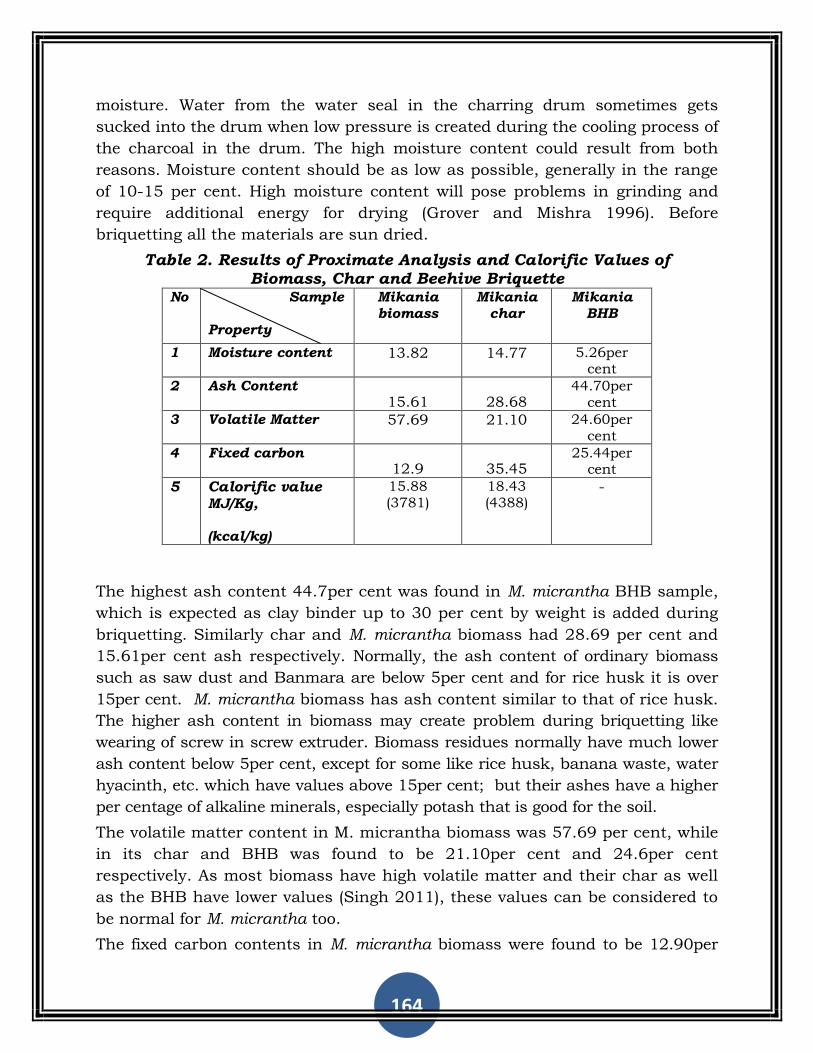
164
moisture. Water from the water seal in the charring drum sometimes gets
sucked into the drum when low pressure is created during the cooling process of
the charcoal in the drum. The high moisture content could result from both
reasons. Moisture content should be as low as possible, generally in the range
of 10-15 per cent. High moisture content will pose problems in grinding and
require additional energy for drying (Grover and Mishra 1996). Before
briquetting all the materials are sun dried.
Table 2. Results of Proximate Analysis and Calorific Values of Biomass, Char and Beehive Briquette
No Sample Property
Mikania biomass
Mikania char
Mikania BHB
1 Moisture content 13.82 14.77 5.26per cent
2 Ash Content 15.61 28.68
44.70per cent
3 Volatile Matter 57.69 21.10 24.60per cent
4 Fixed carbon 12.9 35.45
25.44per cent
5 Calorific value
MJ/Kg, (kcal/kg)
15.88 (3781)
18.43 (4388)
-
The highest ash content 44.7per cent was found in M. micrantha BHB sample,
which is expected as clay binder up to 30 per cent by weight is added during
briquetting. Similarly char and M. micrantha biomass had 28.69 per cent and
15.61per cent ash respectively. Normally, the ash content of ordinary biomass
such as saw dust and Banmara are below 5per cent and for rice husk it is over
15per cent. M. micrantha biomass has ash content similar to that of rice husk.
The higher ash content in biomass may create problem during briquetting like
wearing of screw in screw extruder. Biomass residues normally have much lower
ash content below 5per cent, except for some like rice husk, banana waste, water
hyacinth, etc. which have values above 15per cent; but their ashes have a higher
per centage of alkaline minerals, especially potash that is good for the soil.
The volatile matter content in M. micrantha biomass was 57.69 per cent, while
in its char and BHB was found to be 21.10per cent and 24.6per cent
respectively. As most biomass have high volatile matter and their char as well
as the BHB have lower values (Singh 2011), these values can be considered to
be normal for M. micrantha too.
The fixed carbon contents in M. micrantha biomass were found to be 12.90per
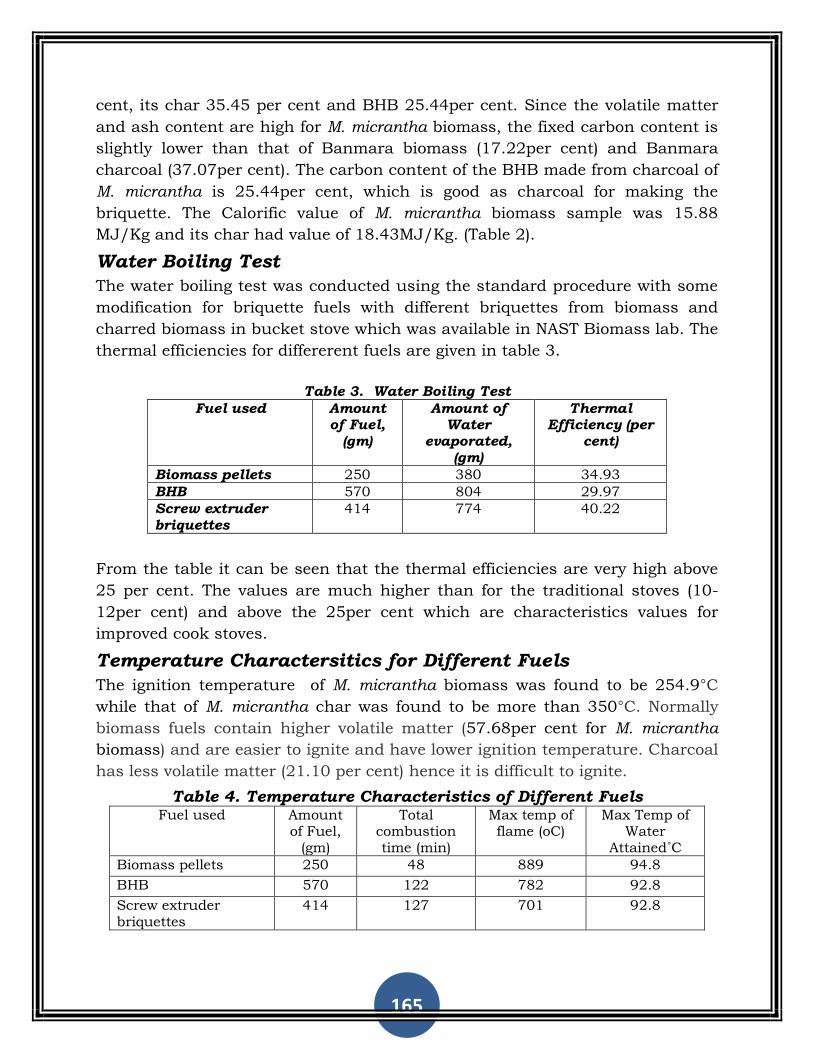
165
cent, its char 35.45 per cent and BHB 25.44per cent. Since the volatile matter
and ash content are high for M. micrantha biomass, the fixed carbon content is
slightly lower than that of Banmara biomass (17.22per cent) and Banmara
charcoal (37.07per cent). The carbon content of the BHB made from charcoal of
M. micrantha is 25.44per cent, which is good as charcoal for making the
briquette. The Calorific value of M. micrantha biomass sample was 15.88
MJ/Kg and its char had value of 18.43MJ/Kg. (Table 2).
Water Boiling Test
The water boiling test was conducted using the standard procedure with some
modification for briquette fuels with different briquettes from biomass and
charred biomass in bucket stove which was available in NAST Biomass lab. The
thermal efficiencies for differerent fuels are given in table 3.
Table 3. Water Boiling Test
Fuel used Amount of Fuel,
(gm)
Amount of Water
evaporated, (gm)
Thermal Efficiency (per
cent)
Biomass pellets 250 380 34.93
BHB 570 804 29.97
Screw extruder briquettes
414 774 40.22
From the table it can be seen that the thermal efficiencies are very high above
25 per cent. The values are much higher than for the traditional stoves (10-
12per cent) and above the 25per cent which are characteristics values for
improved cook stoves.
Temperature Charactersitics for Different Fuels
The ignition temperature of M. micrantha biomass was found to be 254.9°C
while that of M. micrantha char was found to be more than 350°C. Normally
biomass fuels contain higher volatile matter (57.68per cent for M. micrantha
biomass) and are easier to ignite and have lower ignition temperature. Charcoal
has less volatile matter (21.10 per cent) hence it is difficult to ignite.
Table 4. Temperature Characteristics of Different Fuels Fuel used Amount
of Fuel, (gm)
Total combustion time (min)
Max temp of flame (oC)
Max Temp of Water
Attained˚C
Biomass pellets 250 48 889 94.8
BHB 570 122 782 92.8
Screw extruder briquettes
414 127 701 92.8
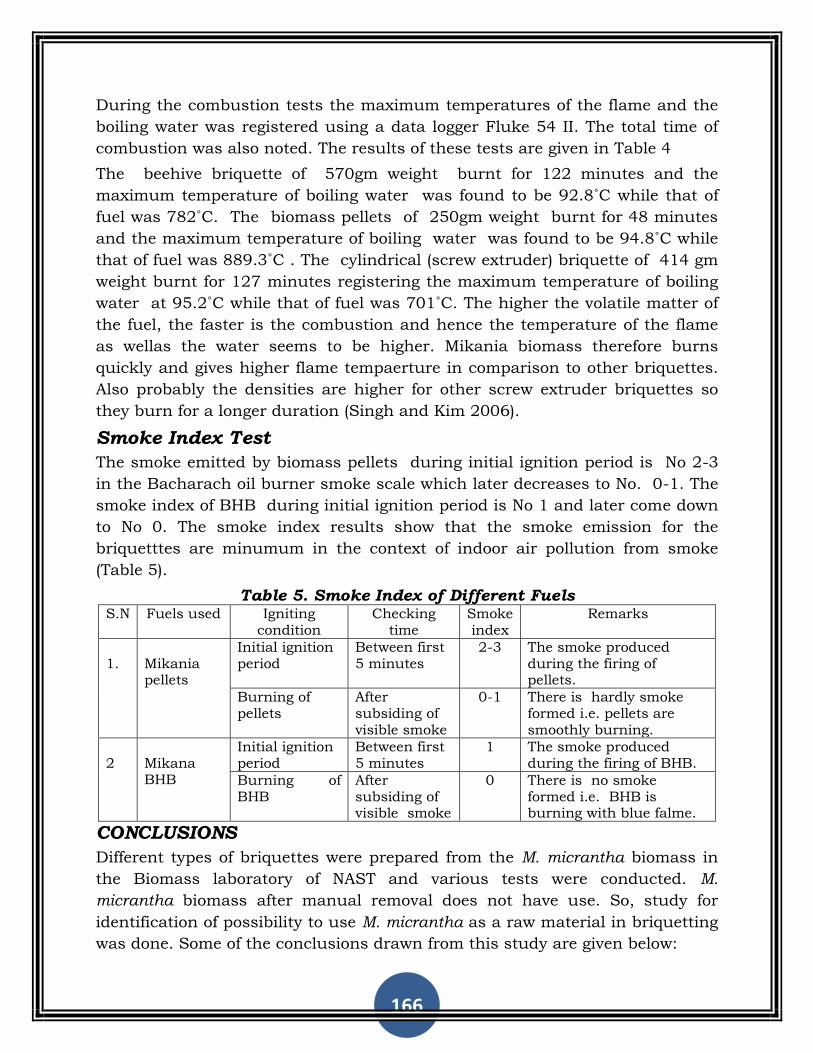
166
During the combustion tests the maximum temperatures of the flame and the
boiling water was registered using a data logger Fluke 54 II. The total time of
combustion was also noted. The results of these tests are given in Table 4
The beehive briquette of 570gm weight burnt for 122 minutes and the
maximum temperature of boiling water was found to be 92.8˚C while that of
fuel was 782˚C. The biomass pellets of 250gm weight burnt for 48 minutes
and the maximum temperature of boiling water was found to be 94.8˚C while
that of fuel was 889.3˚C . The cylindrical (screw extruder) briquette of 414 gm
weight burnt for 127 minutes registering the maximum temperature of boiling
water at 95.2˚C while that of fuel was 701˚C. The higher the volatile matter of
the fuel, the faster is the combustion and hence the temperature of the flame
as wellas the water seems to be higher. Mikania biomass therefore burns
quickly and gives higher flame tempaerture in comparison to other briquettes.
Also probably the densities are higher for other screw extruder briquettes so
they burn for a longer duration (Singh and Kim 2006).
Smoke Index Test
The smoke emitted by biomass pellets during initial ignition period is No 2-3
in the Bacharach oil burner smoke scale which later decreases to No. 0-1. The
smoke index of BHB during initial ignition period is No 1 and later come down
to No 0. The smoke index results show that the smoke emission for the
briquetttes are minumum in the context of indoor air pollution from smoke
(Table 5).
Table 5. Smoke Index of Different Fuels S.N Fuels used Igniting
condition Checking
time Smoke index
Remarks
1.
Mikania pellets
Initial ignition period
Between first 5 minutes
2-3 The smoke produced during the firing of pellets.
Burning of pellets
After subsiding of visible smoke
0-1 There is hardly smoke formed i.e. pellets are smoothly burning.
2
Mikana BHB
Initial ignition period
Between first 5 minutes
1 The smoke produced during the firing of BHB.
Burning of BHB
After subsiding of visible smoke
0 There is no smoke formed i.e. BHB is burning with blue falme.
CONCLUSIONS
Different types of briquettes were prepared from the M. micrantha biomass in
the Biomass laboratory of NAST and various tests were conducted. M.
micrantha biomass after manual removal does not have use. So, study for
identification of possibility to use M. micrantha as a raw material in briquetting
was done. Some of the conclusions drawn from this study are given below:
167
Survey results show that 339881.8 metric tons of fresh M. micrantha could
be harvested annually from the total area of Chitwan National Park and
91,088 tons of dried Mikania or 34,158 tons of Charcoal from Mikania
respectively is available for briquetting purposes annually.
Proximate analysis (moisture content, ash content, volatile matter and fixed
carbon) of M. micrantha was that of a typical biomass except that the ash
content (>15per cent) was in the range of rice husk. The calorific values of
biomass and char of Mikania also have similar values and can be used for
making briquette fuels.
Briquette formation using biomass and char of Mikania with the common
briquetting methods showed that stable briquettes having adequate strength
can be formed to conduct all the combustion and water boiling tests.
Water boiling tests and combustion tests show that briquettes from Mikania
have good combustion as well as fuel properties and can be used as
substitute for fuel wood or an alternative fuel in rural areas.
This research work shows that Mikania micrantha, a problematic biomass
in the Chitwon National Park, can be utilized e for producing biomass as
well as char briquettes and can serve as a management solution to the
proliferation problems from Mikania.
REFERENCES
1. Grover P.D. and Mishra S.K. 1996. Biomass Briquetting: Technology and practices.
Regional Wood Energy Development Programme in Asia Food and Agriculture
Organization of the United Nations, Bangkok, Thailand.
2. IUCN 2005. An inventory and assessment of Invasive Alien Plant Species of Nepal.
International Union for Conservation of Nature, Nepal.
3. Poudel, M.S. 2010. Potentials to Utilize Mikania Micrantha, An Invasive Alien Species of
Chitwan National Park, as a raw material in briquetting. M.Sc. thesis. TU, Kirtipur,
Nepal
4. Sapkota, L. 2006. Corrected Banko Janakari, Vol. 17(2).
5. Shrestha, J. 2002. Biomass briquetting and sources of raw materials, RONAST, Lalitpur.
6. Singh, R. M. and Kim, H.J. 2006. Eco-fuel briquettes for sustainable development
WRSTSD, Vol. 3, No.1 pp. 49 - 57, Brighton, UK
7. Singh, R.M. 2011. Pictorial Training Manual for Production and Use of Beehive
Biobriquettes, Katmandu, Nepal, 32pp.
8. Tiwari, R.D. 2005. Mikania Weed: A Challenge for Conservationists, Our Nature: An
International Biological Journal; vol. 3(1) page 81-82.
www. issg.org
168
Energy Conservation and Management –Towards Sustainable Development
N.V.Kavitha and Smita Asthana
St. Ann‘s College for Women, Mehdipatnam,
Hyderabad
ABSTRACT
“The strength of the energy sector and its development in the right direction is the basis for the normal functioning of the country's economy and public development”. It‟s time for policy makers to take decisions for long term results aimed at ensuring the welfare of the future generations. Energy being an important element for survival its availability on sustainable basis has to be ensured. On the other hand, the demand for energy is growing manifold and the energy sources are becoming scarce and costlier. Among the various strategies to be evolved for meeting energy demand, efficient use of energy and its conservation emerges out to be the least cost option in any given strategies, apart from being environmentally benign. The present paper focuses on the measures to be adopted by various sectors of the economy in energy conservation and discusses implementation of management strategies in conservation of energy. The study is based on both primary and secondary data, as a pilot survey of 200 respondents was conducted to understand the awareness of an individual with regards to scarcity of energy sources and the role played by him in energy conservation. The outcome is an indicator of a mismatch between awareness and action. The improving life styles and huge consumption of energy has led to a sharp increase in the demand for electricity and fossil fuels. Use of fossil fuels has resulted in emission of huge quantity of carbon dioxide causing serious environmental damages. There is still a considerable potential for reducing energy consumption by adopting energy efficiency measures at various sectors of our country. Energy efficiency will not only reduce the need to create new capacity requiring high investment, but also result in substantial environmental benefits. Efficient use of energy and its conservation will succeed as a program if opinion leaders and captains of industry take the lead in supporting the conservation programs. The steps to create sustainable energy system begin with the wise use of resources; energy efficiency is the mantra that leads to sustainable energy management.
KEY WORDS: Energy Conservation, Energy management, Sustainability,
Energy efficiency
169
INTRODUCTION
Energy is the driver of growth. International studies on human development
indicate that India needs much larger per capita energy consumption to
provide better living conditions to its citizens; but such growth has to be
balanced and sustainable. Planning commission of India has estimated that
India has conservation potential at 23per cent of the total commercial energy
generated in the country.
We need to focus on bringing about a first-hand realization of the energy crisis
that we are facing today, and the effect it will have on our future. The youth,
the policy makers of tomorrow, will play a vital role in not only propagating
efficient usage of energy but also furthering the larger cause of educating the
society on environmental issues and helping build a greener and safer
tomorrow. As the demand for power in the country is steadily increasing and
energy resources are being rapidly depleted, it is vital to invite, involve and
impress upon our youth, as ambassadors of tomorrow, to join in initiatives to
avert an energy crisis.
Youth are more likely to develop a greater sense of positive impact on the
environment if they learn easy and creative ways to use energy more efficiently
at a young age. Through the use of practical applications, youth can begin to
make a difference in our environment. They need to be given the opportunities
to learn and develop lifelong environmental protection and eco-friendly habits
through teaching and learning pedagogy.
SURVEY ANALYSIS
A pilot survey of 200 respondents was conducted to understand the awareness
of an individual with regards to scarcity of energy sources and the role played
by her in energy conservation. Basically the survey was conducted to
understand the perceptions of the youth in age group of 18 to 22 years as the
younger generations have to be fully equipped with the concept of energy
conservation and management. The questionnaire was divided into two parts;
the first part dealt with ― I do‖ , recording their actions in small day to day
energy saving activities whereas part two ― I believe‖ focused on their
awareness about energy conservation. The respondents were from different
faculties such as Sciences, Arts and Commerce pursuing their undergraduate
course from different geographical areas. Only 178 students responded and the
data thus collected are analyzed with the statistical software package SPSS,
using descriptive, per centages and chi-square tests.
HYPOTHESIS
H1: There is no association between education qualification of the respondent
and action of the respondents with regards to recycle of old note books and
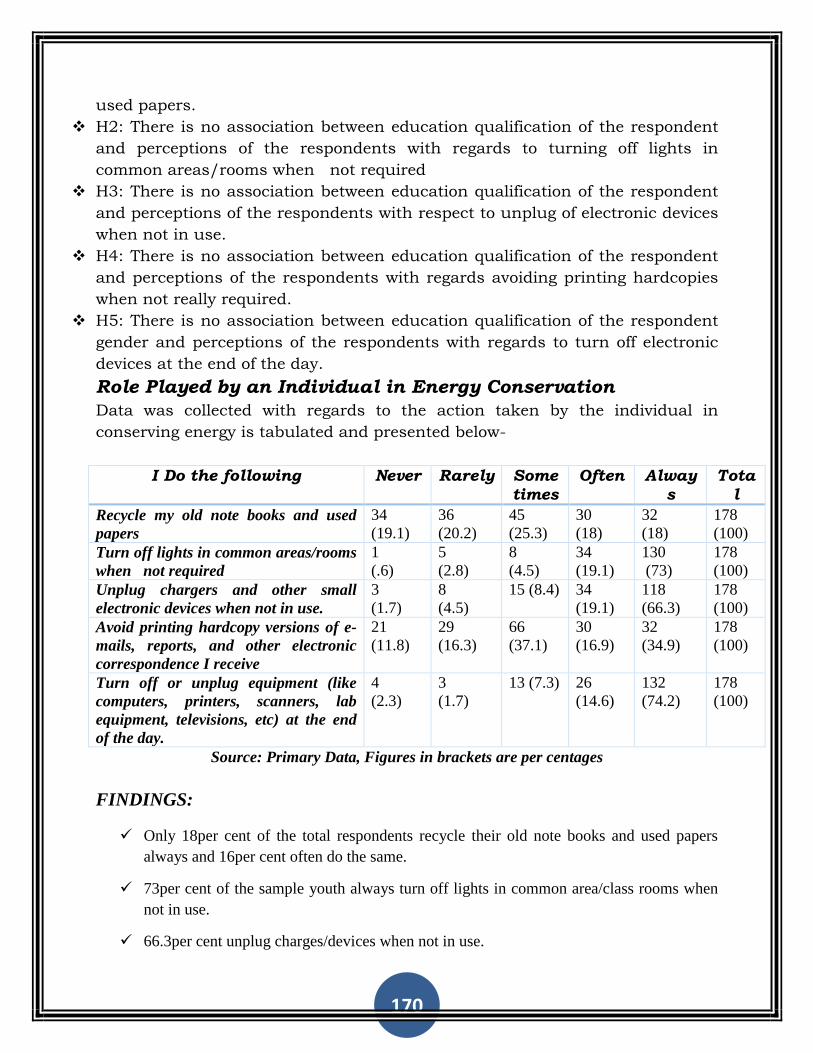
170
used papers.
H2: There is no association between education qualification of the respondent
and perceptions of the respondents with regards to turning off lights in
common areas/rooms when not required
H3: There is no association between education qualification of the respondent
and perceptions of the respondents with respect to unplug of electronic devices
when not in use.
H4: There is no association between education qualification of the respondent
and perceptions of the respondents with regards avoiding printing hardcopies
when not really required.
H5: There is no association between education qualification of the respondent
gender and perceptions of the respondents with regards to turn off electronic
devices at the end of the day.
Role Played by an Individual in Energy Conservation
Data was collected with regards to the action taken by the individual in
conserving energy is tabulated and presented below-
I Do the following Never Rarely Some
times
Often Alway
s
Tota
l
Recycle my old note books and used
papers
34
(19.1)
36
(20.2)
45
(25.3)
30
(18)
32
(18)
178
(100)
Turn off lights in common areas/rooms
when not required
1
(.6)
5
(2.8)
8
(4.5)
34
(19.1)
130
(73)
178
(100)
Unplug chargers and other small
electronic devices when not in use.
3
(1.7)
8
(4.5)
15 (8.4) 34
(19.1)
118
(66.3)
178
(100)
Avoid printing hardcopy versions of e-
mails, reports, and other electronic
correspondence I receive
21
(11.8)
29
(16.3)
66
(37.1)
30
(16.9)
32
(34.9)
178
(100)
Turn off or unplug equipment (like
computers, printers, scanners, lab
equipment, televisions, etc) at the end
of the day.
4
(2.3)
3
(1.7)
13 (7.3) 26
(14.6)
132
(74.2)
178
(100)
Source: Primary Data, Figures in brackets are per centages
FINDINGS:
Only 18per cent of the total respondents recycle their old note books and used papers
always and 16per cent often do the same.
73per cent of the sample youth always turn off lights in common area/class rooms when
not in use.
66.3per cent unplug charges/devices when not in use.

171
Only 34.9per cent avoid printing of hardcopy versions of mails/reports etc.
74.2per cent turn off their equipment at the end of the day.
Perceptions of an Individual in Energy Conservation and Management –
Individual’s Beliefs
I believe in the following Strongly
Disagree
Disagree Neutral Agree Strongly
Agree
Total
We have lots of water, so there's no
reason to conserve.
82
(46)
75
(42.1)
7
(3.9)
12
(6.7)
2
(1.1)
178
(100)
Conserving energy is not very
important to me; I don't pay the bills
so why should I care.
119
(66.9)
56
(31.5)
1
(.6)
1
(.6)
1
(.6)
178
(100)
Energy conservation is an important
issue these days so people should try
to do everything they can at home
and at the work place to save
energy.
3
(1.7)
2
(1.1)
11
(6.2)
77
(43.3)
85
(47.8)
178
(100)
If I tried to conserve energy I'd have
to give up certain comforts and
conveniences and I don't want to do
that.
27
(15.2)
53
(29.8)
66
(37.1)
24
(13.5)
8
(4.5)
178
(100)
If we don't stop using so much
energy we'll be faced with serious
environmental consequences in the
future.
11
(6.2)
6
(3.4)
3
(1.7)
71
(39.9)
87
(48.9)
178
(100)
.Environmental responsibility and
conservation is each individual’s
duty.
4
(2.3)
4
(2.2)
4
(2.2)
56
(31.5)
110
(61.8)
178
(100)
The college has provided us with a
clear direction on its environmental
commitment and green business
philosophy.
9
(5.1)
16
(9)
37
(20.8)
87
(48.9)
29
(16.3)
178
(100)
I think we could do a lot more to
green our homes and college.
1
(.6)
0 13
(7.3)
88
(49.4)
76
(42.7)
178
(100)
.I think we could do a lot more to
green our behaviors.
2
(1.1)
2
(1.1)
16
(9)
100
(56.2)
56
(32.6)
178
(100)
We'd be greener if it didn't cost us
more.
5
(2.8)
8
(4.5)
53
(29.8)
70
(39.3)
42
(23.6)
178
(100)
Source: Primary Data, Figures in brackets are per centages
172
FINDINGS:
46per cent and 42.1per cent of the respondents strongly disagree and disagree of not
conserving energy.
66.9per cent and 31.5per cent of the respondents responded positively for conserving
energy being an important issue in the present scenario.
Almost 90 per cent 9 (i.e. 47.8per cent per cent and 43.3per cent) strongly agree and
agree that it is important for every individual to act on saving energy both at home
and workplace.
More than 80 per cent (15.2 per cent, 29.8 per cent and 37.1 per cent) strongly
disagree, disagree and were neutral, when it comes to giving up some of their
comforts for saving energy.
Around 90 per cent (48.9 per cent and 39.9 per cent) strongly agree and agree that
there is a need to conserve energy or there is a possibility of serious consequences in
the future.
As many as 93 per cent of the respondents (61.8 per cent and 31.5 per cent) strongly
agree and agree that energy conservation is each individual responsibility.
65 per cent of the respondents (16.3 per cent and 48.9 per cent) strongly agree and
agree that their educational institutions have clear direction in its environment
commitment.
More than 90 per cent of the respondents are of the opinion that lot more can be done
to green our homes, workplace and green our behavior.
62 per cent of the respondents opined that “We'd be greener if it didn't cost us more”.
RESULTS: HYPOTHESIS ACCEPTED /REJECTED
Table 3 clearly indicates the acceptance and rejection of the hypothesis for the survey.
SUGGESTIONS:
From the study we find that there is an immense need in establishment of necessary
institutional set-up for formulation of policies, programmes and co-ordination of
implementation of energy conservation activities.
Training of managerial and operating personnel, and establishment of specialized teaching
institutions.
Devising specific strategies for creation of awareness among domestic consumers of
energy.
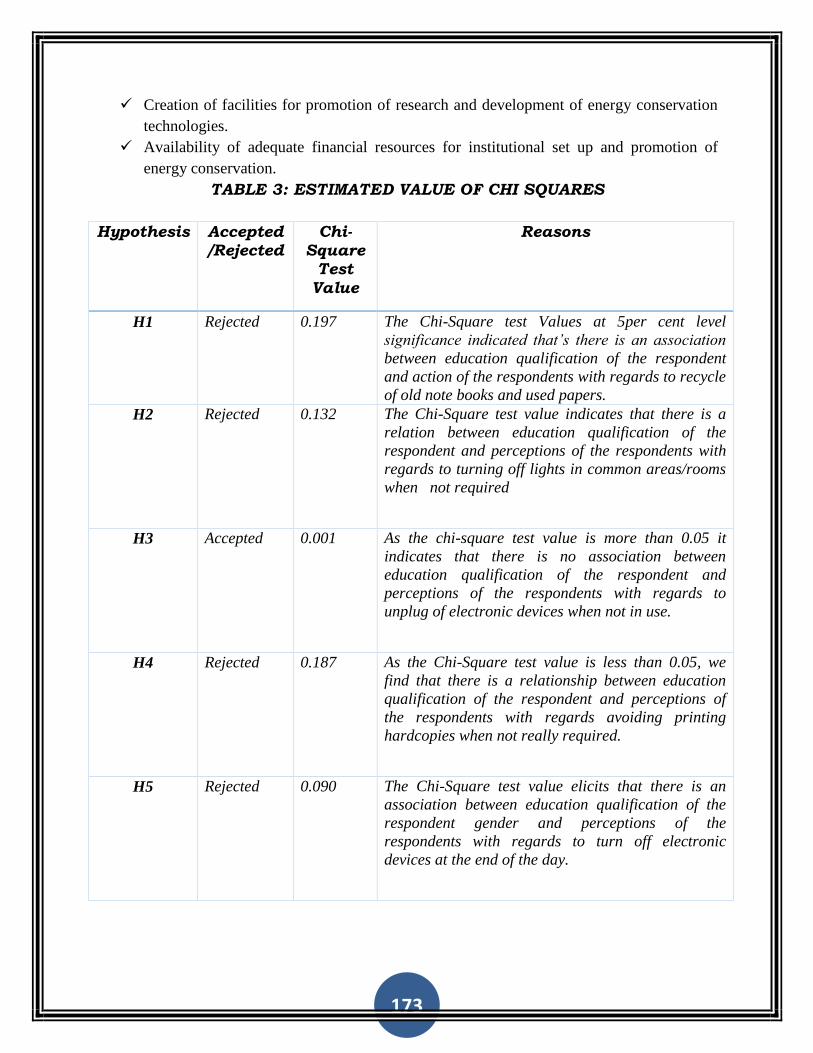
173
Creation of facilities for promotion of research and development of energy conservation
technologies.
Availability of adequate financial resources for institutional set up and promotion of
energy conservation.
TABLE 3: ESTIMATED VALUE OF CHI SQUARES
Hypothesis Accepted/Rejected
Chi- Square
Test
Value
Reasons
H1 Rejected 0.197 The Chi-Square test Values at 5per cent level
significance indicated that‘s there is an association
between education qualification of the respondent
and action of the respondents with regards to recycle
of old note books and used papers.
H2 Rejected 0.132 The Chi-Square test value indicates that there is a
relation between education qualification of the
respondent and perceptions of the respondents with
regards to turning off lights in common areas/rooms
when not required
H3 Accepted 0.001 As the chi-square test value is more than 0.05 it
indicates that there is no association between
education qualification of the respondent and
perceptions of the respondents with regards to
unplug of electronic devices when not in use.
H4 Rejected 0.187 As the Chi-Square test value is less than 0.05, we
find that there is a relationship between education
qualification of the respondent and perceptions of
the respondents with regards avoiding printing
hardcopies when not really required.
H5 Rejected 0.090 The Chi-Square test value elicits that there is an
association between education qualification of the
respondent gender and perceptions of the
respondents with regards to turn off electronic
devices at the end of the day.
174
CONCLUSIONS:
Need of the hour is to promote conservation and wise energy use among youth
at a time when life-long habits begin to form. The next generation has to be
encouraged to use energy more efficiently which will ultimately reduce their
carbon footprint and protect the environment. By learning about energy
efficiency and conservation at a young age, students will adopt positive
attitudes and habits in their daily lives and pass them onto friends and family.
The improving life styles and huge consumption of energy has led to a sharp
increase in the demand for electricity and fossil fuels. There is still a
considerable potential for reducing energy consumption by adopting energy
efficiency measures at various sectors of our country. Energy efficiency will not
only reduce the need to create new capacity requiring high investment, but also
result in substantial environmental benefits. Efficient use of energy and its
conservation will succeed as a program if opinion leaders and captains of
industry take the lead in supporting the conservation programs. The steps to
create sustainable energy system begin with the wise use of resources; energy
efficiency is the mantra that leads to sustainable energy management. We need
to develop educated, aware and active student communities in the society to
share and expand their understanding, and bring about a chain-reaction that
can significantly reduce wastage of energy in the country.
175
Sustainable use of wind resources for high agricultural production in Arid Region of Rajasthan- A case study of
impact of shelterbelt
B.L. Gajja
S.S. Ramdev
Former Principal Scientist Assistant Professor
Central Arid Zone Research Institute Vyas Institute of Management
Jodhpur Jodhpur
ABSTRACT
The sustainable use of natural resources (Wind energy) is the pre-requisite condition for
enhancing the agricultural production and productivity. The sustainability can be manage by
conserving the natural resources for higher agricultural productivity at minimize adverse
impact. In arid region of Rajasthan, sandstorms, wind erosion, shifting sand, droughts and frost
are common phenomenon. Strong winds during summer and penetrating cold breeze in the
winter crated a very serious natural hazards, resultant in to low productivity of land. The
available technology to mitigate such adverse environment, suitable tree shelterbelts technology
proved the most appropriate technology which leads to increased evapo-transpiration leading
to reduce plant stress and increase crop yields. In recent years, there are enough scientific
evidences to for occurrence in climate change. This is also a renewable source produced high
energy in form of electricity but also have negative impact of land productivity. An attempt has
been made documented across in a case study on impacts of shelterbelts in Indian desert. The
study based on selection of 80 farmers with shelterbelt and without shelterbelt under irrigated
condition under tube –well command area in Lathi series and canal command area of Indira
Gandhi Nahar Project Phase – II in the Mohangarh area of Jaisalmer district, indicated that
shelterbelt technology has increased the choice of number of crops to be grown and also reduced
adverse effects of weather extremities i.e. cold and heat waves and by reducing the temperature
in arid region of Rajasthan. Reduction in temperature increase moisture in soils leads to
increase crop yield indicated an improvement in climating condition of the study area. Under
shelterbelt plantation, farmers are now growing various the crops like pearl millet, groundnut
and clusterbean during Kharif season and wheat, mustard, isabgol and cumin during the rabi
season. The isabgol and cumin are very sensitive crops to frost during winter season. The crop
production was estimated to be 200 per cent and 48 per cent more over non-shelterbelt
plantation during Rainy and winter season respectively. The shelterbelt technology could also
generate additional employment to the tune 120 and 40 per cent during Kharif and rabi season,
respectively.. The shelterbelt technology also revealed net return upto 300 and 85 per cent
during Kharif and Rabi season, respectively. Shelterbelt plant produce fuel wood, timber and
fruits generated additional income. The economic losses from crops only due to non – adoption
of shelterbelt was estimated to be Rs.1142 million as only 5 and 10 per cent area has been
coved under canal and tube well systems, respectively.
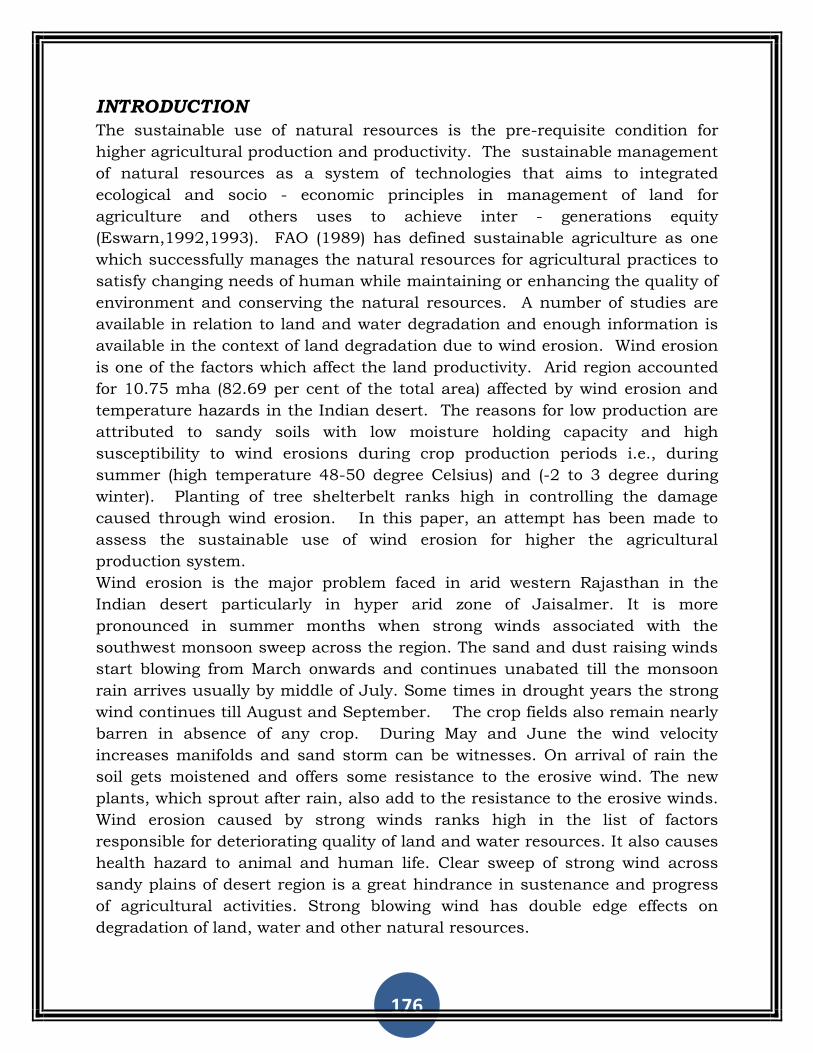
176
INTRODUCTION
The sustainable use of natural resources is the pre-requisite condition for
higher agricultural production and productivity. The sustainable management
of natural resources as a system of technologies that aims to integrated
ecological and socio - economic principles in management of land for
agriculture and others uses to achieve inter - generations equity
(Eswarn,1992,1993). FAO (1989) has defined sustainable agriculture as one
which successfully manages the natural resources for agricultural practices to
satisfy changing needs of human while maintaining or enhancing the quality of
environment and conserving the natural resources. A number of studies are
available in relation to land and water degradation and enough information is
available in the context of land degradation due to wind erosion. Wind erosion
is one of the factors which affect the land productivity. Arid region accounted
for 10.75 mha (82.69 per cent of the total area) affected by wind erosion and
temperature hazards in the Indian desert. The reasons for low production are
attributed to sandy soils with low moisture holding capacity and high
susceptibility to wind erosions during crop production periods i.e., during
summer (high temperature 48-50 degree Celsius) and (-2 to 3 degree during
winter). Planting of tree shelterbelt ranks high in controlling the damage
caused through wind erosion. In this paper, an attempt has been made to
assess the sustainable use of wind erosion for higher the agricultural
production system.
Wind erosion is the major problem faced in arid western Rajasthan in the
Indian desert particularly in hyper arid zone of Jaisalmer. It is more
pronounced in summer months when strong winds associated with the
southwest monsoon sweep across the region. The sand and dust raising winds
start blowing from March onwards and continues unabated till the monsoon
rain arrives usually by middle of July. Some times in drought years the strong
wind continues till August and September. The crop fields also remain nearly
barren in absence of any crop. During May and June the wind velocity
increases manifolds and sand storm can be witnesses. On arrival of rain the
soil gets moistened and offers some resistance to the erosive wind. The new
plants, which sprout after rain, also add to the resistance to the erosive winds.
Wind erosion caused by strong winds ranks high in the list of factors
responsible for deteriorating quality of land and water resources. It also causes
health hazard to animal and human life. Clear sweep of strong wind across
sandy plains of desert region is a great hindrance in sustenance and progress
of agricultural activities. Strong blowing wind has double edge effects on
degradation of land, water and other natural resources.
177
To minimize erosion hazards of speedy winds and optimize production of
agricultural crops, various efforts have been made in the past by adopting
different soil conservation measures. Among them, the reduction in wind
velocity leads to reduction in soil loss, deposition of sand on road, canal and
other water bodies. With the expectation of these results, the work on
shelterbelt was started way back in 1950s. Initial research work was aimed to
develop design of shelterbelt, screen suitable tree species for its composition
and develop techniques for plantation establishment. An attempt has been
made documented a case study on impacts of shelterbelts in Indian desert for
sustainable use of wind erosion for higher agricultural production in arid
region.
MANAGEMENT OF LAND RESOURCES
Land degradation is the major issue which causes decline in land quality and
subsequently threatens to world food security and quality of the environment.
Land degradation can be considered in terms of the loss of actual or potential
productivity. Factors of land degradation are the biophysical processes and
attributes that determine the kind of degradation processes, e.g. erosion,
salinization, etc. Wind erosion is one of the causes of land degradation in western part of
Rajasthan which constitute nearly 10.75 mha of land degradation (82.69 per
cent of total 13.0 mha in India). The hot arid region of western Rajasthan, a
part of the Thar Indian desert, is highly prone to wind erosion and represents
a fragile ecosystem which has resulted from a continued effect of various
natural processes such as low and erratic rainfall, intense heat, high
evaporation, low relative humidity, poor edaphic conditions, high biotic
pressure, high wind speed, etc. The agricultural productivity in the region
remains limited due to un-conducive environment, limited choice of crops and
aberrant weather conditions. The sweep of strong winds across sandy desert is
a big hindrance in the sustenance of agricultural and allied activities (Mertia et
al, 2006). To minimize the erosion hazards of speedy winds and optimize
agricultural production, various efforts have been made in the past by adopting
different soil and water conservation measures. Adoption of shelterbelts on
farm in the arid region of western Rajasthan is considered as one of the most
important technological intervention for minimizing the harmful effects of
strong winds on one hand and increasing the farm productivity on the other
hand through moderation of micro-environment at field level. The shelterbelt
technology involves rising of porous vegetative barriers comprising strips of
trees, shrubs and bushes planted across the prevailing wind direction. These
vegetative barriers provide first line defense against wind erosion, breakage of
178
branches and shedding of fruits and moderates the effects of extreme weather
events like cold and heat waves. The present study was aimed to assess the
extent to which the shelterbelt technology could fulfill its prime objective of
minimizing hazardous effects of strong winds and increasing farm productivity
and returns. The shelterbelt plantation found quite effective in reducing effects
of weather extremities condition viz, cold and heat waves.
MATERIAL AND METHODS
Socio-economic Investigation:
To assess socio-economic impacts of shelterbelt plantations, 80 farmers with
shelterbelt and 80 farmers without shelterbelt (control) were selected randomly
in each area of tube well command Lathi series and canal command area in
Mohangarh. For collection of primary data, all these farmers were surveyed
and basic information on various aspects were collected as per pre-designed
schedule. During survey, discussion with farmers was made in participatory
mode and efforts were made to involve more members of family including
women and children in assessing information on various socio-economic
aspects. The data on various aspects such as cost of inputs used for crop
raising, returns from crops, and production from shelterbelt like fodder,
timber, fruits etc. were also collected. The information on change in assets and
livestock composition was also collected to find out the change in livelihood.
The economic losses were estimated by difference in crop productivity of farms
covered with shelterbelt and average crop productivity of the district.
RESULTS AND DISCUSSION
Cropping Pattern:
The cropping pattern adopted by sample farms with shelterbelt and without
shelterbelt is shown in Table 1. From the Table 1, it is revealed that the
cropping under non - shelterbelt was restricted to pearl millet and
groundnut during Kharif season while mustard during rabi season. However,
a number of crops are grown in the farms under shelterbelt plantation. The
important crops grown during Kharif season under shelterbelt plantation
were pearl millet, cluster bean and groundnut while during rabi season,
wheat, barley, cumin, isabgul and mustard crops were taken. The cumin and
isabgul (plantago ovata) crops are very sensitive to frost (extreme cold) which is
common phenomenon in the study area. The cumin and isabgul (plantago
ovata) occupied nearly 95 per cent area in western part of Rajasthan.
179
Table 1: Cropping Pattern under Shelterbelt and Non-Shelterbelt Farms.
Season Cropping pattern under
Shelterbelt Non - shelterbelt
summer rainfed Pearl millet Pearl millet
Groundnut Groundnut
Cluster bean
Winter Mustard Mustard
Wheat
Barley
Cumin
Isabgul
Economic Indicators:
The positive impact of environmental change can be assessed by increase in
yield, employment, profitability and reduction in unit cost of production
(James, 1994). Per farm total production, employment, total expenditure, total
returns and net returns for shelterbelt and non – shelterbelt were worked and
presented in Table 2. From the Table 2, it is revealed that crop production
under shelterbelt has been double and 48 per cent more over non – shelterbelt
plantation during summer rainfed and winter seasons, respectively. The
overall production under shelterbelt plantation was 94 per cent more over non
– shelterbelt. The farms with shelterbelt plantation generated 135 per cent and
100 per cent more employment during summer rainfed and winter season,
respectively. The overall additional employment generated by farms with
shelterbelt was about 113 per cent. The third criteria were to assess impact of
technology was decrease in unit cost of production. The unit cost of
production during summer rainfed and winter season under shelterbelt was
less than that of under non – shelterbelt. Similarly, the total returns as well
as net returns were more under shelterbelt compare to non – shelterbelt farms
during summer rainfed and winter season and over all, respectively.
Returns from Shelterbelt Plantation:
The shelterbelt plantations have generated various types of product including
fuel wood, timber and fruits. The shelterbelt with three rows of 15 to 20 years
old provided fuel wood, timber while shelterbelt with two rows or one row
having fruit plants like Cordia myxa (gunda) underground water. The D. sissoo
(sisam) based shelterbelt under canal irrigation yields timber, high quality
wood for furniture and decoration which fetches high price in the market. The
returns from shelterbelt were worked out and presented in Table 3. The overall
canopy of dense and partial is more or less same.
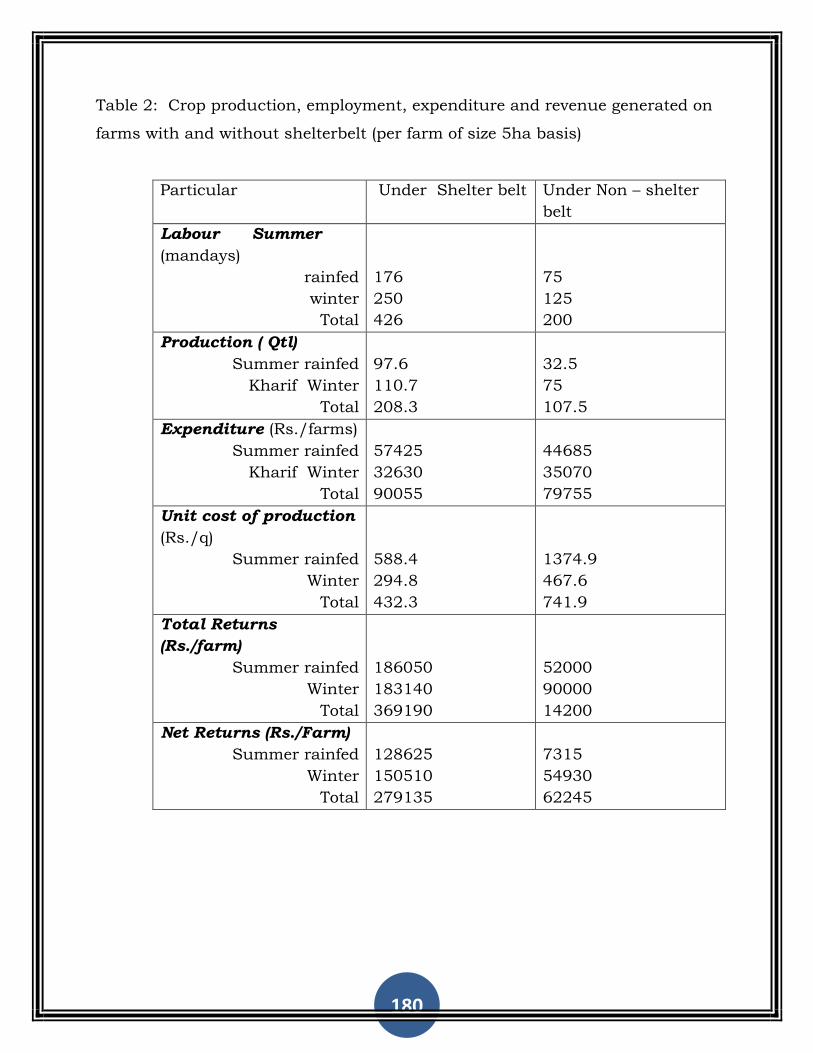
180
Table 2: Crop production, employment, expenditure and revenue generated on
farms with and without shelterbelt (per farm of size 5ha basis)
Particular Under Shelter belt Under Non – shelter
belt
Labour Summer
(mandays)
rainfed
winter
Total
176
250
426
75
125
200
Production ( Qtl)
Summer rainfed
Kharif Winter
Total
97.6
110.7
208.3
32.5
75
107.5
Expenditure (Rs./farms)
Summer rainfed
Kharif Winter
Total
57425
32630
90055
44685
35070
79755
Unit cost of production
(Rs./q)
Summer rainfed
Winter
Total
588.4
294.8
432.3
1374.9
467.6
741.9
Total Returns
(Rs./farm)
Summer rainfed
Winter
Total
186050
183140
369190
52000
90000
14200
Net Returns (Rs./Farm)
Summer rainfed
Winter
Total
128625
150510
279135
7315
54930
62245

181
Table 3: Additional income generated from 15 – 20 years shelterbelt plantation
Particular Annual additional income (Rs./farm of 5ha size)
Under tubewells Canal
Dense Partial Partial
Fuel wood 30000 18000 11000
Timber and fruits
7500 7000 25000
Total 37500 25000 36000
Economic losses due to Non –adoption of Shelterbelt:
The estimated total command area of ‗Indira Gandhi Nahar Priyojna‘ phase II is
9.25 lakhs ha which has been allotted on the basis of ‗One Murba‘ (equivalent
to 5 ha.) to each farmer. The area under tube well irrigation is about 20,000
ha. It is assessed that only 5 per cent and 20 per cent of the total command
area of canal and tube wells, respectively, is covered with shelterbelt
plantations. This indicated that the large
Table 4. Area, Productivity and potential yield under shelterbelt plantations.
Crop Area under
crop (ha)*
Yield of crop
(q/ha)*
Potential
yield (q/ha)**
Economic
losses (Rs. In
lakhs)
Groundnut 3311 15.65 24.00 442.35
Wheat 5377 27.94 31.50 134.00
Gram 9431 6.33 18.20 895.57
Mustard 30090 9.16 22.00 4636.27
Cumin 12797 5.30 9.75 4555.73
Isabgul
(plantago ovata)
8798 5.56 8.25 757.33
Total 69804 69.94 113.70 11421.25
*Area and productivity of Jaisalmer district during 2003-04 collected from ‗Agricultural Statistics of Rajasthan‘
published by Directorate of Econ. And statistics, Govt. of Rajasthan, jaipur
** Average yield of farmers surveyed having shelterbelt plantation.
portion of the irrigated land is still uncovered with shelterbelts and the
tangible and non – tangible benefits which otherwise, would have been
accrued from the shelterbelt area due to presence of shelterbelt are the net
losses to the farmers. The crop – wise estimated losses were worked out and
182
presented in Table 4. On the basis of the potential productivity, the yearly
economic losses from crops due to non – adoption of shelterbelt technology are
around Rs.1142 million. The major losses were from the mustard crop followed
by cumin, isabgol (plantago ovata). The present trend of cumin and isabgol
(plantago ovata) being a high export value crop, more area is likely to put under
these crops in future.
Presently the average number of trees under shelterbelt is around 220 per
murba (equivalent to 5 ha.), which varied from 50 to 400. The number of tree
requirement is 400 per murba (equivalent to 5 ha.). Under the canal area the
number of trees is therefore, less by 180 per murba (equivalent to 5 ha.). The
total trees are around 54 lacs. The present estimated value of wood from the
tree at the age 15-18 years is Rs.5, 000/- which itself would cause losses of
about 27000 million. The total losses therefore from the crops and shelterbelt
are around Rs.82142 millions. Economic returns from shelterbelt plantation all
along the main canal and distributaries have helped in generating additional
income. The livestock productivity has also increased due to availability of
more browse material. The sheep health has improved which is the indicator
in price fixation. The value of one sheep has increased from Rs.1000 to
Rs.2500 of rearing for two years. Secondly, sheep glaziers were forced to
migrate every year in search of fodder and water to nearby states. Now the
process has reverted. The wool production has also increased by 0.5 Kg per
sheep due to proper availability of shade, water and feed. The total population
of sheep of Jaisalmer district as per ―Livestock Census 2003‖ is around one
million. The sheep population around canal shelterbelt considered at 25 per
cent i.e. 2.5 lacs sheep. The present practice in the area is to sell out 25 per
cent each year. The additional revenue generated by selling of sheep is around
Rs. 94 millions. The wool production contributed addition of Rs. 2 million.
The shelterbelt plantation has also generated additional employment on the
basis of the crops grown in study area (Table 2). This would have generated
additional 60 lacs man days if the entire area can be covered with shelterbelt
plantations. Similarly, the machinery (tractor and other equipment used) could
be used for about 3.3 lacs hours more in land preparation and other farm
activities. Additional 1.0 lacs hours can be generated for transportation for
carrying crop produce to storage places and also to the market for sale.
The total murba (one murba equivalent to 5 ha.) allotted are around 1.85 lacs.
The area under crops is only around 15,000 ha, the remaining land (murba) is
out of cultivation which may be due to non-availability of canal water and
damaged water channels, etc. The net returns from partial shelterbelt are
around Rs.2.91lakhs per murba (equivalent to 5 ha.) (Table 12) resultant to net
losses to the tune Rs. 49470 million only due to crops. The losses from
183
plantation around the farm field accounts to be Rs.26000 million if, the
farmers sell the standing plants of age 15 years old at present or current
market price.
Similarly, the uncovered area under tube well irrigation is 15, 000 ha at
present which may further increase up to 25,000 ha. The additional Rs 1455
million can be generated by crop production. The additional income generated
due to shelterbelt plantation is estimated to the tune of around Rs.25000
million apart from existing annual income. The additional employment of 1.5
million man-days can also be generated.
Coming to livestock sector, the entire sheep population can be provided with
sufficient grazing material and shelter from heat waves. This will improve the
health of sheep as mentioned above and consequently increase in market price.
The additional annual revenue from sale of sheep can be generated around
Rs.282 million and the additional income from wool production can go up to
the tune of around Rs. 6.0 million,
As estimated, State Govt. spends nearly Rs.20 million during migration of
livestock population for search of fodder and water every year. During
migration nearly 10 per cent sheep population die due to several reasons. The
shelterbelt technology has helped in the decrease of the migration of sheep to
other areas. The livestock population can also be supported in shelterbelt area
during drought conditions to save drastic losses through mortality in sheep
and goat in particulars.
CONCLUSION
In the present study, it is revealed that besides multifold adverantages it
offered the increases choice to farmer‘s for new crops in addition to traditional
crops. More particularly the pulses and seed spices viz, green gram, cumin
and isabgul (plantago ovativa), which are very sensitive to strong winds in
summer and severe cold during winter. Reduction in temperature increase
moisture in soils leads to increase crop yield indicated an improvement in
climating condition of the study area. Under shelterbelt plantation, farmers are
now growing various the crops like pearl millet, groundnut and clusterbean
during Kharif season and wheat, mustard, isabgol and cumin during the rabi
season. The isabgol and cumin are very sensitive crops to frost during winter
season. The crop production was estimated to be 200 per cent and 48 per cent
more over non-shelterbelt plantation during Rainy and winter season
respectively. The shelterbelt technology could also generate additional
employment to the tune 120 and 40 per cent during Kharif and rabi season,
respectively.. The shelterbelt technology also revealed net return upto 300 and
85 per cent during Kharif and Rabi season, respectively. Shelterbelt plant
184
produce fuel wood, timber and fruits generated additional income. The
economic losses from crops only due to non – adoption of shelterbelt was
estimated to be Rs.1142 million as only 5 and 10 per cent area has been coved
under canal and tube well systems, respectively. The additional annual
revenue from sale of sheep can be generated around Rs.82142 million and the
additional income from wool production can go up to the tune of around Rs.
6.0 million. The shelterbelt technology has helped in the decrease of the
migration of sheep to other areas. The livestock population can also be
supported in shelterbelt area during drought conditions to save drastic losses
through mortality in sheep and goat in particulars.
References
1. Eswaran, H (1992). “Role of soil information in meeting the challenge of sustainable land
management‟ the 8th
Indian Society of soil science. 40; 6 - 24.
2. ESWARAN, H. 1993. Soil resilience and sustainable land management in the context of
Agenda 21. In: Soil Resilience and Sustainable Land Use, eds. D.J Greenland and I.
Szabolcs, 21–32. Wallingford: CABI.
3. FAO (1989) “Sustainable agricultural production for international research” Report of the
Technical Advisory Committee, conservative prop on International Research,
Programme, New York.
4. James, D. (1994) „The application of economic techniques in environmental impact
assessment‟ Kluwer Academic Publisher, London.
5. Mertia, R. S. (1986). Shelterbelt studies in India‟s Thar Desert. M. Sc. Thesis, Univ. of
Wales, U.K.
6. Mertia, R. S. (1992). Shelterbelt research in arid zone. Journal of Tropical Forestry, 8(3):
196-200.
7. Mertia, R. S. (1992). Shelterbelt studies in Thar Desert of India. Advances in Arid Zone,
Vol. 1: 1-52.
8. Mertia, R.S.; Prasad, R; Kandpal, B.K and Pratap Narain (2006). Regeneration of
Lasiurus sindicus in relation to grazing pressure and root zone soil moisture in rang lands
of western Rajasthan, (India). Tropical Grasslands 40:40-44
9. Mertia, R.S., Rajendra Prasad, B.L. Gajja, J.S. Samra and Pratap Narain (2006) Impact of
shelterbelt in arid region of western Rajasthan, CAZRI Research Bulletin, Jodhpur.
185
fulfilling india’s hunger for energy
Agrim Katoch and Rohit Sinha University of Petroleum and Energy Studies (UPES)
Bidholi Campus Office Energy Acres,
P.O. Bidholi Via-Prem Nagar
Dehradun-248007
ABSTRACT India‟s demand for energy is increasing like never before, industrialization has contributed a lot to it. But India is not so much bestowed with crude oil resources and the coal found is not of great quality, so one of the strategies which can be adopted is moving away from conventional energy sources to non-conventional energy sources. Gas hydrates is one such source which has great future if properly researched and explored. This paper investigates the feasibility of using gas hydrates present as an energy source. The area of focus lies in the presence of gas hydrates in the Indian offshore focusing on four regions: KG basin, Mahanadi basin, Andaman offshore and Kerala konkan basin. The research and studies carried out gave positive results and also indicated the presence of huge amount of gas hydrates reservoir. Our main focus lies in how to overcome various problems that has hindered the production of gas hydrates till date. Various problems relating to economically producing gas hydrates are:
1. Deep-water gas hydrates field anywhere in the world have not been found till now
2. Gas production rate ( Gas in the production testing of Mallik well in Canada‟s permafrost area have yielded very low production rate and could not sustain more than 7 days of production using thermal and depressurization methods
3. Due to dissociation of hydrates high amount of water is produced and managing that much amount of water is a big problem.
4. Sand controlling is another of the problem which has hindered gas hydrates production as gas hydrates are found in shallow depth and the sands are no consolidated at such shallow depth.
SHIFT FROM CONVENTIONAL TO NON-CONVENTIONAL
SOURCES
Due to the massive increase in energy demand globally coupled with the
increasing costs, the world has ventured into the non-conventional sources to
fulfill its demand. These non-conventional sources of energy include solar,
wind, tides, waves and geothermal energy. According to Renewables 2012
Global Statistics report, 16.7% energy in the world came from renewables.
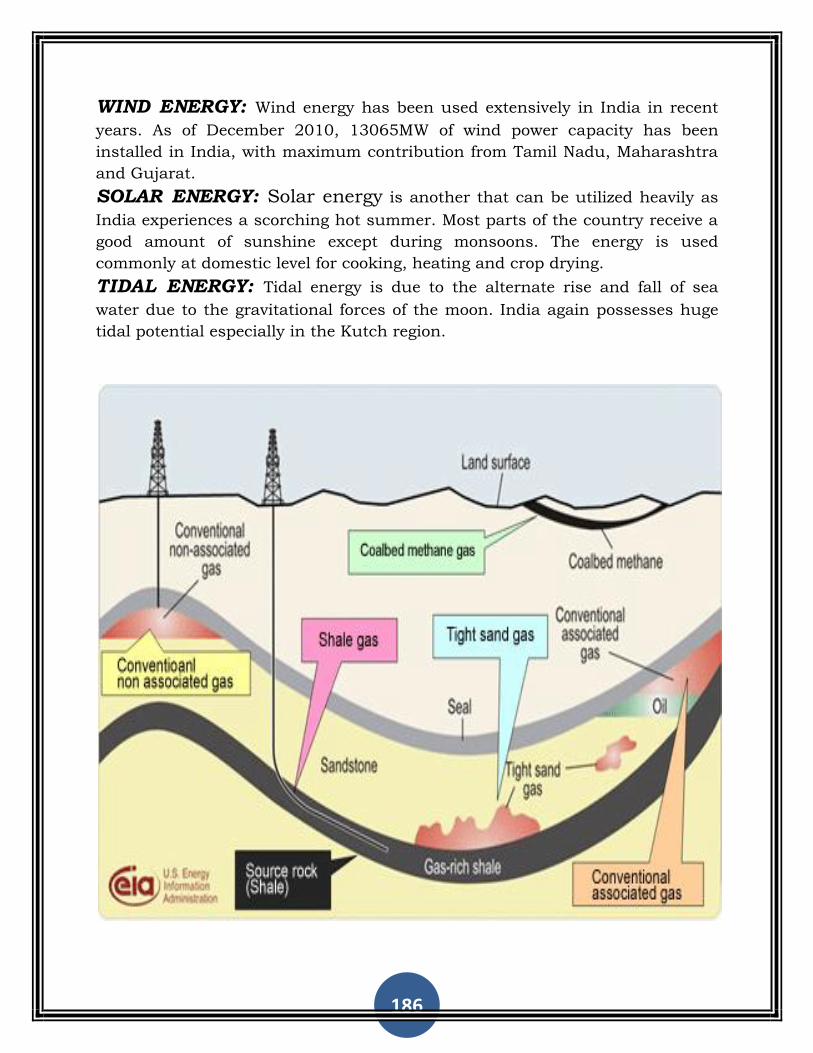
186
WIND ENERGY: Wind energy has been used extensively in India in recent
years. As of December 2010, 13065MW of wind power capacity has been
installed in India, with maximum contribution from Tamil Nadu, Maharashtra
and Gujarat.
SOLAR ENERGY: Solar energy is another that can be utilized heavily as
India experiences a scorching hot summer. Most parts of the country receive a
good amount of sunshine except during monsoons. The energy is used
commonly at domestic level for cooking, heating and crop drying.
TIDAL ENERGY: Tidal energy is due to the alternate rise and fall of sea
water due to the gravitational forces of the moon. India again possesses huge
tidal potential especially in the Kutch region.
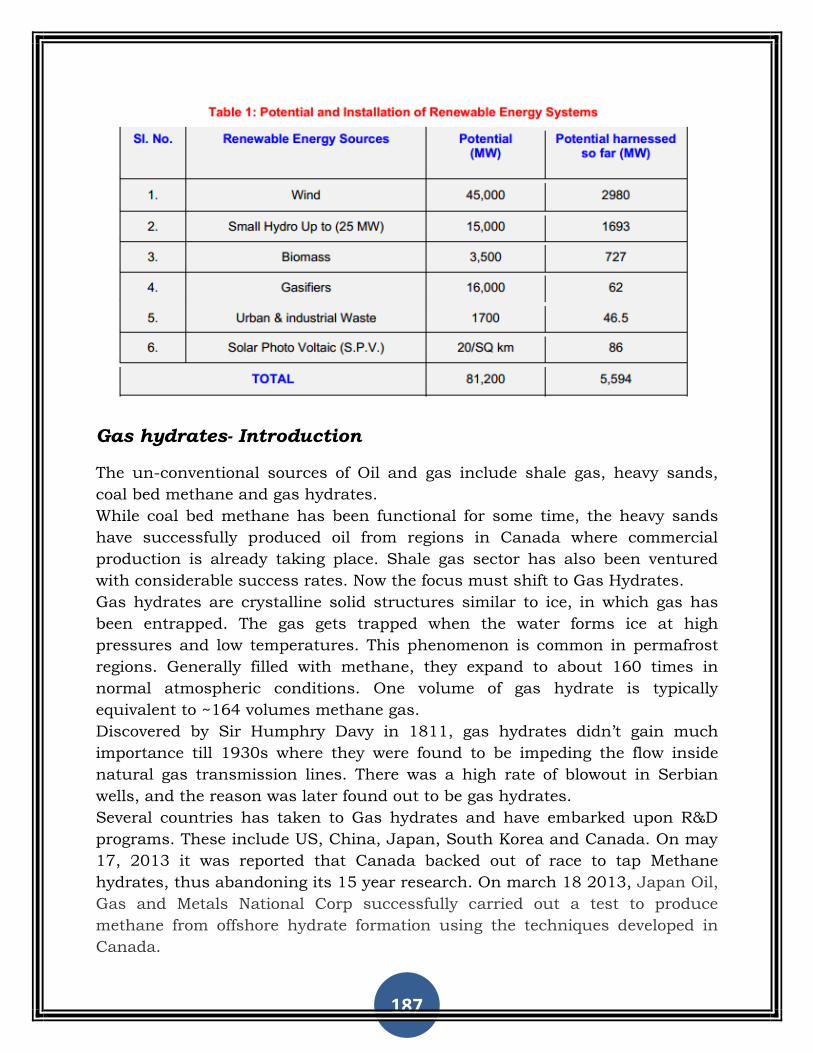
187
Gas hydrates- Introduction
The un-conventional sources of Oil and gas include shale gas, heavy sands,
coal bed methane and gas hydrates.
While coal bed methane has been functional for some time, the heavy sands
have successfully produced oil from regions in Canada where commercial
production is already taking place. Shale gas sector has also been ventured
with considerable success rates. Now the focus must shift to Gas Hydrates.
Gas hydrates are crystalline solid structures similar to ice, in which gas has
been entrapped. The gas gets trapped when the water forms ice at high
pressures and low temperatures. This phenomenon is common in permafrost
regions. Generally filled with methane, they expand to about 160 times in
normal atmospheric conditions. One volume of gas hydrate is typically
equivalent to ~164 volumes methane gas.
Discovered by Sir Humphry Davy in 1811, gas hydrates didn‘t gain much
importance till 1930s where they were found to be impeding the flow inside
natural gas transmission lines. There was a high rate of blowout in Serbian
wells, and the reason was later found out to be gas hydrates.
Several countries has taken to Gas hydrates and have embarked upon R&D
programs. These include US, China, Japan, South Korea and Canada. On may
17, 2013 it was reported that Canada backed out of race to tap Methane
hydrates, thus abandoning its 15 year research. On march 18 2013, Japan Oil,
Gas and Metals National Corp successfully carried out a test to produce
methane from offshore hydrate formation using the techniques developed in
Canada.

188
GAS HYDRATE FORMATION
The major conditions required for the formation of gas hydrates are low
temperate, high pressure, presence of a gas and water. Under appropriate
pressure, they can remain stable above the freezing point of water as well. Due
to hydrate stability, they occur in 2 main locations marine shelf sediments and
permafrost regions. The marine shelf is the continental shelf while on shore
permafrost refers to the areas where the land or soil is at or below the freezing
point of water.
CHALLENGES
The first issue is the release of over pressured gas. When released from
hydrates, methane expands to about 160 times. This creates a sudden increase
in pressure which is difficult to tackle. This over pressured gas can easily
cause blow outs.
The second issue is the production of water. As the pressure is lowered or the
temperature increased, the hydrates melt and along with gas, huge amount of
water is released. This water production has to be controlled during
production.
The third issue is not being able to control the release of gases. Methane
causes more global warming by a factor of 10 as compared to carbon dioxide.
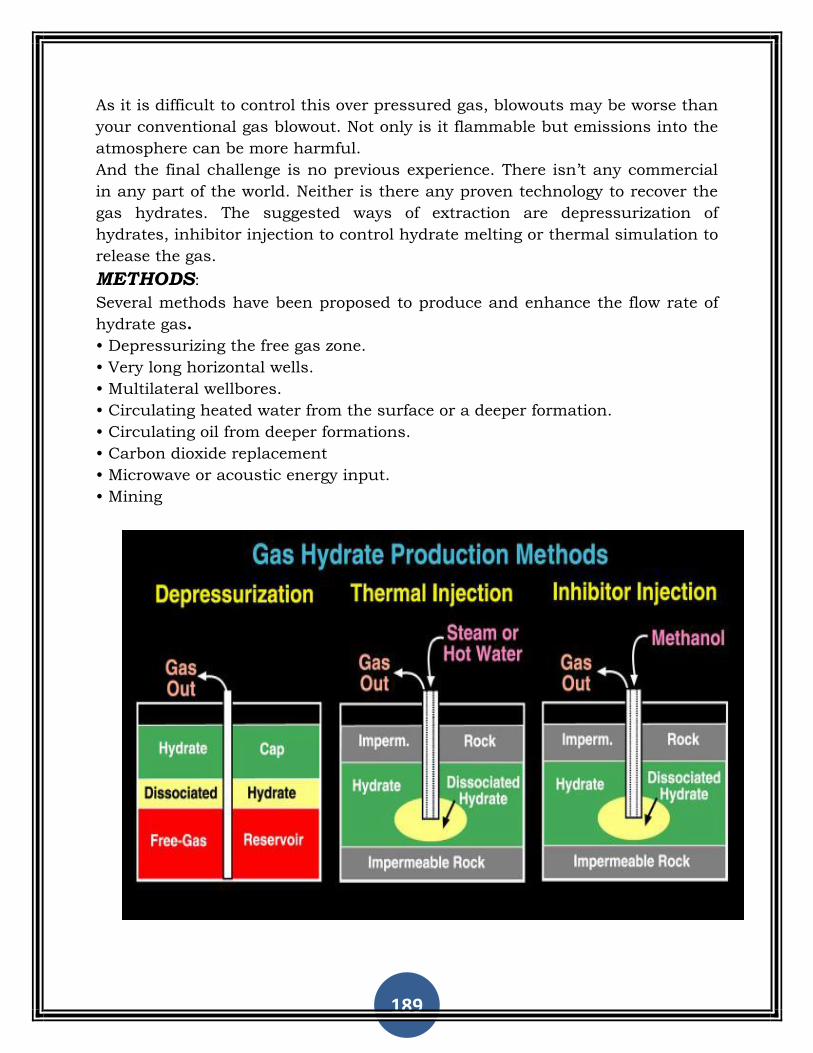
189
As it is difficult to control this over pressured gas, blowouts may be worse than
your conventional gas blowout. Not only is it flammable but emissions into the
atmosphere can be more harmful.
And the final challenge is no previous experience. There isn‘t any commercial
in any part of the world. Neither is there any proven technology to recover the
gas hydrates. The suggested ways of extraction are depressurization of
hydrates, inhibitor injection to control hydrate melting or thermal simulation to
release the gas.
METHODS:
Several methods have been proposed to produce and enhance the flow rate of
hydrate gas.
• Depressurizing the free gas zone.
• Very long horizontal wells.
• Multilateral wellbores.
• Circulating heated water from the surface or a deeper formation.
• Circulating oil from deeper formations.
• Carbon dioxide replacement
• Microwave or acoustic energy input.
• Mining

190
PROPOSAL
According to DGH, estimates of gas hydrates stand at about 1894tcm, about
1500 times more than our current gas reserves. Even though NGHP – 01 was
carried out in 2006 to study the presence of gas hydrates around the Indian
coasts, nothing significant has been carried out since. It was estimated that by
2015, India will start commercial production of gas hydrates. However this
seems too good to be true. The NGHP – 02 has been planned, however no
evident signals are visible about the start of the project.
With the demands for energy rising, especially the increase in the gas demand,
the government must increase its focus in gas hydrates. If India can pioneer in
the field of Gas hydrates, not only will it be able to secure its gas demand for
the coming future but can also export the gas. Rather than having to import
LNG from Qatar, we should be focusing on how as to extract this hidden
treasure and take the lead in the global scenario.
To keep up with the world, one mustn‘t concentrate on the current pace of
others. Rather one should take the step ahead with the road unexplored.
191
Man and Energy Resources Surabhi Aggarwal,
Research Scholar,
H.P.U. Shimla
Ph. +919418639184 ABSTRACT
Industrial advances and population boom put together energy crises in the world today. It has
been well known fact that our way of life is associated with and dependent upon supplies of
energy. Energy is required for number of activities, such as mining, processing and
transportation. Our vehicles, heat, light and other sources are dependent upon energy. Our life
style is also relying upon energy resources indirectly. Many of our domestic requirements such
as air conditioning, cooking, washing also depend upon energy. Machines also require energy in
proportion to the amount of work they do, energy resources have been pressurized intensively.
Our mantle of energy supply comes from limited sources with limited reserves on the earth.
Coal, mineral oil, wood, hydel power and nuclear power are the major power resources. But
coal and mineral oil have traditional trend of contribution for energy demand of the world. But
gradually these energy resources have been came to an end. So we have to try to save these
resources for the future generations. Many rich and vast fields will be over and production will
decline immediately. They may hardly extend the loss by next ten years or so. Therefore,
conservation of energy is the need for hour on the earth unless man gets massive replacement for
energy demand.
We live in the Fossil Fuel Age. Today coal, oil, and natural gas supply 93per
cent of the world's energy; water power accounts for only 1per cent; and the
labour of men and domestic animals the remaining 6per cent. This is a
startling reversal of corresponding figures for 1850 - only a century ago. Then
fossil fuels supplied 5per cent of the world's energy, and men and animals
94per cent. Five sixths of all the coal, oil, and gas consumed since the
beginning of the Fossil Fuel Age has been burned up in the last 55 years.
These fuels have been known to man for more than 3,000 years. Fossil fuels
did not become a major source of energy until machines running on coal, gas,
or oil were invented. Wood, for example, was the most important fuel until
1880 when it was replaced by coal; coal, in turn, has only recently been
surpassed by oil in this country.
Once in full swing, fossil fuel consumption has accelerated at phenomenal
rates. All the fossil fuels used before 1900 would not last five years at today's
rates of consumption. Nowhere are these rates higher and growing faster than
in the United States. Our country, with only 6per cent of the world's
population, uses one third of the world's total energy input; this proportion
192
would be even greater except that we use energy more efficiently than other
countries.
Whether this Golden Age will continue depends entirely upon our ability to
keep energy supplies in balance with the needs of our growing population.
MAN AND RESOURCES
A resource is any such material that is useful for life and survival. It contains
enough valuable material which can be utilized profitably. Some resources are
perennial while others are limited. Man and other organisms depend upon
resources for their satisfaction of the needs of physiological nature. The
distribution of these resources on the earth is not uniform. Nevertheless, man
with his extraordinary power of intellect and techniques, is using these
resources at the tremendous rate of exploitation. There is hardly any resource
that has not been touched by man at all. Many of the resources are heading
towards depletion due to overuse. Thus, depletion of resources is a serious
global hazard.
ENERGY FORMS
There are two types of energy forms which are conventional and non-
conventional. Conventional energy resources are coal, mineral oil, natural gas,
hydro-electric power and nuclear / atomic power. Non – conventional energy
resources are solar energy, wind energy, geothermal energy, tidal power and
wave power.
CONVENTIONAL ENERGY RESOURCES
1. Coal: Coal is relatively well distributed power resource on the earth than
any other conventional energy resource. It is an impure form of carbon formed
from partially decomposed and compressed remains of buried vegetation. It
took a long period of geological time to form coal from vegetation of the earth. It
was partial decomposition and compression of vegetation that led the
geochemical cycle of squeezing the vegetation matter into impure remains of
carbon.
2. Mineral Oil: Petroleum or mineral oil is a liquid energy resource. It is
obtained from crude oil which drilled from underground rock startas. It also
took a longer time to form. Industries, railways, automobiles intensively
pressurized the use of mineral oil. This is mainly due to fact that the use of oil
is more advantageous than the use of coal. But the distribution of mineral oil
in the world is very limited as compared to coal. Mineral oil as a hydrocarbon
was formed in the similar manner as coal was formed only with the difference
of form. Buried organic matter due to overlying pressure and high
temperatures, decompositions resulted into mineral oil and natural gas.
193
Therefore, most of the oil reserves are found in the young folded sediments of
sea floors or continental shelves.
3. Natural Gas: Natural gas is always found in association with mineral oil
or petroleum. It is composed of methane, the simple hydrocarbon. It lies above
natural deposits of petroleum in underground rock layers. It burns clearly than
any other fuel. There has been dramatic growth in the use of natural gas. It
reserves are also limited and exhaustible. It is relatively more advantageous
than oil and coal. It needs no refinement and its transport is worked by
pipelines. It burns cleanly with wide spread range of domestic and industrial
use without pollution hazards.
4. Hydro-Electric Power: Hydel- power today is one of the most efficient
and perennial source of energy since water is well abundant all over the earth
in many parts. Electric water is achieved by directing water under the force of
gravity from higher slopes to lower slopes. Hydel power production is
multipurpose as it presents wide range of uses such as household, industry,
agriculture and transportation. It has numerous merits over coal and mineral
oil use.
5. Nuclear or Atomic Power: nuclear power is a product of present
century that is used intensively in some parts of the world. The fuel in an
atomic reactor is radioactive uranium or thorium and only some amounts are
required as compared to fossil fuel. One pound of uranium produces energy
equal to the energy generated by 6000 tons of coal.
NON-CONVENTIONAL ENERGY RESOURCES
1. Solar Energy: solar energy is a naturally renewable source of energy.
All the life on the earth ultimately derives its energy requirement from the sun.
Energy from sun receives on the earth is in the form of short wave radiation.
The solar radiation is the radiant energy received from the sun and transmitted
in the form of electromagnetic waves. Biological systems are being developed to
use sunlit algae for converting CO2 and water into O2 and protein rich
carbohydrates. Specially designed solar ovens are used for cooking. To produce
salt from sea water by evaporating the water.
2. Wind Energy: wind power has been harnessed for centuries to drive
mills & pumps. The power of winds world -wide may be estimated at 3-4 times
total world energy consumption. Wind is abundant, clean, reliable cost
effective, benefits the community and now is conventional. It is plentiful and is
at its greatest strength in coastal and mountainous areas, maximum wind
velocity and rough weather are the best condition to obtain optimum wind
power. Wind power has been used to drive ships, pump water and to grind
194
grain. It is possible to harness the wind energy into small domestic units or as
large as central generator.
3. Geothermal Energy: Earth‘s interior is a potential of many solid, liquid
and gaseous materials. Energy derived from the heat of the earth‘s crust is
called as geothermal energy. It is tapped from the earth‘s hot interior as it is
evidenced from eruption of volcanic matter. Hot springs and geysers are found
on the earth.
4. Tidal Power: Tidal power is one of the important possible source of
energy. Tapping of ocean water energy is harnessed through waves, currents
and tidal power. It is vital source at present. It is pollution free source of
energy. The method of tapping energy mainly involves building of tidal dam and
installation of turbine. As in many coastal areas the flow of the tide rushes and
moves back twice a day, the strong water current and energy can be tapped
from the movement of strong water current, the incoming tide flowing through
the turbines generates power. When the tide shifts, the blades are reversed. As
a result, outgoing water may produce power.
5. Wave Power: The sea acts as a gigantic energy storage battery for the
energy of the wind. It is estimated that with ware generators along the 1450
Km coast line 50per cent of U.K.‘s electricity requirement could be supplied.
6. Thermal Energy Conversion: Differential temperature conditions of
ocean water are useful for the production of power, 20C. Existing between
warm surface water and cold deep water can be considered for energy
conversion. In this process warm top surface is used to vaporize a liquid, high
pressured vapour drives turbo generator further, cold bottom water is used to
recondense the vapour to liquid thus pressure is relaxed. The liquid passes
back into the cycle.
ENERGY BALANCE:
It has been well recognized fact that our way of life is associated with and
dependent upon supplies of energy. Energy is required for the number of
activities. Energy is required for mining, processing and transportation.
Agricultural operations like tilling, sowing, harvesting, farming, cleaning,
fertilizing requires energy in several ways. Life styles are also indirectly relying
upon energy resources. Standard of living increased with the course of time.
However, the tempo of mechanization consumed energy very fast than
expected. It thus, created a gulf between demand and supply so that balance
between energy reserves and energy exploitation disrupted running life of
human civilization. Many rich and vast fields will be over and production will
be decline immediately. Therefore, conservation of energy is the need for hour
on the earth unless man gets massive replacement for energy demand.
195
ENVIRONMENTAL CONSERVATION:
Conservation means the management and use of the biosphere in such a way
that it provides greatest benefit to the present generation but also maintains its
potential for the future generation. Conservation of environment means the
activities that allow individual or commercial benefits but not the excessive
use, leading to environmental damage. Conservation is the preservation and
maintenance of the environment to meet human needs for production while
insuring that proper consideration is also given to aesthetics and recreation.
The reasonable use of the earth‘s natural resources is a major goal of
conservation. An effective conservation program results in continuous
production and supply of native plants and animals, and the continued
availability of critical mineral resources. People concerned with conservation
seek to present the waste of natural resources, maintain a high quality
environment and to preserve the natural heritage for future generations.
ROLE OF SCHOOL IN ENVIRONMENTAL CONSERVATION AND
SUSTAINABLE DEVELOPMENT
The school is a major agency through which conservation of environment and
sustainable development is actively enforced. Environmental education should
be an interdisciplinary part of the curriculum which develops student‘s
knowledge, skills and commitment to work towards environmental problems.
The students should be made to realize that energy from the sun as basic
source of energy for all life. Different functions related to environmental
conservation and sustainable development should be organized for the
students in the school. To provide every pupil with opportunities to acquire
knowledge, values, attitudes, commitment and skills needed to protect and
improve the environment. Environmental education should be inter-
disciplinary in nature. Different activities like seminars and awareness
campaign, exhibitions, debate, declamations, trips, quizzes, role playing
episodes etc. should be organized turn by turn for the students of different
standards.
196
197
Smart Oil Field: Challenges and Potential Solution
P K Sahoo and Aravinda Kumar Sikharam
University Of Petroleum and Energy Studies (UPES)
Bidholi Campus Office Energy Acres,
P.O. Bidholi Via-Prem Nagar
Dehradun-248007
ABSTRACT Current energy demand mainly depends on fossil fuels i.e., coal, petroleum and natural gas. Oil and Gas contribute 42 per cent of total primary energy, which is expected to raise 45 per cent at the end of 2030.To meet this demand, industries are in the process of exploring more oil and gas blocks, also venturing into deepwater. These industries face certain challenges, in areas relating to financial, technical, safety, environmental, political, logistics, geographic, manpower etc. Out of these challenges HR challenge is the leading one in the forefront of oil and gas industry. The talent shortage in oil and gas industry worldwide has led to some unusual detours. Half of the oil and gas workforce globally are going to retire by 2015.It is said that there is shortfall of about 80 million skills worldwide. It is also seen that the skill gap is more in upstream and it is very difficult to close this talent gap. Faced with this manpower issues, oil industries are beginning to choose technology driven strategies rather than traditional labor intensive operations. This issue calls for technology driven “smart oil fields” in upstream, which is a suite of interactive technologies that help companies gather and analyze data throughout the job site. This helps companies to deploy few numbers of experienced people to perform the task. It also improves the performance of oilfield assets and reduce capex, opex etc. While accomplishing the above, oil and gas companies confront a number of issues and challenges. The objective of the proposed paper is to explore various challenges faced by industries by adopting the technology driven “smart oil field” and also discusses potential
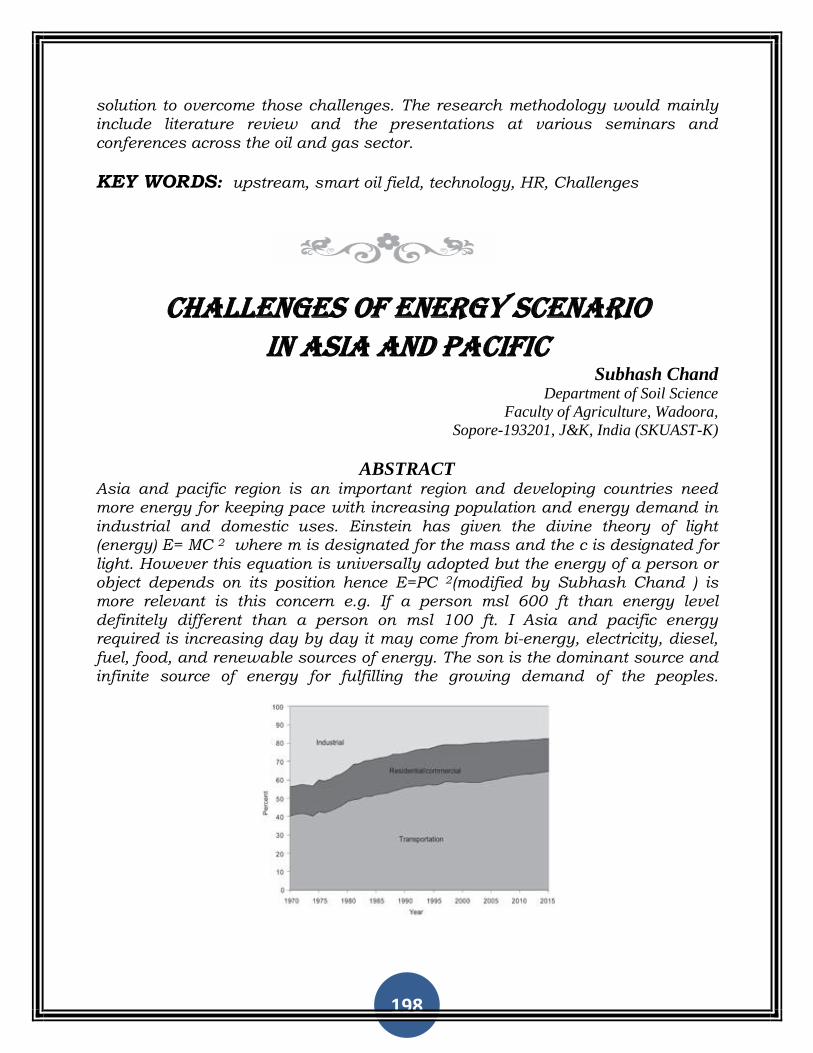
198
solution to overcome those challenges. The research methodology would mainly include literature review and the presentations at various seminars and conferences across the oil and gas sector.
KEY WORDS: upstream, smart oil field, technology, HR, Challenges
Challenges of Energy Scenario in Asia and Pacific
Subhash Chand Department of Soil Science
Faculty of Agriculture, Wadoora,
Sopore-193201, J&K, India (SKUAST-K)
ABSTRACT Asia and pacific region is an important region and developing countries need more energy for keeping pace with increasing population and energy demand in industrial and domestic uses. Einstein has given the divine theory of light (energy) E= MC 2 where m is designated for the mass and the c is designated for light. However this equation is universally adopted but the energy of a person or object depends on its position hence E=PC 2(modified by Subhash Chand ) is more relevant is this concern e.g. If a person msl 600 ft than energy level definitely different than a person on msl 100 ft. I Asia and pacific energy required is increasing day by day it may come from bi-energy, electricity, diesel, fuel, food, and renewable sources of energy. The son is the dominant source and infinite source of energy for fulfilling the growing demand of the peoples.
199
Share of petroleum-product consumption by the industrial, residential/commercial, and
transportation sectors, Asia Pacific region, 1970-2015. Source: FACTS Global Energy (2008).
Study On Energy Consumption Pattern And GHGs Emission: A Case Study In
Belwa Vdc, Parsa, Nepal Binay Sa Kanu
Jagan Nath Shrestha
Center for Energy Studies, Central Department of Environmental Sciences,
Tribhuvan University, Nepal Tribhuvan University, Nepal
ABSTRACT
This present study was conducted in the month of August and September 2011 with the broad objectives to assess the energy consumption pattern, amount of Green House Gases emission from the current energy use pattern and to identify the better energy use options to reduce the current emission. The major energy resources used in the study area were biomass based fuel, hydroelectricity and petroleum products. Biomass based fuel i.e., fuel wood was used in the dominant amount despite the problems associated with its use - including energy inefficiency, deforestation, increasing use of time for collection of fuel, indoor air pollution and deleterious health and environmental effects. The study used both primary and secondary data to assess the energy consumptions situation. More than 95 per cent of the population residing in the VDC used firewood as a main source of fuel wood for cooking. Almost all people were using electricity for the lighting purpose. Among the total sampled households of 104, 734.635 ton/year of fuel wood, 50.61 MWh/ year of electricity, negligible amount of kerosene i.e. 3.248 KL/year was used. The total energy consumption among the sampled households was found as 13968.73 GJ/year with 18.2 GJ/year/person. The total GHGs emission was 1161.764 ton of CO2e/year with per capita share of 1718.56 kg CO2e/year/person. Based on the result of the study, Improved Cooking Stove (ICS) was recommended as the best alternative energy technology in the research area. It will reduce 143.88 ton of CO2e/year if all Traditional Stoves are replaced by ICS. ICS is reported to be more efficient saving fuel wood by 74.91 kg/month in the ICS installed house. There was a reduction of 43.55per cent in the amount of Total Suspended Particle (TSP) concentration compared to Traditional Cook Stove using houses resulting in better indoor air quality and decreased rate of respiratory diseases observed in women and children.
200
KEY WORDS: Alternative energy, GHGs emission, Fuel wood, ICS, Biomass
Gas Hydrate: Recent Development for Sustainable Energy
P K Sahoo and Sambeet Mohapatra
University Of Petroleum and Energy Studies (UPES)
Bidholi Campus Office Energy Acres,
P.O. Bidholi Via-Prem Nagar
Dehradun-248007
ABSTRACT
Current energy demand mainly depends on fossil fuels i.e., coal, petroleum and natural gas, which are a major contributor to primary energy sources. With the increase in population, advancement in technology and improving infrastructure, the present energy sources may not be sufficient to meet the energy demand of the world. The world is shifting towards a gas era. It is predicted that the consumption of natural gas will soar from 24.4 TCF in 2011 to 28.7 TCF in 203557. Starting from electricity generation to city gas distribution, natural gas plays an important role for meeting the energy demand of the world. Natural gas contributes to more than 24per cent of the world's primary energy mix 58 , yet there is a call for unconventional sources of energy, where unconventional gas hydrates are expected to play an important role. Research suggests that these gas hydrates are abundant in offshore areas around the world and subsurface layers in the arctic regions. Despite the fact that estimates of the hydrate reserves have shown positive results, recovery of this unconventional resource presents tremendous challenges. In the field of Gas hydrates, Japan has made a huge success to tap energy from it and USA is undergoing research to develop innovative technology to extract natural gas from gas hydrates in order to have a sustainable energy for future. This paper discusses the present status of the gas hydrates and its current development around world. The research methodology includes literature review from various sources and papers from conferences.
KEY WORDS: Gas Hydrates, Exploration, Petroleum, Natural Gas, City Gas
Distribution, Unconventional Gas, Sustainability
201
Sustainable Development of Hydro-power in India
R.K. Khanna Former Chief Engineer
(Environmental Management Organization\\
Central Water Commission
New Delhi
ABSTRACT
Various hydro-power projects taken up in India, particularly during the post-independence era, have contributed significantly to the socio-economic development. However, all developmental activities have certain environmental impacts and hydro-power projects are no exception. The possible adverse impacts of these projects include submergence of forests, impact on water quality, flora & fauna and socio-economic impacts like displacement of people, the last one being particularly sensitive. Integration of environmental concerns into the development process has been a regular feature of India‟s traditions and policies. India is one of the few countries where specific provisions exist in the constitution for environmental conservation. A number of Acts and Legislations have been enacted for the purpose, including those for protection of water resources. The National Water Policy of India, formulated in 1987 and updated in 2002 and 2012, emphasizes the need for an integrated and multi disciplinary approach to the planning and implementation of water resources development projects, including catchment treatment and management, environmental and ecological aspects. Environmental and forest clearance has been made mandatory and various management measures are insisted for reducing the adverse impacts of projects. An elaborate procedure is followed for according environmental clearance to hydro-power projects to ensure that the implementation of the projects leads to improvement of the ecosystem rather than its degradation. The procedure has even been amended, making it mandatory to consider the public opinion
regarding the project. Before 1994, it was an administrative requirement to get environmental clearance for the projects from the Union Ministry of Environment and Forests. In order to assess the impact of the developmental projects/activities on the environment, the Ministry of Environment and forests (MOEF), Govt. of India issued a gazette notification on the Environmental Impact Assessment (EIA) on January 27, 1994 (as amended on May 4, 1994) and made environmental
202
clearance statutory for all the projects located in ecologically sensitive/fragile areas as notified by the Govt. of India from time to time besides 29 categories of the projects as specified in the Schedule 1 of the notification. These also include river valley projects. The notification was further amended in 1997, making a public hearing also necessary to get environmental clearance. The notification has since been superseded by EIA Notification of 2006. The paper presents the creation of environmental awareness at national and
international level, environmental legislations and policies. It also describes
environmental impact assessment, procedure for environmental clearance in
India, environmental management of hydro-power projects and environmental
monitoring.
Emerging Role of Biomass Derived Biofuels as Renewable Energy Sources
D.K. Sharma Centre for Energy Studies
Indian Institute of Technology Delhi
New Delhi-110016
ABSTRACT
Petroleum reserves of the world are is being depleted fast. Rising oil prices are destabilizing the national economies world over. Need of energy security of the nations is compelling the world to move towards renewable energy sources. Amongst renewable energy sources biomass is going to play an important role as a renewable resource which can totally replace the important role played by the fossil fuels in supplying not only the fuels but even the feed stocks for chemical and petrochemical industries. There are three major routes by which biomass can be converted into value added fuels and chemicals. These are: 1. Chemical processing technologies, 2. Thermo chemical processing technologies, 3. Biochemical processing technologies. Developments in these conversion processes have resulted in a shift from the first generation biofuels to third or fourth generation biofuels, though; efforts are being made especially in USA,
Europe, Brazil, Germany etc. to shift to the use of biodiesel, bioethanol, biogas etc. However, there are challenges especially of the replacement of fossil fuel by biofuels at the huge scales at which these are being used presently. The transition from conventional to renewable fuels, such as, biofuels, would also require the enhancement of the production of biomass, especially by using arid and semiarid lands or marginal lands. There is need to coprocess i.e., co-cracking, catalytic co-cracking or co-gasification of biomass with some of the
203
organic wastes such as plastics or petroleum residues such as vacuum residue or coal etc. to obtain biodiesel or biogasoline. It may take some time before biofuels can totally replace the role played by fossil fuels and considerable amount of research work would further required. It may take some time before biofuels can totally replace the role played by fossil fuels and considerable amount of research work would further required. Intervening period may be used to establish bioeconomy by making further advancements in biomass conversion technologies as well as in biomass generation technologies. Biogasification along with gasification and liquefaction of biomass may lead to the generation of cleaner fuels from biomass. Emerging role of biomass such as agricultural residues, seed oils, aquatic biomass, algae and biomass derived fuels on establishing bioeconomy in future would be discussed.
Energy Trade in South Asia:
Role of Non-State Actors
Udai S Mehta & Gaurav Shukla D-217, Bhaskar Marg,
Bani Park,
Jaipur 302 016
ABSTRACT The potential of power trade within the South Asia has been discussed for many years, especially due to their vast potential in widespread underexploited energy sources. Annual energy consumption in this region ranges from 0.17 million tonnes of oil equivalent (mtoe) to 423.2 mtoe. Several successful examples of such cooperation can be found in the different parts of the world. In South Asia Region, while Bangladesh, India and Pakistan are facing significant level of power shortages; Bhutan, at its current level of generation capacity, exports relatively a large volume of power to India in addition to meeting its own demand. A similar situation would arise in Nepal with the realization of large scale hydropower under development. Such an environment creates opportunities for trade among deficits and surplus countries within the region. However, despite tremendous potential of regional cooperation, the region has had very limited cross border transmission and trading due to social, financial, political, technical & infrastructural reasons. Power shortages have an adverse impact on industrial and economic output as well as on social development. Both industry and household sector are among the key energy consumers in the region, and a disruption in energy supply would have far reaching implications in these sectors. Diversified social, political & economic difference in the countries will require robust political and social mandate for such regional integration. In addition to that, there are several other
204
barriers, such as absence of adequate infrastructure, limited capacity of the regulator, weak policy and regulatory environment etc. In the region, where power sector is predominantly managed by governments/public utilities who mostly work closely with non-state actors (Think Tanks/Research Institutes/Civil Society Organizations/Media etc), there is a strong viability that these non-state actors would be in a better position to persuade the government about the long term benefits of regional energy cooperation. Non-state actors can act as pressure groups influencing government bodies to harmonize policy and regulatory issues and also work towards creating cogent environment through improved socio-economic conditions within the region for cross border investments and regional energy trade. However, at present, the roles of non-state actors are limited and undocumented. Therefore, there is a need to sensitize and develop/create a platform for non-state actors on issues pertaining to regional cooperation and harmonizing policy & regulatory issues for power trade in South Asia region.
Review of Gas pricing formula by C. Rangarajan Committee
Ranjan Sham, Soby Alexander, Amol Agarwal and Somya Sharma
University of Petroleum & Energy Studies
College of Management and Economic Studies,
Energy Acres PO Bidholi via Prem Nagar, Dehradun-248001
ABSTRACT
The C Rangarajan led committee was given the task to review the formula of gas
pricing in July 2012. The old pricing formula had not been reviewed as the prices
were unchanged for more than five years. The panel was appointed to suggest
changes in existing oil & gas exploration contracts with energy firms in order to
minimize monitoring of expenditure, fix system to determine domestically
produced natural gas price and modify existing profit-sharing mechanism. The
Committee came up with sweeping recommendations. As per the recommended
formula the domestic gas price would be calculated based on trailing twelve
month average price of
(1) Volume-weighted net-back pricing of Indian LNG imports.
(2) Volume-weighted price of Henry Hub, NBP and JCC linked price.

205
The new pricing formula will come to effect from April 2014 and will be reviewed
every quarter for the next five years eventually removing all price controls. The
current estimate shows that the prices will be around $8.4 per mm BTU when
the formula will come into effect.
The three major consumers of NG in India are power industry, fertilizer industry
and CGD companies. The study will analyze how the Gas prices of JCC,HH and
NBP will affect India's Gas prices. The study will also consider rupee-dollar
fluctuations while analyzing the effect of gas prices.
KEY WORDS: C Rangarajan committee, Gas Pricing, net-back pricing, Effect of
new pricing.
Bio Fuels- Support Environmental Preservation
Gursharan Singh Kainth
Director
Guru Arjan Dev Institute of Development Studies
14-Preet Avenue, Majitha Road
PO Naushera, Amritsar 143008
ABSTRACT
Biofuel development in India centers mainly around the cultivation and
processing of Jatropha plant seeds which are very rich in oil (40 per cent). The
drivers for this are historic, functional, economic, environmental, moral and
political. Jatropha oil has been used in India for several decades as biodiesel for
the diesel fuel requirements of remote rural and forest communities; Jatropha oil
can be used directly after extraction (i.e. without refining) in diesel generators
and engines. Jatropha has the potential to provide economic benefits at the local
level since under suitable management it has the potential to grow in dry
marginal non-agricultural lands, thereby allowing villagers and farmers to
leverage non-farm land for income generation. As well, increased Jatropha oil
production delivers economic benefits to India on the macroeconomic or national
level as it reduces the nation's fossil fuel import bill for diesel production (the
main transportation fuel used in the country); minimizing the expenditure of
India's foreign-currency reserves for fuel allowing India to increase its growing
foreign currency reserves (which can be better spent on capital expenditures for
206
industrial inputs and production). And since Jatropha oil is carbon-neutral, large-
scale production will improve the country‟s carbon emissions profile. Finally,
since no food producing farmland is required for producing this biofuel (unlike
corn or sugar cane ethanol, or palm oil diesel), it is considered the most politically
and morally acceptable choice among India's current biofuel options; it has no
known negative impact on the production of the massive amounts grains and
other vital agriculture goods India produces to meet the food requirements of its
massive population. Other biofuels which displace food crops from viable
agricultural land such as corn ethanol or palm biodiesel have caused serious
price increases for basic food grains and edible oils in other countries.
Energy Indicators For Sustainable Development
Harinder Singh Gill
Principal, Amritsar College of Hotel Management & Technology,
Amritsar, Punjab, India,
ABSTRACT
Energy poses a formidable challenge to those working to achieve sustainable
development goals. Sustainable energy provides affordable, accessible and
reliable energy services that meet economic, social and environmental needs
within the overall developmental context of society, while recognizing equitable
distribution in meeting those needs measuring sustainability is a major issue as
well as a driving force for the discussion on sustainable development. Developing
tools that reliably measure sustainability is a prerequisite for identifying non-
sustainable processes informing design-makers of products' quality and
monitoring impacts on the social environment. This study focuses on the
indicators themselves and illustrates their individual relevance to the economic,
social and environmental dimensions of sustainable development; it also
identifies their interrelationships and their credibility as a set or system for
analyzing energy within the framework of sustainable development. The system
of energy indicators and their implementation is also discussed in the study.
These energy indicators were formulated in line with sustainable development
goals and were designed to complement the indicators on sustainable
development. The findings of the study are adequate and affordable energy
207
services have been critical to economic development and the transition from
subsistence agricultural economies to modern industrial and service-oriented
societies.
KEY WORDS – Economic Development, Energy Indicators, Sustainability
Development, Social and
Environmental Dimensions Electricity
Consumption and Sustainable Development: Time Series Analysis for Punjab and
Haryana States
Amarjit Singh Sethi and Supreet Kaur Punjab School of Economics,
Guru Nanak Dev University,
Amritsar, Punjab, India
ABSTRACT
Energy is central to sustainable development as it affects all aspects of
development --social, economic, and environmental. It is the golden thread that
connects economic growth, increased social equity and an environment that
allows economy to thrive. None of the development goals could be met without
major improvement in the quality and quantity of energy services in any
economy. It is essentially a prime mover of all economic activities and has
become a major source of improvement of the standard of living. Causal
relationship between energy consumption and sustainable development has
been the prime focus of economists and policy analysts since 1970s, so as to
make appropriate energy policies. But empirical evidence is still inconclusive; i.e.,
whether energy consumption Granger causes the economic growth or the reverse
is still debatable. Therefore, the present study was taken up to investigate
empirically the existence and direction of causal relationship, if any, between
electricity consumption (taken as proxy variable for energy) and economic growth
at aggregated and sectoral levels in Punjab and Haryana states, spanning over
the 30 years' period (i.e., from 1980-81 to 2009-10).
Vector Error Correction Modeling based Granger causality indicated that in
Haryana state, unidirectional causality (running from electricity consumption to
208
real GSDP) was present in case of primary sector, thereby implying that the
supply of electricity is vitally important to meet the growing electricity
consumption and hence to sustain the economic development in the sector. On
the other hand, in case of Tertiary and its sub-sectors, uni-directional causality
(running from real GSDP to electricity consumption) was observed, which
indicates that high growth in income would lead to higher consumption of
electricity in these sectors. However, absence of any forward and backward
linkages among the components of both the variables in Punjab state suggests
that suitable conservation policy measures (through rationalization of the tariff
structure, strict enforcement of laws to check thefts and corrupt practices,
checking free/ unmetered/ unaccounted/ subsidized distribution of electricity
across the board, efficiency improvement, etc.) which aim at curtailment of
wastage of electricity and reduction in the electricity consumption, need be
initiated, without imposing any threat on sustainable growth process, as
development is not possible without energy and sustainable development is not
possible without sustainable energy.
KEY WORDS: Electricity Consumption; Economic Growth; Gross State Domestic
Product; Unit Root; Co-integration; VECM; Granger Causality.
Solar Power Generation: Role of Rajasthan in Empowering the Nation
Rashpal Kaur
Assistant Professor
Shridhar University, Pilani
ABSTRACT
The concept of sustainable development has taken an important place in the
macroeconomic policy formation of most of the economies. The ever rising price of
crude and decreasing quantity and quality of coal has led the nations to think of
the renewable alternatives. India is also working on the same lines. Also,
conventional or fossil fuel resources are limited, non-renewable, polluting and,
therefore, need to be used prudently. On the other hand, renewable energy
resources are indigenous, non-polluting and virtually inexhaustible. India is
endowed with abundant renewable energy resources. Therefore, their use
209
should be encouraged in every possible way. India is blessed with abundant
solar energy and if harnessed efficiently, the country is capable of producing
trillion-kilowatts of electricity. Solar energy is extremely beneficial as it is non-
polluting and its generation can be decentralized. There is need to come together
and take initiatives to create technologies for a greater use of these sources to
combat climate change by reducing the emission of green house gases. The State
of Rajasthan is poised to establish itself as a leader in solar power generation
and a pioneer in providing energy security and sustainable growth to India.
Endowed with conducive conditions with perennial and abundant solar
radiation, Rajasthan has the potential to become the hub for solar power
technologies and generation of sunrise green energy. Rajasthan is favorably
placed to become the largest supplier of solar power among all sources of energy
in India at a competitive cost and achieve the scale on solar power production,
which can change face of the State and alter the complete economic situation for
betterment of the masses. The present paper studies the solar power generation
capacity and capability of the state of Rajasthan. It also looks at the options of
making Rajasthan the hub of India for solar power generation. It also studies the
steps taken up by the state government for promoting and attracting investment
in solar energy projects.
Modernization, Displacement and the Ethnic Identity: Hydro Power Projects in
Undivided Koraput District in Odisha
Sarat Kumar Jena
Adjunct Faculty Member
Udaybhansinhji Regional Institute of Cooperative Management
(National Council for Corporate Training,
Ministry of Agriculture, Govt. of India)
Sector – 30, Gandhinagar – 3820303 (Gujarat)
ABSTRACT
Historically the 'tribal identity' as an ethnic group materialized in India during
the emergence of colonial modernity by hosting of censuses system in 1871 and
introducing land reform and land revenue code for the unsettled land in 1879 for
210
the capitalist interest of the colonial authority. The course of reformation and
development in British India categorized a group of communities living in the
hills, highlands and mountains with a legacy of distinct indigenous knowledge
system, rich culture and set tradition. This process of displacement continued in
independent India through several projects of reformation and development in
the tribal belts. The advancement of modernity through the exercise of science,
technology and industrialization in the Eastern Ghats in undivided Koraput
district in Odisha has been seen as a serious energy project of the nation. In
1960s the state and the central govt. in India turned away their gaze towards
the capitalist consumption of the natural resources of the Eastern Ghats. The
hydro power projects came up in undivided Koraput district during the 1950s
and 1960s are responsible for the large scale deforestation of the Eastern Ghats
there by leaving behind lakhs of tribal people in utter dejection. It resulted in the
displacement of several tribes who subsequently faced extinction of their ethnic
identity. The objective of this interdisciplinary discourse is to locate the nature of
ethnic identity of the displaced tribes who faced the turmoil of annihilation
during the industrial advancements in the undivided Koraput district in Odisha.
The statistics of the hydro power projects in this region and their marketable
economics provide a methodology to analyze the consequence of the industrial
advancements in the Eastern Ghats.
Key Words: Modernity, Displacement, Ethnic Identity, Hydro Power Projects in
Koraput
Present Scenario of Renewable Energy
Resources In India
Anil Kumar, N. K. Tholia and Sheena Jangir
Assistant Professor
Shridhar University, Pilani
ABSTRACT
The Indian economy is one of the fastest growing economies in the world. The
demand for energy during the 12th Five Year Plan is expected to increase as
the economy grows, there is increased access and as access in rural areas
expands. In the past, energy production in our country has favored a
dependence on imported fossil fuels. India is now the eleventh largest economy
211
in the world, fourth in terms of purchasing power. In the face of higher energy
prices and harm to the natural environment from local air pollution and global
climate change, like many countries we also have turned to renewable energy
sources. The dependence has been based on low energy prices, lack of
statutory mandates to encourage development of renewable energy sources,
and a fairly energy-intensive economy. It has been buoyed by reliable, secure
energy sources. India has a vast supply of renewable energy resources, and it
has one of the largest programs in the world for deploying renewable energy
products and systems. In the early 80s, India was estimated to have renewable
energy potential of about 85 GW from commercially exploitable sources,
namely in wind, bio-energy and small hydro. India is the only country in the
world to have an exclusive ministry for renewable energy development, the
Ministry of Non-Conventional Energy Sources (MNES). Many factors influence
development of renewable energy sources: a state's energy prices, energy
infrastructure, energy demand, and energy intensity. Some encourage
development, others discourage it. A very significant part of the total
Renewable Energy (RE) potential still remains to be exploited. The current
installed capacity of renewable energy sources stands at around 26,368 MW
(as on Nov-2012). It is poised to make tremendous economic strides over the
next ten years, with significant development already in the planning stages.
Our concerns are majorly on the renewable energy resources such as hydro,
solar, wind and biomass and see where they are found.
Short Rotation Forestry Wood Based Small Scale Gasifier System For Generation of Power for Rural
Households
Rajesh Soni, Iqbal Singh and Monica Sachdeva Sanjeev K. Chauhan
School of Energy Studies for Agriculture; Department of Forestry and Natural Resources
Punjab Agricultural University,
Ludhiana
Punjab state is on fast track to overall agricultural and industrial development.
However, the pace of the development is hampered by inadequate availability of
212
energy. In villages, the problem is more critical and only 27 per cent of the
households get electricity for 18 hours. This problem can be reduced by using
small scale Gasifier based decentralized electricity power generation systems
for individual household in villages. Gasification is an advanced combustion
process which leads to substantial gains in fuel wood saving as compared to
combustion based processes when used at small scale. These systems can replace
diesel based generators and battery based invertors that are commonly used for
meeting emergency power requirements. The woody fuel required for gasification
can be provided at economic cost by encouraging small and medium farmers to
adopt short rotation forestry (SRF). Short Rotation Forestry (SRF) is the rapid
silvicultural practice which can help enhance farm income from subsistence
farming. This paper gives information about the production of power using small
scale gasification system for meeting household power demands by using short
rotation forestry wood without significantly hindering the production of main crops
as well as income of farmers.
213