contents - agecon search
TRANSCRIPT
3
Contents
Abbreviations 10
Preface 11
Opening Address 12
Professor Ngo The Dan, Vice Minister
Session 1 Overview on Quality 13
Vietnam’s Agriculture in the Context of Regionalisation and Globalisation: Opportunities and Challenges 15
Bui Thi Lan
Globalisation and the Benefits of a Broad-based Approach to Postharvest Systems Development 18
F. Goletti and E. Samman
Quality Assurance: the Concept and its Evolution 41
W.C. Wong, P.Mansour-Nahra, I.Ogle and N. Sorby-Adams
New Food Processing and Preservation Technology 49
A. Noguchi
Standards and Quality Assurance Systems for Horticultural Commodities 56
Ma. C.C. Lizada
Postharvest Handling Status and Problems of thePacific Island Countries 57
E. Cocker
Quality Evaluation of Some Rice Varieties Being Grown in Vietnam 61
Nguyen Thanh Thuy and Nguyen Huong Thuy
Session 2 Fruit Quality 77
Quality Assurance Systems for ASEAN Fruits (Fresh and Minimally Processed) 79
G.I. Alexander and B.C. Peacock
Case Study on Development of a Quality System to Foster the Establishment and Growth of the Durian Industry in Brunei Darussalam 93
Pg Hjh Rosidah Pg Hj Metussin, C. Bunt and M. Piccone
Postharvest Development for Use in Quality Assurance for Durian 96
Sonthat Nanthachai
Quality Assurance System for Dragon Fruit 101
Le V. To, Nguyen Ngu, Nguyen D. Duc, Dang T.K. Trinh, Nguyen C. Thanh, Dang V.H. Mien, Chau N. Hai and Trinh N. Long
Establishment of a Quality Assurance System for Minimally Processed Jackfruit 115
Mohd. Salleh Punan, Abd. Shukor Abd. Rahman, Latifah Mohd. Nor, Pauziah Muda, Ahmad Tarmizi Sapii, Rohani Md. Yon and Faridah Mohd. Som
Minimally Processed Fruits in Singapore 123
Kalanithy Karichiappan, Lim Cheong Huat and Chew Siang Thai
4
Maturity Indices and Harvesting Practice of ‘Arumanis’ Mango Related to the Target Market 129
N.O. Tridjaja and M.S. Mahendra
Quality Assurance Implementation in Practice: Thailand’s Experience with Fresh Longan for Export 134
Sing Ching Tongdee
Study on a Postharvest Handling System for Lychee 138
Nguyen Cong Hoan, Nguyen Kim Vu, Bui Huy Thanh, Bach Van Nghe, Dang Xuan Mai, Le Thi Sau, Hoang Kim Phuong, Le Huu Hieu, Nguyen Tien Khuong and Nguyen Duy Lam
Twist Test Measurement of Mango Texture 145
X.H. Nguyen, L.U. Opara and C.J. Studman
Designing Effective Quality Systems for Horticultural Businesses and Organisations 150
M.F. Piccone and C.J. Bunt
Preliminary Results on a Fruit Fly Investigation in the South of Vietnam 153
Nguyen Ngoc Thuy, Huynh Tri Duc and N.H. Vu
Nondestructive Method for Sorting of Gamboge and Translucent Pulp in Mangosteen by Specific Gravity: Precision and Efficiency 158
J. Sornsrivichai, R. Podee, K. Saengnil and T. Yantarasri
Session 3 Measuring and Maintaining Quality 165
Future Research and Development in Agricultural Produce Quality 167
P.J. Hofman
Biotechnological Approaches to Control Postharvest Problems 175
J.R. Botella
Modelling Respiration of Edible-coated, Minimally Processed Mango in Modified Atmosphere Packaging 184
M. Rusmono, A.M. Syarief and H.K. Purwadaria
Quantitative Descriptive Analysis and Volatile Component Analysis of Minimally Processed ‘Arumanis’ Mango Coated with Edible Film 196
D. Fardiaz, I.S. Setiasih, H.K. Purwadaria and A. Apriyantono
Postharvest Quality Changes in Dokong (
Lansium domesticum
Corr.) Harvested at Different Stages of Ripeness 201
Ahmad Tarmizi Sapii, Norlia Yunus, Pauziah Muda and Tham Sin Lin
Protection of the Environment and Produce from Contamination with Pesticide Residues 206
I.R. Kennedy, F. Sanchez-Bayo, N. Lee, H.M. Shivaramaiah, A. Crossan, S. Baskaran and A.S. Hill
Efficacy of Electrolysed Water as a Disinfectant for Fresh-cut Spinach 216
H. Izumi, T. Kiba and S. Hashimoto
Rapid Analytical Techniques for Pesticide Residues in Food 222
A. Pasha
Effects on the Organoleptic Quality of Arabica Coffee Beans Processed for Export when Pulping is Delayed in Papua New Guinea 223
A.J. Kuri
5
Improvement of Quality of Apples in Shanxi Province, China 236
C.J. Studman, L.U. Opara and Zhang Dong Xing
New Market-pull Factors Influencing Perceptions of Quality in Agribusiness Marketing (or Quality Assurance for Whom?) 244
L.U. Opara
Session 4 Grain Quality 253
Rice Quality Management —Principles and Some Lessons 255
M.A. Bell, R.R. Bakker, D.B. de Padua and J. Rickman
A Systematic Approach to Promote the Dryer as a Major Measure of Quality Assurance for Rice Grain 264
Phan Hieu Hien
Drying Practices and Evaluation of a Low-cost, Low-temperature, In-store Dryer in Bangladesh, India and Myanmar 272
V. Balasubramanian and A. Morales
Prototype of the Cyclonic Rice Husk Furnace 277
T. Swasdisevi, S. Soponronnarit, V. Thepent, A. Shujinda and B. Srisawat
Evaluation of Drying System Performance in Rice Mills 286
N. Meeso, S. Soponronnarit and S. Wetchacama
In-store Drying under Different Climatic Conditions in China 296
G. Srzednicki, R. Driscoll and Niu Xinghe
Methods and Standards for Rice Grain Quality Assessment in the Philippines 303
J.A. Patindol
Prevention of Moisture Migration in Sealed Grain Stacks Stored in the Open in the Tropics Using Reflective Covers 316
J. Donahaye, S. Navarro, F. Caliboso, G. Sabio, G. Mallo and J. Dator
The Quality Changes of Rice Stored Under Vacuum Conditions 324
M. Sidik
Quality Changes in Farm-stored Sorghum Grain Grown in the Wet or Dry Season in Southern India—a Technical and Social Study 333
R.J. Hodges, A.J. Hall, K. Jayaraj, P. Jaiswal,, N. Potdar and B. Yogand
Research on the Sensitivity of Maize Varieties to
Sitophilus zeamais
M. 345
Nguyen Kim Vu, Hoang Ho, Nguyen Thu Huyen, Ta Phuong Thao,Nguyen Dong Tuan and Bui Kim Thuy
Protecting Grain Without Pesticides at the Farm Level in the Tropics 353
S. Navarro, E. Donahaye, M. Rindner, A. Azrieli and R. Dias
Session 5 Uptake and Impact 365
Developing a Computer-assisted Learning (CAL) System to Improve Training of Staff in Grain Quality Management in the ASEAN Region 367
R. Bermundo, R. Tiongson, J. Tumambing, Nguyen Huu Dat, Tran Van An, Phan Hieu Hien, O. Dharmaputra, H. Halid, H. Purwadaria, M. Sidik, B. Chankaewmanee, S. Kositcharoenkul, S. Soponronnarit, R. Driscoll, G. Srzednicki, J. van S. Graver and B. Longstaff
6
Information Network on Post-harvest Operations 373
A. Bell, C. Bothe and O. Mück
Research and Development on Postharvest Handling of Fruits and Vegetables in Malaysia 375
Abdullah Hassan
The Effectiveness of the BPRE Training Program as a Technology Transfer Strategy for the Adoption of Grains Postharvest Technology 379
H.F. Martinez
The Quality Assurance Challenge: Can Village Marketingand Cooperatives Respond? 388
N. Masajo-Manalili
The Philippine Rice Postproduction Consortium: Needs Assessment of the Postproduction Industry 398
D. de Padua
The Role of Quality Assurance in the Pooled Marketing of Horticultural Produce from Smallholders 408
P.A. Nuevo and M.C.C. Lizada
Impact Assessment of Utilisation of an Improved Maize Sheller in Three Major Maize-producing Provinces in the Philippines 415
R.P. Estigoy
National Postproduction Loss Assessment for Rice and Maize 427
C.L. Maranan, R.R. Paz and R.S. Rapusas
Session 6 Vegetables 437
Quality Management Systems in Australian Vegetable and Fruit Industries 439
J.S. Bagshaw and S.N. Ledger
Extending the Shelf Life of Broccoli Florets and Pak Choy Leaves 444
A.J. Able, T.J. O’Hare, L.S. Wong and A. Prasad
Assessment of Postharvest Handling Systems of Vegetable Crops in the Beijing Area 451
Shufang Zheng, Li Wu, Lipu Gao and Ping Wu
Postharvest Handling of ‘Asian’ Vegetables in the Northern Territory 456
M.J. Gosbee and T.K. Lim
Poster Papers Grains 461
Field Evaluation of Pesticides 463
M.G. Andrada, R.C. Donceras, Jr., D.G. Natividad, F.M. Dela Cruz, and Ma. E.M. Martinez
Trial on Storing of Maize Seed in Airtight Storage 469
C. Sukprakarn, K. Bhudhasamai and B. Chankaewmanee
Airtight Storage of Maize: Its Effect on Fungal Infection and Aflatoxin Production 474
O.S. Dharmaputra, I. Retnowati, M. Amad and S. Ambarwati
Bacterial Antagonism Against
Aspergillus
Growth and Aflatoxin Production in Maize Feedstuff 483
R.P. Garcia, O.R. Angeles and E.S. Luis
7
Sustaining the Development of the Grains Industry through Standardisation: the Philippine Experience 489
E.A. Jarcia, C.C. Mangaoang and R.L. Sampang
Monitoring Mycotoxins and Pesticides in Grain and Food Production Systems for Risk Management in Vietnam and Australia 496
N. Lee, A.S. Hill, Bui Van Thin, Tran Van An, Le Van To andI.R. Kennedy
Use of the Flat-bed Dryer SHG-4 for Coffee Drying 501
Nguyen Hung Tam and Phan Hieu Hien
The Study of Aflatoxin-producing Strains, Fumonisin-producing Strains, and Non-producing Strains and their Application in Mycotoxin Prevention in Agricultural Products 507
Nguyen Thuy Chau, Nguyen Thi Huong Tra, Nguyen Thi Hong Ha
Research on the Down-draft Rice Husk Furnace 508
Nguyen Van Xuan and Phan Hieu Hien
Techniques for Grain Dryer Performance Assessment and Effects of Drying on Maize Grain Quality 511
L.U. Opara, P. Meas and A. Hardacre
Rice Milling in Cambodia 520
J.F. Rickman, Som Bunna, Poa Sinath and Meas Pyseth
Strategies to Replace the Use of Methyl Bromide for the Fumigation of Bagged or Bulk Export Shipments of Rice 523
C.R. Watson, N. Pruthi, D. Bureau, C. Macdonald and J. Roca
Ergosterol in Paddy as an Indicator of Quality 534
G. Srzednicki, C. Nimmuntavin, R.G. Mantais, J. Craske and S. Wattananon
Milling, Pasting, and Texture Changes in Rice as Affected by Aging 545
N.V. Zulueta, D.C. Basinga, N.O. Dalangin and B.O. Juliano
Production Performance of Poultry Layers Consuming Aflatoxin-contaminated Feed 553
E.T. Begino
Poster Papers Fruits and Vegetables 557
Model Predicting the Shelf Life of Edible-coated, Minimally Processed Salak 559
S. Wuryani, I.W. Budiastra, A.M. Syarief and H.K. Purwadaria
Conservation of Rambutan and Longan in Polyethylene Bags 567
Do Minh Hien, Thai Thi Hoa and Pham Hoang Lam
Harvesting Maturity of ‘Long’ and ‘Tieu’ Longan in the Mekong Delta, Vietnam 571
Do Minh Hien and Thai Thi Hoa
Enhancing Philippine Horticultural Postharvest Research, Developmentand Technology Transfer through Networking, Demonstration and Thesis Support Grants 574
R.P. Estigoy and A.E. Badua
Foliar Application of Benzothiadiazole and Protection of Postharvest Rockmelons and ‘Hami’ Melons from Disease 582
Y. Huang, B.J. Deverall, W.H. Tang, W. Wang, F.W. Wu and R. Li
Using Perforated Plastic Packaging for Extending the Shelf Life of Okra Pods 586
J. Poubol, S. Kanlayanarat and C. Maneerat
8
Changes in Polyamine Levels and Peroxidase Activity in ‘Khakdum’ Papaya (
Carica papaya
L.) under Low Temperature Storage Conditions 593
S. Setha, S. Kanlayanarat and V. Srilaong
Status of Quality Standards in the South African Fruit Industries 599
L. Korsten and E.S. de Jager
Use of a High-temperature, Forced-air Quarantine (Non-chemical) Treatment forFiji Export Commodities 609
S. Kumar
Induction of Red Grapefruit Resistance to
Penicillium digitatum
and Chilling Injury by a Short Hot Water Brushing Treatment 612
S. Lurie, R. Porat, D. Pavoncello, J. Peretz, B. Weiss, L. Cohen,S. Ben-Yehoshua, E. Fallik and S. Droby
Implementation of Quality Assurance for ‘Arumanis’ Mango 616
M.S. Mahendra and N.O. Tridjaja
The Effects of Hydro-cooling and Plastic Bag Packaging on the Shelf Life of Chinese Kale (
Brassica albograba
L.) 621W. Niyomlao, S. Kanlayanarat and C. Maneerat
Investigation into Postharvest Loss of Cantaloupe 628Chen Nianlai, An Li and Ma Keqi
Postharvest Technology for Vietnamese ‘Buoi’ Mangoes 633L.U. Opara, H.X. Nguyen and Le Van To
Quality Assurance of Fresh Produce in New Zealand – a Personal View 639L.U. Opara
Scientific Tools for Quality Management in Agricultural Produce 651L.U. Opara
Effect of Intermittent Warming on the Reduction of Chilling Injury and Physiological Changes of ‘Khakdum’ Papaya (Carica papaya L.) 656
L. Huajaikaew, V. Srilaong and S. Kanlayanarat Reducing Bruising in Apple Cartons 662
C.J. Studman Improving the Ergonomics of Apple Grading Tables 667
C.J. Studman Investigation and Biological Control of Postharvest Diseases of Muskmelon 673
Wang Wei, Tang Wenhua, Huang Yong and Li Yazhen Biotechnology for Improvement of ‘Mas’ (Musa AA) Bananas 679
H. Nair, S. Chandran, N. Khalid, S.N. Mohd Aris and I.D. Wilson Assessment of Postharvest Handling Systems for Chinese Cabbage in China 688
Wang Xiangyang and Shen Lianqing The Effect of Sugar and Ethylene on Postharvest Pak Choy
(Brassica rapa var. chinensis) Leaf Degreening 693Wang Xiangyang and Shen Lianqing
Evaluation of the Maturity Index for Durian Fruit by Various Destructive and Nondestructive Techniques 700
T. Yantarasri, K. Kalayanamitra, S. Saranwong and J. Sornsrivichai Quality Assurance for Export-oriented Citrus and Tomato Fruit in Morocco 706
A. Ait-Oubahou and M. El-Otmani
9
Workshop Reports 711
Workshop AFruit Quality 713
Workshop BShip Fumigation 714
Workshop CContaminant Management 716
Workshop DGrain Quality Issues 718
Session Summaries 721
Overview on Quality 723Fruit Quality 725Uptake and Impact 728Vegetables 730
List of Participants 731
11
Preface
The Association of South-East Asian Nations (ASEAN) Postharvest Seminarseries is recognised as the premier forum for discussion of research anddevelopment activities by regional postproduction specialists. The seminars aregenerally held every two years and attract participants from throughout the regionand much further afield.
The 19th ASEAN Seminar on Postharvest Technology was special in at leastthree ways. First, the commodity scope was extended from grain and other‘durable’ commodities to include also fruits and vegetables, ‘perishable’commodities whose large postharvest losses in the region demand research anddevelopment attention. Second, the seminar was, for the first time, held under theaegis of APEC, the Asia–Pacific Economic Cooperation forum. Third, this wasthe first ASEAN Postharvest Seminar to be held in Vietnam and, indeed, may havebeen the largest such gathering so far held there.
The theme of the seminar — Quality Assurance in Agricultural Produce —acknowledged that this is a time in which trade in agricultural produce is playinga vital role in stimulating the economies of the region. The nexus between‘quality’ and ‘trade’ was a topic of detailed analysis in presentations anddiscussions during the seminar.
The purpose of postharvest handling is timely delivery of a product that closelymatches buyer specifications and meets regulatory requirements. Satisfyingcustomers underpins quality assurance (QA) and other quality systems that aim toprovide product of the desired standard. As export markets become increasinglycompetitive, responsive QA can be crucial for maintaining and expandingmarkets. In addition, at national and international levels, the deliberations of theWorld Trade Organization and other policy changes have provided the frameworkfor regional moves to promote uptake and harmonisation of quality standards.Ample coverage of all these issues will be found in the papers in this volume.
We thank the Australian Centre for International Agricultural Research(ACIAR) for sponsoring the seminar and publication of the proceedings, and theAustralian Agency for International Development (AusAID) and the DanishInternational Development Assistance Agency (DANIDA) for supporting theattendance of a large number of regional participants. We thank all presenters andparticipants, and all those who were involved in organising the seminar — theenthusiastic contributions of both these groups made the event an outstandingsuccess.
Greg Johnson Le Van ToManager DirectorACIAR Postharvest Technology Post Harvest TechnologyProgram Institute
Ho Chi Minh City
Quality assurance in agricultural produce,edited by G.I. Johnson, Le Van To, Nguyen Duy Duc and M.C. Webb.
ACIAR Proceedings 100(printed version published in 2000)
12
Opening Address
Honourable Mr Chairman, ladies and gentlemen:
On behalf of the Ministry of Agriculture and Rural Development (MARD), Iwould like to welcome the international and local delegates to the 19th Associationof South-East Asian Nations (ASEAN) and 1st Asia–Pacific Economic Cooperation(APEC) Postharvest Technology Seminar organised by the Post-HarvestTechnology Institute (PHTI HCMC) in cooperation with the Australian Centre forInternational Agricultural Research (ACIAR) in Ho Chi Minh City on 9–12November 1999.
The topics of the seminar have drawn much attention from many people,especially farmers, as the development of postharvest technologies will not onlypromote commodity agriculture and raise the commercial value of agro-products,but improve conditions for farmers to exploit and use their land reasonably, createmore jobs for them and help increase their income. The development ofpostharvest technologies will be the basis for the firming-up of rural industrial andservice areas and thus change the rural economic structure as well as reorganisethe labour to speed up the process of industrialisation and modernisation. Thedevelopment of postharvest technology therefore affects not only the economicsbut also the society.
The Ministry of Agriculture and Rural Development would like to express itssupport to the international and local organisers for their good idea of holding theseminar and their hard preparation to ensure its success.
At present, postharvest technologies in Vietnam are still limited: only around50% of agro-products are processed; most products for export are minimallyprocessed; and some are in raw form.
Even though Vietnam is the second largest rice exporting country, the capacityof rice processing enterprises is just 10 million tonnes/year in total. In the wholecountry, there are about 100 coffee processors, 40 rubber enterprises, 50 teaplants, 41 sugar factories, 60 cashew nut units and 20 fruit–vegetable processors.To set up agriculture for export, the Government of Vietnam has approvedprograms of processing development and marketing of agro-products thatrepresent important parts in the total value of agricultural products.
I am glad that hundreds of international and local scientists are taking part in theseminar. This seminar provides a really big forum for the scientists to discuss andcommunicate new findings in postharvest technologies. This is also a good chancefor Asia–Pacific scientists to develop, broaden their cooperation, and exchangeexperiences for new peaks in science.
With this spirit, I wish the seminar great success and wish all the participantsgood health and happiness.
Thank you.
Professor Ngo The DanVice Minister of MARD
Quality assurance in agricultural produce,edited by G.I. Johnson, Le Van To, Nguyen Duy Duc and M.C. Webb.
ACIAR Proceedings 100(printed version published in 2000)
15
Vietnam’s Agriculture in the Context of Regionalisation and Globalisation:
Opportunities and Challenges
Bui Thi Lan*
Abstract
Vietnam is an agricultural country with over 77 million people, 76.5% of them living in rural areas.Agricultural land accounts for 22.2% of the total area of the country. Agricultural production has a greatinfluence on national economic development. Looking back on the national economic developmentprocess, particularly of agriculture, it can be outlined as follows:
— Before 1988: the Vietnamese economy had been operating under the centralised planning mechanism.All the land and materials for agricultural production were under State ownership. Agricultural productionwas centrally planned by the Government of Vietnam (GOV).
— Since 1988: the GOV launched the campaign for economic renovation, with the focus on agriculturalproduction. New policies have been introduced. Profound reforms have also taken place in the agriculturalsector. With adoption of the renovation policy great achievements have been made in agriculture, amongwhich the most outstanding is food production.
The process of regionalisation is taking place worldwide and is a common trend for all the countriesincluding Vietnam. In 1995 Vietnam became a full member of the Association of South-East Asian Nations(ASEAN) and has participated in most regional organisations and agreements, including the CommonEffective Preferential Tariff (CEPT), ASEAN Free Trade Area (AFTA) and the Asia–Pacific EconomicCooperation (APEC) group, and is preparing to join the World Trade Organization. New opportunities areopen for Vietnam, e.g. exchange trade, and economic and financial cooperation with member countriesincluding developed countries. On the other hand, the country is facing great challenges as it is bound toimplement commitments made when joining these organisations, such as reduction in tariffs and removalof non-tariff barriers. This means that Vietnam’s economy in general, and agriculture in particular, will besubject to tougher competition.
The paper also recommends measures to be considered and taken to improve the competitiveness ofVietnam’s agriculture.
Overview of Vietnam’s Agriculture
V
IETNAM
’
S
agriculture plays a very important rolein the country’s economy; 76.5% of the populationlives in rural areas, 76.88% of the total labour force(42.6 million people) consists of rural labour. Agri-cultural land covers 22.2% of the total area of thecountry. The sector provides about 30% of thecountry’s national income. Given these facts it is
obvious that agriculture has a great influence onnational economic development.
Before 1988
The Vietnamese economy operated under a cen-tralised planning mechanism with cooperatives andstate enterprises acting as the main economic com-ponents. All agricultural sources and materials wereunder state ownership. Agricultural production wasplanned by the Government and distribution of theproducts to farmers was on an average basis. During
* International Cooperation Department, Ministry of Agriculture and Rural Development, Vietnam.
Quality assurance in agricultural produce,edited by G.I. Johnson, Le Van To, Nguyen Duy Duc and M.C. Webb.
ACIAR Proceedings 100(printed version published in 2000)
16
this period, the price of agricultural products did notrely on production costs and market supply–demandrules; consequently, farmers were not encouraged tomake efficient use of agricultural resources andtherefore the country’s agricultural productivity wasvery low.
Since 1988
Recognising weaknesses of the centralised planningmechanism, the Government introduced a series ofeconomic renovations focused on the agriculturalsector. Over the past decade, a great number of agri-cultural renovation policies have been issued andimplemented, such as the agricultural and forestry landallocation policy, agricultural and forestry extensionpolicy etc. These policies have brought remarkableachievements in agricultural and forestry productionin general and food production in particular. An agri-cultural annual growth rate has been maintained ataround 4.5–5%. As a result, from a country with a fooddeficit, Vietnam has now become one of the largestexporters in the world of rice, coffee and cashew nuts.The increase of trade turnover from agricultural andforest products for the period from 1989–1999 hasbeen nearly 20% per year.
Vietnam’s Agriculture in the Context of Regional and Global Economic
Integration
Vietnam’s agriculture and its integration process
The opening up of the Vietnamese economy sincethe late 1980s is an integral component of thecountry’s economic renovation and continues to be acentrepiece in the 1990s. Among the main character-istics of this policy are expansion and diversificationof trade activities, promotion of large-scale foreigninvestment flows and integration into the world tradesystem through joining the Association of South-EastAsian Nations (ASEAN) and the Asia–PacificEconomic Cooperation (APEC) group. In 1995,Vietnam became full member of ASEAN. Since thenVietnam has participated in all regional trade agree-ments such as the Common Effective PreferentialTariff (CEPT) and ASEAN Free Trade Area (AFTA).
The main objective of AFTA is that ASEANmember countries commit to reduce tariffs to 0–5% by
the year 2003 (2006 for Vietnam) and remove non-tariff barriers (NTBs) 5 years after the products’ tariffis reduced. Together with other commodities, agricul-tural, forestry and fishery products are also subject totariff reduction with the following classifications:
(1) Inclusion List (IL): commodities subject toimmediate tariff reduction;
(2) Temporary Exclusion List (TEL): commoditieswhich are temporarily exempt from tariffreduction. The time schedule for tariffreduction of those commodities is 1996–2000;and
(3) General Exclusion List (GEL): commodities ofgreat importance for national security, socialmorals, human health, historical and culturalvalues are not subject to tariff reduction andNTB removal when implementing CEPT.
In 1988, Vietnam officially joined APEC and is nownegotiating for the accession to the World TradeOrganization (WTO), the largest trade organisation inthe world. With the entry to ASEAN, APEC and theaccession to WTO, Vietnam will on the one hand haveopportunities to open up its economic activities withthe whole world, but on the other hand it will face verystrong regional and international trade competition.
Opportunities, challenges and recommended measures
Opportunities
By joining regional and global economic inte-gration, some new opportunities are open to Vietnam’sagriculture:• provoking its comparative and competitive
advantages—cheap and abundant labour force,diverse climatic conditions;
• getting new markets for agricultural and forestryproducts—at present, agricultural products ofVietnam are exported to 50 countries. With theentry to ASEAN, APEC and WTO in the future,Vietnam will be able to enter into other markets;
• having a fairer trade environment according toregional and international trade rules (regional andinternational anti-dumping policies, disputesettlement mechanisms etc.);
• being introduced to new technologies fromdeveloped world agriculture; and
• getting access to greater foreign investment inagriculture and food industries from larger foreigninvestors.
Quality assurance in agricultural produce,edited by G.I. Johnson, Le Van To, Nguyen Duy Duc and M.C. Webb.
ACIAR Proceedings 100(printed version published in 2000)
17
Challenges
Being a very backward and poorly productivesector, Vietnam’s agriculture will face the followingchallenges while joining agricultural regionalisationand globalisation:• being exposed to tougher regional and international
competition in terms of productivity, quality andprice;
• becoming less protected because of reduction inagricultural subsidisation, tariff lines, removal ofnon-tariff barriers and development of specialisedagriculture;
• starting from an inefficient production managementmechanism;
• being threatened by agricultural and forestryenvironment degradation;
• losing traditional farming practices, local cropvarieties and animal breeds; and
• having a lack of skilled farmers for making use ofincreased farming technology, and a surplus ofunskilled farmers.
Recommended measures
Some suggested measures to prepare Vietnam’sagriculture to integrate well into regional and interna-tional agricultural competition are as follows:
• continuing the carefully and determinablyagricultural market-oriented economy approachwith the focus on improving quality, and reductionof production costs and prices;
• increasing the exportation of value-addedagricultural and forestry products throughprocessing industries;
• formulating a competitive strategy of selectedagricultural and forestry commodities and investingmore in their production and processing;
• applying temporary development subsidisationmeasures only to selected agricultural, forestry, andfishery commodities considered to be potentiallycompetitive;
• working out incentive investment policies for bothlocal and foreign investments in the agriculture,forestry, fishery and food industries;
• assuring clear legislation for a fairer businessenvironment for all agricultural economic sectors;and
• building a qualified contingent of management staffequipped with good professional knowledge andable to communicate in foreign languages in orderto be able to deal with regional and internationalworking and trade negotiations.
Quality assurance in agricultural produce,edited by G.I. Johnson, Le Van To, Nguyen Duy Duc and M.C. Webb.
ACIAR Proceedings 100(printed version published in 2000)
18
Globalisation and the Benefits of a Broad-based Approach to Postharvest Systems Development
F. Goletti and E. Samman*
Abstract
The paper is organised in three parts. The first part argues that global trends tend to strengthen the importanceof postharvest systems in many developing countries. The global changes are accompanied by the emergenceof large domestic and international enterprises in economies previously dominated by small and mediumenterprises. The second part argues that a broad-based approach to postharvest and agroindustry developmentmay be more adequate than a large-enterprise model of development to respond to the challenges of ruralpoverty. The broad-based approach recognises the scope for economies of scale in the long run, but it is alsoaware that, in the short and medium term, transaction costs, niche markets and intra-industry linkages mightactually make small and medium enterprises more conducive to growth than large enterprises. The third partof the paper presents the case of the starch industry in Vietnam—an industry largely characterised by smallenterprises that have been able to grow and adapt to rapid change over the past decade. High transaction costssuggest a role for small and medium enterprises in a continuum of firm sizes that include large enterprises andmultinational companies. Modelling work shows the employment and growth benefits of a broad-basedapproach that promotes small and medium enterprises.
O
VER
the past two decades, global changes in theagrofood industry have affected postharvest systemsdramatically—as the structure of the industry hasbecome more concentrated, demand patterns haveshifted towards higher value added products, andsupermarkets are increasingly the major actors in thefarmer-to-consumer chain. Yet, in many developingcountries, postharvest systems and agroindustry arestill largely characterised by a multitude of smallenterprises—often household businesses with littlecapital, limited access to modern technology, and poorintegration with urban and international markets.Under the process of globalisation, these small enter-prises are put under pressure by the entry of largedomestic and international agribusinesses. It is notclear what the impact of agroindustry globalisation onrural livelihoods and small enterprises has been. Theobjective of this paper is to understand to what extentglobalisation is compatible with a broad-basedapproach to agroindustrial development. A broad-
based approach implies a balanced structure ofexpanding small, medium, and large enterprises thatcan capture different scale economies, niche markets,linkages with urban and international markets, andintra-industry linkages. To this purpose, the paper isorganised into five sections including this intro-duction. The second section shows how current globaltrends tend to strengthen the importance of postharvestsystems in developing countries. The third sectionargues that a broad-based approach to postharvestsystems can be compatible with the globalisation ofthe agrofood industry. The fourth section presents acase study of the starch industry in Vietnam, a sectorwhere promotion of a broad-based approach is shownto have both equity and growth benefits. The finalsection briefly summarises the arguments and con-cludes.
The Increasing Importance of the Postharvest Sector
Presently in developing countries, several globaltrends highlight the increasing importance of post-
* Markets and Structural Studies, International Food Policy Research Institute (IFPRI), 2033 K Street, NW, Washington DC 20006, USA.
Quality assurance in agricultural produce,edited by G.I. Johnson, Le Van To, Nguyen Duy Duc and M.C. Webb.
ACIAR Proceedings 100(printed version published in 2000)
19
harvest systems. The first trend is the contraction ofthe agricultural sector, measured both by a decliningportion of the labour force engaged in agriculture anda declining share of agriculture in gross domesticproduct (GDP). Moreover, the share of agriculture inGDP tends to contract more rapidly than its share inlabour, implying a growing surplus of labour in ruralareas. In low-income countries, agriculture accountedfor 73% of the labour force and 34% of GDP in 1980.In 1990, agriculture’s share of the labour force hadfallen to 69%, while in 1995 it only accounted for 25%of GDP. In high-income countries, in contrast, agri-culture accounted for only about 5% of employmentand 2% of GDP in 1995 (World Bank 1997). Labourdisplaced by shrinking agricultural employmentusually migrates to the slums of the big cities in searchof more remunerative opportunities. High migrationrates, coupled with the inability of urban areas toabsorb this influx, suggest the need for policy to boostproductive rural employment. Postharvest activitiessuch as processing and marketing tend to be labour-intensive (Boeh-Ocansey 1988; FAO 1995); thereforethey can employ those who otherwise would leave,while increasing value added in rural areas (see Austin1995; Fellows 1997). Policies, institutions, and tech-nologies to develop rural agro-enterprise woulddirectly strengthen the rural economy despite agricul-tural contraction. They would also promote increasedagricultural production to provide the raw materialsfor processing.
A second and related trend is urbanisation. Theshare of the urban population in developing countrieshas grown 3.3% annually since 1980, and about 40%of the population of low- and middle-income countrieswas urban in 1995. In high-income economies, theurban population has become stable at 75% of the totalpopulation, indicating that urbanisation in developingcountries is likely to continue (see World Bank 1997;FAO 1999). As people live further from where food isprepared, they increasingly rely on transport, storage,processing, and marketing systems for a secure andsafe food supply. Reduced time for food preparation(see Kennedy and Reardon 1994) and rising demandfor processed food (see Jaffee and Gordon 1993)increase the need to develop healthy, affordable foodproducts and appropriate processing systems.Moreover, urbanisation and the related income growthaffect dietary composition. As peoples’ incomesincrease, the share of calories they derive from starchystaples declines, while consumption of higher valuefoods increases (Poleman 1994). These higher valuefoods include fresh and processed fruits and vege-
tables, meats, fish, dairy products and vegetable oils.They tend to have shorter shelf lives than traditionalstaples, and require a well organised postharvest chainto ensure freshness. Further, advances in the post-harvest sector often reduce consumer prices,bolstering food security for the urban poor.
The third trend is toward a more liberalised interna-tional trade system and an increasing orientation ofdeveloping countries toward export markets as asource of economic growth. This orientation is attrib-utable both to increased surpluses, arising from theintroduction of green revolution technology, and topolicy changes wrought by structural adjustmentprograms (SAPs) in much of the developing world.One tenet of SAPs is the promotion of exports throughsuch incentives as currency devaluation and deregu-lation of trade. Participation in international marketsrequires relatively sophisticated marketing, infor-mation, and transportation networks. Successfulcompetition requires quality control and productstandardisation, and improved storage and trade facil-ities (see Jaffee and Gordon 1993; Johnson 1998).
The fourth trend is a growing interest in redressinggender inequity (see Fleischer et al. 1996). Womenhave traditionally played an important role inprocessing, handling and preparing food. In WestAfrican countries, for example, the role of women inmarketing agricultural products is well known (seeJaffee and Morton 1995). A large part of women’swork in postproduction is often in the informal sector,including such tasks as the preparation of traditionalfoods, and small-scale production of fish, palm oil,cassava, and dairy products (Petritisch 1985). Thedevelopment of postproduction can play an importantrole in providing further economic opportunities forwomen and in channelling their incorporation intoformal sector employment. This, of course, requiresthat such development explicitly take account of therole of women and their comparative advantage inpostharvest activity (Petritisch 1985).
The fifth trend is rising concern with environmentalissues and sustainable development. Consumers aredemanding reduction in pesticide use, organic foodproducts, and biodegradable packaging, and thesedemands will increase along with rising income. In theUnited States of America (USA), for example,demand for organic produce rose 14% yearly between1988 and 1992 (Thrupp 1995). These concerns presentopportunities and challenges for postharvest research,to develop alternative technologies for storage pestand disease control, waste treatment from processingplants, aquaculture, livestock feedlotting, and
Quality assurance in agricultural produce,edited by G.I. Johnson, Le Van To, Nguyen Duy Duc and M.C. Webb.
ACIAR Proceedings 100(printed version published in 2000)
20
improved food safety (see Austin 1995; Arnold 1996;Johnson 1998).
To date, traditional postharvest research has focusedupon the role of technology as the catalyst forimprovement. However, this narrow emphasis shouldbe broadened to incorporate institutional and policydimensions of the postproduction system that are oftencritical in allowing the dissemination of technologicalimprovements and in expanding their reach to the mostdisadvantaged. For instance, in many countries, small-holder farmers face missing or incomplete markets forinputs and outputs. Institutions such as contractfarming can overcome this gap by linking processorswith smallholder farmers, guaranteeing a stable supplyof raw materials to the former and steady markets andprices to the latter. They thus allow smallholders togain reliable access to markets and prices where trans-action costs would otherwise be too high or priceoutcomes too unpredictable, such as markets for per-ishables and high-value items in tradable sectors(Minot 1986; Delgado 1998).
The Broad-based Approach to Postharvest and Agroindustry
Development
The globalisation of agroindustry over the past decadehas been accompanied by consolidation andincreasing concentration in market share. This is par-ticularly evident in industrialised countries and is alsobecoming widespread in developing countries, as aconsequence of a more liberalised world trade systemand increasing foreign direct investment (FDI) inagroindustry. In the European Union, Viaene andGellynck (1995) report that the food, drink andtobacco industry has become increasingly concen-trated since the early 1980s, while Giles (1999)foresees its further concentration so that as few as 20major groups will dominate by about 2010. In theUnited Kingdom, Dolan et al. (1999) describe adramatic concentration of food retailing in the lastthree decades, with four retailers accounting for nearly75% of food sales in 1998. Turning to the USA,Koontz et al. (1993) find a large increase in the con-centration of meat packing; this is echoed for lamb(Brester and Musick 1995), beef (Azzam 1998) andpork (Hayenga 1998). Evidence for this trend isgrowing in developing countries too. In Brazil, Jank etal. (1999) count 143 mergers and acquisitions in thefood, beverage and tobacco industry in the 3 yearsfollowing the 1994 Real Plan. In South Africa,
Kaplinsky and Manning (1998) report that the Ginicoefficient for industry rose from 0.78 in 1972 to 0.84in 1988. In both Kenya and Zimbabwe, five exportershave come to control over 75% of all fresh vegetableexports (Dolan et al. 1999). The Asian ProductivityOrganization (1992) describes the growing prevalenceof large industry in Indonesia from the mid-1970sonward.
At the same time, there seems to be a shift from spotmarkets to contract farming and vertical integration(see FAO 1997; Schejtman 1998). Notable examplesare palm oil production in Malaysia (see Kajisa andMeredia 1997) and fruit production in Latin America(e.g. see Key and Runsten 1999). This shift is partly aresult of the higher quality standards that largeretailers and supermarkets are requiring from theirsuppliers in developing countries (Dolan et al. 1999).
Even though this process might lead to highergrowth and improved efficiency, there is concern thatit might induce a type of development that is neitherbroad-based nor employment-generating in ruralareas, and that therefore it might not contribute to ruraldevelopment and poverty alleviation. Evidence of theeffects of the globalisation of agroindustry on ruralareas and small enterprise development in developingcountries is very scarce. However they carry importantimplications for development policy. As the agricul-tural sector contracts in many developing countries,the labour force in rural areas does not decrease at thesame rate. An increasing number of rural householdsare engaged in activities with low productivity, andrural–urban migration does not seem a solution in themedium term. Therefore, the priority for many devel-oping countries is to generate rural economic activitiesthat increase the income of the rural population.Agroindustry is an obvious candidate for this type ofactivity, because of its linkages with agriculture andrural development. However, if the development ofglobalised agroindustry is dominated by a smallnumber of large and capital-intensive enterprises, inthe short and medium term, it does not augur well forrural households or small enterprises. Within thiscontext, there is a need to explore alternative policyoptions to promote broad-based agroindustrial devel-opment, without compromising efficiency and theopportunities for growth presented by the globaleconomy.
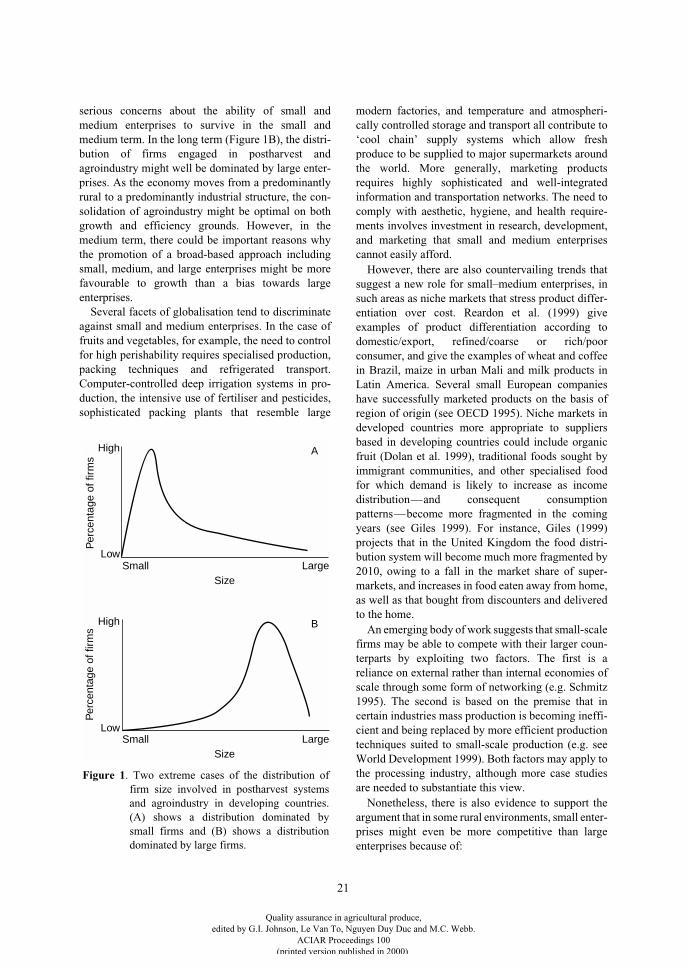
In many developing countries, postharvest systemsand agroindustry are dominated by a multitude ofsmall and medium enterprises (Figure 1A). Under thepressure of changing demand patterns and competitionfrom large domestic or foreign enterprises, there are
Quality assurance in agricultural produce,edited by G.I. Johnson, Le Van To, Nguyen Duy Duc and M.C. Webb.
ACIAR Proceedings 100(printed version published in 2000)
21
serious concerns about the ability of small andmedium enterprises to survive in the small andmedium term. In the long term (Figure 1B), the distri-bution of firms engaged in postharvest andagroindustry might well be dominated by large enter-prises. As the economy moves from a predominantlyrural to a predominantly industrial structure, the con-solidation of agroindustry might be optimal on bothgrowth and efficiency grounds. However, in themedium term, there could be important reasons whythe promotion of a broad-based approach includingsmall, medium, and large enterprises might be morefavourable to growth than a bias towards largeenterprises.
Several facets of globalisation tend to discriminateagainst small and medium enterprises. In the case offruits and vegetables, for example, the need to controlfor high perishability requires specialised production,packing techniques and refrigerated transport.Computer-controlled deep irrigation systems in pro-duction, the intensive use of fertiliser and pesticides,sophisticated packing plants that resemble large
modern factories, and temperature and atmospheri-cally controlled storage and transport all contribute to‘cool chain’ supply systems which allow freshproduce to be supplied to major supermarkets aroundthe world. More generally, marketing productsrequires highly sophisticated and well-integratedinformation and transportation networks. The need tocomply with aesthetic, hygiene, and health require-ments involves investment in research, development,and marketing that small and medium enterprisescannot easily afford.
However, there are also countervailing trends thatsuggest a new role for small–medium enterprises, insuch areas as niche markets that stress product differ-entiation over cost. Reardon et al. (1999) giveexamples of product differentiation according todomestic/export, refined/coarse or rich/poorconsumer, and give the examples of wheat and coffeein Brazil, maize in urban Mali and milk products inLatin America. Several small European companieshave successfully marketed products on the basis ofregion of origin (see OECD 1995). Niche markets indeveloped countries more appropriate to suppliersbased in developing countries could include organicfruit (Dolan et al. 1999), traditional foods sought byimmigrant communities, and other specialised foodfor which demand is likely to increase as incomedistribution—and consequent consumptionpatterns—become more fragmented in the comingyears (see Giles 1999). For instance, Giles (1999)projects that in the United Kingdom the food distri-bution system will become much more fragmented by2010, owing to a fall in the market share of super-markets, and increases in food eaten away from home,as well as that bought from discounters and deliveredto the home.
An emerging body of work suggests that small-scalefirms may be able to compete with their larger coun-terparts by exploiting two factors. The first is areliance on external rather than internal economies ofscale through some form of networking (e.g. Schmitz1995). The second is based on the premise that incertain industries mass production is becoming ineffi-cient and being replaced by more efficient productiontechniques suited to small-scale production (e.g. seeWorld Development 1999). Both factors may apply tothe processing industry, although more case studiesare needed to substantiate this view.
Nonetheless, there is also evidence to support theargument that in some rural environments, small enter-prises might even be more competitive than largeenterprises because of:
Per
cent
age
of fi
rms
Per
cent
age
of fi
rms
SizeLargeSmall
SizeLargeSmall
Low
Low
High
High
A
B
Figure 1. Two extreme cases of the distribution offirm size involved in postharvest systemsand agroindustry in developing countries.(A) shows a distribution dominated bysmall firms and (B) shows a distributiondominated by large firms.
Quality assurance in agricultural produce,edited by G.I. Johnson, Le Van To, Nguyen Duy Duc and M.C. Webb.
ACIAR Proceedings 100(printed version published in 2000)
22
1.
more flexibility in adapting to disruptive cir-cumstances and in responding to frequentinterruptions in the supply of inputs (e.g. seeSandee 1999 on Indonesia);
2. an input supply that is insufficient to permitsubstantial economies of scale (e.g. so thatlarge fish plants are operating below capacityin Tanzania—McCormick 1998);
3.
better labour flexibility either in utilisation oflabour or by combining several businessactivities which can be frozen or expandedaccording to market fluctuations
1
;
4.
markets that are not large or constant enoughto absorb the output of a large plant running atfull capacity (e.g. demand for rattan furniturein Indonesia—Smyth 1992). Local pro-duction costs will often exceed world prices,militating against exports;
5.
managerial problems involved in large-scaleproduction can be very complex and lack ofeffective coordination can result in input loss;and
6.
there may be diseconomies of scale in large-scale plants, especially those which areoutside of the plant itself, e.g. if adequateinfrastructure is lacking, new roads my beneeded, large concentrations of estate workersmay require housing, and poor industriallinkages may make the maintenance of asophisticated, large-scale plant difficult.
2
Kaplinsky (1990) shows how these problems haveled to large-scale sugar processing plants being sup-planted by smaller scale models in China, India andKenya, where production at levels originally envi-sioned would have doubled sugar production costs.
In conclusion, while long-term trends seem to augurincreasing concentration in the agro-processingindustry, there are several factors, at least in the shortto medium term, that argue for continued small firminvolvement. These arguments suggest that a broad-based approach to agroindustrial development mightbe possible, not only on the grounds of equity, but alsoof efficiency.
Growth Benefits of the Broad-based Approach: the Case of
Starch in Vietnam
Despite a decade of remarkable growth of the agricul-tural sector, there is mounting evidence that rural areasin Vietnam are lagging behind urban areas (NguyenVan Bich et al. 1998). The gap between rural andurban incomes is increasing and the prospects forstrong and sustainable growth of non-farm ruralincome are not encouraging. With 80% of populationliving in rural areas, these trends—if they continue—risk raising social tensions. In response to these trendsand the recent crisis in Asia, the government ofVietnam has recognised the key role of agriculture andrural economy for the promotion of industrialisationand modernisation and its contribution to increasingemployment and income of the rural population (seePhan Van Khai 1999).
An example of rural income diversification andindustrialisation concerns the starch industry inVietnam. Ten years ago, starch production wasroughly 10% of the total use of cassava. The industrywas characterised by low levels of production, servinglocal markets for noodles and maltose. Since then, theindustry has grown rapidly, with newer and larger par-ticipants engaging in the production of specialtyvarieties of starch for industrial, food, and exportpurposes. In particular, the past few years havewitnessed the arrival of a few large-scale foreign anddomestic enterprises with significant potential for thedevelopment of the starch industry in Vietnam.However, small-scale production of starch continuesto dominate. Currently, 90% of the starch processorsin Vietnam could be classified as small processors,with less than a 10 t/day capacity.
At the same time, however, as the starch industrydevelops and modernises, there will be an increasingemphasis on technology and capital within the starchindustry. This threatens to crowd out many of thesmall-scale producers, who may not have the capitalresources to compete. While this may be a desirablesituation in the long run, it is possible that it is not themost efficient situation in the short or medium term. Inan environment characterised by high transactioncosts, induced by low levels of infrastructure devel-opment and market integration, and poor productivityof cassava, there are gains to be made in enhancing thescale of small-scale starch processors.
We examine the starch industry of Vietnam usingdata from a household survey undertaken by the Inter-
1.
These first three arguments are adapted from Rasmussen et al. 1992.
2.
These last three arguments are taken from Kaplinsky 1990.
Quality assurance in agricultural produce,edited by G.I. Johnson, Le Van To, Nguyen Duy Duc and M.C. Webb.
ACIAR Proceedings 100(printed version published in 2000)
23
national Food Policy Research Institute (IFPRI) incollaboration with the International Centre forTropical Agriculture (CIAT—Centro Internacional deAgricultura Tropical) and the Post-Harvest Tech-nology Institute (PHTI) in Hanoi during 1998 (seeIFPRI 1998). After an overview of starch uses inVietnam, we provide a detailed profile of the Viet-namese starch industry—highlighting the growthexperienced in the industry, the structure of firms andend users, and constraints facing the industry. We thendiscuss the issue of promoting broad-based growth inthe starch industry by way of using an industry modelto trace the effects of a capital injection into thesubsector.
Overview of starch uses
Starch uses are varied, and are diversifying furtherwith continued global economic development. InVietnam, root crops, especially cassava, have been thetraditional sources of starch for use in food products.Cassava starch is processed into a range of foods,including noodles, crackers and cakes. Cassava starchis also the main raw material for maltose production innorthern Vietnam (maltose is, in turn, used by the con-fectionery industry). All of these traditional uses arefound mainly as household enterprises—Vietnammay be a unique example of the development of small-scale maltose production from cassava starch, forexample.
Non-food industrial uses of cassava are also foundin Vietnam, associated with larger scale enterprises.The textile industry, for example, uses cassava starchfor sizing, while the paper industry uses starch forcoating high quality types of paper. As these industrialsectors develop, demand for starch is likely toincrease. In Vietnam, the recent arrival of a few large-scale starch-producing firms interested in added value
products has resulted in a much more diverse productoffering than was found only a few years ago. The pro-duction of fermentation products (monosodiumglutamate and lysine) has started, for example. TheThai starch industry, which is more developed, hasplaced substantial effort and resources on a shifttowards production of higher valued modified starchesfrom cassava. Cassava starch is seen as the logical rawmaterial for modified starch and for production ofsweeteners in Southeast Asia, comparable to maize inNorth America and potato in Europe. As the starch-using industries develop in Southeast Asia, the rangeof starch-derived intermediate and end products man-ufactured from cassava will also expand.
Profile of the starch industry of Vietnam
In this part, we discuss some of the major highlightsof the starch industry, as well as look at some of theconstraints within the industry that affect its competi-tiveness and efficiency.
Increasing utilisation of cassava production, but excess capacity in the starch industry
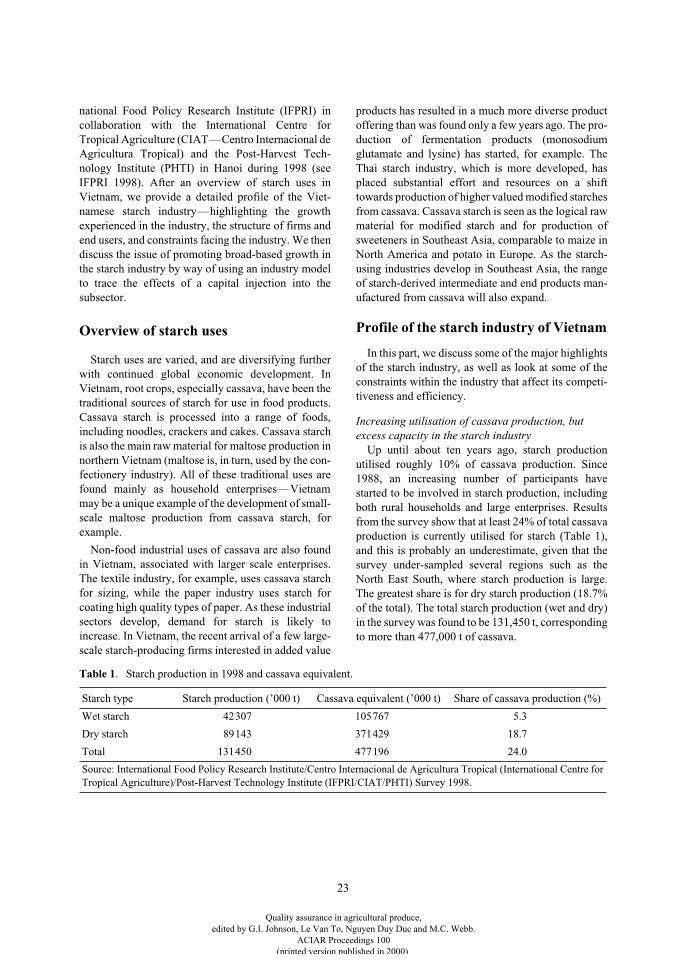
Up until about ten years ago, starch productionutilised roughly 10% of cassava production. Since1988, an increasing number of participants havestarted to be involved in starch production, includingboth rural households and large enterprises. Resultsfrom the survey show that at least 24% of total cassavaproduction is currently utilised for starch (Table 1),and this is probably an underestimate, given that thesurvey under-sampled several regions such as theNorth East South, where starch production is large.The greatest share is for dry starch production (18.7%of the total). The total starch production (wet and dry)in the survey was found to be 131,450 t, correspondingto more than 477,000 t of cassava.
Table 1
. Starch production in 1998 and cassava equivalent.
Starch type Starch production (’000 t) Cassava equivalent (’000 t) Share of cassava production (%)
Wet starch 42307 105767 5.3
Dry starch 89143 371429 18.7
Total 131450 477196 24.0
Source: International Food Policy Research Institute/Centro Internacional de Agricultura Tropical (International Centre for Tropical Agriculture)/Post-Harvest Technology Institute (IFPRI/CIAT/PHTI) Survey 1998.
Quality assurance in agricultural produce,edited by G.I. Johnson, Le Van To, Nguyen Duy Duc and M.C. Webb.
ACIAR Proceedings 100(printed version published in 2000)
24
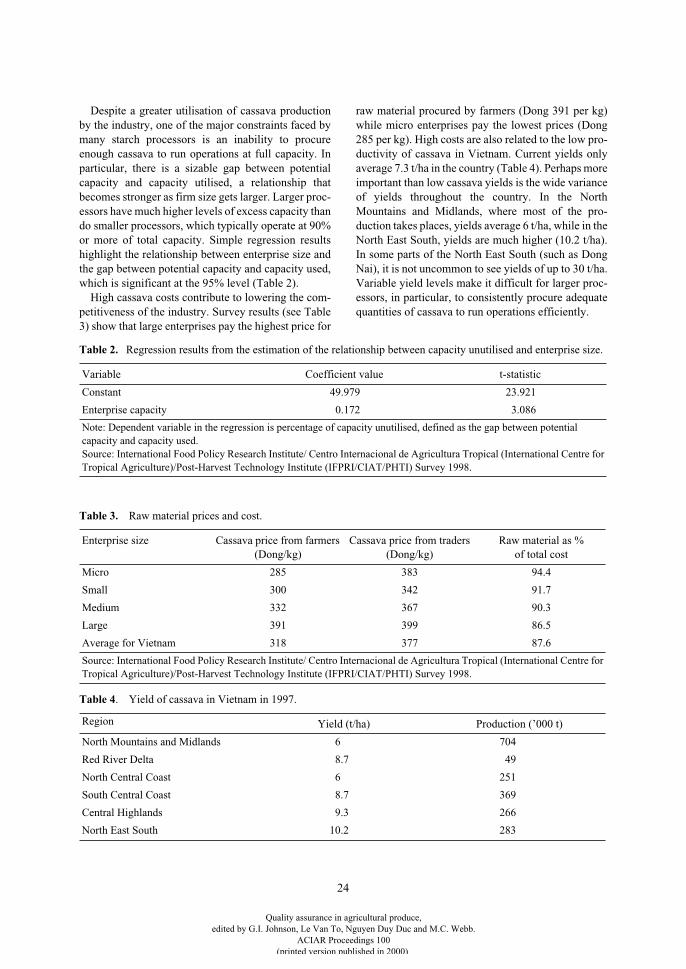
Despite a greater utilisation of cassava productionby the industry, one of the major constraints faced bymany starch processors is an inability to procureenough cassava to run operations at full capacity. Inparticular, there is a sizable gap between potentialcapacity and capacity utilised, a relationship thatbecomes stronger as firm size gets larger. Larger proc-essors have much higher levels of excess capacity thando smaller processors, which typically operate at 90%or more of total capacity. Simple regression resultshighlight the relationship between enterprise size andthe gap between potential capacity and capacity used,which is significant at the 95% level (Table 2).
High cassava costs contribute to lowering the com-petitiveness of the industry. Survey results (see Table3) show that large enterprises pay the highest price for
raw material procured by farmers (Dong 391 per kg)while micro enterprises pay the lowest prices (Dong285 per kg). High costs are also related to the low pro-ductivity of cassava in Vietnam. Current yields onlyaverage 7.3 t/ha in the country (Table 4). Perhaps moreimportant than low cassava yields is the wide varianceof yields throughout the country. In the NorthMountains and Midlands, where most of the pro-duction takes places, yields average 6 t/ha, while in theNorth East South, yields are much higher (10.2 t/ha).In some parts of the North East South (such as DongNai), it is not uncommon to see yields of up to 30 t/ha.Variable yield levels make it difficult for larger proc-essors, in particular, to consistently procure adequatequantities of cassava to run operations efficiently.
Table 2.
Regression results from the estimation of the relationship between capacity unutilised and enterprise size.
Variable Coefficient value t-statistic
Constant 49.979 23.921
Enterprise capacity 0.172 3.086
Note: Dependent variable in the regression is percentage of capacity unutilised, defined as the gap between potential capacity and capacity used.Source: International Food Policy Research Institute/ Centro Internacional de Agricultura Tropical (International Centre for Tropical Agriculture)/Post-Harvest Technology Institute (IFPRI/CIAT/PHTI) Survey 1998.
Table 3.
Raw material prices and cost.
Enterprise size Cassava price from farmers (Dong/kg)
Cassava price from traders (Dong/kg)
Raw material as % of total cost
Micro 285 383 94.4
Small 300 342 91.7
Medium 332 367 90.3
Large 391 399 86.5
Average for Vietnam 318 377 87.6
Source: International Food Policy Research Institute/ Centro Internacional de Agricultura Tropical (International Centre for Tropical Agriculture)/Post-Harvest Technology Institute (IFPRI/CIAT/PHTI) Survey 1998.
Table 4
. Yield of cassava in Vietnam in 1997.
Region
Yield (t/ha) Production (’000 t)
North Mountains and Midlands 6 704
Red River Delta 8.7 49
North Central Coast 6 251
South Central Coast 8.7 369
Central Highlands 9.3 266
North East South 10.2 283
Quality assurance in agricultural produce,edited by G.I. Johnson, Le Van To, Nguyen Duy Duc and M.C. Webb.
ACIAR Proceedings 100(printed version published in 2000)
25
Increasing size of new entrants, but decreasing returns to scale
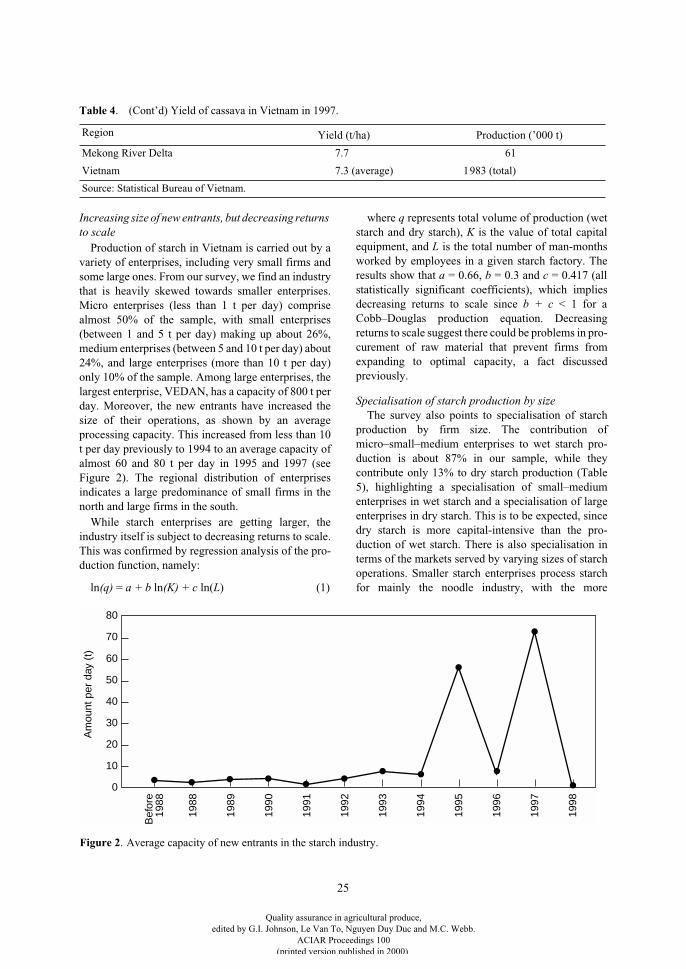
Production of starch in Vietnam is carried out by avariety of enterprises, including very small firms andsome large ones. From our survey, we find an industrythat is heavily skewed towards smaller enterprises.Micro enterprises (less than 1 t per day) comprisealmost 50% of the sample, with small enterprises(between 1 and 5 t per day) making up about 26%,medium enterprises (between 5 and 10 t per day) about24%, and large enterprises (more than 10 t per day)only 10% of the sample. Among large enterprises, thelargest enterprise, VEDAN, has a capacity of 800 t perday. Moreover, the new entrants have increased thesize of their operations, as shown by an averageprocessing capacity. This increased from less than 10t per day previously to 1994 to an average capacity ofalmost 60 and 80 t per day in 1995 and 1997 (seeFigure 2). The regional distribution of enterprisesindicates a large predominance of small firms in thenorth and large firms in the south.
While starch enterprises are getting larger, theindustry itself is subject to decreasing returns to scale.This was confirmed by regression analysis of the pro-duction function, namely:
ln
(q)
=
a + b
ln
(K) + c
ln(
L
) (1)
where
q
represents total volume of production (wetstarch and dry starch),
K
is the value of total capitalequipment, and
L
is the total number of man-monthsworked by employees in a given starch factory. Theresults show that
a
= 0.66,
b
= 0.3 and
c
= 0.417 (allstatistically significant coefficients), which impliesdecreasing returns to scale since
b + c
< 1 for aCobb–Douglas production equation. Decreasingreturns to scale suggest there could be problems in pro-curement of raw material that prevent firms fromexpanding to optimal capacity, a fact discussedpreviously.
Specialisation of starch production by size
The survey also points to specialisation of starchproduction by firm size. The contribution ofmicro–small–medium enterprises to wet starch pro-duction is about 87% in our sample, while theycontribute only 13% to dry starch production (Table5), highlighting a specialisation of small–mediumenterprises in wet starch and a specialisation of largeenterprises in dry starch. This is to be expected, sincedry starch is more capital-intensive than the pro-duction of wet starch. There is also specialisation interms of the markets served by varying sizes of starchoperations. Smaller starch enterprises process starchfor mainly the noodle industry, with the more
Mekong River Delta 7.7 61
Vietnam 7.3 (average) 1983 (total)
Source: Statistical Bureau of Vietnam.
Table 4
. (Cont’d) Yield of cassava in Vietnam in 1997.
Region
Yield (t/ha) Production (’000 t)
0
60
40
20
30
50
10
Am
ount
per
day
(t)
198
8
1988
1989
1990
1991
1992
1993
1994
1995
80
70
1996
1997
1998
Bef
ore
Figure 2. Average capacity of new entrants in the starch industry.
Quality assurance in agricultural produce,edited by G.I. Johnson, Le Van To, Nguyen Duy Duc and M.C. Webb.
ACIAR Proceedings 100(printed version published in 2000)
26
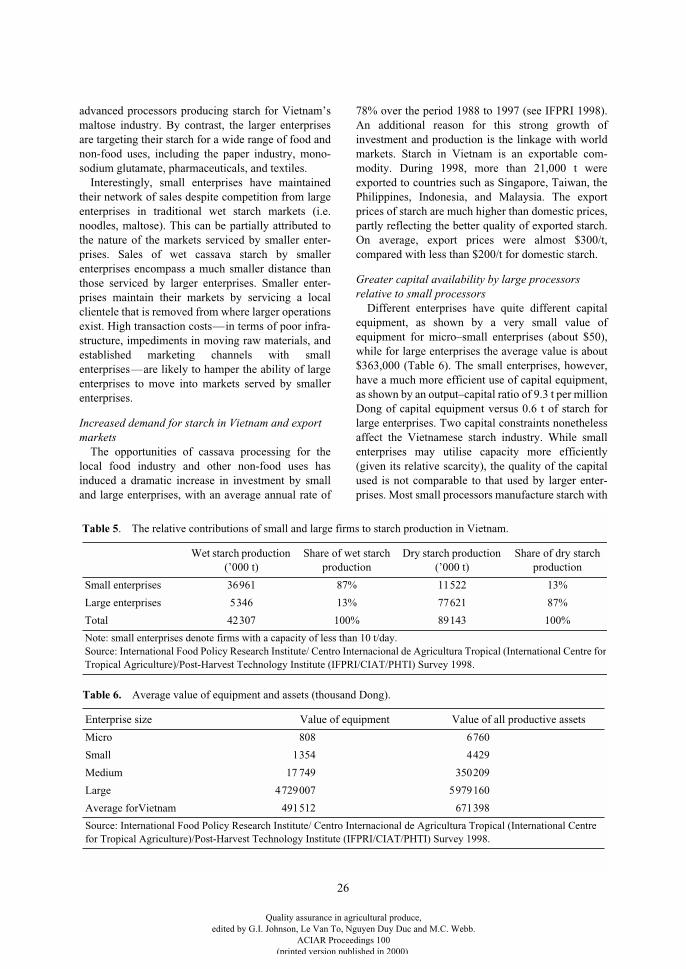
advanced processors producing starch for Vietnam’smaltose industry. By contrast, the larger enterprisesare targeting their starch for a wide range of food andnon-food uses, including the paper industry, mono-sodium glutamate, pharmaceuticals, and textiles.
Interestingly, small enterprises have maintainedtheir network of sales despite competition from largeenterprises in traditional wet starch markets (i.e.noodles, maltose). This can be partially attributed tothe nature of the markets serviced by smaller enter-prises. Sales of wet cassava starch by smallerenterprises encompass a much smaller distance thanthose serviced by larger enterprises. Smaller enter-prises maintain their markets by servicing a localclientele that is removed from where larger operationsexist. High transaction costs—in terms of poor infra-structure, impediments in moving raw materials, andestablished marketing channels with smallenterprises—are likely to hamper the ability of largeenterprises to move into markets served by smallerenterprises.
Increased demand for starch in Vietnam and export markets
The opportunities of cassava processing for thelocal food industry and other non-food uses hasinduced a dramatic increase in investment by smalland large enterprises, with an average annual rate of
78% over the period 1988 to 1997 (see IFPRI 1998).An additional reason for this strong growth ofinvestment and production is the linkage with worldmarkets. Starch in Vietnam is an exportable com-modity. During 1998, more than 21,000 t wereexported to countries such as Singapore, Taiwan, thePhilippines, Indonesia, and Malaysia. The exportprices of starch are much higher than domestic prices,partly reflecting the better quality of exported starch.On average, export prices were almost $300/t,compared with less than $200/t for domestic starch.
Greater capital availability by large processors relative to small processors
Different enterprises have quite different capitalequipment, as shown by a very small value ofequipment for micro–small enterprises (about $50),while for large enterprises the average value is about$363,000 (Table 6). The small enterprises, however,have a much more efficient use of capital equipment,as shown by an output–capital ratio of 9.3 t per millionDong of capital equipment versus 0.6 t of starch forlarge enterprises. Two capital constraints nonethelessaffect the Vietnamese starch industry. While smallenterprises may utilise capacity more efficiently(given its relative scarcity), the quality of the capitalused is not comparable to that used by larger enter-prises. Most small processors manufacture starch with
Table 5. The relative contributions of small and large firms to starch production in Vietnam.
Wet starch production (’000 t)
Share of wet starch production
Dry starch production (’000 t)
Share of dry starch production
Small enterprises 36961 87% 11522 13%
Large enterprises 5346 13% 77621 87%
Total 42307 100% 89143 100%
Note: small enterprises denote firms with a capacity of less than 10 t/day.Source: International Food Policy Research Institute/ Centro Internacional de Agricultura Tropical (International Centre forTropical Agriculture)/Post-Harvest Technology Institute (IFPRI/CIAT/PHTI) Survey 1998.
Table 6.
Average value of equipment and assets (thousand Dong).
Enterprise size Value of equipment Value of all productive assets
Micro 808 6760
Small 1354 4429
Medium 17 749 350209
Large 4729007 5979160
Average forVietnam 491512 671398
Source: International Food Policy Research Institute/ Centro Internacional de Agricultura Tropical (International Centre for Tropical Agriculture)/Post-Harvest Technology Institute (IFPRI/CIAT/PHTI) Survey 1998.
Quality assurance in agricultural produce,edited by G.I. Johnson, Le Van To, Nguyen Duy Duc and M.C. Webb.
ACIAR Proceedings 100(printed version published in 2000)
27
only the bare minimum of equipment, using gratersand pumps for most operations. By contrast, largeenterprises have access to sedimentation tanks, dryers,and complete starch systems. Moreover, throughoutthe industry, the majority of the starch industry isworking with locally manufactured equipment, or oldequipment from Russia and China, which is of quitelow value and inappropriate for producing high qualitystarch.
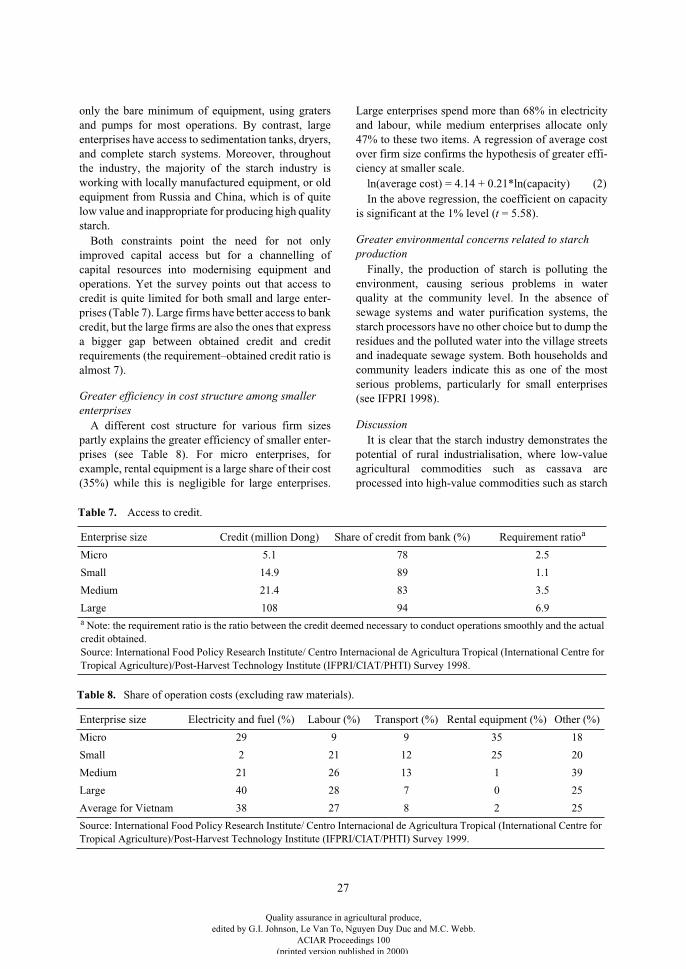
Both constraints point the need for not onlyimproved capital access but for a channelling ofcapital resources into modernising equipment andoperations. Yet the survey points out that access tocredit is quite limited for both small and large enter-prises (Table 7). Large firms have better access to bankcredit, but the large firms are also the ones that expressa bigger gap between obtained credit and creditrequirements (the requirement–obtained credit ratio isalmost 7).
Greater efficiency in cost structure among smaller enterprises
A different cost structure for various firm sizespartly explains the greater efficiency of smaller enter-prises (see Table 8). For micro enterprises, forexample, rental equipment is a large share of their cost(35%) while this is negligible for large enterprises.
Large enterprises spend more than 68% in electricityand labour, while medium enterprises allocate only47% to these two items. A regression of average costover firm size confirms the hypothesis of greater effi-ciency at smaller scale.
ln(average cost) = 4.14 + 0.21*ln(capacity) (2)In the above regression, the coefficient on capacity
is significant at the 1% level (
t
= 5.58).
Greater environmental concerns related to starch production
Finally, the production of starch is polluting theenvironment, causing serious problems in waterquality at the community level. In the absence ofsewage systems and water purification systems, thestarch processors have no other choice but to dump theresidues and the polluted water into the village streetsand inadequate sewage system. Both households andcommunity leaders indicate this as one of the mostserious problems, particularly for small enterprises(see IFPRI 1998).
Discussion
It is clear that the starch industry demonstrates thepotential of rural industrialisation, where low-valueagricultural commodities such as cassava areprocessed into high-value commodities such as starch
Table 7. Access to credit.
Enterprise size Credit (million Dong) Share of credit from bank (%) Requirement ratioa
Micro 5.1 78 2.5
Small 14.9 89 1.1
Medium 21.4 83 3.5
Large 108 94 6.9a Note: the requirement ratio is the ratio between the credit deemed necessary to conduct operations smoothly and the actual credit obtained.Source: International Food Policy Research Institute/ Centro Internacional de Agricultura Tropical (International Centre for Tropical Agriculture)/Post-Harvest Technology Institute (IFPRI/CIAT/PHTI) Survey 1998.
Table 8.
Share of operation costs (excluding raw materials).
Enterprise size Electricity and fuel (%) Labour (%) Transport (%) Rental equipment (%) Other (%)
Micro 29 9 9 35 18
Small 2 21 12 25 20
Medium 21 26 13 1 39
Large 40 28 7 0 25
Average for Vietnam 38 27 8 2 25
Source: International Food Policy Research Institute/ Centro Internacional de Agricultura Tropical (International Centre for Tropical Agriculture)/Post-Harvest Technology Institute (IFPRI/CIAT/PHTI) Survey 1999.
Quality assurance in agricultural produce,edited by G.I. Johnson, Le Van To, Nguyen Duy Duc and M.C. Webb.
ACIAR Proceedings 100(printed version published in 2000)
28
to be used in a variety of industries. There is evidenceof growth in the industry, in terms of the quantity ofcassava utilised by the industry, but also procurementbottlenecks among larger enterprises. This manifestsitself in terms of the industry facing decreasing returnsto scale. Given that new entrants to the starch enter-prises are getting larger, this constrains thedevelopment of the industry. At the same time,however, it points to a significant role to be played bysmall and medium-sized starch enterprises inVietnam. These firms are running at much higherlevels of capacity with fewer constraints in terms ofraw materials or market access. Yet these firms tend tooperate at lower levels of technology and capital andare more prone towards having problems with pol-lution. By providing greater levels of capital andtechnology to small and medium enterprises, therecould be efficiency gains in the industry as a wholegiven the high transactions costs that beset the starchindustry. This will be examined more carefully in thenext section.
Policy options: the optimal allocation of credit to starch enterprises
This section looks at alternative policy options topromote the starch sector, highlighting the role ofcapital availability among small and large enterprises.As identified in the previous section, one of the majorimpediments to the starch sector is limited access tocredit. Both large and small enterprises face diffi-culties in obtaining credit to finance their procurementactivities as well as capital investment. It is unclear,however, how a credit injection to the starch sectorshould be targeted—i.e. should credit be directed atsmall or larger enterprises? To answer this question,we develop a sector model used to describe the starchindustry. We then run a number of simulations to testthe most efficient allocation of capital to the sector.
Starch industry model for Vietnam (SIMV)
In order to evaluate the effects of alternative policieson prices, production, income, and trade, we have builta sector model of the starch industry in Vietnam(SIMV). The model includes four commodities (food,feed, wet starch, and dry starch), five types of agents(farmers, feed producers, wet starch processors, drystarch processors, and end users). It is an aggregatemodel (i.e. does not allow for regional variation andtrade) and incorporates international trade in feed anddry starch. The list of equations and the description ofthe model can be found in Appendix 1.
Policy simulations
To examine the impact of an injection of credit intothe starch sector, we conduct three simulations withSIMV. In all cases, we consider a 10% increase in thetotal value of capital equipment as a proxy for thecredit injection. We note that the total value of capitalequipment in the starch sector (with the exception ofthe large enterprise VEDAN) is roughly $21 million,so that a 10% increase implies an injection of about$2.1 million to the capital available in the sector. Itshould be noted that this expansion of credit should notbe considered a subsidy. Rather, we consider thisinvestment as a type of loan that could generateenough income to be repaid at market interest rates. Inthe case of small enterprises, we assume the creditinjection will translate partly to an increase in theaverage capital of each processing unit and partly to anexpansion of the size and number of small enterprises.
The simulations differ in how capital is distributedamong enterprises. In the first scenario, we examinethe effects of a 10% increase in the value of industrycapital equipment to the entire sector, or to small enter-prises and large enterprises alike. The secondsimulation takes the same amount of capital andallocates it only to small enterprises. In essence, this isakin to increasing the size of small enterprises andtransforming them into ‘larger’ enterprises. In the caseof the third simulation, we increase the capital of largeenterprises only. The goal of this exercise is to seewhether the income benefits from targeting creditinjections into the starch subsector are more beneficialwhen geared differentially (i.e. towards small or largeenterprises) or when the sector is treated equally.
Results
The results of all three scenarios are summarised inTables 9A–9C. In the first simulation, we consider anequal distribution of capital to small and large enter-prises. Total income increases $640,000, or 1.7%.Production of wet and dry starch increases by 1.2%and 3.3%, respectively. At the same time, wet starchincome is reduced slightly, as prices fall (–1.5%) morethan production rises. Dry starch income is buoyed byhigher production and the prospect of export markets.Since dry starch has an export outlet, prices do not fall;rather, excess production is channelled into 4,500 t ofexports. In the cassava market, income rises slightly(1.4%), supported by higher retail prices owing to agreater demand for starch. As expected, highercassava prices reduce feed income marginally(–0.9%). Overall, despite the growth in exportmarkets, it should be noted that the effects of the sector
Quality assurance in agricultural produce,edited by G.I. Johnson, Le Van To, Nguyen Duy Duc and M.C. Webb.
ACIAR Proceedings 100(printed version published in 2000)
29
are not very large. Given the difficulty in ensuring agood recovery rate for investment loans, it is unclearwhether this policy would make much of a difference.
When we examine the second simulation, we see amuch different story. Total income rises by nearly11% (or $4 million). The injection of credit boosts theincome of small starch processors for both wet and drystarch. Wet starch income for small processorsincreases almost 9%, while dry starch income rises anincredible 167%. The capital injection causes a signif-icant increase in wet starch production by smallprocessors. This in turn causes an increase in overallwet starch production (37%) and a significant fall inprices (–33%). Overall wet starch income declines as aresult, which affects large processors more than smallprocessors. Large processors suffer from higher inputprices and low wet starch prices, while small proc-essors increase production due to the capital injection.Since large processors comprise a larger share of totalwet starch income, their income (as well as wet starchincome as a whole) falls considerably. In the dry starchindustry, there is enormous expansion, as small proc-essors expand production into the dry starch sector.While the model does not dynamically capture achange in capacity for starch enterprises, expandinginto dry starch production would necessarily imply aneed to increase enterprise size, given the technologyneeded to enter this market. Exports rise by 137% to52,000 t. Farm income rises considerably (10%), asdemand for cassava boosts production and prices. Thisin turn reduces feed income (6%). Given that thebenefit to the sector is a rise in income of $4 million, acredit injection packaged as a $2.1 million loan (or10% of the value of capital equipment), would implyeasy repayment over a short period of time.
When capital is increased only for large enterprises,the sectoral income benefits are not very large (only1.5% for the sector as a whole, 1.2% increase for farmincome, and 4.4% increase for the dry processors).Indeed, the effects here are similar to those in the firstsimulation. The implication for the three policies
clearly suggests greater benefits to stimulating smallenterprises.
Conclusions
The paper has argued that global trends including thecontraction of agriculture, urbanisation, and the liber-alisation of domestic and world markets tend tostrengthen the importance of postharvest systems inmany developing countries. The global changes have,however, witnessed the emergence of large domesticand international enterprises in economies previouslylargely dominated by small and medium enterprises.The paper has argued that a broad-based approach topostharvest and agroindustry development may bemore adequate than a large-enterprise model of devel-opment to respond to the challenges of rural poverty.The broad-based approach recognises the scope foreconomies of scale in the long run, but it is also awarethat, in the short and medium-term, transaction costs,niche markets and intra-industry linkages mightactually make small and medium enterprises moreconducive to growth than large enterprises. Since notmuch empirical evidence is available on this issue, thispaper has presented the case of the starch industry inVietnam, an industry largely characterised by smallenterprises that have been able to grow and adapt torapid change over the past decade. The broad-basedgrowth process is important because of its implica-tions for rural development in countries characterisedby a large rural population and where the income gapbetween urban and rural areas is growing. The analysisof micro-efficiency and transaction costs suggests arole for small and medium enterprises in a continuumof firm sizes that includes large enterprises and multi-national companies. Modelling work has shown that abroad-based approach that promotes small andmedium enterprises has benefits not only in terms ofemployment but also in terms of growth.
Quality assurance in agricultural produce,edited by G.I. Johnson, Le Van To, Nguyen Duy Duc and M.C. Webb.
ACIAR Proceedings 100(printed version published in 2000)
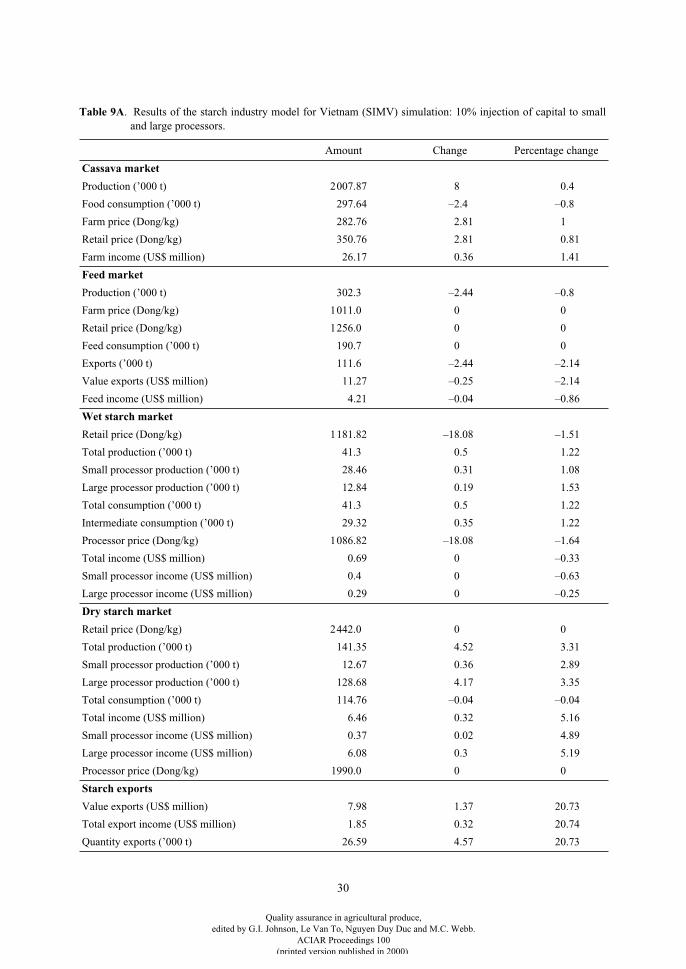
30
Table 9A
. Results of the starch industry model for Vietnam (SIMV) simulation: 10% injection of capital to smalland large processors.
Amount Change Percentage change
Cassava market
Production (’000 t) 2007.87 8 0.4
Food consumption (’000 t) 297.64 –2.4 –0.8
Farm price (Dong/kg) 282.76 2.81 1
Retail price (Dong/kg) 350.76 2.81 0.81
Farm income (US$ million) 26.17 0.36 1.41
Feed market
Production (’000 t) 302.3 –2.44 –0.8
Farm price (Dong/kg) 1011.0 0 0
Retail price (Dong/kg) 1256.0 0 0
Feed consumption (’000 t) 190.7 0 0
Exports (’000 t) 111.6 –2.44 –2.14
Value exports (US$ million) 11.27 –0.25 –2.14
Feed income (US$ million) 4.21 –0.04 –0.86
Wet starch market
Retail price (Dong/kg) 1181.82 –18.08 –1.51
Total production (’000 t) 41.3 0.5 1.22
Small processor production (’000 t) 28.46 0.31 1.08
Large processor production (’000 t) 12.84 0.19 1.53
Total consumption (’000 t) 41.3 0.5 1.22
Intermediate consumption (’000 t) 29.32 0.35 1.22
Processor price (Dong/kg) 1086.82 –18.08 –1.64
Total income (US$ million) 0.69 0 –0.33
Small processor income (US$ million) 0.4 0 –0.63
Large processor income (US$ million) 0.29 0 –0.25
Dry starch market
Retail price (Dong/kg) 2442.0 0 0
Total production (’000 t) 141.35 4.52 3.31
Small processor production (’000 t) 12.67 0.36 2.89
Large processor production (’000 t) 128.68 4.17 3.35
Total consumption (’000 t) 114.76 –0.04 –0.04
Total income (US$ million) 6.46 0.32 5.16
Small processor income (US$ million) 0.37 0.02 4.89
Large processor income (US$ million) 6.08 0.3 5.19
Processor price (Dong/kg) 1990.0 0 0
Starch exports
Value exports (US$ million) 7.98 1.37 20.73
Total export income (US$ million) 1.85 0.32 20.74
Quantity exports (’000 t) 26.59 4.57 20.73
Quality assurance in agricultural produce,edited by G.I. Johnson, Le Van To, Nguyen Duy Duc and M.C. Webb.
ACIAR Proceedings 100(printed version published in 2000)
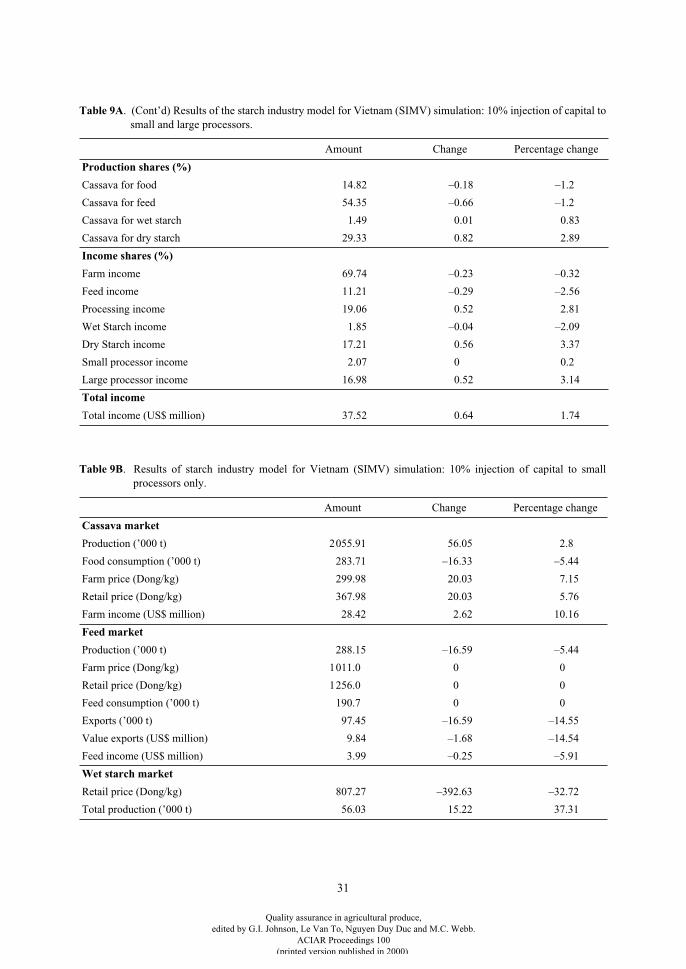
31
Production shares (%)
Cassava for food 14.82 –0.18 –1.2
Cassava for feed 54.35 –0.66 –1.2
Cassava for wet starch 1.49 0.01 0.83
Cassava for dry starch 29.33 0.82 2.89
Income shares (%)
Farm income 69.74 –0.23 –0.32
Feed income 11.21 –0.29 –2.56
Processing income 19.06 0.52 2.81
Wet Starch income 1.85 –0.04 –2.09
Dry Starch income 17.21 0.56 3.37
Small processor income 2.07 0 0.2
Large processor income 16.98 0.52 3.14
Total income
Total income (US$ million) 37.52 0.64 1.74
Table 9A
. (Cont’d) Results of the starch industry model for Vietnam (SIMV) simulation: 10% injection of capital tosmall and large processors.
Amount Change Percentage change
Table 9B
. Results of starch industry model for Vietnam (SIMV) simulation: 10% injection of capital to smallprocessors only.
Amount Change Percentage change
Cassava market
Production (’000 t) 2055.91 56.05 2.8
Food consumption (’000 t) 283.71 –16.33 –5.44
Farm price (Dong/kg) 299.98 20.03 7.15
Retail price (Dong/kg) 367.98 20.03 5.76
Farm income (US$ million) 28.42 2.62 10.16
Feed market
Production (’000 t) 288.15 –16.59 –5.44
Farm price (Dong/kg) 1011.0 0 0
Retail price (Dong/kg) 1256.0 0 0
Feed consumption (’000 t) 190.7 0 0
Exports (’000 t) 97.45 –16.59 –14.55
Value exports (US$ million) 9.84 –1.68 –14.54
Feed income (US$ million) 3.99 –0.25 –5.91
Wet starch market
Retail price (Dong/kg) 807.27 –392.63 –32.72
Total production (’000 t) 56.03 15.22 37.31
Quality assurance in agricultural produce,edited by G.I. Johnson, Le Van To, Nguyen Duy Duc and M.C. Webb.
ACIAR Proceedings 100(printed version published in 2000)
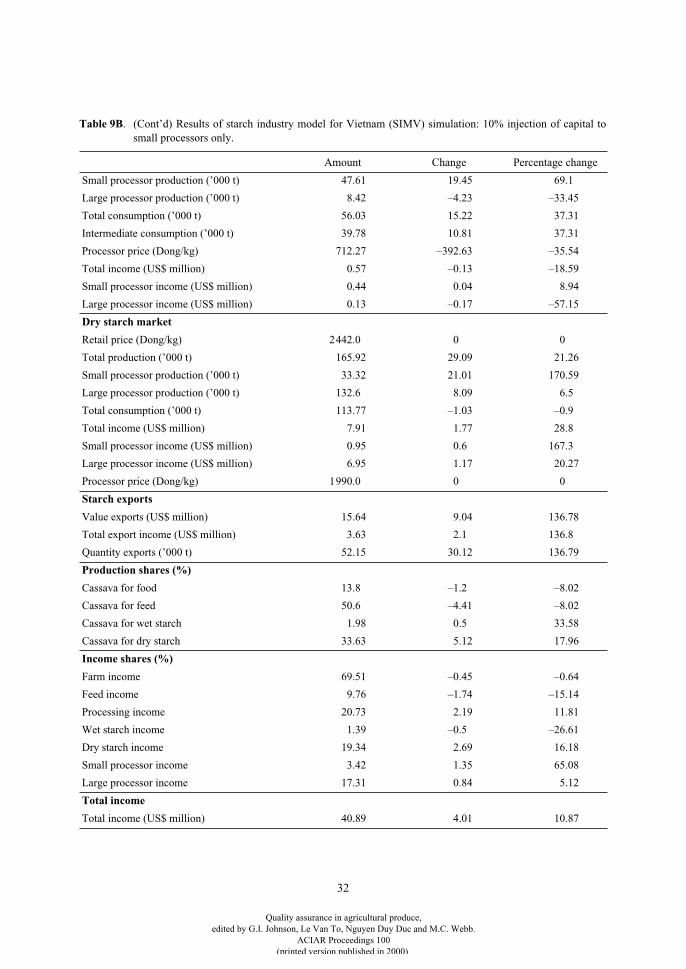
32
Small processor production (’000 t) 47.61 19.45 69.1
Large processor production (’000 t) 8.42 –4.23 –33.45
Total consumption (’000 t) 56.03 15.22 37.31
Intermediate consumption (’000 t) 39.78 10.81 37.31
Processor price (Dong/kg) 712.27 –392.63 –35.54
Total income (US$ million) 0.57 –0.13 –18.59
Small processor income (US$ million) 0.44 0.04 8.94
Large processor income (US$ million) 0.13 –0.17 –57.15
Dry starch market
Retail price (Dong/kg) 2442.0 0 0
Total production (’000 t) 165.92 29.09 21.26
Small processor production (’000 t) 33.32 21.01 170.59
Large processor production (’000 t) 132.6 8.09 6.5
Total consumption (’000 t) 113.77 –1.03 –0.9
Total income (US$ million) 7.91 1.77 28.8
Small processor income (US$ million) 0.95 0.6 167.3
Large processor income (US$ million) 6.95 1.17 20.27
Processor price (Dong/kg) 1990.0 0 0
Starch exports
Value exports (US$ million) 15.64 9.04 136.78
Total export income (US$ million) 3.63 2.1 136.8
Quantity exports (’000 t) 52.15 30.12 136.79
Production shares (%)
Cassava for food 13.8 –1.2 –8.02
Cassava for feed 50.6 –4.41 –8.02
Cassava for wet starch 1.98 0.5 33.58
Cassava for dry starch 33.63 5.12 17.96
Income shares (%)
Farm income 69.51 –0.45 –0.64
Feed income 9.76 –1.74 –15.14
Processing income 20.73 2.19 11.81
Wet starch income 1.39 –0.5 –26.61
Dry starch income 19.34 2.69 16.18
Small processor income 3.42 1.35 65.08
Large processor income 17.31 0.84 5.12
Total income
Total income (US$ million) 40.89 4.01 10.87
Table 9B
. (Cont’d) Results of starch industry model for Vietnam (SIMV) simulation: 10% injection of capital tosmall processors only.
Amount Change Percentage change
Quality assurance in agricultural produce,edited by G.I. Johnson, Le Van To, Nguyen Duy Duc and M.C. Webb.
ACIAR Proceedings 100(printed version published in 2000)
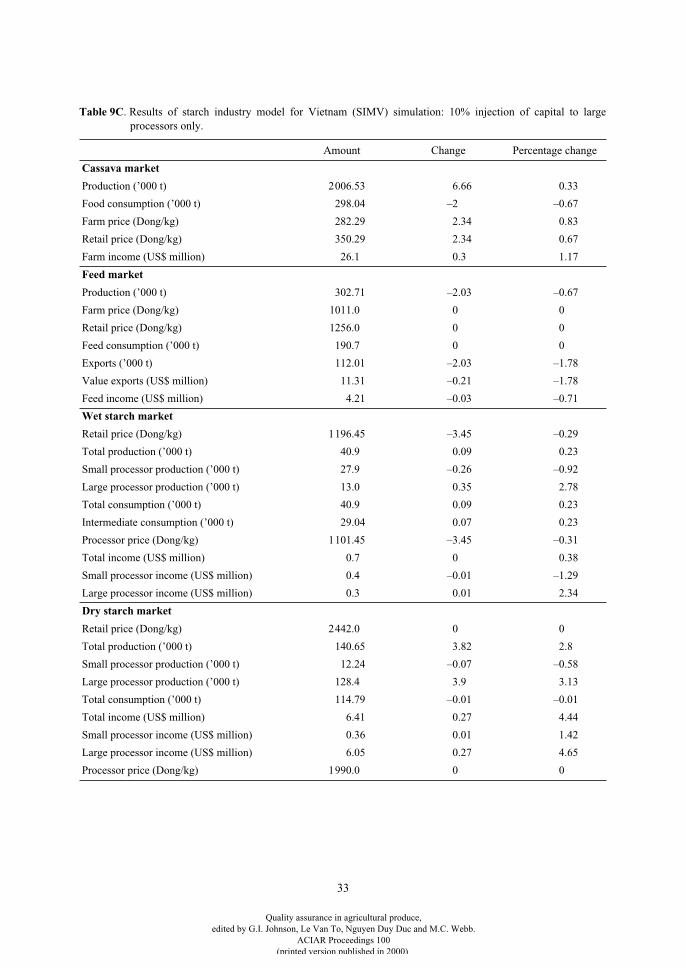
33
Table 9C
. Results of starch industry model for Vietnam (SIMV) simulation: 10% injection of capital to largeprocessors only.
Amount Change Percentage change
Cassava
market
Production (’000 t) 2006.53 6.66 0.33
Food consumption (’000 t) 298.04 –2 –0.67
Farm price (Dong/kg) 282.29 2.34 0.83
Retail price (Dong/kg) 350.29 2.34 0.67
Farm income (US$ million) 26.1 0.3 1.17
Feed market
Production (’000 t) 302.71 –2.03 –0.67
Farm price (Dong/kg) 1011.0 0 0
Retail price (Dong/kg) 1256.0 0 0
Feed consumption (’000 t) 190.7 0 0
Exports (’000 t) 112.01 –2.03 –1.78
Value exports (US$ million) 11.31 –0.21 –1.78
Feed income (US$ million) 4.21 –0.03 –0.71
Wet
starch
market
Retail price (Dong/kg) 1196.45 –3.45 –0.29
Total production (’000 t) 40.9 0.09 0.23
Small processor production (’000 t) 27.9 –0.26 –0.92
Large processor production (’000 t) 13.0 0.35 2.78
Total consumption (’000 t) 40.9 0.09 0.23
Intermediate consumption (’000 t) 29.04 0.07 0.23
Processor price (Dong/kg) 1101.45 –3.45 –0.31
Total income (US$ million) 0.7 0 0.38
Small processor income (US$ million) 0.4 –0.01 –1.29
Large processor income (US$ million) 0.3 0.01 2.34
Dry starch market
Retail price (Dong/kg) 2442.0 0 0
Total production (’000 t) 140.65 3.82 2.8
Small processor production (’000 t) 12.24 –0.07 –0.58
Large processor production (’000 t) 128.4 3.9 3.13
Total consumption (’000 t) 114.79 –0.01 –0.01
Total income (US$ million) 6.41 0.27 4.44
Small processor income (US$ million) 0.36 0.01 1.42
Large processor income (US$ million) 6.05 0.27 4.65
Processor price (Dong/kg) 1990.0 0 0
Quality assurance in agricultural produce,edited by G.I. Johnson, Le Van To, Nguyen Duy Duc and M.C. Webb.
ACIAR Proceedings 100(printed version published in 2000)
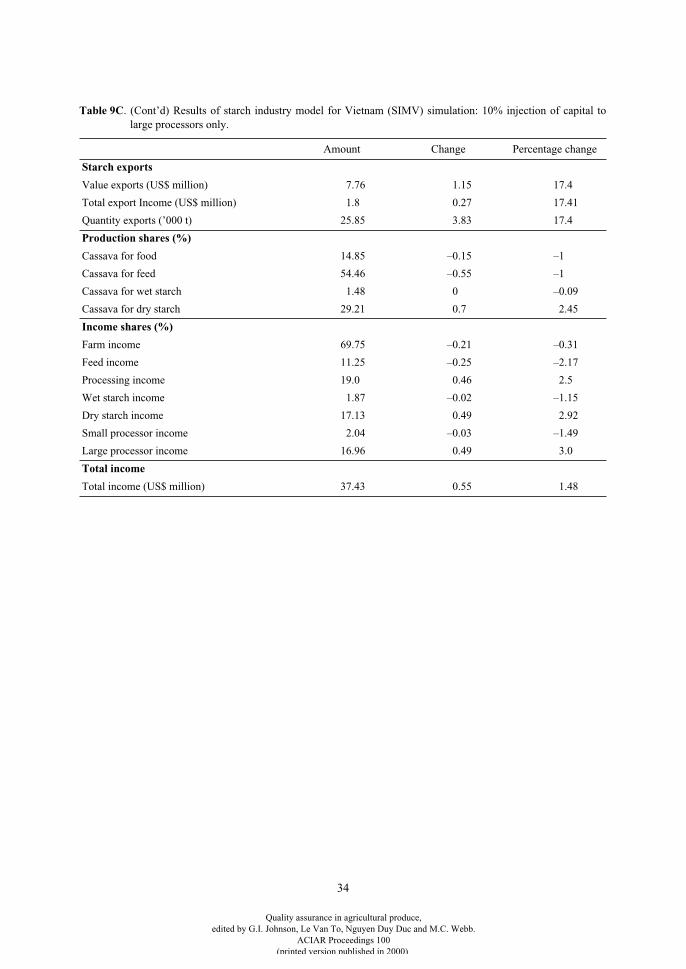
34
Starch exports
Value exports (US$ million) 7.76 1.15 17.4
Total export Income (US$ million) 1.8 0.27 17.41
Quantity exports (’000 t) 25.85 3.83 17.4
Production shares (%)
Cassava for food 14.85 –0.15 –1
Cassava for feed 54.46 –0.55 –1
Cassava for wet starch 1.48 0 –0.09
Cassava for dry starch 29.21 0.7 2.45
Income shares (%)
Farm income 69.75 –0.21 –0.31
Feed income 11.25 –0.25 –2.17
Processing income 19.0 0.46 2.5
Wet starch income 1.87 –0.02 –1.15
Dry starch income 17.13 0.49 2.92
Small processor income 2.04 –0.03 –1.49
Large processor income 16.96 0.49 3.0
Total income
Total income (US$ million) 37.43 0.55 1.48
Table 9C
. (Cont’d) Results of starch industry model for Vietnam (SIMV) simulation: 10% injection of capital tolarge processors only.
Amount Change Percentage change
Quality assurance in agricultural produce,edited by G.I. Johnson, Le Van To, Nguyen Duy Duc and M.C. Webb.
ACIAR Proceedings 100(printed version published in 2000)
35
References
Arnold, M. 1996. Harvest and postharvest problems inagriculture, forestry and fisheries—the CGIARcontribution to research. Consultative Group onInternational Agricultural Research (CGIAR) DocumentNo.: SDR/TAC:IAR/96/5.
Asian Productivity Organization (APO) 1992. APOSeminar on promoting agribusiness for higherproductivity, Jakarta, Indonesia, 4–14 August.
Austin, J.E. 1995. Reflections on IDB strategy foragricultural and rural development. Mimeo.
Azzam, A.M. 1998. Competition in the US meatpackingindustry: is it history? American Journal of AgriculturalEconomies, 80, 96–106.
Boeh-Ocansey, O. 1988. Small scale food industries:improving performance in developing countries. FoodPolicy, November, 334–337.
Brester, G.W. and Musick, D.C. 1995. The effect of marketconcentration on lamb marketing margins. Journal ofAgricultural and Applied Economics, 27, 172–183.
Delgado, C.L. 1998. Sources of growth in smallholderagriculture in Sub-Saharan Africa: the role of verticalintegration with processors of high value-added items.International Food Policy Research Institute (IFPRI).Paper presented at the Inter-Conference Symposium ofthe Association of Agricultural Economists, Badplaas,South Africa, 10–16 August.
Dolan, C., Humphrey, J. and Harris-Pascal, C. 1999.Horticultural commodity chains: the impact of the UKmarket on the African fresh vegetable industry. IDSWorking Paper 96. Sussex, Institute of DevelopmentStudies (IDS), University of Sussex.
FAO (Food and Agricultural Organization of the UnitedNations) 1995. Food for consumers: marketing,processing and distribution. WFS 96/TECH/4:Provisional Version. Rome, FAO.
FAO (Food and Agricultural Organization of the UnitedNations) 1997. The state of food and agriculture. Rome,FAO.
FAO (Food and Agricultural Organization of the UnitedNations) 1999. FAO Fact-File, on the Internet.<http://www.fao.org/NEWS/FOTOFILE/PH9740-e.htm>
Fellows, P. (ed.) 1997. Traditional foods: processing forprofit. London, Intermediate Technology Publications.
Fleischer, G., Waibel, H. and Dirksmeyer, W. 1996. Futurepriorities in postharvest systems development—the roleof GASGA. In: Group for Assistance on Systems Relatedto Grain After-Harvest (GASGA) Executive Seminar No.8, Systems approach in post-harvest activites, 12–13 June1996. Montpellier, France, Centre de CooperationInternationale en Recherche Agronomique pour leDeveloppement (CIRAD).
Giles, J.A. 1999. New structures, new customers and newstrategies: implications for food safety. Paper presented at
the Postharvest Convention 1999 held at Silsoe College,Cranfield University, Bedford, 24 March.
Hayenga, M. 1998. Cost structures of pork slaughter andprocessing firms: behavioral and performanceimplications. Review of Agricultural Economics, 20,574–83.
IFPRI (International Food Policy Research Institute) 1998.Starch industry development as a strategy for agrofoodbased rural industrialization. Washington DC, Marketsand Structural Studies Division, IFPRI, December 1998.
Jaffee, S. and Gordon, P. 1993. Exporting high-value foodcommodities. Washington DC, World Bank DiscussionPapers.
Jaffee, S. and Morton, J. (ed.) 1995. Marketing Africa’shigh-value foods: comparative experiences of anemergent private sector. Washington DC, The WorldBank.
Jank, M.S., de Paula, S.R.L. Filho, P.F., Leme, M.F.P. andNassar, A.M. 1999. Multinationals and intra-industryconcentration: the case of Brazilian agribusinessexporters. Paper presented at the American AgriculturalEconomics Association (AAEA) Preconference onAgroindustrialization, Globalization and EconomicDevelopment, Nashville, Tennessee, 6–7 August.
Johnson, G.I. 1998. Postharvest technology in Asia:ACIAR’s framework for collaborative research anddevelopment. Mimeo.
Kajisa, K. and Meredia, M. 1997. Transformation versusstagnation in the oil palm industry: a comparison betweenMalaysia and Nigeria. Michigan State University StaffPaper 5.
Kaplinsky, R. 1990. The economics of small: appropriatetechnology in a changing world. Exeter, Short Run Press.
Kaplinksy, R. and Manning, C. 1998. Concentration,competition policy and the role of small and medium-sized enterprises in South Africa’s industrialdevelopment. Journal of Development Studies, 35,139–161.
Kennedy, E. and Reardon, T. 1994. Shift to non-traditionalgrains in the diets of East and West Africa: role ofwomen’s opportunity cost of time. Food Policy, Volume19 (February).
Key, N. and Runsten, D. 1999. Contract farming,smallholders and rural development in Latin America: theorganization of agroprocessing firms and the scale ofoutgrower production. World Development, 27,386–401.
Koontz, S., Garcia, P. and Hudson, M. 1993. Meatpackerconduct in fed cattle pricing: an investigation ofOligopsony Power. American Journal of AgriculturalEconomics, 75, 537–48.
McCormick, D. 1998. Enterprise clusters in Africa: on theway to industrialization? IDS Discussion Paper 366.Sussex, Institute of Development Studies (IDS),University of Sussex.
Quality assurance in agricultural produce,edited by G.I. Johnson, Le Van To, Nguyen Duy Duc and M.C. Webb.
ACIAR Proceedings 100(printed version published in 2000)
36
Minot, N. 1986. Contract farming and its effect on smallfarmers in less developed countries. Working paper No.31. East Lansing, Michigan, Department of AgriculturalEconomics, Michigan State University.
Nguyen Van Bich, Nguyen Xuan Nguyen, Chu Tam Quangand Tran Huu Quang 1998. Differences in economicdevelopment in urban and rural areas. Viet NamSocioeconomic Development, No. 13, Spring 1998.
OECD (Organization for Economic Cooperation andDevelopment) 1995. Niche markets as a ruraldevelopment strategy. Paris, OECD.
Petritisch, M. 1985. Women’s participation inmanufacturing in developing countries, with emphasis onagro-industries. United Nations Industrial DevelopmentOrganization: Paper prepared for Expert Group Meetingon Women in Agro-Industries, Vienna, Austria, 14–18October 1985.
Phan Van Khai 1999. Socioeconomic development in 1998and major orientation for socioeconomic development in1999. Government Report presented at the 4
th
Session ofthe 10
th
National Assembly on 28 October 1998. Hanoi,Vietnam, The Gioi Publisher.
Poleman, T.T. and Thomas, L. 1994. Income and dietarychange: international comparisons using purchasing-power-parity conversions. Cornell Agricultural,Resource and Managerial Economics (ARME) WorkingPaper No. 94–1.
Rasmussen, J., Schmitz, H. and van Dijk, M.P. 1992.Introduction: exploring a new approach to small-scaleindustry. IDS (Institute of Development Studies,University of Sussex) Bulletin 23 (2), 1–7.
Reardon, T., Condron, J., Bush, L., Bingen, J. and Harris, C.1999. Food and agriculture standards: their new roles andimpacts on farming and agroindustry in developingcountries. Paper presented at the American Agricultural
Economics Association (AAEA) Preconference onAgroindustrialization, Globalization and EconomicDevelopment, Nashville, Tennessee, 6–7 August.
Sandee, H. 1999. Clustered small enterprise under economicdistress: the impact of the Indonesian crisis on smallindustry clusters, with reference to agroindustries. Paperpresented at the American Agricultural EconomicsAssociation (AAEA) Preconference on Agroindustriali-zation, Globalization and Economic Development,Nashville, Tennessee, August 6–7.
Schejtman, A. 1998. Agroindustria y pequeña agricultura:experiencias y opciones de transformación.CEPAL/GTZ/FAO, ed., Agroindustria y pequeñaagricultura: vínculos, potencialidades y oportunidadescomerciales. Santiago de Chile, Naciones Unidas.
Schmitz, H. 1995. Collective efficiency: growth path forsmall scale industry. Journal of Development Studies, 31,529–566.
Smyth, I. 1992. Collective efficiency and selective benefits:the growth of the rattan industry in Tegalwangi(Indonesia). IDS (Institute of Development Studies,University of Sussex) Bulletin, 23(2), 51–56.
Thrupp, L. 1995. Bittersweet harvests for globalsupermarkets: challenges in Latin America’s agriculturalexport boom. Washington DC, World ResourcesInstitute.
Viaene, J. and Gellynck, X. 1995. Structure, conduct andperformance of the European food sector. EuropeanReview of Agricultural Economics, 22, 282–95.
World Bank 1997. World Development Report 1997. NewYork, Oxford University Press.
World Development (journal) 1999. Special issue onclustering and industrialisation.
Quality assurance in agricultural produce,edited by G.I. Johnson, Le Van To, Nguyen Duy Duc and M.C. Webb.
ACIAR Proceedings 100(printed version published in 2000)
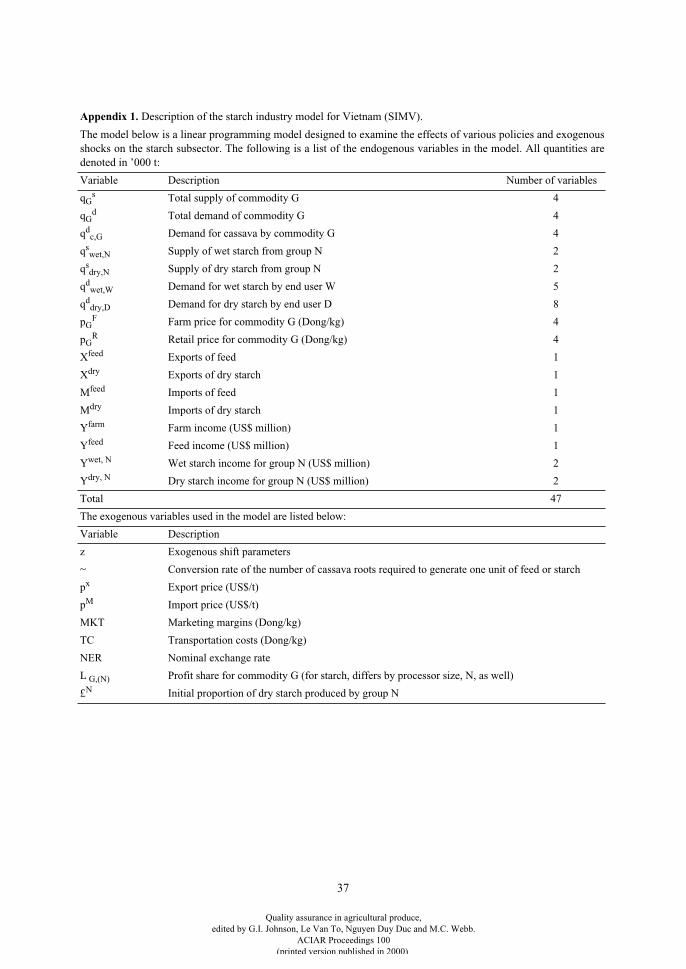
37
Appendix 1. Description of the starch industry model for Vietnam (SIMV).
The model below is a linear programming model designed to examine the effects of various policies and exogenousshocks on the starch subsector. The following is a list of the endogenous variables in the model. All quantities aredenoted in ’000 t:
Variable Description Number of variables
qGs Total supply of commodity G 4
qGd Total demand of commodity G 4
qdc,G Demand for cassava by commodity G 4
qswet,N Supply of wet starch from group N 2
qsdry,N Supply of dry starch from group N 2
qdwet,W Demand for wet starch by end user W 5
qddry,D Demand for dry starch by end user D 8
pGF Farm price for commodity G (Dong/kg) 4
pGR Retail price for commodity G (Dong/kg) 4
Xfeed Exports of feed 1
Xdry Exports of dry starch 1
Mfeed Imports of feed 1
Mdry Imports of dry starch 1
Yfarm Farm income (US$ million) 1
Yfeed Feed income (US$ million) 1
Ywet, N Wet starch income for group N (US$ million) 2
Ydry, N Dry starch income for group N (US$ million) 2
Total 47
The exogenous variables used in the model are listed below:
Variable Description
z Exogenous shift parameters
~ Conversion rate of the number of cassava roots required to generate one unit of feed or starch
px Export price (US$/t)
pM Import price (US$/t)
MKT Marketing margins (Dong/kg)
TC Transportation costs (Dong/kg)
NER Nominal exchange rate
L G,(N) Profit share for commodity G (for starch, differs by processor size, N, as well)
£N Initial proportion of dry starch produced by group N
Quality assurance in agricultural produce,edited by G.I. Johnson, Le Van To, Nguyen Duy Duc and M.C. Webb.
ACIAR Proceedings 100(printed version published in 2000)
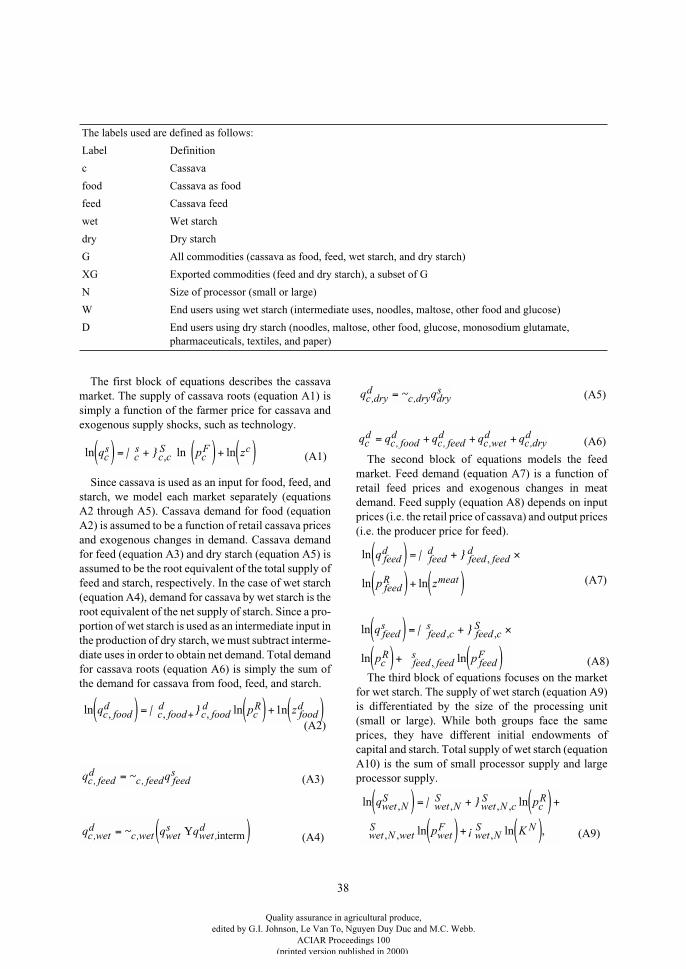
38
The first block of equations describes the cassavamarket. The supply of cassava roots (equation A1) issimply a function of the farmer price for cassava andexogenous supply shocks, such as technology.
Since cassava is used as an input for food, feed, andstarch, we model each market separately (equationsA2 through A5). Cassava demand for food (equationA2) is assumed to be a function of retail cassava pricesand exogenous changes in demand. Cassava demandfor feed (equation A3) and dry starch (equation A5) isassumed to be the root equivalent of the total supply offeed and starch, respectively. In the case of wet starch(equation A4), demand for cassava by wet starch is theroot equivalent of the net supply of starch. Since a pro-portion of wet starch is used as an intermediate input inthe production of dry starch, we must subtract interme-diate uses in order to obtain net demand. Total demandfor cassava roots (equation A6) is simply the sum ofthe demand for cassava from food, feed, and starch.
The second block of equations models the feedmarket. Feed demand (equation A7) is a function ofretail feed prices and exogenous changes in meatdemand. Feed supply (equation A8) depends on inputprices (i.e. the retail price of cassava) and output prices(i.e. the producer price for feed).
The third block of equations focuses on the marketfor wet starch. The supply of wet starch (equation A9)is differentiated by the size of the processing unit(small or large). While both groups face the sameprices, they have different initial endowments ofcapital and starch. Total supply of wet starch (equationA10) is the sum of small processor supply and largeprocessor supply.
The labels used are defined as follows:
Label Definition
c Cassava
food Cassava as food
feed Cassava feed
wet Wet starch
dry Dry starch
G All commodities (cassava as food, feed, wet starch, and dry starch)
XG Exported commodities (feed and dry starch), a subset of G
N Size of processor (small or large)
W End users using wet starch (intermediate uses, noodles, maltose, other food and glucose)
D End users using dry starch (noodles, maltose, other food, glucose, monosodium glutamate, pharmaceuticals, textiles, and paper)
ln ln ln,q p zcs
cs
c cS
cF c( ) = + ( ) + ( )| } (A1)
ln nq p zc foodd
c foodd
c foodd
cR
foodd
, , , ln( ) = ( ) + ( )+| } 1(A2)
q qc feedd
c feed feeds
, ,= ~ (A3)
q q qc wetd
c wet wets
wetd
, , ,= Y( )~ interm (A4)
q qc dryd
c dry drys
, ,= ~ (A5)
q q q q qcd
c foodd
c feedd
c wetd
c dryd= + + +, , , , (A6)
(A7)
ln
ln ln
,q
p z
feedd
feedd
feed feedd
feedR meat
( ) = + ×
( ) + ( )
| }
ln
ln ln
, ,
,
q
p p
feeds
feed cs
feed cS
cR
feed feeds
feedF
( ) = + ×
( ) + ( )
| }
(A8)
ln ln
ln ln ,
, , , ,
, , ,
q p
p K
wet NS
wet NS
wet N cS
cR
wet N wetS
wetF
wet NS N
( ) = + ( ) +
( ) + ( )
| }
¡ (A9)
Quality assurance in agricultural produce,edited by G.I. Johnson, Le Van To, Nguyen Duy Duc and M.C. Webb.
ACIAR Proceedings 100(printed version published in 2000)
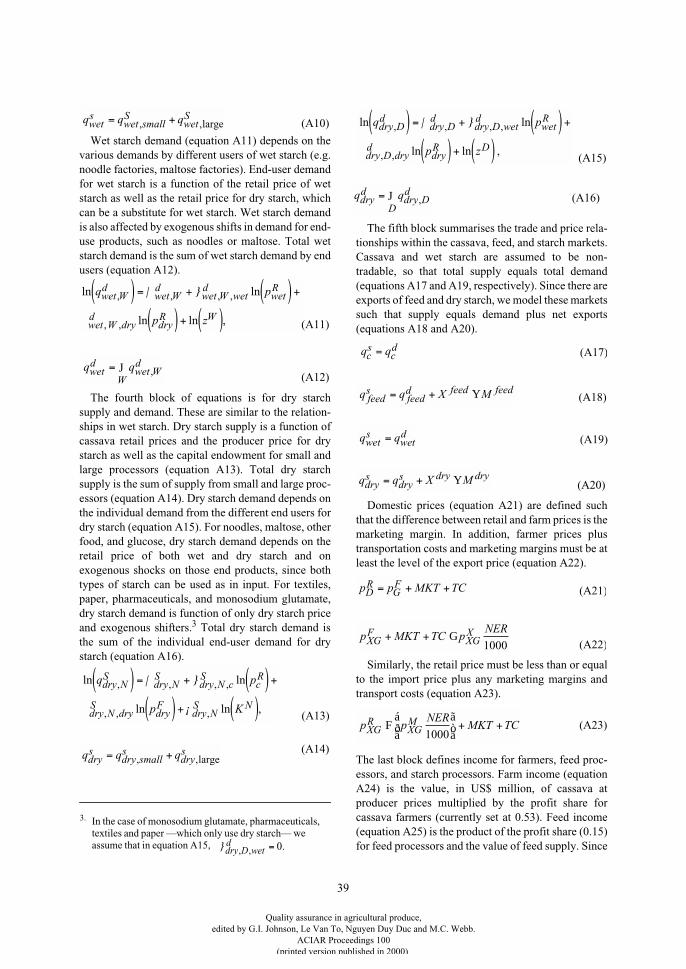
39
Wet starch demand (equation A11) depends on thevarious demands by different users of wet starch (e.g.noodle factories, maltose factories). End-user demandfor wet starch is a function of the retail price of wetstarch as well as the retail price for dry starch, whichcan be a substitute for wet starch. Wet starch demandis also affected by exogenous shifts in demand for end-use products, such as noodles or maltose. Total wetstarch demand is the sum of wet starch demand by endusers (equation A12).
The fourth block of equations is for dry starchsupply and demand. These are similar to the relation-ships in wet starch. Dry starch supply is a function ofcassava retail prices and the producer price for drystarch as well as the capital endowment for small andlarge processors (equation A13). Total dry starchsupply is the sum of supply from small and large proc-essors (equation A14). Dry starch demand depends onthe individual demand from the different end users fordry starch (equation A15). For noodles, maltose, otherfood, and glucose, dry starch demand depends on theretail price of both wet and dry starch and onexogenous shocks on those end products, since bothtypes of starch can be used as in input. For textiles,paper, pharmaceuticals, and monosodium glutamate,dry starch demand is function of only dry starch priceand exogenous shifters.3 Total dry starch demand isthe sum of the individual end-user demand for drystarch (equation A16).
The fifth block summarises the trade and price rela-tionships within the cassava, feed, and starch markets.Cassava and wet starch are assumed to be non-tradable, so that total supply equals total demand(equations A17 and A19, respectively). Since there areexports of feed and dry starch, we model these marketssuch that supply equals demand plus net exports(equations A18 and A20).
Domestic prices (equation A21) are defined suchthat the difference between retail and farm prices is themarketing margin. In addition, farmer prices plustransportation costs and marketing margins must be atleast the level of the export price (equation A22).
Similarly, the retail price must be less than or equalto the import price plus any marketing margins andtransport costs (equation A23).
The last block defines income for farmers, feed proc-essors, and starch processors. Farm income (equationA24) is the value, in US$ million, of cassava atproducer prices multiplied by the profit share forcassava farmers (currently set at 0.53). Feed income(equation A25) is the product of the profit share (0.15)for feed processors and the value of feed supply. Since
3. In the case of monosodium glutamate, pharmaceuticals, textiles and paper —which only use dry starch— we assume that in equation A15,
q q qwets
wet smallS
wetS= +, ,large (A10)
ln ln
ln ln ,
, , , ,
,
q p
p z
wet Wd
wet Wd
wet W wetd
wetR
wet W dryd
dryR W
( ) = + ( ) +
( ) + ( )
| }
, (A11)
q qwetd
wet Wd
W= J , (A12)
}dry D wet
d, , .= 0
ln ln
ln ln ,
, , , ,
, , ,
q p
p K
dry NS
dry NS
dry N cS
cR
dry N dryS
dryF
dry NS N
( ) = + ( ) +
( ) + ( )
| }
¡(A13)
(A14)q q qdrys
dry smalls
drys= +, ,large
q qdryd
dry Dd
D= J , (A16)
ln ln
ln ln ,
, , , ,
, ,
q p
p z
dry Dd
dry Dd
dry D wetd
wetR
dry D dryd
dryR D
( ) = + ( ) +
( ) + ( )
| }
(A15)
q qcs
cd= (A17)
q q X Mfeeds
feedd feed feed= + Y (A18)
q qwets
wetd= (A19)
q q X Mdrys
drys dry dry= + Y (A20)
p p MKT TCDR
GF= + + (A21)
p MKT TC pNER
XGF
XGX+ + G
1000 (A22)
p pNER
MKT TCXGR
XGMF
á
âð
ã
äò + +
1000(A23)
Quality assurance in agricultural produce,edited by G.I. Johnson, Le Van To, Nguyen Duy Duc and M.C. Webb.
ACIAR Proceedings 100(printed version published in 2000)
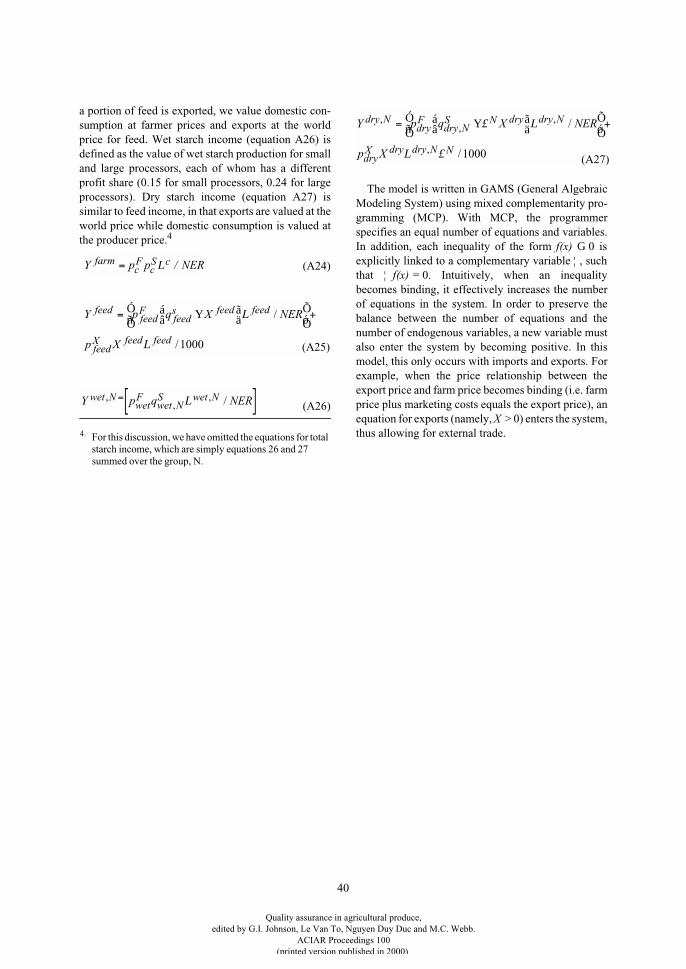
40
a portion of feed is exported, we value domestic con-sumption at farmer prices and exports at the worldprice for feed. Wet starch income (equation A26) isdefined as the value of wet starch production for smalland large processors, each of whom has a differentprofit share (0.15 for small processors, 0.24 for largeprocessors). Dry starch income (equation A27) issimilar to feed income, in that exports are valued at theworld price while domestic consumption is valued atthe producer price.4
The model is written in GAMS (General AlgebraicModeling System) using mixed complementarity pro-gramming (MCP). With MCP, the programmerspecifies an equal number of equations and variables.In addition, each inequality of the form f(x) G 0 isexplicitly linked to a complementary variable ¦, suchthat ¦ f(x) = 0. Intuitively, when an inequalitybecomes binding, it effectively increases the numberof equations in the system. In order to preserve thebalance between the number of equations and thenumber of endogenous variables, a new variable mustalso enter the system by becoming positive. In thismodel, this only occurs with imports and exports. Forexample, when the price relationship between theexport price and farm price becomes binding (i.e. farmprice plus marketing costs equals the export price), anequation for exports (namely, X > 0) enters the system,thus allowing for external trade.4. For this discussion, we have omitted the equations for total
starch income, which are simply equations 26 and 27 summed over the group, N.
Y p p NERfarmcF
cS c= L / (A24)
Y p q X NER
p X
feedfeedF
feeds feed feed
feedX feed feed
= Yáâ
ãä
ÓÔñ
ÕÖó
+L
L
/
/1000 (A25)
Y p q NERwet NwetF
wet NS wet N,
,, /=[ ]L (A26)
Y p q X NER
p X
dry NdryF
dry NS N dry dry N
dryX dry dry N N
,,
,
,
/
/
= Yáâ
ãä
ÓÔñ
ÕÖó
+£ L
L £ 1000 (A27)
Quality assurance in agricultural produce,edited by G.I. Johnson, Le Van To, Nguyen Duy Duc and M.C. Webb.
ACIAR Proceedings 100(printed version published in 2000)
41
Quality Assurance: the Concept and its Evolution
W.C. Wong*, P.Mansour-Nahra†, I.Ogle† and N. Sorby-Adams*
Abstract
The objective of quality assurance is to build quality into processes of a system to prevent quality problems inproducts or services. Its application to agribusiness, especially in postharvest technology, can contribute togreater profitability and customer satisfaction. This paper presents the view that quality embraces wideractivities than the quality of a product. It considers the evolution of the concept of quality and its translationinto legal obligations for all stakeholders including designers, producers, packers, traders and users.
Q
UALITY
management seeks to create prosperitythrough human endeavour. It is a form of businessmanagement committed to customer satisfactionthrough continuous improvement. Since businessculture varies from country to country and fromcompany to company, there is no set standard form ofa good quality management program. Each singleprogram must be planned and implemented on thebasis of the nature of its activities and environment. Aquality management program cannot function as anentity isolated from the daily managerial activities ofan organisation, nor can management be insulatedfrom the requirements of a quality system. However,there are a number of guidelines available for the prep-aration, implementation and maintenance of a qualitymanagement system leading to certification. The ISO9000:1994 series is the most recent internationalstandard to provide basic guidelines for quality man-agement system certification. ISO 9000:2000, whichis currently in draft form, will soon be published.
Over the years, there have been significant changesin the social responsibility of business, such as thelegal obligations to protect the employees and theenvironment while supplying high quality and safeproducts. An example is the European Community,which had made compliance with the quality ISO 9000series of standards necessary for suppliers tothat community. This was put into effect and enforcedin 1992 (Marquardt 1997).
Again, the environmental ISO 14000 standardsintroduced in 1996 could also be used as a non-tariffbarrier to international trade (Rosenbaum 1997)through the requirements of eco-labels (Wilson 1999).To increase assurance in environmental quality, theEuropean Union has recently introduced a number ofstandard procedures for sustainable agriculture. Thesestandards have been addressed in two publicationsedited by Van den Brink et al. (1995) and Roling andWagemakers (1998). It is envisaged that this trendmay have far reaching consequences in agribusiness asthe capacity to meet these standards is virtually nonex-istent in many Third World countries. For this veryreason, environmental factors must be addressedduring strategy formation and implementation (Jameset al. 1999).
Yet again, compliance with workplace health andsafety (or work environment) standards is legislated inmany countries, and has already had a profoundimpact on business activities worldwide (Window1996).
A critical issue for agriculture is the food safetystandard HACCP (Hazard Analysis and CriticalControl Points) or food quality assurance, which hasalso been incorporated into legal requirements thatapply to the food industry in the United States ofAmerica (USA) (Tisler 1997), Canada (Anon. 1998)and the European Union (Anon. 1996). The position oflegal requirements in applying standardised HACCPuniformly to the Australian food industry is unclear atthe point of writing, as the Australian authorities areleaning towards a number of local standards such asHACCP-based quality assurance and the SQF 2000
* Quality Technologies International Pty Limited, PO Box 158, Kenmore, Queensland 4069, Australia.
† Queensland University of Technology, Gardens Point, Brisbane, Australia.
Quality assurance in agricultural produce,edited by G.I. Johnson, Le Van To, Nguyen Duy Duc and M.C. Webb.
ACIAR Proceedings 100(printed version published in 2000)
42
Quality Code: 1997. In New South Wales alone, thereare at least three types of systems recognised by theauthorities (Kellam 1995).
It has now become clear that governments in manycountries have imposed regulations and even legis-lation to ensure acceptable quality and safety offoodstuffs supplied to their people. The qualityconcept and its management system evolve accord-ingly under government intervention.
History in Brief
Quality has been associated with the acceptable per-formance of products from very early times. Theprecision of fit of the stones in the Egyptian pyramidsindicates well-developed production methods andmeasuring procedures.
In the Middle Ages in Europe, the craft guilds wereself-regulating organisations composed of mastercraftsmen, journeymen and apprentices. Each guildlaid down detailed regulations governing the quality ofits products. “Quality assurance was informal; everyeffort was made to ensure that quality was built intothe final product by the people who produced it”(Evans and Lindsay 1996).
In the early 1900s, F.W. Taylor (1856–1915)developed a systematic approach for work improve-ment through the application of knowledge, the use ofstandard tools and conditions, and the use of moti-vation with appropriate rewards. He argued thatproduct quality control was the responsibility ofinspectors. Since then, quality control departmentswere created in organisations and the workers were cutoff from direct involvement in work improvement.
In the 1920s there was a re-emergence of interest inquality through measurement. Statistical tools and thePDCA (plan, do, check and act) cycle were developedby Dr Shewhart (1891–1967). At Bell Telephone Lab-oratories, new methods and theories of inspection formaintaining and improving quality were beingdeveloped. The early pioneers of quality assurancesuch as Walter Shewhart, Harold Dodge, GeorgeEdwards, W. Edwards Deming and Joseph Juran weremembers of this group. It was here that the term‘quality assurance’ was coined (Evans and Lindsay1996).
In the 1930s, following the development of BritishStandards, the application of statistical methods toproduction was introduced. In Australia, the StandardsAssociation of Australia (SAA) was formed in 1929.
The American Society for Quality Control (ASQC),the Australian Laboratory Accreditation System(testing), and many worldwide societies were estab-lished in this period.
The Second World War led to an emphasis on sta-tistical quality control with the Military Standard.After the war, Juran and Deming, along with otherindustrial experts, contributed to Japan’s industrialrehabilitation with the application of quality controlmethods.
From a management perspective, Armand Fei-genbaum wrote “Total Quality Control” in 1957 whichimpressively brought together all the organisationaland managerial ideas relating to quality. Feigenbaumintroduced total quality control as an organisation-wide responsibility and cost of quality as a means ofquantifying the benefits of its application. In 1970, theCategories of Quality Costs were defined by ASQC.
Deming (1900–1990s) extended Shewhart’s ideasinto management theory, covering concepts and prin-ciples of quality, a system approach to work,distinguishing common and special causes and so on.During the same period as Deming, Juran (1900–1990s) put forward the theory of the quality trilogy —planning, control and improvement.
A well-documented account of the historical devel-opment of quality has been given by Banks (1989).But he could not foresee the trends of the 1990s. InAustralia, for example, the State Government ofQueensland in 1987 passed legislation that required alevel of quality assurance as a basis for bidding forGovernment contracts, and the other States andFederal Government established similar standards ofendorsement. The European Community followed in1992, and Hong Kong considered it in 1998. Oddlyenough, Australia then retreated from this position forinternal political and commercial reasons.
More recently, the European Community hasfurther strengthened its requirements through the CEMark system (Kolka 1997; Lemmel 1999) which isconcerned with product quality and safety entering theEuropean Community. Since the World Trade Organ-ization is fostering open trade throughout the world,there is emerging among market economies a need toensure that consumers in any country are protected inboth the quality and safety of the products theypurchase. Legislation in these markets will be aimed atproviding that protection.
Quality assurance in agricultural produce,edited by G.I. Johnson, Le Van To, Nguyen Duy Duc and M.C. Webb.
ACIAR Proceedings 100(printed version published in 2000)
43
Evolution of the Meaning of Quality
The interpretation of the term ‘quality’ has evolvedalong with the growth of managerial thinking. Fromthe historical Guild approach to measurable specifica-tions, quality was defined as ‘fitness for use’. In the1960s, the USA Consumer Product Safety Act andsimilar legislation around the world gave impetus toquality in a product being seen as ‘fitness for itspurpose’, which considered the customer’s expecta-tions. But as products and services became morediverse and complex, the notion of ‘conformance torequirements’, then ‘conformance to agreed require-ments’, seemed to embrace both the needs of thecustomer as well as the need of the supplier to havesome objective criterion to know when acceptablequality had been achieved. Finally, the ISO 8402:1987definition embraced many of these aspects with “thetotality of features and characteristics of a product orservice that bears on its ability to satisfy stated orimplied needs”.
According to ISO/CD2 9000:2000, quality means“achieving sustained customer satisfaction throughmeeting customer needs and expectations within anorganisational environment committed to continualimprovement of efficiency and effectiveness”. Qualitycontrol, quality assurance and continual improvementare integral parts of a quality management systemfocused on the fulfilment of quality requirements.
Quality Concept and Principles
The quality system is a management-led process; itrequires leadership and total commitment from seniormanagement to provide an appropriate infrastructureto support the implementation of such a system. AsCrosby (1979) states, “the purpose of quality man-agement is to set up a system and a management dis-cipline that prevents defects from happening in thecompany’s performance cycle”. To achieve this, itinvolves fundamental change in both company cultureand the technologies employed by the business.
Combining the teachings of the quality theoristswith practical experience, one can identify a number ofcritical factors in the total quality management (TQM)implementation process that are common to soundmanagement theory. Based on Porter and Parker(1993), these include the commitment of management,strategy and structure, communication, training andeducation, employee involvement, a focus on proc-esses, and application of quality technologies. This isin accord with critical factors identified in the
Malcolm Baldrige National quality Award (Anon.1992), such as leadership, information analysis,strategic quality planning, human resource devel-opment, process quality, and customer focus andsatisfaction.
Clearly, these concepts of quality are based on theearly work of Shewhart, Deming, Feigenbaum,Crosby, Ishikawa and Taguchi. It is an organisation-wide approach to control, monitor and direct allresources towards the attainment of corporate goals.Although their approaches differ in techniques andemphasis (Ghobabian and Speller 1994), they all havea common objective—continuous improvement inboth quality and business performance throughcustomer satisfaction, a culture of total involvement,the application of statistical tools, policy and mar-keting. These elements must be fully andsimultaneously integrated leading the way to qualityimprovement through the system.
ISO 9000 Standards and TQM
The ISO 9000 Standards reflect a narrow and staticinspection philosophy emphasising conformance tospecification and system maintenance. The certifi-cation of ISO 9000 and quality audits provide indica-tions that the organisation has achieved the minimumrequirements of the standards.
Total quality management systems constitute struc-tured systems and managerial activities. These includea mix of people issues and an understanding ofsystems and tools of improvement. The people issuesare related to leadership. A critical role of leadership isthe determining of the organisation’s mission, visionand guiding principles. Clearly, people are the key toquality; it is determined by the senior managers withthe involvement of the whole organisation. Thereforeone of the primary conditions for the successful imple-mentation of TQM is a quality culture; this emergesfrom the values, beliefs, attitudes and prejudicesinherent in all the people in the organisation. Theseattributes, along with the technology and traditionalmethods of work, are the prime determinants of theculture of an organisation. To imbue everyone in theorganisation with a quality philosophy focused onalignment of strategies, structures and functions withenvironmental demands, means achieving a culturechange in management behaviour.
There are important ISO requirements common tothe philosophies of TQM. These include managementresponsibility, training, process control, statisticaltechniques, a quality system and internal quality audits
Quality assurance in agricultural produce,edited by G.I. Johnson, Le Van To, Nguyen Duy Duc and M.C. Webb.
ACIAR Proceedings 100(printed version published in 2000)
44
(Smith and Angeli 1995). Therefore, the interrela-tionship between ISO 9000 and TQM can beillustrated by the following equation (Lim and Niew1995; Smith and Angeli 1995):
TQM = People (culture) + tools (technique forimprovement) + system (ISO 9000) (1)
It is indisputable that conformance to technicalstandards is only part of the total process of satisfyingcustomers while making a profit. ISO 9000 is anintegral part of TQM; it acts as a concrete foundationon which to build a quality organisation. It providesguidance in the application of quality improvementtools, techniques, the application of performancemeasures to the whole system, and provides a struc-tured approach to the deployment of an appropriatelytrained workforce.
ISO 9000 is at the basic end of the quality man-agement spectrum, with a focus on survival in themarketplace. This standardisation loop does not ofitself constitute all the factors necessary for businesssuccess (Fuchsberg 1992; Wenmoth and Dobbins1994; Cooper 1995; Spenley 1995) although someorganisations claim that the installation of their ISO9000 certified system or TQM program has improvedtheir business performance (Deming 1982; Garvin1988; Teare et al. 1994).
Evolution from Quality Management to a Total Business System
To ensure competitiveness, business strategists havebeen concerned with the alignment between theinternal and external environments in which theycompete (Miles and Snow 1985; Mintzberg andWaters 1985; Johnson and Scholes 1997) althoughexternal forces are in a state of continuous change.Quality practitioners are not usually concerned withalignment issues during the implementation of qualityprograms. They focus on operational effectiveness(Porter 1996; Ahire 1997) and are usually concernedwith the compliance to certification or quality awardrequirements.
In a turbulent environment, technical standards andTQM systems are not, and were not intended to be, asufficient strategy to address the growing complexityof doing business. While some argue that TQM byitself cannot succeed unless it is integrated with othertime-based philosophies such as just-in-time, totalquality control, total production management, grouptechnology and design for manufacturability (Miyakeet al. 1995; Youssef et al. 1996), others point out that
quality means little in business unless it is fully incor-porated into business strategy (Brown and van derWeile 1996; Liston 1996; Seghezzi 1997; Collins andHill 1998; Wong et al. 1998). One might conclude thatthe failures were most likely associated with the lackof strategic links. At the same time, experience clearlyshows that the application of business strategies hasnot in itself ensured excellence; hence the importantperspective promoted in this paper is that the businessstrategy must have a conscious quality dimension if itis to contribute to improved performance andcompetitiveness.
The evolution of quality in business has beensummed up into four paradigms by Miller (1993); hesuggested quality control was followed by qualityassurance, then TQM, and finally what he calls‘quantum quality’, where learning, creativity, valuesand sustainability are keynotes for business. Eachphase was an improvement based on a response tocultural, political, social and economic environments.It is now evident that the way TQM, or even quantumquality, was understood and implemented in the 1980sor 1990s will become less useful in response to com-petitive demands in the 21
st
century. The key toincrease the speed of design, development, pro-curement, manufacturing and systems integrationmust be identified within a specific time-frame, sincethe requirements may be subject to change on shortnotice under government intervention. Clearly, thequality paradigm has now moved into a newdimension as proposed by the authors. This is what wecall ‘business systems integration’. It involvesmeeting stakeholders’ expectations through thealignment of corporate strategies with operationsfunctions and compliance with legal obligations; it isfounded on innovation and learning, knowledgecreation, organisational agility, improvement of stake-holder values through system capability, competencyand safety.
Under government and community intervention,there are at least three (if not more) technical standardsystems that need to be incorporated into a businessplan in order to comply with the legal and regulatoryrequirements. For example, the implementation ofISO/CD2 9001:2000 needs to address ISO 14001 andAS/NZS 4804 for a manufacturing firm, whereascompanies involved in food production or food-related activities may be required to address ISO14001, AS/NZS 4804 and HACCP. Similar require-ments have been addressed in the CE Mark system. Intheir recent publications, Mangelsdorf (1998) andSeghezzi (1997) strongly support the harmonisation of
Quality assurance in agricultural produce,edited by G.I. Johnson, Le Van To, Nguyen Duy Duc and M.C. Webb.
ACIAR Proceedings 100(printed version published in 2000)
45
these technical standards under one managementsystem, although integration methodology is not yetavailable.
In response to the needs for integration, manycompanies in the United Kingdom have made attemptsto achieve a fully integrated, single managementsystem covering quality, environment, and health andsafety, but with little success (Hillary 1997). Theseinclude the initial attempts made to integrate HACCPwith TQM for retail and food service programs and theguide to integrate ISO 9001/2 with HACCP for thefood industry (Bolton 1997).
In Australia, the Agriculture and Resource Man-agement Council of Australia and New Zealand(ARMCANZ) has published a number of HACCP-based quality assurance standards, e.g. AS 4461: 1997for hygienic production of meat for human con-sumption. AS 4461:1997 (Anon. 1997) is essentiallythe replica of ISO 9002, except that the entire clause4.9 (process control) is replaced by the seven prin-ciples of HACCP. However, these standards are farfrom adequate and are not able to comply fully withthe requirements of the current legislation andregulations.
More recently, Wong et al. (1998) have put forwarda total business system (TBS) covering the integrationof quality (ISO 9001), environment (ISO 14001), agri-culture and food safety (HACCP), workplace healthand safety (AS/NZS 4804) and business strategies. Allthe technical standards described in this model aresub-systems of the total business system. This model(Figure 1) is a self-generating, ‘double loop’ learningprocess which contains a consistent set of principles,procedures and techniques. It provides an umbrellaunder which all the requirements of stakeholders canbe implemented synchronously under a singleauditable management system. These include:• financial goals for the firm; and• non-financial goals for the satisfaction of
customers, suppliers, employees, regulators, theglobal community, social groups and ecology.Undoubtedly, the 21
st
century quality managementsystem is going to be different from what it was in the1980s or 1990s. It will require an appropriate cultureof quality improvement be introduced to a globallycompetitive organisation.
Impact and Legal Implications of Standards and Regulations on Trade
There is an increasing demand in the global marketplacefor regulation regarding the supply of high quality andsafe products. Companies that fail to implement ISO14001 to protect the environment, ISO 9000 seriesstandards for quality, or the HACCP standard for foodquality and safety will be unable to compete in Europe,the USA, Canada, Australia, Japan and elsewhere.Under the Food Act in the United Kingdom and Aus-tralia, poor quality may result in serious consequencesof liability. In the USA, the sale of poor quality productscould lead to product liability litigation and insurancedifficulties (Helms and Hutchins 1992). The breach ofworkplace safety, product safety and environmentalsafety has recently proven to be costly to some nationaland international organisations (The Courier-Mail,Brisbane, Australia—June 04, 05 and 18; August 11and 12 1999).
More recently, a complex and comprehensive regu-latory product certification framework has beenintroduced into the European Union (Lemmel 1999).This is commonly known as the European Union Con-formity Assessment Requirements or the ‘CEMarking’ system. These New-Approach directivescontain a set of essential requirements covering safety,health and environmental components. In these direc-tives, manufacturers (or producers), importers,distributors, assemblers and installers bear liability forproduct failures. Failure to take measures, or cor-rective measures, to comply with a directive willamount to a serious breach of Community law. Itappears that the European Union has intensified itscertification procedures beyond traditional proce-dures. The intention is to improve and maintain thereliability and safety of products marketed in theEuropean Community.
It is generally accepted that to achieve a ‘Due Dili-gence’ defence, one must actively observe theprinciples of the relevant international standards orequivalent legislation as discussed. Clearly, busi-nesses now have to be adept in complying withappropriate standards and regulations, and still be ableto make a solid profit. Commercial growers who donot comply fully with the appropriate standards or leg-islation should be aware of the risks. Similarly,agricultural scientists who are the product designersproviding advice on the growing of crops and post-harvest treatments should also be aware of their legalobligations.
Quality assurance in agricultural produce,edited by G.I. Johnson, Le Van To, Nguyen Duy Duc and M.C. Webb.
ACIAR Proceedings 100(printed version published in 2000)
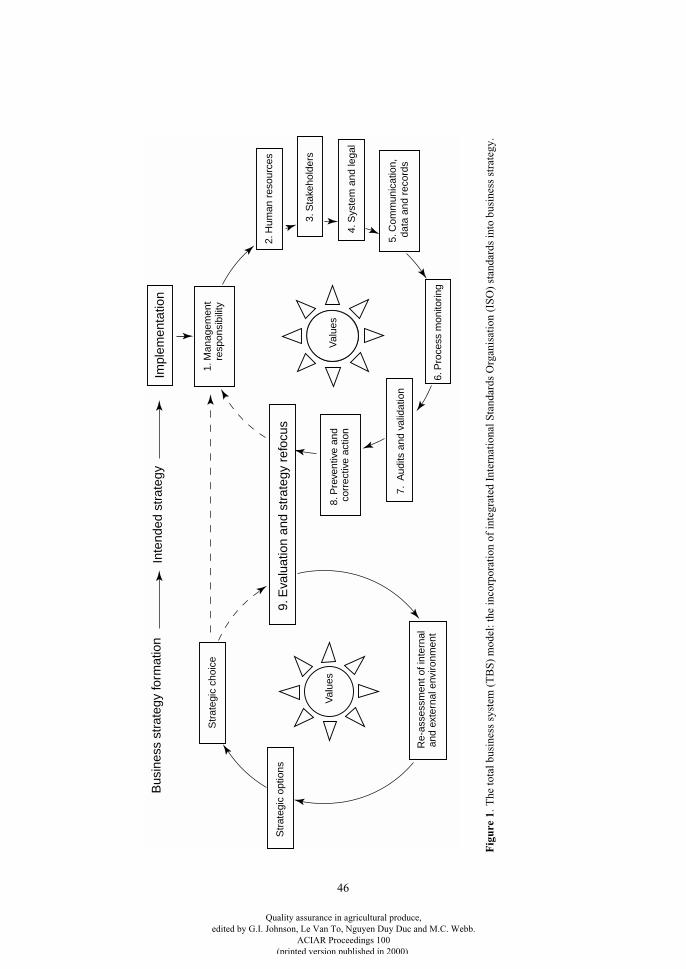
46
Str
ateg
ic c
hoic
e
Str
ateg
ic o
ptio
ns
Re-
asse
ssm
ent o
f int
erna
lan
d ex
tern
al e
nviro
nmen
t
9. E
valu
atio
n an
d st
rate
gy r
efoc
us
8. P
reve
ntiv
e an
dco
rrec
tive
actio
n
7. A
udits
and
val
idat
ion
6. P
roce
ss m
onito
ring
Impl
emen
tatio
n
1. M
anag
emen
tre
spon
sibi
lity
2. H
uman
res
ourc
es
3. S
take
hold
ers
4. S
yste
m a
nd le
gal
5. C
omm
unic
atio
n,
data
and
rec
ords
Val
ues
Val
ues
Bus
ines
s st
rate
gy fo
rmat
ion
Inte
nded
str
ateg
y
Fig
ure
1
.The
tota
l bus
ines
s sy
stem
(T
BS
) m
odel
: the
inco
rpor
atio
n of
inte
grat
ed I
nter
nati
onal
Sta
ndar
ds O
rgan
isat
ion
(IS
O)
stan
dard
s in
to b
usin
ess
stra
tegy
.
Quality assurance in agricultural produce,edited by G.I. Johnson, Le Van To, Nguyen Duy Duc and M.C. Webb.
ACIAR Proceedings 100(printed version published in 2000)
47
It is now apparent that environmental, quality andsafety standards have a significant impact on compet-itiveness and corporate strategy (Porter and van deLinde 1995a,b; Rao 1996; Rugman and Verbeke1998). Similarly, standards and legislation shouldhave significant impact on agrifood productionprocesses (pre and postharvest) and business decisionmaking.
The above issue is further supported by the new ISOstandards (ISO/CD2 9001:2000), and the UnitedNations Industrial Organization (Wilson 1999). Itappears that a new conceptual framework, which iscapable of embracing national legal requirements andinternational standards under a single managementsystem, must be developed to address these require-ments. However, firms do not succeed on operationsand procedures alone—these operational proceduresmust be incorporated into the business strategyframework.
Discussion
It has now become evident that as business compe-tition is getting tougher under the intervention ofstandards and legislation, the production or servicedesign (including crop production, postharvesttreatment, processing, packaging, distribution etc.)will have to be evolved according to the marketperceived quality or expectation. The intention of thechange is an attempt to improve productivity throughadaptation. Therefore, some of the common qualityrules in the 1980s and 1990s are becoming less usefulas the quality evolution movement continues (Miller1993; Wong et al. 1998).
This implies that the attainment of TQM philosophymay no longer guarantee a competitive position in the21st century—we must go beyond TQM. It is furtherevident that if ISO standards or TQM programs are notincorporated into business strategies, their implemen-tation can be regarded as irrelevant. Likewise,business strategies will be difficult to realise withoutquality programs. This means different business strat-egies call for different quality strategies. Clearly, thesetwo elements must be used interactively and thisproblem can be overcome by the use of the totalbusiness system framework presented by Wong et al.(1998; see Figure 1).
It is becoming very clear and widely accepted thatquality is heavily dependent upon the guiding prin-ciples of values, culture and ethos (Duncan 1972).Culture, beliefs and values also guide the daily opera-tional behaviour of a company. As consumers are
always guided by habit or expectation, the very valuesand ethos of a company must be evolved accordingly.
The above concluding remarks further confirm thattechnical standards, legislation and strategies must befully integrated into the existing production plan orresearch program should we wish to succeed inbusiness against the complexity of the changing globalbusiness environment.
References
Ahire, S.L. 1997. Management science—total qualitymanagement interfaces: an integrative framework.Interfaces, 27, 91–105.
Anon. 1992. The Malcolm Boldrige National QualityAward 1992. Application Guidelines. United States ofAmerica, National Institute of Standards andTechnology.
Anon. 1996. Seafood exporters to the European Union (EU).<http://ifse.tamu.edu/alliance/seafood.html>.
Anon. 1997. AS 4461: 1997 Australian Standard forhygienic production of meat for human consumption.Standing Committee on Agriculture and ResearchManagement (SCARM) Report No. 54 (2nd edition).Melbourne, Commonwealth Scientific and IndustrialResearch Organisation (CSIRO) Publishing.
Anon. 1998. Food safety enhancement program (FSEP).<http://www.cfia-acia.agr.ca/english/food/haccp/manual/01-01.html>.
Banks, J. 1989. Principles of quality control. New York,John Wiley, 3–26.
Bolton, A. 1997. Quality management systems for the foodindustry: a guide to ISO 9001/2. London, BlackieAcademic and Professional, 193p.
Brown, A. and van der Wiele, T. 1996. Integrating qualityand business planning using a self-assessment matrix. In:Kanji, G.K., ed., Total quality management in action.London, Chapman and Hall, 148–152.
Collins, L.K. and Hill, F. 1998. The significance of businessprocess reengineering in organisational changestrategies: some survey findings. In: Ho, S.K.M., ed., ISO9000 and total quality management: Proceedings of thethird international conference. Hong Kong, Hong KongBaptist University.
Cooper, P. 1995. How standards achieve efficiency.Management, May, 20–22.
Crosby, P.B. 1979. Quality is free. New York, McGraw-Hill.
Deming, W.E. 1982. Quality, productivity and competitiveposition. Cambridge, Massachusetts Institute ofTechnology (MIT), Centre for Advanced EngineeringStudy, 373p.
Duncan, R.B. 1972. Characteristics of organisationalenvironment and perceived environmental uncertainty.Administrative Service Quarterly, 17, 313–327.
Evans, J.R. and Lindsay, W.M. 1996. The management andcontrol of quality, 3
rd
edition. New York, WestPublishing Company, 767p.
Fuchsberg, G. 1992. Quality programs show shoddy results.Wall Street Journal, May 14, B1.
Quality assurance in agricultural produce,edited by G.I. Johnson, Le Van To, Nguyen Duy Duc and M.C. Webb.
ACIAR Proceedings 100(printed version published in 2000)
48
Garvin, D.A. 1988. Managing quality: the strategic andcompetitive edge. New York, Free Press.
Ghobadian, A. and Speller, S. 1994. Gurus of quality: aframework for comparison. Total Quality Management,5, 53–69.
Helms, M. and Hutchins, B.A. 1992. Poor quality products:is their production unethical? Management Decision, 30,35–46.
Hillary, R. 1997. Total environment management.<http://www.mcb.co.uk/services/conference/jan97/tqm/tqasia/theme 11.htm>.
James, P., Ghobadian, A., Viney, H. and Liu, J. 1999.Addressing the divergence between environmentalstrategy formulation and implementation. ManagementDecision, 37: 338–347.
Johnson, G. and Scholes, K. 1997. Exploring corporatestrategy, 4
th
edition. London, Prentice Hall, 507p.
Kellam, J. 1995. Food safety and standards: trade practicesand product liability. In: Food Safety and StandardsConference, 11–12 July 1995, organised by IBCConferences Pty Ltd, Melbourne.
Kolka, J. 1997. The European Union and conformityassessment. In: Peach, R.W., ed., The ISO 9000handbook, 3
rd
edition. London, Irwin, 605–628.
Lemmel, M. 1999. Guide to the implementation ofdirectives based on new approach and global approach.European Commission, Directorate-General III(Industry), unpublished draft.
Lim, T.E. and Niew, B.C. 1995. Quality managementsystems: assessment to ISO 9000:1994. Singapore,Prentice Hall, 420p.
Liston, A. 1996. Planning for excellence. In: Kanji, G.K.,ed., Total quality management in action. London,Chapman and Hall, 102–107.
Mangelsdorf, D. 1998. Evolution from quality managementto an integrative system in modern business. TotalQuality Management, 9, S164–S166.
Marquardt, D.W. 1997. Background and development ofISO 9000 standards. In: Peach, R.W. ed., The ISO 9000handbook, 3
rd
edition. London, Irwin, 10–30.
Miles, R.E. and Snow, C.C. 1985. Organisational strategy:structure and process. New York, McGraw-Hill, 274p.
Miller, W.C. 1993. Quantum quality. Quality resources.New York, White Plains.
Mintzberg, H. and Waters, J.A. 1985. Of strategies,deliberate and emergent. Strategic Management Journal,6, 257–272.
Miyake, D.I., Enkawa, T. and Fleury, A.C.C. 1995.Improving manufacturing systems performance bycomplementary application of just-in-time, total qualitycontrol and total productive maintenance paradigms.Total Quality Management, 6, 345–363.
Porter, L.J. and Parker, A.J. 1993. Total qualitymanagement—the critical success factors. Total QualityManagement, 4, 13–22.
Porter, M.E. 1996. What is strategy? Harvard BusinessReview, Nov–Dec, 61–78.
Porter, M.E. and van de Linde, C. 1995a. Green andcompetitive. Harvard Business Review, Sep–Oct, 120–134.
Porter, M.E. and van de Linde, C. 1995b. Toward a newconception of the environment–competitivenessrelationship. Journal of Economic Perspectives, 9, 97–118.
Rao, S.M. 1996. The effect of published reports ofenvironmental pollution on stock prices. Journal ofFinancial and Strategic Decisions, 9, 25–32.
Roling, N.G. and Wagemakers, M.A.E. 1998. Facilitatingsustainable agriculture. Cambridge, CambridgeUniversity Press, 318p.
Rosenbaum, S.W. 1997. ISO14000: legal advantages ofreplacing command and control regulation. PracticePeriodical Of Hazardous, Toxic And Radioactive WasteManagement, 1, 124–126.
Rugman, A.M. and Verbeke, A. 1998. Corporate strategiesand environmental regulations: an organizingframework. Strategic Management Journal, 19, 363–375.
Seghezzi, H.D. 1997. Business concept redesign. TotalQuality Management, 8, s36–s43.
Smith, J.A. and Angeli, I.I. 1995. The use of quality functiondeployment to help adopt a total quality strategy. TotalQuality Management, 6, 35–44.
Spenley, P. 1995. Step change total quality: achieving worldclass business performance, 2
nd
edition. London,Chapman and Hall, 189p.
Teare, R., Atkinson, C. and Westwood, C. 1994. Achievingquality performance: lessons from British industry.London, Cassell, 172p.
Tisler, J.M. 1997. FDA’s application of HACCP to retailfood systems. <http://vm.cfsan.fda.gov/~dms/ haccpret.html>.
Van den Brink, W.J., Bosman, R. and Arendt, F. (ed.) 1995.Soil and environment: contaminated soil, volume 1.Proceedings of the 5th international FZK/TNOconference on contaminated soil, 30 Oct–3 Nov 1995,Maastricht, The Netherlands. London, Kluwer AcademicPublishers, 1,662p.
Wenmoth, B. and Dobbins, D. 1994. Experiences withimplementing ISO 9000. Asia Pacific Journal of QualityManagement, 3(3), 9–27.
Wilson, S.R. 1999. The impact of standards on industrialdevelopment and trade. Quality Progress, July, 71–75.
Window, J. 1996. Planning occupational health and safety.4
th
edition. Sydney, CCH Australia Limited.
Wong, W.C., Ogle, I.F. and Mansour, P. 1998. Totalbusiness system: a generic model for the integration ofinternational standards and business strategies.Proceedings of Pan Pacific Qualcon, 98, 185–193.
Youssef, M.A., Boyd, J. and Williams, E. 1996. The impactof total quality management on a firm’s responsiveness:an empirical analysis. Total Quality Management, 7,127–144.
Quality assurance in agricultural produce,edited by G.I. Johnson, Le Van To, Nguyen Duy Duc and M.C. Webb.
ACIAR Proceedings 100(printed version published in 2000)
49
New Food Processing and Preservation Technology
A. Noguchi*
Abstract
Variable shelf life and increasing competition require the food industry to have more technological innovationin food processing and preservation. This paper outlines several types of new food processing and preservationtechnologies which are playing a leading role at present and will do so in the future. These technologies includemembrane technology, low-temperature technology related to chilling and freezing, use of electromagneticwaves, extrusion cooking, high-pressure cooking, and Ohmic heating.
Membrane Technology
T
O
CONCENTRATE
a liquid or separate componentsfrom a liquid, distillation, extraction, adsorption, fil-tration etc. are generally used. The method of usingpressure in the concentration process and performingmolecular-level filtration is an energy-savingtechnique known as membrane technology. Foodprocessors are now using various kinds of membranes,which include: fine filtering membranes capable ofseparating microbe-like fine particles from aboutseveral
µ
m to 0.1
µ
m; ultrafiltration membranescapable of filtering finer components as well as suchbiopolymers as protein and starch; reverse osmosismembranes (Figure 1) capable of permeating onlywater and concentrating salt, sugar, amino acids,aromatic constituents, biopolymers or other solutes;and electric dialysis membranes capable of isolatingelectrolytes by potential differences.
Reverse osmosis concentration
This method was developed for desalinatingseawater into fresh water. It uses synthetic highpolymer membranes, such as cellulose acetate andpolysulfone, and concentrates liquids by removingwater using pressure. Semi-permeable membranesplaced between water and a liquid cause the water tomove into the liquid side, but if a pressure higher than
the osmotic pressure (50–100 kg/m
2
) is applied to theliquid, the water in the liquid moves to the water side.Since the latter phenomenon is opposite to normal per-meation, it is called reverse osmosis. Characteristics ofthe reverse osmosis concentration method are: energyconsumption is small because no phase change occurs;formation of heat-induced flavour and discolorationdo not take place in the product; and there is no greatloss in the nutritive value and flavour. Since thismethod employs no heat, there is a need to prevent thegrowth of microorganisms during the concentrationprocess. It reduces the volume of food, thus making iteasier to transport the product, and is widely adoptedmainly in the production of fruit juice, soup and otherfood categories in which flavour is regarded as mostimportant.
Ultrafiltration
Ultrafiltration membranes have a greater porediameter than those used for reverse osmosis throughwhich low molecular weight solutes can pass. Sincethe difference in osmotic pressures arising in filtrationis smaller, these membranes generally can separatehigh-polymer substances with low pressures of 3–10kg/m
2
.
Application of membrane technology to food production
As noted above, reverse osmosis and ultrafiltrationmembranes filter substances differently, according tomolecular weights. Thus, the combination of these two
* Japan International Research Center for Agricultural Sciences (JIRCAS), 1–2 Ohwashi, Tsukuba, Ibaraki 305–8686, Japan.
Quality assurance in agricultural produce,edited by G.I. Johnson, Le Van To, Nguyen Duy Duc and M.C. Webb.
ACIAR Proceedings 100(printed version published in 2000)
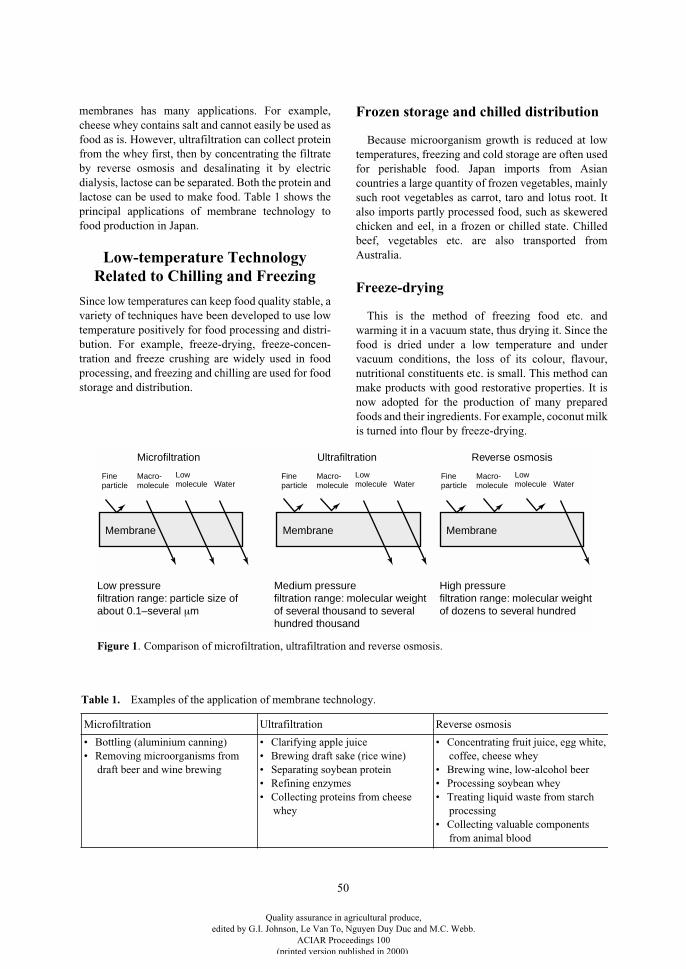
50
membranes has many applications. For example,cheese whey contains salt and cannot easily be used asfood as is. However, ultrafiltration can collect proteinfrom the whey first, then by concentrating the filtrateby reverse osmosis and desalinating it by electricdialysis, lactose can be separated. Both the protein andlactose can be used to make food. Table 1 shows theprincipal applications of membrane technology tofood production in Japan.
Low-temperature Technology Related to Chilling and Freezing
Since low temperatures can keep food quality stable, avariety of techniques have been developed to use lowtemperature positively for food processing and distri-bution. For example, freeze-drying, freeze-concen-tration and freeze crushing are widely used in foodprocessing, and freezing and chilling are used for foodstorage and distribution.
Frozen storage and chilled distribution
Because microorganism growth is reduced at lowtemperatures, freezing and cold storage are often usedfor perishable food. Japan imports from Asiancountries a large quantity of frozen vegetables, mainlysuch root vegetables as carrot, taro and lotus root. Italso imports partly processed food, such as skeweredchicken and eel, in a frozen or chilled state. Chilledbeef, vegetables etc. are also transported fromAustralia.
Freeze-drying
This is the method of freezing food etc. andwarming it in a vacuum state, thus drying it. Since thefood is dried under a low temperature and undervacuum conditions, the loss of its colour, flavour,nutritional constituents etc. is small. This method canmake products with good restorative properties. It isnow adopted for the production of many preparedfoods and their ingredients. For example, coconut milkis turned into flour by freeze-drying.
Membrane Membrane Membrane
Low pressurefiltration range: particle size of about 0.1–several µm
Medium pressurefiltration range: molecular weightof several thousand to severalhundred thousand
High pressurefiltration range: molecular weightof dozens to several hundred
Microfiltration Ultrafiltration Reverse osmosis
Fineparticle
Macro-molecule
Low molecule Water
Fineparticle
Macro-molecule
Low molecule Water
Fineparticle
Macro-molecule
Low molecule Water
Figure 1. Comparison of microfiltration, ultrafiltration and reverse osmosis.
Table 1. Examples of the application of membrane technology.
Microfiltration Ultrafiltration Reverse osmosis
• Bottling (aluminium canning)• Removing microorganisms from
draft beer and wine brewing
• Clarifying apple juice• Brewing draft sake (rice wine)• Separating soybean protein• Refining enzymes• Collecting proteins from cheese
whey
• Concentrating fruit juice, egg white, coffee, cheese whey
• Brewing wine, low-alcohol beer• Processing soybean whey• Treating liquid waste from starch
processing• Collecting valuable components
from animal blood
Quality assurance in agricultural produce,edited by G.I. Johnson, Le Van To, Nguyen Duy Duc and M.C. Webb.
ACIAR Proceedings 100(printed version published in 2000)
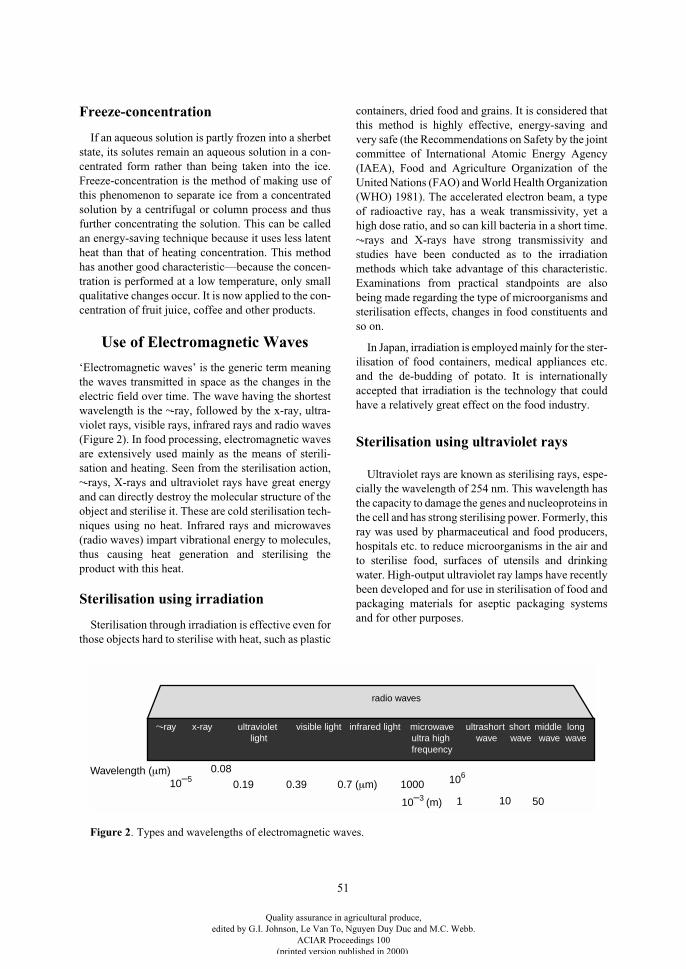
51
Freeze-concentration
If an aqueous solution is partly frozen into a sherbetstate, its solutes remain an aqueous solution in a con-centrated form rather than being taken into the ice.Freeze-concentration is the method of making use ofthis phenomenon to separate ice from a concentratedsolution by a centrifugal or column process and thusfurther concentrating the solution. This can be calledan energy-saving technique because it uses less latentheat than that of heating concentration. This methodhas another good characteristic—because the concen-tration is performed at a low temperature, only smallqualitative changes occur. It is now applied to the con-centration of fruit juice, coffee and other products.
Use of Electromagnetic Waves
‘Electromagnetic waves’ is the generic term meaningthe waves transmitted in space as the changes in theelectric field over time. The wave having the shortestwavelength is the
~
-ray, followed by the x-ray, ultra-violet rays, visible rays, infrared rays and radio waves(Figure 2). In food processing, electromagnetic wavesare extensively used mainly as the means of sterili-sation and heating. Seen from the sterilisation action,
~
-rays, X-rays and ultraviolet rays have great energyand can directly destroy the molecular structure of theobject and sterilise it. These are cold sterilisation tech-niques using no heat. Infrared rays and microwaves(radio waves) impart vibrational energy to molecules,thus causing heat generation and sterilising theproduct with this heat.
Sterilisation using irradiation
Sterilisation through irradiation is effective even forthose objects hard to sterilise with heat, such as plastic
containers, dried food and grains. It is considered thatthis method is highly effective, energy-saving andvery safe (the Recommendations on Safety by the jointcommittee of International Atomic Energy Agency(IAEA), Food and Agriculture Organization of theUnited Nations (FAO) and World Health Organization(WHO) 1981). The accelerated electron beam, a typeof radioactive ray, has a weak transmissivity, yet ahigh dose ratio, and so can kill bacteria in a short time.
~
-rays and X-rays have strong transmissivity andstudies have been conducted as to the irradiationmethods which take advantage of this characteristic.Examinations from practical standpoints are alsobeing made regarding the type of microorganisms andsterilisation effects, changes in food constituents andso on.
In Japan, irradiation is employed mainly for the ster-ilisation of food containers, medical appliances etc.and the de-budding of potato. It is internationallyaccepted that irradiation is the technology that couldhave a relatively great effect on the food industry.
Sterilisation using ultraviolet rays
Ultraviolet rays are known as sterilising rays, espe-cially the wavelength of 254 nm. This wavelength hasthe capacity to damage the genes and nucleoproteins inthe cell and has strong sterilising power. Formerly, thisray was used by pharmaceutical and food producers,hospitals etc. to reduce microorganisms in the air andto sterilise food, surfaces of utensils and drinkingwater. High-output ultraviolet ray lamps have recentlybeen developed and for use in sterilisation of food andpackaging materials for aseptic packaging systemsand for other purposes.
microwaveultra high frequency
~-ray x-ray ultraviolet light
visible light short wave
ultrashort wave
infrared light middle wave
longwave
radio waves
10–50.08
0.19 0.39 0.7 (µm) 1000 106
10–3 (m) 10 501
Wavelength (µm)
Figure 2. Types and wavelengths of electromagnetic waves.
Quality assurance in agricultural produce,edited by G.I. Johnson, Le Van To, Nguyen Duy Duc and M.C. Webb.
ACIAR Proceedings 100(printed version published in 2000)
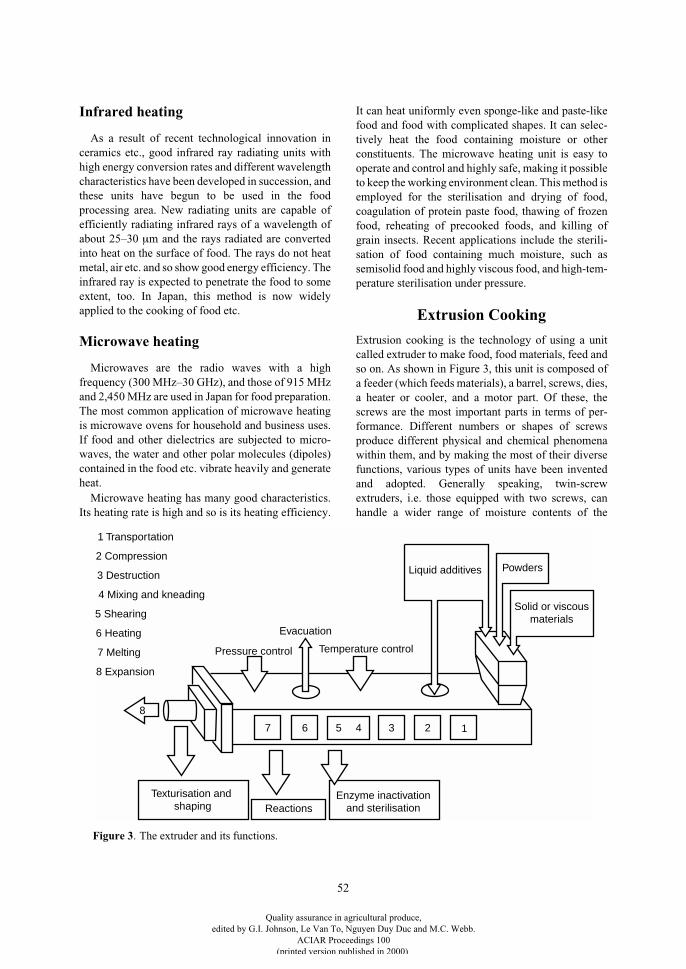
52
Infrared heating
As a result of recent technological innovation inceramics etc., good infrared ray radiating units withhigh energy conversion rates and different wavelengthcharacteristics have been developed in succession, andthese units have begun to be used in the foodprocessing area. New radiating units are capable ofefficiently radiating infrared rays of a wavelength ofabout 25–30
µ
m and the rays radiated are convertedinto heat on the surface of food. The rays do not heatmetal, air etc. and so show good energy efficiency. Theinfrared ray is expected to penetrate the food to someextent, too. In Japan, this method is now widelyapplied to the cooking of food etc.
Microwave heating
Microwaves are the radio waves with a highfrequency (300 MHz–30 GHz), and those of 915 MHzand 2,450 MHz are used in Japan for food preparation.The most common application of microwave heatingis microwave ovens for household and business uses.If food and other dielectrics are subjected to micro-waves, the water and other polar molecules (dipoles)contained in the food etc. vibrate heavily and generateheat.
Microwave heating has many good characteristics.Its heating rate is high and so is its heating efficiency.
It can heat uniformly even sponge-like and paste-likefood and food with complicated shapes. It can selec-tively heat the food containing moisture or otherconstituents. The microwave heating unit is easy tooperate and control and highly safe, making it possibleto keep the working environment clean. This method isemployed for the sterilisation and drying of food,coagulation of protein paste food, thawing of frozenfood, reheating of precooked foods, and killing ofgrain insects. Recent applications include the sterili-sation of food containing much moisture, such assemisolid food and highly viscous food, and high-tem-perature sterilisation under pressure.
Extrusion Cooking
Extrusion cooking is the technology of using a unitcalled extruder to make food, food materials, feed andso on. As shown in Figure 3, this unit is composed ofa feeder (which feeds materials), a barrel, screws, dies,a heater or cooler, and a motor part. Of these, thescrews are the most important parts in terms of per-formance. Different numbers or shapes of screwsproduce different physical and chemical phenomenawithin them, and by making the most of their diversefunctions, various types of units have been inventedand adopted. Generally speaking, twin-screwextruders, i.e. those equipped with two screws, canhandle a wider range of moisture contents of the
Solid or viscousmaterials
PowdersLiquid additives
8
7 6 5 4 3 2 1
Texturisation and shaping Reactions
Enzyme inactivationand sterilisation
Evacuation
Pressure control Temperature control
8 Expansion
7 Melting
6 Heating
5 Shearing
4 Mixing and kneading
3 Destruction
2 Compression
1 Transportation
Figure 3. The extruder and its functions.
Quality assurance in agricultural produce,edited by G.I. Johnson, Le Van To, Nguyen Duy Duc and M.C. Webb.
ACIAR Proceedings 100(printed version published in 2000)
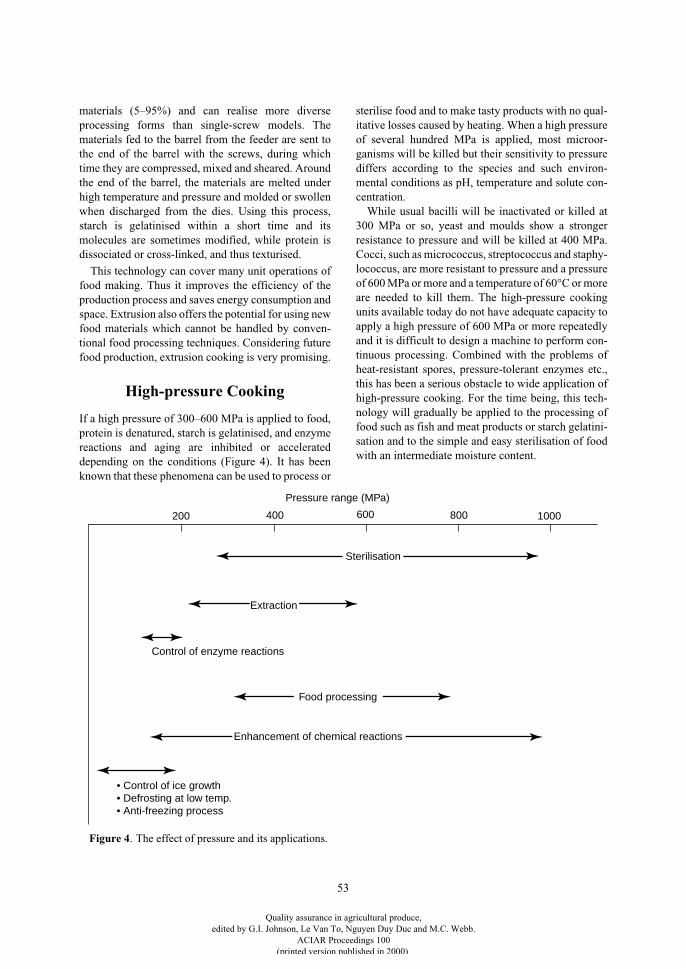
53
materials (5–95%) and can realise more diverseprocessing forms than single-screw models. Thematerials fed to the barrel from the feeder are sent tothe end of the barrel with the screws, during whichtime they are compressed, mixed and sheared. Aroundthe end of the barrel, the materials are melted underhigh temperature and pressure and molded or swollenwhen discharged from the dies. Using this process,starch is gelatinised within a short time and itsmolecules are sometimes modified, while protein isdissociated or cross-linked, and thus texturised.
This technology can cover many unit operations offood making. Thus it improves the efficiency of theproduction process and saves energy consumption andspace. Extrusion also offers the potential for using newfood materials which cannot be handled by conven-tional food processing techniques. Considering futurefood production, extrusion cooking is very promising.
High-pressure Cooking
If a high pressure of 300–600 MPa is applied to food,protein is denatured, starch is gelatinised, and enzymereactions and aging are inhibited or accelerateddepending on the conditions (Figure 4). It has beenknown that these phenomena can be used to process or
sterilise food and to make tasty products with no qual-itative losses caused by heating. When a high pressureof several hundred MPa is applied, most microor-ganisms will be killed but their sensitivity to pressurediffers according to the species and such environ-mental conditions as pH, temperature and solute con-centration.
While usual bacilli will be inactivated or killed at300 MPa or so, yeast and moulds show a strongerresistance to pressure and will be killed at 400 MPa.Cocci, such as micrococcus, streptococcus and staphy-lococcus, are more resistant to pressure and a pressureof 600 MPa or more and a temperature of 60°C or moreare needed to kill them. The high-pressure cookingunits available today do not have adequate capacity toapply a high pressure of 600 MPa or more repeatedlyand it is difficult to design a machine to perform con-tinuous processing. Combined with the problems ofheat-resistant spores, pressure-tolerant enzymes etc.,this has been a serious obstacle to wide application ofhigh-pressure cooking. For the time being, this tech-nology will gradually be applied to the processing offood such as fish and meat products or starch gelatini-sation and to the simple and easy sterilisation of foodwith an intermediate moisture content.
Sterilisation
Control of enzyme reactions
Food processing
• Control of ice growth • Defrosting at low temp. • Anti-freezing process
200 400 600 800 1000
Enhancement of chemical reactions
Extraction
Pressure range (MPa)
Figure 4. The effect of pressure and its applications.
Quality assurance in agricultural produce,edited by G.I. Johnson, Le Van To, Nguyen Duy Duc and M.C. Webb.
ACIAR Proceedings 100(printed version published in 2000)
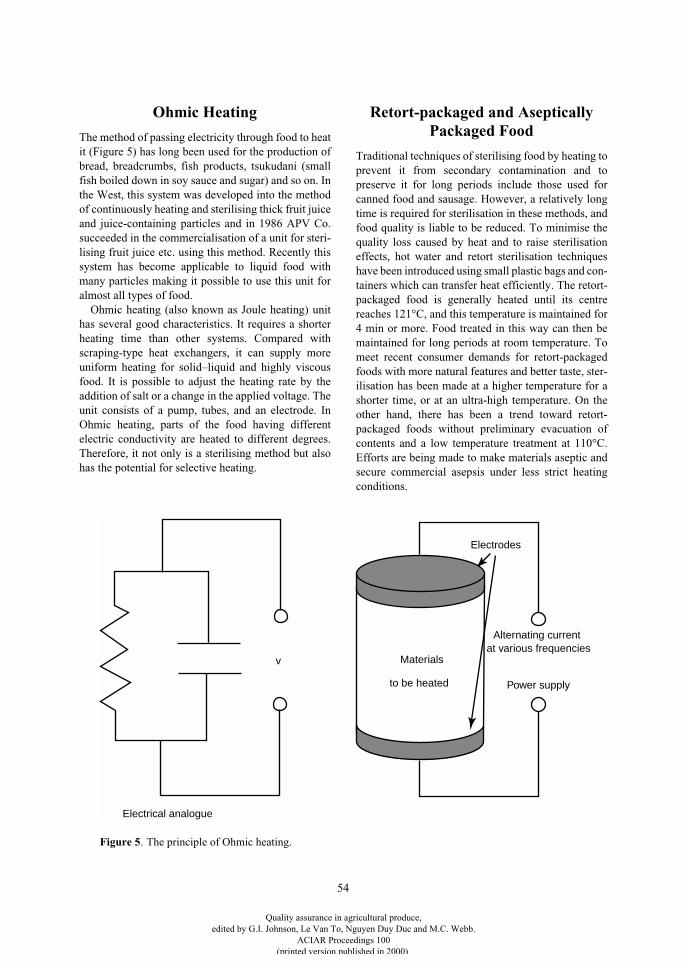
54
Ohmic Heating
The method of passing electricity through food to heatit (Figure 5) has long been used for the production ofbread, breadcrumbs, fish products, tsukudani (smallfish boiled down in soy sauce and sugar) and so on. Inthe West, this system was developed into the methodof continuously heating and sterilising thick fruit juiceand juice-containing particles and in 1986 APV Co.succeeded in the commercialisation of a unit for steri-lising fruit juice etc. using this method. Recently thissystem has become applicable to liquid food withmany particles making it possible to use this unit foralmost all types of food.
Ohmic heating (also known as Joule heating) unithas several good characteristics. It requires a shorterheating time than other systems. Compared withscraping-type heat exchangers, it can supply moreuniform heating for solid–liquid and highly viscousfood. It is possible to adjust the heating rate by theaddition of salt or a change in the applied voltage. Theunit consists of a pump, tubes, and an electrode. InOhmic heating, parts of the food having differentelectric conductivity are heated to different degrees.Therefore, it not only is a sterilising method but alsohas the potential for selective heating.
Retort-packaged and Aseptically Packaged Food
Traditional techniques of sterilising food by heating toprevent it from secondary contamination and topreserve it for long periods include those used forcanned food and sausage. However, a relatively longtime is required for sterilisation in these methods, andfood quality is liable to be reduced. To minimise thequality loss caused by heat and to raise sterilisationeffects, hot water and retort sterilisation techniqueshave been introduced using small plastic bags and con-tainers which can transfer heat efficiently. The retort-packaged food is generally heated until its centrereaches 121°C, and this temperature is maintained for4 min or more. Food treated in this way can then bemaintained for long periods at room temperature. Tomeet recent consumer demands for retort-packagedfoods with more natural features and better taste, ster-ilisation has been made at a higher temperature for ashorter time, or at an ultra-high temperature. On theother hand, there has been a trend toward retort-packaged foods without preliminary evacuation ofcontents and a low temperature treatment at 110°C.Efforts are being made to make materials aseptic andsecure commercial asepsis under less strict heatingconditions.
v
Electrical analogue
Materials
to be heated
Alternating currentat various frequencies
Power supply
Electrodes
Figure 5. The principle of Ohmic heating.
Quality assurance in agricultural produce,edited by G.I. Johnson, Le Van To, Nguyen Duy Duc and M.C. Webb.
ACIAR Proceedings 100(printed version published in 2000)
55
Aseptically packaged food has a number of advan-tages. It does not require a long sterilisation time.Unlike retort sterilisation, it needs no heat-resistantpackaging materials, and large-size containers (suchas drums) can be used. In addition, this food can bekept at room temperature for a long period. Because ofthis, it has attracted much attention from the aspects ofboth food quality improvement and energy saving andmany projects have been carried out regarding itstechnical development. While various asepticpackaging techniques, including Tetrapack andPurepack, have been developed and technically estab-lished (mostly for liquid food), technical developmentactivities are still continuing for the aseptic packagingof solid food (clean packaging, semi-asepticpackaging).
There are two main types of aseptically packagedfood. One of them is the food whose storage period is
extended under low-temperature conditions, e.g.sliced ham and sliced cheese. The other is the foodwhich can be distributed at room temperatures, e.g.aseptically packaged rice, by making the materials asfree as possible from contaminating microorganisms,sterilising by cooking and successive pH control ,applying deoxidisers, and packaging in an asepticroom or through other treatments. It is an advancedtechnology to keep packaged solid foods aseptic and anew system is being introduced to cook the materialsby heat in a heat-resistant container like a retortpackage.
In the general trend toward better quality food, newtechnical development activities are erasing theboundary between retort sterilisation and asepticpackaging.
Quality assurance in agricultural produce,edited by G.I. Johnson, Le Van To, Nguyen Duy Duc and M.C. Webb.
ACIAR Proceedings 100(printed version published in 2000)
56
Standards and Quality Assurance Systems for Horticultural Commodities
Ma. C.C. Lizada*
Abstract
Standards play a critical role in ensuring product safety and defining the competitiveness of horticulturalproduce. Workable standards and their application will be instrumental in:
• developing a culture of quality in horticultural enterprises and the consuming public;• assuring safety and quality in horticultural perishables;• expediting horticultural trade by serving as a common language and basis for pricing;• ensuring success in the pooled marketing of products from associations of small farmers;• adopting appropriate systems and applying technologies to meet market expectations and requirements;• enhancing the image of the horticultural enterprises as reliable suppliers of quality products; and• protecting the consumer from defective products and those that pose a risk to human, animal and plant
health and the environment.The above contributions of workable standards in assuring quality throughout the handling chain and in
designing quality assurance systems for horticultural produce will be illustrated with specific examples. Thepaper will also emphasise the importance of considering the production–marketing continuum in formulatingstandards.
* Postharvest Technology Research Centre, University of the Philippines at Los Baños, College, Laguna, Philippines.
Quality assurance in agricultural produce,edited by G.I. Johnson, Le Van To, Nguyen Duy Duc and M.C. Webb.
ACIAR Proceedings 100(printed version published in 2000)
57
Postharvest Handling Status and Problemsof the Pacific Island Countries
E. Cocker*
Abstract
The significance of proper postharvest handling is recognised globally for its ability to minimise losses.Growers, exporters, packers, inspectors, distributors, carriers, and warehouse operators need to be aware ofproper methods and techniques of postharvest handling. Significant losses will continue to occur in the PacificIsland countries for as long as non-technical personnel in the produce export industries remain unaware of theelementary principles of postharvest handling.
P
ACIFIC
I
SLAND
countries have suffered greatly frompoor market support infrastructure to ensure properhandling after harvest — there has been a chronic lackof understanding of the basics of produce physiologyand produce–environment interactions, and the practi-calities of postharvest handling, storage, and transport.Recommendations for regional groundwork todevelop commercially practicable standards forexportable produce have yet to be made. As a result,there are high levels of losses and wastage of exportproduce.
Background
An absence of accurate diagnosis, coupled with a lackof cooperation between growers and exporters, has ledto a degree of misunderstanding amongst growers,extension officers, inspectors, shipping companies,and salesmen of the actual causes of wastage. Hence,little progress has been made towards preventing ofdamage and wastage.
This is the principal problem in the Pacific region.Qualified technical officers seem to know enough ofwhat the postharvest handling problems are, how todiagnose these problems, and possibly solve them, butthat is not enough. Professional technical advice andcrucial information are not reaching the rural commu-nities, remote locations, and outer islands, where themajority of growers live. A great number of these
growers do not understand why proper handling ofproduce after harvesting is extremely important.
Throughout the Pacific Island countries, cooper-ation between growers, extension officers, andexporters is declining rapidly. This is contributing tolow production yields, falling grades, a drop in qualitystandards, and an increase in wastage. The problem iscurrently affecting exports in a number of countries:squash from Tonga to Japan; kava from Fiji, Tongaand Vanuatu to the United States and Europe; copraand cocoa from Solomon Islands; ginger from Fiji;papaya from the Cook Islands; rootcrops and water-melon from Tonga; and coffee from Papua NewGuinea to Europe.
Compounding the problem are new, ‘fly-by-night’exporters who either fail altogether because they donot understand the importance of proper treatmentafter harvest, or make a lot of money for a short time,then rapidly disappear. We can summarise the majorpostproduction shortcomings throughout the PacificIsland countries as follows.
•
Lack of understanding of postharvest handlingtechniques
. Growers and exporters do notunderstand postharvest handling requirements andtechniques, why they are important, and thelogistics needed.
•
Lack of consultation and feedback
. There is verylittle feedback from the exporters to the growers.Growers need to be kept informed regularly of theimportance of maintaining quality assurance, what* Forum Secretariat, Suva, Fiji.
Quality assurance in agricultural produce,edited by G.I. Johnson, Le Van To, Nguyen Duy Duc and M.C. Webb.
ACIAR Proceedings 100(printed version published in 2000)
58
the market demand is, competition, price variations,the supply situation, and so forth.
•
High operational costs
. There are few extensionoffices to help the growers: they cost too much torun, and there are few qualified people to staff them.
•
Lack of technical and marketing information
, poorsupport infrastructure, and lack of political andbureaucratic support.
Lack of Understanding of Postharvest Handling Requirements:
Its Significance and Logistics
In the Pacific, significant losses have occurred and willcontinue to occur because most of the personnelinvolved in export development are unaware of funda-mental factors such as market requirements and theprinciples of postharvest handling, and that theproduce they are dealing with is living, breathingmaterial that responds to changes in environmentalvariables such as temperature and humidity and issubject to infection by a range of microorganisms.
Most personnel have little or no knowledge aboutmeasures to manage these processes so as to maintainproduct quality and reduce losses. For example: thereis no understanding of, or facilities for, grading,inspection, sorting at packinghouses; water used forcleaning is often heavily charged with fungal andbacterial spores; and foreign matter (such as hair andanimal faeces) is often found in export produce.
The significance of proper postharvest handling isso great that, if it is not properly done, it may causesevere losses. While it is understood that overall lossesdue to poor postharvest handling are often substantial,they are extremely difficult to quantify. Every yearthere are thousands of kilograms of fresh and per-ishable produce that are confiscated, rejected, anddestroyed because of poor handling and inappropriatetreatment after harvesting.
It is estimated that the cause of 90% of the confisca-tions or rejections of shipments originating from thePacific is inappropriate handling after harvest,resulting in dirt and mud (introduction of
Salmonella
and
Escherichia coli
); fishy smells; moulds and mites;bacterial and fungal infections; bruising duringtransport, loading and unloading; animal faeces;spoilage due to improper temperature during storage;spoilage due to poor packaging; and shrinkage due torough handling.
There have been instances of vanilla containersbeing confiscated because of fishy smells, and the
presence of hair and other foreign material; containersof ripe coconuts not de-eyed and cracked because ofexcessive exposure to the sun; containers ofimproperly cleaned, soil-contaminated taro; con-tainers of yam with bruised skin, rotting, stones, andsoil; taro leaves that were excessively dehydrated(moisture loss); containers of kava containing match-sticks, soil, and animal faeces; containers ofwatermelons spoiled because the wrong cooling tem-perature was used; containers of frozen cassavathawed because the electrical system on-board the shipwas mistakenly switched off; and many more. Wecannot afford to continue to incur the losses resultingfrom errors and mishandling after harvest.
Understanding the logistics of every postharvesthandling stage handling is crucial, e.g. the weather,relative humidity, sunrise and sunset, time and seasonof the year, transportation time, using proper light forinspection, packaging time, and chemical reactions.These are the sorts of factors that most of theinspectors, graders, packers, transporters, and loadingpeople are ignoring. While the logistics from har-vesting to transport to packinghouses, cleaning andinspection, grading and sorting, packing and loadingand then delivery to the market places is beingneglected by most growers, exporters, and shippers, abreakdown in this handling and distribution chain willinevitably cause severe damages and losses to everyshipment.
Only by careful attention to all factors in the post-harvest chain will unnecessary losses be reduced.
Lack of Feedback from Exporters/ Marketers to Growers, and Inconsistency in the Supply
of Quality Produce
Lack of feedback of information from exporters togrowers is a worsening problem. Growers are notbeing properly advised, either by the extensionofficers or by the exporters, on factors such as: whatquality is needed; the colour and size of produce pre-ferred; when to harvest; where to transport the produceafter harvest; the best method of transport; whichdistrict to harvest; the anticipated buying price; whichcultivars are suitable; where the inspection and tradinglocation will be; the exact date and time of buying; andmany other important logistical details.
Unclear messages and misinformation have causeda great deal of frustration and considerable losses togrowers. Ginger farmers from the Western District of
Quality assurance in agricultural produce,edited by G.I. Johnson, Le Van To, Nguyen Duy Duc and M.C. Webb.
ACIAR Proceedings 100(printed version published in 2000)
59
Fiji, for example, were prompted in error to harvesttheir ginger, when it was those from the CentralDistrict who should have been asked to do so; growersharvested the white, pink-skin cassava instead ofyellow cassava only; growers transported theirproduce to the Head Office instead of waiting in theirown village for the buying team to arrive; growersharvested the large, long yams instead of the 1–2 kground yams. The result has been a reduction inplantings and less interest in efforts to improve quality.Some growers have switched to unreliable exporters.In addition, the limited supply is being chased by toomany buyers (some ‘fly-by-nights’), driving upbuying prices and lowering grades and qualitystandards. Growers can thus quickly become suppliersof low quality produce.
The marketing system must be tightened andconstant communication between the local buyers/exporters (assuming they know what the overseasmarkets requirements are) and the growers is crucial.The success of exports is highly dependent on constantcommunication and close cooperation between thegrowers, extension officers and inspectors, andexporters. It is important for exporters to consultgrowers regularly on quality — what is right andwrong, and what are the specific requirements of themarkets. Also, growers must be given a qualityassessment of every batch of produce they deliver.Growers need feedback and assessment of how theyare performing. They are also prepared to acceptcriticism made in a spirit of helpfulness.
There is no other solution but to forge much closerlinks between exporters, extension officers, andgrowers. It has to be an all-way communicationsystem. For Pacific suppliers to remain in the interna-tional scene, they have consistently supply qualityproduce, and that will entail close cooperation by allparties involved.
There is a growing need for regular, hands-ontraining in the remote and rural areas. To becomecommitted to production of quality produce, growersmust understand what it means. They must be taughtproper postharvest handling techniques, and havesome knowledge of physiological factors such as res-piration, dehydration, temperature, and ethyleneproduction that affect product quality.
The Role of Extension Officers
A lack of extension officers is one of the major imped-iments to export development in the Pacific region.Growers from remote and outer islands are being dis-
advantaged by poor infrastructural support and lack ofproper technical advice on cropping and postharvesthandling techniques, crop management, and diseasecontrol methods. Lack of technical advice results inconsiderable wastage of exportable produce at ruraland remote areas, while resources, technical expertise,and support facilities are usually well provided atlarger centres of population.
Throughout the Pacific region, there are seriousconcerns about the:• lack of trained and qualified extension officers;• poor working facilities for extension officers;• lack of trained workers in rural and remote areas,
including outer islands;• problems with the electricity supply, inter-island
ferry services, communication means, water, anddomestic airline services;
• insufficient funding for extension officers toproperly execute their duties; and
• abuse of power and improper use of limitedresources by extension officers.When extension officers fail to consult regularly
with growers on quality specifications, harvest andpostharvest logistics, and transport to the marketplaces, the chain that links the growers, localexporters, importers, retailers, and consumers isbroken. This must not be allowed to happen. Growersrely on the help and regular technical and marketingadvice of extension officers.
In many cases, extension officers who are highlyqualified and motivated to provide all the servicesneeded are unable to do so because they have notransport to allow them to make regular visits to thefarmers. A qualified officer alone is not sufficient. Thetools and facilities are the other half of the equation tosuccess.
Availability of Technical and Marketing Information
Limited access to much-needed information, which isvery costly to obtain, is another setback to growers. Insome cases, information is exchanged during kavaparties. Such information is usually unreliable,invalid, and may cause frustration to the growers.
An information system is needed that can assuretimely delivery of critical technical and marketinginformation. The information should be in bilingualform. What is needed are details about market oppor-tunities, consumers’ specific requirements, exporters’and importers’ quality specifications, quarantine
Quality assurance in agricultural produce,edited by G.I. Johnson, Le Van To, Nguyen Duy Duc and M.C. Webb.
ACIAR Proceedings 100(printed version published in 2000)
60
requirements, delivery dates, harvesting dates,diseases and control measures, cropping techniques,varieties that are susceptible to diseases, moisturecontent requirements, and proper postharvest handlingmethods. Such information is usually not available, oronly so at times when the competition is intense andmarket demand has dropped. Timely availability ofimportant information is crucial in every aspect ofexport trade.
It is also noted that 90% of growers in the Pacific aresubsistence farmers whose education does not gobeyond primary school or the early stages of highschool. As a result of this relatively low level of edu-cation, there is always a need for closer supervision byextension officers and exporters to ensure productivityand quality production.
Government Support
Government support for the produce export industry,an industry which has the potential to grow substan-tially, is generally lacking. Governments could facil-itate the development of the industry by providingfinancial support for improved infrastructure (e.g.roads and wharves), processing facilities, and
research, development, and extension services. Gov-ernments need to frame market-orientated policies thatwill foster and promote, among other things, devel-opment of a commercial environment conducive togrowth and prosperity.
Conclusion
In summary, growers, extension officers, inspectorsand exporters must be aware of the basic principles ofpostharvest handling. They need to talk to each otherregularly and to share views, concerns, and expertise.Growers need feedback, respect, and constantdialogue on issues of mutual interest. The implemen-tation of schemes to provide growers with continuinghands-on training on all practical techniques of post-harvest handling is strongly recommended. Also rec-ommended are the implementation of a region-wideservice for identification of postharvest diseases anddisorders, and the regular provision of information onimport requirements and quality specifications togrowers and exporters.
Improved services by extension officers, togetherwith full support of governments, will help to facilitatehealthy growth in export development and trade.
Quality assurance in agricultural produce,edited by G.I. Johnson, Le Van To, Nguyen Duy Duc and M.C. Webb.
ACIAR Proceedings 100(printed version published in 2000)
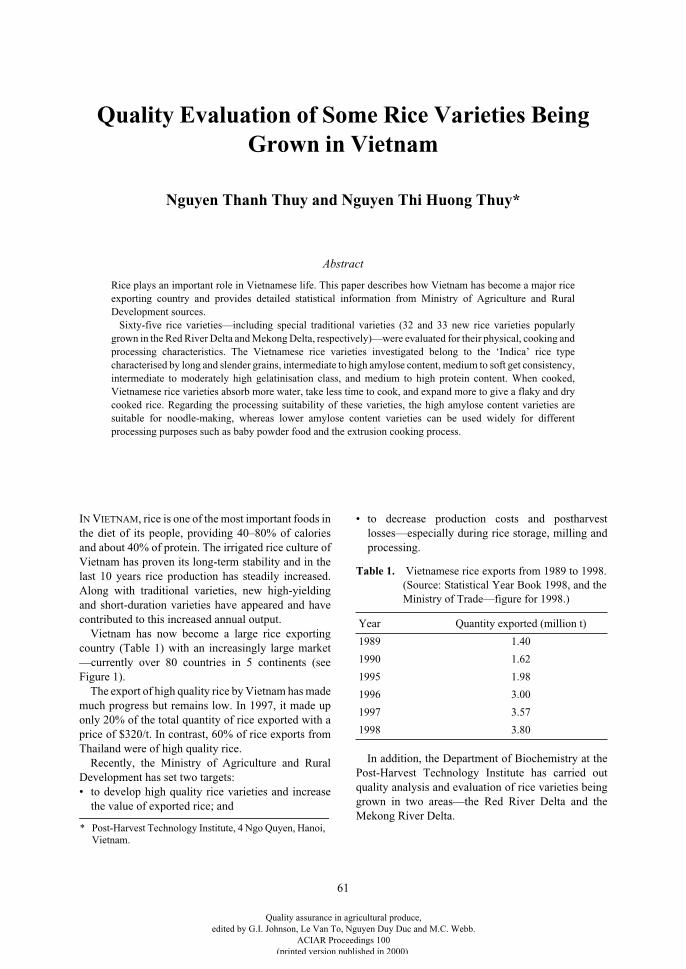
61
Quality Evaluation of Some Rice Varieties Being Grown in Vietnam
Nguyen Thanh Thuy and Nguyen Thi Huong Thuy*
Abstract
Rice plays an important role in Vietnamese life. This paper describes how Vietnam has become a major riceexporting country and provides detailed statistical information from Ministry of Agriculture and RuralDevelopment sources.
Sixty-five rice varieties—including special traditional varieties (32 and 33 new rice varieties popularlygrown in the Red River Delta and Mekong Delta, respectively)—were evaluated for their physical, cooking andprocessing characteristics. The Vietnamese rice varieties investigated belong to the ‘Indica’ rice typecharacterised by long and slender grains, intermediate to high amylose content, medium to soft get consistency,intermediate to moderately high gelatinisation class, and medium to high protein content. When cooked,Vietnamese rice varieties absorb more water, take less time to cook, and expand more to give a flaky and drycooked rice. Regarding the processing suitability of these varieties, the high amylose content varieties aresuitable for noodle-making, whereas lower amylose content varieties can be used widely for differentprocessing purposes such as baby powder food and the extrusion cooking process.
I
N
V
IETNAM
, rice is one of the most important foods inthe diet of its people, providing 40–80% of caloriesand about 40% of protein. The irrigated rice culture ofVietnam has proven its long-term stability and in thelast 10 years rice production has steadily increased.Along with traditional varieties, new high-yieldingand short-duration varieties have appeared and havecontributed to this increased annual output.
Vietnam has now become a large rice exportingcountry (Table 1) with an increasingly large market—currently over 80 countries in 5 continents (seeFigure 1).
The export of high quality rice by Vietnam has mademuch progress but remains low. In 1997, it made uponly 20% of the total quantity of rice exported with aprice of $320/t. In contrast, 60% of rice exports fromThailand were of high quality rice.
Recently, the Ministry of Agriculture and RuralDevelopment has set two targets:• to develop high quality rice varieties and increase
the value of exported rice; and
• to decrease production costs and postharvestlosses—especially during rice storage, milling andprocessing.
In addition, the Department of Biochemistry at thePost-Harvest Technology Institute has carried outquality analysis and evaluation of rice varieties beinggrown in two areas—the Red River Delta and theMekong River Delta.
* Post-Harvest Technology Institute, 4 Ngo Quyen, Hanoi, Vietnam.
Table 1.
Vietnamese rice exports from 1989 to 1998.(Source: Statistical Year Book 1998, and theMinistry of Trade—figure for 1998.)
Year Quantity exported (million t)
1989 1.40
1990 1.62
1995 1.98
1996 3.00
1997 3.57
1998 3.80
Quality assurance in agricultural produce,edited by G.I. Johnson, Le Van To, Nguyen Duy Duc and M.C. Webb.
ACIAR Proceedings 100(printed version published in 2000)
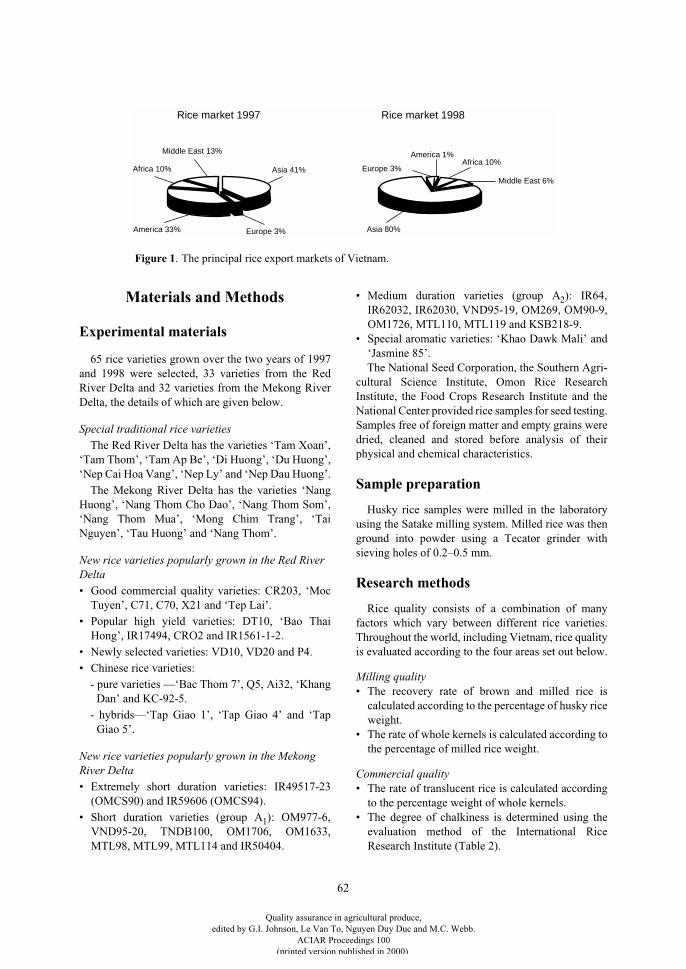
62
Materials and Methods
Experimental materials
65 rice varieties grown over the two years of 1997and 1998 were selected, 33 varieties from the RedRiver Delta and 32 varieties from the Mekong RiverDelta, the details of which are given below.
Special traditional rice varieties
The Red River Delta has the varieties ‘Tam Xoan’,‘Tam Thom’, ‘Tam Ap Be’, ‘Di Huong’, ‘Du Huong’,‘Nep Cai Hoa Vang’, ‘Nep Ly’ and ‘Nep Dau Huong’.
The Mekong River Delta has the varieties ‘NangHuong’, ‘Nang Thom Cho Dao’, ‘Nang Thom Som’,‘Nang Thom Mua’, ‘Mong Chim Trang’, ‘TaiNguyen’, ‘Tau Huong’ and ‘Nang Thom’.
New rice varieties popularly grown in the Red River Delta
• Good commercial quality varieties: CR203, ‘MocTuyen’, C71, C70, X21 and ‘Tep Lai’.
• Popular high yield varieties: DT10, ‘Bao ThaiHong’, IR17494, CRO2 and IR1561-1-2.
• Newly selected varieties: VD10, VD20 and P4.
• Chinese rice varieties:
- pure varieties —‘Bac Thom 7’, Q5, Ai32, ‘KhangDan’ and KC-92-5.
- hybrids—‘Tap Giao 1’, ‘Tap Giao 4’ and ‘TapGiao 5’.
New rice varieties popularly grown in the Mekong River Delta
• Extremely short duration varieties: IR49517-23(OMCS90) and IR59606 (OMCS94).
• Short duration varieties (group A
1
): OM977-6,VND95-20, TNDB100, OM1706, OM1633,MTL98, MTL99, MTL114 and IR50404.
• Medium duration varieties (group A
2
): IR64,IR62032, IR62030, VND95-19, OM269, OM90-9,OM1726, MTL110, MTL119 and KSB218-9.
• Special aromatic varieties: ‘Khao Dawk Mali’ and‘Jasmine 85’.The National Seed Corporation, the Southern Agri-
cultural Science Institute, Omon Rice ResearchInstitute, the Food Crops Research Institute and theNational Center provided rice samples for seed testing.Samples free of foreign matter and empty grains weredried, cleaned and stored before analysis of theirphysical and chemical characteristics.
Sample preparation
Husky rice samples were milled in the laboratoryusing the Satake milling system. Milled rice was thenground into powder using a Tecator grinder withsieving holes of 0.2–0.5 mm.
Research methods
Rice quality consists of a combination of manyfactors which vary between different rice varieties.Throughout the world, including Vietnam, rice qualityis evaluated according to the four areas set out below.
Milling quality
• The recovery rate of brown and milled rice iscalculated according to the percentage of husky riceweight.
• The rate of whole kernels is calculated according tothe percentage of milled rice weight.
Commercial quality
• The rate of translucent rice is calculated accordingto the percentage weight of whole kernels.
• The degree of chalkiness is determined using theevaluation method of the International RiceResearch Institute (Table 2).
Middle East 13%
Africa 10%
America 33% Europe 3%
Asia 41%
America 1%Africa 10%
Middle East 6%
Asia 80%
Europe 3%
Rice market 1997 Rice market 1998
Figure 1. The principal rice export markets of Vietnam.
Quality assurance in agricultural produce,edited by G.I. Johnson, Le Van To, Nguyen Duy Duc and M.C. Webb.
ACIAR Proceedings 100(printed version published in 2000)
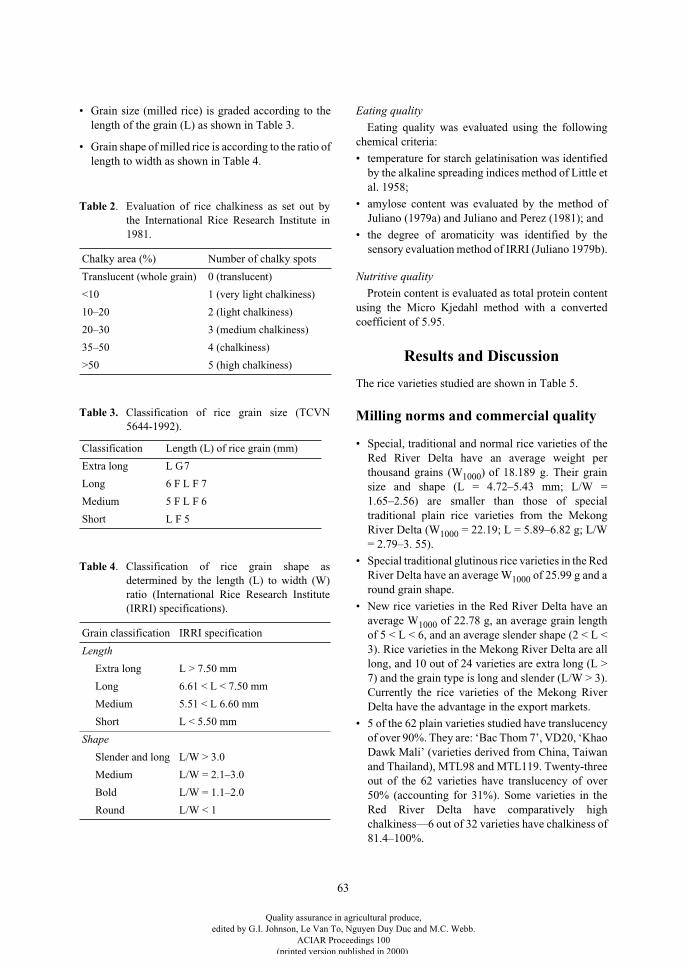
63
• Grain size (milled rice) is graded according to thelength of the grain (L) as shown in Table 3.
• Grain shape of milled rice is according to the ratio oflength to width as shown in Table 4.
Eating quality
Eating quality was evaluated using the followingchemical criteria:
• temperature for starch gelatinisation was identifiedby the alkaline spreading indices method of Little etal. 1958;
• amylose content was evaluated by the method ofJuliano (1979a) and Juliano and Perez (1981); and
• the degree of aromaticity was identified by thesensory evaluation method of IRRI (Juliano 1979b).
Nutritive quality
Protein content is evaluated as total protein contentusing the Micro Kjedahl method with a convertedcoefficient of 5.95.
Results and Discussion
The rice varieties studied are shown in Table 5.
Milling norms and commercial quality
• Special, traditional and normal rice varieties of theRed River Delta have an average weight perthousand grains (W
1000
)
of 18.189 g. Their grainsize and shape (L = 4.72–5.43 mm; L/W =1.65–2.56) are smaller than those of specialtraditional plain rice varieties from the MekongRiver Delta (W
1000
= 22.19; L = 5.89–6.82 g; L/W= 2.79–3. 55).
• Special traditional glutinous rice varieties in the RedRiver Delta have an average W
1000
of 25.99 g and around grain shape.
• New rice varieties in the Red River Delta have anaverage W
1000
of 22.78 g, an average grain lengthof 5 < L < 6, and an average slender shape (2 < L <3). Rice varieties in the Mekong River Delta are alllong, and 10 out of 24 varieties are extra long (L >7) and the grain type is long and slender (L/W > 3).Currently the rice varieties of the Mekong RiverDelta have the advantage in the export markets.
• 5 of the 62 plain varieties studied have translucencyof over 90%. They are: ‘Bac Thom 7’, VD20, ‘KhaoDawk Mali’ (varieties derived from China, Taiwanand Thailand), MTL98 and MTL119. Twenty-threeout of the 62 varieties have translucency of over50% (accounting for 31%). Some varieties in theRed River Delta have comparatively highchalkiness—6 out of 32 varieties have chalkiness of81.4–100%.
Table 2
. Evaluation of rice chalkiness as set out bythe International Rice Research Institute in1981.
Chalky area (%) Number of chalky spots
Translucent (whole grain) 0 (translucent)
<10 1 (very light chalkiness)
10–20 2 (light chalkiness)
20–30 3 (medium chalkiness)
35–50 4 (chalkiness)
>50 5 (high chalkiness)
Table 3.
Classification of rice grain size (TCVN5644-1992).
Classification Length (L) of rice grain (mm)
Extra long L
G
7
Long 6
F
L
F
7
Medium 5
F
L
F
6
Short L
F
5
Table 4
. Classification of rice grain shape asdetermined by the length (L) to width (W)ratio (International Rice Research Institute(IRRI) specifications).
Grain classification IRRI specification
Length
Extra long L > 7.50 mm
Long 6.61 < L < 7.50 mm
Medium 5.51 < L 6.60 mm
Short L < 5.50 mm
Shape
Slender and long L/W > 3.0
Medium L/W = 2.1–3.0
Bold L/W = 1.1–2.0
Round L/W < 1
Quality assurance in agricultural produce,edited by G.I. Johnson, Le Van To, Nguyen Duy Duc and M.C. Webb.
ACIAR Proceedings 100(printed version published in 2000)
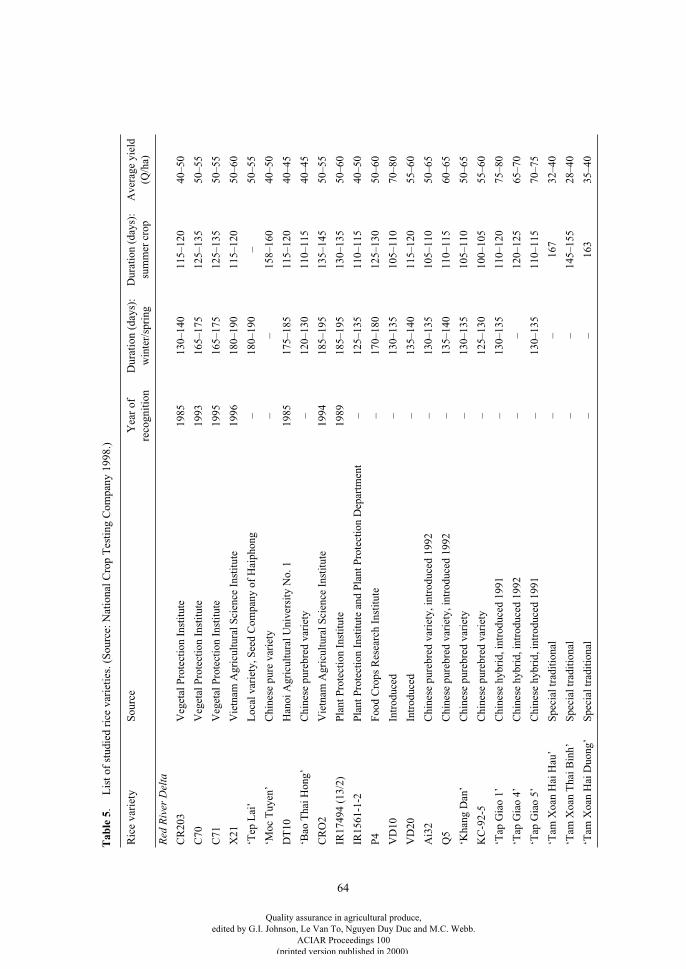
64
Tab
le 5
. L
ist o
f st
udie
d ri
ce v
arie
ties
. (S
ourc
e: N
atio
nal C
rop
Tes
ting
Com
pany
199
8.)
Ric
e va
riet
yS
ourc
eY
ear
of
reco
gnit
ion
Dur
atio
n (d
ays)
:
win
ter/
spri
ngD
urat
ion
(day
s):
sum
mer
cro
pA
vera
ge y
ield
(Q
/ha)
Red
Riv
er D
elta
CR
203
Veg
etal
Pro
tect
ion
Inst
itut
e19
8513
0–14
011
5–12
040
–50
C70
Veg
etal
Pro
tect
ion
Inst
itut
e19
9316
5–17
512
5–13
550
–55
C71
Veg
etal
Pro
tect
ion
Inst
itut
e19
9516
5–17
512
5–13
550
–55
X21
Vie
tnam
Agr
icul
tura
l Sci
ence
Ins
titu
te19
9618
0–19
011
5–12
050
–60
‘Tep
Lai
’L
ocal
var
iety
, See
d C
ompa
ny o
f H
aiph
ong
–18
0–19
0–
50–5
5
‘Moc
Tuy
en’
Chi
nese
pur
e va
riet
y–
–15
8–16
040
–50
DT
10H
anoi
Agr
icul
tura
l Uni
vers
ity
No.
119
8517
5–18
511
5–12
040
–45
‘Bao
Tha
i Hon
g’C
hine
se p
ureb
red
vari
ety
–12
0–13
011
0–11
540
–45
CR
O2
Vie
tnam
Agr
icul
tura
l Sci
ence
Ins
titu
te19
9418
5–19
513
5–14
550
–55
IR17
494
(13/
2)P
lant
Pro
tect
ion
Inst
itut
e19
8918
5–19
513
0–13
550
–60
IR15
61-1
-2P
lant
Pro
tect
ion
Inst
itut
e an
d P
lant
Pro
tect
ion
Dep
artm
ent
–12
5–13
511
0–11
540
–50
P4
Foo
d C
rops
Res
earc
h In
stit
ute
–17
0–18
012
5–13
050
–60
VD
10In
trod
uced
–13
0–13
510
5–11
070
–80
VD
20In
trod
uced
–13
5–14
011
5–12
055
–60
Ai3
2C
hine
se p
ureb
red
vari
ety,
intr
oduc
ed 1
992
–13
0–13
510
5–11
050
–65
Q5
Chi
nese
pur
ebre
d va
riet
y, in
trod
uced
199
2–
135–
140
110–
115
60–6
5
‘Kha
ng D
an’
Chi
nese
pur
ebre
d va
riet
y–
130–
135
105–
110
50–6
5
KC
-92-
5C
hine
se p
ureb
red
vari
ety
–12
5–13
010
0–10
555
–60
‘Tap
Gia
o 1’
Chi
nese
hyb
rid,
intr
oduc
ed 1
991
–13
0–13
511
0–12
075
–80
‘Tap
Gia
o 4’
Chi
nese
hyb
rid,
intr
oduc
ed 1
992
––
120–
125
65–7
0
‘Tap
Gia
o 5’
Chi
nese
hyb
rid,
intr
oduc
ed 1
991
–13
0–13
511
0–11
570
–75
‘Tam
Xoa
n H
ai H
au’
Spe
cial
trad
itio
nal
––
167
32–4
0
‘Tam
Xoa
n T
hai B
inh’
Spe
cial
trad
itio
nal
––
145–
155
28–4
0
‘Tam
Xoa
n H
ai D
uong
’S
peci
al tr
adit
iona
l–
–16
335
–40
Quality assurance in agricultural produce,edited by G.I. Johnson, Le Van To, Nguyen Duy Duc and M.C. Webb.
ACIAR Proceedings 100(printed version published in 2000)
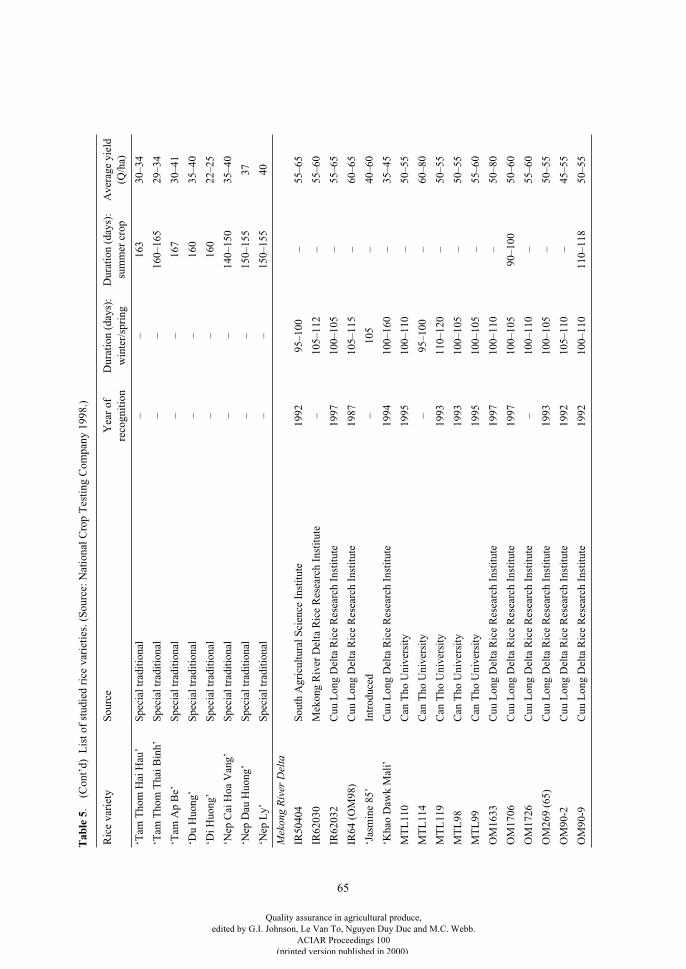
65
‘Tam
Tho
m H
ai H
au’
Spe
cial
trad
itio
nal
––
163
30–3
4
‘Tam
Tho
m T
hai B
inh’
Spe
cial
trad
itio
nal
––
160–
165
29–3
4
‘Tam
Ap
Be’
Spe
cial
trad
itio
nal
––
167
30–4
1
‘Du
Huo
ng’
Spe
cial
trad
itio
nal
––
160
35–4
0
‘Di H
uong
’S
peci
al tr
adit
iona
l–
–16
022
–25
‘Nep
Cai
Hoa
Van
g’S
peci
al tr
adit
iona
l–
–14
0–15
035
–40
‘Nep
Dau
Huo
ng’
Spe
cial
trad
itio
nal
––
150–
155
37
‘Nep
Ly’
Spe
cial
trad
itio
nal
––
150–
155
40
Mek
ong
Riv
er D
elta
IR50
404
Sou
th A
gric
ultu
ral S
cien
ce I
nsti
tute
1992
95–1
00–
55–6
5
IR62
030
Mek
ong
Riv
er D
elta
Ric
e R
esea
rch
Inst
itut
e–
105–
112
–55
–60
IR62
032
Cuu
Lon
g D
elta
Ric
e R
esea
rch
Inst
itut
e19
9710
0–10
5–
55–6
5
IR64
(O
M98
)C
uu L
ong
Del
ta R
ice
Res
earc
h In
stit
ute
1987
105–
115
–60
–65
‘Jas
min
e 85
’In
trod
uced
–10
5–
40–6
0
‘Kha
o D
awk
Mal
i’C
uu L
ong
Del
ta R
ice
Res
earc
h In
stit
ute
1994
100–
160
–35
–45
MT
L11
0C
an T
ho U
nive
rsit
y19
9510
0–11
0–
50–5
5
MT
L11
4C
an T
ho U
nive
rsit
y–
95–1
00–
60–8
0
MT
L11
9C
an T
ho U
nive
rsit
y19
9311
0–12
0–
50–5
5
MT
L98
Can
Tho
Uni
vers
ity
1993
100–
105
–50
–55
MT
L99
Can
Tho
Uni
vers
ity
1995
100–
105
–55
–60
OM
1633
Cuu
Lon
g D
elta
Ric
e R
esea
rch
Inst
itut
e19
9710
0–11
0–
50–8
0
OM
1706
Cuu
Lon
g D
elta
Ric
e R
esea
rch
Inst
itut
e19
9710
0–10
590
–100
50–6
0
OM
1726
Cuu
Lon
g D
elta
Ric
e R
esea
rch
Inst
itut
e–
100–
110
–55
–60
OM
269
(65)
Cuu
Lon
g D
elta
Ric
e R
esea
rch
Inst
itut
e19
9310
0–10
5–
50–5
5
OM
90-2
Cuu
Lon
g D
elta
Ric
e R
esea
rch
Inst
itut
e19
9210
5–11
0–
45–5
5
OM
90-9
Cuu
Lon
g D
elta
Ric
e R
esea
rch
Inst
itut
e19
9210
0–11
011
0–11
850
–55
Tab
le 5
. (
Con
t’d)
Lis
t of
stud
ied
rice
var
ieti
es. (
Sou
rce:
Nat
iona
l Cro
p T
esti
ng C
ompa
ny 1
998.
)
Ric
e va
riet
yS
ourc
eY
ear
of
reco
gnit
ion
Dur
atio
n (d
ays)
:
win
ter/
spri
ngD
urat
ion
(day
s):
sum
mer
cro
pA
vera
ge y
ield
(Q
/ha)
Quality assurance in agricultural produce,edited by G.I. Johnson, Le Van To, Nguyen Duy Duc and M.C. Webb.
ACIAR Proceedings 100(printed version published in 2000)
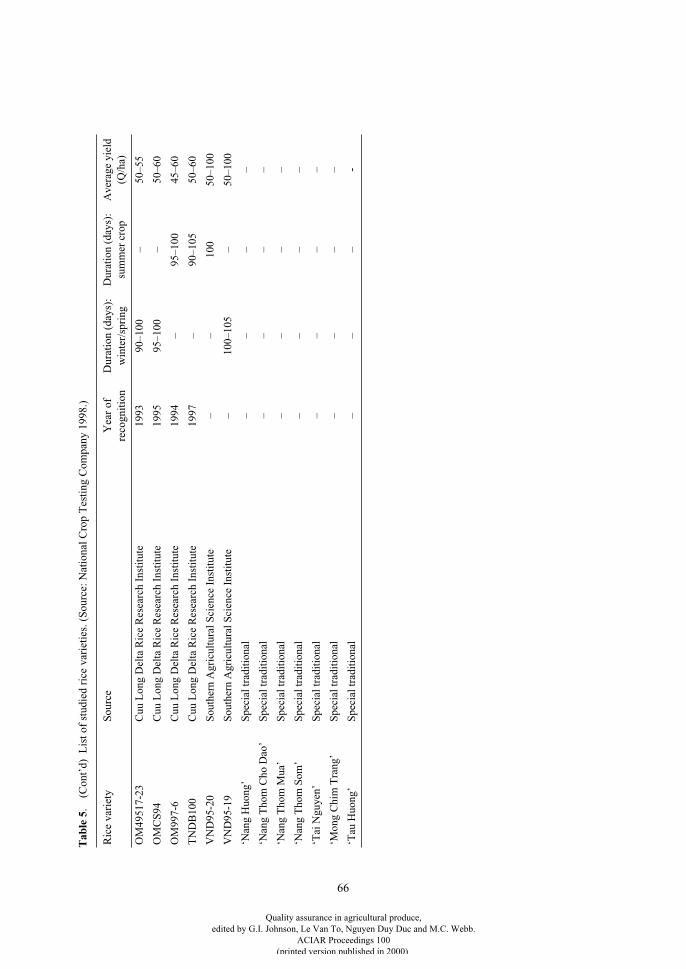
66
OM
4951
7-23
Cuu
Lon
g D
elta
Ric
e R
esea
rch
Inst
itut
e19
9390
–100
–50
–55
OM
CS
94C
uu L
ong
Del
ta R
ice
Res
earc
h In
stit
ute
1995
95–1
00–
50–6
0
OM
997-
6C
uu L
ong
Del
ta R
ice
Res
earc
h In
stit
ute
1994
–95
–100
45–6
0
TN
DB
100
Cuu
Lon
g D
elta
Ric
e R
esea
rch
Inst
itut
e19
97–
90–1
0550
–60
VN
D95
-20
Sou
ther
n A
gric
ultu
ral S
cien
ce I
nsti
tute
––
100
50–1
00
VN
D95
-19
Sou
ther
n A
gric
ultu
ral S
cien
ce I
nsti
tute
–10
0–10
5–
50–1
00
‘Nan
g H
uong
’S
peci
al tr
adit
iona
l–
––
–
‘Nan
g T
hom
Cho
Dao
’S
peci
al tr
adit
iona
l–
––
–
‘Nan
g T
hom
Mua
’S
peci
al tr
adit
iona
l–
––
–
‘Nan
g T
hom
Som
’S
peci
al tr
adit
iona
l–
––
–
‘Tai
Ngu
yen’
Spe
cial
trad
itio
nal
––
––
‘Mon
g C
him
Tra
ng’
Spe
cial
trad
itio
nal
––
––
‘Tau
Huo
ng’
Spe
cial
trad
itio
nal
––
–-
Tab
le 5
. (
Con
t’d)
Lis
t of
stud
ied
rice
var
ieti
es. (
Sou
rce:
Nat
iona
l Cro
p T
esti
ng C
ompa
ny 1
998.
)
Ric
e va
riet
yS
ourc
eY
ear
of
reco
gnit
ion
Dur
atio
n (d
ays)
:
win
ter/
spri
ngD
urat
ion
(day
s):
sum
mer
cro
pA
vera
ge y
ield
(Q
/ha)
Quality assurance in agricultural produce,edited by G.I. Johnson, Le Van To, Nguyen Duy Duc and M.C. Webb.
ACIAR Proceedings 100(printed version published in 2000)
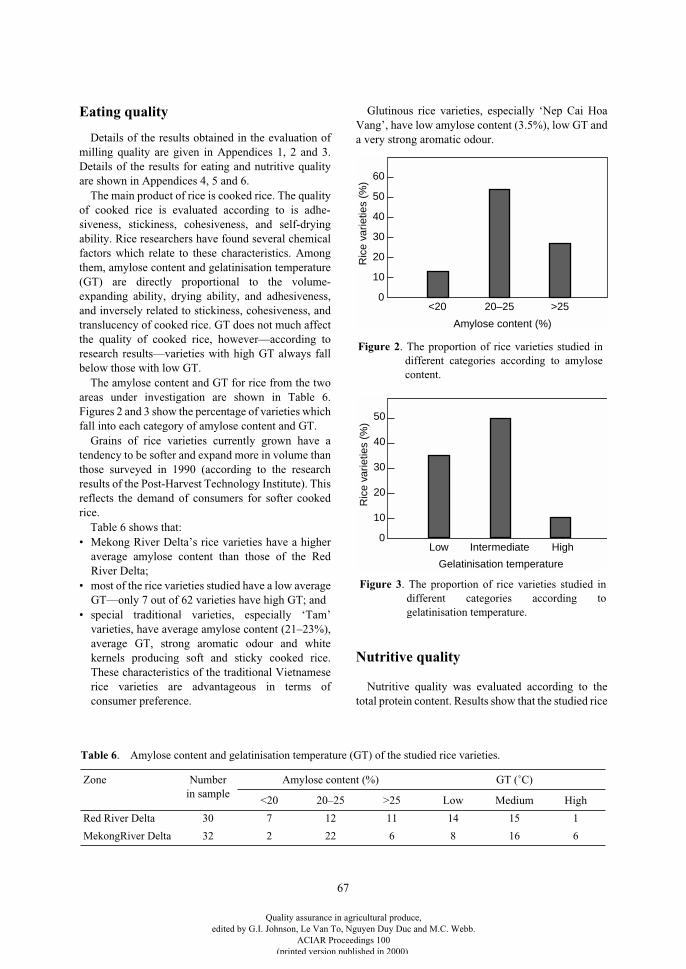
67
Eating quality
Details of the results obtained in the evaluation ofmilling quality are given in Appendices 1, 2 and 3.Details of the results for eating and nutritive qualityare shown in Appendices 4, 5 and 6.
The main product of rice is cooked rice. The qualityof cooked rice is evaluated according to is adhe-siveness, stickiness, cohesiveness, and self-dryingability. Rice researchers have found several chemicalfactors which relate to these characteristics. Amongthem, amylose content and gelatinisation temperature(GT) are directly proportional to the volume-expanding ability, drying ability, and adhesiveness,and inversely related to stickiness, cohesiveness, andtranslucency of cooked rice. GT does not much affectthe quality of cooked rice, however—according toresearch results—varieties with high GT always fallbelow those with low GT.
The amylose content and GT for rice from the twoareas under investigation are shown in Table 6.Figures 2 and 3 show the percentage of varieties whichfall into each category of amylose content and GT.
Grains of rice varieties currently grown have atendency to be softer and expand more in volume thanthose surveyed in 1990 (according to the researchresults of the Post-Harvest Technology Institute). Thisreflects the demand of consumers for softer cookedrice.
Table 6 shows that:• Mekong River Delta’s rice varieties have a higher
average amylose content than those of the RedRiver Delta;
• most of the rice varieties studied have a low averageGT—only 7 out of 62 varieties have high GT; and
• special traditional varieties, especially ‘Tam’varieties, have average amylose content (21–23%),average GT, strong aromatic odour and whitekernels producing soft and sticky cooked rice.These characteristics of the traditional Vietnameserice varieties are advantageous in terms ofconsumer preference.
Glutinous rice varieties, especially ‘Nep Cai HoaVang’, have low amylose content (3.5%), low GT anda very strong aromatic odour.
Nutritive quality
Nutritive quality was evaluated according to thetotal protein content. Results show that the studied rice
Table 6. Amylose content and gelatinisation temperature (GT) of the studied rice varieties.
Zone Number in sample
Amylose content (%) GT (˚C)
<20 20–25 >25 Low Medium High
Red River Delta 30 7 12 11 14 15 1
MekongRiver Delta 32 2 22 6 8 16 6
<200
>25
60
40
20
30
50
10
20–25
Amylose content (%)
Ric
e va
rietie
s (%
)
Low0
High
40
20
30
50
10
Intermediate
Gelatinisation temperature
Ric
e va
rietie
s (%
)
Figure 2. The proportion of rice varieties studied indifferent categories according to amylosecontent.
Figure 3. The proportion of rice varieties studied indifferent categories according togelatinisation temperature.
Quality assurance in agricultural produce,edited by G.I. Johnson, Le Van To, Nguyen Duy Duc and M.C. Webb.
ACIAR Proceedings 100(printed version published in 2000)
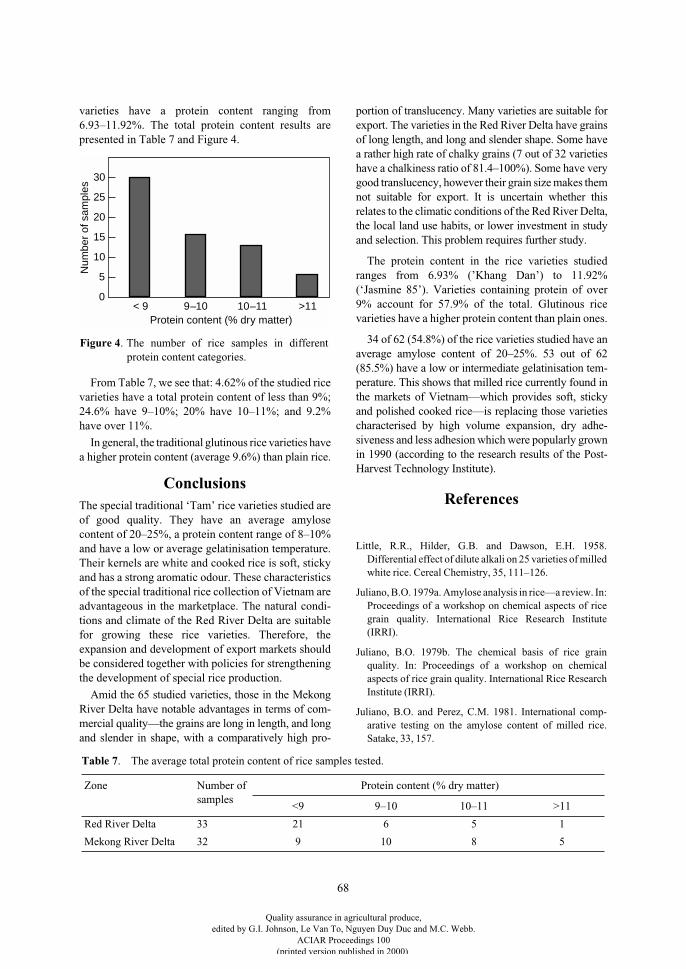
68
varieties have a protein content ranging from6.93–11.92%. The total protein content results arepresented in Table 7 and Figure 4.
From Table 7, we see that: 4.62% of the studied ricevarieties have a total protein content of less than 9%;24.6% have 9–10%; 20% have 10–11%; and 9.2%have over 11%.
In general, the traditional glutinous rice varieties havea higher protein content (average 9.6%) than plain rice.
Conclusions
The special traditional ‘Tam’ rice varieties studied areof good quality. They have an average amylosecontent of 20–25%, a protein content range of 8–10%and have a low or average gelatinisation temperature.Their kernels are white and cooked rice is soft, stickyand has a strong aromatic odour. These characteristicsof the special traditional rice collection of Vietnam areadvantageous in the marketplace. The natural condi-tions and climate of the Red River Delta are suitablefor growing these rice varieties. Therefore, theexpansion and development of export markets shouldbe considered together with policies for strengtheningthe development of special rice production.
Amid the 65 studied varieties, those in the MekongRiver Delta have notable advantages in terms of com-mercial quality—the grains are long in length, and longand slender in shape, with a comparatively high pro-
portion of translucency. Many varieties are suitable forexport. The varieties in the Red River Delta have grainsof long length, and long and slender shape. Some havea rather high rate of chalky grains (7 out of 32 varietieshave a chalkiness ratio of 81.4–100%). Some have verygood translucency, however their grain size makes themnot suitable for export. It is uncertain whether thisrelates to the climatic conditions of the Red River Delta,the local land use habits, or lower investment in studyand selection. This problem requires further study.
The protein content in the rice varieties studiedranges from 6.93% (’Khang Dan’) to 11.92%(‘Jasmine 85’). Varieties containing protein of over9% account for 57.9% of the total. Glutinous ricevarieties have a higher protein content than plain ones.
34 of 62 (54.8%) of the rice varieties studied have anaverage amylose content of 20–25%. 53 out of 62(85.5%) have a low or intermediate gelatinisation tem-perature. This shows that milled rice currently found inthe markets of Vietnam—which provides soft, stickyand polished cooked rice—is replacing those varietiescharacterised by high volume expansion, dry adhe-siveness and less adhesion which were popularly grownin 1990 (according to the research results of the Post-Harvest Technology Institute).
References
Little, R.R., Hilder, G.B. and Dawson, E.H. 1958.Differential effect of dilute alkali on 25 varieties of milledwhite rice. Cereal Chemistry, 35, 111–126.
Juliano, B.O. 1979a. Amylose analysis in rice—a review. In:Proceedings of a workshop on chemical aspects of ricegrain quality. International Rice Research Institute(IRRI).
Juliano, B.O. 1979b. The chemical basis of rice grainquality. In: Proceedings of a workshop on chemicalaspects of rice grain quality. International Rice ResearchInstitute (IRRI).
Juliano, B.O. and Perez, C.M. 1981. International comp-arative testing on the amylose content of milled rice.Satake, 33, 157.
9–10< 9
30
25
20
15
10
5
0
Protein content (% dry matter)10–11 >11
Num
ber
of s
ampl
es
Figure 4. The number of rice samples in differentprotein content categories.
Table 7. The average total protein content of rice samples tested.
Zone Number of samples
Protein content (% dry matter)
<9 9–10 10–11 >11
Red River Delta 33 21 6 5 1
Mekong River Delta 32 9 10 8 5
Quality assurance in agricultural produce,edited by G.I. Johnson, Le Van To, Nguyen Duy Duc and M.C. Webb.
ACIAR Proceedings 100(printed version published in 2000)
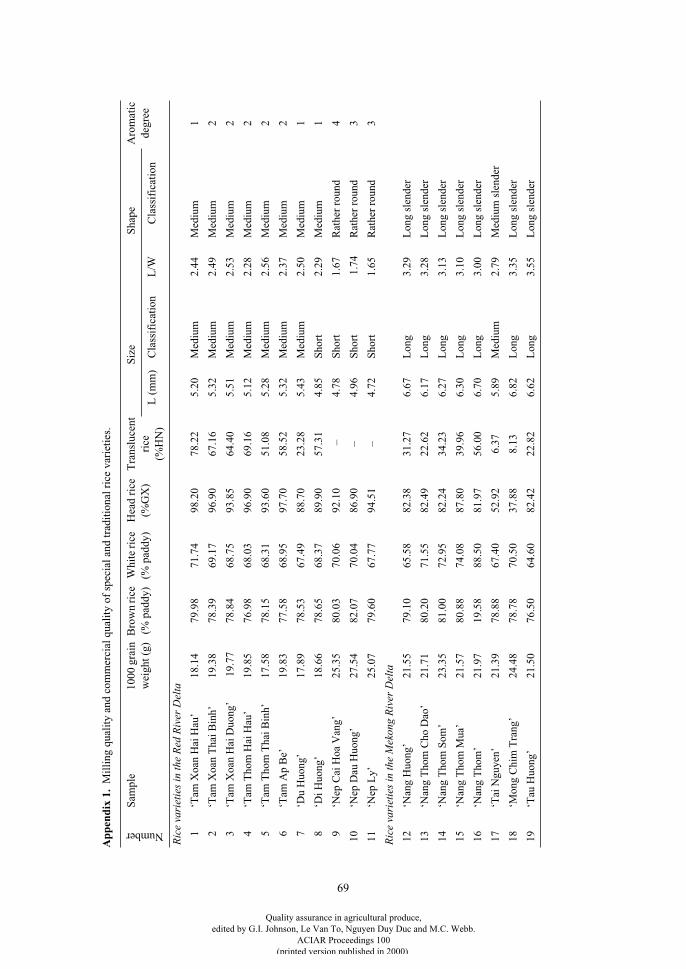
69
App
endi
x 1.
Mil
ling
qua
lity
and
com
mer
cial
qua
lity
of
spec
ial a
nd tr
adit
iona
l ric
e va
riet
ies.
NumberS
ampl
e10
00 g
rain
w
eigh
t (g)
Bro
wn
rice
(%
pad
dy)
Whi
te ri
ce
(% p
addy
)H
ead
rice
(%
GX
)T
rans
luce
nt
rice
(%
HN
)
Siz
eS
hape
Aro
mat
ic
degr
eeL
(m
m)
Cla
ssif
icat
ion
L/W
Cla
ssif
icat
ion
Ric
e va
riet
ies
in th
e R
ed R
iver
Del
ta
1 ‘T
am X
oan
Hai
Hau
’18
.14
79.9
871
.74
98.2
078
.22
5.20
Med
ium
2.44
Med
ium
1
2‘T
am X
oan
Tha
i Bin
h’19
.38
78.3
969
.17
96.9
067
.16
5.32
Med
ium
2.49
Med
ium
2
3‘T
am X
oan
Hai
Duo
ng’
19.
7778
.84
68.7
593
.85
64.4
05.
51
Med
ium
2.53
Med
ium
2
4‘T
am T
hom
Hai
Hau
’19
.85
76.9
868
.03
96.9
069
.16
5.12
Med
ium
2.28
Med
ium
2
5‘T
am T
hom
Tha
i Bin
h’17
.58
78.1
568
.31
93.6
051
.08
5.28
Med
ium
2.56
Med
ium
2
6‘T
am A
p B
e’19
.83
77.5
868
.95
97.7
058
.52
5.32
Med
ium
2.37
Med
ium
2
7‘D
u H
uong
’17
.89
78.5
367
.49
88.7
023
.28
5.43
Med
ium
2.50
Med
ium
1
8‘D
i Huo
ng’
18.6
678
.65
68.3
789
.90
57.3
14.
85S
hort
2.29
Med
ium
1
9‘N
ep C
ai H
oa V
ang’
25.3
580
.03
70.0
692
.10
–4.
78S
hort
1.67
Rat
her
roun
d4
10‘N
ep D
au H
uong
’27
.54
82.0
770
.04
86.9
0–
4.96
Sho
rt 1
.74
Rat
her
roun
d3
11
‘Nep
Ly’
25.0
779
.60
67.7
794
.51
–4.
72S
hort
1.65
Rat
her
roun
d3
Ric
e va
riet
ies
in th
e M
ekon
g R
iver
Del
ta
12
‘Nan
g H
uong
’21
.55
79.1
065
.58
82.3
831
.27
6.67
Lon
g3.
29L
ong
slen
der
13
‘Nan
g T
hom
Cho
Dao
’21
.71
80.2
071
.55
82.4
922
.62
6.17
Lon
g3.
28L
ong
slen
der
14
‘Nan
g T
hom
Som
’23
.35
81.0
072
.95
82.2
434
.23
6.27
Lon
g3.
13L
ong
slen
der
15
‘Nan
g T
hom
Mua
’21
.57
80.8
874
.08
87.8
039
.96
6.30
Lon
g3.
10L
ong
slen
der
16
‘Nan
g T
hom
’21
.97
19.5
888
.50
81.9
756
.00
6.70
Lon
g3.
00L
ong
slen
der
17
‘Tai
Ngu
yen’
21.3
978
.88
67.4
052
.92
6.37
5.89
Med
ium
2.79
Med
ium
sle
nder
18
‘Mon
g C
him
Tra
ng’
24.4
878
.78
70.5
037
.88
8.13
6.82
Lon
g3.
35L
ong
slen
der
19
‘Tau
Huo
ng’
21.5
076
.50
64.6
082
.42
22.8
26.
62L
ong
3.55
Lon
g sl
ende
r
Quality assurance in agricultural produce,edited by G.I. Johnson, Le Van To, Nguyen Duy Duc and M.C. Webb.
ACIAR Proceedings 100(printed version published in 2000)
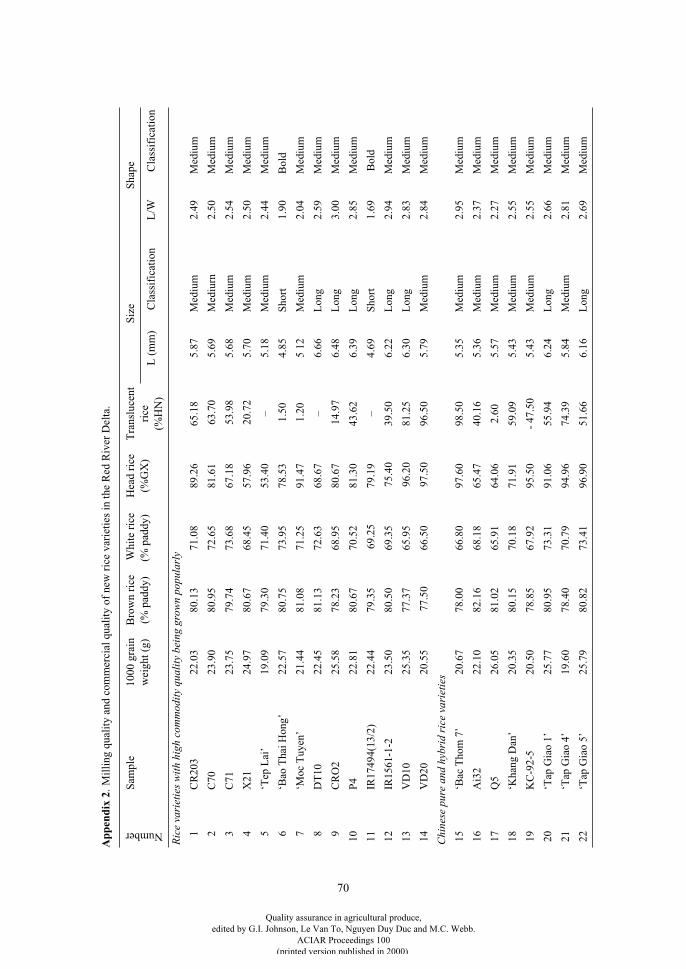
70
App
endi
x 2
.M
illi
ng q
uali
ty a
nd c
omm
erci
al q
uali
ty o
f ne
w r
ice
vari
etie
s in
the
Red
Riv
er D
elta
.
NumberS
ampl
e10
00 g
rain
w
eigh
t (g)
Bro
wn
rice
(%
pad
dy)
Whi
te r
ice
(% p
addy
)H
ead
rice
(%
GX
)T
rans
luce
nt
rice
(%
HN
)
Siz
eS
hape
L (
mm
)C
lass
ific
atio
nL
/WC
lass
ific
atio
n
Ric
e va
riet
ies
wit
h hi
gh c
omm
odit
y qu
alit
y be
ing
grow
n po
pula
rly
1 C
R20
322
.03
80.1
371
.08
89.2
665
.18
5.87
Med
ium
2.49
Med
ium
2 C
7023
.90
80.9
572
.65
81.6
1 6
3.70
5.69
Med
iurn
2.50
Med
ium
3 C
7123
.75
79.7
473
.68
67.1
8 5
3.98
5.68
Med
ium
2.54
Med
ium
4 X
2124
.97
80.6
768
.45
57.9
6 2
0.72
5.70
Med
ium
2.50
Med
ium
5 ‘T
ep L
ai’
19.0
979
.30
71.4
053
.40
–5.
18M
ediu
m2.
44M
ediu
m
6 ‘B
ao T
hai H
ong’
22.5
780
.75
73.9
578
.53
1.5
04.
85S
hort
1.90
Bol
d
7 ‘M
oc T
uyen
’21
.44
81.0
871
.25
91.4
7 1
.20
5 12
Med
ium
2.04
Med
ium
8 D
T10
22.4
581
.13
72.6
368
.67
–6.
66L
ong
2.59
Med
ium
9 C
RO
225
.58
78.2
368
.95
80.6
7 1
4.97
6.48
Lon
g3.
00M
ediu
m
10
P4
22.8
180
.67
70.5
281
.30
43.6
26.
39L
ong
2.85
Med
ium
11IR
1749
4(13
/2)
22.4
479
.35
69.
2579
.19
–4.
69S
hort
1.69
Bol
d
12
IR15
61-1
-223
.50
80.5
069
.35
75.
4039
.50
6.22
Lon
g2.
94M
ediu
m
13V
D10
25.3
577
.37
65.9
5 9
6.20
81.2
56.
30L
ong
2.83
Med
ium
14V
D20
20.5
5 7
7.50
66.5
0 9
7.50
96.5
05.
79M
ediu
m2.
84M
ediu
m
Chi
nese
pur
e an
d hy
brid
ric
e va
riet
ies
15‘B
ac T
hom
7’
20.6
7 78
.00
66.8
097
.60
98.5
05.
35M
ediu
m2.
95M
ediu
m
16A
i32
22.1
082
.16
68.1
865
.47
40.1
65.
36M
ediu
m2.
37M
ediu
m
17Q
526
.05
81.0
265
.91
64.0
62.
605.
57M
ediu
m2.
27M
ediu
m
18‘K
hang
Dan
’20
.35
80.1
570
.18
71.9
159
.09
5.43
Med
ium
2.55
Med
ium
19K
C-9
2-5
20.5
078
.85
67.9
295
.50
- 47
.50
5.43
Med
ium
2.55
Med
ium
20‘T
ap G
iao
1’25
.77
80.9
573
.31
91.0
655
.94
6.24
Lon
g2.
66M
ediu
m
21‘T
ap G
iao
4’19
.60
78.4
070
.79
94.9
674
.39
5.84
Med
ium
2.81
Med
ium
22‘T
ap G
iao
5’25
.79
80.8
273
.41
96.9
051
.66
6.16
Lon
g2.
69M
ediu
m
Quality assurance in agricultural produce,edited by G.I. Johnson, Le Van To, Nguyen Duy Duc and M.C. Webb.
ACIAR Proceedings 100(printed version published in 2000)
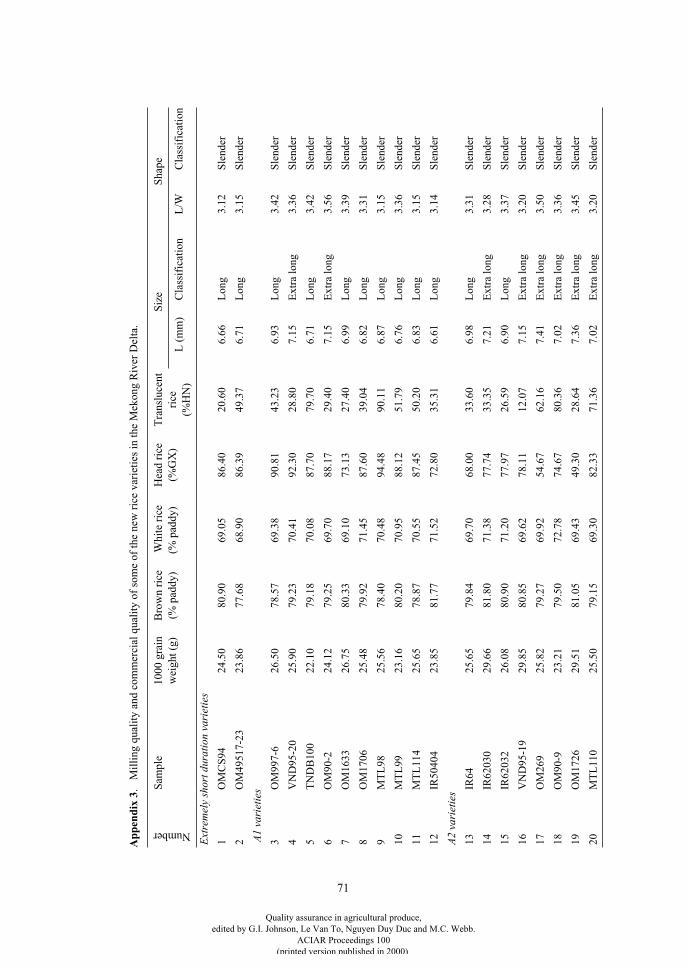
71
App
endi
x 3
. M
illi
ng q
uali
ty a
nd c
omm
erci
al q
uali
ty o
f so
me
of th
e ne
w r
ice
vari
etie
s in
the
Mek
ong
Riv
er D
elta
.Number
Sam
ple
1000
gra
in
wei
ght (
g)B
row
n ri
ce
(% p
addy
) W
hite
ric
e (%
pad
dy)
Hea
d ri
ce
(%G
X)
Tra
nslu
cent
ri
ce
(%H
N)
Siz
eS
hape
L (
mm
)C
lass
ific
atio
nL
/WC
lass
ific
atio
n
Ext
rem
ely
shor
t dur
atio
n va
riet
ies
1O
MC
S94
24.5
080
.90
69.0
586
.40
20.6
06.
66L
ong
3.12
Sle
nder
2O
M49
517-
2323
.86
77.6
868
.90
86.3
949
.37
6.71
Lon
g3.
15S
lend
er
A1
vari
etie
s
3O
M99
7-6
26.5
078
.57
69.3
890
.81
43.2
36.
93L
ong
3.42
Sle
nder
4V
ND
95-2
025
.90
79.2
370
.41
92.3
028
.80
7.15
Ext
ra lo
ng3.
36S
lend
er
5T
ND
B10
022
.10
79.1
870
.08
87.7
079
.70
6.71
Lon
g3.
42S
lend
er
6O
M90
-224
.12
79.2
569
.70
88.1
729
.40
7.15
Ext
ra lo
ng3.
56S
lend
er
7O
M16
3326
.75
80.3
369
.10
73.1
327
.40
6.99
Lon
g3.
39S
lend
er
8O
M17
0625
.48
79.9
271
.45
87.6
039
.04
6.82
Lon
g3.
31S
lend
er
9M
TL
9825
.56
78.4
070
.48
94.4
890
.11
6.87
Lon
g3.
15S
lend
er
10M
TL
9923
.16
80.2
070
.95
88.1
251
.79
6.76
Lon
g3.
36S
lend
er
11M
TL
114
25.6
578
.87
70.5
587
.45
50.2
06.
83L
ong
3.15
Sle
nder
12IR
5040
423
.85
81.7
771
.52
72.8
035
.31
6.61
Lon
g3.
14S
lend
er
A2
vari
etie
s
13IR
6425
.65
79.8
469
.70
68.0
033
.60
6.98
Lon
g3.
31S
lend
er
14IR
6203
029
.66
81.8
071
.38
77.7
433
.35
7.21
Ext
ra lo
ng3.
28S
lend
er
15IR
6203
226
.08
80.9
071
.20
77.9
726
.59
6.90
Lon
g3.
37S
lend
er
16V
ND
95-1
929
.85
80.8
569
.62
78.1
112
.07
7.15
Ext
ra lo
ng3.
20S
lend
er
17O
M26
925
.82
79.2
769
.92
54.6
762
.16
7.41
Ext
ra lo
ng3.
50S
lend
er
18O
M90
-923
.21
79.5
072
.78
74.6
780
.36
7.02
Ext
ra lo
ng3.
36S
lend
er
19O
M17
2629
.51
81.0
569
.43
49.3
028
.64
7.36
Ext
ra lo
ng3.
45S
lend
er
20M
TL
110
25.5
079
.15
69.3
082
.33
71.3
67.
02E
xtra
long
3.20
Sle
nder
Quality assurance in agricultural produce,edited by G.I. Johnson, Le Van To, Nguyen Duy Duc and M.C. Webb.
ACIAR Proceedings 100(printed version published in 2000)
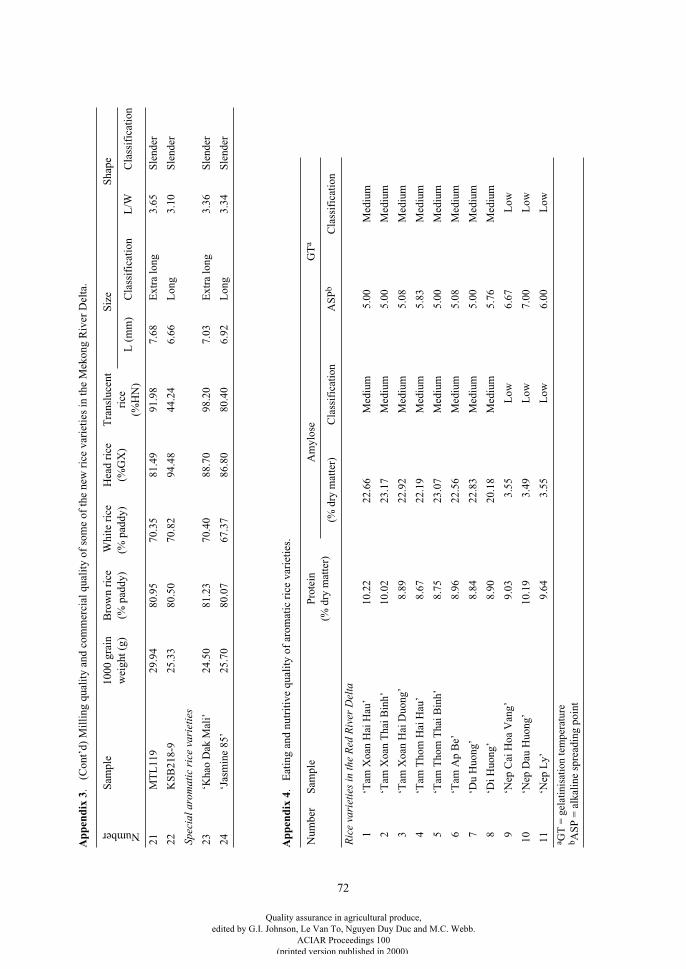
72
21M
TL
119
29.9
480
.95
70.3
581
.49
91.9
87.
68E
xtra
long
3.65
Sle
nder
22K
SB
218-
925
.33
80.5
070
.82
94.4
844
.24
6.66
Lon
g3.
10S
lend
er
Spec
ial a
rom
atic
ric
e va
riet
ies
23‘K
hao
Dak
Mal
i’24
.50
81.2
370
.40
88.7
098
.20
7.03
Ext
ra lo
ng3.
36S
lend
er
24‘J
asm
ine
85’
25.7
080
.07
67.3
786
.80
80.4
06.
92L
ong
3.34
Sle
nder
App
endi
x 4
. E
atin
g an
d nu
trit
ive
qual
ity
of a
rom
atic
ric
e va
riet
ies.
Num
ber
Sam
ple
Pro
tein
(%
dry
mat
ter)
Am
ylos
e G
T
a
(% d
ry m
atte
r)C
lass
ific
atio
nA
SP
b
Cla
ssif
icat
ion
Ric
e va
riet
ies
in th
e R
ed R
iver
Del
ta
1‘T
am X
oan
Hai
Hau
’10
.22
22.6
6M
ediu
m5.
00M
ediu
m
2‘T
am X
oan
Tha
i Bin
h’10
.02
23.1
7M
ediu
m5.
00M
ediu
m
3‘T
am X
oan
Hai
Duo
ng’
8.89
22.9
2M
ediu
m5.
08M
ediu
m
4‘T
am T
hom
Hai
Hau
’8.
6722
.19
Med
ium
5.83
Med
ium
5‘T
am T
hom
Tha
i Bin
h’8.
7523
.07
Med
ium
5.00
Med
ium
6‘T
am A
p B
e’8.
9622
.56
Med
ium
5.08
Med
ium
7‘D
u H
uong
’8.
8422
.83
Med
ium
5.00
Med
ium
8‘D
i Huo
ng’
8.90
20.1
8M
ediu
m5.
76M
ediu
m
9‘N
ep C
ai H
oa V
ang’
9.03
3.55
Low
6.67
Low
10‘N
ep D
au H
uong
’10
.19
3.49
Low
7.00
Low
11‘N
ep L
y’9.
643.
55 L
ow6.
00 L
ow
a
GT
= g
elat
inis
atio
n te
mpe
ratu
re
b
AS
P =
alk
alin
e sp
read
ing
poin
t
App
endi
x 3
. (
Con
t’d)
Mil
ling
qua
lity
and
com
mer
cial
qua
lity
of
som
e of
the
new
ric
e va
riet
ies
in th
e M
ekon
g R
iver
Del
ta.
Number
Sam
ple
1000
gra
in
wei
ght (
g)B
row
n ri
ce
(% p
addy
) W
hite
ric
e (%
pad
dy)
Hea
d ri
ce
(%G
X)
Tra
nslu
cent
ri
ce
(%H
N)
Siz
eS
hape
L (
mm
)C
lass
ific
atio
nL
/WC
lass
ific
atio
n
Quality assurance in agricultural produce,edited by G.I. Johnson, Le Van To, Nguyen Duy Duc and M.C. Webb.
ACIAR Proceedings 100(printed version published in 2000)
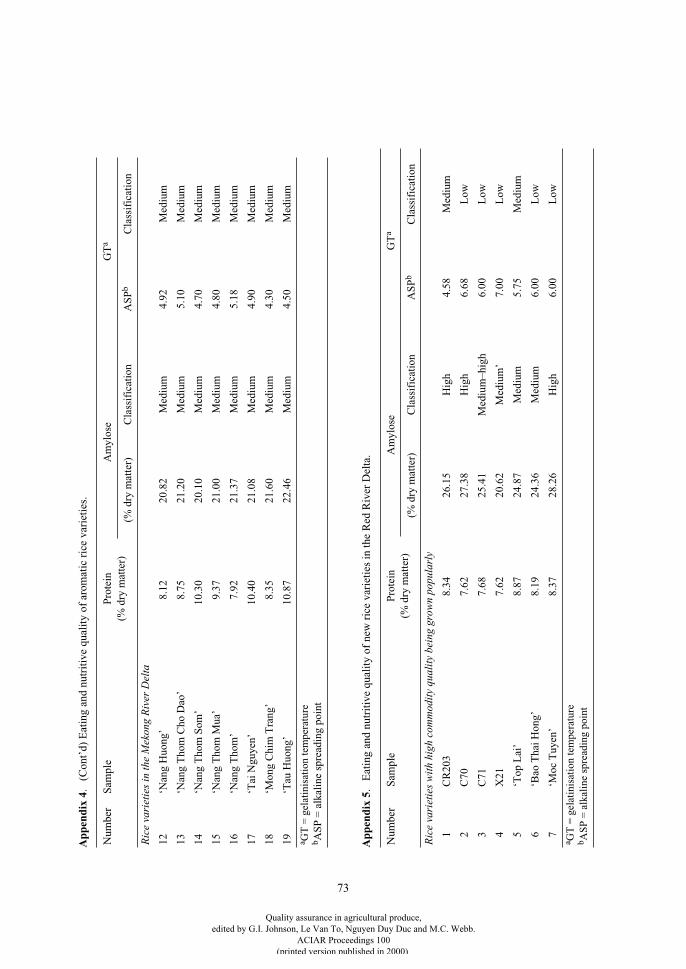
73
Ric
e va
riet
ies
in th
e M
ekon
g R
iver
Del
ta
12‘N
ang
Huo
ng’
8.12
20.8
2M
ediu
m4.
92M
ediu
m
13‘N
ang
Tho
m C
ho D
ao’
8.75
21.2
0M
ediu
m5.
10M
ediu
m
14‘N
ang
Tho
m S
om’
10.3
020
.10
Med
ium
4.70
Med
ium
15‘N
ang
Tho
m M
ua’
9.37
21.0
0M
ediu
m4.
80M
ediu
m
16‘N
ang
Tho
m’
7.92
21.3
7M
ediu
m5.
18M
ediu
m
17‘T
ai N
guye
n’10
.40
21.0
8M
ediu
m4.
90M
ediu
m
18‘M
ong
Chi
m T
rang
’8.
3521
.60
Med
ium
4.30
Med
ium
19‘T
au H
uong
’10
.87
22.4
6M
ediu
m4.
50M
ediu
m
App
endi
x 5
. E
atin
g an
d nu
trit
ive
qual
ity
of n
ew r
ice
vari
etie
s in
the
Red
Riv
er D
elta
.
Num
ber
Sam
ple
Pro
tein
(%
dry
mat
ter)
Am
ylos
e G
T
a
(% d
ry m
atte
r)C
lass
ific
atio
nA
SP
b
Cla
ssif
icat
ion
Ric
e va
riet
ies
wit
h hi
gh c
omm
odit
y qu
alit
y be
ing
grow
n po
pula
rly
1 C
R20
38.
3426
.15
Hig
h4.
58M
ediu
m
2 C
707.
6227
.38
Hig
h6.
68L
ow
3 C
717.
6825
.41
Med
ium
–hig
h6.
00L
ow
4 X
217.
6220
.62
Med
ium
’7.
00L
ow
5 ‘T
op L
ai’
8.87
24.8
7M
ediu
m5.
75M
ediu
m
6 ‘B
ao T
hai H
ong’
8.19
24.3
6M
ediu
m6.
00L
ow
7 ‘M
oc T
uyen
’8.
3728
.26
Hig
h6.
00L
ow
a
GT
= g
elat
inis
atio
n te
mpe
ratu
re
b
AS
P =
alk
alin
e sp
read
ing
poin
t
App
endi
x 4
. (
Con
t’d)
Eat
ing
and
nutr
itiv
e qu
alit
y of
aro
mat
ic r
ice
vari
etie
s.
Num
ber
Sam
ple
Pro
tein
(%
dry
mat
ter)
Am
ylos
e G
T
a
(% d
ry m
atte
r)C
lass
ific
atio
nA
SP
b
Cla
ssif
icat
ion
a
GT
= g
elat
inis
atio
n te
mpe
ratu
re
b
AS
P =
alk
alin
e sp
read
ing
poin
t
Quality assurance in agricultural produce,edited by G.I. Johnson, Le Van To, Nguyen Duy Duc and M.C. Webb.
ACIAR Proceedings 100(printed version published in 2000)
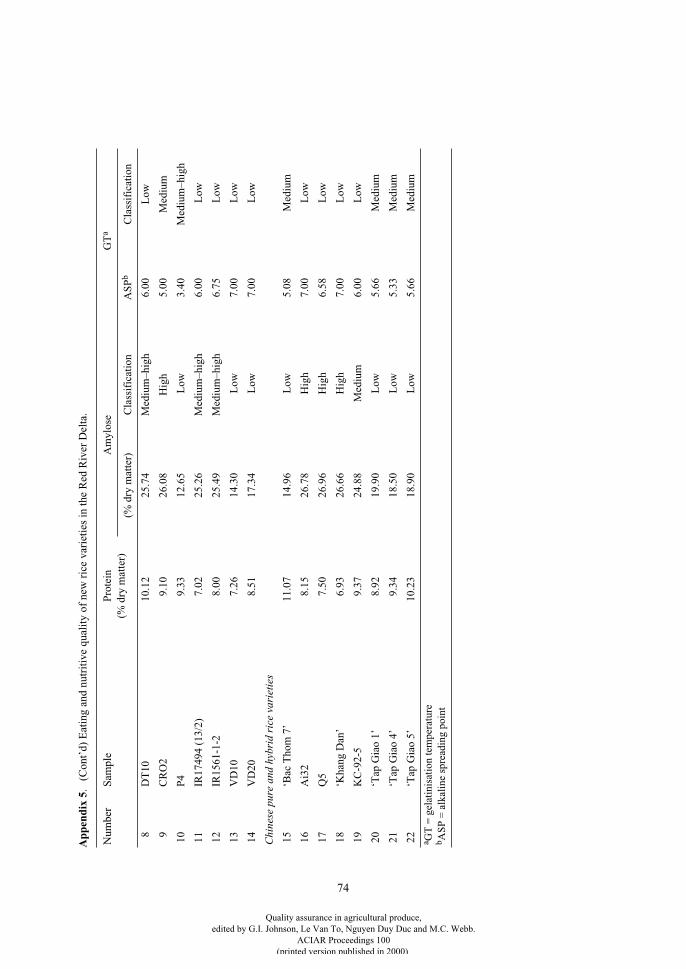
74
8 D
T10
10.1
225
.74
Med
ium
–hig
h6.
00L
ow
9 C
RO
29.
1026
.08
Hig
h5.
00M
ediu
m
10P
49.
3312
.65
Low
3.40
Med
ium
–hig
h
11
IR17
494
(13/
2)7.
0225
.26
Med
ium
–hig
h6.
00 L
ow
12
IR15
61-1
-28.
0025
.49
Med
ium
–hig
h6.
75 L
ow
13
VD
107.
2614
.30
Low
7.00
Low
14
VD
208.
5117
.34
Low
7.00
Low
Chi
nese
pur
e an
d hy
brid
ric
e va
riet
ies
15
‘Bac
Tho
m 7
’11
.07
14.9
6 L
ow5.
08 M
ediu
m
16
Ai3
28.
1526
.78
Hig
h7.
00 L
ow
17
Q5
7.50
26.9
6 H
igh
6.58
Low
18
‘Kha
ng D
an’
6.93
26.6
6 H
igh
7.00
Low
19
KC
-92-
59.
3724
.88
Med
ium
6.00
Low
20
‘Tap
Gia
o 1’
8.92
19.9
0 L
ow5.
66 M
ediu
m
21
‘Tap
Gia
o 4’
9.34
18.5
0 L
ow5.
33 M
ediu
m
22
‘Tap
Gia
o 5’
10.2
318
.90
Low
5.66
Med
ium
App
endi
x 5
. (
Con
t’d)
Eat
ing
and
nutr
itiv
e qu
alit
y of
new
ric
e va
riet
ies
in th
e R
ed R
iver
Del
ta.
Num
ber
Sam
ple
Pro
tein
(%
dry
mat
ter)
Am
ylos
e G
T
a
(% d
ry m
atte
r)C
lass
ific
atio
nA
SP
b
Cla
ssif
icat
ion
a
GT
= g
elat
inis
atio
n te
mpe
ratu
re
b
AS
P =
alk
alin
e sp
read
ing
poin
t
Quality assurance in agricultural produce,edited by G.I. Johnson, Le Van To, Nguyen Duy Duc and M.C. Webb.
ACIAR Proceedings 100(printed version published in 2000)
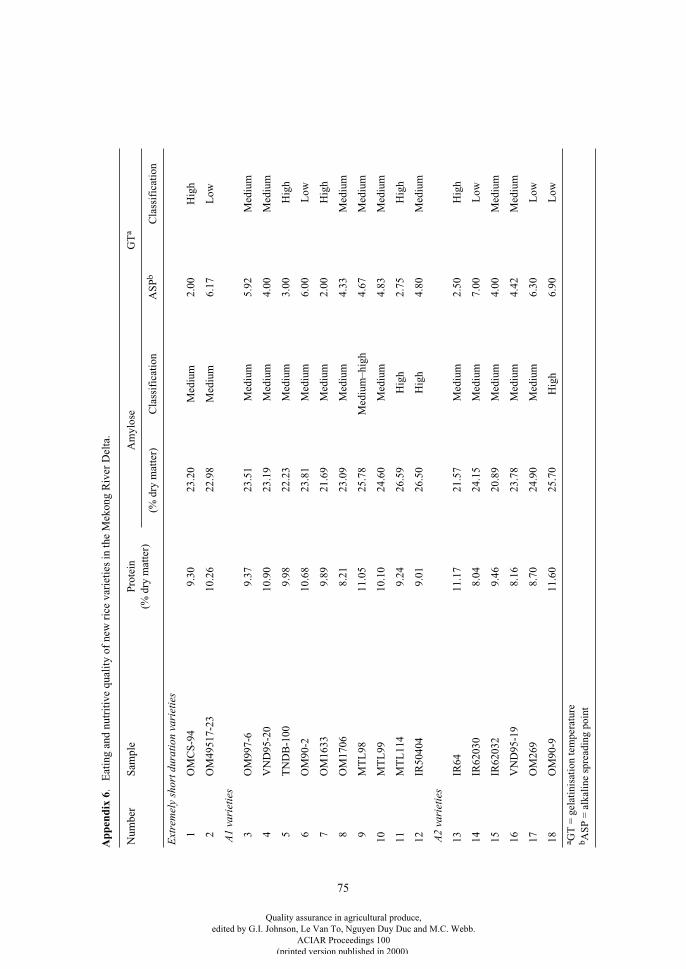
75
App
endi
x 6
. E
atin
g an
d nu
trit
ive
qual
ity
of n
ew r
ice
vari
etie
s in
the
Mek
ong
Riv
er D
elta
.
Num
ber
Sam
ple
Pro
tein
(%
dry
mat
ter)
Am
ylos
e G
T
a
(% d
ry m
atte
r)C
lass
ific
atio
nA
SP
b
Cla
ssif
icat
ion
Ext
rem
ely
shor
t dur
atio
n va
riet
ies
1O
MC
S-9
49.
3023
.20
Med
ium
2.00
Hig
h
2O
M49
517-
2310
.26
22.9
8M
ediu
m6.
17L
ow
A1
vari
etie
s
3O
M99
7-6
9.37
23.5
1 M
ediu
m5.
92M
ediu
m
4V
ND
95-2
010
.90
23.1
9 M
ediu
m4.
00M
ediu
m
5T
ND
B-1
009.
9822
.23
Med
ium
3.00
Hig
h
6O
M90
-210
.68
23.8
1 M
ediu
m6.
00 L
ow
7O
M16
339.
8921
.69
Med
ium
2.00
Hig
h
8O
M17
068.
2123
.09
Med
ium
4.33
Med
ium
9M
TL
9811
.05
25.7
8M
ediu
m–h
igh
4.67
Med
ium
10M
TL
9910
.10
24.6
0 M
ediu
m4.
83M
ediu
m
11M
TL
114
9.24
26.5
9 H
igh
2.75
Hig
h
12IR
5040
49.
0126
.50
Hig
h4.
80M
ediu
m
A2
vari
etie
s
13IR
6411
.17
21.5
7 M
ediu
m2.
50 H
igh
14IR
6203
08.
0424
.15
Med
ium
7.00
Low
15IR
6203
29.
4620
.89
Med
ium
4.00
Med
ium
16V
ND
95-1
98.
1623
.78
Med
ium
4.42
Med
ium
17O
M26
98.
7024
.90
Med
ium
6.30
Low
18O
M90
-911
.60
25.7
0H
igh
6.90
Low
a
GT
= g
elat
inis
atio
n te
mpe
ratu
re
b
AS
P =
alk
alin
e sp
read
ing
poin
t
Quality assurance in agricultural produce,edited by G.I. Johnson, Le Van To, Nguyen Duy Duc and M.C. Webb.
ACIAR Proceedings 100(printed version published in 2000)
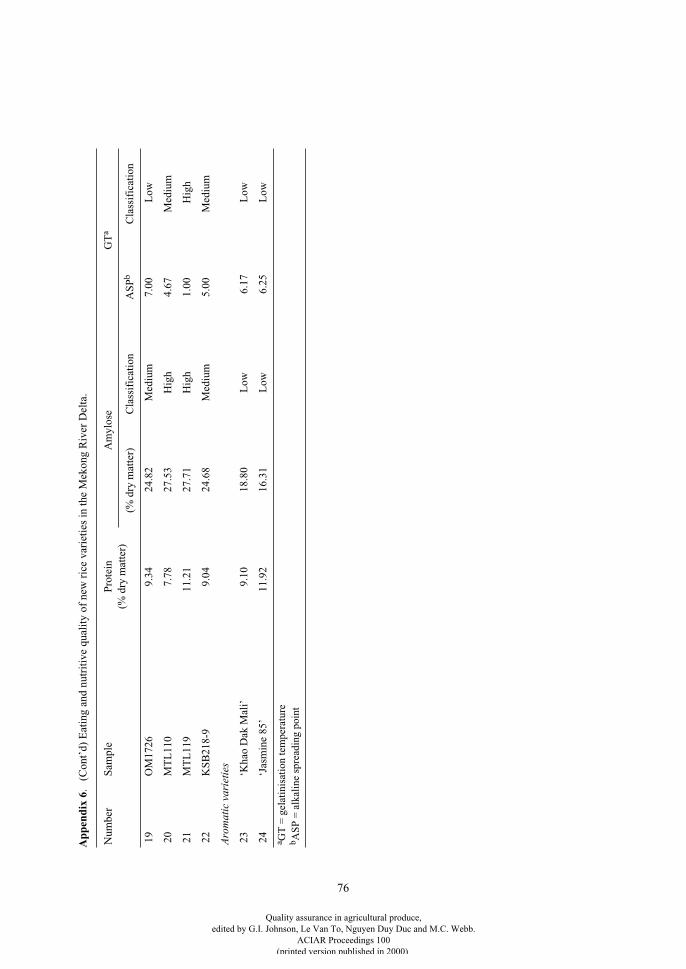
76
19O
M17
269.
3424
.82
Med
ium
7.00
Low
20M
TL
110
7.78
27.5
3 H
igh
4.67
Med
ium
21M
TL
119
11.2
127
.71
Hig
h1.
00 H
igh
22K
SB
218-
99.
0424
.68
Med
ium
5.00
Med
ium
Aro
mat
ic v
arie
ties
23‘K
hao
Dak
Mal
i’9.
1018
.80
Low
6.17
Low
24‘J
asm
ine
85’
11.9
216
.31
Low
6.25
Low
App
endi
x 6.
(C
ont’
d) E
atin
g an
d nu
trit
ive
qual
ity
of n
ew r
ice
vari
etie
s in
the
Mek
ong
Riv
er D
elta
.
Num
ber
Sam
ple
Pro
tein
(%
dry
mat
ter)
Am
ylos
e G
Ta
(% d
ry m
atte
r)C
lass
ific
atio
nA
SP
bC
lass
ific
atio
n
a GT
= g
elat
inis
atio
n te
mpe
ratu
reb A
SP
= a
lkal
ine
spre
adin
g po
int
Quality assurance in agricultural produce,edited by G.I. Johnson, Le Van To, Nguyen Duy Duc and M.C. Webb.
ACIAR Proceedings 100(printed version published in 2000)
79
Quality Assurance Systems for ASEAN Fruits (Fresh and Minimally Processed)
G.I. Alexander and B.C. Peacock*
Abstract
In Association of South-East Asian Nations (ASEAN) countries, postharvest handling and marketing of fruitshave been developing quite rapidly in response to increasing efforts to export fruits to other countries, bothwithin ASEAN and to other countries. A catalyst for these developments has been the ASEAN–AustraliaEconomic Cooperation Program Phase III Project on Quality Assurance Systems for ASEAN Fruits—Freshand Minimally Processed (QASAF). Within the ambit of the project, each country has developed qualityassurance (QA) systems with fruit which they had selected as the subject fruit. A series of projects wasundertaken to develop QA systems for the marketing of fresh fruit for local and export markets. A second seriesof projects was undertaken to develop systems for minimal processing of the selected fruit with a view toachieving an extended shelf life for the product to aid in the penetration of more distant markets.
Brunei Darussalam focused their attention on their local durian varieties, ‘durian otak udang galah’, ‘durianpulu’, ‘durian kuning’ and ‘durian bunga simpur’, which they wished to promote; Indonesia concentrated on‘Arumanis’ mango which is a popular variety of green-skinned mango; Malaysia used jackfruit which wasbeing used for some limited minimal processing; Philippines chose to work with pineapples for which aminimal processing industry could be developed; Singapore, being an importer of fruit from ASEAN,concentrated on product evaluation and the development of minimal processing systems, including goodmanufacturing practice(GMP) and Hazard Analysis and Critical Control Points (HACCP) plans; Thailandplaced its emphasis on furthering its work on the most common durian (Durio zibethinus) in commercial useand which could be used for minimal processing; and Vietnam concentrated attention on dragon fruit—whichis a very popular fruit with considerable export potential, mango (‘Cat Hoa Loc’) and longan.
T
HIS
THREE
-
YEAR
project commenced in January1997 under the auspices of the Association of South-East Asian Nations (ASEAN)–Australia EconomicCooperation Program Phase III (AAECP-III). TheASEAN countries cooperating with Australia in theproject were Brunei Darussalam, Indonesia, Malaysia,Philippines, Singapore, Thailand and Vietnam.Vietnam joined the project six months after theproject’s commencement following Vietnambecoming a member of ASEAN.
The overall goal of the Quality Assurance Systemsfor ASEAN Fruits (QASAF) project was:
“to develop postharvest handling, minimal processing and food safety systems and implement quality assurance (QA) systems
which will expand marketing opportunities for selected tropical fruits and provide improved returns to fruit producers, marketing agents and processors.”
The project was developed in order to build on theachievements of previous horticultural projects underAAECP in which the capacity of the ASEANcountries was strengthened in the postharvest handlingof fruits. The aim of the project was to weld theseimproved technologies into commercially viable QAsystems for the handling and marketing of selectedtropical fruits. With increasing interest in minimalprocessing of fruits and vegetables worldwide, theASEAN countries were anxious to include minimalprocessing into the project. This involved the devel-opment of new technologies for minimal processing ofthe fruits selected by the countries for their programs.Minimal processing of fruits had been practised in
* Palamere Pty Ltd, GPO Box 870, Brisbane, Queensland 4001, Australia.
Quality assurance in agricultural produce,edited by G.I. Johnson, Le Van To, Nguyen Duy Duc and M.C. Webb.
ACIAR Proceedings 100(printed version published in 2000)
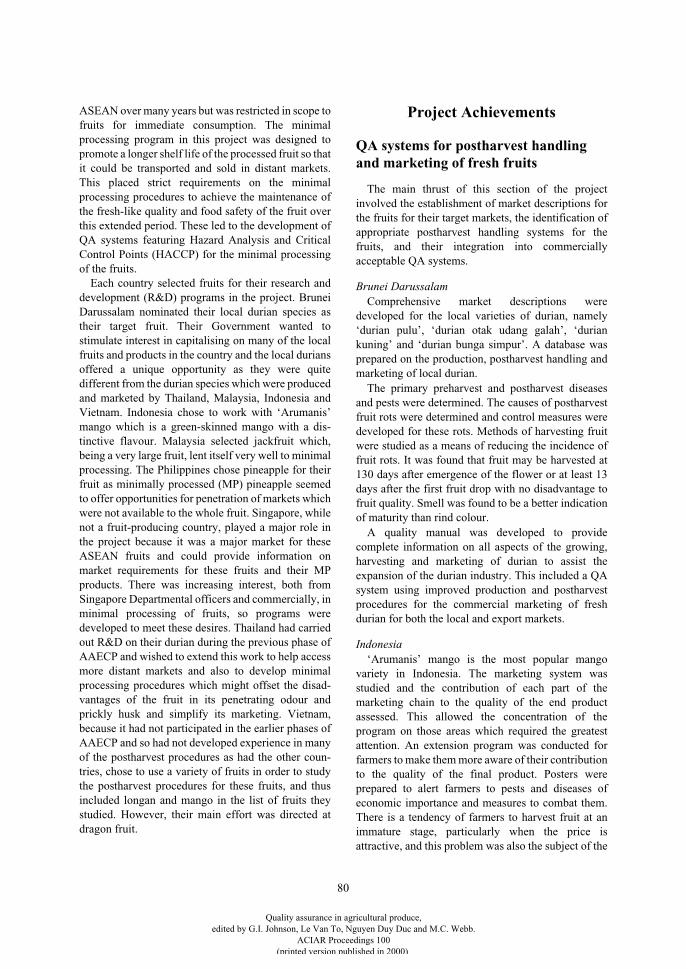
80
ASEAN over many years but was restricted in scope tofruits for immediate consumption. The minimalprocessing program in this project was designed topromote a longer shelf life of the processed fruit so thatit could be transported and sold in distant markets.This placed strict requirements on the minimalprocessing procedures to achieve the maintenance ofthe fresh-like quality and food safety of the fruit overthis extended period. These led to the development ofQA systems featuring Hazard Analysis and CriticalControl Points (HACCP) for the minimal processingof the fruits.
Each country selected fruits for their research anddevelopment (R&D) programs in the project. BruneiDarussalam nominated their local durian species astheir target fruit. Their Government wanted tostimulate interest in capitalising on many of the localfruits and products in the country and the local duriansoffered a unique opportunity as they were quitedifferent from the durian species which were producedand marketed by Thailand, Malaysia, Indonesia andVietnam. Indonesia chose to work with ‘Arumanis’mango which is a green-skinned mango with a dis-tinctive flavour. Malaysia selected jackfruit which,being a very large fruit, lent itself very well to minimalprocessing. The Philippines chose pineapple for theirfruit as minimally processed (MP) pineapple seemedto offer opportunities for penetration of markets whichwere not available to the whole fruit. Singapore, whilenot a fruit-producing country, played a major role inthe project because it was a major market for theseASEAN fruits and could provide information onmarket requirements for these fruits and their MPproducts. There was increasing interest, both fromSingapore Departmental officers and commercially, inminimal processing of fruits, so programs weredeveloped to meet these desires. Thailand had carriedout R&D on their durian during the previous phase ofAAECP and wished to extend this work to help accessmore distant markets and also to develop minimalprocessing procedures which might offset the disad-vantages of the fruit in its penetrating odour andprickly husk and simplify its marketing. Vietnam,because it had not participated in the earlier phases ofAAECP and so had not developed experience in manyof the postharvest procedures as had the other coun-tries, chose to use a variety of fruits in order to studythe postharvest procedures for these fruits, and thusincluded longan and mango in the list of fruits theystudied. However, their main effort was directed atdragon fruit.
Project Achievements
QA systems for postharvest handling and marketing of fresh fruits
The main thrust of this section of the projectinvolved the establishment of market descriptions forthe fruits for their target markets, the identification ofappropriate postharvest handling systems for thefruits, and their integration into commerciallyacceptable QA systems.
Brunei Darussalam
Comprehensive market descriptions weredeveloped for the local varieties of durian, namely‘durian pulu’, ‘durian otak udang galah’, ‘duriankuning’ and ‘durian bunga simpur’. A database wasprepared on the production, postharvest handling andmarketing of local durian.
The primary preharvest and postharvest diseasesand pests were determined. The causes of postharvestfruit rots were determined and control measures weredeveloped for these rots. Methods of harvesting fruitwere studied as a means of reducing the incidence offruit rots. It was found that fruit may be harvested at130 days after emergence of the flower or at least 13days after the first fruit drop with no disadvantage tofruit quality. Smell was found to be a better indicationof maturity than rind colour.
A quality manual was developed to providecomplete information on all aspects of the growing,harvesting and marketing of durian to assist theexpansion of the durian industry. This included a QAsystem using improved production and postharvestprocedures for the commercial marketing of freshdurian for both the local and export markets.
Indonesia
‘Arumanis’ mango is the most popular mangovariety in Indonesia. The marketing system wasstudied and the contribution of each part of themarketing chain to the quality of the end productassessed. This allowed the concentration of theprogram on those areas which required the greatestattention. An extension program was conducted forfarmers to make them more aware of their contributionto the quality of the final product. Posters wereprepared to alert farmers to pests and diseases ofeconomic importance and measures to combat them.There is a tendency of farmers to harvest fruit at animmature stage, particularly when the price isattractive, and this problem was also the subject of the
Quality assurance in agricultural produce,edited by G.I. Johnson, Le Van To, Nguyen Duy Duc and M.C. Webb.
ACIAR Proceedings 100(printed version published in 2000)
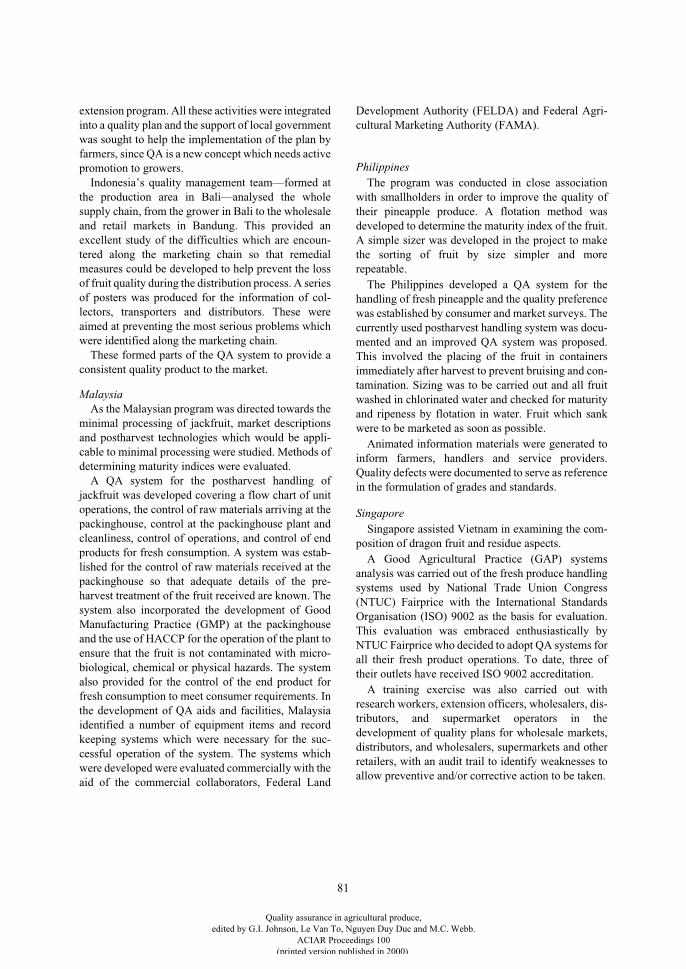
81
extension program. All these activities were integratedinto a quality plan and the support of local governmentwas sought to help the implementation of the plan byfarmers, since QA is a new concept which needs activepromotion to growers.
Indonesia’s quality management team—formed atthe production area in Bali—analysed the wholesupply chain, from the grower in Bali to the wholesaleand retail markets in Bandung. This provided anexcellent study of the difficulties which are encoun-tered along the marketing chain so that remedialmeasures could be developed to help prevent the lossof fruit quality during the distribution process. A seriesof posters was produced for the information of col-lectors, transporters and distributors. These wereaimed at preventing the most serious problems whichwere identified along the marketing chain.
These formed parts of the QA system to provide aconsistent quality product to the market.
Malaysia
As the Malaysian program was directed towards theminimal processing of jackfruit, market descriptionsand postharvest technologies which would be appli-cable to minimal processing were studied. Methods ofdetermining maturity indices were evaluated.
A QA system for the postharvest handling ofjackfruit was developed covering a flow chart of unitoperations, the control of raw materials arriving at thepackinghouse, control at the packinghouse plant andcleanliness, control of operations, and control of endproducts for fresh consumption. A system was estab-lished for the control of raw materials received at thepackinghouse so that adequate details of the pre-harvest treatment of the fruit received are known. Thesystem also incorporated the development of GoodManufacturing Practice (GMP) at the packinghouseand the use of HACCP for the operation of the plant toensure that the fruit is not contaminated with micro-biological, chemical or physical hazards. The systemalso provided for the control of the end product forfresh consumption to meet consumer requirements. Inthe development of QA aids and facilities, Malaysiaidentified a number of equipment items and recordkeeping systems which were necessary for the suc-cessful operation of the system. The systems whichwere developed were evaluated commercially with theaid of the commercial collaborators, Federal Land
Development Authority (FELDA) and Federal Agri-cultural Marketing Authority (FAMA).
Philippines
The program was conducted in close associationwith smallholders in order to improve the quality oftheir pineapple produce. A flotation method wasdeveloped to determine the maturity index of the fruit.A simple sizer was developed in the project to makethe sorting of fruit by size simpler and morerepeatable.
The Philippines developed a QA system for thehandling of fresh pineapple and the quality preferencewas established by consumer and market surveys. Thecurrently used postharvest handling system was docu-mented and an improved QA system was proposed.This involved the placing of the fruit in containersimmediately after harvest to prevent bruising and con-tamination. Sizing was to be carried out and all fruitwashed in chlorinated water and checked for maturityand ripeness by flotation in water. Fruit which sankwere to be marketed as soon as possible.
Animated information materials were generated toinform farmers, handlers and service providers.Quality defects were documented to serve as referencein the formulation of grades and standards.
Singapore
Singapore assisted Vietnam in examining the com-position of dragon fruit and residue aspects.
A Good Agricultural Practice (GAP) systemsanalysis was carried out of the fresh produce handlingsystems used by National Trade Union Congress(NTUC) Fairprice with the International StandardsOrganisation (ISO) 9002 as the basis for evaluation.This evaluation was embraced enthusiastically byNTUC Fairprice who decided to adopt QA systems forall their fresh product operations. To date, three oftheir outlets have received ISO 9002 accreditation.
A training exercise was also carried out withresearch workers, extension officers, wholesalers, dis-tributors, and supermarket operators in thedevelopment of quality plans for wholesale markets,distributors, and wholesalers, supermarkets and otherretailers, with an audit trail to identify weaknesses toallow preventive and/or corrective action to be taken.
Quality assurance in agricultural produce,edited by G.I. Johnson, Le Van To, Nguyen Duy Duc and M.C. Webb.
ACIAR Proceedings 100(printed version published in 2000)
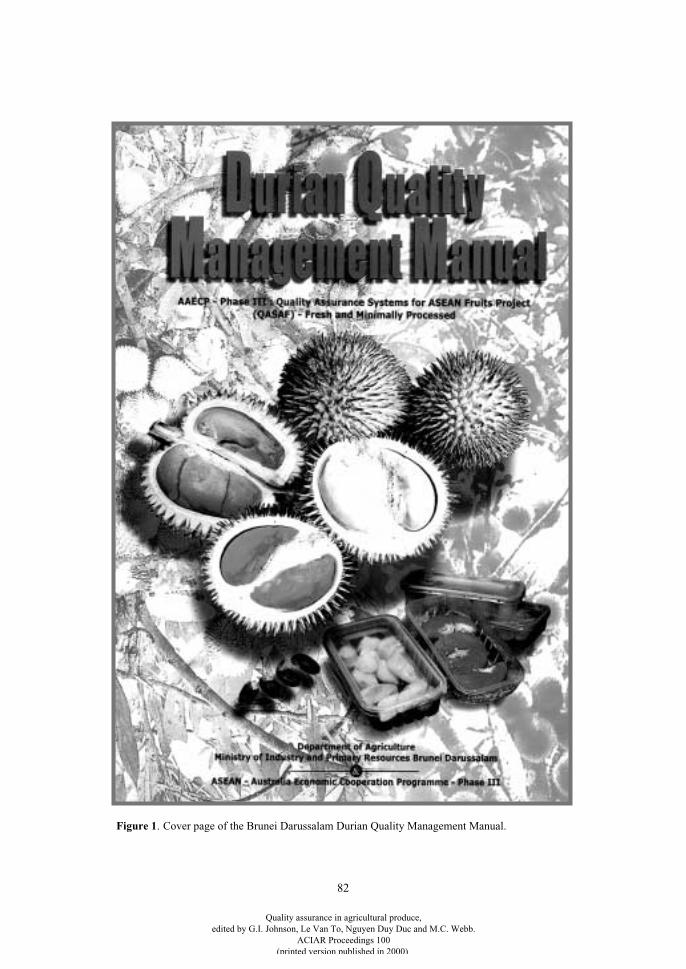
82
Figure 1
. Cover page of the Brunei Darussalam Durian Quality Management Manual.
Quality assurance in agricultural produce,edited by G.I. Johnson, Le Van To, Nguyen Duy Duc and M.C. Webb.
ACIAR Proceedings 100(printed version published in 2000)
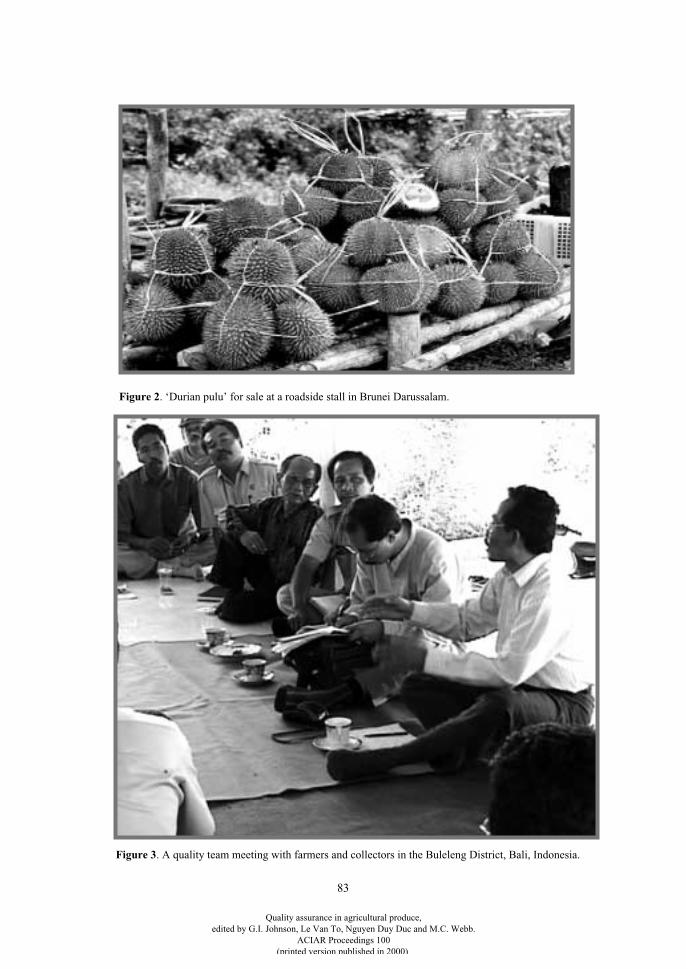
83
Figure 2
. ‘Durian pulu’ for sale at a roadside stall in Brunei Darussalam.
Figure 3
. A quality team meeting with farmers and collectors in the Buleleng District, Bali, Indonesia.
Quality assurance in agricultural produce,edited by G.I. Johnson, Le Van To, Nguyen Duy Duc and M.C. Webb.
ACIAR Proceedings 100(printed version published in 2000)
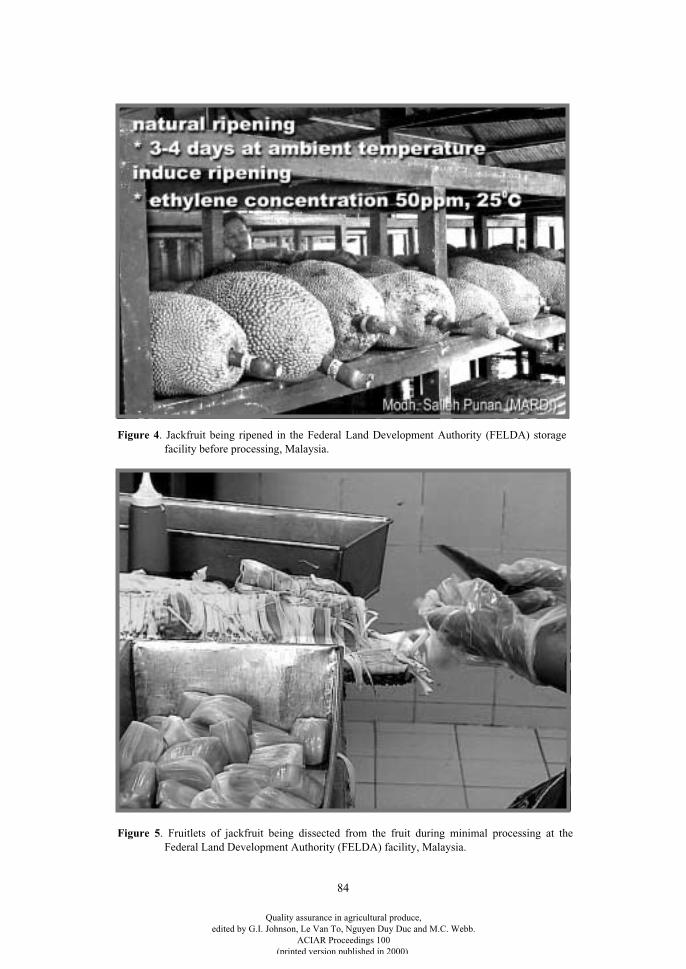
84
Figure 4
. Jackfruit being ripened in the Federal Land Development Authority (FELDA) storagefacility before processing, Malaysia.
Figure 5
. Fruitlets of jackfruit being dissected from the fruit during minimal processing at theFederal Land Development Authority (FELDA) facility, Malaysia.
Quality assurance in agricultural produce,edited by G.I. Johnson, Le Van To, Nguyen Duy Duc and M.C. Webb.
ACIAR Proceedings 100(printed version published in 2000)
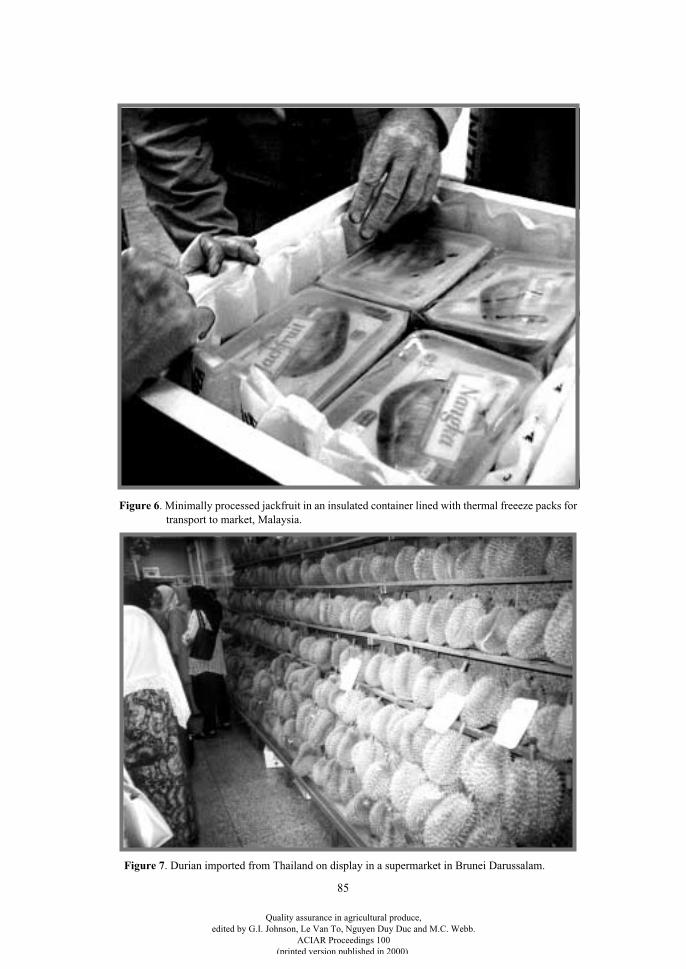
85
Figure 6
. Minimally processed jackfruit in an insulated container lined with thermal freeeze packs fortransport to market, Malaysia.
Figure 7
. Durian imported from Thailand on display in a supermarket in Brunei Darussalam.
Quality assurance in agricultural produce,edited by G.I. Johnson, Le Van To, Nguyen Duy Duc and M.C. Webb.
ACIAR Proceedings 100(printed version published in 2000)
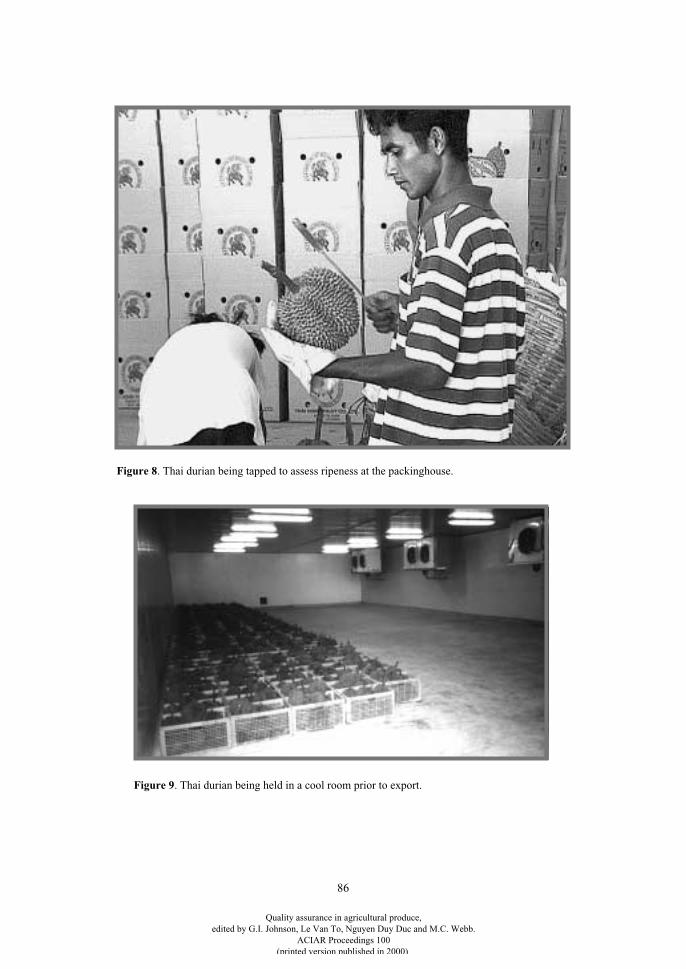
86
Figure 8
. Thai durian being tapped to assess ripeness at the packinghouse.
Figure 9
. Thai durian being held in a cool room prior to export.
Quality assurance in agricultural produce,edited by G.I. Johnson, Le Van To, Nguyen Duy Duc and M.C. Webb.
ACIAR Proceedings 100(printed version published in 2000)
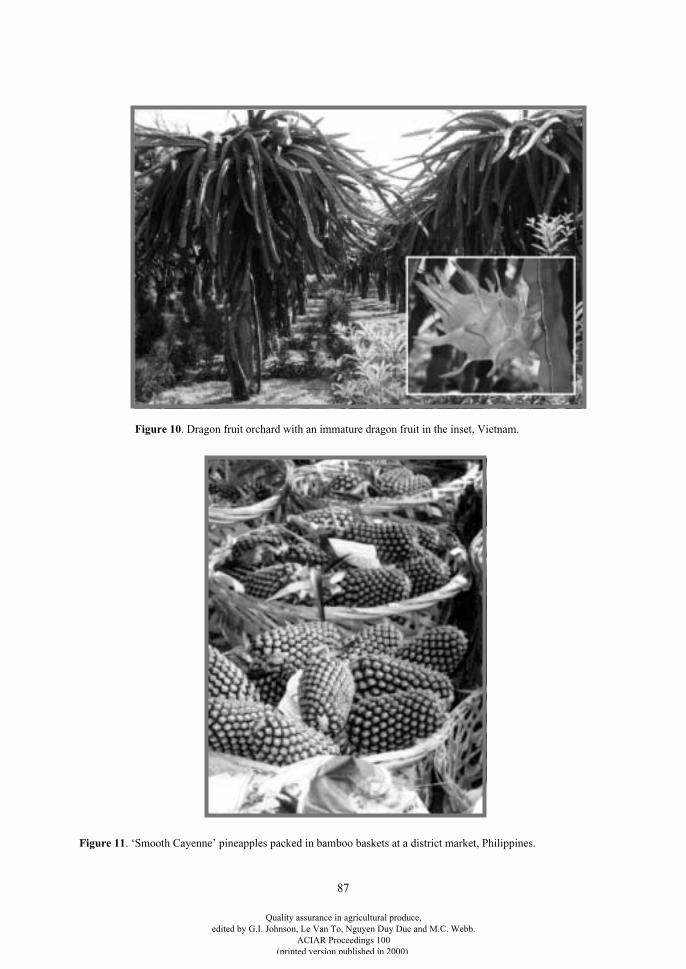
87
Figure 10
. Dragon fruit orchard with an immature dragon fruit in the inset, Vietnam.
Figure 11
. ‘Smooth Cayenne’ pineapples packed in bamboo baskets at a district market, Philippines.
Quality assurance in agricultural produce,edited by G.I. Johnson, Le Van To, Nguyen Duy Duc and M.C. Webb.
ACIAR Proceedings 100(printed version published in 2000)
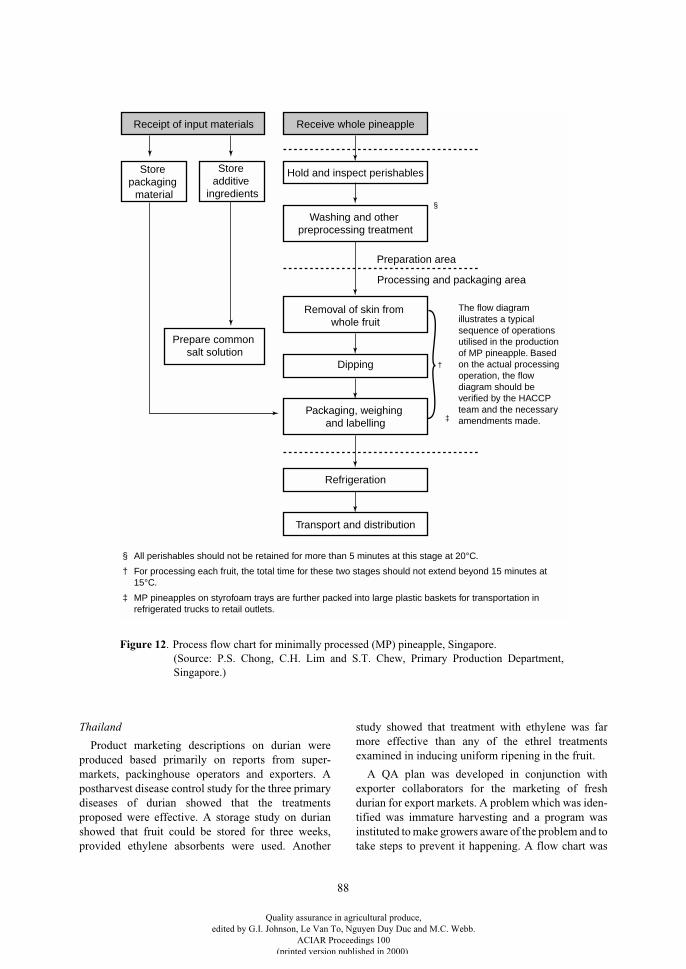
88
Thailand
Product marketing descriptions on durian wereproduced based primarily on reports from super-markets, packinghouse operators and exporters. Apostharvest disease control study for the three primarydiseases of durian showed that the treatmentsproposed were effective. A storage study on durianshowed that fruit could be stored for three weeks,provided ethylene absorbents were used. Another
study showed that treatment with ethylene was farmore effective than any of the ethrel treatmentsexamined in inducing uniform ripening in the fruit.
A QA plan was developed in conjunction withexporter collaborators for the marketing of freshdurian for export markets. A problem which was iden-tified was immature harvesting and a program wasinstituted to make growers aware of the problem and totake steps to prevent it happening. A flow chart was
Preparation area
Processing and packaging area
Dipping
Refrigeration
Transport and distribution
Receive whole pineapple
Hold and inspect perishables
Washing and other preprocessing treatment
Removal of skin from whole fruit
Receipt of input materials
Store packaging
material
Store additive
ingredients
Prepare common salt solution
Packaging, weighing and labelling
The flow diagram illustrates a typical sequence of operations utilised in the production of MP pineapple. Based on the actual processing operation, the flow diagram should be verified by the HACCP team and the necessary amendments made.
§ All perishables should not be retained for more than 5 minutes at this stage at 20°C.
† For processing each fruit, the total time for these two stages should not extend beyond 15 minutes at 15°C.
‡ MP pineapples on styrofoam trays are further packed into large plastic baskets for transportation in refrigerated trucks to retail outlets.
†
§
‡
Figure 12
. Process flow chart for minimally processed (MP) pineapple, Singapore. (Source: P.S. Chong, C.H. Lim and S.T. Chew, Primary Production Department,Singapore.)
Quality assurance in agricultural produce,edited by G.I. Johnson, Le Van To, Nguyen Duy Duc and M.C. Webb.
ACIAR Proceedings 100(printed version published in 2000)
89
prepared of the procedures. A ‘Monthong’ durianmanual was prepared, providing details of defects,misshapen fruit, and packaging and packing methods.Several checks on fruit quality were established at thefarm, before and when harvesting, and again on receiptat the packinghouse. The exporters have now acceptedthat it is necessary to pre-cool the fruit before packinginto the container for export. This has been a majorimprovement as a result of the project as it has allowedthe transport of durian over long distances to HongKong. Recently, an export shipment of fresh durianhas been made to Japan.
An in-country QA workshop carried out atChanthaburi—involving researchers, extensionworkers, farmers, packinghouse operators andexporters—allowed the dissemination of much of theresearch information developed in the project as partof the project’s quality plan.
VietnamDragon fruit
. Product descriptions were developedbased on exporter and importer information. Post-harvest handling surveys were conducted of themarketing system in Binh Thuan Province. Singaporeassisted Vietnam in studying dragon fruit compo-sition, nutritive value, physico-chemicalcharacteristics, and certain chemical and microbio-logical contamination data.
Fruit colour changes were studied, confirminggrower reports that dragon fruit showed three distinctchanges in colour during development. Fruit devel-opment/maturation studies showed that skin colour ordays from flowering were quite appropriate indices forharvesting.
A respiration study showed that dragon fruit isapparently non-climacteric and that ethylene oracetylene treatment could not be used to initiate colourdevelopment in the fruit. In a storage study, it wasfound that dragon fruit could be stored for 40 days at5°C. In a chilling sensitivity study ranging from –2 to6°C, fruit harvested at 25 days were found to besensitive to chilling, but by the time the fruit reached30–35 days the sensitivity had reduced dramatically.
Mango
. Two surveys were conducted into pro-duction and postharvest handling practices for mangoin the Mekong Delta. Storage studies using a numberof mango varieties showed that mango could be storedfor three weeks at 12°C depending on other disease,postharvest treatment and storage factors. A matu-ration study on the ‘Cat Hoa Loc’ variety confirmedthat 13–14% total solids was an appropriate harvestingindex and that specific gravity could be used as a har-
vesting index. A sapburn study on four mangovarieties found that two of the varieties were quitesensitive to sapburn and that the other two (including‘Cat Hoa Loc’) were not so sensitive.
Longan
. A preliminary storage study was under-taken using different levels of benomyl andmetabisulphide, different storage temperatures, anddifferent types of packing treatment. A maturationstudy was also undertaken, examining fruit chemicalchanges and respiratory behaviour. Various SO
2
treatments were examined for fumigating longan andkeeping the residues at appropriate levels. Com-mercial facilities were also examined with a view tokeeping residue levels at permissible levels.
QA systems for minimally processed (MP) fruits
Brunei Darussalam
Studies were carried out on demand and qualityrequirements for specific local and potential exportmarkets. Draft market descriptions and the optimummaturity and ripeness were developed for MP durianfor the local market. The existing procedures and tech-nologies for MP durian were examined. Studies werealso conducted into surface sanitation and types ofpackaging. A flow chart of operations for MP of durianwas constructed. The effect of cool storage on storagelife of MP durian was studied. The effect of a numberof primary packaging materials on shelf life wasexamined and a suitable secondary packaging film forMP durian was selected.
A HACCP plan for MP durian production wasdeveloped and further food safety measures wereincluded in the plan. A Durian Quality ManagementManual for Brunei Darussalam for fresh and MPdurian was published. The quality managementmanual will serve as a basis for commercial appli-cation of the QA systems. Since durian production isstill in its developmental stages, it was not possible tocarry out an evaluation of a commercial system.However the QA system incorporating a HACCP planwas reviewed by the Australian consultants duringtheir visits and assessed as to its technical and com-mercial feasibility.
Indonesia
A survey was made of minimal processing contam-inants and requirements for the local market. Themarket description of fresh ‘Arumanis’ mango wasdeveloped with support of the field operators and col-lectors, and the optimum maturity and stage of
Quality assurance in agricultural produce,edited by G.I. Johnson, Le Van To, Nguyen Duy Duc and M.C. Webb.
ACIAR Proceedings 100(printed version published in 2000)
90
ripeness for MP ‘Arumanis’ mango was established.There is little or no minimal processing of ‘Arumanis’mango but a marketing strategy targeting potentialconsumers was developed. A prototype machine forpeeling and segmenting mangoes was produced. Thetechnologies needed for successful minimalprocessing of ‘Arumanis’ mango were developed andthe treatment procedures for raw materials established.In addition, potential treatments for minimalprocessing of mangoes prior to packaging were inves-tigated and identified.
A comprehensive QA system incorporatingHACCP has been developed for the minimalprocessing of ‘Arumanis’ mango. The QA system hasallowed the storage of MP ‘Arumanis’ mango at 5°Cfor at least 6–9 days. However, because of the need forrefrigeration of the product, the system can only beused by the supermarkets and mini-supermarketswhich have the capacity to store fruit at <5°C.
As aresult, the market for MP ‘Arumanis’ mango is limitedto the higher income groups in the community. Theeconomics of development of a MP ‘Arumanis’mango industry were assessed.
Malaysia
The product marketing systems developed for freshjackfruit were found to be equally applicable forminimal processing and the market description for MPjackfruit was prepared.
Existing minimal processing technologies werereviewed and a flow chart of the operation prepared.The existing system for MP jackfruit was improved inorder to meet handling and processing requirements ofdomestic and export markets. The use of high and con-sistent quality raw material was found to be veryimportant in achieving a 3-week shelf life at 2°C.Latex production was reduced by the temporarystorage of fruit under chilled conditions prior tominimal processing. Various types of primary packagewere evaluated for suitability in packaging MPjackfruit.
It was found that polystyrene and thermal freezepacking could be used as a secondary packagingsystem to extend the storage life of MP jackfruit.Suitable modified atmosphere (MA) packages forkeeping the product have been established. The use ofa water absorbent was found to be effective in mini-mising moisture condensation.
A survey of existing practices showed that there wasa need for improved sanitation during harvesting andhandling to reduce contamination. Procedures weredeveloped for the minimal processing of jackfruit
incorporating a HACCP plan and GMP, listing theoperations for a minimal processing unit.
Studies showed that thermoform was the bestpackaging for reducing microbiological deterioration,making product visible, and providing a semi-rigidpackage to prevent consumer abuse, as well as beingstackable.
Raw material specification, end-product specifi-cation and minimal processing unit operation are someof the important components in the development of theQA system. The requirements of those componentswere structured according to the R&D conductedearlier in the project.
The QA system developed was evaluated on a pilotscale. The minimal processing procedure and the QAcontrol measures undertaken in the study contributedto the preparation of high quality end products.However, serious steps should be taken by farmers toovercome the inconsistent sweetness of the fruit. Thisinvolves the improvement of cultural practices, ferti-liser type and farm management.
The Federal Land Development Authority(FELDA) has already successfully implemented theQA scheme for monitoring MP jackfruit from the farmto marketing. A workshop provided feedback whichwas adopted in the final QA manual. Economicappraisal of the production of MP jackfruit provided abasis for pricing of the product.
Philippines
Cooperative studies with farmers established theproduct marketing descriptions for pineapple for usein minimal processing. A literature search and surveywere undertaken of existing systems. These served asa basis for developing processing and packaging tech-nologies for MP pineapples. A suitable primarypackage was identified and found to be suitable formodified atmosphere packaging of mechanicallypeeled, whole MP pineapple. A modified atmospherewith 2–8% O2 was established which could extend theshelf life by reducing oxidation and retarding thegrowth of microorganisms.
A number of studies highlighted the need toestablish a minimum fruit maturity for MP pineapple.It was found that quarter-ripe criteria based onflotation methods were suitable for minimalprocessing.
A survey on the utilisation of agro-chemicals bypineapple growers and an analysis of pineapple fruitdetermined the type and level of production contami-nants and residues present in MP pineapple.
Quality assurance in agricultural produce,edited by G.I. Johnson, Le Van To, Nguyen Duy Duc and M.C. Webb.
ACIAR Proceedings 100(printed version published in 2000)
91
Suitable packaging materials were identified andused in larger scale trials in combination withchemical treatments to optimise shelf life. Preparationand washing methods were established to reduce thecount of the microorganism of concern by 5 logreduction. It was found that
Listeria monocytogenes
may survive, but not grow, in MP pineapple. Shelf lifevalues at 4–25°C were established. Information wasgathered to prepare sampling plans for microbio-logical analyses and to identify bacterial contaminantsin MP pineapples. It was found that pathogenicorganisms were absent in MP pineapple and controlmeasures were aimed at lowering the aerobic microor-ganisms, yeast and mould counts of the product. Thestudy showed that strict sanitation was important toproduce a product that is microbiologicallyacceptable.
The washing and chlorination of raw whole fruitwhich led to a 5 log cycle reduction in
L. monocy-togenes
from raw material to MP product was used asthe basis for a HACCP plan for MP pineapple. The QAquality requirements were met by determination of thedesirable fruit quality for minimal processing, thecorrect holding conditions for optimum shelf life, andmonitoring of consumer acceptance by taste panel andspoilage. The HACCP plan has been made availablefor commercial use. A training workshop has beenscheduled to demonstrate the whole process to approx-imately 25 participants.
Two runs of MP pineapple were conducted. Packsof MP pineapple cylinders were test-marketed to five-star hotels. The industry collaborator will continuewith the supply of the MP product using the HACCPsystem.
Singapore
Surveys were conducted of current practices for theminimal processing of fruits, and the contaminants(pesticide and microbiological) and quality changesdetermined. Various physical and chemical testmethods for MP fruits were compiled and validated. Arapid screening method for organophosphorous pesti-cides was developed and competency was achieved inthe use of the Vitek Immuno Diagnostic Assay System(VIDAS) detection system for selected pathogens. Themethod of isolating and analysing filth from MP fruitsamples was refined and adopted. Additional ana-lytical procedures were adopted for use in monitoringthe contaminants and quality characters of MP fruits.Two laboratory testing programs were undertaken.Surveys were carried out on jackfruit, pineapple anddragon fruit for pesticide residues.
GMP was studied at a number of MP fruit proc-essors. As a result, a GMP/HACCP guide wasdeveloped for MP fruit plants. This was followed bythe use of GMP for the set-up of a pilot MP fruitprocessing plant. A HACCP program was also used ata MP fruit processing plant.
A Good Agricultural Practice systems analysis wascarried out at the National Trade Union Congress(NTUC) Fairprice Cooperative Ltd and as a result,NTUC is adopting QA for all its fresh outlets, withthree reaching ISO 9002 to date.
Thailand
The market description for MP durian was estab-lished and the existing market chain was studied toproduce a flow chart of the marketing system. Theoptimum level of ripeness was studied in order to testmethods for evaluating this quality parameter. It wasshown that potassium iodide staining could be used asone measure to determine durian maturity. The rawmaterial characteristics for MP durian wereestablished.
An appealing primary package was designed toprevent formation of water film on the surface of theMP fruit. The package, as designed, is suitable forhighly aerobic packaging. No microbial problem wasdetected. However, this does not mean that MP durianwould have less food safety issues.
Shelf life was determined at selected chilling tem-peratures. Pre-storage and storage technologies werestudied to inhibit deterioration with respect to keyfactors. Processing procedures were developed for theremoval and handling of durian flesh. It was found thathigh velocity air could reduce the effort in dehuskingdurian and caused less damage to the pulp.
MP durian were surveyed to identify production/postharvest and processing contaminants, and foodsafety measures were developed to identify these con-taminants. Studies on MP durian indicated that durianpulp does not have any residue problems with pesti-cides of the organophosphate or carbamate groups, orwith toxic heavy metals. The project demonstrated thatthere is a need for hygiene and careful processing ofthe product to prevent microbial contamination.However, no pathogenic organisms were found in thestudies.
The shelf life of the MP product has been deter-mined for selected chilling temperatures. Durian pulppacked in the selected storage system using a tub andPVC film covered with a rigid lid was able to bestored at 2°C and 5°C for 4 weeks. The eating qualitywas acceptable and it was safe for consumption based
Quality assurance in agricultural produce,edited by G.I. Johnson, Le Van To, Nguyen Duy Duc and M.C. Webb.
ACIAR Proceedings 100(printed version published in 2000)
92
on microbial tests. It was demonstrated that contam-ination with moulds was the main factor limiting theshelf life of MP durian. The treatments evaluatedincluded SO
2
, metabisulphite, and alcohol vapour. Ofthese, alcohol vapour offered the best prospects forusage.
Physiological parameters governing these QAsystems were characterised. Research showed that,after removal, the pulp continued to ripen similarly tothat in the intact fruit. The necessary steps for com-mercial adoption of QA systems of MP fruit weredefined and developed with advice from commercialoperators. The QA system incorporating GMP and aninitial HACCP plan was evaluated by the Australianconsultants in October 1999.
Vietnam
MP dragon fruit specifications were defined for thelocal market. Suitable packaging material—packagingfilm having an oxygen transmission rate (OTR) of4,000 cc/m
2
/day (21°C)—was selected. Studies werecarried out on harvest maturity. Shelf life values at 4°Cand 8°C were established. It was demonstrated that theuse of fruit with a maturity of 28 days was essential, asthe fruit had a pH less than 3.8 which allowed satis-factory storage for 8 days at 4°C.
A draft HACCP plan was developed for theprocessing of MP dragon fruit and a layout for anminimal processing facility was prepared. A flowdiagram was developed combining the minimalprocessing and food safety procedures for the pro-duction of MP dragon fruit.
The QA system which was developed under theproject was evaluated commercially by assessingconsumer acceptance of the product marketed at thecommercial outlet operated by the Post-Harvest Tech-nology Institute (PHTI). The draft food safetyguidelines incorporating a HACCP plan wereevaluated by the food safety consultants. Based onthese evaluations of the HACCP plan and the marketacceptance of the product, it is considered that a com-mercially acceptable product using a QA systemincorporating a HACCP plan has been produced.
Conclusions
The initial projects on the development of QA systemsfor the marketing of fruit produced some quite signif-icant results. Some of these results were as the result ofthorough investigation of the total marketing systemsfrom grower to retailer and identification of the majorproblem areas. Others utilised major advances in post-harvest technology. Some of the highlights were:
• Brunei assembled all available information on thelocal durians and related topics to produce a manualfor the production and marketing of local durians.
• Indonesia produced a series of posters to illustratethe problems associated with marketing of‘Arumanis’ mango over long distances and themethods which can be used to mitigate the effects ofthese handling procedures.
• Malaysia developed a set of checks and balances foruse on farms and in packinghouses so that fruit arepresented for marketing in an acceptable condition.
• The
Philippines also produced a series of posters toillustrate the effects of handling malpractice and thecorrect methods of handling the pineapple fruit formarket.
• Singapore established quick analytical proceduresfor fruits so that results can be provided in adequatetime for decision making.
• Thailand conducted research which should allowlong-distance shipping of durian with trialshipments going to Japan.
• Vietnam carried out a broad program resulting in alonger season for dragon fruit marketing, moreconsistent quality fruit and wider marketpenetration.
In the area of minimal processing of fruit, quite sig-nificant advances were made in the processing of thefruits, particularly with peeling of the fruits while min-imising the risk of damage to the pulp and lowering thelevel of contamination to acceptable levels. Fruitquality was maintained for quite considerable periodsusing refrigeration and suitable packaging to preventdamage and provide a modified atmosphere for theproduct. GMP and HACCP programs were providedand evaluated for their effectiveness. Many of theseprograms need to be evaluated over time for theirgeneral applicability under commercial conditions butconsiderable progress was made in the project towardsthese ends. A selection of images taken during thecourse of the project are shown in Figures 1–12.
Quality assurance in agricultural produce,edited by G.I. Johnson, Le Van To, Nguyen Duy Duc and M.C. Webb.
ACIAR Proceedings 100(printed version published in 2000)
93
Case Study on Development of a Quality System to Foster the Establishment and Growth of the Durian
Industry in Brunei Darussalam
Pg Hjh Rosidah Pg Hj Metussin*, C. Bunt† and M. Piccone†
Abstract
A quality system has been developed within the durian industry in Brunei Darussalam. This system has beendesigned to both foster the development of the durian industry in Brunei Darussalam whilst also acting as amodel quality system for horticulture in the region.
The Durian Quality Plan that has been developed focuses on a total management approach — commencingwith initial site selection through to final product delivery to the customer. The development of the qualitysystem was based on the principles of planning, implementation, monitoring and review, and was a cooperativeteam effort in every aspect of program design and development.
Background
T
HE
IN
-
COUNTRY
Quality Assurance (QA) Workshopon Understanding Quality Systems held in BruneiDarussalam on 20–21 August 1997, has provided aspringboard for developing QA systems in horti-culture. The concept of quality planning for the durianindustry as a model for other horticultural industries inthe country was used as the selected case study. Withassistance from the Project Consultant for the QualityAssurance System for Association of South-EastAsian Nations (ASEAN) Fruits (QASAF) Project, theCountry Coordinator in Brunei Darussalam for theproject conducted quality planning meetings with allpersons associated with the durian fruitindustry—from production through postharvest man-agement to marketing the fruit. These quality meetingshave put into action the theoretical principles elabo-rated at the workshop.The whole quality planning process—which wasconducted in a series of quality meetings—covered theselection of locations, soils, planting and other pro-
duction criteria, progressing through the wholeprocess of postharvest handling from the farm,through the collector/trader, wholesaler and marketer,to the retailer. In Brunei Darussalam, the intent of theproject was to initiate a strong, commercial durianindustry rather than to evaluate an existing industry.
Objectives
The major objectives of the work undertaken todevelop the Durian Quality Plan were:• to develop a quality plan as the foundation for the
future development of the QA system;• to establish an appropriate action plan for future
development of the durian quality program,including appointment of a Durian Quality Team;
• to plan an industry over the next 10–20 years; and• to produce a management tool to aid commercial
investors and durian industry operators.
Formation of the Durian Quality Team
The Durian Quality Team was established to defineand prioritise activities required to improve theexisting system and carry out the activities defined inthe quality plan. Participants involved in the team
* Department of Agriculture, Ministry of Industry and Primary Resources, Bandar Seri Begawan BB3510, Brunei Darussalam.
† Piccone PHC, 201 Bruce Highway, Edmonton, Queensland 4869, Australia.
Quality assurance in agricultural produce,edited by G.I. Johnson, Le Van To, Nguyen Duy Duc and M.C. Webb.
ACIAR Proceedings 100(printed version published in 2000)
94
included experts representing production, soil science,crop protection, technical services, growers,extension, postharvest issues, marketers, food tech-nology, and project consultants.
Target Audience of the Project
The audience that the Durian Quality Team targetedwith this project included:• growers in the durian industry;• all people involved in handling, processing,
wholesaling and retailing durian fruit;• potential investors;• researchers;• administrators; and• ASEAN growers in the durian industry.
Activities Involved in the Development of the Durian Quality
Plan and Durian Quality Management Manual
In the development of the Durian Quality Plan, marketpreferences for fresh and minimally processed (MP)durian were analysed using consumer and marketresearch undertaken by the Food Technology Unit ofthe Brunei Agriculture Research Centre. These assess-ments took into account consumer purchasing patternsand other related socioeconomic factors. In turn, draftmarket descriptions for fresh and MP durian weredeveloped.
A quality plan was created in which all operationsinvolved in the production, distribution and marketingof fresh and MP durian in Brunei Darussalam wereencompassed in a flow chart. For each operation, thepotential hazards, their causes, potential or actualcontrols, and critical limits were identified. Specificresponsibilities were allocated for monitoring and/oractioning controls and corrective actions, and recordswere made. Where appropriate controls for hazardswere unknown, further actions were decided upon andthe necessary inputs determined involving whatneeded to be done and by whom, and a time frame wasdeveloped for carrying out the tasks.
Activities for fresh and MP local durian were iden-tified and prioritised by the Durian Quality Team, andtranslated into an action plan for 1998–2000.
Based on the Durian Quality Plan, a Durian QualityManagement Manual for Brunei Darussalam, for freshand MP durian, was developed and documented. Thestructure and content of the manual were developed
during several meetings and discussions involvingmembers of the Durian Quality Team and Project Con-sultants from Australia, and is an output of the DurianQuality Plan developed earlier.
The Durian Quality Plan and the Durian QualityManagement Manual have been reviewed and updatedregularly.
For the manual, each member of the Durian QualityTeam prepared the procedures and information on allthe subjects assigned to them. The first draft was thendistributed by the National Country Coordinator to allmembers of the Team and the Project Consultants forreview and comments. After the reviews and ongoingdevelopment of sections of the manual, the finaldocument was prepared.
Successes of the Project to Date
A combination of ‘unique’ factors make this project astep forward, including:
• market research was undertaken which providedinformation and guidelines for the quality planning;
• the diversity of the Durian Quality Team, wheremembers well represented a wide range ofexpertise;
• the activities were identified and prioritised usingrelevant criteria;
• an action plan with practical time frames wasestablished—this plan assists in the implementationof quality assurance systems for local durian;
• commercial sectors were involved;
• the style of manual gives practical solutions whichallow people to make wise decisions as it providesoptions, unlike many documents which onlyprovide the technology;
• management and prevention of problems wereaddressed;
• information to aid people in decision-making isavailable;
• regular review of the manual and quality plan by theteam;
• identification of information that is known and whatis not known locally or in ASEAN;
• recent research done on durian has reflected resultsof market research and the market descriptions thatare required; and
• all team members’ contributions were reviewed bythe team to ensure the information was completeand could be understood by others.
Quality assurance in agricultural produce,edited by G.I. Johnson, Le Van To, Nguyen Duy Duc and M.C. Webb.
ACIAR Proceedings 100(printed version published in 2000)

95
Future Activities—So Where To From Here?
• Implementation by extension people.• This case study is being used as a foundation for
future development of quality assurance systems forother crops.
• Continuous and regular reviews and updating of themanual.
• The project outcomes and continuing process willbe used to highlight areas where further informationand research are needed to complement existingknowledge.
After all, quality management is all about continuousimprovement; it embraces all aspects of the businessor organisation and there is no finish line.
Quality assurance in agricultural produce,edited by G.I. Johnson, Le Van To, Nguyen Duy Duc and M.C. Webb.
ACIAR Proceedings 100(printed version published in 2000)
96
Postharvest Development for Use in Quality Assurance for Durian
Sonthat Nanthachai*
Abstract
The durian (
Durio zibethinus
Murray) is one of the most famous and popular seasonal fruits in Southeast Asia,especially in Association of South-East Asian Nations (ASEAN) countries of which Thailand is the leadingproducer and exporter of this fruit. In 1998, Thailand produced more than 797,000 t of durian, but exportedonly 87,400 t of the crop, i.e. only 11% of total production. The main problem regarding the low export volumeis a lack of suitable quality assurance (QA) systems for postharvest handling and marketing of durian. Underfinancial and technical support from the Quality Assurance Systems for ASEAN Fruits Project under theASEAN–Australia Economic Cooperation Program III, essential postharvest handling technologies are beingdeveloped to solve this problem.
Postharvest Development of Whole Fruit
Quality requirements for durian fruit in export markets
M
EETINGS
and discussions were held with exportersto ascertain the requirements of ‘Monthong’ durianfruit exports to Taiwan and Hong Kong. The resultsshowed that the Taiwanese market needs a morespecific fruit size (2.5–4.0 kg) than the Hong Kongmarket which accepts a wide range of fruit size (2.0–5.0 kg). This is because the Taiwanese want 3–4 fruitin a 10–12 kg container while the Hong Kong marketaccepts 6–8 fruit in a 18–20 kg box. The two marketsare not so strict regarding branding, but specify that thefruit should have more than three well-developedlocules and green or slightly yellow skin.
Marketing description for fresh durian
The information from exporters has led to the prep-aration of draft quality standards for durian export asfollows:
Fruit must be (minimum requirements)
• intact and sound;
• clean and free from visible traces of chemicals used;• free from defects caused by insects and diseases;• free from mechanical damage; and• skin green to greenish-yellow.
Classification
• Extra —fruit contains more than four well-developed locules and has a uniform shape;
• Class I —fruit contains more than three well-developed locules; and
• Class II —fruit contains at least three well-developed locules.
Fruit in all classes should have no wet core when ripe.
Size
Durian are divided in to three size groups as follows:• 2.0–3.0 kg• 3.0–4.0 kg• 4.0–5.0 kg
Packaging
• 3–4 fruits in 10–12 kg/box to Taiwan• 6–8 fruits in 18–20 kg/box to Hong Kong• identification
–packer’s and exporter’s name and address–name of produce– origin —name of grower, district and/or country– commercial specification —class and/or size or
number of fruit–storage at 14–16°C
* Horticulture Research Institute, Department of Agriculture, Chatuchak, Bangkok 10900, Thailand.
Quality assurance in agricultural produce,edited by G.I. Johnson, Le Van To, Nguyen Duy Duc and M.C. Webb.
ACIAR Proceedings 100(printed version published in 2000)
97
Shipment:
Transport by sea: 10 t per reefer container.
Maturity
Fruit maturity is very important for durian mar-keting. Immature fruit cause a reduction in exportvolume and a drop in selling price. Several criteriasuch as peel colour, sweetness and flexibility of thefruit stalk, pulp and seed colour, percentage dry weightof fruit, days from anthesis, and especially the soundof the fruit when tapped are used for judging durianfruit maturity. These criteria, however, can not beapplied properly to the large volume of durian forexport because of their limitations with respect tospeed and accuracy. In addition, some methods aredestructive to this expensive fruit. Thus theDepartment of Agriculture, Kasetsart University andChiangmai University were given the task of devel-oping a quick and non-destructive test of fruit maturitywhich could be used at the collecting sites orpackinghouse.
Appropriate disease control
The pathogens found in durian during storage weremainly
Phomopsis
,
Laciodiplodia
and especially
Phy-tophthora
species. Two fungicides are generallyused —aliette at 1,000 ppm and thiabendazole at2,000 ppm —which can control the diseases during 10days of storage at 14°C. The potential use of both thesechemicals at higher concentrations for longer termstorage of durian needs further investigation. Ozoneapplication helps to control the mould occurrence onthe peel and stem end of durian stored at 15°C and 80%relative humidity for 3 weeks. A preliminary studyshowed that ozone in combination with fungicide dipis more effective than fungicide dip alone in con-trolling postharvest diseases on the durian fruitsurface.
Effect of temperature on storage
The minimum storage temperature for fully mature‘Monthong’ durian was previously known to be 15°C.The storage life of durian fruit at 14, 20, 25 and 30°Cwas 20, 10–15, 7 and 4–5 days, respectively. Fruitharvested at 118 days after anthesis developed chillinginjury symptoms at 13.5°C and their storage life at16.5°C was 2 weeks. Fully mature fruit (125 days afteranthesis) could be stored at 13.5°C without chilling
injury for 2 weeks. At 16.5°C, fully mature durianripened quite fast and could be stored for only 10 days.
Effects of ethylene and controlled atmosphere storage
‘Monthong’ durian stored in air together withethylene absorbent could be kept for up to 3 weeks,whereas those without absorbent could be stored foronly about 2 weeks and were of inferior quality. Undercontrolled temperatures with 5–7% oxygen, however,there was no difference between fruit stored with orwithout ethylene absorbent. However, the eatingquality of fruit kept under the controlled atmosphereconditions with 10% oxygen was not acceptable due toits off flavour.
Precooling for sea transportation
After packing in the box, the fruit were precooled at13–15°C using room cooling for 3–4 hours beforebeing loaded into a precooled reefer container andtransported by sea at 14–16°C.
Commercial application of QA systems involving the improved postharvest procedure
Postharvest handling practices of durian for seaexport are shown in Figure 1.
Postharvest Development of Minimally Processed Durian
Consumer preference
The varieties of durian preferred by customers forminimal processing —as ascertained through aconsumer questiomnaire—were 67% for ‘Monthong’,32% for ‘Chanee’ and 5% for any cultivar. So the‘Monthong’ cultivar was selected for use in the qualityassurance systems test for minimally processed (MP)durian. The other advantages of this cultivar are itsmild odour and firm texture, it is not sensitive to therainy season and it has a long harvesting period.
Marketing description for MP durian
Information about supermarket requirements led tothe set up of a draft product market description for MPdurian (chilled) as follows:
Quality assurance in agricultural produce,edited by G.I. Johnson, Le Van To, Nguyen Duy Duc and M.C. Webb.
ACIAR Proceedings 100(printed version published in 2000)
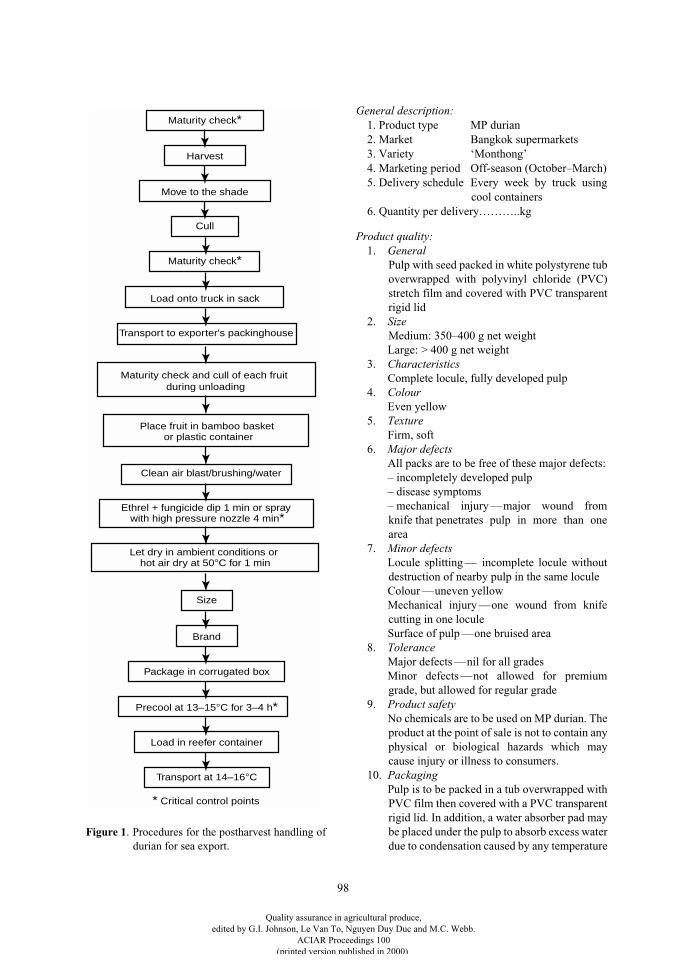
98
General description:
1. Product type MP durian2. Market Bangkok supermarkets3. Variety ‘Monthong’4. Marketing period Off-season (October–March)5. Delivery schedule Every week by truck using
cool containers6. Quantity per delivery………..kg
Product quality:
1.
General
Pulp with seed packed in white polystyrene tuboverwrapped with polyvinyl chloride (PVC)stretch film and covered with PVC transparentrigid lid
2.
Size
Medium: 350–400 g net weightLarge: > 400 g net weight
3.
Characteristics
Complete locule, fully developed pulp4.
Colour
Even yellow5.
Texture
Firm, soft6.
Major defects
All packs are to be free of these major defects: – incompletely developed pulp
– disease symptoms– mechanical injury —major wound fromknife that penetrates pulp in more than onearea
7.
Minor defects
Locule splitting — incomplete locule withoutdestruction of nearby pulp in the same loculeColour —uneven yellowMechanical injury —one wound from knifecutting in one loculeSurface of pulp —one bruised area
8.
Tolerance
Major defects —nil for all gradesMinor defects —not allowed for premiumgrade, but allowed for regular grade
9.
Product safety
No chemicals are to be used on MP durian. Theproduct at the point of sale is not to contain anyphysical or biological hazards which maycause injury or illness to consumers.
10.
Packaging
Pulp is to be packed in a tub overwrapped withPVC film then covered with a PVC transparentrigid lid. In addition, a water absorber pad maybe placed under the pulp to absorb excess waterdue to condensation caused by any temperature
Maturity check*
Harvest
Move to the shade
Cull
Maturity check*
Load onto truck in sack
Transport to exporter's packinghouse
Maturity check and cull of each fruit during unloading
Place fruit in bamboo basket or plastic container
Clean air blast/brushing/water
Ethrel + fungicide dip 1 min or spray with high pressure nozzle 4 min*
Let dry in ambient conditions or hot air dry at 50°C for 1 min
* Critical control points
Size
Brand
Package in corrugated box
Precool at 13–15°C for 3–4 h*
Load in reefer container
Transport at 14–16°C
Figure 1. Procedures for the postharvest handling ofdurian for sea export.
Quality assurance in agricultural produce,edited by G.I. Johnson, Le Van To, Nguyen Duy Duc and M.C. Webb.
ACIAR Proceedings 100(printed version published in 2000)
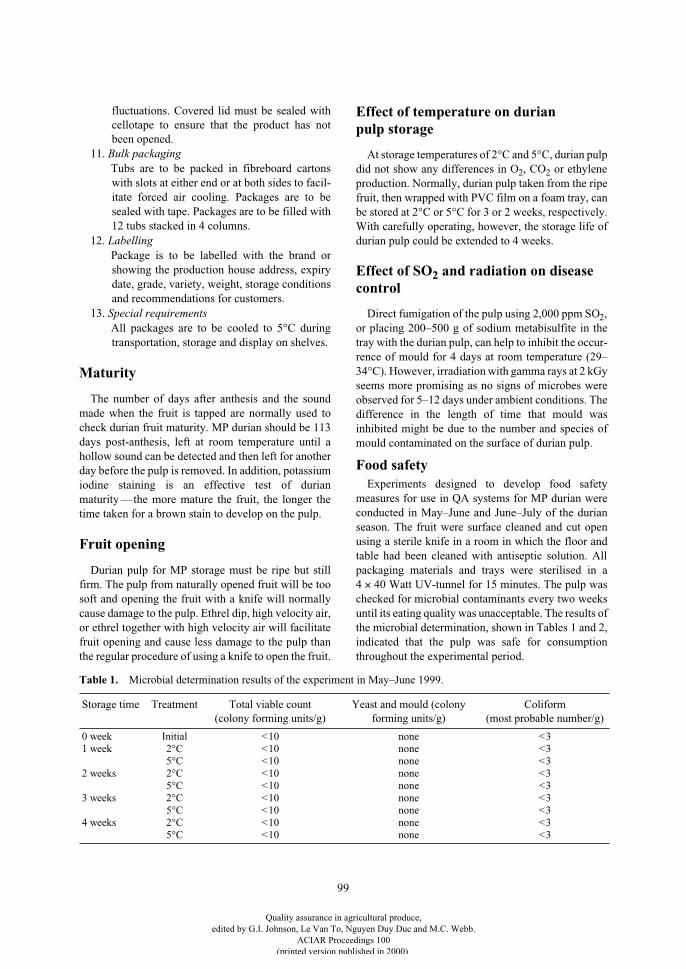
99
fluctuations. Covered lid must be sealed withcellotape to ensure that the product has notbeen opened.
11.
Bulk packaging
Tubs are to be packed in fibreboard cartonswith slots at either end or at both sides to facil-itate forced air cooling. Packages are to besealed with tape. Packages are to be filled with12 tubs stacked in 4 columns.
12.
Labelling
Package is to be labelled with the brand orshowing the production house address, expirydate, grade, variety, weight, storage conditionsand recommendations for customers.
13.
Special requirements
All packages are to be cooled to 5°C duringtransportation, storage and display on shelves.
Maturity
The number of days after anthesis and the soundmade when the fruit is tapped are normally used tocheck durian fruit maturity. MP durian should be 113days post-anthesis, left at room temperature until ahollow sound can be detected and then left for anotherday before the pulp is removed. In addition, potassiumiodine staining is an effective test of durianmaturity —the more mature the fruit, the longer thetime taken for a brown stain to develop on the pulp.
Fruit opening
Durian pulp for MP storage must be ripe but stillfirm. The pulp from naturally opened fruit will be toosoft and opening the fruit with a knife will normallycause damage to the pulp. Ethrel dip, high velocity air,or ethrel together with high velocity air will facilitatefruit opening and cause less damage to the pulp thanthe regular procedure of using a knife to open the fruit.
Effect of temperature on durian pulp storage
At storage temperatures of 2°C and 5°C, durian pulpdid not show any differences in O
2
, CO
2
or ethyleneproduction. Normally, durian pulp taken from the ripefruit, then wrapped with PVC film on a foam tray, canbe stored at 2°C or 5°C for 3 or 2 weeks, respectively.With carefully operating, however, the storage life ofdurian pulp could be extended to 4 weeks.
Effect of SO
2
and radiation on disease control
Direct fumigation of the pulp using 2,000 ppm SO
2
,or placing 200–500 g of sodium metabisulfite in thetray with the durian pulp, can help to inhibit the occur-rence of mould for 4 days at room temperature (29–34°C). However, irradiation with gamma rays at 2 kGyseems more promising as no signs of microbes wereobserved for 5–12 days under ambient conditions. Thedifference in the length of time that mould wasinhibited might be due to the number and species ofmould contaminated on the surface of durian pulp.
Food safety
Experiments designed to develop food safetymeasures for use in QA systems for MP durian wereconducted in May–June and June–July of the durianseason. The fruit were surface cleaned and cut openusing a sterile knife in a room in which the floor andtable had been cleaned with antiseptic solution.
Allpackaging materials and trays were sterilised in a4
×
40 Watt UV-tunnel for 15 minutes. The pulp waschecked for microbial contaminants every two weeksuntil its eating quality was unacceptable. The results ofthe microbial determination, shown in Tables 1 and 2,indicated that the pulp was safe for consumptionthroughout the experimental period.
Table 1.
Microbial determination results of the experiment in May–June 1999.
Storage time Treatment Total viable count(colony forming units/g)
Yeast and mould (colony forming units/g)
Coliform (most probable number/g)
0 week1 week 2 weeks
3 weeks
4 weeks
Initial2°C5°C2°C5°C2°C5°C2°C5°C
<10 <10<10<10<10<10<10<10<10
none none none none none none nonenonenone
<3<3<3<3<3<3<3<3<3
Quality assurance in agricultural produce,edited by G.I. Johnson, Le Van To, Nguyen Duy Duc and M.C. Webb.
ACIAR Proceedings 100(printed version published in 2000)
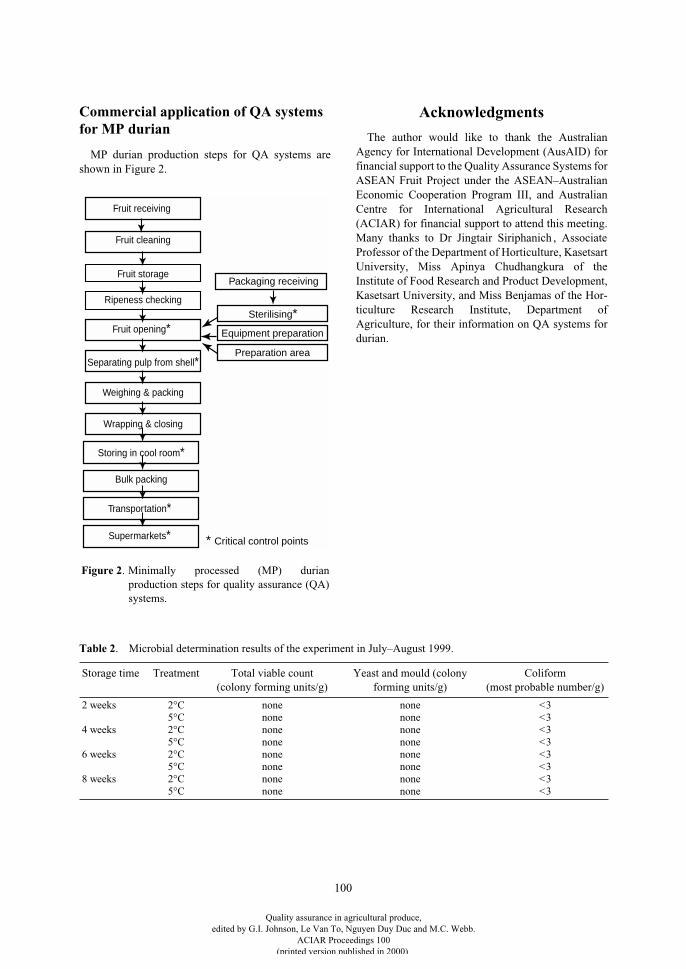
100
Commercial application of QA systems for MP durian
MP durian production steps for QA systems areshown in Figure 2.
Acknowledgments
The author would like to thank the AustralianAgency for International Development (AusAID) forfinancial support to the Quality Assurance Systems forASEAN Fruit Project under the ASEAN–AustralianEconomic Cooperation Program III, and AustralianCentre for International Agricultural Research(ACIAR) for financial support to attend this meeting.Many thanks to Dr Jingtair Siriphanich , AssociateProfessor of the Department of Horticulture, KasetsartUniversity, Miss Apinya Chudhangkura of theInstitute of Food Research and Product Development,Kasetsart University, and Miss Benjamas of the Hor-ticulture Research Institute, Department ofAgriculture, for their information on QA systems fordurian.
Fruit receiving
Fruit cleaning
Fruit storage
Ripeness checking
Fruit opening*
Separating pulp from shell*
Weighing & packing
Wrapping & closing
Storing in cool room*
Bulk packing
Transportation*
Supermarkets*
Packaging receiving
Sterilising*
Preparation area
Equipment preparation
* Critical control points
Figure 2. Minimally processed (MP) durianproduction steps for quality assurance (QA)systems.
Table 2
. Microbial determination results of the experiment in July–August 1999.
Storage time Treatment Total viable count(colony forming units/g)
Yeast and mould (colony forming units/g)
Coliform (most probable number/g)
2 weeks
4 weeks
6 weeks
8 weeks
2°C5°C2°C5°C2°C5°C2°C5°C
none none none none none none nonenone
none none none none none none nonenone
<3<3<3<3<3<3<3<3
Quality assurance in agricultural produce,edited by G.I. Johnson, Le Van To, Nguyen Duy Duc and M.C. Webb.
ACIAR Proceedings 100(printed version published in 2000)
101
Quality Assurance System for Dragon Fruit
Le V. To, Nguyen Ngu, Nguyen D. Duc, Dang T.K. Trinh, Nguyen C. Thanh, Dang V.H. Mien, Chau N. Hai and Trinh N. Long*
Abstract
Dragon plant
(Cereus undatus
(Haw.)) has been grown on a large scale since 1990 in Vietnam and is anattractive product for foreign consumers. However, the problems that affect the fruit quality have not yet beenstudied. The establishment of a quality assurance system for the dragon fruit, as part of the “Quality AssuranceSystems for ASEAN Fruits” project of the Association of South-East Asian Nations (ASEAN)–AustraliaEconomic Cooperation Program, was carried out in various farms and packing houses in Binh Thuan Provinceas well as in the laboratory of the Post-Harvest Technology Institute in Ho Chi Minh City (PHTI-HCM). Theprogram involved PHTI-HCM, the departments of Technologies, Sciences and Environment, and AgriculturalExtension of Binh Thuan Province, farmers, collectors, transporters, exporters, and importers. The qualitystandards, and methods of packing, storage, shipping, and handling, have been formulated to meet therequirements of both local and export markets.
In this study, the appropriate pre- and postharvest technologies for dragon fruit were generated anddisseminated to the end users. The optimal harvesting times vary between the 25
th
and 28
th
days after floweringfor export fruit, and the 29–30
th
days after flowering for local markets. The physico-chemical changesoccurring during the fruit maturity period, such as respiration rate, total soluble solids, total acidity, firmness,skin colour, etc., were determined and used for evaluation of shelf life. Translucent flesh, an indicator of fruitchilling injury, was also determined. The chilling sensitivity of fruit depends on the harvesting time. They weremore sensitive 25 days after flowering as compared to the rest of the experimental period. Dragon fruit shouldbe stored at 5°C and 90% relative humidity to prolong its postharvest life. Application of potassiumpermanganate solution (0.2%) can extend the storage life to 40 days. During the postharvest period, commonfungal pathogens such as
Fusarium lateritium, Aspergillus niger
and
A. flavus
were found and a fungicidemixture (benomyl and copper oxide chloride) was applied to control them.
T
HE
DRAGON
plant
(Cereus undatus
(Haw.)) comesfrom South America. Its fruit has been popular inVietnam for a long time. In 1990, the Government ofVietnam supported the industry through extensionprograms that resulted in the export of between about3,000 to 7,000 t per year between 1992 and 1997. Themain importing countries for dragon fruit are China,Hong Kong, Singapore, and Taiwan. Because of itstaste, attractive colour, and high nutritive values, thelocal and overseas markets for the fruit are growing.However, fruit quality is a problem that needs to beimproved in order to meet market requirements.
The growing of the dragon plant is very attractive tofarmers because they can get more income from
dragon fruit than from crops such as rice, maize, andbeans grown in the same area. Therefore, the gov-ernment is strongly supporting the expansion of thedragon fruit production. The current research, devel-opment, and extension programs on postharvesttechnology focus on: the determination of the best har-vesting time; prevention and control of insects such asants, an unknown pest species of lepidopteran, andfruit fly; the use of plant growth regulators; andmethods of handling and storage of the fruits. Thework is supported by the Australian Agency for Inter-national Development (AusAID) through its project“Quality Assurance Systems for ASEAN Fruits”. Theresults of the project’s dragon fruit activities arereported here.
* Post-Harvest Technology Institute, 45 Dinh Tien Hoang Street, District 1, Ho Chi Minh City, Vietnam.
Quality assurance in agricultural produce,edited by G.I. Johnson, Le Van To, Nguyen Duy Duc and M.C. Webb.
ACIAR Proceedings 100(printed version published in 2000)
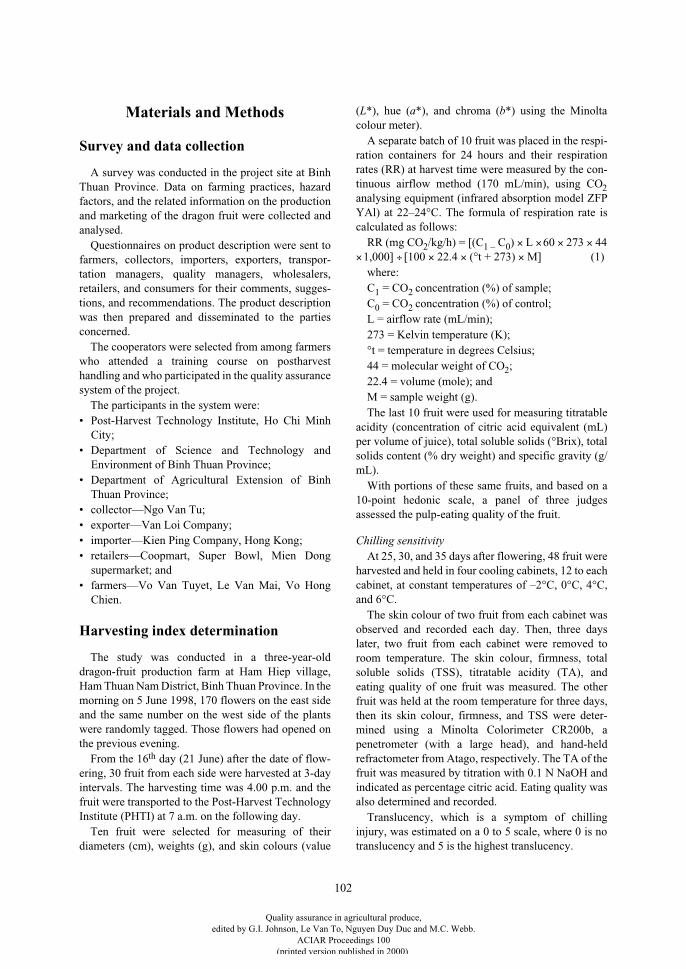
102
Materials and Methods
Survey and data collection
A survey was conducted in the project site at BinhThuan Province. Data on farming practices, hazardfactors, and the related information on the productionand marketing of the dragon fruit were collected andanalysed.
Questionnaires on product description were sent tofarmers, collectors, importers, exporters, transpor-tation managers, quality managers, wholesalers,retailers, and consumers for their comments, sugges-tions, and recommendations. The product descriptionwas then prepared and disseminated to the partiesconcerned.
The cooperators were selected from among farmerswho attended a training course on postharvesthandling and who participated in the quality assurancesystem of the project.
The participants in the system were:• Post-Harvest Technology Institute, Ho Chi Minh
City;• Department of Science and Technology and
Environment of Binh Thuan Province;• Department of Agricultural Extension of Binh
Thuan Province;• collector—Ngo Van Tu;• exporter—Van Loi Company;• importer—Kien Ping Company, Hong Kong;• retailers—Coopmart, Super Bowl, Mien Dong
supermarket; and• farmers—Vo Van Tuyet, Le Van Mai, Vo Hong
Chien.
Harvesting index determination
The study was conducted in a three-year-olddragon-fruit production farm at Ham Hiep village,Ham Thuan Nam District, Binh Thuan Province. In themorning on 5 June 1998, 170 flowers on the east sideand the same number on the west side of the plantswere randomly tagged. Those flowers had opened onthe previous evening.
From the 16
th
day (21 June) after the date of flow-ering, 30 fruit from each side were harvested at 3-dayintervals. The harvesting time was 4.00 p.m. and thefruit were transported to the Post-Harvest TechnologyInstitute (PHTI) at 7 a.m. on the following day.
Ten fruit were selected for measuring of theirdiameters (cm), weights (g), and skin colours (value
(
L
*), hue (
a
*), and chroma (
b
*) using the Minoltacolour meter).
A separate batch of 10 fruit was placed in the respi-ration containers for 24 hours and their respirationrates (RR) at harvest time were measured by the con-tinuous airflow method (170 mL/min), using CO
2
analysing equipment (infrared absorption model ZFPYAl) at 22–24°C. The formula of respiration rate iscalculated as follows:
RR (mg CO
2
/kg/h) = [(C
1 –
C
0
)
×
L
×
60
×
273
×
44
×
1,000]
÷
[100
×
22.4
×
(°t + 273)
×
M] (1)where:C
1
= CO
2
concentration (%)
of sample;C
0
= CO
2
concentration (%)
of control;L = airflow rate (mL/min);273 = Kelvin temperature (K);°t = temperature in degrees Celsius;44 = molecular weight of CO
2
;22.4 = volume (mole); andM = sample weight (g).The last 10 fruit were used for measuring titratable
acidity (concentration of citric acid equivalent (mL)per volume of juice), total soluble solids (°Brix), totalsolids content (% dry weight) and specific gravity (g/mL).
With portions of these same fruits, and based on a10-point hedonic scale, a panel of three judgesassessed the pulp-eating quality of the fruit.
Chilling sensitivity
At 25,
30, and 35 days after flowering, 48 fruit wereharvested and held in four cooling cabinets, 12 to eachcabinet, at constant temperatures of –2°C, 0°C, 4°C,and 6°C.
The skin colour of two fruit from each cabinet wasobserved and recorded each day. Then, three dayslater, two fruit from each cabinet were removed toroom temperature. The skin colour, firmness, totalsoluble solids (TSS), titratable acidity (TA), andeating quality of one fruit was measured. The otherfruit was held at the room temperature for three days,then its skin colour, firmness, and TSS were deter-mined using a Minolta Colorimeter CR200b, apenetrometer (with a large head), and hand-heldrefractometer from Atago, respectively. The TA of thefruit was measured by titration with 0.1 N NaOH andindicated as percentage citric acid. Eating quality wasalso determined and recorded.
Translucency, which is a symptom of chillinginjury, was estimated on a 0 to 5
scale,
where 0 is notranslucency and 5
is the highest translucency.
Quality assurance in agricultural produce,edited by G.I. Johnson, Le Van To, Nguyen Duy Duc and M.C. Webb.
ACIAR Proceedings 100(printed version published in 2000)
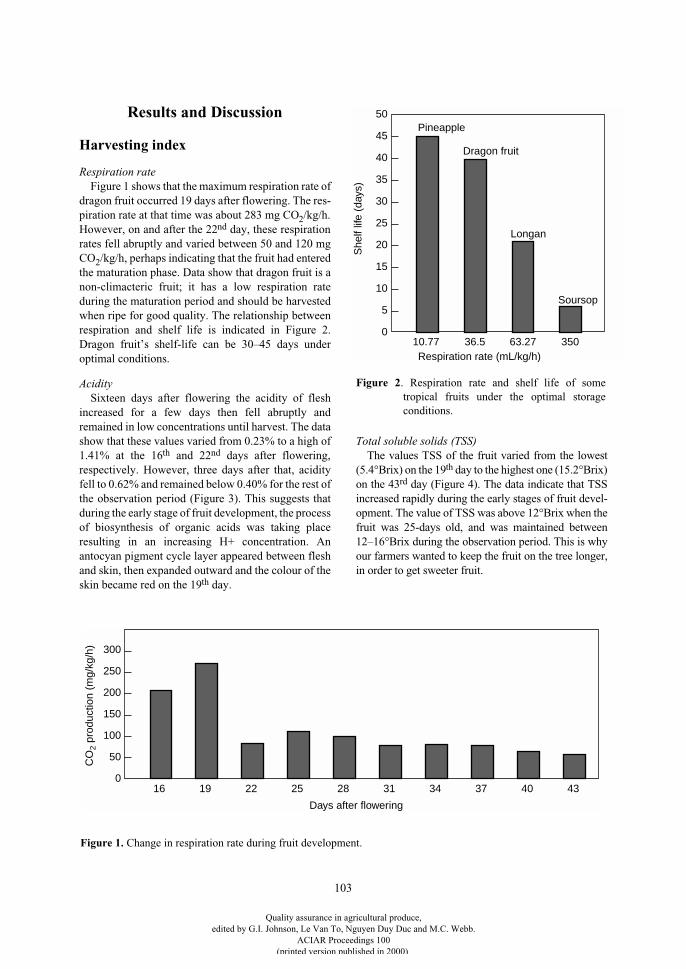
103
Results and Discussion
Harvesting index
Respiration rate
Figure 1 shows that the maximum respiration rate ofdragon fruit occurred 19 days after flowering. The res-piration rate at that time was about 283 mg CO
2
/kg/h.However, on and after the 22
nd
day, these respirationrates fell abruptly and varied between 50 and 120 mgCO
2
/kg/h, perhaps indicating that the fruit had enteredthe maturation phase. Data show that dragon fruit is anon-climacteric fruit; it has a low respiration rateduring the maturation period and should be harvestedwhen ripe for good quality. The relationship betweenrespiration and shelf life is indicated in Figure 2.Dragon fruit’s shelf-life can be 30–45 days underoptimal conditions.
Acidity
Sixteen days after flowering the acidity of fleshincreased for a few days then fell abruptly andremained in low concentrations until harvest. The datashow that these values varied from 0.23% to a high of1.41% at the 16
th
and 22
nd
days after flowering,respectively. However, three days after that, acidityfell to 0.62% and remained below 0.40% for the rest ofthe observation period (Figure 3). This suggests thatduring the early stage of fruit development, the processof biosynthesis of organic acids was taking placeresulting in an increasing H+ concentration. Anantocyan pigment cycle layer appeared between fleshand skin, then expanded outward and the colour of theskin became red on the 19
th
day.
Total soluble solids (TSS)
The values TSS of the fruit varied from the lowest(5.4°Brix) on the 19
th
day to the highest one (15.2°Brix)on the 43
rd
day (Figure 4). The data indicate that TSSincreased rapidly during the early stages of fruit devel-opment. The value of TSS was above 12°Brix when thefruit was 25-days old, and was maintained between12–16°Brix during the observation period. This is whyour farmers wanted to keep the fruit on the tree longer,in order to get sweeter fruit.
0
300
200
100
150
250
50
Days after flowering
C
O2
prod
uctio
n (m
g/kg
/h)
16 19 22 25 28 31 34 37 40 43
Figure 1. Change in respiration rate during fruit development.
0
30
20
10
15
25
5
Respiration rate (mL/kg/h)S
helf
life
(day
s)
10.77 36.5 63.27 350
35
40
45
50Pineapple
Dragon fruit
Longan
Soursop
Figure 2
. Respiration rate and shelf life of sometropical fruits under the optimal storageconditions.
Quality assurance in agricultural produce,edited by G.I. Johnson, Le Van To, Nguyen Duy Duc and M.C. Webb.
ACIAR Proceedings 100(printed version published in 2000)
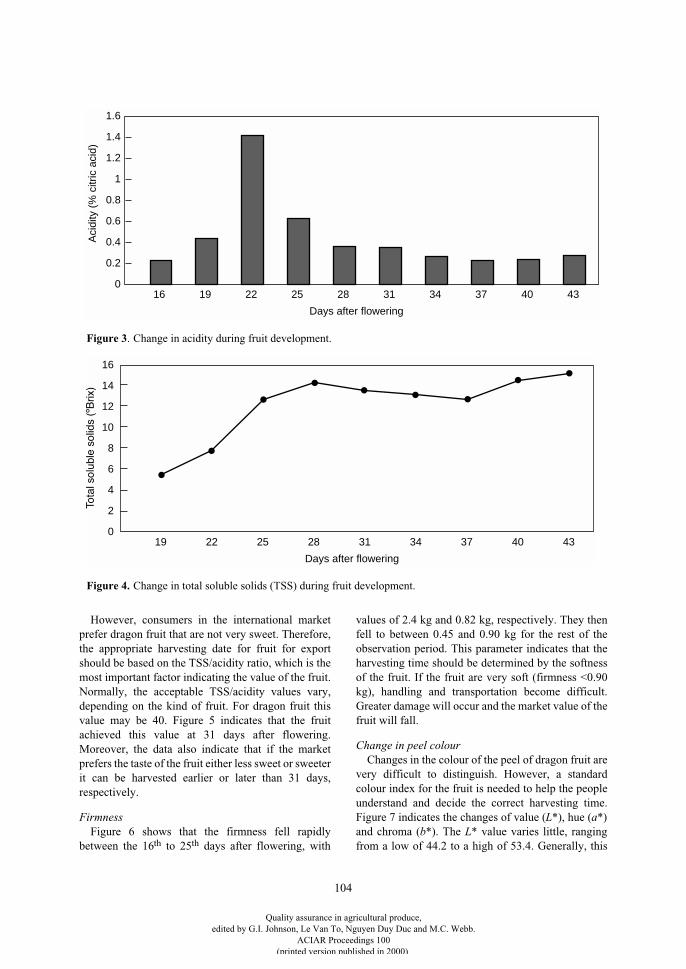
104
However, consumers in the international marketprefer dragon fruit that are not very sweet. Therefore,the appropriate harvesting date for fruit for exportshould be based on the TSS/acidity ratio, which is themost important factor indicating the value of the fruit.Normally, the acceptable TSS/acidity values vary,depending on the kind of fruit. For dragon fruit thisvalue may be 40. Figure 5 indicates that the fruitachieved this value at 31 days after flowering.Moreover, the data also indicate that if the marketprefers the taste of the fruit either less sweet or sweeterit can be harvested earlier or later than 31 days,respectively.
Firmness
Figure 6 shows that the firmness fell rapidlybetween the 16
th
to 25
th
days after flowering, with
values of 2.4 kg and 0.82 kg, respectively. They thenfell to between 0.45 and 0.90 kg for the rest of theobservation period. This parameter indicates that theharvesting time should be determined by the softnessof the fruit. If the fruit are very soft (firmness <0.90kg), handling and transportation become difficult.Greater damage will occur and the market value of thefruit will fall.
Change in peel colour
Changes in the colour of the peel of dragon fruit arevery difficult to distinguish. However, a standardcolour index for the fruit is needed to help the peopleunderstand and decide the correct harvesting time.Figure 7 indicates the changes of value (
L
*), hue (
a
*)and chroma (
b
*). The
L
* value varies little, rangingfrom a low of 44.2 to a high of 53.4. Generally, this
0
1.2
0.8
0.4
0.6
1
0.2
Days after flowering
Aci
dity
(%
citr
ic a
cid)
16 19 22 25 28 31 34 37 40 43
1.4
1.6
0
12
8
4
6
10
2
Days after flowering
19 22 25 28 31 34 37 40 43
14
16
Figure 3. Change in acidity during fruit development.
Figure 4. Change in total soluble solids (TSS) during fruit development.
Quality assurance in agricultural produce,edited by G.I. Johnson, Le Van To, Nguyen Duy Duc and M.C. Webb.
ACIAR Proceedings 100(printed version published in 2000)
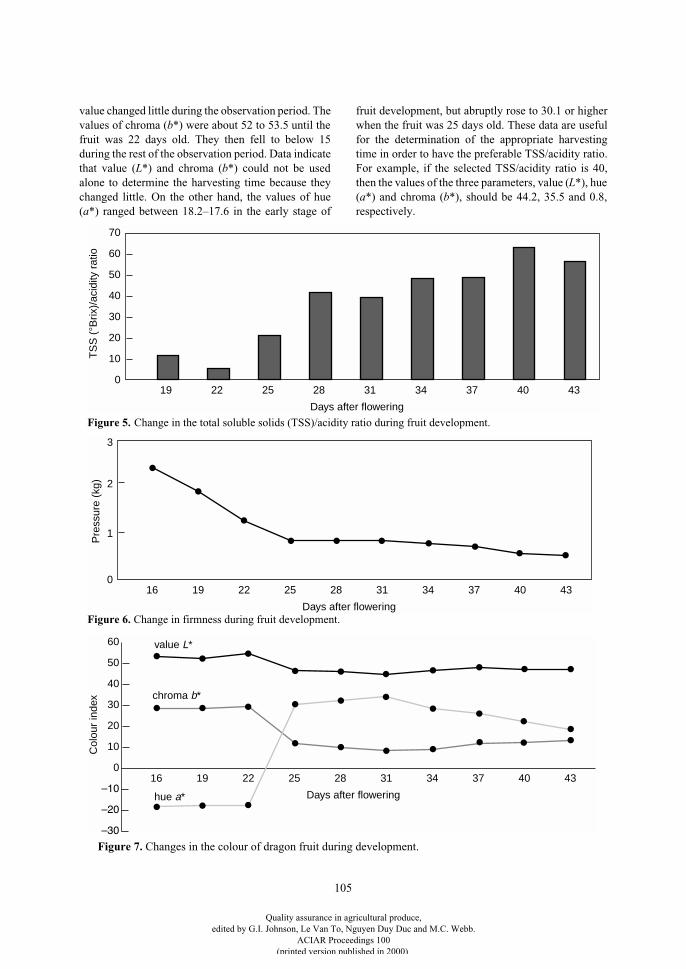
105
value changed little during the observation period. Thevalues of chroma (
b
*) were about 52 to 53.5
until thefruit was 22 days old. They then fell to below 15during the rest of the observation period. Data indicatethat value (
L
*) and chroma (
b
*) could not be usedalone to determine the harvesting time because theychanged little. On the other hand, the values of hue(
a
*) ranged between 18.2–17.6 in the early stage of
fruit development, but abruptly rose to 30.1 or higherwhen the fruit was 25 days old. These data are usefulfor the determination of the appropriate harvestingtime in order to have the preferable TSS/acidity ratio.For example, if the selected TSS/acidity ratio is 40,then the values of the three parameters, value (
L
*), hue(
a
*) and chroma (
b
*), should be 44.2, 35.5
and 0.8,respectively.
0
60
40
20
30
50
10
Days after flowering
TS
S (
°Brix
)/ac
idity
rat
io
19 22 25 28 31 34 37 40 43
70
0
3
2
1
Days after flowering
Pre
ssur
e (k
g)
16 19 22 25 28 31 34 37 40 43
0
60
40
20
30
50
10
Days after flowering
Col
our
inde
x
16 19 22 25 28 31 34 37 40 43
value L*
hue a*
chroma b*
Figure 5. Change in the total soluble solids (TSS)/acidity ratio during fruit development.
Figure 6. Change in firmness during fruit development.
Figure 7. Changes in the colour of dragon fruit during development.
Quality assurance in agricultural produce,edited by G.I. Johnson, Le Van To, Nguyen Duy Duc and M.C. Webb.
ACIAR Proceedings 100(printed version published in 2000)
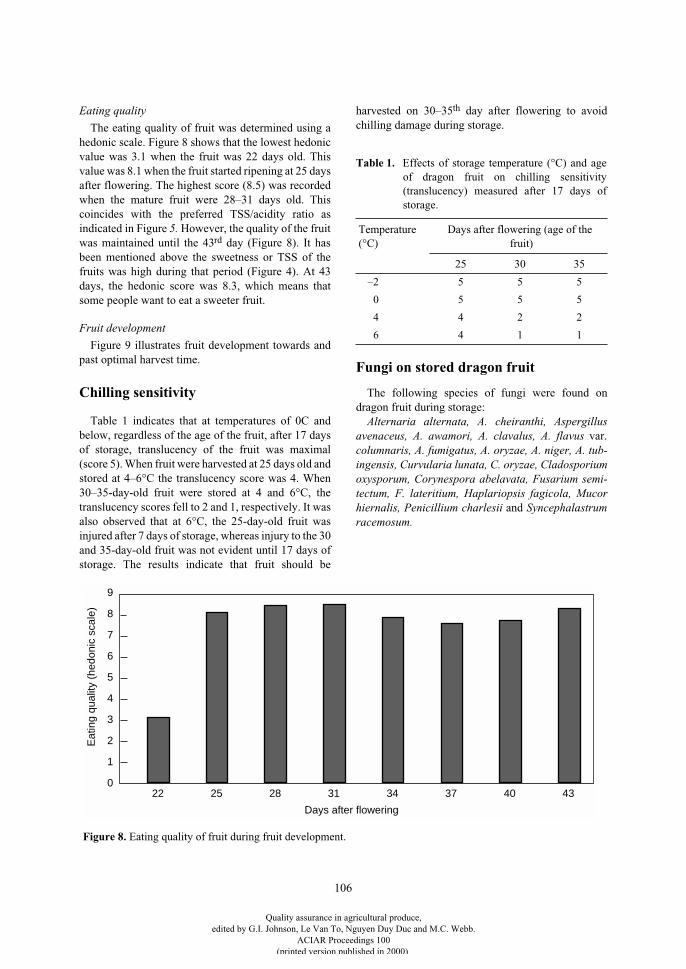
106
Eating quality
The eating quality of fruit was determined using ahedonic scale. Figure 8 shows that the lowest hedonicvalue was 3.1 when the fruit was 22 days old. Thisvalue was 8.1 when the fruit started ripening at 25 daysafter flowering. The highest score (8.5) was recordedwhen the mature fruit were 28–31 days old. Thiscoincides with the preferred TSS/acidity ratio asindicated in Figure
5.
However, the quality of the fruitwas maintained until the 43
rd
day (Figure 8). It hasbeen mentioned above the sweetness or TSS of thefruits was high during that period (Figure 4). At 43days, the hedonic score was 8.3, which means thatsome people want to eat a sweeter fruit.
Fruit development
Figure 9 illustrates fruit development towards andpast optimal harvest time.
Chilling sensitivity
Table 1 indicates that at temperatures of 0C andbelow, regardless of the age of the fruit, after 17 daysof storage, translucency of the fruit was maximal(score 5). When fruit were harvested at 25 days old andstored at 4–6°C the translucency score was 4. When30–35-day-old fruit were stored at 4 and 6°C, thetranslucency scores fell to 2 and 1, respectively. It wasalso observed that at 6°C, the 25-day-old fruit wasinjured after 7 days of storage, whereas injury to the 30and 35-day-old fruit was not evident until 17 days ofstorage. The results indicate that fruit should be
harvested on 30–35
th
day after flowering to avoidchilling damage during storage.
Fungi on stored dragon fruit
The following species of fungi were found ondragon fruit during storage:
Alternaria alternata, A. cheiranthi, Aspergillusavenaceus, A. awamori, A. clavalus, A. flavus
var.
columnaris, A. fumigatus, A. oryzae, A. niger, A. tub-ingensis, Curvularia lunata, C. oryzae, Cladosporiumoxysporum, Corynespora abelavata, Fusarium semi-tectum, F. lateritium, Haplariopsis fagicola, Mucorhiernalis, Penicillium charlesii
and
Syncephalastrumracemosum.
0
6
4
2
3
5
1
Days after flowering
Eat
ing
qual
ity (
hedo
nic
scal
e)
22 25 28 31 34 37 40 43
7
8
9
Figure 8. Eating quality of fruit during fruit development.
Table 1.
Effects of storage temperature (°C) and ageof dragon fruit on chilling sensitivity(translucency) measured after 17 days ofstorage.
Temperature (°C)
Days after flowering (age of the fruit)
25 30 35
–2 5 5 5
0 5 5 5
4 4 2 2
6 4 1 1
Quality assurance in agricultural produce,edited by G.I. Johnson, Le Van To, Nguyen Duy Duc and M.C. Webb.
ACIAR Proceedings 100(printed version published in 2000)
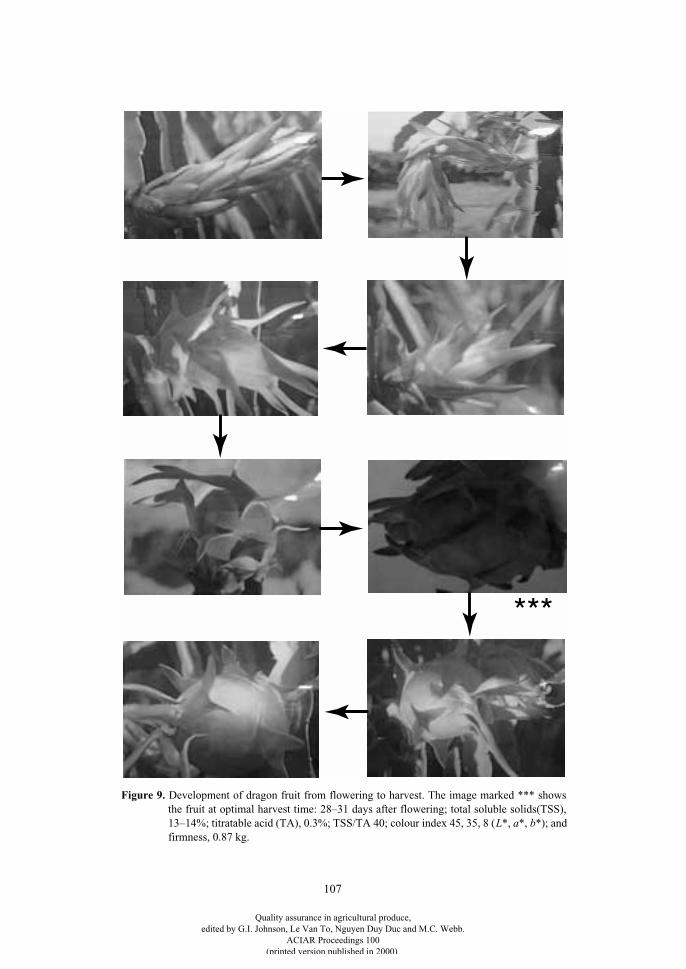
107
***
Figure 9. Development of dragon fruit from flowering to harvest. The image marked *** showsthe fruit at optimal harvest time: 28–31 days after flowering; total soluble solids(TSS),13–14%; titratable acid (TA), 0.3%; TSS/TA 40; colour index 45, 35, 8 (L*, a*, b*); andfirmness, 0.87 kg.
Quality assurance in agricultural produce,edited by G.I. Johnson, Le Van To, Nguyen Duy Duc and M.C. Webb.
ACIAR Proceedings 100(printed version published in 2000)
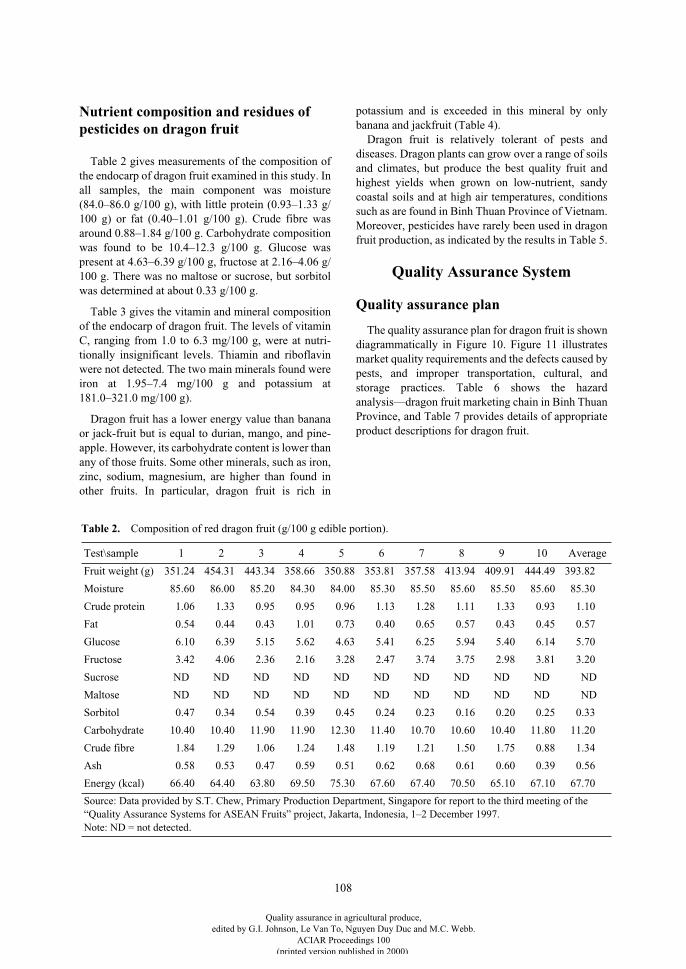
108
Nutrient composition and residues of pesticides on dragon fruit
Table 2 gives measurements of the composition ofthe endocarp of dragon fruit examined in this study. Inall samples, the main component was moisture(84.0–86.0 g/100 g), with little protein (0.93–1.33 g/100 g) or fat (0.40–1.01 g/100 g). Crude fibre wasaround 0.88–1.84 g/100 g. Carbohydrate compositionwas found to be 10.4–12.3 g/100 g. Glucose waspresent at 4.63–6.39 g/100 g, fructose at 2.16–4.06 g/100 g. There was no maltose or sucrose, but sorbitolwas determined at about 0.33 g/100 g.
Table 3 gives the vitamin and mineral compositionof the endocarp of dragon fruit. The levels of vitaminC, ranging from 1.0 to 6.3 mg/100 g, were at nutri-tionally insignificant levels. Thiamin and riboflavinwere not detected. The two main minerals found wereiron at 1.95–7.4 mg/100 g and potassium at181.0–321.0 mg/100 g).
Dragon fruit has a lower energy value than bananaor jack-fruit but is equal to durian, mango, and pine-apple. However, its carbohydrate content is lower thanany of those fruits. Some other minerals, such as iron,zinc, sodium, magnesium, are higher than found inother fruits. In particular, dragon fruit is rich in
potassium and is exceeded in this mineral by onlybanana and jackfruit (Table 4).
Dragon fruit is relatively tolerant of pests anddiseases. Dragon plants can grow over a range of soilsand climates, but produce the best quality fruit andhighest yields when grown on low-nutrient, sandycoastal soils and at high air temperatures, conditionssuch as are found in Binh Thuan Province of Vietnam.Moreover, pesticides have rarely been used in dragonfruit production, as indicated by the results in Table 5.
Quality Assurance System
Quality assurance plan
The quality assurance plan for dragon fruit is showndiagrammatically in Figure 10. Figure 11 illustratesmarket quality requirements and the defects caused bypests, and improper transportation, cultural, andstorage practices. Table 6 shows the hazardanalysis—dragon fruit marketing chain in Binh ThuanProvince, and Table 7 provides details of appropriateproduct descriptions for dragon fruit.
Table 2. Composition of red dragon fruit (g/100 g edible portion).
Test\sample 1 2 3 4 5 6 7 8 9 10 Average
Fruit weight (g) 351.24 454.31 443.34 358.66 350.88 353.81 357.58 413.94 409.91 444.49 393.82
Moisture 85.60 86.00 85.20 84.30 84.00 85.30 85.50 85.60 85.50 85.60 85.30
Crude protein 1.06 1.33 0.95 0.95 0.96 1.13 1.28 1.11 1.33 0.93 1.10
Fat 0.54 0.44 0.43 1.01 0.73 0.40 0.65 0.57 0.43 0.45 0.57
Glucose 6.10 6.39 5.15 5.62 4.63 5.41 6.25 5.94 5.40 6.14 5.70
Fructose 3.42 4.06 2.36 2.16 3.28 2.47 3.74 3.75 2.98 3.81 3.20
Sucrose ND ND ND ND ND ND ND ND ND ND ND
Maltose ND ND ND ND ND ND ND ND ND ND ND
Sorbitol 0.47 0.34 0.54 0.39 0.45 0.24 0.23 0.16 0.20 0.25 0.33
Carbohydrate 10.40 10.40 11.90 11.90 12.30 11.40 10.70 10.60 10.40 11.80 11.20
Crude fibre 1.84 1.29 1.06 1.24 1.48 1.19 1.21 1.50 1.75 0.88 1.34
Ash 0.58 0.53 0.47 0.59 0.51 0.62 0.68 0.61 0.60 0.39 0.56
Energy (kcal) 66.40 64.40 63.80 69.50 75.30 67.60 67.40 70.50 65.10 67.10 67.70
Source: Data provided by S.T. Chew, Primary Production Department, Singapore for report to the third meeting of the “Quality Assurance Systems for ASEAN Fruits” project, Jakarta, Indonesia, 1–2 December 1997.Note: ND = not detected.
Quality assurance in agricultural produce,edited by G.I. Johnson, Le Van To, Nguyen Duy Duc and M.C. Webb.
ACIAR Proceedings 100(printed version published in 2000)
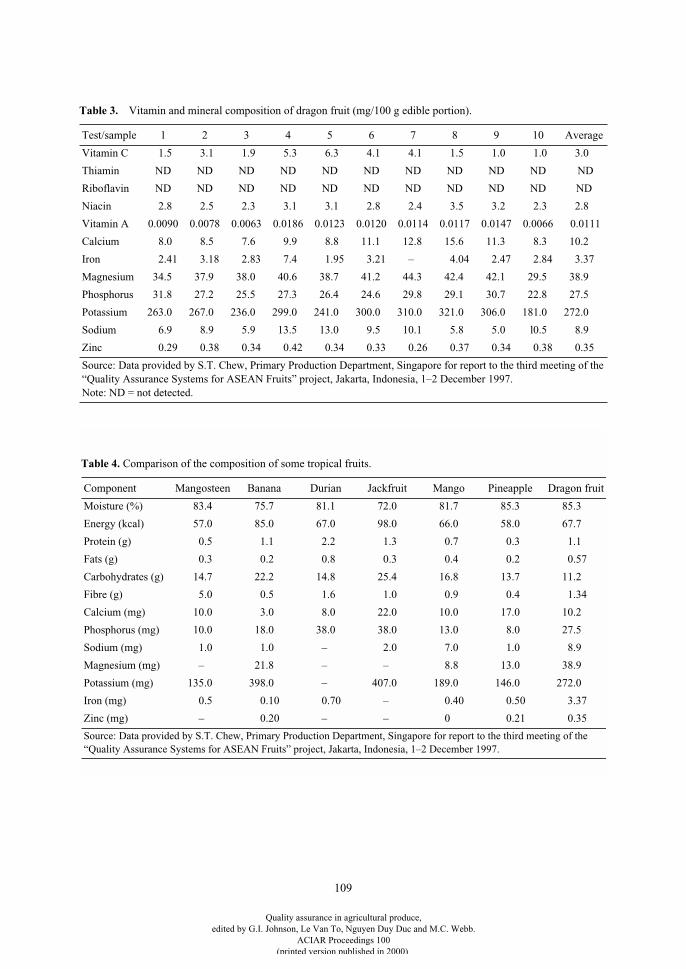
109
Table 3. Vitamin and mineral composition of dragon fruit (mg/100 g edible portion).
Test/sample 1 2 3 4 5 6 7 8 9 10 Average
Vitamin C 1.5 3.1 1.9 5.3 6.3 4.1 4.1 1.5 1.0 1.0 3.0
Thiamin ND ND ND ND ND ND ND ND ND ND ND
Riboflavin ND ND ND ND ND ND ND ND ND ND ND
Niacin 2.8 2.5 2.3 3.1 3.1 2.8 2.4 3.5 3.2 2.3 2.8
Vitamin A 0.0090 0.0078 0.0063 0.0186 0.0123 0.0120 0.0114 0.0117 0.0147 0.0066 0.0111
Calcium 8.0 8.5 7.6 9.9 8.8 11.1 12.8 15.6 11.3 8.3 10.2
Iron 2.41 3.18 2.83 7.4 1.95 3.21 – 4.04 2.47 2.84 3.37
Magnesium 34.5 37.9 38.0 40.6 38.7 41.2 44.3 42.4 42.1 29.5 38.9
Phosphorus 31.8 27.2 25.5 27.3 26.4 24.6 29.8 29.1 30.7 22.8 27.5
Potassium 263.0 267.0 236.0 299.0 241.0 300.0 310.0 321.0 306.0 181.0 272.0
Sodium 6.9 8.9 5.9 13.5 13.0 9.5 10.1 5.8 5.0 l0.5 8.9
Zinc 0.29 0.38 0.34 0.42 0.34 0.33 0.26 0.37 0.34 0.38 0.35
Source: Data provided by S.T. Chew, Primary Production Department, Singapore for report to the third meeting of the “Quality Assurance Systems for ASEAN Fruits” project, Jakarta, Indonesia, 1–2 December 1997.Note: ND = not detected.
Table 4. Comparison of the composition of some tropical fruits.
Component Mangosteen Banana Durian Jackfruit Mango Pineapple Dragon fruit
Moisture (%) 83.4 75.7 81.1 72.0 81.7 85.3 85.3
Energy (kcal) 57.0 85.0 67.0 98.0 66.0 58.0 67.7
Protein (g) 0.5 1.1 2.2 1.3 0.7 0.3 1.1
Fats (g) 0.3 0.2 0.8 0.3 0.4 0.2 0.57
Carbohydrates (g) 14.7 22.2 14.8 25.4 16.8 13.7 11.2
Fibre (g) 5.0 0.5 1.6 1.0 0.9 0.4 1.34
Calcium (mg) 10.0 3.0 8.0 22.0 10.0 17.0 10.2
Phosphorus (mg) 10.0 18.0 38.0 38.0 13.0 8.0 27.5
Sodium (mg) 1.0 1.0 – 2.0 7.0 1.0 8.9
Magnesium (mg) – 21.8 – – 8.8 13.0 38.9
Potassium (mg) 135.0 398.0 – 407.0 189.0 146.0 272.0
Iron (mg) 0.5 0.10 0.70 – 0.40 0.50 3.37
Zinc (mg) – 0.20 – – 0 0.21 0.35
Source: Data provided by S.T. Chew, Primary Production Department, Singapore for report to the third meeting of the “Quality Assurance Systems for ASEAN Fruits” project, Jakarta, Indonesia, 1–2 December 1997.
Quality assurance in agricultural produce,edited by G.I. Johnson, Le Van To, Nguyen Duy Duc and M.C. Webb.
ACIAR Proceedings 100(printed version published in 2000)
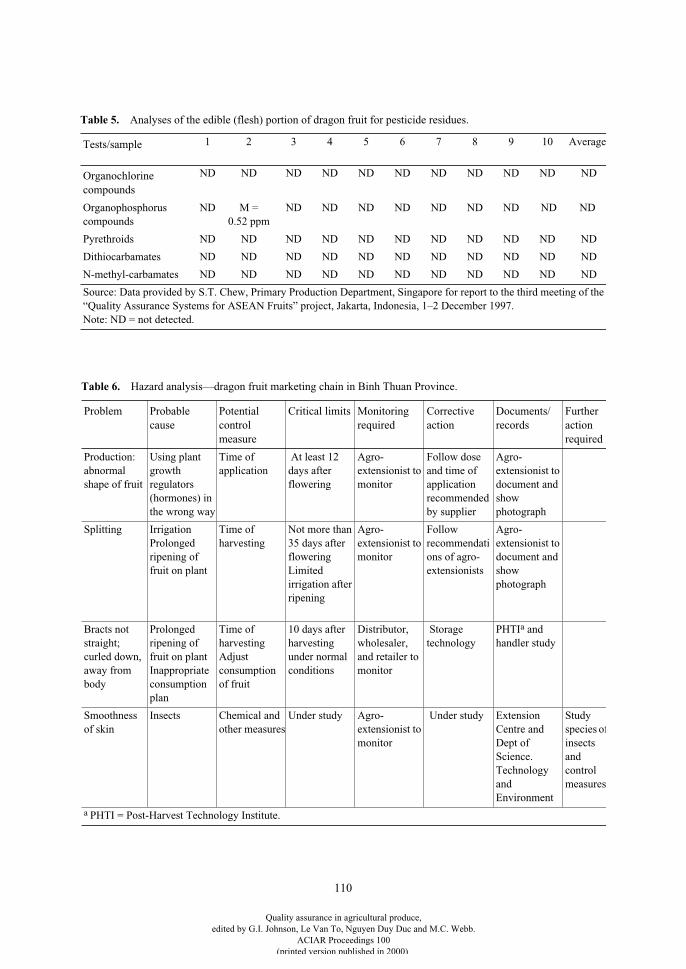
110
Table 5. Analyses of the edible (flesh) portion of dragon fruit for pesticide residues.
Tests/sample 1 2 3 4 5 6 7 8 9 10 Average
Organochlorine compounds
ND ND ND ND ND ND ND ND ND ND ND
Organophosphorus compounds
ND M = 0.52 ppm
ND ND ND ND ND ND ND ND ND
Pyrethroids ND ND ND ND ND ND ND ND ND ND ND
Dithiocarbamates ND ND ND ND ND ND ND ND ND ND ND
N-methyl-carbamates ND ND ND ND ND ND ND ND ND ND ND
Source: Data provided by S.T. Chew, Primary Production Department, Singapore for report to the third meeting of the “Quality Assurance Systems for ASEAN Fruits” project, Jakarta, Indonesia, 1–2 December 1997.Note: ND = not detected.
Table 6. Hazard analysis—dragon fruit marketing chain in Binh Thuan Province.
Problem Probable cause
Potential control measure
Critical limits Monitoring required
Corrective action
Documents/records
Further action required
Production: abnormal shape of fruit
Using plant growth regulators (hormones) in the wrong way
Time of application
At least 12 days after flowering
Agro-extensionist to monitor
Follow dose and time of application recommended by supplier
Agro-extensionist to document and show photograph
Splitting IrrigationProlonged ripening of fruit on plant
Time of harvesting
Not more than 35 days after floweringLimited irrigation after ripening
Agro-extensionist to monitor
Follow recommendations of agro-extensionists
Agro-extensionist to document and show photograph
Bracts not straight; curled down, away from body
Prolonged ripening of fruit on plantInappropriate consumption plan
Time of harvestingAdjust consumption of fruit
10 days after harvesting under normal conditions
Distributor, wholesaler, and retailer to monitor
Storage technology
PHTIa and handler study
Smoothness of skin
Insects Chemical and other measures
Under study Agro-extensionist to monitor
Under study Extension Centre and Dept of Science. Technology and Environment
Study species ofinsects and control measures
a PHTI = Post-Harvest Technology Institute.
Quality assurance in agricultural produce,edited by G.I. Johnson, Le Van To, Nguyen Duy Duc and M.C. Webb.
ACIAR Proceedings 100(printed version published in 2000)
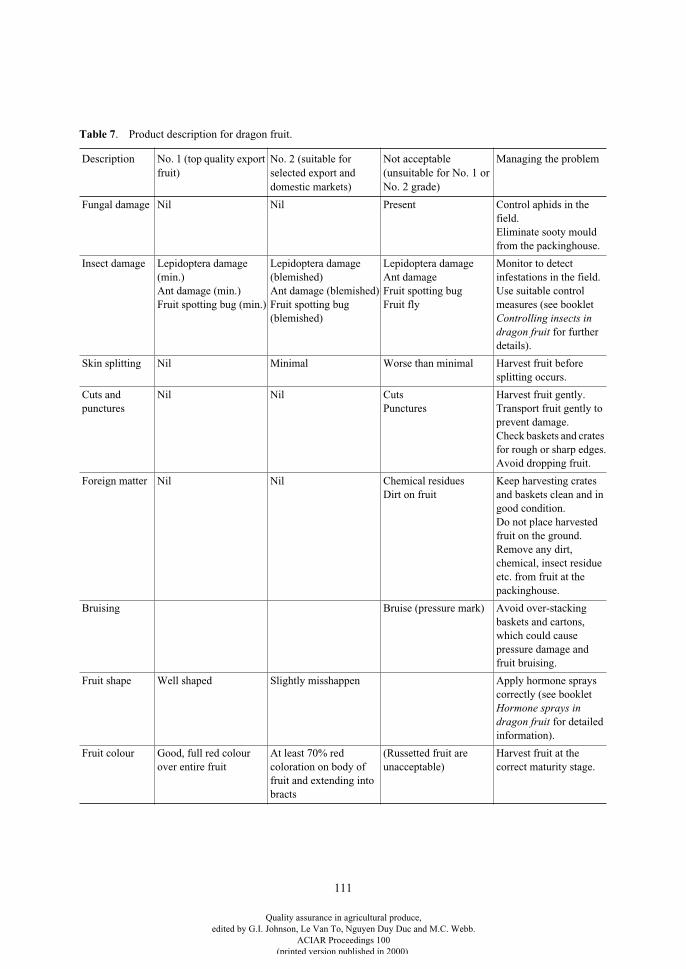
111
Table 7. Product description for dragon fruit.
Description No. 1 (top quality export fruit)
No. 2 (suitable for selected export and domestic markets)
Not acceptable(unsuitable for No. 1 or No. 2 grade)
Managing the problem
Fungal damage Nil Nil Present Control aphids in the field.Eliminate sooty mould from the packinghouse.
Insect damage Lepidoptera damage (min.)Ant damage (min.)Fruit spotting bug (min.)
Lepidoptera damage (blemished)Ant damage (blemished)Fruit spotting bug (blemished)
Lepidoptera damage Ant damage Fruit spotting bug Fruit fly
Monitor to detect infestations in the field.Use suitable control measures (see booklet Controlling insects in dragon fruit for further details).
Skin splitting Nil Minimal Worse than minimal Harvest fruit before splitting occurs.
Cuts and punctures
Nil Nil CutsPunctures
Harvest fruit gently.Transport fruit gently to prevent damage.Check baskets and crates for rough or sharp edges.Avoid dropping fruit.
Foreign matter Nil Nil Chemical residuesDirt on fruit
Keep harvesting crates and baskets clean and in good condition.Do not place harvested fruit on the ground.Remove any dirt, chemical, insect residue etc. from fruit at the packinghouse.
Bruising Bruise (pressure mark) Avoid over-stacking baskets and cartons, which could cause pressure damage and fruit bruising.
Fruit shape Well shaped Slightly misshappen Apply hormone sprays correctly (see booklet Hormone sprays in dragon fruit for detailed information).
Fruit colour Good, full red colour over entire fruit
At least 70% red coloration on body of fruit and extending into bracts
(Russetted fruit are unacceptable)
Harvest fruit at the correct maturity stage.
Quality assurance in agricultural produce,edited by G.I. Johnson, Le Van To, Nguyen Duy Duc and M.C. Webb.
ACIAR Proceedings 100(printed version published in 2000)
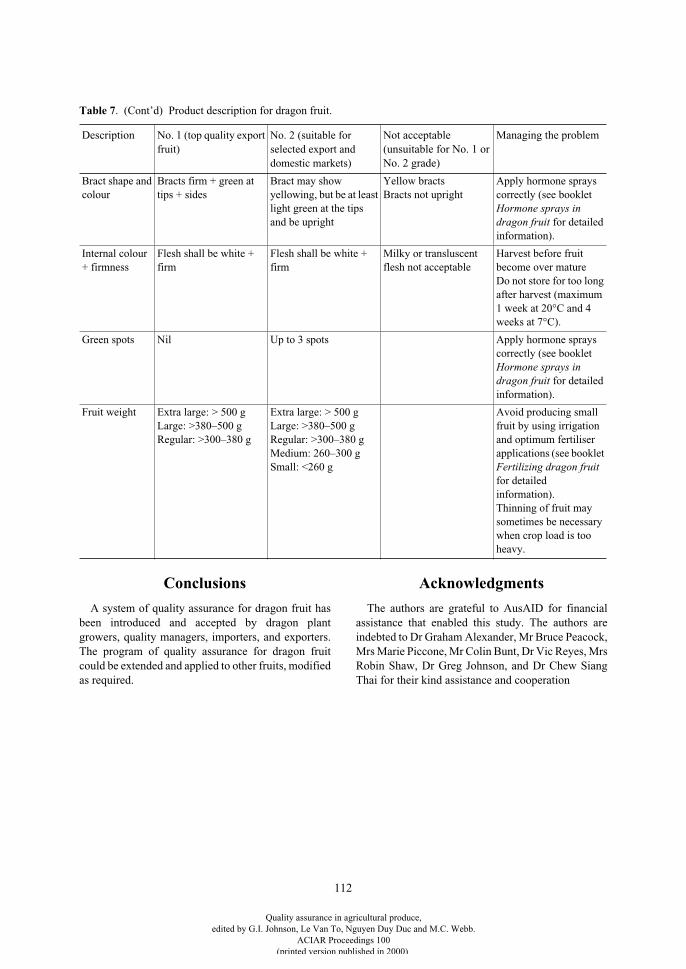
112
Conclusions
A system of quality assurance for dragon fruit hasbeen introduced and accepted by dragon plantgrowers, quality managers, importers, and exporters.The program of quality assurance for dragon fruitcould be extended and applied to other fruits, modifiedas required.
Acknowledgments
The authors are grateful to AusAID for financialassistance that enabled this study. The authors areindebted to Dr Graham Alexander, Mr Bruce Peacock,Mrs Marie Piccone, Mr Colin Bunt, Dr Vic Reyes, MrsRobin Shaw, Dr Greg Johnson, and Dr Chew SiangThai for their kind assistance and cooperation
Bract shape and colour
Bracts firm + green at tips + sides
Bract may show yellowing, but be at least light green at the tips and be upright
Yellow bractsBracts not upright
Apply hormone sprays correctly (see booklet Hormone sprays in dragon fruit for detailed information).
Internal colour + firmness
Flesh shall be white + firm
Flesh shall be white + firm
Milky or transluscent flesh not acceptable
Harvest before fruit become over matureDo not store for too long after harvest (maximum 1 week at 20°C and 4 weeks at 7°C).
Green spots Nil Up to 3 spots Apply hormone sprays correctly (see booklet Hormone sprays in dragon fruit for detailed information).
Fruit weight Extra large: > 500 gLarge: >380–500 gRegular: >300–380 g
Extra large: > 500 gLarge: >380–500 gRegular: >300–380 gMedium: 260–300 gSmall: <260 g
Avoid producing small fruit by using irrigation and optimum fertiliser applications (see booklet Fertilizing dragon fruit for detailed information).Thinning of fruit may sometimes be necessary when crop load is too heavy.
Table 7. (Cont’d) Product description for dragon fruit.
Description No. 1 (top quality export fruit)
No. 2 (suitable for selected export and domestic markets)
Not acceptable(unsuitable for No. 1 or No. 2 grade)
Managing the problem
Quality assurance in agricultural produce,edited by G.I. Johnson, Le Van To, Nguyen Duy Duc and M.C. Webb.
ACIAR Proceedings 100(printed version published in 2000)
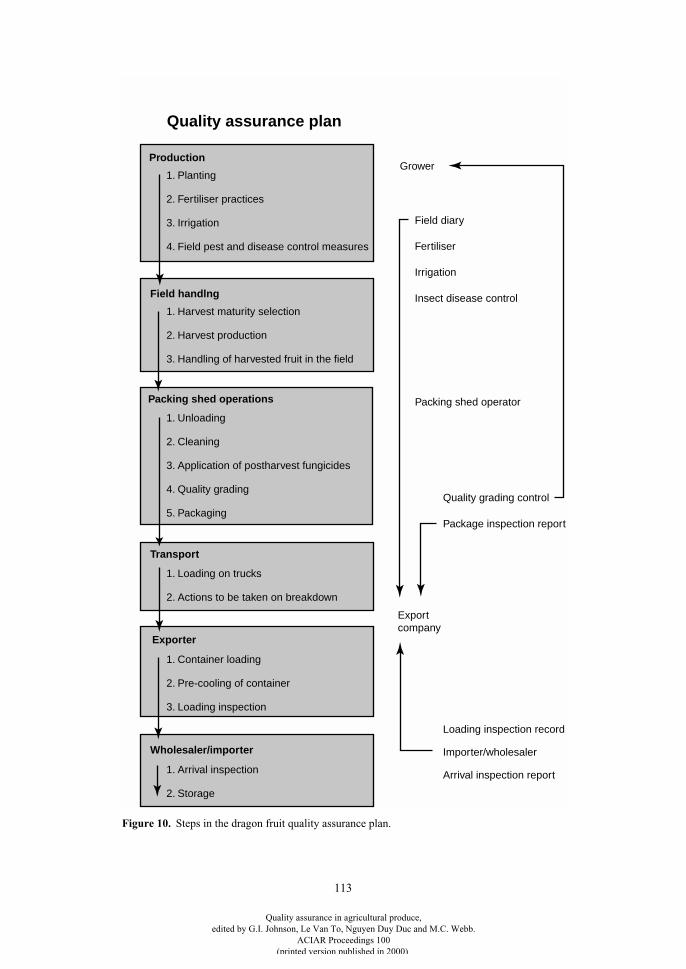
113
Production
Field handlng
1. Planting
2. Fertiliser practices
3. Irrigation
4. Field pest and disease control measures
1. Harvest maturity selection
3. Handling of harvested fruit in the field
2. Harvest production
Packing shed operations
1. Unloading
2. Cleaning
3. Application of postharvest fungicides
4. Quality grading
5. Packaging
Transport
1. Loading on trucks
2. Actions to be taken on breakdown
Exporter
1. Container loading
2. Pre-cooling of container
3. Loading inspection
Wholesaler/importer
1. Arrival inspection
2. Storage
Quality assurance plan
Grower
Field diary
Irrigation
Insect disease control
Packing shed operator
Quality grading control
Package inspection report
Export company
Loading inspection record
Importer/wholesaler
Arrival inspection report
Fertiliser
Figure 10. Steps in the dragon fruit quality assurance plan.
Quality assurance in agricultural produce,edited by G.I. Johnson, Le Van To, Nguyen Duy Duc and M.C. Webb.
ACIAR Proceedings 100(printed version published in 2000)
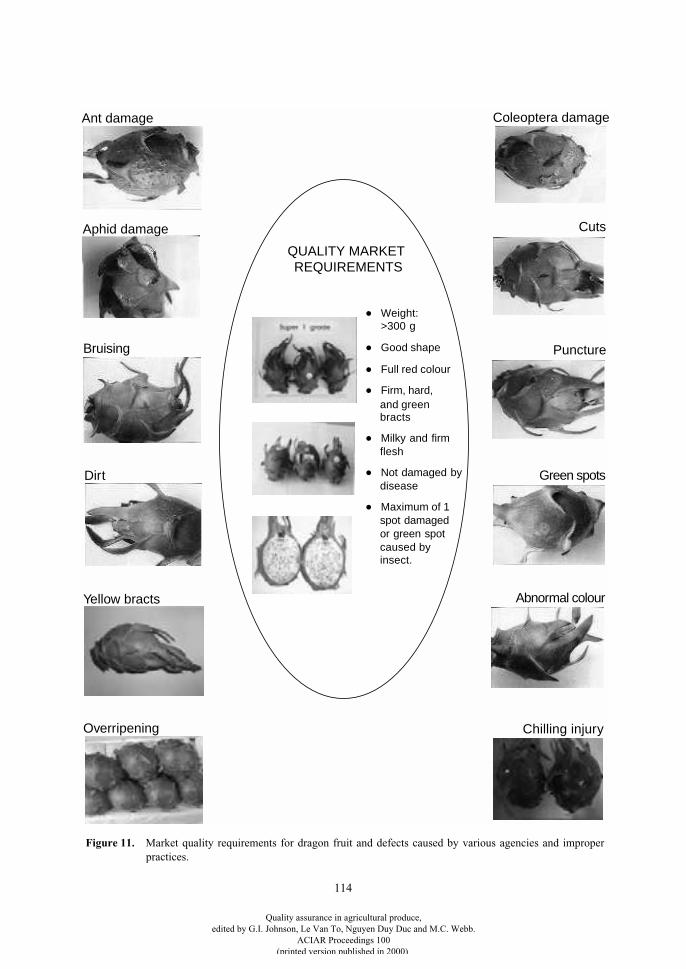
114
Coleoptera damage
Cuts
Bruising Puncture
Dirt Green spots
Yellow bracts Abnormal colour
Overripening Chilling injury
QUALITY MARKETREQUIREMENTS
• Weight: >300 g
• Good shape
• Full red colour
• Firm, hard,and greenbracts
• Milky and firmflesh
• Not damaged bydisease
• Maximum of 1spot damagedor green spotcaused byinsect.
Ant damage
Aphid damage
Figure 11. Market quality requirements for dragon fruit and defects caused by various agencies and improperpractices.
Quality assurance in agricultural produce,edited by G.I. Johnson, Le Van To, Nguyen Duy Duc and M.C. Webb.
ACIAR Proceedings 100(printed version published in 2000)
115
Establishment of a Quality Assurance System for Minimally Processed Jackfruit
Mohd. Salleh Punan, Abd. Shukor Abd. Rahman, Latifah Mohd. Nor, Pauziah Muda, Ahmad Tarmizi Sapii, Rohani Md. Yon and Faridah Mohd. Som*
Abstract
Jackfruit (
Artocarpus heterophyllus
) of Malaysia is commonly consumed as fresh produce and hence is soldas whole fruit, sections/quarters and minimally processed (MP) products. The demand for retailing the fruit asMP products is expanding due to the recent trend of consumers towards ready-to-eat and quality produce. Bothdomestic and export markets prefer MP jackfruit in their retail outlets, especially at supermarkets,hypermarkets and fast food centres. Hence, there is a need to develop a proper minimal processing techniquefor the preparation of MP jackfruit. The operation involves harvesting at the right level of maturity, correct in-field handling, sorting, washing, ripening, cutting and removal of the core, taking and selecting individualfruitlets, packing, storage and transportation. These operations should be monitored consistently to ensure thequality and safety of end products. A quality assurance (QA) system has been established and implemented forthe processing and management of the product from the point of harvest, postharvest operations and minimalprocessing, up to the retailing of the end products. The components in the QA system include control of rawmaterials, postharvest operations, sanitation at the processing plant, minimal processing unit operation andcontrol of end products.
J
ACKFRUIT
(
Artocarpus heterophyllus
) is one of thenon-seasonal fruit crops grown widely in Malaysia.Depending on the type or clone, the fruit is consumedfresh, or as canned slices, fruit juice and dried chips.For fresh consumption, the fruit is commonly sold aswhole fruit, sections/quarters and minimallyprocessed (MP) produce. Recently, the demand formarketing jackfruit as MP product has been expandingdue to the recent trend of consumers towards ready-to-eat and quality fresh produce. The demand isexpanding not only within the traditional marketoutlets, but also in other market sectors such as foodservices, fast food outlets and food processors(Vinning 1995). The trend is similar in other Associ-ation of South-East Asian Nations (ASEAN) countriesincluding Singapore and Brunei, where most of theirproduce comes from Malaysia. The reason for thistrend is understandable, as MP produce offers someadvantages, such as ease in serving portions of large
and difficult-to-peel fruit, reduced costs in packagingand transportation, more convenience, maintainedfreshness, extended shelf life and minimised quar-antine barriers in some importing countries (Reyes1997a).
Product quality is one of the prime factors inensuring consistent marketing of MP jackfruit. It iswell known that quality is a combination of variousparameters demanded by consumers such as colour,appearance, shape, size, texture and taste. However,there is no precise measurement or standard unit toidentify product quality objectively, since it is alwaysassociated with the degree of acceptance by theconsumer (Kramer and Twigg 1970). A qualityassurance (QA) system was proposed for the horticul-tural industry by the Natural Resources Institute(1994) to monitor the quality of fresh produceaccording to consumers’ demands. The ‘assurance’ inQA has been defined as “consistently and reliablydelivering products and services that have been prede-termined by the markets” (Piccone and Bunt 1997).* Malaysian Agricultural Research and Development
Institute (MARDI) Headquarters, PO Box 12301, 50774 Kuala Lumpur, Malaysia.
Quality assurance in agricultural produce,edited by G.I. Johnson, Le Van To, Nguyen Duy Duc and M.C. Webb.
ACIAR Proceedings 100(printed version published in 2000)
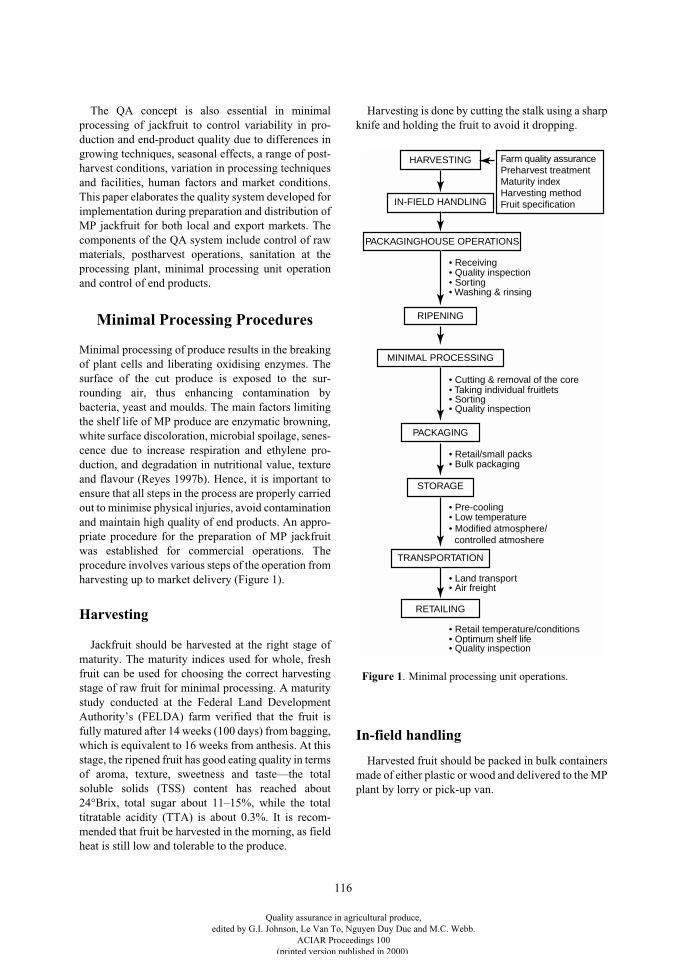
116
The QA concept is also essential in minimalprocessing of jackfruit to control variability in pro-duction and end-product quality due to differences ingrowing techniques, seasonal effects, a range of post-harvest conditions, variation in processing techniquesand facilities, human factors and market conditions.This paper elaborates the quality system developed forimplementation during preparation and distribution ofMP jackfruit for both local and export markets. Thecomponents of the QA system include control of rawmaterials, postharvest operations, sanitation at theprocessing plant, minimal processing unit operationand control of end products.
Minimal Processing Procedures
Minimal processing of produce results in the breakingof plant cells and liberating oxidising enzymes. Thesurface of the cut produce is exposed to the sur-rounding air, thus enhancing contamination bybacteria, yeast and moulds. The main factors limitingthe shelf life of MP produce are enzymatic browning,white surface discoloration, microbial spoilage, senes-cence due to increase respiration and ethylene pro-duction, and degradation in nutritional value, textureand flavour (Reyes 1997b). Hence, it is important toensure that all steps in the process are properly carriedout to minimise physical injuries, avoid contaminationand maintain high quality of end products. An appro-priate procedure for the preparation of MP jackfruitwas established for commercial operations. Theprocedure involves various steps of the operation fromharvesting up to market delivery (Figure 1).
Harvesting
Jackfruit should be harvested at the right stage ofmaturity. The maturity indices used for whole, freshfruit can be used for choosing the correct harvestingstage of raw fruit for minimal processing. A maturitystudy conducted at the Federal Land DevelopmentAuthority’s (FELDA) farm verified that the fruit isfully matured after 14 weeks (100 days) from bagging,which is equivalent to 16 weeks from anthesis. At thisstage, the ripened fruit has good eating quality in termsof aroma, texture, sweetness and taste—the totalsoluble solids (TSS) content has reached about24°Brix, total sugar about 11–15%, while the totaltitratable acidity (TTA) is about 0.3%. It is recom-mended that fruit be harvested in the morning, as fieldheat is still low and tolerable to the produce.
Harvesting is done by cutting the stalk using a sharpknife and holding the fruit to avoid it dropping.
In-field handling
Harvested fruit should be packed in bulk containersmade of either plastic or wood and delivered to the MPplant by lorry or pick-up van.
HARVESTING
IN-FIELD HANDLING
PACKAGINGHOUSE OPERATIONS
RIPENING
• Receiving• Quality inspection• Sorting• Washing & rinsing
MINIMAL PROCESSING
• Cutting & removal of the core• Taking individual fruitlets• Sorting• Quality inspection
• Retail/small packs• Bulk packaging
PACKAGING
STORAGE
• Pre-cooling• Low temperature• Modified atmosphere/
controlled atmoshere
TRANSPORTATION
• Land transport• Air freight
RETAILING
• Retail temperature/conditions• Optimum shelf life• Quality inspection
Farm quality assurancePreharvest treatmentMaturity indexHarvesting methodFruit specification
Figure 1. Minimal processing unit operations.
Quality assurance in agricultural produce,edited by G.I. Johnson, Le Van To, Nguyen Duy Duc and M.C. Webb.
ACIAR Proceedings 100(printed version published in 2000)
117
Packinghouse operations
Fruit received from farms should be inspected toensure that the quantity (weight) and the quality meetthe required specifications. The fruit should thenundergo some minimum postharvest operations priorto minimal processing to ensure maintenance of highquality raw materials for processing. The minimumpackinghouse operations include sorting, washing andrinsing. Washing of produce should be done usingchlorinated water to remove dirt, foreign matter, latexstains and any field contamination. After washing,produce must be rinsed properly to remove excessmoisture from the surface of the fruit.
Ripening
Prior to the minimal processing, fruit should beripened fully to achieve optimum aroma, sweetness,taste and eating quality. Fruit should be kept atambient temperature to allow natural ripening within3–4 days. However, uneven ripening is a majorproblem in the natural ripening process, especially forlarge-sized fruit. An induced ripening method is rec-ommended for jackfruit to achieve more uniformripening of the fruit. Induced ripening is done bykeeping the fruit in a static or closed ripening chamber,equipped with an ethylene gas tank and a flow ratecontroller. Ethylene gas with a concentration of 50parts per million (ppm) is flushed into the chamber setat 25°C. After 24 hours, the chamber is opened toallow continuation of the ripening process underambient conditions. The fruit ripens 3–4 days after thetreatment with ethylene gas.
Minimal processing operation
Fruit ready for minimal processing should be shiftedto a hygienic processing room to avoid microbial con-tamination of the cut surface. Basic operations mayinclude cutting the skin using a clean knife to removethe core, taking individual fruitlets and sorting thefruitlets according to the required size, maturity andcolour. Only full fruitlets (not half or partly cut) arerecommended for retailing. However, fruitlets with orwithout seeds can be prepared according to the con-sumers’ preference. Multiple handling of the fruitletsshould be minimised during minimal processing toavoid injuries and contamination.
Packaging
Minimally processed products should be packedproperly using a suitable packing material and system.Packaging aims to protect the product from physicaland microbiological hazards since their naturalprotector (the fruit skin) has been removed. Thecommon packaging methods for MP jackfruit includepolyethylene bags, polystyrene trays wrapped withpolyvinyl chloride (PVC) film and polypropylene con-tainers with lids. Sealing packages may also involvealtering the concentration of respiratory gases insidethe package to create a modified atmosphere system.Modified atmosphere packaging has also been foundto be capable of preserving freshness and extendingthe shelf life of MP products such as pineapple,pomelo, durian and jackfruit (Anon. 1997).
Storage
After packaging, MP jackfruit should be kept at achilled temperature for storage before distribution. Astorage temperature of 2°C was found to be suitablefor extending the shelf life of MP jackfruit for 3 weeks(Anon. 1997).
Transportation
MP jackfruit should be distributed using a refrig-erated lorry or pick-up van. It is important to maintainthe chilled temperature of 2°C throughout the distri-bution process to avoid deterioration. It isrecommended that pre-cooled MP jackfruit be kept inthermal-freeze box to maintain the chilled temperaturealong the journey to retail outlets. For the export market,air transportation is recommended to ensure fastdelivery. Transportation by refrigerated sea-freight mayalso be viable if the volume of the consignment is largeenough and the shelf life of the product is long enoughto fulfil the total shipping and distribution periods.
Retailing
Most of the retail outlets for MP products are super-markets, hypermarkets, the fast food sector, foodservice sectors and food processors. It is once againimportant to maintain the chilled temperature of theproduct at all outlet sectors to avoid deterioration. Theproduct may be stored temporarily for a period of notmore than the expected shelf life. All display racks orshelves in the supermarket or hypermarket should alsobe equipped with refrigeration facilities.
Quality assurance in agricultural produce,edited by G.I. Johnson, Le Van To, Nguyen Duy Duc and M.C. Webb.
ACIAR Proceedings 100(printed version published in 2000)
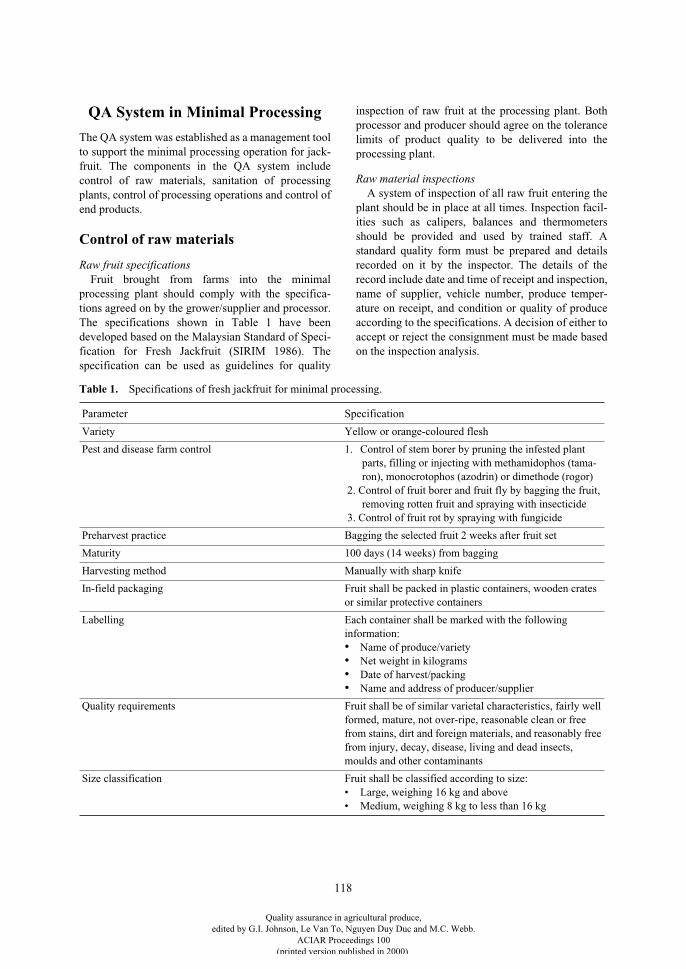
118
QA System in Minimal Processing
The QA system was established as a management toolto support the minimal processing operation for jack-fruit. The components in the QA system includecontrol of raw materials, sanitation of processingplants, control of processing operations and control ofend products.
Control of raw materials
Raw fruit specifications
Fruit brought from farms into the minimalprocessing plant should comply with the specifica-tions agreed on by the grower/supplier and processor.The specifications shown in Table 1 have beendeveloped based on the Malaysian Standard of Speci-fication for Fresh Jackfruit (SIRIM 1986). Thespecification can be used as guidelines for quality
inspection of raw fruit at the processing plant. Bothprocessor and producer should agree on the tolerancelimits of product quality to be delivered into theprocessing plant.
Raw material inspections
A system of inspection of all raw fruit entering theplant should be in place at all times. Inspection facil-ities such as calipers, balances and thermometersshould be provided and used by trained staff. Astandard quality form must be prepared and detailsrecorded on it by the inspector. The details of therecord include date and time of receipt and inspection,name of supplier, vehicle number, produce temper-ature on receipt, and condition or quality of produceaccording to the specifications. A decision of either toaccept or reject the consignment must be made basedon the inspection analysis.
Table 1.
Specifications of fresh jackfruit for minimal processing.
Parameter Specification
Variety Yellow or orange-coloured flesh
Pest and disease farm control 1. Control of stem borer by pruning the infested plant parts, filling or injecting with methamidophos (tama-ron), monocrotophos (azodrin) or dimethode (rogor)
2. Control of fruit borer and fruit fly by bagging the fruit, removing rotten fruit and spraying with insecticide
3. Control of fruit rot by spraying with fungicide
Preharvest practice Bagging the selected fruit 2 weeks after fruit set
Maturity 100 days (14 weeks) from bagging
Harvesting method Manually with sharp knife
In-field packaging Fruit shall be packed in plastic containers, wooden crates or similar protective containers
Labelling Each container shall be marked with the following information:
•
Name of produce/variety
•
Net weight in kilograms
•
Date of harvest/packing
•
Name and address of producer/supplier
Quality requirements Fruit shall be of similar varietal characteristics, fairly well formed, mature, not over-ripe, reasonable clean or free from stains, dirt and foreign materials, and reasonably free from injury, decay, disease, living and dead insects, moulds and other contaminants
Size classification Fruit shall be classified according to size:• Large, weighing 16 kg and above• Medium, weighing 8 kg to less than 16 kg
Quality assurance in agricultural produce,edited by G.I. Johnson, Le Van To, Nguyen Duy Duc and M.C. Webb.
ACIAR Proceedings 100(printed version published in 2000)
119
Sanitation in the processing plant
Plant cleanliness and hygiene
Sanitation in the plant involves consideration oflayout design, maintenance of walls, ceilings, floors,doors, plumbing, water supply, refrigeration system,ventilation, glove/boot locker and toilet facilities(Cantwell 1996). The layout for a minimal processingplant can be divided into four main areas: packing-house area, minimal processing area, cold roomfacilities and management office. The overall clean-liness of the plant should be maintained since it isconsidered to be food processing plant. Non-splin-tering and easily cleaned surface materials should beused for work surfaces, walls and floors. Regularwashing and cleaning works should be implementedusing suitable chemicals and cleaning detergents.
The area in which it is most important to behygienic—and thus should be monitored most closely—is the minimal processing area, where cutting of fruit,sorting and packing fruitlets are performed. The roomshould be isolated from other areas to avoid contami-nation. The room should be provided with a double-dooraccess system to ensure maximum protection frominsects and microorganisms. Surfaces for the walls, floorand ceiling of the room should be made from easy-to-clean materials. Washing, cleaning and sanitising shouldbe scheduled regularly before, during and afterprocessing activities. The room should be air-condi-tioned to control room temperature at about 15–20°C, soas to maintain freshness of produce during processing.
Equipment
All appliances and facilities including knives,scissors, secateurs, containers and the cutting benchmust be made from rust-proof materials, such asstainless steel or plastic. Equipment and appliancesused in the processing works should be cleaned andsanitised. Basic steps for sanitation involve physicalcleaning, pre-rinsing, detergent application, post-rinsing and sanitation using either steam, hot water,chemical detergent or chlorinated water.
Staff and workers
Staff and workers preparing and handling MPjackfruit have a great responsibility to ensure thehealth and safety of the end users. It is important toensure that all staff and workers entering the plant—especially the processing area—wear clean apparel,gloves, caps and boots. Changing rooms and lockersfor personal belongings should also be allocated toeach worker.
Control of processing operations
Production history
Although production activities at the farm level donot directly influence the minimal processing opera-tions, relevant information should be made availableto the processor. This is important to the overall QAsystem so that corrective actions can be taken toimprove the industry. Some of the information to berecorded includes source of fruit, grower’s code orname, cultural practices, pest and disease man-agement, and preharvest practices.
Work instructions
Workers and staff involved in the processing plantshould be given clear and easy-to-understand instruc-tions in order to carry out their duties properly. Thecontent of the instructions should explain the precisework to be done at every processing step. Workinstructions should be made available to the workerseither in the form of a manual or display charts.
HACCP
The Hazard Analysis and Critical Control Points(HACCP) standard is well known in the foodprocessing industry as a system of monitoring andcontrolling quality of processes and product, so thatproduct is not contaminated with microbiological,chemical or physical hazards. The system has beenrecommended for implementation in the minimalprocessing of fruits and vegetables (Cantwell 1996;Reyes 1997c). For MP jackfruit, a HACCP worksheethas been established to monitor minimal processingoperations right from receiving the raw fruit up to thedistribution to retail outlets (Table 2). The guidelinewas verified commercially at the Federal Land Devel-opment Authority’s minimal processing plant.
Control of end products
End-product specifications
The processor/producer and distributor/retailer foreach specific market should clearly define end-productspecifications. For MP jackfruit, the specificationsshown in Table 3 are proposed as guidelines forquality inspection. Both the processor/producer anddistributor/retailer should agree on the tolerance limitsof end-product quality to be delivered into the market.
Quality assurance in agricultural produce,edited by G.I. Johnson, Le Van To, Nguyen Duy Duc and M.C. Webb.
ACIAR Proceedings 100(printed version published in 2000)
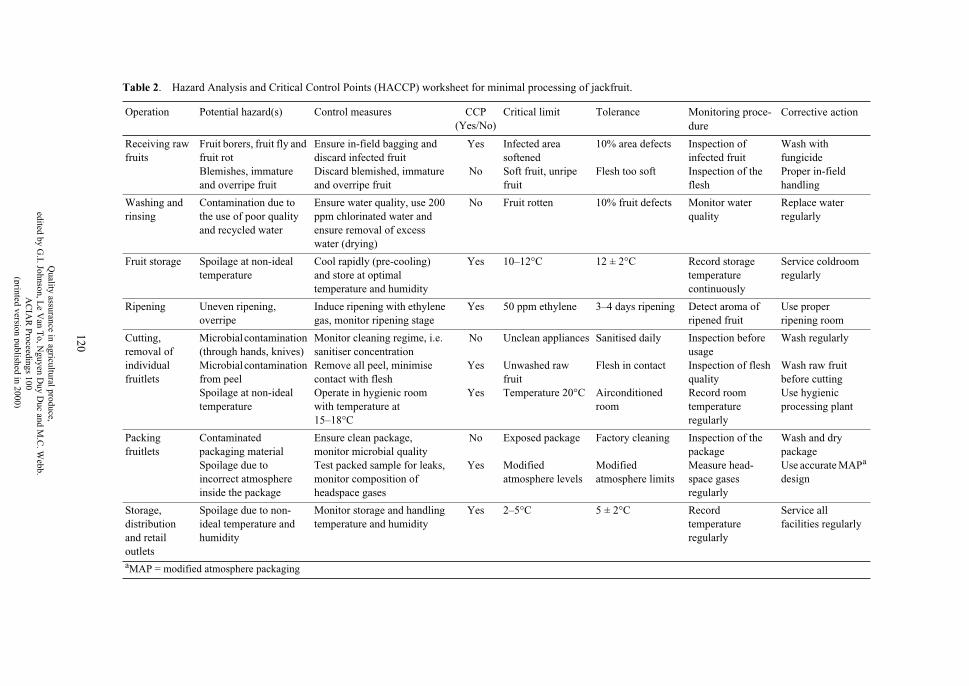
120
Table 2
. Hazard Analysis and Critical Control Points (HACCP) worksheet for minimal processing of jackfruit.
Operation Potential hazard(s) Control measures CCP (Yes/No)
Critical limit Tolerance
Monitoring proce-dure
Corrective
action
Receiving raw fruits
Fruit borers, fruit fly and fruit rotBlemishes, immature and overripe fruit
Ensure in-field bagging and discard infected fruitDiscard blemished, immature and overripe fruit
Yes
No
Infected area softenedSoft fruit, unripe fruit
10% area defects
Flesh too soft
Inspection of infected fruitInspection of the flesh
Wash with fungicideProper in-field handling
Washing and rinsing
Contamination due to the use of poor quality and recycled water
Ensure water quality, use 200 ppm chlorinated water and ensure removal of excess water (drying)
No Fruit rotten 10% fruit defects Monitor water quality
Replace water regularly
Fruit storage Spoilage at non-ideal temperature
Cool rapidly (pre-cooling) and store at optimal temperature and humidity
Yes 10–12°C 12 ± 2°C Record storage temperature continuously
Service coldroom regularly
Ripening Uneven ripening, overripe
Induce ripening with ethylene gas, monitor ripening stage
Yes 50 ppm ethylene 3–4 days ripening Detect aroma of ripened fruit
Use proper ripening room
Cutting, removal of individual fruitlets
Microbial contamination (through hands, knives)Microbial contamination from peelSpoilage at non-ideal temperature
Monitor cleaning regime, i.e. sanitiser concentrationRemove all peel, minimise contact with fleshOperate in hygienic room with temperature at 15–18°C
No
Yes
Yes
Unclean appliances
Unwashed raw fruitTemperature 20°C
Sanitised daily
Flesh in contact
Airconditioned room
Inspection before usageInspection of flesh qualityRecord room temperature regularly
Wash regularly
Wash raw fruit before cuttingUse hygienic processing plant
Packing fruitlets
Contaminated packaging materialSpoilage due to incorrect atmosphere inside the package
Ensure clean package, monitor microbial qualityTest packed sample for leaks, monitor composition of headspace gases
No
Yes
Exposed package
Modified atmosphere levels
Factory cleaning
Modified atmosphere limits
Inspection of the packageMeasure head-space gases regularly
Wash and dry packageUse accurate MAP
a
design
Storage, distribution and retail outlets
Spoilage due to non-ideal temperature and humidity
Monitor storage and handling temperature and humidity
Yes 2–5°C 5 ± 2°C Record temperature regularly
Service all facilities regularly
a
MAP = modified atmosphere packaging
Quality assurance in agricultural produce,
edited by G.I. Johnson, L
e Van T
o, Nguyen D
uy Duc and M
.C. W
ebb.A
CIA
R P
roceedings 100(printed
versionpublished
in2000)
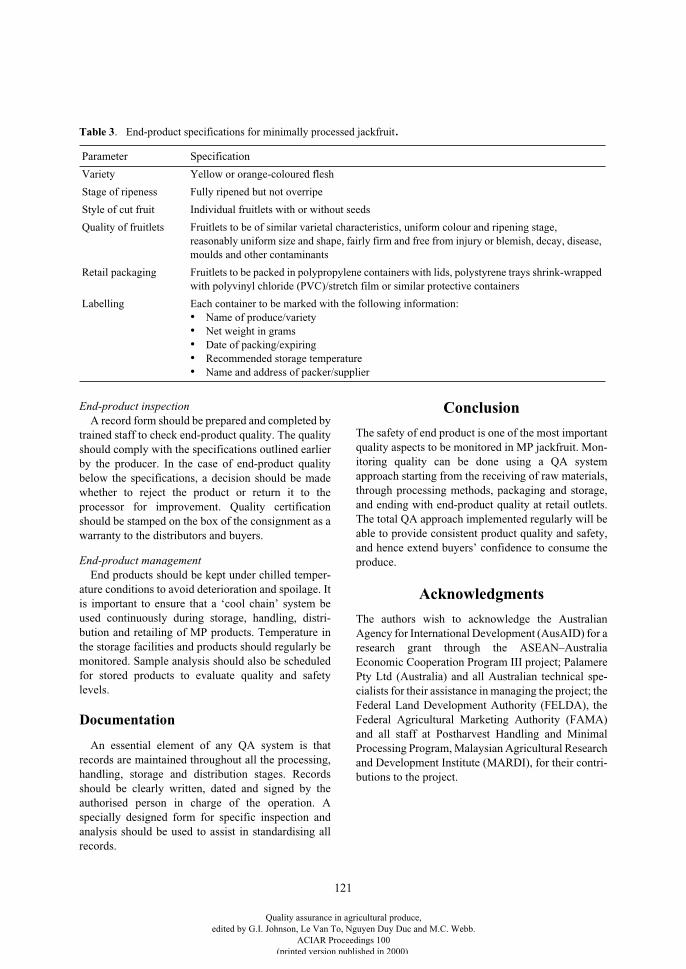
121
End-product inspection
A record form should be prepared and completed bytrained staff to check end-product quality. The qualityshould comply with the specifications outlined earlierby the producer. In the case of end-product qualitybelow the specifications, a decision should be madewhether to reject the product or return it to theprocessor for improvement. Quality certificationshould be stamped on the box of the consignment as awarranty to the distributors and buyers.
End-product management
End products should be kept under chilled temper-ature conditions to avoid deterioration and spoilage. Itis important to ensure that a ‘cool chain’ system beused continuously during storage, handling, distri-bution and retailing of MP products. Temperature inthe storage facilities and products should regularly bemonitored. Sample analysis should also be scheduledfor stored products to evaluate quality and safetylevels.
Documentation
An essential element of any QA system is thatrecords are maintained throughout all the processing,handling, storage and distribution stages. Recordsshould be clearly written, dated and signed by theauthorised person in charge of the operation. Aspecially designed form for specific inspection andanalysis should be used to assist in standardising allrecords.
Conclusion
The safety of end product is one of the most importantquality aspects to be monitored in MP jackfruit. Mon-itoring quality can be done using a QA systemapproach starting from the receiving of raw materials,through processing methods, packaging and storage,and ending with end-product quality at retail outlets.The total QA approach implemented regularly will beable to provide consistent product quality and safety,and hence extend buyers’ confidence to consume theproduce.
Acknowledgments
The authors wish to acknowledge the AustralianAgency for International Development (AusAID) for aresearch grant through the ASEAN–AustraliaEconomic Cooperation Program III project; PalamerePty Ltd (Australia) and all Australian technical spe-cialists for their assistance in managing the project; theFederal Land Development Authority (FELDA), theFederal Agricultural Marketing Authority (FAMA)and all staff at Postharvest Handling and MinimalProcessing Program, Malaysian Agricultural Researchand Development Institute (MARDI), for their contri-butions to the project.
Table 3
. End-product specifications for minimally processed jackfruit
.
Parameter Specification
Variety Yellow or orange-coloured flesh
Stage of ripeness Fully ripened but not overripe
Style of cut fruit Individual fruitlets with or without seeds
Quality of fruitlets Fruitlets to be of similar varietal characteristics, uniform colour and ripening stage, reasonably uniform size and shape, fairly firm and free from injury or blemish, decay, disease, moulds and other contaminants
Retail packaging Fruitlets to be packed in polypropylene containers with lids, polystyrene trays shrink-wrapped with polyvinyl chloride (PVC)/stretch film or similar protective containers
Labelling Each container to be marked with the following information:
•
Name of produce/variety
•
Net weight in grams
•
Date of packing/expiring
•
Recommended storage temperature
•
Name and address of packer/supplier
Quality assurance in agricultural produce,edited by G.I. Johnson, Le Van To, Nguyen Duy Duc and M.C. Webb.
ACIAR Proceedings 100(printed version published in 2000)
122
References
Anon. 1997. Annual Report. Serdang, Selangor,Horticulture Research Centre, Malasian AgriculturalResearch and Development Institute (MARDI).
Cantwell, M. 1996. Plant and worker sanitation: a briefreview. In: Fresh-cut products: maintaining quality andsafety. Davis, University of California.
Kramer, A. and Twigg, B.A. 1970. Quality control for thefood industry. Wesport, Connecticut, AVI Publications.
Natural Resources Institute (1994). Manual for horticulturalexport quality assurance. Chatham, United Kingdom,Natural Resources Institute.
Piccone, M. and Bunt, C. 1997. Understanding qualitysystems. The Association of South-East Asian Nations(ASEAN)–Australia Economic Cooperation Program III:Quality Assurance Systems for ASEAN Fruits (QASAF)Project Workshop, Bangkok, 24–28 March 1997.Brisbane, Palamere Pty Ltd.
Reyes, V.G. 1997a. Current developments in minimalprocessing of fruits and vegetables. The Association ofSouth-East Asian Nations (ASEAN)–AustraliaEconomic Cooperation Program III: Quality AssuranceSystems for ASEAN Fruits (QASAF) Workshop on
Minimal Processing of Tropical Fruits, Kuala Lumpur,21–23 October 1997. Brisbane, Palamere Pty. Ltd.
Reyes, V.G. 1997b. Factors limiting shelf life and quality ofminimally processed fruits and vegetables. TheAssociation of South-East Asian Nations (ASEAN)–Australia Economic Cooperation Program III: QualityAssurance Systems for ASEAN Fruits (QASAF)Workshop on Minimal Processing of Tropical Fruits,Kuala Lumpur, 21–23 October 1997. Brisbane, PalamerePty. Ltd.
Reyes, V.G. 1997c. Preservation technologies and systemsfor minimally processed fruits and vegetables. TheAssociation of South-East Asian Nations (ASEAN)–Australia Economic Cooperation Program III: QualityAssurance Systems for ASEAN Fruits (QASAF)Workshop on Minimal Processing of Tropical Fruits,Kuala Lumpur, 21–23 October 1997. Brisbane, PalamerePty. Ltd.
SIRIM (Standards and Industrial Research Institute ofMalaysia) 1986. Specification for fresh jackfruit.Malaysian Standard MS 1055. Shah Alam, Selangor,SIRIM.
Vinning, G. 1995. Report on a market study of minimallyprocessed tropical fruits. Brisbane, Palamere Pty Ltd.
Quality assurance in agricultural produce,edited by G.I. Johnson, Le Van To, Nguyen Duy Duc and M.C. Webb.
ACIAR Proceedings 100(printed version published in 2000)
123
Minimally Processed Fruits in Singapore
Kalanithy Karichiappan, Lim Cheong Huat and Chew Siang Thai*
Abstract
A survey was conducted to study the quality and food safety status of minimally processed (MP) fruits inSingapore. As the industry is still in its infancy, produce of this category is not widely available in the marketbut is slowly gaining in popularity and the increasing demand has hastened its development. Several analyticalparameters of quality in fruit products were measured to determine quality changes, including physicalexamination, pH, ethylene and oxygen gas levels, surface colour, total sugar, total acidity and water activity.For contaminants, pesticide residues were measured and microbiological levels monitored using total platecounts as well as counts of
Escherichia coli
,
coliforms,
Staphylococcus aureus
,
Lactobacillus
and PPC(psychrophilic count). Results obtained indicated that MP fruits in Singapore are relatively safe.
M
INIMALLY
processed (MP) fruits have gained popu-larity in Singapore since their introduction a few yearsago. MP fruits are prepared and packaged for con-venient consumption. Other advantages includesuperior quality over processed fruits. However, themain disadvantage is their increased perishability andshorter shelf life as compared to fresh whole fruits.Minimal processing is defined as “all unit operationssuch as washing, sorting, trimming, peeling, slicing,coring etc. that might be used prior to blanching inconventional processing” (Rolle and Chism 1987) forthe purposes of this paper.
Presently in Singapore, there are five major sectorsof producers that are involved in MP fruits. Theserange from the small-scale fruit stalls that are locatedin food centres, canteens and hawker centres to large-scale operations such as that of the Singapore AirportTerminal Services in-flight catering centre. The restinclude fresh fruit shops, supermarkets and MP fruitprocessing plants. Currently, all the sectors except theMP fruit processing plants primarily aim to supply MPfruits directly to the consumers. Thus, depending onthe storage needs, attention has been focused tovarying degrees by the different groups with a view toextending the shelf life of this type of produce. Onemajor obstacle that limits the production of MP fruitsis the higher degree of perishability brought about bydamage to the fruit tissue during processing.
A survey was conducted on MP jackfruit and durianfrom September 1997 to June 1998 to study the qualityand food safety status of MP fruits in Singapore.
Materials and Methods
Materials
Several samples of MP jackfruit and MP durianwere analysed for this study. The samples were eithercollected from a local MP plant or purchased from wetmarkets and retail outlets to assess the microbiologicaland pesticide contamination as well as quality changesin the retail outlets.
Methods
The microbiological tests undertaken included totalplate counts, and counts of
Escherichia coli
, col-iforms,
Staphylococcus aureus
,
Lactobacillus
andPPC (psychrophilic count). Total plate counts weredetermined using the spiral plater system according tothe methods described in the Compendium of Methodsfor Microbiological Examination of Foods, AmericanPublic Health Association (APHA) and the Associ-ation of Official Analytical Chemists (AOAC)Official Methods of Analysis. Total coliform and
E. coli
counts were determined using the Colitrakmethod which is based upon the widely used ‘mostprobable number’ (MPN) assay as specified in the
* Veterinary Public Health Laboratory, Primary Production Department, 51 Jalan Buroh, Singapore 619495.
Quality assurance in agricultural produce,edited by G.I. Johnson, Le Van To, Nguyen Duy Duc and M.C. Webb.
ACIAR Proceedings 100(printed version published in 2000)
124
Bacteriological Analytical Manual (Food and DrugAdministration—FDA/BAM) and AOAC.
The pesticide residue analysis included testing fororganochlorine compounds, organophosphorus com-pounds, pyrethroids, dithiocarbamates (as total CS
2
)and N-methylcarbamates. Organochlorines wereanalysed by the multi-residue method. The organo-chlorines were extracted with acetonitrile, the water inthe aqueous mixture was salted out, and the organiclayer was dried and redissolved in hexane followed bycleaning up with florisil solid phase extraction. Theeluent was injected for gas chromatography with anelectron-capture detector. The organophosphorouscompounds were extracted from the fruit samples withethyl acetate in the presence of anhydrous sodiumsulfate and the filtered extracts were determined bygas chromatography using phosphorous-specificdetection. Dithiocarbamate fungicides (Thiram,Maneb, Zineb, Mancozeb, Ferbam, Manam, sodiumdimethyl dithiocarbamate and Ziram) were deter-mined as carbon disulfide by the headspace gaschromatographic method with a flame photometricdetector. N-methyl carbamates were extracted withacetonitrile, the water in the mixture was salted out andthe organic layer was evaporated to dryness. Theresidue was redissolved in methanol, followed bycleaning up with C18 solid phase extraction. Theeluent was injected for high performance liquid chro-matography (HPLC) using a machine equipped with apost-column derivation unit, and the carbamates weredetected using a fluorescence detector. Pyrethroidswere determined by gas chromatography with anelectron-capture detector method. All the pesticideresidue analysis was done using multi-residuemethods as described in Analytical Methods forResidues of Pesticides (Ministry of Welfare, Healthand Cultural Affairs, Rijswijk), fifth edition (1988).
For quality changes, pH, physical examination,ethylene and oxygen gas levels, surface colour, totalsugar, total acidity and water activity were monitored.Surface colour was measured by using MinoltaChroma Meter CR300 based on the Hunter system. pHwas measured using a Fisher Accumet 950 pH meterafter calibration at 25°C. Total acidity was determinedby a titration method using a standard sodiumhydroxide solution. Total sugar (°Brix) was deter-mined by refractometry utilising an Abberefractometer. Water activity was measured using aLUFT Water Activity Analyser. Both ethylene andoxygen gas levels were obtained by using a TEMACgas analyser.
Results and Discussion
Packaging materials
All of the MP fruits were packed in styrofoam trayswith polyethylene film wrapping except for thosewhich were sampled from ready-to-eat, cut fruit stallsin hawker centres and food courts. The ready-to-eat,cut fruit stalls pack the MP fruits in plastic bags or onwooden skewers.
Physical quality attributes
General
Cutting and slicing of fruits has adverse conse-quences on product appearance. Cut surfaces bringenzymes and substrates together which acceleratebrowning. Most fruits have an active wound responsemechanism, which is triggered by the production ofwound ethylene. Ethylene can accelerate colourchanges associated with ripening and senescence. Sig-nificant surface colour changes were observed for thejackfruit and durian samples. The surface colourdarkened from light yellowish-orange to a deep orangecolour for the jackfruit within a day. The durian fleshtook a slightly longer time to change from light creamto a yellow colour. These observations correlate wellwith the high level of ethylene gas detected in thesesamples, which enhances the ripening process.Generally jackfruit were able to maintain goodappearance if stored at a refrigerated temperature for aweek with a minimum amount of polyethylene pack-aging, as refrigeration delays senescence andpolyethylene packaging reduces dehydration. After 7days, some fluid had exuded from the jackfruit and‘off’ aromas became detectable.
MP jackfruit
Eleven samples of MP jackfruit were analysed. ThepH ranged from 5.07 to 5.77—which is within theacidic range. The Brix value (dissolved solids) was ata moderate level—13 to 22.5° and the acid content wasaround 0.08 to 0.29%—which explains the observedpH. The water activity results ranged from 0.94 to0.99. The oxygen composition in some packages wasreduced to as low as 6.3% (high respiration rate, rapidoxygen consumption rate) and in some samples was ashigh as 19.8% (normal atmospheric oxygen compo-sition is 20.8%). The ethylene results ranged from aslow as 300 ppm to as high as above 1,000 ppm (theincrease caused by the ripening process).
Quality assurance in agricultural produce,edited by G.I. Johnson, Le Van To, Nguyen Duy Duc and M.C. Webb.
ACIAR Proceedings 100(printed version published in 2000)
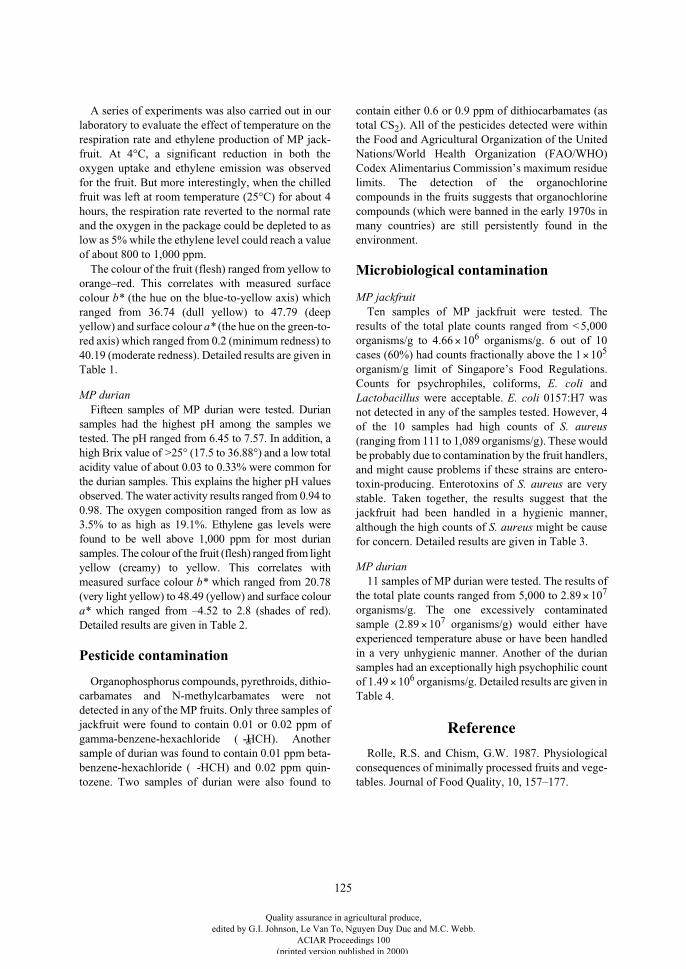
125
A series of experiments was also carried out in ourlaboratory to evaluate the effect of temperature on therespiration rate and ethylene production of MP jack-fruit. At 4°C, a significant reduction in both theoxygen uptake and ethylene emission was observedfor the fruit. But more interestingly, when the chilledfruit was left at room temperature (25°C) for about 4hours, the respiration rate reverted to the normal rateand the oxygen in the package could be depleted to aslow as 5% while the ethylene level could reach a valueof about 800 to 1,000 ppm.
The colour of the fruit (flesh) ranged from yellow toorange–red. This correlates with measured surfacecolour
b*
(the hue on the blue-to-yellow axis) whichranged from 36.74 (dull yellow) to 47.79 (deepyellow) and surface colour
a*
(the hue on the green-to-red axis) which ranged from 0.2 (minimum redness) to40.19 (moderate redness). Detailed results are given inTable 1.
MP durian
Fifteen samples of MP durian were tested. Duriansamples had the highest pH among the samples wetested. The pH ranged from 6.45 to 7.57. In addition, ahigh Brix value of >25° (17.5 to 36.88°) and a low totalacidity value of about 0.03 to 0.33% were common forthe durian samples. This explains the higher pH valuesobserved. The water activity results ranged from 0.94 to0.98. The oxygen composition ranged from as low as3.5% to as high as 19.1%. Ethylene gas levels werefound to be well above 1,000 ppm for most duriansamples. The colour of the fruit (flesh) ranged from lightyellow (creamy) to yellow. This correlates withmeasured surface colour
b*
which ranged from 20.78(very light yellow) to 48.49 (yellow) and surface colour
a*
which ranged from –4.52 to 2.8 (shades of red).Detailed results are given in Table 2.
Pesticide contamination
Organophosphorus compounds, pyrethroids, dithio-carbamates and N-methylcarbamates were notdetected in any of the MP fruits. Only three samples ofjackfruit were found to contain 0.01 or 0.02 ppm ofgamma-benzene-hexachloride (
a
-HCH). Anothersample of durian was found to contain 0.01 ppm beta-benzene-hexachloride (
`
-HCH) and 0.02 ppm quin-tozene. Two samples of durian were also found to
contain either 0.6 or 0.9 ppm of dithiocarbamates (astotal CS
2
). All of the pesticides detected were withinthe Food and Agricultural Organization of the UnitedNations/World Health Organization (FAO/WHO)Codex Alimentarius Commission’s maximum residuelimits. The detection of the organochlorinecompounds in the fruits suggests that organochlorinecompounds (which were banned in the early 1970s inmany countries) are still persistently found in theenvironment.
Microbiological contamination
MP jackfruit
Ten samples of MP jackfruit were tested. Theresults of the total plate counts ranged from < 5,000organisms/g to 4.66
×
10
6
organisms/g. 6 out of 10cases (60%) had counts fractionally above the 1
×
10
5
organism/g limit of Singapore’s Food Regulations.Counts for psychrophiles, coliforms,
E. coli
and
Lactobacillus
were acceptable.
E. coli
0157:H7 wasnot detected in any of the samples tested. However, 4of the 10 samples had high counts of
S. aureus
(ranging from 111 to 1,089 organisms/g). These wouldbe probably due to contamination by the fruit handlers,and might cause problems if these strains are entero-toxin-producing. Enterotoxins of
S. aureus
are verystable. Taken together, the results suggest that thejackfruit had been handled in a hygienic manner,although the high counts of
S. aureus
might be causefor concern. Detailed results are given in Table 3.
MP durian
11 samples of MP durian were tested. The results ofthe total plate counts ranged from 5,000 to 2.89
×
10
7
organisms/g. The one excessively contaminatedsample (2.89
×
10
7
organisms/g) would either haveexperienced temperature abuse or have been handledin a very unhygienic manner. Another of the duriansamples had an exceptionally high psychophilic countof 1.49
×
10
6
organisms/g. Detailed results are given inTable 4.
Reference
Rolle, R.S. and Chism, G.W. 1987. Physiologicalconsequences of minimally processed fruits and vege-tables. Journal of Food Quality, 10, 157–177.
Quality assurance in agricultural produce,edited by G.I. Johnson, Le Van To, Nguyen Duy Duc and M.C. Webb.
ACIAR Proceedings 100(printed version published in 2000)
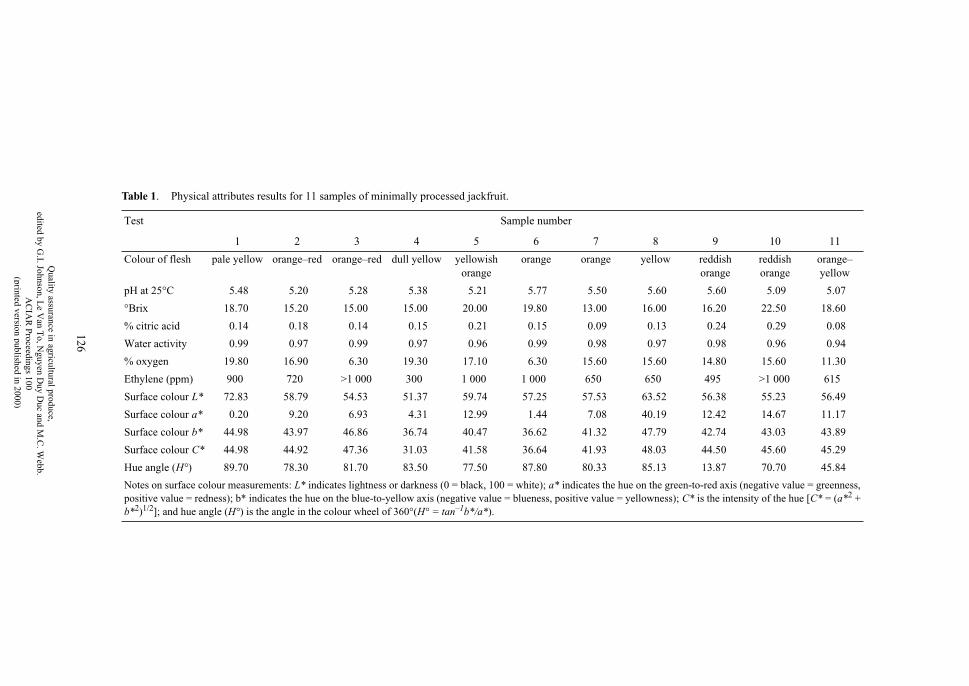
126
Table 1
. Physical attributes results for 11 samples of minimally processed jackfruit.
Test Sample number
1 2 3 4 5 6 7 8 9 10 11
Colour of flesh pale yellow orange–red orange–red dull yellow yellowish orange
orange orange yellow reddish orange
reddish orange
orange–yellow
pH at 25°C 5.48 5.20 5.28 5.38 5.21 5.77 5.50 5.60 5.60 5.09 5.07
°Brix 18.70 15.20 15.00 15.00 20.00 19.80 13.00 16.00 16.20 22.50 18.60
% citric acid 0.14 0.18 0.14 0.15 0.21 0.15 0.09 0.13 0.24 0.29 0.08
Water activity 0.99 0.97 0.99 0.97 0.96 0.99 0.98 0.97 0.98 0.96 0.94
% oxygen 19.80 16.90 6.30 19.30 17.10 6.30 15.60 15.60 14.80 15.60 11.30
Ethylene (ppm) 900 720 >1 000 300 1 000 1 000 650 650 495 >1 000 615
Surface colour
L*
72.83 58.79 54.53 51.37 59.74 57.25 57.53 63.52 56.38 55.23 56.49
Surface colour
a*
0.20 9.20 6.93 4.31 12.99 1.44 7.08 40.19 12.42 14.67 11.17
Surface colour
b*
44.98 43.97 46.86 36.74 40.47 36.62 41.32 47.79 42.74 43.03 43.89
Surface colour
C*
44.98 44.92 47.36 31.03 41.58 36.64 41.93 48.03 44.50 45.60 45.29
Hue angle (
H°
) 89.70 78.30 81.70 83.50 77.50 87.80 80.33 85.13 13.87 70.70 45.84
Notes on surface colour measurements:
L*
indicates lightness or darkness (0 = black, 100 = white);
a*
indicates the hue on the green-to-red axis (negative value = greenness, positive value = redness); b* indicates the hue on the blue-to-yellow axis (negative value = blueness, positive value = yellowness);
C*
is the intensity of the hue [
C*
= (
a*
2
+
b*
2
)
1/2
]; and hue angle (
H°
) is the angle in the colour wheel of 360°(
H° = tan
–1
b*/a*
).
Quality assurance in agricultural produce,
edited by G.I. Johnson, L
e Van T
o, Nguyen D
uy Duc and M
.C. W
ebb.A
CIA
R P
roceedings 100(printed
versionpublished
in2000)
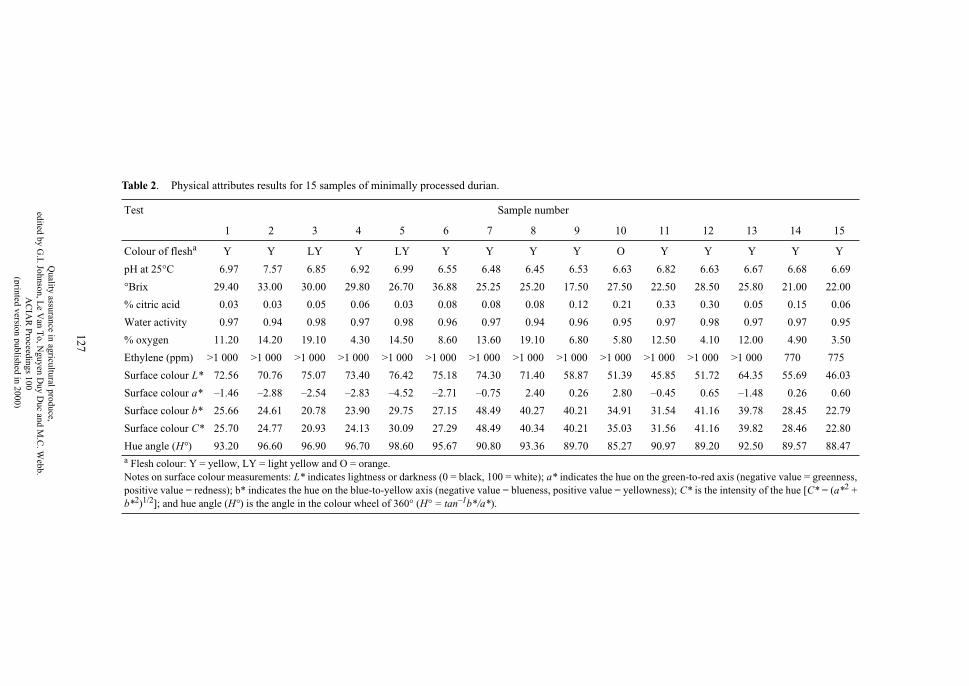
127
Table 2
. Physical attributes results for 15 samples of minimally processed durian.
Test Sample number
1 2 3 4 5 6 7 8 9 10 11 12 13 14 15
Colour of flesh
a
Y Y LY Y LY Y Y Y Y O Y Y Y Y Y
pH at 25°C 6.97 7.57 6.85 6.92 6.99 6.55 6.48 6.45 6.53 6.63 6.82 6.63 6.67 6.68 6.69
°Brix 29.40 33.00 30.00 29.80 26.70 36.88 25.25 25.20 17.50 27.50 22.50 28.50 25.80 21.00 22.00
% citric acid 0.03 0.03 0.05 0.06 0.03 0.08 0.08 0.08 0.12 0.21 0.33 0.30 0.05 0.15 0.06
Water activity 0.97 0.94 0.98 0.97 0.98 0.96 0.97 0.94 0.96 0.95 0.97 0.98 0.97 0.97 0.95
% oxygen 11.20 14.20 19.10 4.30 14.50 8.60 13.60 19.10 6.80 5.80 12.50 4.10 12.00 4.90 3.50
Ethylene (ppm) >1 000 >1 000 >1 000 >1 000 >1 000 >1 000 >1 000 >1 000 >1 000 >1 000 >1 000 >1 000 >1 000 770 775
Surface colour
L*
72.56 70.76 75.07 73.40 76.42 75.18 74.30 71.40 58.87 51.39 45.85 51.72 64.35 55.69 46.03
Surface colour
a*
–1.46 –2.88 –2.54 –2.83 –4.52 –2.71 –0.75 2.40 0.26 2.80 –0.45 0.65 –1.48 0.26 0.60
Surface colour
b*
25.66 24.61 20.78 23.90 29.75 27.15 48.49 40.27 40.21 34.91 31.54 41.16 39.78 28.45 22.79
Surface colour C* 25.70 24.77 20.93 24.13 30.09 27.29 48.49 40.34 40.21 35.03 31.56 41.16 39.82 28.46 22.80
Hue angle (
H°
) 93.20 96.60 96.90 96.70 98.60 95.67 90.80 93.36 89.70 85.27 90.97 89.20 92.50 89.57 88.47
a
Flesh colour: Y = yellow, LY = light yellow and O = orange.Notes on surface colour measurements:
L*
indicates lightness or darkness (0 = black, 100 = white);
a*
indicates the hue on the green-to-red axis (negative value = greenness, positive value = redness); b* indicates the hue on the blue-to-yellow axis (negative value = blueness, positive value = yellowness);
C*
is the intensity of the hue [
C*
= (
a*
2
+
b*
2
)
1/2
]; and hue angle (
H°
) is the angle in the colour wheel of 360° (
H° = tan
–1
b*/a*
).
Quality assurance in agricultural produce,
edited by G.I. Johnson, L
e Van T
o, Nguyen D
uy Duc and M
.C. W
ebb.A
CIA
R P
roceedings 100(printed
versionpublished
in2000)
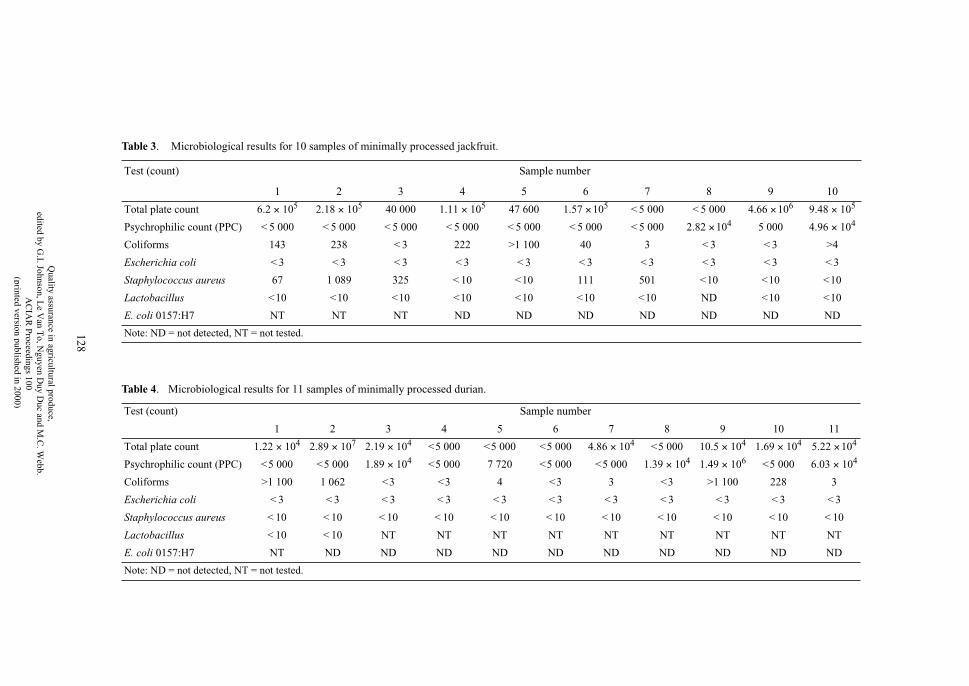
128
Table 3
. Microbiological results for 10 samples of minimally processed jackfruit.
Test (count) Sample number
1 2 3 4 5 6 7 8 9 10
Total plate count 6.2
×
10
5
2.18
×
10
5
40 000 1.11
×
10
5
47 600 1.57
×
10
5
< 5 000 < 5 000 4.66
×
10
6
9.48
×
10
5
Psychrophilic count (PPC) < 5 000 < 5 000 < 5 000 < 5 000 < 5 000 < 5 000 < 5 000 2.82
×
10
4
5 000 4.96
×
10
4
Coliforms 143 238 < 3 222 >1 100 40 3 < 3 < 3 >4
Escherichia coli
< 3 < 3 < 3 < 3 < 3 < 3 < 3 < 3 < 3 < 3
Staphylococcus aureus
67 1 089 325 < 10 <10 111 501 <10 <10 <10
Lactobacillus
<10 <10 <10 <10 <10 <10 <10 ND <10 <10
E. coli
0157:H7 NT NT NT ND ND ND ND ND ND ND
Note: ND = not detected, NT = not tested.
Table 4
. Microbiological results for 11 samples of minimally processed durian.
Test (count)
Sample number
1 2 3 4 5 6 7 8 9 10 11
Total plate count 1.22
×
10
4
2.89
×
10
7
2.19
×
10
4
<5 000 <5 000 <5 000 4.86
×
10
4
<5 000 10.5
×
10
4
1.69
×
104 5.22 × 10⁴
Psychrophilic count (PPC) <5 000 <5 000 1.89 × 10⁴ <5 000 7 720 <5 000 <5 000 1.39 × 10⁴ 1.49 × 10⁶ <5 000 6.03 × 10⁴
Coliforms >1 100 1 062 <3 <3 4 <3 3 <3 >1 100 228 3
Escherichia coli < 3 < 3 < 3 < 3 < 3 < 3 < 3 < 3 < 3 < 3 < 3
Staphylococcus aureus < 10 < 10 < 10 < 10 < 10 < 10 < 10 < 10 < 10 < 10 < 10
Lactobacillus < 10 < 10 NT NT NT NT NT NT NT NT NT
E. coli 0157:H7 NT ND ND ND ND ND ND ND ND ND ND
Note: ND = not detected, NT = not tested.
Quality assurance in agricultural produce,
edited by G.I. Johnson, L
e Van T
o, Nguyen D
uy Duc and M
.C. W
ebb.A
CIA
R P
roceedings 100(printed
versionpublished
in2000)
129
Maturity Indices and Harvesting Practice of ‘Arumanis’ Mango Related to the Target Market
N.O. Tridjaja* and M.S. Mahendra†
Abstract
Mango as a climacteric fruit is frequently harvested when less than fully ripe. This is often necessary to obtainoptimal eating quality at the time of consumption where markets are a considerable distance from the place ofharvest.
In this study the age of fruit was calculated, based on the time of flowering. The orchard selected for the trialswas located in northern part of Bali, Indonesia. The laboratory analyses were carried out at UdayanaUniversity.
The results showed that optimal maturity of ‘Arumanis’ mango for best consumption is when the fruit isharvested 13–14 weeks after flowering. Fruit age has a close relationship with total soluble solids (TSS), totalacidity and pH content. This study found that ‘Arumanis’ mango is best for consumption when the TSS contentof the fruit is not less than 16.8
°
Brix, total acidity 0.18%, pH 4.8, flesh colour rating 6–6.5, and taste score 5.
M
ANGOES
CAN
be classified into two groups based ontheir ability to reproduce from seed: monoembryonicand polyembryonic types. The major commercialcultivars in Indonesia, the Philippines and Thailandare of the polyembryonic type, while in Malaysia andSingapore, a mixture of polyembryonic and monoem-bryonic seeds are extensively grown (Kusumo et al.1984). ‘Arumanis’ mango, which is classified as pol-yembryonic, is considered to have much commercialpotential.
The definition of maturity as ‘the stage of devel-opment giving minimum acceptable quality to theultimate consumer’ implies a need for objectivemeasures of maturity. Indication of maturity is of con-siderable importance during the marketing chain (Reid1985). Mango growers harvest fruit using theirjudgement based on the appearance of the fruit. Con-sequently, fruit harvested by conventional criteria mayexhibit significant variations in both ripening rate and
fruit quality (Kosiyachinda et al. 1984). Therefore,there is a need to find objective measures which can beused to determine fruit maturity in order to determineoptimal harvesting time.
Mango fruit traded commercially are commonlyharvested green. Various methods for determiningmaturity in mango have been proposed, namely,softness of cheeks, peel colour, development ofshoulder, specific gravity, and starch content.However, these methods have found limited com-mercial application since they are mainly applicable tofruit that have reached an advanced degree of ripeness.The objective of this trial was to study the maturityindices and harvesting practice of fresh ‘Arumanis’mango fruit related to the target market.
Materials and Methods
Fruit were obtained from local farmers in the northernpart of Bali island, and the analyses were carried out atthe Analytical Laboratory, Udayana University,Denpasar. Fruit were harvested at six stages ofmaturity at one-week intervals: P1 = harvested 11weeks after fruit set; P2 = harvested 12 weeks afterfruit set; P3 = harvested 13 weeks after fruit set; P4 =harvested 14 weeks after fruit set; P5 = harvested 15
* Postharvest Horticulture Division, Directorate of Farm Agribusiness and Processing Development, Directorate General of Food Crops and Horticulture, Ministry of Agriculture, Jl. Ragunan No. 15 Pasar Minggu 12520, Jakarta, Indonesia.
† Horticulture Section, Department of Agronomy, Faculty of Agriculture, Udayana University, Kampus Bukit Jimbaran, Denpasar, Bali, Indonesia.
Quality assurance in agricultural produce,edited by G.I. Johnson, Le Van To, Nguyen Duy Duc and M.C. Webb.
ACIAR Proceedings 100(printed version published in 2000)
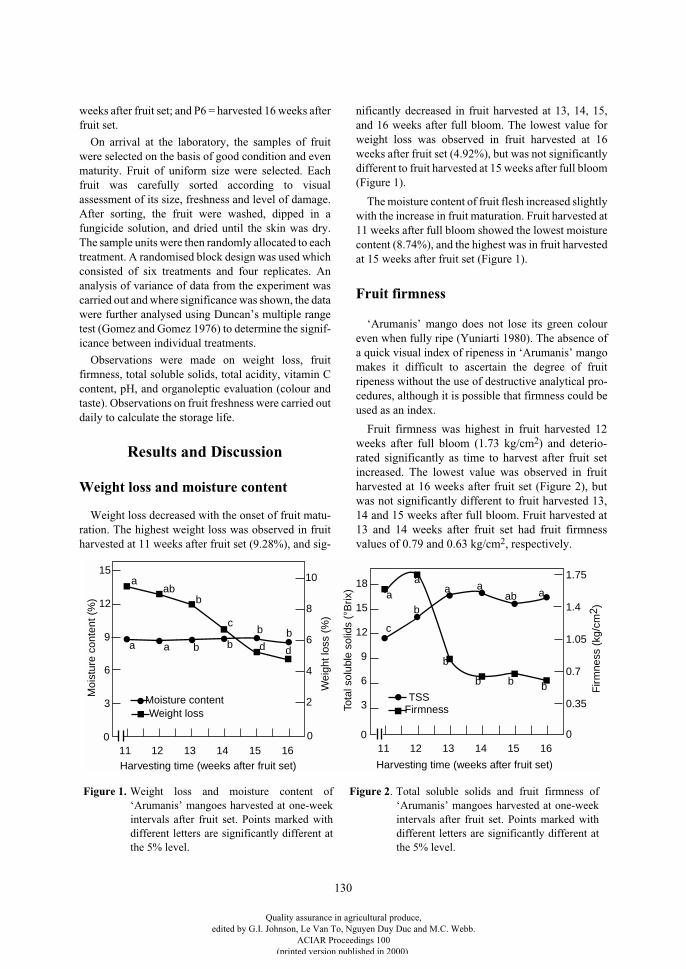
130
weeks after fruit set; and P6 = harvested 16 weeks afterfruit set.
On arrival at the laboratory, the samples of fruitwere selected on the basis of good condition and evenmaturity. Fruit of uniform size were selected. Eachfruit was carefully sorted according to visualassessment of its size, freshness and level of damage.After sorting, the fruit were washed, dipped in afungicide solution, and dried until the skin was dry.The sample units were then randomly allocated to eachtreatment. A randomised block design was used whichconsisted of six treatments and four replicates. Ananalysis of variance of data from the experiment wascarried out and where significance was shown, the datawere further analysed using Duncan’s multiple rangetest (Gomez and Gomez 1976) to determine the signif-icance between individual treatments.
Observations were made on weight loss, fruitfirmness, total soluble solids, total acidity, vitamin Ccontent, pH, and organoleptic evaluation (colour andtaste). Observations on fruit freshness were carried outdaily to calculate the storage life.
Results and Discussion
Weight loss and moisture content
Weight loss decreased with the onset of fruit matu-ration. The highest weight loss was observed in fruitharvested at 11 weeks after fruit set (9.28%), and sig-
nificantly decreased in fruit harvested at 13, 14, 15,and 16 weeks after full bloom. The lowest value forweight loss was observed in fruit harvested at 16weeks after fruit set (4.92%), but was not significantlydifferent to fruit harvested at 15 weeks after full bloom(Figure 1).
The moisture content of fruit flesh increased slightlywith the increase in fruit maturation. Fruit harvested at11 weeks after full bloom showed the lowest moisturecontent (8.74%), and the highest was in fruit harvestedat 15 weeks after fruit set (Figure 1).
Fruit firmness
‘Arumanis’ mango does not lose its green coloureven when fully ripe (Yuniarti 1980). The absence ofa quick visual index of ripeness in ‘Arumanis’ mangomakes it difficult to ascertain the degree of fruitripeness without the use of destructive analytical pro-cedures, although it is possible that firmness could beused as an index.
Fruit firmness was highest in fruit harvested 12weeks after full bloom (1.73 kg/cm
2
) and deterio-rated significantly as time to harvest after fruit setincreased. The lowest value was observed in fruitharvested at 16 weeks after fruit set (Figure 2), butwas not significantly different to fruit harvested 13,14 and 15 weeks after full bloom. Fruit harvested at13 and 14 weeks after fruit set had fruit firmnessvalues of 0.79 and 0.63 kg/cm
2
, respectively.
Harvesting time (weeks after fruit set)11 12 13 14 15 16
00
Harvesting time (weeks after fruit set)
11 12 13 14 15 1600
15
12
9
6
3
Moi
stur
e co
nten
t (%
)
Wei
ght l
oss
(%)
10
8
6
4
2
aab
b
cb b
a a b b d d
Moisture contentWeight loss
aa
b
c
a aab a
b
b b b
1.75
1.4
1.05
0.7
0.35
18
15
12
9
6
3
Fir
mne
ss (
kg/c
m2 )
TSSFirmnessTo
tal s
olub
le s
olid
s (°
Brix
)
Figure 1. Weight loss and moisture content of‘Arumanis’ mangoes harvested at one-weekintervals after fruit set. Points marked withdifferent letters are significantly different atthe 5% level.
Figure 2. Total soluble solids and fruit firmness of‘Arumanis’ mangoes harvested at one-weekintervals after fruit set. Points marked withdifferent letters are significantly different atthe 5% level.
Quality assurance in agricultural produce,edited by G.I. Johnson, Le Van To, Nguyen Duy Duc and M.C. Webb.
ACIAR Proceedings 100(printed version published in 2000)
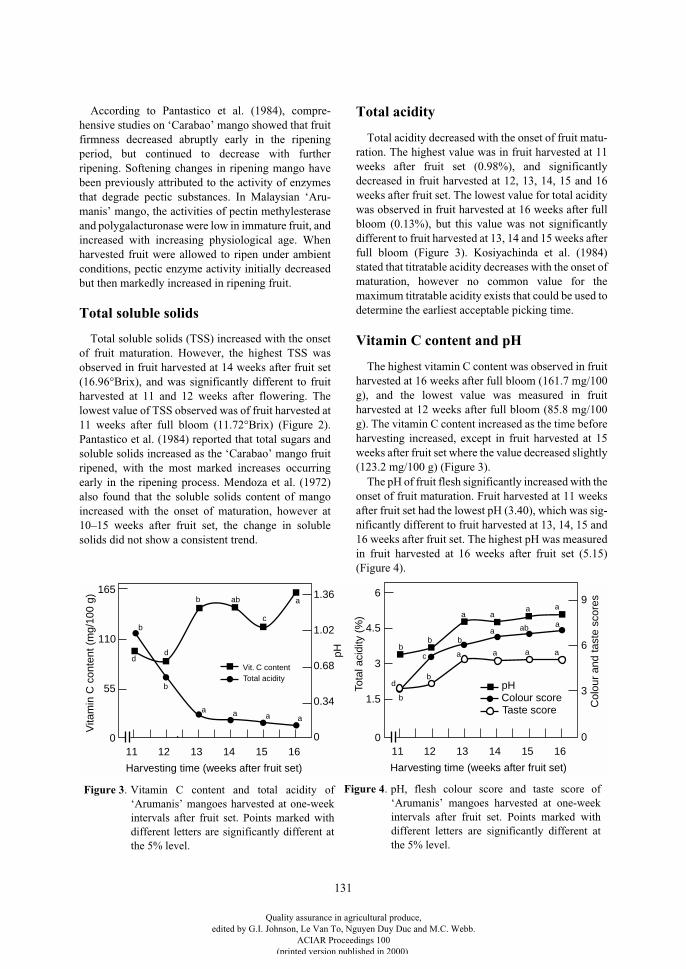
131
According to Pantastico et al. (1984), compre-hensive studies on ‘Carabao’ mango showed that fruitfirmness decreased abruptly early in the ripeningperiod, but continued to decrease with furtherripening. Softening changes in ripening mango havebeen previously attributed to the activity of enzymesthat degrade pectic substances. In Malaysian ‘Aru-manis’ mango, the activities of pectin methylesteraseand polygalacturonase were low in immature fruit, andincreased with increasing physiological age. Whenharvested fruit were allowed to ripen under ambientconditions, pectic enzyme activity initially decreasedbut then markedly increased in ripening fruit.
Total soluble solids
Total soluble solids (TSS) increased with the onsetof fruit maturation. However, the highest TSS wasobserved in fruit harvested at 14 weeks after fruit set(16.96°Brix), and was significantly different to fruitharvested at 11 and 12 weeks after flowering. Thelowest value of TSS observed was of fruit harvested at11 weeks after full bloom (11.72°Brix) (Figure 2).Pantastico et al. (1984) reported that total sugars andsoluble solids increased as the ‘Carabao’ mango fruitripened, with the most marked increases occurringearly in the ripening process. Mendoza et al. (1972)also found that the soluble solids content of mangoincreased with the onset of maturation, however at10–15 weeks after fruit set, the change in solublesolids did not show a consistent trend.
Total acidity
Total acidity decreased with the onset of fruit matu-ration. The highest value was in fruit harvested at 11weeks after fruit set (0.98%), and significantlydecreased in fruit harvested at 12, 13, 14, 15 and 16weeks after fruit set. The lowest value for total aciditywas observed in fruit harvested at 16 weeks after fullbloom (0.13%), but this value was not significantlydifferent to fruit harvested at 13, 14 and 15 weeks afterfull bloom (Figure 3). Kosiyachinda et al. (1984)stated that titratable acidity decreases with the onset ofmaturation, however no common value for themaximum titratable acidity exists that could be used todetermine the earliest acceptable picking time.
Vitamin C content and pH
The highest vitamin C content was observed in fruitharvested at 16 weeks after full bloom (161.7 mg/100g), and the lowest value was measured in fruitharvested at 12 weeks after full bloom (85.8 mg/100g). The vitamin C content increased as the time beforeharvesting increased, except in fruit harvested at 15weeks after fruit set where the value decreased slightly(123.2 mg/100 g) (Figure 3).
The pH of fruit flesh significantly increased with theonset of fruit maturation. Fruit harvested at 11 weeksafter fruit set had the lowest pH (3.40), which was sig-nificantly different to fruit harvested at 13, 14, 15 and16 weeks after fruit set. The highest pH was measuredin fruit harvested at 16 weeks after fruit set (5.15)(Figure 4).
Harvesting time (weeks after fruit set)
11 12 13 14 15 16
1.36
1.02
0.68
0.34
0
165
110
55
0
b
d
b ab
c
a
a a a a
b
dVit. C contentTotal acidity
Harvesting time (weeks after fruit set)
11 12 13 14 15 1600
d
6
4.5
3
1.5
9
6
3
Col
our
and
tast
e sc
ores
pH
Tota
l aci
dity
(%
)
Vita
min
C c
onte
nt (
mg/
100
g)
bb
b
b
a a a a
aabab
c
a aa a
pHColour scoreTaste score
Figure 3. Vitamin C content and total acidity of‘Arumanis’ mangoes harvested at one-weekintervals after fruit set. Points marked withdifferent letters are significantly different atthe 5% level.
Figure 4. pH, flesh colour score and taste score of‘Arumanis’ mangoes harvested at one-weekintervals after fruit set. Points marked withdifferent letters are significantly different atthe 5% level.
Quality assurance in agricultural produce,edited by G.I. Johnson, Le Van To, Nguyen Duy Duc and M.C. Webb.
ACIAR Proceedings 100(printed version published in 2000)
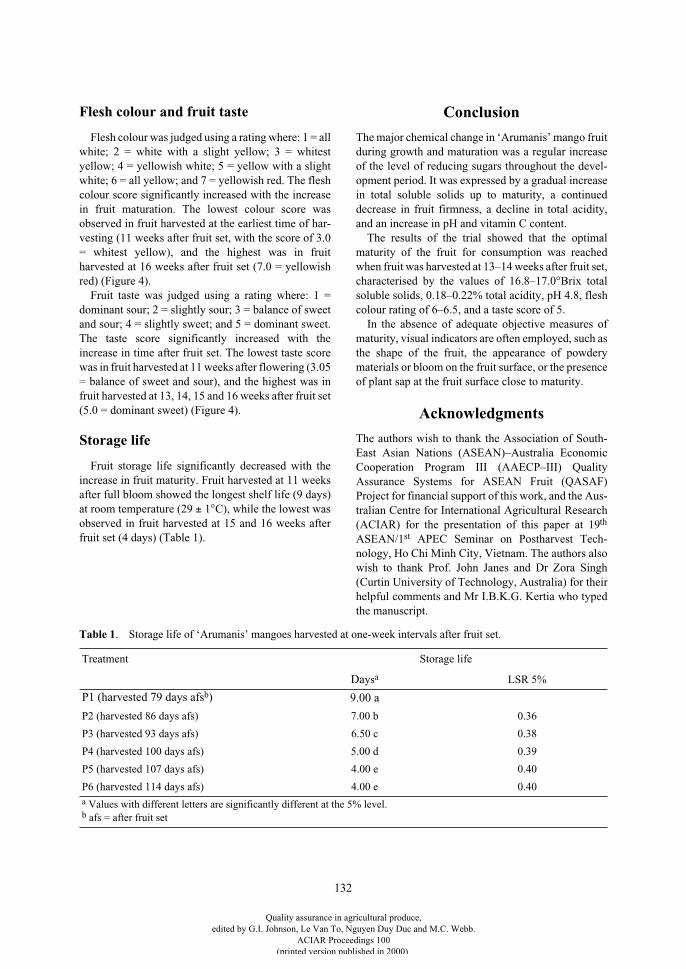
132
Flesh colour and fruit taste
Flesh colour was judged using a rating where: 1 = allwhite; 2 = white with a slight yellow; 3 = whitestyellow; 4 = yellowish white; 5 = yellow with a slightwhite; 6 = all yellow; and 7 = yellowish red. The fleshcolour score significantly increased with the increasein fruit maturation. The lowest colour score wasobserved in fruit harvested at the earliest time of har-vesting (11 weeks after fruit set, with the score of 3.0= whitest yellow), and the highest was in fruitharvested at 16 weeks after fruit set (7.0 = yellowishred) (Figure 4).
Fruit taste was judged using a rating where: 1 =dominant sour; 2 = slightly sour; 3 = balance of sweetand sour; 4 = slightly sweet; and 5 = dominant sweet.The taste score significantly increased with theincrease in time after fruit set. The lowest taste scorewas in fruit harvested at 11 weeks after flowering (3.05= balance of sweet and sour), and the highest was infruit harvested at 13, 14, 15 and 16 weeks after fruit set(5.0 = dominant sweet) (Figure 4).
Storage life
Fruit storage life significantly decreased with theincrease in fruit maturity. Fruit harvested at 11 weeksafter full bloom showed the longest shelf life (9 days)at room temperature (29
±
1
°
C), while the lowest wasobserved in fruit harvested at 15 and 16 weeks afterfruit set (4 days) (Table 1).
Conclusion
The major chemical change in ‘Arumanis’ mango fruitduring growth and maturation was a regular increaseof the level of reducing sugars throughout the devel-opment period. It was expressed by a gradual increasein total soluble solids up to maturity, a continueddecrease in fruit firmness, a decline in total acidity,and an increase in pH and vitamin C content.
The results of the trial showed that the optimalmaturity of the fruit for consumption was reachedwhen fruit was harvested at 13–14 weeks after fruit set,characterised by the values of 16.8–17.0°Brix totalsoluble solids, 0.18–0.22% total acidity, pH 4.8, fleshcolour rating of 6–6.5, and a taste score of 5.
In the absence of adequate objective measures ofmaturity, visual indicators are often employed, such asthe shape of the fruit, the appearance of powderymaterials or bloom on the fruit surface, or the presenceof plant sap at the fruit surface close to maturity.
Acknowledgments
The authors wish to thank the Association of South-East Asian Nations (ASEAN)–Australia EconomicCooperation Program III (AAECP–III) QualityAssurance Systems for ASEAN Fruit (QASAF)Project for financial support of this work, and the Aus-tralian Centre for International Agricultural Research(ACIAR) for the presentation of this paper at 19
th
ASEAN/1
st
APEC Seminar on Postharvest Tech-nology, Ho Chi Minh City, Vietnam. The authors alsowish to thank Prof. John Janes and Dr Zora Singh(Curtin University of Technology, Australia) for theirhelpful comments and Mr I.B.K.G. Kertia who typedthe manuscript.
Table 1
. Storage life of ‘Arumanis’ mangoes harvested at one-week intervals after fruit set.
Treatment Storage life
Days
a
LSR 5%
P1 (harvested 79 days afs
b
) 9.00 a
P2 (harvested 86 days afs) 7.00 b 0.36
P3 (harvested 93 days afs) 6.50 c 0.38
P4 (harvested 100 days afs) 5.00 d 0.39
P5 (harvested 107 days afs) 4.00 e 0.40
P6 (harvested 114 days afs) 4.00 e 0.40
a
Values with different letters are significantly different at the 5% level.
b
afs = after fruit set
Quality assurance in agricultural produce,edited by G.I. Johnson, Le Van To, Nguyen Duy Duc and M.C. Webb.
ACIAR Proceedings 100(printed version published in 2000)
133
References
Gomez, A.A. and Gomez, K.A. 1976. Statistical proceduresfor agricultural research. Los Baños, Philippines, TheInternational Rice Research Institute.
Kosiyachinda, S., Lee, S.K. and Poernomo, S. 1984.Maturity indices for harvesting of mango. In: Mendoza,D.B. Jr and Wills, R.B.H., ed., Mango: fruit development,postharvest physiology and marketing in ASEAN.Malaysia, Association of South-East Asian Nations(ASEAN) Food Handling Bureau, 33–38.
Kusumo, S., Lye, T.T., Vangnai, V., Yong, S.K. andNamuco, L.O. 1984. Commercial mango cultivars inASEAN. In: Mendoza, D.B. Jr and Wills, R.B.H., ed.,Mango: fruit development, postharvest physiology andmarketing in ASEAN. Malaysia, Association of South-East Asian Nations (ASEAN) Food Handling Bureau,12–20.
Mendoza, D.B., Javier, F.B. and Pantastico, E.B. 1972.Physico-chemical studies during growth and maturation
of ‘Carabao’ mango. Animal Husbandry and AgricultureJournal, 7, 33–36.
Pantastico, E.B., Lam, P.F., Ketsa, S., Yuniarti andKosittrakul, M. 1984. Postharvest physiology and storageof mango. In: Mendoza, D.B. Jr and Wills, R.B.H., ed.,Mango: fruit development, postharvest physiology andmarketing in ASEAN. Malaysia, Association of South-East Asian Nations (ASEAN) Food Handling Bureau,39–52.
Reid, M.S. 1985. Product maturation and maturity indices.In: Kader, A.A., Kasmire, R.F., Mitchell, F.G., Reid,M.S., Sommer, N.F. and Thompson, J.F., ed., Postharvesttechnology of horticultural crops. Cooperative Extension,University of California, Division of Agriculture andNatural Resources, USA, 8–11.
Yuniarti 1980. Physico-chemical changes of Arumanismango during storage at ambient temperature. BulletinPenelitian Horticultura, 8, 11–12.
Quality assurance in agricultural produce,edited by G.I. Johnson, Le Van To, Nguyen Duy Duc and M.C. Webb.
ACIAR Proceedings 100(printed version published in 2000)
134
Quality Assurance Implementation in Practice: Thailand’s Experience with Fresh Longan
for Export
Sing Ching Tongdee*
Abstract
Since the introduction of the use of SO
2
fumigation treatment to extend the shelf life of fresh longan fruit inThailand in 1988, SO
2
residues have been the single most important issue in the trade of fresh longan. A qualitycontrol system addressing residue levels of the treated fruit was a part of the SO
2
fumigation technologicaltransfer package recently introduced in Thailand. Intensified efforts to monitor the fumigation process wereinitiated three years ago as a crisis management strategy to counter restrictions on the export of Thai freshlongan imposed by the Singapore Government because of the SO
2
residue problem. The initial focus for longanquality control was based on Good Manufacturing Practice (GMP) and Hazard Analysis and Critical ControlPoints (HACCP). HACCP implementation requires the cooperation of government organisations and thecommitment of the private sector. For this, a HACCP implementation model was designed. The action planincluded: first, to learn; second, to commit; and thirdly, to do. The quality improvement process continuesthrough ongoing improvement. The model has been tested and applied in Thailand for the fresh fruit exportindustry. A quality management system with a consumer and integrated business focus is now underway inview of changing market situations. The fresh fruit and vegetable industry is unique in many respects andadoption of quality management systems originally developed for the manufacturing industry presented a bigchallenge, especially in developing country situations. Some of the factors influencing the speed and successof the implementation of quality assurance systems for fresh produce in Thailand are summarised.
F
RESH
fruit and vegetable handlers have traditionallyregulated their own actions with regard to producequality, standards, and safety. However, there havebeen increased incidences and complications of food-borne illnesses and chemical contamination associatedwith fresh produce. New food hygiene standards havebeen proposed and enforced to ensure that food is safeto consume. Rules and regulations have been amendedto ensure that imported foods are of equal quality tothose produced in the consumer countries, especiallyin matters concerning produce safety.
There has also been a change in consumer attitudeover the past three decades resulting in a shift in‘quality’ perception toward food. Food must simulta-neously meet all safety, quality and legalrequirements.
New Regulatory Trends in the Export of Fresh Produce
In view of increasing liberation and reform of inter-national agricultural trade, the latest scientific andregulatory thinking on the control of perishableproduce is toward a harmonised and mutually recog-nised international norm that the industry can followrather than having to deal with the specific require-ments of respective importing countries. TheAgreement on the Application of Sanitary and Phy-tosanitary Measures (SPS Agreement) was accepted asone of the basic rules for international food trade. TheSPS Agreement encourages members to establish theirprotection measures based on standards/guidelinesdeveloped by intergovernmental organisations such asthe Food and Agricultural Organization of the UnitedNations/World Health Organization (FAO/WHO)Codex Alimentarius Commission, the Office Interna-
* Postharvest Technology Department, Thailand Institute of Scientific and Technological Research, 196 Phaholy-othin Rd, Chatuchak, Bangkok 10900, Thailand.
Quality assurance in agricultural produce,edited by G.I. Johnson, Le Van To, Nguyen Duy Duc and M.C. Webb.
ACIAR Proceedings 100(printed version published in 2000)
135
tional de Epizooties and the FAO International PlantProtection Convention (IPPC). Exporters/importersneed to understand the implications of these interna-tional standards and requirements.
While the SPS Agreement is a legal text, thestandards are not legally binding. Member countriesneed to develop national standards or codes of practiceand to incorporate these practices into operational pro-cedures to suit each specific situation. Countries/industries also need to find feasible implementationmechanisms and this has been one of the major chal-lenges. Many countries, especially developingcountries, have found themselves at a crossroad andill-prepared to face the measures required by the newlyestablished regulations.
The Changing Concept and Changing Ways
Quality was controlled, in the past, by technicianscarrying out testing and analysis of the final product.With increasing competitiveness in the global market,the new ‘quality’ concept is to provide consumer sat-isfaction or even to exceed consumer expectations.The new multidimensional quality concept alsoreflects a change away from compliance with grades/standards with emphasis on final product control/inspection to a concept of assessing productionprocesses or system performance.
Quality is no longer just technology but man-agement. Quality assurance (QA) is an analytical,scientific, preventive and systematic assessmentinvolving the participation of all concerned stake-holders. Quality management is a value-addingprocess and is achieved through three steps: (1) decideupon the appropriate level of quality or value; (2)provide the means to achieve the desired level ofquality; and (3) communicate the value of the achievedlevel of quality. Many—both importing and exportingcountries—remain uncertain of the new systematicapproach. This is considered one of the majorobstacles in implementing quality systems.
Quality Management Systems for Fresh Produce and their
Implementation in Thailand
Examples of quality management system optionsfor horticultural crops include Good Agricultural (orManufacturing) Practice (GAP or GMP), HazardAnalysis and Critical Control Points (HACCP), ISO
9000 series, and ISO 14000. The choice of qualitymanagement systems varies with the specific qualitylevel required, the type of produce and possiblehazards, the operator’s specific business objective(focus) and the quality maturity of the operator and theindustry. This requires careful planning in order tohave the proper balance and to be achievable, espe-cially in a developing country situation. While thereare no regulatory programs as yet, QA measures—especially for the fresh-cut industry—have been inoperation in many countries for some time.
The fresh fruit and vegetable industry is unique inmany respects. Most operations remain an extensionof the domestic market—small scale and family run.From farm to table, the handling chains consist of frag-mented and highly individualised sectors, andconflicts of interest are common. The produce isseasonal and perishable, and produce quality is largelyinfluenced by the skill (and even luck) of the operators.The major challenge is how to adapt the quality man-agement systems originally used in the manufacturingindustry for use in the fresh produce industry.
Some of the factors influencing the speed andsuccess of QA adoption in Thailand are as follows:• The influence of policy and role of governments—
both of the exporting and importing countries. Lackof understanding or reluctance to agree oninternational/regional cooperation regardingequivalence and mutual recognition of rules andregulations in a legal context.
• In a QA system, the exporting countries may placeemphasis on process performance, while theimporting countries have little confidence in themonitoring process carried out by the exportingcountries. There is confusion as to whether to assessthe process performance carried out in the exportingcountry, or to assess the final product after it arrivesin the importing country.
• Lack of understanding of QA systems for perishableproduce results in difficulties in selecting a feasibleand suitable quality management system. The needto meet the legal, quality, and safety requirementsdiffers for different produce—greater significanceis placed on some particular aspects in somesituations, and requirements can be subject tochange. Decisions on the type (or combination oftypes) of QA system to be used are not always clear.For the most part, the operator cannot fullyunderstand the detail and the complexity (or ease) ofa specific quality system, the choice of anappropriate system, and priority activities to beundertaken.
Quality assurance in agricultural produce,edited by G.I. Johnson, Le Van To, Nguyen Duy Duc and M.C. Webb.
ACIAR Proceedings 100(printed version published in 2000)
136
• Lack of cooperation between governmentorganisations, government–private sectors, andbetween private sectors.
• QA is new idea for the fresh produce industry and ittakes time for the concept to spread and be adoptedby its target users. The most important influencingfactors are:- the policies, commitment, readiness, business
objectives and quality maturity of the oper-ators;
- the attitude of the operators toward an inno-vative approach;
- the nature of the industry, in that it mainlyconsists of small, family-run operations withthe long-held view of exports as an extensionof the domestic market;
- influence of stakeholders’ characteristics—given that different stakeholders be highlyindividualised, may not be closely linked toone another, may have conflicting interests andmay lack a common objective. Each partici-pating sector needs to define and develop itsown quality indicators and the sum of the partsthen form the total system;
- there is lack of peer pressure to participate in aQA scheme;
- there are difficulties with the hard agonisingcomplex confusing paperwork (HACCP);
- there is a lack of training for trainers;- there is no competent authorised body to
undertake a QA advisory/inspection service;- training activities need to be decentralised; - the responsibility for training staff on the
quality system and procedures lies with theoperator; and
- QA is perceived as financial burden by most.
Thailand’s Experience with QA of Longan for Export
Longan is now one of the largest export items, in valueterms, of the Thai horticultural industry. Majormarkets lie mainly in the region. There has been arapid expansion in export in recent years to supply thevast and newly opened markets in China. Together,China and Hong Kong account for more than 80% ofexports. Export of fresh longan to Singapore currentlyrepresents less than 10% of total exports.
For export, SO
2
fumigation treatment to extend theshelf life of the longan fruit has become a commonpractice in Thailand. However, there has been
increasing consumer concern in the importingcountries over the SO
2
residues associated withfumigated fruit. In 1996, the Singapore Governmentimposed a strict limit of zero SO
2
residue tolerance inthe aril of the fruit. This has had a dramatic effect onfresh longan exported to Singapore and ripplingeffects on fresh longan exports in general. Manyexporters have voluntarily participated in the GoodFumigation Practice and HACCP schemes.
As a result of this experience with longan, a con-ceptual QA implementation model was designed.Chronologically, the QA implementation model-testing period included the following activities:
(1) The level of value required was designed:GMP and HACCP were proposed.
• Basic requirements were identified. The scope ofthe objectives/standards was defined to meet legal,safety and quality requirements. A written manualon Good Fumigation Practice was used as theoperational standard for SO
2
fumigation for freshlongan. This was a part of the SO
2
fumigationtechnology transfer package given to the exporters.
• Data collection phase. Data from 1995 to 1998 werecollected from more than 20 exporters in Thailandto set fumigation performance standards and SO
2
residue levels in the fumigated fruit. The LonganExporters Quality Assurance Club, established in1993, served as contact point for such activities.
• A gap analysis was undertaken by assessing thegaps/performance of practices in Thailand againstthe requirements of the Codex regulations and theimporting countries.
• A ‘process control plan’ during SO
2
fumigationtreatment was developed. Final product qualitycontrol for residue testing was only required as ameans of monitoring and verification in an overallprogram.Verification of the ‘process control plan’ was con-
ducted, including monitoring of air SO
2
concentrations during the fumigation process andresidue levels in the fruit.
(2) The desired value was provided by: ‘to learn’,‘to commit’, and ‘to do or to adopt’.
• The ‘to learn’ phase. To teach people what GMPand HACCP are. The Thailand Institute ofScientific and Technological Research (TISTR)organised a series of HACCP training courses fordifferent target groups including project staff,growers, exporters and fumigators-in-chargecovering different levels of topics, including
Quality assurance in agricultural produce,edited by G.I. Johnson, Le Van To, Nguyen Duy Duc and M.C. Webb.
ACIAR Proceedings 100(printed version published in 2000)
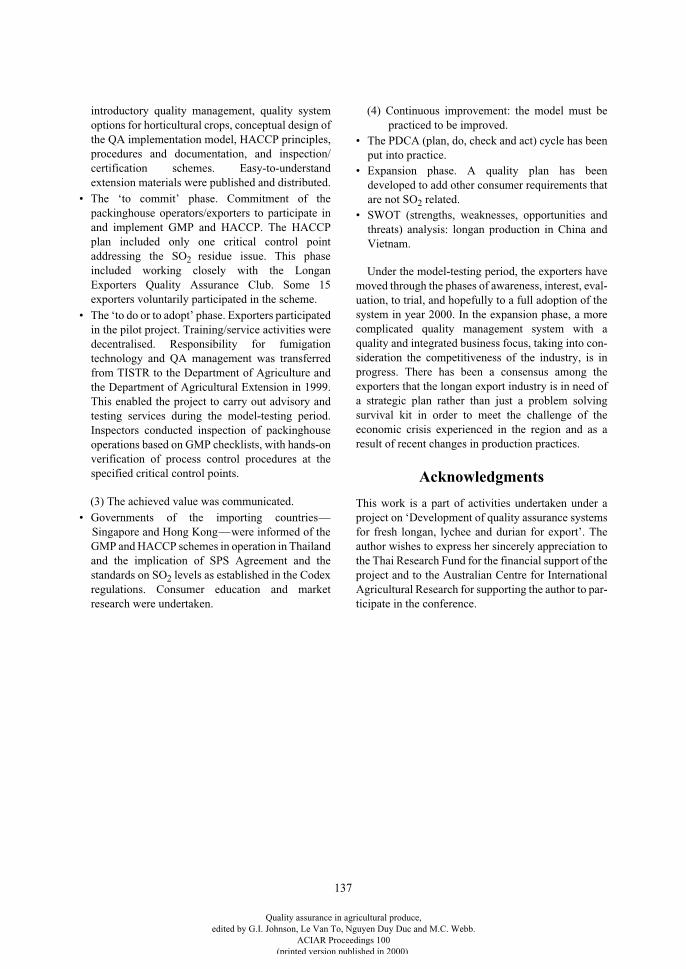
137
introductory quality management, quality systemoptions for horticultural crops, conceptual design ofthe QA implementation model, HACCP principles,procedures and documentation, and inspection/certification schemes. Easy-to-understandextension materials were published and distributed.
• The ‘to commit’ phase. Commitment of thepackinghouse operators/exporters to participate inand implement GMP and HACCP. The HACCPplan included only one critical control pointaddressing the SO
2
residue issue. This phaseincluded working closely with the LonganExporters Quality Assurance Club. Some 15exporters voluntarily participated in the scheme.
• The ‘to do or to adopt’ phase. Exporters participatedin the pilot project. Training/service activities weredecentralised. Responsibility for fumigationtechnology and QA management was transferredfrom TISTR to the Department of Agriculture andthe Department of Agricultural Extension in 1999.This enabled the project to carry out advisory andtesting services during the model-testing period.Inspectors conducted inspection of packinghouseoperations based on GMP checklists, with hands-onverification of process control procedures at thespecified critical control points.
(3) The achieved value was communicated.
• Governments of the importing countries—Singapore and Hong Kong—were informed of theGMP and HACCP schemes in operation in Thailandand the implication of SPS Agreement and thestandards on SO
2
levels as established in the Codexregulations. Consumer education and marketresearch were undertaken.
(4) Continuous improvement: the model must bepracticed to be improved.
• The PDCA (plan, do, check and act) cycle has beenput into practice.
• Expansion phase. A quality plan has beendeveloped to add other consumer requirements thatare not SO
2
related.• SWOT (strengths, weaknesses, opportunities and
threats) analysis: longan production in China andVietnam.
Under the model-testing period, the exporters havemoved through the phases of awareness, interest, eval-uation, to trial, and hopefully to a full adoption of thesystem in year 2000. In the expansion phase, a morecomplicated quality management system with aquality and integrated business focus, taking into con-sideration the competitiveness of the industry, is inprogress. There has been a consensus among theexporters that the longan export industry is in need ofa strategic plan rather than just a problem solvingsurvival kit in order to meet the challenge of theeconomic crisis experienced in the region and as aresult of recent changes in production practices.
Acknowledgments
This work is a part of activities undertaken under aproject on ‘Development of quality assurance systemsfor fresh longan, lychee and durian for export’. Theauthor wishes to express her sincerely appreciation tothe Thai Research Fund for the financial support of theproject and to the Australian Centre for InternationalAgricultural Research for supporting the author to par-ticipate in the conference.
Quality assurance in agricultural produce,edited by G.I. Johnson, Le Van To, Nguyen Duy Duc and M.C. Webb.
ACIAR Proceedings 100(printed version published in 2000)
138
Study on a Postharvest Handling System for Lychee
Nguyen Cong Hoan*, Nguyen Kim Vu*, Bui Huy Thanh*, Bach Van Nghe*, Dang Xuan Mai*, Le Thi Sau*, Hoang Kim Phuong*, Le Huu Hieu*,
Nguyen Tien Khuong* and Nguyen Duy Lam†
Abstract
Lychee is often grown in the northern mountain region of Vietnam. Recently, it has not been possible to exportVietnamese lychee because of the lack of an efficient and adaptable postharvest handling system.
This report presents the technological analysis of the lychee handling system of the Post-Harvest TechnologyInstitute (PHTI). New technology suitable for Vietnamese production conditions was developed in order tomaintain quality and prolong the shelf life of ‘Thieu’ lychee and includes harvesting, transportation, handling,packaging, and storage at normal and low temperatures.
Long postharvest life and good commercial quality can be achieved by using integrated measures, such asSO
2
fumigation, carbendazim (CBZ) dipping and‘ethylene trapping’ using a ripening retardant developed byPHTI called ‘R3’.
I
N
V
IETNAM
, three cultivars of lychee (
Litchichinensis
Sonn.) are grown as economic fruit crops —‘Thieu’, ‘Lai’ and ‘Chua’—with ‘Thieu’ being themost important. Lychee is mainly grown in threezones—Luc Ngan (Bac Giang Province—see Figure1), Thanh Ha (Hai Duong Province) and Dong Trieu(Quang Ninh Province). Lychee production isincreasing rapidly (20–50%) each year. The pro-duction in 1999 was about 20,000 t and is expected toreach 70,000 t in 2003.
A lot of research has been undertaken into pro-longing the shelf life of lychee under normaltemperatures and under cool conditions, in order tocope with high production during the picking seasonand to allow distribution of produce to distant areas.However, up to now, the exportation of fresh lycheehas been unstable because of the lack of an adaptableand efficient postharvest handling system.
Lychee often deteriorates quickly after harvest,especially through discoloration. However, if storedunder cooled conditions, its quality can be maintained
for a week. When the pericarp of lychee has browned,its commercial quality is decreased. Following this,desiccation, black lesions, stem loss, mould etc. occurand finally the fruit is completely spoiled.
We have adopted some of the practices developedthrough the experiences of Thailand, South Africa,Australia, Madagascar, France, Israel etc., such as SO
2
treatment (Duvenhage 1993; Coates et al. 1994; Paullet al. 1995; Holcroft and Mitcham 1996), fungicidedipping (Sittigul et al. 1994; Coates et al. 1995), andcontrolled atmosphere storage and modified atmos-phere storage (Holcroft and Mitcham 1996).
Since 1997, the Post-Harvest Technology Institute(PHTI) has systematically extended the study on thelychee postharvest handling system and assessment ofraw material resources in all three zones (Luc Ngan,Thanh Ha and Dong Trieu) and determination oftechnical measurements from harvesting to retailing—including storage at ambient temperatures (15–39°Cin summer) and at low temperatures (4–6°C). Theamounts of fruit used in the study ranged from a bag’sweight (1–5 kg) to a truck’s quantity (5–10 t).
An important requirement is that the technicalsystem has to be simple and easily applied in ruralareas of Vietnam where the level of development isstill low.
* Post-Harvest Technology Institute, 4 Ngo Quyen, Hanoi, Vietnam.
† Centre of Radiation, Research Institute of Atomic Energy,Vietnam.
Quality assurance in agricultural produce,edited by G.I. Johnson, Le Van To, Nguyen Duy Duc and M.C. Webb.
ACIAR Proceedings 100(printed version published in 2000)
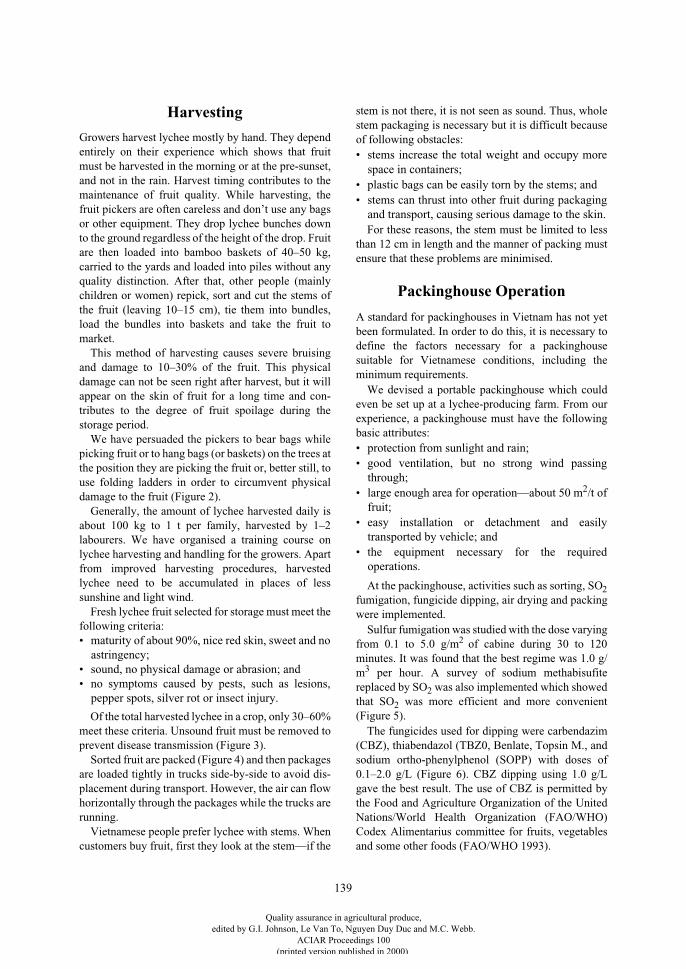
139
Harvesting
Growers harvest lychee mostly by hand. They dependentirely on their experience which shows that fruitmust be harvested in the morning or at the pre-sunset,and not in the rain. Harvest timing contributes to themaintenance of fruit quality. While harvesting, thefruit pickers are often careless and don’t use any bagsor other equipment. They drop lychee bunches downto the ground regardless of the height of the drop. Fruitare then loaded into bamboo baskets of 40–50 kg,carried to the yards and loaded into piles without anyquality distinction. After that, other people (mainlychildren or women) repick, sort and cut the stems ofthe fruit (leaving 10–15 cm), tie them into bundles,load the bundles into baskets and take the fruit tomarket.
This method of harvesting causes severe bruisingand damage to 10–30% of the fruit. This physicaldamage can not be seen right after harvest, but it willappear on the skin of fruit for a long time and con-tributes to the degree of fruit spoilage during thestorage period.
We have persuaded the pickers to bear bags whilepicking fruit or to hang bags (or baskets) on the trees atthe position they are picking the fruit or, better still, touse folding ladders in order to circumvent physicaldamage to the fruit (Figure 2).
Generally, the amount of lychee harvested daily isabout 100 kg to 1 t per family, harvested by 1–2labourers. We have organised a training course onlychee harvesting and handling for the growers. Apartfrom improved harvesting procedures, harvestedlychee need to be accumulated in places of lesssunshine and light wind.
Fresh lychee fruit selected for storage must meet thefollowing criteria:• maturity of about 90%, nice red skin, sweet and no
astringency;• sound, no physical damage or abrasion; and• no symptoms caused by pests, such as lesions,
pepper spots, silver rot or insect injury.
Of the total harvested lychee in a crop, only 30–60%meet these criteria. Unsound fruit must be removed toprevent disease transmission (Figure 3).
Sorted fruit are packed (Figure 4) and then packagesare loaded tightly in trucks side-by-side to avoid dis-placement during transport. However, the air can flowhorizontally through the packages while the trucks arerunning.
Vietnamese people prefer lychee with stems. Whencustomers buy fruit, first they look at the stem—if the
stem is not there, it is not seen as sound. Thus, wholestem packaging is necessary but it is difficult becauseof following obstacles:• stems increase the total weight and occupy more
space in containers;• plastic bags can be easily torn by the stems; and• stems can thrust into other fruit during packaging
and transport, causing serious damage to the skin.For these reasons, the stem must be limited to less
than 12 cm in length and the manner of packing mustensure that these problems are minimised.
Packinghouse Operation
A standard for packinghouses in Vietnam has not yetbeen formulated. In order to do this, it is necessary todefine the factors necessary for a packinghousesuitable for Vietnamese conditions, including theminimum requirements.
We devised a portable packinghouse which couldeven be set up at a lychee-producing farm. From ourexperience, a packinghouse must have the followingbasic attributes:• protection from sunlight and rain;• good ventilation, but no strong wind passing
through;• large enough area for operation—about 50 m
2
/t offruit;
• easy installation or detachment and easilytransported by vehicle; and
• the equipment necessary for the requiredoperations.
At the packinghouse, activities such as sorting, SO
2
fumigation, fungicide dipping, air drying and packingwere implemented.
Sulfur fumigation was studied with the dose varyingfrom 0.1 to 5.0 g/m
2
of cabine during 30 to 120minutes. It was found that the best regime was 1.0 g/m
3
per hour. A survey of sodium methabisufitereplaced by SO
2
was also implemented which showedthat SO
2
was more efficient and more convenient(Figure 5).
The fungicides used for dipping were carbendazim(CBZ), thiabendazol (TBZ0, Benlate, Topsin M., andsodium ortho-phenylphenol (SOPP) with doses of0.1–2.0 g/L (Figure 6). CBZ dipping using 1.0 g/Lgave the best result. The use of CBZ is permitted bythe Food and Agriculture Organization of the UnitedNations/World Health Organization (FAO/WHO)Codex Alimentarius committee for fruits, vegetablesand some other foods (FAO/WHO 1993).
Quality assurance in agricultural produce,edited by G.I. Johnson, Le Van To, Nguyen Duy Duc and M.C. Webb.
ACIAR Proceedings 100(printed version published in 2000)
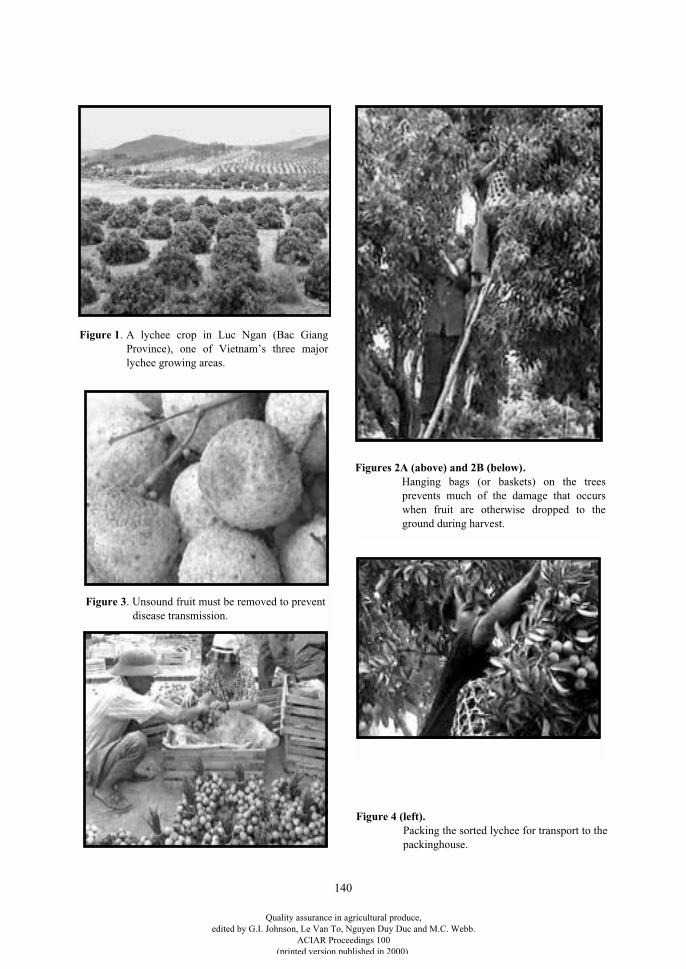
140
Figure 1. A lychee crop in Luc Ngan (Bac GiangProvince), one of Vietnam’s three majorlychee growing areas.
Figures 2A (above) and 2B (below).Hanging bags (or baskets) on the treesprevents much of the damage that occurswhen fruit are otherwise dropped to theground during harvest.
Figure 3. Unsound fruit must be removed to preventdisease transmission.
Figure 4 (left).
Packing the sorted lychee for transport to thepackinghouse.
Quality assurance in agricultural produce,edited by G.I. Johnson, Le Van To, Nguyen Duy Duc and M.C. Webb.
ACIAR Proceedings 100(printed version published in 2000)
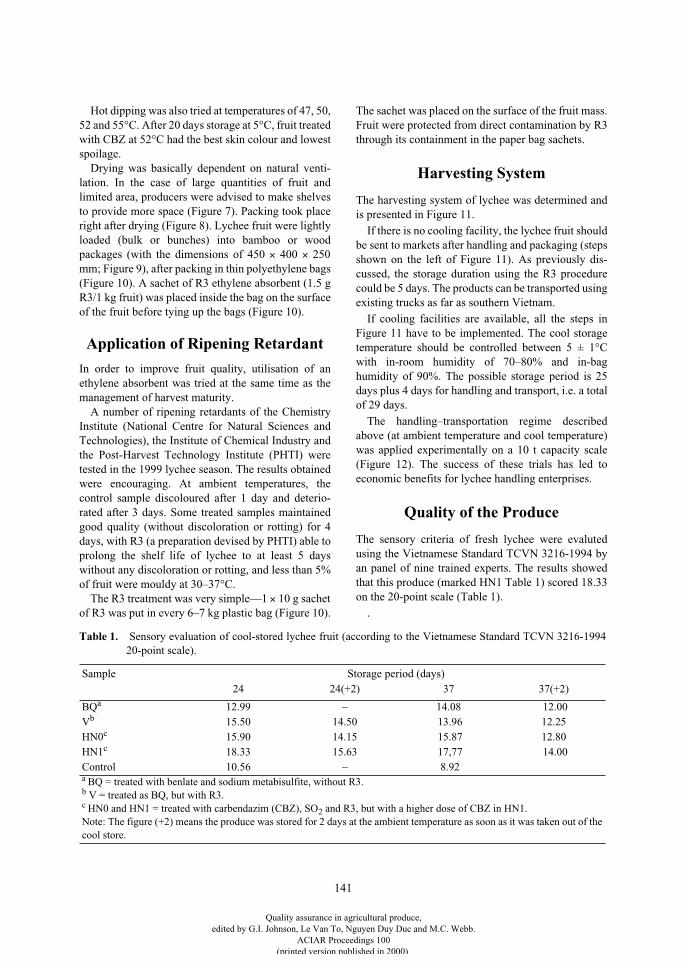
141
Hot dipping was also tried at temperatures of 47, 50,52 and 55°C. After 20 days storage at 5°C, fruit treatedwith CBZ at 52°C had the best skin colour and lowestspoilage.
Drying was basically dependent on natural venti-lation. In the case of large quantities of fruit andlimited area, producers were advised to make shelvesto provide more space (Figure 7). Packing took placeright after drying (Figure 8). Lychee fruit were lightlyloaded (bulk or bunches) into bamboo or woodpackages (with the dimensions of 450
×
400
×
250mm; Figure 9), after packing in thin polyethylene bags(Figure 10). A sachet of R3 ethylene absorbent (1.5 gR3/1 kg fruit) was placed inside the bag on the surfaceof the fruit before tying up the bags (Figure 10).
Application of Ripening Retardant
In order to improve fruit quality, utilisation of anethylene absorbent was tried at the same time as themanagement of harvest maturity.
A number of ripening retardants of the ChemistryInstitute (National Centre for Natural Sciences andTechnologies), the Institute of Chemical Industry andthe Post-Harvest Technology Institute (PHTI) weretested in the 1999 lychee season. The results obtainedwere encouraging. At ambient temperatures, thecontrol sample discoloured after 1 day and deterio-rated after 3 days. Some treated samples maintainedgood quality (without discoloration or rotting) for 4days, with R3 (a preparation devised by PHTI) able toprolong the shelf life of lychee to at least 5 dayswithout any discoloration or rotting, and less than 5%of fruit were mouldy at 30–37°C.
The R3 treatment was very simple—1
×
10 g sachetof R3 was put in every 6–7 kg plastic bag (Figure 10).
The sachet was placed on the surface of the fruit mass.Fruit were protected from direct contamination by R3through its containment in the paper bag sachets.
Harvesting System
The harvesting system of lychee was determined andis presented in Figure 11.
If there is no cooling facility, the lychee fruit shouldbe sent to markets after handling and packaging (stepsshown on the left of Figure 11). As previously dis-cussed, the storage duration using the R3 procedurecould be 5 days. The products can be transported usingexisting trucks as far as southern Vietnam.
If cooling facilities are available, all the steps inFigure 11 have to be implemented. The cool storagetemperature should be controlled between 5 ± 1°Cwith in-room humidity of 70–80% and in-baghumidity of 90%. The possible storage period is 25days plus 4 days for handling and transport, i.e. a totalof 29 days.
The handling–transportation regime describedabove (at ambient temperature and cool temperature)was applied experimentally on a 10 t capacity scale(Figure 12). The success of these trials has led toeconomic benefits for lychee handling enterprises.
Quality of the Produce
The sensory criteria of fresh lychee were evalutedusing the Vietnamese Standard TCVN 3216-1994 byan panel of nine trained experts. The results showedthat this produce (marked HN1 Table 1) scored 18.33on the 20-point scale (Table 1).
.
Table 1.
Sensory evaluation of cool-stored lychee fruit (according to the Vietnamese Standard TCVN 3216-199420-point scale).
Sample Storage period (days)
24 24(+2) 37 37(+2)
BQ
a
12.99 – 14.08 12.00V
b
15.50 14.50 13.96 12.25HN0
c
15.90 14.15 15.87 12.80HN1
c
18.33 15.63 17,77 14.00Control 10.56 – 8.92
a
BQ = treated with benlate and sodium metabisulfite, without R3.
b
V = treated as BQ, but with R3.
c
HN0 and HN1 = treated with carbendazim (CBZ), SO
2
and R3, but with a higher dose of CBZ in HN1.Note: The figure (+2) means the produce was stored for 2 days at the ambient temperature as soon as it was taken out of the cool store.
Quality assurance in agricultural produce,edited by G.I. Johnson, Le Van To, Nguyen Duy Duc and M.C. Webb.
ACIAR Proceedings 100(printed version published in 2000)
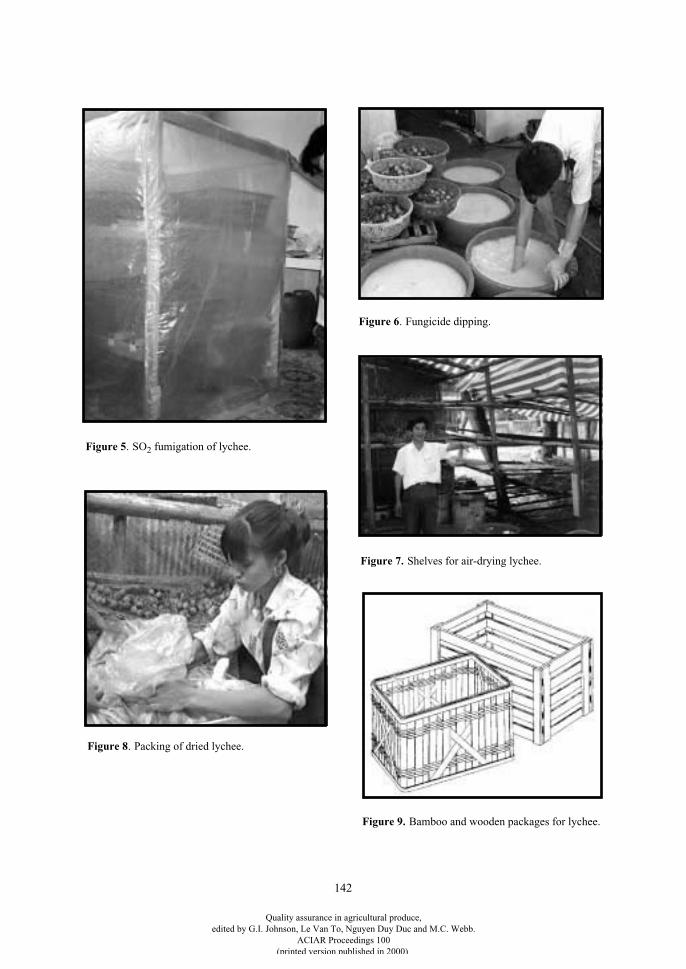
142
Figure 6
. Fungicide dipping.
Figure 5
. SO
2
fumigation of lychee.
Figure 7.
Shelves for air-drying lychee.
Figure 8
. Packing of dried lychee.
Figure 9.
Bamboo and wooden packages for lychee.
Quality assurance in agricultural produce,edited by G.I. Johnson, Le Van To, Nguyen Duy Duc and M.C. Webb.
ACIAR Proceedings 100(printed version published in 2000)
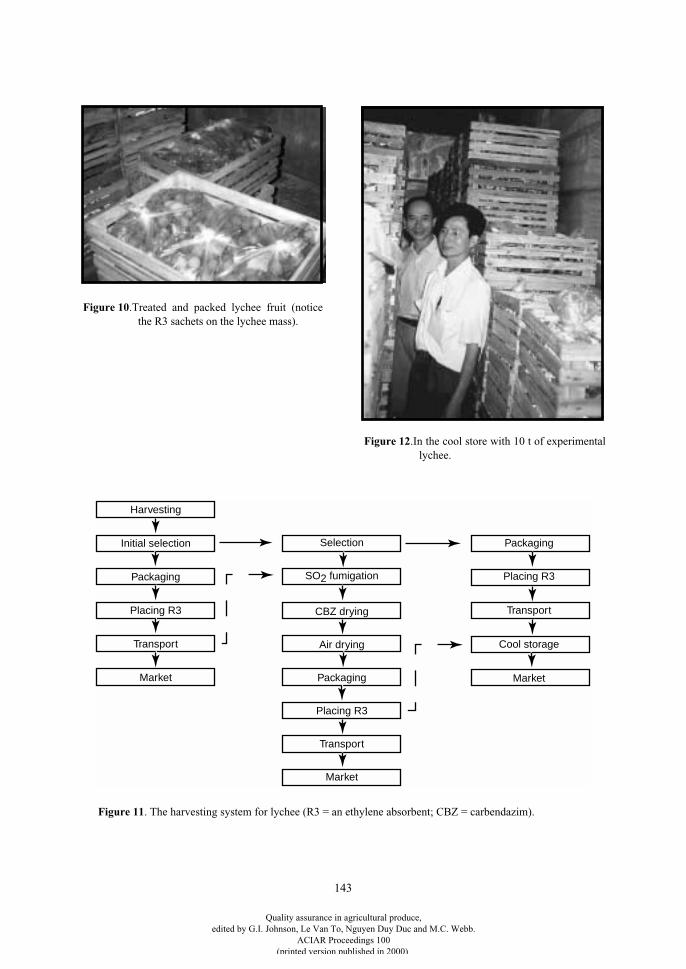
143
Figure 12
.In the cool store with 10 t of experimentallychee.
Harvesting
Initial selection
Packaging
Placing R3
Transport
Market
Selection
SO2 fumigation
CBZ drying
Air drying
Packaging
Placing R3
Transport
Market
Packaging
Placing R3
Transport
Cool storage
Market
Figure 11
. The harvesting system for lychee (R3 = an ethylene absorbent; CBZ = carbendazim).
Figure 10
.Treated and packed lychee fruit (noticethe R3 sachets on the lychee mass).
Quality assurance in agricultural produce,edited by G.I. Johnson, Le Van To, Nguyen Duy Duc and M.C. Webb.
ACIAR Proceedings 100(printed version published in 2000)
144
The hygienic criteria of this produce were tested(microbiological elements and residue of storagechemicals). The results of microbiological analysisshowed that the produce was free from microor-ganisms in amounts which may represent a hazard tohealth. The fungicide residue in produce was iden-tified as a maximum 0.8 mg per kg of fruit (Table 2).
Future Research
On the basis of the success in the storage of the 10 t oflychee fruit, maintenance of sensory quality (odour,taste and status) and the shelf life of the fruit, we havea research plan for wider application in the comingyears.
References
Coates, L.M., Johnson, G.I., Sardsud, U. and Cooke, A.W.1994. Postharvest diseases of lychee in Australia, andtheir control. In: Johnson, G.I. and Highley, E., ed.,Development of postharvest handling technology fortropical tree fruits: a workshop held in Bangkok,Thailand, 16–18 July 1992. ACIAR Proceedings No. 58.Canberra, Australian Centre for InternationalAgricultural Research, 68–69.
Coates, L.M., Fitzell, R.D., Bagshaw, J.S. and Underhill,S.J.R. 1995. Postharvest diseases of horticulturalproduce. Tropical Fruit, Volume 2. Brisbane, QueenslandDepartment of Primary Industries, 41–45.
Duvenhage, J.A. 1993. Control of postharvest decay andbrowning of litchi fruit by sodium metabisulfite and lowpH dips. Yearbook. South African Litchi Grower’sAssociation, 5, 31–32.
FAO/WHO (Food and Agriculture Organization of theUnited Nations/World Health Organization) 1993. CodexAlimentarius, Volume 2. Pesticide Residues in Food.Rome, FAO.
Holcroft, D.M. and Mitcham, E.J. 1996. Postharvestphysiology and handling of litchi. Postharvest Biologyand Technology, 9, 265–277.
Paull, R.E., Reyes, M.E.Q. and Reyes, M.U. 1995. Litchiand rambutan insect desinfestation: treatments tominimize induced pericarp browning. PostharvestBiology and Technology, 6, 139–148.
Sittigul, C., Sardsud, U., Sardsud, V. and Chaiwangsri, T.1994. Effects of fruit maturity at harvest on diseasedevelopment in lychee during storage. In: Johnson, G.I.and Highley, E., ed., Development of postharvesthandling technology for tropical tree fruits: a workshopheld in Bangkok, Thailand, 16–18 July 1992. ACIARProceedings No. 58. Canberra, Australian Centre forInternational Agricultural Research, 9–14.
Table 2.
Pesticide residue analysis report.
Commodity: Stored fresh lychee
Name of producer: Post-Harvest Technology Institute
Date of control: 28 June 1999
Result:
Sample Pesticide name Residue (mg/kg)
HN1 Carbendazim 0.80
HN0 Carbendazim 0.27
Analysed by The Center of Pesticide Analysis, Department of Plant Protection, Ministry of Agriculture and Rural Development.
Quality assurance in agricultural produce,edited by G.I. Johnson, Le Van To, Nguyen Duy Duc and M.C. Webb.
ACIAR Proceedings 100(printed version published in 2000)
145
Twist Test Measurement of Mango Texture
X.H. Nguyen*, L.U. Opara† and C.J. Studman†
Abstract
The softening behaviour of mangoes (cultivar ‘Buoi’ in Vietnam) was investigated during cold storage at 12°Cand 85–90% relative humidity using the Massey University Twist Tester. Crushing stress (CS) significantly(
P
< 0.05) declined with increased storage time during the first 20 days, but there was no significant differencebetween fruit stored for 20 days and longer. During the first 10 days of storage, CS was affected by harvest date.The value of CS
for early harvested fruit was significantly higher than for mid- and late-harvested fruit storedfor up to 10 days, but subsequently this difference disappeared. Differential softening in the inner and outermesocarp tissue of ‘Buoi’ and ‘Thom’ mangoes was also measured. CS values for the outer part of themesocarp were significantly higher than for the inner part when fruit were still firm (up to 10 days storage).However, values were significantly lower when fruit become soft (after 15 days storage).
M
ANGO
is an important commercial fruit in Vietnamand the other tropical countries. In practice, firmnessof the mesocarp is an indicator of the stage of fruitripeness and is commonly measured by finger pressure(Brown et al. 1981), the Magness–Taylor pene-trometer (Thompson 1971), the McCormick pressuretester (Lazan et al. 1993), or an Instron Universaltesting machine (e.g. McLauchlan and Barker 1994).All of these measurement techniques for assessingmaturity are based on the principle of compressionusing a penetrometer. However, there are a number ofdifficulties with these methods. One of the difficultiesis that these methods are unable to assess flesh prop-erties as a function of depth (Studman and Yuwana1992). This can be important in fruit which ripenunevenly in the pulp, such as mangoes and kiwifruit.The Massey University Twist Tester (MTT) offers anew technique for determining fruit texture whicheliminates some of the disadvantages of the pene-trometer (Studman and Yuwana 1992). The twisttester is used to measure the moment required to crushfruit cells using a blade which rotates inside the fruit,and this moment is converted to a crushing stress
figure for the fruit tissue by calculation. The principleof this device is showed in Figure 1. For an element offruit flesh with a radial with
dx
and length
b
, the fleshcrushing stress is obtained through the followingformula:
Where:
m
cr
= flesh crushing stress (
Pa
)
M
= the maximum moment produced when the armis horizontal (
N.m
)
e
= angle of rotation of twist arm at full crushing(
m
)
a
= blade radius (
m
)
b
= blade width (
m
)The objective of this study was to investigate
maturity assessment and uneven ripening in mangofruit grown in Vietnam using the twist tester.
Materials and Methods
Fruit samples
Green mature ‘Buoi’ and ‘Thom’ mangoes wereharvested during the commercial harvest period fromorchards in Hoa Loc area, Cai Be district, in the TienGiang Province in Vietnam. ‘Buoi’ mangoes wereharvested at three different times (12-day intervals)while ‘Thom’ mangoes were harvested only once (the
* Department of Crop Sciences, University of Sydney, New South Wales 2006, Australia.
† Centre for Postharvest and Refrigeration Research, Institute of Technology and Engineering, Massey University, Private Bag 11 222, Palmerston North, New Zealand.
m
ecr
M
a b=
.sin
.2(1)
Quality assurance in agricultural produce,edited by G.I. Johnson, Le Van To, Nguyen Duy Duc and M.C. Webb.
ACIAR Proceedings 100(printed version published in 2000)
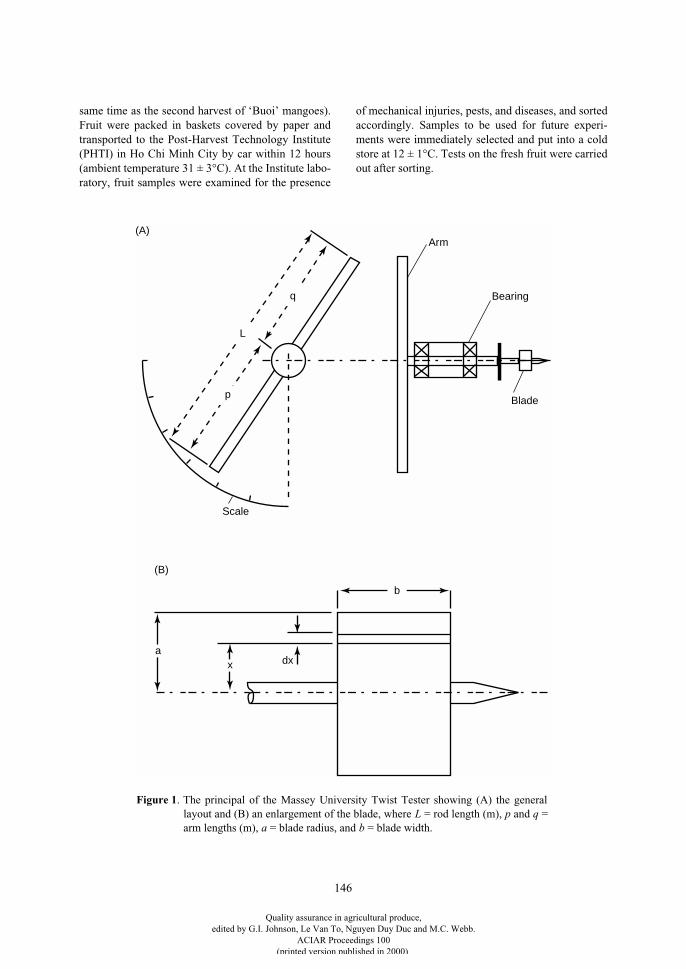
146
same time as the second harvest of ‘Buoi’ mangoes).Fruit were packed in baskets covered by paper andtransported to the Post-Harvest Technology Institute(PHTI) in Ho Chi Minh City by car within 12 hours(ambient temperature 31 ± 3°C). At the Institute labo-ratory, fruit samples were examined for the presence
of mechanical injuries, pests, and diseases, and sortedaccordingly. Samples to be used for future experi-ments were immediately selected and put into a coldstore at 12 ± 1°C. Tests on the fresh fruit were carriedout after sorting.
Blade
Bearing
Arm
L
p
q
Scale
ax
b
dx
(A)
(B)
Figure 1. The principal of the Massey University Twist Tester showing (A) the generallayout and (B) an enlargement of the blade, where L = rod length (m), p and q =arm lengths (m), a = blade radius, and b = blade width.
Quality assurance in agricultural produce,edited by G.I. Johnson, Le Van To, Nguyen Duy Duc and M.C. Webb.
ACIAR Proceedings 100(printed version published in 2000)
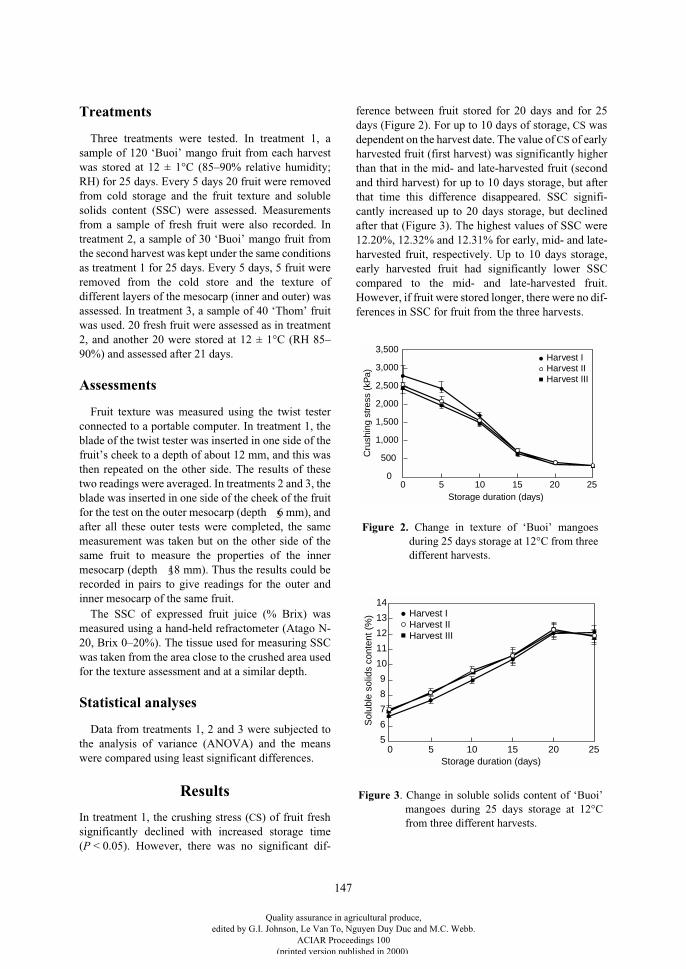
147
Treatments
Three treatments were tested. In treatment 1, asample of 120 ‘Buoi’ mango fruit from each harvestwas stored at 12 ± 1°C (85–90% relative humidity;RH) for 25 days. Every 5 days 20 fruit were removedfrom cold storage and the fruit texture and solublesolids content (SSC) were assessed. Measurementsfrom a sample of fresh fruit were also recorded. Intreatment 2, a sample of 30 ‘Buoi’ mango fruit fromthe second harvest was kept under the same conditionsas treatment 1 for 25 days. Every 5 days, 5 fruit wereremoved from the cold store and the texture ofdifferent layers of the mesocarp (inner and outer) wasassessed. In treatment 3, a sample of 40 ‘Thom’ fruitwas used. 20 fresh fruit were assessed as in treatment2, and another 20 were stored at 12 ± 1°C (RH 85–90%) and assessed after 21 days.
Assessments
Fruit texture was measured using the twist testerconnected to a portable computer. In treatment 1, theblade of the twist tester was inserted in one side of thefruit’s cheek to a depth of about 12 mm, and this wasthen repeated on the other side. The results of thesetwo readings were averaged. In treatments 2 and 3, theblade was inserted in one side of the cheek of the fruitfor the test on the outer mesocarp (depth
5
6 mm), andafter all these outer tests were completed, the samemeasurement was taken but on the other side of thesame fruit to measure the properties of the innermesocarp (depth
5
18 mm). Thus the results could berecorded in pairs to give readings for the outer andinner mesocarp of the same fruit.
The SSC of expressed fruit juice (% Brix) wasmeasured using a hand-held refractometer (Atago N-20, Brix 0–20%). The tissue used for measuring SSCwas taken from the area close to the crushed area usedfor the texture assessment and at a similar depth.
Statistical analyses
Data from treatments 1, 2 and 3 were subjected tothe analysis of variance (ANOVA) and the meanswere compared using least significant differences.
Results
In treatment 1, the crushing stress (
CS
) of fruit freshsignificantly declined with increased storage time(
P
< 0.05). However, there was no significant dif-
ference between fruit stored for 20 days and for 25days (Figure 2). For up to 10 days of storage,
CS
wasdependent on the harvest date. The value of
CS
of earlyharvested fruit (first harvest) was significantly higherthan that in the mid- and late-harvested fruit (secondand third harvest) for up to 10 days storage, but afterthat time this difference disappeared. SSC signifi-cantly increased up to 20 days storage, but declinedafter that (Figure 3). The highest values of SSC were12.20%, 12.32% and 12.31% for early, mid- and late-harvested fruit, respectively. Up to 10 days storage,early harvested fruit had significantly lower SSCcompared to the mid- and late-harvested fruit.However, if fruit were stored longer, there were no dif-ferences in SSC for fruit from the three harvests.
14
13
12
11
10
9
8
Sol
uble
sol
ids
cont
ent (
%)
Storage duration (days)0 5 10 20 2515
Harvest IHarvest IIHarvest III
7
6
5
3,500
3,000
2,500
2,000
1,500
1,000
500
0
Cru
shin
g st
ress
(kP
a)
Storage duration (days)0 5 10 20 2515
Harvest IHarvest IIHarvest III
Figure 2. Change in texture of ‘Buoi’ mangoesduring 25 days storage at 12°C from threedifferent harvests.
Figure 3. Change in soluble solids content of ‘Buoi’mangoes during 25 days storage at 12°Cfrom three different harvests.
Quality assurance in agricultural produce,edited by G.I. Johnson, Le Van To, Nguyen Duy Duc and M.C. Webb.
ACIAR Proceedings 100(printed version published in 2000)
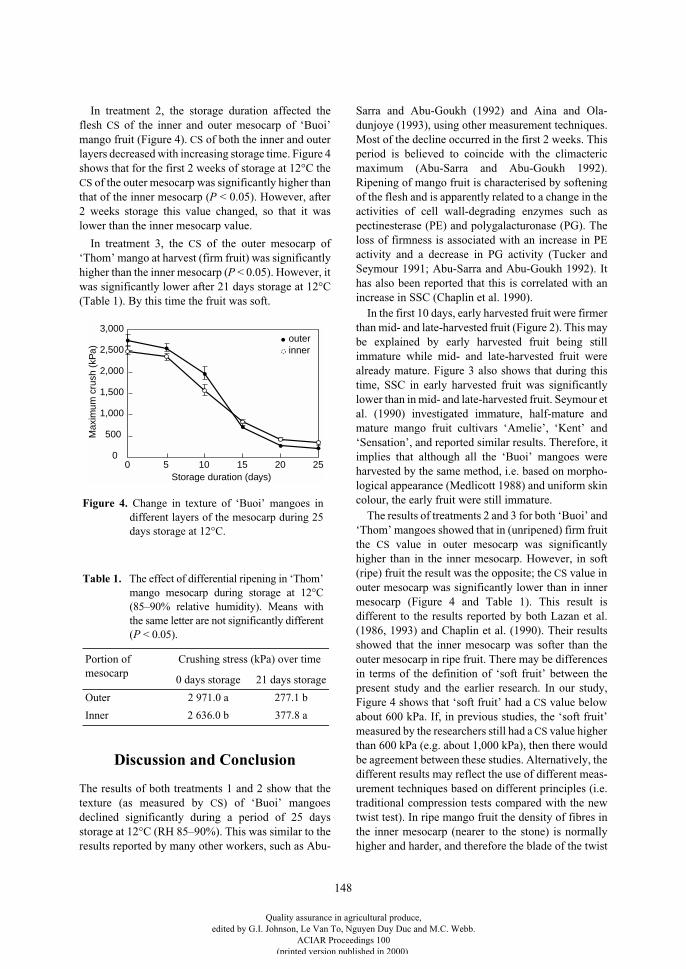
148
In treatment 2, the storage duration affected theflesh
CS
of the inner and outer mesocarp of ‘Buoi’mango fruit (Figure 4).
CS
of both the inner and outerlayers decreased with increasing storage time. Figure 4shows that for the first 2 weeks of storage at 12°C the
CS
of the outer mesocarp was significantly higher thanthat of the inner mesocarp (
P
< 0.05). However, after2 weeks storage this value changed, so that it waslower than the inner mesocarp value.
In treatment 3, the
CS
of the outer mesocarp of‘Thom’ mango at harvest (firm fruit) was significantlyhigher than the inner mesocarp (
P
< 0.05). However, itwas significantly lower after 21 days storage at 12°C(Table 1). By this time the fruit was soft.
Discussion and Conclusion
The results of both treatments 1 and 2 show that thetexture (as measured by
CS
) of ‘Buoi’ mangoesdeclined significantly during a period of 25 daysstorage at 12°C (RH 85–90%). This was similar to theresults reported by many other workers, such as Abu-
Sarra and Abu-Goukh (1992) and Aina and Ola-dunjoye (1993), using other measurement techniques.Most of the decline occurred in the first 2 weeks. Thisperiod is believed to coincide with the climactericmaximum (Abu-Sarra and Abu-Goukh 1992).Ripening of mango fruit is characterised by softeningof the flesh and is apparently related to a change in theactivities of cell wall-degrading enzymes such aspectinesterase (PE) and polygalacturonase (PG). Theloss of firmness is associated with an increase in PEactivity and a decrease in PG activity (Tucker andSeymour 1991; Abu-Sarra and Abu-Goukh 1992). Ithas also been reported that this is correlated with anincrease in SSC (Chaplin et al. 1990).
In the first 10 days, early harvested fruit were firmerthan mid- and late-harvested fruit (Figure 2). This maybe explained by early harvested fruit being stillimmature while mid- and late-harvested fruit werealready mature. Figure 3 also shows that during thistime, SSC in early harvested fruit was significantlylower than in mid- and late-harvested fruit. Seymour etal. (1990) investigated immature, half-mature andmature mango fruit cultivars ‘Amelie’, ‘Kent’ and‘Sensation’, and reported similar results. Therefore, itimplies that although all the ‘Buoi’ mangoes wereharvested by the same method, i.e. based on morpho-logical appearance (Medlicott 1988) and uniform skincolour, the early fruit were still immature.
The results of treatments 2 and 3 for both ‘Buoi’ and‘Thom’ mangoes showed that in (unripened) firm fruitthe
CS
value in outer mesocarp was significantlyhigher than in the inner mesocarp. However, in soft(ripe) fruit the result was the opposite; the
CS
value inouter mesocarp was significantly lower than in innermesocarp (Figure 4 and Table 1). This result isdifferent to the results reported by both Lazan et al.(1986, 1993) and Chaplin et al. (1990). Their resultsshowed that the inner mesocarp was softer than theouter mesocarp in ripe fruit. There may be differencesin terms of the definition of ‘soft fruit’ between thepresent study and the earlier research. In our study,Figure 4 shows that ‘soft fruit’ had a
CS
value belowabout 600 kPa. If, in previous studies, the ‘soft fruit’measured by the researchers still had a
CS
value higherthan 600 kPa (e.g. about 1,000 kPa), then there wouldbe agreement between these studies. Alternatively, thedifferent results may reflect the use of different meas-urement techniques based on different principles (i.e.traditional compression tests compared with the newtwist test). In ripe mango fruit the density of fibres inthe inner mesocarp (nearer to the stone) is normallyhigher and harder, and therefore the blade of the twist
3,000
2,500
2,000
1,500
1,000
500
0
Max
imum
cru
sh (
kPa)
Storage duration (days)0 5 10 20 2515
outerinner
Figure 4. Change in texture of ‘Buoi’ mangoes indifferent layers of the mesocarp during 25days storage at 12°C.
Table 1. The effect of differential ripening in ‘Thom’mango mesocarp during storage at 12°C(85–90% relative humidity). Means withthe same letter are not significantly different(P < 0.05).
Portion of mesocarp
Crushing stress (kPa) over time
0 days storage 21 days storage
Outer 2 971.0 a 277.1 b
Inner 2 636.0 b 377.8 a
Quality assurance in agricultural produce,edited by G.I. Johnson, Le Van To, Nguyen Duy Duc and M.C. Webb.
ACIAR Proceedings 100(printed version published in 2000)
149
tester meets more resistance from these fibres, givinga higher
CS
value. Another possibility is that theresults differ because of the use of different mangocultivars. For example, Chaplin et al. (1990) reportedthat the differences in softness of inner and outermesocarp sections were greater in ‘Arumanis’ and‘Mulgoa’ than in ‘Haden’ and ‘Kensington’.
Overall, this study has shown that for mango,texture can be used as a maturity index, and it can beassessed by the Massey Twist Tester. To determineharvest date for the early harvest of ‘Buoi’ mangoes,morphological and uniform skin colour methods arenot enough and may lead to picking immature fruit.Therefore, additional methods should be combinedwith those mentioned above (such as counting thenumber of days after flowering) to improve maturityassessment. ‘Buoi’ and ‘Thom’ are two mangocultivars which display differential ripeningthroughout their thickness.
Acknowledgments
The first author would like to acknowledge NewZealand Official Development Assistance (NZODA)for travel assistance and award of a Post-GraduateScholarship, Prof. Le Van To and staff of the Post-Harvest Technology Institute (PHTI) in Ho Chi MinhCity in Vietnam for the laboratory facilities andtechnical assistance, and to the Institute for Tech-nology and Engineering, Massey University, forproviding measuring equipment.
References
Abu-Sarra, A.F. and Abu-Goukh, A.A. 1992. Changes inpectinesterase, polygalacturonase and cellulase activityduring mango fruit ripening. Journal of HorticulturalScience, 67, 561–568.
Aina, J.O. and Oladunjoye, O.O. 1993. Respiration,pectolytic activity and textural changes in ripeningAfrican mango (
Irvingia gabonensis
) fruits. Journal ofthe Science of Food and Agriculture, 63, 451–454.
Brown, B.I., Scott, K.J. and Chaplin, G.R. 1981. Spongystem-end in mango. Queensland Fruit and VegetableNews, 52, 479.
Chaplin, G.B., Lai, S.C. and Buckley, M.J. 1990.Differential softening and physico-chemical changes inthe mesocarp of ripening mango fruit. Acta Horticulturae,269, 233–239.
McLauchlan, R.L. and Barker, L.R. 1994. Controlledatmospheres for Kensington mango storage: classicalatmosphere. In: Johnson, G.I. and Highley, E., ed.,Development of postharvest handling technology fortropical tree fruits: a workshop held in Bangkok,Thailand, 16–18 July 1992. ACIAR Proceedings No. 58.Canberra, Australian Centre for InternationalAgricultural Research, 41–44.
Medlicott, A.P., Reynolds, S.B., New, S.W. and Thompson,A.K. 1988. Harvest maturity effects on mango fruitripening. Tropical Agriculture (Trinidad), 65, 153–157.
Lazan, H., Ali, Z.M., Lee, K.W., Woon, J. and Chaplin, G.R.1986. The potential role of polygalacturonase in pectindegradation and softening of mango fruit. ASEAN(Association of South-East Asian Nations) Food Journal,2, 93–95.
Lazan, H., Ali, Z.M., Soh, J.S. and Talkah, Z. 1993. Thebiochemical basis of differential ripening in mango. ActaHorticulturae, 341, 500–509.
Seymour, G.B, N’Diaye, M., Wainwright, H. and Tucker,G.A. 1990. Effects of cultivar and harvest maturity onripening of mangoes during storage. Journal ofHorticultural Science, 65, 479–483.
Studman, C.J. and Yuwana 1992. Twist test for measuringfruit firmness. Journal of Texture Studies, 23, 215–227.
Thompson, A.K. 1971. The storage of fruits. TropicalAgriculture, 48, 63–70.
Tucker, G.A. and Seymour, G.B. 1991. Cell walldegradation during mango fruit ripening. ActaHorticulturae, 291, 454–460.
Quality assurance in agricultural produce,edited by G.I. Johnson, Le Van To, Nguyen Duy Duc and M.C. Webb.
ACIAR Proceedings 100(printed version published in 2000)
150
Designing Effective Quality Systems for Horticultural Businesses and Organisations
M.F. Piccone and C.J. Bunt*
Abstract
An effective quality system in any part of the horticultural supply chain should be designed to meet the needsand requirements of the customer(s), and must also make a valuable contribution to the business or organisationdeveloping and implementing it.
There are several international codes and standards that can be used as guidelines, benchmarks and checklistsfor applying quality systems. This paper outlines options involving practical and economical methodologies todesign and implement an effective, tailored quality system. It also discusses the methodology and uses for‘quality planning’.
T
HE
INTERNATIONAL
food industry has to deal with aseeming ‘tide’ of increasing expectations from gov-ernments, the marketplace and the public. In par-ticular, an expectation that food businesses —including horticultural producers and postharvesthandlers — must be fully accountable in terms of theintegrity of the products they produce and the methodsused in producing these products.
Legislation is being introduced in Australia whichputs the onus squarely on food producers and handlersin terms of their due diligence and the management ofrisk in producing safe food — whilst also protectingthe environment. This is happening concurrently withever increasing expectations from retailers, eateriesand caterers generally for supplier compliance withproduct quality specifications and quality system per-formance standards. To add to this pressure, otherissues such as compliance with workplace health andsafety legislation and codes of practice are alsoimpacting on food producers and handlers.
Quality Management Systems in Australian Horticulture
A large number of Australian growers perceive qualitysystems as basically prescriptive, ‘you must do it this
way’ programs where the primary objective isproducing a ‘top quality’ product aimed at high valuemarkets. Product defects are defined and an ‘inspectand reject’, ‘quality control’ style regime is imple-mented.
These perceptions have developed because many ofthe industry-based quality assurance programs andtraining initiatives that have evolved in Australian hor-ticulture in the last 10 years have been designed withtheir primary focus on product standards and productmaintenance, i.e. grading of product to meet productspecifications and prevention of spoilage, especiallypostharvest.
More recently, this focus has been extended togrowers, packhouses and wholesalers achieving com-pliance with ‘customer’ requirements, such asadherence with retailer-driven food safety codes andalso (where applicable) interstate and export quar-antine protocols. There has been far less emphasis onhorticultural producers and suppliers employingquality management systems as a means to improvetheir own business performance, i.e. utilising theirquality systems to pinpoint internal managementstrengths and weaknesses, increasing efficiencies‘across the board’, quantifying and reducing costs, andfurther strengthening relationships between them-selves and other participants in their respectivemarketing chains. This is hardly surprising, as retailer-driven codes rightly focus on suppliers consistently
* Piccone PHC, 201 Bruce Highway, Edmonton, Queensland 4869, Australia.
Quality assurance in agricultural produce,edited by G.I. Johnson, Le Van To, Nguyen Duy Duc and M.C. Webb.
ACIAR Proceedings 100(printed version published in 2000)
151
meeting retailer requirements. It is not the role ofretailers to rigorously assess or seek to influence theoverall business efficiencies or otherwise of theirsuppliers.
Recent events in Australia, such as the developmentand promotion of the SQF 2000 code and the super-market supplier approval initiatives are reinforcing theperception of quality management as primarily ameans of satisfying customer requirements for productquality and safety. These codes place great emphasison compliance issues such as suppliers exhibiting duediligence and being certified against relevantstandards and codes. However, a more positive, com-mercial approach to quality management from theperspective of suppliers revolves around qualitysystems being used by growers, packhouses, trans-porters, wholesalers etc. as an internal businessimprovement tool, as well as a means of satisfyingcustomer and regulatory requirements.
‘Well rounded’ quality systems are seen as havingtwo main purposes:
• The first is to provide a systematic, objective way offinding out what customers really want in terms ofthe goods and services created and supplied andensuring this information is both complete and up-to-date.
• The second purpose follows on from the first in thatan effective quality system ensures that theorganisation(s) or marketing chain as a whole candeliver exactly what is expected, as cost-effectivelyand efficiently as possible.
Business Management Systems
Management systems are the ‘head and heart’ of anyorganisation. A business or organisation involved inthe production, transportation or marketing of horti-cultural products is likely to (or should!) haveeffective systems in place to manage a raft of interre-lated activities. These would likely include, but maynot be limited to:
• Quality systems — i.e. the policies and practices putinto place by the organisation to ensure thatcustomer requirements are clearly understood.Once more, that people, processes, products andservices are well managed so as to reliably,consistently and cost-effectively meet those needs.
• Food safety systems — i.e. the policies andpractices put into place by the organisation to ensurethat any food safety hazards that potentially apply tothe products being produced, transported or
marketed are clearly understood and are effectivelyprevented or controlled as required.
• Environmental management systems — i.e. thepolicies and practices put into place by theorganisation to not only consider the actual orpotential environmental consequences of theiractivities, but also the actions then taken to preventenvironmental harm and to use environmentalresources efficiently.Other management systems also need to be con-
sidered. Australian horticultural producers forexample, may manage systems for compliance withquarantine protocols, recruitment and training andworkplace health and safety (to say nothing of man-agement of finances).
These systems also need to be understood, inte-grated and effectively managed if an organisation is tobe successful — successful not just financially, butalso in terms of meeting the personal expectations ofthe people active in the organisation whilst alsomeeting all legal obligations and responsibilities to thegreater community.
People genuinely interested in quality, food safetyor environmental management systems (or any combi-nation thereof) can greatly increase theirunderstanding of these disciplines by becomingfamiliar with three ‘core’ sets of documentation:• the ISO 9000 series of quality management
standards;• the Hazard Analysis and Critical Control Point
(HACCP) technique used to identify and controlfood safety hazards; and
• the ISO 14000 environmental managementstandards.The ISO 9000 series is designed to be used in a way
that best reflects the organisation(s) concerned andused properly will simplify rather than complicate anorganisation’s activities. There is nothing in thisstandard that isn’t based on absolute common sense.
Elements in the ISO 9000 compliance standards areapplied only as appropriate and not at all if an elementis not applicable to the organisation(s) concerned.
The emphasis is on simply and clearly documented,market-driven, ever-evolving systems that providediscipline within an organisation yet reflect the pace ofchange in business. They are also likely to accom-modate the need for people to have appropriateflexibility in the way they function wherever this canbenefit the organisation and its customers, whilst stillensuring people operate within acceptable parameters.
Another factor horticultural producers and distrib-utors need to consider is this; the best way to produce
Quality assurance in agricultural produce,edited by G.I. Johnson, Le Van To, Nguyen Duy Duc and M.C. Webb.
ACIAR Proceedings 100(printed version published in 2000)
152
and maintain quality assured, ‘safe’ products is to haveall aspects of the business, including the productionsystem, working efficiently. If all your managementsystems are working well you can’t help but achievegood, reliable outputs in a cost-effective manner.Management codes that focus primarily on mainte-nance of the product rather than management of thesystem as a whole so as to reliably produce goodproducts and services won’t achieve all the principlesof good business practice.
Integrating Management Systems —Quality Planning
Many horticultural producers fall into the ‘small tomedium’ business size category. Many are family-runbusinesses of long standing.
The management systems employed by these busi-nesses are likely to cover a broad spectrum ofmanagement policies and on-farm and postharvestactivities. These systems may be ‘formalised’ to somedegree or another by way of being documented, or theymay operate ‘informally’, i.e. based on long-standingpractices and attitudes instilled on the farm or in thepackhouse by way of verbal instruction and man-agement example. In formalising managementsystems, businesses go through a process of:
• reviewing current policies and practices;
• making adjustments to existing policies andpractices where these are seen to be necessary(perhaps due to changing customer/regulatoryrequirements, perhaps due to managementobjectives for increasing efficiencies); and
• documenting the management system in the form ofcompany policies, job descriptions, procedures/work instructions, perhaps specifications and alsorecords (where seen as necessary).This ‘quality planning’ process repeats itself over
time by way of management reviews, customerfeedback, performance analyses etc. so that thesystems are constantly improved and refined.
Summary
Quality management systems only really work andreach their potential when developed holistically.Given the nature of most horticultural businesses, themost logical way of both structuring and imple-menting on-farm and packhouse management systemsis to integrate quality, food safety, environmental,workplace health and safety, and quarantine man-agement into one, fully-integrated managementsystem. This is a particularly logical approach given arange of factors:• Workers on the farm or in the packhouse are likely
to be dealing with a range of these issuesconcurrently as part of their everyday work.
• All of these issues tend to overlap to some extent oranother.
• The only way to make a management system ‘work’is to incorporate it fully into everyday managementpractices and business operations.
•
I
ntegrating documentation and key activities (suchas training) so as to cover the range of managementissues encountered ‘on the job’ is more cost-effective and less confusing for people active in thesystem.
Quality assurance in agricultural produce,edited by G.I. Johnson, Le Van To, Nguyen Duy Duc and M.C. Webb.
ACIAR Proceedings 100(printed version published in 2000)
153
Preliminary Results on a Fruit Fly Investigation in the South of Vietnam
Nguyen Ngoc Thuy, Huynh Tri Duc and N.H. Vu*
Abstract
Southern Vietnam has a wide variety of tropical fruits whose cultivation has been rapidly developing in recentyears. As many fruit types—both seasonal and non-seasonal—are overlapping, the conditions are veryfavourable for sustaining a diversity of pest species. Losses of fruit caused by fruit fly (family Tephritidae)result from deposition of eggs under the skin of fruit and subsequent larval feeding and premature fruit drop.This leads to unacceptable quality of infested fruit which can not be exported due to the quarantine restrictionsimposed by most of the importing countries.
Therefore, a research program for fruit fly management at the preharvest stage has been conducted to reducethese losses as well as to contribute to improved postharvest treatments to disinfest the fruit. An investigationinto the identification of susceptible species showed that there are about 15 kinds of economically importantfruits which are attacked by fruit fly, including guava, wax apple, jujube, mango, citrus, longan, rambutan,sapodilla and papaya. Of these, damage to guava and wax apple was recorded to be as high as 50% of the yield.
Using traps, we have so far identified 11 species of fruit fly in southern Vietnam, occurring with variousfrequency. The most common were Bactrocera correcta, B. cucurbitae and B. dorsalis complex.
F
RUIT
FLIES
are a global problem, causing damage toa wide range of fruits and vegetables. They comprise alarge number of species, whose distribution andseverity of impact varies from region to region. Fruitflies are crucial to fruit and vegetable import–exportguarantee schemes. During recent years, along withrapid development of fruit production in southernVietnam, the need for an effective investigation intoappropriate control measures has become urgent inorder to allow the export of Vietnamese fruit to inter-national markets.
Although there have been fruit fly studies made indifferent parts of the world, there has been very littlework undertaken in Vietnam in this area. However, inorder to establish effective control measures, we needclear knowledge about the present status of: fruit flyspecies diversity; and the relationship between fruitflies and crops and the environment. This study aimedto investigate the diversity and distribution of fruitflies and the range of host crops to provide a basis forfurther studies.
Materials and Methods
Diversity and distribution of fruit flies
Male fruit fly study
To study the male fruit fly, Steiner traps were usedwith the application of following the chemicals aspheromones:• methyl eugenol (4-allyl-1,2-dimethoxybenzene);• Cuelure (2-butanol,4-hydroxyphenyl acetate); and• Trimedlure (butyl-4,chloro-2-methyl cyclohexane
carboxylate ).The traps were permanently installed under various
environmental conditions in the provinces of TienGiang, Vinh Long, and Can Tho in The Mekong Delta,and Binh Duong, Dong Nai, and Binh Thuan in south-eastern area.
Flies were collected from the traps weekly inMekong Delta and fortnightly in the south-eastern areathen classified and counted. To calculate the rate andthe frequency of a fruit fly species present in onelocation, the following formula were applied:* Southern Fruit Research Institute (SOFRI), PO Box 203,
My Tho, Tien Giang, Vietnam.
Quality assurance in agricultural produce,edited by G.I. Johnson, Le Van To, Nguyen Duy Duc and M.C. Webb.
ACIAR Proceedings 100(printed version published in 2000)
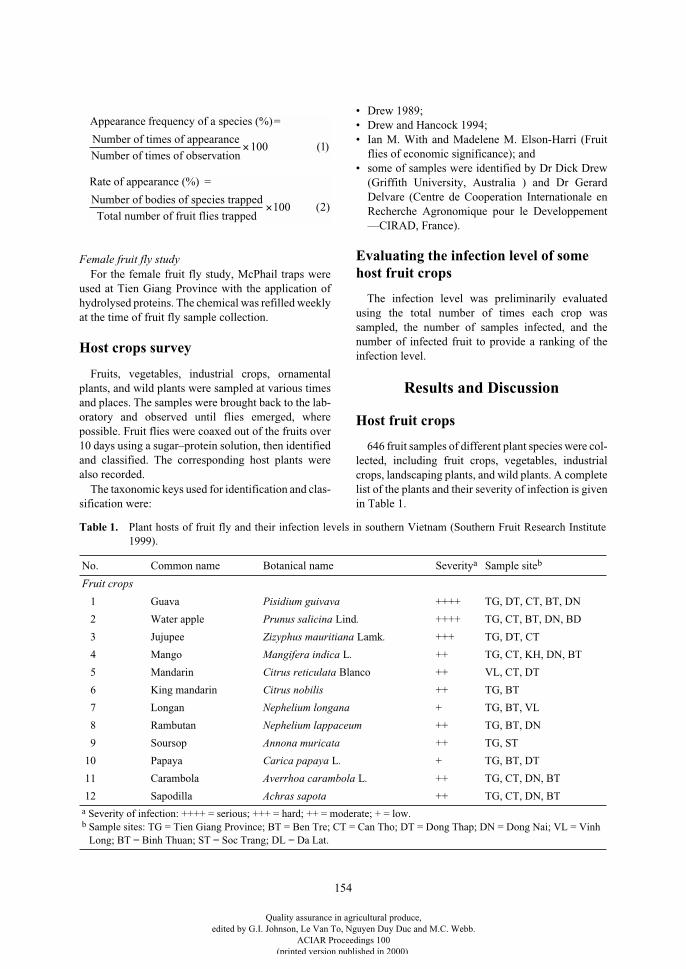
154
Female fruit fly study
For the female fruit fly study, McPhail traps wereused at Tien Giang Province with the application ofhydrolysed proteins. The chemical was refilled weeklyat the time of fruit fly sample collection.
Host crops survey
Fruits, vegetables, industrial crops, ornamentalplants, and wild plants were sampled at various timesand places. The samples were brought back to the lab-oratory and observed until flies emerged, wherepossible. Fruit flies were coaxed out of the fruits over10 days using a sugar–protein solution, then identifiedand classified. The corresponding host plants werealso recorded.
The taxonomic keys used for identification and clas-sification were:
• Drew 1989;• Drew and Hancock 1994;• Ian M. With and Madelene M. Elson-Harri (Fruit
flies of economic significance); and• some of samples were identified by Dr Dick Drew
(Griffith University, Australia ) and Dr GerardDelvare (Centre de Cooperation Internationale enRecherche Agronomique pour le Developpement—CIRAD, France).
Evaluating the infection level of some host fruit crops
The infection level was preliminarily evaluatedusing the total number of times each crop wassampled, the number of samples infected, and thenumber of infected fruit to provide a ranking of theinfection level.
Results and Discussion
Host fruit crops
646 fruit samples of different plant species were col-lected, including fruit crops, vegetables, industrialcrops, landscaping plants, and wild plants. A completelist of the plants and their severity of infection is givenin Table 1.
Appearance frequency of a species (%)=
Number of times of appearance
Number of times of observation×100 1( )
Rate of appearance (%) =
Number of bodies of species trapped
Total number of fruit flies trapped×100 2( )
Table 1.
Plant hosts of fruit fly and their infection levels in southern Vietnam (Southern Fruit Research Institute1999).
No. Common name Botanical name Severity
a
Sample site
b
Fruit crops
1 Guava
Pisidium guivava
++++ TG, DT, CT, BT, DN
2 Water apple
Prunus salicina
Lind
.
++++ TG, CT, BT, DN, BD
3 Jujupee
Zizyphus mauritiana
Lamk
.
+++ TG, DT, CT
4 Mango
Mangifera indica
L
.
++ TG, CT, KH, DN, BT
5 Mandarin
Citrus reticulata
Blanco ++ VL, CT, DT
6 King mandarin
Citrus nobilis
++ TG, BT
7 Longan
Nephelium longana
+ TG, BT, VL
8 Rambutan
Nephelium lappaceum
++ TG, BT, DN
9 Soursop
Annona muricata
++ TG, ST
10 Papaya
Carica papaya
L
.
+ TG, BT, DT
11 Carambola
Averrhoa carambola
L
.
++ TG, CT, DN, BT
12 Sapodilla
Achras sapota
++ TG, CT, DN, BT
a
Severity of infection: ++++ = serious; +++ = hard; ++ = moderate; + = low.
b
Sample sites: TG = Tien Giang Province; BT = Ben Tre; CT = Can Tho; DT = Dong Thap; DN = Dong Nai; VL = Vinh Long; BT = Binh Thuan; ST = Soc Trang; DL = Da Lat.
Quality assurance in agricultural produce,edited by G.I. Johnson, Le Van To, Nguyen Duy Duc and M.C. Webb.
ACIAR Proceedings 100(printed version published in 2000)
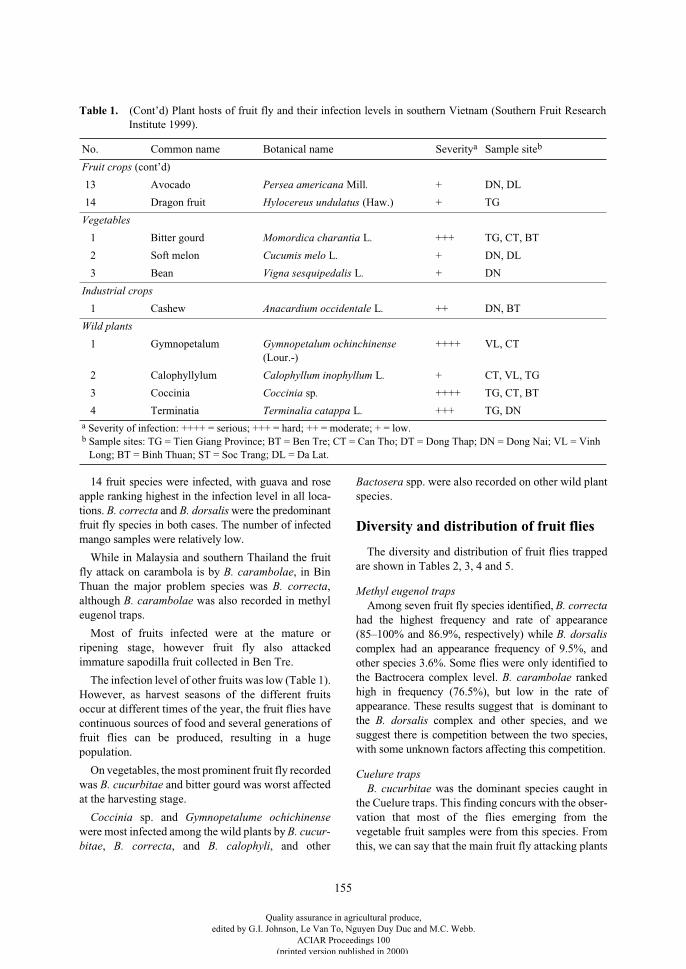
155
14 fruit species were infected, with guava and roseapple ranking highest in the infection level in all loca-tions.
B. correcta
and
B. dorsalis
were the predominantfruit fly species in both cases. The number of infectedmango samples were relatively low.
While in Malaysia and southern Thailand the fruitfly attack on carambola is by
B. carambolae
, in BinThuan the major problem species was
B. correcta
,although
B. carambolae
was also recorded in methyleugenol traps.
Most of fruits infected were at the mature orripening stage, however fruit fly also attackedimmature sapodilla fruit collected in Ben Tre.
The infection level of other fruits was low (Table 1).However, as harvest seasons of the different fruitsoccur at different times of the year, the fruit flies havecontinuous sources of food and several generations offruit flies can be produced, resulting in a hugepopulation.
On vegetables, the most prominent fruit fly recordedwas
B. cucurbitae
and bitter gourd was worst affectedat the harvesting stage.
Coccinia
sp. and
Gymnopetalume ochichinense
were most infected among the wild plants by
B. cucur-bitae
,
B. correcta
, and
B. calophyli
, and other
Bactosera
spp. were also recorded on other wild plantspecies.
Diversity and distribution of fruit flies
The diversity and distribution of fruit flies trappedare shown in Tables 2, 3, 4 and 5.
Methyl eugenol traps
Among seven fruit fly species identified,
B. correcta
had the highest frequency and rate of appearance(85–100% and 86.9%, respectively) while
B. dorsalis
complex had an appearance frequency of 9.5%, andother species 3.6%. Some flies were only identified tothe Bactrocera complex level.
B. carambolae
rankedhigh in frequency (76.5%), but low in the rate ofappearance. These results suggest that is dominant tothe
B. dorsalis
complex and other species, and wesuggest there is competition between the two species,with some unknown factors affecting this competition.
Cuelure trapsB. cucurbitae
was the dominant species caught inthe Cuelure traps. This finding concurs with the obser-vation that most of the flies emerging from thevegetable fruit samples were from this species. Fromthis, we can say that the main fruit fly attacking plants
Fruit crops
(cont’d)
13 Avocado
Persea americana
Mill
.
+ DN, DL
14 Dragon fruit
Hylocereus undulatus
(Haw.) + TG
Vegetables
1 Bitter gourd
Momordica charantia
L
.
+++ TG, CT, BT
2 Soft melon
Cucumis melo
L
.
+ DN, DL
3 Bean
Vigna sesquipedalis
L
.
+ DN
Industrial crops
1 Cashew
Anacardium occidentale
L
.
++ DN, BT
Wild plants
1 Gymnopetalum
Gymnopetalum ochinchinense
(Lour.-)++++ VL, CT
2 Calophyllylum
Calophyllum inophyllum
L
.
+ CT, VL, TG
3 Coccinia
Coccinia
sp
.
++++ TG, CT, BT
4 Terminatia
Terminalia catappa
L
.
+++ TG, DN
Table 1.
(Cont’d) Plant hosts of fruit fly and their infection levels in southern Vietnam (Southern Fruit ResearchInstitute 1999).
No. Common name Botanical name Severity
a
Sample site
b
a
Severity of infection: ++++ = serious; +++ = hard; ++ = moderate; + = low.
b
Sample sites: TG = Tien Giang Province; BT = Ben Tre; CT = Can Tho; DT = Dong Thap; DN = Dong Nai; VL = Vinh Long; BT = Binh Thuan; ST = Soc Trang; DL = Da Lat.
Quality assurance in agricultural produce,edited by G.I. Johnson, Le Van To, Nguyen Duy Duc and M.C. Webb.
ACIAR Proceedings 100(printed version published in 2000)
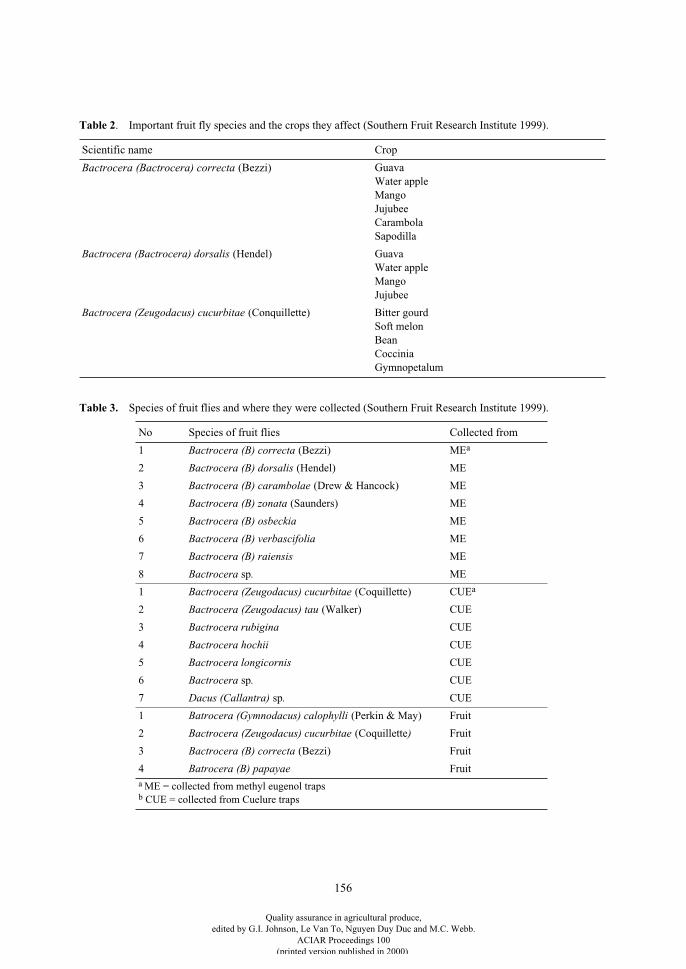
156
Table 2
. Important fruit fly species and the crops they affect (Southern Fruit Research Institute 1999).
Scientific name Crop
Bactrocera (Bactrocera) correcta
(Bezzi) Guava
Water appleMangoJujubeeCarambolaSapodilla
Bactrocera (Bactrocera) dorsalis
(Hendel) GuavaWater appleMangoJujubee
Bactrocera (Zeugodacus) cucurbitae
(Conquillette) Bitter gourdSoft melonBeanCocciniaGymnopetalum
Table 3.
Species of fruit flies and where they were collected (Southern Fruit Research Institute 1999).
No Species of fruit flies Collected from
1
Bactrocera (B) correcta
(Bezzi) ME
a
2
Bactrocera (B) dorsalis
(Hendel) ME
3
Bactrocera (B) carambolae
(Drew & Hancock) ME
4
Bactrocera (B) zonata
(Saunders) ME
5
Bactrocera (B) osbeckia
ME
6
Bactrocera (B) verbascifolia
ME
7
Bactrocera (B) raiensis
ME
8
Bactrocera
sp
.
ME
1
Bactrocera (Zeugodacus) cucurbitae
(Coquillette) CUE
a
2
Bactrocera (Zeugodacus) tau
(Walker) CUE
3
Bactrocera rubigina
CUE
4
Bactrocera hochii
CUE
5
Bactrocera longicornis
CUE
6
Bactrocera
sp
.
CUE
7
Dacus (Callantra)
sp
.
CUE
1
Batrocera (Gymnodacus) calophylli
(Perkin & May) Fruit
2
Bactrocera (Zeugodacus) cucurbitae
(Coquillette
)
Fruit
3
Bactrocera (B) correcta
(Bezzi) Fruit
4
Batrocera (B) papayae Fruita ME = collected from methyl eugenol trapsb CUE = collected from Cuelure traps
Quality assurance in agricultural produce,edited by G.I. Johnson, Le Van To, Nguyen Duy Duc and M.C. Webb.
ACIAR Proceedings 100(printed version published in 2000)
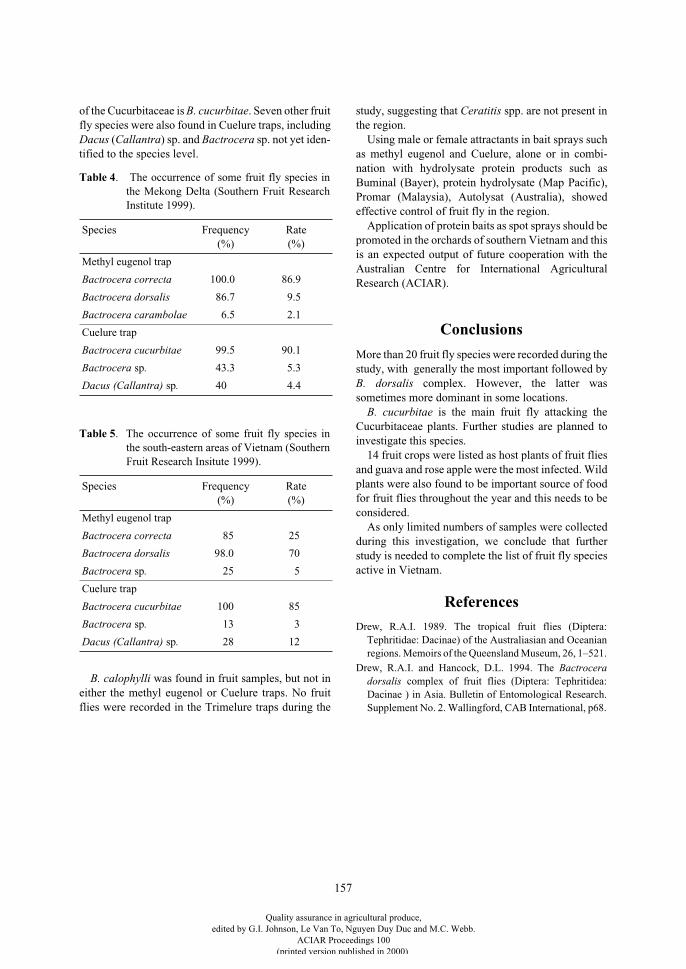
157
of the Cucurbitaceae is B. cucurbitae. Seven other fruitfly species were also found in Cuelure traps, includingDacus (Callantra) sp. and Bactrocera sp. not yet iden-tified to the species level.
B. calophylli was found in fruit samples, but not ineither the methyl eugenol or Cuelure traps. No fruitflies were recorded in the Trimelure traps during the
study, suggesting that Ceratitis spp. are not present inthe region.
Using male or female attractants in bait sprays suchas methyl eugenol and Cuelure, alone or in combi-nation with hydrolysate protein products such asBuminal (Bayer), protein hydrolysate (Map Pacific),Promar (Malaysia), Autolysat (Australia), showedeffective control of fruit fly in the region.
Application of protein baits as spot sprays should bepromoted in the orchards of southern Vietnam and thisis an expected output of future cooperation with theAustralian Centre for International AgriculturalResearch (ACIAR).
Conclusions
More than 20 fruit fly species were recorded during thestudy, with generally the most important followed byB. dorsalis complex. However, the latter wassometimes more dominant in some locations.
B. cucurbitae is the main fruit fly attacking theCucurbitaceae plants. Further studies are planned toinvestigate this species.
14 fruit crops were listed as host plants of fruit fliesand guava and rose apple were the most infected. Wildplants were also found to be important source of foodfor fruit flies throughout the year and this needs to beconsidered.
As only limited numbers of samples were collectedduring this investigation, we conclude that furtherstudy is needed to complete the list of fruit fly speciesactive in Vietnam.
References
Drew, R.A.I. 1989. The tropical fruit flies (Diptera:Tephritidae: Dacinae) of the Australiasian and Oceanianregions. Memoirs of the Queensland Museum, 26, 1–521.
Drew, R.A.I. and Hancock, D.L. 1994. The Bactroceradorsalis complex of fruit flies (Diptera: Tephritidea:Dacinae ) in Asia. Bulletin of Entomological Research.Supplement No. 2. Wallingford, CAB International, p68.
Table 4. The occurrence of some fruit fly species inthe Mekong Delta (Southern Fruit ResearchInstitute 1999).
Species Frequency (%)
Rate(%)
Methyl eugenol trap
Bactrocera correcta 100.0 86.9
Bactrocera dorsalis 86.7 9.5
Bactrocera carambolae 6.5 2.1
Cuelure trap
Bactrocera cucurbitae 99.5 90.1
Bactrocera sp. 43.3 5.3
Dacus (Callantra) sp. 40 4.4
Table 5. The occurrence of some fruit fly species inthe south-eastern areas of Vietnam (SouthernFruit Research Insitute 1999).
Species Frequency (%)
Rate(%)
Methyl eugenol trap
Bactrocera correcta 85 25
Bactrocera dorsalis 98.0 70
Bactrocera sp. 25 5
Cuelure trap
Bactrocera cucurbitae 100 85
Bactrocera sp. 13 3
Dacus (Callantra) sp. 28 12
Quality assurance in agricultural produce,edited by G.I. Johnson, Le Van To, Nguyen Duy Duc and M.C. Webb.
ACIAR Proceedings 100(printed version published in 2000)
158
Nondestructive Method for Sorting of Gamboge and Translucent Pulp in Mangosteen by Specific
Gravity: Precision and Efficiency
J. Sornsrivichai, R. Podee, K. Saengnil and T. Yantarasri*
Abstract
Specific gravity of mangosteen fruit at three different maturity stages and at 0, 2, 4 and 6 days after harvest wasstudied. There were no differences in the specific gravity values of mangosteen fruits at all stages. However,when sorting of the fruit was delayed after harvest, the specific gravity significantly decreased. The specificgravity values of the fruit with gamboge, translucent pulp disorder and the combination of both symptoms werehigher than fruit with normal pulp. Separation of fruit with normal and damaged pulps using different specificgravity values of 0.980, 1.000, 1.016, 1.020 revealed that specific gravity at 0.980 was able to separate alldegrees of translucent pulp disorder with 95% efficiency and with 89% for fruit with the gamboge disorder.The accuracy in sorting of normal fruit depended on the amount of water accumulated in the rind and theinterference of an air cavity created by the drying seed or aril tissue.
T
RANSLUCENT
AND
resin-contaminated (gamboge)pulp disorder of mangosteen is a major cause ofreduced fruit quality. This internal disorder cannot beseparated from normal fruit by external appearanceand causes a significant loss of confidence in thisproduct in the market. The cause of the disorder ismigration of excess water to the pulp caused by heavyrain during the harvesting season (Laivisethkul 1994).Pankasemsuk et al. (1996) showed that fruit withtranslucent pulp disorder had a water content in therind 65% and pulp 82% higher than fruit with normalpulp (63% and 80% in the rind and pulp, respectively).Lakanathinwong (1996) confirmed that the translucentfruit had a 1.21% higher water content and 15 timessmaller air space compared to the normal pulp. Thisindicated that the specific gravity (SG) of fruit with thetranslucent disorder may be higher than the normalfruit. This result was confirmed by Pankasemsuk et al.(1996) who found that 90% of fruit with normal pulpfloated in water and their SGs were less than one. They
also showed that after being subjected to vacuumwater infiltration, normal floating fruit sank, the pulpbecame translucent and contaminated with yellowresin, and the SG increased to more than one.However, Nantachai et al. (1991) found that theaccuracy and efficiency of sorting normal fruit fromfruit with the disorder using the floatation methodvaried from year to year, relating to rainfall conditionsduring harvest. Several factors might affect the changein SG values of normal and damaged fruit. The objec-tives of our study were:
1. to investigate the factors affecting the changein SG values of normal and damaged fruit,namely, maturity of the fruit and delay insorting after harvest;
2. to investigate the SG distribution in man-gosteen with various degrees of flesh translu-cency and types of resin contamination;
3. to determine the accuracy and efficiency ofsorting fruit with various types of disorderusing differences in SG; and
4. to optimise SG values for sorting, consideringrainfall levels during harvest.
* Postharvest Technology Research Center, Co-ordinating Office, Biology Department, Chiang Mai University, Chiang Mai 50200, Thailand.
Quality assurance in agricultural produce,edited by G.I. Johnson, Le Van To, Nguyen Duy Duc and M.C. Webb.
ACIAR Proceedings 100(printed version published in 2000)
159
Materials and Methods
Mangosteen fruit of three different stages ofmaturity selected by peel colour appearance—pinkish-yellow, pink and brownish purple—were sampled fordetermination of SG distribution. The SG values weremeasured on the same day as harvest and then everytwo days for six days.
The SG values in fruit with various degrees of pulptranslucency and types of resin contamination weredetermined using the buoyancy method (Pomeranzand Meloan 1978). In this method, the SG of the fruitis calculated from the ratio of the weight of fruit in airdivided by the difference between the weight of fruit inair and the weight of fruit weighed under water multi-plied by the SG value of water. A total of 1,830 fruitwere used. After the SG determination, the fruit werecut open and assigned to six categories according totheir degree of translucency and severity of resin con-tamination of the pulp. The data collected in theseprocedures were used for the following determinationsand calculations.
Determination of SG distribution
The SG distribution of each type of internal disorderwas recorded. The SG values for sorting were 0.980,1.000, 1.016 and 1.020. The percentage of fruit havingeach level of disorder at each SG level was calculated.The optimal SG values for sorting were selectedaccording to the precision of sorting of the normal fruitand efficiency of sorting out fruit with disorders.
Calculation of sorting precision
The precision of sorting at each SG level was calcu-lated by the following equation:
Calculations of sorting efficiency
The efficiency of sorting at that SG level was calcu-lated of sorting for each symptom (Equation 2) and ofsorting for all symptoms (Equation 3):
Results and Discussion
Effect of fruit maturity on SG value
Mangosteen fruit can be harvested when the peelcolour turns pinkish with deep pink dots scattered overthe whole peel; this is referred to as stage 2. Harvestingof the fruit can be delayed until stage 4 in which thefruit peel colour turns red–purple. It was found that theSG values of fruit at each maturity stage after harvestwere not significantly different, however the SGvalues decreased significantly in the 2–6 days afterharvesting. This suggests that the fruit at differentstages of peel colour could be sorted from the samebatch, but the fruit should be sorted on the same day asharvesting. This is to avoid damaged, but floating, fruitbeing mistaken for normal fruit and thus contami-nating the normal fruit.
Distribution of normal fruit and those with various types of internal disorders according to their SG
The number and percentage of each type of fruitdisorder and their SG distributions are shown inFigures 1 and 2. Calculation of the average SG valuesfor each type of damaged fruit showed that the fruitwith gamboge, translucent pulp disorder and the com-bination of both symptoms had higher SGs than thenormal fruit. However, our data revealed that therewas a wide range of SG values for normal fruit andfruit with each type of internal disorder fruit, and theSG range overlapped. Our data, which was collected inthe 1997 season, is compared to other harvest seasonsstudied by Nanthachai et al. (1991) and Pankasemsuk(1990) in Figure 3. Both the percentage and SG distri-bution of normal fruit and fruit with various types ofdisorder depended on the extent of rainy conditions.Table 1 shows that for the years with light rainfall(1989 and 1991) the percentage of normal fruit was54% and 68%, respectively, but with the heavy rainfallduring harvest in 1990 and 1997) the percentage ofnormal fruit dropped to 35% and 32%. The excesswater from heavy rain may cause more fruit to becometranslucent and develop the gamboge disorder.
Precision =No. of normal fruit sorted 100
Total no. of fruit at that SG
× (1)
Efficiency of sorting for each symptom=
No. of normal fruit sorted correctly for a symptom 100
No. of fruit with that symptom
×
Efficiency of sorting for all symptoms =
No.of normal fruit sortedcorrectly for all symptoms 100
Total no. of fruit
×
(3)
(2)
Quality assurance in agricultural produce,edited by G.I. Johnson, Le Van To, Nguyen Duy Duc and M.C. Webb.
ACIAR Proceedings 100(printed version published in 2000)
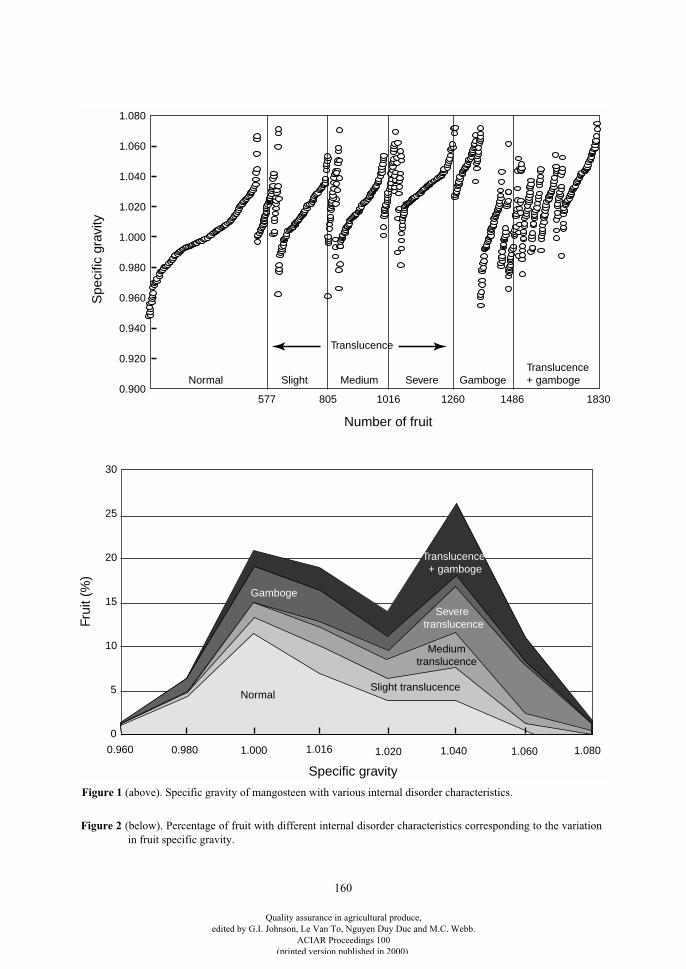
160
Spe
cific
gra
vity
Normal Slight Medium Severe GambogeTranslucence+ gamboge
Number of fruit
Translucence
1.080
1.060
1.040
1.020
1.000
0.980
0.960
0.940
0.920
0.900577 805 1016 1260 1486 1830
30
25
20
15
10
5
0
0.960 0.980 1.000 1.016 1.020 1.040 1.060 1.080
Frui
t (%
)
Specific gravity
NormalSlight translucence
Mediumtranslucence
Severe translucence
Gamboge
Translucence + gamboge
Figure 1 (above). Specific gravity of mangosteen with various internal disorder characteristics.
Figure 2 (below). Percentage of fruit with different internal disorder characteristics corresponding to the variationin fruit specific gravity.
Quality assurance in agricultural produce,edited by G.I. Johnson, Le Van To, Nguyen Duy Duc and M.C. Webb.
ACIAR Proceedings 100(printed version published in 2000)
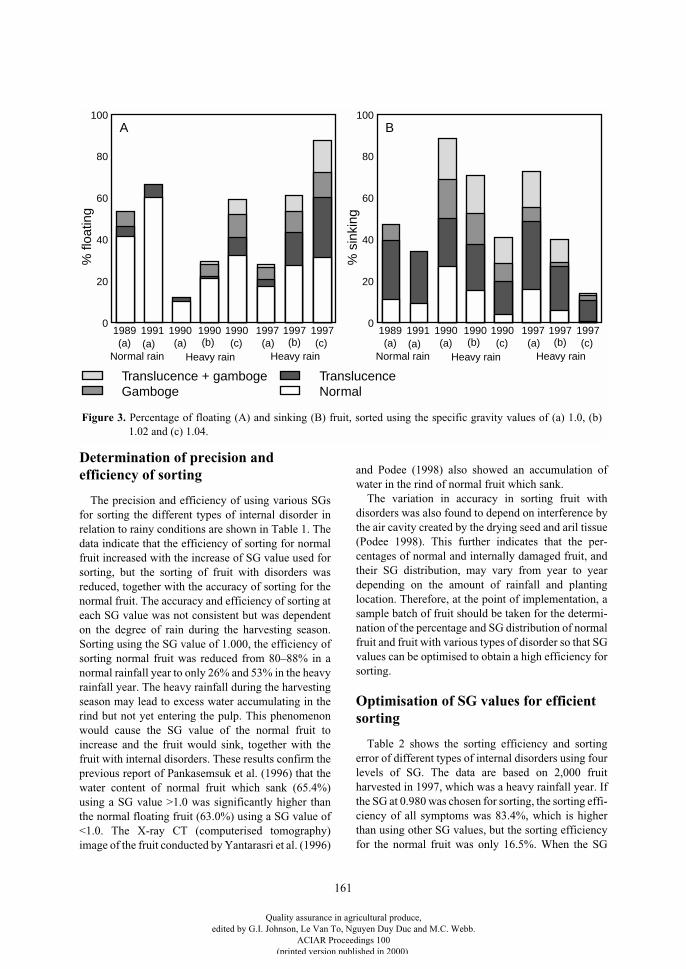
161
Determination of precision and efficiency of sorting
The precision and efficiency of using various SGsfor sorting the different types of internal disorder inrelation to rainy conditions are shown in Table 1. Thedata indicate that the efficiency of sorting for normalfruit increased with the increase of SG value used forsorting, but the sorting of fruit with disorders wasreduced, together with the accuracy of sorting for thenormal fruit. The accuracy and efficiency of sorting ateach SG value was not consistent but was dependenton the degree of rain during the harvesting season.Sorting using the SG value of 1.000, the efficiency ofsorting normal fruit was reduced from 80–88% in anormal rainfall year to only 26% and 53% in the heavyrainfall year. The heavy rainfall during the harvestingseason may lead to excess water accumulating in therind but not yet entering the pulp. This phenomenonwould cause the SG value of the normal fruit toincrease and the fruit would sink, together with thefruit with internal disorders. These results confirm theprevious report of Pankasemsuk et al. (1996) that thewater content of normal fruit which sank (65.4%)using a SG value >1.0 was significantly higher thanthe normal floating fruit (63.0%) using a SG value of<1.0. The X-ray CT (computerised tomography)image of the fruit conducted by Yantarasri et al. (1996)
and Podee (1998) also showed an accumulation ofwater in the rind of normal fruit which sank.
The variation in accuracy in sorting fruit withdisorders was also found to depend on interference bythe air cavity created by the drying seed and aril tissue(Podee 1998). This further indicates that the per-centages of normal and internally damaged fruit, andtheir SG distribution, may vary from year to yeardepending on the amount of rainfall and plantinglocation. Therefore, at the point of implementation, asample batch of fruit should be taken for the determi-nation of the percentage and SG distribution of normalfruit and fruit with various types of disorder so that SGvalues can be optimised to obtain a high efficiency forsorting.
Optimisation of SG values for efficient sorting
Table 2 shows the sorting efficiency and sortingerror of different types of internal disorders using fourlevels of SG. The data are based on 2,000 fruitharvested in 1997, which was a heavy rainfall year. Ifthe SG at 0.980 was chosen for sorting, the sorting effi-ciency of all symptoms was 83.4%, which is higherthan using other SG values, but the sorting efficiencyfor the normal fruit was only 16.5%. When the SG
100
80
60
40
20
0
% fl
oatin
g
A
1989 1991 1990 1990 1990 1997 1997 1997(a) (a) (a) (a)(b) (b)(c) (c)
Normal rain Heavy rain Heavy rain
100
80
60
40
20
0
% s
inki
ng
B
1989 1991 1990 1990 1990 1997 1997 1997(a) (a) (a) (a)(b) (b)(c) (c)
Normal rain Heavy rain Heavy rain
Translucence + gambogeGamboge
Translucence Normal
Figure 3. Percentage of floating (A) and sinking (B) fruit, sorted using the specific gravity values of (a) 1.0, (b)1.02 and (c) 1.04.
Quality assurance in agricultural produce,edited by G.I. Johnson, Le Van To, Nguyen Duy Duc and M.C. Webb.
ACIAR Proceedings 100(printed version published in 2000)
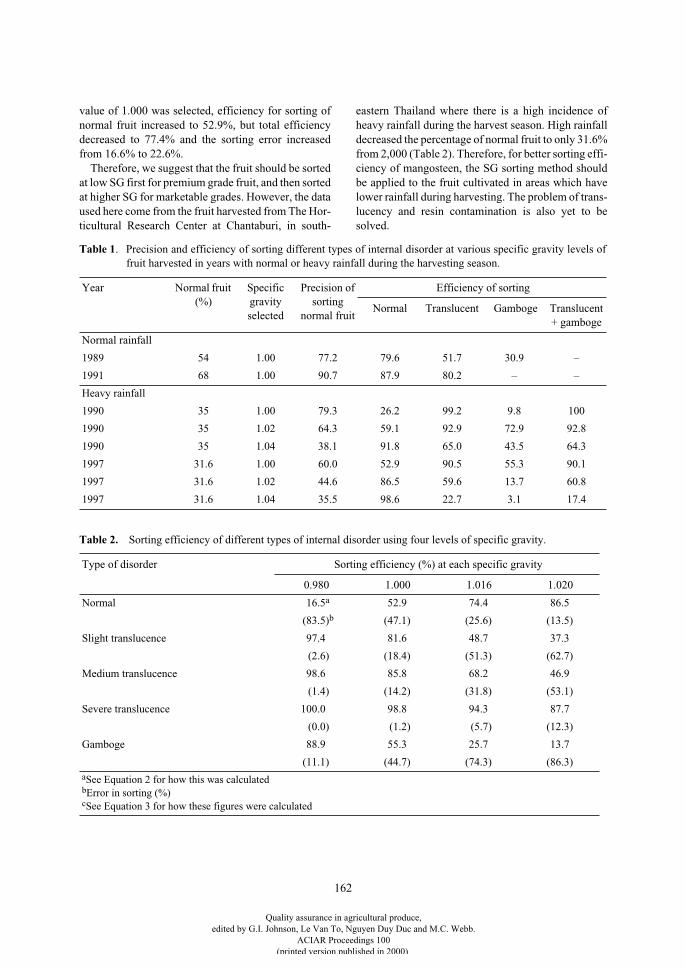
162
value of 1.000 was selected, efficiency for sorting ofnormal fruit increased to 52.9%, but total efficiencydecreased to 77.4% and the sorting error increasedfrom 16.6% to 22.6%.
Therefore, we suggest that the fruit should be sortedat low SG first for premium grade fruit, and then sortedat higher SG for marketable grades. However, the dataused here come from the fruit harvested from The Hor-ticultural Research Center at Chantaburi, in south-
eastern Thailand where there is a high incidence ofheavy rainfall during the harvest season. High rainfalldecreased the percentage of normal fruit to only 31.6%from 2,000 (Table 2). Therefore, for better sorting effi-ciency of mangosteen, the SG sorting method shouldbe applied to the fruit cultivated in areas which havelower rainfall during harvesting. The problem of trans-lucency and resin contamination is also yet to besolved.
Table 1
. Precision and efficiency of sorting different types of internal disorder at various specific gravity levels offruit harvested in years with normal or heavy rainfall during the harvesting season.
Year Normal fruit (%)
Specific gravity selected
Precision of sorting
normal fruit
Efficiency of sorting
Normal Translucent Gamboge Translucent + gamboge
Normal rainfall
1989 54 1.00 77.2 79.6 51.7 30.9 –
1991 68 1.00 90.7 87.9 80.2 – –
Heavy rainfall
1990 35 1.00 79.3 26.2 99.2 9.8 100
1990 35 1.02 64.3 59.1 92.9 72.9 92.8
1990 35 1.04 38.1 91.8 65.0 43.5 64.3
1997 31.6 1.00 60.0 52.9 90.5 55.3 90.1
1997 31.6 1.02 44.6 86.5 59.6 13.7 60.8
1997 31.6 1.04 35.5 98.6 22.7 3.1 17.4
Table 2.
Sorting efficiency of different types of internal disorder using four levels of specific gravity.
Type of disorder Sorting efficiency (%) at each specific gravity
0.980 1.000 1.016 1.020
Normal 16.5
a
52.9 74.4 86.5
(83.5)
b
(47.1) (25.6) (13.5)
Slight translucence 97.4 81.6 48.7 37.3
(2.6) (18.4) (51.3) (62.7)
Medium translucence 98.6 85.8 68.2 46.9
(1.4) (14.2) (31.8) (53.1)
Severe translucence 100.0 98.8 94.3 87.7
(0.0) (1.2) (5.7) (12.3)
Gamboge 88.9 55.3 25.7 13.7
(11.1) (44.7) (74.3) (86.3)
a
See Equation 2 for how this was calculated
b
Error in sorting (%)
c
See Equation 3 for how these figures were calculated
Quality assurance in agricultural produce,edited by G.I. Johnson, Le Van To, Nguyen Duy Duc and M.C. Webb.
ACIAR Proceedings 100(printed version published in 2000)
163
References
Laivisethkul, S. 1994. Factors affecting pulp translucencysymptom of mangosteen. MSc thesis, Department ofHorticulture, Kasetsart University, Thailand (in Thai).
Lakanathinwong, V. 1996. The study on chemicalcomposition, cell viability and influence of water on fleshtranslucent disorder in mangosteen. MSc thesis,Department of Horticulture, Kasetsart University,Thailand (in Thai).
Nantachai, S., Ratanachinakarn, B. and Pumhirum, J. 1991.Method for separation of mangosteen fruit withtranslucent pulp disorder from normal fruit. AnnualReport 1991. Horticultural Research Center at
Chantaburi, Department of Horticulture, Ministry ofAgriculture and Co-operatives, Thailand (in Thai).
Pankasemsuk, T., Garner, J.O. Jr, Matta, F.B. and Silva, J.L.1996. Translucent flesh disorder of mangosteen fruit(
Garcinia mangostana
L.). HortScience, 31, 112–113.
Podee, R. 1998. Nondestructive methods for separation oftranslucent pulp in mangosteen by specific gravity and X-ray computerised tomography. MSc thesis, PostharvestTechnology, Chiang Mai University, Thailand (in Thai).
Pomeranz, D. and Meloan, C.E. 1978. Food analysis theoryand practice. Westport, Connecticut, AVI Publishing.
Yantarasri, T., Sornsrivichai, J. and Chen, P. 1996. X-rayand NMR for nondestructive internal quality evaluationof durian and mangosteen fruits. Acta Horticulturae, 464,97–102.
Translucence + gamboge 99.1 90.1 76.5 60.8
(0.9) (9.9) (23.5) (39.2)
Total efficiency for all symptoms
c
83.4 77.4 64.6 55.5
(16.6) (22.6) (35.4) (44.5)
Table 2.
(Cont’d) Sorting efficiency of different types of internal disorder using four levels of specific gravity.
Type of disorder Sorting efficiency (%) at each specific gravity
0.980 1.000 1.016 1.020
a
See Equation 2 for how this was calculated
b
Error in sorting (%)
c
See Equation 3 for how these figures were calculated
Quality assurance in agricultural produce,edited by G.I. Johnson, Le Van To, Nguyen Duy Duc and M.C. Webb.
ACIAR Proceedings 100(printed version published in 2000)

164
Quality assurance in agricultural produce,edited by G.I. Johnson, Le Van To, Nguyen Duy Duc and M.C. Webb.
ACIAR Proceedings 100(printed version published in 2000)
167
Future Research and Development in Agricultural Produce Quality
P.J. Hofman*
Abstract
Consumer preferences and lifestyle will be the main driving forces for the future research and development(R&D) on quality of agricultural produce. These will centre around consistent quality, a wide range of productchoices, convenience, and sound environmental practices during production and postharvest handling, and willbe achieved at a cost the consumer will tolerate.
On this basis, future R&D will concentrate on:• Food safety, or negligible risk to health from biological contamination and chemical residues. This will
involve research on minimal chemical use through resistant cultivars, reducing non-targeted toxicity,reducing applications, and finding alternative, non-chemical control treatments. Better technologies forminimising and monitoring contaminants will also be developed.
• Waste reduction, to safely prevent deterioration after harvest. Measures such as physical treatments andenhancing host defence mechanisms will be improved. There will be continuing research to controlripening and senescence in perishable commodities through genetic manipulation and other means. Supplychain management will also be pivotal in reducing losses and minimising the time from harvest toconsumption.
• Product differentiation will increase through developing different cultivars with specific qualitycharacteristics, and new processed products. Rapid tests to confirm product identity, varietal purity orsuitability will become more important.
• Quality differentiation will be achieved by differentiating different quality lines from the same cultivars forspecific markets, through better harvesting and sorting techniques. More sophisticated systems will bedeveloped to determine quality.
Underpinning the commercial implementation of these ongoing developments will be quality managementsystems and effective supply chain management.
P
OSTHARVEST
food losses have been quoted as being15–50% for horticultural products, and 10–20% forgrains and oil seeds (Okezie 1998). However, theseestimates generally do not include income losses dueto quality deterioration that do not result in totalwastage. Thus, losses to grower income are likely to behigher than those given above.
In the past, production research and development(R&D) of agricultural produce has received greaterattention than postharvest issues, especially in tradi-tional agricultural development projects (Okezie1998). This has resulted in improvements to pro-
duction outstripping the capacity to minimise lossesafter harvest.
There are also continued changes in consumer pref-erences and demand. For example:
• The consumer is becoming more aware of differentproducts and experiences because of theinformation age and exposure to differentexperiences through multi-culturalism and travel.For example, in the mid-1990s, 58% of Australianspreferred dishes such as pasta, rice, and stir fries,compared to the old favourites such as chops andmince.
• There is a shift of power to the consumer in relationto product availability and quality. Thus, individualchoice is becoming the name of the game.
* Maroochy Research Station, Queensland Horticulture Institute, Department of Primary Industries, PO Box 5083, Sunshine Coast Mail Centre (Mayers Rd), Nambour, Queensland 4560, Australia.
Quality assurance in agricultural produce,edited by G.I. Johnson, Le Van To, Nguyen Duy Duc and M.C. Webb.
ACIAR Proceedings 100(printed version published in 2000)
168
• In the past, purchases were based mainly on searchattributes (characteristics that can be determined byinspecting the product and its packaging) andexperience attributes (those which can be judgedafter using the product, e.g. taste). Now credenceattributes (those that can not be judged even afterthe product has been used), such as pesticideresidues or being organically grown, are becomingmore important (Caswell 1999).
• Tolerable food preparation times are decreasing. Itis currently about 15 minutes, but will soon be downto several minutes.
• By 2000, fresh cuts will make up 20% of all freshproduce sold in Australian supermarkets.
• There is increasing demand that the products areproduced with minimal environmental impact.
Based on these emerging patterns, the followingfactors will influence postharvest R&D in the future:
• There will be increased customer (consumer)demand for consistent quality in all markets.
• Consumers will demand a wider range of productsto suit different lifestyles.
• Perceptions of quality will change with time, e.g.food safety is currently important.
• The demand for value for money will increase.• Postharvest losses will need to decrease to reduce
costs and increase efficiencies.• The imbalance between production and postharvest
research will need re-adjustment.• In developing countries, the increased growth of the
supermarket sector, and the opening of exportmarkets because of trade liberalisation, will requirehigher and more consistent quality.
Based on these characteristics of agricultural indus-tries and their consumers, R&D on product quality willmost likely focus on the following issues.
Food Safety
Biological contamination
Biological contamination can occur during themany production and postharvest operations. Manymechanisms of transmission may be involved,including animals and insects, faeces, sewage, water,soil, cross-contamination from other agriculturalproducts, and from contact with packhouse equipmentetc. (Beuchat 1995; De Roever 1998).
Bacteria are the main causes of biological contami-nation. Instances of contamination from non-economic carriers will be difficult to control, since
control measures against these carriers would notnormally be implemented. Biological contaminationfrom organic manures and recycled water couldincrease with the increased demand for organicproduce and water conservation. More research isrequired to minimise health risks from these sources.Treatments such as non-chemical pasteurisation withheat and better application methods may be furtherinvestigated.
Biological contamination can also be commonduring packhouse operations, especially when water isused for offloading fruit from field bins to reducemechanical damage, and for washing. In mostinstances this contamination results in quality loss dueto disease, but there have been direct health concernsin some instances. More effective chemical and non-chemical means of reducing contamination duringthese processes will continue to be developed.
Biological contamination during processing, espe-cially minimal processing, poses a far greater risk, andis generally addressed in developed countries throughfood safety legislation and programs such as HazardAnalysis and Critical Control Points (HACCP). It is asignificant issue in developing countries because ofthe large number of small food businesses, and the risein demand for prepared foods. Cost-effective andsimple means of improving food safety in these estab-lishments will need to be developed.
Chemical residues
Considerable postharvest pest and disease controlresearch is now focused on developing non-chemicaltreatments, mainly because of the shorter time fromapplication to consumption resulting in less margin forerror with residue levels, and the continued de-regis-tration of existing chemicals.
Several approaches can be used to reduce the risksassociated with chemicals use, as discussed below.
Reduce chemical toxicity
There will be continued effort to develop moreeffective chemicals with minimal environmentalimpact. These may often be natural chemicals or theirderivatives, obtained from plant sources that shownatural resistance. For example, the absence of fungalpathogens in mushrooms is partly due to the stro-bilurin group of chemicals they contain. Strobilurinshave recently been shown to be highly effective in thecontrol of a number of diseases (Miller 1997), and tohave very low toxicity to mammals, birds and fish.Investigations on natural host defence mechanisms
Quality assurance in agricultural produce,edited by G.I. Johnson, Le Van To, Nguyen Duy Duc and M.C. Webb.
ACIAR Proceedings 100(printed version published in 2000)
169
(Johnson et al. 1998) may result in identification ofeffective chemicals with low environmental impact.
Biological control
Integrated pest management during production willcontinue to reduce the risk of chemical residues, eventhough the main driving force may be environmentalimpact rather than food safety. The principles under-lying integrated pest management will be applied to agreater extent to disease control. This will requiremore research on the interaction between diseaseorganisms and the natural microflora. There will bemore effort on understanding the pest and pathogen sothat outbreaks can be more accurately predicted, andmanagement of these risks improved.
It is expected that biological control strategies willconcentrate on organisms that rely on mechanismsother than antibiotics for efficacy, such as competitionfor food. Further commercial development of thisapproach will occur as existing control measuresbecome less acceptable. Preharvest applications arelikely to be developed for quiescent infections such asanthracnose and stem end rot in mango and avocado,and postharvest treatments for wound pathogens(Korsten et al. 1994; Holmes et al. 1998). Issues to beaddressed will include the high costs of commercialdevelopment for lower volume products, and thedifferent handling and application methods requiringchange in grower practices etc.
Immunisation—the process of inoculating the hostwith heat-killed or less virulent strains of the pathogenin order to induce a defence mechanism—has beensuccessfully used to control many human and animaldiseases. There is evidence that similar responses canoccur in plants (Johnson and Sangchote 1994). Thereare relatively few commercial adaptations of thisconcept to control plant diseases, but these mayincrease with further research. Also, investigation ofthe plant responses to ‘immunisation’ may result in theidentification of host defence mechanisms that can betriggered by more direct means.
Physical treatments
Physical treatments are aimed at either directlykilling the pathogen or pest, or reducing pest or diseasesymptom development to a greater extent thanripening or senescence of the host, so that the productis consumed or processed before symptoms appear.
Smarter use of ripening temperatures may havepotential in climacteric fruit. For example, ripeningavocado fruit at 15°C results in less disease in ripe fruitthan when ripened at 20°C (Hopkirk et al. 1994). This
concept needs to be investigated in other tropical fruit.However, cold storage generally results in higherdisease severity, presumably because the lowerstorage temperatures slow down product senescencemore than disease development.
Cold temperatures are also used for insect disinfes-tation, but the 16 days at 1°C generally required forfruit fly control can cause chilling damage, and is oftenconsidered too long when sea freight is required tooverseas markets, or when rapid responses to marketchanges are desired. Hot air and hot water treatments(total treatment times of about 6–12 hours) canovercome these concerns. However, hot water can alsocause damage (Jacobi and Wong 1992), and hot aircurrently requires expensive equipment. Research willcontinue to develop more economic applicationsystems, and to reduce product damage through pre-conditioning treatments (Woolf and Lay-Yee 1997;Woolf et al. 1998). Other ways of applying heat, suchas microwaves, may have commercial potential whenways of reducing the risk of uneven produce heatinghave been developed. Treatment combinations, suchas heat and controlled atmospheres, have shownpotential to control some insects (especially surfacepests), and further development may see commercialapplication of this approach.
Heat is also used in grains to reduce the moisturecontent to levels that minimise disease development.Continued efficiencies in this area will be pursued,which may include more efficient use of solar energy(either direct or captured).
Heat treatments alone (without fungicides) cancontrol postharvest diseases (Suhardjo et al. 1994), butfruit are susceptible to damage, and are more sensitiveto preharvest and postharvest conditions (Cooke andJohnson 1994). Controlled atmospheres have shownlittle potential to directly control disease, with thenotable exception of
Botrytis
in strawberries, due tofruit tolerance to high CO
2
concentrations. Furtherresearch may increase the use of physical treatmentsother than cold to control postharvest diseases.
Irradiation is highly effective for disinfestation in arange of commodities (Hallman 1999). There is lessinformation on disease control by irradiation, but thereare indications that this may also be a useful method.Increased use of irradiation in foods could dependmore on consumer acceptance of the technique morethan on further R&D. Other physical treatments, suchas ultraviolet light, can have direct effects onpathogens or increase host defence mechanisms (elGhaouth 1998). There will be increasing investigation
Quality assurance in agricultural produce,edited by G.I. Johnson, Le Van To, Nguyen Duy Duc and M.C. Webb.
ACIAR Proceedings 100(printed version published in 2000)
170
into these techniques, especially as treatmentcombinations.
Physical contamination
Contamination by wood splinters, glass etc. is animportant commercial consideration. Research maycontinue into better detection systems, but this willrequire relatively lower resource input.
Measuring contaminants
Increased globalisation of markets resulting inaccess to products from a range of countries, greatersensitivity to food safety, and cost pressures willincrease the demand for more rapid and cost-effectivequantification of chemical and biological contami-nants. Quick and reliable techniques such as theenzyme-linked immunosorbent assay (ELISA) arebeing more widely used in developed and developingcountries, and improvements in these systems willcontinue. We can also expect to see smarter systemssuch as specific electronic sensors similar to those forselected volatiles (‘electronic nose’). More rapid andreliable quantification of biological residues can beexpected through simpler DNA-related techniques,which will be facilitated by cheaper equipment forthese tests.
Quality Loss
This section will discuss both quality loss and ‘wastereduction’, since these both occur through similarprocesses.
Quality loss can occur through pest and diseaseactivity, and control measures relating to these areashave been discussed above. This section will discusslosses due to premature senescence, although there issome interaction between treatments intended mainlyto control senescence, and their impact on pests anddiseases (e.g. low temperatures).
Storage systems
Low-cost cooling strategies that rely on concepts,such as cooler night air and evaporative cooling, willcontinue to be developed and applied in developingcountries at the village level (Anon. 1998). There willalso be continued improvements in more sophisticatedenvironmental control systems. More energy and cost-efficient refrigeration systems will result in wider useof temperature-controlled storage. Controlled atmos-phere (CA) applications are becoming more commondue to more reliable and cheaper systems. Advances
will be greater in CA transport systems because ofexpansion in global markets, and lower-cost controlsystems that are more compact and cheaper.
Further research in modified atmosphere (MA)applications will be based on the ability to developfilms with specific permeability, so that MA systemscan be tailored to specific requirements. Currentdevelopments include improving the chemical compo-sition of films, and using smart patches or ‘windows’on bags. Smart MA systems that have the ability toadjust membrane permeability according to changes inproduct behaviour or storage temperature will increasethe robustness of MA systems, and allow wider appli-cation in areas with less developed cool chains.Improved cool chains (maintaining the storage tem-perature at all stages during product distribution) willalso allow increased use of MA.
Chemical and genetic manipulation of senescence and bruising
The recent development of chemicals such as 1-methylcyclopropene (1-MCP), which binds to theethylene binding site to retard ripening and senes-cence, is a good example of further developments wemay see in this area. This chemical is very effective indelaying senescence of cut flowers (Macnish et al.1999, 2000), and in retarding ripening of bananas(Golding et al. 1998) and several other subtropical andtropical fruit (Hofman, unpublished results). Obvi-ously, these need to be considered in relation toreducing chemical use and toxicity when used withedible commodities.
Genetic control of ripening and senescence is thelong-term approach to quality loss and wastage.However, the challenge is to retard the undesirableprocesses for as long as possible, but then ‘switch’them on again when required.
There are several examples of manipulatingripening processes using traditional breedingprograms, e.g. the
rin
and
nor
tomato cultivars.However, genetic engineering will provide additionalpotential in this area. For example, cultivars have beendeveloped where activity of selected enzymes in theripening process have been reduced, and research iscurrently under way to regulate ethylene productionand action in several subtropical and tropical climac-teric fruits by similar means.
Improvements in the ability of a product towithstand other postharvest stresses will continue toreduce quality loss. Increasing firmness to reducebruising etc. has been achieved by traditional breeding
Quality assurance in agricultural produce,edited by G.I. Johnson, Le Van To, Nguyen Duy Duc and M.C. Webb.
ACIAR Proceedings 100(printed version published in 2000)
171
programs in fruit such as tomato and strawberry, butfuture programs will need to achieve these objectiveswithout sacrificing other characteristics such as eatingquality. The ‘anti-browning’ technology of manipu-lating polyphenol oxidase activity has beenincorporated into potato and other commodities, andthere is currently a program to do this for pineapple.These concepts can be applied to a range of fruitswhere browning contributes to quality loss (e.g.avocados) but in some instances there may be moreappropriate approaches, such as improving membranestability to the lower temperatures at which damageusually occurs.
Predicting product quality and performance
There will be increased interest in predicting theability of products to withstand storage and distri-bution, and in ensuring consistent product quality atthe retail level. An important component of this is pre-dicting and controlling the effects of productionpractices on quality. Many production factors caninfluence quality (Hofman and Smith 1994; Hofman etal. 1997) and there is growing recognition and interestin the importance of these influences (Ferguson et al.1999; Kays 1999; Mattheis and Fellman 1999; Sams1999). As knowledge accumulates, modellingapproaches will be used to help alter productionpractices to achieve the desired product quality.
A current, commercial example of this approach isthe use of calcium sprays during fruit growth to reducephysiological disorders in apple during storage. Also,apple physiology is sufficiently well understood toestimate the potential for these disorders to developduring storage by measuring fruit mineral concentra-tions (especially Ca, Mg and K) just before harvest(Ferguson et al. 1999). Fruit batches that do not havethe required minerals ratio are not stored. There areindications that similar relationships exist in other fruit(Hofman et al. 1998), but these will need furtherinvestigation.
Currently, these techniques are applied to batches offruit from orchard blocks etc., even though therewould be variation in storage potential and qualitybetween fruit in that batch. Modelling the relationshipsbetween more easily measurable characteristics of thefruit at harvest, such as colour in cucumbers andfirmness in kiwifruit (Polderdijk et al. 1993; Tijskensand Polderdijk 1996; Johnson and Ridout 1998), canbe used to determine the storage potential of individual
fruit, and further improve product consistency afterstorage.
These approaches are being made possible bytechnical advances allowing in-line systems in thepackhouse. More sophisticated techniques are alsoseeing commercial application because of theseimprovements. For example, near infrared (NIR) spec-troscopy is now used commercially to non-destructively estimate the sugars content of fruit on thesorting line, so that fruit can be marketed as guaranteedsweet (Guthrie and Walsh 1997). Nuclear magneticresonance (NMR) may also have packhouse appli-cation in the future to identify internal defects, such asjelly seed and stem end cavity in mango (Chen et al.1996; Clark et al. 1997). There may even be potentialto determine disease load at harvest by using geneticmarkers and dyes etc.
This concept will be further expanded to allowquality characterisation at the retail level so thatconsumers can determine the stage of ripeness of cli-macteric fruit. For example, simple firmness testers(Mizrach et al. 1997; Galili et al. 1998; Hung et al.1999) can be placed in stores to allow consumers topredict the number of days for fruit to reach the eatingsoft stage, thereby reducing the risk of fruit becomingoverripe. This can also be used by retailers to groupfruit based on firmness or time to eating ripe, againreducing the risk of damage by consumer handling.
The supply chain
A significant cause of quality loss is excessive timefrom harvest to consumption, especially with inade-quate infrastructure to prevent deterioration. Thenegative impacts of excessive time can be reduced bytemperature and atmosphere control systems, howeveroptimising supply chain operations is another essentialcomponent which will have significant impacts in thefuture. Strong commitment by all members of thesupply chain to its mutual development will increasetransparency and communication between members.There will be better information exchange from theretailer to the grower in relation to planting and har-vesting requirements, and from the grower to theretailer about the need to increase product sales due tomore harvests because of climatic conditions etc. Thiswill result in less risk of over-supply at the wholesaleor retail levels, and reduced quality loss. There will bea greater move to the concept of ‘just in time’ productflow common in manufacturing industries, whereharvested product is held at the wholesale and retaillevels for the shortest possible time. These advances
Quality assurance in agricultural produce,edited by G.I. Johnson, Le Van To, Nguyen Duy Duc and M.C. Webb.
ACIAR Proceedings 100(printed version published in 2000)
172
can only be achieved through commitment andefficient information flow.
Quality Differentiation
Improved returns can be achieved by separating linesof differing quality and marketing accordingly, ratherthan marketing the one line with mixed quality. Withimproved systems for measuring quality, higherquality lines (because of better growing conditions andcultivars) can now be identified and sold at prices thatreflect their quality, resulting in improved returns. Thepotential for this approach will increase as measuringsystems improve, and cultivars are developed forspecific purposes and growing conditions. Similarconcepts have been applied to fruits and vegetables formany years by visually sorting into first and secondgrade in the packhouse. However, this concept will beexpanded as new technology is developed. Thepotential to estimate internal quality with NIR andNMR (see above) will allow quality separation basedon parameters other than visual factors.
These concepts may expand to include selectiveharvesting etc. For example, mango fruit harvestedfrom the north side of the canopy (in Australia) aregenerally more mature, and will have better skincolour (Hofman et al. 1997). This is being used com-mercially—mango fruit destined for the Japanesemarket are harvested only from the north side of thetree and from the outside of the canopy, whichimproves the level and consistency of quality. Furtherapplication of these principles may come with thedevelopment of systems that will harvest fruit basedon their internal quality as estimated by NIR or similarmeans.
Product Differentiation
Specific cultivars will continue to be developed fortargeted uses. Cultivar characteristics will includeprocessing quality (for grains), internal quality andflavour, and appearance (fruits and vegetables). Therewill also be continued emphasis on storage potential toovercome seasonal supply fluctuations, and moreefficient access to distant markets. This will seeincreased turnover of cultivars to keep pace withchanging consumer demand, as well as to continuallyoptimise production costs.
Product differentiation is also achieved throughproduct presentation such as packaging. For example,sale of finger packs of bananas has improved presen-tation and sales in some sectors. Minimally processed
products will continue to expand as the demand foreasy-to-prepare products increases. Research anddevelopment will continue to find new and safer waysof presenting these products.
Accurate identification of product constituents willbecome more important to ensure that these meetconsumer requirements. This will become moreimportant as ‘controversial’ techniques such asgenetic engineering and irradiation are used. The highcost of genetic engineering to develop new cultivarswill also require that these can be identified to protectvariety rights and royalties. The rapid development ofbiotechnology has increased efficiency in this area,and these developments will continue.
Summary
Underlying most of the future R&D on quality areseveral important issues. Supply chain managementwill be increasingly important. This will apply to bothdeveloping and developed countries, since supplychains exist as soon as product leaves the farm. Theconcepts of open information sharing between allpartners in the chain to ensure adequate product flow,maintenance of quality, cost reductions and so on, willbe essential in these chains. In addition, the growinginfluence of supermarkets in the developing countries,and the increased potential to access internationalmarkets will further increase the need for appropriatesupply chains at all levels.
The R&D agencies will do a better job of assistingindustry to meet consumer demands. This will beachieved by agencies working with industry toidentify the key constraints in existing supply chainsthat reduce competitive advantage, and then providingappropriate services to facilitate appropriate changes.
Quality management (QM) systems have a signif-icant role to play in maintaining product specifications(safety and quality) within levels required by theconsumer. However, QM systems can also contributeto identifying quality constraints and the importanceof these constraints through data such as rejectsanalysis (Baugher et al. 1996). This information willbe used by R&D agencies to better identify areaswhere improvements will have a real industry impact.
The practical results of biotechnology as an alter-native to conventional breeding will become moreapparent with time. However, consumer concern overthe potential risks associated with this approach willrequire considerable attention if the real benefits ofbiotechnology are to be realised. Also, there is risk thatthe emphasis on biotechnology will result in a loss of
Quality assurance in agricultural produce,edited by G.I. Johnson, Le Van To, Nguyen Duy Duc and M.C. Webb.
ACIAR Proceedings 100(printed version published in 2000)
173
more conventional postharvest skills, and that biotech-nology is applied to problems when better ways ofaddressing the challenges exist. Thus, a clear focusneeds to be maintained on the problem rather than thetechniques.
More integrated approaches to production andmarketing will be developed. No longer can the arti-ficial ‘separation’ of production, postharvestprocesses and marketing be sustained, and approachesto address issues will need to consider the potential forsolutions to exist in other parts of the system. Inaddition, current results indicate that non-chemicaldisease control systems are not as effective as thecurrent chemical controls, so that a number of controlmechanisms, such as biological control agents andnatural host defence techniques, will have to be used incombination. Thus, management of quality in thefuture will have to be more integrated to achieve theincreasing consumer demands for quality.
References
Anon. 1998. African experience in the improvement ofpostharvest techniques. Rome, Food and AgricultureOrganisation of the United Nations.
Baugher, T.A., Hogmire, H.W., Biggs, A.R. and Lightner,G.W. 1996. Packout audits of apples from five orchardmanagement systems. HortTechnology, 6, 34–41.
Beuchat, L.R. 1995. Pathogenic microorganisms associatedwith fresh produce. Journal of Food Protection, 59, 204–216.
Caswell, J. 1999. Consumer food markets of the future: anoverseas (US) perspective. Department of ResourceEconomics, University of Massachusetts USA.
Chen, P., McCarthy, M.J., Kim, S.M. and Zion, B. 1996.Development of a high-speed NMR technique for sensingmaturity of avocados. Transactions of the ASAE(American Society for Agricultural Engineers), 39,2205–2209.
Clark, C.J., Hockings, P.D., Joyce, D.C. and Mazucco, R.A.1997. Application of magnetic resonance imaging to pre-and post-harvest studies of fruits and vegetables.Postharvest Biology and Technology, 11, 1–21.
Cooke, A.W. and Johnson, G.I. 1994. Mango postharvestdisease control: effect of rain at harvest, fungicidetreatments and fruit brushing on fruit appearance. In:Champ, B.R., Highley, E. and Johnson, G.I., ed.,Postharvest handling of tropical fruits. ACIARProceedings No. 50. Canberra, Australian Centre forInternational Agricultural Research, 448–449.
De Roever, C. 1998. Microbial evaluations and recommen-dations on fresh produce. Food Control, 9, 321–347.
el Ghaouth, A. 1998. Use of elicitors to control postharvestdiseases in fruit and vegetables. In: Johnson, G.I.,
Highley, E. and Joyce, D.C., ed., Disease resistance infruit. ACIAR Proceedings No. 80. Canberra, AustralianCentre for International Agricultural Research, 131–135.
Ferguson, I., Volz, R. and Woolf, A. 1999. Preharvestfactors affecting physiological disorders of fruit.Postharvest Biology and Technology, 15, 255–262.
Galili, N., Shmulevich, I. and Benichou, N. 1998. Acoustictesting of avocado for fruit ripeness evaluation.Transactions of the ASAE (American Society forAgricultural Engineers), 41, 399–407.
Golding, J.B., Shearer, D., Wyllie, S.G. and McGlasson,W.B. 1998. Application of 1-MCP and propylene toidentify ethylene-dependent ripening processes in maturebanana fruit. Postharvest Biology and Technology, 14,87–98.
Guthrie, J. and Walsh, K. 1997. Non-invasive assessment ofpineapple and mango fruit quality using near infra-redspectroscopy. Australian Journal of ExperimentalAgriculture, 37, 253–263.
Hallman, G.J. 1999. Ionizing radiation quarantinetreatments against tephritid fruit flies [Review].Postharvest Biology and Technology, 16, 93–106.
Hofman, P.J. and Smith, L.G. 1994. Preharvest effects onpostharvest quality of subtropical and tropical fruit. In:Champ, B.R., Highley, E. and Johnson, G.I., ed.,Postharvest handling of tropical fruits: proceedings of aninternational conference, Chiang Mai, Thailand, 19–23July 1993. ACIAR Proceedings No. 50. Canberra,Australian Centre for International AgriculturalResearch, 261–268.
Hofman, P.J., Smith, L.G., Meiburg, G.F. and Giles, J.E.1997. Production locality affects mango fruit quality.Australian Journal of Experimental Agriculture, 37, 801–808.
Hofman, P.J., Vuthapanich, S., Klieber, A., Whiley, A.W.and Simons, D.H. 1998. Effect of locality, irrigation andpaclobutrazol on quality of ‘Hass’ avocado. In: Coates,L.M., Hofman, P.J. and Johnson, G.I., ed., Diseasecontrol and storage life extension in fruit: proceedings ofan international workshop held at Chiang Mai, Thailand,22–23 May 1997. ACIAR Proceedings No. 81. Canberra,Australian Centre for International AgriculturalResearch, 67–76.
Holmes, R.J., de Alwis, S., Shanmuganathan, N.,Widyastuti, S. and Keane, P.J. 1998. Enhanced biocontrolof postharvest diseases of apples and pears. In: Johnson,G.I., Highley, E. and Joyce, D.C., ed., Disease resistancein fruit. ACIAR Proceedings No. 80. Canberra,Australian Centre for International AgriculturalResearch, 162–166.
Hopkirk, G., White, A., Beever, D.J. and Forbes, S.K. 1994.Influence of postharvest temperatures and the rate of fruitripening on internal postharvest rots and disorders of NewZealand ‘Hass’ avocado fruit. New Zealand Journal ofCrop and Horticultural Science, 22, 305–311.
Quality assurance in agricultural produce,edited by G.I. Johnson, Le Van To, Nguyen Duy Duc and M.C. Webb.
ACIAR Proceedings 100(printed version published in 2000)
174
Hung, Y.C., Prussia, S.E. and Ezeike, G.O.I. 1999.Nondestructive firmness sensing using a laser air-puffdetector. Postharvest Biology and Technology, 16, 15–25.
Jacobi, K.K. and Wong, L.S. 1992. Quality of ‘Kensington’mango (Mangifera indica Linn.) following hot water andvapour heat treatments. Postharvest Biology andTechnology, 1, 349–359.
Johnson, D.S. and Ridout, M.S. 1998. Prediction of storagequality of ‘Cox’s Orange Pippin’ apples from nutritionaland meteorological data using multiple regression modelsselected by cross validation. Journal of HorticulturalScience and Biotechnology, 73, 622–630.
Johnson, G.I., Highley, E. and Joyce, D.C. (ed.) 1998.Disease resistance in fruit. ACIAR Proceedings No. 80.Canberra, Australian Centre for InternationalAgricultural Research.
Johnson, G.I. and Sangchote, S. 1994. Control ofpostharvest disease of tropical fruits: challenges for the21st century. In: Champ, B.R., Highley, E. and Johnson,G.I., ed., Postharvest handling of tropical fruits. ACIARProceedings No. 50. Canberra, Australian Centre forInternational Agricultural Research, 140–161.
Kays, S.J. 1999. Preharvest factors affecting appearance.Postharvest Biology and Technology, 15, 233–247.
Korsten, L., De Villiers, E.E., Wehner, F.C. and Kotze, J.M.1994. A review of biological control of postharvestdiseases of subtropical fruits. In: Champ, B.R., Highley,E. and Johnson, G.I., ed., Postharvest handling of tropicalfruits. ACIAR Proceedings No. 50. Canberra, AustralianCentre for International Agricultural Research, 172–185.
Macnish, A.J., Joyce, D.C., Hofman, P.J. and Simons, D.H.1999. Involvement of ethylene in postharvest senescenceof Boronia heterophylla flowers. Australian Journal ofExperimental Agriculture, 39, 911–913.
Macnish, A.J., Simons, D.H., Joyce, D.C., Faragher, J.D.and Hofman, P.J. 2000. Responses of native Australian
cut flowers to treatment with 1-methylcyclopropene andethylene. HortScience (in press).
Mattheis, J.P. and Fellman, J.K. 1999. Preharvest factorsinfluencing flavor of fresh fruit and vegetables.Postharvest Biology and Technology, 15, 227–232.
Miller, A. 1997. The strobilurin race heats up. Chemistryand Industry London, 1, 7.
Mizrach, A., Flitsanov, U. and Fuchs, Y. 1997. An ultrasonicnondestructive method for measuring maturity of mangofruit. Transactions of the ASAE (American Society forAgricultural Engineers), 40, 1107–1111.
Okezie, B.O. 1998. World food security: the role ofpostharvest technology. Food Technology, 52, 64–69.
Polderdijk, J., Tijskens, L., Robbers, J. and Van Der Valk, H.1993. Predictive model of keeping quality of tomatoes.Postharvest Biology and Technology, 2, 179–185.
Sams, C.E. 1999. Preharvest factors affecting postharvesttexture. Postharvest Biology and Technology, 15, 249–254.
Suhardjo, Hermanto, C. and Yuniarti 1994. Hot-watercontrol of anthracnose on mango varieties Arumanis,Golek and Manalagi. In: Champ, B.R., Highley, E. andJohnson, G.I., ed., Postharvest handling of tropical fruits.ACIAR Proceedings No. 50. Canberra, Australian Centrefor International Agricultural Research, 453–454.
Tijskens, L.M.M. and Polderdijk, J.J. 1996. A generic modelfor keeping quality of vegetable produce during storageand distribution. Agricultural Systems, 51, 431–452.
Woolf, A.B., Ball, S., White, A., Spooner, K.J., Bowen, J.H.,Lay-Yee, M. and Ferguson, I.B. 1998. Hot air and hotwater treatments reduce chilling injury of avocadosduring storage. World avocado congress III proceedings,Tel Aviv, October 1995, 348–353.
Woolf, A.B. and Lay-Yee, M. 1997. Pretreatments at 38°Cof ‘Hass’ avocado confer thermotolerance to 50°C hotwater treatments. HortScience, 32, 705–708.
Quality assurance in agricultural produce,edited by G.I. Johnson, Le Van To, Nguyen Duy Duc and M.C. Webb.
ACIAR Proceedings 100(printed version published in 2000)
175
Biotechnological Approaches to Control Postharvest Problems
J.R. Botella*
Abstract
Fruits and vegetables exhibit short life spans after harvesting. Senescence in vegetables and ripening infruits account for large losses in many crops, especially in temperate and tropical countries. Carefulhandling and development of new technologies are fundamental in minimising postharvest losses.Atmosphere control (carbon dioxide and humidity), refrigeration, irradiation etc. have proven useful incontrolling postharvest losses, but the implementation of many of the existing and new technologies is quitedifficult in many developing countries due to the lack of infrastructure and specialised personnel in ruralareas.
Although still in its infancy, biotechnology is emerging as a useful tool to address many postharvestproblems. To date, several approaches have been implemented in model crops to control traits thatinfluence postharvest characteristics such as firmness and delay of ripening and senescence. Control of thecell wall-degrading enzyme polygalacturonase in tomato has resulted in longer life fruit with increasedsolids content. Transgenic fruit containing very low levels of polygalacturonase enzyme remain firmer fora longer period, decreasing transport losses and increasing effective shelf life. Ethylene is one of the majorfactors contributing to the spoiling of fruits and vegetables after harvest, therefore considerable effort hasbeen directed toward controlling ethylene production. Two enzymes in the ethylene biosynthetic pathway,1-aminocyclopropane-1-carboxylic acid (ACC) synthase and ACC oxidase, have proven to have goodpotential for biotechnological applications. Antisense technology has been used to knockout ACC synthaseand ACC oxidase in tomato with outstanding results. Transgenic fruit showed an extensive delay inripening when compared to control fruit. The recent cloning of the mutant ethylene receptor gene (
etr1
)from
Arabidopsis thaliana
has opened the door to a new approach—ethylene insensitivity. Copies of themutant gene have been introduced into tomato and petunia conferring ethylene insensitivity to both species.
O
NCE
a plant is harvested it starts a process of decaythat will result in the inevitable death of the organismand the deterioration of its organic matter. Thisprocess is even more accentuated if the harvestedtissue is a particular organ (fruit, leaf, seeds etc.)instead of the whole plant. In an ideal world, this factshould not be a problem—we would grow our veg-etables and fruits in our backyard and consume themfresh every day. However, in real life, most of thefood we consume has been grown hundreds or even
thousands of kilometres away from the shop fromwhich we bought it. An agronomist will tell us thatour backyard has the appropriate type of soil forsome crops but not for others; in addition, the placewhere we live is too cold for some plants and too hotfor some others. Even in a perfect world where wecould create microclimates to suit most of the foodcrops, many of them are seasonal, i.e. the supply islimited to one particular season of the year.Therefore, we are daily confronted with the fact thatfood crops, after they are grown, need to be trans-ported to intermediate destinations, stored, trans-ported again and distributed before finally reaching
* Plant Genetic Engineering Laboratory, Department of Botany, University of Queensland, Brisbane 4072, Australia.
Quality assurance in agricultural produce,edited by G.I. Johnson, Le Van To, Nguyen Duy Duc and M.C. Webb.
ACIAR Proceedings 100(printed version published in 2000)
176
the consumer. Aside from the natural/physiologicalreasons stated above, sociological aspects need to beconsidered—the backyard, self-sufficient growingstrategy will not work nowadays because many of usdo not have a backyard. The world is evolving from apredominantly rural population to a new demographicdistribution based on high human concentrations inurban areas. Centres of food production are thereforefar away from centres of food consumption.
We are consequently fighting a continuous battle tobring the right food to the right place with a minimumof losses. Sadly, although important advances havebeen made in postharvest technology, we are stilllosing the battle. Postharvest losses account for lossesranging from 20% to an astounding 100% dependingon the crop, the country and the year. Whereas techni-cally advanced countries such as the United States ofAmerica (USA) and European countries fit in thelower side of the scale, developing countries are closerto the higher end. In addition, many of the developingregions in the world are situated in the tropics, wherehigh temperatures and humidity exacerbate theproblem.
Postharvest technologies such as atmospherecontrol (carbon dioxide and humidity), refrigeration,irradiation etc. have proven useful in controlling post-harvest losses, but the implementation of many of theexisting and new technologies is quite difficult inmany developing countries due to a lack of infra-structure and specialised personnel in rural areas. Inaddition, many crops are grown on small farms,meaning that a single grower is not able to afford theeconomic cost of setting up treatment plants and hasno access to specialised packaging requirements.Regional centres, either governmental or private, canalleviate the situation but require a level of organi-sation commonly non-existent.
Biotechnology is emerging as a powerful tool forplant improvement. Although in its initial stages, thepotential for applying biotechnology to enhance theagronomical characteristics of crops is almost lim-itless. In my view, biotechnology has two majoradvantages over other classical technologies:
1.
Biotechnology can break the species barrier(and even the kingdom barrier), providinggenes from very distant species—a limitationof traditional breeding. Today it is notnecessary to find a disease resistance gene forwheat in a compatible wild relative and breed itin. We can obtain the gene from rice orpineapple and introduce it into the wheatvariety of interest.
2.
In many cases, biotechnological products arethe end products in themselves. A slow-ripening papaya does not need other tech-nology to support it and achieve its goal. Nospecialised personnel or equipment are needed,no farmer training, no refrigerated warehouseor transport. It just lasts longer. The same logicapplies to a disease-resistant mango.
The Plant Genetic Engineering Laboratory isinvolved in several biotechnology projects aimed atimproving the postharvest characteristics of severaltropical and subtropical fruits and this paper willmostly centre on this topic.
Biotechnological Control of Fruit Ripening and Postharvest Diseases
Most fruits ripen, deteriorate in appearance and eatingquality, and succumb to postharvest diseases veryrapidly after harvest. Poor postharvest characteristicssuch as poor flavour development, very short shelflife, quick softening, easy spoilage, sensitivity to lowtemperatures (chilling injury) and sensitivity topathogen attack (by fungi etc.) are major constraints toprofitability for the domestic market, and to theexpansion of existing and new export markets. Amongall fruits, tropical fruits are notorious for their poorerthan average postharvest qualities.
Two major obvious targets to improve the post-harvest characteristics of tropical fruits are (i)extension of shelf life and (ii) resistance to pathogenattack.
Fruit ripening
The ripening process involves a large number ofbiochemical pathways in the fruit that will result inmarked changes in texture, taste and colour. At themolecular level there are a large number of genesinvolved and they are tightly regulated in order toinduce the right changes at the right time in a highlycoordinated process. In general, fleshy fruits are clas-sified as climacteric or non-climacteric dependingupon their patterns of respiration and ethylenesynthesis during ripening. Climacteric fruits are char-acterised by an increased respiration rate at an earlystage in the ripening process accompanied by autocat-alytic ethylene production, whereas non-climactericfruits show a different respiration pattern and display alack of autocatalytic ethylene synthesis. Many of theeconomically important fruit crops are climacteric,therefore a large amount of research has been devoted
Quality assurance in agricultural produce,edited by G.I. Johnson, Le Van To, Nguyen Duy Duc and M.C. Webb.
ACIAR Proceedings 100(printed version published in 2000)
177
to studying the biochemical and molecular pathwaysoperating during the climacteric ripening of fruits.
Genetic engineering techniques
To date, most of the genetic engineering approachesaimed at improving the shelf life and generalappearance of fruits have centred on the set of genescontrolling fruit texture (membrane and cell wall prop-erties) and the ripening rate (ethylene production orperception). These approaches have targeted endog-enous genes with vital functions in the ripeningprocess, aiming to down-regulate (reduce) theiractivity by gene silencing. Gene silencing can beachieved in a variety of ways but the two mostcommon ones used in plants are antisense and co-sup-pression techniques.
The first method involves making a geneticconstruct in which the targeted gene has been invertedand is therefore in an opposite or ‘antisense’ orien-tation with respect to the endogenous gene. Thisconstruct is subsequently transferred to the plant,producing a transgenic plant with the targeted gene inboth orientations. While the endogenous (original)gene will continue to produce regular ribonucleic acid(RNA), the newly introduced antisense gene willproduce molecules of RNA complementary to theendogenous ones, ‘sequestering’ them and reducingthe availability of the original RNA to produce protein.
The mechanism of action of the co-suppressiontechnique is only beginning to be understood. Thetechnique consists of adding extra copies of thetargeted gene into the plant genome (normally underthe control of a strong promoter). The plant ‘senses’the abnormality of having either too many copies ofthe gene or too much RNA of the same species andstarts mechanisms to correct the situation. Thesemechanisms can be either transcriptional inactivationor post-transcriptional targeted RNA degradation.
Control of fruit texture/softening
Softening is an important contributor to losses expe-rienced during the handling and transport of fruits.Among the genes involved in texture, the most exten-sively studied is the one coding for polygalacturonase(PG) (DellaPenna et al. 1986; Grierson et al. 1986), acell wall enzyme that catalyses the hydrolysis ofpolygalacturonic acid chains. Partial silencing of thePG gene has been achieved in tomato by sense andantisense techniques. Experiments using either apartial or the full length PG gene successfully reducedthe levels of PG mRNA and enzyme activity (Sheehy
et al. 1988; Smith et al. 1988, 1990). It is important toremark that these were the first examples of the suc-cessful use of the antisense technique in plants.Different transgenic lines showed different degrees ofgene silencing, indicating that the position where thetransgene is inserted in the genome plays an importantrole in the effectiveness of the technique and sug-gesting that, for a commercial output, it is necessary toproduce a relatively large number of lines. In tomato,PG has been extensively associated with softeningbecause of the temporal and spatial coincidence of theincrease of PG activity during the softening period ofthe fruit.
Contrary to all expectations, the antisense PG fruitsproduced by Smith et al. (1988) did not show anyappreciable change in softening when measured byclassical methods (such as compression tests). Adebate was started on whether PG had any effect ontexture changes and internal softening of the fruits, andthe widely accepted idea that PG was directly respon-sible for the softening process was shaken.Nevertheless, a new and more detailed study of trans-genic, sense and antisense PG plants revealed anumber of important changes in the transgenic fruit(Schuch et al. 1991). Low PG tomatoes are moreresistant to cracking and splitting than regular fruit.They also have superior handling and transport char-acteristics, showing a greatly reduced degree ofdamage during those processes (Schuh et al. 1991).
How much inhibition of the PG gene is necessary toobserve any changes in the fruit phenotype? Thisquestion has not yet been fully answered because ofthe difficulty in regulating the exact amount of genesilencing in transgenic lines. Genetic engineering ofplants has not reached the high level of sophisticationneeded to pre-determine or manually regulate the levelof gene silencing. Nevertheless, molecular analysis ofthe transgenic tomato lines showed that fruit in whichPG activity had decreased to less than 1% of normallevels contain longer polygalacturonic acid chains,affecting cell adhesion and making the fruit sturdier.
Agronomically, the effect of low PG translates intofruit that can be left on the vine for a longer time—therefore enhancing the flavour—since the softeningprocess has been slightly delayed. Nevertheless, themain commercial use of the low PG tomato fruit hasbeen in the processing industry. Transgenic low PGtomatoes show enhanced viscosity of the processedproducts and produce less waste. The new character-istics of these fruit have also allowed simplification ofthe manufacturing process.
Quality assurance in agricultural produce,edited by G.I. Johnson, Le Van To, Nguyen Duy Duc and M.C. Webb.
ACIAR Proceedings 100(printed version published in 2000)
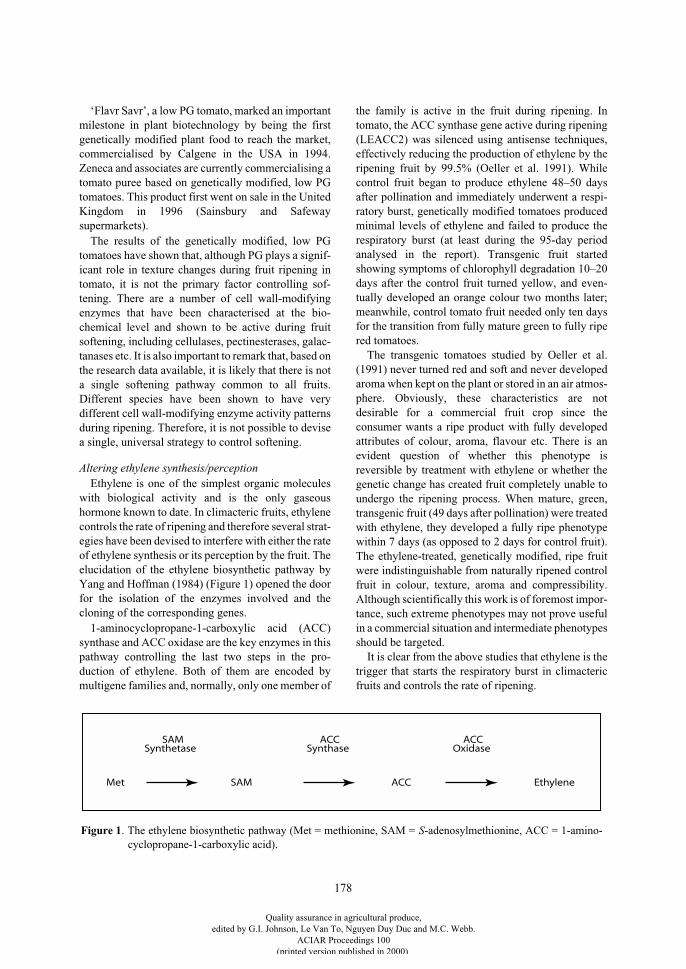
178
‘Flavr Savr’, a low PG tomato, marked an importantmilestone in plant biotechnology by being the firstgenetically modified plant food to reach the market,commercialised by Calgene in the USA in 1994.Zeneca and associates are currently commercialising atomato puree based on genetically modified, low PGtomatoes. This product first went on sale in the UnitedKingdom in 1996 (Sainsbury and Safewaysupermarkets).
The results of the genetically modified, low PGtomatoes have shown that, although PG plays a signif-icant role in texture changes during fruit ripening intomato, it is not the primary factor controlling sof-tening. There are a number of cell wall-modifyingenzymes that have been characterised at the bio-chemical level and shown to be active during fruitsoftening, including cellulases, pectinesterases, galac-tanases etc. It is also important to remark that, based onthe research data available, it is likely that there is nota single softening pathway common to all fruits.Different species have been shown to have verydifferent cell wall-modifying enzyme activity patternsduring ripening. Therefore, it is not possible to devisea single, universal strategy to control softening.
Altering ethylene synthesis/perception
Ethylene is one of the simplest organic moleculeswith biological activity and is the only gaseoushormone known to date. In climacteric fruits, ethylenecontrols the rate of ripening and therefore several strat-egies have been devised to interfere with either the rateof ethylene synthesis or its perception by the fruit. Theelucidation of the ethylene biosynthetic pathway byYang and Hoffman (1984) (Figure 1) opened the doorfor the isolation of the enzymes involved and thecloning of the corresponding genes.
1-aminocyclopropane-1-carboxylic acid (ACC)synthase and ACC oxidase are the key enzymes in thispathway controlling the last two steps in the pro-duction of ethylene. Both of them are encoded bymultigene families and, normally, only one member of
the family is active in the fruit during ripening. Intomato, the ACC synthase gene active during ripening(LEACC2) was silenced using antisense techniques,effectively reducing the production of ethylene by theripening fruit by 99.5% (Oeller et al. 1991). Whilecontrol fruit began to produce ethylene 48–50 daysafter pollination and immediately underwent a respi-ratory burst, genetically modified tomatoes producedminimal levels of ethylene and failed to produce therespiratory burst (at least during the 95-day periodanalysed in the report). Transgenic fruit startedshowing symptoms of chlorophyll degradation 10–20days after the control fruit turned yellow, and even-tually developed an orange colour two months later;meanwhile, control tomato fruit needed only ten daysfor the transition from fully mature green to fully ripered tomatoes.
The transgenic tomatoes studied by Oeller et al.(1991) never turned red and soft and never developedaroma when kept on the plant or stored in an air atmos-phere. Obviously, these characteristics are notdesirable for a commercial fruit crop since theconsumer wants a ripe product with fully developedattributes of colour, aroma, flavour etc. There is anevident question of whether this phenotype isreversible by treatment with ethylene or whether thegenetic change has created fruit completely unable toundergo the ripening process. When mature, green,transgenic fruit (49 days after pollination) were treatedwith ethylene, they developed a fully ripe phenotypewithin 7 days (as opposed to 2 days for control fruit).The ethylene-treated, genetically modified, ripe fruitwere indistinguishable from naturally ripened controlfruit in colour, texture, aroma and compressibility.Although scientifically this work is of foremost impor-tance, such extreme phenotypes may not prove usefulin a commercial situation and intermediate phenotypesshould be targeted.
It is clear from the above studies that ethylene is thetrigger that starts the respiratory burst in climactericfruits and controls the rate of ripening.
SAMSynthetase
ACCSynthase
ACC Oxidase
Met SAM ACC Ethylene
Figure 1. The ethylene biosynthetic pathway (Met = methionine, SAM = S-adenosylmethionine, ACC = 1-amino-cyclopropane-1-carboxylic acid).
Quality assurance in agricultural produce,edited by G.I. Johnson, Le Van To, Nguyen Duy Duc and M.C. Webb.
ACIAR Proceedings 100(printed version published in 2000)
179
The ripening-related ACC oxidase gene has alsobeen cloned in tomato and its expression inhibited by95% (Hamilton et al. 1990; Picton et al. 1993). Thislevel of inhibition did not block ripening in the trans-genic plants and hence allowed normal developmentof the fruit. However, the onset of senescence, over-ripening, cracking of fruit and other general over-ripening effects were delayed. Nevertheless, whenmature green fruit were picked from the plant theynever fully ripened. Even when exposed to ethylene,they developed a full red colour but the levels of caro-tenoids never reached those achieved by fruit fullyripened on the plant (Picton et al. 1993).
Instead of tampering with the enzymes controllingthe biosynthesis of ethylene, two commercialcompanies (Monsanto and Agritope) opted for alter-native strategies aimed at depleting the intermediatesubstrates of the pathway. Monsanto used a bacterialenzyme (ACC deaminase) to drain the cell of theimmediate precursor of ethylene (ACC). Overex-pression of an ACC deaminase gene in tomato plantsled to a marked depletion of the levels of ACC andtherefore reduced the availability of this precursor tobe converted into ethylene (Klee et al. 1991). Thelevels of ethylene reduction achieved with thisstrategy were not as successful as with the ACCsynthase antisense strategy, but the transgenic fruitshowed symptoms of delayed ripening. Agritope usedanother bacterial gene encoding
S
-adenosylme-thionine (SAM) hydrolase, in conjunction with aripening-specific promoter, to hydrolyse the first inter-mediate of the ethylene biosynthetic pathway (SAM)specifically in ripening tomato fruit (Kramer et al.1997). The transgenic fruit exhibited a delayedripening phenotype and a reduction of spoilage due toover-ripening.
Is it possible to control ripening in other fruits? Allthe studies described here have been achieved intomato. The reason for the choice of this system isclear—tomato is a very important crop with anextensive research history into the biochemistry andgenetics of ripening. In addition, tomato transfor-mation is relatively easy when compared to other fruitspecies and the results of a transformation experimentcan be evaluated in a glasshouse in 1 year (as opposedto an entire field and 5–7 years for fruit trees). Never-theless, there is a clear indication that the approachesdescribed earlier can be applied to other crops, as is thecase for melon. Ayub et al. (1996) used antisense tech-niques to inhibit ACC oxidase levels and concomitantethylene production during ripening of cantaloupe‘Chanterais’ melons. This variety has excellent eating
quality but a notoriously poor storage capacity. Genet-ically modified plants were produced with ethylenesynthesis severely impaired (less than 1% of controls).Storage capacity was extended, with transgenic fruitremaining fresh after 10 days at 25°C, at which timethe control fruit had spoiled. Exposing the transgenicfruit to external ethylene restored the ripeningphenotype.
A final alternative to the control of ethylene pro-duction by fruit during ripening is to decrease thesensitivity of the fruit to the hormone. It has beenestablished that during ripening, fruits not onlyincrease the production of ethylene but they alsobecome more sensitive to it (Theologis 1994). Therecent cloning of the first ethylene receptor (
etr1
) in
Arabidopsis thaliana
(a species used as a ‘model’plant for genetic studies) has opened the door to themanipulation of ethylene perception instead ofethylene production. A mutated version of
etr1
in
Ara-bidopsis
(
etr1-1
) confers ethylene insensitivity as agenetically dominant trait. The same mutated gene hasalso been introduced into tomato and petunia con-ferring ethylene insensitivity and producing fruits thatfail to ripen or flowers with extremely delayed senes-cence, respectively (Wilkinson et al. 1997). It is clearthat ethylene insensitivity is not a desired trait for afruit since it would render the fruit unable to ripen evenwhen exposed to ethylene, but decreased levels ofethylene receptors in ripening fruits could proveuseful.
Resistance to pathogens
Resistance to postharvest pathogens is anotherpriority target for genetic engineers but the necessarybasic knowledge on the physiology, biochemistry andgenetics of the resistance mechanisms is not asadvanced as in ripening. In addition, there is nocommon defence mechanism applicable to allpathogens or all crops (as is the case of ethylene in cli-macteric fruit ripening)—which suggests thatresistance genes need to be found on an individualbasis. Nevertheless there is an increasing number ofgenes being cloned and the mechanisms underlyingthe resistance process are being rapidly unravelled.Aside from specific resistance genes, an interestingsecondary effect of reducing the production ofethylene during ripening have been recently reportedby Cooper et al. (1998). An extensive study of the sus-ceptibility of transgenic tomato plants to
Colletotrichum gloeosporioides
was reported usingtwo groups of transgenic tomato plants. The first group
Quality assurance in agricultural produce,edited by G.I. Johnson, Le Van To, Nguyen Duy Duc and M.C. Webb.
ACIAR Proceedings 100(printed version published in 2000)
180
contained genetically modified plants in which thelevels of polygalacturonase had been reduced in trans-genic fruit. The second group consisted of geneticallymodified tomato plants in which antisense constructshad been used to partially silence the ACC oxidasegene and therefore the fruit produced reduced levels ofethylene during ripening. The ripening characteristicsof these fruit have been previously discussed in thispaper and in previous reports (Sheehy et al. 1988;Smith et al. 1988; Hamilton et al. 1990; Picton et al.1993). Wild type and antisense ACC oxidase fruitwere manually inoculated with
C. gloeosporioides
andthe extent of the infection scored 5 days after inocu-lation, showing an average infection score of 44.8%and 15.8%, respectively. Wild type fruit inoculatedwith
C. gloeosporioides
showed a marked increase inethylene production in response to the infectionwhereas in transgenic ACC oxidase fruit this responsewas reduced by 96%. Transgenic fruits with reducedlevels of PG did not show any noticeable change inbehaviour in response to infection or any resistance tofungal infection.
As mentioned before there is an increasing numberof resistance genes being cloned that have provenuseful under laboratory conditions. The main taskremains now of proving their efficacy against com-mercially important pathogens in the field.
Genetic Engineering of Tropical Fruits
Due to their short life and poor storage qualities,tropical fruits could greatly benefit from the use of bio-technology in order to improve the quality and post-harvest characteristics of the fruits. Nevertheless,tropical fruits are not major crops in many of thedeveloped countries and therefore the amount ofresearch devoted to them has been comparativelyscarce. Most of the biotechnological efforts in tropicalspecies have been centred on the development ofmicropropagation and tissue culture methods but thereis a lack of reliable and efficient transformation andregeneration methods.
Papaya
One notable exception to this rule is papaya wherean efficient transformation method has beendeveloped by Fitch et al. (1993). They have not onlydeveloped the method but used it to introduceresistance to ringspot virus through genetic manipu-
lation. Ringspot virus-resistant plants have beenproduced and evaluated under laboratory and fieldconditions and show a great degree of resistanceagainst the virus. Fruit from genetically modified treeshave been tested and approved by the Food and DrugAdministration (FDA) in the United States of Americaand are now under commercial production and beingsold in supermarkets throughout America. Otherresearch groups in Taiwan, Thailand, Malaysia, thePhilippines, Mexico, Cuba and Australia are alsoproducing transgenic papayas resistant to their ownlocal viral isolates and some of them are already at thefield trial stage.
Papaya is a typical climacteric fruit, having a respi-ratory burst and a concomitant increase in theproduction of ethylene at the start of ripening. Never-theless, at the molecular level the ripening process inpapaya is quite uncharacteristic since there are twoACC synthase genes involved instead of one (Masonand Botella 1997). One of the genes (
capacs1
) isexpressed during fruit development—detectable inmature green fruit and decreasing rapidly duringripening. The second gene (
capacs2
) is undetectable inmature green fruit but as soon as the fruit begin to ripenthere is a dramatic increase in the messenger ribonu-cleic acid (mRNA) levels. The presence of two genesin papaya fruit could indicate that ethylene plays a roleduring the development of the fruit as well as con-trolling ripening. According to the expression studies,
capacs1
is the gene implicated in fruit developmentwhile
capacs2
exerts its effect during the ripeningprocess.
My laboratory has been studying papaya fruitripening at the molecular level since 1994. Withsupport from the Australian Centre for InternationalAgricultural Research (ACIAR), we are now involvedin an international effort with collaborators in the Phil-ippines and Malaysia to use genetic engineeringtechniques in order to control ripening in papaya. Wehave prepared genetic constructs containing
capacs1
and
capacs2
in either the sense or antisense orientationand produced a total of 100 independent transgeniclines containing the constructs. The lines are beingnow micropropagated in the laboratory and regulatoryapproval has been requested to start field evaluation ofthe plants during 2000. If successful, this project willprove that genetic engineering approaches are appli-cable to the improvement of postharvestcharacteristics in tropical fruits.
Quality assurance in agricultural produce,edited by G.I. Johnson, Le Van To, Nguyen Duy Duc and M.C. Webb.
ACIAR Proceedings 100(printed version published in 2000)
181
Mango
Mango is one of the tropical fruits with very highcommercial potential if export markets can bedeveloped. Export of mango fruit is notoriouslydifficult due to the poor handling and transport char-acteristics of the fruit, the very short postharvest lifeand the high incidence of postharvest diseases. Inaddition to these problems, traditional mangoimprovement by breeding has been hampered by thelong generation times, making improvement programseither too long-sighted or plainly impractical.Therefore mango seems an ideal candidate for the useof biotechnological approaches.
Agrobacterium tume-faciens
-mediated transformation of mango withreporter genes has been reported (Mathews et al.1992), but the whole transformation process was verylengthy. My laboratory is currently researchingimproved methods for mango transformation using the‘gene gun’. We have also cloned the mango ripening-related ACC synthase genes and will shortly attempttransformation experiments aimed at silencing thegene in fruit during ripening.
Pineapple
Pineapple is not a tropical fruit but it is widelygrown in subtropical regions of many Southeast Asiancountries. Pineapple is affected by a number ofimportant postharvest disorders that could beaddressed using biotechnology techniques, such asblackheart. Australian and Malaysian research teamsare engaged in research aimed at cloning the genesresponsible for this disorder and producing transgenicplants with those gene silenced. Although pineapple isnot a climacteric fruit we have found that the twogenes responsible for ethylene production are up-regulated during ripening (Cazzonelli and Botella1998). We are now performing field trials of geneti-cally modified pineapples in which we aim to silencethe ripening-related ACC synthase gene. These trialswill help to elucidate the role of ethylene in pineappleand whether there are any agronomical traits that canbe controlled by silencing its expression duringripening. One common practice among pineapplegrowers is to gas the harvested pineapple fruit withethylene to enhance chlorophyll degradation andachieve uniform colour development. Therefore it isreasonable to expect that the genetically modified fruitcould show inhibition of colour development but dueto the lack of data on the role of ethylene during
pineapple ripening it is hard to speculate on thepossible phenotypes that will be observed.
Flowering is not an obvious stage affecting the post-harvest period, but it could have a profound effect inthe postharvest area if synchronisation of floweringcould be achieved. Flowering genes are being clonedin model systems and the mechanisms that control theflowering process are being elucidated. Therefore,biotechnological control of flowering is no longer afar-fetched possibility. Nevertheless, in crops such aspineapple, synchronised flowering is already anachievable task since the mechanisms controlling ini-tiation of flowering are known and the genesresponsible have already been cloned. In pineapple,ethylene released on long, cold nights is thought toinstigate the flowering process and growers spray thecrops with ethylene-releasing compounds in order toinduce flowering in the field. Nevertheless there is apercentage of plants that initiate flowering naturallybefore the spraying takes place. The severity of naturalflowering varies from year to year, but its incidence isnoticeable as it forces the growers to perform severalharvesting passes and has meant that mechanised har-vesting machinery has not been developed. We havecloned a set of genes that are putatively involved in theinitiation of flowering in pineapple—transgenicplants bearing genetic constructs to inactivate thosegenes have been produced and are presently beingevaluated in field tests.
Genetic Engineering of Vegetables
Many leafy and flower vegetables exhibit a very shortlife span after harvest and require very elaboratemethods in order to extend their life. Reducing the rateof senescence is not an easy task either by conven-tional or biotechnological methods and the amount ofknowledge available regarding the postharvest manip-ulation of vegetables is scarce when compared to fruitripening.
Senescence is the final stage of development and,contrary to its external appearance, it is a highlyregulated and organised process that plays an integralpart in the plant life cycle. From an agricultural pointof view, senescence is a major contributor to post-harvest losses. It is important to emphasise thecomplexity of the problem and the lack of informationabout the molecular mechanisms involved in the onsetand regulation of senescence. The only attempts to usegenetic manipulation to alter senescence have beenbased on hormone physiology—either enhancing
Quality assurance in agricultural produce,edited by G.I. Johnson, Le Van To, Nguyen Duy Duc and M.C. Webb.
ACIAR Proceedings 100(printed version published in 2000)
182
cytokinin production or blocking ethylene productionor perception.
It has been known for some time that cytokinins candelay leaf senescence and that during senescence thereis a drop in endogenous cytokinin levels (Gan andAmisino 1996). Overproduction of IPT, a bacterialenzyme that catalyses the rate-limiting reaction in thebiosynthesis of cytokinins, resulted in transgenicplants with high levels of cytokinins and delayed leafsenescence. But these plants also showed many devel-opmental abnormalities since cytokinins are not onlyimplied in senescence but in a myriad of other devel-opmental processes. An ingenious solution has beenprovided by Gan and Amasino (1995). These authorsplaced the IPT gene under the control of a senescence-specific promoter that activates the production of cyto-kinins only at the onset of senescence. The over-expression of cytokinins inhibits the senescenceprocess and consequently results in a reduction of theactivity of the senescence-specific promoters,avoiding the accumulation of cytokinins.
Ethylene often has an opposite effect to cytokinins,promoting senescence. Therefore blocking the pro-duction or the perception of ethylene could have apositive effect in the longevity of green tissues. Trans-genic tomato plants with reduced levels of ethyleneproduction have shown retarded leaf senescence (Johnet al. 1995). Transgenic
Arabidopsis
plants with the
etr1-1
dominant mutation that renders them insen-sitive to ethylene have also shown delayed leafsenescence (Grbic and Bleecker 1995).
The only example, to my knowledge, of geneticmanipulation to extend the postharvest life of vege-tables has been done in broccoli. Transgenic broccolihas been produced containing antisense copies of atomato ACC oxidase gene (Henzi et al. 1999). Severalof the transgenic lines have shown a decrease inethylene production after harvest and the evaluation ofthe agronomical characteristics is presently beingcarried out.
References
Ayub, R., Guis, M., Amor, M.B., Gillot, L., Roustan, J.P.,Latche, A., Bouzayen, M. and Pech, J.C. 1996.Expression of ACC oxidase antisense gene inhibitsripening of cantaloupe melon fruits. NatureBiotechnology, 14, 862–866.
Cazzonelli, C., Cavallaro, A. and Botella, J.R. 1998.Cloning and characterisation of ripening-inducedethylene biosynthetic genes from non-climacteric
pineapple (
Ananas comosus
) fruits. Australian Journal ofPlant Physiology, 25, 513–518.
Cooper, W., Bouzayen, M., Hamilton, A., Barry, C.,Rossall, S. and Grierson, D. 1998. Use of transgenicplants to study the role of ethylene and polygalacturonaseduring infection of tomato fruit by
Colletotrichumgloesporioides
. Plant Pathology, 47, 308–316.DellaPenna, D., Alexander, D.C. and Bennett, A.B. 1986.
Molecular cloning of tomato fruit polygalacturonase:analysis of polygalacturonase levels during ripening.Proceedings of the National Academy of Science, USA,83, 6420–6424.
Fitch, M.M.M., Manshardt, R.M., Gonsalves, D. andSlightom, J.L. 1993. Transgenic papaya plants fromAgrobacterium mediated transformation of somaticembryos. Plant Cell Reports, 12, 245–249.
Gan, S. and Amasino, R.M. 1995. Inhibition of leafsenescence by autoregulated production of cytokinin.Science, 270, 1986–1988.
Gan, S. and Amisino, R.M. 1996. Cytokinins in plantsenscence: from spray and pray to clone and play.Bioessays, 18, 557–565.
Grbic, V. and Bleecker, A.B. 1995. Ethylene regulates thetiming of leaf senescence in Arabidopsis. Plant Journal, 8,595–602.
Grierson, D., Maunders, M.J., Slater, A., Ray, J., Bird, C.R.,Schuch, W., Holdworth, M.J., Tucker, G.A. and Knapp,J.E. 1986. Gene expression during tomato ripening.Philosophical Transactions of the Royal Society ofLondon, B314, 399–410.
Hamilton, A., Lycett, G.W. and Grierson, D. 1990.Antisense gene that inhibits synthesis of the hormoneethylene in transgenic plants. Nature, 346, 284–287.
Henzi, M.X., McNeil, D.L., Christey, M.C. and Lill, R.E.1999. A tomato antisense 1-aminocyclopropane-1-carboxylic acid oxidase gene causes reduced ethyleneproduction in transgenic broccoli. Australian Journal ofPlant Physiology, 26, 179–183.
John, I., Drake, R., Farrell, A., Cooper, W., Lee, P., Horton,P. and Grierson, D. 1995. Delayed leaf senescence inethylene deficient ACC-oxidase antisense tomato plants:molecular and physiological analysis. Plant Journal, 7,483–490.
Klee, H.J., Hayford, M.B., Kretzner, K.A., Barry, G.F. andKishore, G.M. 1991. Control of ethylene synthesis byexpression of a bacterial enzyme in transgenic tomatoplants. The Plant Cell, 3, 1197–1193.
Kramer, M.G., Kellog, J., Wagoner, W., Matumura, W.,Good, X., Peters, S., Clough, G. and Bestwick, R.K. 1997.Reduced ethylene synthesis and ripening control intomatoes expressing S-adenosyl-methionine hydrolase.In: Kanellis, A.K., Chang, C., Kende, H. and Grierson, D.,ed., Biology and biotechnology of the plant hormoneethylene. Dordrecht, Kluwer Academic Publishers.
Mason, M.G. and Botella, J.R. 1997. Identification andcharacterisation of two 1-aminocyclopropane-1-
Quality assurance in agricultural produce,edited by G.I. Johnson, Le Van To, Nguyen Duy Duc and M.C. Webb.
ACIAR Proceedings 100(printed version published in 2000)
183
carboxylate (ACC) synthase cDNAs expressed duringpapaya (
Carica papaya
) fruit ripening. Australian Journalof Plant Physiology, 24, 239–244.
Mathews, E., Litz, R.E., Wilde, H.D., Merkle, S.A. andWetzstein, H.Y. 1992. Stable integration and expressionof
`
-glucuronidase and NPTII genes in mango somaticembryos. In Vitro Cellular and Developmental Biology,28, 172–178.
Oeller, P.W., Min Wong, L., Taylor, L.P., Pike, D.A. andTheologis, A. 1991. Reversible inhibition of tomato fruitsenescence by antisense RNA. Science, 254, 437–439.
Picton, S., Barton, S.L., Bouzayen, M., Hamilton, A.J. andGrierson, D. 1993. Altered fruit ripening and leafsenescence in tomatoes expressing an antisense ethylene-forming enzyme transgene. Plant Journal, 3, 469–481.
Schuch, W., Kanczler, J., Robertson, D., Hobson, G.,Tucker, G., Grierson, D., Bright, S. and Bird, C. 1991.Fruit quality characteristics of transgenic tomato fruitwith altered polygalacturonase activity. HortScience, 26,1517–1520.
Sheehy, R.E., Kramer, M. and Hiatt, W.R. 1988. Reductionof polygalacturonase activity in tomato fruit by antisense
RNA. Proceedings of the National Academy of Sciences,USA, 85, 8805–8809.
Smith, C.J.S., Watson, C., Ray, J., Bird, C.R., Morris, P.C.,Scuch, W. and Grierson, D. 1988. Antisense RNAinhibition of polygalacturonase gene expression intransgenic tomatoes. Nature, 334, 724–726.
Smith, C.J.S., Watson, C.F., Bird, C.R., Ray, J., Schuch, W.and Grierson, D. 1990. Expression of a truncated tomatopolygalacturonase gene inhibits expression of theendogenous gene in transgenic plants. Molecular GeneralGenetics, 224, 477–481.
Theologis, A. 1994. Control of ripening. Current Opinion inBiotechnology, 5, 152–157.
Wilkinson, J.Q., Lanahan, M.B., Clark, D.G., Bleecker,A.B., Chang, C., Meyerowitz, E.M. and Klee, H.J. 1997.A dominant mutant receptor from
Arabidopsis
confersethylene insensitivity in heterologous plants. NatureBiotechnology, 15, 444–447.
Yang, S.F. and Hoffman, N.E. 1984. Ethylene biosynthesisand its regulation in higher plants. Annual Review ofPlant Physiology, 35, 155–189.
Quality assurance in agricultural produce,edited by G.I. Johnson, Le Van To, Nguyen Duy Duc and M.C. Webb.
ACIAR Proceedings 100(printed version published in 2000)
184
Modelling Respiration of Edible-coated, Minimally Processed Mango in
Modified Atmosphere Packaging
M. Rusmono, A.M. Syarief and H.K. Purwadaria*
Abstract
The objectives of this study were to assess the respiration parameters and quality changes of edible-coated,minimally processed (ECMP) ‘Arumanis’ mango stored inside modified atmosphere packaging (MAP), and todevelop a computer simulation model to predict the respiration rate and the shelf life of the ECMP ‘Arumanis’mango stored inside MAP. ECMP fruit samples at various weights were stored in respiration chambers coveredby stretch film at various storage temperatures: 5, 10, 15 and 20°C. The respiration rates were observed andrecorded until the oxygen inside the chambers reached a steady state.
The data were calculated to obtain the maximum rate of the oxygen consumption (R
O2max
), the oxygeninternal partial pressure at the half level of R
O2max
(K
1/2
), and the respiration quotient (RQ). The empiricalmodels of R
O2max
, K
1/2
, and RQ as the functions of storage temperatures were found to be R
O2max
= 32.593exp (0.1093 T), K
1/2
= 0.122 exp (0.1291 T), and RQ = 0.995 exp (0.0166 T).The critical quality parameters of the ECMP ‘Arumanis’ mango were the fruit hardness and yellowness
which limited the shelf life of the products in relation to the minimum acceptable score of 3.5 from the resultsof organoleptic testing by 12 panelists. A simulation model for the respiration and shelf life of the ECMPmango has been developed and validated to satisfy the experimental data gained from storing the ECMP mangoinside MAP made from styrofoam trays and stretch film. The ECMP ‘Arumanis’ mango stored inside the MAPsystem using the stretch film at 10°C could maintain an acceptable quality for five days.
I
N
RECENT
years, consumers worldwide have beenmore health-conscious in their eating habits but at thesame time have less time to prepare their meals. As aresult, the market demand is increasing for ‘ready-to-eat’ fresh fruits and ‘ready-to-cook’ vegetables whichhave been washed, skinned, cut and sliced into variousforms. Produce handled in this way is called minimallyprocessed (MP) or lightly processed food and does notinvolve any preservation treatments which couldchange the physical characteristics of the products(Shewfelt 1987). Siriphanich (1993) indicated thatcharacteristics of fruits suitable for minimalprocessing included: a risk of obtaining poor qualitypulp, fruit peeling difficulties, and weight reductionfor transportation. In Indonesia, mango is one of the
most popular fruits, with the ‘Arumanis’ cultivarranked highest in production. ‘Arumanis’ mangoesweigh about 300–500 g per fruit and have a greencolour which hinders consumers in making a goodchoice of fruit of appropriate ripeness.
Studies have been carried out to assess various MPfruits such as kiwifruit, papaya, cantaloupe, pineapple,honeydew melon and apples (O’Connor-Shaw et al.1994; Cameron et al. 1995). The problem with MPfruits is that they deteriorate faster than whole fruitsunder similar low storage temperatures. One way ofreducing the rate of respiration in MP fruits is to coverthe exposed surface with an edible-coating film.Edible-coating film is a continuous film made out ofedible materials which is applied to the food productsby soaking or spraying. Edible coating functions as abarrier to mass transfer (of water vapour, oxygen,lipids and soluble materials). In addition, it can act asa carrier for food additives, facilitates food handling,
* Department of Agricultural Engineering, Institut Pertanian Bogor, FATETA-IPB, PO Box 220, Bogor 16002, Indonesia.
Quality assurance in agricultural produce,edited by G.I. Johnson, Le Van To, Nguyen Duy Duc and M.C. Webb.
ACIAR Proceedings 100(printed version published in 2000)
185
maintains the cell structural integrity, and hinders thelosses of volatile compounds (Kester and Fennema1986; Krochta 1992; Gennadios et al. 1994; Nisperos-Carriedo 1994). Edible coating has been applied tosliced apples (Wong et al. 1994) and tomatoes (Park etal. 1994). Baldwin et al. (1995) found out that edible-coated sliced apples had a shelf life of 3 days underatmospheric conditions.
The application of edible coating onto MP ‘Aru-manis’ mango and its characteristics have beenassessed by Purwadaria et al. (1997), Setiasih et al.(1997) and Wuryani et al. (1998). These researchershave also developed the standard operationalprocedure (SOP) for the minimal processing and theedible coating process of mangoes. Purwadaria andWuryani (1999) developed the respiration model forthe edible-coated, MP (ECMP) ‘Arumanis’ mangostored under known atmospheric compositions atvarious temperatures. However, none of the publica-tions to date have described the ECMP mango storedin modified atmosphere packaging (MAP).
Previous studies have been carried out on wholemango fruit stored under modified atmosphere condi-tions, such as the one carried out by Kader (1992)which recommended a composition of 3–5% O
2
and5–10% CO
2
at 10–15°C, whilst Ratule (1999) deter-mined the optimal atmospheric composition for theECMP ‘Arumanis’ mango to be 4
±
1% O
2
and 11
±
2% CO
2
at 10°C, and suggested stretch film for MAP.The study also found out that the critical qualityparameters for the ECMP mango were the fruithardness and yellowness.
The objectives of this study were (1) to assess therespiration parameters and quality changes of theECMP ‘Arumanis’ mango stored inside MAP, and (2)to develop a computer simulation model to predict therespiration and the shelf life of the ECMP ‘Arumanis’mango stored inside MAP.
Research Methods
Edible coating of MP ‘Arumanis’ mango
‘Arumanis’ mango fruit, harvested 90 days afterpeak blooming from the Galasari orchard in Gresik-East Java, were conditioned at room temperature for 3days prior to minimal processing. The mangoes werethen peeled and cut horizontally into six slices per sidefollowing the standard operational procedure for MPmango (Purwadaria et al. 1997). The mango sliceswere then dipped into the edible coating formula
developed by Setiasih et al. (1998) with isolatesoybean protein and stearic acid as the mainconstituents.
Determination of model inputs
In developing the computer simulation model, thefollowing input parameters were initially determined:(i) the oxygen and carbon dioxide permeabilities of theedible coating and packaging film, (ii) the respirationparameters of the ECMP ‘Arumanis’ mango, and (iii)the critical quality parameters and the shelf life criteriaof the ECMP ‘Arumanis’ mango.
Measurement of edible coating and packaging film permeability
The experimental decay method using a permea-bility cell according to the ASTM D-3985 was used todetermine the O
2
and CO
2
transmission through theedible coating and the stretch film at 5, 10 and 25°C(room temperature) and 80% relative humidity. Theexperimental set-up is illustrated in Figure 1.
Determination of respiration parameters of ECMP ‘Arumanis’ mango
Fruit samples at various weights (30, 56, 82, 107,129 and 154 g), corresponding to the number of ECMPmango slices (1, 2, 3, 4, 5 and 6 slices, respectively),were put inside a respiration chamber with a volume of0.002 m
3
and a surface area of 0.015 m
2
, covered withthe stretch film and stored at 5, 10, 15 or 20°C.Changes in the atmospheric composition inside therespiration chamber due to fruit respiration weremonitored and recorded until a steady state conditionwas achieved.
The symbols used in this paper are explained in Table1. O
2
and CO
2
were then analysed by the gas chromato-graph model 3700 and the results were called (O
2
)
pkg
and (CO
2
)
pkg
. The data were further processed todetermine R
O2
, R
CO2
, (O
2
)
int
, (CO
2
)
int
, R
O2max
, K
1/2
and RQ as functions of the storage temperature. Anethylene absorbent at a concentration of 2% was used toavoid the effects of ethylene on the respiration rate.
Quality assurance in agricultural produce,edited by G.I. Johnson, Le Van To, Nguyen Duy Duc and M.C. Webb.
ACIAR Proceedings 100(printed version published in 2000)
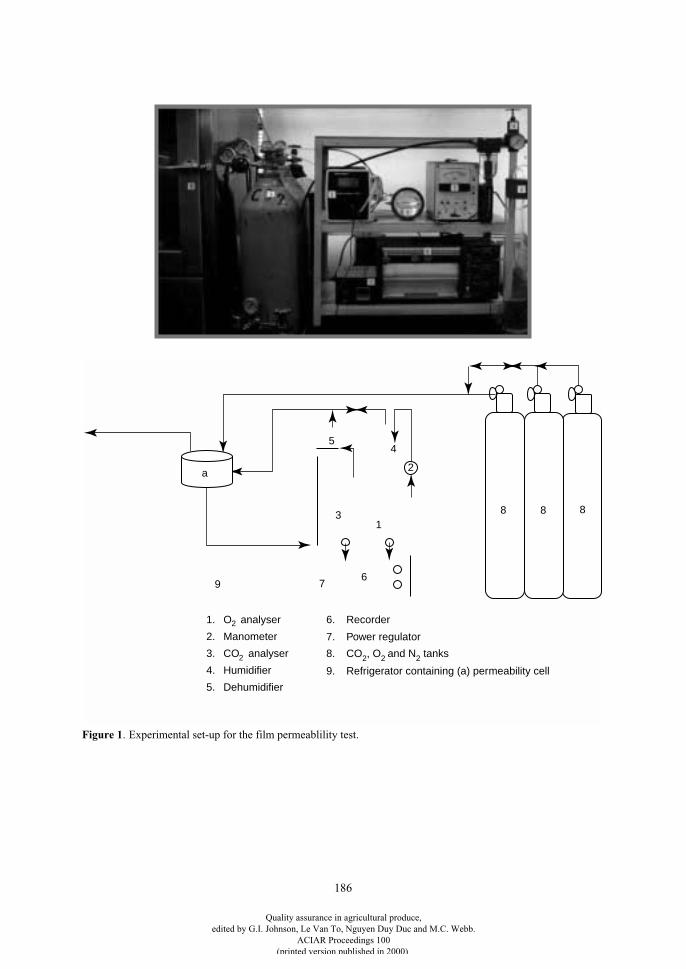
186
9 76
13
54
a
8 8 8
2
1. O analyser
2. Manometer
3. CO analyser
4. Humidifier
5. Dehumidifier
6. Recorder
7. Power regulator
9. Refrigerator containing (a) permeability cell
2
2 8. CO2, O2 and N2 tanks
Figure 1
. Experimental set-up for the film permeablility test.
Quality assurance in agricultural produce,edited by G.I. Johnson, Le Van To, Nguyen Duy Duc and M.C. Webb.
ACIAR Proceedings 100(printed version published in 2000)
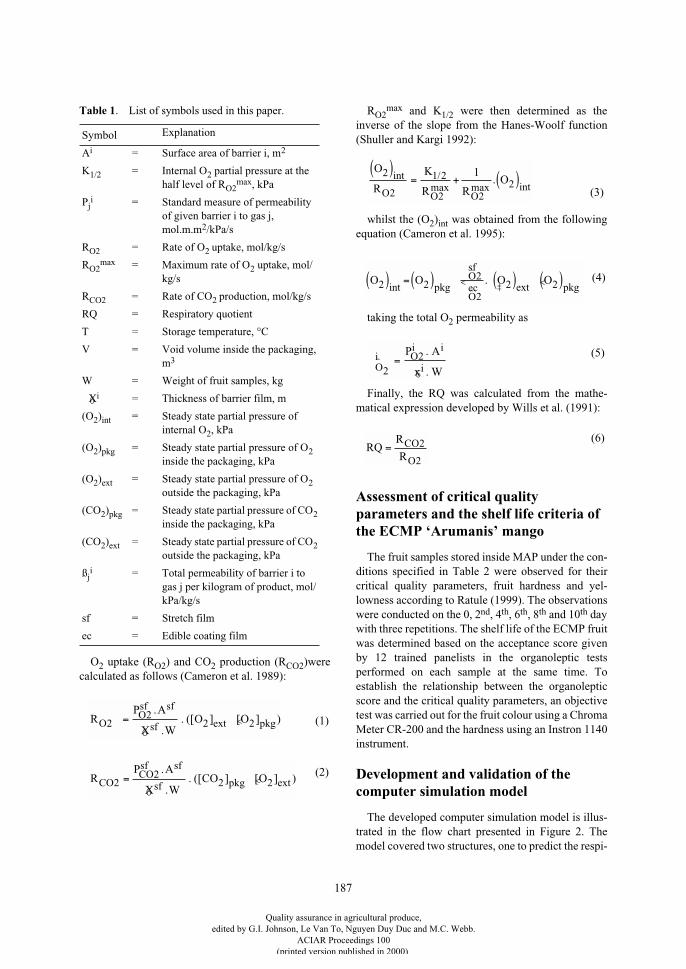
187
O
2
uptake (R
O2
) and CO
2
production (R
CO2
)werecalculated as follows (Cameron et al. 1989):
R
O2max
and K
1/2
were then determined as theinverse of the slope from the Hanes-Woolf function(Shuller and Kargi 1992):
whilst the (O
2
)
int
was obtained from the followingequation (Cameron et al. 1995):
taking the total O
2
permeability as
Finally, the RQ was calculated from the mathe-matical expression developed by Wills et al. (1991):
Assessment of critical quality parameters and the shelf life criteria of the ECMP ‘Arumanis’ mango
The fruit samples stored inside MAP under the con-ditions specified in Table 2 were observed for theircritical quality parameters, fruit hardness and yel-lowness according to Ratule (1999). The observationswere conducted on the 0, 2
nd
, 4
th
, 6
th
, 8
th
and 10
th
daywith three repetitions. The shelf life of the ECMP fruitwas determined based on the acceptance score givenby 12 trained panelists in the organoleptic testsperformed on each sample at the same time. Toestablish the relationship between the organolepticscore and the critical quality parameters, an objectivetest was carried out for the fruit colour using a ChromaMeter CR-200 and the hardness using an Instron 1140instrument.
Development and validation of the computer simulation model
The developed computer simulation model is illus-trated in the flow chart presented in Figure 2. Themodel covered two structures, one to predict the respi-
Table 1
. List of symbols used in this paper.
Symbol
Explanation
A
i
= Surface area of barrier i, m
2
K
1/2
= Internal O
2
partial pressure at the half level of R
O2max
, kPa
P
ji
= Standard measure of permeability of given barrier i to gas j, mol.m.m
2
/kPa/s
R
O2
= Rate of O
2
uptake, mol/kg/s
R
O2max
= Maximum rate of O
2
uptake, mol/kg/s
R
CO2
= Rate of CO
2
production, mol/kg/s
RQ = Respiratory quotient
T = Storage temperature, °C
V = Void volume inside the packaging, m
3
W = Weight of fruit samples, kg
6
X
i
= Thickness of barrier film, m
(O
2
)
int
= Steady state partial pressure of internal O
2
, kPa
(O
2
)
pkg
= Steady state partial pressure of O
2
inside the packaging, kPa
(O
2
)
ext
= Steady state partial pressure of O
2
outside the packaging, kPa
(CO
2
)
pkg
= Steady state partial pressure of CO
2
inside the packaging, kPa
(CO
2
)
ext
= Steady state partial pressure of CO
2
outside the packaging, kPa
ß
ji
= Total permeability of barrier i to gas j per kilogram of product, mol/kPa/kg/s
sf = Stretch film
ec = Edible coating film
RP A
X WO OO
Osf sf
sf ext pkg22
2 2= <.
.. ([ ] [ ] )
6
RP A
X WCO OCO
COsf sf
sf pkg ext22
2 2= <.
.. ([ ] [ ] )
6
(1)
(2)
O
R
K
R RO
O O O
2
2
1 2
2 22
1( )= + ( )int /
max max int.
(3)
O O O Opkg
Osf
Oec ext pkg2 2
2
22 2( ) =( ) < ( ) <( )‡int
.`
`
(4)
Òi O
i i
i
P A
x W2
2=.
.6
(5)
RQR
RCO
O= 2
2
(6)
Quality assurance in agricultural produce,edited by G.I. Johnson, Le Van To, Nguyen Duy Duc and M.C. Webb.
ACIAR Proceedings 100(printed version published in 2000)
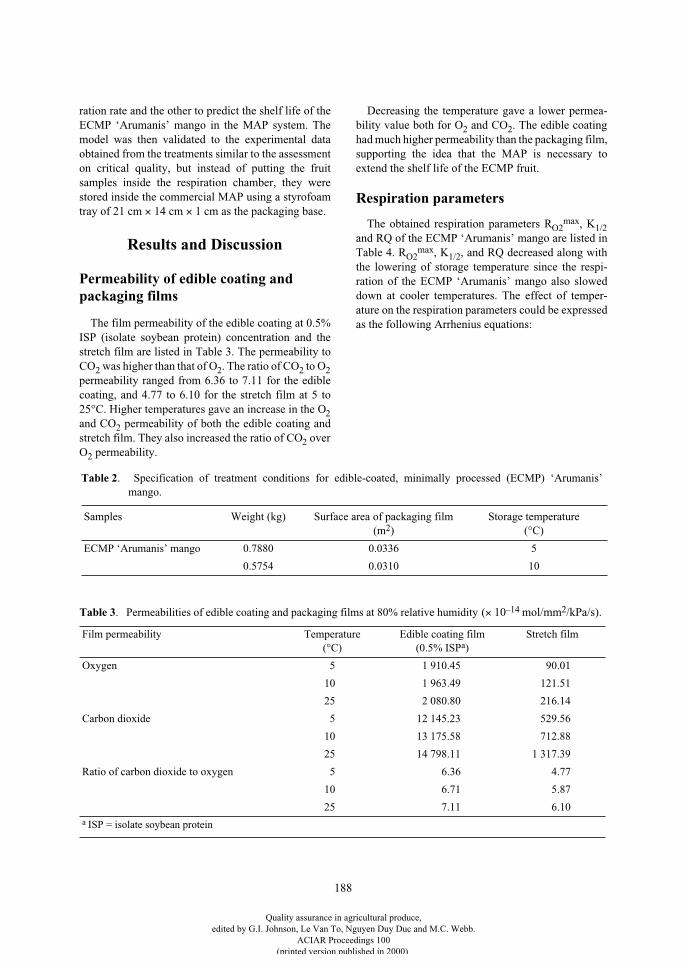
188
ration rate and the other to predict the shelf life of theECMP ‘Arumanis’ mango in the MAP system. Themodel was then validated to the experimental dataobtained from the treatments similar to the assessmenton critical quality, but instead of putting the fruitsamples inside the respiration chamber, they werestored inside the commercial MAP using a styrofoamtray of 21 cm
×
14 cm
×
1 cm as the packaging base.
Results and Discussion
Permeability of edible coating and packaging films
The film permeability of the edible coating at 0.5%ISP (isolate soybean protein) concentration and thestretch film are listed in Table 3. The permeability toCO
2
was higher than that of O
2
. The ratio of CO
2
to O
2
permeability ranged from 6.36 to 7.11 for the ediblecoating, and 4.77 to 6.10 for the stretch film at 5 to25°C. Higher temperatures gave an increase in the O
2
and CO
2
permeability of both the edible coating andstretch film. They also increased the ratio of CO
2
overO
2
permeability.
Decreasing the temperature gave a lower permea-bility value both for O
2
and CO
2
. The edible coatinghad much higher permeability than the packaging film,supporting the idea that the MAP is necessary toextend the shelf life of the ECMP fruit.
Respiration parameters
The obtained respiration parameters R
O2max
, K
1/2and RQ of the ECMP ‘Arumanis’ mango are listed inTable 4. RO2
max, K1/2, and RQ decreased along withthe lowering of storage temperature since the respi-ration of the ECMP ‘Arumanis’ mango also sloweddown at cooler temperatures. The effect of temper-ature on the respiration parameters could be expressedas the following Arrhenius equations:
Table 2. Specification of treatment conditions for edible-coated, minimally processed (ECMP) ‘Arumanis’mango.
Samples Weight (kg) Surface area of packaging film (m2)
Storage temperature (°C)
ECMP ‘Arumanis’ mango 0.7880 0.0336 5
0.5754 0.0310 10
Table 3. Permeabilities of edible coating and packaging films at 80% relative humidity (× 10–14 mol/mm2/kPa/s).
Film permeability Temperature (°C)
Edible coating film (0.5% ISPa)
Stretch film
Oxygen 5 1 910.45 90.01
10 1 963.49 121.51
25 2 080.80 216.14
Carbon dioxide 5 12 145.23 529.56
10 13 175.58 712.88
25 14 798.11 1 317.39
Ratio of carbon dioxide to oxygen 5 6.36 4.77
10 6.71 5.87
25 7.11 6.10a ISP = isolate soybean protein
Quality assurance in agricultural produce,edited by G.I. Johnson, Le Van To, Nguyen Duy Duc and M.C. Webb.
ACIAR Proceedings 100(printed version published in 2000)
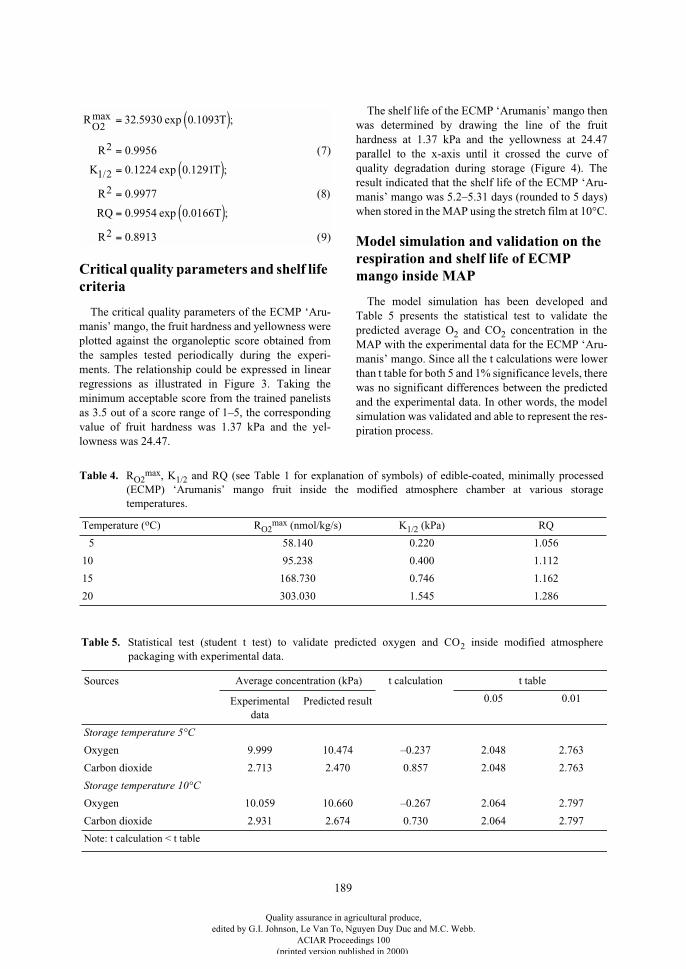
189
Critical quality parameters and shelf life criteria
The critical quality parameters of the ECMP ‘Aru-manis’ mango, the fruit hardness and yellowness wereplotted against the organoleptic score obtained fromthe samples tested periodically during the experi-ments. The relationship could be expressed in linearregressions as illustrated in Figure 3. Taking theminimum acceptable score from the trained panelistsas 3.5 out of a score range of 1–5, the correspondingvalue of fruit hardness was 1.37 kPa and the yel-lowness was 24.47.
The shelf life of the ECMP ‘Arumanis’ mango thenwas determined by drawing the line of the fruithardness at 1.37 kPa and the yellowness at 24.47parallel to the x-axis until it crossed the curve ofquality degradation during storage (Figure 4). Theresult indicated that the shelf life of the ECMP ‘Aru-manis’ mango was 5.2–5.31 days (rounded to 5 days)when stored in the MAP using the stretch film at 10°C.
Model simulation and validation on the respiration and shelf life of ECMP mango inside MAP
The model simulation has been developed andTable 5 presents the statistical test to validate thepredicted average O2 and CO2 concentration in theMAP with the experimental data for the ECMP ‘Aru-manis’ mango. Since all the t calculations were lowerthan t table for both 5 and 1% significance levels, therewas no significant differences between the predictedand the experimental data. In other words, the modelsimulation was validated and able to represent the res-piration process.
R T
R
K T
R
RQ T
R
O2
2
1 2
2
2
32 5930 0 1093
0 9956 7
0 1224 0 1291
0 9977 8
0 9954 0 0166
0 8913 9
max
/
. exp . ;
. ( )
. exp . ;
. ( )
. exp . ;
. ( )
= ( )
=
= ( )=
= ( )=
Table 4. RO2max, K1/2 and RQ (see Table 1 for explanation of symbols) of edible-coated, minimally processed
(ECMP) ‘Arumanis’ mango fruit inside the modified atmosphere chamber at various storagetemperatures.
Temperature (oC) RO2max (nmol/kg/s) K1/2 (kPa) RQ
5 58.140 0.220 1.056
10 95.238 0.400 1.112
15 168.730 0.746 1.162
20 303.030 1.545 1.286
Table 5. Statistical test (student t test) to validate predicted oxygen and CO2 inside modified atmospherepackaging with experimental data.
Sources Average concentration (kPa) t calculation t table
Experimental data
Predicted result 0.05 0.01
Storage temperature 5°C
Oxygen 9.999 10.474 –0.237 2.048 2.763
Carbon dioxide 2.713 2.470 0.857 2.048 2.763
Storage temperature 10°C
Oxygen 10.059 10.660 –0.267 2.064 2.797
Carbon dioxide 2.931 2.674 0.730 2.064 2.797
Note: t calculation < t table
Quality assurance in agricultural produce,edited by G.I. Johnson, Le Van To, Nguyen Duy Duc and M.C. Webb.
ACIAR Proceedings 100(printed version published in 2000)
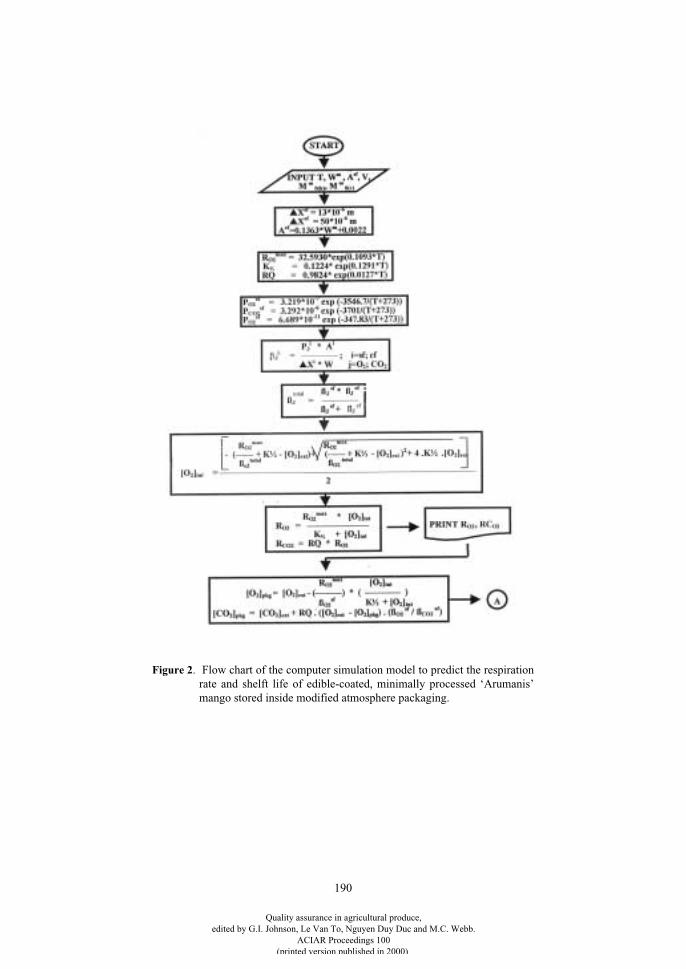
190
Figure 2. Flow chart of the computer simulation model to predict the respirationrate and shelft life of edible-coated, minimally processed ‘Arumanis’mango stored inside modified atmosphere packaging.
Quality assurance in agricultural produce,edited by G.I. Johnson, Le Van To, Nguyen Duy Duc and M.C. Webb.
ACIAR Proceedings 100(printed version published in 2000)
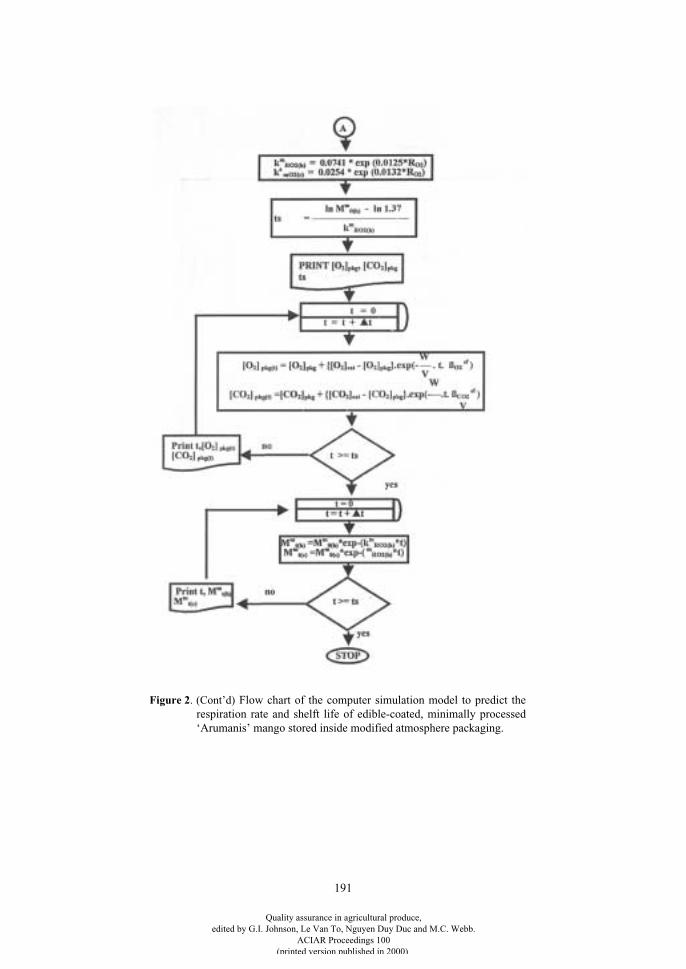
191
Figure 2. (Cont’d) Flow chart of the computer simulation model to predict therespiration rate and shelft life of edible-coated, minimally processed‘Arumanis’ mango stored inside modified atmosphere packaging.
Quality assurance in agricultural produce,edited by G.I. Johnson, Le Van To, Nguyen Duy Duc and M.C. Webb.
ACIAR Proceedings 100(printed version published in 2000)
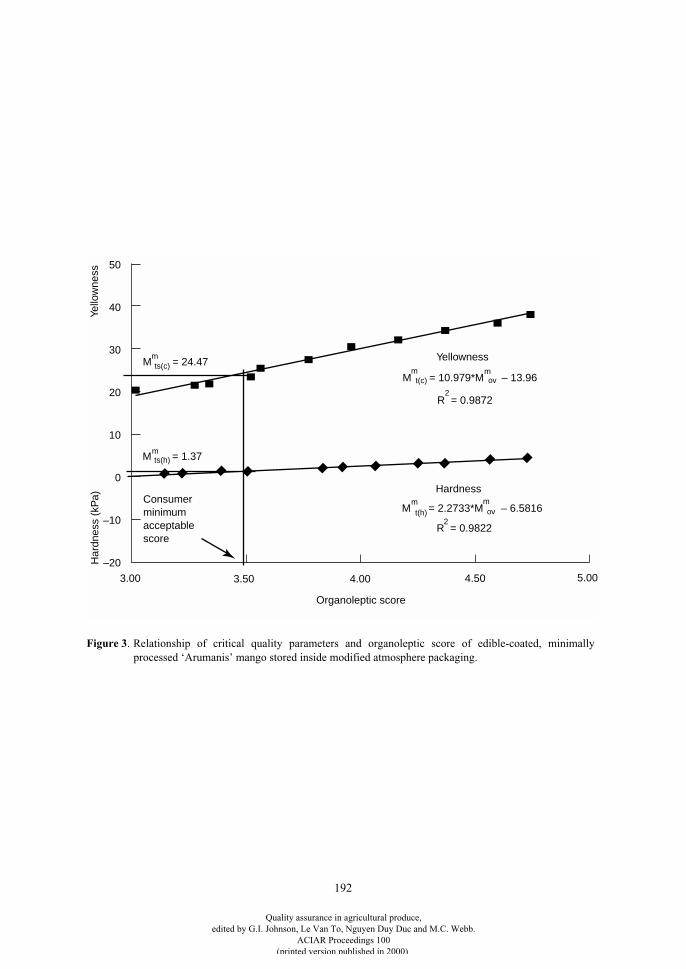
192
50
40
30
20
10
0
–10
–20
3.00 3.50 4.00 4.50 5.00
Yellowness
M = 10.979*M – 13.96m
t(c)mov
R = 0.98722
Hardness
M = 2.2733*M – 6.5816mt(h)
mov
R = 0.98222
M = 24.47ts(c)m
M = 1.37ts(h)m
Consumerminimum
scoreacceptable
Organoleptic score
Yel
low
ness
Har
dnes
s (k
Pa)
Figure 3. Relationship of critical quality parameters and organoleptic score of edible-coated, minimallyprocessed ‘Arumanis’ mango stored inside modified atmosphere packaging.
Quality assurance in agricultural produce,edited by G.I. Johnson, Le Van To, Nguyen Duy Duc and M.C. Webb.
ACIAR Proceedings 100(printed version published in 2000)
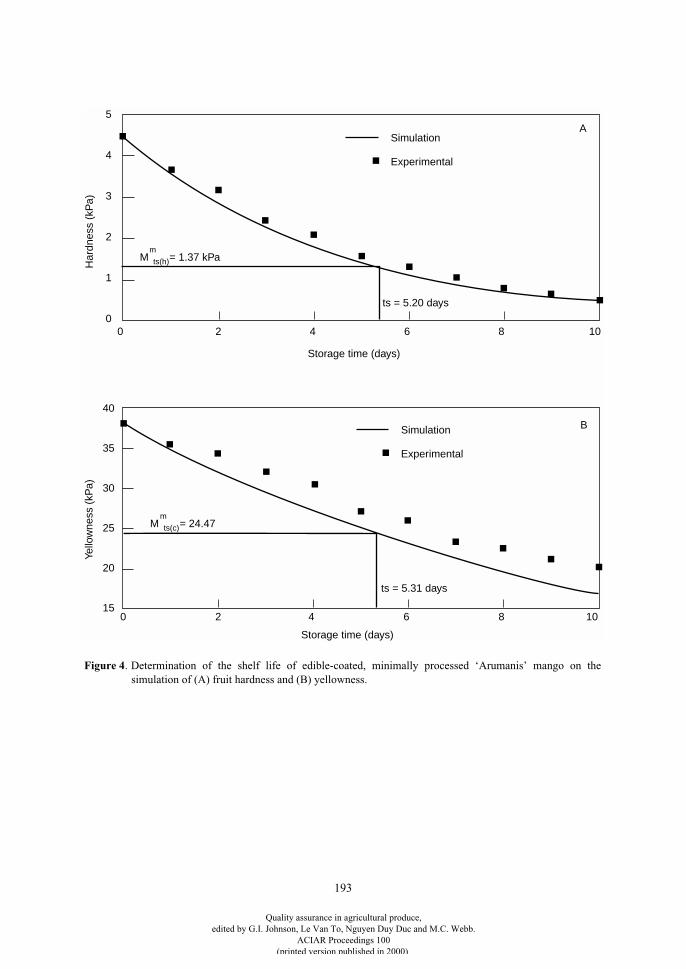
193
5
4
3
2
1
00 2 4 6 8 10
Storage time (days)
Har
dnes
s (k
Pa)
ts = 5.20 days
M = 1.37 kPam
ts(h)
Experimental
Simulation
Experimental
Simulation
Storage time (days)
Yello
wne
ss (
kPa)
M = 24.47m
ts(c)
ts = 5.31 days
40
35
30
25
20
150 2 4 6 8 10
A
B
Figure 4. Determination of the shelf life of edible-coated, minimally processed ‘Arumanis’ mango on thesimulation of (A) fruit hardness and (B) yellowness.
Quality assurance in agricultural produce,edited by G.I. Johnson, Le Van To, Nguyen Duy Duc and M.C. Webb.
ACIAR Proceedings 100(printed version published in 2000)
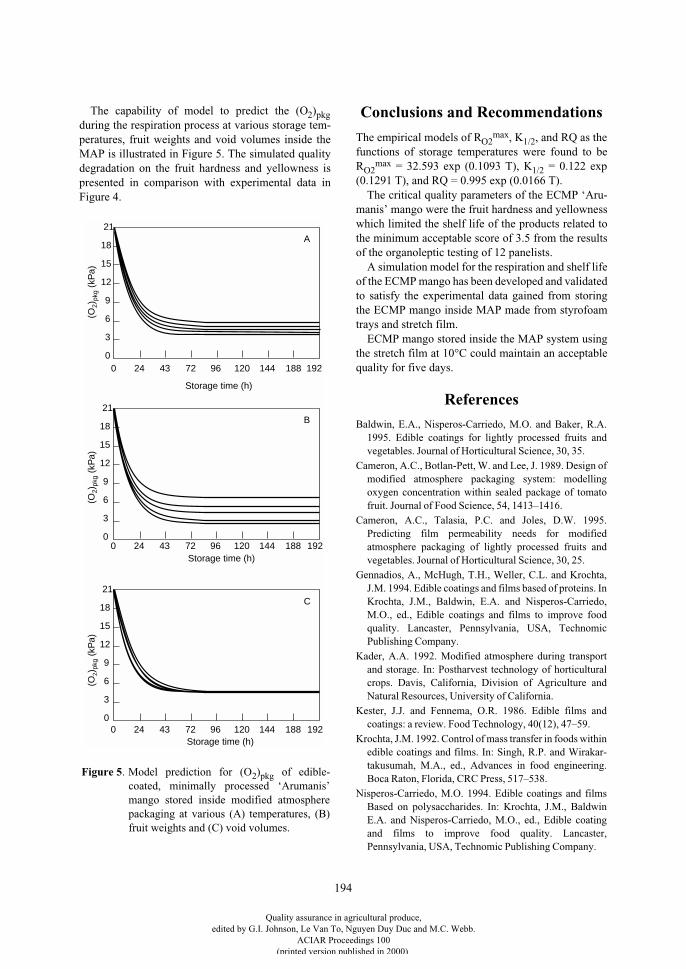
194
The capability of model to predict the (O2)pkgduring the respiration process at various storage tem-peratures, fruit weights and void volumes inside theMAP is illustrated in Figure 5. The simulated qualitydegradation on the fruit hardness and yellowness ispresented in comparison with experimental data inFigure 4.
Conclusions and Recommendations
The empirical models of RO2max, K1/2, and RQ as the
functions of storage temperatures were found to beRO2
max = 32.593 exp (0.1093 T), K1/2 = 0.122 exp(0.1291 T), and RQ = 0.995 exp (0.0166 T).
The critical quality parameters of the ECMP ‘Aru-manis’ mango were the fruit hardness and yellownesswhich limited the shelf life of the products related tothe minimum acceptable score of 3.5 from the resultsof the organoleptic testing of 12 panelists.
A simulation model for the respiration and shelf lifeof the ECMP mango has been developed and validatedto satisfy the experimental data gained from storingthe ECMP mango inside MAP made from styrofoamtrays and stretch film.
ECMP mango stored inside the MAP system usingthe stretch film at 10°C could maintain an acceptablequality for five days.
References
Baldwin, E.A., Nisperos-Carriedo, M.O. and Baker, R.A.1995. Edible coatings for lightly processed fruits andvegetables. Journal of Horticultural Science, 30, 35.
Cameron, A.C., Botlan-Pett, W. and Lee, J. 1989. Design ofmodified atmosphere packaging system: modellingoxygen concentration within sealed package of tomatofruit. Journal of Food Science, 54, 1413–1416.
Cameron, A.C., Talasia, P.C. and Joles, D.W. 1995.Predicting film permeability needs for modifiedatmosphere packaging of lightly processed fruits andvegetables. Journal of Horticultural Science, 30, 25.
Gennadios, A., McHugh, T.H., Weller, C.L. and Krochta,J.M. 1994. Edible coatings and films based of proteins. InKrochta, J.M., Baldwin, E.A. and Nisperos-Carriedo,M.O., ed., Edible coatings and films to improve foodquality. Lancaster, Pennsylvania, USA, TechnomicPublishing Company.
Kader, A.A. 1992. Modified atmosphere during transportand storage. In: Postharvest technology of horticulturalcrops. Davis, California, Division of Agriculture andNatural Resources, University of California.
Kester, J.J. and Fennema, O.R. 1986. Edible films andcoatings: a review. Food Technology, 40(12), 47–59.
Krochta, J.M. 1992. Control of mass transfer in foods withinedible coatings and films. In: Singh, R.P. and Wirakar-takusumah, M.A., ed., Advances in food engineering.Boca Raton, Florida, CRC Press, 517–538.
Nisperos-Carriedo, M.O. 1994. Edible coatings and filmsBased on polysaccharides. In: Krochta, J.M., BaldwinE.A. and Nisperos-Carriedo, M.O., ed., Edible coatingand films to improve food quality. Lancaster,Pennsylvania, USA, Technomic Publishing Company.
Storage time (h)
21
18
15
12
9
6
3
00 24 43 72 96 120 144 188 192
Storage time (h)
21
18
15
12
9
6
3
00 24 43 72 96 120 144 188 192
Storage time (h)
21
18
15
12
9
6
3
00 24 43 72 96 120 144 188 192
A
B
C
(O2)
pkg
(kP
a)(O
2)pk
g (k
Pa)
(O2)
pkg
(kP
a)
Figure 5. Model prediction for (O2)pkg of edible-coated, minimally processed ‘Arumanis’mango stored inside modified atmospherepackaging at various (A) temperatures, (B)fruit weights and (C) void volumes.
Quality assurance in agricultural produce,edited by G.I. Johnson, Le Van To, Nguyen Duy Duc and M.C. Webb.
ACIAR Proceedings 100(printed version published in 2000)
195
O’Connor-Shaw, R. Roberts, R., Ford, A.L. andNottingham, S.M. 1994. Shelf life of minimallyprocessed honeydew, kiwifruit, papaya, pineapple andcantaloupe. Journal of Food Science, 59, 1202.
Park, H.J., Chinnan, M.S. and Shewfelt, R.L. 1994. Ediblecoating effect on storage life and quality of tomatoes.Journal of Food Science, 56, 568–570.
Purwadaria, H.K., Budaraga, I.K., Pujantoro, L. andBudiastra, I.W. 1997. Pengkajian awal respirasiminimally processed buah mangga Arumanis padakondisi penyimpanan atmosfir normal. [Assessment onthe respiration of minimally processed Arumanis mangoin the atmospheric condition.] Proceedings. SeminarPERTETA, Bandung, Indonesia, 7–8 July 1997.
Purwadaria, H.K. and Wuryani, S. 1999. Respiration modelfor edible coated minimally processed mango. Paperpresented at the Sixth International Mango Symposium.Pattaya, Thailand, 6–9 April 1999.
Ratule, M.T. 1999. Penentuan komposisi atmosfirpenyimpanan irisan buah mangga segar terlapis filmedibel. [Determination of Atmospheric Composition forStoring Edible Coated Minimally Processed Mango.]Thesis, Program Pascasarjana, Institut Pertanian Bogor.
Setiasih, I.S., Wuryani, S., Rusmono, M. and Fardiaz, D.1997. Preliminary study on utilization of low methoxypectins and alginates as edible coatings for minimallyprocessed fruits. Poster paper, Third InternationalSymposium of Horticultural Economics in DevelopingCountries and 1st International Conference of Woman
and Horticultural Development, Malang, Indonesia,13–17 October 1997.
Shewfelt, R.L. 1987. Quality of minimally processed fruitsand vegetables. Journal of Food Quality, 10, 143–156.
Shuller, M.L. and Kargi, F. 1992. Bioprocess engineering,basic concepts. New York, Prentice Hall.
Siriphanich, J. 1993. Minimal processing of tropical fruits.In: Champ, B.R., Highley, E. and Johnson, G.I., ed.,Postharvest handling of tropical fruits. Proceedings of aninternational conference held at Chiang Mai, Thailand,19–23 July 1993. ACIAR Proceedings No. 50. Canberra,Australian Centre for International AgriculturalResearch, 127–137.
Wills, R.B.H., McGlasson, W.B., Graham, D. and Hall, E.G.1991. Postharvest, an introduction to the physiology andhandling of fruit and vegetables. New York, VanNostrand Reinhold.
Wong, D.W.S., Camirand, W.M. and Pavlath, A.E. 1994.Development of edible coating for minimally processedfruits and vegetables. In: Krochta, J.M., Baldwin, E.A.and Nisperos-Carriedo, M.O., ed., Edible coatings andfilms to improve food quality. Lancaster, Pennsylvania,USA, Technomic Publishing Compnay, 65–88.
Wuryani, S., Zulfebriadi, Purwadaria, H.K. and Syarief,A.M. 1998. Penentuan konstanta laju perubahan mutumangga terolah minimal berlapis film edibel.[Determination of the rate constants for the qualitychanges of edible coated minimally processed mango.]Proceedings Seminar dan Kongres PERTETA,Yogyakarta, Indonesia 27–28 July 1998.
Quality assurance in agricultural produce,edited by G.I. Johnson, Le Van To, Nguyen Duy Duc and M.C. Webb.
ACIAR Proceedings 100(printed version published in 2000)
196
Quantitative Descriptive Analysis and Volatile Component Analysis of Minimally Processed ‘Arumanis’ Mango Coated with Edible Film
D. Fardiaz*, I.S. Setiasih†, H.K. Purwadaria§ and A. Apriyantono*
Abstract
An experiment was conducted to assess the taste and aroma of minimally processed (MP) ‘Arumanis’ mangocoated with low methoxy pectin-based edible film. Quantitative descriptive analysis (QDA) was used in theexperiment with twelve trained panelists. In addition, volatile components of the fruit were determined usinga gas chromatograph/mass spectrometer. Four types of taste and six types of aroma were detected using QDAin MP ‘Arumanis’ mango either without or with edible film coating. The four types of taste are ‘sour’, ‘sweetsour’, ‘sweet honey’ and ‘sweet sucrose’. The six types of aroma are ‘fresh’, ‘sour’, ‘sweet mango peel’, ‘sweetmango’, ‘sweet ethereal’ and ‘sweet honey’. There were 53 types of volatile component identified in MP‘Arumanis’ mango which consisted of the following groups: aldehyde, alcohol, ester, aliphatic hydrocarbon,carboxylic acid, ketone, furan, lactone, and terpene. Storage at relatively low temperatures affects themagnitude of the taste and aroma as well as the volatile components of MP ‘Arumanis’ mango.
I
N
RECENT
years, there has been an increasing demandfrom consumers for more healthy foods and for‘speedy foods’ which can be prepared quickly. Conse-quently, consumers have shifted their demand to foodsthat are fresh as well as ‘ready-to-eat’ or ‘ready-to-cook’. Ready-to-eat fresh fruits and ready-to-cookvegetables which have been washed, skinned, cut andsliced into various forms are examples of foodproducts that are increasingly sold in the market. Theprocess of preparing such products is called ‘minimalprocessing’ or ‘light processing’ and is done withoutapplying any preservation treatment which maychange the characteristics of the product. The advan-tages of minimally processed (MP) products are veryobvious if the process is applied to fruits that aredifficult to peel and to fruits that have a bulky skin andseed.
Several studies were previously conducted to assessthe shelf life of various MP fruits such as kiwifruit,papaya, cantaloupe, pineapple, honeydew melon andapples (O’Connor-Shaw et al. 1994; Cameron et al.1995). A major problem of MP fruits is that the shelflife of these products is shorter than that of the wholefruits under similar low storage temperatures. Onetechnique to overcome this problem is to reduce therespiration rate of MP fruits by coating them with anedible, thin film. Edible coating is a continuous filmmade of edible materials that are applied to food bydipping or spraying. Several functions of the coatingare as follows: as a barrier to the mass transfer of watervapour, oxygen, or soluble materials etc.; as a carrierfor food additives; to facilitate food handling; tomaintain the cell structural integrity; and to hinder theloss of volatile compounds (Krochta et al. 1994).Edible coating has been applied in sliced apples(Wong et al. 1994; Baldwin et al. 1995) and tomatoes(Park et al. 1994).
Mango, especially the ‘Arumanis’ variety, is one ofthe favourite fruits in Indonesia. The fruit has a char-acteristic green colour which makes it difficult forconsumers to make a good judgement on the appro-
* Department of Food Technology and Human Nutrition, Faculty of Agricultural Engineering and Technology, Bogor Agricultural University, Bogor, Indonesia.
† Department of Agricultural Technology, Faculty of Agriculture, University of Pajajaran, Bandung, Indonesia.
§ Department of Agricultural Engineering, Faculty of Agricultural Engineering and Technology, Bogor Agricultural University, Bogor, Indonesia.
Quality assurance in agricultural produce,edited by G.I. Johnson, Le Van To, Nguyen Duy Duc and M.C. Webb.
ACIAR Proceedings 100(printed version published in 2000)
197
priate ripeness of the fruit. Therefore, the applicationof minimal processing to ‘Arumanis’ mango may helpconsumers to make a better choice. Low methoxypectin-based edible coating was applied in this exper-iment on MP ‘Arumanis’ mango and thecharacteristics of its taste and aroma were assessed bythe quantitative descriptive analysis (QDA) method.Furthermore, the volatile components of the productswere determined using a gas chromatograph/massspectrometer.
Materials and Methods
Application of edible coating film on MP ‘Arumanis’ mango
Mangoes of the ‘Arumanis’ variety were obtainedfrom the orchard of Galasari Co., Gresik, East Java.The fruit were harvested at 97 days after flowering andripened for 3 days, including the time used for trans-portation, at room temperature before they wereminimally processed.
Edible coating film was made of low methoxypectin as a gel-based material, mixed with 87%glycerol as a plasticiser, and other components suchprotein isolate and stearic acid. The pH of the filmsolution was adjusted with sodium bicarbonate andcitric acid. The edible coating film solution was heatedto 69.7°C, cooled to room temperature, degassed, andapplied onto MP ‘Arumanis’ mango by dipping thefruit in the film solution for several seconds. Asolution of 0.75% calcium chloride was used as a gelhardening agent. Dipping time was adjusted so that thethickness of the coating was around 50
µ
m. Both MP‘Arumanis’ mangoes with and without edible coatingfilm were stored in a refrigerator at 5 and 10°C forcertain periods of time and evaluated for their charac-teristics of taste and aroma.
Quantitative descriptive analysis (QDA)
As many as 32 candidates were recruited aspotential sensory panelists and their sensitivity in thedetection of taste and aroma was tested. Twelve ofthose tested panelists were selected as sensorypanelists and were further trained in order to beeligible as QDA panelists. The QDA was applied todescribe the taste and aroma of both MP ‘Arumanis’mango with and without edible coating during storageat 5 and 10°C. The results of the analysis were plottedin the form of spider web graph.
Analysis of volatile components
Extraction of volatile components of both MP ‘Aru-manis’ mango with and without edible coating wasdone through the following steps: maceration ofmango fruit to form a pulpy slurry; addition of theinternal standard 1,4 dichlorobenzene; mixing of theslurry with pentane and dichloromethane; and storageof the mixture in a freezer for 24 h. Following this, themixture was evaporated in a ‘rotavapor’ until itsvolume was 5 mL, then blown with nitrogen gas untilthe volume of the mixture was 1 mL. The 1
µ
L samplewas injected into a gas chromatograph/mass spec-trometer (Shimadzu 17A-QP-5000). Gaschromatographic separation of volatile componentswas done in 30 m
×
0.32 mm (i.d.) HP-5 capillarycolumn with helium at 40.4 KPa pressure as the carriergas. The conditions of separation were as follows:injector and interface temperature 230°C; initial tem-perature 40°C with 5 min holding; rate of temperatureincrease 4°C/min; final temperature 225°C for 5 min.Mass spectra were interpreted using the mass spectralibrary of the National Institute for Standards andTechnology. Furthermore, the linear retention indices(LRI) of the interpreted component mass spectra werecompared with the LRI of the corresponding compo-nents which had been published.
Principal component analysis
To determine the relationship between volatile com-ponents and descriptive taste and aroma, principalcomponent analysis (PCA) and partial least square-2(PLS-2) analysis were made using the computerprogram The Unscrambler
•
6.0 (Camo, AS,Norwegia, 1996).
Results and Discussion
Edible-coated, MP ‘Arumanis’ mango
Low methoxy pectin-based edible coating was suc-cessfully applied onto MP ‘Arumanis’ mango. It hasthe following characteristics: water vapour trans-mission rate of 770.76 g/m
2
/24 h; moisture content of38.66%; and water activity (a
w
) of 0.61. The edible-coated, MP (ECMP) ‘Arumanis’ mango had a shelflife of 5 days if stored in a refrigerator at 5°C and 4days at 10°C. The advantage of applying ediblecoating onto MP ‘Arumanis’ mango is an additional 2days of storage. The results of the experiment showedthat the application of edible coating onto MP ‘Aru-
Quality assurance in agricultural produce,edited by G.I. Johnson, Le Van To, Nguyen Duy Duc and M.C. Webb.
ACIAR Proceedings 100(printed version published in 2000)
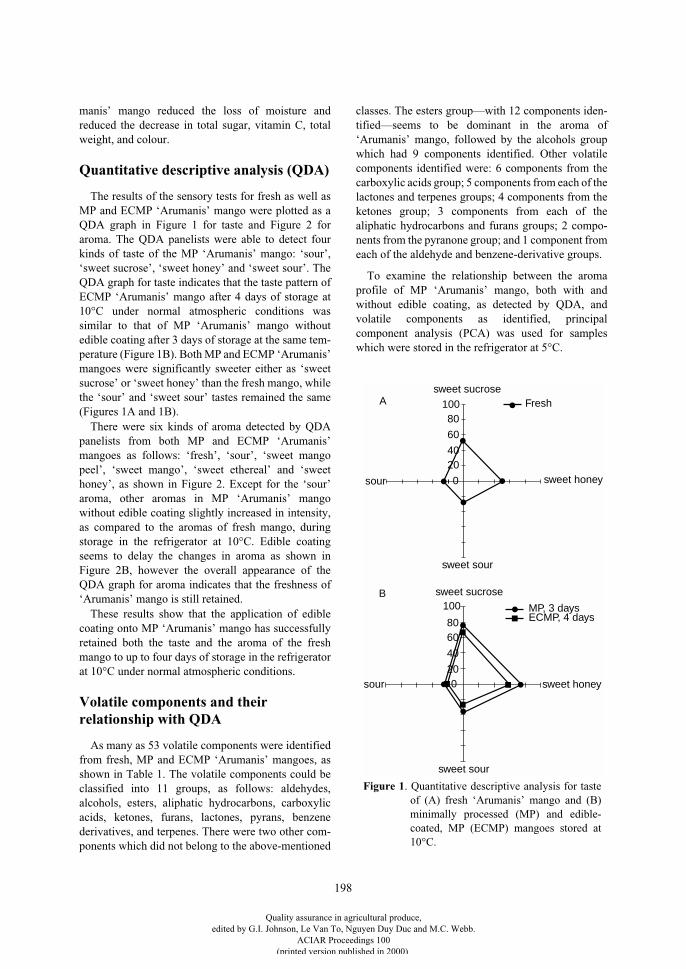
198
manis’ mango reduced the loss of moisture andreduced the decrease in total sugar, vitamin C, totalweight, and colour.
Quantitative descriptive analysis (QDA)
The results of the sensory tests for fresh as well asMP and ECMP ‘Arumanis’ mango were plotted as aQDA graph in Figure 1 for taste and Figure 2 foraroma. The QDA panelists were able to detect fourkinds of taste of the MP ‘Arumanis’ mango: ‘sour’,‘sweet sucrose’, ‘sweet honey’ and ‘sweet sour’. TheQDA graph for taste indicates that the taste pattern ofECMP ‘Arumanis’ mango after 4 days of storage at10°C under normal atmospheric conditions wassimilar to that of MP ‘Arumanis’ mango withoutedible coating after 3 days of storage at the same tem-perature (Figure 1B). Both MP and ECMP ‘Arumanis’mangoes were significantly sweeter either as ‘sweetsucrose’ or ‘sweet honey’ than the fresh mango, whilethe ‘sour’ and ‘sweet sour’ tastes remained the same(Figures 1A and 1B).
There were six kinds of aroma detected by QDApanelists from both MP and ECMP ‘Arumanis’mangoes as follows: ‘fresh’, ‘sour’, ‘sweet mangopeel’, ‘sweet mango’, ‘sweet ethereal’ and ‘sweethoney’, as shown in Figure 2. Except for the ‘sour’aroma, other aromas in MP ‘Arumanis’ mangowithout edible coating slightly increased in intensity,as compared to the aromas of fresh mango, duringstorage in the refrigerator at 10°C. Edible coatingseems to delay the changes in aroma as shown inFigure 2B, however the overall appearance of theQDA graph for aroma indicates that the freshness of‘Arumanis’ mango is still retained.
These results show that the application of ediblecoating onto MP ‘Arumanis’ mango has successfullyretained both the taste and the aroma of the freshmango to up to four days of storage in the refrigeratorat 10°C under normal atmospheric conditions.
Volatile components and their relationship with QDA
As many as 53 volatile components were identifiedfrom fresh, MP and ECMP ‘Arumanis’ mangoes, asshown in Table 1. The volatile components could beclassified into 11 groups, as follows: aldehydes,alcohols, esters, aliphatic hydrocarbons, carboxylicacids, ketones, furans, lactones, pyrans, benzenederivatives, and terpenes. There were two other com-ponents which did not belong to the above-mentioned
classes. The esters group—with 12 components iden-tified—seems to be dominant in the aroma of‘Arumanis’ mango, followed by the alcohols groupwhich had 9 components identified. Other volatilecomponents identified were: 6 components from thecarboxylic acids group; 5 components from each of thelactones and terpenes groups; 4 components from theketones group; 3 components from each of thealiphatic hydrocarbons and furans groups; 2 compo-nents from the pyranone group; and 1 component fromeach of the aldehyde and benzene-derivative groups.
To examine the relationship between the aromaprofile of MP ‘Arumanis’ mango, both with andwithout edible coating, as detected by QDA, andvolatile components as identified, principalcomponent analysis (PCA) was used for sampleswhich were stored in the refrigerator at 5°C.
10080
60
4020
0
sweet sucrose
sweet honey
sweet sour
sour
Fresh
100
8060
40
200
sweet sucrose
sweet honey
sweet sour
sour
MP, 3 daysECMP, 4 days
B
A
Figure 1. Quantitative descriptive analysis for tasteof (A) fresh ‘Arumanis’ mango and (B)minimally processed (MP) and edible-coated, MP (ECMP) mangoes stored at10°C.
Quality assurance in agricultural produce,edited by G.I. Johnson, Le Van To, Nguyen Duy Duc and M.C. Webb.
ACIAR Proceedings 100(printed version published in 2000)
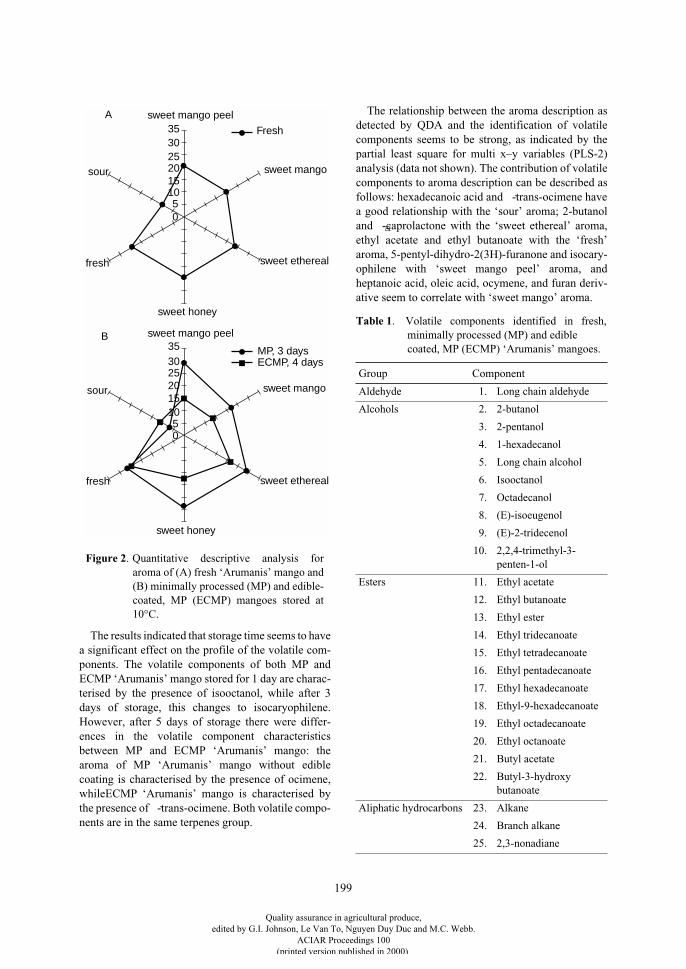
199
The results indicated that storage time seems to havea significant effect on the profile of the volatile com-ponents. The volatile components of both MP andECMP ‘Arumanis’ mango stored for 1 day are charac-terised by the presence of isooctanol, while after 3days of storage, this changes to isocaryophilene.However, after 5 days of storage there were differ-ences in the volatile component characteristicsbetween MP and ECMP ‘Arumanis’ mango: thearoma of MP ‘Arumanis’ mango without ediblecoating is characterised by the presence of ocimene,whileECMP ‘Arumanis’ mango is characterised bythe presence of
`
-trans-ocimene. Both volatile compo-nents are in the same terpenes group.
The relationship between the aroma description asdetected by QDA and the identification of volatilecomponents seems to be strong, as indicated by thepartial least square for multi x–y variables (PLS-2)analysis (data not shown). The contribution of volatilecomponents to aroma description can be described asfollows: hexadecanoic acid and
`
-trans-ocimene havea good relationship with the ‘sour’ aroma; 2-butanoland
a
-caprolactone with the ‘sweet ethereal’ aroma,ethyl acetate and ethyl butanoate with the ‘fresh’aroma, 5-pentyl-dihydro-2(3H)-furanone and isocary-ophilene with ‘sweet mango peel’ aroma, andheptanoic acid, oleic acid, ocymene, and furan deriv-ative seem to correlate with ‘sweet mango’ aroma.
353025
1510
0
sweet mango peel
sweet mango
sweet honey
Fresh
20
5
sweet ethereal
sour
fresh
353025
1510
0
sweet mango peel
sweet mango
sweet honey
MP, 3 days
20
5
sweet ethereal
sour
fresh
ECMP, 4 days
B
A
Figure 2. Quantitative descriptive analysis foraroma of (A) fresh ‘Arumanis’ mango and(B) minimally processed (MP) and edible-coated, MP (ECMP) mangoes stored at10°C.
Table 1
. Volatile components identified in fresh,minimally processed (MP) and edible coated, MP (ECMP) ‘Arumanis’ mangoes.
Group Component
Aldehyde 1. Long chain aldehyde
Alcohols 2. 2-butanol
3. 2-pentanol
4. 1-hexadecanol
5. Long chain alcohol
6. Isooctanol
7. Octadecanol
8. (E)-isoeugenol
9. (E)-2-tridecenol
10. 2,2,4-trimethyl-3-penten-1-ol
Esters 11. Ethyl acetate
12. Ethyl butanoate
13. Ethyl ester
14. Ethyl tridecanoate
15. Ethyl tetradecanoate
16. Ethyl pentadecanoate
17. Ethyl hexadecanoate
18. Ethyl-9-hexadecanoate
19. Ethyl octadecanoate
20. Ethyl octanoate
21. Butyl acetate
22. Butyl-3-hydroxy butanoate
Aliphatic hydrocarbons 23. Alkane
24. Branch alkane
25. 2,3-nonadiane
Quality assurance in agricultural produce,edited by G.I. Johnson, Le Van To, Nguyen Duy Duc and M.C. Webb.
ACIAR Proceedings 100(printed version published in 2000)
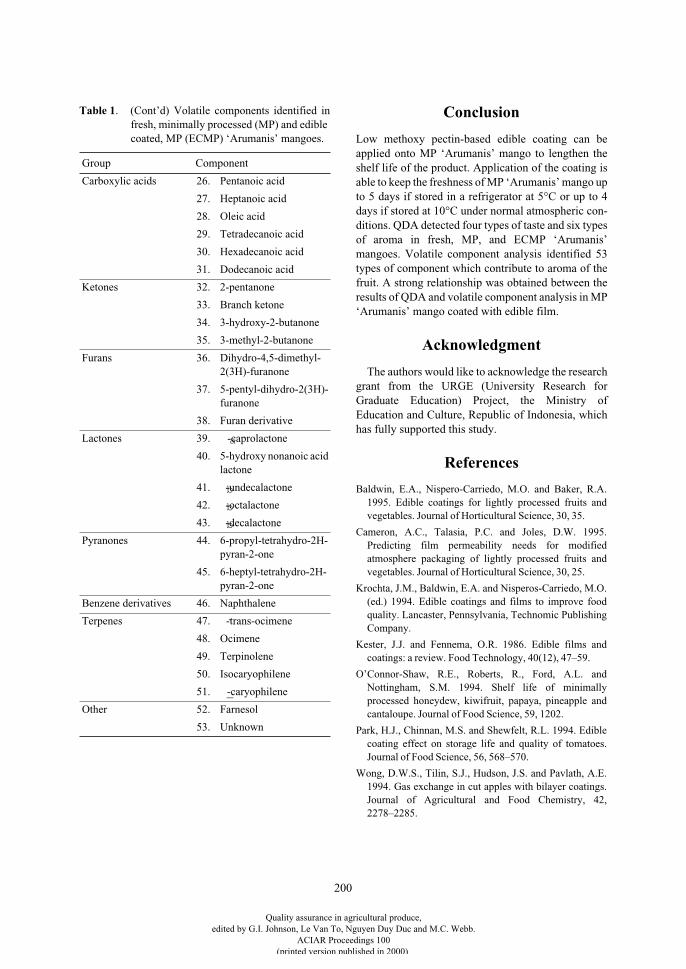
200
Conclusion
Low methoxy pectin-based edible coating can beapplied onto MP ‘Arumanis’ mango to lengthen theshelf life of the product. Application of the coating isable to keep the freshness of MP ‘Arumanis’ mango upto 5 days if stored in a refrigerator at 5°C or up to 4days if stored at 10°C under normal atmospheric con-ditions. QDA detected four types of taste and six typesof aroma in fresh, MP, and ECMP ‘Arumanis’mangoes. Volatile component analysis identified 53types of component which contribute to aroma of thefruit. A strong relationship was obtained between theresults of QDA and volatile component analysis in MP‘Arumanis’ mango coated with edible film.
Acknowledgment
The authors would like to acknowledge the researchgrant from the URGE (University Research forGraduate Education) Project, the Ministry ofEducation and Culture, Republic of Indonesia, whichhas fully supported this study.
References
Baldwin, E.A., Nispero-Carriedo, M.O. and Baker, R.A.1995. Edible coatings for lightly processed fruits andvegetables. Journal of Horticultural Science, 30, 35.
Cameron, A.C., Talasia, P.C. and Joles, D.W. 1995.Predicting film permeability needs for modifiedatmosphere packaging of lightly processed fruits andvegetables. Journal of Horticultural Science, 30, 25.
Krochta, J.M., Baldwin, E.A. and Nisperos-Carriedo, M.O.(ed.) 1994. Edible coatings and films to improve foodquality. Lancaster, Pennsylvania, Technomic PublishingCompany.
Kester, J.J. and Fennema, O.R. 1986. Edible films andcoatings: a review. Food Technology, 40(12), 47–59.
O’Connor-Shaw, R.E., Roberts, R., Ford, A.L. andNottingham, S.M. 1994. Shelf life of minimallyprocessed honeydew, kiwifruit, papaya, pineapple andcantaloupe. Journal of Food Science, 59, 1202.
Park, H.J., Chinnan, M.S. and Shewfelt, R.L. 1994. Ediblecoating effect on storage life and quality of tomatoes.Journal of Food Science, 56, 568–570.
Wong, D.W.S., Tilin, S.J., Hudson, J.S. and Pavlath, A.E.1994. Gas exchange in cut apples with bilayer coatings.Journal of Agricultural and Food Chemistry, 42,2278–2285.
Carboxylic acids 26. Pentanoic acid
27. Heptanoic acid
28. Oleic acid
29. Tetradecanoic acid
30. Hexadecanoic acid
31. Dodecanoic acid
Ketones 32. 2-pentanone
33. Branch ketone
34. 3-hydroxy-2-butanone
35. 3-methyl-2-butanone
Furans 36. Dihydro-4,5-dimethyl-2(3H)-furanone
37. 5-pentyl-dihydro-2(3H)-furanone
38. Furan derivative
Lactones 39.
a
-caprolactone
40. 5-hydroxy nonanoic acid lactone
41.
b
-undecalactone
42.
b
-octalactone
43.
b
-decalactone
Pyranones 44. 6-propyl-tetrahydro-2H-pyran-2-one
45. 6-heptyl-tetrahydro-2H-pyran-2-one
Benzene derivatives 46. Naphthalene
Terpenes 47.
`
-trans-ocimene
48. Ocimene
49. Terpinolene
50. Isocaryophilene
51.
_
-caryophilene
Other 52. Farnesol
53. Unknown
Table 1
. (Cont’d) Volatile components identified infresh, minimally processed (MP) and edible coated, MP (ECMP) ‘Arumanis’ mangoes.
Group Component
Quality assurance in agricultural produce,edited by G.I. Johnson, Le Van To, Nguyen Duy Duc and M.C. Webb.
ACIAR Proceedings 100(printed version published in 2000)
201
Postharvest Quality Changes in Dokong (Lansium domesticum Corr.) Harvested at
Different Stages of Ripeness
Ahmad Tarmizi Sapii*, Norlia Yunus†, Pauziah Muda* and Tham Sin Lin*
Abstract
Dokong harvested at different stages of colour development 4, 7, 10 and 14 days after the fruit yellowingstage were observed for quality changes after being stored for 5 days under ambient conditions. Fruityellowing (FY) is the stage at which all dokong fruit in a bunch have a yellowish-green pericarp. Resultsfrom this experiment suggested that fruit of dokong could be harvested as early as at 4 days after FY (6–8fruit in a bunch exhibited a shade of green on their skin, while the rest were yellow) if the fruit were to bestored for a longer period of time. The pericarp colour of fruit from all stages of ripeness changed tobrownish-yellow after 5 days of storage. Fruit firmness decreased 2-fold after storage. The amount of totalsoluble solids (TSS) in fruit harvested at 4 and 7 days after FY was found to increase during storage whilsttotal titratable acidity (TTA) in fruit from all stages of ripeness decreased, which resulted in an increase inthe TSS-to-TTA ratio. The fruit harvested at an early stage of ripeness were able to attain acceptablesweetness after 5 days of storage under ambient conditions.
D
OKONG
is another form of
Lansium domesticum
Corr. (Meliaceae) besides langsat (or lanzones of thePhilippines), duku-langsat and duku. In terms ofexternal and internal characteristics of the fruit fromthis species, dokong is intermediate between langsatand duku-langsat (Norlia 1997) while duku-langsatis intermediate between langsat and duku (Salma andRazali 1987). Dokong is generally regarded assuperior to langsat and duku but its taste and flavourare comparable to duku-langsat. Dokong is almostseedless, thin-skinned and free of latex while langsathas 1–2 seeds and thin skin that exudates latex whenpeeled even when fully ripe (Bamroongrugsa 1992).
Another good characteristic of dokong which isabsent in duku-langsat is that all the fruit in a bunchripen simultaneously which facilitates harvesting.
Dokong, which is known as ‘longkong’ inThailand, is a new, important economic crop that isgaining popularity in Malaysia. The demand for thisfruit is increasing tremendously compared to other
Lansium
species because the fruit is juicy and has apleasant taste. However, reports on postharvest char-acteristics of dokong and other
Lansium
species ingeneral are very limited. Some information on thecompositional changes in langsat during growth anddevelopment are reported by Del Rosario et al.(1977) and Paull et al. (1987) and Ahmad Tarmizi etal. (1998) recently reported some changes in dokongfruit during maturation. According to AhmadTarmizi et al. (1998), the change in fruit colour wasthe best indicator for determining fruit maturation of
* Horticulture Research Centre, Malaysian Agricultural Research and Development Institute (MARDI), GPO Box 12301, 50774 Kuala Lumpur, Malaysia.
† MARDI Station Jeram Pasu, 16800 Pasir Putih, Kelantan, Malaysia.
Quality assurance in agricultural produce,edited by G.I. Johnson, Le Van To, Nguyen Duy Duc and M.C. Webb.
ACIAR Proceedings 100(printed version published in 2000)
202
dokong since the degree of yellowness at differentstages is quite easily distinguishable. Dokong fruitstart to develop yellow colour on their pericarp about87 days after fruit set (Norlia 1997) and the fruit can beharvested 11–17 days after that stage (Ahmad Tarmiziet al. 1998). At 11 days, all the fruit in a bunch haveattained their maximum size and have developed afully yellow colour and maximum soluble solidscontent, whilst at 17 days, fruit colour turns brownish-yellow. However, fruit harvested at this stage have avery short shelf life (about 4 days under ambient con-ditions). Harvesting the dokong fruit at earlier stagesof colour development may help to extend the shelflife of fruit provided that the fruit quality is compa-rable to the fruit harvested at 11 days or at later stages.Therefore, this study aimed to determine the qualitychanges during storage at ambient temperature indokong harvested at different stages of ripeness.
Materials and Methods
Dokong used in this study were obtained from theMalaysian Agricultural Research and DevelopmentInstitute (MARDI) Research Station, Jeram PasuKelantan, in October 1998. The colour stage called‘fruit yellowing’ (FY), at which all fruit in a bunchturned yellowish-green, was used as the basis for har-vesting. Fruit bunches were harvested randomly fromfive trees at 4, 7, 10 and 14 days after FY (DAFY). Tenbunches from each colour stage were individuallywrapped with newspaper, packed in corrugated fibre-board cartons and transported on the same day to thelaboratory in Serdang, Selangor. Fruit were thenstored for 5 days under ambient conditions (24–28°C,70–80% relative humidity).
Observations on fruit quality such as colour,firmness, soluble solids content, acidity and dry mattercontent were carried out before and after the fruit werestored for 5 days. The surface colour of individual fruitwas measured using a Minolta Chroma meter and thecolour was recorded in numerical notation system as
L*
,
a*
and
b*
, where:
L*
indicates lightness ordarkness (0, black; 100, white);
a*
indicates the hue ona green-to-red axis (negative value, greeness; positivevalue, redness); and
b*
indicates the hue on a blue-to-yellow axis (negative value, blueness; positive value,yellowness). The numerical values of
a*
and
b*
wereconverted into hue angle (
H°
= tan
-1
b*/a*
) and chroma[
C*
= (
a*
2
+
b*
2
)
1/2
] (Carreño et al. 1995; Nunes et al.1995).
H°
is an angle in the colour wheel of 360°, with0, 90, 180 and 270° representing the hue red–purple,
yellow, bluish-green and blue, respectively, while
C*
is the intensity of the hue (vivid or dull).
Fruit firmness was measured with a texture meterSteven’s Texture Referencing & Analysis Systemusing a 7 mm diameter Magness Taylor’s plunger. Theplunger was forced down the fruit surface to thedistance of 5 mm from the original position withoutbreaking the pericarp. For chemical analysis, the fruitaril was homogenised in a Waring blender and thehomogenate was used to measure total soluble solids,total titratable acidity and dry matter content. Totalsoluble solids was determined with a hand-held digitalrefractometer (Model PR-1, Atago Co. Ltd., TokyoJapan). Results were expressed as degrees Brix. Totaltitratable acidity was determined by titrating theknown volume of homogenate with 0.1 N NaOH to theend point of pH 8.1 and results were expressed as per-centage anhydrous citric acid. Dry matter wasdetermined by drying the sample in an oven at 60°Cfor 36 h and its value was calculated based on per-centage of water loss.
Results and Discussion
The pericarp colour of dokong changed from green to‘trace of yellow’ as the fruit were approaching theripening stage. In this study, the colour stage called‘fruit yellowing’ (FY) was used as the basis for har-vesting. The colour of each fruit in a bunch harvestedat the FY stage varied from yellowish-green togreenish-yellow. The fruit took about 87 days afterfruit set to reach this colour stage (Norlia 1997). As thefruit reached advanced stages of ripening, the greencolour disappeared and the fruit became yellow.However, there were 6–8 fruit in a bunch harvested at4 DAFY, and 1–2 fruit in a bunch (located at thebottom of the bunch) harvested at 7 DAFY, which stillshowed shade of green at the stylar end of the fruit.The colour of fruit harvested at different ripenessstages is presented in Table 1.
Data on fruit colour at harvest and after storagerecorded using the
L*
,
a* and b*
notation system arepresented in Table 2. Higher
L*
,
a*
,
b*
and
C*
valuesrespectively indicated lighter, more reddish, moreyellowish and brighter (more intense) surface colourof the fruit. Furthermore, fruit with higher
H°
or lower
H°
were more yellowish or more brownish, respec-tively. Generally, the colour of dokong at harvest wasfound to differ significantly with different ripenessstage as indicated by differences in
a*
,
b*
and
H°
values.
Quality assurance in agricultural produce,edited by G.I. Johnson, Le Van To, Nguyen Duy Duc and M.C. Webb.
ACIAR Proceedings 100(printed version published in 2000)
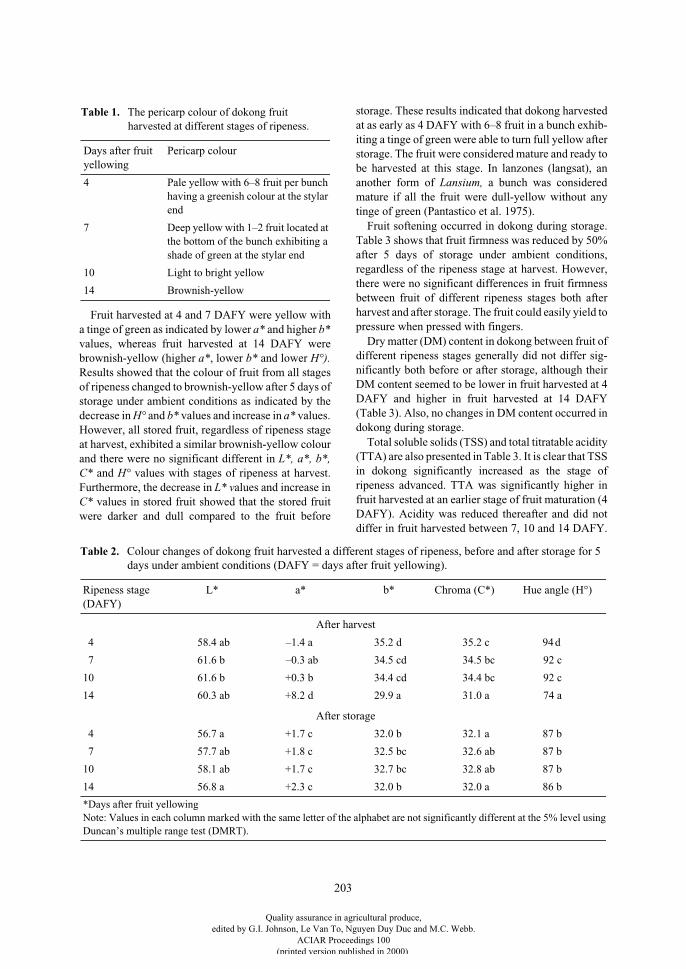
203
Fruit harvested at 4 and 7 DAFY were yellow witha tinge of green as indicated by lower
a*
and higher
b*
values, whereas fruit harvested at 14 DAFY werebrownish-yellow (higher
a*
, lower
b*
and lower
H°).
Results showed that the colour of fruit from all stagesof ripeness changed to brownish-yellow after 5 days ofstorage under ambient conditions as indicated by thedecrease in
H°
and
b*
values and increase in
a*
values.However, all stored fruit, regardless of ripeness stageat harvest, exhibited a similar brownish-yellow colourand there were no significant different in
L*, a*, b*,C*
and
H°
values with stages of ripeness at harvest.Furthermore, the decrease in
L* v
alues and increase in
C*
values in stored fruit showed that the stored fruitwere darker and dull compared to the fruit before
storage. These results indicated that dokong harvestedat as early as 4 DAFY with 6–8 fruit in a bunch exhib-iting a tinge of green were able to turn full yellow afterstorage. The fruit were considered mature and ready tobe harvested at this stage. In lanzones (langsat), ananother form of
Lansium,
a bunch was consideredmature if all the fruit were dull-yellow without anytinge of green (Pantastico et al. 1975).
Fruit softening occurred in dokong during storage.Table 3 shows that fruit firmness was reduced by 50%after 5 days of storage under ambient conditions,regardless of the ripeness stage at harvest. However,there were no significant differences in fruit firmnessbetween fruit of different ripeness stages both afterharvest and after storage. The fruit could easily yield topressure when pressed with fingers.
Dry matter (DM) content in dokong between fruit ofdifferent ripeness stages generally did not differ sig-nificantly both before or after storage, although theirDM content seemed to be lower in fruit harvested at 4DAFY and higher in fruit harvested at 14 DAFY(Table 3). Also, no changes in DM content occurred indokong during storage.
Total soluble solids (TSS) and total titratable acidity(TTA) are also presented in Table 3. It is clear that TSSin dokong significantly increased as the stage ofripeness advanced. TTA was significantly higher infruit harvested at an earlier stage of fruit maturation (4DAFY). Acidity was reduced thereafter and did notdiffer in fruit harvested between 7, 10 and 14 DAFY.
Table 1. The pericarp colour of dokong fruit harvested at different stages of ripeness.
Days after fruit yellowing
Pericarp colour
4 Pale yellow with 6–8 fruit per bunch having a greenish colour at the stylar end
7 Deep yellow with 1–2 fruit located at the bottom of the bunch exhibiting a shade of green at the stylar end
10 Light to bright yellow
14 Brownish-yellow
Table 2. Colour changes of dokong fruit harvested a different stages of ripeness, before and after storage for 5 days under ambient conditions (DAFY = days after fruit yellowing).
Ripeness stage (DAFY)
L* a* b* Chroma (C*) Hue angle (H°)
After harvest
4 58.4 ab –1.4 a 35.2 d 35.2 c 94 d
7 61.6 b –0.3 ab 34.5 cd 34.5 bc 92 c
10 61.6 b +0.3 b 34.4 cd 34.4 bc 92 c
14 60.3 ab +8.2 d 29.9 a 31.0 a 74 a
After storage
4 56.7 a +1.7 c 32.0 b 32.1 a 87 b
7 57.7 ab +1.8 c 32.5 bc 32.6 ab 87 b
10 58.1 ab +1.7 c 32.7 bc 32.8 ab 87 b
14 56.8 a +2.3 c 32.0 b 32.0 a 86 b
*Days after fruit yellowingNote: Values in each column marked with the same letter of the alphabet are not significantly different at the 5% level using Duncan’s multiple range test (DMRT).
Quality assurance in agricultural produce,edited by G.I. Johnson, Le Van To, Nguyen Duy Duc and M.C. Webb.
ACIAR Proceedings 100(printed version published in 2000)
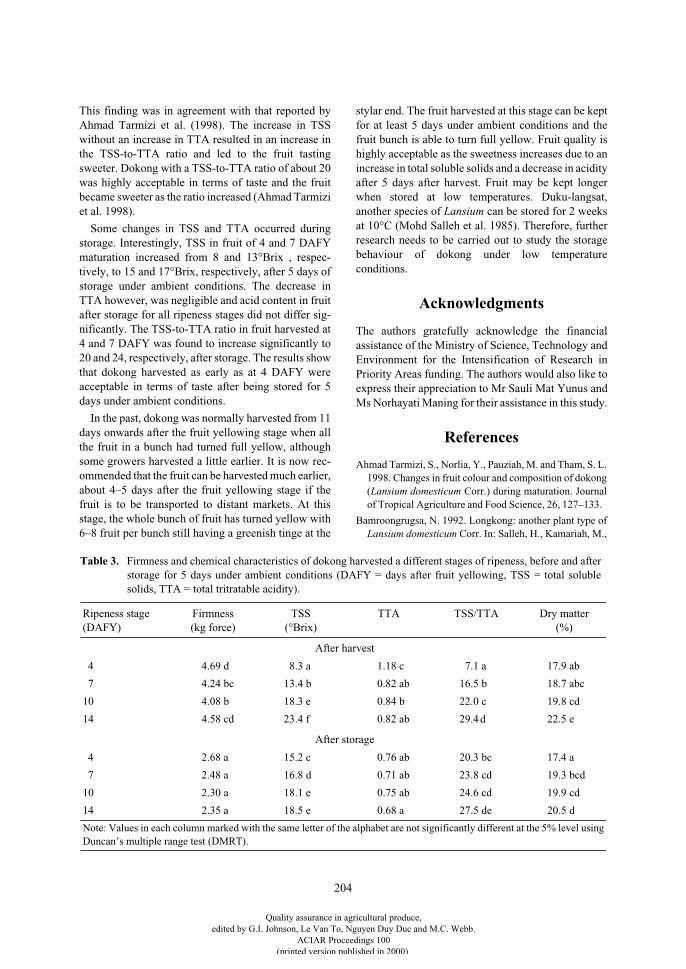
204
This finding was in agreement with that reported byAhmad Tarmizi et al. (1998). The increase in TSSwithout an increase in TTA resulted in an increase inthe TSS-to-TTA ratio and led to the fruit tastingsweeter. Dokong with a TSS-to-TTA ratio of about 20was highly acceptable in terms of taste and the fruitbecame sweeter as the ratio increased (Ahmad Tarmiziet al. 1998).
Some changes in TSS and TTA occurred duringstorage. Interestingly, TSS in fruit of 4 and 7 DAFYmaturation increased from 8 and 13°Brix , respec-tively, to 15 and 17°Brix, respectively, after 5 days ofstorage under ambient conditions. The decrease inTTA however, was negligible and acid content in fruitafter storage for all ripeness stages did not differ sig-nificantly. The TSS-to-TTA ratio in fruit harvested at4 and 7 DAFY was found to increase significantly to20 and 24, respectively, after storage. The results showthat dokong harvested as early as at 4 DAFY wereacceptable in terms of taste after being stored for 5days under ambient conditions.
In the past, dokong was normally harvested from 11days onwards after the fruit yellowing stage when allthe fruit in a bunch had turned full yellow, althoughsome growers harvested a little earlier. It is now rec-ommended that the fruit can be harvested much earlier,about 4–5 days after the fruit yellowing stage if thefruit is to be transported to distant markets. At thisstage, the whole bunch of fruit has turned yellow with6–8 fruit per bunch still having a greenish tinge at the
stylar end. The fruit harvested at this stage can be keptfor at least 5 days under ambient conditions and thefruit bunch is able to turn full yellow. Fruit quality ishighly acceptable as the sweetness increases due to anincrease in total soluble solids and a decrease in acidityafter 5 days after harvest. Fruit may be kept longerwhen stored at low temperatures. Duku-langsat,another species of
Lansium
can be stored for 2 weeksat 10°C (Mohd Salleh et al. 1985). Therefore, furtherresearch needs to be carried out to study the storagebehaviour of dokong under low temperatureconditions.
Acknowledgments
The authors gratefully acknowledge the financialassistance of the Ministry of Science, Technology andEnvironment for the Intensification of Research inPriority Areas funding. The authors would also like toexpress their appreciation to Mr Sauli Mat Yunus andMs Norhayati Maning for their assistance in this study.
References
Ahmad Tarmizi, S., Norlia, Y., Pauziah, M. and Tham, S. L.1998. Changes in fruit colour and composition of dokong(
Lansium domesticum
Corr.) during maturation. Journalof Tropical Agriculture and Food Science, 26, 127–133.
Bamroongrugsa, N. 1992. Longkong: another plant type ofLansium domesticum Corr. In: Salleh, H., Kamariah, M.,
Table 3. Firmness and chemical characteristics of dokong harvested a different stages of ripeness, before and afterstorage for 5 days under ambient conditions (DAFY = days after fruit yellowing, TSS = total solublesolids, TTA = total tritratable acidity).
Ripeness stage(DAFY)
Firmness(kg force)
TSS(°Brix)
TTA TSS/TTA Dry matter (%)
After harvest
4 4.69 d 8.3 a 1.18 c 7.1 a 17.9 ab
7 4.24 bc 13.4 b 0.82 ab 16.5 b 18.7 abc
10 4.08 b 18.3 e 0.84 b 22.0 c 19.8 cd
14 4.58 cd 23.4 f 0.82 ab 29.4 d 22.5 e
After storage
4 2.68 a 15.2 c 0.76 ab 20.3 bc 17.4 a
7 2.48 a 16.8 d 0.71 ab 23.8 cd 19.3 bcd
10 2.30 a 18.1 e 0.75 ab 24.6 cd 19.9 cd
14 2.35 a 18.5 e 0.68 a 27.5 de 20.5 d
Note: Values in each column marked with the same letter of the alphabet are not significantly different at the 5% level using Duncan’s multiple range test (DMRT).
Quality assurance in agricultural produce,edited by G.I. Johnson, Le Van To, Nguyen Duy Duc and M.C. Webb.
ACIAR Proceedings 100(printed version published in 2000)
205
Norlia, Y., Abd. Jamil, Z., Hashim, A.B. and Tan, H.H.,ed., Proceedings of a seminar on cultivation of dukuterengganu, dokong and salak (in Bahasa Malaysia) 4October 1992, Kuala Terengganu, Terengganu. Serdang,Malaysian Agricultural Research and DevelopmentInstitute (MARDI), 29–33.
Carreño, J., Almela, L., Martínez, A. and Fernández-López,J.A. 1995. Colour changes associated with maturation ofthe table grape cv. Don Mariano. Journal of HorticulturalScience, 70, 841–846.
Del Rosario, R.P., Abilay, R.M. and Pantastico, E.B. 1977.Fruit set and development of lanzones sprayed with somegrowth regulators. Philippines Agriculture, 60, 330–8.
Norlia, Y. 1997. Flowering and fruiting of dokong (
Lansiumdomesticum
Corr.). In: Vejaysegaran, S., Pauziah, M.,Mohamed, M.S. and Ahmad Tarmizi, S., ed., Proceedingsof an international conference on tropical fruits, 23–26July 1996, Kuala Lumpur. Serdang, MalaysianAgricultural Research and Development Institute(MARDI), Vol 3, 281–286.
Mohd Salleh, P., Abdullah, H. and Abd Aziz, I. 1985. Effectof temperature on storage of duku-langsat fruit (Lansium
domesticum). Teknologi Buah-buahan: 1, 5–10 (inBahasa Malaysia).
Nunes, M.C.N., Brecht, J.K., Morais, A.M.M.B. andSargent, S.A. 1995. Physical and chemical qualitycharacteristics of strawberries after storage are reducedby a short delay to cooling. Postharvest Biology andTechnology, 6, 17–28.
Pantastico, E.B., Subramanyam, H., Bhatti, M.B., Ali, N.and Akamine, E.K. 1975. Harvest indices. In: Pantastico,E.B. ed., Postharvest physiology, handling and utilisationof tropical and subtropical fruits and vegetables.Westport, Connecticut, USA, AVI Publ. Co. Inc., 56–74.
Paull, R.E., Goo, T. and Chen, N.J. 1987. Growth andcompositional changes during development of lanzonefruit. HortScience, 22, 1252–1253.
Salma, I. and Razali, B. 1987. The reproductive biology ofduku langsat,
Lansium domesticum
Corr. (Meliaceae), inPeninsular Malaysia. MARDI (Malaysian AgriculturalResearch and Development Institute) Research Bulletin,15, 142–151.
Quality assurance in agricultural produce,edited by G.I. Johnson, Le Van To, Nguyen Duy Duc and M.C. Webb.
ACIAR Proceedings 100(printed version published in 2000)
206
Protection of the Environment and Produce from Contamination with Pesticide Residues
I.R. Kennedy*, F. Sanchez-Bayo*, N. Lee*, H.M. Shivaramaiah*, A. Crossan*, S. Baskaran* and A.S. Hill†
Abstract
Preventing the contamination of the environment and of agricultural produce with pesticide residues is acomplex task. The design of a successful strategy demands:
• accurate information on the physical and chemical properties of agrochemicals;
• reliable research data on their fate and transport;
• simple techniques for ecological risk assessment and risks to human health;
• an economical means to monitor produce and the environment for contamination; and
• means of instituting best management practices, based on traceback of cases of contamination.
In Australia, an extensive program of research for the cotton industry has been undertaken to reduce the levelof contamination by chemicals, such as endosulfan, pyrethroids, organophosphates and carbamate and other,newer chemicals, such as the benzoylphenylureas and herbicides. This has required a very comprehensiveapproach involving the development of new technology for monitoring pesticide residues. In this paper, byexamining several case studies, we will demonstrate our approach to developing these techniques over the past10 years. Specific topics include: the role of quality assurance in analysis; enzyme-linked immunosorbentassays (ELISAs) for specific, sensitive screening for residues; and studies of pesticide sorption and desorptionfrom soil and transport aerially, in water and sediments in run-off. We will also consider the role of tracebackto determine the cause of contamination and of fugacity modelling to carry out ecological risk assessment. Thepossibility that a new theory—the action resonance theory—will soon yield models of ecosystem processesallowing better regulation of the amount of contamination in ecosystems is discussed.
U
SING
modern methods of chemical pest control,achieving an environment and produce free of signif-icant levels of pesticide contamination is a challengingtask. In this paper, we will examine some of the keyfactors producing risk and the measures that can betaken to reduce this risk to a minimum level. However,it must be understood at the outset that a complexstrategy is needed for success to be assured.
Unfortunately, it is almost impossible to apply pes-ticides in such a way that only the target pest isexposed. It is natural that chemicals applied almostanywhere in the environment will tend to be dis-tributed to all of the surrounding environment. Therate and extent of this distribution is a complex inter-action between the physical and chemical properties ofthe pesticide, the methods of application, environ-mental conditions and management practices.However, for all these factors, the key to successfulenvironmental management always depends onaccurate knowledge about these processes. Unwar-ranted optimism regarding risk and even grossignorance regarding some essential features is usuallythe cause of serious problems that may develop.
* Cooperative Research Centre (CRC) for Sustainable Cotton Production, Department of Agricultural Chemistry and Soil Science, University of Sydney, NSW 2006, Australia.
† Commonwealth Scientific and Industrial Research Organisation (CSIRO) Plant Industry, Canberra,ACT 2601, Australia.
Quality assurance in agricultural produce,edited by G.I. Johnson, Le Van To, Nguyen Duy Duc and M.C. Webb.
ACIAR Proceedings 100(printed version published in 2000)

207
Chemical and Physical Properties of Agrochemicals Affecting Dissipation
The main physico-chemical factors of relevance in thecontamination of ecosystems and produce includethose discussed below.
Solubility
Agrochemicals display a wide range of solubilitiesin different solvents or phases in the environment.Thermodynamically, solutes will dissolve to thegreatest extent in phases where they can minimisetheir chemical potential and free energy. At equi-librium, the chemical potential (
µ
I,
a measure ofcapacity to do chemical work) reaches the same valuein all phases involved in the equilibrium. Thus:
This may be achieved at vastly different concen-tration values in different phases. In effect, thisequality involves matching the quantum state transi-tions for molecules leaving or entering each phase.When the magnitude of the quantum of energy neededfor molecular transition to a common phase (e.g. to theatmosphere as vapour) is equal, the chemicalsubstance in each phase is said to have the samechemical potential and they will be at equilibrium withone another.
Reference texts, such as The Pesticide Manual(Tomlin 1997), contain information on laboratorystudies related to solubility in different phases. Theseinclude values for
K
ow
,
the octanol–water coefficient,which measures the ratio of the equilibrium concentra-tions in octanol and water;
K
oc
,
the equilibriumpartition coefficient in organic carbon and an aqueoussolution, which will vary depending on the propertiesof the organic material; and
K
d
,
which is a measure ofthe partition coefficient in phases such as soil or water.Thus,
K
d
=
K
aw
would be the distribution coefficientbetween air and water. Practical relationships betweenthese may be expressed as mathematical equations andare of relevance in examining the distribution of pes-ticides in soil fractions. Isotherms relating the constanttemperature distribution of agrochemicals dissolved orsuspended in water with soil or clay, such as the Fre-undlich isotherm (equation 2) are also often of utilityin describing their behaviour.
where:
S
= concentration sorbed on soil;
Ce
= equi-librium concentration on soil; and
K
and
n
areconstants (Baskaran and Kennedy 1999).
The
octanol–water coefficient (
K
ow
) can be used topredict the likelihood of persistence of chemicals inproduce or the environment. Lipophilicity or solubilityin fats indicates that a substance is non-polar, withlittle or no distortion of electron clouds in themolecular structure. Halogenated organic moleculeshave increased solubility in fats so that substances likeDDT (1,1,1-trichloro-2,2-bis(4-chlorophenyl ethane))and the cyclodienes such as endosulfan and dieldrintend to be very strongly partitioned into fats. Theyhave a correspondingly high
K
ow
.
This makes themprone to contaminate fatty foods, such as animalproducts like beef, dairy products and other oils. Theyalso tend to become immobilised in soil organic matteror in sediments in aquatic systems. In general, they arealso unavailable for degradation or for transfer to otherphases when dissolved in fat. The case study inAustralia involving chlorfluazuron (Helix
©
) contami-nation of beef in the mid-1990s (Kennedy et al. 1998)as a result of feeding cotton trash from ginning mills tolivestock was eminently predictable—given that thischemical has one of the highest
K
ow
values known.Unfortunately, those with the appropriate chemicalknowledge were unaware that cotton trash would befed to stock during a drought period and were notconsulted about the wisdom of this action.
Volatility
Another physical property of significance is thetendency of an agrochemical to volatilise, thusentering the atmosphere. The vapour pressure of achemical substance in a closed space over a sample ofthe pure compound is one measure of the tendency ofa chemical to become volatile. However, the rate andextent of volatilisation also depends on the solubilityof the chemical in solid and liquid phases. Where achemical has high solubility in soil, water or vege-tation, indicating its preference for that particularmedium, the chemical potential is very much reducedfrom that of the pure compound, and the resultantvapour pressure is also reduced. Where the solubilityin soil or water is relatively low, the chemicalpotential, the escaping tendency and the rate of vola-tilisation are correspondingly increased.
µi = constant (1)
S KCen= (2)
Quality assurance in agricultural produce,edited by G.I. Johnson, Le Van To, Nguyen Duy Duc and M.C. Webb.
ACIAR Proceedings 100(printed version published in 2000)
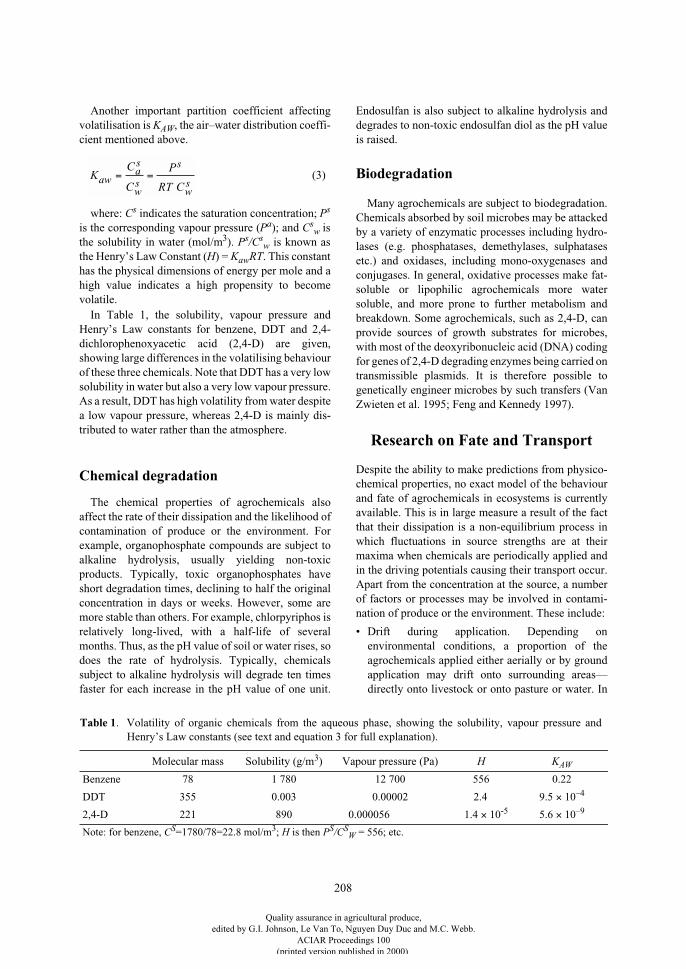
208
Another important partition coefficient affectingvolatilisation is
K
AW
, the air–water distribution coeffi-cient mentioned above.
where:
C
s
indicates the saturation concentration;
P
s
is the corresponding vapour pressure (
P
a
); and
C
sw
isthe solubility in water (mol/m
3
).
P
s
/C
sw
is known asthe Henry’s Law Constant (
H
) =
K
aw
RT
. This constanthas the physical dimensions of energy per mole and ahigh value indicates a high propensity to becomevolatile.
In Table 1, the solubility, vapour pressure andHenry’s Law constants for benzene, DDT and 2,4-dichlorophenoxyacetic acid (2,4-D) are given,showing large differences in the volatilising behaviourof these three chemicals. Note that DDT has a very lowsolubility in water but also a very low vapour pressure.As a result, DDT has high volatility from water despitea low vapour pressure, whereas 2,4-D is mainly dis-tributed to water rather than the atmosphere.
Chemical degradation
The chemical properties of agrochemicals alsoaffect the rate of their dissipation and the likelihood ofcontamination of produce or the environment. Forexample, organophosphate compounds are subject toalkaline hydrolysis, usually yielding non-toxicproducts. Typically, toxic organophosphates haveshort degradation times, declining to half the originalconcentration in days or weeks. However, some aremore stable than others. For example, chlorpyriphos isrelatively long-lived, with a half-life of severalmonths. Thus, as the pH value of soil or water rises, sodoes the rate of hydrolysis. Typically, chemicalssubject to alkaline hydrolysis will degrade ten timesfaster for each increase in the pH value of one unit.
Endosulfan is also subject to alkaline hydrolysis anddegrades to non-toxic endosulfan diol as the pH valueis raised.
Biodegradation
Many agrochemicals are subject to biodegradation.Chemicals absorbed by soil microbes may be attackedby a variety of enzymatic processes including hydro-lases (e.g. phosphatases, demethylases, sulphatasesetc.) and oxidases, including mono-oxygenases andconjugases. In general, oxidative processes make fat-soluble or lipophilic agrochemicals more watersoluble, and more prone to further metabolism andbreakdown. Some agrochemicals, such as 2,4-D, canprovide sources of growth substrates for microbes,with most of the deoxyribonucleic acid (DNA) codingfor genes of 2,4-D degrading enzymes being carried ontransmissible plasmids. It is therefore possible togenetically engineer microbes by such transfers (VanZwieten et al. 1995; Feng and Kennedy 1997).
Research on Fate and Transport
Despite the ability to make predictions from physico-chemical properties, no exact model of the behaviourand fate of agrochemicals in ecosystems is currentlyavailable. This is in large measure a result of the factthat their dissipation is a non-equilibrium process inwhich fluctuations in source strengths are at theirmaxima when chemicals are periodically applied andin the driving potentials causing their transport occur.Apart from the concentration at the source, a numberof factors or processes may be involved in contami-nation of produce or the environment. These include:
• Drift during application. Depending onenvironmental conditions, a proportion of theagrochemicals applied either aerially or by groundapplication may drift onto surrounding areas—directly onto livestock or onto pasture or water. In
KC
C
P
RT Caw
as
ws
s
ws
= = (3)
Table 1. Volatility of organic chemicals from the aqueous phase, showing the solubility, vapour pressure andHenry’s Law constants (see text and equation 3 for full explanation).
Molecular mass Solubility (g/m3) Vapour pressure (Pa) H KAW
Benzene 78 1 780 12 700 556 0.22
DDT 355 0.003 0.00002 2.4 9.5 × 10⁻⁴
2,4-D 221 890 0.000056 1.4 × 10⁻⁵ 5.6 × 10⁻⁹
Note: for benzene, CS=1780/78=22.8 mol/m3; H is then PS/CSW = 556; etc.
Quality assurance in agricultural produce,edited by G.I. Johnson, Le Van To, Nguyen Duy Duc and M.C. Webb.
ACIAR Proceedings 100(printed version published in 2000)
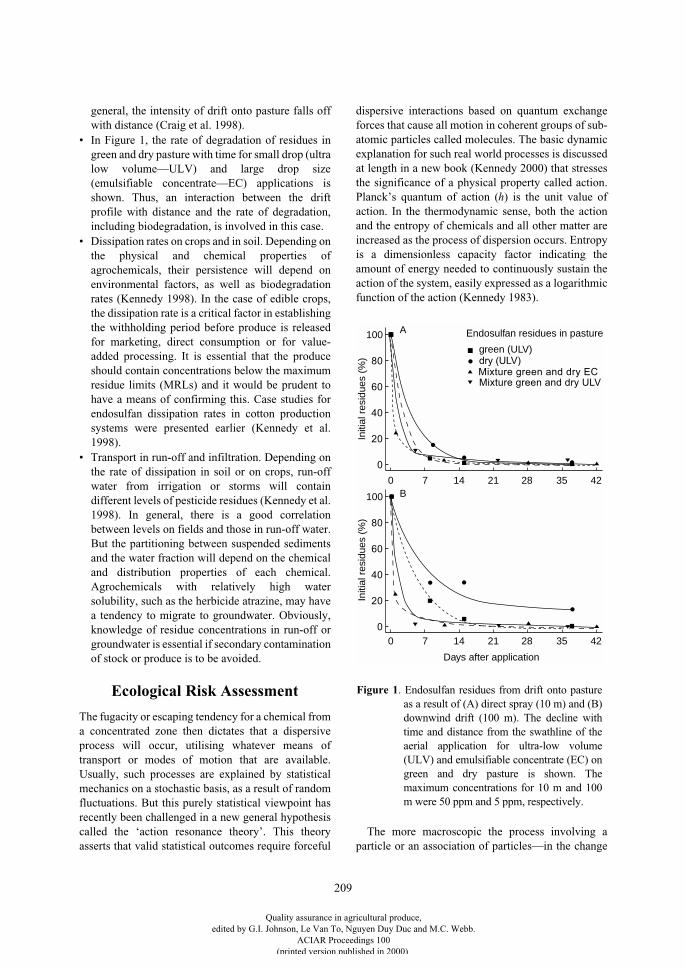
209
general, the intensity of drift onto pasture falls offwith distance (Craig et al. 1998).
• In Figure 1, the rate of degradation of residues ingreen and dry pasture with time for small drop (ultralow volume—ULV) and large drop size(emulsifiable concentrate—EC) applications isshown. Thus, an interaction between the driftprofile with distance and the rate of degradation,including biodegradation, is involved in this case.
• Dissipation rates on crops and in soil. Depending onthe physical and chemical properties ofagrochemicals, their persistence will depend onenvironmental factors, as well as biodegradationrates (Kennedy 1998). In the case of edible crops,the dissipation rate is a critical factor in establishingthe withholding period before produce is releasedfor marketing, direct consumption or for value-added processing. It is essential that the produceshould contain concentrations below the maximumresidue limits (MRLs) and it would be prudent tohave a means of confirming this. Case studies forendosulfan dissipation rates in cotton productionsystems were presented earlier (Kennedy et al.1998).
• Transport in run-off and infiltration. Depending onthe rate of dissipation in soil or on crops, run-offwater from irrigation or storms will containdifferent levels of pesticide residues (Kennedy et al.1998). In general, there is a good correlationbetween levels on fields and those in run-off water.But the partitioning between suspended sedimentsand the water fraction will depend on the chemicaland distribution properties of each chemical.Agrochemicals with relatively high watersolubility, such as the herbicide atrazine, may havea tendency to migrate to groundwater. Obviously,knowledge of residue concentrations in run-off orgroundwater is essential if secondary contaminationof stock or produce is to be avoided.
Ecological Risk Assessment
The fugacity or escaping tendency for a chemical froma concentrated zone then dictates that a dispersiveprocess will occur, utilising whatever means oftransport or modes of motion that are available.Usually, such processes are explained by statisticalmechanics on a stochastic basis, as a result of randomfluctuations. But this purely statistical viewpoint hasrecently been challenged in a new general hypothesiscalled the ‘action resonance theory’. This theoryasserts that valid statistical outcomes require forceful
dispersive interactions based on quantum exchangeforces that cause all motion in coherent groups of sub-atomic particles called molecules. The basic dynamicexplanation for such real world processes is discussedat length in a new book (Kennedy 2000) that stressesthe significance of a physical property called action.Planck’s quantum of action (
h
) is the unit value ofaction. In the thermodynamic sense, both the actionand the entropy of chemicals and all other matter areincreased as the process of dispersion occurs. Entropyis a dimensionless capacity factor indicating theamount of energy needed to continuously sustain theaction of the system, easily expressed as a logarithmicfunction of the action (Kennedy 1983).
The more macroscopic the process involving aparticle or an association of particles—in the change
dry (ULV) Mixture green and dry EC Mixture green and dry ULV
green (ULV)
Endosulfan residues in pasture
Days after application
Initi
al r
esid
ues
(%)
Initi
al r
esid
ues
(%)
A
B
0
20
40
60
80
100
0
20
40
60
80
100
0 7 14 21 28 35 42
0 7 14 21 28 35 42
Figure 1. Endosulfan residues from drift onto pastureas a result of (A) direct spray (10 m) and (B)downwind drift (100 m). The decline withtime and distance from the swathline of theaerial application for ultra-low volume(ULV) and emulsifiable concentrate (EC) ongreen and dry pasture is shown. Themaximum concentrations for 10 m and 100m were 50 ppm and 5 ppm, respectively.
Quality assurance in agricultural produce,edited by G.I. Johnson, Le Van To, Nguyen Duy Duc and M.C. Webb.
ACIAR Proceedings 100(printed version published in 2000)
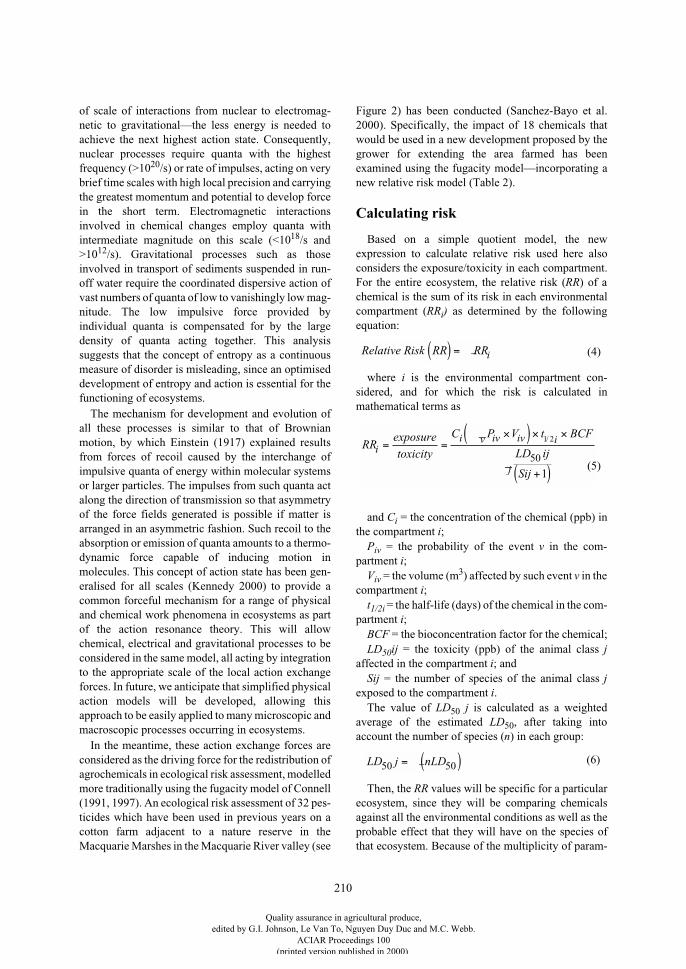
210
of scale of interactions from nuclear to electromag-netic to gravitational—the less energy is needed toachieve the next highest action state. Consequently,nuclear processes require quanta with the highestfrequency (>10
20
/s) or rate of impulses, acting on verybrief time scales with high local precision and carryingthe greatest momentum and potential to develop forcein the short term. Electromagnetic interactionsinvolved in chemical changes employ quanta withintermediate magnitude on this scale (<10
18
/s and>10
12
/s). Gravitational processes such as thoseinvolved in transport of sediments suspended in run-off water require the coordinated dispersive action ofvast numbers of quanta of low to vanishingly low mag-nitude. The low impulsive force provided byindividual quanta is compensated for by the largedensity of quanta acting together. This analysissuggests that the concept of entropy as a continuousmeasure of disorder is misleading, since an optimiseddevelopment of entropy and action is essential for thefunctioning of ecosystems.
The mechanism for development and evolution ofall these processes is similar to that of Brownianmotion, by which Einstein (1917) explained resultsfrom forces of recoil caused by the interchange ofimpulsive quanta of energy within molecular systemsor larger particles. The impulses from such quanta actalong the direction of transmission so that asymmetryof the force fields generated is possible if matter isarranged in an asymmetric fashion. Such recoil to theabsorption or emission of quanta amounts to a thermo-dynamic force capable of inducing motion inmolecules. This concept of action state has been gen-eralised for all scales (Kennedy 2000) to provide acommon forceful mechanism for a range of physicaland chemical work phenomena in ecosystems as partof the action resonance theory. This will allowchemical, electrical and gravitational processes to beconsidered in the same model, all acting by integrationto the appropriate scale of the local action exchangeforces. In future, we anticipate that simplified physicalaction models will be developed, allowing thisapproach to be easily applied to many microscopic andmacroscopic processes occurring in ecosystems.
In the meantime, these action exchange forces areconsidered as the driving force for the redistribution ofagrochemicals in ecological risk assessment, modelledmore traditionally using the fugacity model of Connell(1991, 1997). An ecological risk assessment of 32 pes-ticides which have been used in previous years on acotton farm adjacent to a nature reserve in theMacquarie Marshes in the Macquarie River valley (see
Figure 2) has been conducted (Sanchez-Bayo et al.2000). Specifically, the impact of 18 chemicals thatwould be used in a new development proposed by thegrower for extending the area farmed has beenexamined using the fugacity model—incorporating anew relative risk model (Table 2).
Calculating risk
Based on a simple quotient model, the newexpression to calculate relative risk used here alsoconsiders the exposure/toxicity in each compartment.For the entire ecosystem, the relative risk (
RR
) of achemical is the sum of its risk in each environmentalcompartment (
RR
i
)
as determined by the followingequation:
where
i
is the environmental compartment con-sidered, and for which the risk is calculated inmathematical terms as
and
C
i
= the concentration of the chemical (ppb) inthe compartment
i
;
P
iv
= the probability of the event
v
in the com-partment
i
;
V
iv
= the volume (m
3
) affected by such event
v
in thecompartment
i
;
t
1/2i
= the half-life (days) of the chemical in the com-partment
i
;
BCF
= the bioconcentration factor for the chemical;
LD
50
ij
= the toxicity (ppb) of the animal class
j
affected in the compartment
i
; and
Sij
= the number of species of the animal class
j
exposed to the compartment
i
.The value of
LD
50
j
is calculated as a weightedaverage of the estimated
LD
50
, after taking intoaccount the number of species (
n
) in each group:
Then, the
RR
values will be specific for a particularecosystem, since they will be comparing chemicalsagainst all the environmental conditions as well as theprobable effect that they will have on the species ofthat ecosystem. Because of the multiplicity of param-
Relative Risk RR RRi( ) = - (4)
RRC P V t BCF
LD ij
Sij
ii iv ivv i
j
= =×( ) × ×
+( )
-
-
exposure
toxicity1 2
50
1
/
(5)
LD j nLD50 50= ( )- (6)
Quality assurance in agricultural produce,edited by G.I. Johnson, Le Van To, Nguyen Duy Duc and M.C. Webb.
ACIAR Proceedings 100(printed version published in 2000)
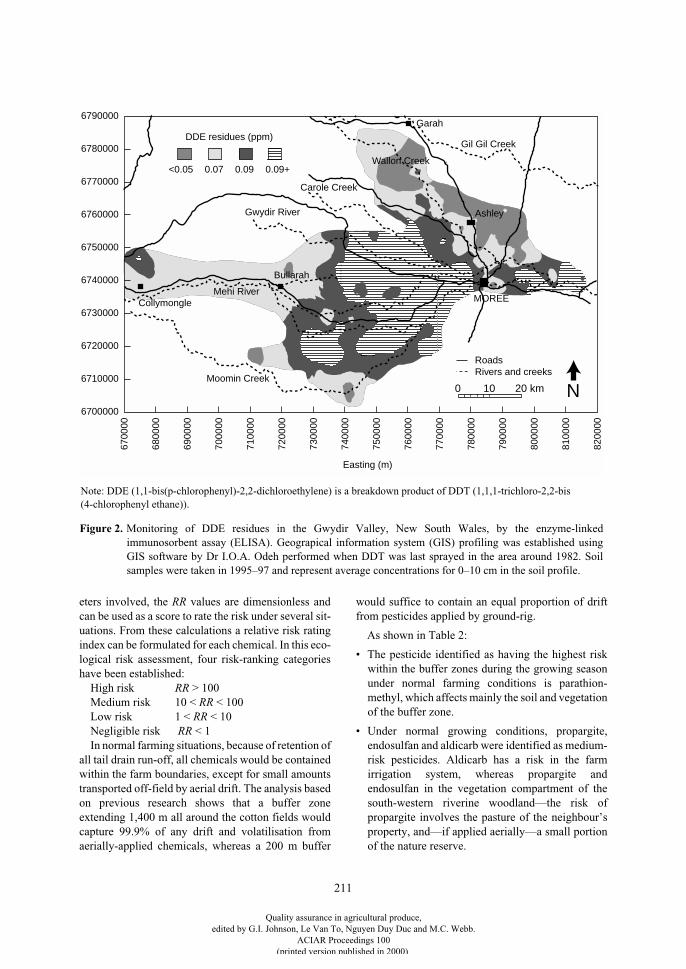
211
eters involved, the RR values are dimensionless andcan be used as a score to rate the risk under several sit-uations. From these calculations a relative risk ratingindex can be formulated for each chemical. In this eco-logical risk assessment, four risk-ranking categorieshave been established:
High risk RR > 100Medium risk 10 < RR < 100Low risk 1 < RR < 10Negligible risk RR < 1In normal farming situations, because of retention of
all tail drain run-off, all chemicals would be containedwithin the farm boundaries, except for small amountstransported off-field by aerial drift. The analysis basedon previous research shows that a buffer zoneextending 1,400 m all around the cotton fields wouldcapture 99.9% of any drift and volatilisation fromaerially-applied chemicals, whereas a 200 m buffer
would suffice to contain an equal proportion of driftfrom pesticides applied by ground-rig.
As shown in Table 2:
• The pesticide identified as having the highest riskwithin the buffer zones during the growing seasonunder normal farming conditions is parathion-methyl, which affects mainly the soil and vegetationof the buffer zone.
• Under normal growing conditions, propargite,endosulfan and aldicarb were identified as medium-risk pesticides. Aldicarb has a risk in the farmirrigation system, whereas propargite andendosulfan in the vegetation compartment of thesouth-western riverine woodland—the risk ofpropargite involves the pasture of the neighbour’sproperty, and—if applied aerially—a small portionof the nature reserve.
6700
00
6800
00
6900
00
7000
00
7100
00
7200
00
7300
00
7400
00
7500
00
7600
00
7700
00
7800
00
7900
00
8000
00
8100
00
8200
00
6790000
6780000
6770000
6760000
6750000
6740000
6730000
6720000
6710000
6700000
<0.05 0.07 0.09 0.09+
DDE residues (ppm)
RoadsRivers and creeks
Easting (m)
Garah
Gil Gil Creek
Wallon Creek
Ashley
MOREE
Moomin Creek
Mehi RiverCollymongle
Bullarah
Gwydir River
Carole Creek
N0 10 20 km
Figure 2. Monitoring of DDE residues in the Gwydir Valley, New South Wales, by the enzyme-linkedimmunosorbent assay (ELISA). Geograpical information system (GIS) profiling was established usingGIS software by Dr I.O.A. Odeh performed when DDT was last sprayed in the area around 1982. Soilsamples were taken in 1995–97 and represent average concentrations for 0–10 cm in the soil profile.
Note: DDE (1,1-bis(p-chlorophenyl)-2,2-dichloroethylene) is a breakdown product of DDT (1,1,1-trichloro-2,2-bis(4-chlorophenyl ethane)).
Quality assurance in agricultural produce,edited by G.I. Johnson, Le Van To, Nguyen Duy Duc and M.C. Webb.
ACIAR Proceedings 100(printed version published in 2000)
212
• During winter time, however, none of the 32chemicals are of great concern.
• Other than by drift and volatilisation, the majortransport route off-farm is by floodwaters. Highfloods occur once in 3 years and, in this case,pesticide residues would spread over the bufferzone and downslope. Despite the dilution ofresidues experienced under these situations, someimpact would be felt in the marshes ecosystems.Large storms, with a probability of 1/year or less,could wash chemicals from soil and vegetation, butthese residues are contained within the farmirrigation system or in the reservoirs established inthe buffer zone to contain stormwater run-off. Inthese situations, the risk of pesticides to waterbirdscoming to the farm for feeding/drinking is to beconsidered. This approach has been generalised(Sanchez-Bayo et al. 2000) for other cases wherefarms may be established near areas posing risk,such as rivers and other farming enterprises.
Monitoring of Produce and the Environment
It is essential to have means of ensuring produce or theenvironment in which it is produced is not contami-
nated. This demands some system of monitoring theconcentration of a large range of agrochemicals.Effective monitoring requires considerable infra-structure and a set of validated sampling and analyticalprotocols to ensure that reliable data are generated. Aquality assurance manual for the monitoring ofpesticide residues in cotton production systems isavailable (Kennedy et al. 1998), emphasising the needfor highly skilled and experienced personnel andextensive equipment.
The possibility of using simple tests for screeningpurposes is becoming more feasible. This is a result ofthe development of testing procedures, based on tech-niques such as the enzyme-linked immunosorbentassay (ELISA). We describe the feasibility of suchapproaches separately (Lee et al., this proceedings).We have previously described the application ofELISA to environmental monitoring, pointing out howa much more comprehensive assessment of contami-nation can be obtained with chemicals such asendosulfan (Lee et al. 1997). The advantages of suchtests can be considerable in cost and also the numbersof samples that can be analysed promptly, so thataction can be taken immediately. It may also bepossible to provide special advantages in such assays.
Table 2. Chemicals of high (bold) and medium risk under several scenarios.
Area at risk Flooding scenarios Normal scenarios
Summer Winter Summer Winter
On farm
Buffer zone Parathion-methylPropargiteEndosulfanChlorpyrifos
_-cypermethrin BifenthrinProfenofos
Parathion-methylPropargite
Parathion-methylPropargiteEndosulfan
None
Buffer zone Propargite Propargite Propargite None
Irrigation system Dimethipin Dimethipin Aldicarb None
Quality assurance in agricultural produce,edited by G.I. Johnson, Le Van To, Nguyen Duy Duc and M.C. Webb.
ACIAR Proceedings 100(printed version published in 2000)
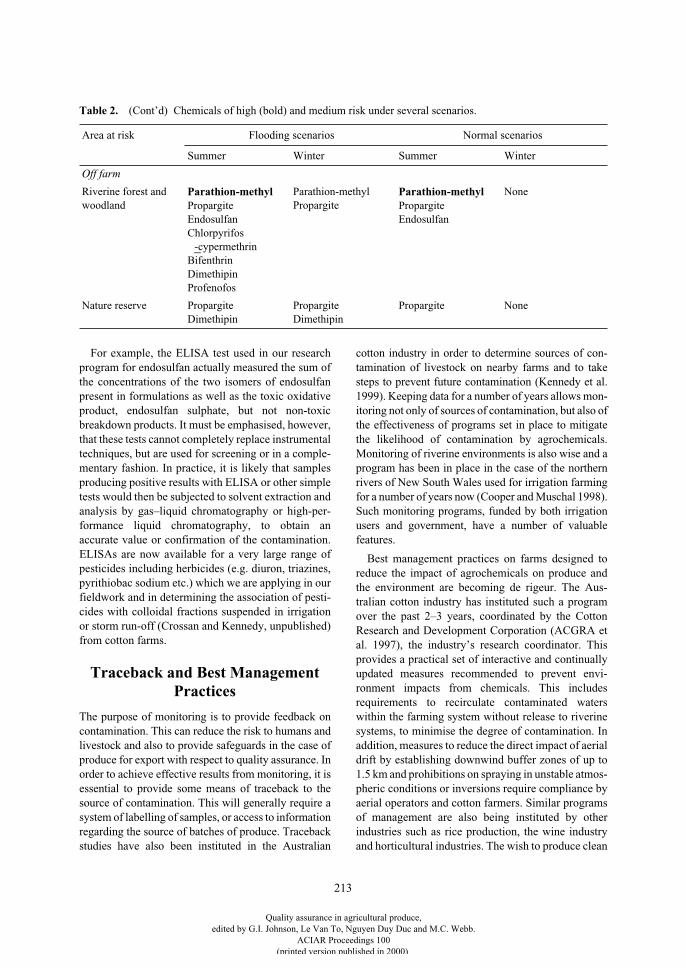
213
For example, the ELISA test used in our researchprogram for endosulfan actually measured the sum ofthe concentrations of the two isomers of endosulfanpresent in formulations as well as the toxic oxidativeproduct, endosulfan sulphate, but not non-toxicbreakdown products. It must be emphasised, however,that these tests cannot completely replace instrumentaltechniques, but are used for screening or in a comple-mentary fashion. In practice, it is likely that samplesproducing positive results with ELISA or other simpletests would then be subjected to solvent extraction andanalysis by gas–liquid chromatography or high-per-formance liquid chromatography, to obtain anaccurate value or confirmation of the contamination.ELISAs are now available for a very large range ofpesticides including herbicides (e.g. diuron, triazines,pyrithiobac sodium etc.) which we are applying in ourfieldwork and in determining the association of pesti-cides with colloidal fractions suspended in irrigationor storm run-off (Crossan and Kennedy, unpublished)from cotton farms.
Traceback and Best Management Practices
The purpose of monitoring is to provide feedback oncontamination. This can reduce the risk to humans andlivestock and also to provide safeguards in the case ofproduce for export with respect to quality assurance. Inorder to achieve effective results from monitoring, it isessential to provide some means of traceback to thesource of contamination. This will generally require asystem of labelling of samples, or access to informationregarding the source of batches of produce. Tracebackstudies have also been instituted in the Australian
cotton industry in order to determine sources of con-tamination of livestock on nearby farms and to takesteps to prevent future contamination (Kennedy et al.1999). Keeping data for a number of years allows mon-itoring not only of sources of contamination, but also ofthe effectiveness of programs set in place to mitigatethe likelihood of contamination by agrochemicals.Monitoring of riverine environments is also wise and aprogram has been in place in the case of the northernrivers of New South Wales used for irrigation farmingfor a number of years now (Cooper and Muschal 1998).Such monitoring programs, funded by both irrigationusers and government, have a number of valuablefeatures.
Best management practices on farms designed toreduce the impact of agrochemicals on produce andthe environment are becoming de rigeur. The Aus-tralian cotton industry has instituted such a programover the past 2–3 years, coordinated by the CottonResearch and Development Corporation (ACGRA etal. 1997), the industry’s research coordinator. Thisprovides a practical set of interactive and continuallyupdated measures recommended to prevent envi-ronment impacts from chemicals. This includesrequirements to recirculate contaminated waterswithin the farming system without release to riverinesystems, to minimise the degree of contamination. Inaddition, measures to reduce the direct impact of aerialdrift by establishing downwind buffer zones of up to1.5 km and prohibitions on spraying in unstable atmos-pheric conditions or inversions require compliance byaerial operators and cotton farmers. Similar programsof management are also being instituted by otherindustries such as rice production, the wine industryand horticultural industries. The wish to produce clean
Off farm
Riverine forest and woodland
Parathion-methylPropargiteEndosulfanChlorpyrifos
_-cypermethrin BifenthrinDimethipinProfenofos
Parathion-methylPropargite
Parathion-methylPropargiteEndosulfan
None
Nature reserve PropargiteDimethipin
PropargiteDimethipin
Propargite None
Table 2. (Cont’d) Chemicals of high (bold) and medium risk under several scenarios.
Area at risk Flooding scenarios Normal scenarios
Summer Winter Summer Winter
Quality assurance in agricultural produce,edited by G.I. Johnson, Le Van To, Nguyen Duy Duc and M.C. Webb.
ACIAR Proceedings 100(printed version published in 2000)
214
produce is almost universal, but it will remainnecessary to provide means of monitoring the successof these measures. There may also be a small minorityof ‘renegade’ farmers who may deliberately fail tocomply with recommendations. In any case, producewhich has been shown to be free of contaminationshould command a premium in the marketplace andthe Australian dried fruit industry has set up its ownmonitoring program to ensure that all batches of fruitare certified as pesticide-free. Similar measures arenow being adopted by the wine industry.
ConclusionProtection of produce and the environment frompesticide contamination is a multi-faceted processrequiring an integrated response involving the fullrange of factors considered in this paper. Neglect ofeven one aspect of this response can have disastrousconsequences and cooperative action by personnelwith the full range of expertise is essential. Moreresearch is needed to improve the current capability.
AcknowledgmentsFinancial support for the research work discussed inthis paper from the Cotton Research and DevelopmentCorporation, the Land and Water Resources Researchand Development Corporation, the Rural CreditsDevelopment Fund, the Cooperative Research Centrefor Sustainable Cotton Production and the AustralianCentre for International Agricultural Research(ACIAR) is gratefully acknowledged. We also wish toacknowledge the assistance of Dr I.O.A. Odeh withpreparation of Figure 2, Dr Lyndal Hugo, and manyother colleagues including Nazir Ahmad (AustralianWater Technologies), Stephen Kimber and Lukas VanZwieten (New South Wales Agriculture), John Skerritt(CSIRO/ACIAR) and Mark Silburn (QueenslandDepartment of Natural Resources).
ReferencesACGRA (Australian Cotton Growers Research
Association), CRDC (Cotton Research and DevelopmentCorporation) and Cotton Australia 1997. Australiancotton best practices management manual. Narrabri,CRDC.
Baskaran, S. and Kennedy, I.R. 1999. Sorption anddesorption kinetics of diuron, fluometurn, prometryn andpyrithiobac sodium in soils. Journal of EnvironmentalScience and Health, B34, 943–963.
Connell, D.W. 1991. Fugacity modelling and the fate ofchemicals in the environment. Proceedings of theWorkshop on Modelling Fate Chemicals in the
Environment. Canberra, Centre for Resource andEnvironmental Studies, Australian National University.
Connell, D.W. 1997. Basic concepts of environmentalchemistry. Boca Raton, Florida, Lewis Publishers.
Cooper, B, and Muschal, M. 1998. Monitoring the fate ofpesticides in the riverine environment—a case study. In:Kennedy, I.R. Baskaran, S. and Sanchez-Bayo, F., ed.,Pesticides in soil, water and produce: analysis,environmental monitoring and remediation.Sydney,Cooperative Research Centre (CRC) forSustainable Cotton Production, University of Sydney,11–19 (copies available on request).
Craig, I., Woods, N. and Dorr, G. 1998. A simple guide topredicting aircraft spray drift. Crop Protection, 17, 475–482.
Einstein, A. 1917. Zur Quantentheorie der Strahlung.Physikalische Zeitschrift, 18, 121.
Feng, L. and Kennedy, I.R. 1997. Biodegradation and plantprotection from the herbicide 2,4-D by plant–microbialassociations in cotton production systems. Biotechnologyand Bioengineering, 54, 513–519.
Kennedy, I.R. 1983. Action and entropy in a neurologicaldisorder. In: Jeffrey, P.L. and Austin, L., ed., Molecularaspects of neurological disorders. Sydney, AcademicPress, 147–150.
Kennedy, I.R. 1998. Pesticides in perspective: balancingtheir benefits with the need for environmental protectionand remediation of their residues. In: Kennedy, I.R.,Skerritt, J.H., Johnson, G.I. and Highley, E., ed., Seekingagricultural produce free of pesticide residues. ACIARProceedings No. 85. Canberra, Australian Centre forInternational Agricultural Research, 23–30.
Kennedy, I.R., Hugo, L. and Sanchez-Bayo, F. 1999.Endosulfian residues in cattle: traceback project. CottonResearch and Development Corporation (CRDC) report,September 1999. Narrabri, New South Wales, CRDC.
Kennedy, I,R., Sanchez-Bayo, F., Kimber, S.W.L., Ahmad,N., Beasley, H., Lee, N. and Southan, S. 1998. Integratedmonitoring and dissipation studies for the development ofbest practice management of chemicals used in cottonfarming. In: Kennedy, I.R., Skerritt, J.H., Johnson, G.I.and Highley, E., ed., Seeking agricultural produce free ofpesticide residues. ACIAR Proceedings No. 85.Canberra, Australian Centre for InternationalAgricultural Research, 88–99.
Kennedy, I.R. 2000. Action in ecosystems: biothermody-namics for sustainability. Baldock, United Kingdom,Research Studies Press/John Wiley and Sons Distributor,220 p.
Lee, N., Beasley, H.L., Kimber, S.W.L., Silburn, M.,Woods, N., Skerritt, J.H. and Kennedy, I.R. 1997.Application of immunoassays to studies of the
Quality assurance in agricultural produce,edited by G.I. Johnson, Le Van To, Nguyen Duy Duc and M.C. Webb.
ACIAR Proceedings 100(printed version published in 2000)

215
environmental fate of endosulfan. Journal of AgriculturalFood Chemistry, 45, 4147–4155.
Sanchez-Bayo, F., Kennedy, I.R. and Baskaran, S. 2000.Ecological risk assessment and risk management for newcotton developments. Final project report. Narrabri, NewSouth Wales, Australia, Cotton Research andDevelopment Corporation, 116 p.
Tomlin, C.D.S. 1997. The pesticide manual. UnitedKingdom, BCPC Publications.
Van Zwieten, L., Feng, L. and Kennedy, I.R. 1995.Colonisation of seedling roots by 2,4-D degradingbacteria: a plant–microbial model. Acta Biotechnologica,15, 27–39.
Quality assurance in agricultural produce,edited by G.I. Johnson, Le Van To, Nguyen Duy Duc and M.C. Webb.
ACIAR Proceedings 100(printed version published in 2000)
216
Efficacy of Electrolysed Water as a Disinfectant for Fresh-cut Spinach
H. Izumi, T. Kiba and S. Hashimoto*
Abstract
The effect of electrolysed water on bacterial count was evaluated on freshly prepared and stored fresh-cutspinach leaves. Electrolysed water (pH 6.8), containing 15 to 50 ppm available chlorine, was generated byelectrolysis of a 2.5% NaCl solution using an electrolysed neutral water generator. Trimmed spinach leaveswere treated with electrolysed water containing 20 ppm available chlorine by dipping, rinsing ordipping/blowing. These treatments reduced the total microbial count (mesophilic aerobic bacteria) by 1.0to 1.6 log
10
colony forming units (CFU)/g when compared with untreated samples. Electrolysed watercontaining 50 ppm available chlorine had a stronger bactericidal effect than water containing 15 or 30 ppmchlorine, and was as effective as sodium hypochlorite solution containing 100 to 200 ppm chlorine. Whenthe trimmed leaves were rinsed with electrolysed water containing 50 ppm chlorine and stored in normalair or 4% O
2
at 10 and 20°C, the increasing count of mesophilic aerobic bacteria was restricted whencompared with the water-rinsed control. Electrolysed water did not affect the respiration rate nor surfacecolour of fresh-cut spinach during storage. Microbial populations increased on intact leaves stored at 0°Cfor 7, 14, 21 or 28 days. The electrolysed water was more effective in reducing the counts of mesophilicaerobic bacteria, psychrotrophic aerobic bacteria and coliform bacteria when the treatment was made usingleaves stored for a brief period than for leaves stored for a long period.
F
RESH
-
CUT
vegetables are more perishable thanintact vegetables mainly due to microbial contami-nation during and after processing (Brackett 1987;Watada et al. 1996; Zagory 1999). Microbial safetyis of major concern in the production and distributionof fresh-cut vegetables in conjunction with theHazard Analysis and Critical Control Points(HACCP) system (IFPA 1996). HACCP is a systemof hazard prevention implemented by the foodindustry to produce safe food. It involves the sys-tematic assessment of all steps involved in food man-ufacturing operations and the identification of thosesteps which are critical with respect to food safety(Willocx et al. 1994). To reduce microbiological
hazards of fresh-cut vegetables, washing duringprocessing is the only step taken to actively reducemicrobial populations. A 50 to 150 parts per million(ppm) chlorine solution prepared from sodiumhypochlorite has been widely used in the foodindustry as a disinfectant, but a high concentration ofsodium hypochlorite for increased effectiveness maycause product tainting (Adams et al. 1989) as well asresult in sodium residues on the product and theequipment (Ritenour and Crisosto 1996).
Alternatives to sodium hypochlorite, such aschlorine dioxide (Zhang and Farber 1996), sodiumbisulfite (Krahn 1997), organic acid (Adams et al.1989; Zhang and Farber 1996) and ozone(Nagashima and Kamoi 1997), have been studied tocontrol microbial populations on fresh-cut vege-tables. We previously reported the effect ofelectrolysed water on the microflora on several
* School of Biology-Oriented Science and Technology, Kinki University, 930 Nishimitani, Naga, Wagayama 649-9493, Japan.
Quality assurance in agricultural produce,edited by G.I. Johnson, Le Van To, Nguyen Duy Duc and M.C. Webb.
ACIAR Proceedings 100(printed version published in 2000)
217
fresh-cut vegetables (Izumi 1999). Electrolysed watercontains hypochlorous acid generated from thereaction of H
2
O and Cl
2
produced by electrolysis of aNaCl solution of less than 10% using an electrolysedwater generator. Our earlier study indicated that elec-trolysed water containing 15 to 50 ppm availablechlorine was effective as a disinfectant for severalfresh-cut vegetables, and the potential problems expe-rienced using sodium hypochlorite—highconcentration of available chlorine and sodiumresidue—were not of concern when using electro-lysed water.
In this study, we initially determined the effect ofelectrolysed water on microbial populations on freshlyprepared and stored fresh-cut spinach leaves in com-parison to that of sodium hypochlorite. Treated, fresh-cut spinach was stored in normal air or 4% O
2
, asvirtually all fresh-cuts are packaged in modifiedatmosphere packaging (MAP). Subsequently, ourresearch was expanded to determine the effect of elec-trolysed water on the microflora on cut spinachprepared from intact leaves at 0°C, because raw vege-tables for fresh-cuts are sometimes several days old bythe time they are processed.
Materials and Methods
Generation of electrolysed water
Electrolysed water (pH 6.8) containing 15, 20, 30 or50 ppm available chlorine was generated by elec-trolysis of a 2.5% NaCl solution using an electrolysedneutral water generator, Ameni Clean (Model FJ-W25M1; Matsushita Seiko, Osaka). The generatorwas connected to a water faucet and the electrolysedwater of each chlorine concentration was automati-cally provided at a rate of 4 L/min. The concentrationof available chlorine was confirmed by the sodium thi-osulfate titration method (Asada et al. 1981).
Sample preparation and electrolysed water treatments
Spinach (
Spinach oleracea
L. ‘Sunbest’ or ‘Joker’)leaves were freshly harvested at a farm in WakayamaCity, Japan. Sub-samples of the leaves were cut tohave 0.5 cm petioles using scissors. Each 50 g samplewas treated with tap water as a control or electrolysedwater (20 ppm available chlorine) at room temper-ature. The treatments included: (a) control = rinsed inrunning tap water at 2 L/min for 4 min; (b) rinsing =
rinsed in running, electrolysed water at 2 L/min for 3min followed by rinsing in running tap water for 1 min;(c) dipping = dipped in 500 mL electrolysed water for3 min followed by rinsing in running tap water for 1min; and (d) dipping/blowing = dipped in 500 mLelectrolysed water while simultaneously blowing air at25 L/min for 3 min, followed by rinsing in running tapwater for 1 min. The water rinse after treatments wasadded because hypochlorous acid had not beenapproved for use as a food additive by the JapaneseMinistry of Health and Welfare. The constraints on theuse of electrolysed water had been waived as a specialcase. All samples were then centrifuged for 3 min toremove surface water.
50 g samples from a different lot were rinsed inrunning tap water or running electrolysed water con-taining 15, 30, or 50 ppm available chlorine for 4 minand centrifuged for 3 min to determine the effect ofdifferent concentrations of chlorine. A rinsingtreatment using sodium hypochlorite solution con-taining 50, 100, 150 or 200 ppm available chlorine wasalso included to compare with the effect of electro-lysed water containing 50 ppm available chlorine. Allof the above treatments were replicated three times.
Total microbial counts (mesophilic aerobicbacteria) were made from the surface of a 10 g sampleand of 10 g of macerated sample and the resultsexpressed as log
10
colony forming units (CFU)/gsample as previously described (Izumi and Watada1994; Izumi 1999).
Storage of trimmed spinach leaves
Nine trimmed spinach leaves (
5
30 g) were rinsedwith tap water or electrolysed water containing 50 ppmavailable chlorine for 4 min and centrifuged for 3 minand then placed in a 1.5 L plastic container containing20 mL of distilled water in a beaker to maintain highrelative humidity. Three replicated samples were storedat 10 or 20°C under a continuous stream of normal air or4% O
2
at 10 or 15 mL/min, respectively. The balance ofthe gas mixture for the 4% O
2
atmosphere was N
2
. Thecarbon dioxide content of the inlet and outlet streams ofeach container was monitored with a CO
2
analyser(Model CD-3A; Ametek, PA) during storage. Threereplicated samples of each treatment were taken period-ically to measure counts of mesophilic aerobic bacteriaand lactic acid bacteria in 10 g samples and surfacecolour (hue angle = tan
-1
b*/a*) with a chroma meter(Model NR-300; Nippon Denshoku, Tokyo), as previ-ously described (Izumi et al. 1997).
Quality assurance in agricultural produce,edited by G.I. Johnson, Le Van To, Nguyen Duy Duc and M.C. Webb.
ACIAR Proceedings 100(printed version published in 2000)
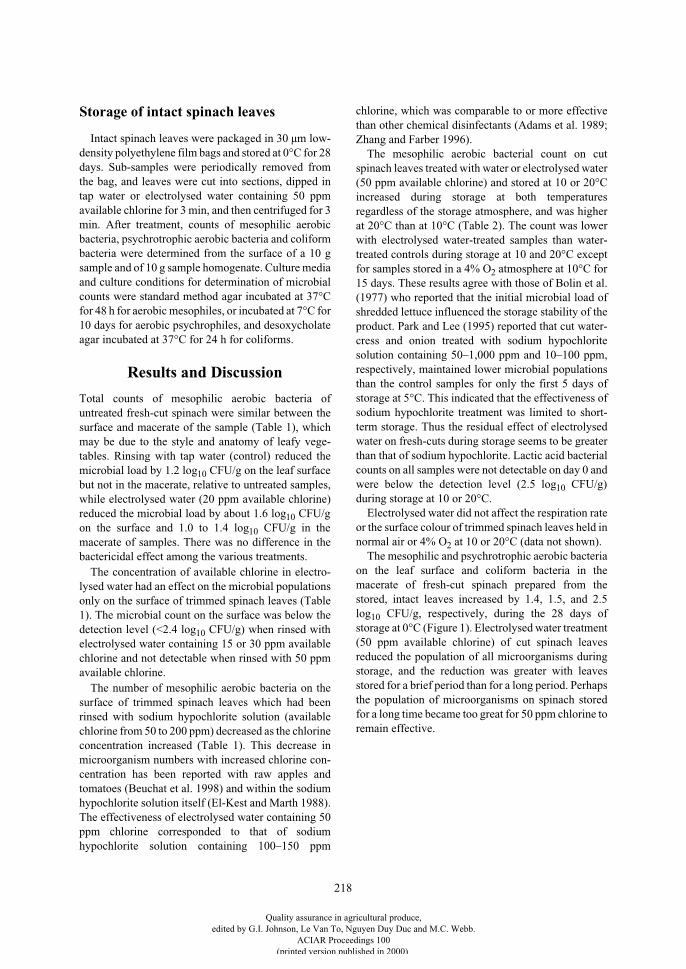
218
Storage of intact spinach leaves
Intact spinach leaves were packaged in 30 µm low-density polyethylene film bags and stored at 0°C for 28days. Sub-samples were periodically removed fromthe bag, and leaves were cut into sections, dipped intap water or electrolysed water containing 50 ppmavailable chlorine for 3 min, and then centrifuged for 3min. After treatment, counts of mesophilic aerobicbacteria, psychrotrophic aerobic bacteria and coliformbacteria were determined from the surface of a 10 gsample and of 10 g sample homogenate. Culture mediaand culture conditions for determination of microbialcounts were standard method agar incubated at 37°Cfor 48 h for aerobic mesophiles, or incubated at 7°C for10 days for aerobic psychrophiles, and desoxycholateagar incubated at 37°C for 24 h for coliforms.
Results and Discussion
Total counts of mesophilic aerobic bacteria ofuntreated fresh-cut spinach were similar between thesurface and macerate of the sample (Table 1), whichmay be due to the style and anatomy of leafy vege-tables. Rinsing with tap water (control) reduced themicrobial load by 1.2 log
10
CFU/g on the leaf surfacebut not in the macerate, relative to untreated samples,while electrolysed water (20 ppm available chlorine)reduced the microbial load by about 1.6 log
10
CFU/gon the surface and 1.0 to 1.4 log
10
CFU/g in themacerate of samples. There was no difference in thebactericidal effect among the various treatments.
The concentration of available chlorine in electro-lysed water had an effect on the microbial populationsonly on the surface of trimmed spinach leaves (Table1). The microbial count on the surface was below thedetection level (<2.4 log
10
CFU/g) when rinsed withelectrolysed water containing 15 or 30 ppm availablechlorine and not detectable when rinsed with 50 ppmavailable chlorine.
The number of mesophilic aerobic bacteria on thesurface of trimmed spinach leaves which had beenrinsed with sodium hypochlorite solution (availablechlorine from 50 to 200 ppm) decreased as the chlorineconcentration increased (Table 1). This decrease inmicroorganism numbers with increased chlorine con-centration has been reported with raw apples andtomatoes (Beuchat et al. 1998) and within the sodiumhypochlorite solution itself (El-Kest and Marth 1988).The effectiveness of electrolysed water containing 50ppm chlorine corresponded to that of sodiumhypochlorite solution containing 100–150 ppm
chlorine, which was comparable to or more effectivethan other chemical disinfectants (Adams et al. 1989;Zhang and Farber 1996).
The mesophilic aerobic bacterial count on cutspinach leaves treated with water or electrolysed water(50 ppm available chlorine) and stored at 10 or 20°Cincreased during storage at both temperaturesregardless of the storage atmosphere, and was higherat 20°C than at 10°C (Table 2). The count was lowerwith electrolysed water-treated samples than water-treated controls during storage at 10 and 20°C exceptfor samples stored in a 4% O
2
atmosphere at 10°C for15 days. These results agree with those of Bolin et al.(1977) who reported that the initial microbial load ofshredded lettuce influenced the storage stability of theproduct. Park and Lee (1995) reported that cut water-cress and onion treated with sodium hypochloritesolution containing 50–1,000 ppm and 10–100 ppm,respectively, maintained lower microbial populationsthan the control samples for only the first 5 days ofstorage at 5°C. This indicated that the effectiveness ofsodium hypochlorite treatment was limited to short-term storage. Thus the residual effect of electrolysedwater on fresh-cuts during storage seems to be greaterthan that of sodium hypochlorite. Lactic acid bacterialcounts on all samples were not detectable on day 0 andwere below the detection level (2.5 log
10
CFU/g)during storage at 10 or 20°C.
Electrolysed water did not affect the respiration rateor the surface colour of trimmed spinach leaves held innormal air or 4% O
2
at 10 or 20°C (data not shown).The mesophilic and psychrotrophic aerobic bacteria
on the leaf surface and coliform bacteria in themacerate of fresh-cut spinach prepared from thestored, intact leaves increased by 1.4, 1.5, and 2.5log
10
CFU/g, respectively, during the 28 days ofstorage at 0°C (Figure 1). Electrolysed water treatment(50 ppm available chlorine) of cut spinach leavesreduced the population of all microorganisms duringstorage, and the reduction was greater with leavesstored for a brief period than for a long period. Perhapsthe population of microorganisms on spinach storedfor a long time became too great for 50 ppm chlorine toremain effective.
Quality assurance in agricultural produce,edited by G.I. Johnson, Le Van To, Nguyen Duy Duc and M.C. Webb.
ACIAR Proceedings 100(printed version published in 2000)
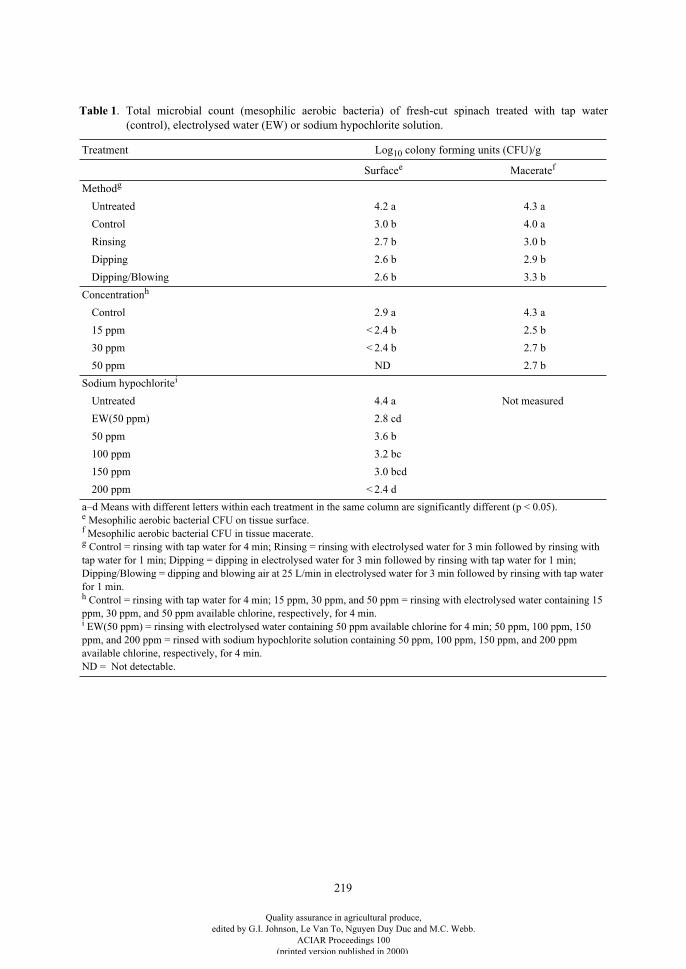
219
Table 1
. Total microbial count (mesophilic aerobic bacteria) of fresh-cut spinach treated with tap water(control), electrolysed water (EW) or sodium hypochlorite solution.
Treatment Log
10
colony forming units (CFU)/g
Surface
e
Macerate
f
Method
g
Untreated 4.2 a 4.3 a
Control 3.0 b 4.0 a
Rinsing 2.7 b 3.0 b
Dipping 2.6 b 2.9 b
Dipping/Blowing 2.6 b 3.3 b
Concentration
h
Control 2.9 a 4.3 a
15 ppm < 2.4 b 2.5 b
30 ppm < 2.4 b 2.7 b
50 ppm ND 2.7 b
Sodium hypochlorite
i
Untreated 4.4 a Not measured
EW(50 ppm) 2.8 cd
50 ppm 3.6 b
100 ppm 3.2 bc
150 ppm 3.0 bcd
200 ppm < 2.4 d
a–d Means with different letters within each treatment in the same column are significantly different (p < 0.05).
e
Mesophilic aerobic bacterial CFU on tissue surface.
f
Mesophilic aerobic bacterial CFU in tissue macerate.
g
Control = rinsing with tap water for 4 min; Rinsing = rinsing with electrolysed water for 3 min followed by rinsing with tap water for 1 min; Dipping = dipping in electrolysed water for 3 min followed by rinsing with tap water for 1 min; Dipping/Blowing = dipping and blowing air at 25 L/min in electrolysed water for 3 min followed by rinsing with tap water for 1 min.
h
Control = rinsing with tap water for 4 min; 15 ppm, 30 ppm, and 50 ppm = rinsing with electrolysed water containing 15 ppm, 30 ppm, and 50 ppm available chlorine, respectively, for 4 min.
i
EW(50 ppm) = rinsing with electrolysed water containing 50 ppm available chlorine for 4 min; 50 ppm, 100 ppm, 150 ppm, and 200 ppm = rinsed with sodium hypochlorite solution containing 50 ppm, 100 ppm, 150 ppm, and 200 ppm available chlorine, respectively, for 4 min.ND = Not detectable.
Quality assurance in agricultural produce,edited by G.I. Johnson, Le Van To, Nguyen Duy Duc and M.C. Webb.
ACIAR Proceedings 100(printed version published in 2000)
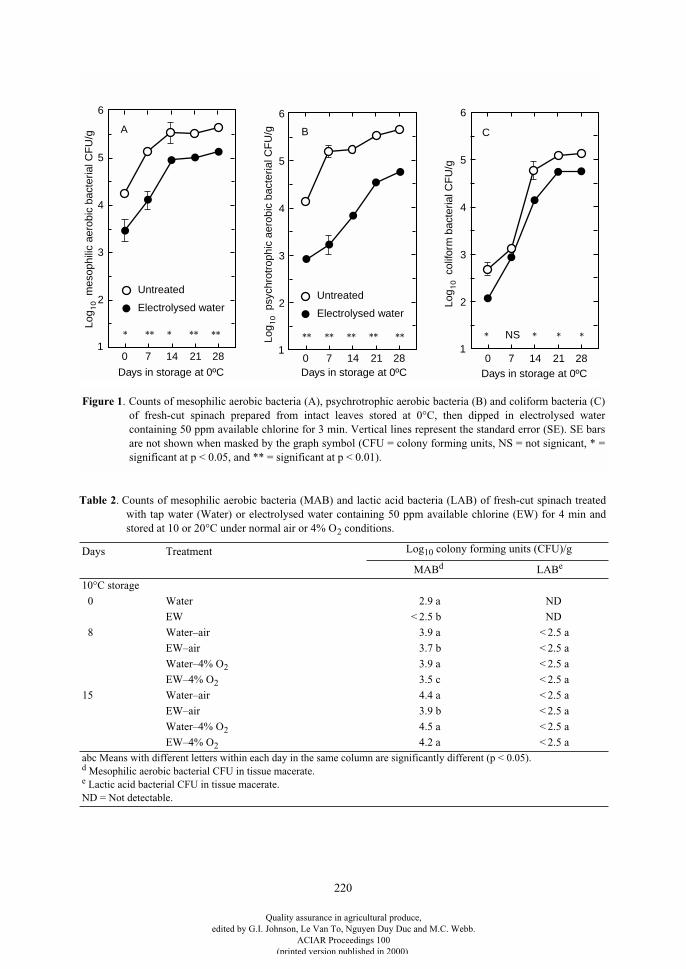
220
Table 2
. Counts of mesophilic aerobic bacteria (MAB) and lactic acid bacteria (LAB) of fresh-cut spinach treatedwith tap water (Water) or electrolysed water containing 50 ppm available chlorine (EW) for 4 min andstored at 10 or 20°C under normal air or 4% O
2
conditions.
Days Treatment Log
10
colony forming units (CFU)/g
MAB
d
LAB
e
10°C storage
0 Water 2.9 a ND
EW < 2.5 b ND
8 Water–air 3.9 a < 2.5 a
EW–air 3.7 b < 2.5 a
Water–4% O
2
3.9 a < 2.5 a
EW–4% O
2
3.5 c < 2.5 a
15 Water–air 4.4 a < 2.5 a
EW–air 3.9 b < 2.5 a
Water–4% O
2
4.5 a < 2.5 a
EW–4% O
2
4.2 a < 2.5 a
abc Means with different letters within each day in the same column are significantly different (p < 0.05).
d
Mesophilic aerobic bacterial CFU in tissue macerate.
e
Lactic acid bacterial CFU in tissue macerate.ND = Not detectable.
0 7
* **Log
m
esop
hilic
aer
obic
bac
teria
l CF
U/g
10
1
2
3
4
5
6
A
14 21 28
Untreated
Electrolysed water
* * * **
Days in storage at 0ºC
Untreated
Electrolysed water
B
* * * * * * * * * *
Log
p
sych
rotr
ophi
c ae
robi
c ba
cter
ial C
FU
/g1
0
Days in storage at 0ºC0 7 14 21 28
1
2
3
4
5
6
Log
c
olifo
rm b
acte
rial C
FU
/g1
0
Days in storage at 0ºC
****
0 7 14 21 28
C
NS1
2
3
4
5
6
Figure 1. Counts of mesophilic aerobic bacteria (A), psychrotrophic aerobic bacteria (B) and coliform bacteria (C)of fresh-cut spinach prepared from intact leaves stored at 0°C, then dipped in electrolysed watercontaining 50 ppm available chlorine for 3 min. Vertical lines represent the standard error (SE). SE barsare not shown when masked by the graph symbol (CFU = colony forming units, NS = not signicant, * =significant at p < 0.05, and ** = significant at p < 0.01).
Quality assurance in agricultural produce,edited by G.I. Johnson, Le Van To, Nguyen Duy Duc and M.C. Webb.
ACIAR Proceedings 100(printed version published in 2000)
221
References
Adams, M.R., Hartley, A.D. and Cox, L.J. 1989. Factorsaffecting the efficacy of washing procedures used in theproduction of prepared salads. Food Microbiology, 6, 69–77.
Asada, S., Uchide, S. and Kobayashi, M. 1981. Analysis ofavailable chlorine in bleaching powder. In: Quantitativeanalysis. Tokyo, Japan, Gihodo, 95–97.
Beuchat, L.R., Nail, B.V., Adler, B.B. and Clavero, M.R.S.1998. Efficacy of spray application of chlorinated waterin killing pathogenic bacteria on raw apples, tomatoes,and lettuce. Journal of Food Protection, 61, 1305–1311.
Bolin, H.R., Stafford, A.E., King, A.D.Jr and Huxsoll C.C.1977. Factors affecting the storage stability of shreddedlettuce. Journal of Food Science, 42, 1319–1321.
Brackett, R.E. 1987. Microbiological consequences ofminimally processed fruits and vegetables. Journal ofFood Quality, 10, 195–206
El-Kest, S.E. and Marth, E.H. 1988. Inactivation of Listeriamonocytogenes by chlorine. Journal of Food Protection,51, 520–524.
IFPA (International Fresh-cut Produce Association) 1996.HACCP for the fresh-cut produce industry. In: Foodsafety guidelines for the fresh-cut produce industry, 3rdedition. Alexandria, Virginia, IFPA, 27–36.
Izumi, H. 1999. Electrolyzed water as a disinfectant forfresh-cut vegetables. Journal of Food Science, 64, 536–539.
Izumi, H., Nonaka, T. and Muraoka, T. 1997. Physiologyand quality of fresh-cut spinach stored in low O
2
controlled atmospheres at various temperatures. In:Gorny, J.R., ed., Proceedings of the 7
th
InternationalControlled Atmosphere Research Conference, Volume 5.Davis, University of California, 130–132.
Izumi, H. and Watada, A.E. 1994. Calcium treatments affectstorage quality of shredded carrots. Journal of FoodScience, 59, 106–109.
Krahn, T.R. 1977. Improving the keeping quality of cut headlettuce. Acta Horticulturae, 62, 79–92.
Nagashima, T. and Kamoi, K. 1997. Sterilization andpreservation of vegetables by ozonated water treatment.Food Preservation Science, 23, 127–131.
Park, W.P. and Lee, D.S. 1995. Effect of chlorine treatmenton cut watercress and onion. Journal of Food Quality, 18,415–424.
Ritenour, M.A. and Crisosto, C.H. 1996. Hydrocooler watersanitation in the San Joaquin Valley stone fruit industry.Central Valley Postharvest Newsletter, 5, 15–17.
Watada, A.E., Ko, N.P. and Minott, D.A. 1996. Factorsaffecting quality of fresh-cut horticultural products.Postharvest Biology and Technology, 9, 115–125.
Willocx, F., Tobback, P. and Hendrickx, M. 1994. Microbialsafety assurance of minimally processed vegetables byimplementation of the hazard analysis critical controlpoint (HACCP) system. Acta Alimentaria, 23, 221–238.
Zagory, D. 1999. Effects of post-processing handling andpackaging on microbial populations. Postharvest Biologyand Technology, 15, 313–321.
Zhang S. and Farber, J.M. 1996. The effects of variousdisinfectants against Listeria monocytogenes on fresh-cutvegetables. Food Microbiology, 13, 311–321.
20°C storage
0 Water 3.9 a ND
EW < 2.5 b ND
3 Water–air 5.4 a < 2.5 a
EW–air 3.6 c < 2.5 a
Water–4% O
2
4.9 b < 2.5 a
EW–4% O
2
3.8 c < 2.5 a
5 Water–air 6.6 a < 2.5 a
EW–air 6.1 b < 2.5 a
Water–4% O
2
6.5 a < 2.5 a
EW–4%O
2
5.7 b < 2.5 a
Table 2
. (Cont’d) Counts of mesophilic aerobic bacteria (MAB) and lactic acid bacteria (LAB) of fresh-cut spinachtreated with tap water (Water) or electrolysed water containing 50 ppm available chlorine (EW) for 4 minand stored at 10 or 20°C under normal air or 4% O
2
conditions.
Days Treatment Log
10
colony forming units (CFU)/g
MAB
d
LAB
e
abc Means with different letters within each day in the same column are significantly different (p < 0.05).
d
Mesophilic aerobic bacterial CFU in tissue macerate.
e
Lactic acid bacterial CFU in tissue macerate.ND = Not detectable.
Quality assurance in agricultural produce,edited by G.I. Johnson, Le Van To, Nguyen Duy Duc and M.C. Webb.
ACIAR Proceedings 100(printed version published in 2000)
222
Rapid Analytical Techniques for Pesticide Residues in Food
A. Pasha*
Abstract
Pesticide residues encountered in agricultural produce are often above permissible limits, posing healthhazards. They is also one of the major problems in international trade. Pesticide residues are analysed byconventional methods like gas chromatography and high performance liquid chromatography (HPLC) whichare time-consuming and need trained personnel and expensive equipment. Elaborate sample preparation,clean-up and a low throughput of 4–5 samples/day are the main disadvantages of these methods. Hence thereis need to develop simple and rapid alternatives to these classical methods. Enzyme-linked immunosorbentassay (ELISA) is suggested as an alternative technique, but it can give false positive and negative results dueto matrix interference and responds to structurally similar compounds.
This paper describes simple and rapid chemical-based methods for analysis of various pesticide residues.Sensitive reagents like N,N-diphenylbenzidine, 4-amino-N,N-dimethylaniline, and o-tolidine were developedearlier for organochlorine, organophosphate and pyrethroid insecticide residues. Highly sensitive reagentswere also developed by the author for the analysis of benzimidazole fungicides like carbendazim and benomyland also thiram residues.
N-bromosuccinimide, N-bromo-1,2-benzisothiazol-3-(2H)-one-1,1-dioxide and copper (I) thiocyanate wereused to determine these fungicide residues using a colorimetric method. Fungicide residues as low as 20 ngcould be detected on paper strips prepared from some of these reagents using a densitometer. A new reagent,1,3-dibromo-5,5-diphenyl-(3H,5H)-imidazol-2,4-dione, is now developed to analyse residues ofbenzimidazole fungicides on fruits and vegetables. 2-aminobenzimidazole (2-AB) obtained from thesefungicides under different conditions reacts with the reagent to give a product having
h
max
at 450 nm. 2-ADforms brick-red and purple coloured zones instantaneously on paper strips containing N-bromo-1,2-benzisothiazol-3-(
2H
)-one-1,1-dioxide and l,3-dibromo-5,5-diphenyl (
3H,5H
)-imidazol-2,4-dionewith aminimum detectable limit of 20 ng.
* Central Food Technological Research Institute, Mysore, India.
Quality assurance in agricultural produce,edited by G.I. Johnson, Le Van To, Nguyen Duy Duc and M.C. Webb.
ACIAR Proceedings 100(printed version published in 2000)
223
Effects on the Organoleptic Quality of Arabica Coffee Beans Processed for Export
when Pulping is Delayed in Papua New Guinea
A.J. Kuri*
Abstract
Green bean coffee produced from cherries pulped on the same day of harvest and parchment which was soakedwas rated the best in terms of the final raw bean, roasted bean and cup taste qualities. The quality of the greenbeans progressively deteriorated each day the cherries were not pulped from the day of harvest.
Cherries pulped on the fourth day after harvest produced green beans that were rated low and their qualitydiffered significantly (p < 0.05) from those produced from cherries pulped on the day of harvest.
Soaking the cherries prior to pulping had an adverse effect on the final quality of the green beans producedfor export, caused by the aqueous environment, and differed significantly (p < 0.005) in their total scores forthe raw bean, roasted bean and cup taste quality.
Soaked parchment produced superior quality coffee compared to unsoaked parchment and differedsignificantly (p < 0.001) in the total scores for the raw bean, roasted bean and cup taste. The results confirmedthat two-stage fermentation of arabica coffee when ‘wet processed’ produces a superior quality coffee.
P
APUA
N
EW
G
UINEA
has faced quality problems withtheir arabica coffee with overseas buyers over theyears, which have been caused, in part, by delays inpulping the cherries. Hence, it has been recommendedto farmers that they pulp on the same day as harvestingto maintain the final quality. However, pulping on theday of harvest can be delayed for the followingreasons:
• limitations in transport due to bad road conditionsor no vehicles;
• limited availability or capacity of processingfacilities, pulpers and fermention vats;
• involvement of farmers in other communalactivities that may prevent them from pulping thecherries on the day of harvest; or
• unexpected breakdown of processing equipmentand transport vehicles.
Each day that pulping is delayed, the quality of thecoffee beans is adversely affected. This study wasundertaken to evaluate the effects on the organolepticquality of arabica coffee beans processed for exportwhen pulping is delayed in Papua New Guinea.
Further to that, the effects on the total quality of thegreen beans when cherries and parchment were soakedin water as compared to those not soaked for the testedcoffee were evaluated. The soaking tests were carriedout to see if the final bean quality could be improvedby soaking in cherry form prior to pulping or inparchment form prior to drying.
Thus the objective was to evaluate the organolepticquality of ‘raw beans’, ‘roasted beans’ and ‘cup taste’when:
• pulping was delayed for up to 6 days after harvest;
• the cherries were soaked in water, compared tothose not soaked, before pulping; and
• washed parchment was soaked in water andcompared to parchment which was not soaked.
* Papua New Guinea Coffee Research Institute, PO Box 105, Kainantu 443, Eastern Highlands Province, Papua New Guinea.
Quality assurance in agricultural produce,edited by G.I. Johnson, Le Van To, Nguyen Duy Duc and M.C. Webb.
ACIAR Proceedings 100(printed version published in 2000)
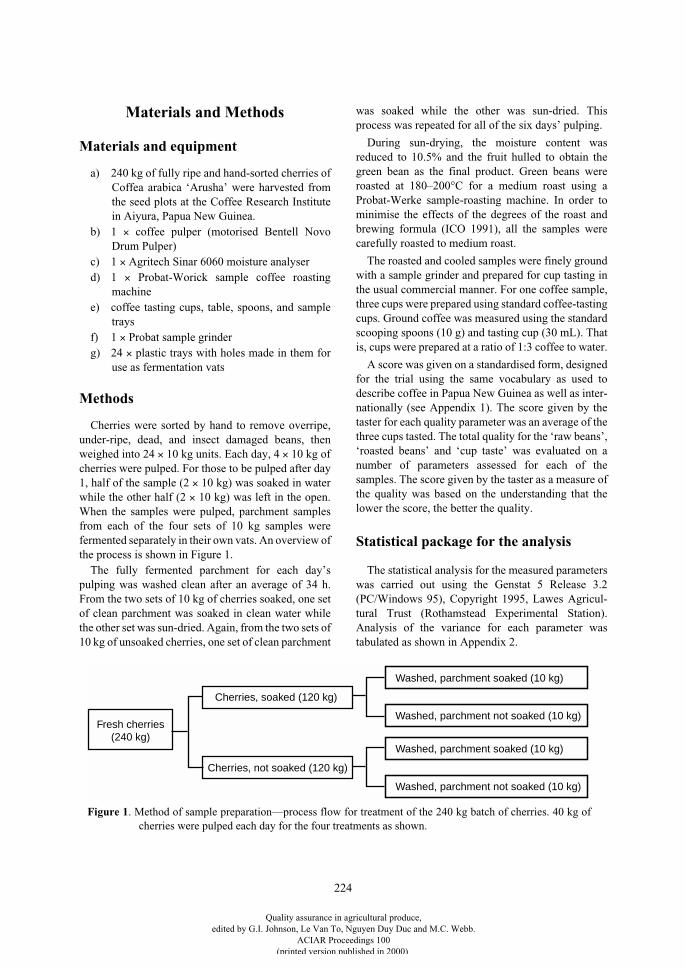
224
Materials and Methods
Materials and equipment
a) 240 kg of fully ripe and hand-sorted cherries ofCoffea arabica ‘Arusha’ were harvested fromthe seed plots at the Coffee Research Institutein Aiyura, Papua New Guinea.
b) 1
×
coffee pulper (motorised Bentell NovoDrum Pulper)
c) 1
×
Agritech Sinar 6060 moisture analyserd) 1
×
Probat-Worick sample coffee roastingmachine
e) coffee tasting cups, table, spoons, and sampletrays
f) 1
×
Probat sample grinderg) 24
×
plastic trays with holes made in them foruse as fermentation vats
Methods
Cherries were sorted by hand to remove overripe,under-ripe, dead, and insect damaged beans, thenweighed into 24
×
10 kg units. Each day, 4
×
10 kg ofcherries were pulped. For those to be pulped after day1, half of the sample (2
×
10 kg) was soaked in waterwhile the other half (2
×
10 kg) was left in the open.When the samples were pulped, parchment samplesfrom each of the four sets of 10 kg samples werefermented separately in their own vats. An overview ofthe process is shown in Figure 1.
The fully fermented parchment for each day’spulping was washed clean after an average of 34 h.From the two sets of 10 kg of cherries soaked, one setof clean parchment was soaked in clean water whilethe other set was sun-dried. Again, from the two sets of10 kg of unsoaked cherries, one set of clean parchment
was soaked while the other was sun-dried. Thisprocess was repeated for all of the six days’ pulping.
During sun-drying, the moisture content wasreduced to 10.5% and the fruit hulled to obtain thegreen bean as the final product. Green beans wereroasted at 180–200°C for a medium roast using aProbat-Werke sample-roasting machine. In order tominimise the effects of the degrees of the roast andbrewing formula (ICO 1991), all the samples werecarefully roasted to medium roast.
The roasted and cooled samples were finely groundwith a sample grinder and prepared for cup tasting inthe usual commercial manner. For one coffee sample,three cups were prepared using standard coffee-tastingcups. Ground coffee was measured using the standardscooping spoons (10 g) and tasting cup (30 mL). Thatis, cups were prepared at a ratio of 1:3 coffee to water.
A score was given on a standardised form, designedfor the trial using the same vocabulary as used todescribe coffee in Papua New Guinea as well as inter-nationally (see Appendix 1). The score given by thetaster for each quality parameter was an average of thethree cups tasted. The total quality for the ‘raw beans’,‘roasted beans’ and ‘cup taste’ was evaluated on anumber of parameters assessed for each of thesamples. The score given by the taster as a measure ofthe quality was based on the understanding that thelower the score, the better the quality.
Statistical package for the analysis
The statistical analysis for the measured parameterswas carried out using the Genstat 5 Release 3.2(PC/Windows 95), Copyright 1995, Lawes Agricul-tural Trust (Rothamstead Experimental Station).Analysis of the variance for each parameter wastabulated as shown in Appendix 2.
Fresh cherries(240 kg)
Cherries, soaked (120 kg)
Cherries, not soaked (120 kg)
Washed, parchment soaked (10 kg)
Washed, parchment soaked (10 kg)
Washed, parchment not soaked (10 kg)
Washed, parchment not soaked (10 kg)
Figure 1. Method of sample preparation—process flow for treatment of the 240 kg batch of cherries. 40 kg ofcherries were pulped each day for the four treatments as shown.
Quality assurance in agricultural produce,edited by G.I. Johnson, Le Van To, Nguyen Duy Duc and M.C. Webb.
ACIAR Proceedings 100(printed version published in 2000)
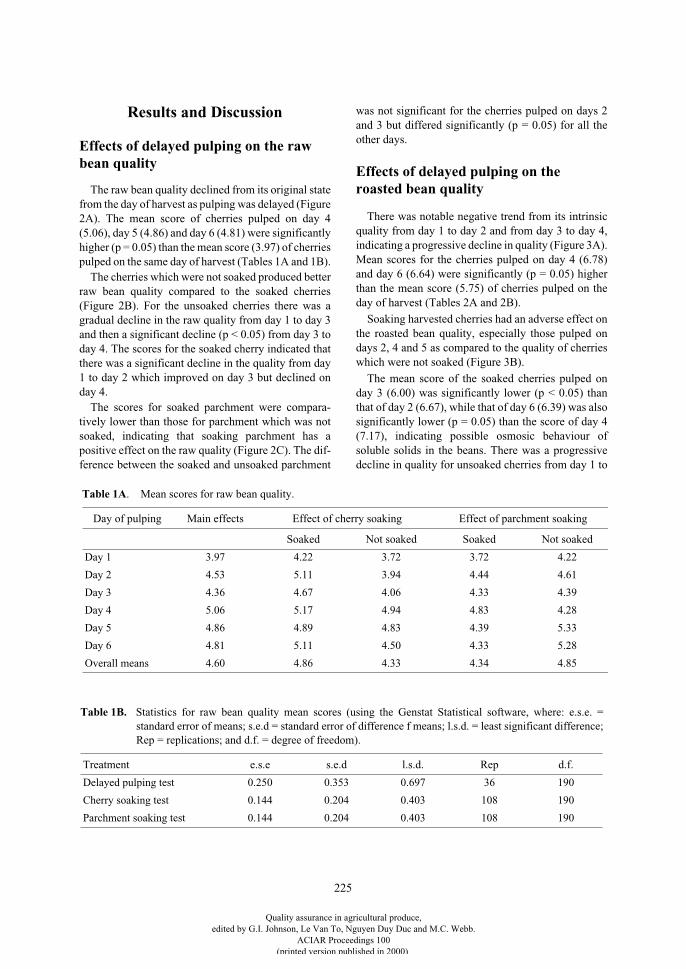
225
Results and Discussion
Effects of delayed pulping on the raw bean quality
The raw bean quality declined from its original statefrom the day of harvest as pulping was delayed (Figure2A). The mean score of cherries pulped on day 4(5.06), day 5 (4.86) and day 6 (4.81) were significantlyhigher (p = 0.05) than the mean score (3.97) of cherriespulped on the same day of harvest (Tables 1A and 1B).
The cherries which were not soaked produced betterraw bean quality compared to the soaked cherries(Figure 2B). For the unsoaked cherries there was agradual decline in the raw quality from day 1 to day 3and then a significant decline (p < 0.05) from day 3 today 4. The scores for the soaked cherry indicated thatthere was a significant decline in the quality from day1 to day 2 which improved on day 3 but declined onday 4.
The scores for soaked parchment were compara-tively lower than those for parchment which was notsoaked, indicating that soaking parchment has apositive effect on the raw quality (Figure 2C). The dif-ference between the soaked and unsoaked parchment
was not significant for the cherries pulped on days 2and 3 but differed significantly (p = 0.05) for all theother days.
Effects of delayed pulping on the roasted bean quality
There was notable negative trend from its intrinsicquality from day 1 to day 2 and from day 3 to day 4,indicating a progressive decline in quality (Figure 3A).Mean scores for the cherries pulped on day 4 (6.78)and day 6 (6.64) were significantly (p = 0.05) higherthan the mean score (5.75) of cherries pulped on theday of harvest (Tables 2A and 2B).
Soaking harvested cherries had an adverse effect onthe roasted bean quality, especially those pulped ondays 2, 4 and 5 as compared to the quality of cherrieswhich were not soaked (Figure 3B).
The mean score of the soaked cherries pulped onday 3 (6.00) was significantly lower (p < 0.05) thanthat of day 2 (6.67), while that of day 6 (6.39) was alsosignificantly lower (p = 0.05) than the score of day 4(7.17), indicating possible osmosic behaviour ofsoluble solids in the beans. There was a progressivedecline in quality for unsoaked cherries from day 1 to
Table 1A. Mean scores for raw bean quality.
Day of pulping Main effects Effect of cherry soaking Effect of parchment soaking
Soaked Not soaked Soaked Not soaked
Day 1 3.97 4.22 3.72 3.72 4.22
Day 2 4.53 5.11 3.94 4.44 4.61
Day 3 4.36 4.67 4.06 4.33 4.39
Day 4 5.06 5.17 4.94 4.83 4.28
Day 5 4.86 4.89 4.83 4.39 5.33
Day 6 4.81 5.11 4.50 4.33 5.28
Overall means 4.60 4.86 4.33 4.34 4.85
Table 1B. Statistics for raw bean quality mean scores (using the Genstat Statistical software, where: e.s.e. =standard error of means; s.e.d = standard error of difference f means; l.s.d. = least significant difference;Rep = replications; and d.f. = degree of freedom).
Treatment e.s.e s.e.d l.s.d. Rep d.f.
Delayed pulping test 0.250 0.353 0.697 36 190
Cherry soaking test 0.144 0.204 0.403 108 190
Parchment soaking test 0.144 0.204 0.403 108 190
Quality assurance in agricultural produce,edited by G.I. Johnson, Le Van To, Nguyen Duy Duc and M.C. Webb.
ACIAR Proceedings 100(printed version published in 2000)
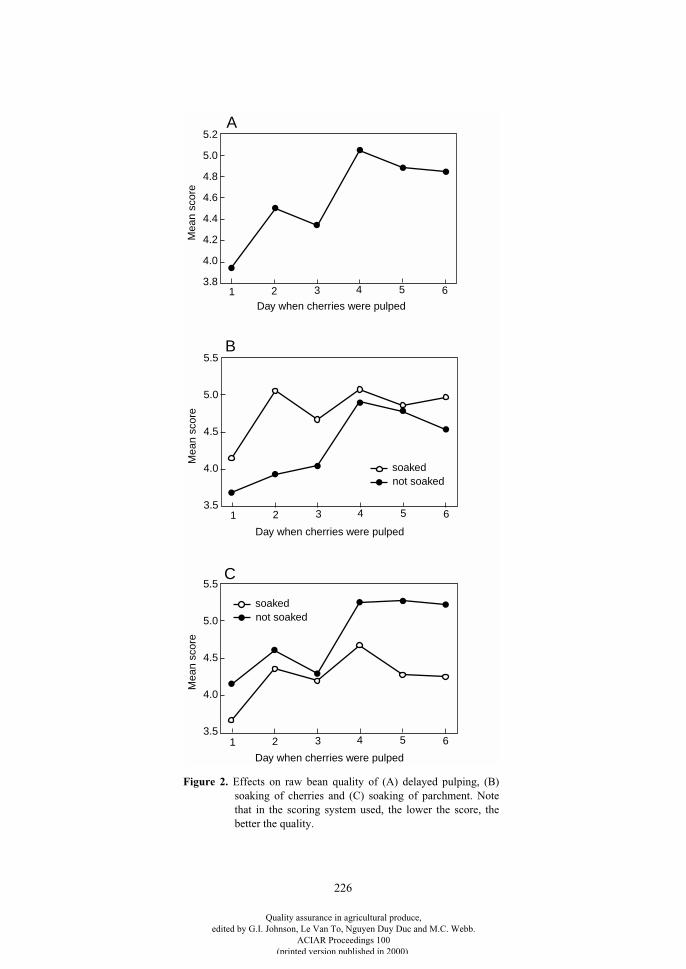
226
3.8
4.0
4.2
4.4
4.6
5.2
3.5
4.0
4.5
5.0
5.5
Day when cherries were pulped
Day when cherries were pulped
4.8
3.5
4.0
4.5
5.0
5.5
1 2 3 4 5 6
Day when cherries were pulped
5.0
1 2 3 4 5 6
1 2 3 4 5 6
Mea
n sc
ore
Mea
n sc
ore
Mea
n sc
ore
C
B
A
not soakedsoaked
not soakedsoaked
Figure 2.
Effects on raw bean quality of (A) delayed pulping, (B)soaking of cherries and (C) soaking of parchment. Notethat in the scoring system used, the lower the score, thebetter the quality.
Quality assurance in agricultural produce,edited by G.I. Johnson, Le Van To, Nguyen Duy Duc and M.C. Webb.
ACIAR Proceedings 100(printed version published in 2000)
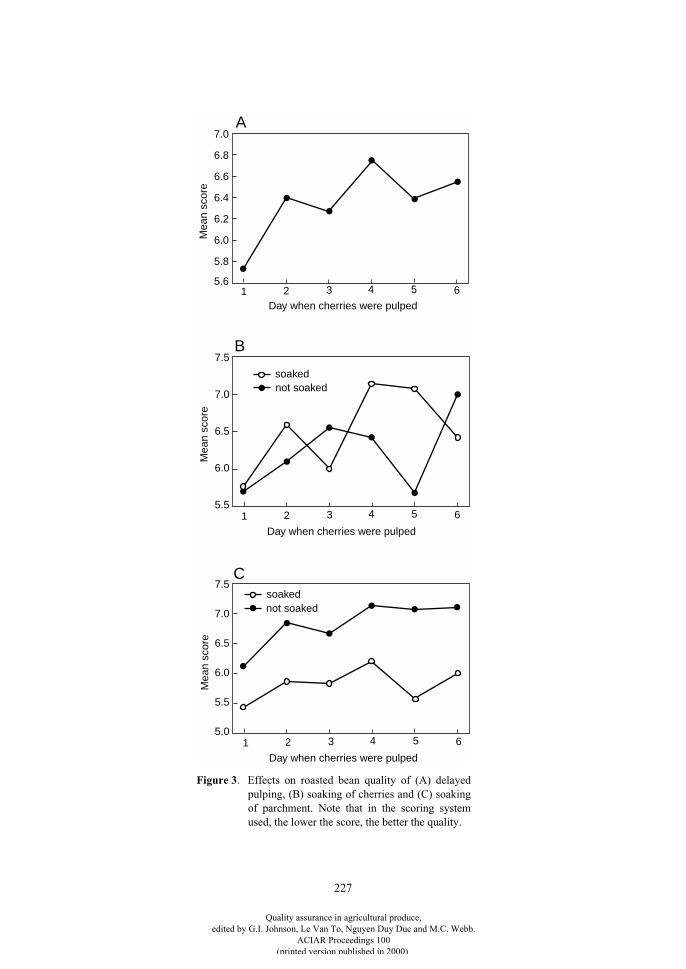
227
5.6
5.8
6.0
6.2
6.4
6.6
6.8
7.0
5.5
6.0
6.5
7.0
7.5
5.0
6.0
6.5
7.0
7.5
5.5
Day when cherries were pulped
Day when cherries were pulped
Day when cherries were pulped
not soakedsoaked
not soakedsoaked
1 2 3 4 5 6
1 2 3 4 5 6
1 2 3 4 5 6
Mea
n sc
ore
Mea
n sc
ore
Mea
n sc
ore
C
B
A
Figure 3
. Effects on roasted bean quality of (A) delayedpulping, (B) soaking of cherries and (C) soakingof parchment. Note that in the scoring systemused, the lower the score, the better the quality.
Quality assurance in agricultural produce,edited by G.I. Johnson, Le Van To, Nguyen Duy Duc and M.C. Webb.
ACIAR Proceedings 100(printed version published in 2000)
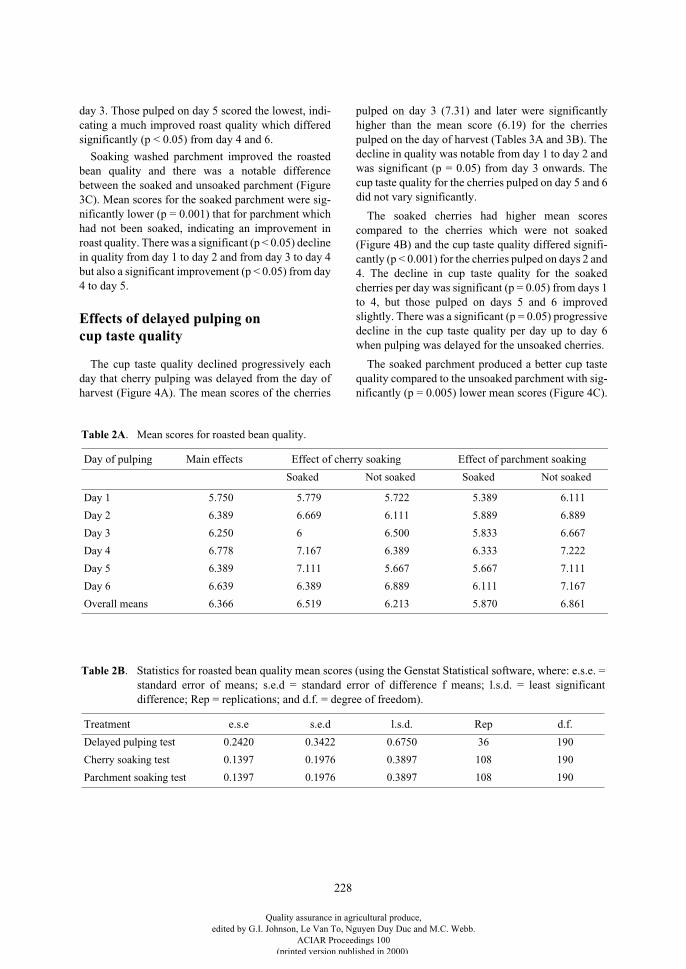
228
day 3. Those pulped on day 5 scored the lowest, indi-cating a much improved roast quality which differedsignificantly (p < 0.05) from day 4 and 6.
Soaking washed parchment improved the roastedbean quality and there was a notable differencebetween the soaked and unsoaked parchment (Figure3C). Mean scores for the soaked parchment were sig-nificantly lower (p = 0.001) that for parchment whichhad not been soaked, indicating an improvement inroast quality. There was a significant (p < 0.05) declinein quality from day 1 to day 2 and from day 3 to day 4but also a significant improvement (p < 0.05) from day4 to day 5.
Effects of delayed pulping on cup taste quality
The cup taste quality declined progressively eachday that cherry pulping was delayed from the day ofharvest (Figure 4A). The mean scores of the cherries
pulped on day 3 (7.31) and later were significantlyhigher than the mean score (6.19) for the cherriespulped on the day of harvest (Tables 3A and 3B). Thedecline in quality was notable from day 1 to day 2 andwas significant (p = 0.05) from day 3 onwards. Thecup taste quality for the cherries pulped on day 5 and 6did not vary significantly.
The soaked cherries had higher mean scorescompared to the cherries which were not soaked(Figure 4B) and the cup taste quality differed signifi-cantly (p < 0.001) for the cherries pulped on days 2 and4. The decline in cup taste quality for the soakedcherries per day was significant (p = 0.05) from days 1to 4, but those pulped on days 5 and 6 improvedslightly. There was a significant (p = 0.05) progressivedecline in the cup taste quality per day up to day 6when pulping was delayed for the unsoaked cherries.
The soaked parchment produced a better cup tastequality compared to the unsoaked parchment with sig-nificantly (p = 0.005) lower mean scores (Figure 4C).
Table 2A. Mean scores for roasted bean quality.
Day of pulping Main effects Effect of cherry soaking Effect of parchment soaking
Soaked Not soaked Soaked Not soaked
Day 1 5.750 5.779 5.722 5.389 6.111
Day 2 6.389 6.669 6.111 5.889 6.889
Day 3 6.250 6 6.500 5.833 6.667
Day 4 6.778 7.167 6.389 6.333 7.222
Day 5 6.389 7.111 5.667 5.667 7.111
Day 6 6.639 6.389 6.889 6.111 7.167
Overall means 6.366 6.519 6.213 5.870 6.861
Table 2B. Statistics for roasted bean quality mean scores (using the Genstat Statistical software, where: e.s.e. =standard error of means; s.e.d = standard error of difference f means; l.s.d. = least significantdifference; Rep = replications; and d.f. = degree of freedom).
Treatment e.s.e s.e.d l.s.d. Rep d.f.
Delayed pulping test 0.2420 0.3422 0.6750 36 190
Cherry soaking test 0.1397 0.1976 0.3897 108 190
Parchment soaking test 0.1397 0.1976 0.3897 108 190
Quality assurance in agricultural produce,edited by G.I. Johnson, Le Van To, Nguyen Duy Duc and M.C. Webb.
ACIAR Proceedings 100(printed version published in 2000)
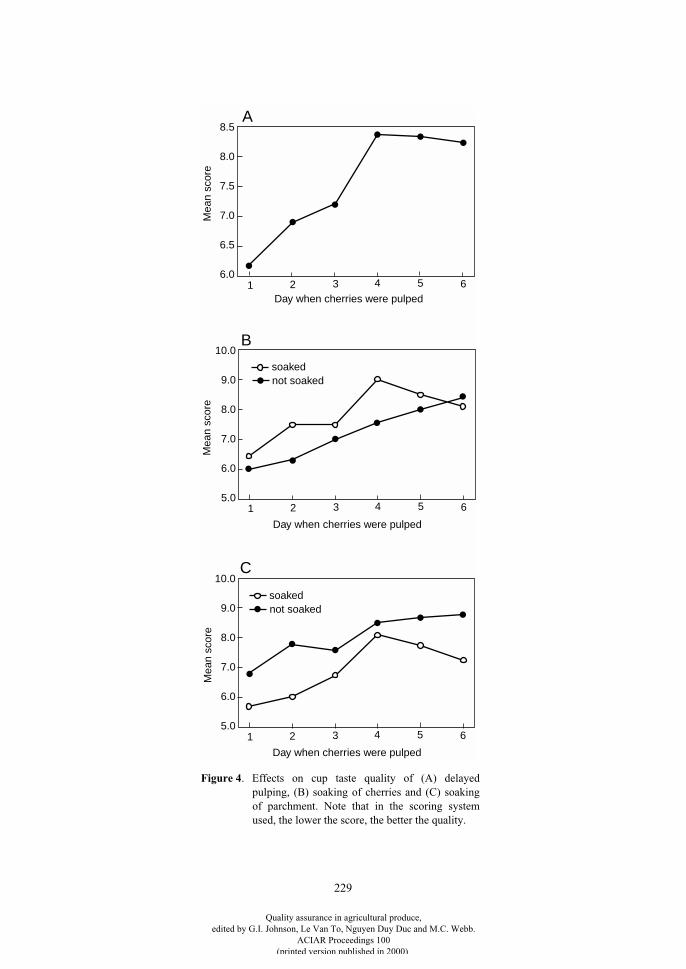
229
6.0
6.5
7.0
7.5
8.0
8.5
5.0
6.0
7.0
8.0
10.0
Day when cherries were pulped
Day when cherries were pulped
9.0
5.0
6.0
7.0
8.0
10.0
Day when cherries were pulped
9.0
1 2 3 4 5 6
1 2 3 4 5 6
1 2 3 4 5 6
Mea
n sc
ore
Mea
n sc
ore
Mea
n sc
ore
C
B
A
not soakedsoaked
not soakedsoaked
Figure 4
. Effects on cup taste quality of (A) delayedpulping, (B) soaking of cherries and (C) soakingof parchment. Note that in the scoring systemused, the lower the score, the better the quality.
Quality assurance in agricultural produce,edited by G.I. Johnson, Le Van To, Nguyen Duy Duc and M.C. Webb.
ACIAR Proceedings 100(printed version published in 2000)
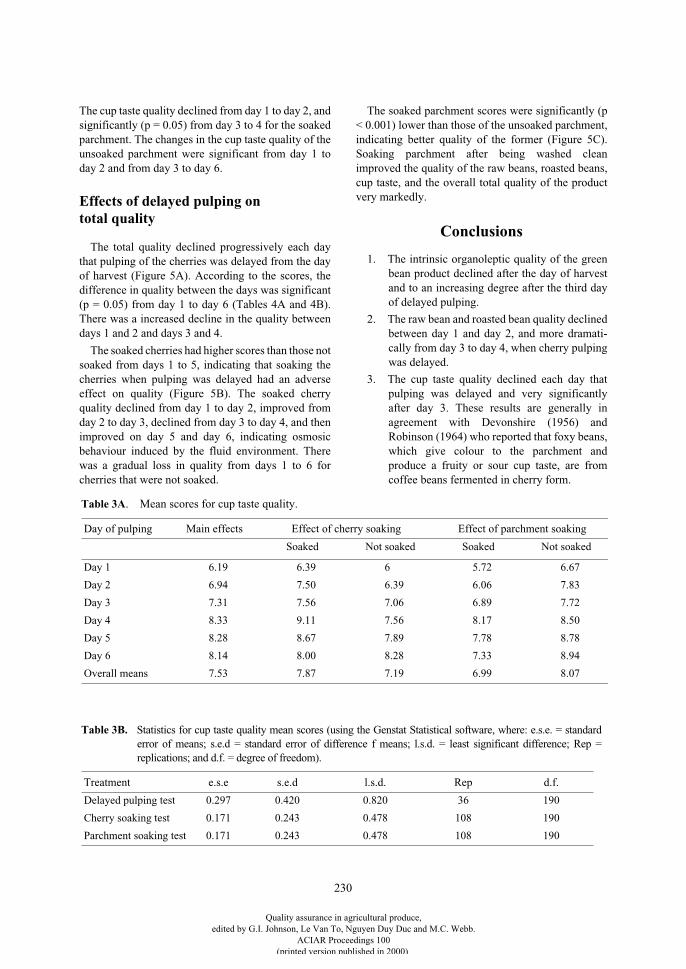
230
The cup taste quality declined from day 1 to day 2, andsignificantly (p = 0.05) from day 3 to 4 for the soakedparchment. The changes in the cup taste quality of theunsoaked parchment were significant from day 1 today 2 and from day 3 to day 6.
Effects of delayed pulping on total quality
The total quality declined progressively each daythat pulping of the cherries was delayed from the dayof harvest (Figure 5A). According to the scores, thedifference in quality between the days was significant(p = 0.05) from day 1 to day 6 (Tables 4A and 4B).There was a increased decline in the quality betweendays 1 and 2 and days 3 and 4.
The soaked cherries had higher scores than those notsoaked from days 1 to 5, indicating that soaking thecherries when pulping was delayed had an adverseeffect on quality (Figure 5B). The soaked cherryquality declined from day 1 to day 2, improved fromday 2 to day 3, declined from day 3 to day 4, and thenimproved on day 5 and day 6, indicating osmosicbehaviour induced by the fluid environment. Therewas a gradual loss in quality from days 1 to 6 forcherries that were not soaked.
The soaked parchment scores were significantly (p< 0.001) lower than those of the unsoaked parchment,indicating better quality of the former (Figure 5C).Soaking parchment after being washed cleanimproved the quality of the raw beans, roasted beans,cup taste, and the overall total quality of the productvery markedly.
Conclusions
1. The intrinsic organoleptic quality of the greenbean product declined after the day of harvestand to an increasing degree after the third dayof delayed pulping.
2. The raw bean and roasted bean quality declinedbetween day 1 and day 2, and more dramati-cally from day 3 to day 4, when cherry pulpingwas delayed.
3. The cup taste quality declined each day thatpulping was delayed and very significantlyafter day 3. These results are generally inagreement with Devonshire (1956) andRobinson (1964) who reported that foxy beans,which give colour to the parchment andproduce a fruity or sour cup taste, are fromcoffee beans fermented in cherry form.
Table 3A. Mean scores for cup taste quality.
Day of pulping Main effects Effect of cherry soaking Effect of parchment soaking
Soaked Not soaked Soaked Not soaked
Day 1 6.19 6.39 6 5.72 6.67
Day 2 6.94 7.50 6.39 6.06 7.83
Day 3 7.31 7.56 7.06 6.89 7.72
Day 4 8.33 9.11 7.56 8.17 8.50
Day 5 8.28 8.67 7.89 7.78 8.78
Day 6 8.14 8.00 8.28 7.33 8.94
Overall means 7.53 7.87 7.19 6.99 8.07
Table 3B. Statistics for cup taste quality mean scores (using the Genstat Statistical software, where: e.s.e. = standarderror of means; s.e.d = standard error of difference f means; l.s.d. = least significant difference; Rep =replications; and d.f. = degree of freedom).
Treatment e.s.e s.e.d l.s.d. Rep d.f.
Delayed pulping test 0.297 0.420 0.820 36 190
Cherry soaking test 0.171 0.243 0.478 108 190
Parchment soaking test 0.171 0.243 0.478 108 190
Quality assurance in agricultural produce,edited by G.I. Johnson, Le Van To, Nguyen Duy Duc and M.C. Webb.
ACIAR Proceedings 100(printed version published in 2000)
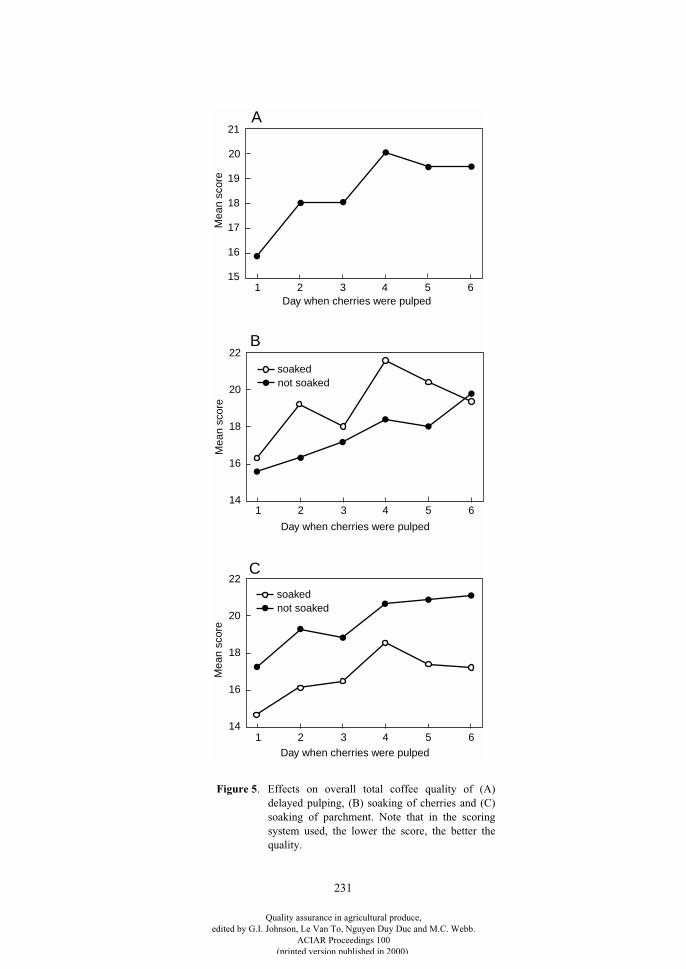
231
Figure 5
. Effects on overall total coffee quality of (A)delayed pulping, (B) soaking of cherries and (C)soaking of parchment. Note that in the scoringsystem used, the lower the score, the better thequality.
15
16
17
18
19
21
14
16
18
20
22
Day when cherries were pulped
Day when cherries were pulped
20
14
16
18
20
22
Day when cherries were pulped
Mea
n sc
ore
Mea
n sc
ore
Mea
n sc
ore
1 2 3 4 5 6
1 2 3 4 5 6
1 2 3 4 5 6
C
B
A
not soakedsoaked
not soakedsoaked
Quality assurance in agricultural produce,edited by G.I. Johnson, Le Van To, Nguyen Duy Duc and M.C. Webb.
ACIAR Proceedings 100(printed version published in 2000)
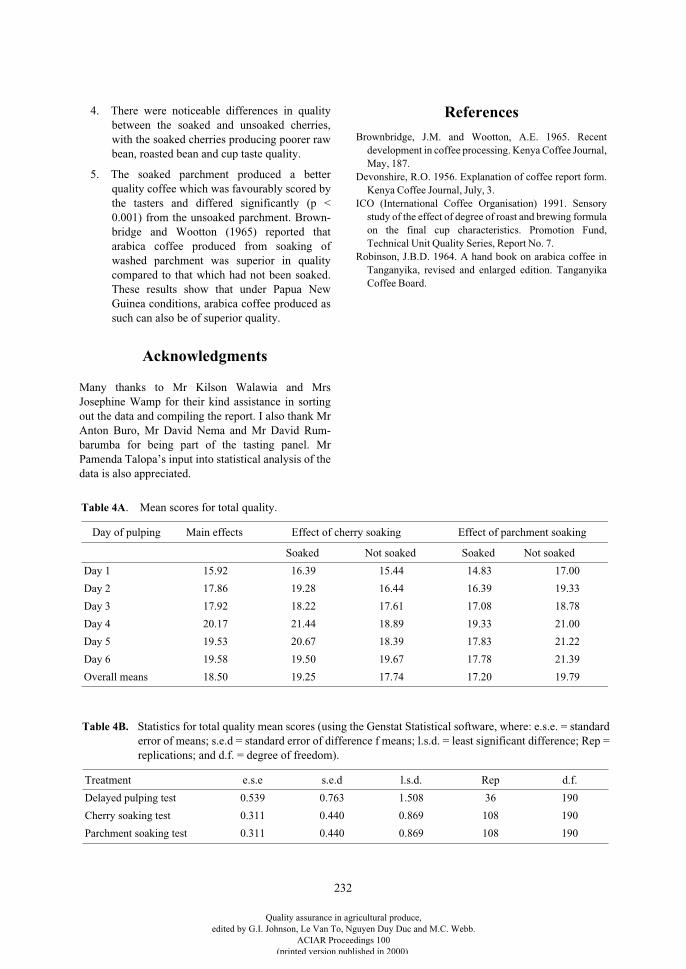
232
4. There were noticeable differences in qualitybetween the soaked and unsoaked cherries,with the soaked cherries producing poorer rawbean, roasted bean and cup taste quality.
5. The soaked parchment produced a betterquality coffee which was favourably scored bythe tasters and differed significantly (p <0.001) from the unsoaked parchment. Brown-bridge and Wootton (1965) reported thatarabica coffee produced from soaking ofwashed parchment was superior in qualitycompared to that which had not been soaked.These results show that under Papua NewGuinea conditions, arabica coffee produced assuch can also be of superior quality.
Acknowledgments
Many thanks to Mr Kilson Walawia and MrsJosephine Wamp for their kind assistance in sortingout the data and compiling the report. I also thank MrAnton Buro, Mr David Nema and Mr David Rum-barumba for being part of the tasting panel. MrPamenda Talopa’s input into statistical analysis of thedata is also appreciated.
References
Brownbridge, J.M. and Wootton, A.E. 1965. Recentdevelopment in coffee processing. Kenya Coffee Journal,May, 187.
Devonshire, R.O. 1956. Explanation of coffee report form.Kenya Coffee Journal, July, 3.
ICO (International Coffee Organisation) 1991. Sensorystudy of the effect of degree of roast and brewing formulaon the final cup characteristics. Promotion Fund,Technical Unit Quality Series, Report No. 7.
Robinson, J.B.D. 1964. A hand book on arabica coffee inTanganyika, revised and enlarged edition. TanganyikaCoffee Board.
Table 4A. Mean scores for total quality.
Day of pulping Main effects Effect of cherry soaking Effect of parchment soaking
Soaked Not soaked Soaked Not soaked
Day 1 15.92 16.39 15.44 14.83 17.00
Day 2 17.86 19.28 16.44 16.39 19.33
Day 3 17.92 18.22 17.61 17.08 18.78
Day 4 20.17 21.44 18.89 19.33 21.00
Day 5 19.53 20.67 18.39 17.83 21.22
Day 6 19.58 19.50 19.67 17.78 21.39
Overall means 18.50 19.25 17.74 17.20 19.79
Table 4B.
Statistics for total quality mean scores (using the Genstat Statistical software, where: e.s.e. = standarderror of means; s.e.d = standard error of difference f means; l.s.d. = least significant difference; Rep =replications; and d.f. = degree of freedom).
Treatment e.s.e s.e.d l.s.d. Rep d.f.
Delayed pulping test 0.539 0.763 1.508 36 190
Cherry soaking test 0.311 0.440 0.869 108 190
Parchment soaking test 0.311 0.440 0.869 108 190
Quality assurance in agricultural produce,edited by G.I. Johnson, Le Van To, Nguyen Duy Duc and M.C. Webb.
ACIAR Proceedings 100(printed version published in 2000)
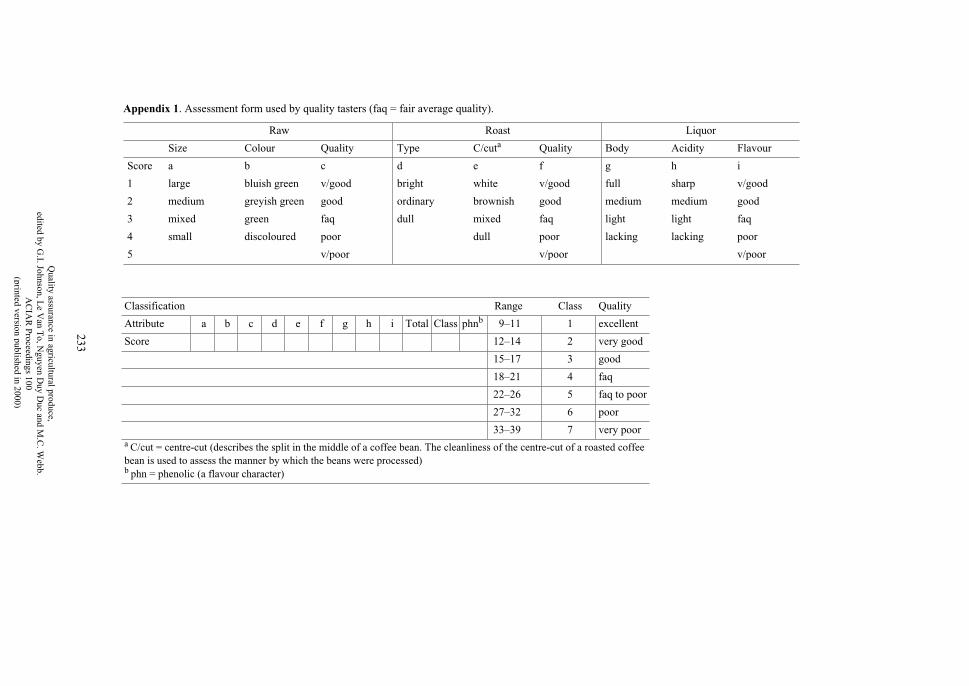
233
Appendix 1
. Assessment form used by quality tasters (faq = fair average quality).
Raw Roast Liquor
Size Colour Quality Type C/cut
a
Quality Body Acidity Flavour
Score a b c d e f g h i
1 large bluish green v/good bright white v/good full sharp v/good
2 medium greyish green good ordinary brownish good medium medium good
3 mixed green faq dull mixed faq light light faq
4 small discoloured poor dull poor lacking lacking poor
5 v/poor v/poor v/poor
Classification Range Class Quality
Attribute a b c d e f g h i Total Class phn
b
9–11 1 excellent
Score 12–14 2 very good
15–17 3 good
18–21 4 faq
22–26 5 faq to poor
27–32 6 poor
33–39 7 very poor
a
C/cut = centre-cut (describes the split in the middle of a coffee bean. The cleanliness of the centre-cut of a roasted coffee bean is used to assess the manner by which the beans were processed)
b
phn = phenolic (a flavour character)
Quality assurance in agricultural produce,
edited by G.I. Johnson, L
e Van T
o, Nguyen D
uy Duc and M
.C. W
ebb.A
CIA
R P
roceedings 100(printed
versionpublished
in2000)
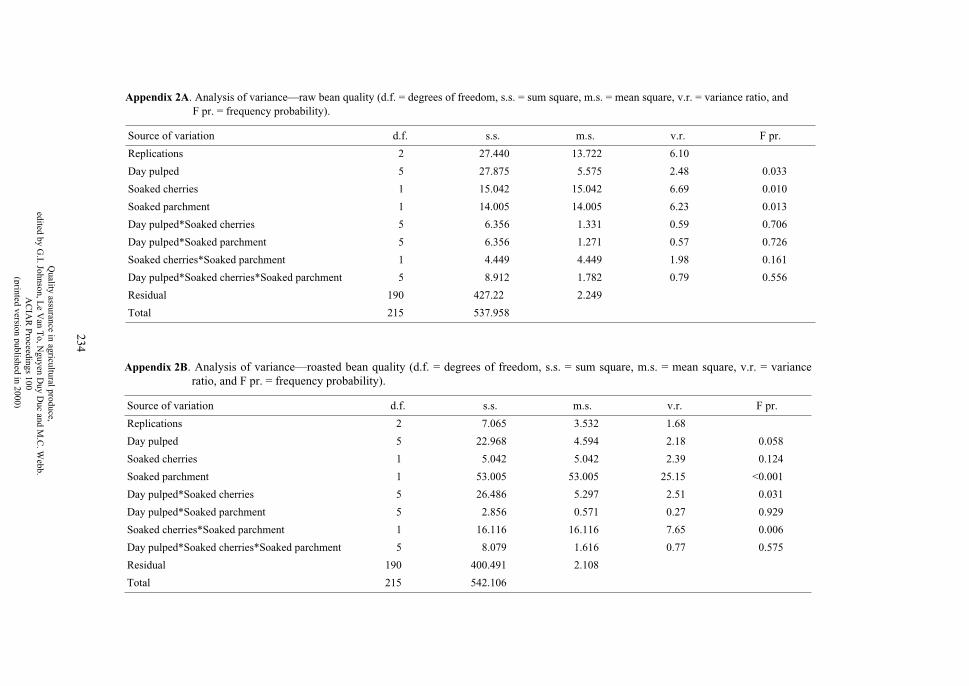
234
Appendix 2A
. Analysis of variance—raw bean quality (d.f. = degrees of freedom, s.s. = sum square, m.s. = mean square, v.r. = variance ratio, and F pr. = frequency probability).
Source of variation d.f. s.s. m.s. v.r. F pr.
Replications 2 27.440 13.722 6.10
Day pulped 5 27.875 5.575 2.48 0.033
Soaked cherries 1 15.042 15.042 6.69 0.010
Soaked parchment 1 14.005 14.005 6.23 0.013
Day pulped*Soaked cherries 5 6.356 1.331 0.59 0.706
Day pulped*Soaked parchment 5 6.356 1.271 0.57 0.726
Soaked cherries*Soaked parchment 1 4.449 4.449 1.98 0.161
Day pulped*Soaked cherries*Soaked parchment 5 8.912 1.782 0.79 0.556
Residual 190 427.22 2.249
Total 215 537.958
Appendix 2B
. Analysis of variance—roasted bean quality (d.f. = degrees of freedom, s.s. = sum square, m.s. = mean square, v.r. = varianceratio, and F pr. = frequency probability).
Source of variation d.f. s.s. m.s. v.r. F pr.
Replications 2 7.065 3.532 1.68
Day pulped 5 22.968 4.594 2.18 0.058
Soaked cherries 1 5.042 5.042 2.39 0.124
Soaked parchment 1 53.005 53.005 25.15 <0.001
Day pulped*Soaked cherries 5 26.486 5.297 2.51 0.031
Day pulped*Soaked parchment 5 2.856 0.571 0.27 0.929
Soaked cherries*Soaked parchment 1 16.116 16.116 7.65 0.006
Day pulped*Soaked cherries*Soaked parchment 5 8.079 1.616 0.77 0.575
Residual 190 400.491 2.108
Total 215 542.106
Quality assurance in agricultural produce,
edited by G.I. Johnson, L
e Van T
o, Nguyen D
uy Duc and M
.C. W
ebb.A
CIA
R P
roceedings 100(printed
versionpublished
in2000)
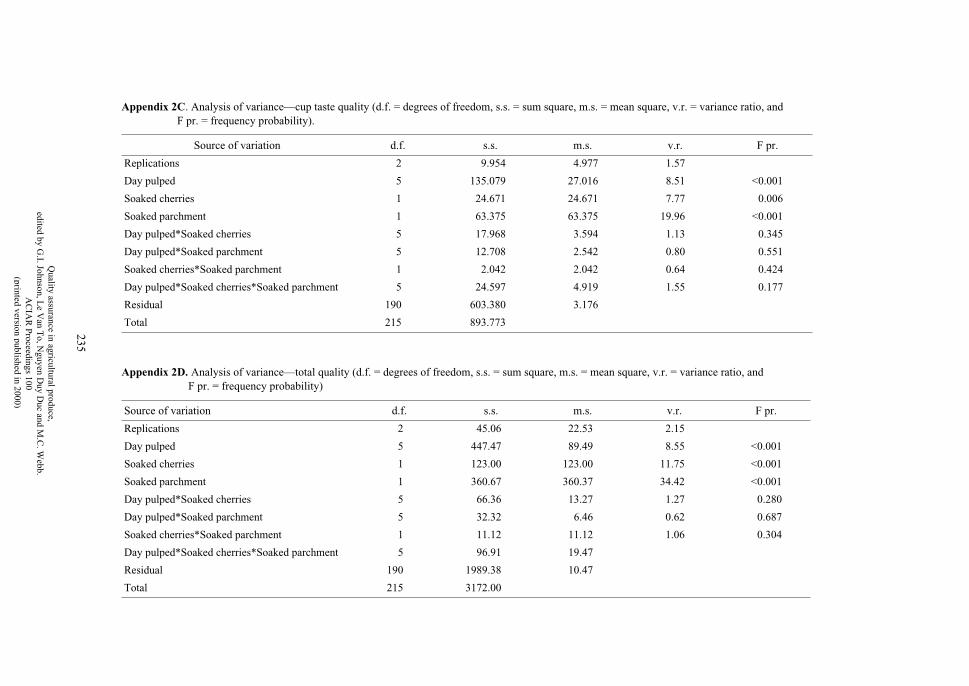
235
Appendix 2C
. Analysis of variance—cup taste quality (d.f. = degrees of freedom, s.s. = sum square, m.s. = mean square, v.r. = variance ratio, and F pr. = frequency probability).
Source of variation d.f. s.s. m.s. v.r. F pr.
Replications 2 9.954 4.977 1.57
Day pulped 5 135.079 27.016 8.51 <0.001
Soaked cherries 1 24.671 24.671 7.77 0.006
Soaked parchment 1 63.375 63.375 19.96 <0.001
Day pulped*Soaked cherries 5 17.968 3.594 1.13 0.345
Day pulped*Soaked parchment 5 12.708 2.542 0.80 0.551
Soaked cherries*Soaked parchment 1 2.042 2.042 0.64 0.424
Day pulped*Soaked cherries*Soaked parchment 5 24.597 4.919 1.55 0.177
Residual 190 603.380 3.176
Total 215 893.773
Appendix 2D. Analysis of variance—total quality (d.f. = degrees of freedom, s.s. = sum square, m.s. = mean square, v.r. = variance ratio, and F pr. = frequency probability)
Source of variation d.f. s.s. m.s. v.r. F pr.
Replications 2 45.06 22.53 2.15
Day pulped 5 447.47 89.49 8.55 <0.001
Soaked cherries 1 123.00 123.00 11.75 <0.001
Soaked parchment 1 360.67 360.37 34.42 <0.001
Day pulped*Soaked cherries 5 66.36 13.27 1.27 0.280
Day pulped*Soaked parchment 5 32.32 6.46 0.62 0.687
Soaked cherries*Soaked parchment 1 11.12 11.12 1.06 0.304
Day pulped*Soaked cherries*Soaked parchment 5 96.91 19.47
Residual 190 1989.38 10.47
Total 215 3172.00
Quality assurance in agricultural produce,
edited by G.I. Johnson, L
e Van T
o, Nguyen D
uy Duc and M
.C. W
ebb.A
CIA
R P
roceedings 100(printed
versionpublished
in2000)
236
Improvement of Quality of Apples in Shanxi Province, China
C.J. Studman*, L.U. Opara* and Zhang Dong Xing†
Abstract
In the past six years in Shanxi Province there have been extensive plantings of fruit trees (particularly apples),but the postharvest system is largely undeveloped. This report describes the results of a project on postharvestsystems development, intended to develop and deliver an educational training program on the development offruit quality assurance systems, and to develop a framework for fruit total quality management systems for onefruit crop in China. After visits by the two collaborating postharvest research groups in China and New Zealandit was agreed to hold a workshop in Shanxi, and the objectives were carefully defined.
The New Zealand team presented a five-day workshop to 37 selected representatives of local growers andsupport industries. A workshop manual was prepared in English and Chinese.
Before, during and after the workshop, discussions took place between the New Zealand team and the localagricultural development bureau representatives. At the conclusion of the workshop, a summary of the findingsand recommendations from the workshop were completed and signed by all involved. Pre and post workshopquestionnaires and other evaluation techniques were used in order to evaluate the effectiveness of theworkshop. These showed that we had brought about a clear change in attitude of delegates towards recognisingthe value of postharvest factors, and as a result it was decided to proceed immediately with the formation of agrowers’ association to focus on developing a quality management system for apples. Establishment of amarketing effort was identified as a key task of the association.
There was a need for research, testing, and advisory systems to be established to enable growers to makecontinuous improvements to their pre and postharvest systems. A major improvement in infrastructure and infacilities for postharvest systems and quality management of apples should be achieved.
I
N
C
HINA
, fruit production has increased dramaticallyover the past ten years, and in the southern part ofShanxi Province fruit has become a major incomesource for farmers. However quality control, and post-harvest handling and storage techniques are still at avery early stage of development. There is cool-storagecapacity for less than one-third of the current appleproduction, resulting in the need to sell fruit at harvest-time. Considerable gains in quality and profitabilitycould be achieved if modern postharvest technologywas used by the industry.
In New Zealand, on the other hand, postharvesttechnology is already at a very sophisticated state ofdevelopment, with major export markets beingsupplied with high quality product. Improvements in
product quality through quality management systemsare known to be effective in adding market value tofresh product, and hence to increase the financialreturn to growers. In addition, quality improvementreduces environmental impact through a reduction inthe amount of poor quality product which is shippedand ultimately requires disposal in the marketplacewhen it cannot be sold.
Shanxi Province lies 1,000 km south-west ofBeijing. It is one of the poorest provinces in China.During the project formulation stages, the Shanxi gov-ernment officials stressed that their production wasmarket driven and that they sought a high yield of highquality fruit. Furthermore they recognised the need forsubstantial training in postharvest systems in order tomeet international standards.
One of the main apple production areas is in YunCheng District. This district covers the south-western
* Massey University, Palmerston North, New Zealand.† China Agricultural University, Beijing, China.
Quality assurance in agricultural produce,edited by G.I. Johnson, Le Van To, Nguyen Duy Duc and M.C. Webb.
ACIAR Proceedings 100(printed version published in 2000)
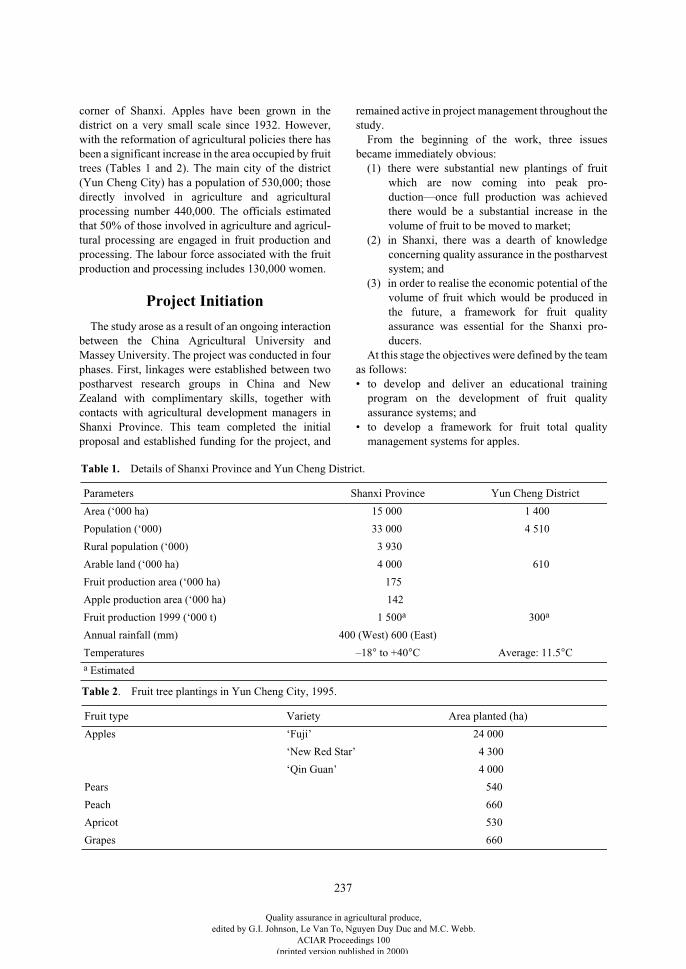
237
corner of Shanxi. Apples have been grown in thedistrict on a very small scale since 1932. However,with the reformation of agricultural policies there hasbeen a significant increase in the area occupied by fruittrees (Tables 1 and 2). The main city of the district(Yun Cheng City) has a population of 530,000; thosedirectly involved in agriculture and agriculturalprocessing number 440,000. The officials estimatedthat 50% of those involved in agriculture and agricul-tural processing are engaged in fruit production andprocessing. The labour force associated with the fruitproduction and processing includes 130,000 women.
Project Initiation
The study arose as a result of an ongoing interactionbetween the China Agricultural University andMassey University. The project was conducted in fourphases. First, linkages were established between twopostharvest research groups in China and NewZealand with complimentary skills, together withcontacts with agricultural development managers inShanxi Province. This team completed the initialproposal and established funding for the project, and
remained active in project management throughout thestudy.
From the beginning of the work, three issuesbecame immediately obvious:
(1) there were substantial new plantings of fruitwhich are now coming into peak pro-duction—once full production was achievedthere would be a substantial increase in thevolume of fruit to be moved to market;
(2) in Shanxi, there was a dearth of knowledgeconcerning quality assurance in the postharvestsystem; and
(3) in order to realise the economic potential of thevolume of fruit which would be produced inthe future, a framework for fruit qualityassurance was essential for the Shanxi pro-ducers.
At this stage the objectives were defined by the teamas follows:• to develop and deliver an educational training
program on the development of fruit qualityassurance systems; and
• to develop a framework for fruit total qualitymanagement systems for apples.
Table 1. Details of Shanxi Province and Yun Cheng District.
Parameters Shanxi Province Yun Cheng District
Area (‘000 ha) 15 000 1 400
Population (‘000) 33 000 4 510
Rural population (‘000) 3 930
Arable land (‘000 ha) 4 000 610
Fruit production area (‘000 ha) 175
Apple production area (‘000 ha) 142
Fruit production 1999 (‘000 t) 1 500a 300a
Annual rainfall (mm) 400 (West) 600 (East)
Temperatures –18° to +40°C Average: 11.5°Ca Estimated
Table 2. Fruit tree plantings in Yun Cheng City, 1995.
Fruit type Variety Area planted (ha)
Apples ‘Fuji’ 24 000
‘New Red Star’ 4 300
‘Qin Guan’ 4 000
Pears 540
Peach 660
Apricot 530
Grapes 660
Quality assurance in agricultural produce,edited by G.I. Johnson, Le Van To, Nguyen Duy Duc and M.C. Webb.
ACIAR Proceedings 100(printed version published in 2000)
238
These objectives were subsequently affirmed in theintermediate stages of the study.
A proposal was presented to the New Zealand AsiaDevelopment Aid Foundation, a government organi-sation within the New Zealand Ministry of ExternalRelations and Trade. After appropriate modificationsthe project was approved in 1997.
Methodology
Following funding approval, the New Zealand teamvisited Shanxi Province and completed an assessmentof the current state of the quality systems used for fruithandling. This visit involved inspection of postharvesthandling facilities and orchards in four counties insouthern Shanxi Province. Discussions took placebetween the New Zealand team and representatives ofthe Shanxi Agricultural Development Bureau. As aresult of discussions during this visit, specific requestsfor information, and the objectives of the proposedworkshop (phase 4), were established in consultationwith the Chinese team (Studman 1997).
In the next phase of the project three representativesof the Chinese counterparts visited New Zealand, anddiscussed postharvest handling systems with growers,cool-store operators, industry representatives, CrownResearch Institutes, and researchers at Massey Uni-versity. During this period, further discussion tookplace to define more clearly the nature of theworkshop, details of participants, and identification oftarget groups for the development of the project afterthe workshop.
In the final phase of the project, the New Zealandteam visited Yun Cheng City and presented a five-dayworkshop to selected representatives of local growersand support industries.
Project Implementation
Preliminary visits
The initial visit of the New Zealand team took placein October 1997, and was designed to coincide withthe harvesting period. Four counties in the Yun ChengDistrict were visited (Studman 1997).
During the visits, we spoke to several growers, cool-store operators, and government officials from theFruit Enterprises Bureau on the problems they arecurrently experiencing and which they would likefurther information about during the workshop in1998. Problems identified included aspects of fruit
production and postharvest handling, qualityassurance, export marketing, and finance.
Discussions were also held with Provincial gov-ernment officials and staff from Yun Cheng DistrictFruit Enterprises Bureau to assist in formulating thetopics to be covered during the workshop in 1998. Thetopics identified included the following:• new types of agro-chemicals, application methods
and regulatory standards;• quality standards—what are they?• equipment and measurement techniques for fruit
quality;• implementation of a quality assurance system—the
people involved and their tasks (i.e. organisationframework required);
• the role of research and development (R&D);• new production and postharvest techniques to assist
in meeting export standards;• pre-cooling and extending storage and shelf life;• food safety—criteria and measurement; and• overview of the New Zealand fruit industry
—production, postharvest handling, and marketing.Next the Chinese team visited New Zealand, where
delegates were able to meet with a range of peopleinvolved in postharvest operations, and to study post-harvest facilities and equipment. Due to unavoidabledelays, this took place in October 1998, after theresults from the previous season in China had beencompleted. These data indicated that, while pro-duction was increasing as expected, returns to growerswere falling as a result of oversupply to the market atthe peak harvest times. This highlighted the challengesfaced by growers, and the need for better domestic andinternational marketing options. Extensive discus-sions took place about the nature of the workshop. Itwas agreed that the workshop would be run with thepurpose of introducing the concept of total qualitymanagement to growers and support personnel whowould be involved in the development of a pilotprogram based on the Yun Cheng City region.
Workshop in China
In the final phase of the project, the New Zealandteam visited Yun Cheng City and presented a five-dayworkshop to selected representatives of local growersand support industries. Names of delegates wereadvised to the New Zealand team approximately threeweeks before the workshop. In this way the NewZealand team was able to ensure that a reasonable rep-resentation of women, growers, and support personnelwere included in the list of delegates. In the end, a total
Quality assurance in agricultural produce,edited by G.I. Johnson, Le Van To, Nguyen Duy Duc and M.C. Webb.
ACIAR Proceedings 100(printed version published in 2000)
239
of 37 people attended the workshop, although most ofthe time there were 28 persons present including 10women. The majority of those attending the con-ference full-time were growers. Support personnelattended various sessions, particularly the sessions atthe later stage of the workshop where the critical issuesof management, structure and policy were discussed.A variety of training techniques was employed, recog-nising the nature of the participants. Most of thedelegates attended every session for the entireworkshop.
In preparation for the workshop, the New Zealandteam prepared a workshop manual (Studman andOpara 1999). The key parts of this manual were trans-lated into Chinese. Information received fromcompanies was compiled into an appendix. Themanual was given to all delegates at the workshop. Aspart of the workshop manual, a draft outline of a codeof practice was prepared.
At the start of the workshop, growers indicatedsome concern about the nature of the workshop. It wasevident that they required as much technical infor-mation from us as possible about ways to improvewhat they were doing in the orchard. It became evidentthat if this view predominated, then the growersamongst the delegates would be unlikely to shift theirattitudes towards a more market and customer-orien-tated view of quality. For the first day and a half of theconference the prevailing attitude was that there wastoo much information being given about postharvesttechnology, whereas the majority of people presentwere growers who were really only interested inimproving what they did in the orchard. The criticalphase of the workshop was reached when we used the‘leaky barrel’ model to describe a total quality man-agement system. During this phase, we asked thegrowers, using a show of hands (5 = excellent to 1 =poor) to indicate their views on the state of variousparts of the system for growing, handling, storage andmarketing of their fruit. When we asked them to sayhow good each system was, growers indicated that, onthe whole, what they were doing in the orchard was ofa reasonably high quality. However, they realisedimmediately that the postharvest components werelacking. When this was presented to them in the formof the ‘leaky barrel’ (Figure 1), the message appearedto go home. Subsequently, we were advised by two orthree observers that this model had been highlyeffective in convincing the growers of the need toimprove the postharvest component of the system. Theleaky barrel was subsequently left displayed in aprominent position for the remainder of the workshop.
It became evident that an important aspect of theworkshop was to bring growers on board with theconcepts of a total quality management system, incor-porating some form of marketing organisation whichcould handle the development of quality standards forthe industry.
Before, during, and after the workshop, discussionstook place between the New Zealand team and ShanxiAgricultural Development Bureau representatives.These discussions focused on the continuation of theprogram and the development of the initiatives startedby the project. At the conclusion of the workshop, asummary of the findings and recommendations of theworkshop was completed.
Evaluation of the Effectiveness of the Training and Technology Transfer
In order to evaluate the effectiveness of the workshop,delegates were asked to fill in a questionnaire at thebeginning of the workshop. This questionnaireattempted to identify the delegates’ understanding ofquality and quality management systems. At the end ofthe workshop, the delegates were asked to fill in thesame questionnaire again.
In addition, on the first day, delegates were asked tovote on the best definition of the term ‘quality’. At theend of the workshop, delegates were asked to voteagain. Each delegate was given 10 yellow stickers andinvited to place them against a series of suggested def-initions of ‘quality’ which had been provided bysuggestions from the delegates and by the workshoporganisers. Finally, at the end of the workshop,delegates were asked to indicate how successfully theybelieved the workshop had met the objectives spec-ified. This was achieved by asking delegates to raiseone hand with the number of digits indicating theirviews. Thus the scale used was 5 = excellent; 4 = good;3 = reasonable; 2 = not so good; 1 = poor.
Delegates were clearly satisfied at the end of theworkshop that the objectives had been achieved(Table 3). For all objectives we obtained a score ofaround 4 (indicating that we had met the objectivewell). In addition, in the written survey, almost alldelegates indicated that they had learned more aboutthe subjects listed, or now understood the subject well.
From the assessment, it was clear that growers hadmoved from a view that value for money would be anacceptable definition of quality to a more customer-orientated view. This was the clear aim of theworkshop, indicating that we had achieved our
Quality assurance in agricultural produce,edited by G.I. Johnson, Le Van To, Nguyen Duy Duc and M.C. Webb.
ACIAR Proceedings 100(printed version published in 2000)
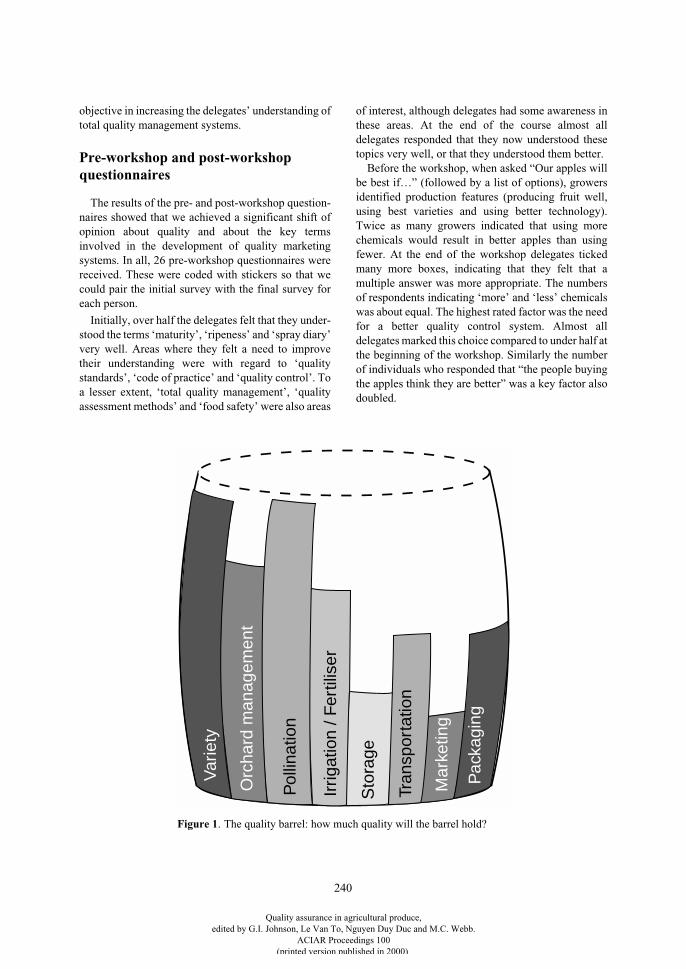
240
objective in increasing the delegates’ understanding oftotal quality management systems.
Pre-workshop and post-workshop questionnaires
The results of the pre- and post-workshop question-naires showed that we achieved a significant shift ofopinion about quality and about the key termsinvolved in the development of quality marketingsystems. In all, 26 pre-workshop questionnaires werereceived. These were coded with stickers so that wecould pair the initial survey with the final survey foreach person.
Initially, over half the delegates felt that they under-stood the terms ‘maturity’, ‘ripeness’ and ‘spray diary’very well. Areas where they felt a need to improvetheir understanding were with regard to ‘qualitystandards’, ‘code of practice’ and ‘quality control’. Toa lesser extent, ‘total quality management’, ‘qualityassessment methods’ and ‘food safety’ were also areas
of interest, although delegates had some awareness inthese areas. At the end of the course almost alldelegates responded that they now understood thesetopics very well, or that they understood them better.
Before the workshop, when asked “Our apples willbe best if…” (followed by a list of options), growersidentified production features (producing fruit well,using best varieties and using better technology).Twice as many growers indicated that using morechemicals would result in better apples than usingfewer. At the end of the workshop delegates tickedmany more boxes, indicating that they felt that amultiple answer was more appropriate. The numbersof respondents indicating ‘more’ and ‘less’ chemicalswas about equal. The highest rated factor was the needfor a better quality control system. Almost alldelegates marked this choice compared to under half atthe beginning of the workshop. Similarly the numberof individuals who responded that “the people buyingthe apples think they are better” was a key factor alsodoubled.
Var
iety
Orc
hard
man
agem
ent
Pol
linat
ion
Irrig
atio
n / F
ertil
iser
Sto
rage
Tran
spor
tatio
n
Mar
ketin
g
Pac
kagi
ng
Figure 1. The quality barrel: how much quality will the barrel hold?
Quality assurance in agricultural produce,edited by G.I. Johnson, Le Van To, Nguyen Duy Duc and M.C. Webb.
ACIAR Proceedings 100(printed version published in 2000)
241
When asked “Where is the best place to startimproving the
quality
of our apples?”, a similarresponse occurred. Initially delegates identifiedorchard characteristics and activities as being the areain which to improve quality. After the workshop theyidentified quality control systems, teaching andtraining, better cool-stores, and a quality research lab-oratory, higher than the in-orchard features. Again,many more choices were ticked after the workshopthan before.
In response to the question “Where is the best placeto start to improve the
income
from apples?”, delegatesbefore and after the workshop identified the qualitycontrol system as the best place to start. However,afterwards teaching and training were also highlyrated. Other aspects of a quality system were also iden-tified by more delegates.
In response to questions on specific subjects, itappeared that more delegates were aware after theworkshop that marketing was used. However the shiftappears to have been from those who felt that it wasalready working well to those who felt it could be donebetter. In response to the questions on quality control,cool chain management, spray diary, controlledatmosphere storage, and food safety, there was a shiftto the view that these were in use but could be donebetter. The change came from delegates who previ-
ously had indicated that they did not know what theseterms were.
Summary
These questionnaire responses showed that, afterthe workshop, the attitude of many of the delegates hadshifted to the view that it would be possible to do keypostharvest operations better. Delegates also indicatedthat they were better informed, and were concernedthat the current system was not working effectively.
Implementation of a Total Quality Management System
On the last full day of the workshop, a considerableamount of time was devoted to discussion groupsamong the delegates to identify what would be neededfor the introduction of a quality management systemfor apples in Yun Cheng. Delegates were put intogroups of five or six and asked to discuss the question“Could we develop a total quality management (TQM)system in Yun Cheng?” They were also asked toconsider how close they were to a system and whatwould be needed to implement a TQM system. Eachgroup was asked to look at one aspect of the TQMsystem.
The responses indicated that the delegates had takenon board the ideas and concepts developed in the
Table 3.
Assessment of how well workshop aims were met, where: 5 = excellent, 4 = good, 3 = reasonable, 2 = notso good, 1 = poor (average estimated by two observers).
Objective Score
To provide information about pre and postharvest equipment and systems used in New Zealand.
4
To provide a basis for a plan for the development of the project 3.75
To develop the outline for a code of practice for a quality assurance system 4
To improve delegates understanding of quality, and total quality management (TQM) 4.75
To identify steps required to set up a TQM system in the County 4.25
To answer the following requests for information:
New types of agro-chemicals, application methods and regulatory standards 4
Quality standards—what are they? 4.25
Equipment and measurement techniques for fruit quality 4
Implementation of a quality assurance system—people involved and their tasks (i.e. organisational framework required) 4
The role of research and development (R&D) 4
New production and postharvest techniques to assist in meeting export standards 4
Pre-cooling and extending storage and shelf life 4.25
Food safety—criteria and measurement 4.25
Overview of the New Zealand fruit industry—marketing 3.75
Quality assurance in agricultural produce,edited by G.I. Johnson, Le Van To, Nguyen Duy Duc and M.C. Webb.
ACIAR Proceedings 100(printed version published in 2000)
242
workshop. Given the predominance of growers ratherthan administrative and support personnel, this repre-sented a clear shift of opinion and also indicated aninterest and a willingness to adopt the ideas which theShanxi Agricultural Development Bureau wereanxious to achieve. We subsequently learned that thegrowers had decided to initiate the formation of theGrowers’ Association, and had arranged the firstmeeting to take place just 10 days after the workshop.Given that this initiative came from the growers, ratherthan the Development Bureau, this indicated the extentto which we had achieved a shift in attitude of growers.
At the completion of the workshop, the Chineseteam asked us to give our recommendations and viewson the implementation of the decisions made at theworkshop to establish a cool-store facility and agrowers’ association in Yun Cheng. These recommen-dations were conveyed verbally to the Chinese team,and presented in the final report (Studman 1999).
The issues covered were: who will be involved inthe grower’ association, decisions on the cool-storagesystem, the quality management system, publicity,marketing, grower association structure, the devel-opment of the quality assurance manual, developmentof appropriate infrastructure facilities, furthertechnical inputs and funding for additional projects,and the future involvement of consultants.
Gender Issues
In accordance with the sponsor’s requirements, ourinsistence on a minimum of 10 female delegates at theworkshop ensured the issue of gender balance wasaddressed by the Chinese farmers. Although womenwere in a minority in all areas, nevertheless there werewomen filling a number of key roles in the infra-structure. In particular, at the district level, one of thekey coordinators was involved in the strategic discus-sions with the Shanxi Agricultural DevelopmentBureau was female. Amongst the growers’ represent-atives, three or four of the women exercised significantleadership roles in the groups. Since delegatesattending the workshop will now have a significantrole in the formation of the Yun Cheng Growers’Association, we believe the workshop has facilitatedand empowered women in leadership roles. It wasnoted that the initiative for establishing the firstmeeting of the Growers’ Association came from oneof the women delegates.
Discussion
The introduction of total quality managementsystems to any industry or organisation carries with itsome implied basics. One of the key features is thecommitment to participation of everyone involved inthe organisation. This appears to be particularly fittingfor the Chinese system where collective decision-making is a possibility. A further key feature is thatquality improvement arises by identifying the currentposition and attempting an improvement from thatposition. Therefore the workshop has been effective incommitting the delegates to identify improvementswhich are appropriate to the level of technology whichthey have already reached.
The initial visit made by the New Zealand teamconvinced us that implementation of technology fromoverseas was achievable in the environment withincertain limitations. The major difficulty we identifiedwas a narrow focus on quality, largely based on theidea that fruit produced to the top quality in the orchardwill therefore be top quality fruit to the customer.Unfortunately this is not the case, since postharvestfactors can completely alter the situation. By identi-fying the need for a systems approach to the problem,the workshop achieved the aim of identifying weak-nesses with the current system and seeking to identifyways to move forward from this. The decision toproceed with the program to develop a pilot plantfocused around the development of postharvesthandling and storage facilities by the Chineseindicates the success of our training.
Inherent in the total quality management approachto the postharvest system for fruit is the recognitionthat the introduction of technology carries with it theneed for equipment maintenance and support. Sincethe cool-store facility is likely to be developed usingChinese funds and resources, it is evident that ongoingcosts are more likely to be funded from localresources.
In our view this project has indeed been an out-standing success. Taken as a whole, our initiative inproviding technical input to run the workshop andprovide external assistance to the fruit growers inShanxi Province has resulted directly in the decision toapply for a two million yuan grant to enable the devel-opment of cool-store facilities. This in itself will bringabout a significant improvement in the quality of post-harvest systems in the county. The pilot program willalso act as a project capable of wider application whendemonstrated to be successful.
Quality assurance in agricultural produce,edited by G.I. Johnson, Le Van To, Nguyen Duy Duc and M.C. Webb.
ACIAR Proceedings 100(printed version published in 2000)
243
Our workshop has also been instrumental in con-vincing growers of the need for a growers’ associationin Yun Cheng. This organisation has the potential to bea marketing body for the growers, thereby ensuring aunited front in marketing their produce. The impor-tance of apples and other fruits as a developmental toolin the region is readily apparent from discussions andobservations in the area. Significant redevelopment istaking place, and extensive rebuilding and prosperityhas come to the region. The return from apples hasbeen extremely good, giving growers a three or four-fold increase in profits per unit area of land. While thefall in price for fresh fruit in October/November 1998has dampened the enthusiasm somewhat, ourworkshop and the suggestions for ways of increasingthe return through good postharvest handling systemshas given the delegates some refreshed enthusiasm forfruit growing.
It was evident from the emphasis on a final signingceremony, and the importance attributed to writtenfindings from the workshop which indicated thepotential for external technical assistance, that thevalue of our input could not be underestimated. It isevident that the Chinese side is extremely dependenton continued inputs of technological assistance fromoutside China. Our willingness to be involved in thelong-term in this project was paramount to the successof the program.
Conclusions and Recommendations
• The project met and exceeded its aims.• The workshop and our involvement with the Shanxi
Agricultural Development Bureau have resulted inthe Chinese counterparts wishing to commitsignificant in-country funds to the project’sdevelopment base.
• We have provided a framework for the introductionof a total quality management system amongstgrowers in Yun Cheng City. This system has givenleads and guidelines for the introduction oftechnical, institutional and developmentalimprovements.
• Gender issues have been addressed successfully inthis project.
• The involvement of the Shanxi AgriculturalDevelopment Bureau, the China AgriculturalUniversity, and Massey University has resulted inan increased understanding between these threegroups. We believe we have laid the foundation fora continued interaction and collaboration for a long-term program of technical assistance in the
development of postharvest systems in ShanxiProvince.
The main recommendations were as follows:• Formation of a growers’ association to focus on
developing a quality management system for apples(already actioned). Establishment of a marketingeffort was identified as a key task of the association.
• Development of additional cool-storage facilities(Chinese proposal supported and submitted).
• Further proposal to extend the project, with thecontinued involvement of the New Zealand team inassisting with the development of facilities,postharvest systems and the quality managementprogram.
• There is a need for research, testing, and advisorysystems to be established to enable growers to makecontinuous improvements to their pre andpostharvest systems.
• Further international technical assistance is stillrequired, both in the short and long term.
• The workshop was most successful and could berepeated with other groups in China and elsewhere.
Acknowledgments
We would like to thank Professor Gao Huanwen(China Agricultural University), Mr Li Ren An(Director of the Shanxi Provincial Agricultural Com-prehensive Development Board), and Professor GavinWall (Massey University) for their assistance in for-mulating the proposal and enabling this project toproceed.
We would also like to thank the New ZealandMinistry of Foreign Affairs and Trade for theirsupport, through the Asia Development AidFoundation.
References
Studman, C.J. 1997. Postharvest systems in ShanxiProvince, China. Report to the Ministry of ForeignAffairs and Trade, New Zealand. Palmerston North,Massey University, Centre for Postharvest andRefrigeration Research.
Studman, C.J. 1999. Fruit quality improvement in ShanxiProvince, China. Report to the Ministry of ForeignAffairs and Trade, New Zealand.
Studman, C.J. and Opara L.U. 1999. Fruit qualitymanagement workshop manual, volume 1, Englishversion. Palmerston North, New Zealand, MasseyUniversity, 108p.
Quality assurance in agricultural produce,edited by G.I. Johnson, Le Van To, Nguyen Duy Duc and M.C. Webb.
ACIAR Proceedings 100(printed version published in 2000)
244
New Market-pull Factors Influencing Perceptions of Quality in Agribusiness Marketing(or Quality Assurance for Whom?)
L.U. Opara*
Abstract
The term ‘quality’ is elusive and connotes different meanings to different people. Quality is also dynamic andreflects both time and position in the entire food supply chain. The producer, handler/marketer, consumer, andother stakeholders have both influences and perceptions on product quality. There is also a product-orienteddefinition of quality. In many developing countries, it is a commonly held view that importers from developedcountries usually wanted it all their own way by defining both the quality required and the price to be paid. Inthis paper, we will review the different orientations of quality, including the emerging influences ofsustainability of production systems and genetic modification, and the implications on export marketing ofagricultural produce from developing countries.
I
NTERNATIONAL
TRADE
in fresh agricultural (and hor-ticultural) food products has expanded tremendouslyduring the past decade. This trend has been spurred onby changes in food consumption patterns, particularlyin the developed economies in Europe and the UnitedStates of America (USA). Consumers are increasinglyeating to express their personal values, concerns andaspirations. Consumers also want assurances onfreshness, taste, safety/traceability, health/nutrition,animal welfare, sustainability/environment impacts,zero waste, and fair trade. These factors contribute tothe overall perception of ‘quality’. More than before,the quality of fresh agricultural produce has comeunder considerable scrutiny by consumers and thegeneral public. Both producers and marketers face thechallenge of balancing profitability with increasingcustomer demand for high quality products backed bya consistently reliable support service.
The increasing global demand for fresh fruits andvegetables creates opportunities for many developingcountries, which produce a range of tropical andsub–tropical products. However, to participate com-
petitively in the growing and marketing of fresh foodproducts, appropriate quality assurance (QA) must bedeveloped and implemented to meet customer expec-tations. This requires a good understanding of (a) theinternational trends and challenges in agribusinessmarketing; (b) the various perceptions of ‘quality’throughout the entire chain; and (c) the market-pull(demand/consumer) factors influencing these percep-tions. The objective of this paper is to discuss theseglobal trends and perceptions of quality in relation tothe development of QA systems.
Globalisation and Current Trends in Fresh Food Consumption
Global trade in fresh fruits and vegetables hasincreased steadily during the past decade. Changingmarket trends and innovative industry managementhave characterised this era, and will continue toinfluence the way fresh commodities are supplied.Greater labour mobility and demographic shifts inmajor metropolitan areas have resulted in the intro-duction of new fresh food products and changing foodpatterns, particularly where new immigrants arehigher consumers of fresh fruits and vegetables. Thisopens up further opportunities for international trade
* Centre for Postharvest and Refrigeration Research, Institute of Technology and Engineering, Massey University, Palmerston North, New Zealand.
Quality assurance in agricultural produce,edited by G.I. Johnson, Le Van To, Nguyen Duy Duc and M.C. Webb.
ACIAR Proceedings 100(printed version published in 2000)
245
in both tropical, subtropical and temperate fruits andvegetables.
Several global trends in business will continue toimpact on current and future global agribusiness mar-keting, including:• increasing competition;• legislative and regulatory demands;• speed of economic change; • rapidly changing information and communications
technology; and• global sourcing and strategic alliances.
Rapid growth in information and communicationstechnology, and the unrelenting surge in the use of theWorldwide Web, have led a single, highly networkedworld, affecting the way we access data and technicalinformation for production, handling and marketing ofproducts. The General Agreement on Trade andTariffs (GATT), formation of regional trading blocs,and increasing influence of the World Trade Organi-zation (WTO) have facilitated the expansion ofinternational trade in horticultural and agriculturalproducts. The increase in global fresh commoditytrading during the past decade is exemplified by thesteady increase in the export and import of horticul-tural products in the USA, a trend that is forecast to
continue (Tables 1 and 2). This trend is also matchedby an increase in fresh fruit and vegetable con-sumption for the past three decades, rising from 257 kgper person in 1970 to 307 kg per person in 1993 (Anon.1996).
The rise in fresh fruit and vegetable consumption(ranked #7) is one of the top 10 ‘mega-trends’ in foodconsumption patterns (Sloan 1996). Particularlycritical also is the popularity of ‘fresh’ as the mostdesirable food label (ranked #5). The quality andvariety of (i) fresh fruits and vegetables and (ii) freshmeat ranked second and third, respectively, rightbehind a clean store, as the reasons consumers elect toshop in a grocery store. This study further noted thatthe emerging trend for organic foods was yet to reachits full potential (Sloan 1996). Increasingly,consumers are eating to express their personal values,concerns and aspirations. Consumers also want assur-ances on freshness, taste, safety/traceability, health/nutrition, animal welfare, sustainability/environment,zero waste, and fair trade. These trends in food con-sumption patterns, coupled with the overwhelmingdesire for convenience, provide a powerful drivingforce behind food production and international agri-business marketing.
Table 1. Exports of fruits and vegetables from the United States of America (US$1,000). (Source: Brown 1996.)
Year Fresh fruits Fresh vegetables Processed fruits and vegetables
1989 356 015 1 134 657 1 000 616
1990 728 648 1 486 489 1 246 753
1991 832 935 1 561 053 1 394 490
1992 899 624 1 683 344 1 558 121
1993 985 953 1 707 147 1 639 583
1994 1 046 789 1 953 767 1 720 891
1995 1 068 572 1 972 864 1 906 561
Table 2. Imports of fresh and processed fruits andvegetables into the United States of America (US$million). (Source: Brown 1996.)
Year Fresh and processed fruit
Fresh and processed vegetables
1989 1 820 2 047
1990 2 219 2 266
1991 2 131 2 214
1992 2 216 2 184
1993 2 037 2 450
Quality assurance in agricultural produce,edited by G.I. Johnson, Le Van To, Nguyen Duy Duc and M.C. Webb.
ACIAR Proceedings 100(printed version published in 2000)
246
Strategic Trends in Agribusiness Marketing and Impacts on Quality
Management
Agriculture (and horticulture) is a dynamic industry.Over the past century, we have witnessed the evolutionfrom production-focused agriculture (basic familyfood supply) to market-oriented agribusiness. Agri-culture (including farming) is radically changing tofewer, larger, more sophisticated firms with growingglobal influence. Competition is shifting to exclusive,shorter, higher technology, higher integrity supplychains, with increasing power of supermarket chains.For instance, global corporations such as Dole, DelMonte, and Chiquita dealing with fresh foods, as wellas highly successful marketing cooperatives (such asENZAFRUIT and ZESPRI in New Zealand), areincreasingly expanding their global network so as toincrease their market share and provide year-roundsupply of commodities.
These firms are increasingly applying the concept of‘supply chain management’ to the production anddelivery of products and services worldwide (Lummusand Vokurda 1999). Global interest in supply chainmanagement has increased steadily since the 1980s asa result of the realisation that collaborative relation-ships within companies and beyond their ownorganisations was beneficial. This concept involvesmanaging supply and demand, sourcing raw materialsand/or products, manufacturing and assembly, ware-housing and inventory tracking, order entry and ordermanagement, distribution across all channels, deliveryto the customer, and the information systemsnecessary to monitor all these activities. Supply chainmanagement coordinates and integrates all these activ-ities into a seamless process to ensure that thefollowing conditions are met in the production andhandling of agricultural produce:
• use of uncontaminated raw materials;
• clean growing and harvesting conditions;
• specification of product attributes;
• cool-chain control and maintenance;
• commitment to regulatory protocols;
• evidence of an agreed quality assurance (QA)system; and
• use of Good Agricultural Practice (GAP) andapplication of internationally recognised qualityfood safety programs such as Hazard Analysis andCritical Control Points (HACCP).
What is Quality?
The use of superior product quality as a competitiveweapon is widely recognised and documented (Garvin1984). Although the quality of both product andservice is widely recognised as important for suc-cessful agribusiness, there is often a lack of under-standing or agreement on the meaning. This hasresulted in a plethora of definitions of quality, oftenreflecting the type of product, stage in the postharvesthandling chain, or the intended use (Botta 1995;Abbott 1999; Shewfelt 1999; Bremner 2000).
Quality is a concept and is dynamic; and thus thereis no single, brief, consistent, and universally accepteddefinition. Shewfelt (1999) argued that the primarydividing line between differing concepts of quality isorientation. Producers, researchers and handlers aremostly product-oriented, in that quality is described byspecific attributes of the produce (such as firmness orcolour), while consumers, marketers and economistsare more likely to be consumer-oriented in that qualityis described by consumer wants and needs. Plausibleas these viewpoints may sound, particularly in relationto commercial needs, Abbott (1999) argued that it isdifficult to divorce the two viewpoints and viewedquality in terms of instrumental or sensory measure-ments of product attributes that combine to provide anestimate of customer acceptability.
With respect to agricultural and horticulturalproducts, quality involves all of the attributes, charac-teristics, and features of a product that the buyer,purchaser, consumer, or user expects. A product withexcellent quality clearly meets the buyer’s or user’shighest expectations. Kruithof and Ryall (1994)provide a succinct and definition of quality applicableto agribusiness: “Quality is consistently meeting the
continuously
negotiated expectations of the customerand other stakeholders in a way that represents valuefor all involved”. In practical terms, the customerwants the right product, at the right time, at the rightprice, and with the right support! The quality of anagricultural/horticultural product is assessed from therelative values of several characteristics which, con-sidered together, will determine the acceptability ofthe product to the buyer and ultimately the consumer
Developing a good understanding of qualityconcepts is necessary before strategic marketing issuescan be adequately addressed. The orientation ofquality adopted will undoubtedly influence the qualitystandards (product specifications) and techniques usedto assess quality. It could also create barriers to qualityimprovement (Shewfelt 1999). In this respect, the
Quality assurance in agricultural produce,edited by G.I. Johnson, Le Van To, Nguyen Duy Duc and M.C. Webb.
ACIAR Proceedings 100(printed version published in 2000)
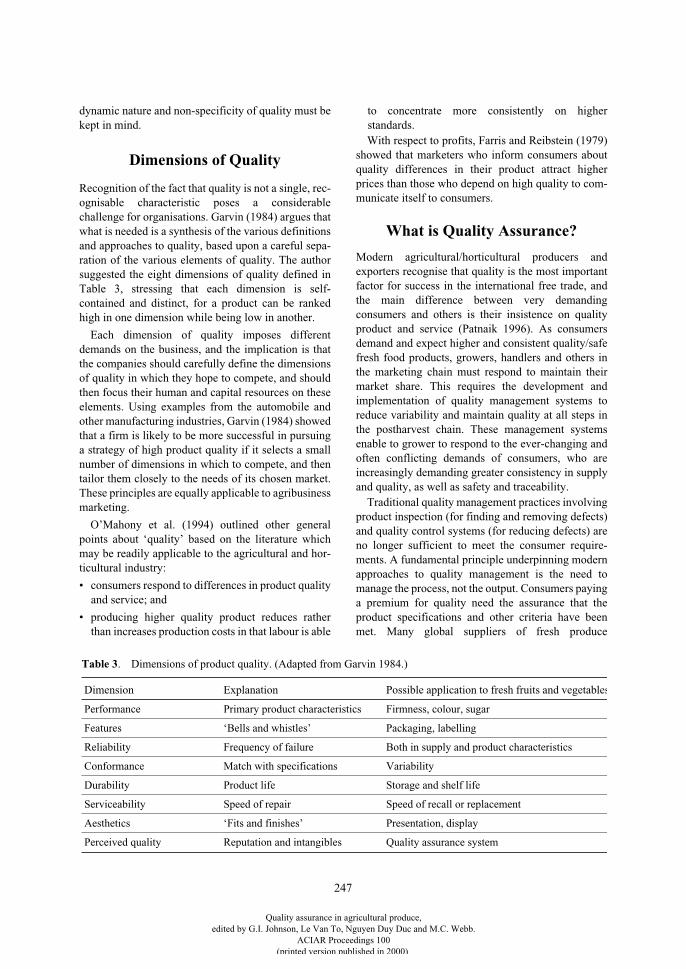
247
dynamic nature and non-specificity of quality must bekept in mind.
Dimensions of Quality
Recognition of the fact that quality is not a single, rec-ognisable characteristic poses a considerablechallenge for organisations. Garvin (1984) argues thatwhat is needed is a synthesis of the various definitionsand approaches to quality, based upon a careful sepa-ration of the various elements of quality. The authorsuggested the eight dimensions of quality defined inTable 3, stressing that each dimension is self-contained and distinct, for a product can be rankedhigh in one dimension while being low in another.
Each dimension of quality imposes differentdemands on the business, and the implication is thatthe companies should carefully define the dimensionsof quality in which they hope to compete, and shouldthen focus their human and capital resources on theseelements. Using examples from the automobile andother manufacturing industries, Garvin (1984) showedthat a firm is likely to be more successful in pursuinga strategy of high product quality if it selects a smallnumber of dimensions in which to compete, and thentailor them closely to the needs of its chosen market.These principles are equally applicable to agribusinessmarketing.
O’Mahony et al. (1994) outlined other generalpoints about ‘quality’ based on the literature whichmay be readily applicable to the agricultural and hor-ticultural industry:
• consumers respond to differences in product qualityand service; and
• producing higher quality product reduces ratherthan increases production costs in that labour is able
to concentrate more consistently on higherstandards.With respect to profits, Farris and Reibstein (1979)
showed that marketers who inform consumers aboutquality differences in their product attract higherprices than those who depend on high quality to com-municate itself to consumers.
What is Quality Assurance?
Modern agricultural/horticultural producers andexporters recognise that quality is the most importantfactor for success in the international free trade, andthe main difference between very demandingconsumers and others is their insistence on qualityproduct and service (Patnaik 1996). As consumersdemand and expect higher and consistent quality/safefresh food products, growers, handlers and others inthe marketing chain must respond to maintain theirmarket share. This requires the development andimplementation of quality management systems toreduce variability and maintain quality at all steps inthe postharvest chain. These management systemsenable to grower to respond to the ever-changing andoften conflicting demands of consumers, who areincreasingly demanding greater consistency in supplyand quality, as well as safety and traceability.
Traditional quality management practices involvingproduct inspection (for finding and removing defects)and quality control systems (for reducing defects) areno longer sufficient to meet the consumer require-ments. A fundamental principle underpinning modernapproaches to quality management is the need tomanage the process, not the output. Consumers payinga premium for quality need the assurance that theproduct specifications and other criteria have beenmet. Many global suppliers of fresh produce
Table 3. Dimensions of product quality. (Adapted from Garvin 1984.)
Dimension Explanation Possible application to fresh fruits and vegetables
Performance Primary product characteristics Firmness, colour, sugar
Features ‘Bells and whistles’ Packaging, labelling
Reliability Frequency of failure Both in supply and product characteristics
Conformance Match with specifications Variability
Durability Product life Storage and shelf life
Serviceability Speed of repair Speed of recall or replacement
Aesthetics ‘Fits and finishes’ Presentation, display
Perceived quality Reputation and intangibles Quality assurance system
Quality assurance in agricultural produce,edited by G.I. Johnson, Le Van To, Nguyen Duy Duc and M.C. Webb.
ACIAR Proceedings 100(printed version published in 2000)
248
acknowledge food safety guarantees as the singlebiggest issue for consumers (Marks 1999). As a result,retailers want not only documentation of every aspectof growing and delivery regimes, but also want dem-onstrated and audited efficacy of labour practices,energy conservation or community contributions(Marks 1999). In addition to the consumer, there areother influential stakeholders who have shown interestin the way we grow and market agricultural products.In a recent article on securing market access, Chandler(1999) argues that it is no longer the customer thatneeds to be sold, but rather the government, consumergroups and public perception itself.
Quality assurance (QA), therefore, involves thoseplanned activities designed to consistently satisfycustomer expectations by defining objectives,planning activities, and controlling variability.Leamon (1989) defined QA as all those planned andsystematic actions necessary to provide adequate con-fidence that a product or service will satisfy stated orimplied needs. Obviously, this requires the systematicinteraction of products, services, processes andpeople. An effective QA system ensures that thequality of the inputs (resources, staff, aims andintended outcomes) and the quality of the process(grading, handling and marketing) are well plannedand managed. The intended output quality (productspecifications) must be agreed upon from the outsetand not imposed or manipulated at the end of thechain. Ultimately, the success of any QA scheme isdependent on the integrity of the auditors who conductthe QA assessment or verification (Lewis-Jones1998).
Several factors have been identified as important inthe development process for QA in horticulture(Leamon 1989):
• definition of quality specifications for the product;
• development of quality control procedures andrecording system;
• documentation of the first two points withphotographic interpretation in a product qualitymanual and training material;
• documentation of ‘typical’ process flow charts andhazard analysis—these are incorporated in a ‘modelQA manual’ which can be used as an example forpeople unfamiliar with QA; and
• development of training programs for peopleinvolved in controlling quality, e.g. pickers, packersand quality controllers.
Legge (1998) discussed four preconditions for suc-cessful QA, namely:
• clearly set objectives which are part of the corporatephilosophy, ensuring that QA staff cannot agree toshort-term expedients which may damage long-term growth;
• a strategic plan incorporated into commercialobjectives;
• use of all available tools; and• an adequate number of suitably trained staff.
It was considered that the most important factor ofall these is that QA staff must be an integral part of abuying/selling team.
Implementing a QA program brings several obviousbenefits to the grower, marketer, consumer, and otherstakeholders including (LRQA 1999):• better management control;• improved producer – supplier – consumer relation-
ships;• less waste and lower costs;• greater staff motivation and reduced staff turnover;
and• improved customer satisfaction.
QA plays an important role in the maintenance ofquality at all levels and tolerances acceptable to theconsumer. With respect to international agribusinessmarketing, QA and quality standards play a crucialrole in creating confidence and ensuring the deliveryof consistent quality and safe products. It musttherefore be considered as a science and not an art. It isnot based on individual personal judgement, but onstatistically treated physical, chemical, microbio-logical and sensory measurements (Askar andTreptow 1993). QA considerations and proceduresmust be applied at all stages in agricultural production,including procurement of planting materials andextending to all steps in the postharvest chain, with themain emphasis on creating the conditions that lead tothe satisfaction of consumer needs and want. QAacknowledges that fixing a quality defect after it hasoccurred is either very difficult or very costly(Andrews 1999).
Quality Assurance for Whom?
The production and handling of fresh fruits and vege-tables is an integral part of the global food manufac-turing industry. Unlike other manufacturingindustries, such as automobile and electronics, theagricultural and horticultural industry is characterisedby huge variations in growing conditions, which alsocontribute to considerable variation in product quality.Improper control of the numerous postharvest condi-tions (such environmental temperature, relative
Quality assurance in agricultural produce,edited by G.I. Johnson, Le Van To, Nguyen Duy Duc and M.C. Webb.
ACIAR Proceedings 100(printed version published in 2000)
249
humidity and packaging) and differences in staff per-formance at each stage in the chain create additionalvariations which exacerbate the quality variabilityproblem. Therefore, the importance of QA coveringall aspects of the production and distribution chaincannot be overemphasised. However, given thevarious orientations and dimensions of qualitydiscussed above, and the considerable influence ofmany stakeholders (Chandler 1999), one could ask thequestion: QA for whom?
Earlier in this paper, I highlighted some trendsaffecting agribusiness and consumption patterns. Glo-balisation, changing technology and the increasingimpact on the production and marketing of products,increased international competition, internationaltrade agreements, and the increasing consumerdemand for consistent high quality products are someof factors forcing growers to re-examine the way theydo business. Put together, these factors createpush–pull factors that influence the perception ofquality as well as the strategy for agribusiness mar-keting. To meet the challenges posed by these globaltrends and remain profitable, we are now witnessing aparadigm shift from technology-push (orientedtowards the product, output/yield, producer, supply-driven) to market-pull (consumer, attitudes, demand-driven) in agribusiness.
Market-pull Factors Influencing Perceptions of Quality
The successful fresh food supply chain will become anincreasingly complex web, resulting in mutual rela-tionships between the producer, marketer andconsumer to meet new consumer demands. The newmarket-pull factors (new demands) include (Hughes1994; Hofstede et al. 1998):
• high quality and safe products;
• environmental and ecological sustainabilityconsiderations in production and distribution;
• animal welfare considerations;
• products in broad assortments available year-round;
• short lead times (fresh products!); and
• competitive prices.
These factors have resulted in increasing productdifferentiation and customisation to satisfy consumerdemands for health/nutrition, safety, organics/natu-ralness, labelling, ecological/environmentalresponsibility, social responsibility, and a peace ofmind! Let me comment briefly further on safety and
organics, two factors which have become increasinglyinfluential quality factors in fresh food marketing.
Food safety
Unfortunately, fresh food products such as eggs,beef, chicken, milk, pork, fruit and vegetables haveone thing in common: pathogens. This is exacerbatedby some agricultural practices (such as spreadinganimal slurries and human faeces as manure) and poorsanitation and inappropriate postharvest handlingpractices. Recent fresh food poisoning incidentsaround the world have resulted in crises of confidencein the food supply chain. Food safety has come underthe spotlight and is now the single biggest issue forconsumers. Fresh fruits and vegetables, meat, eggs andchicken have been implicated with pathogens, whichpose health risks to humans.
Campylobacter
inchickens,
Mycobacterium paratuberculosis
in milk,
Salmonella
in poultry and eggs, and the link betweenbovine spongiform encephalopathy (BSE) in cattleand new variants of Cruetzfeldt Jacob disease (CJD) inhumans are some of the potential safety hazards in ourfood chain.
Although the incidence of food-related illnessesfrom direct consumption of raw fruits and vegetablesis low, the risks are real. The potential for highpesticide residue levels on produce and the discoveryof newly emerging pathogens present furtherproblems for the fresh food industries (Andrews1999). Many countries have passed new, stringentfood safety laws, and set up new food safety agenciesto develop policy and implement strategies to ensurepublic confidence in the food chain. In addition toreducing the incidence of food-related illnesses anddeath, these actions will also reduce the costs to thepublic health system and increase labour productivity.
Despite the above actions of some governmentsaround the world, many consumers have generally lostconfidence in the ability of governments to protectpublic health and of science to understand the nature ofsome of the food problems (McKechnie 1997). Thisfocuses attention on producers, the fresh food industryand retailers. As consumers demand action andanswers, there is no indication that this pressure willreduce in the near future especially as the debate overgenetically modified foods continues (Halford 1999).Increasing transparency, traceability and assurancehave become the norm in modern agribusinessenterprises.
Quality assurance in agricultural produce,edited by G.I. Johnson, Le Van To, Nguyen Duy Duc and M.C. Webb.
ACIAR Proceedings 100(printed version published in 2000)
250
Organics—a new quality attribute
Increasing public interest in environmental sustain-ability and our changing lifestyles have raised concernabout current farming practices and raw materialinputs. These interests have been championed by verypowerful political and social interest groups such asthe Green Party in New Zealand, Greenpeace, and theSociety for the Prevention of Cruelty to Animals(SPCA). The increasing awareness and support ofthese environmental and animal welfare philosophieshas created a new demand for ‘organic’ food products.For some consumers, ‘organic’ equates with ‘farmfresh’, and represents a critical quality attribute. Theincreasing demand for organic products and thepremium prices they command in the marketplace arevery significant trends that cannot be ignored bygrowers and marketers of fresh foods.
To illustrate this growing influence of organic freshfoods in the global agribusiness, let us consider thedata from the USA showing dramatic sales increasesin recent times. Currently, organic foods account forless than 1% of all food sales, with over 20% annualgrowth over the past 6 years. It is projected thatorganic sales will double from $3.7b in 1997 to $7.2bin 2000 (Stauffer 1999). A recent survey showed that60% of all Americans are either consumers of organicfoods or interested in these products (Sloan 1998).Increasing concerns about food safety, whole-someness and genetic modification are convertingerstwhile cynics into believers in organic fruits, vege-tables and meat products.
The ‘organic wave’ has also been noticeable inmany other parts of the world, including New Zealand.Newspaper headlines such as “Farmers urged to rideEurope’s organic meat wave”, “Organic applesgrowers’ hope”, and “Organic apples sweet” aretypical. Over the past three years, organic apples rep-resented 1.5% of the 15.5 million apple cartonsexported through ENZAFRUIT International, with 30of New Zealand’s 1,600 export apple growers makingthe switch to organic. Premium returns up to 30% overconventional fruit were recorded over the same period(Sheeran 1999). One Hawke’s Bay organic applegrower earned a gross return of NZ$109,231.00 per ha,earning NZ$39.88 per carton compared with growingconventional apples which would have earned himNZ$39,000.00 per ha, at NZ$14.10 per carton.Organic meat could demand a premium of 20-40%(lamb), 100% (beef), 200% (pork) and 300%(chicken), reflecting the difficulties in producing theseanimals organically (Anon. 1999). The three years of
transition from conventional farming to gain organiccertification represents loss in production over thattime, and growers need to be aware of this.
Implications of QA for Least Developed Countries
Many developing countries cannot participate in thegrowing international and regional trade in freshproduce due to a lack of appropriate postharvest tech-niques, and inadequate infrastructure and marketingsystems. Numerous smallholder farms, often less than2–3 ha and scattered in many locations, pose specialproblems in forecasting product supply and managingvariability. Agriculture in these countries is still at sub-sistence level, with limited scope for market-orientedproduction. With stringent quality and phytosanitaryrequirements in an international market dominated bya few large companies and marketing cooperatives,small-scale farmers in developing countries face hugedifficulties to compete favourably.
Most developing countries suffer trade deficits onfruits and vegetables (Hutabarat 1989). However,there is a large number of crops in these countrieswhich bear edible fleshy parts or nuts of acceptablequality and which have considerable economicpotential as international commodities (Menini 1991;Wood and Payne 1991). As the production andmarketing of the traditional tropical and subtropicalfruit crops come under pressure due to increasingsupply and over-supply and declining profits in someregions or seasons, there is a need to develop suitablepostharvest technologies and quality managementsystems for the production and marketing of theselesser known crops which have food potential.Improving quality control and implementing QAsystems will enable these developing countries toderive benefits from these crops by trading competi-tively in the lucrative global trade in freshcommodities. The domestic market could also benefitfrom the improvements to quality standards and devel-opment of QA systems.
Certain socio-cultural factors must be considered indeveloping quality management systems in thesedeveloping countries. For instance, horticultural pro-duction and marketing follow a clearly-defined genderline in many places, with women predominantlyengaged in vegetable production and marketing, whilethe men are active in fruit production. Religiousbeliefs and cultural taboos cannot be ignored as thesemay impact on the adoption and continued use of
Quality assurance in agricultural produce,edited by G.I. Johnson, Le Van To, Nguyen Duy Duc and M.C. Webb.
ACIAR Proceedings 100(printed version published in 2000)
251
appropriate postharvest technology and the successfulimplementation of QA techniques.
Where export marketing is pursued, growers mustparticipate in setting the quality standards, and receivefinancial incentives (higher price) to raise quality.Personal experience of the author in the developmentof horticultural export marketing in Mali under aWorld Bank Project, showed that many small-scalefarmers feel powerless and believe that importers wantit all their way by setting quality standards as well asthe product price. Efforts to assist these countries mustequip them with the tools of QA and the marketingskills to derive the benefits of improvements inproduct quality.
Conclusions
Globalisation, competition in international trade infresh food commodities, changing food consumptionpatterns, and increasing consumer-orientation ofquality are challenging the traditional perceptions ofquality. These create strong market-pull influencessuch as food safety, organics and personal attitudes asimportant new quality factors in agribusiness mar-keting. QA systems are necessary to demonstratetransparency, traceability and assure quality of theproduct and other consumer expectations. These newmarket-pull factors pose considerable challenges fordeveloping countries which have limited postharvestinfrastructure and inadequate QA systems. In order tomeet existing international quality standards so as toparticipate favourably in the competitive internationaltrade in fresh commodities, postharvest technologytransfer to developing countries must include the skillsto develop and implement appropriate QA systems.
References
Abbott, J.A. 1999. Quality measurement of fruits andvegetables. Postharvest Biology and Technology, 15,207–225.
Andrews, G. 1999. Research priorities in food quality andsafety. Food Science and Technology Today, 13(3),156–158.
Anon. 1996. Agriculture facts book 1996. Washington,D.C., United States Department of Agriculture, Office ofCommunications.
Anon. 1999. Farmers urged to ride Europe’s organic meatwave. Evening Standard, 26 May, p11.
Askar, A. and Treptow, H. 1993. Quality assurance intropical fruit processing. Berlin, Springer-Verlag.
Botta, J.R. 1995. Evaluation of seafood freshness quality.New York, VCH Publishers.
Bremner, H.A. 2000. Toward practical definitions of qualityfor food science. Critical Reviews in Food Science andNutrition, 40, 83–90.
Brown, M.W. 1996. Postharvest—essential for successfulexport marketing of horticultural products. Paperpresented at the South Pacific Regional Workshop onPostharvest Handling and Export Marketing of FreshCommodities in the South Pacific, Nuku’alofa, TheKingdom of Tonga.
Chandler, N. 1999. Securing market access. The FifthQuarter. Meat and Livestock Australia Co-ProductsNewsletter, October, 2–3.
Farris, P.W. and Reibstein, D.J. 1979. Low prices, andexpenditure and profits are linked. Harvard BusinessReview, Nov–Dec, 173–184.
Garvin, D.A. 1984. Product quality: an important strategicweapon. Business Horizons, 27(3), 40–43.
Halford, N.G. 1999. Dr Frankenstein I presume? FoodScience and Technology Today, 13(2), 66–67.
Hofstede, G.J., Trienekens, J.W. and Ziggers, G.W. 1998.The strawberry chain. In: Ziggers, G.W., Trienekens, J.H.and Zuurbier, P.J., ed., Proceedings of the 3
rd
international conference on chain management inagribusiness and the food industry. Wageningen, TheNetherlands, Management Studies Group, WageningenAgricultural University, 76–85.
Hughes, D. 1994. Breaking with tradition: buildingpartnerships and alliances in the European food industry.Wye, Wye College Press.
Hutabarat, B. 1989. Issues and strategies for developingIndonesian horticultural subsector. IndonesianAgricultural Research and Development (IARD) Journal,11, 5–15.
Kruithof, J. and Ryall, J. 1994. The quality standardshandbook: how to understand and implement qualitysystems and ISO 9000 standards in a context of totalquality and continuous improvement. Melbourne, TheBusiness Library.
Leamon, K.C. 1989. Introducing quality assurance intoVictorian horticulture. In: Beattie, B.B., ed., Proceedingsof the Australian conference on postharvest horticulture,Gosford, New South Wales Agriculture and Fisheries.The Australian Institute of Agricultural Science,335–338.
Legge, A. 1998. Quality assurance—the driving force. In:Stenning, B., ed., Quality assessment for the freshproduce market. Conference proceedings, PostharvestConvention, Silsoe College, Cranfield University,Bedford, United Kingdom, 2–3.
Lewis-Jones, C.A. 1998. Quality assurance assessment. ThePig Journal—Proceedings Section, 41, 99–104.
Quality assurance in agricultural produce,edited by G.I. Johnson, Le Van To, Nguyen Duy Duc and M.C. Webb.
ACIAR Proceedings 100(printed version published in 2000)
252
LRQA (Lloyd’s Register Quality Assurance) 1999. Globalchange. Quality Progress, 32(10), 25.
Lummus, R.R. and Vodurka, R.J. 1999. Defining supplychain management: a historical perspective and practicalguidelines. Industrial Management and Data Systems, 99,11–17.
Marks, T. 1999. Innovation lifeblood for kiwifruit growers,but food safety critical too. Zespri News, 30 (June 21),2–3.
McKechnie, S. 1997. Biotechnology—meeting consumerconcerns. In Davies, W.P. and Harrison, S., ed.,Advancing biotechnology—prospects for agriculture andthe food industry. United Kingdom, Eye Press, 69–81.
Menini, U.G. 1991. Potential and issues for collaborativeaction on tropical fruit research and development.Chronica Horticulturae, 31(3): 38–89.
O’Mahony, R., Lucey, D.I.F. and Cowan, C. 1994. Aspectsof quality management in the pigmeat chain. In: Hagelaar,
G., ed., Management studies and the agri-business:management of agri-chains. Wageningen, TheNetherlands, Department of Management Studies,Wageningen Agricultural University, 307–319.
Patnaik, G. 1996. Quality is the key to success. In:International fruit world. Switzerland, AgroPress Inc., 59.
Sheeran, G. 1999. Organic apples growers’s hope. SundayStar-Times, 22 May, pE1.
Shewfelt, R.L. 1999. What is quality? Postharvest Biologyand Technology, 15, 197–200.
Sloan, A.E. 1996. The top 10 trends to watch and work on.Food Technology, 50(7), 55–71.
Sloan, A.E. 1998. Organics: grown by the book. FoodTechnology, 52(3), 32.
Stauffer, J.E. 1999. Organic foods. Cereal Foods World, 44,677–680.
Wood, B.W. and Payne, J.A. 1991. Pecan—an emergingcrop. Chronica Horticulturae, 31(2), 21–23.
Quality assurance in agricultural produce,edited by G.I. Johnson, Le Van To, Nguyen Duy Duc and M.C. Webb.
ACIAR Proceedings 100(printed version published in 2000)
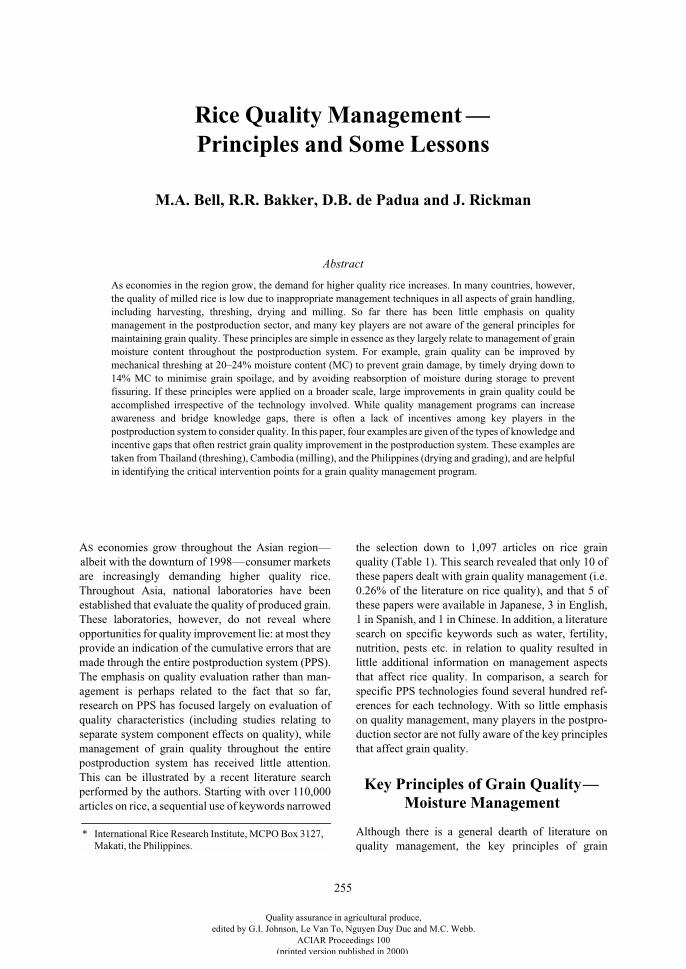
255
Rice Quality Management —Principles and Some Lessons
M.A. Bell, R.R. Bakker, D.B. de Padua and J. Rickman
Abstract
As economies in the region grow, the demand for higher quality rice increases. In many countries, however,the quality of milled rice is low due to inappropriate management techniques in all aspects of grain handling,including harvesting, threshing, drying and milling. So far there has been little emphasis on qualitymanagement in the postproduction sector, and many key players are not aware of the general principles formaintaining grain quality. These principles are simple in essence as they largely relate to management of grainmoisture content throughout the postproduction system. For example, grain quality can be improved bymechanical threshing at 20–24% moisture content (MC) to prevent grain damage, by timely drying down to14% MC to minimise grain spoilage, and by avoiding reabsorption of moisture during storage to preventfissuring. If these principles were applied on a broader scale, large improvements in grain quality could beaccomplished irrespective of the technology involved. While quality management programs can increaseawareness and bridge knowledge gaps, there is often a lack of incentives among key players in thepostproduction system to consider quality. In this paper, four examples are given of the types of knowledge andincentive gaps that often restrict grain quality improvement in the postproduction system. These examples aretaken from Thailand (threshing), Cambodia (milling), and the Philippines (drying and grading), and are helpfulin identifying the critical intervention points for a grain quality management program.
A
S
economies grow throughout the Asian region—albeit with the downturn of 1998—consumer marketsare increasingly demanding higher quality rice.Throughout Asia, national laboratories have beenestablished that evaluate the quality of produced grain.These laboratories, however, do not reveal whereopportunities for quality improvement lie: at most theyprovide an indication of the cumulative errors that aremade through the entire postproduction system (PPS).The emphasis on quality evaluation rather than man-agement is perhaps related to the fact that so far,research on PPS has focused largely on evaluation ofquality characteristics (including studies relating toseparate system component effects on quality), whilemanagement of grain quality throughout the entirepostproduction system has received little attention.This can be illustrated by a recent literature searchperformed by the authors. Starting with over 110,000articles on rice, a sequential use of keywords narrowed
the selection down to 1,097 articles on rice grainquality (Table 1). This search revealed that only 10 ofthese papers dealt with grain quality management (i.e.0.26% of the literature on rice quality), and that 5 ofthese papers were available in Japanese, 3 in English,1 in Spanish, and 1 in Chinese. In addition, a literaturesearch on specific keywords such as water, fertility,nutrition, pests etc. in relation to quality resulted inlittle additional information on management aspectsthat affect rice quality. In comparison, a search forspecific PPS technologies found several hundred ref-erences for each technology. With so little emphasison quality management, many players in the postpro-duction sector are not fully aware of the key principlesthat affect grain quality.
Key Principles of Grain Quality—Moisture Management
Although there is a general dearth of literature onquality management, the key principles of grain
* International Rice Research Institute, MCPO Box 3127, Makati, the Philippines.
Quality assurance in agricultural produce,edited by G.I. Johnson, Le Van To, Nguyen Duy Duc and M.C. Webb.
ACIAR Proceedings 100(printed version published in 2000)
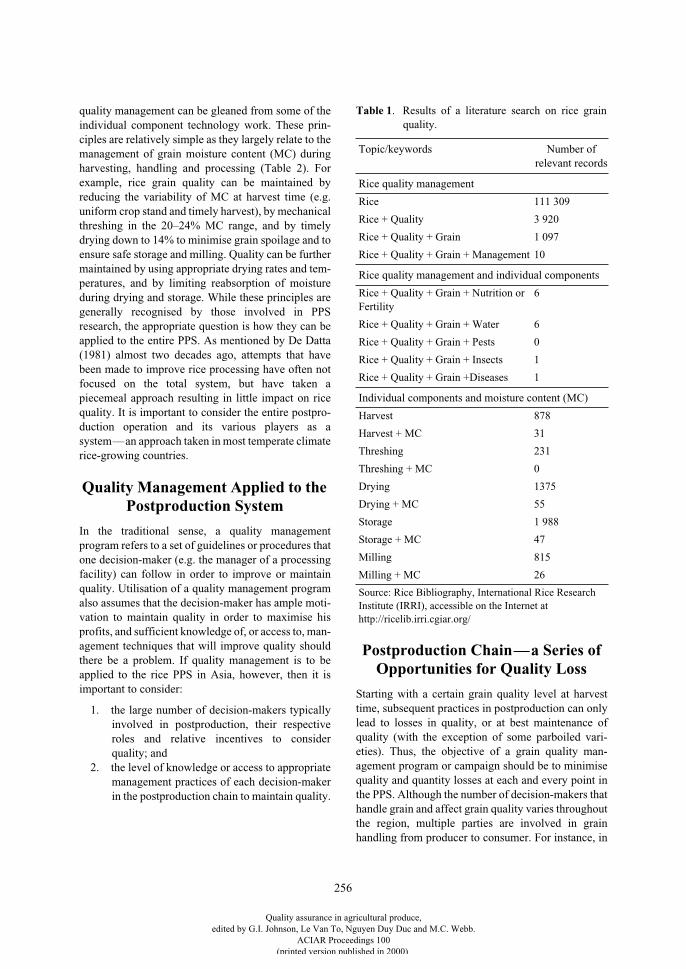
256
quality management can be gleaned from some of theindividual component technology work. These prin-ciples are relatively simple as they largely relate to themanagement of grain moisture content (MC) duringharvesting, handling and processing (Table 2). Forexample, rice grain quality can be maintained byreducing the variability of MC at harvest time (e.g.uniform crop stand and timely harvest), by mechanicalthreshing in the 20–24% MC range, and by timelydrying down to 14% to minimise grain spoilage and toensure safe storage and milling. Quality can be furthermaintained by using appropriate drying rates and tem-peratures, and by limiting reabsorption of moistureduring drying and storage. While these principles aregenerally recognised by those involved in PPSresearch, the appropriate question is how they can beapplied to the entire PPS. As mentioned by De Datta(1981) almost two decades ago, attempts that havebeen made to improve rice processing have often notfocused on the total system, but have taken apiecemeal approach resulting in little impact on ricequality. It is important to consider the entire postpro-duction operation and its various players as asystem—an approach taken in most temperate climaterice-growing countries.
Quality Management Applied to the Postproduction System
In the traditional sense, a quality managementprogram refers to a set of guidelines or procedures thatone decision-maker (e.g. the manager of a processingfacility) can follow in order to improve or maintainquality. Utilisation of a quality management programalso assumes that the decision-maker has ample moti-vation to maintain quality in order to maximise hisprofits, and sufficient knowledge of, or access to, man-agement techniques that will improve quality shouldthere be a problem. If quality management is to beapplied to the rice PPS in Asia, however, then it isimportant to consider:
1. the large number of decision-makers typicallyinvolved in postproduction, their respectiveroles and relative incentives to considerquality; and
2. the level of knowledge or access to appropriatemanagement practices of each decision-makerin the postproduction chain to maintain quality.
Postproduction Chain—a Series of Opportunities for Quality Loss
Starting with a certain grain quality level at harvesttime, subsequent practices in postproduction can onlylead to losses in quality, or at best maintenance ofquality (with the exception of some parboiled vari-eties). Thus, the objective of a grain quality man-agement program or campaign should be to minimisequality and quantity losses at each and every point inthe PPS. Although the number of decision-makers thathandle grain and affect grain quality varies throughoutthe region, multiple parties are involved in grainhandling from producer to consumer. For instance, in
Table 1
. Results of a literature search on rice grainquality.
Topic/keywords Number of relevant records
Rice quality management
Rice 111 309
Rice + Quality 3 920
Rice + Quality + Grain 1 097
Rice + Quality + Grain + Management 10
Rice quality management and individual components
Rice + Quality + Grain + Nutrition or Fertility
6
Rice + Quality + Grain + Water 6
Rice + Quality + Grain + Pests 0
Rice + Quality + Grain + Insects 1
Rice + Quality + Grain +Diseases 1
Individual components and moisture content (MC)
Harvest 878
Harvest + MC 31
Threshing 231
Threshing + MC 0
Drying 1375
Drying + MC 55
Storage 1 988
Storage + MC 47
Milling 815
Milling + MC 26
Source: Rice Bibliography, International Rice Research Institute (IRRI), accessible on the Internet at http://ricelib.irri.cgiar.org/
Quality assurance in agricultural produce,edited by G.I. Johnson, Le Van To, Nguyen Duy Duc and M.C. Webb.
ACIAR Proceedings 100(printed version published in 2000)
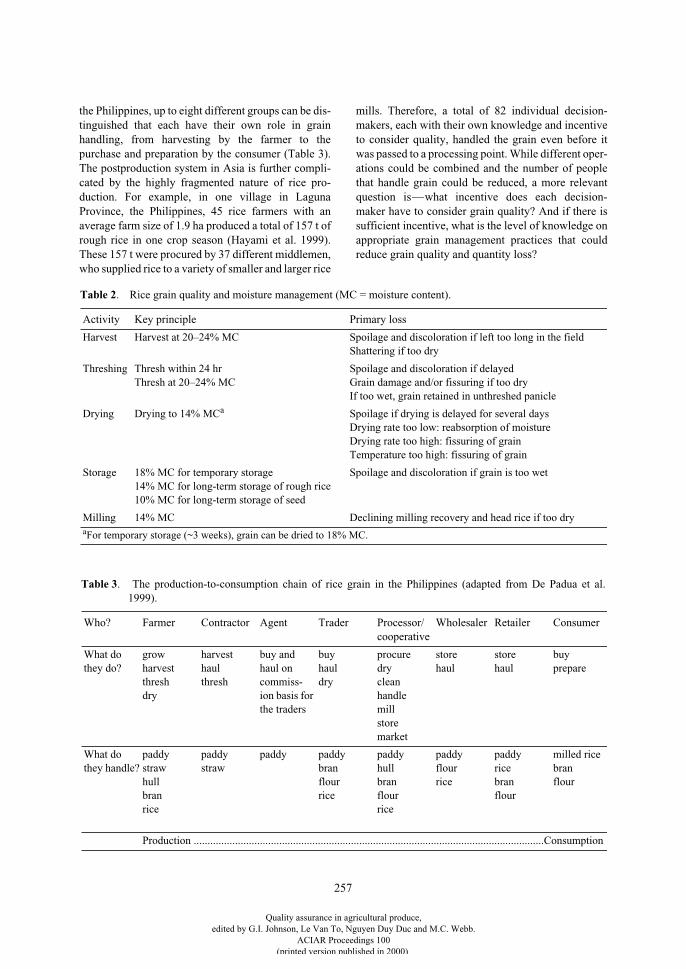
257
the Philippines, up to eight different groups can be dis-tinguished that each have their own role in grainhandling, from harvesting by the farmer to thepurchase and preparation by the consumer (Table 3).The postproduction system in Asia is further compli-cated by the highly fragmented nature of rice pro-duction. For example, in one village in LagunaProvince, the Philippines, 45 rice farmers with anaverage farm size of 1.9 ha produced a total of 157 t ofrough rice in one crop season (Hayami et al. 1999).These 157 t were procured by 37 different middlemen,who supplied rice to a variety of smaller and larger rice
mills. Therefore, a total of 82 individual decision-makers, each with their own knowledge and incentiveto consider quality, handled the grain even before itwas passed to a processing point. While different oper-ations could be combined and the number of peoplethat handle grain could be reduced, a more relevantquestion is—what incentive does each decision-maker have to consider grain quality? And if there issufficient incentive, what is the level of knowledge onappropriate grain management practices that couldreduce grain quality and quantity loss?
Table 2. Rice grain quality and moisture management (MC = moisture content).
Activity Key principle Primary loss
Harvest Harvest at 20–24% MC Spoilage and discoloration if left too long in the fieldShattering if too dry
Threshing Thresh within 24 hrThresh at 20–24% MC
Spoilage and discoloration if delayedGrain damage and/or fissuring if too dryIf too wet, grain retained in unthreshed panicle
Drying Drying to 14% MCa Spoilage if drying is delayed for several daysDrying rate too low: reabsorption of moistureDrying rate too high: fissuring of grainTemperature too high: fissuring of grain
Storage 18% MC for temporary storage14% MC for long-term storage of rough rice10% MC for long-term storage of seed
Spoilage and discoloration if grain is too wet
Milling 14% MC Declining milling recovery and head rice if too dry aFor temporary storage (~3 weeks), grain can be dried to 18% MC.
Table 3. The production-to-consumption chain of rice grain in the Philippines (adapted from De Padua et al.1999).
Who? Farmer Contractor Agent Trader Processor/cooperative
Wholesaler Retailer Consumer
What do they do?
growharvestthreshdry
harvesthaulthresh
buy and haul on commiss-ion basis for the traders
buyhauldry
procuredrycleanhandlemillstoremarket
storehaul
storehaul
buyprepare
What do they handle?
paddystrawhullbranrice
paddystraw
paddy paddybranflourrice
paddyhullbranflourrice
paddyflourrice
paddyricebranflour
milled ricebranflour
Production ...............................................................................................................................Consumption
Quality assurance in agricultural produce,edited by G.I. Johnson, Le Van To, Nguyen Duy Duc and M.C. Webb.
ACIAR Proceedings 100(printed version published in 2000)
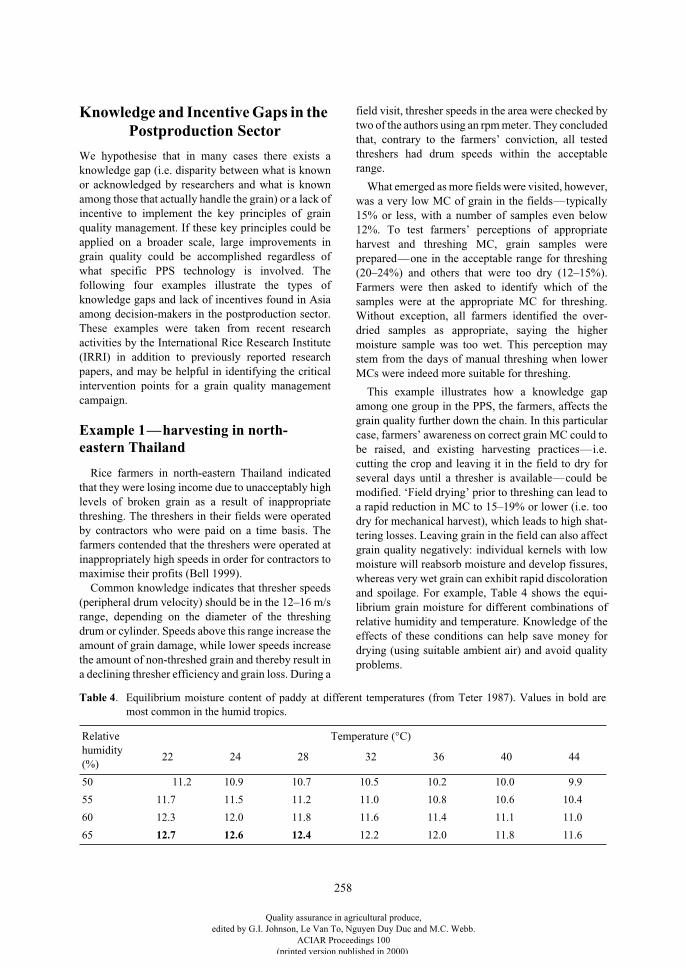
258
Knowledge and Incentive Gaps in the Postproduction Sector
We hypothesise that in many cases there exists aknowledge gap (i.e. disparity between what is knownor acknowledged by researchers and what is knownamong those that actually handle the grain) or a lack ofincentive to implement the key principles of grainquality management. If these key principles could beapplied on a broader scale, large improvements ingrain quality could be accomplished regardless ofwhat specific PPS technology is involved. Thefollowing four examples illustrate the types ofknowledge gaps and lack of incentives found in Asiaamong decision-makers in the postproduction sector.These examples were taken from recent researchactivities by the International Rice Research Institute(IRRI) in addition to previously reported researchpapers, and may be helpful in identifying the criticalintervention points for a grain quality managementcampaign.
Example 1—harvesting in north- eastern Thailand
Rice farmers in north-eastern Thailand indicatedthat they were losing income due to unacceptably highlevels of broken grain as a result of inappropriatethreshing. The threshers in their fields were operatedby contractors who were paid on a time basis. Thefarmers contended that the threshers were operated atinappropriately high speeds in order for contractors tomaximise their profits (Bell 1999).
Common knowledge indicates that thresher speeds(peripheral drum velocity) should be in the 12–16 m/srange, depending on the diameter of the threshingdrum or cylinder. Speeds above this range increase theamount of grain damage, while lower speeds increasethe amount of non-threshed grain and thereby result ina declining thresher efficiency and grain loss. During a
field visit, thresher speeds in the area were checked bytwo of the authors using an rpm meter. They concludedthat, contrary to the farmers’ conviction, all testedthreshers had drum speeds within the acceptablerange.
What emerged as more fields were visited, however,was a very low MC of grain in the fields—typically15% or less, with a number of samples even below12%. To test farmers’ perceptions of appropriateharvest and threshing MC, grain samples wereprepared—one in the acceptable range for threshing(20–24%) and others that were too dry (12–15%).Farmers were then asked to identify which of thesamples were at the appropriate MC for threshing.Without exception, all farmers identified the over-dried samples as appropriate, saying the highermoisture sample was too wet. This perception maystem from the days of manual threshing when lowerMCs were indeed more suitable for threshing.
This example illustrates how a knowledge gapamong one group in the PPS, the farmers, affects thegrain quality further down the chain. In this particularcase, farmers’ awareness on correct grain MC could tobe raised, and existing harvesting practices—i.e.cutting the crop and leaving it in the field to dry forseveral days until a thresher is available—could bemodified. ‘Field drying’ prior to threshing can lead toa rapid reduction in MC to 15–19% or lower (i.e. toodry for mechanical harvest), which leads to high shat-tering losses. Leaving grain in the field can also affectgrain quality negatively: individual kernels with lowmoisture will reabsorb moisture and develop fissures,whereas very wet grain can exhibit rapid discolorationand spoilage. For example, Table 4 shows the equi-librium grain moisture for different combinations ofrelative humidity and temperature. Knowledge of theeffects of these conditions can help save money fordrying (using suitable ambient air) and avoid qualityproblems.
Table 4
.
Equilibrium moisture content of paddy at different temperatures (from Teter 1987). Values in bold aremost common in the humid tropics.
Relative humidity (%)
Temperature (°C)
22 24 28 32 36 40 44
50 11.2 10.9 10.7 10.5 10.2 10.0 9.9
55 11.7 11.5 11.2 11.0 10.8 10.6 10.4
60 12.3 12.0 11.8 11.6 11.4 11.1 11.0
65
12.7 12.6 12.4
12.2 12.0 11.8 11.6
Quality assurance in agricultural produce,edited by G.I. Johnson, Le Van To, Nguyen Duy Duc and M.C. Webb.
ACIAR Proceedings 100(printed version published in 2000)
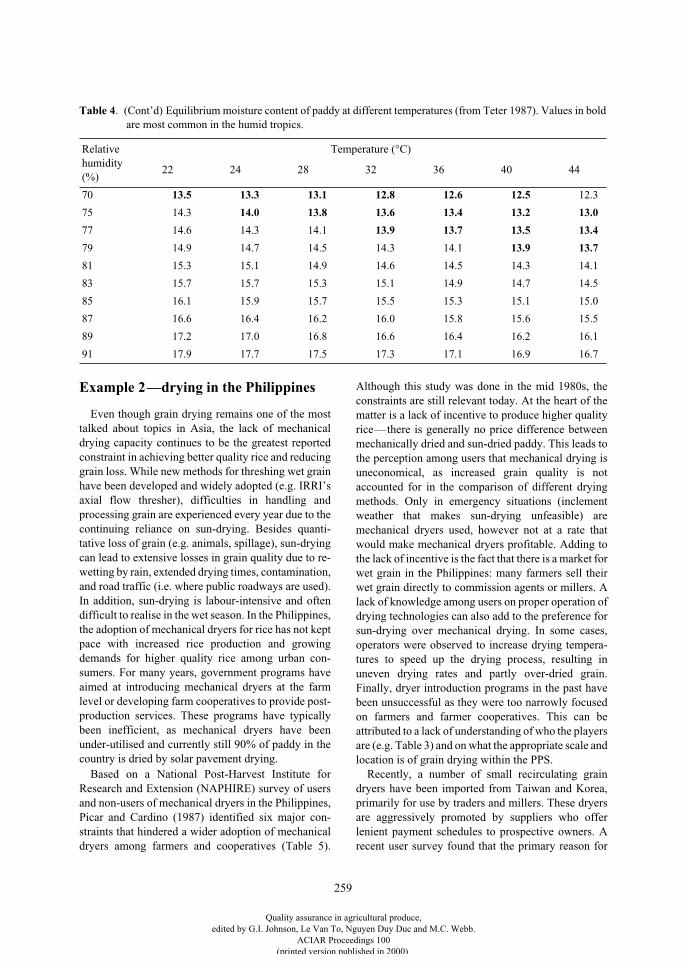
259
Example 2—drying in the Philippines
Even though grain drying remains one of the mosttalked about topics in Asia, the lack of mechanicaldrying capacity continues to be the greatest reportedconstraint in achieving better quality rice and reducinggrain loss. While new methods for threshing wet grainhave been developed and widely adopted (e.g. IRRI’saxial flow thresher), difficulties in handling andprocessing grain are experienced every year due to thecontinuing reliance on sun-drying. Besides quanti-tative loss of grain (e.g. animals, spillage), sun-dryingcan lead to extensive losses in grain quality due to re-wetting by rain, extended drying times, contamination,and road traffic (i.e. where public roadways are used).In addition, sun-drying is labour-intensive and oftendifficult to realise in the wet season. In the Philippines,the adoption of mechanical dryers for rice has not keptpace with increased rice production and growingdemands for higher quality rice among urban con-sumers. For many years, government programs haveaimed at introducing mechanical dryers at the farmlevel or developing farm cooperatives to provide post-production services. These programs have typicallybeen inefficient, as mechanical dryers have beenunder-utilised and currently still 90% of paddy in thecountry is dried by solar pavement drying.
Based on a National Post-Harvest Institute forResearch and Extension (NAPHIRE) survey of usersand non-users of mechanical dryers in the Philippines,Picar and Cardino (1987) identified six major con-straints that hindered a wider adoption of mechanicaldryers among farmers and cooperatives (Table 5).
Although this study was done in the mid 1980s, theconstraints are still relevant today. At the heart of thematter is a lack of incentive to produce higher qualityrice—there is generally no price difference betweenmechanically dried and sun-dried paddy. This leads tothe perception among users that mechanical drying isuneconomical, as increased grain quality is notaccounted for in the comparison of different dryingmethods. Only in emergency situations (inclementweather that makes sun-drying unfeasible) aremechanical dryers used, however not at a rate thatwould make mechanical dryers profitable. Adding tothe lack of incentive is the fact that there is a market forwet grain in the Philippines: many farmers sell theirwet grain directly to commission agents or millers. Alack of knowledge among users on proper operation ofdrying technologies can also add to the preference forsun-drying over mechanical drying. In some cases,operators were observed to increase drying tempera-tures to speed up the drying process, resulting inuneven drying rates and partly over-dried grain.Finally, dryer introduction programs in the past havebeen unsuccessful as they were too narrowly focusedon farmers and farmer cooperatives. This can beattributed to a lack of understanding of who the playersare (e.g. Table 3) and on what the appropriate scale andlocation is of grain drying within the PPS.
Recently, a number of small recirculating graindryers have been imported from Taiwan and Korea,primarily for use by traders and millers. These dryersare aggressively promoted by suppliers who offerlenient payment schedules to prospective owners. Arecent user survey found that the primary reason for
70
13.5 13.3 13.1 12.8 12.6 12.5
12.3
75 14.3
14.0 13.8 13.6 13.4 13.2 13.0
77 14.6 14.3 14.1
13.9 13.7 13.5 13.4
79 14.9 14.7 14.5 14.3 14.1
13.9 13.7
81 15.3 15.1 14.9 14.6 14.5 14.3 14.1
83 15.7 15.7 15.3 15.1 14.9 14.7 14.5
85 16.1 15.9 15.7 15.5 15.3 15.1 15.0
87 16.6 16.4 16.2 16.0 15.8 15.6 15.5
89 17.2 17.0 16.8 16.6 16.4 16.2 16.1
91 17.9 17.7 17.5 17.3 17.1 16.9 16.7
Table 4
. (Cont’d) Equilibrium moisture content of paddy at different temperatures (from Teter 1987). Values in boldare most common in the humid tropics.
Relative humidity (%)
Temperature (°C)
22 24 28 32 36 40 44
Quality assurance in agricultural produce,edited by G.I. Johnson, Le Van To, Nguyen Duy Duc and M.C. Webb.
ACIAR Proceedings 100(printed version published in 2000)
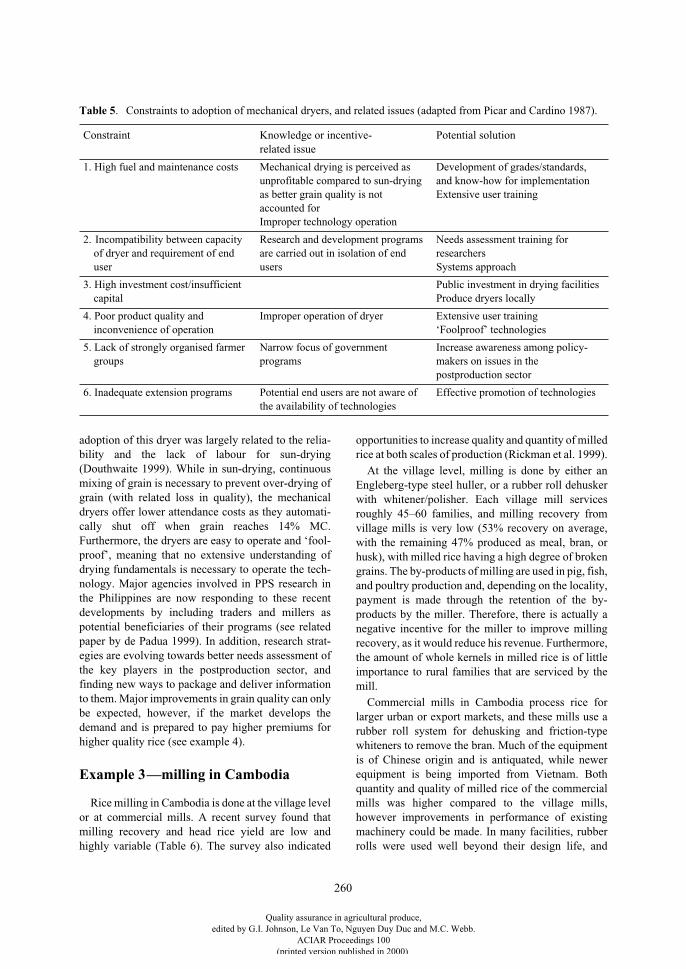
260
adoption of this dryer was largely related to the relia-bility and the lack of labour for sun-drying(Douthwaite 1999). While in sun-drying, continuousmixing of grain is necessary to prevent over-drying ofgrain (with related loss in quality), the mechanicaldryers offer lower attendance costs as they automati-cally shut off when grain reaches 14% MC.Furthermore, the dryers are easy to operate and ‘fool-proof’, meaning that no extensive understanding ofdrying fundamentals is necessary to operate the tech-nology. Major agencies involved in PPS research inthe Philippines are now responding to these recentdevelopments by including traders and millers aspotential beneficiaries of their programs (see relatedpaper by de Padua 1999). In addition, research strat-egies are evolving towards better needs assessment ofthe key players in the postproduction sector, andfinding new ways to package and deliver informationto them. Major improvements in grain quality can onlybe expected, however, if the market develops thedemand and is prepared to pay higher premiums forhigher quality rice (see example 4).
Example 3—milling in Cambodia
Rice milling in Cambodia is done at the village levelor at commercial mills. A recent survey found thatmilling recovery and head rice yield are low andhighly variable (Table 6). The survey also indicated
opportunities to increase quality and quantity of milledrice at both scales of production (Rickman et al. 1999).
At the village level, milling is done by either anEngleberg-type steel huller, or a rubber roll dehuskerwith whitener/polisher. Each village mill servicesroughly 45–60 families, and milling recovery fromvillage mills is very low (53% recovery on average,with the remaining 47% produced as meal, bran, orhusk), with milled rice having a high degree of brokengrains. The by-products of milling are used in pig, fish,and poultry production and, depending on the locality,payment is made through the retention of the by-products by the miller. Therefore, there is actually anegative incentive for the miller to improve millingrecovery, as it would reduce his revenue. Furthermore,the amount of whole kernels in milled rice is of littleimportance to rural families that are serviced by themill.
Commercial mills in Cambodia process rice forlarger urban or export markets, and these mills use arubber roll system for dehusking and friction-typewhiteners to remove the bran. Much of the equipmentis of Chinese origin and is antiquated, while newerequipment is being imported from Vietnam. Bothquantity and quality of milled rice of the commercialmills was higher compared to the village mills,however improvements in performance of existingmachinery could be made. In many facilities, rubberrolls were used well beyond their design life, and
Table 5
. Constraints to adoption of mechanical dryers, and related issues (adapted from Picar and Cardino 1987).
Constraint Knowledge or incentive-related issue
Potential solution
1. High fuel and maintenance costs Mechanical drying is perceived as unprofitable compared to sun-drying as better grain quality is not accounted forImproper technology operation
Development of grades/standards, and know-how for implementationExtensive user training
2. Incompatibility between capacity of dryer and requirement of end user
Research and development programs are carried out in isolation of end users
Needs assessment training for researchersSystems approach
3. High investment cost/insufficient capital
Public investment in drying facilitiesProduce dryers locally
4. Poor product quality and inconvenience of operation
Improper operation of dryer Extensive user training‘Foolproof’ technologies
5. Lack of strongly organised farmer groups
Narrow focus of government programs
Increase awareness among policy-makers on issues in the postproduction sector
6. Inadequate extension programs Potential end users are not aware of the availability of technologies
Effective promotion of technologies
Quality assurance in agricultural produce,edited by G.I. Johnson, Le Van To, Nguyen Duy Duc and M.C. Webb.
ACIAR Proceedings 100(printed version published in 2000)
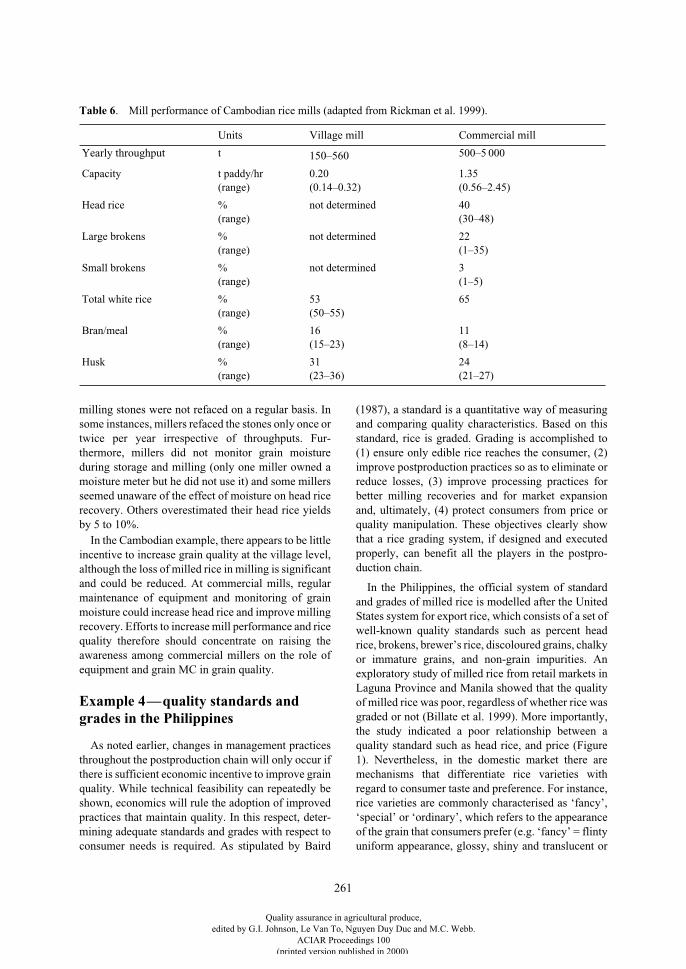
261
milling stones were not refaced on a regular basis. Insome instances, millers refaced the stones only once ortwice per year irrespective of throughputs. Fur-thermore, millers did not monitor grain moistureduring storage and milling (only one miller owned amoisture meter but he did not use it) and some millersseemed unaware of the effect of moisture on head ricerecovery. Others overestimated their head rice yieldsby 5 to 10%.
In the Cambodian example, there appears to be littleincentive to increase grain quality at the village level,although the loss of milled rice in milling is significantand could be reduced. At commercial mills, regularmaintenance of equipment and monitoring of grainmoisture could increase head rice and improve millingrecovery. Efforts to increase mill performance and ricequality therefore should concentrate on raising theawareness among commercial millers on the role ofequipment and grain MC in grain quality.
Example 4—quality standards and grades in the Philippines
As noted earlier, changes in management practicesthroughout the postproduction chain will only occur ifthere is sufficient economic incentive to improve grainquality. While technical feasibility can repeatedly beshown, economics will rule the adoption of improvedpractices that maintain quality. In this respect, deter-mining adequate standards and grades with respect toconsumer needs is required. As stipulated by Baird
(1987), a standard is a quantitative way of measuringand comparing quality characteristics. Based on thisstandard, rice is graded. Grading is accomplished to(1) ensure only edible rice reaches the consumer, (2)improve postproduction practices so as to eliminate orreduce losses, (3) improve processing practices forbetter milling recoveries and for market expansionand, ultimately, (4) protect consumers from price orquality manipulation. These objectives clearly showthat a rice grading system, if designed and executedproperly, can benefit all the players in the postpro-duction chain.
In the Philippines, the official system of standardand grades of milled rice is modelled after the UnitedStates system for export rice, which consists of a set ofwell-known quality standards such as percent headrice, brokens, brewer’s rice, discoloured grains, chalkyor immature grains, and non-grain impurities. Anexploratory study of milled rice from retail markets inLaguna Province and Manila showed that the qualityof milled rice was poor, regardless of whether rice wasgraded or not (Billate et al. 1999). More importantly,the study indicated a poor relationship between aquality standard such as head rice, and price (Figure1). Nevertheless, in the domestic market there aremechanisms that differentiate rice varieties withregard to consumer taste and preference. For instance,rice varieties are commonly characterised as ‘fancy’,‘special’ or ‘ordinary’, which refers to the appearanceof the grain that consumers prefer (e.g. ‘fancy’ = flintyuniform appearance, glossy, shiny and translucent or
Table 6
. Mill performance of Cambodian rice mills (adapted from Rickman et al. 1999).
Units Village mill Commercial mill
Yearly throughput
t
150–560
500–5 000
Capacity t paddy/hr(range)
0.20(0.14–0.32)
1.35(0.56–2.45)
Head rice %(range)
not determined 40(30–48)
Large brokens %(range)
not determined 22(1–35)
Small brokens %(range)
not determined 3(1–5)
Total white rice %(range)
53(50–55)
65
Bran/meal %(range)
16(15–23)
11(8–14)
Husk %(range)
31(23–36)
24(21–27)
Quality assurance in agricultural produce,edited by G.I. Johnson, Le Van To, Nguyen Duy Duc and M.C. Webb.
ACIAR Proceedings 100(printed version published in 2000)
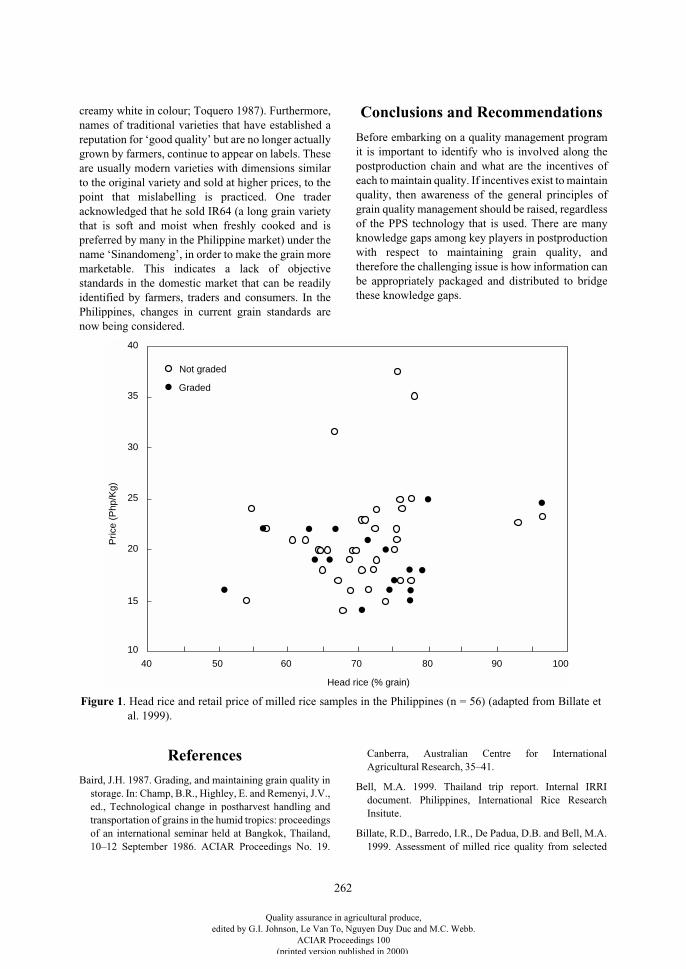
262
creamy white in colour; Toquero 1987). Furthermore,names of traditional varieties that have established areputation for ‘good quality’ but are no longer actuallygrown by farmers, continue to appear on labels. Theseare usually modern varieties with dimensions similarto the original variety and sold at higher prices, to thepoint that mislabelling is practiced. One traderacknowledged that he sold IR64 (a long grain varietythat is soft and moist when freshly cooked and ispreferred by many in the Philippine market) under thename ‘Sinandomeng’, in order to make the grain moremarketable. This indicates a lack of objectivestandards in the domestic market that can be readilyidentified by farmers, traders and consumers. In thePhilippines, changes in current grain standards arenow being considered.
Conclusions and Recommendations
Before embarking on a quality management programit is important to identify who is involved along thepostproduction chain and what are the incentives ofeach to maintain quality. If incentives exist to maintainquality, then awareness of the general principles ofgrain quality management should be raised, regardlessof the PPS technology that is used. There are manyknowledge gaps among key players in postproductionwith respect to maintaining grain quality, andtherefore the challenging issue is how information canbe appropriately packaged and distributed to bridgethese knowledge gaps.
References
Baird, J.H. 1987. Grading, and maintaining grain quality instorage. In: Champ, B.R., Highley, E. and Remenyi, J.V.,ed., Technological change in postharvest handling andtransportation of grains in the humid tropics: proceedingsof an international seminar held at Bangkok, Thailand,10–12 September 1986. ACIAR Proceedings No. 19.
Canberra, Australian Centre for InternationalAgricultural Research, 35–41.
Bell, M.A. 1999. Thailand trip report. Internal IRRIdocument. Philippines, International Rice ResearchInsitute.
Billate, R.D., Barredo, I.R., De Padua, D.B. and Bell, M.A.1999. Assessment of milled rice quality from selected
35
30
25
20
15
10
40
40 50 60 70 80 90 100
Head rice (% grain)
Pric
e (P
hp/K
g)
Not graded
Graded
Figure 1. Head rice and retail price of milled rice samples in the Philippines (n = 56) (adapted from Billate etal. 1999).
Quality assurance in agricultural produce,edited by G.I. Johnson, Le Van To, Nguyen Duy Duc and M.C. Webb.
ACIAR Proceedings 100(printed version published in 2000)
263
markets. Paper presented at the National Food AuthorityGrain Standardization Workshop, Manila, October 1999.
De Datta, S.K. 1981. Principles and practices of riceproduction. New York, John Wiley and Sons.
de Padua, D.P., Bell, M.A., Razote, E. and Billate, R. (ed.)1999. Moving to a brighter future. Proceedings ofworkshops and discussions, International Rice ResearchInstitute—Australian Centre for InternationalAgricultural Research (IRRI–ACIAR).
Douthwaite, B.D. 1999. Equipment evolution: case studiesof changes in postharvest technology in the Philippines.PhD dissertation, University of Reading.
Hayami, Y., Kikuchi, M. and Marciano, E. 1999.Middlemen and peasants in rice marketing in thePhilippines, Agricultural Economics, 20(2), 79–93.
Picar, G.D. and Cardino, A.G. 1987. Application of graindryers at farm level. In: Champ, B.R., Highley, E. andRemenyi, J.V., ed., Technological change in postharvesthandling and transportation of grains in the humid tropics:proceedings of an international seminar held at Bangkok,
Thailand, 10–12 September 1986. ACIAR ProceedingsNo. 19. Canberra, Australian Centre for InternationalAgricultural Research, 176–182.
Rickman, J.F., Som Bunna and Poa Sinath 1999. Ricemilling in Cambodia. Phnom Penh, Cambodia–International Rice Research Institute (IRRI)–AustraliaProject.
Teter, N. 1987. Paddy drying manual. Food and AgricultureOrganization of the United Nations (FAO) AgriculturalServices Bulletin No. 70, 123p.
Toquero, Z.F. 1987. Issues determining the capitalisation ofthe rice processing industry in the Philippines. In: Champ,B.R., Highley, E. and Remenyi, J.V., ed., Technologicalchange in postharvest handling and transportation ofgrains in the humid tropics: proceedings of aninternational seminar held at Bangkok, Thailand, 10–12September 1986. ACIAR Proceedings No. 19. Canberra,Australian Centre for International AgriculturalResearch, 77–91.
Quality assurance in agricultural produce,edited by G.I. Johnson, Le Van To, Nguyen Duy Duc and M.C. Webb.
ACIAR Proceedings 100(printed version published in 2000)
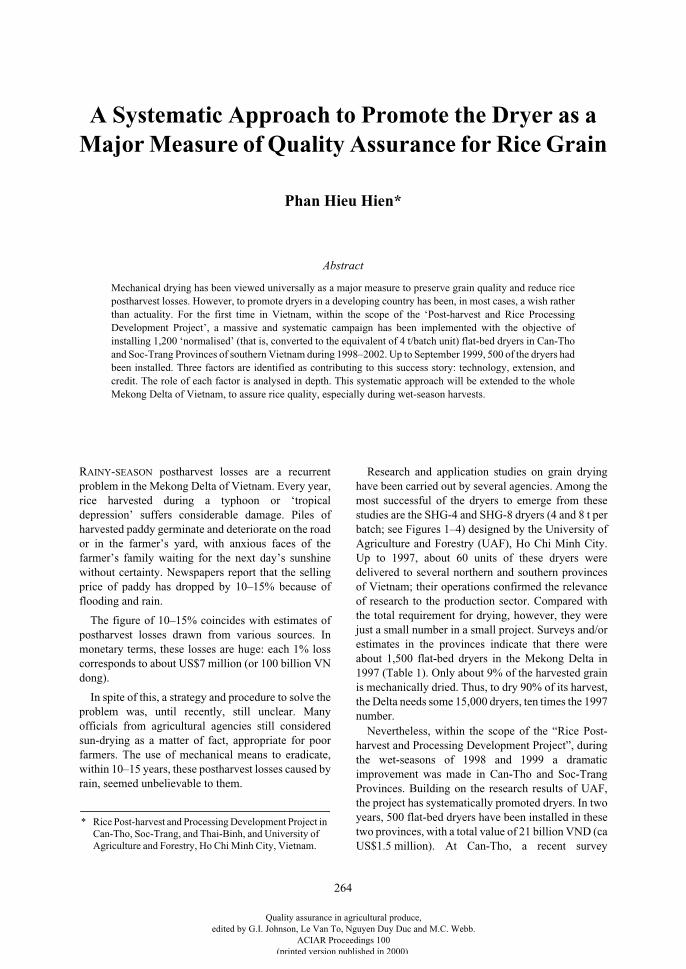
264
A Systematic Approach to Promote the Dryer as a Major Measure of Quality Assurance for Rice Grain
Phan Hieu Hien*
Abstract
Mechanical drying has been viewed universally as a major measure to preserve grain quality and reduce ricepostharvest losses. However, to promote dryers in a developing country has been, in most cases, a wish ratherthan actuality. For the first time in Vietnam, within the scope of the ‘Post-harvest and Rice ProcessingDevelopment Project’, a massive and systematic campaign has been implemented with the objective ofinstalling 1,200 ‘normalised’ (that is, converted to the equivalent of 4 t/batch unit) flat-bed dryers in Can-Thoand Soc-Trang Provinces of southern Vietnam during 1998–2002. Up to September 1999, 500 of the dryers hadbeen installed. Three factors are identified as contributing to this success story: technology, extension, andcredit. The role of each factor is analysed in depth. This systematic approach will be extended to the wholeMekong Delta of Vietnam, to assure rice quality, especially during wet-season harvests.
R
AINY
-
SEASON
postharvest losses are a recurrentproblem in the Mekong Delta of Vietnam. Every year,rice harvested during a typhoon or ‘tropicaldepression’ suffers considerable damage. Piles ofharvested paddy germinate and deteriorate on the roador in the farmer’s yard, with anxious faces of thefarmer’s family waiting for the next day’s sunshinewithout certainty. Newspapers report that the sellingprice of paddy has dropped by 10–15% because offlooding and rain.
The figure of 10–15% coincides with estimates ofpostharvest losses drawn from various sources. Inmonetary terms, these losses are huge: each 1% losscorresponds to about US$7 million (or 100 billion VNdong).
In spite of this, a strategy and procedure to solve theproblem was, until recently, still unclear. Manyofficials from agricultural agencies still consideredsun-drying as a matter of fact, appropriate for poorfarmers. The use of mechanical means to eradicate,within 10–15 years, these postharvest losses caused byrain, seemed unbelievable to them.
Research and application studies on grain dryinghave been carried out by several agencies. Among themost successful of the dryers to emerge from thesestudies are the SHG-4 and SHG-8 dryers (4 and 8 t perbatch; see Figures 1–4) designed by the University ofAgriculture and Forestry (UAF), Ho Chi Minh City.Up to 1997, about 60 units of these dryers weredelivered to several northern and southern provincesof Vietnam; their operations confirmed the relevanceof research to the production sector. Compared withthe total requirement for drying, however, they werejust a small number in a small project. Surveys and/orestimates in the provinces indicate that there wereabout 1,500 flat-bed dryers in the Mekong Delta in1997 (Table 1). Only about 9% of the harvested grainis mechanically dried. Thus, to dry 90% of its harvest,the Delta needs some 15,000 dryers, ten times the 1997number.
Nevertheless, within the scope of the “Rice Post-harvest and Processing Development Project”, duringthe wet-seasons of 1998 and 1999 a dramaticimprovement was made in Can-Tho and Soc-TrangProvinces. Building on the research results of UAF,the project has systematically promoted dryers. In twoyears, 500 flat-bed dryers have been installed in thesetwo provinces, with a total value of 21 billion VND (caUS$1.5 million). At Can-Tho, a recent survey
* Rice Post-harvest and Processing Development Project in Can-Tho, Soc-Trang, and Thai-Binh, and University of Agriculture and Forestry, Ho Chi Minh City, Vietnam.
Quality assurance in agricultural produce,edited by G.I. Johnson, Le Van To, Nguyen Duy Duc and M.C. Webb.
ACIAR Proceedings 100(printed version published in 2000)
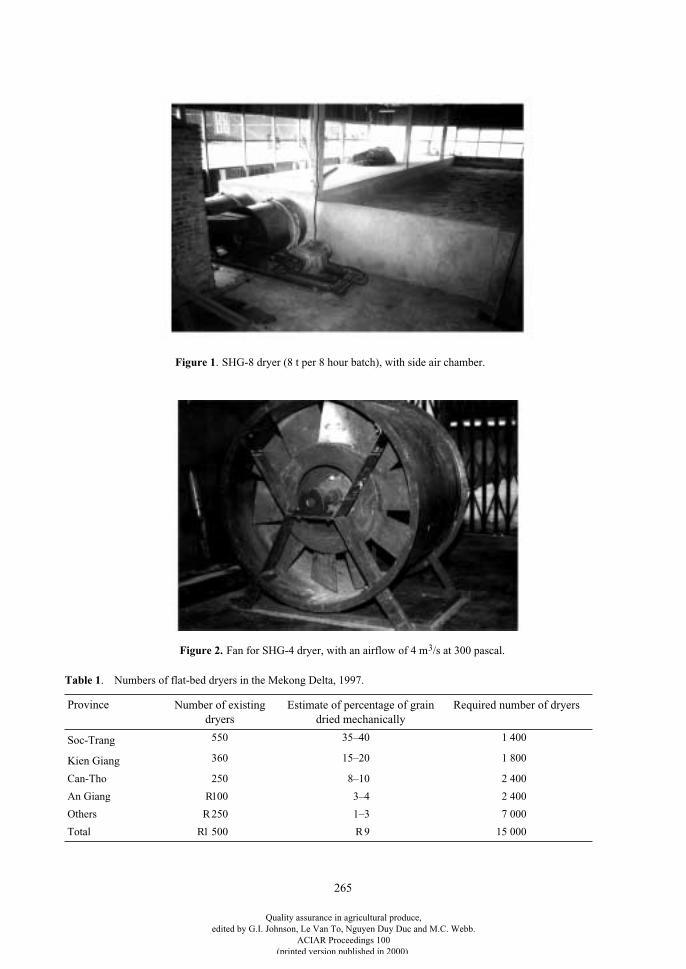
265
Figure 2.
Fan for SHG-4 dryer, with an airflow of 4 m
3
/s at 300 pascal.
Figure 1
. SHG-8 dryer (8 t per 8 hour batch), with side air chamber.
Table 1
. Numbers of flat-bed dryers in the Mekong Delta, 1997.
Province Number of existing dryers
Estimate of percentage of grain dried mechanically
Required number of dryers
Soc-Trang
550 35–40 1 400
Kien Giang
360 15–20 1 800
Can-Tho 250 8–10 2 400
An Giang
R
100 3–4 2 400
Others
R
250 1–3 7 000
Total
R
1 500
R
9 15 000
Quality assurance in agricultural produce,edited by G.I. Johnson, Le Van To, Nguyen Duy Duc and M.C. Webb.
ACIAR Proceedings 100(printed version published in 2000)
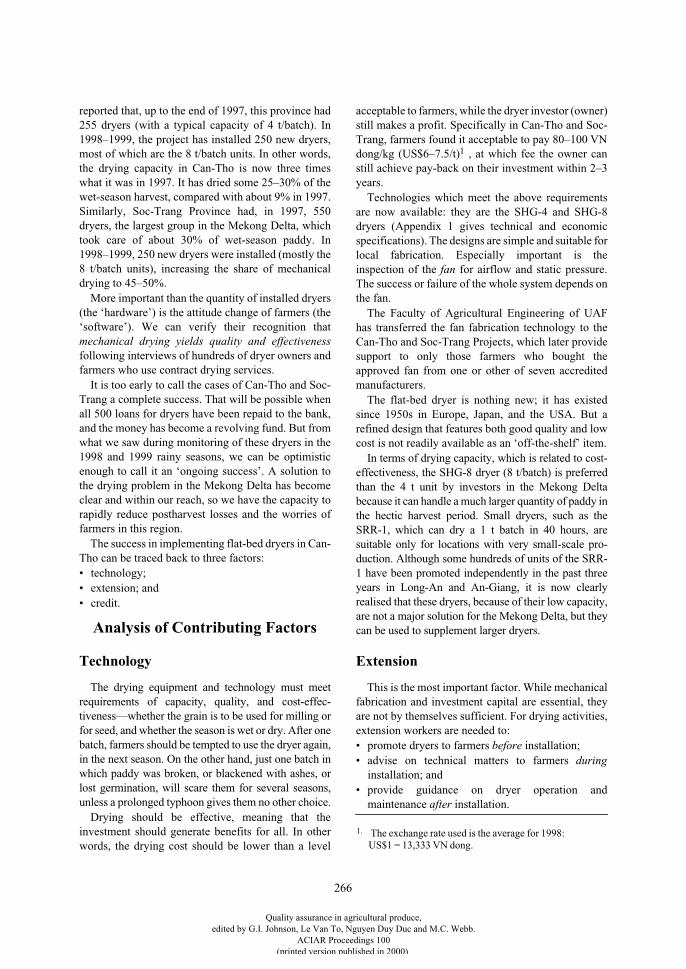
266
reported that, up to the end of 1997, this province had255 dryers (with a typical capacity of 4 t/batch). In1998–1999, the project has installed 250 new dryers,most of which are the 8 t/batch units. In other words,the drying capacity in Can-Tho is now three timeswhat it was in 1997. It has dried some 25–30% of thewet-season harvest, compared with about 9% in 1997.Similarly, Soc-Trang Province had, in 1997, 550dryers, the largest group in the Mekong Delta, whichtook care of about 30% of wet-season paddy. In1998–1999, 250 new dryers were installed (mostly the8 t/batch units), increasing the share of mechanicaldrying to 45–50%.
More important than the quantity of installed dryers(the ‘hardware’) is the attitude change of farmers (the‘software’). We can verify their recognition that
mechanical drying yields quality and effectiveness
following interviews of hundreds of dryer owners andfarmers who use contract drying services.
It is too early to call the cases of Can-Tho and Soc-Trang a complete success. That will be possible whenall 500 loans for dryers have been repaid to the bank,and the money has become a revolving fund. But fromwhat we saw during monitoring of these dryers in the1998 and 1999 rainy seasons, we can be optimisticenough to call it an ‘ongoing success’. A solution tothe drying problem in the Mekong Delta has becomeclear and within our reach, so we have the capacity torapidly reduce postharvest losses and the worries offarmers in this region.
The success in implementing flat-bed dryers in Can-Tho can be traced back to three factors:• technology;• extension; and• credit.
Analysis of Contributing Factors
Technology
The drying equipment and technology must meetrequirements of capacity, quality, and cost-effec-tiveness—whether the grain is to be used for milling orfor seed, and whether the season is wet or dry. After onebatch, farmers should be tempted to use the dryer again,in the next season. On the other hand, just one batch inwhich paddy was broken, or blackened with ashes, orlost germination, will scare them for several seasons,unless a prolonged typhoon gives them no other choice.
Drying should be effective, meaning that theinvestment should generate benefits for all. In otherwords, the drying cost should be lower than a level
acceptable to farmers, while the dryer investor (owner)still makes a profit. Specifically in Can-Tho and Soc-Trang, farmers found it acceptable to pay 80–100 VNdong/kg (US$6–7.5/t)
1
, at which fee the owner canstill achieve pay-back on their investment within 2–3years.
Technologies which meet the above requirementsare now available: they are the SHG-4 and SHG-8dryers (Appendix 1 gives technical and economicspecifications). The designs are simple and suitable forlocal fabrication. Especially important is theinspection of the
fan
for airflow and static pressure.The success or failure of the whole system depends onthe fan.
The Faculty of Agricultural Engineering of UAFhas transferred the fan fabrication technology to theCan-Tho and Soc-Trang Projects, which later providesupport to only those farmers who bought theapproved fan from one or other of seven accreditedmanufacturers.
The flat-bed dryer is nothing new; it has existedsince 1950s in Europe, Japan, and the USA. But arefined design that features both good quality and lowcost is not readily available as an ‘off-the-shelf’ item.
In terms of drying capacity, which is related to cost-effectiveness, the SHG-8 dryer (8 t/batch) is preferredthan the 4 t unit by investors in the Mekong Deltabecause it can handle a much larger quantity of paddy inthe hectic harvest period. Small dryers, such as theSRR-1, which can dry a 1 t batch in 40 hours, aresuitable only for locations with very small-scale pro-duction. Although some hundreds of units of the SRR-1 have been promoted independently in the past threeyears in Long-An and An-Giang, it is now clearlyrealised that these dryers, because of their low capacity,are not a major solution for the Mekong Delta, but theycan be used to supplement larger dryers.
Extension
This is the most important factor. While mechanicalfabrication and investment capital are essential, theyare not by themselves sufficient. For drying activities,extension workers are needed to:• promote dryers to farmers
before
installation;• advise on technical matters to farmers
during
installation; and• provide guidance on dryer operation and
maintenance
after
installation.
1.
The exchange rate used is the average for 1998: US$1 = 13,333 VN dong.
Quality assurance in agricultural produce,edited by G.I. Johnson, Le Van To, Nguyen Duy Duc and M.C. Webb.
ACIAR Proceedings 100(printed version published in 2000)
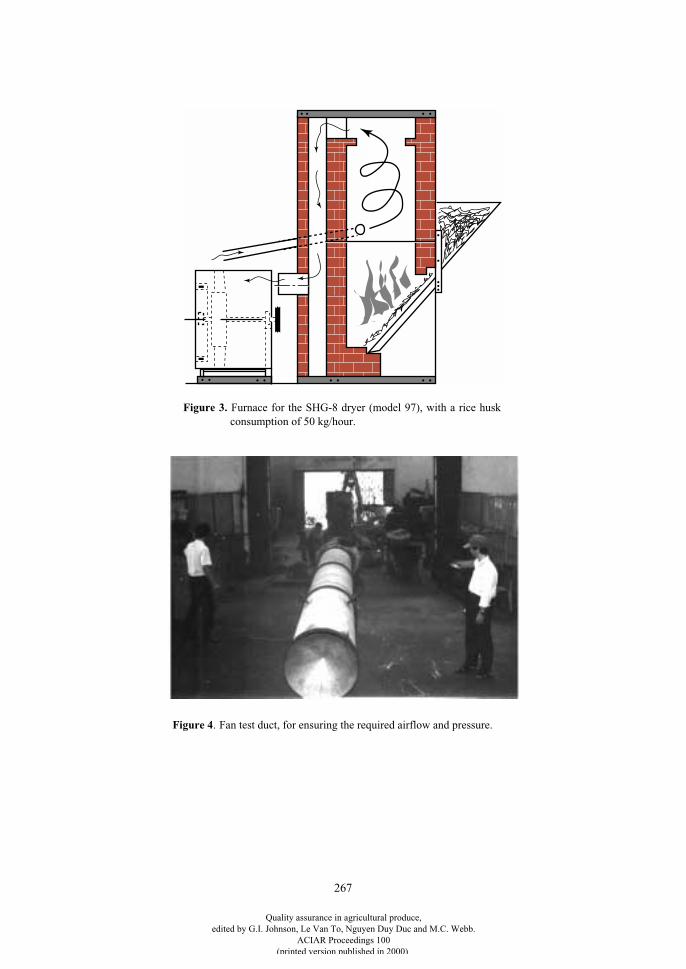
267
Figure 3.
Furnace for the SHG-8 dryer (model 97), with a rice huskconsumption of 50 kg/hour.
Figure 4
. Fan test duct, for ensuring the required airflow and pressure.
Quality assurance in agricultural produce,edited by G.I. Johnson, Le Van To, Nguyen Duy Duc and M.C. Webb.
ACIAR Proceedings 100(printed version published in 2000)
268
The role of the extensionist is similar to the agent formarketing + installation + after-sales service forindustrial goods in the city. Similarly, the income ofthese staff is proportional to the number of dryersinstalled.
Our experience with staffing in Can-Tho and Soc-Trang is worth some remarks. At the start, there wereno mechanical or agricultural engineers at theextension centres—they were at the city factories orsomewhere else. The only personnel available werescience graduates or technicians in agronomy andplant protection whose normal work involved somedozens of kilograms of seeds or bags of fertilisersvalued at less than US$100. They were not familiarwith higher-value, larger-scale mechanical equipment.Their strong point, however, was their closeness tofarmers. So, to use these staff for assembling a dryer ofvalue $2,000–3,500 required appropriate retraining.
Extensionists in Can-Tho and Soc-Trang partici-pated in various training activities to reorientate theirskills. First, they took part in a 3-day seminar ondrying. Next they participated in a survey on dryersand drying in their province. Following that, theyunderwent 2 weeks of intensive training on basicmechanical skills (welding, sheetmetal work,adjustment of diesel engines, wiring a 3-phase motor,reading a simple drawing etc.) hosted by Can-ThoUniversity’s Faculty of Technology. The aim was tofamiliarise them with dryer components, and toovercome any fear of machinery; they were not trainedto become mechanics.
Next in the training, the trainees (first by group, laterindividually) were guided by UAF staff in the instal-lation of six dryers. This was a risky business, becauseUAF was contracted to supply these dryers to farmers.Any errors made by the trainee were thus the respon-sibility of UAF. Eventually, 15 trainees ‘graduated’from the course.
The success of the training was reflected in the factthat farmers allowed extensionists to install more than90% of the 500 dryers delivered.
Besides the quantity of dryers installed, theextension workers made a substantial commitment tothe success of the exercise. They responded whenfarmers called them, which was at all times andwhether the problem was big or small. No manufac-turer could have done that. The result was the goodoperation of all dryers, delivering quality productsthroughout the harvest period (about one month ineach area) without major problems.
Persuading farmers to invest in dryers has not beeneasy. Previously, among dryers installed by farmer/
mechanics, many did not perform well (causing grainbreakage, blackened grain, and other problems). Inthese cases, farmers subsequently brought their paddyto the dryer only as a last resort, and usually when thegrain was about to germinate, in which case dryingwas too late to preserve quality. The result was avicious circle involving the dryer owner and the paddyowner. The machine was used for only about 2 weeksper year, representing the time involved in attempts to‘rescue’ paddy, and yielding none of the qualityadvantages of well-managed mechanical drying. Theshort utilisation time made the payback on investmentdifficult. Among the questions often raised by farmerswas:
“Assume we can dry 4–5 weeks per year, then thedryer is still idle for almost 11 months; how could wemake a profit?”
To answer this question to the satisfaction andassurance of farmers requires an extensionist with anunderstanding of the drying process, with experiencein installing dryers, and with confidence in thepractical operation of dryers.
In short, the role of dryer extension is not unlikeextension in agronomy. The aim of both is to ensurethat
farmers understand
,
farmers believe
, and
farmersact
. The main difference lies in the US$2,000–3,000purchase price of a dryer, much higher than the costsof, say, seeds or insecticides. We therefore come to thethird essential factor—credit.
Credit
The dryer promotion in Can-Tho and Soc-Trang hasbeen favoured with a large credit scheme. Through agovernment-to-government agreement, the DanishInternational Development Assistance Agency(DANIDA) provided US$1.2 million for establishing600 (4 t) dryers in each province. The Provincial Bankfor Agriculture managed the money as a revolvingfund. Up to the end of September 1999, the Banks hadissued total loans of 21 billion VND (about US$1.5million) for dryers. Features of the soft loanarrangement are:
• reduction of collateral (for example, a loan ofUS$3,000 for the 8 t dryer needs 1 ha of collateral,instead of the 5 ha normally applied);
• lower interest rate, which was 0.8%/month in 1998,or equal to the rate for the poor, and lower than thecommercial interest rate; and
• longer repayment period of 2–3 years, instead of 6months or 1 year as otherwise applied.
Quality assurance in agricultural produce,edited by G.I. Johnson, Le Van To, Nguyen Duy Duc and M.C. Webb.
ACIAR Proceedings 100(printed version published in 2000)
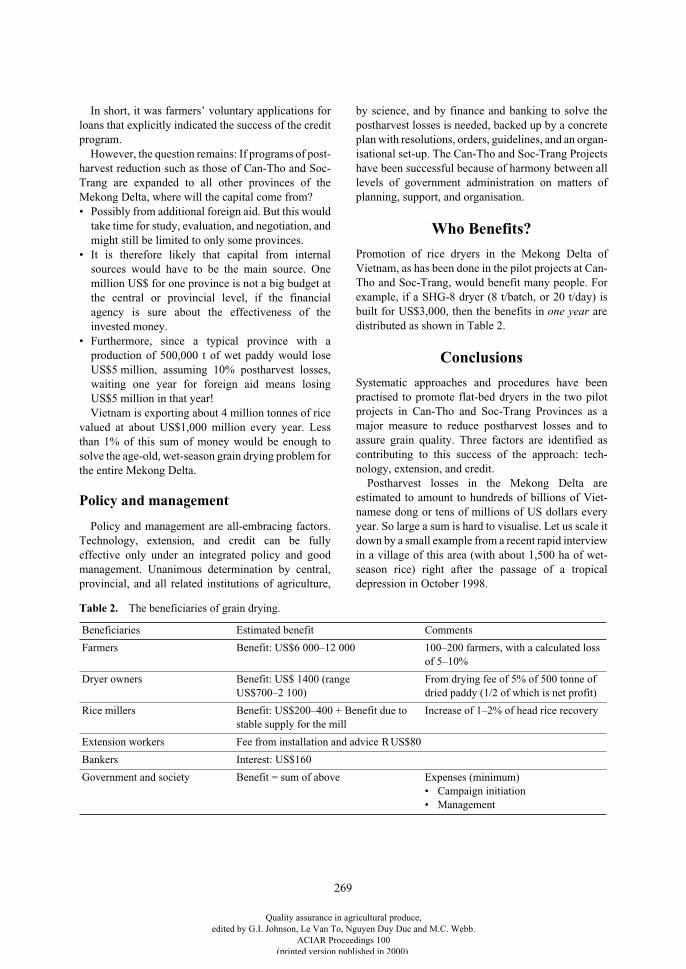
269
In short, it was farmers’ voluntary applications forloans that explicitly indicated the success of the creditprogram.
However, the question remains: If programs of post-harvest reduction such as those of Can-Tho and Soc-Trang are expanded to all other provinces of theMekong Delta, where will the capital come from?• Possibly from additional foreign aid. But this would
take time for study, evaluation, and negotiation, andmight still be limited to only some provinces.
• It is therefore likely that capital from internalsources would have to be the main source. Onemillion US$ for one province is not a big budget atthe central or provincial level, if the financialagency is sure about the effectiveness of theinvested money.
• Furthermore, since a typical province with aproduction of 500,000 t of wet paddy would loseUS$5 million, assuming 10% postharvest losses,waiting one year for foreign aid means losingUS$5 million in that year!Vietnam is exporting about 4 million tonnes of rice
valued at about US$1,000 million every year. Lessthan 1% of this sum of money would be enough tosolve the age-old, wet-season grain drying problem forthe entire Mekong Delta.
Policy and management
Policy and management are all-embracing factors.Technology, extension, and credit can be fullyeffective only under an integrated policy and goodmanagement. Unanimous determination by central,provincial, and all related institutions of agriculture,
by science, and by finance and banking to solve thepostharvest losses is needed, backed up by a concreteplan with resolutions, orders, guidelines, and an organ-isational set-up. The Can-Tho and Soc-Trang Projectshave been successful because of harmony between alllevels of government administration on matters ofplanning, support, and organisation.
Who Benefits?
Promotion of rice dryers in the Mekong Delta ofVietnam, as has been done in the pilot projects at Can-Tho and Soc-Trang, would benefit many people. Forexample, if a SHG-8 dryer (8 t/batch, or 20 t/day) isbuilt for US$3,000, then the benefits in
one year
aredistributed as shown in Table 2.
Conclusions
Systematic approaches and procedures have beenpractised to promote flat-bed dryers in the two pilotprojects in Can-Tho and Soc-Trang Provinces as amajor measure to reduce postharvest losses and toassure grain quality. Three factors are identified ascontributing to this success of the approach: tech-nology, extension, and credit.
Postharvest losses in the Mekong Delta areestimated to amount to hundreds of billions of Viet-namese dong or tens of millions of US dollars everyyear. So large a sum is hard to visualise. Let us scale itdown by a small example from a recent rapid interviewin a village of this area (with about 1,500 ha of wet-season rice) right after the passage of a tropicaldepression in October 1998.
Table 2.
The beneficiaries of grain drying.
Beneficiaries Estimated benefit Comments
Farmers Benefit: US$6 000–12 000 100–200 farmers, with a calculated loss of 5–10%
Dryer owners Benefit: US$ 1400 (range US$700–2 100)
From drying fee of 5% of 500 tonne of dried paddy (1/2 of which is net profit)
Rice millers Benefit: US$200–400 + Benefit due to stable supply for the mill
Increase of 1–2% of head rice recovery
Extension workers Fee from installation and advice
R
US$80
Bankers Interest: US$160
Government and society Benefit = sum of above Expenses (minimum)• Campaign initiation• Management
Quality assurance in agricultural produce,edited by G.I. Johnson, Le Van To, Nguyen Duy Duc and M.C. Webb.
ACIAR Proceedings 100(printed version published in 2000)
270
A conservative figure was that 50% of the paddydeteriorated in quality (in terms of blackening, germi-nation, overheating etc.); as a consequence, farmershad to sell paddy for 300 VND/kg less than normal (forexample, 1,600 VND/kg instead of 1,900 VND/kg, orUS$120 instead of US$143/t). Thus, in total, thefarmers of that village lost 1 billion VND(US$75,000). This money would have been enough toconsolidate the infrastructure of the village. Say tobuild some more bridges to facilitate the transport ofproduce. Or to build a good primary school, with adecent salary for its 10 teachers, in order to increasethe educational level of the people. It can be saidwithout exaggeration that the introduction and properuse of paddy dryers helps to break the vicious circle of‘the farmer is poor because he is poor; he is ignorantbecause he is ignorant’; which is the biggest worry ofthose concerned about the agriculture and farmers ofthe Mekong Delta.
Acknowledgments
Active contributions of the following in the dryerpromotion are gratefully acknowledged:
• the technical support of the staff of the Faculty ofAgricultural Engineering and Technology,University of Agriculture and Forestry in Ho ChiMinh City;
• the training on mechanical skills by the Faculty ofTechnology, Can-Tho University;
• the extension and promotion by the technical staff,Can-Tho and Soc-Trang Post-harvest Project;
• the administrative coordination at various levels ofCan-Tho and Soc-Trang Provinces; and
• the credit scheme from the Danish InternationalDevelopment Assistance Agency (DANIDA).
Quality assurance in agricultural produce,edited by G.I. Johnson, Le Van To, Nguyen Duy Duc and M.C. Webb.
ACIAR Proceedings 100(printed version published in 2000)
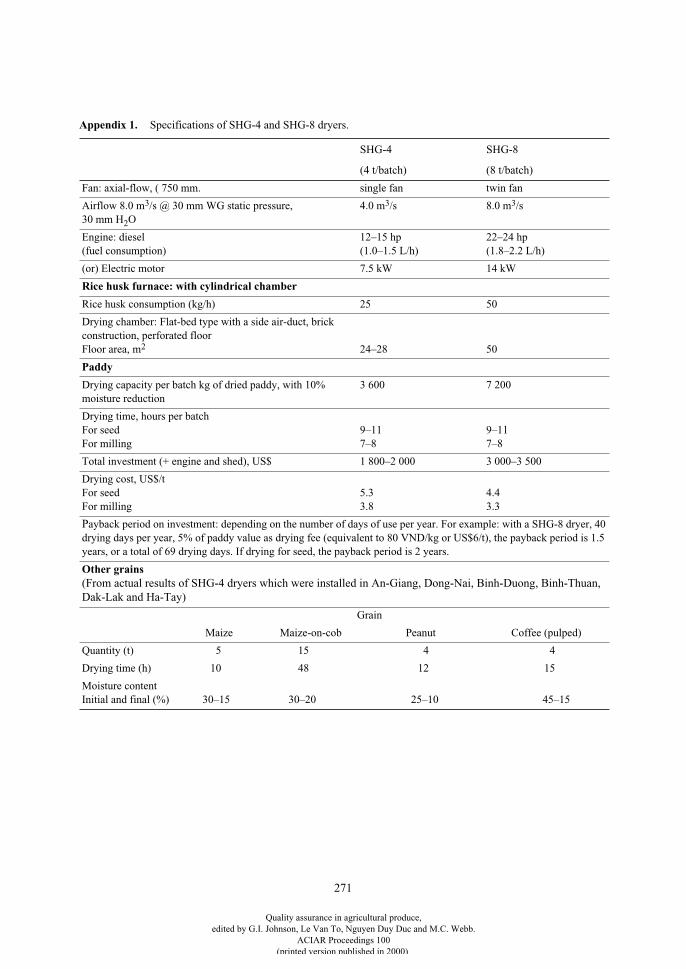
271
Appendix 1.
Specifications of SHG-4 and SHG-8 dryers.
SHG-4 SHG-8
(4 t/batch) (8 t/batch)
Fan: axial-flow, ( 750 mm. single fan twin fan
Airflow 8.0 m
3
/s @ 30 mm WG static pressure, 30 mm H
2
O4.0 m
3
/s 8.0 m
3
/s
Engine: diesel (fuel consumption)
12–15 hp(1.0–1.5 L/h)
22–24 hp(1.8–2.2 L/h)
(or) Electric motor 7.5 kW 14 kW
Rice husk furnace: with cylindrical chamber
Rice husk consumption (kg/h) 25 50
Drying chamber: Flat-bed type with a side air-duct, brick construction, perforated floor Floor area, m
2
24–28 50
Paddy
Drying capacity per batch kg of dried paddy, with 10% moisture reduction
3 600 7 200
Drying time, hours per batchFor seedFor milling
9–117–8
9–117–8
Total investment (+ engine and shed), US$ 1 800–2 000 3 000–3 500
Drying cost, US$/t For seedFor milling
5.33.8
4.43.3
P
ayback period on investment: depending on the number of days of use per year. For example: with a SHG-8 dryer, 40 drying days per year, 5% of paddy value as drying fee (equivalent to 80 VND/kg or US$6/t), the payback period is 1.5 years, or a total of 69 drying days. If drying for seed, the payback period is 2 years.
Other grains
(From actual results of SHG-4 dryers which were installed in An-Giang, Dong-Nai, Binh-Duong, Binh-Thuan, Dak-Lak and Ha-Tay)
Grain
Maize Maize-on-cob Peanut Coffee (pulped)
Quantity (t) 5 15 4 4
Drying time (h) 10 48 12 15
Moisture contentInitial and final (%) 30–15 30–20 25–10 45–15
Quality assurance in agricultural produce,edited by G.I. Johnson, Le Van To, Nguyen Duy Duc and M.C. Webb.
ACIAR Proceedings 100(printed version published in 2000)
272
Drying Practices and Evaluation of a Low-cost, Low-temperature, In-store Dryer in Bangladesh,
India and Myanmar
V. Balasubramanian and A. Morales*
Abstract
Drying of fresh rough rice (paddy) is a problem in the coastal districts of several Asian countries, due to excessmoisture of harvested grains, and rains during the harvesting period of certain crops. A simple, low-cost dryer(named the ‘SRR-1’ dryer), developed by the University of Agriculture and Forestry (UAF) in Vietnam, wouldbe highly useful to farmers in such areas. In addition, the Vietnamese dryer could be built with local materialsin small metal workshops. However, the operation of this dryer requires electricity. In a collaborative projectof International Rice Research Institute, UAF, and the National Agricultural Research System, we surveyed thepaddy drying practices in selected areas of Bangladesh, India and Myanmar. With the help of UAF engineers,we organised the training of local engineers and technicians, built and commissioned a prototype dryer in eachlocation, and collected users’ feedback for follow-up action. Essentially, the farmers and small rice millers inBangladesh were highly interested in the SRR-1 dryer and 10 demonstration dryers were built throughout thecountry. Farmers in Myanmar preferred large, village-level dryers rather than small, individually-owneddryers. In India, the farmers’ reactions were mixed. They felt that the SRR-1 dryer was most suited to seedproducers for drying harvested seed paddy at low temperature to maintain high percentage germination.
D
RYING
of harvested rough rice (paddy), especiallyduring rainy season, has been a major constraint to riceproduction in many Asian countries. At present, morethan 80% of farmers still use the sun-drying methodthat can result in high losses in grain quantity andquality. Owing to inadequate drying floors in ruralareas, many farmers use the public roads to dry theirpaddy. Hence, there is a need for a simple, low-costdryer that could dry paddy economically and effi-ciently, reduce grain losses, maintain high grainquality and head rice recovery, and reduce labour usein drying.
In 1994–95, the University of Agriculture andForestry (UAF), Vietnam, participated in a technicalcooperation project with the International RiceResearch Institute, Philippines, and the donor agency
GTZ (Deutsche Gesellschaft für Technische Zusam-menarbeit—German Agency for Technical Coop-eration), and developed a low-cost, low-temperature,in-store dryer (called the ‘SRR-1’ dryer). It can dry 1t of rough rice (paddy) in 2–4 days and the same unitcan be used for storage. Its design was based on theprinciple of one-stage, low-temperature, in-storedrying, and it has application in areas where sun-drying is not feasible. Targeted users are resource-poor farmers with less than 0.5 ha of rice land, havinga surplus of 1–2 t of paddy for storage in each season,and living in areas with an electricity supply.
The dryer has three components: a 373 watt, two-stage axial fan; a 1,000 watt electric heater; and adrying bin of bamboo mat or other material. Thedrying bin consists of two concentric bamboo-matcylinders of 0.4 m and 1.5 m diameter, with a height of1.1 m. The inner cylinder is supported by a frame madeof 6 mm steel wire. A 373 watt, single-phase, 2,800
* International Rice Research Institute (IRRI), MCPO 3127, 1271 Makati, Philippines.
Quality assurance in agricultural produce,edited by G.I. Johnson, Le Van To, Nguyen Duy Duc and M.C. Webb.
ACIAR Proceedings 100(printed version published in 2000)
273
rpm electric motor drives the fan. Two 350 mmdiameter, 7-blade plastic rotors are mounted on bothends of the motor shaft and enclosed in a steel-wirecasing. The fan is positioned on top of the innerbamboo-mat cylinder. At 40 Pa static pressure, theairflow is 0.3 m
3
/s. The heater is a 1,000 watt resistorfrom the electric stove which is mounted beneath thelower motor. Supplemental heat from the resistor isused only during certain nights (e.g. cool nights orduring continuous rains) (Hien et al 1997).
Tests in Vietnam showed that 1 t of high moisture(26–30% moisture content—MC) paddy could bedried to 14–15% MC in 2–4 days (Ban et al. 1995;Hien et al. 1997). The calculated drying cost wasUS$6.00/t. In Vietnam, this dryer costs only US$55/unit.
Objectives
This study was conducted to (a) assess the dryingpractices and problems of small-scale rice farmers inselected target areas of Bangladesh, India andMyanmar; (b) construct, commission, and pilot-testthe dryer in each location; (c) train local engineers andtechnicians; and (d) gather feedback from the farmer-collaborators on the performance and usefulness of thedryer.
Methodology
Prior to the pilot-testing of the dryer, a rapid ruralappraisal was conducted on the drying practices andproblems of small-scale rice farmers in selected areasin the three countries in collaboration with NationalAgricultural Research System staff. A uniform ques-tionnaire for the survey was developed, pre-tested, andcirculated to the partners. The survey was conductedby the Bangladesh Rice Research Institute, Bang-ladesh, in June–July 1996; the Agricultural Mechani-zation Department, Myanmar, in October–November1996; and the M.S. Swaminathan Research Foun-dation, India, in March–April 1997.
A 2-week seminar/training workshop was organisedin each country to train the local engineers and techni-cians on the design, construction, and operation of thedryer. Two Vietnamese engineers from UAF visitedeach country for 2 weeks to commission and pilot-testthe pre-fabricated dryer and work with the NationalAgricultural Research System collaborators on thedesign, fabrication and testing of a locally-fabricateddryer. Training and pilot-testing were conductedduring 1–14 September 1996 in Bangladesh, 12–22
November 1996 in Myanmar, and 21 April–4 May1997 in India.
Results and Discussion
Survey on paddy drying practices
Bangladesh
The survey on the drying practices and problems ofsmall-scale rice farmers was conducted in selectedvillages of the Sylhet and Chittagong Districts. Thesedistricts encounter their most acute drying problemsduring rice harvests in rainy weather. The surveyrevealed that about 54% of the sample farmers wereeducated above secondary school level, and 83% had amedium level of income. Only 27% of their totalincome came from agricultural sources. Almost all thefarmers had a landholding of less than 2 ha each. Onaverage, 73% of the respondents cultivated modernrice varieties, and 82% transplanted their rice crops.About 58% of them obtained an average yield of 2–4 t/ha. All farmers used the traditional methods of riceharvesting with sickles, manual threshing, and sun-drying. 98% of the farmers spent a maximum ofUS$12–35/ha (Taka—Tk. 500–1,500) for sun-dryingin Chittagong District. The drying cost was less inSylhet District (US$1.20–2.40/t or Tk. 50–100).About 65% of the farmers reported a drying loss of 1–3%, and 95% felt the need for a dryer. They expressedthat a simple, portable, and variable volume/capacitydryer such as SRR-1, that could be built and repairedin village workshops, would be suitable for them.
Almost 94% of the respondents stored their roughrice for 1–7 months for use during the next season, andall of them experienced serious problems in storage.Most farmers (82%) sold their paddy in different lots1–4 months after harvesting. The dry paddy had ahigher market value of US$130–150/t (Tk. 5,500–6,500/t) than wet paddy sold at US$117–140/t (Tk.5,000–6,000/t) at the time of harvesting. Farmerscould obtain still higher prices for stored, dry paddywhen sold 3–4 months after harvesting. In 1996, about58% of the farmers sold a portion of their excess paddy1 month after harvesting at US$140–150/t (Tk. 6,000–6,500/t), 42% sold 2 months later at US$150–164/t(Tk. 6,500–7,000/t), 55% sold 3 months later atUS$150–175/t (Tk. 6,500–7,500/t), and 60% sold 4months later at US$175–200/t (Tk. 7,500–8,500/t).
Harvesting (99%) and threshing (57%) were carriedout by male workers, while drying (57%) and cleaning(77%) by female workers. The wages were US$0.94–
Quality assurance in agricultural produce,edited by G.I. Johnson, Le Van To, Nguyen Duy Duc and M.C. Webb.
ACIAR Proceedings 100(printed version published in 2000)
274
1.87 (Tk. 40–80) per male worker and US$ 0.94–1.40(Tk. 40–60) per female worker. Labour scarcity andwages were higher in Chittagong than in SylhetDistrict. Farmers in Chittagong District faced labourshortages during harvest (94%), threshing (63%), anddrying (75%). Some farmers complained that appro-priate machines were not available for threshing(16%), drying (70%), and milling (12%).
India
The survey was conducted by M.S. SwaminathanResearch Foundation staff on the drying practices inthree biovillages of Pondichery State. The resultsshowed that farmers faced difficulties in drying the dryseason (‘Kuruvai’) rice harvested in moist weather inSeptember/October. Many farmers sold their excesswet paddy immediately after harvest to middlemen orgovernment procurement agents. Procurement agentsor millers dry the wet paddy as such, or after par-boiling. Most of the farmers dried their paddy forhome consumption in open sun on a hard, mud-plastered surface near their homestead or sometimeson public roads. Drying on roads poses a serious traffichazard. Grain loss due to sun-drying is highly variabledepending on the condition of the drying surface andthe invasion by birds, ants etc. Parboiling of roughrice, a common practice in Pondichery, repairs cracksand improves head rice recovery during milling.Farmers felt that seed growers would greatly benefitfrom a small, inexpensive, low-temperature dryer suchas the SRR-1.
Myanmar
The survey covered six villages from fivetownships—Hlegu, Hnawbi, Tikkyi, Gyobingauk, andZegone—in Yangon and Bogo Divisions (Myint Waiet al. 1996). In the study area, farmers’ landholdingranged from 2.4–5.8 ha with a mean of 4.1 ha. Farmincome constituted 87–100% of the total income. Har-vesting time is April for the summer rice and Octoberfor the monsoon rice. Harvested paddy is kept on thethreshing floor for 5–10 days before threshing thatcould adversely affect the grain quality and head ricerecovery. According to Myint Wai et al. (1996), about70% of the farmers used mechanical threshers hiredfrom local Agricultural Mechanization DepartmentTractor Stations. The machine threshing took about 4h/ha and the cost was US$10/ha (kyat—K 1,750/ha) atthe official rate of exchange (1 US$ = K 175). All thefarmers used the traditional method of sun-drying.About 13–15 workers/ha were employed for sun-drying at a cost of US$6.85–7.17/ha (K 1,200–1,255/
ha). The estimated drying loss was 3.0–4.3%. Thedried paddy was stored in bamboo bins for 3–5months. The price of paddy was US$70/t (K 12,000/t)at harvesting time and US$83/t (K 14,500/t) 2 monthslater. Selling milled rice is the most profitable forMyanmar farmers. Most farmers surveyed preferredvillage-level, high-capacity dryers rather than individ-ually-owned, low-cost, low-capacity dryers such asSRR-1.
Pilot-testing of the SRR-1 dryer
Bangladesh
The pilot-testing of the dryer was conducted at theBangladesh Rice Research Institute (BRRI) ResearchStation, Gazipur. Mr Truong Vinh and Mr VuongThanh Tien of UAF built a unit of SRR-1 dryer locally,and trained the engineers and technicians of the FarmMachinery and Postharvest Technology Division ofBRRI. Two test-runs of the dryer were conducted withtwo samples of wet raw rice of 23% and 27% MC. TheMC was reduced to 14.4% and 13.3%, respectively,for the two samples in 60 hours with a total energyconsumption of 59.5 kilowatt-hours (kwh). Inaddition, 500 kg of parboiled rough rice of 28.8% MCwas dried to 11.6% MC within 42 hours and the energyconsumption was 30.9 kwh. The head rice recoverywas higher when rough rice was dried in the dryer thanin open sun. The milling out-turn of both raw andparboiled rough rice was 72%, of which 93% was headrice for raw and 98% for parboiled samples. The costof the locally manufactured dryer was US$117 (aboutTk. 4,800) and the drying cost was US$ 6.57/t (Tk.280/t) of paddy.
The dryer was thus successfully tested in thepresence of farmers, extension workers, farmmachinery manufacturers, and rice millers. All theparticipants were impressed by the low cost and goodperformance of this dryer for drying raw and parboiledpaddy. They requested the widespread demonstrationof the dryer to farmers and other clients in potentialareas, before manufacturing it locally. Ten moredryers were produced in November 1997 to field-testand demonstrate them to farmers in various parts ofBangladesh in 1998 and 1999. Baqui et al. (1996)reported that the initial responses were highly encour-aging and that Bangladeshi farmers in coastal areaswould benefit immensely from this dryer. It wouldsave the paddy harvested during the wet season andimprove the quality of milled rice. It is vital that creditbe organised for poor farmers to buy and use thedryers.
Quality assurance in agricultural produce,edited by G.I. Johnson, Le Van To, Nguyen Duy Duc and M.C. Webb.
ACIAR Proceedings 100(printed version published in 2000)
275
India
Drs P.H. Hien and P.D. Dung of UAF worked withDr R.S.S. Hopper and staff of the M.S. SwaminathanResearch Foundation (MSSRF) Biovillages Project inPondichery, India. They pilot-tested the SRR-1 dryerand trained the local engineers on the design, con-struction, and commissioning of the dryer. Theprefabricated dryer was installed on a farm in Sivaran-thakam village and the drying of wet rough rice(paddy) was demonstrated to about 100 farmersassembled from nearby villages. It took 40 h to dry 1 tof rough rice from 16.0% to 13.2% MC. Another dryerprototype was built from local materials to train thecounterpart engineers. Further testing was conductedin other villages in June and September 1997. TheMSSRF staff tried using the dryer for dryingmushrooms and other produce to see if it could be usedas a multi-purpose dryer.
Farmers felt that the dryer was useful for certifiedseed producers to dry seed at low temperature. Dr Hienexplained that germination was 85% for seed dried inthe dryer, compared with 70% for sun-dried rice seed.Large-scale farmers could install 3–4 SRR-1 dryers tohandle large volumes of paddy.
One SRR-1 unit was given to Dr B.V. Prasad, Agri-cultural Engineer from the LAM Research Institute,Andra Pradesh, for field-testing and demonstrating tofarmers in the coastal districts of Andra Pradesh wheredrying is a serious problem for rice harvested in wetseason.
Myanmar
Two Vietnamese engineers, Mr Nguyen Hay andMr Thi Hong Xuan, worked with Agricultural Mech-anization Department (AMD) engineers to pilot-testthe Vietnamese-built dryer prototype, and builtanother prototype locally to demonstrate the design,construction, and commissioning of the dryer toengineers and technicians from AMD and the Agricul-tural Machine Manufacturers Cooperative. Thefarmers’ feedback was that they preferred a high-capacity, village-level dryer. Moreover, the SRR-1dryer requires electricity for operation which is notavailable in some villages in Myanmar.
Summary and Recommendations
After the survey on paddy drying practices, pilot-testing of a Vietnamese low-cost, low-temperatureSRR-1 dryer was organised at the farm level in Bang-ladesh, India, and Mynamar during 1996–97. Post-harvest engineers from UAF visited the three
countries, pilot-tested the dryer, and trained of localengineers and technicians on its design, fabricationand operation. In Bangladesh, farmers in coastaldistricts expressed that a simple, portable, and variablevolume/capacity dryer like the SRR-1 could be highlysuitable for them. Farmers and rice millers requestedthe widespread demonstration of the SRR-1 dryer invarious parts of the country, before manufacturing itlocally. In Myanmar, farmers preferred large, village-level dryers to the SRR-1 model. They pointed out thatthe need for electricity to run the dryer would be a bigconstraint in several villages, hence an alternativesource of heat for the dryer must be explored, althoughelectricity is still needed to run the fan to circulate air.In India, farmers showed a mixed reaction to the SRR-1 dryer. Some farmers felt that the dryer could beuseful to seed producers who have to dry their seeds atlow temperature, while others said it might be suitablefor drying other produce such as mushrooms, groundnuts, cashew nuts, chillies etc.
Acknowledgments
We are grateful to the National Agricultural ResearchSystem teams under Dr M.A. Baqui (Bangladesh,1996), Mr Myint Wai (Myanmar, 1996) and DrHooper (India, 1997) for conducting the surveys ondrying practices and facilitating the evaluation of theSRR dryer in their respective locations. We thank DrsNguyen Quang Loc and Phan Hieu Hien and the staffof the Faculty of Agricultural Engineering, Universityof Agriculture and Forestry, Vietnam, for theirassistance in training the local engineers and techni-cians on the design, construction, and testing of theSRR-1 dryer in Bangladesh, India and Myanmar. Weacknowledge the funding of this project by GTZ(Deutsche Gesellschaft für Technische Zusamme-narbeit—German Agency for Technical Cooperation).
References
Ban, L.V., Hung, B.N and Hien, P.H. 1995. A low-cost in-store dryer for small farmers.
Paper presented at the International Conference on GrainDrying in Asia, Bangkok, Thailand, 17–20 October 1995,p5.
Baqui, M.A., Miah, M. and Huda, M.D. 1996. The potentialof the Vietnamese low-cost, low-temperature in-bin dryer(SRR-1) for drying rough rice (raw and parboiled) inBangladesh. Paper presented at the International Seminaron Recent Developments on Agricultural Machinery forPost-harvest Handling of Rice, Surabaya, Indonesia, 9–11 December 1996, p17.
Quality assurance in agricultural produce,edited by G.I. Johnson, Le Van To, Nguyen Duy Duc and M.C. Webb.
ACIAR Proceedings 100(printed version published in 2000)
276
Hien, P.H., Van, L.V. and Hung, B.N. 1997. The “SRR-1”dryer: an application of low-temperature in-bin dryingand storage systems in Vietnam. Paper presented at the18
th
Association of South-East Asian Nations (ASEAN)Technical Seminar on Grain Postharvest Technology,Manila, Philippines, 11–13 March 1997.
Myint Wai, Soe Hlaing and Garcia, A.G. 1996. Ricepostharvest drying in Myanmar. Paper presented at theInternational Seminar on Recent Developments onAgricultural Machinery for Post-harvest Handling ofRice, Surabaya, Indonesia, 9–11 December 1996, p18.
Quality assurance in agricultural produce,edited by G.I. Johnson, Le Van To, Nguyen Duy Duc and M.C. Webb.
ACIAR Proceedings 100(printed version published in 2000)
277
Prototype of the Cyclonic Rice Husk Furnace
T. Swasdisevi*, S. Soponronnarit*, V. Thepent†, A. Shujinda* and B. Srisawat*
Abstract
The objectives of this research were to design, construct and test a rice husk furnace for a commercial fluidisedbed paddy dryer with capacity of 10 t/h. The furnace was cylindrical in shape with an inner diameter of 1.37 mand height of 2.75 m. Rice husk was fed into the furnace at a feed rate of 110–136 kg/h. Air and rice huskentered the combustion chamber in a tangential direction with vortex rotation. Experiments were carried outwith: ash heights on the grate, 30, 45, 50 and 60 cm; rice husk feed rates, 110–136 kg/h; excess air, 265–350%;and combustion gas temperature, 523–710
°C. The thermal efficiency of the furnace system, increasing withexcess air, was approximately 57–73%, while the carbon conversion efficiency was approximately 89–97%.The height of ash on the grate had no effect on the system performance. More than 20 units of the furnace havebeen commercially produced since the beginning of 1999.
S
INGH
ET
AL
. (1980) designed and tested a cyclonicrice husk furnace for drying one tonne of paddy from35% moisture content (MC) down to 14% dry basis(d.b.). Efficiencies of the furnace were different atvarious rice husk feed rates and airflow rates. Thehighest efficiency was 80% with a rice husk feed rateof 20 kg/h and airflow rate of 168 m
3
/h. Tumambing(1984) investigated the cyclonic rice husk furnace ofPadicor for paddy drying and found that combustionefficiency was 98%. Xuan et al. (1995) investigatedtwo types of husk furnace. The first one was a furnacewith an inclined grate and cylindrical combustionchamber. The upper part of the furnace was a heatexchanger. Inlet air entered at the lower part ofinclined grate on which rice husk with a feed rate of20–25 kg/h was burnt. The efficiency of the furnacewas 70%. The second one was a pneumatic-fedcyclonic furnace. It consisted of combustion chamberand rice husk feed system. Rice husk was fed into thecombustion chamber with primary air and was burnt.Then it fell down to the lower part of the chamber. Thesecondary air entered at the upper part of the com-
bustion chamber in tangential direction in order toeliminate dust from the flue gas. Rice husk con-sumption and furnace efficiency were 10–12 kg/h and75%, respectively.
The past research showed that there were severaldesigns of rice husk furnace, i.e. vortex or inclinedgrate types, and direct use of flue gas or indirect use ofthermal energy from combustion via a heat exchanger.Acceptance of the furnace was still limited in theexperimental sites. Therefore, the objectives of thisresearch were to design, construct and test a com-mercial-scale prototype of cyclonic rice husk furnacefor a commercial fluidised bed paddy dryer with acapacity of 10 t/h. The dryer has been sold in severalcountries for more than 3 years (Soponronnarit et al.1996).
Materials and Methods
Design details of the rice husk furnace prototype areavailable in Shujinda (1997). It consisted of a com-bustion chamber, rice husk feeding system, air feedingsystem, controller system and air suction blower. Thecombustion chamber was made of steel in a cylindricalshape with inner and outer diameters of 1.37 and1.76 m, respectively, and height of 2.75 m. Materialsinside the combustion chamber at the lower part from
* School of Energy and Minerals, King Mongkut’s University of Technology Thonburi, Suksawat 48 Road, Bangkok 10140, Thailand.
† Storage and Processing Section, Ministry of Agricultural and Co-operatives, Bangkok, Thailand.
Quality assurance in agricultural produce,edited by G.I. Johnson, Le Van To, Nguyen Duy Duc and M.C. Webb.
ACIAR Proceedings 100(printed version published in 2000)
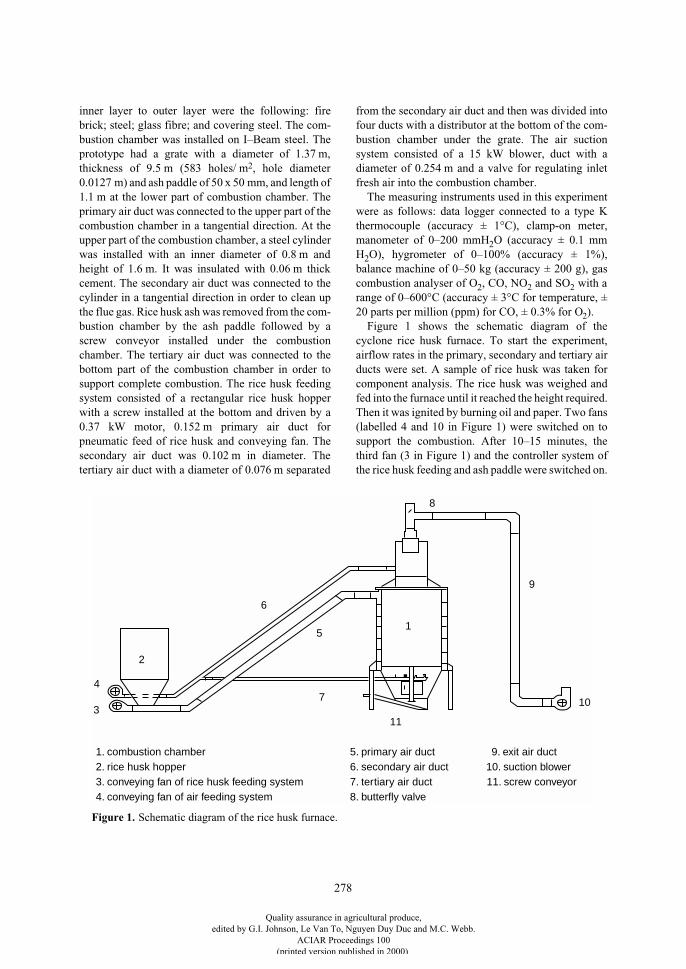
278
inner layer to outer layer were the following: firebrick; steel; glass fibre; and covering steel. The com-bustion chamber was installed on I–Beam steel. Theprototype had a grate with a diameter of 1.37 m,thickness of 9.5 m (583 holes/ m
2
, hole diameter0.0127 m) and ash paddle of 50 x 50 mm, and length of1.1 m at the lower part of combustion chamber. Theprimary air duct was connected to the upper part of thecombustion chamber in a tangential direction. At theupper part of the combustion chamber, a steel cylinderwas installed with an inner diameter of 0.8 m andheight of 1.6 m. It was insulated with 0.06 m thickcement. The secondary air duct was connected to thecylinder in a tangential direction in order to clean upthe flue gas. Rice husk ash was removed from the com-bustion chamber by the ash paddle followed by ascrew conveyor installed under the combustionchamber. The tertiary air duct was connected to thebottom part of the combustion chamber in order tosupport complete combustion. The rice husk feedingsystem consisted of a rectangular rice husk hopperwith a screw installed at the bottom and driven by a0.37 kW motor, 0.152 m primary air duct forpneumatic feed of rice husk and conveying fan. Thesecondary air duct was 0.102 m in diameter. Thetertiary air duct with a diameter of 0.076 m separated
from the secondary air duct and then was divided intofour ducts with a distributor at the bottom of the com-bustion chamber under the grate. The air suctionsystem consisted of a 15 kW blower, duct with adiameter of 0.254 m and a valve for regulating inletfresh air into the combustion chamber.
The measuring instruments used in this experimentwere as follows: data logger connected to a type Kthermocouple (accuracy ± 1°C), clamp-on meter,manometer of 0–200 mmH
2
O (accuracy ± 0.1 mmH
2
O), hygrometer of 0–100% (accuracy ± 1%),balance machine of 0–50 kg (accuracy ± 200 g), gascombustion analyser of O
2
, CO, NO
2
and SO
2
with arange of 0–600°C (accuracy ± 3°C for temperature, ±20 parts per million (ppm) for CO, ± 0.3% for O
2
).Figure 1 shows the schematic diagram of the
cyclone rice husk furnace. To start the experiment,airflow rates in the primary, secondary and tertiary airducts were set. A sample of rice husk was taken forcomponent analysis. The rice husk was weighed andfed into the furnace until it reached the height required.Then it was ignited by burning oil and paper. Two fans(labelled 4 and 10 in Figure 1) were switched on tosupport the combustion. After 10–15 minutes, thethird fan (3 in Figure 1) and the controller system ofthe rice husk feeding and ash paddle were switched on.
3
4
2
6
7
51
8
9
10
11
1. combustion chamber2. rice husk hopper3. conveying fan of rice husk feeding system4. conveying fan of air feeding system
5. primary air duct6. secondary air duct7. tertiary air duct8. butterfly valve
9. exit air duct10. suction blower11. screw conveyor
Figure 1. Schematic diagram of the rice husk furnace.
Quality assurance in agricultural produce,edited by G.I. Johnson, Le Van To, Nguyen Duy Duc and M.C. Webb.
ACIAR Proceedings 100(printed version published in 2000)
279
The control temperature was set at 325°C. The temper-ature was measured every 3 min and flue gas wasanalysed every 10 min. Relative humidity wasmeasured by hygrometer. Dry bulb and wet bulb tem-peratures of ambient air were also measured. When theexperiment finished, the rice husk feeding system andtwo fans (3 and 4 in Figure 1) were switched off, whilethe third fan (10 in Figure 1) was left on in order tosuck hot air from the furnace. Finally, this fan was alsoswitched off and samples of ash were taken forcomponent analysis.
The efficiency of the furnace was determined byusing the following equation:
where:
¢
r
= efficiency of the furnace (%)m
a
= flow rate of mixed air between fresh air andflue gas (kg/h)c
p
= specific heat of air (kJ/kg, K)T
1
= ambient air temperature (K)T
2
= temperature of mixed air between fresh air andflue gas (K)m
f
= rice husk feed rate (kg/h)HHV = high heating value of rice husk (kJ/kg)The carbon conversion efficiency was calculated
using the following equation:
where:
¢
c
= carbon conversion efficiency (%)c
a
= percentage of carbon in ash
×
ash weight (kg)c
h
= percentage of carbon in rice husk
×
husk weight(kg).
Results and Discussion
Air distribution in the tertiary air duct
Tables 1 and 2 show the efficiencies of the furnaceand carbon conversion efficiencies at various heightsof ash with four air distributors under the grate. Theresults of experiments 1/97, 2/97, 3/97 and 4/97 withash heights of 30, 45, 50 and 60 cm were as follows:the carbon conversion efficiencies were 93, 95, 96 and97%, respectively, and the efficiencies of the furnacewere 57–59%. Tables 3 and 4 show the carbon con-version efficiencies at ash heights of 30, 45, 50 and 60
cm with only one air distributor. The results of exper-iments 1/96, 2/96, 3/96 and 4/96 show that the carbonconversion efficiencies were 88, 93, 85 and 90%,respectively, while the efficiencies of the furnace were58–63%. It can be concluded that the method of airdistribution in the tertiary duct did not significantlyaffect the carbon conversion efficiency and efficiencyof the furnace.
Airflow rate in the tertiary duct
Combustion was not complete when the airflow rateused in the tertiary duct was too high. This wasbecause increased air made some of the ash fall fromthe grate. Consequently, the carbon component aftercombustion was high which resulted in low carbonconversion efficiency, as shown in Tables 1 and 2(comparison between experiment numbers 6/97 and11/97).
Excess air
The results in Table 1 show that when excess air incombustion was 260–280% (experiment numbers 1/97–4/97), the efficiencies of the furnace were 58–59%and the carbon conversion efficiencies were 93–97%.When the excess air increased to 342–350% (exper-iment numbers 5/97–7/97), the efficiency of thefurnace increased to 70–73% and the carbon con-version efficiency increased to be 95–97%. Theincrease of excess air was derived from decreasing therice husk feed rate. The best conditions as shown byseveral experiments were as follows: height of ash ongrate, 50 cm; rice husk feed rate, 110 kg/h; excess airin combustion, 350%; and average furnace temper-ature, 628
°
C. Carbon in ash after combustion was5.5%. The carbon conversion efficiency was 96% andthe efficiency of the furnace was 73%. Temperaturedistribution in the furnace with ash height of 50 cm isshown in Figure 2.
Height of ash on the grate during combustion
The height of ash on the grate during combustiondid not affect the efficiency of the furnace, as shown inTable 3.
Component analysis of rice husk and ash
The composition of substances in the rice huskbefore combustion was as follows: carbon, 39%;
¢ra p
f
m c T T
m HHV=
× Y( )×
×2 1
100 (1)
¢ch a
h
c c
c=
Y×100 2( )
Quality assurance in agricultural produce,edited by G.I. Johnson, Le Van To, Nguyen Duy Duc and M.C. Webb.
ACIAR Proceedings 100(printed version published in 2000)
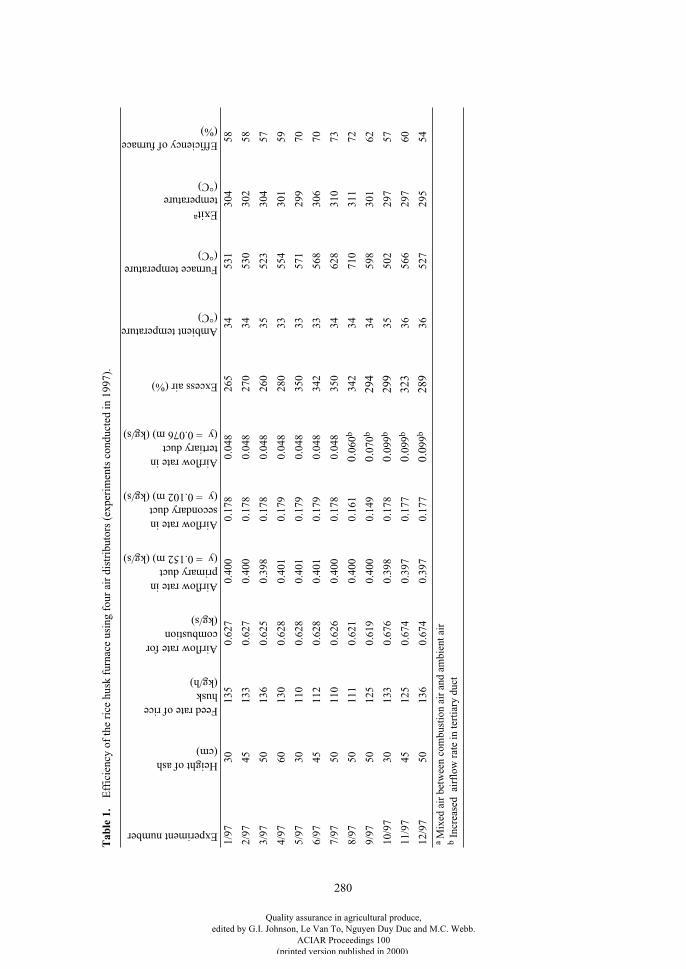
280
Tab
le 1
.
Eff
icie
ncy
of th
e ri
ce h
usk
furn
ace
usin
g fo
ur a
ir d
istr
ibut
ors
(exp
erim
ents
con
duct
ed in
199
7).
Experiment number
Height of ash(cm)
Feed rate of rice husk(kg/h)
Airflow rate for combustion(kg/s)
Airflow rate in primary duct(
y
= 0.152 m) (kg/s)
Airflow rate in secondary duct(
y
= 0.102 m) (kg/s)
Airflow rate in tertiary duct(
y
= 0.076 m) (kg/s)
Excess air (%)
Ambient temperature(°C)
Furnace temperature(°C)
Exit
a
temperature(°C)
Efficiency of furnace(%)
1/97
3013
50.
627
0.40
00.
178
0.04
8 2
6534
531
304
58
2/97
4513
30.
627
0.40
00.
178
0.04
8 2
7034
530
302
58
3/97
5013
60.
625
0.39
80.
178
0.04
8 2
6035
523
304
57
4/97
6013
00.
628
0.40
10.
179
0.04
8 2
8033
554
301
59
5/97
3011
00.
628
0.40
10.
179
0.04
8 3
5033
571
299
70
6/97
4511
20.
628
0.40
10.
179
0.04
8 3
4233
568
306
70
7/97
5011
00.
626
0.40
00.
178
0.04
8 3
5034
628
310
73
8/97
5011
10.
621
0.40
00.
161
0.
060
b
342
3471
031
172
9/97
5012
50.
619
0.40
00.
149
0.
070
b
294
3459
830
162
10/9
730
133
0.67
60.
398
0.17
8
0.
099
b
299
3550
229
757
11/9
745
125
0.67
40.
397
0.17
7
0.
099
b
323
3656
629
760
12/9
750
136
0.67
40.
397
0.17
7
0.0
99
b
289
3652
729
554
a
Mix
ed a
ir b
etw
een
com
bust
ion
air
and
ambi
ent a
ir
b
Inc
reas
ed a
irfl
ow r
ate
in te
rtia
ry d
uct
Quality assurance in agricultural produce,edited by G.I. Johnson, Le Van To, Nguyen Duy Duc and M.C. Webb.
ACIAR Proceedings 100(printed version published in 2000)
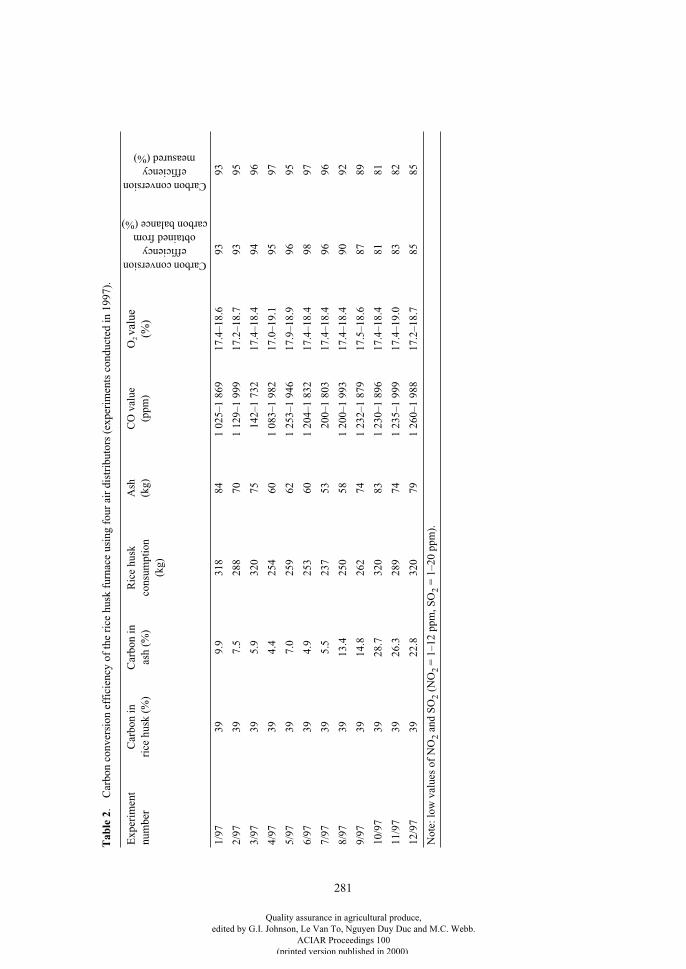
281
Tab
le 2
. C
arbo
n co
nver
sion
eff
icie
ncy
of th
e ri
ce h
usk
furn
ace
usin
g fo
ur a
ir d
istr
ibut
ors
(exp
erim
ents
con
duct
ed in
199
7).
Exp
erim
ent
num
ber
Car
bon
in
rice
hus
k (%
)C
arbo
n in
as
h (%
)
Ric
e hu
sk
cons
umpt
ion
(kg)
Ash
(k
g)C
O v
alue
(p
pm)
O
2
valu
e (%
)
Carbon conversion efficiency
obtained from carbon balance (%)
Carbon conversion efficiency
measured (%)
1/97
399.
931
884
1 02
5–1
869
17.4
–18.
693
93
2/97
397.
528
870
1 12
9–1
999
17.2
–18.
793
95
3/97
395.
932
075
142–
1 73
217
.4–1
8.4
9496
4/97
394.
425
460
1 08
3–1
982
17.0
–19.
195
97
5/97
397.
025
962
1 25
3–1
946
17.9
–18.
996
95
6/97
394.
925
360
1 20
4–1
832
17.4
–18.
498
97
7/97
395.
523
753
200–
1 80
317
.4–1
8.4
9696
8/97
3913
.425
058
1 20
0–1
993
17.4
–18.
490
92
9/97
3914
.826
274
1 23
2–1
879
17.5
–18.
687
89
10/9
739
28.7
320
831
230–
1 89
617
.4–1
8.4
8181
11/9
739
26.3
289
741
235–
1 99
917
.4–1
9.0
8382
12/9
739
22.8
320
791
260–
1 98
817
.2–1
8.7
8585
Not
e: lo
w v
alue
s of
NO
2
and
SO
2
(N
O
2
= 1
–12
ppm
, SO
2
= 1
–20
ppm
).
Quality assurance in agricultural produce,edited by G.I. Johnson, Le Van To, Nguyen Duy Duc and M.C. Webb.
ACIAR Proceedings 100(printed version published in 2000)
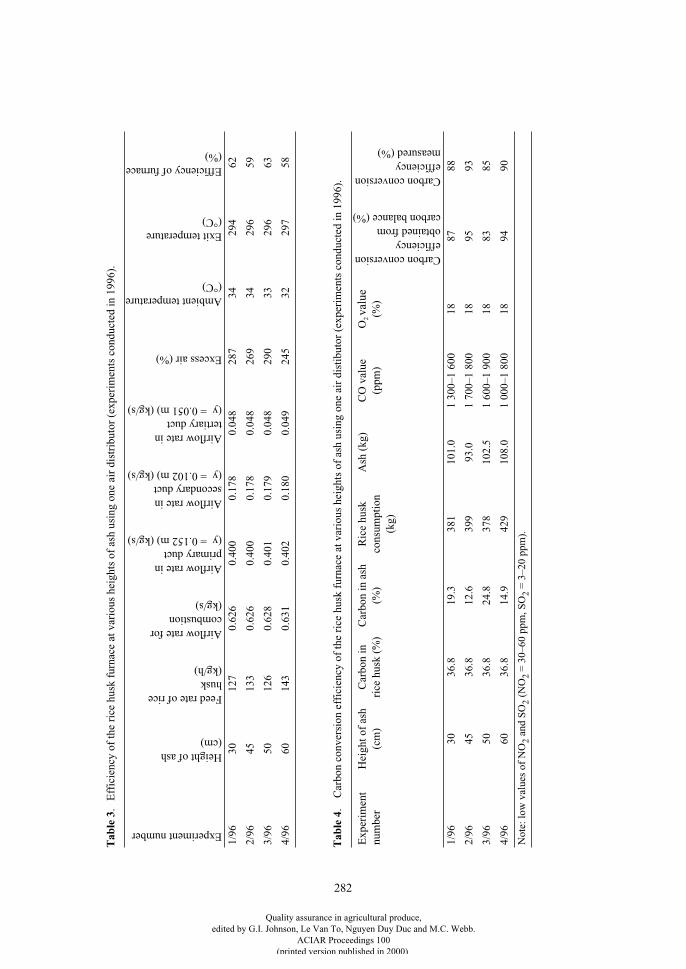
282
Tab
le 3
. E
ffic
ienc
y of
the
rice
hus
k fu
rnac
e at
var
ious
hei
ghts
of
ash
usin
g on
e ai
r di
stri
buto
r (e
xper
imen
ts c
ondu
cted
in 1
996)
.
Experiment number
Height of ash(cm)
Feed rate of rice husk(kg/h)
Airflow rate for combustion(kg/s)
Airflow rate in primary duct(
y
= 0.152 m) (kg/s)
Airflow rate in secondary duct(
y
= 0.102 m) (kg/s)
Airflow rate in tertiary duct(
y
= 0.051 m) (kg/s)
Excess air (%)
Ambient temperature(°C)
Exit temperature(°C)
Efficiency of furnace(%)
1/96
3012
70.
626
0.40
00.
178
0.04
8 2
8734
294
62
2/96
4513
30.
626
0.40
00.
178
0.04
8 2
6934
296
59
3/96
5012
60.
628
0.40
10.
179
0.04
8 2
9033
296
63
4/96
6014
30.
631
0.40
20.
180
0.04
9 2
4532
297
58
Tab
le 4
. C
arbo
n co
nver
sion
eff
icie
ncy
of th
e ri
ce h
usk
furn
ace
at v
ario
us h
eigh
ts o
f as
h us
ing
one
air
dist
ibut
or (
expe
rim
ents
con
duct
ed in
199
6).
Exp
erim
ent
num
ber
Hei
ght o
f as
h (c
m)
Car
bon
in
rice
hus
k (%
)C
arbo
n in
ash
(%
)R
ice
husk
co
nsum
ptio
n(k
g)
Ash
(kg
)C
O v
alue
(p
pm)
O
2
valu
e (%
)
Carbon conversion efficiency obtained from carbon balance (%)
Carbon conversion efficiency measured (%)
1/96
3036
.819
.338
110
1.0
1 30
0–1
600
18 8
788
2/96
4536
.812
.639
993
.01
700–
1 80
018
95
93
3/96
5036
.824
.837
810
2.5
1 60
0–1
900
18 8
385
4/96
6036
.814
.942
910
8.0
1 00
0–1
800
18 9
490
Not
e: lo
w v
alue
s of
NO
2
and
SO
2
(N
O
2
= 3
0–60
ppm
, SO
2
= 3
–20
ppm
).
Quality assurance in agricultural produce,edited by G.I. Johnson, Le Van To, Nguyen Duy Duc and M.C. Webb.
ACIAR Proceedings 100(printed version published in 2000)
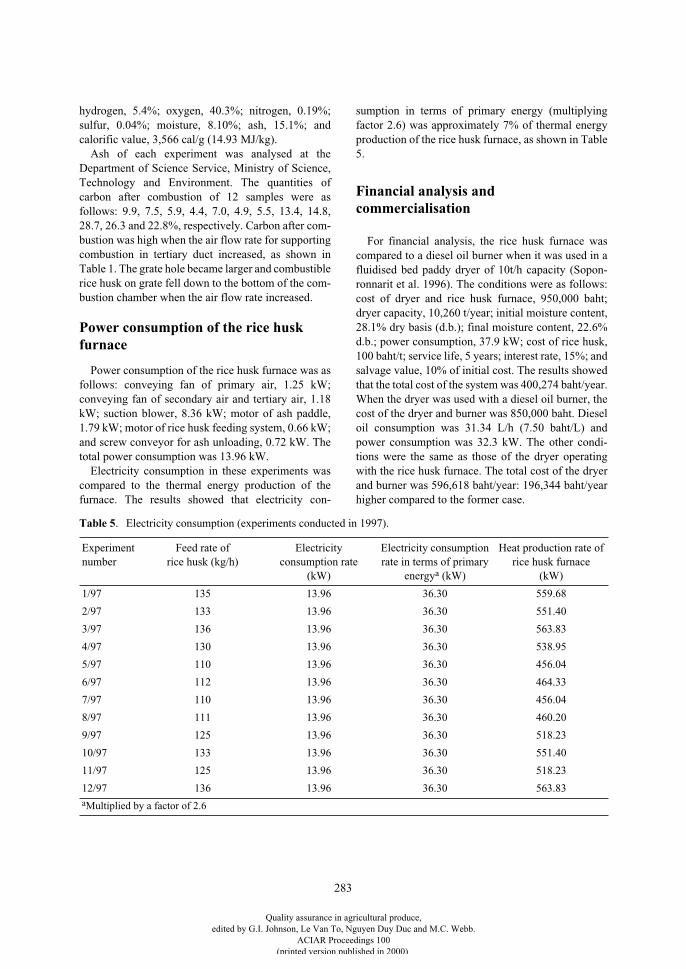
283
hydrogen, 5.4%; oxygen, 40.3%; nitrogen, 0.19%;sulfur, 0.04%; moisture, 8.10%; ash, 15.1%; andcalorific value, 3,566 cal/g (14.93 MJ/kg).
Ash of each experiment was analysed at theDepartment of Science Service, Ministry of Science,Technology and Environment. The quantities ofcarbon after combustion of 12 samples were asfollows: 9.9, 7.5, 5.9, 4.4, 7.0, 4.9, 5.5, 13.4, 14.8,28.7, 26.3 and 22.8%, respectively. Carbon after com-bustion was high when the air flow rate for supportingcombustion in tertiary duct increased, as shown inTable 1. The grate hole became larger and combustiblerice husk on grate fell down to the bottom of the com-bustion chamber when the air flow rate increased.
Power consumption of the rice husk furnace
Power consumption of the rice husk furnace was asfollows: conveying fan of primary air, 1.25 kW;conveying fan of secondary air and tertiary air, 1.18kW; suction blower, 8.36 kW; motor of ash paddle,1.79 kW; motor of rice husk feeding system, 0.66 kW;and screw conveyor for ash unloading, 0.72 kW. Thetotal power consumption was 13.96 kW.
Electricity consumption in these experiments wascompared to the thermal energy production of thefurnace. The results showed that electricity con-
sumption in terms of primary energy (multiplyingfactor 2.6) was approximately 7% of thermal energyproduction of the rice husk furnace, as shown in Table5.
Financial analysis and commercialisation
For financial analysis, the rice husk furnace wascompared to a diesel oil burner when it was used in afluidised bed paddy dryer of 10t/h capacity (Sopon-ronnarit et al. 1996). The conditions were as follows:cost of dryer and rice husk furnace, 950,000 baht;dryer capacity, 10,260 t/year; initial moisture content,28.1% dry basis (d.b.); final moisture content, 22.6%d.b.; power consumption, 37.9 kW; cost of rice husk,100 baht/t; service life, 5 years; interest rate, 15%; andsalvage value, 10% of initial cost. The results showedthat the total cost of the system was 400,274 baht/year.When the dryer was used with a diesel oil burner, thecost of the dryer and burner was 850,000 baht. Dieseloil consumption was 31.34 L/h (7.50 baht/L) andpower consumption was 32.3 kW. The other condi-tions were the same as those of the dryer operatingwith the rice husk furnace. The total cost of the dryerand burner was 596,618 baht/year: 196,344 baht/yearhigher compared to the former case.
Table 5
. Electricity consumption (experiments conducted in 1997).
Experiment number
Feed rate of rice husk (kg/h)
Electricity consumption rate
(kW)
Electricity consumption rate in terms of primary
energy
a
(kW)
Heat production rate of rice husk furnace
(kW)
1/97 135 13.96 36.30 559.68
2/97 133 13.96 36.30 551.40
3/97 136 13.96 36.30 563.83
4/97 130 13.96 36.30 538.95
5/97 110 13.96 36.30 456.04
6/97 112 13.96 36.30 464.33
7/97 110 13.96 36.30 456.04
8/97 111 13.96 36.30 460.20
9/97 125 13.96 36.30 518.23
10/97 133 13.96 36.30 551.40
11/97 125 13.96 36.30 518.23
12/97 136 13.96 36.30 563.83
a
Multiplied by a factor of 2.6
Quality assurance in agricultural produce,edited by G.I. Johnson, Le Van To, Nguyen Duy Duc and M.C. Webb.
ACIAR Proceedings 100(printed version published in 2000)
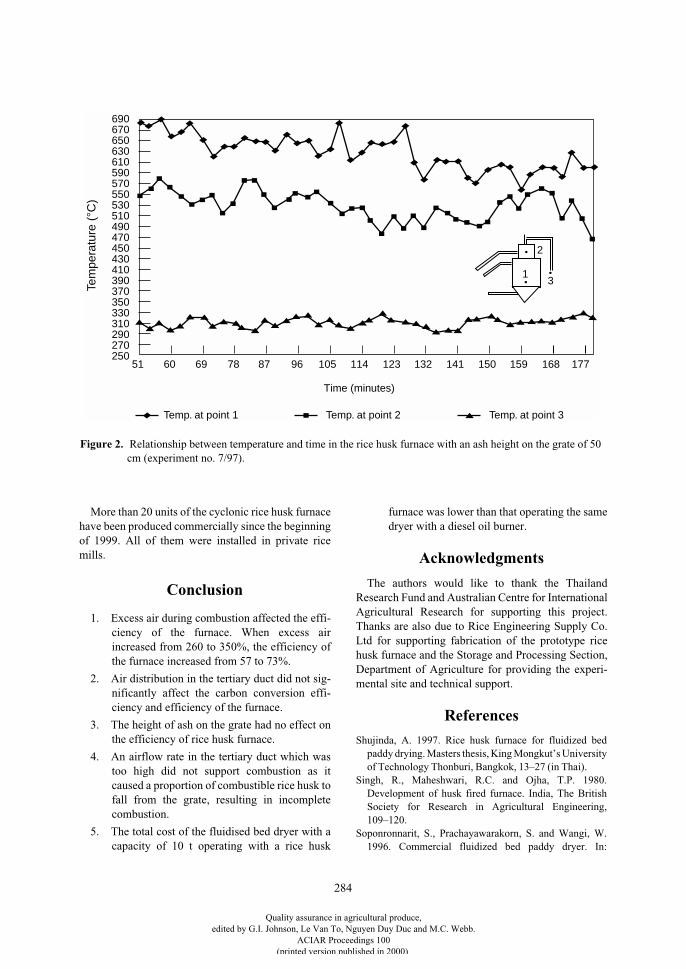
284
More than 20 units of the cyclonic rice husk furnacehave been produced commercially since the beginningof 1999. All of them were installed in private ricemills.
Conclusion
1. Excess air during combustion affected the effi-ciency of the furnace. When excess airincreased from 260 to 350%, the efficiency ofthe furnace increased from 57 to 73%.
2. Air distribution in the tertiary duct did not sig-nificantly affect the carbon conversion effi-ciency and efficiency of the furnace.
3. The height of ash on the grate had no effect onthe efficiency of rice husk furnace.
4. An airflow rate in the tertiary duct which wastoo high did not support combustion as itcaused a proportion of combustible rice husk tofall from the grate, resulting in incompletecombustion.
5. The total cost of the fluidised bed dryer with acapacity of 10 t operating with a rice husk
furnace was lower than that operating the samedryer with a diesel oil burner.
Acknowledgments
The authors would like to thank the ThailandResearch Fund and Australian Centre for InternationalAgricultural Research for supporting this project.Thanks are also due to Rice Engineering Supply Co.Ltd for supporting fabrication of the prototype ricehusk furnace and the Storage and Processing Section,Department of Agriculture for providing the experi-mental site and technical support.
References
Shujinda, A. 1997. Rice husk furnace for fluidized bedpaddy drying. Masters thesis, King Mongkut’s Universityof Technology Thonburi, Bangkok, 13–27 (in Thai).
Singh, R., Maheshwari, R.C. and Ojha, T.P. 1980.Development of husk fired furnace. India, The BritishSociety for Research in Agricultural Engineering,109–120.
Soponronnarit, S., Prachayawarakorn, S. and Wangi, W.1996. Commercial fluidized bed paddy dryer. In:
Time (minutes)
Tem
pera
ture
(°C
)
690670650630610590570550530510490470450430410390370350330310290270250
51 60 69 78 87 96 105 114 123 132 141 150 159 168 177
3
2
1
Temp. at point 1 Temp. at point 2 Temp. at point 3
Figure 2. Relationship between temperature and time in the rice husk furnace with an ash height on the grate of 50cm (experiment no. 7/97).
Quality assurance in agricultural produce,edited by G.I. Johnson, Le Van To, Nguyen Duy Duc and M.C. Webb.
ACIAR Proceedings 100(printed version published in 2000)
285
Proceedings of the 10
th
International Drying Symposium(IDS’96), Krakow, Poland, 30 July–2 August 1996,volume A, 638–644.
Tumambing, J.A. 1984. Testing and evaluation of rice hull-fed furnaces for grain drying. In: Semple, R.L. and Frio,A.S., ed., Proceedings of the 7
th
ASEAN TechnicalSeminar on Grain Post-harvest Technology—Health and
Ecology in Grain Post-harvest Technology, KualaLumpur, Malaysia, 21–24 August 1984, 197–214.
Xuan, N.V., Vinh., T., Anh, P.T. and Hien, P. 1995.Development of rice husk furnaces for grain drying.Proceedings of the International Conference on GrainDrying in Asia, Bangkok, Thailand, 17–20 October 1995,109–120.
Quality assurance in agricultural produce,edited by G.I. Johnson, Le Van To, Nguyen Duy Duc and M.C. Webb.
ACIAR Proceedings 100(printed version published in 2000)
286
Evaluation of Drying System Performance in Rice Mills
N. Meeso, S. Soponronnarit and S. Wetchacama*
Abstract
The suitability of paddy drying systems in three rice mills with different product capacity and drying systeminstallations was examined. The study included drying technique, paddy quality, energy consumption andproblems arising during operation. Finally, the most suitable paddy drying system was decided upon. Thisprovides a guide for improving the efficiency of paddy drying systems and minimising the cost of drying.Important other results can be summarised as follows:
1. Use of a fluidised bed dryer with tempering during each drying stage reduced the moisture content (MC)of paddy from 24% to 14% dry basis with acceptable paddy quality.
2. Partial air recirculation reduced energy consumption in the fluidised bed dryer. 3. Energy consumption of each drying system depended on the initial and final MC of paddy, i.e. higher MC,
lower energy consumption.
A
T
PRESENT
, mechanical dryers—i.e. the LouisianaState University (LSU) dryer, cross flow dryer, recir-culation batch dryer and fluidised bed dryer—arewidely used in Thai rice mills. In-store drying isbecoming more widely adopted. Soponronnarit (1995)studied the damage to moist paddy after harvest—analysing the causes and using a systematic approachto solving these problems. The solution includedaeration of ambient air through the moist paddy bulkusing a low flow rate of 0.35 m
3
/min/m
3
of paddy toexhaust the heat liberated through respiration duringthe waiting period before drying. Two-stage dryingwas necessary in order to reduce the moisture content(MC) of paddy rapidly to 23% dry basis (d.b.) in thefirst stage using a fluidised bed dryer or other type ofdryer, for quality reasons. This was followed by asecond stage of slow drying to reduce the MC from 23to 16% d.b. This stage was carried out in a shed usingaeration of ambient air with a flow rate of 0.5–1.0m
3
/min/m
3
of paddy during the daytime. In the case ofstoring paddy for several months, intermittent aerationof ambient air through the paddy bulk for 1–3 h/weekwas necessary to exhaust heat liberated from thepaddy.
Mongkonthad (1994) reported that paddy dryingusing the LSU grain dryer gave a lower head rice yield(maximum 5%) than ambient air drying and reducedthe MC of paddy from 27 to 18% d.b., with an outputof 30 t of paddy/day. Using rice husk as fuel costsapproximately 20 baht/t of paddy. Soponronnarit et al.(1995) designed and tested a prototype, 0.82 t/hcapacity, fluidised bed paddy dryer for high MCpaddy. Exhaust air was partially recirculated. Experi-mental results showed that it could reduce the MC ofpaddy from 45 to 24% d.b. using a drying air temper-ature of 100–150°C, with the fraction of recirculatedair 0.66, a specific air flow rate of 0.05 kg/s/kg of drymatter, superficial air velocity of 3.2 m/s, bed depth of0.1 m, and total primary energy consumption of 2.32MJ/kg of water evaporated. Reference data of theenergy consumption of many rice mills showed thatprimary energy consumption ranged between 3–6MJ/kg of water evaporated, based on the moisturelevel of paddy.
Soponronnarit et al. (1999) investigated a strategyfor reducing moisture in paddy using a combination ofthe fluidisation technique, tempering, and ambient airventilation, and examined the results with respect tototal operation time and milling quality. The resultsshowed that after the three processes, the MC of paddywas reduced from 33 to 16.5% d.b. within approxi-
* School of Energy and Materials, King Mongkut’s University of Technology Thonburi, Suksawat 48 Road, Bangkok 10140, Thailand.
Quality assurance in agricultural produce,edited by G.I. Johnson, Le Van To, Nguyen Duy Duc and M.C. Webb.
ACIAR Proceedings 100(printed version published in 2000)
287
mately 53 min. During the first process, a fluidised beddryer was used to reduce the MC of paddy to 19.5%d.b. within 3 min. Then the paddy was tempered for atleast 30 minutes, but for not more than 1 h. Finally, itwas cooled using ambient air with a velocity of 0.15m/s for 20 min. The quality of paddy in terms of headrice yield and whiteness was acceptable. Taweerattan-apanish et al. (1999) studied the yield of paddy driedusing the fluidisation technique with paddy of varyinginitial and final MC using a high inlet air temperature(140 and 150°C). After tempering, head rice yieldincreased compared to ambient air drying. The initialand final MC of paddy—ranging between 30–45%d.b. and 23–28% d.b., respectively—affected theincrease in head rice yield. The head rice yield oftempered paddy was higher than that of untemperedpaddy, while there was no difference in eating qualityscores between the samples.
Each rice mill has a different drying system. Someof these may damage the paddy (i.e. produce lowquality paddy), or be expensive to run. This studyinvolved a comparison of drying system performanceat three rice mills. The study included paddy dryingmethod, paddy quality, energy consumption andproblems arising during operation. The results will beuseful for improving the efficiency of paddy dryingsystems and minimising the cost of drying.
Materials and Methods
The paddy drying systems were studied in threedifferent rice mills—Nithithanyakit, Kungleechan andPoonsinthai. Each rice mill uses a different paddydrying system, consisting of some components asfollows: fluidised bed dryer, LSU dryer, cross flowdryer, cleaner, cooling bin and tempering bin.Schematic diagrams of the three drying systems areshown in Figures 1–4. In all cases, the MC of paddywas reduced from at least 23 to 14% d.b.
The drying air temperature used depended on thetype of dryer and the MC of paddy as follows: 100–150°C for a 10 t/h capacity fluidised bed dryer with abed depth of 15 cm; and 80–100°C for a 6–40 tcapacity LSU dryer.
Results and Discussion
Moisture and paddy quality
Nithithanyakit rice mill
Two-stage drying system, 20 t/h capacity (Figures 1and 2).
First stage
The first stage included two parallel system instal-lations (Figure 1). In the first half of the system, theaverage MC, head rice yield and whiteness of paddy ina paddy pit (position 1 in Figure 1) were 23.3% d.b.,39.2% and 46.8, respectively. After passing through afluidised bed dryer (2) at a feed rate of 9.30 t/h and anaverage drying air temperature of 145°C, the MC,paddy temperature, head rice yield and whiteness ofpaddy were 18.5% d.b., 62°C, 44.2% and 45, respec-tively. Then the paddy passed through a 9 t capacitytempering and cooling bin (3). The average MC,paddy temperature, head rice yield and whiteness were17.3% d.b., 34°C, 47.7% and 44.7, respectively.
In the second half of the system, the average MC,head rice yield and whiteness of paddy in the paddy pit(position 4 in Figure 1) were 20.6% d.b., 36.6% and47.8, respectively. After passing through a fluidisedbed dryer (5) at a feed rate of 10.5 t/h and an averagedrying air temperature of 149°C, the MC, paddy tem-perature, head rice yield and whiteness were 18.4%d.b., 65°C, 38.8% and 47.7, respectively. Then thepaddy passed through a 9 t capacity tempering andcooling bin (6). The average MC, paddy temperatureand head rice yield of paddy were 17.0% d.b., 39°C,and 41.8%, respectively, and there was no change inthe average rice whiteness.
Second stage
In the second stage (Figure 2), paddy from thetempering and cooling bins (positions 3 and 6 inFigure 1) was conveyed to a paddy bulk (7 in Figure 1;1 in Figure 2)—which had an average head rice yieldof 46.3% and rice whiteness of 45.3, then passedthrough silos (2 and 3 in Figure 2) to reduce the tem-perature of paddy to 34°C using ambient air. Theaverage head rice yield and whiteness were 47.4% and45.8, respectively. Then the paddy passed through a 40t capacity LSU dryer (4 in Figure 2), with an averagedrying air temperature of 79°C. The LSU dryerreduced the MC of paddy to 14.0% d.b., with anaverage paddy temperature of 46°C, head rice yield of36.4% and whiteness of 46.3. Then the paddy passedthrough silos (5 and 6 in Figure 2) in order to reduce itstemperature using ambient air ventilation. The averagehead rice yield was 38.7% with no change in ricewhiteness.
From these experimental results, the average initialMC of paddy was 20.6–23.3% d.b. After the first stageof drying, the average MC of paddy was 17.0–17.3%d.b. Head rice yield and whiteness were in good rangescompared to the initial condition.
Quality assurance in agricultural produce,edited by G.I. Johnson, Le Van To, Nguyen Duy Duc and M.C. Webb.
ACIAR Proceedings 100(printed version published in 2000)
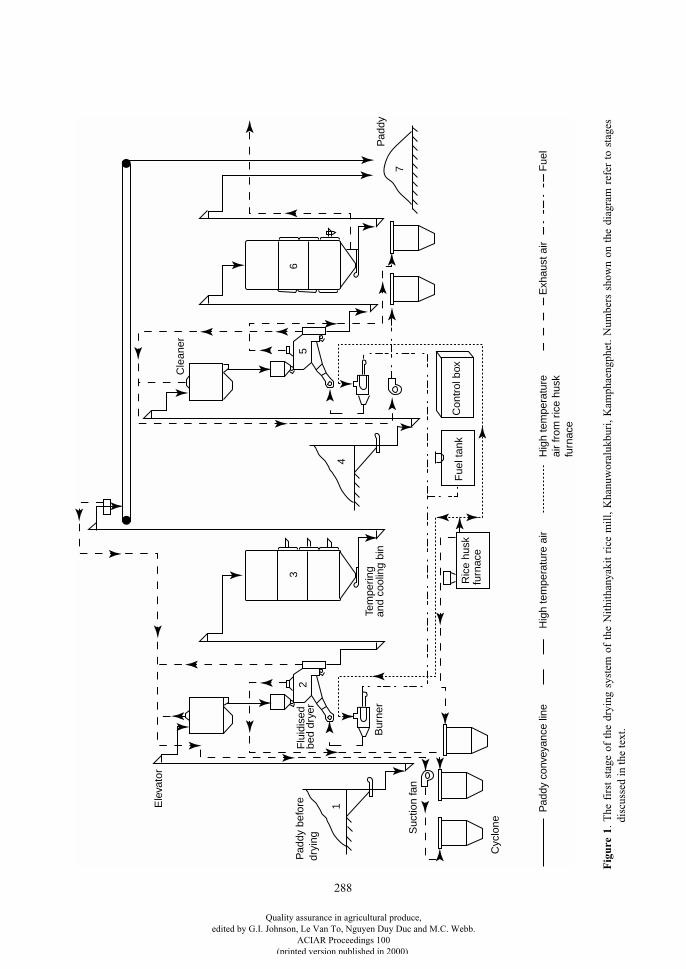
288
Ele
vato
r
Flu
idis
edbe
d dr
yer
Cle
aner
Pad
dyTe
mpe
ring
and
cool
ing
bin
Bur
ner
Suc
tion
fan
Pad
dy b
efor
e dr
ying
Cyc
lone
Ric
e hu
skfu
rnac
e
Fue
l tan
kC
ontr
ol b
ox
1
23
4
7
65
Pad
dy c
onve
yanc
e lin
eH
igh
tem
pera
ture
air
Hig
h te
mpe
ratu
reai
r fr
om r
ice
husk
fu
rnac
e
Exh
aust
air
Fue
l
Fig
ure
1
. T
he f
irst
sta
ge o
f th
e dr
ying
sys
tem
of
the
Nit
hith
anya
kit
rice
mil
l, K
hanu
wor
aluk
buri
, K
amph
aeng
phet
. N
umbe
rs s
how
n on
the
dia
gram
ref
er t
o st
ages
disc
usse
d in
the
text
.
Quality assurance in agricultural produce,edited by G.I. Johnson, Le Van To, Nguyen Duy Duc and M.C. Webb.
ACIAR Proceedings 100(printed version published in 2000)
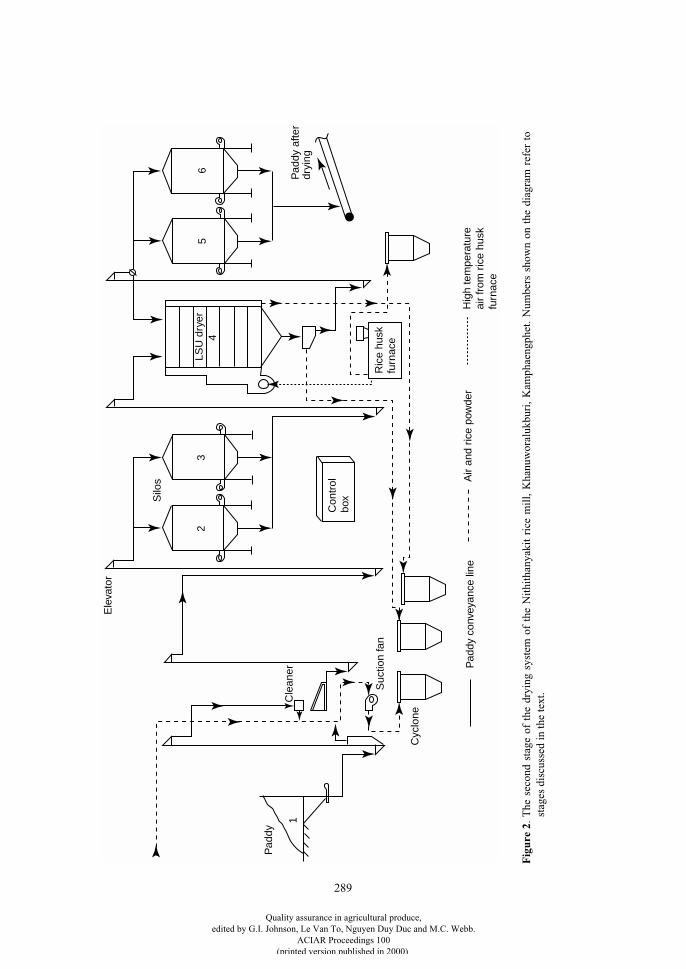
289
1
Con
trol
box
23
56
4
Cle
aner
Suc
tion
fan
Ele
vato
r
Ric
e hu
sk
furn
ace
Silo
s
LSU
dry
er
Cyc
lone
Pad
dy a
fter
dryi
ng
Pad
dy c
onve
yanc
e lin
eA
ir an
d ric
e po
wde
rH
igh
tem
pera
ture
air
from
ric
e hu
skfu
rnac
e
Pad
dy
Fig
ure
2
.The
sec
ond
stag
e of
the
dry
ing
syst
em o
f th
e N
ithi
than
yaki
t ri
ce m
ill,
Kha
nuw
oral
ukbu
ri,
Kam
phae
ngph
et.
Num
bers
sho
wn
on t
he d
iagr
am r
efer
to
stag
es d
iscu
ssed
in th
e te
xt.
Quality assurance in agricultural produce,edited by G.I. Johnson, Le Van To, Nguyen Duy Duc and M.C. Webb.
ACIAR Proceedings 100(printed version published in 2000)
290
After the second stage, the average MC of paddywas 14% d.b. Head rice yield was not very high whilethe average rice whiteness was good at 46.3, based onthe initial whiteness.
Kungleechan rice mill
Two-stage drying system, 6.06 t/h capacity(Figure 3).
First stage
The average MC of paddy in the paddy pit (position1 in Figure 3) was 24.4% d.b. After passing through acleaner, the average MC was reduced to 23.9% d.b.,and average head rice yield and whiteness were 46.0%and 40.9, respectively. Then the paddy passed througha fluidised bed dryer (2) with a feed rate of 9.54 t/h,average drying air temperature of 142°C, bed depth of15 cm and residence time of 1.4 min. The dryerreduced the MC of paddy to 20.5% d.b. with averagepaddy temperature of 67°C, head rice yield of 45.9%and whiteness of 41.8. After passing through a 18 tcapacity tempering and cooling bin (3), the MC ofpaddy was reduced to 18.4% d.b., with average paddytemperature, head rice yield and whiteness of 43°C,44.4% and 40.7, respectively.
Second stage
Paddy was further dried using a fluidised bed dryer(4) with a feed rate of 9.06 t/h, average drying air tem-perature of 141°C, bed depth of 12 cm and residencetime of 1.2 min. The dryer reduced the MC of paddy to15.6% d.b. with an average paddy temperature of75°C, head rice yield of 43.7% and whiteness of 41.2.Then the paddy passed through a 17 t capacity LSUdryer, which operated as a tempering and cooling bin(5) instead of drying. It reduced the MC of paddy to14.2% d.b. with an average paddy temperature of42°C, head rice yield of 44.5% and whiteness of 40.2.The paddy was then conveyed to the dust extractionbin (6) where its temperature was reduced to 41°C.
At the Kungleechan rice mill, the average initial MCof paddy was about 24.4% d.b. After two-stage dryingusing fluidised bed dryers, the MC of paddy wasreduced to 14.2% d.b. Head rice yield and ricewhiteness were in good ranges.
Poonsinthai rice mill
Two-stage drying system, 0.893 t/h capacity(Figure 4).
First stage
The average MC of paddy in the paddy pit (position1 in Figure 4) was 28.6% d.b. After passing through acleaner (2), the MC of paddy was reduced to 28.2%d.b. with an average head rice yield and whiteness of41.0% and 44.6, respectively. Then the paddy passedthrough a fluidised bed dryer (3) with a feed rate of9.32 t/h, average drying air temperature of 103°C, beddepth of 10 cm and residence time of 0.96 min. Thedryer reduced the MC of the paddy to 21.7% d.b., withan average paddy temperature of 65°C, head rice yieldof 39.6% and whiteness of 45.9.
Second stage
The paddy was conveyed to a paddy pit (position 4in Figure 4) for 1 h which reduced the paddy temper-ature to 49°C. Then the paddy was ventilated withambient air in a 7 t capacity cross flow dryer (5) for 1.5h, reducing the MC to 21.0% d.b. with an averagepaddy temperature of 33°C, head rice yield of 44.1%and whiteness of 44.0. The paddy was then passedback though the same cross flow dryer, with anaverage drying air temperature of 71°C. Circulatedpaddy was in this dryer for 10 rounds (47 min/round),resulting in the reduction of MC to 17.0% d.b. with anaverage paddy temperature of 36°C, head rice yield of42.0 and whiteness of 44.8. Then it was conveyed to adust extraction bin (6).
At the Poonsinthai mill, the average initial MC ofpaddy was 28.6% d.b. The paddy was dried to 17%d.b. with head rice yield and rice whiteness in goodranges. It should be noted that a bottleneck in thedrying capacity was due to the limited capacity of thecross flow dryer.
Energy consumption
Energy consumption for the paddy drying systemswas thermal energy for air heating and electricity forrunning motors. Tables 1 and 2 show that energy con-sumption increased as the MC of paddy decreased. Airrecirculation reduced energy requirements, i.e. first-stage drying in the Nithithanyakit mill, which did nothave air recirculation, used more energy than that ofthe Kungleechan mill which did have air recirculation.A too low drying air temperature also caused higherenergy consumption, as shown in the second-stagedrying at the Poonsinthai mill.
Quality assurance in agricultural produce,edited by G.I. Johnson, Le Van To, Nguyen Duy Duc and M.C. Webb.
ACIAR Proceedings 100(printed version published in 2000)
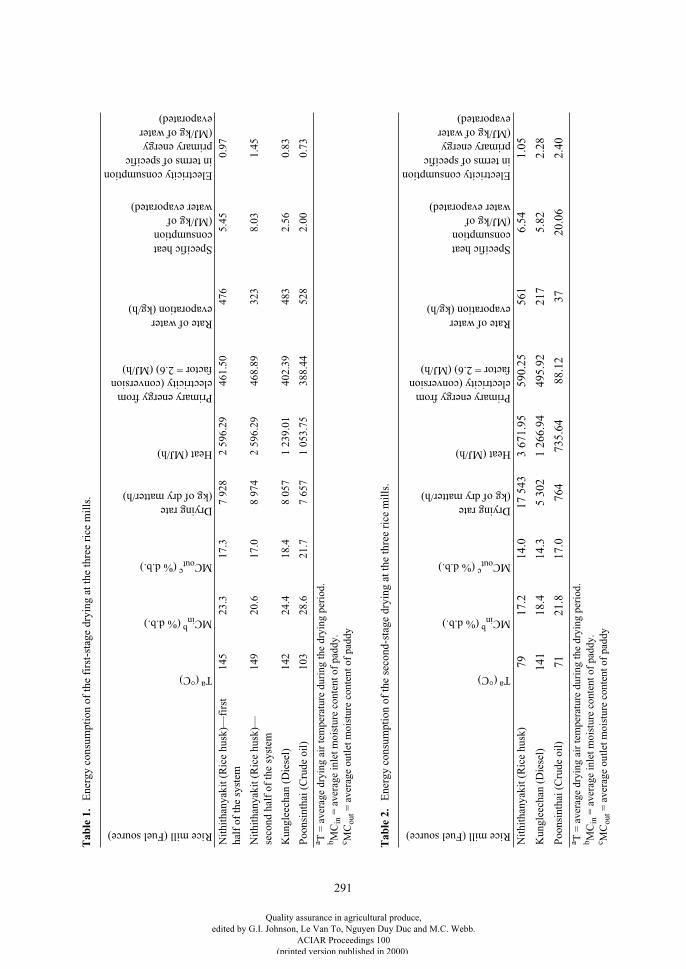
291
Tab
le 1
.
E
nerg
y co
nsum
ptio
n of
the
firs
t-st
age
dryi
ng a
t the
thre
e ri
ce m
ills
.
Rice mill (Fuel source)
T
a
(°C)
MC
inb
(% d.b.)
MC
outc
(% d.b.)
Drying rate(kg of dry matter/h)
Heat (MJ/h)
Primary energy from electricity (conversion factor = 2.6) (MJ/h)
Rate of waterevaporation (kg/h)
Specific heatconsumption(MJ/kg of water evaporated)
Electricity consumption in terms of specific primary energy(MJ/kg of water evaporated)
Nit
hith
anya
kit (
Ric
e hu
sk)—
firs
t ha
lf o
f th
e sy
stem
145
23.3
17.3
7 92
82
596.
2946
1.50
476
5.45
0.97
Nit
hith
anya
kit (
Ric
e hu
sk)—
seco
nd h
alf
of th
e sy
stem
149
20.6
17.0
8 97
42
596.
2946
8.89
323
8.03
1.45
Kun
glee
chan
(D
iese
l)14
224
.418
.48
057
1 23
9.01
402.
3948
32.
560.
83
Poo
nsin
thai
(C
rude
oil
)10
328
.621
.77
657
1 05
3.75
388.
4452
82.
000.
73
a
T =
ave
rage
dry
ing
air
tem
pera
ture
dur
ing
the
dryi
ng p
erio
d.
b
MC
in
= a
vera
ge in
let m
oist
ure
cont
ent o
f pa
ddy.
c
MC
out
= a
vera
ge o
utle
t moi
stur
e co
nten
t of
padd
y
Tab
le 2
.
E
nerg
y co
nsum
ptio
n of
the
seco
nd-s
tage
dry
ing
at th
e th
ree
rice
mil
ls.
Rice mill (Fuel source)
T
a
(°C)
MC
inb
(% d.b.)
MC
outc
(% d.b.)
Drying rate(kg of dry matter/h)
Heat (MJ/h)
Primary energy from electricity (conversion factor = 2.6) (MJ/h)
Rate of waterevaporation (kg/h)
Specific heatconsumption(MJ/kg of water evaporated)
Electricity consumption in terms of specific primary energy(MJ/kg of water evaporated)
Nit
hith
anya
kit (
Ric
e hu
sk)
7917
.214
.017
543
3 67
1.95
590.
2556
16.
541.
05
Kun
glee
chan
(D
iese
l)
141
18.4
14.3
5 30
21
266.
9449
5.92
217
5.82
2.28
Poo
nsin
thai
(C
rude
oil
)
7121
.817
.076
473
5.64
88.1
237
20.0
62.
40
a
T =
ave
rage
dry
ing
air
tem
pera
ture
dur
ing
the
dryi
ng p
erio
d.
b
MC
in
= a
vera
ge in
let m
oist
ure
cont
ent o
f pa
ddy.
c
MC
out
= a
vera
ge o
utle
t moi
stur
e co
nten
t of
padd
y
Quality assurance in agricultural produce,edited by G.I. Johnson, Le Van To, Nguyen Duy Duc and M.C. Webb.
ACIAR Proceedings 100(printed version published in 2000)
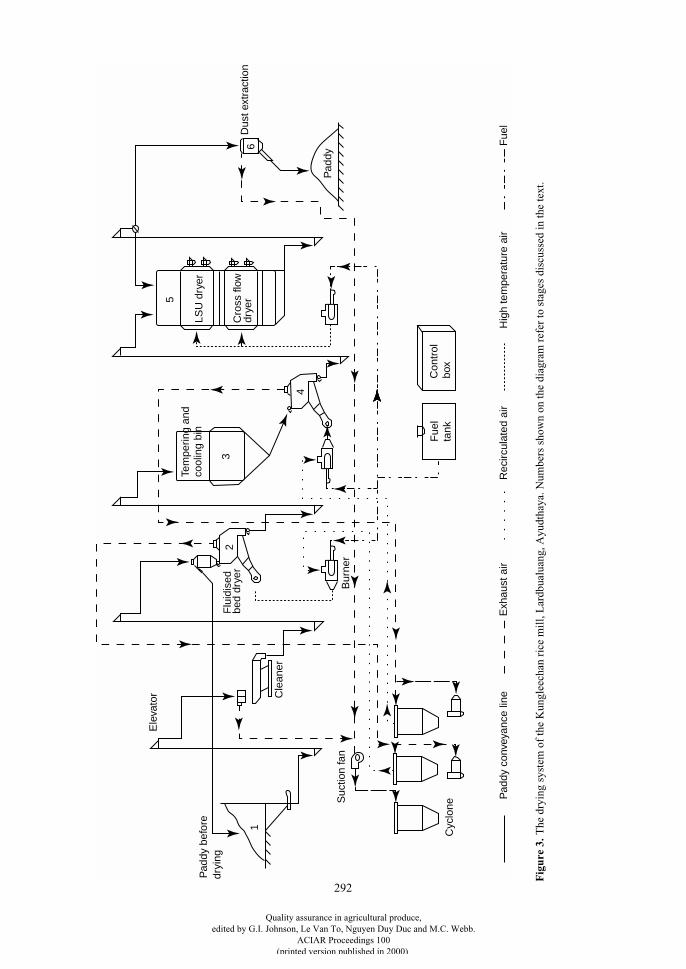
292
Pad
dy b
efor
e dr
ying
1
Pad
dy
Fue
l ta
nkC
ontr
ol
box
Flu
idis
edbe
d dr
yer
2
4
Bur
ner
3
5
6
Cyc
lone
Suc
tion
fan
Cle
aner
Ele
vato
r
Tem
perin
g an
dco
olin
g bi
nLS
U d
ryer
Cro
ss fl
owdr
yer
Dus
t ext
ract
ion
Pad
dy c
onve
yanc
e lin
eR
ecirc
ulat
ed a
irH
igh
tem
pera
ture
air
Fue
lE
xhau
st a
ir
Fig
ure
3.
The
dry
ing
syst
em o
f th
e K
ungl
eech
an r
ice
mil
l, L
ardb
ualu
ang,
Ayu
dtha
ya. N
umbe
rs s
how
n on
the
diag
ram
ref
er to
sta
ges
disc
usse
d in
the
text
.
Quality assurance in agricultural produce,edited by G.I. Johnson, Le Van To, Nguyen Duy Duc and M.C. Webb.
ACIAR Proceedings 100(printed version published in 2000)
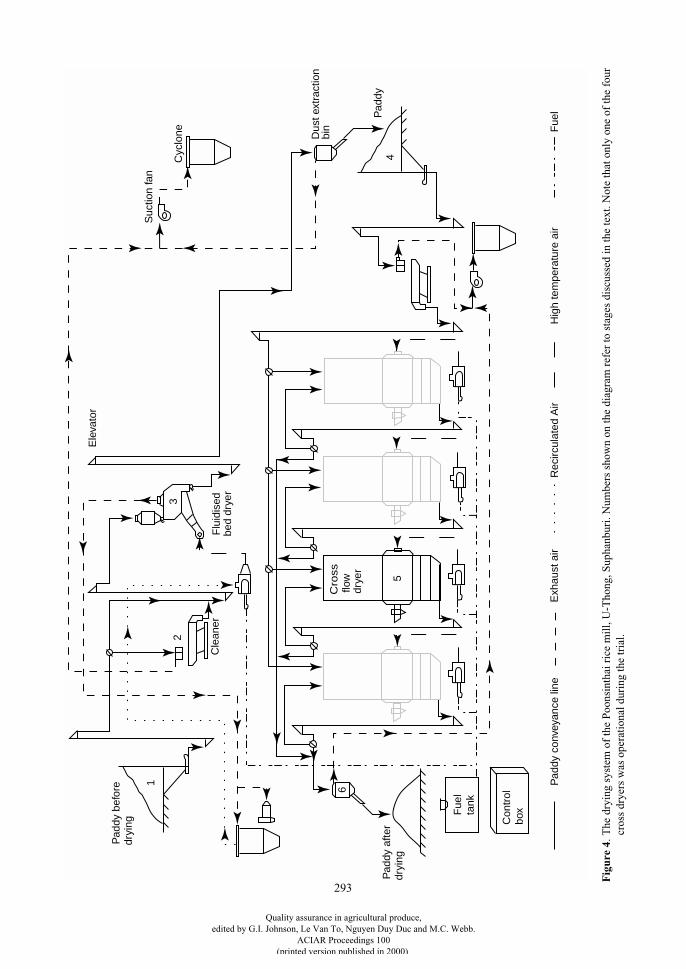
293
Fue
l ta
nk
Con
trol
bo
x
Cle
aner
Suc
tion
fan
Cyc
lone Dus
t ext
ract
ion
bin
Pad
dy
Ele
vato
r
Flu
idis
edbe
d dr
yer
Pad
dy b
efor
edr
ying
Cro
ss
flow
drye
r
Pad
dy a
fter
dryi
ng5
4
1
6
32
Pad
dy c
onve
yanc
e lin
eR
ecirc
ulat
ed A
irH
igh
tem
pera
ture
air
Fue
lE
xhau
st a
ir
Fig
ure
4
.The
dry
ing
syst
em o
f th
e P
oons
inth
ai r
ice
mil
l, U
-Tho
ng, S
upha
nbur
i. N
umbe
rs s
how
n on
the
diag
ram
ref
er to
sta
ges
disc
usse
d in
the
text
. Not
e th
at o
nly
one
of th
e fo
urcr
oss
drye
rs w
as o
pera
tion
al d
urin
g th
e tr
ial.
Quality assurance in agricultural produce,edited by G.I. Johnson, Le Van To, Nguyen Duy Duc and M.C. Webb.
ACIAR Proceedings 100(printed version published in 2000)
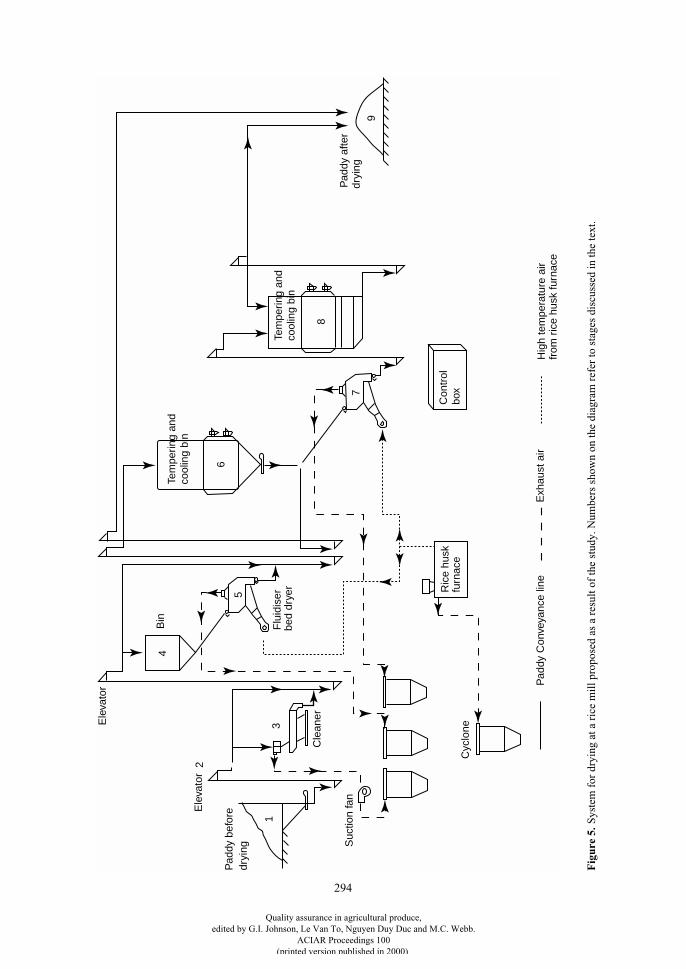
294
Con
trol
bo
x
Pad
dy a
fter
dryi
ng
cool
ing
bin
8
6
7
13
9
5
Pad
dy C
onve
yanc
e lin
eH
igh
tem
pera
ture
air
Exh
aust
air
from
ric
e hu
sk fu
rnac
e
Ele
vato
r
Bin
Pad
dy b
efor
edr
ying
Cle
aner
Flu
idis
erbe
d dr
yer
Suc
tion
fan
Cyc
lone
Ric
e hu
skfu
rnac
e
Tem
perin
g an
d
cool
ing
bin
Tem
perin
g an
d
2E
leva
tor
4
Fig
ure
5.
Sys
tem
for
dry
ing
at a
ric
e m
ill p
ropo
sed
as a
res
ult o
f th
e st
udy.
Num
bers
sho
wn
on th
e di
agra
m r
efer
to s
tage
s di
scus
sed
in th
e te
xt.
Quality assurance in agricultural produce,edited by G.I. Johnson, Le Van To, Nguyen Duy Duc and M.C. Webb.
ACIAR Proceedings 100(printed version published in 2000)
295
Other problems
1. Rotary feeders did not work well due to feedblockages caused by high pressure in the dryingchamber. The exception was in the second-stagedrying at the Kungleechan mill where a large bin hadbeen installed in front of the rotary feeder.
2. The burners could not be reliably set to a fixeddrying air temperature due to prolonged use of fuel oilwhich caused fuel nozzle blockages.
3. Using fuel oil as fuel could cause rust to accu-mulate inside the drying chamber.
4. Lack of knowledge about operating the dryers.
Conclusions
Important results can be summarised as follows:1. A fluidised bed dryer with tempering during each
drying stage reduced the MC of paddy from24% d.b. to 14% d.b. with acceptable paddyquality.
2. Partial air recirculation reduced energy con-sumption in the fluidised bed dryer.
3. Energy consumption of each drying systemdepended on the initial and final MC ofpaddy—i.e. higher MC, lower energy con-sumption.
4. The main problems at all the rice mills wererotary feed operation of the fluidised beddryers and a lack of knowledge about operatingthe dryers.
5. The best drying system performance of the threerice mills—in terms of drying management,paddy quality, energy consumption and extentof other problems—was Kungleechan,followed by Nithithayakit, then Poonsinthai.
Suggestions
As a result of this study, guidelines have been devisedfor designing a high performance drying system(Figure 5). Paddy with 25% d.b. MC in a paddy pit
(position 1 in Figure 5) is conveyed by an elevator (2)to a cleaner (3), a 5 t bin (4) and a 10 t/h fluidised beddryer (5) which is expected to reduce the MC of paddyto 20% d.b. The paddy is then conveyed to a 10 tcapacity tempering and cooling bin (6).
In the second-stage, paddy flows through a 10 t/hfluidised bed dryer (7) with the MC of paddy expectedto be 16% d.b. at output. Then it is conveyed to a 10 tcapacity tempering and cooling bin (8), and finally toa paddy bulk (9).
The use of a rice husk burner is also recommendedas it allows lower energy costs.
Acknowledgment
The authors would like to thank the Thailand ResearchFund and the Australian Centre for International Agri-cultural Research for financial support, Rice Engi-neering Supply Co. Ltd for supplying data andvehicles to the rice mills, and finally to theNithithayakit, Kungleechan and Poonsinthai rice millsfor their helpful collaboration.
References
Mongkonthad, J. 1994. Grain dryer of the AgricultureDivision at present rice production. AgriculturalEngineering Division News, October–December, 2–5 (inThai).
Soponronnarit, S. 1995. Strategy for managing moist paddy.The Royal Institute Journal, 20(4), 115–125 (in Thai).
Soponronnarit, S., Yapha, M. and Prachayawarakorn, S.1995. Cross flow fluidized bed paddy dryer: prototypeand commercialization. Drying Technology, 13(8&9),2207–2216.
Soponronnarit, S., Wetchacama, S., Swasdisevi, T. andPoomsa-ad, N. 1999. Managing moist paddy by drying,tempering and ambient air ventilation. DryingTechnology, 17(1&2), 335–344.
Taweerattanapanich, A., Soponronnarit, S., Wetchacama,S., Kongseri, N. and Wongpiyachon, S. 1999. Effects ofdrying on head rice yield using fluidization technique.Drying Technology, 17 (1&2), 345–354.
Quality assurance in agricultural produce,edited by G.I. Johnson, Le Van To, Nguyen Duy Duc and M.C. Webb.
ACIAR Proceedings 100(printed version published in 2000)
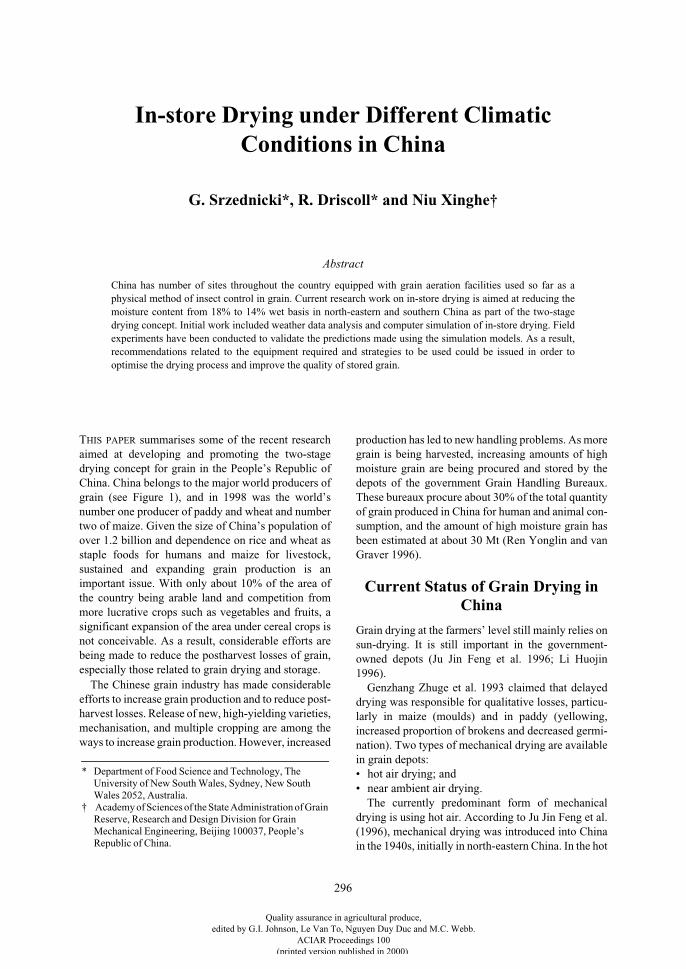
296
In-store Drying under Different Climatic Conditions in China
G. Srzednicki*, R. Driscoll* and Niu Xinghe†
Abstract
China has number of sites throughout the country equipped with grain aeration facilities used so far as aphysical method of insect control in grain. Current research work on in-store drying is aimed at reducing themoisture content from 18% to 14% wet basis in north-eastern and southern China as part of the two-stagedrying concept. Initial work included weather data analysis and computer simulation of in-store drying. Fieldexperiments have been conducted to validate the predictions made using the simulation models. As a result,recommendations related to the equipment required and strategies to be used could be issued in order tooptimise the drying process and improve the quality of stored grain.
T
HIS
PAPER
summarises some of the recent researchaimed at developing and promoting the two-stagedrying concept for grain in the People’s Republic ofChina. China belongs to the major world producers ofgrain (see Figure 1), and in 1998 was the world’snumber one producer of paddy and wheat and numbertwo of maize. Given the size of China’s population ofover 1.2 billion and dependence on rice and wheat asstaple foods for humans and maize for livestock,sustained and expanding grain production is animportant issue. With only about 10% of the area ofthe country being arable land and competition frommore lucrative crops such as vegetables and fruits, asignificant expansion of the area under cereal crops isnot conceivable. As a result, considerable efforts arebeing made to reduce the postharvest losses of grain,especially those related to grain drying and storage.
The Chinese grain industry has made considerableefforts to increase grain production and to reduce post-harvest losses. Release of new, high-yielding varieties,mechanisation, and multiple cropping are among theways to increase grain production. However, increased
production has led to new handling problems. As moregrain is being harvested, increasing amounts of highmoisture grain are being procured and stored by thedepots of the government Grain Handling Bureaux.These bureaux procure about 30% of the total quantityof grain produced in China for human and animal con-sumption, and the amount of high moisture grain hasbeen estimated at about 30 Mt (Ren Yonglin and vanGraver 1996).
Current Status of Grain Drying in China
Grain drying at the farmers’ level still mainly relies onsun-drying. It is still important in the government-owned depots (Ju Jin Feng et al. 1996; Li Huojin1996).
Genzhang Zhuge et al. 1993 claimed that delayeddrying was responsible for qualitative losses, particu-larly in maize (moulds) and in paddy (yellowing,increased proportion of brokens and decreased germi-nation). Two types of mechanical drying are availablein grain depots:• hot air drying; and• near ambient air drying.
The currently predominant form of mechanicaldrying is using hot air. According to Ju Jin Feng et al.(1996), mechanical drying was introduced into Chinain the 1940s, initially in north-eastern China. In the hot
* Department of Food Science and Technology, The University of New South Wales, Sydney, New South Wales 2052, Australia.
† Academy of Sciences of the State Administration of GrainReserve, Research and Design Division for Grain Mechanical Engineering, Beijing 100037, People’s Republic of China.
Quality assurance in agricultural produce,edited by G.I. Johnson, Le Van To, Nguyen Duy Duc and M.C. Webb.
ACIAR Proceedings 100(printed version published in 2000)
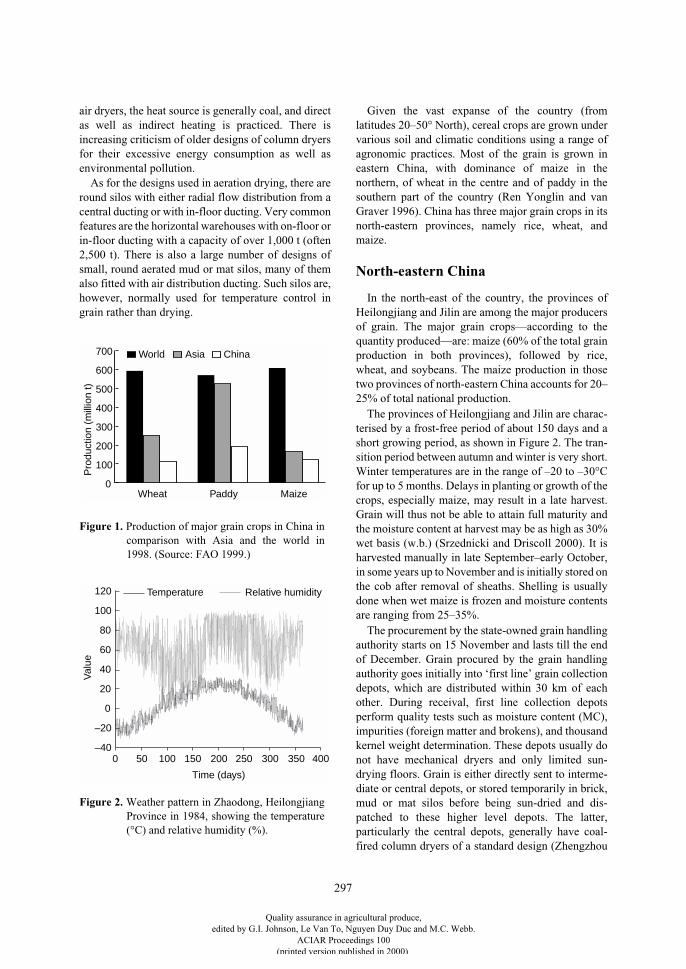
297
air dryers, the heat source is generally coal, and directas well as indirect heating is practiced. There isincreasing criticism of older designs of column dryersfor their excessive energy consumption as well asenvironmental pollution.
As for the designs used in aeration drying, there areround silos with either radial flow distribution from acentral ducting or with in-floor ducting. Very commonfeatures are the horizontal warehouses with on-floor orin-floor ducting with a capacity of over 1,000 t (often2,500 t). There is also a large number of designs ofsmall, round aerated mud or mat silos, many of themalso fitted with air distribution ducting. Such silos are,however, normally used for temperature control ingrain rather than drying.
Given the vast expanse of the country (fromlatitudes 20–50° North), cereal crops are grown undervarious soil and climatic conditions using a range ofagronomic practices. Most of the grain is grown ineastern China, with dominance of maize in thenorthern, of wheat in the centre and of paddy in thesouthern part of the country (Ren Yonglin and vanGraver 1996). China has three major grain crops in itsnorth-eastern provinces, namely rice, wheat, andmaize.
North-eastern China
In the north-east of the country, the provinces ofHeilongjiang and Jilin are among the major producersof grain. The major grain crops—according to thequantity produced—are: maize (60% of the total grainproduction in both provinces), followed by rice,wheat, and soybeans. The maize production in thosetwo provinces of north-eastern China accounts for 20–25% of total national production.
The provinces of Heilongjiang and Jilin are charac-terised by a frost-free period of about 150 days and ashort growing period, as shown in Figure 2. The tran-sition period between autumn and winter is very short.Winter temperatures are in the range of –20 to –30°Cfor up to 5 months. Delays in planting or growth of thecrops, especially maize, may result in a late harvest.Grain will thus not be able to attain full maturity andthe moisture content at harvest may be as high as 30%wet basis (w.b.) (Srzednicki and Driscoll 2000). It isharvested manually in late September–early October,in some years up to November and is initially stored onthe cob after removal of sheaths. Shelling is usuallydone when wet maize is frozen and moisture contentsare ranging from 25–35%.
The procurement by the state-owned grain handlingauthority starts on 15 November and lasts till the endof December. Grain procured by the grain handlingauthority goes initially into ‘first line’ grain collectiondepots, which are distributed within 30 km of eachother. During receival, first line collection depotsperform quality tests such as moisture content (MC),impurities (foreign matter and brokens), and thousandkernel weight determination. These depots usually donot have mechanical dryers and only limited sun-drying floors. Grain is either directly sent to interme-diate or central depots, or stored temporarily in brick,mud or mat silos before being sun-dried and dis-patched to these higher level depots. The latter,particularly the central depots, generally have coal-fired column dryers of a standard design (Zhengzhou
700
600
500
400
300
200
100
0Wheat Paddy Maize
Pro
duct
ion
(mill
ion
t)
World Asia China
Temperature Relative humidity
Time (days)
Val
ue
120
100
80
60
40
20
0
–20
–400 50 100 150 200 250 300 350 400
Figure 1. Production of major grain crops in China incomparison with Asia and the world in1998. (Source: FAO 1999.)
Figure 2. Weather pattern in Zhaodong, HeilongjiangProvince in 1984, showing the temperature(°C) and relative humidity (%).
Quality assurance in agricultural produce,edited by G.I. Johnson, Le Van To, Nguyen Duy Duc and M.C. Webb.
ACIAR Proceedings 100(printed version published in 2000)
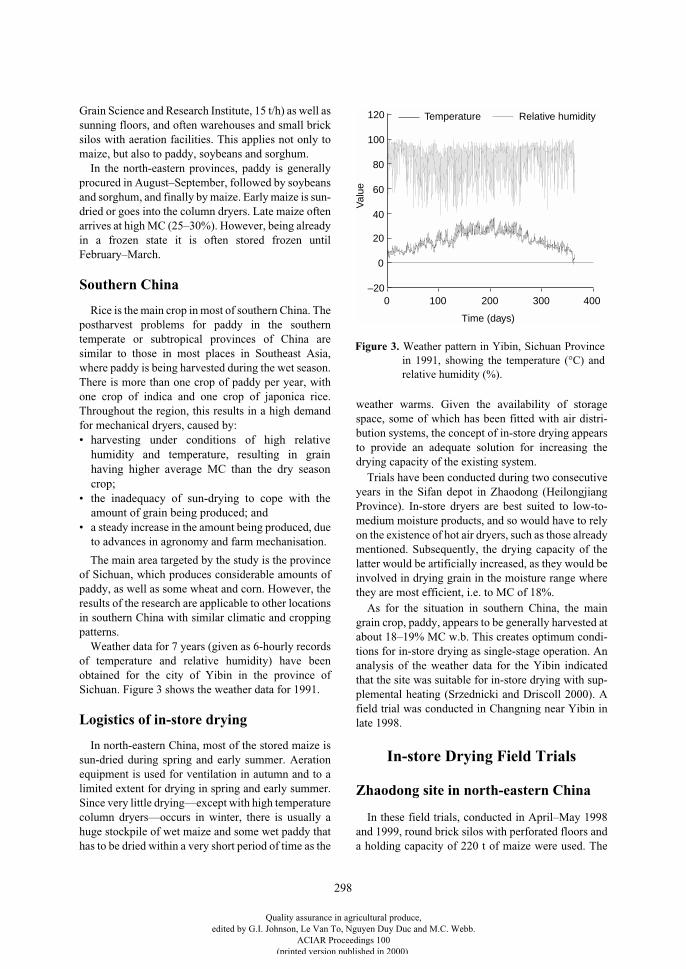
298
Grain Science and Research Institute, 15 t/h) as well assunning floors, and often warehouses and small bricksilos with aeration facilities. This applies not only tomaize, but also to paddy, soybeans and sorghum.
In the north-eastern provinces, paddy is generallyprocured in August–September, followed by soybeansand sorghum, and finally by maize. Early maize is sun-dried or goes into the column dryers. Late maize oftenarrives at high MC (25–30%). However, being alreadyin a frozen state it is often stored frozen untilFebruary–March.
Southern China
Rice is the main crop in most of southern China. Thepostharvest problems for paddy in the southerntemperate or subtropical provinces of China aresimilar to those in most places in Southeast Asia,where paddy is being harvested during the wet season.There is more than one crop of paddy per year, withone crop of indica and one crop of japonica rice.Throughout the region, this results in a high demandfor mechanical dryers, caused by:• harvesting under conditions of high relative
humidity and temperature, resulting in grainhaving higher average MC than the dry seasoncrop;
• the inadequacy of sun-drying to cope with theamount of grain being produced; and
• a steady increase in the amount being produced, dueto advances in agronomy and farm mechanisation.
The main area targeted by the study is the provinceof Sichuan, which produces considerable amounts ofpaddy, as well as some wheat and corn. However, theresults of the research are applicable to other locationsin southern China with similar climatic and croppingpatterns.
Weather data for 7 years (given as 6-hourly recordsof temperature and relative humidity) have beenobtained for the city of Yibin in the province ofSichuan. Figure 3 shows the weather data for 1991.
Logistics of in-store drying
In north-eastern China, most of the stored maize issun-dried during spring and early summer. Aerationequipment is used for ventilation in autumn and to alimited extent for drying in spring and early summer.Since very little drying—except with high temperaturecolumn dryers—occurs in winter, there is usually ahuge stockpile of wet maize and some wet paddy thathas to be dried within a very short period of time as the
weather warms. Given the availability of storagespace, some of which has been fitted with air distri-bution systems, the concept of in-store drying appearsto provide an adequate solution for increasing thedrying capacity of the existing system.
Trials have been conducted during two consecutiveyears in the Sifan depot in Zhaodong (HeilongjiangProvince). In-store dryers are best suited to low-to-medium moisture products, and so would have to relyon the existence of hot air dryers, such as those alreadymentioned. Subsequently, the drying capacity of thelatter would be artificially increased, as they would beinvolved in drying grain in the moisture range wherethey are most efficient, i.e. to MC of 18%.
As for the situation in southern China, the maingrain crop, paddy, appears to be generally harvested atabout 18–19% MC w.b. This creates optimum condi-tions for in-store drying as single-stage operation. Ananalysis of the weather data for the Yibin indicatedthat the site was suitable for in-store drying with sup-plemental heating (Srzednicki and Driscoll 2000). Afield trial was conducted in Changning near Yibin inlate 1998.
In-store Drying Field Trials
Zhaodong site in north-eastern China
In these field trials, conducted in April–May 1998and 1999, round brick silos with perforated floors anda holding capacity of 220 t of maize were used. The
Time (days)
Val
ue
0 100 200 300 400
120
100
80
60
40
20
0
–20
Temperature Relative humidity
Figure 3.
Weather pattern in Yibin, Sichuan Provincein 1991, showing the temperature (°C) andrelative humidity (%).
Quality assurance in agricultural produce,edited by G.I. Johnson, Le Van To, Nguyen Duy Duc and M.C. Webb.
ACIAR Proceedings 100(printed version published in 2000)
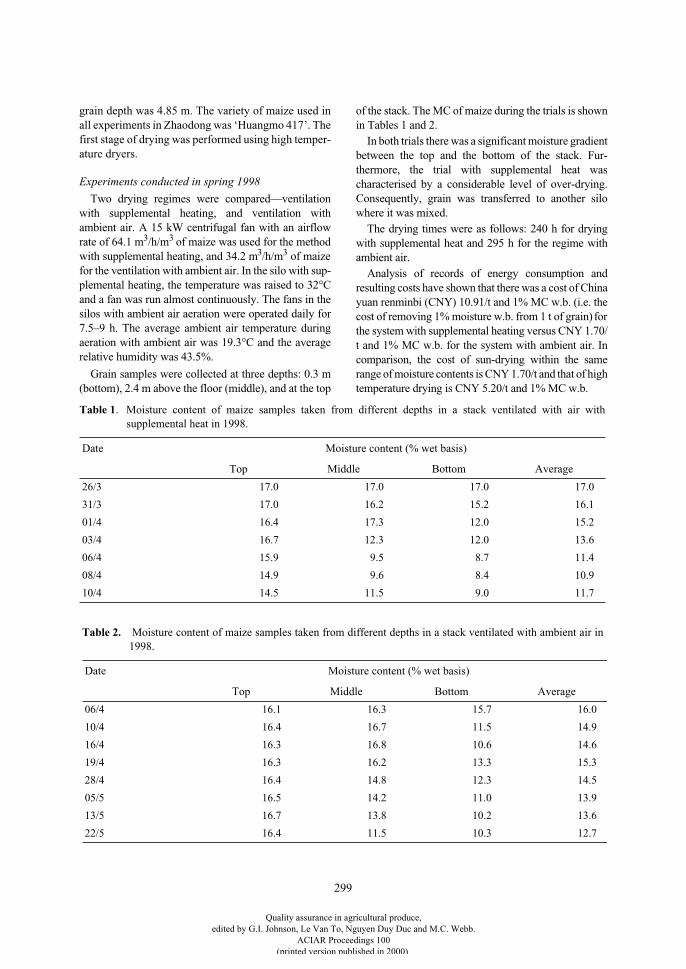
299
grain depth was 4.85 m. The variety of maize used inall experiments in Zhaodong was ‘Huangmo 417’. Thefirst stage of drying was performed using high temper-ature dryers.
Experiments conducted in spring 1998
Two drying regimes were compared—ventilationwith supplemental heating, and ventilation withambient air. A 15 kW centrifugal fan with an airflowrate of 64.1 m
3
/h/m
3
of maize was used for the methodwith supplemental heating, and 34.2 m
3
/h/m
3
of maizefor the ventilation with ambient air. In the silo with sup-plemental heating, the temperature was raised to 32°Cand a fan was run almost continuously. The fans in thesilos with ambient air aeration were operated daily for7.5–9 h. The average ambient air temperature duringaeration with ambient air was 19.3°C and the averagerelative humidity was 43.5%.
Grain samples were collected at three depths: 0.3 m(bottom), 2.4 m above the floor (middle), and at the top
of the stack. The MC of maize during the trials is shownin Tables 1 and 2.
In both trials there was a significant moisture gradientbetween the top and the bottom of the stack. Fur-thermore, the trial with supplemental heat wascharacterised by a considerable level of over-drying.Consequently, grain was transferred to another silowhere it was mixed.
The drying times were as follows: 240 h for dryingwith supplemental heat and 295 h for the regime withambient air.
Analysis of records of energy consumption andresulting costs have shown that there was a cost of Chinayuan renminbi (CNY) 10.91/t and 1% MC w.b. (i.e. thecost of removing 1% moisture w.b. from 1 t of grain)
forthe system with supplemental heating versus CNY 1.70/t and 1% MC w.b. for the system with ambient air. Incomparison, the cost of sun-drying within the samerange of moisture contents is CNY 1.70/t and that of hightemperature drying is CNY 5.20/t and 1% MC w.b.
Table 1. Moisture content of maize samples taken from different depths in a stack ventilated with air withsupplemental heat in 1998.
Date Moisture content (% wet basis)
Top Middle Bottom Average
26/3 17.0 17.0 17.0 17.0
31/3 17.0 16.2 15.2 16.1
01/4 16.4 17.3 12.0 15.2
03/4 16.7 12.3 12.0 13.6
06/4 15.9 9.5 8.7 11.4
08/4 14.9 9.6 8.4 10.9
10/4 14.5 11.5 9.0 11.7
Table 2. Moisture content of maize samples taken from different depths in a stack ventilated with ambient air in1998.
Date Moisture content (% wet basis)
Top Middle Bottom Average
06/4 16.1 16.3 15.7 16.0
10/4 16.4 16.7 11.5 14.9
16/4 16.3 16.8 10.6 14.6
19/4 16.3 16.2 13.3 15.3
28/4 16.4 14.8 12.3 14.5
05/5 16.5 14.2 11.0 13.9
13/5 16.7 13.8 10.2 13.6
22/5 16.4 11.5 10.3 12.7
Quality assurance in agricultural produce,edited by G.I. Johnson, Le Van To, Nguyen Duy Duc and M.C. Webb.
ACIAR Proceedings 100(printed version published in 2000)
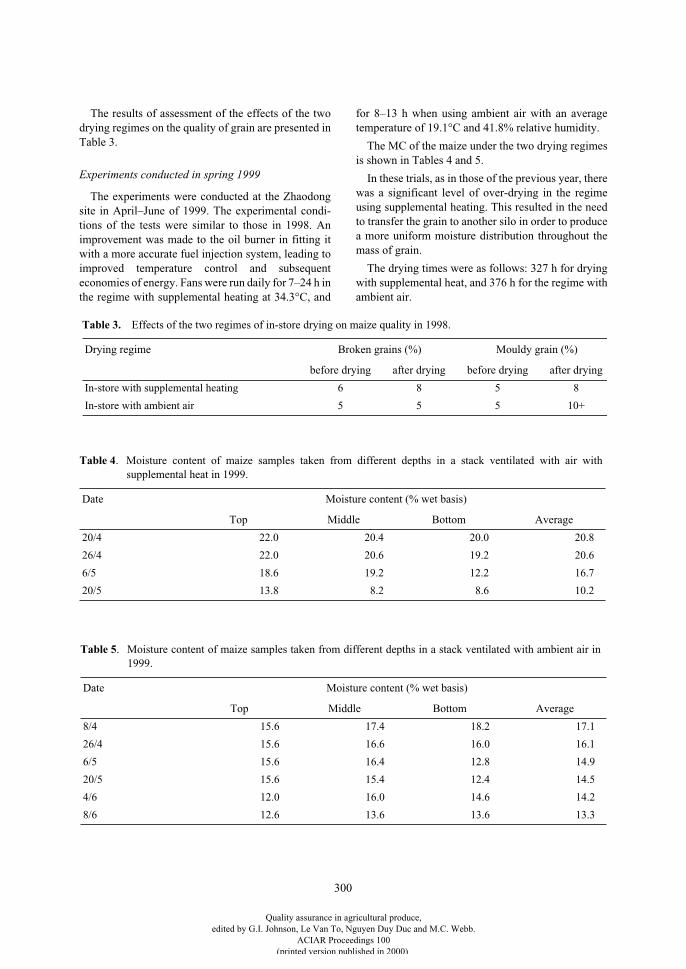
300
The results of assessment of the effects of the twodrying regimes on the quality of grain are presented inTable 3.
Experiments conducted in spring 1999
The experiments were conducted at the Zhaodongsite in April–June of 1999. The experimental condi-tions of the tests were similar to those in 1998. Animprovement was made to the oil burner in fitting itwith a more accurate fuel injection system, leading toimproved temperature control and subsequenteconomies of energy. Fans were run daily for 7–24 h inthe regime with supplemental heating at 34.3°C, and
for 8–13 h when using ambient air with an averagetemperature of 19.1°C and 41.8% relative humidity.
The MC of the maize under the two drying regimesis shown in Tables 4 and 5.
In these trials, as in those of the previous year, therewas a significant level of over-drying in the regimeusing supplemental heating. This resulted in the needto transfer the grain to another silo in order to producea more uniform moisture distribution throughout themass of grain.
The drying times were as follows: 327 h for dryingwith supplemental heat, and 376 h for the regime withambient air.
Table 3. Effects of the two regimes of in-store drying on maize quality in 1998.
Drying regime Broken grains (%) Mouldy grain (%)
before drying after drying before drying after drying
In-store with supplemental heating 6 8 5 8
In-store with ambient air 5 5 5 10+
Table 4. Moisture content of maize samples taken from different depths in a stack ventilated with air withsupplemental heat in 1999.
Date Moisture content (% wet basis)
Top Middle Bottom Average
20/4 22.0 20.4 20.0 20.8
26/4 22.0 20.6 19.2 20.6
6/5 18.6 19.2 12.2 16.7
20/5 13.8 8.2 8.6 10.2
Table 5. Moisture content of maize samples taken from different depths in a stack ventilated with ambient air in1999.
Date Moisture content (% wet basis)
Top Middle Bottom Average
8/4 15.6 17.4 18.2 17.1
26/4 15.6 16.6 16.0 16.1
6/5 15.6 16.4 12.8 14.9
20/5 15.6 15.4 12.4 14.5
4/6 12.0 16.0 14.6 14.2
8/6 12.6 13.6 13.6 13.3
Quality assurance in agricultural produce,edited by G.I. Johnson, Le Van To, Nguyen Duy Duc and M.C. Webb.
ACIAR Proceedings 100(printed version published in 2000)
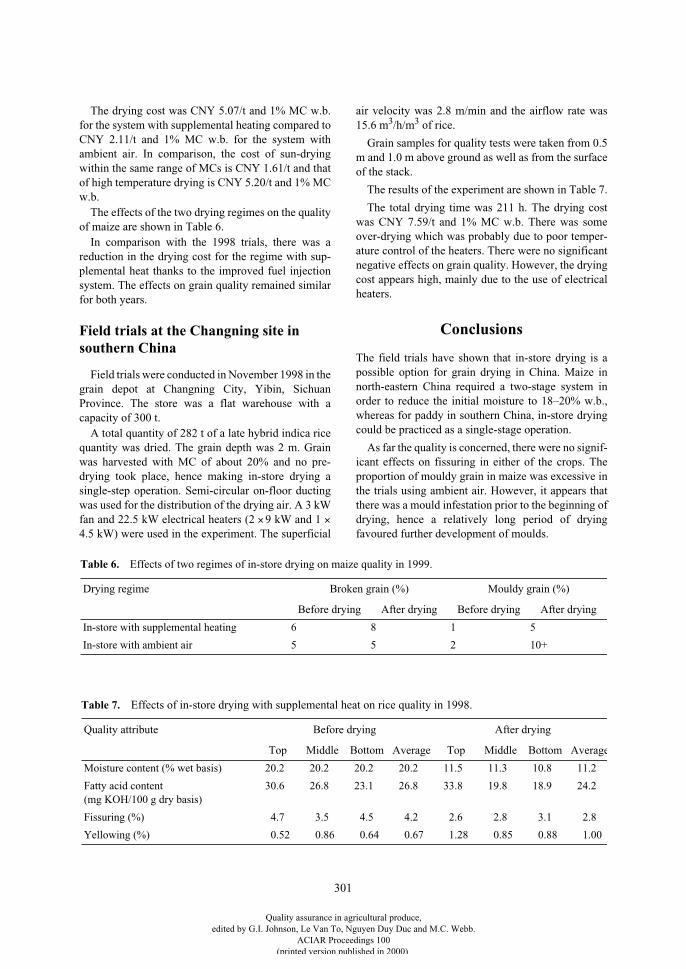
301
The drying cost was CNY 5.07/t and 1% MC w.b.for the system with supplemental heating compared toCNY 2.11/t and 1% MC w.b. for the system withambient air. In comparison, the cost of sun-dryingwithin the same range of MCs is CNY 1.61/t and thatof high temperature drying is CNY 5.20/t and 1% MCw.b.
The effects of the two drying regimes on the qualityof maize are shown in Table 6.
In comparison with the 1998 trials, there was areduction in the drying cost for the regime with sup-plemental heat thanks to the improved fuel injectionsystem. The effects on grain quality remained similarfor both years.
Field trials at the Changning site in southern China
Field trials were conducted in November 1998 in thegrain depot at Changning City, Yibin, SichuanProvince. The store was a flat warehouse with acapacity of 300 t.
A total quantity of 282 t of a late hybrid indica ricequantity was dried. The grain depth was 2 m. Grainwas harvested with MC of about 20% and no pre-drying took place, hence making in-store drying asingle-step operation. Semi-circular on-floor ductingwas used for the distribution of the drying air. A 3 kWfan and 22.5 kW electrical heaters (2
×
9 kW and 1
×
4.5 kW) were used in the experiment. The superficial
air velocity was 2.8 m/min and the airflow rate was15.6 m
3
/h/m
3
of rice.
Grain samples for quality tests were taken from 0.5m and 1.0 m above ground as well as from the surfaceof the stack.
The results of the experiment are shown in Table 7.
The total drying time was 211 h. The drying costwas CNY 7.59/t and 1% MC w.b. There was someover-drying which was probably due to poor temper-ature control of the heaters. There were no significantnegative effects on grain quality. However, the dryingcost appears high, mainly due to the use of electricalheaters.
Conclusions
The field trials have shown that in-store drying is apossible option for grain drying in China. Maize innorth-eastern China required a two-stage system inorder to reduce the initial moisture to 18–20% w.b.,whereas for paddy in southern China, in-store dryingcould be practiced as a single-stage operation.
As far the quality is concerned, there were no signif-icant effects on fissuring in either of the crops. Theproportion of mouldy grain in maize was excessive inthe trials using ambient air. However, it appears thatthere was a mould infestation prior to the beginning ofdrying, hence a relatively long period of dryingfavoured further development of moulds.
Table 6. Effects of two regimes of in-store drying on maize quality in 1999.
Drying regime Broken grain (%) Mouldy grain (%)
Before drying After drying Before drying After drying
In-store with supplemental heating 6 8 1 5
In-store with ambient air 5 5 2 10+
Table 7. Effects of in-store drying with supplemental heat on rice quality in 1998.
Quality attribute Before drying After drying
Top Middle Bottom Average Top Middle Bottom Average
Moisture content (% wet basis) 20.2 20.2 20.2 20.2 11.5 11.3 10.8 11.2
Fatty acid content (mg KOH/100 g dry basis)
30.6 26.8 23.1 26.8 33.8 19.8 18.9 24.2
Fissuring (%) 4.7 3.5 4.5 4.2 2.6 2.8 3.1 2.8
Yellowing (%) 0.52 0.86 0.64 0.67 1.28 0.85 0.88 1.00
Quality assurance in agricultural produce,edited by G.I. Johnson, Le Van To, Nguyen Duy Duc and M.C. Webb.
ACIAR Proceedings 100(printed version published in 2000)
302
The drying costs using supplemental heating aresomewhat excessive due to high cost of the energysource chosen. However, improvements appearpossible if biomass or coal heating systems were used.In contrast, ventilation using ambient air comparesvery favourably with the cheapest form of drying sofar, i.e. sun-drying. It appears that an automatic controlsystem could improve the situation by making a betteruse of the ambient air when conditions are favourablefor drying. The efficiency of the heating system couldalso be improved, thus reducing the cost.
Current research is looking at the possibility ofusing ambient air during the winter months in north-eastern China in order to reduce the spoilage of graindue to moulds and also to increase the time when in-store drying can be performed.
Acknowledgments
The authors of this paper would like to acknowledgethe financial support of the Australian Centre for theInternational Agricultural Research for this project.
References
FAO (Food and Agriculture Organization of the UnitedNations) 1999. FAOSTAT Agriculture Data, on theInternet at <http://apps.fao.org/cgi-bin/nph-db.pl?subset=agriculture>
Genzhang Zhuge, Renyong Chi, Yangshen He, ZuhuiHuang, Yung He and Dulin Son 1993. The grain
postproduction system in China. In: Naewbanij, J.O. andManilay, A.A., eds., Proceedings of the 14
th
ASEAN(Association of South-East Asian Nations) TechnicalSeminar on Grain Postharvest Technology, Manila,Philippines, 5–8 November 1991. Bangkok, ASEANGrain Postharvest Programme, 21–37.
Ju Jin Feng, Liu Fang Jiu, Du Shu Xiao and Xu Zeng Tao1996. The current situation and prospects for grain dryingin Northeastern China. In: Champ, B.R., Highley, E. andJohnson, G.I., ed., Grain drying in Asia: proceedings of aninternational conference held at the FAO Regional Officefor Asia and Pacific, Bangkok, Thailand. ACIARProceedings No. 71. Canberra, Australian Centre forInternational Agricultural Research, 284–293.
Li Huojin 1996. The present situation and directions fordevelopment of grain drying in China. In: Champ, B.R.,Highley, E. and Johnson, G.I., ed., Grain drying in Asia:proceedings of an international conference held at theFAO Regional Office for Asia and Pacific, Bangkok,Thailand. ACIAR Proceedings No. 71. Canberra,Australian Centre for International AgriculturalResearch, 314–315.
Ren Yonglin and van Graver, J. 1996. Grain drying in China:problems and priorities. In: Champ, B.R., Highley, E. andJohnson, G.I., ed., Grain drying in Asia: proceedings of aninternational conference held at the FAO Regional Officefor Asia and Pacific, Bangkok, Thailand. ACIARProceedings No. 71. Canberra, Australian Centre forInternational Agricultural Research, 23–30.
Srzednicki, G.S. and Driscoll, R.H. 2000. Feasibility of in-store drying in China. Paper presented at the 7
th
International Working Conference on Stored ProductProtection, Beijing, October 1998 (in press).
Quality assurance in agricultural produce,edited by G.I. Johnson, Le Van To, Nguyen Duy Duc and M.C. Webb.
ACIAR Proceedings 100(printed version published in 2000)
303
Methods and Standards for Rice Grain Quality Assessment in the Philippines
J.A. Patindol*
Abstract
Changes in economic status, social structure and trade policies, and the commercial release of numerous ricevarieties, have spurred the growing attention given to grain quality. In the Philippines, premium quality traitsin general are: long, slender grains; high milled rice and head rice yield; and tender and smooth cooked ricewith some degree of stickiness. Routine grain quality works are mainly done as part of the national researchprogram on varietal improvement and in grains business. This paper highlights the current methods andstandards employed by the key stakeholders of the Philippine rice industry—the rice varietal improvementresearch group, government inspectors and regulators, and private millers, traders, and retailers. Rice qualityhas four major aspects, namely, (1) milling potential, (2) physical attributes, (3) physico-chemical properties,and (4) organoleptic qualities. Results that show the trends in grain quality characteristics of improvedPhilippine rice cultivars are presented. Moreover, the paper delves into other related techniques that areimportant in identifying and judging the suitability of the grain for table rice consumption and for processinginto other value-added products.
R
ICE
dominates Philippine agriculture. It is a majorsource of employment, income and growth for thePhilippine economy. It is the staple food of thecountry’s 73.5 million people. Annual per capita con-sumption is about 100 kg and it constitutes 40% ofenergy and 31% of protein of the Filipino diet (Juliano1995). About 7.3 million t of milled rice was producedin 1997 while actual food use reached 7.8 million t, ora deficit of half a million t (PhilRice–BAS 1999).
While rice production in the Philippines has beenfalling short of demand, attention given to grainquality is on the rise. Premium quality characteristicsfor Philippine table rice are slender and translucentgrains, stable high milled rice and head rice yields,good cooking and eating quality, and aroma (Juliano1996a). Quality preference has become evident in thedomestic market (Andales et al. 1995). Someconsumers are now willing to pay a higher price for thespecific quality of rice that they desire. Changes ineconomic status, consumption pattern, and socialstructure spur this trend. On top of this is the com-mercial release of numerous rice cultivars as a result of
intensive rice breeding activities. With more varietiesto choose from, farmers, consumers, and processorsbecome more picky as well.
The ratification of the General Agreement onTariffs and Trade–World Trade Organization (GATT–WTO) by the Philippine Government likewise broughtsome changes in the country’s trade policies andprograms. GATT–WTO requires global competi-tiveness. Producing quality rice and the strictimposition of national quality standards for grainmarketing are some of the strategies for improving theefficiency and competitiveness of the local riceindustry.
Grain Quality and Rice Breeding
Varietal improvement is the surest and most eco-nomical means of improving grain quality (Juliano1990). In the Philippine Rice Varietal ImprovementProgram (RVIP), grain quality is considered animportant breeding objective along with higher yieldand resistance to pests and diseases. A pool ofchemists, food scientists and nutritionists is carryingout the quality evaluation of rice selections enteredinto the National Cooperative Testing (NCT) Project
* Philippine Rice Research Institute, Maligaya, Muñoz, Nueva Ecija 3119, Philippines.
Quality assurance in agricultural produce,edited by G.I. Johnson, Le Van To, Nguyen Duy Duc and M.C. Webb.
ACIAR Proceedings 100(printed version published in 2000)
304
for rice. Over recent years, the methods for evaluatingvarious quality factors have not changed substantially.Four important aspects of quality are considered—milling recovery, physical attributes, physico-chemical qualities, and organoleptic characteristics.
Milling recovery
Milling yield of rough rice is an estimate of thequantity of head rice and of total milled rice that can beproduced from a unit of rough rice (Khush et al. 1979).The moisture content of paddy rice samples to beanalysed should be 12–14% to minimise grainfissures. With a 125 g sample, dehulling, polishing andgrading are carried out using a Satake testing huskerTH35A, McGill Miller No.2, and Satake rice graderTRG05A, respectively. Brown rice (BR), total milledrice (TMR), and head rice (HR) yield are expressed aspercentage of paddy rice. Resulting values are thenclassified based on the grading system presented inTable 1. For a sample to pass the milling yield criteria,its BR, TMR and HR should be
G
75.0%,
G
65.0%, and
G
39.0%, respectively (RTWG 1997). For the varietiesreleased since 1990 the ranges are: 75.0–79.5% BR,61.1–69.3% TMR, and 29.4–52.5% HR (Table 2).
Physical attributes
Physical attributes that are routinely assessed are:grain size (grain length in mm), grain shape (ratio ofgrain length to grain width) and percentage chalkygrains. Grain length and width are measured under aFujimoto photo-enlarger (450M-C) and then classified
based on the standards presented in Table 3. Filipinosin general prefer rice varieties with long-slender grains(del Mundo 1995). Of the 41 varieties released since1990, only 21 are long-slender type (Table 5).
Chalky grains are whole or broken kernels with 50%or more opaque-white portions. Percentage chalkygrains is measured by manual separation of the chalkykernels from the non-chalky ones in a 50 g milled ricesample. The standard specifications for chalkiness areshown in Table 3 (RTWG 1997). Starch granules inthe chalky portion of the grain are less densely packedthan those in translucent areas (del Rosario et al. 1968)and there are air spaces between starch granules(Khush et al. 1979). This makes the chalky areas not ashard as the translucent portion and chalky grains aremore prone to breakage when milled (Khush et al.1979). Because of this, rice samples with >10% chalkygrains are considered unacceptable based on the RiceVarietal Improvement Program (RVIP) guidelines.Chalky grains of RVIP-developed varieties rangefrom 1.9 to 11.0% (Table 5).
Physico-chemical properties
Some grain physico-chemical properties are used asindirect indices of rice processing and eating qualities.The most notable ones are amylose content (AC),gelatinisation temperature, gel consistency, and crudeprotein. Amylose, the linear fraction of starch, is themajor factor contributing to varietal differences incooked rice texture (Juliano 1985). It is analysed bythe simplified method of Juliano et al. (1981). Basedon AC, rice is classified as glutinous (0–2% amylose)or non-glutinous (>2% amylose).
Table 1. Quality standards for milled rice recovery (RTWG 1997).
Milling parameter Grade Range Ideal value
% brown rice Good (G) 80.0% and above 75.0% or higher
Fair (F) 75.0–79.9% (F to G)
Poor (P) Below 75.0%
% milled rice Premium (Pr) 70.1% and above 65.1% or higher
Grade 1 (G1) 65.1–70.0% (G1 to Pr)
Grade 2 (G2) 60.1–65.0%
Grade 3 (G3) 55.1–60.0%
% head rice Premium (Pr) 57.0% and above 39.0% or higher
Grade 1 (G1) 48.0–56.9% (G2 to Pr)
Grade 2 (G2) 39.0–47.9%
Grade 3 (G3) 30.0–38.9%
Quality assurance in agricultural produce,edited by G.I. Johnson, Le Van To, Nguyen Duy Duc and M.C. Webb.
ACIAR Proceedings 100(printed version published in 2000)
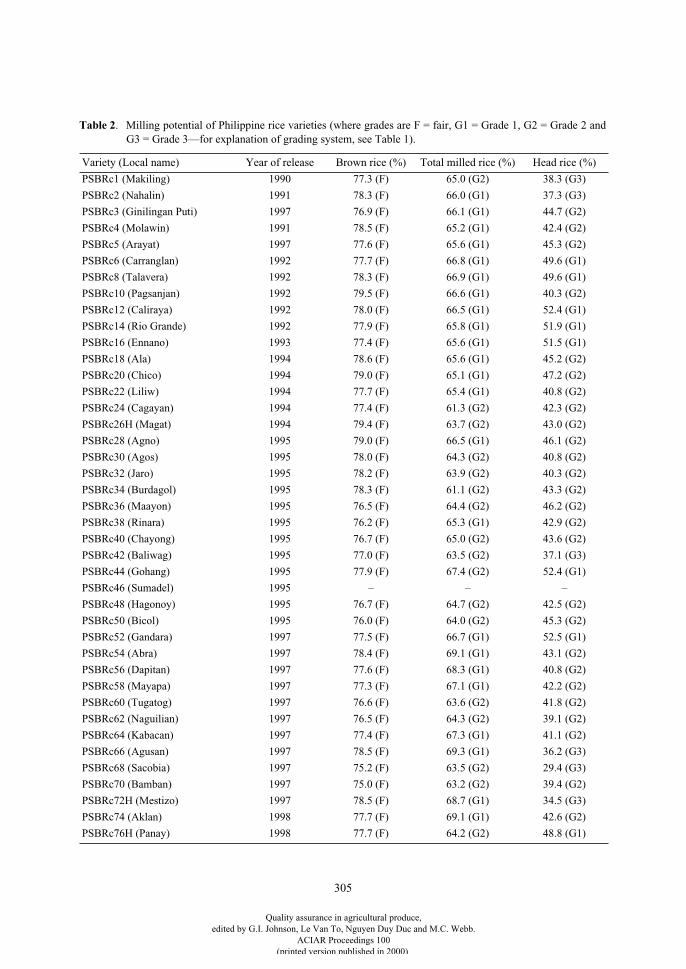
305
Table 2
. Milling potential of Philippine rice varieties (where grades are F = fair, G1 = Grade 1, G2 = Grade 2 andG3 = Grade 3—for explanation of grading system, see Table 1).
Variety (Local name) Year of release Brown rice (%) Total milled rice (%) Head rice (%)
PSBRc1 (Makiling) 1990 77.3 (F) 65.0 (G2) 38.3 (G3)
PSBRc2 (Nahalin) 1991 78.3 (F) 66.0 (G1) 37.3 (G3)
PSBRc3 (Ginilingan Puti) 1997 76.9 (F) 66.1 (G1) 44.7 (G2)
PSBRc4 (Molawin) 1991 78.5 (F) 65.2 (G1) 42.4 (G2)
PSBRc5 (Arayat) 1997 77.6 (F) 65.6 (G1) 45.3 (G2)
PSBRc6 (Carranglan) 1992 77.7 (F) 66.8 (G1) 49.6 (G1)
PSBRc8 (Talavera) 1992 78.3 (F) 66.9 (G1) 49.6 (G1)
PSBRc10 (Pagsanjan) 1992 79.5 (F) 66.6 (G1) 40.3 (G2)
PSBRc12 (Caliraya) 1992 78.0 (F) 66.5 (G1) 52.4 (G1)
PSBRc14 (Rio Grande) 1992 77.9 (F) 65.8 (G1) 51.9 (G1)
PSBRc16 (Ennano) 1993 77.4 (F) 65.6 (G1) 51.5 (G1)
PSBRc18 (Ala) 1994 78.6 (F) 65.6 (G1) 45.2 (G2)
PSBRc20 (Chico) 1994 79.0 (F) 65.1 (G1) 47.2 (G2)
PSBRc22 (Liliw) 1994 77.7 (F) 65.4 (G1) 40.8 (G2)
PSBRc24 (Cagayan) 1994 77.4 (F) 61.3 (G2) 42.3 (G2)
PSBRc26H (Magat) 1994 79.4 (F) 63.7 (G2) 43.0 (G2)
PSBRc28 (Agno) 1995 79.0 (F) 66.5 (G1) 46.1 (G2)
PSBRc30 (Agos) 1995 78.0 (F) 64.3 (G2) 40.8 (G2)
PSBRc32 (Jaro) 1995 78.2 (F) 63.9 (G2) 40.3 (G2)
PSBRc34 (Burdagol) 1995 78.3 (F) 61.1 (G2) 43.3 (G2)
PSBRc36 (Maayon) 1995 76.5 (F) 64.4 (G2) 46.2 (G2)
PSBRc38 (Rinara) 1995 76.2 (F) 65.3 (G1) 42.9 (G2)
PSBRc40 (Chayong) 1995 76.7 (F) 65.0 (G2) 43.6 (G2)
PSBRc42 (Baliwag) 1995 77.0 (F) 63.5 (G2) 37.1 (G3)
PSBRc44 (Gohang) 1995 77.9 (F) 67.4 (G2) 52.4 (G1)
PSBRc46 (Sumadel) 1995 – – –
PSBRc48 (Hagonoy) 1995 76.7 (F) 64.7 (G2) 42.5 (G2)
PSBRc50 (Bicol) 1995 76.0 (F) 64.0 (G2) 45.3 (G2)
PSBRc52 (Gandara) 1997 77.5 (F) 66.7 (G1) 52.5 (G1)
PSBRc54 (Abra) 1997 78.4 (F) 69.1 (G1) 43.1 (G2)
PSBRc56 (Dapitan) 1997 77.6 (F) 68.3 (G1) 40.8 (G2)
PSBRc58 (Mayapa) 1997 77.3 (F) 67.1 (G1) 42.2 (G2)
PSBRc60 (Tugatog) 1997 76.6 (F) 63.6 (G2) 41.8 (G2)
PSBRc62 (Naguilian) 1997 76.5 (F) 64.3 (G2) 39.1 (G2)
PSBRc64 (Kabacan) 1997 77.4 (F) 67.3 (G1) 41.1 (G2)
PSBRc66 (Agusan) 1997 78.5 (F) 69.3 (G1) 36.2 (G3)
PSBRc68 (Sacobia) 1997 75.2 (F) 63.5 (G2) 29.4 (G3)
PSBRc70 (Bamban) 1997 75.0 (F) 63.2 (G2) 39.4 (G2)
PSBRc72H (Mestizo) 1997 78.5 (F) 68.7 (G1) 34.5 (G3)
PSBRc74 (Aklan) 1998 77.7 (F) 69.1 (G1) 42.6 (G2)
PSBRc76H (Panay) 1998 77.7 (F) 64.2 (G2) 48.8 (G1)
Quality assurance in agricultural produce,edited by G.I. Johnson, Le Van To, Nguyen Duy Duc and M.C. Webb.
ACIAR Proceedings 100(printed version published in 2000)
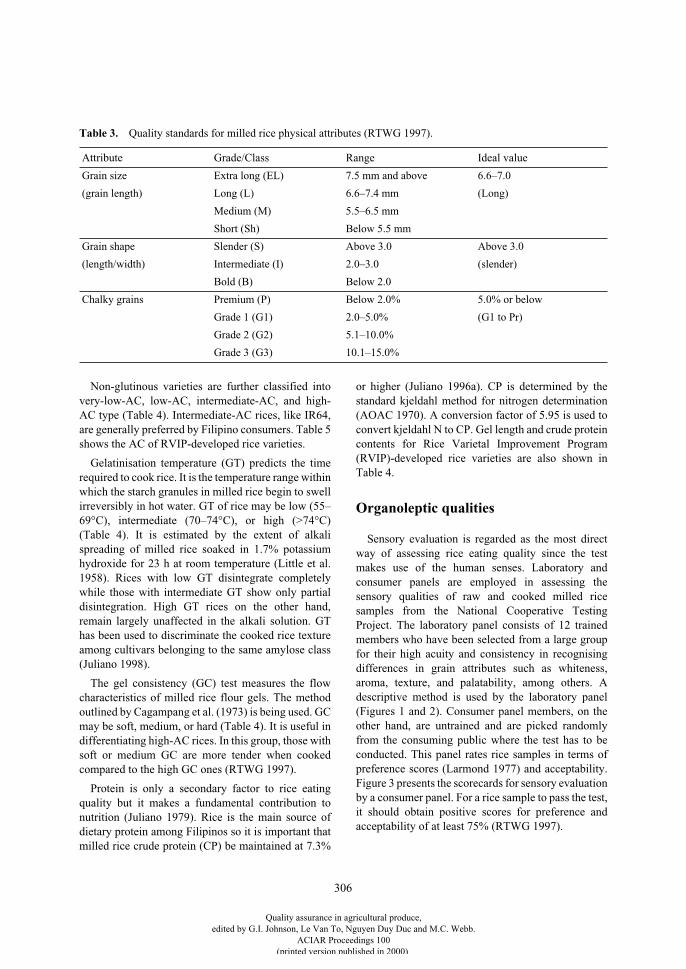
306
Non-glutinous varieties are further classified intovery-low-AC, low-AC, intermediate-AC, and high-AC type (Table 4). Intermediate-AC rices, like IR64,are generally preferred by Filipino consumers. Table 5shows the AC of RVIP-developed rice varieties.
Gelatinisation temperature (GT) predicts the timerequired to cook rice. It is the temperature range withinwhich the starch granules in milled rice begin to swellirreversibly in hot water. GT of rice may be low (55–69°C), intermediate (70–74°C), or high (>74°C)(Table 4). It is estimated by the extent of alkalispreading of milled rice soaked in 1.7% potassiumhydroxide for 23 h at room temperature (Little et al.1958). Rices with low GT disintegrate completelywhile those with intermediate GT show only partialdisintegration. High GT rices on the other hand,remain largely unaffected in the alkali solution. GThas been used to discriminate the cooked rice textureamong cultivars belonging to the same amylose class(Juliano 1998).
The gel consistency (GC) test measures the flowcharacteristics of milled rice flour gels. The methodoutlined by Cagampang et al. (1973) is being used. GCmay be soft, medium, or hard (Table 4). It is useful indifferentiating high-AC rices. In this group, those withsoft or medium GC are more tender when cookedcompared to the high GC ones (RTWG 1997).
Protein is only a secondary factor to rice eatingquality but it makes a fundamental contribution tonutrition (Juliano 1979). Rice is the main source ofdietary protein among Filipinos so it is important thatmilled rice crude protein (CP) be maintained at 7.3%
or higher (Juliano 1996a). CP is determined by thestandard kjeldahl method for nitrogen determination(AOAC 1970). A conversion factor of 5.95 is used toconvert kjeldahl N to CP. Gel length and crude proteincontents for Rice Varietal Improvement Program(RVIP)-developed rice varieties are also shown inTable 4.
Organoleptic qualities
Sensory evaluation is regarded as the most directway of assessing rice eating quality since the testmakes use of the human senses. Laboratory andconsumer panels are employed in assessing thesensory qualities of raw and cooked milled ricesamples from the National Cooperative TestingProject. The laboratory panel consists of 12 trainedmembers who have been selected from a large groupfor their high acuity and consistency in recognisingdifferences in grain attributes such as whiteness,aroma, texture, and palatability, among others. Adescriptive method is used by the laboratory panel(Figures 1 and 2). Consumer panel members, on theother hand, are untrained and are picked randomlyfrom the consuming public where the test has to beconducted. This panel rates rice samples in terms ofpreference scores (Larmond 1977) and acceptability.Figure 3 presents the scorecards for sensory evaluationby a consumer panel. For a rice sample to pass the test,it should obtain positive scores for preference andacceptability of at least 75% (RTWG 1997).
Table 3.
Quality standards for milled rice physical attributes (RTWG 1997).
Attribute Grade/Class Range Ideal value
Grain size Extra long (EL) 7.5 mm and above 6.6–7.0
(grain length) Long (L) 6.6–7.4 mm (Long)
Medium (M) 5.5–6.5 mm
Short (Sh) Below 5.5 mm
Grain shape Slender (S) Above 3.0 Above 3.0
(length/width) Intermediate (I) 2.0–3.0 (slender)
Bold (B) Below 2.0
Chalky grains Premium (P) Below 2.0% 5.0% or below
Grade 1 (G1) 2.0–5.0% (G1 to Pr)
Grade 2 (G2) 5.1–10.0%
Grade 3 (G3) 10.1–15.0%
Quality assurance in agricultural produce,edited by G.I. Johnson, Le Van To, Nguyen Duy Duc and M.C. Webb.
ACIAR Proceedings 100(printed version published in 2000)
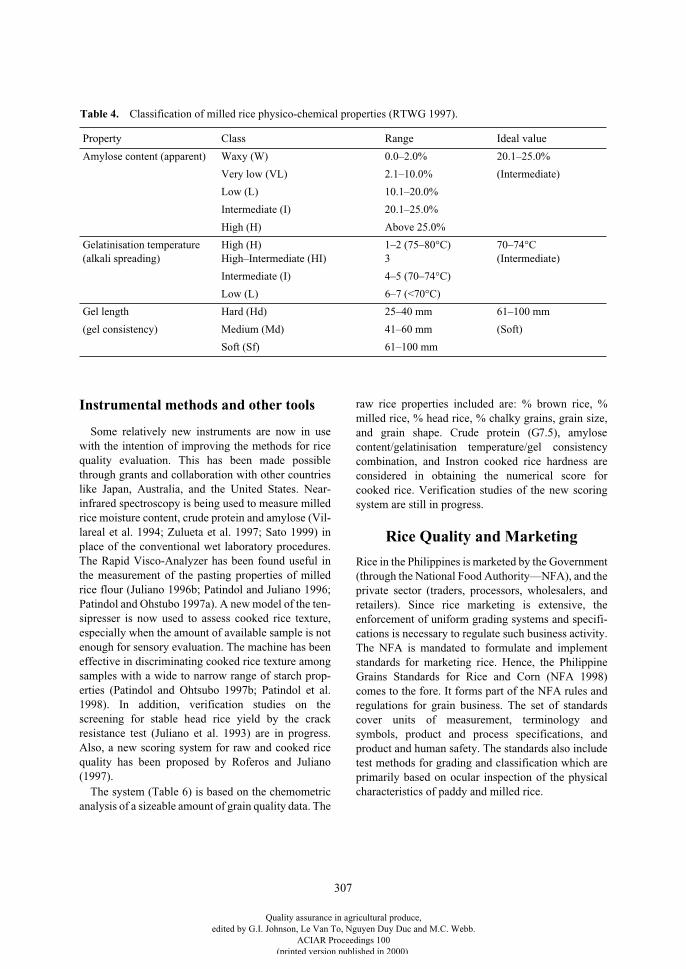
307
Instrumental methods and other tools
Some relatively new instruments are now in usewith the intention of improving the methods for ricequality evaluation. This has been made possiblethrough grants and collaboration with other countrieslike Japan, Australia, and the United States. Near-infrared spectroscopy is being used to measure milledrice moisture content, crude protein and amylose (Vil-lareal et al. 1994; Zulueta et al. 1997; Sato 1999) inplace of the conventional wet laboratory procedures.The Rapid Visco-Analyzer has been found useful inthe measurement of the pasting properties of milledrice flour (Juliano 1996b; Patindol and Juliano 1996;Patindol and Ohstubo 1997a). A new model of the ten-sipresser is now used to assess cooked rice texture,especially when the amount of available sample is notenough for sensory evaluation. The machine has beeneffective in discriminating cooked rice texture amongsamples with a wide to narrow range of starch prop-erties (Patindol and Ohtsubo 1997b; Patindol et al.1998). In addition, verification studies on thescreening for stable head rice yield by the crackresistance test (Juliano et al. 1993) are in progress.Also, a new scoring system for raw and cooked ricequality has been proposed by Roferos and Juliano(1997).
The system (Table 6) is based on the chemometricanalysis of a sizeable amount of grain quality data. The
raw rice properties included are: % brown rice, %milled rice, % head rice, % chalky grains, grain size,and grain shape. Crude protein (
G
7.5), amylosecontent/gelatinisation temperature/gel consistencycombination, and Instron cooked rice hardness areconsidered in obtaining the numerical score forcooked rice. Verification studies of the new scoringsystem are still in progress.
Rice Quality and Marketing
Rice in the Philippines is marketed by the Government(through the National Food Authority—NFA), and theprivate sector (traders, processors, wholesalers, andretailers). Since rice marketing is extensive, theenforcement of uniform grading systems and specifi-cations is necessary to regulate such business activity.The NFA is mandated to formulate and implementstandards for marketing rice. Hence, the PhilippineGrains Standards for Rice and Corn (NFA 1998)comes to the fore. It forms part of the NFA rules andregulations for grain business. The set of standardscover units of measurement, terminology andsymbols, product and process specifications, andproduct and human safety. The standards also includetest methods for grading and classification which areprimarily based on ocular inspection of the physicalcharacteristics of paddy and milled rice.
Table 4. Classification of milled rice physico-chemical properties (RTWG 1997).
Property Class Range Ideal value
Amylose content (apparent) Waxy (W) 0.0–2.0% 20.1–25.0%
Very low (VL) 2.1–10.0% (Intermediate)
Low (L) 10.1–20.0%
Intermediate (I) 20.1–25.0%
High (H) Above 25.0%
Gelatinisation temperature(alkali spreading)
High (H)High–Intermediate (HI)
1–2 (75–80°C)3
70–74°C(Intermediate)
Intermediate (I) 4–5 (70–74°C)
Low (L) 6–7 (<70°C)
Gel length Hard (Hd) 25–40 mm 61–100 mm
(gel consistency) Medium (Md) 41–60 mm (Soft)
Soft (Sf) 61–100 mm
Quality assurance in agricultural produce,edited by G.I. Johnson, Le Van To, Nguyen Duy Duc and M.C. Webb.
ACIAR Proceedings 100(printed version published in 2000)

308
Philippine Rice Research InstituteMaligaya, Muñoz, Nueva Ecija
3119 Philippines
LABORATORY PANEL SCORECARD FOR MILLED RICE
Name: Judge No:Date: Time:
INSTRUCTIONS: Carefully evaluate the samples in the order given to you and writethe numerical rating corresponding to the degree of each sensory attribute specified.
SENSORY ATTRIBUTECODED SAMPLES
AROMA4 very aromatic3 aromatic2 slightly aromatic1 none
OFF-ODOUR4 very perceptible3 perceptible2 slightly perceptible1 none
WHITENESS4 white3 creamish white2 greyish white1 white with coloured streaks
GLOSS4 very glossy3 glossy2 slightly glossy1 dull
BRITTLENESS4 very brittle3 brittle2 slightly brittle1 soft
TRANSLUCENCY4 translucent3 white belly2 chalky1 opaque
Figure 1
. Laboratory panel scorecard for the sensory evaluation of milled rice (RTWG 1997).
Quality assurance in agricultural produce,edited by G.I. Johnson, Le Van To, Nguyen Duy Duc and M.C. Webb.
ACIAR Proceedings 100(printed version published in 2000)
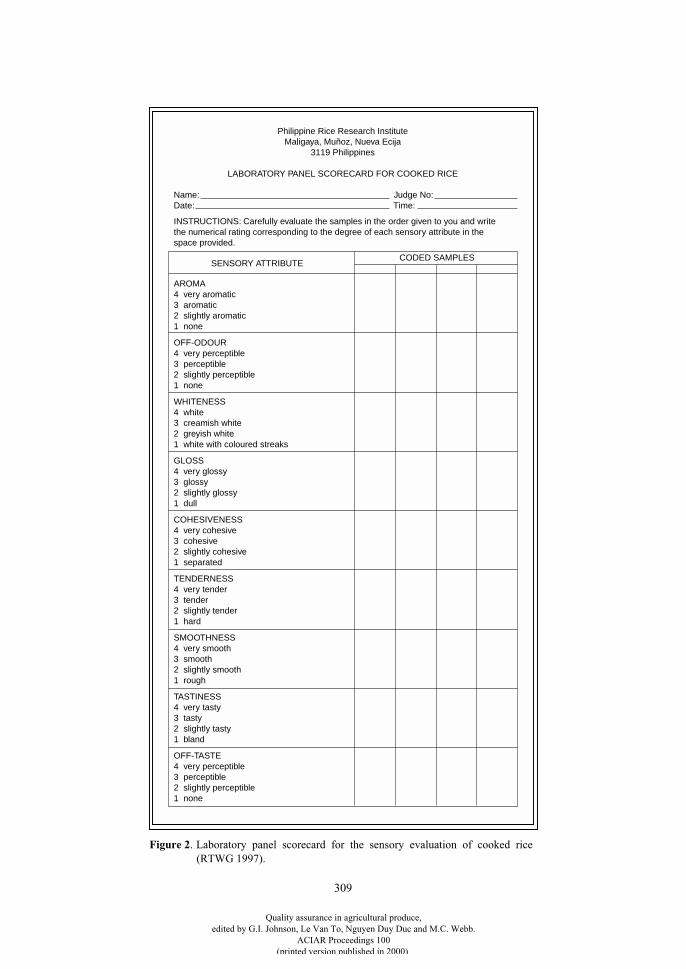
309
Philippine Rice Research InstituteMaligaya, Muñoz, Nueva Ecija
3119 Philippines
LABORATORY PANEL SCORECARD FOR COOKED RICE
Name: Judge No:Date: Time:
INSTRUCTIONS: Carefully evaluate the samples in the order given to you and writethe numerical rating corresponding to the degree of each sensory attribute in the space provided.
SENSORY ATTRIBUTECODED SAMPLES
AROMA4 very aromatic3 aromatic2 slightly aromatic1 none
OFF-ODOUR4 very perceptible3 perceptible2 slightly perceptible1 none
WHITENESS4 white3 creamish white2 greyish white1 white with coloured streaks
GLOSS4 very glossy3 glossy2 slightly glossy1 dull
TENDERNESS4 very tender3 tender2 slightly tender1 hard
SMOOTHNESS4 very smooth3 smooth2 slightly smooth1 rough
TASTINESS4 very tasty3 tasty2 slightly tasty1 bland
OFF-TASTE4 very perceptible3 perceptible2 slightly perceptible1 none
COHESIVENESS4 very cohesive3 cohesive2 slightly cohesive1 separated
Figure 2
. Laboratory panel scorecard for the sensory evaluation of cooked rice(RTWG 1997).
Quality assurance in agricultural produce,edited by G.I. Johnson, Le Van To, Nguyen Duy Duc and M.C. Webb.
ACIAR Proceedings 100(printed version published in 2000)
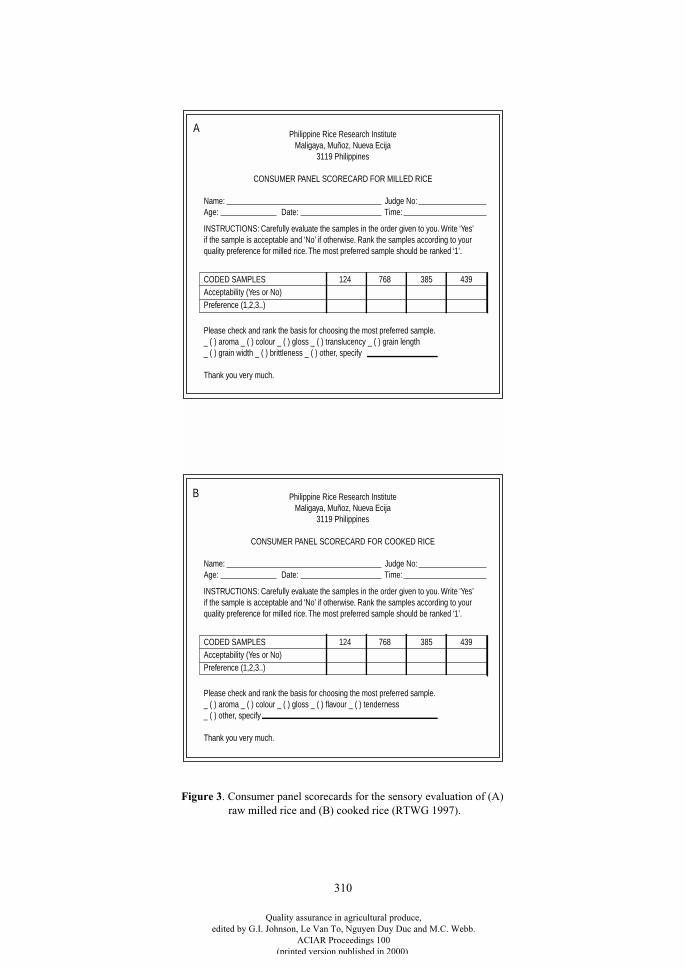
310
Philippine Rice Research InstituteMaligaya, Muñoz, Nueva Ecija
3119 Philippines
CONSUMER PANEL SCORECARD FOR MILLED RICE
Name: Judge No:Age: Date: Time:
INSTRUCTIONS: Carefully evaluate the samples in the order given to you. Write ‘Yes’ if the sample is acceptable and ‘No’ if otherwise. Rank the samples according to your quality preference for milled rice. The most preferred sample should be ranked ‘1’.
CODED SAMPLES 124 768 385 439Acceptability (Yes or No)Preference (1,2,3..)
Please check and rank the basis for choosing the most preferred sample._ ( ) aroma _ ( ) colour _ ( ) gloss _ ( ) translucency _ ( ) grain length_ ( ) grain width _ ( ) brittleness _ ( ) other, specify
Thank you very much.
Philippine Rice Research InstituteMaligaya, Muñoz, Nueva Ecija
3119 Philippines
CONSUMER PANEL SCORECARD FOR COOKED RICE
Name: Judge No:Age: Date: Time:
INSTRUCTIONS: Carefully evaluate the samples in the order given to you. Write ‘Yes’ if the sample is acceptable and ‘No’ if otherwise. Rank the samples according to your quality preference for milled rice. The most preferred sample should be ranked ‘1’.
CODED SAMPLES 124 768 385 439Acceptability (Yes or No)Preference (1,2,3..)
Please check and rank the basis for choosing the most preferred sample._ ( ) aroma _ ( ) colour _ ( ) gloss _ ( ) flavour _ ( ) tenderness_ ( ) other, specify
Thank you very much.
A
B
Figure 3
. Consumer panel scorecards for the sensory evaluation of (A)raw milled rice and (B) cooked rice (RTWG 1997).
Quality assurance in agricultural produce,edited by G.I. Johnson, Le Van To, Nguyen Duy Duc and M.C. Webb.
ACIAR Proceedings 100(printed version published in 2000)
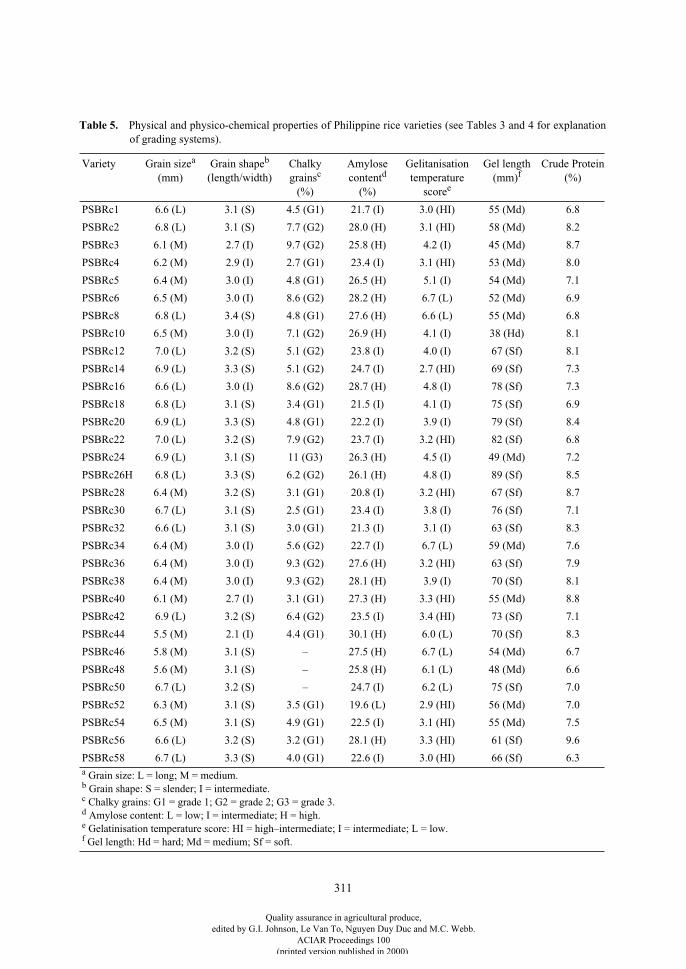
311
Table 5.
Physical and physico-chemical properties of Philippine rice varieties (see Tables 3 and 4 for explanationof grading systems).
Variety Grain size
a
(mm)Grain shape
b
(length/width)Chalky grains
c
(%)
Amylose content
d
(%)
Gelitanisation temperature
score
e
Gel length(mm)
f
Crude Protein(%)
PSBRc1 6.6 (L) 3.1 (S) 4.5 (G1) 21.7 (I) 3.0 (HI) 55 (Md) 6.8
PSBRc2 6.8 (L) 3.1 (S) 7.7 (G2) 28.0 (H) 3.1 (HI) 58 (Md) 8.2
PSBRc3 6.1 (M) 2.7 (I) 9.7 (G2) 25.8 (H) 4.2 (I) 45 (Md) 8.7
PSBRc4 6.2 (M) 2.9 (I) 2.7 (G1) 23.4 (I) 3.1 (HI) 53 (Md) 8.0
PSBRc5 6.4 (M) 3.0 (I) 4.8 (G1) 26.5 (H) 5.1 (I) 54 (Md) 7.1
PSBRc6 6.5 (M) 3.0 (I) 8.6 (G2) 28.2 (H) 6.7 (L) 52 (Md) 6.9
PSBRc8 6.8 (L) 3.4 (S) 4.8 (G1) 27.6 (H) 6.6 (L) 55 (Md) 6.8
PSBRc10 6.5 (M) 3.0 (I) 7.1 (G2) 26.9 (H) 4.1 (I) 38 (Hd) 8.1
PSBRc12 7.0 (L) 3.2 (S) 5.1 (G2) 23.8 (I) 4.0 (I) 67 (Sf) 8.1
PSBRc14 6.9 (L) 3.3 (S) 5.1 (G2) 24.7 (I) 2.7 (HI) 69 (Sf) 7.3
PSBRc16 6.6 (L) 3.0 (I) 8.6 (G2) 28.7 (H) 4.8 (I) 78 (Sf) 7.3
PSBRc18 6.8 (L) 3.1 (S) 3.4 (G1) 21.5 (I) 4.1 (I) 75 (Sf) 6.9
PSBRc20 6.9 (L) 3.3 (S) 4.8 (G1) 22.2 (I) 3.9 (I) 79 (Sf) 8.4
PSBRc22 7.0 (L) 3.2 (S) 7.9 (G2) 23.7 (I) 3.2 (HI) 82 (Sf) 6.8
PSBRc24 6.9 (L) 3.1 (S) 11 (G3) 26.3 (H) 4.5 (I) 49 (Md) 7.2
PSBRc26H 6.8 (L) 3.3 (S) 6.2 (G2) 26.1 (H) 4.8 (I) 89 (Sf) 8.5
PSBRc28 6.4 (M) 3.2 (S) 3.1 (G1) 20.8 (I) 3.2 (HI) 67 (Sf) 8.7
PSBRc30 6.7 (L) 3.1 (S) 2.5 (G1) 23.4 (I) 3.8 (I) 76 (Sf) 7.1
PSBRc32 6.6 (L) 3.1 (S) 3.0 (G1) 21.3 (I) 3.1 (I) 63 (Sf) 8.3
PSBRc34 6.4 (M) 3.0 (I) 5.6 (G2) 22.7 (I) 6.7 (L) 59 (Md) 7.6
PSBRc36 6.4 (M) 3.0 (I) 9.3 (G2) 27.6 (H) 3.2 (HI) 63 (Sf) 7.9
PSBRc38 6.4 (M) 3.0 (I) 9.3 (G2) 28.1 (H) 3.9 (I) 70 (Sf) 8.1
PSBRc40 6.1 (M) 2.7 (I) 3.1 (G1) 27.3 (H) 3.3 (HI) 55 (Md) 8.8
PSBRc42 6.9 (L) 3.2 (S) 6.4 (G2) 23.5 (I) 3.4 (HI) 73 (Sf) 7.1
PSBRc44 5.5 (M) 2.1 (I) 4.4 (G1) 30.1 (H) 6.0 (L) 70 (Sf) 8.3
PSBRc46 5.8 (M) 3.1 (S) – 27.5 (H) 6.7 (L) 54 (Md) 6.7
PSBRc48 5.6 (M) 3.1 (S) – 25.8 (H) 6.1 (L) 48 (Md) 6.6
PSBRc50 6.7 (L) 3.2 (S) – 24.7 (I) 6.2 (L) 75 (Sf) 7.0
PSBRc52 6.3 (M) 3.1 (S) 3.5 (G1) 19.6 (L) 2.9 (HI) 56 (Md) 7.0
PSBRc54 6.5 (M) 3.1 (S) 4.9 (G1) 22.5 (I) 3.1 (HI) 55 (Md) 7.5
PSBRc56 6.6 (L) 3.2 (S) 3.2 (G1) 28.1 (H) 3.3 (HI) 61 (Sf) 9.6
PSBRc58 6.7 (L) 3.3 (S) 4.0 (G1) 22.6 (I) 3.0 (HI) 66 (Sf) 6.3
a
Grain size: L = long; M = medium.
b
Grain shape: S = slender; I = intermediate.
c
Chalky grains: G1 = grade 1; G2 = grade 2; G3 = grade 3.
d
Amylose content: L = low; I = intermediate; H = high.
e
Gelatinisation temperature score: HI = high–intermediate; I = intermediate; L = low.
f
Gel length: Hd = hard; Md = medium; Sf = soft.
Quality assurance in agricultural produce,edited by G.I. Johnson, Le Van To, Nguyen Duy Duc and M.C. Webb.
ACIAR Proceedings 100(printed version published in 2000)
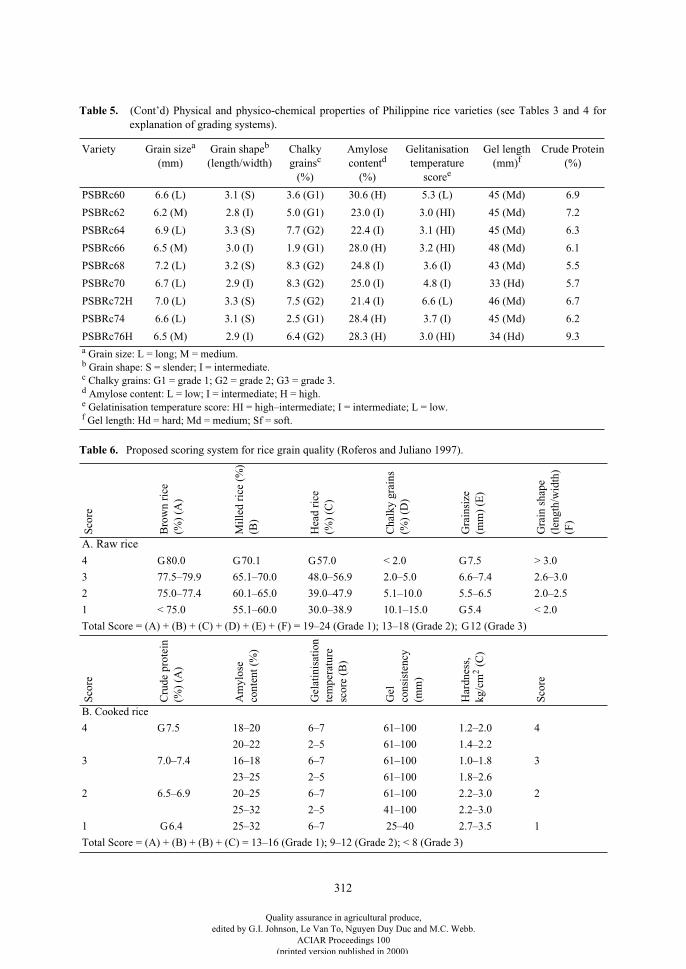
312
PSBRc60 6.6 (L) 3.1 (S) 3.6 (G1) 30.6 (H) 5.3 (L) 45 (Md) 6.9
PSBRc62 6.2 (M) 2.8 (I) 5.0 (G1) 23.0 (I) 3.0 (HI) 45 (Md) 7.2
PSBRc64 6.9 (L) 3.3 (S) 7.7 (G2) 22.4 (I) 3.1 (HI) 45 (Md) 6.3
PSBRc66 6.5 (M) 3.0 (I) 1.9 (G1) 28.0 (H) 3.2 (HI) 48 (Md) 6.1
PSBRc68 7.2 (L) 3.2 (S) 8.3 (G2) 24.8 (I) 3.6 (I) 43 (Md) 5.5
PSBRc70 6.7 (L) 2.9 (I) 8.3 (G2) 25.0 (I) 4.8 (I) 33 (Hd) 5.7
PSBRc72H 7.0 (L) 3.3 (S) 7.5 (G2) 21.4 (I) 6.6 (L) 46 (Md) 6.7
PSBRc74 6.6 (L) 3.1 (S) 2.5 (G1) 28.4 (H) 3.7 (I) 45 (Md) 6.2
PSBRc76H 6.5 (M) 2.9 (I) 6.4 (G2) 28.3 (H) 3.0 (HI) 34 (Hd) 9.3
Table 5.
(Cont’d) Physical and physico-chemical properties of Philippine rice varieties (see Tables 3 and 4 forexplanation of grading systems).
Variety Grain size
a
(mm)Grain shape
b
(length/width)Chalky grains
c
(%)
Amylose content
d
(%)
Gelitanisation temperature
score
e
Gel length(mm)
f
Crude Protein(%)
a
Grain size: L = long; M = medium.
b
Grain shape: S = slender; I = intermediate.
c
Chalky grains: G1 = grade 1; G2 = grade 2; G3 = grade 3.
d
Amylose content: L = low; I = intermediate; H = high.
e
Gelatinisation temperature score: HI = high–intermediate; I = intermediate; L = low.
f
Gel length: Hd = hard; Md = medium; Sf = soft.
Table 6.
Proposed scoring system for rice grain quality (Roferos and Juliano 1997).
Sco
re
Bro
wn
rice
(%
) (A
)
Mil
led
rice
(%
)(B
)
Hea
d ri
ce(%
) (C
)
Cha
lky
grai
ns
(%)
(D)
Gra
insi
ze
(mm
) (E
)
Gra
in s
hape
(l
engt
h/w
idth
)(F
)
A. Raw rice
4
G
80.0
G
70.1
G
57.0 < 2.0
G
7.5 > 3.0
3 77.5–79.9 65.1–70.0 48.0–56.9 2.0–5.0 6.6–7.4 2.6–3.0
2 75.0–77.4 60.1–65.0 39.0–47.9 5.1–10.0 5.5–6.5 2.0–2.5
1 < 75.0 55.1–60.0 30.0–38.9 10.1–15.0
G
5.4 < 2.0
Total Score = (A) + (B) + (C) + (D) + (E) + (F) = 19–24 (Grade 1); 13–18 (Grade 2);
G
12 (Grade 3)
Sco
re
Cru
de p
rote
in
(%)
(A)
Am
ylos
e co
nten
t (%
)
Gel
atin
isat
ion
tem
pera
ture
scor
e (B
)
Gel
co
nsis
tenc
y(m
m)
Har
dnes
s,
kg/c
m
2
(C
)
Sco
re
B. Cooked rice
4
G
7.5 18–20 6–7 61–100 1.2–2.0 4
20–22 2–5 61–100 1.4–2.2
3 7.0–7.4 16–18 6–7 61–100 1.0–1.8 3
23–25 2–5 61–100 1.8–2.6
2 6.5–6.9 20–25 6–7 61–100 2.2–3.0 2
25–32 2–5 41–100 2.2–3.0
1
G
6.4 25–32 6–7 25–40 2.7–3.5 1
Total Score = (A) + (B) + (B) + (C) = 13–16 (Grade 1); 9–12 (Grade 2); < 8 (Grade 3)
Quality assurance in agricultural produce,edited by G.I. Johnson, Le Van To, Nguyen Duy Duc and M.C. Webb.
ACIAR Proceedings 100(printed version published in 2000)
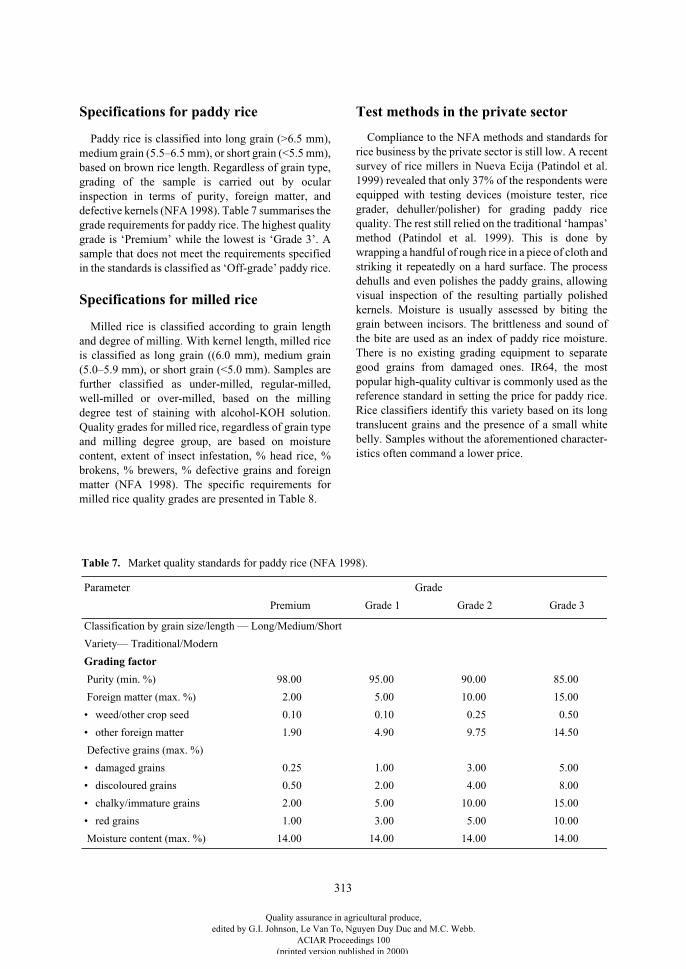
313
Specifications for paddy rice
Paddy rice is classified into long grain (>6.5 mm),medium grain (5.5–6.5 mm), or short grain (<5.5 mm),based on brown rice length. Regardless of grain type,grading of the sample is carried out by ocularinspection in terms of purity, foreign matter, anddefective kernels (NFA 1998). Table 7 summarises thegrade requirements for paddy rice. The highest qualitygrade is ‘Premium’ while the lowest is ‘Grade 3’. Asample that does not meet the requirements specifiedin the standards is classified as ‘Off-grade’ paddy rice.
Specifications for milled rice
Milled rice is classified according to grain lengthand degree of milling. With kernel length, milled riceis classified as long grain ((6.0 mm), medium grain(5.0–5.9 mm), or short grain (<5.0 mm). Samples arefurther classified as under-milled, regular-milled,well-milled or over-milled, based on the millingdegree test of staining with alcohol-KOH solution.Quality grades for milled rice, regardless of grain typeand milling degree group, are based on moisturecontent, extent of insect infestation, % head rice, %brokens, % brewers, % defective grains and foreignmatter (NFA 1998). The specific requirements formilled rice quality grades are presented in Table 8.
Test methods in the private sector
Compliance to the NFA methods and standards forrice business by the private sector is still low. A recentsurvey of rice millers in Nueva Ecija (Patindol et al.1999) revealed that only 37% of the respondents wereequipped with testing devices (moisture tester, ricegrader, dehuller/polisher) for grading paddy ricequality. The rest still relied on the traditional ‘hampas’method (Patindol et al. 1999). This is done bywrapping a handful of rough rice in a piece of cloth andstriking it repeatedly on a hard surface. The processdehulls and even polishes the paddy grains, allowingvisual inspection of the resulting partially polishedkernels. Moisture is usually assessed by biting thegrain between incisors. The brittleness and sound ofthe bite are used as an index of paddy rice moisture.There is no existing grading equipment to separategood grains from damaged ones. IR64, the mostpopular high-quality cultivar is commonly used as thereference standard in setting the price for paddy rice.Rice classifiers identify this variety based on its longtranslucent grains and the presence of a small whitebelly. Samples without the aforementioned character-istics often command a lower price.
Table 7. Market quality standards for paddy rice (NFA 1998).
Parameter Grade
Premium Grade 1 Grade 2 Grade 3
Classification by grain size/length — Long/Medium/Short
Variety— Traditional/Modern
Grading factor
Purity (min. %) 98.00 95.00 90.00 85.00
Foreign matter (max. %) 2.00 5.00 10.00 15.00
• weed/other crop seed 0.10 0.10 0.25 0.50
• other foreign matter 1.90 4.90 9.75 14.50
Defective grains (max. %)
• damaged grains 0.25 1.00 3.00 5.00
• discoloured grains 0.50 2.00 4.00 8.00
• chalky/immature grains 2.00 5.00 10.00 15.00
• red grains 1.00 3.00 5.00 10.00
Moisture content (max. %) 14.00 14.00 14.00 14.00
Quality assurance in agricultural produce,edited by G.I. Johnson, Le Van To, Nguyen Duy Duc and M.C. Webb.
ACIAR Proceedings 100(printed version published in 2000)
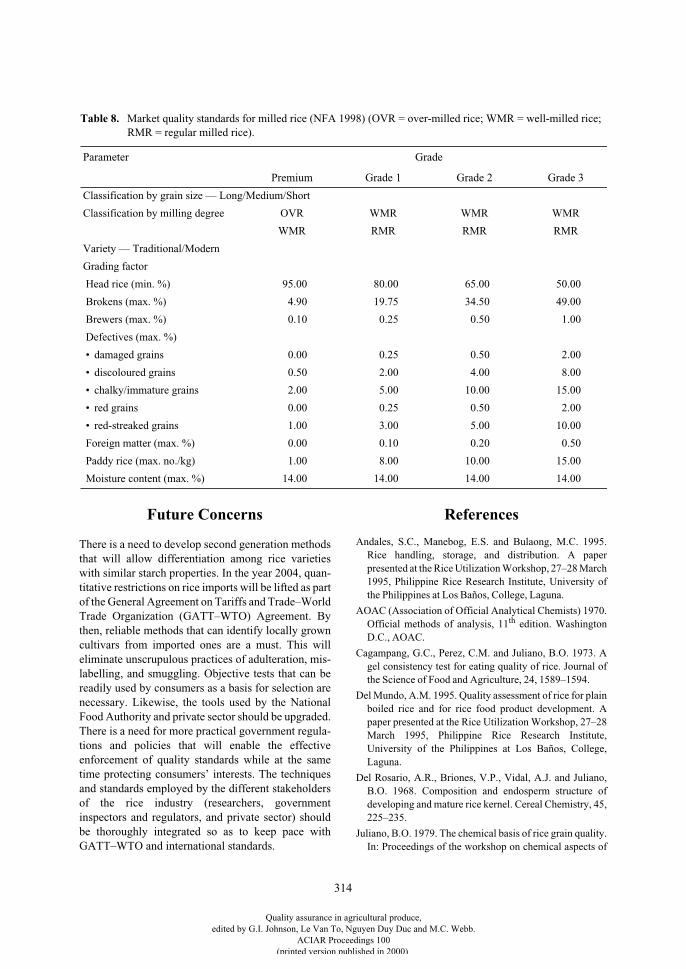
314
Future Concerns
There is a need to develop second generation methodsthat will allow differentiation among rice varietieswith similar starch properties. In the year 2004, quan-titative restrictions on rice imports will be lifted as partof the General Agreement on Tariffs and Trade–WorldTrade Organization (GATT–WTO) Agreement. Bythen, reliable methods that can identify locally growncultivars from imported ones are a must. This willeliminate unscrupulous practices of adulteration, mis-labelling, and smuggling. Objective tests that can bereadily used by consumers as a basis for selection arenecessary. Likewise, the tools used by the NationalFood Authority and private sector should be upgraded.There is a need for more practical government regula-tions and policies that will enable the effectiveenforcement of quality standards while at the sametime protecting consumers’ interests. The techniquesand standards employed by the different stakeholdersof the rice industry (researchers, governmentinspectors and regulators, and private sector) shouldbe thoroughly integrated so as to keep pace withGATT–WTO and international standards.
References
Andales, S.C., Manebog, E.S. and Bulaong, M.C. 1995.Rice handling, storage, and distribution. A paperpresented at the Rice Utilization Workshop, 27–28 March1995, Philippine Rice Research Institute, University ofthe Philippines at Los Baños, College, Laguna.
AOAC (Association of Official Analytical Chemists) 1970.Official methods of analysis, 11
th
edition. WashingtonD.C., AOAC.
Cagampang, G.C., Perez, C.M. and Juliano, B.O. 1973. Agel consistency test for eating quality of rice. Journal ofthe Science of Food and Agriculture, 24, 1589–1594.
Del Mundo, A.M. 1995. Quality assessment of rice for plainboiled rice and for rice food product development. Apaper presented at the Rice Utilization Workshop, 27–28March 1995, Philippine Rice Research Institute,University of the Philippines at Los Baños, College,Laguna.
Del Rosario, A.R., Briones, V.P., Vidal, A.J. and Juliano,B.O. 1968. Composition and endosperm structure ofdeveloping and mature rice kernel. Cereal Chemistry, 45,225–235.
Juliano, B.O. 1979. The chemical basis of rice grain quality.In: Proceedings of the workshop on chemical aspects of
Table 8. Market quality standards for milled rice (NFA 1998) (OVR = over-milled rice; WMR = well-milled rice;RMR = regular milled rice).
Parameter Grade
Premium Grade 1 Grade 2 Grade 3
Classification by grain size — Long/Medium/Short
Classification by milling degree OVR WMR WMR WMR
WMR RMR RMR RMR
Variety — Traditional/Modern
Grading factor
Head rice (min. %) 95.00 80.00 65.00 50.00
Brokens (max. %) 4.90 19.75 34.50 49.00
Brewers (max. %) 0.10 0.25 0.50 1.00
Defectives (max. %)
• damaged grains 0.00 0.25 0.50 2.00
• discoloured grains 0.50 2.00 4.00 8.00
• chalky/immature grains 2.00 5.00 10.00 15.00
• red grains 0.00 0.25 0.50 2.00
• red-streaked grains 1.00 3.00 5.00 10.00
Foreign matter (max. %) 0.00 0.10 0.20 0.50
Paddy rice (max. no./kg) 1.00 8.00 10.00 15.00
Moisture content (max. %) 14.00 14.00 14.00 14.00
Quality assurance in agricultural produce,edited by G.I. Johnson, Le Van To, Nguyen Duy Duc and M.C. Webb.
ACIAR Proceedings 100(printed version published in 2000)
315
rice grain quality. Los Baños, Laguna, Philippines,International Rice Research Institute, 69–90.
Juliano, B.O. 1985. Criteria and tests for rice grain qualities.In: Juliano, B.O., ed., Rice chemistry and technology, 2
nd
edition. St. Paul, Minnesota, American Association ofCereal Chemists, 442–524.
Juliano, B.O. 1990. Rice grain quality: problems andchallenges. Cereal Foods World, 35, 245–253.
Juliano, B.O. 1995. Some unique properties of the rice grain.A paper presented at the Rice Utilization Workshop, 27–28 March 1995, Philippine Rice Research Institute,University of the Philippines at Los Baños, Laguna.
Juliano, B.O. 1996a. Research on rice grain qualityevaluation at the Philippine Rice Research Institute. In:Crop research in Asia: achievements and perspectives(Proceedings of the 2
nd
Asian Crop Science Conference,Fukui, Japan 21–23 August 1995). Tokyo, Japan, The 2
nd
Asian Crop Science Conference Organizing Committee,University of Tokyo, 88–93.
Juliano, B.O. 1996b. Rice quality screening with the RapidVisco-Analyzer. In: Walker, C.E. and Hazelton, J.L., ed.,Applications of the Rapid Visco Analyzer. Warriewood,New South Wales, Newport Science Pty Ltd, 19–24.
Juliano, B.O. 1998. Varietal impact on rice quality. CerealFoods World, 43, 207–220.
Juliano, B.O., Perez, C.M., Blakeney, A.B., Castillo, D.T.,Kongseree, N., Laignelet, B., Lapis, E.T., Murty, V.V.S.,Paule, C.M. and Webb, B.D. 1981. Internationalcooperative testing on the amylose content of milled rice.Starch, 33, 157–162.
Juliano, B.O., Perez, C.M. and Cuevas-Perez, F. 1993.Screening for stable high head rice yields in rough rice.Cereal Chemistry, 70, 650–655.
Khush, G.S., Paule, C.M. and de la Cruz, N.M. 1979. Ricegrain quality evaluation and improvement at IRRI. In:Proceedings of the workshop on chemical aspects of ricegrain quality. Los Baños, Laguna, Philippines,International Rice Research Institute, 21–32.
Larmond, E. 1977. Laboratory methods for sensoryevaluation of food. Food Research Institute, CentralExperimental Farm, Ottawa, Canada Department ofAgriculture Publication 1637, 74p.
Little, R.R., Hilder, G.B. and Dawson, E.H. 1958.Differential effect of dilute alkali on 25 varieties of milledwhite rice. Cereal Chemistry, 35, 111–126.
NFA (National Food Authority) 1998. Primer on Philippinegrains standardization program. Quezon City,Philippines, National Food Authority, 40p.
Patindol, J.A., Ablaza, M.J.C., Guloy, M.B., Tibayan, P.A.,Roferos, L.T. and Juliano, B.O. 1999. Criteria used byrice millers in Nueva Ecija in estimating palay price. In:Philippine rice R&D highlights 1998. Muñoz, NuevaEcija, Philippine Rice Research Institute, 72–73.
Patindol, J.A. and Juliano, B.O. 1996. Effect of temperingmilled rice on some properties of dry-milled flour.Philippine Agriculture, 79, 207–215.
Patindol J.A. and Ohtsubo, K. 1997a. Flour pasting viscosityprofiles of Philippine rices with the Rapid ViscoAnalyzer. In: Philippine rice R&D highlights 1996.Muñoz, Nueva Ecija, Philippine Rice Research Institute,176–177.
Patindol J.A. and Ohtsubo, K. 1997b. Measurement ofcooked rice texture with the new tensipresser. In:Philippine rice R&D highlights 1996. Muñoz, NuevaEcija, Philippine Rice Research Institute, 174–175.
Patindol, J.A., Okadome, O. and Ohtsubo, K. 1998.Discriminating the quality of Philippine rice cultivarswith the new-tensipresser. In: Lu, H.Y., Sung, J.M. andKao, C.H., ed., Asian crop science 1998 (Proceedings ofthe 3
rd
Asian Crop Science Conference, Taichung,Taiwan, 27 April–2 May 1998). Taichung, Taiwan,Chinese Society of Agronomy, 462–470.
PhilRice–BAS (Philippine Rice Research Institute–Bureauof Agricultural Statistics) 1999. Philippine rice statisticshandbook, 1990–1998. Collaborative project of PhilRiceand BAS (unpublished).
Roferos, L.T. and Juliano, B.O. 1997. Chemometrics ofgrain quality of raw and cooked Philippine milled rice.Philippine Agriculture, 80, 211–236.
RTWG (Rice Technical Working Group) 1997. Nationalcooperative testing manual for rice: guidelines andpolicies. Muñoz, Nueva Ecija, Philippine Rice ResearchInstitute, 113p.
Sato, T. 1999. Estimation of contents of major constituentsin rice by near infrared reflectance technique: a report,1999 24 February–9 April. Report submitted to thePhilippine Rice Research Institute, Muñoz, Nueva Ecija,Philippines (unpublished).
Villareal, C.P., de la Cruz, N.M. and Juliano, B.O. 1994.Rice amylose analysis by near-infrared transmittancespectroscopy. Cereal Chemistry, 71, 292–296.
Zulueta, N.V. Tayag, C.L., Basinga D.C. and Patindol, J.A.1997. Applications of near infrared reflectancespectroscopy in grain quality evaluation. In: Philippinerice R&D highlights 1996. Muñoz, Nueva Ecija,Philippine Rice Research Institute, 172–173.
Quality assurance in agricultural produce,edited by G.I. Johnson, Le Van To, Nguyen Duy Duc and M.C. Webb.
ACIAR Proceedings 100(printed version published in 2000)
316
Prevention of Moisture Migration in Sealed Grain Stacks Stored in the Open in the Tropics
Using Reflective Covers
J. Donahaye*, S. Navarro*, F. Caliboso†, G. Sabio†, G. Mallo† and J. Dator†
Abstract
A sealed structure that provides protection of grain without the use of chemical pesticides and termed a‘Volcani Cube’ was used in these experiments. A major advantage of the Volcani Cube is that it can be usedto safely store grain outdoors when no suitable storage buildings are available. However, under tropicalconditions, when grain is stored in the open with no shade, ambient diurnal temperature fluctuations can createtemperature gradients within the stack that cause convection currents to carry moisture to the upper layers ofthe grain. To overcome this, an upper insulating layer of bags containing straw or husks was employed. UnderFilipino conditions this solution enables safe storage of maize and paddy for periods of up to three months,while for more extended periods the top moistened layer of husks should be replaced with dry material. Thismethod, although solving the problem, suffers from the inherent disadvantages of reduction in effective storagecapacity, the necessity to procure and transport material to fill the bags, and the added expense of bags not usedfor storing grain.
In a search to develop an alternative, inexpensive and convenient method of insulating the stack from diurnaltemperature fluctuations, the use of a shade screen placed above the cube was investigated. This material,described as a ‘knitted thermal screen’, is formed from aluminum-coated high-density polyethylene threads.
Trials in Israel and the Philippines showed that the reflective covers had a strong attenuating influence ontemperature gradients and condensation at the top of the cubes on the condition that a space for the freemovement of air was allowed between the cover and the plastic liner. For dry paddy, it was shown that afterfive months storage under a reflective cover, no perceptible increase in moisture content was found at the topof the stack and the grain remained in good condition.
T
WO
research and development projects carried outover the past nine years by The Bureau of PostharvestResearch and Extension (BPRE) in the Philippines,with the cooperation and support of the AgriculturalResearch Organization (ARO) in Israel, have focusedon the outdoor storage of grain inside hermeticallysealed plastic liners termed ‘Volcani Cubes’ (Alvindiaet al. 1994; Navarro et al. 1996, 1997; Caliboso et al.1997; Donahaye et al. 1998, 1999; Navarro
andDonahaye 1998). The practical outcome of the firstproject was to strengthen the present policy of the
Filipino Government which is directed at providingfarmer cooperatives with on-site storage units so as todecentralise storage of the national grain reserve aswell as provide rural communities with a higher levelof food security. Implementation of this policy isunder way, and already the concept of sealed storage toprotect dry grain from insect infestation has beenwidely promoted, together with the distribution of theflexible plastic outdoor storage cubes that weredeveloped during the course of this project. In 1998,about 200 units were distributed to farmer cooperativerecipients nationwide. Presently, Government ordershave been placed to purchase additional units for dis-tribution among farmer cooperatives. The secondproject was designed to provide a solution to the acuteregional problem where paddy-rice is harvested at
* Department of Stored Products, Agricultural Research Organization, The Volcani Center, PO Box 6, Bet Dagan 50 250, Israel.
† Bureau of Postharvest Research and Extension, Muñoz, Philippines.
Quality assurance in agricultural produce,edited by G.I. Johnson, Le Van To, Nguyen Duy Duc and M.C. Webb.
ACIAR Proceedings 100(printed version published in 2000)
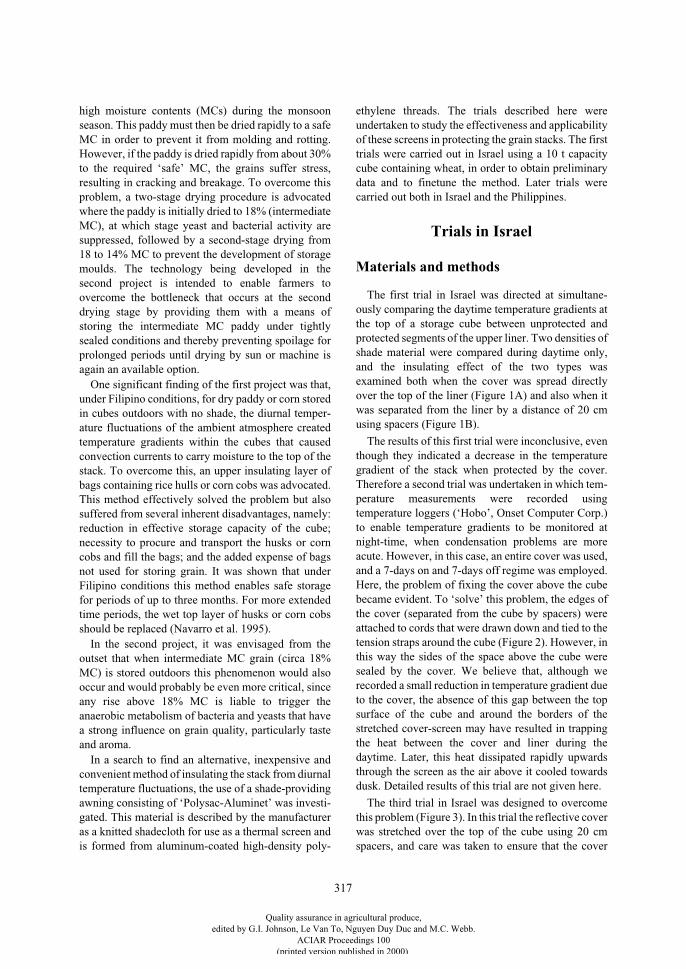
317
high moisture contents (MCs) during the monsoonseason. This paddy must then be dried rapidly to a safeMC in order to prevent it from molding and rotting.However, if the paddy is dried rapidly from about 30%to the required ‘safe’ MC, the grains suffer stress,resulting in cracking and breakage. To overcome thisproblem, a two-stage drying procedure is advocatedwhere the paddy is initially dried to 18% (intermediateMC), at which stage yeast and bacterial activity aresuppressed, followed by a second-stage drying from18 to 14% MC to prevent the development of storagemoulds. The technology being developed in thesecond project is intended to enable farmers toovercome the bottleneck that occurs at the seconddrying stage by providing them with a means ofstoring the intermediate MC paddy under tightlysealed conditions and thereby preventing spoilage forprolonged periods until drying by sun or machine isagain an available option.
One significant finding of the first project was that,under Filipino conditions, for dry paddy or corn storedin cubes outdoors with no shade, the diurnal temper-ature fluctuations of the ambient atmosphere createdtemperature gradients within the cubes that causedconvection currents to carry moisture to the top of thestack. To overcome this, an upper insulating layer ofbags containing rice hulls or corn cobs was advocated.This method effectively solved the problem but alsosuffered from several inherent disadvantages, namely:reduction in effective storage capacity of the cube;necessity to procure and transport the husks or corncobs and fill the bags; and the added expense of bagsnot used for storing grain. It was shown that underFilipino conditions this method enables safe storagefor periods of up to three months. For more extendedtime periods, the wet top layer of husks or corn cobsshould be replaced (Navarro et al. 1995).
In the second project, it was envisaged from theoutset that when intermediate MC grain (circa 18%MC) is stored outdoors this phenomenon would alsooccur and would probably be even more critical, sinceany rise above 18% MC is liable to trigger theanaerobic metabolism of bacteria and yeasts that havea strong influence on grain quality, particularly tasteand aroma.
In a search to find an alternative, inexpensive andconvenient method of insulating the stack from diurnaltemperature fluctuations, the use of a shade-providingawning consisting of ‘Polysac-Aluminet’ was investi-gated. This material is described by the manufactureras a knitted shadecloth for use as a thermal screen andis formed from aluminum-coated high-density poly-
ethylene threads. The trials described here wereundertaken to study the effectiveness and applicabilityof these screens in protecting the grain stacks. The firsttrials were carried out in Israel using a 10 t capacitycube containing wheat, in order to obtain preliminarydata and to finetune the method. Later trials werecarried out both in Israel and the Philippines.
Trials in Israel
Materials and methods
The first trial in Israel was directed at simultane-ously comparing the daytime temperature gradients atthe top of a storage cube between unprotected andprotected segments of the upper liner. Two densities ofshade material were compared during daytime only,and the insulating effect of the two types wasexamined both when the cover was spread directlyover the top of the liner (Figure 1A) and also when itwas separated from the liner by a distance of 20 cmusing spacers (Figure 1B).
The results of this first trial were inconclusive, eventhough they indicated a decrease in the temperaturegradient of the stack when protected by the cover.Therefore a second trial was undertaken in which tem-perature measurements were recorded usingtemperature loggers (‘Hobo’, Onset Computer Corp.)to enable temperature gradients to be monitored atnight-time, when condensation problems are moreacute. However, in this case, an entire cover was used,and a 7-days on and 7-days off regime was employed.Here, the problem of fixing the cover above the cubebecame evident. To ‘solve’ this problem, the edges ofthe cover (separated from the cube by spacers) wereattached to cords that were drawn down and tied to thetension straps around the cube (Figure 2). However, inthis way the sides of the space above the cube weresealed by the cover. We believe that, although werecorded a small reduction in temperature gradient dueto the cover, the absence of this gap between the topsurface of the cube and around the borders of thestretched cover-screen may have resulted in trappingthe heat between the cover and liner during thedaytime. Later, this heat dissipated rapidly upwardsthrough the screen as the air above it cooled towardsdusk. Detailed results of this trial are not given here.
The third trial in Israel was designed to overcomethis problem (Figure 3). In this trial the reflective coverwas stretched over the top of the cube using 20 cmspacers, and care was taken to ensure that the cover
Quality assurance in agricultural produce,edited by G.I. Johnson, Le Van To, Nguyen Duy Duc and M.C. Webb.
ACIAR Proceedings 100(printed version published in 2000)
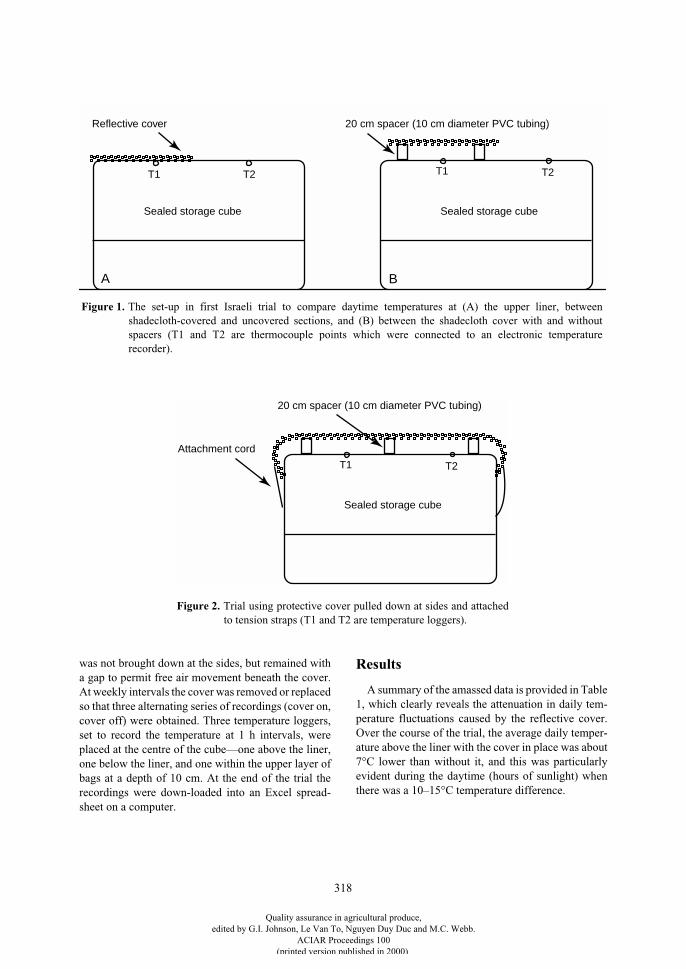
318
was not brought down at the sides, but remained witha gap to permit free air movement beneath the cover.At weekly intervals the cover was removed or replacedso that three alternating series of recordings (cover on,cover off) were obtained. Three temperature loggers,set to record the temperature at 1 h intervals, wereplaced at the centre of the cube—one above the liner,one below the liner, and one within the upper layer ofbags at a depth of 10 cm. At the end of the trial therecordings were down-loaded into an Excel spread-sheet on a computer.
Results
A summary of the amassed data is provided in Table1, which clearly reveals the attenuation in daily tem-perature fluctuations caused by the reflective cover.Over the course of the trial, the average daily temper-ature above the liner with the cover in place was about7°C lower than without it, and this was particularlyevident during the daytime (hours of sunlight) whenthere was a 10–15°C temperature difference.
Sealed storage cube Sealed storage cube
20 cm spacer (10 cm diameter PVC tubing)
T1 T2T2T1
Reflective cover
A B
Sealed storage cube
20 cm spacer (10 cm diameter PVC tubing)
T1 T2
Attachment cord
Figure 1. The set-up in first Israeli trial to compare daytime temperatures at (A) the upper liner, betweenshadecloth-covered and uncovered sections, and (B) between the shadecloth cover with and withoutspacers (T1 and T2 are thermocouple points which were connected to an electronic temperaturerecorder).
Figure 2. Trial using protective cover pulled down at sides and attachedto tension straps (T1 and T2 are temperature loggers).
Quality assurance in agricultural produce,edited by G.I. Johnson, Le Van To, Nguyen Duy Duc and M.C. Webb.
ACIAR Proceedings 100(printed version published in 2000)
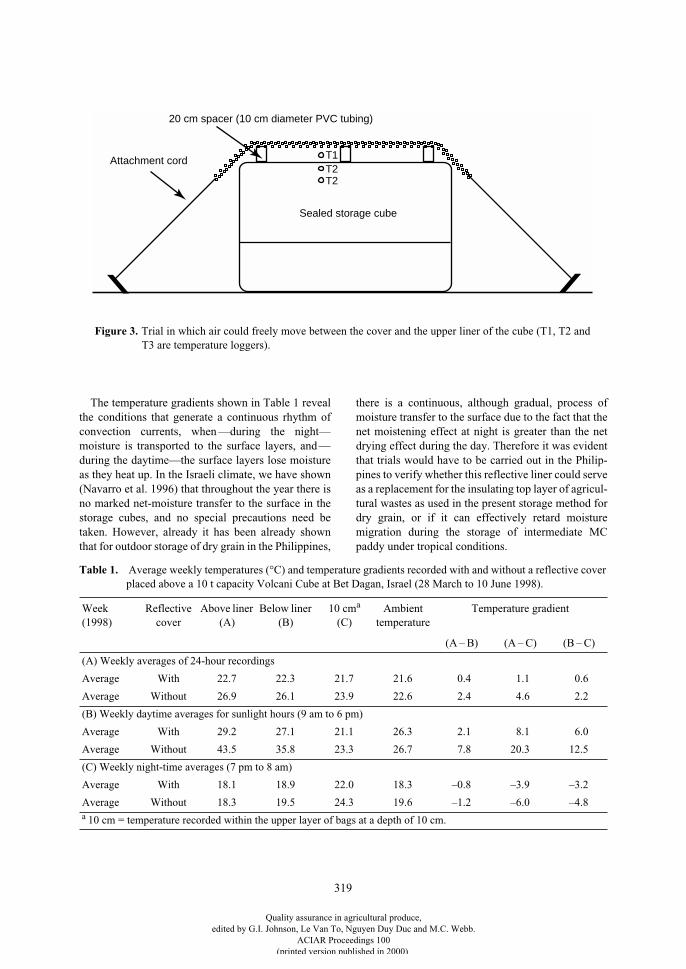
319
The temperature gradients shown in Table 1 revealthe conditions that generate a continuous rhythm ofconvection currents, when —during the night—moisture is transported to the surface layers, and —during the daytime—the surface layers lose moistureas they heat up. In the Israeli climate, we have shown(Navarro et al. 1996) that throughout the year there isno marked net-moisture transfer to the surface in thestorage cubes, and no special precautions need betaken. However, already it has been already shownthat for outdoor storage of dry grain in the Philippines,
there is a continuous, although gradual, process ofmoisture transfer to the surface due to the fact that thenet moistening effect at night is greater than the netdrying effect during the day. Therefore it was evidentthat trials would have to be carried out in the Philip-pines to verify whether this reflective liner could serveas a replacement for the insulating top layer of agricul-tural wastes as used in the present storage method fordry grain, or if it can effectively retard moisturemigration during the storage of intermediate MCpaddy under tropical conditions.
Sealed storage cube
20 cm spacer (10 cm diameter PVC tubing)
T1T2
Attachment cord
T2
Figure 3. Trial in which air could freely move between the cover and the upper liner of the cube (T1, T2 andT3 are temperature loggers).
Table 1.
Average weekly temperatures (°C) and temperature gradients recorded with and without a reflective coverplaced above a 10 t capacity Volcani Cube at Bet Dagan, Israel (28 March to 10 June 1998).
Week (1998)
Reflective cover
Above liner (A)
Below liner (B)
10 cm
a
(C)
Ambient temperature
Temperature gradient
(A – B) (A – C) (B – C)
(A) Weekly averages of 24-hour recordings
Average With 22.7 22.3 21.7 21.6 0.4 1.1 0.6
Average Without 26.9 26.1 23.9 22.6 2.4 4.6 2.2
(B) Weekly daytime averages for sunlight hours (9 am to 6 pm)
Average With 29.2 27.1 21.1 26.3 2.1 8.1 6.0
Average Without 43.5 35.8 23.3 26.7 7.8 20.3 12.5
(C) Weekly night-time averages (7 pm to 8 am)
Average With 18.1 18.9 22.0 18.3 –0.8 –3.9 –3.2
Average Without 18.3 19.5 24.3 19.6 –1.2 –6.0 –4.8
a
10 cm = temperature recorded within the upper layer of bags at a depth of 10 cm.
Quality assurance in agricultural produce,edited by G.I. Johnson, Le Van To, Nguyen Duy Duc and M.C. Webb.
ACIAR Proceedings 100(printed version published in 2000)
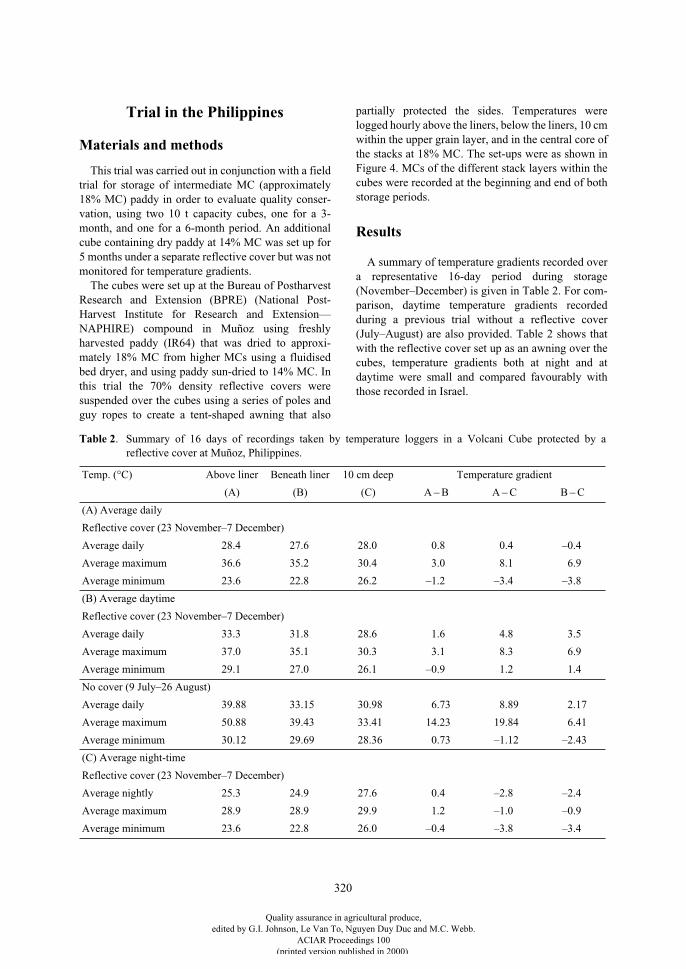
320
Trial in the Philippines
Materials and methods
This trial was carried out in conjunction with a fieldtrial for storage of intermediate MC (approximately18% MC) paddy in order to evaluate quality conser-vation, using two 10 t capacity cubes, one for a 3-month, and one for a 6-month period. An additionalcube containing dry paddy at 14% MC was set up for5 months under a separate reflective cover but was notmonitored for temperature gradients.
The cubes were set up at the Bureau of PostharvestResearch and Extension (BPRE) (National Post-Harvest Institute for Research and Extension—NAPHIRE) compound in Muñoz using freshlyharvested paddy (IR64) that was dried to approxi-mately 18% MC from higher MCs using a fluidisedbed dryer, and using paddy sun-dried to 14% MC. Inthis trial the 70% density reflective covers weresuspended over the cubes using a series of poles andguy ropes to create a tent-shaped awning that also
partially protected the sides. Temperatures werelogged hourly above the liners, below the liners, 10 cmwithin the upper grain layer, and in the central core ofthe stacks at 18% MC. The set-ups were as shown inFigure 4. MCs of the different stack layers within thecubes were recorded at the beginning and end of bothstorage periods.
Results
A summary of temperature gradients recorded overa representative 16-day period during storage(November–December) is given in Table 2. For com-parison, daytime temperature gradients recordedduring a previous trial without a reflective cover(July–August) are also provided. Table 2 shows thatwith the reflective cover set up as an awning over thecubes, temperature gradients both at night and atdaytime were small and compared favourably withthose recorded in Israel.
Table 2
. Summary of 16 days of recordings taken by temperature loggers in a Volcani Cube protected by areflective cover at Muñoz, Philippines.
Temp. (°C) Above liner Beneath liner 10 cm deep Temperature gradient
(A) (B) (C) A
–
B A
–
C B
–
C
(A) Average daily
Reflective cover (23 November–7 December)
Average daily 28.4 27.6 28.0 0.8 0.4 –0.4
Average maximum 36.6 35.2 30.4 3.0 8.1 6.9
Average minimum 23.6 22.8 26.2 –1.2 –3.4 –3.8
(B) Average daytime
Reflective cover (23 November–7 December)
Average daily 33.3 31.8 28.6 1.6 4.8 3.5
Average maximum 37.0 35.1 30.3 3.1 8.3 6.9
Average minimum 29.1 27.0 26.1 –0.9 1.2 1.4
No cover (9 July–26 August)
Average daily 39.88 33.15 30.98 6.73 8.89 2.17
Average maximum 50.88 39.43 33.41 14.23 19.84 6.41
Average minimum 30.12 29.69 28.36 0.73 –1.12 –2.43
(C) Average night-time
Reflective cover (23 November–7 December)
Average nightly 25.3 24.9 27.6 0.4 –2.8 –2.4
Average maximum 28.9 28.9 29.9 1.2 –1.0 –0.9
Average minimum 23.6 22.8 26.0 –0.4 –3.8 –3.4
Quality assurance in agricultural produce,edited by G.I. Johnson, Le Van To, Nguyen Duy Duc and M.C. Webb.
ACIAR Proceedings 100(printed version published in 2000)
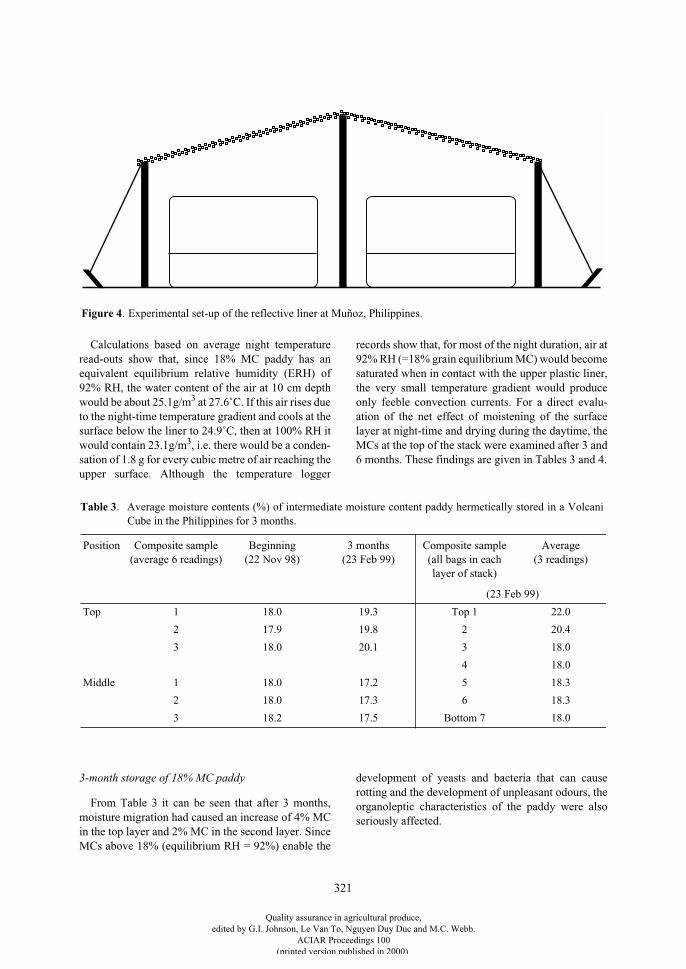
321
Calculations based on average night temperatureread-outs show that, since 18% MC paddy has anequivalent equilibrium relative humidity (ERH) of92% RH, the water content of the air at 10 cm depthwould be about 25.1g/m
3
at 27.6˚C. If this air rises dueto the night-time temperature gradient and cools at thesurface below the liner to 24.9˚C, then at 100% RH itwould contain 23.1g/m
3
, i.e. there would be a conden-sation of 1.8 g for every cubic metre of air reaching theupper surface. Although the temperature logger
records show that, for most of the night duration, air at92% RH (=18% grain equilibrium MC) would becomesaturated when in contact with the upper plastic liner,the very small temperature gradient would produceonly feeble convection currents. For a direct evalu-ation of the net effect of moistening of the surfacelayer at night-time and drying during the daytime, theMCs at the top of the stack were examined after 3 and6 months. These findings are given in Tables 3 and 4.
3-month storage of 18% MC paddy
From Table 3 it can be seen that after 3 months,moisture migration had caused an increase of 4% MCin the top layer and 2% MC in the second layer. SinceMCs above 18% (equilibrium RH = 92%) enable the
development of yeasts and bacteria that can causerotting and the development of unpleasant odours, theorganoleptic characteristics of the paddy were alsoseriously affected.
Figure 4. Experimental set-up of the reflective liner at Muñoz, Philippines.
Table 3. Average moisture contents (%) of intermediate moisture content paddy hermetically stored in a VolcaniCube in the Philippines for 3 months.
Position Composite sample (average 6 readings)
Beginning (22 Nov 98)
3 months (23 Feb 99)
Composite sample (all bags in each layer of stack)
Average(3 readings)
(23 Feb 99)
Top 1 18.0 19.3 Top 1 22.0
2 17.9 19.8 2 20.4
3 18.0 20.1 3 18.0
4 18.0
Middle 1 18.0 17.2 5 18.3
2 18.0 17.3 6 18.3
3 18.2 17.5 Bottom 7 18.0
Quality assurance in agricultural produce,edited by G.I. Johnson, Le Van To, Nguyen Duy Duc and M.C. Webb.
ACIAR Proceedings 100(printed version published in 2000)
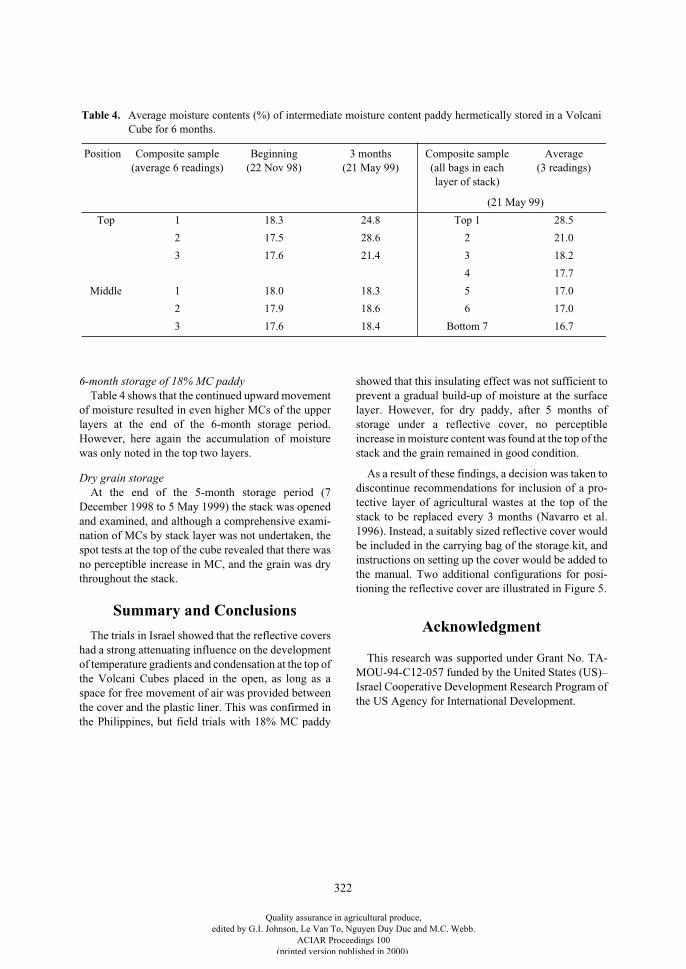
322
6-month storage of 18% MC paddy
Table 4 shows that the continued upward movementof moisture resulted in even higher MCs of the upperlayers at the end of the 6-month storage period.However, here again the accumulation of moisturewas only noted in the top two layers.
Dry grain storage
At the end of the 5-month storage period (7December 1998 to 5 May 1999) the stack was openedand examined, and although a comprehensive exami-nation of MCs by stack layer was not undertaken, thespot tests at the top of the cube revealed that there wasno perceptible increase in MC, and the grain was drythroughout the stack.
Summary and Conclusions
The trials in Israel showed that the reflective covershad a strong attenuating influence on the developmentof temperature gradients and condensation at the top ofthe Volcani Cubes placed in the open, as long as aspace for free movement of air was provided betweenthe cover and the plastic liner. This was confirmed inthe Philippines, but field trials with 18% MC paddy
showed that this insulating effect was not sufficient toprevent a gradual build-up of moisture at the surfacelayer. However, for dry paddy, after 5 months ofstorage under a reflective cover, no perceptibleincrease in moisture content was found at the top of thestack and the grain remained in good condition.
As a result of these findings, a decision was taken todiscontinue recommendations for inclusion of a pro-tective layer of agricultural wastes at the top of thestack to be replaced every 3 months (Navarro et al.1996). Instead, a suitably sized reflective cover wouldbe included in the carrying bag of the storage kit, andinstructions on setting up the cover would be added tothe manual. Two additional configurations for posi-tioning the reflective cover are illustrated in Figure 5.
Acknowledgment
This research was supported under Grant No. TA-MOU-94-C12-057 funded by the United States (US)–Israel Cooperative Development Research Program ofthe US Agency for International Development.
Table 4. Average moisture contents (%) of intermediate moisture content paddy hermetically stored in a VolcaniCube for 6 months.
Position Composite sample (average 6 readings)
Beginning (22 Nov 98)
3 months (21 May 99)
Composite sample (all bags in each layer of stack)
Average(3 readings)
(21 May 99)
Top 1 18.3 24.8 Top 1 28.5
2 17.5 28.6 2 21.0
3 17.6 21.4 3 18.2
4 17.7
Middle 1 18.0 18.3 5 17.0
2 17.9 18.6 6 17.0
3 17.6 18.4 Bottom 7 16.7
Quality assurance in agricultural produce,edited by G.I. Johnson, Le Van To, Nguyen Duy Duc and M.C. Webb.
ACIAR Proceedings 100(printed version published in 2000)
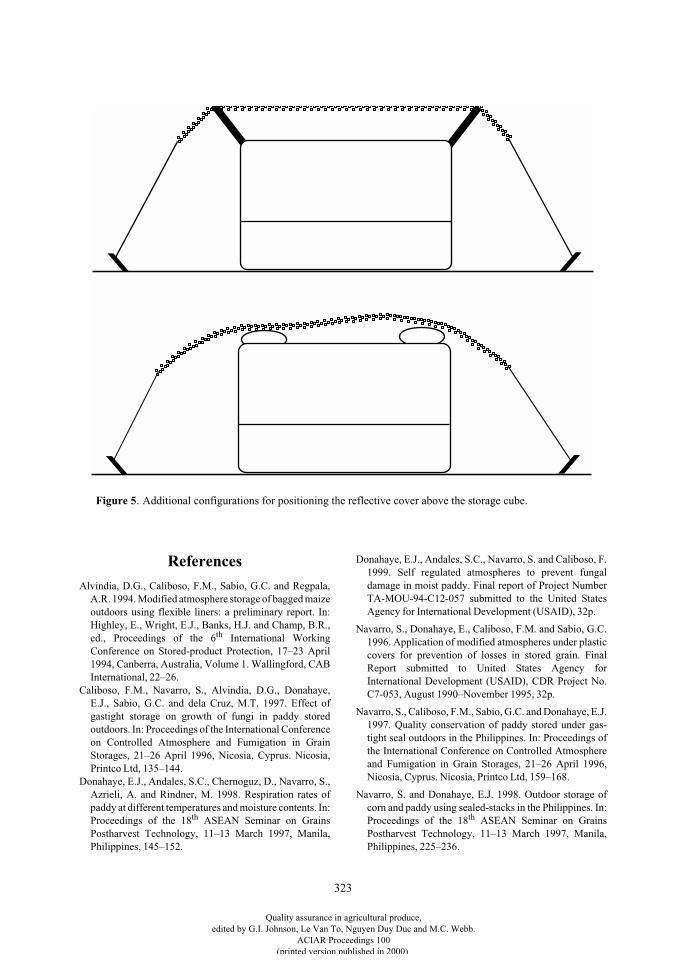
323
References
Alvindia, D.G., Caliboso, F.M., Sabio, G.C. and Regpala,A.R. 1994. Modified atmosphere storage of bagged maizeoutdoors using flexible liners: a preliminary report. In:Highley, E., Wright, E.J., Banks, H.J. and Champ, B.R.,ed., Proceedings of the 6
th
International WorkingConference on Stored-product Protection, 17–23 April1994, Canberra, Australia, Volume 1. Wallingford, CABInternational, 22–26.
Caliboso, F.M., Navarro, S., Alvindia, D.G., Donahaye,E.J., Sabio, G.C. and dela Cruz, M.T. 1997. Effect ofgastight storage on growth of fungi in paddy storedoutdoors. In: Proceedings of the International Conferenceon Controlled Atmosphere and Fumigation in GrainStorages, 21–26 April 1996, Nicosia, Cyprus. Nicosia,Printco Ltd, 135–144.
Donahaye, E.J., Andales, S.C., Chernoguz, D., Navarro, S.,Azrieli, A. and Rindner, M. 1998. Respiration rates ofpaddy at different temperatures and moisture contents. In:Proceedings of the 18
th
ASEAN Seminar on GrainsPostharvest Technology, 11–13 March 1997, Manila,Philippines, 145–152.
Donahaye, E.J., Andales, S.C., Navarro, S. and Caliboso, F.1999. Self regulated atmospheres to prevent fungaldamage in moist paddy. Final report of Project NumberTA-MOU-94-C12-057 submitted to the United StatesAgency for International Development (USAID), 32p.
Navarro, S., Donahaye, E., Caliboso, F.M. and Sabio, G.C.1996. Application of modified atmospheres under plasticcovers for prevention of losses in stored grain. FinalReport submitted to United States Agency forInternational Development (USAID), CDR Project No.C7-053, August 1990–November 1995, 32p.
Navarro, S., Caliboso, F.M., Sabio, G.C. and Donahaye, E.J.1997. Quality conservation of paddy stored under gas-tight seal outdoors in the Philippines. In: Proceedings ofthe International Conference on Controlled Atmosphereand Fumigation in Grain Storages, 21–26 April 1996,Nicosia, Cyprus. Nicosia, Printco Ltd, 159–168.
Navarro, S. and Donahaye, E.J. 1998. Outdoor storage ofcorn and paddy using sealed-stacks in the Philippines. In:Proceedings of the 18
th
ASEAN Seminar on GrainsPostharvest Technology, 11–13 March 1997, Manila,Philippines, 225–236.
Figure 5. Additional configurations for positioning the reflective cover above the storage cube.
Quality assurance in agricultural produce,edited by G.I. Johnson, Le Van To, Nguyen Duy Duc and M.C. Webb.
ACIAR Proceedings 100(printed version published in 2000)
324
The Quality Changes of Rice Stored UnderVacuum Conditions
M. Sidik*
Abstract
The National Logistics Agency (BULOG)—the Government institution responsible for maintaining reservefood stocks—encountered problems of quality deterioration of milled rice during storage, primarily due toinsect infestation and microbial infection. Previous efforts to control these problems have included use offumigants and contact pesticides, however increased concern about pesticide residues and their impact on theenvironment has led to the search for alternative approaches, including the application of modified atmospheretechnology. In this respect, BULOG has constructed an integrated vacuum container processing plant to storerice under low oxygen conditions (less than 2%).
A study was carried out to observe the effect of low oxygen on the quality of rice during prolonged storage.Rice was stored for 16 months, either inside or outside, in 18 specially designed polyethylene plastic containers(1,000 kg capacity per container) with an oxygen level of less than 2%. Changes were recorded in: moisturecontent; number of insects; level of fungal and yeast infections; and quality parameters such as proportion ofyellow rice, aroma, colour, and cooking factors.
The results revealed that lack of oxygen had a significant impact on the mortality of insects, and inhibited thedevelopment of fungi and yeast. The quality of rice was relatively unchanged after 16 months ofstorage—although, as the vacuum conditions decreased the moisture content of the rice, it absorbed more waterduring cooking and the rice became less sticky and fluffy. Overall, the results indicated that vacuum containerscould be used to maintain the quality of rice during long-term storage. However, this technology should besupported with selection of initial good quality rice prior to storage, and accurate planning regarding the lengthof storage—recognising that this technology is relatively expensive.
T
HE
I
NDONESIAN
Government has consistently imple-mented a policy to ensure the availability of basicstaple food commodities, particularly rice, at a stableand affordable price as an integral part of its foodsecurity policy. To realise the policy, the Gov-ernment—through the National Logistics Agency(BULOG)—maintains an adequate strategic foodreserve, to counter price fluctuations during the yearand food shortages due to production failure caused bythe impact of long droughts, floods and other naturalcalamities. BULOG maintains its stock in the form ofmilled rice rather than rough rice (paddy), and the riceis packed in jute or polypropylene bags (100 or 50 kgper bag) and stored in conventional horizontal‘godowns’ (warehouses) throughout the country. A
standard BULOG godown has a 3,500 t capacity andnormally consists of 12 stacks with a total quantity perstack of approximately 250–300 t.
The year-round, hot and humid climate typicallyfound in tropical areas provides favourable conditionsfor the development of storage pests such as insects,rodents and fungi. This environment, coupled withinadequate postharvest processing of grain, accel-erates the degradation of the quality of rice duringstorage, which poses a serious threat to BULOG.Annually, significant quantitative and qualitativelosses occur due to an inability to prevent rice frominsect infestation and preserve rice quality throughoutthe storage period.
Storage losses are very counterproductive to thehuge amount of energy spent increasing grain pro-duction to ensure the availability of sufficient food forthe people. Thus efforts should be geared toward
* National Logistics Agency (BULOG), Jalan Gatot Subroto 49, Jakarta 12950, Indonesia.
Quality assurance in agricultural produce,edited by G.I. Johnson, Le Van To, Nguyen Duy Duc and M.C. Webb.
ACIAR Proceedings 100(printed version published in 2000)
325
improving quality maintenance and minimising lossesthrough storage management programs. Efforts totackle storage problems have been carried out usingvarious measures, including chemical controls such asfumigation and the application of contact insecticides,in combination with the implementation of sanitationprograms. However, a greater concern of consumersabout the excessive use of pesticides—owing to theirimpact on environment and human health—has led torenewed interest and vigour in finding new methods tocombat insect infestation and fungal invasion. Suchtechnology includes the use of modified atmosphereand controlled atmosphere storage systems. BULOGhas implemented modified atmosphere technology inthe form of a vacuum container in which the concen-tration of oxygen is kept below 2% throughout thestorage period.
The application of low oxygen levels has beenknown since ancient times as ‘hermetic storage’, andrecently the principle of this storage technique (usingless than 1% O
2
) in combination with a high concen-tration of carbon dioxide (above 35%) has beenreported to provide good disinfestation and preventioneffects against storage insects (Banks et al. 1980,1991). However, maintaining a very low concen-tration of O
2
(below 1%) for a long period of time,although providing good control of various insectstages, is expensive. Therefore, use of oxygen concen-trations within the range of 1–5% is likely to be morecost-effective in large-scale applications (Annis andDowsett 1992).
The effect of temperature on the mortality of insectsunder low oxygen conditions is considered to be sig-nificant. In the tropics this effect is more dramatic thanin temperate zones, given that insect metabolism ismuch slower in cold areas than in warm climates(Navarro et al. 1994).
This paper aims to review the results of field-testingstorage of milled rice under vacuum conditions, withparticular emphasis on its quality changes based onseveral criteria. The prospects and further applicationof this technology in different forms are also brieflyoutlined.
Materials and Methods
Vacuum storage containers
Specially designed plastic containers with acapacity of 1,000 kg of rice per container were used.The plastic used was polyethylene, with anti-oxidation
and anti-ultraviolet chemicals added during themoulding process to make the containers moreresistant to the impact of the sun’s rays. The dimen-sions of the containers were 100
×
100
×
120 cm, withthe plastic approximately 1–3 mm thick and resistantto cold and hot temperatures (–60°C to 60°C). All ofthe processes involved—manufacture of the con-tainers (from plastic grain), filling the containers withrice, applying the vacuum conditions, and sealing thecontainers—were carried out in an integrated mannerin an automatic processing plant which was con-structed in East Java, with a capacity of 100,000 t/year.A schematic diagram of the overall process is shown inFigure 1.
Materials
Milled rice of the ‘Cisadane’ variety (a mixture ofInternational Rice Research Institute and local vari-eties) was procured by BULOG. The rice had met thequality standards of this organisation, which includedthe following criteria:• moisture content, maximum 14.0%;• milling degree, minimum 85%;• percentage of broken kernels, maximum 25%; and• chalky kernels and yellow kernels, maximum 2%
and 3%, respectively.18 containers (18,000 kg) were randomly selected
for this study, and samples was drawn at 60-dayintervals for a period of 16 months. Nine containerswere stored inside, and the rest were stored outside.
At each time interval, samples of 5 kg were takenfrom one container from each storage condition andsent to the laboratory for analysis of moisture content(MC), insect counts, microorganism identification andcounts, quality analysis (odour/aroma, colour,appearance/translucency) and organoleptic tests of thecooked rice.
Methods of analysis
The MC of the rice was determined by a forced-airoven method—drying 10 g rice samples at 120°C for24 h. For insect observations, 100 g samples wereanalysed visually to count the number of dead and liveinsects. The percentage of yellow kernels was deter-mined by hand-picking discoloured kernels from a 25g milled rice sample.
For identification of microorganisms (fungi andyeast), 25 rice kernels were plated onto potato dextroseagar (PDA) media in petri dishes after surface-disin-fecting the rice by rinsing for 5–10 seconds in 95%
Quality assurance in agricultural produce,edited by G.I. Johnson, Le Van To, Nguyen Duy Duc and M.C. Webb.
ACIAR Proceedings 100(printed version published in 2000)
326
ethanol, shaking for 1 min in 2% NaOCl (bleachingagent), and then rinsing in sterilised distilled water.The species of fungi were identified and counted todetermine the percentage of rice kernels infected bymicroorganisms. The average of two replicates wasused to determine the results of each analysis.
The quality of the raw rice was determined throughpanel tests, using 10 panelists to detect changes inodour (aroma), colour and translucency of the ricekernels. Similarly, cooked rice was subjected to orga-noleptic tests covering odour, colour, stickiness andmouth-feel (softness). Panelists were requested toscore each parameter from 1 to 7 (the higher the scorethe better).
Results and Discussion
Moisture content
The MC of the rice declined throughout the obser-vation period of 16 months. The initial MC of the ricewas 14.20% and after 16 months the MC was 12.87%for rice stored inside and 11.95% for rice storedoutside. The results indicate that temperature had asignificant effect on the MC of the rice and the dif-ference between the final MCs of rice stored at the twolocations was significant. The variations in MCbetween individual sampling times were not signif-icant, however the difference between the initial andfinal MC of the rice after 16 months of storage was sig-nificant. Thus, it seems likely that vacuum conditionssignificantly altered the MC of rice, particularly ricestored outside, which showed a >2% decrease in MC(Tables 1 and 2, Figure 2).
Together with temperature, MC is considered to beone of the most important factors in determining thequality retention of stored grains, including rice(Juliano 1994), and 14.00% MC is the maximum safelevel for the storage of cereals. In this study, the MC ofmilled rice under vacuum conditions decreasedgradually with storage time, to a level of nearly 12% inopen storage and slightly above 12% for rice storedinside. At these low MCs the milled rice quality wasmaintained, as indicated by the low percentage ofyellow kernels and quality of the cooked rice, eventhough the temperatures were relatively highthroughout the storage period (the temperature of the
inside storage was 27–35°C and outside storage was30–35°C).
Number of insects
There were three species of insects found in the riceat the beginning of the study, namely
Sitophiluszeamais
,
Tribolium castaneum
and
Oryzaephilus suri-namensis
, and the numbers were relatively low (lessthan 5 per 100 g rice sample) with
T. castaneum
beingthe most common. Live insects were only found at thebeginning of the study. After that, only dead insectswere found throughout the 16 months of storage, indi-cating that the low level of oxygen had killed allspecies of insects (Tables 1 and 2, Figure 2). Thisshows that lack of oxygen is an important factor inincreasing the mortality of storage insect pests and isin agreement with the observations made by Bailey(1965) and Caliboso and Sabio (1999). Interestingly,
Sitophilus
sp. had been thought to be resistant to lowoxygen levels, however in this study no
Sitophilus
sp.were found alive after 2 months of storage.
Percentage of yellow kernels
Statistical analysis showed no significant differencein the percentage of yellow kernels over time orbetween locations (Tables 1 and 2, Figure 2). Yellowrice kernels are assumed to be a result of a non-enzymatic browning reaction rather than due tomicrobial action (Phillips et al. 1988). This may becaused by delayed drying of rough rice harvested athigh MC (above 20%) (Phillips et al. 1988, 1989).Although the occurrence of a moderate proportion ofyellow kernels has no adverse effects on rats andbroiler chicks in nutritionally balanced diet tests (NRI1991), in practice, the presence of yellow kernelsabove the maximum tolerable level (>3%) leads to asignificant drop in price in the rice market. With amaximum of 3.05%, the proportion of yellow kernelsin outside storage was slightly above this level, whilein inside storage the highest proportion was 2.56%which is below the maximum allowable level. Ourresults indicate that the yellowing process almoststopped under low oxygen conditions, even though therelatively high temperatures (up to 35°C) throughoutthe study period provided otherwise suitable condi-tions for discoloured grain development.
Quality assurance in agricultural produce,edited by G.I. Johnson, Le Van To, Nguyen Duy Duc and M.C. Webb.
ACIAR Proceedings 100(printed version published in 2000)
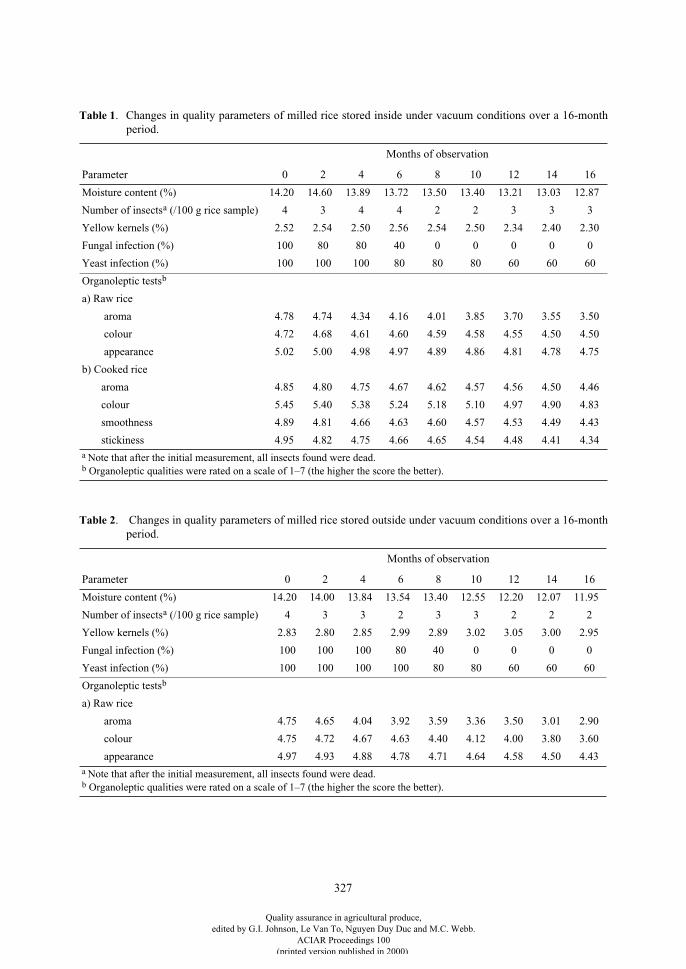
327
Table 1
. Changes in quality parameters of milled rice stored inside under vacuum conditions over a 16-monthperiod.
Months of observation
Parameter 0 2 4 6 8 10 12 14 16
Moisture content (%) 14.20 14.60 13.89 13.72 13.50 13.40 13.21 13.03 12.87
Number of insects
a
(/100 g rice sample) 4 3 4 4 2 2 3 3 3
Yellow kernels (%) 2.52 2.54 2.50 2.56 2.54 2.50 2.34 2.40 2.30
Fungal infection (%) 100 80 80 40 0 0 0 0 0
Yeast infection (%) 100 100 100 80 80 80 60 60 60
Organoleptic tests
b
a) Raw rice
aroma 4.78 4.74 4.34 4.16 4.01 3.85 3.70 3.55 3.50
colour 4.72 4.68 4.61 4.60 4.59 4.58 4.55 4.50 4.50
appearance 5.02 5.00 4.98 4.97 4.89 4.86 4.81 4.78 4.75
b) Cooked rice
aroma 4.85 4.80 4.75 4.67 4.62 4.57 4.56 4.50 4.46
colour 5.45 5.40 5.38 5.24 5.18 5.10 4.97 4.90 4.83
smoothness 4.89 4.81 4.66 4.63 4.60 4.57 4.53 4.49 4.43
stickiness 4.95 4.82 4.75 4.66 4.65 4.54 4.48 4.41 4.34
a
Note that after the initial measurement, all insects found were dead.
b
Organoleptic qualities were rated on a scale of 1–7 (the higher the score the better).
Table 2
. Changes in quality parameters of milled rice stored outside under vacuum conditions over a 16-monthperiod.
Months of observation
Parameter 0 2 4 6 8 10 12 14 16
Moisture content (%) 14.20 14.00 13.84 13.54 13.40 12.55 12.20 12.07 11.95
Number of insects
a
(/100 g rice sample) 4 3 3 2 3 3 2 2 2
Yellow kernels (%) 2.83 2.80 2.85 2.99 2.89 3.02 3.05 3.00 2.95
Fungal infection (%) 100 100 100 80 40 0 0 0 0
Yeast infection (%) 100 100 100 100 80 80 60 60 60
Organoleptic tests
b
a) Raw rice
aroma 4.75 4.65 4.04 3.92 3.59 3.36 3.50 3.01 2.90
colour 4.75 4.72 4.67 4.63 4.40 4.12 4.00 3.80 3.60
appearance 4.97 4.93 4.88 4.78 4.71 4.64 4.58 4.50 4.43
a
Note that after the initial measurement, all insects found were dead.
b
Organoleptic qualities were rated on a scale of 1–7 (the higher the score the better).
Quality assurance in agricultural produce,edited by G.I. Johnson, Le Van To, Nguyen Duy Duc and M.C. Webb.
ACIAR Proceedings 100(printed version published in 2000)
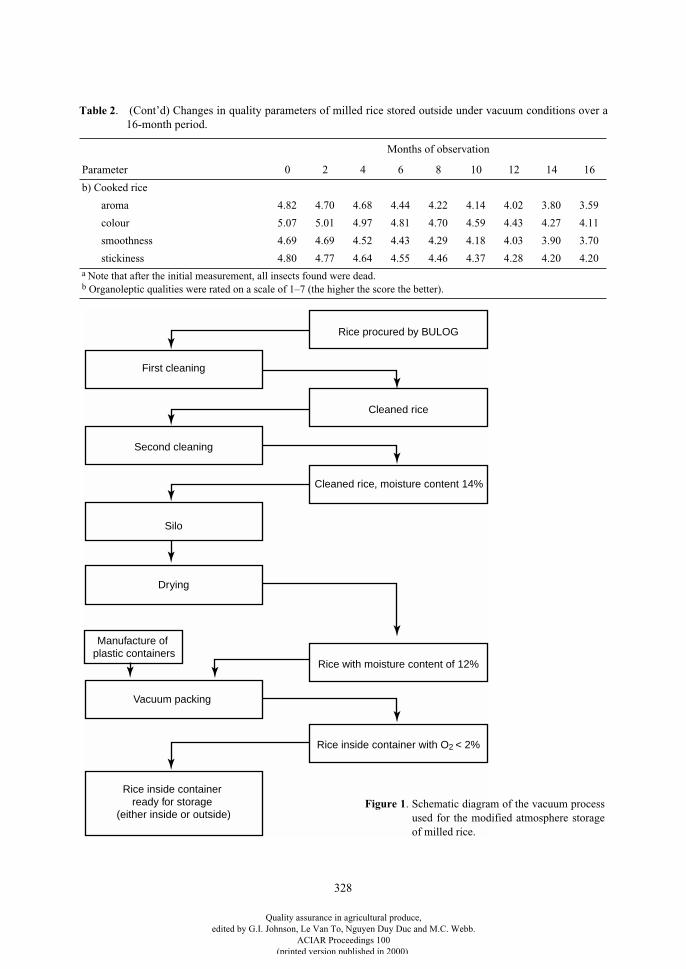
328
b) Cooked rice
aroma 4.82 4.70 4.68 4.44 4.22 4.14 4.02 3.80 3.59
colour 5.07 5.01 4.97 4.81 4.70 4.59 4.43 4.27 4.11
smoothness 4.69 4.69 4.52 4.43 4.29 4.18 4.03 3.90 3.70
stickiness 4.80 4.77 4.64 4.55 4.46 4.37 4.28 4.20 4.20
Table 2
. (Cont’d) Changes in quality parameters of milled rice stored outside under vacuum conditions over a16-month period.
Months of observation
Parameter 0 2 4 6 8 10 12 14 16
a
Note that after the initial measurement, all insects found were dead.
b
Organoleptic qualities were rated on a scale of 1–7 (the higher the score the better).
Rice procured by BULOG
First cleaning
Second cleaning
Silo
Drying
Vacuum packing
Cleaned rice
Cleaned rice, moisture content 14%
Rice inside container with O2 < 2%
Rice with moisture content of 12%
Rice inside container ready for storage
(either inside or outside)
Manufacture of plastic containers
Figure 1
. Schematic diagram of the vacuum processused for the modified atmosphere storageof milled rice.
Quality assurance in agricultural produce,edited by G.I. Johnson, Le Van To, Nguyen Duy Duc and M.C. Webb.
ACIAR Proceedings 100(printed version published in 2000)
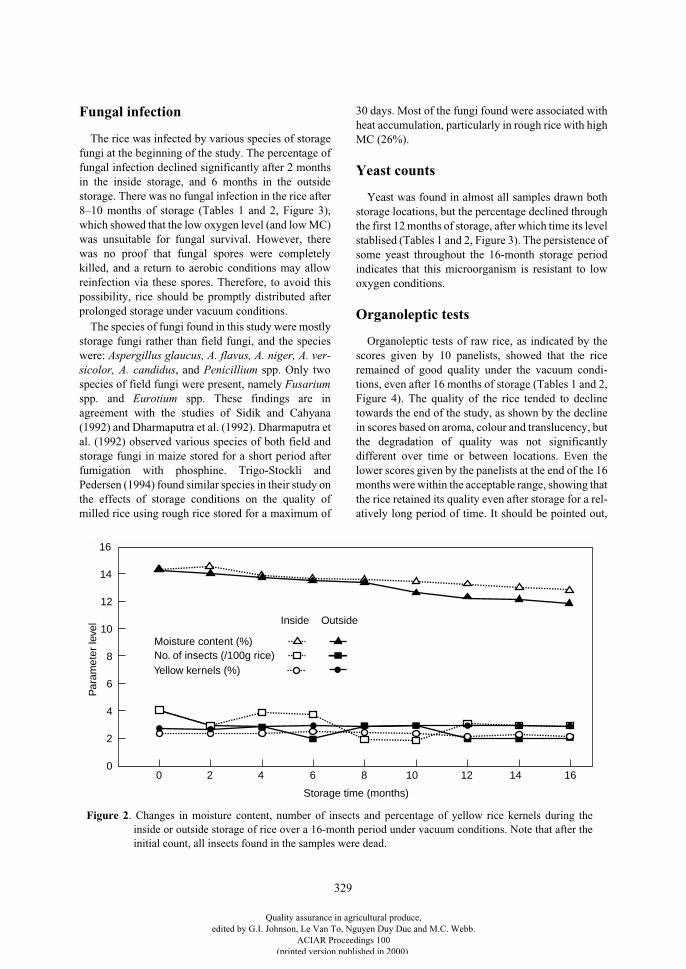
329
Fungal infection
The rice was infected by various species of storagefungi at the beginning of the study. The percentage offungal infection declined significantly after 2 monthsin the inside storage, and 6 months in the outsidestorage. There was no fungal infection in the rice after8–10 months of storage (Tables 1 and 2, Figure 3),which showed that the low oxygen level (and low MC)was unsuitable for fungal survival. However, therewas no proof that fungal spores were completelykilled, and a return to aerobic conditions may allowreinfection via these spores. Therefore, to avoid thispossibility, rice should be promptly distributed afterprolonged storage under vacuum conditions.
The species of fungi found in this study were mostlystorage fungi rather than field fungi, and the specieswere:
Aspergillus glaucus, A. flavus, A. niger, A. ver-sicolor, A. candidus
, and
Penicillium
spp. Only twospecies of field fungi were present, namely
Fusarium
spp. and
Eurotium
spp. These findings are inagreement with the studies of Sidik and Cahyana(1992) and Dharmaputra et al. (1992). Dharmaputra etal. (1992) observed various species of both field andstorage fungi in maize stored for a short period afterfumigation with phosphine. Trigo-Stockli andPedersen (1994) found similar species in their study onthe effects of storage conditions on the quality ofmilled rice using rough rice stored for a maximum of
30 days. Most of the fungi found were associated withheat accumulation, particularly in rough rice with highMC (26%).
Yeast counts
Yeast was found in almost all samples drawn bothstorage locations, but the percentage declined throughthe first 12 months of storage, after which time its levelstablised (Tables 1 and 2, Figure 3). The persistence ofsome yeast throughout the 16-month storage periodindicates that this microorganism is resistant to lowoxygen conditions.
Organoleptic tests
Organoleptic tests of raw rice, as indicated by thescores given by 10 panelists, showed that the riceremained of good quality under the vacuum condi-tions, even after 16 months of storage (Tables 1 and 2,Figure 4). The quality of the rice tended to declinetowards the end of the study, as shown by the declinein scores based on aroma, colour and translucency, butthe degradation of quality was not significantlydifferent over time or between locations. Even thelower scores given by the panelists at the end of the 16months were within the acceptable range, showing thatthe rice retained its quality even after storage for a rel-atively long period of time. It should be pointed out,
0
6
2
4
8
Storage time (months)
12
Par
amet
er le
vel
10
0 2 6 10 14 16
14
16
1284
Yellow kernels (%)
Inside Outside
No. of insects (/100g rice)Moisture content (%)
Figure 2. Changes in moisture content, number of insects and percentage of yellow rice kernels during theinside or outside storage of rice over a 16-month period under vacuum conditions. Note that after theinitial count, all insects found in the samples were dead.
Quality assurance in agricultural produce,edited by G.I. Johnson, Le Van To, Nguyen Duy Duc and M.C. Webb.
ACIAR Proceedings 100(printed version published in 2000)
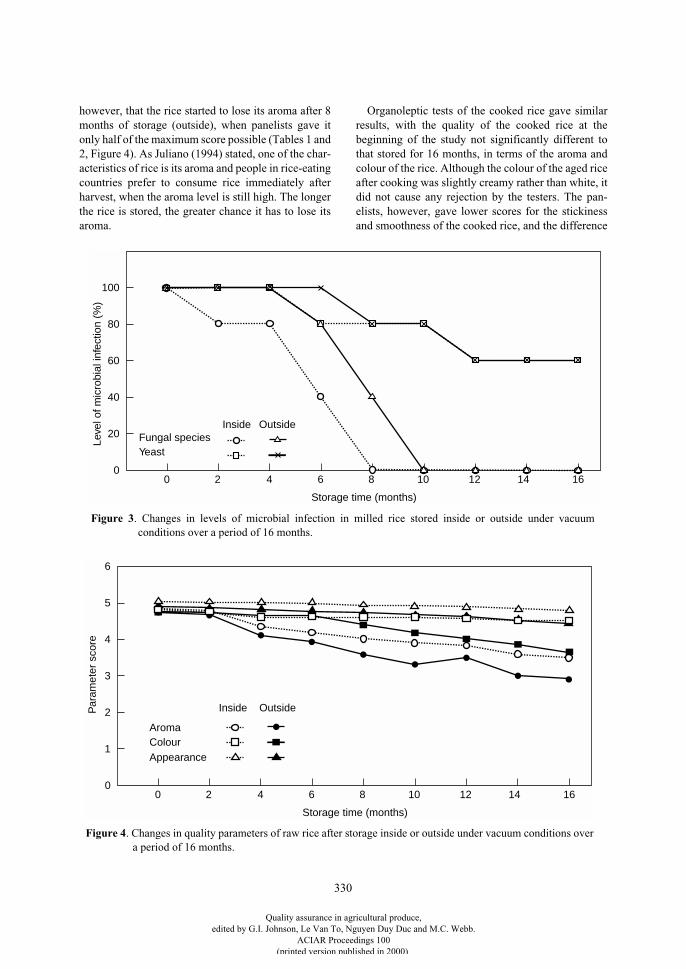
330
however, that the rice started to lose its aroma after 8months of storage (outside), when panelists gave itonly half of the maximum score possible (Tables 1 and2, Figure 4). As Juliano (1994) stated, one of the char-acteristics of rice is its aroma and people in rice-eatingcountries prefer to consume rice immediately afterharvest, when the aroma level is still high. The longerthe rice is stored, the greater chance it has to lose itsaroma.
Organoleptic tests of the cooked rice gave similarresults, with the quality of the cooked rice at thebeginning of the study not significantly different tothat stored for 16 months, in terms of the aroma andcolour of the rice. Although the colour of the aged riceafter cooking was slightly creamy rather than white, itdid not cause any rejection by the testers. The pan-elists, however, gave lower scores for the stickinessand smoothness of the cooked rice, and the difference
0
20
40
Storage time (months)
80
Leve
l of m
icro
bial
infe
ctio
n (%
)
60
0 2 6 10 14 16
100
1284
Yeast Fungal species
Inside Outside
0
1
2
Storage time (months)
4
Par
amet
er s
core
3
0 2 6 10 14 16
5
6
1284
Appearance Colour Aroma
Inside Outside
Figure 3. Changes in levels of microbial infection in milled rice stored inside or outside under vacuumconditions over a period of 16 months.
Figure 4. Changes in quality parameters of raw rice after storage inside or outside under vacuum conditions overa period of 16 months.
Quality assurance in agricultural produce,edited by G.I. Johnson, Le Van To, Nguyen Duy Duc and M.C. Webb.
ACIAR Proceedings 100(printed version published in 2000)
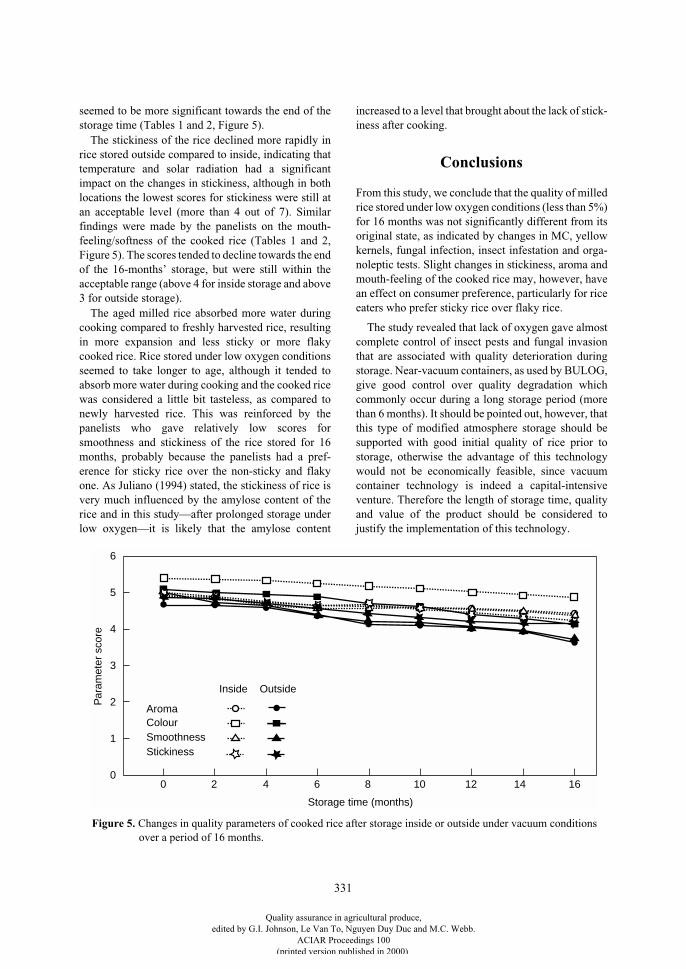
331
seemed to be more significant towards the end of thestorage time (Tables 1 and 2, Figure 5).
The stickiness of the rice declined more rapidly inrice stored outside compared to inside, indicating thattemperature and solar radiation had a significantimpact on the changes in stickiness, although in bothlocations the lowest scores for stickiness were still atan acceptable level (more than 4 out of 7). Similarfindings were made by the panelists on the mouth-feeling/softness of the cooked rice (Tables 1 and 2,Figure 5). The scores tended to decline towards the endof the 16-months’ storage, but were still within theacceptable range (above 4 for inside storage and above3 for outside storage).
The aged milled rice absorbed more water duringcooking compared to freshly harvested rice, resultingin more expansion and less sticky or more flakycooked rice. Rice stored under low oxygen conditionsseemed to take longer to age, although it tended toabsorb more water during cooking and the cooked ricewas considered a little bit tasteless, as compared tonewly harvested rice. This was reinforced by thepanelists who gave relatively low scores forsmoothness and stickiness of the rice stored for 16months, probably because the panelists had a pref-erence for sticky rice over the non-sticky and flakyone. As Juliano (1994) stated, the stickiness of rice isvery much influenced by the amylose content of therice and in this study—after prolonged storage underlow oxygen—it is likely that the amylose content
increased to a level that brought about the lack of stick-iness after cooking.
Conclusions
From this study, we conclude that the quality of milledrice stored under low oxygen conditions (less than 5%)for 16 months was not significantly different from itsoriginal state, as indicated by changes in MC, yellowkernels, fungal infection, insect infestation and orga-noleptic tests. Slight changes in stickiness, aroma andmouth-feeling of the cooked rice may, however, havean effect on consumer preference, particularly for riceeaters who prefer sticky rice over flaky rice.
The study revealed that lack of oxygen gave almostcomplete control of insect pests and fungal invasionthat are associated with quality deterioration duringstorage. Near-vacuum containers, as used by BULOG,give good control over quality degradation whichcommonly occur during a long storage period (morethan 6 months). It should be pointed out, however, thatthis type of modified atmosphere storage should besupported with good initial quality of rice prior tostorage, otherwise the advantage of this technologywould not be economically feasible, since vacuumcontainer technology is indeed a capital-intensiveventure. Therefore the length of storage time, qualityand value of the product should be considered tojustify the implementation of this technology.
Figure 5. Changes in quality parameters of cooked rice after storage inside or outside under vacuum conditionsover a period of 16 months.
0
1
2
Storage time (months)
4
Par
amet
er s
core
3
0 2 6 10 14 16
5
6
1284
Stickiness
Aroma
Smoothness Colour
Inside Outside
Quality assurance in agricultural produce,edited by G.I. Johnson, Le Van To, Nguyen Duy Duc and M.C. Webb.
ACIAR Proceedings 100(printed version published in 2000)
332
References
Annis, P.C. and Dowsett, H.A. 1992. Low oxygendisinfestation of grain: exposure period needed for highmortality. In: Navarro, S. and Donahaye, E. ed.,Proceedings of the international conference on controlledatmosphere and fumigation in grain storages, Winnipeg,Canada, 11–13 June 1992, 70–82.
Bailey, S.W. 1965. Air-tight storage of grains: its effect oninsects
Rhyzoperta dominica
(F) and some otherColeoptera that infest stored grains. Journal of StoredProducts Research, 1, 25.
Banks, H.J., Annis, P.C., Henning, R.C. and Wilson, A.D.1980. Experimental and commercial modifiedatmosphere treatment of stored grains in Australia. In:Shejbal, J. ed., Controlled atmosphere storage of grains,207–224.
Banks, H.J., Annis, P.C. and Rigby, G.R. 1991. Controlledatmosphere storage of grains: the known and the future.In: Fleurat-Lessart, F. and Ducom, P. ed., Proceedings ofthe International Working Conference on Stored ProductsProtection, Bordeaux, September 1990, 695–707.
Caliboso, F.M. and Sabio, G.C. 1999. Hermetic storage ofgrains in the tropics. In: Nawa, Y., Takagi, H., Noguchi,A. and Tsubota, K. ed., Postharvest technology in Asia.Proceedings of the 5
th
JIRCAS (Japan InternationalResearch Centre for Agricultural Sciences) Symposium,Tsukuba, Japan, 9–10 September 1998, 59–72.
Dharmaputra, O.S., Tjitrosomo, H.S.S, Sidik, M. and Halid,H. 1992. The effects of phosphine on storage fungi ofmaize. In: Sidik, M. et al., ed., Proceedings of theSymposium on Pests of Stored Products, SEAMEO-BIOTROP, Bogor, Indonesia, 29–31 January 1991,107–118.
Juliano, B. 1994. Concerns for quality maintenance duringstorage of cereals and cereals products. In: Highley E.,
Wright, E.J., Banks, H.J. and Champ, B.R., ed.,Proceedings of the 6
th
International Working Conferenceon Stored-product Protection, 17–23 April 1994,Canberra, Australia, Volume 1. Wallingford, CABInternational, 17–24.
Navarro, S., Donahaye, E. and Fishman, S. 1994. The futureof hermetic storage of dry grains in tropical andsubtropical climates. In: Highley, E., Wright, E.J., Banks,H.J. and Champ, B.R., ed., Proceedings of the 6
th
International Working Conference on Stored-ProductProtection, Canberra, Australia, 17–23 April 1994.Wallingford, CAB International, 130–138.
NRI (Natural Resources Institute) 1991. Postharvestdiscoloration of cereal grains. In: Report on operationalprogrammes 1989–1991. Chatham Maritime, NRI,256–258.
Phillips, S., Widjaja, S., Wallbridge, A. and Cooke, R. 1988.Rice yellowing during post-harvest drying by aerationand during storage. Journal of Stored Products Research,24, 173–181.
Phillips, S., Mitfa, R. and Wallbridge, A. 1989. Riceyellowing during drying-delays. Journal of StoredProducts Research, 25, 155–164.
Sidik, M. and Cahyana, Y. 1992. Storage pest problems andtheir management in Indonesia. In: Sidik, M. et al., ed.,Proceedings of the Symposium on Pests of StoredProducts, SEAMEO-BIOTROP, Bogor, Indonesia,19–31 January 1991, 75–87.
Trigo-Stockli, D.M. and Pedersen, J.R. 1994. Effect of ricestorage conditions on the quality of milled rice. In:Highley E., Wright, E.J., Banks, H.J. and Champ, B.R.,ed., Proceedings of the 6
th
International WorkingConference on Stored-product Protection, 17–23 April1994, Canberra, Australia, Volume 1. Wallingford, CABInternational, 706–711.
Quality assurance in agricultural produce,edited by G.I. Johnson, Le Van To, Nguyen Duy Duc and M.C. Webb.
ACIAR Proceedings 100(printed version published in 2000)
333
Quality Changes in Farm-stored Sorghum Grain Grown in the Wet or Dry Season in Southern
India—a Technical and Social Study
R.J. Hodges*, A.J. Hall*, K. Jayaraj†, P. Jaiswal§, N. Potdar§
and B. Yogand§
Abstract
In the last 20 years, production and consumption of sorghum in parts of southern India have declined. Tounderstand the factors responsible for this, a survey of postharvest practice was undertaken which included aparticipatory rural appraisal with farmers and sampling to test the quality of grain in their stores. Twelvevillages were chosen which grow sorghum during the monsoon rains (kharif season) or after the rains (rabiseason). The grain samples were taken from stores both before and after the monsoon, analysed for quality, andtested for mycotoxins.
Overall, grain storage problems of farmers in southern India seem not to be a disincentive to sorghumcultivation. Both crops suffered mycotoxin contamination but this was below limits likely to represent a healthhazard. Hybrid sorghum varieties, by virtue either of the season in which they grow or intrinsic characteristics,suffered considerable quality decline in storage, although this is clearly not an issue in the current scenario offarming practice. This does not mean that these traits are not impacting on the wider sorghum economy, butonly that they are not impacting on the components of the sorghum production and utilisation systemexamined. A related project has shown a different picture for storage by wholesale traders and industrial users.So, while the current study has certainly laid to rest many concerns relating to farm storage, components of theutilisation chain where these factors now seem to be more critical remain to be studied in detail. In addition,if farmers in the future wish to retain stocks between seasons, in order to market grain strategically, then currentpractice may be inappropriate since grain quality at the end of the storage season was poor.
S
ORGHUM
production and consumption has eitherstagnated or declined in many areas of southern Indiaover the last 20 years (Hall and Brough 1997;Marsland 1998). In an effort to address agriculturalpolicy needs and future research priorities forsorghum, a study was undertaken of postharvestquality issues to determine whether or not these areinvolved in the apparent decline in production. Twoother projects, not reported here, considered sorghumutilisation and marketing issues.
The extent of storage losses and quality deterio-ration were investigated in sorghum grain fromfarmers’ stores, and a study made of farmers’ percep-tions of these parameters, and of the relativeimportance of these to household food security, usingparticipatory rural appraisal. The study was under-taken in 12 selected villages in the states of Karnataka,Maharashtra and Andhra Pradesh. In addition toassessing the visible grain quality characteristics,further insights into postharvest problems were gainedby an analysis of mould and mycotoxin contamination,since these can have an important bearing on issues ofhuman and animal health. During a rapid ruralappraisal in March 1997, it was established thatfarmers considered most grain deterioration to occurduring the period of the monsoon. In view of this, adecision was made to collect grain samples before therains in June and after the rains in October (Table 1).
* Natural Resources Institute, Chatham Maritime, Kent ME4 4TB, United Kingdom.
† Indian Grain Storage Management and Research Institute, Rajendranagar, Hyderabad 500 030, Andhra Pradesh, India.
§ International Crop Research Institute for the Semi Arid Tropics, Patancheru, Andhra Pradesh, India.
Quality assurance in agricultural produce,edited by G.I. Johnson, Le Van To, Nguyen Duy Duc and M.C. Webb.
ACIAR Proceedings 100(printed version published in 2000)
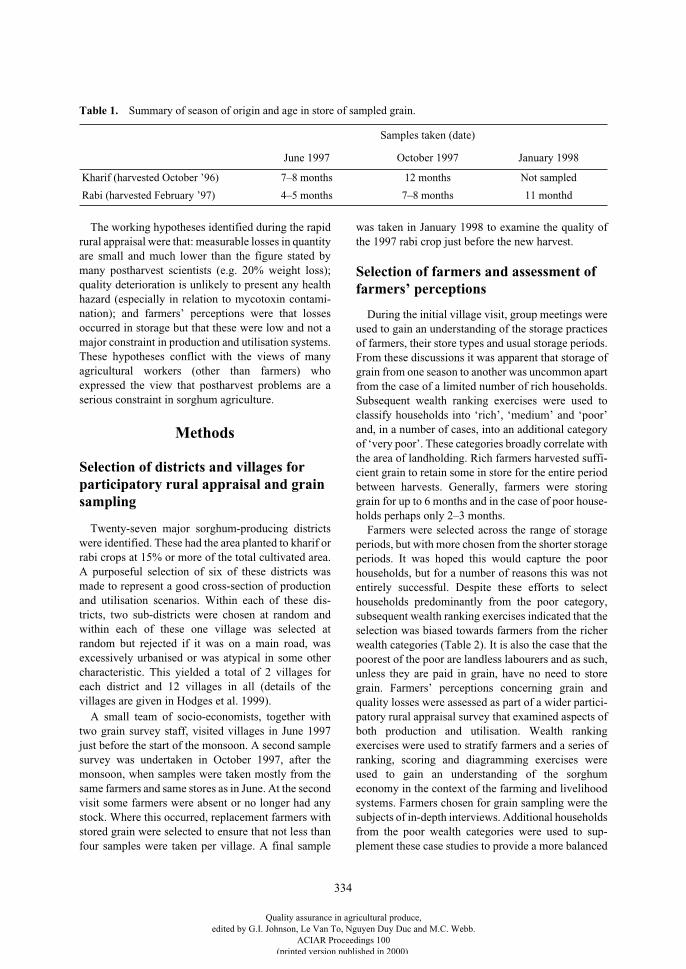
334
The working hypotheses identified during the rapidrural appraisal were that: measurable losses in quantityare small and much lower than the figure stated bymany postharvest scientists (e.g. 20% weight loss);quality deterioration is unlikely to present any healthhazard (especially in relation to mycotoxin contami-nation); and farmers’ perceptions were that lossesoccurred in storage but that these were low and not amajor constraint in production and utilisation systems.These hypotheses conflict with the views of manyagricultural workers (other than farmers) whoexpressed the view that postharvest problems are aserious constraint in sorghum agriculture.
Methods
Selection of districts and villages for participatory rural appraisal and grain sampling
Twenty-seven major sorghum-producing districtswere identified. These had the area planted to kharif orrabi crops at 15% or more of the total cultivated area.A purposeful selection of six of these districts wasmade to represent a good cross-section of productionand utilisation scenarios. Within each of these dis-tricts, two sub-districts were chosen at random andwithin each of these one village was selected atrandom but rejected if it was on a main road, wasexcessively urbanised or was atypical in some othercharacteristic. This yielded a total of 2 villages foreach district and 12 villages in all (details of thevillages are given in Hodges et al. 1999).
A small team of socio-economists, together withtwo grain survey staff, visited villages in June 1997just before the start of the monsoon. A second samplesurvey was undertaken in October 1997, after themonsoon, when samples were taken mostly from thesame farmers and same stores as in June. At the secondvisit some farmers were absent or no longer had anystock. Where this occurred, replacement farmers withstored grain were selected to ensure that not less thanfour samples were taken per village. A final sample
was taken in January 1998 to examine the quality ofthe 1997 rabi crop just before the new harvest.
Selection of farmers and assessment of farmers’ perceptions
During the initial village visit, group meetings wereused to gain an understanding of the storage practicesof farmers, their store types and usual storage periods.From these discussions it was apparent that storage ofgrain from one season to another was uncommon apartfrom the case of a limited number of rich households.Subsequent wealth ranking exercises were used toclassify households into ‘rich’, ‘medium’ and ‘poor’and, in a number of cases, into an additional categoryof ‘very poor’. These categories broadly correlate withthe area of landholding. Rich farmers harvested suffi-cient grain to retain some in store for the entire periodbetween harvests. Generally, farmers were storinggrain for up to 6 months and in the case of poor house-holds perhaps only 2–3 months.
Farmers were selected across the range of storageperiods, but with more chosen from the shorter storageperiods. It was hoped this would capture the poorhouseholds, but for a number of reasons this was notentirely successful. Despite these efforts to selecthouseholds predominantly from the poor category,subsequent wealth ranking exercises indicated that theselection was biased towards farmers from the richerwealth categories (Table 2). It is also the case that thepoorest of the poor are landless labourers and as such,unless they are paid in grain, have no need to storegrain. Farmers’ perceptions concerning grain andquality losses were assessed as part of a wider partici-patory rural appraisal survey that examined aspects ofboth production and utilisation. Wealth rankingexercises were used to stratify farmers and a series ofranking, scoring and diagramming exercises wereused to gain an understanding of the sorghumeconomy in the context of the farming and livelihoodsystems. Farmers chosen for grain sampling were thesubjects of in-depth interviews. Additional householdsfrom the poor wealth categories were used to sup-plement these case studies to provide a more balanced
Table 1.
Summary of season of origin and age in store of sampled grain.
Samples taken (date)
June 1997 October 1997 January 1998
Kharif (harvested October ’96) 7–8 months 12 months Not sampled
Rabi (harvested February ’97) 4–5 months 7–8 months 11 monthd
Quality assurance in agricultural produce,edited by G.I. Johnson, Le Van To, Nguyen Duy Duc and M.C. Webb.
ACIAR Proceedings 100(printed version published in 2000)
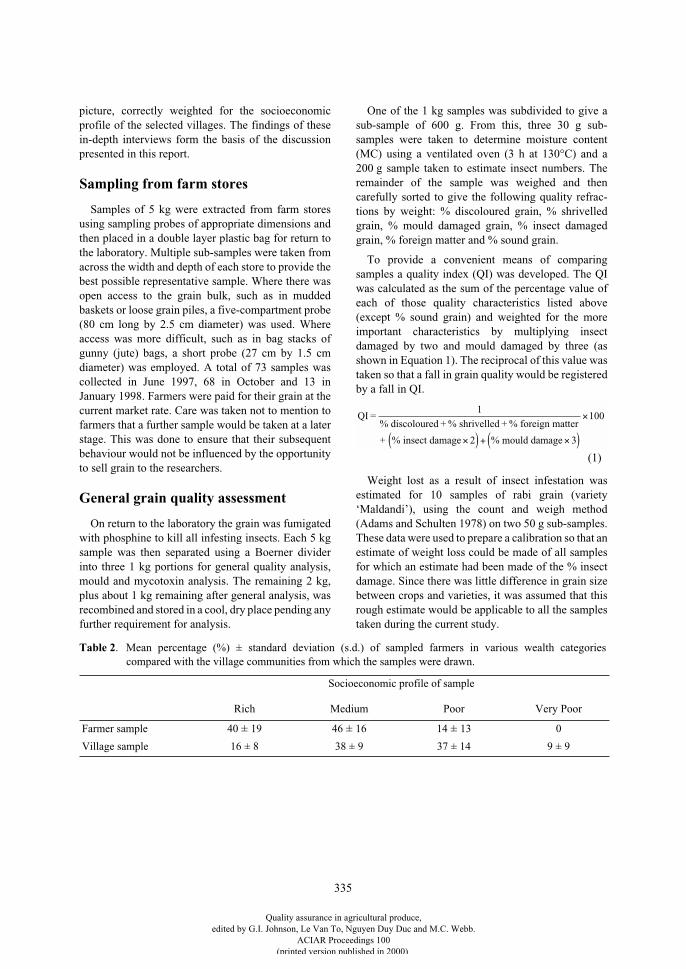
335
picture, correctly weighted for the socioeconomicprofile of the selected villages. The findings of thesein-depth interviews form the basis of the discussionpresented in this report.
Sampling from farm stores
Samples of 5 kg were extracted from farm storesusing sampling probes of appropriate dimensions andthen placed in a double layer plastic bag for return tothe laboratory. Multiple sub-samples were taken fromacross the width and depth of each store to provide thebest possible representative sample. Where there wasopen access to the grain bulk, such as in muddedbaskets or loose grain piles, a five-compartment probe(80 cm long by 2.5 cm diameter) was used. Whereaccess was more difficult, such as in bag stacks ofgunny (jute) bags, a short probe (27 cm by 1.5 cmdiameter) was employed. A total of 73 samples wascollected in June 1997, 68 in October and 13 inJanuary 1998. Farmers were paid for their grain at thecurrent market rate. Care was taken not to mention tofarmers that a further sample would be taken at a laterstage. This was done to ensure that their subsequentbehaviour would not be influenced by the opportunityto sell grain to the researchers.
General grain quality assessment
On return to the laboratory the grain was fumigatedwith phosphine to kill all infesting insects. Each 5 kgsample was then separated using a Boerner dividerinto three 1 kg portions for general quality analysis,mould and mycotoxin analysis. The remaining 2 kg,plus about 1 kg remaining after general analysis, wasrecombined and stored in a cool, dry place pending anyfurther requirement for analysis.
One of the 1 kg samples was subdivided to give asub-sample of 600 g. From this, three 30 g sub-samples were taken to determine moisture content(MC) using a ventilated oven (3 h at 130°C) and a200 g sample taken to estimate insect numbers. Theremainder of the sample was weighed and thencarefully sorted to give the following quality refrac-tions by weight: % discoloured grain, % shrivelledgrain, % mould damaged grain, % insect damagedgrain, % foreign matter and % sound grain.
To provide a convenient means of comparingsamples a quality index (QI) was developed. The QIwas calculated as the sum of the percentage value ofeach of those quality characteristics listed above(except % sound grain) and weighted for the moreimportant characteristics by multiplying insectdamaged by two and mould damaged by three (asshown in Equation 1). The reciprocal of this value wastaken so that a fall in grain quality would be registeredby a fall in QI.
Weight lost as a result of insect infestation wasestimated for 10 samples of rabi grain (variety‘Maldandi’), using the count and weigh method(Adams and Schulten 1978) on two 50 g sub-samples.These data were used to prepare a calibration so that anestimate of weight loss could be made of all samplesfor which an estimate had been made of the % insectdamage. Since there was little difference in grain sizebetween crops and varieties, it was assumed that thisrough estimate would be applicable to all the samplestaken during the current study.
QI =1
% discoloured + % shrivelled + % foreign matter
+ % insect damage 2 % mould damage 3×( ) + ×( )
×100
(1)
Table 2
. Mean percentage (%) ± standard deviation (s.d.) of sampled farmers in various wealth categoriescompared with the village communities from which the samples were drawn.
Socioeconomic profile of sample
Rich Medium Poor Very Poor
Farmer sample 40
±
19 46
±
16 14
±
13 0
Village sample 16 ± 8 38 ± 9 37 ± 14 9 ± 9
Quality assurance in agricultural produce,edited by G.I. Johnson, Le Van To, Nguyen Duy Duc and M.C. Webb.
ACIAR Proceedings 100(printed version published in 2000)
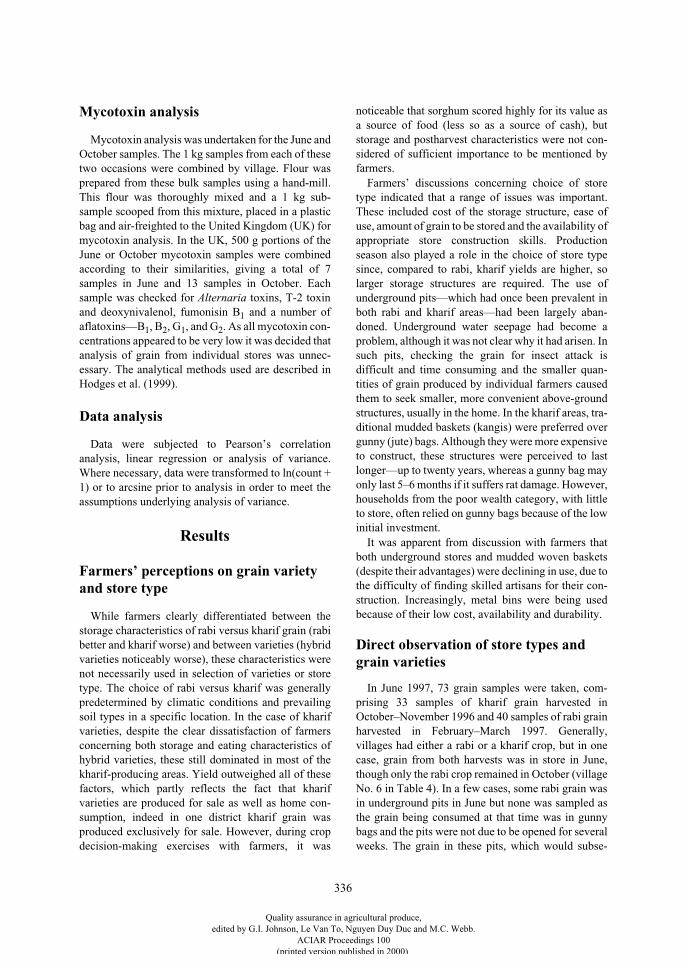
336
Mycotoxin analysis
Mycotoxin analysis was undertaken for the June andOctober samples. The 1 kg samples from each of thesetwo occasions were combined by village. Flour wasprepared from these bulk samples using a hand-mill.This flour was thoroughly mixed and a 1 kg sub-sample scooped from this mixture, placed in a plasticbag and air-freighted to the United Kingdom (UK) formycotoxin analysis. In the UK, 500 g portions of theJune or October mycotoxin samples were combinedaccording to their similarities, giving a total of 7samples in June and 13 samples in October. Eachsample was checked for
Alternaria
toxins, T-2 toxinand deoxynivalenol, fumonisin B
1
and a number ofaflatoxins—B
1
, B
2
, G
1
, and G
2
. As all mycotoxin con-centrations appeared to be very low it was decided thatanalysis of grain from individual stores was unnec-essary. The analytical methods used are described inHodges et al. (1999).
Data analysis
Data were subjected to Pearson’s correlationanalysis, linear regression or analysis of variance.Where necessary, data were transformed to ln(count +1) or to arcsine prior to analysis in order to meet theassumptions underlying analysis of variance.
Results
Farmers’ perceptions on grain variety and store type
While farmers clearly differentiated between thestorage characteristics of rabi versus kharif grain (rabibetter and kharif worse) and between varieties (hybridvarieties noticeably worse), these characteristics werenot necessarily used in selection of varieties or storetype. The choice of rabi versus kharif was generallypredetermined by climatic conditions and prevailingsoil types in a specific location. In the case of kharifvarieties, despite the clear dissatisfaction of farmersconcerning both storage and eating characteristics ofhybrid varieties, these still dominated in most of thekharif-producing areas. Yield outweighed all of thesefactors, which partly reflects the fact that kharifvarieties are produced for sale as well as home con-sumption, indeed in one district kharif grain wasproduced exclusively for sale. However, during cropdecision-making exercises with farmers, it was
noticeable that sorghum scored highly for its value asa source of food (less so as a source of cash), butstorage and postharvest characteristics were not con-sidered of sufficient importance to be mentioned byfarmers.
Farmers’ discussions concerning choice of storetype indicated that a range of issues was important.These included cost of the storage structure, ease ofuse, amount of grain to be stored and the availability ofappropriate store construction skills. Productionseason also played a role in the choice of store typesince, compared to rabi, kharif yields are higher, solarger storage structures are required. The use ofunderground pits—which had once been prevalent inboth rabi and kharif areas—had been largely aban-doned. Underground water seepage had become aproblem, although it was not clear why it had arisen. Insuch pits, checking the grain for insect attack isdifficult and time consuming and the smaller quan-tities of grain produced by individual farmers causedthem to seek smaller, more convenient above-groundstructures, usually in the home. In the kharif areas, tra-ditional mudded baskets (kangis) were preferred overgunny (jute) bags. Although they were more expensiveto construct, these structures were perceived to lastlonger—up to twenty years, whereas a gunny bag mayonly last 5–6 months if it suffers rat damage. However,households from the poor wealth category, with littleto store, often relied on gunny bags because of the lowinitial investment.
It was apparent from discussion with farmers thatboth underground stores and mudded woven baskets(despite their advantages) were declining in use, due tothe difficulty of finding skilled artisans for their con-struction. Increasingly, metal bins were being usedbecause of their low cost, availability and durability.
Direct observation of store types and grain varieties
In June 1997, 73 grain samples were taken, com-prising 33 samples of kharif grain harvested inOctober–November 1996 and 40 samples of rabi grainharvested in February–March 1997. Generally,villages had either a rabi or a kharif crop, but in onecase, grain from both harvests was in store in June,though only the rabi crop remained in October (villageNo. 6 in Table 4). In a few cases, some rabi grain wasin underground pits in June but none was sampled asthe grain being consumed at that time was in gunnybags and the pits were not due to be opened for severalweeks. The grain in these pits, which would subse-
Quality assurance in agricultural produce,edited by G.I. Johnson, Le Van To, Nguyen Duy Duc and M.C. Webb.
ACIAR Proceedings 100(printed version published in 2000)
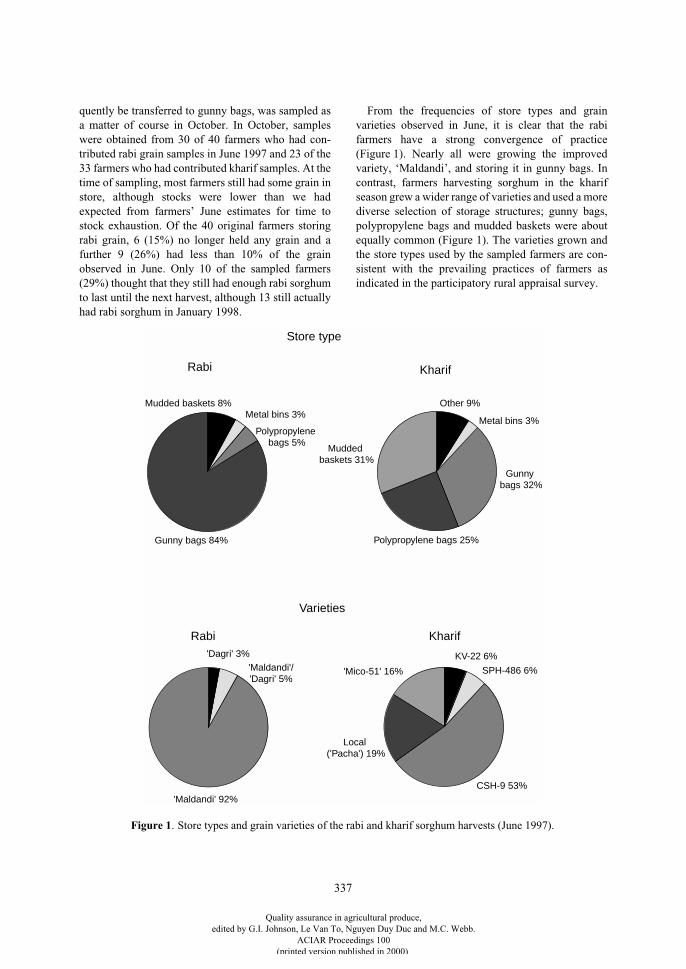
337
quently be transferred to gunny bags, was sampled asa matter of course in October. In October, sampleswere obtained from 30 of 40 farmers who had con-tributed rabi grain samples in June 1997 and 23 of the33 farmers who had contributed kharif samples. At thetime of sampling, most farmers still had some grain instore, although stocks were lower than we hadexpected from farmers’ June estimates for time tostock exhaustion. Of the 40 original farmers storingrabi grain, 6 (15%) no longer held any grain and afurther 9 (26%) had less than 10% of the grainobserved in June. Only 10 of the sampled farmers(29%) thought that they still had enough rabi sorghumto last until the next harvest, although 13 still actuallyhad rabi sorghum in January 1998.
From the frequencies of store types and grainvarieties observed in June, it is clear that the rabifarmers have a strong convergence of practice(Figure 1). Nearly all were growing the improvedvariety, ‘Maldandi’, and storing it in gunny bags. Incontrast, farmers harvesting sorghum in the kharifseason grew a wider range of varieties and used a morediverse selection of storage structures; gunny bags,polypropylene bags and mudded baskets were aboutequally common (Figure 1). The varieties grown andthe store types used by the sampled farmers are con-sistent with the prevailing practices of farmers asindicated in the participatory rural appraisal survey.
Rabi
Rabi Kharif
Kharif
Gunny bags 32%
Mudded baskets 31%
Polypropylene bags 25%
Metal bins 3%
Other 9%Mudded baskets 8%Metal bins 3%
Gunny bags 84%
Polypropylene bags 5%
'Dagri' 3%'Maldandi'/'Dagri' 5%
'Maldandi' 92%
KV-22 6%
SPH-486 6%
CSH-9 53%
Local ('Pacha') 19%
'Mico-51' 16%
Store type
Varieties
Figure 1. Store types and grain varieties of the rabi and kharif sorghum harvests (June 1997).
Quality assurance in agricultural produce,edited by G.I. Johnson, Le Van To, Nguyen Duy Duc and M.C. Webb.
ACIAR Proceedings 100(printed version published in 2000)
338
Postharvest handling practices
Farmers indicated that the postharvest handlingpractices for rabi and kharif grain are similar. Afterthreshing and drying, at the home or other convenientplace, the grain is placed in the chosen storage con-tainer. Neem leaves and ash may be admixed andGammexane (benzene hexachloride or lindane)powder sprinkled on store surfaces, particularly ongunny bags. Insect infestation is noticed after 4–5months in kharif grain and 6–7 months in rabi grain.Frequent sun-drying and cleaning by picking andwinnowing (every 2–3 months) is used to controlinsect infestation. Farmers said that, by using thismethod, rabi sorghum could be stored safely for up toone year after harvest.
Women were responsible for the management ofhousehold grain stores in all the case-study villages.The usual period of storage is determined mainly byfarmers’ wealth category and by whether the grain isof the kharif or rabi harvest. Discussions with farmerssuggest that only those from the rich wealth categorywere able to store from one harvest to the next. House-holds from the medium and particularly the poorwealth category often had insufficient land resources(both quantity and soil types) to produce enough grainfor household consumption throughout the year. Theusual storage period was 2–6 months depending on theland available for individual farmers. It was apparentthat for most of the poorer households the length ofgrain storage was such that insect infestation andmould damage was rarely a problem (grain blackeningbeing the exception as discussed below).
Grain quality analysis
The June rabi sample, which had been stored for 3–4 months, had a significantly higher QI than the kharifgrain which by June had been in store 8–9 months(Table 3) (
F
(1,72)
= 101.2,
p
< 0.0001). The differenceseemed to be due to the kharif crop having signifi-cantly more mouldy grains (
F
(1,72)
= 8.6,
p
< 0.0001),as no insect damage was apparent as at this time.
The grain samples from both harvests were equallydry, the highest MC was only 10.7% and the average8.9%, and there was no evidence of any significant dif-ference between the moisture values for the two crops.Thus with neither harvest was there any obvious cor-
relation between MC and mould damage at the time ofsampling. It therefore seems likely that the conditionspromoting mould growth on the kharif grain occurredpreharvest and/or early in the storage season. Farmers’responses lead us to believe that this damage was the‘grain blackening’ that occurs on kharif sorghum,especially hybrids, dampened by unseasonal rain inthe field. The degree of blackening varies from year toyear and occurs to a significant extent at least once inevery three years, depending on the amount of rainfall.Despite the blackening, much of this grain is used forhome consumption; farmers from the medium andpoor wealth categories indicated that they have littlechoice but to eat it. For this purpose it is washed andsun-dried. Despite this, farmers did suggest that theblackened grain is associated with health problems.Blackened grain has a low market price and the worstaffected is used for animal feed (both on farm and bythose purchasing it in the market).
Grain sampled in October had been stored throughthe monsoon period and, as expected, this had resultedin a rise in grain MC. Both crops exceeded 11%(Table 3) and the small difference between them, only0.3%, was significant (
F
(1,62)
= 4.48,
p
< 0.038). Thissuggests that the kharif crops were grown in areaswhere the monsoon is more prolonged. The differencein QI between crops was large and statistically signif-icant (
F
(1,65)
= 85.7,
p
< 0.0001). For both crops therewas a large October fall in QI, both because insectdamage was apparent for the first time (Table 3) andbecause there was an increase in % mouldy grain. Forthe crops combined, there was a strong significant cor-relation between the incidence of mould damage andinsect damage (
r
= 0.539,
p
< 0.01), suggesting thateither mould attack facilitates insect attack or the samefactor(s) may predispose the grain to both types ofdamage. The overall differences between the twocrops are reflected in the average values for moulddamage and insect damage observed in the villages(Table 4). There was no evidence of significant differ-ences between store types in the incidence of mould,insect damage or for values of the QI (Table 5);however, the small numbers of observations on mostof the store types precludes any firm conclusions onthis matter.
Quality assurance in agricultural produce,edited by G.I. Johnson, Le Van To, Nguyen Duy Duc and M.C. Webb.
ACIAR Proceedings 100(printed version published in 2000)
339
Table 5. Store type averages for the incidence (%) (± standard deviation) of insect and mould damage to grain inthe rabi and kharif harvests sampled in October 1997.
Crop Store No. in sample Insect damage (%) Mould damage (%) Quality index
Rabi Gunny bag 34 2.9 ± 2.4 1.45 ± 2.3 10.5 ± 6.7
Metal bin 1 2.0 0.9 7.1
Kharif Gunny bag 8 6.9 ± 3.8 16.0 ± 12.6 1.6 ± 0.7
Metal bin 1 6.6 17.4 1.4
Polypropylene bag 5 4.7 ± 3.5 7.7 ± 5.6 2.6 ± 1.0
Mudded basket 9 9.7 ± 6.0 17.8 ± 10.3 1.4 ± 0.6
Box storea 1 33.7 20.8 0.7
Corner of house 2 9.6 ± 11.8 12.4 ± 1.9 0.7 ± 1.1a Brickwork box built in house
Table 4. Village averages for the incidence (%) (± standard deviation) of insect and mould damage to grain in therabi and kharif harvests sampled in October 1997.
Villageno.
Rabi Villageno.
Kharif
Insect damage(%)
Mould damage(%)
Quality index Insect damage(%)
Mould damage(%)
Quality index
1 4.0 ± 2.7 0.3 ± 0.3 10.9 ± 5.1 6 Kharif crop all consumed
2 4.2 ± 4.3 1.4 ± 1.0 16.0 ± 7.7 7 11.9 ± 12.6 22.3 ± 16.8 2.3 ± 1.0
3 2.0 ± 1.0 0.6 ± 0.5 9.9 ± 2.8 8 4.5 ± 2.8 13.2 ± 3.8 3.5 ± 2.3
4 3.0 ± 2.5 1.7 ± 0.9 15.3 ± 2.0 9 11.5 ± 5.1 14.6 ± 8.9 3.36 ±1.7
5 2.8 ± 1.1 5.0 ± 4.7 24.9 ± 14.5 10 8.4 ± 3.4 15.4 ± 3.1 5.3 ± 5.7
6 3.2 ± 2.3 0.7 ± 0.6 12.2 ± 7.4 11 7.6 ± 5.6 8.2 ± 5.7 3.7 ± 1.5
12 5.4 ± 5.8 0.6 ± 0.4 6.9 ± 4.9
Table 3.
Mean quality parameters for the 1996 kharif and 1997 rabi harvests of sorghum grain for samples taken inJune and October 1997.
Moisture content
Discoloured grain
Mould damage
Insect damage
Foreign matter
Shrivelled grains
Soundgrain
Quality index
Percentage
June
Kharif 8.90 1.74 9.61 0.00 4.64 2.13 80.75 2.67
Rabi 8.93 1.08 1.10 0.00 1.88 0.78 95.15 14.20
October
Kharif 11.49 8.25 15.11 8.62 1.60 0.65 62.98 1.36
Rabi 11.16 1.83 1.44 2.86 1.22 0.51 92.30 7.30
Quality assurance in agricultural produce,edited by G.I. Johnson, Le Van To, Nguyen Duy Duc and M.C. Webb.
ACIAR Proceedings 100(printed version published in 2000)
340
Table 7.
Mean values for quality factors of rabi season grain from the same 13 stores sampled on 3 occasionsduring a storage period of about 11 months.
Quality factor June 1997 October 1997 January 1998
% discoloured 1.0 1.9 2.8
% mouldy 0.9 1.1 1.7
% insect damage 0 3.1 4.9
% foreign matter 1.5 1.4 2.7
% shrivelled 0.8 0.6 0.8
Quality index 26.6 9.6 5.7
Insect infestation and associated grain weight loss
The primary pests
Rhyzopertha dominica
(Fabr-icius) and Sitophilus oryzae (L.) were the mostnumerous insects and the most likely to causedamage and weight loss in the rabi and kharif grainsamples taken in October 1997 (Table 6). The per-centages of rabi and kharif samples infested byR. dominica
were very similar (about 84%) but thenumbers of this species were about three timesgreater on kharif grain. In contrast,
S. oryzae
clearlypreferred rabi grain, since about 20% more rabisamples were infested and numbers of this specieswere about six times greater than on kharif grain. Thesecondary pest
Cryptolestes ferrugineus
(Stephens)was considerably more numerous on kharif sampleswhile the two harvests were similar in the extent ofinfestation by
Tribolium castaneum
(Herbst)(Table 6). Sorghum grain weight losses due to insectdamage were determined for 10 samples of‘Maldandi’ grain taken in October 1997. Theregression of these weight losses with their corre-sponding percentages of insect damaged grain was
statistically significant (
r
2
= 0.79,
df
= 8,
p
< 0.001).The regression equation from this relationship wasused to estimate what the likely weight losses werefor other grain samples for which only estimates of %grain damage had been made. The mean values ofthese estimates were weight losses of 0.88 ± 0.30%for the rabi crop and 1.71 ± 1.17% for the kharif.
Quality decline in rabi sorghum through to January 1998
Only 13 of the rabi stocks first sampled in June 1997were still available for sampling in January 1998. Thequality assessment of these samples showed evidenceof continued quality decline (Table 7). In the 3 monthsbetween June and October 1997, through themonsoon, the QI fell by about 63% and in thefollowing 3 months to January 1998 it fell again by15% of its June value. Although the major reduction inquality occurred during the period of the monsoon,thereafter there were increases in mould and insectdamage and a noticeable increase in the proportion ofdiscoloured grain (Table 7).
Table 6. Percentage of rabi and kharif sorghum samples infested by insects and mean numbers of live and deadinsects/kg (± standard deviation), from samples taken in October 1997.
Harvest Rhyzopertha dominica Sitophilus oryzae Tribolium castaneum Cryptolestes ferrugineus
Rabi % samples infested
83 70 36 3
Mean no./kg
135 ± 245 170 ± 300 10 ± 20 0.5 ± 40
Kharif % samples infested
84 50 31 13
Mean no./kg
365 ± 470 30 ± 45 15 ± 25 30 ± 85
Quality assurance in agricultural produce,edited by G.I. Johnson, Le Van To, Nguyen Duy Duc and M.C. Webb.
ACIAR Proceedings 100(printed version published in 2000)
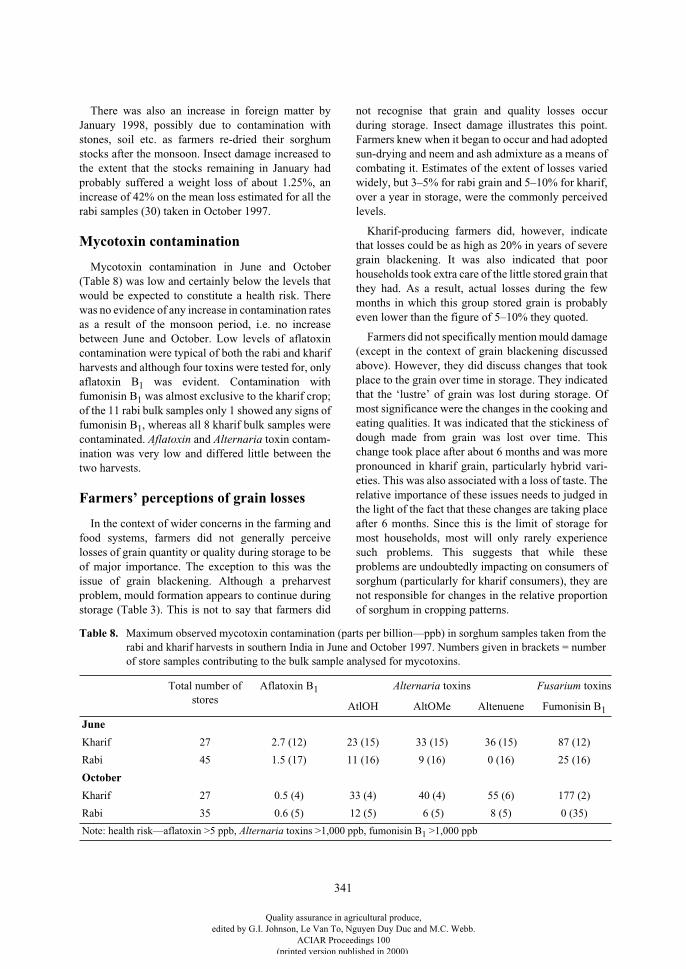
341
There was also an increase in foreign matter byJanuary 1998, possibly due to contamination withstones, soil etc. as farmers re-dried their sorghumstocks after the monsoon. Insect damage increased tothe extent that the stocks remaining in January hadprobably suffered a weight loss of about 1.25%, anincrease of 42% on the mean loss estimated for all therabi samples (30) taken in October 1997.
Mycotoxin contamination
Mycotoxin contamination in June and October(Table 8) was low and certainly below the levels thatwould be expected to constitute a health risk. Therewas no evidence of any increase in contamination ratesas a result of the monsoon period, i.e. no increasebetween June and October. Low levels of aflatoxincontamination were typical of both the rabi and kharifharvests and although four toxins were tested for, onlyaflatoxin B
1
was evident. Contamination withfumonisin B
1
was almost exclusive to the kharif crop;of the 11 rabi bulk samples only 1 showed any signs offumonisin B
1
, whereas all 8 kharif bulk samples werecontaminated.
Aflatoxin
and
Alternaria
toxin contam-ination was very low and differed little between thetwo harvests.
Farmers’ perceptions of grain losses
In the context of wider concerns in the farming andfood systems, farmers did not generally perceivelosses of grain quantity or quality during storage to beof major importance. The exception to this was theissue of grain blackening. Although a preharvestproblem, mould formation appears to continue duringstorage (Table 3). This is not to say that farmers did
not recognise that grain and quality losses occurduring storage. Insect damage illustrates this point.Farmers knew when it began to occur and had adoptedsun-drying and neem and ash admixture as a means ofcombating it. Estimates of the extent of losses variedwidely, but 3–5% for rabi grain and 5–10% for kharif,over a year in storage, were the commonly perceivedlevels.
Kharif-producing farmers did, however, indicatethat losses could be as high as 20% in years of severegrain blackening. It was also indicated that poorhouseholds took extra care of the little stored grain thatthey had. As a result, actual losses during the fewmonths in which this group stored grain is probablyeven lower than the figure of 5–10% they quoted.
Farmers did not specifically mention mould damage(except in the context of grain blackening discussedabove). However, they did discuss changes that tookplace to the grain over time in storage. They indicatedthat the ‘lustre’ of grain was lost during storage. Ofmost significance were the changes in the cooking andeating qualities. It was indicated that the stickiness ofdough made from grain was lost over time. Thischange took place after about 6 months and was morepronounced in kharif grain, particularly hybrid vari-eties. This was also associated with a loss of taste. Therelative importance of these issues needs to judged inthe light of the fact that these changes are taking placeafter 6 months. Since this is the limit of storage formost households, most will only rarely experiencesuch problems. This suggests that while theseproblems are undoubtedly impacting on consumers ofsorghum (particularly for kharif consumers), they arenot responsible for changes in the relative proportionof sorghum in cropping patterns.
Table 8.
Maximum observed mycotoxin contamination (parts per billion—ppb) in sorghum samples taken from therabi and kharif harvests in southern India in June and October 1997. Numbers given in brackets = numberof store samples contributing to the bulk sample analysed for mycotoxins.
Total number of stores
Aflatoxin B
1
Alternaria
toxins
Fusarium
toxins
AtlOH AltOMe Altenuene Fumonisin B
1
June
Kharif 27 2.7 (12) 23 (15) 33 (15) 36 (15) 87 (12)
Rabi 45 1.5 (17) 11 (16) 9 (16) 0 (16) 25 (16)
October
Kharif 27 0.5 (4) 33 (4) 40 (4) 55 (6) 177 (2)
Rabi 35 0.6 (5) 12 (5) 6 (5) 8 (5) 0 (35)
Note: health risk—aflatoxin >5 ppb, Alternaria toxins >1,000 ppb, fumonisin B
1
>1,000 ppb
Quality assurance in agricultural produce,edited by G.I. Johnson, Le Van To, Nguyen Duy Duc and M.C. Webb.
ACIAR Proceedings 100(printed version published in 2000)
342
Conclusions
It is clear that rabi sorghum enters storage with betterquality characteristics than its kharif counterpart,which may suffer some moulding prior to storage. Themonsoon period is associated with a major decline inquality for both crops, in particular a rise in moulddamage and the start of insect attack. Both thesefactors were somewhat greater for kharif sorghum,presumably due to the rather lower quality of kharifgrain at the onset of the monsoon. However, an intrin-sically greater susceptibility of kharif varieties tomould and insect attack cannot be ruled out. Bothgrain types are of rather poor quality by the end of thestorage season, whether it be October in the case of thekharif crop or January in the case of the rabi.
Although farmers of kharif sorghum appeared to usea wider range of storage methods, this appeared not tobe a factor affecting the grain quality, since QI valuesfor kharif grain in gunny bags, the storage technique ofmost rabi farmers, differed little from the grain storedby other methods. It appears that choice of storagemethod is dependent on a wider set of factors thanstorage efficiency alone. Differences between rabi andkharif can be explained to some extent by the amountof grain to be stored, particularly the larger kharif crop.Ease of use, availability of appropriate artisanal skillsand costs are among the issues mentioned by farmers.Regional preferences also undoubtedly play a role.
In the period under study, grain weight losses due toinsect attack were relatively low and in October, at theend of the kharif storage season, amounted to anaverage of only 1.7%, while at the same time the rabicrop appeared to have lost only 0.9%. The losses in thekharif crop due to insect damage were low consideringthat the estimate was made on grain that was close tothe end of the storage period. It might be consideredthat the technique used to estimate the grain weightloss, the count and weigh method, could have resultedin an underestimate of loss. This tends to happen ifgrains are removed completely from the store, e.g.when they are reduced to dust, as may be the case withsome of the kharif or rabi grain. However, applying theend-of-season loss figure to the whole stock is likely togive an overestimate of loss since much of the grain issold or consumed long before the monsoon, i.e. beforethe time when insect attack becomes prevalent. Thusthe weight losses of the entire stock were probablysomewhat smaller than our estimate.
The two crops differed with respect to the predom-inant insect pests, with
R. dominica
and
S. oryzae
equally common on rabi but
R. dominica
predominanton the kharif. Although the two species differ in their
abilities to tolerate dry conditions (Haines 1991), with
S. oryzae
being seriously limited on grain with MCbelow 11%, it seems that this is not a major consider-ation in this case as
S. oryzae
was more common on thedrier crop. The predominance of
R. dominica
on thekharif crop is presumably a reflection of the suscepti-bility of the different grain varieties to the two species.In connection with this, it is interesting to note thatReddy and Nusrath (1988), studying insect infestationand mycotoxin production in kharif sorghum varieties,list
R. dominica
as a major pest of this grain and makeno mention of any
Sitophilus
spp. Furthermore,Kishore et al. (1977) noted that in high-yielding kharifvarieties the percentage damage caused by
R. dominica
was many times greater than that causedby
S. oryzae
. Mycotoxin contamination generally remained
below levels that would represent a human healthhazard. Similar low contamination rates were reportedfrom earlier surveys in southern India (Bhat andRukmini 1978; Sashidhar et al. 1992). In the currentstudy, there was no notable increase in prevalence ofmycotoxins after the monsoon season even thoughmould attack rose significantly during this period.Fumonisin B
1
was almost exclusively restricted to thekharif crop where it was found in all samples, evenprior to the monsoon. It seems likely that thismycotoxin is associated with preharvest moulddamage. The picture given here, of relatively slightmycotoxin contamination, should not be taken toimply that there are no potential problems with myco-toxicosis, as other researchers have reportedsignificant aflatoxin (Mall et al. 1986),
Alternaria
toxin (Anasari and Shrivastava 1990) and fumonisin(Bhat et al. 1997) contamination in kharif crops inIndia. In the case of fumonisin, a disease outbreak wasreported in a few villages on the Deccan Plain inhouseholds where rain-damaged mouldy grain wasbeing consumed (Bhat et al. 1997). In the storagesystem we investigated, mycotoxin contaminationrates may sometimes be higher in those years whereweather conditions are less favourable or otherwisedue to poor storage by individual farmers. Preharvestgrain blackening, therefore, remains an issue ofconcern both for reasons of health and for themarketing of kharif grain. Research on ‘hard’ varietiesof sorghum with a high degree of resistance to fungalattack, particularly to
Fusarium moniliforme
, showthat specific anti-fungal proteins are involved (Kumariand Chandrashekar 1994). The possibility of trans-ferring this characteristic to sorghum varieties, thatotherwise already have good agronomic character-istics, presents one possible approach to the problem
Quality assurance in agricultural produce,edited by G.I. Johnson, Le Van To, Nguyen Duy Duc and M.C. Webb.
ACIAR Proceedings 100(printed version published in 2000)
343
of grain blackening. This may be particularly suc-cessful when transferred to varieties whosemorphology does not favour mould growth, e.g. thosewith panicles that hang downwards which are lessprone to moisture accumulation.
Overall, the grain storage practices of farmers insouthern India do not appear to be a constraint to theproduction and consumption of sorghum. Mycotoxincontamination and grain losses due to insect attackappear to remain low, although towards the end oftheir respective storage seasons the kharif and rabicrops have suffered a considerable decline in quality.This appears not to be a significant problem as thisdecline was limited to only a small portion of theremaining stock. However, if farmers wish to retainstocks between seasons, to market grain strategically,then their current practices are likely to be inappro-priate. By all accounts the major issue facing sorghumgrain would appear to be the preharvest mould damagesustained by kharif varieties.
Farmers’ perceptions of the nature and extent ofgrain weight and quality losses are entirely consistentwith the findings of the technical study. Farmers arecertainly aware that quantitative and qualitativechanges take place. They have developed practices tokeep these changes within acceptable limits and whatchanges do occur apparently do not influence farmers’choice of crop or variety. This reflects to a certainextent the fact that, for many households, the ability tostore grain for periods of more than 6 months is con-strained by production resources rather thanpostharvest practice. To be more specific, thosefarmers who might be significantly affected by seriousgrain quality deterioration towards the end of theharvest are those without grain at this time. There areundoubtedly characteristics of hybrid sorghum grainwhich cause it to store poorly and its qualities todecline, although this is clearly not an important issuein the current scenario of farm practice. This does notmean that these traits are not impacting on the widersorghum economy (and therefore on farmers), but onlythat they are not impacting on the components of thesorghum production and utilisation system examined.Storage by wholesale traders and industrial usersshows a different picture—this has been highlightedby other parts of this study (Kleih et al. 1998). So whilethe current study has certainly laid to rest manyconcerns relating to farm storage, it is clear that com-ponents of the utilisation chain need more detailedstudy.
Acknowledgements
We wish to thank Mr C.P. Ramam for his support ofthis study, Dr Murty for help with grain sampling, MrNeil Marsland for assistance with the pilot study, andMr Martin Nagler and Mr John Gibbs for themycotoxin analysis. The study would not have beenpossible without the patience and hospitality of thefarmers of southern India. This report is an output froma research project funded by the United Kingdom’sDepartment for International Development (DFID) forthe benefit of developing countries. The viewsexpressed are not necessarily those of DFID.
References
Adams, J.M. and Schulten, G.G.M. 1978. Lossescaused by insects, mites and micro-organisms. In:Harris, K.L. and Lindblad, C.J., ed., Post-harvest grainloss assessment methods. Washington DC, AmericanAssociation of Cereal Chemists, 83–89.
Anasari, A.A. and Shrivastava, A.K. 1990. Naturaloccurrence of
Alternaria
mycotoxins in sorghum andragi from North Bihar, India. Food Additives and Con-taminants, 7, 815–820.
Bhat, R.V. and Rukmini, B. 1978. Mycotoxins insorghum: toxigenic fungi during storage and naturaloccurrence of T2 toxin. Proceedings of the interna-tional workshop on sorghum diseases, Hyderabad,India, 1–15 December 1978. Patancheru, AndraPradesh, India, International Crops Research Institutefor the Semi-Arid Tropics (ICRISAT).
Bhat, R.V., Shetty, P.H., Amruth, R.P. andSudershan, R.V. 1997. A foodbourne disease outbreakdue to the consumption of mouldy sorghum and maizecontaining fumonisin mycotoxins. Journal of Toxi-cology—Clinical Toxicology, 35, 249–255.
Haines, C.P. (ed.) 1991. Insects and arachnids oftropical stored products: their biology and identifi-cation, 2nd edition. Chatham, United Kingdom,Natural Resources Institute, 246p.
Hall, A.J. and Brough, S. 1997. Sorghum utilisationin India: emerging patterns and research needs.Natural Resources Institute, unpublished projectdocument.
Hodges, R.J., Hall, A.J., Jayaraj, K., Jaiswal, P.,Potdar, N., Yogand, B. and Navi, S.S. 1999. Qualitychanges in farm-stored sorghum grain grown in thewet or dry season in south India—a technical andsocial study. Natural Resources Institute (NRI) report2412. Chatham Maritime, Kent, NRI, 33p.
Quality assurance in agricultural produce,edited by G.I. Johnson, Le Van To, Nguyen Duy Duc and M.C. Webb.
ACIAR Proceedings 100(printed version published in 2000)
344
Kishore, P., Jotwani, M.G. and Sharma, G.C. 1977.Relative susceptibility of released high-yieldingvarieties and hybrids of sorghum to insect attack instorage. Entomologists’ Newsletter, 7, 14–15.
Kleih, U., BalaRavi, K. and Dayakar, B. 1998.Industrial utilisation of sorghum in India. NaturalResources Institute, unpublished report document.
Kumari, S.R. and Chandrashekar, A. 1994. Isolationand purification of three antifungal proteins fromsorghum endosperm. Journal of Food Science, 64,357–364.
Mall, O.P., Pateria, H.M. and Chauhan, S.K. 1986.Mycoflora and aflatoxin in wet harvested sorghum.Indian Phytopathology, 39, 409–413.
Marsland, N.K. 1998. Factors influencing the con-sumption of sorghum as food in India. NaturalResources Institute (NRI) socio-economics series No.XX. Chatham Maritime, Kent, NRI.
Reddy, B.N. and Nusrath, M. 1988. Relationshipbetween the incidence of storage pests and productionof mycotoxin in jowar. National Academy ScienceLetters, 11(10), 307–308.
Sashidhar, R.B., Ramakrishna, N. and Bhat, R.V.1992. Moulds and mycotoxins in sorghum stored intraditional containers in India. Journal of StoredProducts Research, 28, 257–260.
Quality assurance in agricultural produce,edited by G.I. Johnson, Le Van To, Nguyen Duy Duc and M.C. Webb.
ACIAR Proceedings 100(printed version published in 2000)
345
Research on the Sensitivity of Maize Varieties to
Sitophilus zeamais
M.
Nguyen Kim Vu, Hoang Ho, Nguyen Thu Huyen, Ta Phuong Thao,Nguyen Dong Tuan and Bui Kim Thuy*
Abstract
This paper reports on two years of research into the
Sitophilus zeamais
M. sensitivity of 25 maize varieties,among them 20 hybrids. Some obtained results are as follow:
• 72 hours after placing samples of maize and
S. zeamais
(imago) 50 cm apart, the frequency of appearanceof
S. zeamais
was highest in variety B9681 (19.1%), followed by NEP.HN (
Zea mays
var
. ceratina
)(17.6%) and LVN10 (14.4%); it was lower in 4728 (5.3%), P11 (3.4%), and 3024 (2.4%). Green pea wasused as the control sample (1%).
• The preference of
S. zeamais
for different maize varieties clearly varied over the period of 60 days. In allof four experiments, two maize varieties — B9681 and NEP.HN — were damaged by
S. zeamais
to thehighest extent possible (100%); two varieties — 3024 and LVN28 — were damaged to a lesser extent(60–70%). After a period of 60 days the weight decreases of these samples were different. The highestweight decrease was found in two varieties — NEP.HN (31.3%) and B9681 (20.4%); a lower weightdecrease was measured in 3024 (1.6%) and LVN28 (1.3%). After a period of 90 days, almost all thevarieties of maize were damaged to a high degree: 7 varieties to 100%, 11 varieties to 91–99%, and 4varieties to 80–90%, with LVN28 having the lowest level of damage (80%).
• After a period of 60 days, numbers of
S. zeamais
(imago) increased in three maize varieties — NEP.HN,LVN20, and B9681 (3–6 times the initial number) and fell in three varieties — 3024, LVN31, and 4728(0.5–0.7 times).
A
T
PRESENT
, high productivity has been achievedwith over 70% of the hybrid maize varieties grown inVietnam. However, farmers believe that the hybridmaize varieties are more easily damaged by insectsduring storage. Thus, this study was carried out toanswer two questions.• Are hybrid maize varieties more susceptible to
insect damage than local varieties?• Do different maize varieties differ in their
attractiveness to the maize weevil,
Sitophiluszeamais
?
Materials and Methods
Materials
Maize varieties
Twenty-five maize varieties were studied:• LVN4, LVN5, LVN6, LVN10, LVNl7, LVNl8,
LVN20, LVN24, LVN27, LVN28, LVN29,LVN3L, 2891, 3012, 3023, 3024, 4728, P11, Q2and SC95.30 were collected by the Maize ResearchInstitute; and
• NEP.HN, B9681, ‘Pioneer’, TSB2 and VM1 werecultivated in Hanoi and Ha Bac.Q2, NEP.HN, TSB2 and VM1 are open-pollinating
varieties; the rest are hybrids.* Post-Harvest Technology Institute, 4 Ngo Quyen, Hanoi,
Vietnam.
Quality assurance in agricultural produce,edited by G.I. Johnson, Le Van To, Nguyen Duy Duc and M.C. Webb.
ACIAR Proceedings 100(printed version published in 2000)
346
Black beans and green peas were used as controls.Maize, black bean, and green pea samples were driedto a moisture content (MC) of 14% and cleaned toremove damaged grains.
InsectsSitophilus zeamais
Motsch adults bred in the labo-ratory were used in the study. The experiments werecarried out during 1997–1999.
Specifications
The analyses made were:• ratio of damaged grains after 30, 60, and 90 days;• ratio of live and dead adult
S. zeamais
individualsafter 30, 60, and 90 days; and
• penetration of maize varieties by
S. zeamais
.
Methods
To assess the sensitivity of maize to
S. zeamais
, sixexperiments (numbered 1, 2A, 2B, 3, 4, and 5) werecarried out as described below.
Experiment 1
A mixture was made of six maize varieties (100grains of each) and 60 adult
S. zeamais
individuals ina bottle. The amount of damaged grains was estimatedafter 30, 60 and 90 days.
Experiments 2A and 2B
The objective of these experiments was to study theattraction of
S. zeamais
to different maize varieties.Experiment 2A: A box was separated into eight
compartments. 100 grains of maize were placed ineach compartment. A petri dish of 80 adult
S. zeamais
individuals was placed in the centre of the box, and the
S. zeamais
were then free to choose their preferredmaize variety.
Experiment 2B: This experiment was similar to 2A,but with only 10 adult
S. zeamais
individuals intro-duced into the box.
The amount of grain damage caused by
S. zeamais
was assessed after 30, 60 and 90 days.
Experiment 3
In order to assess the level of damage to maizegrains caused by
S. zeamais
, maize varieties with thesame moisture content were separated into bottles.Each bottle included 100 grains and 10 adult
S.zeamais
. The numbers of live and dead
S. zeamais
individuals were counted after 30, 60 and 90 days.
Experiment 4
In order to assess the level of damage to maizevarieties caused by a single pair (male + female) ofadult
S. zeamais
, maize varieties with the samemoisture content were separated into bottles. Eachbottle contained 100 grains and one pair of adults. Thenumbers of live and dead
S. zeamais
individuals werecounted after 30, 60 and 90 days.
Experiment 5
To study the role of maize odour in attracting theinsects, eight locations were marked on the bottom ofa glass cabinet (measuring 1
×
1
×
1 m), each of equaldistance from the centre. Different maize varieties (50g of grain/variety) were placed in each of the eightlocations. An open jar containing 60 adult
S. zeamais
individuals was placed at the centre. Every 48 hours,the maize varieties were rotated clockwise to the nextlocation until each variety had occupied all positions.At each rotation, the number of
S. zeamais
individualsin each of the eight maize varieties was counted, thena fresh jar of 60 adult
S. zeamais
individuals wasintroduced.
Results and Discussion
The results of the experiments are shown in Tables lA,lB, 2A, 2B, 3, 4 and 5—the table numbers coincidingwith the experiment numbers.
Table 1A shows the following.
• After 30 days, the NEP.HN and B9681 varietieswere the most damaged (74.0% and 71.7% damage,respectively). The 3024 and LVN28 varieties werethe least damaged (49.5% and 15.0%, respectively).
• After 60 days, the number of adult insects increased2–3 times, and the percentage of damaged grainsincreased accordingly. More than 95% of NEP.HN,B9681, LVN4, LVN6, and LVN24 grains weredamaged. Varieties with more than 80% damageincluded VM1, 3023, LVN31, LVN20 and LVN10.The LVN28 grains were least damaged at 42%.
• After 90 days, among 22 maize varieties, 21varieties were damaged in the range of 95–100%.The LVN28 variety was least damaged at 80.5%.
The data in Table 1B reinforce these findings.
Quality assurance in agricultural produce,edited by G.I. Johnson, Le Van To, Nguyen Duy Duc and M.C. Webb.
ACIAR Proceedings 100(printed version published in 2000)
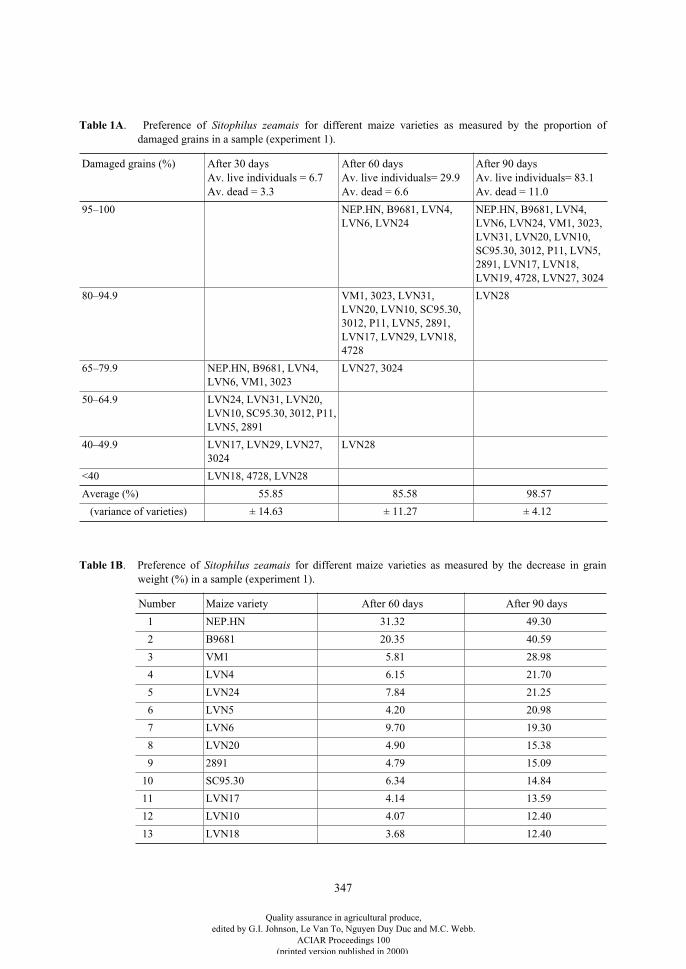
347
Table 1A
. Preference of
Sitophilus zeamais
for different maize varieties as measured by the proportion ofdamaged grains in a sample (experiment 1).
Damaged grains (%) After 30 daysAv. live individuals = 6.7Av. dead = 3.3
After 60 daysAv. live individuals= 29.9Av. dead = 6.6
After 90 daysAv. live individuals= 83.1Av. dead = 11.0
95–100 NEP.HN, B9681, LVN4, LVN6, LVN24
NEP.HN, B9681, LVN4, LVN6, LVN24, VM1, 3023, LVN31, LVN20, LVN10, SC95.30, 3012, P11, LVN5, 2891, LVN17, LVN18, LVN19, 4728, LVN27, 3024
80–94.9 VM1, 3023, LVN31, LVN20, LVN10, SC95.30, 3012, P11, LVN5, 2891, LVN17, LVN29, LVN18, 4728
LVN28
65–79.9 NEP.HN, B9681, LVN4, LVN6, VM1, 3023
LVN27, 3024
50–64.9 LVN24, LVN31, LVN20, LVN10, SC95.30, 3012, P11, LVN5, 2891
40–49.9 LVN17, LVN29, LVN27, 3024
LVN28
<40 LVN18, 4728, LVN28
Average (%) 55.85 85.58 98.57
(variance of varieties) ± 14.63 ± 11.27 ± 4.12
Table 1B
. Preference of
Sitophilus zeamais
for different maize varieties as measured by the decrease in grainweight (%) in a sample (experiment 1).
Number Maize variety After 60 days After 90 days
1 NEP.HN 31.32 49.30
2 B9681 20.35 40.59
3 VM1 5.81 28.98
4 LVN4 6.15 21.70
5 LVN24 7.84 21.25
6 LVN5 4.20 20.98
7 LVN6 9.70 19.30
8 LVN20 4.90 15.38
9 2891 4.79 15.09
10 SC95.30 6.34 14.84
11 LVN17 4.14 13.59
12 LVN10 4.07 12.40
13 LVN18 3.68 12.40
Quality assurance in agricultural produce,edited by G.I. Johnson, Le Van To, Nguyen Duy Duc and M.C. Webb.
ACIAR Proceedings 100(printed version published in 2000)
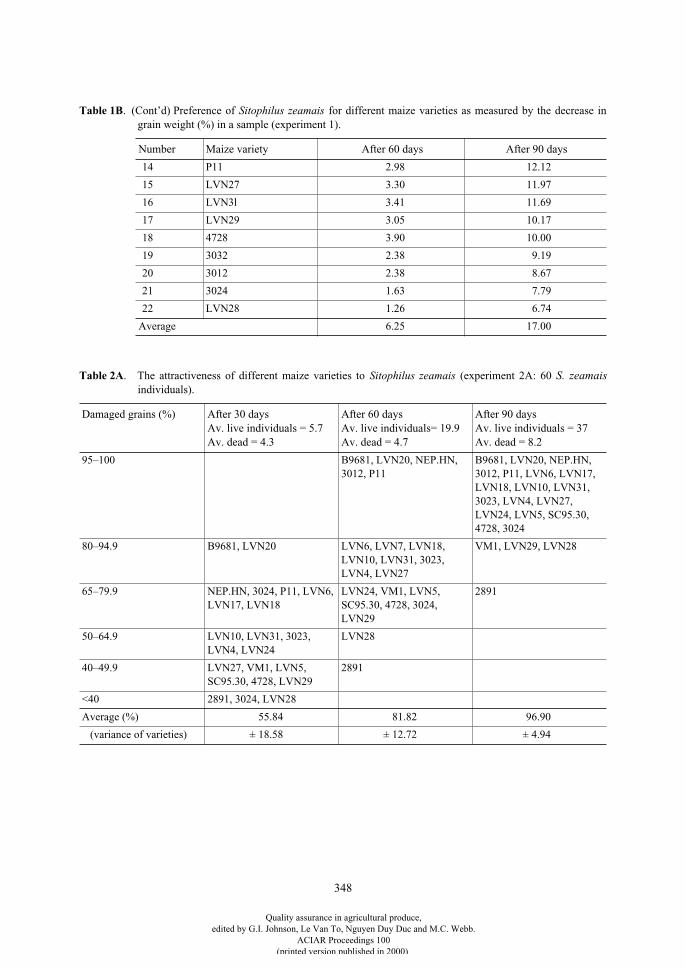
348
14 P11 2.98 12.12
15 LVN27 3.30 11.97
16 LVN3l 3.41 11.69
17 LVN29 3.05 10.17
18 4728 3.90 10.00
19 3032 2.38 9.19
20 3012 2.38 8.67
21 3024 1.63 7.79
22 LVN28 1.26 6.74
Average 6.25 17.00
Table 1B
. (Cont’d) Preference of
Sitophilus zeamais
for different maize varieties as measured by the decrease ingrain weight (%) in a sample (experiment 1).
Number Maize variety After 60 days After 90 days
Table 2A
. The attractiveness of different maize varieties to
Sitophilus zeamais
(experiment 2A: 60
S. zeamais
individuals).
Damaged grains (%) After 30 daysAv. live individuals = 5.7Av. dead = 4.3
After 60 daysAv. live individuals= 19.9Av. dead = 4.7
After 90 daysAv. live individuals = 37Av. dead = 8.2
95–100 B9681, LVN20, NEP.HN, 3012, P11
B9681, LVN20, NEP.HN, 3012, P11, LVN6, LVN17, LVN18, LVN10, LVN31, 3023, LVN4, LVN27, LVN24, LVN5, SC95.30, 4728, 3024
80–94.9 B9681, LVN20 LVN6, LVN7, LVN18, LVN10, LVN31, 3023, LVN4, LVN27
VM1, LVN29, LVN28
65–79.9 NEP.HN, 3024, P11, LVN6, LVN17, LVN18
LVN24, VM1, LVN5, SC95.30, 4728, 3024, LVN29
2891
50–64.9 LVN10, LVN31, 3023, LVN4, LVN24
LVN28
40–49.9 LVN27, VM1, LVN5, SC95.30, 4728, LVN29
2891
<40 2891, 3024, LVN28
Average (%) 55.84 81.82 96.90
(variance of varieties) ± 18.58 ± 12.72 ± 4.94
Quality assurance in agricultural produce,edited by G.I. Johnson, Le Van To, Nguyen Duy Duc and M.C. Webb.
ACIAR Proceedings 100(printed version published in 2000)
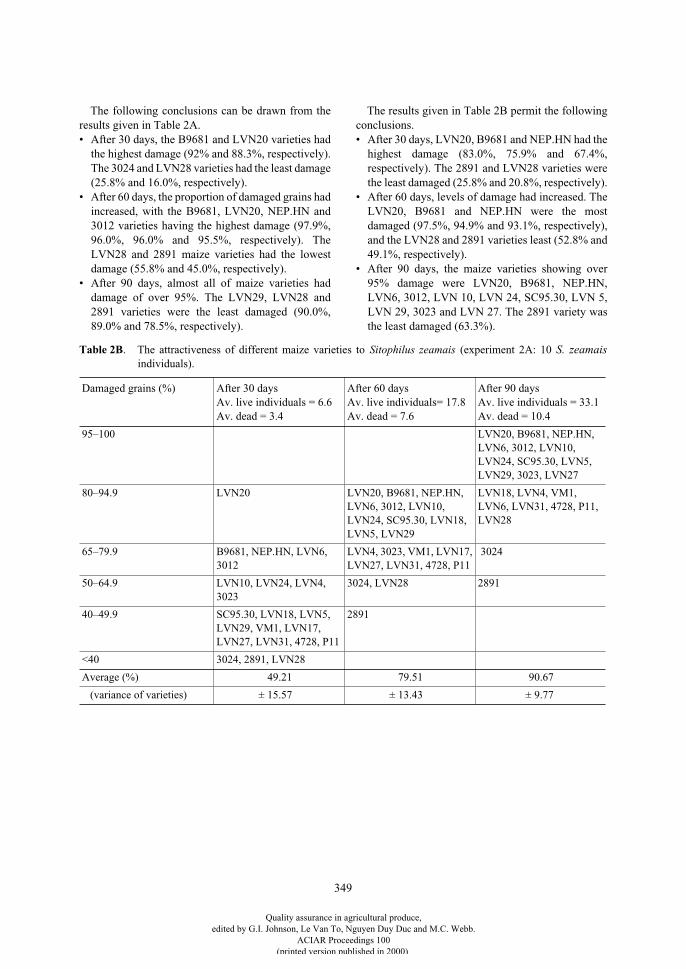
349
The following conclusions can be drawn from theresults given in Table 2A.• After 30 days, the B9681 and LVN20 varieties had
the highest damage (92% and 88.3%, respectively).The 3024 and LVN28 varieties had the least damage(25.8% and 16.0%, respectively).
• After 60 days, the proportion of damaged grains hadincreased, with the B9681, LVN20, NEP.HN and3012 varieties having the highest damage (97.9%,96.0%, 96.0% and 95.5%, respectively). TheLVN28 and 2891 maize varieties had the lowestdamage (55.8% and 45.0%, respectively).
• After 90 days, almost all of maize varieties haddamage of over 95%. The LVN29, LVN28 and2891 varieties were the least damaged (90.0%,89.0% and 78.5%, respectively).
The results given in Table 2B permit the followingconclusions.• After 30 days, LVN20, B9681 and NEP.HN had the
highest damage (83.0%, 75.9% and 67.4%,respectively). The 2891 and LVN28 varieties werethe least damaged (25.8% and 20.8%, respectively).
• After 60 days, levels of damage had increased. TheLVN20, B9681 and NEP.HN were the mostdamaged (97.5%, 94.9% and 93.1%, respectively),and the LVN28 and 2891 varieties least (52.8% and49.1%, respectively).
• After 90 days, the maize varieties showing over95% damage were LVN20, B9681, NEP.HN,LVN6, 3012, LVN 10, LVN 24, SC95.30, LVN 5,LVN 29, 3023 and LVN 27. The 2891 variety wasthe least damaged (63.3%).
Table 2B
. The attractiveness of different maize varieties to
Sitophilus zeamais
(experiment 2A: 10
S. zeamais
individuals).
Damaged grains (%) After 30 daysAv. live individuals = 6.6Av. dead = 3.4
After 60 daysAv. live individuals= 17.8Av. dead = 7.6
After 90 daysAv. live individuals = 33.1Av. dead = 10.4
95–100 LVN20, B9681, NEP.HN, LVN6, 3012, LVN10, LVN24, SC95.30, LVN5, LVN29, 3023, LVN27
80–94.9 LVN20 LVN20, B9681, NEP.HN, LVN6, 3012, LVN10, LVN24, SC95.30, LVN18, LVN5, LVN29
LVN18, LVN4, VM1, LVN6, LVN31, 4728, P11, LVN28
65–79.9 B9681, NEP.HN, LVN6, 3012
LVN4, 3023, VM1, LVN17, LVN27, LVN31, 4728, P11
3024
50–64.9 LVN10, LVN24, LVN4, 3023
3024, LVN28 2891
40–49.9 SC95.30, LVN18, LVN5, LVN29, VM1, LVN17, LVN27, LVN31, 4728, P11
2891
<40 3024, 2891, LVN28
Average (%) 49.21 79.51 90.67
(variance of varieties) ± 15.57 ± 13.43 ± 9.77
Quality assurance in agricultural produce,edited by G.I. Johnson, Le Van To, Nguyen Duy Duc and M.C. Webb.
ACIAR Proceedings 100(printed version published in 2000)
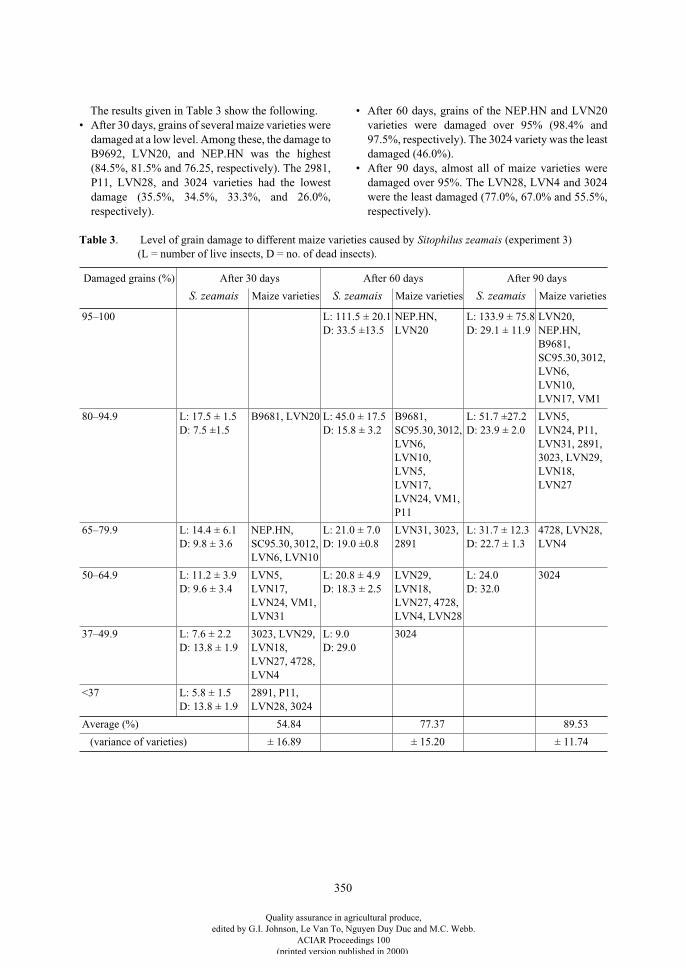
350
The results given in Table 3 show the following.• After 30 days, grains of several maize varieties were
damaged at a low level. Among these, the damage toB9692, LVN20, and NEP.HN was the highest(84.5%, 81.5% and 76.25, respectively). The 2981,P11, LVN28, and 3024 varieties had the lowestdamage (35.5%, 34.5%, 33.3%, and 26.0%,respectively).
• After 60 days, grains of the NEP.HN and LVN20varieties were damaged over 95% (98.4% and97.5%, respectively). The 3024 variety was the leastdamaged (46.0%).
• After 90 days, almost all of maize varieties weredamaged over 95%. The LVN28, LVN4 and 3024were the least damaged (77.0%, 67.0% and 55.5%,respectively).
Table 3
. Level of grain damage to different maize varieties caused by
Sitophilus zeamais
(experiment 3)(L = number of live insects, D = no. of dead insects).
Damaged grains (%) After 30 days After 60 days After 90 days
S. zeamais
Maize varieties
S. zeamais
Maize varieties
S. zeamais
Maize varieties
95–100 L: 111.5 ± 20.1D: 33.5 ±13.5
NEP.HN, LVN20
L: 133.9 ± 75.8D: 29.1 ± 11.9
LVN20, NEP.HN, B9681, SC95.30, 3012, LVN6, LVN10, LVN17, VM1
80–94.9 L: 17.5 ± 1.5D: 7.5 ±1.5
B9681, LVN20 L: 45.0 ± 17.5D: 15.8 ± 3.2
B9681, SC95.30, 3012, LVN6, LVN10, LVN5, LVN17, LVN24, VM1, P11
L: 51.7 ±27.2D: 23.9 ± 2.0
LVN5, LVN24, P11, LVN31, 2891, 3023, LVN29, LVN18, LVN27
65–79.9 L: 14.4 ± 6.1D: 9.8 ± 3.6
NEP.HN, SC95.30, 3012, LVN6, LVN10
L: 21.0 ± 7.0D: 19.0 ±0.8
LVN31, 3023, 2891
L: 31.7 ± 12.3D: 22.7 ± 1.3
4728, LVN28, LVN4
50–64.9 L: 11.2 ± 3.9D: 9.6 ± 3.4
LVN5, LVN17, LVN24, VM1, LVN31
L: 20.8 ± 4.9D: 18.3 ± 2.5
LVN29, LVN18, LVN27, 4728, LVN4, LVN28
L: 24.0D: 32.0
3024
37–49.9 L: 7.6 ± 2.2D: 13.8 ± 1.9
3023, LVN29, LVN18, LVN27, 4728, LVN4
L: 9.0D: 29.0
3024
<37 L: 5.8 ± 1.5D: 13.8 ± 1.9
2891, P11, LVN28, 3024
Average (%) 54.84 77.37 89.53
(variance of varieties) ± 16.89 ± 15.20 ± 11.74
Quality assurance in agricultural produce,edited by G.I. Johnson, Le Van To, Nguyen Duy Duc and M.C. Webb.
ACIAR Proceedings 100(printed version published in 2000)
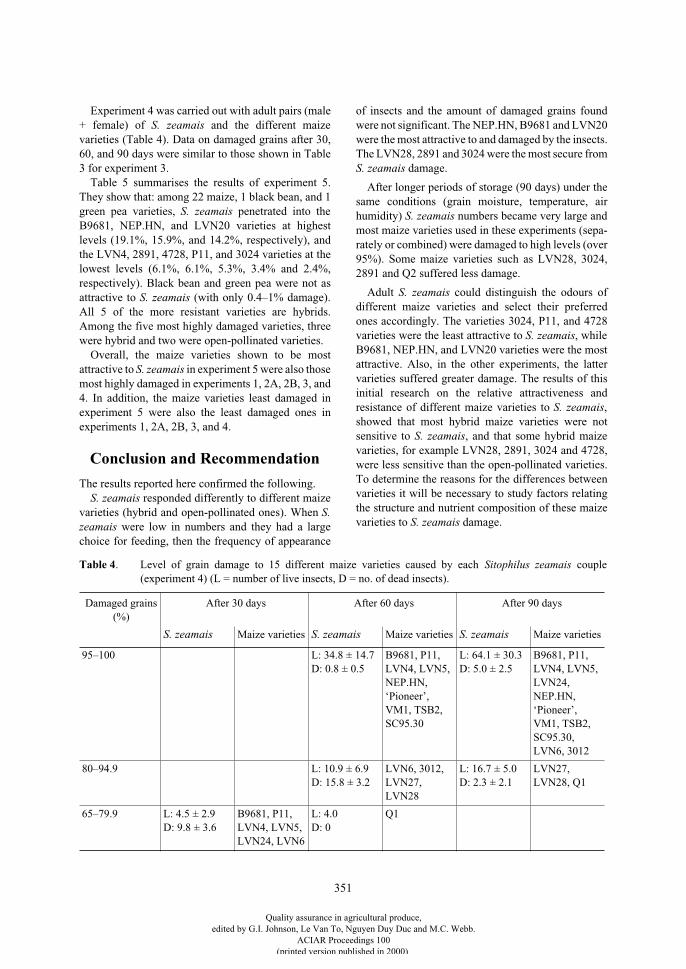
351
Experiment 4 was carried out with adult pairs (male+ female) of
S. zeamais
and the different maizevarieties (Table 4). Data on damaged grains after 30,60, and 90 days were similar to those shown in Table3 for experiment 3.
Table 5 summarises the results of experiment 5.They show that: among 22 maize, 1 black bean, and 1green pea varieties,
S. zeamais
penetrated into theB9681, NEP.HN, and LVN20 varieties at highestlevels (19.1%, 15.9%, and 14.2%, respectively), andthe LVN4, 2891, 4728, P11, and 3024 varieties at thelowest levels (6.1%, 6.1%, 5.3%, 3.4% and 2.4%,respectively). Black bean and green pea were not asattractive to
S. zeamais
(with only 0.4–1% damage).All 5 of the more resistant varieties are hybrids.Among the five most highly damaged varieties, threewere hybrid and two were open-pollinated varieties.
Overall, the maize varieties shown to be mostattractive to
S. zeamais
in experiment 5 were also thosemost highly damaged in experiments 1, 2A, 2B, 3, and4. In addition, the maize varieties least damaged inexperiment 5 were also the least damaged ones inexperiments 1, 2A, 2B, 3, and 4.
Conclusion and Recommendation
The results reported here confirmed the following.
S. zeamais
responded differently to different maizevarieties (hybrid and open-pollinated ones). When
S.zeamais
were low in numbers and they had a largechoice for feeding, then the frequency of appearance
of insects and the amount of damaged grains foundwere not significant. The NEP.HN, B9681 and LVN20were the most attractive to and damaged by the insects.The LVN28, 2891 and 3024 were the most secure from
S. zeamais
damage.
After longer periods of storage (90 days) under thesame conditions (grain moisture, temperature, airhumidity)
S. zeamais
numbers became very large andmost maize varieties used in these experiments (sepa-rately or combined) were damaged to high levels (over95%). Some maize varieties such as LVN28, 3024,2891 and Q2 suffered less damage.
Adult
S. zeamais
could distinguish the odours ofdifferent maize varieties and select their preferredones accordingly. The varieties 3024, P11, and 4728varieties were the least attractive to
S. zeamais
, whileB9681, NEP.HN, and LVN20 varieties were the mostattractive. Also, in the other experiments, the lattervarieties suffered greater damage. The results of thisinitial research on the relative attractiveness andresistance of different maize varieties to
S. zeamais
,showed that most hybrid maize varieties were notsensitive to
S. zeamais
, and that some hybrid maizevarieties, for example LVN28, 2891, 3024 and 4728,were less sensitive than the open-pollinated varieties.To determine the reasons for the differences betweenvarieties it will be necessary to study factors relatingthe structure and nutrient composition of these maizevarieties to
S. zeamais
damage.
Table 4
. Level of grain damage to 15 different maize varieties caused by each
Sitophilus zeamais
couple(experiment 4) (L = number of live insects, D = no. of dead insects).
Damaged grains (%)
After 30 days After 60 days After 90 days
S. zeamais
Maize varieties
S. zeamais
Maize varieties
S. zeamais
Maize varieties
95–100 L: 34.8 ± 14.7D: 0.8 ± 0.5
B9681, P11, LVN4, LVN5, NEP.HN, ‘Pioneer’, VM1, TSB2, SC95.30
L: 64.1 ± 30.3D: 5.0 ± 2.5
B9681, P11, LVN4, LVN5, LVN24, NEP.HN, ‘Pioneer’, VM1, TSB2, SC95.30, LVN6, 3012
80–94.9 L: 10.9 ± 6.9D: 15.8 ± 3.2
LVN6, 3012, LVN27, LVN28
L: 16.7 ± 5.0D: 2.3 ± 2.1
LVN27, LVN28, Q1
65–79.9 L: 4.5 ± 2.9D: 9.8 ± 3.6
B9681, P11, LVN4, LVN5, LVN24, LVN6
L: 4.0D: 0
Q1
Quality assurance in agricultural produce,edited by G.I. Johnson, Le Van To, Nguyen Duy Duc and M.C. Webb.
ACIAR Proceedings 100(printed version published in 2000)
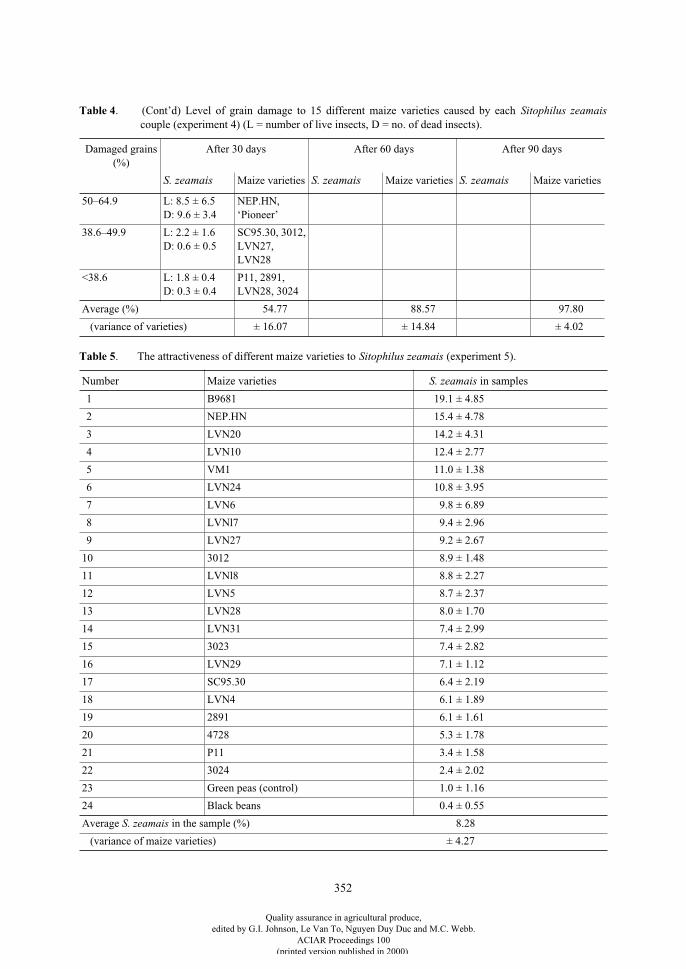
352
50–64.9 L: 8.5 ± 6.5D: 9.6 ± 3.4
NEP.HN,‘Pioneer’
38.6–49.9 L: 2.2 ± 1.6D: 0.6 ± 0.5
SC95.30, 3012, LVN27, LVN28
<38.6 L: 1.8 ± 0.4D: 0.3 ± 0.4
P11, 2891, LVN28, 3024
Average (%) 54.77 88.57 97.80
(variance of varieties) ± 16.07 ± 14.84 ± 4.02
Table 4
. (Cont’d) Level of grain damage to 15 different maize varieties caused by each
Sitophilus zeamais
couple (experiment 4) (L = number of live insects, D = no. of dead insects).
Damaged grains (%)
After 30 days After 60 days After 90 days
S. zeamais
Maize varieties
S. zeamais
Maize varieties
S. zeamais
Maize varieties
Table 5
. The attractiveness of different maize varieties to
Sitophilus zeamais
(experiment 5).
Number Maize varieties
S. zeamais
in samples
1 B9681 19.1 ± 4.85
2 NEP.HN 15.4 ± 4.78
3 LVN20 14.2 ± 4.31
4 LVN10 12.4 ± 2.77
5 VM1 11.0 ± 1.38
6 LVN24 10.8 ± 3.95
7 LVN6 9.8 ± 6.89
8 LVNl7 9.4 ± 2.96
9 LVN27 9.2 ± 2.67
10 3012 8.9 ± 1.48
11 LVNl8 8.8 ± 2.27
12 LVN5 8.7 ± 2.37
13 LVN28 8.0 ± 1.70
14 LVN31 7.4 ± 2.99
15 3023 7.4 ± 2.82
16 LVN29 7.1 ± 1.12
17 SC95.30 6.4 ± 2.19
18 LVN4 6.1 ± 1.89
19 2891 6.1 ± 1.61
20 4728 5.3 ± 1.78
21 P11 3.4 ± 1.58
22 3024 2.4 ± 2.02
23 Green peas (control) 1.0 ± 1.16
24 Black beans 0.4 ± 0.55
Average
S. zeamais
in the sample (%) 8.28
(variance of maize varieties) ± 4.27
Quality assurance in agricultural produce,edited by G.I. Johnson, Le Van To, Nguyen Duy Duc and M.C. Webb.
ACIAR Proceedings 100(printed version published in 2000)
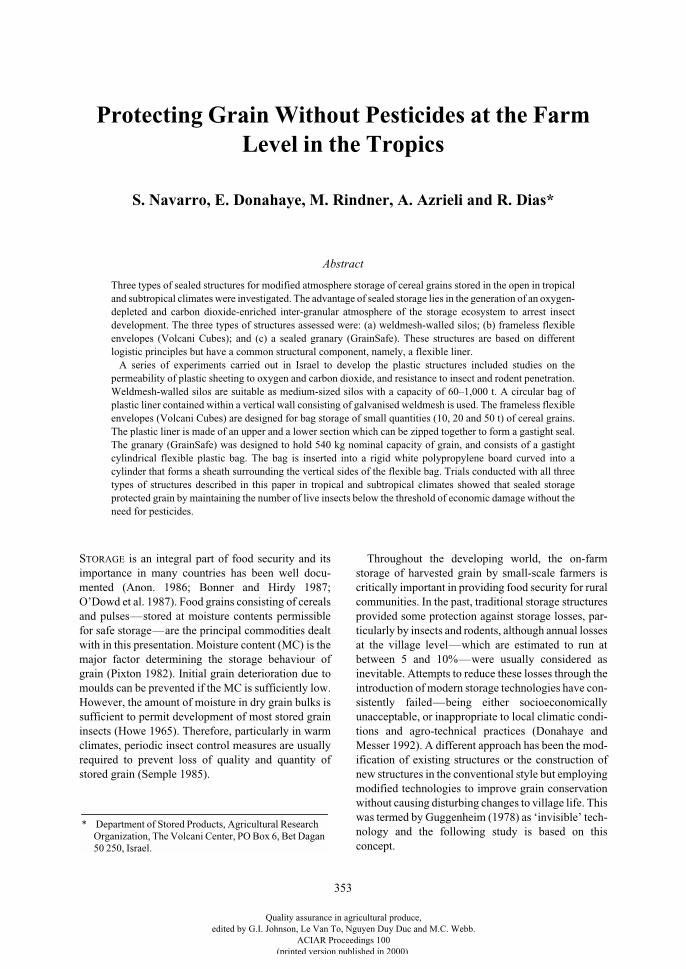
353
Protecting Grain Without Pesticides at the Farm Level in the Tropics
S. Navarro, E. Donahaye, M. Rindner, A. Azrieli and R. Dias*
Abstract
Three types of sealed structures for modified atmosphere storage of cereal grains stored in the open in tropicaland subtropical climates were investigated. The advantage of sealed storage lies in the generation of an oxygen-depleted and carbon dioxide-enriched inter-granular atmosphere of the storage ecosystem to arrest insectdevelopment. The three types of structures assessed were: (a) weldmesh-walled silos; (b) frameless flexibleenvelopes (Volcani Cubes); and (c) a sealed granary (GrainSafe). These structures are based on differentlogistic principles but have a common structural component, namely, a flexible liner.
A series of experiments carried out in Israel to develop the plastic structures included studies on thepermeability of plastic sheeting to oxygen and carbon dioxide, and resistance to insect and rodent penetration.Weldmesh-walled silos are suitable as medium-sized silos with a capacity of 60–1,000 t. A circular bag ofplastic liner contained within a vertical wall consisting of galvanised weldmesh is used. The frameless flexibleenvelopes (Volcani Cubes) are designed for bag storage of small quantities (10, 20 and 50 t) of cereal grains.The plastic liner is made of an upper and a lower section which can be zipped together to form a gastight seal.The granary (GrainSafe) was designed to hold 540 kg nominal capacity of grain, and consists of a gastightcylindrical flexible plastic bag. The bag is inserted into a rigid white polypropylene board curved into acylinder that forms a sheath surrounding the vertical sides of the flexible bag. Trials conducted with all threetypes of structures described in this paper in tropical and subtropical climates showed that sealed storageprotected grain by maintaining the number of live insects below the threshold of economic damage without theneed for pesticides.
S
TORAGE
is an integral part of food security and itsimportance in many countries has been well docu-mented (Anon. 1986; Bonner and Hirdy 1987;O’Dowd et al. 1987). Food grains consisting of cerealsand pulses—stored at moisture contents permissiblefor safe storage—are the principal commodities dealtwith in this presentation. Moisture content (MC) is themajor factor determining the storage behaviour ofgrain (Pixton 1982). Initial grain deterioration due tomoulds can be prevented if the MC is sufficiently low.However, the amount of moisture in dry grain bulks issufficient to permit development of most stored graininsects (Howe 1965). Therefore, particularly in warmclimates, periodic insect control measures are usuallyrequired to prevent loss of quality and quantity ofstored grain (Semple 1985).
Throughout the developing world, the on-farmstorage of harvested grain by small-scale farmers iscritically important in providing food security for ruralcommunities. In the past, traditional storage structuresprovided some protection against storage losses, par-ticularly by insects and rodents, although annual lossesat the village level—which are estimated to run atbetween 5 and 10%—were usually considered asinevitable. Attempts to reduce these losses through theintroduction of modern storage technologies have con-sistently failed—being either socioeconomicallyunacceptable, or inappropriate to local climatic condi-tions and agro-technical practices (Donahaye andMesser 1992). A different approach has been the mod-ification of existing structures or the construction ofnew structures in the conventional style but employingmodified technologies to improve grain conservationwithout causing disturbing changes to village life. Thiswas termed by Guggenheim (1978) as ‘invisible’ tech-nology and the following study is based on thisconcept.
* Department of Stored Products, Agricultural Research Organization, The Volcani Center, PO Box 6, Bet Dagan 50 250, Israel.
Quality assurance in agricultural produce,edited by G.I. Johnson, Le Van To, Nguyen Duy Duc and M.C. Webb.
ACIAR Proceedings 100(printed version published in 2000)
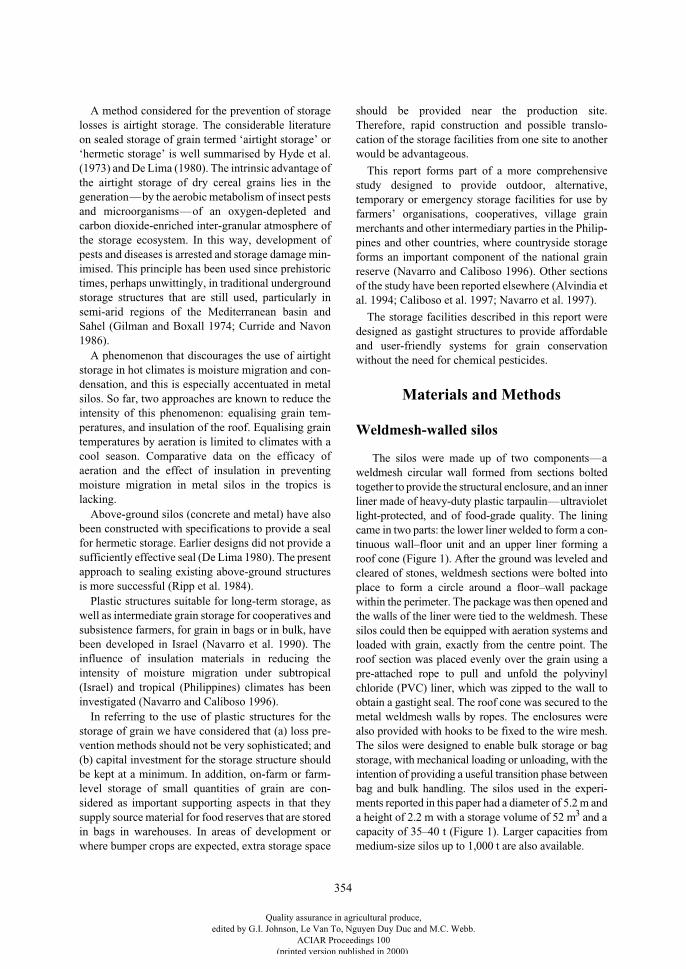
354
A method considered for the prevention of storagelosses is airtight storage. The considerable literatureon sealed storage of grain termed ‘airtight storage’ or‘hermetic storage’ is well summarised by Hyde et al.(1973) and De Lima (1980). The intrinsic advantage ofthe airtight storage of dry cereal grains lies in thegeneration—by the aerobic metabolism of insect pestsand microorganisms—of an oxygen-depleted andcarbon dioxide-enriched inter-granular atmosphere ofthe storage ecosystem. In this way, development ofpests and diseases is arrested and storage damage min-imised. This principle has been used since prehistorictimes, perhaps unwittingly, in traditional undergroundstorage structures that are still used, particularly insemi-arid regions of the Mediterranean basin andSahel (Gilman and Boxall 1974; Curride and Navon1986).
A phenomenon that discourages the use of airtightstorage in hot climates is moisture migration and con-densation, and this is especially accentuated in metalsilos. So far, two approaches are known to reduce theintensity of this phenomenon: equalising grain tem-peratures, and insulation of the roof. Equalising graintemperatures by aeration is limited to climates with acool season. Comparative data on the efficacy ofaeration and the effect of insulation in preventingmoisture migration in metal silos in the tropics islacking.
Above-ground silos (concrete and metal) have alsobeen constructed with specifications to provide a sealfor hermetic storage. Earlier designs did not provide asufficiently effective seal (De Lima 1980). The presentapproach to sealing existing above-ground structuresis more successful (Ripp et al. 1984).
Plastic structures suitable for long-term storage, aswell as intermediate grain storage for cooperatives andsubsistence farmers, for grain in bags or in bulk, havebeen developed in Israel (Navarro et al. 1990). Theinfluence of insulation materials in reducing theintensity of moisture migration under subtropical(Israel) and tropical (Philippines) climates has beeninvestigated (Navarro and Caliboso 1996).
In referring to the use of plastic structures for thestorage of grain we have considered that (a) loss pre-vention methods should not be very sophisticated; and(b) capital investment for the storage structure shouldbe kept at a minimum. In addition, on-farm or farm-level storage of small quantities of grain are con-sidered as important supporting aspects in that theysupply source material for food reserves that are storedin bags in warehouses. In areas of development orwhere bumper crops are expected, extra storage space
should be provided near the production site.Therefore, rapid construction and possible translo-cation of the storage facilities from one site to anotherwould be advantageous.
This report forms part of a more comprehensivestudy designed to provide outdoor, alternative,temporary or emergency storage facilities for use byfarmers’ organisations, cooperatives, village grainmerchants and other intermediary parties in the Philip-pines and other countries, where countryside storageforms an important component of the national grainreserve (Navarro and Caliboso 1996). Other sectionsof the study have been reported elsewhere (Alvindia etal. 1994; Caliboso
et al. 1997; Navarro et al. 1997).
The storage facilities described in this report weredesigned as gastight structures to provide affordableand user-friendly systems for grain conservationwithout the need for chemical pesticides.
Materials and Methods
Weldmesh-walled silos
The silos were made up of two components—aweldmesh circular wall formed from sections boltedtogether to provide the structural enclosure, and an innerliner made of heavy-duty plastic tarpaulin—ultravioletlight-protected, and of food-grade quality. The liningcame in two parts: the lower liner welded to form a con-tinuous wall–floor unit and an upper liner forming aroof cone (Figure 1). After the ground was leveled andcleared of stones, weldmesh sections were bolted intoplace to form a circle around a floor–wall packagewithin the perimeter. The package was then opened andthe walls of the liner were tied to the weldmesh. Thesesilos could then be equipped with aeration systems andloaded with grain, exactly from the centre point. Theroof section was placed evenly over the grain using apre-attached rope to pull and unfold the polyvinylchloride (PVC) liner, which was zipped to the wall toobtain a gastight seal. The roof cone was secured to themetal weldmesh walls by ropes. The enclosures werealso provided with hooks to be fixed to the wire mesh.The silos were designed to enable bulk storage or bagstorage, with mechanical loading or unloading, with theintention of providing a useful transition phase betweenbag and bulk handling. The silos used in the experi-ments reported in this paper had a diameter of 5.2 m anda height of 2.2 m with a storage volume of 52 m
3
and acapacity of 35–40 t (Figure 1). Larger capacities frommedium-size silos up to 1,000 t are also available.
Quality assurance in agricultural produce,edited by G.I. Johnson, Le Van To, Nguyen Duy Duc and M.C. Webb.
ACIAR Proceedings 100(printed version published in 2000)
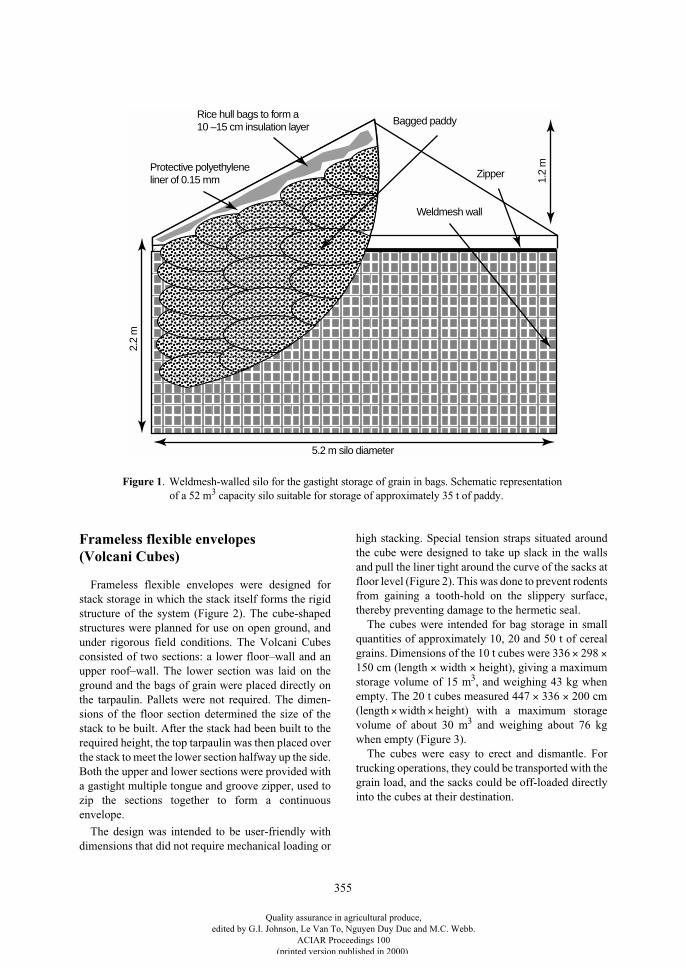
355
Frameless flexible envelopes (Volcani Cubes)
Frameless flexible envelopes were designed forstack storage in which the stack itself forms the rigidstructure of the system (Figure 2). The cube-shapedstructures were planned for use on open ground, andunder rigorous field conditions. The Volcani Cubesconsisted of two sections: a lower floor–wall and anupper roof–wall. The lower section was laid on theground and the bags of grain were placed directly onthe tarpaulin. Pallets were not required. The dimen-sions of the floor section determined the size of thestack to be built. After the stack had been built to therequired height, the top tarpaulin was then placed overthe stack to meet the lower section halfway up the side.Both the upper and lower sections were provided witha gastight multiple tongue and groove zipper, used tozip the sections together to form a continuousenvelope.
The design was intended to be user-friendly withdimensions that did not require mechanical loading or
high stacking. Special tension straps situated aroundthe cube were designed to take up slack in the wallsand pull the liner tight around the curve of the sacks atfloor level (Figure 2). This was done to prevent rodentsfrom gaining a tooth-hold on the slippery surface,thereby preventing damage to the hermetic seal.
The cubes were intended for bag storage in smallquantities of approximately 10, 20 and 50 t of cerealgrains. Dimensions of the 10 t cubes were 336
×
298
×
150 cm (length
×
width
×
height), giving a maximumstorage volume of 15 m
3
, and weighing 43 kg whenempty. The 20 t cubes measured 447
×
336
×
200 cm(length
×
width
×
height) with a maximum storagevolume of about 30 m
3
and weighing about 76 kgwhen empty (Figure 3).
The cubes were easy to erect and dismantle. Fortrucking operations, they could be transported with thegrain load, and the sacks could be off-loaded directlyinto the cubes at their destination.
Rice hull bags to form a 10 –15 cm insulation layer
Protective polyethylene liner of 0.15 mm
Bagged paddy
Zipper
Weldmesh wall
1.2
m
5.2 m silo diameter
2.2
m
Figure 1. Weldmesh-walled silo for the gastight storage of grain in bags. Schematic representationof a 52 m3 capacity silo suitable for storage of approximately 35 t of paddy.
Quality assurance in agricultural produce,edited by G.I. Johnson, Le Van To, Nguyen Duy Duc and M.C. Webb.
ACIAR Proceedings 100(printed version published in 2000)
356
10 t cube, side view
10 t cube, top view
20 t cube, side view
Gastight zipper
1.5 m
2 m
2.98 m
3.36 m4.45 m
Commodities tested:Wheat, corn, paddy
Monitoring ambient conditions:• Air temperature• Air relative humidity
Moisture migration• Monitoring intensity of moisture migration• Test of insulation material
Tension straps
Development of plastic zipper
Development of agas inlet port
Monitoring stack conditions:• Moisture content• Temperature• Gas concentration
Laboratory studies• Selection of plastic sheeting characteristics• Plastic sheeting integrity (resistance to insect and rodents)
Generation of selected modified atmosphere• Carbon dioxide purge• Biogeneration of carbon dioxide
Gas outlet port
Parameters tested:• Insect presence and species• Microfloral species• Mycotoxins• Germination• Grain quality
Test for gastightness
Selection of ground material
Figure 2. Schematic representation of the different experimental steps and parameters used in the development ofthe Volcani Cube for gastight storage of bagged grain.
Figure 3. Plan of 10 t and 20 t capacity Volcani Cubes for gastight storage of grain in bags.
Quality assurance in agricultural produce,edited by G.I. Johnson, Le Van To, Nguyen Duy Duc and M.C. Webb.
ACIAR Proceedings 100(printed version published in 2000)
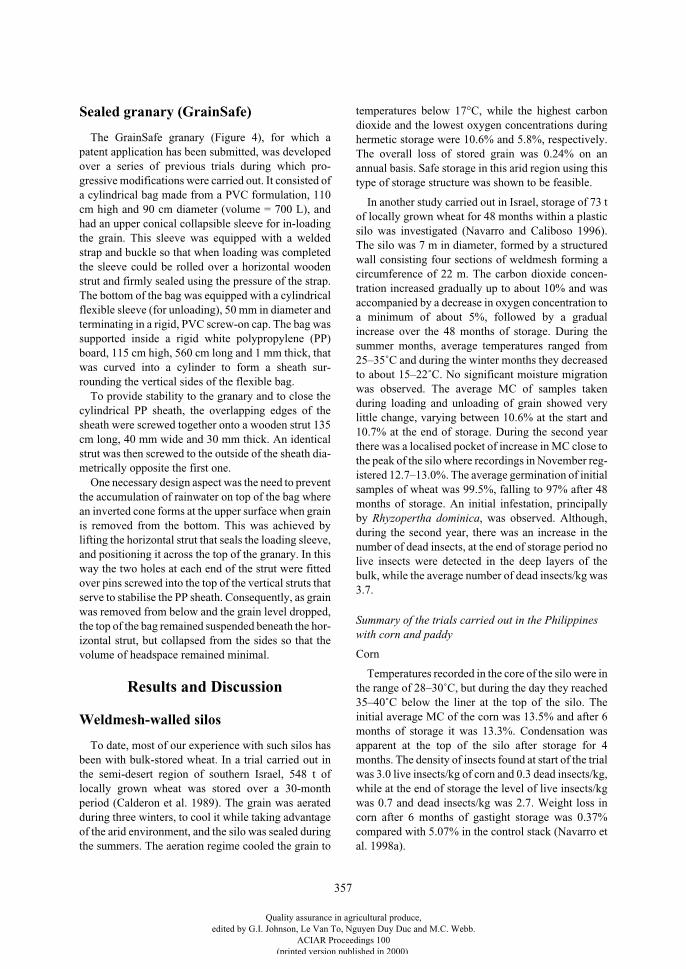
357
Sealed granary (GrainSafe)
The GrainSafe granary (Figure 4), for which apatent application has been submitted, was developedover a series of previous trials during which pro-gressive modifications were carried out. It consisted ofa cylindrical bag made from a PVC formulation, 110cm high and 90 cm diameter (volume = 700 L), andhad an upper conical collapsible sleeve for in-loadingthe grain. This sleeve was equipped with a weldedstrap and buckle so that when loading was completedthe sleeve could be rolled over a horizontal woodenstrut and firmly sealed using the pressure of the strap.The bottom of the bag was equipped with a cylindricalflexible sleeve (for unloading), 50 mm in diameter andterminating in a rigid, PVC screw-on cap. The bag wassupported inside a rigid white polypropylene (PP)board, 115 cm high, 560 cm long and 1 mm thick, thatwas curved into a cylinder to form a sheath sur-rounding the vertical sides of the flexible bag.
To provide stability to the granary and to close thecylindrical PP sheath, the overlapping edges of thesheath were screwed together onto a wooden strut 135cm long, 40 mm wide and 30 mm thick. An identicalstrut was then screwed to the outside of the sheath dia-metrically opposite the first one.
One necessary design aspect was the need to preventthe accumulation of rainwater on top of the bag wherean inverted cone forms at the upper surface when grainis removed from the bottom. This was achieved bylifting the horizontal strut that seals the loading sleeve,and positioning it across the top of the granary. In thisway the two holes at each end of the strut were fittedover pins screwed into the top of the vertical struts thatserve to stabilise the PP sheath. Consequently, as grainwas removed from below and the grain level dropped,the top of the bag remained suspended beneath the hor-izontal strut, but collapsed from the sides so that thevolume of headspace remained minimal.
Results and Discussion
Weldmesh-walled silos
To date, most of our experience with such silos hasbeen with bulk-stored wheat. In a trial carried out inthe semi-desert region of southern Israel, 548 t oflocally grown wheat was stored over a 30-monthperiod (Calderon et al. 1989). The grain was aeratedduring three winters, to cool it while taking advantageof the arid environment, and the silo was sealed duringthe summers. The aeration regime cooled the grain to
temperatures below 17°C, while the highest carbondioxide and the lowest oxygen concentrations duringhermetic storage were 10.6% and 5.8%, respectively.The overall loss of stored grain was 0.24% on anannual basis. Safe storage in this arid region using thistype of storage structure was shown to be feasible.
In another study carried out in Israel, storage of 73 tof locally grown wheat for 48 months within a plasticsilo was investigated (Navarro and Caliboso 1996).The silo was 7 m in diameter, formed by a structuredwall consisting four sections of weldmesh forming acircumference of 22 m. The carbon dioxide concen-tration increased gradually up to about 10% and wasaccompanied by a decrease in oxygen concentration toa minimum of about 5%, followed by a gradualincrease over the 48 months of storage. During thesummer months, average temperatures ranged from25–35˚C and during the winter months they decreasedto about 15–22˚C. No significant moisture migrationwas observed. The average MC of samples takenduring loading and unloading of grain showed verylittle change, varying between 10.6% at the start and10.7% at the end of storage. During the second yearthere was a localised pocket of increase in MC close tothe peak of the silo where recordings in November reg-istered 12.7–13.0%. The average germination of initialsamples of wheat was 99.5%, falling to 97% after 48months of storage. An initial infestation, principallyby
Rhyzopertha dominica
, was observed. Although,during the second year, there was an increase in thenumber of dead insects, at the end of storage period nolive insects were detected in the deep layers of thebulk, while the average number of dead insects/kg was3.7.
Summary of the trials carried out in the Philippines with corn and paddy
Corn
Temperatures recorded in the core of the silo were inthe range of 28–30˚C, but during the day they reached35–40˚C below the liner at the top of the silo. Theinitial average MC of the corn was 13.5% and after 6months of storage it was 13.3%. Condensation wasapparent at the top of the silo after storage for 4months. The density of insects found at start of the trialwas 3.0 live insects/kg of corn and 0.3 dead insects/kg,while at the end of storage the level of live insects/kgwas 0.7 and dead insects/kg was 2.7. Weight loss incorn after 6 months of gastight storage was 0.37%compared with 5.07% in the control stack (Navarro etal. 1998a).
Quality assurance in agricultural produce,edited by G.I. Johnson, Le Van To, Nguyen Duy Duc and M.C. Webb.
ACIAR Proceedings 100(printed version published in 2000)
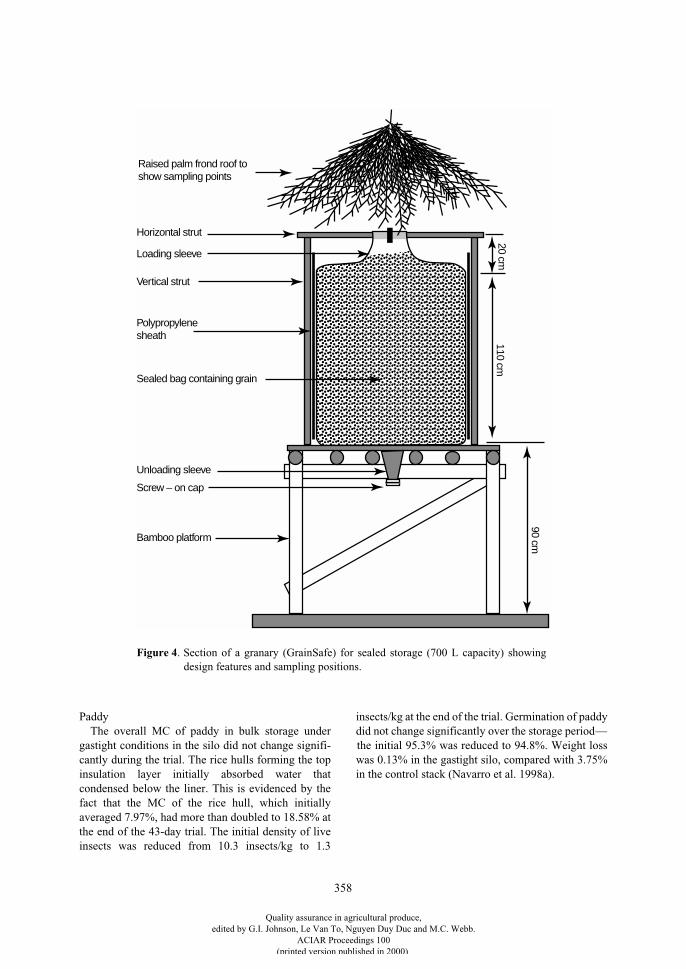
358
PaddyThe overall MC of paddy in bulk storage under
gastight conditions in the silo did not change signifi-cantly during the trial. The rice hulls forming the topinsulation layer initially absorbed water thatcondensed below the liner. This is evidenced by thefact that the MC of the rice hull, which initiallyaveraged 7.97%, had more than doubled to 18.58% atthe end of the 43-day trial. The initial density of liveinsects was reduced from 10.3 insects/kg to 1.3
insects/kg at the end of the trial. Germination of paddydid not change significantly over the storage period—the initial 95.3% was reduced to 94.8%. Weight losswas 0.13% in the gastight silo, compared with 3.75%in the control stack (Navarro et al. 1998a).
Raised palm frond roof to show sampling points
Horizontal strut
Loading sleeve
Vertical strut
Polypropylenesheath
Sealed bag containing grain
Unloading sleeve
Bamboo platform
Screw – on cap
20 cm110 cm
90 cm
Figure 4. Section of a granary (GrainSafe) for sealed storage (700 L capacity) showingdesign features and sampling positions.
Quality assurance in agricultural produce,edited by G.I. Johnson, Le Van To, Nguyen Duy Duc and M.C. Webb.
ACIAR Proceedings 100(printed version published in 2000)
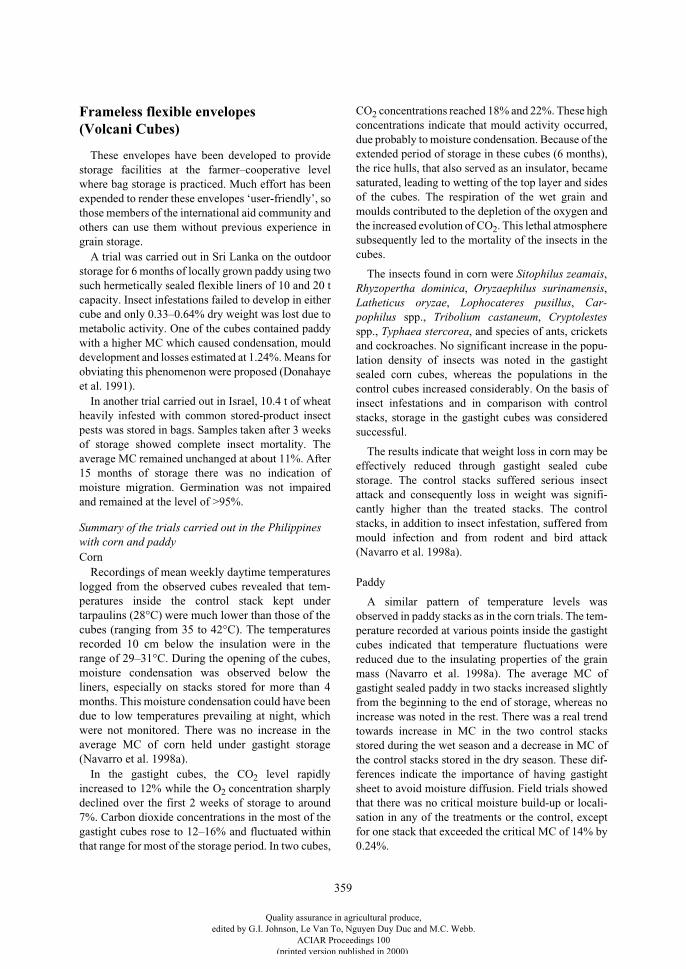
359
Frameless flexible envelopes (Volcani Cubes)
These envelopes have been developed to providestorage facilities at the farmer–cooperative levelwhere bag storage is practiced. Much effort has beenexpended to render these envelopes ‘user-friendly’, sothose members of the international aid community andothers can use them without previous experience ingrain storage.
A trial was carried out in Sri Lanka on the outdoorstorage for 6 months of locally grown paddy using twosuch hermetically sealed flexible liners of 10 and 20 tcapacity. Insect infestations failed to develop in eithercube and only 0.33–0.64% dry weight was lost due tometabolic activity. One of the cubes contained paddywith a higher MC which caused condensation, moulddevelopment and losses estimated at 1.24%. Means forobviating this phenomenon were proposed (Donahayeet al. 1991).
In another trial carried out in Israel, 10.4 t of wheatheavily infested with common stored-product insectpests was stored in bags. Samples taken after 3 weeksof storage showed complete insect mortality. Theaverage MC remained unchanged at about 11%. After15 months of storage there was no indication ofmoisture migration. Germination was not impairedand remained at the level of >95%.
Summary of the trials carried out in the Philippines with corn and paddy
CornRecordings of mean weekly daytime temperatures
logged from the observed cubes revealed that tem-peratures inside the control stack kept undertarpaulins (28°C)
were much lower than those of thecubes (ranging from 35 to 42°C). The temperaturesrecorded 10 cm below the insulation were in therange of 29–31°C. During the opening of the cubes,moisture condensation was observed below theliners, especially on stacks stored for more than 4months. This moisture condensation could have beendue to low temperatures prevailing at night, whichwere not monitored. There was no increase in theaverage MC of corn held under gastight storage(Navarro et al. 1998a).
In the gastight cubes, the CO
2
level rapidlyincreased to 12% while the O
2
concentration sharplydeclined over the first 2 weeks of storage to around7%. Carbon dioxide concentrations in the most of thegastight cubes rose to 12–16% and fluctuated withinthat range for most of the storage period. In two cubes,
CO
2
concentrations reached 18% and 22%. These highconcentrations indicate that mould activity occurred,due probably to moisture condensation. Because of theextended period of storage in these cubes (6 months),the rice hulls, that also served as an insulator, becamesaturated, leading to wetting of the top layer and sidesof the cubes. The respiration of the wet grain andmoulds contributed to the depletion of the oxygen andthe increased evolution of CO
2
. This lethal atmospheresubsequently led to the mortality of the insects in thecubes.
The insects found in corn were
Sitophilus zeamais
,
Rhyzopertha dominica
,
Oryzaephilus surinamensis
,
Latheticus oryzae
,
Lophocateres pusillus
,
Car-pophilus
spp.,
Tribolium castaneum
,
Cryptolestes
spp.,
Typhaea stercorea
, and species of ants, cricketsand cockroaches. No significant increase in the popu-lation density of insects was noted in the gastightsealed corn cubes, whereas the populations in thecontrol cubes increased considerably. On the basis ofinsect infestations and in comparison with controlstacks, storage in the gastight cubes was consideredsuccessful.
The results indicate that weight loss in corn may beeffectively reduced through gastight sealed cubestorage. The control stacks suffered serious insectattack and consequently loss in weight was signifi-cantly higher than the treated stacks. The controlstacks, in addition to insect infestation, suffered frommould infection and from rodent and bird attack(Navarro et al. 1998a).
Paddy
A similar pattern of temperature levels wasobserved in paddy stacks as in the corn trials. The tem-perature recorded at various points inside the gastightcubes indicated that temperature fluctuations werereduced due to the insulating properties of the grainmass (Navarro et al. 1998a). The average MC ofgastight sealed paddy in two stacks increased slightlyfrom the beginning to the end of storage, whereas noincrease was noted in the rest. There was a real trendtowards increase in MC in the two control stacksstored during the wet season and a decrease in MC ofthe control stacks stored in the dry season. These dif-ferences indicate the importance of having gastightsheet to avoid moisture diffusion. Field trials showedthat there was no critical moisture build-up or locali-sation in any of the treatments or the control, exceptfor one stack that exceeded the critical MC of 14% by0.24%.
Quality assurance in agricultural produce,edited by G.I. Johnson, Le Van To, Nguyen Duy Duc and M.C. Webb.
ACIAR Proceedings 100(printed version published in 2000)
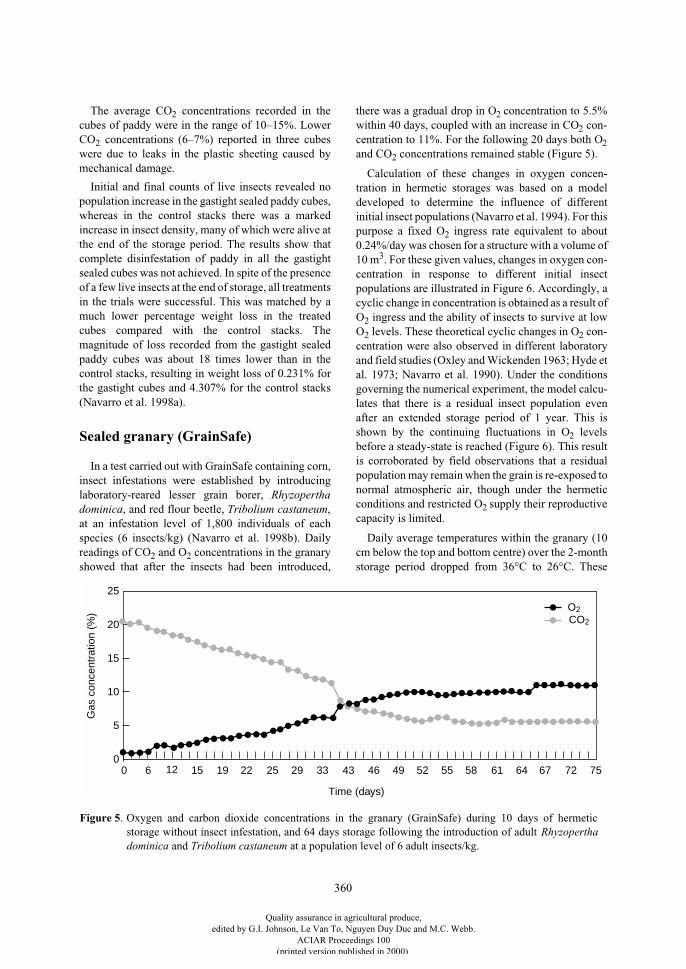
360
The average CO
2
concentrations recorded in thecubes of paddy were in the range of 10–15%. LowerCO
2
concentrations (6–7%) reported in three cubeswere due to leaks in the plastic sheeting caused bymechanical damage.
Initial and final counts of live insects revealed nopopulation increase in the gastight sealed paddy cubes,whereas in the control stacks there was a markedincrease in insect density, many of which were alive atthe end of the storage period. The results show thatcomplete disinfestation of paddy in all the gastightsealed cubes was not achieved. In spite of the presenceof a few live insects at the end of storage, all treatmentsin the trials were successful. This was matched by amuch lower percentage weight loss in the treatedcubes compared with the control stacks. Themagnitude of loss recorded from the gastight sealedpaddy cubes was about 18 times lower than in thecontrol stacks, resulting in weight loss of 0.231% forthe gastight cubes and 4.307% for the control stacks(Navarro et al. 1998a).
Sealed granary (GrainSafe)
In a test carried out with GrainSafe containing corn,insect infestations were established by introducinglaboratory-reared lesser grain borer,
Rhyzoperthadominica
, and red flour beetle,
Tribolium castaneum
,at an infestation level of 1,800 individuals of eachspecies (6 insects/kg) (Navarro et al. 1998b). Dailyreadings of CO
2
and O
2
concentrations in the granaryshowed that after the insects had been introduced,
there was a gradual drop in O
2
concentration to 5.5%within 40 days, coupled with an increase in CO
2
con-centration to 11%. For the following 20 days both O
2
and CO
2
concentrations remained stable (Figure 5).
Calculation of these changes in oxygen concen-tration in hermetic storages was based on a modeldeveloped to determine the influence of differentinitial insect populations (Navarro et al. 1994). For thispurpose a fixed O
2
ingress rate equivalent to about0.24%/day was chosen for a structure with a volume of10 m
3
. For these given values, changes in oxygen con-centration in response to different initial insectpopulations are illustrated in Figure 6. Accordingly, acyclic change in concentration is obtained as a result ofO
2
ingress and the ability of insects to survive at lowO
2
levels. These theoretical cyclic changes in O
2
con-centration were also observed in different laboratoryand field studies (Oxley and Wickenden 1963; Hyde etal. 1973; Navarro et al. 1990). Under the conditionsgoverning the numerical experiment, the model calcu-lates that there is a residual insect population evenafter an extended storage period of 1 year. This isshown by the continuing fluctuations in O
2
levelsbefore a steady-state is reached (Figure 6). This resultis corroborated by field observations that a residualpopulation may remain when the grain is re-exposed tonormal atmospheric air, though under the hermeticconditions and restricted O
2
supply their reproductivecapacity is limited.
Daily average temperatures within the granary (10cm below the top and bottom centre) over the 2-monthstorage period dropped from 36°C to 26°C. These
0
10
5
15
25
CO2
O2
Gas
con
cent
ratio
n (%
)
20
0 6 12 15 19 22 2925 33 43 46 49 52 55 58 61 64 67 72 75
Time (days)
Figure 5. Oxygen and carbon dioxide concentrations in the granary (GrainSafe) during 10 days of hermeticstorage without insect infestation, and 64 days storage following the introduction of adult Rhyzoperthadominica and Tribolium castaneum at a population level of 6 adult insects/kg.
Quality assurance in agricultural produce,edited by G.I. Johnson, Le Van To, Nguyen Duy Duc and M.C. Webb.
ACIAR Proceedings 100(printed version published in 2000)
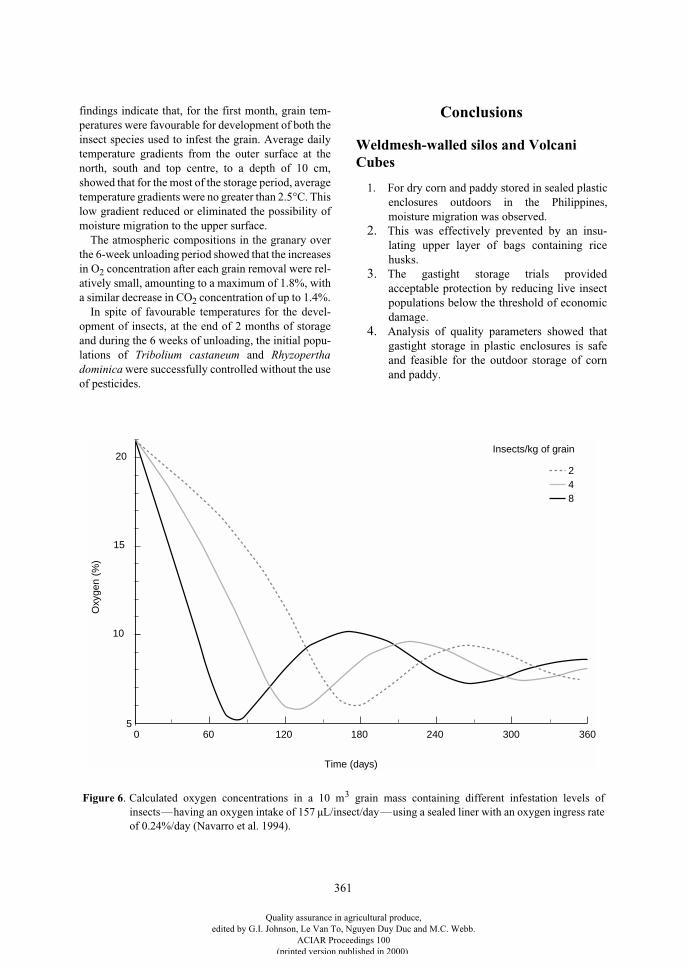
361
findings indicate that, for the first month, grain tem-peratures were favourable for development of both theinsect species used to infest the grain. Average dailytemperature gradients from the outer surface at thenorth, south and top centre, to a depth of 10 cm,showed that for the most of the storage period, averagetemperature gradients were no greater than 2.5°C. Thislow gradient reduced or eliminated the possibility ofmoisture migration to the upper surface.
The atmospheric compositions in the granary overthe 6-week unloading period showed that the increasesin O
2
concentration after each grain removal were rel-atively small, amounting to a maximum of 1.8%, witha similar decrease in CO
2
concentration of up to 1.4%.In spite of favourable temperatures for the devel-
opment of insects, at the end of 2 months of storageand during the 6 weeks of unloading, the initial popu-lations of
Tribolium castaneum
and
Rhyzoperthadominica
were successfully controlled without the useof pesticides.
Conclusions
Weldmesh-walled silos and Volcani Cubes
1. For dry corn and paddy stored in sealed plasticenclosures outdoors in the Philippines,moisture migration was observed.
2.
This was effectively prevented by an insu-lating upper layer of bags containing ricehusks.
3.
The gastight storage trials providedacceptable protection by reducing live insectpopulations below the threshold of economicdamage.
4.
Analysis of quality parameters showed thatgastight storage in plastic enclosures is safeand feasible for the outdoor storage of cornand paddy.
5
Oxy
gen
(%)
0 60 120 180 240 300 360
Time (days)
10
15
20
842
Insects/kg of grain
Figure 6. Calculated oxygen concentrations in a 10 m3 grain mass containing different infestation levels ofinsects—having an oxygen intake of 157 µL/insect/day—using a sealed liner with an oxygen ingress rateof 0.24%/day (Navarro et al. 1994).
Quality assurance in agricultural produce,edited by G.I. Johnson, Le Van To, Nguyen Duy Duc and M.C. Webb.
ACIAR Proceedings 100(printed version published in 2000)
362
5.
Under Philippine climatic conditions theperiod of safe storage without significant con-densation damage did not exceed 4 months.
6.
The technology has strong potential foradoption by farmers and cooperatives in theirpostharvest operations.
GrainSafe granary
1.
This trial clearly showed that, under Israeliconditions, dry corn could be safely stored for5 months in the sealed granary, without theneed for chemical control, even though it wasperiodically opened to permit partial removalof its contents.
2.
The level of gastightness and the constructiondesign contributed to a minimal change in gascomposition within the granary during eachunloading.
3.
A residual insect population survived, butcould not develop to a level causing economicdamage.
4.
Gas concentrations indicate adequate sealingto a level that prevented grain damage.
5.
Gas losses throughout the emptying processof 100 kg per week caused an increase in O
2
concentration at an average rate of 1.8% perdischarge. However, this unloading rate didnot adversely influence the storage potentialof the corn.
6.
The granary was shaded with a roof cone ofplant material, resulting in minimal temper-ature fluctuations, while condensation wasnot detectable at the top surface of thegranary.
7.
The initial 10.1% MC of the corn did not sig-nificantly change throughout the storageperiod.
8.
The granary still has to be field tested in targetcountries, both to examine it under local con-ditions and to evaluate its acceptability fromthe socioeconomic viewpoint.
Acknowledgments
The authors wish to thank Mr Tom deBruin, exportmanager, and Eng. Igor Koltunov of Haogenplast,Israel, for their close cooperation in the developmentand construction of the GrainSafe. Part of this studyrelated to the weldmesh plastic silo and the VolcaniCube was undertaken with the support of the UnitedStates Agency for International Development, under
the Cooperative Development Research (CDR)project C7-053.
References
Alvindia, D.G., Caliboso, F.M., Sabio, G.C. and Regpala,A.R. 1994. Modified atmosphere storage of bagged maizeoutdoors using flexible liners: a preliminary report. In:Highley, E., Wright, E.J., Banks, H.J. and Champ, B.R.,ed., Proceedings of the 6
th
International WorkingConference on Stored-Product Protection, Canberra,Australia, 17–23 April 1994. Wallingford, CABInternational, 22–26.
Anon. 1986. Warehouse management of bag storage ofgrains. Food and Agriculture Organization of the UnitedNations/United Nations Development Programme(FAO/UNDP) and Department of Food, Ministry of Foodand Civil Supplies, New Delhi, India, 359p.
Bonner, R.R.M. and Hirdy, W. 1987. RRC grain storage inWelo region, northern Ethiopia. Survey results andrecommendations, Sep–Dec 1987, Addis Ababa, 56p.
Calderon, M., Donahaye, E., Navarro, S. and Davis, R.1989. Wheat storage in a semi-desert region. TropicalScience, 29, 91–110.
Caliboso, F.M., Navarro, S., Alvindia, D.G., Donahaye,E.J., Sabio, G.C. and dela Cruz, M.T. 1997. Effect ofgastight storage on growth of fungi in paddy storedoutdoors. In: Proceedings of the International Conferenceon Controlled Atmosphere and Fumigation in GrainStorages, 21–26 April 1996, Nicosia, Cyprus, 135–144.
Curride, D.J. and Navon, A. 1986. Iron Age pits and theLahav (Tel Halif) grain storage project. In: PhDdissertation (Curride), Archaeological investigations intothe grain storage practices of Iron Age Palestine. Chicago,University of Chicago, 67–78.
De Lima, C.P.F. 1980. Requirements for the integration oflarge-scale hermetic storage facilities with conventionalsystems. In: Shejbal, J., ed., Controlled atmospherestorage of grains. Amsterdam, Holland, ElsevierScientific Publishing, 427–444.
Donahaye, E., Navarro. S., Ziv, A., Blauschild, Y. andWeerasinghe, D. 1991. Storage of paddy in hermeticallysealed plastic liners in Sri Lanka. Tropical Science, 31,109–121.
Donahaye, E.J. and Messer, E. 1992. Reduction in grainstorage losses of small-scale farmers in tropical countries.Research Report RR-91-7, The Allan Shawn FeinsteinWorld Hunger Program, Brown University, USA, 19p.
Gilman, G.A. and Boxall, R.A. 1974. The storage of foodgrains in traditional underground pits. Tropical StoredProduct Information, 28, 19–38.
Guggenheim, H. 1978. Of millet, mice and men: traditionaland invisible technology solutions to postharvest losses inMali. In: Pimentel, D., ed., World food, pest losses and theenvironment. AAAS Selected Symposium 13. Boulder,Colorado, Westview Press, 109–162.
Quality assurance in agricultural produce,edited by G.I. Johnson, Le Van To, Nguyen Duy Duc and M.C. Webb.
ACIAR Proceedings 100(printed version published in 2000)
363
Howe, R.W. 1965. A summary of estimates of optimal andminimal conditions for population increase of somestored products insects. Journal of Stored ProductResearch, 1, 177–184.
Hyde, M.B., Baker, A.A. and Ross, A.C. 1973. Airtightgrain storage. FAO (Food and Agriculture Organizationof the United Nations) Agricultural Service Bulletin No.17, 71p.
Navarro, S. and Caliboso, F.M. 1996. Application ofmodified atmospheres under plastic covers for preventionof losses in stored grain. Final Report submitted to UnitedStates Agency for International Development,Cooperative Development Research (CDR) Project No.C7-053, August 1990–November 1995, 32p.
Navarro, S., Caliboso, F.M., Sabio, G.C. and Donahaye, E.J.1997. Quality conservation of paddy stored under gas-tight seal outdoors in the Philippines. In: Proceedings ofthe International Conference on Controlled Atmosphereand Fumigation in Grain Storages, 21–26 April 1996,Nicosia, Cyprus, 159–168.
Navarro, S., Donahaye, E., Rindner, M. and Azrieli, A.1990. Airtight storage of grain in plastic structures.Hassadeh Quarterly, 1(2), 85–88.
Navarro, S., Donahaye, E. and Fishman, S. 1994. The futureof hermetic storage of dry grains in tropical andsubtropical climates. In: Highley, E., Wright, E.J., Banks,H.J. and Champ, B.R., ed., Proceedings of the 6
th
International Working Conference on Stored-ProductProtection, Canberra, Australia, 17–23 April 1994.Wallingford, CAB International, 130–138.
Navarro
S., Donahaye, E.J., Caliboso, F.M. and Sabio, G.C.1998a. Outdoor storage of corn and paddy using sealed-stacks in the Philippines. In: Proceedings of the 18
th
Association of South-East Asian Nations (ASEAN)Seminar on Grains Postharvest Technology, 11–13March 1997, Manila, Philippines, 225–236.
Navarro, S., Donahaye, E.J., Ferizli, A.G., Rindner,
M. andAzrieli, A. 1998b. A sealed granary for use by small-scalefarmers.
In: Proceedings of the 7
th
International WorkingConference on Stored-Product Protection,
14–19October, Beijing, China.
O’Dowd, E.T., New, J.H., Bisbrown, A.J.K., Hallam, J.A.and Joy, C. 1987. An evaluation of structures suitable foremergency storage in tropical countries. OverseasDevelopment Natural Resources Institute Bulletin No.10, 78p.
Oxley, T.A. and Wickenden, G. 1963. The effect ofrestricted air supply on some insects which infest grain.Annals of Applied Biology, 51, 313–324.
Pixton, S.W. 1982. The importance of moisture andequilibrium relative humidity in stored products. TropicalStored Product Information, 43, 16–29.
Ripp, B.E., Banks, H.J., Bond, E.J., Calverley, D.J., Jay,E.G. and Navarro, S. (ed.) 1984. Controlled atmosphereand fumigation in grain storages. Developments inagricultural engineering 5. Amsterdam, ElsevierScientific Publishing, 798p.
Semple, L. 1985. Pest control in grain storage systems in theASEAN region. Philippines, Association of South-EastAsian Nations (ASEAN) Crops Post-HarvestProgramme, 77p.
Quality assurance in agricultural produce,edited by G.I. Johnson, Le Van To, Nguyen Duy Duc and M.C. Webb.
ACIAR Proceedings 100(printed version published in 2000)

364
Quality assurance in agricultural produce,edited by G.I. Johnson, Le Van To, Nguyen Duy Duc and M.C. Webb.
ACIAR Proceedings 100(printed version published in 2000)
367
Developing a Computer-assisted Learning (CAL) System to Improve Training of Staff in Grain Quality Management in the ASEAN Region
R. Bermundo*, R. Tiongson*, J. Tumambing*, Nguyen Huu Dat†, Tran Van An§, Phan Hieu Hien¶, O. Dharmaputra**, H. Halid††, H. Purwadaria§§, M. Sidik††, B. Chankaewmanee¶¶, S. Kositcharoenkul¶¶, S. Soponronnarit***, R. Driscoll†††, G. Srzednicki†††, J. van S. Graver§§§ and B. Longstaff§§§
Abstract
An important aspect in grain storage is the need for all people, from chief executive to labourer, to understandclearly the actions and events involved in pest management and quality control. Any improvements made inthe decision-making processes leading to these actions should increase their efficacy.
A collaborative project involving Indonesia, the Philippines, Thailand, Vietnam, and Australia has developeda computer-assisted learning (CAL) system to strengthen conventional training methods. The package includestutorial and reference systems and ranges across the most important issues facing pest management staff: graindrying, moulds and mycotoxins, and pest management. The package also includes simulation models thatallow users to explore the consequences of using different management strategies.
Courses have been conducted in which this approach to training has been integrated with conventionallectures and practicals. Benefits arising from this project can spill over to other countries in the region, andadoption and integration of CAL by organisations should lead to more effective training systems andsubstantial reductions in the cost of training pest management staff, particularly where there aregeographically-distributed workforces.
* Bureau of Postharvest Research and Extension, CLSU Compound, 3120 Muñoz, Nueva Ecija, Philippines.
† Southern Region Plant Quarantine Office, 28 Mac Dinh Chi Street, District 1, Ho Chi Minh City, Vietnam.
§ Post-Harvest Technology Institute, 45 Dinh Tien Hoang St, District 1, Ho Chi Minh City, Vietnam.
¶ University of Agriculture and Forestry, Thu Duc, Vietnam.
** Southeast Asian Ministers of Education Organization (SEAMEO) BIOTROP, PO Box 116, Bogor, Indonesia.
†† BULOG, Jalan Gatot Subroto 49, Jakarta, Indonesia.
§§ Universitas Pertanian Bogor, Indonesia.
¶¶ Department of Agriculture, Jatujak, Bangkok, Thailand.
*** King Mongkut’s University of Technology Thonburi, Suksawat Road 48, Bangkok 10140, Thailand.
††† Department of Food Science and Technology, University of New South Wales, Sydney NSW 2052, Australia.
§§§ Commonwealth Scientific and Industrial Research Organisation (CSIRO) Entomology, GPO Box 1700, Canberra, ACT 2601, Australia.
Quality assurance in agricultural produce,edited by G.I. Johnson, Le Van To, Nguyen Duy Duc and M.C. Webb.
ACIAR Proceedings 100(printed version published in 2000)
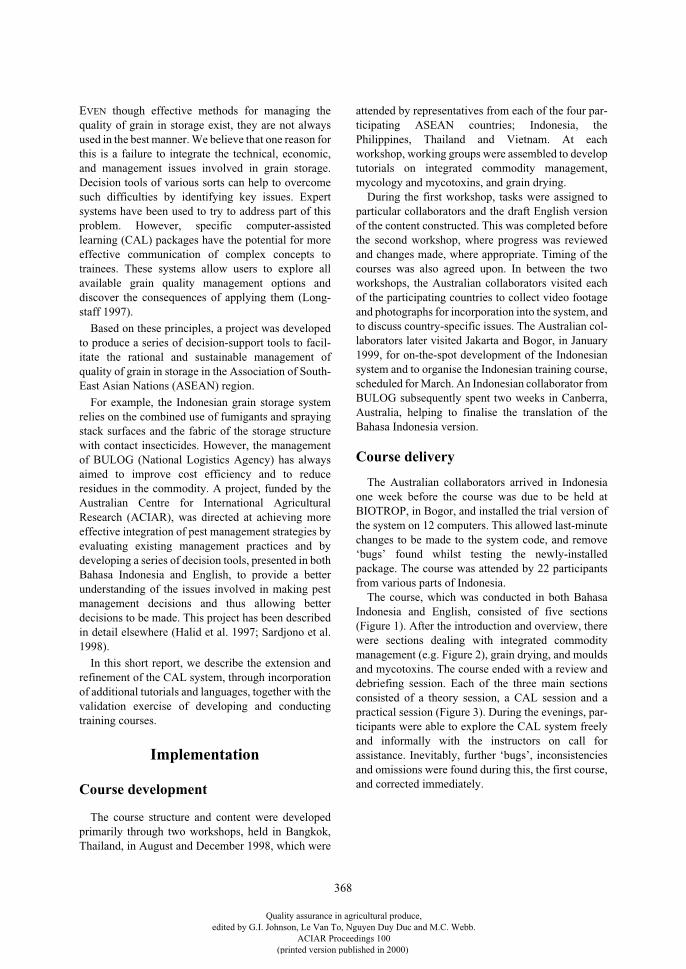
368
E
VEN
though effective methods for managing thequality of grain in storage exist, they are not alwaysused in the best manner. We believe that one reason forthis is a failure to integrate the technical, economic,and management issues involved in grain storage.Decision tools of various sorts can help to overcomesuch difficulties by identifying key issues. Expertsystems have been used to try to address part of thisproblem. However, specific computer-assistedlearning (CAL) packages have the potential for moreeffective communication of complex concepts totrainees. These systems allow users to explore allavailable grain quality management options anddiscover the consequences of applying them (Long-staff 1997).
Based on these principles, a project was developedto produce a series of decision-support tools to facil-itate the rational and sustainable management ofquality of grain in storage in the Association of South-East Asian Nations (ASEAN) region.
For example, the Indonesian grain storage systemrelies on the combined use of fumigants and sprayingstack surfaces and the fabric of the storage structurewith contact insecticides. However, the managementof BULOG (National Logistics Agency) has alwaysaimed to improve cost efficiency and to reduceresidues in the commodity. A project, funded by theAustralian Centre for International AgriculturalResearch (ACIAR), was directed at achieving moreeffective integration of pest management strategies byevaluating existing management practices and bydeveloping a series of decision tools, presented in bothBahasa Indonesia and English, to provide a betterunderstanding of the issues involved in making pestmanagement decisions and thus allowing betterdecisions to be made. This project has been describedin detail elsewhere (Halid et al. 1997; Sardjono et al.1998).
In this short report, we describe the extension andrefinement of the CAL system, through incorporationof additional tutorials and languages, together with thevalidation exercise of developing and conductingtraining courses.
Implementation
Course development
The course structure and content were developedprimarily through two workshops, held in Bangkok,Thailand, in August and December 1998, which were
attended by representatives from each of the four par-ticipating ASEAN countries; Indonesia, thePhilippines, Thailand and Vietnam. At eachworkshop, working groups were assembled to developtutorials on integrated commodity management,mycology and mycotoxins, and grain drying.
During the first workshop, tasks were assigned toparticular collaborators and the draft English versionof the content constructed. This was completed beforethe second workshop, where progress was reviewedand changes made, where appropriate. Timing of thecourses was also agreed upon. In between the twoworkshops, the Australian collaborators visited eachof the participating countries to collect video footageand photographs for incorporation into the system, andto discuss country-specific issues. The Australian col-laborators later visited Jakarta and Bogor, in January1999, for on-the-spot development of the Indonesiansystem and to organise the Indonesian training course,scheduled for March. An Indonesian collaborator fromBULOG subsequently spent two weeks in Canberra,Australia, helping to finalise the translation of theBahasa Indonesia version.
Course delivery
The Australian collaborators arrived in Indonesiaone week before the course was due to be held atBIOTROP, in Bogor, and installed the trial version ofthe system on 12 computers. This allowed last-minutechanges to be made to the system code, and remove‘bugs’ found whilst testing the newly-installedpackage. The course was attended by 22 participantsfrom various parts of Indonesia.
The course, which was conducted in both BahasaIndonesia and English, consisted of five sections(Figure 1). After the introduction and overview, therewere sections dealing with integrated commoditymanagement (e.g. Figure 2), grain drying, and mouldsand mycotoxins. The course ended with a review anddebriefing session. Each of the three main sectionsconsisted of a theory session, a CAL session and apractical session (Figure 3). During the evenings, par-ticipants were able to explore the CAL system freelyand informally with the instructors on call forassistance. Inevitably, further ‘bugs’, inconsistenciesand omissions were found during this, the first course,and corrected immediately.
Quality assurance in agricultural produce,edited by G.I. Johnson, Le Van To, Nguyen Duy Duc and M.C. Webb.
ACIAR Proceedings 100(printed version published in 2000)
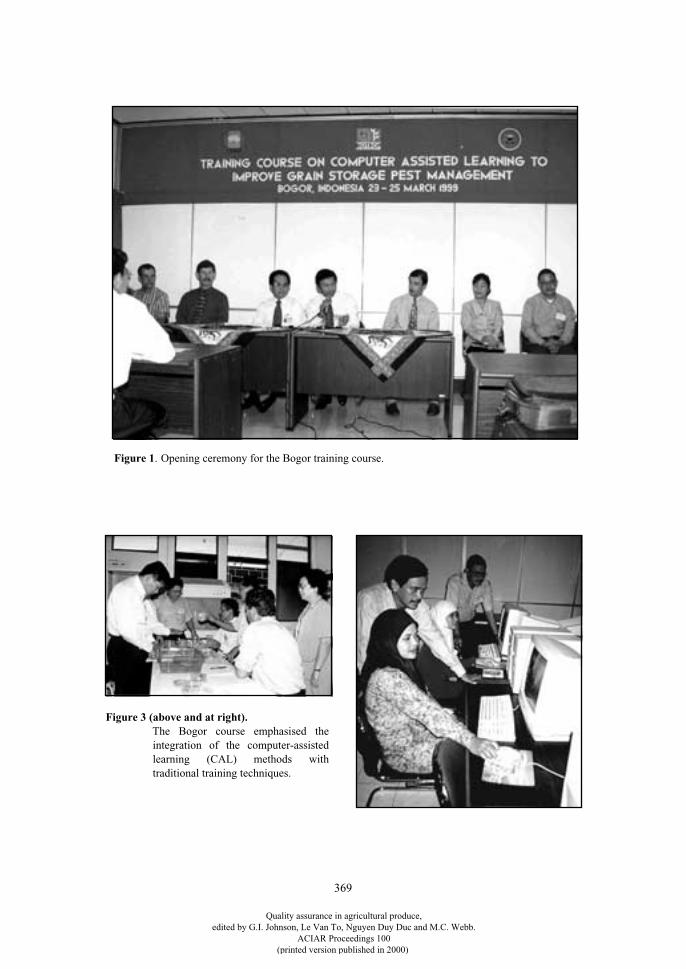
369
Figure 1
. Opening ceremony for the Bogor training course.
Figure 3
(above and at right).
The Bogor course emphasised theintegration of the computer-assistedlearning (CAL) methods withtraditional training techniques.
Quality assurance in agricultural produce,edited by G.I. Johnson, Le Van To, Nguyen Duy Duc and M.C. Webb.
ACIAR Proceedings 100(printed version published in 2000)
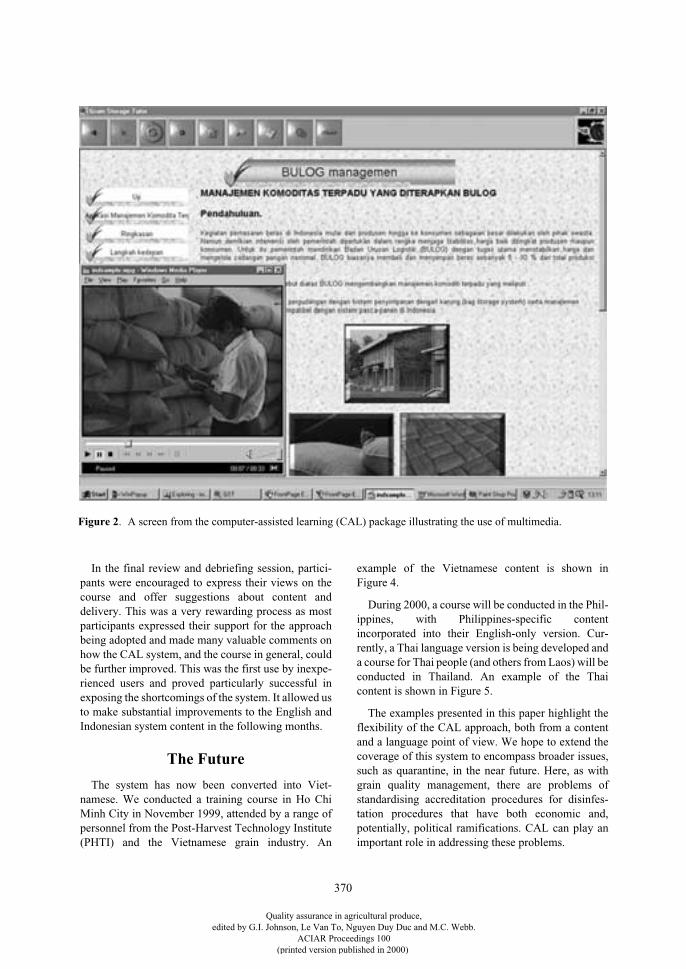
370
Figure 2
. A screen from the computer-assisted learning (CAL) package illustrating the use of multimedia.
In the final review and debriefing session, partici-pants were encouraged to express their views on thecourse and offer suggestions about content anddelivery. This was a very rewarding process as mostparticipants expressed their support for the approachbeing adopted and made many valuable comments onhow the CAL system, and the course in general, couldbe further improved. This was the first use by inexpe-rienced users and proved particularly successful inexposing the shortcomings of the system. It allowed usto make substantial improvements to the English andIndonesian system content in the following months.
The Future
The system has now been converted into Viet-namese. We conducted a training course in Ho ChiMinh City in November 1999, attended by a range ofpersonnel from the Post-Harvest Technology Institute(PHTI) and the Vietnamese grain industry. An
example of the Vietnamese content is shown inFigure 4.
During 2000, a course will be conducted in the Phil-ippines, with Philippines-specific contentincorporated into their English-only version. Cur-rently, a Thai language version is being developed anda course for Thai people (and others from Laos) will beconducted in Thailand. An example of the Thaicontent is shown in Figure 5.
The examples presented in this paper highlight theflexibility of the CAL approach, both from a contentand a language point of view. We hope to extend thecoverage of this system to encompass broader issues,such as quarantine, in the near future. Here, as withgrain quality management, there are problems ofstandardising accreditation procedures for disinfes-tation procedures that have both economic and,potentially, political ramifications. CAL can play animportant role in addressing these problems.
Quality assurance in agricultural produce,edited by G.I. Johnson, Le Van To, Nguyen Duy Duc and M.C. Webb.
ACIAR Proceedings 100(printed version published in 2000)
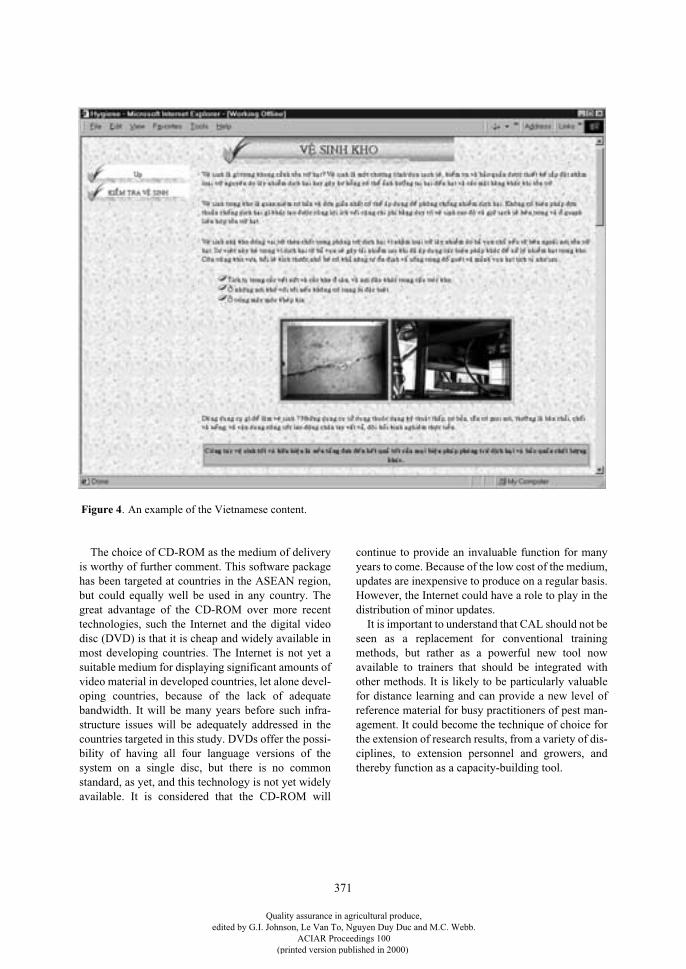
371
Figure 4
. An example of the Vietnamese content.
The choice of CD-ROM as the medium of deliveryis worthy of further comment. This software packagehas been targeted at countries in the ASEAN region,but could equally well be used in any country. Thegreat advantage of the CD-ROM over more recenttechnologies, such the Internet and the digital videodisc (DVD) is that it is cheap and widely available inmost developing countries. The Internet is not yet asuitable medium for displaying significant amounts ofvideo material in developed countries, let alone devel-oping countries, because of the lack of adequatebandwidth. It will be many years before such infra-structure issues will be adequately addressed in thecountries targeted in this study. DVDs offer the possi-bility of having all four language versions of thesystem on a single disc, but there is no commonstandard, as yet, and this technology is not yet widelyavailable. It is considered that the CD-ROM will
continue to provide an invaluable function for manyyears to come. Because of the low cost of the medium,updates are inexpensive to produce on a regular basis.However, the Internet could have a role to play in thedistribution of minor updates.
It is important to understand that CAL should not beseen as a replacement for conventional trainingmethods, but rather as a powerful new tool nowavailable to trainers that should be integrated withother methods. It is likely to be particularly valuablefor distance learning and can provide a new level ofreference material for busy practitioners of pest man-agement. It could become the technique of choice forthe extension of research results, from a variety of dis-ciplines, to extension personnel and growers, andthereby function as a capacity-building tool.
Quality assurance in agricultural produce,edited by G.I. Johnson, Le Van To, Nguyen Duy Duc and M.C. Webb.
ACIAR Proceedings 100(printed version published in 2000)
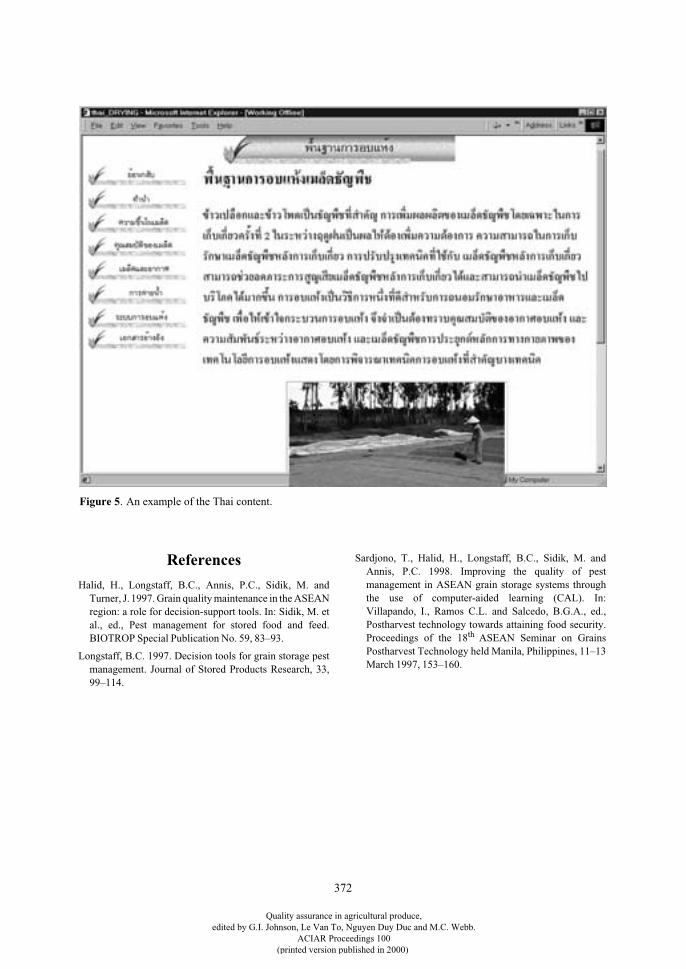
372
Figure 5
. An example of the Thai content.
References
Halid, H., Longstaff, B.C., Annis, P.C., Sidik, M. andTurner, J.
1997. Grain quality maintenance in the ASEANregion: a role for decision-support tools. In: Sidik, M. etal., ed., Pest management for stored food and feed.BIOTROP Special Publication No. 59, 83–93.
Longstaff, B.C. 1997. Decision tools for grain storage pestmanagement. Journal of Stored Products Research, 33,99–114.
Sardjono, T., Halid, H., Longstaff, B.C., Sidik, M. andAnnis, P.C. 1998. Improving the quality of pestmanagement in ASEAN grain storage systems throughthe use of computer-aided learning (CAL). In:Villapando, I., Ramos C.L. and Salcedo, B.G.A., ed.,Postharvest technology towards attaining food security.Proceedings of the 18
th
ASEAN Seminar on GrainsPostharvest Technology held Manila, Philippines, 11–13March 1997, 153–160.
Quality assurance in agricultural produce,edited by G.I. Johnson, Le Van To, Nguyen Duy Duc and M.C. Webb.
ACIAR Proceedings 100(printed version published in 2000)
373
Information Network on Post-harvest Operations
A. Bell*, C. Bothe† and O. Mück§
Abstract
The Information Network on Post-harvest Operations (INPhO) is a project led by the Food and AgricultureOrganization of the United Nations (FAO) in partnership with the Deusche Gesellschaft für TechnischeZusammenarbeit (GTZ) and French Centre de Coopération Internationale en Recherche Agronomique pour leDéveloppement (CIRAD). Furthermore the project is supported by international, regional and nationalinstitutions dealing with postharvest operations. It provides information on postharvest systems from harvestto consumption. INPhO disseminates useful information through new media such as the Internet (see websiteat <http://www.fao.org/inpho/>) and CD-ROMs.
I
N
THE
past, much effort has been devoted toimproving different aspects of postproduction systemscovering major staple crops in developing countries.This has resulted in the accumulation of a largeamount of research results, useful practical experi-ences, technical information, and products. Untilrecently, however, most of this know-how was noteasily accessible since work has been carried outwithout central coordination or a focal point for dis-semination.
Following requests from donor agencies, devel-opment organisations, and research and traininginstitutions, the Food and Agriculture Organization ofthe United Nations (FAO) established a secretariatwhich collects, collates and disseminates informationon proven technologies, practical information, experi-ences and other details of the postharvest systems of agreat number of products. The name of the secretariatis the Information Network on Post-harvest Opera-tions (INPhO). It acts as a reference forum and playsan important role in giving a better direction to post-production endeavours. The program is beingsupported by Deutsche Gesellschaft für TechnischeZusammenarbeit (GTZ—Germany Agency for
Technical Cooperation) GmbH and the French Centrede Coopération Internationale en RechercheAgronomique pour le Développement (CIRAD).
Methods
The INPhO program uses methods of informationtransfer that are based on computerised communicationfacilities. The standard access to the databank and addi-tional features of the program is through the INPhOwebsite on the Internet at <http://www.fao.org/inpho/>.INPhO is composed of a growing number of smalldatabases (DBs), such as “Who is Who in PH”,“Cookbook-Processing for Profit”, “Training DB” andthe “Link DB”. All the small DBs are connected via acentral search function. At present, this central functiondeals with one key word, but in the near future it willallow a choice of commodity, country and topic. Userswho do not have access to the Internet may obtain thedatabase part of the INPhO site on a CD-ROM that isregularly updated. INPhO is available in English,French and Spanish. The design is very basic in order toassure acceptable retrieval times even in developingcountries.
Achievements and Discussion
Since its launch online in May 1998, the pilot versionof the INPhO site has been considerably expanded. It
* Deutsche Gesellschaft für Technische Zusammenarbeit (GTZ), PO Box 5180, D-65726 Eschborn, Germany.
† Food and Agriculture Organization of the United Nations (FAO), Agro-industries and Post-harvest Management Service (AGSI), Rome, Italy.
§ Falkenstr. 14, D-22885 Barsbüttel, Germany.
Quality assurance in agricultural produce,edited by G.I. Johnson, Le Van To, Nguyen Duy Duc and M.C. Webb.
ACIAR Proceedings 100(printed version published in 2000)
374
includes a databank, interactive communicationservices, and links with other libraries and databases.
The databank elements cover the following areas:• postproduction facts (including product files for
different groups of commodities such as cereals,roots and tubers, fruits, vegetables etc., a resourcelist, country information and postproductiontechnologies including pest control and othertopics);
• archives (including bibliographic references fromthe Agris database of FAO, document highlights,numerous full documents in four languages,proceedings, pictures and movies);
• decision-support tools (in areas including projectpreparation and evaluation, investment costs andfeasibility, marketing, and postproductionanalysis); and
•
r
elated information such as phytosanitary issuesand farming systems.
The communication services consist of a questionand answer service, operating in collaboration with theInternational Network for Technical Information(INTI), e-mail conferences on relevant topics, andforums that involve setting up electronic exchangesites. Finally, INPhO invites users to provide their
information to the database through special data inputareas.
The Link DB contains more than 200 connections tolibraries, databases and static webpages dealing withpostharvest and related issues. The Link DB leads outof the information area directly organised and struc-tured by INPhO and completes the wealth ofinformation available through this site.
INPhO provides users with consolidated and fullyintegrated information on all aspects of postharvestsystems. This information is currently area and/orregion specific. In future it will be country specific inorder to assist in formulating better national policiesfor agricultural development and improvement of foodsecurity. Since the establishment of INPhO, a betterexchange of information between donors and recipientinstitutions has become possible, allowing improvedchannelling of the limited resources available andminimising duplication. Users include people workingin the agricultural production and marketing sector,such as producers, researchers, policy-makers, privateinvestors, donors etc.
For full information on the INPhO program visit thewebsite at <http://www.fao.org/inpho/>.
Quality assurance in agricultural produce,edited by G.I. Johnson, Le Van To, Nguyen Duy Duc and M.C. Webb.
ACIAR Proceedings 100(printed version published in 2000)
375
Research and Development on Postharvest Handling of Fruits and Vegetables in Malaysia
Abdullah Hassan*
Abstract
There are several institutions in Malaysia involved in research and development (R&D) activities on thepostharvest handling of fruits and vegetables, including the Malaysian Agricultural Research and DevelopmentInstitute (MARDI), Universiti Putra Malaysia, Universiti Kebangsaan Malaysia, University Malaya,Universiti Sains Malaysia and the Malaysian Institute of Nuclear Technology. MARDI is considered the focalpoint, with the most comprehensive R&D program and activities on food and agriculture. One of the mainobjectives of the program is to establish packaged technologies on postharvest handling of fresh fruits andvegetables for both local and export markets. This is considered vital in our attempts to develop the Malaysianhorticultural industry. The research activities cover a wide range of handling aspects, including harvesting,storage, transportation, packaging and ripening. Over the past 20 years, many significant achievements havebeen made. Some of the technologies have been transferred to target groups, including individuals, farmers,exporters, relevant government agencies and the private sector. The postharvest group at MARDI has also beenactively involved in regional activities, especially through the Association of South-East Asian Nations(ASEAN)–Australia Economic Cooperation Program and the Australian Centre for International AgriculturalResearch. Research collaborations have also been established with the International Atomic Energy Agency,United States Department of Agriculture, Japan International Cooperation Agency, and other agencies.
T
WENTY
FOUR
years ago, in September 1975 in NewYork, the United Nations General Assembly passedthe following resolution:
“The further reduction of postharvest food losses in developing countries should be undertaken as a matter of priority, with the view to reaching at least a 50% reduction by 1985. All countries and competent inter-national organizations should cooperate financially and technically in the effort to achieve this objective”.
This resolution drew the attention of the highestlevels of government authorities around the world andmarked a turning point in the recognising the impor-tance of postharvest food losses (Bourne 1986). Manygovernments and other organisations have developedcomprehensive programs to ensure that consistent
attention is given to the problems of caring for food,including fruits and vegetables. Malaysia is noexception.
Today, the research and development (R&D) activ-ities on postharvest handling of fruits and vegetablesin Malaysia are conducted at several institutions,including the Malaysian Agricultural Research andDevelopment Institute (MARDI), Universiti PutraMalaysia, Universiti Kebangsaan Malaysia, Uni-versity Malaya, Universiti Sains Malaysia and theMalaysian Institute of Nuclear Technology. MARDIis considered to be the focal point, since the institutehas had the most comprehensive R&D program andactivities on food and agriculture for more than 20years. While earlier studies were targeted mainly at thereduction of postharvest losses, the current research isemphasising technology development to support andstrengthen the horticultural industry in the country.Due to time constraints, the following discussion willfocus on MARDI.
* Horticulture Research Centre, Malaysian Agricultural Research and Development Institute (MARDI), GPO Box 12301, 50774 Kuala Lumpur, Malaysia.
Quality assurance in agricultural produce,edited by G.I. Johnson, Le Van To, Nguyen Duy Duc and M.C. Webb.
ACIAR Proceedings 100(printed version published in 2000)
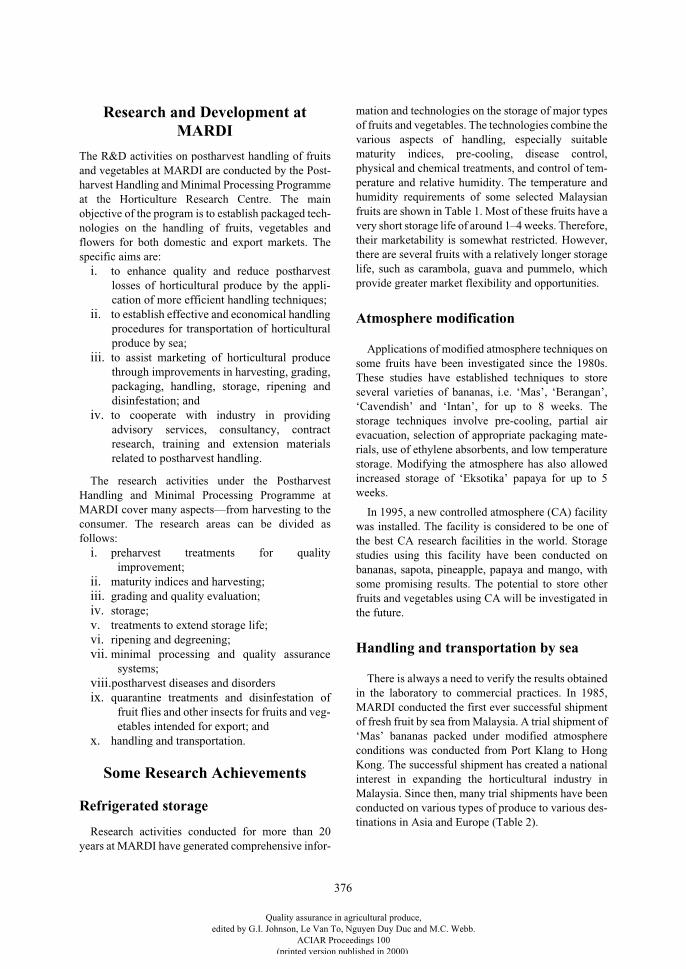
376
Research and Development at MARDI
The R&D activities on postharvest handling of fruitsand vegetables at MARDI are conducted by the Post-harvest Handling and Minimal Processing Programmeat the Horticulture Research Centre. The mainobjective of the program is to establish packaged tech-nologies on the handling of fruits, vegetables andflowers for both domestic and export markets. Thespecific aims are:
i.
to enhance quality and reduce postharvestlosses of horticultural produce by the appli-cation of more efficient handling techniques;
ii.
to establish effective and economical handlingprocedures for transportation of horticulturalproduce by sea;
iii.
to assist marketing of horticultural producethrough improvements in harvesting, grading,packaging, handling, storage, ripening anddisinfestation; and
iv.
to cooperate with industry in providingadvisory services, consultancy, contractresearch, training and extension materialsrelated to postharvest handling.
The research activities under the PostharvestHandling and Minimal Processing Programme atMARDI cover many aspects—from harvesting to theconsumer. The research areas can be divided asfollows:
i.
preharvest treatments for qualityimprovement;
ii.
maturity indices and harvesting;
iii.
grading and quality evaluation;
iv.
storage;
v.
treatments to extend storage life;
vi.
ripening and degreening;
vii.
minimal processing and quality assurancesystems;
viii.
postharvest diseases and disorders
ix.
quarantine treatments and disinfestation offruit flies and other insects for fruits and veg-etables intended for export; and
x.
handling and transportation.
Some Research Achievements
Refrigerated storage
Research activities conducted for more than 20years at MARDI have generated comprehensive infor-
mation and technologies on the storage of major typesof fruits and vegetables. The technologies combine thevarious aspects of handling, especially suitablematurity indices, pre-cooling, disease control,physical and chemical treatments, and control of tem-perature and relative humidity. The temperature andhumidity requirements of some selected Malaysianfruits are shown in Table 1. Most of these fruits have avery short storage life of around 1–4 weeks. Therefore,their marketability is somewhat restricted. However,there are several fruits with a relatively longer storagelife, such as carambola, guava and pummelo, whichprovide greater market flexibility and opportunities.
Atmosphere modification
Applications of modified atmosphere techniques onsome fruits have been investigated since the 1980s.These studies have established techniques to storeseveral varieties of bananas, i.e. ‘Mas’, ‘Berangan’,‘Cavendish’ and ‘Intan’, for up to 8 weeks. Thestorage techniques involve pre-cooling, partial airevacuation, selection of appropriate packaging mate-rials, use of ethylene absorbents, and low temperaturestorage. Modifying the atmosphere has also allowedincreased storage of ‘Eksotika’ papaya for up to 5weeks.
In 1995, a new controlled atmosphere (CA) facilitywas installed. The facility is considered to be one ofthe best CA research facilities in the world. Storagestudies using this facility have been conducted onbananas, sapota, pineapple, papaya and mango, withsome promising results. The potential to store otherfruits and vegetables using CA will be investigated inthe future.
Handling and transportation by sea
There is always a need to verify the results obtainedin the laboratory to commercial practices. In 1985,MARDI conducted the first ever successful shipmentof fresh fruit by sea from Malaysia. A trial shipment of‘Mas’ bananas packed under modified atmosphereconditions was conducted from Port Klang to HongKong. The successful shipment has created a nationalinterest in expanding the horticultural industry inMalaysia. Since then, many trial shipments have beenconducted on various types of produce to various des-tinations in Asia and Europe (Table 2).
Quality assurance in agricultural produce,edited by G.I. Johnson, Le Van To, Nguyen Duy Duc and M.C. Webb.
ACIAR Proceedings 100(printed version published in 2000)
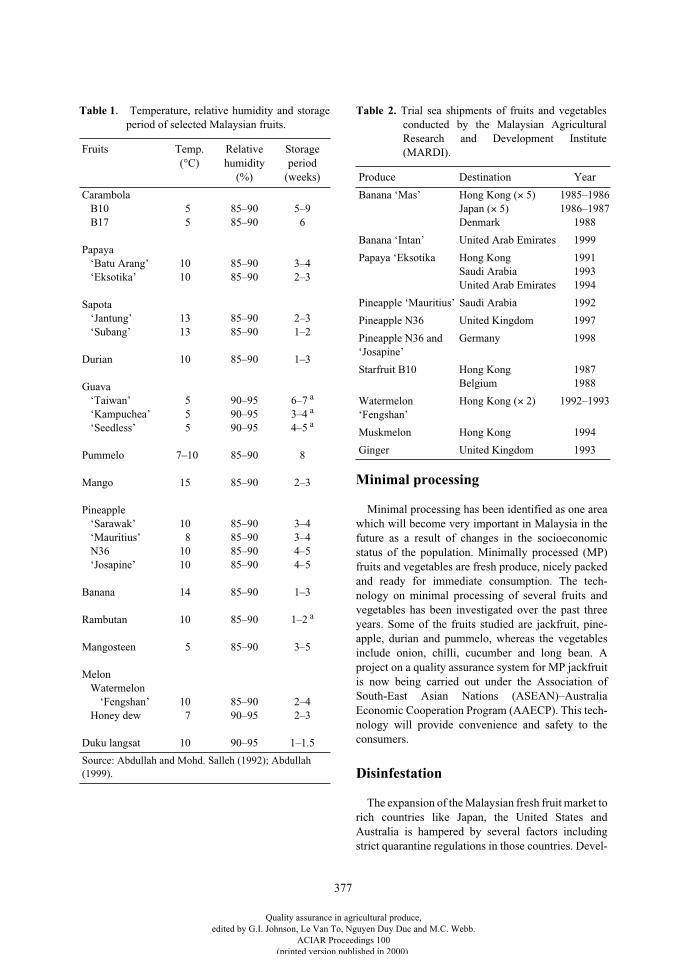
377
Minimal processing
Minimal processing has been identified as one areawhich will become very important in Malaysia in thefuture as a result of changes in the socioeconomicstatus of the population. Minimally processed (MP)fruits and vegetables are fresh produce, nicely packedand ready for immediate consumption. The tech-nology on minimal processing of several fruits andvegetables has been investigated over the past threeyears. Some of the fruits studied are jackfruit, pine-apple, durian and pummelo, whereas the vegetablesinclude onion, chilli, cucumber and long bean. Aproject on a quality assurance system for MP jackfruitis now being carried out under the Association ofSouth-East Asian Nations (ASEAN)–AustraliaEconomic Cooperation Program (AAECP). This tech-nology will provide convenience and safety to theconsumers.
Disinfestation
The expansion of the Malaysian fresh fruit market torich countries like Japan, the United States andAustralia is hampered by several factors includingstrict quarantine regulations in those countries. Devel-
Table 1
. Temperature, relative humidity and storageperiod of selected Malaysian fruits.
Fruits Temp.(°C)
Relative humidity
(%)
Storage period
(weeks)
CarambolaB10B17
Papaya‘Batu Arang’‘Eksotika’
Sapota‘Jantung’‘Subang’
Durian
Guava‘Taiwan’‘Kampuchea’‘Seedless’
Pummelo
Mango
Pineapple‘Sarawak’‘Mauritius’N36‘Josapine’
Banana
Rambutan
Mangosteen
MelonWatermelon
‘Fengshan’Honey dew
Duku langsat
55
1010
1313
10
555
7–10
15
108
1010
14
10
5
107
10
85–9085–90
85–9085–90
85–9085–90
85–90
90–9590–9590–95
85–90
85–90
85–9085–9085–9085–90
85–90
85–90
85–90
85–9090–95
90–95
5–96
3–42–3
2–31–2
1–3
6–7
a
3–4
a
4–5
a
8
2–3
3–43–44–54–5
1–3
1–2
a
3–5
2–42–3
1–1.5
Source: Abdullah and Mohd. Salleh (1992); Abdullah (1999).
Table 2.
Trial sea shipments of fruits and vegetablesconducted by the Malaysian AgriculturalResearch and Development Institute(MARDI).
Produce Destination Year
Banana ‘Mas’ Hong Kong (
×
5)Japan (
×
5)Denmark
1985–19861986–1987
1988
Banana ‘Intan’ United Arab Emirates 1999
Papaya ‘Eksotika Hong KongSaudi ArabiaUnited Arab Emirates
199119931994
Pineapple ‘Mauritius’ Saudi Arabia 1992
Pineapple N36 United Kingdom 1997
Pineapple N36 and ‘Josapine’
Germany 1998
Starfruit B10 Hong KongBelgium
19871988
Watermelon ‘Fengshan’
Hong Kong (
×
2) 1992–1993
Muskmelon Hong Kong 1994
Ginger United Kingdom 1993
Quality assurance in agricultural produce,edited by G.I. Johnson, Le Van To, Nguyen Duy Duc and M.C. Webb.
ACIAR Proceedings 100(printed version published in 2000)
378
opment of protocols for disinfestation of selectedfruits will help future expansion of the industry. Dis-infestation studies have been conducted on mango,papaya and starfruit. Some of the treatments tested arechemicals (methyl bromide), vapour heat, gamma irra-diation, modified atmosphere and low temperature.Future work will include disinfestation of minimallyprocessed fruits such as jackfruit.
Cooperation
MARDI has been working very closely with manyrelevant institutions and agencies inside and outsidethe country. In the local scene, MARDI has cooperatedwith the Federal Agricultural Marketing Authority, theDepartment of Agriculture, the Malaysian PineappleIndustry Board, the Malaysian Institute of NuclearTechnology, the Standards and Industrial ResearchInstitute of Malaysia, the Federal Land DevelopmentAuthority, Federal Land Consolidation and Rehabili-tation Authority, some universities and other institu-tions. Cooperation is in the form of researchcollaborations and technology transfer.
At the international level, MARDI has beeninvolved with many agencies, including InternationalAtomic Energy Agency, AAECP, the AustralianCentre for International Agricultural Research(ACIAR), United States Department of Agriculture,Japan International Cooperation Agency, QueenslandDepartment of Primary Industries, PostharvestInstitute of Perishables, Codex and the Tropical FruitNetwork.
Close cooperation has also been established withmany private companies inside and outside thecountry. This kind of cooperation is very important,especially in evaluating the effectiveness or suitabilityof a technology or system for commercial application.Most of the trial shipments were conducted with
support from the local exporters and importers in therespective countries.
Conclusion
Postharvest handling is a very important research areain Malaysia, especially for fruits and vegetables. Thereare several institutions and agencies involved in R&Dactivities in this area with MARDI taking the leadingrole. Many research achievements have been made butthe real achievement is only when the technology canbe translated into financial gains for the benefit of thepeople and the nation.
Acknowledgment
The author wishes to thank ACIAR for supportinghis trip to Vietnam for this seminar.
References
Abdullah, H. (ed.) 1999. Pengendalian lepastuai buah-buahandan sayur-sayuran tropika [Postharvest handling oftropical fruits and vegetables]. Serdang, MalaysianAgricultural Research and Development Institute, 120p (inBahasa Malaysia).
Abdullah, H. and Mohd. Salleh, P. 1992. Improvement onpostharvest handling system of fruits and vegetables inMalaysia. Food Technology in Malaysia 13, 46–51.
Bourne, M.C. 1986. Overview of postharvest problems infruits and vegetables. In: Bourne, M.C., Zonglun, Y. andLiu, F.W., ed., Proceedings of the United States–Chinaseminar on handling, storage and processing of fruits andvegetables, 6–9 November 1984, Hangzhou, China.Washington DC, National Academy Press, 1–18.
Quality assurance in agricultural produce,edited by G.I. Johnson, Le Van To, Nguyen Duy Duc and M.C. Webb.
ACIAR Proceedings 100(printed version published in 2000)
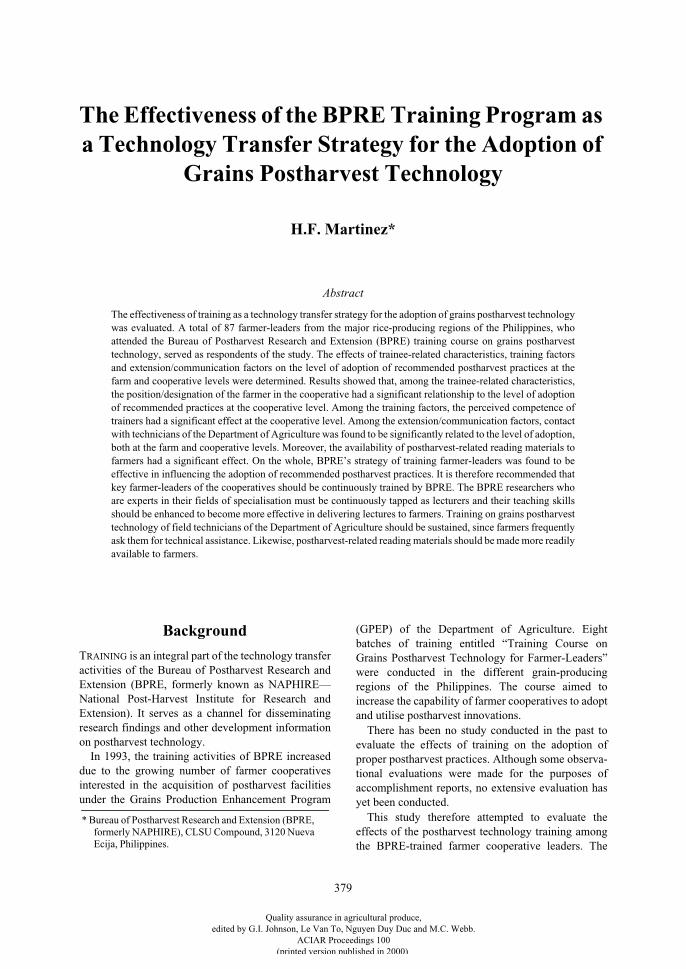
379
The Effectiveness of the BPRE Training Program as a Technology Transfer Strategy for the Adoption of
Grains Postharvest Technology
H.F. Martinez*
Abstract
The effectiveness of training as a technology transfer strategy for the adoption of grains postharvest technologywas evaluated. A total of 87 farmer-leaders from the major rice-producing regions of the Philippines, whoattended the Bureau of Postharvest Research and Extension (BPRE) training course on grains postharvesttechnology, served as respondents of the study. The effects of trainee-related characteristics, training factorsand extension/communication factors on the level of adoption of recommended postharvest practices at thefarm and cooperative levels were determined. Results showed that, among the trainee-related characteristics,the position/designation of the farmer in the cooperative had a significant relationship to the level of adoptionof recommended practices at the cooperative level. Among the training factors, the perceived competence oftrainers had a significant effect at the cooperative level. Among the extension/communication factors, contactwith technicians of the Department of Agriculture was found to be significantly related to the level of adoption,both at the farm and cooperative levels. Moreover, the availability of postharvest-related reading materials tofarmers had a significant effect. On the whole, BPRE’s strategy of training farmer-leaders was found to beeffective in influencing the adoption of recommended postharvest practices. It is therefore recommended thatkey farmer-leaders of the cooperatives should be continuously trained by BPRE. The BPRE researchers whoare experts in their fields of specialisation must be continuously tapped as lecturers and their teaching skillsshould be enhanced to become more effective in delivering lectures to farmers. Training on grains postharvesttechnology of field technicians of the Department of Agriculture should be sustained, since farmers frequentlyask them for technical assistance. Likewise, postharvest-related reading materials should be made more readilyavailable to farmers.
Background
T
RAINING
is an integral part of the technology transferactivities of the Bureau of Postharvest Research andExtension (BPRE, formerly known as NAPHIRE—National Post-Harvest Institute for Research andExtension). It serves as a channel for disseminatingresearch findings and other development informationon postharvest technology.
In 1993, the training activities of BPRE increaseddue to the growing number of farmer cooperativesinterested in the acquisition of postharvest facilitiesunder the Grains Production Enhancement Program
(GPEP) of the Department of Agriculture. Eightbatches of training entitled “Training Course onGrains Postharvest Technology for Farmer-Leaders”were conducted in the different grain-producingregions of the Philippines. The course aimed toincrease the capability of farmer cooperatives to adoptand utilise postharvest innovations.
There has been no study conducted in the past toevaluate the effects of training on the adoption ofproper postharvest practices. Although some observa-tional evaluations were made for the purposes ofaccomplishment reports, no extensive evaluation hasyet been conducted.
This study therefore attempted to evaluate theeffects of the postharvest technology training amongthe BPRE-trained farmer cooperative leaders. The
* Bureau of Postharvest Research and Extension (BPRE, formerly NAPHIRE), CLSU Compound, 3120 Nueva Ecija, Philippines.
Quality assurance in agricultural produce,edited by G.I. Johnson, Le Van To, Nguyen Duy Duc and M.C. Webb.
ACIAR Proceedings 100(printed version published in 2000)
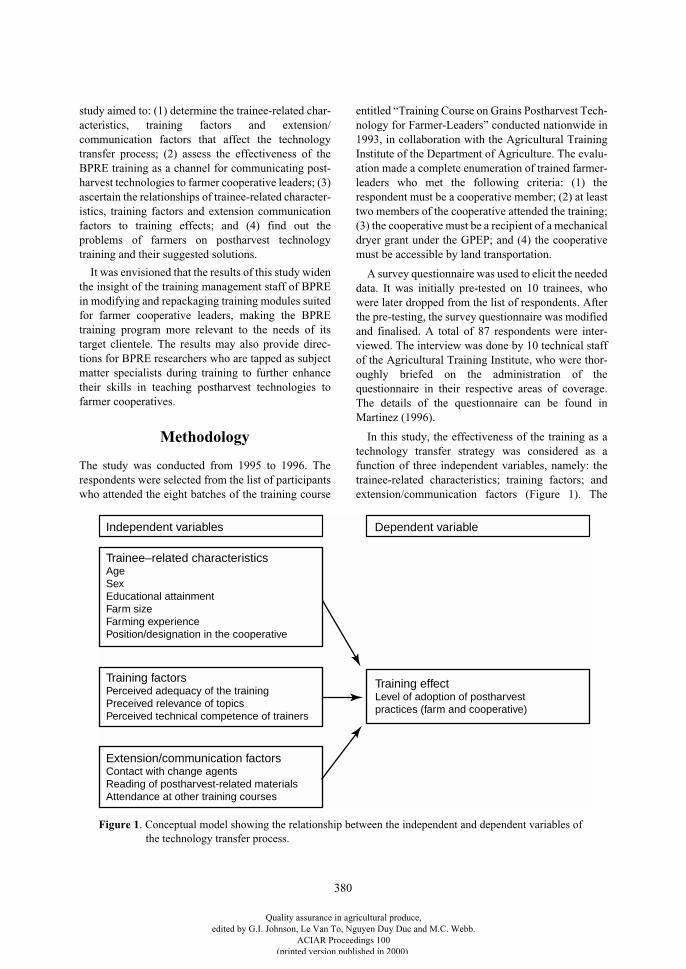
380
study aimed to: (1) determine the trainee-related char-acteristics, training factors and extension/communication factors that affect the technologytransfer process; (2) assess the effectiveness of theBPRE training as a channel for communicating post-harvest technologies to farmer cooperative leaders; (3)ascertain the relationships of trainee-related character-istics, training factors and extension communicationfactors to training effects; and (4) find out theproblems of farmers on postharvest technologytraining and their suggested solutions.
It was envisioned that the results of this study widenthe insight of the training management staff of BPREin modifying and repackaging training modules suitedfor farmer cooperative leaders, making the BPREtraining program more relevant to the needs of itstarget clientele. The results may also provide direc-tions for BPRE researchers who are tapped as subjectmatter specialists during training to further enhancetheir skills in teaching postharvest technologies tofarmer cooperatives.
Methodology
The study was conducted from 1995 to 1996. Therespondents were selected from the list of participantswho attended the eight batches of the training course
entitled “Training Course on Grains Postharvest Tech-nology for Farmer-Leaders” conducted nationwide in1993, in collaboration with the Agricultural TrainingInstitute of the Department of Agriculture. The evalu-ation made a complete enumeration of trained farmer-leaders who met the following criteria: (1) therespondent must be a cooperative member; (2) at leasttwo members of the cooperative attended the training;(3) the cooperative must be a recipient of a mechanicaldryer grant under the GPEP; and (4) the cooperativemust be accessible by land transportation.
A survey questionnaire was used to elicit the neededdata. It was initially pre-tested on 10 trainees, whowere later dropped from the list of respondents. Afterthe pre-testing, the survey questionnaire was modifiedand finalised. A total of 87 respondents were inter-viewed. The interview was done by 10 technical staffof the Agricultural Training Institute, who were thor-oughly briefed on the administration of thequestionnaire in their respective areas of coverage.The details of the questionnaire can be found inMartinez (1996).
In this study, the effectiveness of the training as atechnology transfer strategy was considered as afunction of three independent variables, namely: thetrainee-related characteristics; training factors; andextension/communication factors (Figure 1). The
Training effectLevel of adoption of postharvestpractices (farm and cooperative)
Independent variables
Trainee–related characteristicsAgeSexEducational attainmentFarm sizeFarming experiencePosition/designation in the cooperative
Training factorsPerceived adequacy of the trainingPreceived relevance of topicsPerceived technical competence of trainers
Extension/communication factorsContact with change agentsReading of postharvest-related materialsAttendance at other training courses
Dependent variable
Figure 1. Conceptual model showing the relationship between the independent and dependent variables ofthe technology transfer process.
Quality assurance in agricultural produce,edited by G.I. Johnson, Le Van To, Nguyen Duy Duc and M.C. Webb.
ACIAR Proceedings 100(printed version published in 2000)
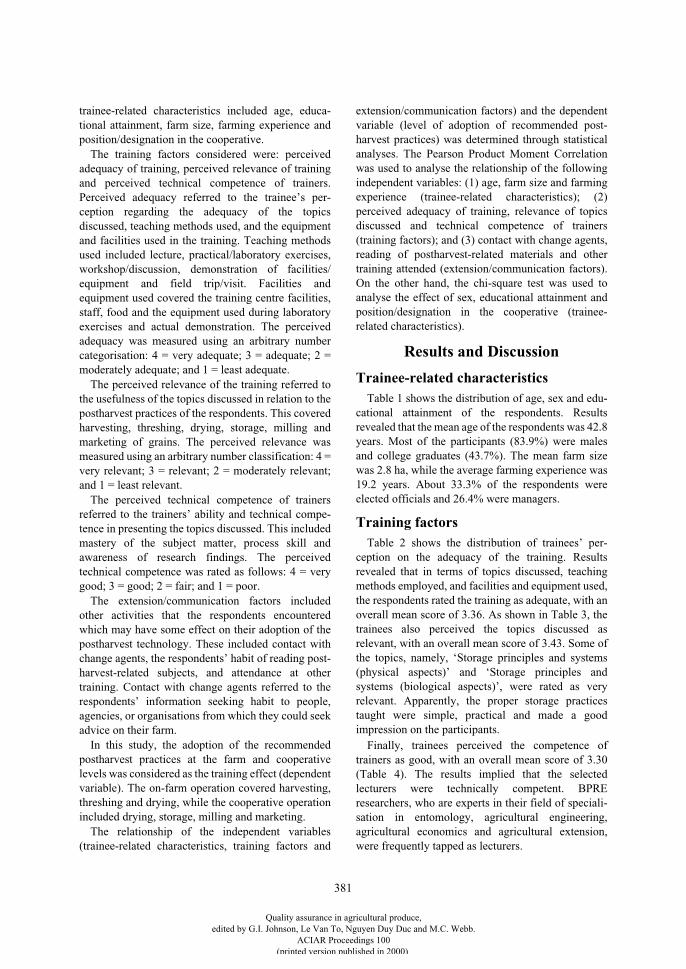
381
trainee-related characteristics included age, educa-tional attainment, farm size, farming experience andposition/designation in the cooperative.
The training factors considered were: perceivedadequacy of training, perceived relevance of trainingand perceived technical competence of trainers.Perceived adequacy referred to the trainee’s per-ception regarding the adequacy of the topicsdiscussed, teaching methods used, and the equipmentand facilities used in the training. Teaching methodsused included lecture, practical/laboratory exercises,workshop/discussion, demonstration of facilities/equipment and field trip/visit. Facilities andequipment used covered the training centre facilities,staff, food and the equipment used during laboratoryexercises and actual demonstration. The perceivedadequacy was measured using an arbitrary numbercategorisation: 4 = very adequate; 3 = adequate; 2 =moderately adequate; and 1 = least adequate.
The perceived relevance of the training referred tothe usefulness of the topics discussed in relation to thepostharvest practices of the respondents. This coveredharvesting, threshing, drying, storage, milling andmarketing of grains. The perceived relevance wasmeasured using an arbitrary number classification: 4 =very relevant; 3 = relevant; 2 = moderately relevant;and 1 = least relevant.
The perceived technical competence of trainersreferred to the trainers’ ability and technical compe-tence in presenting the topics discussed. This includedmastery of the subject matter, process skill andawareness of research findings. The perceivedtechnical competence was rated as follows: 4 = verygood; 3 = good; 2 = fair; and 1 = poor.
The extension/communication factors includedother activities that the respondents encounteredwhich may have some effect on their adoption of thepostharvest technology. These included contact withchange agents, the respondents’ habit of reading post-harvest-related subjects, and attendance at othertraining. Contact with change agents referred to therespondents’ information seeking habit to people,agencies, or organisations from which they could seekadvice on their farm.
In this study, the adoption of the recommendedpostharvest practices at the farm and cooperativelevels was considered as the training effect (dependentvariable). The on-farm operation covered harvesting,threshing and drying, while the cooperative operationincluded drying, storage, milling and marketing.
The relationship of the independent variables(trainee-related characteristics, training factors and
extension/communication factors) and the dependentvariable (level of adoption of recommended post-harvest practices) was determined through statisticalanalyses. The Pearson Product Moment Correlationwas used to analyse the relationship of the followingindependent variables: (1) age, farm size and farmingexperience (trainee-related characteristics); (2)perceived adequacy of training, relevance of topicsdiscussed and technical competence of trainers(training factors); and (3) contact with change agents,reading of postharvest-related materials and othertraining attended (extension/communication factors).On the other hand, the chi-square test was used toanalyse the effect of sex, educational attainment andposition/designation in the cooperative (trainee-related characteristics).
Results and Discussion
Trainee-related characteristics
Table 1 shows the distribution of age, sex and edu-cational attainment of the respondents. Resultsrevealed that the mean age of the respondents was 42.8years. Most of the participants (83.9%) were malesand college graduates (43.7%). The mean farm sizewas 2.8 ha, while the average farming experience was19.2 years. About 33.3% of the respondents wereelected officials and 26.4% were managers.
Training factors
Table 2 shows the distribution of trainees’ per-ception on the adequacy of the training. Resultsrevealed that in terms of topics discussed, teachingmethods employed, and facilities and equipment used,the respondents rated the training as adequate, with anoverall mean score of 3.36. As shown in Table 3, thetrainees also perceived the topics discussed asrelevant, with an overall mean score of 3.43. Some ofthe topics, namely, ‘Storage principles and systems(physical aspects)’ and ‘Storage principles andsystems (biological aspects)’, were rated as veryrelevant. Apparently, the proper storage practicestaught were simple, practical and made a goodimpression on the participants.
Finally, trainees perceived the competence oftrainers as good, with an overall mean score of 3.30(Table 4). The results implied that the selectedlecturers were technically competent. BPREresearchers, who are experts in their field of speciali-sation in entomology, agricultural engineering,agricultural economics and agricultural extension,were frequently tapped as lecturers.
Quality assurance in agricultural produce,edited by G.I. Johnson, Le Van To, Nguyen Duy Duc and M.C. Webb.
ACIAR Proceedings 100(printed version published in 2000)
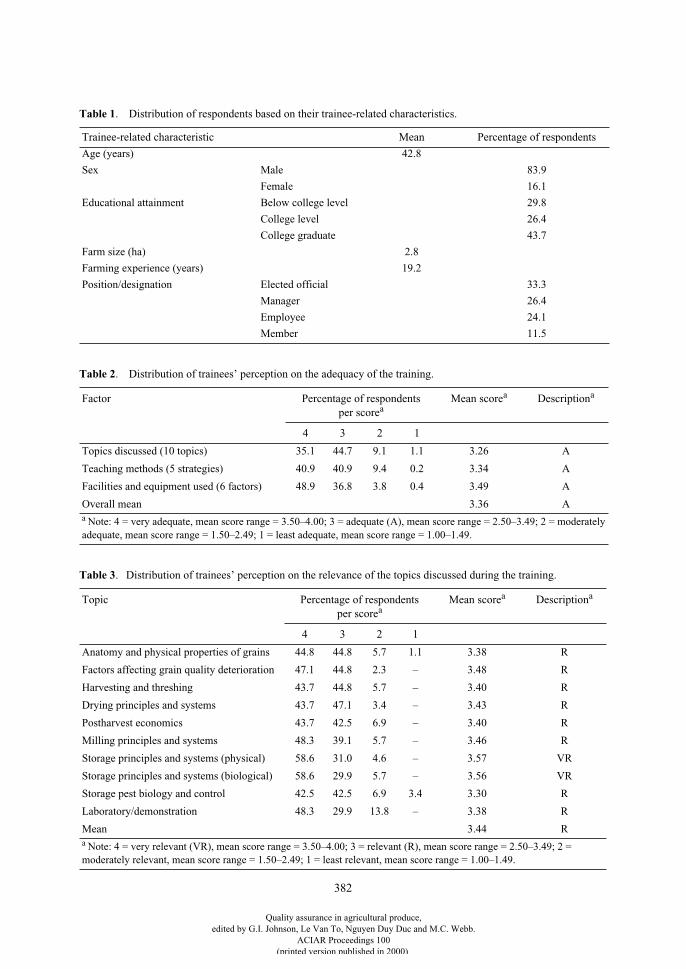
382
Table 1
. Distribution of respondents based on their trainee-related characteristics.
Trainee-related characteristic Mean Percentage of respondents
Age (years) 42.8
Sex Male 83.9
Female 16.1
Educational attainment Below college level 29.8
College level 26.4
College graduate 43.7
Farm size (ha) 2.8
Farming experience (years) 19.2
Position/designation Elected official 33.3
Manager 26.4
Employee 24.1
Member 11.5
Table 2
. Distribution of trainees’ perception on the adequacy of the training.
Factor Percentage of respondents per score
a
Mean score
a
Description
a
4 3 2 1
Topics discussed (10 topics) 35.1 44.7 9.1 1.1 3.26 A
Teaching methods (5 strategies) 40.9 40.9 9.4 0.2 3.34 A
Facilities and equipment used (6 factors) 48.9 36.8 3.8 0.4 3.49 A
Overall mean 3.36 A
a
Note: 4 = very adequate, mean score range = 3.50–4.00; 3 = adequate (A), mean score range = 2.50–3.49; 2 = moderately adequate, mean score range = 1.50–2.49; 1 = least adequate, mean score range = 1.00–1.49.
Table 3
. Distribution of trainees’ perception on the relevance of the topics discussed during the training.
Topic Percentage of respondents per score
a
Mean score
a
Description
a
4 3 2 1
Anatomy and physical properties of grains 44.8 44.8 5.7 1.1 3.38 R
Factors affecting grain quality deterioration 47.1 44.8 2.3 – 3.48 R
Harvesting and threshing 43.7 44.8 5.7 – 3.40 R
Drying principles and systems 43.7 47.1 3.4 – 3.43 R
Postharvest economics 43.7 42.5 6.9 – 3.40 R
Milling principles and systems 48.3 39.1 5.7 – 3.46 R
Storage principles and systems (physical) 58.6 31.0 4.6 – 3.57 VR
Storage principles and systems (biological) 58.6 29.9 5.7 – 3.56 VR
Storage pest biology and control 42.5 42.5 6.9 3.4 3.30 R
Laboratory/demonstration 48.3 29.9 13.8 – 3.38 R
Mean 3.44 R
a
Note: 4 = very relevant (VR), mean score range = 3.50–4.00; 3 = relevant (R), mean score range = 2.50–3.49; 2 = moderately relevant, mean score range = 1.50–2.49; 1 = least relevant, mean score range = 1.00–1.49.
Quality assurance in agricultural produce,edited by G.I. Johnson, Le Van To, Nguyen Duy Duc and M.C. Webb.
ACIAR Proceedings 100(printed version published in 2000)
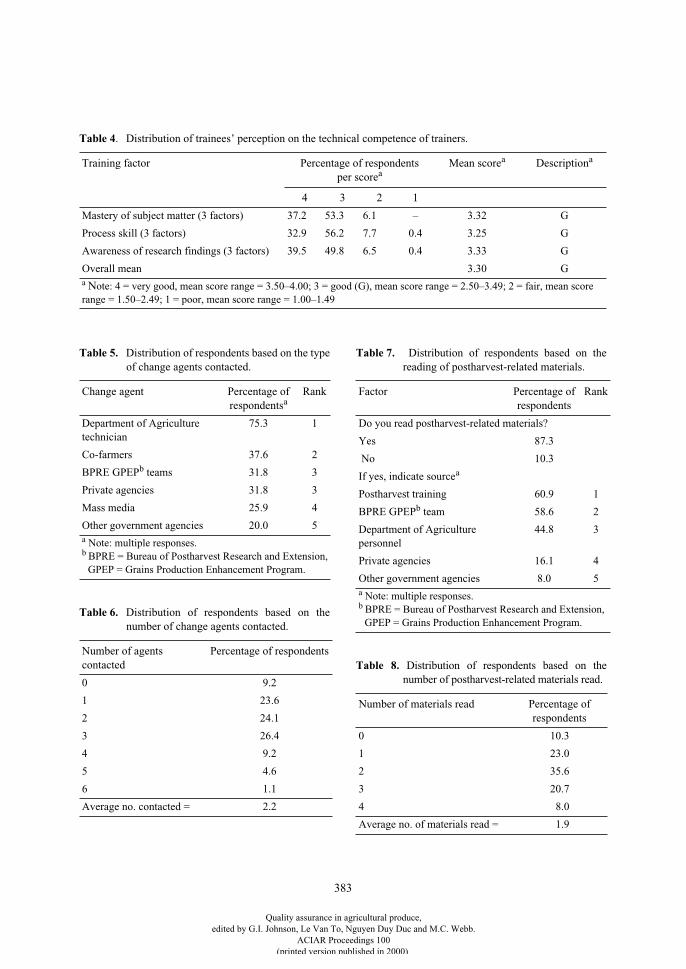
383
Table
4
. Distribution of trainees’ perception on the technical competence of trainers.
Training factor Percentage of respondents per score
a
Mean score
a
Description
a
4 3 2 1
Mastery of subject matter (3 factors) 37.2 53.3 6.1 – 3.32 G
Process skill (3 factors) 32.9 56.2 7.7 0.4 3.25 G
Awareness of research findings (3 factors) 39.5 49.8 6.5 0.4 3.33 G
Overall mean 3.30 G
a
N
ote: 4 = very good, mean score range = 3.50–4.00; 3 = good (G), mean score range = 2.50–3.49; 2 = fair, mean score range = 1.50–2.49; 1 = poor, mean score range = 1.00–1.49
Table 5.
Distribution of respondents based on the typeof change agents contacted.
Change agent Percentage of respondents
a
Rank
Department of Agriculture technician
75.3 1
Co-farmers 37.6 2
BPRE GPEP
b
teams 31.8 3
Private agencies 31.8 3
Mass media 25.9 4
Other government agencies 20.0 5
a
Note: multiple responses.
b
BPRE = Bureau of Postharvest Research and Extension, GPEP = Grains Production Enhancement Program.
Table 6.
Distribution of respondents based on thenumber of change agents contacted.
Number of agents contacted
Percentage of respondents
0 9.2
1 23.6
2 24.1
3 26.4
4 9.2
5 4.6
6 1.1
Average no. contacted = 2.2
Table 7.
Distribution of respondents based on thereading of postharvest-related materials.
Factor Percentage of respondents
Rank
Do you read postharvest-related materials?
Yes 87.3
No 10.3
If yes, indicate source
a
Postharvest training 60.9 1
BPRE GPEP
b
team 58.6 2
Department of Agriculture personnel
44.8 3
Private agencies 16.1 4
Other government agencies 8.0 5
a
Note: multiple responses.
b
BPRE = Bureau of Postharvest Research and Extension, GPEP = Grains Production Enhancement Program.
Table 8.
Distribution of respondents based on thenumber of postharvest-related materials read.
Number of materials read Percentage of respondents
0 10.3
1 23.0
2 35.6
3 20.7
4 8.0
Average no. of materials read = 1.9
Quality assurance in agricultural produce,edited by G.I. Johnson, Le Van To, Nguyen Duy Duc and M.C. Webb.
ACIAR Proceedings 100(printed version published in 2000)
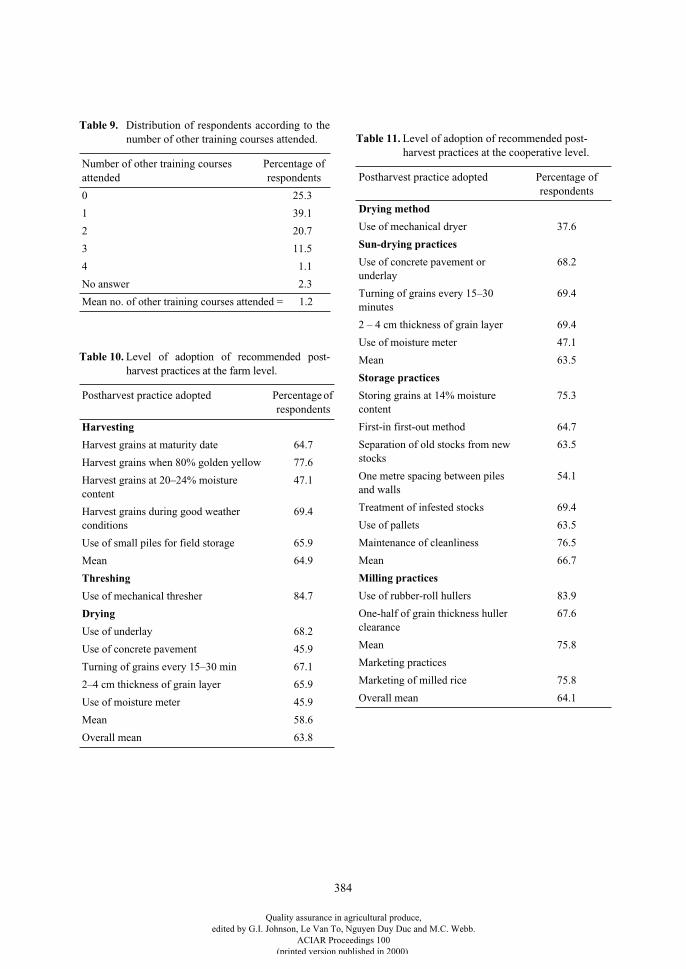
384
Table 9.
Distribution of respondents according to thenumber of other training courses attended.
Number of other training courses attended
Percentage of respondents
0 25.3
1 39.1
2 20.7
3 11.5
4 1.1
No answer 2.3
Mean no. of other training courses attended = 1.2
Table 10.
Level of adoption of recommended post-harvest practices at the farm level.
Postharvest practice adopted Percentage of respondents
Harvesting
Harvest grains at maturity date 64.7
Harvest grains when 80% golden yellow 77.6
Harvest grains at 20–24% moisture content
47.1
Harvest grains during good weather conditions
69.4
Use of small piles for field storage 65.9
Mean 64.9
Threshing
Use of mechanical thresher 84.7
Drying
Use of underlay 68.2
Use of concrete pavement 45.9
Turning of grains every 15–30 min 67.1
2–4 cm thickness of grain layer 65.9
Use of moisture meter 45.9
Mean 58.6
Overall mean 63.8
Table 11.
Level of adoption of recommended post-harvest practices at the cooperative level.
Postharvest practice adopted Percentage of respondents
Drying method
Use of mechanical dryer 37.6
Sun-drying practices
Use of concrete pavement or underlay
68.2
Turning of grains every 15–30 minutes
69.4
2 – 4 cm thickness of grain layer 69.4
Use of moisture meter 47.1
Mean 63.5
Storage practices
Storing grains at 14% moisture content
75.3
First-in first-out method 64.7
Separation of old stocks from new stocks
63.5
One metre spacing between piles and walls
54.1
Treatment of infested stocks 69.4
Use of pallets 63.5
Maintenance of cleanliness 76.5
Mean 66.7
Milling practices
Use of rubber-roll hullers 83.9
One-half of grain thickness huller clearance
67.6
Mean 75.8
Marketing practices
Marketing of milled rice 75.8
Overall mean 64.1
Quality assurance in agricultural produce,edited by G.I. Johnson, Le Van To, Nguyen Duy Duc and M.C. Webb.
ACIAR Proceedings 100(printed version published in 2000)
385
Extension/communication factors
Table 5 shows the various change agents that therespondents have contacted and sought for advice con-cerning problems related to postharvest operations.The results showed that majority of the respondents(75.3%) sought the advice of the Department of Agri-culture technicians. This could be attributed to theregular presence of these personnel in the area. Table6 shows that the mean number of change agentscontacted by the respondents was 2.2. Table 7 showsthat the majority of the respondents (87.3%) read post-harvest-related materials. About 60.9% of themobtained these materials during their attendance atpostharvest training, while some (58.6%) obtained thematerials from BPRE teams implementing the GPEP.Table 8 shows that the mean number of postharvest-related materials read was 1.9. It was noted that about10.3% of the respondents were not able to read anypostharvest-related material at all. Finally, in terms ofother training attended, most of the respondents(39.1%) have attended only one other training course(Table 9). About 25.3% of the respondents have notattended any other training at all. This implies thatfarmer-leaders are given very limited opportunities toattend training courses.
Training effects
Table 10 shows the level of adoption of the 11 rec-ommended postharvest practices at the farm level,which covered harvesting, threshing and drying oper-ations. Results revealed that the mean level ofadoption was 63.8%. Among the three operationsexamined, the adoption of recommended threshingpractice obtained the highest level of adoption at84.7%. This implies that majority of the farmers arenow using mechanical threshers instead of the tradi-tional ‘hampasan’ (manual) method. Under therecommended harvesting practices, the use ofmoisture content as a harvesting index was adoptedonly by 47.1% of the respondents. This could be due tothe limited availability and high cost of moisturemeters. Finally, the adoption of recommended dryingpractices obtained a relatively low mean of 58.6%.This result could be attributed to the increasingdependence of farmers on the cooperative to performtheir drying operation, because of the greater availa-bility of drying facilities in the cooperative comparedto at the farm level.
Table 11 shows the level of adoption of the 15 rec-ommended postharvest practices at the cooperativelevel of operation, which covered drying, storage,milling and marketing. Results revealed that the meanlevel of adoption was 64.1%. Among the four post-harvest operations considered, both the adoption ofrecommended milling practices and the marketing ofmilled rice were among those practices whichobtained the highest level of adoption (both 75.8%).This implies that the respondents favour the use ofrubber-roll hullers over traditional hulling equipmentto obtain higher milling recovery, and prefer to selltheir produce in the form of milled rice rather than inpaddy form to gain higher profit. In the drying oper-ation, the use of mechanical dryers obtained the lowestlevel of adoption (37.6%), despite the cooperativesbeing recipients of mechanical dryer grants fromGPEP. The reasons for the low level of adoptionincluded the high cost of operating mechanical dryers,the poor performance of some installed units, and theirpreference to use sun-drying over mechanical dryingduring good weather conditions (Martinez 1997).
Relationship of the independent variables to training effects
Tables 12 and 13 show the relationships between theindependent variables (trainee-related characteristics,training factors, and extension/communicationfactors) and the dependent variable (level of adoptionof recommended postharvest practices at the farm andcooperative levels). Among the trainee-related charac-teristics, age, sex, educational attainment, farm sizeand farming experience have no significant rela-tionship with the level of adoption of recommendedpostharvest practices. On the other hand, position/des-ignation in the cooperative was found to besignificantly related to the level of adoption at thecooperative level, but not at the farm level. This resultsuggests that trainees who hold key leadershippositions are more likely to influence the adoption ofproper practices in the cooperative operation. Theresult could be attributed to the presence of more post-harvest facilities at the cooperative for drying, milling,storage and marketing, greater volume of grains beinghandled, and the increasing dependence of farmer-members on the cooperative for processing andmarketing of their products.
Quality assurance in agricultural produce,edited by G.I. Johnson, Le Van To, Nguyen Duy Duc and M.C. Webb.
ACIAR Proceedings 100(printed version published in 2000)
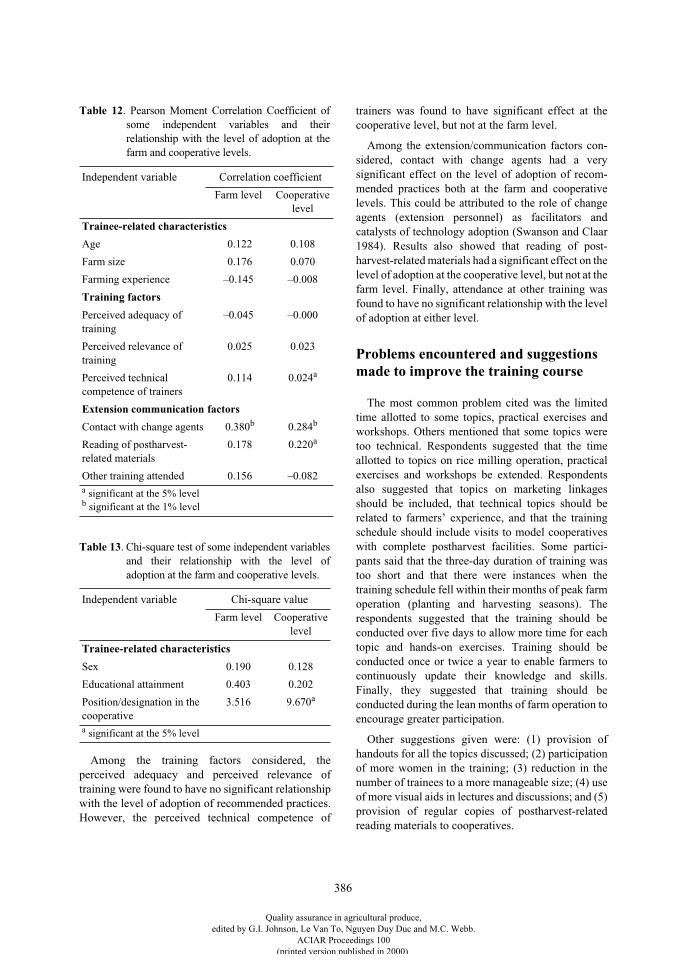
386
Among the training factors considered, theperceived adequacy and perceived relevance oftraining were found to have no significant relationshipwith the level of adoption of recommended practices.However, the perceived technical competence of
trainers was found to have significant effect at thecooperative level, but not at the farm level.
Among the extension/communication factors con-sidered, contact with change agents had a verysignificant effect on the level of adoption of recom-mended practices both at the farm and cooperativelevels. This could be attributed to the role of changeagents (extension personnel) as facilitators andcatalysts of technology adoption (Swanson and Claar1984). Results also showed that reading of post-harvest-related materials had a significant effect on thelevel of adoption at the cooperative level, but not at thefarm level. Finally, attendance at other training wasfound to have no significant relationship with the levelof adoption at either level.
Problems encountered and suggestions made to improve the training course
The most common problem cited was the limitedtime allotted to some topics, practical exercises andworkshops. Others mentioned that some topics weretoo technical. Respondents suggested that the timeallotted to topics on rice milling operation, practicalexercises and workshops be extended. Respondentsalso suggested that topics on marketing linkagesshould be included, that technical topics should berelated to farmers’ experience, and that the trainingschedule should include visits to model cooperativeswith complete postharvest facilities. Some partici-pants said that the three-day duration of training wastoo short and that there were instances when thetraining schedule fell within their months of peak farmoperation (planting and harvesting seasons). Therespondents suggested that the training should beconducted over five days to allow more time for eachtopic and hands-on exercises. Training should beconducted once or twice a year to enable farmers tocontinuously update their knowledge and skills.Finally, they suggested that training should beconducted during the lean months of farm operation toencourage greater participation.
Other suggestions given were: (1) provision ofhandouts for all the topics discussed; (2) participationof more women in the training; (3) reduction in thenumber of trainees to a more manageable size; (4) useof more visual aids in lectures and discussions; and (5)provision of regular copies of postharvest-relatedreading materials to cooperatives.
Table 12
. Pearson Moment Correlation Coefficient ofsome independent variables and theirrelationship with the level of adoption at thefarm and cooperative levels.
Independent variable Correlation coefficient
Farm level Cooperative level
Trainee-related characteristics
Age 0.122 0.108
Farm size 0.176 0.070
Farming experience –0.145 –0.008
Training factors
Perceived adequacy of training
–0.045 –0.000
Perceived relevance of training
0.025 0.023
Perceived technical competence of trainers
0.114 0.024
a
Extension communication
factors
Contact with change agents 0.380
b
0.284
b
Reading of postharvest-related materials
0.178 0.220
a
Other training attended 0.156 –0.082
a
significant at the 5% level
b
significant at the 1% level
Table
13
. Chi-square test of some independent variablesand their relationship with the level ofadoption at the farm and cooperative levels.
Independent variable Chi-square value
Farm level Cooperative level
Trainee-related characteristics
Sex 0.190 0.128
Educational attainment 0.403 0.202
Position/designation in the cooperative
3.516 9.670
a
a
significant at the 5% level
Quality assurance in agricultural produce,edited by G.I. Johnson, Le Van To, Nguyen Duy Duc and M.C. Webb.
ACIAR Proceedings 100(printed version published in 2000)
387
Conclusions and Recommendations
On the basis of the findings, the following conclu-sions and recommendations were drawn:
1. Position/designation in the cooperative wassignificantly related to the adoption of recom-mended postharvest practices in the cooper-ative operation. Training the most influentialmembers of the organisation resulted in greateradoption since these individuals are the onesresponsible for the operation and managementof the cooperative. They also have greateropportunities to apply the knowledge gainedfrom the training, because of the presence ofmore postharvest facilities, greater volume ofgrains handled, and growing dependence offarmer-members on the cooperative forprocessing and marketing of their produce.
2. The perceived technical competence of trainerswas significantly related to the adoption of rec-ommended practices at the cooperative level.BPRE researchers who are experts in theirrespective fields of specialisation must be con-tinuously tapped as lecturers. Their teachingskills should be further enhanced to enablethem to become more effective in deliveringlectures to farmers.
3. Contact with change agents is significantlyrelated to the level of adoption of recom-mended practices both at the farm and cooper-ative levels. Training of Department ofAgriculture technicians should be sustainedsince they are the ones frequently contacted byfarmers for technical assistance.
4. The habit of farmers to read postharvest-relatedmaterials had a significant effect on the level ofadoption of recommended practices in thecooperative operation. These materials shouldbe made more readily available to farmers,since they serve as ready references and sup-plement knowledge and skills gained fromtraining courses.
5. Training should be conducted for five daysduring lull periods of farm operation. This willallow more time for each topic, practical andworkshop, and provide greater participationamong farmer-leaders.
6. On the whole, BPRE’s strategy of trainingfarmer cooperative leaders was found to beeffective in influencing the adoption of grainspostharvest technology.
References
Martinez, H.F. 1996. Evaluation of training as acommunication strategy on grains postharvesttechnology transfer process. Unpublished Masters thesis,Central Luzon State University, Nueva Ecija,Philippines.
Martinez, H.F. 1997. Effectiveness of NAPHIRE trainingcourses conducted in support to the development of thepostharvest industry. Terminal Report, Bureau ofPostharvest Research and Extension, CLSU Compound,Nueva Ecija, Philippines.
Swanson, B.E. and Claar, J.B. 1984. The history anddevelopment of agricultural extension. In: Swanson,B.E., ed., Agricultural extension, a reference manual.Rome, Food and Agriculture Organization of the UnitedNations, 1–19.
Quality assurance in agricultural produce,edited by G.I. Johnson, Le Van To, Nguyen Duy Duc and M.C. Webb.
ACIAR Proceedings 100(printed version published in 2000)
388
The Quality Assurance Challenge: Can Village Marketing and Cooperatives Respond?
N. Masajo-Manalili*
Abstract
This paper reviews the changing agricultural scenario amidst current global developments and pressingenvironmental issues with emphasis on the quality assurance requirements for agricultural produce. Anevaluation and analysis of village marketing and cooperative practices, as they relate to postharvest handlingand quality concerns, is undertaken to establish gaps, capacities, and potentials for further growth anddevelopment. Highlights of the paper are the country experiences depicting varying response modalities ofvillage marketing and cooperatives in the Association of South-East Asian Nations (ASEAN).
Modern strategies for product quality maintenance and their cost efficiencies are also elaborated leading toconclusions as to how best strategic policy and systems approaches can be devised to meet the expectations ofdiverse stakeholders.
With concerns such as enhanced cost efficiencies, product handling, and emerging forms of structures,suggestions on how the village marketing and cooperative responses could be made more appropriate andresponsive to the heightened call for quality assurance in agricultural produce are similarly tackled.
F
OOD
AVAILABILITY
remains the major concern— atvarying levels—of rich and poor countries alike. It wasknown as ‘food supply’ at the time when availabilitywas greatly dependent on enhancing production andproductivity. Today, it is termed ‘food security’, asproduction and productivity improvement haveproven inadequate in addressing the problem of foodavailability. Whatever term is used and at whateverstage it may be in, food security will be a continuingglobal thrust.
Despite periodic concern about the world’s abilityto feed itself, it has been in fact doing so at ever-improving levels and at lower real prices even with amuch larger population (Duncan 1997). These pastdecades, for instance, developing Asia has maderemarkable progress since the food crisis years of the1960s, with substantial gains in food security, povertyreduction, and per capita income growth despite a 60%(one billion) population growth (ADB 1999). What
has made the transformation remarkable, according tothe Asian Development Bank (ADB), is that anincrease in yield was obtained with barely a 4%change in area harvested and was accompanied by a25% reduction in the total number of poor people,from 930 million in 1975 to 700 million in 1995.
With such economic transformation, however,came a declining agricultural share in the nationalincome, but only in terms of its relative importance tothe other sectors, namely, manufacturing and services.Despite this declining contribution of agriculture, theagro-industrial sector of developing countriesnoticeably has maintained or increased its share ofeconomic output (Manalili 1998a).
Developing countries try to sustain agriculturalgrowth, not only to feed the growing population, butalso to continuously trigger growth and developmentin the rural, non-farm sector. The fact is, farm incomeremains the primary source of rural purchasing powerwhich, when enhanced, extends demand for basicstaple foods to demand for variety in products andservices. Consumers who decades ago took most oftheir cereals as rice or maize, now demand wheatproducts such as bread and noodles, as well as more
* Agro-industrial Development Program and Policy StudiesProject (AIDP/PSP) of the (Southeast Asian Ministers of Education Organization (SEAMEO) Regional Center for Graduate Study and Research in Agriculture (SEARCA), College, Laguna 4031, Philippines.
Quality assurance in agricultural produce,edited by G.I. Johnson, Le Van To, Nguyen Duy Duc and M.C. Webb.
ACIAR Proceedings 100(printed version published in 2000)
389
meat, fruits and vegetables (Pingali et al. 1997).Likewise, canned goods such as tomato paste,condensed milk, and tinned fish find their way intovillage stores and weekly markets in the most remoteregions (Baun and Tolbert 1985).
As farm diversification continues and the demandfor product variety increases, production of basicstaple foods such as rice, fish, meat, fruits, and vege-tables has to be made more profitable and efficient forit to compete with more lucrative options for farmresources. Otherwise, food security will again be atstake.
The battle for food security and production effi-ciency was felt more significantly in 1997 as themajority of the countries in the region were severelyhit by the Asian financial crisis eroding whatever agri-cultural gains that may have been achieved earlier.Weather disturbances caused by the El Niño and LaNiña phenomena added to the onslaught of the regionresulting in, again, declining agricultural production.The production efficiency and profitability, crisis orno crisis, however, is greatly dependent on marketfunctionalities, thus—in the agricultural sector’scase—on agricultural marketing. This paper,therefore, examines the state of agricultural marketingin the Asia–Pacific region, mostly carried out at thevillage and cooperative levels to see whether there isstill a role for them in the heightened quality assurancechallenge in ensuring food security in a fast-trans-forming agricultural sector.
Agricultural Marketing and Food Security
While initial thrusts on food security were geared toproductivity issues, efforts these past decades havebeen focused on the long-neglected marketing andpostharvest sectors. These sectors basically ensure notonly the availability but also the quality of agriculturalproducts. In as much as quality, specifically at post-production stages, is a function of the postharvestsector, agricultural marketing when referred to in thispaper already includes postharvest concerns. This issupported by Baun and Tolbert (1985) when forbrevity they referred to the postharvest system of col-lecting, storing, transporting, processing and retailingfarm surpluses as marketing.
The efficiency and effectiveness of the marketingsystem should move at the same rate as the increase in
food supply. Otherwise, the farmers and the economywill be hurt if resources are used to produce output thatcan not be sold (Deomampo 1997). Generally, the effi-ciency of the marketing system can be gauged by thequality, quantity, and price of goods available as wellas the cost of performing the marketing functions(Deomampo 1997). Quantity and price are likewisetied up with marketing, as the absence of a market is adisincentive to enhance production volume, the sameway that price, to a large extent, is a function ofmarketing efficiencies/inefficiencies.
Marketing accounts for a greater share of total pro-duction through delivery costs in areas whereproducers are more dispersed. Improving themarketing system can be as important as introducingfarming methods that increase yields, which mayotherwise be ineffective without an improvedmarketing system (Baun and Tolbert 1985). Even inricher countries, consumers pay more for the value ofparts of the system of non-agricultural origin,including the cost of storage, processing, marketing,and catering, than for the cost of agricultural productsthemselves (Tsubota 1999). Postharvest technologythat prevents crop losses during storage and transpor-tation and that adds value to agricultural products is asimportant as increasing the yield of crops for sus-tainable food supply (Kainuma 1999).
Two previous regional conferences of the AsianProductivity Organization (APO) in 1989 and theFood and Agriculture Organization of the UnitedNations (FAO) in 1998, almost a decade apart, tackledthe issues of agricultural marketing in the Asia–Pacificregion. Foremost of the identified problems (Table 1)are related to postharvest and marketing infrastructureinadequacies. These problems are further com-pounded by limited production scale, unplannedproduction systems and poor delivery of extensionservices. Suggested measures to address theseproblems were put forth at the aforementioned confer-ences (Table 2). While considerable gains may havebeen reported, such as the promotion of the market-oriented approach, enhancement of markets andmarketing activities, and provision of appropriatepolicy support, the problems persist even after decadesof continued effort in most countries in the region.This implies that the problems are of a large magnitudeand that efforts undertaken, although commendable,need to be made more sustainable.
Quality assurance in agricultural produce,edited by G.I. Johnson, Le Van To, Nguyen Duy Duc and M.C. Webb.
ACIAR Proceedings 100(printed version published in 2000)
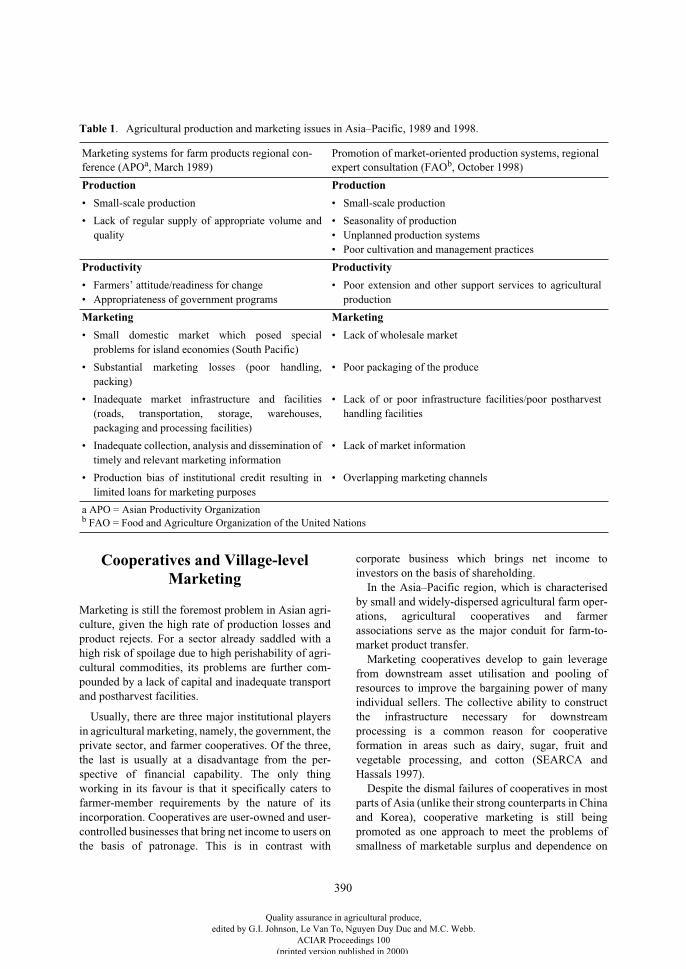
390
Cooperatives and Village-level Marketing
Marketing is still the foremost problem in Asian agri-culture, given the high rate of production losses andproduct rejects. For a sector already saddled with ahigh risk of spoilage due to high perishability of agri-cultural commodities, its problems are further com-pounded by a lack of capital and inadequate transportand postharvest facilities.
Usually, there are three major institutional playersin agricultural marketing, namely, the government, theprivate sector, and farmer cooperatives. Of the three,the last is usually at a disadvantage from the per-spective of financial capability. The only thingworking in its favour is that it specifically caters tofarmer-member requirements by the nature of itsincorporation. Cooperatives are user-owned and user-controlled businesses that bring net income to users onthe basis of patronage. This is in contrast with
corporate business which brings net income toinvestors on the basis of shareholding.
In the Asia–Pacific region, which is characterisedby small and widely-dispersed agricultural farm oper-ations, agricultural cooperatives and farmerassociations serve as the major conduit for farm-to-market product transfer.
Marketing cooperatives develop to gain leveragefrom downstream asset utilisation and pooling ofresources to improve the bargaining power of manyindividual sellers. The collective ability to constructthe infrastructure necessary for downstreamprocessing is a common reason for cooperativeformation in areas such as dairy, sugar, fruit andvegetable processing, and cotton (SEARCA andHassals 1997).
Despite the dismal failures of cooperatives in mostparts of Asia (unlike their strong counterparts in Chinaand Korea), cooperative marketing is still beingpromoted as one approach to meet the problems ofsmallness of marketable surplus and dependence on
Table 1
. Agricultural production and marketing issues in Asia–Pacific, 1989 and 1998.
Marketing systems for farm products regional con-ference (APO
a
, March 1989)Promotion of market-oriented production systems, regional expert consultation (FAO
b
, October 1998)
Production Production
• Small-scale production • Small-scale production
• Lack of regular supply of appropriate volume andquality
• Seasonality of production• Unplanned production systems• Poor cultivation and management practices
Productivity Productivity
• Farmers’ attitude/readiness for change• Appropriateness of government programs
• Poor extension and other support services to agriculturalproduction
Marketing Marketing
• Small domestic market which posed specialproblems for island economies (South Pacific)
• Lack of wholesale market
• Substantial marketing losses (poor handling,packing)
• Poor packaging of the produce
• Inadequate market infrastructure and facilities(roads, transportation, storage, warehouses,packaging and processing facilities)
• Lack of or poor infrastructure facilities/poor postharvesthandling facilities
• Inadequate collection, analysis and dissemination oftimely and relevant marketing information
• Lack of market information
• Production bias of institutional credit resulting inlimited loans for marketing purposes
• Overlapping marketing channels
a APO = Asian Productivity Organization
b
FAO = Food and Agriculture Organization of the United Nations
Quality assurance in agricultural produce,edited by G.I. Johnson, Le Van To, Nguyen Duy Duc and M.C. Webb.
ACIAR Proceedings 100(printed version published in 2000)
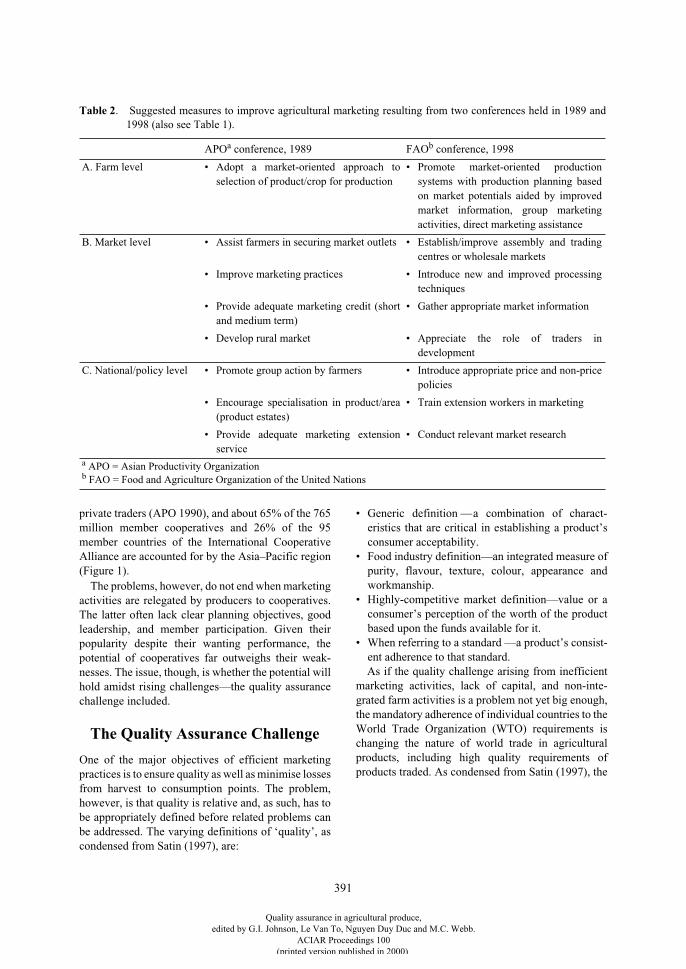
391
private traders (APO 1990), and about 65% of the 765million member cooperatives and 26% of the 95member countries of the International CooperativeAlliance are accounted for by the Asia–Pacific region(Figure 1).
The problems, however, do not end when marketingactivities are relegated by producers to cooperatives.The latter often lack clear planning objectives, goodleadership, and member participation. Given theirpopularity despite their wanting performance, thepotential of cooperatives far outweighs their weak-nesses. The issue, though, is whether the potential willhold amidst rising challenges—the quality assurancechallenge included.
The Quality Assurance Challenge
One of the major objectives of efficient marketingpractices is to ensure quality as well as minimise lossesfrom harvest to consumption points. The problem,however, is that quality is relative and, as such, has tobe appropriately defined before related problems canbe addressed. The varying definitions of ‘quality’, ascondensed from Satin (1997), are:
• Generic definition —a combination of charact-eristics that are critical in establishing a product’sconsumer acceptability.
• Food industry definition—an integrated measure ofpurity, flavour, texture, colour, appearance andworkmanship.
• Highly-competitive market definition—value or aconsumer’s perception of the worth of the productbased upon the funds available for it.
• When referring to a standard —a product’s consist-ent adherence to that standard.As if the quality challenge arising from inefficient
marketing activities, lack of capital, and non-inte-grated farm activities is a problem not yet big enough,the mandatory adherence of individual countries to theWorld Trade Organization (WTO) requirements ischanging the nature of world trade in agriculturalproducts, including high quality requirements ofproducts traded. As condensed from Satin (1997), the
Table 2
. Suggested measures to improve agricultural marketing resulting from two conferences held in 1989 and1998 (also see Table 1).
APO
a
conference, 1989 FAO
b
conference, 1998
A. Farm level • Adopt a market-oriented approach toselection of product/crop for production
• Promote market-oriented productionsystems with production planning basedon market potentials aided by improvedmarket information, group marketingactivities, direct marketing assistance
B. Market level • Assist farmers in securing market outlets • Establish/improve assembly and tradingcentres or wholesale markets
• Improve marketing practices • Introduce new and improved processingtechniques
• Provide adequate marketing credit (shortand medium term)
• Gather appropriate market information
• Develop rural market • Appreciate the role of traders indevelopment
C. National/policy level • Promote group action by farmers • Introduce appropriate price and non-pricepolicies
• Encourage specialisation in product/area(product estates)
• Train extension workers in marketing
• Provide adequate marketing extensionservice
• Conduct relevant market research
a
APO = Asian Productivity Organization
b
FAO = Food and Agriculture Organization of the United Nations
Quality assurance in agricultural produce,edited by G.I. Johnson, Le Van To, Nguyen Duy Duc and M.C. Webb.
ACIAR Proceedings 100(printed version published in 2000)
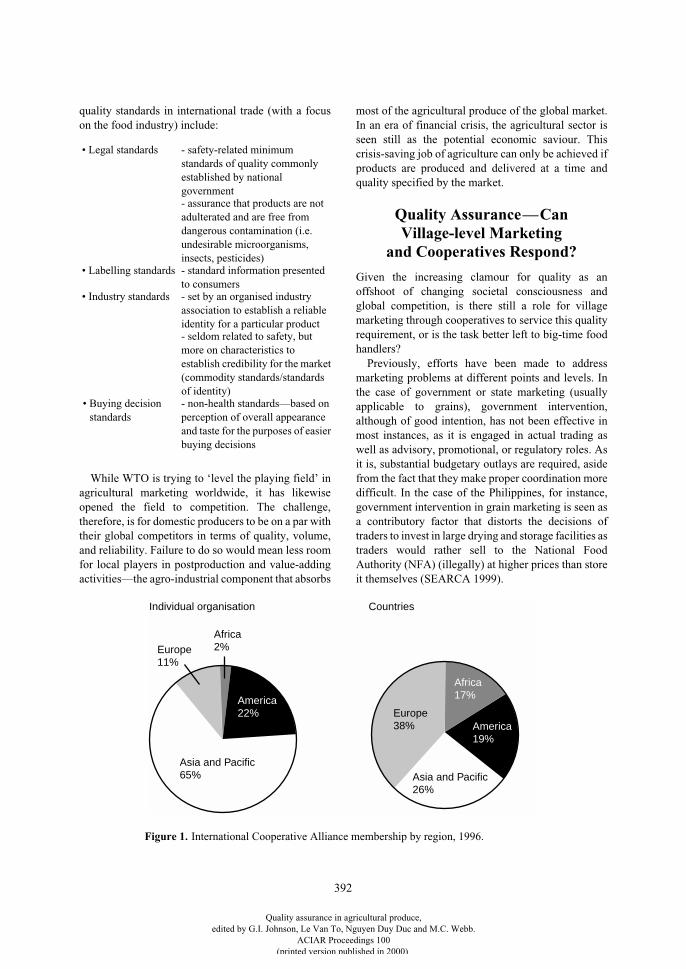
392
quality standards in international trade (with a focuson the food industry) include:
While WTO is trying to ‘level the playing field’ inagricultural marketing worldwide, it has likewiseopened the field to competition. The challenge,therefore, is for domestic producers to be on a par withtheir global competitors in terms of quality, volume,and reliability. Failure to do so would mean less roomfor local players in postproduction and value-addingactivities—the agro-industrial component that absorbs
most of the agricultural produce of the global market.In an era of financial crisis, the agricultural sector isseen still as the potential economic saviour. Thiscrisis-saving job of agriculture can only be achieved ifproducts are produced and delivered at a time andquality specified by the market.
Quality Assurance—Can Village-level Marketing
and Cooperatives Respond?
Given the increasing clamour for quality as anoffshoot of changing societal consciousness andglobal competition, is there still a role for villagemarketing through cooperatives to service this qualityrequirement, or is the task better left to big-time foodhandlers?
Previously, efforts have been made to addressmarketing problems at different points and levels. Inthe case of government or state marketing (usuallyapplicable to grains), government intervention,although of good intention, has not been effective inmost instances, as it is engaged in actual trading aswell as advisory, promotional, or regulatory roles. Asit is, substantial budgetary outlays are required, asidefrom the fact that they make proper coordination moredifficult. In the case of the Philippines, for instance,government intervention in grain marketing is seen asa contributory factor that distorts the decisions oftraders to invest in large drying and storage facilities astraders would rather sell to the National FoodAuthority (NFA) (illegally) at higher prices than storeit themselves (SEARCA 1999).
• Legal standards - safety-related minimum standards of quality commonly established by national government- assurance that products are not adulterated and are free from dangerous contamination (i.e. undesirable microorganisms, insects, pesticides)
• Labelling standards - standard information presented to consumers
• Industry standards - set by an organised industry association to establish a reliable identity for a particular product- seldom related to safety, but more on characteristics to establish credibility for the market (commodity standards/standards of identity)
• Buying decision standards
- non-health standards—based on perception of overall appearance and taste for the purposes of easier buying decisions
Individual organisation
Europe11%
Africa2%
America22%
Asia and Pacific65%
Africa17%
Europe38% America
19%
Asia and Pacific26%
Countries
Figure 1. International Cooperative Alliance membership by region, 1996.
Quality assurance in agricultural produce,edited by G.I. Johnson, Le Van To, Nguyen Duy Duc and M.C. Webb.
ACIAR Proceedings 100(printed version published in 2000)
393
Private sector marketing, on the other hand, is asso-ciated with large marketing margins. Considering thatprivate sector enterprises are usually owned by tradersand non-producers, relying on them for marketingagricultural products often diminishes the farmers’share in the price paid by the consumer. While the keyrole of traders in agricultural marketing is duly recog-nised, the ideal is to keep them to a minimum in anygiven chain. Thus the field is left open to cooperatives.
The assessment of capability of a village-levelmarketing unit or cooperative usually focuses on theissue of size, appropriateness, and responsiveness tothe demands of the time. Size is considered owing tothe degree of sophistication it connotes. Appropri-ateness, on the other hand, is considered as a measureof level of fit to varying requirements, while respon-siveness, as a measure of one’s ability to meetchanging requirements.
Size and level of sophistication
Often, the notion is that anything that is big, sophis-ticated, or technically advanced, is the best option, ifever choices are available. The problem with thisthinking is that one loses sight of the flexibility ofsmall marketing units, cooperatives included, thatleads to a more focused approach for technologicaloptions. This flexibility on focused operations makethe small marketing units more effective than big onesfor catering to the requirements of smaller farms.
Technical appropriateness
In less-developed nations, postharvest technologiesare severely constrained by poor infrastructure. Large-scale processing may therefore not be applicableunless a stable supply of electricity, water, and well-trained technicians is guaranteed (Tsubota 1999).While large-scale operations may benefit fromexpensive handling machinery or from technologi-cally-advanced postharvest systems, simpler, low-costtechnologies can be more appropriate for smallervolume, resource-limited commercial operations(FAO 1998). According to the same FAO report, thekey in reaching the desired postharvest objectives ofquality and loss reduction is effective managementduring the postharvest period more than the level ofsophistication of any given technology.
Responsiveness to the demands of the times
In developed countries, where infrastructure andfacilities are far more developed than in the Asia–Pacific region, cooperatives had been prophesised todisappear altogether. However, cooperativemovements are still growing in these countries—infact, they are surpassing the records of those in Asia–Pacific in terms of membership development. In theUnited States (US), for instance, Agriculture Under-secretary for Rural Development, Jill LongThompson, reported in 1997 that farmer-orientedcooperatives market about one-third of US farm com-modities and handle more than one-quarter of all farmsupplies sold in the US. She said that the cooperatives’popularity stems from the fact that they are turningfarmers’ produce into value-added goods which helpskeep more farm dollars at home in rural areas.
The International Cooperative Alliance (ICA)Asia–Pacific regional assembly in 1997 sent themessage to WTO that liberalisation of agriculturaltrade should not be regarded as an end in itself.Instead, it should also aim to improve the functioningof agricultural markets, increase farm incomes,eradicate poverty, and promote socially and environ-mentally sustainable programs. Given that agriculturein the region is usually carried out by family members,it is the ICA’s belief that more than ever they need tostrengthen cooperative relationships to protectmembers’ interests in the light of the WTOagreements.
Cooperatives still play a major role, even during aperiod where strategic alliances between small andlarge enterprises are already in place. In a study of 71agri-business enterprises, Manalili (1998b) found thatthe small and medium enterprises (SMEs) are stillusually powerless, even if they are allied with largecorporations (LCs), as they are still dependent LCs inreaching their intended market. The study results showthat cooperative endeavours afford SMEs greater com-petency to directly shape their strategic options andmarket their produce. Through cooperatives, SMEshave facilitated raw material bulk purchases thatreduced operating costs and collective bargaining thatimproved prices for their produce. As competencieshave been acquired, the potential of cooperatives in theareas of market information sourcing as well as intechnical, operational, and financial enhancement, hasincreased.
Thus, based on the preceding discussion, there isstill a role for village marketing and cooperatives to
Quality assurance in agricultural produce,edited by G.I. Johnson, Le Van To, Nguyen Duy Duc and M.C. Webb.
ACIAR Proceedings 100(printed version published in 2000)
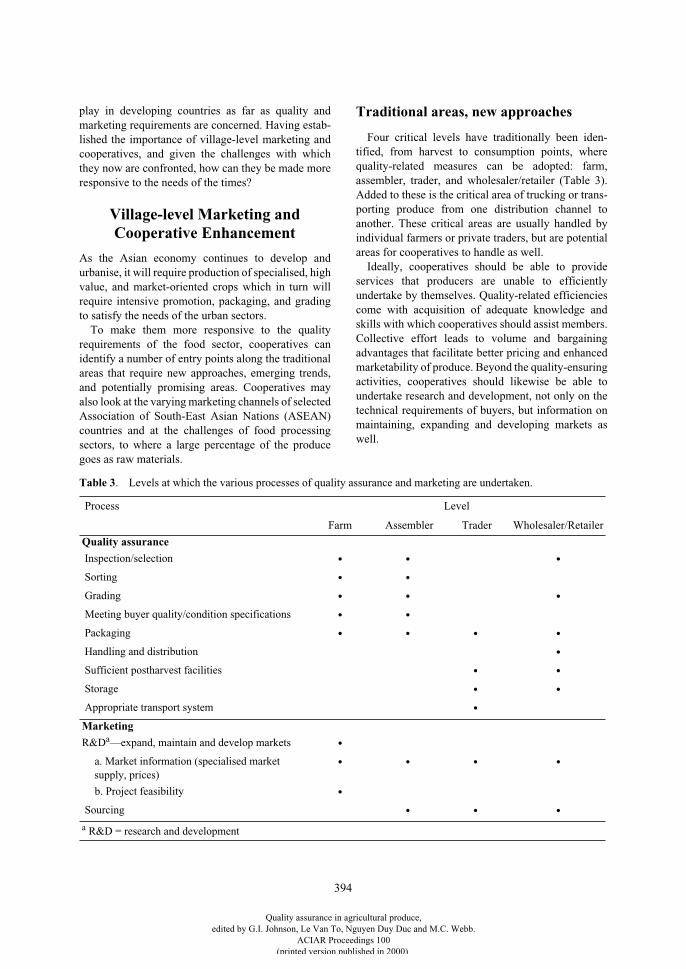
394
play in developing countries as far as quality andmarketing requirements are concerned. Having estab-lished the importance of village-level marketing andcooperatives, and given the challenges with whichthey now are confronted, how can they be made moreresponsive to the needs of the times?
Village-level Marketing and Cooperative Enhancement
As the Asian economy continues to develop andurbanise, it will require production of specialised, highvalue, and market-oriented crops which in turn willrequire intensive promotion, packaging, and gradingto satisfy the needs of the urban sectors.
To make them more responsive to the qualityrequirements of the food sector, cooperatives canidentify a number of entry points along the traditionalareas that require new approaches, emerging trends,and potentially promising areas. Cooperatives mayalso look at the varying marketing channels of selectedAssociation of South-East Asian Nations (ASEAN)countries and at the challenges of food processingsectors, to where a large percentage of the producegoes as raw materials.
Traditional areas, new approaches
Four critical levels have traditionally been iden-tified, from harvest to consumption points, wherequality-related measures can be adopted: farm,assembler, trader, and wholesaler/retailer (Table 3).Added to these is the critical area of trucking or trans-porting produce from one distribution channel toanother. These critical areas are usually handled byindividual farmers or private traders, but are potentialareas for cooperatives to handle as well.
Ideally, cooperatives should be able to provideservices that producers are unable to efficientlyundertake by themselves. Quality-related efficienciescome with acquisition of adequate knowledge andskills with which cooperatives should assist members.Collective effort leads to volume and bargainingadvantages that facilitate better pricing and enhancedmarketability of produce. Beyond the quality-ensuringactivities, cooperatives should likewise be able toundertake research and development, not only on thetechnical requirements of buyers, but information onmaintaining, expanding and developing markets aswell.
Table 3
. Levels at which the various processes of quality assurance and marketing are undertaken.
Process Level
Farm Assembler Trader Wholesaler/Retailer
Quality assurance
Inspection/selection
• • •
Sorting
• •
Grading
• • •
Meeting buyer quality/condition specifications
• •
Packaging
• • • •
Handling and distribution
•
Sufficient postharvest facilities
• •
Storage
• •
Appropriate transport system
•
Marketing
R&D
a
—expand, maintain and develop markets
•
a. Market information (specialised market supply, prices)
• • • •
b. Project feasibility
•
Sourcing
• • •
a
R&D = research and development
Quality assurance in agricultural produce,edited by G.I. Johnson, Le Van To, Nguyen Duy Duc and M.C. Webb.
ACIAR Proceedings 100(printed version published in 2000)
395
Providing information to members—e.g. knowingtheir market fully, including quality requirements—isone of the most important services that cooperativescan offer. The usual problem with agriculturalmarketing is that buyer specifications are usually onlyknown at a stage where varietal decisions can nolonger be reversed, resulting in produce not meetingbuyer requirements and consequently being rejected.
Emerging trends
The traditional way to reduce marketing losses is forfirms to situate processing facilities close to the pointof production. The purpose of this is to reduce rawmaterial damage, thereby enhancing the quality of thefinished product. While there is logic in this approach,it may not always be possible for technical reasons,thus variations occur.
Taking into account the fact that cooperatives havehigh failure rates, the strategy is to identify entrypoints that will capitalise on current strengths whilesimultaneously requiring competency in weak areas.One strategy is to build partnerships with other sectors.
Private sector linkagesVillage-level tie-up (Thailand)
. In Thailand, a fruitand vegetable processing firm employs villagerswithout the need for the latter to report daily to thefactory. The raw materials to be processed, such astomatoes for peeling, longan for seed removal, or babycorn for leaf removal, are brought to a village near theharvest area and are picked up at collection pointsevery 30 min by the factory vehicle. Usually a villageleader is appointed to coordinate these activities. Thevillages selected for this kind of tie-up are usually 5–10 km from the factory production sites.
The village-level preliminary processing activities(washing, peeling, seeding) could very well be under-taken by a village cooperative in the same manner, andthe trucking activity could likewise be a potential entrypoint. The key, however, is for cooperatives to acquirethe quality and reliability (timely delivery) compe-tencies that such firms so consistently require.
Strategic alliances (Philippines)
. Strategic allianceswere a predominant feature of the Philippine agri-business sector in past decades, specifically in theMindanao area. While initially all aspects of a largecorporation’s (LC’s) operations were company-ownedand managed, individuals, groups or small-to-mediumenterprises were later contracted to perform tasks forLCs at a lesser cost but comparable quality. Thesewere mostly in the areas of supply, channel, and
physical distribution systems. The move was inresponse to an LC’s need to cut costs, enhance opera-tions and to stay in competition, i.e. getting value forthe least cost (Manalili 1998b).
There are cases where employee associations orfarmer-growers form cooperatives to service the saidrequirements of a large corporation. The advantage ofthis arrangement is that cooperatives are provided withopportunities at a reduced cost and risk level forreasons that the market is assured and quality specifi-cations are provided (monitored/maintained) by theallied firms.
Long-term supply arrangements between parties arelikewise considered as strategic alliances, as in thecase of banana and pineapple contract growers in thePhilippines. Similarly, cooperative formation amonggrowers is not uncommon. Cooperatives could play agreater role only if they equip themselves with fullknowledge of contract-growing arrangements so as toprotect their members from unscrupulous practicesand potential abuse by allied companies.
Research and development linkage
In remote areas where raw materials abound andprocessing facilities are limited, the only otherproducer option aside from selling fresh at low pricesis to process produce through cooperative endeavour.Chances are these village-level cooperative enter-prises will have difficulty in accessing markets whereproduct quality is a primary consideration for reasonsof poor product quality. Being new in the processingbusiness they still lack required competencies.
To address quality problems, a technology transferand marketing tie-up between a research and devel-opment institution and a potential village cooperativeis an option, as in the case of Vietnam’s Post-HarvestTechnology Institute (PHTI). As PHTI is a recognisedinstitution in food technology generation, a number ofits mature technologies were proposed for transfer to avillage-level cooperative enterprise in collaborationwith Southeast Asian Ministers of Education Organi-zation (SEAMEO) Regional Center for GraduateStudy and Research in Agriculture (SEARCA) and theCollege of Agriculture and Forestry. In the “Strength-ening Marketability and Transfer of Technology forSustained Food Processing at a Village Level inVietnam” project, the approach is to equip the villagecooperatives with economic and technical tools,leading to a high level of quality. On a sustainablebasis, these economic activities in rural villages canprogress to a higher level where the cooperative bene-
Quality assurance in agricultural produce,edited by G.I. Johnson, Le Van To, Nguyen Duy Duc and M.C. Webb.
ACIAR Proceedings 100(printed version published in 2000)
396
ficiaries will become the precursors of agro-industrialdevelopment in their respective communities.
A potentially promising area
Cooperatives have recently abandoned the tradi-tional sectors of agriculture or retail distribution infavour of financial services. This is either because theyhave been ‘squeezed out’ of operation by competitors,or because they have recognised the potential of thefinancial service sector.
In the Asia–Pacific region, usually accompanying alack of marketing options for farmers is a lack of fundsto support marketing activities. The tightness of creditis associated with the rigid requirements of formallenders (bank) and the high interest rates of informalones. To address this, cooperatives can serve as aconduit for providing financial services that is a crossbetween formal and informal lending. Instead ofcontract growers individually applying for loansdirectly from the bank, a cooperative can apply forloans and re-loan to grower members at rates highenough to cover service and fund handling. The coop-erative will thus reduce the rigidity of formal lendingby shouldering the risk, which is at a reduced levelcompared to banks owing to the cooperative’sproximity to growers and buyers which facilitatesregular harvest monitoring and payment collection.
Conclusion
Village-level marketing through cooperatives still hasa role to play in the quality assurance requirement ofagricultural produce. Despite high failure rates, coop-eratives—by virtue of their size, technology require-ments, and proximity to and knowledge of their area ofproduction—are still the better option to service themarketing needs of rural agricultural producers.
The key to successful marketing is effective man-agement rather than the level of sophistication of themarketing system. Measures should therefore begeared towards enhancing cooperatives’ organisa-tional management and operational efficiencies.Strategies should capitalise on competency-enhancinglinkages that enable cooperatives to acquire the com-petencies of their partners while at the same time‘learning the ropes’ of the business. This willgradually prepare them for the bigger role they need toplay in their village’s bid for agro-industrialenhancement and sustainable development.
References
ADB (Asian Development Bank) 1999. Rural Asia: beyondthe green revolution. Prepared for the 32
nd
AnnualMeeting Seminar, 29 April 1999.
APO (Asian Productivity Organization) 1990. Marketingsystems for farm products in Asia and the Pacific (reportof APO seminar held in Japan in 1989). Tokyo, AsianProductivity Organization.
Baun, W. and Tolbert, S. 1985. Investing in development—lessons of World Bank experience. Oxford, OxfordUniversity Press.
Deomampo, N.R. 1997. Agricultural marketing systems inAsia and the Pacific region. Marketing systems foragricultural products—a seminar report. Tokyo, AsianProductivity Organization.
Duncan, R. 1997. World food markets into the 21
st
century.Paper presented at the 41
st
Australian Agricultural andResource Economics Society Conference, Pan PacificHotel, Gold Coast, Australia.
FAO (Food and Agriculture Organization of the UnitedNations) 1998. Regional expert consultation on thepromotion of market oriented production system report.Bangkok, Food and Agriculture Organization.
Kainuma, K. 1999. Role of postharvest technology researchfor sustainable food supply. In: Postharvest technology inAsia, symposium proceedings. Japan InternationalResearch Centre for Agricultural Science (JIRCAS) andMinistry of Agriculture, Forestry and Fisheries.
Manalili, N.M. 1998a. Development of agro-industries andrural–urban linkages in developing countries. Paperpresented at the Asian Productivity Organization’sSeminar on Measures for Rural Employment Generationheld in Hanoi, Vietnam.
Manalili, N.M. 1998b. Strategic alliances between small ormedium scale agribusiness enterprises and largecorporations. Doctoral dissertation, University of thePhilippines, Diliman, Quezon City (soon to be publishedin the Asian Academy of Management Journal).
Pingali, P., Hossain, M. and Gerpacio, R. 1997. Asian ricebowls—the returning crisis? Published by CABInternational in association with the International RiceResearch Institute.
Satin, M. 1997. Food quality and international trade. Food andAgriculture Organization of the United Nations (FAO)Internet site: <http://www.fao.org/waicent/faoinfo/agricult/ags/Agsi/AGSI.htm>.
SEARCA (SEAMEO Asian Regional Center for GraduateStudy and Research in Agriculture) 1999. Terminalreport—technology, trade and policy imperatives forinternational competitiveness in corn. College, Laguna,SEARCA.
Quality assurance in agricultural produce,edited by G.I. Johnson, Le Van To, Nguyen Duy Duc and M.C. Webb.
ACIAR Proceedings 100(printed version published in 2000)
397
SEARCA (South-East Asian Regional Center for GraduateStudy and Research in Agriculture) and Hassall &Associates Pty Ltd 1997. Final report for All ChinaFederation of Supply and Marketing Cooperatives(ACFSMC) Project—TA No. 2539-PRC. Unpublishedreport, People’s Republic of China, Asian DevelopmentBank.
Tsubota, K. 1999. Relation between postharvesttechnologies and economic development. In: Nawa, Y.,Takagi, H., Noguchi, A. and Tsubota, K., ed., Postharvesttechnology in Asia—symposium proceedings. JapanInternational Research Centre for Agricultural Sciences(JIRCAS) and Ministry of Agriculture, Forestry andFisheries, Japan.
Quality assurance in agricultural produce,edited by G.I. Johnson, Le Van To, Nguyen Duy Duc and M.C. Webb.
ACIAR Proceedings 100(printed version published in 2000)
398
The Philippine Rice Postproduction Consortium: Needs Assessment of the Postproduction Industry
D. de Padua*
Abstract
The Philippines is a net importer of grains, but the Philippine Department of Agriculture believes the countryhas the resources and the capability to be self-sufficient in rice and maize to meet the needs of its increasingpopulation. The postproduction sector—that brings the harvest from the farms to its processing plants,processes the grain and distributes the milled products to consumers—plays an important role in the country’sfood security program. There are many stakeholders in the rice and maize processing and marketing industry,and it is expected that they have many concerns. The International Rice Research Institute and four othergovernment agencies have mandates in the development of the postproduction sector. These institutions haveformed a consortium to work in collaboration with each other on priority projects. The issues and concernsraised in a needs assessment workshop of the consortium can be categorised as dealing with informationdevelopment and dissemination, technology development, adaptation and commercialisation, policy studiesand advocacy, and systems study. An indication of problems in the industry is the poor quality of milled riceproduced. Grain quality is a function of many factors, but the basic technical cause of poor milled rice qualityis traced to the lack of drying capability for the wet-season harvest. Providing the needed drying capacity is acomplex issue that involves not only technology, but involves economic, social and political considerationswhich has confounded researchers for a long time.
T
HE
P
HILIPPINES
has always been a net cereal grainimporter, and the government’s food securityprogram’s aim is “to ensure that rice and maize isavailable, accessible, and affordable to the people atall times”. This policy has many implications.Researchers from the Philippine Rice ResearchInstitute, however, believe that the country has what ittakes to be self-sufficient in rice. From what can begathered from the different pronouncements of gov-ernment, the strategic plan is to modernise agricultureto improve farm productivity, and improve the capa-bility of farmers to handle their harvest. The operativepolicy is to transform the grain industry from aresource-based to a technology-based industry. Forthose charged to make things happen, this is under-stood to mean that farm production and grainprocessing yields have to be increased and lossesdecreased in the harvesting, processing and marketing
chain of operations, through the application of locallyappropriate, proven, and acceptable technologies.Where the farmers are concerned, the plan is toprovide them with certified seeds, irrigation water,farm machinery, farm to market roads, and primarypostharvest facilities. With regard to the lastitem—postharvest facilities—it has been suggestedthat drying service centres be provided under the man-agement of local government units. These are publicsector investments, where users will be charged fees,presumably to cover direct operating costs. The Phil-ippine Rice Postproduction Consortium, a researchgroup, is responding to the challenge.
The rice and maize industry scenario has changed alot in the last three decades. Since the green revolutionin the late 1960s, postproduction research was initiallytrying to cope first with how to handle the increasedvolume of farm yields under adverse weather condi-tions, and now the pressure is on how to improve foodsecurity—read this as the marketing functions—for anincreasing population. Land reform has shifted focuson the production and postproduction needs of the
* Consultant, International Rice Research Institute, Agricultural Engineering Division, Los Baños, Laguna, Philippines, PO Box 3127 Makati Central Post Office, Philippines.
Quality assurance in agricultural produce,edited by G.I. Johnson, Le Van To, Nguyen Duy Duc and M.C. Webb.
ACIAR Proceedings 100(printed version published in 2000)
399
many small farmers liberated from landlords. Farmerorganisations have mushroomed and are the newclients. The cost of farm labour has increased to thepoint that processors see the need for increasing levelsof mechanising grain handling.
The Consultative Group for International Agricul-tural Research (CGIAR) is the highest internationalbody that gives policy direction and financial alloca-tions to 16 international research centres, such as theInternational Rice Research Institute (IRRI) in LosBaños. In the past, postharvest or postproductionresearch was given low priority. In the words of agovernor of the CGIAR, the grain postharvest systemswere already highly developed in the developed econ-omies, private sector research initiative has beenactively pursuing opportunities, and the need wassimply “the transfer of technology” from the West toAsia. The CGIAR has never been so off in itsprognosis of priorities, and lately the CGIAR hasdirected its centres to look at the agricultural commod-ities as a system from the farm to the consumer’s table.At IRRI’s Agricultural Engineering Division, postpro-duction research has been revitalised.
IRRI does its work in collaboration with theNational Agricultural Research System, and so col-leagues in the industry and stakeholders were invitedto discuss postproduction problems and priorities.Many problem issues and constraints were raised byinterest groups and are summarised below.
Needs Assessment:Issues and Concerns
Farmers and farmer groups (cooperatives)
• The lack of access to information vis-à-vis newtechnology, due to limited sources of information,lack of extension material or qualified extensionofficers.
• The lack of knowledge in choosing new andappropriate technology, foisted on them bygovernment, e.g. mechanical dryers.
• The lack of postharvest facilities for handling wetharvest, resulting in grain quality deterioration oroutright loss.
• The high investment cost (to farmers) ofpostproduction facilities (e.g. mechanical dryers).
• The lack of knowledge in business management byfarmer groups encouraged to go into rice processingand trading.
• The lowering of the farm-gate price of paddy everytime rice is imported to protect consumers.
• Increasing farm labour costs in some locations dueto other employment opportunities.
• Non-payment of loans by farmers from governmentfinancing institutions leading to the suspension ofaccess to credit, and high cost of credit frominformal sources.
Rice processors and traders
• No access to information on technology forupgrading processing facilities.
• Poor quality or inappropriate technology from somelocal sources.
• Imported technologies for drying and milling areexpensive, with no after-sales service.
• Poor-quality milled rice due to poor quality palay orobsolete processing facilities.
• High cost of electric power or energy.• High losses due to lack of drying capacity.• Processing facilities operating below capacity.• Plant operators have no formal training on the basic
principles of rice processing.
Manufacturers of processing facilities
• High cost of manufacturing; high cost of rawmaterials.
• Poor quality or obsolete manufacturing tools andequipment.
• Low impact of research and development on themanufacturing industry.
• Government policy and programs do not support thelocal manufacturing sector.
• No engineering design capability for postharvestequipment. (Reference made to drying equipment.)
Research and development
• Lack of research funds.• Lack of understanding of industry needs;
fragmented approach.• Lack of research focus on priorities.• Lack of participation of end users.• Too much research not adopted or has no relevance
to industry; inappropriate designs.• No understanding of implications of small farm
production to the processing and trading sector.• Insistence on farm drying where palay traders and
millers have taken over the responsibility fordrying.
Quality assurance in agricultural produce,edited by G.I. Johnson, Le Van To, Nguyen Duy Duc and M.C. Webb.
ACIAR Proceedings 100(printed version published in 2000)
400
• No quantification of benefits of the use ofmechanical dryers.
• Loss assessment studies have not captured the reallosses due to the lack of drying capacity or due toantiquated facilities.
• No understanding of the technology requirements ofgrain handling and storage in tropical climates.
• No local design standards.• Designs not globally competitive.• No protection for intellectual property rights.
Extension and training
• No information on tested technologies.• No proper evaluation of technologies before they
are promoted.• Researchers acting as extension agents for their own
designs.• No extension capability at the local government
levels.
Government programs and policy
• Policy on rice importation: consumer protectionversus farmer support.
• Tariff on raw materials higher than finishedproducts.
• Public sector investment for postharvest facilities isundefined.
• No program on industry development for the privatesector.
• No technology assistance provided to private sectorprocessing industry.
• Continuing ‘life support systems’ for not viable orunsustainable cooperatives in rice processing andtrading.In summary, the response to all these needs may be
categorised under (1) information synthesis and dis-semination; (2) appropriate technology developmentor adaptation; (3) policy research and advocacy; and(4) systems study. The issues are varied and requiremultidisciplinary and multi-sectoral collaboration.
Public Institutions Involved in Postproduction Systems
There are many agencies of government mandated tolook after the health and welfare of the differentsectors of the rice industry. The National FoodAuthority has the most comprehensive responsibilityto support the farmers in the marketing of theirproduce, of protecting the consumers, and are also
charged with the responsibility of regulation anddevelopment of the rice processing and trading sector.The Bureau of Postharvest Research and Extension ofthe Department of Agriculture has taken upon itself tolook after the postharvest technology requirements offarmer-based cooperatives. The Philippine RiceResearch Institute has focused on the postharvestrequirements of farmers. Academe-based researchers,such as those at the University of the Philippines LosBaños have been looking at the more basic, theoreticalaspects. IRRI Agricultural Engineering Divisionfocused on technology hardware development in thepast, but has now expanded its work to include post-production systems research, with emphasis onanalysis of systems as they relate to improving grainquality. It became very clear that if we had to makeheadway in the development of the grain postpro-duction industry, the five agencies had to collaboratewith each other, lending each other their expertise andfield experience. Thus was born the Philippines RicePostproduction Consortium. The collaboration hasbeen formalised with a Memorandum of Agreementbetween the agencies involved. The Consortium meetsquarterly to report and review progress of work takenon by the different agencies.
Reports of Consortium Institutions on Current Postproduction
System Activities
A peer review of the activities of the different agencieswas undertaken. The different agencies have not beenlacking in activities.
Bureau of Postharvest Research and Extension (BPRE)
• Design and development of a high-temperaturefluidised bed dryer.
• Industrial utilisation of by-products: rice hull andstraw.
• Advanced systems: development of a computer-aided management tool for bulk storage systems.
• Establishment of an electronic trading informationsystem.
• Development of controlled atmosphere storagetechnology for prolonging the storage life of 18%moisture content paddy.
• Assistance to three pilot cooperatives, by providingBPRE-trained managers.
Quality assurance in agricultural produce,edited by G.I. Johnson, Le Van To, Nguyen Duy Duc and M.C. Webb.
ACIAR Proceedings 100(printed version published in 2000)
401
• Technical assistance to the rice industry:- distribution of paddy moisture meters- promotion of Volcani cubes storage technology- promotion of in-store drying technology- review of postharvest proposals of local govern-
ments- assistance to local governments in postproduction
systems projects.• Software development: decision support system in
drying and pest management in storage.• Impact assessment of postharvest facilities
distributed to farmer cooperatives.
University of the Philippines at Los Baños/College of Engineering andAgro-industrial Technology/Agricultural Processing Engineering and Processing (AGPET)
• Design and development of a recirculating dryer.• Design and development of a three-stage, high-
temperature dryer.• Resistance to airflow of local paddy varieties.• Adsorption drying with rice hull.• Improving eating quality of rice with pandan leaves.• Improving head rice recovery through cooling in the
polishing stages.• Testing and evaluation of the rice hull furnace.• Optimisation of the rice-drying process.• Utilisation of rice bran for feed formulations.
National Food Authority-Technology Resource Department (TRD)
• Milled rice mist polishing studies: for improvementin appearance and monitoring of quality in storage.
• Evaluation of the double-pass mist polisher.• Pile (paddy and rice in bags) control system for
inventory control and liquidation.• Evaluation of plastic pallets with respect to
preventing insect infestation.• Validation of feasibility of Volcani cube
technology.• Evaluation of recommended fumigants for pest
control in storage.• Evaluation of sealed enclosure fumigation storage
technology (SEFUST) (controlled atmospherestorage technology—CAST) technology.
• Evaluation of organoleptic properties andpreservation of packaged milled rice.
• Design and development of receiving tanks forrecirculating dryers.
• Evaluation of the effect of insulating liners for roofsof warehouses in minimising stock deterioration.
• Evaluation of gamma irradiation technology of ricefor insect disinfestation.
• Evaluation of moisture meters for milled rice.• Review and revision of Philippine Grades and
Standards for Palay and Milled Rice.• Upgrading of rice milling facilities.
Philippine Rice Research Institute
• Evaluation of harvesting technology:- stripper gatherer- LS 600 stripper harvester- LS 120 stripper harvester- rotary reaper- combine harvesters.
• Evaluation and promotion of farm dryingtechnology:- Vietnam model flat-bed dryer—4, 6, 10 t capacity- bamboo bin dryer (Vietnam SRR dryer).
• Development of paddy grain cleaner.• Evaluation and promotion of rice flour mill.• Evaluation and promotion of micro-mill.• Evaluation and promotion of Department of Science
and Technology rice hull gasifier technology.• Impact assessment studies:
- analytical tools for grain quality evaluation- improvement of rice food products- field tests of milled rice flour for major rice
products- determinants of grain quality.
IRRI Agricultural Engineering Division
• Production of information series bulletins:- maintaining paddy quality in harvest operations- inventory and application of paddy drying tech-
nology- rice quality—seed to seed- rice quality—increasing head rice recovery by
preventing fissuring- inventory of new rice milling technology for
upgrading rice mills.• Development and building of database on rice
postharvest technology.• Development of a decision support system package
in rice production engineering.• Development of seed processing technology.
Quality assurance in agricultural produce,edited by G.I. Johnson, Le Van To, Nguyen Duy Duc and M.C. Webb.
ACIAR Proceedings 100(printed version published in 2000)
402
• Research and development programs in:- Bangladesh—introduction of rice harvesting and
processing technology- Bangladesh—survey of rice products and by-
products utilisation among rice farming house-holds.
• Grain quality management research:- harvest and quality- storage and discoloration -quality assessment of rice in the retail markets.
Consortium Work Program
A collaborative work program for the consortium hasevolved based on the identified priorities. These are:• A continuing validation and definition of the
problems of the different stakeholders to guide theresearch agenda of the consortium. The capabilityof engineering researchers to undertake needsassessment studies through a training course isbeing worked out with social scientists.
• Undertaking of case studies of successes andfailures in the introduction or application oftechnologies in postproduction systems.
• The development of a computer-based databank onthe different technologies available locally andabroad.
• Undertaking of studies on the basic thermodynamicproperties of rice and maize to help designengineers.
• Development of information bulletins on thedifferent technologies available to help thosewishing to upgrade their processing plant orefficiency of their operations.
• Support of the National Food Authority effort in thewider use of grain standards in the trading andmarketing of grain.
• Development of grain drying capability both at thefarm level by farmers and processing plant level bymillers.
• Support of government policy studies relevant to thedevelopment of the grain industry.
Rice Grain Quality Assessment
The rice quality characteristics that the rice-eatingcountries of Asia prefer are well-formed, polishedhead rice that is white and translucent, and free of con-taminants. The quality deviations from this are the dis-coloration, breakage, immature grains, pest damage,and contaminants. The cooking and eating character-istics which are inherent in the biochemical properties
of varieties differ with different cultures. Grain qualityimprovement in breeding, production, and processingare important in the business of rice as it increases themarket potential of the rice. This is true for bothdomestic and export markets.
Consumer preferences
Rice is a staple food in Southeast Asia, and thepreferred rice properties depend on geographiclocations and what the people are used to eating. Somecultures prefer parboiled rice, others the glutinouswaxy rice, and still others, such as in the Philippinesand Indonesia, serve steamed raw rice. Generally,countries that produce surpluses for export likeThailand go for ‘better quality’ rice even in thedomestic markets. Higher income groups pay substan-tially higher prices for the quality characteristics theyprefer. Market research indicates that in the rural areasthey prefer the softer-textured rice that clumpstogether, while the restaurants in the urban commu-nities prefer the fluffier rice. This kind of informationis important to processors and traders finding nichesfor their products.
Inherent varietal characteristics
Grain quality is many things to different people, butmostly ‘the proof of the pudding is in the eating’. It isnot unusual for farmers in the Philippines to plant aportion of their farms to traditional varieties they areuse to eating for their own household consumption andthe rest to modern varieties. Commercial farmers lookfor varieties that yield not only higher for their farmingconditions, but varieties that will also sell at higherprices. Varieties that have established a ‘good quality’reputation in the markets command significantlyhigher prices, to the point that a certain amount of mis-labelling is practised by unscrupulous farmers andtraders. IR64, a long grain rice that is soft and moistwhen freshly cooked, is preferred by many in the Phil-ippine market, and sells 2 to 4 pesos higher perkilogram. This kind of information is generated too bymarket research.
Head rice recovery
Grain quality is an economic measure. Like all thegood things in life, quality has a cost. Milled rice thatis referred to as ‘better quality rice’ in the market isvery much a subjective judgement. Rice retailmarketing does not as yet follow any set of grades and
Quality assurance in agricultural produce,edited by G.I. Johnson, Le Van To, Nguyen Duy Duc and M.C. Webb.
ACIAR Proceedings 100(printed version published in 2000)
403
standards. In general, however, milled rice with a highpercentage of head rice, or few broken grains, ispreferred in the higher end markets. The cooking andeating quality is reported by Japanese researchers to beaffected by grain breakage. Head rice sells at premiumprices, while the broken grains sell at about half thepremium price. Maximising head rice recovery startsat the farm, and all the technologies in the chain ofprocessing operations can affect positively or nega-tively the head rice recovery. Fissuring due tomechanical stresses, fissuring during the dryingprocess, and breakage during milling have not beenfully explored by researchers for different cultivars.
Grain discoloration
Discoloration of grain from its natural translucentwhite colour is known to be caused by postharvestconditions. Delay in drying wet harvest is observed toresult in a general darkening of the starchy endospermand erroneously referred to as fermented rice in thePhilippines. Cereal chemists explain the discolorationas due to staining of the starchy endosperm by the ricebran and husk. Yellow kernels are attributed to heatand mould damage. It has been shown that fieldstacking overnight of unthreshed grain results in heatbuild-up, resulting in yellow kernels. ‘Hot spots’ instorage induced by insect infestation and subsequentmoisture migration, also explain discoloration of grainin storage. Discoloured grains are considered damagedgrain and severely discounted in the markets. The truenature and specific environmental limits for grain dis-coloration have not been established.
Damaged grain
The rice kernel can be damaged in the field duringthe production stage resulting in immature kernels,half-filled grains, or formation of chalky belly grains.In the processing and storage plants, insect pests alsoinflict damage to the grain. Weed seeds, small stones,and other foreign matter that cannot be readilyremoved reduce the quality assessment of milled rice.Technologies have not been developed to completelyseparate the damaged grain and contaminants. Proc-essors employ a platoon of women facing beltconveyors to manually sort out the damaged grain.
Incentives for grain quality improvement
Economic incentive or increased profitability to astakeholder is the driving force for grain qualityimprovement. For example, drying is a key operationfor maintaining quality of paddy. In some instancesfarmers do not realise any benefit from investing oreven using a mechanical drying facility, but millers do.It pays for millers to invest in a drying facility. Aneconomic analysis of paddy and milled rice tradingmight show who benefits most, aside from society ingeneral, in a rice grain quality improvement program.
Public Sector Investment in Grain Dryers
Many of the issues and concerns raised are related todrying of the wet harvest. Rice and maize have to beharvested as soon as they reach maturity to preventfield losses. The high moisture harvest has to be stabi-lised to prevent bio-deterioration. Drying of theharvested grain is the key technology for preservation.The harvested grain can either be dried at the farmlevel by farmers or farmer groups, or at the mill levelby processors. The traditional method is sun-drying,but increased yields and double cropping whereharvest coincides with the rainy season has accen-tuated the need for more reliable mechanical dryers.
Paddy drying is a critical operation that has to bedone in a timely fashion to minimise losses, and doneproperly to prevent damage to the milling quality.Postharvest losses that are normally attributed todrying are in the order of 5% of the crop yield. Theseare due to spillage, or a reduction in milling yields dueto grain breakage. The loss due to sprouting, rotting, orqualitative loss due to lack of drying capacity are unac-counted for.
Since the introduction of higher yielding varieties in1964, the demand for appropriate drying technologywas identified and has increased. There are two systemtypes—one category is for farm-level drying byfarmers or farmer groups, and the other category isplant-level drying by rice millers or traders. There areabout 25 dryer models that have been introduced in thecountry. Out of this number of designs only 3 or 4 havethe potential to be adapted and adopted. These are allheated-air, forced-convection systems.
National Food Authority (NFA) statistics indicate thatdespite all these designs, our mechanical drying capacityis only for about 10% of production. Government has
Quality assurance in agricultural produce,edited by G.I. Johnson, Le Van To, Nguyen Duy Duc and M.C. Webb.
ACIAR Proceedings 100(printed version published in 2000)
404
pursued many schemes to provide drying capacity tofarmers. NFA provides incentives to farmers to dry theirharvest for delivery to NFA. The Department of Agri-culture has also directed the distribution of mechanicalgrain dryers to farmer cooperatives. This refers to themechanical flash dryers of BPRE. Reports in an e-mailconference in 1997 indicated that the recipients, forvarious technical and economic reasons, were not usingthese dryers.
An NFA internal report indicates that 600 millionPhilippine pesos—proceeds of the 1993 Thailand riceimportation—was authorised for the purchase and dis-tribution of some 830 mechanical flash dryers, 670multipurpose drying pavements, and other postharvestfacilities. A monitoring report indicates that “severalmechanical dryers were non-operational from the timeof award due to manufacturing defects”. A moreformal survey indicated that 47% of respondents werenot satisfied with the mechanical flash dryer, notingthat they preferred a dryer that could dry their palaydown to 14% moisture, while 38% indicated they weresatisfied with their mechanical flash dryers. Othersindicated they preferred the use of a multipurposepavement (for drying). The majority of respondentsobserved that the dryer’s capacity is not large enoughto handle the volume of palay of the cooperative. Onthe positive side, the dryer provided employment tosome, and others claim having reduced postharvestlosses. Some indicated good drying results, whileothers indicated uneven drying, discoloration of grain,and grain breakage when milled. No additional incomerealised was also reported because of the high cost ofoperating the dryers. In general, a reading of the reportgives the impression that the mechanical flash dryerhas an inherent design limitation, quality of manu-facture was defective in some instances, and theprogram implementation procedure was foundwanting.
Grain drying remains a key problem of the industry,and the Consortium is studying how to provide theneeded grain drying capacity in support of the foodsecurity program of government. Naturally, we wereinterested to obtain a deeper understanding of the flashdryer story, first hand. Our findings are summarisedbelow and confirm the NFA statistical survey.
1. The flash dryer was designed as a first-stagedryer to skin dry palay, for a second-stage in-storage drying system. It was therefore designedto dry the grain to 18% moisture content (MC).The flash dryers were distributed without thesecond-stage system, and most of the farmersinterviewed did not comprehend why, with the
flash dryer, they had to sun-dry a second timebefore it could be milled. Forcing the flash dryerto dry to 14% MC resulted in heavy grainbreakage, because of the high operating temper-ature, and this further aggravated the farmers’dislike for the flash dryer.
2. The farmers only used the flash dryer in atyphoon situation when there were endless daysof rain, and their grain was in danger of souring.They preferred sun-drying if the option waspossible. It cost them 4–5 pesos/44 kg sack todry, while it costs 25-30 pesos per sack to usethe flash dryer, because of gasoline andkerosene costs. In some instances where a coop-erative would handle some 2,000 bags of grainin a season, only about 50 to 200 bags werereported to have been dried using the flashdryer. It might be noted that the grain dried withthe flash dryer might have otherwise been lostdue to spoilage—representing 2.5–10%.
3. The batch capacity of the flash dryer per load is10 bags (44 kg), which takes about 3 hours toskin dry. In a 24 hour day, only 6 batches couldbe skin dried, or 60 bags. A typical cooperativehandles 100 to 200 bags a day for its members,and they find the dryer capacity too small fortheir requirements.
4. Farmers’ cooperatives are basically farm pro-duction cooperatives. The cooperatives providethe farmers with production loans, which theyrepay in kind. The cooperative in turn cleans,dries, and stores the palay delivered as paymentfor their loans by the farmers, and later sells thepalay to millers with a slight mark-up. There is adefinite need for mechanical grain dryers toallow farmer groups to dry their harvest, partic-ularly during the monsoon harvest season.
5. It may be impossible to compete with sun-drying cost-wise, and while the farmers do notdirectly realise the benefits of improved grainquality with proper mechanical dryers,consumers benefit with better grain quality.Millers, however, pay discounted prices forpalay that is damaged due to delayed orimproper drying, or better prices for goodquality palay.
6. Despite the minimal usage of the flash dryer,since it was given to them by government forfree, most of the farmers interviewed werehappy to keep the dryer as insurance for theirwet harvest in case of prolonged rainy days.
Quality assurance in agricultural produce,edited by G.I. Johnson, Le Van To, Nguyen Duy Duc and M.C. Webb.
ACIAR Proceedings 100(printed version published in 2000)
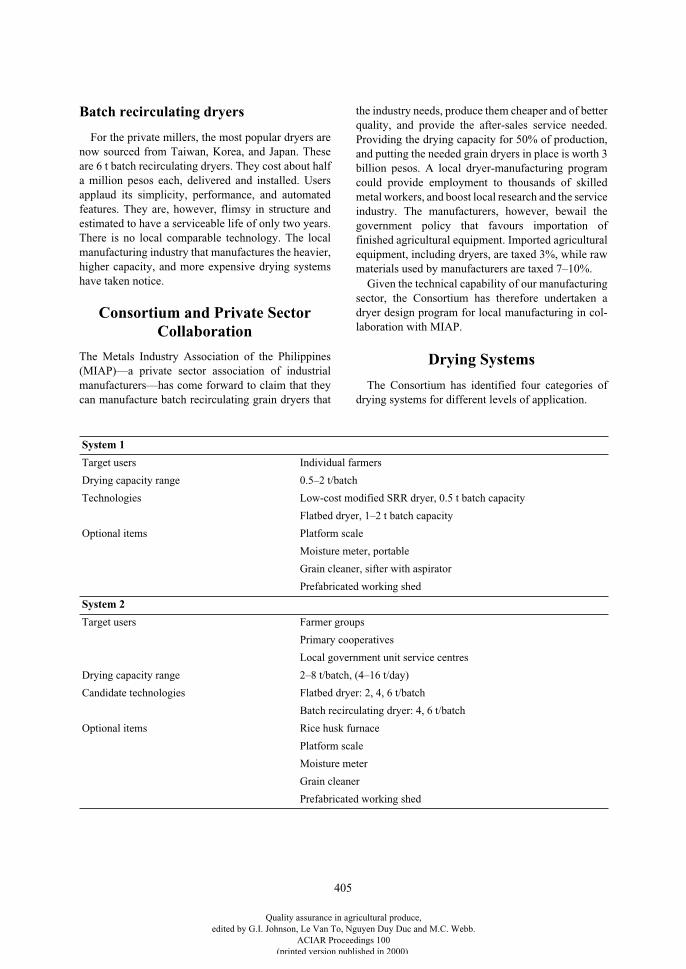
405
Batch recirculating dryers
For the private millers, the most popular dryers arenow sourced from Taiwan, Korea, and Japan. Theseare 6 t batch recirculating dryers. They cost about halfa million pesos each, delivered and installed. Usersapplaud its simplicity, performance, and automatedfeatures. They are, however, flimsy in structure andestimated to have a serviceable life of only two years.There is no local comparable technology. The localmanufacturing industry that manufactures the heavier,higher capacity, and more expensive drying systemshave taken notice.
Consortium and Private Sector Collaboration
The Metals Industry Association of the Philippines(MIAP)—a private sector association of industrialmanufacturers—has come forward to claim that theycan manufacture batch recirculating grain dryers that
the industry needs, produce them cheaper and of betterquality, and provide the after-sales service needed.Providing the drying capacity for 50% of production,and putting the needed grain dryers in place is worth 3billion pesos. A local dryer-manufacturing programcould provide employment to thousands of skilledmetal workers, and boost local research and the serviceindustry. The manufacturers, however, bewail thegovernment policy that favours importation offinished agricultural equipment. Imported agriculturalequipment, including dryers, are taxed 3%, while rawmaterials used by manufacturers are taxed 7–10%.
Given the technical capability of our manufacturingsector, the Consortium has therefore undertaken adryer design program for local manufacturing in col-laboration with MIAP.
Drying Systems
The Consortium has identified four categories ofdrying systems for different levels of application.
System 1
Target users Individual farmers
Drying capacity range 0.5–2 t/batch
Technologies Low-cost modified SRR dryer, 0.5 t batch capacity
Flatbed dryer, 1–2 t batch capacity
Optional items Platform scale
Moisture meter, portable
Grain cleaner, sifter with aspirator
Prefabricated working shed
System 2
Target users Farmer groups
Primary cooperatives
Local government unit service centres
Drying capacity range 2–8 t/batch, (4–16 t/day)
Candidate technologies Flatbed dryer: 2, 4, 6 t/batch
Batch recirculating dryer: 4, 6 t/batch
Optional items Rice husk furnace
Platform scale
Moisture meter
Grain cleaner
Prefabricated working shed
Quality assurance in agricultural produce,edited by G.I. Johnson, Le Van To, Nguyen Duy Duc and M.C. Webb.
ACIAR Proceedings 100(printed version published in 2000)
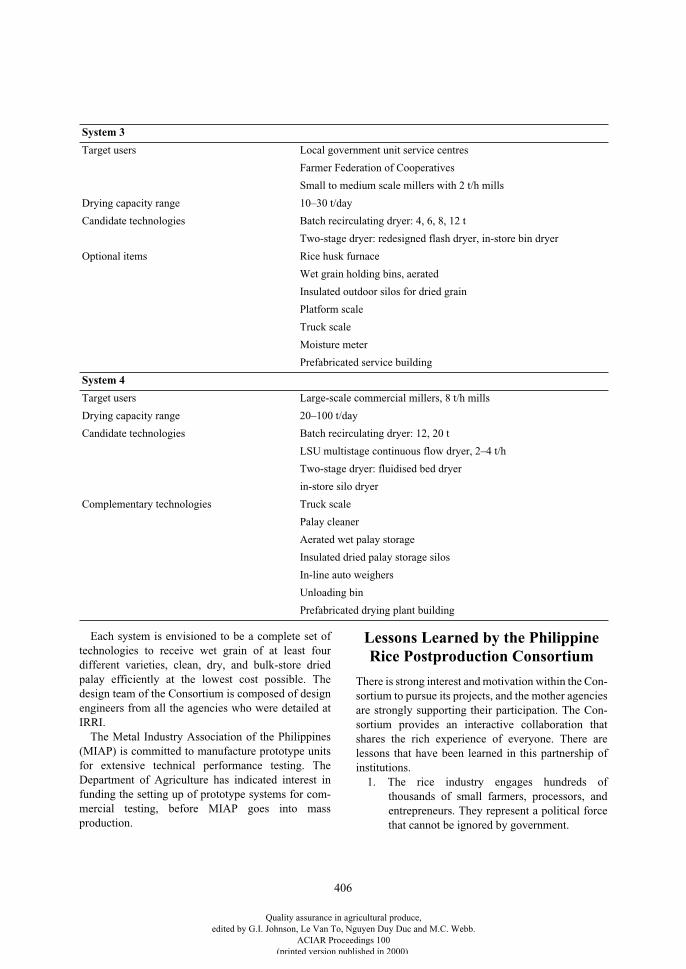
406
Each system is envisioned to be a complete set oftechnologies to receive wet grain of at least fourdifferent varieties, clean, dry, and bulk-store driedpalay efficiently at the lowest cost possible. Thedesign team of the Consortium is composed of designengineers from all the agencies who were detailed atIRRI.
The Metal Industry Association of the Philippines(MIAP) is committed to manufacture prototype unitsfor extensive technical performance testing. TheDepartment of Agriculture has indicated interest infunding the setting up of prototype systems for com-mercial testing, before MIAP goes into massproduction.
Lessons Learned by the Philippine Rice Postproduction Consortium
There is strong interest and motivation within the Con-sortium to pursue its projects, and the mother agenciesare strongly supporting their participation. The Con-sortium provides an interactive collaboration thatshares the rich experience of everyone. There arelessons that have been learned in this partnership ofinstitutions.
1. The rice industry engages hundreds ofthousands of small farmers, processors, andentrepreneurs. They represent a political forcethat cannot be ignored by government.
System 3
Target users Local government unit service centres
Farmer Federation of Cooperatives
Small to medium scale millers with 2 t/h mills
Drying capacity range 10–30 t/day
Candidate technologies Batch recirculating dryer: 4, 6, 8, 12 t
Two-stage dryer: redesigned flash dryer, in-store bin dryer
Optional items Rice husk furnace
Wet grain holding bins, aerated
Insulated outdoor silos for dried grain
Platform scale
Truck scale
Moisture meter
Prefabricated service building
System 4
Target users Large-scale commercial millers, 8 t/h mills
Drying capacity range 20–100 t/day
Candidate technologies Batch recirculating dryer: 12, 20 t
LSU multistage continuous flow dryer, 2–4 t/h
Two-stage dryer: fluidised bed dryer
in-store silo dryer
Complementary technologies Truck scale
Palay cleaner
Aerated wet palay storage
Insulated dried palay storage silos
In-line auto weighers
Unloading bin
Prefabricated drying plant building
Quality assurance in agricultural produce,edited by G.I. Johnson, Le Van To, Nguyen Duy Duc and M.C. Webb.
ACIAR Proceedings 100(printed version published in 2000)
407
They have many social problems, which are theresponsibility of government. Thus any gov-ernment program mandated to provide the riceindustry with the technologies needed has tocontend with the political and social realities ofthe local rice industry.
2. Farmers, the traders and processors, and theconsumers view grain quality differently.Farmers naturally want higher yields anddisease resistant varieties. Processors wanthigher milling recoveries. Consumers wantvarieties to which they are accustomed. Ricetrading has to be market-oriented, and marketorientation requires backward linkages all theway to the farmer. Grain quality, therefore,requires a systems orientation.
3. Technology has to be appropriate to the socialstructure of the end user, must have a strongfoundation in science, and yet must be cost-competitive. Requirements for the acceptanceand utilisation of technology—particularly bythe farmers—must demonstrate an addedeconomic benefit to them, must help themhandle a biological product prone to deterio-ration, and must meet the volumes of producthandled. Usually, to be able to cover all thesebases, researchers must establish a strong par-ticipation or consultative process with thefarmers.
There will be many more lessons to be learned inworking with the rice industry and with each other inthe Consortium.
Quality assurance in agricultural produce,edited by G.I. Johnson, Le Van To, Nguyen Duy Duc and M.C. Webb.
ACIAR Proceedings 100(printed version published in 2000)
408
The Role of Quality Assurance in the Pooled Marketing of Horticultural Produce
from Smallholders
P.A. Nuevo* and M.C.C. Lizada†
Abstract
In the Philippines, most horticultural crops are raised by a single grower, in an area averaging 0.5–1 ha. As aconsequence, the volume of the produce is small and its quality is variable. Non-uniformity of produce couldbe a result of: non-certified planting materials; inappropriate cultural techniques; or unsatisfactory handling bythe grower. Moreover, traders dealing with produce from small farms try to cut costs to the extent of sacrificingquality. One big concern is that most growers have no identified market before planting. Thus, there is no cleardefinition of the market quality requirements.
Through their research experiences, the Postharvest Horticulture Training and Research Center (PHTRC)has underscored the role of the people, product and operations in defining product quality. Even iftechnological interventions are in place, quality assurance will not be realised if one element is missing. Thispaper illustrates the observations that quality assurance can be incorporated into the pooled marketing of fruits,vegetables and cut flowers from smallholders.
Q
UALITY
ASSURANCE
(QA) is when a customer canbuy a product with confidence that the product willmeet his or her expectations. QA, however, is easier toachieve in non-biological products such as appliances,cars, computers and the like. A control in the processitself effects acceptable quality. In contrast, QA in bio-logical products, such as fruits, vegetables and cutflowers, is harder to attain. This is because we aredealing with a live specimen which may have experi-enced a range of environmental conditions during thegrowing period. Food reserves accumulated duringthis period are used to retain the freshness and whole-someness of the produce after harvest. Improper post-harvest handling can cause injuries to produce, leadingto early deterioration.
QA in biological produce begins with the choice ofvariety to be planted. Its quality in terms of visual,
textural, flavour and nutritional factors must be con-sidered. QA should be market-driven rather thanproduction-driven. It must answer the following: Whatdo customers want? How much are they willing to payfor a particular product? If the volume required can bedelivered with acceptable quality, given the right priceat the right time, then it can be said that QA has beenattained.
This paper illustrates that QA can be incorporated inthe pooled marketing of fruits, vegetables and cutflowers from smallholders.
The Elements of Quality Assurance
The successful implementation of a quality assuranceprogram involves a planned and systematic integrationof the people, produce, systems/procedures, marketand infrastructure (Figure 1).
A critical factor to assure the quality of agriculturalproduce is the availability of infrastructure such as irri-gation, farm-to-market access, an efficientcommunication system, functional postharvest facil-ities and equipment etc.
* Postharvest Horticulture Training and Research Center, University of the Philippines at Los Baños, College, Laguna 4031, Philippines.
† Bureau of Agriculture, Fisheries and Product Stands, Bureau of Plant Industry, Visayas Avenue, Quezon City, Philippines.
Quality assurance in agricultural produce,edited by G.I. Johnson, Le Van To, Nguyen Duy Duc and M.C. Webb.
ACIAR Proceedings 100(printed version published in 2000)
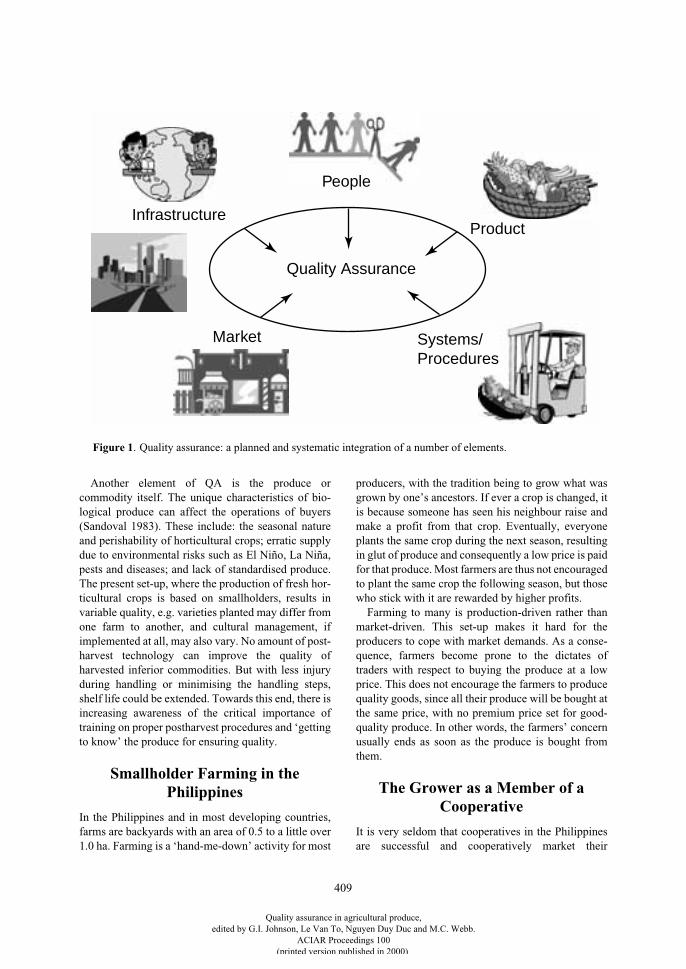
409
Another element of QA is the produce orcommodity itself. The unique characteristics of bio-logical produce can affect the operations of buyers(Sandoval 1983). These include: the seasonal natureand perishability of horticultural crops; erratic supplydue to environmental risks such as El Niño, La Niña,pests and diseases; and lack of standardised produce.The present set-up, where the production of fresh hor-ticultural crops is based on smallholders, results invariable quality, e.g. varieties planted may differ fromone farm to another, and cultural management, ifimplemented at all, may also vary. No amount of post-harvest technology can improve the quality ofharvested inferior commodities. But with less injuryduring handling or minimising the handling steps,shelf life could be extended. Towards this end, there isincreasing awareness of the critical importance oftraining on proper postharvest procedures and ‘gettingto know’ the produce for ensuring quality.
Smallholder Farming in the Philippines
In the Philippines and in most developing countries,farms are backyards with an area of 0.5 to a little over1.0 ha. Farming is a ‘hand-me-down’ activity for most
producers, with the tradition being to grow what wasgrown by one’s ancestors. If ever a crop is changed, itis because someone has seen his neighbour raise andmake a profit from that crop. Eventually, everyoneplants the same crop during the next season, resultingin glut of produce and consequently a low price is paidfor that produce. Most farmers are thus not encouragedto plant the same crop the following season, but thosewho stick with it are rewarded by higher profits.
Farming to many is production-driven rather thanmarket-driven. This set-up makes it hard for theproducers to cope with market demands. As a conse-quence, farmers become prone to the dictates oftraders with respect to buying the produce at a lowprice. This does not encourage the farmers to producequality goods, since all their produce will be bought atthe same price, with no premium price set for good-quality produce. In other words, the farmers’ concernusually ends as soon as the produce is bought fromthem.
The Grower as a Member of a Cooperative
It is very seldom that cooperatives in the Philippinesare successful and cooperatively market their
People
Infrastructure
Market Systems/Procedures
Product
Quality Assurance
Figure 1. Quality assurance: a planned and systematic integration of a number of elements.
Quality assurance in agricultural produce,edited by G.I. Johnson, Le Van To, Nguyen Duy Duc and M.C. Webb.
ACIAR Proceedings 100(printed version published in 2000)
410
products. Firstly, the objective of joining or formingthe cooperative is not based on the principle of coop-eration and commitment. Seemingly, commitmentfollows the more popular adage of members having‘one foot in and the other foot out’. This scenario isaggravated by the fact that leadership is quite weak. InKorea, as cited by Sun-Hoon (1983), the sevenelements necessary for a marketing group to be suc-cessful are:• strong leadership from a devoted and self-
sacrificing leader;• a shared need felt by village members to improve
the livelihood gained from their farms;• mutual trust among members, who are all relatively
young in age, highly educated and belong to thesame family clan;
• continuing improvement in farming technology bythe villages working as a group;
• rational decision-making procedures and scientificfarm management planning and implementation;
• an honest and sincere trade relationship with themerchants; and
• timely support received from the district primarycooperative.
The usual practice of farmers is that they look for amarket only when their crops are ready for harvest.This leaves them with only a very limited time to selltheir crops. Farmers single out the market as being theproblem, however they do not commit to efforts madeto link them to it. Farmers need to understand that themarket should be considered before planting—whatdo the markets/consumers want? If they can supplycrops at the right time, in sufficient volumes, ofacceptable quality, and at a reasonable price, then theyare ‘in business’.
According to the farmers, another reason whytraders are buying at low prices is that farmers are notin the position to demand the price they deem rea-sonable. This is because they have no records as totheir inputs in terms of labour, irrigation, diseasecontrol or fertilisation—thus there is no basis forsaying whether a profit was made. Aside from this,price is dictated by the traders according to previouscredit marketing arrangements. In addition, a tradermay buy from a farmer but not pay him/her uponreceipt of the produce. Delay in payment makesfarmers frustrated.
Those who become successful are the privategrower-entrepreneurs who serve as marketers for thesmall producers. They pool the produce and demandthe quality required of them by their market. They can
then require that only a certain variety is to be plantedwith standard cultural practices and proper postharvesthandling.
Attaining Quality of Pooled Produce: the PHTRC Experience
The Postharvest Horticulture Training and ResearchCenter (PHTRC) has been assisting the fresh horticul-tural produce industry since the unit’s establishment in1977. Sites where the PHTRC has assisted in theimprovement of the postharvest systems are indicatedin Figure 2.
Papaya in Balingasag, Misamis Oriental
‘Solo’ papaya is commercially cultivated in smallfarms in the southern islands of the Philippines, partic-ularly Mindanao. This area is free of the papaya ringspot virus, a disease that devastated the papaya farmsin Luzon.
Earlier loss assessment studies conducted byPHTRC showed that with the traditional handling ofpapaya coming from Mindanao and marketed inManila, losses of 40% were usually incurred. Reasonsfor rejection included compression, diseases, ‘ever-green’ fruits, and over-ripening. With PHTRCinterventions, such as improving the handling systemand establishing a packinghouse where pooledproduce is prepared for marketing by small growercooperatives, losses have been substantially reducedfrom 40 to 14%. The wholesaler from Manila whobuys the cooperative’s produce no longer re-sorts thefruit prior to retail.
‘Queen’ pineapple in Camarines Norte
This variety of pineapple is grown on small farmsunder coconut trees, particularly in Camarines Norte.About 3,000 ha are devoted to this crop with a fruityield of 45,000 t. Based on farm and market visits, theproblems aired by pineapple growers in the areaincluded: lack of finances to buy inputs, lack of pro-duction technologies, the short shelf life of pineapple,lack of postharvest technologies, lack of processingtechnologies, low buying prices, no product standards,lack of market outlets, low consumer demand, lack ofstorage facilities, production area far from urbancentres, fruit too small for a family of five, difficulty inremoving the fruit peel, and lack of a way to determinethe presence of brown spot at the core without openingthe fruit.
Quality assurance in agricultural produce,edited by G.I. Johnson, Le Van To, Nguyen Duy Duc and M.C. Webb.
ACIAR Proceedings 100(printed version published in 2000)
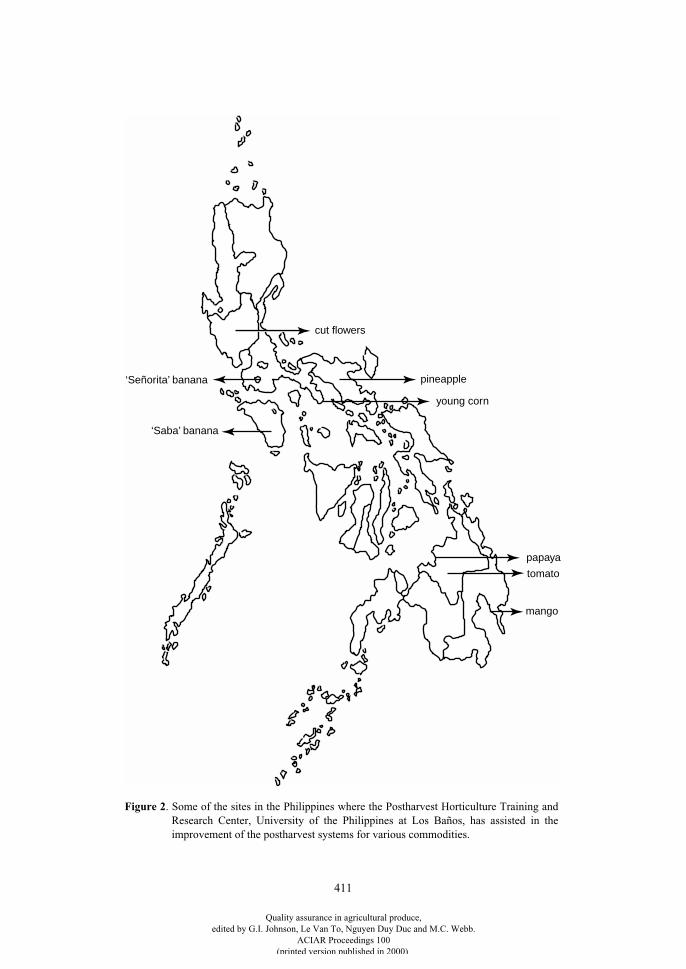
411
cut flowers
pineapple
young corn
papaya
tomato
mango
‘Saba’ banana
‘Señorita’ banana
Figure 2. Some of the sites in the Philippines where the Postharvest Horticulture Training andResearch Center, University of the Philippines at Los Baños, has assisted in theimprovement of the postharvest systems for various commodities.
Quality assurance in agricultural produce,edited by G.I. Johnson, Le Van To, Nguyen Duy Duc and M.C. Webb.
ACIAR Proceedings 100(printed version published in 2000)
412
With the traditional handling of pineapple, 10% ofthe produce was wasted during transport due tomechanical damage and over-ripening, 20–30%because of diseases and over-ripening in storage, and28–40% during marketing when fruit were not imme-diately sold and subsequently deteriorated.
The following postharvest interventions wereimplemented for the improvement of the handlingsystem: establishment of appropriate maturity indicesfor both fresh and minimally processed fruit; devel-opment of a wax formulation for the ‘Queen’pineapple to prolong its shelf life (Serrano 1994,unpublished report); establishment of a packinghouse;and modification of the transport vehicles (provisionof horizontal dividers to minimise transport-relatedmechanical damage).
The pineapple growers were linked with whole-salers and retailers in Manila and Lucena. They nowconstitute regular market outlets for the fresh fruit.
Cut flowers in La Trinidad, Benguet
The traditional handling of cut flowers fromBenguet is rather crude. Harvested roses are dumpedon the ground in make-shift packinghouses, pre-cooled by applying water directly to the pile of stemswhile still on the ground, then trimmed and packed inused wholesale cigarette carton boxes which holdabout 30 bundles. In the cartons, bundles of roses arearranged without any liners or sleeving materials. Theflowers are all in direct contact with one another.Cartons are loaded into non-air-conditioned buses ortrucks and transported to Manila—a distance of260 km.
The postharvest intervention suggested by PHTRCand now practised by grower-traders is the use ofsleeving materials to protect bundled roses duringtransport. Sleeving is done by wrapping bundles ofapproximately two dozen roses in newsprint.
Mango in Mati, Davao Oriental
Although mango is an export crop, the fruit aregrown mostly on small farms. The limited volumenecessitates the pooling of produce for marketing. Acritical component for the successful marketing ofpooled produce is a system for managing quality. Toprovide a mechanism for ensuring uniformity ofquality mango, packinghouses were established inMati, Davao Oriental and Argao, Cebu for MenziFarmers’ Cooperative and the Farmers’ Association
for the Rational Management of EcologicalResources, Inc. (FARMER), respectively.
The packinghouses were provided with sorting andpacking tables and hot water tanks. Hot watertreatment (52–55°C, 10 min) reduced postharvestdisease incidence by as much as 70%. The treatment issimple, safe and environmentally friendly. The hotwater treatment is thus of indispensable assistance tothe mango industry.
Bananas in Cavite and Mindoro Oriental
The handling of ‘Señorita’ and ‘Saba’ bananas inCavite and Mindoro Oriental, respectively, wereassessed. Both varieties were handled similarly in thetwo areas. Harvested bananas were dehanded anddumped onto the bare ground in the field, with orwithout leaves as liners, before transportation by‘weapon’ truck or an animal-driven cart to the col-lection area. Counting was in multiples of five and thefruit in a hand which were in excess of these multipleswere discarded in counting. Buyers also counted twosmall-sized fruit as a single fruit. Bulk-loading in jeepswas the mode of transport from the production area tothe market. However, ‘Saba’ bananas in jeepneys
1
coming from Mindoro were transported by ship forabout 3 hours. The jeeps containing the ‘Saba’ bananastravelled to Metro Manila markets.
Problems associated with bananas were: lack offruit-quality consciousness among growers andtraders, with the price based solely on size; and a highincidence of handling-related injuries (bruises andcompression damage).
In ‘Señorita’ bananas, bagging while still on the treewas recommended for better quality produce.Adoption of the improved system resulted in superiorquality fruit which were marketed in the upscalemarkets and fetched a premium price. It would havebeen a success story for the ‘Señorita’ growers todayhad it been that land conversions in the area were con-trolled. Moreover, diseases such as bunchy top viruscontributed to the devastation of the farms.
In ‘Saba’ banana grown in Mindoro Oriental,training on the basic principles and use of packing-houses is being implemented in preparation for thedomestic marketing of the cooperative’s produce.
1.
Jeepneys are vehicles which are open at the back, used to ferry people and produce. They are unique to the Philippines.
Quality assurance in agricultural produce,edited by G.I. Johnson, Le Van To, Nguyen Duy Duc and M.C. Webb.
ACIAR Proceedings 100(printed version published in 2000)
413
A packinghouse with sorting tables was establishedfor ‘Saba’ growers in Mindoro. This facilitates thequality maintenance of their produce. One activity thatwe find very useful is documentation of the traditionalhandling and practical demonstrations during training.The training serves as an opportunity to pinpointwhere their handling is going wrong. With time, all thehandlers of bananas will become conscious of theirhandling technique—with the result being fruit ofacceptable quality. The overall result or impact of thistraining will be known as soon as commercial trialshave been undertaken.
Tomato in Claveria, Misamis Oriental
Over-packing of tomatoes is practiced in the southwhere tomatoes are sourced during the off-season inLuzon, i.e. from July to December. Over-fillingwooden crates is a way of making up for damagedfruit. However, this further worsens the condition ofthe tomato fruit upon arrival in Manila. Losses due tocracking, abrasion, compression and diseases arecommon. The PHTRC demonstrated to the farmersand traders the proper way of packing. This wasadopted for some time before they shifted back to theirold ways.
Baby corn in Sariaya, Quezon
Contract growing of young corn was done by aprivate entrepreneur. Assistance was sought from thePHTRC regarding proper market preparation. Shelvesand sorting tables with magnifying lens were recom-mended. This helped in complying with the qualityrequirements of the importing country. However, thegrowers were lured by the price offered by anotherentrepreneur for the domestic market to the detrimentof the first. Consequently, the exporter was not able tosupply his clientele, leading to the closure of his deal.Farmers only sold to the other trader for a ‘fleetingmoment’. When this type of ‘pole vaulting’ occurs itruins the relationship between the farmers and theentrepreneur, as trust is lost. This spreads very quickly,leaving everyone as ‘victims’ of a closed shop. Ifgrowers would really aim for a long-term relationshipwith the market rather than a one-shot bigger profit,the situation would be more stable. If we work onquality before profit—then profit automaticallyfollows.
Important Lessons Learned
• In the Philippine setting, it is better to be reactiverather than pro-active in the field of postharvesthorticulture. This way, the technical assistanceextended will not go to waste.
• However, in some cases, such as at piers and ports,being pro-active is much more effective as thepeople otherwise have no information on how tohandle produce properly.
• It is the private sector/entrepreneur who makes fulluse of our (PHTRC) expertise.
• With most cooperatives experiencing a range ofproblems, technical expertise is generally not fullyutilised. There are, however, a few success stories.
• In almost all activities involving the producercooperatives, the most frequently cited problem isthe market.
• However, efforts to link cooperatives with themarket are not always fruitful. The reason is thatproducers cannot deliver the required quality orvolume of the produce at the right time.
• No amount of postharvest technologies can improvethe quality of the produce after harvest.
• Rough roads from the production areas to thepackinghouse (if any) or market contribute to thepoor quality of produce.
• Awareness training on the proper handling of theproduce is very important among the growers,handlers and consumers.
• Values, attitudes and culture in general add to theconstraints in producing acceptable quality inproduce. However, the PHTRC experience hasshown that the provision of entrepreneurial skills isfundamental.
• Local government units must be involved to ensurecontinuity of projects.
Although we at the PHTRC are aware that beingreactive in this endeavour produces better results, wesee the need to be pro-active through awarenesstraining. This not only informs all concerned in thepostharvest chain of the basic principles on thehandling of horticultural crops, but develops in them aculture of quality. Lastly, the desired quality can beattained if each and every person involved becomesconscious and put efforts to attain it.
Quality only happens when you care enough to doyour best
.
Quality assurance in agricultural produce,edited by G.I. Johnson, Le Van To, Nguyen Duy Duc and M.C. Webb.
ACIAR Proceedings 100(printed version published in 2000)
414
References
Sandoval, P. 1983. Fruit/vegetable marketingdevelopment in the Philippines. In: Proceedings ofan international seminar on producer-orientedmarketing: strategies and programs, Seoul, Korea.Food and Fertilizer Technology Center for the Asianand Pacific Region, 41–59.
Sun-Hoon, K. 1983. The HA-EE village crop unit: acase study of a successful farmers’ cooperative inKorea. In: Proceedings of an international seminaron producer-oriented marketing: strategies andprograms, Seoul, Korea. Food and FertilizerTechnology Center for the Asian and PacificRegion, 130–142.
Quality assurance in agricultural produce,edited by G.I. Johnson, Le Van To, Nguyen Duy Duc and M.C. Webb.
ACIAR Proceedings 100(printed version published in 2000)
415
Impact Assessment of Utilisation of an Improved Maize Sheller in Three Major Maize-producing
Provinces in the Philippines
R.P. Estigoy*
Abstract
This study was conducted to assess the consequences or effects of grain postharvest technology utilisation atthe end-user level in three major maize-producing provinces in the Philippines. Specifically, a number ofvariables—personal, social, physico-economic, attributes of the improved maize sheller (IMS), andtechnology transfer—were related to the use of this technology. It likewise determined the effects of utilisationon the technological, socioeconomic and institutional milieus of IMS users.
Respondents to this study were composed of 169 IMS users from Bukidnon, Cotabato and Lanao del Sur.Data were gathered through the use of an interview schedule.
Correlation analysis showed that both training through an agricultural program and membership of anorganisation were significantly and highly significantly related to levels of IMS utilisation, respectively.Infrastructure, especially accessibility of roads, was also found to be significantly correlated with utilisation,as were technical, social, ecological and educational attributes.
Multiple regression analysis showed that the following are determinants or predictors of IMS utilisation:accessibility of roads; mobility of the sheller; and the availability of the IMS and its spare parts in the market.These factors can therefore predict utilisation of the IMS at the farm-level.
Z-tests and t-tests revealed that IMS utilisation had impacted positively on the technological (quality ofshelled maize, efficiency and shelling time), socioeconomic (income, shelling costs) and institutional(harvesting payment, shelling payment and shelling location) milieus of the end users. Also, culturalmanagement in maize production, such as land preparation, drying practice, storage practice and harvestingpractice were also modified and changed significantly by the use of the IMS.
O
NE
OF
the most important means of accelerating ruraldevelopment in agricultural economies like the Philip-pines is the adoption of new agricultural technologiesby the farming sector. Adoption and eventual diffusionof these technologies can lead to higher incomes offarmer-producers, lower prices of food products, andgreater economic efficiency and growth. The adoptionand use of new technologies—especially research anddevelopment (R&D) results—have spurred theeconomic development of agriculturally basedeconomies in the Third World.
There are two ways in which agricultural devel-opment take place, according to Valdez and Drilon(1979). Firstly, agricultural development takes placewhen there is an increased use of new inputs like fer-tilisers, improved seeds, pesticides, irrigation, andimplements. Secondly, new and improved institutionalarrangements affect such things as land tenure, agri-cultural credit, inputs and product markets, publicsafety, and the generation and dissemination oftechnical knowledge, extension services, pricesupports, crop insurance and government subsidies.Another avenue for agricultural development isadoption of research results by the intended users. Thelate J. Drilon Jr, a prominent Filipino R&D adminis-trator, once said: “Development is research put to use,made a part of the country’s productive efforts”.
* Training and Extension Department, Bureau of Postharvest Research and Extension, CLSU Compound, Muñoz, Nueva Ecija, Philippines.
Quality assurance in agricultural produce,edited by G.I. Johnson, Le Van To, Nguyen Duy Duc and M.C. Webb.
ACIAR Proceedings 100(printed version published in 2000)
416
The Bureau of Postharvest Research and Extension(BPRE), formerly the National Post-Harvest Institutefor Research and Extension (NAPHIRE), shifted itsfocus from postharvest technology generation toresearch results utilisation in 1989. In doing so, BPREaimed to have its designs and technologies reach theend users by making them available in the market.With this target, the Bureau mapped out a strategy thatwould serve as a linchpin between technology gener-ation and commercialisation, and eventualutilisation—the BPRE Industrial Promotion Program(BIPP). This program involved the private sector,especially the local agricultural machinery manufac-turers, in commercialising BPRE designs and makingthem available in the market.
In 1989, an improved maize sheller (IMS) wasdesigned by BPRE and promoted under BIPP. Thispaved way for the adoption of the IMS in the majormaize-producing areas of Mindanao, Philippines’southern island. The Land Bank of the Philippinesinitially financed multi-purpose farmers’ cooperativesto purchase 20 IMSs. The wide use of new sheller wasalso attributed to the presence of a IMS manufacturerbased in Mindanao. As a result of these factors, thereare already over a hundred IMS units used by cooper-atives and farmer-producers in Bukidnon and theneighbouring provinces of Lanao del Sur and NorthCotabato. The IMS won the Best Technology forCommercialisation Award given by the Department ofScience and Technology in 1995.
Five years after the introduction of the IMS, there isa need to assess its effects on the agricultural sector,particularly on the farm-level users. It is also worthassessing the contribution of this new technology tothe maize industry and to agricultural development ingeneral.
Objectives of the Study
1. To describe the personal, social, and physico-economic profile of IMS users and how theserelate to IMS use.
2. To determine the attributes of the IMS andcomponents of technology transfer affectingthe level of IMS use.
3. To ascertain the effects of IMS use on the tech-nological, socioeconomic and institutionalmilieus of users.
4. To determine what factors predict IMS use.
Scope and Limitations of the Study
This study covered three provinces inMindanao—Bukidnon, Cotabato and Lanao delSur—where utilisation of the IMS took place between1992 and 1995. Since there was no benchmark infor-mation established before the use of the IMS, the recallmethod was used. Considering that farmers do notkeep records of their farm activities, the recall methodmight not accurately reflect the information before theutilisation of the IMS or even the information after itsintroduction. Also, this study covered only theobservable and measurable effects of utilisation ontechnological, socioeconomic and institutionalmilieus of users. Deeper and more far-reachingimpacts, such as social, psychological and otherpossible effects or consequences, were beyond thescope of this study.
Methodology
Locale and respondents
The respondents of this study were the users ofIMSs from Bukidnon, North Cotabato and Lanao delSur who made use of the IMS between 1992 and 1995.
A complete list of IMS owners who purchasedwithin this period was furnished by the local manufac-turer of the shellers. 50% of these 117 owners assistedin obtaining a short list of farmer-users who wouldanswer the survey. A proportional sampling methodwas used to determine the number of respondents. Aninterview schedule was used to gather the data.Descriptive design was used to describe the qualitativevariables and correlational design was used toestablish the relationships of several variables understudy. Descriptive statistics were used to describe thequantitative variables, while the t-test and Z-test wereused to measure the significance of variables beforeand after the use of the IMS. The Pearson Product-Moment Correlation coefficient and the chi-squarevalue were used to analyse the relationship betweenthe independent and dependent variables. Regressionanalysis (general linear model) was used to testpredictor variables of IMS use.
Theoretical framework
The study was based on Parson’s equilibrium theorywhich states that when a force is impressed upon acertain system, resultant modifications will take placewithin that system. When a technology is introduced
Quality assurance in agricultural produce,edited by G.I. Johnson, Le Van To, Nguyen Duy Duc and M.C. Webb.
ACIAR Proceedings 100(printed version published in 2000)
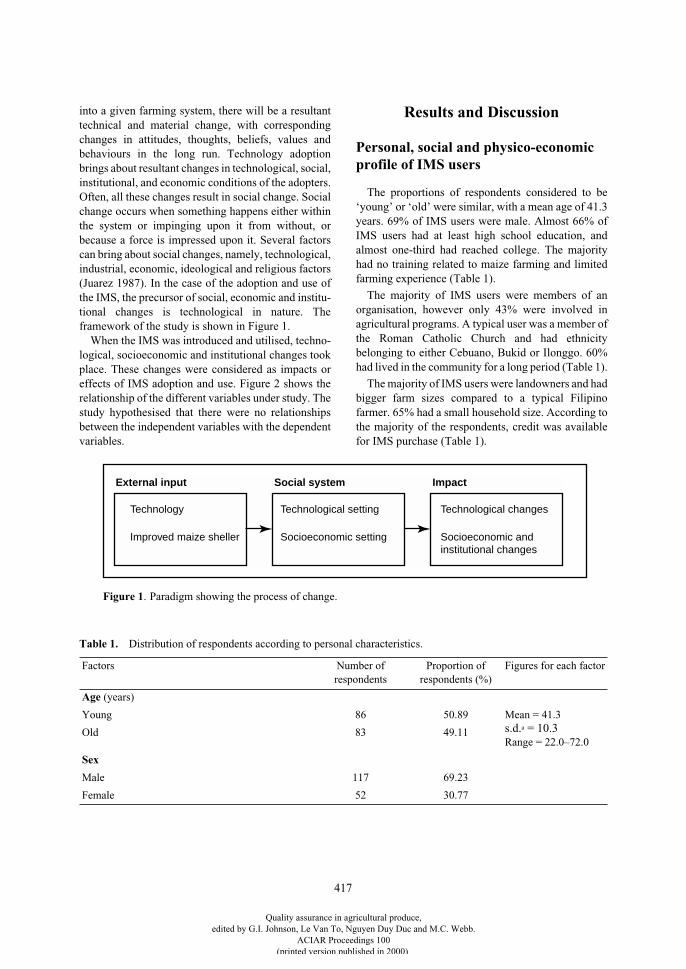
417
into a given farming system, there will be a resultanttechnical and material change, with correspondingchanges in attitudes, thoughts, beliefs, values andbehaviours in the long run. Technology adoptionbrings about resultant changes in technological, social,institutional, and economic conditions of the adopters.Often, all these changes result in social change. Socialchange occurs when something happens either withinthe system or impinging upon it from without, orbecause a force is impressed upon it. Several factorscan bring about social changes, namely, technological,industrial, economic, ideological and religious factors(Juarez 1987). In the case of the adoption and use ofthe IMS, the precursor of social, economic and institu-tional changes is technological in nature. Theframework of the study is shown in Figure 1.
When the IMS was introduced and utilised, techno-logical, socioeconomic and institutional changes tookplace. These changes were considered as impacts oreffects of IMS adoption and use. Figure 2 shows therelationship of the different variables under study. Thestudy hypothesised that there were no relationshipsbetween the independent variables with the dependentvariables.
Results and Discussion
Personal, social and physico-economic profile of IMS users
The proportions of respondents considered to be‘young’ or ‘old’ were similar, with a mean age of 41.3years. 69% of IMS users were male. Almost 66% ofIMS users had at least high school education, andalmost one-third had reached college. The majorityhad no training related to maize farming and limitedfarming experience (Table 1).
The majority of IMS users were members of anorganisation, however only 43% were involved inagricultural programs. A typical user was a member ofthe Roman Catholic Church and had ethnicitybelonging to either Cebuano, Bukid or Ilonggo. 60%had lived in the community for a long period (Table 1).
The majority of IMS users were landowners and hadbigger farm sizes compared to a typical Filipinofarmer. 65% had a small household size. According tothe majority of the respondents, credit was availablefor IMS purchase (Table 1).
Table 1.
Distribution of respondents according to personal characteristics.
Factors Number of respondents
Proportion of respondents (%)
Figures for each factor
Age
(years)
Young 86 50.89 Mean = 41.3
s.d.
a
= 10.3
Range = 22.0–72.0Old 83 49.11
Sex
Male 117 69.23
Female 52 30.77
Improved maize sheller
Technological setting
Socioeconomic setting
Technological changes
Socioeconomic and institutional changes
Technology
External input Social system Impact
Figure 1. Paradigm showing the process of change.
Quality assurance in agricultural produce,edited by G.I. Johnson, Le Van To, Nguyen Duy Duc and M.C. Webb.
ACIAR Proceedings 100(printed version published in 2000)
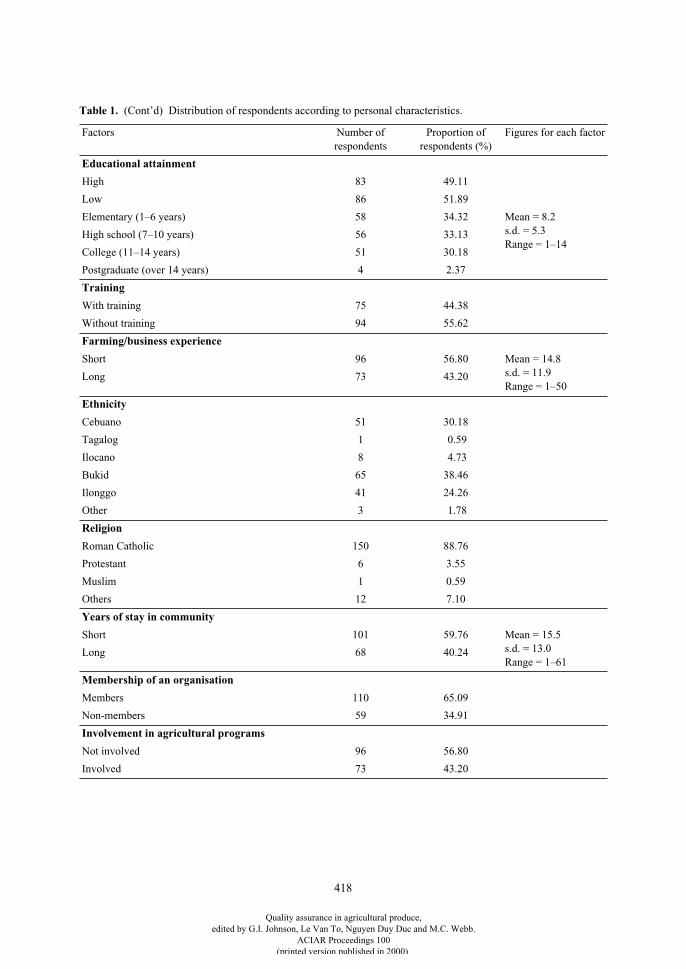
418
Educational attainment
High 83 49.11
Low 86 51.89
Elementary (1–6 years) 58 34.32 Mean = 8.2s.d. = 5.3Range = 1–14
High school (7–10 years) 56 33.13
College (11–14 years) 51 30.18
Postgraduate (over 14 years) 4 2.37
Training
With training 75 44.38
Without training 94 55.62
Farming/business experience
Short 96 56.80 Mean = 14.8s.d. = 11.9Range = 1–50
Long 73 43.20
Ethnicity
Cebuano 51 30.18
Tagalog 1 0.59
Ilocano 8 4.73
Bukid 65 38.46
Ilonggo 41 24.26
Other 3 1.78
Religion
Roman Catholic 150 88.76
Protestant 6 3.55
Muslim 1 0.59
Others 12 7.10
Years of stay in community
Short 101 59.76 Mean = 15.5s.d. = 13.0Range = 1–61
Long 68 40.24
Membership of an organisation
Members 110 65.09
Non-members 59 34.91
Involvement in agricultural programs
Not involved 96 56.80
Involved 73 43.20
Table 1.
(Cont’d) Distribution of respondents according to personal characteristics.
Factors Number of respondents
Proportion of respondents (%)
Figures for each factor
Quality assurance in agricultural produce,edited by G.I. Johnson, Le Van To, Nguyen Duy Duc and M.C. Webb.
ACIAR Proceedings 100(printed version published in 2000)
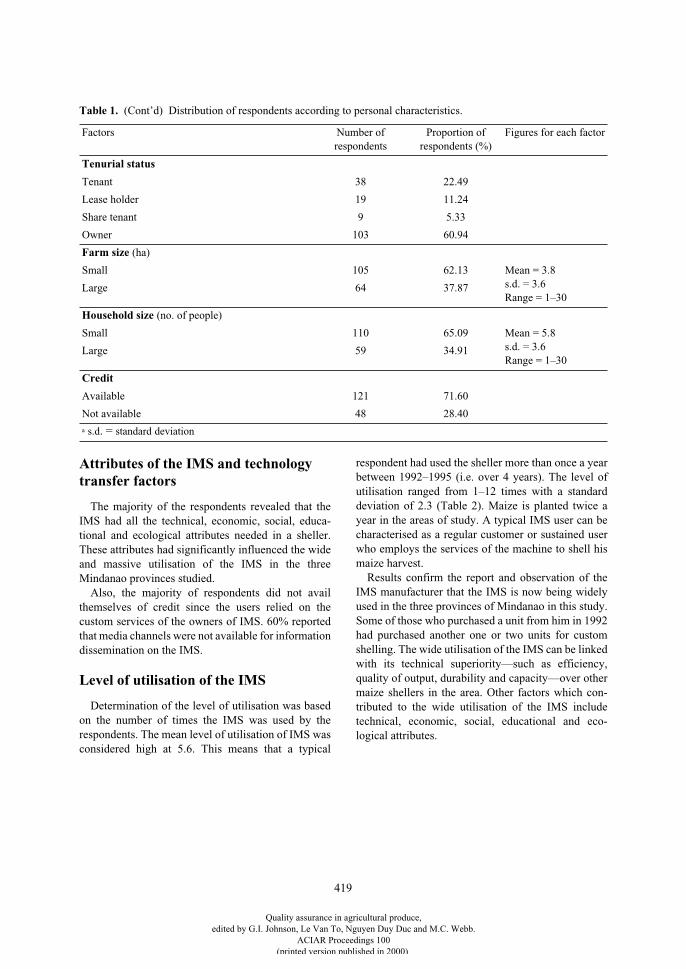
419
Attributes of the IMS and technology transfer factors
The majority of the respondents revealed that theIMS had all the technical, economic, social, educa-tional and ecological attributes needed in a sheller.These attributes had significantly influenced the wideand massive utilisation of the IMS in the threeMindanao provinces studied.
Also, the majority of respondents did not availthemselves of credit since the users relied on thecustom services of the owners of IMS. 60% reportedthat media channels were not available for informationdissemination on the IMS.
Level of utilisation of the IMS
Determination of the level of utilisation was basedon the number of times the IMS was used by therespondents. The mean level of utilisation of IMS wasconsidered high at 5.6. This means that a typical
respondent had used the sheller more than once a yearbetween 1992–1995 (i.e. over 4 years). The level ofutilisation ranged from 1–12 times with a standarddeviation of 2.3 (Table 2). Maize is planted twice ayear in the areas of study. A typical IMS user can becharacterised as a regular customer or sustained userwho employs the services of the machine to shell hismaize harvest.
Results confirm the report and observation of theIMS manufacturer that the IMS is now being widelyused in the three provinces of Mindanao in this study.Some of those who purchased a unit from him in 1992had purchased another one or two units for customshelling. The wide utilisation of the IMS can be linkedwith its technical superiority—such as efficiency,quality of output, durability and capacity—over othermaize shellers in the area. Other factors which con-tributed to the wide utilisation of the IMS includetechnical, economic, social, educational and eco-logical attributes.
Tenurial status
Tenant 38 22.49
Lease holder 19 11.24
Share tenant 9 5.33
Owner 103 60.94
Farm size
(ha)
Small 105 62.13 Mean = 3.8s.d. = 3.6Range = 1–30
Large 64 37.87
Household size
(no. of people)
Small 110 65.09 Mean = 5.8s.d. = 3.6Range = 1–30
Large 59 34.91
Credit
Available 121 71.60
Not available 48 28.40
a
s.d
. =
standard
deviation
Table 1.
(Cont’d) Distribution of respondents according to personal characteristics.
Factors Number of respondents
Proportion of respondents (%)
Figures for each factor
Quality assurance in agricultural produce,edited by G.I. Johnson, Le Van To, Nguyen Duy Duc and M.C. Webb.
ACIAR Proceedings 100(printed version published in 2000)
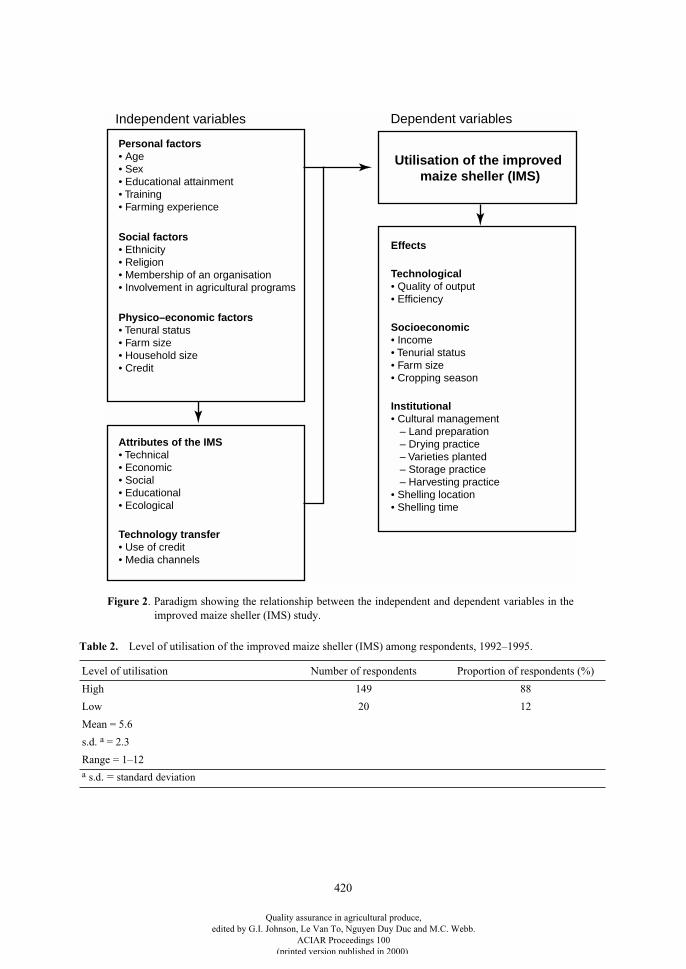
420
Table 2.
Level of utilisation of the improved maize sheller (IMS) among respondents, 1992–1995.
Level of utilisation Number of respondents Proportion of respondents (%)
High 149 88
Low 20 12
Mean = 5.6
s.d.
a
= 2.3
Range = 1–12
a
s.d
. =
standard
deviation
Independent variables Dependent variables
Personal factors• Age• Sex• Educational attainment• Training• Farming experience
Physico–economic factors• Tenural status• Farm size• Household size• Credit
Attributes of the IMS• Technical• Economic• Social• Educational• Ecological
Technology transfer• Use of credit• Media channels
Utilisation of the improved maize sheller (IMS)
Effects
Technological• Quality of output• Efficiency
Socioeconomic• Income• Tenurial status• Farm size• Cropping season
Institutional• Cultural management – Land preparation – Drying practice – Varieties planted – Storage practice – Harvesting practice• Shelling location• Shelling time
Social factors• Ethnicity• Religion• Membership of an organisation• Involvement in agricultural programs
Figure 2. Paradigm showing the relationship between the independent and dependent variables in theimproved maize sheller (IMS) study.
Quality assurance in agricultural produce,edited by G.I. Johnson, Le Van To, Nguyen Duy Duc and M.C. Webb.
ACIAR Proceedings 100(printed version published in 2000)
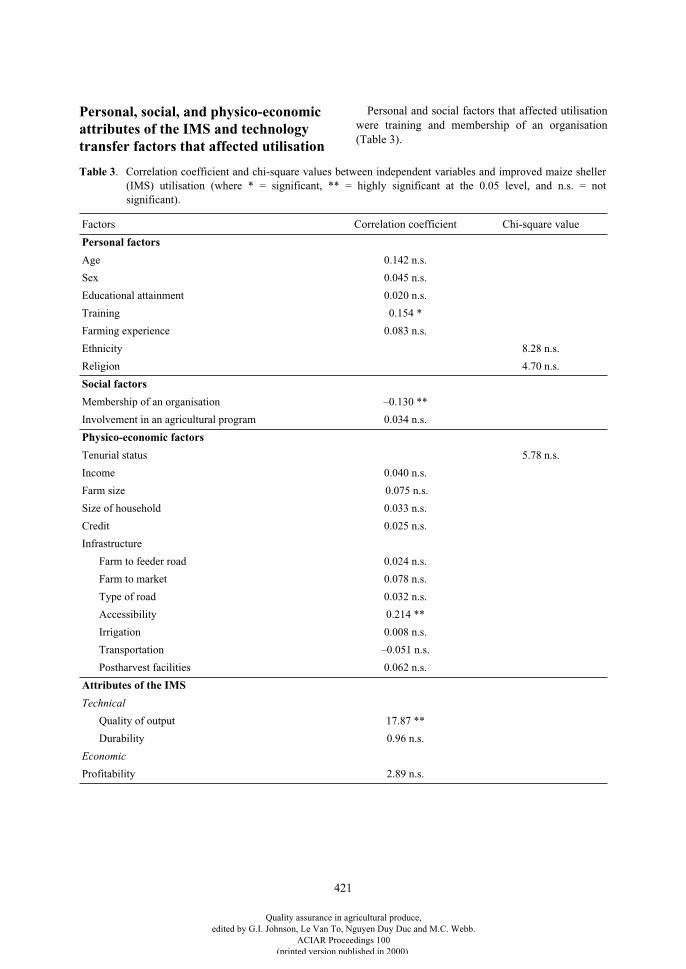
421
Personal, social, and physico-economic attributes of the IMS and technology transfer factors that affected utilisation
Personal and social factors that affected utilisationwere training and membership of an organisation(Table 3).
Table 3
. Correlation coefficient and chi-square values between independent variables and improved maize sheller(IMS) utilisation (where * = significant, ** = highly significant at the 0.05 level, and n.s. = notsignificant).
Factors Correlation coefficient Chi-square value
Personal factors
Age 0.142 n.s.
Sex 0.045 n.s.
Educational attainment 0.020 n.s.
Training 0.154 *
Farming experience 0.083 n.s.
Ethnicity 8.28 n.s.
Religion 4.70 n.s.
Social factors
Membership of an organisation –0.130 **
Involvement in an agricultural program 0.034 n.s.
Physico-economic factors
Tenurial status 5.78 n.s.
Income 0.040 n.s.
Farm size 0.075 n.s.
Size of household 0.033 n.s.
Credit 0.025 n.s.
Infrastructure
Farm to feeder road 0.024 n.s.
Farm to market 0.078 n.s.
Type of road 0.032 n.s.
Accessibility 0.214 **
Irrigation 0.008 n.s.
Transportation –0.051 n.s.
Postharvest facilities 0.062 n.s.
Attributes of the IMS
Technical
Quality of output 17.87 **
Durability 0.96 n.s.
Economic
Profitability 2.89 n.s.
Quality assurance in agricultural produce,edited by G.I. Johnson, Le Van To, Nguyen Duy Duc and M.C. Webb.
ACIAR Proceedings 100(printed version published in 2000)
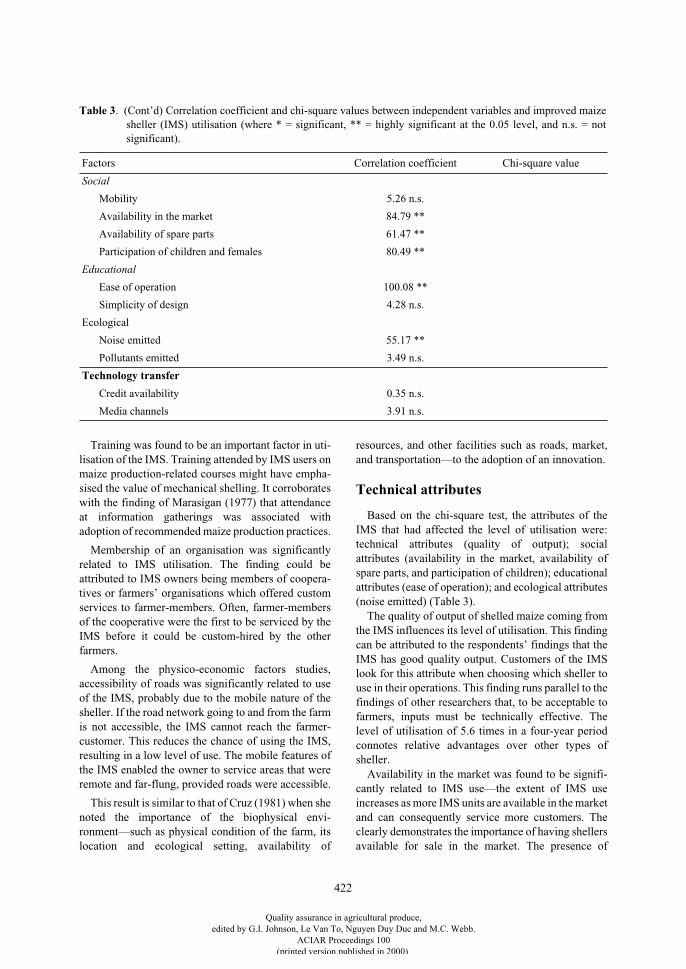
422
Training was found to be an important factor in uti-lisation of the IMS. Training attended by IMS users onmaize production-related courses might have empha-sised the value of mechanical shelling. It corroborateswith the finding of Marasigan (1977) that attendanceat information gatherings was associated withadoption of recommended maize production practices.
Membership of an organisation was significantlyrelated to IMS utilisation. The finding could beattributed to IMS owners being members of coopera-tives or farmers’ organisations which offered customservices to farmer-members. Often, farmer-membersof the cooperative were the first to be serviced by theIMS before it could be custom-hired by the otherfarmers.
Among the physico-economic factors studies,accessibility of roads was significantly related to useof the IMS, probably due to the mobile nature of thesheller. If the road network going to and from the farmis not accessible, the IMS cannot reach the farmer-customer. This reduces the chance of using the IMS,resulting in a low level of use. The mobile features ofthe IMS enabled the owner to service areas that wereremote and far-flung, provided roads were accessible.
This result is similar to that of Cruz (1981) when shenoted the importance of the biophysical envi-ronment—such as physical condition of the farm, itslocation and ecological setting, availability of
resources, and other facilities such as roads, market,and transportation—to the adoption of an innovation.
Technical attributes
Based on the chi-square test, the attributes of theIMS that had affected the level of utilisation were:technical attributes (quality of output); socialattributes (availability in the market, availability ofspare parts, and participation of children); educationalattributes (ease of operation); and ecological attributes(noise emitted) (Table 3).
The quality of output of shelled maize coming fromthe IMS influences its level of utilisation. This findingcan be attributed to the respondents’ findings that theIMS has good quality output. Customers of the IMSlook for this attribute when choosing which sheller touse in their operations. This finding runs parallel to thefindings of other researchers that, to be acceptable tofarmers, inputs must be technically effective. Thelevel of utilisation of 5.6 times in a four-year periodconnotes relative advantages over other types ofsheller.
Availability in the market was found to be signifi-cantly related to IMS use—the extent of IMS useincreases as more IMS units are available in the marketand can consequently service more customers. Theclearly demonstrates the importance of having shellersavailable for sale in the market. The presence of
Social
Mobility 5.26 n.s.
Availability in the market 84.79 **
Availability of spare parts 61.47 **
Participation of children and females 80.49 **
Educational
Ease of operation 100.08 **
Simplicity of design 4.28 n.s.
Ecological
Noise emitted 55.17 **
Pollutants emitted 3.49 n.s.
Technology transfer
Credit availability 0.35 n.s.
Media channels 3.91 n.s.
Table 3
. (Cont’d) Correlation coefficient and chi-square values between independent variables and improved maizesheller (IMS) utilisation (where * = significant, ** = highly significant at the 0.05 level, and n.s. = notsignificant).
Factors Correlation coefficient Chi-square value
Quality assurance in agricultural produce,edited by G.I. Johnson, Le Van To, Nguyen Duy Duc and M.C. Webb.
ACIAR Proceedings 100(printed version published in 2000)
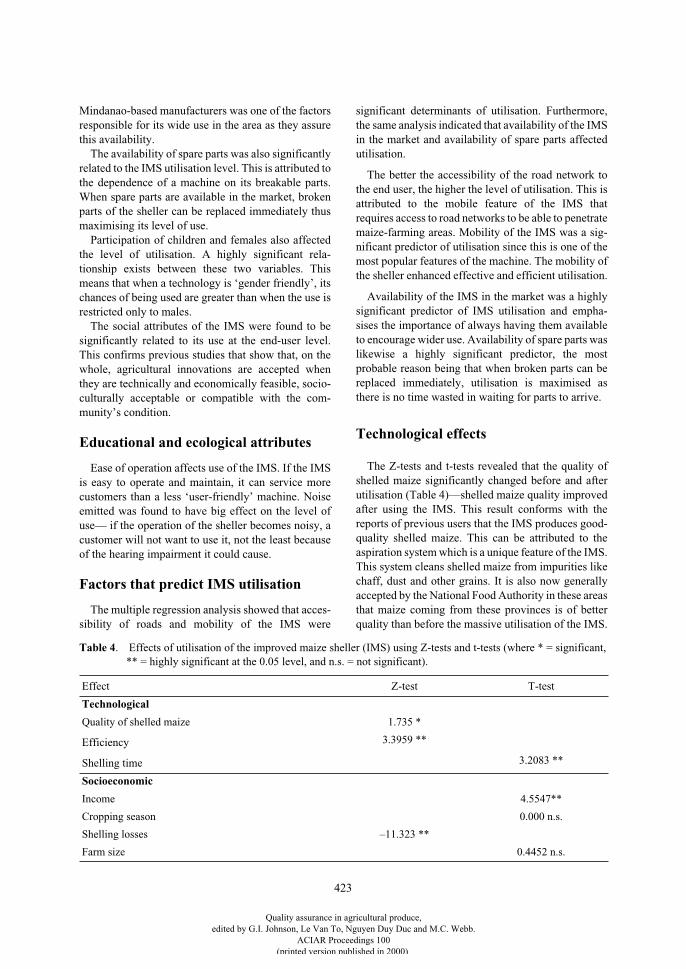
423
Mindanao-based manufacturers was one of the factorsresponsible for its wide use in the area as they assurethis availability.
The availability of spare parts was also significantlyrelated to the IMS utilisation level. This is attributed tothe dependence of a machine on its breakable parts.When spare parts are available in the market, brokenparts of the sheller can be replaced immediately thusmaximising its level of use.
Participation of children and females also affectedthe level of utilisation. A highly significant rela-tionship exists between these two variables. Thismeans that when a technology is ‘gender friendly’, itschances of being used are greater than when the use isrestricted only to males.
The social attributes of the IMS were found to besignificantly related to its use at the end-user level.This confirms previous studies that show that, on thewhole, agricultural innovations are accepted whenthey are technically and economically feasible, socio-culturally acceptable or compatible with the com-munity’s condition.
Educational and ecological attributes
Ease of operation affects use of the IMS. If the IMSis easy to operate and maintain, it can service morecustomers than a less ‘user-friendly’ machine. Noiseemitted was found to have big effect on the level ofuse— if the operation of the sheller becomes noisy, acustomer will not want to use it, not the least becauseof the hearing impairment it could cause.
Factors that predict IMS utilisation
The multiple regression analysis showed that acces-sibility of roads and mobility of the IMS were
significant determinants of utilisation. Furthermore,the same analysis indicated that availability of the IMSin the market and availability of spare parts affectedutilisation.
The better the accessibility of the road network tothe end user, the higher the level of utilisation. This isattributed to the mobile feature of the IMS thatrequires access to road networks to be able to penetratemaize-farming areas. Mobility of the IMS was a sig-nificant predictor of utilisation since this is one of themost popular features of the machine. The mobility ofthe sheller enhanced effective and efficient utilisation.
Availability of the IMS in the market was a highlysignificant predictor of IMS utilisation and empha-sises the importance of always having them availableto encourage wider use. Availability of spare parts waslikewise a highly significant predictor, the mostprobable reason being that when broken parts can bereplaced immediately, utilisation is maximised asthere is no time wasted in waiting for parts to arrive.
Technological effects
The Z-tests and t-tests revealed that the quality ofshelled maize significantly changed before and afterutilisation (Table 4)—shelled maize quality improvedafter using the IMS. This result conforms with thereports of previous users that the IMS produces good-quality shelled maize. This can be attributed to theaspiration system which is a unique feature of the IMS.This system cleans shelled maize from impurities likechaff, dust and other grains. It is also now generallyaccepted by the National Food Authority in these areasthat maize coming from these provinces is of betterquality than before the massive utilisation of the IMS.
Table 4
. Effects of utilisation of the improved maize sheller (IMS) using Z-tests and t-tests (where * = significant,** = highly significant at the 0.05 level, and n.s. = not significant).
Effect Z-test T-test
Technological
Quality of shelled maize 1.735 *
Efficiency
3.3959 **
Shelling time
3.2083 **
Socioeconomic
Income 4.5547**
Cropping season 0.000 n.s.
Shelling losses –11.323 **
Farm size 0.4452 n.s.
Quality assurance in agricultural produce,edited by G.I. Johnson, Le Van To, Nguyen Duy Duc and M.C. Webb.
ACIAR Proceedings 100(printed version published in 2000)
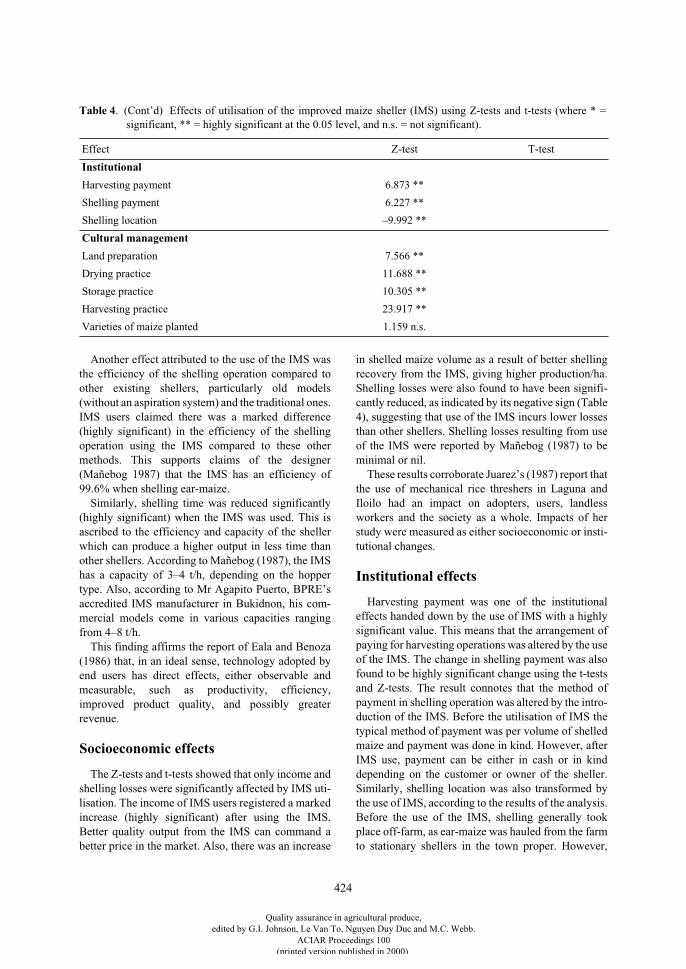
424
Another effect attributed to the use of the IMS wasthe efficiency of the shelling operation compared toother existing shellers, particularly old models(without an aspiration system) and the traditional ones.IMS users claimed there was a marked difference(highly significant) in the efficiency of the shellingoperation using the IMS compared to these othermethods. This supports claims of the designer(Mañebog 1987) that the IMS has an efficiency of99.6% when shelling ear-maize.
Similarly, shelling time was reduced significantly(highly significant) when the IMS was used. This isascribed to the efficiency and capacity of the shellerwhich can produce a higher output in less time thanother shellers. According to Mañebog (1987), the IMShas a capacity of 3–4 t/h, depending on the hoppertype. Also, according to Mr Agapito Puerto, BPRE’saccredited IMS manufacturer in Bukidnon, his com-mercial models come in various capacities rangingfrom 4–8 t/h.
This finding affirms the report of Eala and Benoza(1986) that, in an ideal sense, technology adopted byend users has direct effects, either observable andmeasurable, such as productivity, efficiency,improved product quality, and possibly greaterrevenue.
Socioeconomic effects
The Z-tests and t-tests showed that only income andshelling losses were significantly affected by IMS uti-lisation. The income of IMS users registered a markedincrease (highly significant) after using the IMS.Better quality output from the IMS can command abetter price in the market. Also, there was an increase
in shelled maize volume as a result of better shellingrecovery from the IMS, giving higher production/ha.Shelling losses were also found to have been signifi-cantly reduced, as indicated by its negative sign (Table4), suggesting that use of the IMS incurs lower lossesthan other shellers. Shelling losses resulting from useof the IMS were reported by Mañebog (1987) to beminimal or nil.
These results corroborate Juarez’s (1987) report thatthe use of mechanical rice threshers in Laguna andIloilo had an impact on adopters, users, landlessworkers and the society as a whole. Impacts of herstudy were measured as either socioeconomic or insti-tutional changes.
Institutional effects
Harvesting payment was one of the institutionaleffects handed down by the use of IMS with a highlysignificant value. This means that the arrangement ofpaying for harvesting operations was altered by the useof the IMS. The change in shelling payment was alsofound to be highly significant change using the t-testsand Z-tests. The result connotes that the method ofpayment in shelling operation was altered by the intro-duction of the IMS. Before the utilisation of IMS thetypical method of payment was per volume of shelledmaize and payment was done in kind. However, afterIMS use, payment can be either in cash or in kinddepending on the customer or owner of the sheller.Similarly, shelling location was also transformed bythe use of IMS, according to the results of the analysis.Before the use of the IMS, shelling generally tookplace off-farm, as ear-maize was hauled from the farmto stationary shellers in the town proper. However,
Institutional
Harvesting payment 6.873 **
Shelling payment 6.227 **
Shelling location –9.992 **
Cultural management
Land preparation 7.566 **
Drying practice 11.688 **
Storage practice 10.305 **
Harvesting practice 23.917 **
Varieties of maize planted 1.159 n.s.
Table 4
. (Cont’d) Effects of utilisation of the improved maize sheller (IMS) using Z-tests and t-tests (where * =significant, ** = highly significant at the 0.05 level, and n.s. = not significant).
Effect Z-test T-test
Quality assurance in agricultural produce,edited by G.I. Johnson, Le Van To, Nguyen Duy Duc and M.C. Webb.
ACIAR Proceedings 100(printed version published in 2000)
425
since the introduction of the IMS, shelling is nowbeing done on the farm, because the sheller is mobileand can service farms with accessible road networks.
Effects on cultural management
It was hypothesised that cultural management, suchas land preparation, varieties planted, harvesting,drying, and storage practices were not significantlyaffected by IMS utilisation. However, the Z-testrevealed that all these factors were significant, with theexception of varieties planted (Table 4):•
Land preparation
. The usual practice of landpreparation was changed to partly mechanicalbecause of the proliferation of small-type handtractors, thus this change was not solely attributed tothe use of the IMS but to other factors affecting landpreparation.
•
Drying
practice
. Before introduction of the IMS,ear-maize was partially dried in the field becausemost shellers could not shell ear-maize with a highmoisture content of 22–35%. However, partial fielddrying was no longer necessary after IMS utilisationas this sheller can shell ear-maize even with arelatively high moisture content. Moreover, shelledmaize with high impurities must be driedimmediately as the presence of impuritiespredisposes the grains to agents of deterioration likefungi, insects and other microorganisms. With theadvent of the IMS, this practice is not necessarybecause IMS’s output is of good quality and neednot be dried immediately.
•
Harvesting practice
. Traditionally, a typical farmerhad to harvest his maize crop by lot to allow for fielddrying and availability of shellers. After this, theharvest was hauled to the nearest stationary shellerfor maize-shelling. The use of IMS has minimisedthe time spent drying maize before shelling.Hauling time from the farm to the nearest stations orcentres is also reduced.
•
Storage practice
. Traditionally, shelled maize wasstored only for a short time at farmers’ warehousesfor fear of contamination due to impurities.However, using the IMS allows shelled maize to bekept for longer because the risk of fungal infectionis low due to the good quality of grain.
Conclusions
1
.
The improved maize sheller (IMS) is nowwidely utilised in Bukidnon, Cotabato andLanao del Sur because of its outstanding
features and its local manufacture. IMS usershad tested the technical, economic, social,educational and ecological attributes of thesheller. The IMS was found to be better andmore efficient than the existing types as wellas traditional manual shelling.
2. Training and membership of organisationsenhanced the IMS level of utilisation. Trainingis still an appropriate strategy in technologyutilisation, information and education offarmers. Membership of an organisationwidens the knowledge and horizons offarmers as they interact with other members.
3. Roads, as part of the physico-economic envi-ronment of the IMS users, affected the levelof utilisation. This shows that infrastructuresuch as roads is needed in technology utili-sation. Road networks open avenues for allhuman, technological and social devel-opment.
4
.
Availability of machines in the market is apredictor of IMS utilisation. This implies thattechnology promotion is easier if the tech-nology is easily accessible.
5
.
The utilisation of the IMS has, to some extent,had effects on the technological, socioeco-nomic and institutional milieus of its users.From these effects, further consequences willredound to more far-reaching impacts on themaize farming system, agricultural and ruraldevelopment, and the society as a whole, as itssupra system. These consequences can be feltin the long run after the technology hasreached its ultimate objective of serving thegreatest good for the greatest number ofpeople.
Recommendations
1. It is recommended that the IMS be aggres-sively promoted and extended to otherMindanao provinces as well as in the maize-growing areas in Visayas and Luzon. Localmanufacturers must be identified, accreditedand supported. Based on the results of thisstudy, there is a strong indication that maizeproduction in Mindanao can be mechanised.
2. A well-funded, continuous and massive IMSpromotion and commercialisation must bedone in the country to compensate for theamount used to generate the technology. Theexperiences in the three Mindanao provinces
Quality assurance in agricultural produce,edited by G.I. Johnson, Le Van To, Nguyen Duy Duc and M.C. Webb.
ACIAR Proceedings 100(printed version published in 2000)
426
shed light on the usefulness of this technology.Similarly, a massive technology promotion andextension program via varied communicationmodalities, particularly radio, television andprint media, such as posters, leaflets and flyers,and newspapers, must be pursued. In addition,an awareness campaign through demonstra-tions and symposia to attract cooperatives andother organised groups to invest in the IMSsmust complement the multi-media approach.
3. Training of farmers in postharvest technologiesis still much needed as it showed a significantrelationship with the level of technology utili-sation. BPRE should continue to conduct on-site or on-farm training using local or indig-enous resource persons to talk on their experi-ences and effects of the use of the IMS.Success stories on the use of the IMS could bewritten as comics or other popular formats.
4. Accessible road networks at the end-users levelinfluenced IMS utilisation. It is therefore rec-ommended that this complementary physicalinfrastructure must be in place so that technol-ogies can reach the end users. It is imperativethat technologies be introduced and acceptableto local government units and officials so theycan provide the necessary environment fortechnologies to be utilised. Road constructionopens avenues for all human and physicaldevelopment.
5. One of the major predictors of IMS utilisationwas the availability of the machine in themarket. It is recommended that BPRE continu-ously select, screen and accredit local manu-facturers in each area where the IMS isintroduced. They must be assisted andmonitored in order to be a source of good-quality postharvest technology.
6. The findings on the consequences or effects oftechnology utilisation provide guarantees toDepartment of Agriculture and related organi-sations that government research and devel-opment (R&D) programs are paying off well atthe end-user level. It is thus important to dis-seminate these findings to the appropriate
decision- or policy-makers so that agriculturalpolicies will support increased funding foragricultural R&D and extension.
7. Agencies of the government like theDepartment of Agriculture, Land Bank of thePhilippines, Agricultural Credit Policy Counciland related entities must continue to supportthe adoption of research-based technologiesthrough credit support facilities with lesserinterest rates.
8. For further research work, the other conse-quences of technology utilisation like impacts,which entail more in-depth analysis, are areasworth researching. Similarly, a study on unin-tended consequences of technology utili-sation—e.g. displacement of labour, changesto indigenous practices—would also be bene-ficial. This would include social, psychologicaland environmental consequences.
References
Cruz, T.S. 1981. A communication analysis of rice–fishtechnology dissemination and utilisation. UnpublishedPhD dissertation. College, Laguna, University of thePhilippines at Los Baños.
Eala, R.C. and Benoza, B.E. 1986. Technology impactassessment. Paper presented during the region IIISeminar-Workshop on technology impact assessmentheld at San Fernando, Pampanga, Philippines, 19–21November 1986.
Juares, F.S. 1987. The institutional and economic impact ofmechanical rice thresher in Laguna and Iloilo,Philippines. Unpublished Masters thesis. College,Laguna, University of the Philippines at Los Baños.
Mañebog 1987. Development and pilot testing of improvedcorn sheller. CLSU Muñoz, Nueva Ecija, National Post-Harvest Institute for Research and Extension(NAPHIRE).
Marasigan, M.S. 1977. Some factors associated with theadoption of recommended corn production practices inRegion XI, Philippines. Unpublished Masters thesis.College, Laguna, University of the Philippines at LosBaños.
Valdez and Drilon, J. 1979. Economics and the small farmertechnology, first edition. Ames, Iowa State UniversityPress.
Quality assurance in agricultural produce,edited by G.I. Johnson, Le Van To, Nguyen Duy Duc and M.C. Webb.
ACIAR Proceedings 100(printed version published in 2000)
427
National Postproduction Loss Assessment for Rice and Maize
C.L. Maranan, R.R. Paz and R.S. Rapusas*
Abstract
This project assessed the state and magnitude of postproduction losses in both rice and maize in the Philippinesat the farmers’ and traders/millers’ levels of operation. Actual measurements of these losses at both on-farmand off-farm operations were made for both wet and dry cropping seasons in 13 major rice-producing regionsin the country. Surveys of the farmers’ and traders/millers’ postproduction practices were likewise conductedin order to be able to explain the reasons behind these measured losses.
For paddy, losses from harvesting to milling averaged 14.84% with a range from 1.13 to 31.94%. The mostcritical operation was drying—with an average loss estimated at 4.50%, constituting about 30% of the totallosses, while the next highest loss was incurred during the milling operation with an average loss of 3.10%(21% of the total losses).
These losses were compared with those measured in 1974 and in 1984, although the latter was conducted ona more limited scale. The total losses from harvesting to milling measured in 1974 averaged 23.5% with a rangeof 10–37%, while those measured in 1984 had an average estimated at 16% with a range of 9–23%. Theseresults indicated declining losses attributable to advances in technologies for postproduction operations in riceand maize.
For maize, the average estimated losses for the country were 12.7% and, again, drying was the most criticalamong the various postproduction operations—assessed at 4.6% (constituting 37% of the total losses),followed by storage with an average of 3.1% (24% of total losses).
Based on the results of the surveys, there were a number of socioeconomic and technical factors found tohave influenced the magnitudes of losses for both rice and maize.
I
N
1993, the Department of Agriculture implementedthe Grains Production Enhancement Program (GPEP),later renamed the ‘Gintong Ani’ Program (whichtranslates to ‘Golden Harvest’ Program). The programconsisted of different aspects of the agriculture sector,one of which is postharvest, which the Bureau of Post-harvest Research and Extension (BPRE), our agency,was mandated to lead. In supporting this program,BPRE conceptualised and conducted a nationalassessment of rice and maize postproduction lossesand technologies in order to document the present riceand maize postharvest situation in the country. Theproject results were to serve as the basis for identifying
specific problems and solutions for increasing and sus-taining grain production through the reduction oflosses.
There is very little information available regardingpaddy loss measurements, and consequently howmuch losses have been reduced with the adoption ofmodern postproduction technology, if any, especiallyby farmers.
Objectives
The aim of the project was to generate a wealth ofinformation on the state and magnitude of losses intypical rice and maize postproduction systems in thePhilippines that would serve as the basis for formu-lating government programs and policies needed tofurther develop the grains postproduction sector.Moreover, the results could also serve to measure tech-
* Postharvest Systems Analysis and Development Department, Bureau of Postharvest Research and Extension (BPRE) (formerly NAPHIRE), CLSU Compound, Muñoz 3120, Nueva Ecija, the Philippines.
Quality assurance in agricultural produce,edited by G.I. Johnson, Le Van To, Nguyen Duy Duc and M.C. Webb.
ACIAR Proceedings 100(printed version published in 2000)
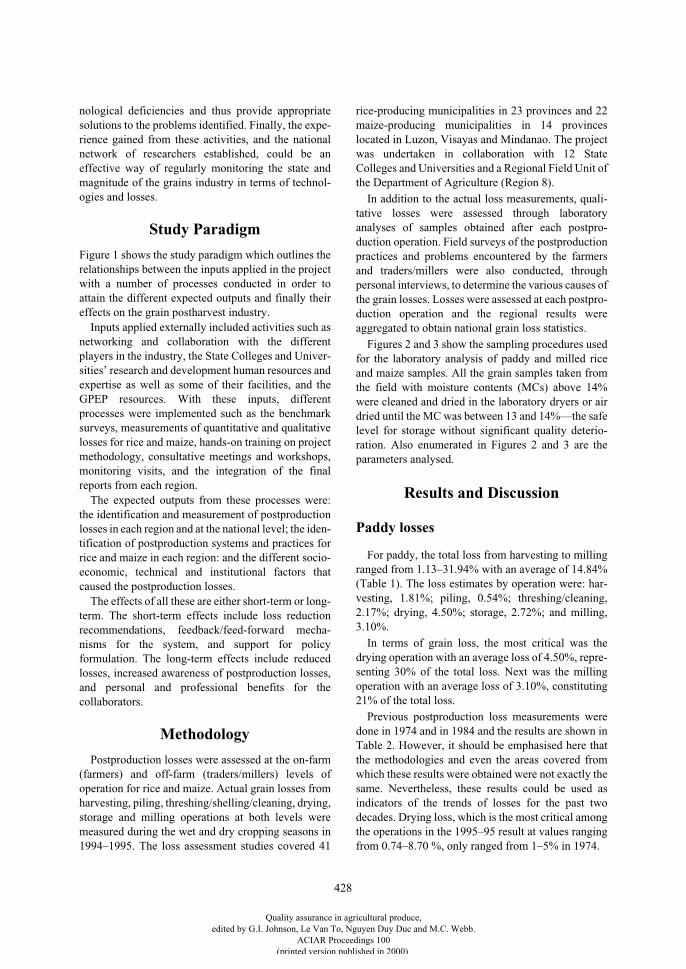
428
nological deficiencies and thus provide appropriatesolutions to the problems identified. Finally, the expe-rience gained from these activities, and the nationalnetwork of researchers established, could be aneffective way of regularly monitoring the state andmagnitude of the grains industry in terms of technol-ogies and losses.
Study Paradigm
Figure 1 shows the study paradigm which outlines therelationships between the inputs applied in the projectwith a number of processes conducted in order toattain the different expected outputs and finally theireffects on the grain postharvest industry.
Inputs applied externally included activities such asnetworking and collaboration with the differentplayers in the industry, the State Colleges and Univer-sities’ research and development human resources andexpertise as well as some of their facilities, and theGPEP resources. With these inputs, differentprocesses were implemented such as the benchmarksurveys, measurements of quantitative and qualitativelosses for rice and maize, hands-on training on projectmethodology, consultative meetings and workshops,monitoring visits, and the integration of the finalreports from each region.
The expected outputs from these processes were:the identification and measurement of postproductionlosses in each region and at the national level; the iden-tification of postproduction systems and practices forrice and maize in each region: and the different socio-economic, technical and institutional factors thatcaused the postproduction losses.
The effects of all these are either short-term or long-term. The short-term effects include loss reductionrecommendations, feedback/feed-forward mecha-nisms for the system, and support for policyformulation. The long-term effects include reducedlosses, increased awareness of postproduction losses,and personal and professional benefits for thecollaborators.
Methodology
Postproduction losses were assessed at the on-farm(farmers) and off-farm (traders/millers) levels ofoperation for rice and maize. Actual grain losses fromharvesting, piling, threshing/shelling/cleaning, drying,storage and milling operations at both levels weremeasured during the wet and dry cropping seasons in1994–1995. The loss assessment studies covered 41
rice-producing municipalities in 23 provinces and 22maize-producing municipalities in 14 provinceslocated in Luzon, Visayas and Mindanao. The projectwas undertaken in collaboration with 12 StateColleges and Universities and a Regional Field Unit ofthe Department of Agriculture (Region 8).
In addition to the actual loss measurements, quali-tative losses were assessed through laboratoryanalyses of samples obtained after each postpro-duction operation. Field surveys of the postproductionpractices and problems encountered by the farmersand traders/millers were also conducted, throughpersonal interviews, to determine the various causes ofthe grain losses. Losses were assessed at each postpro-duction operation and the regional results wereaggregated to obtain national grain loss statistics.
Figures 2 and 3 show the sampling procedures usedfor the laboratory analysis of paddy and milled riceand maize samples. All the grain samples taken fromthe field with moisture contents (MCs) above 14%were cleaned and dried in the laboratory dryers or airdried until the MC was between 13 and 14%—the safelevel for storage without significant quality deterio-ration. Also enumerated in Figures 2 and 3 are theparameters analysed.
Results and Discussion
Paddy losses
For paddy, the total loss from harvesting to millingranged from 1.13–31.94% with an average of 14.84%(Table 1). The loss estimates by operation were: har-vesting, 1.81%; piling, 0.54%; threshing/cleaning,2.17%; drying, 4.50%; storage, 2.72%; and milling,3.10%.
In terms of grain loss, the most critical was thedrying operation with an average loss of 4.50%, repre-senting 30% of the total loss. Next was the millingoperation with an average loss of 3.10%, constituting21% of the total loss.
Previous postproduction loss measurements weredone in 1974 and in 1984 and the results are shown inTable 2. However, it should be emphasised here thatthe methodologies and even the areas covered fromwhich these results were obtained were not exactly thesame. Nevertheless, these results could be used asindicators of the trends of losses for the past twodecades. Drying loss, which is the most critical amongthe operations in the 1995–95 result at values rangingfrom 0.74–8.70 %, only ranged from 1–5% in 1974.
Quality assurance in agricultural produce,edited by G.I. Johnson, Le Van To, Nguyen Duy Duc and M.C. Webb.
ACIAR Proceedings 100(printed version published in 2000)
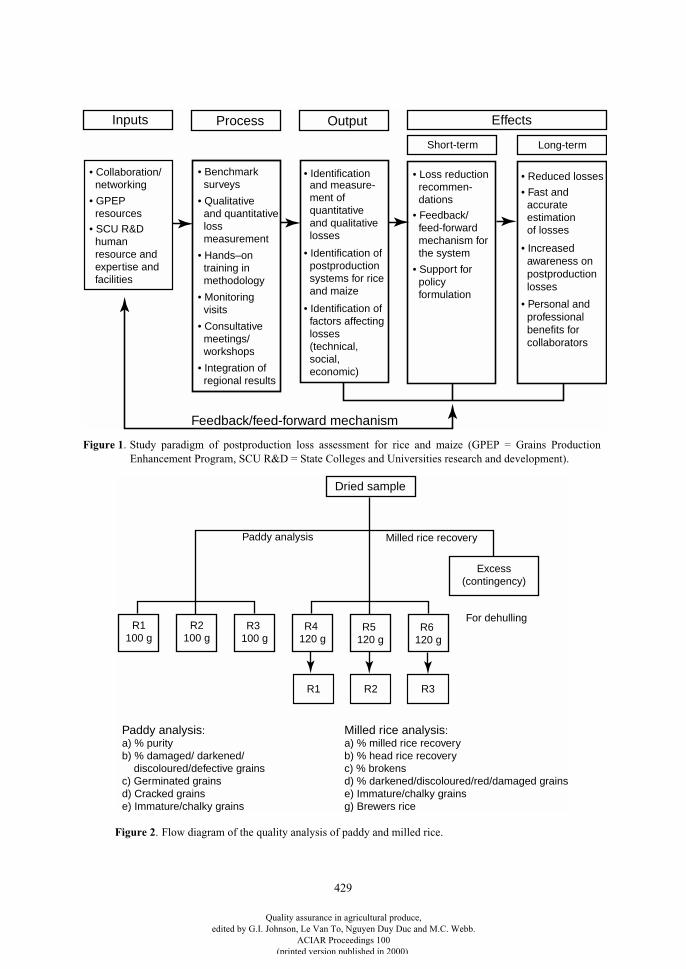
429
Inputs Process Output Effects
• Collaboration/ networking
• GPEP resources
• SCU R&D human resource and expertise and facilities
• Benchmark surveys
• Qualitative and quantitative loss measurement
• Hands–on training in methodology
• Monitoring visits
• Consultative meetings/ workshops
• Integration of regional results
• Identification and measure- ment of quantitative and qualitative losses
• Identification of postproduction systems for rice and maize
• Identification of factors affecting losses (technical, social, economic)
• Loss reduction recommen- dations
• Feedback/ feed-forward mechanism for the system
• Support for policy formulation
• Fast and accurate estimation of losses
• Reduced losses
• Increased awareness on postproduction losses
• Personal and professional benefits for collaborators
Short-term Long-term
Feedback/feed-forward mechanism
Figure 1. Study paradigm of postproduction loss assessment for rice and maize (GPEP = Grains ProductionEnhancement Program, SCU R&D = State Colleges and Universities research and development).
Dried sample
Excess(contingency)
Paddy analysis Milled rice recovery
For dehullingR1
100 gR2
100 gR3
100 gR4
120 gR5
120 gR6
120 g
R1 R2 R3
Paddy analysis:a) % purityb) % damaged/ darkened/ discoloured/defective grainsc) Germinated grainsd) Cracked grainse) Immature/chalky grains
Milled rice analysis:a) % milled rice recoveryb) % head rice recoveryc) % brokensd) % darkened/discoloured/red/damaged grainse) Immature/chalky grainsg) Brewers rice
Figure 2. Flow diagram of the quality analysis of paddy and milled rice.
Quality assurance in agricultural produce,edited by G.I. Johnson, Le Van To, Nguyen Duy Duc and M.C. Webb.
ACIAR Proceedings 100(printed version published in 2000)
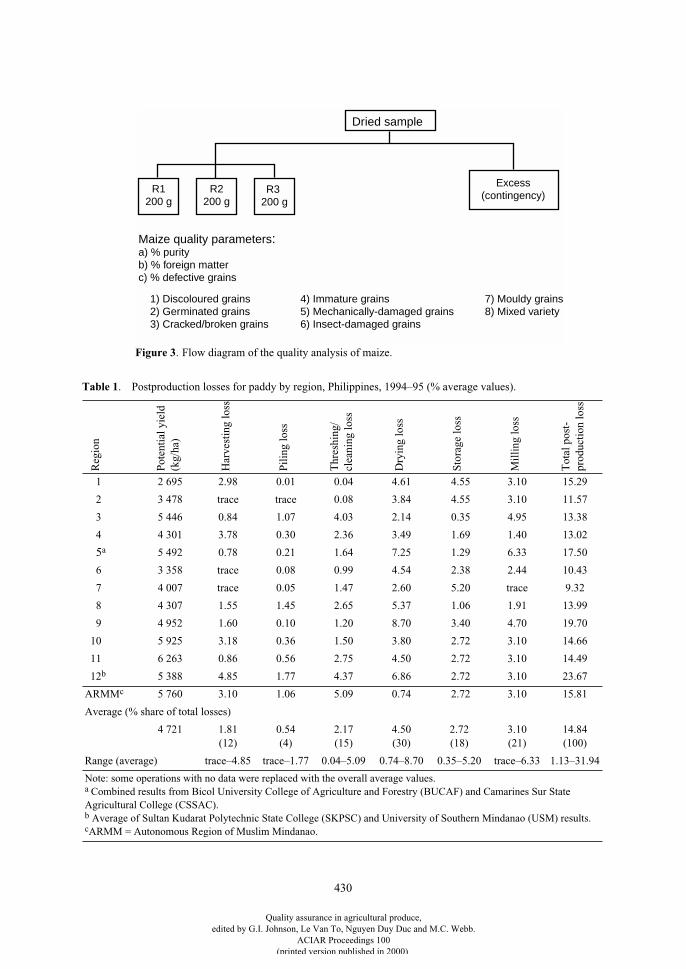
430
Dried sample
Excess(contingency)
R1200 g
R2200 g
R3 200 g
Maize quality parameters:a) % purityb) % foreign matterc) % defective grains
1) Discoloured grains2) Germinated grains3) Cracked/broken grains
4) Immature grains5) Mechanically-damaged grains6) Insect-damaged grains
7) Mouldy grains8) Mixed variety
Table 1. Postproduction losses for paddy by region, Philippines, 1994–95 (% average values).
Reg
ion
Pot
enti
al y
ield
(k
g/ha
)
Har
vest
ing
loss
Pil
ing
loss
Thr
eshi
ng/
clea
ning
loss
Dry
ing
loss
Sto
rage
loss
Mil
ling
loss
Tot
al p
ost-
prod
ucti
on lo
ss
1 2 695 2.98 0.01 0.04 4.61 4.55 3.10 15.29
2 3 478 trace trace 0.08 3.84 4.55 3.10 11.57
3 5 446 0.84 1.07 4.03 2.14 0.35 4.95 13.38
4 4 301 3.78 0.30 2.36 3.49 1.69 1.40 13.02
5a 5 492 0.78 0.21 1.64 7.25 1.29 6.33 17.50
6 3 358 trace 0.08 0.99 4.54 2.38 2.44 10.43
7 4 007 trace 0.05 1.47 2.60 5.20 trace 9.32
8 4 307 1.55 1.45 2.65 5.37 1.06 1.91 13.99
9 4 952 1.60 0.10 1.20 8.70 3.40 4.70 19.70
10 5 925 3.18 0.36 1.50 3.80 2.72 3.10 14.66
11 6 263 0.86 0.56 2.75 4.50 2.72 3.10 14.49
12b 5 388 4.85 1.77 4.37 6.86 2.72 3.10 23.67
ARMMc 5 760 3.10 1.06 5.09 0.74 2.72 3.10 15.81
Average (% share of total losses)
4 721 1.81(12)
0.54(4)
2.17(15)
4.50(30)
2.72(18)
3.10(21)
14.84(100)
Range (average) trace–4.85 trace–1.77 0.04–5.09 0.74–8.70 0.35–5.20 trace–6.33 1.13–31.94
Note: some operations with no data were replaced with the overall average values.a Combined results from Bicol University College of Agriculture and Forestry (BUCAF) and Camarines Sur State Agricultural College (CSSAC).b Average of Sultan Kudarat Polytechnic State College (SKPSC) and University of Southern Mindanao (USM) results.cARMM = Autonomous Region of Muslim Mindanao.
Figure 3. Flow diagram of the quality analysis of maize.
Quality assurance in agricultural produce,edited by G.I. Johnson, Le Van To, Nguyen Duy Duc and M.C. Webb.
ACIAR Proceedings 100(printed version published in 2000)
431
This could be partly attributed to the deterioration ofthe drying facilities being used by farmers and traders/millers, and also to a reversion to sun-drying methodsdue to high cost of mechanical drying facilities, andcarelessness of the drying labour, among other factors.Overall, however, total losses have graduallydecreased since 1974 (Table 2).
Qualitative analysis of representative paddysamples obtained from all the regions covered in thestudy showed a steady decline in quality as the grainspassed through each operation. The quality reductionwas in terms of milled rice recovery, head ricerecovery and percentage broken rice (Table 3).
Maize losses
For maize, the total losses ranged from 5.5%–16.8%with an average of 12.7% (Table 4). By operation, thelosses obtained were as follows: harvesting, 1.3%;piling, 1.0%; shelling/cleaning, 2.7%; drying, 4.6%;and storage, 3.1%.
As with paddy, the drying operation was the mostcritical among the maize postproduction operations.The drying loss was 4.6%, constituting 37% of thetotal loss. Storage came next at 3.1%, representing24% of the total loss (Table 4).
In terms of qualitative loss, there was an increasingtrend in the amount of discoloured grains, germinatedgrains, cracked/broken grains, immature grains,mechanically damaged grains and moldy grains aftereach postproduction operation (Table 5).
Postproduction practices
The field survey provided information on the post-production practices and the level of technologyapplied by the rice and maize farmers and traders/millers. Harvesting is still predominantly manual.Threshing and cleaning operations (for paddy) variedfrom traditional (manual) to semi-traditional (i.e. useof pedal threshers and manual and/or mechanisedblowers), to axial flow threshers with built-in cleaners.For maize, shelling and cleaning varied from manual(using a simple tool made of wood and a piece ofmetal) to a mechanised sheller. Hauling of harvestedmaize to the drying and shelling area utilises variousmeans of transport from manual to carabao-pulled sledor cart to motorised means, such as tractor–trailer,jeeps, trucks etc.
Sun-drying was the method generally used byfarmers for both paddy and maize, because of the lowvolume handled, while many traders/millers utilised
mechanical drying to complement their sun-dryingoperations in order to cope with larger volume of grainhandled. Rice mills used were of the single-pass type,in addition to the multi-pass units owned by mediumand big millers. Many rice mills were found to be oldand inefficient. Grain storage was usually in bags.Farmers generally practiced household storage, whiletraders/millers used semi-concrete and concrete ware-houses. In general, proper maintenance and sanitationpractices were not followed in these warehouses.
Causes of postproduction losses
Postproduction grain losses occurred due to severalreasons as mentioned by the farmers and traders/millers interviewed and as observed by the collabo-rating research teams. These were mainly related tooperational, technical, socioeconomic, cultural,political, and environmental factors.
Operational factors
• Inefficient postproduction practices due to:improper handling of paddy or maize by hiredlabour; ignorance or lack of awareness of theimportance of using underlay during piling,threshing, cleaning, and drying; poor warehousekeeping and sanitation during storage; lack ofeffective pest control; and carelessness duringstacking or piling resulting in tearing of sacks andgrain spillage.
• Size, shape and type of piling of harvested paddystalks for threshing. Smaller sized piles means morepiles and therefore more spillage incurred. Theshape of the pile depends on the method of threshingand the type of thresher used.
• Type of postproduction facilities.
• Lack of efficient postproduction facilities in thearea.
• Inefficient stacking and lack of inventoryprocedures.
Technical factors
• Inappropriate size and type of facilities used.
• Inefficiency of facilities used due to age (wear andtear), outdated models, or even lack of properdesign, testing and proper spare parts, especially forlocally fabricated, copied versions of the machines.
• Lack of regular repair and maintenance of facilities.
• Over-drying due to lack of moisture meters.
• Limited experience and lack of training andtechnical skills of operators.
Quality assurance in agricultural produce,edited by G.I. Johnson, Le Van To, Nguyen Duy Duc and M.C. Webb.
ACIAR Proceedings 100(printed version published in 2000)
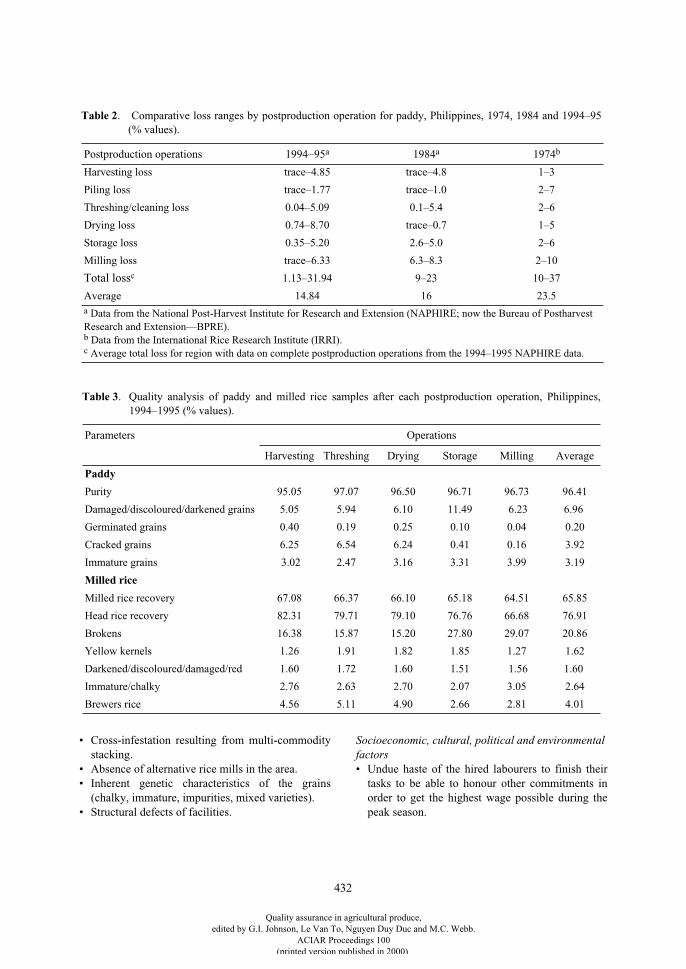
432
• Cross-infestation resulting from multi-commoditystacking.
• Absence of alternative rice mills in the area.• Inherent genetic characteristics of the grains
(chalky, immature, impurities, mixed varieties).• Structural defects of facilities.
Socioeconomic, cultural, political and environmental factors
• Undue haste of the hired labourers to finish theirtasks to be able to honour other commitments inorder to get the highest wage possible during thepeak season.
Table 3. Quality analysis of paddy and milled rice samples after each postproduction operation, Philippines,1994–1995 (% values).
Parameters Operations
Harvesting Threshing Drying Storage Milling Average
Paddy
Purity 95.05 97.07 96.50 96.71 96.73 96.41
Damaged/discoloured/darkened grains 5.05 5.94 6.10 11.49 6.23 6.96
Germinated grains 0.40 0.19 0.25 0.10 0.04 0.20
Cracked grains 6.25 6.54 6.24 0.41 0.16 3.92
Immature grains 3.02 2.47 3.16 3.31 3.99 3.19
Milled rice
Milled rice recovery 67.08 66.37 66.10 65.18 64.51 65.85
Head rice recovery 82.31 79.71 79.10 76.76 66.68 76.91
Brokens 16.38 15.87 15.20 27.80 29.07 20.86
Yellow kernels 1.26 1.91 1.82 1.85 1.27 1.62
Darkened/discoloured/damaged/red 1.60 1.72 1.60 1.51 1.56 1.60
Immature/chalky 2.76 2.63 2.70 2.07 3.05 2.64
Brewers rice 4.56 5.11 4.90 2.66 2.81 4.01
Table 2
. Comparative loss ranges by postproduction operation for paddy, Philippines, 1974, 1984 and 1994–95(% values).
Postproduction operations 1994–95
a
1984
a
1974
b
Harvesting loss trace–4.85 trace–4.8 1–3
Piling loss trace–1.77 trace–1.0 2–7
Threshing/cleaning loss 0.04–5.09 0.1–5.4 2–6
Drying loss 0.74–8.70 trace–0.7 1–5
Storage loss 0.35–5.20 2.6–5.0 2–6
Milling loss trace–6.33 6.3–8.3 2–10
Total loss
c
1.13–31.94 9–23 10–37
Average 14.84 16 23.5
a
Data from the National Post-Harvest Institute for Research and Extension (NAPHIRE; now the Bureau of Postharvest Research and Extension—BPRE).
b
Data from the International Rice Research Institute (IRRI).
c
Average total loss for region with data on complete postproduction operations from the 1994–1995 NAPHIRE data.
Quality assurance in agricultural produce,edited by G.I. Johnson, Le Van To, Nguyen Duy Duc and M.C. Webb.
ACIAR Proceedings 100(printed version published in 2000)
433
• Intentionally leaving out some grains for the gleanerswho were relatives or family members of the hiredlabourers.
• Clinging to traditional practices (possibly due toinherent aversion to change usually associated withrisk, distance from market sources and information onmodern postharvest facilities).
• Non-affordability of modern and more efficientfacilities.
• Fear of or hesitance to kill rats due to some old beliefs.• Strong patron–client relationship which obligates
farmers to continually use a given facility despite itspoor performance.
• Bad weather conditions during the operation.• Low salaries and limited incentives given to machine
operators (especially for rice mills) resulting in theirfast turnover and low productivity.
• Non-discriminating attitude of mill customers to ricequality, especially those who usually give a higherpremium to total milled rice recovery than the headrice recovery.
Project recommendations
Based on the results of the project and the responsesof the project cooperators (farmers and traders/millers)as well as the research teams from the various collab-orating institutions, the following courses of actionwere recommended:• Results of the study should be fed back to the
different sectors involved in the project, especiallythe farmers and the trader/millers, to sustain theinterest generated during the project imple-mentation.
• Awareness campaigns should be conducted throughvarious mass media, such as print and radio/television, among others, for a more effectivedissemination of the project findings to a greaternumber of people.
• Demonstration farms/centres should be establishedin strategic locations to showcase alternativepostproduction technologies involving both thetraditional and improved systems to exhibit theirvaried features, potentials, advantages anddisadvantages, problems and limitations.
• Grain Service Centers should be set up to cater tothe needs of farmers who would like to takeadvantage of the benefits and other potentials ofimproved postproduction practices, machines andequipment as well as be updated with newdevelopments in the grain postproduction industry.
• Actual hands-on training should be conducted onthe operation, maintenance, trouble-shooting and
repair of improved postproduction facilities andequipment with greater emphasis on the technicalprinciples, features and parameters that need to berecognised and understood by the potential users forhigher productivity results.
• Linkages with local equipment and machinerymanufacturers and distributors should bestrengthened to ensure provision of after-saleservices, such as repairs and maintenance, andassurance of the availability of spare parts andaccessories in the area.
• A regulating body with the mandate to test andcertify the technical efficiency of the locallymanufactured postharvest facilities prior tocommercialisation to protect the potential usersshould be established.
Immediate impacts of the project
The actual implementation of the project in thedifferent regions of the country elicited severalimmediate impacts such as those outlined below.
• The field loss assessment trials created awareness,not only among farmer-cooperators but also farmersof adjacent farms, of the pattern, magnitude andcauses of postproduction losses in rice and in maize.This awareness brought about some improvementsin their practices such as the following:
i. use of additional underlays during piling,threshing, and cleaning/shelling to allowrecovery of spilled grains;
ii. animals were no longer allowed to feed onthreshed straws unless carefully re-threshedand gleaned to recover the remaining grains;and
iii. a number of farmers and/or their familymembers started to closely supervise the har-vesting and threshing operations to ensurehired labourers worked efficiently.
• Another immediate impact was the discovery of theuse of tampered weighing scales by someunscrupulous paddy/maize traders andmanipulation of moisture measurements in theirfavour to take advantage of the farmers’ trust and/orignorance of the true weight and quality of theircrop.
• Knowledge of the magnitude of losses and theircauses opened the eyes of the farmer-cooperators tothe fact that it would be more cost-effective toprevent loss of the grain already produced than tospend more money and time on capital-intensiveinputs to increase farm productivity.
Quality assurance in agricultural produce,edited by G.I. Johnson, Le Van To, Nguyen Duy Duc and M.C. Webb.
ACIAR Proceedings 100(printed version published in 2000)
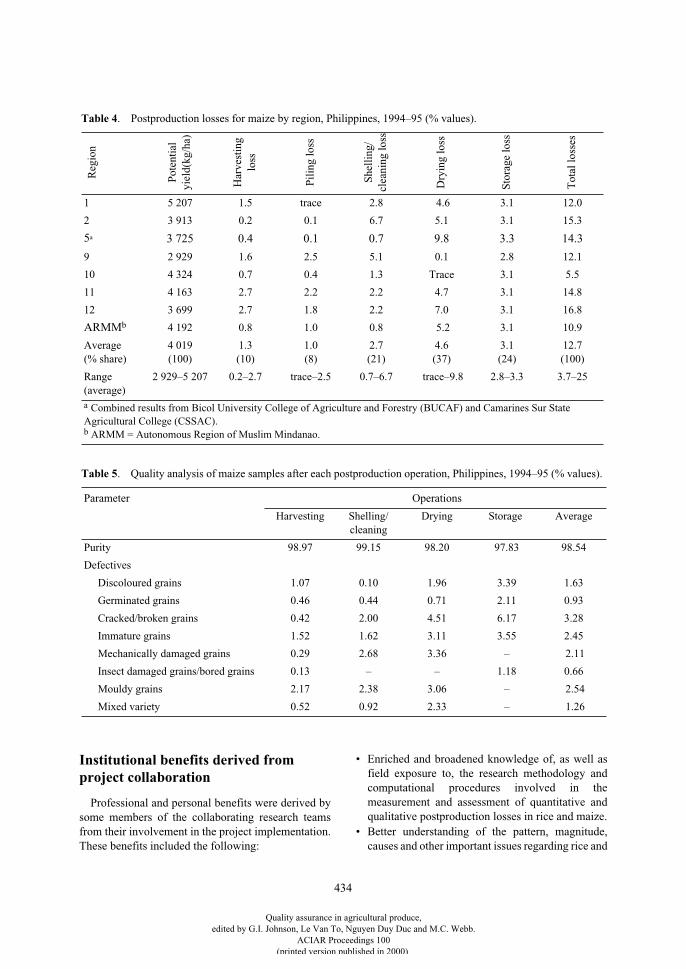
434
Institutional benefits derived from project collaboration
Professional and personal benefits were derived bysome members of the collaborating research teamsfrom their involvement in the project implementation.These benefits included the following:
• Enriched and broadened knowledge of, as well asfield exposure to, the research methodology andcomputational procedures involved in themeasurement and assessment of quantitative andqualitative postproduction losses in rice and maize.
• Better understanding of the pattern, magnitude,causes and other important issues regarding rice and
Table 4. Postproduction losses for maize by region, Philippines, 1994–95 (% values).
Reg
ion
Pot
enti
al
yiel
d(kg
/ha)
Har
vest
ing
loss
Pil
ing
loss
She
llin
g/cl
eani
ng lo
ss
Dry
ing
loss
Sto
rage
loss
Tot
al lo
sses
1 5 207 1.5 trace 2.8 4.6 3.1 12.0
2 3 913 0.2 0.1 6.7 5.1 3.1 15.3
5a 3 725 0.4 0.1 0.7 9.8 3.3 14.3
9 2 929 1.6 2.5 5.1 0.1 2.8 12.1
10 4 324 0.7 0.4 1.3 Trace 3.1 5.5
11 4 163 2.7 2.2 2.2 4.7 3.1 14.8
12 3 699 2.7 1.8 2.2 7.0 3.1 16.8
ARMMb 4 192 0.8 1.0 0.8 5.2 3.1 10.9
Average (% share)
4 019(100)
1.3(10)
1.0(8)
2.7(21)
4.6(37)
3.1(24)
12.7(100)
Range (average)
2 929–5 207 0.2–2.7 trace–2.5 0.7–6.7 trace–9.8 2.8–3.3 3.7–25
a Combined results from Bicol University College of Agriculture and Forestry (BUCAF) and Camarines Sur State Agricultural College (CSSAC).b ARMM = Autonomous Region of Muslim Mindanao.
Table 5. Quality analysis of maize samples after each postproduction operation, Philippines, 1994–95 (% values).
Parameter Operations
Harvesting Shelling/cleaning
Drying Storage Average
Purity 98.97 99.15 98.20 97.83 98.54
Defectives
Discoloured grains 1.07 0.10 1.96 3.39 1.63
Germinated grains 0.46 0.44 0.71 2.11 0.93
Cracked/broken grains 0.42 2.00 4.51 6.17 3.28
Immature grains 1.52 1.62 3.11 3.55 2.45
Mechanically damaged grains 0.29 2.68 3.36 – 2.11
Insect damaged grains/bored grains 0.13 – – 1.18 0.66
Mouldy grains 2.17 2.38 3.06 – 2.54
Mixed variety 0.52 0.92 2.33 – 1.26
Quality assurance in agricultural produce,edited by G.I. Johnson, Le Van To, Nguyen Duy Duc and M.C. Webb.
ACIAR Proceedings 100(printed version published in 2000)
435
maize postproduction losses, as viewed andanalysed from different perspectives. This wasmade possible by the multi-disciplinary approachemployed, and the constant monitoring, field visits,consultative meetings and seminars held by theBPRE staff and their consultants with the researchteams from the different collaborating institutions.
• Linkage and networking activities with otheracademic institutions, government research andextension agencies, and local government unitsprovided the necessary logistics and technicalsupport as well as facilitated the implementation ofthe project and other related activities. This linkagealso provided opportunities for future collaborativeactivities with them.
• For those institutions that collaborated with BPREfor the first time, the opportunity was considered abig breakthrough that enabled them to get into themainstream of research, extension and trainingactivities in the postharvest field.
• Involvement in the project provided additionalprofessional growth, recognition, and incentives tosome members of the research team. In someinstances, partial results from the project werepresented during in-house and even regionalexhibits and research competitions that reaped
rewards and prizes, while others were even able toutilise the findings for their school term papers,class requirements, teaching and training materialsetc.
• The team spirit and collegial relationshipsestablished during the implementation of the fieldtrials and data analyses provided a stronger bondbetween and among the research staff involved inthe project.
Future plans
A sequel project is envisaged to evaluate the impactof the Postharvest Component of the Grains Pro-duction Enhancement Program (GPEP), in particular,the impact of the postharvest facility assistance andtraining courses provided to the farmers, manufac-turers, and other stakeholders in the grainspostproduction sector.
Another plan of action would be nationwide dissem-ination of the results of the study to farmers and otherstakeholders through popular publications and bro-chures, and through symposia and other publicforums, to increase awareness regarding themagnitude of the postharvest losses and how toprevent them.
Quality assurance in agricultural produce,edited by G.I. Johnson, Le Van To, Nguyen Duy Duc and M.C. Webb.
ACIAR Proceedings 100(printed version published in 2000)

436
Quality assurance in agricultural produce,edited by G.I. Johnson, Le Van To, Nguyen Duy Duc and M.C. Webb.
ACIAR Proceedings 100(printed version published in 2000)
439
Quality Management Systems in Australian Vegetable and Fruit Industries
J.S. Bagshaw and S.N. Ledger*
Abstract
Quality management (QM) systems have been in use in the Australian vegetable and fruit industries since thelate 1980s. These early systems, based on the QM standard ISO 9002, were used mainly to achieve consistentquality products to meet customer requirements.
From 1997, consumer concerns about food safety increased after some major food poisoning outbreaksimplicating non-horticultural produce. The major supermarket chains in Australia reacted by requiring theirdirect suppliers to adopt stringent management practices to ensure provision of safe, acceptable qualityproducts. This applies to the fruit and vegetable industries as well as other food sectors. Externally auditedHazard Analysis and Critical Control Point (HACCP )-based QM systems provide the levels of assurance thesupermarkets are requiring.
Indirect suppliers are now also required to implement on-farm practices under an approved supplier programto assure provision of safe, quality produce. Growers are required to provide proof of these practices in the formof records and other documentation. Most growers in Australia are affected by these supermarket requirements.To adopt QM systems, growers must firstly be motivated to implement them, then gain knowledge about thevarious QM systems and their specific requirements, and finally have the resources to implement them. Thereis now strong motivation to adopt QM systems in Australia (access to supermarkets) and knowledge is slowlybuilding through training programs and support services. Larger farms have more resources and are betterpositioned to implement QM systems. Small family farms struggle to find the time and resources to implementQM systems. Documentation of QM systems is a major challenge for vegetable and fruit growers.
In this paper, we discuss the requirements under externally audited HACCP-based QM systems for directsuppliers and approved supplier programs for indirect suppliers, as well as some implications for othercountries from the Australian experience with QM systems.
C
ONSUMERS
of vegetables and fruits are becomingincreasingly demanding. They want vegetables andfruits to be consistently attractive, fresh, nutritious,tasty and safe to eat. Retailers and wholesalers inAustralia have responded to this consumer pressure,particularly for food safety, by asking for assurancefrom suppliers that their products meet these require-ments. They are looking to quality management (QM)systems to provide the level of assurance they require.
A Brief History of QM Systems in Australia
Quality management systems were first used inAustralia in the late 1980s, having been introducedfrom New Zealand. At about the same time, the Aus-tralian Quarantine and Inspection Service (AQIS)introduced a QM system focusing on quarantine issuesthat businesses could use as an alternative to AQISinspection. The QM systems from New Zealand andthe AQIS systems were based on ISO 9002, an inter-national standard for QM systems.
Those Australian businesses that used non-quar-antine QM systems initially focused on using them tocontrol product quality, with an emphasis on product
* Queensland Horticulture Institute, Queensland Department of Primary Industries, 80 Meiers Road, Indooroopilly, Queensland 4068, Australia.
Quality assurance in agricultural produce,edited by G.I. Johnson, Le Van To, Nguyen Duy Duc and M.C. Webb.
ACIAR Proceedings 100(printed version published in 2000)
440
inspections just before harvest, at harvest, and duringhandling and packing. Large customers wanted largevolumes of consistent quality product, and QMsystems were seen as the best way to achieve this, bothby high volume businesses and by smaller businessesmarketing together under a common brand.
As vegetable and fruit growers became morefamiliar with QM principles, they started using themfor broader business improvement. Growers thatimplemented QM systems (particularly thoseemploying large numbers of staff) indicated importantbusiness benefits, including more control of their pro-duction system, better efficiency and improved staffperformance (Maltby et al. 1998).
During the early 1990s, larger businesses imple-mented QM systems to the ISO 9002 standard andsought certification by independent auditors toprovide a competitive edge. It was estimated (Anon.1995) that between 1 and 2% of horticulture producersin Australia had audited QM systems in place.
Since 1997, consumer concerns about food safetyhave increased after some major food poisoningoutbreaks in Australia. These have mainly implicatedprocessed products (e.g. salami and peanut paste), butone recently was traced to contaminated oranges. Themajor supermarket chains in Australia reacted byrequiring their direct suppliers to adopt stringent man-agement practices to ensure provision of safe,acceptable quality products. This applied to allproduce, including fruits and vegetables.
The Current Situation
The supermarkets initially targeted their directsuppliers (businesses supplying directly into thesupermarket central distribution systems). Directsuppliers included a relatively small proportion ofgrowers and packers (mainly large volume busi-nesses), and most wholesalers and processors. Thesedirect suppliers are required to have an externallyaudited, Hazard Analysis and Critical Control Point(HACCP)-based QM standard in place. Acceptablestandards are ISO 9002 + HACCP or SQF 2000
cm
(includes HACCP). One supermarket has its ownvendor QM standard which includes HACCP. Thesupermarkets have allowed their direct suppliers sometime to implement their QM systems, with deadlinesranging from the end of 1999 to mid-2000.
In Australia, most smaller growers supply topackers, wholesalers and/or processors, who in turnsupply directly to retailers (including the super-markets) and other food service businesses.
Supermarkets now require these indirect suppliers tohave practices in place to ensure safety and quality atthe farm level. These practices are commonly referredto as ‘approved supplier programs’ and are a lowerlevel of QM than that required of direct suppliers.Some indirect suppliers deemed to be a high foodsafety risk may be required to implement HACCP.Examples are products that have a history of foodpoisoning (e.g. bean sprouts) or where some minimalprocessing is done on-farm. Supermarkets place theonus of assurance for safety and quality on their directsuppliers. These direct suppliers are audited to verifythat their own QM system meets the QM standard, andthat their approved supplier programs with indirectsuppliers are adequate. Figure 1 summarises theserequirements.
The three major supermarkets in Australia handle alarge proportion of Australia’s fresh vegetables andfruits, so most producers are affected, either directly orindirectly, by their requirements.
The QM Standards
ISO 9002 (1994) is an international QM standard thatcan be applied to any type of business. It does notinclude HACCP, so this must be added to the ISO9002 standard. SQF 2000
cm
Quality Code (1997) hasbeen developed by AGWEST Trade and Developmentin Western Australia specifically for food businesses,and includes HACCP. One supermarket has developedits own vendor QM standard for direct suppliers.
HACCP
HACCP is an internationally recognised method toidentify, evaluate and control hazards to foodproducts. It was originally developed to control foodsafety hazards, but is now being used in Australia toalso control product quality hazards. The HACCPprocess involves seven ‘principles’ (Codex Alimen-tarius Commission 1997):
• Conduct a hazard analysis• Determine the critical control points• Establish critical limits• Establish a system to monitor control of the critical
control points• Establish the corrective actions to be taken when
monitoring indicates that a particular control pointis not under control
Quality assurance in agricultural produce,edited by G.I. Johnson, Le Van To, Nguyen Duy Duc and M.C. Webb.
ACIAR Proceedings 100(printed version published in 2000)
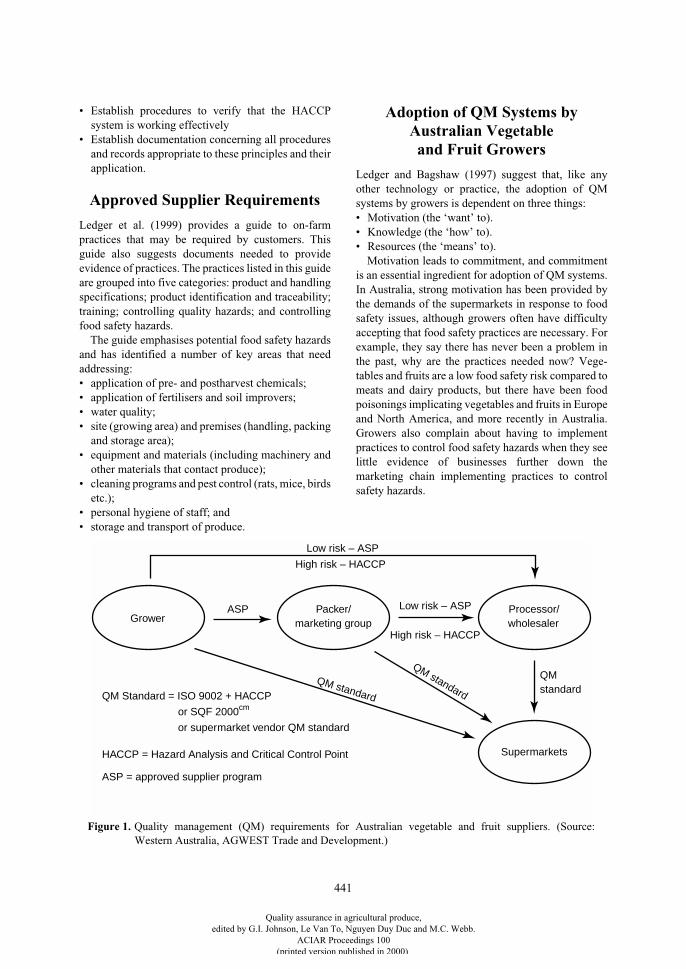
441
• Establish procedures to verify that the HACCPsystem is working effectively
• Establish documentation concerning all proceduresand records appropriate to these principles and theirapplication.
Approved Supplier Requirements
Ledger et al. (1999) provides a guide to on-farmpractices that may be required by customers. Thisguide also suggests documents needed to provideevidence of practices. The practices listed in this guideare grouped into five categories: product and handlingspecifications; product identification and traceability;training; controlling quality hazards; and controllingfood safety hazards.
The guide emphasises potential food safety hazardsand has identified a number of key areas that needaddressing:• application of pre- and postharvest chemicals;• application of fertilisers and soil improvers;• water quality;• site (growing area) and premises (handling, packing
and storage area);• equipment and materials (including machinery and
other materials that contact produce);• cleaning programs and pest control (rats, mice, birds
etc.);• personal hygiene of staff; and• storage and transport of produce.
Adoption of QM Systems by Australian Vegetable and Fruit Growers
Ledger and Bagshaw (1997) suggest that, like anyother technology or practice, the adoption of QMsystems by growers is dependent on three things:• Motivation (the ‘want’ to).• Knowledge (the ‘how’ to).• Resources (the ‘means’ to).
Motivation leads to commitment, and commitmentis an essential ingredient for adoption of QM systems.In Australia, strong motivation has been provided bythe demands of the supermarkets in response to foodsafety issues, although growers often have difficultyaccepting that food safety practices are necessary. Forexample, they say there has never been a problem inthe past, why are the practices needed now? Vege-tables and fruits are a low food safety risk compared tomeats and dairy products, but there have been foodpoisonings implicating vegetables and fruits in Europeand North America, and more recently in Australia.Growers also complain about having to implementpractices to control food safety hazards when they seelittle evidence of businesses further down themarketing chain implementing practices to controlsafety hazards.
Low risk – ASP
High risk – HACCP
ASP Low risk – ASP
High risk – HACCP
GrowerPacker/
marketing groupProcessor/wholesaler
Supermarkets
QMstandard
QM standard
QM standard
HACCP = Hazard Analysis and Critical Control Point
ASP = approved supplier program
QM Standard = ISO 9002 + HACCP
or SQF 2000cm
or supermarket vendor QM standard
Figure 1. Quality management (QM) requirements for Australian vegetable and fruit suppliers. (Source:Western Australia, AGWEST Trade and Development.)
Quality assurance in agricultural produce,edited by G.I. Johnson, Le Van To, Nguyen Duy Duc and M.C. Webb.
ACIAR Proceedings 100(printed version published in 2000)
442
Once motivated, growers then need to gainknowledge about QM systems. The wide range of QMstandards and guidelines, all with slightly differentrequirements, are very confusing and growers find itvery difficult to determine what they need. They mustrely on external sources to gain this information. Themessages from these many sources can sometimes beconflicting, so gaining a clear understanding aboutwhat is required is not as simple as it sounds. But clearunderstanding is essential if growers are to progresstoward implementing an effective QM system. Anon.(1995) acknowledged these problems and suggestededucation and training programs with informationpackages reflecting market requirements, free of QMjargon, horticulture-oriented, consistent and concise.Accredited training programs providing informationabout QM requirements have been developed and arebeing conducted for growers.
Once growers are motivated and knowledgableabout QM systems, their ability to implement thesesystems depends on the resources they have available.The QM standards, ISO 9002 plus HACCP, SQF2000
cm
and the retailer vendor QM standard, require asignificant amount of time to develop, document andmaintain. Most growers are not practiced or com-fortable with documentation, and find this the mostchallenging part of a QM standard. Also, the rigour,formatting, and detailed thinking and documentationrequired for the HACCP component is very chal-lenging for most people, let alone growers who aregenerally not trained or experienced in office skills.
Some industries have attempted to address thisproblem by developing generic documents that indi-vidual businesses can adapt to their unique businesspractices. These generic documents go some way tohelping growers but do not provide an understandingof the underlying QM principles. Generic documentsare best used as part of a broader training program.
In our experience, businesses require skilled peoplededicating much of their time to develop andimplement the QM standards. Large businesses arebetter positioned to provide this resource, either bycontracting an external consultant or employing staffto coordinate the job. In some instances the owners ormanagers delegate some of their normal duties to staff,freeing the owners/managers to develop their QMsystem. Small family businesses often do not have theresources to pay for consultants or staff to implementa QM system, and struggle to find the time over andabove normal farming activities to implement QMstandards. Some groups of small businesses combineresources and enlist external help, with financial
support from government programs. However, at leastone person from each business must learn about therequirements of the QM system, maintain the systemand supporting documentation, and perhaps learn newskills, such as computer skills, to aid documentation.Ongoing auditing costs can also be a barrier to smallbusinesses.
The practices under an approved supplier programare simpler to implement and easier to document, andmost growers in Australia have many of the practicesalready in place (e.g. responsible chemical use, sprayrecords, and cleaning programs for harvestingequipment and packing areas). Once again, docu-menting the approved supplier program is the biggestbarrier for small businesses to overcome. Customersrequire documentation as proof that growers arecarrying out the required practices. Some farms enlistthe help of family members not directly involved inrunning the farm to help with documentation andrecord keeping.
Implications for Other Countries
Food safety issues will increase, firstly with exports tocountries with affluent communities, then with localcommunities as they become more affluent. Safe foodis a basic expectation of all people, and communityoutrage in the event of major food poisoning can bevery damaging to a business, or industry, through lossof markets or litigation. Vegetable and fruit growersneed to be aware of what causes food safety problemsand the practices to prevent or limit them to acceptablelevels.
There are many benefits to be gained from imple-menting a QM system, particularly for larger farmsand other businesses in the marketing chain employingmany staff, or for groups of businesses marketingunder a common brand. QM principles encouragebetter planning, clearer objectives and smoother oper-ations, leading to more efficiency and less waste.Sensible application of QM principles will result inmore motivated and well-trained staff.
Certification to a particular QM standard maybenefit larger businesses whose customers value thislevel of assurance. This must be balanced against theextra costs associated with certification.
QM standards would be most applicable to largecentral packinghouses (for operations within the pack-inghouse) or to businesses sourcing and packingproduce for export. These businesses will requiregrower-suppliers to implement certain farm practicesunder an approved supplier program.
Quality assurance in agricultural produce,edited by G.I. Johnson, Le Van To, Nguyen Duy Duc and M.C. Webb.
ACIAR Proceedings 100(printed version published in 2000)
443
Industry and government support agencies need tobe familiar with domestic and export market QMrequirements and communicate them clearly togrowers, packers and distributors in appropriatetraining activities.
References
Anon. 1995. Quality management strategies forhorticulture. Industry Report No. 8. Canberra, Australia,Horticulture Policy Council.
Codex Alimentarius Commission 1997. Hazard Analysisand Critical Control Point (HACCP) system andguidelines for its application. Alinorm 97/13A, App 2,Vol 1B Supplement, Rev 3. Rome, Codex AlimentariusCommission.
ISO 9002 1994. Quality systems—model for qualityassurance in production, installation and servicing.Homebush, New South Wales, Standards Australia.
Ledger, S. and Bagshaw, J. 1997. Reflections on ten years ofhelping improve horticulture quality management. 2
nd
Australasian Pacific Extension Conference Proceedings,Albury, 1997, Vol. 1, 451–459.
Ledger, S., Bennett, R., Beattie, B., Ekman, J., White, D.,Leamon, K., Premier, R., Darton, M., Hart, R., Lovell, J.and Hill, J. 1999. Developing an approved supplierprogram for fresh produce—a guide for customers andsuppliers. Indooroopilly, Queensland DepartmentPrimary Industries.
Maltby, J., Ledger, S. and Bagshaw, J. 1998. Queenslandtomato quality management final report (project VG429). Sydney, Horticultural Research and DevelopmentCorporation.
SQF 2000
cm
Quality Code 1997. A HACCP quality code forthe food industry. Perth, Western Australia, AGWESTTrade and Development.
Quality assurance in agricultural produce,edited by G.I. Johnson, Le Van To, Nguyen Duy Duc and M.C. Webb.
ACIAR Proceedings 100(printed version published in 2000)
444
Extending the Shelf Life of Broccoli Florets and Pak Choy Leaves
A.J. Able, T.J. O’Hare, L.S. Wong and A. Prasad*
Abstract
The shelf life of broccoli (
Brassica oleracea
var.
italica
) florets and detached leaves of pak choy (
Brassicarapa
var.
chinensis
) is severely limited by yellowing. A single initial fumigation using the ethylene actioninhibitor 1-methylcyclopropene (1-MCP) delayed yellowing in broccoli and pak choy by 20–45% and 10–20%, respectively, at supermarket retail temperature (10°C). Fumigation with 1-MCP provided protectionagainst contact with exogenous ethylene (1 ppm), a promoter of yellowing. However, multiple applications of1-MCP did not increase its ability to prolong shelf life. 1-MCP was most effective at concentrations between1–14 ppm. Lower concentrations were less effective. At concentrations above 25 ppm, 1-MCP induceddamage to florets and leaves in the form of brown–red colouring and brown spotting, respectively. When 1-MCP was applied at 20°C or 2°C and the leaves then stored at these respective temperatures, its effect was nodifferent to that observed at 10°C. 1-MCP was effective in extending the shelf life of broccoli florets at all threetemperatures. Atmosphere modification (2% O
2
/5% CO
2
) was found to be more effective than 1-MCP,extending the shelf life of pak choy leaves and broccoli florets by 115% and 174% at 10°C, respectively. Theresearch presented highlights differences in the effectiveness of 1-MCP and the modified atmosphere as wellas comparing differences between floral and leafy brassica tissues.
P
AK
CHOY
(
Brassica rapa
var.
chinensis
) is an openleafy brassica that is marketed as a shoot (commonlyin bunches) or as a component in salad mix or stir-fry.Deterioration is essentially marked by leaf yellowingdue to the breakdown of chlorophyll during storageand senescence (Hirata et al. 1987; Wang and Herner1989; O’Hare et al. 1995). Quality deterioration due tochlorophyll loss also occurs in the high value, seasonalcommodity broccoli (
Brassica oleracea
var.
italica
)(Wang 1979).
The presence of ethylene (whether produced byplant tissue or from an external source) has beenreported by other authors to enhance postharvest chlo-rophyll degradation in leafy brassicas such as cabbage(Pratt and Goeschl 1969; Pendergrass et al. 1976) andin broccoli (Aharoni et al. 1985). Potential regulationof this degradation through the application of ethyleneinhibitors and atmosphere control has been investi-gated. Although refrigeration (5°C or lower) is the
ideal for storage, these temperatures are rarely main-tained in commercial handling systems with mostwholesale/retail outlets displaying produce at approx-imately 10–15°C. Within this temperature range,atmosphere modification has been found to beeffective in retarding chlorophyll loss in pak choy.Reduced oxygen (2% O
2
) (O’Hare et al. 1995) andenhanced carbon dioxide (5% CO
2
) (Wang and Herner1989) retarded yellowing at 10°C. Atmosphere modi-fication (2–3% O
2
/5–6% CO
2
) has also been shown toincrease the storage life of broccoli over a range oftemperatures (Isenberg 1979). However, problems doexist with the practicality and the infrastructurerequired to support the use of controlled atmospheresand modified atmosphere packaging (MAP) forbrassicas in some countries. Less expensive post-harvest treatments to extend storage life would bemore suitable.
Recently, the gaseous ethylene antagonist 1-methyl-cyclopropene (1-MCP) has been shown to be aneffective inhibitor of ethylene action (Serek et al.1994, 1995b; Sisler et al. 1995). Pre-treatment fumi-gation of a range of ornamental species (Porat et al.
* Horticulture Postharvest Group, Queensland HorticultureInstitute, Queensland Department of Primary Industries, 19 Hercules St, Hamilton, Queensland 4007, Australia.
Quality assurance in agricultural produce,edited by G.I. Johnson, Le Van To, Nguyen Duy Duc and M.C. Webb.
ACIAR Proceedings 100(printed version published in 2000)
445
1995; Serek et al. 1995a) and fruits (Sisler et al. 1995)with low levels of 1-MCP has been shown to effec-tively block ethylene action. This paper highlightsdifferences in the effectiveness of 1-MCP andmodified atmosphere as well as differences inresponse between floral and leafy tissues.
Methods and Materials
Plant material
‘Shanghai’ (green-stemmed) pak choy plants weregrown under field conditions in Brisbane (at theQueensland Horticulture Institute—QHI) and harvestedwhen 4 to 5 weeks old. Broccoli (‘Maverick’ and‘Green Belt’) were grown under field conditions atGatton (Queensland) and heads harvested when approx-imately 15–25 cm in diameter (market-ready) andtransported to QHI laboratories (1 h transit) in poly-styrene foam boxes with ice.
In all experiments with pak choy (unless otherwiseindicated) the youngest fully expanded leaf was used(cut as close to the abscission zone as possible). Withbroccoli, the inner branches (with florets and stem)were cut from the broccoli head for use. Prior to use,plant material was surface-sterilised in 2% sodiumhypochlorite for 1 min and then air-dried at 10°C (forup to 30 min). All treatments were stored in the dark at2, 10 or 20°C in lots of 5 in 4 L containers for broccoliand lots of 10 in 2 L containers for pak choy. The con-tainers were flushed with humidified air at a flow rateof 15 L/h. Excess ethylene (produced by the plantmaterial) in control samples was absorbed usingPurafil
®
.
Postharvest treatments
1-methylcyclopropene (1-MCP) was prepared fromEthylBloc
®
(Floralife, USA) by dissolving it in 2%KOH buffer in an airtight glass container. The concen-tration of the gaseous 1-MCP was determined usingflame-ionisation gas chromatography with an n-octane/porasil C column, and the peak response wascalibrated against 1-butene. 1-MCP was injected to afinal concentration of 12 ppm (unless otherwise indi-cated) into sealed vacuum desiccators containing theplant material to be treated. Plant material was treatedwith 1-MCP for 16 hours in the dark at the storage tem-perature. Controls were treated in a similar manner butwithout the addition of 1-MCP. The optimal 1-MCPconcentration was determined over a range of concen-trations (0.0875 ppb to 280 ppm). Where multiple
applications of 1-MCP were required, the initial fumi-gation was performed as detailed previously. Furtherapplications (up to 5 applications in total) wereperformed daily and for 6 h each.
Ethylene was applied, where required, at concentra-tions of 0.1 ppm or 1 ppm as part of the airflow systemused to flush the containers containing the plantmaterial.
To study the effect of a modified atmosphere, anatmosphere of 2% O
2
/5% CO
2
was maintained at10°C as per O’Hare et al. 1998.
Measurements
Hue angle (used as a measure of yellowing) wasmeasured using a Minolta chromoameter and theaverage of three readings on either leaves or floretswas calculated. General appearance (GA) was deter-mined using a scale where 9 was the best condition and1 was the worst condition. When plant materialreached a GA of 5.5, it was considered to be at the endof its shelf life. The degree of yellowing, as observedvisually, was monitored using a scale from 1 (noyellowing evident) to 6 (all yellow). Rot and physio-logical damage were also noted on a scale from 0(none) to 4 (extreme).
Ethylene was measured using flame-ionisation gaschromatography. Soluble sugars were measured afterextraction using a method developed from theenzymatic assay of Boehringer-Roche. Protein wasextracted using a sodium dodecyl sulfate (SDS)-basedmethod (Pogson and Morris 1997) and was thenassayed using a protein analytical kit (Bio-Rad) basedon the Bradford method (Bradford 1976).
Results and Discussion
At 10°C, pak choy had a shelf life of approximately 8days (Figure 1). In the presence of 1 ppm ethylene, theshelf life significantly declined while a lower concen-tration of 0.1 ppm ethylene failed to have a significanteffect (least significant difference—LSD = 1.113)(Figure 1). The shelf life of broccoli florets at 10°Cwas slightly less than that of pak choy. Ethylene (1ppm) significantly decreased the shelf life of theflorets while 0.1 ppm did not have a significant effect(LSD = 0.5979)(Figure 1). Both florets and leaves,therefore, appear to be sensitive to relatively highlevels of ethylene.
When pak choy leaves were treated with 1-MCP, nosignificant change in shelf life was observed for leavesheld in air or under 0.1 ppm ethylene (Figure 2).
Quality assurance in agricultural produce,edited by G.I. Johnson, Le Van To, Nguyen Duy Duc and M.C. Webb.
ACIAR Proceedings 100(printed version published in 2000)
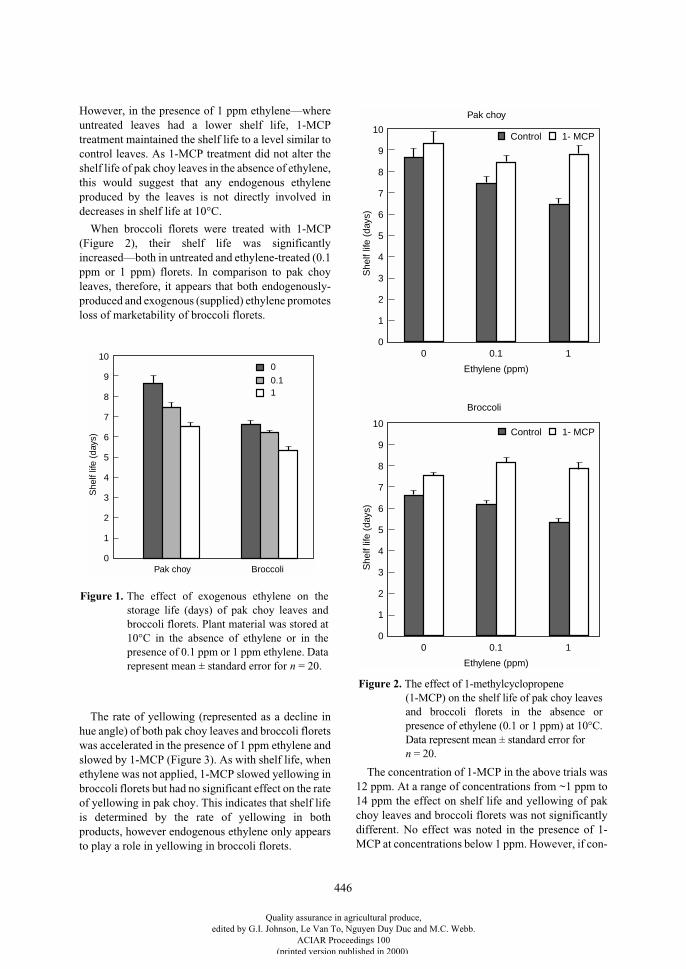
446
However, in the presence of 1 ppm ethylene—whereuntreated leaves had a lower shelf life, 1-MCPtreatment maintained the shelf life to a level similar tocontrol leaves. As 1-MCP treatment did not alter theshelf life of pak choy leaves in the absence of ethylene,this would suggest that any endogenous ethyleneproduced by the leaves is not directly involved indecreases in shelf life at 10°C.
When broccoli florets were treated with 1-MCP(Figure 2), their shelf life was significantlyincreased—both in untreated and ethylene-treated (0.1ppm or 1 ppm) florets. In comparison to pak choyleaves, therefore, it appears that both endogenously-produced and exogenous (supplied) ethylene promotesloss of marketability of broccoli florets.
The rate of yellowing (represented as a decline inhue angle) of both pak choy leaves and broccoli floretswas accelerated in the presence of 1 ppm ethylene andslowed by 1-MCP (Figure 3). As with shelf life, whenethylene was not applied, 1-MCP slowed yellowing inbroccoli florets but had no significant effect on the rateof yellowing in pak choy. This indicates that shelf lifeis determined by the rate of yellowing in bothproducts, however endogenous ethylene only appearsto play a role in yellowing in broccoli florets.
The concentration of 1-MCP in the above trials was12 ppm. At a range of concentrations from ~1 ppm to14 ppm the effect on shelf life and yellowing of pakchoy leaves and broccoli florets was not significantlydifferent. No effect was noted in the presence of 1-MCP at concentrations below 1 ppm. However, if con-
6
5
4
3
2
1
0
She
lf lif
e (d
ays)
7
8
9
10
Pak choy Broccoli
0
0.11
Figure 1. The effect of exogenous ethylene on thestorage life (days) of pak choy leaves andbroccoli florets. Plant material was stored at10°C in the absence of ethylene or in thepresence of 0.1 ppm or 1 ppm ethylene. Datarepresent mean ± standard error for n = 20.
6
5
4
3
2
1
0
She
lf lif
e (d
ays)
7
8
9
10
Ethylene (ppm)
Control 1- MCP
0 0.1 1
6
5
4
3
2
1
0
She
lf lif
e (d
ays)
7
8
9
10
Ethylene (ppm)
0 0.1 1
Broccoli
Pak choy
Control 1- MCP
Figure 2. The effect of 1-methylcyclopropene(1-MCP) on the shelf life of pak choy leavesand broccoli florets in the absence orpresence of ethylene (0.1 or 1 ppm) at 10°C.Data represent mean ± standard error for n = 20.
Quality assurance in agricultural produce,edited by G.I. Johnson, Le Van To, Nguyen Duy Duc and M.C. Webb.
ACIAR Proceedings 100(printed version published in 2000)
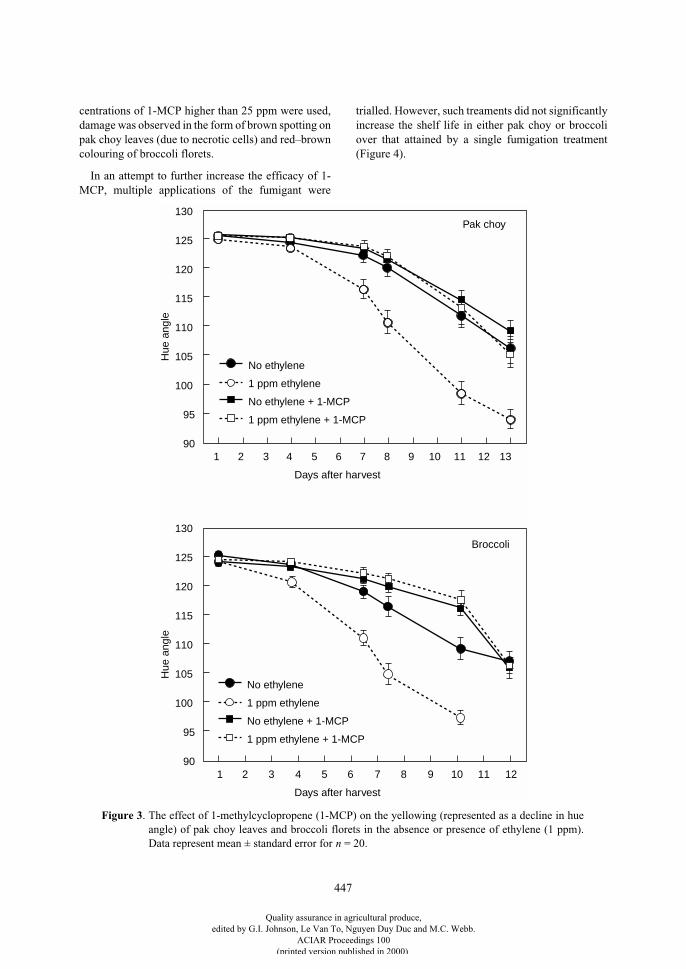
447
centrations of 1-MCP higher than 25 ppm were used,damage was observed in the form of brown spotting onpak choy leaves (due to necrotic cells) and red–browncolouring of broccoli florets.
In an attempt to further increase the efficacy of 1-MCP, multiple applications of the fumigant were
trialled. However, such treaments did not significantlyincrease the shelf life in either pak choy or broccoliover that attained by a single fumigation treatment(Figure 4).
90
95
100
105
110
115
Days after harvest
1 8 12 13
Hue
ang
le
4 11
120
125
130
2 3 5 6 7 9 10
90
95
100
105
110
115
Days after harvest
1 8 12
Hue
ang
le
4 11
120
125
130
2 3 5 6 7 9 10
No ethylene
1 ppm ethylene
No ethylene + 1-MCP
1 ppm ethylene + 1-MCP
Broccoli
Pak choy
No ethylene
1 ppm ethylene
No ethylene + 1-MCP
1 ppm ethylene + 1-MCP
Figure 3. The effect of 1-methylcyclopropene (1-MCP) on the yellowing (represented as a decline in hueangle) of pak choy leaves and broccoli florets in the absence or presence of ethylene (1 ppm).Data represent mean ± standard error for n = 20.
Quality assurance in agricultural produce,edited by G.I. Johnson, Le Van To, Nguyen Duy Duc and M.C. Webb.
ACIAR Proceedings 100(printed version published in 2000)
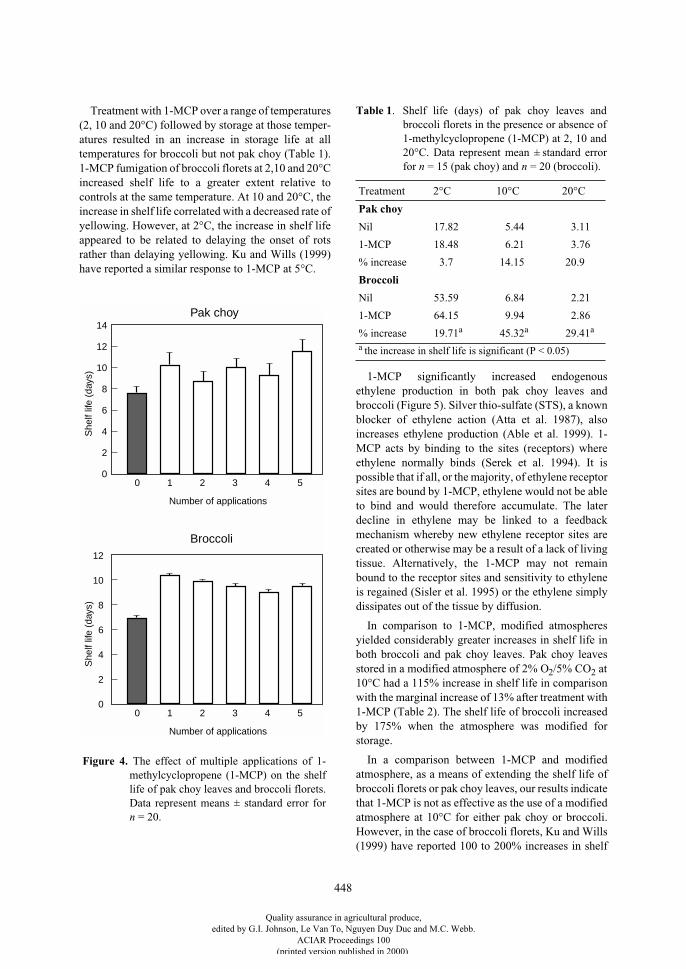
448
Treatment with 1-MCP over a range of temperatures(2, 10 and 20°C) followed by storage at those temper-atures resulted in an increase in storage life at alltemperatures for broccoli but not pak choy (Table 1).1-MCP fumigation of broccoli florets at 2,10 and 20°Cincreased shelf life to a greater extent relative tocontrols at the same temperature. At 10 and 20°C, theincrease in shelf life correlated with a decreased rate ofyellowing. However, at 2°C, the increase in shelf lifeappeared to be related to delaying the onset of rotsrather than delaying yellowing. Ku and Wills (1999)have reported a similar response to 1-MCP at 5°C.
1-MCP significantly increased endogenousethylene production in both pak choy leaves andbroccoli (Figure 5). Silver thio-sulfate (STS), a knownblocker of ethylene action (Atta et al. 1987), alsoincreases ethylene production (Able et al. 1999). 1-MCP acts by binding to the sites (receptors) whereethylene normally binds (Serek et al. 1994). It ispossible that if all, or the majority, of ethylene receptorsites are bound by 1-MCP, ethylene would not be ableto bind and would therefore accumulate. The laterdecline in ethylene may be linked to a feedbackmechanism whereby new ethylene receptor sites arecreated or otherwise may be a result of a lack of livingtissue. Alternatively, the 1-MCP may not remainbound to the receptor sites and sensitivity to ethyleneis regained (Sisler et al. 1995) or the ethylene simplydissipates out of the tissue by diffusion.
In comparison to 1-MCP, modified atmospheresyielded considerably greater increases in shelf life inboth broccoli and pak choy leaves. Pak choy leavesstored in a modified atmosphere of 2% O
2
/5% CO
2
at10°C had a 115% increase in shelf life in comparisonwith the marginal increase of 13% after treatment with1-MCP (Table 2). The shelf life of broccoli increasedby 175% when the atmosphere was modified forstorage.
In a comparison between 1-MCP and modifiedatmosphere, as a means of extending the shelf life ofbroccoli florets or pak choy leaves, our results indicatethat 1-MCP is not as effective as the use of a modifiedatmosphere at 10°C for either pak choy or broccoli.However, in the case of broccoli florets, Ku and Wills(1999) have reported 100 to 200% increases in shelf
12
10
8
6
4
2
0
She
lf lif
e (d
ays)
14
Number of applications
0 1 5
Broccoli
Pak choy
2 3 4
10
8
6
4
2
0
She
lf lif
e (d
ays)
12
Number of applications
0 1 52 3 4
Figure 4. The effect of multiple applications of 1-methylcyclopropene (1-MCP) on the shelflife of pak choy leaves and broccoli florets.Data represent means ± standard error forn = 20.
Table 1
. Shelf life (days) of pak choy leaves andbroccoli florets in the presence or absence of1-methylcyclopropene (1-MCP) at 2, 10 and20°C. Data represent mean ± standard errorfor
n
= 15 (pak choy) and
n
= 20 (broccoli).
Treatment 2°C 10°C 20°C
Pak choy
Nil 17.82 5.44 3.11
1-MCP 18.48 6.21 3.76
% increase 3.7 14.15 20.9
Broccoli
Nil 53.59 6.84 2.21
1-MCP 64.15 9.94 2.86
% increase 19.71
a
45.32
a
29.41
a
a
the increase in shelf life is significant (P < 0.05)
Quality assurance in agricultural produce,edited by G.I. Johnson, Le Van To, Nguyen Duy Duc and M.C. Webb.
ACIAR Proceedings 100(printed version published in 2000)
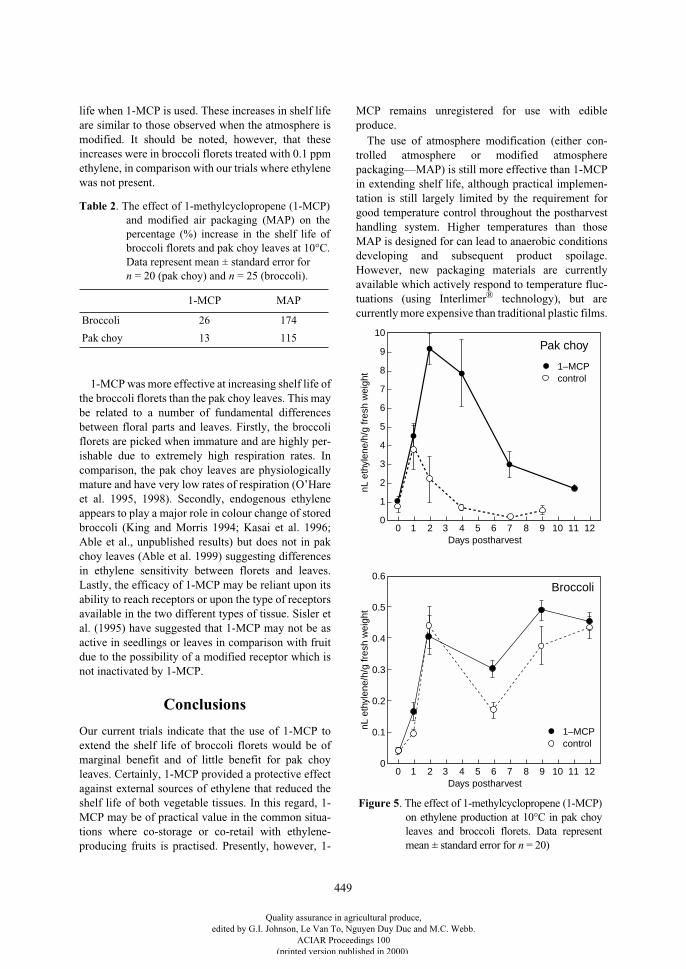
449
life when 1-MCP is used. These increases in shelf lifeare similar to those observed when the atmosphere ismodified. It should be noted, however, that theseincreases were in broccoli florets treated with 0.1 ppmethylene, in comparison with our trials where ethylenewas not present.
1-MCP was more effective at increasing shelf life ofthe broccoli florets than the pak choy leaves. This maybe related to a number of fundamental differencesbetween floral parts and leaves. Firstly, the broccoliflorets are picked when immature and are highly per-ishable due to extremely high respiration rates. Incomparison, the pak choy leaves are physiologicallymature and have very low rates of respiration (O’Hareet al. 1995, 1998). Secondly, endogenous ethyleneappears to play a major role in colour change of storedbroccoli (King and Morris 1994; Kasai et al. 1996;Able et al., unpublished results) but does not in pakchoy leaves (Able et al. 1999) suggesting differencesin ethylene sensitivity between florets and leaves.Lastly, the efficacy of 1-MCP may be reliant upon itsability to reach receptors or upon the type of receptorsavailable in the two different types of tissue. Sisler etal. (1995) have suggested that 1-MCP may not be asactive in seedlings or leaves in comparison with fruitdue to the possibility of a modified receptor which isnot inactivated by 1-MCP.
Conclusions
Our current trials indicate that the use of 1-MCP toextend the shelf life of broccoli florets would be ofmarginal benefit and of little benefit for pak choyleaves. Certainly, 1-MCP provided a protective effectagainst external sources of ethylene that reduced theshelf life of both vegetable tissues. In this regard, 1-MCP may be of practical value in the common situa-tions where co-storage or co-retail with ethylene-producing fruits is practised. Presently, however, 1-
MCP remains unregistered for use with edibleproduce.
The use of atmosphere modification (either con-trolled atmosphere or modified atmospherepackaging—MAP) is still more effective than 1-MCPin extending shelf life, although practical implemen-tation is still largely limited by the requirement forgood temperature control throughout the postharvesthandling system. Higher temperatures than thoseMAP is designed for can lead to anaerobic conditionsdeveloping and subsequent product spoilage.However, new packaging materials are currentlyavailable which actively respond to temperature fluc-tuations (using Interlimer
®
technology), but arecurrently more expensive than traditional plastic films.
Table 2
. The effect of 1-methylcyclopropene (1-MCP)and modified air packaging (MAP) on thepercentage (%) increase in the shelf life ofbroccoli florets and pak choy leaves at 10°C.Data represent mean ± standard error for
n
= 20 (pak choy) and
n
= 25 (broccoli).
1-MCP MAP
Broccoli 26 174
Pak choy 13 115
0
1
2
3
4
5
Days postharvest 0 7 11 123 10
6
7
8
1 2 4 5 6 8 9
1–MCPcontrol
Broccoli
Pak choy9
10
0
0.1
0.2
0.3
0.4
Days postharvest 0 7 11 12
nL e
thyl
ene/
h/g
fres
h w
eigh
tnL
eth
ylen
e/h/
g fr
esh
wei
ght
3 101 2 4 5 6 8 9
0.5
0.6
1–MCPcontrol
Figure 5. The effect of 1-methylcyclopropene (1-MCP)on ethylene production at 10°C in pak choyleaves and broccoli florets. Data representmean ± standard error for n = 20)
Quality assurance in agricultural produce,edited by G.I. Johnson, Le Van To, Nguyen Duy Duc and M.C. Webb.
ACIAR Proceedings 100(printed version published in 2000)
450
Acknowledgments
The authors wish to acknowledge help from AndrewMacnish with 1-MCP preparation and Mary ValleyPlantation, Australia, for supplying pak choy seed.The research presented is supported by the AustralianCentre for International Agricultural Research(ACIAR) Project 9416 and the Rural IndustriesResearch and Development Corporation (RIRDC)project DAQ213A/DAQ239A.
References
Able, A.J, Wong, L.S., Prasad, A. and O’Hare, T.J. 1999.Postharvest physiology of pak choy (
Brassica rapa
var.
chinensis
). Proceedings of the Australasian PostharvestHorticulture Conference, Waitangi, New Zealand, 3–7October 1999, 33.
Aharoni, N., Philosoph-Hadas, S. and Barkai-Golan, R.1985. Modified atmospheres to delay senescence anddecay of broccoli. In: Blankenship, S.M., ed., Controlledatmospheres for storage and transport of perishableagricultural commodities. NCSU Department ofHorticultural Science, 169–177.
Atta, A.M.A., Saltveit, M.E. Jr and Hobson, G.E. 1987.Effect of silver ions on ethylene biosynthesis by tomatofruit tissue. Plant Physiology, 83, 44–48.
Bradford, M.M. 1976. Quantitation of microgram quantitiesof protein utilizing the principle of protein-dye binding.Analytical Biochemistry, 72, 248–254.
Hirata, K., Chachin, K. and Iwata, T. 1987. Quality changesof some vegetables used in tropical and subtropical areasduring storage at various temperatures. Journal of theJapanese Society of Food Science and Technology, 34,566–573.
Isenberg, F.M.R. 1979. Controlled atmosphere storage ofvegetables. Horticultural Reviews, 1, 337.
Kasai, Y., Kato, M. and Hyodo, H. 1996. Ethylenebiosynthesis and its involvement in senescence ofbroccoli florets. Journal of the Japanese Society ofHorticultural Science, 65, 185–191.
King, G.A. and Morris, S.C. 1994. Physiological changesduring early postharvest senescence and through thepreharvest–postharvest continuum. Journal of theAmerican Society of Horticultural Science, 119, 270–275.
Ku, V.V.V. and Wills, R.B.H. 1999. Effect of 1-methylcy-clopropene on the storage life of broccoli. PostharvestBiology and Technology, 17, 127–132.
O’Hare, T.J., Smith, L.G., Wong, L.S. and Meiburg, G.F.1995. Low-oxygen storage of whole and minimally-processed pak choy. Proceedings of the AustralasianPostharvest Conference, Waitangi, New Zealand, 3–7October 1999, 459–462.
O’Hare, T.J., Wong, L.S. and Prasad, A. 1998. Extendingthe shelf-life of leafy Asian vegetables—a report for theRural Industries Research and Development Corporation.Final Report DAQ213A.
Pendergrass, A., Isenberg, F.M.R., Howell, L.L. andCarroll, J.E. 1976. Ethylene-induced changes inappearance and hormone content of Florida growncabbage. Canadian Journal of Plant Science, 56, 319.
Pogson, B.J. and Morris, S.C. 1997. Consequences of coolstorage of broccoli on physiological and biochemicalchanges and subsequent senescence at 20°C. Journal ofthe American Society of Horticultural Science, 122, 553–558.
Porat, R., Shlomo, E., Serek, M., Sisler, C.L. and Borochov,A. 1995. 1-methylcyclopropene inhibits ethylene actionin cut phlox flowers. Postharvest Biology andTechnology, 6, 313–319.
Pratt, H.K. and Goeschl, J.D. 1969. Physiological roles ofethylene in plants. Annual Review of Plant Physiology,20, 541.
Serek, M., Sisler, E.C. and Reid, M.S. 1994. Novel gaseousethylene binding inhibitor prevents ethylene effects inpotted flowering plants. Journal of the American Societyof Horticultural Science, 119, 1230–1233.
Serek, M., Sisler, E.C., Torsh, T. and Mayak, S. 1995a. 1-Methylcyclopropene prevents bud, flower and leafabscission of Geraldton waxflower. HortScience, 30,1310–1311.
Serek, M., Tamari, G., Sisler, E.C. and Borochov, A. 1995b.Inhibition of ethylene-induced cellular senescencesymptoms by 1-methylcyclopropene, a new inhibitor ofethylene action. Physiologia Plantarum, 94, 229–232.
Sisler, E.C., Serek, M. and Dupille, E. 1995. Comparison ofcyclopropene, 1-methylcyclopropene and 3,3-dimethyl-cyclopropene as ethylene antagonists in plants. PlantGrowth Regulation, 17, 1–6.
Wang, C.Y. 1979. Effect of short-term carbon dioxidetreatment on the market quality of stored broccoli. Journalof Food Science, 44, 1478–1482.
Wang, H. and Herner, R.C. 1989. Effect of CA storage onthe ultrastructure of chloroplasts and chlorophyll contentof Chinese mustard. Proceedings of the 5
th
InternationalControlled Atmosphere Research Conference, 2, 9–17.
Quality assurance in agricultural produce,edited by G.I. Johnson, Le Van To, Nguyen Duy Duc and M.C. Webb.
ACIAR Proceedings 100(printed version published in 2000)
451
Assessment of Postharvest Handling Systems of Vegetable Crops in the Beijing Area
Shufang Zheng, Li Wu, Lipu Gao and Ping Wu*
Abstract
The postharvest handling systems of four crops (cabbage, Chinese cabbage, broccoli and Oriental bunchingonion) in the Beijing area were assessed. Data were collected on: the time of harvest; types, timing andavailability of transport; grading; pre-cooling; packaging; and storage of produce. The main factors responsiblefor postharvest losses were a lack of proper packaging, no pre-cooling, no proper transportation and lack ofgood storage techniques. It was estimated that postharvest losses of Chinese cabbage and Oriental bunchingonions after storage were 20% and 50%, respectively.
W
ITH
the improvement of life in China, vegetable pro-duction has increased enormously in its volume andvarieties. Correct postharvest handling techniques areessential to prevent damage to produce. However, theuse of correct postharvest techniques may be limitedby market price, cost and grower skills. Fifteen yearsago, there were almost no postharvest handling tech-niques such as grading, washing, packaging and pre-cooling. Vegetables were often packed in willow orbamboo baskets from field to market. Sometimesproduce was delivered directly to the market in nocontainer at all. The vegetable weight loss and qualityloss was therefore very high, generally 30–50%.Although some postharvest handling methods havebeen introduced into vegetable production systems,these are difficult to apply in a general manner as thehandling system employed is dependent both upon thecrop, season and market. In China at the present time,potential profit decides what kind of handling methodsare to be used. In order to obtain information about thehandling systems of vegetable crops with an aim toimprove grower skills, we conducted an assessment ofsystems in the Beijing area, using cabbage, Chinesecabbage, Oriental bunching onion and broccoli asassessment crops.
Assessment Methodology
The assessment was made following the stepsdisplayed in Figure 1. Distribution of vegetable crops,technique application, postharvest losses, environ-mental conditions, quality, tools and materials wererecorded.
Results
Distribution of vegetables after harvest
Three kinds of farm contribute to vegetable pro-duction in the Beijing area: individual farmers,corporate farms and company farms (see Figure 2).Production by individual farmers amounts to 90%,corporate farms 7%, and company farms 3%. Vege-tables produced by individual farmers are delivered towholesale markets through crop-collectors who buyvegetables from the farmer and then transport them tothe wholesale market in Beijing city. For the cropsunder study, 60% of vegetables were produced in theBeijing area when ‘in season’, and almost 80%supplied by southern China when out of season.
Harvest
Chinese cabbage, broccoli and Oriental bunchingonion were all harvested by hand, knife or spade.
* Beijing Vegetable Research Center, PO Box 2443, Beijing 100089, China.
Quality assurance in agricultural produce,edited by G.I. Johnson, Le Van To, Nguyen Duy Duc and M.C. Webb.
ACIAR Proceedings 100(printed version published in 2000)
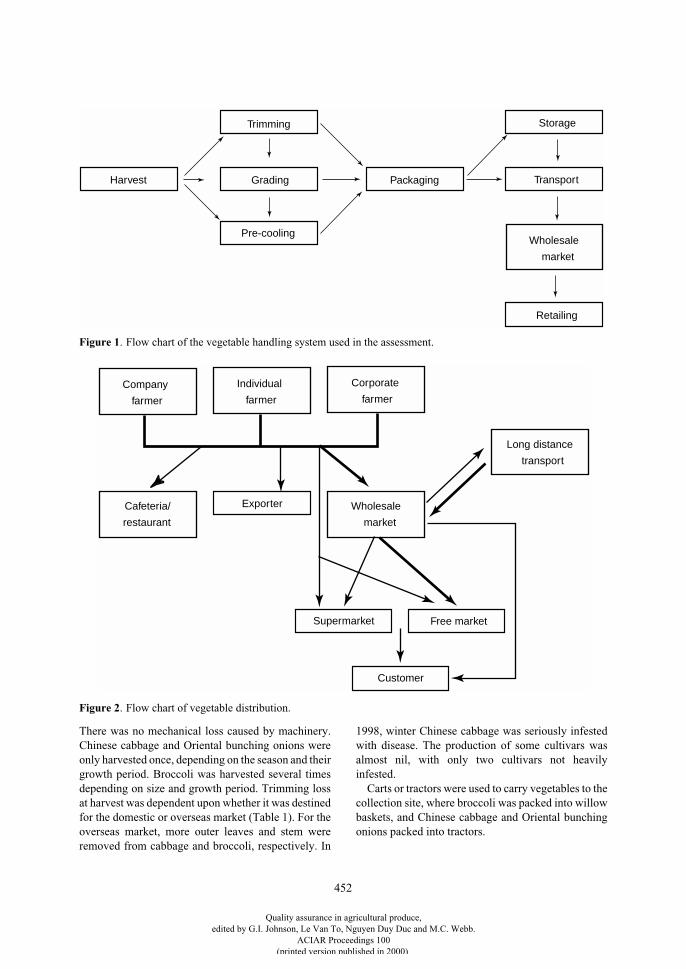
452
There was no mechanical loss caused by machinery.Chinese cabbage and Oriental bunching onions wereonly harvested once, depending on the season and theirgrowth period. Broccoli was harvested several timesdepending on size and growth period. Trimming lossat harvest was dependent upon whether it was destinedfor the domestic or overseas market (Table 1). For theoverseas market, more outer leaves and stem wereremoved from cabbage and broccoli, respectively. In
1998, winter Chinese cabbage was seriously infestedwith disease. The production of some cultivars wasalmost nil, with only two cultivars not heavilyinfested.
Carts or tractors were used to carry vegetables to thecollection site, where broccoli was packed into willowbaskets, and Chinese cabbage and Oriental bunchingonions packed into tractors.
Grading
Pre-cooling
Trimming
Harvest Packaging Transport
Storage
Wholesale
market
Retailing
Exporter
Supermarket Free market
Cafeteria/
restaurant
Wholesale
market
Long distance
transport
Customer
Company
farmer
Individual
farmer
Corporate
farmer
Figure 1. Flow chart of the vegetable handling system used in the assessment.
Figure 2. Flow chart of vegetable distribution.
Quality assurance in agricultural produce,edited by G.I. Johnson, Le Van To, Nguyen Duy Duc and M.C. Webb.
ACIAR Proceedings 100(printed version published in 2000)
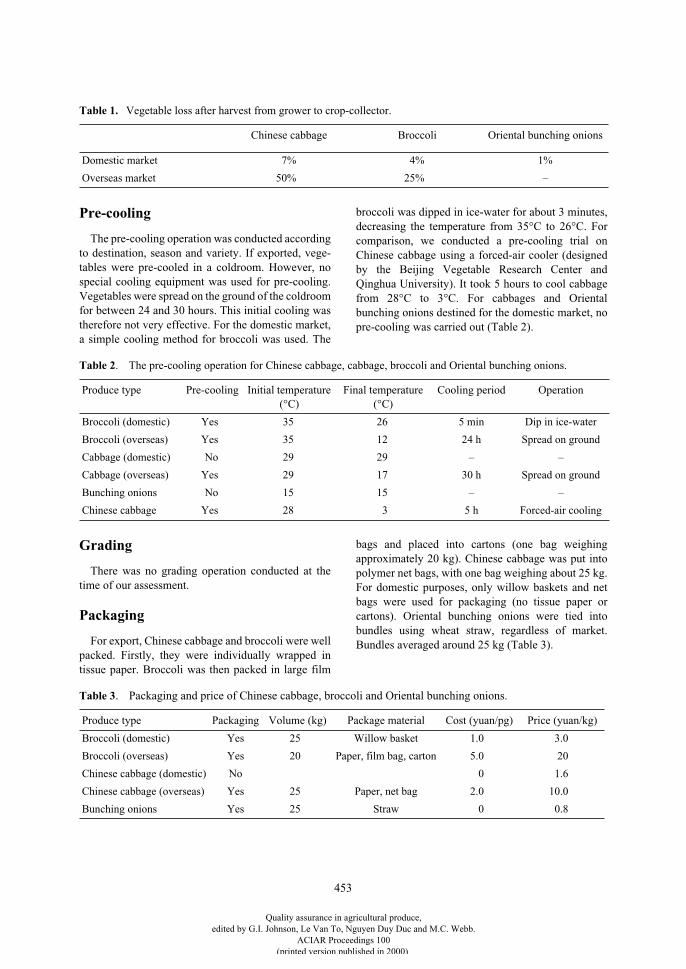
453
Pre-cooling
The pre-cooling operation was conducted accordingto destination, season and variety. If exported, vege-tables were pre-cooled in a coldroom. However, nospecial cooling equipment was used for pre-cooling.Vegetables were spread on the ground of the coldroomfor between 24 and 30 hours. This initial cooling wastherefore not very effective. For the domestic market,a simple cooling method for broccoli was used. The
broccoli was dipped in ice-water for about 3 minutes,decreasing the temperature from 35°C to 26°C. Forcomparison, we conducted a pre-cooling trial onChinese cabbage using a forced-air cooler (designedby the Beijing Vegetable Research Center andQinghua University). It took 5 hours to cool cabbagefrom 28°C to 3°C. For cabbages and Orientalbunching onions destined for the domestic market, nopre-cooling was carried out (Table 2).
Grading
There was no grading operation conducted at thetime of our assessment.
Packaging
For export, Chinese cabbage and broccoli were wellpacked. Firstly, they were individually wrapped intissue paper. Broccoli was then packed in large film
bags and placed into cartons (one bag weighingapproximately 20 kg). Chinese cabbage was put intopolymer net bags, with one bag weighing about 25 kg.For domestic purposes, only willow baskets and netbags were used for packaging (no tissue paper orcartons). Oriental bunching onions were tied intobundles using wheat straw, regardless of market.Bundles averaged around 25 kg (Table 3).
Table 1.
Vegetable loss after harvest from grower to crop-collector.
Chinese cabbage Broccoli Oriental bunching onions
Domestic market 7% 4% 1%
Overseas market 50% 25% –
Table 2
. The pre-cooling operation for Chinese cabbage, cabbage, broccoli and Oriental bunching onions.
Produce type Pre-cooling Initial temperature (°C)
Final temperature (°C)
Cooling period Operation
Broccoli (domestic) Yes 35 26 5 min Dip in ice-water
Broccoli (overseas) Yes 35 12 24 h Spread on ground
Cabbage (domestic) No 29 29 – –
Cabbage (overseas) Yes 29 17 30 h Spread on ground
Bunching onions No 15 15 – –
Chinese cabbage Yes 28 3 5 h Forced-air cooling
Table 3
. Packaging and price of Chinese cabbage, broccoli and Oriental bunching onions.
Produce type Packaging Volume (kg) Package material Cost (yuan/pg) Price (yuan/kg)
Broccoli (domestic) Yes 25 Willow basket 1.0 3.0
Broccoli (overseas) Yes 20 Paper, film bag, carton 5.0 20
Chinese cabbage (domestic) No 0 1.6
Chinese cabbage (overseas) Yes 25 Paper, net bag 2.0 10.0
Bunching onions Yes 25 Straw 0 0.8
Quality assurance in agricultural produce,edited by G.I. Johnson, Le Van To, Nguyen Duy Duc and M.C. Webb.
ACIAR Proceedings 100(printed version published in 2000)
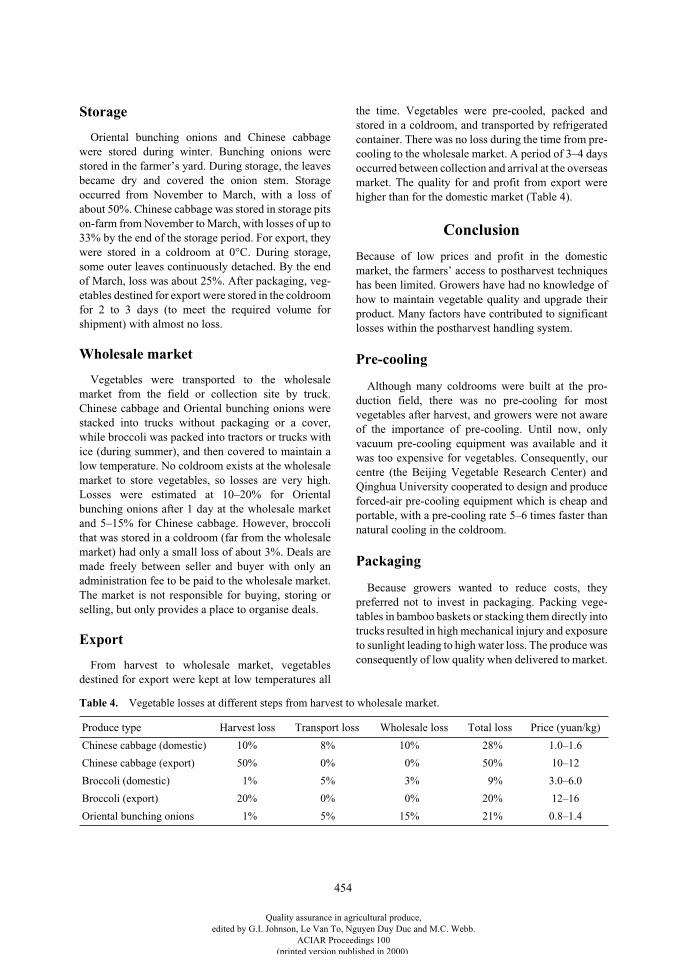
454
Storage
Oriental bunching onions and Chinese cabbagewere stored during winter. Bunching onions werestored in the farmer’s yard. During storage, the leavesbecame dry and covered the onion stem. Storageoccurred from November to March, with a loss ofabout 50%. Chinese cabbage was stored in storage pitson-farm from November to March, with losses of up to33% by the end of the storage period. For export, theywere stored in a coldroom at 0°C. During storage,some outer leaves continuously detached. By the endof March, loss was about 25%. After packaging, veg-etables destined for export were stored in the coldroomfor 2 to 3 days (to meet the required volume forshipment) with almost no loss.
Wholesale market
Vegetables were transported to the wholesalemarket from the field or collection site by truck.Chinese cabbage and Oriental bunching onions werestacked into trucks without packaging or a cover,while broccoli was packed into tractors or trucks withice (during summer), and then covered to maintain alow temperature. No coldroom exists at the wholesalemarket to store vegetables, so losses are very high.Losses were estimated at 10–20% for Orientalbunching onions after 1 day at the wholesale marketand 5–15% for Chinese cabbage. However, broccolithat was stored in a coldroom (far from the wholesalemarket) had only a small loss of about 3%. Deals aremade freely between seller and buyer with only anadministration fee to be paid to the wholesale market.The market is not responsible for buying, storing orselling, but only provides a place to organise deals.
Export
From harvest to wholesale market, vegetablesdestined for export were kept at low temperatures all
the time. Vegetables were pre-cooled, packed andstored in a coldroom, and transported by refrigeratedcontainer. There was no loss during the time from pre-cooling to the wholesale market. A period of 3–4 daysoccurred between collection and arrival at the overseasmarket. The quality for and profit from export werehigher than for the domestic market (Table 4).
Conclusion
Because of low prices and profit in the domesticmarket, the farmers’ access to postharvest techniqueshas been limited. Growers have had no knowledge ofhow to maintain vegetable quality and upgrade theirproduct. Many factors have contributed to significantlosses within the postharvest handling system.
Pre-cooling
Although many coldrooms were built at the pro-duction field, there was no pre-cooling for mostvegetables after harvest, and growers were not awareof the importance of pre-cooling. Until now, onlyvacuum pre-cooling equipment was available and itwas too expensive for vegetables. Consequently, ourcentre (the Beijing Vegetable Research Center) andQinghua University cooperated to design and produceforced-air pre-cooling equipment which is cheap andportable, with a pre-cooling rate 5–6 times faster thannatural cooling in the coldroom.
Packaging
Because growers wanted to reduce costs, theypreferred not to invest in packaging. Packing vege-tables in bamboo baskets or stacking them directly intotrucks resulted in high mechanical injury and exposureto sunlight leading to high water loss. The produce wasconsequently of low quality when delivered to market.
Table 4.
Vegetable losses at different steps from harvest to wholesale market.
Produce type Harvest loss Transport loss Wholesale loss Total loss Price (yuan/kg)
Chinese cabbage (domestic) 10% 8% 10% 28% 1.0–1.6
Chinese cabbage (export) 50% 0% 0% 50% 10–12
Broccoli (domestic) 1% 5% 3% 9% 3.0–6.0
Broccoli (export) 20% 0% 0% 20% 12–16
Oriental bunching onions 1% 5% 15% 21% 0.8–1.4
Quality assurance in agricultural produce,edited by G.I. Johnson, Le Van To, Nguyen Duy Duc and M.C. Webb.
ACIAR Proceedings 100(printed version published in 2000)
455
Transport
In summer, when produce was directly exposed tohigh temperatures and sunlight without covering andcooling, water loss was high for Chinese cabbage andbroccoli. Refrigerated container trucks were not usedunless the vegetables were destined for export.
Wholesale market
Wholesale markets could not provide coldrooms forsellers, and vegetables could remain there for up to 3days. During this time, produce remained packed inthe truck in a condensed manner, with respiration andtemperature in the produce stack being very high.
In summary, growers must learn techniques necessaryfor pre-cooling, packaging and transport of vegetableproduce if vegetable quality is to be improved.
Acknowledgments
This work is part of the Australian Centre for Interna-tional Agricultural Research project 9416 ‘Extensionof shelf-life of Asian leafy vegetables’. The authorswould like to extend their thanks to Dr Tim O’Hare,Mr John Bagshaw and Mr Lung Wong from theQueensland Department of Primary Industries (QDPI)who gave much advice and help during this research.
Quality assurance in agricultural produce,edited by G.I. Johnson, Le Van To, Nguyen Duy Duc and M.C. Webb.
ACIAR Proceedings 100(printed version published in 2000)
456
Postharvest Handling of ‘Asian’ Vegetables in the Northern Territory
M.J. Gosbee* and T.K. Lim†
Abstract
In the Northern Territory (NT) of Australia a significant proportion of vegetable production is based on ‘Asian’type vegetables. These are mainly grown in the dry season (April–October) and are sold locally and interstate.Interstate markets are 4,000 km away from the place of production. Most vegetables are transported south byrefrigerated road freight, which takes up to 4 days. This has necessitated careful handling and cooling of thevegetables to ensure they reach the market in an acceptable condition.
The most popular vegetables grown in the NT are bitter melon (
Momordica charantia
), snake bean (
Vignaunguiculata
cv. Group Sesquipedalis), okra (
Abelmoschus esculentus
), angled luffa or sinqua (
Luffaacutangula
), long, hairy and winter melon (all types of
Benincasa hispida
), kang kong (
Ipomoea aquatica
), andbasil (
Ocimum basilicum
). These vegetables have different postharvest storage requirements. Storage experiments testing the shelf life of some of these vegetables have been carried out over several
years. Boxes of vegetables stored in several types of packaging at 5, 10, 15, and 20°C were evaluated for overallquality, chilling injury, water loss, and decay. Bitter melon and sinqua were best stored at 5°C in paperwrapping or a perforated plastic bag. Okra and snake bean developed chilling injury at 5°C, and were beststored at 10°C in plastic bags. Kang kong maintained its quality for longest when stored at 5°C. Generally,vegetables need to be cooled to less than 12°C before packaging. A more difficult issue has been educating thegrowers to thoroughly cool produce before packing to ensure the vegetables remain cool during transport.
T
EMPERATURE
control is the single most importantfactor in maintaining the shelf life and quality of veg-etables after harvest (Kader 1992). In the NorthernTerritory (NT) of Australia, ambient daytime temper-atures during the main vegetable production season(May to October) are hot and dry: temperature 19.3–33.1°C and relative humidity 38–78% (Bureau ofMeteorology 1999). Vegetables of both ‘European’and ‘Asian’ origin are grown in the NT. The ‘Asian’vegetables are mainly tropical cucurbits, along withothers requiring similar tropical climates. Interstatemarkets for these commodities are 4,000 km away.Produce is generally transported by refrigerated roadfreight which takes up to 4 days. Information on themedium-term storage of these vegetables is limited.
This paper describes several storage experimentsconducted to determine the optimum temperature fortransporting these vegetables, and some of theproblems encountered with their postharvest handling.
Materials and Methods
Five types of Asian vegetables were chosen for thisstudy. Bitter melon (
Momordica charantia
) and snakebeans (
Vigna unguiculata
cv. Group Sesquipedalis)are the most commonly grown vegetables (H. Ngo, NTDepartment of Primary Industry and Fisheries Econ-omist, 1999, pers. comm.) and frequently have deteri-oration problems. Okra (
Abelmoschus esculentus
) alsotends to have similar problems, presumably because ofits high respiration rate (Kader 1992). Sinqua, orangled luffa, (
Luffa acutangula
) was chosen to be rep-resentative of several types of melon which are con-sidered by growers to be less sensitive to temperature.Kang kong (
Ipomoea aquatica
) was chosen as a repre-sentative of common leafy vegetables.
* Northern Territory Department of Primary Industry and Fisheries, GPO Box 990, Darwin NT 0801 Australia.
† Plant Quarantine Policy Branch, Australian Quarantine and Inspection Service, GPO Box 858, Canberra ACT Australia
Quality assurance in agricultural produce,edited by G.I. Johnson, Le Van To, Nguyen Duy Duc and M.C. Webb.
ACIAR Proceedings 100(printed version published in 2000)
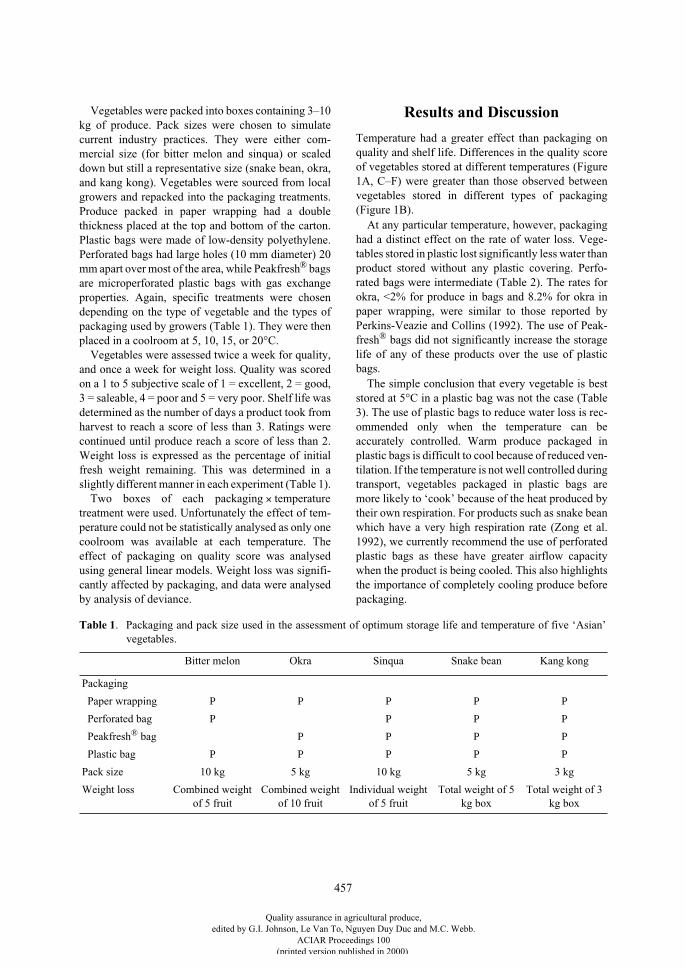
457
Vegetables were packed into boxes containing 3–10kg of produce. Pack sizes were chosen to simulatecurrent industry practices. They were either com-mercial size (for bitter melon and sinqua) or scaleddown but still a representative size (snake bean, okra,and kang kong). Vegetables were sourced from localgrowers and repacked into the packaging treatments.Produce packed in paper wrapping had a doublethickness placed at the top and bottom of the carton.Plastic bags were made of low-density polyethylene.Perforated bags had large holes (10 mm diameter) 20mm apart over most of the area, while Peakfresh
®
bagsare microperforated plastic bags with gas exchangeproperties. Again, specific treatments were chosendepending on the type of vegetable and the types ofpackaging used by growers (Table 1). They were thenplaced in a coolroom at 5, 10, 15, or 20°C.
Vegetables were assessed twice a week for quality,and once a week for weight loss. Quality was scoredon a 1 to 5 subjective scale of 1 = excellent, 2 = good,3 = saleable, 4 = poor and 5 = very poor. Shelf life wasdetermined as the number of days a product took fromharvest to reach a score of less than 3. Ratings werecontinued until produce reach a score of less than 2.Weight loss is expressed as the percentage of initialfresh weight remaining. This was determined in aslightly different manner in each experiment (Table 1).
Two boxes of each packaging
×
temperaturetreatment were used. Unfortunately the effect of tem-perature could not be statistically analysed as only onecoolroom was available at each temperature. Theeffect of packaging on quality score was analysedusing general linear models. Weight loss was signifi-cantly affected by packaging, and data were analysedby analysis of deviance.
Results and Discussion
Temperature had a greater effect than packaging onquality and shelf life. Differences in the quality scoreof vegetables stored at different temperatures (Figure1A, C–F) were greater than those observed betweenvegetables stored in different types of packaging(Figure 1B).
At any particular temperature, however, packaginghad a distinct effect on the rate of water loss. Vege-tables stored in plastic lost significantly less water thanproduct stored without any plastic covering. Perfo-rated bags were intermediate (Table 2). The rates forokra, <2% for produce in bags and 8.2% for okra inpaper wrapping, were similar to those reported byPerkins-Veazie and Collins (1992). The use of Peak-fresh
®
bags did not significantly increase the storagelife of any of these products over the use of plasticbags.
The simple conclusion that every vegetable is beststored at 5°C in a plastic bag was not the case (Table3). The use of plastic bags to reduce water loss is rec-ommended only when the temperature can beaccurately controlled. Warm produce packaged inplastic bags is difficult to cool because of reduced ven-tilation. If the temperature is not well controlled duringtransport, vegetables packaged in plastic bags aremore likely to ‘cook’ because of the heat produced bytheir own respiration. For products such as snake beanwhich have a very high respiration rate (Zong et al.1992), we currently recommend the use of perforatedplastic bags as these have greater airflow capacitywhen the product is being cooled. This also highlightsthe importance of completely cooling produce beforepackaging.
Table 1
. Packaging and pack size used in the assessment of optimum storage life and temperature of five ‘Asian’vegetables.
Bitter melon Okra Sinqua Snake bean Kang kong
Packaging
Paper wrapping
P P P P P
Perforated bag
P P P P
Peakfresh
®
bag
P P P P
Plastic bag
P P P P P
Pack size 10 kg 5 kg 10 kg 5 kg 3 kg
Weight loss Combined weight of 5 fruit
Combined weight of 10 fruit
Individual weight of 5 fruit
Total weight of 5 kg box
Total weight of 3 kg box
Quality assurance in agricultural produce,edited by G.I. Johnson, Le Van To, Nguyen Duy Duc and M.C. Webb.
ACIAR Proceedings 100(printed version published in 2000)
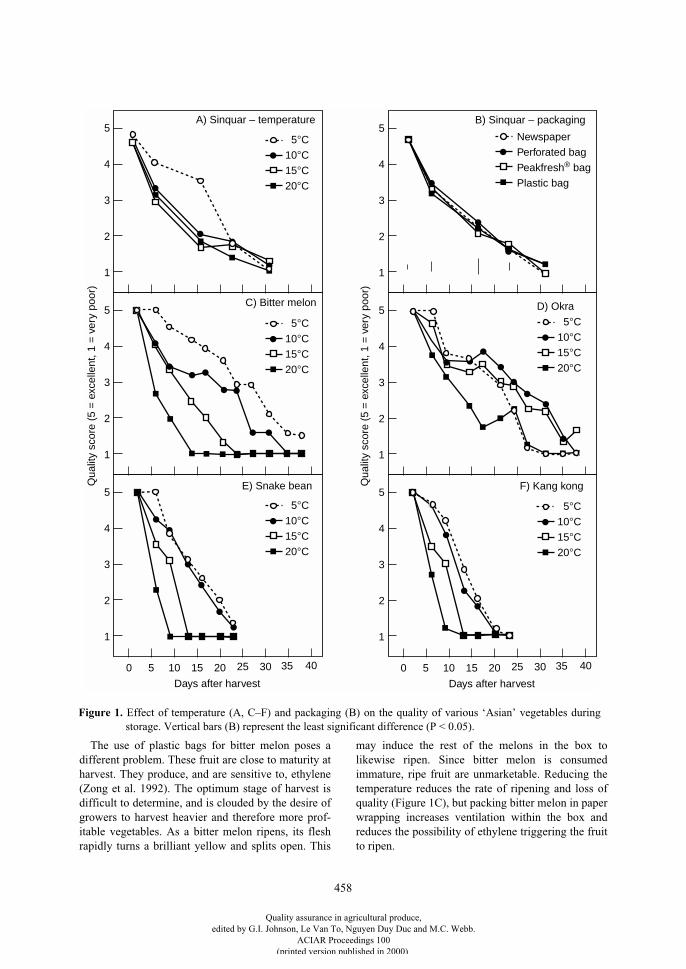
458
The use of plastic bags for bitter melon poses adifferent problem. These fruit are close to maturity atharvest. They produce, and are sensitive to, ethylene(Zong et al. 1992). The optimum stage of harvest isdifficult to determine, and is clouded by the desire ofgrowers to harvest heavier and therefore more prof-itable vegetables. As a bitter melon ripens, its fleshrapidly turns a brilliant yellow and splits open. This
may induce the rest of the melons in the box tolikewise ripen. Since bitter melon is consumedimmature, ripe fruit are unmarketable. Reducing thetemperature reduces the rate of ripening and loss ofquality (Figure 1C), but packing bitter melon in paperwrapping increases ventilation within the box andreduces the possibility of ethylene triggering the fruitto ripen.
0 5 10 15 20 25
Qua
lity
scor
e (5
= e
xcel
lent
, 1 =
ver
y po
or)
30 35 40
1
2
3
4
5
1
2
3
4
5
1
2
3
4
5
Days after harvest
E) Snake bean
C) Bitter melon
A) Sinquar – temperature
0 5 10 15 20 25
Qua
lity
scor
e (5
= e
xcel
lent
, 1 =
ver
y po
or)
30 35 40
1
2
3
4
5
1
2
3
4
5
1
2
3
4
5
Days after harvest
F) Kang kong
D) Okra
B) Sinquar – packaging
Plastic bag
Peakfresh® bag
Newspaper
Perforated bag
20°C
15°C
5°C
10°C
20°C
15°C
5°C
10°C
20°C
15°C
5°C
10°C
20°C
15°C
5°C
10°C
20°C
15°C
5°C
10°C
Figure 1. Effect of temperature (A, C–F) and packaging (B) on the quality of various ‘Asian’ vegetables duringstorage. Vertical bars (B) represent the least significant difference (P < 0.05).
Quality assurance in agricultural produce,edited by G.I. Johnson, Le Van To, Nguyen Duy Duc and M.C. Webb.
ACIAR Proceedings 100(printed version published in 2000)
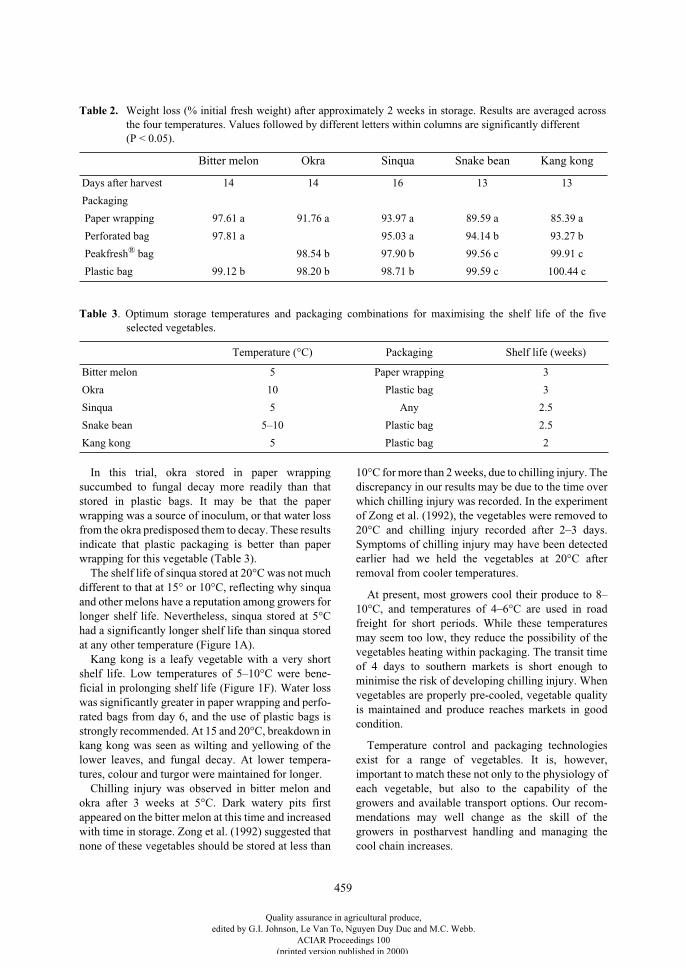
459
In this trial, okra stored in paper wrappingsuccumbed to fungal decay more readily than thatstored in plastic bags. It may be that the paperwrapping was a source of inoculum, or that water lossfrom the okra predisposed them to decay. These resultsindicate that plastic packaging is better than paperwrapping for this vegetable (Table 3).
The shelf life of sinqua stored at 20°C was not muchdifferent to that at 15° or 10°C, reflecting why sinquaand other melons have a reputation among growers forlonger shelf life. Nevertheless, sinqua stored at 5°Chad a significantly longer shelf life than sinqua storedat any other temperature (Figure 1A).
Kang kong is a leafy vegetable with a very shortshelf life. Low temperatures of 5–10°C were bene-ficial in prolonging shelf life (Figure 1F). Water losswas significantly greater in paper wrapping and perfo-rated bags from day 6, and the use of plastic bags isstrongly recommended. At 15 and 20°C, breakdown inkang kong was seen as wilting and yellowing of thelower leaves, and fungal decay. At lower tempera-tures, colour and turgor were maintained for longer.
Chilling injury was observed in bitter melon andokra after 3 weeks at 5°C. Dark watery pits firstappeared on the bitter melon at this time and increasedwith time in storage. Zong et al. (1992) suggested thatnone of these vegetables should be stored at less than
10°C for more than 2 weeks, due to chilling injury. Thediscrepancy in our results may be due to the time overwhich chilling injury was recorded. In the experimentof Zong et al. (1992), the vegetables were removed to20°C and chilling injury recorded after 2–3 days.Symptoms of chilling injury may have been detectedearlier had we held the vegetables at 20°C afterremoval from cooler temperatures.
At present, most growers cool their produce to 8–10°C, and temperatures of 4–6°C are used in roadfreight for short periods. While these temperaturesmay seem too low, they reduce the possibility of thevegetables heating within packaging. The transit timeof 4 days to southern markets is short enough tominimise the risk of developing chilling injury. Whenvegetables are properly pre-cooled, vegetable qualityis maintained and produce reaches markets in goodcondition.
Temperature control and packaging technologiesexist for a range of vegetables. It is, however,important to match these not only to the physiology ofeach vegetable, but also to the capability of thegrowers and available transport options. Our recom-mendations may well change as the skill of thegrowers in postharvest handling and managing thecool chain increases.
Table 2.
Weight loss (% initial fresh weight) after approximately 2 weeks in storage. Results are averaged acrossthe four temperatures. Values followed by different letters within columns are significantly different (P < 0.05).
Bitter melon Okra Sinqua Snake bean Kang kong
Days after harvest 14 14 16 13 13
Packaging
Paper wrapping 97.61 a 91.76 a 93.97 a 89.59 a 85.39 a
Perforated bag 97.81 a 95.03 a 94.14 b 93.27 b
Peakfresh
®
bag 98.54 b 97.90 b 99.56 c 99.91 c
Plastic bag 99.12 b 98.20 b 98.71 b 99.59 c 100.44 c
Table 3
. Optimum storage temperatures and packaging combinations for maximising the shelf life of the fiveselected vegetables.
Temperature (°C) Packaging Shelf life (weeks)
Bitter melon 5 Paper wrapping 3
Okra 10 Plastic bag 3
Sinqua 5 Any 2.5
Snake bean 5–10 Plastic bag 2.5
Kang kong 5 Plastic bag 2
Quality assurance in agricultural produce,edited by G.I. Johnson, Le Van To, Nguyen Duy Duc and M.C. Webb.
ACIAR Proceedings 100(printed version published in 2000)
460
Acknowledgments
Thank you to Susan Marte who helped with theexperiments and preparation of this paper, and toCarole Wright for statistical analysis. We are gratefulto the Horticultural Research and Development Cor-poration and the Rural Industries Research andDevelopment Corporation for funding this project.
References
Bureau of Meteorology, Commonwealth of Australia 1999.<http://www.bom.gov.au/climate/averages/tables>.
Kader, A.A. 1992. Postharvest biology and technology: anoverview. In: Kader, A.A., ed., Postharvest technology ofhorticultural crops. University of California (Division ofAgriculture and Natural Resources), USA, SpecialPublication No. 3311, 15–20.
Perkins-Veazie, P. and Collins, J.K. 1992. Cultivar,packaging, and storage temperature differences inpostharvest shelf life of okra. HortTechnology, 2, 350–352.
Zong, R.J., Cantwell, M., Morris, L. and Rubatzky, V. 1992.Postharvest studies on four fruit-type Chinese vegetables.Acta Horticulturae, 318, 345–354.
Quality assurance in agricultural produce,edited by G.I. Johnson, Le Van To, Nguyen Duy Duc and M.C. Webb.
ACIAR Proceedings 100(printed version published in 2000)
463
Field Evaluation of Pesticides
M.G. Andrada, R.C. Donceras, Jr., D.G. Natividad, F.M. Dela Cruz, and Ma. E.M. Martinez*
Abstract
A field evaluation was conducted on three new pesticides alongside the two pesticides currently used inNational Food Authority (NFA) warehouses. The evaluation was undertaken to source alternative pesticidesfor possible inclusion into the agency’s pest control program.
The three NFA pest control methods—protective spraying, residual spraying, and fogging—were used to testcyfluthrin, deltamethrin, and permethrin-s-biol-piperonyl butoxide as the new pesticides, and permethrin andpirimiphos-methyl as controls.
Technical findings revealed that the new pesticides were comparable to the existing pesticides used by theNFA. Furthermore, all pesticides gave similar results in the control of stored product pests.
I
NFESTATION
is one of the factors principally respon-sible for the deterioration of stored grains. Insects,mites etc. develop and reproduce rapidly in storedgrains stored under ambient conditions, and have theability to adapt to their environment. Insects usuallyaffect stored product through feeding, subsequent heatdamage caused by insect respiration, and microbio-logical activity on the infested stock.
Continuous use of same pesticide in a storagefacility can trigger the evolution of resistant strainsand eventually lead to the development of some levelsof tolerance or resistance to pesticides. Even the use oflethal fumigants, such as phosphine gas, has failed toarrest the development of resistant strains. As new andmore resistant strains of insect species develop, newpesticides need to be evaluated in order to discoveralternative chemicals that could effectively eradicateinsects. Promising candidates are include the pyre-throids. These are synthetic compounds that havechemical structures modelled on pyrethrin (or rethrin),a potent insecticide extracted from chrysanthemumflowers. The advantage of these chemicals is that they
have high biological activity against insects whilebeing relatively safe for mammals (Magallona 1980).
This study, therefore, aimed to pursue improved andcost-effective pest control measures suitable forNational Food Authority (NFA) stock managementoperations.
Objectives
General
To determine the effectiveness of cyfluthrin, deltame-thrin, permethrin-s-biol-piperonyl butoxide, per-methrin, and pirimiphos-methyl pesticides againststored product insects under field conditions.
Specific
1. To determine the percentage insect mortality,and analyse pesticide residues and persistencyof these five pesticides used as surface, stack,and space sprays under field conditions.
2. To compare the efficacy of cyfluthrin, deltame-thrin, and permethrin-s-biol-piperonyl butoxidewith existing chemicals used by NFA in theirwarehouses.
3. To determine the cost of application of thedifferent pesticides tested.
* Technical Research Division, Technology Resource Development Department, National Food Authority, 101 E. Rodriguez Sr. Avenue, Quezon City 1100, The Philippines.
Quality assurance in agricultural produce,edited by G.I. Johnson, Le Van To, Nguyen Duy Duc and M.C. Webb.
ACIAR Proceedings 100(printed version published in 2000)
464
Materials and Methods
The materials and equipment used in this study werestored bags of paddy and milled rice, nine warehousesand piles, test chemicals of cyfluthrin, deltamethrin,permethrin-s-biol-piperonyl butoxide, permthrin, andpirimiphos-methyl insecticides, backpack sprayers(10 L capacity), fogging machines, high-poweredsprayers (200 L capacity), fumigating sheets,phosphine tablets, phosphine trays, plastic petridishes, insect brush, magnifying lamp, microscope,forceps, masking tape, label forms, sample bags, grainprobes, flashlights, extendable ladders, chalk,sampling frame, record books, bottom and sieve pans,sampling probe, sampling frame, and light traps.
Experimental warehouses and piles
Identification of experimental warehouses and pileswas conducted in NFA warehouses. Warehousedesign and the materials used in construction, as wellas the provision for prevention of insect infestation,were considered. The condition and volume of thestocks were also determined and pile size was based onwhat existed inside the warehouses.
Preliminary survey of insect occurrence
Identification and assessment of insect occurrenceper species was determined in all designated experi-mental warehouses. Insects were collected in thesewarehouses every other day (3 pm–8 am). The surveywas conducted to provide baseline data on thepresence of different insect species found in eachwarehouse before the application of the test chemical,and was followed by a 3-day break before the pestcontrol treatments were applied, in order to stablise thesituation inside the warehouse with respect to insectactivity.
Data gathering
The different chemicals applied using the variouspest control methods were evaluated using datagathered on the follow factors: percentage insectmortality and/or knockdown, persistency, devel-opment of inner infestation, and pesticide residueanalysis.
Pest control experimental treatments
The following treatments were applied, using threereplications per treatment.
Protective spraying
This treatment involves the application of contactpesticides (wettable powder) to piles of commodities,and aims to kill insects on the surface of the bags aswell as to provide protection against reinfestation. Thechemicals tested were cyfluthrin, deltamethrin, andpermethrin (control).
Before chemical application, all experimental pileswere fumigated and aerated for 7 days, to ensure thatall piles began the trial in the same condition, i.e. freefrom outside and inner infestation. The three testchemicals are all synthetic pyrethroid insecticideswhich act mainly as contact poisons for the control ofcrawling and flying insects. The wettable powder formis odourless, off-white in colour, and does not stain.Protective spraying was applied with the aid of abackpack sprayer. A single application was made,following the mixing instructions and rate of appli-cation recommended by the manufacturer. All foursides and the top portion of the piles were sprayed.There were 23 identified sampling points per pile(peripheries and top portion of the pile) and on thefloor base of the piles. Each sampling point measured0.3 m
×
0.3 m and a customised styropor was used as asampling frame. The development of inner infestationinside the bags was monitored through the sampling ofmilled rice after fumigation on the initial, 7
th
, 14
th
,21
st
, and 30
th
days of the observation period. Sampledbags were marked ‘X’ in order to have a uniformsample size and source for the initial and finalsampling schedules. Similarly, samples from the samebags taken on the initial and 21
st
day (NFA standardoperational procedure on protective spraying is every21 days) were submitted immediately for pesticideresidue analysis using gas–liquid chromatography atthe Bureau of Plant Industry (BPI), National PesticideResidue Analytical Laboratory. Insects were collectedeach morning from all experimental piles andsubmitted to the laboratory for insect counting andidentification. Observations and sampling for per-sistency assessment of the pesticides took place fromthe 2
nd
day until the 30
th
day.
Fogging
Fogging is a type of space-spraying intended to killflying and crawling insects. It is also a necessary sup-plement to protective spraying. Smoke is generated
Quality assurance in agricultural produce,edited by G.I. Johnson, Le Van To, Nguyen Duy Duc and M.C. Webb.
ACIAR Proceedings 100(printed version published in 2000)
465
inside the warehouse by vaporising the insecticide inan oil solution or water emulsion. To maximise theeffect, it is conducted at dawn or dusk, when insectsare usually active.
There were nine experimental piles used in thissegment of the project. Monitoring inside the ware-houses was conducted for 28 days. Test chemicalsused were cyfluthrin and permethrin-s-biol-piperonylbutoxide, while the control chemical was pirimiphos-methyl. Cyfluthrin and permethrin-s-biol-piperonylbutoxide are space-spray concentrates that are suitablefor dilution in light oil or water and applied as an ultra-low volume aerosol, thermal fog or mist. They controla broad spectrum of flying insects and aid in thecontrol of crawling insects such as cockroaches. Theyare pyrethroid-based chemicals with the principalactive ingredient of cyfluthrin and permethrin, respec-tively. The latter has the addition of a synergist(piperonyl butoxide) and s-biol for knockdown effect.These were mixed and applied as per the manufac-turer’s recommendation. Pirimiphos-methyl, on theother hand, belongs to the organo-phosphate group ofinsecticides, also for use with stored products. It is inthe form of an emulsifiable concentrate that eliminatesboth crawling and flying insects. Mixing and appli-cation of the chemical was followed as per the labelrecommendation. Cleaning of the warehouses wasimplemented prior to the application of treatments. Allpesticides were applied in the late afternoon starting at3:30 pm. 20 predetermined sampling points were des-ignated in each of the 9 experimental warehouses,again using the sampling frame. Before the applicationof the chemicals, all sampling points were cleared ofdead insects. Sampling was conducted on a daily basis.Initial samples were gathered after approximately 3–4hours, or after the fog had cleared considerably orpermitted sampling inside the warehouse, to observethe knockdown effect of the chemical.
Residual spraying
This treatment is a preventive pest control measureapplied in storage buildings or warehouses. It aims tokill insects on all the surfaces in the building andprovides protection against infestation. Only insectsthat come into contact with the insecticide are killed.Cyfluthrin, deltamethrin, and permethrin were againutilised in this phase of the project. All insecticideswere tested in three NFA warehouses. Treatmentswere applied once and monitored for 30 days. Thetreatment chemical was applied to all walls, floors,posts, postharvest facilities and other structures as wellas on the piles of paddy stored inside the warehouse. A
high-power sprayer that has the ability to reach higherparts of the warehouse structure—up to 15 metres—was used in this segment of the project. The mixingratio for this phase was doubled for cyfluthrin (as perthe manufacturer’s suggested mixing ratio) while themixing ratios for deltamethrin and permethrin werekept at the levels used previously. As in previous partsof this study, cleaning of the warehouse was conductedbefore treatment application. There were 25 identifiedsampling points scattered inside the warehouse floors.Initial samples to determine the insect mortality andknockdown effect of the pesticides were gathered aday after treatment. Pesticide persistency wasmeasured through daily sampling from the 2
nd
dayuntil the end of the monitoring period.
Results and Discussion
Protective spraying
Insect mortality and/or knockdown
The mortality/knockdown effect of the testchemical cyfluthrin indicated complete mortality,achieving a 100% mean on all major and minor pestsafter treatment, as shown in Table 1. Meanwhile, bothdeltamethrin and permethrin produced very similarresults, with a mean mortality range value of 98–100%on all major and minor pests.
Development of inner infestation
Analysis of the inner infestation in bags showedthat, directly after fumigation and aeration, all kinds ofinsect species collected were dead. As the monitoringperiod progressed, Psocopteran species reappearedafter a week in all treatments. Towards the start of thethird week, rust-red flour beetle, rusty grain beetle,psocids, and larvae were observed on the pile appliedwith cyfluthrin. On the other hand, using deltrame-thrin, psocids reappeared within 7 days and rusty grainbeetle or
Cryptolestes
spp. on the 14
th
day and wereobserved throughout the rest of the 30-day monitoringperiod. Another minor pest,
Oryzaephilus surina-mensis
, reappeared only on the 21
st
day, while the re-emergence of larvae started at the beginning of thethird week of monitoring. For permethrin, only livepsocids and larvae were observed, the latter emergingtowards the fourth week of monitoring.
Persistence of chemicals
The persistence of all three chemicals was quitehigh, as indicated by mean mortality rates above 81%throughout the 30-day monitoring period. Live larvae
Quality assurance in agricultural produce,edited by G.I. Johnson, Le Van To, Nguyen Duy Duc and M.C. Webb.
ACIAR Proceedings 100(printed version published in 2000)
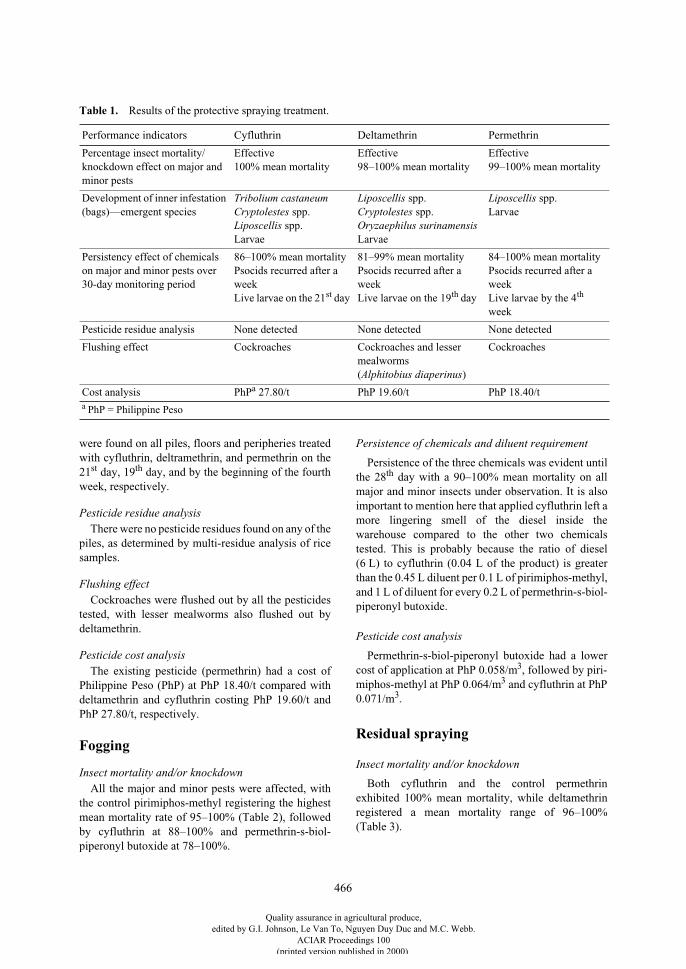
466
were found on all piles, floors and peripheries treatedwith cyfluthrin, deltramethrin, and permethrin on the21
st
day, 19
th
day, and by the beginning of the fourthweek, respectively.
Pesticide residue analysis
There were no pesticide residues found on any of thepiles, as determined by multi-residue analysis of ricesamples.
Flushing effect
Cockroaches were flushed out by all the pesticidestested, with lesser mealworms also flushed out bydeltamethrin.
Pesticide cost analysis
The existing pesticide (permethrin) had a cost ofPhilippine Peso (PhP) at PhP 18.40/t compared withdeltamethrin and cyfluthrin costing PhP 19.60/t andPhP 27.80/t, respectively.
Fogging
Insect mortality and/or knockdown
All the major and minor pests were affected, withthe control pirimiphos-methyl registering the highestmean mortality rate of 95–100% (Table 2), followedby cyfluthrin at 88–100% and permethrin-s-biol-piperonyl butoxide at 78–100%.
Persistence of chemicals and diluent requirement
Persistence of the three chemicals was evident untilthe 28
th
day with a 90–100% mean mortality on allmajor and minor insects under observation. It is alsoimportant to mention here that applied cyfluthrin left amore lingering smell of the diesel inside thewarehouse compared to the other two chemicalstested. This is probably because the ratio of diesel(6 L) to cyfluthrin (0.04 L of the product) is greaterthan the 0.45 L diluent per 0.1 L of pirimiphos-methyl,and 1 L of diluent for every 0.2 L of permethrin-s-biol-piperonyl butoxide.
Pesticide cost analysis
Permethrin-s-biol-piperonyl butoxide had a lowercost of application at PhP 0.058/m
3
, followed by piri-miphos-methyl at PhP 0.064/m
3
and cyfluthrin at PhP0.071/m
3
.
Residual spraying
Insect mortality and/or knockdown
Both cyfluthrin and the control permethrinexhibited 100% mean mortality, while deltamethrinregistered a mean mortality range of 96–100%(Table 3).
Table 1.
Results of the protective spraying treatment.
Performance indicators Cyfluthrin Deltamethrin Permethrin
Percentage insect mortality/knockdown effect on major and minor pests
Effective100% mean mortality
Effective98–100% mean mortality
Effective99–100% mean mortality
Development of inner infestation (bags)—emergent species
Tribolium castaneumCryptolestes
spp.
Liposcellis
spp.Larvae
Liposcellis
spp.
Cryptolestes
spp.
Oryzaephilus
surinamensis
Larvae
Liposcellis
spp.Larvae
Persistency effect of chemicals on major and minor pests over 30-day monitoring period
86–100% mean mortality Psocids recurred after a week Live larvae on the 21
st
day
81–99% mean mortality Psocids recurred after a week Live larvae on the 19
th
day
84–100% mean mortality Psocids recurred after a week Live larvae by the 4
th
week
Pesticide residue analysis None detected None detected None detected
Flushing effect Cockroaches Cockroaches and lesser mealworms(
Alphitobius
diaperinus
)
Cockroaches
Cost analysis PhP
a
27.80/t PhP 19.60/t PhP 18.40/t
a
PhP = Philippine Peso
Quality assurance in agricultural produce,edited by G.I. Johnson, Le Van To, Nguyen Duy Duc and M.C. Webb.
ACIAR Proceedings 100(printed version published in 2000)
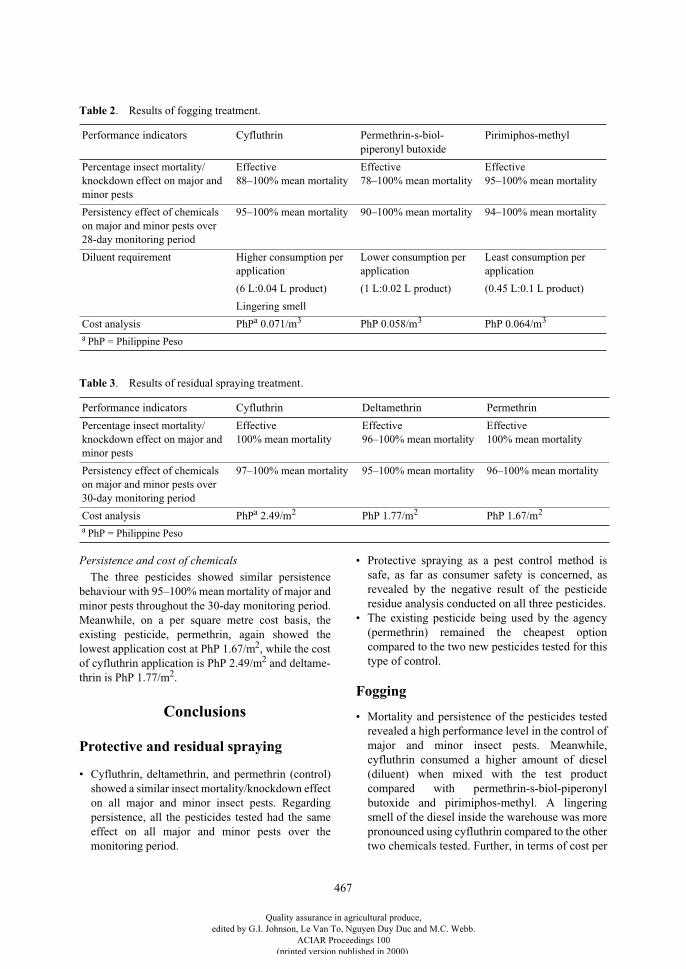
467
Persistence and cost of chemicals
The three pesticides showed similar persistencebehaviour with 95–100% mean mortality of major andminor pests throughout the 30-day monitoring period.Meanwhile, on a per square metre cost basis, theexisting pesticide, permethrin, again showed thelowest application cost at PhP 1.67/m
2
, while the costof cyfluthrin application is PhP 2.49/m
2
and deltame-thrin is PhP 1.77/m
2
.
Conclusions
Protective and residual spraying
• Cyfluthrin, deltamethrin, and permethrin (control)showed a similar insect mortality/knockdown effecton all major and minor insect pests. Regardingpersistence, all the pesticides tested had the sameeffect on all major and minor pests over themonitoring period.
• Protective spraying as a pest control method issafe, as far as consumer safety is concerned, asrevealed by the negative result of the pesticideresidue analysis conducted on all three pesticides.
• The existing pesticide being used by the agency(permethrin) remained the cheapest optioncompared to the two new pesticides tested for thistype of control.
Fogging
• Mortality and persistence of the pesticides testedrevealed a high performance level in the control ofmajor and minor insect pests. Meanwhile,cyfluthrin consumed a higher amount of diesel(diluent) when mixed with the test productcompared with permethrin-s-biol-piperonylbutoxide and pirimiphos-methyl. A lingeringsmell of the diesel inside the warehouse was morepronounced using cyfluthrin compared to the othertwo chemicals tested. Further, in terms of cost per
Table 2
. Results of fogging treatment.
Performance indicators Cyfluthrin Permethrin-s-biol-piperonyl butoxide
Pirimiphos-methyl
Percentage insect mortality/knockdown effect on major and minor pests
Effective88–100% mean mortality
Effective78–100% mean mortality
Effective95–100% mean mortality
Persistency effect of chemicals on major and minor pests over 28-day monitoring period
95–100% mean mortality 90–100% mean mortality 94–100% mean mortality
Diluent requirement Higher consumption per application
Lower consumption per application
Least consumption per application
(6 L:0.04 L product) (1 L:0.02 L product) (0.45 L:0.1 L product)
Lingering smell
Cost analysis PhP
a
0.071/m
3
PhP 0.058/m
3
PhP 0.064/m
3
a
PhP = Philippine Peso
Table 3
. Results of residual spraying treatment.
Performance indicators Cyfluthrin Deltamethrin Permethrin
Percentage insect mortality/knockdown effect on major and minor pests
Effective100% mean mortality
Effective96–100% mean mortality
Effective100% mean mortality
Persistency effect of chemicals on major and minor pests over 30-day monitoring period
97–100% mean mortality 95–100% mean mortality 96–100% mean mortality
Cost analysis PhP
a
2.49/m
2
PhP 1.77/m
2
PhP 1.67/m
2
a
PhP = Philippine Peso
Quality assurance in agricultural produce,edited by G.I. Johnson, Le Van To, Nguyen Duy Duc and M.C. Webb.
ACIAR Proceedings 100(printed version published in 2000)
468
application, permethrin-s-biol-piperonyl butoxidewas found to be cheaper than cyfluthrin andpirimiphos-methyl.
In summary, all chemicals evaluated in these trialsbehaved similarly in the control of stored productpests.
Recommendations
1. Based on their technical performance, it isrecommended that cyfluthrin, deltamethrinand permethrin-s-biol-piperonyl butoxide beincluded in the approved list of pesticides tobe used by the NFA in its Pest ManagementProgram. This will provider users with awider choice of pesticides to be used with themost appropriate pest control method for
warehouse application. Furthermore, rotationin the use of different pesticides can beadopted to aid in the reduction of build-up ofresistance in insect pests to a single chemical.
2. Based on the findings, NFA could continue touse the existing pesticides (permethrin andpirimiphos-methyl) provided that the correctmixing ratio, dosage, and application methodsare strictly followed.
3. Lastly, there is no substitute for the appli-cation of the basic principles of hygiene andsanitation to minimise, if not completely erad-icate, infestation in the warehouse.
Reference
Magallona, E.D. 1980. Pesticide management. Philippines,Fertilizer and Pesticide Authority, 45–46.
Quality assurance in agricultural produce,edited by G.I. Johnson, Le Van To, Nguyen Duy Duc and M.C. Webb.
ACIAR Proceedings 100(printed version published in 2000)
469
Trial on Storing of Maize Seed in Airtight Storage
C. Sukprakarn*, K. Bhudhasamai† and B. Chankaewmanee*
Abstract
Trials on the preservation of maize seed quality under airtight storage conditions were carried out in theNakornrachasima Province of Thailand during 1996–7. Sacks of maize for seed purposes (‘Suwan #l’) werestored in sealed polyvinyl chloride (PVC) sheeting, 0.8 mm thick and tailored to a shape known as the Volcanicube, with a volume of 15 m
3
and a storage capacity of approximately 10 t. Two cubes were loaded with grainand placed outdoors for 3 and 9 months, respectively, and observations were made at 2-week intervals tomonitor temperature, relative humidity and seed moisture content inside the cubes. At the end of the respectivestorage periods, the cubes were opened to enable evaluation of numbers of insects, grain damage by insects,mould infection, percentage germination, and moisture content of the maize seed. The results of both trialsindicated that the cubes could preserve maize seed quality. At the end of the trials, insect damage and liveinsects were not observed. Also, the levels of mould infection had only slightly increased and a low level ofaflatoxin was revealed only in the second trial. Seed moisture content, germination percentage, temperatureand relative humidity within the cubes before and after treatment showed only slightly differences and the seedwas still in good condition.
M
AIZE
, when shelled, lacks its outer protective sheath,making it more susceptible to insect infestation. InThailand, infestation may start in the field or in storagewhen sanitation is poor, and moulds may develop ifthe grain is not properly dried. It has been observedthat severe damage to maize usually occurs within afew months of storage. Sukprakarn and Visarath-anonth (1989) reported seven species of insectattacking maize during storage, with the maize weevil(
Sitophilus zeamais
Motsch.) being the mostdestructive pest. This insect caused damage of up to50% damaged grains within six months of storage.
To reduce losses, grain protectants and fumigantsare widely employed in spite of the fact that they leavepesticide residues that are detrimental to health and areenvironmentally hazardous. Safety concerns includeboth acute and chronic toxicity to pesticide operators
in particular, and to humans and animal life in general.Methyl bromide, for example, as an ozone-depletingsubstance, has been subjected to international restric-tions in its use through the Montreal Protocol. (Insome countries, pollution of surface and ground waterby methyl bromide is also a concern.) Continuous andincorrect use of the fumigant phosphine has beenshown to lead to insect resistance problems (Suk-prakarn 1996).
The present trend in many countries is to use alter-natives to these chemicals such as controlled ormodified atmospheres by flushing with carbon dioxide(CO
2
) to control the insect pests. Furthermore, airtightor hermetic storage inside structures tailored fromflexible polyvinyl chloride (PVC) liners (termed theVolcani cube) has been shown to provide an excellentgrain storage solution where permanent structures arenot available or affordable (e.g. Alvindia et al. 1994;Donahaye and Navarro 1990; Donahaye et al. 1991;Navarro and Donahaye 1993; Navarro et al. 1994,1997). Such storage structures have also been adaptedfor the application of modified atmospheres, particu-larly for the prolonged storage of high valuecommodities.
* Stored Product Research Group, Division of Entomology and Zoology, Department of Agriculture, Ladyao, Chatujak, Thailand.
† Postharvest Pathology Group, Division of Plant Pathology and Microbiology, Department of Agriculture, Ladyao, Chatujak, Thailand.
Quality assurance in agricultural produce,edited by G.I. Johnson, Le Van To, Nguyen Duy Duc and M.C. Webb.
ACIAR Proceedings 100(printed version published in 2000)
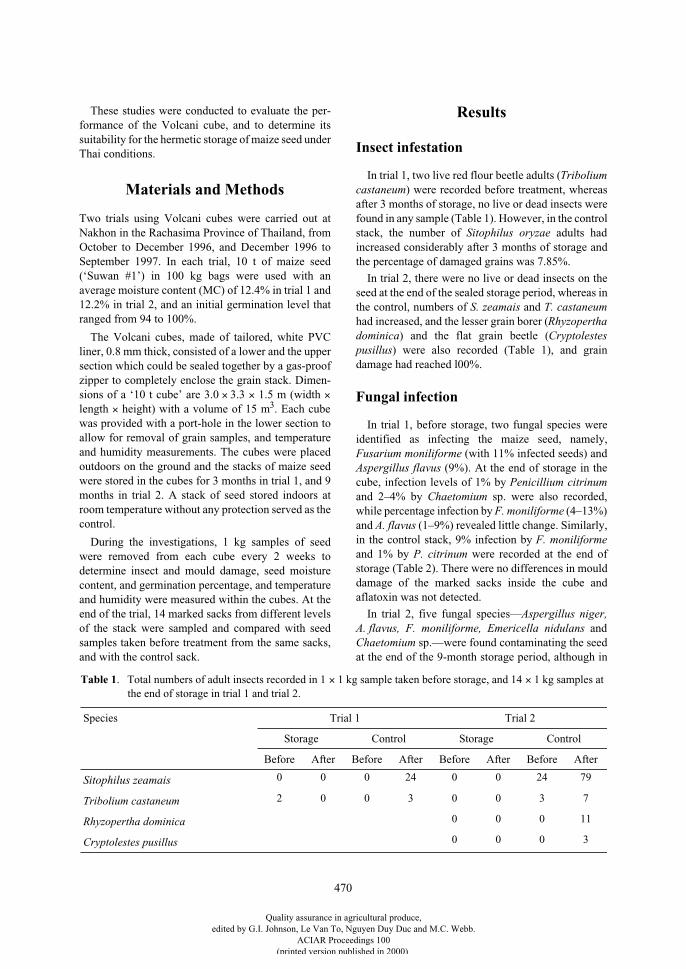
470
These studies were conducted to evaluate the per-formance of the Volcani cube, and to determine itssuitability for the hermetic storage of maize seed underThai conditions.
Materials and Methods
Two trials using Volcani cubes were carried out atNakhon in the Rachasima Province of Thailand, fromOctober to December 1996, and December 1996 toSeptember 1997. In each trial, 10 t of maize seed(‘Suwan #1’) in 100 kg bags were used with anaverage moisture content (MC) of 12.4% in trial 1 and12.2% in trial 2, and an initial germination level thatranged from 94 to 100%.
The Volcani cubes, made of tailored, white PVCliner, 0.8 mm thick, consisted of a lower and the uppersection which could be sealed together by a gas-proofzipper to completely enclose the grain stack. Dimen-sions of a ‘10 t cube’ are 3.0
×
3.3
×
1.5 m (width
×
length
×
height) with a volume of 15 m
3
. Each cubewas provided with a port-hole in the lower section toallow for removal of grain samples, and temperatureand humidity measurements. The cubes were placedoutdoors on the ground and the stacks of maize seedwere stored in the cubes for 3 months in trial 1, and 9months in trial 2. A stack of seed stored indoors atroom temperature without any protection served as thecontrol.
During the investigations, 1 kg samples of seedwere removed from each cube every 2 weeks todetermine insect and mould damage, seed moisturecontent, and germination percentage, and temperatureand humidity were measured within the cubes. At theend of the trial, 14 marked sacks from different levelsof the stack were sampled and compared with seedsamples taken before treatment from the same sacks,and with the control sack.
Results
Insect infestation
In trial 1, two live red flour beetle adults (
Triboliumcastaneum
) were recorded before treatment, whereasafter 3 months of storage, no live or dead insects werefound in any sample (Table 1). However, in the controlstack, the number of
Sitophilus oryzae
adults hadincreased considerably after 3 months of storage andthe percentage of damaged grains was 7.85%.
In trial 2, there were no live or dead insects on theseed at the end of the sealed storage period, whereas inthe control, numbers of
S. zeamais
and
T. castaneum
had increased, and the lesser grain borer (
Rhyzoperthadominica
) and the flat grain beetle (
Cryptolestespusillus
) were also recorded (Table 1), and graindamage had reached l00%.
Fungal infection
In trial 1, before storage, two fungal species wereidentified as infecting the maize seed, namely,
Fusarium moniliforme
(with 11% infected seeds) and
Aspergillus flavus
(9%). At the end of storage in thecube, infection levels of 1% by
Penicillium citrinum
and 2–4% by
Chaetomium
sp. were also recorded,while percentage infection by
F. moniliforme
(4–13%)and
A. flavus
(1–9%) revealed little change. Similarly,in the control stack, 9% infection by
F. moniliforme
and 1% by
P. citrinum
were recorded at the end ofstorage (Table 2). There were no differences in moulddamage of the marked sacks inside the cube andaflatoxin was not detected.
In trial 2, five fungal species—
Aspergillus niger,A. flavus, F. moniliforme, Emericella nidulans
and
Chaetomium
sp.—were found contaminating the seedat the end of the 9-month storage period, although in
Table 1. Total numbers of adult insects recorded in 1 × 1 kg sample taken before storage, and 14 × 1 kg samples atthe end of storage in trial 1 and trial 2.
Species Trial 1 Trial 2
Storage Control Storage Control
Before After Before After Before After Before After
Sitophilus zeamais 0 0 0 24 0 0 24 79
Tribolium castaneum 2 0 0 3 0 0 3 7
Rhyzopertha dominica 0 0 0 11
Cryptolestes pusillus 0 0 0 3
Quality assurance in agricultural produce,edited by G.I. Johnson, Le Van To, Nguyen Duy Duc and M.C. Webb.
ACIAR Proceedings 100(printed version published in 2000)
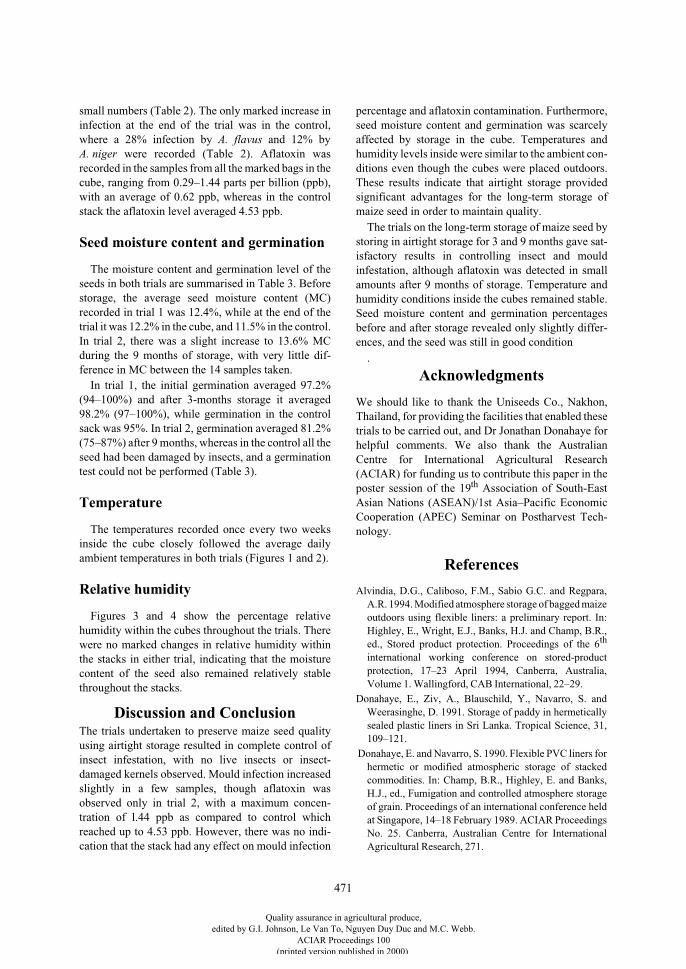
471
small numbers (Table 2). The only marked increase ininfection at the end of the trial was in the control,where a 28% infection by
A. flavus
and 12% by
A. niger
were recorded (Table 2). Aflatoxin wasrecorded in the samples from all the marked bags in thecube, ranging from 0.29–1.44 parts per billion (ppb),with an average of 0.62 ppb, whereas in the controlstack the aflatoxin level averaged 4.53 ppb.
Seed moisture content and germination
The moisture content and germination level of theseeds in both trials are summarised in Table 3. Beforestorage, the average seed moisture content (MC)recorded in trial 1 was 12.4%, while at the end of thetrial it was 12.2% in the cube, and 11.5% in the control.In trial 2, there was a slight increase to 13.6% MCduring the 9 months of storage, with very little dif-ference in MC between the 14 samples taken.
In trial 1, the initial germination averaged 97.2%(94–100%) and after 3-months storage it averaged98.2% (97–100%), while germination in the controlsack was 95%. In trial 2, germination averaged 81.2%(75–87%) after 9 months, whereas in the control all theseed had been damaged by insects, and a germinationtest could not be performed (Table 3).
Temperature
The temperatures recorded once every two weeksinside the cube closely followed the average dailyambient temperatures in both trials (Figures 1 and 2).
Relative humidity
Figures 3 and 4 show the percentage relativehumidity within the cubes throughout the trials. Therewere no marked changes in relative humidity withinthe stacks in either trial, indicating that the moisturecontent of the seed also remained relatively stablethroughout the stacks.
Discussion and Conclusion
The trials undertaken to preserve maize seed qualityusing airtight storage resulted in complete control ofinsect infestation, with no live insects or insect-damaged kernels observed. Mould infection increasedslightly in a few samples, though aflatoxin wasobserved only in trial 2, with a maximum concen-tration of l.44 ppb as compared to control whichreached up to 4.53 ppb. However, there was no indi-cation that the stack had any effect on mould infection
percentage and aflatoxin contamination. Furthermore,seed moisture content and germination was scarcelyaffected by storage in the cube. Temperatures andhumidity levels inside were similar to the ambient con-ditions even though the cubes were placed outdoors.These results indicate that airtight storage providedsignificant advantages for the long-term storage ofmaize seed in order to maintain quality.
The trials on the long-term storage of maize seed bystoring in airtight storage for 3 and 9 months gave sat-isfactory results in controlling insect and mouldinfestation, although aflatoxin was detected in smallamounts after 9 months of storage. Temperature andhumidity conditions inside the cubes remained stable.Seed moisture content and germination percentagesbefore and after storage revealed only slightly differ-ences, and the seed was still in good condition
.
Acknowledgments
We should like to thank the Uniseeds Co., Nakhon,Thailand, for providing the facilities that enabled thesetrials to be carried out, and Dr Jonathan Donahaye forhelpful comments. We also thank the AustralianCentre for International Agricultural Research(ACIAR) for funding us to contribute this paper in theposter session of the 19
th
Association of South-EastAsian Nations (ASEAN)/1st Asia–Pacific EconomicCooperation (APEC) Seminar on Postharvest Tech-nology.
References
Alvindia, D.G., Caliboso, F.M., Sabio G.C. and Regpara,A.R. 1994. Modified atmosphere storage of bagged maizeoutdoors using flexible liners: a preliminary report. In:Highley, E., Wright, E.J., Banks, H.J. and Champ, B.R.,ed., Stored product protection. Proceedings of the 6
th
international working conference on stored-productprotection, 17–23 April 1994, Canberra, Australia,Volume 1. Wallingford, CAB International, 22–29.
Donahaye, E., Ziv, A., Blauschild, Y., Navarro, S. andWeerasinghe, D. 1991. Storage of paddy in hermeticallysealed plastic liners in Sri Lanka. Tropical Science, 31,109–121.
Donahaye, E. and Navarro, S. 1990. Flexible PVC liners forhermetic or modified atmospheric storage of stackedcommodities. In: Champ, B.R., Highley, E. and Banks,H.J., ed., Fumigation and controlled atmosphere storageof grain. Proceedings of an international conference heldat Singapore, 14–18 February 1989. ACIAR ProceedingsNo. 25. Canberra, Australian Centre for InternationalAgricultural Research, 271.
Quality assurance in agricultural produce,edited by G.I. Johnson, Le Van To, Nguyen Duy Duc and M.C. Webb.
ACIAR Proceedings 100(printed version published in 2000)
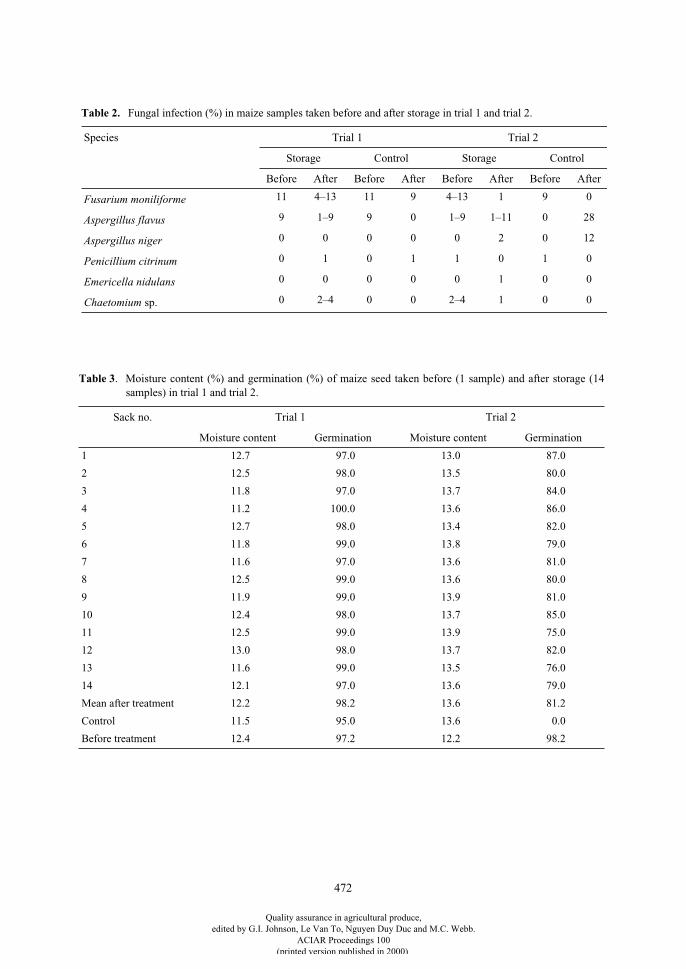
472
Table 2. Fungal infection (%) in maize samples taken before and after storage in trial 1 and trial 2.
Species Trial 1 Trial 2
Storage Control Storage Control
Before After Before After Before After Before After
Fusarium moniliforme 11 4–13 11 9 4–13 1 9 0
Aspergillus flavus 9 1–9 9 0 1–9 1–11 0 28
Aspergillus niger 0 0 0 0 0 2 0 12
Penicillium citrinum 0 1 0 1 1 0 1 0
Emericella nidulans 0 0 0 0 0 1 0 0
Chaetomium sp. 0 2–4 0 0 2–4 1 0 0
Table 3
. Moisture content (%) and germination (%) of maize seed taken before (1 sample) and after storage (14samples) in trial 1 and trial 2.
Sack no. Trial 1 Trial 2
Moisture content Germination Moisture content Germination
1 12.7 97.0 13.0 87.0
2 12.5 98.0 13.5 80.0
3 11.8 97.0 13.7 84.0
4 11.2 100.0 13.6 86.0
5 12.7 98.0 13.4 82.0
6 11.8 99.0 13.8 79.0
7 11.6 97.0 13.6 81.0
8 12.5 99.0 13.6 80.0
9 11.9 99.0 13.9 81.0
10 12.4 98.0 13.7 85.0
11 12.5 99.0 13.9 75.0
12 13.0 98.0 13.7 82.0
13 11.6 99.0 13.5 76.0
14 12.1 97.0 13.6 79.0
Mean after treatment 12.2 98.2 13.6 81.2
Control 11.5 95.0 13.6 0.0
Before treatment 12.4 97.2 12.2 98.2
Quality assurance in agricultural produce,edited by G.I. Johnson, Le Van To, Nguyen Duy Duc and M.C. Webb.
ACIAR Proceedings 100(printed version published in 2000)
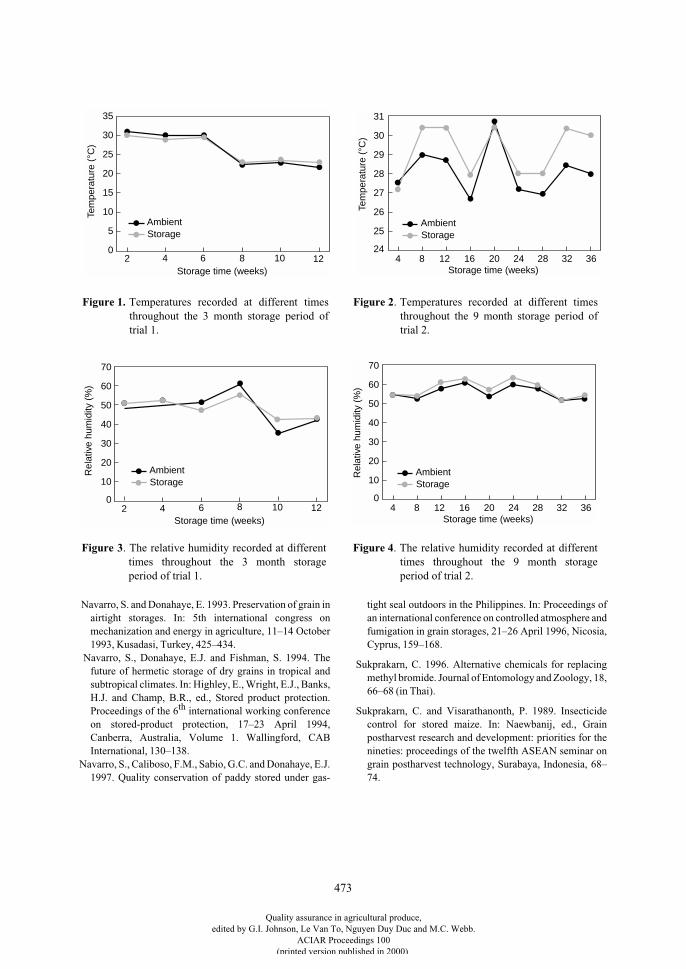
473
Navarro, S. and Donahaye, E. 1993. Preservation of grain inairtight storages. In: 5th international congress onmechanization and energy in agriculture, 11–14 October1993, Kusadasi, Turkey, 425–434.
Navarro, S., Donahaye, E.J. and Fishman, S. 1994. Thefuture of hermetic storage of dry grains in tropical andsubtropical climates. In: Highley, E., Wright, E.J., Banks,H.J. and Champ, B.R., ed., Stored product protection.Proceedings of the 6
th
international working conferenceon stored-product protection, 17–23 April 1994,Canberra, Australia, Volume 1. Wallingford, CABInternational, 130–138.
Navarro, S., Caliboso, F.M., Sabio, G.C. and Donahaye, E.J.1997. Quality conservation of paddy stored under gas-
tight seal outdoors in the Philippines. In: Proceedings ofan international conference on controlled atmosphere andfumigation in grain storages, 21–26 April 1996, Nicosia,Cyprus, 159–168.
Sukprakarn, C. 1996. Alternative chemicals for replacingmethyl bromide. Journal of Entomology and Zoology, 18,66–68 (in Thai).
Sukprakarn, C. and Visarathanonth, P. 1989. Insecticidecontrol for stored maize. In: Naewbanij, ed., Grainpostharvest research and development: priorities for thenineties: proceedings of the twelfth ASEAN seminar ongrain postharvest technology, Surabaya, Indonesia, 68–74.
0
10
20
30
40
50
60
70
Storage time (weeks) 2 4 6 8 10 12
Rel
ativ
e hu
mid
ity (
%)
StorageAmbient
0
10
20
30
40
50
60
70
Storage time (weeks) 4 8 12 16 20 24
Rel
ativ
e hu
mid
ity (
%)
28 32 36
StorageAmbient
Figure 3. The relative humidity recorded at differenttimes throughout the 3 month storageperiod of trial 1.
Figure 4. The relative humidity recorded at differenttimes throughout the 9 month storageperiod of trial 2.
Figure 2. Temperatures recorded at different timesthroughout the 9 month storage period oftrial 2.
24
25
26
27
28
29
30
31
Storage time (weeks) 4 8 12 16 20 24
Tem
pera
ture
(°C
)
28 32 36
StorageAmbient
0
5
10
15
20
25
Storage time (weeks) 2 6 10 12
Tem
pera
ture
(°C
)
4 8
30
35
StorageAmbient
Figure 1. Temperatures recorded at different timesthroughout the 3 month storage period oftrial 1.
Quality assurance in agricultural produce,edited by G.I. Johnson, Le Van To, Nguyen Duy Duc and M.C. Webb.
ACIAR Proceedings 100(printed version published in 2000)
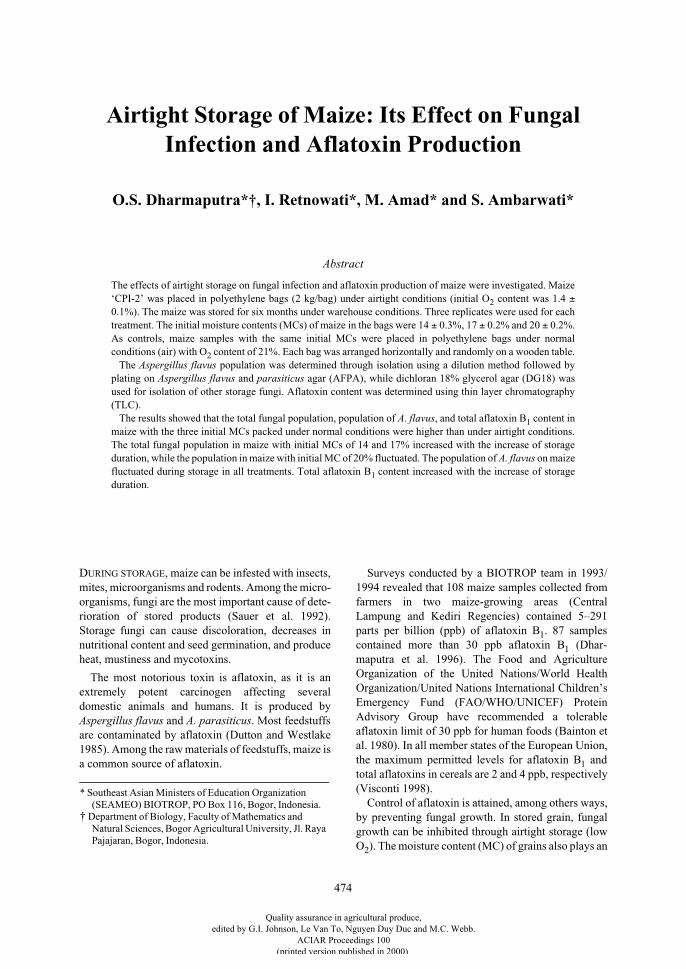
474
Airtight Storage of Maize: Its Effect on Fungal Infection and Aflatoxin Production
O.S. Dharmaputra*†, I. Retnowati*, M. Amad* and S. Ambarwati*
Abstract
The effects of airtight storage on fungal infection and aflatoxin production of maize were investigated. Maize‘CPI-2’ was placed in polyethylene bags (2 kg/bag) under airtight conditions (initial O
2
content was 1.4
±
0.1%). The maize was stored for six months under warehouse conditions. Three replicates were used for eachtreatment. The initial moisture contents (MCs) of maize in the bags were 14
±
0.3%, 17
±
0.2% and 20
±
0.2%.As controls, maize samples with the same initial MCs were placed in polyethylene bags under normalconditions (air) with O
2
content of 21%. Each bag was arranged horizontally and randomly on a wooden table.The
Aspergillus flavus
population was determined through isolation using a dilution method followed byplating on
Aspergillus flavus
and
parasiticus
agar (AFPA), while dichloran 18% glycerol agar (DG18) wasused for isolation of other storage fungi. Aflatoxin content was determined using thin layer chromatography(TLC).
The results showed that the total fungal population, population of
A. flavus
, and total aflatoxin B
1
content inmaize with the three initial MCs packed under normal conditions were higher than under airtight conditions.The total fungal population in maize with initial MCs of 14 and 17% increased with the increase of storageduration, while the population in maize with initial MC of 20% fluctuated. The population of A. flavus on maizefluctuated during storage in all treatments. Total aflatoxin B
1
content increased with the increase of storageduration.
D
URING
STORAGE
, maize can be infested with insects,mites, microorganisms and rodents. Among the micro-organisms, fungi are the most important cause of dete-rioration of stored products (Sauer et al. 1992).Storage fungi can cause discoloration, decreases innutritional content and seed germination, and produceheat, mustiness and mycotoxins.
The most notorious toxin is aflatoxin, as it is anextremely potent carcinogen affecting severaldomestic animals and humans. It is produced by
Aspergillus flavus
and
A. parasiticus
. Most feedstuffsare contaminated by aflatoxin (Dutton and Westlake1985). Among the raw materials of feedstuffs, maize isa common source of aflatoxin.
Surveys conducted by a BIOTROP team in 1993/1994 revealed that 108 maize samples collected fromfarmers in two maize-growing areas (CentralLampung and Kediri Regencies) contained 5–291parts per billion (ppb) of aflatoxin B
1
. 87 samplescontained more than 30 ppb aflatoxin B
1
(Dhar-maputra et al. 1996). The Food and AgricultureOrganization of the United Nations/World HealthOrganization/United Nations International Children’sEmergency Fund (FAO/WHO/UNICEF) ProteinAdvisory Group have recommended a tolerableaflatoxin limit of 30 ppb for human foods (Bainton etal. 1980). In all member states of the European Union,the maximum permitted levels for aflatoxin B
1
andtotal aflatoxins in cereals are 2 and 4 ppb, respectively(Visconti 1998).
Control of aflatoxin is attained, among others ways,by preventing fungal growth. In stored grain, fungalgrowth can be inhibited through airtight storage (lowO
2
). The moisture content (MC) of grains also plays an
* Southeast Asian Ministers of Education Organization (SEAMEO) BIOTROP, PO Box 116, Bogor, Indonesia.
† Department of Biology, Faculty of Mathematics and Natural Sciences, Bogor Agricultural University, Jl. Raya Pajajaran, Bogor, Indonesia.
Quality assurance in agricultural produce,edited by G.I. Johnson, Le Van To, Nguyen Duy Duc and M.C. Webb.
ACIAR Proceedings 100(printed version published in 2000)
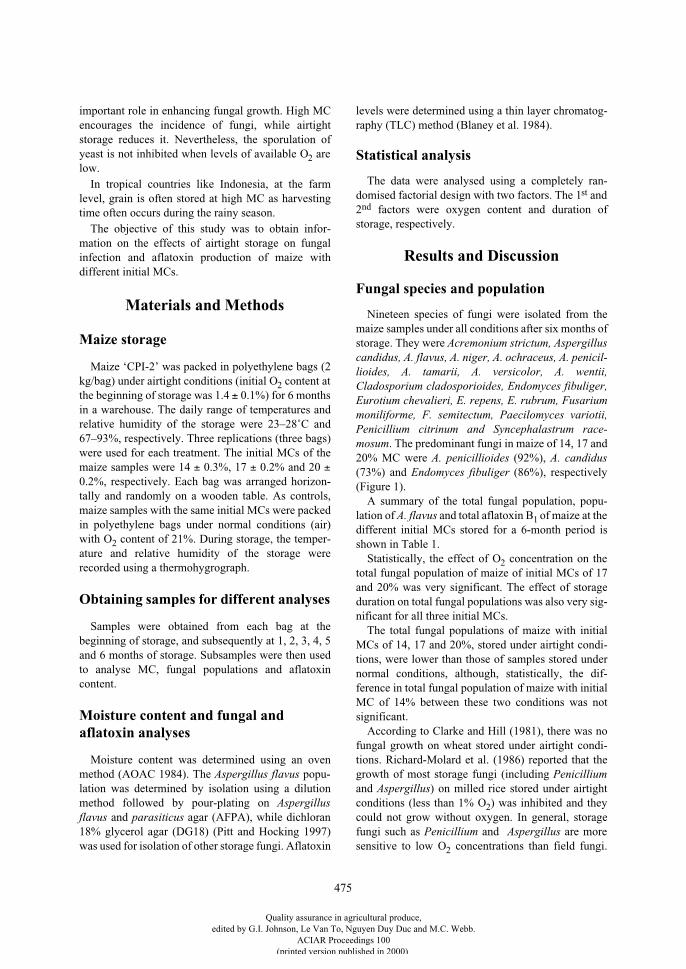
475
important role in enhancing fungal growth. High MCencourages the incidence of fungi, while airtightstorage reduces it. Nevertheless, the sporulation ofyeast is not inhibited when levels of available O
2
arelow.
In tropical countries like Indonesia, at the farmlevel, grain is often stored at high MC as harvestingtime often occurs during the rainy season.
The objective of this study was to obtain infor-mation on the effects of airtight storage on fungalinfection and aflatoxin production of maize withdifferent initial MCs.
Materials and Methods
Maize storage
Maize ‘CPI-2’ was packed in polyethylene bags (2kg/bag) under airtight conditions (initial O
2
content atthe beginning of storage was 1.4
±
0.1%) for 6 monthsin a warehouse. The daily range of temperatures andrelative humidity of the storage were 23–28˚C and67–93%, respectively. Three replications (three bags)were used for each treatment. The initial MCs of themaize samples were 14
±
0.3%, 17
±
0.2% and 20
±
0.2%, respectively. Each bag was arranged horizon-tally and randomly on a wooden table. As controls,maize samples with the same initial MCs were packedin polyethylene bags under normal conditions (air)with O
2
content of 21%. During storage, the temper-ature and relative humidity of the storage wererecorded using a thermohygrograph.
Obtaining samples for different analyses
Samples were obtained from each bag at thebeginning of storage, and subsequently at 1, 2, 3, 4, 5and 6 months of storage. Subsamples were then usedto analyse MC, fungal populations and aflatoxincontent.
Moisture content and fungal and aflatoxin analyses
Moisture content was determined using an ovenmethod (AOAC 1984). The
Aspergillus flavus
popu-lation was determined by isolation using a dilutionmethod followed by pour-plating on
Aspergillusflavus
and
parasiticus
agar (AFPA), while dichloran18% glycerol agar (DG18) (Pitt and Hocking 1997)was used for isolation of other storage fungi. Aflatoxin
levels were determined using a thin layer chromatog-raphy (TLC) method (Blaney et al. 1984).
Statistical analysis
The data were analysed using a completely ran-domised factorial design with two factors. The 1
st
and2
nd
factors were oxygen content and duration ofstorage, respectively.
Results and Discussion
Fungal species and population
Nineteen species of fungi were isolated from themaize samples under all conditions after six months ofstorage. They were
Acremonium strictum, Aspergilluscandidus, A. flavus, A. niger, A. ochraceus, A. penicil-lioides, A. tamarii, A. versicolor, A. wentii,Cladosporium cladosporioides, Endomyces fibuliger,Eurotium chevalieri, E. repens, E. rubrum, Fusariummoniliforme, F. semitectum, Paecilomyces variotii,Penicillium citrinum and Syncephalastrum race-mosum
. The predominant fungi in maize of 14, 17 and20% MC were
A. penicillioides
(92%),
A. candidus
(73%) and
Endomyces fibuliger
(86%), respectively(Figure 1).
A summary of the total fungal population, popu-lation of
A. flavus
and total aflatoxin B
1
of maize at thedifferent initial MCs stored for a 6-month period isshown in Table 1.
Statistically, the effect of O
2
concentration on thetotal fungal population of maize of initial MCs of 17and 20% was very significant. The effect of storageduration on total fungal populations was also very sig-nificant for all three initial MCs.
The total fungal populations of maize with initialMCs of 14, 17 and 20%, stored under airtight condi-tions, were lower than those of samples stored undernormal conditions, although, statistically, the dif-ference in total fungal population of maize with initialMC of 14% between these two conditions was notsignificant.
According to Clarke and Hill (1981), there was nofungal growth on wheat stored under airtight condi-tions. Richard-Molard et al. (1986) reported that thegrowth of most storage fungi (including
Penicillium
and
Aspergillus
) on milled rice stored under airtightconditions (less than 1% O
2
) was inhibited and theycould not grow without oxygen. In general, storagefungi such as
Penicillium
and
Aspergillus
are moresensitive to low O
2
concentrations than field fungi.
Quality assurance in agricultural produce,edited by G.I. Johnson, Le Van To, Nguyen Duy Duc and M.C. Webb.
ACIAR Proceedings 100(printed version published in 2000)
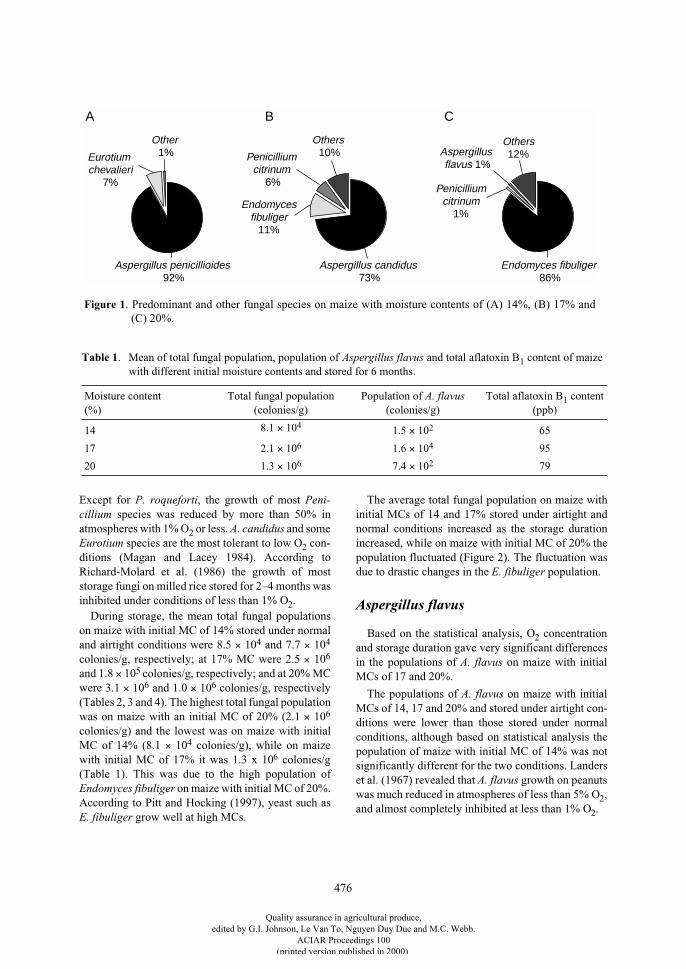
476
Except for
P. roqueforti
, the growth of most
Peni-cillium
species was reduced by more than 50% inatmospheres with 1% O
2
or less.
A. candidus
and some
Eurotium
species are the most tolerant to low O
2
con-ditions (Magan and Lacey 1984). According toRichard-Molard et al. (1986) the growth of moststorage fungi on milled rice stored for 2–4 months wasinhibited under conditions of less than 1% O
2
.During storage, the mean total fungal populations
on maize with initial MC of 14% stored under normaland airtight conditions were 8.5
×
10
4
and 7.7
×
10
4
colonies/g, respectively; at 17% MC were 2.5
×
10
6
and 1.8
×
10
5
colonies/g, respectively; and at 20% MCwere 3.1
×
10
6
and 1.0
×
10
6
colonies/g, respectively(Tables 2, 3 and 4). The highest total fungal populationwas on maize with an initial MC of 20% (2.1
×
10
6
colonies/g) and the lowest was on maize with initialMC of 14% (8.1
×
10
4
colonies/g), while on maizewith initial MC of 17% it was 1.3 x 10
6
colonies/g(Table 1). This was due to the high population of
Endomyces fibuliger
on maize with initial MC of 20%.According to Pitt and Hocking (1997), yeast such as
E. fibuliger
grow well at high MCs.
The average total fungal population on maize withinitial MCs of 14 and 17% stored under airtight andnormal conditions increased as the storage durationincreased, while on maize with initial MC of 20% thepopulation fluctuated (Figure 2). The fluctuation wasdue to drastic changes in the
E. fibuliger
population.
Aspergillus flavus
Based on the statistical analysis, O
2
concentrationand storage duration gave very significant differencesin the populations of
A. flavus
on maize with initialMCs of 17 and 20%.
The populations of
A. flavus
on maize with initialMCs of 14, 17 and 20% and stored under airtight con-ditions were lower than those stored under normalconditions, although based on statistical analysis thepopulation of maize with initial MC of 14% was notsignificantly different for the two conditions. Landerset al. (1967) revealed that
A. flavus
growth on peanutswas much reduced in atmospheres of less than 5% O
2
,and almost completely inhibited at less than 1% O
2
.
Aspergillus penicillioides 92%
Eurotium chevalieri
7%
Other 1%
Aspergillus candidus 73%
Endomyces fibuliger
11%
Penicillium citrinum
6%
Others 10%
Penicillium citrinum
1%
Aspergillus flavus 1%
Others12%
Endomyces fibuliger 86%
A B C
Figure 1. Predominant and other fungal species on maize with moisture contents of (A) 14%, (B) 17% and(C) 20%.
Table 1. Mean of total fungal population, population of Aspergillus flavus and total aflatoxin B1 content of maizewith different initial moisture contents and stored for 6 months.
Moisture content (%)
Total fungal population (colonies/g)
Population of A. flavus (colonies/g)
Total aflatoxin B1 content (ppb)
14 8.1 × 10⁴ 1.5 × 10² 65
17 2.1 × 10⁶ 1.6 × 10⁴ 95
20 1.3 × 10⁶ 7.4 × 10² 79
Quality assurance in agricultural produce,edited by G.I. Johnson, Le Van To, Nguyen Duy Duc and M.C. Webb.
ACIAR Proceedings 100(printed version published in 2000)
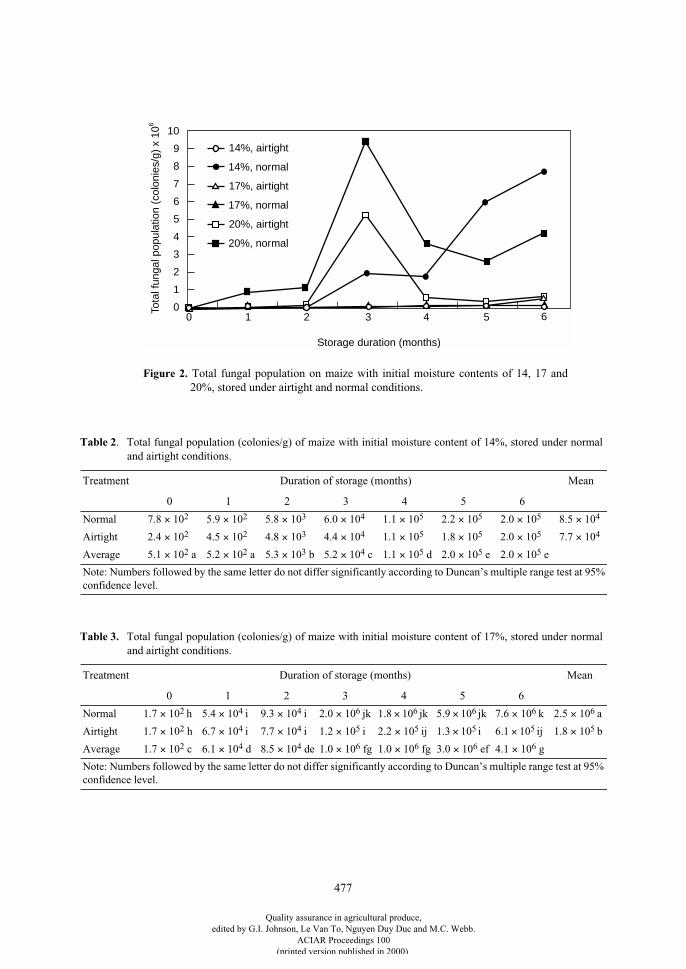
477
3
4
5
6
7
8
9
10
2
1
0Tota
l fun
gal p
opul
atio
n (c
olon
ies/
g) x
106
Storage duration (months)
14%, airtight
14%, normal
17%, airtight
17%, normal
20%, airtight
20%, normal
0 1 2 3 4 5 6
Figure 2. Total fungal population on maize with initial moisture contents of 14, 17 and20%, stored under airtight and normal conditions.
Table 2. Total fungal population (colonies/g) of maize with initial moisture content of 14%, stored under normaland airtight conditions.
Treatment Duration of storage (months) Mean
0 1 2 3 4 5 6
Normal 7.8 × 10² 5.9 × 10² 5.8 × 10³ 6.0 × 10⁴ 1.1 × 10⁵ 2.2 × 10⁵ 2.0 × 10⁵ 8.5 × 10⁴
Airtight 2.4 × 10² 4.5 × 10² 4.8 × 10³ 4.4 × 10⁴ 1.1 × 10⁵ 1.8 × 10⁵ 2.0 × 10⁵ 7.7 × 10⁴
Average 5.1 × 10² a 5.2 × 10² a 5.3 × 10³ b 5.2 × 10⁴ c 1.1 × 10⁵ d 2.0 × 10⁵ e 2.0 × 10⁵ e
Note: Numbers followed by the same letter do not differ significantly according to Duncan’s multiple range test at 95% confidence level.
Table 3. Total fungal population (colonies/g) of maize with initial moisture content of 17%, stored under normaland airtight conditions.
Treatment Duration of storage (months) Mean
0 1 2 3 4 5 6
Normal 1.7 × 10² h 5.4 × 10⁴ i 9.3 × 10⁴ i 2.0 × 10⁶ jk 1.8 × 10⁶ jk 5.9 × 10⁶ jk 7.6 × 10⁶ k 2.5 × 10⁶ a
Airtight 1.7 × 10² h 6.7 × 10⁴ i 7.7 × 10⁴ i 1.2 × 10⁵ i 2.2 × 10⁵ ij 1.3 × 10⁵ i 6.1 × 10⁵ ij 1.8 × 10⁵ b
Average 1.7 × 10² c 6.1 × 10⁴ d 8.5 × 10⁴ de 1.0 × 10⁶ fg 1.0 × 10⁶ fg 3.0 × 10⁶ ef 4.1 × 10⁶ g
Note: Numbers followed by the same letter do not differ significantly according to Duncan’s multiple range test at 95% confidence level.
Quality assurance in agricultural produce,edited by G.I. Johnson, Le Van To, Nguyen Duy Duc and M.C. Webb.
ACIAR Proceedings 100(printed version published in 2000)
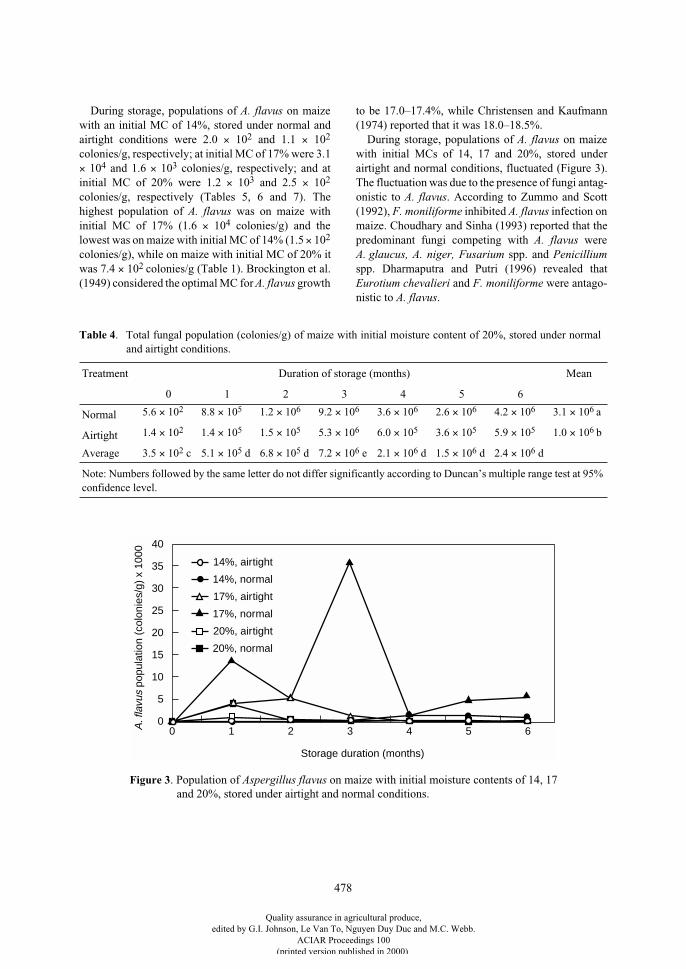
478
During storage, populations of A. flavus on maizewith an initial MC of 14%, stored under normal andairtight conditions were 2.0 × 10² and 1.1 × 10²
colonies/g, respectively; at initial MC of 17% were 3.1× 10⁴ and 1.6 × 10³ colonies/g, respectively; and atinitial MC of 20% were 1.2 × 10³ and 2.5 × 10²
colonies/g, respectively (Tables 5, 6 and 7). Thehighest population of A. flavus was on maize withinitial MC of 17% (1.6 × 10⁴ colonies/g) and thelowest was on maize with initial MC of 14% (1.5 × 10²
colonies/g), while on maize with initial MC of 20% itwas 7.4 × 10² colonies/g (Table 1). Brockington et al.(1949) considered the optimal MC for A. flavus growth
to be 17.0–17.4%, while Christensen and Kaufmann(1974) reported that it was 18.0–18.5%.
During storage, populations of A. flavus on maizewith initial MCs of 14, 17 and 20%, stored underairtight and normal conditions, fluctuated (Figure 3).The fluctuation was due to the presence of fungi antag-onistic to A. flavus. According to Zummo and Scott(1992), F. moniliforme inhibited A. flavus infection onmaize. Choudhary and Sinha (1993) reported that thepredominant fungi competing with A. flavus wereA. glaucus, A. niger, Fusarium spp. and Penicilliumspp. Dharmaputra and Putri (1996) revealed thatEurotium chevalieri and F. moniliforme were antago-nistic to A. flavus.
15
20
25
30
35
40
10
5
0A. f
lavu
s po
pula
tion
(col
onie
s/g)
x 1
000
0 1 2 3 4 5 6
Storage duration (months)
14%, airtight
14%, normal
17%, airtight
17%, normal
20%, airtight
20%, normal
Table 4. Total fungal population (colonies/g) of maize with initial moisture content of 20%, stored under normaland airtight conditions.
Treatment Duration of storage (months) Mean
0 1 2 3 4 5 6
Normal 5.6 × 10² 8.8 × 10⁵ 1.2 × 10⁶ 9.2 × 10⁶ 3.6 × 10⁶ 2.6 × 10⁶ 4.2 × 10⁶ 3.1 × 10⁶ a
Airtight 1.4 × 10² 1.4 × 10⁵ 1.5 × 10⁵ 5.3 × 10⁶ 6.0 × 10⁵ 3.6 × 10⁵ 5.9 × 10⁵ 1.0 × 10⁶ b
Average 3.5 × 10² c 5.1 × 10⁵ d 6.8 × 10⁵ d 7.2 × 10⁶ e 2.1 × 10⁶ d 1.5 × 10⁶ d 2.4 × 10⁶ d
Note: Numbers followed by the same letter do not differ significantly according to Duncan’s multiple range test at 95% confidence level.
Figure 3. Population of Aspergillus flavus on maize with initial moisture contents of 14, 17and 20%, stored under airtight and normal conditions.
Quality assurance in agricultural produce,edited by G.I. Johnson, Le Van To, Nguyen Duy Duc and M.C. Webb.
ACIAR Proceedings 100(printed version published in 2000)
479
Total aflatoxin B1 content
In this study, two kinds of aflatoxin were obtained,i.e. aflatoxin B1 and B2. Aflatoxin B2 was convertedinto aflatoxin B1, and calculated as total B1. Accordingto Heathcote and Hibbert (1978), aflatoxin B1 was themost acutely toxic of the first four aflatoxins to berecognised.
Based on the statistical analysis, O2 concentrationand storage duration gave very significant differencesin the total aflatoxin B1 content of maize with initialMCs of 14, 17 and 20%. Their interaction regardingmaize with initial MCs of 14 and 20% were signifi-cantly different, but did not give significantdifferences in maize with an initial MC of 17%.
During storage, the total aflatoxin B1 content onmaize with initial MCs of 14, 17 and 20%, storedunder airtight conditions was lower than that storedunder normal conditions. Wilson and Jay (1976)observed that aflatoxin accumulation was controlledeffectively under atmospheres of less than 1% O2. Fur-thermore, Wilson et al. (1977) reported that noaflatoxin was detected on maize with a MC of 18.8%stored under conditions of 14–15% CO2 and 0.5–1.0%O2 for 35 and 109 days, respectively, whereas acontrol sample stored in the air contained 472 ppb totalaflatoxin. The aflatoxin content of wheat stored in anatmosphere of 0.03% O2 was less than 1 ppb, while forthe control (air) it was more than 1,000 ppb (Fabbri etal. 1980). Landers et al. (1967) revealed that aflatoxinproduced by A. flavus on peanuts stored under airtight
Table 5. Population of Aspergillus flavus (colonies/g) of maize with initial moisture content of 14%, stored undernormal and airtight conditions.
Treatment Duration of storage (months) Mean
0 1 2 3 4 5 6
Normal 1.8 × 10² 4.8 × 10² 3.2 × 10² 2.3 × 10² 5.3 × 10 4.3 × 10 8.9 × 10 2.0 × 10²
Airtight 9.2 × 10 1.6 × 10² 1.9 × 10² 9.8 × 10 7.6 × 10 7.3 × 10 6.2 × 10 1.1 × 10²
Average 1.3 × 10² 3.2 × 10² 2.5 × 10² 1.7 × 10² 6.5 × 10 5.8 × 10 7.6 × 10
Table 6. Population of Aspergillus flavus (colonies/g) of maize with initial moisture content of 17%, stored undernormal and airtight conditions.
Treatment Duration of storage (months) Mean
0 1 2 3 4 5 6
Normal 5.6 × 10 f 1.4 × 10⁴ hi 5.0 × 10³ hi 3.6 × 10⁴ i 1.5 × 10⁵ j 4.6 × 10³ hi 5.7 × 10³ hi 3.1 × 10⁴ a
Airtight 1.9 × 10 f 3.8 × 10³ h 5.7 × 10³ hi 1.0 × 10³ g 3.2 × 10² g 4.5 × 10 f 3.2 × 10 f 1.6 × 10³ b
Average 3.7 × 10 c 9.0 × 10³ e 5.4 × 10³ e 1.9 × 10⁴ e 7.4 × 10⁴ e 2.3 × 10³ d 2.9 × 10³ f
Note: Numbers followed by the same letter do not differ significantly according to Duncan’s multiple range test at 95% confidence level.
Table 7. Population of Aspergillus flavus (colonies/g) of maize with initial moisture content of 20%, stored undernormal and airtight conditions.
Treatment Duration of storage (months) Mean
0 1 2 3 4 5 6
Normal 7.5 × 10 3.9 × 10³ 6.6 × 10² 1.6 × 10² 1.3 × 10³ 1.4 × 10³ 1.1 × 10³ 1.2 × 10³ a
Airtight 3.9 × 10 9.5 × 10² 9.9 × 10 3.9 × 10² 1.6 × 10² 1.0 × 10² 2.0 × 10 2.5 × 10² b
Average 5.7 × 10 cd 2.4 × 10³ e 3.8 × 10² cde 2.8 × 10² cd 7.5 × 10² de 7.3 × 10² cd 5.4 × 10² c
Note: Numbers followed by the same letter do not differ significantly according to Duncan’s multiple range test at 95% confidence level.
Quality assurance in agricultural produce,edited by G.I. Johnson, Le Van To, Nguyen Duy Duc and M.C. Webb.
ACIAR Proceedings 100(printed version published in 2000)
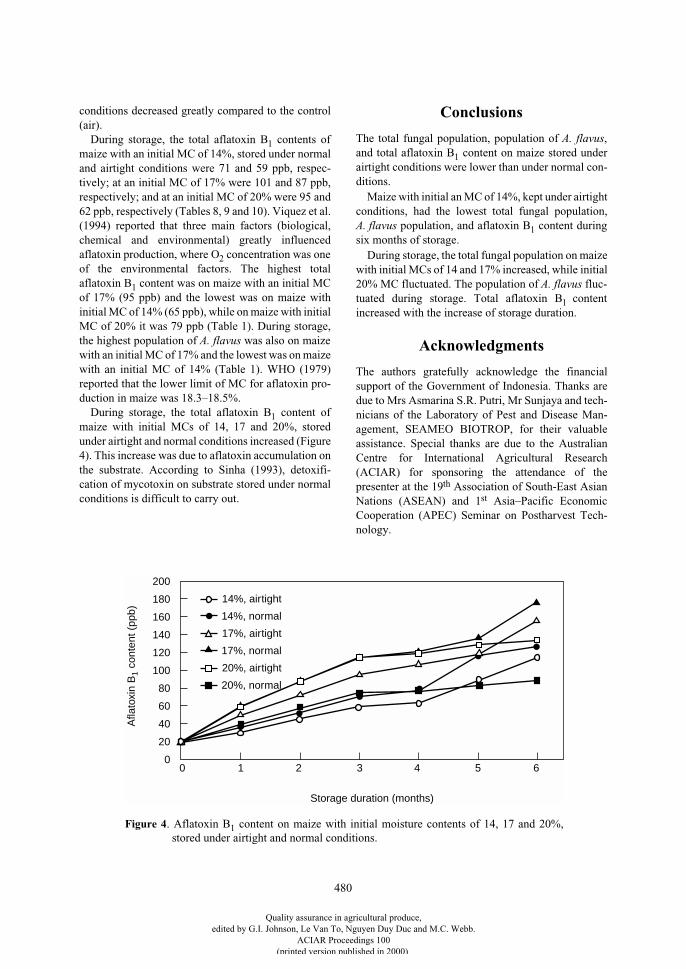
480
conditions decreased greatly compared to the control(air).
During storage, the total aflatoxin B1 contents ofmaize with an initial MC of 14%, stored under normaland airtight conditions were 71 and 59 ppb, respec-tively; at an initial MC of 17% were 101 and 87 ppb,respectively; and at an initial MC of 20% were 95 and62 ppb, respectively (Tables 8, 9 and 10). Viquez et al.(1994) reported that three main factors (biological,chemical and environmental) greatly influencedaflatoxin production, where O2 concentration was oneof the environmental factors. The highest totalaflatoxin B1 content was on maize with an initial MCof 17% (95 ppb) and the lowest was on maize withinitial MC of 14% (65 ppb), while on maize with initialMC of 20% it was 79 ppb (Table 1). During storage,the highest population of A. flavus was also on maizewith an initial MC of 17% and the lowest was on maizewith an initial MC of 14% (Table 1). WHO (1979)reported that the lower limit of MC for aflatoxin pro-duction in maize was 18.3–18.5%.
During storage, the total aflatoxin B1 content ofmaize with initial MCs of 14, 17 and 20%, storedunder airtight and normal conditions increased (Figure4). This increase was due to aflatoxin accumulation onthe substrate. According to Sinha (1993), detoxifi-cation of mycotoxin on substrate stored under normalconditions is difficult to carry out.
Conclusions
The total fungal population, population of A. flavus,and total aflatoxin B1 content on maize stored underairtight conditions were lower than under normal con-ditions.
Maize with initial an MC of 14%, kept under airtightconditions, had the lowest total fungal population,A. flavus population, and aflatoxin B1 content duringsix months of storage.
During storage, the total fungal population on maizewith initial MCs of 14 and 17% increased, while initial20% MC fluctuated. The population of A. flavus fluc-tuated during storage. Total aflatoxin B1 contentincreased with the increase of storage duration.
Acknowledgments
The authors gratefully acknowledge the financialsupport of the Government of Indonesia. Thanks aredue to Mrs Asmarina S.R. Putri, Mr Sunjaya and tech-nicians of the Laboratory of Pest and Disease Man-agement, SEAMEO BIOTROP, for their valuableassistance. Special thanks are due to the AustralianCentre for International Agricultural Research(ACIAR) for sponsoring the attendance of thepresenter at the 19th Association of South-East AsianNations (ASEAN) and 1st Asia–Pacific EconomicCooperation (APEC) Seminar on Postharvest Tech-nology.
Afla
toxi
n B
1 co
nten
t (pp
b)
0 1 2 3 4 5 6
Storage duration (months)
14%, airtight
14%, normal
17%, airtight
17%, normal
20%, airtight
20%, normal
0
20
40
60
80
100
120
140
160
180
200
Figure 4. Aflatoxin B1 content on maize with initial moisture contents of 14, 17 and 20%,stored under airtight and normal conditions.
Quality assurance in agricultural produce,edited by G.I. Johnson, Le Van To, Nguyen Duy Duc and M.C. Webb.
ACIAR Proceedings 100(printed version published in 2000)
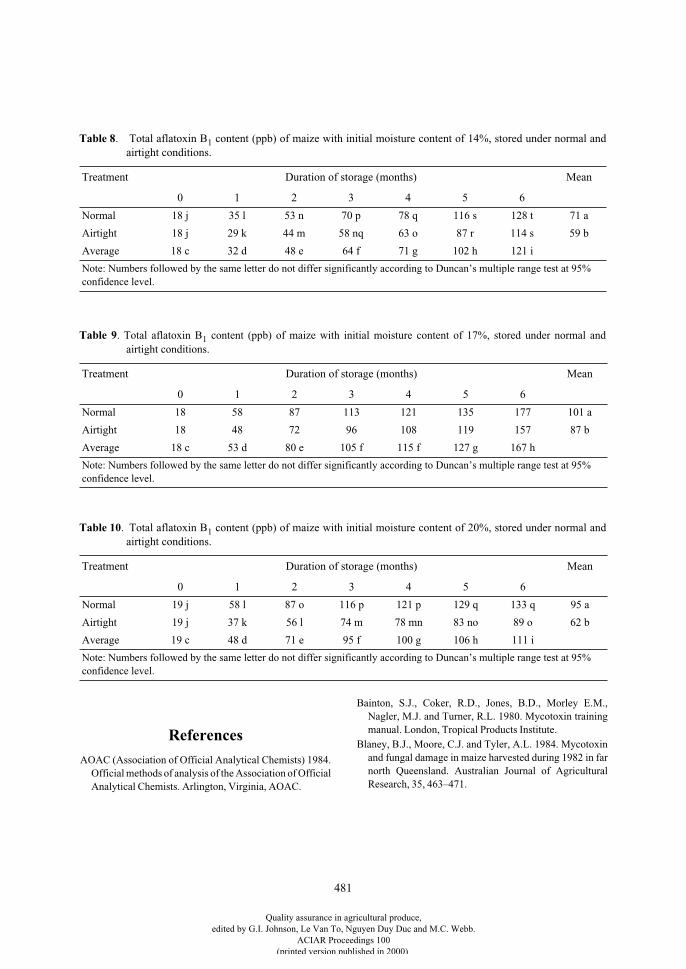
481
Table 8. Total aflatoxin B1 content (ppb) of maize with initial moisture content of 14%, stored under normal andairtight conditions.
Treatment Duration of storage (months) Mean
0 1 2 3 4 5 6
Normal 18 j 35 l 53 n 70 p 78 q 116 s 128 t 71 a
Airtight 18 j 29 k 44 m 58 nq 63 o 87 r 114 s 59 b
Average 18 c 32 d 48 e 64 f 71 g 102 h 121 i
Note: Numbers followed by the same letter do not differ significantly according to Duncan’s multiple range test at 95% confidence level.
Table 9. Total aflatoxin B1 content (ppb) of maize with initial moisture content of 17%, stored under normal andairtight conditions.
Treatment Duration of storage (months) Mean
0 1 2 3 4 5 6
Normal 18 58 87 113 121 135 177 101 a
Airtight 18 48 72 96 108 119 157 87 b
Average 18 c 53 d 80 e 105 f 115 f 127 g 167 h
Note: Numbers followed by the same letter do not differ significantly according to Duncan’s multiple range test at 95% confidence level.
Table 10. Total aflatoxin B1 content (ppb) of maize with initial moisture content of 20%, stored under normal andairtight conditions.
Treatment Duration of storage (months) Mean
0 1 2 3 4 5 6
Normal 19 j 58 l 87 o 116 p 121 p 129 q 133 q 95 a
Airtight 19 j 37 k 56 l 74 m 78 mn 83 no 89 o 62 b
Average 19 c 48 d 71 e 95 f 100 g 106 h 111 i
Note: Numbers followed by the same letter do not differ significantly according to Duncan’s multiple range test at 95% confidence level.
References
AOAC (Association of Official Analytical Chemists) 1984.Official methods of analysis of the Association of OfficialAnalytical Chemists. Arlington, Virginia, AOAC.
Bainton, S.J., Coker, R.D., Jones, B.D., Morley E.M.,Nagler, M.J. and Turner, R.L. 1980. Mycotoxin trainingmanual. London, Tropical Products Institute.
Blaney, B.J., Moore, C.J. and Tyler, A.L. 1984. Mycotoxinand fungal damage in maize harvested during 1982 in farnorth Queensland. Australian Journal of AgriculturalResearch, 35, 463–471.
Quality assurance in agricultural produce,edited by G.I. Johnson, Le Van To, Nguyen Duy Duc and M.C. Webb.
ACIAR Proceedings 100(printed version published in 2000)
482
Brockington, S.F., Dorin, H.C. and Howerton, H.K. 1949.Hygroscopic equilibria of whole kernel corn. CerealChemistry, 16, 166–173.
Choudhary, A.K. and Sinha, K.K. 1993. Competitionbetween a toxigenic Aspergillus flavus strain and otherfungi on stored maize kernels. Journal of Stored ProductResearch, 29, 75–80.
Christensen, C.M. and Kaufmann, H.H. 1974. Microflora.In: Christensen, C.M., ed., Storage of cereal grains andtheir products. American Association of CerealChemistry, 158–191.
Clarke, J.H. and Hill, S.T. 1981. Microfloras of moist barleyduring sealed storage in farm and laboratory silos.Transactions of the British Mycology Society, 77,557–565.
Dharmaputra, O.S., Retnowati, I. and Ambarwati, S. 1996.Aspergillus flavus and aflatoxin in maize and peanutcollected from different parts of the postharvest handlingchain. In: Nakase T. and Takeo, K., ed., Proceedings ofAsian International Mycological Congress ‘96, Chiba,Japan, 3–5 July 1996, 150 (Abstract).
Dharmaputra, O.S. and Putri, A.S.R. 1996. Antagonisticeffect of Eurotium chevalieri and Fusarium moniliformeto Aspergillus flavus in vitro. Internal report. Bogor,SEAMEO BIOTROP (in Indonesian).
Dutton, M.F. and Westlake, K. 1985. Occurrence ofmycotoxin in cereals and animal feedstuffs in Natal,South Africa. Journal of Association of OfficialAnalytical Chemists, 68, 839–842.
Fabbri, A.A., Fanelli, C., Serafini, M., Di Magio, D. andPirazzi, R. 1980. Aflatoxin production on wheat seedstored in air and nitrogen. Transactions of the BritishMycology Society, 74, 197–198.
Heathcote, J.G. and Hibbert, J.R. 1978. Aflatoxin: chemicaland biological aspects. New York, Elsevier Scientific.
Landers, K.E., Davis, N.D. and Diener, U.L. 1967. Influenceof atmospheric gases on aflatoxin production byAspergillus flavus in peanuts. Phytopathology, 57,1086–1090.
Magan, N. and Lacey, J. 1984. The effect of gas compositionand water activity on field and storage fungi and their
interactions. Transactions of the British MycologySociety, 82, 305–314.
Pitt, J.I. and Hocking A.D. 1997. Fungi and food spoilage.London, Blackie Academic and Professional.
Richard-Molard, D., Diawara, B. and Cahagnier, B. 1986.Susceptibility of cereal microflora to oxygen deficiencyand carbon dioxide concentration. In: Donahaye, E. andNavarro, S., ed., Proceedings of the 4th internationalworking conference on stored-product protection, TelAviv. Israel, Agricultural Research Organization, 85–92.
Sauer, D.B., Meronuck, R.A. and Christensen, C.M. 1992.Microflora. In: Sauer, D.B., ed., Storage of cereal grainsand their products. St. Paul, Minnesota, AmericanAssociation of Cereal Chemists, 313–340.
Sinha, K.K. 1993. Mycotoxins. Association of South-EastAsian Nations (ASEAN) Food Journal, 8, 87–93.
Viquez, O.M., Castell-Perez, M.E., Shelby, R.A. andBrown, G. 1994. Aflatoxin contamination in cornsamples due to environmental conditions, aflatoxin-producing strain and nutrient in grain grown in CostaRica. Journal of Agricultural Food Chemistry, 42,2552–2555.
Visconti, A. (ed.) 1998. New European Union regulation foraflatoxins in foodstuffs. Mycotoxicology Newsletter,4(2), 1.
WHO (World Health Organization) 1979. Mycotoxins.Geneva, World Health Organization, 126p.
Wilson, D.M. and Jay, E.G. 1976. Effect of controlledatmosphere storage on aflatoxin production in highmoisture peanuts. Journal of Stored Products Research,12, 97–100.
Wilson, D.M., Jay E.G., Hale, O.M. and Huang, L.H. 1977.Controlled atmosphere storage of high-moisture corn andpeanuts to control aflatoxin production. Annals deTechnologie Agricole, 26, 339–342.
Zummo, N. and Scott, G.E. 1992. Interaction of Fusariummoniliforme and Aspergillus flavus on kernel infectionand aflatoxin contamination in maize ears. Plant Disease,76, 771–773.
Quality assurance in agricultural produce,edited by G.I. Johnson, Le Van To, Nguyen Duy Duc and M.C. Webb.
ACIAR Proceedings 100(printed version published in 2000)
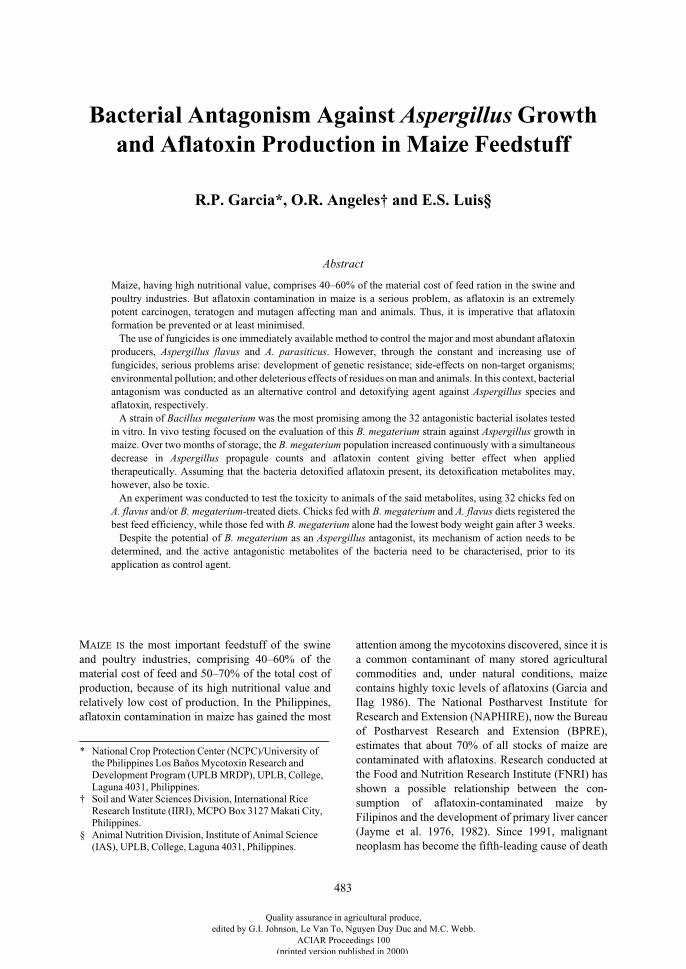
483
Bacterial Antagonism Against
Aspergillus
Growth and Aflatoxin Production in Maize Feedstuff
R.P. Garcia*, O.R. Angeles† and E.S. Luis§
Abstract
Maize, having high nutritional value, comprises 40–60% of the material cost of feed ration in the swine andpoultry industries. But aflatoxin contamination in maize is a serious problem, as aflatoxin is an extremelypotent carcinogen, teratogen and mutagen affecting man and animals. Thus, it is imperative that aflatoxinformation be prevented or at least minimised.
The use of fungicides is one immediately available method to control the major and most abundant aflatoxinproducers,
Aspergillus flavus
and
A. parasiticus
. However, through the constant and increasing use offungicides, serious problems arise: development of genetic resistance; side-effects on non-target organisms;environmental pollution; and other deleterious effects of residues on man and animals. In this context, bacterialantagonism was conducted as an alternative control and detoxifying agent against
Aspergillus
species andaflatoxin, respectively.
A strain of
Bacillus megaterium
was the most promising among the 32 antagonistic bacterial isolates testedin vitro. In vivo testing focused on the evaluation of this B. megaterium strain against Aspergillus growth inmaize. Over two months of storage, the B. megaterium population increased continuously with a simultaneousdecrease in Aspergillus propagule counts and aflatoxin content giving better effect when appliedtherapeutically. Assuming that the bacteria detoxified aflatoxin present, its detoxification metabolites may,however, also be toxic.
An experiment was conducted to test the toxicity to animals of the said metabolites, using 32 chicks fed onA. flavus and/or B. megaterium-treated diets. Chicks fed with B. megaterium and A. flavus diets registered thebest feed efficiency, while those fed with B. megaterium alone had the lowest body weight gain after 3 weeks.
Despite the potential of B. megaterium as an Aspergillus antagonist, its mechanism of action needs to bedetermined, and the active antagonistic metabolites of the bacteria need to be characterised, prior to itsapplication as control agent.
M
AIZE
IS
the most important feedstuff of the swineand poultry industries, comprising 40–60% of thematerial cost of feed and 50–70% of the total cost ofproduction, because of its high nutritional value andrelatively low cost of production. In the Philippines,aflatoxin contamination in maize has gained the most
attention among the mycotoxins discovered, since it isa common contaminant of many stored agriculturalcommodities and, under natural conditions, maizecontains highly toxic levels of aflatoxins (Garcia andIlag 1986). The National Postharvest Institute forResearch and Extension (NAPHIRE), now the Bureauof Postharvest Research and Extension (BPRE),estimates that about 70% of all stocks of maize arecontaminated with aflatoxins. Research conducted atthe Food and Nutrition Research Institute (FNRI) hasshown a possible relationship between the con-sumption of aflatoxin-contaminated maize byFilipinos and the development of primary liver cancer(Jayme et al. 1976, 1982). Since 1991, malignantneoplasm has become the fifth-leading cause of death
* National Crop Protection Center (NCPC)/University of the Philippines Los Baños Mycotoxin Research and Development Program (UPLB MRDP), UPLB, College, Laguna 4031, Philippines.
† Soil and Water Sciences Division, International Rice Research Institute (IIRI), MCPO Box 3127 Makati City, Philippines.
§ Animal Nutrition Division, Institute of Animal Science (IAS), UPLB, College, Laguna 4031, Philippines.
Quality assurance in agricultural produce,edited by G.I. Johnson, Le Van To, Nguyen Duy Duc and M.C. Webb.
ACIAR Proceedings 100(printed version published in 2000)
484
in the Philippines. There could be a link between thehigh incidence of cancer cases and the presence ofmycotoxins, particularly aflatoxins, in the diet.
Aflatoxin is an extremely potent carcinogen,teratogen and mutagen affecting man and animals. Inlivestock and poultry production, aflatoxin-associatedproblems are manifested in poor performance, such asdecreased efficiency in nutrient absorption and utili-sation, and immune system impairment that increasesthe susceptibility of the animals to various diseases. Ina pioneering extrapolation and mathematicalmodelling paper published by Lubulwa and Davis(1994), it was reported that aflatoxin contamination inmaize and peanuts incurred animal health losses ofA$78 million which were associated with loss of effi-ciency in animals, and death in some cases.
In this context, bacterial antagonism againstaflatoxin-forming fungi was explored as an alternativepreventive control agent. Bacterial application mayprove useful because, aside from their mycostaticpotential, they may have nutritive value in thefeedstuff and likewise thrive under normal conditionsof warehousing and storage. Hence, isolation,screening and identification of bacterial isolatescapable of inhibiting
Aspergillus
growth and detoxi-fying aflatoxin were conducted. To test the toxicity ofmost promising strain of
Bacillus megaterium
, anexperiment using broiler chicks fed with
B. mega-terium
-treated diets was carried out.Various preventive and control measures that will
inhibit the growth of
A. flavus
and destroy/detoxify theaflatoxin from contaminated products have beentested by some investigators in different countries.However, acceptable control measures/methodsshould meet the following criteria: wide-scale appli-cation; economically advantageous; effective; noadverse effects on the nutritive and aesthetic quality ofthe commodity; and no new toxic products formed.
Microbial degradation of toxin can be a means ofcontrolling aflatoxin in some food products. Ciegler(1975) reported that one bacterium,
Flavobacteriumauranticum
(NRRLB-184), can completely removeaflatoxin in contaminated milk, maize oil, peanutbutter and maize, and partially detoxify contaminatedsoybeans. Duckling tests showed that detoxification ofaflatoxin solutions by this organism was complete andno new toxic products were found. The same line ofstudies (e.g. Chintana et al. 1988; Lauzon 1992) usingother microorganisms followed, which further under-scores the possibility of employing this method.
Even if a particular microbial control approach hasbeen explored as a potential means to control
Aspergillus
infection and aflatoxin formation,questions regarding its effectiveness and safeness inapplication remain to be resolved.
Materials and Methods
Isolation, purification and screening of the bacterial isolates
Different feeds and maize samples were seriallydiluted and surface-plated on potato dextrose agar(PDA) plates. After 3–5 days of incubation at roomtemperature (29–33°C), bacterial colonies wereisolated and transferred to nutrient agar slants, using astandard purification procedure. The desired colonieswere picked and re-isolated on suitable agar slants.The inhibitory/antagonistic activity of bacterialisolates against
A. flavus
and
A. parasiticus
was deter-mined using filter paper disc assay (in vitro test).Bacterial isolates which exhibited a minimum zone ofinhibition of 70–80% compared to the positive (+Benlate) control plate were considered promising andmaintained/preserved for further study.
In vivo test of the most promising
B. megaterium
isolate
Of the promising antagonists selected in vitro,
B. megaterium
was further investigated for practicalapplication on small-scale storage of maize (in vivo).Only grain previously tested and found to be leastinfected with
Aspergillus
and negative for aflatoxincontent were used in this study. To test the protectiveeffect of the antagonist, the maize was treated with
B. megaterium
two days before
A. flavus
or
A. para-siticus
inoculation. In the therapeutic treatment, themaize was treated with
B. megaterium
two days after
A. flavus
or
A. parasiticus
inoculation. Controlsconsisted of non-inoculated maize with no
B. mega-terium
. The population levels of
Aspergillus
weredetermined by plating.
The aflatoxin content of the variously treated maizesamples was determined following the Wilson et al.(1976) extraction method and thin-layer chromatog-raphy (TLC) analysis set by the Association of OfficialAnalytical Chemists (AOAC). All treatments werecompletely randomised. Three replicates per treatmentwere made.
Quality assurance in agricultural produce,edited by G.I. Johnson, Le Van To, Nguyen Duy Duc and M.C. Webb.
ACIAR Proceedings 100(printed version published in 2000)
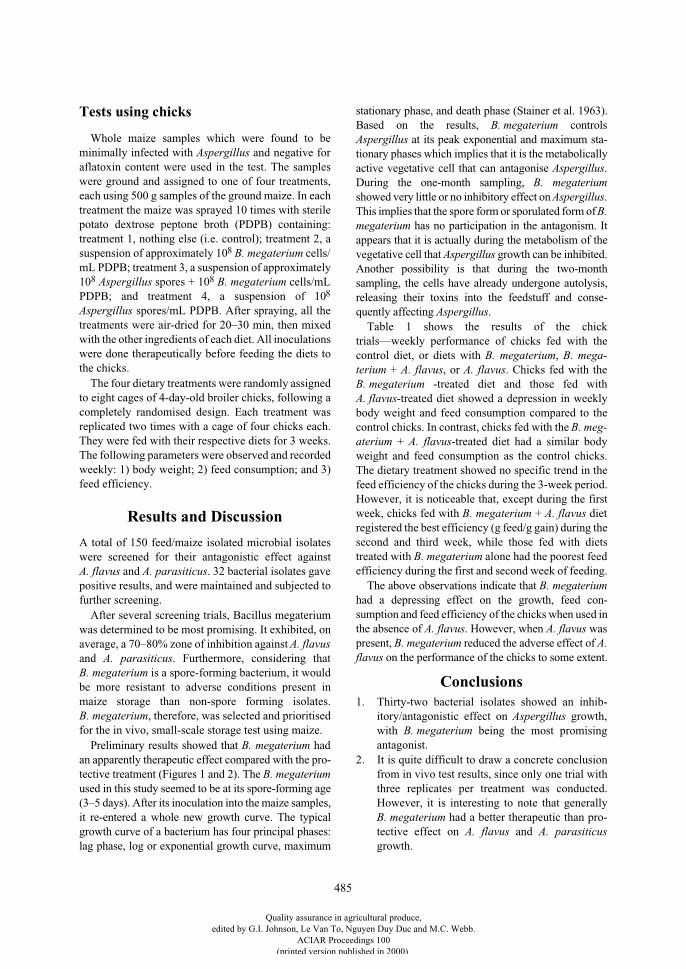
485
Tests using chicks
Whole maize samples which were found to beminimally infected with
Aspergillus
and negative foraflatoxin content were used in the test. The sampleswere ground and assigned to one of four treatments,each using 500 g samples of the ground maize. In eachtreatment the maize was sprayed 10 times with sterilepotato dextrose peptone broth (PDPB) containing:treatment 1, nothing else (i.e. control); treatment 2, asuspension of approximately 10
8
B. megaterium
cells/mL PDPB; treatment 3, a suspension of approximately10
8
Aspergillus
spores + 10
8
B. megaterium
cells/mLPDPB; and treatment 4, a suspension of 10
8
Aspergillus
spores/mL PDPB. After spraying, all thetreatments were air-dried for 20–30 min, then mixedwith the other ingredients of each diet. All inoculationswere done therapeutically before feeding the diets tothe chicks.
The four dietary treatments were randomly assignedto eight cages of 4-day-old broiler chicks, following acompletely randomised design. Each treatment wasreplicated two times with a cage of four chicks each.They were fed with their respective diets for 3 weeks.The following parameters were observed and recordedweekly: 1) body weight; 2) feed consumption; and 3)feed efficiency.
Results and Discussion
A total of 150 feed/maize isolated microbial isolateswere screened for their antagonistic effect against
A. flavus
and
A. parasiticus
. 32 bacterial isolates gavepositive results, and were maintained and subjected tofurther screening.
After several screening trials, Bacillus megateriumwas determined to be most promising. It exhibited, onaverage, a 70–80% zone of inhibition against
A. flavus
and
A. parasiticus
. Furthermore, considering that
B. megaterium
is a spore-forming bacterium, it wouldbe more resistant to adverse conditions present inmaize storage than non-spore forming isolates.
B. megaterium
, therefore, was selected and prioritisedfor the in vivo, small-scale storage test using maize.
Preliminary results showed that
B. megaterium
hadan apparently therapeutic effect compared with the pro-tective treatment (Figures 1 and 2). The
B. megaterium
used in this study seemed to be at its spore-forming age(3–5 days). After its inoculation into the maize samples,it re-entered a whole new growth curve. The typicalgrowth curve of a bacterium has four principal phases:lag phase, log or exponential growth curve, maximum
stationary phase, and death phase (Stainer et al. 1963).Based on the results,
B. megaterium
controls
Aspergillus
at its peak exponential and maximum sta-tionary phases which implies that it is the metabolicallyactive vegetative cell that can antagonise
Aspergillus
.During the one-month sampling,
B. megaterium
showed very little or no inhibitory effect on
Aspergillus
.This implies that the spore form or sporulated form of
B.megaterium
has no participation in the antagonism. Itappears that it is actually during the metabolism of thevegetative cell that
Aspergillus
growth can be inhibited.Another possibility is that during the two-monthsampling, the cells have already undergone autolysis,releasing their toxins into the feedstuff and conse-quently affecting
Aspergillus
.Table 1 shows the results of the chick
trials—weekly performance of chicks fed with thecontrol diet, or diets with
B. megaterium
,
B. mega-terium
+
A. flavus
, or
A. flavus
. Chicks fed with the
B. megaterium
-treated diet and those fed with
A. flavus
-treated diet showed a depression in weeklybody weight and feed consumption compared to thecontrol chicks. In contrast, chicks fed with the
B. meg-aterium
+
A. flavus
-treated diet had a similar bodyweight and feed consumption as the control chicks.The dietary treatment showed no specific trend in thefeed efficiency of the chicks during the 3-week period.However, it is noticeable that, except during the firstweek, chicks fed with
B. megaterium
+
A. flavus
dietregistered the best efficiency (g feed/g gain) during thesecond and third week, while those fed with dietstreated with
B. megaterium
alone had the poorest feedefficiency during the first and second week of feeding.
The above observations indicate that
B. megaterium
had a depressing effect on the growth, feed con-sumption and feed efficiency of the chicks when used inthe absence of
A. flavus
. However, when
A. flavus
waspresent,
B. megaterium
reduced the adverse effect of
A.flavus
on the performance of the chicks to some extent.
Conclusions
1. Thirty-two bacterial isolates showed an inhib-itory/antagonistic effect on
Aspergillus
growth,with
B. megaterium
being the most promisingantagonist.
2. It is quite difficult to draw a concrete conclusionfrom in vivo test results, since only one trial withthree replicates per treatment was conducted.However, it is interesting to note that generally
B. megaterium
had a better therapeutic than pro-tective effect on
A. flavus
and
A. parasiticus
growth.
Quality assurance in agricultural produce,edited by G.I. Johnson, Le Van To, Nguyen Duy Duc and M.C. Webb.
ACIAR Proceedings 100(printed version published in 2000)
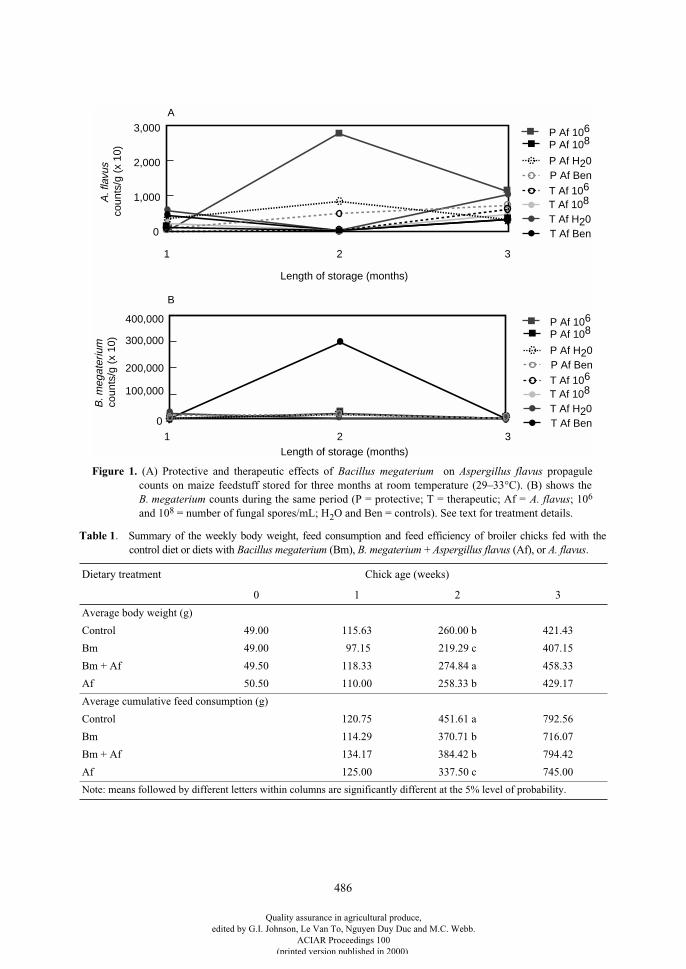
486
Table 1
. Summary of the weekly body weight, feed consumption and feed efficiency of broiler chicks fed with thecontrol diet or diets with
Bacillus megaterium
(Bm),
B. megaterium
+
Aspergillus
flavus
(Af), or
A. flavus
.
Dietary treatment Chick age (weeks)
0 1 2 3
Average body weight (g)
Control 49.00 115.63 260.00 b 421.43
Bm 49.00 97.15 219.29 c 407.15
Bm + Af 49.50 118.33 274.84 a 458.33
Af 50.50 110.00 258.33 b 429.17
Average cumulative feed consumption (g)
Control 120.75 451.61 a 792.56
Bm 114.29 370.71 b 716.07
Bm + Af 134.17 384.42 b 794.42
Af 125.00 337.50 c 745.00
Note: means followed by different letters within columns are significantly different at the 5% level of probability.
Figure 1. (A) Protective and therapeutic effects of Bacillus megaterium on Aspergillus flavus propagulecounts on maize feedstuff stored for three months at room temperature (29–33°C). (B) shows theB. megaterium counts during the same period (P = protective; T = therapeutic; Af = A. flavus; 106
and 108 = number of fungal spores/mL; H2O and Ben = controls). See text for treatment details.
T Af Ben
T Af 106
T Af H20
P Af BenP Af H20
T Af 108
P Af 108P Af 106
T Af Ben
T Af 106
T Af H20
P Af BenP Af H20
T Af 108
P Af 108P Af 106
Length of storage (months)
3,000
2,000
1,000
0
1 2 3
400,000
300,000
200,000
100,000
0
Length of storage (months)1 2 3
B. m
egat
eriu
m c
ount
s/g
(x 1
0)A
. fla
vus
cou
nts/
g (x
10)
A
B
Quality assurance in agricultural produce,edited by G.I. Johnson, Le Van To, Nguyen Duy Duc and M.C. Webb.
ACIAR Proceedings 100(printed version published in 2000)
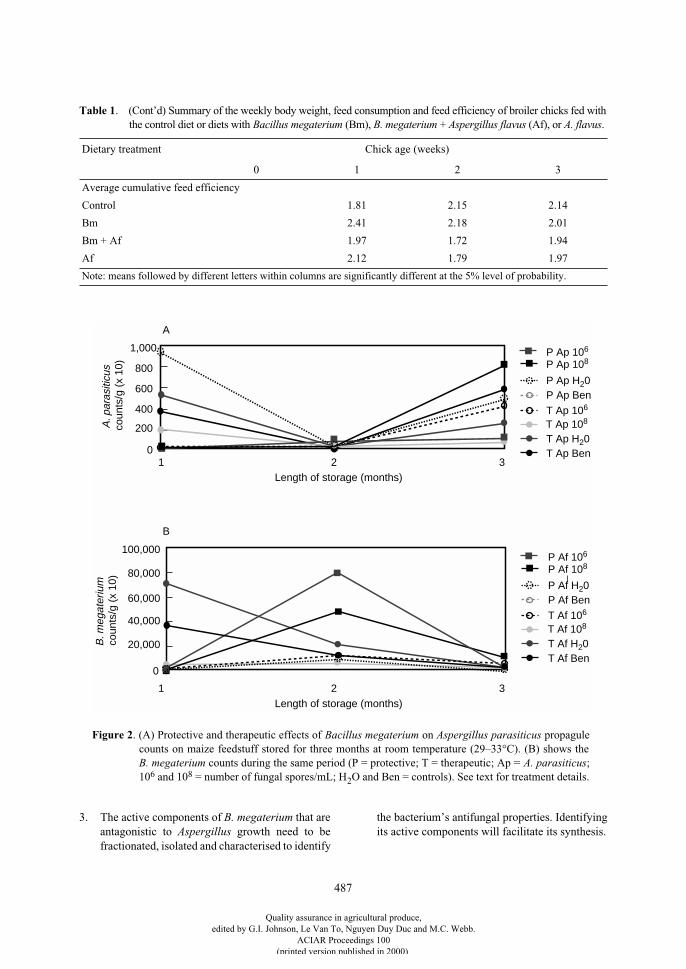
487
3. The active components of B. megaterium that areantagonistic to Aspergillus growth need to befractionated, isolated and characterised to identify
the bacterium’s antifungal properties. Identifyingits active components will facilitate its synthesis.
Average cumulative feed efficiency
Control 1.81 2.15 2.14
Bm 2.41 2.18 2.01
Bm + Af 1.97 1.72 1.94
Af 2.12 1.79 1.97
Table 1. (Cont’d) Summary of the weekly body weight, feed consumption and feed efficiency of broiler chicks fed withthe control diet or diets with Bacillus megaterium (Bm), B. megaterium + Aspergillus flavus (Af), or A. flavus.
Dietary treatment Chick age (weeks)
0 1 2 3
Note: means followed by different letters within columns are significantly different at the 5% level of probability.
T Ap Ben
T Ap 106
T Ap H20
P Ap BenP Ap H20
T Ap 108
P Ap 108P Ap 106
T Af Ben
T Af 106
T Af H20
P Af BenP Af H20
T Af 108
P Af 108P Af 106
Length of storage (months)1 2 3
Length of storage (months)1 2 3
1,000
800
600
400
200
0
100,000
80,000
60,000
40,000
20,000
0
B. m
egat
eriu
m c
ount
s/g
(x 1
0)A
. par
asiti
cus
cou
nts/
g (x
10)
A
B
Figure 2. (A) Protective and therapeutic effects of Bacillus megaterium on Aspergillus parasiticus propagulecounts on maize feedstuff stored for three months at room temperature (29–33°C). (B) shows theB. megaterium counts during the same period (P = protective; T = therapeutic; Ap = A. parasiticus;106 and 108 = number of fungal spores/mL; H2O and Ben = controls). See text for treatment details.
Quality assurance in agricultural produce,edited by G.I. Johnson, Le Van To, Nguyen Duy Duc and M.C. Webb.
ACIAR Proceedings 100(printed version published in 2000)
488
4. Bioassay tests are indispensable in biologicalcontrol agent evaluation. It is recommended thatusefulness and safeness of the most promisingantagonists should pass bioassay tests prior to useas control agents.
Acknowledgments
Research financial assistance by the PhilippineCouncil for Agriculture, Forestry, Natural ResourcesResearch and Development–Department of Scienceand Technology (PCCARD–DOST) is gratefullyacknowledged. The Australian Centre for Interna-tional Agricultural Research (ACIAR) is highly appre-ciated for providing financial support to present thispaper at the 19th ASEAN and 1st APEC PostharvestTechnology Seminar held at Ho Chi Minh City,Vietnam, 9–12 November 1999.
References
Chintana, C., Somsiri, S. and Unnop, O. 1988. Progressreport on: mycotoxins and their control in corn and inother cereals. Research report of the 19th Conference onThai National Corn and Sorghum. Bangkok, Departmentof Agricultural Extension, 88–89.
Ciegler, A. 1975. Mycotoxins: occurrence, chemistry,biological activity. Lloydia, 38, 21.
Garcia, R.P. and Ilag, L.L. 1986. Aflatoxins in the Philippines.Proceedings of the United States Agency for InternationalDevelopment–United National Development Programme
–International Maize and Wheat Improvement Centre(USAID – UNDP – CIMMYT) Aflatoxin Workshop,Mexico City, Mexico April 6–11.
Jayme, J.B., Almero, E.M. and Salamat, L.A. 1976.Epidemiology of primary liver cancer in the Philippineswith special considerations of a possible aflatoxin factor.Journal of the Philippines Medical Association, 52,129–150.
Jayme, J.B., Almero, J.E.M., Castro, M.C.A., Jardaleza,M.T.R. and Salamat, L.A. 1982. A case control dietarystudy of primary liver cancer risk from aflatoxinexposure. International Journal of Epidemiology, 11,112–119.
Lauzon, R.D. 1992. Control of Aspergillus parasiticus byCladosporium fulvum in rice and corn. PhD dissertation,Food Science, University of the Philippines at Los Baños.
Lubulwa, A.S.G. and Davis, J.S. 1994. Estimating the socialcosts of the impacts of fungi and aflatoxins in maize andpeanuts. In: Highley, E., Wright, E.J., Banks, H.J. andChamp, B.R., ed., Stored product protection. Proceedingsof the 6th international working conference in stored-product protection, Volume 2. Wallingford, CABInternational, 1017–1042.
Stainer, R.V., Doudoroff, M. and Adelberg, E.A. 1963.General microbiology. London, MacMillan andCompany Limited.
Wilson, D.M., Tabor, W.H. and Trucksess, M.W. 1976.Screening method for the detection of aflatoxins,ochratoxin, zearalenone, penicillic acid, and citrinin.Journal of the Association of Official AnalyticalChemists (AOAC), 59, 125–127.
Quality assurance in agricultural produce,edited by G.I. Johnson, Le Van To, Nguyen Duy Duc and M.C. Webb.
ACIAR Proceedings 100(printed version published in 2000)
489
Sustaining the Development of the Grains Industry through Standardisation: the Philippine Experience
E.A. Jarcia, C.C. Mangaoang and R.L. Sampang*
Abstract
The effective implementation of national grains standards, notably for the major staples of rice and maize, isthe key factor in the evolution of a dynamic, progressive and globally competitive grains industry, particularlyamong developing countries. Standardisation efforts in the grains industry, along with similar efforts in allother sectors of the economy, gain critical significance in modernising the industry and agriculture sectors asthe Philippines gears up for the challenges and opportunities of globalisation in the 21
st
century.This paper presents the Philippine experience in pursuing its national grains standardisation program. It
highlights the strategies and significant achievements, as well as constraints and prospects of the program,nearly three years after its launch. It also underscores the prospects of promoting harmonisation of the nationalgrains standards with prevailing international standards toward enhancing trade and economic cooperationamong countries in the Association of South-East Asian Nations (ASEAN) and Asia–Pacific regions.
S
TANDARDISATION
plays a vital role in the socioeco-nomic, cultural and technological development ofcountries and peoples worldwide. Advances in theproduction, trade and utilisation of various productsand services, in agriculture and industry, and in prac-tically all sectors of the economy and society, havebeen made possible over the years by the extensiveapplication of certain sets of national or internationalstandards on quality, quantity and safety, amongothers. As the level of standardisation varies amongcountries, it provides an indication of the developmentstatus and potential of a given country.
The extensive application of national standards as adevelopment tool has enabled developed andadvanced economies to attain their status. But ascountries worldwide gear up for globalisation, whereattaining international competitiveness is the bottomline, it has become crucial for developing countrieslike the Philippines and the rest of the countries in theAssociation of South-East Asian Nations (ASEAN)and Asia–Pacific regions to pursue standardisation inall sectors of the economy. Participation in interna-tional markets requires relatively sophisticatedmarketing, information and transport networks. Suc-
cessful competition requires quality control andproduct standardisation. National standards areintegral components of the country’s food controlsystem which safeguards the integrity of domestic andinternational trade. The development of the Philippineagriculture sector, as in many less-developed coun-tries, has been hampered (among other factors) by thelack or limited application of standards and codes ofpractice in the production–consumption continuum ofagricultural products.
Thus, the effective implementation of nationalgrains standards, notably for the major staples of riceand maize, is the key factor in the evolution of thedynamic, progressive and globally competitive grainsindustry, in the Philippines and other developing coun-tries. Standardisation efforts in the grains industry,along with similar efforts in all other sectors of theeconomy, are critical to the success of the agriculturalmodernisation agenda of the government in responseto the challenges and opportunities of globalisation inthe 21
st
century. The National Food Authority (NFA),in line with its mandate to promote the integratedgrowth and development of the grains industry,initiated the national grains standardisation program in1996. The implementation of the program has beengiven further impetus by the recent enactment of the* Technology Resource Development Department,
National Food Authority, Quezon City, Philippines.
Quality assurance in agricultural produce,edited by G.I. Johnson, Le Van To, Nguyen Duy Duc and M.C. Webb.
ACIAR Proceedings 100(printed version published in 2000)
490
Agriculture and Fisheries Modernization Act (AFMA)which provided for (among other issues) the creationof an agency to oversee the standardisation of agricul-tural and fisheries products in coordination with otherconcerned agencies and institutions.
This paper presents an overview of the Philippineexperience in pursuing its national grains standardi-sation program, highlighting, among other aspects, thestrategies and significant achievements, as well asconstraints and prospects of the program, nearly threeyears after its launch. It also underscores the prospectsof pursuing standards harmonisation as one of thepossible areas for collaboration towards enhancingglobal trade and economic cooperation amongcountries in the ASEAN and Asia–Pacific regions.
The Grains Industry Situation and Standardisation
The Philippine rice and maize industry, morecommonly known as the grains industry, is a vitalsector of the economy, accounting for about 3.4% ofthe gross national product and providing livelihood,directly or indirectly, to about 70% of the population,about 4.1 million of which are rice and maize farmers.As rice is a staple food to about 85% of the population,it constitutes 23.2% of the food basket while maize,eaten by 15% of the population, constitutes about2.4% of the food basket. Per capita consumption ofrice ranges from 92 kg to 103 kg per year, while dailynational consumption was estimated at 22,000 t in1998.
Aside from the farmers and the consumers, thegrains industry is also composed of some 120,000grains businessmen engaged mainly in the processing,storage, wholesaling and retailing of rice and maize,and other related business activities. These economicactivities are under the regulatory function of the NFAthrough registration and licensing, as well asenforcement of pertinent rules and regulation ongrains business.
Typical of any developing economy which has tocontend with ensuring the supply and affordability ofgrain food for its increasing population, regardless ofwhether the products strictly conform with thenational standards, serious efforts to introduce andpromote standardisation in the grains industry beganonly in recent years. Notions of ‘standards’ on ricequality and local terminology used among producers,traders and consumers were quite diverse, parochialand simple. Rice quality preferences are influenced or
dictated to a varying extent by regional cultural differ-ences, personal idiosyncrasies and the socioeconomicstatus of the people. For instance, white or well-milledrice (
maputi
) with desirable cooking qualities (i.e.
mabango
) is generally preferred to the more nutritiousregular milled or under-milled rice. Among lowincome groups, aged rice (
laon
) is preferred, and insome remote rural areas, bahai or rice with a high pro-portion of discoloured or yellow kernels is alsoacceptable. Premium or export quality rice with a highhead rice to brokens ratio, along with fancy oraromatic rice types, are preferred by the upscalemarkets. Despite the official adoption of the metricsystem, the volumetric method of selling rice using theganta (
salop
) and chupas is still practiced in some ruralareas.
In the absence of a concerted effort to introducestandardisation, the basis for the supply or sale of riceby the producers, processors and traders, and theacceptance of same by the buyers or consumers islargely arbitrary, has depended on the demand orspecial preference for a given product. This situationoften perpetuates confusion and misinformationamong market-players, including regulatory author-ities, that results in unfair trade practices such asmislabelling, short-selling, and price manipulation,specially in time of shortages. On the part of the pro-ducers, this state of affairs has not provided them withenough motivation to modernise or invest in moderngrain processing and marketing facilities, despite thelifting of price control in recent years, as a result of thederegulation and economic liberalisation policies ofthe government.
Introducing innovations in the grains industry
Given the scenario described above, the progress ofstandardisation in the grains industry and the agri-culture sector at large has been rather slow comparedto other sectors of the economy, such as the electronicand manufacturing industries. But with the increasingnational focus on agricultural modernisation in recentyears as the key to achieving and sustaining foodsecurity and national development in the 21
st
century,the need to intensify national grains standardisationefforts has become more prominent.
Initial efforts to introduce standardisation in thelocal rice markets began in the mid-1990s, when agroup of NFA middle-level executives conducted apilot advocacy project among millers, retailers,consumers and students on the adoption of rice grades
Quality assurance in agricultural produce,edited by G.I. Johnson, Le Van To, Nguyen Duy Duc and M.C. Webb.
ACIAR Proceedings 100(printed version published in 2000)
491
and standards in selected Davao markets in Mindanao.The activity was part of their productivityimprovement plan as participants in a seminar–workshop on the Productivity Management andDevelopment Program. The promising results of thisactivity in terms of generating enthusiastic supportfrom targeted stakeholders and the prospects of insti-tuting reforms and innovations in the grains market ledto the nationwide implementation of a grains standard-isation program starting in the latter part of 1996, insupport of the grains production enhancementprograms of the government.
Philippine Grains Standardization Program
The Philippine Grains Standardization Program is amulti-sectoral effort spearheaded by the NFA thataims to effectively implement or institutionalise thenational standards in the grains industry through con-tinuing advocacy, enforcement and monitoring activ-ities among grains farmers, millers, traders or retailersand the general consuming public. The NFA, by virtueof Presidential Decree No. 4 and Republic Act 7394(Consumers Act of the Philippines) is mandated toestablish and enforce the national grains standards incollaboration with various sectors.
The program consists of two major project compo-nents, namely: Grains Standards Implementation andGrains Standards Revision. The grains standardsimplementation project involves the implementationof existing national standards for paddy, milled rice,maize and maize grits. These standards are set ofofficial rules prescribing standard specifications on thequality (grade), packaging, and labelling, as well astests and analysis for a given commodity. The featuresof these national standards are summarised in Table 1.On the other hand, the grains standards revisionproject is concerned with the review and update of theexisting standards to conform with recent develop-ments in technology and marketing, through an inter-agency, national technical committee organised andled by the NFA.
Program strategies and activities
In implementing the program, the NFA pursued thefollowing strategies and activities.
Creation of program management structures
Project management committees were organised atthe national, regional and provincial offices of theNFA nationwide. This ensured proper coordination inthe planning and execution of the various projects andactivities between the NFA and its cooperators fromthe public and private sectors.
Forging of public and private sector partnership
Memorandums of agreement (MOAs) between theNFA and various program cooperators were executedat the national and local levels to ensure broad, multi-sectoral support in institutionalising the program.Public and private sector cooperators who are signa-tories of the MOAs include: grains industrystakeholders associations (farmers, millers/proc-essors, retailers); national government agencies(NGAs), such as those in the agriculture education,and trade sectors; local government units (LGUs); andother private organisations such as the media, con-sumers, and agri-machinery and sack manufacturers.
Continuing advocacy, enforcement and monitoring activities
These ensure broad support and cooperation fromall concerned sectors, especially the stakeholders. Theconduct of briefings, workshops and media advocacyhave been made part of the regular program activities,including the establishment of Philippine GrainsStandardization Program showcase markets in allprovinces and municipalities.
Annual celebration of National Grains Industry Week (September 20–26)
Presidential Proclamation 1058 mandates thisannual celebration which coincides with the foundinganniversary of NFA, and serves as the occasion forhighlighting the significance of standardisation andthe grains industry in national development, andgiving recognition to outstanding achievers amongprogram implementers and cooperators through thePhilippine Grains Standardisation AchievementAward. The award has been institutionalised to be ableto build up and sustain broad sectoral support for theprogram.
Program review and evaluation
The progress of program implementation isreviewed and evaluated annually, based on theapproved medium-term strategic action plan.
Quality assurance in agricultural produce,edited by G.I. Johnson, Le Van To, Nguyen Duy Duc and M.C. Webb.
ACIAR Proceedings 100(printed version published in 2000)
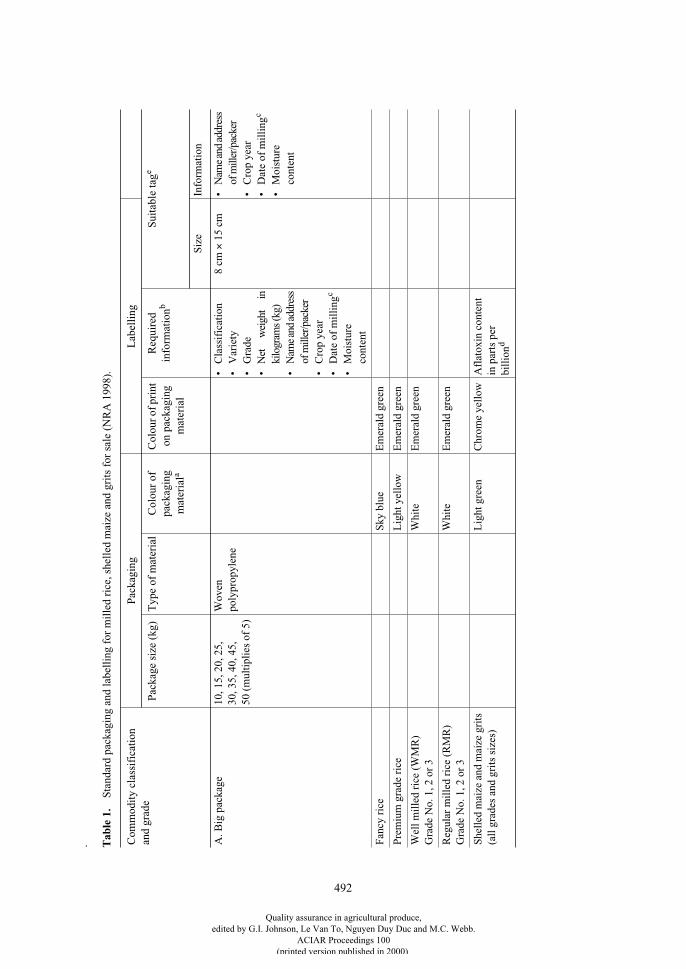
492
.
Tab
le 1
.
S
tand
ard
pack
agin
g an
d la
bell
ing
for
mil
led
rice
, she
lled
mai
ze a
nd g
rits
for
sal
e (N
RA
199
8).
Com
mod
ity
clas
sifi
cati
on
and
grad
eP
acka
ging
Lab
elli
ng
Pac
kage
siz
e (k
g)T
ype
of m
ater
ial
Col
our
of
pack
agin
g m
ater
ial
a
Col
our o
f pri
nt
on p
acka
ging
m
ater
ial
Req
uire
d in
form
atio
n
b
Sui
tabl
e ta
g
e
Siz
eIn
form
atio
n
A. B
ig p
acka
ge10
, 15,
20,
25,
30
, 35,
40,
45,
50
(m
ulti
plie
s of
5)
Wov
en
poly
prop
ylen
e•
Cla
ssif
icat
ion
•V
arie
ty•
Gra
de•
Net
w
eigh
t in
kilo
gram
s (k
g)•
Nam
e an
d ad
dres
sof
mill
er/p
acke
r•
Cro
p ye
ar•
Dat
e of
mil
ling
c
•M
oist
ure
cont
ent
8 cm
×
15
cm•
Nam
e an
d ad
dres
sof
mill
er/p
acke
r•
Cro
p ye
ar•
Dat
e of
mil
ling
c
•M
oist
ure
cont
ent
Fan
cy r
ice
Sky
blu
eE
mer
ald
gree
n
Pre
miu
m g
rade
ric
eL
ight
yel
low
Em
eral
d gr
een
Wel
l mil
led
rice
(W
MR
)G
rade
No.
1, 2
or
3W
hite
Em
eral
d gr
een
Reg
ular
mil
led
rice
(R
MR
) G
rade
No.
1, 2
or
3W
hite
Em
eral
d gr
een
She
lled
mai
ze a
nd m
aize
gri
ts
(all
gra
des
and
grit
s si
zes)
Lig
ht g
reen
Chr
ome
yell
owA
flat
oxin
con
tent
in
par
ts p
er
bill
ion
d
Quality assurance in agricultural produce,edited by G.I. Johnson, Le Van To, Nguyen Duy Duc and M.C. Webb.
ACIAR Proceedings 100(printed version published in 2000)
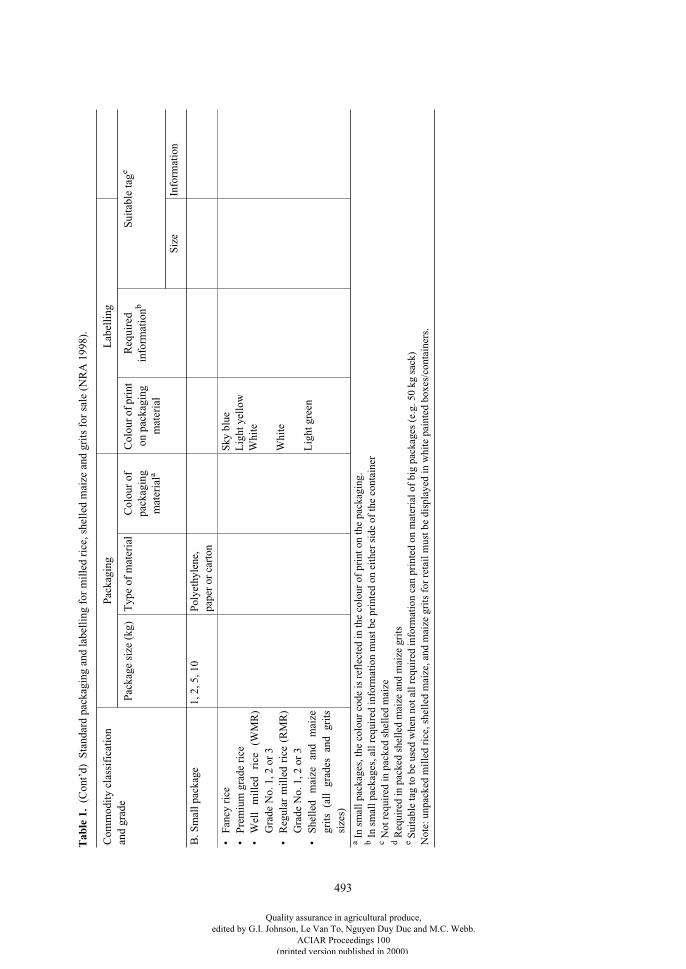
493
B. S
mal
l pac
kage
1, 2
, 5, 1
0P
olye
thyl
ene,
pa
per
or c
arto
n
•F
ancy
ric
e•
Pre
miu
m g
rade
ric
e•
Wel
l m
ille
d ri
ce
(WM
R)
Gra
de N
o. 1
, 2 o
r 3
•R
egul
ar m
ille
d ri
ce (
RM
R)
Gra
de N
o. 1
, 2 o
r 3
•S
hell
ed
mai
ze
and
mai
zegr
its
(all
gra
des
and
grit
ssi
zes)
Sky
blu
eL
ight
yel
low
Whi
te
Whi
te
Lig
ht g
reen
a
In
smal
l pac
kage
s, th
e co
lour
cod
e is
ref
lect
ed in
the
colo
ur o
f pr
int o
n th
e pa
ckag
ing.
b
In
smal
l pac
kage
s, a
ll r
equi
red
info
rmat
ion
mus
t be
prin
ted
on e
ithe
r si
de o
f th
e co
ntai
ner
c
Not
req
uire
d in
pac
ked
shel
led
mai
ze
d
Req
uire
d in
pac
ked
shel
led
mai
ze a
nd m
aize
gri
ts
e
Sui
tabl
e ta
g to
be
used
whe
n no
t all
req
uire
d in
form
atio
n ca
n pr
inte
d on
mat
eria
l of
big
pack
ages
(e.
g. 5
0 kg
sac
k)N
ote:
unp
acke
d m
ille
d ri
ce, s
hell
ed m
aize
, and
mai
ze g
rits
for
ret
ail m
ust b
e di
spla
yed
in w
hite
pai
nted
box
es/c
onta
iner
s.
Tab
le 1
.
(C
ont’
d) S
tand
ard
pack
agin
g an
d la
bell
ing
for
mil
led
rice
, she
lled
mai
ze a
nd g
rits
for
sal
e (N
RA
199
8).
Com
mod
ity
clas
sifi
cati
on
and
grad
eP
acka
ging
Lab
elli
ng
Pac
kage
siz
e (k
g)T
ype
of m
ater
ial
Col
our
of
pack
agin
g m
ater
ial
a
Col
our o
f pri
nt
on p
acka
ging
m
ater
ial
Req
uire
d in
form
atio
n
b
Sui
tabl
e ta
g
e
Siz
eIn
form
atio
n
Quality assurance in agricultural produce,edited by G.I. Johnson, Le Van To, Nguyen Duy Duc and M.C. Webb.
ACIAR Proceedings 100(printed version published in 2000)
494
Impact of Standardisation on the Industry
As a result of the continuing multi-sectoral efforts toimplement the program nationwide, the stage has beenset for the long-envisioned modernisation of the grainsindustry. While the implementation has alreadycovered all the provinces and cities, it is graduallyspreading to the surrounding rural areas of theprovinces and urban centres. The grains sections ofmajor urban and suburban markets—particularlyshowcase markets in these areas—are now marked byorder, transparency and improved observance of basicsanitation and hygiene. Colour-coded price tags andcontainers/sacks for various grades of rice and maizeproducts—complete with the prescribed product infor-mation, along with signboards and boxes, havebecome common features of these markets. This is aclear indication that standardisation effectively servesas a catalyst for instituting reforms and infusingdynamism in the industry. There is also a gradualtransformation in orientation and values of theindustry and its key players from being traditional andparochial to more socially-responsive, competitiveand forward-looking economic entities.
As the prime-mover of the grains industry thatshould thrive under a free-market environment, theNFA for its part, was able to harness standardisation asa strategic tool for modernising the industry, particu-larly in the pursuit of developmental regulation. It hasenabled the NFA to rationalise its domestic and inter-national marketing policies and operations, includingthe integration of ‘clean and green’ concepts in qualityassurance systems for maintaining the country’sbuffer-stocks. The agency also initiated other inno-vative programs, such as those on electronic grainsmarketing and facility modernisation, as part of itsindirect market intervention activities on grainsindustry development.
Consumers
The implementation of the national grains standardsensured the protection of consumers against unfairtrade practices such as short-weighing, mislabellingand price manipulation, among others. It helpedminimise confusion brought about by numerous localrice and maize varieties classified or labelled atrandom, and retailed under an equally confusingpricing system in the market. More importantly, thisprovided them with opportunities to exercise theirpower of choice and enjoy real value for their money
that helps advance the cause of consumerismworldwide.
Retailers
The implementation of the program in the retailingsubsector served as the ‘show-window’ for the initialmodest gains of the program, providing the neededimpact on the grains industry and public at large. Thesupport and cooperation extended by the retailersgreatly complemented the enforcement activities ofNFA. The strict adherence and compliance of theretailers to the set standards on quality, labelling andpackaging compelled millers and processors tolikewise comply with the same prescribed standards.The ultimate result was a relatively stable supply andmulti-tiered pricing of rice and maize that enabledretailers to optimise their profit while providingconsumers with a wide array of affordable, competi-tively priced products.
Millers/Processors
Grains standardisation opened a wide door ofopportunity for higher returns on the processing andtrading activities of the grain milling/processing sub-sector. The same premium grade paddy procured andgraded in highly efficient milling facilities produceshigher-priced rice intended for the upscale markets.The cost of upgrading facilities is eventually compen-sated by higher returns. Essentially, standardisationprovided the grain-processing sector with theincentive to invest in modern, highly efficientprocessing facilities and equipment that will enablethem to offer quality, but affordable, rice due to aneventual reduction in operating costs. The adoption ofInternational Standards Organisation (ISO) standardsby more advanced processing enterprises will enablethem to develop a market niche for their premiumproducts in both the local and export markets.
Farmer-producers
Although the immediate impact of the program maynot be actually felt or enjoyed by the farmer-pro-ducers, they could ultimately benefit fromstandardisation. The increasing demand for higherpriced, premium-grade paddy could motivate them toadopt improved production and postproduction tech-nologies. Farmer-cooperatives with capability to milland trade their paddy produce would also be able tooptimise their returns.
Quality assurance in agricultural produce,edited by G.I. Johnson, Le Van To, Nguyen Duy Duc and M.C. Webb.
ACIAR Proceedings 100(printed version published in 2000)
495
Constraints and Prospects for Standardisation Efforts
Although the local grains marketing landscape hasconsiderably improved through the initial gains ofstandardisation efforts, there are still underlying con-straints that must be addressed so that the success ofthe program can be sustained. The implementation ofthe strategic action plan is constrained by a lack offinancial and logistical resources for: undertakingmassive advocacy activities; upgrading or expandingexisting grain postharvest and laboratory facilities,such as those for grain quality and mycotoxin analysis;and drying and milling facilities of the private sector.There is also a need to further strengthen institutionalcapabilities and collaboration in the conduct ofresearch and development (R&D), advocacy/extension, and enforcement activities in the entiregrains production and postproduction system. Thereare also technical, policy and operational issues, suchas the attainability and practicality of the standards toensure acceptance in both the domestic and interna-tional markets.
Existing mechanisms and institutional arrange-ments for addressing the foregoing constraints arebeing actively pursued by the NFA. Program man-agement is being strengthened and more focus is beinggiven to advocacy and enforcement activities amongthe millers and processors whose active cooperation iscritical to the success and sustainability of theprogram. Institutional linkages with program cooper-ators are being strengthened at the national and locallevels so that, with the complementation and sharingof physical and human resources, the effective imple-mentation of various program activities is ensured.The establishment of the Philippine Corn MycotoxinNetwork and the Philippine Rice Postproduction Con-sortium, for instance, provides the NFA withopportunities for pursuing collaboration and net-working with local and international R&D institutionsand funding agencies to support the program and othergrains industry initiatives of the NFA.
Prospects of standards harmonisation
With the anticipated globalisation of trade in riceand maize in the 21
st
century, as World Trade Organ-
ization member countries open up their economies, theprospect of eventually harmonising nationalstandards, along with other agriculture and industrialproducts, has become inevitable. In fact, this is one ofthe principal considerations in the continuing processof updating or revising existing national standards.However, given that the peculiarities and uniquenessof the national standards of a given country (e.g. in theASEAN region) make full harmonisation difficult, ifnot impossible, the equivalency of standards withinthe region could be explored. This would helpminimise trade disputes and enhance trade andeconomic cooperation among countries in the ASEANand Asia–Pacific regions. The adoption of ISOstandards series in local integrated rice processing andmarketing would also be a strategic step towardsenhancing the competitiveness of the local grainsindustry and its integration in the global economy.
Conclusion and Recommendation
Standardisation, as demonstrated by the Philippineexperience, is a strategic development tool for mod-ernising the grains industry as developing countriesgear up for globalisation. The success of pursuingsimilar efforts in other countries would depend largelyon socio-cultural considerations, receptivity to changeof industry players, and strong public and privatesector partnership. As an integral part of the foodcontrol system of countries worldwide, the harmoni-sation of national standards for grains, as in otherproducts and services, would be a great opportunity forstrengthening trade and economic cooperation amongcountries in the ASEAN and Asia–Pacific regionsunder an emerging free-market global economy in the21
st
century. It is recommended that harmonisation ofnational standards for grains be actively pursued as acomponent of the trade and economic agenda in futureASEAN and Asia–Pacific Economic Cooperation(APEC) forums.
Reference
NFA (National Food Authority) 1998. Primer on Philippinegrains standardization program. Quezon City, NationalFood Authority, 40p.
Quality assurance in agricultural produce,edited by G.I. Johnson, Le Van To, Nguyen Duy Duc and M.C. Webb.
ACIAR Proceedings 100(printed version published in 2000)
496
Monitoring Mycotoxins and Pesticides in Grain and Food Production Systems for Risk Management in Vietnam and Australia
N. Lee*, A.S. Hill†, Bui Van Thin§, Tran Van An§, Le Van To§ andI.R. Kennedy*
Abstract
Contamination of agricultural produce with mycotoxins and pesticides can present serious problems, bothfor human health and the economic value of crops. Mycotoxins may develop either in crop production, orin storage, where drying technology may be preventative. Pesticide contamination occurs either by directapplication to food commodities or as a result of environmental transport as drift, volatilisation, or in run-off. Contamination can be reduced or prevented by correct practices, both while farming and postharvest.However, the development of effective practices demands a rigorous monitoring program to ensurecontaminated produce is detected and not consumed by humans or livestock.
A collaborative research project (PHT/1996/004) funded by the Australian Centre for InternationalAgricultural Research (ACIAR) to monitor mycotoxins and pesticides in grain and food productionsystems for risk management in Vietnam and Australia has commenced. This project involves six researchorganisations—three in Vietnam and three in Australia. These are the Post-Harvest Technology Institute(PHTI), the Pasteur Institute, and Vietnam National University College of Agriculture and Forestry (UAF)in Ho Chi Minh City, University of Sydney, Commonwealth Scientific and Industrial ResearchOrganisation (CSIRO) Plant Industry and AWB Research Pty Ltd (Agrifood Technology). The objectivesof the project are listed below:
• to develop immunochemical methods for major mycotoxins and pesticides for detection ofcontamination in grain, vegetables, dried fruits and peanuts;
• to train Vietnamese project scientists both in the methodology for the development of immunoassaysand related simple tests and in protocols for their application;
• to strengthen the monitoring network in Vietnam to ensure ongoing monitoring of mycotoxin andpesticide contamination;
• to monitor the incidence and quantify the severity of contamination by mycotoxins and pesticides inboth Vietnam and Australia; and
• to review methods to limit production of mycotoxins and to reduce sources of pesticide contaminationthrough traceback and other appropriate method
s.
This paper will illustrate these different aspects of the project and its role in quality assurance foragricultural produce.
* University of Sydney, Department of Agricultural Chemistry and Soil Science, Sydney, New South Wales 2006, Australia.
† Commonwealth Scientific and Industrial Research Organisation (CSIRO) Plant Industry, GPO Box 1700, Canberra, Australian Capital Territory (ACT) 2601, Australia.
§ Post-Harvest Technology Institute (PHTI), Ho Chi Minh City, Vietnam.
Quality assurance in agricultural produce,edited by G.I. Johnson, Le Van To, Nguyen Duy Duc and M.C. Webb.
ACIAR Proceedings 100(printed version published in 2000)
497
Background
C
ONTAMINATION
of agricultural produce with myco-toxins and pesticides affects the economical and tradevalues of the produce, and also presents serious humanhealth and environmental problems. These problemsare becoming more critical for developing countriessuch as Vietnam, where the tropical climate favoursthe growth of fungi with mycotoxins and invasion byinsects requiring the use of insecticides. Mycotoxinsare toxic fungal metabolites that occur naturally whencrop produce is infested with moulds. Contaminationis more common when the harvest is stored in an inad-equate drying facility, however it can occur duringcrop production, processing and transport. It isestimated that 25% of the world’s food crops areaffected by mycotoxins each year (Mannon andJohnson 1985). Mycotoxins can directly affect thehealth of both humans and livestock and are potentialcarcinogens. Human mycotoxicosis caused by intakeof a high dose of mycotoxin-contaminated food indeveloping countries has been documented. However,little or no convincing scientific data relating humandiseases to dietary intake of mycotoxins at low levelsare available.
In Vietnam, many of the higher-yielding maize andrice cultivars are harvested during the wet season,increasing the risk of fungal/mycotoxin contami-nation. The problem of contamination of produce hassignificantly increased as food production hasincreased in regions such as the Mekong Delta, out-stripping available food storage facilities. Maize is amajor export product and also represents a major feedsource for domestic livestock production. Contami-nated maize presents a major problem with pigs and, toa lesser extent, poultry—together forming a major partof the meat component of the Vietnamese diet. Thesespecies cannot detoxify aflatoxins, which may then bepassed to humans. Also, coffee, another major exportcommodity grown in the highlands of central Vietnam,is a candidate for ochratoxin contamination. A majorconcern is that less is known about toxins other thanaflatoxins, or feedstuffs other than maize, rice orpeanuts. As well, current aflatoxin-monitoringmethods are neither sufficiently quantitative, norsuitable for use in poorly equipped field-testing facil-ities. Additionally, imported enzyme-linked immuno-sorbent assay (ELISA) test kits are too expensive.
Studies show that 40% of crop and fibre productioncan be lost through ineffective pest (insect, disease andweed) management (O’Brien 1992). As far as seekingmore economical agricultural production, the benefits
of agrochemicals for effective control of pests duringthe crop production and postharvest outweigh theproblems caused by agrochemicals, when properlyused. Unlike mycotoxins which occur naturally,pesticide contamination occurs either by direct appli-cation to food commodities or by environmentaltransport such as drift, volatilisation, or in run-off. Pes-ticides may also be very toxic to humans whenmisused at concentrations higher than recommended,but are more likely to affect the commercial value ofproduce or have impacts on the environment.
In recent years, there has been a number of life-threatening cases of pesticide contamination in food inVietnam (Nguyen et al. 1998). Acute pesticidepoisoning in developing countries is often attributed toeither misuse or abuse of pesticides by uneducatedfarmers using low-quality pesticides. Contaminationcan be reduced or prevented by correct practices, bothwhile farming and postharvest. Thus, direct educationof farmers seems to be urgently needed. Also,stringent regulations enforced by national regulatoryauthorities require attention. For these to be suc-cessful, simple but effective monitoring technologyneeds to be developed and employed. In view of allthese issues, a collaborative research project, PHT/1996/004, has been funded by the Australian Centrefor International Agricultural Research (ACIAR).This project sets the objectives to develop simpleELISA tests for problem pesticides and mycotoxins,and to monitor mycotoxins and pesticides in grain andfood production systems for risk management inVietnam and Australia.
Baseline Survey
A baseline survey will be conducted in Vietnamduring the course of this project, intending to study theoccurrence of mycotoxins and the level of contami-nation in food and feedstuffs by mycotoxins and pes-ticides. The primary objective of this study in Vietnamis to select the contaminants associated with the pro-duction of these products presenting the greatest risks,for which monitoring technology (ELISAs) will berequired. This baseline study will be divided into twoparts. The first part, which will be conducted at thebeginning of the project, will target aflatoxins, ochra-toxin, cyclodiene insecticides (endosulfan dieldrin,aldrin and heptachlor) and dichlorodiphenyltrichlo-roethane (DDT). A range of crops, including maize,rice, wheat and soybean, will be monitored foraflatoxin using commercial ELISA kits. For ochra-toxin, coffee will be the target commodity. For pesti-
Quality assurance in agricultural produce,edited by G.I. Johnson, Le Van To, Nguyen Duy Duc and M.C. Webb.
ACIAR Proceedings 100(printed version published in 2000)
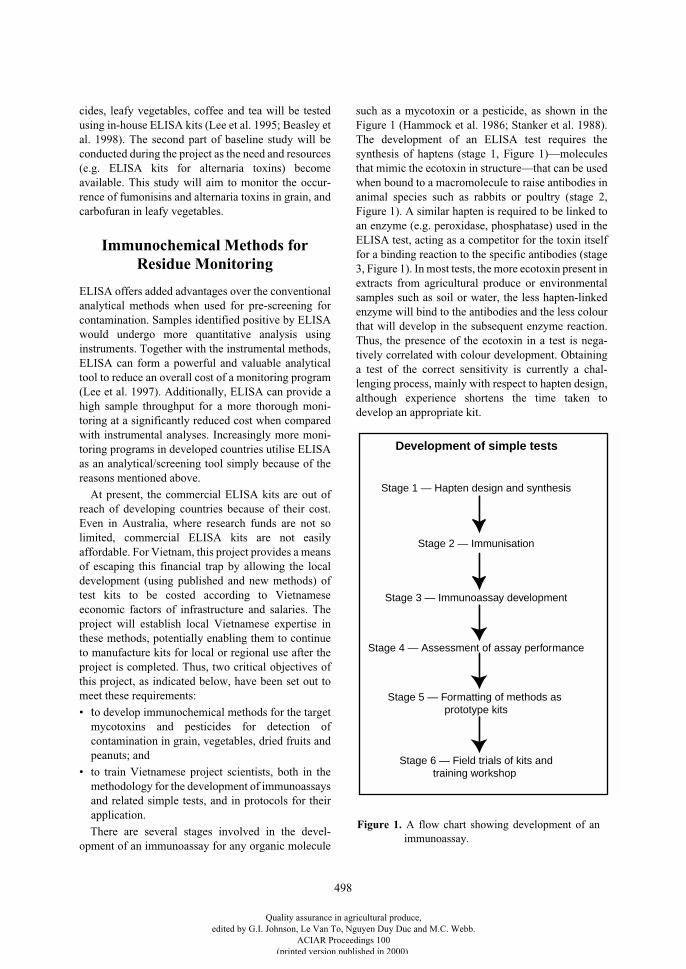
498
cides, leafy vegetables, coffee and tea will be testedusing in-house ELISA kits (Lee et al. 1995; Beasley etal. 1998). The second part of baseline study will beconducted during the project as the need and resources(e.g. ELISA kits for alternaria toxins) becomeavailable. This study will aim to monitor the occur-rence of fumonisins and alternaria toxins in grain, andcarbofuran in leafy vegetables.
Immunochemical Methods for Residue Monitoring
ELISA offers added advantages over the conventionalanalytical methods when used for pre-screening forcontamination. Samples identified positive by ELISAwould undergo more quantitative analysis usinginstruments. Together with the instrumental methods,ELISA can form a powerful and valuable analyticaltool to reduce an overall cost of a monitoring program(Lee et al. 1997). Additionally, ELISA can provide ahigh sample throughput for a more thorough moni-toring at a significantly reduced cost when comparedwith instrumental analyses. Increasingly more moni-toring programs in developed countries utilise ELISAas an analytical/screening tool simply because of thereasons mentioned above.
At present, the commercial ELISA kits are out ofreach of developing countries because of their cost.Even in Australia, where research funds are not solimited, commercial ELISA kits are not easilyaffordable. For Vietnam, this project provides a meansof escaping this financial trap by allowing the localdevelopment (using published and new methods) oftest kits to be costed according to Vietnameseeconomic factors of infrastructure and salaries. Theproject will establish local Vietnamese expertise inthese methods, potentially enabling them to continueto manufacture kits for local or regional use after theproject is completed. Thus, two critical objectives ofthis project, as indicated below, have been set out tomeet these requirements:
•
t
o develop immunochemical methods for the targetmycotoxins and pesticides for detection ofcontamination in grain, vegetables, dried fruits andpeanuts; and
• to train Vietnamese project scientists, both in themethodology for the development of immunoassaysand related simple tests, and in protocols for theirapplication.
There are several stages involved in the devel-opment of an immunoassay for any organic molecule
such as a mycotoxin or a pesticide, as shown in theFigure 1 (Hammock et al. 1986; Stanker et al. 1988).The development of an ELISA test requires thesynthesis of haptens (stage 1, Figure 1)—moleculesthat mimic the ecotoxin in structure—that can be usedwhen bound to a macromolecule to raise antibodies inanimal species such as rabbits or poultry (stage 2,Figure 1). A similar hapten is required to be linked toan enzyme (e.g. peroxidase, phosphatase) used in theELISA test, acting as a competitor for the toxin itselffor a binding reaction to the specific antibodies (stage3, Figure 1). In most tests, the more ecotoxin present inextracts from agricultural produce or environmentalsamples such as soil or water, the less hapten-linkedenzyme will bind to the antibodies and the less colourthat will develop in the subsequent enzyme reaction.Thus, the presence of the ecotoxin in a test is nega-tively correlated with colour development. Obtaininga test of the correct sensitivity is currently a chal-lenging process, mainly with respect to hapten design,although experience shortens the time taken todevelop an appropriate kit.
Development of simple tests
Stage 1 — Hapten design and synthesis
Stage 2 — Immunisation
Stage 3 — Immunoassay development
Stage 4 — Assessment of assay performance
Stage 5 — Formatting of methods as prototype kits
Stage 6 — Field trials of kits andtraining workshop
Figure 1.
A flow chart showing development of animmunoassay.
Quality assurance in agricultural produce,edited by G.I. Johnson, Le Van To, Nguyen Duy Duc and M.C. Webb.
ACIAR Proceedings 100(printed version published in 2000)
499
Monitoring Network for Risk Assessment
The importance of proper monitoring for pesticide andmycotoxin contamination in produce for generalpublic welfare and for international trade cannot beoveremphasised. Risk management by monitoringnetworks, in the longer term, will bring about a cost-effective solution to the current trade problem relatingto quality assurance issues. There is already a largescope for monitoring of both pesticide and mycotoxinsin Vietnam, as well as in Australia for risk man-agement (Kennedy et al. 1998). Currently, monitoringin Vietnam is conducted centrally at a small number oflocations. It is desirable from a logistical viewpointthat such monitoring takes place in regional labora-tories, preferably near the sites of primary production.Already a limited monitoring network has been estab-lished in Vietnam. This project will help extend thatnetwork from local laboratories to provincial labora-tories by application of the ELISA technique, so thatcontamination can be detected at the earliest possibletime to avoid unnecessary costs involved in transportof produce. This project provides technical aid forprototype ELISA kit manufacture and protocols fortheir application in Vietnam (stage 5, Figure 1).Possible users of these ELISA kits, such as regulatoryauthorities, university personnel and even farmers willbe trained in workshops conducted by both local andcollaborating partners (stage 6, Figure 1).
When ELISA development (stages 1–6, Figure 1) iscompleted, implementing this technology will allowwork to commence on the following three objectives:•
to s
trengthen the monitoring network in Vietnam toensure ongoing monitoring of mycotoxin andpesticide contamination;
• to monitor the incidence and quantify the severity ofcontamination by mycotoxins and pesticides in bothVietnam and Australia; and
• to examine methods to limit production ofmycotoxins and reduce sources of pesticidecontamination through traceback and otherappropriate methods.
Conclusion
The main goal of the ACIAR project, PHT/1996/004,can be simply summed up as risk management of pes-ticides and mycotoxins using ELISA technology. Thisproject can be considered as having three phases. Thefirst phase involves a baseline survey of suspected pes-ticides and mycotoxins, during which time the
suspected problem contaminants will be confirmed.The second phase involves the development of immu-nochemical methods for the target mycotoxins andpesticides for detection of contamination in grain, veg-etables, dried fruits and peanuts. This phase alsoinvolves the training of the Vietnamese collaboratorsin the methodology for the development of immu-noassays and related simple tests and in protocols fortheir application. A number of prototype ELISA kitswill be developed and tested for their performance.Workshops will be conducted to train local farmersand potential users in the use of ELISA kits for moni-toring of contaminants. The final phase of the projectinvolves strengthening the existing monitoringnetwork in Vietnam to ensure ongoing monitoring ofmycotoxin and pesticide contamination. The expectedoutcomes of this project are thus:
•
Hi
gher quality produce for national consumption.In addition, the knowledge that food and feedstuffsare of high quality will act to encourage industryand stimulate national and international interactionin the countries involved.
• Higher quality produce for export will commandhigher prices. In addition, penalties are likely to beimposed and losses suffered where produce iscontaminated.
• Better health in humans and livestock. Theprospects for improved health of both Vietnameseand Australians has direct economic benefits byreducing costs for medical treatment andinfrastructure for maintaining human health andnational productivity.
• These outcomes would result in sustainableagricultural production in Vietnam, thus enhancingthe economic benefits arising from improved tradebetween Australia and Vietnam.
References
Beasley, H.L., Phongkham, T., Daunt, M.H., Guihot, S.L.and Skerritt, J.H. 1998. Development of a panel ofimmunoassays for monitoring DDT, its metabolites andanalogs in food and environmental matrices. Journal ofAgricultural and Food Chemistry, 46, 3339–3352.
Hammock, B.D., Gee, S.J., Cheng, P.Y.K., Miyamoto, T.,Goodrow, M.H. and Seiber, J.N. 1986. Utility ofimmunoassay in pesticide trace analysis. In: The SixthInternational Congress of Pesticide ChemistryProceedings, Ottawa, Canada, 11–15 August, 309–316.
Kennedy, I.R., Skerritt, J.H., Johnson, G.I. and Highley, E.(ed.) 1998. Seeking agricultural produce free of pesticideresidues. ACIAR Proceedings No. 85. Canberra,
Quality assurance in agricultural produce,edited by G.I. Johnson, Le Van To, Nguyen Duy Duc and M.C. Webb.
ACIAR Proceedings 100(printed version published in 2000)
500
Australian Centre for International AgriculturalResearch, 406p.
Lee, N., Beasley, H.L., Kimber, S.W.L., Silburn, M.,Woods, N., Skerritt, J.H. and Kennedy, I.R. 1997.Application of immunoassays to studies of theenvironmental fate of endosulfan. Journal of Agriculturaland Food Chemistry, 45, 4147–4155.
Lee, N., Skerritt, J.H. and McAdam, D.P. 1995. Haptensynthesis and development of ELISAs for detection ofendosulfan in water and soil. Journal of Agricultural andFood Chemistry, 43, 1730–1739.
Mannon, J. and Johnson, E. 1985. Fungi down on the farm.New Scientist, 1446, 12–16.
Nguyen, T., Bui, V.T. and Nguyen, D.D. 1998. Reduction ofpesticide residue contamination on vegetables by agro-
extension work. In: Kennedy, I.R., Skerritt, J.H.,Johnson, G.I. and Highley, E., ed., Seeking agriculturalproduce free of pesticide residues. ACIAR ProceedingsNo. 85. Canberra, Australian Centre for InternationalAgricultural Research, 318–322.
O’Brien, R.J. 1992. Pesticides and world food supply. In:Pimentel, D. and Dinnette, D.A., ed., The science ofglobal change: the impact of human activities on theenvironment. American Chemical Society SymposiumSeries, 483, 309–323.
Stanker, L.H., Watkins, B.E. and Vanderlaan, M. 1988.Environmental monitoring by immunoassay.Environmental Science and Technology, 22, 387–407.
Quality assurance in agricultural produce,edited by G.I. Johnson, Le Van To, Nguyen Duy Duc and M.C. Webb.
ACIAR Proceedings 100(printed version published in 2000)
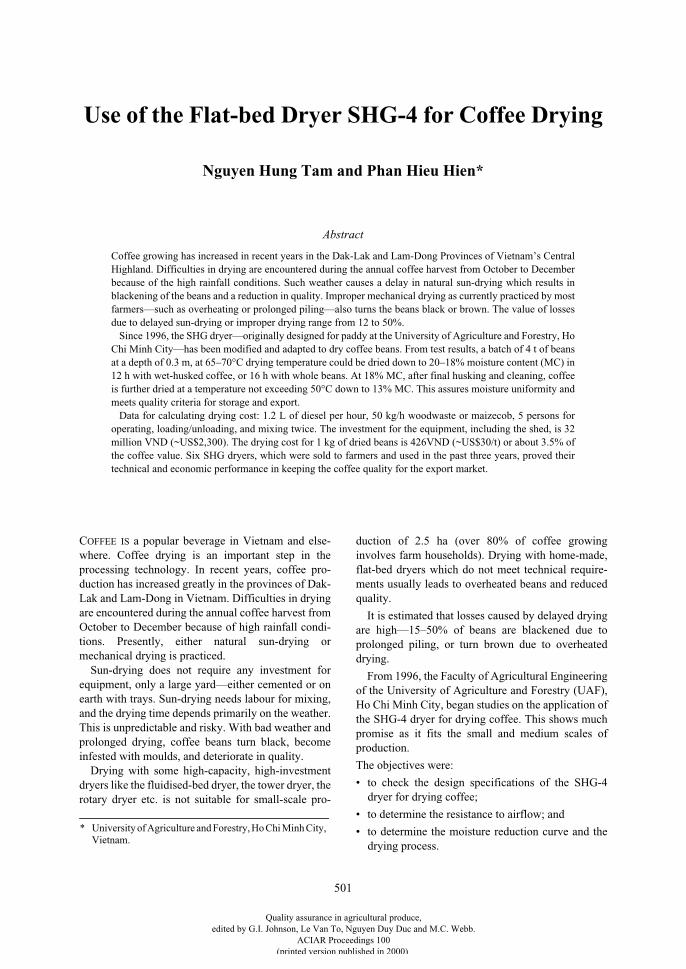
501
Use of the Flat-bed Dryer SHG-4 for Coffee Drying
Nguyen Hung Tam and Phan Hieu Hien*
Abstract
Coffee growing has increased in recent years in the Dak-Lak and Lam-Dong Provinces of Vietnam’s CentralHighland. Difficulties in drying are encountered during the annual coffee harvest from October to Decemberbecause of the high rainfall conditions. Such weather causes a delay in natural sun-drying which results inblackening of the beans and a reduction in quality. Improper mechanical drying as currently practiced by mostfarmers—such as overheating or prolonged piling—also turns the beans black or brown. The value of lossesdue to delayed sun-drying or improper drying range from 12 to 50%.
Since 1996, the SHG dryer—originally designed for paddy at the University of Agriculture and Forestry, HoChi Minh City—has been modified and adapted to dry coffee beans. From test results, a batch of 4 t of beansat a depth of 0.3 m, at 65–70°C drying temperature could be dried down to 20–18% moisture content (MC) in12 h with wet-husked coffee, or 16 h with whole beans. At 18% MC, after final husking and cleaning, coffeeis further dried at a temperature not exceeding 50°C down to 13% MC. This assures moisture uniformity andmeets quality criteria for storage and export.
Data for calculating drying cost: 1.2 L of diesel per hour, 50 kg/h woodwaste or maizecob, 5 persons foroperating, loading/unloading, and mixing twice. The investment for the equipment, including the shed, is 32million VND (~US$2,300). The drying cost for 1 kg of dried beans is 426VND (~US$30/t) or about 3.5% ofthe coffee value. Six SHG dryers, which were sold to farmers and used in the past three years, proved theirtechnical and economic performance in keeping the coffee quality for the export market.
C
OFFEE
IS
a popular beverage in Vietnam and else-where. Coffee drying is an important step in theprocessing technology. In recent years, coffee pro-duction has increased greatly in the provinces of Dak-Lak and Lam-Dong in Vietnam. Difficulties in dryingare encountered during the annual coffee harvest fromOctober to December because of high rainfall condi-tions. Presently, either natural sun-drying ormechanical drying is practiced.
Sun-drying does not require any investment forequipment, only a large yard—either cemented or onearth with trays. Sun-drying needs labour for mixing,and the drying time depends primarily on the weather.This is unpredictable and risky. With bad weather andprolonged drying, coffee beans turn black, becomeinfested with moulds, and deteriorate in quality.
Drying with some high-capacity, high-investmentdryers like the fluidised-bed dryer, the tower dryer, therotary dryer etc. is not suitable for small-scale pro-
duction of 2.5 ha (over 80% of coffee growinginvolves farm households). Drying with home-made,flat-bed dryers which do not meet technical require-ments usually leads to overheated beans and reducedquality.
It is estimated that losses caused by delayed dryingare high—15–50% of beans are blackened due toprolonged piling, or turn brown due to overheateddrying.
From 1996, the Faculty of Agricultural Engineeringof the University of Agriculture and Forestry (UAF),Ho Chi Minh City, began studies on the application ofthe SHG-4 dryer for drying coffee. This shows muchpromise as it fits the small and medium scales ofproduction.
The objectives were:
• to check the design specifications of the SHG-4dryer for drying coffee;
• to determine the resistance to airflow; and
• to determine the moisture reduction curve and thedrying process.
* University of Agriculture and Forestry, Ho Chi Minh City, Vietnam.
Quality assurance in agricultural produce,edited by G.I. Johnson, Le Van To, Nguyen Duy Duc and M.C. Webb.
ACIAR Proceedings 100(printed version published in 2000)
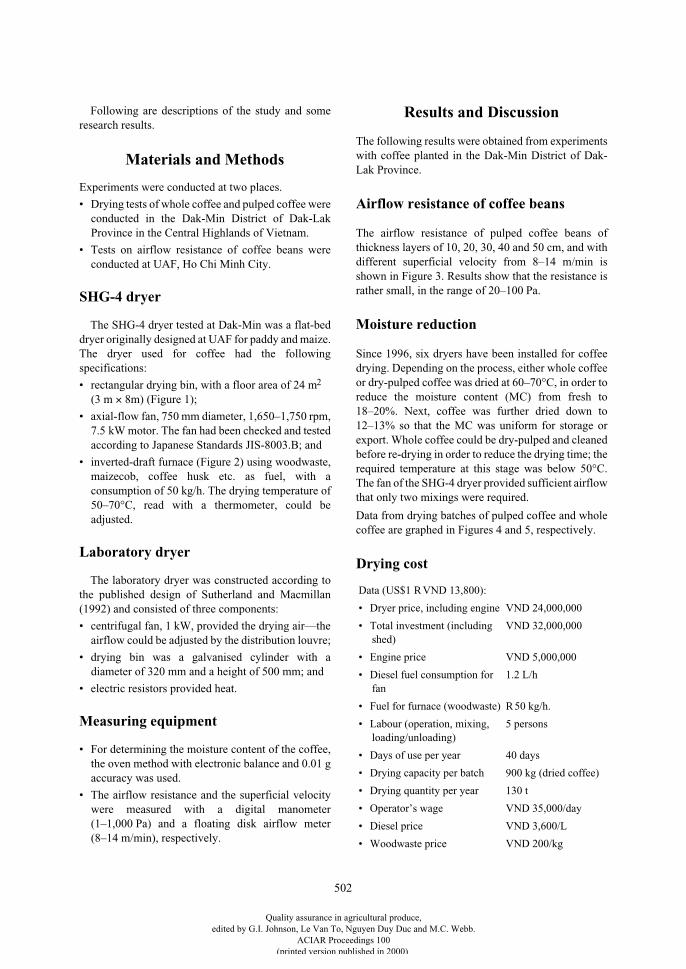
502
Following are descriptions of the study and someresearch results.
Materials and Methods
Experiments were conducted at two places.
• Drying tests of whole coffee and pulped coffee wereconducted in the Dak-Min District of Dak-LakProvince in the Central Highlands of Vietnam.
• Tests on airflow resistance of coffee beans wereconducted at UAF, Ho Chi Minh City.
SHG-4 dryer
The SHG-4 dryer tested at Dak-Min was a flat-beddryer originally designed at UAF for paddy and maize.The dryer used for coffee had the followingspecifications:
• rectangular drying bin, with a floor area of 24 m
2
(3 m
×
8m) (Figure 1);
• axial-flow fan, 750 mm diameter, 1,650–1,750 rpm,7.5 kW motor. The fan had been checked and testedaccording to Japanese Standards JIS-8003.B; and
• inverted-draft furnace (Figure 2) using woodwaste,maizecob, coffee husk etc. as fuel, with aconsumption of 50 kg/h. The drying temperature of50–70°C, read with a thermometer, could beadjusted.
Laboratory dryer
The laboratory dryer was constructed according tothe published design of Sutherland and Macmillan(1992) and consisted of three components:
• centrifugal fan, 1 kW, provided the drying air—theairflow could be adjusted by the distribution louvre;
• drying bin was a galvanised cylinder with adiameter of 320 mm and a height of 500 mm; and
• electric resistors provided heat.
Measuring equipment
• For determining the moisture content of the coffee,the oven method with electronic balance and 0.01 gaccuracy was used.
• The airflow resistance and the superficial velocitywere measured with a digital manometer(1–1,000 Pa) and a floating disk airflow meter(8–14 m/min), respectively.
Results and Discussion
The following results were obtained from experimentswith coffee planted in the Dak-Min District of Dak-Lak Province.
Airflow resistance of coffee beans
The airflow resistance of pulped coffee beans ofthickness layers of 10, 20, 30, 40 and 50 cm, and withdifferent superficial velocity from 8–14 m/min isshown in Figure 3. Results show that the resistance israther small, in the range of 20–100 Pa.
Moisture reduction
Since 1996, six dryers have been installed for coffeedrying. Depending on the process, either whole coffeeor dry-pulped coffee was dried at 60–70°C, in order toreduce the moisture content (MC) from fresh to18–20%. Next, coffee was further dried down to12–13% so that the MC was uniform for storage orexport. Whole coffee could be dry-pulped and cleanedbefore re-drying in order to reduce the drying time; therequired temperature at this stage was below 50°C.The fan of the SHG-4 dryer provided sufficient airflowthat only two mixings were required.
Data from drying batches of pulped coffee and wholecoffee are graphed in Figures 4 and 5, respectively.
Drying cost
Data (US$1
R
VND 13,800):
• Dryer price, including engine VND 24,000,000
• Total investment (including shed)
VND 32,000,000
• Engine price VND 5,000,000
• Diesel fuel consumption for fan
1.2 L/h
• Fuel for furnace (woodwaste)
R
50 kg/h.
• Labour (operation, mixing, loading/unloading)
5 persons
• Days of use per year 40 days
• Drying capacity per batch 900 kg (dried coffee)
• Drying quantity per year 130 t
• Operator’s wage VND 35,000/day
• Diesel price VND 3,600/L
• Woodwaste price VND 200/kg
Quality assurance in agricultural produce,edited by G.I. Johnson, Le Van To, Nguyen Duy Duc and M.C. Webb.
ACIAR Proceedings 100(printed version published in 2000)
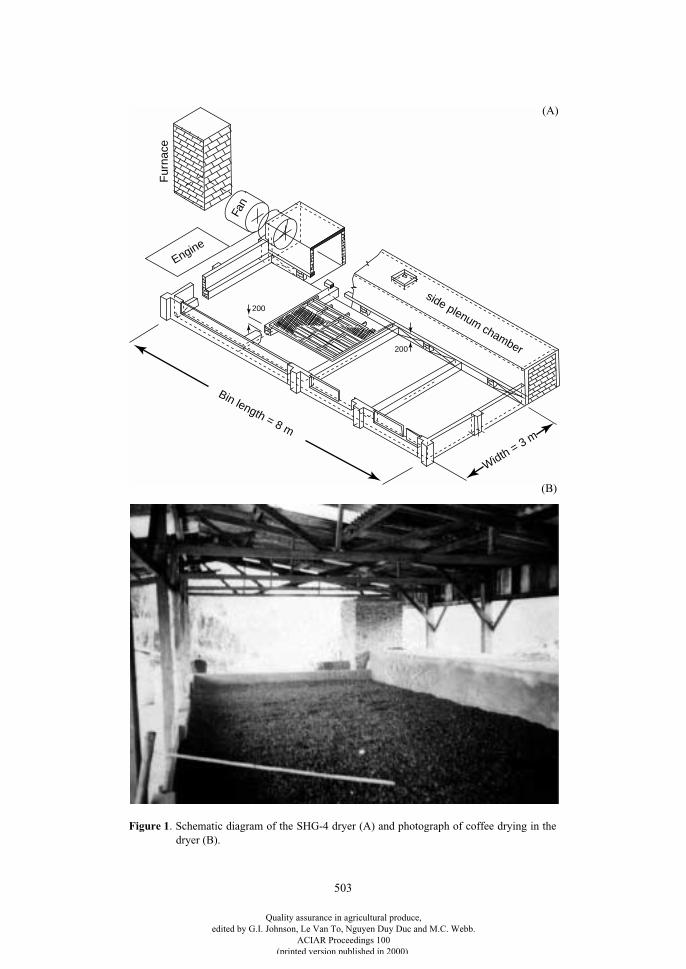
503
side plenum chamber
Engine
Fur
nace
Fan
Width = 3 m
Bin length = 8 m
200
200
Figure 1
. Schematic diagram of the SHG-4 dryer (A) and photograph of coffee drying in thedryer (B).
(A)
(B)
Quality assurance in agricultural produce,edited by G.I. Johnson, Le Van To, Nguyen Duy Duc and M.C. Webb.
ACIAR Proceedings 100(printed version published in 2000)
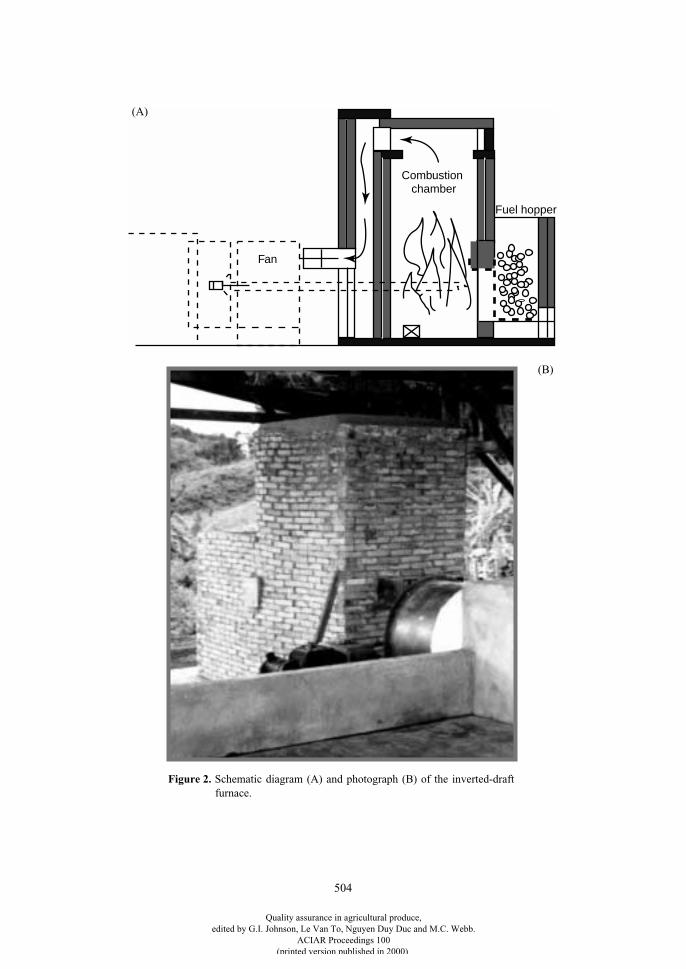
504
Combustion chamber
Fan
Fuel hopper
Figure 2.
Schematic diagram (A) and photograph (B) of the inverted-draftfurnace.
(B)
(A)
Quality assurance in agricultural produce,edited by G.I. Johnson, Le Van To, Nguyen Duy Duc and M.C. Webb.
ACIAR Proceedings 100(printed version published in 2000)
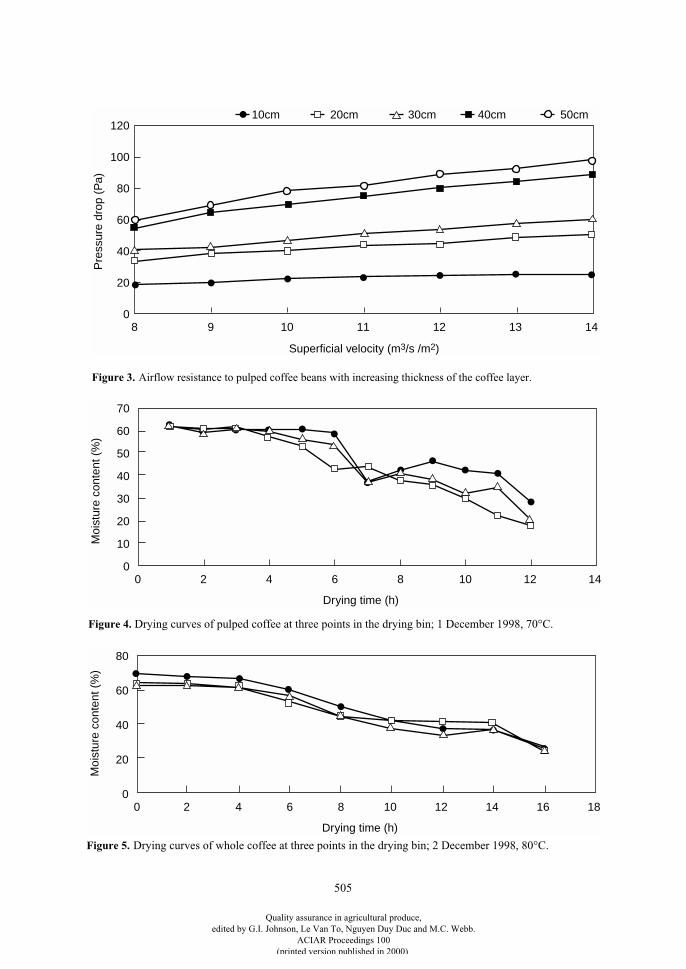
505
80
100
120
60
40
20
08 9 10 11 12 13 14
Superficial velocity (m3/s /m2)
Pre
ssur
e dr
op (
Pa)
10cm 20cm 30cm 40cm 50cm
70
60
40
20
00 2 4 6 8 10 12 14
Drying time (h)
Moi
stur
e co
nten
t (%
)
50
30
10
80
60
40
20
00 2 4 6 8 10 12 14 16 18
Drying time (h)
Moi
stur
e co
nten
t (%
)
Figure 3.
Airflow resistance to pulped coffee beans with increasing thickness of the coffee layer.
Figure 4.
Drying curves of pulped coffee at three points in the drying bin; 1 December 1998, 70°C.
Figure 5.
Drying curves of whole coffee at three points in the drying bin; 2 December 1998, 80°C.
Quality assurance in agricultural produce,edited by G.I. Johnson, Le Van To, Nguyen Duy Duc and M.C. Webb.
ACIAR Proceedings 100(printed version published in 2000)

506
The calculated drying cost is VND 426/kg of driedcoffee (
R
US$30/t). The cost components are: labour,19%; fuel, 30%; diesel, 13%; depreciation and repairs,30%; and interest and land rent, 8%. This drying costis about 3.5% of the coffee value.
Conclusion
The tests and use of the SHG-4 dryer with inverted-draft furnace for drying both whole and pulped coffeeshow good results: high quality, low investment, andlow drying cost. These results demonstrate the possi-
bility of promoting this type of dryer under the presentconditions of small and medium production.
Reference
Sutherland, J.W. and Macmillan, R.H. 1992. Grain dryingrig. Manual No. 7.1. Equipment for teaching and researchin agricultural engineering and development techniques.Melbourne, Australia, Department of Civil andAgricultural Engineering, University of Melbourne.
Quality assurance in agricultural produce,edited by G.I. Johnson, Le Van To, Nguyen Duy Duc and M.C. Webb.
ACIAR Proceedings 100(printed version published in 2000)
507
The Study of Aflatoxin-producing Strains, Fumonisin-producing Strains, and Non-producing
Strains and their Application in Mycotoxin Prevention in Agricultural Products
Nguyen Thuy Chau, Nguyen Thi Huong Tra, Nguyen Thi Hong Ha*
Abstract
The aflatoxin-producing ability of 17 strains of
Aspergillus flavus
and
A. parasiticus
isolated from maizesampled in some provinces in northern Vietnam was studied. 8 of the 17 strains produced aflatoxin. Inoculationusing a mixture of a strain of
A. flavus
producing 331 parts per billion (ppb) aflatoxin with each of 8 strains ofnon-aflatoxin producing
A. flavus
showed a reduction in aflatoxin production which varied between strains.Non-producing strain VN
2
gave the best results, reducing the aflatoxin yield in the inoculation mixture by98.5%. Use of the VN
2
strain reduced aflatoxin contamination in maize from 3,000 ppb before treatment to 253ppb after treatment.
The fumonisin-producing ability of
Fusarium
species isolated from maize sampled in northern Vietnam wasalso studied. 6 of strains produced fumonisin B
1
(FB
1
) and fumonisin B
2
(FB
2
), namely,
F. moniliforme
-strain1,
F. moniliforme
-strain 2,
F. fusarioides
-strain 1,
F. fusarioides
-strain 2,
F. oxysporum
, and
F. proliferatum
.The yield of FB
1
was highest in the strain of
F. proliferatum
(5,800,000 ppb). Inoculation using a mixture ofnon-fumonisin producing strain F. moniliforme var. subglutinans with the strain of F. proliferatum producing5,800,000 ppb reduced the fumonisin yield considerably—the yield of FB
1
and FB
2
in the inoculation mixturewas 13,700 ppb and 800 ppb, respectively.
These results indicate that the non-producing fungi we isolated are potential candidates for application toprevent aflatoxin and fumonisin contamination in agricultural products in both the preharvest and postharveststages. Experiments to clarify the mechanism of the reduction of aflatoxin and fumonisin yields of toxin-producing strains as well as contaminated maize samples by non-producing strains will be carried out in thefuture.
* Post-Harvest Technology Institute, 4 Ngo Quyen, Hanoi, Vietnam.
Quality assurance in agricultural produce,edited by G.I. Johnson, Le Van To, Nguyen Duy Duc and M.C. Webb.
ACIAR Proceedings 100(printed version published in 2000)
508
Research on the Down-draft Rice Husk Furnace
Nguyen Van Xuan and Phan Hieu Hien*
Abstract
Rice husk has been widely used as a heat source for dryer furnaces in the Mekong Delta of Vietnam. It has takenadvantage of using local by-product bulk as well as principally reducing the cost of dried products. The concernis to optimise the effective usage of this biomass material as the energy demand increases gradually, along withrequirements on environment protection.
Due to its highly volatile nature, rice husk burning by the traditional methods is smoky. This reduces the driedproduct’s quality, pollutes the environment and lowers the efficiency.
Rice husk gasification, although attractive, requires high investment, leading to high drying costs.Additionally, the design of a low-cost, continuous rice husk gasification system is still a challenge toresearchers worldwide.
Burning rice husk directly and completely is considered more appropriate. Thus, a down-draft rice huskfurnace for use with the low-cost SRR-1 dryer has been designed and built at the University of Agriculture andForestry Ho Chi Minh City. It consists of a cylindrical container with a concentric inner grate and combustionchamber. The key feature of this furnace is that the pyrolysis gases have to pass through the char combustionarea, and reach the high temperatures needed for good combustion. In addition, heat of the char combustion istransferred by radiation to sustain a high temperature inside the gas combustion area, which results in an almostcomplete combustion of the volatile matter.
Experimental results showed that the average rice husk consumption rate was about 2.6 kg/h, and the gas–airmixture was clean and stable. The CO content in flue gases is 0.3–0.7% which was lower than the permissiblelimits of the permitted limitations in environmental standards of Vietnam and other countries. The goodcombustion efficiency of 90% and furnace efficiency of 80–82% was obtained.
R
ICE
HUSK
has been widely used as a heat source fordryer furnaces in the Mekong Delta of Vietnam. It hastaken advantage of using local by-product bulk as wellas principally reduced the cost of dried products. Theconcern is to optimise the effective usage of thisbiomass material as energy demands increase andenvironmental protection becomes an increasingconcern.
Due to its high volatile matter, rice husk burning bythe traditional methods is smoky. This reduces thedried product’s quality, pollutes the environment andlowers the efficiency.
Rice husk gasification, although attractive, requireshigh investment, leading to high drying costs. Addi-
tionally, the design of a low-cost, continuous rice huskgasification system is still a challenge to researchersworldwide.
Burning rice husk directly and completely is con-sidered more appropriate. Thus, a study on a down-draftrice husk furnace for use with the low-cost SRR-1 dryerhas been carried out. The furnace was designed andbuilt at the University of Agriculture and Forestry, HoChi Minh City.
Objective of the Study
To develop a rice husk furnace which is smokeless andhighly efficient so that the flue gases can be useddirectly as drying air without the need for a heatexchanger.
* University of Agriculture and Forestry, Thu Doc, Ho Chi Minh City, Vietnam.
Quality assurance in agricultural produce,edited by G.I. Johnson, Le Van To, Nguyen Duy Duc and M.C. Webb.
ACIAR Proceedings 100(printed version published in 2000)
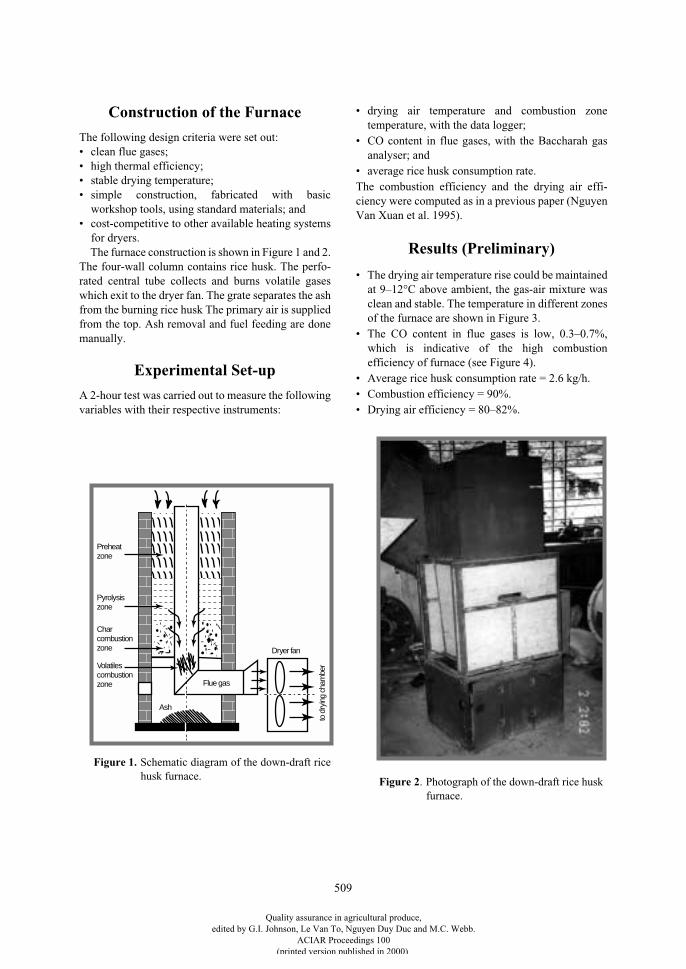
509
Construction of the Furnace
The following design criteria were set out:• clean flue gases;• high thermal efficiency;• stable drying temperature;• simple construction, fabricated with basic
workshop tools, using standard materials; and• cost-competitive to other available heating systems
for dryers.The furnace construction is shown in Figure 1 and 2.
The four-wall column contains rice husk. The perfo-rated central tube collects and burns volatile gaseswhich exit to the dryer fan. The grate separates the ashfrom the burning rice husk The primary air is suppliedfrom the top. Ash removal and fuel feeding are donemanually.
Experimental Set-up
A 2-hour test was carried out to measure the followingvariables with their respective instruments:
• drying air temperature and combustion zonetemperature, with the data logger;
• CO content in flue gases, with the Baccharah gasanalyser; and
• average rice husk consumption rate.The combustion efficiency and the drying air effi-ciency were computed as in a previous paper (NguyenVan Xuan et al. 1995).
Results (Preliminary)
• The drying air temperature rise could be maintainedat 9–12°C above ambient, the gas-air mixture wasclean and stable. The temperature in different zonesof the furnace are shown in Figure 3.
• The CO content in flue gases is low, 0.3–0.7%,which is indicative of the high combustionefficiency of furnace (see Figure 4).
• Average rice husk consumption rate = 2.6 kg/h.• Combustion efficiency = 90%.• Drying air efficiency = 80–82%.
to d
ryin
g ch
ambe
r
Dryer fan
Flue gas
Ash
Preheat zone
Pyrolysis zone
Char combustion zone
Volatilescombustion zone
Figure 1. Schematic diagram of the down-draft ricehusk furnace. Figure 2. Photograph of the down-draft rice husk
furnace.
Quality assurance in agricultural produce,edited by G.I. Johnson, Le Van To, Nguyen Duy Duc and M.C. Webb.
ACIAR Proceedings 100(printed version published in 2000)
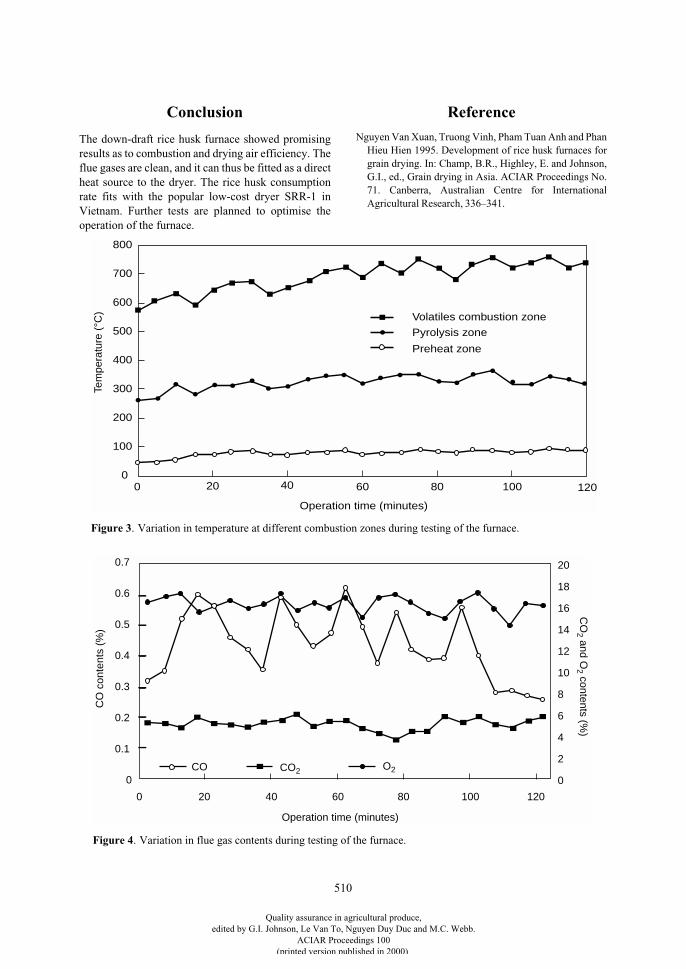
510
Conclusion
The down-draft rice husk furnace showed promisingresults as to combustion and drying air efficiency. Theflue gases are clean, and it can thus be fitted as a directheat source to the dryer. The rice husk consumptionrate fits with the popular low-cost dryer SRR-1 inVietnam. Further tests are planned to optimise theoperation of the furnace.
Reference
Nguyen Van Xuan, Truong Vinh, Pham Tuan Anh and PhanHieu Hien 1995. Development of rice husk furnaces forgrain drying. In: Champ, B.R., Highley, E. and Johnson,G.I., ed., Grain drying in Asia. ACIAR Proceedings No.71. Canberra, Australian Centre for InternationalAgricultural Research, 336–341.
0 20 40 60 80 100 1200
100
200
300
400
500
600
700
800
Operation time (minutes)
Tem
pera
ture
(°C
) Volatiles combustion zone
Pyrolysis zone
Preheat zone
0 20 40 60 80 100 120
0
2
4
6
8
10
12
14
16
18
20
0
0.1
0.2
0.3
0.4
0.5
0.6
0.7
Operation time (minutes)
CO
con
tent
s (%
)C
O2 and O
2 contents (%)
CO CO2 O2
Figure 3. Variation in temperature at different combustion zones during testing of the furnace.
Figure 4. Variation in flue gas contents during testing of the furnace.
Quality assurance in agricultural produce,edited by G.I. Johnson, Le Van To, Nguyen Duy Duc and M.C. Webb.
ACIAR Proceedings 100(printed version published in 2000)
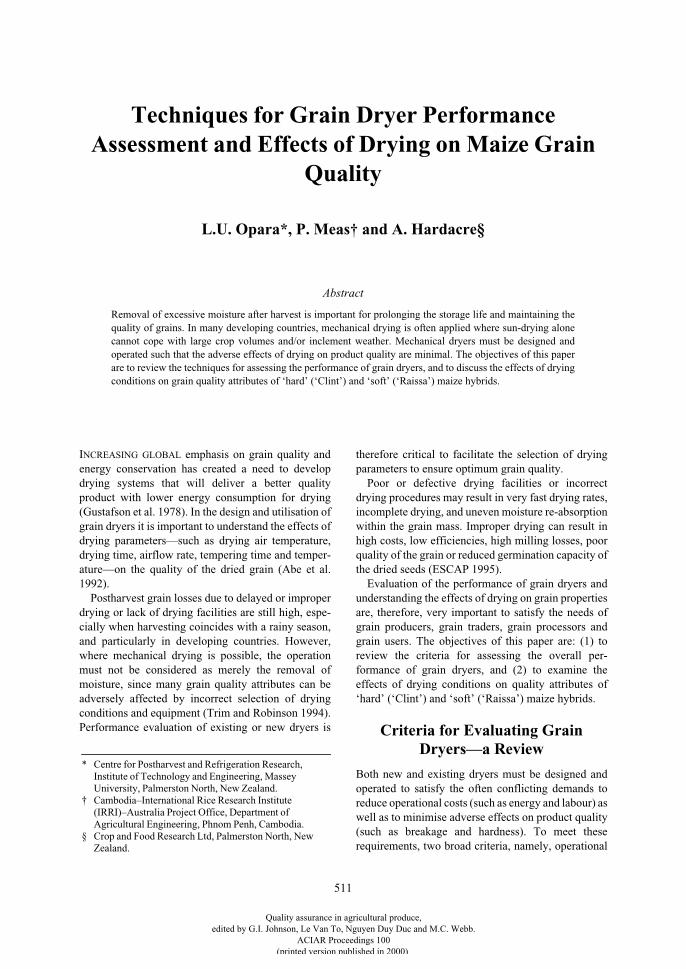
511
Techniques for Grain Dryer Performance Assessment and Effects of Drying on Maize Grain
Quality
L.U. Opara*, P. Meas† and A. Hardacre§
Abstract
Removal of excessive moisture after harvest is important for prolonging the storage life and maintaining thequality of grains. In many developing countries, mechanical drying is often applied where sun-drying alonecannot cope with large crop volumes and/or inclement weather. Mechanical dryers must be designed andoperated such that the adverse effects of drying on product quality are minimal. The objectives of this paperare to review the techniques for assessing the performance of grain dryers, and to discuss the effects of dryingconditions on grain quality attributes of ‘hard’ (‘Clint’) and ‘soft’ (‘Raissa’) maize hybrids.
I
NCREASING
GLOBAL
emphasis on grain quality andenergy conservation has created a need to developdrying systems that will deliver a better qualityproduct with lower energy consumption for drying(Gustafson et al. 1978). In the design and utilisation ofgrain dryers it is important to understand the effects ofdrying parameters—such as drying air temperature,drying time, airflow rate, tempering time and temper-ature—on the quality of the dried grain (Abe et al.1992).
Postharvest grain losses due to delayed or improperdrying or lack of drying facilities are still high, espe-cially when harvesting coincides with a rainy season,and particularly in developing countries. However,where mechanical drying is possible, the operationmust not be considered as merely the removal ofmoisture, since many grain quality attributes can beadversely affected by incorrect selection of dryingconditions and equipment (Trim and Robinson 1994).Performance evaluation of existing or new dryers is
therefore critical to facilitate the selection of dryingparameters to ensure optimum grain quality.
Poor or defective drying facilities or incorrectdrying procedures may result in very fast drying rates,incomplete drying, and uneven moisture re-absorptionwithin the grain mass. Improper drying can result inhigh costs, low efficiencies, high milling losses, poorquality of the grain or reduced germination capacity ofthe dried seeds (ESCAP 1995).
Evaluation of the performance of grain dryers andunderstanding the effects of drying on grain propertiesare, therefore, very important to satisfy the needs ofgrain producers, grain traders, grain processors andgrain users. The objectives of this paper are: (1) toreview the criteria for assessing the overall per-formance of grain dryers, and (2) to examine theeffects of drying conditions on quality attributes of‘hard’ (‘Clint’) and ‘soft’ (‘Raissa’) maize hybrids.
Criteria for Evaluating Grain Dryers—a Review
Both new and existing dryers must be designed andoperated to satisfy the often conflicting demands toreduce operational costs (such as energy and labour) aswell as to minimise adverse effects on product quality(such as breakage and hardness). To meet theserequirements, two broad criteria, namely, operational
* Centre for Postharvest and Refrigeration Research, Institute of Technology and Engineering, Massey University, Palmerston North, New Zealand.
† Cambodia–International Rice Research Institute (IRRI)–Australia Project Office, Department of Agricultural Engineering, Phnom Penh, Cambodia.
§ Crop and Food Research Ltd, Palmerston North, New Zealand.
Quality assurance in agricultural produce,edited by G.I. Johnson, Le Van To, Nguyen Duy Duc and M.C. Webb.
ACIAR Proceedings 100(printed version published in 2000)
512
performance and economic performance, can be iden-tified for evaluating grain dryer performance, inaddition to the effects of drying on dried grain quality.These will be briefly reviewed in the followingsections.
Operational performance
Several factors contribute to the operational per-formance of a dryer including drying efficiency,drying capacity, energy efficiency, and labour aspects.
Drying efficiency
The drying efficiency of the drying operation is animportant factor in the assessment and selection of theoptimal dryer. There are three groups of factorsaffecting drying efficiency: (i) those related to theenvironment, in particular, ambient air conditions; (ii)those specific to the crop; and (iii) those specific to thedesign and operation of the dryer (Trim and Robinson1994).
There are several different ways of expressing theefficiency of drying. Adeyemo (1993) noted thatdrying efficiency (expressed also in terms of fuel effi-ciency and sensible heat utilisation efficiency) arevery important considerations in dryer selection.Drying efficiency (DE) is based on how well a dryingsystem converts sensible heat to latent heat, which canbe expressed as:
where:HU = heat utilised for moisture removal (kJ)HA = heat available for moisture removal (kJ)WWE = weight of water evaporated (kg)LHV = latent heat of vaporisation (kJ/kg)WF = weight of fuel utilised (kg)HVF = heat value of fuel (kJ/kg)
Drying capacity
Arinze et al. (1996) defined the drying capacity(DC) of a dryer as the rate at which the wet product canbe dried to specified moisture content (MC) while thedryer is operated at specified drying conditions. DC isone of the most important factors in the design and uti-lisation of grain dryers. Decision making bypurchasers or operators of grain dryers would be sim-plified if manufacturers or designers used commoncriteria to describe the performance of their products(McLean 1989), e.g. the weight of maize at 25% MCthat can be dried to 14% when the drying air temper-
ature is 58°C. If the capacity of the dryer is inadequate,in practice it is possible that the following extremepossibilities may be encountered: (i) harvesting will bedelayed to the extent that grain will be overripe andshattered; (ii) its MC may rise in the field and thusadditional fuel or energy will be required to dry itwhen it is eventually harvested; (iii) the grain that hasbeen harvested will be deteriorated when drying has tobe delayed; or (iv) the amount of grain to be dried maybe very small compared to the high capacity of dryers.
Specific total energy consumption
ESCAP (1995) defined the specific total energyconsumption as the total energy used per kilogram ofwater evaporated. The utilisation of the world’sreserves of fossil fuel is a controversial subject whichmakes it appropriate that the energy requirements ofgrain drying systems are considered when new instal-lations are planned (McLean 1989).
Labour requirements, ease and safety of operation
A well-designed grain dryer should not be verycomplicated to operate nor require many workers oroperators. It is also necessary for the design andoperation of grain dryer to be carried out safely bythose who operate it, or have reason to visit graindrying facilities (McLean 1989). ESCAP (1995) listedthe ease of use and safety features and hazards, relatedto the operational performance of grain dryers,including the following:• fire and electrical hazards;• unguarded power transmission shafts, belts, pulleys
etc.;• noise level;• unusual vibration;• dust emission control;• ease or difficulty of loading and unloading grain;• ease or difficulty of making adjustments;• ease or difficulty of cleaning and repairing parts;
and• other significant operational, safety and hazardous
features of the dryer.
Economic performance
It is beneficial to design and operate mechanicaldryers to minimise their capital and drying costs. Thewidespread introduction and adoption of grain dryerswill be inevitable in the near future in many devel-oping countries. However, to be successful, the dryerswill have to be economical in terms of capital andrunning (or drying) costs (Ofoche et al. 1991). To
DEHU
HA
WWE LHV
WF HVF= × =
×
××100 100 1% % ( )
Quality assurance in agricultural produce,edited by G.I. Johnson, Le Van To, Nguyen Duy Duc and M.C. Webb.
ACIAR Proceedings 100(printed version published in 2000)
513
achieve this goal, dryers should be designed takinginto full consideration the costs, local environmentalconditions, and technical skill and constructionmaterial available.
Variations in the capital cost of grain dryers andtheir specific energy consumption do exist. In addi-tions, most grain dryers are utilised only a few weeksper year. It may be necessary to compare the relativemerits of purchasing an expensive dryer with low fuelor energy consumption with a less expensive one(McLean 1989). In India, for instance, an importantreason for not using dryers is their high initial cost.Most of the commercially available dryers aredesigned to suit the needs of the processing industryand their output capacity is therefore far above theneeds of individual farmers, or even of farmer groups(Shukla and Patil 1988).
The major components and sources of grain dryerexpenditure include fan(s), motor(s) and air heatingsystem (Hall 1980). The cost of fuel and/or power fordrying grain is greatly dependent on weather condi-tions. The cost of drying grain with unheated or heatedforced air varies greatly with atmospheric temper-ature, humidity, and grain MC. Overall, the economicperformance of a new or existing drying system is animportant factor affecting the adoption and continueduse by farmers (Rodriguez 1999).
Effects of postharvest drying on grain quality attributes
The drying process has been known to affect thequality of the dried grain, resulting in cracking,increase in breakage susceptibility, and opportunisticmicrobial infection. Damage to grain may be causedby either drying it too slowly or too rapidly. If grain isdried too slowly and for too long a period, undesirabledeterioration occurs, such as mould growth. Otherdamage occurs when grain is dried too rapidly.Reducing grain damage and maintaining post-dryingquality is therefore important in evaluating the per-formance of a drying system.
Previous studies have shown that maize grain driedfrom a higher initial MC cracked and broke moreeasily than that dried from a lower initial MC (Welleret al. 1990). Ross and White (1972) concluded that theMC prior to drying affected stress crack formation indried maize. Higher grain initial MC increased theincidence of cracking in dried grain.
Fast drying—high drying rate and capacity—isnormally obtained using air of high temperature andflow rate. Rapid drying, however, makes the grain
more brittle and more subject to damage whenhandled. Extremely rapid drying results in grain ofreduced bulk density with kernels that are enlarged orpuffed. If grain is dried at high temperatures, discolor-ation and other kinds of heat damage may occur(Foster 1973).
Thompson and Foster (1963) found that internaldamage was frequently the consequence of a high-temperature drying process and as the number of stresscracks in the maize grain increased the susceptibilityto breakage increased. When handled and transported,kernels with stress cracks broke more readily thansound kernels, leading to considerable amounts ofbroken grain and fine material. The authors alsoreported that shelled maize dried with heated air at60–115°C was two to three times more susceptible tobreakage than the same maize dried with unheated air.
Peplinski et al. (1994) reported that as the air-dryingtemperature increased from 25 to 100°C, maize kerneltest weight and germination decreased, kernelbreakage susceptibility and percentage of floatingkernels increased, and 100-kernel weight and stress-cracked kernels were unchanged. Brooker et al. (1992)reported that the feed efficiency (average daily gain,daily maize intake and feed/gain ratio of rats), and thusthe nutritive value of the maize, were adverselyaffected when the grain was dried at 50°C.
For each of the three maize hybrids (‘hard’, ‘inter-mediate’ and ‘soft’), Kirleis and Stroshine (1990)found that Stenvert hardness values remained rela-tively constant when grain was dried at temperaturesfrom 27–60°C. The hardness declined only slightly,but not significantly, at the higher drying tempera-tures. At drying temperatures of 60–93°C, bulkdensity was significantly different among the threetested hybrids and decreased in the following order:hard > intermediate > soft. The authors concluded thatStein breakage susceptibility was primarily influencedby hardness. Stein breakage was greatest for the softhybrid and least for the hard hybrid.
Summary of the literature
Grains are important direct sources of food forhumans and feed for livestock. As they are producedon a seasonal basis, it is essential to store the grains forlate consumption for periods varying from one monthup to more than a year. Grains are often harvested atMCs that are too high for safe storage. Drying is themost practised grain preservation method that enablesgrains to attain a MC sufficiently low to ensure goodquality grain that is free of fungi and microorganisms
Quality assurance in agricultural produce,edited by G.I. Johnson, Le Van To, Nguyen Duy Duc and M.C. Webb.
ACIAR Proceedings 100(printed version published in 2000)
514
and that has desirable quality characteristics formarketing and final use. It is generally agreed thatimproper drying is the major cause of high dryingcosts, low efficiencies, and poor grain quality. Poor ordefective drying facilities or incorrect drying proce-dures may result in a very fast drying rate, incompletedrying and uneven moisture re-absorption within thegrain mass.
Very slow drying of high MC grain (as in sun or cribdrying in inclement weather or in a deep bed dryerwith unheated air) provides conditions for: mouldgrowth; rapid loss of vigour and eventually germi-nation loss; deterioration due to sprouting, weatheringand respiration heating; and discoloration. These con-ditions result in both quantitative and qualitativepostharvest losses. Very fast drying accomplishedusing large volumes of high temperature air, however,is likely to be inefficient in energy use and liable todamage the grain by over-heating and/or over-drying.Fast drying can cause cracking and splitting (includinginternal cracking), case hardening, discoloration, andloss of germination and vigour.
The design and operation of mechanical dryerswhich are cost-effective and efficient, and which haveminimum detrimental impact on grain quality is amajor, continuing challenge for the cereal industry.Mechanical dryers are important for commercialdrying of grains and as aids for evaluating newcultivars and postharvest research. Performance eval-uation of new and existing dryer designs facilitates theoptimisation of dryer parameters, drying conditionsand dried grain quality.
Experimental Study of the Effects of Grain Initial MC and Drying Air
Temperature on QualityAttributes of ‘Hard’ and ‘Soft’
Maize Hybrids
Materials and methods
Two maize hybrids, representing hard (‘Clint’) andsoft (‘Raissa’) grains were used in the experiments toassess the effects of drying on grain quality attributes.Mature cobs were harvested and shelled manually.Firstly, grains were wetted to achieve the desiredinitial MC before drying. Grain at three initial MCs(approximately 20, 25 and 30%) were dried at threedrying air temperatures (58, 80 and 110°C) in threereplications. The flow rate of the drying air was
constant for all the drying treatments (approximately0.16 m/s). A new prototype flat-bed grain dryer wasused, and details of the dryer design and experimentalprocedure have been documented by Meas (1999).
For each drying run, a 5 kg sample of one hybrid atone initial MC was dried in one of three drying bins.The depth of the drying sample was approximately 5cm. A 100–150 g subsample of grain from each binwas put into a small, metal-mesh bag and replacedwithin the grain bulk. During the drying process, themetal-mesh bags containing the grain subsampleswere taken out of the drying bins every 10 minutes andweighed, in order to the monitor moisture reduction ofthe drying samples. Drying was stopped when thesubsample weight reduced to a predetermined value,which was related to the MC of: 16% at 110°C, 15.4%at 80°C, and 14.6% at 58°C.
In addition to mechanical drying, grain samples ofeach hybrid, at each of the three initial MCs, weredried at room temperature (approximately 20°C) toserve as the control—a sample of 1 kg was put onto aperforated tray, spread in thin layer (approximately 1.5cm) and left in the laboratory for about one week untilthe MC equilibrated. After drying, grain samples wereassessed for their mechanical properties, which areoften major determinants of grain quality (Liu et al.1999; Meas 1999).
Results and discussion
Bulk density
Analysis of variance of the change in bulk densityshows that grain bulk density means were significantlyaffected by the interaction of the grain initial MC andthe drying air temperature. However, the density of thetwo hybrids tended to decrease as the MC and dryingtemperature increased (Table 1).
Maxiumum grain bulk density (approximately 78kg/hL) of the dried ‘Clint’ maize occurred when thegrain was dried at ambient air temperature (20°C). Itdecreased as the MC increased from 25 to 30% butincreased as the MC increased from 20 to 25% MC(Table 1). Black spots observed within the grainsamples dried with this air—presumably caused byfungal growth—caused this irregularity. At 58 and80°C, the density decreased almost linearly as the MCincreased (Table 1). At 110°C, the density droppedmore sharply when the moisture increased from 20 to25% than when the moisture increased from 25 to30%.
The trend of the bulk density for the ‘Clint’ maizewas the same for the ‘Raissa’ maize dried from all the
Quality assurance in agricultural produce,edited by G.I. Johnson, Le Van To, Nguyen Duy Duc and M.C. Webb.
ACIAR Proceedings 100(printed version published in 2000)
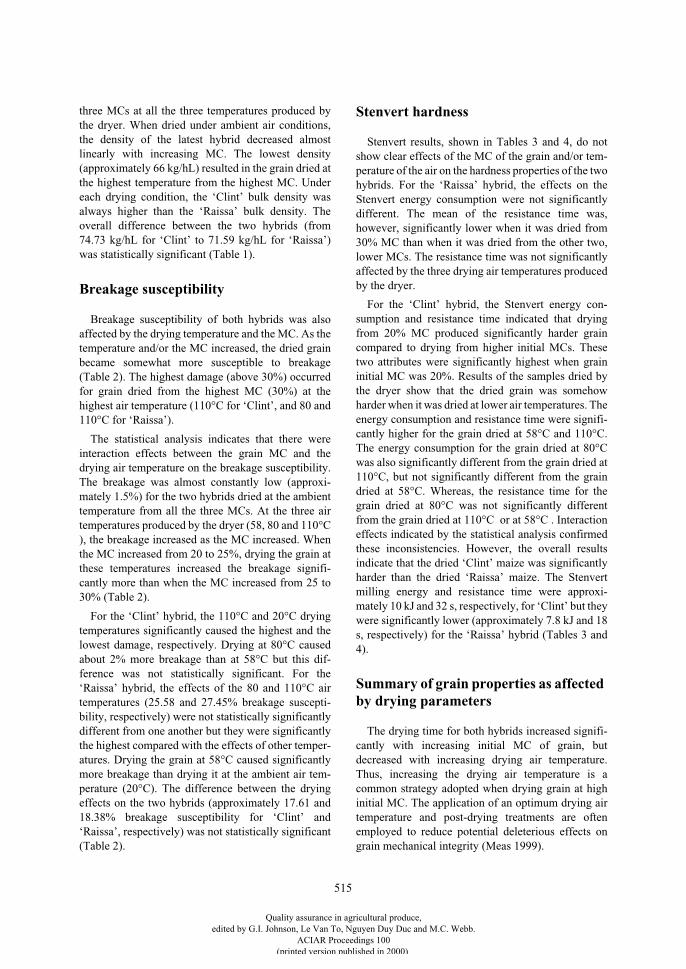
515
three MCs at all the three temperatures produced bythe dryer. When dried under ambient air conditions,the density of the latest hybrid decreased almostlinearly with increasing MC. The lowest density(approximately 66 kg/hL) resulted in the grain dried atthe highest temperature from the highest MC. Undereach drying condition, the ‘Clint’ bulk density wasalways higher than the ‘Raissa’ bulk density. Theoverall difference between the two hybrids (from74.73 kg/hL for ‘Clint’ to 71.59 kg/hL for ‘Raissa’)was statistically significant (Table 1).
Breakage susceptibility
Breakage susceptibility of both hybrids was alsoaffected by the drying temperature and the MC. As thetemperature and/or the MC increased, the dried grainbecame somewhat more susceptible to breakage(Table 2). The highest damage (above 30%) occurredfor grain dried from the highest MC (30%) at thehighest air temperature (110°C for ‘Clint’, and 80 and110°C for ‘Raissa’).
The statistical analysis indicates that there wereinteraction effects between the grain MC and thedrying air temperature on the breakage susceptibility.The breakage was almost constantly low (approxi-mately 1.5%) for the two hybrids dried at the ambienttemperature from all the three MCs. At the three airtemperatures produced by the dryer (58, 80 and 110°C), the breakage increased as the MC increased. Whenthe MC increased from 20 to 25%, drying the grain atthese temperatures increased the breakage signifi-cantly more than when the MC increased from 25 to30% (Table 2).
For the ‘Clint’ hybrid, the 110°C and 20°C dryingtemperatures significantly caused the highest and thelowest damage, respectively. Drying at 80°C causedabout 2% more breakage than at 58°C but this dif-ference was not statistically significant. For the‘Raissa’ hybrid, the effects of the 80 and 110°C airtemperatures (25.58 and 27.45% breakage suscepti-bility, respectively) were not statistically significantlydifferent from one another but they were significantlythe highest compared with the effects of other temper-atures. Drying the grain at 58°C caused significantlymore breakage than drying it at the ambient air tem-perature (20°C). The difference between the dryingeffects on the two hybrids (approximately 17.61 and18.38% breakage susceptibility for ‘Clint’ and‘Raissa’, respectively) was not statistically significant(Table 2).
Stenvert hardness
Stenvert results, shown in Tables 3 and 4, do notshow clear effects of the MC of the grain and/or tem-perature of the air on the hardness properties of the twohybrids. For the ‘Raissa’ hybrid, the effects on theStenvert energy consumption were not significantlydifferent. The mean of the resistance time was,however, significantly lower when it was dried from30% MC than when it was dried from the other two,lower MCs. The resistance time was not significantlyaffected by the three drying air temperatures producedby the dryer.
For the ‘Clint’ hybrid, the Stenvert energy con-sumption and resistance time indicated that dryingfrom 20% MC produced significantly harder graincompared to drying from higher initial MCs. Thesetwo attributes were significantly highest when graininitial MC was 20%. Results of the samples dried bythe dryer show that the dried grain was somehowharder when it was dried at lower air temperatures. Theenergy consumption and resistance time were signifi-cantly higher for the grain dried at 58°C and 110°C.The energy consumption for the grain dried at 80°Cwas also significantly different from the grain dried at110°C, but not significantly different from the graindried at 58°C. Whereas, the resistance time for thegrain dried at 80°C was not significantly differentfrom the grain dried at 110°C or at 58°C . Interactioneffects indicated by the statistical analysis confirmedthese inconsistencies. However, the overall resultsindicate that the dried ‘Clint’ maize was significantlyharder than the dried ‘Raissa’ maize. The Stenvertmilling energy and resistance time were approxi-mately 10 kJ and 32 s, respectively, for ‘Clint’ but theywere significantly lower (approximately 7.8 kJ and 18s, respectively) for the ‘Raissa’ hybrid (Tables 3 and4).
Summary of grain properties as affected by drying parameters
The drying time for both hybrids increased signifi-cantly with increasing initial MC of grain, butdecreased with increasing drying air temperature.Thus, increasing the drying air temperature is acommon strategy adopted when drying grain at highinitial MC. The application of an optimum drying airtemperature and post-drying treatments are oftenemployed to reduce potential deleterious effects ongrain mechanical integrity (Meas 1999).
Quality assurance in agricultural produce,edited by G.I. Johnson, Le Van To, Nguyen Duy Duc and M.C. Webb.
ACIAR Proceedings 100(printed version published in 2000)
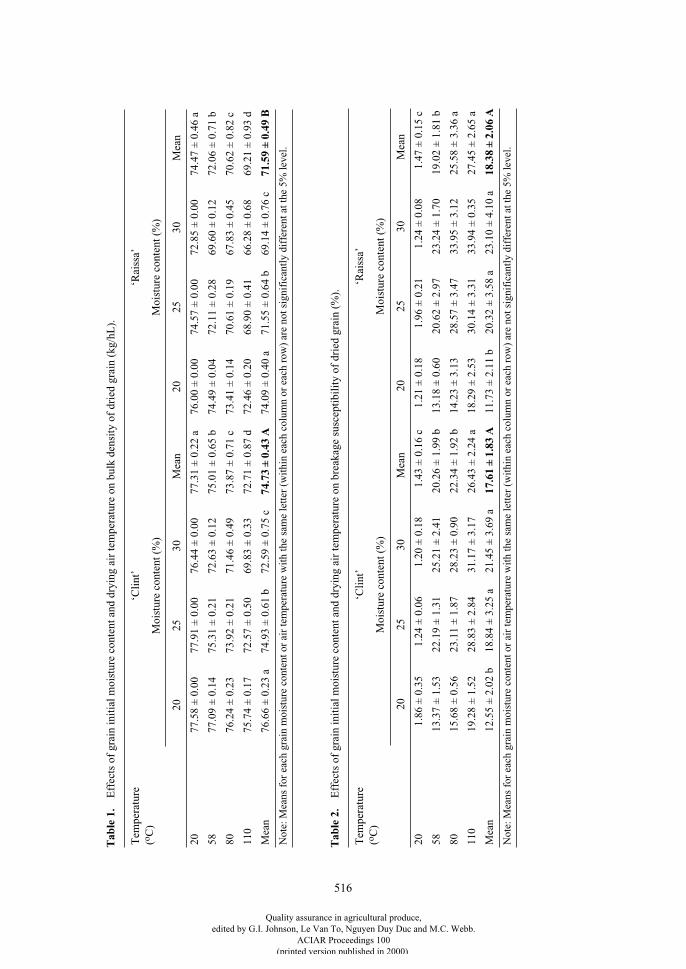
516
Tab
le 1
.
Eff
ects
of
grai
n in
itia
l moi
stur
e co
nten
t and
dry
ing
air
tem
pera
ture
on
bulk
den
sity
of
drie
d gr
ain
(kg/
hL).
Tem
pera
ture
(
o
C)
‘Cli
nt’
‘Rai
ssa’
Moi
stur
e co
nten
t (%
)M
oist
ure
cont
ent (
%)
2025
30M
ean
2025
30M
ean
2077
.58
± 0
.00
77.9
1 ±
0.0
076
.44
± 0
.00
77.3
1 ±
0.2
2 a
76.0
0 ±
0.0
074
.57
± 0
.00
72.8
5 ±
0.0
074
.47
± 0
.46
a
5877
.09
± 0
.14
75.3
1 ±
0.2
172
.63
± 0
.12
75.0
1 ±
0.6
5 b
74.4
9 ±
0.0
472
.11
± 0
.28
69.6
0 ±
0.1
272
.06
± 0
.71
b
8076
.24
± 0
.23
73.9
2 ±
0.2
171
.46
± 0
.49
73.8
7 ±
0.7
1 c
73.4
1 ±
0.1
470
.61
± 0
.19
67.8
3 ±
0.4
570
.62
± 0
.82
c
110
75.7
4 ±
0.1
772
.57
± 0
.50
69.8
3 ±
0.3
372
.71
± 0
.87
d72
.46
± 0
.20
68.9
0 ±
0.4
166
.28
± 0
.68
69.2
1 ±
0.9
3 d
Mea
n76
.66
± 0
.23
a74
.93
± 0
.61
b72
.59
± 0
.75
c
74.7
3 ±
0.4
3 A
74.0
9 ±
0.4
0 a
71.5
5 ±
0.6
4 b
69.1
4 ±
0.7
6 c
71.5
9 ±
0.4
9 B
Not
e: M
eans
for
eac
h gr
ain
moi
stur
e co
nten
t or
air
tem
pera
ture
wit
h th
e sa
me
lett
er (
wit
hin
each
col
umn
or e
ach
row
) ar
e no
t sig
nifi
cant
ly d
iffe
rent
at t
he 5
% le
vel.
Tab
le 2
.
Eff
ects
of
grai
n in
itia
l moi
stur
e co
nten
t and
dry
ing
air
tem
pera
ture
on
brea
kage
sus
cept
ibil
ity
of d
ried
gra
in (
%).
Tem
pera
ture
(
o
C)
‘Cli
nt’
‘Rai
ssa’
Moi
stur
e co
nten
t (%
)M
oist
ure
cont
ent (
%)
2025
30M
ean
2025
30M
ean
20 1
.86
± 0
.35
1.2
4 ±
0.0
6 1
.20
± 0
.18
1.4
3 ±
0.1
6 c
1.2
1 ±
0.1
8 1
.96
± 0
.21
1.2
4 ±
0.0
8 1
.47
± 0
.15
c
5813
.37
± 1
.53
22.1
9 ±
1.3
125
.21
± 2
.41
20.2
6 ±
1.9
9 b
13.1
8 ±
0.6
020
.62
± 2
.97
23.2
4 ±
1.7
019
.02
± 1
.81
b
8015
.68
± 0
.56
23.1
1 ±
1.8
728
.23
± 0
.90
22.3
4 ±
1.9
2 b
14.2
3 ±
3.1
328
.57
± 3
.47
33.9
5 ±
3.1
225
.58
± 3
.36
a
110
19.2
8 ±
1.5
228
.83
± 2
.84
31.1
7 ±
3.1
726
.43
± 2
.24
a18
.29
± 2
.53
30.1
4 ±
3.3
133
.94
± 0
.35
27.4
5 ±
2.6
5 a
Mea
n12
.55
± 2
.02
b18
.84
± 3
.25
a21
.45
± 3
.69
a
17.6
1 ±
1.8
3 A
11.7
3 ±
2.1
1 b
20.3
2 ±
3.5
8 a
23.1
0 ±
4.1
0 a
18.3
8 ±
2.0
6 A
Not
e: M
eans
for
eac
h gr
ain
moi
stur
e co
nten
t or
air
tem
pera
ture
wit
h th
e sa
me
lett
er (
wit
hin
each
col
umn
or e
ach
row
) ar
e no
t sig
nifi
cant
ly d
iffe
rent
at t
he 5
% le
vel.
Quality assurance in agricultural produce,edited by G.I. Johnson, Le Van To, Nguyen Duy Duc and M.C. Webb.
ACIAR Proceedings 100(printed version published in 2000)
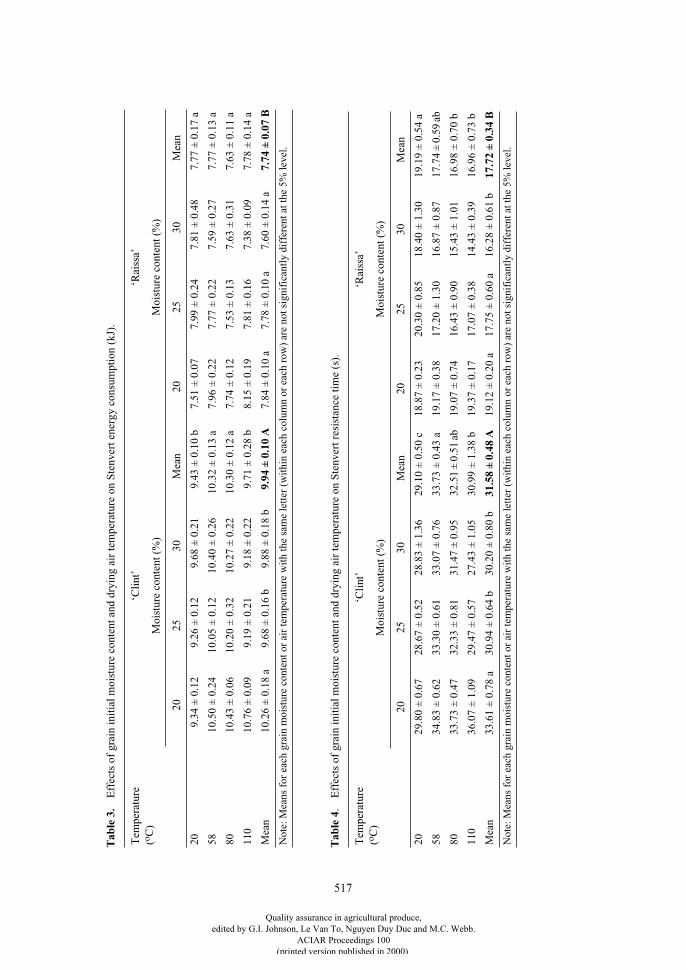
517
Tab
le 3
.
Eff
ects
of
grai
n in
itia
l moi
stur
e co
nten
t and
dry
ing
air
tem
pera
ture
on
Ste
nver
t ene
rgy
cons
umpt
ion
(kJ)
.
Tem
pera
ture
(
o
C)
‘Cli
nt’
‘Rai
ssa’
Moi
stur
e co
nten
t (%
)M
oist
ure
cont
ent (
%)
2025
30M
ean
2025
30M
ean
20 9
.34
± 0
.12
9.2
6 ±
0.1
2 9
.68
± 0
.21
9.4
3 ±
0.1
0 b
7.51
± 0
.07
7.99
± 0
.24
7.81
± 0
.48
7.77
± 0
.17
a
5810
.50
± 0
.24
10.0
5 ±
0.1
210
.40
± 0
.26
10.3
2 ±
0.1
3 a
7.96
± 0
.22
7.77
± 0
.22
7.59
± 0
.27
7.77
± 0
.13
a
8010
.43
± 0
.06
10.2
0 ±
0.3
210
.27
± 0
.22
10.3
0 ±
0.1
2 a
7.74
± 0
.12
7.53
± 0
.13
7.63
± 0
.31
7.63
± 0
.11
a
110
10.7
6 ±
0.0
9 9
.19
± 0
.21
9.1
8 ±
0.2
2 9
.71
± 0
.28
b8.
15 ±
0.1
97.
81 ±
0.1
67.
38 ±
0.0
97.
78 ±
0.1
4 a
Mea
n10
.26
± 0
.18
a 9
.68
± 0
.16
b 9
.88
± 0
.18
b
9.94
± 0
.10
A
7.84
± 0
.10
a7.
78 ±
0.1
0 a
7.60
± 0
.14
a
7.74
± 0
.07
B
Not
e: M
eans
for
eac
h gr
ain
moi
stur
e co
nten
t or
air
tem
pera
ture
wit
h th
e sa
me
lett
er (
wit
hin
each
col
umn
or e
ach
row
) ar
e no
t sig
nifi
cant
ly d
iffe
rent
at t
he 5
% le
vel.
Tab
le 4
. E
ffec
ts o
f gr
ain
init
ial m
oist
ure
cont
ent a
nd d
ryin
g ai
r te
mpe
ratu
re o
n S
tenv
ert r
esis
tanc
e ti
me
(s).
Tem
pera
ture
(
o
C)
‘Cli
nt’
‘Rai
ssa’
Moi
stur
e co
nten
t (%
)M
oist
ure
cont
ent (
%)
2025
30M
ean
2025
30M
ean
2029
.80
± 0
.67
28.6
7 ±
0.5
228
.83
± 1
.36
29.1
0 ±
0.5
0 c
18.8
7 ±
0.2
320
.30
± 0
.85
18.4
0 ±
1.3
019
.19
± 0
.54
a
5834
.83
± 0
.62
33.3
0 ±
0.6
133
.07
± 0
.76
33.7
3 ±
0.4
3 a
19.1
7 ±
0.3
817
.20
± 1
.30
16.8
7 ±
0.8
717
.74
± 0
.59
ab
8033
.73
± 0
.47
32.3
3 ±
0.8
131
.47
± 0
.95
32.5
1 ±
0.5
1 ab
19.0
7 ±
0.7
416
.43
± 0
.90
15.4
3 ±
1.0
116
.98
± 0
.70
b
110
36.0
7 ±
1.0
929
.47
± 0
.57
27.4
3 ±
1.0
530
.99
± 1
.38
b19
.37
± 0
.17
17.0
7 ±
0.3
814
.43
± 0
.39
16.9
6 ±
0.7
3 b
Mea
n33
.61
± 0
.78
a30
.94
± 0
.64
b30
.20
± 0
.80
b
31.5
8 ±
0.4
8 A
19.1
2 ±
0.2
0 a
17.7
5 ±
0.6
0 a
16.2
8 ±
0.6
1 b
17.7
2 ±
0.3
4 B
Not
e: M
eans
for
eac
h gr
ain
moi
stur
e co
nten
t or
air
tem
pera
ture
wit
h th
e sa
me
lett
er (
wit
hin
each
col
umn
or e
ach
row
) ar
e no
t sig
nifi
cant
ly d
iffe
rent
at t
he 5
% le
vel.
Quality assurance in agricultural produce,edited by G.I. Johnson, Le Van To, Nguyen Duy Duc and M.C. Webb.
ACIAR Proceedings 100(printed version published in 2000)
518
The hard hybrid (‘Clint’) had lower, but statisticallyinsignificant, breakage susceptibility than the softhybrid (‘Raissa’). However, ‘Clint’ had significantlyhigher bulk density and hardness characteristics than‘Raissa’. The low breakage susceptibility and highbulk density of ‘Clint’ could help explain the highpreference for ‘hard’ hybrids by maize processors. Thebulk density and the breakage susceptibility of the twohybrids tended to decrease and increase, respectively,as the initial MC increased, and as the drying air tem-perature increased. These results agree with thosepreviously reported by Gunasekaran and Paulsen(1985) and other researchers. Kirleis and Stroshine(1990) had also found that for each of their testedhybrids, Stenvert hardness test values remained rela-tively constant for maize dried at temperatures up to60°C and then declined only slightly, but not signifi-cantly, at higher drying temperatures (93.3°C). Thelevel of the damage was very small for both hybridswhen dried at the ambient air temperature, but thedrying took a longer time and the dried samplesdeveloped pathological problems such as mould orfungal infection.
Conclusions
Postharvest drying is important for removing excessgrain moisture. Mechanical dryers must be designedand operated efficiently to reduce operating costs andminimise adverse effects on grain quality. The param-eters and techniques used to evaluate the overall per-formance of grain dryers have been reviewed based onliterature evidence. Experimental studies using ‘hard’and ‘soft’ maize hybrids showed that both the initialMC of grain and drying air temperature affected grainquality attributes. The breakage and bulk density of thedried grain were most adversely affected at highdrying air temperatures and high initial grain MC. Thehardness characteristics of the dried grain decreased athigher initial MC and/or at higher drying air temper-ature. Grains of ‘Clint’ hybrid were consistentlyharder and had lower breakage susceptibility than‘Raissa’ hybrid grains.
References
Abe T., Otoche, C.E., Hikida, Y. and Yamashita, J. 1992.Effects of drying parameters on the quality of artificiallydried rough rice. Journal of Agricultural Mechanisation inAsia, Africa and Latin America, 23(4), 42–46.
Adeyemo, L.T. 1993. Modification of a natural airconvection dryer. Journal of Agricultural Mechanisationin Asia, Africa and Latin America, 24(2), 33–36.
Arinze, E.A., Sokhansanj, S., Schoenau, G.J. and Trautt-mansdorff, F.G. 1996. Experimental evaluation,simulation and optimisation of a commercial heated-airbatch hay drier: part 1, drier functional performance,product quality, and economic analysis of drying. Journalof Agricultural Engineering Research, 63, 301–314.
Brooker, B.D., Bakker-Arkema, W.F. and Hall, W.C. 1992.Drying and storage of grains and oilseeds. New York,Van Nostrand Reinhold.
ESCAP (Economic and Social Commission for Asia and thePacific) 1995. Regional Network for AgriculturalMachinery (RNAM) test codes and procedures for farmmachinery. Technical Series No. 12.
Foster, H.G. 1973. Dryeration: heated air drying and cornquality. Annales de Technologie Agricole, 22, 233–244.
Gunasekaran, S. and Paulsen, M.R. 1985. Breakageresistance of corn as a function of drying rates.Transactions of the American Society of AgriculturalEngineers, 28, 2071.
Gustafson, R.J., Morey, R.V, Christensen, C.M. andMeronuck, R.A. 1978. Quality changes during high–-lowtemperature drying. American Society of AgriculturalEngineers (ASAE) Paper No. 76-3523. St Paul,Minnesota, Scientific Journal Series No. 9747 of theMinnesota Agricultural Experiment Station.
Hall, C.W. 1980. Drying and storage of agricultural crops.Westport, Connecticut, AVI Publishing Company.
Kirleis, A.W. and Stroshine, R.L. 1990. Effects of hardnessand drying air temperature on breakage susceptibility anddry-milling characteristics of yellow dent corn. CerealChemistry, 67, 523–528.
Liu, Q., Cao, C.W. and Bakker-Arkema, F.W. 1999. Graindrying. In: CIGR (International Commission onAgricultural Engineering) Agricultural EngineeringHand Book, volume IV. St. Joseph, Michigan, USA,American Society of Agricultural Engineers.
Meas, P. 1999. Performance evaluation of a protype flat-bedgrain dryer. MApplSc thesis, Massey University,Palmerston North, New Zealand.
McLean, A.K. 1989. Drying and storing combinable crops,2
nd
edition. Ipswich, United Kingdom, Farming Press.
Ofoche, E.C., Abe, T. and Hikida, Y. 1991. Acceleratingdesign and performance test evaluation of cross-flowtempering drier using computer simulation model.Agricultural Mechanisation in Asia, Africa and LatinAmerica, 22(4), 54–60.
Peplinski, J.A., Paulis, W.J., Bietz, A.J. and Pratt, C.R.1994. Drying of high-moisture corn: changes inproperties and physical quality. Cereal Chemistry, 71,129–133.
Quality assurance in agricultural produce,edited by G.I. Johnson, Le Van To, Nguyen Duy Duc and M.C. Webb.
ACIAR Proceedings 100(printed version published in 2000)
519
Rodriguez, A. 1999. Factors affecting the adoption andcontinued use of mechanical dryers in the Philippines.MApplSc thesis, Massey University, Palmerston North,New Zealand.
Ross, I.J. and White, G.M. 1972. Thin layer drying charac-teristics of white corn. Transactions of the AmericanSociety of Agricultural Engineers, 15, 175 –176 + 179.
Shukla, D.B. and Patil, T.R. 1988. Overview of grain dryingand storage problems in India. In: Research anddevelopment issues in grain postharvest problems inAsia. GASGA (Group for Assistance on Systems relatingto Grain After harvest) Executive Seminar Series No. 2.Eschborn, Germany, Deutsche Gesellschaft fürTechnische Zusammenarbeit (GTZ) GmbH.
Trim, D.S. and Robinson, A.P. 1994. Drying methods. In:Proctor, L.D., ed., Grain storage techniques, evolutionand trends in developing countries. Food and AgricultureOrganization of the United Nations. Agricultural ServicesBulletin 1994, No. 109.
Thompson, R.A. and Foster, G.H. 1963. Stress cracks andbreakage in artificially dried corn. United StatesDepartment of Agriculture. Marketing Research ReportNo. 631, 24p.
Weller, C.L., Paulsen, M.R. and Steinberg, M.P. 1990.Stress cracking and breakage susceptibility as affected bymoisture content at harvest for four Yellow Dent cornhybrids. Transactions of the American Society ofAgricultural Engineers, 33, 863–869.
Quality assurance in agricultural produce,edited by G.I. Johnson, Le Van To, Nguyen Duy Duc and M.C. Webb.
ACIAR Proceedings 100(printed version published in 2000)
520
Rice Milling in Cambodia
J.F. Rickman, Som Bunna, Poa Sinath and Meas Pyseth*
Abstract
Rice milling in Cambodia can be broadly classified as village or commercial milling. The white rice and headrice yield from these rice mills is low and highly variable. The value of paddy milled by village mills issignificantly lower than that milled in modern commercial mills. There are opportunities to increase both thequantity and quality of white rice recovered if farmers and millers dried, stored and milled rice at the correctmoisture level and maintained their milling equipment regularly.
Background
T
HE
white rice and head rice yield (whole kernels) ofmills in Cambodia is low and highly variable. Ricemilling can be broadly classified as village or com-mercial milling. Village milling is normally under-taken on a part-time basis for village families.Commercial milling is done in larger mills using moremodern equipment for larger urban populations orexport.
Village milling
Village households store their rice as paddy rice.They take small quantities, normally about 20 kg, tothe mill several times a week for processing. Thevillage miller usually operates the mill on a part-timebasis, milling for 2–3 h/day. Depending on thelocality, payment is made through the retention of themeal and husk by the miller or cash payment on awhite rice basis. A single mill usually services 45–60families.
There are two types of mill used in villages. The firstis a steel huller and polisher that removes the husk andpolishes the paddy in one operation. The second typeuses rubber rollers to remove the husk, and steelpolishers to remove the bran and polish the rice. Thesesmall mills have a relatively high power requirement(10–15 kW) and subject the paddy to high pressure andfriction, which results in heating, low mill recovery
and high breakage of grain. The milling recovery,which is the percentage of white rice obtained from thepaddy, is relatively low. These mills are capable ofprocessing 150–300 kg of paddy/h and are very wellknown and accepted in villages. They are fairly cheapto operate and easy to repair, and produce one mixedgrade of white rice, one grade of meal and the ricehusk. The by-products of milling are used in pig, fishand poultry production.
Commercial milling
The modern commercial mills are capable ofmilling 0.5–2.5 t/h. While they do some local milling,they prefer to buy paddy and mill it for a larger urbanor export market. The modern mills in Cambodia arecommon in most provinces, especially in or near largetowns or transport routes. Much of the equipment inthese mills came from China and is very old. Most newequipment is imported from Vietnam. These millsincorporate a rubber roller system for removing thehusk from the grain and use stone polishing wheels toremove the bran to produce white rice. When properlyadjusted, they give the highest white and head riceyields. Milling outputs are graded into head rice, 1 or2 grades of cracked rice, 1 to 3 grades of meal, and therice husk.
We examined the cost and efficiency of millingoperations in 25 village and modern mills in 4provinces in Cambodia. Mills were performancetested under normal working conditions. Head rice
* Cambodia–International Rice Research Institute (IRRI)–Australia Project, PO Box 1, Phnom Penh, Cambodia.
Quality assurance in agricultural produce,edited by G.I. Johnson, Le Van To, Nguyen Duy Duc and M.C. Webb.
ACIAR Proceedings 100(printed version published in 2000)
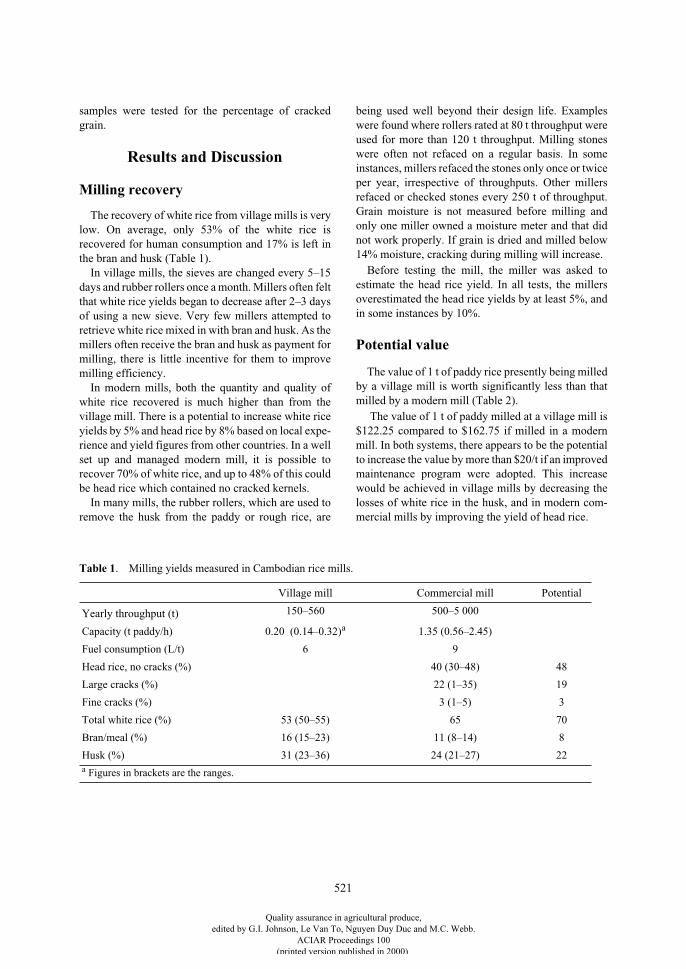
521
samples were tested for the percentage of crackedgrain.
Results and Discussion
Milling recovery
The recovery of white rice from village mills is verylow. On average, only 53% of the white rice isrecovered for human consumption and 17% is left inthe bran and husk (Table 1).
In village mills, the sieves are changed every 5–15days and rubber rollers once a month. Millers often feltthat white rice yields began to decrease after 2–3 daysof using a new sieve. Very few millers attempted toretrieve white rice mixed in with bran and husk. As themillers often receive the bran and husk as payment formilling, there is little incentive for them to improvemilling efficiency.
In modern mills, both the quantity and quality ofwhite rice recovered is much higher than from thevillage mill. There is a potential to increase white riceyields by 5% and head rice by 8% based on local expe-rience and yield figures from other countries. In a wellset up and managed modern mill, it is possible torecover 70% of white rice, and up to 48% of this couldbe head rice which contained no cracked kernels.
In many mills, the rubber rollers, which are used toremove the husk from the paddy or rough rice, are
being used well beyond their design life. Exampleswere found where rollers rated at 80 t throughput wereused for more than 120 t throughput. Milling stoneswere often not refaced on a regular basis. In someinstances, millers refaced the stones only once or twiceper year, irrespective of throughputs. Other millersrefaced or checked stones every 250 t of throughput.Grain moisture is not measured before milling andonly one miller owned a moisture meter and that didnot work properly. If grain is dried and milled below14% moisture, cracking during milling will increase.
Before testing the mill, the miller was asked toestimate the head rice yield. In all tests, the millersoverestimated the head rice yields by at least 5%, andin some instances by 10%.
Potential value
The value of 1 t of paddy rice presently being milledby a village mill is worth significantly less than thatmilled by a modern mill (Table 2).
The value of 1 t of paddy milled at a village mill is$122.25 compared to $162.75 if milled in a modernmill. In both systems, there appears to be the potentialto increase the value by more than $20/t if an improvedmaintenance program were adopted. This increasewould be achieved in village mills by decreasing thelosses of white rice in the husk, and in modern com-mercial mills by improving the yield of head rice.
Table 1
. Milling yields measured in Cambodian rice mills.
Village mill Commercial mill Potential
Yearly throughput (t)
150–560 500–5 000
Capacity (t paddy/h) 0.20 (0.14–0.32)
a
1.35 (0.56–2.45)
Fuel consumption (L/t) 6 9
Head rice, no cracks (%) 40 (30–48) 48
Large cracks (%) 22 (1–35) 19
Fine cracks (%) 3 (1–5) 3
Total white rice (%) 53 (50–55) 65 70
Bran/meal (%) 16 (15–23) 11 (8–14) 8
Husk (%) 31 (23–36) 24 (21–27) 22
a
Figures in brackets are the ranges.
Quality assurance in agricultural produce,edited by G.I. Johnson, Le Van To, Nguyen Duy Duc and M.C. Webb.
ACIAR Proceedings 100(printed version published in 2000)
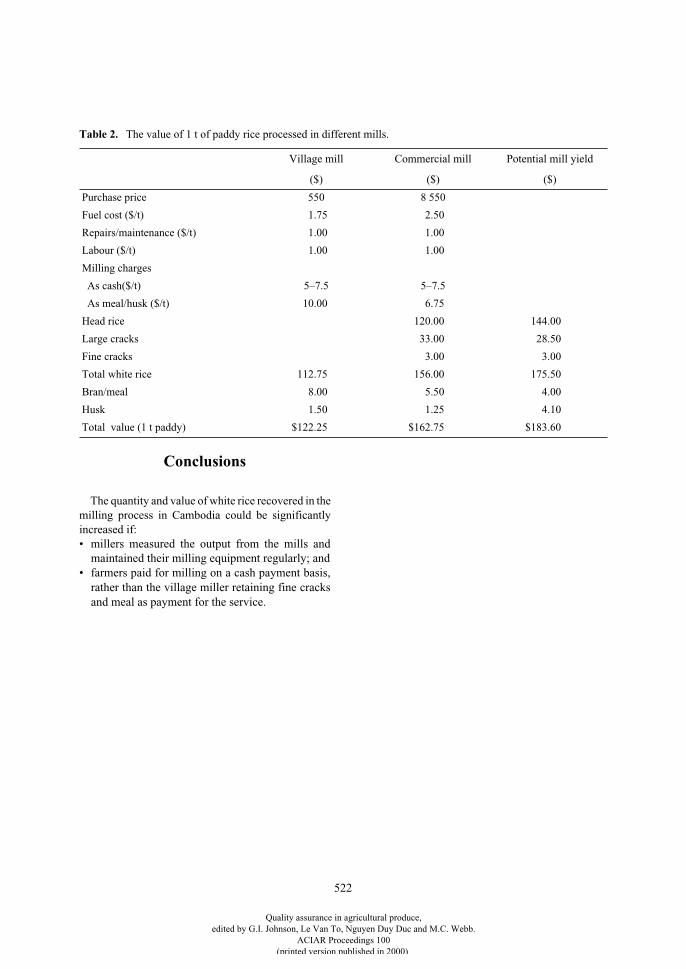
522
Conclusions
The quantity and value of white rice recovered in themilling process in Cambodia could be significantlyincreased if:• millers measured the output from the mills and
maintained their milling equipment regularly; and• farmers paid for milling on a cash payment basis,
rather than the village miller retaining fine cracksand meal as payment for the service.
Table 2.
The value of 1 t of paddy rice processed in different mills.
Village mill Commercial mill Potential mill yield
($) ($) ($)
Purchase price 550 8 550
Fuel cost ($/t) 1.75 2.50
Repairs/maintenance ($/t) 1.00 1.00
Labour ($/t) 1.00 1.00
Milling charges
As cash($/t) 5–7.5 5–7.5
As meal/husk ($/t) 10.00 6.75
Head rice 120.00 144.00
Large cracks 33.00 28.50
Fine cracks 3.00 3.00
Total white rice 112.75 156.00 175.50
Bran/meal 8.00 5.50 4.00
Husk 1.50 1.25 4.10
Total value (1 t paddy) $122.25 $162.75 $183.60
Quality assurance in agricultural produce,edited by G.I. Johnson, Le Van To, Nguyen Duy Duc and M.C. Webb.
ACIAR Proceedings 100(printed version published in 2000)
523
Strategies to Replace the Use of Methyl Bromide for the Fumigation of Bagged or Bulk Export
Shipments of Rice
C.R. Watson*, N. Pruthi†, D. Bureau§, C. Macdonald¶ and J. Roca**
Abstract
For many years, exports of rice have been fumigated with methyl bromide either prior to loading on board thevessel, or after loading but before sailing. This remains normal practice in most of the rice-exporting countries,and in some situations this type of fumigation is believed to be a mandatory requirement of the exportingcountry.
Methyl bromide is being phased out of production under the United Nations Montreal Protocol Agreementas it has been identified as depleting the ozone layer. Although it may be some years before productioncompletely ceases, the reduction in availability will inevitably lead to an increase in cost. In addition, buyersof rice are likely to give preference to rice that has not been fumigated with methyl bromide. Therefore, thereis an urgent requirement to introduce alternative, cost-effective measures.
This paper sets out the specific methodology that has been developed to meet this requirement by a group oforganisations based in different parts of the world. It describes the development work, tests, and resultingprocedures that have been evolved to allow phosphine fumigation of rice in bags and bulk to be carried out inships economically, safely and more efficiently than fumigation with methyl bromide.
M
ETHYL
BROMIDE
has been used for the fumigation ofrice shipments for many years. It has proved to beeffective, rapid and economical, whether used forfumigation in ships or in warehouses before loading orafter discharge.
In 1991, methyl bromide was identified as affectingthe ozone layer. It was subsequently assessed by theTechnical Experts of the United Nations EnvironmentProgramme (UNEP) and, following recommendationsto the Montreal Protocol Treaty on ozone-depletingsubstances, it was agreed that a phase-out or ban on itsproduction and use would be introduced.
The phase-out schedule currently agreed on is asfollows:• developed countries (Article 2)—25% reduction on
1 January 1999, 50% reduction on 1 January 2001,70% reduction on 1 January 2003, and phase-out on1 January 2005; and
• developing countries (Article 5)—20% reduction in2005, and phase-out on 1 January 2015.Quarantine and pre-shipment uses are currently
exempt from controls. After phase-out there will beexemptions for ‘critical uses’ which are still to bedefined, but they are likely to be almost impractical.
The European Union Commission has agreed to amore rigorous schedule of controls in the EuropeanUnion which are as follows: 60% reduction on 1January 2001, 75% reduction on 1 January 2003, andphase-out on 1 January 2005.
It is expected that the time of the Montreal Protocolphase-out schedule for Article 5 countries will bereduced considerably following negotiations due totake place during the next 12 months. In addition, the
* Igrox Ltd, White Hall, Worlingworth, Woodbridge, Suffolk IP13 7HW, United Kingdom.
† Pest Control (M. Walshe), 503 Embassy Centre, Nariman Point, Bombay 400 021, India.
§ Adalia Preventative Services Ltd, 8685 Lafrenal Street, St Leonard, Quebec H1P 2B6, Canada.
¶ Pestmaster, PO Box 3625, Cresta, South Africa.** Roca Defisan Sl, Partida de Vera 29, 46129 Alboraya
(Valenci), Spain.
Quality assurance in agricultural produce,edited by G.I. Johnson, Le Van To, Nguyen Duy Duc and M.C. Webb.
ACIAR Proceedings 100(printed version published in 2000)
524
exemptions for pre-shipment and quarantine receiveda critical analysis from UNEP experts and the resultingrecommendations mean that the current controlmeasures are likely to be significantly tightened in thefuture.
In addition to the restrictions that will be introducedby the Montreal Protocol, there will also be significantpressure from buyers, on suppliers of rice to guaranteethat their produce is supplied without methyl bromidehaving been used on it. The demands of the consumersin Article 2 countries where methyl bromide is bannedare likely to enforce this. Therefore, it is necessary toconsider alternatives to methyl bromide for thetreatment of rice.
The paper sets out to show that the fumigant gasphosphine can be used safely, effectively and econom-ically to replace the use of methyl bromide in manyshipment situations.
Estimates of Tonnages of Rice and Other Commodity Shipments
Currently Fumigated withMethyl Bromide Per Annum
India 2 million tonnes of rice; 1 million tonnesof other commodities.
Thailand 4 million tonnes of rice; 1 million tonnesof tapioca; 1 million tonnes of other com-modities.
Vietnam 4 million tonnes of rice; 1 million tonnesof other commodities.
Korea 2 million tonnes of imported cargoes thatare fumigated in vessels prior to dis-charge.
Japan Large quantities of imported cargo arebelieved to be fumigated in vessels prior todischarge and immediately following dis-charge.
Africa Imported cargoes are regularly fumigatedat ports in the south, east, west, and north,usually in the vessel prior to dischargebecause cargoes arrive with easilydetectable infestation.
Article 2 countries
Imported cargoes are regularly fumigatedin many countries, usually immediatelyfollowing discharge, due to importedinfestation.
What does the Receiver or End User of the Cargo Want?
The receiver does not want to receive live infestationat any time, but especially not from imported cargoes.This is because imported cargoes may contain speciesor strains that are not present in the receiving country(DSV 1996). For example, with resistance tophosphine becoming more widespread in some Asianand African countries, it is especially important thatphosphine-resistant strains not be allowed to entercountries where resistance is not present.
In addition, in many countries the food processorswill not accept commodities that show any signs oflive infestation. In the United Kingdom, for example,most food production companies, including flourmillers, have a zero insect tolerance policy.
Is it Possible to Achieve Fully-effective, In-transit
Fumigation of Goods?
In 1994, a group of independent fumigation companieslocated in different parts of the world drew up aprotocol to work together to address this issue. It wasrecognised that methyl bromide and phosphine arevery different fumigants (see Figures 1 and 2). Theobjectives were also set to take into account the manyvariables which existed worldwide with reference tophosphine in-transit fumigation, but the commonfactors were:
1. A ship’s hold can be an excellent fumigationchamber if it can be made gastight.
2. A lot of research has been carried out by well-respected government laboratories throughout theworld on the movement and distribution offumigants and on the concentrations necessary toeradicate a wide range of pests at different tem-peratures (Hole et al. 1976). Most of the researchis ignored by exporters when specifying fumi-gation.
3. In some countries, systems which provide anexcellent distribution of the fumigant are alreadyavailable (e.g. Degesch recirculation J System inEurope, Africa and the United States: J.T.Rogerson and P. Winspear, 1996, pers. comm.),while in other countries (e.g. India) they are not.
4. Control of the fumigation once it leaves the loadport is largely ignored. The responsibility for thecompletion of the fumigation and the ventilation
Quality assurance in agricultural produce,edited by G.I. Johnson, Le Van To, Nguyen Duy Duc and M.C. Webb.
ACIAR Proceedings 100(printed version published in 2000)
525
at the discharge port is generally left to the masterof the vessel (Watson et al. 1999).
5. Safety—in some countries (e.g. Canada), thesafety recommendations and regulations set outby the United Nations International MaritimeOrganization (Anon. 1996) are strictly adhered to.In others countries, such as Spain and India, theyare often ignored.
The objective of the group was therefore to providethe receiver or the end user with the opportunity tochoose to specify that their cargo be treated so that alllive infestation was eradicated, with little or nodetectable residues remaining, and using methods andprocedures which ensured the safety of the vessel’screw and of all those involved in discharging thevessel.
Development Work
It was decided that various methods of fumigationwere needed to address different situations andtherefore the following schedule of development workwas followed.
Verification of the Degesch J System
A request was received to arrange for a cargo ofbagged rice to be fumigated which had been loaded inSoutheast Asia and had then been fumigated withmethyl bromide before sailing for Cuba. The vessel,which had already set sail, was redirected to Durban,Republic of South Africa. The request for fumigationwas that the cargo must be fully guaranteed to have nolive infestation of any type of insect at any stage of thelife cycle on arrival in Havana.
It was decided to use the Degesch J System which isnormally fitted before loading (Figure 3), but becauseof the way the rice had been stowed could be fittedafter loading. Pestmaster of South Africa met thevessel in Durban and carried out the fumigation asspecified and directed by Igrox Ltd in the UnitedKingdom. It was decided to use this opportunity to testthe efficacy of the Degesch J System under these mostdifficult conditions.
Method
The Degesch J System was fitted to the ‘MV AsianProgress’ as shown in Figure 4. There was sufficientaccess down the side of the hold and below the tweendeck to allow the Pestmaster technicians to fit thepipes in each hold. Gas sample lines were also fitted in
three places in each hold. Live infestation (
Tribolium
spp.) was detected throughout the cargo.Aluminium phosphide in retrievable sachets was
placed on top of the cargo and the fans switched on.The holds and all access points were sealed and testscarried out for leakage. When all requirements as perUnited Nations International Maritime OrganizationRecommendations on the Safe Use of Pesticides inShips had been met, the vessel was allowed to sail on27 February 1996 with strict instructions to ensure allseals remained intact and the fans switched on untilarrival in Cuba.
Findings: Havana, Cuba, 27 March 1996
The inspection of the fumigation commenced onboard the vessel at approximately 10:30 am with rep-resentatives of Cuba Plant Quarantine, Igrox Ltd andthe shipper in attendance.
The fans were switched off (No. 2 was already notrunning as it stopped 10 days after the vessel leftDurban), then the access manholes to each hold wereopened in turn. The three gas sampling lines posi-tioned in each hold were retrieved. The lines werelabelled as B (bottom), M (middle), H (near to the top).Samples were drawn using an Agridox PhosphineMeter. Low levels of approximately 1 parts per million(ppm) were recorded on all lines in the first holdchecked (No. 5). Further samples were then drawnusing a Drager pump and phosphine tube 0.1/a(meaning the lowest concentration it can reliablymeasure is 0.1 ppm). This confirmed that the concen-trations were between approximately 0.7 and 1.00ppm. The remaining four holds were tested in a similarway and all lines indicated concentrations between 0.6and 1.00 ppm.
On completion of these measurements the venti-lators were opened and the ship’s ventilation systemwas switched on. Phosphine was immediately detectedby smell on the deck. The hatch covers were openedand the polythene sheets used to seal the holds wereremoved and ventilation continued. Gas concentrationchecks carried out indicated it was safe to work in theholds and initial checks were made by Cuba PlantQuarantine inspectors in each hold to ensure all fumi-gation ducts and fans had been located correctly,which was confirmed. Ducts to the lower holds couldbe clearly seen.
The sachets containing the aluminium phosphideresidues were collected and taken away for disposal byPlant Quarantine.
Further gas-measuring checks with the Dragerequipment were carried out in the air-space below the
Quality assurance in agricultural produce,edited by G.I. Johnson, Le Van To, Nguyen Duy Duc and M.C. Webb.
ACIAR Proceedings 100(printed version published in 2000)
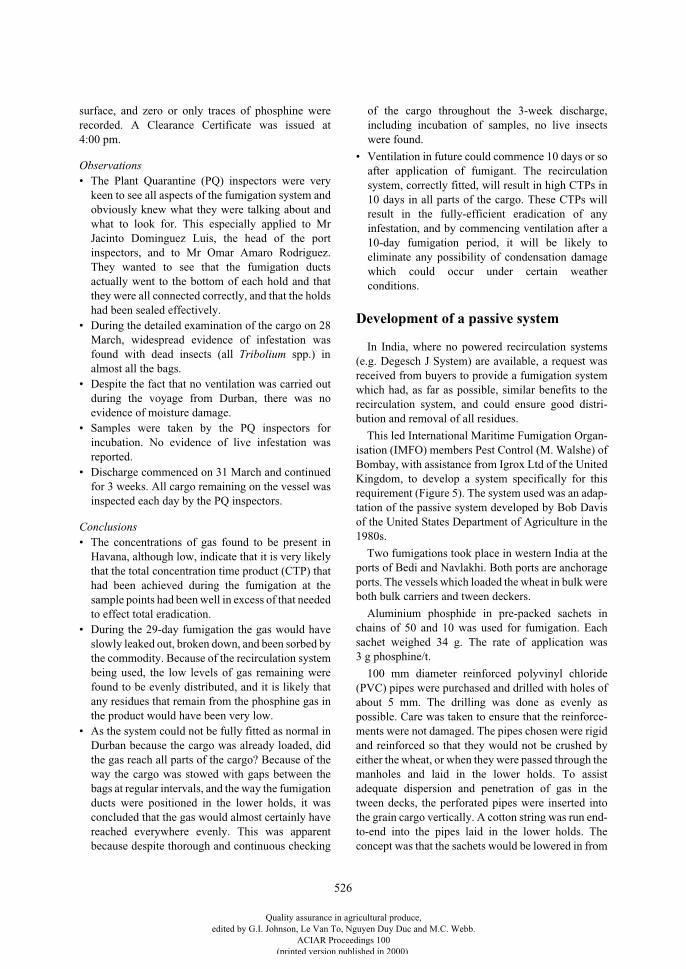
526
surface, and zero or only traces of phosphine wererecorded. A Clearance Certificate was issued at4:00 pm.
Observations
• The Plant Quarantine (PQ) inspectors were verykeen to see all aspects of the fumigation system andobviously knew what they were talking about andwhat to look for. This especially applied to MrJacinto Dominguez Luis, the head of the portinspectors, and to Mr Omar Amaro Rodriguez.They wanted to see that the fumigation ductsactually went to the bottom of each hold and thatthey were all connected correctly, and that the holdshad been sealed effectively.
• During the detailed examination of the cargo on 28March, widespread evidence of infestation wasfound with dead insects (all
Tribolium
spp.) inalmost all the bags.
• Despite the fact that no ventilation was carried outduring the voyage from Durban, there was noevidence of moisture damage.
• Samples were taken by the PQ inspectors forincubation. No evidence of live infestation wasreported.
• Discharge commenced on 31 March and continuedfor 3 weeks. All cargo remaining on the vessel wasinspected each day by the PQ inspectors.
Conclusions
• The concentrations of gas found to be present inHavana, although low, indicate that it is very likelythat the total concentration time product (CTP) thathad been achieved during the fumigation at thesample points had been well in excess of that neededto effect total eradication.
• During the 29-day fumigation the gas would haveslowly leaked out, broken down, and been sorbed bythe commodity. Because of the recirculation systembeing used, the low levels of gas remaining werefound to be evenly distributed, and it is likely thatany residues that remain from the phosphine gas inthe product would have been very low.
• As the system could not be fully fitted as normal inDurban because the cargo was already loaded, didthe gas reach all parts of the cargo? Because of theway the cargo was stowed with gaps between thebags at regular intervals, and the way the fumigationducts were positioned in the lower holds, it wasconcluded that the gas would almost certainly havereached everywhere evenly. This was apparentbecause despite thorough and continuous checking
of the cargo throughout the 3-week discharge,including incubation of samples, no live insectswere found.
• Ventilation in future could commence 10 days or soafter application of fumigant. The recirculationsystem, correctly fitted, will result in high CTPs in10 days in all parts of the cargo. These CTPs willresult in the fully-efficient eradication of anyinfestation, and by commencing ventilation after a10-day fumigation period, it will be likely toeliminate any possibility of condensation damagewhich could occur under certain weatherconditions.
Development of a passive system
In India, where no powered recirculation systems(e.g. Degesch J System) are available, a request wasreceived from buyers to provide a fumigation systemwhich had, as far as possible, similar benefits to therecirculation system, and could ensure good distri-bution and removal of all residues.
This led International Maritime Fumigation Organ-isation (IMFO) members Pest Control (M. Walshe) ofBombay, with assistance from Igrox Ltd of the UnitedKingdom, to develop a system specifically for thisrequirement (Figure 5). The system used was an adap-tation of the passive system developed by Bob Davisof the United States Department of Agriculture in the1980s.
Two fumigations took place in western India at theports of Bedi and Navlakhi. Both ports are anchorageports. The vessels which loaded the wheat in bulk wereboth bulk carriers and tween deckers.
Aluminium phosphide in pre-packed sachets inchains of 50 and 10 was used for fumigation. Eachsachet weighed 34 g. The rate of application was3 g phosphine/t.
100 mm diameter reinforced polyvinyl chloride(PVC) pipes were purchased and drilled with holes ofabout 5 mm. The drilling was done as evenly aspossible. Care was taken to ensure that the reinforce-ments were not damaged. The pipes chosen were rigidand reinforced so that they would not be crushed byeither the wheat, or when they were passed through themanholes and laid in the lower holds. To assistadequate dispersion and penetration of gas in thetween decks, the perforated pipes were inserted intothe grain cargo vertically. A cotton string was run end-to-end into the pipes laid in the lower holds. Theconcept was that the sachets would be lowered in from
Quality assurance in agricultural produce,edited by G.I. Johnson, Le Van To, Nguyen Duy Duc and M.C. Webb.
ACIAR Proceedings 100(printed version published in 2000)
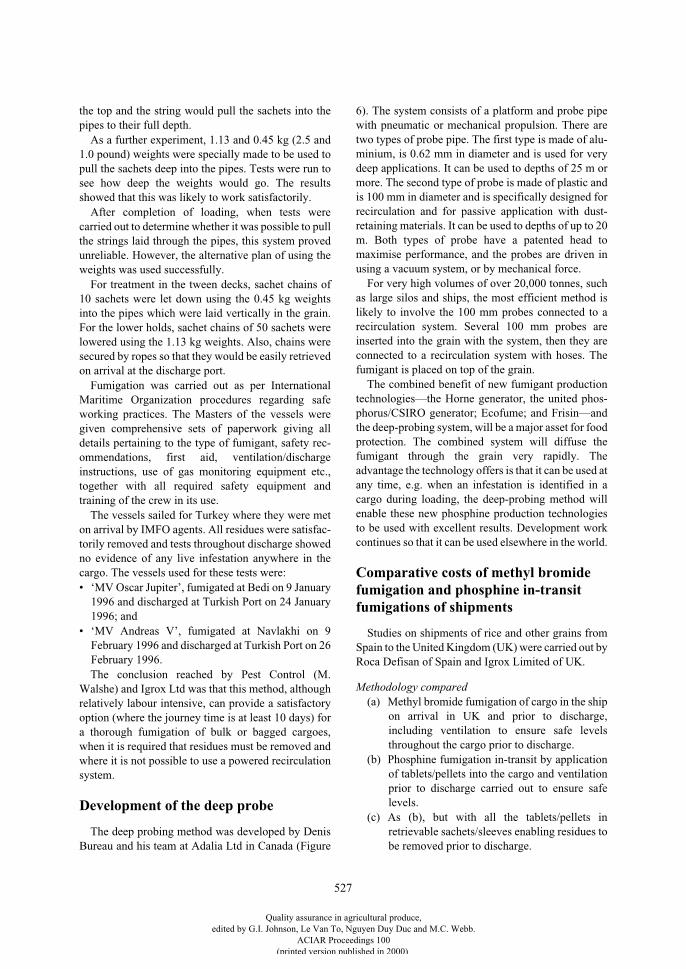
527
the top and the string would pull the sachets into thepipes to their full depth.
As a further experiment, 1.13 and 0.45 kg (2.5 and1.0 pound) weights were specially made to be used topull the sachets deep into the pipes. Tests were run tosee how deep the weights would go. The resultsshowed that this was likely to work satisfactorily.
After completion of loading, when tests werecarried out to determine whether it was possible to pullthe strings laid through the pipes, this system provedunreliable. However, the alternative plan of using theweights was used successfully.
For treatment in the tween decks, sachet chains of10 sachets were let down using the 0.45 kg weightsinto the pipes which were laid vertically in the grain.For the lower holds, sachet chains of 50 sachets werelowered using the 1.13 kg weights. Also, chains weresecured by ropes so that they would be easily retrievedon arrival at the discharge port.
Fumigation was carried out as per InternationalMaritime Organization procedures regarding safeworking practices. The Masters of the vessels weregiven comprehensive sets of paperwork giving alldetails pertaining to the type of fumigant, safety rec-ommendations, first aid, ventilation/dischargeinstructions, use of gas monitoring equipment etc.,together with all required safety equipment andtraining of the crew in its use.
The vessels sailed for Turkey where they were meton arrival by IMFO agents. All residues were satisfac-torily removed and tests throughout discharge showedno evidence of any live infestation anywhere in thecargo. The vessels used for these tests were:• ‘MV Oscar Jupiter’, fumigated at Bedi on 9 January
1996 and discharged at Turkish Port on 24 January1996; and
• ‘MV Andreas V’, fumigated at Navlakhi on 9February 1996 and discharged at Turkish Port on 26February 1996.The conclusion reached by Pest Control (M.
Walshe) and Igrox Ltd was that this method, althoughrelatively labour intensive, can provide a satisfactoryoption (where the journey time is at least 10 days) fora thorough fumigation of bulk or bagged cargoes,when it is required that residues must be removed andwhere it is not possible to use a powered recirculationsystem.
Development of the deep probe
The deep probing method was developed by DenisBureau and his team at Adalia Ltd in Canada (Figure
6). The system consists of a platform and probe pipewith pneumatic or mechanical propulsion. There aretwo types of probe pipe. The first type is made of alu-minium, is 0.62 mm in diameter and is used for verydeep applications. It can be used to depths of 25 m ormore. The second type of probe is made of plastic andis 100 mm in diameter and is specifically designed forrecirculation and for passive application with dust-retaining materials. It can be used to depths of up to 20m. Both types of probe have a patented head tomaximise performance, and the probes are driven inusing a vacuum system, or by mechanical force.
For very high volumes of over 20,000 tonnes, suchas large silos and ships, the most efficient method islikely to involve the 100 mm probes connected to arecirculation system. Several 100 mm probes areinserted into the grain with the system, then they areconnected to a recirculation system with hoses. Thefumigant is placed on top of the grain.
The combined benefit of new fumigant productiontechnologies—the Horne generator, the united phos-phorus/CSIRO generator; Ecofume; and Frisin—andthe deep-probing system, will be a major asset for foodprotection. The combined system will diffuse thefumigant through the grain very rapidly. Theadvantage the technology offers is that it can be used atany time, e.g. when an infestation is identified in acargo during loading, the deep-probing method willenable these new phosphine production technologiesto be used with excellent results. Development workcontinues so that it can be used elsewhere in the world.
Comparative costs of methyl bromide fumigation and phosphine in-transit fumigations of shipments
Studies on shipments of rice and other grains fromSpain to the United Kingdom (UK) were carried out byRoca Defisan of Spain and Igrox Limited of UK.
Methodology compared
(a) Methyl bromide fumigation of cargo in the shipon arrival in UK and prior to discharge,including ventilation to ensure safe levelsthroughout the cargo prior to discharge.
(b) Phosphine fumigation in-transit by applicationof tablets/pellets into the cargo and ventilationprior to discharge carried out to ensure safelevels.
(c) As (b), but with all the tablets/pellets inretrievable sachets/sleeves enabling residues tobe removed prior to discharge.
Quality assurance in agricultural produce,edited by G.I. Johnson, Le Van To, Nguyen Duy Duc and M.C. Webb.
ACIAR Proceedings 100(printed version published in 2000)
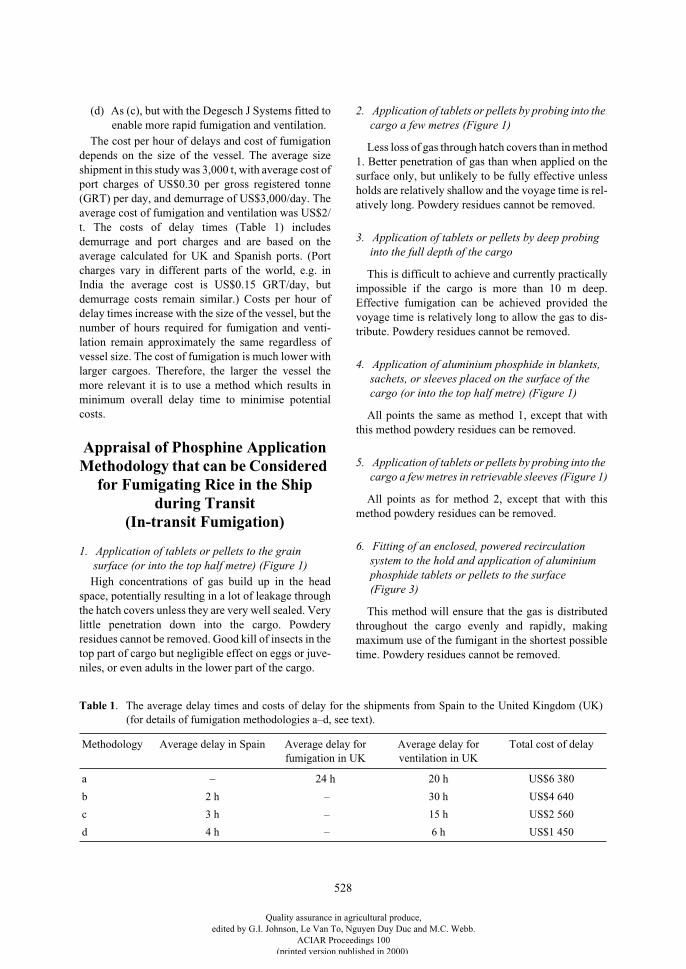
528
(d) As (c), but with the Degesch J Systems fitted toenable more rapid fumigation and ventilation.
The cost per hour of delays and cost of fumigationdepends on the size of the vessel. The average sizeshipment in this study was 3,000 t, with average cost ofport charges of US$0.30 per gross registered tonne(GRT) per day, and demurrage of US$3,000/day. Theaverage cost of fumigation and ventilation was US$2/t. The costs of delay times (Table 1) includesdemurrage and port charges and are based on theaverage calculated for UK and Spanish ports. (Portcharges vary in different parts of the world, e.g. inIndia the average cost is US$0.15 GRT/day, butdemurrage costs remain similar.) Costs per hour ofdelay times increase with the size of the vessel, but thenumber of hours required for fumigation and venti-lation remain approximately the same regardless ofvessel size. The cost of fumigation is much lower withlarger cargoes. Therefore, the larger the vessel themore relevant it is to use a method which results inminimum overall delay time to minimise potentialcosts.
Appraisal of Phosphine Application Methodology that can be Considered
for Fumigating Rice in the Ship during Transit
(In-transit Fumigation)
1. Application of tablets or pellets to the grain surface (or into the top half metre) (Figure 1)
High concentrations of gas build up in the headspace, potentially resulting in a lot of leakage throughthe hatch covers unless they are very well sealed. Verylittle penetration down into the cargo. Powderyresidues cannot be removed. Good kill of insects in thetop part of cargo but negligible effect on eggs or juve-niles, or even adults in the lower part of the cargo.
2. Application of tablets or pellets by probing into the cargo a few metres (Figure 1)
Less loss of gas through hatch covers than in method1. Better penetration of gas than when applied on thesurface only, but unlikely to be fully effective unlessholds are relatively shallow and the voyage time is rel-atively long. Powdery residues cannot be removed.
3. Application of tablets or pellets by deep probing into the full depth of the cargo
This is difficult to achieve and currently practicallyimpossible if the cargo is more than 10 m deep.Effective fumigation can be achieved provided thevoyage time is relatively long to allow the gas to dis-tribute. Powdery residues cannot be removed.
4. Application of aluminium phosphide in blankets, sachets, or sleeves placed on the surface of the cargo (or into the top half metre) (Figure 1)
All points the same as method 1, except that withthis method powdery residues can be removed.
5. Application of tablets or pellets by probing into the cargo a few metres in retrievable sleeves (Figure 1)
All points as for method 2, except that with thismethod powdery residues can be removed.
6. Fitting of an enclosed, powered recirculation system to the hold and application of aluminium phosphide tablets or pellets to the surface(Figure 3)
This method will ensure that the gas is distributedthroughout the cargo evenly and rapidly, makingmaximum use of the fumigant in the shortest possibletime. Powdery residues cannot be removed.
Table 1. The average delay times and costs of delay for the shipments from Spain to the United Kingdom (UK)(for details of fumigation methodologies a–d, see text).
Methodology Average delay in Spain Average delay for fumigation in UK
Average delay for ventilation in UK
Total cost of delay
a – 24 h 20 h US$6 380
b 2 h – 30 h US$4 640
c 3 h – 15 h US$2 560
d 4 h – 6 h US$1 450
Quality assurance in agricultural produce,edited by G.I. Johnson, Le Van To, Nguyen Duy Duc and M.C. Webb.
ACIAR Proceedings 100(printed version published in 2000)
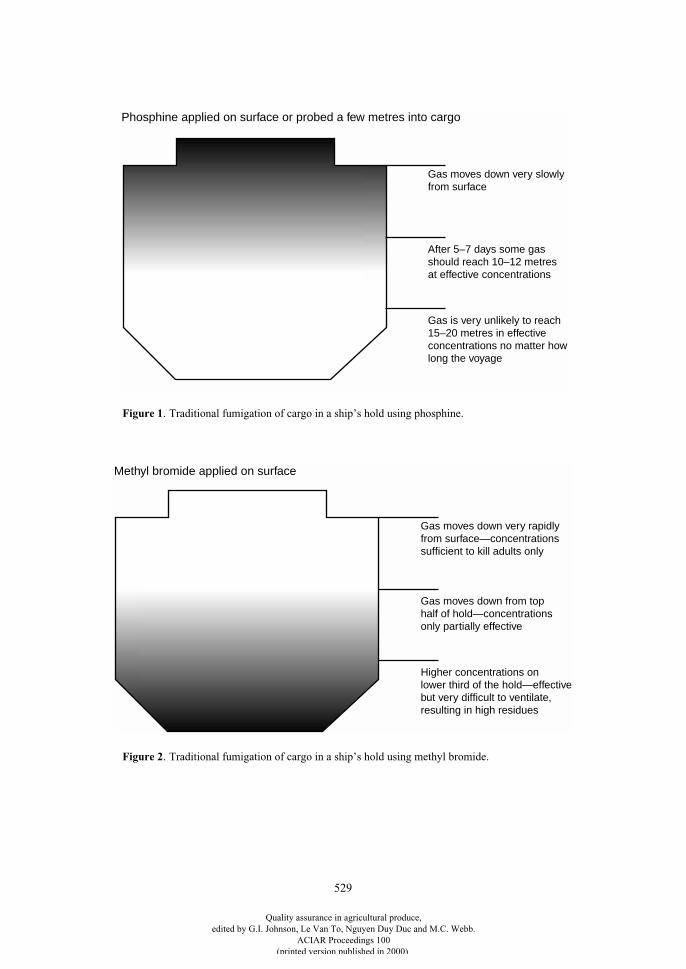
529
Gas moves down very slowlyfrom surface
After 5–7 days some gasshould reach 10–12 metresat effective concentrations
Gas is very unlikely to reach 15–20 metres in effectiveconcentrations no matter howlong the voyage
Phosphine applied on surface or probed a few metres into cargo
Gas moves down very rapidlyfrom surface—concentrations sufficient to kill adults only
Gas moves down from tophalf of hold—concentrationsonly partially effective
Higher concentrations on lower third of the hold—effectivebut very difficult to ventilate,resulting in high residues
Methyl bromide applied on surface
Figure 1
. Traditional fumigation of cargo in a ship’s hold using phosphine.
Figure 2
. Traditional fumigation of cargo in a ship’s hold using methyl bromide.
Quality assurance in agricultural produce,edited by G.I. Johnson, Le Van To, Nguyen Duy Duc and M.C. Webb.
ACIAR Proceedings 100(printed version published in 2000)
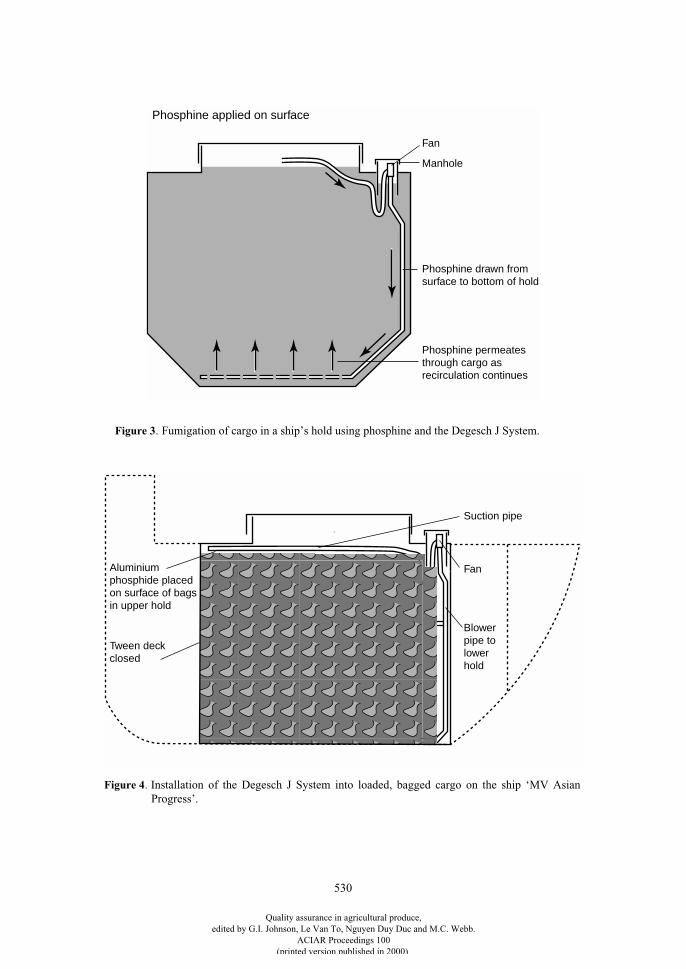
530
Manhole
Phosphine drawn from surface to bottom of hold
Phosphine permeatesthrough cargo asrecirculation continues
Phosphine applied on surface
Fan
Fan
Suction pipe
Blowerpipe tolowerhold
Aluminiumphosphide placed on surface of bagsin upper hold
Tween deckclosed
Figure 4
. Installation of the Degesch J System into loaded, bagged cargo on the ship ‘MV AsianProgress’.
Figure 3
. Fumigation of cargo in a ship’s hold using phosphine and the Degesch J System.
Quality assurance in agricultural produce,edited by G.I. Johnson, Le Van To, Nguyen Duy Duc and M.C. Webb.
ACIAR Proceedings 100(printed version published in 2000)
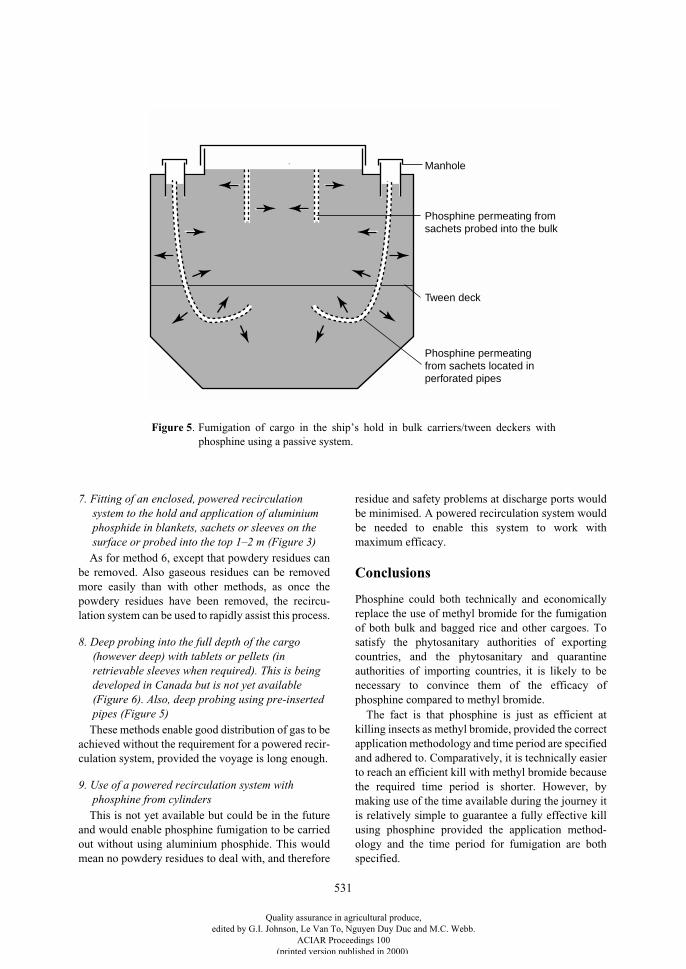
531
Manhole
Phosphine permeating fromsachets probed into the bulk
Tween deck
Phosphine permeatingfrom sachets located in perforated pipes
Figure 5
. Fumigation of cargo in the ship’s hold in bulk carriers/tween deckers withphosphine using a passive system.
7. Fitting of an enclosed, powered recirculation system to the hold and application of aluminium phosphide in blankets, sachets or sleeves on the surface or probed into the top 1–2 m (Figure 3)
As for method 6, except that powdery residues canbe removed. Also gaseous residues can be removedmore easily than with other methods, as once thepowdery residues have been removed, the recircu-lation system can be used to rapidly assist this process.
8. Deep probing into the full depth of the cargo (however deep) with tablets or pellets (in retrievable sleeves when required). This is being developed in Canada but is not yet available (Figure 6). Also, deep probing using pre-inserted pipes (Figure 5)
These methods enable good distribution of gas to beachieved without the requirement for a powered recir-culation system, provided the voyage is long enough.
9. Use of a powered recirculation system with phosphine from cylinders
This is not yet available but could be in the futureand would enable phosphine fumigation to be carriedout without using aluminium phosphide. This wouldmean no powdery residues to deal with, and therefore
residue and safety problems at discharge ports wouldbe minimised. A powered recirculation system wouldbe needed to enable this system to work withmaximum efficacy.
Conclusions
Phosphine could both technically and economicallyreplace the use of methyl bromide for the fumigationof both bulk and bagged rice and other cargoes. Tosatisfy the phytosanitary authorities of exportingcountries, and the phytosanitary and quarantineauthorities of importing countries, it is likely to benecessary to convince them of the efficacy ofphosphine compared to methyl bromide.
The fact is that phosphine is just as efficient atkilling insects as methyl bromide, provided the correctapplication methodology and time period are specifiedand adhered to. Comparatively, it is technically easierto reach an efficient kill with methyl bromide becausethe required time period is shorter. However, bymaking use of the time available during the journey itis relatively simple to guarantee a fully effective killusing phosphine provided the application method-ology and the time period for fumigation are bothspecified.
Quality assurance in agricultural produce,edited by G.I. Johnson, Le Van To, Nguyen Duy Duc and M.C. Webb.
ACIAR Proceedings 100(printed version published in 2000)
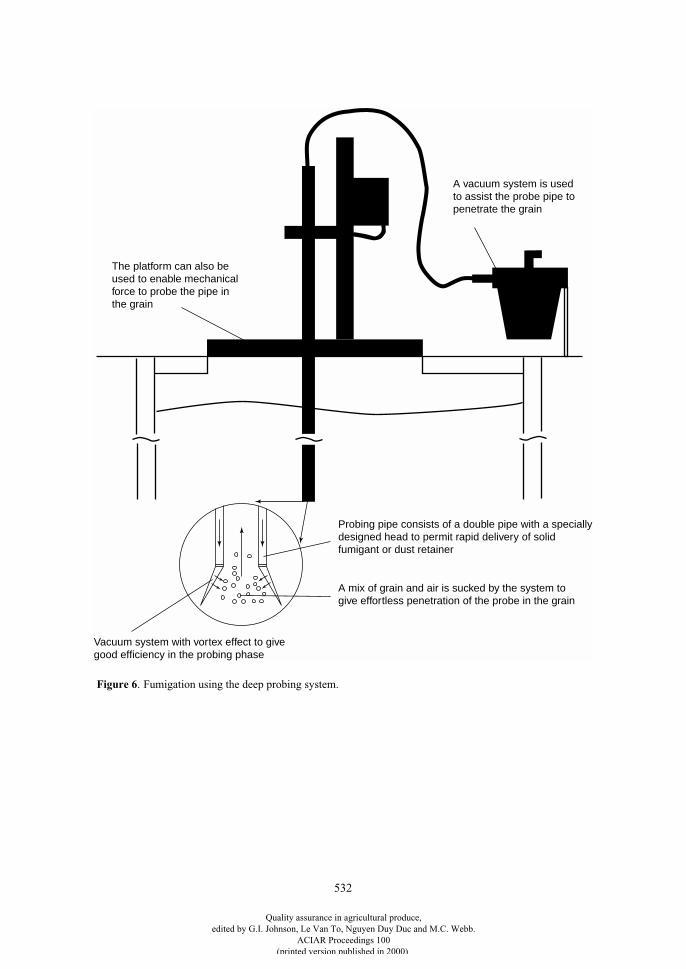
532
A vacuum system is used to assist the probe pipe topenetrate the grain
The platform can also be used to enable mechanicalforce to probe the pipe in the grain
Probing pipe consists of a double pipe with a speciallydesigned head to permit rapid delivery of solidfumigant or dust retainer
A mix of grain and air is sucked by the system togive effortless penetration of the probe in the grain
Vacuum system with vortex effect to givegood efficiency in the probing phase
Figure 6
. Fumigation using the deep probing system.
Quality assurance in agricultural produce,edited by G.I. Johnson, Le Van To, Nguyen Duy Duc and M.C. Webb.
ACIAR Proceedings 100(printed version published in 2000)
533
The key to the more widespread use of phosphine inreplacing methyl bromide is that the phytosanitary orquarantine authority or the purchaser of the cargo mustspecify in writing a precise specification requirementthat can then be monitored to ensure it is adhered to.
References
Anon. 1996. Recommendations for the safe use of pesticideson ships. London, International Maritime Organization.
DSV (Departmento De Sanidade Vegetal) 1996. Quarantinerequirements relating to import/trasit of maize grain fromcountries where larger grain borer (
Prosterphanustruncatus
) is present. Maputo, Mozambique, DSV.
Hole, B.D., Bell, C.H., Mills, K.A. and Goodship, G. 1976.The toxicity of phosphine to all developmental stages ofthirteen species of stored product beetles. Journal ofStored Products Research, 12, 235–244.
Watson, C.R., Pruthi, N., Bureau, D., Macdonald, C. andRoca, J. 1999. Intransit disinfestation of bulk and baggedcommodities: a new approach to safety and efficacy. In:Jin Zuxun, Liang Quan, Liang Yongsheng, TanXianchang and Guan Lianghua, ed., Stored productprotection. Proceedings of the 7
th
international workingconference on stored-product protection, 14–19 October1998, Beijing, P.R. China., volume 1. Chengdu, SichuanProvince, Sichuan Publishing House of Science andTechnology, 462–476.
Quality assurance in agricultural produce,edited by G.I. Johnson, Le Van To, Nguyen Duy Duc and M.C. Webb.
ACIAR Proceedings 100(printed version published in 2000)
534
Ergosterol in Paddy as an Indicator of Quality
G. Srzednicki, C. Nimmuntavin, R.G. Mantais, J. Craske and S. Wattananon*
Abstract
Ergosterol is the predominant sterol component in fungi and can be used as an indicator of the extent of fungalinfection in grain. One of the analytical methods available to extract ergosterol from grain is solid-phaseextraction (SPE). SPE is a simpler and faster method than the conventional liquid extraction methods. Differentanalytical steps have been determined for the use of SPE in paddy samples. Storage studies in conjunction withdifferent drying treatments have been conducted in which levels of ergosterol have been monitored. The resultsof these observations have been related to the ambient conditions during storage. An attempt has been madeto use ergosterol determination by SPE for quality control purposes in stored paddy.
C
EREAL
CROPS
, such as maize, rice and wheat, areamong the major food crops for both humans andanimals throughout the world. Due to the progress inproduction techniques, farmers are encouraged togrow high-yielding crop varieties in order to increaseproduction as well as to achieve a marketable surplus(Boxall and Calverley 1985). In a number of countries,irrigation is used and then two or more crops of rice aregrown per year (Kent and Evers 1994). As a result,grain producers and handlers are faced with a newproblem, which is to dry a larger amount of grain at thesame time. Failing to solve this problem may result ingrain quality deterioration from insect pests, mouldsand biochemical processes occurring within the grainitself (Boxall and Calverley 1985).
Rice, especially the wet season crop, is oftenharvested at very high moisture contents (MCs) whichare well above those suitable for safe storage. Post-harvest treatments, such as sealed storage, chemicaltreatment, chilling and drying are available to ensureshort- and long-term preservation of grains. Inpractice, drying of grain is the most widely used grain-preservation method (Brooker et al. 1992).
The aim of grain drying is to reduce the MC in thegrain from 22–30% to 12–14% in order to prevent thecrop from deteriorating during storage (Bakker-Arkema and Salleh 1985). Grains can be dried in
various ways, such as traditional sun-drying ormechanical drying (e.g. high temperature continuousor batch drying, near ambient air drying or a combi-nation of both). For paddy, once the moisture isreduced below 18%, high temperature drying becomesinefficient and tends to cause fissuring. Consequently,a two-stage drying system has been developed in orderto solve this problem. The basic principle is to use hightemperatures for removing initial moisture down to18% and to use low temperatures in the second stage ofdrying (Driscoll and Srzednicki 1995). The advantageof in-store drying is to maximise the drying capacity ofthe grain dryer at minimum consumption of energy,without affecting the quality of the rice. In order todetermine the optimum air temperature and dryingtime for the second stage of drying, the quality of grainafter drying should be investigated. As fungal invasionis one of major causes of grain deterioration, determi-nation of the amount of fungal activity is one of themost important methods available for examining thequality of grain (Brooker et al. 1992).
Fungi can be detected in various ways, such asmicrobiological methods, reduction of seed germi-nation, discoloration, and chitin content measurement.However, these methods are quite ineffective in deter-mining the grain quality. Some of them require a longperiod of time in determining fungal biomass, whileothers require sophisticated laboratory equipment, e.g.for chitin content measurement (Nurjanah 1996).
Seitz et al. (1977) proposed the determination ofergosterol, which is the predominant sterol in most
* Department of Food Science and Technology, The University of New South Wales, Sydney, NSW 2052, Australia.
Quality assurance in agricultural produce,edited by G.I. Johnson, Le Van To, Nguyen Duy Duc and M.C. Webb.
ACIAR Proceedings 100(printed version published in 2000)
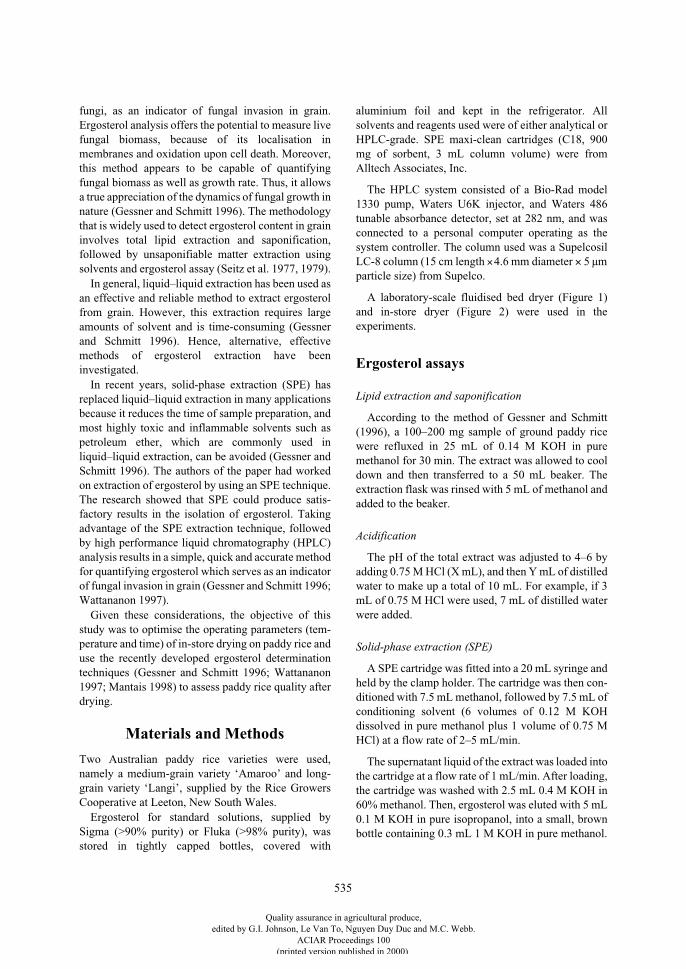
535
fungi, as an indicator of fungal invasion in grain.Ergosterol analysis offers the potential to measure livefungal biomass, because of its localisation inmembranes and oxidation upon cell death. Moreover,this method appears to be capable of quantifyingfungal biomass as well as growth rate. Thus, it allowsa true appreciation of the dynamics of fungal growth innature (Gessner and Schmitt 1996). The methodologythat is widely used to detect ergosterol content in graininvolves total lipid extraction and saponification,followed by unsaponifiable matter extraction usingsolvents and ergosterol assay (Seitz et al. 1977, 1979).
In general, liquid–liquid extraction has been used asan effective and reliable method to extract ergosterolfrom grain. However, this extraction requires largeamounts of solvent and is time-consuming (Gessnerand Schmitt 1996). Hence, alternative, effectivemethods of ergosterol extraction have beeninvestigated.
In recent years, solid-phase extraction (SPE) hasreplaced liquid–liquid extraction in many applicationsbecause it reduces the time of sample preparation, andmost highly toxic and inflammable solvents such aspetroleum ether, which are commonly used inliquid–liquid extraction, can be avoided (Gessner andSchmitt 1996). The authors of the paper had workedon extraction of ergosterol by using an SPE technique.The research showed that SPE could produce satis-factory results in the isolation of ergosterol. Takingadvantage of the SPE extraction technique, followedby high performance liquid chromatography (HPLC)analysis results in a simple, quick and accurate methodfor quantifying ergosterol which serves as an indicatorof fungal invasion in grain (Gessner and Schmitt 1996;Wattananon 1997).
Given these considerations, the objective of thisstudy was to optimise the operating parameters (tem-perature and time) of in-store drying on paddy rice anduse the recently developed ergosterol determinationtechniques (Gessner and Schmitt 1996; Wattananon1997; Mantais 1998) to assess paddy rice quality afterdrying.
Materials and Methods
Two Australian paddy rice varieties were used,namely a medium-grain variety ‘Amaroo’ and long-grain variety ‘Langi’, supplied by the Rice GrowersCooperative at Leeton, New South Wales.
Ergosterol for standard solutions, supplied bySigma (>90% purity) or Fluka (>98% purity), wasstored in tightly capped bottles, covered with
aluminium foil and kept in the refrigerator. Allsolvents and reagents used were of either analytical orHPLC-grade. SPE maxi-clean cartridges (C18, 900mg of sorbent, 3 mL column volume) were fromAlltech Associates, Inc.
The HPLC system consisted of a Bio-Rad model1330 pump, Waters U6K injector, and Waters 486tunable absorbance detector, set at 282 nm, and wasconnected to a personal computer operating as thesystem controller. The column used was a SupelcosilLC-8 column (15 cm length
×
4.6 mm diameter
×
5 µmparticle size) from Supelco.
A laboratory-scale fluidised bed dryer (Figure 1)and in-store dryer (Figure 2) were used in theexperiments.
Ergosterol assays
Lipid extraction and saponification
According to the method of Gessner and Schmitt(1996), a 100–200 mg sample of ground paddy ricewere refluxed in 25 mL of 0.14 M KOH in puremethanol for 30 min. The extract was allowed to cooldown and then transferred to a 50 mL beaker. Theextraction flask was rinsed with 5 mL of methanol andadded to the beaker.
Acidification
The pH of the total extract was adjusted to 4–6 byadding 0.75 M HCl (X mL), and then Y mL of distilledwater to make up a total of 10 mL. For example, if 3mL of 0.75 M HCl were used, 7 mL of distilled waterwere added.
Solid-phase extraction (SPE)
A SPE cartridge was fitted into a 20 mL syringe andheld by the clamp holder. The cartridge was then con-ditioned with 7.5 mL methanol, followed by 7.5 mL ofconditioning solvent (6 volumes of 0.12 M KOHdissolved in pure methanol plus 1 volume of 0.75 MHCl) at a flow rate of 2–5 mL/min.
The supernatant liquid of the extract was loaded intothe cartridge at a flow rate of 1 mL/min. After loading,the cartridge was washed with 2.5 mL 0.4 M KOH in60% methanol. Then, ergosterol was eluted with 5 mL0.1 M KOH in pure isopropanol, into a small, brownbottle containing 0.3 mL 1 M KOH in pure methanol.
Quality assurance in agricultural produce,edited by G.I. Johnson, Le Van To, Nguyen Duy Duc and M.C. Webb.
ACIAR Proceedings 100(printed version published in 2000)
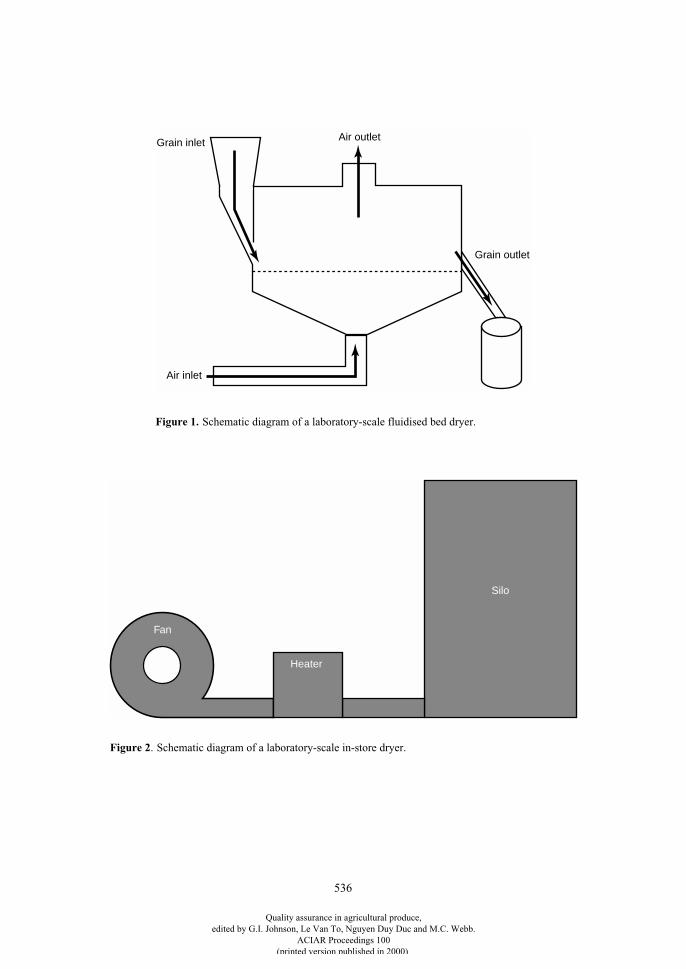
536
Grain inlet Air outlet
Air inlet
Grain outlet
Fan
Heater
Silo
Figure 1.
Schematic diagram of a laboratory-scale fluidised bed dryer.
Figure 2
. Schematic diagram of a laboratory-scale in-store dryer.
Quality assurance in agricultural produce,edited by G.I. Johnson, Le Van To, Nguyen Duy Duc and M.C. Webb.
ACIAR Proceedings 100(printed version published in 2000)
537
Quantitation by HPLC
The ergosterol eluate was analysed by HPLC. Thesystem was run isocratically with mixture of isopro-panol, acetronitrile and deionised water (45:30:25 byvolume) at a flow rate of 1 mL/min. 25 µL of samplewas injected and ergosterol was detected at 10–12 min.Ergosterol was quantified by measuring the peak areaobtained from the chromatogram.
Calculation
The ergosterol content was determined as shown inEquation 1:
Ergosterol (g/g dry matter) = (C
×
V)/D (1)where:
C=Concentration of ergosterol reading fromstandard curve (mg/mL)
V=Volume of final separation of ergosterol (5 mL)D=Dry matter of grain (g)
Standard curve
A 1.25 mg/mL stock solution was prepared by accu-rately weighing 0.125 g of ergosterol using a fourdecimal place, digital analytical balance, and dis-solving the ergosterol in 100 mL methanol. The stocksolution was then diluted with methanol to obtain con-centrations of 0.125, 0.1, 0.05, 0.025, 0.01, 0.005,0.002 and 0.001 mg/mL. Each standard solution(except the 1.25 mg/mL stock solution) was injectedinto the HPLC apparatus six times in random order. Astandard curve was constructed from the relationshipbetween concentration of ergosterol and average peakarea obtained from the chromatograms.
Recovery of ergosterol after SPE in the absence of paddy sample
5 mL each of 0.125 mg/mL and 0.05 mg/mLstandard solutions were subjected to lipid extraction,acidification, SPE and injected for HPLC four times inrandom order. A standard curve was constructed in thesame way as for the pure standard.
Recovery of ergosterol after SPE in the presence of paddy sample
The same method was used, but in the presence of apaddy sample (both long and medium grain with 14%MC).
Grain drying
Grain preparation
10 batches (11 kg per batch) of long-grain paddyrice (‘Langi’) were rewetted from 14% to 26% MC,closed tightly and stored in a cold room (5°C) for
several weeks (until the MC of all grain in the batchwas uniform).
Treatments
Two batches of wetted grain were dried in afluidised bed dryer at 90°C with an airflow rate of 66m/min for 11 min to reduce the MC of the grain from26% to 18%. This was followed by drying in an in-store dryer at ambient temperature with an airflow rateof 25.5 m
3
/m
3
/min (treatment 1) or 51 m
3
/m
3
/min(treatment 2) to reduce the MC of grain from 18% to14%. Another three batches were dried directly in anin-store dryer at ambient temperature with an airflowrate of 25.5, 83, or 117 m
3
/m
3
/min (treatments 3, 4,and 5) to reduce the MC of grain from 26% to 14% inthe surface layer of grain. Each treatment was carriedout in duplicate.
Grain analysis
Grain samples were taken from three depths: 0 cm(surface), 12 cm (middle) and 24 cm (bottom) from thepaddy rice surface. MC was determined using aninfrared dryer (3 g of ground paddy rice, dried for 13min). Ergosterol content determination was carried outby SPE and HPLC (see above).
Results
Standard curve
The standard curve was linear with a R
2
value of0.9947 as shown in Figure 3.
Recovery of ergosterol after SPE work up in the presence of paddy sample
The recovery studies of ergosterol through the SPEprocedures were carried out in long-grain andmedium-grain paddy. However, only 0.125 mg/mLand 0.05 mg/mL stock solutions were used, which wasenough to study the ergosterol recovery in thepresence of paddy rice. The results obtained are shownin Figure 4.
The ergosterol recovery was reduced by 14% in thepresence of both varieties of grains when comparedwith the standard curve. The recovery varied veryslightly between the two grain types. Furthermore, theergosterol recovery in the presence of both grainstended to decrease as the concentration of stocksolution increased. The result obtained was quitesimilar to that found by Mantais (1998).
Quality assurance in agricultural produce,edited by G.I. Johnson, Le Van To, Nguyen Duy Duc and M.C. Webb.
ACIAR Proceedings 100(printed version published in 2000)
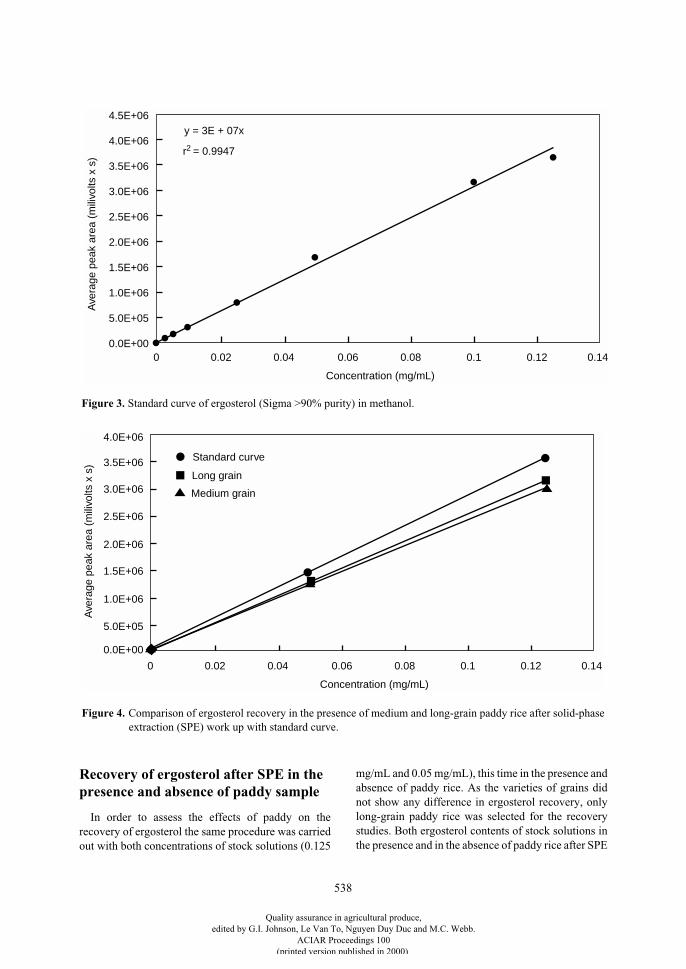
538
Recovery of ergosterol after SPE in the presence and absence of paddy sample
In order to assess the effects of paddy on therecovery of ergosterol the same procedure was carriedout with both concentrations of stock solutions (0.125
mg/mL and 0.05 mg/mL), this time in the presence andabsence of paddy rice. As the varieties of grains didnot show any difference in ergosterol recovery, onlylong-grain paddy rice was selected for the recoverystudies. Both ergosterol contents of stock solutions inthe presence and in the absence of paddy rice after SPE
4.5E+06
4.0E+06
3.5E+06
3.0E+06
2.5E+06
2.0E+06
1.5E+06
1.0E+06
5.0E+05
0.0E+000 0.02 0.04 0.06 0.08 0.1 0.12 0.14
Concentration (mg/mL)
Ave
rage
pea
k ar
ea (
mili
volts
x s
)
y = 3E + 07x
r2 = 0.9947
4.0E+06
3.5E+06
3.0E+06
2.5E+06
2.0E+06
1.5E+06
1.0E+06
5.0E+05
0.0E+00
0 0.02 0.04 0.06 0.08 0.1 0.12 0.14
Concentration (mg/mL)
Ave
rage
pea
k ar
ea (
mili
volts
x s
)
Standard curve
Long grain
Medium grain
Figure 3. Standard curve of ergosterol (Sigma >90% purity) in methanol.
Figure 4. Comparison of ergosterol recovery in the presence of medium and long-grain paddy rice after solid-phaseextraction (SPE) work up with standard curve.
Quality assurance in agricultural produce,edited by G.I. Johnson, Le Van To, Nguyen Duy Duc and M.C. Webb.
ACIAR Proceedings 100(printed version published in 2000)
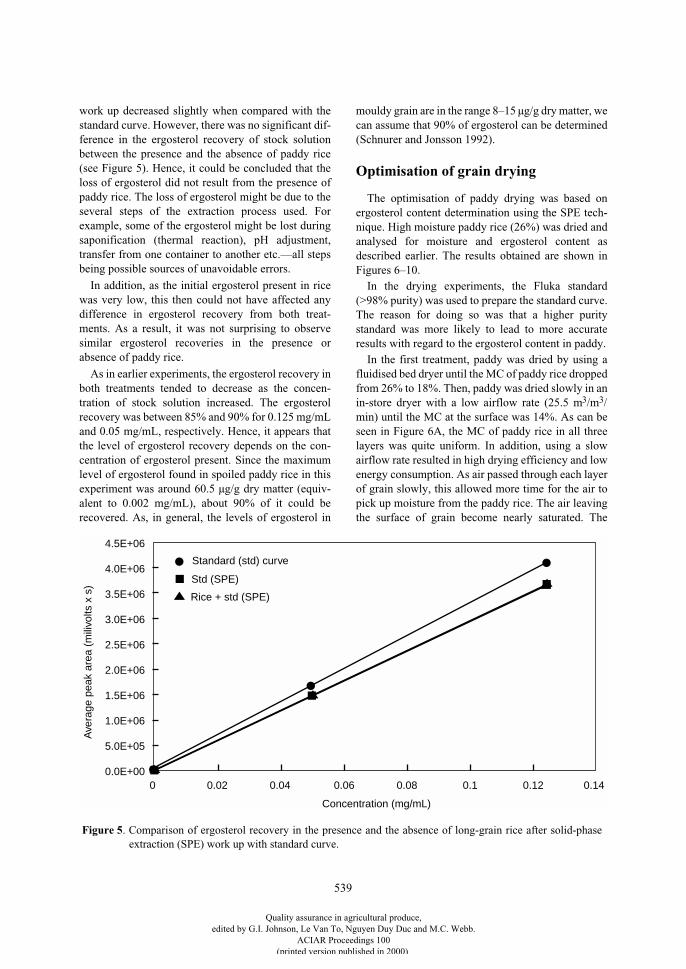
539
work up decreased slightly when compared with thestandard curve. However, there was no significant dif-ference in the ergosterol recovery of stock solutionbetween the presence and the absence of paddy rice(see Figure 5). Hence, it could be concluded that theloss of ergosterol did not result from the presence ofpaddy rice. The loss of ergosterol might be due to theseveral steps of the extraction process used. Forexample, some of the ergosterol might be lost duringsaponification (thermal reaction), pH adjustment,transfer from one container to another etc.—all stepsbeing possible sources of unavoidable errors.
In addition, as the initial ergosterol present in ricewas very low, this then could not have affected anydifference in ergosterol recovery from both treat-ments. As a result, it was not surprising to observesimilar ergosterol recoveries in the presence orabsence of paddy rice.
As in earlier experiments, the ergosterol recovery inboth treatments tended to decrease as the concen-tration of stock solution increased. The ergosterolrecovery was between 85% and 90% for 0.125 mg/mLand 0.05 mg/mL, respectively. Hence, it appears thatthe level of ergosterol recovery depends on the con-centration of ergosterol present. Since the maximumlevel of ergosterol found in spoiled paddy rice in thisexperiment was around 60.5 µg/g dry matter (equiv-alent to 0.002 mg/mL), about 90% of it could berecovered. As, in general, the levels of ergosterol in
mouldy grain are in the range 8–15 µg/g dry matter, wecan assume that 90% of ergosterol can be determined(Schnurer and Jonsson 1992).
Optimisation of grain drying
The optimisation of paddy drying was based onergosterol content determination using the SPE tech-nique. High moisture paddy rice (26%) was dried andanalysed for moisture and ergosterol content asdescribed earlier. The results obtained are shown inFigures 6–10.
In the drying experiments, the Fluka standard(>98% purity) was used to prepare the standard curve.The reason for doing so was that a higher puritystandard was more likely to lead to more accurateresults with regard to the ergosterol content in paddy.
In the first treatment, paddy was dried by using afluidised bed dryer until the MC of paddy rice droppedfrom 26% to 18%. Then, paddy was dried slowly in anin-store dryer with a low airflow rate (25.5 m
3
/m
3
/min) until the MC at the surface was 14%. As can beseen in Figure 6A, the MC of paddy rice in all threelayers was quite uniform. In addition, using a slowairflow rate resulted in high drying efficiency and lowenergy consumption. As air passed through each layerof grain slowly, this allowed more time for the air topick up moisture from the paddy rice. The air leavingthe surface of grain become nearly saturated. The
4.5E+06
4.0E+06
3.5E+06
3.0E+06
2.5E+06
2.0E+06
1.5E+06
1.0E+06
5.0E+05
0.0E+000 0.02 0.04 0.06 0.08 0.1 0.12 0.14
Concentration (mg/mL)
Ave
rage
pea
k ar
ea (
mili
volts
x s
)
Standard (std) curve
Std (SPE)
Rice + std (SPE)
Figure 5. Comparison of ergosterol recovery in the presence and the absence of long-grain rice after solid-phaseextraction (SPE) work up with standard curve.
Quality assurance in agricultural produce,edited by G.I. Johnson, Le Van To, Nguyen Duy Duc and M.C. Webb.
ACIAR Proceedings 100(printed version published in 2000)
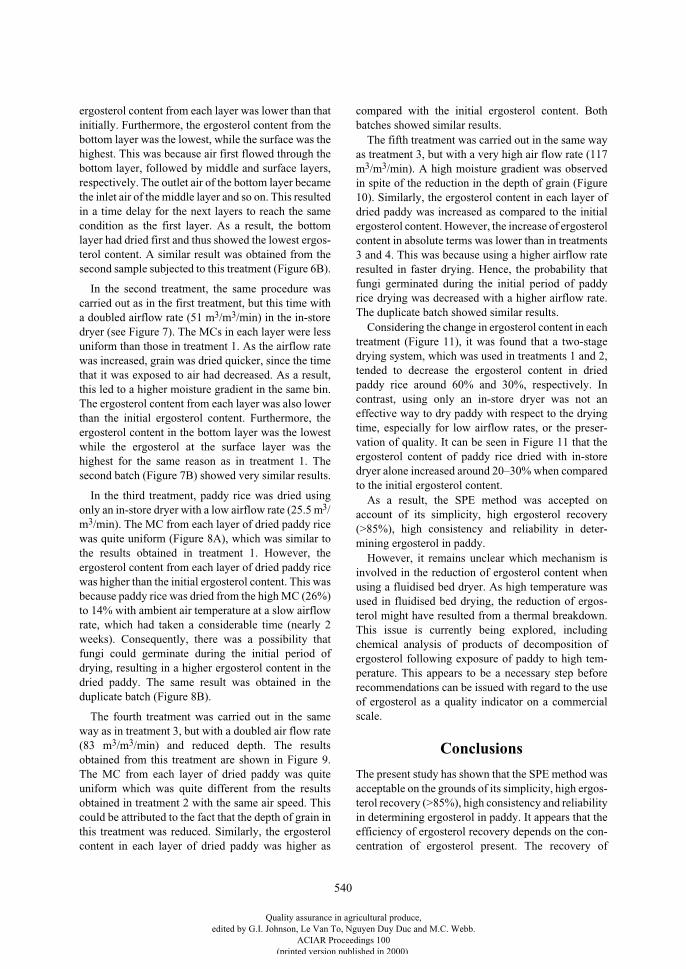
540
ergosterol content from each layer was lower than thatinitially. Furthermore, the ergosterol content from thebottom layer was the lowest, while the surface was thehighest. This was because air first flowed through thebottom layer, followed by middle and surface layers,respectively. The outlet air of the bottom layer becamethe inlet air of the middle layer and so on. This resultedin a time delay for the next layers to reach the samecondition as the first layer. As a result, the bottomlayer had dried first and thus showed the lowest ergos-terol content. A similar result was obtained from thesecond sample subjected to this treatment (Figure 6B).
In the second treatment, the same procedure wascarried out as in the first treatment, but this time witha doubled airflow rate (51 m
3
/m
3
/min) in the in-storedryer (see Figure 7). The MCs in each layer were lessuniform than those in treatment 1. As the airflow ratewas increased, grain was dried quicker, since the timethat it was exposed to air had decreased. As a result,this led to a higher moisture gradient in the same bin.The ergosterol content from each layer was also lowerthan the initial ergosterol content. Furthermore, theergosterol content in the bottom layer was the lowestwhile the ergosterol at the surface layer was thehighest for the same reason as in treatment 1. Thesecond batch (Figure 7B) showed very similar results.
In the third treatment, paddy rice was dried usingonly an in-store dryer with a low airflow rate (25.5 m
3
/m
3
/min). The MC from each layer of dried paddy ricewas quite uniform (Figure 8A), which was similar tothe results obtained in treatment 1. However, theergosterol content from each layer of dried paddy ricewas higher than the initial ergosterol content. This wasbecause paddy rice was dried from the high MC (26%)to 14% with ambient air temperature at a slow airflowrate, which had taken a considerable time (nearly 2weeks). Consequently, there was a possibility thatfungi could germinate during the initial period ofdrying, resulting in a higher ergosterol content in thedried paddy. The same result was obtained in theduplicate batch (Figure 8B).
The fourth treatment was carried out in the sameway as in treatment 3, but with a doubled air flow rate(83 m
3
/m
3
/min) and reduced depth. The resultsobtained from this treatment are shown in Figure 9.The MC from each layer of dried paddy was quiteuniform which was quite different from the resultsobtained in treatment 2 with the same air speed. Thiscould be attributed to the fact that the depth of grain inthis treatment was reduced. Similarly, the ergosterolcontent in each layer of dried paddy was higher as
compared with the initial ergosterol content. Bothbatches showed similar results.
The fifth treatment was carried out in the same wayas treatment 3, but with a very high air flow rate (117m
3
/m
3
/min). A high moisture gradient was observedin spite of the reduction in the depth of grain (Figure10). Similarly, the ergosterol content in each layer ofdried paddy was increased as compared to the initialergosterol content. However, the increase of ergosterolcontent in absolute terms was lower than in treatments3 and 4. This was because using a higher airflow rateresulted in faster drying. Hence, the probability thatfungi germinated during the initial period of paddyrice drying was decreased with a higher airflow rate.The duplicate batch showed similar results.
Considering the change in ergosterol content in eachtreatment (Figure 11), it was found that a two-stagedrying system, which was used in treatments 1 and 2,tended to decrease the ergosterol content in driedpaddy rice around 60% and 30%, respectively. Incontrast, using only an in-store dryer was not aneffective way to dry paddy with respect to the dryingtime, especially for low airflow rates, or the preser-vation of quality. It can be seen in Figure 11 that theergosterol content of paddy rice dried with in-storedryer alone increased around 20–30% when comparedto the initial ergosterol content.
As a result, the SPE method was accepted onaccount of its simplicity, high ergosterol recovery(>85%), high consistency and reliability in deter-mining ergosterol in paddy.
However, it remains unclear which mechanism isinvolved in the reduction of ergosterol content whenusing a fluidised bed dryer. As high temperature wasused in fluidised bed drying, the reduction of ergos-terol might have resulted from a thermal breakdown.This issue is currently being explored, includingchemical analysis of products of decomposition ofergosterol following exposure of paddy to high tem-perature. This appears to be a necessary step beforerecommendations can be issued with regard to the useof ergosterol as a quality indicator on a commercialscale.
Conclusions
The present study has shown that the SPE method wasacceptable on the grounds of its simplicity, high ergos-terol recovery (>85%), high consistency and reliabilityin determining ergosterol in paddy. It appears that theefficiency of ergosterol recovery depends on the con-centration of ergosterol present. The recovery of
Quality assurance in agricultural produce,edited by G.I. Johnson, Le Van To, Nguyen Duy Duc and M.C. Webb.
ACIAR Proceedings 100(printed version published in 2000)
541
Surface
Middle
Bottom
Initial3.42
27.00
14.06
0.90
14.16
1.18
14.42
1.20A
Ergosterol (µg/g dry matter)
Moisture (% wet basis)
Surface
Middle
Bottom
Initial4.24
26.10
14.06
1.20
14.16
1.36
14.19
1.44B
Ergosterol (µg/g dry matter)
Moisture (% wet basis)
Surface
Middle
Bottom
Initial9.54
27.00
12.19
6.50
13.96
6.70
14.96
7.15A
Ergosterol (µg/g dry matter)
Moisture (% wet basis)
Surface
Middle
Bottom
Initial9.03
26.70
12.76
5.15
13.96
6.52
15.33
7.74B
Ergosterol (µg/g dry matter)
Moisture (% wet basis)
Figure 6
. Moisture and ergosterol content of dried paddy rice. Treatment 1: fluidised bed drying + in-store drying(airflow rate 25.5 m
3
/m
3
/min). (A) and (B) are replicates.
Figure 7
. Moisture and ergosterol content of dried paddy rice. Treatment 2: fluidised bed drying + in-store drying(airflow rate 51 m
3
/m
3
/min). (A) and (B) are replicates.
Quality assurance in agricultural produce,edited by G.I. Johnson, Le Van To, Nguyen Duy Duc and M.C. Webb.
ACIAR Proceedings 100(printed version published in 2000)
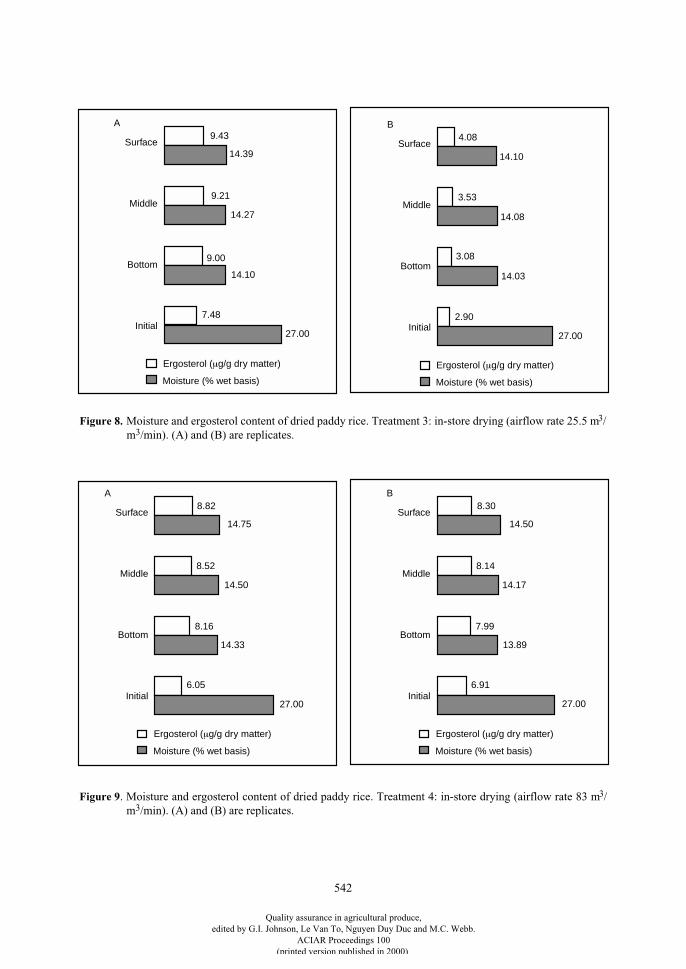
542
Surface
Middle
Bottom
Initial7.48
27.00
14.10
9.00
14.27
9.21
14.39
9.43A
Ergosterol (µg/g dry matter)
Moisture (% wet basis)
Surface
Middle
Bottom
Initial2.90
27.00
14.03
3.08
14.08
3.53
14.10
4.08B
Ergosterol (µg/g dry matter)
Moisture (% wet basis)
Surface
Middle
Bottom
Initial6.05
27.00
14.33
8.16
14.50
8.52
14.75
8.82A
Ergosterol (µg/g dry matter)
Moisture (% wet basis)
Surface
Middle
Bottom
Initial6.91
27.00
13.89
7.99
14.17
8.14
14.50
8.30B
Ergosterol (µg/g dry matter)
Moisture (% wet basis)
Figure 8.
Moisture and ergosterol content of dried paddy rice. Treatment 3: in-store drying (airflow rate 25.5 m
3
/m
3
/min). (A) and (B) are replicates.
Figure 9
. Moisture and ergosterol content of dried paddy rice. Treatment 4: in-store drying (airflow rate 83 m
3
/m
3
/min). (A) and (B) are replicates.
Quality assurance in agricultural produce,edited by G.I. Johnson, Le Van To, Nguyen Duy Duc and M.C. Webb.
ACIAR Proceedings 100(printed version published in 2000)
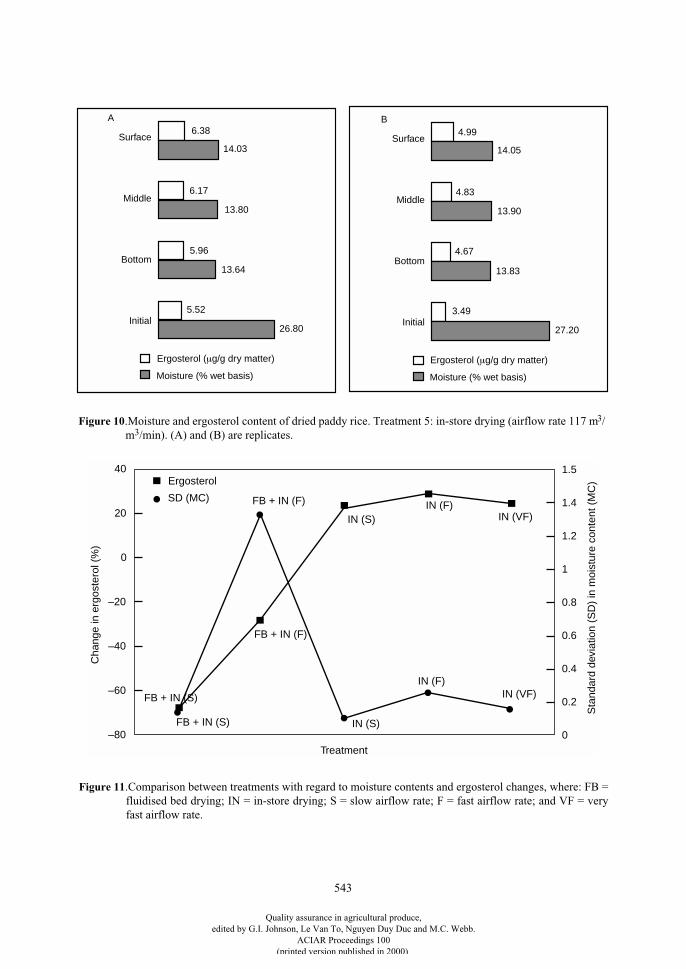
543
Surface
Middle
Bottom
Initial5.52
26.80
13.64
5.96
13.80
6.17
14.03
6.38A
Ergosterol (µg/g dry matter)
Moisture (% wet basis)
Surface
Middle
Bottom
Initial3.49
27.20
13.83
4.67
13.90
4.83
14.05
4.99B
Ergosterol (µg/g dry matter)
Moisture (% wet basis)
40
20
0
–20
–40
–60
–80
1.5
1.4
1.2
1
0.8
0.6
0.4
0.2
0Treatment
FB + IN (S)
FB + IN (S)
FB + IN (F)
FB + IN (F)
IN (S)
IN (S)
IN (F)
IN (F)IN (VF)
IN (VF)
Cha
nge
in e
rgos
tero
l (%
)
Sta
ndar
d de
viat
ion
(SD
) in
moi
stur
e co
nten
t (M
C)Ergosterol
SD (MC)
Figure 10
.Moisture and ergosterol content of dried paddy rice. Treatment 5: in-store drying (airflow rate 117 m
3
/m
3
/min). (A) and (B) are replicates.
Figure 11
.Comparison between treatments with regard to moisture contents and ergosterol changes, where: FB =fluidised bed drying; IN = in-store drying; S = slow airflow rate; F = fast airflow rate; and VF = veryfast airflow rate.
Quality assurance in agricultural produce,edited by G.I. Johnson, Le Van To, Nguyen Duy Duc and M.C. Webb.
ACIAR Proceedings 100(printed version published in 2000)
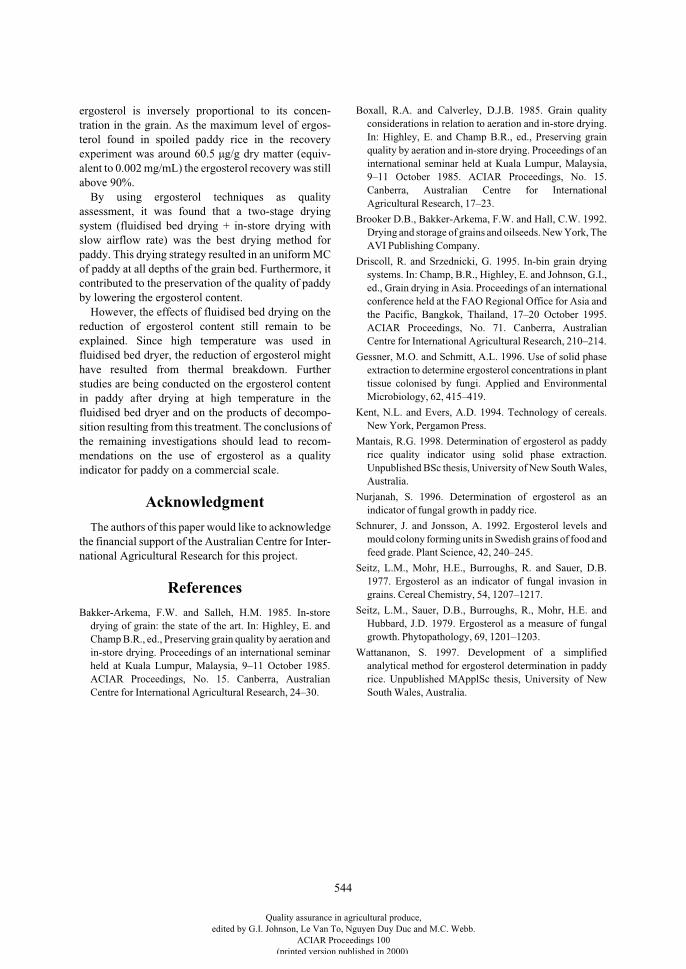
544
ergosterol is inversely proportional to its concen-tration in the grain. As the maximum level of ergos-terol found in spoiled paddy rice in the recoveryexperiment was around 60.5 µg/g dry matter (equiv-alent to 0.002 mg/mL) the ergosterol recovery was stillabove 90%.
By using ergosterol techniques as qualityassessment, it was found that a two-stage dryingsystem (fluidised bed drying + in-store drying withslow airflow rate) was the best drying method forpaddy. This drying strategy resulted in an uniform MCof paddy at all depths of the grain bed. Furthermore, itcontributed to the preservation of the quality of paddyby lowering the ergosterol content.
However, the effects of fluidised bed drying on thereduction of ergosterol content still remain to beexplained. Since high temperature was used influidised bed dryer, the reduction of ergosterol mighthave resulted from thermal breakdown. Furtherstudies are being conducted on the ergosterol contentin paddy after drying at high temperature in thefluidised bed dryer and on the products of decompo-sition resulting from this treatment. The conclusions ofthe remaining investigations should lead to recom-mendations on the use of ergosterol as a qualityindicator for paddy on a commercial scale.
Acknowledgment
The authors of this paper would like to acknowledgethe financial support of the Australian Centre for Inter-national Agricultural Research for this project.
References
Bakker-Arkema, F.W. and Salleh, H.M. 1985. In-storedrying of grain: the state of the art. In: Highley, E. andChamp B.R., ed., Preserving grain quality by aeration andin-store drying. Proceedings of an international seminarheld at Kuala Lumpur, Malaysia, 9–11 October 1985.ACIAR Proceedings, No. 15. Canberra, AustralianCentre for International Agricultural Research, 24–30.
Boxall, R.A. and Calverley, D.J.B. 1985. Grain qualityconsiderations in relation to aeration and in-store drying.In: Highley, E. and Champ B.R., ed., Preserving grainquality by aeration and in-store drying. Proceedings of aninternational seminar held at Kuala Lumpur, Malaysia,9–11 October 1985. ACIAR Proceedings, No. 15.Canberra, Australian Centre for InternationalAgricultural Research, 17–23.
Brooker D.B., Bakker-Arkema, F.W. and Hall, C.W. 1992.Drying and storage of grains and oilseeds. New York, TheAVI Publishing Company.
Driscoll, R. and Srzednicki, G. 1995. In-bin grain dryingsystems. In: Champ, B.R., Highley, E. and Johnson, G.I.,ed., Grain drying in Asia. Proceedings of an internationalconference held at the FAO Regional Office for Asia andthe Pacific, Bangkok, Thailand, 17–20 October 1995.ACIAR Proceedings, No. 71. Canberra, AustralianCentre for International Agricultural Research, 210–214.
Gessner, M.O. and Schmitt, A.L. 1996. Use of solid phaseextraction to determine ergosterol concentrations in planttissue colonised by fungi. Applied and EnvironmentalMicrobiology, 62, 415–419.
Kent, N.L. and Evers, A.D. 1994. Technology of cereals.New York, Pergamon Press.
Mantais, R.G. 1998. Determination of ergosterol as paddyrice quality indicator using solid phase extraction.Unpublished BSc thesis, University of New South Wales,Australia.
Nurjanah, S. 1996. Determination of ergosterol as anindicator of fungal growth in paddy rice.
Schnurer, J. and Jonsson, A. 1992. Ergosterol levels andmould colony forming units in Swedish grains of food andfeed grade. Plant Science, 42, 240–245.
Seitz, L.M., Mohr, H.E., Burroughs, R. and Sauer, D.B.1977. Ergosterol as an indicator of fungal invasion ingrains. Cereal Chemistry, 54, 1207–1217.
Seitz, L.M., Sauer, D.B., Burroughs, R., Mohr, H.E. andHubbard, J.D. 1979. Ergosterol as a measure of fungalgrowth. Phytopathology, 69, 1201–1203.
Wattananon, S. 1997. Development of a simplifiedanalytical method for ergosterol determination in paddyrice. Unpublished MApplSc thesis, University of NewSouth Wales, Australia.
Quality assurance in agricultural produce,edited by G.I. Johnson, Le Van To, Nguyen Duy Duc and M.C. Webb.
ACIAR Proceedings 100(printed version published in 2000)
545
Milling, Pasting, and Texture Changes in Rice as Affected by Aging
N.V. Zulueta*, D.C. Basinga*, N.O. Dalangin*and B.O. Juliano†
Abstract
This study was conducted to verify the effect of aging on rice grain quality, and to determine the minimumperiod wherein rice properties become stable. Four varieties (PSBRc10, PSBRc14, IR64, and IR74) of freshlyharvested rice differing in amylose content and gelatinisation temperature, and stored at room temperature for90 days, were assessed every 15 days for their milling quality, pasting characteristics, and texture properties.As the storage period increased, a decreasing trend in total milled rice recovery was observed for all the ricevarieties. Percentage brown rice of PSBRc10 and head rice recovery of IR64, however, were not affected bystorage. Aging of the four varieties also resulted in changes in their characteristics. Peak and cooked pasteviscosity and breakdown values increased with prolonged storage. Changes in cooked rice hardness occurredwithin 15 days of storage, but the texture of aged IR64 remained unaffected up to the end of the 90-day storageperiod. A minimum of 60 days of storage was required for stabilisation of the grain characteristics.
T
HE
quality of rice is one of the major considerationsin the breeding program of the Philippine RiceResearch Institute (PhilRice). As such, promisingselections entered under the National Rice Cooper-ative Testing Project are constantly being evaluatedfor rice grain quality.
In the evaluation of grain quality, significant differ-ences in the milling potential of rice have beenobserved from season to season. Since samples areaged for different periods prior to evaluation, discrep-ancies have been attributed to these differences inlength of storage. Rice samples are also aged for atleast three months prior to the conduct of sensory eval-uation. This lengthy storage period often causes delaysin the processing and evaluation of rice grain qualitydata.
Some physico-chemical properties of rice whichhave been reported to be affected by storage includeswelling fragility, shape of the rice grain, and thevolume of cooked rice (Chrastil 1990). Cooking andprocessing qualities of freshly harvested rice have alsobeen shown to differ from those of stored or aged rice
(Normand et al. 1964). Changes in texture and pastingcharacteristics of rice during storage have likewisebeen reported (Perez and Juliano 1981). Hence, thisstudy was conducted to verify the effect of storage onthe milling potential, pasting, and texture properties ofrice. It also aimed to determine the critical period inwhich changes occur and the optimum period whereingrain quality stabilises.
Materials and Methods
Sample preparation
Four varieties (PSBRc10, PSBRc14, IR64, andIR74) of freshly harvested rice differing in amylosecontent and gelatinisation temperature were used.Samples of each variety were procured from the SeedProduction and Health Division of the Philippine RiceResearch Institute after harvest. The samples wereimmediately dried to a moisture content of approxi-mately 12%, cleaned, placed in paper bags, and storedat room temperature. Samples were withdrawn at 15-day intervals starting from the beginning of the trial upto 90 days of storage, and analysed for moisturecontent, milling potential, gelatinisation properties,and cooked rice texture.
* Philippine Rice Research Institute, Maligaya, Muñoz, Nueva Ecija 3119, Philippines.
† Philippine Rice Research Institute, University of the Philippines at Los Baños, Laguna, Philippines.
Quality assurance in agricultural produce,edited by G.I. Johnson, Le Van To, Nguyen Duy Duc and M.C. Webb.
ACIAR Proceedings 100(printed version published in 2000)
546
Milling potential
The milling quality of rice was evaluated by deter-mining percentage brown rice, total milled rice andhead rice recoveries. The percentage of brown rice wasmeasured by dehulling a 125 g sample of rough riceusing the SATAKE dehuller. The brown rice waswhitened using the McGill #2 polisher to obtain totalmilled rice. The head rice recovery was then measuredby separating the whole grains and broken grains frommilled rice using a SATAKE rice grader. Percentagebrown rice and total milled rice were based on theweight of rough rice (125 g). Head rice recovery wasbased on the weight of total milled rice.
Gelatinisation properties
The pasting characteristics of the rice varieties weremeasured using the Rapid Visco Analyzer (RVA)(Newport Scientific Model 3CR). The test wasconducted using the standard AACC Method 61–02 ofthe American Association of Cereal Chemists.
A 3.0 g sample of rice flour was weighed and placedin the RVA canister. 25 mL of distilled water wasadded and the RVA paddle was inserted into thecanister. The whole assembly was then lowered intothe instrument for measurements. The test proceededand terminated automatically. The peak, minimumand final viscosity at 50°C was recorded. Viscositywas measured in rapid visco units (RVU). Breakdownvalues (peak-minimum) are indicative of the fragilityof the starch granules and are good indices of the sus-ceptibility of starch to disintegration (Juliano 1985).Setback viscosity (final-minimum), on the other hand,is a measure of the degree of retrogradation orhardening of starch upon cooling.
Cooked rice texture
Milled rice samples from the different rice varietieswere cleaned with cheese cloth to remove adheringbran. A 5 g sample was weighed and placed in analuminum canister. 8 mL of distilled water was addedto obtain a rice to water ratio of 1:1.6. The rice–watermixture was allowed to stand for 30 min. The canistercontaining the sample was placed inside a rice cookercontaining 75 mL of distilled water. The sample wascooked and kept inside the rice cooker for an addi-tional 15 min after the rice cooker automatically shutoff. The cooked sample was removed from the ricecooker and allowed to cool for 1 hour. Texture meas-urements were then immediately taken using a
tensipresser (My Boy System Analyzer and Con-troller, Japan).
Duplicate samples of cooked rice were evaluatedand the texture profiles of 10 single grains were taken.An average of 10 measurements was reported.
Results and Discussion
Storage changes
Milling quality
The effects of storage on the milling quality of fourdifferent rice varieties differing in amylose contentand gelatinisation temperature are shown in Tables 1and 2. Storage of up to 75 days did not cause any sig-nificant changes to percentage brown rice of IR64harvested during the wet and dry seasons. A slightdecrease, however, was observed at the end of the 90-day storage period. Percentage brown rice of the wet-season harvest of IR74 and PSBRc14 was not affectedby the length of storage, but the dry-season harvest ofthe same varieties decreased upon storage. Percentagebrown rice of PSBRc10 for both the wet and the dryseason decreased as the storage period increased.
A decreasing trend in total milled rice recovery withincreasing storage period was observed for all the ricevarieties when planted during the dry season (Table 2).IR64 and PSBRc10 also exhibited the same trendwhen planted during the wet season. Total milled riceof IR74 and PSBRc14 remained unaffectedthroughout the 90-day storage period during the wetseason.
The percentage head rice recovery of IR64 wasstable across the seasons. Head rice recovery of IR74harvested during the wet and dry seasons, however,decreased as the storage period increased. Theopposite trend was noted for PSBRc10. PSBRc14showed an increase in head rice recovery as the storageperiod increased during the wet season. Dry-seasonharvest of the same variety was also noted to havelower head rice recovery when aged.
Pasting characteristics
Significant changes in the viscosity of the fourdifferent rice varieties were observed upon storage offreshly harvested rice, as shown in Tables 3 and 4. Anincrease in peak viscosity of high amylose ricevarieties (IR74 and PSBRc10) sampled during the wetseason was observed after 90 days of storage. Wet-season harvest of rice varieties with intermediateamylose content (PSBRc14 and IR64) likewiseshowed an increase in peak viscosity during storage.
Quality assurance in agricultural produce,edited by G.I. Johnson, Le Van To, Nguyen Duy Duc and M.C. Webb.
ACIAR Proceedings 100(printed version published in 2000)
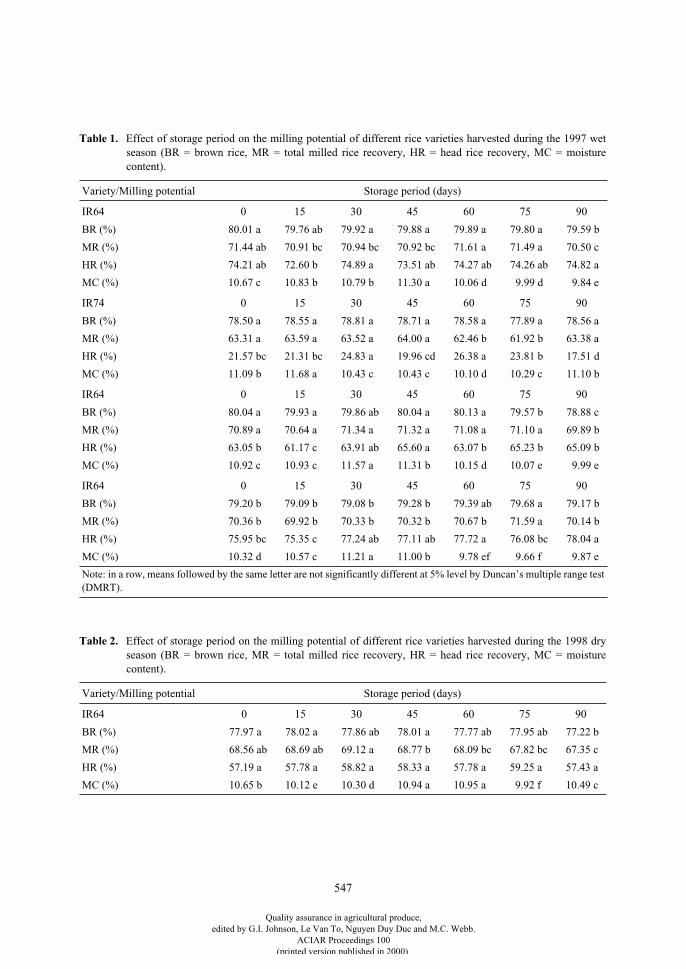
547
Table 1.
Effect of storage period on the milling potential of different rice varieties harvested during the 1997 wetseason (BR = brown rice, MR = total milled rice recovery, HR = head rice recovery, MC = moisturecontent).
Variety/Milling potential Storage period (days)
IR64 0 15 30 45 60 75 90
BR (%) 80.01 a 79.76 ab 79.92 a 79.88 a 79.89 a 79.80 a 79.59 b
MR (%) 71.44 ab 70.91 bc 70.94 bc 70.92 bc 71.61 a 71.49 a 70.50 c
HR (%) 74.21 ab 72.60 b 74.89 a 73.51 ab 74.27 ab 74.26 ab 74.82 a
MC (%) 10.67 c 10.83 b 10.79 b 11.30 a 10.06 d 9.99 d 9.84 e
IR74 0 15 30 45 60 75 90
BR (%) 78.50 a 78.55 a 78.81 a 78.71 a 78.58 a 77.89 a 78.56 a
MR (%) 63.31 a 63.59 a 63.52 a 64.00 a 62.46 b 61.92 b 63.38 a
HR (%) 21.57 bc 21.31 bc 24.83 a 19.96 cd 26.38 a 23.81 b 17.51 d
MC (%) 11.09 b 11.68 a 10.43 c 10.43 c 10.10 d 10.29 c 11.10 b
IR64 0 15 30 45 60 75 90
BR (%) 80.04 a 79.93 a 79.86 ab 80.04 a 80.13 a 79.57 b 78.88 c
MR (%) 70.89 a 70.64 a 71.34 a 71.32 a 71.08 a 71.10 a 69.89 b
HR (%) 63.05 b 61.17 c 63.91 ab 65.60 a 63.07 b 65.23 b 65.09 b
MC (%) 10.92 c 10.93 c 11.57 a 11.31 b 10.15 d 10.07 e 9.99 e
IR64 0 15 30 45 60 75 90
BR (%) 79.20 b 79.09 b 79.08 b 79.28 b 79.39 ab 79.68 a 79.17 b
MR (%) 70.36 b 69.92 b 70.33 b 70.32 b 70.67 b 71.59 a 70.14 b
HR (%) 75.95 bc 75.35 c 77.24 ab 77.11 ab 77.72 a 76.08 bc 78.04 a
MC (%) 10.32 d 10.57 c 11.21 a 11.00 b 9.78 ef 9.66 f 9.87 e
Note: in a row, means followed by the same letter are not significantly different at 5% level by Duncan’s multiple range test (DMRT).
Table 2.
Effect of storage period on the milling potential of different rice varieties harvested during the 1998 dryseason (BR = brown rice, MR = total milled rice recovery, HR = head rice recovery, MC = moisturecontent).
Variety/Milling potential Storage period (days)
IR64 0 15 30 45 60 75 90
BR (%) 77.97 a 78.02 a 77.86 ab 78.01 a 77.77 ab 77.95 ab 77.22 b
MR (%) 68.56 ab 68.69 ab 69.12 a 68.77 b 68.09 bc 67.82 bc 67.35 c
HR (%) 57.19 a 57.78 a 58.82 a 58.33 a 57.78 a 59.25 a 57.43 a
MC (%) 10.65 b 10.12 e 10.30 d 10.94 a 10.95 a 9.92 f 10.49 c
Quality assurance in agricultural produce,edited by G.I. Johnson, Le Van To, Nguyen Duy Duc and M.C. Webb.
ACIAR Proceedings 100(printed version published in 2000)
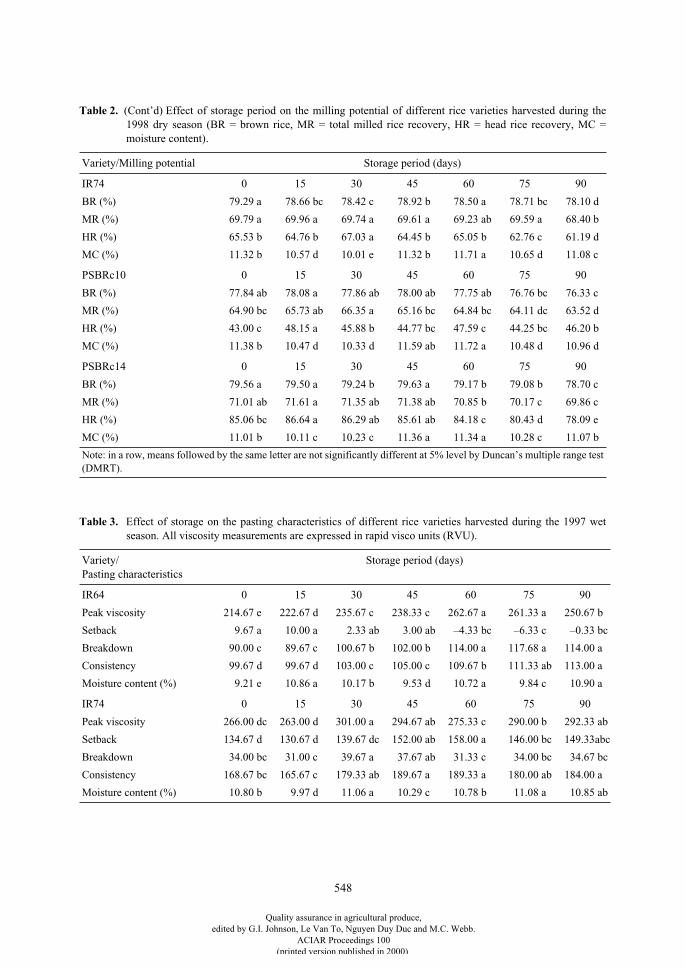
548
IR74 0 15 30 45 60 75 90
BR (%) 79.29 a 78.66 bc 78.42 c 78.92 b 78.50 a 78.71 bc 78.10 d
MR (%) 69.79 a 69.96 a 69.74 a 69.61 a 69.23 ab 69.59 a 68.40 b
HR (%) 65.53 b 64.76 b 67.03 a 64.45 b 65.05 b 62.76 c 61.19 d
MC (%) 11.32 b 10.57 d 10.01 e 11.32 b 11.71 a 10.65 d 11.08 c
PSBRc10 0 15 30 45 60 75 90
BR (%) 77.84 ab 78.08 a 77.86 ab 78.00 ab 77.75 ab 76.76 bc 76.33 c
MR (%) 64.90 bc 65.73 ab 66.35 a 65.16 bc 64.84 bc 64.11 dc 63.52 d
HR (%) 43.00 c 48.15 a 45.88 b 44.77 bc 47.59 c 44.25 bc 46.20 b
MC (%) 11.38 b 10.47 d 10.33 d 11.59 ab 11.72 a 10.48 d 10.96 d
PSBRc14 0 15 30 45 60 75 90
BR (%) 79.56 a 79.50 a 79.24 b 79.63 a 79.17 b 79.08 b 78.70 c
MR (%) 71.01 ab 71.61 a 71.35 ab 71.38 ab 70.85 b 70.17 c 69.86 c
HR (%) 85.06 bc 86.64 a 86.29 ab 85.61 ab 84.18 c 80.43 d 78.09 e
MC (%) 11.01 b 10.11 c 10.23 c 11.36 a 11.34 a 10.28 c 11.07 b
Note: in a row, means followed by the same letter are not significantly different at 5% level by Duncan’s multiple range test (DMRT).
Table 2.
(Cont’d) Effect of storage period on the milling potential of different rice varieties harvested during the1998 dry season (BR = brown rice, MR = total milled rice recovery, HR = head rice recovery, MC =moisture content).
Variety/Milling potential Storage period (days)
Table 3.
Effect of storage on the pasting characteristics of different rice varieties harvested during the 1997 wetseason. All viscosity measurements are expressed in rapid visco units (RVU).
Variety/Pasting characteristics
Storage period (days)
IR64 0 15 30 45 60 75 90
Peak viscosity 214.67 e 222.67 d 235.67 c 238.33 c 262.67 a 261.33 a 250.67 b
Setback 9.67 a 10.00 a 2.33 ab 3.00 ab –4.33 bc –6.33 c –0.33 bc
Breakdown 90.00 c 89.67 c 100.67 b 102.00 b 114.00 a 117.68 a 114.00 a
Consistency 99.67 d 99.67 d 103.00 c 105.00 c 109.67 b 111.33 ab 113.00 a
Moisture content (%) 9.21 e 10.86 a 10.17 b 9.53 d 10.72 a 9.84 c 10.90 a
IR74 0 15 30 45 60 75 90
Peak viscosity 266.00 dc 263.00 d 301.00 a 294.67 ab 275.33 c 290.00 b 292.33 ab
Setback 134.67 d 130.67 d 139.67 dc 152.00 ab 158.00 a 146.00 bc 149.33 abc
Breakdown 34.00 bc 31.00 c 39.67 a 37.67 ab 31.33 c 34.00 bc 34.67 bc
Consistency 168.67 bc 165.67 c 179.33 ab 189.67 a 189.33 a 180.00 ab 184.00 a
Moisture content (%) 10.80 b 9.97 d 11.06 a 10.29 c 10.78 b 11.08 a 10.85 ab
Quality assurance in agricultural produce,edited by G.I. Johnson, Le Van To, Nguyen Duy Duc and M.C. Webb.
ACIAR Proceedings 100(printed version published in 2000)
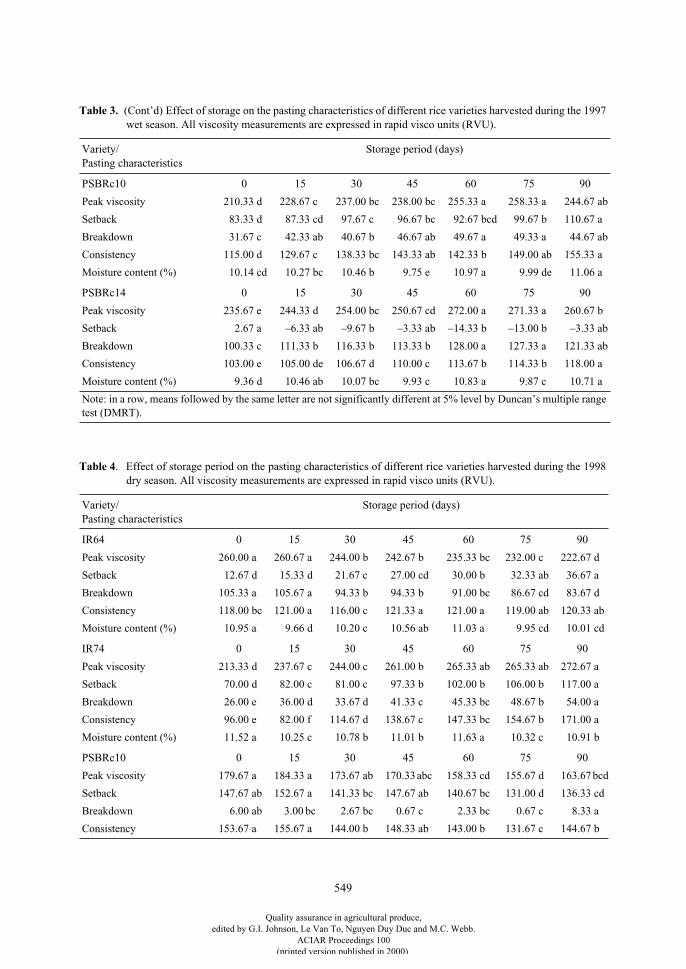
549
PSBRc10 0 15 30 45 60 75 90
Peak viscosity 210.33 d 228.67 c 237.00 bc 238.00 bc 255.33 a 258.33 a 244.67 ab
Setback 83.33 d 87.33 cd 97.67 c 96.67 bc 92.67 bcd 99.67 b 110.67 a
Breakdown 31.67 c 42.33 ab 40.67 b 46.67 ab 49.67 a 49.33 a 44.67 ab
Consistency 115.00 d 129.67 c 138.33 bc 143.33 ab 142.33 b 149.00 ab 155.33 a
Moisture content (%) 10.14 cd 10.27 bc 10.46 b 9.75 e 10.97 a 9.99 de 11.06 a
PSBRc14 0 15 30 45 60 75 90
Peak viscosity 235.67 e 244.33 d 254.00 bc 250.67 cd 272.00 a 271.33 a 260.67 b
Setback 2.67 a –6.33 ab –9.67 b –3.33 ab –14.33 b –13.00 b –3.33 ab
Breakdown 100.33 c 111.33 b 116.33 b 113.33 b 128.00 a 127.33 a 121.33 ab
Consistency 103.00 e 105.00 de 106.67 d 110.00 c 113.67 b 114.33 b 118.00 a
Moisture content (%) 9.36 d 10.46 ab 10.07 bc 9.93 c 10.83 a 9.87 c 10.71 a
Note: in a row, means followed by the same letter are not significantly different at 5% level by Duncan’s multiple range test (DMRT).
Table 3.
(Cont’d) Effect of storage on the pasting characteristics of different rice varieties harvested during the 1997wet season. All viscosity measurements are expressed in rapid visco units (RVU).
Variety/Pasting characteristics
Storage period (days)
Table 4
. Effect of storage period on the pasting characteristics of different rice varieties harvested during the 1998dry season. All viscosity measurements are expressed in rapid visco units (RVU).
Variety/Pasting characteristics
Storage period (days)
IR64 0 15 30 45 60 75 90
Peak viscosity 260.00 a 260.67 a 244.00 b 242.67 b 235.33 bc 232.00 c 222.67 d
Setback 12.67 d 15.33 d 21.67 c 27.00 cd 30.00 b 32.33 ab 36.67 a
Breakdown 105.33 a 105.67 a 94.33 b 94.33 b 91.00 bc 86.67 cd 83.67 d
Consistency 118.00 bc 121.00 a 116.00 c 121.33 a 121.00 a 119.00 ab 120.33 ab
Moisture content (%) 10.95 a 9.66 d 10.20 c 10.56 ab 11.03 a 9.95 cd 10.01 cd
IR74 0 15 30 45 60 75 90
Peak viscosity 213.33 d 237.67 c 244.00 c 261.00 b 265.33 ab 265.33 ab 272.67 a
Setback 70.00 d 82.00 c 81.00 c 97.33 b 102.00 b 106.00 b 117.00 a
Breakdown 26.00 e 36.00 d 33.67 d 41.33 c 45.33 bc 48.67 b 54.00 a
Consistency 96.00 e 82.00 f 114.67 d 138.67 c 147.33 bc 154.67 b 171.00 a
Moisture content (%) 11.52 a 10.25 c 10.78 b 11.01 b 11.63 a 10.32 c 10.91 b
PSBRc10 0 15 30 45 60 75 90
Peak viscosity 179.67 a 184.33 a 173.67 ab 170.33 abc 158.33 cd 155.67 d 163.67 bcd
Setback 147.67 ab 152.67 a 141.33 bc 147.67 ab 140.67 bc 131.00 d 136.33 cd
Breakdown 6.00 ab 3.00 bc 2.67 bc 0.67 c 2.33 bc 0.67 c 8.33 a
Consistency 153.67 a 155.67 a 144.00 b 148.33 ab 143.00 b 131.67 c 144.67 b
Quality assurance in agricultural produce,edited by G.I. Johnson, Le Van To, Nguyen Duy Duc and M.C. Webb.
ACIAR Proceedings 100(printed version published in 2000)
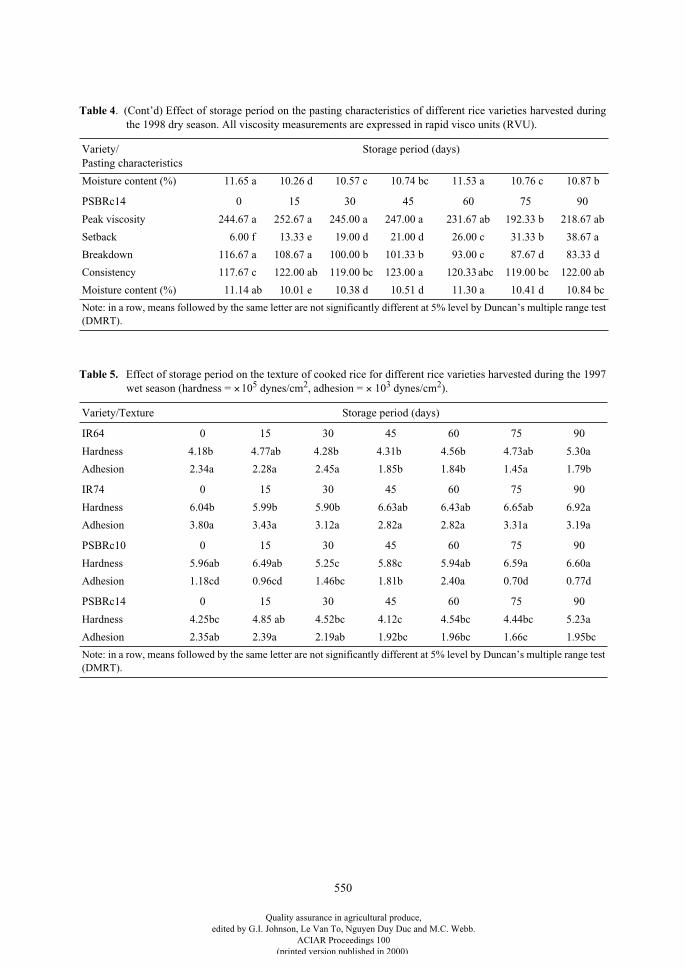
550
Moisture content (%) 11.65 a 10.26 d 10.57 c 10.74 bc 11.53 a 10.76 c 10.87 b
PSBRc14 0 15 30 45 60 75 90
Peak viscosity 244.67 a 252.67 a 245.00 a 247.00 a 231.67 ab 192.33 b 218.67 ab
Setback 6.00 f 13.33 e 19.00 d 21.00 d 26.00 c 31.33 b 38.67 a
Breakdown 116.67 a 108.67 a 100.00 b 101.33 b 93.00 c 87.67 d 83.33 d
Consistency 117.67 c 122.00 ab 119.00 bc 123.00 a 120.33 abc 119.00 bc 122.00 ab
Moisture content (%) 11.14 ab 10.01 e 10.38 d 10.51 d 11.30 a 10.41 d 10.84 bc
Note: in a row, means followed by the same letter are not significantly different at 5% level by Duncan’s multiple range test (DMRT).
Table 4
. (Cont’d) Effect of storage period on the pasting characteristics of different rice varieties harvested duringthe 1998 dry season. All viscosity measurements are expressed in rapid visco units (RVU).
Variety/Pasting characteristics
Storage period (days)
Table 5.
Effect of storage period on the texture of cooked rice for different rice varieties harvested during the 1997wet season (hardness =
×
10
5
dynes/cm
2
, adhesion =
×
10
3
dynes/cm
2
).
Variety/Texture Storage period (days)
IR64 0 15 30 45 60 75 90
Hardness 4.18b 4.77ab 4.28b 4.31b 4.56b 4.73ab 5.30a
Adhesion 2.34a 2.28a 2.45a 1.85b 1.84b 1.45a 1.79b
IR74 0 15 30 45 60 75 90
Hardness 6.04b 5.99b 5.90b 6.63ab 6.43ab 6.65ab 6.92a
Adhesion 3.80a 3.43a 3.12a 2.82a 2.82a 3.31a 3.19a
PSBRc10 0 15 30 45 60 75 90
Hardness 5.96ab 6.49ab 5.25c 5.88c 5.94ab 6.59a 6.60a
Adhesion 1.18cd 0.96cd 1.46bc 1.81b 2.40a 0.70d 0.77d
PSBRc14 0 15 30 45 60 75 90
Hardness 4.25bc 4.85 ab 4.52bc 4.12c 4.54bc 4.44bc 5.23a
Adhesion 2.35ab 2.39a 2.19ab 1.92bc 1.96bc 1.66c 1.95bc
Note: in a row, means followed by the same letter are not significantly different at 5% level by Duncan’s multiple range test (DMRT).
Quality assurance in agricultural produce,edited by G.I. Johnson, Le Van To, Nguyen Duy Duc and M.C. Webb.
ACIAR Proceedings 100(printed version published in 2000)
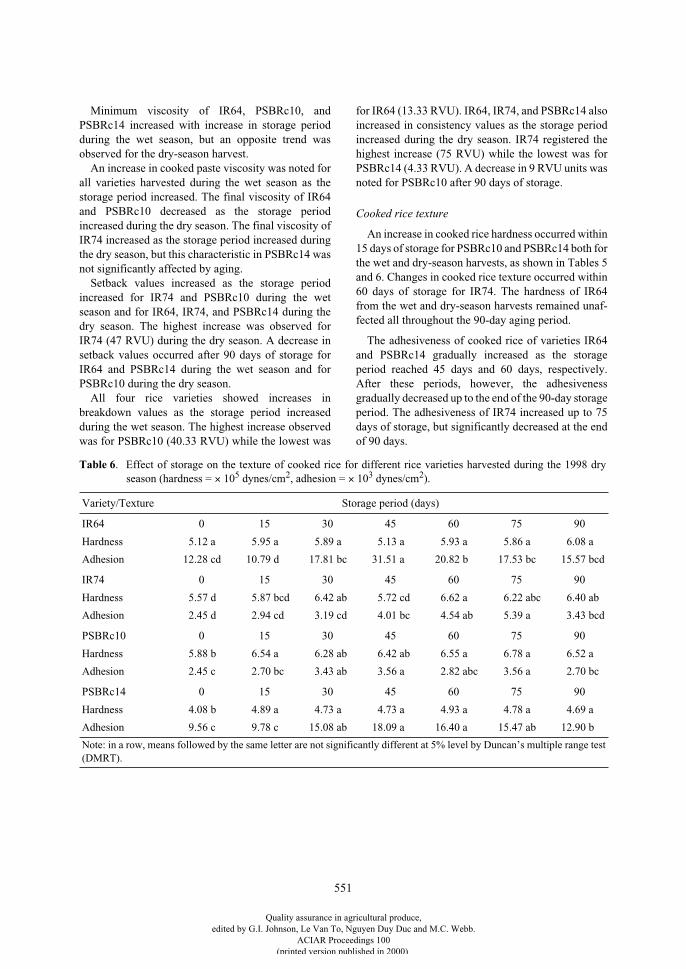
551
Minimum viscosity of IR64, PSBRc10, andPSBRc14 increased with increase in storage periodduring the wet season, but an opposite trend wasobserved for the dry-season harvest.
An increase in cooked paste viscosity was noted forall varieties harvested during the wet season as thestorage period increased. The final viscosity of IR64and PSBRc10 decreased as the storage periodincreased during the dry season. The final viscosity ofIR74 increased as the storage period increased duringthe dry season, but this characteristic in PSBRc14 wasnot significantly affected by aging.
Setback values increased as the storage periodincreased for IR74 and PSBRc10 during the wetseason and for IR64, IR74, and PSBRc14 during thedry season. The highest increase was observed forIR74 (47 RVU) during the dry season. A decrease insetback values occurred after 90 days of storage forIR64 and PSBRc14 during the wet season and forPSBRc10 during the dry season.
All four rice varieties showed increases inbreakdown values as the storage period increasedduring the wet season. The highest increase observedwas for PSBRc10 (40.33 RVU) while the lowest was
for IR64 (13.33 RVU). IR64, IR74, and PSBRc14 alsoincreased in consistency values as the storage periodincreased during the dry season. IR74 registered thehighest increase (75 RVU) while the lowest was forPSBRc14 (4.33 RVU). A decrease in 9 RVU units wasnoted for PSBRc10 after 90 days of storage.
Cooked rice texture
An increase in cooked rice hardness occurred within15 days of storage for PSBRc10 and PSBRc14 both forthe wet and dry-season harvests, as shown in Tables 5and 6. Changes in cooked rice texture occurred within60 days of storage for IR74. The hardness of IR64from the wet and dry-season harvests remained unaf-fected all throughout the 90-day aging period.
The adhesiveness of cooked rice of varieties IR64and PSBRc14 gradually increased as the storageperiod reached 45 days and 60 days, respectively.After these periods, however, the adhesivenessgradually decreased up to the end of the 90-day storageperiod. The adhesiveness of IR74 increased up to 75days of storage, but significantly decreased at the endof 90 days.
Table 6
. Effect of storage on the texture of cooked rice for different rice varieties harvested during the 1998 dryseason (hardness =
×
10
5
dynes/cm
2
, adhesion =
×
10
3
dynes/cm
2
).
Variety/Texture Storage period (days)
IR64 0 15 30 45 60 75 90
Hardness 5.12 a 5.95 a 5.89 a 5.13 a 5.93 a 5.86 a 6.08 a
Adhesion 12.28 cd 10.79 d 17.81 bc 31.51 a 20.82 b 17.53 bc 15.57 bcd
IR74 0 15 30 45 60 75 90
Hardness 5.57 d 5.87 bcd 6.42 ab 5.72 cd 6.62 a 6.22 abc 6.40 ab
Adhesion 2.45 d 2.94 cd 3.19 cd 4.01 bc 4.54 ab 5.39 a 3.43 bcd
PSBRc10 0 15 30 45 60 75 90
Hardness 5.88 b 6.54 a 6.28 ab 6.42 ab 6.55 a 6.78 a 6.52 a
Adhesion 2.45 c 2.70 bc 3.43 ab 3.56 a 2.82 abc 3.56 a 2.70 bc
PSBRc14 0 15 30 45 60 75 90
Hardness 4.08 b 4.89 a 4.73 a 4.73 a 4.93 a 4.78 a 4.69 a
Adhesion 9.56 c 9.78 c 15.08 ab 18.09 a 16.40 a 15.47 ab 12.90 b
Note: in a row, means followed by the same letter are not significantly different at 5% level by Duncan’s multiple range test (DMRT).
Quality assurance in agricultural produce,edited by G.I. Johnson, Le Van To, Nguyen Duy Duc and M.C. Webb.
ACIAR Proceedings 100(printed version published in 2000)
552
Conclusion/Recommendation
The results of this study show that slight changes tosome of the physico-chemical properties of rice occurduring storage. The storage period at which thesechanges occur, however, varies between rice varieties.It was previously reported by Perez and Juliano (1981)that the minimum storage period for major changes tooccur in the hardness of cooked rice, gel consistency,and amylograph viscosity was 3 months. In this exper-iment, texture changes in cooked rice tended to begreatest within 15–45 days of storage. Pasting charac-teristics as measured by the Rapid Visco Analyzerseemed to stabilise after 60 days of storage. Thus,measurements of these characteristics should becarried out on rice samples aged for at least 2 months
after harvest. Sun-drying may have contributed to therapid aging of the rough rice samples.
References
Chrastil, J. 1990. Chemical and physicochemical changes ofrice during storage at different temperatures. Journal ofCereal Science, 11, 71–85.
Juliano, B.O. 1985. Criteria and tests for rice grain qualities.In: Rice chemistry and technology. St Paul, Minnesota,The American Association of Cereal Chemists, 480–486.
Normand, F.L., Hogan, J.T. and Deobald, H.J. 1964.Improvement of culinary quality of freshly harvested riceby heat treatment. Rice Journal, 67(13), 7–11.
Perez, C.M. and Juliano, B.O. 1981. Texture changes andstorage of rice. Journal of Texture Studies, 12, 321–333.
Quality assurance in agricultural produce,edited by G.I. Johnson, Le Van To, Nguyen Duy Duc and M.C. Webb.
ACIAR Proceedings 100(printed version published in 2000)
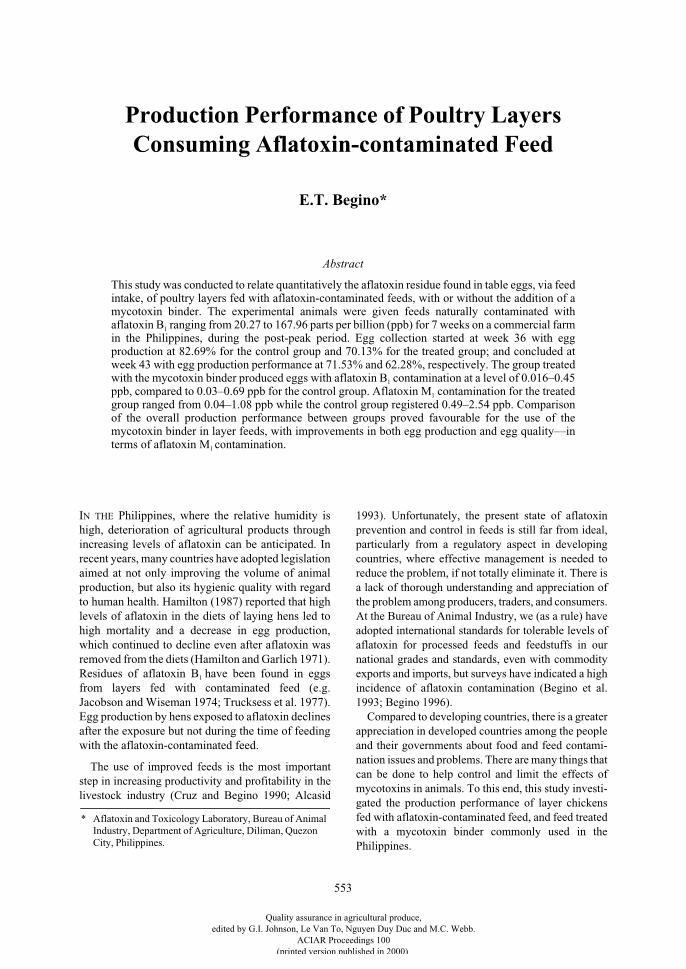
553
Production Performance of Poultry Layers Consuming Aflatoxin-contaminated Feed
E.T. Begino*
Abstract
This study was conducted to relate quantitatively the aflatoxin residue found in table eggs, via feedintake, of poultry layers fed with aflatoxin-contaminated feeds, with or without the addition of amycotoxin binder. The experimental animals were given feeds naturally contaminated withaflatoxin B
1
ranging from 20.27 to 167.96 parts per billion (ppb) for 7 weeks on a commercial farmin the Philippines, during the post-peak period. Egg collection started at week 36 with eggproduction at 82.69% for the control group and 70.13% for the treated group; and concluded atweek 43 with egg production performance at 71.53% and 62.28%, respectively. The group treatedwith the mycotoxin binder produced eggs with aflatoxin B
1
contamination at a level of 0.016–0.45ppb, compared to 0.03–0.69 ppb for the control group. Aflatoxin M
1
contamination for the treatedgroup ranged from 0.04–1.08 ppb while the control group registered 0.49–2.54 ppb. Comparisonof the overall production performance between groups proved favourable for the use of themycotoxin binder in layer feeds, with improvements in both egg production and egg quality—interms of aflatoxin M
1
contamination.
I
N
THE
Philippines, where the relative humidity ishigh, deterioration of agricultural products throughincreasing levels of aflatoxin can be anticipated. Inrecent years, many countries have adopted legislationaimed at not only improving the volume of animalproduction, but also its hygienic quality with regardto human health. Hamilton (1987) reported that highlevels of aflatoxin in the diets of laying hens led tohigh mortality and a decrease in egg production,which continued to decline even after aflatoxin wasremoved from the diets (Hamilton and Garlich 1971).Residues of aflatoxin B
1
have been found in eggsfrom layers fed with contaminated feed (e.g.Jacobson and Wiseman 1974; Trucksess et al. 1977).Egg production by hens exposed to aflatoxin declinesafter the exposure but not during the time of feedingwith the aflatoxin-contaminated feed.
The use of improved feeds is the most importantstep in increasing productivity and profitability in thelivestock industry (Cruz and Begino 1990; Alcasid
1993). Unfortunately, the present state of aflatoxinprevention and control in feeds is still far from ideal,particularly from a regulatory aspect in developingcountries, where effective management is needed toreduce the problem, if not totally eliminate it. There isa lack of thorough understanding and appreciation ofthe problem among producers, traders, and consumers.At the Bureau of Animal Industry, we (as a rule) haveadopted international standards for tolerable levels ofaflatoxin for processed feeds and feedstuffs in ournational grades and standards, even with commodityexports and imports, but surveys have indicated a highincidence of aflatoxin contamination (Begino et al.1993; Begino 1996).
Compared to developing countries, there is a greaterappreciation in developed countries among the peopleand their governments about food and feed contami-nation issues and problems. There are many things thatcan be done to help control and limit the effects ofmycotoxins in animals. To this end, this study investi-gated the production performance of layer chickensfed with aflatoxin-contaminated feed, and feed treatedwith a mycotoxin binder commonly used in thePhilippines.
* Aflatoxin and Toxicology Laboratory, Bureau of Animal Industry, Department of Agriculture, Diliman, Quezon City, Philippines.
Quality assurance in agricultural produce,edited by G.I. Johnson, Le Van To, Nguyen Duy Duc and M.C. Webb.
ACIAR Proceedings 100(printed version published in 2000)
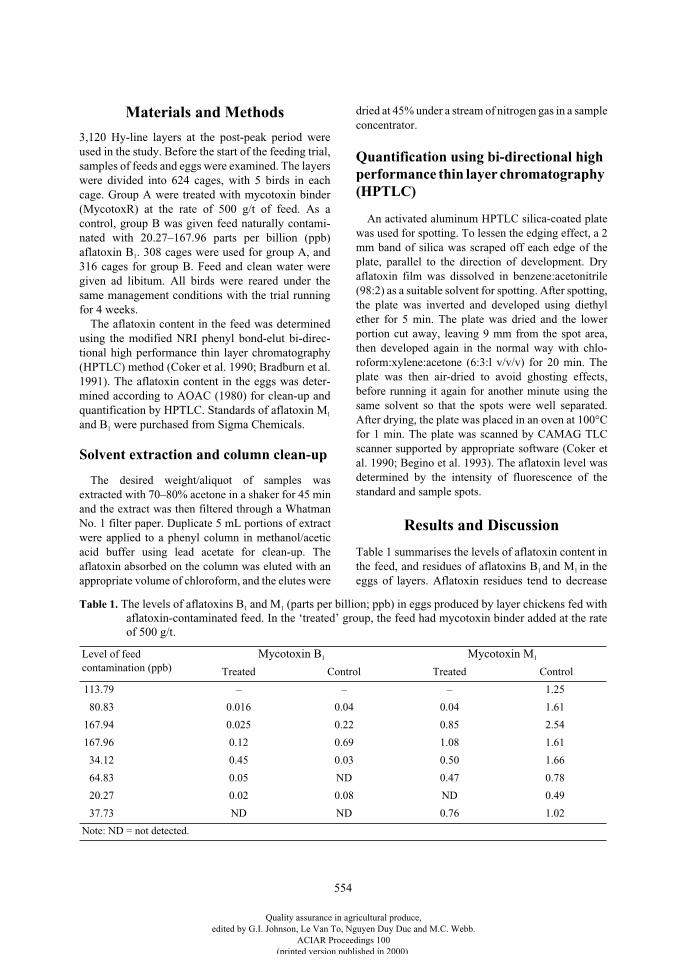
554
Materials and Methods
3,120 Hy-line layers at the post-peak period wereused in the study. Before the start of the feeding trial,samples of feeds and eggs were examined. The layerswere divided into 624 cages, with 5 birds in eachcage. Group A were treated with mycotoxin binder(MycotoxR) at the rate of 500 g/t of feed. As acontrol, group B was given feed naturally contami-nated with 20.27–167.96 parts per billion (ppb)aflatoxin B
1
. 308 cages were used for group A, and316 cages for group B. Feed and clean water weregiven ad libitum. All birds were reared under thesame management conditions with the trial runningfor 4 weeks.
The aflatoxin content in the feed was determinedusing the modified NRI phenyl bond-elut bi-direc-tional high performance thin layer chromatography(HPTLC) method (Coker et al. 1990; Bradburn et al.1991). The aflatoxin content in the eggs was deter-mined according to AOAC (1980) for clean-up andquantification by HPTLC. Standards of aflatoxin M
1
and B
1
were purchased from Sigma Chemicals.
Solvent extraction and column clean-up
The desired weight/aliquot of samples wasextracted with 70–80% acetone in a shaker for 45 minand the extract was then filtered through a WhatmanNo. 1 filter paper. Duplicate 5 mL portions of extractwere applied to a phenyl column in methanol/aceticacid buffer using lead acetate for clean-up. Theaflatoxin absorbed on the column was eluted with anappropriate volume of chloroform, and the elutes were
dried at 45% under a stream of nitrogen gas in a sampleconcentrator.
Quantification using bi-directional high performance thin layer chromatography (HPTLC)
An activated aluminum HPTLC silica-coated platewas used for spotting. To lessen the edging effect, a 2mm band of silica was scraped off each edge of theplate, parallel to the direction of development. Dryaflatoxin film was dissolved in benzene:acetonitrile(98:2) as a suitable solvent for spotting. After spotting,the plate was inverted and developed using diethylether for 5 min. The plate was dried and the lowerportion cut away, leaving 9 mm from the spot area,then developed again in the normal way with chlo-roform:xylene:acetone (6:3:l v/v/v) for 20 min. Theplate was then air-dried to avoid ghosting effects,before running it again for another minute using thesame solvent so that the spots were well separated.After drying, the plate was placed in an oven at 100°Cfor 1 min. The plate was scanned by CAMAG TLCscanner supported by appropriate software (Coker etal. 1990; Begino et al. 1993). The aflatoxin level wasdetermined by the intensity of fluorescence of thestandard and sample spots.
Results and Discussion
Table 1 summarises the levels of aflatoxin content inthe feed, and residues of aflatoxins B
1
and M
1
in theeggs of layers. Aflatoxin residues tend to decrease
Table 1.
The levels of aflatoxins B
1
and M
1
(parts per billion; ppb) in eggs produced by layer chickens fed withaflatoxin-contaminated feed. In the ‘treated’ group, the feed had mycotoxin binder added at the rateof 500 g/t.
Level of feed contamination (ppb)
Mycotoxin B
1
Mycotoxin M
1
Treated Control Treated Control
113.79 – – – 1.25
80.83 0.016 0.04 0.04 1.61
167.94 0.025 0.22 0.85 2.54
167.96 0.12 0.69 1.08 1.61
34.12 0.45 0.03 0.50 1.66
64.83 0.05 ND 0.47 0.78
20.27 0.02 0.08 ND 0.49
37.73 ND ND 0.76 1.02
Note: ND = not detected.
Quality assurance in agricultural produce,edited by G.I. Johnson, Le Van To, Nguyen Duy Duc and M.C. Webb.
ACIAR Proceedings 100(printed version published in 2000)
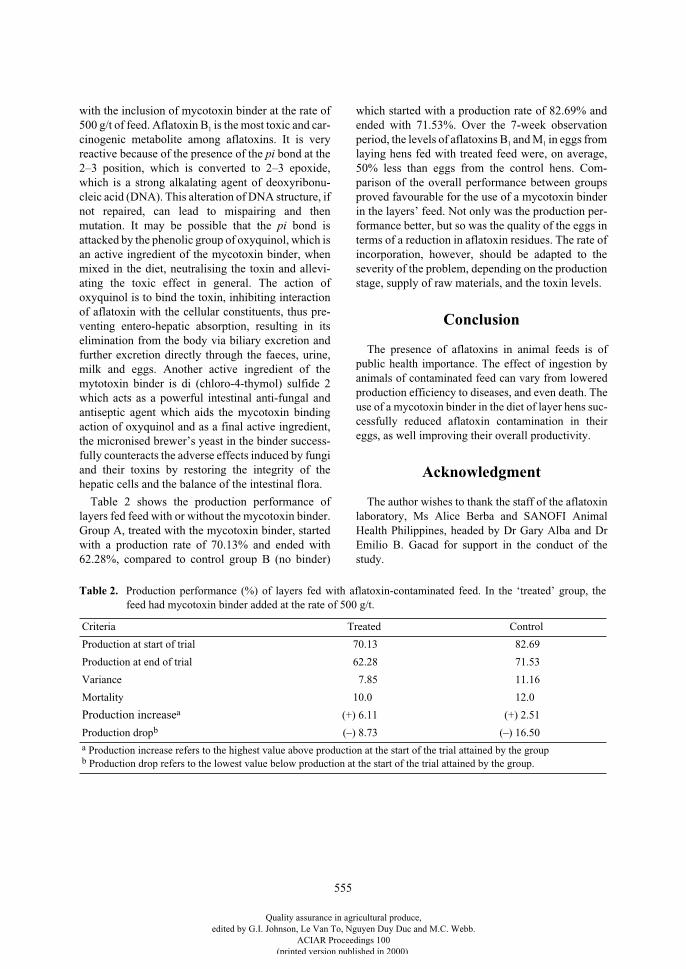
555
with the inclusion of mycotoxin binder at the rate of500 g/t of feed. Aflatoxin B
1
is the most toxic and car-cinogenic metabolite among aflatoxins. It is veryreactive because of the presence of the
pi
bond at the2–3 position, which is converted to 2–3 epoxide,which is a strong alkalating agent of deoxyribonu-cleic acid (DNA). This alteration of DNA structure, ifnot repaired, can lead to mispairing and thenmutation. It may be possible that the pi bond isattacked by the phenolic group of oxyquinol, which isan active ingredient of the mycotoxin binder, whenmixed in the diet, neutralising the toxin and allevi-ating the toxic effect in general. The action ofoxyquinol is to bind the toxin, inhibiting interactionof aflatoxin with the cellular constituents, thus pre-venting entero-hepatic absorption, resulting in itselimination from the body via biliary excretion andfurther excretion directly through the faeces, urine,milk and eggs. Another active ingredient of themytotoxin binder is di (chloro-4-thymol) sulfide 2which acts as a powerful intestinal anti-fungal andantiseptic agent which aids the mycotoxin bindingaction of oxyquinol and as a final active ingredient,the micronised brewer’s yeast in the binder success-fully counteracts the adverse effects induced by fungiand their toxins by restoring the integrity of thehepatic cells and the balance of the intestinal flora.
Table 2 shows the production performance oflayers fed feed with or without the mycotoxin binder.Group A, treated with the mycotoxin binder, startedwith a production rate of 70.13% and ended with62.28%, compared to control group B (no binder)
which started with a production rate of 82.69% andended with 71.53%. Over the 7-week observationperiod, the levels of aflatoxins B
1
and M
1
in eggs fromlaying hens fed with treated feed were, on average,50% less than eggs from the control hens. Com-parison of the overall performance between groupsproved favourable for the use of a mycotoxin binderin the layers’ feed. Not only was the production per-formance better, but so was the quality of the eggs interms of a reduction in aflatoxin residues. The rate ofincorporation, however, should be adapted to theseverity of the problem, depending on the productionstage, supply of raw materials, and the toxin levels.
Conclusion
The presence of aflatoxins in animal feeds is ofpublic health importance. The effect of ingestion byanimals of contaminated feed can vary from loweredproduction efficiency to diseases, and even death. Theuse of a mycotoxin binder in the diet of layer hens suc-cessfully reduced aflatoxin contamination in theireggs, as well improving their overall productivity.
Acknowledgment
The author wishes to thank the staff of the aflatoxinlaboratory, Ms Alice Berba and SANOFI AnimalHealth Philippines, headed by Dr Gary Alba and DrEmilio B. Gacad for support in the conduct of thestudy.
Table 2.
Production performance (%) of layers fed with aflatoxin-contaminated feed. In the ‘treated’ group, thefeed had mycotoxin binder added at the rate of 500 g/t.
Criteria Treated Control
Production at start of trial 70.13 82.69
Production at end of trial 62.28 71.53
Variance 7.85 11.16
Mortality 10.0 12.0
Production increase
a
(+) 6.11 (+) 2.51
Production drop
b
(–) 8.73 (–) 16.50
a
Production increase refers to the highest value above production at the start of the trial attained by the group
b
Production drop refers to the lowest value below production at the start of the trial attained by the group.
Quality assurance in agricultural produce,edited by G.I. Johnson, Le Van To, Nguyen Duy Duc and M.C. Webb.
ACIAR Proceedings 100(printed version published in 2000)
556
References
Alcasid, R.N. 1993. The role of food and feed control serviceat domestic and export levels: processed feedcommodities. Paper presented at the Regional Workshopon Mycotoxin Prevention and Control Programs in Asia,6–9 December 1993, Manila, Philippines.
AOAC (Association of Official Analytical Chemists) 1980.Official methods of analysis: natural poisons, 13thedition. Arlington, Virginia, AOAC, 423p.
Begino, E.T., Agaceta, L.M. and Miranda, C.O. 1993.Survey on the aflatoxin content of commerciallyavailable feeds in the Philippines. Paper presented at the110th International Symposium of World Association ofVeterinary Food Hygienists, Bangkok, Thailand.
Begino, E.T. 1996. An update on aflatoxin levels in feedsand feedstuff in the Philippines. Paper presented duringthe 110
th
Association of Official Analytical Chemists(AOAC) International Annual Meeting and Exposition inOrlando, Florida, USA, 8–12 September 1996.
Bradburn, N., Coker, R.D. and Jewers, K. 1991. Chromato-graphia, 29, 435.
Coker, R.D., Jewers, K. and Blunder, G. 1990. Chromato-graphia, 29, 177.
Cruz, M.S. and Begino, E.T. 1990. Pathology reports.Bureau of Animal Industry, Quezon City, Philippines,unpublished report.
Hamilton, P.B. 1987. Why the animal industry worriesabout mycotoxins. Proceedings of Symposium of RecentDevelopment in the Study of Mycotoxin, A, 1–12.
Hamilton, P.B. 1971. A natural and extremely severeoccurrence of aflatoxicosis in laying hens. PoultryScience, 50, 1880–1882.
Hamilton, P.B. and Garlich, J.D. 1971. Aflatoxin as possiblecause of fatty liver syndrome in laying hens. PoultryScience, 50, 800–804.
J
acobson, W.C. and Wisemen, H.G. 1974. The transmissionof aflatoxin B1 into eggs. Poultry Science, 53, 688–692.
Trucksess, M.W., Stoloff, L., Pon, W.A. Jr., Cucullu, A.F.,Lee, L.S. and Franz, A.O. Jr. 1977. Thin layer chromato-graphic determination of aflatoxin B
1
in eggs. Journal ofthe Association of Official Analytical Chemists(AOAC), 60, 795–798.
Quality assurance in agricultural produce,edited by G.I. Johnson, Le Van To, Nguyen Duy Duc and M.C. Webb.
ACIAR Proceedings 100(printed version published in 2000)
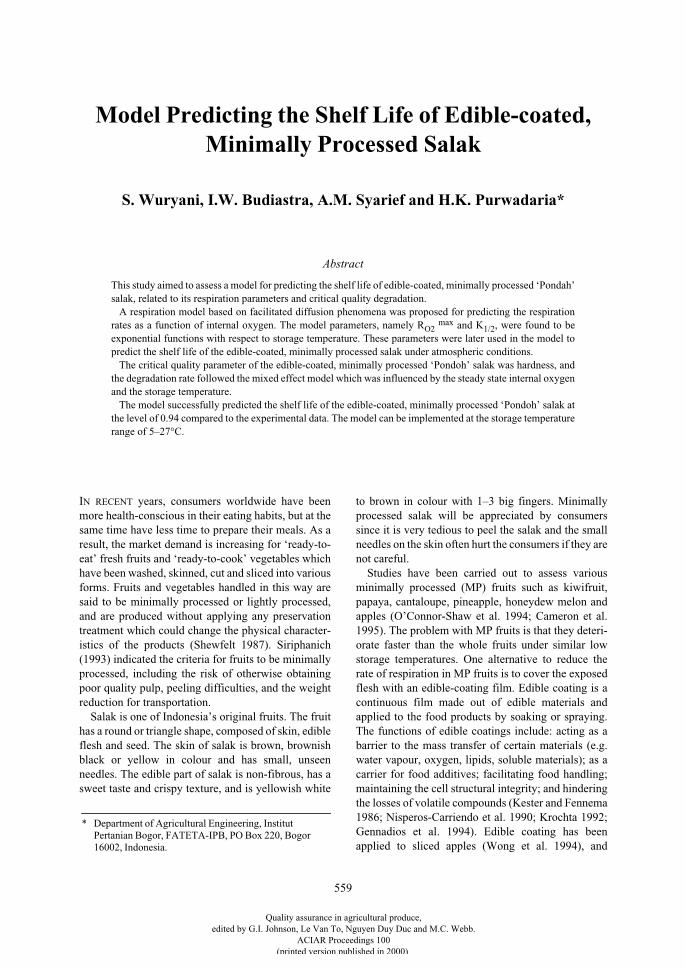
559
Model Predicting the Shelf Life of Edible-coated, Minimally Processed Salak
S. Wuryani, I.W. Budiastra, A.M. Syarief and H.K. Purwadaria*
Abstract
This study aimed to assess a model for predicting the shelf life of edible-coated, minimally processed ‘Pondah’salak, related to its respiration parameters and critical quality degradation.
A respiration model based on facilitated diffusion phenomena was proposed for predicting the respirationrates as a function of internal oxygen. The model parameters, namely R
O2
max
and K
1/2
, were found to beexponential functions with respect to storage temperature. These parameters were later used in the model topredict the shelf life of the edible-coated, minimally processed salak under atmospheric conditions.
The critical quality parameter of the edible-coated, minimally processed ‘Pondoh’ salak was hardness, andthe degradation rate followed the mixed effect model which was influenced by the steady state internal oxygenand the storage temperature.
The model successfully predicted the shelf life of the edible-coated, minimally processed ‘Pondoh’ salak atthe level of 0.94 compared to the experimental data. The model can be implemented at the storage temperaturerange of 5–27°C.
I
N
RECENT
years, consumers worldwide have beenmore health-conscious in their eating habits, but at thesame time have less time to prepare their meals. As aresult, the market demand is increasing for ‘ready-to-eat’ fresh fruits and ‘ready-to-cook’ vegetables whichhave been washed, skinned, cut and sliced into variousforms. Fruits and vegetables handled in this way aresaid to be minimally processed or lightly processed,and are produced without applying any preservationtreatment which could change the physical character-istics of the products (Shewfelt 1987). Siriphanich(1993) indicated the criteria for fruits to be minimallyprocessed, including the risk of otherwise obtainingpoor quality pulp, peeling difficulties, and the weightreduction for transportation.
Salak is one of Indonesia’s original fruits. The fruithas a round or triangle shape, composed of skin, edibleflesh and seed. The skin of salak is brown, brownishblack or yellow in colour and has small, unseenneedles. The edible part of salak is non-fibrous, has asweet taste and crispy texture, and is yellowish white
to brown in colour with 1–3 big fingers. Minimallyprocessed salak will be appreciated by consumerssince it is very tedious to peel the salak and the smallneedles on the skin often hurt the consumers if they arenot careful.
Studies have been carried out to assess variousminimally processed (MP) fruits such as kiwifruit,papaya, cantaloupe, pineapple, honeydew melon andapples (O’Connor-Shaw et al. 1994; Cameron et al.1995). The problem with MP fruits is that they deteri-orate faster than the whole fruits under similar lowstorage temperatures. One alternative to reduce therate of respiration in MP fruits is to cover the exposedflesh with an edible-coating film. Edible coating is acontinuous film made out of edible materials andapplied to the food products by soaking or spraying.The functions of edible coatings include: acting as abarrier to the mass transfer of certain materials (e.g.water vapour, oxygen, lipids, soluble materials); as acarrier for food additives; facilitating food handling;maintaining the cell structural integrity; and hinderingthe losses of volatile compounds (Kester and Fennema1986; Nisperos-Carriendo et al. 1990; Krochta 1992;Gennadios et al. 1994). Edible coating has beenapplied to sliced apples (Wong et al. 1994), and
* Department of Agricultural Engineering, Institut Pertanian Bogor, FATETA-IPB, PO Box 220, Bogor 16002, Indonesia.
Quality assurance in agricultural produce,edited by G.I. Johnson, Le Van To, Nguyen Duy Duc and M.C. Webb.
ACIAR Proceedings 100(printed version published in 2000)
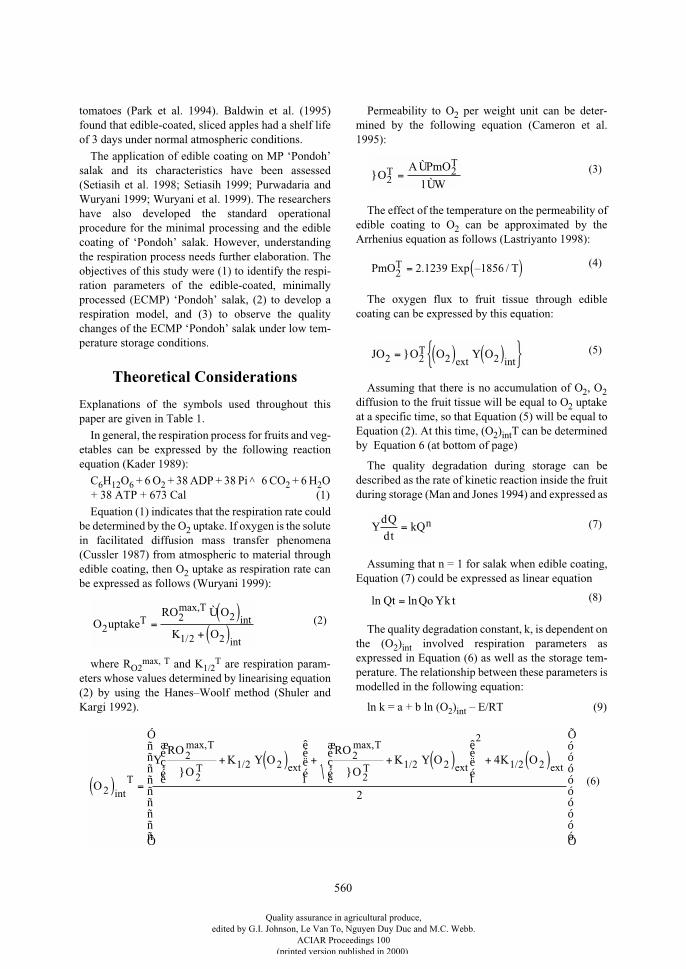
560
tomatoes (Park et al. 1994). Baldwin et al. (1995)found that edible-coated, sliced apples had a shelf lifeof 3 days under normal atmospheric conditions.
The application of edible coating on MP ‘Pondoh’salak and its characteristics have been assessed(Setiasih et al. 1998; Setiasih 1999; Purwadaria andWuryani 1999; Wuryani et al. 1999). The researchershave also developed the standard operationalprocedure for the minimal processing and the ediblecoating of ‘Pondoh’ salak. However, understandingthe respiration process needs further elaboration. Theobjectives of this study were (1) to identify the respi-ration parameters of the edible-coated, minimallyprocessed (ECMP) ‘Pondoh’ salak, (2) to develop arespiration model, and (3) to observe the qualitychanges of the ECMP ‘Pondoh’ salak under low tem-perature storage conditions.
Theoretical Considerations
Explanations of the symbols used throughout thispaper are given in Table 1.
In general, the respiration process for fruits and veg-etables can be expressed by the following reactionequation (Kader 1989):
C
6
H
12
O
6
+ 6 O
2
+ 38 ADP + 38 Pi
^
6 CO
2
+ 6 H
2
O+ 38 ATP + 673 Cal (1)
Equation (1) indicates that the respiration rate couldbe determined by the O
2
uptake. If oxygen is the solutein facilitated diffusion mass transfer phenomena(Cussler 1987) from atmospheric to material throughedible coating, then O
2
uptake as respiration rate canbe expressed as follows (Wuryani 1999):
where R
O2max, T
and K
1/2T
are respiration param-eters whose values determined by linearising equation(2) by using the Hanes–Woolf method (Shuler andKargi 1992).
Permeability to O
2
per weight unit can be deter-mined by the following equation (Cameron et al.1995):
The effect of the temperature on the permeability ofedible coating to O
2
can be approximated by theArrhenius equation as follows (Lastriyanto 1998):
The oxygen flux to fruit tissue through ediblecoating can be expressed by this equation:
Assuming that there is no accumulation of O
2
, O
2
diffusion to the fruit tissue will be equal to O
2
uptakeat a specific time, so that Equation (5) will be equal toEquation (2). At this time, (O
2
)
int
T can be determinedby Equation 6 (at bottom of page)
The quality degradation during storage can bedescribed as the rate of kinetic reaction inside the fruitduring storage (Man and Jones 1994) and expressed as
Assuming that n = 1 for salak when edible coating,Equation (7) could be expressed as linear equation
The quality degradation constant, k, is dependent onthe (O
2
)
int
involved respiration parameters asexpressed in Equation (6) as well as the storage tem-perature. The relationship between these parameters ismodelled in the following equation:
ln k = a + b ln (O
2
)
int
– E/RT (9)
ORO O
K OT
T
22 2
1 2 2uptake =
Ù( )+ ( )
max,int
/ int
(2)
}OA PmO
WT
T
22
1=Ù
Ù(3)
PmOT2 2 1239= ( ). Exp –1856 / T (4)
JO O O OText2 2 2 2= ( ) Y ( ){ }}
int(5)
O
RO
OK O
RO
OK O K O
T
T
T ext
T
T ext ext
2
2
21 2 2
2
21 2 2
2
1 2 24
2( ) =
Y + Y ( )æ
çé
èé
ê
ëé
ìé+ + Y ( )æ
çé
èé
ê
ëé
ìé+ ( )
Ó
Ô
ñññññññññ
Õ
Ö
óóóóóóóóó
int
max,
/
max,
/ /} }
(6)
Y =dQ
dtkQn (7)
ln lnQt Qo k t= Y (8)
Quality assurance in agricultural produce,edited by G.I. Johnson, Le Van To, Nguyen Duy Duc and M.C. Webb.
ACIAR Proceedings 100(printed version published in 2000)
561
Table 1
. Explanation of symbols used in this paper.
Symbols Explanations
a, b Constants
A Surface area of barrier, m
2
ß
O2T
Total permeability of barrier to O2 per kg of product at temperature T, mol.kPa/kg.s
dO
2
/dt Oxygen concentration gradient, %/h
Quality gradient
E Activation energy, J/mol
JO
2
Oxygen flux to fruit tissue, g.mol/cm
2
.s
k Constant of quality degradation, days
k
hdT
Hardness degradation rate at temperature T
K
1/2
Internal O
2
partial pressure at the half level of R
O2max
, kPa
l Film thickness, m
O
2
uptake
T
Rate of oxygen consumption at temperature T, mol/s/kg
(O
2
)
int
Steady state partial pressure of internal O
2
, kPa
(O
2
)
intT
Steady state partial pressure of O
2
inside the packaging at temperature T, kPa
(O
2
)
ext
Steady state partial pressure of O
2
outside the packaging, kPa
Pm O
2T
Permeability of edible coating to O
2
, at temperature T, nmol.m/m
2
.kPa.s
Q Quality index
Qo Initial critical quality
Qt Limit of the shelf life of the fruit
R Gas constants, J/mol.K
R
O2max, T
Maximum rate of O
2
uptake, mol/kg/s at temperature T
T Storage temperature, °C
ts Shelf life, days
V Void volume inside the packaging, m3
Vb Chamber volume, L
W Weight of fruit samples, kg
dQ
dt
Quality assurance in agricultural produce,edited by G.I. Johnson, Le Van To, Nguyen Duy Duc and M.C. Webb.
ACIAR Proceedings 100(printed version published in 2000)
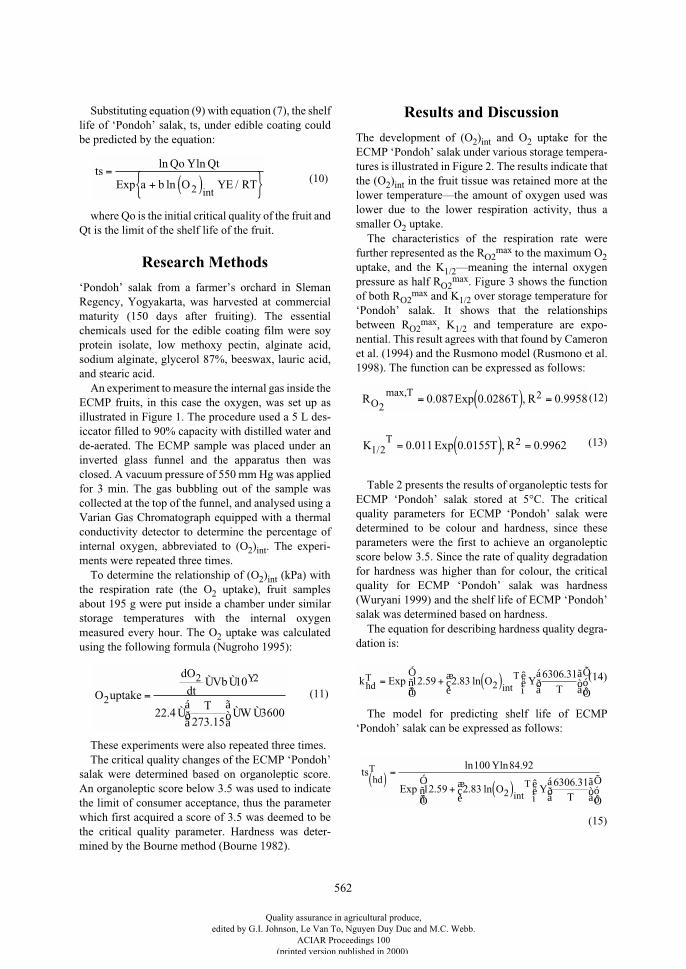
562
Substituting equation (9) with equation (7), the shelflife of ‘Pondoh’ salak, ts, under edible coating couldbe predicted by the equation:
where Qo is the initial critical quality of the fruit andQt is the limit of the shelf life of the fruit.
Research Methods
‘Pondoh’ salak from a farmer’s orchard in SlemanRegency, Yogyakarta, was harvested at commercialmaturity (150 days after fruiting). The essentialchemicals used for the edible coating film were soyprotein isolate, low methoxy pectin, alginate acid,sodium alginate, glycerol 87%, beeswax, lauric acid,and stearic acid.
An experiment to measure the internal gas inside theECMP fruits, in this case the oxygen, was set up asillustrated in Figure 1. The procedure used a 5 L des-iccator filled to 90% capacity with distilled water andde-aerated. The ECMP sample was placed under aninverted glass funnel and the apparatus then wasclosed. A vacuum pressure of 550 mm Hg was appliedfor 3 min. The gas bubbling out of the sample wascollected at the top of the funnel, and analysed using aVarian Gas Chromatograph equipped with a thermalconductivity detector to determine the percentage ofinternal oxygen, abbreviated to (O
2
)
int
. The experi-ments were repeated three times.
To determine the relationship of (O
2
)
int
(kPa) withthe respiration rate (the O
2
uptake), fruit samplesabout 195 g were put inside a chamber under similarstorage temperatures with the internal oxygenmeasured every hour. The O
2
uptake was calculatedusing the following formula (Nugroho 1995):
These experiments were also repeated three times.The critical quality changes of the ECMP ‘Pondoh’
salak were determined based on organoleptic score.An organoleptic score below 3.5 was used to indicatethe limit of consumer acceptance, thus the parameterwhich first acquired a score of 3.5 was deemed to bethe critical quality parameter. Hardness was deter-mined by the Bourne method (Bourne 1982).
Results and Discussion
The development of (O
2
)
int
and O
2
uptake for theECMP ‘Pondoh’ salak under various storage tempera-tures is illustrated in Figure 2. The results indicate thatthe (O
2
)
int
in the fruit tissue was retained more at thelower temperature—the amount of oxygen used waslower due to the lower respiration activity, thus asmaller O
2
uptake.The characteristics of the respiration rate were
further represented as the R
O2max
to the maximum O
2
uptake, and the K
1/2
—meaning the internal oxygenpressure as half R
O2max
. Figure 3 shows the functionof both R
O2max
and K
1/2
over storage temperature for‘Pondoh’ salak. It shows that the relationshipsbetween R
O2max
, K
1/2
and temperature are expo-nential. This result agrees with that found by Cameronet al. (1994) and the Rusmono model (Rusmono et al.1998). The function can be expressed as follows:
Table 2 presents the results of organoleptic tests forECMP ‘Pondoh’ salak stored at 5°C. The criticalquality parameters for ECMP ‘Pondoh’ salak weredetermined to be colour and hardness, since theseparameters were the first to achieve an organolepticscore below 3.5. Since the rate of quality degradationfor hardness was higher than for colour, the criticalquality for ECMP ‘Pondoh’ salak was hardness(Wuryani 1999) and the shelf life of ECMP ‘Pondoh’salak was determined based on hardness.
The equation for describing hardness quality degra-dation is:
The model for predicting shelf life of ECMP‘Pondoh’ salak can be expressed as follows:
tsQo Qt
Exp a b O E RT=
Y
+ ( ) Y{ }ln ln
ln /int2
(10)
O uptake
dO
dtVb
TW
2
2 210
22 4273 15
3600
=Ù Ù
Ùá
âð
ã
äò Ù Ù
Y
..
(11)
R Exp T ROT
220 087 0 0286 0 9958
max,. . , .= ( ) =
K Exp T RT
1 220 011 0 0155 0 9962/ . . , .= ( ) =
(12)
(13)
k Exp OThd
T T= + ( )æ
çè
êëìYá
âð
ã
äò
Ó
Ôññ
Õ
Öóó
12 59 2 836306 31
2. . ln.
int(14)
ts
Exp OT
hdT
T( )=
Y
+ ( )æçè
êëìYá
âð
ã
äò
Ó
Ôññ
Õ
Öóó
ln ln .
. . ln.
int
100 84 92
12 59 2 836306 31
2
(15)
Quality assurance in agricultural produce,edited by G.I. Johnson, Le Van To, Nguyen Duy Duc and M.C. Webb.
ACIAR Proceedings 100(printed version published in 2000)
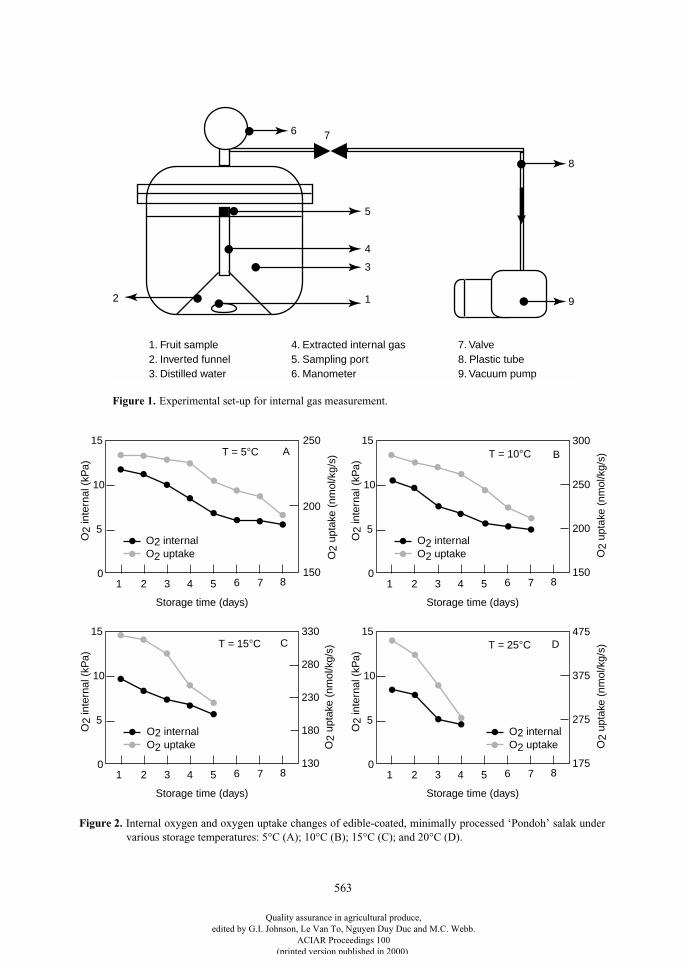
563
5
4
3
1
6
8
92
7
1. Fruit sample2. Inverted funnel3. Distilled water
4. Extracted internal gas5. Sampling port6. Manometer
7. Valve8. Plastic tube9. Vacuum pump
Storage time (days)
1 2 3 4 5 61750
O2
inte
rnal
(kP
a)
O2
upta
ke (
nmol
/kg/
s)
5
10
15
7 8
375
275O2 internalO2 uptake
475D
Storage time (days)
1 2 3 4 5 61300
O2
inte
rnal
(kP
a)
O2
upta
ke (
nmol
/kg/
s)
5
10
15
7 8
330
230
O2 internalO2 uptake
180
280
C
Storage time (days)
1 2 3 4 5 61500
O2
inte
rnal
(kP
a)
O2
upta
ke (
nmol
/kg/
s)
5
10
15
7 8
250
200O2 internalO2 uptake
300B
Storage time (days)
1 2 3 4 5 61500
O2
inte
rnal
(kP
a)
O2
upta
ke (
nmol
/kg/
s)
5
10
15
7 8
250
200
O2 internalO2 uptake
A
T = 25°C
T = 10°C T = 5°C
T = 15°C
Figure 1.
Experimental set-up for internal gas measurement.
Figure 2.
Internal oxygen and oxygen uptake changes of edible-coated, minimally processed ‘Pondoh’ salak undervarious storage temperatures: 5°C (A); 10°C (B); 15°C (C); and 20°C (D).
Quality assurance in agricultural produce,edited by G.I. Johnson, Le Van To, Nguyen Duy Duc and M.C. Webb.
ACIAR Proceedings 100(printed version published in 2000)
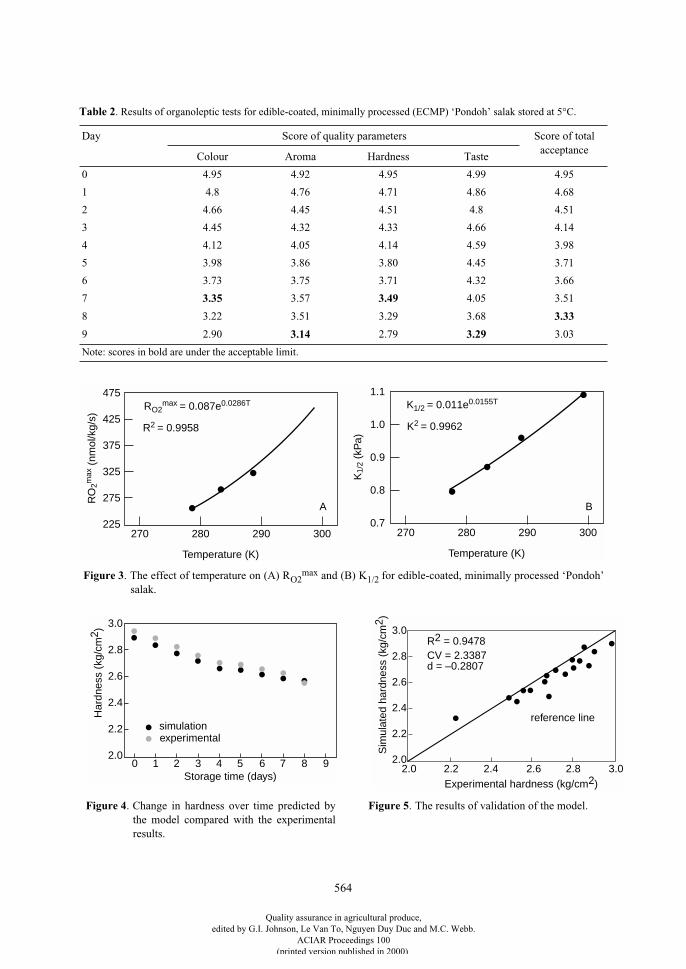
564
Temperature (K)
225
RO
2max
(nm
ol/k
g/s)
300290280270
275
325
375
425
475RO2
max = 0.087e0.0286T
R2 = 0.9958
A
Temperature (K)
0.7
K1/
2 (k
Pa)
300290280270
0.8
0.9
1.0
1.1K1/2 = 0.011e0.0155T
K2 = 0.9962
B
Table 2
. Results of organoleptic tests for edible-coated, minimally processed (ECMP) ‘Pondoh’ salak stored at 5°C.
Day Score of quality parameters Score of
total acceptance
Colour Aroma Hardness Taste
0 4.95 4.92 4.95 4.99 4.95
1 4.8 4.76 4.71 4.86 4.68
2 4.66 4.45 4.51 4.8 4.51
3 4.45 4.32 4.33 4.66 4.14
4 4.12 4.05 4.14 4.59 3.98
5 3.98 3.86 3.80 4.45 3.71
6 3.73 3.75 3.71 4.32 3.66
7
3.35
3.57
3.49
4.05 3.51
8 3.22 3.51 3.29 3.68
3.33
9 2.90
3.14
2.79
3.29 3.03
Note: scores in bold are under the acceptable limit.
Figure 3. The effect of temperature on (A) RO2max and (B) K1/2 for edible-coated, minimally processed ‘Pondoh’
salak.
2.0
2.2
2.4
2.6
2.8
3.0
Storage time (days) 0 2 4 6 8 9
Har
dnes
s (k
g/cm
2 )
experimentalsimulation
1 3 5 7 2.0
2.2
2.4
2.6
2.8
3.0
Experimental hardness (kg/cm2) 2.0 2.2 2.4 2.6 2.8 3.0
Sim
ulat
ed h
ardn
ess
(kg/
cm2 )
reference line
R2 = 0.9478CV = 2.3387d = –0.2807
Figure 4. Change in hardness over time predicted bythe model compared with the experimentalresults.
Figure 5. The results of validation of the model.
Quality assurance in agricultural produce,edited by G.I. Johnson, Le Van To, Nguyen Duy Duc and M.C. Webb.
ACIAR Proceedings 100(printed version published in 2000)
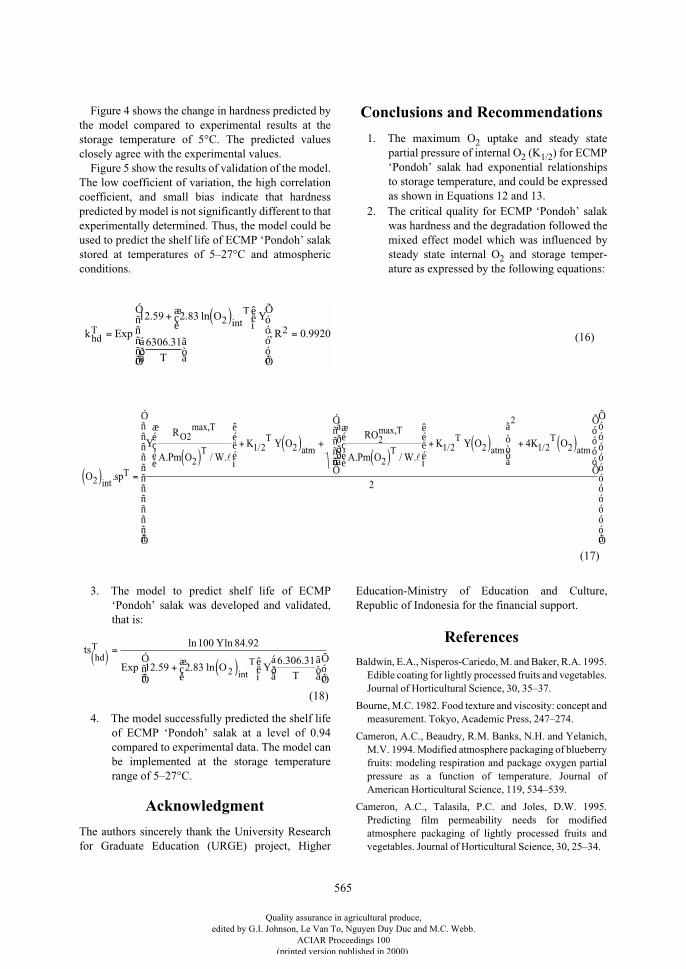
565
Figure 4 shows the change in hardness predicted bythe model compared to experimental results at thestorage temperature of 5°C. The predicted valuesclosely agree with the experimental values.
Figure 5 show the results of validation of the model.The low coefficient of variation, the high correlationcoefficient, and small bias indicate that hardnesspredicted by model is not significantly different to thatexperimentally determined. Thus, the model could beused to predict the shelf life of ECMP ‘Pondoh’ salakstored at temperatures of 5–27°C and atmosphericconditions.
Conclusions and Recommendations
1. The maximum O2 uptake and steady statepartial pressure of internal O2 (K1/2) for ECMP‘Pondoh’ salak had exponential relationshipsto storage temperature, and could be expressedas shown in Equations 12 and 13.
2. The critical quality for ECMP ‘Pondoh’ salakwas hardness and the degradation followed themixed effect model which was influenced bysteady state internal O2 and storage temper-ature as expressed by the following equations:
3. The model to predict shelf life of ECMP‘Pondoh’ salak was developed and validated,that is:
4. The model successfully predicted the shelf lifeof ECMP ‘Pondoh’ salak at a level of 0.94compared to experimental data. The model canbe implemented at the storage temperaturerange of 5–27°C.
Acknowledgment
The authors sincerely thank the University Researchfor Graduate Education (URGE) project, Higher
Education-Ministry of Education and Culture,Republic of Indonesia for the financial support.
References
Baldwin, E.A., Nisperos-Cariedo, M. and Baker, R.A. 1995.Edible coating for lightly processed fruits and vegetables.Journal of Horticultural Science, 30, 35–37.
Bourne, M.C. 1982. Food texture and viscosity: concept andmeasurement. Tokyo, Academic Press, 247–274.
Cameron, A.C., Beaudry, R.M. Banks, N.H. and Yelanich,M.V. 1994. Modified atmosphere packaging of blueberryfruits: modeling respiration and package oxygen partialpressure as a function of temperature. Journal ofAmerican Horticultural Science, 119, 534–539.
Cameron, A.C., Talasila, P.C. and Joles, D.W. 1995.Predicting film permeability needs for modifiedatmosphere packaging of lightly processed fruits andvegetables. Journal of Horticultural Science, 30, 25–34.
O sp
R
A Pm O WK O
RO
A Pm O WK O K O
T
OT
TT
atm
T
TT
atmT
atm
2
2
2
1 2 22
2
1 2 2
2
1 2 24
( ) =
Y
( )
æ
çé
èé
ê
ëé
ìé
+ Y ( ) +
( )
æ
çé
èé
ê
ëé
ìé
+ Y ( )á
â
ððð
ã
ä
òòò
+ ( )
Ó
Ô
ñññ
int
max,
/
max,
/ /
.
. / . . / .l lññ
Õ
Ö
óóóó
Ó
Ô
ññññññññññññ
Õ
Ö
óóóóóóóóóóóó
2
k Exp
O
T
RhdT
T
=
+ ( )æçè
êëìY
á
âð
ã
äò
Ó
Ô
ñññññ
Õ
Ö
óóóóó
=
12 59 2 83
6306 310 9920
22
. . ln
.; .
int
(16)
(17)
ts
Exp OT
hdT
T( )=
Y
+ ( )æçè
êëìYá
âð
ã
äò
Ó
Ôññ
Õ
Öóó
ln ln .
. . ln. .
int
100 84 92
12 59 2 836 306 31
2
(18)
Quality assurance in agricultural produce,edited by G.I. Johnson, Le Van To, Nguyen Duy Duc and M.C. Webb.
ACIAR Proceedings 100(printed version published in 2000)
566
Cussler, E.L. 1987. Diffusion. Mass transfer in fluidsystems. Melbourne, Cambridge University Press.
Gennadios, A., McHugh, T.H., Weller, C.L. and Krochta,J.M. 1994. Edible coatings and films based on proteins. InKrochta, J.M., Baldwin, E.A. and Nisperos-Carriedo,M.O., ed., Edible coating and films to improve foodquality. Lancaster, Pennsylvania, Technomic PublishingCo., 201–278.
Kader, A.A. 1989. Respiration and gas exchange ofvegetables. Davis, University of California.
Kester, J.J. and Fennema, O.R. 1986. Edible films andcoatings: a review. Food Technology, 40(12), 47–59.
Krochta, J.M. 1992. Control of mass transfer in foods withinedible coatings and films. In: Sing, R.P. and Wirakartaku-sumah, M.A., ed., Advances in food engineering. BocaRaton, CRC Press, 517–538.
Lastriyanto, A. 1998. Determination of the edible filmpermeability to oxygen and carbon dioxide. MSc thesis,Bogor Agricultural University, Indonesia.
Man, C.M.D. and Jones, A.A. 1994. Shelf life evaluation offoods. London, Bleckie Academic and Professional.
Nisperos-Carriedo, M.O., Shaw, P.E. and Baldwin, E.A.1990. Changes in volatile flavor component of pineappleorange as influenced by applications of lipid andcomposite film. Journal of Agricultural and FoodChemistry, 38, 1382–1387.
Nugroho, L.P.E. 1995. Study on quality preservation offresh agricultural products under controlled atmosphereconditions. PhD thesis, Tokyo University of Agricultureand Technology.
O’Connor-Shaw, R.E., Robert, R., Ford, A.L. andNottingham, S.M. 1994. Shelf life of minimallyprocessed honeydew kiwifruit, papaya, pineapple andcantaloupe. Journal of Food Science, 59, 1202.
Park, H.J., Chinnan, M.S. and Shewfelt, R.L. 1994. Ediblecoating effect on storage life and quality of tomatoes.Journal of Food Science, 56, 568–570.
Purwadaria, H.K. and Wuryani, S. 1999. Respiration modelfor edible coated minimally processed mango. Paperpresented at the 6th International Mango Symposium,Pattaya, Thailand, 6–9 April 1999.
Rusmono, M., Wuryani, S. Purwadaria, H.K. and, Syarief,A.M. 1998. Respiration model and concentration gas inthe package of modified atmosphere for edible coatedminimally processed fresh fruits. Paper presented at theSeminar and Congress PERTETA, Yogyakarta,Indonesia, July 27–28 1998.
Setiasih, I.S. 1999. Application of edible coating film onminimally processed pondoh salak. Paper presented onPostgraduate Seminar, Bogor Agricultural UniversityBogor, Indonesia, 22 February 1999.
Setiasih, I.S., Zulfebriadi, Fardiaz, D. and Purwadaria, H.K.1998. Characteristics of edible coated minimallyprocessed mango. Paper presented the Seminar andCongress PERTETA, Yogyakarta, Indonesia, July 27–281998.
Shewfelt, R.L. 1987. Quality of minimally processed fruitsand vegetables. Journal of Food Quality, 10, 143–156.
Shuler, M.L. and Kargi, F. 1992. Bioprocess engineering.Basic concepts. New Jersey, Prentice Hall.
Siriphanich, J. 1993. Minimal processing of tropical fruits.In: Champ, B.R., Highley, E. and Johnson, G.I., ed.,Postharvest handling of tropical fruits. Proceedings of aninternational conference held at Chiang Mai, Thailand,19–23 July 1993. ACIAR Proceedings No. 50. Canberra,Australian Centre for International AgriculturalResearch, 127–137.
Wong, D.W.S., Tilin, S.J., Hudson, J.S. and Pavlath, A.E.1994. Gas exchange in cut apples with bilayer coatings.Journal of Agricultural and Food Chemistry, 42,2278–2285.
Wuryani, S. 1999. A simulation model of the shelf lifeprediction for edible coated minimally processed fruitsunder the atmospheric condition: Arumanis mango andPondoh salak. PhD dissertation, Bogor AgriculturalUniversity, Indonesia.
Quality assurance in agricultural produce,edited by G.I. Johnson, Le Van To, Nguyen Duy Duc and M.C. Webb.
ACIAR Proceedings 100(printed version published in 2000)
567
Conservation of Rambutan and Longan in Polyethylene Bags
Do Minh Hien, Thai Thi Hoa and Pham Hoang Lam*
Abstract
A major problem of postharvest handling of rambutan and longan is that their skin colour browns within 2 daysof harvest because of water loss. The use of plastic films enables an environment of high humidity to be created,resulting in a near-saturated package atmosphere. Polyethylene bags were used to maintain rambutan andlongan fruits in combination with low temperature. Fruits harvested in Tiengiang Province were sent to thelaboratory for sorting, cleaning and bagging in polyethylene bags. Bagged fruits were stored at 8°C. Goodquality of rambutan and longan could be maintained for 2 and 4 weeks after harvest, respectively, without anyskin colour changes. In addition, using polyethylene bags reduced weight losses during storage.
L
ONGAN
AND
RAMBUTAN
are two crops popularlygrown in the Mekong River Delta and the south-eastern region of Vietnam. In 1998, longan cropscovered nearly 30,000 ha and rambutan over 8,000 ha,with production of about 344,000 t and 158,000 t/year,respectively. The area under cultivation of these cropsis expanding every year. However, harvested longanand rambutan fruits have short shelf lives and the fruitrind turns brown within 2–3 days after harvest becauseof water loss. This problem results in a limited marketfor the crops, reduced income for the growers, andincreases postharvest losses.
Reducing water loss from the fruit skin allows fruitfreshness to be maintained. A simple and low-costmeasure is to use polyethylene bags to create a high-humidity atmosphere around the fruits. This paperreports some experiments carried out on longan andrambutan.
Materials and Methods
Longan
Longan fruit (‘Tieu’ longan) at the fully maturestage were harvested from trees grown in TiengiangProvince and sent to the laboratory on the same day.
Harvested fruit were trimmed, then sorted to obtainuniform fruit. Selected fruit were washed with tapwater and dried using an electric fan. The fruit weredivided into two groups—the first group was packedin polyethylene bags (4 µm thickness), and the secondwas not packed (control). Each group was furtherdivided into two subgroups, one of which was treatedwith benomyl at a concentration of 500 parts permillion (ppm) while the other was not treated. Eachsubgroup was again divided into two parts—onestored at ambient temperature, and one was stored at8°C.
Fruit were checked during storage and ratedaccording to: weight loss, eating quality (on a hedonicscale of 1–9), total soluble solids (by refractometer),and fruit rot ratio.
Rambutan
Fruit (‘Java’ rambutan) were harvested when thefruit rind reached red in colour. Treatments and exper-iments were carried out similarly to those describedfor longan.
* Southern Fruit Research Institute (SOFRI), Box 203 My Tho, Tiengiang, Vietnam.
Quality assurance in agricultural produce,edited by G.I. Johnson, Le Van To, Nguyen Duy Duc and M.C. Webb.
ACIAR Proceedings 100(printed version published in 2000)
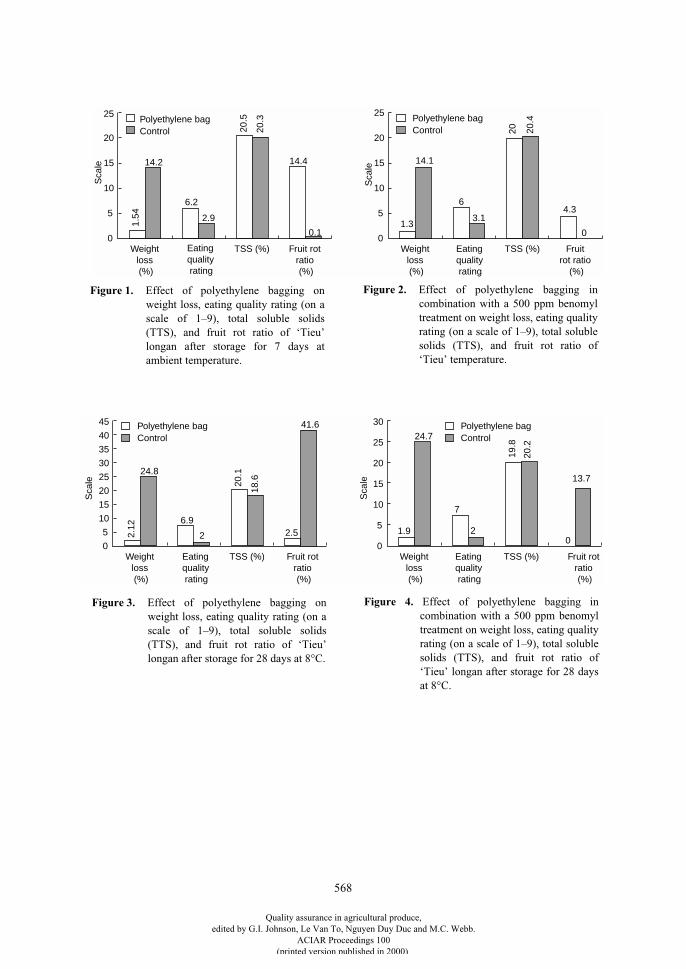
568
1.3
14.1
6
3.1
20 20.4
4.3
0
25
20
15
10
5
0Weight
loss (%)
Eating quality rating
TSS (%) Fruit rot ratio
(%)
Polyethylene bagControl
Sca
le
1.54
14.2
6.2
2.9
20.5
20.3
14.4
0.1
25
20
15
10
5
0Weight
loss (%)
Eating quality rating
TSS (%) Fruit rot ratio (%)
Polyethylene bagControl
Sca
le
Figure 1.
Effect of polyethylene bagging onweight loss, eating quality rating (on ascale of 1–9), total soluble solids(TTS), and fruit rot ratio of ‘Tieu’longan after storage for 7 days atambient temperature.
Figure 2.
Effect of polyethylene bagging incombination with a 500 ppm benomyltreatment on weight loss, eating qualityrating (on a scale of 1–9), total solublesolids (TTS), and fruit rot ratio of‘Tieu’ temperature.
1.9
24.7
7
2
19.8
20.2
0
13.7
25
30
20
15
10
5
0Weight
loss (%)
Eating quality rating
TSS (%) Fruit rot ratio (%)
Polyethylene bagControl
Sca
le
2.12
24.8
6.9
2
20.1
18.6
2.5
41.6
25
30
35
40
45
20
15
10
5
0Weight
loss (%)
Eating quality rating
TSS (%) Fruit rot ratio (%)
Polyethylene bagControl
Sca
le
Figure 3.
Effect of polyethylene bagging onweight loss, eating quality rating (on ascale of 1–9), total soluble solids(TTS), and fruit rot ratio of ‘Tieu’longan after storage for 28 days at 8°C.
Figure 4.
Effect of polyethylene bagging incombination with a 500 ppm benomyltreatment on weight loss, eating qualityrating (on a scale of 1–9), total solublesolids (TTS), and fruit rot ratio of‘Tieu’ longan after storage for 28 daysat 8°C.
Quality assurance in agricultural produce,edited by G.I. Johnson, Le Van To, Nguyen Duy Duc and M.C. Webb.
ACIAR Proceedings 100(printed version published in 2000)
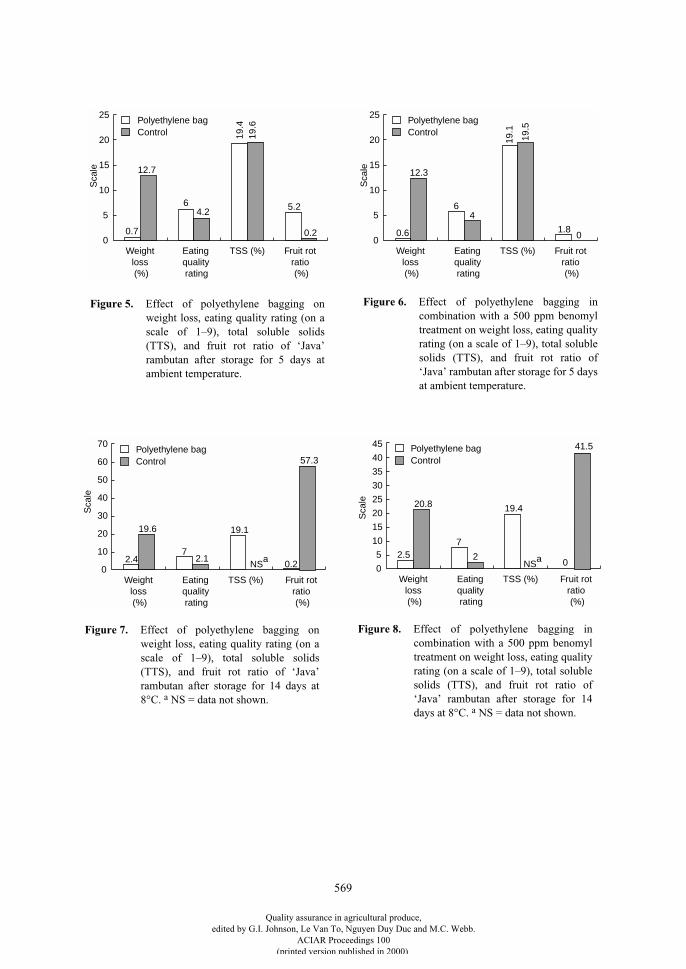
569
0.6
12.3
64
19.1
19.5
1.80
25
20
15
10
5
0Weight
loss (%)
Eating quality rating
TSS (%) Fruit rot ratio (%)
Polyethylene bagControl
Sca
le
0.7
12.7
64.2
19.4
19.6
5.2
0.2
25
20
15
10
5
0Weight
loss (%)
Eating quality rating
TSS (%) Fruit rot ratio (%)
Polyethylene bagControl
Sca
le
2.5
20.8
7
2
19.4
0
41.5
25
30
35
40
45
20
15
10
5
0Weight
loss (%)
Eating quality rating
TSS (%) Fruit rot ratio (%)
Polyethylene bagControl
Sca
le
NSa2.4
19.6
72.1
19.1
0.2
57.3
50
60
70
40
30
20
10
0Weight
loss (%)
Eating quality rating
TSS (%) Fruit rot ratio (%)
Polyethylene bagControl
Sca
le
NSa
Figure 5.
Effect of polyethylene bagging onweight loss, eating quality rating (on ascale of 1–9), total soluble solids(TTS), and fruit rot ratio of ‘Java’rambutan after storage for 5 days atambient temperature.
Figure 6.
Effect of polyethylene bagging incombination with a 500 ppm benomyltreatment on weight loss, eating qualityrating (on a scale of 1–9), total solublesolids (TTS), and fruit rot ratio of‘Java’ rambutan after storage for 5 daysat ambient temperature.
Figure 7.
Effect of polyethylene bagging onweight loss, eating quality rating (on ascale of 1–9), total soluble solids(TTS), and fruit rot ratio of ‘Java’rambutan after storage for 14 days at8°C.
a
NS = data not shown.
Figure 8.
Effect of polyethylene bagging incombination with a 500 ppm benomyltreatment on weight loss, eating qualityrating (on a scale of 1–9), total solublesolids (TTS), and fruit rot ratio of‘Java’ rambutan after storage for 14days at 8°C.
a
NS = data not shown.
Quality assurance in agricultural produce,edited by G.I. Johnson, Le Van To, Nguyen Duy Duc and M.C. Webb.
ACIAR Proceedings 100(printed version published in 2000)
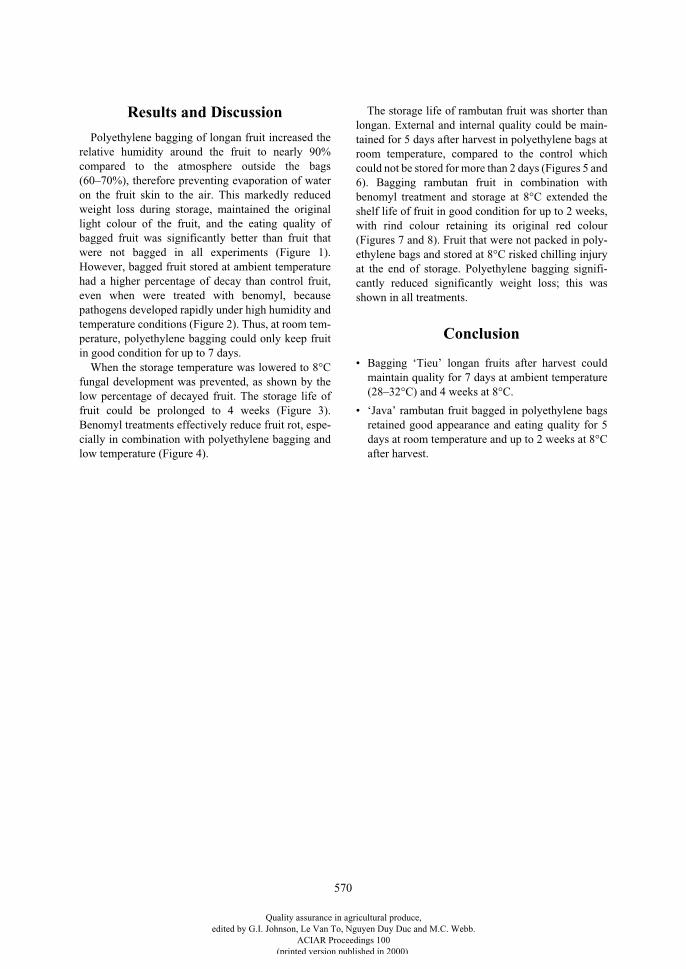
570
Results and Discussion
Polyethylene bagging of longan fruit increased therelative humidity around the fruit to nearly 90%compared to the atmosphere outside the bags(60–70%), therefore preventing evaporation of wateron the fruit skin to the air. This markedly reducedweight loss during storage, maintained the originallight colour of the fruit, and the eating quality ofbagged fruit was significantly better than fruit thatwere not bagged in all experiments (Figure 1).However, bagged fruit stored at ambient temperaturehad a higher percentage of decay than control fruit,even when were treated with benomyl, becausepathogens developed rapidly under high humidity andtemperature conditions (Figure 2). Thus, at room tem-perature, polyethylene bagging could only keep fruitin good condition for up to 7 days.
When the storage temperature was lowered to 8°Cfungal development was prevented, as shown by thelow percentage of decayed fruit. The storage life offruit could be prolonged to 4 weeks (Figure 3).Benomyl treatments effectively reduce fruit rot, espe-cially in combination with polyethylene bagging andlow temperature (Figure 4).
The storage life of rambutan fruit was shorter thanlongan. External and internal quality could be main-tained for 5 days after harvest in polyethylene bags atroom temperature, compared to the control whichcould not be stored for more than 2 days (Figures 5 and6). Bagging rambutan fruit in combination withbenomyl treatment and storage at 8°C extended theshelf life of fruit in good condition for up to 2 weeks,with rind colour retaining its original red colour(Figures 7 and 8). Fruit that were not packed in poly-ethylene bags and stored at 8°C risked chilling injuryat the end of storage. Polyethylene bagging signifi-cantly reduced significantly weight loss; this wasshown in all treatments.
Conclusion
• Bagging ‘Tieu’ longan fruits after harvest couldmaintain quality for 7 days at ambient temperature(28–32°C) and 4 weeks at 8°C.
• ‘Java’ rambutan fruit bagged in polyethylene bagsretained good appearance and eating quality for 5days at room temperature and up to 2 weeks at 8°Cafter harvest.
Quality assurance in agricultural produce,edited by G.I. Johnson, Le Van To, Nguyen Duy Duc and M.C. Webb.
ACIAR Proceedings 100(printed version published in 2000)
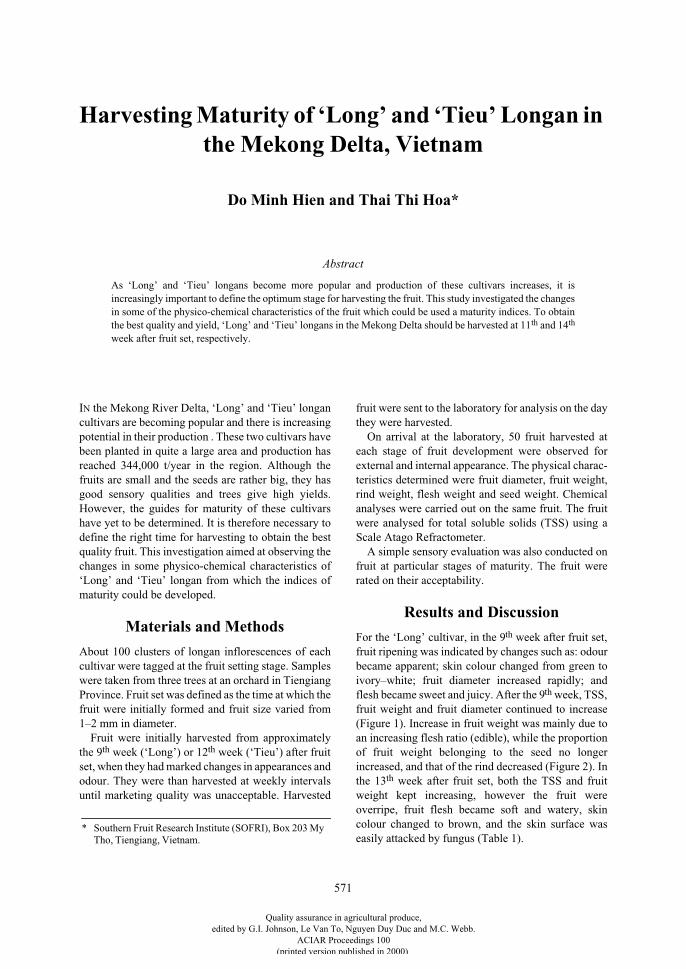
571
Harvesting Maturity of ‘Long’ and ‘Tieu’ Longan in the Mekong Delta, Vietnam
Do Minh Hien and Thai Thi Hoa*
Abstract
As ‘Long’ and ‘Tieu’ longans become more popular and production of these cultivars increases, it isincreasingly important to define the optimum stage for harvesting the fruit. This study investigated the changesin some of the physico-chemical characteristics of the fruit which could be used a maturity indices. To obtainthe best quality and yield, ‘Long’ and ‘Tieu’ longans in the Mekong Delta should be harvested at 11
th
and 14
th
week after fruit set, respectively.
I
N
the Mekong River Delta, ‘Long’ and ‘Tieu’ longancultivars are becoming popular and there is increasingpotential in their production . These two cultivars havebeen planted in quite a large area and production hasreached 344,000 t/year in the region. Although thefruits are small and the seeds are rather big, they hasgood sensory qualities and trees give high yields.However, the guides for maturity of these cultivarshave yet to be determined. It is therefore necessary todefine the right time for harvesting to obtain the bestquality fruit. This investigation aimed at observing thechanges in some physico-chemical characteristics of‘Long’ and ‘Tieu’ longan from which the indices ofmaturity could be developed.
Materials and Methods
About 100 clusters of longan inflorescences of eachcultivar were tagged at the fruit setting stage. Sampleswere taken from three trees at an orchard in TiengiangProvince. Fruit set was defined as the time at which thefruit were initially formed and fruit size varied from1–2 mm in diameter.
Fruit were initially harvested from approximatelythe 9
th
week (‘Long’) or 12
th
week (‘Tieu’) after fruitset, when they had marked changes in appearances andodour. They were than harvested at weekly intervalsuntil marketing quality was unacceptable. Harvested
fruit were sent to the laboratory for analysis on the daythey were harvested.
On arrival at the laboratory, 50 fruit harvested ateach stage of fruit development were observed forexternal and internal appearance. The physical charac-teristics determined were fruit diameter, fruit weight,rind weight, flesh weight and seed weight. Chemicalanalyses were carried out on the same fruit. The fruitwere analysed for total soluble solids (TSS) using aScale Atago Refractometer.
A simple sensory evaluation was also conducted onfruit at particular stages of maturity. The fruit wererated on their acceptability.
Results and Discussion
For the ‘Long’ cultivar, in the 9
th
week after fruit set,fruit ripening was indicated by changes such as: odourbecame apparent; skin colour changed from green toivory–white; fruit diameter increased rapidly; andflesh became sweet and juicy. After the 9
th
week, TSS,fruit weight and fruit diameter continued to increase(Figure 1). Increase in fruit weight was mainly due toan increasing flesh ratio (edible), while the proportionof fruit weight belonging to the seed no longerincreased, and that of the rind decreased (Figure 2). Inthe 13
th
week after fruit set, both the TSS and fruitweight kept increasing, however the fruit wereoverripe, fruit flesh became soft and watery, skincolour changed to brown, and the skin surface waseasily attacked by fungus (Table 1).
* Southern Fruit Research Institute (SOFRI), Box 203 My Tho, Tiengiang, Vietnam.
Quality assurance in agricultural produce,edited by G.I. Johnson, Le Van To, Nguyen Duy Duc and M.C. Webb.
ACIAR Proceedings 100(printed version published in 2000)
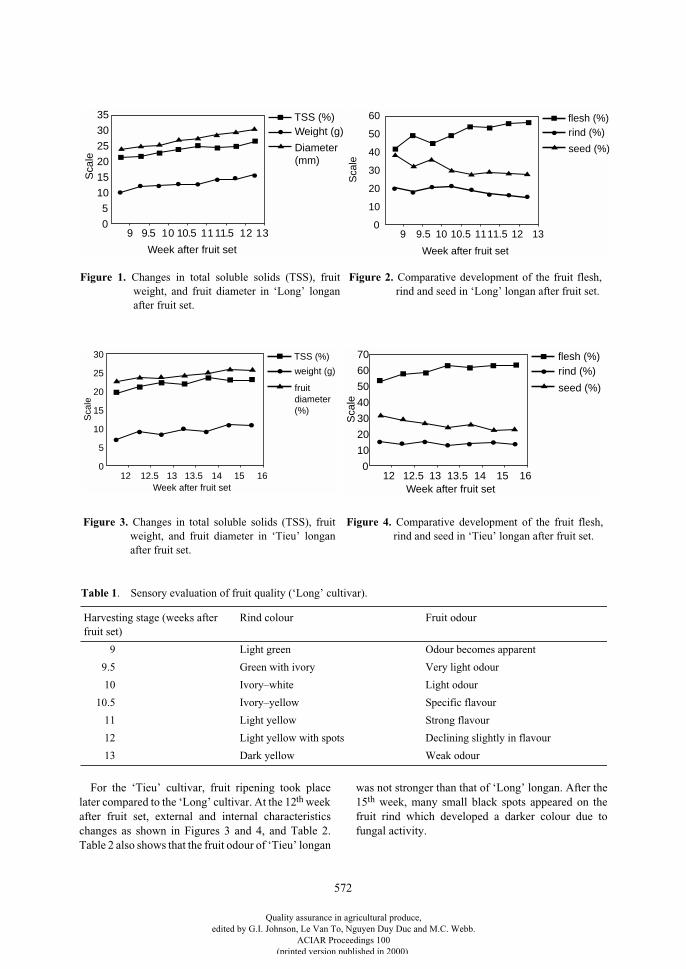
572
For the ‘Tieu’ cultivar, fruit ripening took placelater compared to the ‘Long’ cultivar. At the 12
th
weekafter fruit set, external and internal characteristicschanges as shown in Figures 3 and 4, and Table 2.Table 2 also shows that the fruit odour of ‘Tieu’ longan
was not stronger than that of ‘Long’ longan. After the15
th
week, many small black spots appeared on thefruit rind which developed a darker colour due tofungal activity.
9 9.5 10 10.5 11.511 12 130
5
10
15
20
25
30
35 TSS (%)Weight (g)
Diameter (mm)
Week after fruit set
Sca
le
Figure 1. Changes in total soluble solids (TSS), fruitweight, and fruit diameter in ‘Long’ longanafter fruit set.
Figure 2. Comparative development of the fruit flesh,rind and seed in ‘Long’ longan after fruit set.
Table 1. Sensory evaluation of fruit quality (‘Long’ cultivar).
Harvesting stage (weeks after fruit set)
Rind colour Fruit odour
9 Light green Odour becomes apparent
9.5 Green with ivory Very light odour
10 Ivory–white Light odour
10.5 Ivory–yellow Specific flavour
11 Light yellow Strong flavour
12 Light yellow with spots Declining slightly in flavour
13 Dark yellow Weak odour
Week after fruit set
9 9.5 10 10.5 11.511 12 130
10
20
30
40
50
60 flesh (%)rind (%)
seed (%)
Sca
le
Week after fruit set12 12.5 13 13.5 1514 16
0
5
10
15
20
25
30 TSS (%)
weight (g)
fruit diameter (%)
Sca
le
Week after fruit set12 12.5 13 13.5 1514 16
0
10
20
30
40
50
60
70 flesh (%)rind (%)
seed (%)
Sca
le
Figure 3. Changes in total soluble solids (TSS), fruitweight, and fruit diameter in ‘Tieu’ longanafter fruit set.
Figure 4. Comparative development of the fruit flesh,rind and seed in ‘Tieu’ longan after fruit set.
Quality assurance in agricultural produce,edited by G.I. Johnson, Le Van To, Nguyen Duy Duc and M.C. Webb.
ACIAR Proceedings 100(printed version published in 2000)
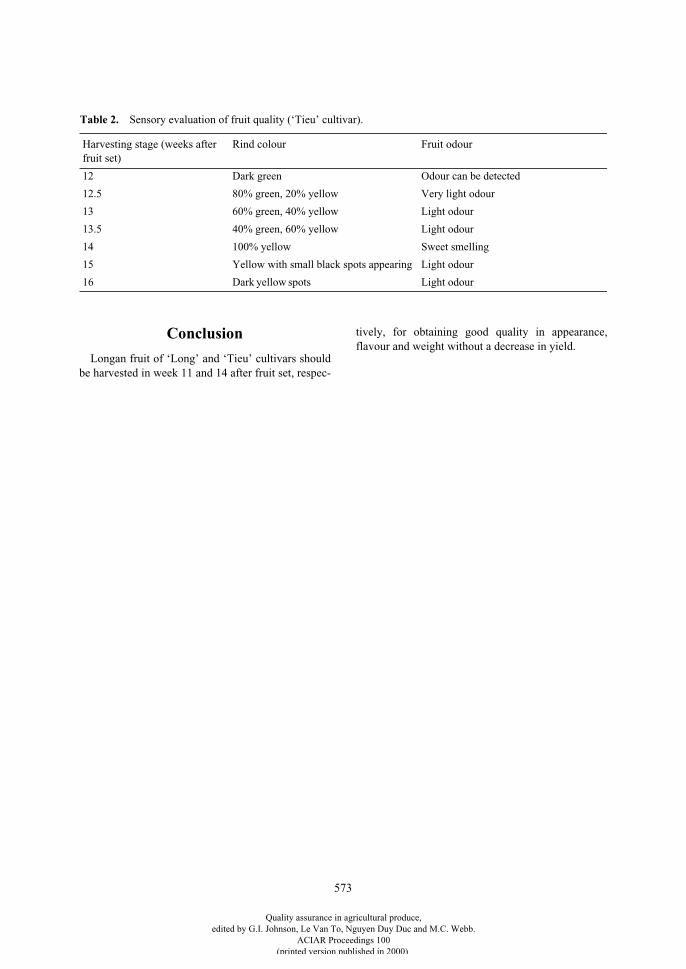
573
Conclusion
Longan fruit of ‘Long’ and ‘Tieu’ cultivars shouldbe harvested in week 11 and 14 after fruit set, respec-
tively, for obtaining good quality in appearance,flavour and weight without a decrease in yield.
Table 2. Sensory evaluation of fruit quality (‘Tieu’ cultivar).
Harvesting stage (weeks after fruit set)
Rind colour Fruit odour
12 Dark green Odour can be detected
12.5 80% green, 20% yellow Very light odour
13 60% green, 40% yellow Light odour
13.5 40% green, 60% yellow Light odour
14 100% yellow Sweet smelling
15 Yellow with small black spots appearing Light odour
16 Dark yellow spots Light odour
Quality assurance in agricultural produce,edited by G.I. Johnson, Le Van To, Nguyen Duy Duc and M.C. Webb.
ACIAR Proceedings 100(printed version published in 2000)
574
Enhancing Philippine Horticultural Postharvest Research, Development and Technology Transfer
through Networking, Demonstration andThesis Support Grants
R.P. Estigoy and A.E. Badua*
Abstract
The Republic of the Philippines is an archipelago of 7,100 islands. Being an archipelago has manydisadvantages in the conduct of research, development and technology transfer projects. Problems associatedwith this include: overlapping and duplication of research and development (R&D) agenda; uncoordinatedimplementation of R&D; and unsystematic, fragmented technology transfer projects.
The Bureau of Postharvest Research and Extension (BPRE; formerly NAPHIRE) under the Philippines’Department of Agriculture devised strategies to cope with these above-said problems. A generally unifiedpostharvest R&D agenda has been mapped out through the creation of the Philippine Postharvest R&Dnetwork, composed of 22 agencies.
Similarly, the transfer of research based-designs, technologies and information is facilitated through theTechnology Demonstration Project. This project aims to systematically disseminate research results inpostharvest horticulture and processing to the stakeholders through training, information campaigns anddemonstration activities at the Technology Demonstration Centers (TDCs). The Centers have become a venuefor hands-on learning opportunities in the latest postharvest technologies among smallholder entrepreneursbefore undertaking ventures related to postharvest business. Seven TDCs have been established in differentisland groups to cover commodities such as potato, mango, squash, carrot and some nuts which are consideredhigh value crops. The TDCs have bridged the gap between business and research.
Another mechanism to speed up the R&D process is the provision of thesis support grants to students whoare involved in postharvest research as a requirement for graduation in agricultural colleges and universities.Thesis support grants have already assisted 52 students enrolled in Bachelor of Science, Master of Science andDoctor of Philosophy from 1992–1998. Horticultural crops covered by the research projects include carrot,lemon, banana, papaya, mango, potato, cabbage, onion, and rose. These research results are a take-off point forfurther generation and development of postharvest technologies.
With these strategies, it is expected that scarce R&D resources are judiciously and efficiently used as a resultof coordinated, unified and systematic R&D and technology transfer programs.
Rationale
T
HE
postharvest sector forms a vital link between theproduction and eventual use of food. Because of this,efforts are being focused on postharvest research anddevelopment (R&D). The Philippines, being an archi-
pelago, faces many disadvantages in the conduct ofR&D and technology transfer. Added to this, severalinstitutions and agencies are involved in the conduct ofpostharvest R&D which has resulted in overlappingand duplication of R&D efforts as these efforts havenot been coordinated. This has resulted in wasteful andinefficient use of scarce resources. It has alsopromoted inefficient strategies for addressing thevarious ills of the postharvest sector. When researchresults are disseminated to end users the same
* Training and Extension Department, Bureau of Postharvest Research and Extension, CLSU Compound, Muñoz, Nueva Ecija, Philippines.
Quality assurance in agricultural produce,edited by G.I. Johnson, Le Van To, Nguyen Duy Duc and M.C. Webb.
ACIAR Proceedings 100(printed version published in 2000)
575
problems arise. Extension strategies are fragmentedand unsystematic, and this negates the gains of R&D.
The Bureau of Postharvest Research and Extension(BPRE) is mandated to spearhead the generation,application and extension of appropriate postharvesttechnologies for agricultural crops and other food andfeed commodities. Its aim is to minimise quantitativeand qualitative food losses in the production–postpro-duction chain.
To realise its mandate, it needs to devise schemes toaddress the above-mentioned problems. As such, theBureau created the Philippine Postharvest Researchand Development Collaborative Network (PhNet),and implemented the technology demonstrationproject and thesis support grants. This paper discussesthe features of each strategy.
The Philippine Postharvest Research and Development Collaborative
Network (PhNet)
Started in 1996, PhNet aims to institute a network thatcan address the various postharvest problems andthereby fast-track technology development and dis-semination. PhNet formulates and evaluates strategiesand plans to effectively implement and carry out theprograms, projects and activities on postharvesthandling and processing of strategic commercialcrops.
Organisation and management
A management committee (MANCOM) providesthe framework and formulates the policies, thrusts andstrategies of PhNet.
The Commodity Co-ordinating Committee formu-lates R&D plans for commodity concerns, evaluatesand recommends, monitors R&D activities on perish-ables, durables, industrial and root crops. A secretariatbased at BPRE was also created to backstop thesecommittees.
Terms of collaboration
A separate memorandum of agreement (MOA)defines the specific terms of collaboration whichinclude: the approval and effectiveness of the project;the manner and release of finances, obligation,appointments, cooperation, ownership; and utilisationof inventions, discoveries and improvements. Ingeneral, discoveries, technologies and information,
invention, and improvements that generated fromR&D are jointly owned by the collaborator and BPRE.
Status of PhNet activities
The commodity coordinating committees haveprepared their program frameworks on perishables,durables, industrial crops and root crops. PhNet tooktwo years to prepare the program frameworks andproject proposals are yet to be implemented.
Benefits of networking
Member agencies, specifically state college and uni-versities, are equipped with R&D facilities and haveongoing R&D work on postharvest topics. Likewise,there are existing experts on postharvest R&Dcovering a wide gamut of disciplines. Added to this,almost all R&D agencies have existing extensionprograms and facilities.
Research and development agencies
1. Bureau of Postharvest Research and Extension
2. Philippine Council for Agriculture Forestryand Natural Resources Research and TrainingCentre
3. Central Luzon State University
4. Benguet State University
5. Camarines Sur State Agricultural College
6. Western Luzon Agricultural College
7. Mariano Marcos State University
8. University of the Philippines at Los Baños
9. Philippine Rootcrops Research and TrainingCentre
10. Central Mindanao University
11. Visayas State College of Agriculture
12. Isabela State University
13. Northern Philippines Rootcrops Research andTraining Centre
14. University of Southeastern Philippines
15. Tarlac College of Agriculture
16. Don Severino Agricultural College
17. Fiber Industry Development Authority
18. Bureau of Agricultural Research
19. University of Southern Mindanao
20. Bureau of Plant Industry
21. State Polytechnic College of Palawan
22. Bicol University
Quality assurance in agricultural produce,edited by G.I. Johnson, Le Van To, Nguyen Duy Duc and M.C. Webb.
ACIAR Proceedings 100(printed version published in 2000)
576
Future project
A journal of R&D results in postharvest is targetedto be published to consolidate information for easyaccess and dissemination.
Establishment of Postharvest Demonstration Centres for High
Value Crops
These centres were established because of the hugepostharvest losses (40–50%) of high value crops.Fruits and vegetables require efficient postharvesthandling to reduce these losses. The centres provide asupport system to showcase existing technologies inpostharvest handling and processing of high valuecrops.
The centres serve as venues for technology transferusing micro, small-scale and village-level postharvestand processing equipment. They serve as an indispen-sable primary step towards encouraging and preparingsmallholder-entrepreneurs (SHEs) to engage in post-harvest and processing activities. Would-be investorscan gain exposure and expertise on value-addingactivities of horticultural produce. Consequently,these SHEs become more confident to engage in microor small-scale enterprise related to postharvest orprocessing of high value crops.
Objectives of the project
The overall objective of the project is to promote thecommercial use of improved postharvest processingtechnologies, facilities and equipment of selectedcommercial crops in order to increase income derivedfrom value-added processing operations and reducepostharvest losses.
Specifically, the project aims to:
1. Accelerate the utilisation of postharvest andprocessing technologies for high value cropsamong various stakeholders, especially small-holder-entrepreneurs.
2. Encourage the participation of various stake-holders, especially smallholder-entrepreneurs,in the postharvest and processing operations ofhigh value crops.
3. Provide equitable access and opportunities tovarious stakeholders, especially smallholder-entrepreneurs to communication systems, andtraining, technical and support services.
4. Provide an opportunity for the local gov-ernment units (LGUs) to generate additionalincome through the provision of customservicing and/or rental of the TechnologyDemonstration Center (TDC) equipment/facil-ities to their interested constituents.
5. Document the processes and effects of tech-nology utilisation in the local community.
6. Provide an opportunity for developed post-harvest technology to be demonstrated forpossible commercial utilisation.
7. The TDC serves as ‘one-stop-information-shop’ for stakeholders involved in the com-modity.
Project description
The Technology Demonstration Center (TDC)Project for High Value Crops (Postharvest) showcasesmore efficient and effective technologies that alreadyexist but which have not been sufficiently promotedand/or others that have been recently developed byresearch on postharvest handling and processing ofcommercial crops. This includes the postharvest andcommercial processing of white potato, cashew,mango, squash, carrot, pili nut and other crops. A totalof seven TDCs have been established nationwide.Commercial-scale models of different postharvesthandling and processing facilities/equipment of highvalue commercial crops are installed to provide first-hand familiarisation for farmers on such technologiesand processes.
Generally the TDCs’ main function is to serve ashands-on laboratories for the training of smallholder-entrepreneurs, such as farmers, housewives, busi-nessmen, processors, and other parties interested in theprocessing of their produce. General and specialisedtraining courses on postharvest technology andprocessing are conducted in the centres. TDCsfunction as channels for the spread of new livelihoodopportunities for farm households and develop inter-action among farmers and government officials. Theyalso serve as ‘one-stop-information-shops’ for thecommodity concerned. Farmer-growers, entrepre-neurs and other stakeholders who need training andinformation can avail themselves of these services.
In addition, The TDC is envisioned to be operatedby the local government unit (LGU). Thus, during thetimes that these facilities are not used for training, theLGU can operate the TDC to provide custom serviceson postharvest and processing to its various clients.Furthermore, the LGU can rent/lease the facilities to
Quality assurance in agricultural produce,edited by G.I. Johnson, Le Van To, Nguyen Duy Duc and M.C. Webb.
ACIAR Proceedings 100(printed version published in 2000)
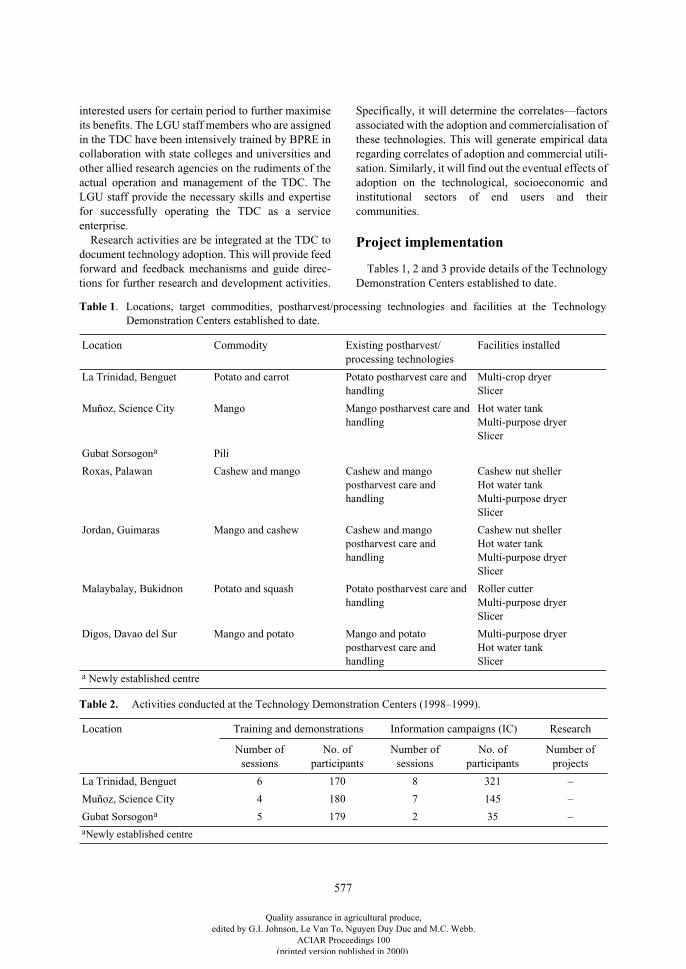
577
interested users for certain period to further maximiseits benefits. The LGU staff members who are assignedin the TDC have been intensively trained by BPRE incollaboration with state colleges and universities andother allied research agencies on the rudiments of theactual operation and management of the TDC. TheLGU staff provide the necessary skills and expertisefor successfully operating the TDC as a serviceenterprise.
Research activities are be integrated at the TDC todocument technology adoption. This will provide feedforward and feedback mechanisms and guide direc-tions for further research and development activities.
Specifically, it will determine the correlates—factorsassociated with the adoption and commercialisation ofthese technologies. This will generate empirical dataregarding correlates of adoption and commercial utili-sation. Similarly, it will find out the eventual effects ofadoption on the technological, socioeconomic andinstitutional sectors of end users and theircommunities.
Project implementation
Tables 1, 2 and 3 provide details of the TechnologyDemonstration Centers established to date.
Table 1
. Locations, target commodities, postharvest/processing technologies and facilities at the TechnologyDemonstration Centers established to date.
Location Commodity Existing postharvest/ processing technologies
Facilities installed
La Trinidad, Benguet Potato and carrot Potato postharvest care and handling
Multi-crop dryerSlicer
Muñoz, Science City Mango Mango postharvest care and handling
Hot water tankMulti-purpose dryerSlicer
Gubat Sorsogon
a
Pili
Roxas, Palawan Cashew and mango Cashew and mango postharvest care and handling
Cashew nut shellerHot water tankMulti-purpose dryerSlicer
Jordan, Guimaras Mango and cashew Cashew and mango postharvest care and handling
Cashew nut shellerHot water tankMulti-purpose dryerSlicer
Malaybalay, Bukidnon Potato and squash Potato postharvest care and handling
Roller cutterMulti-purpose dryerSlicer
Digos, Davao del Sur Mango and potato Mango and potato postharvest care and handling
Multi-purpose dryerHot water tankSlicer
a
Newly established centre
Table 2.
Activities conducted at the Technology Demonstration Centers (1998–1999).
Location Training and demonstrations Information campaigns (IC) Research
Number of sessions
No. of participants
Number of sessions
No. of participants
Number of projects
La Trinidad, Benguet 6 170 8 321 –
Muñoz, Science City 4 180 7 145 –
Gubat Sorsogon
a
5 179 2 35 –
a
Newly established centre
Quality assurance in agricultural produce,edited by G.I. Johnson, Le Van To, Nguyen Duy Duc and M.C. Webb.
ACIAR Proceedings 100(printed version published in 2000)
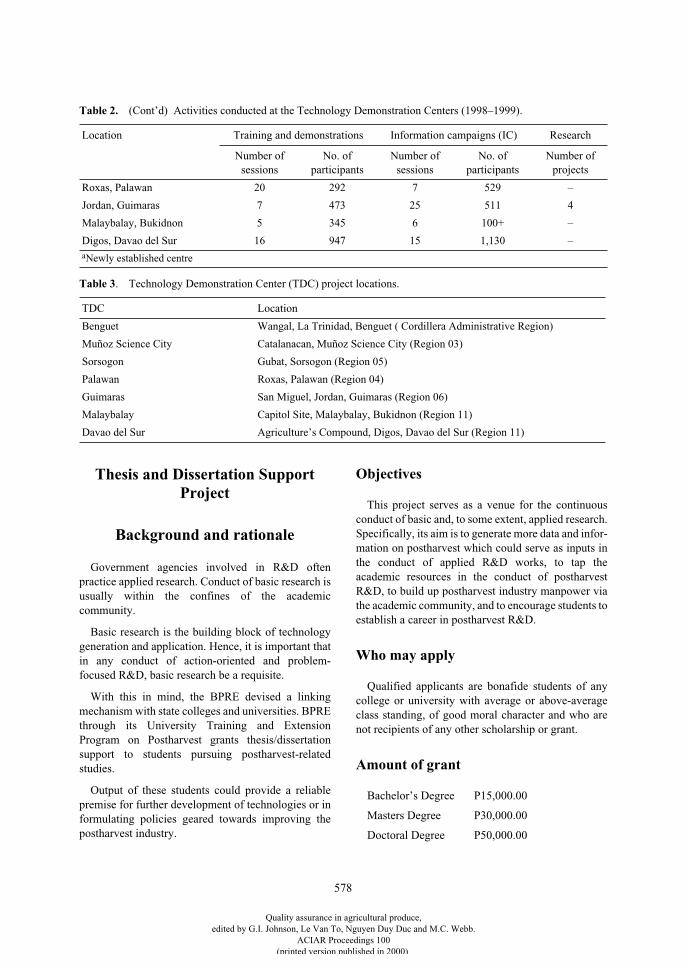
578
Thesis and Dissertation Support Project
Background and rationale
Government agencies involved in R&D oftenpractice applied research. Conduct of basic research isusually within the confines of the academiccommunity.
Basic research is the building block of technologygeneration and application. Hence, it is important thatin any conduct of action-oriented and problem-focused R&D, basic research be a requisite.
With this in mind, the BPRE devised a linkingmechanism with state colleges and universities. BPREthrough its University Training and ExtensionProgram on Postharvest grants thesis/dissertationsupport to students pursuing postharvest-relatedstudies.
Output of these students could provide a reliablepremise for further development of technologies or informulating policies geared towards improving thepostharvest industry.
Objectives
This project serves as a venue for the continuousconduct of basic and, to some extent, applied research.Specifically, its aim is to generate more data and infor-mation on postharvest which could serve as inputs inthe conduct of applied R&D works, to tap theacademic resources in the conduct of postharvestR&D, to build up postharvest industry manpower viathe academic community, and to encourage students toestablish a career in postharvest R&D.
Who may apply
Qualified applicants are bonafide students of anycollege or university with average or above-averageclass standing, of good moral character and who arenot recipients of any other scholarship or grant.
Amount of grant
Bachelor’s Degree P15,000.00
Masters Degree P30,000.00
Doctoral Degree P50,000.00
Roxas, Palawan 20 292 7 529 –
Jordan, Guimaras 7 473 25 511 4
Malaybalay, Bukidnon 5 345 6 100+ –
Digos, Davao del Sur 16 947 15 1,130 –
Table 3
. Technology Demonstration Center (TDC) project locations.
TDC Location
Benguet Wangal, La Trinidad, Benguet ( Cordillera Administrative Region)
Muñoz Science City Catalanacan, Muñoz Science City (Region 03)
Sorsogon Gubat, Sorsogon (Region 05)
Palawan Roxas, Palawan (Region 04)
Guimaras San Miguel, Jordan, Guimaras (Region 06)
Malaybalay Capitol Site, Malaybalay, Bukidnon (Region 11)
Davao del Sur Agriculture’s Compound, Digos, Davao del Sur (Region 11)
Table 2.
(Cont’d) Activities conducted at the Technology Demonstration Centers (1998–1999).
Location Training and demonstrations Information campaigns (IC) Research
Number of sessions
No. of participants
Number of sessions
No. of participants
Number of projects
a
Newly established centre
Quality assurance in agricultural produce,edited by G.I. Johnson, Le Van To, Nguyen Duy Duc and M.C. Webb.
ACIAR Proceedings 100(printed version published in 2000)
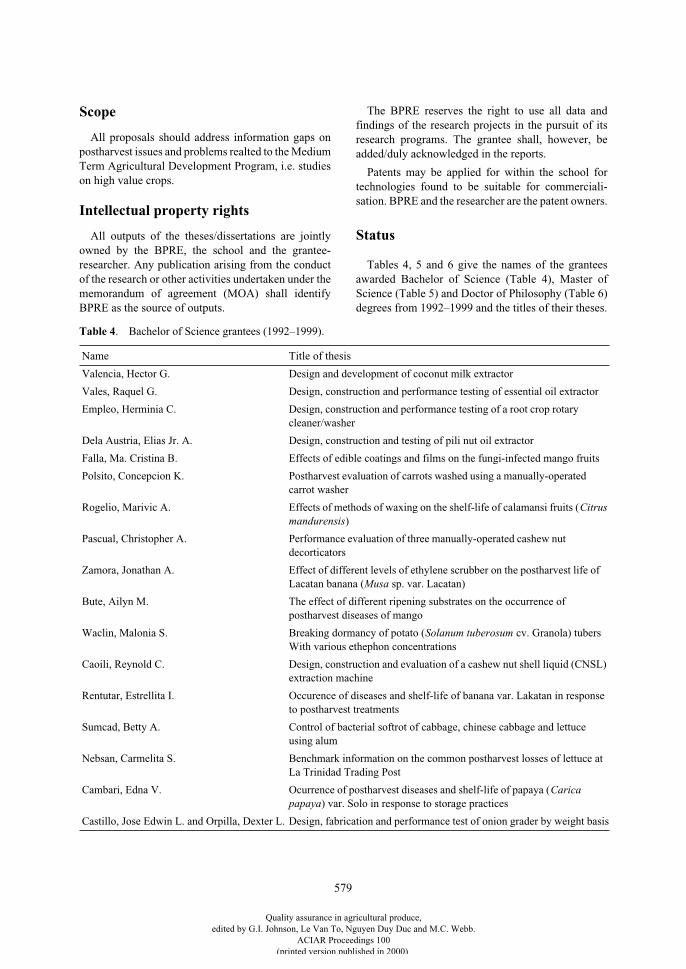
579
Scope
All proposals should address information gaps onpostharvest issues and problems realted to the MediumTerm Agricultural Development Program, i.e. studieson high value crops.
Intellectual property rights
All outputs of the theses/dissertations are jointlyowned by the BPRE, the school and the grantee-researcher. Any publication arising from the conductof the research or other activities undertaken under thememorandum of agreement (MOA) shall identifyBPRE as the source of outputs.
The BPRE reserves the right to use all data andfindings of the research projects in the pursuit of itsresearch programs. The grantee shall, however, beadded/duly acknowledged in the reports.
Patents may be applied for within the school fortechnologies found to be suitable for commerciali-sation. BPRE and the researcher are the patent owners.
Status
Tables 4, 5 and 6 give the names of the granteesawarded Bachelor of Science (Table 4), Master ofScience (Table 5) and Doctor of Philosophy (Table 6)degrees from 1992–1999 and the titles of their theses.
Table 4
. Bachelor of Science grantees (1992–1999).
Name Title of thesis
Valencia, Hector G. Design and development of coconut milk extractor
Vales, Raquel G. Design, construction and performance testing of essential oil extractor
Empleo, Herminia C. Design, construction and performance testing of a root crop rotary cleaner/washer
Dela Austria, Elias Jr. A. Design, construction and testing of pili nut oil extractor
Falla, Ma. Cristina B. Effects of edible coatings and films on the fungi-infected mango fruits
Polsito, Concepcion K. Postharvest evaluation of carrots washed using a manually-operated carrot washer
Rogelio, Marivic A. Effects of methods of waxing on the shelf-life of calamansi fruits (
Citrus mandurensis
)
Pascual, Christopher A. Performance evaluation of three manually-operated cashew nut decorticators
Zamora, Jonathan A. Effect of different levels of ethylene scrubber on the postharvest life of Lacatan banana (
Musa
sp. var. Lacatan)
Bute, Ailyn M. The effect of different ripening substrates on the occurrence of postharvest diseases of mango
Waclin, Malonia S. Breaking dormancy of potato (
Solanum tuberosum
cv. Granola) tubers With various ethephon concentrations
Caoili, Reynold C. Design, construction and evaluation of a cashew nut shell liquid (CNSL) extraction machine
Rentutar, Estrellita I. Occurence of diseases and shelf-life of banana var. Lakatan in response to postharvest treatments
Sumcad, Betty A. Control of bacterial softrot of cabbage, chinese cabbage and lettuce using alum
Nebsan, Carmelita S. Benchmark information on the common postharvest losses of lettuce at La Trinidad Trading Post
Cambari, Edna V. Ocurrence of postharvest diseases and shelf-life of papaya (
Carica papaya
) var. Solo in response to storage practices
Castillo, Jose Edwin L. and Orpilla, Dexter L. Design, fabrication and performance test of onion grader by weight basis
Quality assurance in agricultural produce,edited by G.I. Johnson, Le Van To, Nguyen Duy Duc and M.C. Webb.
ACIAR Proceedings 100(printed version published in 2000)
580
Ladiao, Jaime Z. and Tuates, Andres Jr. M. Modification, fabrication and performance test of an onion grader by size
Dapat, Joy Ruth D. Shelf-life quality of roses (Rosaceae spp.) in response to postharvest treatments, packaging and storage conditions
Ramos, Chyrel A. Longevity and quality of gladiolus (
Gladiolus grandiflorus
L.) var. Carqueranni cutflower in response to postharvest treatments and polyethylene sleeve
Barra, Elvie G. Fungal incidence in stored pili kernels treated with tuba seed
Mira, Wilfredo B. Identification of postharvest insect pests in pili
Abonado, Jeunah B. Knowledge gained on Burong Mangga preparation messages communicated via Teknogiya by some housewives in Brgy. Rizal, Bansalan, Davao Del Sur
Cartagena, Luz A. Knowledge gained from multi-lingual leaflet disseminating banana flour making technology among Maguindanaoans in Malamote, Matalam, Cotabato
Hora, Mariedith C. Knowledge gained on mango puree preparation messages communicated via bilingual leaflet by mango growers in Sangat, Mlang, Cotabato
Dela Cruz, Arminda E. Development of a technology package for the postharvest handling of peanut in prevention of aflatoxin contamination
Cervantes, Honeylee Faith C. Moisture sorption properties of selected seedboard-approved Philippine variety peanuts
Table 4
. (Cont’d) Bachelor of Science grantees (1992–1999).
Name Title of thesis
Table 5.
Master of Science grantees (1992–1999).
Name Title of thesis
Calica, Helen R. Postproduction practices and training needs of cashew farmers in San Marcelino, Zambales and Limay, Bataan
Capariño, Ofero A. Mango powder production by freeze drying process
Tolentino, Genaro M. Effect of pre-conditioning treatments and degree of dryness on the extraction and quality of cashew kernel
Mohammad Yamin Sprout and rotting inhibition of onion through MH-30 application, curing, bagging and cold storage
Velilla, Allan D. Ethylene production and pectic enzyme activity in papaya (
Carica papaya
L. cv. ‘Solo’) fruit infected by
Lasiodiplodia theobromae
(Pat) Griff. and Maubl.
Marañon, Ramon P. The effect of location and harvest season on the histo-physiological characteristic of Guimaras grown mango
Artes, Leonisa A. Role of CO
2
, O
2
and C
2
H
4
in the development of ripening disorders in ‘Saba’ banana
Quality assurance in agricultural produce,edited by G.I. Johnson, Le Van To, Nguyen Duy Duc and M.C. Webb.
ACIAR Proceedings 100(printed version published in 2000)
581
Conclusion
With these strategies, it is expected that scarce R&Dresources will be judiciously and efficiently used as aresult of coordinated, unified and systematic R&D andtechnology transfer programs.
Table 6.
Doctor of Philosophy grantees (1992–1999).
Name Title of thesis
Roldan, Marissa B. Anatomical and biochemical mechanism of tissue hardening in heat-treated ‘Solo’ papaya (
Carica papaya
L.) fruits
Dela Cruz, Anselmo Q. Astringency removal in cashew (
Anacardium occidentale
L.) apple treated with carbon dioxide and ethanol
Anterola, Marrietta G. An exploratory study of gender participation in selected mango postharvest activities on Region III
Abon, Carlos Jr. Production and postharvest activities on soybean
Amestoso, Felix J. Single screw extrusion processing of sweet potato flour into artificial grains for snacks
Mpayamaguru, Josue Correlates to soybean processing technology adoption for utilisation in human diet in selected towns of Nueva Ecija
Quality assurance in agricultural produce,edited by G.I. Johnson, Le Van To, Nguyen Duy Duc and M.C. Webb.
ACIAR Proceedings 100(printed version published in 2000)
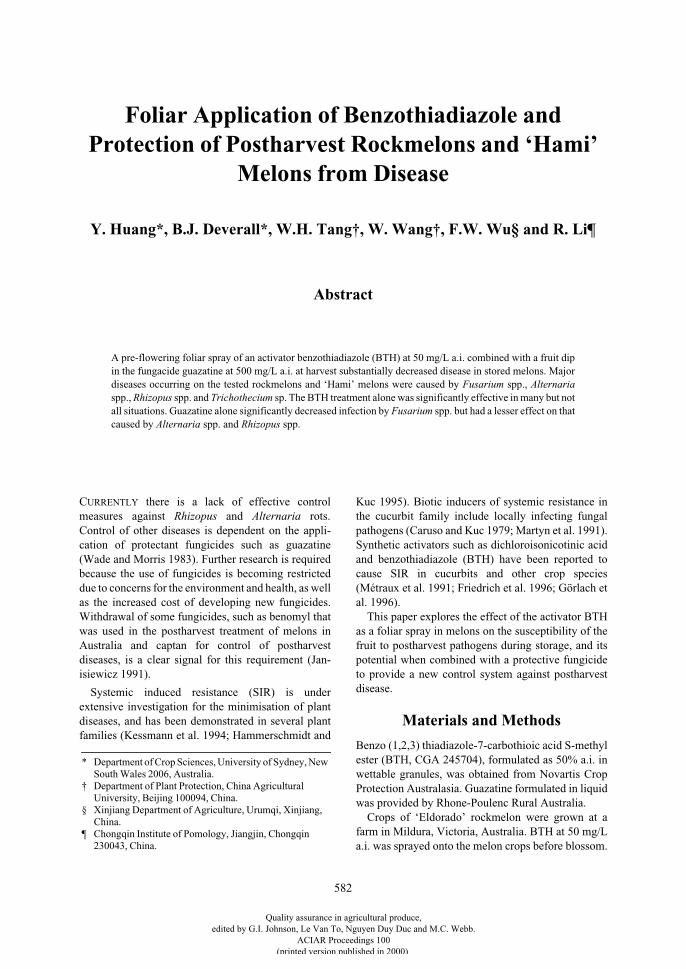
582
Foliar Application of Benzothiadiazole and Protection of Postharvest Rockmelons and ‘Hami’
Melons from Disease
Y. Huang*, B.J. Deverall*, W.H. Tang†, W. Wang†, F.W. Wu§ and R. Li¶
Abstract
A pre-flowering foliar spray of an activator benzothiadiazole (BTH) at 50 mg/L a.i. combined with a fruit dipin the fungacide guazatine at 500 mg/L a.i. at harvest substantially decreased disease in stored melons. Majordiseases occurring on the tested rockmelons and ‘Hami’ melons were caused by
Fusarium
spp.,
Alternaria
spp.,
Rhizopus
spp. and
Trichothecium
sp. The BTH treatment alone was significantly effective in many but notall situations. Guazatine alone significantly decreased infection by
Fusarium
spp. but had a lesser effect on thatcaused by Alternaria spp. and Rhizopus spp.
C
URRENTLY
there is a lack of effective controlmeasures against
Rhizopus
and
Alternaria
rots.Control of other diseases is dependent on the appli-cation of protectant fungicides such as guazatine(Wade and Morris 1983). Further research is requiredbecause the use of fungicides is becoming restricteddue to concerns for the environment and health, as wellas the increased cost of developing new fungicides.Withdrawal of some fungicides, such as benomyl thatwas used in the postharvest treatment of melons inAustralia and captan for control of postharvestdiseases, is a clear signal for this requirement (Jan-isiewicz 1991).
Systemic induced resistance (SIR) is underextensive investigation for the minimisation of plantdiseases, and has been demonstrated in several plantfamilies (Kessmann et al. 1994; Hammerschmidt and
Kuc 1995). Biotic inducers of systemic resistance inthe cucurbit family include locally infecting fungalpathogens (Caruso and Kuc 1979; Martyn et al. 1991).Synthetic activators such as dichloroisonicotinic acidand benzothiadiazole (BTH) have been reported tocause SIR in cucurbits and other crop species(Métraux et al. 1991; Friedrich et al. 1996; Görlach etal. 1996).
This paper explores the effect of the activator BTHas a foliar spray in melons on the susceptibility of thefruit to postharvest pathogens during storage, and itspotential when combined with a protective fungicideto provide a new control system against postharvestdisease.
Materials and Methods
Benzo (1,2,3) thiadiazole-7-carbothioic acid S-methylester (BTH, CGA 245704), formulated as 50% a.i. inwettable granules, was obtained from Novartis CropProtection Australasia. Guazatine formulated in liquidwas provided by Rhone-Poulenc Rural Australia.
Crops of ‘Eldorado’ rockmelon were grown at afarm in Mildura, Victoria, Australia. BTH at 50 mg/La.i. was sprayed onto the melon crops before blossom.
* Department of Crop Sciences, University of Sydney, New South Wales 2006, Australia.
† Department of Plant Protection, China Agricultural University, Beijing 100094, China.
§ Xinjiang Department of Agriculture, Urumqi, Xinjiang, China.
¶ Chongqin Institute of Pomology, Jiangjin, Chongqin 230043, China.
Quality assurance in agricultural produce,edited by G.I. Johnson, Le Van To, Nguyen Duy Duc and M.C. Webb.
ACIAR Proceedings 100(printed version published in 2000)
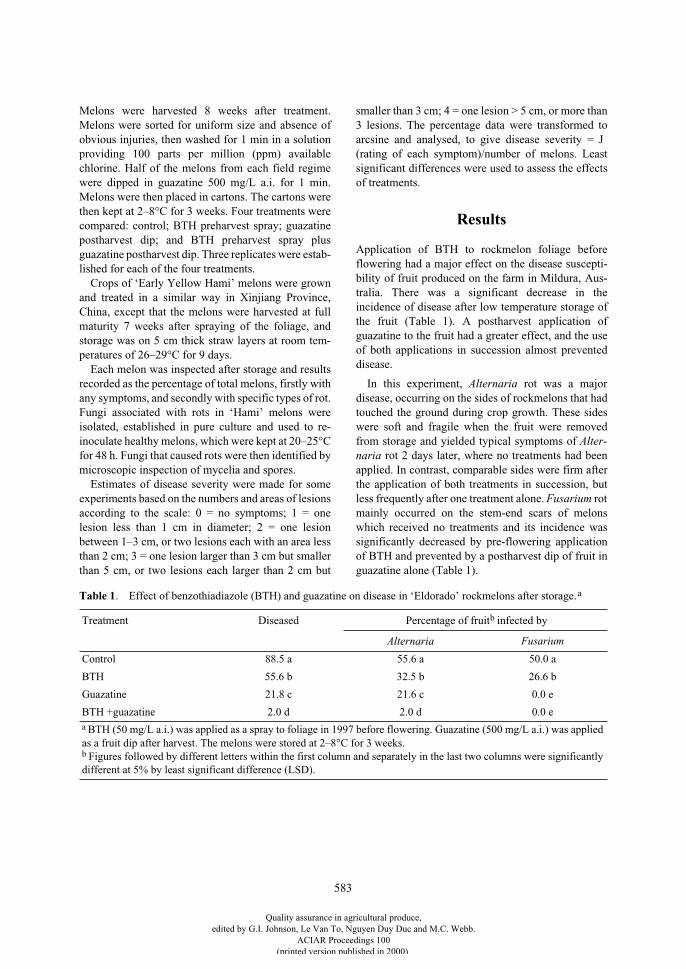
583
Melons were harvested 8 weeks after treatment.Melons were sorted for uniform size and absence ofobvious injuries, then washed for 1 min in a solutionproviding 100 parts per million (ppm) availablechlorine. Half of the melons from each field regimewere dipped in guazatine 500 mg/L a.i. for 1 min.Melons were then placed in cartons. The cartons werethen kept at 2–8°C for 3 weeks. Four treatments werecompared: control; BTH preharvest spray; guazatinepostharvest dip; and BTH preharvest spray plusguazatine postharvest dip. Three replicates were estab-lished for each of the four treatments.
Crops of ‘Early Yellow Hami’ melons were grownand treated in a similar way in Xinjiang Province,China, except that the melons were harvested at fullmaturity 7 weeks after spraying of the foliage, andstorage was on 5 cm thick straw layers at room tem-peratures of 26–29°C for 9 days.
Each melon was inspected after storage and resultsrecorded as the percentage of total melons, firstly withany symptoms, and secondly with specific types of rot.Fungi associated with rots in ‘Hami’ melons wereisolated, established in pure culture and used to re-inoculate healthy melons, which were kept at 20–25°Cfor 48 h. Fungi that caused rots were then identified bymicroscopic inspection of mycelia and spores.
Estimates of disease severity were made for someexperiments based on the numbers and areas of lesionsaccording to the scale: 0 = no symptoms; 1 = onelesion less than 1 cm in diameter; 2 = one lesionbetween 1–3 cm, or two lesions each with an area lessthan 2 cm; 3 = one lesion larger than 3 cm but smallerthan 5 cm, or two lesions each larger than 2 cm but
smaller than 3 cm; 4 = one lesion > 5 cm, or more than3 lesions. The percentage data were transformed toarcsine and analysed, to give disease severity =
J
(rating of each symptom)/number of melons. Leastsignificant differences were used to assess the effectsof treatments.
Results
Application of BTH to rockmelon foliage beforeflowering had a major effect on the disease suscepti-bility of fruit produced on the farm in Mildura, Aus-tralia. There was a significant decrease in theincidence of disease after low temperature storage ofthe fruit (Table 1). A postharvest application ofguazatine to the fruit had a greater effect, and the useof both applications in succession almost preventeddisease.
In this experiment,
Alternaria
rot was a majordisease, occurring on the sides of rockmelons that hadtouched the ground during crop growth. These sideswere soft and fragile when the fruit were removedfrom storage and yielded typical symptoms of
Alter-naria
rot 2 days later, where no treatments had beenapplied. In contrast, comparable sides were firm afterthe application of both treatments in succession, butless frequently after one treatment alone.
Fusarium
rotmainly occurred on the stem-end scars of melonswhich received no treatments and its incidence wassignificantly decreased by pre-flowering applicationof BTH and prevented by a postharvest dip of fruit inguazatine alone (Table 1).
Table 1
. Effect of benzothiadiazole (BTH) and guazatine on disease in ‘Eldorado’ rockmelons after storage.
a
Treatment Diseased Percentage of fruit
b
infected by
Alternaria
Fusarium
Control 88.5 a 55.6 a 50.0 a
BTH 55.6 b 32.5 b 26.6 b
Guazatine 21.8 c 21.6 c 0.0 e
BTH +guazatine 2.0 d 2.0 d 0.0 e
a
BTH (50 mg/L a.i.) was applied as a spray to foliage in 1997 before flowering. Guazatine (500 mg/L a.i.) was applied as a fruit dip after harvest. The melons were stored at 2–8°C for 3 weeks.
b
Figures followed by different letters within the first column and separately in the last two columns were significantly different at 5% by least significant difference (LSD).
Quality assurance in agricultural produce,edited by G.I. Johnson, Le Van To, Nguyen Duy Duc and M.C. Webb.
ACIAR Proceedings 100(printed version published in 2000)
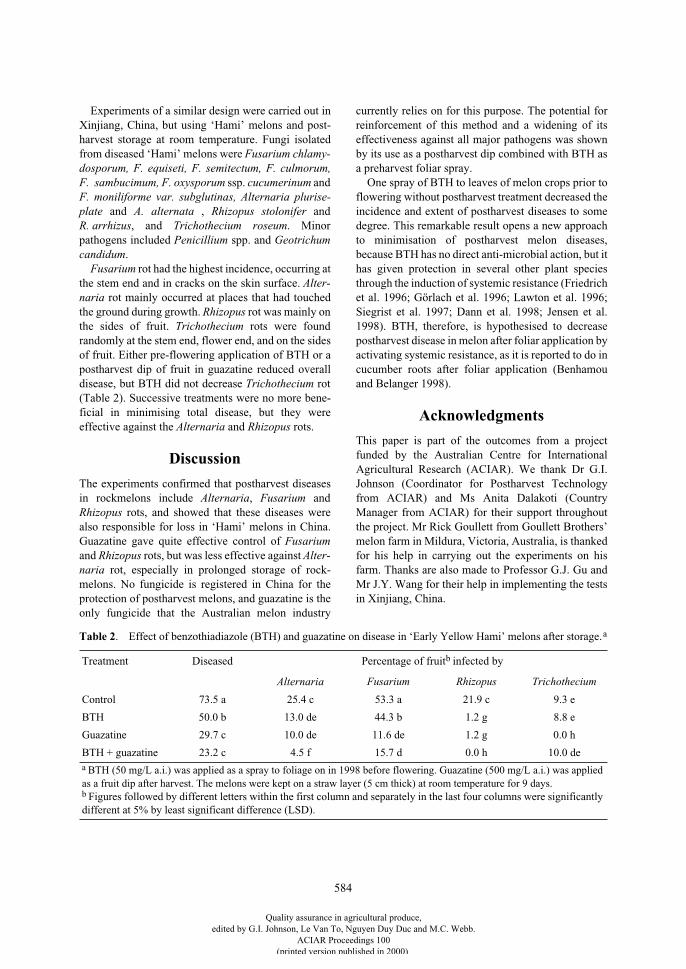
584
Experiments of a similar design were carried out inXinjiang, China, but using ‘Hami’ melons and post-harvest storage at room temperature. Fungi isolatedfrom diseased ‘Hami’ melons were
Fusarium chlamy-dosporum, F. equiseti, F. semitectum, F. culmorum,F. sambucimum, F. oxysporum
ssp.
cucumerinum
and
F. moniliforme var. subglutinas, Alternaria plurise-plate
and
A. alternata
,
Rhizopus
stolonifer
and
R. arrhizus
, and
Trichothecium roseum
. Minorpathogens included
Penicillium
spp. and
Geotrichumcandidum
.
Fusarium
rot had the highest incidence, occurring atthe stem end and in cracks on the skin surface.
Alter-naria
rot mainly occurred at places that had touchedthe ground during growth.
Rhizopus
rot was mainly onthe sides of fruit.
Trichothecium
rots were foundrandomly at the stem end, flower end, and on the sidesof fruit. Either pre-flowering application of BTH or apostharvest dip of fruit in guazatine reduced overalldisease, but BTH did not decrease
Trichothecium
rot(Table 2). Successive treatments were no more bene-ficial in minimising total disease, but they wereeffective against the
Alternaria
and
Rhizopus
rots.
Discussion
The experiments confirmed that postharvest diseasesin rockmelons include
Alternaria
,
Fusarium
and
Rhizopus
rots, and showed that these diseases werealso responsible for loss in ‘Hami’ melons in China.Guazatine gave quite effective control of
Fusarium
and
Rhizopus
rots, but was less effective against
Alter-naria
rot, especially in prolonged storage of rock-melons. No fungicide is registered in China for theprotection of postharvest melons, and guazatine is theonly fungicide that the Australian melon industry
currently relies on for this purpose. The potential forreinforcement of this method and a widening of itseffectiveness against all major pathogens was shownby its use as a postharvest dip combined with BTH asa preharvest foliar spray.
One spray of BTH to leaves of melon crops prior toflowering without postharvest treatment decreased theincidence and extent of postharvest diseases to somedegree. This remarkable result opens a new approachto minimisation of postharvest melon diseases,because BTH has no direct anti-microbial action, but ithas given protection in several other plant speciesthrough the induction of systemic resistance (Friedrichet al. 1996; Görlach et al. 1996; Lawton et al. 1996;Siegrist et al. 1997; Dann et al. 1998; Jensen et al.1998). BTH, therefore, is hypothesised to decreasepostharvest disease in melon after foliar application byactivating systemic resistance, as it is reported to do incucumber roots after foliar application (Benhamouand Belanger 1998).
Acknowledgments
This paper is part of the outcomes from a projectfunded by the Australian Centre for InternationalAgricultural Research (ACIAR). We thank Dr G.I.Johnson (Coordinator for Postharvest Technologyfrom ACIAR) and Ms Anita Dalakoti (CountryManager from ACIAR) for their support throughoutthe project. Mr Rick Goullett from Goullett Brothers’melon farm in Mildura, Victoria, Australia, is thankedfor his help in carrying out the experiments on hisfarm. Thanks are also made to Professor G.J. Gu andMr J.Y. Wang for their help in implementing the testsin Xinjiang, China.
Table 2
. Effect of benzothiadiazole (BTH) and guazatine on disease in ‘Early Yellow Hami’ melons after storage.
a
Treatment Diseased Percentage of fruit
b
infected by
Alternaria
Fusarium Rhizopus Trichothecium
Control 73.5 a 25.4 c 53.3 a 21.9 c 9.3 e
BTH 50.0 b 13.0 de 44.3 b 1.2 g 8.8 e
Guazatine 29.7 c 10.0 de 11.6 de 1.2 g 0.0 h
BTH + guazatine 23.2 c 4.5 f 15.7 d 0.0 h 10.0 de
a
BTH (50 mg/L a.i.) was applied as a spray to foliage on in 1998 before flowering. Guazatine (500 mg/L a.i.) was applied as a fruit dip after harvest. The melons were kept on a straw layer (5 cm thick) at room temperature for 9 days.
b
Figures followed by different letters within the first column and separately in the last four columns were significantly different at 5% by least significant difference (LSD).
Quality assurance in agricultural produce,edited by G.I. Johnson, Le Van To, Nguyen Duy Duc and M.C. Webb.
ACIAR Proceedings 100(printed version published in 2000)
585
References
Benhamou, N. and Belanger, R.R. 1998. Induction ofsystemic resistance to
Pythium
damping-off in cucumberplants by benzothiadiazole: ultrastructure andcytochemistry of the host response. The Plant Journal, 14,13–21.
Caruso, F.L. and Kuc, J. 1979. Induced resistance ofcucumber to anthracnose and angular leaf spot by
Pseudomonas lachrymans
and
Collectotrichumlagenarium
. Physiology Plant Pathology, 14, 191–201.Dann, E., Diers, B., Byrum, J. and Hammerschmidt, R.
1998. Effect of treating soybean with 2,6-dichloroisonic-otinic acid (INA) and benzothiadiazole (BTH) on seedyields and the level of disease caused by Sclerotiniasclerotiorum in field and greenhouse studies. EuropeanJournal of Plant Pathology, 104, 271–278.
Friedrich, L., Lawton, K., Ruess, W., Masner, P., Specker,N., Gut Rella, M., Meiers, B., Dincher, S., Staub, T.,Uknes, S., Metraux, J.-P., Kessmann, H. and Ryals, J.1996. A benzothiadiazole derivative induces systemicacquired resistance in tobacco. The Plant Journal, 10,61–70.
Görlach, J., Volrath, S., Knauf-Beiter, G., Hengy, G.,Beckhove, U., Kogel, K.H., Oostendorp, M., Staub, T.,Ward, E., Kessmann, H. and Ryals, J. 1996. Benzothiadi-azole, a novel class of inducers of systemic acquiredresistance, activates gene expression and diseaseresistance in wheat. Plant Cell, 8, 629–643.
Hammerschmidt, R. and Kuc, J. (ed.) 1995. Inducedresistance to disease in plants. Amsterdam, KluwerAcademic Publishers.
Janisiewicz, W.J. 1991 Control of postharvest diseases offruit with biocontrol agents. In: Bay-Petersen, J. ed., Thebiological control of plant diseases. Based on proceedingsof the international seminar: Biological control of plant
diseases and virus vectors, Japan, 17–21 September 1990,215p.
Jensen, B.D., Latunde-Dada, A.O., Hudson, D. and Lucas,J.A. 1998. Protection of
Brassica
seedlings againstdowny mildew and damping-off by seed treatment withCGA 245704, an activator of systemic acquiredresistance. Pesticide Science, 52, 63–69.
Kessmann, H., Staub, T., Hofmann, C., Maetzke, T.,Herzoc, J., Ward, E., Uknes, S. and Ryals, J. 1994.Induction of systemic acquired resistance in plants bychemicals. Annual Review of Phytopathology, 32,439–459.
Lawton K.A., Friedrich, L., Hunt, M., Weymann, K.,Delaney, T., Kessmann, H., Staub, T. and Ryals, J. 1996.Benzothiadiazole induces disease resistance in
Arabidopsis
by activation of the systemic acquiredresistance signal transduction pathway. The PlantJournal, 10, 71–82.
Martyn, R.D., Biles, C.L. and Dillard, E.A. 1991. Inducedresistance to Fusarium wilt of watermelon undersimulated field conditions. Plant Disease, 75, 874–877.
Métraux, J.P., Ahl Goy, P., Staub, T., Speich, J., Steinmann,A., Ryals, J. and Ward, E. 1991. Induced systemicresistance in cucumber in response to 2,6-dichloroisonic-otinic acid and pathogens. In: Hennecke, H. and Verma,D.P.S. ed., Advances in molecular genetics ofplant–microbe interactions, volume 1. Dordrecht, KluwerAcademic Publishers, 432–439.
Siegrist, J., Glenewinkel, D., Kolle, C. and Schmidtke, M.1997. Chemically induced resistance in green beanagainst bacterial and fungal pathogens. Journal of PlantDiseases and Protection, 104, 599–610.
Wade, N.L. and Morris, S.C. 1983. Efficacy of fungicidesfor postharvest treatment of muskmelon fruit.HortScience, 18, 344–345.
Quality assurance in agricultural produce,edited by G.I. Johnson, Le Van To, Nguyen Duy Duc and M.C. Webb.
ACIAR Proceedings 100(printed version published in 2000)
586
Using Perforated Plastic Packaging for Extending the Shelf Life of Okra Pods
J. Poubol, S. Kanlayanarat and C. Maneerat*
Abstract
Perforated plastic bags were tested for use in extending the shelf life of okra pods (
Abelmoschus esculentus
L.Moench). Okra pods were packed in four different types of perforated plastic bags: (1) 4 holes, polyethylenebag ; (2) 12 holes, polyethylene bag; (3) 4 holes, polypropylene bag; and (4) 12 holes, polypropylene bag.Packed okra pods were stored at 10°C for 10 days. Firmness, fibre content, weight loss, gas composition, visualappearance, and shelf life of okra pods were determined during storage. The results showed no significantdifferences in either the gas concentrations within the packages nor the firmness and fibre content of the okrapods. However, okra pods packed in polypropylene bags perforated with four holes had the best visualappearance and lower weight loss than the other treatments and resulted in an extension of the shelf life of goodquality okra pods from 6 days to 10 days.
O
KRA
,
Hibiscus esculentus
L. (
Abelmoschus escu-lentus
(L.) Moench), is a tropical vegetable of highexport potential. It is desirable to harvest okra podsdaily or frequently at the young and tender stage, sincemature pods become fibrous and tough (Snowdon1991). The immature fruit are used as a boiled or friedvegetable. They are particularly popular for adding tosoups and stews. Okra pod is a non-climacteric fruit/vegetable which has a high respiration rate, isextremely perishable (Hardenburg et al. 1986), and isprone to discoloration and toughening (Snowdon1991). The immature pods have a very high respirationrate and their metabolism changes rapidly, resulting ina short storage life. High quality pods should be brightgreen, firm, and free from yellow blemishes. Soft andhigh fibre content pods are of low quality and will berejected by consumers.
Modified atmosphere storage was reported to beeffective in extending the storage life of okra (Anan-daswamy 1963). In Thailand, packaging of freshhorticultural produce using various plastic bags hasbeen shown to be useful for extending their shelf life.However, fresh produce like okra stored in suchpackages in cold storage—commonly found in retail
markets—has a limited shelf life due to desiccation,decay or injury caused by excessive moisture. Con-densation is an important problem for the conservationof fresh horticultural produce. Presence of free wateron the surface of the produce enhance risks of fungalgrowth and often leads to a bad appearance whichmakes the produce unsaleable (Kader 1991).
The main aim of this research was to determine theeffect of perforated plastic bags in reducing water lossand biochemical changes in fresh okra packages.Moreover, the number of perforations per package andthe type of plastic bags most suitable for the optimalconservation of okra were determined.
Materials and Methods
Sample preparation
Okra pods (
Abelmoschus esculentus
L. Moench)were hand-harvested using a knife. They were trans-ported from Ratchaburi Province in the western part ofThailand to the Postharvest Laboratory at KingMongkut’s University of Technology Thonburi by air-conditioned bus within 4 hours and stored at 10 ± 3°Cand 87 ± 10% relative humidity (RH). Experimentalsamples which were uniform green in colour and 8–10cm long were selected. Samples were then randomly
* Division of Postharvest Technology, King Mongkut’s University of Technology Thonburi, Thungkru, Bangkok 10140, Thailand.
Quality assurance in agricultural produce,edited by G.I. Johnson, Le Van To, Nguyen Duy Duc and M.C. Webb.
ACIAR Proceedings 100(printed version published in 2000)
587
divided into four groups (treatments). Each group hadfour replications of eight pods per replication.
The bags used were approximately 15
×
23 cm (6
×
9inches). Two kinds of perforated plastic bag weretested—polypropylene and polyethylene. The diameterof each hole (perforation) was 0.5 cm.
Monitoring of gas composition
The gas composition within each bag wasmonitored during storage using gas chromatography. 1mL of internal gas was withdrawn from each bag usinga gastight syringe fitted with a 25 G stainless steelneedle. Gas samples were analysed for O
2
and CO
2
byinjection into a gas chromatograph fitted with athermal conductivity detector equipped with astainless steel column (3 mm
×
1.5 m) containingporapak Q (80/100 mesh) (Shimadzu, GC-8A, Japan).The temperature of the injector and detector was100°C and the column temperature was 50°C. Heliumwas used as the carrier gas. C
2
H
4
was determined byinjecting 1 cc of internal gas atmosphere into a gaschromatograph fitted with a flame ionisation detectorequipped with a stainless steel column (3.2 mm
×
2.5m) containing 20% carbowax 20 m, 60/80 mesh (Shi-madzu, GC-14B, Japan). The temperature of theinjector and detector was 120°C and the column tem-perature was 85°C. Nitrogen was used as the carriergas.
Analytical methods
Percentage weight loss
. Determined by comparingthe average weight of 100 g samples taken from eachtreatment at each sampling date to the initial weight.
Soluble solids
. Measured (°Brix) with an Atagorefractometer (model N1) at 20°C.
Texture
. Shear resistance was determined bymeasuring the force required to cut through four rawokra pods using a Texture Analyzer TA-XT2 equippedwith a 500 kg load cell, fitted with 7
×
12 cm knife (3.2mm thick blade). The pods were placed horizontally inthe cell and were cut 3.0 cm from the base. Crossheadand chart speed were 100 mm/min and 300 mm/min,respectively. The crosshead speed chosen was themost consistent in relating shear strength to podmaturity and quality (unpublished data). Themaximum value on the force scale was taken as ameasure of shear resistance.
Colour
. Measurements were determined with aHunter Lab Tristimulus Color Model (Minolta DP-301) calibrated with a white standard tile (X = 92.40;Y = 0.3134; Z = 0.3195).
L
* and
b
* values were
assigned as the average for four representativesamples, with two replications for each treatment. The
b
*
is positive value for yellow fruits and
L
*
is positivevalue for lightness.
Titratable acidity
. The method of the Association ofOfficial Analytical Chemists was used (AOAC 1990).
Ascorbic acid
. The method of the Association ofOfficial Analytical Chemists was used (AOAC 1990).
Fibre content
. Determined using an alkali extractionmethod. The pods without seeds (10 g) were cookedfor 10 min in boiling water, macerated with 12.5 mL50% NaOH and boiled for 5 min. Fibre was filteredand washed through a 25–30 mesh screen to separatethe fibre. Fibre was then dried at 100°C for 2 h andweighed (Gould 1977).
Statistical analysis
Statistical analyses performed on the data includedanalysis of variance (ANOVA) using the GeneralLinear Models Procedure by SAS (SAS Institute,Cary, NC.), Duncan’s multiple range test, andstandard deviation calculations. The experimentaldesign used for analytical measurements was com-pletely randomised with four replications.
Results and Discussion
Changes in gas composition of the package atmosphere
Oxygen and carbon dioxide concentrations
In the initial period of storage, rapid changes in CO
2
accumulation and O
2
depletion were observed. Levelsof O
2
and CO
2
inside the packages were 17% and1.5%, within 2 and 6 days, respectively, as shown inFigures 1A and 1B. Thereafter the concentration of O
2
and CO
2
gradually changed over time according to therate of okra respiration. Okra used O
2
in the packagefor its respiration and produced CO
2
.
Ethylene levels
Figure 1C shows that the C
2
H
4
concentrationswithin the perforated plastic bags at 10°C showed nosignificant difference between treatments. It was notedthat the rate of ethylene diffusion from the fruitinternal atmosphere may have obscured the rates ofethylene evolution and contributed to relatively lowlevels of ethylene inside the packages during the first 8days of storage.
Quality assurance in agricultural produce,edited by G.I. Johnson, Le Van To, Nguyen Duy Duc and M.C. Webb.
ACIAR Proceedings 100(printed version published in 2000)
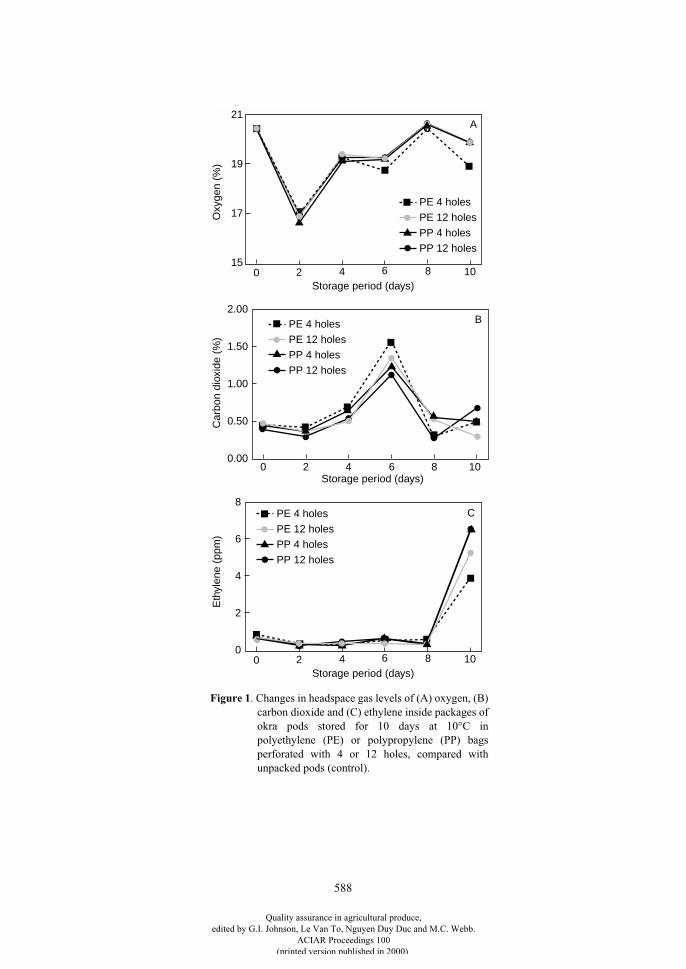
588
0.00
0.50
1.00
1.50
2.00
0 2 4 6 8 10
Car
bon
diox
ide
(%)
PP 12 holes
PP 4 holes
PE 4 holes
PE 12 holes
Storage period (days)
B
0
4
6
8
Storage period (days) 0 2 4 6 8 10
Eth
ylen
e (p
pm)
PP 12 holes
PP 4 holes
PE 4 holes
PE 12 holes
2
C
15
17
19
21
Storage period (days) 0 2 4 6 8 10
Oxy
gen
(%)
PP 12 holes
PP 4 holes
PE 4 holes
PE 12 holes
A
Figure 1
. Changes in headspace gas levels of (A) oxygen, (B)carbon dioxide and (C) ethylene inside packages ofokra pods stored for 10 days at 10°C inpolyethylene (PE) or polypropylene (PP) bagsperforated with 4 or 12 holes, compared withunpacked pods (control).
Quality assurance in agricultural produce,edited by G.I. Johnson, Le Van To, Nguyen Duy Duc and M.C. Webb.
ACIAR Proceedings 100(printed version published in 2000)
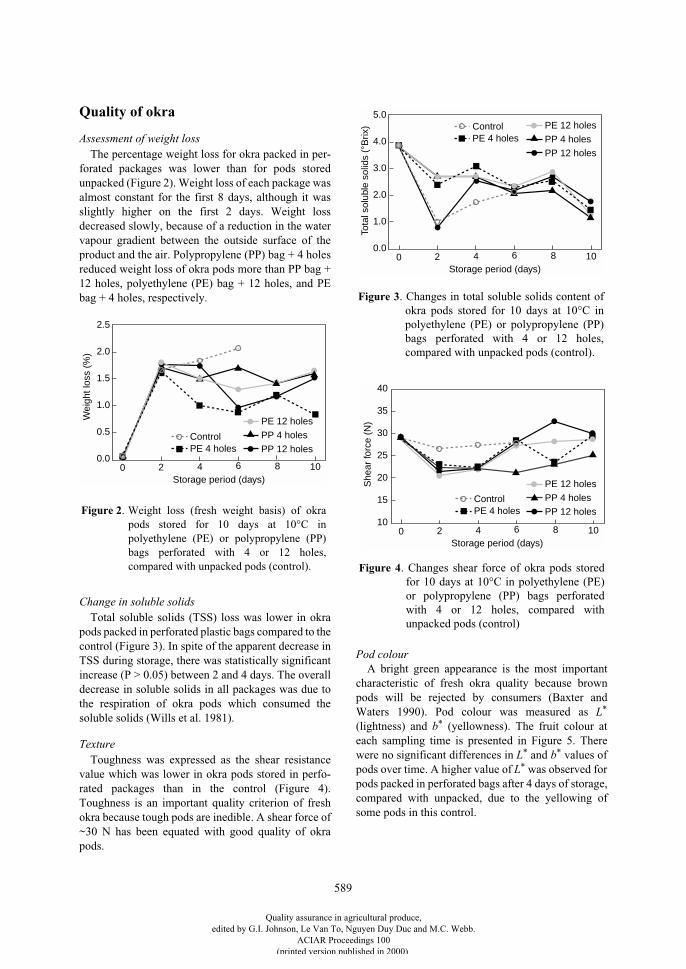
589
Quality of okra
Assessment of weight loss
The percentage weight loss for okra packed in per-forated packages was lower than for pods storedunpacked (Figure 2). Weight loss of each package wasalmost constant for the first 8 days, although it wasslightly higher on the first 2 days. Weight lossdecreased slowly, because of a reduction in the watervapour gradient between the outside surface of theproduct and the air. Polypropylene (PP) bag + 4 holesreduced weight loss of okra pods more than PP bag +12 holes, polyethylene (PE) bag + 12 holes, and PEbag + 4 holes, respectively.
Change in soluble solids
Total soluble solids (TSS) loss was lower in okrapods packed in perforated plastic bags compared to thecontrol (Figure 3). In spite of the apparent decrease inTSS during storage, there was statistically significantincrease (P > 0.05) between 2 and 4 days. The overalldecrease in soluble solids in all packages was due tothe respiration of okra pods which consumed thesoluble solids (Wills et al. 1981).
Texture
Toughness was expressed as the shear resistancevalue which was lower in okra pods stored in perfo-rated packages than in the control (Figure 4).Toughness is an important quality criterion of freshokra because tough pods are inedible. A shear force of~30 N has been equated with good quality of okrapods.
Pod colour
A bright green appearance is the most importantcharacteristic of fresh okra quality because brownpods will be rejected by consumers (Baxter andWaters 1990). Pod colour was measured as
L
*
(lightness) and
b
*
(yellowness). The fruit colour ateach sampling time is presented in Figure 5. Therewere no significant differences in
L
*
and
b
*
values ofpods over time. A higher value of
L
*
was observed forpods packed in perforated bags after 4 days of storage,compared with unpacked, due to the yellowing ofsome pods in this control.
0.0
1.0
1.5
2.0
Storage period (days) 0 2 4 6 8 10
Wei
ght l
oss
(%)
PP 12 holes
PP 4 holesPE 4 holes
PE 12 holes0.5
2.5
Control
Figure 2. Weight loss (fresh weight basis) of okrapods stored for 10 days at 10°C inpolyethylene (PE) or polypropylene (PP)bags perforated with 4 or 12 holes,compared with unpacked pods (control).
0.0
2.0
3.0
4.0
Storage period (days) 0 2 4 6 8 10
Tota
l sol
uble
sol
ids
(°B
rix)
PP 12 holes
PP 4 holesPE 4 holesPE 12 holes
1.0
5.0Control
Figure 3. Changes in total soluble solids content ofokra pods stored for 10 days at 10°C inpolyethylene (PE) or polypropylene (PP)bags perforated with 4 or 12 holes,compared with unpacked pods (control).
10
20
25
30
Storage period (days) 0 2 4 6 8 10
She
ar fo
rce
(N)
PP 12 holes
PP 4 holesPE 4 holes
PE 12 holes
15
35
Control
40
Figure 4. Changes shear force of okra pods storedfor 10 days at 10°C in polyethylene (PE)or polypropylene (PP) bags perforatedwith 4 or 12 holes, compared withunpacked pods (control)
Quality assurance in agricultural produce,edited by G.I. Johnson, Le Van To, Nguyen Duy Duc and M.C. Webb.
ACIAR Proceedings 100(printed version published in 2000)
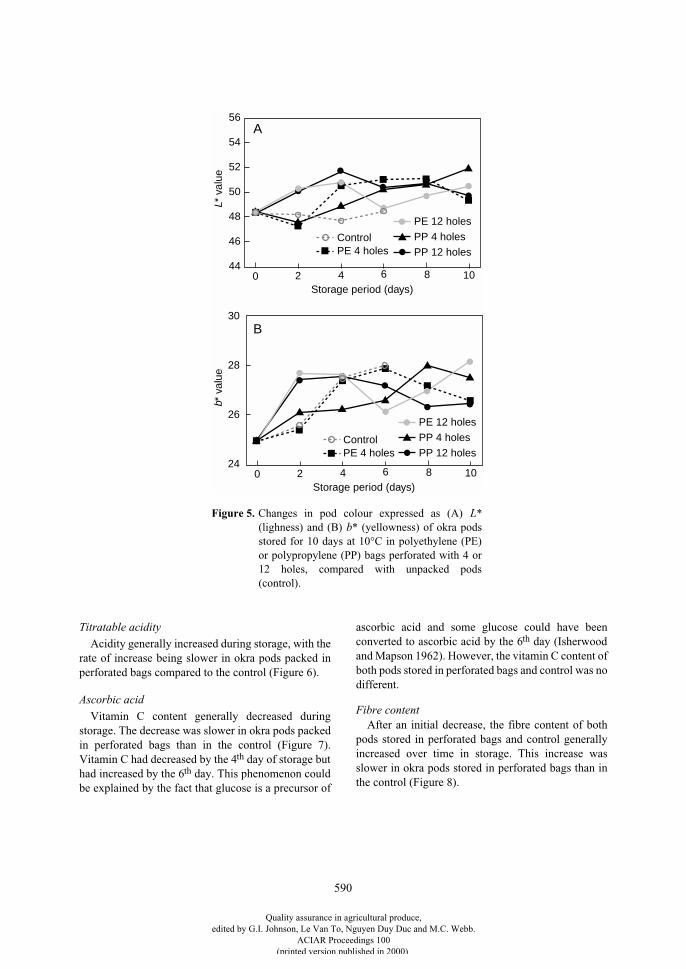
590
Titratable acidity
Acidity generally increased during storage, with therate of increase being slower in okra pods packed inperforated bags compared to the control (Figure 6).
Ascorbic acid
Vitamin C content generally decreased duringstorage. The decrease was slower in okra pods packedin perforated bags than in the control (Figure 7).Vitamin C had decreased by the 4
th
day of storage buthad increased by the 6
th
day. This phenomenon couldbe explained by the fact that glucose is a precursor of
ascorbic acid and some glucose could have beenconverted to ascorbic acid by the 6
th
day (Isherwoodand Mapson 1962). However, the vitamin C content ofboth pods stored in perforated bags and control was nodifferent.
Fibre content
After an initial decrease, the fibre content of bothpods stored in perforated bags and control generallyincreased over time in storage. This increase wasslower in okra pods stored in perforated bags than inthe control (Figure 8).
24
28
30
Storage period (days) 0 2 4 6 8 10
b* v
alue
PP 12 holes
PP 4 holes
PE 4 holes
PE 12 holes26
Control
44
48
50
52
Storage period (days) 0 2 4 6 8 10
L* v
alue
PP 12 holes
PP 4 holesPE 4 holes
PE 12 holes
46
54
Control
56A
B
Figure 5. Changes in pod colour expressed as (A) L*(lighness) and (B) b* (yellowness) of okra podsstored for 10 days at 10°C in polyethylene (PE)or polypropylene (PP) bags perforated with 4 or12 holes, compared with unpacked pods(control).
Quality assurance in agricultural produce,edited by G.I. Johnson, Le Van To, Nguyen Duy Duc and M.C. Webb.
ACIAR Proceedings 100(printed version published in 2000)
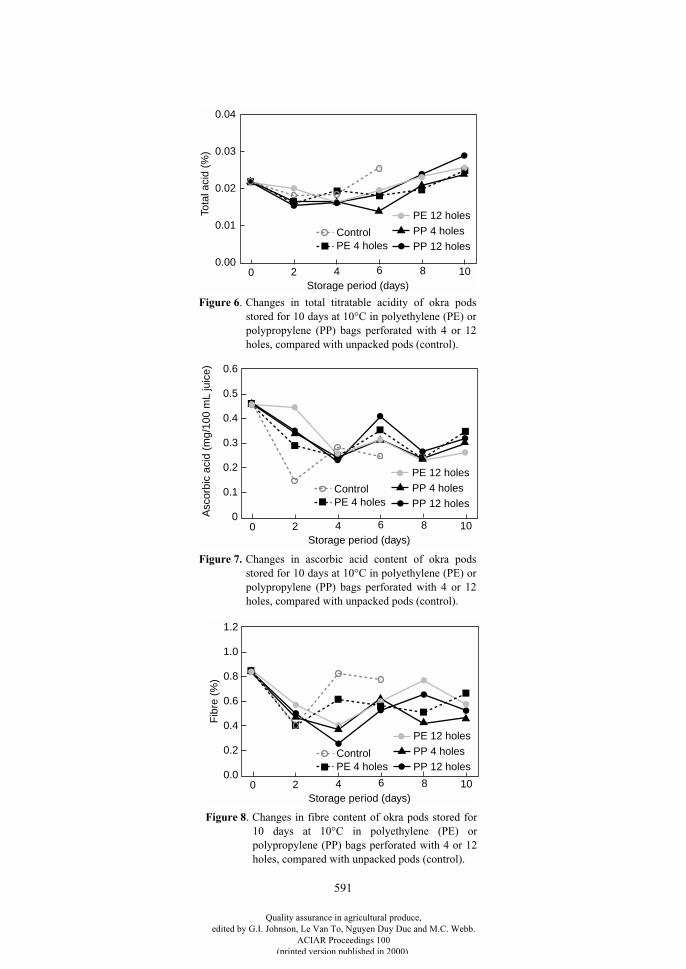
591
0.00
0.02
0.03
0.04
Storage period (days) 0 2 4 6 8 10
Tota
l aci
d (%
)
PP 12 holes
PP 4 holesPE 4 holes
PE 12 holes0.01
Control
0
0.2
0.3
Storage period (days) 0 2 4 6 8 10
Asc
orbi
c ac
id (
mg/
100
mL
juic
e)
PP 12 holes
PP 4 holesPE 4 holes
PE 12 holes
0.1 Control
0.4
0.5
0.6
0.0
0.4
0.6
Storage period (days) 0 2 4 6 8 10
Fib
re (
%)
PP 12 holes
PP 4 holesPE 4 holes
PE 12 holes0.2 Control
0.8
1.0
1.2
Figure 6
. Changes in total titratable acidity of okra podsstored for 10 days at 10°C in polyethylene (PE) orpolypropylene (PP) bags perforated with 4 or 12holes, compared with unpacked pods (control).
Figure 7.
Changes in ascorbic acid content of okra podsstored for 10 days at 10°C in polyethylene (PE) orpolypropylene (PP) bags perforated with 4 or 12holes, compared with unpacked pods (control).
Figure 8
. Changes in fibre content of okra pods stored for10 days at 10°C in polyethylene (PE) orpolypropylene (PP) bags perforated with 4 or 12holes, compared with unpacked pods (control).
Quality assurance in agricultural produce,edited by G.I. Johnson, Le Van To, Nguyen Duy Duc and M.C. Webb.
ACIAR Proceedings 100(printed version published in 2000)
592
Conclusion
Perforated plastic packaging reduced weight losscompared to the control. Okra pods packed in PP bag+ 4 holes delayed weight loss more successfully thanokra pods in PP bag + 12 holes, PE + 12 holes, and PE+ 4 holes, respectively. Moreover, storage in PP bag +4 holes gave the best visual appearance, resulting in anextension of the marketing period of good quality okrapods from 6 to 10 days.
References
Anandaswamy, B. 1963. Prepackaging studies on freshproduce. IV. Okra (
Abelmoschus esculentus
L.). FoodScience (Mysore), 12, 332–335.
AOAC (Association of Official Analytical Chemists) 1990.Official method of analysis. Virginia, Association ofOfficial Analytical Chemists, 1298p.
Baxter, L. and Waters, L. Jr 1990. Controlled atmosphereeffects on physical change and ethylene evolution inharvested okra. HortScience, 25, 92–95.
Gould, W.A. 1977. Food quality assurance. Connecticut,The AVI Publishing Company, 314p.
Hardenburg, R.E., Watada, A.E. and Wang, C.Y. 1986. Thecommercial storage of fruits, vegetables, and florists andnursery stocks. United States Department of AgricultureHandbook, 66p.
Isherwood, F.A. and Mapson, L.W. 1962. Ascorbic acidmetabolism in plants, part 2. Biosynthesis. AnnualReview of Plant Physiology, 13, 329–348.
Kader, A.A. 1991. Postharvest biology and technology: anoverview. In: Kader, A.A., ed., Postharvest technology ofhorticultural crops, 2
nd
edition. University of California,Publication 3311, 15–20.
Snowdon, A.L. 1991. A color atlas of postharvest diseasesand disorders of fruit and vegetables. Volume 2:vegetables. Aylesbury, Wolfe Scientific, 416p.
Wills, R.H.H., Lee, T.H., Graham, D., McGlasson, W.B.and Hall, E.C. 1981. Postharvest. An introduction to thephysiology and handling of fruits and vegetables.Sydney, New South Wales University Press, 161p.
Quality assurance in agricultural produce,edited by G.I. Johnson, Le Van To, Nguyen Duy Duc and M.C. Webb.
ACIAR Proceedings 100(printed version published in 2000)
593
Changes in Polyamine Levels and Peroxidase Activity in ‘Khakdum’ Papaya (Carica papaya L.)
under Low Temperature Storage Conditions
S. Setha, S. Kanlayanarat and V. Srilaong*
Abstract
‘Khakdum’ papaya fruits were stored at 5°C or 15°C to study the relationships of polyamine content andperoxidase activity to chilling injury. Chilling injury of papaya stored under 5°C was developed as a pittingsymptom on the peel after 15 days of storage. The injury became more severe (over 20% damage) after 30 daysof storage. Polyamine content, as measured by putrescine, spermidine and spermine levels, graduallydecreased over time. Peroxidase activity increased gradually until it reached a peak at 10 days storage, afterwhich it fell slightly. At the end of storage, chilled papaya fruit stored at 5°C could not ripen normally, whilethe fruit stored at 15°C showed a climacteric rise and normal ripening.
P
APAYA
(
Carica papaya
L.) is a member of familyCaricaceae and is a popular fruit crop throughouttropical and subtropical regions. Papaya is tropical inorigin and the fruit changes rapidly, both physiologi-cally and biochemically, after harvest. Postharvestlosses of papaya quality could be minimised bystorage at low temperature. Under such conditions,fruit metabolism, respiration and the ripening processare retarded. Papaya fruit are sensitive to temperaturesbelow 12.5°C and chilling injury is observed as apitting symptom on the peel surface (Chen and Paull1986). The physiological and biochemical alterationsoccur in response to chilling stress which induces thedegradation process in membranes and disruptsmetabolism (Raison and Orr 1990). In a previousstudy, it was found that oxidative damage was an earlyresponse of sensitive tissue to chilling and many freeradicals were induced (Hariyadi and Parkin 1991).Polyamines are free radical scavenger agents that canprotect membranes from peroxidation (Kramer andWang 1989). Furthermore, peroxidase also has freeradical scavenger properties under chilling stress con-ditions (Burris 1960). The objective of this study was
to investigate the changes in polyamine content andperoxidase activity in papaya in response to chilling.
Materials and Methods
Sample preparation
Papaya fruit (
Carica papaya
L.) of the ‘Khakdum’cultivar were harvested from an orchard in ChantaburiProvince in the eastern part of Thailand. The fruitselected were uniform in size and 5–10% yellow incolour. Selected fruit were dipped in 500 ppm thiaben-dazole (TBZ) for 5 min to control microorganisms,then well drained and placed in a coolroom at 5°C or15°C and 90–95% relative humidity (RH).
Sample analysis
Samples were withdrawn every 3 days to determine:polyamine as putrescine, spermidine, and sperminecontent; peroxidase activity; respiration rate; andchilling injury index (see below). The means of threereplications for each treatment are presented. Leastsignificant difference (LSD) was used to comparemean differences.
* Division of Postharvest Technology,King Mongkut’s University of Technology Thonburi, Thungkru, Bangkok 10140 Thailand.
Quality assurance in agricultural produce,edited by G.I. Johnson, Le Van To, Nguyen Duy Duc and M.C. Webb.
ACIAR Proceedings 100(printed version published in 2000)
594
The severity of chilling symptoms was calculatedusing the following equation:
Levels of severity were determined as: 0 = normal,1 = pitting less than 10%, 2 = 10–20% pitting, and 3 =pitting more than 20% (Martinez-Tellez and Lafuente1997).
Respiration rate
Each fruit sample was sealed in a 1.17 L chamberand incubated for 3 h at room temperature. A 1 µL gassample was withdrawn with a syringe. Samples wereinjected into a gas chromatograph (Shimadzu GC-8A,Porapak N column, TCD, 60°C) for determination ofcarbon dioxide levels.
Assay for peroxidase activity
Pulp tissue (100 mg) was homogenised in 12 mLcold 0.1 M phosphate buffer (pH 6.1) containing 90mg of insoluble polyvinylpyrollidone (PVP) and 30mg sodium ascorbate in chilled mortars and pestles.The homogenate was filtered through four layers ofmiracloth and centrifuged at 12,000 g for 10 min at4°C. The supernatant was used for the peroxidaseassay. The assay mixture contained 0.1 M phosphatebuffer (pH 6.1), 4 mM guaiacol as hydrogen donor, 3mM H
2
O
2
as substrate and 0.4 mL crude enzymeextract. The total reaction volume was 1.2 mL. Therate of change in absorbance (optical density—OD) at420 nm was measured using a spectrophotometer(Shimadzu UV 160 A). The levels of enzyme activitywere expressed as OD difference/min/mg protein(Wang 1995).
Polyamine analysis
Each sample (1 g) was extracted in 10 mL of 5%cold HClO
4
. After extraction for 1 h in an ice bath,samples were pelleted at 48,000 g for 20 min. Thesupernatant phase contained the ‘free’ polyaminefraction. The crude extract of 0.5 mL was mixed with2 mL of 4 N NaOH and 5 µL of benzoylchloride wasimmediately added, mixed with a vortex for 15 s, andincubated at 35°C for 20 min in a water bath. 4 mL ofsaturated NaCl was then added. Benzoyl polyaminewas extracted in cold ether. After centrifugation at1,500 g for 10 mins, 2 mL of the top solution (ether
fraction) was collected, evaporated to dryness undernitrogen gas, then redissolved in 200 µL acetonitrileand injected into a high performance liquid chroma-tography (HPLC) apparatus. Densyl polyamine wasseparated by the HPLC system with a C
18
reversecolumn. The mobile phase used was ace-tonitrile:water, 1:1 (v/v) at a flow rate of 1 mL/min.Ultraviolet (UV) waves were detected at 254 nm. Sen-sitivity was set at 0.04 a.u.f.s. (McDonald and Kushad1986).
Results
Chilling injury index
The physiological changes to papaya fruit caused bychilling temperature (5°C) were observed as slightpitting on the peel after 15 days of storage. Thissymptom was more severe when the fruit were trans-ferred to room temperature. The level of chilling injurycorrelated with storage time and most severe symptomof more than 20% was observed after 30 days ofstorage (Figure 1). The fruit stored at 15°C showedslight chilling injury after their maximum storage lifeof 20 days (Figure 1), after which time they decayed.
Respiration rate
Low respiration rates of approximately 3–5 mgCO
2
/kg/hr were measured in fruit chilled at 5°C, whilethe rate of 15–20 mg CO
2
/kg/h were measured in fruitstored at 15°C (Figure 2). A respiration climactericpeak was not detected in papaya fruit stored at 5°C.Furthermore, the fruit did not ripen as normal.However, papaya that stored at 15°C showed a climac-teric rise after 3 days of storage and ripened graduallyuntil 20 days of storage (data not shown).
Peroxidase activity
Activity of peroxidase is an indicator of chillinginjury symptom. The peroxidase activity of papayafruit stored at 5°C was higher than at 15°C. The per-oxidase activity of fruit stored at 5°C increased up to10 days, then rapidly decreased after 15 days until theend of storage. Papaya stored at 15°C had only slightchanges in peroxidase activity throughout the storageperiod (Figure 3).
Chilling injury index
=level of severity number of chilled fruit
total no. of fruit
×á
âð
ã
äò
(1)
Quality assurance in agricultural produce,edited by G.I. Johnson, Le Van To, Nguyen Duy Duc and M.C. Webb.
ACIAR Proceedings 100(printed version published in 2000)
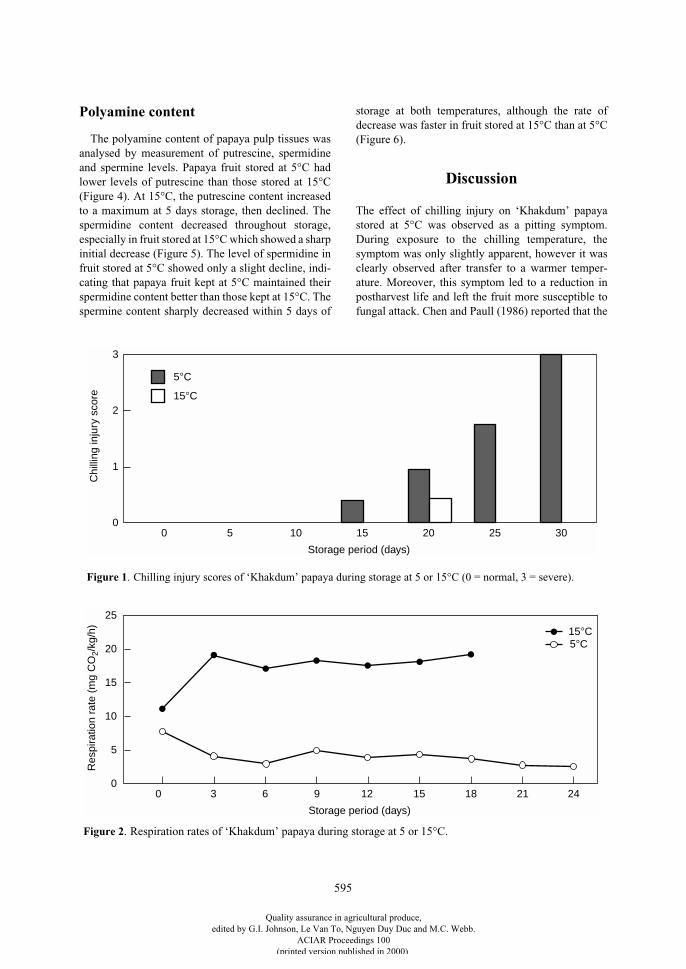
595
Polyamine content
The polyamine content of papaya pulp tissues wasanalysed by measurement of putrescine, spermidineand spermine levels. Papaya fruit stored at 5°C hadlower levels of putrescine than those stored at 15°C(Figure 4). At 15°C, the putrescine content increasedto a maximum at 5 days storage, then declined. Thespermidine content decreased throughout storage,especially in fruit stored at 15°C which showed a sharpinitial decrease (Figure 5). The level of spermidine infruit stored at 5°C showed only a slight decline, indi-cating that papaya fruit kept at 5°C maintained theirspermidine content better than those kept at 15°C. Thespermine content sharply decreased within 5 days of
storage at both temperatures, although the rate ofdecrease was faster in fruit stored at 15°C than at 5°C(Figure 6).
Discussion
The effect of chilling injury on ‘Khakdum’ papayastored at 5°C was observed as a pitting symptom.During exposure to the chilling temperature, thesymptom was only slightly apparent, however it wasclearly observed after transfer to a warmer temper-ature. Moreover, this symptom led to a reduction inpostharvest life and left the fruit more susceptible tofungal attack. Chen and Paull (1986) reported that the
0
2
1
Storage period (days)
Chi
lling
inju
ry s
core
0 5 10 15 20 25
3
30
5°C
15°C
Figure 1. Chilling injury scores of ‘Khakdum’ papaya during storage at 5 or 15°C (0 = normal, 3 = severe).
0
15
5
10
20
Storage period (days)
Res
pira
tion
rate
(m
g C
O2/
kg/h
)
0 3 6 9 12 15 18 21 24
25
5°C15°C
Figure 2. Respiration rates of ‘Khakdum’ papaya during storage at 5 or 15°C.
Quality assurance in agricultural produce,edited by G.I. Johnson, Le Van To, Nguyen Duy Duc and M.C. Webb.
ACIAR Proceedings 100(printed version published in 2000)
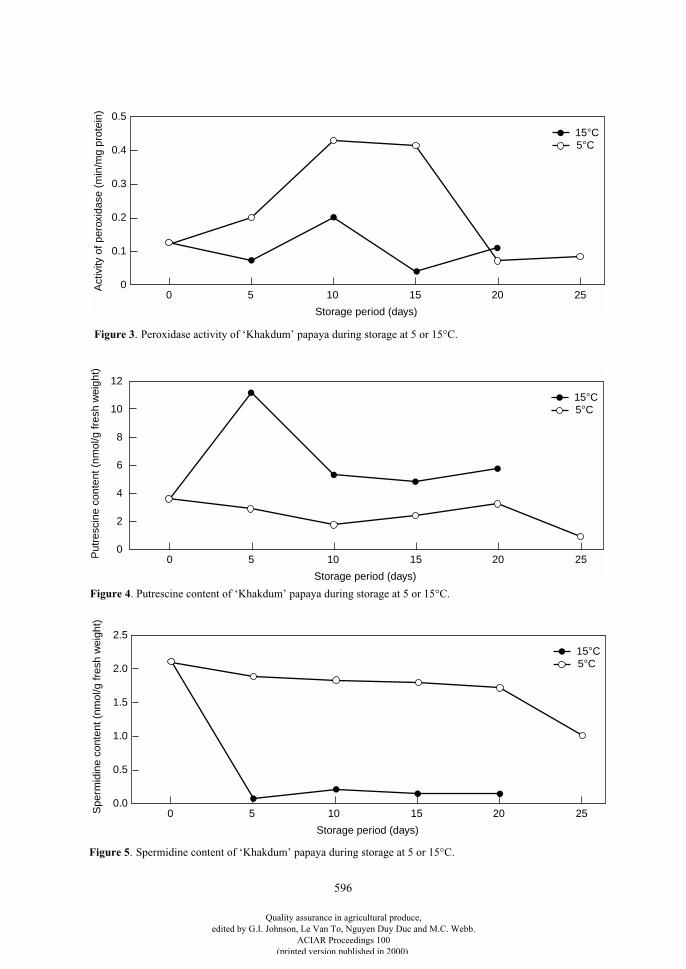
596
0
0.3
0.1
0.2
0.4
Storage period (days)
Act
ivity
of p
erox
idas
e (m
in/m
g pr
otei
n)
0 5 10 15 20 25
0.5
5°C15°C
0
6
2
4
8
Storage period (days)
12
5°C15°C
Put
resc
ine
cont
ent (
nmol
/g fr
esh
wei
ght)
10
0 5 10 15 20 25
0.0
1.5
0.5
1.0
2.0
Storage period (days)
2.5
0 5 10 15 20 25
5°C15°C
Spe
rmid
ine
cont
ent (
nmol
/g fr
esh
wei
ght)
Figure 3
. Peroxidase activity of ‘Khakdum’ papaya during storage at 5 or 15°C.
Figure 4
. Putrescine content of ‘Khakdum’ papaya during storage at 5 or 15°C.
Figure 5
. Spermidine content of ‘Khakdum’ papaya during storage at 5 or 15°C.
Quality assurance in agricultural produce,edited by G.I. Johnson, Le Van To, Nguyen Duy Duc and M.C. Webb.
ACIAR Proceedings 100(printed version published in 2000)
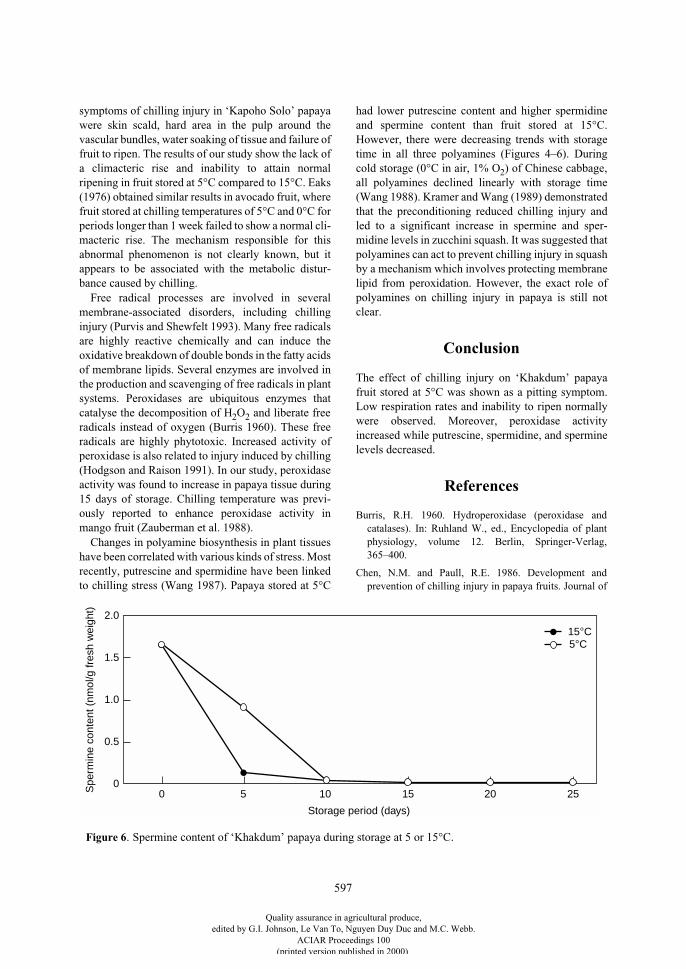
597
symptoms of chilling injury in ‘Kapoho Solo’ papayawere skin scald, hard area in the pulp around thevascular bundles, water soaking of tissue and failure offruit to ripen. The results of our study show the lack ofa climacteric rise and inability to attain normalripening in fruit stored at 5°C compared to 15°C. Eaks(1976) obtained similar results in avocado fruit, wherefruit stored at chilling temperatures of 5°C and 0°C forperiods longer than 1 week failed to show a normal cli-macteric rise. The mechanism responsible for thisabnormal phenomenon is not clearly known, but itappears to be associated with the metabolic distur-bance caused by chilling.
Free radical processes are involved in severalmembrane-associated disorders, including chillinginjury (Purvis and Shewfelt 1993). Many free radicalsare highly reactive chemically and can induce theoxidative breakdown of double bonds in the fatty acidsof membrane lipids. Several enzymes are involved inthe production and scavenging of free radicals in plantsystems. Peroxidases are ubiquitous enzymes thatcatalyse the decomposition of H
2
O
2
and liberate freeradicals instead of oxygen (Burris 1960). These freeradicals are highly phytotoxic. Increased activity ofperoxidase is also related to injury induced by chilling(Hodgson and Raison 1991). In our study, peroxidaseactivity was found to increase in papaya tissue during15 days of storage. Chilling temperature was previ-ously reported to enhance peroxidase activity inmango fruit (Zauberman et al. 1988).
Changes in polyamine biosynthesis in plant tissueshave been correlated with various kinds of stress. Mostrecently, putrescine and spermidine have been linkedto chilling stress (Wang 1987). Papaya stored at 5°C
had lower putrescine content and higher spermidineand spermine content than fruit stored at 15°C.However, there were decreasing trends with storagetime in all three polyamines (Figures 4–6). Duringcold storage (0°C in air, 1% O
2
) of Chinese cabbage,all polyamines declined linearly with storage time(Wang 1988). Kramer and Wang (1989) demonstratedthat the preconditioning reduced chilling injury andled to a significant increase in spermine and sper-midine levels in zucchini squash. It was suggested thatpolyamines can act to prevent chilling injury in squashby a mechanism which involves protecting membranelipid from peroxidation. However, the exact role ofpolyamines on chilling injury in papaya is still notclear.
Conclusion
The effect of chilling injury on ‘Khakdum’ papayafruit stored at 5°C was shown as a pitting symptom.Low respiration rates and inability to ripen normallywere observed. Moreover, peroxidase activityincreased while putrescine, spermidine, and sperminelevels decreased.
References
Burris, R.H. 1960. Hydroperoxidase (peroxidase andcatalases). In: Ruhland W., ed., Encyclopedia of plantphysiology, volume 12. Berlin, Springer-Verlag,365–400.
Chen, N.M. and Paull, R.E. 1986. Development andprevention of chilling injury in papaya fruits. Journal of
0
1.0
0.5
1.5
Storage period (days)
Spe
rmin
e co
nten
t (nm
ol/g
fres
h w
eigh
t)
0 5 10 15 20 25
2.0
5°C15°C
Figure 6. Spermine content of ‘Khakdum’ papaya during storage at 5 or 15°C.
Quality assurance in agricultural produce,edited by G.I. Johnson, Le Van To, Nguyen Duy Duc and M.C. Webb.
ACIAR Proceedings 100(printed version published in 2000)
598
the American Society of Horticultural Science, 111,639–643.
Eaks, I.L. 1976. Ripening, chilling injury, and respiratoryresponse of ‘Has’ and ‘Fuerte’ avocado fruits at 20°Cfollowing chilling. Journal of the American Society ofHorticultural Science, 101, 538–540.
Hariyadi, P. and Parkin, K.L. 1991. Chilling-inducedoxidative stress in cucumber fruits. Postharvest Biologyand Technology, 1, 33–45.
Hodgson, R.A.J. and Raison, J.K. 1991. Superoxideproduction by thylakoids during chilling and itsimplication in the susceptibility of plants to chilling-induced photoinhibition. Planta, 183, 222–228.
Kramer, G.F. and Wang, C.Y. 1989. Correlation of reducedchilling injury with increased spermine and spermidinelevels in zucchini squash. Physiologia Plantarum, 76,479–484.
Martinez-Tellez, M.A. and Lafuente, M.T. 1997. Effect ofhigh temperature conditioning on ethylene, phenyl-alanine ammonia-lyase, peroxidase and polyphynoloxidase activities in flavedo of chilled (Fortune)mandarin fruit. Plant Physiology, 150, 674–678.
McDonald, R.E. and Kushad M.M. 1986. Accumulation ofputrescine during chilling injury of fruits. PlantPhysiology, 82, 324–326.
Purvis, A.C. and Shewfelt, R.L. 1993. Does the alternativepathway ameliorate chilling injury in sensitive planttissue? Physiologia Plantarum, 88, 712–718.
Raison, J.K. and Orr, G.R. 1990. Proposals for a betterunderstanding of the molecular basis of chilling injury.In: Wang, C.Y., ed., (Editor), Chilling injury ofhorticultural crops. Boca Raton, CRC Press, 145–164.
Wang, C.Y. 1987. Changes of polyamines and ethylene incucumber seedlings in response to chilling stress.Physiologia Plantarum, 69, 253–257.
Wang, C.Y. 1988. Changes of polyamine content in chinesecabbage during storage in air or low oxygen atmosphere.Journal of Food Quality, 11, 289.
Wang, C.Y. 1995. Effect of temperature preconditioning oncatalase, peroxidase, and superoxide dismutase in chilledzucchini squash. Postharvest Biology and Technology, 5,67–76.
Zauberman, G., Fuchs, Y., Rot, I. and Wexler, A. 1988.Chilling injury, peroxidase, and cellulase activities in thepeel of mango fruit at low temperature. HortScience, 23,732–733.
Quality assurance in agricultural produce,edited by G.I. Johnson, Le Van To, Nguyen Duy Duc and M.C. Webb.
ACIAR Proceedings 100(printed version published in 2000)
599
Status of Quality Standards in the South African Fruit Industries
L. Korsten and E.S. de Jager*
Abstract
Improving quality standards is inevitable if the South African fruit industries are to conform to increasinglystringent regulations on export consignments and maintain their competitive edge. This paper reviews thedevelopment of standardisation including export product standardisation and the impact of sanctions andderegulation on South Africa’s international trade. The establishment of various International StandardsOrganisation (ISO) 9000 and Hazard Analysis and Critical Control Points-based quality certification systemsis described. South Africa’s commitment to the observance of internationally agreed core labour standards,addressing global environmental problems and ensuring the quality and safety of its products throughlegislation is reviewed.
S
OUTH
A
FRICA
is a country of extremes in terms ofclimate and topography. The variability in rainfall,temperature and soil types makes it extremely difficultto farm effectively and produce optimal yields of highquality. Of the total area of 122 million hectares, 101million hectares are farmland. Of this, only 13.5% isarable land and a mere 3% is land of high potential(Huntley et al. 1989). Notwithstanding the limitationsin climatic and physical conditions, a diversity of agri-cultural products are produced and even exported.Indeed, in the Southern Hemisphere, South Africa setsthe pace in the development of a strong export-oriented industry, particularly in citrus and deciduousfruit growing (Davies and Albrigo 1994).
Global expansion in trade in agricultural productsresulted in specific discussions of these topics at theUruguay round of the General Agreement on Tariffsand Trade (GATT). The most important outcome ofthis agreement was the establishment of a new set ofrules regarding international agricultural policy devel-opment (Satin 1999). Agriculture traditionally evadedGATT measures, but now had to comply with the newrules. The agreement on sanitary and phytosanitarymeasures dealt more specifically with questionablehealth and safety concerns often disguised as trade
barriers. Countries could still set their own safetystandards but they had to be based on sound scientificevidence. The use of accepted international standardshas been encouraged and provides great potential fornew products and emerging markets.
Free trade and the removal of restrictions on themovement of goods and people are typically asso-ciated with increased globalisation. The dynamics ofworld trade are continuously and rapidly changing andlocal industries in South Africa have been addressingcritical quality issues to remain a small but key playerin world trade. In order to gain access to newlyemerging markets and remain competitive in tradi-tional markets frequented by South African exporters,consistent product quality of the highest standard hadto be assured. Quality remained a critical factor inaccessing competitive new markets and all effort hasbeen made to ensure that all products meet and exceedestablished standards.
Traditionally, quality was the accepted norm ininternational trade, but with globalisation cameincreased human exposure to newly emerging infec-tious food-borne diseases and more resistant groups ofpathogens. Chemical contamination of products or theenvironment, and fair trade principles, are alsochanging the face of minimum export criteria to whichgrowers and exporters have to adhere. Ensuring foodsafety along the food chain has become one of the
* Department of Microbiology and Plant Pathology, University of Pretoria, Pretoria, South Africa.
Quality assurance in agricultural produce,edited by G.I. Johnson, Le Van To, Nguyen Duy Duc and M.C. Webb.
ACIAR Proceedings 100(printed version published in 2000)
600
minimum requirements of First World countries, forboth locally produced and imported food products.These new challenges are currently sweeping throughthe world, and growers and exporters have in manyinstances been caught unprepared for new legislationof minimum food safety standards required by mostmajor First World countries such as the United Statesof America (USA) and in the European Community.
South Africa is one of the many countries thatentered the new millennium unprepared for the newminimum export requirements. Both the governmentand industry are currently haphazardly trying to dealwith the new incoming legislation, requirements andguidelines. This review presents an overview ofquality assurance systems in South Africa.
Economic Overview
Official census statistics indicate that South Africa’spopulation has increased by 62%, from 25 million in1980 to 40.6 million in 1996, when the last officialcensus was conducted. The current South African pop-ulation is estimated at 44 million. However, theongoing influx of illegal immigrants from mostlyother African countries, estimated by some as being ashigh as 10–12 million, distorts figures and signifi-cantly contributes to widespread poverty and ine-quality (Feneyes 1996). Furthermore, the country’seconomic development has not kept pace with therapidly increasing population. The economicallyactive group within the population has increased by5% only from 8.7 million in 1980 to 9.1 million in1996. Thus, whereas 35% of South Africa’s popu-lation was economically active in 1980, this numberdropped to 22% in 1996 (Abstracts of AgriculturalStatistics 2000).
The contribution of agriculture to South Africa’sgross domestic product (GDP) decreased from 6.1% in1980 to an estimated 4% in 1998. During the sameperiod, the percentage of the economically active pop-ulation in agriculture dropped from 35% to less than10%. Notwithstanding the general decline in agri-culture, the horticultural sector has maintained steadygrowth, from 14% of the gross value of agriculture in1980 to 25% (about $1.65 billion) at present. This hasbeen achieved on only 4.7% of the total agriculturalland. Fruits contribute 48.5% of the total value of hor-ticultural produce. Citrus is the largest singlecontributor, accounting for 32.8%, subtropical fruitscontribute 12.9% and deciduous fruit combined withtable grapes, 54.3% (Abstracts of Agricultural Sta-tistics 2000).
South Africa’s return to the international fold in theearly 1990s resulted in a major boom for exporters.Since 1990, fruit exports have increased dramaticallyfrom less than Rand (R) 1 billion to an estimated R4billion per annum. New export markets opened up andnew trade agreements were established once sanctionswere lifted. Provided South African fruit exportersremain competitive in terms of quality and price andthe industry can adapt to changing requirements, thisgrowth could be maintained in the years to come.
Development of Quality Standards and Certification Systems in South
Africa
Quality standards evolved in South Africa long beforethe arrival of Western civilisations. However, coloni-alism greatly influenced and structured qualitystandards over the past 300 years. Indigenous blacknations were applying quality standards in metal andwood works, tribal architecture, agriculture and trade.In 1652, the first Dutch settlement was established atthe then Cape of Good Hope (Cape Town), to providefresh produce to Dutch ships, which were en route tothe East Indies, based on Dutch standards. Britishstandards were introduced with the first occupation ofthe Cape in 1795 by the English and were usedalongside Dutch measuring and weighing standardseven after the Cape was handed back to the Dutch in1802. With the second British occupation in 1806, theBritish imperial system was introduced and trade andagricultural standards in South Africa were based onthe British systems for the remainder of the 19
th
century.
South African standards
In 1910, the Union of South Africa was formed as amember of the British Commonwealth. The BritishStandard Institute (BSI), which was eventuallyreplaced by the South African Bureau of Standards(SABS), had a strong influence on the development ofquality standards in South Africa. SABS was officiallyformed in 1945 to improve the quality of SouthAfrican products through the development ofgenerally accepted standards. Acceptance of standardswas voluntary for the most part and compulsorystandards were only enforced in exceptional cases.With the appearance of poor quality products incertain sectors, minimum standards were introduced toprevent the sale of such inferior products.
Quality assurance in agricultural produce,edited by G.I. Johnson, Le Van To, Nguyen Duy Duc and M.C. Webb.
ACIAR Proceedings 100(printed version published in 2000)
601
Based on the development of “The Operational andEvaluation of Quality Assurance Systems” (BS5179:1974) in Britain, the first quality managementstandards were published in South Africa (Pelser1995). Based on BS 5179, the first quality man-agement standard was published in South Africa,namely SABS 0157 of 1979. Increasing demand forthe implementation and certification of such qualitymanagement systems necessitated the establishmentof a listing scheme. The national listing scheme forquality auditors, namely the South African Committeefor the Certification of Quality Auditors (SACCQA)was established during the mid-eighties and is stillresponsible for the independent listing of qualityauditors. The first company was listed in 1983 and by1999 the number of listed companies had grown toapproximately 3,000, representing companies from allsectors but mostly mechanical engineering companies(40%). Seventy-six certified companies (2.5%) are inthe food and beverage industry.
The International Standards Organisation (ISO)9000 document was published in 1987 and SABS0157 of 1979 was revised to that of SABS 9000 in1992. Today, the SABS ISO 9000–9004 series ofstandards form the backbone of quality schemes usedby South African producers or marketers tobenchmark against international competition.
In 1990, with the debanning of the African NationalCongress, South Africa entered a new era with regardto politics and economics. Apartheid ended and a newgovernment came in power in 1994 under leadershipof President Nelson Mandela. A new South Africa wasborn accompanied by a drive to improve the quality oflife of all its people. The SABS initiated an extensiveplan to implement quality standards nation-wideworking within existing social, political and eco-nomical restrains. This initiative resulted in theregistration in 1991 of the South African QualityInstitute as a non-profit company in terms of Section21 of the Companies Act.
The rapid growth in global trade has necessitated theneed for international standards to be harmonised inorder for all countries to complete equally and fairly.South Africa became a signatory to the Agreement onTechnical Trade and Barriers (TBT) of the WorldTrade Organization (WTO) in 1994, agreeing tocomply with its code of good practice for the prepa-ration, adoption and application standards. In 1995,South Africa also signed the General Agreement onTariffs and Trade (GATT) treaty that necessitated arevision of its existing standards legislation. Conse-quently, in order to allow other organisations, both
locally and internationally, to test products for com-pliance with the SABS standards, the range of SABSmarks was modified. Before South Africa’sacceptance of GATT in 1995, SABS was the onlybody authorised to apply certification marks toproducts, but this new standard legislation introducedan element of competition which countered themonopolistic position of SABS in the field of qualitycertification. Currently a number of certificationschemes exist in direct competition to SABS certifi-cation, including Safe Quality Food (SQF™), SGSInternational Certification Services (Pty) Ltd, andVertitas. Despite being aimed at different targetmarkets, all of these certification schemes embrace thesame concepts of total quality management, qualityassurance, quality control and ISO 9000 and/or HazardAnalysis and Critical Control Points (HACCP)principles.
Industry schemes
A number of voluntary schemes are in place in theUnited Kingdom (UK), which require adherence tostandards or codes by members of trade associations.Some of these are completely self-regulated and othersinvolve use of third-party auditors, assessors orinspectors. Since the bulk of the South African exportsgo to the UK, these industry schemes would be appli-cable and regulated from abroad.
In South Africa, the different growers’ associationsare in the process of presenting minimum productionguidelines to growers based on good farming prac-tices. Most of these codes have been developedspecifically for South African growers taking intoaccount our unique socio-political situation, geo-graphical position, climatic conditions, culturalpractices, and export markets and their requirements.The most notable of these is the previous Outspanquality production guidelines and integrated pest man-agement certified programs. The Sunshine Seal ofQuality and the quality management system have beenimplemented successfully with most growers andpackers exporting through Capespan. However, thisremains a contentious issue with citrus growersexporting through other channels who do not haveaccess to this information. Although Capespan regardthis as their competitive edge, ‘outside’ growers feelthat the system was initially developed before deregu-lation and the information is therefore a national asset.More recently, the South African Mango Growers’Association has completed their quality assuranceguideline for both internal and external markets and
Quality assurance in agricultural produce,edited by G.I. Johnson, Le Van To, Nguyen Duy Duc and M.C. Webb.
ACIAR Proceedings 100(printed version published in 2000)
602
the South African Avocado Growers’ Guideline isalmost complete.
The deciduous fruit industry has followed an inte-grated fruit production (IFP) system since 1992.Currently this system is being upgraded to a completegrower guideline in line with new legislation on foodsafety and compliance with international standards ofGood Agricultural Practices (GAP). The estab-lishment of necessary guarantees to satisfyinternational markets and to audit the system are beingdeveloped for implementation in 2001 as part of avision 2010 strategic plan.
Distributors’ own brands and contracts
Most distributors’ own brand products—alsoreferred to as ‘own label’ products—are produced bythird-party packers against very specific standards.The majority of the brand owners conduct technicalaudits of their suppliers at regular intervals and/or usethird-party auditors for this purpose. ISO 9001 certifi-cation can assist in reducing the depth of audit in thequality systems area and minimise duplication ofeffort where one producer is manufacturing for severaldistributors’ own brands (Bolton 1997).
Fruit producers from South Africa supplying inter-national supermarket and retailer groups (e.g. Tescoand Euro Retailer Group) must also adhere to internalcodes of conduct or GAPs as stipulated by these cus-tomers. The codes of conduct and quality prerequisitesprescribed by these supermarket and retailer groupsare typically more stringent than minimum standardsrequired by UK and European Union legislation. It isthus possible to encounter a requirement to meet ISOstandard components without there being arequirement to hold the certification itself.
In South Africa, retail groups (e.g. Woolworths) andtheir suppliers (e.g. GEEST) have their own growerguidelines based on GAPs. These distributors’ ownbrands are currently regarded as special niche marketsin South Africa and are gaining in popularity. This isparticularly evident since deregulation, where biggercommercial growers opted for direct super chain storelinkages.
Ethical trade
Over the past year, corporate codes of conduct havebecome an increasingly important issue, particularlysince the formation of the Ethical Trading Initiative(ETI) in 1997. Supermarkets are playing an importantrole within the ETI, and the main European Union
supermarkets are in the process of introducing codesof conduct to their suppliers (Barrientos et al. 1999).Worldwide human rights issues such as child labour,exploitation of workers—particularly female workers,unfair wages etc. have become a contentious issue. Alarge proportion of the workforce within developingcountries is female, particularly in the production offood. This is especially so in the case of fresh producein South Africa.
Ethical trade covers the assurance of good labourand environmental standards in export production,within all developed and developing countries (Barri-entos et al. 1999). Several fair trade assignedorganisations, i.e. Max Havelaar, are currently negoti-ating with South African producers to market theirfresh products abroad under the fair trade banner.These selected niche markets are currently gainingpopularity in South Africa as a viable alternative fordisadvantaged producers.
Previously disadvantaged producers
Another selected niche market developing in SouthAfrica is partnerships between growers and farmlabourers. In certain partnerships, growers (particu-larly grape growers) have given labourers part of theland, guidance, training in specific skills, equipmentand funding from (generally) non-government organ-isations, to establish and develop their own products.One such success story is Thandi Wines produced in apartnership with Paul Cluver Wines, with a vision toassist the historically disadvantaged community inreaping the fruits of their labour.
Harmonized Generic Framework for African Codes of Practice for the Horticultural Sector (COLEACP)
In eastern and southern African countries severalCodes have been, or are being, developed underseparate initiatives by the respective export trade asso-ciations. The use of several African Codes containingdifferent standards risks undermining the position ofAfrican export products in the European markets bycreating confusion in the marketplace. In order toimprove market recognition of African produce and torespond to the market demands for environmentallyand socially responsible conditions of production,COLEACP took the initiative to encourage horticul-tural export associations from eastern and southern
Quality assurance in agricultural produce,edited by G.I. Johnson, Le Van To, Nguyen Duy Duc and M.C. Webb.
ACIAR Proceedings 100(printed version published in 2000)
603
African countries to move towards harmonisation oftheir Codes of Practice.
During a November 1999 meeting, a harmonisedframework was developed which will be evaluated ona yearly basis. The specific objectives and core criteriainclude:
a) Ensure the welfare of workers and out-growers(fair remuneration, fair labour conditions, noexploitation of minors and fair purchasingpolicy for producers /out-growers);
b) Ensure workers’ occupational health and safety(preventing risks and adequate provision ofhealth services);
c) Control and reduce environmental degradationfrom agrochemical use (reducing quantityused; ensuring safe transport, usage, storageand disposal thereof; and minimising oravoiding environmental contamination);
d) Safeguard soil, water and air (sustainable waterresource and land use management, soil con-servation, management of hazardous waste,reduction in in use of non-renewal energyresources, use of environmentally friendlypackaging);
e) Safeguard consumer health (through duediligence in crop production and pesticide use,safeguarding of product from contaminationthroughout the chain, identification and controlof hazards, ensuring the personal hygiene ofworkers, effective temperature management toprevent spoilage, and ensuring that packagingmaterial is not a source of contamination).
Development of South African Agricultural Export Product
Standarisation
The Cape Government requested the appointment ofan officer to inspect export fruits shipped from CapeTown Harbour in 1899. Inspection Regulations weredrafted and in 1904 an official inspection officer wasappointed. However, participation in inspections wasvoluntary until 1910 with the establishment of theUnion of South Africa. The Export Fruit Act No. 1 of1910 was publicised and inspections of export fruitsbecame compulsory. The Fruit Export Control Board(FECB) was established in 1925 to distribute andassign vessel space to citrus and deciduous fruitexporters. The FECB board was replaced in 1926 bythe Perishable Products Export Control Board(PPECB) through Act No. 53 of 1926. Its main
objective was to ensure equal space allocation forexporters of all perishable products. In addition,PPECB was responsible for formulating temperatureregimes and for treatments of various products, and toensure that these were effectively applied throughoutthe export and marketing chain.
Extensive investigation by the Commission ofAdministration led to the privatisation of PPECB andpromulgation of the Perishable Products Exportcontrol Act No. 9 of 1983. This Act provided forPPECB control of all perishable products intended forexport from South Africa and all matters connectedtherewith. Following specific requests by major exportindustries, the Ministry of Agriculture in 1990delegated all export quality inspection functions ofagricultural products to PPECB in terms of the Agri-cultural Product Standard Act No. 119 of 1990. ThisAct provides for control over sales and export of agri-cultural and related products and all relevant mattersrelated to endpoint inspections and quality assurancealong the marketing chain ‘from the gate to the plate’.PPECB is responsible for 226 different types ofproducts at 679 permanent inspection points aroundSouth and southern Africa (including Zimbabwe,Mozambique, Swaziland and Namibia). The totalvolume of sea exports handled by PPECB is sevenmillion m
3
per annum (p.a.), valued at R24 billion p.a.,and exports have grown at an average of 30% p.a. overthe last five years.
Today, PPECB is an independent statutory bodyfunctioning under the two acts, and is divided into fourindependent departments namely (a) quality assuranceand logistics; (b) technical services; (c) financialservices; and (d) human resources and development.Only relevant issues pertaining to the first two depart-ments will be discussed.
Department of Quality Assurance and Logistics
The objective of this department is to verify exportproduct conformity to specific regulations and themaintenance thereafter, including handling, storageand transport. All products are inspected at the point ofdispatch. Upon approval, an export certificate is issuedand pallets marked with the PPECB mark of approval.Product samples are also tested at two state labora-tories for maximum pesticide residue levels anddangerous substances. All ship holds and containersare inspected and temperatures monitored to complywith prescribed standards.
Quality assurance in agricultural produce,edited by G.I. Johnson, Le Van To, Nguyen Duy Duc and M.C. Webb.
ACIAR Proceedings 100(printed version published in 2000)
604
Department of Technical Services
This department is responsible for research, andproduct, equipment and systems development. This isachieved through cooperation with research institutessuch as the Agricultural Research Council (ARC), uni-versities and various international institutes. Producthandling, storage and transportation systems arerefined and improved and recommendations madeaccordingly. New opportunities in technology andmarketing are identified, evaluated and developed intopractical commercial applications. Product systemsfor various South African perishable product exportindustries have been developed according to interna-tionally prescribed procedures such as ISO andHACCP. The department is accredited by the UnitedStates Department of Agriculture (USDA) and otherstate departments of agriculture, including those ofJapan and Taiwan.
Deregulation and Its Effect on the South African Agricultural Sector
The new government of national unity, elected in1994, introduced numerous policy changes directlyaffecting agriculture. These included the promulgationof the Marketing of Agricultural Products Act, No. 47of 1996. This act nullified the era of controlled, singlemarketing, which was established during the 1930s formost agricultural products. The objectives of the newAct were to promote efficiency in agriculture, increasemarket access, optimise export earnings and promotethe viability of the sector (Kirsten and Vink 2000). Inaddition, the National Agricultural Marketing Councilwas set up, with the main function of monitoring thelimited market interventions and thereby preventingmarket distortions. The main functions of the previousAct (the control boards) were to implement marketinterventions.
In addition, the new government embarked on aprocess of trade policy reform aimed at reversingdecades of ‘inward industrialisation’ strategies(Kirsten and Vink 2000). This exposed business totariffs that were often below the bound rates nego-tiated at the Uruguay round of GATT. However, tariffson agricultural goods had been reduced faster thanrequired by GATT. The fact that South Africa gainedmembership of the Cairns group signalled thecountries intention to unilaterally liberalise farmersupport programs. In the interim, South Africa hassuccessfully negotiated a free trade agreement with theEuropean Union, has agreed to the new South African
Development Counties (SADC) protocol and re-nego-tiated the new Southern African Customs Union treaty(Kirsten and Vink 2000).
The final aspect was labour market reforms, whichresulted in new legislation becoming more applicableto the agricultural sectors. Other new agriculturalpolicy initiatives focused strongly on the transfor-mation, reconstruction and development of small-scale farmer systems. These programs are becomingmore important to ensure sustained growth in agri-culture within an equity structure (Van Rooyen andNene 1996). In future, systems will increasingly beintroduced to establish new and emerging farmers inthe wider South African environment.
The competitive status of agribusiness in SouthAfrica was recently determined and revealed that themajority of commodity chains are marginally compet-itive (Esterhuizen and Van Rooyen 2000). Except forwheat, maize, apple and pineapple chains, the compet-itive index generally decreases when moving fromprimary to processed products. This implies thatvalue-adding opportunities in South Africa arerestricted. In order to ensure global competitiveness,improvements in the whole supply chain should bemade. It is no longer good enough for growers tocompete globally at the farm-gate level. Due to longheld market interventions, regulation and control,growers grew complacent in taking responsibility forthe quality of their product all the way through themarketing chain. It was generally perceived in SouthAfrica that the growers’ responsibility stopped at thefarm gate and that the regulatory control board had totake the full responsibility from the gate to the plate.This incorporated marketing, transport, shipping andselling that is often managed through a pool system. Incertain cases these systems of no traceability and non-accountability bred mediocrity and suboptimal qualitythrough sloppy management practices.
With increased global competition South Africanexporters will now have to take more responsibility fortheir product and be accountable for its standards andsafety. This is inevitable if our agricultural exportindustry is to survive, as increased competition frommore sophisticated and adaptive competitors caneasily destroy our competitive edge in the market-place. Adding to these internal political and socialchanges, ongoing restructuring processes and majortransformations in agriculture all contribute to uncer-tainty and insecurity, which further threaten our exportindustry. Taking note of new changes in the market-place and adapting to new minimum requirements forfood safety and quality can ensure that we ‘ride the
Quality assurance in agricultural produce,edited by G.I. Johnson, Le Van To, Nguyen Duy Duc and M.C. Webb.
ACIAR Proceedings 100(printed version published in 2000)
605
storm’ and thereby strengthen our export-orientatedfruit industries.
Deregulation has had a positive impact on theconsumer price index with food inflation decliningfrom a high of 25% in 1992 to around 7.5% currently.Deregulation has also attracted new business andinvestments from domestic and foreign investors andcreated new business and job opportunities in farmingand associated industries to replace the activities of thevarious control boards. This is illustrated by the factthat new company registrations in the agricultural andfishery sectors increased by 209% between 1994 and1997. Deregulation has also resulted in changes incropping patterns with the focus shifting from uncom-petitive field crops to the cultivation of high valuehorticultural production.
Land Reform and Redistribution
With current redistribution policies in Zimbabwe,South African landowners are very much aware of thedisproportional ownership of agricultural land in thehands of white commercial farmers. Current SouthAfrican government policies are aimed at redistrib-uting land through organised programs and hope toavoid the land grab chaos eminent in Zimbabwe.Current estimated figures place 70% of agriculturalland in the hands of white commercial farmers(Huntley et al. 1989). Current emphasis on devel-opment, research and extension services for emergingblack farmers, small-scale farmers and subsistencefarmers are high on the agenda of government depart-ments and funding organisations such as the USAKellogg’s Foundation. Developing quality assuranceand food safety systems for these categories of farmersare another high priority for the Department of Agri-culture, and are currently being developed by theDepartment and the post-harvest technology hub ofthe University of Pretoria and the Scientific ResearchCouncil (CSIR).
Legislation Affecting Quality Assurance or
Good Farming Practices
Since the rebirth of a new South Africa in 1994,changing political or economical climates signifi-cantly influenced the introduction of new legislationand revisions to existing legislation, incorporatinglessons from the past. South Africa is also committed(a) to the observance of internationally agreed core
labour standards, (b) to address global environmentalproblems and (c) to ensure quality and safety ofproducts through its legislation.
Core labour standards
Free trade and globalisation increase competitionbetween countries and negatively impact on labourcosts. The International Labour Organization foundedcore labour standards that are used as base codes in theEthical Trading Initiative (ETI). These are minimumstandards that are voluntarily adopted to raise labourstandards.
Unemployment Insurance Act (UIA), 1993
This Act is the first labour legislation to cover farmworkers and provides for the creation of an Unem-ployment Insurance Fund (UIF) for farm workers.
Occupational Health and Safety Act, 1993
This Act provides for the health and safety ofpersons at work, persons in connection with the use ofplant and machinery, and the protection of othersagainst health and safety hazards arising out of or inconnection with the activities of persons at work.
Labour Relations Act, 1995
This act provides employees with the freedom oforganisation to join a union. Unionised employees alsohave the right to strike. Unions who are sufficientlyrepresented must be allowed to enter farms/work-places and have access to their members. Employeeshave also the right to decision-making in theworkplace through the formation of a workplaceforum. The formation of such a forum is permitted ifmore than 100 people are employed and if it supportsthe majority union. Workers that are unfairlydismissed have the right to be represented by theirunion in subsequent negotiation with their employersand other interested parties.
Employment Equity Act, 1998
The Act aims to provide for employment equitythrough the implementation of affirmative actionprograms for a designated group of employees and toeliminate unfair discrimination in the workplace. Thisdesignated group of employees includes Africanpeople, women and people with disabilities.
Skills Development Act, 1998
This Act aims to develop and improve the skills ofthe South African workforce and to provide for
Quality assurance in agricultural produce,edited by G.I. Johnson, Le Van To, Nguyen Duy Duc and M.C. Webb.
ACIAR Proceedings 100(printed version published in 2000)
606
education that leads to recognised occupationalqualifications.
Basic Conditions of Employment Act, 1997
The purpose of this Act is to advance economicdevelopment and social justice through establishingand enforcing basic conditions of employment and toregulate the variation of basic conditions ofemployment. The Act also makes provision for farmworkers and provides greater protection for temporaryand seasonal workers.
Extension of Security of Tenure Act (ESTA), 1997
This Act protects occupiers living on agriculturalfarms with the permission of the landowner. The Actprohibits unlawful evictions and provides a greatertenure security to farm workers living on the farm.
Global environmental problems
Agriculture is a prime user of natural resources anddespite its advantage as a supplier of foreign exchange,food and employment opportunities in South Africaneconomy, a high price has been paid with the degra-dation of natural ecosystems.
Environmental Conservation Act, 1989 (Act No. 73 of 1989)
This Act provides for the effective protection andcontrolled utilisation of the environment.
Quality and safety
Trade Metrology Act, 1973 (Act No. 77 of 1973)
This Act, which replaced the previous Weights andMeasures Act, 1958 and amendments thereafter, stip-ulates that products must conform to quantitystatements as indicated and comply to weights,measures and standards regulations.
Health Act, 1977 (Act No. 63 of 1977)
This Act, which replaced the old Public Health Actof 1919, makes provision for measures to promote thehealth of South African people. The responsibilities ofvarious health services and the rendering of healthservices are stipulated. Amongst others, legislationrequires that preventative action must be taken toeliminate transmission of infectious diseases.
The latest amendment to the Act, revised on 17 July1999, specifies requirements relating to hygiene andthe transportation of food. Certificates of acceptabilityby food handlers are now required and regulationsstipulate minimum requirements for food premises,
such as building requirements, ventilation, illumi-nation and sanitary facilities. Surfaces should becleaned and washed before and after food handlingwith a cleaning material that will not contaminate thefood. The Act permits a maximum of 100 viablemicroorganisms/cm
2
upon analysis taken by the swabtechnique (SABS Standard Test Method 763). Thehandling of food is not permitted without handlerswearing suitable protective clothing and food handlersmust apply basic hygienic habits. Spitting, smoking,eating or drinking is prohibited in a food handlingarea. Cleanliness (chemical, physical and microbio-logical) is a prerequisite for food containers and theparts of vehicles in which food containers are trans-ported. Storage, display and transport of perishablefood must be at a core temperature in order to maintainfood quality. Inspections of premises may lead to theevacuation, closing and demolition of those premisesnot adhering to required specifications. Individualsmay also be prosecuted for failing to comply with anyprovision of this Act.
Agricultural Product Standard Act, 1990 (Act No. 119 of 1990)
This Act provides minimum standards for the exportof produce. Individual specifications are listed andspecifications and regulations are revised on anongoing basis. Aspects specified in the Act coverquality standards of produce as well as produce com-pliance with packing requirements. requirements forcontainers in which produce are packed, the markingand labelling of containers, and inspections. Produceis inspected for uniformity and quality standards, thepresence of arthropods and prescribed residue limits.Exporters are also required to provide inspectors withdetails of the preharvest spray program that was usedon trees and postharvest chemical treatments on fruits.
Regulations regarding control over the sale oforganically produced products in the South Africa
wasrecently drafted as an extension of the AgriculturalProduct Standards Act, 1990. This new Act providesgeneral standards for organically produced productsand makes provision for the improvement oflandscape and biodiversity through productionmeasures employed.
General guidelines for code of practice, regardinggeneral principles of food hygiene, in the agriculturalfood industry
are being drafted and will be based onphytosanitary, ISO 9000 and HACCP principles.
Quality assurance in agricultural produce,edited by G.I. Johnson, Le Van To, Nguyen Duy Duc and M.C. Webb.
ACIAR Proceedings 100(printed version published in 2000)
607
Perishable Product Export Control Act, 1983 (Act No. 9 of 1983)
This Act provides for the control of perishableproducts intended for export from the Republic ofSouth Africa and provides for the continued existenceof the Perishable Products Export Control Board(PPECB).
The functions of the board are as follows: to (a)control the export shipment of perishable productsfrom the Republic and the order of shipment thereof atall ports; (b) determine which ships are suitable for theconveyance of perishable products and the class ofaccommodation to which any perishable product shallbe assigned; (c) call for and receive from intendingexporters of perishable products estimates and otherparticulars of their intended exports; (d) call for andreceive from ship owners or their representatives,information regarding the amount of space suitable forthe conveyance of perishable products available onany ship appointed to call at any port in the Republic;(e) arrange for the provision of port facilities andshipping space; (f) divert ships to most suitable ports;(g) investigate conveyance and cold storage require-ments for perishable products and makerecommendations thereon; (h) make recommenda-tions regarding the way perishable products arehandled during transport; (i) promote uniform freightrates in respect of the export of perishable products,with due allowance for particular perishable products,port of export and means of conveyance; and (j)perform such other functions related to the export ofperishable products from the Republic as may be pre-scribed by regulations.
The Act also provides for the imposition of leviespayable to the Board by exporters of perishableproduct to meet expenditures incurred by the Board.Levies are determined by the type of transport, time ofyear, and the category and quality of the perishableproduct that has been exported.
Marketing of Agricultural Products Act, 1996 (Act No. 47 of 1996)
The objectives of this Act are to (a) increase themarket access for all market participants; (b) promotethe efficiency of the marketing of agriculturalproducts; (c) optimise export earnings from agricul-tural products; and (d) enhance the viability of theagricultural sector. This Act also provides for theestablishment of a National Agricultural MarketingCouncil (NAMC) that replaced various control boardsand the National Marketing Council (NMC) createdunder the previous Act. Whereas the main function of
the now defunct control boards and NMC was toimplement market interventions, the NAMC onlymonitors those few interventions that are permitted toprevent the creation of market distortions that couldadversely affect the welfare of the agricultural sectoror the country at large.
Conclusions
With the ever-growing world population there willremain an increased need to store agricultural producefor longer periods of time. This will be required toaccommodate global movement of produce to regionswhere there is a demand for or shortage of the par-ticular commodity and for regional local storage oftheir crops for periods of extended marketing.Increased competition on the export markets fromemerging, underdeveloped countries and the simulta-neous ‘wider’ range of exotic fruits and vegetablesthey can deliver all year round, will shift the emphasisto effective marketing and quality assurance.According to Basker (1988), quality of a horticulturalproduct is a composite of those characteristics thatdetermine the degree of acceptability by a consumer.
Ensuring food safety throughout the food supplychain requires a comprehensive and coordinatedeffort. The responsibility to safeguard the food supplyis shared by everyone involved, from farmers to con-sumers. This includes growers, farm workers, packers,shippers, transporters, importers, wholesalers,retailers, government agencies, and consumers.
There is a great need in Southern Africa to developan economically acceptable, practical managementsystem to minimise microbial food safety hazards.Once prerequisite programs such as GAP are in place,it is important to ensure that the process is workingcorrectly and is sustained. Without accountability toensure the process is working, the best attempts tominimise microbial food safety hazards in fresh fruitsand vegetables are subject to failure.
South Africa is well positioned to extend its marketshare, providing it can maintain its high level ofresearch and technology development capacity andredress imbalances of the past. A systematic approachof bringing emerging black farmers and small-scalefarmers on board the export ‘bus’, and in particulardeveloping niche markets for these growers, willensure political and economic stability in the regionand continent. The challenges are enormous for SouthAfrican agriculture and require visionary thinkers thatwill lead the way.
Quality assurance in agricultural produce,edited by G.I. Johnson, Le Van To, Nguyen Duy Duc and M.C. Webb.
ACIAR Proceedings 100(printed version published in 2000)
608
References
Barrientos, S., McClenaghan, S. and Orton, L. 1999. Genderand codes of conduct: a case study from horticulture inSouth Africa. United Kingdom, Department forInternational Development (DFID).
Bolton, A. 1997. Quality management systems for the foodindustry: a guide to ISO 9001/2. London, BlackieAcademic and Professional, 193p.
Davies, F.S. and Albrigo, L.G. 1994. Citrus. Cropproduction science in horticulture. Wallingford, CABInternational.
Esterhuizen, D. and Van Rooyen, C.J. 2000. Howcompetitive is agribusiness in the South Africancommodity chain? On the Internet at <http://www.up.ac.za.academic/ecoagric/research/index.html>.
Feneyes, T.I. 1996. South Africa, Africa and the world: apolitical economy perspective. Agrekon, 35, 73–75.
Huntley, B., Siegfried, R. and Sunter, C. 1989. SouthAfrican environments into the 21
st
century. Tafelberg,Human and Rousseau.
Kirsten, J. and Vink, N. 2000. Agricultural policy in SouthAfrica in the 1990s. On the Internet at <http://www.up.ac.za.academic/ecoagric/research/index.html>.
Pelser, C. 1995. Standardisation in South Africa. Pretoria,South African Bureau of Standards.
Satin, M. 1999. Food quality and international trade. On theInternet at <http://www.fao.org/ag/ags/agsi/gtz/5Fhtml.htm>.
Van Rooyen, C.J. and Nene, S. 1996. What can we learnfrom previous small scale farmer development strategiesin South Africa? Agrekon, 35, 325–330.
Quality assurance in agricultural produce,edited by G.I. Johnson, Le Van To, Nguyen Duy Duc and M.C. Webb.
ACIAR Proceedings 100(printed version published in 2000)
609
Use of a High-temperature, Forced-air Quarantine (Non-chemical) Treatment for
Fiji Export Commodities
S. Kumar*
Abstract
Exports from Fiji were greatly affected when the fumigant ethylene dibromide was lost as a quarantinetreatment. However, the use of a high-temperature, forced-air (HTFA) treatment, introduced to Fiji through theNature’s Way Cooperative (Fiji) Limited, has allowed not only re-establishment but also expansion of theexport market for papaya, eggplant and breadfruit. The market potential for these commodities in NewZealand, Australia and Canada is discussed.
I
NCREASING
ENVIRONMENTAL
and health concerns ofimporting countries have created both problems andopportunities for exports. The fumigant ethylenedibromide was lost as a quarantine treatment (fruitsand vegetables) in 1992 and methyl dibromide (rootcrops) is being phased out because of the damage itcauses to the ozone layer.
However, meeting the low pesticide residuerequirement of importing countries has increasinglybecome a part of the quality standards that must be metfor successful high-value exports. Taken a stepfurther, some Fiji farmers are now starting to takeadvantage of the significant and growing market forcertified organic products.
Background
Fiji’s potential for developing significant fresh fruitexport industries has been identified in numerous con-sultancy reports and development plans over the last20 years or so. At last this potential is now starting tobe realised. Nature’s Way Cooperative (Fiji) Limited(NWC), through the high-temperature, forced-air(HTFA) quarantine treatment facility it operates, has
contributed to the progress now being made in thediversification of Fiji’s agricultural exports.
Expanding Exports to New Zealand
When the fumigant ethylene dibromide was lost as aquarantine treatment in 1992, the modest export tradein fresh fruit to New Zealand and Australia was largelylost. Fiji responded more quickly than most of its com-petitors, including Australia, by adopting the non-chemical HTFA quarantine treatment technology.NWC’s HTFA facility was certified for the export ofpapaya to New Zealand in October 1996. Certificationfor eggplant, mango and breadfruit soon followed, andexports to New Zealand have grown steadily (Table 1).
Nature’s Way Cooperative (Fiji) Ltd
NWC owns and operates the HTFA facility at NadiAirport. The Cooperative has 86 financial members,made up of 72 farmers and 14 exporters. NWCprovides the quarantine treatment service to itsmembers. The Cooperative also packs the fruit for theexporter after treatment. For this service, exporters arecharged a fee of 40 cents/kg of fruit treated. The man-agement of the facility is under the responsibility of aBoard of Directors, with day-to-day operations underthe direction of the facility manager.
* Nature’s Way Cooperative (Fiji) Limited, PO Box 9825, Nadi Airport, Fiji Islands.
Quality assurance in agricultural produce,edited by G.I. Johnson, Le Van To, Nguyen Duy Duc and M.C. Webb.
ACIAR Proceedings 100(printed version published in 2000)
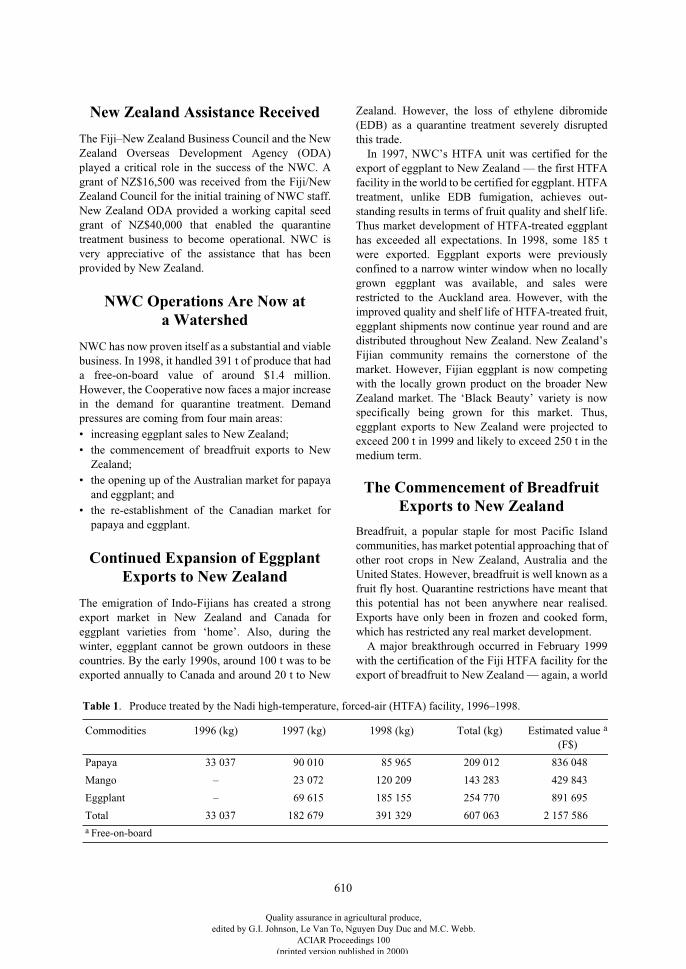
610
New Zealand Assistance Received
The Fiji–New Zealand Business Council and the NewZealand Overseas Development Agency (ODA)played a critical role in the success of the NWC. Agrant of NZ$16,500 was received from the Fiji/NewZealand Council for the initial training of NWC staff.New Zealand ODA provided a working capital seedgrant of NZ$40,000 that enabled the quarantinetreatment business to become operational. NWC isvery appreciative of the assistance that has beenprovided by New Zealand.
NWC Operations Are Now ata Watershed
NWC has now proven itself as a substantial and viablebusiness. In 1998, it handled 391 t of produce that hada free-on-board value of around $1.4 million.However, the Cooperative now faces a major increasein the demand for quarantine treatment. Demandpressures are coming from four main areas:• increasing eggplant sales to New Zealand;• the commencement of breadfruit exports to New
Zealand;• the opening up of the Australian market for papaya
and eggplant; and• the re-establishment of the Canadian market for
papaya and eggplant.
Continued Expansion of Eggplant Exports to New Zealand
The emigration of Indo-Fijians has created a strongexport market in New Zealand and Canada foreggplant varieties from ‘home’. Also, during thewinter, eggplant cannot be grown outdoors in thesecountries. By the early 1990s, around 100 t was to beexported annually to Canada and around 20 t to New
Zealand. However, the loss of ethylene dibromide(EDB) as a quarantine treatment severely disruptedthis trade.
In 1997, NWC’s HTFA unit was certified for theexport of eggplant to New Zealand — the first HTFAfacility in the world to be certified for eggplant. HTFAtreatment, unlike EDB fumigation, achieves out-standing results in terms of fruit quality and shelf life.Thus market development of HTFA-treated eggplanthas exceeded all expectations. In 1998, some 185 twere exported. Eggplant exports were previouslyconfined to a narrow winter window when no locallygrown eggplant was available, and sales wererestricted to the Auckland area. However, with theimproved quality and shelf life of HTFA-treated fruit,eggplant shipments now continue year round and aredistributed throughout New Zealand. New Zealand’sFijian community remains the cornerstone of themarket. However, Fijian eggplant is now competingwith the locally grown product on the broader NewZealand market. The ‘Black Beauty’ variety is nowspecifically being grown for this market. Thus,eggplant exports to New Zealand were projected toexceed 200 t in 1999 and likely to exceed 250 t in themedium term.
The Commencement of Breadfruit Exports to New Zealand
Breadfruit, a popular staple for most Pacific Islandcommunities, has market potential approaching that ofother root crops in New Zealand, Australia and theUnited States. However, breadfruit is well known as afruit fly host. Quarantine restrictions have meant thatthis potential has not been anywhere near realised.Exports have only been in frozen and cooked form,which has restricted any real market development.
A major breakthrough occurred in February 1999with the certification of the Fiji HTFA facility for theexport of breadfruit to New Zealand — again, a world
Table 1. Produce treated by the Nadi high-temperature, forced-air (HTFA) facility, 1996–1998.
Commodities 1996 (kg) 1997 (kg) 1998 (kg) Total (kg) Estimated value a (F$)
Papaya 33 037 90 010 85 965 209 012 836 048
Mango – 23 072 120 209 143 283 429 843
Eggplant – 69 615 185 155 254 770 891 695
Total 33 037 182 679 391 329 607 063 2 157 586a Free-on-board
Quality assurance in agricultural produce,edited by G.I. Johnson, Le Van To, Nguyen Duy Duc and M.C. Webb.
ACIAR Proceedings 100(printed version published in 2000)
611
first. Breadfruit shipments were expected tocommence in June. NWC made a decision to delay thefirst shipment until growers were registered and a baitspray program was in place. Also, NWC’s managerwas undertaking shelf life tests for various HTFA-treated breadfruit varieties. It is anticipated that, aswith eggplant, HTFA treatment will enhance the shelflife of breadfruit.
In 1998, the value of New Zealand root crop importswas almost NZ$8 million. A 5% market share forbreadfruit of the New Zealand root crop market wouldnot seem unreasonable. This would mean treating inthe vicinity of 200–300 t of fruit, concentrated in thetwo breadfruit seasons. Smaller, but significant,markets could be expected in Australia and the UnitedStates West Coast.
Opening Up of the Australian Market for Papaya and Eggplant
Progress in opening up the Australian market forHTFA-treated papaya has been disappointingly slow.Prior to the loss of EDB, Fiji was exporting 50–150 tannually to Australia. Thus, it was assumed that thismarket would be re-established soon after HTFA-treated papaya shipments started to New Zealand.However, it is only now that the Australian Quarantineand Inspection Service has requested confirmatorytests for papaya to be undertaken at the Nadi HTFAfacility. The expectation is that exports will commencereasonably soon after these data have been submitted.Papaya exports are expected to exceed 150 t annuallyonce the supply is available.
It is anticipated that eggplant shipments to Australiawill follow reasonably quickly after the certification of
papaya. Australia has a sizeable Fijian communitywhich, based on the New Zealand experience, offers asignificant market for HTFA-treated eggplant. Aus-tralia’s largest ethnic communities, particularlyMelbourne’s Greek population, offer an even largerpotential market.
Re-establishment of the Canadian Market for Papaya and Eggplant
Prior to 1992, there were sizeable exports of papaya,eggplant and other produce to Canada. These air-freight exports were transshipped through Hawaii.However, in 1992, the United States Department ofAgriculture (USDA) banned the transshipment of allfruit fly host material through Hawaii. Indications arethat this ban will finally be lifted for HTFA-treatedproduce. As a result of intervention of the UnitedStates–Pacific Island Joint Commercial Commission,a high-level USDA mission was to visit Fiji in June1999 to inspect the HTFA facility.
Based on past export performance, several hundredtonnes of papaya could be exported to Canada, oncethe supplies are available. NWC’s exporters arelooking forward to sizeable eggplant exports toCanada. In the past, more eggplant was exported toCanada than to New Zealand.
The HTFA technology was developed by the Uni-versity of Hawaii and Dr Mike Williamson is theengineer responsible for commercialising HTFA tech-nology. He has been closely involved in the Fijifacility since its inception, commissioning the facilityand providing ongoing technical support and trainingservices. Dr Williamson is the Principal of QuarantineTechnologies International.
Quality assurance in agricultural produce,edited by G.I. Johnson, Le Van To, Nguyen Duy Duc and M.C. Webb.
ACIAR Proceedings 100(printed version published in 2000)
612
Induction of Red Grapefruit Resistance to
Penicillium digitatum
and Chilling Injury bya Short Hot Water Brushing Treatment
S. Lurie, R. Porat, D. Pavoncello, J. Peretz, B. Weiss, L. Cohen,S. Ben-Yehoshua, E. Fallik and S. Droby*
Abstract
Postharvest heat treatments have been used for many years as alternative, non-chemical methods to controlfungal diseases and insect infestation in fruits and vegetables. In this study, we examined the effects of a newhot water brushing (HWB) treatment, which sprays hot water on fruit as they move along a belt of brush rollers,on the resistance of red grapefruit (
Citrus paradisi
‘Star Ruby’) to green mould decay caused by
Penicilliumdigitatum
(Pers.: Fr.) Sacc. and on the development of chilling injury (CI) symptoms during cold storage. Wefound that a 20 s HWB treatment at 59°C and 62°C reduced decay, after artificial inoculation of wounded fruit,by 52% and 70%, respectively, as compared to untreated fruit (control), whereas rinsing and brushing the fruitwith tap water (~20°C), or with hot water at lower temperatures of 53°C and 56°C, were ineffective in reducingdecay development. The HWB treatments were most effective in enhancing fruit disease resistance when thefruit were inoculated 1 or 3 days after the heat treatments, and were much less effective when the fruit wereinoculated on the same day or after 7 days. The HWB treatments at 59°C and 62°C for 20 s also significantlyreduced the CI index and the percentage of fruit displaying CI symptoms after 6 weeks of storage at 2°C andan additional week at 20°C by 42% and 58%, respectively, as compared to untreated fruit. Again, rinsing andbrushing the fruit with tap water, or HWB treatments at lower temperatures of 53°C and 56°C, had nosignificant effect on CI incidence. The HWB treatments further cleaned the fruit and improved its generalappearance without causing any surface damage, and did not influence fruit weight loss, percentage of totalsoluble solids in the juice, juice acidity, or fruit colour.
H
EAT
TREATMENTS
, including hot water dips, vapourheat and forced hot air, have been used for many yearsas non-chemical methods to control fungal rots andinsect infestation in various fruits and vegetables(Couey 1989; Barkai-Golan and Phillips 1991; Lurie1998). In addition, some of these heat treatments havealso been used to enhance the tolerance of commod-ities to chilling injury (CI) development during coldstorage (reviewed by Lurie 1998). During the last fewyears, physical heat treatments have receivedincreasing interest due to the de-registration of anumber of chemical treatments that have previouslybeen used to control postharvest pathogens, andbecause of the public interest in chemical-freeproduce.
In the present study, we examined the use of a recentimprovement in the hot water dip treatment, which hasbeen developed to comprise a hot water rinsing andbrushing treatment (Fallik et al. 1999). The advantagesof this technique are that it simultaneously cleans anddisinfects the fruit; it fits into the packinghouse sortingline; and it requires a much shorter exposure time(10–30 s) than the conventional hot water dip treat-ments, which usually require a few minutes.
Materials and Methods
Plant material and storage conditions
Red grapefruit (
Citrus paradisi
‘Star Ruby’) wereobtained from a local orchard and used on the day ofharvest. For storage experiments, fruit were kept for 6weeks at 2°C and then transferred for another week to
* Department of Postharvest Science of Fresh Produce, Agricultural Research Organization, The Volcani Center, PO Box 6, Bet Dagan 50250, Israel.
Quality assurance in agricultural produce,edited by G.I. Johnson, Le Van To, Nguyen Duy Duc and M.C. Webb.
ACIAR Proceedings 100(printed version published in 2000)
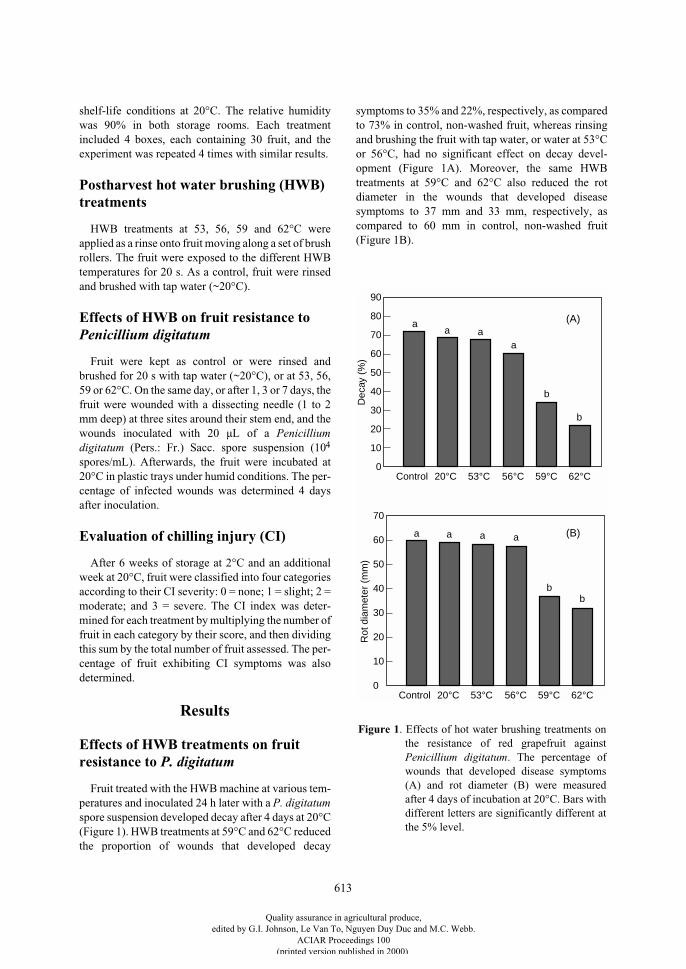
613
shelf-life conditions at 20°C. The relative humiditywas 90% in both storage rooms. Each treatmentincluded 4 boxes, each containing 30 fruit, and theexperiment was repeated 4 times with similar results.
Postharvest hot water brushing (HWB) treatments
HWB treatments at 53, 56, 59 and 62°C wereapplied as a rinse onto fruit moving along a set of brushrollers. The fruit were exposed to the different HWBtemperatures for 20 s. As a control, fruit were rinsedand brushed with tap water (~20°C).
Effects of HWB on fruit resistance to
Penicillium digitatum
Fruit were kept as control or were rinsed andbrushed for 20 s with tap water (~20°C), or at 53, 56,59 or 62°C. On the same day, or after 1, 3 or 7 days, thefruit were wounded with a dissecting needle (1 to 2mm deep) at three sites around their stem end, and thewounds inoculated with 20 µL of a
Penicilliumdigitatum
(Pers.: Fr.) Sacc. spore suspension (10
4
spores/mL). Afterwards, the fruit were incubated at20°C in plastic trays under humid conditions. The per-centage of infected wounds was determined 4 daysafter inoculation.
Evaluation of chilling injury (CI)
After 6 weeks of storage at 2°C and an additionalweek at 20°C, fruit were classified into four categoriesaccording to their CI severity: 0 = none; 1 = slight; 2 =moderate; and 3 = severe. The CI index was deter-mined for each treatment by multiplying the number offruit in each category by their score, and then dividingthis sum by the total number of fruit assessed. The per-centage of fruit exhibiting CI symptoms was alsodetermined.
Results
Effects of HWB treatments on fruit resistance to
P. digitatum
Fruit treated with the HWB machine at various tem-peratures and inoculated 24 h later with a
P. digitatum
spore suspension developed decay after 4 days at 20°C(Figure 1). HWB treatments at 59°C and 62°C reducedthe proportion of wounds that developed decay
symptoms to 35% and 22%, respectively, as comparedto 73% in control, non-washed fruit, whereas rinsingand brushing the fruit with tap water, or water at 53°Cor 56°C, had no significant effect on decay devel-opment (Figure 1A). Moreover, the same HWBtreatments at 59°C and 62°C also reduced the rotdiameter in the wounds that developed diseasesymptoms to 37 mm and 33 mm, respectively, ascompared to 60 mm in control, non-washed fruit(Figure 1B).
20°CControl
60
50
40
30
20
10
056°C 62°C
Rot
dia
met
er (
mm
)
53°C 59°C
70
20°CControl
60
50
40
30
20
10
056°C 62°C
Dec
ay (
%)
53°C 59°C
70
80
90
a a a a
bb
aa a
a
b
b
(A)
(B)
Figure 1. Effects of hot water brushing treatments onthe resistance of red grapefruit againstPenicillium digitatum. The percentage ofwounds that developed disease symptoms(A) and rot diameter (B) were measuredafter 4 days of incubation at 20°C. Bars withdifferent letters are significantly different atthe 5% level.
Quality assurance in agricultural produce,edited by G.I. Johnson, Le Van To, Nguyen Duy Duc and M.C. Webb.
ACIAR Proceedings 100(printed version published in 2000)
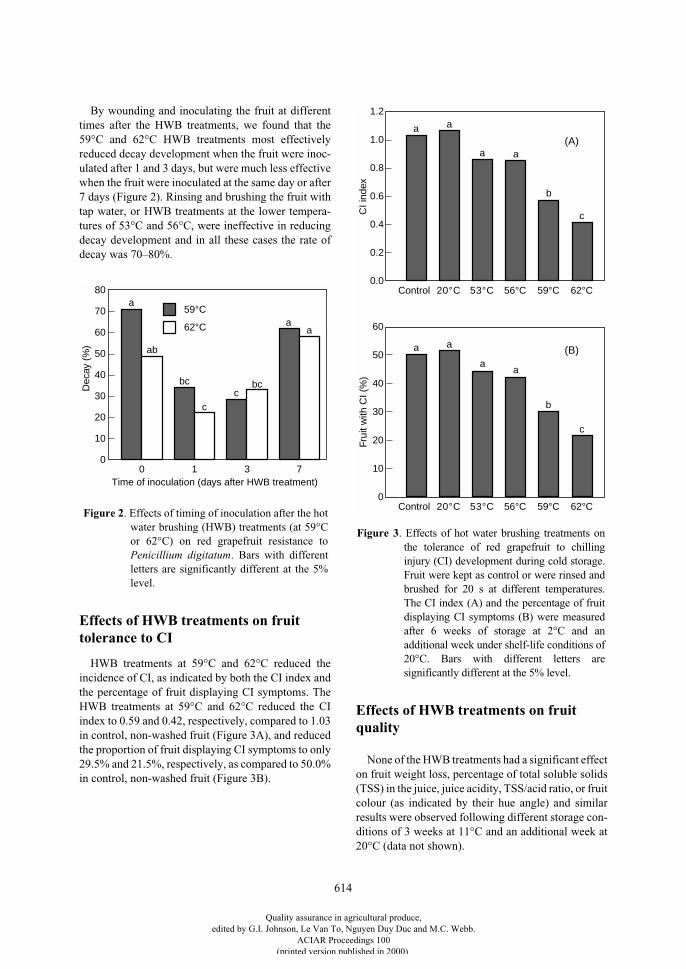
614
By wounding and inoculating the fruit at differenttimes after the HWB treatments, we found that the59°C and 62°C HWB treatments most effectivelyreduced decay development when the fruit were inoc-ulated after 1 and 3 days, but were much less effectivewhen the fruit were inoculated at the same day or after7 days (Figure 2). Rinsing and brushing the fruit withtap water, or HWB treatments at the lower tempera-tures of 53°C and 56°C, were ineffective in reducingdecay development and in all these cases the rate ofdecay was 70–80%.
Effects of HWB treatments on fruit tolerance to CI
HWB treatments at 59°C and 62°C reduced theincidence of CI, as indicated by both the CI index andthe percentage of fruit displaying CI symptoms. TheHWB treatments at 59°C and 62°C reduced the CIindex to 0.59 and 0.42, respectively, compared to 1.03in control, non-washed fruit (Figure 3A), and reducedthe proportion of fruit displaying CI symptoms to only29.5% and 21.5%, respectively, as compared to 50.0%in control, non-washed fruit (Figure 3B).
Effects of HWB treatments on fruit quality
None of the HWB treatments had a significant effecton fruit weight loss, percentage of total soluble solids(TSS) in the juice, juice acidity, TSS/acid ratio, or fruitcolour (as indicated by their hue angle) and similarresults were observed following different storage con-ditions of 3 weeks at 11°C and an additional week at20°C (data not shown).
0
60
50
40
30
20
10
03 7
Dec
ay (
%)
1
70
80a
ab
bc
cc
bc
aa
Time of inoculation (days after HWB treatment)
59°C
62°C
Figure 2. Effects of timing of inoculation after the hotwater brushing (HWB) treatments (at 59°Cor 62°C) on red grapefruit resistance toPenicillium digitatum. Bars with differentletters are significantly different at the 5%level.
20°CControl
1.2
1.0
0.8
0.6
0.4
0.2
0.056°C 62°C
CI i
ndex
53°C 59°C
20°CControl
60
50
40
30
20
10
056°C 62°C
Frui
t with
CI (
%)
53°C 59°C
a a
a a
b
c
a a
aa
b
c
(A)
(B)
Figure 3. Effects of hot water brushing treatments onthe tolerance of red grapefruit to chillinginjury (CI) development during cold storage.Fruit were kept as control or were rinsed andbrushed for 20 s at different temperatures.The CI index (A) and the percentage of fruitdisplaying CI symptoms (B) were measuredafter 6 weeks of storage at 2°C and anadditional week under shelf-life conditions of20°C. Bars with different letters aresignificantly different at the 5% level.
Quality assurance in agricultural produce,edited by G.I. Johnson, Le Van To, Nguyen Duy Duc and M.C. Webb.
ACIAR Proceedings 100(printed version published in 2000)
615
Conclusion
This new postharvest HWB treatment, that has alreadybeen commercially adapted to clean and disinfectvarious fruits and vegetables, can provide an alter-native, non-chemical method to reduce decay devel-opment, and allow storage at lower temperatures thatare unfavourable to the development the pathogens,without causing any harm to the fruit.
References
Barkai-Golan, R. and Phillips, D.J. 1991. Postharvest heattreatments of fresh fruits and vegetables for decaycontrol. Plant Disease, 75, 1085–1089.
Couey, H.M. 1989. Heat treatment for control of postharvestdiseases and insect pests of fruits. HortScience, 24,198–202.
Fallik, E., Grinberg, S., Alkalai, S., Yekutieli, O.,Wiseblum, A., Regev, R., Beres, H. and Bar-Lev, E.1999. A unique rapid hot water treatment to improvestorage quality of sweet pepper. Postharvest Biology andTechnology, 15, 25–32.
Lurie, S. 1998. Postharvest heat treatments of horticulturalcrops. Horticultural Review, 22, 91–121.
Quality assurance in agricultural produce,edited by G.I. Johnson, Le Van To, Nguyen Duy Duc and M.C. Webb.
ACIAR Proceedings 100(printed version published in 2000)
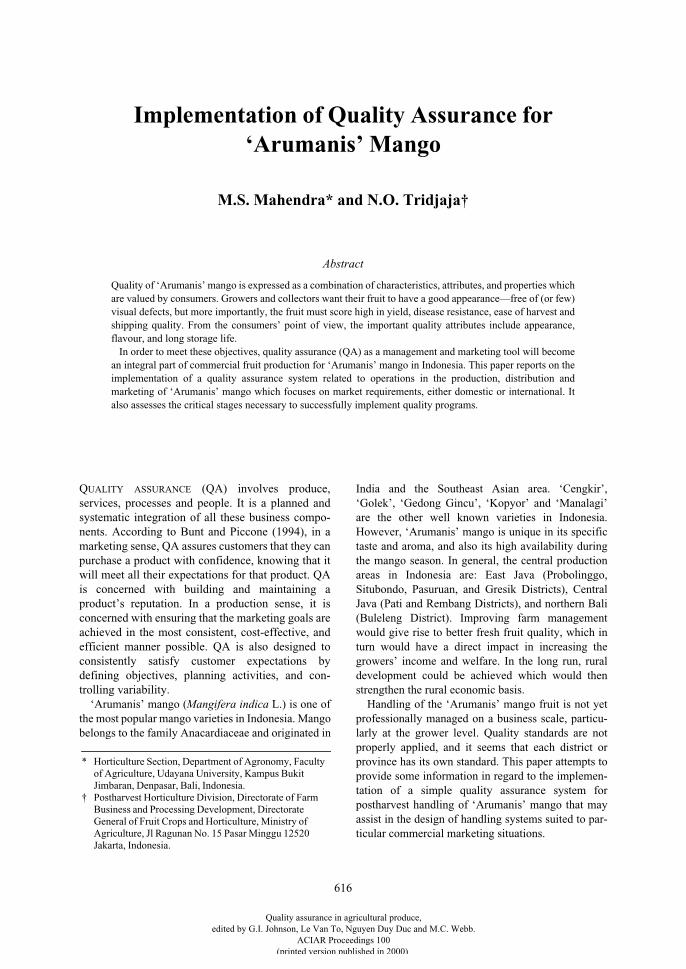
616
Implementation of Quality Assurance for ‘Arumanis’ Mango
M.S. Mahendra* and N.O. Tridjaja†
Abstract
Quality of ‘Arumanis’ mango is expressed as a combination of characteristics, attributes, and properties whichare valued by consumers. Growers and collectors want their fruit to have a good appearance—free of (or few)visual defects, but more importantly, the fruit must score high in yield, disease resistance, ease of harvest andshipping quality. From the consumers’ point of view, the important quality attributes include appearance,flavour, and long storage life.
In order to meet these objectives, quality assurance (QA) as a management and marketing tool will becomean integral part of commercial fruit production for ‘Arumanis’ mango in Indonesia. This paper reports on theimplementation of a quality assurance system related to operations in the production, distribution andmarketing of ‘Arumanis’ mango which focuses on market requirements, either domestic or international. Italso assesses the critical stages necessary to successfully implement quality programs.
Q
UALITY
ASSURANCE
(QA) involves produce,services, processes and people. It is a planned andsystematic integration of all these business compo-nents. According to Bunt and Piccone (1994), in amarketing sense, QA assures customers that they canpurchase a product with confidence, knowing that itwill meet all their expectations for that product. QAis concerned with building and maintaining aproduct’s reputation. In a production sense, it isconcerned with ensuring that the marketing goals areachieved in the most consistent, cost-effective, andefficient manner possible. QA is also designed toconsistently satisfy customer expectations bydefining objectives, planning activities, and con-trolling variability.
‘Arumanis’ mango (
Mangifera indica
L.) is one ofthe most popular mango varieties in Indonesia. Mangobelongs to the family Anacardiaceae and originated in
India and the Southeast Asian area. ‘Cengkir’,‘Golek’, ‘Gedong Gincu’, ‘Kopyor’ and ‘Manalagi’are the other well known varieties in Indonesia.However, ‘Arumanis’ mango is unique in its specifictaste and aroma, and also its high availability duringthe mango season. In general, the central productionareas in Indonesia are: East Java (Probolinggo,Situbondo, Pasuruan, and Gresik Districts), CentralJava (Pati and Rembang Districts), and northern Bali(Buleleng District). Improving farm managementwould give rise to better fresh fruit quality, which inturn would have a direct impact in increasing thegrowers’ income and welfare. In the long run, ruraldevelopment could be achieved which would thenstrengthen the rural economic basis.
Handling of the ‘Arumanis’ mango fruit is not yetprofessionally managed on a business scale, particu-larly at the grower level. Quality standards are notproperly applied, and it seems that each district orprovince has its own standard. This paper attempts toprovide some information in regard to the implemen-tation of a simple quality assurance system forpostharvest handling of ‘Arumanis’ mango that mayassist in the design of handling systems suited to par-ticular commercial marketing situations.
* Horticulture Section, Department of Agronomy, Faculty of Agriculture, Udayana University, Kampus Bukit Jimbaran, Denpasar, Bali, Indonesia.
† Postharvest Horticulture Division, Directorate of Farm Business and Processing Development, Directorate General of Fruit Crops and Horticulture, Ministry of Agriculture, Jl Ragunan No. 15 Pasar Minggu 12520 Jakarta, Indonesia.
Quality assurance in agricultural produce,edited by G.I. Johnson, Le Van To, Nguyen Duy Duc and M.C. Webb.
ACIAR Proceedings 100(printed version published in 2000)
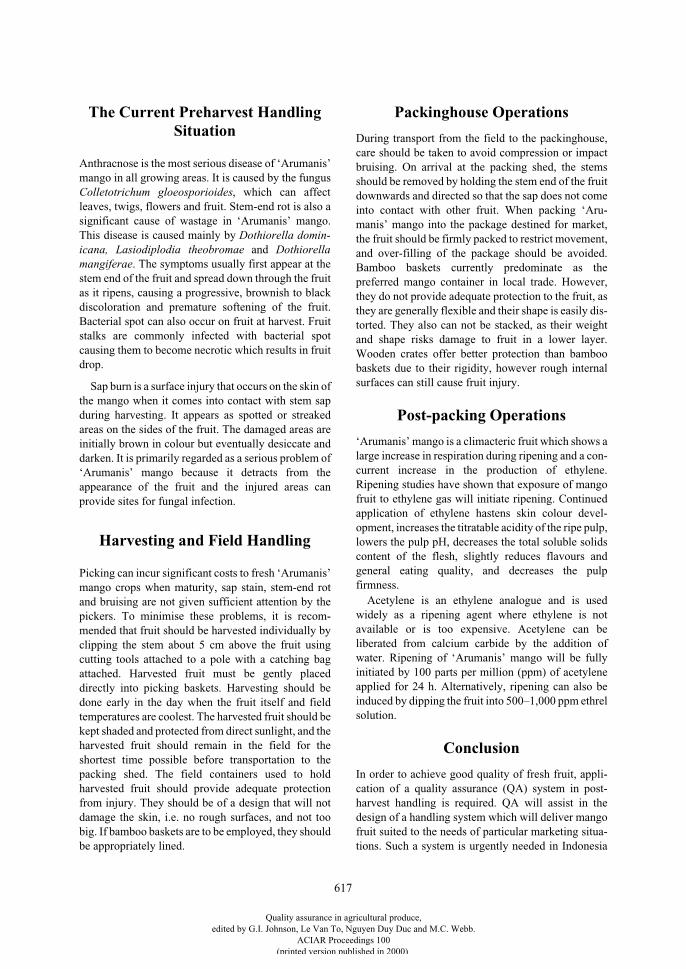
617
The Current Preharvest Handling Situation
Anthracnose is the most serious disease of ‘Arumanis’mango in all growing areas. It is caused by the fungus
Colletotrichum gloeosporioides
, which can affectleaves, twigs, flowers and fruit. Stem-end rot is also asignificant cause of wastage in ‘Arumanis’ mango.This disease is caused mainly by
Dothiorella domin-icana, Lasiodiplodia theobromae
and
Dothiorellamangiferae
. The symptoms usually first appear at thestem end of the fruit and spread down through the fruitas it ripens, causing a progressive, brownish to blackdiscoloration and premature softening of the fruit.Bacterial spot can also occur on fruit at harvest. Fruitstalks are commonly infected with bacterial spotcausing them to become necrotic which results in fruitdrop.
Sap burn is a surface injury that occurs on the skin ofthe mango when it comes into contact with stem sapduring harvesting. It appears as spotted or streakedareas on the sides of the fruit. The damaged areas areinitially brown in colour but eventually desiccate anddarken. It is primarily regarded as a serious problem of‘Arumanis’ mango because it detracts from theappearance of the fruit and the injured areas canprovide sites for fungal infection.
Harvesting and Field Handling
Picking can incur significant costs to fresh ‘Arumanis’mango crops when maturity, sap stain, stem-end rotand bruising are not given sufficient attention by thepickers. To minimise these problems, it is recom-mended that fruit should be harvested individually byclipping the stem about 5 cm above the fruit usingcutting tools attached to a pole with a catching bagattached. Harvested fruit must be gently placeddirectly into picking baskets. Harvesting should bedone early in the day when the fruit itself and fieldtemperatures are coolest. The harvested fruit should bekept shaded and protected from direct sunlight, and theharvested fruit should remain in the field for theshortest time possible before transportation to thepacking shed. The field containers used to holdharvested fruit should provide adequate protectionfrom injury. They should be of a design that will notdamage the skin, i.e. no rough surfaces, and not toobig. If bamboo baskets are to be employed, they shouldbe appropriately lined.
Packinghouse Operations
During transport from the field to the packinghouse,care should be taken to avoid compression or impactbruising. On arrival at the packing shed, the stemsshould be removed by holding the stem end of the fruitdownwards and directed so that the sap does not comeinto contact with other fruit. When packing ‘Aru-manis’ mango into the package destined for market,the fruit should be firmly packed to restrict movement,and over-filling of the package should be avoided.Bamboo baskets currently predominate as thepreferred mango container in local trade. However,they do not provide adequate protection to the fruit, asthey are generally flexible and their shape is easily dis-torted. They also can not be stacked, as their weightand shape risks damage to fruit in a lower layer.Wooden crates offer better protection than bamboobaskets due to their rigidity, however rough internalsurfaces can still cause fruit injury.
Post-packing Operations
‘Arumanis’ mango is a climacteric fruit which shows alarge increase in respiration during ripening and a con-current increase in the production of ethylene.Ripening studies have shown that exposure of mangofruit to ethylene gas will initiate ripening. Continuedapplication of ethylene hastens skin colour devel-opment, increases the titratable acidity of the ripe pulp,lowers the pulp pH, decreases the total soluble solidscontent of the flesh, slightly reduces flavours andgeneral eating quality, and decreases the pulpfirmness.
Acetylene is an ethylene analogue and is usedwidely as a ripening agent where ethylene is notavailable or is too expensive. Acetylene can beliberated from calcium carbide by the addition ofwater. Ripening of ‘Arumanis’ mango will be fullyinitiated by 100 parts per million (ppm) of acetyleneapplied for 24 h. Alternatively, ripening can also beinduced by dipping the fruit into 500–1,000 ppm ethrelsolution.
Conclusion
In order to achieve good quality of fresh fruit, appli-cation of a quality assurance (QA) system in post-harvest handling is required. QA will assist in thedesign of a handling system which will deliver mangofruit suited to the needs of particular marketing situa-tions. Such a system is urgently needed in Indonesia
Quality assurance in agricultural produce,edited by G.I. Johnson, Le Van To, Nguyen Duy Duc and M.C. Webb.
ACIAR Proceedings 100(printed version published in 2000)
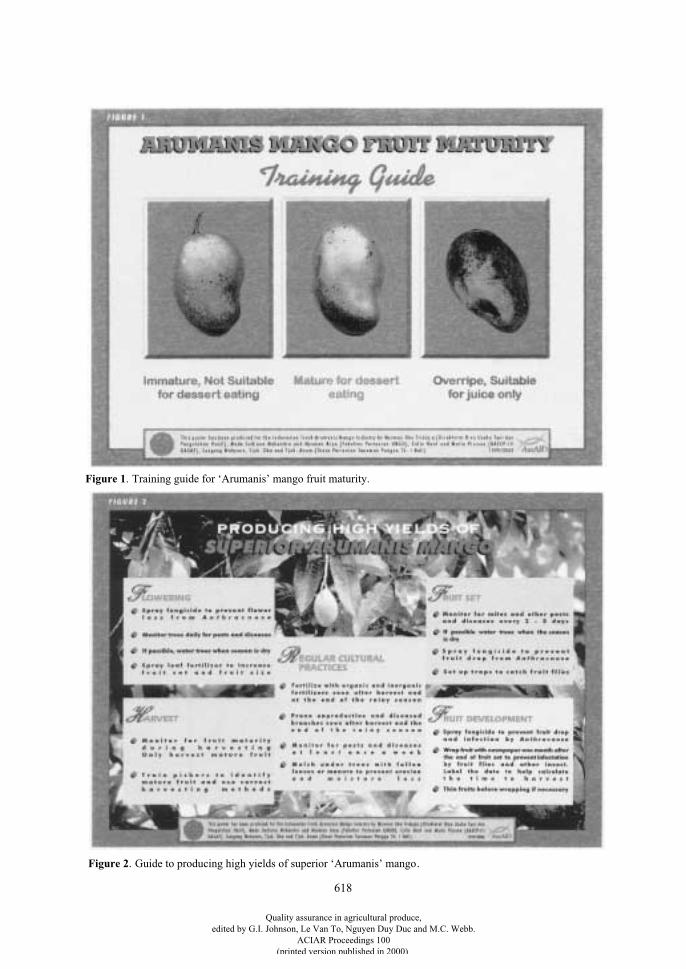
618
Figure 1
. Training guide for ‘Arumanis’ mango fruit maturity.
Figure 2
. Guide to producing high yields of superior ‘Arumanis’ mango.
Quality assurance in agricultural produce,edited by G.I. Johnson, Le Van To, Nguyen Duy Duc and M.C. Webb.
ACIAR Proceedings 100(printed version published in 2000)
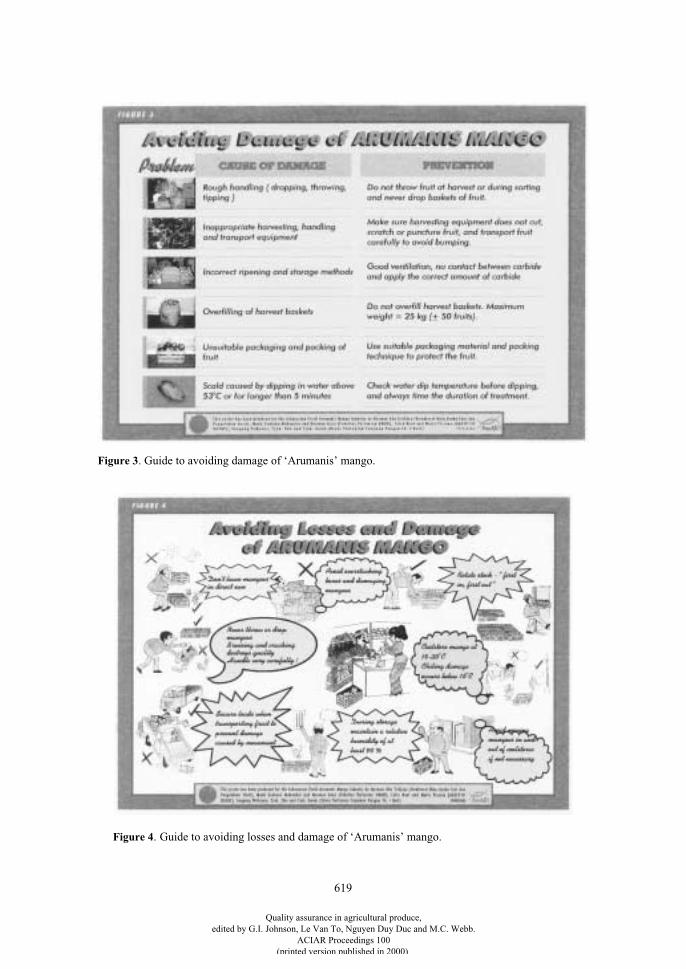
619
Figure 3
. Guide to avoiding damage of ‘Arumanis’ mango.
Figure 4
. Guide to avoiding losses and damage of ‘Arumanis’ mango.
Quality assurance in agricultural produce,edited by G.I. Johnson, Le Van To, Nguyen Duy Duc and M.C. Webb.
ACIAR Proceedings 100(printed version published in 2000)
620
and elsewhere to increase consumer confidence in thisproduce. Posters have been produced as part of anextension kit for the Indonesian fresh ‘Arumanis’mango industry. The kit was specifically designed bythe Association of South-East Asian Nations(ASEAN)–Australia Economic Cooperation ProgramIII Quality Assurance Systems for ASEAN Fruits(AAECP–III QASAF) Project, specifically to guidegrowers, collectors, wholesalers, and retailers, asshown in Figures 1 to 4.
Acknowledgments
The authors wish to thank AAECP–III QASAF whofinancially supported this work, and the AustralianCentre for International Agricultural Research
(ACIAR) for the presentation of this paper at 19
th
ASEAN/1
st
Asia–Pacific Economic Cooperation(APEC) Seminar on Postharvest Technology, Ho ChiMinh City, Vietnam. The authors also wish to thankProf. John Janes and Dr Zora Singh (Curtin Universityof Technology, Australia) for their helpful commentsand Mr I.B.K.G. Kertia who typed the manuscript.
Reference
Bunt, C. and Piccone, M. 1994. Quality assurance: a totalapproach. In: Champ, B.R., Highley, E. and Johnson,G.I., ed., Postharvest handling of tropical fruits.Proceedings of an international conference held at ChiangMai, Thailand, 19–23 July 1993. ACIAR ProceedingsNo. 50. Canberra, Australian Centre for InternationalAgricultural Research, 27–31.
Quality assurance in agricultural produce,edited by G.I. Johnson, Le Van To, Nguyen Duy Duc and M.C. Webb.
ACIAR Proceedings 100(printed version published in 2000)
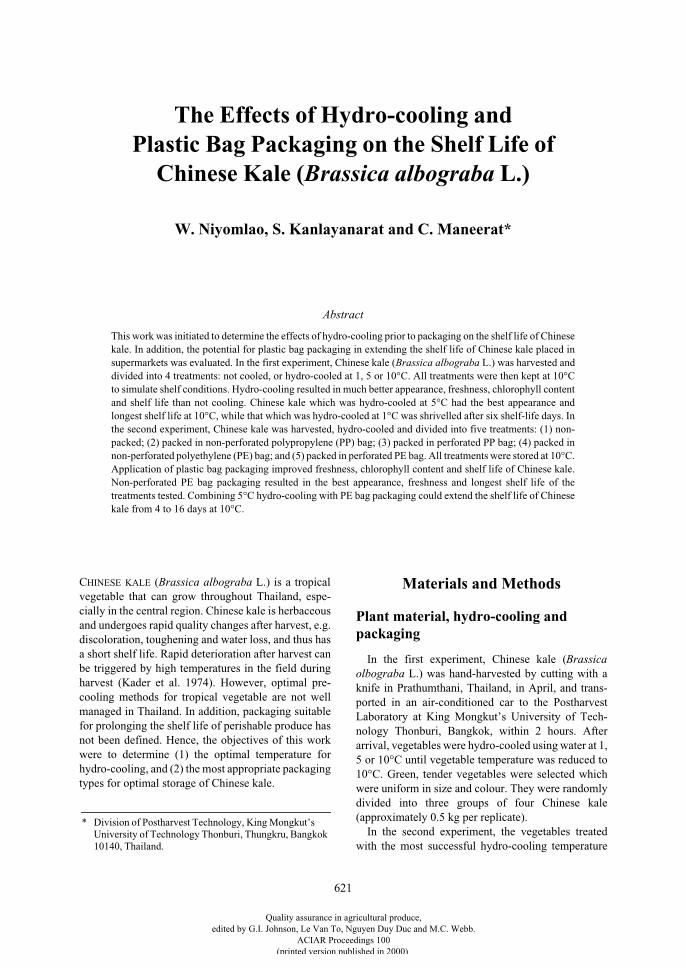
621
The Effects of Hydro-cooling and Plastic Bag Packaging on the Shelf Life of
Chinese Kale (Brassica albograba L.)
W. Niyomlao, S. Kanlayanarat and C. Maneerat*
Abstract
This work was initiated to determine the effects of hydro-cooling prior to packaging on the shelf life of Chinesekale. In addition, the potential for plastic bag packaging in extending the shelf life of Chinese kale placed insupermarkets was evaluated. In the first experiment, Chinese kale (
Brassica albograba
L.) was harvested anddivided into 4 treatments: not cooled, or hydro-cooled at 1, 5 or 10°C. All treatments were then kept at 10°Cto simulate shelf conditions. Hydro-cooling resulted in much better appearance, freshness, chlorophyll contentand shelf life than not cooling. Chinese kale which was hydro-cooled at 5°C had the best appearance andlongest shelf life at 10°C, while that which was hydro-cooled at 1°C was shrivelled after six shelf-life days. Inthe second experiment, Chinese kale was harvested, hydro-cooled and divided into five treatments: (1) non-packed; (2) packed in non-perforated polypropylene (PP) bag; (3) packed in perforated PP bag; (4) packed innon-perforated polyethylene (PE) bag; and (5) packed in perforated PE bag. All treatments were stored at 10°C.Application of plastic bag packaging improved freshness, chlorophyll content and shelf life of Chinese kale.Non-perforated PE bag packaging resulted in the best appearance, freshness and longest shelf life of thetreatments tested. Combining 5°C hydro-cooling with PE bag packaging could extend the shelf life of Chinesekale from 4 to 16 days at 10°C.
C
HINESE
KALE
(
Brassica albograba
L.) is a tropicalvegetable that can grow throughout Thailand, espe-cially in the central region. Chinese kale is herbaceousand undergoes rapid quality changes after harvest, e.g.discoloration, toughening and water loss, and thus hasa short shelf life. Rapid deterioration after harvest canbe triggered by high temperatures in the field duringharvest (Kader et al. 1974). However, optimal pre-cooling methods for tropical vegetable are not wellmanaged in Thailand. In addition, packaging suitablefor prolonging the shelf life of perishable produce hasnot been defined. Hence, the objectives of this workwere to determine (1) the optimal temperature forhydro-cooling, and (2) the most appropriate packagingtypes for optimal storage of Chinese kale.
Materials and Methods
Plant material, hydro-cooling and packaging
In the first experiment, Chinese kale (
Brassicaolbograba
L.) was hand-harvested by cutting with aknife in Prathumthani, Thailand, in April, and trans-ported in an air-conditioned car to the PostharvestLaboratory at King Mongkut’s University of Tech-nology Thonburi, Bangkok, within 2 hours. Afterarrival, vegetables were hydro-cooled using water at 1,5 or 10°C until vegetable temperature was reduced to10°C. Green, tender vegetables were selected whichwere uniform in size and colour. They were randomlydivided into three groups of four Chinese kale(approximately 0.5 kg per replicate).
In the second experiment, the vegetables treatedwith the most successful hydro-cooling temperature
* Division of Postharvest Technology, King Mongkut’s University of Technology Thonburi, Thungkru, Bangkok 10140, Thailand.
Quality assurance in agricultural produce,edited by G.I. Johnson, Le Van To, Nguyen Duy Duc and M.C. Webb.
ACIAR Proceedings 100(printed version published in 2000)
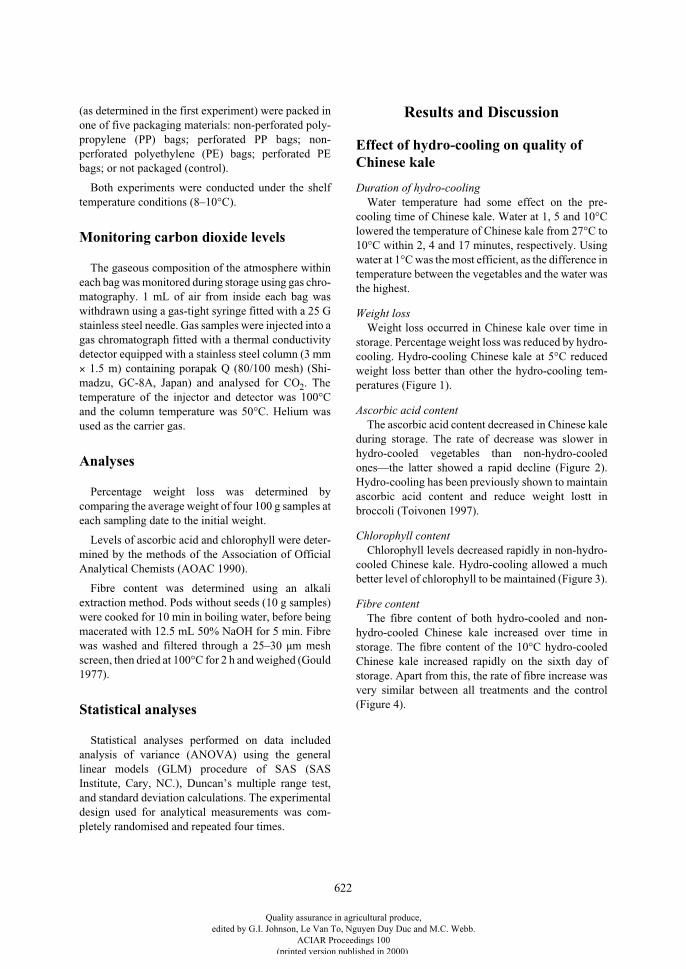
622
(as determined in the first experiment) were packed inone of five packaging materials: non-perforated poly-propylene (PP) bags; perforated PP bags; non-perforated polyethylene (PE) bags; perforated PEbags; or not packaged (control).
Both experiments were conducted under the shelftemperature conditions (8–10°C).
Monitoring carbon dioxide levels
The gaseous composition of the atmosphere withineach bag was monitored during storage using gas chro-matography. 1 mL of air from inside each bag waswithdrawn using a gas-tight syringe fitted with a 25 Gstainless steel needle. Gas samples were injected into agas chromatograph fitted with a thermal conductivitydetector equipped with a stainless steel column (3 mm
×
1.5 m) containing porapak Q (80/100 mesh) (Shi-madzu, GC-8A, Japan) and analysed for CO
2
. Thetemperature of the injector and detector was 100°Cand the column temperature was 50°C. Helium wasused as the carrier gas.
Analyses
Percentage weight loss was determined bycomparing the average weight of four 100 g samples ateach sampling date to the initial weight.
Levels of ascorbic acid and chlorophyll were deter-mined by the methods of the Association of OfficialAnalytical Chemists (AOAC 1990).
Fibre content was determined using an alkaliextraction method. Pods without seeds (10 g samples)were cooked for 10 min in boiling water, before beingmacerated with 12.5 mL 50% NaOH for 5 min. Fibrewas washed and filtered through a 25–30 µm meshscreen, then dried at 100°C for 2 h and weighed (Gould1977).
Statistical analyses
Statistical analyses performed on data includedanalysis of variance (ANOVA) using the generallinear models (GLM) procedure of SAS (SASInstitute, Cary, NC.), Duncan’s multiple range test,and standard deviation calculations. The experimentaldesign used for analytical measurements was com-pletely randomised and repeated four times.
Results and Discussion
Effect of hydro-cooling on quality of Chinese kale
Duration of hydro-cooling
Water temperature had some effect on the pre-cooling time of Chinese kale. Water at 1, 5 and 10°Clowered the temperature of Chinese kale from 27°C to10°C within 2, 4 and 17 minutes, respectively. Usingwater at 1°C was the most efficient, as the difference intemperature between the vegetables and the water wasthe highest.
Weight loss
Weight loss occurred in Chinese kale over time instorage. Percentage weight loss was reduced by hydro-cooling. Hydro-cooling Chinese kale at 5°C reducedweight loss better than other the hydro-cooling tem-peratures (Figure 1).
Ascorbic acid content
The ascorbic acid content decreased in Chinese kaleduring storage. The rate of decrease was slower inhydro-cooled vegetables than non-hydro-cooledones—the latter showed a rapid decline (Figure 2).Hydro-cooling has been previously shown to maintainascorbic acid content and reduce weight lostt inbroccoli (Toivonen 1997).
Chlorophyll content
Chlorophyll levels decreased rapidly in non-hydro-cooled Chinese kale. Hydro-cooling allowed a muchbetter level of chlorophyll to be maintained (Figure 3).
Fibre content
The fibre content of both hydro-cooled and non-hydro-cooled Chinese kale increased over time instorage. The fibre content of the 10°C hydro-cooledChinese kale increased rapidly on the sixth day ofstorage. Apart from this, the rate of fibre increase wasvery similar between all treatments and the control(Figure 4).
Quality assurance in agricultural produce,edited by G.I. Johnson, Le Van To, Nguyen Duy Duc and M.C. Webb.
ACIAR Proceedings 100(printed version published in 2000)
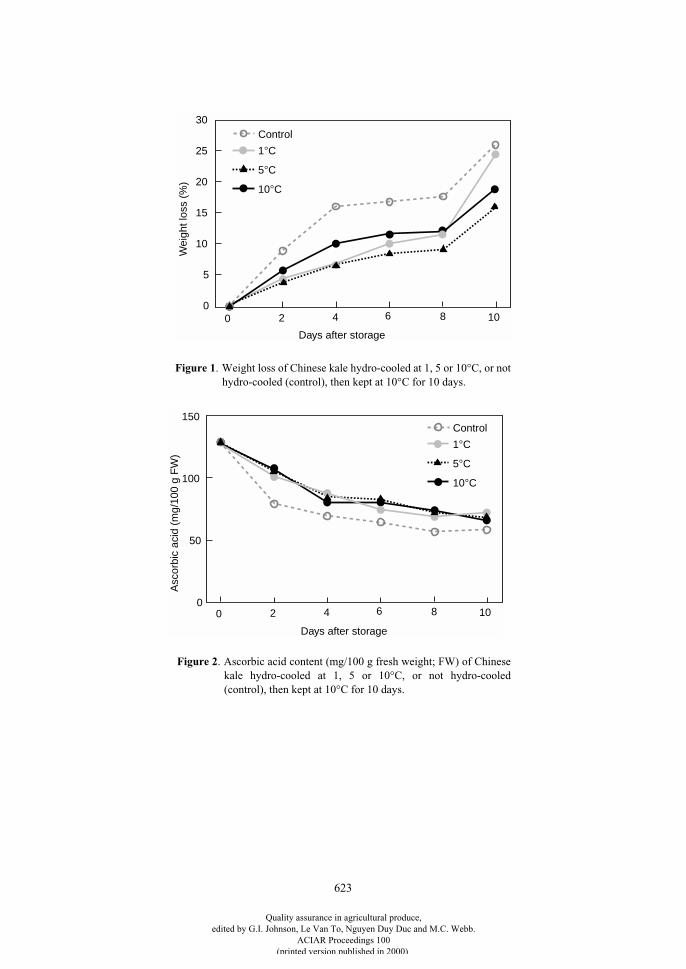
623
0
10
15
20
Days after storage
0 2 4 6 8 10
Wei
ght l
oss
(%)
10°C
5°C
1°C
5
25
Control30
0
100
150
Days after storage
0 2 4 6 8 10
Asc
orbi
c ac
id (
mg/
100
g F
W)
10°C
5°C
1°C
50
Control
Figure 1. Weight loss of Chinese kale hydro-cooled at 1, 5 or 10°C, or nothydro-cooled (control), then kept at 10°C for 10 days.
Figure 2. Ascorbic acid content (mg/100 g fresh weight; FW) of Chinesekale hydro-cooled at 1, 5 or 10°C, or not hydro-cooled(control), then kept at 10°C for 10 days.
Quality assurance in agricultural produce,edited by G.I. Johnson, Le Van To, Nguyen Duy Duc and M.C. Webb.
ACIAR Proceedings 100(printed version published in 2000)
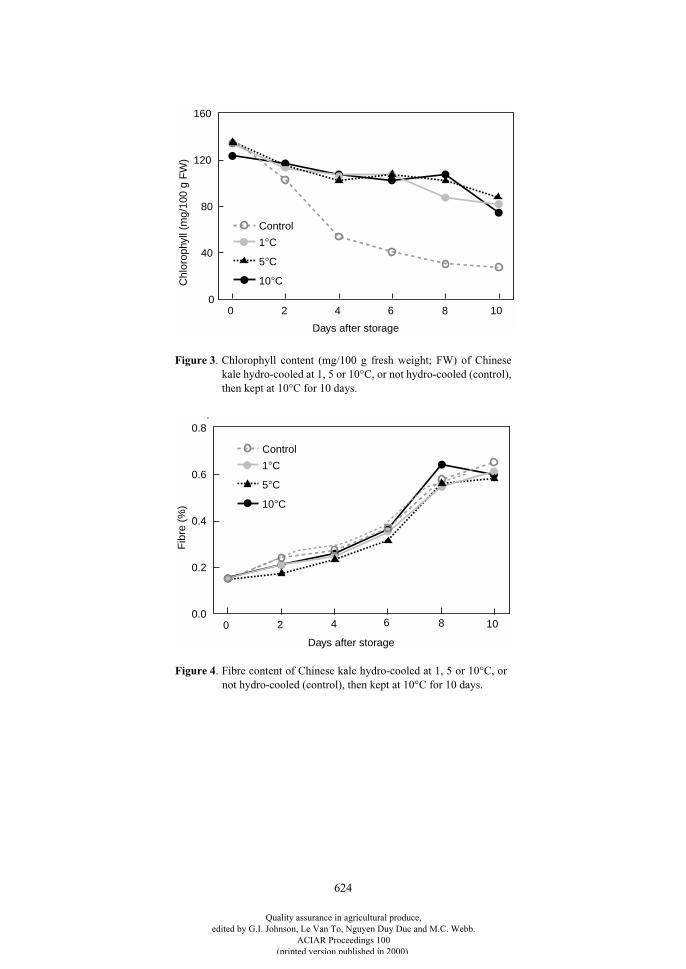
624
80
160
120
0
Days after storage
0 2 4 6 8
Chl
orop
hyll
(mg/
100
g F
W)
40
10
10°C
5°C
1°C
Control
0.0
0.4
0.6
0.8
Days after storage
0 2 4 6 8 10
Fib
re (
%) 10°C
5°C
1°C
0.2
Control
Figure 3
. Chlorophyll content (mg/100 g fresh weight; FW) of Chinesekale hydro-cooled at 1, 5 or 10°C, or not hydro-cooled (control),then kept at 10°C for 10 days.
Figure 4
. Fibre content of Chinese kale hydro-cooled at 1, 5 or 10°C, ornot hydro-cooled (control), then kept at 10°C for 10 days.
Quality assurance in agricultural produce,edited by G.I. Johnson, Le Van To, Nguyen Duy Duc and M.C. Webb.
ACIAR Proceedings 100(printed version published in 2000)
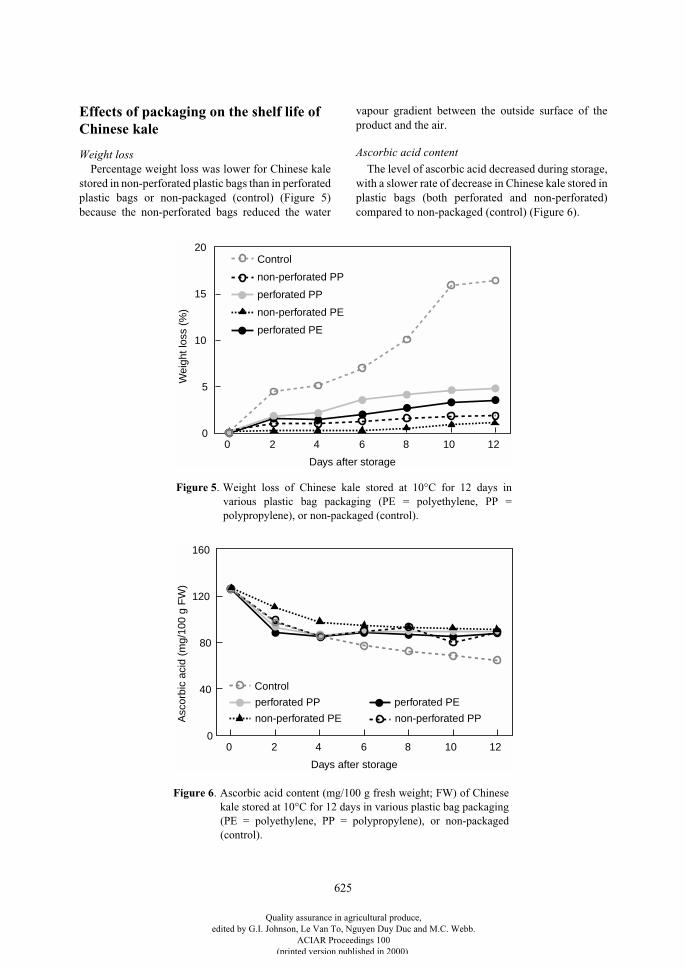
625
Effects of packaging on the shelf life of Chinese kale
Weight loss
Percentage weight loss was lower for Chinese kalestored in non-perforated plastic bags than in perforatedplastic bags or non-packaged (control) (Figure 5)because the non-perforated bags reduced the water
vapour gradient between the outside surface of theproduct and the air.
Ascorbic acid content
The level of ascorbic acid decreased during storage,with a slower rate of decrease in Chinese kale stored inplastic bags (both perforated and non-perforated)compared to non-packaged (control) (Figure 6).
0
10
20
Days after storage
0 2 4 6 8 12
Wei
ght l
oss
(%)
perforated PE
non-perforated PE
perforated PP
5
Control
15
10
non-perforated PP
0
80
160
Days after storage
0 2 4 6 8 12
Asc
orbi
c ac
id (
mg/
100
g F
W)
perforated PEperforated PP40 Control
120
10
non-perforated PPnon-perforated PE
Figure 5. Weight loss of Chinese kale stored at 10°C for 12 days invarious plastic bag packaging (PE = polyethylene, PP =polypropylene), or non-packaged (control).
Figure 6. Ascorbic acid content (mg/100 g fresh weight; FW) of Chinesekale stored at 10°C for 12 days in various plastic bag packaging(PE = polyethylene, PP = polypropylene), or non-packaged(control).
Quality assurance in agricultural produce,edited by G.I. Johnson, Le Van To, Nguyen Duy Duc and M.C. Webb.
ACIAR Proceedings 100(printed version published in 2000)
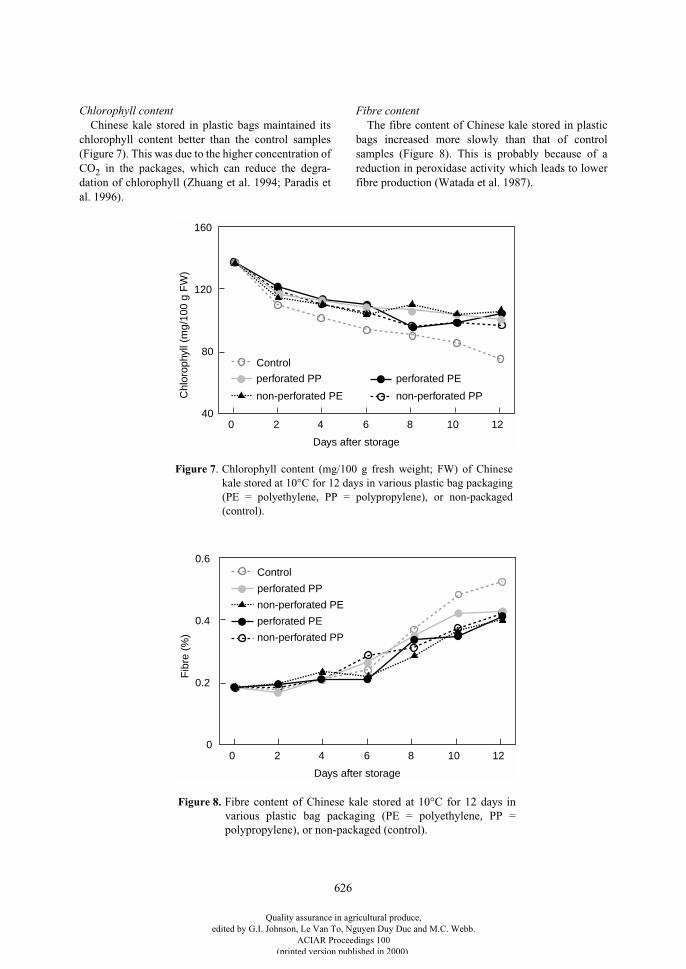
626
Chlorophyll content
Chinese kale stored in plastic bags maintained itschlorophyll content better than the control samples(Figure 7). This was due to the higher concentration ofCO
2
in the packages, which can reduce the degra-dation of chlorophyll (Zhuang et al. 1994; Paradis etal. 1996).
Fibre content
The fibre content of Chinese kale stored in plasticbags increased more slowly than that of controlsamples (Figure 8). This is probably because of areduction in peroxidase activity which leads to lowerfibre production (Watada et al. 1987).
40
80
160
Days after storage
0 2 4 6 8 12
Chl
orop
hyll
(mg/
100
g F
W)
perforated PEperforated PP
120
10
non-perforated PP
Control
non-perforated PE
0
0.2
0.6
Days after storage
0 2 4 6 8 12
Fib
re (
%)
perforated PE
perforated PP
Control
0.4
10
non-perforated PP
non-perforated PE
Figure 7. Chlorophyll content (mg/100 g fresh weight; FW) of Chinesekale stored at 10°C for 12 days in various plastic bag packaging(PE = polyethylene, PP = polypropylene), or non-packaged(control).
Figure 8. Fibre content of Chinese kale stored at 10°C for 12 days invarious plastic bag packaging (PE = polyethylene, PP =polypropylene), or non-packaged (control).
Quality assurance in agricultural produce,edited by G.I. Johnson, Le Van To, Nguyen Duy Duc and M.C. Webb.
ACIAR Proceedings 100(printed version published in 2000)
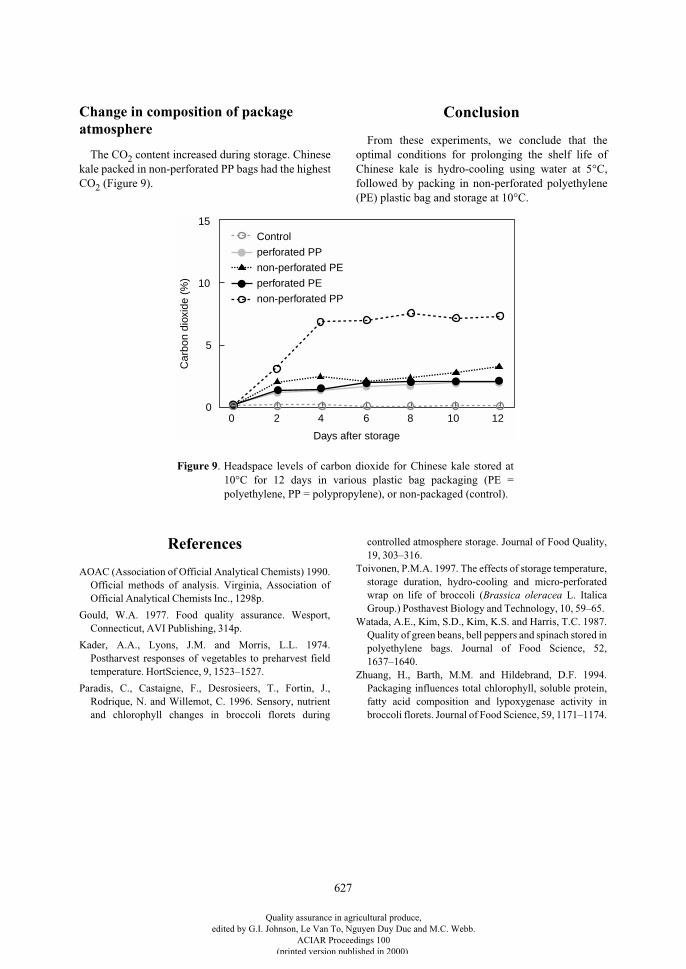
627
Change in composition of package atmosphere
The CO
2
content increased during storage. Chinesekale packed in non-perforated PP bags had the highestCO
2
(Figure 9).
Conclusion
From these experiments, we conclude that theoptimal conditions for prolonging the shelf life ofChinese kale is hydro-cooling using water at 5°C,followed by packing in non-perforated polyethylene(PE) plastic bag and storage at 10°C.
References
AOAC (Association of Official Analytical Chemists) 1990.Official methods of analysis. Virginia, Association ofOfficial Analytical Chemists Inc., 1298p.
Gould, W.A. 1977. Food quality assurance. Wesport,Connecticut, AVI Publishing, 314p.
Kader, A.A., Lyons, J.M. and Morris, L.L. 1974.Postharvest responses of vegetables to preharvest fieldtemperature. HortScience, 9, 1523–1527.
Paradis, C., Castaigne, F., Desrosieers, T., Fortin, J.,Rodrique, N. and Willemot, C. 1996. Sensory, nutrientand chlorophyll changes in broccoli florets during
controlled atmosphere storage. Journal of Food Quality,19, 303–316.
Toivonen, P.M.A. 1997. The effects of storage temperature,storage duration, hydro-cooling and micro-perforatedwrap on life of broccoli (
Brassica oleracea
L. ItalicaGroup.) Posthavest Biology and Technology, 10, 59–65.
Watada, A.E., Kim, S.D., Kim, K.S. and Harris, T.C. 1987.Quality of green beans, bell peppers and spinach stored inpolyethylene bags. Journal of Food Science, 52,1637–1640.
Zhuang, H., Barth, M.M. and Hildebrand, D.F. 1994.Packaging influences total chlorophyll, soluble protein,fatty acid composition and lypoxygenase activity inbroccoli florets. Journal of Food Science, 59, 1171–1174.
0
5
15
Days after storage
0 2 4 6 8 12
Car
bon
diox
ide
(%) perforated PE
perforated PP
Control
10
10
non-perforated PP
non-perforated PE
Figure 9. Headspace levels of carbon dioxide for Chinese kale stored at10°C for 12 days in various plastic bag packaging (PE =polyethylene, PP = polypropylene), or non-packaged (control).
Quality assurance in agricultural produce,edited by G.I. Johnson, Le Van To, Nguyen Duy Duc and M.C. Webb.
ACIAR Proceedings 100(printed version published in 2000)
628
Investigation into Postharvest Loss of Cantaloupe
Chen Nianlai, An Li and Ma Keqi*
Abstract
Factors responsible for the postharvest loss of ‘Huanghemigua’ cantaloupe were investigated. Postharvest lossin cantaloupe under commercial practice in Gansu, China was as high as 29.3% and was mainly caused bypostharvest disease. The diseases caused by pathogens were related to the handling methods used duringharvest and transport.
T
HE
H
EXI
C
ORRIDOR
in western Gansu has alwaysbeen a traditional and major cantaloupe productionarea in China due to the favourable climatic condi-tions—dry, hot and with a large temperature dif-ference between day and night in summer. In the pastdecade, melon production has been growing rapidly inwestern Gansu. Over 70% of the cantaloupes producedthere are transported more than 2,000 km (on average)to the markets in other provinces, since the localmarketing capacity is quite limited by it small popu-lation. Careless handling practices during harvesting,loading, unloading and transport, with very simple oreven without packaging, have all contributed to melonloss, which is harmful to the economic benefit of bothfarmers and salesmen, consumers’ acceptance and thereputation of Gansu melon produce. In spite of theirrough rind, cantaloupes have a short shelf life. Morrisand Wade (1985) reported that cantaloupe could bestored safely for only 7–15 days, even under suitabletemperatures (5–7°C), and that the main limitingfactor was postharvest disease caused by variouspathogens such as
Fusarium
and
Alternaria
. In aninvestigation of Chinese ‘Hami’ melon decay duringtransport, Zhang Weiyi et al. (1990) found that the tra-ditional handling techniques employed in melon har-vesting and shipping offered much opportunity for thefruit to be damaged and infected by diseases. Wereport in the present paper the relationship betweenweight loss (caused by water evaporation and decay)
and maturity, mechanical injury and packaging of‘Huanghemigua’ cantaloupe under normal air temper-ature conditions as a first step toward devising alter-native techniques for harvest and postharvest handlingto minimise fruit loss and marketing risk.
Materials and Methods
Materials
The experiment and survey were carried out in1997–1998. The cantaloupe variety employed was‘Huanghemigua’ (honeydew type) from commercialmelon fields in Wuwei and Mingqin. Fruit wereshipped to Lanzhou the day after picking and initialtreatment.
Determination of water loss
Melons were picked at physiological maturity of70% (about 35 days after blossom) or 90% (about 50days after blossom), then each melon was weighedand labelled on the rind with a bold oil pen on thesame day, packed in cartons, plastic net bags or notpacked. The samples were then sent to Lanzhou andkept at room temperature (17–22°C). For everytreatment 3 replicates of 24 melons each were inves-tigated. Melon samples were weighed and assessedfor disease spot diameter and disease percentage theday after they were sent to Lanzhou, and subse-quently at the end of the 1
st
, 2
nd
, or 4
th
week afterharvest.
* Melon Institute, Gansu Agricultural University, Lanzhou 730070, People’s Republic of China.
Quality assurance in agricultural produce,edited by G.I. Johnson, Le Van To, Nguyen Duy Duc and M.C. Webb.
ACIAR Proceedings 100(printed version published in 2000)
629
Measurement of fruit injury
The whole harvesting procedure was divided intofour stages, including picking, transport from of thefield, loading on and off tractors, and transport to thepacking site. 72 mature fruit were divided into 3groups, wrapped with soft paper and packed incartons after each of the above stages. The melonsamples were then transported to Lanzhou andvisually examined for surface injury on the 3
rd
dayafter transport. The degree of injury was rated on ascale of 1–5 where: 1 = cracked; 2 = punctured; 3 =bruise diameter >2 cm; 4 = bruise diameter 1–2 cm;and 5 = bruise diameter <1 cm. The total degree ofinjury for each melon was determined by summingproducts of injury spots and their degree scale values.Melon disease and rot were investigated at 1 week, 2weeks and 30 days after harvest.
Disease investigation
Sample melons stored at room temperature wereexamined five times at 5 or 10-day intervals in 1997,or six times at 5 or 7-day intervals in 1998 and diseaseswere identified according their symptoms. Diseasespot location and diameter were also recorded. Diseaseseverity was categorised into three grades according tothe diameter of the disease spots, where: small = <1cm; medium = 1–2 cm; and large = >2 cm. Melonswith at least one large disease spot or two mediumspots were thought to be unacceptable and lost.
Results and Discussion
The reasons for weight loss
The natural loss rates of ‘Huanghemigua’ melonsstored for different periods after truck transport wereinvestigated (Table 1). The results show that theweight loss of melon fruit increased as storage timeincreased. The peak loss period was in the 2
nd
weekafter harvest and was caused mainly by disease rot. Inthe 1
st
week after picking, weight loss of melons wassevere due to water evaporation promoted by the highwater content of the fruit and many wounds andbruises produced during picking and transport. Ahigh respiration rate including wound respiration,which caused metabolism consumption, contributed
to the water loss. Melon fruit of different physio-logical status and under different transport conditionsrevealed different weight losses (Table 2). Lessmature fruit lost slightly more weight than fullymatured ones—even under the same transport condi-tions—because of their less developed protectivestructure. Unpacked and bagged melons lost morewater than those packed in cartons due to differentinjury severity.
Postharvest diseases and their major causes
Table 3 shows the main diseases causing post-harvest melon rot. During the initial 2 weeks instorage, the major decay was caused by
Rhizopus
,followed by pink rot caused by
Trichothecium
sp. Theincidence of the two main diseases was well related tofruit injury before storage—the more severely themelon was injured, the more quickly it decayed.
The relationship between packaging and fruit injury
At various harvest stages, fruit loss due to diseasewas a major factor in postharvest weight loss and shelflife of ‘Huanghemigua’. Wounds and bruisessustained during harvest and transport were respon-sible for the main infection by pathogens, for waterloss and respiration consumption. Therefore, weightloss during storage and marketing was, in fact,dependent upon the severity of fruit injury (Table 4).
The results show that, under present commercialoperations, melons were severally damaged duringeach of the investigated harvest stages. Approximately45% of melons were injured with four spots per melonwhen being carried out of the field in bags. Transportby tractor on a rough path to the truck loading site innet bags or without any packaging brought about themost severe damage to the melons—many woundswere made at this stage.
The possibility of being bruised during harvest andtransport was almost the same regardless of maturity,however fully matured melons presented morewounds than less mature ones since their flesh hadalready softened. Melons transported in net bags orunpacked sustained a higher number and more severeinjuries than those in cartons (Table 5).
Quality assurance in agricultural produce,edited by G.I. Johnson, Le Van To, Nguyen Duy Duc and M.C. Webb.
ACIAR Proceedings 100(printed version published in 2000)
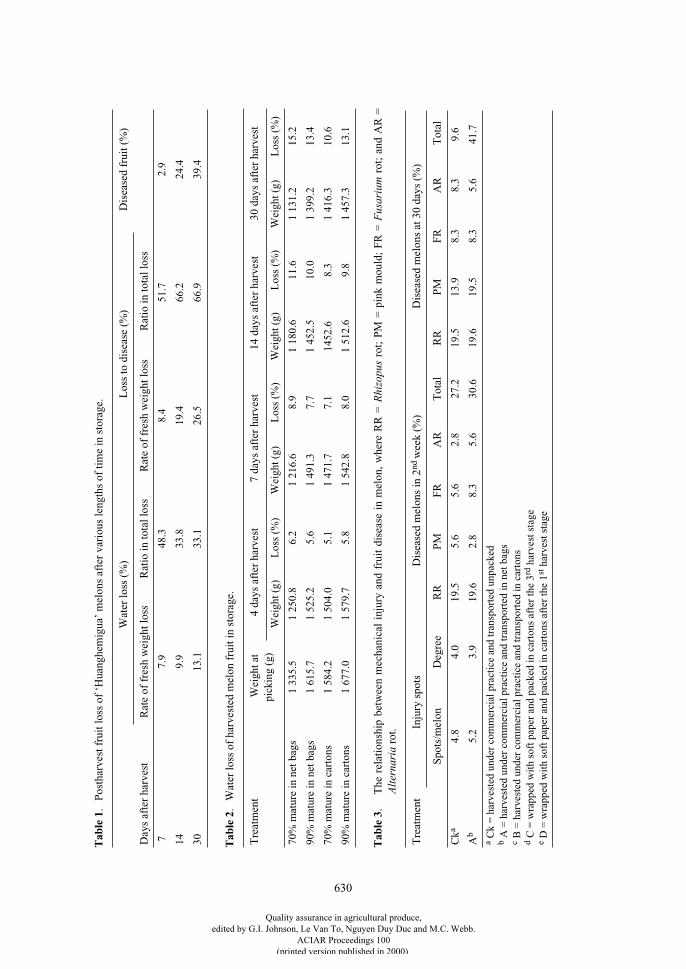
630
Tab
le 1
. P
osth
arve
st f
ruit
loss
of
‘Hua
nghe
mig
ua’
mel
ons
afte
r va
riou
s le
ngth
s of
tim
e in
sto
rage
.
W
ater
loss
(%
)L
oss
to d
isea
se (
%)
Dis
ease
d fr
uit (
%)
Day
s af
ter
harv
est
Rat
e of
fre
sh w
eigh
t los
sR
atio
in to
tal l
oss
Rat
e of
fre
sh w
eigh
t los
s R
atio
in to
tal l
oss
77.
948
.38.
451
.72.
9
149.
933
.819
.466
.224
.4
3013
.133
.126
.566
.939
.4
Tab
le 2
. W
ater
loss
of
harv
este
d m
elon
fru
it in
sto
rage
.
Tre
atm
ent
Wei
ght a
t pi
ckin
g (g
)
4 d
ays
afte
r ha
rves
t 7
day
s af
ter
harv
est
14
days
aft
er h
arve
st30
day
s af
ter
harv
est
Wei
ght (
g)L
oss
(%)
Wei
ght (
g)L
oss
(%)
Wei
ght (
g)L
oss
(%)
Wei
ght (
g) L
oss
(%)
70%
mat
ure
in n
et b
ags
1 33
5.5
1 25
0.8
6.2
1 21
6.6
8.9
1 18
0.6
11.6
1 13
1.2
15.
2
90%
mat
ure
in n
et b
ags
1 61
5.7
1 52
5.2
5.6
1 49
1.3
7.7
1 45
2.5
10.0
1 39
9.2
13.
4
70%
mat
ure
in c
arto
ns1
584.
21
504.
05.
11
471.
77.
114
52.6
8.3
1 41
6.3
10.
6
90%
mat
ure
in c
arto
ns1
677.
01
579.
75.
81
542.
88.
01
512.
69.
81
457.
3 1
3.1
Tab
le 3
.
The
rel
atio
nshi
p be
twee
n m
echa
nica
l in
jury
and
fru
it d
isea
se i
n m
elon
, w
here
RR
=
Rhi
zopu
s
rot
; P
M =
pin
k m
ould
; F
R =
Fus
ariu
m
rot
; an
d A
R =
Alt
erna
ria
rot
.
Tre
atm
ent
Inju
ry s
pots
Dis
ease
d m
elon
s in
2
nd
wee
k (%
)D
isea
sed
mel
ons
at 3
0 da
ys (
%)
Spo
ts/m
elon
Deg
ree
RR
PM
FR
AR
Tot
alR
RP
MF
RA
R T
otal
Ck
a
4.8
4.0
19.5
5.6
5.6
2.8
27.2
19.5
13.9
8.3
8.3
9.6
A
b
5.2
3.9
19.6
2.8
8.3
5.6
30.6
19.6
19.5
8.3
5.6
41.7
a
Ck
= h
arve
sted
und
er c
omm
erci
al p
ract
ice
and
tran
spor
ted
unpa
cked
b
A =
har
vest
ed u
nder
com
mer
cial
pra
ctic
e an
d tr
ansp
orte
d in
net
bag
s
c
B =
har
vest
ed u
nder
com
mer
cial
pra
ctic
e an
d tr
ansp
orte
d in
car
tons
d
C =
wra
pped
wit
h so
ft p
aper
and
pac
ked
in c
arto
ns a
fter
the
3
rd
har
vest
sta
ge
e
D =
wra
pped
wit
h so
ft p
aper
and
pac
ked
in c
arto
ns a
fter
the
1
st
har
vest
sta
ge
Quality assurance in agricultural produce,edited by G.I. Johnson, Le Van To, Nguyen Duy Duc and M.C. Webb.
ACIAR Proceedings 100(printed version published in 2000)
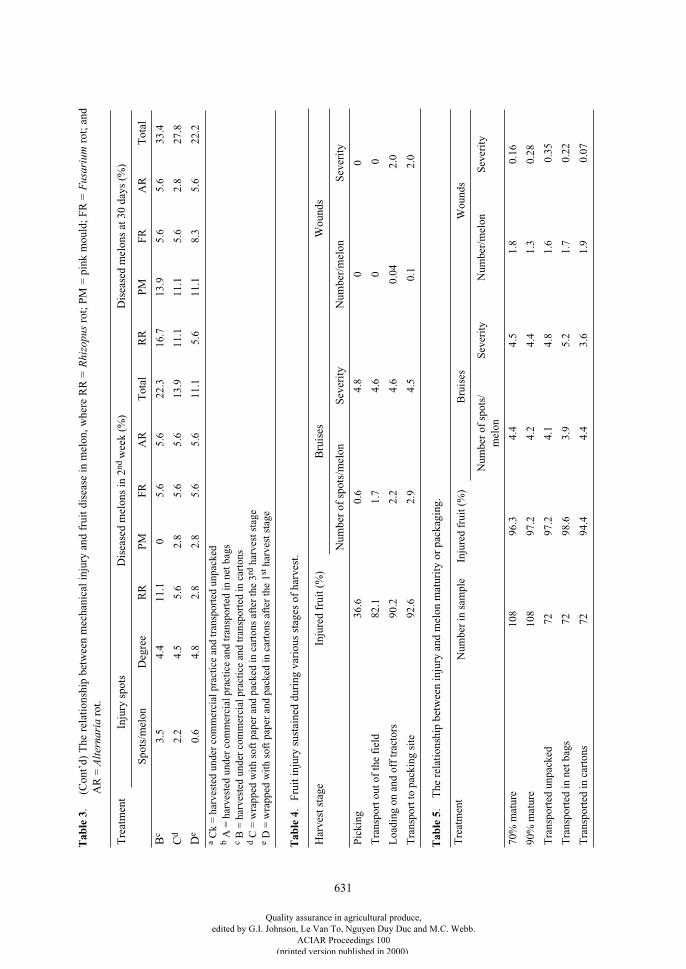
631
B
c
3.5
4.4
11.1
05.
65.
622
.316
.713
.95.
65.
633
.4
C
d
2.2
4.5
5.6
2.8
5.6
5.6
13.9
11.1
11.1
5.6
2.8
27.8
D
e
0.6
4.8
2.8
2.8
5.6
5.6
11.1
5.6
11.1
8.3
5.6
22.2
Tab
le 4
. F
ruit
inju
ry s
usta
ined
dur
ing
vari
ous
stag
es o
f ha
rves
t.
Har
vest
sta
geIn
jure
d fr
uit (
%)
Bru
ises
Wou
nds
Num
ber
of s
pots
/mel
onS
ever
ity
Num
ber/
mel
onS
ever
ity
Pic
king
36.6
0.6
4.8
00
Tra
nspo
rt o
ut o
f th
e fi
eld
82.1
1.7
4.6
0 0
Loa
ding
on
and
off
trac
tors
90.2
2.2
4.6
0.04
2.0
Tra
nspo
rt to
pac
king
sit
e92
.62.
94.
50.
1 2
.0
Tab
le 5
. T
he r
elat
ions
hip
betw
een
inju
ry a
nd m
elon
mat
urit
y or
pac
kagi
ng.
Tre
atm
ent
Num
ber
in s
ampl
eIn
jure
d fr
uit (
%)
Bru
ises
Wou
nds
Num
ber
of s
pots
/m
elon
Sev
erit
yN
umbe
r/m
elon
Sev
erit
y
70%
mat
ure
108
96.3
4.4
4.5
1.8
0.16
90%
mat
ure
108
97.2
4.2
4.4
1.3
0.28
Tra
nspo
rted
unp
acke
d72
97.2
4.1
4.8
1.6
0.3
5
Tra
nspo
rted
in n
et b
ags
7298
.63.
95.
21.
7 0
.22
Tra
nspo
rted
in c
arto
ns72
94.4
4.4
3.6
1.9
0.0
7
Tab
le 3
. (
Con
t’d)
The
rel
atio
nshi
p be
twee
n m
echa
nica
l in
jury
and
fru
it d
isea
se i
n m
elon
, whe
re R
R =
Rhi
zopu
s
rot
; P
M =
pin
k m
ould
; F
R =
Fus
ariu
m
rot
; an
dA
R =
Alt
erna
ria
rot
.
Tre
atm
ent
Inju
ry s
pots
Dis
ease
d m
elon
s in
2
nd
wee
k (%
)D
isea
sed
mel
ons
at 3
0 da
ys (
%)
Spo
ts/m
elon
Deg
ree
RR
PM
FR
AR
Tot
alR
RP
MF
RA
R T
otal
a
Ck
= h
arve
sted
und
er c
omm
erci
al p
ract
ice
and
tran
spor
ted
unpa
cked
b
A =
har
vest
ed u
nder
com
mer
cial
pra
ctic
e an
d tr
ansp
orte
d in
net
bag
s
c
B =
har
vest
ed u
nder
com
mer
cial
pra
ctic
e an
d tr
ansp
orte
d in
car
tons
d
C =
wra
pped
wit
h so
ft p
aper
and
pac
ked
in c
arto
ns a
fter
the
3
rd
har
vest
sta
ge
e
D =
wra
pped
wit
h so
ft p
aper
and
pac
ked
in c
arto
ns a
fter
the
1
st
har
vest
sta
ge
Quality assurance in agricultural produce,edited by G.I. Johnson, Le Van To, Nguyen Duy Duc and M.C. Webb.
ACIAR Proceedings 100(printed version published in 2000)
632
Conclusion
• ‘Huanghemigua’ melon fruit lost most of theirweight in two weeks after harvest when kept atroom temperature, and the major factor responsiblefor weight loss was postharvest disease.
• Melon injury during harvest and transportcontributed to postharvest diseases and water loss.
• Injury-dependent weight loss was related toharvesting and transport as well as packingpractices.
References
Morris, S. and Wade, N. 1985. Postharvest handling ofvegetables. In: Vegetable growing handbook. Griffith,Australia, Irrigation Research and Extension Committee,127–138.
Zhang Weiyi, Bi Yang and Zhang Manyu 1990. Problemsand the treatments in muskmelon transportation. In:Research reports for storage techniques and postharvestphysiology of muskmelon. Xingjiang, PR China,Agricultural College.
Quality assurance in agricultural produce,edited by G.I. Johnson, Le Van To, Nguyen Duy Duc and M.C. Webb.
ACIAR Proceedings 100(printed version published in 2000)
633
Postharvest Technology for Vietnamese‘Buoi’ Mangoes
L.U. Opara*, H.X. Nguyen* and Le Van To†
Abstract
Mango is an important fruit crop in Vietnam. Despite their excellent eating quality, export marketing ofimportant varieties such as ‘Buoi’, ‘Thom’ and ‘Cat Hoa Loc’ is currently limited due mainly to inadequatepostharvest techniques to maintain fruit quality. Postharvest losses also result from incidence of diseases suchas anthracnose, stem-end rot, and physiological disorders. The aim of this research program was to characterisethe quality attributes of ‘Buoi’ mango by investigating the effects of storage temperature, harvest date andpostharvest treatments on quality attributes during cold storage. Our results showed that avoiding theharvesting of fruit at very early maturity, and applying a postharvest hot water treatment at 52°C for 5 min werebeneficial in reducing the incidence of physiological diseases as well as minimising mass loss and shrivel.Flesh firmness declined significantly (P
F
0.05) with increasing length of storage and increasing storagetemperature. Cold storage at 7°C or 12°C maintained fruit firmness and extended storage life better thanstorage under ambient conditions.
P
OSTHARVEST
DISEASES
and disorders such as anthra-cnose lesions and stem-end rot have been known tocause major quality and quarantine problems in themango export trade all over the world (Johnson et al.1990; McIntyre et al. 1993). Mango anthracnosecaused by
Colletotrichum gloeosporioides
Penz.(Dodd et al. 1997) is the most common cause of decayof mango fruit in Vietnam (Minh et al. 1993). Anthra-cnose occurs pre and postharvest and is associatedwith high rainfall and humidity (Dodd et al. 1992).
Postharvest hot water treatment is now acceptedworldwide to satisfy quarantine requirements forcontrol of anthracnose in mango (McIntyre et al. 1993;Suhardjo et al. 1994). For hot water treatment,different dipping conditions have been recommendedto control anthracnose effectively, but a general con-clusion is that the water temperature should bebetween 50 and 55°C and the dipping time must be atleast 5 min (Dodd et al. 1997). The use of hot benomyldips appeared to be the most effective means of con-
trolling anthracnose development. However, theworldwide concern on the use of agrichemicalsbecause of the danger to food product safety hasreduced the use of benomyl dips.
Stem-end rot is the other major mango disease—it ismore specific and difficult to control (Huang and Liu1995). Sangchote (1989) found that dipping fruit in hotwater at 55°C for 5 min gave good control of stem-endrot of ‘Nam Dorkmai’ mango without heat injury.Immersion in hot water (52°C for 5 min) plus benomylhas also been reported to reduce stem-end rot inmangoes (Johnson et al. 1990).
Chilling injury is the most serious disadvantage ofrefrigeration in extending the storage life of mangoes(Veloz et al. 1977). McCollum et al. (1993) showedthat heat treatment can inhibit chilling injury ofmango. The authors reported that when ‘Keitt’ mangowere kept at 38°C for 0, 24, or 48 hours before storageat 5°C for 11 days, non-heated fruit developed severerind pitting and discoloration, whereas chilling injurysymptoms decreased with increased duration at 38°C.
In Vietnam, ‘Buoi’ mangoes are usually harvestedover a period of about 1 month, but the effects onquality changes during storage are not known. Thepurpose of this study was to determine suitable post-
* Centre for Postharvest and Refrigeration Research, Institute of Technology and Engineering, Massey University, Palmerston North, New Zealand.
† Postharvest Technology Institute, Ho Chi Minh City, Vietnam.
Quality assurance in agricultural produce,edited by G.I. Johnson, Le Van To, Nguyen Duy Duc and M.C. Webb.
ACIAR Proceedings 100(printed version published in 2000)
634
harvest storage and treatment technologies formaintaining the quality of Vietnamese ‘Buoi’mangoes. The specific objectives were to: (a) evaluatethe effects of storage temperature on fruit firmness; (b)determine the effects of postharvest hot watertreatment on postharvest quality attributes; and (c)investigate the development of anthracnose, stem-endrot, shrivel and chilling injury in ‘Buoi’ mangoesharvested at different times during storage at 12°C(relative humidity (RH) 85–90%).
Experimental Design
In experiment 1, mature-green ‘Buoi’ mangoes wereharvested on 24/3/1997 from an orchard in Hoa Locarea, Cai Be District, Tien Giang Province, Vietnamand transferred to a laboratory at the Post-harvestTechnology Institute (PHTI) in Ho Chi Minh City.Fruit were harvested based on skin colour and uniformsize. A random sample of 480 fruit were selected anddivided into 4 groups. Individual fruit were selected onthe basis of freedom from mechanical damage, pests,and diseases. Four subsamples of 120 fruit each werestored at each of the following cool-store tempera-tures: 7°C, 12°C, 17°C (
±
1°C, RH 85–90%) andambient temperature (27°C). On each testing date, 10fruit were assessed for firmness using a hand-heldEffegi penetrometer (Model FT 327) fitted with a 10.9mm diameter probe. Each fruit was tested twice onopposite sides along the equatorial axis after removingthe skin using a potato peeler.
In experiment 2, fruit were harvested from the sameorchard at 3 different times at 14-day intervals repre-senting early (10/3/1997), mid (24/3/1997), and lateharvest (7/4/1997). On each date, a sample of 40 fruitwithout disease and physical injury were randomlyselected and divided into 4 subsamples (10 in eachsubsample). The fruit samples were then randomlyassigned to the following treatments and put into coldstorage at 12
±
1°C (RH 85–90%): treatment 1 = fruitdipped in hot water at 52°C
for 5 min; treatment 2 =fruit dipped in hot water at 52°C
for 10 min; treatment3 = fruit placed in a polyvinyl chloride (PVC) plasticbag; and treatment 4 = control (untreated) fruit. After25 days of storage, fruit were assessed for mass loss,peel and pulp colour, soluble solids content, anthra-cnose, stem-end rot, shrivel and chilling injury(Nguyen 1998).
Data Analysis
Data on fruit firmness, mass loss, peel and pulp colour,soluble solids content, anthracnose, stem-end rot,shrivel and chilling injury were subjected to analysisof variance, and the treatment means were comparedusing least significant difference (Everitt and Der1996). In experiment 1, regression models weredeveloped (for each storage temperature) for pre-dicting fruit firmness based on storage time, and forpredicting fruit firmness as a function of storage tem-perature and length of storage.
Results
Fruit firmness
The effect of length of storage and storage temper-ature on flesh firmness of ‘Buoi’ mangoes is shown inTable 1. Flesh firmness declined significantly (P < 0.05)with increasing storage time. Storing fruit underambient conditions resulted in accelerated ripening andreduction in fruit firmness, and fruit quality becameunacceptable between 10–15 days. However, coldstorage of fruit at 7°C or 12°C significantly maintainedfruit firmness during the 25-day interval.
Fruit firmness was highly dependent on storagetemperature such that increasing storage temperatureled to a significant (P
F
0.05) decline in firmness.Regression analyses between fruit firmness andstorage time at different storage temperatures showedthat length of storage was a good predictor for fruitfirmness (Table 2). Combining the effects of temper-ature and length of storage improved the prediction offruit firmness during 15 days storage in the range7–27°C.
Postharvest treatments
The effects of hot water treatments and storing fruitin plastic bags on fruit quality attributes are summa-rised in Table 3. Both hot water treatmentssignificantly (P < 0.05) increased the rate of peel andpulp colour development compared to plastic bagstorage and the control. However, there was no signif-icant difference in peel and pulp colour of fruit dippedin hot water for 5 or 10 min. Fruit stored in plastic bagshad the lowest rate of skin and pulp colour devel-opment. The harvest date did not affect the colourdevelopment of both treated and untreated fruit.
Quality assurance in agricultural produce,edited by G.I. Johnson, Le Van To, Nguyen Duy Duc and M.C. Webb.
ACIAR Proceedings 100(printed version published in 2000)
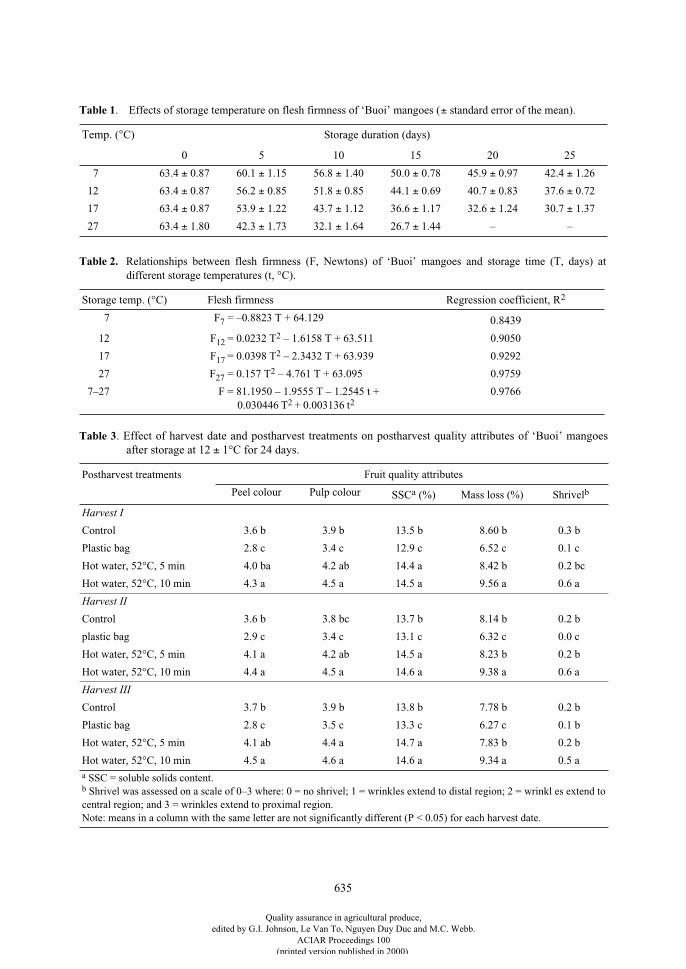
635
Table 1
. Effects of storage temperature on flesh firmness of ‘Buoi’ mangoes (
±
standard error of the mean).
Temp. (
°
C) Storage duration (days)
0 5 10 15 20 25
7 63.4
±
0.87 60.1
±
1.15 56.8
±
1.40 50.0
±
0.78 45.9
±
0.97 42.4
±
1.26
12 63.4
±
0.87 56.2
±
0.85 51.8
±
0.85 44.1
±
0.69 40.7
±
0.83 37.6
±
0.72
17 63.4
±
0.87 53.9
±
1.22 43.7
±
1.12 36.6
±
1.17 32.6
±
1.24 30.7
±
1.37
27 63.4
±
1.80 42.3
±
1.73 32.1
±
1.64 26.7
±
1.44 – –
Table 2.
Relationships between flesh firmness (F, Newtons) of ‘Buoi’ mangoes and storage time (T, days) atdifferent storage temperatures (t, °C).
Storage temp. (°C) Flesh firmness Regression coefficient, R
2
7 F
7
= –0.8823 T + 64.129
0.8439
12 F
12
= 0.0232 T
2
– 1.6158 T + 63.511 0.9050
17 F
17
= 0.0398 T
2
– 2.3432 T + 63.939 0.9292
27 F
27
= 0.157 T
2
– 4.761 T + 63.095 0.9759
7–27 F = 81.1950 – 1.9555 T – 1.2545 t +0.030446 T
2
+ 0.003136 t
2
0.9766
Table 3
. Effect of harvest date and postharvest treatments on postharvest quality attributes of ‘Buoi’ mangoesafter storage at 12
±
1°C for 24 days.
Postharvest treatments Fruit quality attributes
Peel colour Pulp colour
SSC
a
(%)
Mass loss (%) Shrivel
b
Harvest I
Control 3.6 b 3.9 b 13.5 b 8.60 b 0.3 b
Plastic bag 2.8 c 3.4 c 12.9 c 6.52 c 0.1 c
Hot water, 52°C, 5 min 4.0 ba 4.2 ab 14.4 a 8.42 b 0.2 bc
Hot water, 52°C, 10 min 4.3 a 4.5 a 14.5 a 9.56 a 0.6 a
Harvest II
Control 3.6 b 3.8 bc 13.7 b 8.14 b 0.2 b
plastic bag 2.9 c 3.4 c 13.1 c 6.32 c 0.0 c
Hot water, 52°C, 5 min 4.1 a 4.2 ab 14.5 a 8.23 b 0.2 b
Hot water, 52°C, 10 min 4.4 a 4.5 a 14.6 a 9.38 a 0.6 a
Harvest III
Control 3.7 b 3.9 b 13.8 b 7.78 b 0.2 b
Plastic bag 2.8 c 3.5 c 13.3 c 6.27 c 0.1 b
Hot water, 52°C, 5 min 4.1 ab 4.4 a 14.7 a 7.83 b 0.2 b
Hot water, 52°C, 10 min 4.5 a 4.6 a 14.6 a 9.34 a 0.5 a
a
SSC = soluble solids content.
b
Shrivel was assessed on a scale of 0–3 where: 0 = no shrivel; 1 = wrinkles extend to distal region; 2 = wrinkl es extend to central region; and 3 = wrinkles extend to proximal region.Note: means in a column with the same letter are not significantly different (P < 0.05) for each harvest date.
Quality assurance in agricultural produce,edited by G.I. Johnson, Le Van To, Nguyen Duy Duc and M.C. Webb.
ACIAR Proceedings 100(printed version published in 2000)
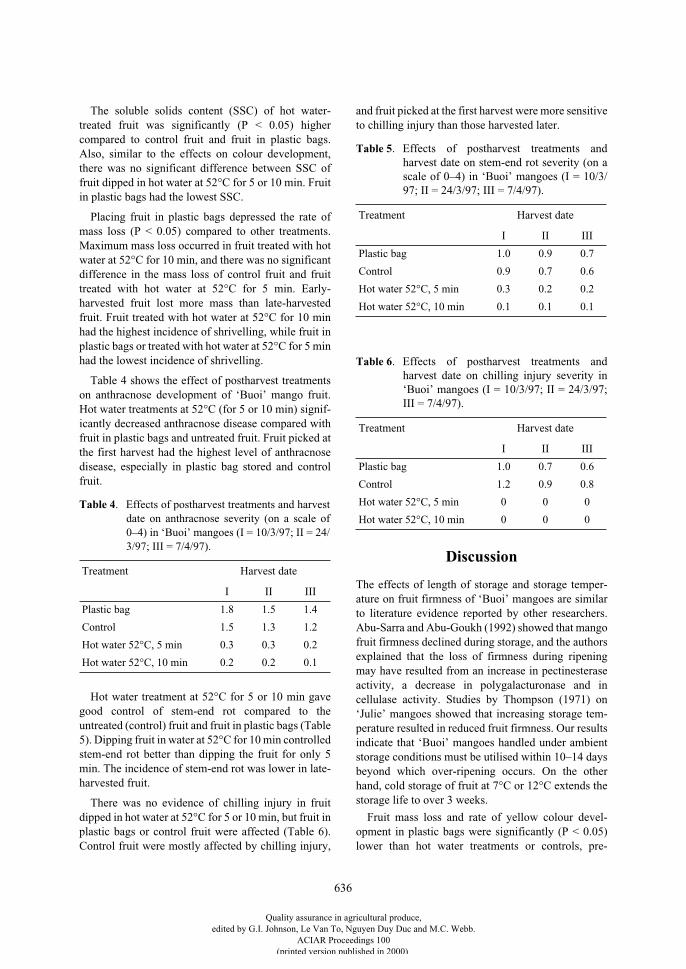
636
The soluble solids content (SSC) of hot water-treated fruit was significantly (P < 0.05) highercompared to control fruit and fruit in plastic bags.Also, similar to the effects on colour development,there was no significant difference between SSC offruit dipped in hot water at 52°C for 5 or 10 min. Fruitin plastic bags had the lowest SSC.
Placing fruit in plastic bags depressed the rate ofmass loss (P < 0.05) compared to other treatments.Maximum mass loss occurred in fruit treated with hotwater at 52°C for 10 min, and there was no significantdifference in the mass loss of control fruit and fruittreated with hot water at 52°C for 5 min. Early-harvested fruit lost more mass than late-harvestedfruit. Fruit treated with hot water at 52°C for 10 minhad the highest incidence of shrivelling, while fruit inplastic bags or treated with hot water at 52°C for 5 minhad the lowest incidence of shrivelling.
Table 4 shows the effect of postharvest treatmentson anthracnose development of ‘Buoi’ mango fruit.Hot water treatments at 52°C (for 5 or 10 min) signif-icantly decreased anthracnose disease compared withfruit in plastic bags and untreated fruit. Fruit picked atthe first harvest had the highest level of anthracnosedisease, especially in plastic bag stored and controlfruit.
Hot water treatment at 52°C for 5 or 10 min gavegood control of stem-end rot compared to theuntreated (control) fruit and fruit in plastic bags (Table5). Dipping fruit in water at 52°C for 10 min controlledstem-end rot better than dipping the fruit for only 5min. The incidence of stem-end rot was lower in late-harvested fruit.
There was no evidence of chilling injury in fruitdipped in hot water at 52°C for 5 or 10 min, but fruit inplastic bags or control fruit were affected (Table 6).Control fruit were mostly affected by chilling injury,
and fruit picked at the first harvest were more sensitiveto chilling injury than those harvested later.
Discussion
The effects of length of storage and storage temper-ature on fruit firmness of ‘Buoi’ mangoes are similarto literature evidence reported by other researchers.Abu-Sarra and Abu-Goukh (1992) showed that mangofruit firmness declined during storage, and the authorsexplained that the loss of firmness during ripeningmay have resulted from an increase in pectinesteraseactivity, a decrease in polygalacturonase and incellulase activity. Studies by Thompson (1971) on‘Julie’ mangoes showed that increasing storage tem-perature resulted in reduced fruit firmness. Our resultsindicate that ‘Buoi’ mangoes handled under ambientstorage conditions must be utilised within 10–14 daysbeyond which over-ripening occurs. On the otherhand, cold storage of fruit at 7°C or 12°C extends thestorage life to over 3 weeks.
Fruit mass loss and rate of yellow colour devel-opment in plastic bags were significantly (P < 0.05)lower than hot water treatments or controls, pre-
Table 4
. Effects of postharvest treatments and harvestdate on anthracnose severity (on a scale of0–4) in ‘Buoi’ mangoes (I = 10/3/97; II = 24/3/97; III = 7/4/97).
Treatment Harvest date
I II III
Plastic bag 1.8 1.5 1.4
Control 1.5 1.3 1.2
Hot water 52°C, 5 min 0.3 0.3 0.2
Hot water 52°C, 10 min 0.2 0.2 0.1
Table 5
. Effects of postharvest treatments andharvest date on stem-end rot severity (on ascale of 0–4) in ‘Buoi’ mangoes (I = 10/3/97; II = 24/3/97; III = 7/4/97).
Treatment Harvest date
I II III
Plastic bag 1.0 0.9 0.7
Control 0.9 0.7 0.6
Hot water 52°C, 5 min 0.3 0.2 0.2
Hot water 52°C, 10 min 0.1 0.1 0.1
Table 6
. Effects of postharvest treatments andharvest date on chilling injury severity in‘Buoi’ mangoes (I = 10/3/97; II = 24/3/97;III = 7/4/97).
Treatment Harvest date
I II III
Plastic bag 1.0 0.7 0.6
Control 1.2 0.9 0.8
Hot water 52°C, 5 min 0 0 0
Hot water 52°C, 10 min 0 0 0
Quality assurance in agricultural produce,edited by G.I. Johnson, Le Van To, Nguyen Duy Duc and M.C. Webb.
ACIAR Proceedings 100(printed version published in 2000)
637
sumably due to the higher relative humidity (RH)inside the plastic bags. High RH may also contribute tothe high incidence of postharvest diseases such asanthracnose and stem-end rot in fruit stored in plasticbags.
Hot water treatment at 52°C for 5 or 10 min gavegood control of diseases—anthracnose, and stem-endrot—of ‘Buoi’ mango compared to plastic bag storageand the control (P < 0.05). Disease control increasedwith increased dipping time (mango fruit in hot waterat 52°C for 10 min showed a better control of anthra-cnose and stem-end rot than fruit dipped for 5 min).However, increasing the dipping time led to anincrease in mass loss and shrivelling incidence (Table3). These results are similar to those reported bySangchote (1989) on ‘Nam Dorkmai’ mangoes. Theauthor indicated that disease control increased withincreased temperature and dipping time.
The peel and pulp colour, soluble solids content, andmass loss of fruit dipped in hot water (52°C for 5 or 10min) increased significantly (P < 0.05) compared withfruit in plastic bag and controls. On the other hand,these quality attributes of fruit dipped in hot water at52°C for 5 were not significantly different (P > 0.05)compared with dipping fruit in hot water at 52°C for 10min.. Fruit in plastic bags had the lowest mass loss rateand incidence of shrivelling, but they were more sus-ceptible to anthracnose and stem-end rot than hotwater-treated fruit. Harvest date did not significantly(P > 0.05) affect the postharvest quality attributes suchas peel colour, pulp colour, soluble solids content, andshrivel, but fruit mass loss, incidence of diseases andchilling injury were affected. Fruit picked during theearly-season harvest had a higher mass loss rate andwere more susceptible to anthracnose, stem-end rotand chilling injury. A higher incidence of chillinginjury in early harvested mango fruit ‘Tommy Atkins’has been reported by Medlicott et al. (1990).
There was no evidence of chilling injury in fruitdipped in hot water at 52°C for 5 or 10 min after 24days of storage at 12°C, while fruit in plastic bags andespecially untreated fruit were affected by chillinginjury (Table 6). This result indicates that hot watertreatment at 52°C for 5 or 10 min can inhibit chillinginjury in ‘Buoi’ mango as reported by McCollum et al.(1993) with heat treatment of ‘Keitt’ mangoes.
Conclusions
Fruit firmness of ‘Buoi’ mangoes declined duringstorage and with increasing storage temperature. Coldstorage at 7°C or 12°C was beneficial in extending
storage life and maintaining fruit firmness. For eachstorage temperature, regression models weredeveloped for predicting fruit firmness as a function ofthe length of storage. Including the length of storagefurther improved the strength of the prediction.
Fruit treated with hot water at 52°C for 5 or 10 minsignificantly reduced the incidence of anthracnose andstem-end rot disease and also minimised the occur-rence of chilling injury compared to fruit stored inplastic bags or untreated fruit. Fruit stored in plasticbags lost less mass than in the other treatments.Although treating ‘Buoi’ mangoes with hot water at52°C for 10 min gave better control of anthracnose andstem-end rot, immersing fruit in hot water at 52°C for5 min is recommended because this treatment alsoreduces mass loss and shrivelling which are veryimportant factors in mango fruit marketing.
Harvest date affected the incidence of postharvestdiseases, such as anthracnose and stem-end rot, andchilling injury. Early-harvested fruit lost more massand were more susceptible to anthracnose, stem-endrot and chilling injury than mid- and late-harvestedfruit. It is therefore recommended that very early har-vesting of ‘Buoi’ mango fruit destined for longdistance markets and for export should be avoided inorder to minimise the development of postharvestdiseases and disorders and to maintain eating quality.Cold storage at 7°C or 12°C will extend the storage lifeand enhance the scope for distribution and marketingof the fruit in both domestic and regional markets.
References
Abu-Sarra, A.F., and Abu-Goukh. A.A. 1992. Changes inpectinesterase, polygalacturonase and cellulase activityduring mango fruit ripening. Journal of HorticulturalScience, 67, 561–568.
Dodd, J.C., Estrada, A.B. and Jeger, M.J. 1992.Epidemiology of Colletotrichum gloeosporioides in thetropics. In: Bailey, J.A. and Jeger, M.J., ed., Colletot-richum: biology, pathology and control. Wallingford,CAB International.
Dodd, J.C., Prusky, D. and Jeffries, P. 1997. Fruit diseases.In: Litz, R.E., ed., The mango: botany, production anduses. Wallingford, CAB International.
Everitt, B.S. and Der, G. 1996. A handbook of statisticalanalyses using SAS. London, Chapman and Hall.
Huang, S. and Liu, X. 1995. Control of postharvest stem-endrot of mango. Tropical Science, 35, 321–326.
Johnson, G.I., Sangchote, S. and Cooke, A.W. 1990. Controlof stem-end rot (Dothiorella dominicana) and otherpostharvest diseases of mangoes (cv. Kensington Pride)
Quality assurance in agricultural produce,edited by G.I. Johnson, Le Van To, Nguyen Duy Duc and M.C. Webb.
ACIAR Proceedings 100(printed version published in 2000)
638
during short and long-term storage. Tropical Agriculture(Trinidad), 67, 183–187.
McCollum, T.G., D’Aquino, S. and McDonald, R.E. 1993.Heat treatment inhibits mango chilling injury.HortScience, 28, 197–198.
McIntyre, A., Wickham, L.D., Wilson, L.A. and Malins, A.1993. Hot water treatments for the postharvest control offruit fly and anthracnose in the Caribbean mango ‘Julie’.Acta Horticulturae, 341, 533–538.
Medlicott, A.P., Sigrist, J.M.M. and Sy, O. 1990. Ripeningof mangoes following low-temperature storage. Journalof the American Society of Horticultural Scientists, 115,430–434.
Minh, D., Phong, L.T. and Hoang, V.T. 1993. Mangoplanting. An Giang, Vietnamese Department of Science,Technology and Environment.
Nguyen, H.X. 1998. Studies on postharvest cold storage of‘Buoi’ mangoes. MApplSc thesis, Massey University,Palmerston North, New Zealand.
Thompson, A.K. 1971. The storage of mango fruits.Tropical Agriculture (Trinidad), 48, 63–70.
Sangchote, S. 1989. Effect of postharvest treatments onanthracnose (Colletotrichum gloeosporioides Penz) andstem-end rot (Dothiorella dominicana Pet. Et. Cif.) ofmangoes stored in air or modified atmosphere.Association of South-East Asian Nations (ASEAN) FoodJournal, 4(4), 142–144.
Suhardjo, Hermanto, C. and Yuniarti 1994. Hot-watercontrol of anthracnose on mango varieties Arumanis,Golek, and Manalagi. In: Champ, B.R., Highley, E. andJohnson, G.I., ed., Postharvest handling of tropical fruits.Proceedings of an international conference held at ChiangMai, Thailand, 19–23 July 1993. ACIAR ProceedingsNo. 50. Canberra, Australian Centre for InternationalAgricultural Research, 453–454.
Veloz, C.S., Torres, F.E. and Lakshminarayana, S. 1977.Effect of refrigerated temperatures on the incidence ofchilling injury and ripening quality of mango fruit.Proceedings of the Florida State Horticultural Society,90, 205–210.
Quality assurance in agricultural produce,edited by G.I. Johnson, Le Van To, Nguyen Duy Duc and M.C. Webb.
ACIAR Proceedings 100(printed version published in 2000)
639
Quality Assurance of Fresh Produce in New Zealand – a Personal View
L.U. Opara*
Abstract
New Zealand is primarily a land-based economy, with 60% of export earnings derived from the primaryindustries. Despite its small size and long distance from major international markets, New Zealand’sagriculture (and related biological industries) has been successful in the international arena and agriculture hasbeen the major source of export income. Well-established marketing cooperatives and stringent qualityassurance systems for the production and marketing of high quality products underpin this continued successand competitiveness. Recently in the pipfruit (apples, pears etc.) industry, the quality assurance system hasplaced greater responsibility on individual growers for the overall quality of their products throughout thesupply chain. The objective of this paper is to review the quality assurance schemes employed by the NewZealand pipfruit industry, and to highlight the impact of these schemes on the production, postharvest handlingand export marketing of commodities.
N
EW
Z
EALAND
(NZ) is located in the South Pacificwith a population of 3.6 million people and liesbetween the 34
th
and 48
th
parallels of the SouthernHemisphere. The subtropical to temperate climatecontributes to high crop yields as well as the pro-duction of a wide range of crops. The warm, drysummers and cool winters provide an ideal climate forgrowing fresh produce. Average temperatures are8–18˚C in winter and 21–27˚C in summer. Rainfallincidence varies across the fruit growing areas, anddeclines southwards from Auckland (top of the NorthIsland) to the bottom of the South Island. Averagerainfall incidence varies from 1.76 mm in Auckland to1.28 mm in the Hawke’s Bay area, and 1.0 mm inNelson.
NZ is a land-based economy with dairy, horti-culture, forestry, wool, and meat products continuingto dominate both the domestic economy and export
income. Agriculture and horticulture contribute nearly60% of the value of exports and 6% of the grossdomestic product (GDP). The considerable distancefrom the major markets in the Northern Hemispherepresents unique challenges (and opportunities) for thedevelopment and application of cutting-edge technol-ogies in postharvest handling and marketing. Until theearly 1970s, up to 95% of NZ’s produce was exportedto the United Kingdom (UK), but this situation soonchanged histrionically when England became part ofthe European Community. Combined with rising oilprices worldwide which resulted in very expensivetransport costs, survival became a major concern and itbecame vital for NZ industries to seek new marketsand develop new products. Today, NZ pipfruit (apples,pears etc.) is marketed in over 50 countries spread overall continents, although the European Union remainsthe major export market, accounting for over 61.5% ofthe 10-year average from 1990–99 (Table 1). Ourisolation from major industrial regions, and adoptionof environmentally sustainable practices haveenhanced our reputation as a ‘clean green’ country andproducer.
* Centre for Postharvest and Refrigeration Research, Institute of Technology and Engineering, Massey University, Palmerston North, New Zealand.
Quality assurance in agricultural produce,edited by G.I. Johnson, Le Van To, Nguyen Duy Duc and M.C. Webb.
ACIAR Proceedings 100(printed version published in 2000)
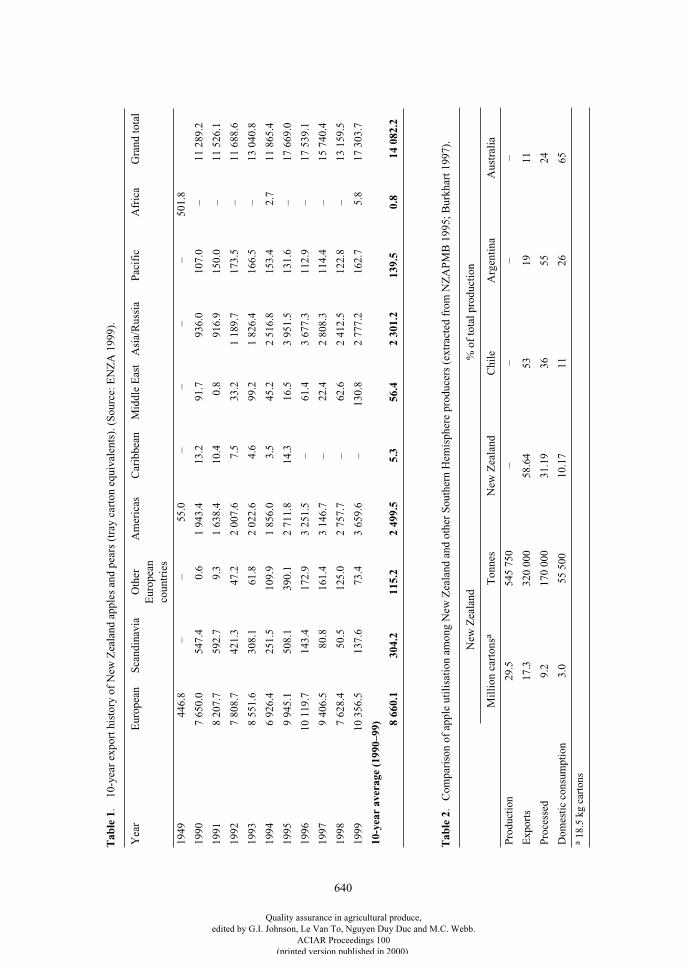
640
Tab
le 1
. 1
0-ye
ar e
xpor
t his
tory
of
New
Zea
land
app
les
and
pear
s (t
ray
cart
on e
quiv
alen
ts).
(S
ourc
e: E
NZ
A 1
999)
.
Yea
rE
urop
ean
Sca
ndin
avia
Oth
er
Eur
opea
n co
untr
ies
Am
eric
asC
arib
bean
Mid
dle
Eas
tA
sia/
Rus
sia
Pac
ific
Afr
ica
Gra
nd to
tal
1949
446.
8–
–55
.0–
––
–50
1.8
1990
7 65
0.0
547.
40.
61
943.
413
.291
.793
6.0
107.
0–
11 2
89.2
1991
8 20
7.7
592.
79.
31
638.
410
.40.
891
6.9
150.
0–
11 5
26.1
1992
7 80
8.7
421.
347
.22
007.
67.
533
.21
189.
717
3.5
–11
688
.6
1993
8 55
1.6
308.
161
.82
022.
64.
699
.21
826.
416
6.5
–13
040
.8
1994
6 92
6.4
251.
510
9.9
1 85
6.0
3.5
45.2
2 51
6.8
153.
42.
711
865
.4
1995
9 94
5.1
508.
139
0.1
2 71
1.8
14.3
16.5
3 95
1.5
131.
6–
17 6
69.0
1996
10 1
19.7
143.
417
2.9
3 25
1.5
–61
.43
677.
311
2.9
–17
539
.1
1997
9 40
6.5
80.8
161.
43
146.
7–
22.4
2 80
8.3
114.
4–
15 7
40.4
1998
7 62
8.4
50.5
125.
02
757.
7–
62.6
2 41
2.5
122.
8–
13 1
59.5
1999
10 3
56.5
137.
673
.43
659.
6–
130.
82
777.
216
2.7
5.8
17 3
03.7
10-y
ear
aver
age
(199
0–99
)
8 66
0.1
304.
211
5.2
2 49
9.5
5.3
56.4
2 30
1.2
139.
50.
814
082
.2
Tab
le 2
. C
ompa
riso
n of
app
le u
tili
sati
on a
mon
g N
ew Z
eala
nd a
nd o
ther
Sou
ther
n H
emis
pher
e pr
oduc
ers
(ext
ract
ed f
rom
NZ
AP
MB
199
5; B
urkh
art 1
997)
.
New
Zea
land
% o
f to
tal p
rodu
ctio
n
Mil
lion
car
tons
a
Ton
nes
New
Zea
land
Chi
leA
rgen
tina
Aus
tral
ia
Pro
duct
ion
29.5
545
750
––
––
Exp
orts
17.3
320
000
58.6
453
1911
Pro
cess
ed9.
217
0 00
031
.19
3655
24
Dom
esti
c co
nsum
ptio
n3.
055
500
10.1
711
2665
a
18.
5 kg
car
tons
Quality assurance in agricultural produce,edited by G.I. Johnson, Le Van To, Nguyen Duy Duc and M.C. Webb.
ACIAR Proceedings 100(printed version published in 2000)
641
To be competitive and win the confidence of its dis-cerning consumers, the need for innovation, value-adding and quality became paramount for NZ indus-tries. In particular, the fresh produce industriesfocused on the top tier of the international market(mainly in Europe), who in turn paid more forpremium quality produce. Today, the NZ freshproduce industries are acknowledged worldwide fortheir competitiveness and consistent top qualityproducts. This success is underpinned by the devel-opment of efficient production systems, sophisticatedmarketing strategies, stringent quality assurancesystems, and innovation at all levels in the supplychain. The fresh produce industries in NZ are diverse,with pipfruit and kiwifruit being the most significant.In this article, I will discuss the NZ pipfruit industryand its contribution to the national economy, and offermy personal view on the evolution and implications ofthe current quality assurance system.
Development of the Pipfruit Industry in New Zealand
Apples and pears dominate the NZ commercialpipfruit industry, accounting for 97.40% and 2.52%,respectively, of the current export income from thepipfruit sector. The early European migrants broughtthe first seedlings into the country in the mid-1800s,and by the 1860s apples were grown in sufficientquantities to sell in the domestic market. Withincreasing recognition of the economic potential ofcommercial fruit growing, supported by developmentsin the science of production, postharvest handling andexport marketing, fruit sales grew rapidly from 5,650cases (18.5 kg containers) in 1910 to 68,000 cases in1914. “To foster, promote and protect the fruitindustry”, growers came together and formed the NewZealand Fruitgrowers Federation in 1916 (NZAPMB,undated). Up to 50% of the pipfruit crop was exported,and as the industry expanded, growers and the gov-ernment agreed on a need to set up a controlledmarketing strategy.
During World War II, pipfruit growers sufferedbecause the UK government restricted the freight offood items from NZ and demanded only meat andother proteins. After the war, government passed theenabling legislation (The Apple and Pear MarketingAct of 1948) which set up the New Zealand Apple andPear Marketing Board (NZAPMB) with the power toacquire and market all apples and pears grown in NZ.The Board was set up to protect the benefits to growers
and provide stability and security to a rapidlyexpanding industry. In pursuance of the aspirations ofthe growers, the Board’s mission statement is to“maximise sustainable export returns to New Zealandand pipfruit growers” (NZAPMB 1995). The 1948 Actrequired that the Board must accept all pipfruit thatmeets the grade standards for export. The domesticmarket for fresh and processed fruit was deregulatedby legislation passed in 1993, and the Board nowgrants specific export licences to third parties undervery strict criteria, which are set out in publishedguidelines. With deregulation, New Zealanders cannow buy export-grade fruit in local supermarkets.Today, the Board seeks to maximise the returns to itssuppliers primarily by the worldwide marketing ofpipfruit, horticultural products and related productsand services. The vision is to “be the world’s foremostpipfruit marketing orgnisation in order to achievepremium returns through an effectively integratedvolume business and excellence in value creation,customer satisfaction and innovation” (NZAPMB1995).
Today, there are over 1,600 pipfruit growers with atotal of about 13,800 ha planted. Based on 1995 esti-mates, over 59% of all pipfruit production is exportedto 60 countries as fresh produce (17.2 million cartons),which is higher than all our Southern Hemispherecompetitors which have much more domestic con-sumption and lower exports (Table 2). Pipfruitproduction is carried out in many regions, withHawke’s Bay alone (latitude 39
°
S, annual rainfall1,132 mm, average temperature 18.8
°
C max. and7.0
°
C min.) in the North accounting for 48.04% ofregional paid crop summary during the past decade(Table 3). In 1997, Hawke’s Bay and Nelsonaccounted for 80.5% of the total exports of pipfruit(Table 4), both having similar growing conditions.
Overall, NZ horticulture is diverse, and has severalcharacteristics (Hewett 1997):• a maritime climate with good soils and high light
intensities;• successful breeding programs and variety selection;• a well structured industry;• an export orientation;• well educated producers and cost-effective
production systems;• excellent education and research systems;• a complementary production season to the Northern
Hemisphere;• an international reputation for diversity and quality
of products; and• distance from international markets.
Quality assurance in agricultural produce,edited by G.I. Johnson, Le Van To, Nguyen Duy Duc and M.C. Webb.
ACIAR Proceedings 100(printed version published in 2000)
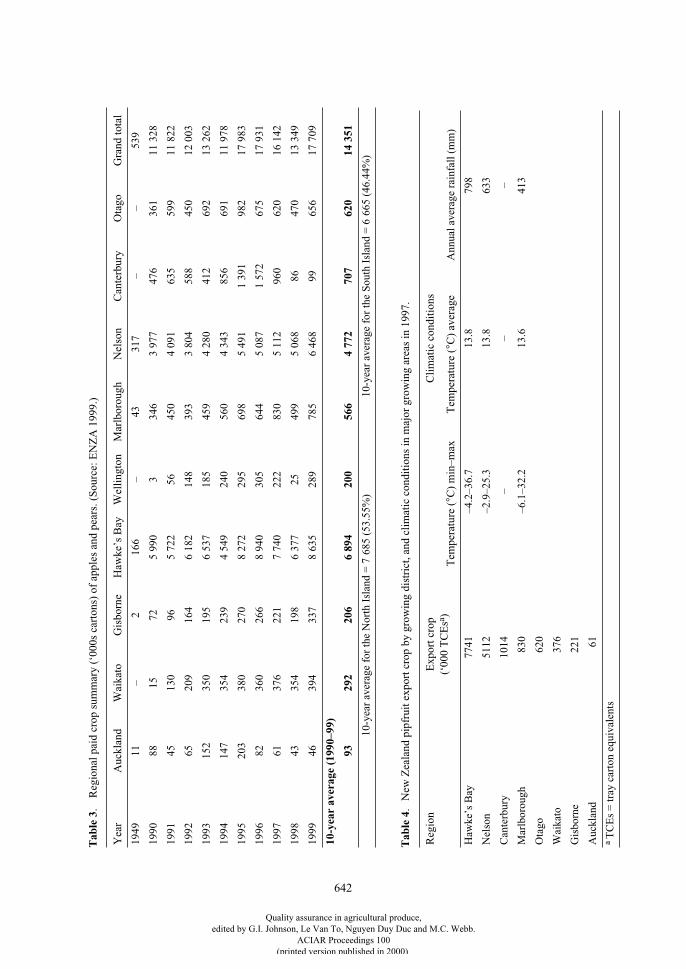
642
Tab
le 3
. R
egio
nal p
aid
crop
sum
mar
y (‘
000s
car
tons
) of
app
les
and
pear
s. (
Sou
rce:
EN
ZA
199
9.)
Yea
rA
uckl
and
Wai
kato
Gis
born
eH
awke
’s B
ayW
elli
ngto
nM
arlb
orou
ghN
elso
nC
ante
rbur
yO
tago
Gra
nd to
tal
1949
11–
216
6–
4331
7–
–53
9
1990
8815
725
990
334
63
977
476
361
11 3
28
1991
4513
096
5 72
256
450
4 09
163
559
911
822
1992
6520
916
46
182
148
393
3 80
458
845
012
003
1993
152
350
195
6 53
718
545
94
280
412
692
13 2
62
1994
147
354
239
4 54
924
056
04
343
856
691
11 9
78
1995
203
380
270
8 27
229
569
85
491
1 39
198
217
983
1996
8236
026
68
940
305
644
5 08
71
572
675
17 9
31
1997
6137
622
17
740
222
830
5 11
296
062
016
142
1998
4335
419
86
377
2549
95
068
8647
013
349
1999
4639
433
78
635
289
785
6 46
899
656
17 7
09
10-y
ear
aver
age
(199
0–99
)
9329
220
66
894
200
566
4 77
270
762
014
351
10-y
ear
aver
age
for
the
Nor
th I
slan
d =
7 6
85 (
53.5
5%)
10-y
ear
aver
age
for
the
Sou
th I
slan
d =
6 6
65 (
46.4
4%)
Tab
le 4
.N
ew Z
eala
nd p
ipfr
uit e
xpor
t cro
p by
gro
win
g di
stri
ct, a
nd c
lim
atic
con
diti
ons
in m
ajor
gro
win
g ar
eas
in 1
997.
Reg
ion
Exp
ort c
rop
(‘00
0 T
CE
s
a
)C
lim
atic
con
diti
ons
Tem
pera
ture
(
°
C)
min
–max
Tem
pera
ture
(
°
C)
aver
age
Ann
ual a
vera
ge r
ainf
all (
mm
)
Haw
ke’s
Bay
7741
–4.2
–36.
713
.879
8
Nel
son
5112
–2.9
–25.
313
.863
3
Can
terb
ury
1014
––
–
Mar
lbor
ough
830
–6.1
–32.
213
.641
3
Ota
go62
0
Wai
kato
376
Gis
born
e22
1
Auc
klan
d61
a
TC
Es
= tr
ay c
arto
n eq
uiva
lent
s
Quality assurance in agricultural produce,edited by G.I. Johnson, Le Van To, Nguyen Duy Duc and M.C. Webb.
ACIAR Proceedings 100(printed version published in 2000)
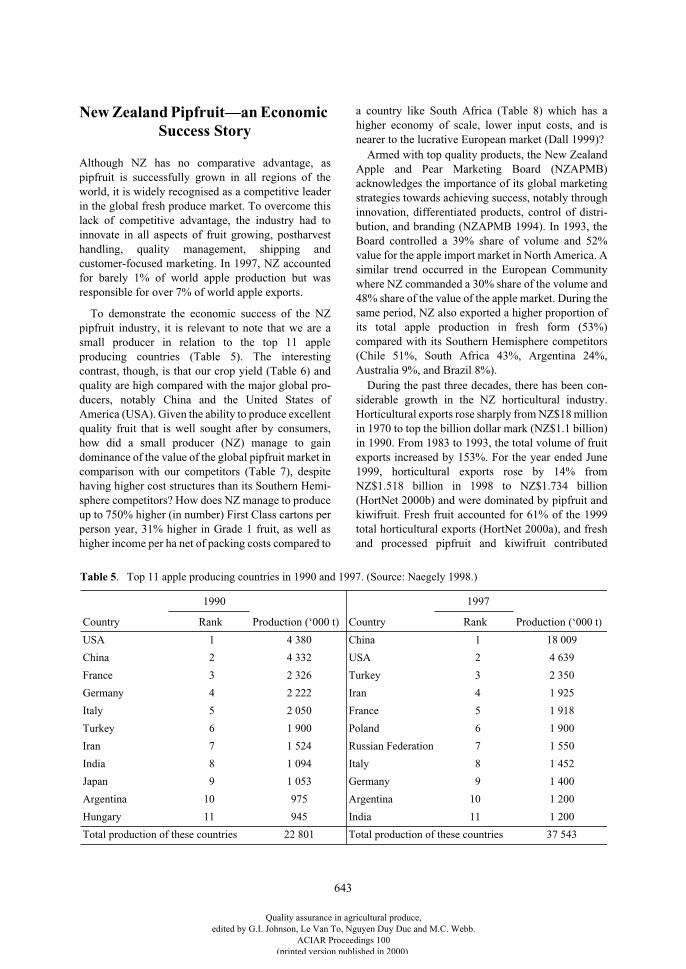
643
New Zealand Pipfruit—an Economic Success Story
Although NZ has no comparative advantage, aspipfruit is successfully grown in all regions of theworld, it is widely recognised as a competitive leaderin the global fresh produce market. To overcome thislack of competitive advantage, the industry had toinnovate in all aspects of fruit growing, postharvesthandling, quality management, shipping andcustomer-focused marketing. In 1997, NZ accountedfor barely 1% of world apple production but wasresponsible for over 7% of world apple exports.
To demonstrate the economic success of the NZpipfruit industry, it is relevant to note that we are asmall producer in relation to the top 11 appleproducing countries (Table 5). The interestingcontrast, though, is that our crop yield (Table 6) andquality are high compared with the major global pro-ducers, notably China and the United States ofAmerica (USA). Given the ability to produce excellentquality fruit that is well sought after by consumers,how did a small producer (NZ) manage to gaindominance of the value of the global pipfruit market incomparison with our competitors (Table 7), despitehaving higher cost structures than its Southern Hemi-sphere competitors? How does NZ manage to produceup to 750% higher (in number) First Class cartons perperson year, 31% higher in Grade 1 fruit, as well ashigher income per ha net of packing costs compared to
a country like South Africa (Table 8) which has ahigher economy of scale, lower input costs, and isnearer to the lucrative European market (Dall 1999)?
Armed with top quality products, the New ZealandApple and Pear Marketing Board (NZAPMB)acknowledges the importance of its global marketingstrategies towards achieving success, notably throughinnovation, differentiated products, control of distri-bution, and branding (NZAPMB 1994). In 1993, theBoard controlled a 39% share of volume and 52%value for the apple import market in North America. Asimilar trend occurred in the European Communitywhere NZ commanded a 30% share of the volume and48% share of the value of the apple market. During thesame period, NZ also exported a higher proportion ofits total apple production in fresh form (53%)compared with its Southern Hemisphere competitors(Chile 51%, South Africa 43%, Argentina 24%,Australia 9%, and Brazil 8%).
During the past three decades, there has been con-siderable growth in the NZ horticultural industry.Horticultural exports rose sharply from NZ$18 millionin 1970 to top the billion dollar mark (NZ$1.1 billion)in 1990. From 1983 to 1993, the total volume of fruitexports increased by 153%. For the year ended June1999, horticultural exports rose by 14% fromNZ$1.518 billion in 1998 to NZ$1.734 billion(HortNet 2000b) and were dominated by pipfruit andkiwifruit. Fresh fruit accounted for 61% of the 1999total horticultural exports (HortNet 2000a), and freshand processed pipfruit and kiwifruit contributed
Table 5. Top 11 apple producing countries in 1990 and 1997. (Source: Naegely 1998.)
1990 1997
Country Rank Production (‘000 t) Country Rank Production (‘000 t)
USA 1 4 380 China 1 18 009
China 2 4 332 USA 2 4 639
France 3 2 326 Turkey 3 2 350
Germany 4 2 222 Iran 4 1 925
Italy 5 2 050 France 5 1 918
Turkey 6 1 900 Poland 6 1 900
Iran 7 1 524 Russian Federation 7 1 550
India 8 1 094 Italy 8 1 452
Japan 9 1 053 Germany 9 1 400
Argentina 10 975 Argentina 10 1 200
Hungary 11 945 India 11 1 200
Total production of these countries 22 801 Total production of these countries 37 543
Quality assurance in agricultural produce,edited by G.I. Johnson, Le Van To, Nguyen Duy Duc and M.C. Webb.
ACIAR Proceedings 100(printed version published in 2000)
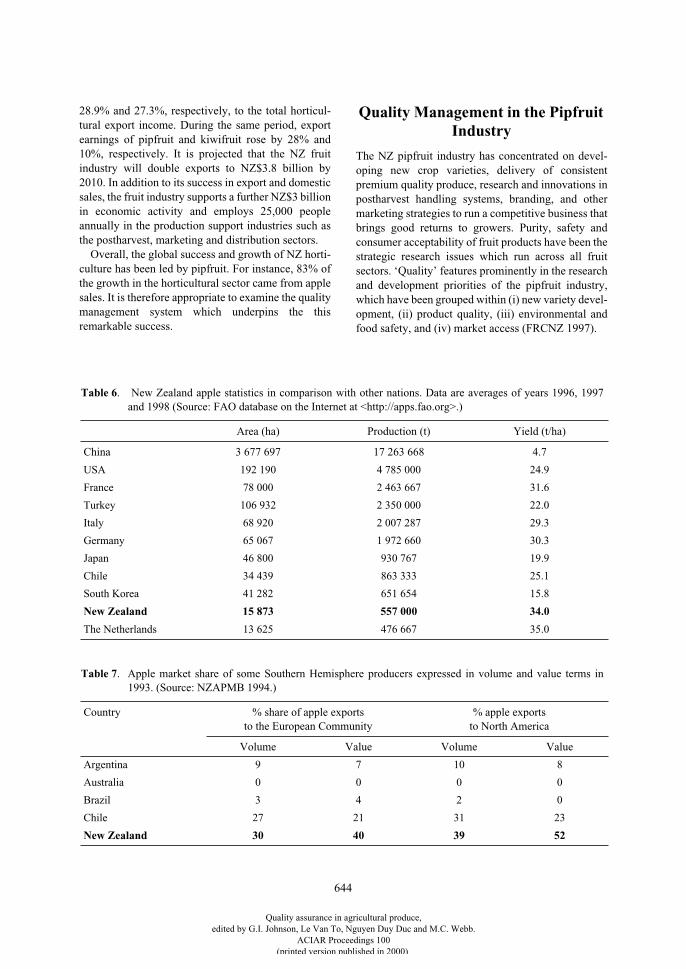
644
28.9% and 27.3%, respectively, to the total horticul-tural export income. During the same period, exportearnings of pipfruit and kiwifruit rose by 28% and10%, respectively. It is projected that the NZ fruitindustry will double exports to NZ$3.8 billion by2010. In addition to its success in export and domesticsales, the fruit industry supports a further NZ$3 billionin economic activity and employs 25,000 peopleannually in the production support industries such asthe postharvest, marketing and distribution sectors.
Overall, the global success and growth of NZ horti-culture has been led by pipfruit. For instance, 83% ofthe growth in the horticultural sector came from applesales. It is therefore appropriate to examine the qualitymanagement system which underpins the thisremarkable success.
Quality Management in the Pipfruit Industry
The NZ pipfruit industry has concentrated on devel-oping new crop varieties, delivery of consistentpremium quality produce, research and innovations inpostharvest handling systems, branding, and othermarketing strategies to run a competitive business thatbrings good returns to growers. Purity, safety andconsumer acceptability of fruit products have been thestrategic research issues which run across all fruitsectors. ‘Quality’ features prominently in the researchand development priorities of the pipfruit industry,which have been grouped within (i) new variety devel-opment, (ii) product quality, (iii) environmental andfood safety, and (iv) market access (FRCNZ 1997).
Table 6
. New Zealand apple statistics in comparison with other nations. Data are averages of years 1996, 1997and 1998 (Source: FAO database on the Internet at <http://apps.fao.org>.)
Area (ha) Production (t) Yield (t/ha)
China 3 677 697 17 263 668 4.7
USA 192 190 4 785 000 24.9
France 78 000 2 463 667 31.6
Turkey 106 932 2 350 000 22.0
Italy 68 920 2 007 287 29.3
Germany 65 067 1 972 660 30.3
Japan 46 800 930 767 19.9
Chile 34 439 863 333 25.1
South Korea 41 282 651 654 15.8
New Zealand 15 873 557 000 34.0
The Netherlands 13 625 476 667 35.0
Table 7
. Apple market share of some Southern Hemisphere producers expressed in volume and value terms in1993. (Source: NZAPMB 1994.)
Country % share of apple exports to the European Community
% apple exports to North America
Volume Value Volume Value
Argentina 9 7 10 8
Australia 0 0 0 0
Brazil 3 4 2 0
Chile 27 21 31 23
New Zealand 30 40 39 52
Quality assurance in agricultural produce,edited by G.I. Johnson, Le Van To, Nguyen Duy Duc and M.C. Webb.
ACIAR Proceedings 100(printed version published in 2000)
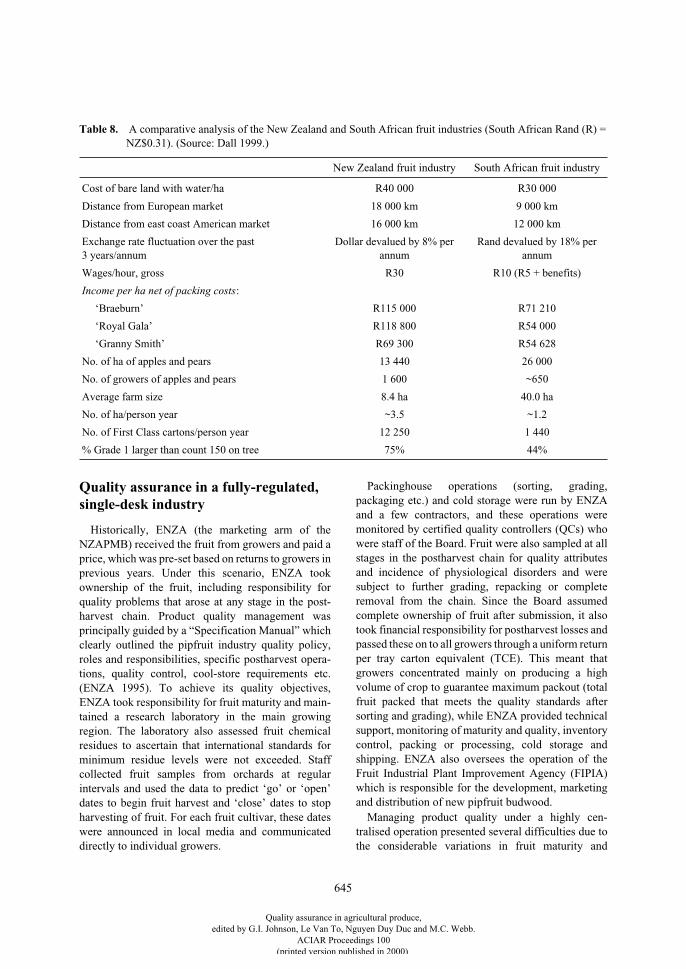
645
Quality assurance in a fully-regulated, single-desk industry
Historically, ENZA (the marketing arm of theNZAPMB) received the fruit from growers and paid aprice, which was pre-set based on returns to growers inprevious years. Under this scenario, ENZA tookownership of the fruit, including responsibility forquality problems that arose at any stage in the post-harvest chain. Product quality management wasprincipally guided by a “Specification Manual” whichclearly outlined the pipfruit industry quality policy,roles and responsibilities, specific postharvest opera-tions, quality control, cool-store requirements etc.(ENZA 1995). To achieve its quality objectives,ENZA took responsibility for fruit maturity and main-tained a research laboratory in the main growingregion. The laboratory also assessed fruit chemicalresidues to ascertain that international standards forminimum residue levels were not exceeded. Staffcollected fruit samples from orchards at regularintervals and used the data to predict ‘go’ or ‘open’dates to begin fruit harvest and ‘close’ dates to stopharvesting of fruit. For each fruit cultivar, these dateswere announced in local media and communicateddirectly to individual growers.
Packinghouse operations (sorting, grading,packaging etc.) and cold storage were run by ENZAand a few contractors, and these operations weremonitored by certified quality controllers (QCs) whowere staff of the Board. Fruit were also sampled at allstages in the postharvest chain for quality attributesand incidence of physiological disorders and weresubject to further grading, repacking or completeremoval from the chain. Since the Board assumedcomplete ownership of fruit after submission, it alsotook financial responsibility for postharvest losses andpassed these on to all growers through a uniform returnper tray carton equivalent (TCE). This meant thatgrowers concentrated mainly on producing a highvolume of crop to guarantee maximum packout (totalfruit packed that meets the quality standards aftersorting and grading), while ENZA provided technicalsupport, monitoring of maturity and quality, inventorycontrol, packing or processing, cold storage andshipping. ENZA also oversees the operation of theFruit Industrial Plant Improvement Agency (FIPIA)which is responsible for the development, marketingand distribution of new pipfruit budwood.
Managing product quality under a highly cen-tralised operation presented several difficulties due tothe considerable variations in fruit maturity and
Table 8.
A comparative analysis of the New Zealand and South African fruit industries (South African Rand (R) =NZ$0.31). (Source: Dall 1999.)
New Zealand fruit industry South African fruit industry
Cost of bare land with water/ha R40 000 R30 000
Distance from European market 18 000 km 9 000 km
Distance from east coast American market 16 000 km 12 000 km
Exchange rate fluctuation over the past 3 years/annum
Dollar devalued by 8% per annum
Rand devalued by 18% per annum
Wages/hour, gross R30 R10 (R5 + benefits)
Income per ha net of packing costs
:
‘Braeburn’ R115 000 R71 210
‘Royal Gala’ R118 800 R54 000
‘Granny Smith’ R69 300 R54 628
No. of ha of apples and pears 13 440 26 000
No. of growers of apples and pears 1 600 ~650
Average farm size 8.4 ha 40.0 ha
No. of ha/person year ~3.5 ~1.2
No. of First Class cartons/person year 12 250 1 440
% Grade 1 larger than count 150 on tree 75% 44%
Quality assurance in agricultural produce,edited by G.I. Johnson, Le Van To, Nguyen Duy Duc and M.C. Webb.
ACIAR Proceedings 100(printed version published in 2000)
646
quality attributes across growing regions and evenbetween orchards in the same region. The pooled,standard pre-set price for each fruit cultivar (and evenacross cultivars many years ago) did not provide suf-ficient incentives for growers and postharvestoperators to invest in quality improvement technologyand practices. Indeed, compliance with the ENZASpecifications Manual was becoming more and moredifficult for some growers who believed that their cropwas unique and had the right attributes, but may notmeet the ENZA quality specifications. Growers whoinvested in quality assurance systems and/or regularlysubmitted top quality fruit complained that the flat pre-set payment system was unfair. They promoted thenotion that the system did not support quality man-agement initiatives, as poor quality growers were‘subsidised’ by growers of good quality fruit andcultivars that commanded a premium price.
Quality assurance after regulation of the domestic market
Over the past five years, there have been significantchanges in the roles and responsibilities of ENZA,growers, and third party operators (for packinghouses,transportation and cool-storage) in regard to fruitquality management. In particular, grower responsi-bility and accountability for product quality hasincreased dramatically, while ENZA has invested indeveloping the relevant quality assurance guidelinesfor growers and postharvest operators. Individualgrowers who choose to submit their fruit to ENZA‘own’ their crop until it is sold, and are therefore heldresponsible by ENZA for product quality problemswhich arise (called ‘inherent vices’, which includefruit physiological disorders and diseases). Growersare now responsible for developing and managingtheir own maturity program to guarantee that theircrop meets the product specifications (ENZA 1995).In practical terms, they choose their own ‘go’ and‘closing’ dates to enable them meet ENZA qualitystandards, achieve maximum packout, and minimisethe development of inherent vices during postharvesthandling, marketing and distribution. Some growersconduct their own maturity tests, others enlist theservices of professional horticultural consultants,while many who do not pack their own crop haveformed partnerships with the packinghouse whichhandles their crop.
As part of the industry strategies to assure producequality, many packinghouse and cool-store operatorshave started implementing their own documented
quality systems (DQSs) designed to help achieve con-sistent, quality and safe product, and to meet marketand ENZA requirements. To assist these operators,ENZA has provided guidelines detailed in a ‘DQSstart-up pack’, and the result is that each operatordevelops her/his own DQS, usually comprised of amanual with an appendix which clearly cross-refer-ences to ENZA support material such as wall charts.
In view of the dynamic nature of quality (Opara,New market-pull factors influencing perceptions ofquality in agribusiness marketing, these proceedings)and pipfruit business, it is necessary to audit the DQSand revise the manual to reflect current practicenecessary meet ENZA quality assurance require-ments. In general, the key phases in the developmentof a DQS are:• decide who’s responsible for it;• develop the activities flow chart and the
organisational structure chart;• describe present practices;• integrate ENZA’s requirements;• decide on a system auditor and the system of
auditing; and• action the results of an audit.
One grower who packs his own crop and those ofeight others (annual packing shed throughput of about112,000 tray carton equivalents) outlined the steps hetook to develop a simple DQS (ENZA 1997):• compiled a flowchart of events through the packing
shed, detailing all processes followed along theway;
• documented job descriptions for all staff;• questioned historical processes and justified or
amended them as appropriate in order to streamlineand/or to comply with ENZA specifications; and
• invited staff to scrutinise the draft DQS manual toensure it correctly described what happens inpractice.These changes in roles and responsibility for
assuring the quality of fresh produce for export enableENZA to concentrate further on market access andglobal marketing activities, and providing leadershipfor quality management. Specifically, ENZA performsthe following functions:• accepts fruit for export that meet set standards;• markets fruit;• arranges transport, stevedoring and shipping;• owns some cool-stores;• manages overall crop inventory;• establishes industry standards covering growing,
spraying, harvesting, grading, packing andhandling; and
Quality assurance in agricultural produce,edited by G.I. Johnson, Le Van To, Nguyen Duy Duc and M.C. Webb.
ACIAR Proceedings 100(printed version published in 2000)
647
• runs an intensive quality inspection program toensure that fruit meets export standards.ENZA quality inspectors are audited periodically by
MAFQual, a service unit in the Ministry of Agricultureand Fisheries.
In summary, product quality is maintained in thepipfruit industry through:• maturity management at harvest (by growers);• strict export grade standards (set by ENZA);• orchard and packinghouse quality control
procedures;• application of cool-chain concepts and portable
controlled atmosphere technology for shipping; and• monitoring residue levels on fruit by random testing
to detect violations in spray diaries.
Impacts of the Current Quality Management System
Crop maturity and postharvest operations
Managing fruit maturity and quality programsrequires capital investments in appropriate equipmentand human resources far beyond the capacity of manyindividual small-scale pipfruit growers. This hascreated opportunities for the large-scale growers andpostharvest operators to service the needs of the smallgrowers for maturity management, and packinghouseoperations for grading and packaging, and transpor-tation. Private entrepreneurs have also invested in newpackinghouses and cool-stores capable of handlinglarge volumes of crop. To achieve economy of scale,the number of packinghouses has decreased dramati-cally during the past few years. In the Hawke’s Bay,for instance, the number of packinghouses hasdeclined from over 100 to about 38, with more ration-alisation and consolidation expected in the future.
Grower returns vis-à-vis incentives for ‘quality’
To be effective, the changes in fruit quality man-agement strategy described earlier have been linked togrowers’ returns. In consultation with growers andother customers, ENZA developed and implementedthe concept of ENZA Submission Profiles (ESPs) forthe classification of fruit submitted to ENZA. Com-mencing in 1998, the price received by a grower waslinked to the quality attributes at harvest and theassurance provided by the grower that the product will
store well over a stated period of time while retainingthe desired quality and freedom from storage dis-orders. Thus, under the ESPs:
• growers take responsibility for fruit quality;
• growers set own opening dates and the ESP on theirfruit at harvest, and these are audited by thepackinghouse during packing;
• growers receive payment over a range of pricesdepending on their fruit profile; and
• ENZA pays a premium price for top quality fruitover and above the average pay-out.
During the period 1995–1998, ENZA set up cropmaturity programs in all the fruit growing regions, andused the results of this study in conjunction with dataaccumulated over the past 30–40 years for severalvarieties to develop three profiles of fruit (A, B, C) tomeet its marketing objectives. Non-compliance due toimproper quality specifications or following detectionof inherent vice during marketing (e.g. scald, water-core, internal browning disorder etc.) requires that thegrower must be held responsible for the necessary cor-rective actions. The affected grower is also heldaccountable for the cost of cold-storage and shipping ifthe fruit must be withdrawn from the supply chain.This arrangement suits the marketing focus and objec-tives of ENZA because fruit with longer storage andshelf life has more value due to the increased flexi-bility for marketing. Under the ESP system, growersare paid more for better storage characteristics andeating quality.
Under a typical ESP system (Table 9), a growerreceives higher payment for being responsible for fruitquality over a longer period of time (both on and off-shore). Considering the 4–5 weeks of transportationrequired to get our fruit to the Northern Hemisphere,growers will be ill-advised to submit their fruit under ahigh profile if they have doubts on the storagepotential. Table 10 illustrates the effects of ESPs andrelative fruit size on final prices for high colour grade‘Fuji’ apples during the 1999 season. It is important tonote that the target attributes and specifications forassigning fruit to the ESPs are not constant and mayvary from season to season to account for changes inconsumer requirements and weather and climaticfactors affecting crop yield and quality.
Future Trends and Prospects for Quality Management
Horticulture—and indeed pipfruit production—isdynamic, and so is the consumer demand for quality.
Quality assurance in agricultural produce,edited by G.I. Johnson, Le Van To, Nguyen Duy Duc and M.C. Webb.
ACIAR Proceedings 100(printed version published in 2000)
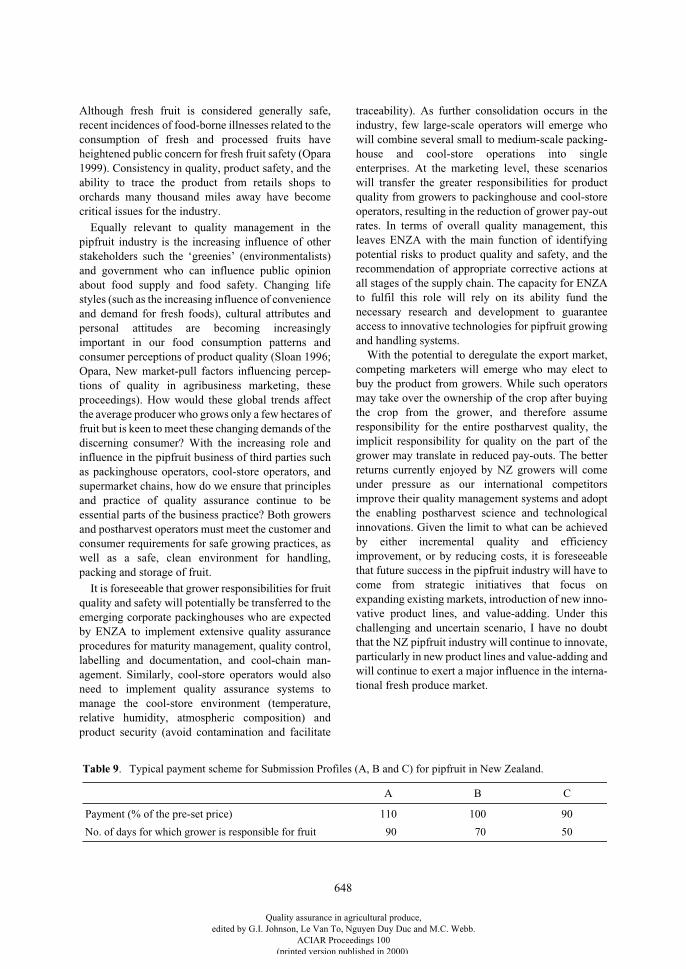
648
Although fresh fruit is considered generally safe,recent incidences of food-borne illnesses related to theconsumption of fresh and processed fruits haveheightened public concern for fresh fruit safety (Opara1999). Consistency in quality, product safety, and theability to trace the product from retails shops toorchards many thousand miles away have becomecritical issues for the industry.
Equally relevant to quality management in thepipfruit industry is the increasing influence of otherstakeholders such the ‘greenies’ (environmentalists)and government who can influence public opinionabout food supply and food safety. Changing lifestyles (such as the increasing influence of convenienceand demand for fresh foods), cultural attributes andpersonal attitudes are becoming increasinglyimportant in our food consumption patterns andconsumer perceptions of product quality (Sloan 1996;Opara, New market-pull factors influencing percep-tions of quality in agribusiness marketing, theseproceedings). How would these global trends affectthe average producer who grows only a few hectares offruit but is keen to meet these changing demands of thediscerning consumer? With the increasing role andinfluence in the pipfruit business of third parties suchas packinghouse operators, cool-store operators, andsupermarket chains, how do we ensure that principlesand practice of quality assurance continue to beessential parts of the business practice? Both growersand postharvest operators must meet the customer andconsumer requirements for safe growing practices, aswell as a safe, clean environment for handling,packing and storage of fruit.
It is foreseeable that grower responsibilities for fruitquality and safety will potentially be transferred to theemerging corporate packinghouses who are expectedby ENZA to implement extensive quality assuranceprocedures for maturity management, quality control,labelling and documentation, and cool-chain man-agement. Similarly, cool-store operators would alsoneed to implement quality assurance systems tomanage the cool-store environment (temperature,relative humidity, atmospheric composition) andproduct security (avoid contamination and facilitate
traceability). As further consolidation occurs in theindustry, few large-scale operators will emerge whowill combine several small to medium-scale packing-house and cool-store operations into singleenterprises. At the marketing level, these scenarioswill transfer the greater responsibilities for productquality from growers to packinghouse and cool-storeoperators, resulting in the reduction of grower pay-outrates. In terms of overall quality management, thisleaves ENZA with the main function of identifyingpotential risks to product quality and safety, and therecommendation of appropriate corrective actions atall stages of the supply chain. The capacity for ENZAto fulfil this role will rely on its ability fund thenecessary research and development to guaranteeaccess to innovative technologies for pipfruit growingand handling systems.
With the potential to deregulate the export market,competing marketers will emerge who may elect tobuy the product from growers. While such operatorsmay take over the ownership of the crop after buyingthe crop from the grower, and therefore assumeresponsibility for the entire postharvest quality, theimplicit responsibility for quality on the part of thegrower may translate in reduced pay-outs. The betterreturns currently enjoyed by NZ growers will comeunder pressure as our international competitorsimprove their quality management systems and adoptthe enabling postharvest science and technologicalinnovations. Given the limit to what can be achievedby either incremental quality and efficiencyimprovement, or by reducing costs, it is foreseeablethat future success in the pipfruit industry will have tocome from strategic initiatives that focus onexpanding existing markets, introduction of new inno-vative product lines, and value-adding. Under thischallenging and uncertain scenario, I have no doubtthat the NZ pipfruit industry will continue to innovate,particularly in new product lines and value-adding andwill continue to exert a major influence in the interna-tional fresh produce market.
Table 9. Typical payment scheme for Submission Profiles (A, B and C) for pipfruit in New Zealand.
A B C
Payment (% of the pre-set price) 110 100 90
No. of days for which grower is responsible for fruit 90 70 50
Quality assurance in agricultural produce,edited by G.I. Johnson, Le Van To, Nguyen Duy Duc and M.C. Webb.
ACIAR Proceedings 100(printed version published in 2000)
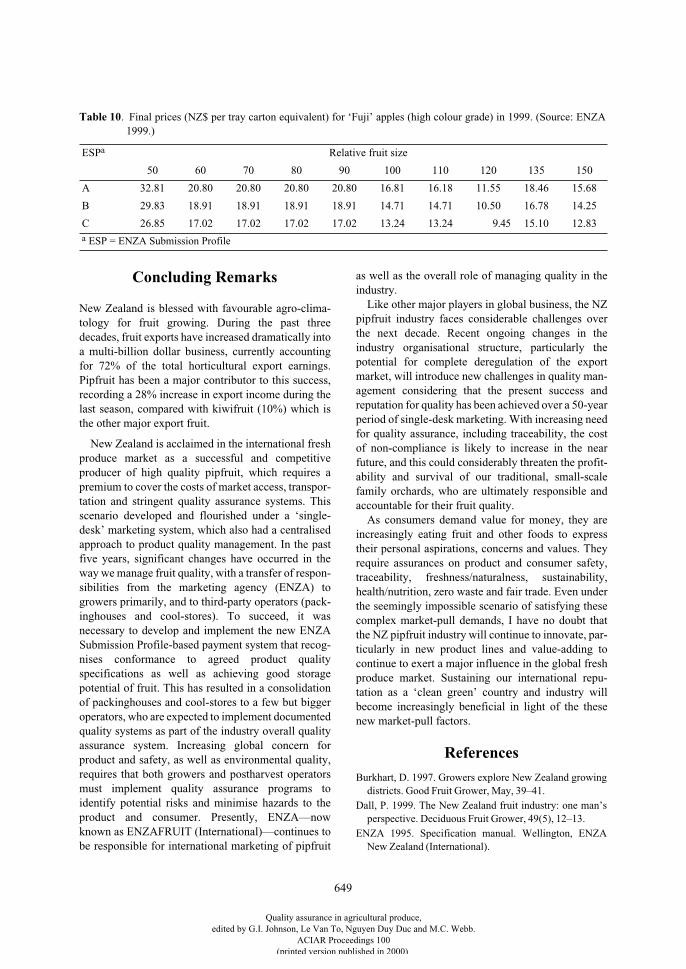
649
Concluding Remarks
New Zealand is blessed with favourable agro-clima-tology for fruit growing. During the past threedecades, fruit exports have increased dramatically intoa multi-billion dollar business, currently accountingfor 72% of the total horticultural export earnings.Pipfruit has been a major contributor to this success,recording a 28% increase in export income during thelast season, compared with kiwifruit (10%) which isthe other major export fruit.
New Zealand is acclaimed in the international freshproduce market as a successful and competitiveproducer of high quality pipfruit, which requires apremium to cover the costs of market access, transpor-tation and stringent quality assurance systems. Thisscenario developed and flourished under a ‘single-desk’ marketing system, which also had a centralisedapproach to product quality management. In the pastfive years, significant changes have occurred in theway we manage fruit quality, with a transfer of respon-sibilities from the marketing agency (ENZA) togrowers primarily, and to third-party operators (pack-inghouses and cool-stores). To succeed, it wasnecessary to develop and implement the new ENZASubmission Profile-based payment system that recog-nises conformance to agreed product qualityspecifications as well as achieving good storagepotential of fruit. This has resulted in a consolidationof packinghouses and cool-stores to a few but biggeroperators, who are expected to implement documentedquality systems as part of the industry overall qualityassurance system. Increasing global concern forproduct and safety, as well as environmental quality,requires that both growers and postharvest operatorsmust implement quality assurance programs toidentify potential risks and minimise hazards to theproduct and consumer. Presently, ENZA—nowknown as ENZAFRUIT (International)—continues tobe responsible for international marketing of pipfruit
as well as the overall role of managing quality in theindustry.
Like other major players in global business, the NZpipfruit industry faces considerable challenges overthe next decade. Recent ongoing changes in theindustry organisational structure, particularly thepotential for complete deregulation of the exportmarket, will introduce new challenges in quality man-agement considering that the present success andreputation for quality has been achieved over a 50-yearperiod of single-desk marketing. With increasing needfor quality assurance, including traceability, the costof non-compliance is likely to increase in the nearfuture, and this could considerably threaten the profit-ability and survival of our traditional, small-scalefamily orchards, who are ultimately responsible andaccountable for their fruit quality.
As consumers demand value for money, they areincreasingly eating fruit and other foods to expresstheir personal aspirations, concerns and values. Theyrequire assurances on product and consumer safety,traceability, freshness/naturalness, sustainability,health/nutrition, zero waste and fair trade. Even underthe seemingly impossible scenario of satisfying thesecomplex market-pull demands, I have no doubt thatthe NZ pipfruit industry will continue to innovate, par-ticularly in new product lines and value-adding tocontinue to exert a major influence in the global freshproduce market. Sustaining our international repu-tation as a ‘clean green’ country and industry willbecome increasingly beneficial in light of the thesenew market-pull factors.
References
Burkhart, D. 1997. Growers explore New Zealand growingdistricts. Good Fruit Grower, May, 39–41.
Dall, P. 1999. The New Zealand fruit industry: one man’sperspective. Deciduous Fruit Grower, 49(5), 12–13.
ENZA 1995. Specification manual. Wellington, ENZANew Zealand (International).
Table 10
. Final prices (NZ$ per tray carton equivalent) for ‘Fuji’ apples (high colour grade) in 1999. (Source: ENZA1999.)
ESP
a
Relative fruit size
50 60 70 80 90 100 110 120 135 150
A 32.81 20.80 20.80 20.80 20.80 16.81 16.18 11.55 18.46 15.68
B 29.83 18.91 18.91 18.91 18.91 14.71 14.71 10.50 16.78 14.25
C 26.85 17.02 17.02 17.02 17.02 13.24 13.24 9.45 15.10 12.83
a
ESP = ENZA Submission Profile
Quality assurance in agricultural produce,edited by G.I. Johnson, Le Van To, Nguyen Duy Duc and M.C. Webb.
ACIAR Proceedings 100(printed version published in 2000)
650
ENZA 1997. Pipmark (August). Wellington, New ZealandApple and Pear Marketing Board.
ENZA 1999. Final prices and statistical information.Wellington, New Zealand Apple and Pear MarketingBoard.
FRCNZ (Fruit Research Council of New Zealand) 1997.Fruit research in New Zealand 1996. Wellington,FRCNZ.
Hewett, E.W. 1997. Postharvest physiology: some basicconcepts. Paper prepared for Block Course 38.756Postharvest Engineering, 14 March.
HortNet 2000a. Contribution of horticultural commoditytypes to total horticultural exports in 1999. On the Internetat <http://www.hortnet.co.nz>.
HortNet 2000b. Summary of horticultural commodity totals.On the Internet at <http://www.hortnet.co.nz>.
Naegely, S. 1998. The great orchards. Fruit Grower, 118(9),6–7.
NZAPMB (New Zealand Apple and Pear Marketing Board)(undated). Board bibliography. Wellington, NZAPMB(leaflet).
NZAPMB (New Zealand Apple and Pear Marketing Board)1994. The New Zealand pipfruit industry. Wellington,NZAPMB.
NZAPMB (New Zealand Apple and Pear Marketing Board)1995. Annual report. Wellington, NZAPMB.
Opara, L.U. 1999. The recent US Food Quality ProtectionAct (FQPA) and implication on global fresh producetrade. Paper presented at the International Workshop onQuality and Phytosanitary Issues in Agribusiness held atthe University of Pretoria, South Africa, 3
rd
December.
Sloan, A.E. 1996. The top 10 trends to watch and work on.Food Technology, 50(7), 55–71.
Quality assurance in agricultural produce,edited by G.I. Johnson, Le Van To, Nguyen Duy Duc and M.C. Webb.
ACIAR Proceedings 100(printed version published in 2000)
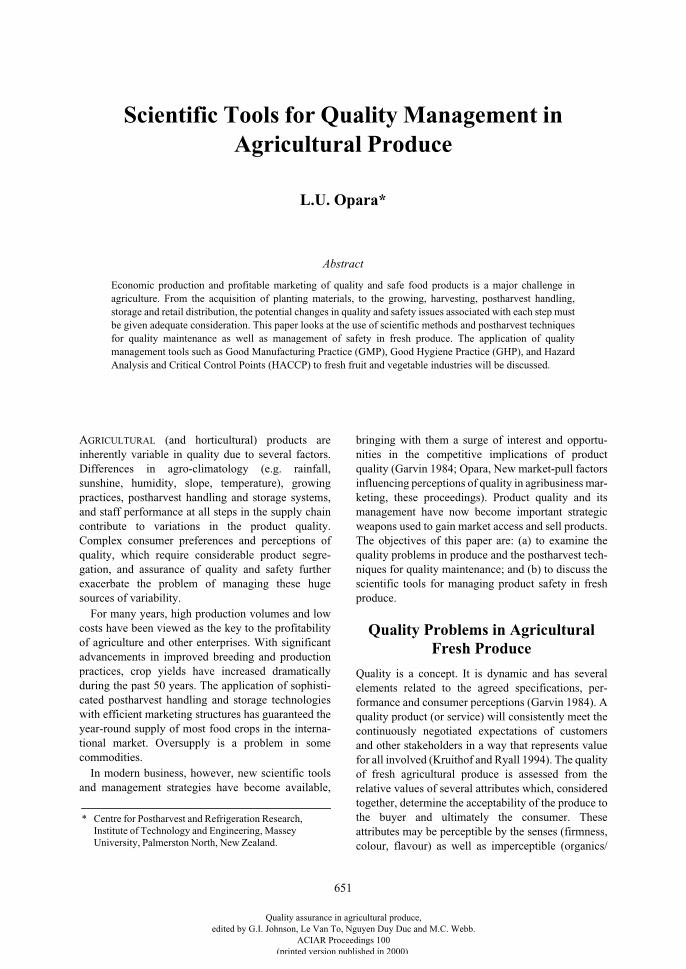
651
Scientific Tools for Quality Management in Agricultural Produce
L.U. Opara*
Abstract
Economic production and profitable marketing of quality and safe food products is a major challenge inagriculture. From the acquisition of planting materials, to the growing, harvesting, postharvest handling,storage and retail distribution, the potential changes in quality and safety issues associated with each step mustbe given adequate consideration. This paper looks at the use of scientific methods and postharvest techniquesfor quality maintenance as well as management of safety in fresh produce. The application of qualitymanagement tools such as Good Manufacturing Practice (GMP), Good Hygiene Practice (GHP), and HazardAnalysis and Critical Control Points (HACCP) to fresh fruit and vegetable industries will be discussed.
A
GRICULTURAL
(and horticultural) products areinherently variable in quality due to several factors.Differences in agro-climatology (e.g. rainfall,sunshine, humidity, slope, temperature), growingpractices, postharvest handling and storage systems,and staff performance at all steps in the supply chaincontribute to variations in the product quality.Complex consumer preferences and perceptions ofquality, which require considerable product segre-gation, and assurance of quality and safety furtherexacerbate the problem of managing these hugesources of variability.
For many years, high production volumes and lowcosts have been viewed as the key to the profitabilityof agriculture and other enterprises. With significantadvancements in improved breeding and productionpractices, crop yields have increased dramaticallyduring the past 50 years. The application of sophisti-cated postharvest handling and storage technologieswith efficient marketing structures has guaranteed theyear-round supply of most food crops in the interna-tional market. Oversupply is a problem in somecommodities.
In modern business, however, new scientific toolsand management strategies have become available,
bringing with them a surge of interest and opportu-nities in the competitive implications of productquality (Garvin 1984; Opara, New market-pull factorsinfluencing perceptions of quality in agribusiness mar-keting, these proceedings). Product quality and itsmanagement have now become important strategicweapons used to gain market access and sell products.The objectives of this paper are: (a) to examine thequality problems in produce and the postharvest tech-niques for quality maintenance; and (b) to discuss thescientific tools for managing product safety in freshproduce.
Quality Problems in Agricultural Fresh Produce
Quality is a concept. It is dynamic and has severalelements related to the agreed specifications, per-formance and consumer perceptions (Garvin 1984). Aquality product (or service) will consistently meet thecontinuously negotiated expectations of customersand other stakeholders in a way that represents valuefor all involved (Kruithof and Ryall 1994). The qualityof fresh agricultural produce is assessed from therelative values of several attributes which, consideredtogether, determine the acceptability of the produce tothe buyer and ultimately the consumer. Theseattributes may be perceptible by the senses (firmness,colour, flavour) as well as imperceptible (organics/
* Centre for Postharvest and Refrigeration Research, Institute of Technology and Engineering, Massey University, Palmerston North, New Zealand.
Quality assurance in agricultural produce,edited by G.I. Johnson, Le Van To, Nguyen Duy Duc and M.C. Webb.
ACIAR Proceedings 100(printed version published in 2000)
652
naturalness, genetically modified plants, safety,cultural attitudes).
Agricultural fresh produce, such as fruits and vege-tables, is prone to problems which downgrade qualityor pose health/safety risks to the consumer. In general,quality problems can be caused by physical, chemical,microbiological and environmental factors. Physicalimpacts, compression, abrasion and cuts manifest asskin damage such as bruising. Bruised produce isdowngraded and reduces the profitability of agribus-iness. Temperature affects fruit susceptibility tobruising, with a higher level of damage at low temper-atures (Crisostos 1993). Produce with cuts, stempunctures and other skin breakage are also down-graded and provide avenues for opportunisticmicrobial infection and contamination during subse-quent handling and storage. Harvested produce mustmeet standard requirements for minimum residuelevels. Opportunities for chemical problems can arisefrom residues of preharvest spraying and postharvestchemical contamination during handling.
Food safety is a problem in the fresh food industrydue to hazards of physical, chemical and microbio-logical contaminants (Douglass 1999).Microbiological pathogens such as bacteria, parasitesand viruses occur in agricultural produce. These getinto produce through insects, rodents, birds, contami-nated water, soil, and plant and equipment, andthrough cross-contamination from humans and otherproduce (meat, milk, eggs) during handling andstorage. Contaminated produce become sources offood-borne illness, which can result in death in severecases. Clinical cases of food-borne illnesses caused bycontaminated fruits and vegetables have been recentlydocumented or reported with increasing frequency(Wells and Butterfield 1997, 1999).
Environmental factors such as temperature, relativehumidity and light affect the rate of quality degra-dation and storage life of produce. Indeed, temperatureexerts the most influential effect on postharvestquality attributes. Fresh commodities store better atlow temperature and high relative humidity. High tem-perature accelerates the ripening process, resulting intissue softening, yellowing and water loss. Root andtuber crops store better in the dark to reduce greeningand sprouting. Improper environmental storage condi-tions also result in the development of physiologicaldisorders and diseases in produce. The biologicalprocesses involved in product deterioration are tem-perature dependent. Temperature management istherefore an essential scientific tool to delay productdeterioration and assure quality.
After harvest, two strategies are necessary to reducethese losses: first is to apply appropriate postharvesttechniques which maintain product quality, and thesecond is to implement quality systems for managingfood safety hazards as well as product quality. Theoverall approach recognises the fact that the quality ofharvested produce cannot be increased—it can onlymaintained!
Postharvest Technologies for Quality Maintenance
The postharvest sector is critical in meeting theconsumer requirement for consistent quality and safeproducts. General postharvest operations includecleaning, sorting, grading, packaging, storage and dis-tribution. Postharvest technologies assist in thehandling and marketing of agricultural produce by:• maintaining quality;• extending shelf life and thereby expanding the
marketing season;• guaranteeing consistent supply;• providing uniformity of grade standards;• reducing losses; and• adding value to the product (such as customised
packaging).To achieve these benefits, specific postharvest tech-
nologies are applied for maturity and qualityassessment, control of the postharvest built envi-ronment to maintain a cool-chain, and improvement ofthe handling system.
Scientific tools for maturity and quality assessment
Determining adequate crop maturity (readiness forharvest) is vital for optimal postharvest performance.Equipment and techniques exist for maturity andquality evaluation of fresh produce (Bourne 1980;Chen and Sun 1991; Abbott et al. 1997; Stenning1998). These include physical tests (size, shape,density), chemical (sugar, acidity, flavour, chemicalresidue) and mechanical (texture) tests. Non-destructive devices exist for maturity and qualityassessment as well as for detecting diseases andinternal defects such as bruising (Katayama et al.1996; Abbott et al. 1997; Muir et al. 1998). Sensoryscience is also employed for taste-testing to providedata on human sensory perceptions of quality. Trainedpanels or untrained consumers can be used dependingon budget limitations and scope of study. Even where
Quality assurance in agricultural produce,edited by G.I. Johnson, Le Van To, Nguyen Duy Duc and M.C. Webb.
ACIAR Proceedings 100(printed version published in 2000)
653
objective tests are used to assess the product, the resultobtained must be correlated to subjective humanassessment for practical applications.
Environmental control and monitoring
Establishing, maintaining and controlling the tem-perature, relative humidity and airflow inside thepostharvest handling and storage environment (pack-aging, cool-store, truck) is essential to maintain thecool-chain which is necessary to maintain productquality. The use of ventilated packaging designsenhances airflow around produce to achieve rapidcooling rates and maintain the desired product temper-ature. Temperature sensors, humidity probes, thermalanemometers (air velocity sensors) are used tomeasure important environmental fluctuations. Whereproduce is stored in controlled atmospheres, gas chro-matographs are used to monitor the oxygen and carbondioxide concentrations. Both environmental and gasmonitoring can be automated and linked to earlywarning signal systems.
Handling systems
The mechanisation of fresh produce handling oper-ations has increased the potential for physical damagesuch as bruising, which can occur at any stage in thepostharvest chain. New package designs made up ofcorrugated fibre-boards with paper-based ‘Friday’ traylayers assist in absorbing impact and compressionforces during handling. Force deceleration devicessuch as foam pads and cushions are placed on thesurface of grading machinery to reduce fruit-to-fruitimpacts and fruit impact to hard surfaces. Forcesensors (or ‘instrumented spheres’) containing accel-erometers can be used to assess the ‘health’ ofhandling systems to demonstrate where improvementsmay be needed.
Quality and Safety Management Tools
Managing fresh food quality and safety to guaranteethe supply of consistent and reliable business is amajor challenge facing modern agriculture. Evenwhere agreed product specifications have been met,assurance of food safety and other new market-pullfactors have become increasingly paramount (Opara,New market-pull factors influencing perceptions ofquality in agribusiness marketing, these proceedings).There is both theoretical and practical evidence that
consumers are willing to pay more for food that theybelieve is safer and/or of higher quality (Kinsey 1998;Opara, New market-pull factors influencing percep-tions of quality in agribusiness marketing, these pro-ceedings).
There is also the social psychology aspect of foodsafety, which includes fear and vulnerability, alongwith the hesitancy to give up the security, freedom,convenience, and peace of mind to which we areaccustomed as we enjoy our food products. Intriguingas some of these concerns may be, it is worth notingthat a recent survey by the World Health Organizationconcluded that “none of the chemical or physical treat-ments currently used to disinfect raw fruits andvegetables can be relied on to eliminate all types ofpathogens from the surface or internal tissues whenusing application conditions that will not adverselyaffect sensory or nutritional qualities” (WHO 1998).
In addition to physical, chemical and microbio-logical hazards, other food safety challenges in thefresh food industry include genetically modifiedfoods, emerging pathogens, allergens, pesticideresidues and mycotoxins. Currently, microbial con-tamination remains arguably the biggest food safetyhazard in the fresh food industry. Therefore, thefollowing discussion will concentrate on managingthis hazard, granted that the management systemsdiscussed will inevitably reduce the safety risk asso-ciated with the other hazards.
The principles of quality and product safety man-agement are well established and documented, and areoften referred to collectively as ‘food control’. Severalinternationally recognised model managementsystems can be applied to all the production andhandling operations to assure the safety and quality offresh and processed foods. These include Good Man-ufacturing Practice (GMP), Good Hygiene Practice(GHP), Hazard Analysis and Critical Control Points(HACCP), and other tools of more general applicationsuch as quality assurance (QA) methods and systemsincluding the ISO 9000 series of standards and totalquality management (TQM). In this paper, GMP, GHPand HACCP will be discussed, with particularattention paid to HACCP applications.
Good Manufacturing Practice (GMP) and Good Hygiene Practice
(GHP)
The basic principles of cleaning and sanitation, andgood hygiene practice form an integral part of GMP.
Quality assurance in agricultural produce,edited by G.I. Johnson, Le Van To, Nguyen Duy Duc and M.C. Webb.
ACIAR Proceedings 100(printed version published in 2000)
654
GMP may be considered as having two comple-mentary functions—‘effective manufacturing opera-tions’ and ‘effective quality control’ (Porter 1998).GMP covers the fundamental principles, proceduresand means needed to design an environment suitablefor the production of food of acceptable quality (Jouveet al. 1999).
On the other hand, GHP outlines the basic hygienicmeasures which business should meet and which arethe prerequisite(s) to other approaches, particularlyHACCP. Good hygiene practice requires: (a) thehygienic design and construction of food manufac-turing premises; (b) the hygienic design, constructionand proper use of machinery; (c) cleaning and disin-fection procedures (including pest control); and (d)general hygienic and safety practices in foodprocessing. The last requirement covered includesmicrobial quality of raw foods, hygienic operation ofeach process step, and the hygiene of personnel andtheir training in the hygiene and safety of food (Jouveet al. 1999). Based on a definition of hygiene as“ensuring that all measures are taken to ensure thesafety and wholesomeness of foodstuffs”, Porter(1998) identified five components of GHP:• premises—well protected and in good repair;• people—adequately trained with good standards of
personal hygiene;• equipment—suitable equipment for the job;• controls—good control over the process, including
adequate cleaning and sanitation; and• systems—assessment of risks and the
implementation of written systems and records.
Hazard Analysis and Critical Control Points (HACCP)
HACCP quality and safety management procedureswere originally developed in the late 1960s in theUnited States of America to assure food safety for thespace program. In the early 1970s, the Food and DrugAdministration started to use an HACCP approach forthe inspection of factories manufacturing low-acidfoods. Since then, an increasing number of fresh andprocessed food industries have adopted HACCP totheir quality control and assurance programs.
HACCP is a food safety management systeminvolving systematic and logical assessment of all thesteps in a food production and processing operation(Savage 1995; MOH 1997; Kennedy 1998). It aims toidentify those steps that are critical to the safety of theproduct, so that management can then concentrate its
scarce technical resources in those processes/stepswhich critically affect the safety of the product.HACCP transforms a food production and handlingoperation from the traditional control philosophy,based primarily on end-point testing, to a preventativeapproach. It provides a structured approach to theassurance of the quality and safety of specific productsand their processes, involving:
• identification of hazards of concern (such aspathogens);
• identification of the specific requirements for theircontrol; and
• mechanisms to continuously measure theeffectiveness of the HACCP system.
HACCP is comprised of seven basic principles,which must be followed in implementing a HACCP-based quality management program: conductinghazard analysis, identifying the critical points for eachstep, establishing critical limits, establishing moni-toring requirements, taking corrective action, keepingrecords, and verifying the HACCP system is workingcorrectly.
In the HACCP system, hazard is defined as apotential to cause harm to the consumer (safety) or theproduct (spoilage). A critical control point is alocation, stage, operation, step or raw material which,if not controlled, provides a threat (risk) to consumersafety, or the product acceptability. Although HACCPwas developed initially and has still mainly applied toassure the microbiological safety of foods, it is appli-cable to other forms of hazard such as chemical andphysical contaminants. HACCP is also suitable as amanagement tool to ensure consistent product qualityor increased production efficiency.
Concluding Remarks and Future Prospects
The production and marketing of quality agriculturalproduce is a major challenge facing growers, handlersand marketers, particularly due the myriad of climatic,production, environmental and postharvest handlingfactors which contribute to a highly variable product.Food safety is now recognised as a problem in thefresh food industry, and consumers and other stake-holders are increasing demanding safe foods that areof the highest quality. Several tools for maintaining theproduct quality during postharvest operations aredescribed in this paper. They comprise the technol-ogies for assessing and monitoring product qualityattributes, technologies for reducing physical damage,
Quality assurance in agricultural produce,edited by G.I. Johnson, Le Van To, Nguyen Duy Duc and M.C. Webb.
ACIAR Proceedings 100(printed version published in 2000)
655
and environmental techniques for maintaining thecool-chain and minimising deterioration.
Quality and safety management tools, which areapplicable to fresh agricultural produce are alsodescribed, specifically Good Manufacturing Practice(GMP), Good Hygiene Practice (GHP), and theHazard Analysis and Critical Control Points (HACCP)systems. Although microbial hazard is currently themain safety concern in the fresh food industry, thesequality management tools have the potential toprovide the agricultural and horticultural industrieswith new science-based tools to systematicallymanage other food hazards and product quality.
References
Abbott, J.A., Lu, R., Upchurch, B.L. and Stroshine, R.L.1997. Technologies for nondestructive quality evaluationof fruits and vegetables. Horticultural Reviews,20,1–126.
Bourne, M.C. 1980. Texture evaluation of horticulturalcrops. HortScience, 15, 51–57.
Chen, P. and Sun, Z. 1991. A review of nondestructivemethods for quality evaluation and sorting of agriculturalproducts. Journal of Agricultural Engineering Research,49, 85–98.
Crisostos, C.H. 1993. Postharvest factors affecting fruitquality and postharvest deterioration. PerishablesHandling, 75, 2–5.
Douglass, P. (ed.) 1999. Food safety in the postharvestindustry. Conference Proceedings, PostharvestConvention held at Silsoe College, Cranfield University,Bedford, United Kingdom.
Garvin, D.A. 1984. Product quality: an important strategicweapon. Business Horizons, 27(3), 40–43.
Jouve, J.L., Stringer, M.F. and Baird-Parker, A.C. 1999.Food safety management tools. Food Science andTechnology Today, 12(3), 82–91.
Katayama, K., Komaki, K. and Tamiya, S. 1996. Predictionof starch, moisture, and sugar in sweet potato by infraredtransmittance. HortScience, 31, 1003–1006.
Kennedy, G. 1998. Introduction of HACCP into thesmallgoods industry. Food Australia, 50(2), 80–82.
Kinsey, J.D. 1998. Food safety—why now? Cereal FoodsWorld, 43, 224–226.
Kruithof, J. and Ryall, J. 1994. The quality standardshandbook: how to understand and implement qualitysystems and ISO 9000 standards in a context of totalquality and continuous improvement. Melbourne, TheBusiness Library.
MOH (Ministry of Health) 1997. An introduction toHACCP. Food safety information for New Zealandbusinesses, revised edition. Wellington, New Zealand,Ministry of Health.
Muir, A.Y., Ross, D.W., Dewar, C.J. and Kennedy, D. 1998.Defect and diseases detection in potatoes. In: Stenning, B.ed., Quality assessment for the fresh produce market.Conference Proceedings, Postharvest Convention held atSilsoe College, Cranfield University, Bedford, UnitedKingdom, 12–15.
Porter, A. 1998. Quality and product safety management.Food Science and Technology Today, 12, 160–165.
Savage, R.A. 1995. Hazard analysis critical control point: areview. Food Reviews International, 11, 575–595.
Stenning, B. (ed.) 1998. Quality assessment for the freshproduce market. Conference Proceedings, PostharvestConvention held at Silsoe College, Cranfield University,Bedford, United Kingdom.
Wells, J.M. and Butterfield, J.E. 1997. Salmonellacontamination associated with bacterial soft rot of freshfruits and vegetables in the market place. Plant Disease,81, 867–872.
Wells, J.M. and Butterfield, J.E. 1999. Incidence ofSalmonella on fresh fruits and vegetables affected byfungal rots or physical injury. Plant Disease, 83, 722–726.
WHO (World Health Organization) 1998. Surface decon-tamination of fruit and vegetables eaten raw: a review.Geneva, WHO/FSF/FOS/98.2.
Quality assurance in agricultural produce,edited by G.I. Johnson, Le Van To, Nguyen Duy Duc and M.C. Webb.
ACIAR Proceedings 100(printed version published in 2000)
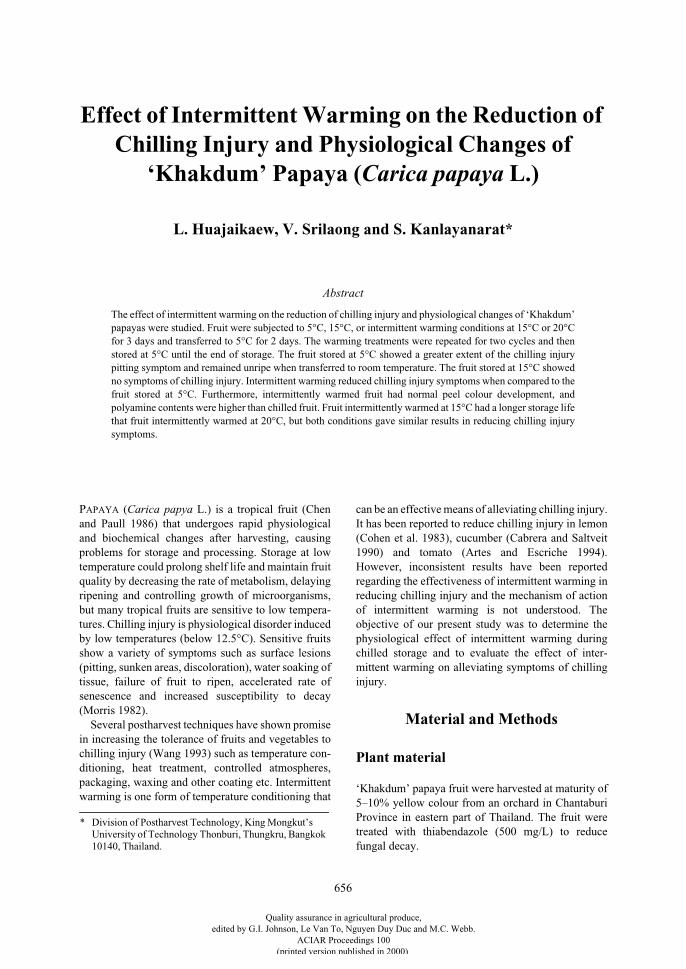
656
Effect of Intermittent Warming on the Reduction of Chilling Injury and Physiological Changes of
‘Khakdum’ Papaya (Carica papaya L.)
L. Huajaikaew, V. Srilaong and S. Kanlayanarat*
Abstract
The effect of intermittent warming on the reduction of chilling injury and physiological changes of ‘Khakdum’papayas were studied. Fruit were subjected to 5°C, 15°C, or intermittent warming conditions at 15°C or 20°Cfor 3 days and transferred to 5°C for 2 days. The warming treatments were repeated for two cycles and thenstored at 5°C until the end of storage. The fruit stored at 5°C showed a greater extent of the chilling injurypitting symptom and remained unripe when transferred to room temperature. The fruit stored at 15°C showedno symptoms of chilling injury. Intermittent warming reduced chilling injury symptoms when compared to thefruit stored at 5°C. Furthermore, intermittently warmed fruit had normal peel colour development, andpolyamine contents were higher than chilled fruit. Fruit intermittently warmed at 15°C had a longer storage lifethat fruit intermittently warmed at 20°C, but both conditions gave similar results in reducing chilling injurysymptoms.
P
APAYA
(
Carica papya
L.) is a tropical fruit (Chenand Paull 1986) that undergoes rapid physiologicaland biochemical changes after harvesting, causingproblems for storage and processing. Storage at lowtemperature could prolong shelf life and maintain fruitquality by decreasing the rate of metabolism, delayingripening and controlling growth of microorganisms,but many tropical fruits are sensitive to low tempera-tures. Chilling injury is physiological disorder inducedby low temperatures (below 12.5°C). Sensitive fruitsshow a variety of symptoms such as surface lesions(pitting, sunken areas, discoloration), water soaking oftissue, failure of fruit to ripen, accelerated rate ofsenescence and increased susceptibility to decay(Morris 1982).
Several postharvest techniques have shown promisein increasing the tolerance of fruits and vegetables tochilling injury (Wang 1993) such as temperature con-ditioning, heat treatment, controlled atmospheres,packaging, waxing and other coating etc. Intermittentwarming is one form of temperature conditioning that
can be an effective means of alleviating chilling injury.It has been reported to reduce chilling injury in lemon(Cohen et al. 1983), cucumber (Cabrera and Saltveit1990) and tomato (Artes and Escriche 1994).However, inconsistent results have been reportedregarding the effectiveness of intermittent warming inreducing chilling injury and the mechanism of actionof intermittent warming is not understood. Theobjective of our present study was to determine thephysiological effect of intermittent warming duringchilled storage and to evaluate the effect of inter-mittent warming on alleviating symptoms of chillinginjury.
Material and Methods
Plant material
‘Khakdum’ papaya fruit were harvested at maturity of5–10% yellow colour from an orchard in ChantaburiProvince in eastern part of Thailand. The fruit weretreated with thiabendazole (500 mg/L) to reducefungal decay.
* Division of Postharvest Technology, King Mongkut’s University of Technology Thonburi, Thungkru, Bangkok 10140, Thailand.
Quality assurance in agricultural produce,edited by G.I. Johnson, Le Van To, Nguyen Duy Duc and M.C. Webb.
ACIAR Proceedings 100(printed version published in 2000)
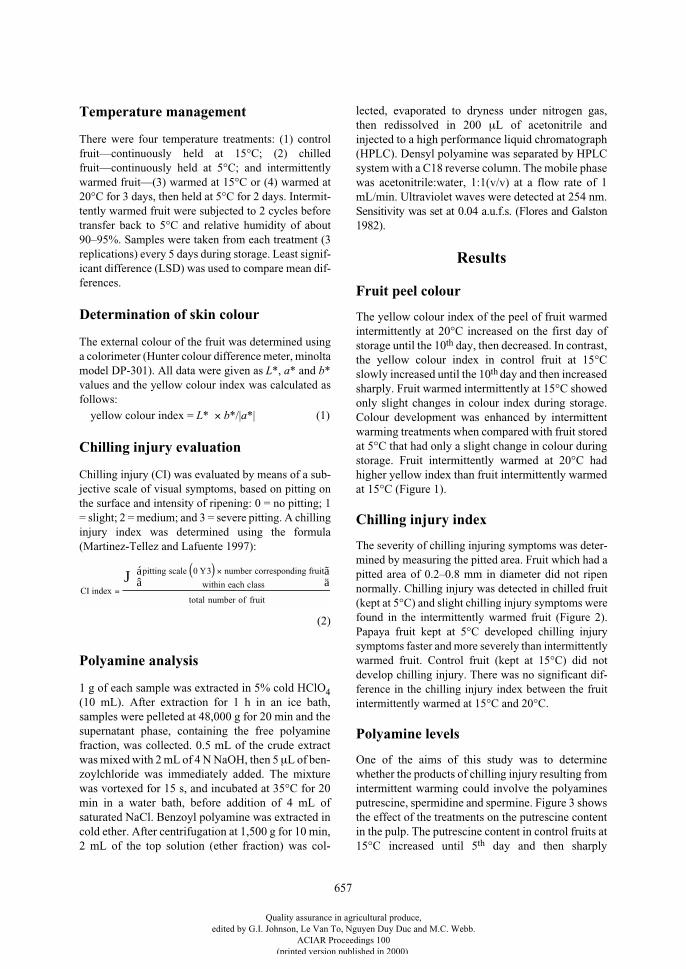
657
Temperature management
There were four temperature treatments: (1) controlfruit—continuously held at 15°C; (2) chilledfruit—continuously held at 5°C; and intermittentlywarmed fruit—(3) warmed at 15°C or (4) warmed at20°C for 3 days, then held at 5°C for 2 days. Intermit-tently warmed fruit were subjected to 2 cycles beforetransfer back to 5°C and relative humidity of about90–95%. Samples were taken from each treatment (3replications) every 5 days during storage. Least signif-icant difference (LSD) was used to compare mean dif-ferences.
Determination of skin colour
The external colour of the fruit was determined usinga colorimeter (Hunter colour difference meter, minoltamodel DP-301). All data were given as
L
*,
a
* and
b
*values and the yellow colour index was calculated asfollows:
yellow colour index =
L
*
×
b
*/|
a
*| (1)
Chilling injury evaluation
Chilling injury (CI) was evaluated by means of a sub-jective scale of visual symptoms, based on pitting onthe surface and intensity of ripening: 0 = no pitting; 1= slight; 2 = medium; and 3 = severe pitting. A chillinginjury index was determined using the formula(Martinez-Tellez and Lafuente 1997):
Polyamine analysis
1 g of each sample was extracted in 5% cold HClO
4
(10 mL). After extraction for 1 h in an ice bath,samples were pelleted at 48,000 g for 20 min and thesupernatant phase, containing the free polyaminefraction, was collected. 0.5 mL of the crude extractwas mixed with 2 mL of 4 N NaOH, then 5
µ
L of ben-zoylchloride was immediately added. The mixturewas vortexed for 15 s, and incubated at 35°C for 20min in a water bath, before addition of 4 mL ofsaturated NaCl. Benzoyl polyamine was extracted incold ether. After centrifugation at 1,500 g for 10 min,2 mL of the top solution (ether fraction) was col-
lected, evaporated to dryness under nitrogen gas,then redissolved in 200
µ
L of acetonitrile andinjected to a high performance liquid chromatograph(HPLC). Densyl polyamine was separated by HPLCsystem with a C18 reverse column. The mobile phasewas acetonitrile:water, 1:1(v/v) at a flow rate of 1mL/min. Ultraviolet waves were detected at 254 nm.Sensitivity was set at 0.04 a.u.f.s. (Flores and Galston1982).
Results
Fruit peel colour
The yellow colour index of the peel of fruit warmedintermittently at 20°C increased on the first day ofstorage until the 10
th
day, then decreased. In contrast,the yellow colour index in control fruit at 15°Cslowly increased until the 10
th
day and then increasedsharply. Fruit warmed intermittently at 15°C showedonly slight changes in colour index during storage.Colour development was enhanced by intermittentwarming treatments when compared with fruit storedat 5°C that had only a slight change in colour duringstorage. Fruit intermittently warmed at 20°C hadhigher yellow index than fruit intermittently warmedat 15°C (Figure 1).
Chilling injury index
The severity of chilling injuring symptoms was deter-mined by measuring the pitted area. Fruit which had apitted area of 0.2–0.8 mm in diameter did not ripennormally. Chilling injury was detected in chilled fruit(kept at 5°C) and slight chilling injury symptoms werefound in the intermittently warmed fruit (Figure 2).Papaya fruit kept at 5°C developed chilling injurysymptoms faster and more severely than intermittentlywarmed fruit. Control fruit (kept at 15°C) did notdevelop chilling injury. There was no significant dif-ference in the chilling injury index between the fruitintermittently warmed at 15°C and 20°C.
Polyamine levels
One of the aims of this study was to determinewhether the products of chilling injury resulting fromintermittent warming could involve the polyaminesputrescine, spermidine and spermine. Figure 3 showsthe effect of the treatments on the putrescine contentin the pulp. The putrescine content in control fruits at15°C increased until 5
th
day and then sharply
CI index
pitting scale number corresponding fruit
within each class
total number of fruit=
Y ×( )áâ
ãäJ 0 3
(2)
Quality assurance in agricultural produce,edited by G.I. Johnson, Le Van To, Nguyen Duy Duc and M.C. Webb.
ACIAR Proceedings 100(printed version published in 2000)
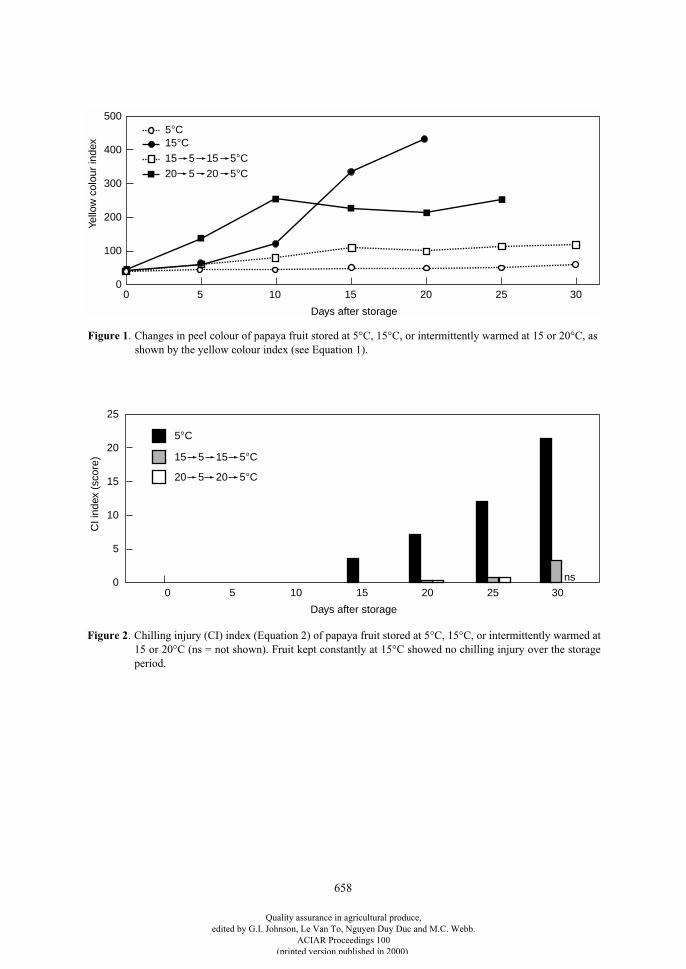
658
0
300
100
200
400
Days after storage
Yello
w c
olou
r in
dex
0 5 10 15 20 25
500
30
20 5 20 5°C
15 5 15 5°C
15°C5°C
0
15
5
10
20
Days after storage
CI i
ndex
(sc
ore)
0 5 10 15 20 25 30
25
5°C
15 5 15 5°C
20 5 20 5°C
ns
Figure 1
. Changes in peel colour of papaya fruit stored at 5°C, 15°C, or intermittently warmed at 15 or 20°C, asshown by the yellow colour index (see Equation 1).
Figure 2
. Chilling injury (CI) index (Equation 2) of papaya fruit stored at 5°C, 15°C, or intermittently warmed at15 or 20°C (ns = not shown). Fruit kept constantly at 15°C showed no chilling injury over the storageperiod.
Quality assurance in agricultural produce,edited by G.I. Johnson, Le Van To, Nguyen Duy Duc and M.C. Webb.
ACIAR Proceedings 100(printed version published in 2000)
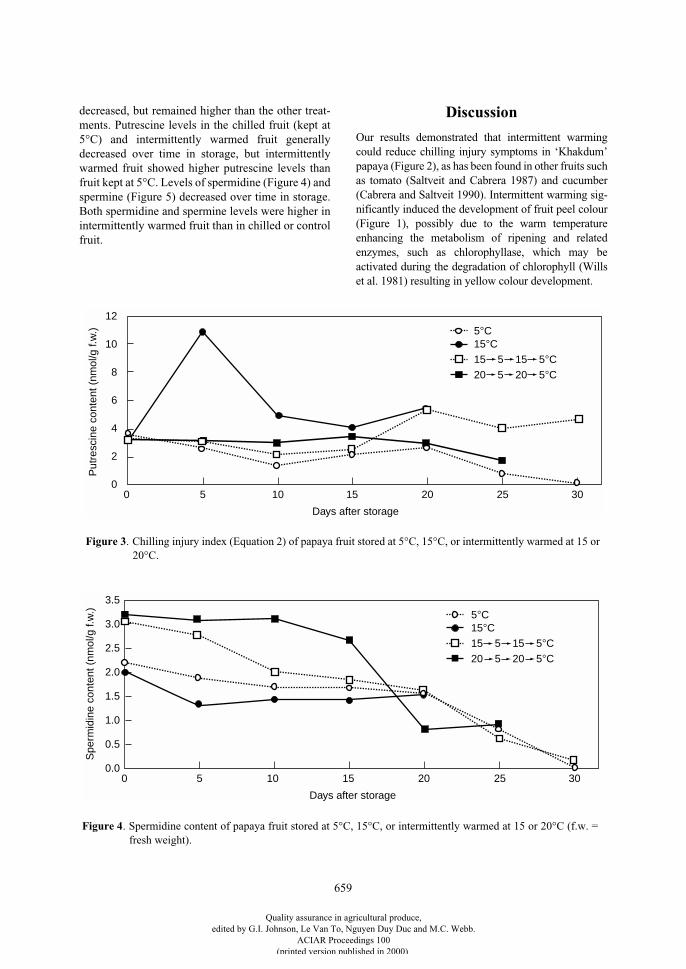
659
decreased, but remained higher than the other treat-ments. Putrescine levels in the chilled fruit (kept at5°C) and intermittently warmed fruit generallydecreased over time in storage, but intermittentlywarmed fruit showed higher putrescine levels thanfruit kept at 5°C. Levels of spermidine (Figure 4) andspermine (Figure 5) decreased over time in storage.Both spermidine and spermine levels were higher inintermittently warmed fruit than in chilled or controlfruit.
Discussion
Our results demonstrated that intermittent warmingcould reduce chilling injury symptoms in ‘Khakdum’papaya (Figure 2), as has been found in other fruits suchas tomato (Saltveit and Cabrera 1987) and cucumber(Cabrera and Saltveit 1990). Intermittent warming sig-nificantly induced the development of fruit peel colour(Figure 1), possibly due to the warm temperatureenhancing the metabolism of ripening and relatedenzymes, such as chlorophyllase, which may beactivated during the degradation of chlorophyll (Willset al. 1981) resulting in yellow colour development.
0
8
4
6
10
Days after storage
Put
resc
ine
cont
ent (
nmol
/g f.
w.)
0 5 10 15 20 25
12
30
20 5 20 5°C
15 5 15 5°C
15°C5°C
2
Figure 3. Chilling injury index (Equation 2) of papaya fruit stored at 5°C, 15°C, or intermittently warmed at 15 or20°C.
Figure 4. Spermidine content of papaya fruit stored at 5°C, 15°C, or intermittently warmed at 15 or 20°C (f.w. =fresh weight).
0.0
2.5
1.5
2.0
3.0
Days after storage
Spe
rmid
ine
cont
ent (
nmol
/g f.
w.)
0 5 10 15 20 25
3.5
30
20 5 20 5°C
15 5 15 5°C
15°C5°C
1.0
0.5
Quality assurance in agricultural produce,edited by G.I. Johnson, Le Van To, Nguyen Duy Duc and M.C. Webb.
ACIAR Proceedings 100(printed version published in 2000)
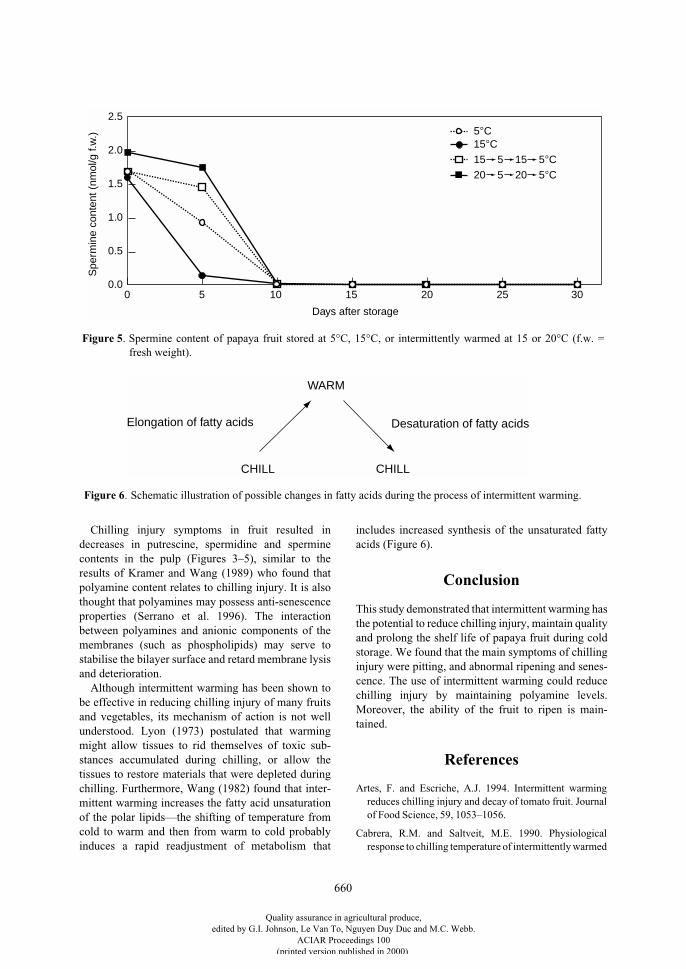
660
Chilling injury symptoms in fruit resulted indecreases in putrescine, spermidine and sperminecontents in the pulp (Figures 3–5), similar to theresults of Kramer and Wang (1989) who found thatpolyamine content relates to chilling injury. It is alsothought that polyamines may possess anti-senescenceproperties (Serrano et al. 1996). The interactionbetween polyamines and anionic components of themembranes (such as phospholipids) may serve tostabilise the bilayer surface and retard membrane lysisand deterioration.
Although intermittent warming has been shown tobe effective in reducing chilling injury of many fruitsand vegetables, its mechanism of action is not wellunderstood. Lyon (1973) postulated that warmingmight allow tissues to rid themselves of toxic sub-stances accumulated during chilling, or allow thetissues to restore materials that were depleted duringchilling. Furthermore, Wang (1982) found that inter-mittent warming increases the fatty acid unsaturationof the polar lipids—the shifting of temperature fromcold to warm and then from warm to cold probablyinduces a rapid readjustment of metabolism that
includes increased synthesis of the unsaturated fattyacids (Figure 6).
Conclusion
This study demonstrated that intermittent warming hasthe potential to reduce chilling injury, maintain qualityand prolong the shelf life of papaya fruit during coldstorage. We found that the main symptoms of chillinginjury were pitting, and abnormal ripening and senes-cence. The use of intermittent warming could reducechilling injury by maintaining polyamine levels.Moreover, the ability of the fruit to ripen is main-tained.
References
Artes, F. and Escriche, A.J. 1994. Intermittent warmingreduces chilling injury and decay of tomato fruit. Journalof Food Science, 59, 1053–1056.
Cabrera, R.M. and Saltveit, M.E. 1990. Physiologicalresponse to chilling temperature of intermittently warmed
0.0
2.5
1.5
2.0
Days after storage
Spe
rmin
e co
nten
t (nm
ol/g
f.w
.)
0 5 10 15 20 25 30
20 5 20 5°C
15 5 15 5°C
15°C5°C
1.0
0.5
Figure 5. Spermine content of papaya fruit stored at 5°C, 15°C, or intermittently warmed at 15 or 20°C (f.w. =fresh weight).
Elongation of fatty acids Desaturation of fatty acids
WARM
CHILL CHILL
Figure 6. Schematic illustration of possible changes in fatty acids during the process of intermittent warming.
Quality assurance in agricultural produce,edited by G.I. Johnson, Le Van To, Nguyen Duy Duc and M.C. Webb.
ACIAR Proceedings 100(printed version published in 2000)
661
cucumber fruit. Journal of the American Society forHorticultural Science, 115, 256–261.
Chen, N.M. and Paull, R.E. 1986. Development andprevention of chilling injury in papaya fruit. Journal of theAmerican Society of Horticultural Scientists, 111,693–643.
Cohen, E., Shuali, M. and Shalom, Y. 1983. Effect ofintermittent warming on the reduction of chilling injury ofVilla Franka lemon fruits stored at cold temperature.Journal of Horticultural Science, 58, 593–598.
Flores, H.E. and Galston, A.W. 1982. Analysis ofpolyamines in higher plants by high performance liquidchromatography. Plant Physiology, 69, 701–706.
Kramer, G.F. and Wang, C.Y. 1989. Correlation of reducedchilling injury with increased spermine and spermidinelevels in zucchini squash. Physiologia Plantarum, 76,470–484.
Lyon, J.M. 1973. Chilling injury in plants. Annual Reviewof Plant Physiology, 24, 445–466.
Martinez-Tellez, M.A. and Lafuente, M.T. 1997. Effect ofhigh temperature conditioning on ethylene, phenyl-
alanine ammonia-lyase, peroxidase and poly-phenoloxidase activities in Flavedo chilled (Fortune) mandarinfruit. Plant Physiology, 150, 674–678.
Morris, L.L. 1982. Chilling injury of horticultural crops: onoverview. HortScience, 17, 161–162.
Saltveit, M.E. and Cabrera, R.M. 1987. Tomato fruittemperature before chilling influences ripening afterchilling. HortScience, 22, 452–454.
Serrano, M., Martinez-Madried, M.C., Martinez, G.,Riquelme, F., Pretel, M.T. and Romojaro, F. 1996.Review: role of polyamines in chilling injury of fruit andvegetables. Food Science and Technology International,2, 195–199.
Wang, C.Y. 1982. Physiological and biochemical responsesof plants to chilling stress. HortScience, 17, 173–186.
Wang, C.Y. 1993. Approaches to reduce chilling injury offruits and vegetables. Horticultural Review, 15, 63–65.
Wills, R.B.H., Lee, T.H., Graham, D., McGlosson, W.B.and Hall, F.G. 1981. Postharvest: an introduction to thephysiology and handling of fruit and vegetables. Sydney,New South Wales University Press, 161p.
Quality assurance in agricultural produce,edited by G.I. Johnson, Le Van To, Nguyen Duy Duc and M.C. Webb.
ACIAR Proceedings 100(printed version published in 2000)
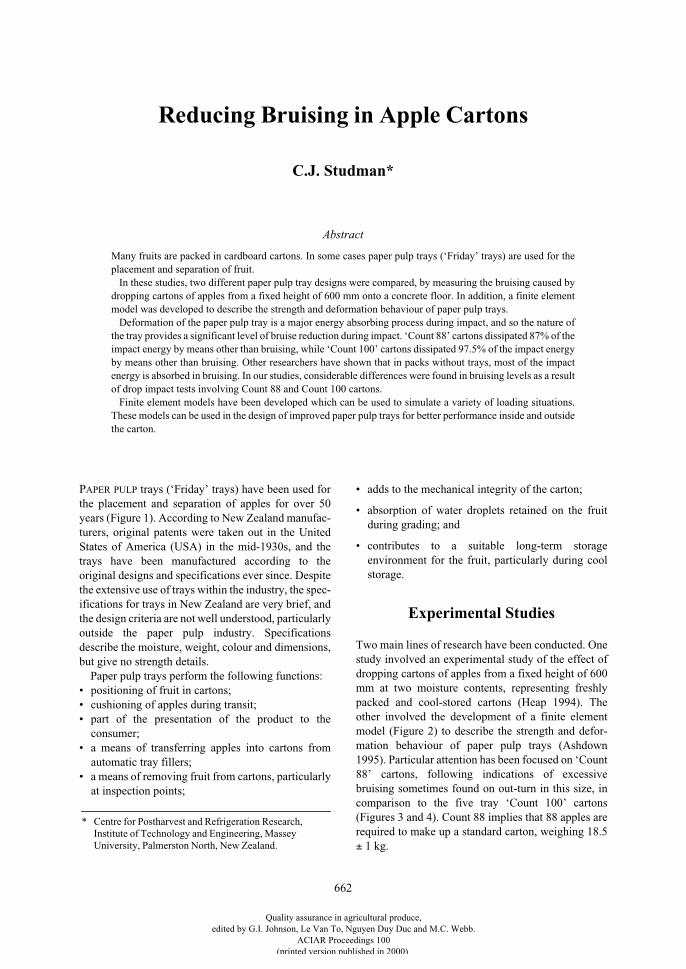
662
Reducing Bruising in Apple Cartons
C.J. Studman*
Abstract
Many fruits are packed in cardboard cartons. In some cases paper pulp trays (‘Friday’ trays) are used for theplacement and separation of fruit.
In these studies, two different paper pulp tray designs were compared, by measuring the bruising caused bydropping cartons of apples from a fixed height of 600 mm onto a concrete floor. In addition, a finite elementmodel was developed to describe the strength and deformation behaviour of paper pulp trays.
Deformation of the paper pulp tray is a major energy absorbing process during impact, and so the nature ofthe tray provides a significant level of bruise reduction during impact. ‘Count 88’ cartons dissipated 87% of theimpact energy by means other than bruising, while ‘Count 100’ cartons dissipated 97.5% of the impact energyby means other than bruising. Other researchers have shown that in packs without trays, most of the impactenergy is absorbed in bruising. In our studies, considerable differences were found in bruising levels as a resultof drop impact tests involving Count 88 and Count 100 cartons.
Finite element models have been developed which can be used to simulate a variety of loading situations.These models can be used in the design of improved paper pulp trays for better performance inside and outsidethe carton.
P
APER
PULP
trays (‘Friday’ trays) have been used forthe placement and separation of apples for over 50years (Figure 1). According to New Zealand manufac-turers, original patents were taken out in the UnitedStates of America (USA) in the mid-1930s, and thetrays have been manufactured according to theoriginal designs and specifications ever since. Despitethe extensive use of trays within the industry, the spec-ifications for trays in New Zealand are very brief, andthe design criteria are not well understood, particularlyoutside the paper pulp industry. Specificationsdescribe the moisture, weight, colour and dimensions,but give no strength details.
Paper pulp trays perform the following functions:• positioning of fruit in cartons;• cushioning of apples during transit;• part of the presentation of the product to the
consumer;• a means of transferring apples into cartons from
automatic tray fillers;• a means of removing fruit from cartons, particularly
at inspection points;
• adds to the mechanical integrity of the carton;
• absorption of water droplets retained on the fruitduring grading; and
• contributes to a suitable long-term storageenvironment for the fruit, particularly during coolstorage.
Experimental Studies
Two main lines of research have been conducted. Onestudy involved an experimental study of the effect ofdropping cartons of apples from a fixed height of 600mm at two moisture contents, representing freshlypacked and cool-stored cartons (Heap 1994). Theother involved the development of a finite elementmodel (Figure 2) to describe the strength and defor-mation behaviour of paper pulp trays (Ashdown1995). Particular attention has been focused on ‘Count88’ cartons, following indications of excessivebruising sometimes found on out-turn in this size, incomparison to the five tray ‘Count 100’ cartons(Figures 3 and 4). Count 88 implies that 88 apples arerequired to make up a standard carton, weighing 18.5
±
1 kg.
* Centre for Postharvest and Refrigeration Research, Institute of Technology and Engineering, Massey University, Palmerston North, New Zealand.
Quality assurance in agricultural produce,edited by G.I. Johnson, Le Van To, Nguyen Duy Duc and M.C. Webb.
ACIAR Proceedings 100(printed version published in 2000)
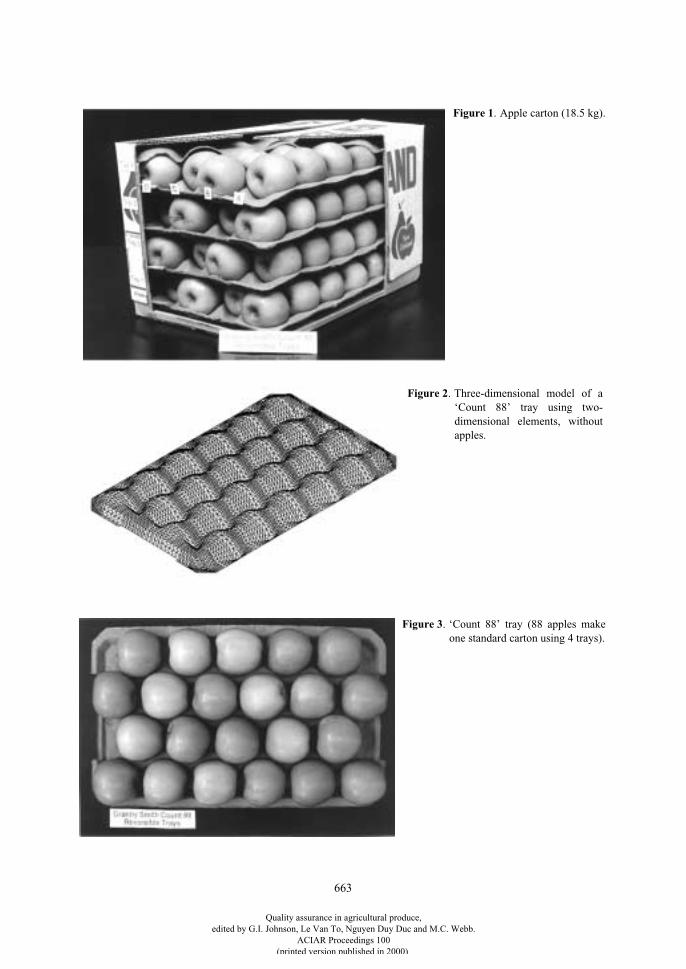
663
Figure 2
. Three-dimensional model of a‘Count 88’ tray using two-dimensional elements, withoutapples.
Figure 3
. ‘Count 88’ tray (88 apples makeone standard carton using 4 trays).
Figure 1
. Apple carton (18.5 kg).
Quality assurance in agricultural produce,edited by G.I. Johnson, Le Van To, Nguyen Duy Duc and M.C. Webb.
ACIAR Proceedings 100(printed version published in 2000)
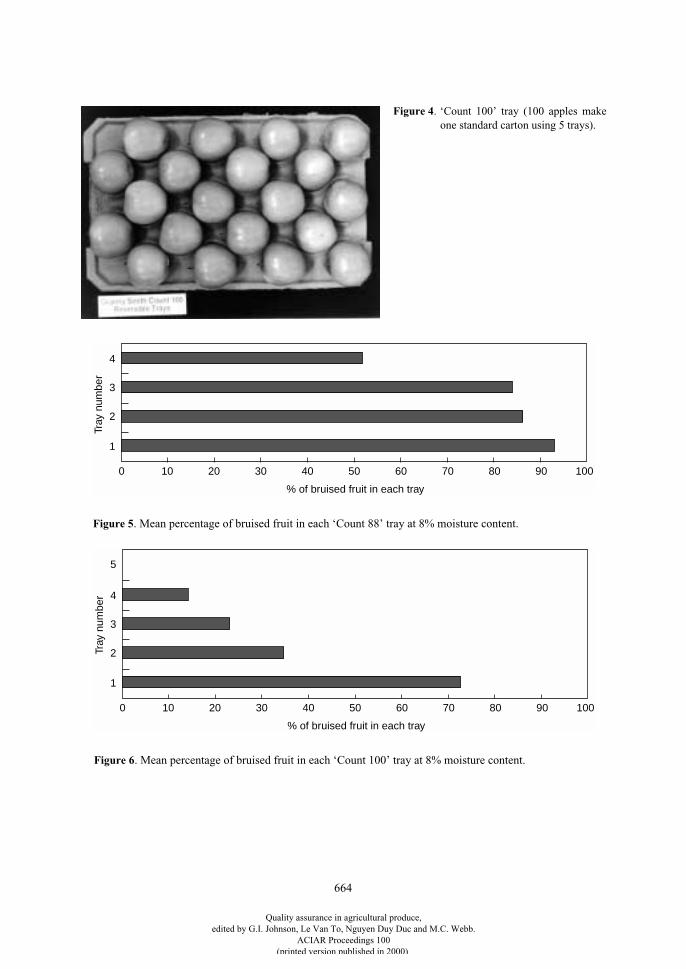
664
0 10 20 30 40 50 60 70 80 90 100
1
2
3
4
% of bruised fruit in each tray
Tray
num
ber
0 10 20 30 40 50 60 70 80 90 100
1
2
3
4
5
% of bruised fruit in each tray
Tray
num
ber
Figure 4
. ‘Count 100’ tray (100 apples makeone standard carton using 5 trays).
Figure 5
. Mean percentage of bruised fruit in each ‘Count 88’ tray at 8% moisture content.
Figure 6
. Mean percentage of bruised fruit in each ‘Count 100’ tray at 8% moisture content.
Quality assurance in agricultural produce,edited by G.I. Johnson, Le Van To, Nguyen Duy Duc and M.C. Webb.
ACIAR Proceedings 100(printed version published in 2000)
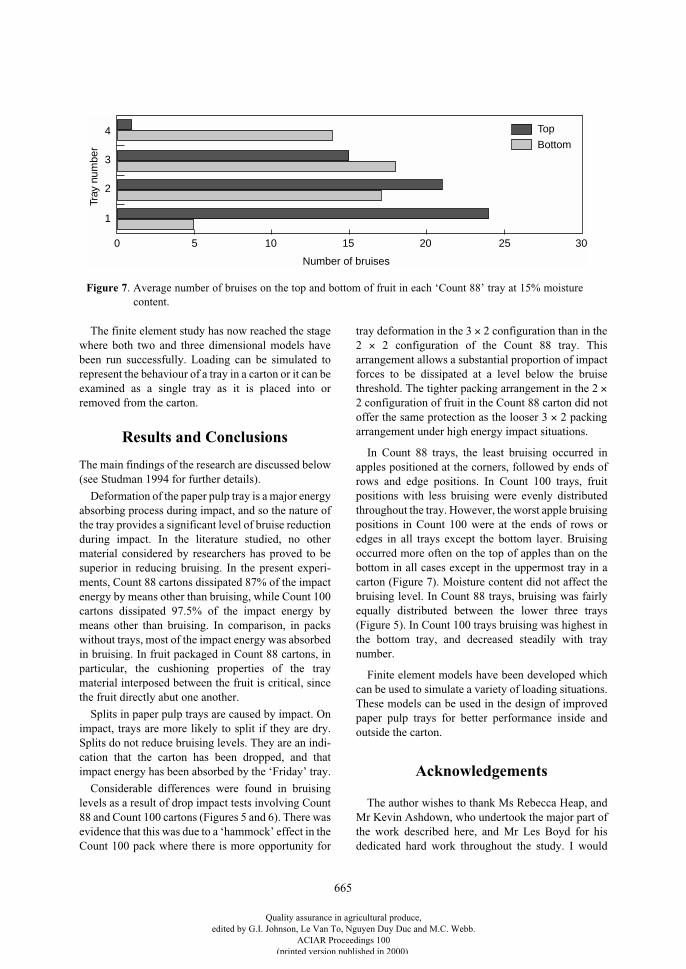
665
The finite element study has now reached the stagewhere both two and three dimensional models havebeen run successfully. Loading can be simulated torepresent the behaviour of a tray in a carton or it can beexamined as a single tray as it is placed into orremoved from the carton.
Results and Conclusions
The main findings of the research are discussed below(see Studman 1994 for further details).
Deformation of the paper pulp tray is a major energyabsorbing process during impact, and so the nature ofthe tray provides a significant level of bruise reductionduring impact. In the literature studied, no othermaterial considered by researchers has proved to besuperior in reducing bruising. In the present experi-ments, Count 88 cartons dissipated 87% of the impactenergy by means other than bruising, while Count 100cartons dissipated 97.5% of the impact energy bymeans other than bruising. In comparison, in packswithout trays, most of the impact energy was absorbedin bruising. In fruit packaged in Count 88 cartons, inparticular, the cushioning properties of the traymaterial interposed between the fruit is critical, sincethe fruit directly abut one another.
Splits in paper pulp trays are caused by impact. Onimpact, trays are more likely to split if they are dry.Splits do not reduce bruising levels. They are an indi-cation that the carton has been dropped, and thatimpact energy has been absorbed by the ‘Friday’ tray.
Considerable differences were found in bruisinglevels as a result of drop impact tests involving Count88 and Count 100 cartons (Figures 5 and 6). There wasevidence that this was due to a ‘hammock’ effect in theCount 100 pack where there is more opportunity for
tray deformation in the 3
×
2 configuration than in the2
×
2 configuration of the Count 88 tray. Thisarrangement allows a substantial proportion of impactforces to be dissipated at a level below the bruisethreshold. The tighter packing arrangement in the 2
×
2 configuration of fruit in the Count 88 carton did notoffer the same protection as the looser 3
×
2 packingarrangement under high energy impact situations.
In Count 88 trays, the least bruising occurred inapples positioned at the corners, followed by ends ofrows and edge positions. In Count 100 trays, fruitpositions with less bruising were evenly distributedthroughout the tray. However, the worst apple bruisingpositions in Count 100 were at the ends of rows oredges in all trays except the bottom layer. Bruisingoccurred more often on the top of apples than on thebottom in all cases except in the uppermost tray in acarton (Figure 7). Moisture content did not affect thebruising level. In Count 88 trays, bruising was fairlyequally distributed between the lower three trays(Figure 5). In Count 100 trays bruising was highest inthe bottom tray, and decreased steadily with traynumber.
Finite element models have been developed whichcan be used to simulate a variety of loading situations.These models can be used in the design of improvedpaper pulp trays for better performance inside andoutside the carton.
Acknowledgements
The author wishes to thank Ms Rebecca Heap, andMr Kevin Ashdown, who undertook the major part ofthe work described here, and Mr Les Boyd for hisdedicated hard work throughout the study. I would
0 5 10 15 20 25 30
1
2
3
4
Number of bruises
Tray
num
ber
Top
Bottom
Figure 7. Average number of bruises on the top and bottom of fruit in each ‘Count 88’ tray at 15% moisturecontent.
Quality assurance in agricultural produce,edited by G.I. Johnson, Le Van To, Nguyen Duy Duc and M.C. Webb.
ACIAR Proceedings 100(printed version published in 2000)
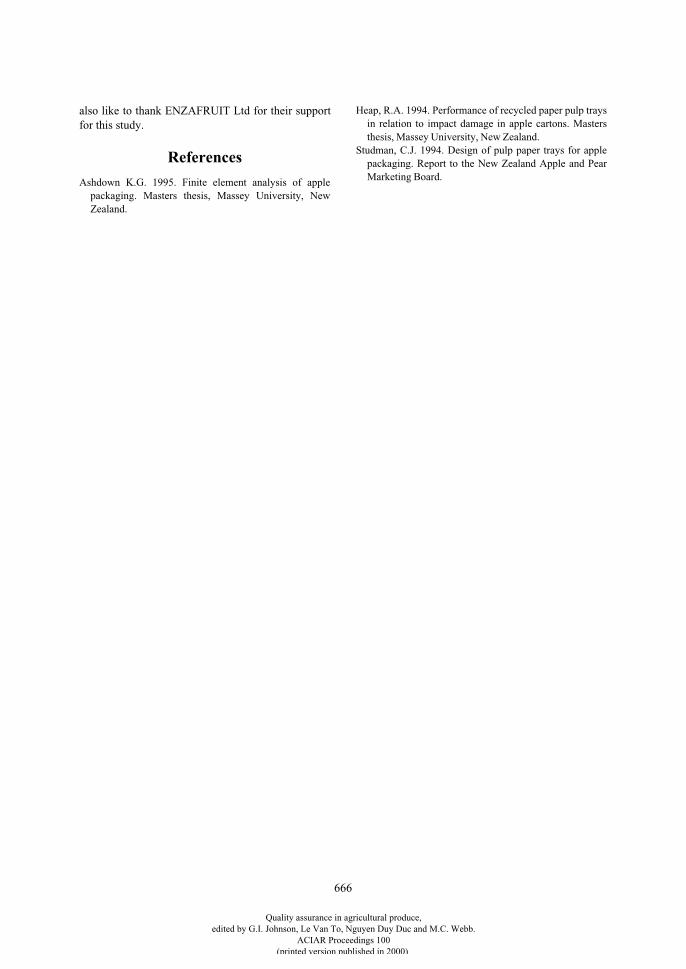
666
also like to thank ENZAFRUIT Ltd for their supportfor this study.
References
Ashdown K.G. 1995. Finite element analysis of applepackaging. Masters thesis, Massey University, NewZealand.
Heap, R.A. 1994. Performance of recycled paper pulp traysin relation to impact damage in apple cartons. Mastersthesis, Massey University, New Zealand.
Studman, C.J. 1994. Design of pulp paper trays for applepackaging. Report to the New Zealand Apple and PearMarketing Board.
Quality assurance in agricultural produce,edited by G.I. Johnson, Le Van To, Nguyen Duy Duc and M.C. Webb.
ACIAR Proceedings 100(printed version published in 2000)
667
Improving the Ergonomics of Apple Grading Tables
C.J. Studman*
Abstract
The grading table in a packing shed is a key part of the quality chain, as it is the only point at which all fruitare inspected thoroughly. Its design has a major influence on how well the operator is able to perform the task.Key issues are ergonomic design and illumination.
These experiments tested whether the performance and comfort of sorters could be altered by changes to thedesign of the table. A study was also made of an alternative sorter design, where fruit moved towards the sorter.Finally, experiments evaluated the effect of background colour on sorter perception of defects.
The study showed that the level of comfort of sorters was significantly greater on the conventional table witha barrier placed down the centre to restrict the amount of forward stretch. Studies on the new sorter indicatedthat this design was even more comfortable for operators. No conclusions were drawn on the effects onperformance.
Studies on background colour showed that it had an effect on how fruit defects were perceived by theinspector. In the tests, the most defects were observed against a grey background. Sorters expressed apreference for dark background tables. Overall light levels in the field of view of the sorter could have an effecton comfort, and these should be included in design guidelines.
T
HE
GRADING
table in a packing shed is one of themost important components of the quality chain. It isthe only point at which all fruit are inspected thor-oughly and where the bulk of substandard fruit areremoved. It is therefore essential that the table isdesigned so that sorters can be as effective andaccurate in their work as possible.
Despite its importance, there have been virtually noreported in-depth studies aimed at providing data tooptimise the design for apple handling systems.Ergonomic studies involving other work tasks haveattempted to relate the performance of humans to thephysical, sociological and psychological environment.These studies show that, in general, humans are betterable to function for longer periods of time when thelevels of physical stress are minimised.
In New Zealand, the majority of grading tables areset up so that graders stand to inspect fruit as it movespast them from one side to the other. The lightingsource is strip fluorescent tubes normally installedaccording to guidelines laid down by the export
marketing authority (ENZAFRUIT Ltd), while thegrading table itself is usually white in colour.
The purpose of the grading table in New Zealandpacking sheds is to remove sub-standard fruit from theproduct line. This is achieved mainly by humangraders (strictly sorters) who inspect fruit visually as itpasses in front of them. Sorters identify defective fruitand remove it from the line, placing the reject fruit intoan appropriate chute. Sometimes they will roll fruit inorder to view the underside of the fruit, even thoughmost grading tables are designed to rotate fruit auto-matically as it moves past the inspection point.Workers at a grading table are required to make a largenumber of decisions based on visual observation, andthey must also perform physical actions in order tocarry out their task. The job is repetitive, and pay ratesare not particularly high. The work is also highlyseasonal, lasting around four to five months.
There are many sorting criteria: these include mostof the criteria associated with quality for fruit and veg-etables (Kader 1992; Studman 1994), such as shape,colour, bruising, insect and mite damage or presence,sunburn, rots and cuts, as well as defects which arelimited to one or more cultivars, such as stem-endsplits in ‘Gala’ and ‘Fuji’ apples (Studman 1991;
* Centre for Postharvest and Refrigeration Research, Institute of Technology and Engineering, Massey University, Palmerston North, New Zealand.
Quality assurance in agricultural produce,edited by G.I. Johnson, Le Van To, Nguyen Duy Duc and M.C. Webb.
ACIAR Proceedings 100(printed version published in 2000)
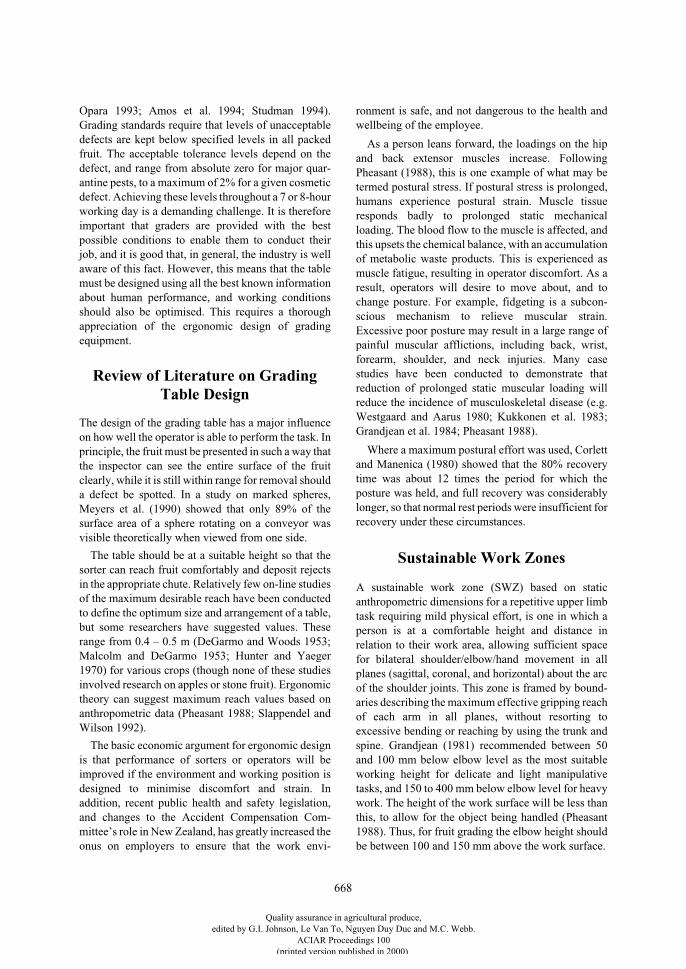
668
Opara 1993; Amos et al. 1994; Studman 1994).Grading standards require that levels of unacceptabledefects are kept below specified levels in all packedfruit. The acceptable tolerance levels depend on thedefect, and range from absolute zero for major quar-antine pests, to a maximum of 2% for a given cosmeticdefect. Achieving these levels throughout a 7 or 8-hourworking day is a demanding challenge. It is thereforeimportant that graders are provided with the bestpossible conditions to enable them to conduct theirjob, and it is good that, in general, the industry is wellaware of this fact. However, this means that the tablemust be designed using all the best known informationabout human performance, and working conditionsshould also be optimised. This requires a thoroughappreciation of the ergonomic design of gradingequipment.
Review of Literature on Grading Table Design
The design of the grading table has a major influenceon how well the operator is able to perform the task. Inprinciple, the fruit must be presented in such a way thatthe inspector can see the entire surface of the fruitclearly, while it is still within range for removal shoulda defect be spotted. In a study on marked spheres,Meyers et al. (1990) showed that only 89% of thesurface area of a sphere rotating on a conveyor wasvisible theoretically when viewed from one side.
The table should be at a suitable height so that thesorter can reach fruit comfortably and deposit rejectsin the appropriate chute. Relatively few on-line studiesof the maximum desirable reach have been conductedto define the optimum size and arrangement of a table,but some researchers have suggested values. Theserange from 0.4 – 0.5 m (DeGarmo and Woods 1953;Malcolm and DeGarmo 1953; Hunter and Yaeger1970) for various crops (though none of these studiesinvolved research on apples or stone fruit). Ergonomictheory can suggest maximum reach values based onanthropometric data (Pheasant 1988; Slappendel andWilson 1992).
The basic economic argument for ergonomic designis that performance of sorters or operators will beimproved if the environment and working position isdesigned to minimise discomfort and strain. Inaddition, recent public health and safety legislation,and changes to the Accident Compensation Com-mittee’s role in New Zealand, has greatly increased theonus on employers to ensure that the work envi-
ronment is safe, and not dangerous to the health andwellbeing of the employee.
As a person leans forward, the loadings on the hipand back extensor muscles increase. FollowingPheasant (1988), this is one example of what may betermed postural stress. If postural stress is prolonged,humans experience postural strain. Muscle tissueresponds badly to prolonged static mechanicalloading. The blood flow to the muscle is affected, andthis upsets the chemical balance, with an accumulationof metabolic waste products. This is experienced asmuscle fatigue, resulting in operator discomfort. As aresult, operators will desire to move about, and tochange posture. For example, fidgeting is a subcon-scious mechanism to relieve muscular strain.Excessive poor posture may result in a large range ofpainful muscular afflictions, including back, wrist,forearm, shoulder, and neck injuries. Many casestudies have been conducted to demonstrate thatreduction of prolonged static muscular loading willreduce the incidence of musculoskeletal disease (e.g.Westgaard and Aarus 1980; Kukkonen et al. 1983;Grandjean et al. 1984; Pheasant 1988).
Where a maximum postural effort was used, Corlettand Manenica (1980) showed that the 80% recoverytime was about 12 times the period for which theposture was held, and full recovery was considerablylonger, so that normal rest periods were insufficient forrecovery under these circumstances.
Sustainable Work Zones
A sustainable work zone (SWZ) based on staticanthropometric dimensions for a repetitive upper limbtask requiring mild physical effort, is one in which aperson is at a comfortable height and distance inrelation to their work area, allowing sufficient spacefor bilateral shoulder/elbow/hand movement in allplanes (sagittal, coronal, and horizontal) about the arcof the shoulder joints. This zone is framed by bound-aries describing the maximum effective gripping reachof each arm in all planes, without resorting toexcessive bending or reaching by using the trunk andspine. Grandjean (1981) recommended between 50and 100 mm below elbow level as the most suitableworking height for delicate and light manipulativetasks, and 150 to 400 mm below elbow level for heavywork. The height of the work surface will be less thanthis, to allow for the object being handled (Pheasant1988). Thus, for fruit grading the elbow height shouldbe between 100 and 150 mm above the work surface.
Quality assurance in agricultural produce,edited by G.I. Johnson, Le Van To, Nguyen Duy Duc and M.C. Webb.
ACIAR Proceedings 100(printed version published in 2000)
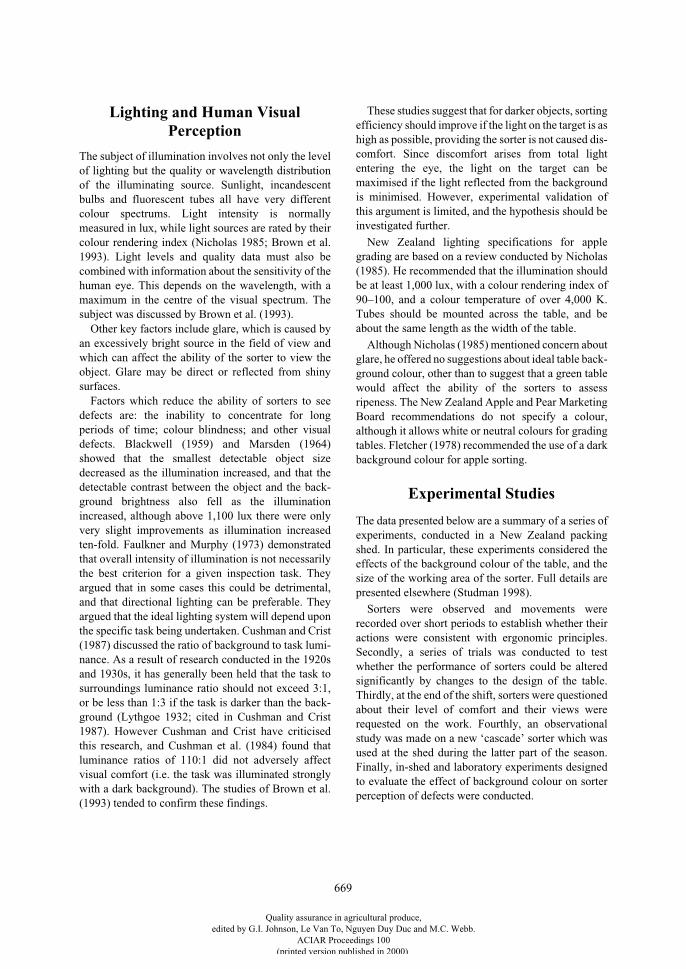
669
Lighting and Human Visual Perception
The subject of illumination involves not only the levelof lighting but the quality or wavelength distributionof the illuminating source. Sunlight, incandescentbulbs and fluorescent tubes all have very differentcolour spectrums. Light intensity is normallymeasured in lux, while light sources are rated by theircolour rendering index (Nicholas 1985; Brown et al.1993). Light levels and quality data must also becombined with information about the sensitivity of thehuman eye. This depends on the wavelength, with amaximum in the centre of the visual spectrum. Thesubject was discussed by Brown et al. (1993).
Other key factors include glare, which is caused byan excessively bright source in the field of view andwhich can affect the ability of the sorter to view theobject. Glare may be direct or reflected from shinysurfaces.
Factors which reduce the ability of sorters to seedefects are: the inability to concentrate for longperiods of time; colour blindness; and other visualdefects. Blackwell (1959) and Marsden (1964)showed that the smallest detectable object sizedecreased as the illumination increased, and that thedetectable contrast between the object and the back-ground brightness also fell as the illuminationincreased, although above 1,100 lux there were onlyvery slight improvements as illumination increasedten-fold. Faulkner and Murphy (1973) demonstratedthat overall intensity of illumination is not necessarilythe best criterion for a given inspection task. Theyargued that in some cases this could be detrimental,and that directional lighting can be preferable. Theyargued that the ideal lighting system will depend uponthe specific task being undertaken. Cushman and Crist(1987) discussed the ratio of background to task lumi-nance. As a result of research conducted in the 1920sand 1930s, it has generally been held that the task tosurroundings luminance ratio should not exceed 3:1,or be less than 1:3 if the task is darker than the back-ground (Lythgoe 1932; cited in Cushman and Crist1987). However Cushman and Crist have criticisedthis research, and Cushman et al. (1984) found thatluminance ratios of 110:1 did not adversely affectvisual comfort (i.e. the task was illuminated stronglywith a dark background). The studies of Brown et al.(1993) tended to confirm these findings.
These studies suggest that for darker objects, sortingefficiency should improve if the light on the target is ashigh as possible, providing the sorter is not caused dis-comfort. Since discomfort arises from total lightentering the eye, the light on the target can bemaximised if the light reflected from the backgroundis minimised. However, experimental validation ofthis argument is limited, and the hypothesis should beinvestigated further.
New Zealand lighting specifications for applegrading are based on a review conducted by Nicholas(1985). He recommended that the illumination shouldbe at least 1,000 lux, with a colour rendering index of90–100, and a colour temperature of over 4,000 K.Tubes should be mounted across the table, and beabout the same length as the width of the table.
Although Nicholas (1985) mentioned concern aboutglare, he offered no suggestions about ideal table back-ground colour, other than to suggest that a green tablewould affect the ability of the sorters to assessripeness. The New Zealand Apple and Pear MarketingBoard recommendations do not specify a colour,although it allows white or neutral colours for gradingtables. Fletcher (1978) recommended the use of a darkbackground colour for apple sorting.
Experimental Studies
The data presented below are a summary of a series ofexperiments, conducted in a New Zealand packingshed. In particular, these experiments considered theeffects of the background colour of the table, and thesize of the working area of the sorter. Full details arepresented elsewhere (Studman 1998).
Sorters were observed and movements wererecorded over short periods to establish whether theiractions were consistent with ergonomic principles.Secondly, a series of trials was conducted to testwhether the performance of sorters could be alteredsignificantly by changes to the design of the table.Thirdly, at the end of the shift, sorters were questionedabout their level of comfort and their views wererequested on the work. Fourthly, an observationalstudy was made on a new ‘cascade’ sorter which wasused at the shed during the latter part of the season.Finally, in-shed and laboratory experiments designedto evaluate the effect of background colour on sorterperception of defects were conducted.
Quality assurance in agricultural produce,edited by G.I. Johnson, Le Van To, Nguyen Duy Duc and M.C. Webb.
ACIAR Proceedings 100(printed version published in 2000)
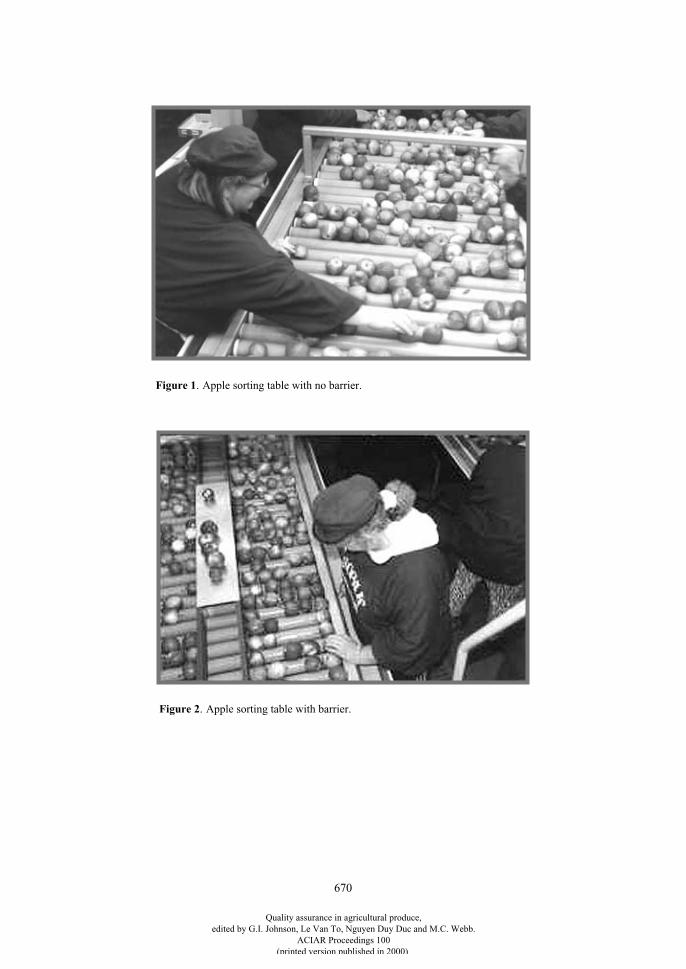
670
Figure 1
. Apple sorting table with no barrier.
Figure 2
. Apple sorting table with barrier.
Quality assurance in agricultural produce,edited by G.I. Johnson, Le Van To, Nguyen Duy Duc and M.C. Webb.
ACIAR Proceedings 100(printed version published in 2000)
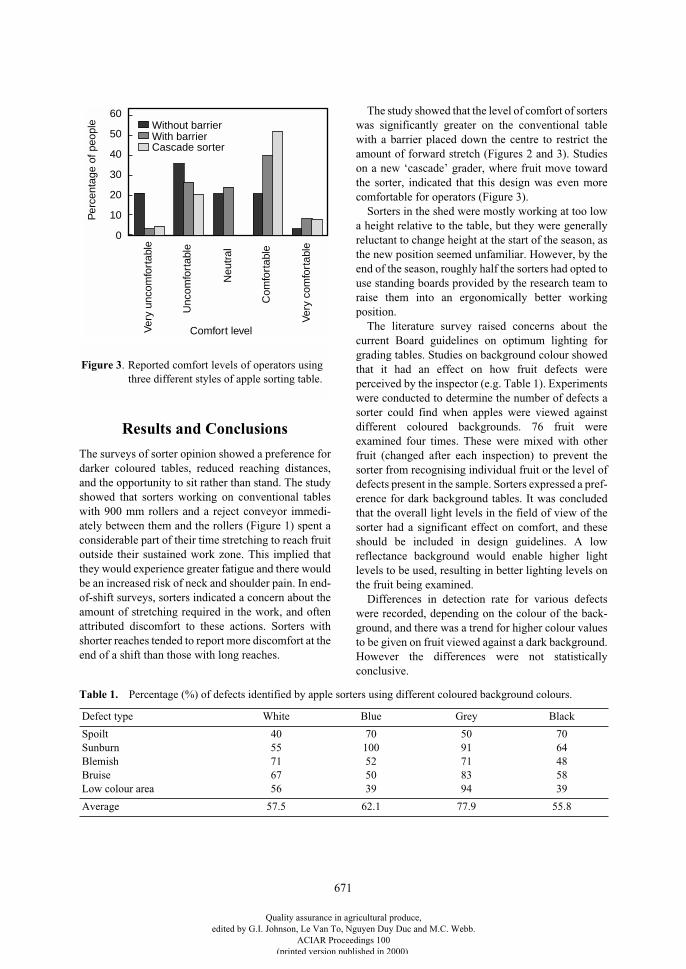
671
Results and Conclusions
The surveys of sorter opinion showed a preference fordarker coloured tables, reduced reaching distances,and the opportunity to sit rather than stand. The studyshowed that sorters working on conventional tableswith 900 mm rollers and a reject conveyor immedi-ately between them and the rollers (Figure 1) spent aconsiderable part of their time stretching to reach fruitoutside their sustained work zone. This implied thatthey would experience greater fatigue and there wouldbe an increased risk of neck and shoulder pain. In end-of-shift surveys, sorters indicated a concern about theamount of stretching required in the work, and oftenattributed discomfort to these actions. Sorters withshorter reaches tended to report more discomfort at theend of a shift than those with long reaches.
The study showed that the level of comfort of sorterswas significantly greater on the conventional tablewith a barrier placed down the centre to restrict theamount of forward stretch (Figures 2 and 3). Studieson a new ‘cascade’ grader, where fruit move towardthe sorter, indicated that this design was even morecomfortable for operators (Figure 3).
Sorters in the shed were mostly working at too lowa height relative to the table, but they were generallyreluctant to change height at the start of the season, asthe new position seemed unfamiliar. However, by theend of the season, roughly half the sorters had opted touse standing boards provided by the research team toraise them into an ergonomically better workingposition.
The literature survey raised concerns about thecurrent Board guidelines on optimum lighting forgrading tables. Studies on background colour showedthat it had an effect on how fruit defects wereperceived by the inspector (e.g. Table 1). Experimentswere conducted to determine the number of defects asorter could find when apples were viewed againstdifferent coloured backgrounds. 76 fruit wereexamined four times. These were mixed with otherfruit (changed after each inspection) to prevent thesorter from recognising individual fruit or the level ofdefects present in the sample. Sorters expressed a pref-erence for dark background tables. It was concludedthat the overall light levels in the field of view of thesorter had a significant effect on comfort, and theseshould be included in design guidelines. A lowreflectance background would enable higher lightlevels to be used, resulting in better lighting levels onthe fruit being examined.
Differences in detection rate for various defectswere recorded, depending on the colour of the back-ground, and there was a trend for higher colour valuesto be given on fruit viewed against a dark background.However the differences were not statisticallyconclusive.
Table 1.
Percentage (%) of defects identified by apple sorters using different coloured background colours.
Defect type White Blue Grey Black
SpoiltSunburnBlemishBruiseLow colour area
4055716756
70100525039
5091718394
7064485839
Average 57.5 62.1 77.9 55.8
60
50
40
30
20
10
0
Without barrierWith barrierCascade sorter
Ver
y un
com
fort
able
Unc
omfo
rtab
le
Neu
tral
Com
fort
able
Ver
y co
mfo
rtab
le
Comfort level
Per
cent
age
of p
eopl
e
Figure 3. Reported comfort levels of operators usingthree different styles of apple sorting table.
Quality assurance in agricultural produce,edited by G.I. Johnson, Le Van To, Nguyen Duy Duc and M.C. Webb.
ACIAR Proceedings 100(printed version published in 2000)
672
Conclusions
Apart from the spoilt fruit category, the inspectorobserved the most defects against a grey background(Table 1). This may represent a good compromisebetween good overall illumination and excessiveglare. It was therefore proved that background colouraffects the grading of fruit.
Acknowledgments
The author wishes to thank the staff and managementof Grocorp Pacific Ltd (Waipawa) for their cooper-ation in enabling this study to be conducted. Particularthanks are due to Mr Les Boyd for his dedicated hardwork throughout the study. I would also like to thankENZAFRUIT Ltd for their support for this study.
References
Amos, N.D., Ponter, B., Studman, C.J. and Wall, G.L. 1994.Techniques to assist with meeting international standardsfor the export of fresh produce. In: Proceedings of the XIICIGR (International Commission of AgriculturalEngineering) World Congress, Milan, Italy, volume 2,1587–1594.
Blackwell, H.R. 1959. Specification of interior illuminationlevels. Illuminating Engineering, June, 317–353.
Brown, G.K., Marshall, D. and Timm, E.D. 1993. Lightingfor fruit and vegetable sorting. In: Proceedings of the 4
th
International Symposium on Fruit, Nut and VegetableProduction Engineering, Valencia, March 1993.
Corlett, E.M. and Manenica, I. 1980. The effects andmeasurement of working postures. Applied Ergonomics,11, 7–16.
Cushman W.H., and Crist, B. 1987. Illumination. In:Salvendy, G., ed., Handbook of human factors. NewYork, Wiley.
Cushman, W.H., Dunn, J.E. and Peters, K.A. 1984.Workplace luminance ratios: do they affect subjectivefatigue and performance? In: Proceedings of the HumanFactors Society 28
th
Annual Meeting. Santa Monica,California, Human Factors Society, p991.
DeGarmo, E.P., and Woods, B.M. 1953. Introduction toengineering economy. New York, Macmillan.
Faulkner, T.W. and Murphy, T.J. 1973. Lighting for difficultvisual tasks. Human Factors, 15, 149–162.
Fletcher, T.O.T. 1978. Top fruit grading and blemishdetection in artificial light. Ministry of Agriculture,Fisheries and Food (MAFF), Agricultural Development
Advisory Service (ADAS), Maidstone and WorcesterDivisional Offices, England.
Grandjean, E. 1981. Fitting the task to the man: anergonomic approach, 2
nd
edition. London, Taylor andFrancis.
Grandjean, E., Hunting, W. and Nishiyama, K. 1984.Preferred VDT workstation settings, body posture, andphysical impairments. Applied Ergonomics, 15, 99–104.
Hunter, J.H. and Yaeger, E.C. 1970. Use of a float roll tablein potato grading operations. Maine AgriculturalExperimental Station Bulletin No. 690. Maine, Ororo.
Kader, A.A. 1992. Postharvest manual. California,University of Davis.
Kukkonen, R., Luopajarvi, T. and Riihimaki, V. 1983.Prevention of fatigue amongst data entry operators. In:Kvalseth, T.O., ed., Ergonomics in workstation design.London, Butterworths.
Malcolm, D.G. and DeGarmo, E.D. 1953. Visual inspectionof products for surface characteristics in gradingoperations. United States Department of Agriculture(USDA) Marketing Research Report No. 45.Washington, DC, US Government Printing Office.
Marsden, A.M. 1964. Visibility and illumination levels.Light and Lighting, August, 234–239.
Meyers, J.B., Prussia, S.E., Thai, C.N., Sadosky, T.L. andCampbell, D.J. 1990. Visual inspection of agriculturalproducts moving along sorting conveyors. Transactionsof the American Society for Agricultural Engineers(ASAE), 33, 367–372.
Nicholas, J.V. 1985. Colour and light for the inspectiontable. Sirtec Publication No. 1. Wellington, Departmentof Scientific and Industrial Research.
Opara, U.L. 1993. A study of stem-end splitting in apples.PhD thesis, Massey University, New Zealand.
Pheasant, S.T. 1988. Bodyspace: anthropometry,ergonomics and design. London, Taylor and Francis.
Slappendel, C. and Wilson, B. 1992. Anthropometricestimates for New Zealand adults. Ergonomics NewZealand, 7(3), 5–7.
Studman, C.J. 1991. Detection of stem-end splits in red andstriped fruit. Final project report, New Zealand Apple andPear Marketing Board.
Studman, C.J. 1994. Quality in fresh fruit—meaning,measurement and maintenance. In: Proceedings ofAGENG’94, Milan, Italy, p897.
Studman, C.J. 1998. Ergonomics in apple sorting: a pilotstudy. Journal of Agricultural Engineering Research, 70,323–334.
Westgaard, R.H. and Aarus, A. 1980. Static muscle load andillness among workers during electromechanicalassembly work. Oslo, Institute of Work Physiology.
Quality assurance in agricultural produce,edited by G.I. Johnson, Le Van To, Nguyen Duy Duc and M.C. Webb.
ACIAR Proceedings 100(printed version published in 2000)
673
Investigation and Biological Control of Postharvest Diseases of Muskmelon
Wang Wei*, Tang Wenhua*, Huang Yong†
and Li Yazhen§
Abstract
An investigation was made of the postharvest diseases of muskmelon produced from fields across fourprovinces and cities of China. The pathogenic microorganisms responsible for the decay were isolated bycutting tissues from the leading edge of lesions. These were then incubated on potato dextrose agar (PDA)medium. Koch’s postulates were followed to confirm the organisms as the causal agents. Some 324 isolates offungi were obtained of which 161 were pathogenic. The pathogenic isolates were identified using standard,international taxonomic keys. It was shown that the major postharvest pathogens of muskmelon in Chinainclude
Trichothecium roseum
and various species in the genera
Fusarium, Alternaria, Rhizopus andAscochyta
. The species were
F. chlamydosporum, F. equiseti, F. semitectum, F. culmorum, F. sambucinum,F. oxysporum
Schl. f.sp.
cucumerinum
Owen,
F. moniliforme
var.
subglutinas
Wr & Peink.,
A. alternata,A. pluriseplate, R. stolonifer
(Ehrenb. Ex Fr.) Vuillemin, and
R. arrhizus
Fisher in Rabenh. The randomamplified polymorphic DNA (RAPD) technique was used to identify intra-species genetic variations in thegenus Ascochyta. The results showed that the isolates of Ascochyta cluster into three groups.
In the field, the induced systematic resistance agent benzothiadiazole (BTH) was applied to melon cropsbefore flowering, reducing the latent infection by pathogens. After harvest, the melons were treated with thebiological control agents B908, Px, and T4. These were effective in reducing the incidence of disease and inextending the shelf life of muskmelon for 2–3 weeks.
T
HE
C
HINESE
MELON
industry produces more than 6million tonnes of muskmelons every year. About 70%of the crop needs to be transported more than 1,500 kmfrom the production areas to markets. Muskmelon isproduced mainly in the north-western provinces ofInner Mongolia, Gansu and Xinjiang, with melonsthen transported to markets along the east coast, suchas in Beijing, Shanghai and Guangzhou. Postharvestmelon losses in China during transport and storage areestimated to be 35–50% (Tang et al. 1998). This isprimarily due to poor postharvest handling systemsand disease control.
Some 20 diseases have been found infecting melonafter harvest (Snowdon 1990). The main diseasesreported in melon are
Fusarium, Rhizopus
and
Alter-naria
rots. In China, there are few reports about thepostharvest diseases of melon.
Systemic induced resistance (SIR) is attractingmuch attention for minimisation of plant diseases, andhas been demonstrated in several plant families. Bioticinducers of systemic resistance in the cucurbit familyinclude locally infecting fungal pathogens. Syntheticactivators such as dichloroisonicotinic acid and benzo-thiadiazole (BTH) have been reported to stimulate SIRin cucurbits and other crop species.
Biological control of postharvest fruit diseases hasbeen extensively studied. Bacterial antagonists such as
Pseudomonas
sp. and
Bacillus
sp. have yielded verygood control of postharvest citrus diseases (Huang etal. 1991, 1992, 1993), but there are few reports relatingto melons.
* Department of Plant Pathology, China Agricultural University, Beijing, China 100094.
† Department of Crop Sciences, The University of Sydney, Sydney NSW 2006, Australia.
§ Department of Agronomy, He Tao University, Linhe, China.
Quality assurance in agricultural produce,edited by G.I. Johnson, Le Van To, Nguyen Duy Duc and M.C. Webb.
ACIAR Proceedings 100(printed version published in 2000)
674
Methods and Materials
Isolation and investigation
Collection of diseased melons
‘Hami’ and ‘Huanghe Honey’ melons: Melons weretransported to Beijing by air and train from Xinjiangand Gansu Provinces. They were held in a coolroom at5–8˚C.
‘Elizabethan’ melon: The melons were grown inprotected fields in Beijing, Hebei, Inner Mongolia andShandong Provinces. Diseased melons were collectedin the field and at the Beijing markets.
Isolation of the pathogens
Blocks of tissue of 0.2 cm
3
were cut from over-lapping parts of diseased and healthy tissues of themelons. The samples were disinfected with 5% NaClOfor 3 min, washed 3–5 times with sterilised water, thentransferred to potato dextrose agar (PDA) medium.Incubation was for 5 days at 25˚C. Microorganismswere then isolated.
Pathogenicity test
Melons of similar size and condition were surface-sterilised with 75% alcohol. Holes 6 mm in diameterand 2 mm deep were made in the skin. The isolatesfrom the PDA medium were placed into the holes, theholes sealed with rubberised tape, and the melons heldat 25˚C for 48 hours. Observations were made after 5days.
The isolates that produced areas of rot of greaterthan 15 mm diameter were considered to be pathogens.
Identification of the pathogens
The pathogens were grown on PDA medium at 25˚Cfor one week. The genera were identified on the basisof growth and morphological characteristics.
Identification of
Fusarium
species
. The pathogenic
Fusarium
isolates were cultured on PDA medium at25˚C and 30˚C for 3 days. The size and morphology ofthe colony were then recorded. Also, the
Fusarium
were grown on PDA and CLA at 25˚C and, after 10days, the conidia, conidiophores and chlamydosporeswere observed under the microscope.
Identification of
Ascochyta
species
. The randomamplified polymorphic DNA (RAPD) technique wasused to detect genetic variation in the genus
Asco-chyta
. Total
Ascochyta
and
Didymella
DNA extractionwas made by CTAB, and the DNA obtained dissolvedin TE buffer (10 M Tris HCl, pH 7.4, 1 mM EDTA)and stored at 4˚C.
Five kits made by Operon Technologies, including100 primers, were used. They were OPG, OPL, OPS,OPH, and OPJ.
Amplification reactions were performed in a totalvolume of 25 µL, containing 10 mM Tris HCl (pH8.3), 50 mM KCl, 1.5 mM MgCl
2
, 0.001% gelatin, 50mM each of dATP, dCTP, dGTP, dTTP, 15 pmol ofprimer, 25 ng of genomic DNA, and 1 µL Taqpolymerase (Promega). Negative controls, in whichthe DNA template solution was replaced by water,were performed in all experiments to check contami-nation. The amplification was performed with apolymerase chain reaction (PCR) Sprint TemperatureCycling System (Hybaid Limited, United Kingdom)programmed as follows: 1 cycle for 3 min at 94˚C, 1min at 36˚C, and 2 min at 72˚C, followed by 40 cyclesof 1 min at 94˚C,1 min at 36˚C, and 2 min at 72˚C, andextended to 10 min at 72˚C. The amplificationproducts were separated by electrophoresis in 1.4%agarose gels with ethidium bromide and photographedunder ultraviolet lights. Amplification reactions wereconducted with each primer on the DNA of the 8
Ascochyta
isolates and one
Didymella bryoniae
atleast twice and in two separate experiments.
The polymorphic bands amplified by 12 primers to
Ascochyta
isolates and
Didymella broniae
were usedfor cluster analysis by ‘Ntsys’.
Identification of
Rhizopus
species
. The
Rhizopus
isolates were held on PDA medium at 25˚C for oneweek. The morphology of the colony was thenrecorded and microscopic observations made of therhizoids, sporangiophores and zygospores.
Rhizopus
was grown at different temperatures to determine itsmaximal growth temperature.
The important characters used in the identificationof
Rhizopus
species are:• shapes of the rhizoids;• length of sporangiophores;• diameter of sporangia;• colour and diameter of zygospores;• growth habit of suspensors; and• upper limit of temperature for continued growth.
Identification of
Alternaria
species
. The
Alternaria
isolates were grown on PDA medium at 25˚C for oneweek, the colony morphology described and the mor-phology of their large conidia observed under themicroscope. The primary factor used in the identifi-cation of
Alternaria
species is the morphology of theirlarge conidia. They are catenate (formed in chains) orsolitary, typically ovoid or obclavate, often rostrate(beaked), pale brown to brown, and multi-celled, withtransverse and frequently also oblique or longitudinal
Quality assurance in agricultural produce,edited by G.I. Johnson, Le Van To, Nguyen Duy Duc and M.C. Webb.
ACIAR Proceedings 100(printed version published in 2000)
675
septa. The character of the beak, the length of conidi-ophores, and the number of transverse septa are mostimportant. The dimensions of the spore body,including the beak, are considered to be an importantcharacteristic of a given species.
Identification of
Trichothecium
species
.
Tri-chothecium
isolates were grown on PDA medium at25˚C for one week, then identified by colony mor-phology and microscopic observation of the conidia.
Biocontrol of postharvest diseases on ‘Hualaishi’ melons in China
‘Hualaishi’ melons were grown in a glasshouse andfields in Inner Mongolia Province. Each site wasarranged in three blocks. Crops in one block weresprayed with water as the control, and in other twoblocks were sprayed once at flowering with 50 mg/Lbenzo(1,2,3) thiadiazole-7-carbothioic acid S-methylester (BTH, CGA 245704) formulated as 50% a.i.BTH. One of the blocks sprayed with BTH atflowering was again sprayed with BTH at 50 mg/L 3weeks later. Melons were harvested 6 weeks afterflowering and stored at room temperature (23–28˚C).Eighty melons from each of the two field regimes weredipped in three solutions of biological control agents(
Bacillus
sp. B908,
Trichoderma
spp. T4, or
Pseu-domonas
sp. Px), three chemical fungicides (Tocdu,Fongaflon or Octae), or water for 3 minutes. Themelons were stored at room temperature for 30 days.The melons were checked every week for disease andthose in which symptoms of diseases were evidentwere discarded. The rate of commodity is the per-centage of good melons and total melons.
Results
Pathogenicity testing
The isolates were inoculated on the melons. Some324 isolates of fungi were obtained, 161 of which wereconsidered to be pathogenic.
Identification of the pathogens
Based on growth and morphological characteristics,the pathogens were identified as belonging to thefollowing genera:
Ascochyta, Fusarium, Alternaria,Rhizopus
and
Trichothecium
.
Identification of
Fusarium
species
Seven species of pathogenic
Fusarium
isolates wereidentified:
F. clamydosporum, F. equiseti, F. semi-tectum, F. oxysporum
Schl. f.sp.
cucumerinum
Owen,
F. sambucinum, F. culmorum
and
F. moniliforme
var.
subglutinans
.
F. clamydosporum
and
F. sambucinum
are new records for melon.
Identification of
Ascochyta
species
One hundred primers were used to amplify isolatesfor DNA primering. 20 primers had polymorphicbands. 12 primers had good polymorphic bands for 8
Ascochyta
isolates and a single
Didymella
strain(Table 1).
The combined data from all strains were analysedby ‘Ntsys’ to produce a dendrogram (Figure 1). Itdivided the strains into three major groups. Group 1contained isolates MF8, MF31, MF24, AS1 and D1.They came from Beijing and Inner Mongolia. Group 2contained isolates MF5, MF28 and GMF2. They camefrom Xinjiang, Gansu and Beijing. Group 3 onlycontained one isolate, MF32. It came from InnerMongolia. Groups 1 and 2 were very similar.
Identification of
Rhizopus
species
Two species of
Rhizopus
were identified:
R. stolo-nifer
(Ehrenb. Ex Fr.) Vuillemin, and
R. arrhizus
Fisher in Rabenh.
Identification of
Alternaria
species
Two
Alternaria
species were identified:
A. alternata
and
A. pluriseplate
.
Identification of
Trichothecium
species
Only one
Trichothecium
species was identified:
T. roseum.
Biological control of postharvest diseases on ‘Hualaishi’ melon
Greenhouse grown melons
Application of BTH to ‘Hualaishi’ melon foliagebefore flowering and biological control gents afterharvest yielded good disease control (Table 2). Therewas a significant increase in the rate of commodity. T4gave the best control for up to three weeks storage.Thereafter, B908 gave better control.
Field grown melons
The results of field application were similar to thosefrom the greenhouse study. B908 gave a significantcontrol effect for all storage intervals. Px also gavegood disease control (Table 3).
Quality assurance in agricultural produce,edited by G.I. Johnson, Le Van To, Nguyen Duy Duc and M.C. Webb.
ACIAR Proceedings 100(printed version published in 2000)
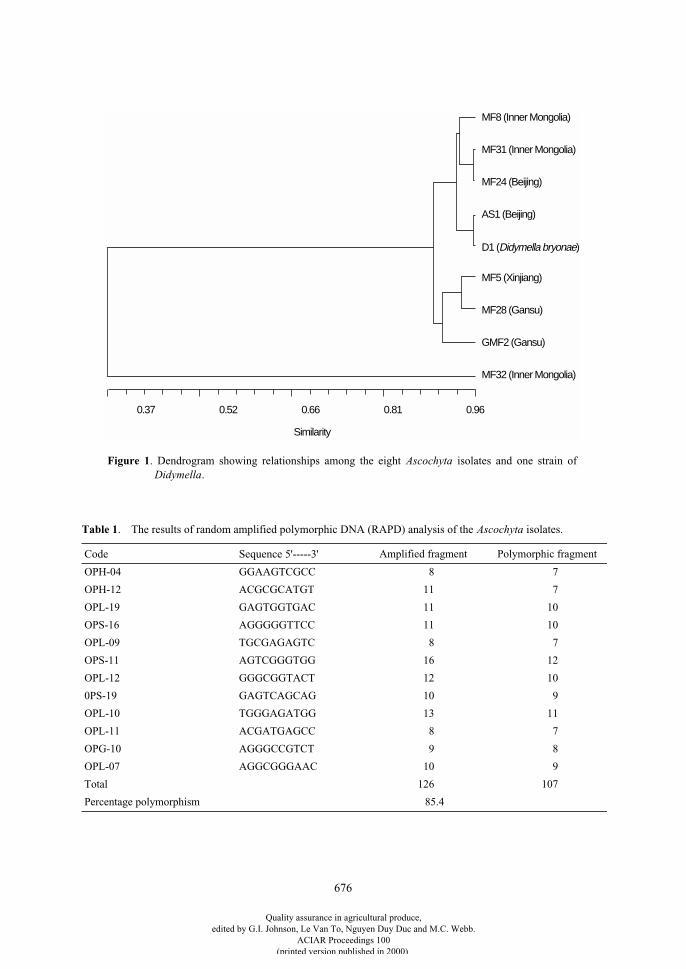
676
MF8 (Inner Mongolia)
MF31 (Inner Mongolia)
MF24 (Beijing)
AS1 (Beijing)
D1 (Didymella bryonae)
MF5 (Xinjiang)
MF28 (Gansu)
GMF2 (Gansu)
MF32 (Inner Mongolia)
0.37 0.52 0.66 0.81 0.96
Similarity
Figure 1. Dendrogram showing relationships among the eight Ascochyta isolates and one strain ofDidymella.
Table 1. The results of random amplified polymorphic DNA (RAPD) analysis of the Ascochyta isolates.
Code Sequence 5'-----3' Amplified fragment Polymorphic fragment
OPH-04 GGAAGTCGCC 8 7
OPH-12 ACGCGCATGT 11 7
OPL-19 GAGTGGTGAC 11 10
OPS-16 AGGGGGTTCC 11 10
OPL-09 TGCGAGAGTC 8 7
OPS-11 AGTCGGGTGG 16 12
OPL-12 GGGCGGTACT 12 10
0PS-19 GAGTCAGCAG 10 9
OPL-10 TGGGAGATGG 13 11
OPL-11 ACGATGAGCC 8 7
OPG-10 AGGGCCGTCT 9 8
OPL-07 AGGCGGGAAC 10 9
Total 126 107
Percentage polymorphism 85.4
Quality assurance in agricultural produce,edited by G.I. Johnson, Le Van To, Nguyen Duy Duc and M.C. Webb.
ACIAR Proceedings 100(printed version published in 2000)
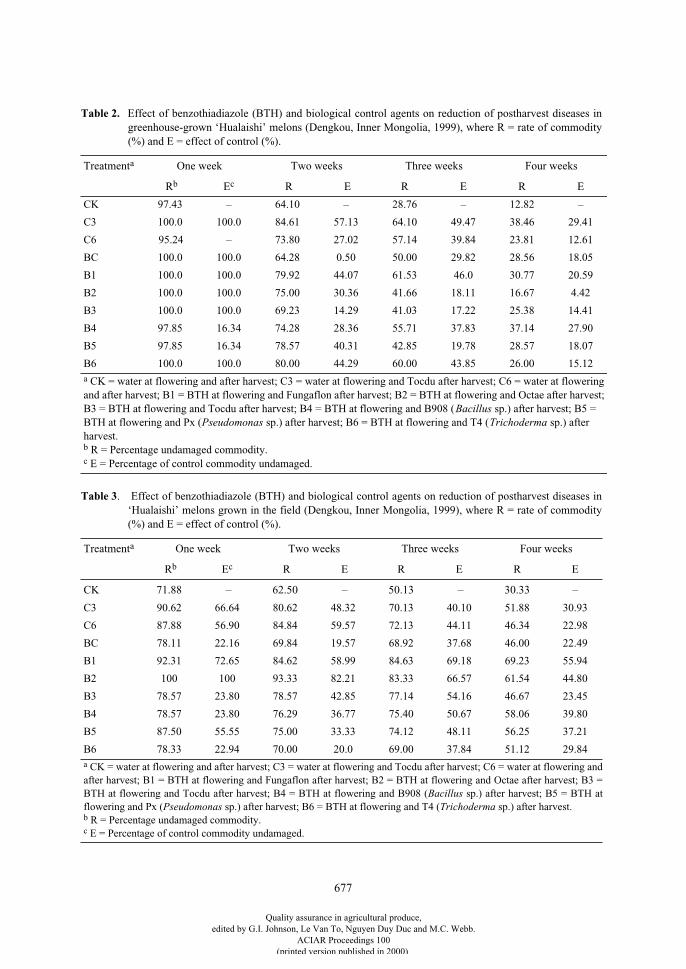
677
Table 2. Effect of benzothiadiazole (BTH) and biological control agents on reduction of postharvest diseases ingreenhouse-grown ‘Hualaishi’ melons (Dengkou, Inner Mongolia, 1999), where R = rate of commodity(%) and E = effect of control (%).
Treatmenta One week Two weeks Three weeks Four weeks
Rb Ec R E R E R E
CK 97.43 – 64.10 – 28.76 – 12.82 –
C3 100.0 100.0 84.61 57.13 64.10 49.47 38.46 29.41
C6 95.24 – 73.80 27.02 57.14 39.84 23.81 12.61
BC 100.0 100.0 64.28 0.50 50.00 29.82 28.56 18.05
B1 100.0 100.0 79.92 44.07 61.53 46.0 30.77 20.59
B2 100.0 100.0 75.00 30.36 41.66 18.11 16.67 4.42
B3 100.0 100.0 69.23 14.29 41.03 17.22 25.38 14.41
B4 97.85 16.34 74.28 28.36 55.71 37.83 37.14 27.90
B5 97.85 16.34 78.57 40.31 42.85 19.78 28.57 18.07
B6 100.0 100.0 80.00 44.29 60.00 43.85 26.00 15.12a CK = water at flowering and after harvest; C3 = water at flowering and Tocdu after harvest; C6 = water at flowering and after harvest; B1 = BTH at flowering and Fungaflon after harvest; B2 = BTH at flowering and Octae after harvest; B3 = BTH at flowering and Tocdu after harvest; B4 = BTH at flowering and B908 (Bacillus sp.) after harvest; B5 = BTH at flowering and Px (Pseudomonas sp.) after harvest; B6 = BTH at flowering and T4 (Trichoderma sp.) after harvest.b R = Percentage undamaged commodity.c E = Percentage of control commodity undamaged.
Table 3. Effect of benzothiadiazole (BTH) and biological control agents on reduction of postharvest diseases in‘Hualaishi’ melons grown in the field (Dengkou, Inner Mongolia, 1999), where R = rate of commodity(%) and E = effect of control (%).
Treatmenta One week Two weeks Three weeks Four weeks
Rb Ec R E R E R E
CK 71.88 – 62.50 – 50.13 – 30.33 –
C3 90.62 66.64 80.62 48.32 70.13 40.10 51.88 30.93
C6 87.88 56.90 84.84 59.57 72.13 44.11 46.34 22.98
BC 78.11 22.16 69.84 19.57 68.92 37.68 46.00 22.49
B1 92.31 72.65 84.62 58.99 84.63 69.18 69.23 55.94
B2 100 100 93.33 82.21 83.33 66.57 61.54 44.80
B3 78.57 23.80 78.57 42.85 77.14 54.16 46.67 23.45
B4 78.57 23.80 76.29 36.77 75.40 50.67 58.06 39.80
B5 87.50 55.55 75.00 33.33 74.12 48.11 56.25 37.21
B6 78.33 22.94 70.00 20.0 69.00 37.84 51.12 29.84a CK = water at flowering and after harvest; C3 = water at flowering and Tocdu after harvest; C6 = water at flowering andafter harvest; B1 = BTH at flowering and Fungaflon after harvest; B2 = BTH at flowering and Octae after harvest; B3 =BTH at flowering and Tocdu after harvest; B4 = BTH at flowering and B908 (Bacillus sp.) after harvest; B5 = BTH atflowering and Px (Pseudomonas sp.) after harvest; B6 = BTH at flowering and T4 (Trichoderma sp.) after harvest.b R = Percentage undamaged commodity.c E = Percentage of control commodity undamaged.
Quality assurance in agricultural produce,edited by G.I. Johnson, Le Van To, Nguyen Duy Duc and M.C. Webb.
ACIAR Proceedings 100(printed version published in 2000)
678
Discussion and Conclusion
Postharvest diseases in melon production are veryserious in China. We found that postharvest diseases inmelon include Fusarium, Alternaria, Rhizopus, Tri-chothecium and Asochyta rots. The kinds of diseasespresent varied between different areas of production.Fusarium and Rhizopus rots had the highest incidencein all areas. Trichothecium rot was more prevalentunder greenhouse than field conditions. The occur-rence of F. clamydosporum and F. sambucinum werenew reports for melon.
In our experiment, the random amplified poly-morphic DNA (RAPD) technique was used todetermine the intra-specific or interspecific relation-ships, and to assess genetic diversity among eightisolates of Ascochyta from different origins. Theresults showed that this method yielded DNA finger-prints useful for species’ characterisation. We wereable to differentiate the isolates into three main groupsdirectly related to their geographic origin. Groups 1and 2 were very similar, and closely related toDidymella bryonae. They may be one species. Group3, however, might represent another species.
BTH and biological control agents were moreeffective when used together for control of postharvest
disease in melon. Bacillus sp. B908 and Trichodermaspp. T4 were most efficacious against Rhizopus rot,and Pseudomonas sp. Px against Alternaria rot. All thebiological control agents showed similar effects to thechemical fungicides.
References
Huang, Y., Deverall, B.J. and Morris, S.C. 1991. Promotionof Penicillium digitatum infection of orange fruit by astrain of Pseudomonas capacia. Phytopathology, 81,615–618.
— 1992. Postharvest biological control of Penicilliumdigitatum decay on citrus fruit by Bacillus pumilus.Annals of Applied Biology, 120, 367–372.
— 1993. Effect of Pseudomonas capacia on postharvestbiocontrol of infection by Penicillium digitatum and onwound responses of citrus fruit. Australasian PlantPathology, 22, 84–93.
Snowdon, A.L. 1990. A colour atlas of postharvest diseasesand disorders of fruits and vegetables. Volume 1. Generalintroduction and fruits. London, Wolfe Scientific, 302p.
Tang Wenhua, Chen, C., Wang, W. and Huang, Y. 1998.Investigation and biological control of postharvestdiseases on melon. Chinese Journal of Microecology, 10,65–67.
Quality assurance in agricultural produce,edited by G.I. Johnson, Le Van To, Nguyen Duy Duc and M.C. Webb.
ACIAR Proceedings 100(printed version published in 2000)
679
Biotechnology for Improvement of ‘Mas’ (Musa AA) Bananas
H. Nair, S. Chandran, N. Khalid, S.N. Mohd Aris and I.D. Wilson*
Abstract
Bananas and plantains (
Musa
spp.) economically rank fourth in the world as a food source and form a staplediet for more than 400 million people. Commercially, more than 95% of the banana fruit sold worldwide areof one variety, ‘Cavendish’ (AAA). However, this variety is becoming increasingly susceptible to devastatingdiseases and there is an urgent need to look for new banana clones. Two major areas for banana improvementhave been targeted by biotechnology companies, namely pathogen resistance and increased quality and/orprocessing value in the fruit. Development of molecular techniques, especially the ability to introduce novelgenes through genetic transformation, has allowed research to focus in these areas. In the current climate ofpublic wariness of genetically engineered foods, increasing the intrinsic value of bananas also favours their useas a ‘bio-factory’ for the production of tertiary products that are not necessarily directly eaten.
We have isolated a gene from a local diploid banana (‘Mas’, AA group) that encompasses many of the aboveconsiderations. This gene encodes a fruit-specific 31 kDa class III acidic chitinase, the most abundant proteinin developing banana fruit. Chitinases have been widely implicated in resistance to fungal diseases. Thus,ectopic over-production of this protein may confer wider resistance of bananas to fungi. The protein alsopossesses highly conserved signature sequences for a cGMP-binding-protein associated N-terminal transit orsignal peptide and an inner membrane attachment site. Such signature sequences are useful in directingdifferent proteins to specific compartments within the cell in order to specifically alter their biochemistry or toredirect synthesis towards desired tertiary products. In depth knowledge of its in vivo function and regulationcould show whether the system might be put to use to artificially introduce proteins to specific parts of bananafruit cells.
B
ANANAS
AND
plantains (
Musa
spp.) economicallyrank fourth in the world as a food source and form astaple diet for more than 400 million people. Thus,there is significant scope for Southeast Asia to developa lucrative and exportable banana market based onimproved varieties and processed food products. Pre-viously, direct improvement of this crop has beenseriously hindered by the inability to breed viaclassical methods; commercial bananas are sterile andare normally propagated from suckers or by tissueculture. However, in recent years the development ofmolecular-genetic biotechnology techniques, espe-cially the ability to introduce novel genes throughgenetic transformation, has allowed research to focus
on improving the qualitative traits of this species. Twomajor areas for improvement have been targeted bybiotechnology companies, namely pathogenresistance in the crop and increased quality/processingability in ripening fruit—the rationale being increasedproductivity through reduced losses and an increasedmarket share of a qualitatively improved product. Boththe fresh fruit dessert market and the processed foodsmarket have been targeted as areas whereimprovement of fruit quality traits would be bene-ficial. The use of the banana as a ‘bio-factory’ is alsounder serious consideration as is the development ofan oral delivery system for antibodies to combatdisease in developing countries.
Commercially, more than 95% of the banana fruitsold worldwide are of one variety, ‘Cavendish’(AAA). Alone, this disease-susceptible variety doesnot offer sufficient or appropriately coordinated
* Agrobiotechnology Division, Institute of Biological Sciences, University of Malaya, 50603 Kuala Lumpur, Malaysia.
Quality assurance in agricultural produce,edited by G.I. Johnson, Le Van To, Nguyen Duy Duc and M.C. Webb.
ACIAR Proceedings 100(printed version published in 2000)
680
genetic diversity from which to sample genes for thedesired improvement. Southeast Asia has some 70additional varieties of bananas including both the AAand BB wild type ancestors. It is this genetic diversitywhich promises to be an important genetic resourcefrom which to sample for the improvement of thebanana crop as a whole. Here we present bothimmediate and long-term technological approachesthat may add to the improvement of bananas in theAssociation of South-East Nations (ASEAN) region.These include the selection of more disease-resistantvarieties, exploitation of the cooking banana varietiesin processing, technology for fruit storage, and the useof molecular biotechnology for added crop value.
Materials and Methods
Plant material
All the experiments detailed were performed withfruit of
Musa acuminata
‘Mas’ (AA) banana, a diploidPan ASEAN variety characterised by the goldenyellow colour attained by the small fruit at the fullyripe stage.
Vacuum-packed storage and protein profiling
The approaches used for storing ‘Mas’ banana fruitwere as described earlier (Nair and Tung 1992) and theprotocols for protein extraction and analysis aredetailed in Nair et al. (1996) as well as Chandran et al.(2000). N-terminal sequencing of the gel-purified 31kDa polypeptide was performed by Dr Maxcy Chungat the Biotechnological Processing Centre (BTC),National University of Singapore, Singapore.
Extraction of RNA from banana pulp and RT-PCR cloning of the 31 kDa protein
Total ribonucleic acid (RNA) was extracted fromdifferent stages of developing and ripening bananafruit pulp tissue using the method of Liu et al. (1998).Reverse transcriptase-polymerase chain reaction (RT-PCR) was performed using the Access RT-PCRsystem (Promega) with total RNA extracted frommature, unripe banana fruit pulp tissue using theprimers 5'-CGGCGCAGCTCATGCATTGGC-3' and5'-TTTTTTTTTTTTTTTTTTG-3' and following themanufacturer’s protocol. The resulting PCR products
were cloned into the plasmid pCRScript SK+ (Strat-agene) following the manufacturer’s instructions andstandard approaches (Sambrook et al. 1989).Automated sequencing of cloned PCR products wasperformed by the DNA Sequencing Research Service,University of Durham, United Kingdom. Sequenceanalysis was conducted online using various computa-tional analysis programs, as detailed in the results.
Tissue culture of ‘Mas’ bananas
‘Mas’ banana plants were entered into tissue cultureusing modifications of methods and approachesdescribed previously (Dhed’a et al. 1991; Panis et al.1993; Schoofs 1997) to obtain in vitro plant regener-ation via shoot tip culture and scalps.
Results
Vacuum-packed storage and protein profiles of ‘Mas’ banana fruit
The physiological effects of the vacuum-packedstorage of ‘Mas’ bananas have been reported previ-ously (Nair and Tung 1992). Essentially, mature fruit,hermetically sealed in polyethylene bags under avacuum not exceeding 300 mm Hg, could be stored at17°C for realistic periods of up to 8 weeks. Duringstorage, high CO
2
(10–15% v/v) and low O
2
(3–5% v/v) levels were attained within hours, repressingpotential ripening-associated ethylene synthesis. Thefruit lost negligible weight and remained green duringstorage. On release to ambient conditions in air thefruit ripened normally to a quality similar to that ofripened, non-stored fruit.
The developmental protein profiles of mature,vacuum-packed stored and ripening ‘Mas’ bananashave been reported previously (Chandran et al. 2000).After sodium dodecyl sulfate–polyacrylamide gelelectrophoresis (SDS-PAGE) and Coomassie Bluestaining, 22 polypeptides were obvious. Seven of thesepolypeptides increased in apparent abundance duringthe ripening of non-stored fruit while seven otherswere observed to decrease. The eight remaining didnot show any changes and remained constantthroughout ripening. The most dramatic change wasobserved in a 31 kDa polypeptide which appearedhighly abundant in extracts from mature fruit and wassignificantly reduced in ripe fruit. During three weeksof vacuum-packed storage at 17°C there was littlechange in the obvious protein profiles. However, the
Quality assurance in agricultural produce,edited by G.I. Johnson, Le Van To, Nguyen Duy Duc and M.C. Webb.
ACIAR Proceedings 100(printed version published in 2000)
681
abundance of the 31 kDa polypeptide decreased sig-nificantly during the storage period. On ripening, afterrelease from storage, the profiles attained were similarto those of non-stored, ripened fruit, although the 31kDa polypeptide was further reduced in abundance.
Tissue culture of ‘Mas’ (AA) bananas
In preparation for genetic transformation experi-ments, sterile, tissue-cultured ‘Mas’ (AA) bananaplants were established and cell suspension cultures ofthis variety obtained (Figure 1). A complete regener-ation protocol is now available.
31 kDa protein in developingbanana fruit
SDS–PAGE analysis of proteins isolated from devel-oping, mature and ripening ‘Mas’ banana fruitidentified a protein of approximately 31 kDa as one ofthe most abundant protein constituents of this organ.The protein predominantly accumulates in unripe fruitand declines significantly during ripening and duringthe vacuum-packed storage of mature fruit (Figure 2).Isolation of the protein from one-dimensional polyacr-ylamide gels and its transfer to PVDF membranesallowed N-terminal micro-sequencing to be performed.Blast homology searches predicted the N-terminalsequence of the extracted protein to be contained withinthat of the predicted amino acid sequence of a previ-ously reported banana cDNA (Clendennen et al. 1998)encoding a family 18 class III acidic chitinase. Reversetranscribed PCR using the primers indicated in Figure 3and total RNA extracted from mature ‘Mas’ bananafruit yielded a single DNA fragment which, whencloned and sequenced, was found to be identical to thepreviously reported chitinase sequence. Significantly,the N-terminal sequence of the protein purified from‘Mas’ banana fruit commences at amino acid residue 26of the predicted protein. Analysis of the proteinsequence using SignalP (Nielsen et al. 1997), acomputer program to detect signal peptides and theirpossible cleavage sites within proteins, indicated thatthe N-terminal 25 amino acids of the predictedpolypeptide comprised a signal peptide that wasprobably cleaved between amino acid residues A
25
andR
26
(95% certainty). This probable 25 amino acid signalsequence also contained a similar signature sequence(92% similarity) to that for the G-protein binding sitefound in the rhodopsin-like G-protein coupledreceptors. Further analysis of the chitinase sequencerevealed some other significant features. In addition to
the conserved chitinase active site residues betweenL
148
to N
154
with the conserved E
161
, comparison of thesequence against the Prosite and Pfam databases ofhighly conserved protein motifs and patterns using theprogram Pfscan, revealed the presence of a cGMPbinding site between amino acids A
13
to S
29
(100%identity) and predicted that R
26
R
27
S
28
S
29
is a motiftargeted by a cGMP-dependent kinase with either theS
28
or
S
29
being the phosphorylated residue (Fremiscoet al. 1980; Glass and Smith 1983; Glass et al. 1986).Such analysis also revealed a signature sequence (con-sensus sequence [LIVMFY] -
×
(8) - [EQR] - [STAGV]- [STAG] -
×
(3) - G - [LIVMFYSTAC] -
×
(5) -[LIVMFYSTA] - [PA] -
×
(4) - [LIVMFY] - [PKR])found in protein binding-dependent inner membranetransport proteins (96.7% similarity) between residuesL
245
and P
273
. Thus, one of the most abundant proteinsin developing banana fruit is predicted to be synthesisedas a pre-protein with Mr 35,298 and to be a G-proteinbinding-dependent targeted, membrane-associated,phosphorylated chitinase with a post-processing Mr of32,610.
Discussion
Developing a banana export market for the ASEANregion offers significant economic opportunities, butneeds a coordinated approach in order to realise thepotential benefits. The region holds much of thegenetic diversity with which to gain an improvedmarket share and from which improvements toexisting varieties can be made. Increasing the land areain production of local, more disease-resistant varieties,the application of storage and transport technologiesfor maintaining qualitative improvement, and appro-priate marketing are the first of many steps that can betaken to develop the banana market. However, devel-oping a sustainable market share inevitably requiresthat significant, patentable, added value is attached tothe crop. This added value may be achieved throughprocessing to produce higher-value end products.Currently this approach is utilised on a small scale forthe production of processed banana food productsfrom some high-starch cooking varieties. However,most of this processed produce is consumed locally.
Alternatively, significant improvements can bemade to the qualitative aspects of the fresh fruit.Increasing the spectrum of carotenoids found in theripe fruit is an obvious example of a commerciallydesired trait. Current medical opinion is thatincreasing the antioxidant properties of foods may bebeneficial in reducing carcinomas and heart disease.
Quality assurance in agricultural produce,edited by G.I. Johnson, Le Van To, Nguyen Duy Duc and M.C. Webb.
ACIAR Proceedings 100(printed version published in 2000)
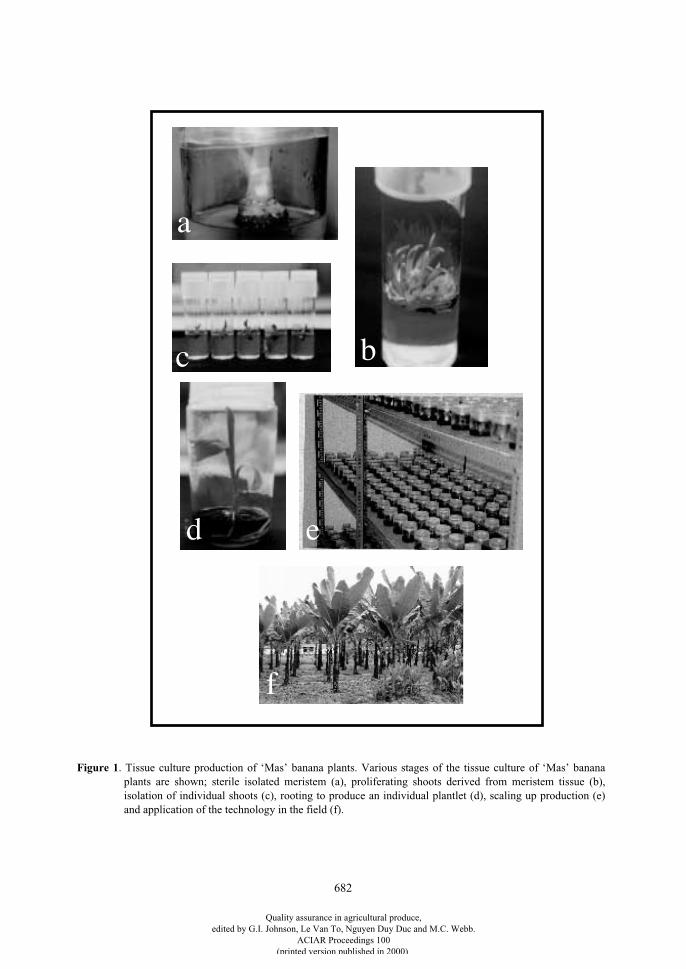
682
Figure 1
. Tissue culture production of ‘Mas’ banana plants. Various stages of the tissue culture of ‘Mas’ bananaplants are shown; sterile isolated meristem (a), proliferating shoots derived from meristem tissue (b),isolation of individual shoots (c), rooting to produce an individual plantlet (d), scaling up production (e)and application of the technology in the field (f).
a
bc
d e
f
Quality assurance in agricultural produce,edited by G.I. Johnson, Le Van To, Nguyen Duy Duc and M.C. Webb.
ACIAR Proceedings 100(printed version published in 2000)
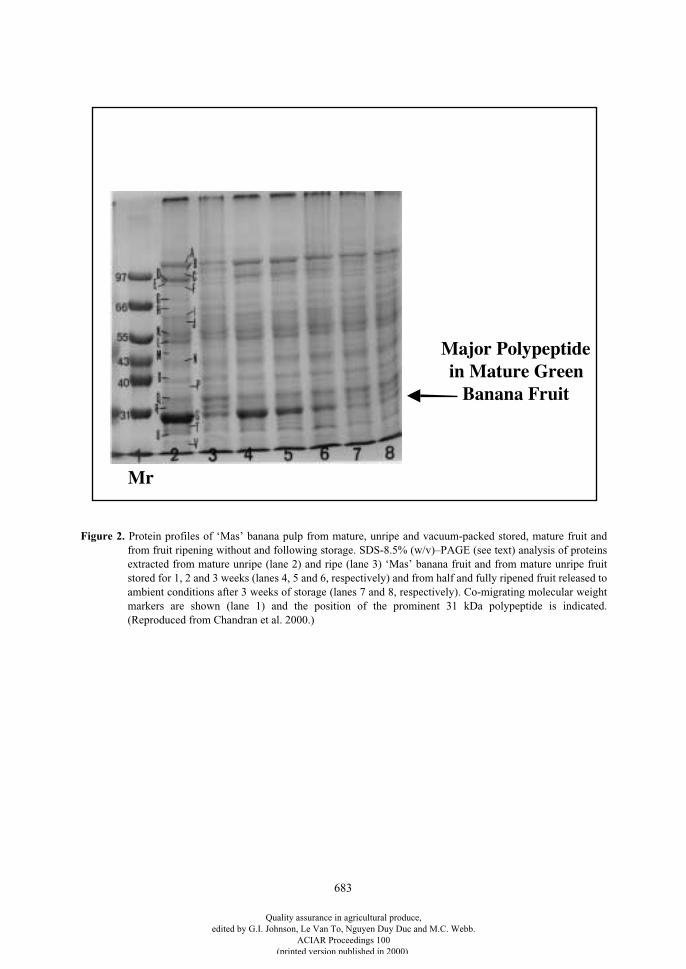
683
Figure 2.
Protein profiles of ‘Mas’ banana pulp from mature, unripe and vacuum-packed stored, mature fruit andfrom fruit ripening without and following storage. SDS-8.5% (w/v)–PAGE (see text) analysis of proteinsextracted from mature unripe (lane 2) and ripe (lane 3) ‘Mas’ banana fruit and from mature unripe fruitstored for 1, 2 and 3 weeks (lanes 4, 5 and 6, respectively) and from half and fully ripened fruit released toambient conditions after 3 weeks of storage (lanes 7 and 8, respectively). Co-migrating molecular weightmarkers are shown (lane 1) and the position of the prominent 31 kDa polypeptide is indicated.(Reproduced from Chandran et al. 2000.)
Mr
Major Polypeptidein Mature Green
Banana Fruit
Quality assurance in agricultural produce,edited by G.I. Johnson, Le Van To, Nguyen Duy Duc and M.C. Webb.
ACIAR Proceedings 100(printed version published in 2000)
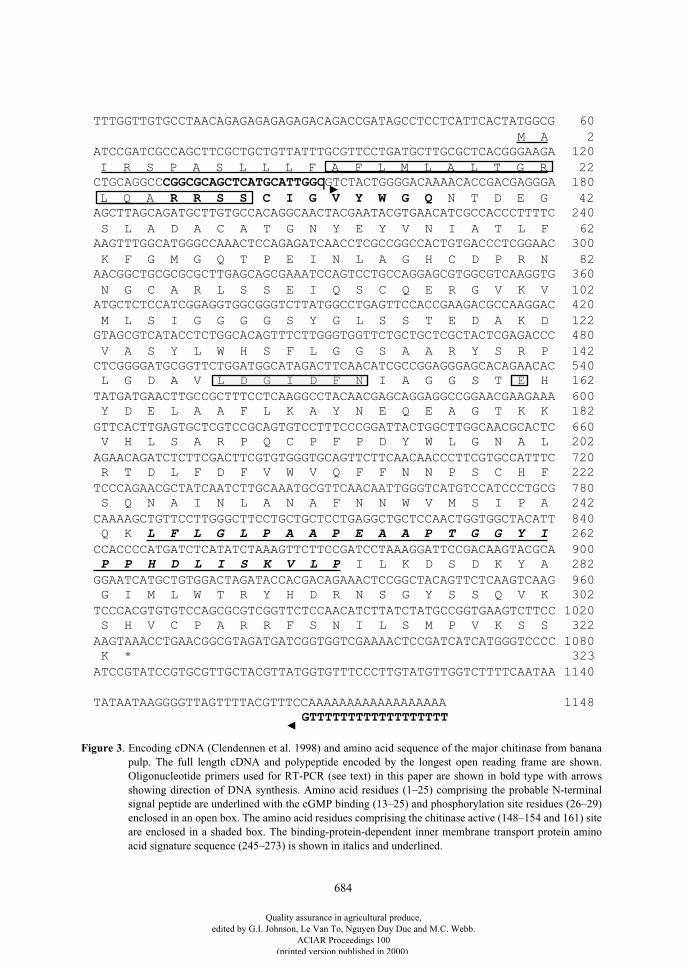
684
TTTGGTTGTGCCTAACAGAGAGAGAGAGACAGACCGATAGCCTCCTCATTCACTATGGCG 60
M A 2
ATCCGATCGCCAGCTTCGCTGCTGTTATTTGCGTTCCTGATGCTTGCGCTCACGGGAAGA 120
I R S P A S L L L F A F L M L A L T G R 22
CTGCAGGCCCGGCGCAGCTCATGCATTGGCGTCTACTGGGGACAAAACACCGACGAGGGA 180
L Q A R R S S C I G V Y W G Q N T D E G 42
AGCTTAGCAGATGCTTGTGCCACAGGCAACTACGAATACGTGAACATCGCCACCCTTTTC 240
S L A D A C A T G N Y E Y V N I A T L F 62
AAGTTTGGCATGGGCCAAACTCCAGAGATCAACCTCGCCGGCCACTGTGACCCTCGGAAC 300
K F G M G Q T P E I N L A G H C D P R N 82
AACGGCTGCGCGCGCTTGAGCAGCGAAATCCAGTCCTGCCAGGAGCGTGGCGTCAAGGTG 360
N G C A R L S S E I Q S C Q E R G V K V 102
ATGCTCTCCATCGGAGGTGGCGGGTCTTATGGCCTGAGTTCCACCGAAGACGCCAAGGAC 420
M L S I G G G G S Y G L S S T E D A K D 122
GTAGCGTCATACCTCTGGCACAGTTTCTTGGGTGGTTCTGCTGCTCGCTACTCGAGACCC 480
V A S Y L W H S F L G G S A A R Y S R P 142
CTCGGGGATGCGGTTCTGGATGGCATAGACTTCAACATCGCCGGAGGGAGCACAGAACAC 540
L G D A V L D G I D F N I A G G S T E H 162
TATGATGAACTTGCCGCTTTCCTCAAGGCCTACAACGAGCAGGAGGCCGGAACGAAGAAA 600
Y D E L A A F L K A Y N E Q E A G T K K 182
GTTCACTTGAGTGCTCGTCCGCAGTGTCCTTTCCCGGATTACTGGCTTGGCAACGCACTC 660
V H L S A R P Q C P F P D Y W L G N A L 202
AGAACAGATCTCTTCGACTTCGTGTGGGTGCAGTTCTTCAACAACCCTTCGTGCCATTTC 720
R T D L F D F V W V Q F F N N P S C H F 222
TCCCAGAACGCTATCAATCTTGCAAATGCGTTCAACAATTGGGTCATGTCCATCCCTGCG 780
S Q N A I N L A N A F N N W V M S I P A 242
CAAAAGCTGTTCCTTGGGCTTCCTGCTGCTCCTGAGGCTGCTCCAACTGGTGGCTACATT 840
Q K L F L G L P A A P E A A P T G G Y I 262
CCACCCCATGATCTCATATCTAAAGTTCTTCCGATCCTAAAGGATTCCGACAAGTACGCA 900
P P H D L I S K V L P I L K D S D K Y A 282
GGAATCATGCTGTGGACTAGATACCACGACAGAAACTCCGGCTACAGTTCTCAAGTCAAG 960
G I M L W T R Y H D R N S G Y S S Q V K 302
TCCCACGTGTGTCCAGCGCGTCGGTTCTCCAACATCTTATCTATGCCGGTGAAGTCTTCC 1020
S H V C P A R R F S N I L S M P V K S S 322
AAGTAAACCTGAACGGCGTAGATGATCGGTGGTCGAAAACTCCGATCATCATGGGTCCCC 1080
K * 323
ATCCGTATCCGTGCGTTGCTACGTTATGGTGTTTCCCTTGTATGTTGGTCTTTTCAATAA 1140
TATAATAAGGGGTTAGTTTTACGTTTCCAAAAAAAAAAAAAAAAAA 1148
GTTTTTTTTTTTTTTTTTT
Figure 3
. Encoding cDNA (Clendennen et al. 1998) and amino acid sequence of the major chitinase from bananapulp. The full length cDNA and polypeptide encoded by the longest open reading frame are shown.Oligonucleotide primers used for RT-PCR (see text) in this paper are shown in bold type with arrowsshowing direction of DNA synthesis. Amino acid residues (1–25) comprising the probable N-terminalsignal peptide are underlined with the cGMP binding (13–25) and phosphorylation site residues (26–29)enclosed in an open box. The amino acid residues comprising the chitinase active (148–154 and 161) siteare enclosed in a shaded box. The binding-protein-dependent inner membrane transport protein aminoacid signature sequence (245–273) is shown in italics and underlined.
Quality assurance in agricultural produce,edited by G.I. Johnson, Le Van To, Nguyen Duy Duc and M.C. Webb.
ACIAR Proceedings 100(printed version published in 2000)
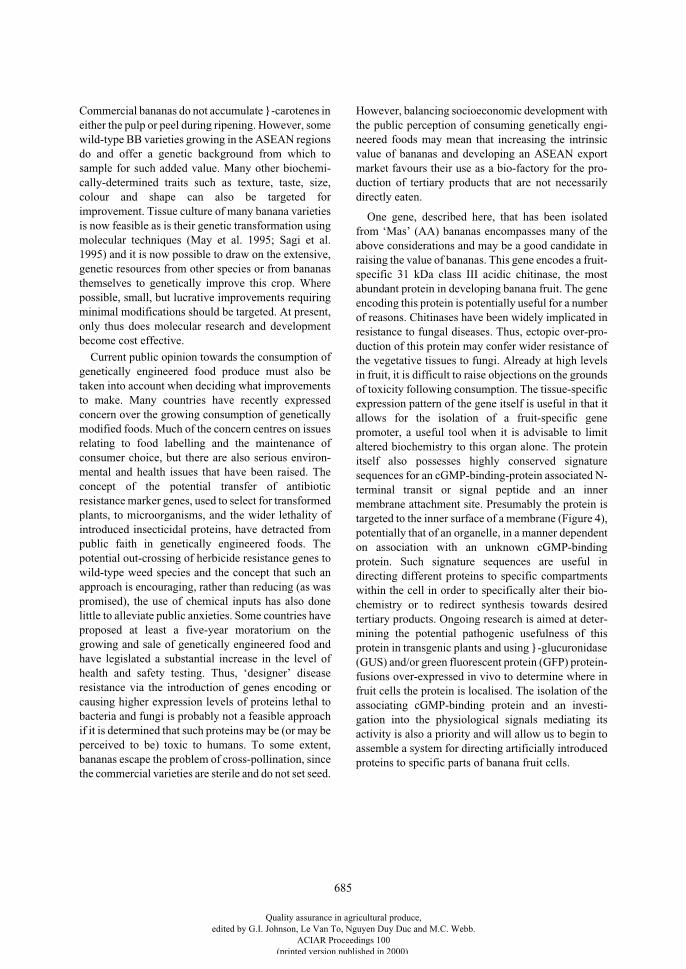
685
Commercial bananas do not accumulate
}
-carotenes ineither the pulp or peel during ripening. However, somewild-type BB varieties growing in the ASEAN regionsdo and offer a genetic background from which tosample for such added value. Many other biochemi-cally-determined traits such as texture, taste, size,colour and shape can also be targeted forimprovement. Tissue culture of many banana varietiesis now feasible as is their genetic transformation usingmolecular techniques (May et al. 1995; Sagi et al.1995) and it is now possible to draw on the extensive,genetic resources from other species or from bananasthemselves to genetically improve this crop. Wherepossible, small, but lucrative improvements requiringminimal modifications should be targeted. At present,only thus does molecular research and developmentbecome cost effective.
Current public opinion towards the consumption ofgenetically engineered food produce must also betaken into account when deciding what improvementsto make. Many countries have recently expressedconcern over the growing consumption of geneticallymodified foods. Much of the concern centres on issuesrelating to food labelling and the maintenance ofconsumer choice, but there are also serious environ-mental and health issues that have been raised. Theconcept of the potential transfer of antibioticresistance marker genes, used to select for transformedplants, to microorganisms, and the wider lethality ofintroduced insecticidal proteins, have detracted frompublic faith in genetically engineered foods. Thepotential out-crossing of herbicide resistance genes towild-type weed species and the concept that such anapproach is encouraging, rather than reducing (as waspromised), the use of chemical inputs has also donelittle to alleviate public anxieties. Some countries haveproposed at least a five-year moratorium on thegrowing and sale of genetically engineered food andhave legislated a substantial increase in the level ofhealth and safety testing. Thus, ‘designer’ diseaseresistance via the introduction of genes encoding orcausing higher expression levels of proteins lethal tobacteria and fungi is probably not a feasible approachif it is determined that such proteins may be (or may beperceived to be) toxic to humans. To some extent,bananas escape the problem of cross-pollination, sincethe commercial varieties are sterile and do not set seed.
However, balancing socioeconomic development withthe public perception of consuming genetically engi-neered foods may mean that increasing the intrinsicvalue of bananas and developing an ASEAN exportmarket favours their use as a bio-factory for the pro-duction of tertiary products that are not necessarilydirectly eaten.
One gene, described here, that has been isolatedfrom ‘Mas’ (AA) bananas encompasses many of theabove considerations and may be a good candidate inraising the value of bananas. This gene encodes a fruit-specific 31 kDa class III acidic chitinase, the mostabundant protein in developing banana fruit. The geneencoding this protein is potentially useful for a numberof reasons. Chitinases have been widely implicated inresistance to fungal diseases. Thus, ectopic over-pro-duction of this protein may confer wider resistance ofthe vegetative tissues to fungi. Already at high levelsin fruit, it is difficult to raise objections on the groundsof toxicity following consumption. The tissue-specificexpression pattern of the gene itself is useful in that itallows for the isolation of a fruit-specific genepromoter, a useful tool when it is advisable to limitaltered biochemistry to this organ alone. The proteinitself also possesses highly conserved signaturesequences for an cGMP-binding-protein associated N-terminal transit or signal peptide and an innermembrane attachment site. Presumably the protein istargeted to the inner surface of a membrane (Figure 4),potentially that of an organelle, in a manner dependenton association with an unknown cGMP-bindingprotein. Such signature sequences are useful indirecting different proteins to specific compartmentswithin the cell in order to specifically alter their bio-chemistry or to redirect synthesis towards desiredtertiary products. Ongoing research is aimed at deter-mining the potential pathogenic usefulness of thisprotein in transgenic plants and using
}
-glucuronidase(GUS) and/or green fluorescent protein (GFP) protein-fusions over-expressed in vivo to determine where infruit cells the protein is localised. The isolation of theassociating cGMP-binding protein and an investi-gation into the physiological signals mediating itsactivity is also a priority and will allow us to begin toassemble a system for directing artificially introducedproteins to specific parts of banana fruit cells.
Quality assurance in agricultural produce,edited by G.I. Johnson, Le Van To, Nguyen Duy Duc and M.C. Webb.
ACIAR Proceedings 100(printed version published in 2000)
686
Figure 4
. Proposed scheme for membrane targeting of the 31 kDa chitinase from ‘Mas’ banana fruit. Thechitinase pre-protein probably associates with a G-protein which facilitates transport to a specificmembrane (A). The association is likely to be dependent on binding of cGMP andphosphorylation. Upon reaching the membrane the G-protein dissociates as the pre-proteincrosses the membrane (B). On reaching the inner surface the pre-protein is processed by removalof the N-terminal signal peptide to yield the mature protein which probably couples with otherproteins via the binding protein dependent signature sequence contained therein (C).
Transport to inner surface
Target membrane
Protein
cGMP
cGMP
(A)
(B)
(C)
PiPi
PiPi
GTP
GTP
Disassociation of
cGMP binding
protein
Association with other
2HN
Cleavage of signal
peptide
2HN
membrane proteins via
BPD signature sequence
COOH
Membrane
COOH
of membrane
2HN
Acknowledgments
This work was funded by the Government ofMalaysia IRPA Grant No. 01/02/03/0080 awarded toHN and her group.
References
Chandran S., Harikrishnan, J.A., Ong, E.K. and Nair, H.2000. Changes in protein profiles and starch break-downduring ripening and storage of vacuum-packed bananas.Transactions of the Malaysian Society of PlantPhysiology, volume 7 (in press).
Clenennen, S.K., Lopez-Gomez, R., Gomez-Lim, M.,Artnzen, C.J. and May, G.D. 1998. The abundant 31-kilodalton banana pulp protein is homologous to class-IIIacidic chitinases. Phytochemistry, 47, 613–619.
Dhed’a, D., Dumortier, F., Panis, B., Vuylsteke, D. and DeLanghe, E. 1991. Plant regeneration in cell suspensioncultures of the cooking banana cv. ‘Bluggoe’ (
Musa
spp.ABB group). Fruits, 46, 125–135.
Fremisco, J.R., Glass, D.B. and Krebs, E.G. 1980. Optimalspatial requirements for the location of basic residues inpeptide substrates for the cyclic AMP-dependent proteinkinase. Journal of Biological Chemistry, 255,4240–4245.
Quality assurance in agricultural produce,edited by G.I. Johnson, Le Van To, Nguyen Duy Duc and M.C. Webb.
ACIAR Proceedings 100(printed version published in 2000)
687
Glass, D.B. and Smith, S.B. 1983. Phosphorylation by cyclicGMP-dependent protein kinase of a synthetic peptidecorresponding to the autophosphorylation site in theenzyme. Journal of Biological Chemistry 258,14797–14803.
Glass D.B., El-Maghrabi, M.R. and Pilkis, S.J. 1986.Synthetic peptides corresponding to the sitephosphorylated in 6-phosphofructo-2-kinase/fructose-2,6-bisphosphatase as substrates of cyclic nucleotide-dependent protein kinases. Journal of BiologicalChemistry, 261, 2987–2993.
Liu, J.-J., Goh, C.-J., Loh, C.-S., Liu, P. and Pua, E.-C. 1998.A method for isolation of total RNA from fruit tissues ofbanana. Plant Molecular Biology Reports, 00, 1–6.
May, G.D., Afza, R., Mason, H.S., Wiecko, A., Novak, F.J.and Arntzen, C.J. 1995. Generation of transgenic banana(Musa acuminata) plants via Agrobacterium-mediatedtransformation. Biotechnology, 13, 486–492.
Nair, H., Andaikalavan, N. and Tung, H.F. 1996. Somephysiological and protein changes during storage ofbananas. In: Frisina, C., Mason, K. and Faragher, J., ed.,Australasian Postharvest Horticulture Conference 1995.
Melbourne, Victorian Department of Natural Resourcesand Environment, 97–104.
Nair, H. and Tung, H.F. 1992. Low oxygen effect andstorage of Mas bananas (
Musa
, AA group). ActaHorticulturae, 292, 209–215.
Nielsen, H., Engelbrecht, J., Brunak, S. and von Heijne, G.1997. Identification of prokaryotic and eukaryotic signalpeptides and prediction of their cleavage sites. ProteinEngineering, 10, 1–6.
Panis, B., Dhed’a, D. and Swennen, R. 1993. Embryogenic
Musa
plant cell cultures: current and future applications.InfoMusa, 2, 3–6.
Sagi, L., Panis, B., Remy, S., Schoofs, H., De Smet, K.,Swennen, R. and Cammue, B.P. 1995. Genetictransformation of banana and plantain (Musa spp.) viaparticle bombardment. Bio/Technology, 13, 481–485.
Sambrook, J., Fritsch, E.F. and Maniatis, T. 1989. Molecularcloning. A laboratory manual. USA, Cold Spring HarborLaboratory Press.
Schoofs, H., 1997. The origin of embryogenic cells in Musa.PhD thesis, Katholieke Universiteit Leuven, Belgium.Dissertatione de Agricultural No. 330, 258p.
Quality assurance in agricultural produce,edited by G.I. Johnson, Le Van To, Nguyen Duy Duc and M.C. Webb.
ACIAR Proceedings 100(printed version published in 2000)
688
Assessment of Postharvest Handling Systems for Chinese Cabbage in China
Wang Xiangyang and Shen Lianqing*
Abstract
The postharvest handing systems for heading and non-heading Chinese cabbages in eastern central China wereinvestigated and some traditional handling methods assessed. With heading Chinese cabbage, the effects oftrimming the outer leaves and subsequent exposure to the sun for several hours before transport were studied.With non-heading Chinese cabbage, the effects of root removal, outer leaf trimming, water dipping and waterspraying (at market) were studied.
The studies indicated that, with heading Chinese cabbage, trimmed and untrimmed cabbages had anequivalent loss of outer leaves before entry into the retail market sector, but trimming reduced the cost oftransport. The practice of exposing trimmed cabbages to the sun significantly reduced rotting, but increasedmoisture loss. Moisture loss had a greater impact on losses than did rotting in cabbages stored for less than fourdays. Exposing cabbages to the sun before shipment significantly decreased losses from rotting if cabbageswere transported during rainy weather, or were to be stored for longer than a week in summer.
Removal of roots or trimming of outer leaves of non-heading Chinese cabbage at harvest had little impact onsubsequent postharvest losses. Weight loss during harvest and short-term storage before transport to marketwas not more than 10% and could be regained by dipping the plants in water for 90 minutes.
A
LARGE
amount of
heading
Chinese cabbage(
Brassica rapa
‘Pekinensis’) grows in China. It isharvested mainly in winter before freezing tempera-tures can damage the crop and is stored for 2–3 monthson farms in northern China during winter at ambienttemperatures. It is a relatively non-perishable crop, butlosses of 20–30% (sometimes more than 50%) caneventuate from disease during storage. To reducerotting, some farmers place Chinese cabbage heads inthe sun to wilt the outer leaves before storage. Thisresults in a 15–20% moisture loss from the heads.Heading Chinese cabbage grows in all regions ofChina in winter, and is sold in local towns or nearbycities.
The handling system for heading Chinese cabbageis quite different in summer. It is grown mainly innorthern China and is harvested for local sale and fortransport to, and sale in, southern China. For transport
to southern China, moisture control is most important.The heads need to be dry during transport and at thewholesale market, otherwise losses caused by rottingcan be large.
We can take Hangzhou City’s wholesale market asan example of the handling system. Throughput ofheading Chinese cabbage can be 20–30 t/day inHangzhou City in summer. Most Chinese cabbagecomes from Shandong Province or the north ofJiangshu Province, 700–800 km away from HangzhouCity. The transport time is 16–24 hours. The vege-tables are carried on open-tray trucks (10–12 t/truck)without packaging. Some wholesalers trim the outerhead leaves before transport, while others do so after-wards. No one knows which is better.
The trucks need to reach Hangzhou City late in theafternoon (about 6 pm). After each truck, packed withcabbage, arrives at Hangzhou wholesale market, threepeople trim off some of the outer leaves and any rottedleaves, then pack the trimmed heads into 60–80 cmplastic net or polyethylene bags. Losses of about10–15% occur at this time, although some wholesalersincur losses of 40–50% during rainy weather.
* Department of Food Science and Technique, Hangzhou Institute of Commerce, 29 Jiao Gong Road, Hangzhou City, Zhejiang Province 310035, People’s Republic of China.
Quality assurance in agricultural produce,edited by G.I. Johnson, Le Van To, Nguyen Duy Duc and M.C. Webb.
ACIAR Proceedings 100(printed version published in 2000)
689
Most of the vegetables are sold from 4–6 am at theHangzhou wholesale market. Some heading Chinesecabbage is sometimes not sold because of oversupplyor the late arrival of trucks from the north. The Chinesecabbage then has to wait in the wholesale market untilthe next day. Some wholesalers place these heads inthe sun for several hours, then shade them with ricestraw to reduce losses from rots. However, this leads toabout a 10% increase in moisture loss, and there arefurther losses from the removal of wilted, yellowingouter leaves. Reduced quality results in lower prices.In our study we assessed the effectiveness of placingChinese cabbage heads in the sun.
Large amounts of
non-heading
Chinese cabbage arealso grown in China. The crop is harvested in June andJuly, 20–50 days after planting. It is a perishable croplike pak choy, suffering heavy losses in summer due towilting, yellowing, and mechanical damage. Thevegetable is harvested in the late afternoon (5–8 pm) orearly morning (2–4 am) in summer, and packed intobamboo baskets.
Some farmers harvest this vegetable by pulling itout, leaving the roots intact. They believe that keepingthe roots and outer leaves on can protect the innerleaves, and this practice allows faster harvesting. Theroots and outer leaves are trimmed off by these farmersat market. Other farmers cut off the roots and outerleaves at harvest. These farmers believe that there is noadvantage in keeping the roots and outer leaves, whichonly cause the vegetables to get dirty.
90% of non-heading Chinese cabbage is deliveredto market by the farmers themselves. The vegetable issold locally or in nearby towns, mainly within 20 kmof the farm. The vegetables harvested in the earlymorning are delivered to wholesale and retail marketsimmediately after harvest. If the vegetables areharvested in the afternoon, they are stored in thefarmer’s home for selling next morning. These storedvegetables are covered with paper or sprayed withwater to reduce weight loss and wilting during storage,transport and marketing. Non-heading Chinesecabbage is not pre-cooled or stored in coolrooms.Unsold non-heading Chinese cabbage is mainlythrown away. Only a few farmers carry it back to thefarm for animal feed or try to store it for sale on thefollowing day. If the vegetable is harvested duringrainy weather, it suffers much mechanical injurybecause of its turgid, tender leaves. Also, rots andyellowing cause large losses.
These traditional handling methods need to bestudied and modified.
Materials and Methods
Heading Chinese cabbage was sourced from theHangzhou local wholesale market. Non-headingChinese cabbage was sourced from local farms andarrived at the Hangzhou University of Commerce lab-oratory within an hour of harvest.
Instrumental colour analysis
This was performed with a chromatic aberrationmeter. White board calibration (X = 80.727, Y =85.842 and Z = 85.335) was performed before meas-uring. Derived functions of the
L*
,
b*
and
a*
valuesincluded hue angle or tan
-1
b*/a*
. Visual change wasmeasured non-destructively by reflectance as hueangle (Shewfelt et al. 1984).
Heading Chinese cabbage
Placement in the sun
Twenty-seven heading Chinese cabbage wereplaced in the sun for: (1) 8 h; (2) 4 h in the sun plus 4h in the shade; or (3) 8 h in the shade. The treatmentswere repeated the next day. The cabbages were thenstored for 8 days at ambient temperature (30 ± 2
°
C).Rot losses were measured as rotted leaves, not wholeheads.
Trimming treatment
Leaves which were old, insect and disease-damaged, mechanically damaged, or wilted outerleaves were trimmed from 24 heading Chinesecabbage before transport. Trimming loss beforetransport and a second trimming loss after transport inwholesale market were measured. Another sample of24 cabbages was trimmed only after transport, andlosses measured. The cabbages were trimmedaccording to customer acceptability.
Non-heading Chinese cabbage
Cutting roots and outer leaves
Five treatments were applied to non-headingChinese cabbage (20 plants per treatment) just afterharvest: (1) keep roots and outer leaves; (2) removeroots but keep outer leaves; (3) remove roots and oneouter leaf; (4) remove roots and two outer leaves; and(5) remove roots and three outer leaves. The hueangles of all remaining leaves were measured atharvest time and after 2 days of storage at ambienttemperature (30 ± 2
°
C).
Quality assurance in agricultural produce,edited by G.I. Johnson, Le Van To, Nguyen Duy Duc and M.C. Webb.
ACIAR Proceedings 100(printed version published in 2000)
690
Irrigation
Four treatments were applied to non-headingChinese cabbage grown in pots (20 plants pertreatment). The plants were watered 1, 2, or 3 daysbefore harvest; control plants were not watered. Hueangles of all leaves of the plants were measured atharvest time and after 3 and 4 days storage at ambienttemperature (30 ± 2
°
C).
Water dipping
Detached non-heading Chinese cabbage leaveswere placed in the shade for 1 h at ambient temperature(30 ± 2
°
C), then 20 outer leaves (two leaves from eachvegetable), 20 middle leaves, and 20 inner leaves weredipped in water for 2.5 h. The weights and hue anglesof leaves were measured.
Statistical analysis
Statistical analysis of the data was performed usingstandard analysis of variance, Duncan’s multiplerange test and multiple correlation techniques (Helwigand Council 1979).
Results and Discussion
Effects of exposure to the sun on losses of heading Chinese cabbage
When heading Chinese cabbage is carried over, orarrives late at wholesale market in summer, and mustbe stored until the next day, some wholesalers exposethe heads to the sun to reduce rot damage. Exposure ofheads to the sun for 4 and 8 h caused weight losses of8.1% and 10.5%, respectively, at the end of one day(Table 1). These were significantly higher than the3.1% weight loss of the control. There was no rottingduring the first 2 days. After 4 days or 8 days storage,losses from rotting were similar for heads exposed tothe sun for 4 or 8 h. Both were significantly lower thanthe control (Table 1).
The results showed that placing Chinese cabbageheads in the sun reduced rotting losses but increasedweight loss. If heads are sold soon after harvest (e.g.within 2 days), or have no serious mechanical damage,or are not harvested during rainy weather, they neednot be placed in the sun. But if the heads are harvestedor transported during rainy weather in summer, orneed to be stored for some time, or suffer seriousmechanical damage, then to reduce losses from rottingthey need to be either exposed to the sun or stored in acoolroom.
The effect of timing of trimming outer leaves on losses of heading Chinese cabbage
After-transport rotting losses in Chinese cabbageheads were higher (10.2% by weight) in cabbagestrimmed before transport than in untrimmed heads(6.0%). But untrimmed heads needed much moretrimming (22%) after transport, to remove old leavesand mechanical injury. Thus, cabbages both trimmedand untrimmed before transport had similar totallosses after transport (Table 2). Nevertheless,trimming heads before transport could reducetransport costs.
The effect of cutting outer leaves and roots atharvest time on non-heading Chinese cabbage leafyellowing
Keeping the roots on after harvest had no significanteffect on the yellowing of leaves of non-headingChinese cabbage. Removing the outer leaves slightlyretarded the yellowing of inner leaves. Cutting off 1, 2,or 3 leaves similarly retarded inner leaf yellowing(Table 3). Cutting off the root and 1 to 3 old outerleaves at harvest time was feasible for increasing netsaleable vegetable (less waste) in the market.
The effect of irrigation before harvest on yellowing of non-heading Chinese cabbage
Irrigation before harvest increased postharvestyellowing of leaves (reduced hue angle). The closerirrigation is to harvest, the greater the postharvest leafyellowing (Table 4). Thus, the vegetable needs beharvested at least 3 days before rainy weather toreduce leaf yellowing after harvest, and crops shouldnot be irrigated within 3 days of harvest.
The effect of water dipping on non-heading Chinese cabbage weight and hue angle
Moisture loss after harvest caused weight loss andyellowing (hue angle decline). Dipping in water for1.5 hours was the best treatment to restore weight andappearance after the vegetable had lost moisture. Itresulted in the highest weight and the most favourablehue angle (Tables 5 and 6).
Quality assurance in agricultural produce,edited by G.I. Johnson, Le Van To, Nguyen Duy Duc and M.C. Webb.
ACIAR Proceedings 100(printed version published in 2000)
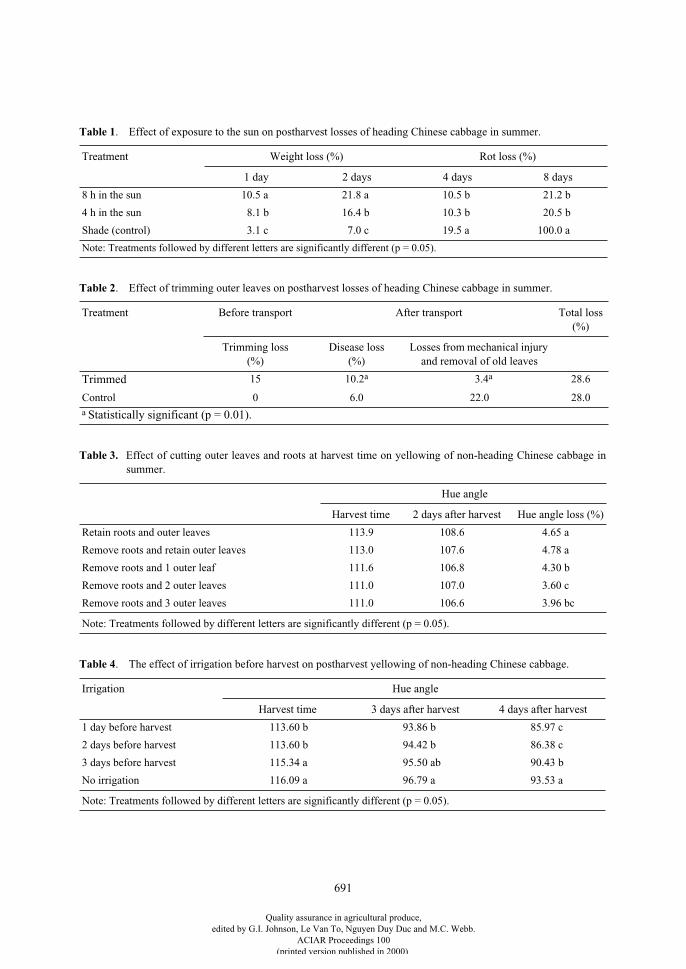
691
Table 1
. Effect of exposure to the sun on postharvest losses of heading Chinese cabbage in summer.
Treatment Weight loss (%) Rot loss (%)
1 day 2 days 4 days 8 days
8 h in the sun 10.5 a 21.8 a 10.5 b 21.2 b
4 h in the sun 8.1 b 16.4 b 10.3 b 20.5 b
Shade (control) 3.1 c 7.0 c 19.5 a 100.0 a
Note: Treatments followed by different letters are significantly different (p = 0.05).
Table 2
. Effect of trimming outer leaves on postharvest losses of heading Chinese cabbage in summer.
Treatment Before transport After transport Total loss (%)
Trimming loss(%)
Disease loss (%)
Losses from mechanical injury and removal of old leaves
Trimmed
15 10.2
a
3.4
a
28.6
Control 0 6.0 22.0 28.0
a
Statistically significant (p = 0.01).
Table 3.
Effect of cutting outer leaves and roots at harvest time on yellowing of non-heading Chinese cabbage insummer.
Hue angle
Harvest time 2 days after harvest Hue angle loss (%)
Retain roots and outer leaves 113.9 108.6 4.65 a
Remove roots and retain outer leaves 113.0 107.6 4.78 a
Remove roots and 1 outer leaf 111.6 106.8 4.30 b
Remove roots and 2 outer leaves 111.0 107.0 3.60 c
Remove roots and 3 outer leaves 111.0 106.6 3.96 bc
Note: Treatments followed by different letters are significantly different (p = 0.05).
Table 4
. The effect of irrigation before harvest on postharvest yellowing of non-heading Chinese cabbage.
Irrigation Hue angle
Harvest time 3 days after harvest 4 days after harvest
1 day before harvest 113.60 b 93.86 b 85.97 c
2 days before harvest 113.60 b 94.42 b 86.38 c
3 days before harvest 115.34 a 95.50 ab 90.43 b
No irrigation 116.09 a 96.79 a 93.53 a
Note: Treatments followed by different letters are significantly different (p = 0.05).
Quality assurance in agricultural produce,edited by G.I. Johnson, Le Van To, Nguyen Duy Duc and M.C. Webb.
ACIAR Proceedings 100(printed version published in 2000)
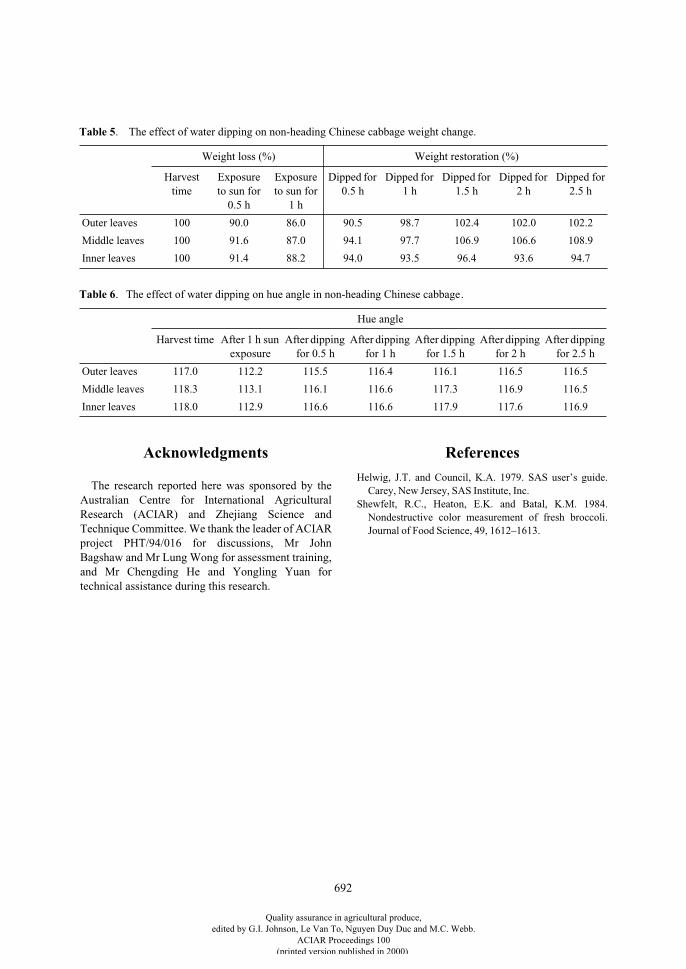
692
Table 5
. The effect of water dipping on non-heading Chinese cabbage weight change.
Weight loss (%) Weight restoration (%)
Harvest time
Exposure to sun for
0.5 h
Exposure to sun for
1 h
Dipped for 0.5 h
Dipped for 1 h
Dipped for 1.5 h
Dipped for 2 h
Dipped for 2.5 h
Outer leaves 100 90.0 86.0 90.5 98.7 102.4 102.0 102.2
Middle leaves 100 91.6 87.0 94.1 97.7 106.9 106.6 108.9
Inner leaves 100 91.4 88.2 94.0 93.5 96.4 93.6 94.7
Table 6
. The effect of water dipping on hue angle in non-heading Chinese cabbage.
Hue angle
Harvest time After 1 h sun exposure
After dipping for 0.5 h
After dipping for 1 h
After dipping for 1.5 h
After dipping for 2 h
After dipping for 2.5 h
Outer leaves 117.0 112.2 115.5 116.4 116.1 116.5 116.5
Middle leaves 118.3 113.1 116.1 116.6 117.3 116.9 116.5
Inner leaves 118.0 112.9 116.6 116.6 117.9 117.6 116.9
Acknowledgments
The research reported here was sponsored by theAustralian Centre for International AgriculturalResearch (ACIAR) and Zhejiang Science andTechnique Committee. We thank the leader of ACIARproject PHT/94/016 for discussions, Mr JohnBagshaw and Mr Lung Wong for assessment training,and Mr Chengding He and Yongling Yuan fortechnical assistance during this research.
References
Helwig, J.T. and Council, K.A. 1979. SAS user’s guide.Carey, New Jersey, SAS Institute, Inc.
Shewfelt, R.C., Heaton, E.K. and Batal, K.M. 1984.Nondestructive color measurement of fresh broccoli.Journal of Food Science, 49, 1612–1613.
Quality assurance in agricultural produce,edited by G.I. Johnson, Le Van To, Nguyen Duy Duc and M.C. Webb.
ACIAR Proceedings 100(printed version published in 2000)
693
The Effect of Sugar and Ethylene on Postharvest Pak Choy (Brassica rapa var. chinensis)
Leaf Degreening
Wang Xiangyang and Shen Lianqing*
Abstract
Sugar is the main energy substrate of pak choy leaves, consisting of glucose and fructose. The sugarconcentration in the outer leaves of the pak choy plant decreased sharply during storage at ambient temperature(20 ± 2°C), while total amino acid concentration increased. Treatment of pak choy by placing leaves in an 8%sugar solution for 2 hours increased the sugar content in the pak choy leaves and retarded leaf yellowing. Hotwater treatment was also found to retard both decline in sugar content and leaf yellowing. Initial ethyleneproduction from pak choy stored at 20°C was low, but increased sharply during storage, concomitant with leafyellowing. Exposure of pak choy to exogenous ethylene (60 ppm) at 20°C did not significantly accelerate leafyellowing, although a significant increase was induced by 600 ppm. Ethylene did not appear to accelerate leafyellowing of pak choy stored at 2°C.
P
AK
CHOY
(
Brassica rapa
var.
chinensis
) is an openleafy brassica. It has an inherently short storage lifeand is usually marketed soon after harvest. Its shelf lifeis limited primarily by wilting and outer leaf yel-lowing. Yellowing has been implicated as a limitingfactor in storage of pak choy (Hirata et al. 1987; Wangand Herner 1989; O’Hare et al. 1995). Leaf yellowingis associated with the breakdown of chlorophyllduring storage and senescence.
Ishii and Shinbori (1988) reported that the initialchlorophyll content and total sugar of older leaves ofJapanese turnip (
B. rapa
var.
rapifera
) were alreadylower than younger leaves at harvest and continued todecline during storage. It was suggested that the rapiddecline of these components may have been directlyrelated to product deterioration. Older leaves ofspinach (
Spinacia oleracea
var.
read
) declined insugar levels at a faster rate than inner leaves, withyellowing beginning once sugar levels fell below acritical concentration.
The presence of ethylene, whether produced byplant tissue or an external source, is potentially detri-mental to the shelf life of leafy brassicas such ascabbage (Pratt and Goeschl 1969; Pendergrass et al.1976). It has been proposed that ethylene has animportant role in this chlorophyll loss (Aharoni et al.1985). Broccoli (‘Dominator’) (
Brassica oleracea
L.var.
italica
) treated at 45°C for 14 min retained 81% ofits chlorophyll for 5 days postharvest (Kazami et al.1991). A hot water treatment of 47°C for 7.5 min wasselected as the best treatment. This treatment consist-ently reduced yellowing of floret groups of ‘Shogun’broccoli for up to 5 days (Tian et al. 1996).
It is possible that respiratory substrate availability,as well as hormonal factors, may play a major role inthe rate of leaf senescence, both of which appear to beof importance in regulating broccoli shelf life (Kingand Morris 1994a,b; Tian et al. 1995). However, it isunclear whether yellowing of pak choy leaves isregulated by postharvest changes in endogenousethylene production or total sugars.
* Department of Food Science and Technology, Hangzhou University of Commerce, 29 Jiao Gong Road, Hangzhou, Zhejiang Province 310035, People’s Republic of China.
Quality assurance in agricultural produce,edited by G.I. Johnson, Le Van To, Nguyen Duy Duc and M.C. Webb.
ACIAR Proceedings 100(printed version published in 2000)
694
Materials and Methods
Pak choy was obtained from the local market. Theleaves were washed thoroughly with running water.
Ethylene production measurement
100 g of pak choy was sealed in a 1 L glass bottle at20°C for 1 h, and a 1 mL gas sample measured forethylene concentration using a sp-6800 gas chroma-togram fitted with GDX 502 column. Treatments werereplicated five times.
Colour analysis
Instrumental colour analysis was performed with achromatic aberration meter. Visual changes weremeasured non-destructively by reflectance as hueangle (Shewfelt et al. 1984).
Measurement of chlorophyll, soluble sugars and amino acids
Chlorophyll changes were destructively assessedusing an extraction method based on Batal et al
.
(1982)for spectrophotometric analysis. Soluble sugars andamino acids were assessed by high performance liquidchromatography (Wade and Morris 1982).
STS/ethylene treatment
The effect of silver thiosulfate (STS)—as a sourceof silver ions, which are potent inhibitors of ethyleneaction—on physiological parameters of pak choywas measured. Three pak choy shoots were dipped ineither 4.63 mM STS (AgS
2
O
3
) or water (control) for30 min. Samples were subsequently sealed in 5 Lglass bottles which were injected with ethylene togive a final concentration of 4.95 parts per million(ppm). The hue angles of leaves were measuredinitially and after 3 days at 20°C, and 8 days at 2°C.
20 detached outer leaves and 20 inner leaves werecut into two equal parts by scissors along the centralmidrib. One half was dipped in 4.63 mM STS for 30min and the other half dipped in water (control). Bothtreated and control leaves were sealed together in a 5 Lbottle and injected with ethylene as described above.Measurements were similar to above.
The effect of ethylene concentration of physio-logical parameters was performed similarly to thatdescribed above. Detached leaves were sealed in 5 L
bottles with final ethylene concentrations of 0.6, 6, 60,600 and 6,000 parts per million (ppm).
Sugar treatment
12 outer leaves (replicated four times) weredetached and cut into two equal parts along the midriband divided into two groups. One group was dipped in2%, 4%, 6%, or 8% sugar, and the other group dippedin water (control). The leaf halves were taken out ofthe solutions after 1, 3 or 5 h and washed thoroughlywith running water. Treated and control leaves werestored for 2 days under ambient conditions, coveredwith polyethylene film to minimise moisture loss.Leaves were measured for hue angle both initially andafter 2 days.
20 outer leaves (replicated twice) were prepared asabove and dipped in water, 6%, or 8% sugar for either1, 2, 3, 4, or 5 h followed by washing. Leaves werestored as above and measured for hue angle, sugar andamino acid content over 3 days of storage.
Hot water treatment
Intact pak choy shoots were dipped in hot water(ambient, 38, 40, 42, 44, 46, 48°C) for 10 min. Shootswere subsequently stored at 20°C and 2°C for 3 and 8days, respectively.
Statistical analysis
Statistical analysis of the data was performed usingstandard analysis of variance, Duncan's multiple rangetest and multiple correlation techniques (Helwig andCouncil 1979).
Results
Ethylene production
Ethylene production of intact pak choy leavesincreased rapidly after 4 days of storage at 20°C, butdid not exhibit a large increase during 8 days of storageat 2°C (Table 1).
Ethylene production of detached outer leaves storedat 2°C reached 141.82 mL/h/kg (7 days), which wassignificantly higher than 24.94 mL/h/kg of detachedinner leaves. Both were significantly higher than intactpak choy ethylene production which was only 1.66mL/h/kg after 8 days storage at 2°C.
Quality assurance in agricultural produce,edited by G.I. Johnson, Le Van To, Nguyen Duy Duc and M.C. Webb.
ACIAR Proceedings 100(printed version published in 2000)
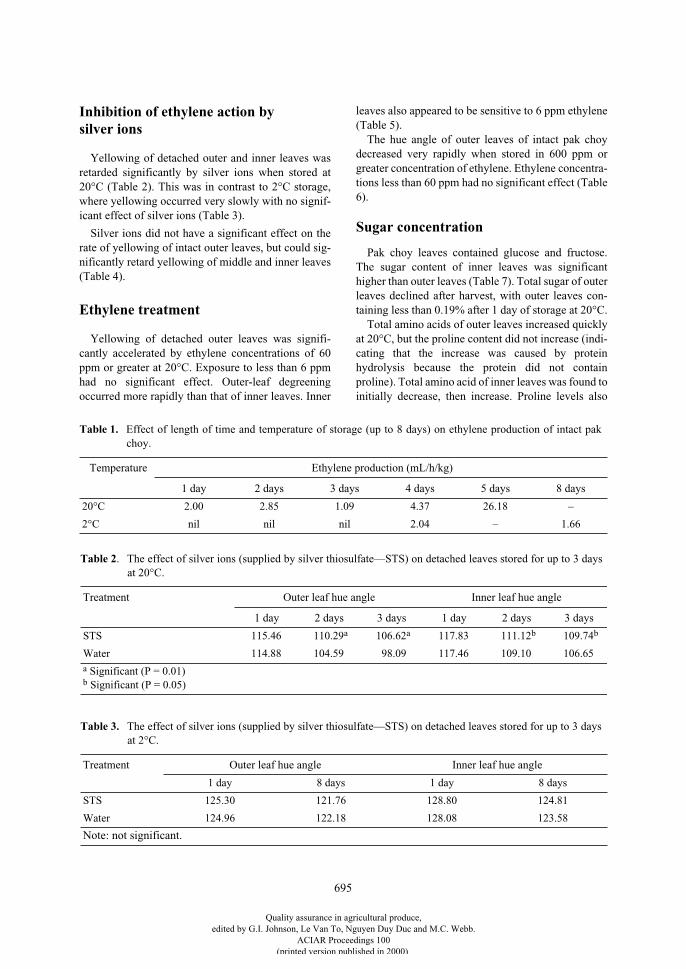
695
Inhibition of ethylene action bysilver ions
Yellowing of detached outer and inner leaves wasretarded significantly by silver ions when stored at20°C (Table 2). This was in contrast to 2°C storage,where yellowing occurred very slowly with no signif-icant effect of silver ions (Table 3).
Silver ions did not have a significant effect on therate of yellowing of intact outer leaves, but could sig-nificantly retard yellowing of middle and inner leaves(Table 4).
Ethylene treatment
Yellowing of detached outer leaves was signifi-cantly accelerated by ethylene concentrations of 60ppm or greater at 20°C. Exposure to less than 6 ppmhad no significant effect. Outer-leaf degreeningoccurred more rapidly than that of inner leaves. Inner
leaves also appeared to be sensitive to 6 ppm ethylene(Table 5).
The hue angle of outer leaves of intact pak choydecreased very rapidly when stored in 600 ppm orgreater concentration of ethylene. Ethylene concentra-tions less than 60 ppm had no significant effect (Table6).
Sugar concentration
Pak choy leaves contained glucose and fructose.The sugar content of inner leaves was significanthigher than outer leaves (Table 7). Total sugar of outerleaves declined after harvest, with outer leaves con-taining less than 0.19% after 1 day of storage at 20°C.
Total amino acids of outer leaves increased quicklyat 20°C, but the proline content did not increase (indi-cating that the increase was caused by proteinhydrolysis because the protein did not containproline). Total amino acid of inner leaves was found toinitially decrease, then increase. Proline levels also
Table 1. Effect of length of time and temperature of storage (up to 8 days) on ethylene production of intact pakchoy.
Temperature Ethylene production (mL/h/kg)
1 day 2 days 3 days 4 days 5 days 8 days
20°C 2.00 2.85 1.09 4.37 26.18 –
2°C nil nil nil 2.04 – 1.66
Table 2. The effect of silver ions (supplied by silver thiosulfate—STS) on detached leaves stored for up to 3 daysat 20°C.
Treatment Outer leaf hue angle Inner leaf hue angle
1 day 2 days 3 days 1 day 2 days 3 days
STS 115.46 110.29a 106.62a 117.83 111.12b 109.74b
Water 114.88 104.59 98.09 117.46 109.10 106.65a Significant (P = 0.01)b Significant (P = 0.05)
Table 3.
The effect of silver ions (supplied by silver thiosulfate—STS) on detached leaves stored for up to 3 daysat 2°C.
Treatment Outer leaf hue angle Inner leaf hue angle
1 day 8 days 1 day 8 days
STS 125.30 121.76 128.80 124.81
Water 124.96 122.18 128.08 123.58
Note: not significant.
Quality assurance in agricultural produce,edited by G.I. Johnson, Le Van To, Nguyen Duy Duc and M.C. Webb.
ACIAR Proceedings 100(printed version published in 2000)
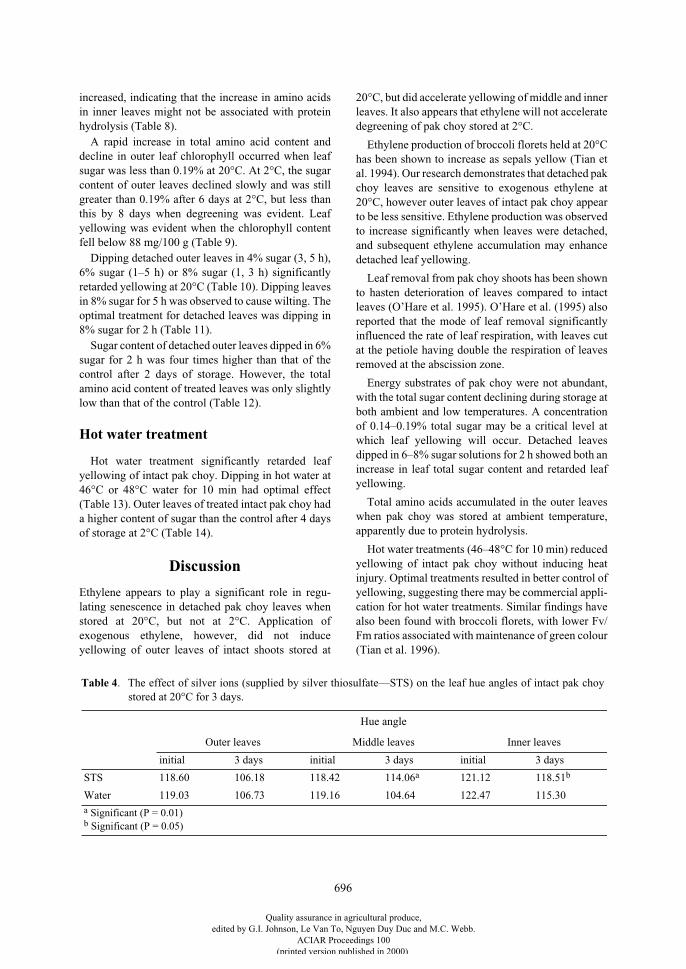
696
increased, indicating that the increase in amino acidsin inner leaves might not be associated with proteinhydrolysis (Table 8).
A rapid increase in total amino acid content anddecline in outer leaf chlorophyll occurred when leafsugar was less than 0.19% at 20°C. At 2°C, the sugarcontent of outer leaves declined slowly and was stillgreater than 0.19% after 6 days at 2°C, but less thanthis by 8 days when degreening was evident. Leafyellowing was evident when the chlorophyll contentfell below 88 mg/100 g (Table 9).
Dipping detached outer leaves in 4% sugar (3, 5 h),6% sugar (1–5 h) or 8% sugar (1, 3 h) significantlyretarded yellowing at 20°C (Table 10). Dipping leavesin 8% sugar for 5 h was observed to cause wilting. Theoptimal treatment for detached leaves was dipping in8% sugar for 2 h (Table 11).
Sugar content of detached outer leaves dipped in 6%sugar for 2 h was four times higher than that of thecontrol after 2 days of storage. However, the totalamino acid content of treated leaves was only slightlylow than that of the control (Table 12).
Hot water treatment
Hot water treatment significantly retarded leafyellowing of intact pak choy. Dipping in hot water at46°C or 48°C water for 10 min had optimal effect(Table 13). Outer leaves of treated intact pak choy hada higher content of sugar than the control after 4 daysof storage at 2°C (Table 14).
Discussion
Ethylene appears to play a significant role in regu-lating senescence in detached pak choy leaves whenstored at 20°C, but not at 2°C. Application ofexogenous ethylene, however, did not induceyellowing of outer leaves of intact shoots stored at
20°C, but did accelerate yellowing of middle and innerleaves. It also appears that ethylene will not acceleratedegreening of pak choy stored at 2°C.
Ethylene production of broccoli florets held at 20°Chas been shown to increase as sepals yellow (Tian etal. 1994). Our research demonstrates that detached pakchoy leaves are sensitive to exogenous ethylene at20°C, however outer leaves of intact pak choy appearto be less sensitive. Ethylene production was observedto increase significantly when leaves were detached,and subsequent ethylene accumulation may enhancedetached leaf yellowing.
Leaf removal from pak choy shoots has been shownto hasten deterioration of leaves compared to intactleaves (O’Hare et al. 1995). O’Hare et al. (1995) alsoreported that the mode of leaf removal significantlyinfluenced the rate of leaf respiration, with leaves cutat the petiole having double the respiration of leavesremoved at the abscission zone.
Energy substrates of pak choy were not abundant,with the total sugar content declining during storage atboth ambient and low temperatures. A concentrationof 0.14–0.19% total sugar may be a critical level atwhich leaf yellowing will occur. Detached leavesdipped in 6–8% sugar solutions for 2 h showed both anincrease in leaf total sugar content and retarded leafyellowing.
Total amino acids accumulated in the outer leaveswhen pak choy was stored at ambient temperature,apparently due to protein hydrolysis.
Hot water treatments (46–48°C for 10 min) reducedyellowing of intact pak choy without inducing heatinjury. Optimal treatments resulted in better control ofyellowing, suggesting there may be commercial appli-cation for hot water treatments. Similar findings havealso been found with broccoli florets, with lower Fv/Fm ratios associated with maintenance of green colour(Tian et al. 1996).
Table 4. The effect of silver ions (supplied by silver thiosulfate—STS) on the leaf hue angles of intact pak choystored at 20°C for 3 days.
Hue angle
Outer leaves Middle leaves Inner leaves
initial 3 days initial 3 days initial 3 days
STS 118.60 106.18 118.42 114.06a 121.12 118.51b
Water 119.03 106.73 119.16 104.64 122.47 115.30a Significant (P = 0.01)b Significant (P = 0.05)
Quality assurance in agricultural produce,edited by G.I. Johnson, Le Van To, Nguyen Duy Duc and M.C. Webb.
ACIAR Proceedings 100(printed version published in 2000)
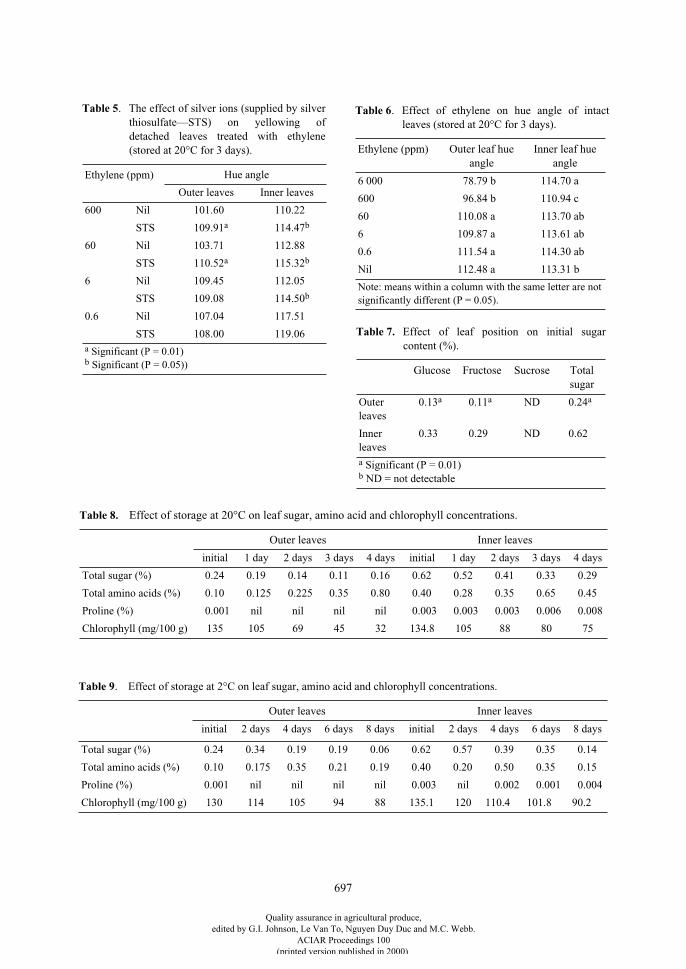
697
Table 5
. The effect of silver ions (supplied by silverthiosulfate—STS) on yellowing ofdetached leaves treated with ethylene(stored at 20°C for 3 days).
Ethylene (ppm) Hue angle
Outer leaves Inner leaves
600 Nil 101.60 110.22
STS 109.91
a
114.47
b
60 Nil 103.71 112.88
STS 110.52
a
115.32
b
6 Nil 109.45 112.05
STS 109.08 114.50
b
0.6 Nil 107.04 117.51
STS 108.00 119.06
a
Significant (P = 0.01)
b
Significant (P = 0.05))
Table 6
. Effect of ethylene on hue angle of intactleaves (stored at 20°C for 3 days).
Ethylene (ppm) Outer leaf hue angle
Inner leaf hue angle
6 000 78.79 b 114.70 a
600 96.84 b 110.94 c
60 110.08 a 113.70 ab
6 109.87 a 113.61 ab
0.6 111.54 a 114.30 ab
Nil 112.48 a 113.31 b
Note: means within a column with the same letter are not significantly different (P = 0.05).
Table 7.
Effect of leaf position on initial sugarcontent (%).
Glucose Fructose Sucrose Total sugar
Outer leaves
0.13
a
0.11
a
ND 0.24
a
Inner leaves
0.33 0.29 ND 0.62
a
Significant (P = 0.01)
b
ND = not detectable
Table 8.
Effect of storage at 20°C on leaf sugar, amino acid and chlorophyll concentrations.
Outer leaves Inner leaves
initial 1 day 2 days 3 days 4 days initial 1 day 2 days 3 days 4 days
Total sugar (%) 0.24 0.19 0.14 0.11 0.16 0.62 0.52 0.41 0.33 0.29
Total amino acids (%) 0.10 0.125 0.225 0.35 0.80 0.40 0.28 0.35 0.65 0.45
Proline (%) 0.001 nil nil nil nil 0.003 0.003 0.003 0.006 0.008
Chlorophyll (mg/100 g) 135 105 69 45 32 134.8 105 88 80 75
Table 9
. Effect of storage at 2°C on leaf sugar, amino acid and chlorophyll concentrations.
Outer leaves Inner leaves
initial 2 days 4 days 6 days 8 days initial 2 days 4 days 6 days 8 days
Total sugar (%) 0.24 0.34 0.19 0.19 0.06 0.62 0.57 0.39 0.35 0.14
Total amino acids (%) 0.10 0.175 0.35 0.21 0.19 0.40 0.20 0.50 0.35 0.15
Proline (%) 0.001 nil nil nil nil 0.003 nil 0.002 0.001 0.004
Chlorophyll (mg/100 g) 130 114 105 94 88 135.1 120 110.4 101.8 90.2
Quality assurance in agricultural produce,edited by G.I. Johnson, Le Van To, Nguyen Duy Duc and M.C. Webb.
ACIAR Proceedings 100(printed version published in 2000)
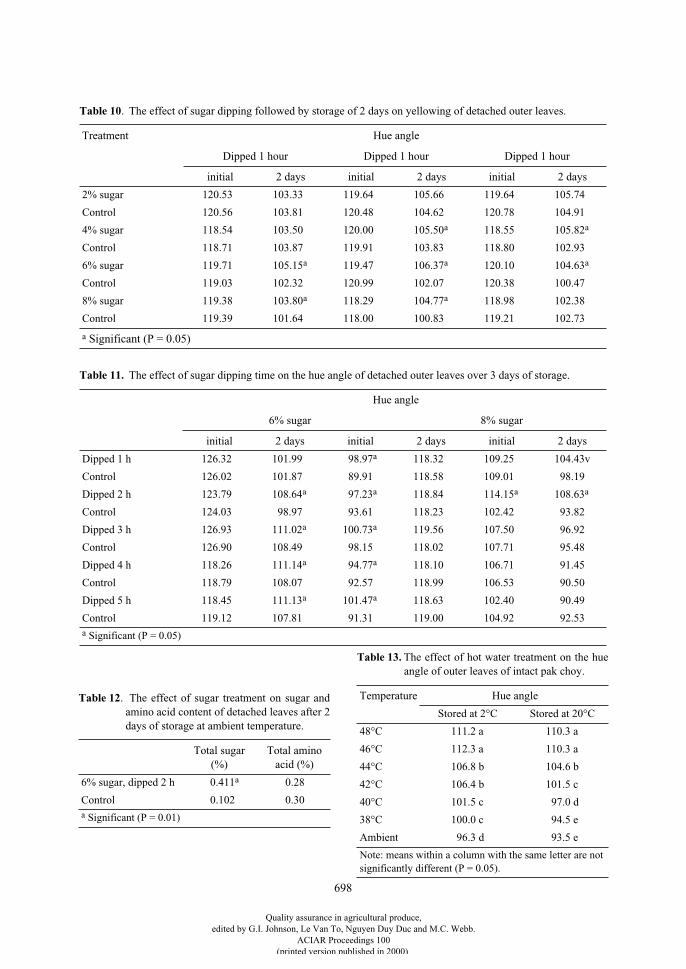
698
Table 10
. The effect of sugar dipping followed by storage of 2 days on yellowing of detached outer leaves.
Treatment Hue angle
Dipped 1 hour Dipped 1 hour Dipped 1 hour
initial 2 days initial 2 days initial 2 days
2% sugar 120.53 103.33 119.64 105.66 119.64 105.74
Control 120.56 103.81 120.48 104.62 120.78 104.91
4% sugar 118.54 103.50 120.00 105.50
a
118.55 105.82
a
Control 118.71 103.87 119.91 103.83 118.80 102.93
6% sugar 119.71 105.15
a
119.47 106.37
a
120.10 104.63
a
Control 119.03 102.32 120.99 102.07 120.38 100.47
8% sugar 119.38 103.80
a
118.29 104.77
a
118.98 102.38
Control 119.39 101.64 118.00 100.83 119.21 102.73
a
Significant (P = 0.05)
Table 12
. The effect of sugar treatment on sugar andamino acid content of detached leaves after 2days of storage at ambient temperature.
Total sugar (%)
Total amino acid (%)
6% sugar, dipped 2 h 0.411
a
0.28
Control 0.102 0.30
a
Significant (P = 0.01)
Table 11.
The effect of sugar dipping time on the hue angle of detached outer leaves over 3 days of storage.
Hue angle
6% sugar 8% sugar
initial 2 days initial 2 days initial 2 days
Dipped 1 h 126.32 101.99 98.97
a
118.32 109.25 104.43v
Control 126.02 101.87 89.91 118.58 109.01 98.19
Dipped 2 h 123.79 108.64
a
97.23
a
118.84 114.15
a
108.63
a
Control 124.03 98.97 93.61 118.23 102.42 93.82
Dipped 3 h 126.93 111.02
a
100.73
a
119.56 107.50 96.92
Control 126.90 108.49 98.15 118.02 107.71 95.48
Dipped 4 h 118.26 111.14
a
94.77
a
118.10 106.71 91.45
Control 118.79 108.07 92.57 118.99 106.53 90.50
Dipped 5 h 118.45 111.13
a
101.47
a
118.63 102.40 90.49
Control 119.12 107.81 91.31 119.00 104.92 92.53
a
Significant (P = 0.05)
Table 13.
The effect of hot water treatment on the hueangle of outer leaves of intact pak choy.
Temperature Hue angle
Stored at 2°C Stored at 20°C
48°C 111.2 a 110.3 a
46°C 112.3 a 110.3 a
44°C 106.8 b 104.6 b
42°C 106.4 b 101.5 c
40°C 101.5 c 97.0 d
38°C 100.0 c 94.5 e
Ambient 96.3 d 93.5 e
Note: means within a column with the same letter are not significantly different (P = 0.05).
Quality assurance in agricultural produce,edited by G.I. Johnson, Le Van To, Nguyen Duy Duc and M.C. Webb.
ACIAR Proceedings 100(printed version published in 2000)
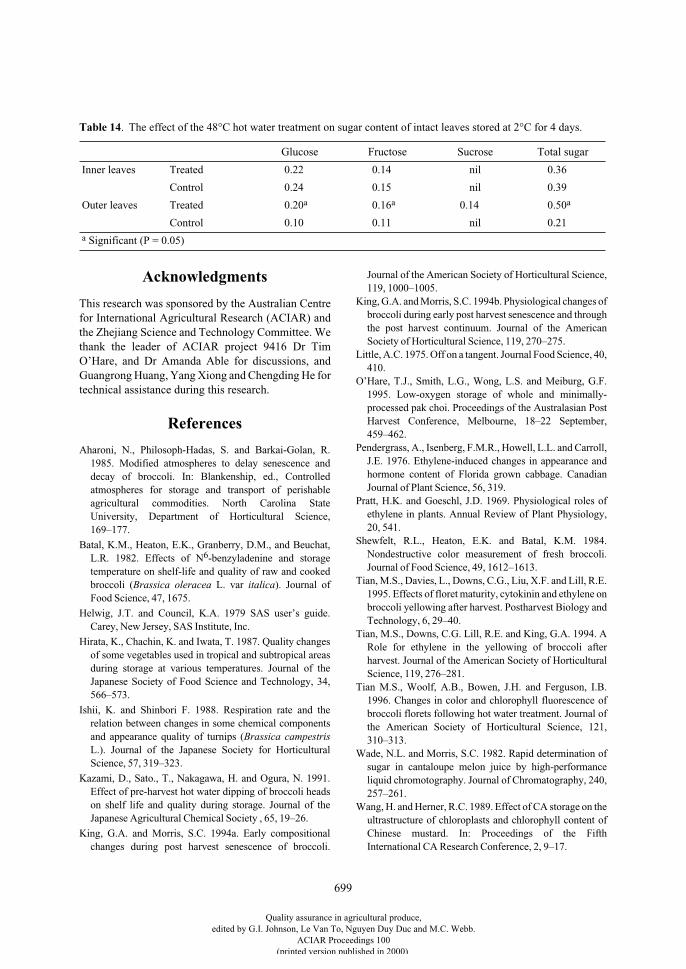
699
Acknowledgments
This research was sponsored by the Australian Centrefor International Agricultural Research (ACIAR) andthe Zhejiang Science and Technology Committee. Wethank the leader of ACIAR project 9416 Dr TimO’Hare, and Dr Amanda Able for discussions, andGuangrong Huang, Yang Xiong and Chengding He fortechnical assistance during this research.
References
Aharoni, N., Philosoph-Hadas, S. and Barkai-Golan, R.1985. Modified atmospheres to delay senescence anddecay of broccoli. In: Blankenship, ed., Controlledatmospheres for storage and transport of perishableagricultural commodities. North Carolina StateUniversity, Department of Horticultural Science,169–177.
Batal, K.M., Heaton, E.K., Granberry, D.M., and Beuchat,L.R. 1982. Effects of N
6
-benzyladenine and storagetemperature on shelf-life and quality of raw and cookedbroccoli (
Brassica oleracea
L. var
italica
). Journal ofFood Science, 47, 1675.
Helwig, J.T. and Council, K.A. 1979 SAS user’s guide.Carey, New Jersey, SAS Institute, Inc.
Hirata, K., Chachin, K. and Iwata, T. 1987. Quality changesof some vegetables used in tropical and subtropical areasduring storage at various temperatures. Journal of theJapanese Society of Food Science and Technology, 34,566–573.
Ishii, K. and Shinbori F. 1988. Respiration rate and therelation between changes in some chemical componentsand appearance quality of turnips (Brassica campestrisL.). Journal of the Japanese Society for HorticulturalScience, 57, 319–323.
Kazami, D., Sato., T., Nakagawa, H. and Ogura, N. 1991.Effect of pre-harvest hot water dipping of broccoli headson shelf life and quality during storage. Journal of theJapanese Agricultural Chemical Society , 65, 19–26.
King, G.A. and Morris, S.C. 1994a. Early compositionalchanges during post harvest senescence of broccoli.
Journal of the American Society of Horticultural Science,119, 1000–1005.
King, G.A. and Morris, S.C. 1994b. Physiological changes ofbroccoli during early post harvest senescence and throughthe post harvest continuum. Journal of the AmericanSociety of Horticultural Science, 119, 270–275.
Little, A.C. 1975. Off on a tangent. Journal Food Science, 40,410.
O’Hare, T.J., Smith, L.G., Wong, L.S. and Meiburg, G.F.1995. Low-oxygen storage of whole and minimally-processed pak choi. Proceedings of the Australasian PostHarvest Conference, Melbourne, 18–22 September,459–462.
Pendergrass, A., Isenberg, F.M.R., Howell, L.L. and Carroll,J.E. 1976. Ethylene-induced changes in appearance andhormone content of Florida grown cabbage. CanadianJournal of Plant Science, 56, 319.
Pratt, H.K. and Goeschl, J.D. 1969. Physiological roles ofethylene in plants. Annual Review of Plant Physiology,20, 541.
Shewfelt, R.L., Heaton, E.K. and Batal, K.M. 1984.Nondestructive color measurement of fresh broccoli.Journal of Food Science, 49, 1612–1613.
Tian, M.S., Davies, L., Downs, C.G., Liu, X.F. and Lill, R.E.1995. Effects of floret maturity, cytokinin and ethylene onbroccoli yellowing after harvest. Postharvest Biology andTechnology, 6, 29–40.
Tian, M.S., Downs, C.G. Lill, R.E. and King, G.A. 1994. ARole for ethylene in the yellowing of broccoli afterharvest. Journal of the American Society of HorticulturalScience, 119, 276–281.
Tian M.S., Woolf, A.B., Bowen, J.H. and Ferguson, I.B.1996. Changes in color and chlorophyll fluorescence ofbroccoli florets following hot water treatment. Journal ofthe American Society of Horticultural Science, 121,310–313.
Wade, N.L. and Morris, S.C. 1982. Rapid determination ofsugar in cantaloupe melon juice by high-performanceliquid chromotography. Journal of Chromatography, 240,257–261.
Wang, H. and Herner, R.C. 1989. Effect of CA storage on theultrastructure of chloroplasts and chlorophyll content ofChinese mustard. In: Proceedings of the FifthInternational CA Research Conference, 2, 9–17.
Table 14
. The effect of the 48°C hot water treatment on sugar content of intact leaves stored at 2°C for 4 days.
Glucose Fructose Sucrose Total sugar
Inner leaves Treated 0.22 0.14 nil 0.36
Control 0.24 0.15 nil 0.39
Outer leaves Treated 0.20
a
0.16
a
0.14 0.50
a
Control 0.10 0.11 nil 0.21
a
Significant (P = 0.05)
Quality assurance in agricultural produce,edited by G.I. Johnson, Le Van To, Nguyen Duy Duc and M.C. Webb.
ACIAR Proceedings 100(printed version published in 2000)
700
Evaluation of the Maturity Index for Durian Fruit by Various Destructive and Nondestructive Techniques
T. Yantarasri*, K. Kalayanamitra*, S. Saranwong† and J. Sornsrivichai†
Abstract
Durian is one of the most economically important fresh fruits of Thailand. Exported durian are often rejectedby the marked because of an immature fruit problem. Sorting immature from mature fruit is quite difficult evenfor an experienced person. Moreover, there is no acceptable, objective index to determine fruit maturity afterharvest. In this research, various techniques for maturity evaluation were performed and compared—bothdestructive and nondestructive. Nondestructive measurements were made by external examination usingexperienced harvesters, counting the days required for proper ripening, scanning the pulp image to obtain CTnumbers using medical X-ray computed tomography (X-ray CT) and scanning the pulp with near infraredspectroscopy (NIRS). The methods were evaluated and compared to the sensory test of the ripened pulp. Theresults showed that there were correlations between the maturity stages evaluated by the sensory test andseveral destructive and nondestructive measurements, including visual evaluation, days to ripen, X-ray CT andNIRS.
D
URIAN
(
Durio ziberthinus
Murray) is one of the mosteconomically important fresh fruits of Thailand. Themajor problems experienced in exporting durian arethe difficulty of differentiating between immature andmature fruit, even by experienced sorters, resulting ina significant proportion of immature fruit reaching themarket (10–50%) during the early harvesting season,and uneven ripening during the heavy rainy season.These problems cause a significant loss of confidencein this product and often bring down the market price,since immature or unevenly ripened fruit will notripen, or else ripen with significantly less flavour andtaste, and are usually discarded. Therefore, it would beextremely beneficial to develop an objective,destructive method, as well as a nondestructive evalu-ation technique, for detecting this problem.
Use of X-rays is a common nondestructivetechnique for internal quality evaluation of fruits and
vegetables. They can easily penetrate the bulky tissueof most agricultural products. X-ray transmission,which depends on the mass density and massabsorption coefficient of the material, has been used todetect bruises in apples (Diener et al. 1970), spongytissue in radish head (Marcelis et al. 1995), hollowheart in potatoes (Finney and Norris 1973), and defectsand damage in watermelon (Tollner 1993). X-raycomputed tomography (X-ray CT) can generate aprecise cross-section image of an object electronicallyusing a movable X-ray source and detector assembly.This method has been used to determine vapour heattreatment injury in papaya (Suzuki et al. 1994), woollybreakdown in nectarines (Sonego et al. 1995), internaldefects disorder of durian, mangosteen and mango(Yantarasri et al. 1997a; Yantarasri and Sornsrivichai1998), dry juice sac and granulation of tangerine fruits(Yantarasri et al. 1998) and internal bruising andripeness of pineapple (Yantarasri et al. 1999).
Near infrared spectroscopy (NIRS) is widely usedfor the identification of organic compounds. Norrisand Hart (1965) studied NIR reflectance and transmit-tance characteristics of many agricultural products and
* Postharvest Engineering Research Unit, Mechanical Engineering Department, Chiang Mai University, Chiang Mai 50200, Thailand.
† Postharvest Technology Institute, Chiang Mai University, Chiang Mai 50200, Thailand.
Quality assurance in agricultural produce,edited by G.I. Johnson, Le Van To, Nguyen Duy Duc and M.C. Webb.
ACIAR Proceedings 100(printed version published in 2000)
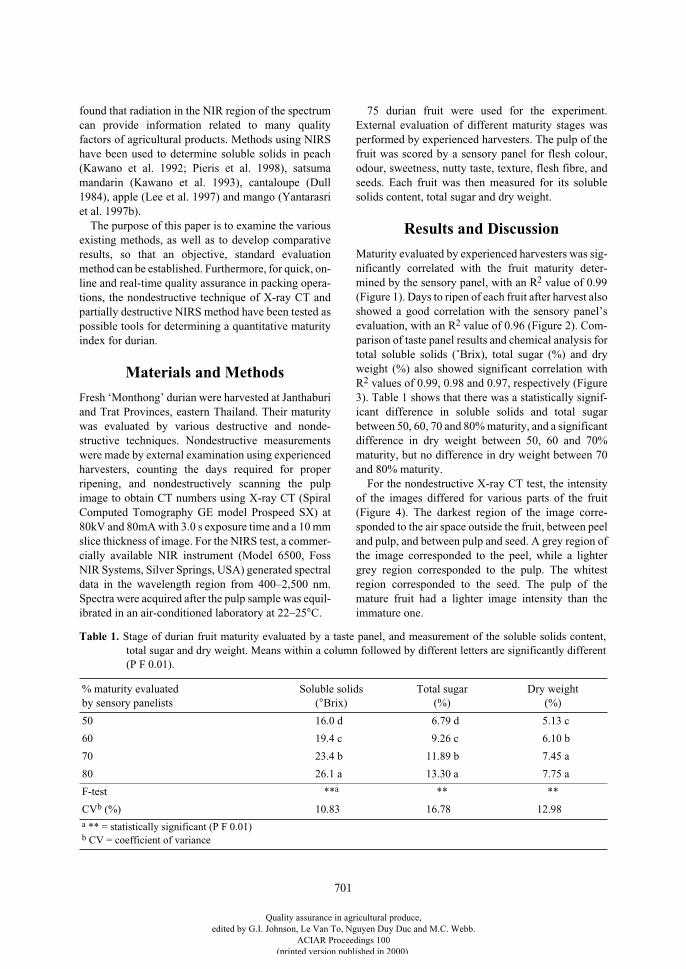
701
found that radiation in the NIR region of the spectrumcan provide information related to many qualityfactors of agricultural products. Methods using NIRShave been used to determine soluble solids in peach(Kawano et al. 1992; Pieris et al. 1998), satsumamandarin (Kawano et al. 1993), cantaloupe (Dull1984), apple (Lee et al. 1997) and mango (Yantarasriet al. 1997b).
The purpose of this paper is to examine the variousexisting methods, as well as to develop comparativeresults, so that an objective, standard evaluationmethod can be established. Furthermore, for quick, on-line and real-time quality assurance in packing opera-tions, the nondestructive technique of X-ray CT andpartially destructive NIRS method have been tested aspossible tools for determining a quantitative maturityindex for durian.
Materials and Methods
Fresh ‘Monthong’ durian were harvested at Janthaburiand Trat Provinces, eastern Thailand. Their maturitywas evaluated by various destructive and nonde-structive techniques. Nondestructive measurementswere made by external examination using experiencedharvesters, counting the days required for properripening, and nondestructively scanning the pulpimage to obtain CT numbers using X-ray CT (SpiralComputed Tomography GE model Prospeed SX) at80kV and 80mA with 3.0 s exposure time and a 10 mmslice thickness of image. For the NIRS test, a commer-cially available NIR instrument (Model 6500, FossNIR Systems, Silver Springs, USA) generated spectraldata in the wavelength region from 400–2,500 nm.Spectra were acquired after the pulp sample was equil-ibrated in an air-conditioned laboratory at 22–25
°
C.
75 durian fruit were used for the experiment.External evaluation of different maturity stages wasperformed by experienced harvesters. The pulp of thefruit was scored by a sensory panel for flesh colour,odour, sweetness, nutty taste, texture, flesh fibre, andseeds. Each fruit was then measured for its solublesolids content, total sugar and dry weight.
Results and Discussion
Maturity evaluated by experienced harvesters was sig-nificantly correlated with the fruit maturity deter-mined by the sensory panel, with an R
2
value of 0.99(Figure 1). Days to ripen of each fruit after harvest alsoshowed a good correlation with the sensory panel’sevaluation, with an R
2
value of 0.96 (Figure 2). Com-parison of taste panel results and chemical analysis fortotal soluble solids (˚Brix), total sugar (%) and dryweight (%) also showed significant correlation withR
2
values of 0.99, 0.98 and 0.97, respectively (Figure3). Table 1 shows that there was a statistically signif-icant difference in soluble solids and total sugarbetween 50, 60, 70 and 80% maturity, and a significantdifference in dry weight between 50, 60 and 70%maturity, but no difference in dry weight between 70and 80% maturity.
For the nondestructive X-ray CT test, the intensityof the images differed for various parts of the fruit(Figure 4). The darkest region of the image corre-sponded to the air space outside the fruit, between peeland pulp, and between pulp and seed. A grey region ofthe image corresponded to the peel, while a lightergrey region corresponded to the pulp. The whitestregion corresponded to the seed. The pulp of themature fruit had a lighter image intensity than theimmature one.
Table 1.
Stage of durian fruit maturity evaluated by a taste panel, and measurement of the soluble solids content,total sugar and dry weight. Means within a column followed by different letters are significantly different(P
F
0.01).
% maturity evaluated by sensory panelists
Soluble solids(
°
Brix)Total sugar
(%)Dry weight
(%)
50 16.0 d 6.79 d 5.13 c
60 19.4 c 9.26 c 6.10 b
70 23.4 b 11.89 b 7.45 a
80 26.1 a 13.30 a 7.75 a
F-test **
a
** **
CV
b
(%) 10.83 16.78 12.98
a
** = statistically significant (P
F 0.01)
b
CV = coefficient of variance
Quality assurance in agricultural produce,edited by G.I. Johnson, Le Van To, Nguyen Duy Duc and M.C. Webb.
ACIAR Proceedings 100(printed version published in 2000)
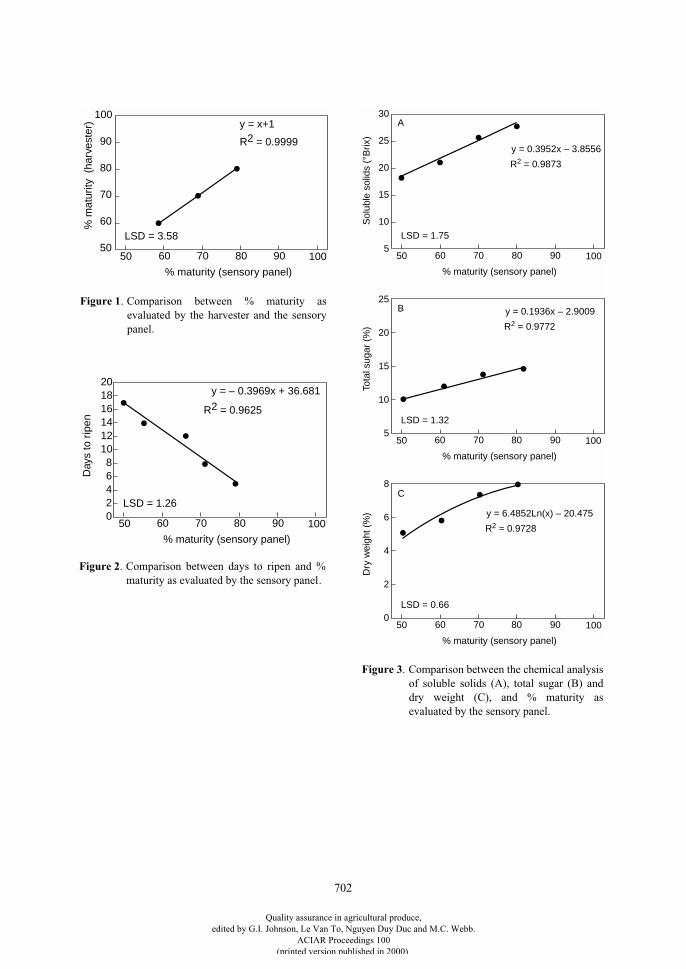
702
50
60
70
80
90
100
% maturity (sensory panel)
50 70 90 100
% m
atur
ity (
harv
este
r)
60 80
LSD = 3.58
y = x+1
R2 = 0.9999
5
10
20
30
% maturity (sensory panel)
50 70 90 100
Sol
uble
sol
ids
(°B
rix)
60 80
LSD = 1.75
y = 0.3952x – 3.8556
R2 = 0.9873
15
25
5
10
20
% maturity (sensory panel)
50 70 90 100
Tota
l sug
ar (
%)
60 80
LSD = 1.32
y = 0.1936x – 2.9009
R2 = 0.9772
15
25
0
2
6
% maturity (sensory panel)
50 70 90 100
Dry
wei
ght (
%)
60 80
LSD = 0.66
y = 6.4852Ln(x) – 20.475
R2 = 0.9728
4
8C
B
A
Figure 1
. Comparison between % maturity asevaluated by the harvester and the sensorypanel.
02
6
10
14
20
% maturity (sensory panel)
50 70 90 100
Day
s to
rip
en
60 80
LSD = 1.26
y = – 0.3969x + 36.681
R2 = 0.9625
4
8
12
1618
Figure 2
. Comparison between days to ripen and %maturity as evaluated by the sensory panel.
Figure 3
. Comparison between the chemical analysisof soluble solids (A), total sugar (B) anddry weight (C), and % maturity asevaluated by the sensory panel.
Quality assurance in agricultural produce,edited by G.I. Johnson, Le Van To, Nguyen Duy Duc and M.C. Webb.
ACIAR Proceedings 100(printed version published in 2000)
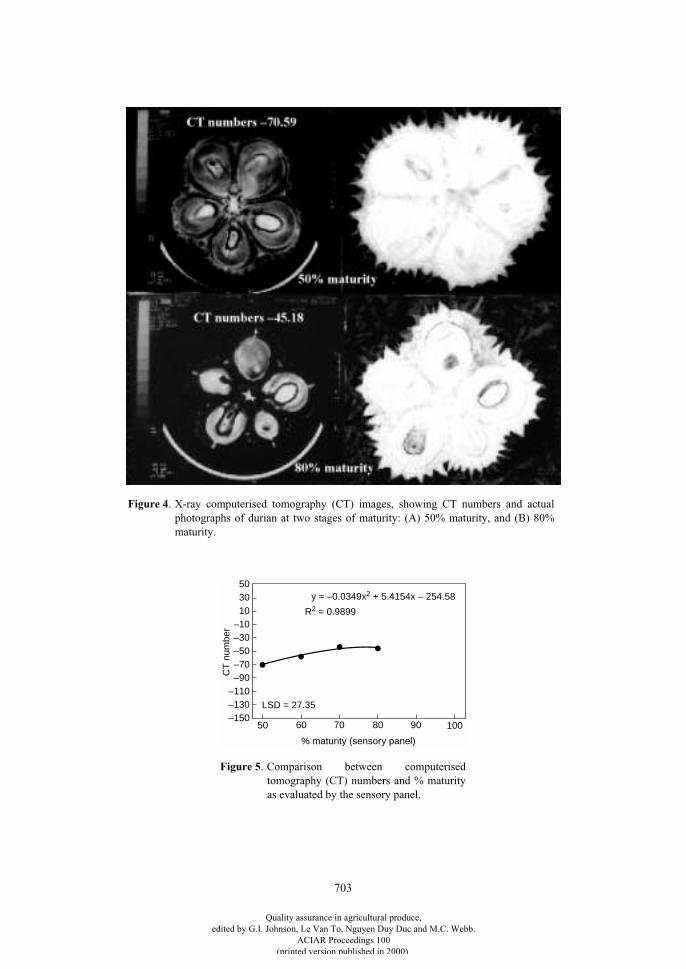
703
–150–130
–10
% maturity (sensory panel)
50 70 90 100
CT
num
ber
60 80
LSD = 27.35
y = –0.0349x2 + 5.4154x – 254.58
R2 = 0.9899
–70
503010
–30–50
–90–110
Figure 5
. Comparison between computerisedtomography (CT) numbers and % maturityas evaluated by the sensory panel.
Figure 4
. X-ray computerised tomography (CT) images, showing CT numbers and actualphotographs of durian at two stages of maturity: (A) 50% maturity, and (B) 80%maturity.
Quality assurance in agricultural produce,edited by G.I. Johnson, Le Van To, Nguyen Duy Duc and M.C. Webb.
ACIAR Proceedings 100(printed version published in 2000)
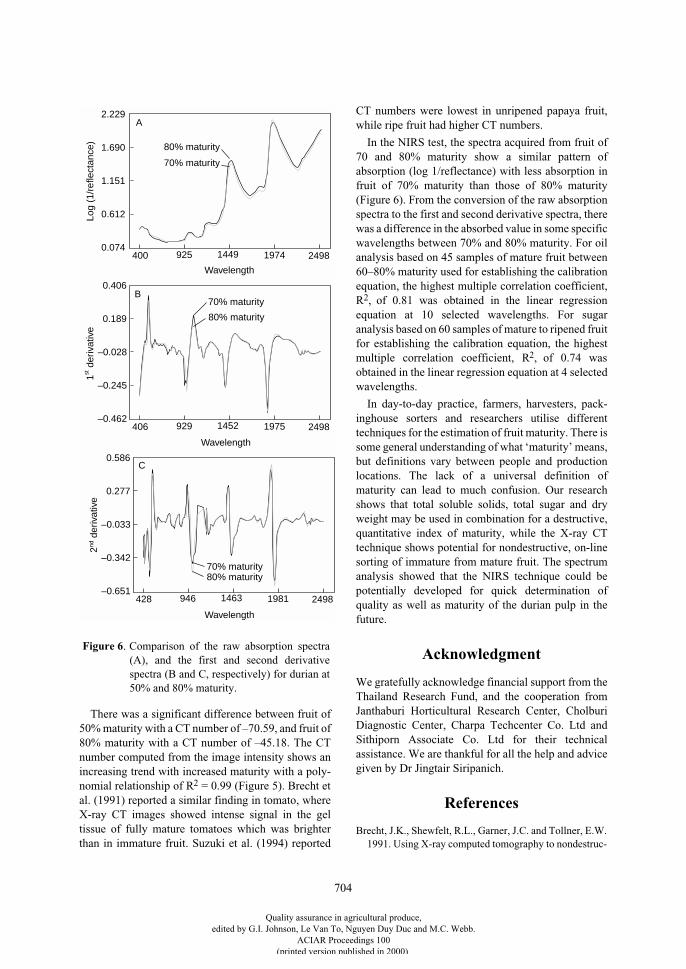
704
There was a significant difference between fruit of50% maturity with a CT number of –70.59, and fruit of80% maturity with a CT number of –45.18. The CTnumber computed from the image intensity shows anincreasing trend with increased maturity with a poly-nomial relationship of R
2
= 0.99 (Figure 5). Brecht etal. (1991) reported a similar finding in tomato, whereX-ray CT images showed intense signal in the geltissue of fully mature tomatoes which was brighterthan in immature fruit. Suzuki et al. (1994) reported
CT numbers were lowest in unripened papaya fruit,while ripe fruit had higher CT numbers.
In the NIRS test, the spectra acquired from fruit of70 and 80% maturity show a similar pattern ofabsorption (log 1/reflectance) with less absorption infruit of 70% maturity than those of 80% maturity(Figure 6). From the conversion of the raw absorptionspectra to the first and second derivative spectra, therewas a difference in the absorbed value in some specificwavelengths between 70% and 80% maturity. For oilanalysis based on 45 samples of mature fruit between60–80% maturity used for establishing the calibrationequation, the highest multiple correlation coefficient,R
2
,
of 0.81 was obtained in the linear regressionequation at 10 selected wavelengths. For sugaranalysis based on 60 samples of mature to ripened fruitfor establishing the calibration equation, the highestmultiple correlation coefficient, R
2
,
of 0.74 wasobtained in the linear regression equation at 4 selectedwavelengths.
In day-to-day practice, farmers, harvesters, pack-inghouse sorters and researchers utilise differenttechniques for the estimation of fruit maturity. There issome general understanding of what ‘maturity’ means,but definitions vary between people and productionlocations. The lack of a universal definition ofmaturity can lead to much confusion. Our researchshows that total soluble solids, total sugar and dryweight may be used in combination for a destructive,quantitative index of maturity, while the X-ray CTtechnique shows potential for nondestructive, on-linesorting of immature from mature fruit. The spectrumanalysis showed that the NIRS technique could bepotentially developed for quick determination ofquality as well as maturity of the durian pulp in thefuture.
Acknowledgment
We gratefully acknowledge financial support from theThailand Research Fund, and the cooperation fromJanthaburi Horticultural Research Center, CholburiDiagnostic Center, Charpa Techcenter Co. Ltd andSithiporn Associate Co. Ltd for their technicalassistance. We are thankful for all the help and advicegiven by Dr Jingtair Siripanich.
References
Brecht, J.K., Shewfelt, R.L., Garner, J.C. and Tollner, E.W.1991. Using X-ray computed tomography to nondestruc-
Wavelength
400 925 1974 2498
Log
(1/r
efle
ctan
ce)
1449
2.229
0.074
0.612
1.151
1.690 80% maturity
70% maturity
A
Wavelength
406 929 1975 2498
1st d
eriv
ativ
e
1452
0.406
–0.462
–0.245
–0.028
0.189 80% maturity
70% maturityB
Wavelength
428 946 1981 2498
2nd d
eriv
ativ
e
1463
0.586
–0.651
–0.342
–0.033
0.277
70% maturity80% maturity
C
Figure 6
. Comparison of the raw absorption spectra(A), and the first and second derivativespectra (B and C, respectively) for durian at50% and 80% maturity.
Quality assurance in agricultural produce,edited by G.I. Johnson, Le Van To, Nguyen Duy Duc and M.C. Webb.
ACIAR Proceedings 100(printed version published in 2000)
705
tively determine maturity in green tomatoes.HortScience, 26, 45–47.
Diener, R.G., Mitchell, J.P. and Rhoten, M.L. 1970. Usingan X-ray image scan to sort bruised apples. AgriculturalEngineering, 51, 356–361.
Dull, G.G. 1984. Measurement of cantaloupe quality withnear infrared spectrophotometry. Transactions of theASAE (American Society of Agricultural Engineers), 32,321–326.
Finney, E.E. and Norris, K.H. 1973. X-ray images of hollowheart potatoes in water. American Potato Journal, 50, 1–8.
Kawano, S., Fujiwara, K. and Iwamoto, M. 1993.Nondestructive determination of sugar content inSatsuma mandarin using near infrared (NIR)transmittance. Journal of the Japanese Society forHorticultural Science, 62, 465–470.
Kawano, S., Watanabe, H. and Iwamoto, M. 1992.Nondestructive determination of sugar content in intactpeaches by near infrared spectroscopy with fiber optics ininteractance mode. Journal of the Japanese Society forHorticultural Science, 61, 445–451.
Lee, K.J., Hruschka, W.R., Abbott, J.A., Noh S.H. andChen, Y.R. 1997. Comparison of statistical methods forcalibrating soluble solid measurement from NIRinteractance in apples. Proceedings of the Korean Societyfor Agricultural Machinery 1997 Winter Conference, 2,206–212.
Marcelis, L.F.M., Verkerke, D.R., van der Burg, W.J.,Aartse, J.W., Frankhuizen, R. and Boekestein, A. 1995.Non-destructive evaluation of internal quality of radishtubers using specific gravity. Acta Horticulturae, 379,527–535.
Norris, K.H. and Hart, J.R. 1965. Direct spectrophotometricdetermination of moisture content of grain and seeds.Proceedings of the 1963 international symposium onhumidity and moisture, volume 4. New York, Reinhold,19–25.
Pieris, K.H.S., Dull, G.G., Leffler, R.G. and Kays, S.J. 1998.Near-infrared spectrometric method for nondestructivedetermination of soluble solids content of peaches.Journal of the American Society for HorticulturalScience, 123, 898–905.
Sonego, L., Ben-Arie, R., Raynal, J. and Pech, J.C. 1995.Biochemical and physical evaluation of textural charac-teristics of nectarines exhibiting woolly breakdown:NMR imaging, X-ray computed tomography and pectincomposition. Postharvest Biology and Technology, 5,187–198.
Suzuki, K., Tajima, T., Takano, S., Asano, T. and Hasegawa,T. 1994. Nondestructive methods for identifying injury tovapor heat-treated papaya. Journal of Food Science, 59,855–857.
Tollner, E.W. 1993. X-ray technology for detecting physicalquality attributes in agricultural produce. PostharvestNews Information, 4(6), 149N–155N.
Yantarasri, T., Sornsrivichai, J. and Chen, P. 1997a.Nondestructive X-ray and NMR imaging for qualitydetermination of mango fruit. Presented at the 5
th
International Symposium on Fruit, Nut and VegetableProduction Engineering, Davis, California.
Yantarasri, T., Kawano, S., Sornsrivichai, J. and Chen, P.1997b. Nondestructive NIR technique for sugardetermination in intact mango. Presented at the 5
th
International Symposium on Fruit, Nut and VegetableProduction Engineering, Davis, California.
Yantarasri, T., Sornsrivichai, J. and Chen, J. 1998. X-ray andNMR for nondestructive internal quality evaluation ofdurian and mangosteen fruits. Acta Horticulturae, 464,97–101.
Yantarasri, T. and Sornsrivichai, J. 1998. Internal qualityevaluation of tangerines. Acta Horticulturae, 464, 494.
Yantarasri, T., Sornsrivichai, J. and Kalayanamitra, K.1999. Nondestructive techniques for quality evaluation ofpineapple fruits. The Third International PineappleSymposium, Pattaya, Thailand (in press).
Quality assurance in agricultural produce,edited by G.I. Johnson, Le Van To, Nguyen Duy Duc and M.C. Webb.
ACIAR Proceedings 100(printed version published in 2000)
706
Quality Assurance for Export-oriented Citrus and Tomato Fruit in Morocco
A. Ait-Oubahou and M. El-Otmani*
Abstract
Morocco’s horticulture sector is among the largest in the southern Mediterranean region in terms of productionand export. The country’s climatic conditions allow for the production of a wide range of fruits and vegetablesof temperate, subtropical and tropical types. Annually, Morocco produces about 6–7 million t of fruits andvegetables, including 1.5 million t of citrus fruits and 450,000–750,000 t of tomatoes. Average exportquantities represent about 550,000–600,000 t for citrus and 230,000–250,000 t for fresh tomato. The dominantdestination is the European Union markets because of proximity, historical ties (mainly with France andSpain), and trade agreements with many European countries. Since 1986, the year in which Spain and Portugalbecame full members of the European Economic Community, Moroccan horticultural exports have been facingvarious barriers and difficulties regarding access to European Union markets. This type of protection aims toreduce free access to European markets and thus to reduce competition between Moroccan products and localproduction in Europe. These barriers include sanitary measures, quality control at ports of entry, entry fees, andquotas per month for specific products, including fruits and vegetables. As more than 90% of our exportedhorticultural produce has European Union markets as its final destination, Moroccan professionals have beenobliged to develop appropriate means and techniques to improve quality and produce fruits and vegetables thatare more competitive in the international markets, particularly those of Europe and North America.
M
OROCCO
’
S
CITRUS
industry is one of the largest inthe Mediterranean basin in terms of land occupation(75,000 ha), with annual production oscillating from1–1.5 million t. Citrus fruit is by far the most importanthorticultural export crop, with an annual average of550,000–600,000 t destined to European markets(MAMVA 1997). Harvest season starts with veryearly varieties such as ‘Bekria’ in late September andends in June with late-season cultivars such as‘Valencia’ late orange. Although several varieties areproduced commercially, the main varieties which areexported are Clementine mandarins, including ‘Fina’and ‘Nour’, and oranges represented by ‘Washington’navel and ‘Valencia’ late. Clementine mandarin andnavel and ‘Valencia’ late oranges represent more than80% of citrus plantations. In recent years, plantationsof new varieties, mainly the Clementine mandarintypes such as ‘Nour’, ‘Afourer’ and ‘Ortanique’ areincreasing. Over 70 packinghouses exist in the
country, treating over 1.2 million t of fruit (EACCE1995). About 30% of that is ‘discarded’ (unsuitable forexport) fruits which are sold either in the local marketor used for processing. The percentage of discardedfruits is still high due to the requirements of EuropeanUnion (EU) markets and the severe certification regu-lations for export. The citrus export volume to EUmarkets represents more than 75% of the total export(MAMVA 1997). France alone imports about 30%and Germany 15% of the total exported citrus fruit.Other destinations include Russia (9%), Canada (5%),Poland and Norway (importing 4% each).
The tomato export industry is based on winter pro-duction and export to Europe is allowed from Octoberto the end of April, with quotas for each month and anannual total of 150,000 t. In the 1998/99 season,Morocco exported about 230,000 t of tomato,compared to 90,000 in the 1989/90 season (EACCE1999). This large increase in export quantity is mainlydue to the export of 35,000–40,000 t to the Russianmarket. Over the last decade there has been a sub-stantial increase in export destinations as well as a
* Institut Agronomique et Vétérinaire Hassan II, Complexe d’Agadir, BP 18/S, 80 001 Agadir, Morocco.
Quality assurance in agricultural produce,edited by G.I. Johnson, Le Van To, Nguyen Duy Duc and M.C. Webb.
ACIAR Proceedings 100(printed version published in 2000)
707
significant improvement in production techniques.Most of tomatoes are exported to France (more than80%), however this is only allowed in off-season whenthe European weather conditions do not permit a com-petitive production.
Since 1986, the year that Spain and Portugal enteredthe EU, different agreements have been signed withMorocco in order to limit this country’s free access toEuropean markets and thus to protect their own pro-duction. Preferential access was granted for someproducts that are not produced in Europe, while othercrops were subjected to different restrictions,including annual and monthly quotas, a reference pricesystem, and minimum prices under which taxes wereimposed to the export contingent for a certain period.New restrictions include pesticide residue levels in theproducts, sanitary certification, declaration of impor-tation, banning of certain chemicals, and stipulationson packaging types. In order to overcome thesebarriers and restrictions, Moroccan professionals havebeen obliged to meet all the requirements for export toEU markets. Nowadays, new strategies are beingdeveloped to comply with the market demand,including sanitary measures and quality considera-tions. The growers and exporters are thus making thenecessary effort to produce and guarantee highproduce quality in the foreign market. New strategiesof production are now employed as well as intro-duction of new varieties with sought-aftercharacteristics, including easy-to-peel Clementinemandarins (‘Nour’ and ‘Afourer’) and long shelf-lifetomatoes.
For tomato, greenhouse production is dominant forwinter crops while the open field is largely practicedfor processing and summer crops. The production isdone in a way to assure tracing the product pre andpostharvest. Professionals are helped and supervisedby specialists from research institutes, growers’ asso-ciations, private consultants and experts. Thisassociation and collaboration between institutions andgrowers has improved production practices such asirrigation and fertilisation technology, quality andgrade standards, and postharvest handling of differentcrops.
Quality Control System
Quality control and standardisation are under theresponsibility of a public sector enterprise known asEtablissement Autonome du Contrôle et de la Coordi-nation des Exportations (EACCE). Other activities ofthis institution include quality inspection (maturity,
pesticide residues etc.), certification for exportproducts (sanitary as well quality standards) and thecoordination of exported quantities through consul-tation with exporting groups and associations. Twolaboratories of EACCE, one in Casablanca andanother in Agadir, are used for quality analysis ofdifferent crops. Quality inspection and certificationtake place at the port for sea shipments or in the pack-inghouse for land transport using refrigerated trucksand containers. EACCE has offices in severalcountries in Europe to follow the quality, quantitiesand the prices of the products. Adherence to exportedquantities quotas, periods of export, marketing regula-tions and other clauses of the agreements between EUand Morocco are the responsibility of EACCE. Thisquality control organisation also gives license andauthorisation for packinghouses to operate for exportpurposes. Different criteria related to quality areevaluated objectively and subjectively based onimporters’ standards and requirements. Société Agric-ole des Services au Maroc (SASMA), an advisoryinstitution financed by growers’ associations of citrusand vegetables, is also participating, through technicalsupport and technology transfer. This institution haslaboratories for quality and pesticide residue analysis.Growers can seek information and support free ofcharge, and receive recommendations for leaf, soil,water, and pesticide residue analysis from SASMA fora minimal fee.
Preharvest Considerations for Quality Assurance
Both EACCE and SASMA, as well as other institu-tions such as Institut Agronomique et Vétérinaire(IVA) Hassan II, Institut National de la RechercheAgronomique (INRA), Plant Protection Services andthe logistics organisation, are heavily involved withgrowers and exporters in order to produce and ensuregood quality and safe produce for export (Figure 1).Implementation of a field sanitary program to identifyand prevent factors that will adulterate the product isbecoming an important concern for growers andexporters. Nowadays, fruit production and handlingtracing is required by the importers and thus all majoroperations, from planting to export, must be docu-mented. This approach ensures a better understandingof the steps and conditions to which the fruit has beensubject.
Quality assurance in agricultural produce,edited by G.I. Johnson, Le Van To, Nguyen Duy Duc and M.C. Webb.
ACIAR Proceedings 100(printed version published in 2000)
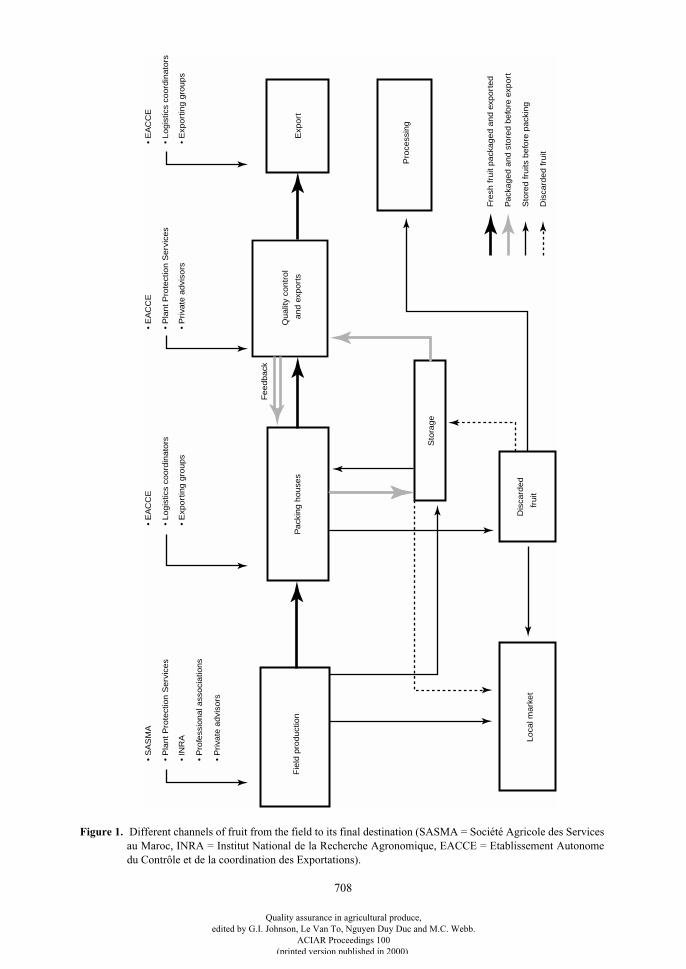
708
• S
AS
MA
• P
lant P
rote
ctio
n S
erv
ices
• IN
RA
• P
rofe
ssio
nal a
ssoci
atio
ns
• P
riva
te a
dvi
sors
• E
AC
CE
• Logis
tics
coord
inato
rs
• E
xport
ing g
roups
• E
AC
CE
• P
lant P
rote
ctio
n S
erv
ices
• P
riva
te a
dvi
sors
• E
AC
CE
• Logis
tics
coord
inato
rs
• E
xport
ing g
roups
Exp
ort
Qualit
y co
ntr
ol
and e
xport
sP
ack
ing h
ouse
s
Feedback
Fie
ld p
roduct
ion
Loca
l mark
et
Dis
card
ed
fruit
Sto
rage
Pro
cess
ing
Fre
sh fru
it pack
aged a
nd e
xport
ed
Pack
aged a
nd s
tore
d b
efo
re e
xport
Sto
red fru
its b
efo
re p
ack
ing
Dis
card
ed fru
it
Figure 1.
Different channels of fruit from the field to its final destination (SASMA = Société Agricole des Servicesau Maroc, INRA = Institut National de la Recherche Agronomique, EACCE = Etablissement Autonomedu Contrôle et de la coordination des Exportations).
Quality assurance in agricultural produce,edited by G.I. Johnson, Le Van To, Nguyen Duy Duc and M.C. Webb.
ACIAR Proceedings 100(printed version published in 2000)
709
In addition, sanitary and environmental issues arebecoming a major concern in modern agriculture. Fortomato production, particularly for the cultivars thatare sensitive to nematodes, the use of methyl bromidefor soil disinfestation will be totally banned in the nearfuture. At the same time, residues of pesticides andheavy metals in the fruits are not tolerated. The newtrend is to use alternatives of disinfestation, such ascultural practices, solarisation, grafted tomatoes usingtolerant rootstocks, and implementing the integratedpest management (IPM) strategy. The IPM approach isspreading rapidly among growers in the major areasproducing ‘primeurs’ (winter crops). Other preharvestfactors that are regularly monitored include irrigationwater quality (with respect to pesticides, nitrates andheavy metals), application methods and nature ofchemicals, and hygiene of field workers—mainlyduring the harvest season where the fruits can be easilycontaminated when injured or bruised. Equipment andmaterials used during harvest are regularly cleaned.
Postharvest Considerations for Quality Assurance
Harvested fruits undergo many changes which lead tosenescence and deterioration. The quality of citrus andtomato fruits is determined by preharvest factors (e.g.variety, maturity stage and cultural practices) andpostharvest care during harvesting, handling, pack-aging, transport, storage, and distribution. Each stepmust be controlled and verified in order to meet qualitystandards. Citrus and tomato packinghouses are nowwell convinced of the necessity for certification andthus many of them are implementing strategies tocomply with quality system and InternationalStandards Organisation (ISO) 9000 standards. Someof the aspects that are influenced by certificationinclude technical advising, handling, packaging,storage and export systems.
For packing fruits, it is advised that all packing-houses must be isolated from other industrial facilitiesto avoid any contamination. Several units which werelocated in urban areas have been moved outside thecities, and are now often built in the production farms.For sanitary reasons, all facility openings aremonitored to avoid the entry of animals like birds,lizards, cats etc. Nets are placed on windows and otheropenings.
The main operations which have a direct effect onpostharvest quality are dumping, sorting, sizing,treatment application, packing, and loading ontopallets. Each operation must fulfill the requiredstandards of quality and hygiene. Every point must bechecked daily to prevent any damage or contaminationof fruits. Different measures, including monitoring,prevention and correction, are taken for each criticalpoint. Continuous monitoring of workers’ activities,and quality inspection at different levels of the packingline, is required. Packing lines are designed in such away as to allow easy access to different operationsfrom dumping fruits to packing tables. Separation ofincoming fruits and discarded fruits from the packingline area is obligatory. The dumping area is alsoseparated from the area where other operations ofhandling are executed. Waste and decayed fruits areremoved daily to avoid any contamination of thefacility, and decayed fruits are dumped in tanks orbuckets containing a solution of sodium hypochlorite.The packinghouses are checked routinely to avoidentry of birds, rats and other contaminants such asinsects. Disinfestation of the facility is done frequentlythrough monitoring the level of contamination and thebuild-up of pathogens. Packing line equipment iscleaned daily and sanitised using a sodiumhypochlorite solution. Waste and foreign materials(debris, paper etc.) are removed daily.
Fruits are sorted into different sizes and packagedaccording to the market requirements and differentcountries’ regulations. Fruits are handled in such away that none of the different operations will causeany damage. The packing boxes and material must becertified by EACCE before use and no reuse of exportboxes is tolerated. The packages are designed toconform with EU standards and must contain infor-mation regarding the product variety, size, colour,number of fruits or weight, origin of the product, pack-inghouse and grower’s code, exporting group, productcategory, type of postharvest treatment applied, lengthand width of the package, and the number of units perpallet. Other precautions are taken in order tominimise postharvest problems during export andalong the marketing channels. The identification of theprobable hazards and means of prevention arepresented in Table 1.
Quality assurance in agricultural produce,edited by G.I. Johnson, Le Van To, Nguyen Duy Duc and M.C. Webb.
ACIAR Proceedings 100(printed version published in 2000)
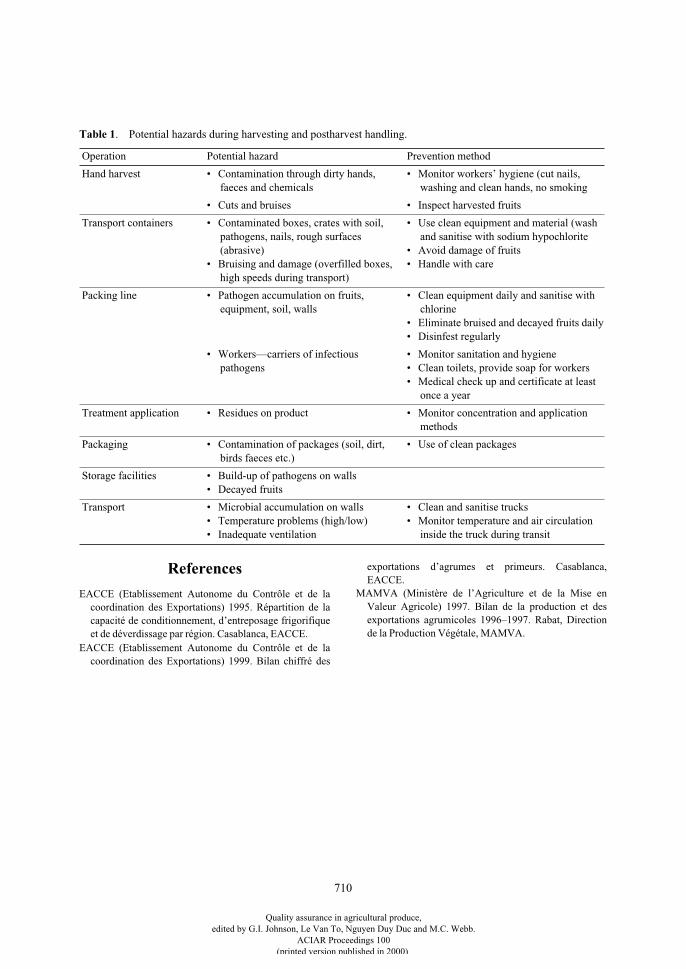
710
References
EACCE (Etablissement Autonome du Contrôle et de lacoordination des Exportations) 1995. Répartition de lacapacité de conditionnement, d’entreposage frigorifiqueet de déverdissage par région. Casablanca, EACCE.
EACCE (Etablissement Autonome du Contrôle et de lacoordination des Exportations) 1999. Bilan chiffré des
exportations d’agrumes et primeurs. Casablanca,EACCE.
MAMVA (Ministère de l’Agriculture et de la Mise enValeur Agricole) 1997. Bilan de la production et desexportations agrumicoles 1996–1997. Rabat, Directionde la Production Végétale, MAMVA.
Table 1
. Potential hazards during harvesting and postharvest handling.
Operation Potential hazard Prevention method
Hand harvest • Contamination through dirty hands, faeces and chemicals
• Monitor workers’ hygiene (cut nails, washing and clean hands, no smoking
• Cuts and bruises • Inspect harvested fruits
Transport containers • Contaminated boxes, crates with soil, pathogens, nails, rough surfaces (abrasive)
• Bruising and damage (overfilled boxes, high speeds during transport)
• Use clean equipment and material (wash and sanitise with sodium hypochlorite
• Avoid damage of fruits• Handle with care
Packing line • Pathogen accumulation on fruits, equipment, soil, walls
• Clean equipment daily and sanitise with chlorine
• Eliminate bruised and decayed fruits daily• Disinfest regularly
• Workers—carriers of infectious pathogens
• Monitor sanitation and hygiene• Clean toilets, provide soap for workers• Medical check up and certificate at least
once a year
Treatment application • Residues on product • Monitor concentration and application methods
Packaging • Contamination of packages (soil, dirt, birds faeces etc.)
• Use of clean packages
Storage facilities • Build-up of pathogens on walls• Decayed fruits
Transport • Microbial accumulation on walls• Temperature problems (high/low)• Inadequate ventilation
• Clean and sanitise trucks• Monitor temperature and air circulation
inside the truck during transit
Quality assurance in agricultural produce,edited by G.I. Johnson, Le Van To, Nguyen Duy Duc and M.C. Webb.
ACIAR Proceedings 100(printed version published in 2000)

711
WorkshopReports
Quality assurance in agricultural produce,edited by G.I. Johnson, Le Van To, Nguyen Duy Duc and M.C. Webb.
ACIAR Proceedings 100(printed version published in 2000)
713
Workshop AFruit Quality
The Fruit Quality Workshop was facilitated by Colin Bunt and Marie Piccone of PicconePHC, Australia, and was attended by over 45 conference delegates, representing manycountries and professional disciplines and each with a wealth of experience.
Workshop objectives
The primary objectives of the workshop were to:
• Facilitate a ‘hands on’ exercise in working in Quality Teams, where groups of peoplewith differing skills and backgrounds work together in solving common problems.
• Consider a range of issues pertinent to the successful development of quality systems infood industries.
Activities
The workshop participants broke into five groups, each of which spent time considering oneof the following questions:
• How best can quality networks and teams be established and what are the key successfactors in making quality networks function effectively?
• How can market research be used in focusing and ‘driving’ the development of qualitysystems in the fruit industry?
• How can we measure the true costs of quality and the cost benefits of a well designed andfunctioning quality system?
• How can quality systems be used to identify, integrate and successfully manageregulatory, business and marketing issues?
• Why is the development and use of a ‘common language’ so important in thedevelopment and implementation of quality systems and how can we ensure a commonunderstanding amongst industry sectors?
The questions put to the workshop teams were not meant to be ‘easy’. What they weredesigned to do was to stimulate discussion amongst the team members and make peoplethink—often about subjects they had not considered before or had limited direct experienceof, hence the requirement for a Quality Team approach.
Outcomes
There was very enthusiastic participation from all workshop attendees. The generalconsensus was that the workshop was ‘good work, good experience and good fun’.
Every person attending the workshop made a contribution to its success.
Many relevant issues and key success factors were identified and discussed in regard todeveloping quality systems in the food industry.
The workshop proved a valuable exercise in the importance of establishing and working inQuality Teams and the benefits to all parties that can result. It was also recognised by thegroup that establishment of Quality Teams was the first step in effective quality planning.
Marie Piccone and Colin Bunt
Co-convenors
Quality assurance in agricultural produce,edited by G.I. Johnson, Le Van To, Nguyen Duy Duc and M.C. Webb.
ACIAR Proceedings 100(printed version published in 2000)
714
Workshop BShip Fumigation
This workshop was attended by 28 persons, who actively questioned presentations andparticipated in discussions arising from presentations made during the workshop.
In-ship fumigation of grains and other commodities is a disinfestation technique that has beendeveloped over the past 25 years. The technique is applied in many countries around the worldfor both static (in port) and in-transit disinfestation for quarantine or trade (contract) reasons.Worldwide it is estimated that some 40–50 million tonnes of grain and other commoditieswere disinfested using this technique during 1998.
This workshop specifically drew attention to the extent to which this fumigation technique isused in the South Asian region. For example, during 1999 in India, Vietnam and Thailandalone, it is estimated that approximately 15 million tonnes of grain were disinfested whileloaded in ships. In Vietnam this involved about 400 vessels, of which approximately 70%were tween deckers.
Presently in the South Asian region, more than 80% of these fumigations are undertaken usingmethyl bromide. Use of this fumigant is subject to international controls through the MontrealProtocol due to its powerful ozone-depleting properties, and its use in developing countries(for applications other than quarantine and pre-shipment treatments) is presently due to bephased out by 2015.
The workshop commenced with three introductory presentations by members of theInternational Maritime Fumigation Organisation (IMFO) that set the scene with respect to:
• current ship fumigation practice worldwide, by Mr Chris Watson;
• current ship fumigation in Vietnam, by Mr Nguyen Bao Son; and
• new developments in ship fumigation practice, by Mr Dennis Bureau.
Given that in-ship fumigation is an established disinfestation technique in the region, and thatmuch of the grain treated in this manner is traded internationally, the speakers highlighted theneed to identify safe and effective alternatives to methyl bromide (Watson et al. 1999, Watsonet al. these proceedings) to allow the continued use of this technique.
Presently phosphine is the only replacement fumigant available for immediate use with thistechnique. However, the need to use this fumigant correctly, and sustainably, was highlightedand subject to considerable discussion during presentations at the workshop. Specificallyattention was drawn to the need to:
• ensure that fumigant is evenly distributed throughout the stow;
• ensure that lethal fumigant concentrations are achieved and maintained overinternationally accepted exposure periods; and
• agree and harmonise application techniques and dosage regimes on a regional basis tofacilitate regional and international trade.
Quality assurance in agricultural produce,edited by G.I. Johnson, Le Van To, Nguyen Duy Duc and M.C. Webb.
ACIAR Proceedings 100(printed version published in 2000)
715
With these objectives in mind, participants at the workshop suggested that steps should betaken within the ASEAN region to:
• obtain regional recognition of phosphine as an alternative to methyl bromide for in-shipfumigation;
• obtain regional recognition of phosphine as a disinfestation procedure for phytosanitaryand quarantine purposes; and
• codify approved methods for safe and effective in-ship fumigation.
These proposals were submitted to the seminar organisers as recommendations from thisworkshop for inclusion in the seminar outcomes/recommendations.
Reference
Watson, C.R., Pruthi, N., Bureau, D., Macdonald, C. and Roca, J. 1999. Intransit disinfestation ofbulk and bagged commodities: a new approach to safety and efficacy. In: Jin Zuxun, Liang Quan,Liang Yongsheng, Tan Xianchang, and Guan Lianghua, ed., Stored product protection.Proceedings of the 7
th
international working conference on stored product protection, Beijing,People’s Republic of China, 14–19 October 1998, volume 1. Chengdu, Sichuan Province, SichuanPublishing House of Science and Technology, 462–476.
C.R. Watson and J.E. van S. Graver
Co-convenors
Quality assurance in agricultural produce,edited by G.I. Johnson, Le Van To, Nguyen Duy Duc and M.C. Webb.
ACIAR Proceedings 100(printed version published in 2000)
716
Workshop CContaminant Management
This workshop was attended by about 15 delegates. From the floor, a range of contaminantsof agricultural produce of concern were recognised. These included:
1. Pesticides
• Primary applications for control of pests
• Secondary contamination as a result of environmental contamination, drift and in run-off.
2. Mycotoxins
• As natural products of fungal growth
• Highly variable levels of contamination. This raised issues with respect to theirmeasurement.
3. Microbes and microbial endotoxins
•
Listeria, Salmonella, Staphylococcus, Esherichia coli
etc.
• Microbial endotoxins.
The concern expressed was a result of perceived impacts in the areas of
a. Human health
• Direct toxic effects
• Indirect effects, e.g. carcinogenicity,
b. Animal health
• Loss of production
• Antibiotics and reduced effectiveness,
c. Responsible agriculture
• Environmental protection.
Confronting the issues
In confronting the issues involved, a number of factors were suggested as important andneeding better definition. These included the following factors:
• acceptable levels of contamination;
• direct toxic effects where there is heavy contamination;
• indirect effects, e.g. carcinogenicity;
• setting maximum residue limits (MRLs), which may vary from country to country,depending on consumption patterns;
• health;
• trade issues;
• meeting MRLs;
• withholding periods and their enforcement; and
• education about all these factors and with the aim of reducing contamination.
Quality assurance in agricultural produce,edited by G.I. Johnson, Le Van To, Nguyen Duy Duc and M.C. Webb.
ACIAR Proceedings 100(printed version published in 2000)
717
Solutions
Monitoring was suggested as the most urgent need. Issues that emerged in discussionincluded:
• laboratory analysis and aspects such as cost and relative accuracy;
• simple tests, such as enzyme-linked immunosorbent assay (ELISA) techniques, whichdeliver quick, cheaper analysis and the possibility of much more extensive screening toindicate negatives;
• specificity and screening – the most specific is not necessarily the best analysis wherescreening for a group of compounds may yield enough information to allow effectiveaction to be taken; and
• official analytical methods versus simple tests.
Attention was drawn to Kennedy et al. 1998. The executive summary of this book providesan excellent prescription for dealing with contamination of agricultural produce withpesticide residues. The key issues and recommendations to which attention was drawnincluded:
• monitoring of residues in produce and the environment;
• research into contaminant behaviour;
• development of test methods;
• the role of integrated pest management;
• remediation of contaminated produce;
• training and extension; and
• networking and collaboration between researchers and others.
The workshop closed with an affirmation that there was a need for targeted programsadopting these recommendations.
Reference
Kennedy, I.R., Skerritt, J.H., Johnson, G.I. and Highley, E. (ed.) 1998. Seeking agriculturalproduce free of pesticide residues. ACIAR Proceedings No. 85. Canberra, Australian Centre forInternational Agricultural Research, 406p.
Ivan Kennedy and Amanda Hill
Co-convenors
Quality assurance in agricultural produce,edited by G.I. Johnson, Le Van To, Nguyen Duy Duc and M.C. Webb.
ACIAR Proceedings 100(printed version published in 2000)
718
Workshop DGrain Quality Issues
Grain and seed quality problems raised by different countries
Cambodia
Seed germination
Seed storage
Seed vigour
Seed processing
Mill turnout
Damage to grain in the milling process
Vietnam
Red rice contamination
Poor milling yield
Yellowing (grain discoloration), light to heavy
Control of yellowing, important for export trade
Cause of yellowing attributed to moisture, heat, fermentation, and generally referred to asmoist grain damage
Damaged grain due to insect pests
High moisture content during milling
South India
High moisture content at point of sale
Mill-level drying, no mechanical dryers, resulting in spoilage
Different definitions of storage
Farm-level shattering of grain
Thailand
Few problems
Grain too dry, seen as cause of cracking during milling
(note: there are many known causes contributing to cracking)
Adulteration of fragrant rice
Rice for blending of fragrant rice, desired by some importing countries
Philippines
Varietal mixing starting at the farm, and practiced in the mills
Yellowing of grains, particularly heavy for the rainy season harvest
Generally low head rice yields, compared to potential
General issues raised and discussed
• Lack of functional grades and standards in some countries, e.g. Cambodia, Myanmar andPhilippines
Quality assurance in agricultural produce,edited by G.I. Johnson, Le Van To, Nguyen Duy Duc and M.C. Webb.
ACIAR Proceedings 100(printed version published in 2000)
719
• Thailand, India and Vietnam have grades and standards used in their grain tradingsystem
• Quality standards different in different markets
• Grades and standards—need a broader knowledge for commercial trade as againstgovernment trade
• Need for greater harmonisation of grades and standards for the region
• Important quality parameters mentioned: grain type, varietal characteristics, percentageof cracked grains, volume expansion when steamed
• Production issues affecting grain quality
– Uneven crop—water management
– Nutrition
– Seed quality, variety
– Weeds
– Lodging—weather
• Some information is known about factors affecting grain quality but not commonlyavailable to farmers and processors
• Need for measuring performance of different types of processing machines in regard tomilling quality
• Extent of integration of processing operation affects incentives, accountability, andoutput quality
• Need definition for milling degree, or whiteness
• Lack of information on grain drying as it relates to grain quality
• Lack of incentives for grain quality improvement
• Lack of information on appropriate technology for different levels of users
• Lack of information or knowledge on causes of poor grain quality
• Relationship between poor grain quality and losses is directly correlated
• Significance of percentage head rice:
Philippines medium
Hong Kong high
Japan high
Cambodia low (high for small segment of market)
India high
Thailand high
Vietnam high (for export market)
• Priority: minimise yellowing of grain, damage to grain, and control of moisture
• It was noted that there are several underused, large-scale drying projects.
Dante de Padua
Convenor
Quality assurance in agricultural produce,edited by G.I. Johnson, Le Van To, Nguyen Duy Duc and M.C. Webb.
ACIAR Proceedings 100(printed version published in 2000)

721
SessionSummaries
Quality assurance in agricultural produce,edited by G.I. Johnson, Le Van To, Nguyen Duy Duc and M.C. Webb.
ACIAR Proceedings 100(printed version published in 2000)
723
Overview on Quality
Chairs
Mr Nguyen Kim Vu (Post-Harvest Technology Institute, Ho Chi Minh City, Vietnam)
Dr Greg Johnson (Australian Centre for International Agricultural Research)
Rapporteurs
Mr Alistair Hicks (Food and Agriculture Organization of the United Nations)
Prof. Helen Nair (University of Malaya)
Agriculture in the context of regionalisation and globalisation: opportunities and challenges
Mme Bui Thi Lan gave an overview of Vietnamese agriculture, touching on pre- and post-1998 influencing factors in relation to national economic development. In this economy-in-transition, agricultural reforms (or renovations) had a substantial impact, resulting in a4.5–5% agricultural annual growth rate. Vietnam is now among the leaders in the export ofrice, coffee and cashew nut. Key aspects of the policies are:
• expansion and diversification of trade activities;
• promotion of large-scale foreign direct investment;
• integration into the world trade system through the Association of South-East AsianNations (ASEAN), Asia–Pacific Economic Cooperation (APEC), Common EffectivePreferential Tariff (CEPT) and the ASEAN Free Trade Area (AFTA); and
• negotiating access to the World Trade Organization (WTO).
These opportunities, challenges and measures will ensure new opportunities for Vietnam’sagriculture, ensuring a bright future for the small farmers who are the backbone of thecountry.
Growth benefits of a broad-based approach to postharvest systems development
Dr Francesco Goletti presented an integrated tripartite view of globalisation, postharvestsystems development and agro-industry development. He argued that:
• globalisation and postharvest systems have a mutual synergy and importance indeveloping countries;
• a broad-based approach to postharvest and agroindustry development, using small andmedium enterprises, is the engine of growth; and used
• agro-industry in the form of the starch industry in Vietnam as a case study of thisdevelopment—originating in small enterprises, and his modelling showed the potentialfor development across a continuum, with small and medium feeding the large andmultinational concerns. There is potential to enhance income generation for the smallfarmers engaged in efficient starch agro-industry.
Quality assurance
The concept and its evolution was presented by Dr Wee Chong Wong. Pre and postharvestresearch is concerned with optimisation of yield, shelf life and nutritional value, and
Quality assurance in agricultural produce,edited by G.I. Johnson, Le Van To, Nguyen Duy Duc and M.C. Webb.
ACIAR Proceedings 100(printed version published in 2000)
724
minimisation of waste, cost, pests and diseases. Globalisation encourages removal of non-tariff barriers, and international standards are concerned with environmental quality, andworkplace health and safety. Legal obligations apply to growers and researchers alike, as wellas to packers, retailers and shippers. The paper discussed an integrated management systemcovering quality (International Standards Organisation—ISO 9001), environmental safety(ISO 14001), agriculture and food safety (Hazard Analysis and Critical ControlPoints—HACCP), workplace health and safety (AS1 NZS4504) and packaged businessstrategies.
New food processing and preservation technology
This paper was presented by Prof. Akinori Noguchi, and outlined several types of new foodprocessing and preservation technologies: membrane technology, low temperaturetechnology, use of electromagnetic waves, extrusion cooking, high pressure cooking, Ohmicheating and electroporation. These new food processing and preservation technologies areplaying a leading role and the advantages of these techniques include minimal effects on thefoods (except extrusion) and ability to minimise bacterial loads.
Standards and quality assurance systems for horticultural commodities
Dr Ma. Conception C. Lizada outlined in her paper how standards play a critical role inhorticultural product safety and competitiveness. She reported that workable standards forhorticultural products should:
• develop a culture of quality;
• assure safety and quality;
• expedite and enable trade;
• ensure success in pooled marketing;
• adopt appropriate systems;
• enhance the image of the technologies enterprises; and
• protect the consumer from defective and risky products.
The paper emphasised the importance of considering the production–marketing continuum informulating standards.
Postharvest handling status and problems of the Pacific Island countries
Mr Edgar Cocker spoke on Pacific island countries and how they have suffered from poormarket support infrastructure to ensure sound postharvest handling. There is a chronic lack ofunderstanding of technical aspects of postharvest technologies, and quality assurancepractices. Growers, packers, exporters, inspectors, distributors, carriers and warehouseoperators need to be aware of and communicate to each other on proper methods andtechniques of postharvest handling.
Quality evaluation of some rice varieties being grown in Vietnam
Mrs Nguyen Thanh Thuy oulined in her paper the importance of rice in the diet of theVietnamese people. Vietnam has become a large exporter of rice, however much of this riceis not of high quality. This paper examined the characteristics of some sixty-five varieties ofrice grown in the Red River Delta and Mekong River Delta of Vietnam, for milling,commercial, eating, and nutritive qualities. Suggestions were made as to varieties mostappropriate for growth in these areas.
Quality assurance in agricultural produce,edited by G.I. Johnson, Le Van To, Nguyen Duy Duc and M.C. Webb.
ACIAR Proceedings 100(printed version published in 2000)
725
Fruit Quality
Chairs
Dr Le Van To (Post-Harvest Technology Institute, Ho Chi Minh City, Vietnam)
Dr Made Sudiana Mahendra (Udayana University, Indonesia)
Rapporteurs
Dr Graham Alexander (AAECP –III QASAF Project, Palamere Pty Ltd, Australia)
Prof. Tang Wenhua (China Agricultural University)
Eleven papers were presented. The presentation of the other two papers was postponed to thenext session due to the limitation of time.
Quality assurance systems for ASEAN fruits (fresh and minimally processed)
This paper was presented by Dr Graham Alexander and Mr Bruce Peacock. They stated thatthe QASAF Project was established under the auspices of the AAECP Phase III, began inJanuary 1997, and was scheduled to finish in December 1999. The project objectives were todevelop quality assurance (QA) systems and minimal processing procedures for durian,jackfruit, ‘Arumanis’ mango, pineapple, dragon fruit, and longan, which incorporatedsuitable postharvest technology, and to ensure their continued access to local and exportmarkets. The ASEAN countries participating in the project were Brunei Darussalam,Indonesia, Malaysia, Philippines, Singapore, Thailand and Vietnam. Regional and a series ofin-country workshops were conducted on QA systems, minimal processing and food safetyprocedures.
Case study on development of a quality system to foster the establishment and growth of the durian industry in Brunei Darussalam
Mrs Marie Piccone and Mr Colin Bunt presented this paper in which they reported that theconcept of quality planning for a durian industry as a model for other horticultural industriesin Brunei Darussalam was used as the selected case study. The development of QA systeminvolved data analysis from market and consumer surveys, establishment of marketdescriptions and Durian Quality Team, and creation of a Durian Quality Plan. A DurianQuality Management Manual for fresh and minimally processed local durian was developed.
Postharvest developments for use in QA for durian
Dr Sonthat Nathachai reported that postharvest handling for both fresh and minimallyprocessed (MP) durian has been developed as part of a QA system project. Ripening andstorage of durian were studied. Application of ethrel to initiate ripening and potassiumpermanganate as an ethylene absorbent to extend the shelf life were confirmed. Aniodine–starch test was used to predict the pulp maturity and the use of suitable packagingmaterial for MP durian was studied.
Quality assurance in agricultural produce,edited by G.I. Johnson, Le Van To, Nguyen Duy Duc and M.C. Webb.
ACIAR Proceedings 100(printed version published in 2000)
726
Quality assurance system for dragon fruit
Dr Le Van To reported on activities for setting up a QA system for dragon fruit that wereconducted at dragon fruit farms, packinghouses in Binh Thuan Province and the laboratory ofPHTI under the AACEP–Phase III QASAF Project. Factors influencing harvest andpostharvest handling were studied including: optimum harvesting time; physico-chemicalchanges during storage; chilling sensitivity; and fungal infection during the postharvestperiod.
Establishment of a quality assurance system for minimally processed jackfruit
Mr Mohm. Salleh Punan reported that the demand for retailing the fruit as MP product isexpanding due to the recent consumer trend towards high quality, ready-to-eat fresh produce.There was a need to develop a proper minimal processing technique for preparation of MPjackfruit. The operation involved harvesting time, in-field handling, sorting, washing,ripening, cutting, selecting individual fruitlets, packing, storage and transportation. The totalQA approach implemented regularly was able to provide consistent product quality andsafety, and hence the extend buyers’ confidence to consume the product.
Minimally processed fruits in Singapore
Mr Kalanithy Karichiappan reported on a survey that was conducted to study the quality andfood safety status of MP fruits in Singapore. Physical examination, pH, ethylene and oxygengas levels, surface colour, total sugar, total acidity and water activity were determined.Pesticide residues and microbiological pathogens were also monitored. He indicated that therelatively safe MP fruits in Singapore do not have a more than 2 or 3 day shelf life.
Maturity indices and harvesting practice of ‘Arumanis’ mango
Dr Nyoman Tridjaja related his presentation to the target market for optimal maturity of‘Arumanis’ mango. He found that best consumption was reached when the fruit washarvested between 13–14 weeks after fruit set, characterised by the value of total solublesolids, total acidity, pH, flesh colour and taste score.
Quality assurance implementation in practice: Thailand’s experience with fresh longan for export
Mrs Sing Ching Tongdee reported that with the liberation and reform of agricultural trade, theAgreement on the Application of Sanitary and Phytosanitary Measures (SPS Agreement) hasbeen used to facilitate as well as restrict international trade. She stated that the new qualityconcept is about organisation, systems and assurance and those with good management win.A pilot project on implementing QA systems for longan and durian started in Thailand aboutthree years ago involving the cooperation of government and the private sector, and hasgenerated awareness and interest in a national campaign.
Study on the postharvest handling system for lychee
Mr Nguyen Cong Hoan reported that a new methodology was developed in Vietnam tomaintain quality and prolong the shelf life of the ‘Thieu’ lychee including: harvesting,transportation, postharvest handling, packing, storage and distribution. He found out that thefresh life of lychee was extended by CO
2
fumigation, carbendazim dipping and ethylenetrapping by a ripening retardant, R3.
Quality assurance in agricultural produce,edited by G.I. Johnson, Le Van To, Nguyen Duy Duc and M.C. Webb.
ACIAR Proceedings 100(printed version published in 2000)
727
Twist test measurement of mango texture
Mr Nguyen X. Ha presented his paper the softening of mangoes investigated during storageat 12
°
C and 85–90% relative humidity. Crushing stress (CS) was affected by harvest date of‘Buoi’ and ‘Thom’ mangoes. He also found that CS of the outer part of the mesocarp washigher than CS of the inner part when the fruit still firm, but was lower when the fruit becamesoft.
Designing effective quality systems for horticultural businesses and organisations
The last paper was delivered by Mrs Marie Piccone and Mr Colin Bunt, who outlined optionsinvolving practical and economical methodologies to design and implement an effective,tailored quality system. They also stated that an effective quality system in any part of thehorticultural supply chain should be designed to meet the needs and requirements of thecustomers, and must make a valuable contribution to the business or organisation developingand implementing it.
Quality assurance in agricultural produce,edited by G.I. Johnson, Le Van To, Nguyen Duy Duc and M.C. Webb.
ACIAR Proceedings 100(printed version published in 2000)
728
Uptake and Impact
Chairs
Mrs Sing Ching Tongdee (Thailand Institute for Scientific and Technological Research)
Dr Nguyen Minh Chau (Southern Fruit Research Institute, Vitenam)
Rapporteurs
Mr Rod Jordan (Queensland Department of Primary Industries, Australia)
Dr Adhi Santika (Ministry of Horticulture, Indonesia)
The session on ‘Uptake and Impact’ provided a total of nine papers. The subject matter wasdiverse with presentations on ‘state of the art’ training and information transfer, approachesto assessing the effectiveness of technology transfer, and how quality systems might beincorporated into village-level production and marketing.
Research and development on postharvest handling of fruits and vegetables in Malaysia
This paper (presented by Mr Abdullah Hassan) provided an overview of the work done over20 years by the major research and development organisations in assisting the developmentof technology for both domestic and export markets. Research achievements were identifiedin storage, handling and packaging for a diverse range of horticultural crops, includingcommercial export trialing with industry.
The effectiveness of the BPRE training program as a technology transfer strategy for the adoption of grains postharvest technology (Ms Helen F. Martinez)
National postproduction loss assessment for rice and maize (Ms Celerina Maranan)
The authors reported on evaluation of the uptake of technology. Ms Maranan describedsurvey results relating practices to postproduction losses, with a reduction in losses asevidence of an improvement in practices. Ms Martinez reported on training courses as ameans of technology transfer, finding that involvement of farmers in a cooperative, as well asthe position within the structure of that cooperative, had a positive impact on the level ofadoption. Perceived competence of trainers and availability of written material also had apositive impact.
Impact assessment of utilisation of an improved maize sheller in three major maize producing provinces in the Philippines
Dr Rodolfo Estigoy described factors affecting the uptake of technology and the impact ofthese on users. As before, both effectiveness of training and organisational membership hada positive impact on uptake, although infrastructure, particularly availability of roads, alsohad an influence. There were also measurable social and socioeconomic impacts ofutilisation.
Quality assurance in agricultural produce,edited by G.I. Johnson, Le Van To, Nguyen Duy Duc and M.C. Webb.
ACIAR Proceedings 100(printed version published in 2000)
729
The quality assurance challenge—can village marketing and cooperatives respond? (Dr Nerlita Manalili)
The role of quality assurance on the pooled marketing of horticultural produce from smallholders(Ms Perlita Nuevo
)
Dr Nerlita Manalili’s paper and Ms Perlita Nuevo’s presentation both considered quality andmarketing from the perspective of small, village-scale producers. In broad terms, pooledmarketing and cooperative organisation are regarded as being effective methods of marketinghorticultural produce in a quality system, provided all required elements of the system are inplace.
The Philippine Rice Postproduction Consortium: needs assessment of the postproduction industry
Dr Dante de Padua described high-level strategic initiatives to overcome constraints totechnology utilisation, by coordination of the major research organisations that work acrossthe whole grains industry. The resulting Philippine Rice Postproduction Consortium hasundertaken a range of activities to facilitate technology utilisation.
Developing a computer-assisted learning (CAL) system to improve training staff in grain quality management in the ASEAN region
Dr Barry Longstaff reported on progress on the development of the training system inVietnamese, expanding on the previous Indonesian and English versions. The developershave concluded that the CD-ROM format is the most suitable method of making the systemand its information accessible to the greatest number of people at lowest cost.
Information network on postharvest operations
Mr Albert Bell provided an overview of the features of the Internet-based network (INP
h
O)set up by the Food and Agriculture Organization of the United Nations, supported by variousinternational and national organisations. The system maintains a collection of informationsupplied by users and sponsoring organisations. The discussion surrounding this topicdemonstrated widespread support for the concept, but also a recognition that ongoingcommitment will be required from agencies, users and suppliers of information to maintainthe system’s viability and to ensure that information available is as up-to-date as possible.
Quality assurance in agricultural produce,edited by G.I. Johnson, Le Van To, Nguyen Duy Duc and M.C. Webb.
ACIAR Proceedings 100(printed version published in 2000)
730
Vegetables
Chair
Dr Akinori Noguchi (Japan International Research Center for Agricultural Sciences)
Rapporteur
Mr Abdullah Hassan (Malaysian Agricultural Research and Development Institute)
Quality management systems in Australian vegetable and fruit industries
Mr John Bagshaw reported that supermarkets in Australia are demanding qualitymanagement (QM) systems of Australian growers to assure supply of safe, quality fruits andvegetable. The demand is not driven by the government. Supermarkets are concerned aboutlost sales if they are implicated in a food poisoning outbreak, and concern about litigation.However, small growers have difficulty implementing QM systems due to lack of money,time and relevant skills. Three things for adoption of QM are needed—motivation,understanding and resources. It was also highlighted that the Chinese vegetables produced aremostly for domestic markets and sold within a day of harvest. Refrigeration is only used forexport product. Appropriate technology is therefore needed.
Extending the shelf life of broccoli florets and pak choy leaves
Dr Amanda Able reported on the severe effect of yellowing on the shelf life of broccoli floretsand detached leaves of pak choy. Application of 0.1–12 parts per million (ppm) of 1-methyl-cyclopropene (1-MCP) controlled the yellowing effectively, especially during storage at 10and 20°C. Atmosphere modification of 2% O
2
/5% CO
2
was found to be more effective than1-MCP in extending the shelf life of pak choy leaves.
Assessment of postharvest handling systems of vegetable crops in the Beijing area
Shufang Zheng’s paper was on factors affecting postharvest losses of Chinese cabbage,broccoli and oriental bunching onion in the Beijing area. The factors affecting losses of thesevegetables were identified as: lack of proper packaging, no pre-cooling, impropertransportation and poor storage techniques. The estimated losses after storage for Chinesecabbage and oriental bunching onion were 20% and 50%, respectively.
Postharvest handling of ‘Asian’ vegetables in the Northern Territory
Melinda Gosbee’s paper reported on Asian-type vegetables that are produced in the NorthernTerritory of Australia between April and October. Typical vegetables are bitter melon, snakebeans, okra, angled luffa, long hairy and winter melon, kang kong and basil. These vegetablesare sold locally and interstate up to 4,000 km away from the production region. Storageexperiments testing the shelf life and packaging of some of these vegetables have beenconducted over several years. It is an issue to educate the growers to thoroughly cool theirproduce before packing. Information on improved handling is available.
Quality assurance in agricultural produce,edited by G.I. Johnson, Le Van To, Nguyen Duy Duc and M.C. Webb.
ACIAR Proceedings 100(printed version published in 2000)
731
Participants
Australia
Dr Amanda J. Able
, Queensland Horticulture Institute, 19Hercules Street, Hamilton Qld 4007, email: [email protected]
Dr Graham I. Alexander
, Palamere Pty Ltd, GPO Box 870,Brisbane Qld 4001, email: [email protected]
Mr John S. Bagshaw
, Department of Primary Industries, 80Meiers Road, Indooroopilly Qld 4068, email: [email protected]
Dr José Ramón Botella
, Department of Botany, Universityof Queensland, Brisbane Qld 4072, Email: [email protected]
Mr Colin Bunt
, Piccone PHC, 201 Bruce Highway,Edmonton Qld 4869, email: [email protected]
Mrs Melinda J. Gosbee
, Department of Primary Industryand Fisheries, PO Box 990, Darwin NT 0801, email:[email protected]
Mr Jan van S. Graver
, Stored Grain Research Laboratory,CSIRO Entomology, GPO Box 1700, Canberra ACT 2601,email: [email protected]
Mr Ed Highley
, Arawang Communication Group, GPO Box661, Canberra ACT 2601, Email: [email protected]
Ms Amanda S. Hill
, CSIRO Plant Industry, GPO Box 1700,Canberra ACT 2601, email: [email protected]
Dr Peter J. Hofman
, Maroochy Research Station,Department of Primary Industries, PO Box 5083, SunshineCoast Mail Centre, Nambour Qld 4560, email: [email protected]
Dr Greg I. Johnson
, ACIAR Postharvest TechnologyProgram, GPO Box 1571, Canberra ACT 2601, email:[email protected]
Mr Rod A. Jordan
, Department of Primary Industries, 19Hercules Street, Hamilton Qld 4007, email: [email protected]
Prof. Ivan R. Kennedy
, Department of AgriculturalChemistry and Soil Science, University of Sydney, SydneyNSW 2006, email: [email protected]
Dr Nanju Alice Lee, Department of Agricultural Chemistryand Soil Science, University of Sydney, Sydney NSW 2006,email: [email protected]
Dr Barry C. Longstaff, CSIRO Entomology, GPO Box1700, Canberra ACT 2601, email: [email protected]
Prof. William B. McGlasson, University of Western SydneyHawkesbury, Locked Bag 1, Richmond NSW 2753, email:[email protected]
Mr Nguyen Xuan Ha, Department of Crop Sciences, A20University of Sydney, Sydney NSW 2006, email: [email protected]
Dr Tim J. O’Hare, Queensland Horticulture Institute, 19Hercules Street, Hamilton Qld 4007, email: [email protected]
Dr Bruce C. Peacock, Palamere Pty Ltd, GPO Box 870,Brisbane Qld 4001, email: [email protected]
Ms Marie Piccone, Piccone PHC, 201 Bruce Highway,Edmonton Qld 4869, email: [email protected]
Dr George S. Szrednicki, Department of Food Science andTechnology, University of New South Wales, Sydney NSW2052, email: [email protected]
Mr Geoffrey Tuckett, Tuckett International Pty Ltd, PO Box686, Leeton NSW 2705, fax: +61 2 6953 4864
Mr Lung Sing Wong, Department of Primary Industries, 19Hercules Street, Hamilton Qld 4006, email: [email protected]
Dr Wee Chong Wong, Quality Technologies International,PO Box 185, Kenmore Qld 4069, email: [email protected]
Belgium
Dr Mohamed Fekry El-Saidy
, SANITEC N.V.,Keetberglaan 4 Haven 1091, B-9120-Melsele, email:[email protected]
Cambodia
Ms Theary Chang
, Cambodia–Australia AgriculturalExtension Project, c/- CAAEP, PO Box 1239, Phnom Penh,email: [email protected]
Mr Pyseth Meas
, Cambodia–IRRI–Australia Project, 14Monireth Street (PO Box 1) Phnom Penh, email:IRRI–[email protected]
Mr Joseph F. Rickman
, Cambodia–IRRI–Australia Project,14 Monireth Street (PO Box 1) Phnom Penh, email:[email protected]
Mr Bunna Som
, Cambodia–IRRI–Australia Project, 14Monireth Street (PO Box 1) Phnom Penh, email: [email protected]
Canada
Mr Denis Bureau
, Adalia Services Ltd, 8685 La Frenaie, StLeonard, Quebec, fax: +1 514 852 9809
China
Prof. Wenhua Tang
, Department of Plant Pathology, ChinaAgricultural University, Beijing 100094, email: [email protected]
Mr Xiangyang Wang
, Food Research Department,Hangzhou University of Commerce, 29 Jiaogong Road,Hangzhou 310035, email: [email protected]
Quality assurance in agricultural produce,edited by G.I. Johnson, Le Van To, Nguyen Duy Duc and M.C. Webb.
ACIAR Proceedings 100(printed version published in 2000)
732
Ms Ping Wu
, Beijing Vegetable Research Center, PO Box2443, Beijing 100089, email: [email protected]
Mr Shufang Zheng
, Beijing Vegetable Research Center, POBox 2443, Beijing 100089, email: [email protected]
Fiji
Mr Edgar Cocker
, Forum Secretariat, Private Mail Bag,Suva, email: [email protected]
Mr Sant Kumar
, Natures Way Cooperative (Fiji) Ltd, POBox 9825, Nadi Airport, fax: +679 724 569
France
Mr Drouin Julien,
student in Vietnam
Germany
Mr Albert Bell
, GTZ, PO Box 5180, D-65726 Eschborn,email: [email protected]
India
Mr Kolagani Jayaraj
, Indian Grain Storage Managementand Research Institute, Field Station Rajendranagar,Hyderabad 500 030, Andra Pradesh, email: [email protected]
Dr Akmal Pasha
, Food Protectants and Infestation ControlDepartment, Central Food Technological Research Institute,Mysore-570013, email: [email protected]
Mr Navreet S. Pruthi
, Pest Control M. Walshe/IMFO, 503Embassy Centre, Nariman Point, Mumbai 21, email: [email protected]
Mr Prithipal S. Pruthi
, Pest Control M. Walshe/IMFO, 503Embassy Centre, Nariman Point, Mumbai 21, email: [email protected]
Indonesia
Mr Damianus Adar
, Fakultas Pertanian, Universitas NusaCendana, Jalan Adi Sucipto, Lampus Baru Penfui, Kupang,NTT, email: [email protected]
Dr Sjamsul Bahri
, Research Institute for Veterinary Science,Jl R.E. Matinada No. 30, Bogor 16114, fax: +62 251 622 202
Dr I. Wayan Budiastra
, Institut Pertanian Bogor, Fateta-IPB, Kampus IPB Darmaga, PO Box 220, Bogor 16002,email: [email protected]
Dr Okky S. Dharmaputra
, SEAMEO BIOTROP, PO Box116, Bogor, email: [email protected]
Dr Dedi Fardiaz
, Department of Food Technology andHuman Nutrition, Bogor Agricultural University, KampusIPB, Bogor, email: [email protected]
Dr Hariyadi Halid
, Ministry of Food/National LogisticsAgency (Bulog), 49 Jalan Gatot Subroto, Jakarta, fax: +62 21521 0275
Dr Made S. Mahendra
, Horiculture Section, Department ofAgronomy, Faculty of Agriculture, Udayana University,Denpasar, Bali, email: [email protected]
Dr Hadi K. Purwadaria
, Institut Pertanian Bogor, Fateta-IPB, Kampus IPB Darmaga, PO Box 220, Bogor 16002,email: [email protected]
Dr Adhi Santika
, Assistant to the Minister of Horticulture,BULOG II Building, 2
nd
Floor, Jalan Kuningan Timur M2/5,Jakarta 12950, fax: +62 21 521 0275
Dr Mulyo Sidik
, Ministry of Food and Horticulture/Bulog,49 Jalan Gatot Subroto, Jakarta 12950, email: [email protected]
Dr Nyoman O. Tridjaja
, Postharvest Horticulture Division,Directorate of Farm Agribusiness and ProcessingDevelopment, Directorate of Food Crops and Horticulture,Jakarta, email: [email protected]
Israel
Mr Tom De Bruin
, Haogenplast Projects (1970) Ltd,Kibbutz Haogen 42880, email: [email protected]
Dr Jonathon (Ezra) Donahaye
, Department of StoredProducts, Agricultural Research Organization, PO Box 6, BetDagan 50250, email: [email protected]
Dr Susan Lurie
, Department of Postharvest Science, VolcaniCenter, PO Box 6, Bet Dagan 50250, email: [email protected]
Dr Shlomo Navarro
, Agricultural Research Organization,PO Box 6, Bet Dagan 50250, email: [email protected]
Japan
Dr Hidema Izumi
, Kinki University, 930 Nishimatani,Uchita Naga, Wakayama 649-6493, email: [email protected]
Dr Akinori Noguchi
, Japan International Research Centrefor Agricultural Sciences (JIRCAS), 1–2 Ohwashi, Tsukuba,Ibaraki 305-8686, email: [email protected]
Laos
Mr Thong Chanh Bounthala
, Director General, HaddpkeoHorticultural Research Centre, Ministry of Agriculture andForestry, PO Box 811, Vientiane, fax: +856 21 732 047
Mr Sitha Khemmarath, Faculty of Agriculture andForestry, National University of Lao PDR, Nabong Campus,fax: +854 21 73 20 94
Malaysia
Mr Abdullah Hassan
, Horticulture Research Centre,MARDI, GPO Box 12301, 50774 Kuala Lumpur, email:[email protected]
Ms Koh Siew Hua
,
Global Food
Management
Services, 29Jalan SS 19/6M, 47500 Subang Jaya, Selangor, email:[email protected]
Prof. Helen Nair
, Institute of Biological Sciences, Universityof Malaya, email: [email protected]
Mohd. Salleh Punan
, Horticulture Research Centre,MARDI, GPO Box 12301, 50774 Kuala Lumpur, [email protected]
Quality assurance in agricultural produce,edited by G.I. Johnson, Le Van To, Nguyen Duy Duc and M.C. Webb.
ACIAR Proceedings 100(printed version published in 2000)
733
Mr Ahmad T. Sapii
, Horticulture Research Centre, MARDI,GPO Box 12301, 50774 Kuala Lumpur, [email protected]
Morocco
Prof. Ahmed Ait-Oubahou
, Institut Agronomique etVétérinaire Hassan II, Complexe d’Agadir, BP 18/S Agadir,email: [email protected]
New Zealand
Dr Linus U. Opara
, Centre for Postharvest and RefrigerationResearch, Institute of Technology and Engineering, MasseyUniversity, Palmerston North, email: [email protected]
A/Prof. Cliff Studman
, Centre for Postharvest andRefrigeration Research, Institute of Technology andEngineering, Massey University, Palmerston North, email:[email protected]
Papua New Guinea
Mr Anis J. Kuri
, Papua New Guinea Coffee ResearchInstitute, PO Box 105, Kainantu, fax: +675 73 73524
Philippines
Dr Silvestre Andales
, Bureau of Postharvest Research andExtension, 3/F ATI Building, Elliptical Road, Diliman,Quezon City, email: [email protected]
Mr Mario Andrada
, National Food Authority, 101Matimyas Building, E. Rodriguez Sr. Avenue, Quezon City1100, email: [email protected]
Dr Robert R. Bakker
, Agricultural Engineering Division,International Rice Research Institute, MCPO Box 3127, 1271Makati City, Philippines, email: [email protected]
Dr Vethaiya T. Balasubramanian
, International RiceResearch Institute, MCPO Box 3127, Makati, email: [email protected]
Ms Edna T. Begino
, Bureau of Animal Industry, Departmentof Agriculture, Visayas Avenue, Diliman, Quezon City
Dr Mark A. Bell
, AED, International Rice Research Institute,MCPO Box 3127, Makati, email: [email protected]
Dr Dante de Padua
, Agricultural Engineering Division,International Rice Research Institute, MCPO Box 3127, 1271Makati City, Philippines, email: [email protected] [email protected]
Dr Rodolfo P. Estigoy
, Buroau of Postharvest Research andExtension, CLSU Compound, Muñoz, Nueva Ecija 3120,email: [email protected]
Mr Eduardo A. Jarcia
, National Food Authority, 101Matimyas Building, E. Rodriguez Sr. Avenue, Quezon City1100, fax: +63 2 712 1924
Dr M.C.C. Lizada
, Postharvest Technology ResearchCentre, University of the Philippines at Los Baños, College,Laguna, Philippines
Ms Celerina Maranan
, Bureau of Postharvest Research andExtension, CLSU Compound, Muñoz, Nueva Ecija 3120, fax:+63 44 456 0110
Ms Helen F. Martinez
, Bureau of Postharvest Research andExtension, CLSU Compound, Muñoz, Nueva Ecija 3120,email: [email protected]
Ms Perlita A. Nuevo
, Postharvest Horiculture Training andResearch Center, Univerity of the Philippines at Los Baños,email: [email protected]
Mr James A. Patindol
, Philippine Rice Research Institute,Maligaya, Muñoz, Nueva Ecija 3119, email: [email protected]
Prof. José P.A.A. Peralta
, University of the PhilippinesVisayas, 5023 Miag-ao, Iliolo
Mr Rolando L. Tiongson
, Bureau of Postharvest Researchand Extension, CLSU Compound, Muñoz, Nueva Ecija,email: [email protected]
Ms Nanette V. Zulueta
, Philippine Rice Research Institute,Maligaya, Muñoz, Nueva Ecija 3119, email: [email protected] or [email protected]
Samoa
Mr Tuulima Laiti,
Department of Agriculture.
Singapore
Mr Kalanithy Karichiappan
, Veterinary Public HealthLaboratory, Primary Production Department, 51 Jalan Buroh,email: [email protected]
South Africa
Prof. Lise M. Korsten
, Department of Microbiology andPlant Pathology, University of Pretoria, Pretoria 0002, email:[email protected]
Thailand
Ms Bussara Chankaewmanee
, Stored Product ResearchGroup, Division of Entomology and Zoology, Department ofAgriculture, Ladyao, Chatujak, Bangkok 10900, email:[email protected]
Mr Alastair Hicks
, FAO/UN Regional Office, MaliwanMansion, 39 Phra Atit Road, Bangkok, email: [email protected]
Dr Sonthat Nanthachai
, Horticulture Research Institute,Department of Agriculture, Chatuchak, Bangkok 10900, fax:+66 2 561 4667
Mr Peerapong Sangwanangkul
, Kasetsart UniversityResearch and Development Institute, Kampangsaen 73140,email: [email protected]
Prof. Somchart Soponronnarit
, King Mongkut’sUniversity of Technology, Suksawat 48 Road, Bangkok10140, [email protected]
Prof. Jinda Sornsrivichai
, Postharvest TechnologyResearch Centre, Biology Department, Chiang MaiUniversity, Chiang Mai 50200, email: [email protected]
Mr Varit Srilaong
, King Mongkut’s University ofTechnology Thonburi, 91 Prachautit Road, Thung-Kru,Bangkok 10140, email: [email protected]
Quality assurance in agricultural produce,edited by G.I. Johnson, Le Van To, Nguyen Duy Duc and M.C. Webb.
ACIAR Proceedings 100(printed version published in 2000)
734
Mrs Sing Ching Tongdee
, Thailand Institute for Scientificand Technological Research, 196 Phahonyothin Road,Chatuchak, Bangkok 10900, email: [email protected]
Mr Somboon Wetchacama
, King Mongkut’s University ofTechnology, Suksawat 48 Road, Bangkok 10140, email:[email protected]
Dr Thongchai Yantarasri
, Mechanical EngineeringDepartment, Chiang Mai University, email: [email protected]
United KingdomDr Rick J. Hodges, Natural Resources Institute, ChathamMaritime, Kent ME4 4TB, email: [email protected]
Dr Chris R. Watson, International Maritime FumigationOrganisation, c/- IGROX Ltd, Worlingworth, Woodbridge,Suffolk 1PI 37HW, email: [email protected]
United States of AmericaDr Francesco Goletti, International Food Policy ResearchInstitute, 2033 K Street, N.W., Washington, D.C. 20006,email: [email protected]
Dr Ronald T. Noyes, Oklahoma State University, 111 AgHall, Stillwater, OK 74078-6016, email: nron@ceat. okstate.edu
VietnamMs Teresa Scott, ACIAR Office, Australian Embassy, 8 DaoTan, Ba Dinh, Ha Noi, fax: +84 4 831 7707
Ms Duong Huong Ly, ACIAR Office, Australian Embassy,8 Dao Tan, Ba Dinh, Ha Noi, fax: +84 4 831 7707
Mr Le Tuan Quoc, Director, Agricultural & ForestryExtension Center of Ba Ria – V. Tau, 27 April St., Ba Ria,email: [email protected]
Mr Tran Xuan Dinh, Vice Director, Agricultural & ForestryExtension Center of Thai Binh, Phuc Khanh Ward, Thai Binh,fax: +84 36 839 910
Mr Nguyen Xuan Thu, Director Agricultural ExtensionCenter of Thai Binh, Phuc Khanh Ward, Thai Binh, fax: +8436 839 910
Mr Le Nguyen Vu, Agricultural Planning and DesigningInstitute, 20 Vo Thi Sau, Dist. 1, Ho Chi Minh City
Ms Bui Thi Lan, Vice Director, ASEAN Dept., Ministry ofAgriculture and Rural Development, 2 Ngoc Ha, Ha Noi,email: [email protected]
Mr Ho Ngoc Thanh, Director, Bayer Agritech Saigon, 1/3Xom Moi, Phuoc Long B, Dist. 9, Ho Chi Minh City, fax: +848 846 1523
Mr Steven Smith, British Cosulate General, 25 Le Duan,Dist.1, Ho Chi Minh City, email: [email protected]
Mr Nguyen Minh Thao, Director, Center for AppliedResearch in Agricultural Engineering, 10A Tran Nhat Duat,Dist. 1, Ho Chi Minh City, fax: +84 8 843 8842
Ms Nguyen Viet Thu, Consulting Centre for Technology &Environment, 66 Nguyen Van Troi, Phu Nhuan, Ho Chi MinhCity, email: [email protected]
Dr Phan Hieu Hien, Coodinator, DANIDA Project, 4 NgoHuu Hanh, Can Tho, email: [email protected]
Mr Bjarne Christensen, DANIDA Project Advisor, 4 NgoHuu Hanh, Can Tho, email: [email protected]
Mr Huynh Ngoc Ba, DANIDA Project Management Board,4 Ngo Huu Hanh, Can Tho, email: [email protected]
Mr Doan Phu Cuong, DANIDA Project ManagementBoard, 4 Ngo Huu Hanh, Can Tho, email: [email protected]
Mr Nguyen van Ngau, Director, DANIDA ProjectManagement Board, 4 Ngo Huu Hanh, Can Tho, email:[email protected]
Mr Nguyen Van Nghiep, Vice-director, DANIDA ProjectManagement Board, 4 Ngo Huu Hanh, Can Tho, email:[email protected]
Mr Dinh Van Nghia, Director, DANIDA Soc Trang, 26Hung Vuong, Soc Trang, email: [email protected]
Mr Truong Thanh Phuong, DANIDA Soc Trang, 26, HungVuong, Soc Trang, email: [email protected]
Mr Nguyen Duc Thang, Vice Director, DANIDA SocTrang, 26, Hung Vuong, Soc Trang, email: [email protected]
Mr Doan Huu Luc, Vice Director, Dept. of Agriculture &Rural Development of An Giang, 4, Nguyen Du, Long Xuyen
Mr Diep Chan Ben, Vice Director, Dept. of Agriculture &Rural Development of Bac Lieu, 11/1, Vo Thi Sau, Ward 7,Bac Lieu, fax: +84 781 823 944
Ms Huynh Thi Truc, Dept. of Agriculture & RuralDevelopment of Ben Tre, 26, 3 Feb.,Ward 3, Ben Tre, fax:+84 75 825 294
Mr Nguyen Van Thien, Director, Dept. of Agriculture &Rural Development of Binh Dinh, 77, Le Hong Phong, QuiNhon, fax: +84 56 827 777
Mr Dinh Gia Thuy, Dept. of Agriculture & RuralDevelopment of Dac lak, 47, Nguyen Tat Thanh, Buon MeThuot, fax: +84 50 952 575
Mr Nguyen Kha Son, Dept. of Agriculture & RuralDevelopment of Dong Nai, Tan Hiep, Bien Hoa, Dong Nai,fax: 84-61-827393
Ms Vu Anh Dao, Vice Director, Dept. of Agriculture & RuralDevelopment of Dong Thap, National Road 30, My Tan, CaoLanh, Dong Thap, fax: +84 67 853 028
Mr Tran Quang Cui, Vice Director, Dept. of Agriculture &Rural Development of Kien Giang, 1066 Nguyen Trung Tuc,Rach Gia, fax: +84 77 812 417
Mr Nguyen Van Chau, Dept. of Agriculture & RuralDevelopment of Lam Dong, 1–3 Nguyen Viet Xuan, Da Lat,fax: +84 63 828 630
Quality assurance in agricultural produce,edited by G.I. Johnson, Le Van To, Nguyen Duy Duc and M.C. Webb.
ACIAR Proceedings 100(printed version published in 2000)
735
Mr Pham Thanh Doan, Vice Director, Dept. of Agriculture& Rural Development of Long An, 8B Nnational Way No. 1,Ward 4, Dist.5, Tan An, fax: +84 72 822 967
Mr Truong Xuan Quy, Dept. of Agriculture & RuralDevelopment of Nghe An, 52 Le Hong Phong, Vinh, fax: +8438 835993
Ms Le Thi Kim Nhung, Dept. of Agriculture & RuralDevelopment of Soc Trang, 33 Hung Vuong, Soc Trang, fax:+84 79 826 086
Mr Tran Vien Thong, Vice Director, Dept. of Agriculture &Rural Development of Tay Ninh, 118, Ngueyn Chi thanh, TayNinh, fax: +84 66 820 236
Mr Huynh Van Nguyen, Dept. of Agriculture & RuralDevelopment of Tien Giang, 3,4,5, Trung Luong, Tien Giang
Mr Huynh Van Danh, Dept. of Agriculture & RuralDevelopment of Tra Vinh, 560B Nguyen Dang, Ward 6, TraVinh,
Mr Van Van Hanh, Vice Director, Dept. of Agriculture andRural Development of Binh Phuoc, Dong Xoai, Dong Phu,Binh Phuoc, fax: +84 65 870 267
Mr Nguyen Huy Hoang, Director, Dept. of Science,Technology & Environment of Binh Thuan, Nguyen TanThanh, Phan Thiet, fax: +84 62 824 053
Mr Bui Minh Tao, Vice Director, Dept. of Science,Technology & Environment of Can Tho, 2 Ly Thuong Kiet,email: [email protected]
Mr Le Minh Tung, Director, Dept. of Science, Technology& Environmont of An Giang, 36 Le Loi, Long Xuyen, email:[email protected]
Mr Nguyen Duc Quang, Dept.of Agricultural and ForestryProduct Processing, 2 Phung Khac Hoan, Dist.1, Ho ChiMinh City, fax: +84 8 823 1730
Mr Dinh The Khoa, Food Processing & Trading Co., 24 VoVan Tan, Dist.3, Ho Chi Minh City, email: [email protected]
Ms Tran Thi Ngoc Loan, Forster’s Tien Giang Co., BinhDuc, Chau thanh, Tien Giang, email: [email protected]
Ms Huynh Thi Thu Thao, Ho Chi Minh City Food Co(FOOCOSA), 57 Nguyen Thi Minh Khai, Dist.1, Ho ChiMinh City, email: [email protected]
Mr Nguyen Van Hoang, Industrial Design Co. (IDC), 146Nguyen Cong Tru, Dist.1, Ho Chi Minh City, fax: +84 8 8213004
Mr Duong Le Hoang, Long An Food Co., Cu Luyen Road,Ward 5, Tan An, Long An, fax: +84 72 826 566
Mr Nguyen Van Thoai, Long An Food Co., Cu Luyen Road,Ward 5, Tan An, Long An, fax: +84 72 826 566
Mr Gerald Hitzler, Management Training Center, 112,Nguyen Dinh Chieu, Dist.1, Ho Chi Minh City, email:[email protected]
Mr Nobuo Fukuda, OMIC, 45 Dinh Tien Hoang, Dist.1, HoChi Minh City, fax: +84 8 910 0243
Mr Vu Ngoc Thu, People’s Committee of Thai Binh, 2 LeLoi, Thai Binh, fax: +84 36 831 513
Mr Tran Duc, PHTI (Ha Noi), 4 Ngo Quyen, Ha Noi, Fax:+84 4 825 8440
Mr Nguyen Cong Hoan, PHTI (Ha Noi), 4 Ngo Quyen, HaNoi, fax: +84 4 825 8440
Ms Nguyen T. Huong Thuy, PHTI (Ha Noi), 4 Ngo Quyen,Ha Noi, fax: +84 4 825 8440
Mr Nguyen Kim Vu, Director, PHTI (Ha Noi), 4 NgoQuyen, Ha Noi, fax: +84 4 825 8440
Mr Duong Minh Tu, Plant Protection Dept., 189B Tay Son,Dong Da, Ha Noi, fax: +84 4 857 4719
Dr Nguyen Manh Son, Research Institute for Fruit andVegatables, Trau Quy, Gia Lam, Ha Noi, fax: +84 4 827 6148
Ms Nguyen Thi Xuan Hien, Research Institute for Fruits andVegetables, Trau Quy, Gia Lam, Ha Noi, email: [email protected]
Dr Le Van Banh, Rice Institute of Cuu Long River Delta, OMon, Can Tho, fax: +84 71 861 457
Dr Bui Ba Bong, Director, Rice Institute of Cuu Long RiverDelta, O Mon, Can Tho, email: [email protected]
Prof. Nguyen Van Luat, Rice Institute of Cuu Long RiverDelta, O Mon, Can Tho, fax: +84 71 861 457
Mr Thai Thanh Nam, D. General Director, Saigon Wewong,1707 National Way1A, An Phu Dong, Dist.12, Ho Chi MinhCity, fax: +84 8 891 9159
Mr Duong Le Dung, c/o Southern Food Cooperation, 42 ChuManh Trinh, fax: +84 8 829 2344
Mr Nguyen Tien Dung, D. General Director, c/o SouthernFood Cooperation, 42 Chu Manh Trinh, fax: +84 8 829 2344
Ms Truong Thuy Duong, c/o Southern Food Cooperation,42 Chu Manh Trinh, fax: +84 8 829 2344
Ms Vuong Thi Loc, c/o Southern Food Cooperation, 42 ChuManh Trinh, fax: +84 8 829 2344
Ms To Thi Ngoan, c/o Southern Food Cooperation, 42 ChuManh Trinh, fax: +84 8 829 2344
Mr Truong Thanh Phong, Director, c/o Southern FoodCooperation, 42 Chu Manh Trinh, fax: +84 8 829 2344
Mr Cao Thang, Director, c/o Southern Food Cooperation, 42Chu Manh Trinh, fax: +84 8 829 2344
Mr Nguyen Huu Thanh, Director, c/o Southern FoodCooperation, 42 Chu Manh Trinh, fax: +84 8 829 2344
Mr Le Van Thoai, Director, c/o Southern Food Cooperation,42 Chu Manh Trinh, fax: +84 8 829 2344
Mr Huynh Van Thong, Director, c/o Southern FoodCooperation, 42 Chu Manh Trinh, fax: +84 8 829 2344
A/Prof. Cong Doan Sat, Vice Director, Southern Institute forAgricultural Science Technique, 121 Nguyen Binh Khiem,Dist.1, Ho Chi Minh City, fax: +84 8 829 7650
Dr Nguyen Minh Chau, Director, Southern Institute forFruit Research, Long Dinh, Chau thanh, Tien Giang, email:[email protected]
Mr Phan Quang Danh, Southern Institute for FruitResearch, Long Dinh, Chau thanh, Tien Giang, email:[email protected]
Quality assurance in agricultural produce,edited by G.I. Johnson, Le Van To, Nguyen Duy Duc and M.C. Webb.
ACIAR Proceedings 100(printed version published in 2000)
736
Mr Huynh Tri Duc, Southern Institute for Fruit Research,Long Dinh, Chau thanh, Tien Giang, email: [email protected]
Mr Do Minh Hien, Southern Institute for Fruit Research,Long Dinh, Chau thanh, Tien Giang, email: [email protected]
Ms Le Thi Thu Hong, Southern Institute for Fruit Research,Long Dinh, Chau thanh, Tien Giang, email: [email protected]
Mr Pham Ngoc Lieu, Vice Director, Southern Institute forFruit Research, Long Dinh, Chau thanh, Tien Giang, email:[email protected]
Ms Nguyen Ngoc Thuy, Southern Institute for FruitResearch, Long Dinh, Chau thanh, Tien Giang, email:[email protected]
Mr Ngo Van Giao, Acting Director, Southern Seedling Co,282 Le Van Sy, Tan Binh, Ho Chi Minh City, fax: +84 8 8442387
Mr Nguyen Van Canh, Director, Tan Binh Dong Food Co.,400 Nguyen Duy, Dist.8, Ho Chi Minh City, email: [email protected]
Mr Nguyen Lai Phuc, Termite Control Fumigation Co.(TCFC), 31 Hai Trieu, Dist.1, Ho Chi Minh City, email:[email protected]
Mr Do Tri, Termite Control Fumigation Co. (TCFC), 31 HaiTrieu, Dist.1, Ho Chi Minh City, email: [email protected]
Mr Khuong Buu Hong, Director, Thien Ha Ltd., Co., 5, HanThuyen, Dist.1, Ho Chi Minh City, fax: +84 8 823 0999
Ms Tran Anh Tho, United Phosphorus Ltd, 8th Floor, Unit802A MeLinh pain tower, 2 Ngo Duc Ke, Dist. 1, Ho ChiMinh City, email: [email protected]
Mr Nguyen Hung Tam, Lecturer, University of Agricultureand Forestry in HCMC, Linh Trung, Thu Duc, Ho Chi MinhCity, fax: +84 8 896 0713
Ms Lam Thanh Hien, University of Agriculture and Forestryin HCMC, Linh Trung, Thu Duc, Ho Chi Minh City, email:[email protected]
Mr Le Do Hien, University of Agriculture and Forestry inHCMC, Linh Trung, Thu Duc, Ho Chi Minh City, email:[email protected]
Prof. Nguyen Quang Loc, University of Agriculture andForestry in HCMC, Thu Duc, Ho Chi Minh City
Dr Bui Van Mien, University of Agriculture and Forestry inHCMC, Linh Trung, Thu Duc, Ho Chi Minh City, email:[email protected]
Mr Vu Truong Son, Lecturer, University of Can Tho, Dept.of Agriculture, University of Can Tho, 3 Feb, Can Tho, fax:+84 71 830 814
Mr Truong Van Thao, University of Can Tho, Dept. ofTechnology, Area 2, University of Can Tho, 3 Feb., Can Tho,email: [email protected]
Ms Nguyen Thi Xuan Thu, Lecturer, University of Can Tho,Dept. of Agriculture, University of Can Tho, 3 Feb, Can Tho,fax: +84 71 830 814
Mr Truong Cong Cu, Vice Director, Vietnam FumigationCo. (VFC), 29 Ton Duc Thang, Dist.1, Ho Chi Minh City,email: [email protected]
Mr Tran Quang Minh, Vietnam Fumigation Co. (VFC), 29,Ton Duc Thang, Dist.1, Ho Chi Minh City, email: [email protected]
Mr Nguyen Bao Son, Vietnam Fumigation Co. (VFC), 29,Ton Duc Thang, Dist.1, Ho Chi Minh City, email: [email protected]
Ms Nguyen Bach Tuyet, Director, Vietnam Fumigation Co.(VFC), 29 Ton Duc Thang, Dist.1, Ho Chi Minh City, email:[email protected]
Mr Ngo Van Dat, Vietnam Pesticide Co. (Vipesco), 102Nguyen Dinh Chieu, Dist.1, Ho Chi Minh City, fax: +84 8 8230752
Mr Vo Van Duc, General Director, Vietnam Pesticide Co.(Vipesco), 102 Nguyen Dinh Chieu, Dist.1, Ho Chi MinhCity, fax: +84 8 823 0752
Mr Van Phu Tam, Vietnam Pesticide Co. (Vipesco), 102Nguyen Dinh Chieu, Dist.1, Ho Chi Minh City, fax: +84 8 8230752
Mr Anthony Lam, Vinarice, My tho Industrial Zone, TienGiang, Vietnam, fax: 84 73 853 088
Mr Nguyen Thanh Hoang, Vinh Long Food Co., 38 2/9Street, Ward 1, Vinh Long, fax: +84 70 823 773
Post-Harvest Technology Institute, Ho Chi Minh City, 45Dinh Tien Hoang, Dist.1, Ho Chi Minh City, email: [email protected]
Quality assurance in agricultural produce,edited by G.I. Johnson, Le Van To, Nguyen Duy Duc and M.C. Webb.
ACIAR Proceedings 100(printed version published in 2000)