developing a personal leadership competency model for
TRANSCRIPT
�����������������
Citation: Alidrisi, H.M.; Mohamed, S.
Developing a Personal Leadership
Competency Model for Safety
Managers: A Systems Thinking
Approach. Int. J. Environ. Res. Public
Health 2022, 19, 2197. https://
doi.org/10.3390/ijerph19042197
Academic Editor:
Paul B. Tchounwou
Received: 6 January 2022
Accepted: 7 February 2022
Published: 15 February 2022
Publisher’s Note: MDPI stays neutral
with regard to jurisdictional claims in
published maps and institutional affil-
iations.
Copyright: © 2022 by the authors.
Licensee MDPI, Basel, Switzerland.
This article is an open access article
distributed under the terms and
conditions of the Creative Commons
Attribution (CC BY) license (https://
creativecommons.org/licenses/by/
4.0/).
International Journal of
Environmental Research
and Public Health
Article
Developing a Personal Leadership Competency Model forSafety Managers: A Systems Thinking ApproachHassan M. Alidrisi 1,* and Sherif Mohamed 2
1 Department of Industrial Engineering, Faculty of Engineering, King Abdulaziz University,Jeddah 21589, Saudi Arabia
2 School of Engineering and Built Environment, Griffith University, Brisbane 4222, Australia;[email protected]
* Correspondence: [email protected]
Abstract: The roles of all levels of management in influencing safety, particularly in a complex workenvironment, are crucial. Therefore, safety managers need to develop leadership competencies (i.e., ef-fectiveness in terms of person-oriented behaviours) to reinforce their influencing capabilities throughtheir safety responsibilities. However, practising leadership behaviours without considering how andwhen these behaviours should be executed is not enough. Therefore, this paper develops a personalleadership competency model by adopting the Systems Thinking approach. The model was devel-oped by conducting exploratory factor analysis and confirmatory factor analysis of three behaviouralleadership competencies (emotional, social and cognitive) selected to fulfil the holistic view of Sys-tems Thinking. Data were collected via self-administered questionnaire surveys. A total of 180 validresponses were received from construction managers responsible for overseeing site safety. Thestatistical results revealed three factors belonging to emotional competency—achievement orientationand adaptability, positive outlook, and emotional self-control. Regarding social competency, fourfactors represented it—teamwork, organisational awareness, coach and mentor, and conflict manage-ment. Finally, cognitive competency was found to be formed by two factors—interaction recognitionand pattern recognition. All nine identified factors should, in combination, help safety managers toachieve a better understanding of themselves, of others and of their worksite environments.
Keywords: safety leadership behaviour; leadership model; leadership competencies; systems think-ing; complex environment
1. Introduction
As leaders, safety managers play an important role in maintaining the safety of workenvironments [1]. However, managing safety is a complex process because, according toBerhanu [2], accidents usually happen randomly even though their causes can be predicted.This complexity increases if the work environment is also complex. Managing a complexenvironment has many challenges, such as dynamic situations that depend on numerouscomponents and containing conflicts between stakeholders. Therefore, safety leaders needto prepare themselves by mastering competencies to better understand themselves, toinfluence others and to manage the work environment. Regarding the ability to influenceothers, this paper presents three kinds of leadership competency—emotional, social andcognitive. Aiming to acquire a better understanding of the effect of these three competencieson leaders’ influencing skills, the paper develops a personal leadership competency modelthat has its roots in the well-known Systems Thinking approach. The model is expected toprovide an iterative process for leaders to understand themselves better, others and theirwork environment.
This paper is structured as follows. The next section briefly introduces the concept ofleadership competency(ies), leadership models and categorisations, as reported in the rele-vant literature. Following this is a presentation of a holistic view of safety leadership, which
Int. J. Environ. Res. Public Health 2022, 19, 2197. https://doi.org/10.3390/ijerph19042197 https://www.mdpi.com/journal/ijerph

Int. J. Environ. Res. Public Health 2022, 19, 2197 2 of 21
is explored (as a process) in light of the Systems Thinking approach in order to developa personal leadership competency model. Section 2 presents the research methodology,data collection and data analysis. Section 3 sheds light on the participants’ profiles as wellas the reliability and validity of the measurement scale. Section 4 discusses the findingsthat emerge from the statistical data analysis and implications for safety leaders. Section 5describes the study limitations and Section 6 highlights the conclusion.
1.1. Leadership Competencies
Boyatzis [3], who came up with one of the earliest definitions of competency in themanagement context, defined it as ‘the underlying characteristics of a person that lead to, orcause effective and outstanding performance’. The importance of this definition lies in howit originated. According to Boyatzis [4], the basic competency concept originates from jobperformance theory. This definition clearly aligns with the competencies that leaders need.
Rather than base leadership assessment on personality traits, competency modelsspecify the actions and behaviours needed for successful leaders. In the last two decades, anumber of studies developed competency models for safety managers. Blair [5] identifiedthe most needed competencies for safety managers based on a managerial competencymodel. The findings revealed the most important competencies for the eight differentroles of safety managers—communicating effectively (mentor role); obtaining input fromothers (facilitator role); auditing and analysing the safety effort (monitor role); sharingand exchanging relevant information (coordinator role); translating a solution into prac-tical terms (innovator role); maintaining a positive image and reputation (broker role);accepting responsibility (producer role); and maintaining and sharing a vision for safety(director role).
Based on environmental health and safety (EHS) functions, Leemann [6] developeda model of 19 competencies for safety managers. These competencies are categorisedinto three clusters—cognitive competencies, interpersonal competencies and intrapersonalcompetencies. Daud et al. [7] investigated an EHS competency model to identify the mostneeded competencies for the safety profession. Their main interest was to enhance safetymanagers’ ability in four tasks (standard setting, enforcement, promotion and specificfunctions). They classified these competencies into two groups, threshold competenciesand differentiating competencies, based on their level of importance.
Instead of developing a competency model for safety managers from an educator’sperspective, Chang et al. [8] introduced a competency model based on the perspectivesof safety professionals. They identified the 10 most essential competencies for safetyprofessionals and clustered them into 5 main dimensions: (1) recognising safety and healthhazards; (2) measuring, evaluating, and controlling safety and health hazards; (3) safetyand health training and management; (4) applying business principles, practices andmetrics in safety and health practice; and (5) applying industrial safety and health lawsand regulations.
The literature on leadership discusses many different competencies. However, twosets of leadership competencies can encompass all the competencies emphasising the cog-nitive and emotional functions of leadership [9]. The first set, suggested by Dulewiczand Higgs [10], includes three types of competencies—intellectual, managerial and emo-tional [9]. The combination of these competencies accounts for 79% of leadership perfor-mance [10]. The second set, suggested by Boyatzis et al. [11], includes two competencies,emotional and social, with cognitive competence added later. These two sets are similar intheir functions and components, as they emphasise the same functions and have mutualcomponents. Yet, the conceptual basis of the two sets is different. The components of thefirst set were identified through the functions of leadership [9], whereas the components ofthe second set were identified through the theory of action and job performance [12].

Int. J. Environ. Res. Public Health 2022, 19, 2197 3 of 21
1.2. Safety Leadership and Systems Thinking
Safety leadership, defined as ‘the process of defining the desired state, setting up theteam to succeed, and engaging in the discretionary efforts that drive the safety value’ [13],is widely recognised to be critical [14]. However, the role of safety leadership is changingand is becoming multi-dimensional. On the one hand, safety leadership requires a rigorousunderstanding of the systems that control hazards and reduce exposure. On the other hand,it is also more personal. Leaders who know themselves and understand their effects on theirrelationships, teams and organisational culture enable themselves to be more effective [15].It is in this context that the authors argue that contemporary safety leadership should beviewed as a complex process through the lens of Systems Thinking, as described below.
Systems Thinking offers an interdependent view of systems [16], as it assumes thatone event in the system could impact the other. This allows the understanding of thelinear and non-linear cause-and-effect relationships, in addition to the underlying patternof events [17]. It also adopts a dynamic view as a way of making sense of the context [16].On this basis, Systems Thinking and the holistic view it offers represent an ideal approachto better understand leadership competencies considering the leader, followers and workenvironment and how all these interact with each other. To facilitate this understanding, thisstudy argues that Systems Thinking—which gives an interdependent view of systems [18]—has the ability to provide a leadership competency model that focuses on the elements ofthe influencing process of leadership.
The aforementioned competency models focus on the management role of safetyprofessionals. The lack of a personal leadership competency model concerned with leaders’safety responsibility should be noted, and its importance lies in the essential role of leader-ship in influencing safety [19]. Moreover, whereas the previous studies identified and thencategorised the competencies based on responsibilities without investigating the leadershipitself as a process, the competencies developed in this study are part of a bigger modelthat reflects the process of leadership. The following section sheds light on the developedcompetencies as part of the whole leadership process, unlike previous studies that haveneglected the process.
1.3. Safety Leadership as a Process
To comprehend the whole of a system, Gharajedaghi [20] suggests applying an itera-tive process based on four independent variables comprising a relationship cycle. Thesevariables are (1) function, (2) structure, (3) process, and (4) context. Each variable works asa co-producer for other variables, and the cycle is closed once the holistic view is achieved.Gharajedaghi [20] also discusses the difficulty of seeing the whole in the case of failing tofigure out these interdependencies. Therefore, the iterative process is of great importancein understanding the complexity of a whole system.
In this paper, applying the iterative process to the adopted definition of leadershipcan help to comprehend and interpret the leadership concept holistically (Figure 1). Thedefinition of leadership used in the study is that developed by Northouse [21]; leadershipis “a process whereby an individual influences a group of individuals to achieve a commongoal”. The leader, the followers and the environment make up the structure of leadership.The leaders’ ability to influence followers, their ability to understand how their followersare influenced, and their ability to understand the environment to allow efficient influencingcomprise the process explaining the manner in which the structure generates leadershipfunctions. By developing an understanding of the relationship between the function, thestructure and the process and placing leadership in a suitable context afterwards, the abilityto achieve the desired leadership-driven targets is possible. Therefore, it can be said thatsuch a holistic view can provide a helpful explanation in the midst of understanding howleaders influence their followers.

Int. J. Environ. Res. Public Health 2022, 19, 2197 4 of 21
Int. J. Environ. Res. Public Health 2022, 19, x 4 of 22
it can be said that such a holistic view can provide a helpful explanation in the midst of understanding how leaders influence their followers.
Figure 1. Iterative process for understanding leadership.
The holistic view of safety leadership may be explained as the manner in which lead-ers utilise their leadership abilities, their followers’ abilities, and the environment. Know-ing how to influence, how followers are influenced and how to use the environment for influencing is essential for leaders to effectively practice safety leadership. Both Mumford et al. [22] and Yukl and Mahsud [23] have proposed a view of flexible leadership that aligns well with the proposed holistic view. Mumford et al. [22] contend there is more to leadership than just practising influencing behaviour. Yukl and Mahsud [23] state that, to provide leaders with a better understanding of themselves, others and the environment, emotional, social and cognitive competencies are required. By reinforcing these three com-petencies, leaders become more competent in influencing their followers and are provided with flexibility and a holistic view when exercising their leadership roles.
Many studies, such as Palaima and Skaržauskiene [16], Goleman [24] and Boyatzis [4], contend that adopting these competencies could lead to outstanding performances in leadership. Boyatzis [4] defines the above-mentioned three competencies as follows: Emotional competency is ‘the ability to recognise, understand, and use emotional in-
formation about oneself that leads to or causes effective or superior performance’. Social competency is ‘the ability to recognise, understand and use emotional infor-
mation about others that leads to or causes effective or superior performance’. Cognitive competency is ‘the ability to think [about] or analyse information and sit-
uations that leads to or causes effective or superior performance’. It has been found that people with a higher emotional competency experience out-
standing success in their lives; therefore, there is a relationship between emotional com-
Figure 1. Iterative process for understanding leadership.
The holistic view of safety leadership may be explained as the manner in which leadersutilise their leadership abilities, their followers’ abilities, and the environment. Knowinghow to influence, how followers are influenced and how to use the environment forinfluencing is essential for leaders to effectively practice safety leadership. Both Mumfordet al. [22] and Yukl and Mahsud [23] have proposed a view of flexible leadership that alignswell with the proposed holistic view. Mumford et al. [22] contend there is more to leadershipthan just practising influencing behaviour. Yukl and Mahsud [23] state that, to provideleaders with a better understanding of themselves, others and the environment, emotional,social and cognitive competencies are required. By reinforcing these three competencies,leaders become more competent in influencing their followers and are provided withflexibility and a holistic view when exercising their leadership roles.
Many studies, such as Palaima and Skaržauskiene [16], Goleman [24] and Boyatzis [4],contend that adopting these competencies could lead to outstanding performances inleadership. Boyatzis [4] defines the above-mentioned three competencies as follows:
• Emotional competency is ‘the ability to recognise, understand, and use emotionalinformation about oneself that leads to or causes effective or superior performance’.
• Social competency is ‘the ability to recognise, understand and use emotional informa-tion about others that leads to or causes effective or superior performance’.
• Cognitive competency is ‘the ability to think [about] or analyse information andsituations that leads to or causes effective or superior performance’.
It has been found that people with a higher emotional competency experience outstand-ing success in their lives; therefore, there is a relationship between emotional competency,which includes social competency, and positive social behaviour [25,26]. According toBoyatzis et al. [11], their Emotional Competence Inventory 360 (ECI 360) model is relatedto an individual’s performance on a work site. Bar-On [27] is another leading researchstudy exploring emotional competency. The study developed an emotional competency
Int. J. Environ. Res. Public Health 2022, 19, 2197 5 of 21
model that increases individuals’ ability to deal with their work environments [25]. Theresearchers who established these models contend that the combination of emotional com-petency (and social competency) and cognitive competency provides a greater chance ofbetter performance [4,24,28].
1.4. Complex Work Environment
Many industries, such as the aviation, oil and gas and construction industries, havecomplex work environments. The current study selected the construction industry as itsapplied setting for the following reasons: (1) the industry has one of the worst workplaceaccident records worldwide; (2) construction site management perceive projects as complex,dynamic phenomena in a non-linear setting; (3) a typical construction site is a workenvironment where humans are expected to interact, but because of its temporary character,the site has a highly transient social system; and (4) construction projects are dynamic, asvirtually all supplies and resources are highly dependent on the world surrounding theproject. Therefore, this study uses the construction industry as the setting to develop apersonal leadership competency model for construction safety leaders.
2. Research Methodology2.1. Population and Sample
The investigation area of this study is the construction industry in Saudi Arabia.According to the objective of the study, safety leaders—such as project managers, safetymanagers or any other managers with safety responsibilities—were considered the targetpopulation. In total, more than 500 questionnaires were collected from the participants bysnowball sampling method. A large number of returned responses were incomplete. Thisresulted in data analysis using 180 completed questionnaires.
2.2. Measures
The Emotional and Social Competency Inventory (ESCI-U) instrument established byBoyatzis and Goleman [29] was adopted and adjusted for the context of construction safety.It comprises three sections (emotional, social and cognitive competency). The details ofeach section are as follows:
• The emotional competency section includes 21 items, originally distributed into5 factors: (1) emotional self-awareness (factor ESA, 4 items); (2) achievement orienta-tion (factor AO, 4 items); (3) adaptability (factor A, 4 items); (4) emotional self-control(factor ESC, 4 items); and (5) positive outlook (factor PO, 5 items). The first factorbelongs to the self-awareness cluster, whereas the remaining four factors are associatedwith the self-management cluster.
• The social competency section includes 28 items, originally distributed into 7 factors:(1) empathy (factor E, 4 items); (2) organisational awareness (factor OA, 4 items);(3) conflict management (factor C, 4 items); (4) coach and mentor (factor CM, 4 items);(5) influence (factor I, 4 items); (6) inspirational leadership (factor IL, 4 items); and(7) teamwork (factor T, 4 items). The first two factors belong to the social awareness clus-ter, whereas the remaining five are associated with the relationship management cluster.
• The cognitive competency section includes 10 items, originally distributed into2 factors: (1) interaction recognition (factor IR, 5 items) and (2) pattern recognition(factor PR, 5 items).
Finally, it is important to mention that a five-point Likert-type scale was employedto measure leaders’ awareness of the items, where 1 = never, 2 = rarely, 3 = sometimes,4 = often and 5 = always.
2.3. Data Analysis
A series of quantitative approaches were applied in the presented study, specificallydescriptive analyses, exploratory factor analysis (EFA) and confirmatory factor analysis(CFA). The descriptive analyses were employed to check the data reliability using statistical

Int. J. Environ. Res. Public Health 2022, 19, 2197 6 of 21
techniques, such as Cronbach’s alpha analysis. Assessing the validity of the measurementscale was performed using EFA and CFA, sequentially. This was accomplished using thestatistical package for social science (SPSS 24.0, IBM Corp., Armonk, NY, USA) and AMOS25.0 (IBM Corp., Armonk, NY, USA), an extension of SPSS.
3. Results3.1. Overview of the Participants
Almost half of the respondents were employed as construction site managers (49.7%),whereas 32.7% and 17.6% worked in project manager and safety manager positions, respec-tively. Regarding work experience, more than 40% had more than 5 years of experience.Regarding the organisation safety performance level, 40.3% of the participants believedthey were working in organisations with safety performance levels the same as the averagelevel of the local industry, whereas 35.2% believed safety levels in their organisation werebelow average and 24.5% believed safety levels were above average.
According to the analysis, the responses were considered a suitable representation ofthe opinions of the population for two reasons. First, the majority of the participants hadnotable experiences. Second, the participants reflected a good mix of organisation safetyperformance levels.
3.2. Validity and Reliability of the Safety Competency Scale3.2.1. Item Analysis
Based on the five-point Likert-type scale, the mean values of the emotional competencyvariables seem to be high. All mean values were above 3.75, ranging from 3.79 to 4.45. Morespecifically, the professional individuals were perceived as seeking to do things in a saferway and as hard workers who improved their safety performance, as indicated by the twohighest mean values EI2BQ3 (4.45, SD = 0.691) and EI2BQ4 (4.30, SD = 0.739); see Table A1for item descriptions. Interestingly, despite their interest in adopting safety behaviours, suchas in variable EI2BQ3, their planning and strategy to cope with unexpected safety accidentshad the lowest score (EI2CQ3: 3.79, SD = 0865). Evidently, showing the ability to deal withstress in unsafe situations was not the main attribute of these professionals when comparedwith other perceived characteristics, such as variable EI1AQ1 (showing awareness of theirown feelings regarding safety concerns; 4.27, SD = 0.780) and variable EI2CQ1 (applyingsafety standard procedures flexibly; 4.20, SD = 0.759). These variables were more obvious,particularly as emotional competency mainly depends on understanding and utilisingone’s feelings and abilities. A description of each emotional competency item along withits mean and standard deviation values is presented in Table A1.
Except for one variable, all other mean values of social competency variables wereabove the mean level of 3.00. The mean values ranging from 3.58 to 4.36 and a singlevariable (SI2JQ2: convincing others by appealing to their self-interest; 2.91, SD = 1.373)were significantly below the range. The participants believed strongly in being respectfuland supportive of other team members, as indicated by the two highest mean valuesSI2LQ1 (4.36, SD = 0.713) and SI2LQ2 (4.32, SD = 0.680). Interestingly, in addition to thetwo highest variables, two other variables, SI2LQ3 (4.13, SD = 0.766) and SI2LQ4 (4.02,SD = 0.776), more related to building team capability and working co-operatively, were alsosignificantly higher compared to other variables. Evidently, understanding the reasons forunsafe actions taken by others was not the main aspect for the participants (SI1FQ3; 3.58,SD = 1.077), despite their strong belief in understanding others’ concerns about safety andunderstanding others from different backgrounds, SI1FQ1 (4.29, SD = 0.705) and SI1FQ2(4.02, SD = 0.796). A description of each social competency item along with its mean andstandard deviation values is presented in Table A2.
With a similar outcome, the overall levels of cognitive competency variables wereperceived to be strong. All the variables had mean values greater than 3.50, which meansthe respondents had a strong belief in the characteristics of their cognitive competency.The highest mean value was 4.11 (SD = 0.758), which was concerned with how safety

Int. J. Environ. Res. Public Health 2022, 19, 2197 7 of 21
accidents are viewed as a cause–effect relationship (CIMQ5). In addition, the participantswere perceived to consider safety when they explained complex processes. In contrast,interpreting a new situation using a story relating it to a different type of situation had thelowest mean value (CINQ5; 3.77, SD = 0.948). A description of each cognitive competencyitem along with its mean and standard deviation values is presented in Table A3.
3.2.2. Factorability of Data
The factorability of data was tested using the Kaiser–Meyer–Olkin (KMO) test andBartlett’s test of sphericity. Table 1 shows that all three constructs (emotional competency,social competency, and cognitive competency) had KMO values greater than 0.60, whichis the minimum agreement level acceptable [30]. The values ranged from 0.891 to 0.908.Therefore, these results were good and indicated sampling adequacy. Regarding Bartlett’stest of sphericity, all the statistical values were significant at p < 0.001. Therefore, therewere adequate relationships between the variables [31]. These results thus confirmed thefactorability of each construct for conducting the EFA.
Table 1. Kaiser–Meyer–Olkin test and Bartlett’s test of sphericity.
Construct KMOBartlett’s Test of Sphericity
Approx. Chi-Square df Sig.
Emotional competency 0.908 1809.838 210 0.000Social competency 0.891 2457.044 378 0.000
Cognitive competency 0.901 824.622 45 0.000
3.2.3. EFA Results
Principal component analysis and the Varimax orthogonal rotation method wereapplied to the three constructs to perform factor extraction and rotation. The scree test,which is used with the principal component analysis, was applied to determine the numberof factors that should be retained [32]. This test recognised four sub-factors, which explained64.7% of the total variance for the emotional competency (EI) construct. Table 2 shows thepatterns of the rotated component matrix that indicate most of the variables were found tosignificantly exceed the threshold level of 0.5. One variable was deleted due to its failure toreach the acceptable level (EI2BQ3; 0.478). Another variable, EI2DQ1 (I act safely even inemotionally charged situations), was deleted because, theoretically, it does not belong tothe extracted factor. As a result, 4 factors were identified from the remaining 19 variables,and a pre-measurement model of the EI construct was developed (Figure 2).
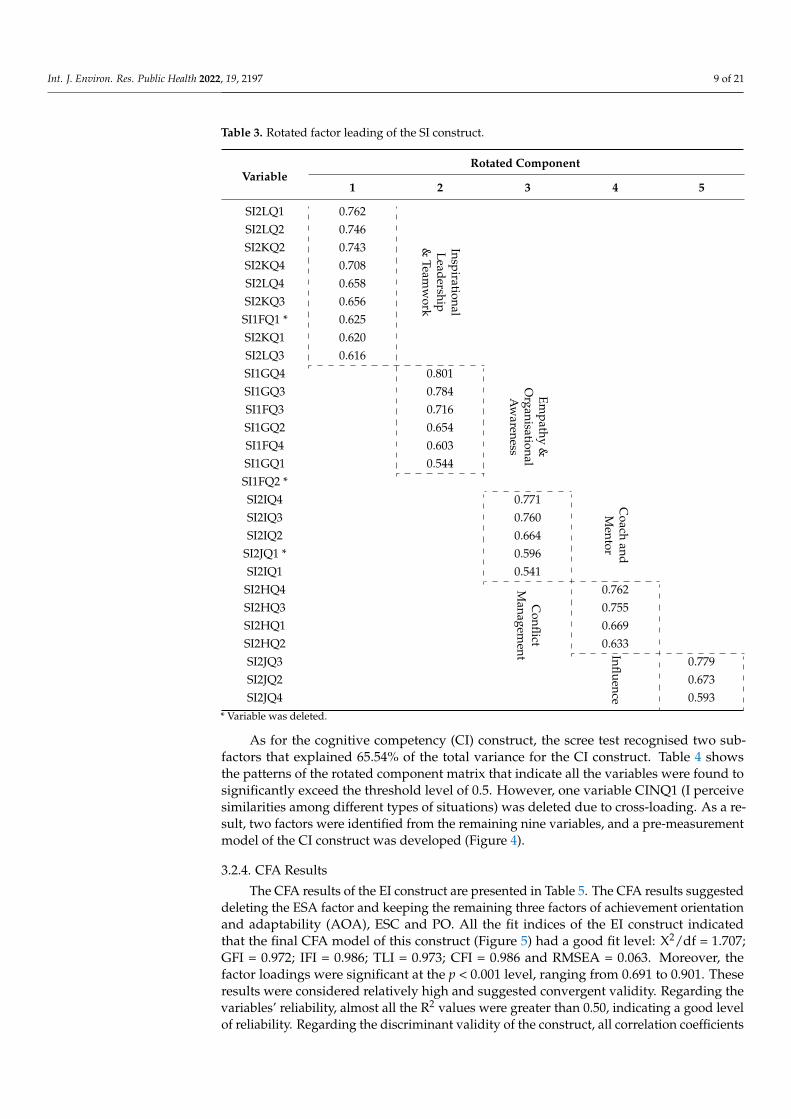
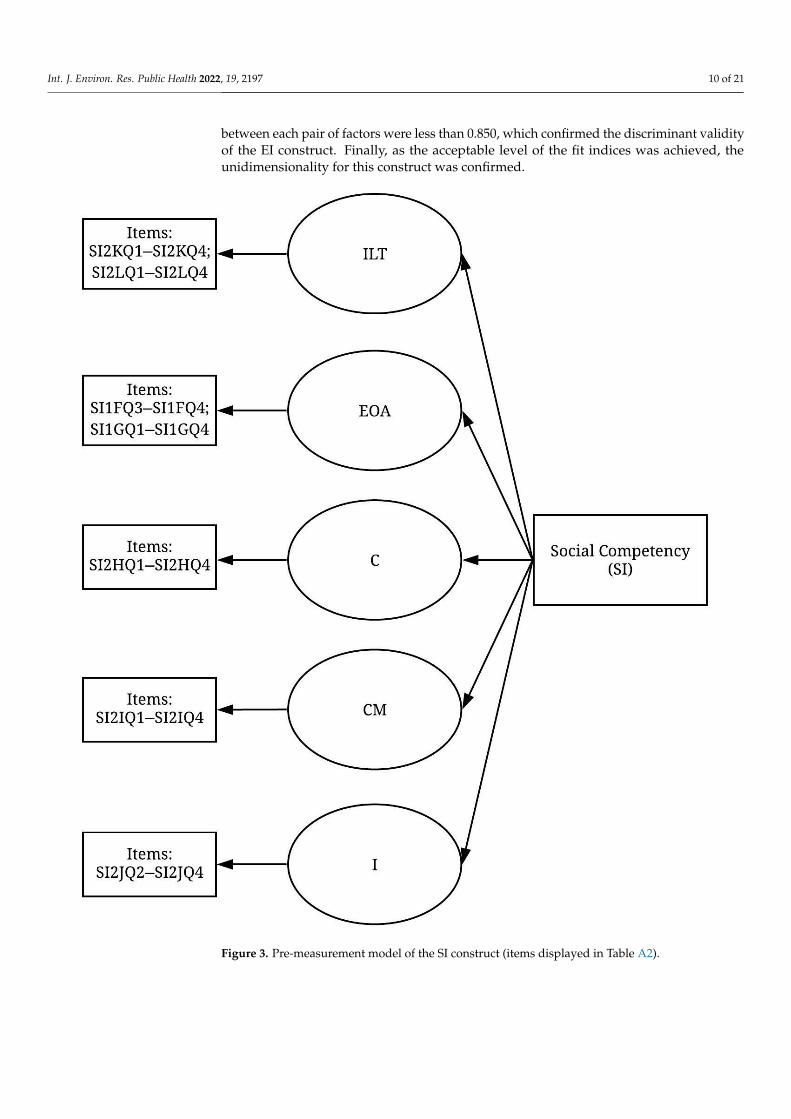
As for the social competency (SI) construct, both the scree test and the eigenvaluesuggested that five factors should be derived from the SI construct. These five factorsexplained 62.96% of the total variance. Table 3 shows the patterns of the rotated componentmatrix indicating that most of the variables were found to significantly exceed the thresholdlevel of 0.5. One variable was deleted due to its failure to reach the acceptable level (SI1FQ2;0.491). Two more variables, EI2FQ1 (I understand others’ concerns about safety by listeningattentively) and SI2JQ1 (In safety matters, I convince others by getting support from keypeople), were deleted because, theoretically, they do not belong to the extracted factor.Therefore, 5 factors were derived from the remaining 24 variables, and a pre-measurementmodel of the SI construct was developed (Figure 3).

Int. J. Environ. Res. Public Health 2022, 19, 2197 8 of 21
Table 2. Rotated factor loading of the IE construct.
VariableRotated Component
1 2 3 4
EI2CQ3 0.742
Achievem
entO
rientationand
Adaptability
EI2BQ2 0.723
EI2CQ4 0.693
EI2CQ1 0.686
EI2DQ1 * 0.657
EI2BQ1 0.654
EI2CQ2 0.653
EI2BQ4 0.594
EI2EQ3 0.745
PositiveO
utlook
EI2EQ2 0.719
EI2EQ5 0.699
EI2EQ4 0.671
EI2EQ1 0.575
EI2BQ3 *EI1AQ3 Em
otionalSelf-
Aw
areness
0.848
EI1AQ2 0.807
EI1AQ4 0.724
EI1AQ1 0.533
EI2DQ3 Emo-
tionalSelf-
Control
0.803
EI2DQ4 0.789
EI2DQ2 0.711* Variable was deleted.
Int. J. Environ. Res. Public Health 2022, 19, x 8 of 22
Figure 2. Pre-measurement model of the EI construct (items displayed in Table A1).
Table 2. Rotated factor loading of the IE construct.
Variable Rotated Component
1 2 3 4
EI2CQ3 0.742 Achievem
ent Orientation
and Adaptability
EI2BQ2 0.723
EI2CQ4 0.693
EI2CQ1 0.686
EI2DQ1 * 0.657
EI2BQ1 0.654
EI2CQ2 0.653
EI2BQ4 0.594
EI2EQ3
0.745
Positive Outlook
EI2EQ2
0.719
EI2EQ5
0.699
EI2EQ4
0.671
EI2EQ1
0.575
EI2BQ3 *
EI1AQ3
Emotional Self-
Aw
areness
0.848
EI1AQ2
0.807
EI1AQ4
0.724
EI1AQ1
0.533
EI2DQ3
Emo-
tion-al Self-C
on-trol
0.803 EI2DQ4
0.789
EI2DQ2
0.711 * Variable was deleted.
Figure 2. Pre-measurement model of the EI construct (items displayed in Table A1).
Int. J. Environ. Res. Public Health 2022, 19, 2197 9 of 21
Table 3. Rotated factor leading of the SI construct.
VariableRotated Component
1 2 3 4 5
SI2LQ1 0.762
InspirationalLeadership
&Team
work
SI2LQ2 0.746SI2KQ2 0.743SI2KQ4 0.708SI2LQ4 0.658SI2KQ3 0.656SI1FQ1 * 0.625SI2KQ1 0.620SI2LQ3 0.616SI1GQ4 0.801
Empathy
&O
rganisationalA
wareness
SI1GQ3 0.784SI1FQ3 0.716SI1GQ2 0.654SI1FQ4 0.603SI1GQ1 0.544SI1FQ2 *SI2IQ4 0.771 C
oachand
Mentor
SI2IQ3 0.760SI2IQ2 0.664
SI2JQ1 * 0.596SI2IQ1 0.541SI2HQ4
Conflict
Managem
ent
0.762SI2HQ3 0.755SI2HQ1 0.669SI2HQ2 0.633SI2JQ3
Influence
0.779SI2JQ2 0.673SI2JQ4 0.593
* Variable was deleted.
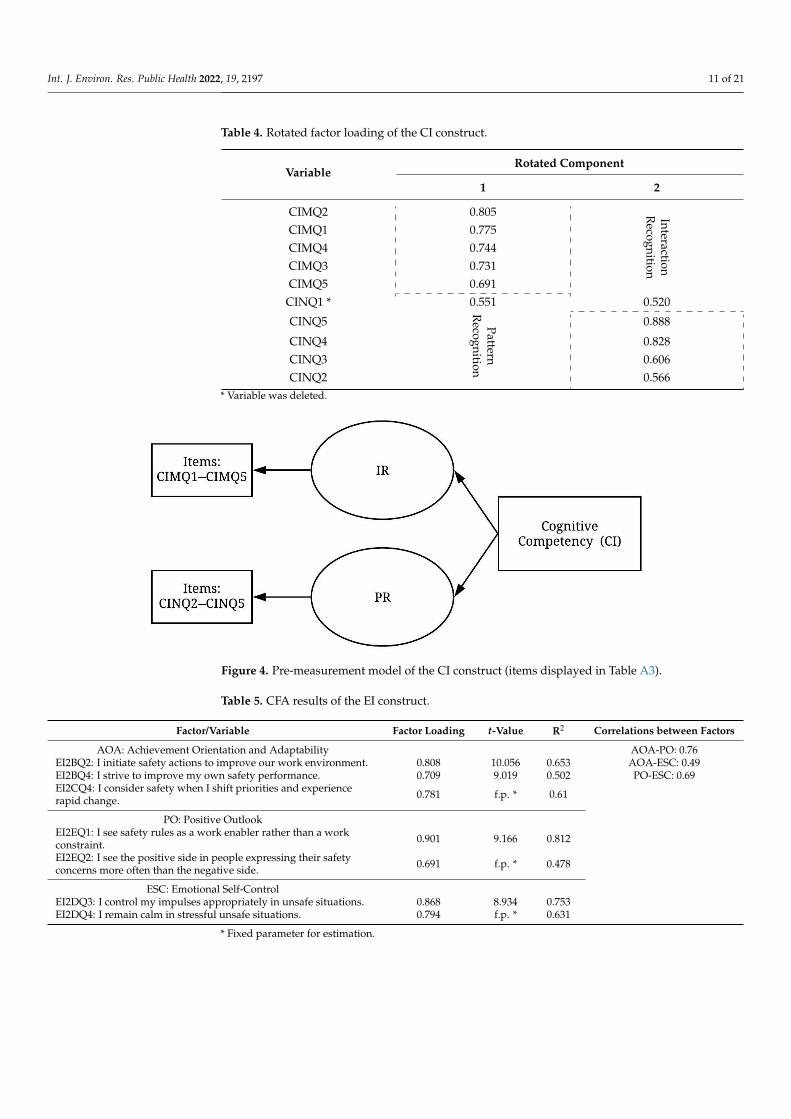
As for the cognitive competency (CI) construct, the scree test recognised two sub-factors that explained 65.54% of the total variance for the CI construct. Table 4 showsthe patterns of the rotated component matrix that indicate all the variables were found tosignificantly exceed the threshold level of 0.5. However, one variable CINQ1 (I perceivesimilarities among different types of situations) was deleted due to cross-loading. As a re-sult, two factors were identified from the remaining nine variables, and a pre-measurementmodel of the CI construct was developed (Figure 4).
3.2.4. CFA Results
The CFA results of the EI construct are presented in Table 5. The CFA results suggesteddeleting the ESA factor and keeping the remaining three factors of achievement orientationand adaptability (AOA), ESC and PO. All the fit indices of the EI construct indicatedthat the final CFA model of this construct (Figure 5) had a good fit level: X2/df = 1.707;GFI = 0.972; IFI = 0.986; TLI = 0.973; CFI = 0.986 and RMSEA = 0.063. Moreover, thefactor loadings were significant at the p < 0.001 level, ranging from 0.691 to 0.901. Theseresults were considered relatively high and suggested convergent validity. Regarding thevariables’ reliability, almost all the R2 values were greater than 0.50, indicating a good levelof reliability. Regarding the discriminant validity of the construct, all correlation coefficients
Int. J. Environ. Res. Public Health 2022, 19, 2197 10 of 21
between each pair of factors were less than 0.850, which confirmed the discriminant validityof the EI construct. Finally, as the acceptable level of the fit indices was achieved, theunidimensionality for this construct was confirmed.
Int. J. Environ. Res. Public Health 2022, 19, x 9 of 22
As for the social competency (SI) construct, both the scree test and the eigenvalue suggested that five factors should be derived from the SI construct. These five factors ex-plained 62.96% of the total variance. Table 3 shows the patterns of the rotated component matrix indicating that most of the variables were found to significantly exceed the thresh-old level of 0.5. One variable was deleted due to its failure to reach the acceptable level (SI1FQ2; 0.491). Two more variables, EI2FQ1 (I understand others’ concerns about safety by listening attentively) and SI2JQ1 (In safety matters, I convince others by getting sup-port from key people), were deleted because, theoretically, they do not belong to the ex-tracted factor. Therefore, 5 factors were derived from the remaining 24 variables, and a pre-measurement model of the SI construct was developed (Figure 3).
Figure 3. Pre-measurement model of the SI construct (items displayed in Table A2).
Figure 3. Pre-measurement model of the SI construct (items displayed in Table A2).
Int. J. Environ. Res. Public Health 2022, 19, 2197 11 of 21
Table 4. Rotated factor loading of the CI construct.
VariableRotated Component
1 2
CIMQ2 0.805 InteractionR
ecognition
CIMQ1 0.775CIMQ4 0.744CIMQ3 0.731CIMQ5 0.691
CINQ1 * 0.551 0.520
CINQ5 PatternR
ecognition0.888
CINQ4 0.828CINQ3 0.606CINQ2 0.566
* Variable was deleted.
Int. J. Environ. Res. Public Health 2022, 19, x 11 of 22
Figure 4. Pre-measurement model of the CI construct (items displayed in Table A3).
Table 4. Rotated factor loading of the CI construct.
Variable Rotated Component
1 2 CIMQ2 0.805 Interaction
Recognition
CIMQ1 0.775 CIMQ4 0.744 CIMQ3 0.731 CIMQ5 0.691
CINQ1 * 0.551 0.520 CINQ5 Pattern
Recognition
0.888 CINQ4 0.828 CINQ3 0.606
CINQ2 0.566
* Variable was deleted.
3.2.4. CFA Results The CFA results of the EI construct are presented in Table 5. The CFA results sug-
gested deleting the ESA factor and keeping the remaining three factors of achievement orientation and adaptability (AOA), ESC and PO. All the fit indices of the EI construct indicated that the final CFA model of this construct (Figure 5) had a good fit level: X2/df = 1.707; GFI = 0.972; IFI = 0.986; TLI = 0.973; CFI = 0.986 and RMSEA = 0.063. Moreover, the factor loadings were significant at the p < 0.001 level, ranging from 0.691 to 0.901. These results were considered relatively high and suggested convergent validity. Regarding the variables’ reliability, almost all the R² values were greater than 0.50, indicating a good level of reliability. Regarding the discriminant validity of the construct, all correlation co-efficients between each pair of factors were less than 0.850, which confirmed the discrimi-nant validity of the EI construct. Finally, as the acceptable level of the fit indices was achieved, the unidimensionality for this construct was confirmed.
Figure 4. Pre-measurement model of the CI construct (items displayed in Table A3).
Table 5. CFA results of the EI construct.
Factor/Variable Factor Loading t-Value R2 Correlations between Factors
AOA: Achievement Orientation and Adaptability AOA-PO: 0.76EI2BQ2: I initiate safety actions to improve our work environment. 0.808 10.056 0.653 AOA-ESC: 0.49EI2BQ4: I strive to improve my own safety performance. 0.709 9.019 0.502 PO-ESC: 0.69EI2CQ4: I consider safety when I shift priorities and experiencerapid change. 0.781 f.p. * 0.61
PO: Positive OutlookEI2EQ1: I see safety rules as a work enabler rather than a workconstraint. 0.901 9.166 0.812
EI2EQ2: I see the positive side in people expressing their safetyconcerns more often than the negative side. 0.691 f.p. * 0.478
ESC: Emotional Self-ControlEI2DQ3: I control my impulses appropriately in unsafe situations. 0.868 8.934 0.753EI2DQ4: I remain calm in stressful unsafe situations. 0.794 f.p. * 0.631
* Fixed parameter for estimation.

Int. J. Environ. Res. Public Health 2022, 19, 2197 12 of 21
Int. J. Environ. Res. Public Health 2022, 19, x 12 of 22
Table 5. CFA results of the EI construct.
Factor/Variable Factor Loading t-Value R² Correlations between Factors AOA: Achievement Orientation and Adaptability AOA-PO: 0.76
EI2BQ2: I initiate safety actions to improve our work environment. 0.808 10.056 0.653 AOA-ESC: 0.49
EI2BQ4: I strive to improve my own safety performance.
0.709 9.019 0.502 PO-ESC: 0.69
EI2CQ4: I consider safety when I shift priorities and experience rapid change. 0.781 f.p. * 0.61
PO: Positive Outlook
EI2EQ1: I see safety rules as a work enabler rather than a work constraint.
0.901 9.166 0.812
EI2EQ2: I see the positive side in people expressing their safety concerns more often than the negative side.
0.691 f.p. * 0.478
ESC: Emotional Self-Control
EI2DQ3: I control my impulses appropriately in unsafe situations. 0.868 8.934 0.753
EI2DQ4: I remain calm in stressful unsafe situations. 0.794 f.p. * 0.631 * Fixed parameter for estimation.
Figure 5. CFA model of the EI construct.
The CFA results of the SI construct are presented in Table 6. The CFA results sug-gested deleting the influence (I) factor and differentiated and keeping the T factor from
Figure 5. CFA model of the EI construct.
The CFA results of the SI construct are presented in Table 6. The CFA results suggesteddeleting the influence (I) factor and differentiated and keeping the T factor from theILT factor and the OA factor from the EOA factor. The results also suggested keepingthe remaining two factors, CM and C. All the fit indices of the SI construct indicatedthat the final CFA model of this construct (Figure 6) had a good fit level: X2/df = 1.517;GFI = 0.962; IFI = 0.985; TLI = 0.975; CFI = 0.985 and RMSEA = 0.054. Moreover, thefactor loadings were significant at the p < 0.001 level, ranging from 0.613 to 0.888. Theseresults were considered relatively high and suggested convergent validity. Regardingthe variables’ reliability, almost all the R2 values were greater than 0.50, indicating agood level of reliability. Regarding the discriminant validity of the construct, all thecorrelation coefficients between each pair of factors were less than 0.850, which confirmedthe discriminant validity of the SI construct. Finally, as an acceptable level of the fit indiceswas achieved, the unidimensionality for this construct was confirmed.

Int. J. Environ. Res. Public Health 2022, 19, 2197 13 of 21
Table 6. CFA results of the SI construct.
Factor/Variable Factor Loading t-Value R2 Correlations between Factors
T: Teamwork T-OA: 0.47SI2LQ3: I work well in teams by soliciting others’ inputregarding safety. 0.779 9.997 0.608 T-CM: 0.81
SI2LQ4: I work well in teams by encouraging cooperation insafety matters. 0.832 f.p. * 0.692 T-C: 0.55
OA: Organizational Awareness OA-CM: 0.42SI1GQ3: I understand the informal processes by which work isachieved in the team or organisation. 0.888 8.612 0.789 OA-C: 0.52
SI1GQ4: I understand the informal structure in the team ororganisation. 0.854 f.p. * 0.729 CM-C: 0.52
CM: Coach and MentorSI2IQ2: I coach and mentor others about safety. 0.818 11.96 0.669SI2IQ3: I personally invest time and effort in developing others’safety performance. 0.807 11.788 0.651
SI2IQ4: I provide on-going safety mentoring. 0.831 f.p. * 0.69
C: Conflict ManagementSI2HQ2: To avoid unsafe situations, I try to resolve conflict byopenly talking about disagreements with those involved. 0.795 5.392 0.632
SI2HQ4: When resolving conflict, I de-escalate the emotionsin the situation. 0.613 f.p.* 0.375
* Fixed parameter for estimation.
The CFA results of the CI construct are presented in Table 7. The CFA results suggestedtwo factors, IR and PR. All the fit indices of the CI construct indicated that the final CFAmodel of this construct (Figure 7) had a good fit level: X2/df = 0.023; GFI = 1.0; IFI = 1.0;TLI = 1.0; CFI = 1.0 and RMSEA = 0.000. Moreover, the factor loadings were significantat the p < 0.001 level, ranging from 0.587 to 0.904. This result was considered relativelyhigh and suggested convergent validity. Regarding the variables’ reliability, almost allthe R2 values were greater than 0.50, indicating a good level of reliability. Regarding thediscriminant validity of the construct, the correlation coefficient between the two factorswas less than 0.850, which confirmed the discriminant validity of the CI construct. Finally, asan acceptable level of the fit indices was achieved, the unidimensionality for this constructwas confirmed. In summary, the CFA results revealed three, four and two factors belongingto the emotional, social and cognitive constructs, respectively. The listed items for thesefactors are presented in Table 8.
Table 7. CFA results of the CI construct.
Factor/Variable Factor Loading t-Value R2 Correlations between Factors
IR: Interaction Recognition IR-PR: 0.78CIMQ1: I see a situation as multiple cause and effectinteractions impacting safety. 0.718 7.717 0.516
CIMQ2: I explain how certain things affect othersresulting in a particular outcome that may affect safety. 0.904 f.p. * 0.817
PR: Pattern RecognitionCINQ3: I perceive common trends in work accidents. 0.747 5.824 0.558CINQ5: I interpret a new situation by using a storyrelating it to a different type of situation. 0.587 f.p. * 0.345
* Fixed parameter for estimation.

Int. J. Environ. Res. Public Health 2022, 19, 2197 14 of 21
Int. J. Environ. Res. Public Health 2022, 19, x 14 of 22
Figure 6. CFA model of the SI construct.
The CFA results of the CI construct are presented in Table 7. The CFA results sug-gested two factors, IR and PR. All the fit indices of the CI construct indicated that the final CFA model of this construct (Figure 7) had a good fit level: X^2/df = 0.023; GFI = 1.0; IFI = 1.0; TLI = 1.0; CFI = 1.0 and RMSEA = 0.000. Moreover, the factor loadings were significant at the p < 0.001 level, ranging from 0.587 to 0.904. This result was considered relatively high and suggested convergent validity. Regarding the variables’ reliability, almost all the R^2 values were greater than 0.50, indicating a good level of reliability. Regarding the discriminant validity of the construct, the correlation coefficient between the two factors
Figure 6. CFA model of the SI construct.

Int. J. Environ. Res. Public Health 2022, 19, 2197 15 of 21
Int. J. Environ. Res. Public Health 2022, 19, x 15 of 22
was less than 0.850, which confirmed the discriminant validity of the CI construct. Finally, as an acceptable level of the fit indices was achieved, the unidimensionality for this con-struct was confirmed. In summary, the CFA results revealed three, four and two factors belonging to the emotional, social and cognitive constructs, respectively. The listed items for these factors are presented in Table 8.
Table 7. CFA results of the CI construct.
Factor/Variable Factor Loading t-Value R² Correlations between Factors IR: Interaction Recognition IR-PR: 0.78
CIMQ1: I see a situation as multiple cause and effect interactions impacting safety. 0.718 7.717 0.516
CIMQ2: I explain how certain things affect others resulting in a particular outcome that may affect safety.
0.904 f.p. * 0.817
PR: Pattern Recognition CINQ3: I perceive common trends in work accidents. 0.747 5.824 0.558
CINQ5: I interpret a new situation by using a story relating it to a different type of situation.
0.587 f.p. * 0.345
* Fixed parameter for estimation.
Figure 7. CFA model of the CI construct.
Figure 7. CFA model of the CI construct.
Table 8. Summary of the CFA results.
Construct Factor Item: Description
Emot
iona
lCom
pete
ncy
(IE) Achievement Orientation and
Adaptability (AOA)
EI2BQ2: I initiate safety actions to improve our work environment.
EI2BQ4: I strive to improve my own safety performance.
EI2CQ4: I consider safety when I shift priorities and experience rapid change.
Positive Outlook (PO)EI2EQ1: I see safety rules as a work enabler rather than a work constraint.
EI2EQ2: I see the positive side in people expressing their safety concerns moreoften than the negative side.
Emotional Self-Control (ESC)EI2DQ3: I control my impulses appropriately in unsafe situations.
EI2DQ4: I remain calm in stressful unsafe situations.
Soci
alC
ompe
tenc
y(S
I)
Teamwork (T)SI2LQ3: I work well in teams by soliciting others’ input regarding safety.
SI2LQ4: I work well in teams by encouraging cooperation in safety matters.
Organisational Awareness (OA)SI1GQ3: I understand the informal processes by which work is achieved in theteam or organisation.
SI1GQ4: I understand the informal structure in the team or organisation.
Coach and Mentor (CM)SI2IQ2: I coach and mentor others about safety.
SI2IQ3: I personally invest time and effort in developing others’ safetyperformance.
SI2IQ4: I provide on-going safety mentoring.
Conflict Management (C)SI2HQ2: To avoid unsafe situations, I try to resolve conflict by openly talkingabout disagreements with those involved.
SI2HQ4: When resolving conflict, I de-escalate the emotions in the situation.

Int. J. Environ. Res. Public Health 2022, 19, 2197 16 of 21
Table 8. Cont.
Construct Factor Item: Description
Cog
niti
veC
ompe
tenc
y(C
I) Interaction Recognition (IR)CIMQ1: I see a situation as multiple cause and effect interactions impactingsafety.CIMQ2: I explain how certain things affect others resulting in a particularoutcome that may affect safety.
Pattern Recognition (PR) CINQ3: I perceive common trends in work accidents.CINQ5: I interpret a new situation by using a story relating it to a differenttype of situation.
4. Discussion
The objective of this study was to develop a personal leadership competency modelfor safety leaders and to investigate the leadership competencies needed to successfullyfulfil the influencing process demonstrated by the Systems Thinking concept. The threeselected leadership competencies (emotional, social and cognitive) were proven to be a partof the model. These results are compatible with Boyatzis [4] and Yukl and Mahsud [22], asthey emphasised the role these competencies have in leaders’ influencing process. Basedon the findings, safety leaders need the three competencies to enhance their ability tounderstand the leadership influencing process that involves leaders, followers and theenvironment (Figure 8).
Int. J. Environ. Res. Public Health 2022, 19, x 17 of 22
Figure 8. The role of leadership competencies in understanding the leadership influencing process.
For emotional competency, the CFA results revealed the importance of three compe-tency factors: (1) Achievement Orientation and Adaptability (AOA); (2) Positive Outlook (PO); and (3) Emotional Self-Control (ESC). The AOA factor helps safety leaders to achieve a standard of excellence in their role, which requires flexibility, such as changing percep-tions and ideas based on new input. This could be mastered by safety leaders by regularly consulting others and reviewing the way their work is performed in order to assess safety situations and by investing more time to recall previous unsafe situations to evaluate their responses to those situations. Regarding the PO factor, it helps safety leaders to look at difficult situations as opportunities for learning and improvement. This could be mastered by taking notes about responses to situations and how to turn them into learning and improvement opportunities. The ESC factor helps safety leaders to develop the ability to keep negative actions under control when provoked. This could be mastered by under-standing the implications of their safety actions and controlling the potential triggers of losing self-control. Collectively, these three competencies provide safety leaders with the ability to enhance their safety performance.
Regarding social competency, the CFA results revealed the importance of four com-petency factors: (1) Teamwork (T); (2) Organisational Awareness (OA); (3) Coach and Mentor (CM); and (4) Conflict Management (C). The T factor supports safety leaders’ abil-ity to discuss and share safety matters with their followers. This could be mastered by regularly asking followers to share their opinions regarding safety aspects. Regarding the OA factor, it helps safety leaders to understand their organisations’ culture and identify those with the influencing power in their teams by understanding the cultural norms of their organisations. The CM factor is concerned with improving safety leaders’ ability to set up a continuous development program for team members. This competency is achieved by providing followers with constructive feedback and demonstrating what they could do differently, how they could improve their safety and pointing out their strengths that can be utilised to improve their safety performance. Moreover, leaders may take time for a friendly chat about things they may want feedback on. Regarding the C factor, it helps safety leaders to focus on the issues of conflict and work on de-escalating the associated negative feelings. This could be mastered by openly discussing the views
Figure 8. The role of leadership competencies in understanding the leadership influencing process.
For emotional competency, the CFA results revealed the importance of three compe-tency factors: (1) Achievement Orientation and Adaptability (AOA); (2) Positive Outlook(PO); and (3) Emotional Self-Control (ESC). The AOA factor helps safety leaders to achieve astandard of excellence in their role, which requires flexibility, such as changing perceptionsand ideas based on new input. This could be mastered by safety leaders by regularlyconsulting others and reviewing the way their work is performed in order to assess safetysituations and by investing more time to recall previous unsafe situations to evaluate theirresponses to those situations. Regarding the PO factor, it helps safety leaders to look at

Int. J. Environ. Res. Public Health 2022, 19, 2197 17 of 21
difficult situations as opportunities for learning and improvement. This could be masteredby taking notes about responses to situations and how to turn them into learning andimprovement opportunities. The ESC factor helps safety leaders to develop the ability tokeep negative actions under control when provoked. This could be mastered by under-standing the implications of their safety actions and controlling the potential triggers oflosing self-control. Collectively, these three competencies provide safety leaders with theability to enhance their safety performance.
Regarding social competency, the CFA results revealed the importance of four compe-tency factors: (1) Teamwork (T); (2) Organisational Awareness (OA); (3) Coach and Mentor(CM); and (4) Conflict Management (C). The T factor supports safety leaders’ ability todiscuss and share safety matters with their followers. This could be mastered by regularlyasking followers to share their opinions regarding safety aspects. Regarding the OA fac-tor, it helps safety leaders to understand their organisations’ culture and identify thosewith the influencing power in their teams by understanding the cultural norms of theirorganisations. The CM factor is concerned with improving safety leaders’ ability to set upa continuous development program for team members. This competency is achieved byproviding followers with constructive feedback and demonstrating what they could dodifferently, how they could improve their safety and pointing out their strengths that canbe utilised to improve their safety performance. Moreover, leaders may take time for afriendly chat about things they may want feedback on. Regarding the C factor, it helpssafety leaders to focus on the issues of conflict and work on de-escalating the associatednegative feelings. This could be mastered by openly discussing the views on safety that aredisagreed upon before conflict arises. Collectively, these four competencies provide safetyleaders the ability to enhance their followers’ safety performance.
Regarding cognitive competency, the CFA results revealed the importance of twocompetency factors: (1) Interaction Recognition (IR) and (2) Pattern Recognition (PR). TheIR factor helps safety leaders to identify and view an event as cause and effect. Thiscompetency could be mastered by spending time to recall previous unsafe situationsto analyse and connect the people or other events that could have caused and affectedthe situation. Regarding the PR factor, it helps safety leaders to recognise and assesssafety situation patterns and see the commonality among diff0erent safety situations.Collectively, these two competencies provide safety leaders with the ability to prepareworksite environments for better safety performance.
As leaders execute safety practices, the how and when of these practices must beconsidered. The Systems Thinking approach considers these two aspects in terms ofbehaviour in complex environments. This is fundamental in improving leaders’ influencingprocess, which can be achieved through the nine identified competencies. CompetenciesIR and PR deal with understanding the environment, whereas competencies AOA, POand ESC are about understanding the leaders themselves. At the beginning, novice safetyleaders might attempt to assess and build an understanding of how elements of a worksiteenvironment impact each other. As they learn to prepare worksite environments, they arestrongly advised to start the iteration 1 where competencies AOA, PO and ESC help themto understand themselves. This will help to improve their safety level at their worksites.As they improve this skill, they may opt for the next iteration where competencies T, OA,CM and C are related to their relationship with their followers. These competencies aim tounderstand followers’ perceptions and help to improve their safety performance, aligningit with the targeted safety level.
From the above, and to improve influencing skills, it could be recommended thatsafety leaders need to:
• View a safety event as cause and effect.• Assess safety situation patterns regularly.• Consult others regarding safety situations.• Record and review safety situational responses.• Improve self-discipline.

Int. J. Environ. Res. Public Health 2022, 19, 2197 18 of 21
To further enhance safety leaders’ influencing skills, they are encouraged to:
• Share their safety opinions among their team.• Learn the cultural norms of their organisations.• Set up a continuous development program for their followers.• Discuss divergent views before conflict arises.
5. Study Limitations
Two potential limitations were noted about the current research study. First, themain concern of this study was to develop a personal leadership competency for safetymanagers who work in complex environments. All the voluntary participants were fromthe construction industry. Although the environment of this industry is considered oneof the most complex environments, different environments could have revealed differentcompetency models. Therefore, a sample from other industries with complex environmentsis suggested to generalise this model for complex environments. Second, similar to otherresearch studies that use self-assessment surveys to collect data, the findings of this studymay have been exposed to some amount of bias. Despite both limitations, this study offerssupport for the holistic competency model for safety managers.
6. Conclusions
This study aimed to develop a personal leadership competency model for safetymanagers in a complex environment with the help of the concept of Systems Thinking.The study identified nine leadership competencies categorised into three main domains—emotional, social and cognitive. Collectively, these competencies enable safety leaders tounderstand the complexities that face them in their work environment. This research studyhas opened up more questions that require exploration. Further investigation of the effectof this leadership competency model on safety outcomes would be useful. This would testthe impact of these competencies on safety performance in complex environments.
Author Contributions: Conceptualization, H.M.A. and S.M.; methodology, H.M.A. and S.M..; datacollection, H.M.A.; analysis and interpretation of results, H.M.A. and S.M.; resources, H.M.A.;writing—original draft preparation, H.M.A.; writing—review and editing, S.M.; supervision, S.M. Allauthors have read and agreed to the published version of the manuscript.
Funding: This research received no external funding.
Institutional Review Board Statement: The study was conducted according to the guidelines ofthe Declaration of RIMS Griffith and approved by GRIFFITH UNIVERSITY HUMAN RESEARCHETHICS COMMITTEE with a reference number of 2017/248.
Informed Consent Statement: Informed consent was obtained from all subjects involved in the study.
Data Availability Statement: The data that support the findings of this study are available on requestfrom the corresponding author (H.M.A.). The data are not publicly available due to privacy andethical restrictions.
Acknowledgments: The authors would like to acknowledge to the survey respondents, withoutwhom this research study would not have been possible to complete.
Conflicts of Interest: The authors declare no conflict of interest.

Int. J. Environ. Res. Public Health 2022, 19, 2197 19 of 21
Appendix A
Table A1. Descriptive items and statistical analysis of emotional competency (EI) variables.
Variable: Description Mean Std. Deviation
EI1AQ1: I show awareness of my own feelings regarding safety concerns. 4.27 0.780
EI1AQ2: I acknowledge my own strengths and weaknesses within the safety context. 4.05 0.907
EI1AQ3: I am able to describe how my feelings affect my safety actions. 3.89 0.816
EI1AQ4: I understand the connection between upcoming safety issues and my ownfeelings. 3.93 0.793
EI2BQ1: I seek to improve safety conditions by setting higher goals. 4.10 0.864
EI2BQ2: I initiate safety actions to improve our work environment. 4.06 0.854
EI2BQ3: I seek ways to do things in a safer manner. 4.45 0.691
EI2BQ4: I strive to improve my own safety performance. 4.30 0.739
EI2CQ1: I apply safety standard procedures flexibly. 4.20 0.759
EI2CQ2: I smoothly juggle multiple demands in safety-related accidents. 4.12 0.820
EI2CQ3: I plan suitable overall strategy, goals or projects to cope with unexpectedsafety-related accidents. 3.79 0.865
EI2CQ4: I consider safety when I shift priorities and experience rapid change. 4.07 0.821
EI2DQ1: I act safely, even in emotionally charged situations. 4.00 0.838
EI2DQ2: I remain composed, even in unsafe situations. 3.94 0.889
EI2DQ3: I control my impulses appropriately in unsafe situations. 3.85 0.805
EI2DQ4: I remain calm in stressful unsafe situations. 3.80 0.880
EI2EQ1: I see safety rules as a work enabler rather than a work constraint. 4.12 0.811
EI2EQ2: I see the positive side in people expressing their safety concerns more oftenthan the negative side. 4.01 0.805
EI2EQ3: I see learning opportunities in safety incidents rather than punishing orblaming. 4.17 0.802
EI2EQ4: I am optimistic when thinking about future safety performance. 4.23 0.747
EI2EQ5: I believe our safety record in the future will be better than the previous one(s). 4.24 0.743
Table A2. Descriptive items and statistical analysis of social competency (SI) variables.
Variable: Description Mean Std. Deviation
SI1FQ1: I understand others’ concerns about safety by listening attentively. 4.29 0.705
SI1FQ2: I understand others from different backgrounds who are concerned or not concernedabout safety. 4.02 0.796
SI1FQ3: I understand the reasons for someone else’s unsafe actions at work. 3.58 1.077
SI1FQ4: I understand others’ perceptions of safety rules when they are different from myown. 3.77 0.855
SI1GQ1: I understand the importance of social networks in improving our safetyperformance. 4.16 0.890
SI1GQ2: I understand the team’s or organisation’s unspoken rules that might affect safety. 3.92 0.883
SI1GQ3: I understand the informal processes by which work is achieved in the team ororganization. 3.97 0.882
SI1GQ4: I understand the informal structure in the team or organization. 3.78 0.944

Int. J. Environ. Res. Public Health 2022, 19, 2197 20 of 21
Table A2. Cont.
Variable: Description Mean Std. Deviation
SI2HQ1: To avoid unsafe situations, I try to resolve conflicts by finding a solution thataddresses everyone’s interests. 4.02 0.878
SI2HQ2: To avoid unsafe situations, I try to resolve conflict by openly talking aboutdisagreements with those involved. 4.10 0.799
SI2HQ3: To avoid unsafe situations, I try to resolve conflict by finding a common groundposition everyone involved can endorse. 4.00 0.847
SI2HQ4: When resolving conflict, I de-escalate the emotions in the situation. 4.13 0.814
SI2IQ1: I provide feedback that others find helpful for their safety performance development. 3.99 0.843
SI2IQ2: I coach and mentor others about safety. 4.09 0.912
SI2IQ3: I personally invest time and effort in developing others’ safety performance. 3.66 0.940
SI2IQ4: I provide on-going safety mentoring. 3.94 0.880
SI2JQ1: In safety matters, I convince others by getting support from key people. 3.82 0.872
SI2JQ2: In safety matters, I convince others by appealing to their self-interest. 2.91 1.373
SI2JQ3: In safety matters, I convince others by engaging them in discussion. 3.70 0.889
SI2JQ4: I anticipate how others will respond when trying to convince them. 3.75 0.832
SI2KQ1: I lead by building pride in the group. 3.91 0.912
SI2KQ2: I lead by bringing out the best in people. 4.20 0.795
SI2KQ3: I lead by inspiring people and articulating a compelling vision for our safety. 4.00 0.865
Table A3. Descriptive items and statistical analysis of cognitive competency (CI) variables.
Variable: Description Mean Std. Deviation
CIMQ1: I see a situation as multiple cause-and-effect interactions impacting safety. 3.84 0.836
CIMQ2: I explain how certain things affect others resulting in a particular outcome that mayaffect safety. 4.01 0.757
CIMQ3: I consider safety when explaining complex processes. 4.08 0.778
CIMQ4: I explain an accident in terms of how multiple factors involved affect each other andconsequently affect safety. 4.07 0.831
CIMQ5: I see a safety-related accident as a set of cause-and-effect relationships. 4.11 0.758
CINQ1: I perceive similarities among different types of situations. 3.95 0.785
CINQ2: I identify patterns or trends in seemingly random information. 3.78 0.813
CINQ3: I perceive common trends in work accidents. 3.94 0.854
CINQ4: I use examples or stories to describe themes or patterns in an accident. 4.06 0.914
CINQ5: I interpret a new situation by using a story relating it to a different type of situation. 3.77 0.948
References1. Tam, C.M.; Zeng, S.X.; Deng, Z.M. Identifying Elements of Poor Construction Safety Management in China. Saf. Sci. 2004, 42,
569–586. [CrossRef]2. Berhanu, G. Models Relating Traffic Safety with Road Environment and Traffic Flows on Arterial Roads in Addis Ababa. Accid.
Anal. Prev. 2004, 5, 697–704. [CrossRef] [PubMed]3. Boyatzis, R.E. The Competent Manager: A Model for Effective Performance; John Wiley & Sons: New York, NY, USA, 1982.4. Boyatzis, R. Competencies in the 21st Century. J. Manag. Dev. 2008, 27, 5–12. [CrossRef]5. Blair, E. Critical Competencies for SHandE Managers—Implications for Educators. J. SHE Res. 2005, 1, 1–13.6. Leemann, J.E. Delivering Business Value by Linking Behavioral EHS Competencies to Corporate Core Competencies. Int. J.
Sustain. Bus. 2005, 12, 3–16.

Int. J. Environ. Res. Public Health 2022, 19, 2197 21 of 21
7. Daud, R.; Ismail, M.; Omar, Z. Identification of Competencies for Malaysian Occupational Safety and Health Professionals. Ind.Health 2010, 48, 824–834. [CrossRef] [PubMed]
8. Chang, S.H.; Chen, D.F.; Wu, T.C. Developing a Competency Model for Safety Professionals: Correlations between Competencyand Safety Functions. J. Saf. Res. 2012, 43, 339–350. [CrossRef] [PubMed]
9. Turner, J.R.; Müller, R. The Project Manager’s Leadership Style as a Success Factor on Projects: A Literature Review. Proj. Manag.J. 2005, 36, 49–61. [CrossRef]
10. Dulewicz, V.; Higgs, M. Emotional Intelligence—A Review and Evaluation Study. J. Manag. Psychol. 2000, 15, 341–372. [CrossRef]11. Boyatzis, R.; Goleman, D.; Rhee, K. Clustering Competence in Emotional Intelligence: Insights from the Emotional Competence
Inventory (ECI). Handb. Emot. Intell. 2000, 99, 343–362.12. Boyatzis, R.E. Competencies as a Behavioral Approach to Emotional Intelligence. J. Manag. Dev. 2009, 28, 749–770. [CrossRef]13. Cooper, M.D. Safety Leadership in Construction: A Case Study. Ital. J. Occup. Med. Ergon. Suppl. A Psychol. 2010, 32, A18–A23.14. HSE (Health Safety Executive). Leadership for the Major Hazard Industries: Effective Health and Safety Management. 2011.
Available online: https://www.hse.gov.uk/pubns/indg277.pdf (accessed on 2 July 2018).15. Krause, T.R.; Weekley, T. Safety Leadership. Prof. Saf. 2005, 50, 34–40.16. Palaima, T.; Skaržauskiene, A. Systems Thinking as a Platform for Leadership Performance in a Complex World. Balt. J. Manag.
2010, 5, 330–355. [CrossRef]17. Senge, P.M. The Fifth Discipline: The Art and Practice of the Learning Organisation; Doubleday/Currency: New York, NY, USA, 2006.18. Aronson, D. Overview of Systems Thinking. The Thinking Page. Available online: http://www.stefanibardin.net/wp-content/
uploads/2017/01/Overview-of-Systems-Thinking.pdf (accessed on 19 July 2018).19. Alidrisi, H.M.; Mohamed, S. Systematic Review of Safety Leadership: A Fresh Perspective. In International Conference on
Engineering, Project, and Product Management; Springer: Amman, Jordan, 2017; pp. 215–223.20. Gharajedaghi, J. Systems Thinking: Managing Chaos and Complexity: A Platform for Designing Business Architecture, 3th ed.; Elsevier:
Burlington, MA, USA, 2011.21. Northouse, P. Leadership: Theory and Practice, 6th ed.; SAGE Publications: Thousand Oaks, CA, USA, 2013.22. Mumford, M.D.; Zaccaro, S.J.; Harding, F.D.; Jacobs, T.O.; Fleishman, E.A. Leadership Skills for a Changing World: Solving
Complex Social Problems. Leadersh. Q. 2000, 11, 11–35. [CrossRef]23. Yukl, G.; Mahsud, R. Why Flexible and Adaptive Leadership is Essential. Consult. Psychol. J. 2010, 62, 81–93. [CrossRef]24. Goleman, D. Working with Emotional Intelligence; Bantam Books: New York, NY, USA, 1998.25. Butler, C.J.; Chinowsky, P.S. Emotional Intelligence and Leadership Behavior in Construction Executives. J. Manag. Eng. 2006, 22,
119–125. [CrossRef]26. Goleman, D. Emotional Intelligence; Bantam Books: New York, NY, USA, 1995.27. Bar-On, R. BarOn Emotional Quotient Inventory; Multi-Health Systems: Toronto, ON, Canada, 1997.28. Johnson, D.J. Leadership Competencies in Public Safety Communications. Master’s Thesis, Royal Roads University, Victoria, BC,
Canada, 2009.29. Boyatzis, R.E.; Goleman, D. Emotional and Social Competency Inventory; Hay Group Transforming Learning: Philadelphia, PA,
USA, 2007.30. Tabachnick, B.G.; Fidell, L.S. Using Multivariate Statistics; Pearson: Boston, MA, USA, 2007.31. Field, A. Discovering Statistics Using IBM SPSS Statistics, 4th ed.; Sage: Thousand Oaks, CA, USA, 2013.32. Ledesma, R.D.; Valero-Mora, P.; Macbeth, G. The Scree Test and the Number of Factors: A Dynamic Graphics Approach. Span. J.
Psychol. 2015, 18, E11. [CrossRef] [PubMed]