administration of high school competency
TRANSCRIPT
ADMINISTRATION OF HIGH SCHOOL COMPETENCY REQUIREMENTS
FOR CHEMICAL AND PETROLEUM ENGINEERS
by
JAMES THAYDAS ROLLINS, B . S . , M. Ed.
A DISSERTATION
IN
EDUCATION
Submitted to the Graduate Faculty of Texas Tech University in
Part i al Fulfillment of the Requirements for
the Degree of
DOCTOR OF EDUCATION
Approved
December, 1984

A C K N O W L E D G E M E N T S
The writer is sincerely grateful to the c o m m i t t e e m e m b e r s
D r . Weldon E . B e c k n e r , C h a i r m a n , Dr. Joe B. C o r n e t t , Dr. John
R. C h a m p l i n , and Dr. Charles A. Reavis for their g u i d a n c e and
c o n t r i b u t i o n db ciuvisors in this study. A special thinks is
owed Dr. Berlie J. F a l l o n , deceased Chairman of the A d v i s o r y
C o m m i t t e e , for his patience and early direction t h r o u g h o u t the
d e v e l o p m e n t of the p r o j e c t .
A great debt of gratitude is due Professor Virgil M.
F a i r e s , a d i s t i n g u i s h e d engineer and e d u c a t o r , who influenced
the writer to devote his later life to teaching and to M r . D.
E . R a m s e y , long-time a s s o c i a t e , who helped make this p o s s i b l e .
F u r t h e r gratitude is due Dr. James T. Smith and Dr. W. D.
Von Gonten for their e n c o u r a g e m e n t and kindness and support of
a c t i v i t e s in d e v e l o p m e n t of data for the study.
F i n a l l y , a lasting gratitude to my w i f e , W i n n i f r e d , and
our c h i l d r e n , p r o f e s s i o n a l s in their own right, for their
faith toward completion of the study.
1 1

TABLE OF CONTENTS
ACKNOWLEDGEMENTS
LIST OF TABLES
LIST OF FIGURES
CHAPTER
I. THE PROBLEM AND ITS DEVELOPMENT
Background
Statement of the Problem
Hypotheses
Definition of Terms
Purpose of the Study
Scope and Limitations of the Study
II. REVIEW OF THE RELATED LITERATURE
Types of Competency Measures
Self-Prediction Methods
Speci al Analyses
The Problem of Transfer Students
Restructuring of Freshman Courses
Required Competencies
Summary
III. DATA AND STATISTICAL PROCEDURE
The Data
Data Acquisition
11
v
X
1
1
9
10
12
13
14
15
15
16
24
44
45
56
58
61
61
62
1 1 1

IV. PRESENTATION AND INTERPRETATION OF RESULTS
Testing Procedure for Null Hypotheses
Comparison of Groups
Evaluation of Predictors
Summary
V. SUMMARY, CONCLUSIONS, AND RECOMMENDATIONS
Summary of the Study
Conclusions of the Study
General Recommendations
LIST OF REFERENCES
APPENDIX
A.
B.
C.
D.
ABBREVIATIONS USED WITH STANDARDIZED TESTS
FRESHMAN DATA QUESTIONNAIRE AND SUMMARY
RECOMMENDED PREDICTION EQUATIONS
EVALUATION OF SAT-TOT AND RANK
70
70
71
75
110
118
118
121
122
125
131
132
135
141
144
1 V
LIST OF TABLES
1. First year engineering curriculum at Texas A&M Uni versi ty 48
2 . The freshman curriculum (two semesters) at Carnegie Institute of Technology, Carnegie-Mellon Uni versi ty 53
3. T tests for differences in mean SAT scores and freshman GPA for chemical and petroleum e n g i n e e r i n g students 73
4. Regression equations for SAT scores as functions of academic major for chemical and petroleum engineering students 74
5. Regression equation for freshman GPA as a function of academic major, SAT total score, high school science g r a d e s , advanced placement status, and h i g h s c h o o l r a n k 76
6. Regression equation for freshman GPA as a function of academic m a j o r , SAT mathematics score, high school science g r a d e s , advanced placement status, and high school rank 77
7. Regression equation for freshman GPA as a function of academic major, SAT total score, high school science g r a d e s , and high school mathematics grades 78
8. Regression equation for freshman GPA as a function of academic major, SAT total score, high school science grades, high school mathematics grades, and advanced placement status 79
9. Regression equation for freshman GPA as a function of SAT total score, high school science grades, advanced placement status, and high school rank 81
10. Regression equation for freshman GPA as a function of SAT mathematics score, high school science g r a d e s , advanced placement status, and high school rank 82
11. Regression equation for freshman GPA as a function of SAT total score, high school mathematics g r a d e s , advanced placement s t a t u s , and high school rank 83

1 2 . Regression equation for freshman GPA as a function of SAT verbal score, high school m a t h e m a t i c s g r a d e s , advanced placement s t a t u s , and high school rank 84
13. Regression equation for freshman GPA as a function of SAT m a t h e m a t i c s score, high school m a t h e m a t i c s g r a d e s , advanced placement s t a t u s , and high school rank 85
1 4 . Regression equation for freshman GPA as a function of SAT total score, high school science grades, high school mathematics g r a d e s , advanced placement s t a t u s , high school rank, and average achievement test score 87
15. Regression equation for freshman GPA as a function of SAT m a t h e m a t i c s score, high school science g r a d e s , high school mathematics g r a d e s , advanced placement s t a t u s , and high school rank 88
16. Regression equation for freshman GPA as a function of SAT verbal score, high school science g r a d e s , high school mathematics g r a d e s , advanced placement s t a t u s , and high school rank 89
17. Regression equation for freshman GPA as a function of SAT total score, high school mathematics grades, advanced placement s t a t u s , and high school rank 91
18. Regression equation for freshman GPA as a function of SAT verbal score, high school basic mathematics g r a d e s , advanced placement s t a t u s , and high school rank 92
19. Regression equation for freshman GPA as a function of SAT mathematics score, high school basic mathematics g r a d e s , advanced placement status, and high school rank 93
2U. Regression equation for freshman GPA as a function of SAT total score, high school advanced mathematics g r a d e s , advanced placement status, and high school rank 94
2 1 . Regression equation for freshman GPA as a function of SAT verbal score, high school advanced mathematics g r a d e s , advanced placement status, and high school rank 95
VI

2 2 . Regression equation for freshman GPA as a function of SAT mathematics score, high school advanced mathematics grades, advanced placement status, and high school rank 96
2 3 . Regression equation for freshman GPA as a function of SAT total score, high school science grades, advanced placement status, high school rank, and average achievement test score 98
2 4 . Regression equation for freshman GPA as a function of SAT mathematics score, high school science grades, advanced placement status, high school rank, and average achievement test score 99
2 5 . Regression equation for freshman GPA as a function of SAT total score, high school science grades, high school mathematics grades, advanced placement status, high school rank, and average achievement test score lUO
26. Regression equation for freshman GPA as function of SAT mathematics score, high school science grades, high school mathematics grades, advanced placement status, high school rank, and average achievement test score 101
2 7 . Correlation coefficients for pairs of predictors 103
2 8 . Regression equation for freshman GPA as a function of SAT total score, high school science grades, advanced placement status, and average achievement test score 104
29. Regression equation for freshman GPA as a function of SAT verbal score, high school science grades, advanced placement status, and average achievement test score 105
3 0 . Regression equation for freshman GPA as a function of SAT mathematics score, high school science grades, advanced placement status, and average achievement test score 106
3 1 . Regression equation for freshman GPA as a function of SAT total score, high school mathematics grades, advanced placement status, and average achievement test score 107
VI 1
3 2 . Regression equation for freshman GPA as a function of SAT verbal score, high school mathematics g r a d e s , advanced placement s t a t u s , and average achievement test score
3 3 . Regression equation for freshman GPA as a function of sex, SAT total score, high school mathematics grades, advanced placement status, and average achievement test score 109
3 4 . Regression equation for freshman GPA as a function of sex, SAT total score, high school science grades, advanced placement status, and high school rank 111
35. Regression equation for freshman GPA as a function of sex, SAT mathematics score, high school science grades, advanced placement status, and high school rank 112
36. Regression equation for freshman GPA as a function of sex, SAT total score, high school mathematics grades, advanced placement status, and high school rank 113
3 7 . Regression equation for freshman GPA as a function of sex, SAT verbal score, high school mathematics grades, advanced placement status, and high school rank 114
3 8 . Regression equation for freshman GPA as a function of sex, SAT mathematics score, high school mathematics g r a d e s , advanced placement status, and high school rank 115
3 9 . Freshman data questionnaire summary for chemical engi neeri ng 138
4 0 . Freshman data questionnaire summary for petroleum engi neeri ng 139
4 1 . Freshman data questionnaire summary for chemical and petroleum engineering 140
4 2 . Regression equation for freshman GPA as a function of SAT total score and high school rank, for chemical and petroleum engineering students combi ned 146
V l l l

43. Regression equations for freshman GPA as a function of SAT total score and high school rank, for chemical engineering students 147
4 4 . Regression equation for freshman GPA as a function of SAT total score and high school rank, for petroleum engineering students 148
1 X

LIST OF FIGURES
1. Engineering starting salary offers relative to petroleum graduates
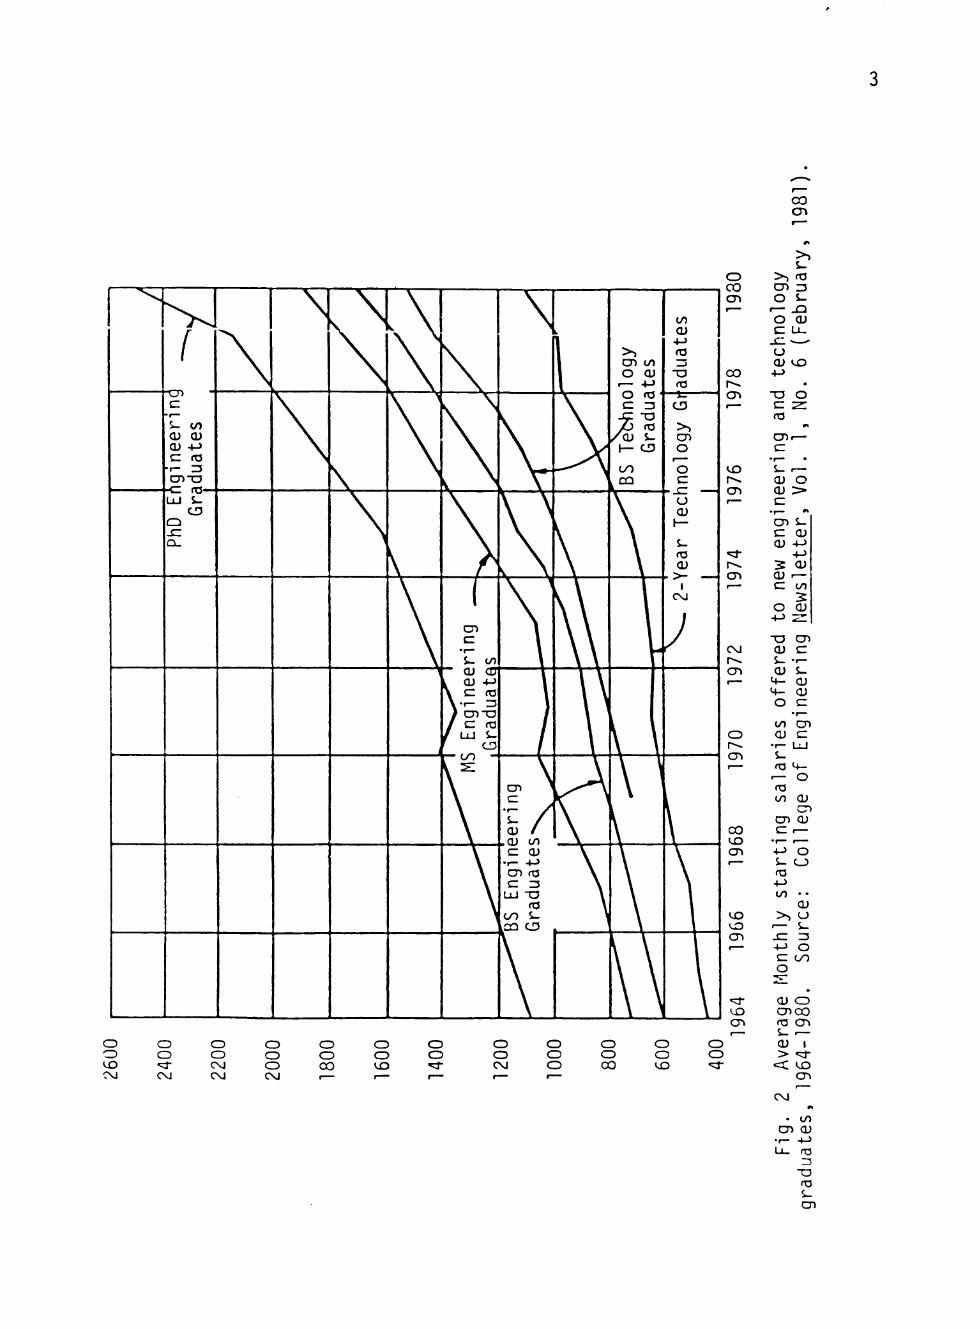
2. Average monthly starting salaries offered to new engineering and technology g r a d u a t e s , 1964-1980
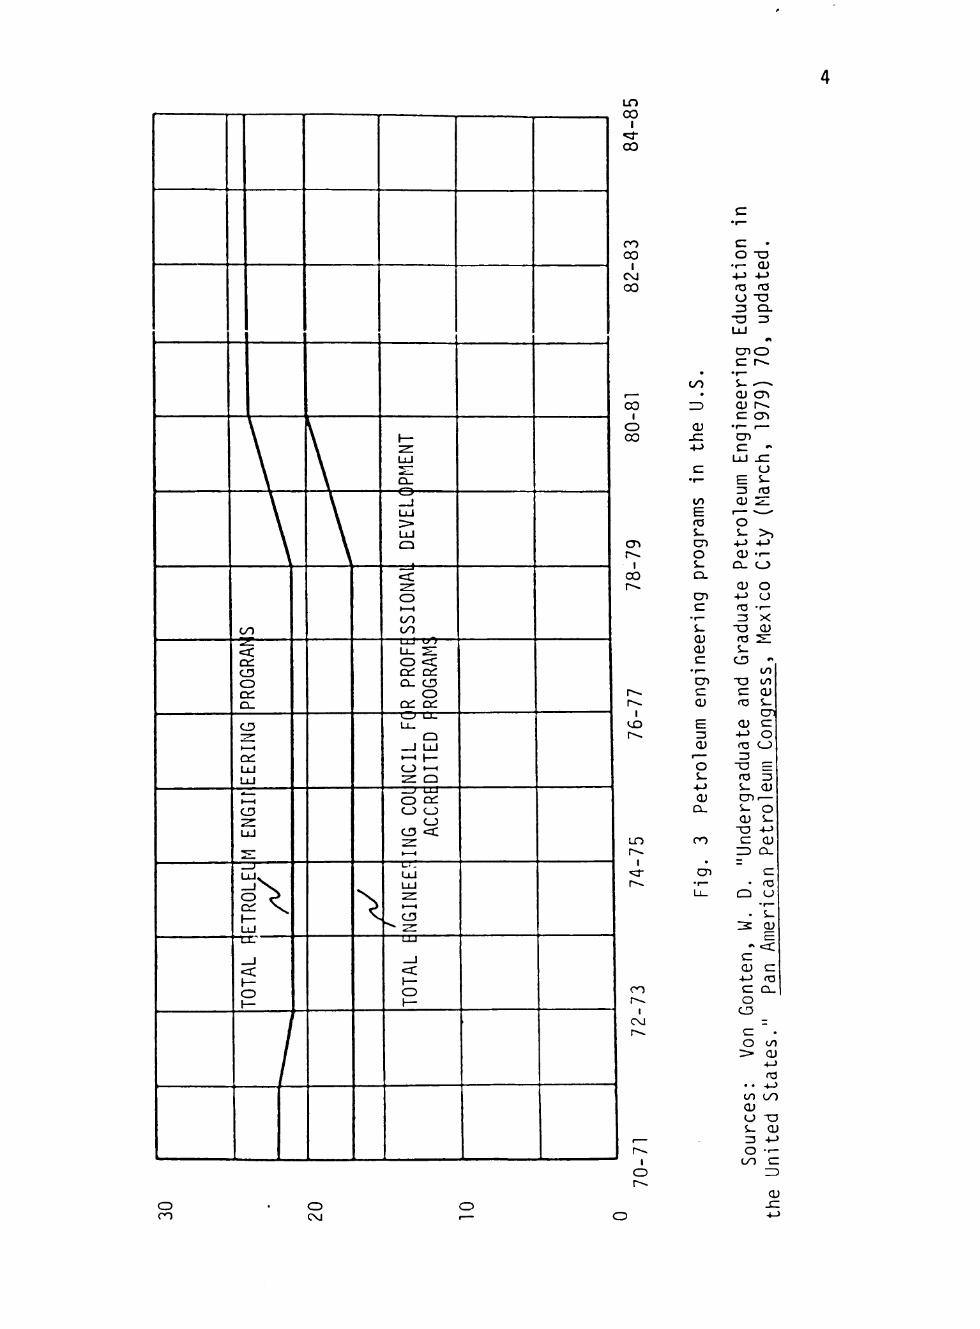
3. Petroleum engineering programs in the U . S .
4. Fall engineering enrollments for major Texas universities
3
4
5. U . S . petroleum engineering undergraduate enrol 1ment
6. Placement diagram used for English and mathematics courses for entering freshmen. Petroleum Engineering Department, Texas A&M University, 1984 5U
7. Standard and alternate first semester freshman engineering c o u r s e s . College of Engineering, Texas A&M University, 1984 51
8. Freshman Data Sheet for recording transcript information for chemical engineering students 63
9. Freshman Data Sheet for recording transcript information for petroleum engineering students 64
10. Transcription form used to process information on chemical/petroleum engineering students 65

CHAPTER I
THE PROBLEM AND ITS DEVELOPMENT
Background
Since 1973, our economy has been significantly affected
by drastically higher crude oil p r i c e s . One outgrowth of
these higher prices has been an increase in demand for
graduates in petroleum and chemical e n g i n e e r i n g . Starting
salaries depicted in Figure 1 for these g r a d u a t e s ,
particularly petroleum e n g i n e e r s , are at an all-time high
(JPT, 1979, p. 189; J P T , 1984, p. 588; Von Gonten, 1 9 7 9 ) .
Salaries for each eduoational degree through 1980 are shown in
Figure 2. As a result, increasingly large numbers of students
are enrolling in the relatively few departments of petroleum
engineering in the nation's universities (Figure 3 ) .
At the same time that enrollments are escalating (Figures
4 and 5 ) , engineering faculty are becoming more difficult to
acquire and to retain because of the increasing differential
between industry and university pay s c a l e s . Petroleum
engineering faculty replacement in particular is at a critical
stage and is expected to remain so for at least the next few
years (SPE Manpower C o n f e r e n c e , 1 9 7 8 ) . Since 1973, the ratio
of petroleum engineering students to faculty has doubled (Von
G o n t e n , 1 9 7 9 ) .
During this same period of increasing demand for

1.10 n
1.00
0.90 -
0.80 -
0.76
PETROLEUM
CHEMICAL
ECHANICAL
ELECTRICAL
SOURCES TEXAS A^M UNIVERSITY COLLEGE PLACEMENT COUNCIL SPE SURVEYS AERONAUTICAL
1960 1966 1970 1976 1980 1983
F i g . 1 E n g i n e e r i n g s t a r t i n g s a l a r y o f f e r s r e l a t i v e t o p e t r o l e u m g r a d u a t e s .
S o u r c e : B rown , D.C. " E f f e c t o f E n g i n e e r i n g S a l a r y T rends on E n g i n e e r i n g Manpower Supp ly and Demand." J o u r n a 1 o f P e t r o l e u m T e c h n o l o g y . ( A p r i l , 1984) 5 8 8 . 0 SPE-AIME.
CO
f
"igi
neer
in^
idua
tes
UJ s-CD
JZ ex.
\
\
\
\
^
\
\ 1
1
>
1 t l CO
. En
gine
e Gr
adua
te
\
\
\
V \
\
k
\
"BS
Engi
n Gr
adua
te
•
\
BS Te
bhno
logy
Gr
adua
tes
\ 1 \ \
\ \
\
\ \
adua
tes
inol
ogy
Gr
1
<'ea
r Te
c^
1 CSJ
I
o CO
CO
VO
cr>
O
CO
cn
VO VO cn
VO
s-> , 03 cn 13 O i-
•— X ) O OJ C U -
Sl o <L> V O
-a o 03
c n i —
s_ .— O) o
cn s -E O)
+->
c : CO
O <D
XJ cn OJ e s- •.-a; s-
i + - OJ Vf- O)
o c
CO cn OJ c
• f - U J
s_ 03 M -
. — O 03 CO QJ
cn cn O) c 1—
+-> o 03 +-> CO • •
OJ
>^ u i— S -
JZ Z3 4-> O
OJ CD cnoo 03 cn
0 0 VO CNJ
0 0 ^d-CVJ
0 0 C\J CNJ
0 0 0 CO
0 0 CO
CD 0 VO
0 0 «^
o o CvJ
O o o
o o CO
CD o VO
o CD
> I
vo cn
CvJ
• CO cn <u
• f - 4-> U _ 03
•C3 03 i _ O l
\
\
t / 1
PROG
RAr
EERI
NG
M EN
GIf
U J
TOTA
L F
\
\
>
IPME
NT
. DE
VEL(
SS
IONA
l 1
R PR
OFf
ROGR
AM!
NCIL
F(
DITE
D F
ING
COL
ACCR
E NG
INEE
^ TO
TAL
E
1
LT) 0 0
I
0 0
ro 00
I C\J 00
CO I
CD 0 0
• oo
. I D
OJ sz +->
c: • o -o
•r- <D - M ••-> fO 03 U X 3 13 Q .
-a :3 U J
0%
c n o c r-
'T—
s- ^—. QJ CT» (U t ^
c cr» • f— 1 —
cn C "
CT»
I CO
I VO
LO I—
I
ro
I
CvJ I—
I CD
CD CO
CD CvJ
c r—
CO
i r 03 S-
cn o s-Q .
CD C r—
i -QJ QJ C r— cn c Q;
E 3 O)
1 —
o s-
+ J QJ
D -
cn
cn • 1 —
Ll_
O
E s-3 03 QJ 2 ;
n^ — o i - > >
+ J -t->
a; ••-a . C J
QJ O 4-> O 03 • > -13 X
- O OJ 03 s : s_
CD •* CO
T D CO
c Q; 03 S-
cn QJ cr
• M O 03 C J Z5
•C3 E 03 13 S- QJ
cn.— s- o QJ S_
-o -^ C QJ
Z D Q_
C • 03
Q U •r—
• S-3 QJ
a " <C
C QJ C
-•-J 03 e CL.
o CD
c O CO
> QJ -l->
ro • • +-) CO o o QJ
u -a S- QJ Z3 4-> O T -
C/1 c rD
QJ J Z -t->

10,000
8.000
6,000
4,000
2,000
Texas A&M
YEAR
FALL SEMESTER OF RESPECTIVE YEAR
Univ. Tex
Texas Tech
Univ. Houston
74 75 76 77 78 79 80
Fig. 4 Fall engineering enrollments for major Texas u n i v e r s i t i e s .
Sources: College of Engineering News 1etter, V o1. 1, No. 5 (January, 1 9 8 1 ) .

1000 • • • • ! • • • • i I • I 1 I I 1 t I I I t 1 I I 1 1 1 1 I I t I I I I 1 • I I ' ' ' '
0 45 50 55 60 65 70 75 80 85 90
FALL SEMESTER OF RESPECTIVE YEAR
Fig. 5 U.S. petroleum engineering undergraduate enrol 1ment.
Source: Bourgoyne, A.T. Jr. "Petroleum Engineering Manpower Supply." Journal of Petroleum Technology, (March 1984) 407. @ S P E - A T M T :
chemical and petroleum engineering g r a d u a t e s , a "back to
b a s i c s " movement has been gaining momentum in public
e d u c a t i o n . This movement has given rise to such terms as
"coping s k i l l s , " "adult literacy," and "survivial s k i l l s . "
The main support for the movement toward competency-based
education seems to come from the lay community rather than
from professional e d u c a t o r s . Many lay people are concerned
about y o u n g s t e r s who leave school but are unable to read,
w r i t e , compute, or meet the skill demands of daily life in our
complex society (Walker, 1977, p. 8 5 ) . A recent Gallup poll
indicates that, by a two-to-one majority, Americans believe
that the quality of public education is declining (Cawelti,
1977, p. 8 6 ) .
In response to increasing concern on the part of the
American public over this perceived decline in student
competency, policies have been implemented by state
l e g i s l a t u r e s , state boards and departments of education, and
local school boards to require students to attain certain
minimum competencies before they are either passed on to the
next grade or graduated from high school. Legislatures in
several large and influential states have passed laws
establishing minimum competency requirements for promotion or
g r a d u a t i o n . To date, 36 states now have some type of
competency law. For example, in C a l i f o r n i a , these laws
require all students to pass tests in reading, w r i t i n g ,
a r i t h m e t i c , and other academic s k i l l s . In Oregon, the

8
required competencies are more p r a c t i c a l , such as balancing a
c h e c k b o o k , writing a letter, or applying for a job. Even in
states that do not mandate competency testing, local districts
may adopt such t e s t i n g .
T h u s , c o mpetency-based education applies to the public
school systems in the form of the 3-R's. However, competency-
based education should extend to the college-bound student,
not just the student entering the labor force immediately upon
high school g r a d u a t i o n . It is equally important that the
college-bound student have those competencies required for
advanced instruction. This conflict of purpose is described
by a leading e d u c a t o r :
In the long run, even the most constructive and responsible action by professional educators will yield only mixed r e s u l t s . Competency testing will be discovered to be e x p e n s i v e , and no one will want to pay. Evaluations will show mixed results at best. Those who favor competency-based education for the college-bound will fall out with those who see it as a way to combat functional illiteracy among low achievers (Walker, 1977, p. 8 4 ) .
For this reason, the public school administrator must be
able to respond to the question of whether or not the college-
bound graduate does in fact have those competency skills
necessary to succeed in technical fields such as chemical or
petroleum e n g i n e e r i n g . Further, the overextension of
faculties and educational f a c i l i t i e s , coupled with the fact
that many chemical and petroleum engineering students are
lured by high salaries rather than genuine interest in and
a p p r o p r i a t e preparation for these f i e l d s , makes it imperative
that better means be sought to predict success or failure of
these s t u d e n t s .
If competency skill measures can be shown to have a
meaningful degree of predictive s i g n i f i c a n c e , many
d i s a p p o i n t m e n t s can be avoided within the college student
p o p u l a t i o n , and the increasingly scarce spaces within
d e p a r t m e n t s of engineering can be better allocated. In
a d d i t i o n , a d m i n i s t r a t o r s in colleges of engineering will be
able to make better decisions concerning curricula changes and
scheduling of s t u d e n t s . Therefore, the fundamental problem
addressed by this study is concerned with the degree to which
the success or failure of entering freshmen in chemical and
petroleum engineering can be predicted on the basis of
competencies observable at the time of enrollment.
Statement of the Problem
Rising enrollment and a substantially higher
student/faculty ratio in chemical and petroleum engineering
departments have increased the need for administrators to be
more selective in accepting students into these c u r r i c u l a .
Some students entering these courses of study lack the
competencies necessary to succeed in them. Further,
a d m i n i s t r a t o r s and counselors often do not fully understand
which combinations of competencies are required for the
success of prospective petroleum and chemical engineering
students and, hence, are relatively ineffective in directing

10
high school graduates into these c u r r i c u l a . To illustrate, a
survey of 128 freshmen entering these two disciplines
indicated that over half of them entered these fields
primarily because of parental influence, while only a fourth
were influenced by administrators or counselors (Appendix B ) .
A comprehensive search of the literature produced little
information on the identification of specific competencies
required of prospective chemical and petroleum engineering
s t u d e n t s , which would be of assistance to departmental
administrators in counseling students and selecting entrants
to these curricula. The present research, therefore,
addresses three primary q u e s t i o n s . First, what specific
competencies are required of the student in chemical or
petroleum engineering? Second, are these competencies already
being implanted in the majority of these freshman students?
Third, what degree of predictive significance can be
attributed to competency measures that are readily obtainable
from academic records?
Hypotheses
The hypotheses tested in this study fall into two sets.
The first set of hypotheses concerns the degree of scholastic
homogeneity of petroleum and chemical engineering s t u d e n t s .
The second set evaluates certain predictors of academic
success for petroleum and chemical engineering s t u d e n t s , who
are treated either separately or compositely with respect to
11
c u r r i c u l u m , depending on the outcome of the first set of
hypothesis t e s t s .
The first set consists of the following null
h y p o t h e s e s :
H
H
Qj^ There is no significant difference between mean SAT
scores for chemical versus petroleum engineering
s t u d e n t s .
Q2 Academic major has no significant predictability of
freshman GPA for chemical versus petroleum engineering
s t u d e n t s .
The second set consists of the following null
H 03
H 04
H 05
H 06
H 07
h y p o t h e s e s :
SAT score has no significant predictability of freshman
GPA for chemical and/or petroleum engineering s t u d e n t s .
High school rank has no significant predictability of
freshman GPA for chemical and/or petroleum engineering
students .
Advanced placement status has no significant
predictability of freshman GPA for chemical and/or
petroleum engineering s t u d e n t s .
Degree of success in high school science courses has no
significant predictability of freshman GPA for chemical
and/or petroleum engineering s t u d e n t s .
Degree of success in high school mathematics courses
has no significant predictability of freshman GPA for
chemical and/or petroleum engineering s t u d e n t s .

12
H
H
Qg Achievement test score has no significant
predictability of freshman GPA for chemical and/or
petroleum engineering s t u d e n t s .
Qg Sex has no significant predictability of freshman GPA
for chemical and/or petroleum engineering s t u d e n t s .
An additional question, that of the relationship of
ethnic group to freshman GPA, was not addressed in this
study. Since only nine students in the study sample were
members of minority groups, the null hypothesis that ethnic
group has no significant predictability of freshman GPA for
chemical and/or petroleum engineering students could not be
tested.
Defi ni ti on of Terms
The operational definitions for this study were as
fol1ows :
Advanced m a t h e m a t i c s : High school mathematics courses
consisting of geometry, trigonometry, p r e - c a l c u l u s , math
a n a l y s i s , computer science, or other courses beyond
introductory required courses.
Competency: Ability to perform certain skill-tasks
necessary for academic success.
GPA: Cumulative college grade point average, on a four
point system, for the freshman year (two s e m e s t e r s ) .
Hi gh school sci ence: High school courses in chemistry,
b i ology , or physi cs .
13
HSR: High school rank relative to class size.
SAT: Scholastic Aptitude Test developed by the College
Entrance Examination Board. Basic scores reported as
verbal, m a t h e m a t i c s , and total, usually designated SAT-V,
SAT-M, SAT-T or SATT, respectively.
S u c c e s s / N o n s u c c e s s : College GPA of 2.0 or higher indicates
s u c c e s s ; GPA less than 2.0 GPA indicates n o n s u c c e s s .
Purpose of the Study
The purpose of this study was threefold:
1. To identify those competencies required of the
entering chemical or petroleum engineering
student to succeed at a highly technical
undergraduate level.
2. To determine whether these competencies are
already being implanted at the high school
level of study.
3. To evaluate the degree to which these
competency measures can predict a chemical or
petroleum engineering student's academic
s u c c e s s , in order to enhance the role of the
administrator and counselor in curriculum
planning and advisement.
Since a comprehensive review of prior studies indicated
that these questions have not been satisfactorily resolved,
this research contributes to the clarification and existing
14
knowledge of competency-based e d u c a t i o n . Further, the
results of this study provide information to assist
administrators and counselors in curriculum planning and
advisement for petroleum and chemical engineering students
Scope and Limitations of the Study
The data sample for this study included freshman
chemical and petroleum engineering students enrolled as
freshmen between August, 1972, and May, 1977, at Texas Tech
University, the sixth largest petroleum engineering school.
All universities offering the B . S . degree in petroleum
engineering also offer the chemical engineering d e g r e e . The
inverse is not true; approximately 90 percent of all
petroleum engineering students are concentrated at the top
six s c h o o l s . This particular university was chosen because
it does not offer a graduate program in petroleum
e n g i n e e r i n g ; hence, faculty efforts are devoted primarily to
ful1-time teachi ng .
The sample includes those students who entered the two
curricula under consideration but transferred to other
departments or left the university. Transfer students from
other d e p a r t m e n t s , junior c o l l e g e s , or universities were
excluded from the study, since transfer records do not
include high school data.

CHAPTER II
REVIEW OF THE RELATED LITERATURE
Types of Competency Measures
The problem of identifying those students having the
required competencies for success in the first year at a
university has been a troublesome one. Most studies are
directed at incoming freshmen as a group. Few have
subdivided these groups into specific d i s c i p l i n e s . None
have focused on the subsets of petroleum or chemical
e n g i n e e r i n g . Basically, the studies can be allocated to two
c a t e g o r i e s : that of student self-prediction and that of
special analyses to identify predictors of success. Both
categories have been further diffused because of the
transfer student problem. However, there have been attempts
to restructure freshman engineering courses in an effort to
combat the mobility of freshmen. For instance, Purdue
University has found that only 40 percent of its freshmen
engineers remain in engineering after seven semesters
(Molnar and D e l a u r e t i s , 1973, p. 5 0 ) .
Several reasons have been projected as to the causes of
this high mobility; one has been that the mobile student did
not fit an engineering student stereotype. But, a research
study of 41 senior and 164 freshman engineering students at
the University of T e x a s , Austin, found them to be less
conservative than the student body as a whole (Gallessich,
15
16
1 9 7 0 , p. 9 8 2 ) . Another reason has been the lack of
engineering instructors' ability to reduce aversive
consequences of student behavioral approach toward a subject
(Mager, 1969, p. 8 4 3 ) .
The majority of reasons revolve around the fact that
the student was poorly prepared for the curriculum. These
reasons have been discussed somewhat by Sexton and Ray
(1975, pp. 30-37) in their review of high school preparatory
c o u r s e s . Their findings showed that the pattern of number
of courses taken in high school was not truly an indicator
of success; but, rather, a measure of success was the grade
made in these c o u r s e s .
T h e r e f o r e , a more in-depth search was made to discover
if more revealing indicators could be found as measures of
competency. This search focused on the types and methods of
measures available to the educational administrator. The
following case studies illustrate the difficulty of a single
solution in the measurement of competency.
Self-Prediction Methods
There are several methods in use to self-predict
success or failure in both vocational and academic settings
Some of the methods are arbitrarily given a classification
to represent studies of s e l f - p r e d i c t i o n . Some
c l a s s i f i c a t i o n s overlap and are essentially the same type,
but are included to indicate the variables used in the
17
p a r t i c u l a r study.
Self-Persi stence
U n d e r g r a d u a t e students were presented with a series of
20 tasks involving mathematical reasoning, syllogistic
r e a s o n i n g , v o c a b u l a r y , spatial reasoning, and rate s e a r c h .
They were asked to estimate how long, relative to their
p e e r s , they would persist on each problem. Then, from the
sum of responses to the t a s k s , a single measure of self-
estimated p e r s i s t e n c e was created. The researchers used
c u r v i l i n e a r regression to then investigate the relationship
between self-estimated persistence and GPA. The curvilinear
regression equation fit the data w e l l . Tests of regression
weights indicated a highly significant curvilinear
c o m p o n e n t . The multiple-partial regression coefficient of
GPA on self-estimated persistence remained high when ability
m e a s u r e s were partialed out (Goldman, H u d s o n , and Daharsh,
1973, p. 2 1 6 ) .
Self-Esteem Type
Three measures of self-esteem were used to test the
hypothesis that college students with low self-esteem would
predict getting lower grades on an exam than students with
high self-esteenu The sample was 94 students enrolled in
introductory psychology classes at a small c o l l e g e . The
C o o p e r s m i t h Self-Esteem Inventory ( C o o p e r s m i t h , 1967) and

18
the Ziller Social Self-Esteem Scale (Ziller, et a l . , 1969)
were test i n s t r u m e n t s . The hypothesis was confirmed for the
Coopersmith Self-Esteem Inventory, but not for the Ziller
Social Self-Esteem Scale or for the subscale of the
Coopersmith Inventory specifically related to school self-
esteem (Morrison, T h o m a s , and W e a v e r , 1973, p. 4 1 3 ) .
Student Judgment Type
Hypotheses that increased use of student judgment of
achievement for grading purposes presupposes student ability
to supplement or supplant traditional systems based on test
data were tested. One hundred fifty-nine college juniors
and seniors who supplied high school and college grade
a v e r a g e s , prerequisite courses grades, and a prediction of
their performance on an objectively scored course exam were
used in the e x p e r i m e n t . Tests were scored and results were
matched with each subject's prediction data. Summary
statistics were calculated and reliability of test
determined using the Keeder-Richardson 20 Formula. Product-
moment correlations were computed and an analysis of
regression was run comparing a full regression model to a
restructured regression model in which the predicted score
was deleted. Predicted performance correlated as highly
with actual performance as did college average and
significantly higher than other predictors (Holen and
N e w h o u s e , 1973, p. 2 1 9 ) .
19
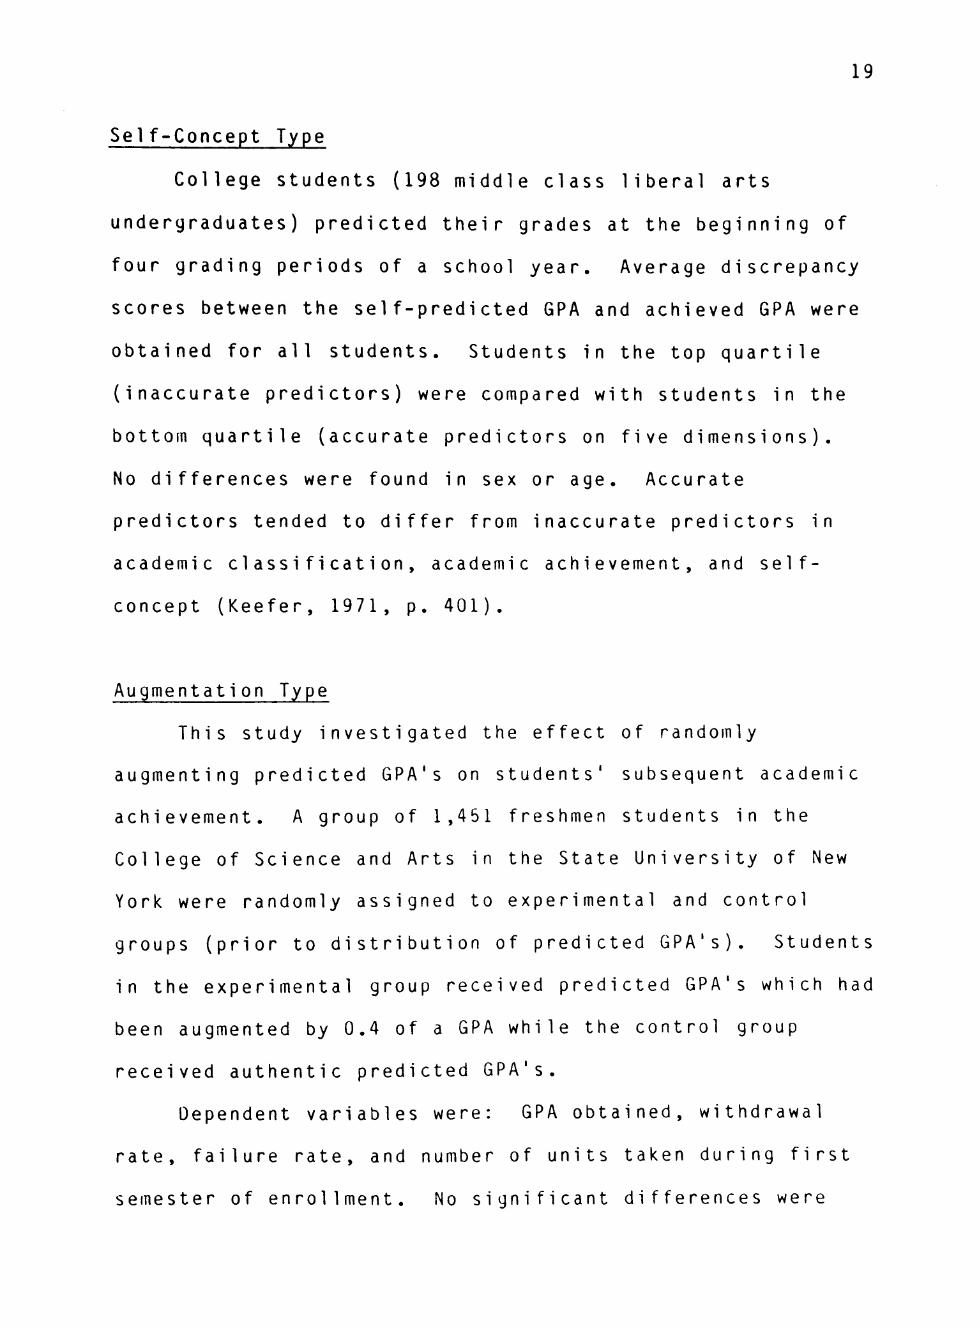
Self-Concept Type
College students (198 middle class liberal arts
u n d e r g r a d u a t e s ) predicted their grades at the beginning of
four grading periods of a school y e a r . Average d i s c r e p a n c y
scores between the self-predicted GPA and achieved GPA were
obtained for all s t u d e n t s . Students in the top quartile
(inaccurate p r e d i c t o r s ) were compared with students in the
bottom quartile (accurate predictors on five d i m e n s i o n s ) .
No differences were found in sex or age. Accurate
predictors tended to differ from inaccurate predictors in
academic c l a s s i f i c a t i o n , academic achievement, and self-
concept (Keefer, 1971, p. 4 0 1 ) .
Augmentation Type
This study investigated the effect of randomly
augmenting predicted GPA's on students' subsequent academic
a c h i e v e m e n t . A group of 1,451 freshmen students in the
College of Science and Arts in the State University of New
York were randomly assigned to experimental and control
groups (prior to distribution of predicted G P A ' s ) . Students
in the experimental group received predicted GPA's which had
been augmented by 0.4 of a GPA while the control group
received authentic predicted G P A ' s .
Dependent variables were: GPA obtained, withdrawal
rate, failure rate, and number of units taken during first
semester of e n r o l l m e n t . No significant differences were

20
obtained between experimental and control groups on any of
the dependent variables (Beyer, 1 9 7 1 , p. 6 0 3 ) .
Experienced Group Type
College students predicted their own GPA for a
semester's work during weeks one, nine, and 16 of that
s e m e s t e r . Hypotheses were that internals are more accurate
predictors than e x t e r n a l s , and that internals increase their
accuracy more rapidly than e x t e r n a l s . Data from students
with no previous college experience supported the first but
not the second h y p o t h e s i s . Neither hypothesis received
support from predictions made by experienced s t u d e n t s , who
predicted more accurately than the inexperienced group
(Wolfe, 1972, p. 8 0 ) .
Self-Reported Variables Type
A sample of 272 seniors enrolled in eight sections of a
measurement and evaluation course were administered the
Q u a n t i t a t i v e Evaluative D e v i c e , the C o o p e r a t i v e English
Test: Reading C o m p r e h e n s i o n , the Concept Mastery Test, and
two q u e s t i o n n a i r e s concerning past academic p e r f o r m a n c e ,
student estimated a b i l i t i e s , and reading h a b i t s . Criteria
were composite test scores and letter g r a d e s . The best
p r e d i c t o r s were two self-reported v a r i a b l e s , GPA and grade
in an educational psychology c o u r s e , and a list v a r i a b l e ,
the Q E D .

21
Utility of the tests was not supported by either zero
order correlations or by cross-validated i n c r e m e n t s . A
reminder to any investigator with these tests to include
quick self-report measures in his set of predictors was a
major conclusion (McMorris and Ambrosino, 1973, p. 1 3 ) .
Self-Made Predictors Type
A College Opinion Survey (COS) constructed to measure
self-made academic predictions was administered to 4,300
freshmen at the University of Minnesota College of Liberal
A r t s . All but four of the 24 correlations between COS
scores and four other variables are significant at the 0.01
level or less. Past p e r f o r m a n c e , future performance,
academic a p t i t u d e , and academic achievement interest were
more related to students' estimates of future performance
relative to other students than to students' feelings of the
importance of good p e r f o r m a n c e . A student's knowlege of his
relative standing in different reference groups strongly
affects the accuracy of his self-made academic p r e d i c t i o n .
Interest in academic achievement is more related to
estimates of relative performance than to feelings of the
importance of a c h i e v e m e n t . Self-made academic prediction
based on students' estimates of how well they think they
will perform relative to other students have strong
relationships with past p e r f o r m a n c e , scholastic a p t i t u d e ,
future p e r f o r m a n c e , and interest in academic predictions

22
have substantial validity as guides to students in making
d e c i s i o n s and pacing their p e r f o r m a n c e s . There is
substantial error in these predictions (Biggs, Roth, and
S t r o n g , 1 9 7 0 , p. 8 5 ) .
Locus of Control Type
The h y p o t h e s i s in this study was that subjects with
some years of college would differ in their ability to
predict their scores on a classroom exam according to how
they scored on the Locus of Control scale. A sample of 56
male s t u d e n t s , seniors at Rensselaer Polytechnic Institute
in Industrial Engineering Production Scheduling, were given
the Rotter's I-E S c a l e . Two months later, students
estimated the numerical grade tnade on an examination first
taken at the start of the semester. The results supported
the h y p o t h e s i s and indicated that externals are more
a c c u r a t e p r e d i c t o r s of their own academic performance than
are internals (Steger, Simmons, and Lavelle, 1973, p. 5 9 ) .
Personality Trait Type
This study was done to identify underachievers and
0 v e r a c h i e v e r s in Intermediate French at the University of
Kentucky on a basis of s e 1 f - p r e d i c t o r s . The study suggests
that personality traits can be used to identify
u n d e r a c h i e v e r and o v e r a c h i e v e r s in intermediate F r e n c h . The
most accurate predictor of success in this course was the

23
ACT Mathematics score (Smart, Elton, and Burnett, 1974, p.
4 ) .
Start-of-Course Type
The purpose of this study was to determine (1) if
student's estimate of his academic performance was more
accurate initially than at points halfway through and at the
end of the term, (2) if age, sex, grade point average, grade
received, or personality variables would differ
significantly among the subjects who accurately estimated
from those who either over-estimated or underestimated their
final grade and, (3) if there were differences of the
variables between the three groups of subjects in education,
engineering, and business. It was found that subjects were
best able to evaluate their performance at the beginning of
the term. Little difference was found between high-
achieving and low-achieving subjects in ability to predict
their course grade. Engineering underestimators possessed
higher self-sentiment than overestimators or accurate
estimators. Overestimators were more naive than
underestimators. Business overestimators were less mature
than underestimators and lower in self-sentiment than
accurate estimators.
The results indicate that it is possible to identify at
the beginning of the term those students who are unable to
realistically evaluate their potential performance, thus
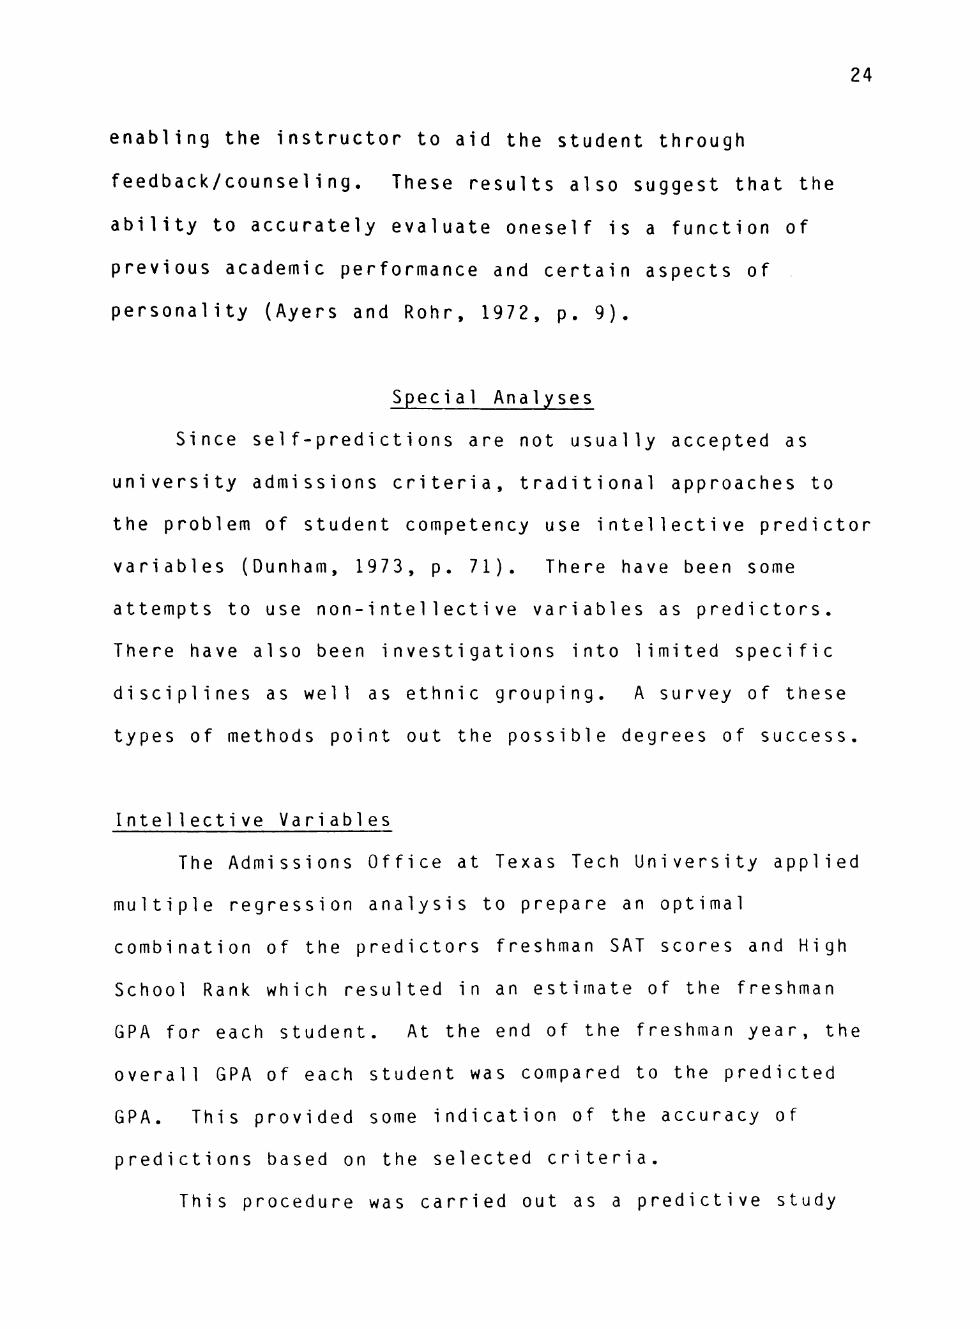
24
e n a b l i n g the i n s t r u c t o r to aid the student through
f e e d b a c k / c o u n s e l i n g . These results also suggest that the
ability to a c c u r a t e l y evaluate oneself is a function of
previous academic p e r f o r m a n c e and certain aspects of
personality (Ayers and R o h r , 1 9 7 2 , p. 9 ) .
Speci al Analyses
Since s e l f - p r e d i c t i o n s are not usually accepted as
university a d m i s s i o n s c r i t e r i a , traditional approaches to
the problem of student competency use intellective predictor
variables (Dunham, 1 9 7 3 , p. 7 1 ) . There have been some
attempts to use n o n - i n t e l l e c t i v e variables as p r e d i c t o r s .
There have also been i n v e s t i g a t i o n s into limited specific
d i s c i p l i n e s as well as ethnic g r o u p i n g . A survey of these
types of methods point out the possible degrees of s u c c e s s .
Intellective V a r i a b l e s
The A d m i s s i o n s Office at Texas Tech University applied
m u l t i p l e regression analysis to prepare an optimal
combination of the predictors freshman SAT scores and High
School Rank which resulted in an estimate of the freshman
GPA for each s t u d e n t . At the end of the freshman y e a r , the
overall GPA of each student was compared to the predicted
GPA. This provided some indication of the accuracy of
p r e d i c t i o n s based on the selected c r i t e r i a .
This procedure was carried out as a predictive study

25
for several years utilizing the predicted grades based on
SAT scores and high school rank and the resulting academic
achievement of Texas Tech University freshmen. Over the
years, the accuracy of the predictions remained relatively
the same. There were some differences between undergraduate
colleges in the accuracy of predictions of freshman GPA.
Thus, the accuracy of these predictors has been accepted at
the 80 percent level. The inaccuracies tend to be heavily
weighted toward the prediction of a higher level of
achievement than is obtained by some entering freshmen. It
appears that the use of SAT scores and HSR as an indication
of freshman achievement is a valid indication of success for
the majority of those who seek admission to this university
(Texas Tech University, 1978).
A second study concerning intellective variables
concerned the procedure of the ACT Program computed for
various selection scores on academic and nonacademic
achievement, the percentage of the admitted students who
achieve in various areas in college, and the college
achievers in the same areas who would be eliminated. Data
were obtained as part of a comprehensive follow up of the
Student Profile Section part of the assessment of college
applicants which was administered nationally by the ACT
program. The total number of students surveyed was 8,908.
The data collected included high school achievement (grades,
nonacademic achievement scales), college achievement
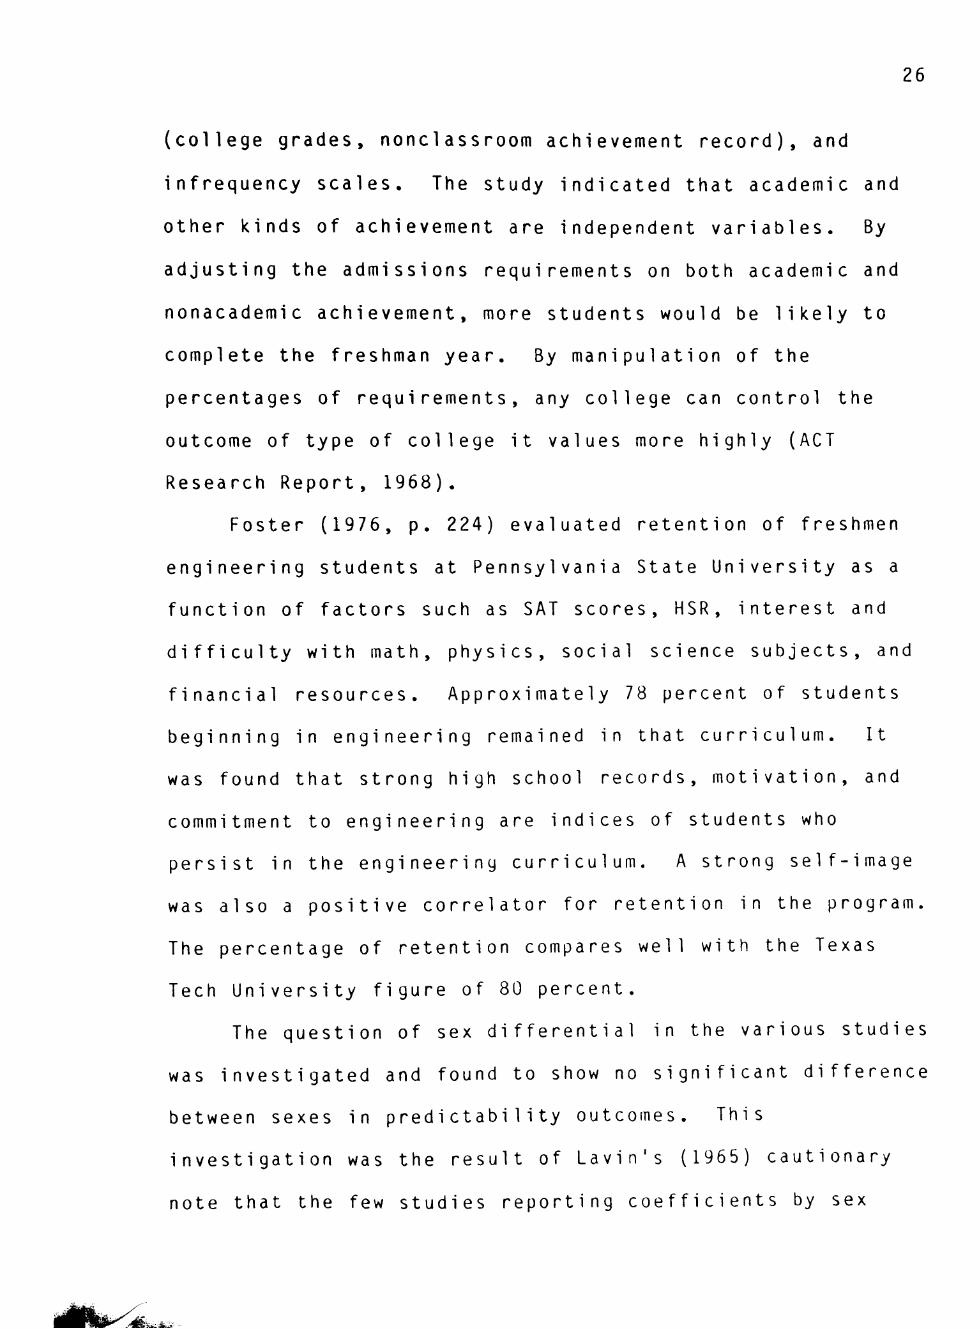
26
(college g r a d e s , n o n c l a s s r o o m achievement r e c o r d ) , and
infrequency s c a l e s . The study indicated that academic and
other kinds of a c h i e v e m e n t are independent v a r i a b l e s . By
adjusting the a d m i s s i o n s requirements on both academic and
n o n a c a d e m i c a c h i e v e m e n t , more students would be likely to
complete the freshman y e a r . By manipulation of the
p e r c e n t a g e s of r e q u i r e m e n t s , any college can control the
outcome of type of college it values more highly (ACT
Research R e p o r t , 1 9 6 8 ) .
Foster (1976, p. 224) evaluated retention of freshmen
e ngineering students at Pennsylvania State University as a
function of factors such as SAT scores, HSR, interest and
difficulty with math, p h y s i c s , social science s u b j e c t s , and
financial r e s o u r c e s . Approximately 78 percent of students
beginning in en g i n e e r i n g remained in that curriculum. It
was found that strong high school records, m o t i v a t i o n , and
commitment to e n g i n e e r i n g are indices of students who
persist in the e n g i n e e r i n g curriculum. A strong self-image
was also a positive correlator for retention in the program.
The percentage of retention compares well with the Texas
Tech University figure of 80 percent.
The question of sex differential in the various studies
was investigated and found to show no significant d i f f e r e n c e
between sexes in predictability o u t c o m e s . This
i n v e s t i g a t i o n was the result of Lavin's (1965) cautionary
note that the few studies reporting coefficients by sex

27
usually indicated better prediction for females (Jones,
1 9 7 0 , p. 9 0 ) .
In an attempt to improve p r e d i c t i v e success within a
single u n i v e r s i t y , efforts were improved somewhat by the use
of a m u l t i p l i c a t i v e weight formula based on the relative
mean success of former graduates from each of various feeder
high s c h o o l s . A weighted method was also used where
p o s s i b l e and was superior to the unweighted methods and was
also equal to the m u l t i p l i c a t i v e m e t h o d . H o w e v e r , due to
the d i f f i c u l t y in applying these m e t h o d s , there is some
doubt whether the gains in predictive efficiency are
warranted with the methods used (Sockloff, Ebert, and
D e g n a n , 1971, p. 3 9 6 ) .
The validity of ACT assessment scores and high school
a v e r a g e s for predicting the academic success in college of
high school j u n i o r s , and s e n i o r s , and juniors and seniors as
a group was tested by Maxey and F e r g u s o n . H i s t o r i c a l l y , the
prediction systems that ACT provides to colleges have been
based primarily on the grades and ACT test scores of high
school s e n i o r s . This is a t t r i b u t a b l e to the fact that
students have t r a d i t i o n a l l y completed the ACT as high school
s e n i o r s . More r e c e n t l y , h o w e v e r , a growing number of high
school juniors have been taking the ACT.
Two g e n e r a l i z a t i o n s related to the predictor variables
of ACT test scores and high school average emerge when data
from 28 colleges are a n a l y z e d . F i r s t , as a group, students
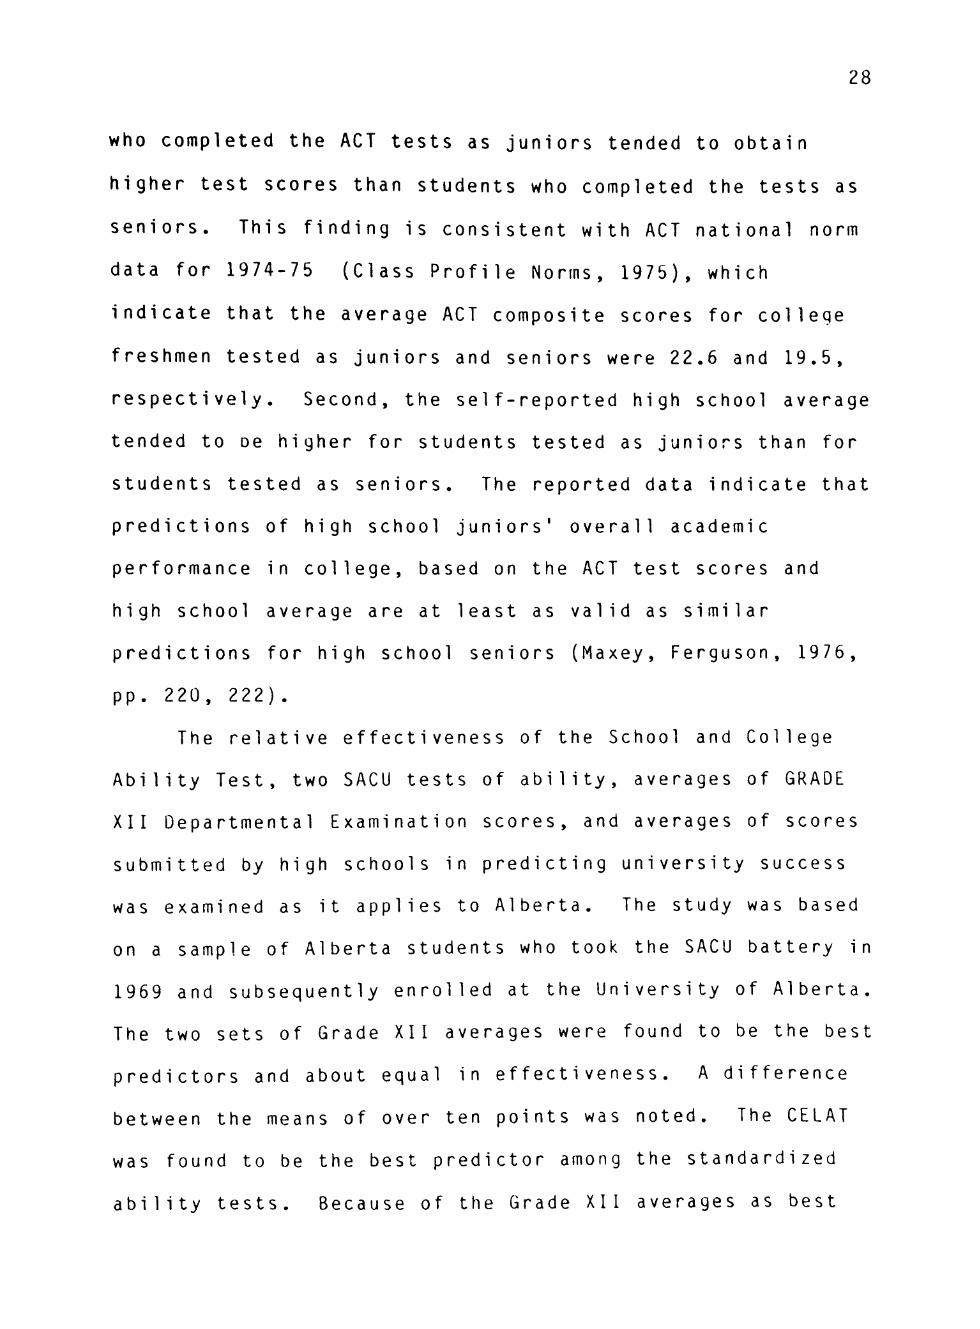
28
who completed the ACT tests as juniors tended to obtain
higher test scores than students who completed the tests as
s e n i o r s . This finding is consistent with ACT national norm
data for 1974-75 (Class Profile N o r m s , 1 9 7 5 ) , which
indicate that the average ACT composite scores for college
freshmen tested as juniors and seniors were 22.6 and 19.5,
r e s p e c t i v e l y . Second, the self-reported high school average
tended to oe higher for students tested as juniors than for
students tested as s e n i o r s . The reported data indicate that
p r e d i c t i o n s of high school juniors' overall academic
p e r f o r m a n c e in c o l l e g e , based on the ACT test scores and
high school average are at least as valid as similar
p r e d i c t i o n s for high school seniors (Maxey, Ferguson, 1976,
pp. 2 2 0 , 2 2 2 ) .
The relative effectiveness of the School and College
Ability Test, two SACU tests of ability, averages of GRADE
XII Departmental Examination s c o r e s , and averages of scores
submitted by high schools in predicting university success
was examined as it applies to A l b e r t a . The study was based
on a sample of Alberta students who took the SACU battery in
1969 and subsequently enrolled at the University of A l b e r t a .
The two sets of Grade XII averages were found to be the best
p r e d i c t o r s and about equal in e f f e c t i v e n e s s . A difference
between the means of over ten points was noted. The CELAT
was found to be the best predictor among the standardized
ability t e s t s . Because of the Grade XII averages as best

29
p r e d i c t o r s , the Alberta D e p a r t m e n t of Education no longer
r e q u i r e s students to take Departmental E x a m i n a t i o n s (Nyberg,
B a r i l , 1973, p. 3 0 3 ) .
Stanley ( 1 9 7 1 , p. 646) concluded that the traditional
a c a d e m i c p r e d i c t o r s of high school p e r f o r m a n c e and academic
a p t i t u d e tests such as the SAT were equally applicable for
the m i d d l e - c l a s s Anglo student and the financially
d i s a d v a n t a g e d student in the special programs recently
instituted to assist the latter at several s c h o o l s . Most of
the research reviewed by Stanley concentrated on prediction
of college GPA with little attention to persistence in the
a c a d e m i c program. While p e r s i s t e n c e in an academic program
and GPA are not mutually e x c l u s i v e , a closer examination of
the r e l a t i o n s h i p between the traditional academic predictors
and p e r s i s t e n c e by regular and special students seemed
a p p r o p r i a t e . His study involved students who over a three-
year period had been admitted to a special program for
f i n a n c i a l l y d i s a d v a n t a g e d students conducted by a western
uni vers i ty .
Selection for the program was based on financial
s t a t u s . The program was composed primarily of Black and
C h i c a n o students with smaller numbers of American Indian and
Anglo s t u d e n t s . There were no special classes for the
program group, so that any d i f f e r e n c e s in the academic
program from the regular students would have been by self
c h o i c e . Efforts were made to offer services to the program

30
s t u d e n t s through a u n i v e r s i t y learning l a b o r a t o r y , but the
laboratory was equally open to all students at the
uni vers i ty.
Stanley's c o n c l u s i o n that the traditional academic
p r e d i c t o r s function equally for financially d i s a d v a n t a g e d
and regular students was confirmed for predicting GPA. Only
21 and 22 percent of the predictable variance, h o w e v e r , was
achieved for either g r o u p . This is lower than a national
average of p r e d i c t a b l e GPA variance found by Munday (1970,
p. 1 0 5 ) . His study for the ACT program, in which several
hundred m u l t i p l e R c o r r e l a t i o n s using ACT scores and High
School Rank as p r e d i c t o r s were examined, found a multiple R
average of 0.62 with a range of 0.29 to 0.80. The average
accounted for 38 percent of the v a r i a n c e . The persist data
i n d i c a t e d , h o w e v e r , that persistence could be better
predicted for the special program than for the regular
program students .
The majority of research has concentrated on GPA as the
criterion of academic s u c c e s s , but it could be argued that
completion of their education is more crucial than GPA to
those in programs for financially disadvantaged students
(Hal 1 , C o a t s , 1973, pp. 14, 1 6 ) .
The purpose of another study was to investigate the
importance of using levels of intellectual ability as a
control variable in studies of non-intellectual factors in
a c a d e m i c achievement and to determine the utility of the
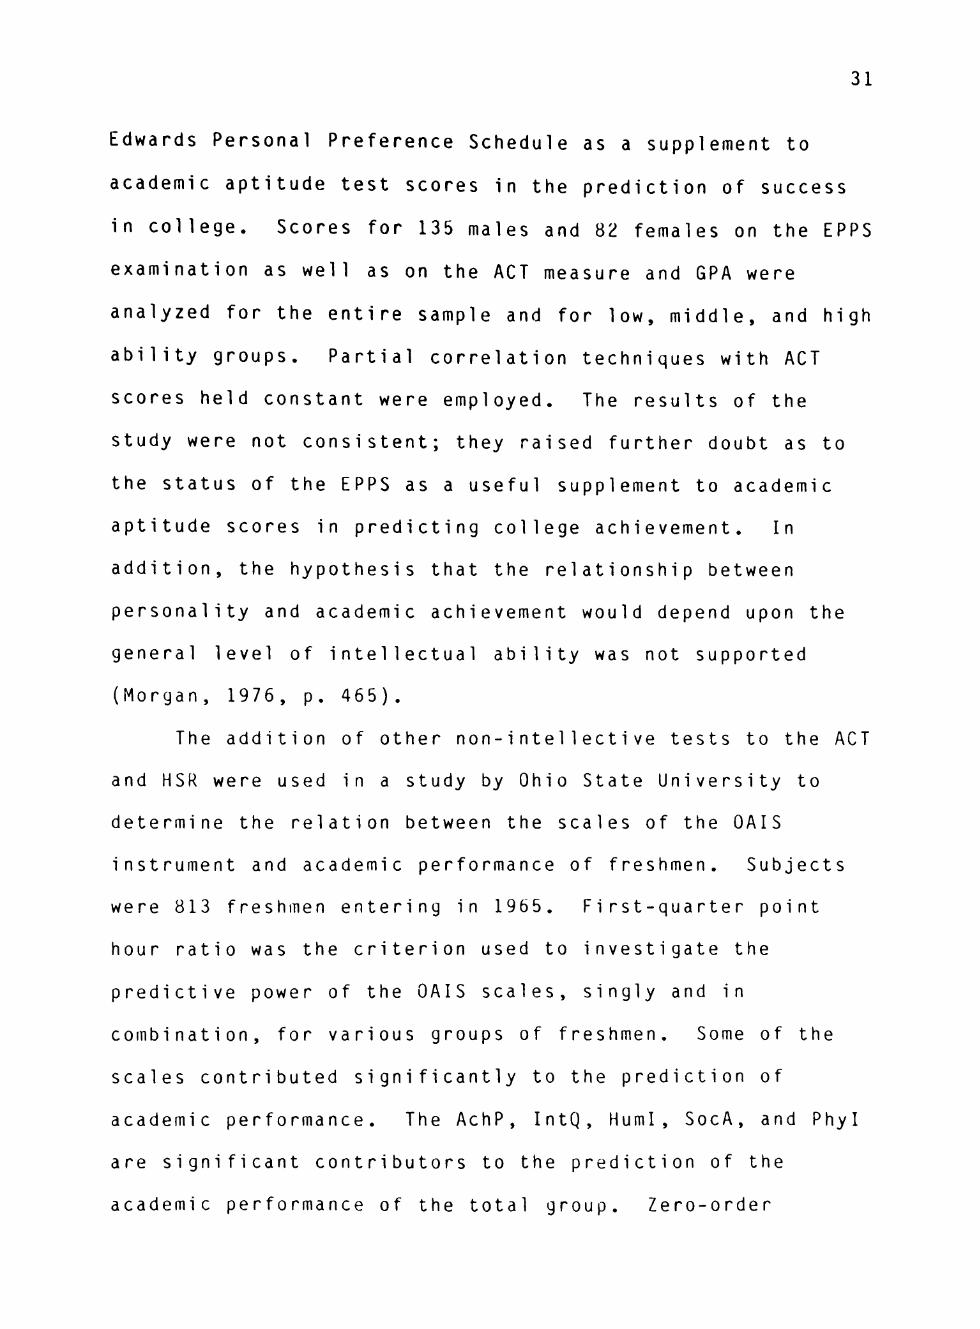
31
E d w a r d s Personal P r e f e r e n c e Schedule as a supplement to
academic a p t i t u d e test scores in the prediction of success
in c o l l e g e . Scores for 135 males and 82 females on the EPPS
e x a m i n a t i o n as well as on the ACT measure and GPA were
analyzed for the entire sample and for low, m i d d l e , and high
ability g r o u p s . Partial correlation techniques with ACT
scores held constant were employed. The results of the
study were not c o n s i s t e n t ; they raised further doubt as to
the status of the EPPS as a useful supplement to academic
aptitude scores in predicting college a c h i e v e m e n t . In
a d d i t i o n , the hypothesis that the relationship between
personality and academic achievement would depend upon the
general level of intellectual ability was not supported
(Morgan, 1976, p. 4 6 5 ) .
The addition of other n o n - i n t e l 1 e c t i v e tests to the ACT
and HSR were used in a study by Ohio State University to
d e t e r m i n e the relation between the scales of the OAIS
instrument and academic performance of freshmen. Subjects
were 813 freshmen entering in 1965. First-quarter point
hour ratio was the criterion used to investigate the
predictive power of the OAIS s c a l e s , singly and in
c o m b i n a t i o n , for various groups of freshmen. Some of the
scales contributed significantly to the prediction of
academic p e r f o r m a n c e . The AchP, IntQ, H u m I , SocA, and Phyl
are significant c o n t r i b u t o r s to the prediction of the
a c a d e m i c p e r f o r m a n c e of the total group. Zero-order
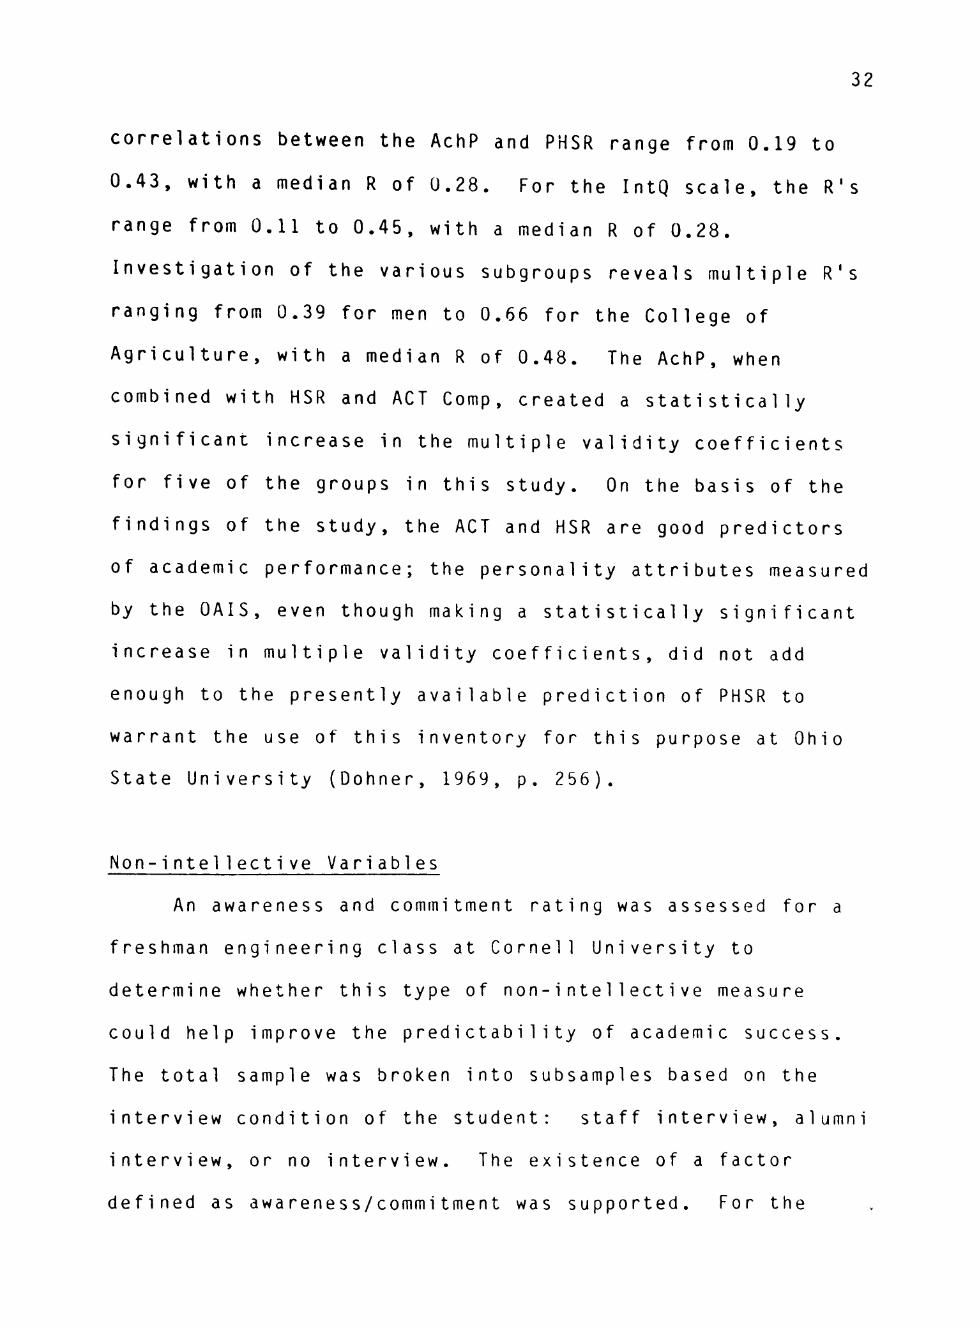
32
c o r r e l a t i o n s between the AchP and PHSR range from 0.19 to
0 . 4 3 , with a median R of 0.28. For the IntQ s c a l e , the R's
range from 0.11 to 0.45, with a median R of 0.28.
Investigation of the various subgroups reveals multiple R's
ranging from 0.39 for men to 0.66 for the College of
A g r i c u l t u r e , with a median R of 0.48. The AchP, when
combined with HSR and ACT Comp, created a statistically
s i g n i f i c a n t increase in the multiple validity coefficients
for five of the groups in this study. On the basis of the
findings of the study, the ACT and HSR are good predictors
of academic p e r f o r m a n c e ; the personality attributes measured
by the O A I S , even though making a statistically significant
increase in m u l t i p l e validity c o e f f i c i e n t s , did not add
enough to the presently available prediction of PHSR to
warrant the use of this inventory for this purpose at Ohio
State University (Dohner, 1969, p. 2 5 6 ) .
N o n - i n t e l l e c t i v e Variables
An a w a r e n e s s and commitment rating was assessed for a
freshman e n g i n e e r i n g class at Cornell University to
d e t e r m i n e whether this type of n o n - i n t e l 1 e c t i v e measure
could help improve the predictability of academic s u c c e s s .
The total sample was broken into subsamples based on the
interview condition of the student: staff interview, alumni
i n t e r v i e w , or no i n t e r v i e w . The existence of a factor
defined as a w a r e n e s s / c o m m i t m e n t was supported. For the
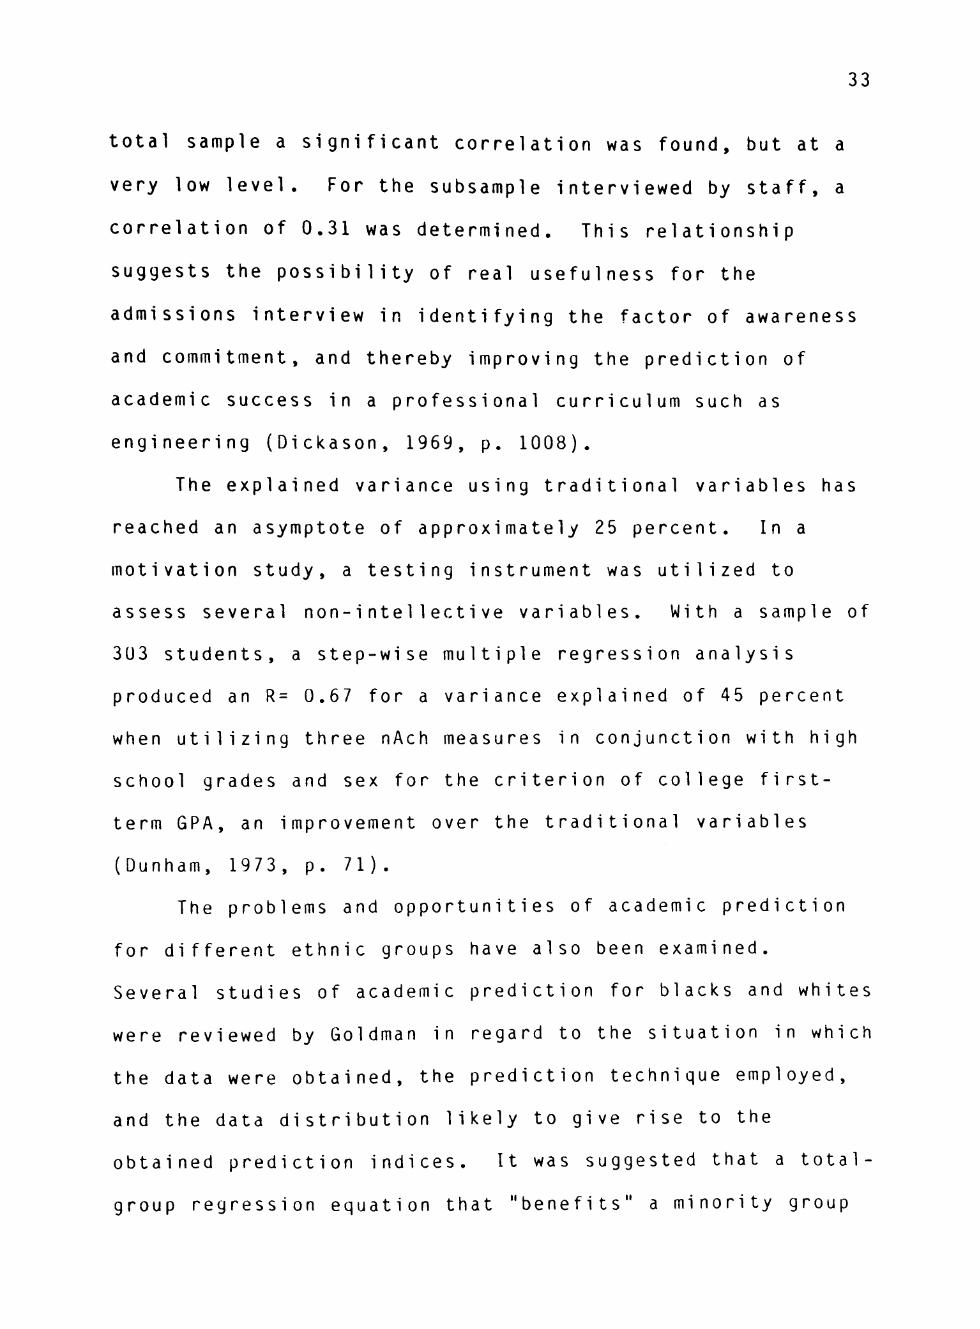
33
total sample a s i g n i f i c a n t c o r r e l a t i o n was found, but at a
very low l e v e l . For the subsample interviewed by s t a f f , a
c o r r e l a t i o n of 0.31 was d e t e r m i n e d . This relationship
suggests the p o s s i b i l i t y of real u s e f u l n e s s for the
a d m i s s i o n s interview in identifying the factor of a w a r e n e s s
and c o m m i t m e n t , and thereby improving the prediction of
a c a d e m i c success in a professional curriculum such as
e n g i n e e r i n g ( D i c k a s o n , 1969, p. 1 0 0 8 ) .
The e x p l a i n e d variance using traditional variables has
reached an a s y m p t o t e of approximately 25 percent. In a
m o t i v a t i o n study, a testing instrument was utilized to
assess several n o n - i n t e l 1 e c t i v e v a r i a b l e s . With a sample of
303 s t u d e n t s , a step-wise multiple regression analysis
produced an R= 0.67 for a variance explained of 45 percent
when utilizing three nAch measures in conjunction with high
school grades and sex for the criterion of college first-
term GPA, an improvement over the traditional variables
(Dunham, 1973, p. 7 1 ) .
The problems and o p p o r t u n i t i e s of academic prediction
for different ethnic groups have also been e x a m i n e d .
Several studies of academic prediction for blacks and whites
were reviewed by Goldman in regard to the situation in which
the data were o b t a i n e d , the prediction technique e m p l o y e d ,
and the data d i s t r i b u t i o n likely to give rise to the
obtained prediction i n d i c e s . It was suggested that a total-
group regression equation that " b e n e f i t s " a minority group

34
by overpredicting mean grade may actually be yery
disadvantageous if accompanied by a large error of estimate.
The damage can be produced by precluding selection of the
most qualified minority group members and thus lowering the
group's performance. Differential process theory was
proposed as a potential source of explanations for
differential prediction.
It was also proposed that alternative strategic
approaches to scholastic tasks might alter the covariance of
predictor tests with grades. Finally, it was pointed out
that, under certain circumstances, the patterns of
standardized regression weights in the prediction of grades,
might suggest group difference in problem-solving strategies
(Goldman, 1973, pp. 205-209).
A recent phenomenon in the area of college admissions
has been the advent of special programs designed to identify
and recruit students of minority background for admission to
colleges and universities. Perhaps the most difficult phase
within the admissions procedure is the identification of
qualified students from a minority background who can
succeed in university academic work. Student Profile
Section responses from 176 black university students at the
University of Colorado were examined for non-intel1ective
academic prediction potential. Fourteen SPS variables
yielded significant correlation coefficients with both first
semester GPA and cumulative GPA. It was concluded that non-

35
i n t e l l e c t i v e factors did exist and were useful predictors of
a c a d e m i c success for black university students (Beasley and
S e a s e , 1974, p. 2 0 1 ) .
In a further study of 45 black males and 28 black
f e m a l e s , the subjects were designated as being either
a c a d e m i c a l l y successful or academically u n s u c c e s s f u l . A
two-way (Sex x A c a d e m i c Success) multivariate analysis of
variance indicated that with respect to SAT-V, SAT-M, and
HSR standard s c o r e , the males differed significantly from
the f e m a l e s . The successful males differed from the
unsuccessful males with respect to these three v a r i a b l e s ,
but no such d i f f e r e n c e was found for females. Measures of
academic achievement should not be the only measures used in
selecting black students for admittance to college. Other
m e a s u r e s such as m o t i v a t i o n and socio-economic background
need to be included (Tatham and Tatham, 1974, p. 3 7 1 ) .
An inventory was developed to identify potentially
successful college students who are from minority cultures
and therefore might be missed by traditional screening
p r o c e d u r e s . An initial pool of 145 items was developed and
field tested. The final instrument, entitled Relevant
Aspects of P o t e n t i a l , consists of 30 items and is intended
to supplement other methods for evaluating student
p e r f o r m a n c e (Grant and R e n z e l l i , 1975, p. 2 5 5 ) .
Thomas and Stanley (1969, p. 203) reviewed several
studies and concluded that aptitude and achievement test
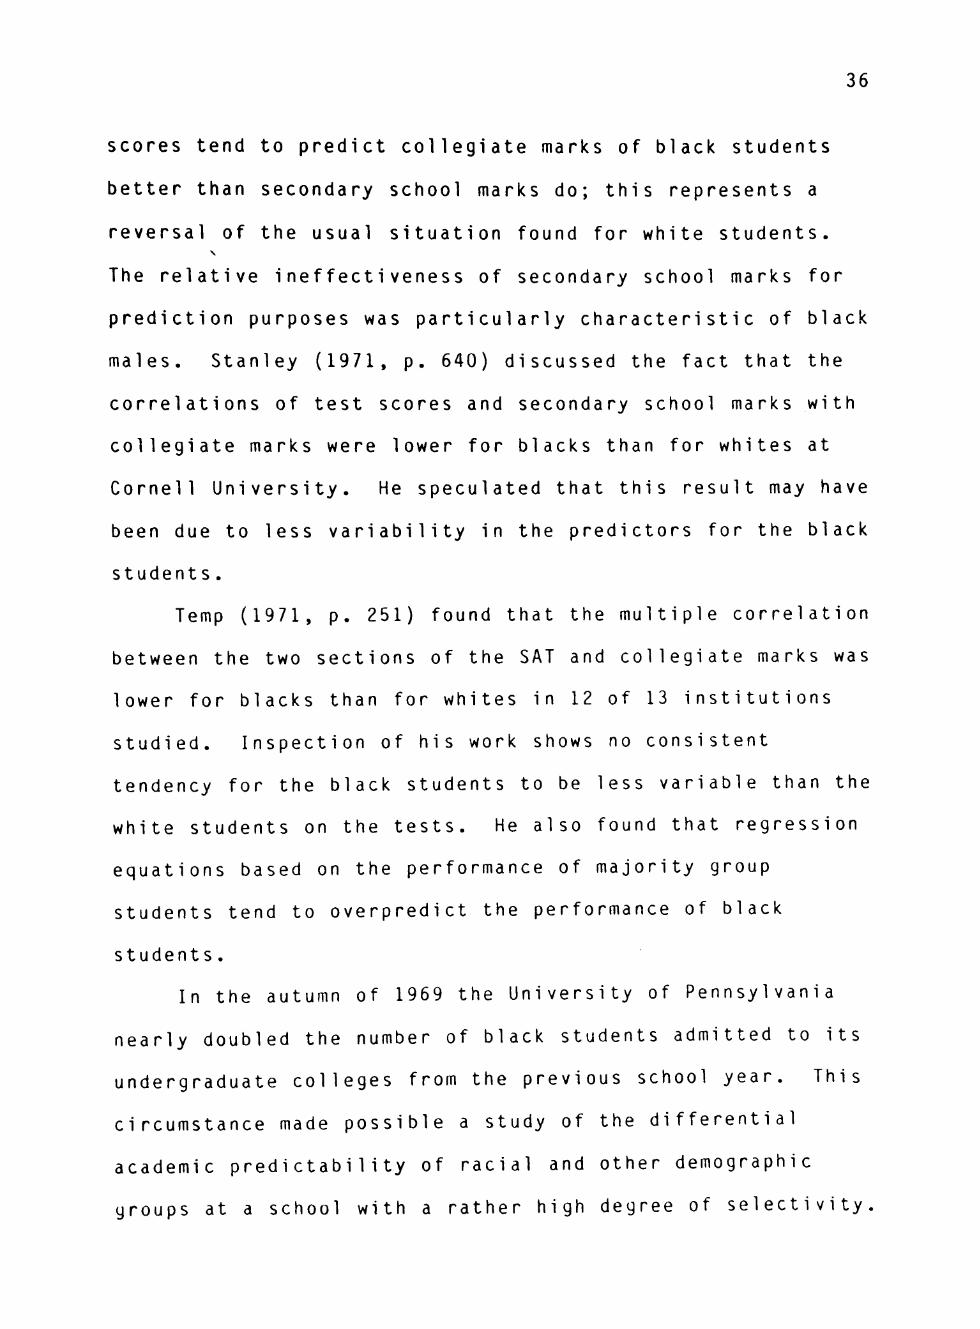
36
scores tend to predict c o l l e g i a t e marks of black students
better than secondary school marks do; this represents a
reversal of the usual situation found for white s t u d e n t s .
The relative i n e f f e c t i v e n e s s of secondary school marks for
prediction purposes was particularly characteristic of black
m a l e s . Stanley ( 1 9 7 1 , p. 640) discussed the fact that the
c o r r e l a t i o n s of test scores and secondary school marks with
collegiate marks were lower for blacks than for whites at
Cornell U n i v e r s i t y . He speculated that this result may have
been due to less variability in the predictors for the black
students .
Temp (1971, p. 251) found that the multiple correlation
between the two sections of the SAT and collegiate marks was
lower for blacks than for whites in 12 of 13 institutions
studied. Inspection of his work shows no consistent
tendency for the black students to be less variable than the
white students on the t e s t s . He also found that regression
equations based on the performance of majority group
students tend to overpredict the performance of black
s t u d e n t s .
In the autumn of 1969 the University of Pennsylvania
nearly doubled the number of black students admitted to its
u n d e r g r a d u a t e colleges from the previous school y e a r . This
c i r c u m s t a n c e made possible a study of the differential
academic p r e d i c t a b i l i t y of racial and other demographic
groups at a school with a rather high degree of s e l e c t i v i t y .

37
The trend seems to be for school marks to be more valid than
test scores for white s t u d e n t s , particularly black f e m a l e s .
Black students did not show appreciably less variability
than the white students on the four v a r i a b l e s . The
d i f f e r e n c e s in p r e d i c t a b i l i t y by socioeconomic level of
family were s m a l l . The apparent contradiction between the
values of m u l t i p l e R and standard error of estimate is
explained by the fact that the GPA's averages of the lower
s o c i o e c o n o m i c status groups were more variable than those of
the higher g r o u p s . The results are in agreement with those
of Thomas and Stanley in the low validity of secondary
school marks for black students (Bagley, 1974, p. 2 3 2 ) .
The State University of New York at Fredonia
investigated the relationship between the complexity of
resident a s s i s t a n t s ' cognitive systems and their abilities
to predict the academic performance of s t u d e n t s . The
analyzed data indicated no evidence to support this
c o n c e p t i o n . The results did indicate, however, a
significant correlation between resident a s s i s t a n t s '
p r e d i c t i o n s and the students' achievements (Vacc, 1974, p.
194) .
Speci fie D i s c i p l i n e s
1. Economic S t a t i s t i c s : A study at the Pennsylvania
State University was designed to determine if student
p e r f o r m a n c e should be related to such c h a r a c t e r i s t i c s as

38
i n t e l l i g e n c e , m o t i v a t i o n , m a t u r i t y , and background for
e c o n o m i c s t a t i s t i c s . GPA was established as the proxy for
i n t e l l i g e n c e . Results of the study indicated that a greater
background in e c o n o m i c s does not appear to be a p r e r e q u i s i t e
for success in economic s t a t i s t i c s . However, a greater
background in m a t h e m a t i c s is significantly related to
success (Cohn, 1 9 7 2 , p. 1 1 0 ) .
2. N u r s i n g : A study of correlations between objective
b a c k g r o u n d variables and achievement in an upper division
B . S . degree program in nursing at Winona State College
revealed significant correlations for GPA in required
college p r e - n u r s i n g c o u r s e s , GPA in elective college pre-
nursing c o u r s e s , and rank in high school graduating c l a s s .
The results of a multiple regression analysis showed that
grade point average in required pre-nursing courses was the
only variable to yield a significant regression weight
( L e w i s , W e l c h , 1975, p. 4 6 7 ) .
3. G e o l o g y : Ninety subjects were selected randomly
from Nova Scotia public schools offering twelfth grade
geology and were given the Geology Performance Exam ( G P E ) .
This investigation attempted to determine the relationship
between n o n - c o g n i t i v e factors and performance on a measure
of geology a c h i e v e m e n t . Resultant geology achievement test
scores earned by 90 randomly selected subjects were
regressed in a stepwise fashion on 34 variables representing
four classes of n o n - c o g n i t i v e i n f o r m a t i o n . The regression
39
s o l u t i o n y i e l d e d a s i x - v a r i a b l e prediction system that
a c c o u n t e d for nearly three quarters of the criterion
v a r i a n c e . The single most valid predictor of geology
p e r f o r m a n c e was the number of completed field t r i p s .
T e a c h e r c h a r a c t e r i s t i c s accounted for approximately half of
the e x p l a i n e d c r i t e r i o n v a r i a n c e . The predictive accuracy
of factors such as interest in geology and science
b a c k g r o u n d were insufficient to be of importance (Grobe,
M a c d o n a l d , 1973 , p . 1 ) .
4. E n g i n e e r i n g T e c h n o l o g y : Although a survey
i n v e s t i g a t i o n , this study summarizes the c h a r a c t e r i s t i c s of
s t u d e n t s enrolled in engineering technology curriculum in 20
d i f f e r e n t i n s t i t u t i o n s . The engineering technology student
probably is a recent high school g r a d u a t e , most likely from
the second quarter of his high school c l a s s . He will have
studied m a t h e m a t i c s for three or more y e a r s , and there are
three chances in four that he had a physical science
(physics or chemistry or both) in high s c h o o l . There is
about a 50 percent chance that he had studied drafting in
high s c h o o l , but he is less likely to have encountered
industrial arts or v o c a t i o n a l - t e c h n i c a l s u b j e c t s . Choice of
c o l l e g e was made on the basis of the institution's location
and c o s t s , although the reputation of the school had some
i n f l u e n c e . Plans are technical or professional e m p l o y m e n t ,
but he made his career decision fairly late in high school
or after working for a period. Personal interest and work

40
e x p e r i e n c e were major factors influencing his c h o i c e .
E n g i n e e r i n g technology students most frequently plan to
seek employment after receiving their associate d e g r e e s .
H o w e v e r , nearly one-third plan to continue s c h o o l i n g ,
usually to work toward a b a c c a l a u r e a t e engineering
t e c h n o l o g y d e g r e e .
Students in associate degree engineering technology
p r o g r a m s are typically males who are 19 to 21 years old,
although an a p p r e c i a b l e number of older students enroll in
such c u r r i c u l a . Engineering technology students are often
i n d i v i d u a l s from rural areas or small towns; the proportion
of e n g i n e e r i n g technology students with such origins is
a p p r e c i a b l y greater than their representation in the
p o p u l a t i o n as a w h o l e . These students are likely to come
from families with monthly incomes above the national mean
and are likely to have fathers who are c r a f t s m e n , skilled
w o r k e r s , t e c h n i c i a n s , supervisors or foremen, or in some way
related to technical fields (Defore, 1971, p. 8 4 6 ) .
5. C h e m i s t r y : The purpose of the study was to measure
the d i f f e r e n c e s between the levels of achievement of
freshman general chemistry students as related to the type
of high school chemistry curricula they had e x p e r i e n c e d .
The two types of high school chemistry curricula studied
were the CHEM Study and traditional p r o g r a m s . The
c o n c l u s i o n s of the study found the differences in
a c h i e v e m e n t between the CHEM Study and traditional groups
41
clearly indicated that significant d i f f e r e n c e s existed
between the two curricula studied as related to the success
of the student in college chemistry and the d i f f e r e n c e s in
a c h i e v e m e n t favored the CHEM Study group in each c a s e .
Except for the high school grade earned, the achievement
test was valid for testing both curricula studied.
Highly significant correlations between the high school
and college grades earned by both groups indicated that a
substantial relationship exists between high school and
college c h e m i s t r y . The significant correlation between high
school and college grades for the CHEM Study group when
evaluated with the level of achievement measured indicated
that CHEM Study was adequate for the needs of the average
student (Cottingham, 1970, p. 5 ) .
A second study concerned with chemistry concentrated on
three problems dealing with academic backgrounds which are
related to academic achievement in freshman programs in
c h e m i s t r y . The three problems w e r e : (1) to identify those
factors in the high school science education which are
related to achievement in freshman college chemistry, (2) to
d e t e r m i n e whether a prediction scheme, based on available
data from s t u d e n t s ' academic background, can be devised, and
(3) to make a critical analysis of the arrangements and
c l a s s i f i c a t i o n procedures employed in the freshman college
chemistry program in the University of South Dakota, taking
into consideration the two schemes used. Major findings
42
i n c l u d e d : (1) the percentile rank of students in the
g r a d u a t i n g class had the highest correlation with
a c h i e v e m e n t in freshman college c h e m i s t r y , (2) the high
school grade point average had a lower correlation with
a c h i e v e m e n t in freshman college chemistry than either high
school m a t h e m a t i c s grade or high school chemistry grade, and
(3) high school grade in mathematics had a slightly higher
c o r r e l a t i o n with achievement in freshman college chemistry
than did high school chemistry g r a d e .
Of all the ACT s c o r e s , the natural science score had
the lowest correlation with achievement in freshman college
c h e m i s t r y , while mathematics score had the highest
c o r r e l a t i o n . The ACT Composite score and the First Hour
E x a m i n a t i o n score in chemistry combined are better
p r e d i c t o r s of achievement in freshman college chemistry than
ACT C o m p o s i t e score and high school percentile rank
c o m b i n e d . Students who had traditional chemistry in high
school performed just as well in freshman chemistry as the
students who had CHEMS in high school (Bajah, 1972, p. 1 0 3 ) .
6. P h y s i c s : This study was designed to try to answer
the basic question of whether or not the PSSC student would
be at a d i s a d v a n t a g e in the conventional college physics
c u r r i c u l u m . The opinions of physicists at all levels have
been mixed. A great number of spokesmen are willing to
defend the newer PSSC physics as better preparation for
c o l l e g e physics and another group is equally willing to
43
support the conventional high school physics program as the
best college p r e p a r a t i o n . Another basic issue needing
r e s e a r c h , if only to lend credence to the curriculum
c o m p a r i s o n , was to determine if the taking of high school
physics improved a student's performance in college p h y s i c s .
An e x a m i n a t i o n of the statistical comparisons indicated the
following c o n c l u s i o n s : (1) students enrolled in PSSC
physics in high school were superior in achievement to those
students that did not take physics in high school, when
first year college physics is used as a criterion, (2)
students enrolled in traditional physics in high school were
superior in achievement to those students that did not take
physics in high s c h o o l , when first year college physics is
used as a c r i t e r i o n , and (3) students enrolled in PSSC
physics did not achieve significantly higher than students
enrolled in traditional physics when performance in first
year college physics is used as a criterion (Hudek, 1970, p.
62) .
7. Aeronautical Engineering: The primary objectives
of this research project were the development of predictors
of academic p e r f o r m a n c e and satisfaction for Aeronautical
E n g i n e e r i n g students at the Naval Postgraduate S c h o o l . The
three basic types of data used to develop predictors were
biographical ( h i s t o r i c a l ) , academic aptitude (Graduate
Record E x a m ) , and individual interests (Strong Vocational
Interest Blank) d a t a . Several successful predictors of

44
satisfaction c r o s s - v a l i d a t e d at a statistically significant
level (Sofge, 1 9 7 4 , p. 4 ) .
The Problem of Transfer Students
Transfer students were not included in this study
because of age and a t t i t u d e , along with the difficulty of
obtaining a comparable GPA for the first year in the same
courses as a freshman at a senior institution. Neither SAT
or similar scores are usually reported on transfer
transcri p t s .
A survey by Stone and Webster Engineering Corporation
shows the transfer student to be at a disadvantage in that
not all his junior college credits will transfer into the
senior institution, especially in the fields of e n g i n e e r i n g .
The overall results of the survey indicated that students
transferring with two-year technology degrees into four-year
baccalaureate programs in engineering can expect to lose
from one to one and a half years of credit from their prior
e d u c a t i o n . The survey also indicated that those students
transferring from a pre-engineering program into a four-year
baccalaureate program can expect to lose some credit,
although not as much as technology students (Greenwald and
W e c k e r , 1975, p. 8 1 7 ) .
T h u s , the combination of these factors prevents a valid
comparison between groups of transfer students and freshman
g r o u p s . F u r t h e r , the number of transfers to chemical/
45
petroleum engineering is small as compared to the number of
entering f r e s h m e n .
R e s t r u c t u r i n g of Freshman Courses
Watley and Nichols (1969, p. 975) state that:
The choice of a career is a personal decision. In the a g g r e g a t e , h o w e v e r , the early career decisions of able youth determine the future supply of talent a v a i l a b l e . This is particularly true of occupations that require high levels of ability and long periods of specialized t r a i n i n g , because long-range educational planning is necessary to enter these fields and occupational mobility is reduced once an initial choice is m a d e .
Their review of the National Merit Scholarship trends
of careers of the top one percent of the student population
offer few clues as to why certain students enter any given
field. Apparently several factors affect this complex
p h e n o m e n o n , and those influencers which heavily affect
decisions reached by one student may not enter into
another's decision at all. Because of these factors, there
have been major efforts in the engineering colleges to
restructure their freshman year in order to cause that
freshman engineering student to remain in the c o l l e g e . Some
of these efforts are described in the following e x a m p l e s .
Change in Course Content
In the early 1 9 6 0 ' s , the College of Engineering at Iowa
State U n i v e r s i t y , like many engineering schools, was
concerned that engineering student attrition was too high.
46
The natural question asked was whether a more meaningful set
of courses could be developed that would motivate the
student to remain in the engineering college. A c c o r d i n g l y ,
an experimental freshman program which numbered
approximately ten percent of the total freshman engineering
enrollment was attempted. Standardized tests showed that at
least during the first y e a r , when the highest attrition rate
is established, grades are perhaps a large motivation factor
to withdrawal from the engineering college. The
experimental program was conducted for three academic years
beginning in the fall of 1967. During the 1967-68 and 1968-
69 academic y e a r s , approximately 120 students were in the
program. In the fall of 1969, the decision was made to
double the size of the experimental groups to 240 students.
After three years of administering the sequence of
courses in the experimental program and the corresponding
selection of students to participate, this program formally
ended in the spring quarter of 1970. This termination was
caused in part by funding difficulties and in part because
the courses normally taken by freshman engineering students
were being restructured in accordance with the experimental
design (Ellingson, 1972, p. 8 7 9 ) .
Change in First Year Courses
A rearrangement of freshman courses in the College of
E n g i n e e r i n g , Texas A&M U n i v e r s i t y , occurred in the 1984-85
47
academic year. Table 1 lists the new schedule of courses.
The principal change is the division of Engineering 101 into
two one-hour courses rather than a single two-hour credit
course used in prior years (Texas A&M University, Catalog
107, 1984, p. 1 7 1 ) . This division will have several
advantages for the student: (1) contact with his
prospective major department for the full year rather than
one semester, (2) an introduction the first semester to
problem-solving which is the underlying structure of
engineering, and (3) an introduction by senior faculty the
second semester to the basic elements of his prospecitve
major.
Enrollment pressure also requires the student to apply
at the completion of the freshman year for admission to his
prospective major department in the college. To be
accepted, he must be passing in specific courses and [lave
completed 30 semester hours. Admission will also be
contingent upon the available instructional faculty and
facilities in the specific department. If not accepted, the
student must switch goals and apply to another department or
even to another college.
To further control the growth of the largest college of
engineering, exceeding 12,000 students in 1983, a unique
screening device is used to place the freshman student into
the proper first semester mathematics course. This device
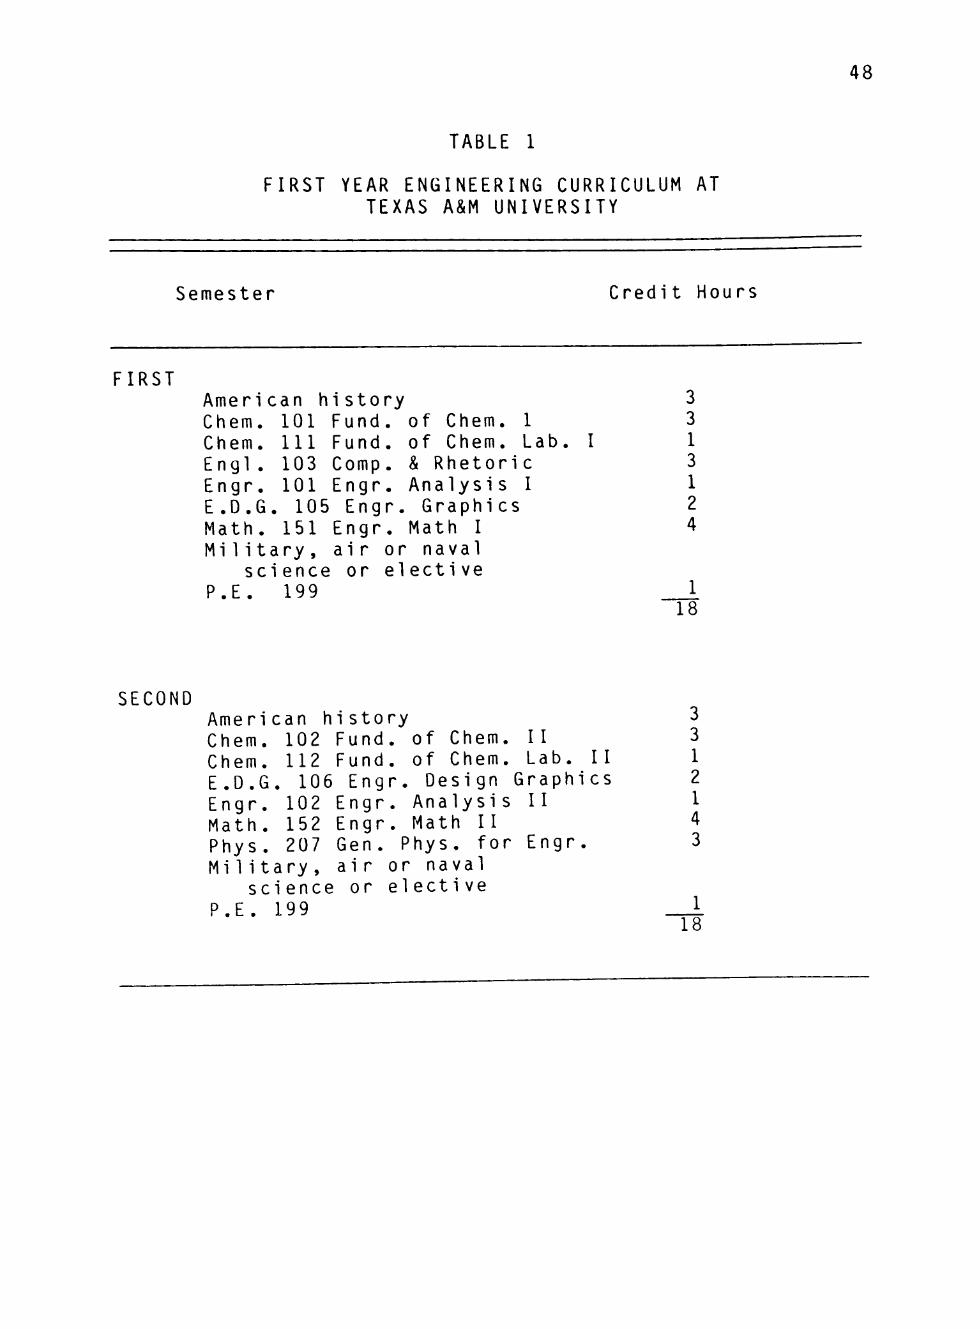
48
TABLE 1
FIRST YEAR ENGINEERING CURRICULUM AT TEXAS A&M UNIVERSITY
Semester Credit Hours
FIRST American history Chem. 101 Fund, of Chem. 1 Chem. H I Fund, of Chem. Lab Engl. 103 Comp. & Rhetoric Engr. 101 Engr. Analysis I E.D.G. 105 Engr. Graphics Math. 151 Engr. Math I Mi 1 i tary , air or naval
science or elective P.E. 199
3 3 1 3 1 2 4
18
SECOND American history Chem. 102 Fund, of Chem. II
112 Fund, of Chem. Lab. 11 106 Engr. Design Graphics
102 Engr. Analysis II 152 Engr. Math II 207 Gen. Phys. for Engr.
Mi 1itary , air or naval sci ence or electi ve
P.E. 199
Chem. E.D.G Engr. Math. Phys.
3 3 1 2 1 4 3
18

49
is shown in Figure 6. The Placement Diagram averages the
SATT and SAT-M scores with a University-administered
examination in algebra and trigonometry. Student averages
below line AA on the diagram enroll in the standard calculus
course. Those between lines AA and BB are in a gray area.
Mathematics course is their choice. Those between lines BB
and CC enroll in a lower course while those below line CC
enroll in college algebra and plane trigonometry. Courses
below line BB cause the student to need more than eight
semesters for graduation but reduce his likelihood of
nonsuccess. A composite of this placement technique is
drawn in Figure 7.
Block Teaching
Northwestern University was the first school of
engineering to install the concept of block teaching for
freshman engineering. Since their experiences in the 1970's
resulted in better student satisfaction and retention, the
concept is a vital part of their program. A faculty member
was teaching the entire day during his block for two to
three weeks each quarter, but then was involved only in
advising and planning for the remainder of the quarter. A
team of faculty was formed involving a mix of engineers,
physicists, chemists, mathematicians, graduate student
teaching assistants, teaching assistants, and other support
personnel (Stevens and Cohen, 1974, p. 577).

ENGLISH PLACEMENT Engl Achiev
> 650 600-649 550-599 < 550
Engl 103
Credit Credit Exam Take it
Engl 104
Exam No Credit No Credit No Credit
50
MATH PLACEMENT
MATH SAT MATH ACHIEV. ALGEBRA TRIG,
A-
B—=
700 680 660 640
7 0 0 T 3 0 680-1 6 6 0 -640-1-25 620 MATH 151 ONLY IF 600--TRIG>15 •580-^20-
MATH BI
hMATH 151 150 B
jviMi n
"MATH
Primary Line
Average of y) & ®
MATH 150
hlO MATH 102
AND - MATH 103 - 5
- 0
Fig. 6 Placement Diagram used for English and mathematics courses for entering freshmen, Petroleum Engineering Department Texas A&M University, 1984.

Elect.
Chem 101-3
Chem 111-1
EDG 105-2
Engl. 103-3
Math 150-4
Hist.-3
PE 199-1
AS.MS.NS
[ngincering Technology 51
Mfg
EDG 105-2
Engl. 103-3
ET 112-3
Hist.-3
Math 150-4
PE 199-1
AS.MS.NS
i
Mech,
Chem 101-3
Chem 111-1
Engl. 103-3
ET 112-3
Math 150-4
PE 199-1
AS.MS.NS
Engl. 104 Later
Ind.Oist ,
EDG 105-2
Engl. 103-3
ET 112-3
H i s t . - 3
Math 130-3
PE 199-1
AS.MS.NS
Computer Science
Science-4
Engl. 103-3
Hist.-3
Math 151-4
PE 199-1
AS.MS.NS
' CS 203-3
Engl 104 Later
Chem 101-3
Chem 111-1
EDG 105-2
Engl. 103-3
Engr 101-1
Math 151-4
Hist.-3
PE 199-1
AS.MS.NS
Ne^
Lng1necFing
Chem 101-3
Chem 111-1
EDG 105-2
Engl. 103-3
Engr 101-1
Math 150-4
Hist.-3
PE 199-1
AS.MS.NS
/er Engl. 104
^
ET 201-2
EDG 105-2
Engl. 103-3
Math 102-3
Math 103-3
"RTit::3"
PE 199-1
AS.MS.NS
1
F i g . 7 S t a n d a r d and a l t e r n a t e f i r s t semes te r f reshman e n g i n e e r i n g c o u r s e s . C o l l e g e o f E n g i n e e r i n g , Texas A&M U n i v e r s i t y , 1984 .

52
Team-Teachi ng
A unique program was instituted by Carnegie-Mellon
University in that the freshman year curriculum was changed
to a semi-block teaching concept. However, it differed in
the way course content in most block teaching programs are
d e v e l o p e d . For i n s t a n c e , mathematics and physics were
taught jointly by senior members of the mathematics and
physics f a c u l t i e s , both always present in the classroom at
the same t i m e . The presentation was coordinated in almost a
day-to-day manner and provided flexibility for the two
faculty members involved to change pace and emphasis, and to
engage in ad hoc e x p l o r a t i o n . A comparison of the two
curricula is shown in Table 2. Benefits claimed for the
change include more exposure to a variety of career areas so
better decisions can be made, more flexibility in choice of
c o u r s e s , a degree of exposure to senior faculty members,
professional areas not duplicated anywhere for first year
s t u d e n t s , presentation of material (especially mathematics
and physics) in such a way as to stress the value of the
other, and giving engineers and scientists the opportunity
for more contact with fellow social scientists, as well as
with m u s i c i a n s , a r t i s t s , and architects (Moore, 1969, p.
2 9 3 ) .
Use of Behavioral Objectives
To examine under classroom conditions the impact of

53
TABLE 2
THE FRESHMAN C U R R I C U L U M (TWO S E M E S T E R S ) AT C A R N E G I E INSTITUTE OF T E C H N O L O G Y ,
C A R N E G I E - M E L L O N U N I V E R S I T Y
uiG c u r r i c u l u m New u r r i c u 1 u m
C h e m i s t r y I , II
C a l c u l u s I , II Phy s i cs I , II
E n g l i s h C o m p o s i ti on ( f i r s t s e m e s t e r ) I n t r o d u c t i o n to W o r l d L i t e r a t u r e ( s e c o n d s e m e s t e r ) H i s t o r i c a l D e v e l o p m e n t of W e s t e r n Ci vi1i zati on I, II
P h y s i c a l E d u c a t i o n I, II Mi 1i t a r y Sci e n c e I, II ( e l e c t i ves )
C h e m i s t r y : E l e m e n t a r y P h y s i c a l C h e m i c a l P r i n c i p l e s , or B o n d i n g and S t r u c t u r a l P r i n c i p l e s ( o n l y o n e r e q u i r e d )
F u n d a m e n t a l s of M a t h e m a t i c s and P h y s i cs I , II
L i t e r a r y I m a g i n a t i o n H i s t o r i c a l U n d e r s t a n d i n g (one or t h e o t h e r e a c h s e m e s t e r )
Any th electi y e a r : Chemi c Engine neeri n i ng, M Sci enc M a n a g e mati cs or Lin Lab, C Stati s (Two 0 taken be tak
ree of ves du
al Eng eri ng, g, Mec atal1u e , Adm ment S (Foun
ear Al hemi st t i c s , f any in fre en i n
the following ring the freshman
i neeri ng , Civil Electri cal E n g i -
hani cal Engi neer-rgy and Materi als inistration and c i e n c e , M a t h e -dati ons of Analysi s g e b r a ) , Physi cs ry Lab, B i o l o g y ,
electi ves not shman year may sophomore y e a r . )

54
behavioral o b j e c t i v e s on s t u d e n t s , a classroom research
study was conducted with students enrolled in three
introductory e n g i n e e r i n g courses at Purdue University in the
fall s e m e s t e r , 1 9 7 3 . The study sought to determine whether
an instructor who provides written behavioral objectives at
the start of instruction is, in essence, giving students
advance notice of what is expected of them.
For achievement prediction, stepwise regression with
five variables was used to determine the strength of
relationship with the criterion examination to obtain the
best prediction with the fewest independent v a r i a b l e s . The
five variables were; SAT-V, SAT-M, SATT, OP, and RS
Correlation coefficient between instructor ranking of
behavioral objectives and ranking based on a student's
o p i n i o n n a i r e s c o r e s .
The three best predictors in the initial treatment
cases were OP, SATT, and SAT-M. The three best in repeated
treatment cases were SAT-M, OP, and SATT for one case, and
SAT-M, RS, and OP for the other. SAT-V did not increase the
prediction value in any case.
O p i n i o n n a i r e scores had higher predictive value for the
student's criterion examination than the verbal SAT s c o r e s .
Student a w a r e n e s s , k n o w l e d g e , and use of behavioral
o b j e c t i v e s can be a critical factor in learning, especially
when students are first given instructional information in
the form of behavioral objectives (Adams and M u n s t e r m a n ,

55
1 9 7 7 , p. 3 9 3 ) .
Graduate Programs
Everitt (1970, p. 449) describes the filtering-down
effect of graduate education that eventually changes
freshman c u r r i c u l a . He states that research and graduate
programs attract support from government agencies and
industry and this support has included not only the
financing of p e r s o n n e l , but also the purchase of adequate
e q u i p m e n t . Since such programs are at the very forefront of
k n o w l e d g e , the instrumentation must be of the most
sophisticated sort. Equipment built to carry out advanced
e x p e r i m e n t s can in turn be used for undergraduate
i n s t r u c t i o n . Buildings to house the research programs can
be m u l t i - p u r p o s e . The universities which are deeply
involved in research are also the ones best equipped for
i n s t r u c t i o n , and the excellent facilities essential for good
graduate work are made available for undergraduate education
as w e l l .
Further, he shows that graduate programs have had a
profound influence on undergraduate engineering education in
four major w a y s : (1) developing and maintaining a strong
up-to-date faculty, (2) influencing the structure of and the
professional material incorporated into the undergraduate
c u r r i c u l a , (3) attracting the best students to the areas
where the research programs are most active, and (4)
56
improving the physical facilities, including equipment,
available in the universities, which has benefited both
undergraduate and graduate programs.
Required Competencies
No list of specific competencies of the entering
student in the engineering curriculum appears in the case
studies previously mentioned in this chapter. The most
comprehensive description of these competencies was in
recommendations of an undergraduate curriculum study
committee (Startzman, 1984, p. 3 ) .
The recommendations of the committee included these
major competencies:
1. Knowledge of mathematics
2. Problem-solving ability
3. Communications skills:
Laboratory reports, written
Special problems reports, oral and written
4. Elementary computer literacy
5. Physical stamina for field work required in
i nternshi ps
At the present time, no exact measure of these
competencies exist as a group. Knowledge of mathematics can
be determined by the SAT-M score and some measure of
communications skills from the SAT-V score although this
will not reflect the oral portion of the verbal skills.

57
Problem-solving ability includes judgemental skills for
which there is no m e a s u r e . Achievement test scores may
m e a s u r e in part this ability.
No common standardized test presently tests the
computer literacy of the student. "Literacy" in the
committee recommendations means some introduction to the
c o m p u t e r , preferably in Fortran language. This competency
is in combination with mathematics proficiency. It was not
expected that the student be an expert in computer
o p e r a t i o n s , but have some familiarity with the device as a
tool in p r o b l e m - s o l v i n g . This assumes the student is well
versed in hand-held calculator usage.
The only common measurement directed towards physical
stamina is that of a physical examination if required by the
u n i v e r s i t y . An examination of this type will usually not
measure stamina. This means no measure exists until the
student completes the freshman year plus the internship.
T h u s , there can be no prior measure of this competency.
Summary
The lot of the first year engineering student is
difficult at best. As two investigators aptly describe this
y e a r :

58
It is wi th wi th backg diffi expec the f only probl facts that tapes teach f rust f rust engi n seem Cohen
usually the cone p e e r s , i rounds, culty is t a t i 0 n s eet" of rare occ e m s , but
Often employed , teachi er/many rati ng. rati on: eeri ng, to be an , 1 9 7 4 .
the first extended period away from home, omitant strains of self regulation, living nteraction with people of different v i e w s , and s t a n d a r d s . Not the least caused by the difference between his
and the real situation: not "sitting at some famous p r o f e s s o r , but seeing him on a s i o n s , not delving into the "relevant" cramming to learn seemingly useless these students come from high schools modern teaching t o o l s , such as films,
ng machines and so forth. The one student lecture can be, needless to say. The aspiring engineer faces one more he often has no contact with real
so that his first two years of college other preparatory e d u c a t i o n . (Stevens and p. 5 7 7 ) .
These inherent conditions help lead to nonsuccess for
many engineering s t u d e n t s . To reduce these n o n s u c c e s s e s , a
review of the literature was instrumental in the selection
of the dependent variables used in this study. The various
methods described under the section entitled "Self-
Prediction M e t h o d s " did not offer a consistent measure of
competency skills for e n g i n e e r i n g . Most of these methods
added little to the prediction profile of student s u c c e s s .
Those variables listed in the "Intellective Variables"
section of "Special A n a l y s i s " are the traditional ones of
high school rank coupled with SAT s c o r e s . These are the
most widely used predictors of success by the u n i v e r s i t i e s .
Studies concerning those variables called " N o n - I n t e l l e c t i v e "
suggested some improvement beyond the traditional
c o r r e l a t i o n s when directed toward minority g r o u p s . The few
studies on specific disciplines again supported the
traditional variable c h o i c e s .

59
Perhaps the most viable change in freshmen engineering
retention comes from the restructuring in some manner of the
freshmen courses in e n g i n e e r i n g . For complex reasons, this
restructuring solves some of the problems addressed by
Stevens and C o h e n .
The use of additional mathematical testing during
freshmen preregistrati on conferences places further emphasis
on fitting the student to his proper course number although
no correlation has yet been prepared to define this method
as a better solution. However, it is noted that the
University of Alberta no longer requires departmental
examinations as a screening t e c h n i q u e . These examinations
could be construed as being similar to the additional
algebra and trigonometry testing at admissions.
None of the studies discovered a significant difference
in gender or ethnic groupings even though the female
enrollment in chemical and petroleum engineering is at the
15 to 25 percent level.
The basic competencies recommended for success by the
student are (1) a knowledge of m a t h e m a t i c s , (2) problem-
solving ability, (3) communications skills, and (4) some
computer literacy. In part, these competencies can be
measured by the use of traditional variables.
This study was undertaken in an effort to determine if
a significant difference exists between chemical and
petroleum engineering students in regard to entering and

60
final measures of competency skills and to determine if
additional traditional variables can be applied to these
disciplines to predict success of the student.

CHAPTER III
DATA AND STATISTICAL PROCEDURE
In order to test the null hypotheses enumerated in the
preceding c h a p t e r , a statistical analysis of data on
chemical and petroleum engineering s t u d e n t s ' academic
p e r f o r m a n c e and predictors thereof was performed. This
c h a p t e r d e s c r i b e s the data base and the analytical
p r o c e d u r e .
The Data
The data used in this study consisted of information
from academic records of chemical and petroleum engineering
students at Texas Tech U n i v e r s i t y , the sixth largest
petroleum e n g i n e e r i n g school. Data were taken from records
of 307 students enrolled as freshmen between August, 1972
and May, 1977. Since transfer records do not include high
school academic information needed for this study, transfer
students from other departments at Texas Tech and from other
u n i v e r s i t i e s were excluded from the sample.
The sample contained nine females in chemical
e n g i n e e r i n g and 14 in petroleum engineering for a total of
22 or 7.5 p e r c e n t . Ethnic minority count in chemical
e n g i n e e r i n g was four, with 10 in petroleum e n g i n e e r i n g , for
a total of 14. H o w e v e r , ethnic data were incomplete for
five s t u d e n t s . The remaining nine then comprised
61
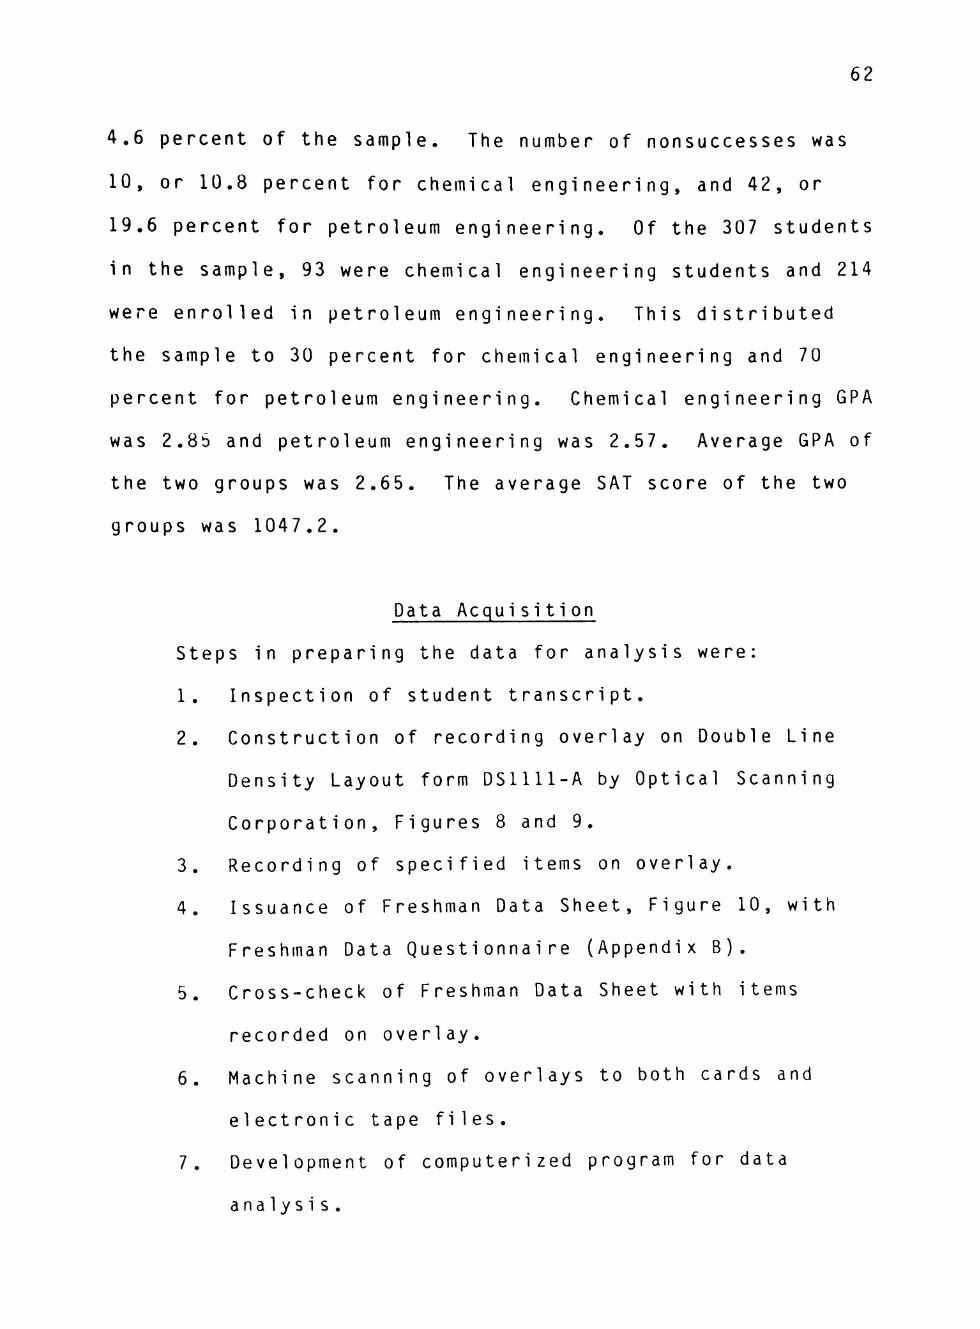
62
4.6 percent of the sample. The number of nonsuccesses was
10, or 10.8 percent for chemical engineering, and 4 2 , or
19.6 percent for petroleum engineering. Of the 307 students
in the sample, 93 were chemical engineering students and 214
were enrolled in petroleum engineering. This distributed
the sample to 30 percent for chemical engineering and 70
percent for petroleum engineering. Chemical engineering GPA
was 2.85 and petroleum engineering was 2.57. Average GPA of
the two groups was 2.65. The average SAT score of the two
groups was 1 0 4 7 . 2 .
Data Acquisition
Steps in preparing the data for analysis were:
1. Inspection of student transcript.
2. Construction of recording overlay on Double Line
Density Layout form DSllll-A by Optical Scanning
Corporation, Figures 8 and 9.
3. Recording of specified items on overlay.
4. Issuance of Freshman Data Sheet, Figure 10, with
Freshman Data Questionnaire (Appendix B ) .
5. Cross-check of Freshman Data Sheet with items
recorded on overlay.
6. Machine scanning of overlays to both cards and
electronic tape files.
7. Development of computerized program for data
a n a l y s i s .

h-
o <
>• X
»-CL
- 2 lUi
^O UJ (J
>Z UJ ly
T»-< ) < <5
K < s
.cn oc
< > H-
w O h-
0'-ciC3^in<Dr^cD0)
O *" f^ p^ «n <0 f*-CO o>
o ' - C M CO ^ m <o ("^ CO O l
(E UJ ^
2 < 2 UJ G 2
©•^cMco^iotor^^ooo
^ U J >
2 0 ' ~ c M n ^ m < o f ^ o o o
>-»-
-J rr < D C.I <-5 O " (/) (/3
O T-
o
00
^ h* UJ
H-OJ <o UJ
2 UI in (0
> • ^
(D
< CO CL
O CM
V-
O'~<^c^ ' * io<or^coo
c <
UI Q ^
^2 CD
<COCJQU.
H-
o -J CL O i
- O N xco -
(n
o CM
o r-
00 *-
h-V-
(D ^
in *-
^ *-
CO ^
CM •-
*-*-
63
C - c j c o ^ i n t o r - c o o )
z : •—
on UJ UJ az UJ CO
•-> -<
CD I—
UJ o
c_) 2 :
as: CO UJ UJ UJ 21 or Q: < : c_) u- z :
( 0 2 U .
Q <
OUJ
<o 2 0 0 '~CMco^ in (or * ' aoo i
CO
GC>-2 ;n H-Q^ — c N i n ^ m t o
U J O
O *-CM n TT mto r^ CO cn 0 ' ~ c M c o ^ m t o r ^ c o o
CO > -CO. I oc UJ < l 1 K Q , ,
^ U J 2 ^ C ^ * ^ * *
Fig. 8 F r e s h m a n Data Sheet for rec o r d i n g t r a n s c r i p t i n f o r m a t i o n for chemical e n g i n e e r i n g s t u d e n t s .
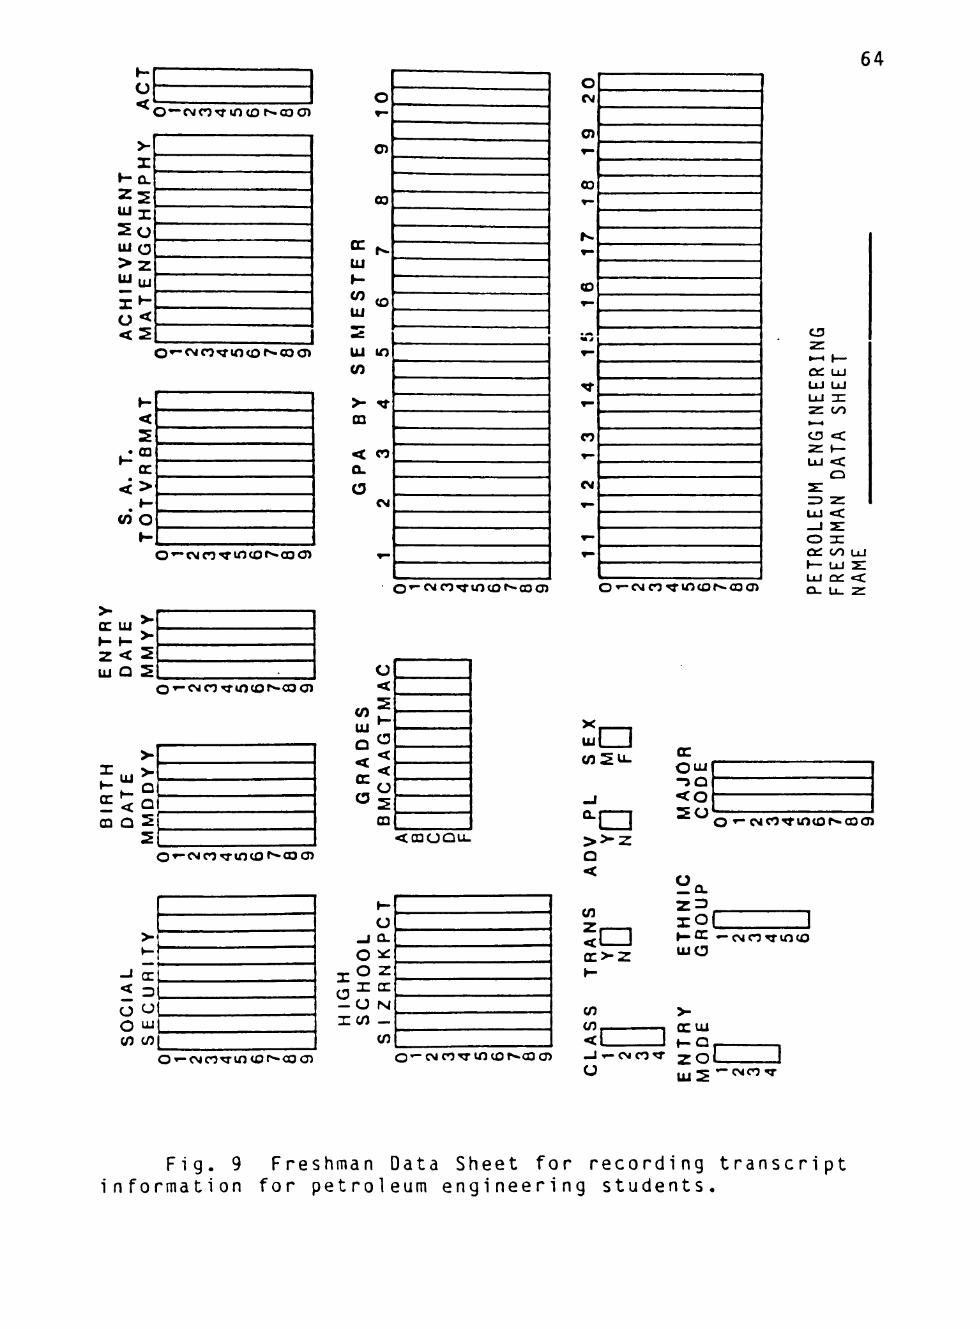
AC
T >-X
H C L
- 2 U J x
^ o Ol o > 2 UJ lij
T ^ -o< <2
»-<
2
- S ? < >
»-V) O
H
O —CM CO TTUICD r-03C3)
O •-CM CO TT «n <0 «^ CO C3»
64
O'-cMco^incof^cooi
> >. CC UJ ^ »- t - ^
z< 2 UJ O 2 O •»-CM CO TT «n to r^ CO o)
CD Q 2
2 -cMcoTTincof^coo)
> >-
-1 a: < D (1 o O UJ CO CO
o r-
O)
00
^ h-UJ
J-•'^ CD UJ •£
UJ in (O
> - ^ CD
< CO
a. O
(M
^
O ' " C M C 0 ^ » n ( O ^ » C 0 ( 3 J
CO UJ
a
o <
2 K
c < <
o 2 CD
<cQoau.
O
xco -
t -
o a. ^
z CC
N —
CO
o CM
0) * -
00 T -
N. r-
(D ^-
w ^
^
^ »-
CO T -
CM
^
^ T -
C-cMco^intor^cocn
CD
«-• I— C^ UJ UJ UJ UJ or
2 : CO
C3 <C
UJ < :
Q
=3 Z UJ < : _ J 2E o 3: Q i C>0 UJ h - UJ 2 : UJ Qc < : ex. u_ 2 :
UJCH <o2u-
>>-z
CC OUJ
<o 2 0 O '-cMCOTtintor*-co<3)
Q <
CO
cr>2 ;•
Ha. xoC H - C —CMCOTTin tO UJC
O'-CMcOTTincor-coOT O ' " CM CO TT in CO r».co oi
CO > -C O , , cnuj <l 1 f -Qp -J 'T-CMCOTT 2 O L
O UJ • - CM CO TT
Fig. 9 Freshman Data Sheet for recording transcript information for petroleum e n g i n e e r i n g s t u d e n t s .

65
FRESHMAN DATA SHEET
1979
4-> fZ (U E <U o «a
»— OL.
0) O c «o >
• o
<c c: o
«n <U L. O o
t o
<u c n o c «o
t - 1 — 4_> X Q. o o c
r— * f— to 0) O 0) >
« ^ L. (O O J =
(U O x r trt 3 4-> O
OJ > , «4- x : O +J «4-
t—<
>> <u c > (Q (T3 •
. n to c : OJ OJ + J o
J i i O rt3
t/» (U o «T3 Ci . v>
<u X I 4.^
(U > •a <u
f —
«
e <u .cr
<a c C::L4-> •t-> tn
o <u - a o) > sz fO •»-> ••->
x : r j . Q (Z
13 t— o «/» >»-•-> X
to «4- OJ C •—• 4-> lO
«4-o
> > c : «o
• cr . ^ (U c :
.b^ n3 «o i—
+ j X I
1—«
x : 4-> «a
^
»—t
»-.«
J Z 4-> «a
s:
o • ^ 4-> •»— •_/%
b Q . E o
C_) > , C-
x r +J to to
•^" " ^ •— E C7) OJ C JZ
UJ C_>
to o
- ^ «n >»
JZ O -
to 3
f ^
3 o
^— (O
CJ
c <u > ,
>> E <-t - C 4-> O C_ CO + j a; M-lo > E
T - O Ol 3 = C3 x :
o (Z d 1X3 ns >— o o »o
• 1 - f - c_ t - C- <u OJ OJ c E E O)
^ < : CD
C Q Q Q C Q C Q C Q C Q C Q Q Q C Q U J U J U J I I I 111 I I I 111 I I I I I I U J U J U J l i t 111 111 I I I I I I 111 C _ ) C J C _ > < _ 3 0 C _ > C _ ) C J 0
iA tu
o c: C -
lO
<u O o to
<T3 X3
<: to
4->
<: to
<u
ZJ CD-
to
C7>
c UJ
< : CJ
i/)
<u E <T3
•*->
fcO 'O
_ J
OJ E ro
Z
to C-
.,— U -
dJ E fO
z :
(U
• o • a • r -
3 1
C_ <D
umb
2 ^
t o OO
to to O) c_
• a • o •a :
OJ E o
x :
to t/> <u t -
• o - o • <
x : o (U
1—
(U c o
x : a .
QJ E o
r e
OJ c o
x : a .
x : CJ <u
1—
c: OJ
. ^ to
t—
to (U to c 3 o
o
r ^ o o
JZ o
t o
JZ cn
•r— :JZ
o z
to (U
> -
OJ - a (T3 t_
cu
> » (_ 4-» O) E o c o c n
T — t -
1—
CO >>
lO c
< :
>^ c_ <T3 +J
OJ E <u
^— UJ
4-> O) E o <u
c s
^— (T3 o
•^-
>>
to c
<c
>> C-
•»-> to
* E <u
x : C_)
c n cz
•^-^ to ( -
• a
(/) t_ <o
> »
t_ (U
JZl E ZJ
F i g . 10 T r a n s c r i p t i o n form used t o process i n f o r m a t i o n on p e t r o l e u m / c h e m i c a l e n g i n e e r i n g s t u d e n t s .
66
Variable Codes
The data from students' records were compiled into a
set of variables for use in testing the null h y p o t h e s e s .
The dependent variable used to measure the degree of
academic success was cumulative (two-semester) freshman GPA.
Independent variables tested for their ability to predict
freshman GPA consisted of information readily obtainable
from academic r e c o r d s . The following variables, derived
from the available data, were evaluated as predictors of
freshman GPA:
1. SAT total score
2. SAT verbal score
3. SAT mathematics score
4. High school rank
5. Advanced placement status
6. Grades in high school science courses
7. Grades in high school mathematics courses
8. Achievement test scores
9. Sex
SAT scores were used directly as reported. The
variable names used in the statistical analysis discussed in
the following chapter were SAT-TOT, S A T - V E R 6 , and SAT-MATH.
Grades in two high school science courses, biology and
c h e m i s t r y , were combined into a single variable called
G R A D E - S . For each course taken, grade points from four to
zero were assigned for grades of A to F, respectively. The
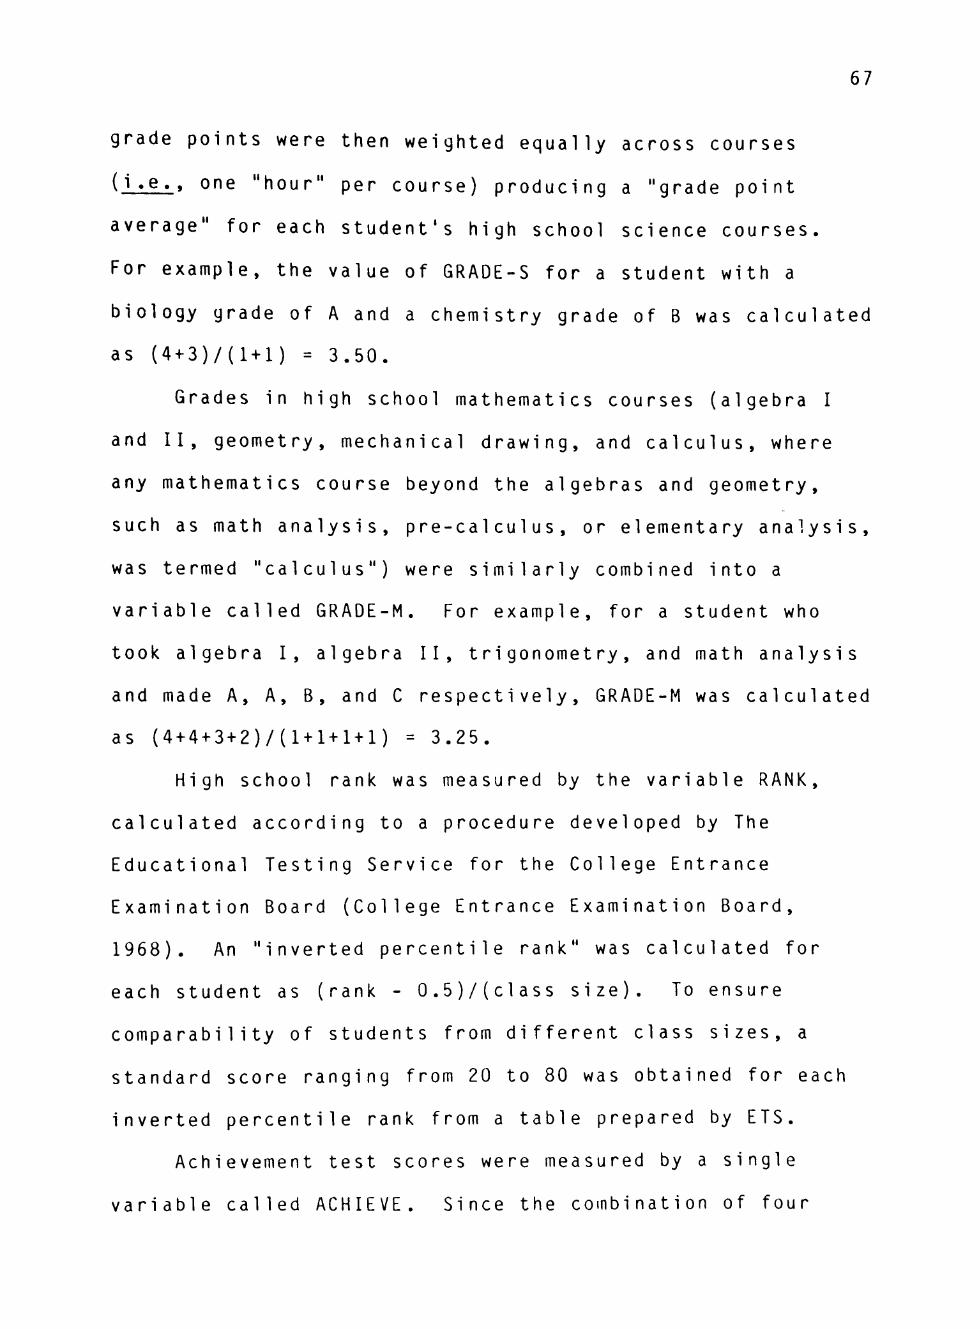
67
grade points were then weighted equally across courses
(i «e» » one "hour" per c o u r s e ) producing a "grade point
a v e r a g e " for each student's high school science c o u r s e s .
For e x a m p l e , the value of GRADE-S for a student with a
biology grade of A and a chemistry grade of B was calculated
as (4+3)7(1+1) = 3 . 5 0 .
Grades in high school m a t h e m a t i c s courses (algebra I
and II, g e o m e t r y , mechanical d r a w i n g , and c a l c u l u s , where
any m a t h e m a t i c s course beyond the algebras and geometry,
such as math a n a l y s i s , pre-cal cul u s , or elementary a n a l y s i s ,
was termed " c a l c u l u s " ) were similarly combined into a
variable called GRADE-M. For e x a m p l e , for a student who
took algebra I, algebra II, t r i g o n o m e t r y , and math analysis
and made A, A, B, and C respectively, GRADE-M was calculated
as ( 4 + 4 + 3 + 2 ) 7 ( 1 + 1 + 1 + 1 ) = 3.25.
High school rank was measured by the variable RANK,
calculated according to a procedure developed by The
Educational Testing Service for the College Entrance
E x a m i n a t i o n Board (College Entrance Examination Board,
1 9 6 8 ) . An "inverted percentile rank" was calculated for
each student as (rank - 0.5)7(class s i z e ) . To ensure
comparability of students from different class sizes, a
standard score ranging from 20 to 80 was obtained for each
inverted percentile rank from a table prepared by E T S .
Achievement test scores were measured by a single
v a r i a b l e called A C H I E V E . Since the combination of four
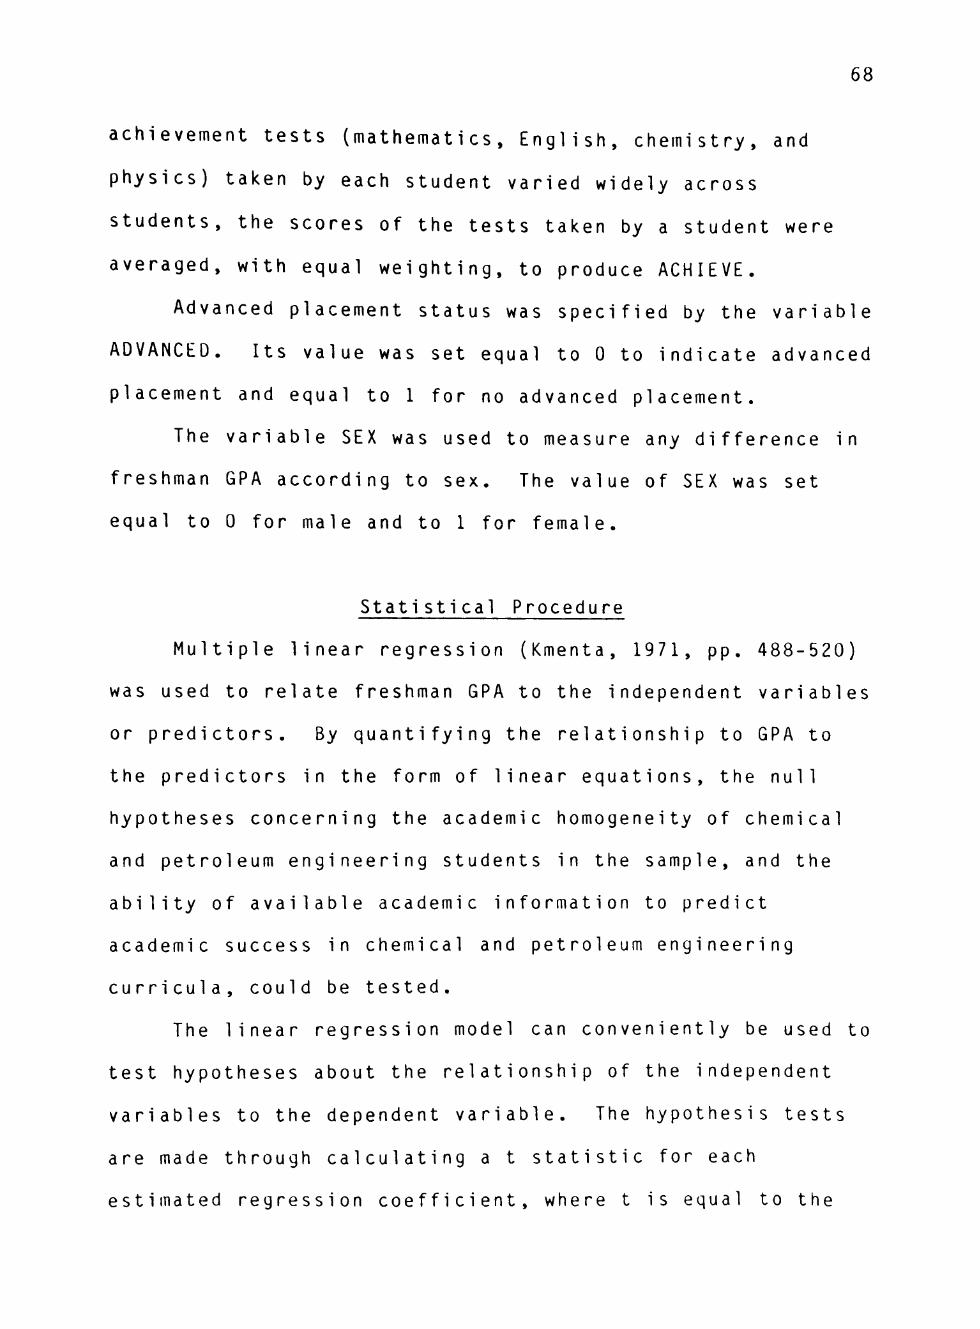
68
a c h i e v e m e n t tests ( m a t h e m a t i c s , E n g l i s h , c h e m i s t r y , and
p h y s i c s ) taken by each student varied widely across
s t u d e n t s , the scores of the tests taken by a student were
a v e r a g e d , with equal w e i g h t i n g , to produce A C H I E V E .
Advanced placement status was specified by the variable
A D V A N C E D . Its value was set equal to 0 to indicate advanced
placement and equal to 1 for no advanced placement.
The variable SEX was used to measure any difference in
freshman GPA according to sex. The value of SEX was set
equal to 0 for male and to 1 for f e m a l e .
Statistical Procedure
M u l t i p l e linear regression (Kmenta, 1971, pp. 4 8 8 - 5 2 0 )
was used to relate freshman GPA to the independent variables
or p r e d i c t o r s . By quantifying the relationship to GPA to
the p r e d i c t o r s in the form of linear e q u a t i o n s , the null
h y p o t h e s e s c o n c e r n i n g the academic homogeneity of chemical
and petroleum e n g i n e e r i n g students in the sample, and the
ability of a v a i l a b l e academic information to predict
academic success in chemical and petroleum engineering
c u r r i c u l a , could be tested.
The linear regression model can conveniently be used to
test h y p o t h e s e s about the relationship of the independent
variables to the dependent v a r i a b l e . The hypothesis tests
are made through calculating a t statistic for each
estimated regression c o e f f i c i e n t , where t is equal to the

69
ratio of the c o e f f i c i e n t to its standard e r r o r . The null
h y p o t h e s i s is typically that the coefficient is equal to
zero (i.e., has no significant relationship with the
dependent v a r i a b l e ) and, therefore the t statistic for the
coefficient is equal to zero. Rejection of the null
h y p o t h e s i s is based upon a calculated t statistic for which
the probability that a larger absolute value of t could have
o c c u r r e d , under a true null h y p o t h e s i s , is less than a
specified amount such as = 0.01. The multiple linear
regression equation used was of the following general form:
GPA. = b^ + bj X.^ = B2 X.2 . ... . B^ X.^
Where freshman GPA was expressed as a function of k
p r e d i c t o r s for each student i = 1, 2, 3, ..., N for a sample
of N s t u d e n t s . The intercept and regression coefficients
bpj, b, , bp, ..., b. were calculated using least squares
regression e s t i m a t i o n .
In addition to providing a means for testing the null
h y p o t h e s e s , the regression equations developed in this study
provided an instrument for predicting an entering freshman's
degree of success in chemical or petroleum e n g i n e e r i n g ,
thereby providing a tool to assist administrators and
c o u n s e l o r s in placing and advising s t u d e n t s . The results of
the statistical analysis and their interpretation are
presented in the following c h a p t e r .

CHAPTER IV
P R E S E N T A T I O N AND INTERPRETATION OF RESULTS
M u l t i p l e linear regression models for predicting
a c a d e m i c s u c c e s s , measured by freshman GPA, were developed
using variables derived from s t u d e n t s ' academic r e c o r d s , as
indicated in the previous c h a p t e r . This statistical
a n a l y s i s allowed the testing of the null hypotheses set
forth in Chapter I. In a d d i t i o n , equations developed in the
a n a l y s i s can be used by a d m i n i s t r a t o r s and counselors as an
e v a l u a t i o n instrument in advising and placing prospective
chemical or petroleum engineering s t u d e n t s . This chapter
p r e s e n t s the findings of the statistical a n a l y s i s .
Testing Procedure for Null Hypotheses
In all h y p o t h e s i s t e s t s , the significance of each
p a r a m e t e r , either regression coefficient or difference in
sample m e a n s , was tested by calculating a t s t a t i s t i c . The
t statistic for each parameter was used to test the null
h y p o t h e s e s that the parameter was not significantly
d i f f e r e n t from zero for a specified probability a . The
value of represented the probability that a t value larger
than the calculated value could have occurred if the null
h y p o t h e s e s were c o r r e c t . In this a n a l y s i s , a parameter was
c o n s i d e r e d to be s i g n i f i c a n t l y different from zero for ^ =
0.10 or less. Tables of critical t values for various
70
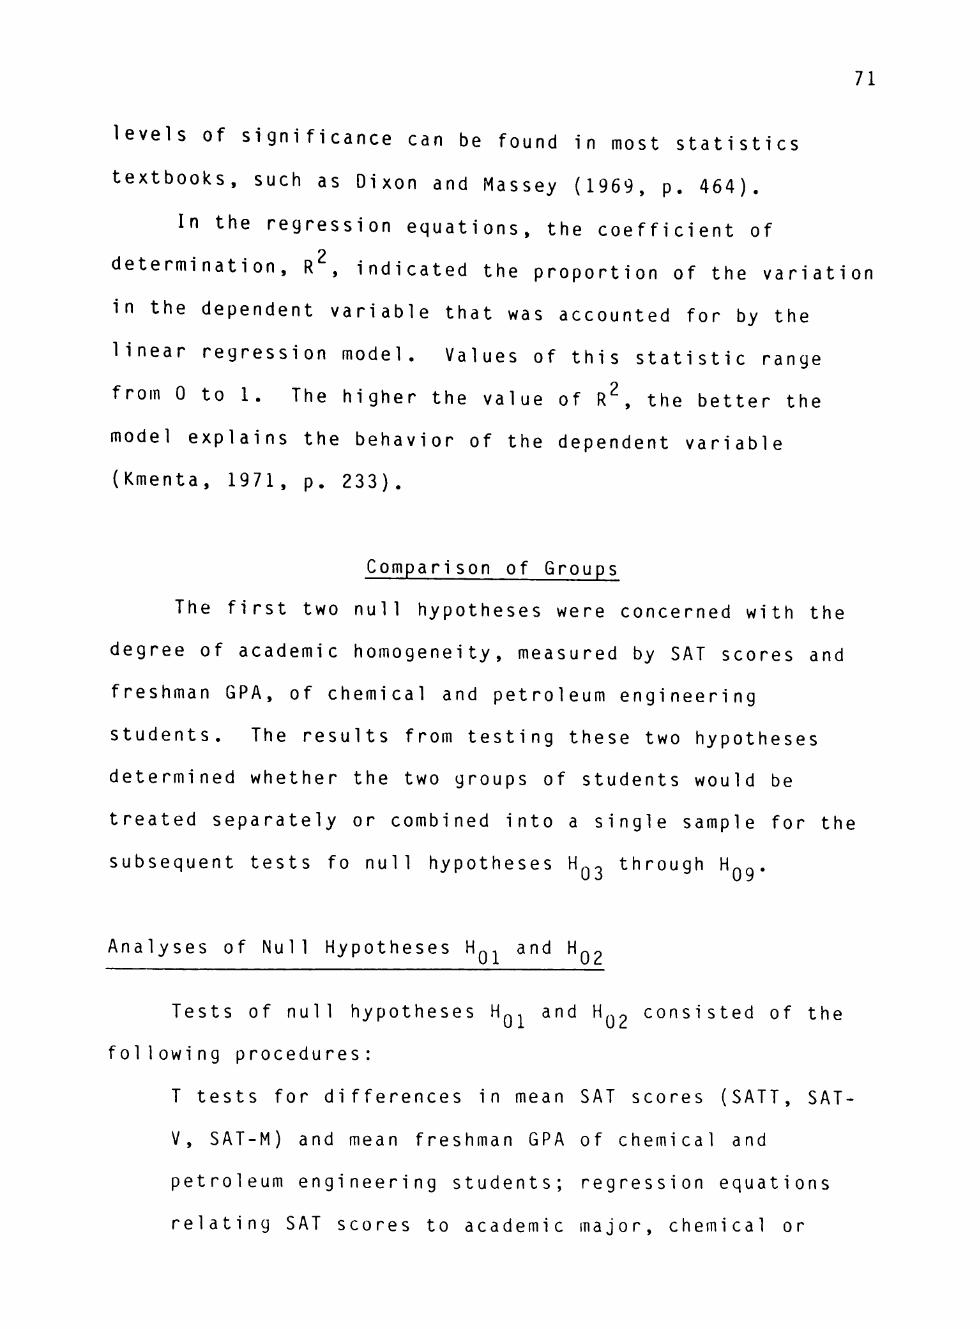
71
levels of significance can be found in most statistics
t e x t b o o k s , such as Dixon and Massey (1969, p. 4 6 4 ) .
In the regression e q u a t i o n s , the coefficient of
d e t e r m i n a t i o n , R , indicated the proportion of the variation
in the dependent variable that was accounted for by the
linear regression m o d e l . Values of this statistic range
from 0 to 1. The higher the value of R^, the better the
model explains the behavior of the dependent variable
(Kmenta, 1971, p. 2 3 3 ) .
Comparison of Groups
The first two null hypotheses were concerned with the
degree of academic h o m o g e n e i t y , measured by SAT scores and
freshman GPA, of chemical and petroleum engineering
s t u d e n t s . The results from testing these two hypotheses
determined whether the two groups of students would be
treated separately or combined into a single sample for the
subsequent tests fo null hypotheses H^^ through H ^ Q .
Analyses of Null Hypotheses H^j, and H^^
Tests of null hypotheses H Q , and H.-j consisted of the
following p r o c e d u r e s :
T tests for d i f f e r e n c e s in mean SAT scores (SATT, SAT
V, SAT-M) and mean freshman GPA of chemical and
petroleum engineering s t u d e n t s ; regression equations
relating SAT scores to academic major, chemical or

72
petroleum e n g i n e e r i n g ; and regression equations
relating freshman GPA to academic major and other
predictors of GPA.
Table 3 presents the results of t tests for d i f f e r e n c e s
in mean SAT and mean freshman GPA by major. In all three
c a s e s , the t s t a t i s t i c s for the three SAT scores indicated
significant d i f f e r e n c e s in scores for chemical and petroleum
e n g i n e e r i n g s t u d e n t s , with chemical engineering students
scoring higher in each instance. The t test for a
d i f f e r e n c e in mean freshman GPA by major likewise indicated
s i g n i f i c a n c e (a = 0 . 0 1 ) .
H o w e v e r , these t tests of mean SAT scores and mean
freshman GPA did not take into account the extent to which
factors other than academic major might explain variations
in SAT scores and GPA, possibly rendering academic major
insignificant in its relationship to GPA. T h e r e f o r e , to
further evaluate the question of whether to combine chemical
and petroleum engineering students into one sample or to
treat them as two separate groups, regression equations were
estimated for the three SAT scores and freshman GPA,
relating these variables to academic major. Academic major
was represented in the regression equations by the variable
MAJOR, which was set equal to 0 for chemical engineering
students and to 1 for petroleum engineering s t u d e n t s .
As shown in Table 4, SAT scores expressed as functions
of major indicated that there was a significant difference

73
TABLE 3
T TESTS FOR DIFFERENCES IN MEAN SAT SCORES AND FRESHMAN GPA FOR CHEMICAL AND PETROLEUM
ENGINEERING STUDENTS
StaLisLicb Chemical Petroleum t Statistic Degrees of freedom
SAT-TOT mean 1,094.8 1,026.5 3.42*** 182 variance 25,385.2 26,874.0
2.70*** 170 SAT-VERB mean variance
SAT-MATH mean variance
GPA mean variance
492.6 10.394.7
602.3 10.394.7
285.0 5,839.3
458.9 9.479.8
567.6 8.378.8
257.1 6,248.9
2.82*** 161
2.91*** 182
Sample Size 93 214
NOTE: Significance of the t statistic is indicated by *** for ot = o.Ol.
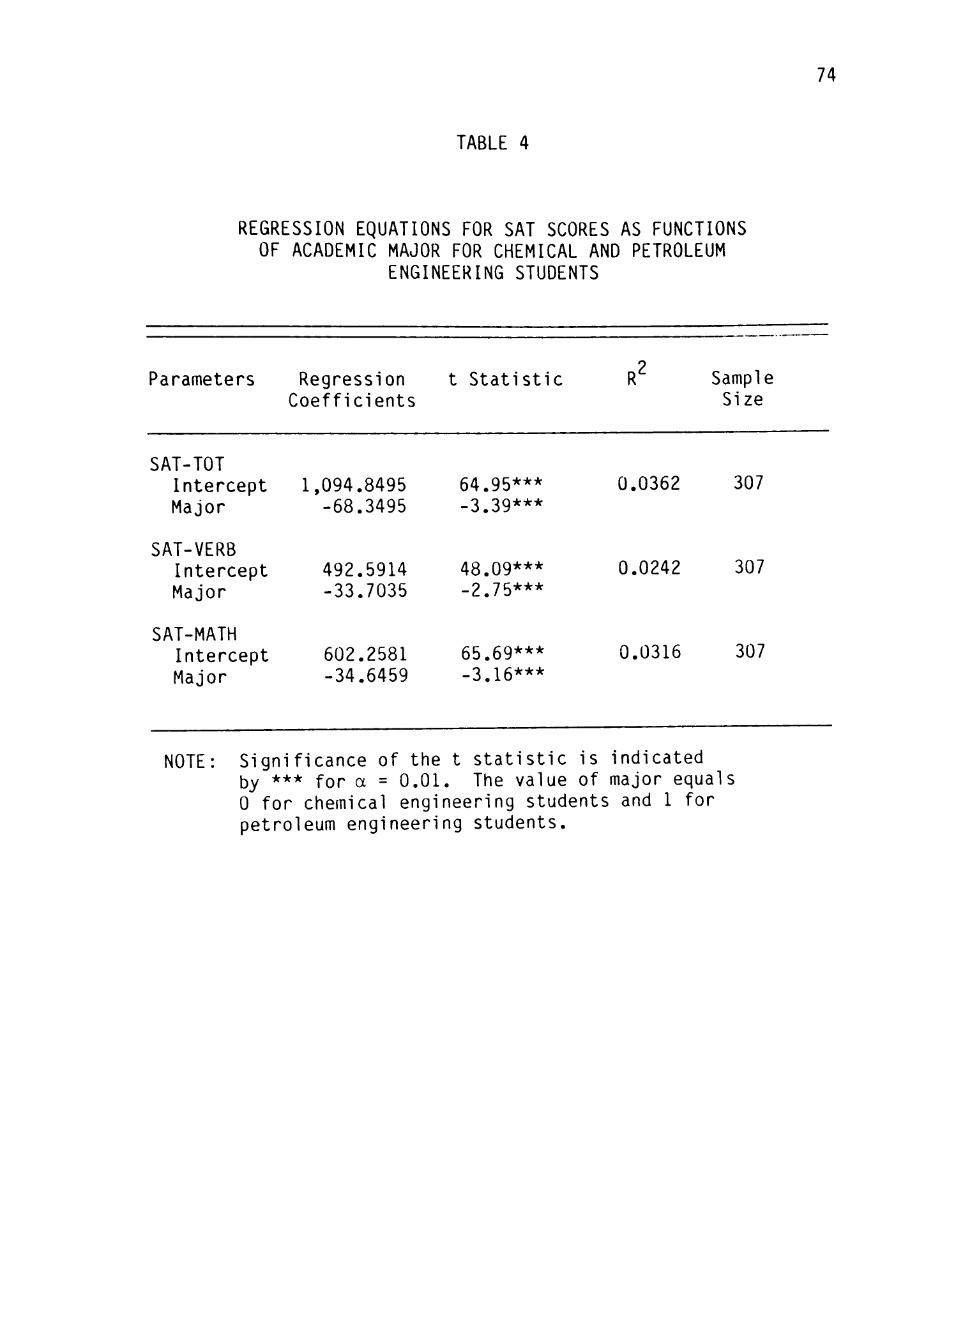
74
TABLE 4
REGRESSION EQUATIONS FOR SAT SCORES AS FUNCTIONS OF ACADEMIC MAJOR FOR CHEMICAL AND PETROLEUM
ENGINEERING STUDENTS
Parameters
SAT-TOT Intercept Major
SAT-VERB Intercept Major
SAT-MATH Intercept Major
Regression Coefficients
1,094.8495 -68.3495
492.5914 -33.7035
602.2581 -34.6459
t Statistic
64.95*** -3.39***
48.09*** -2.75***
65.69*** -3.16***
R2
0.0362
0.0242
0.0316
Sample Size
307
307
307
NOTE: Significance of the t statistic is indicated by *** for a = 0.01. The value of major equals 0 for chemical engineering students and 1 for petroleum engineering students.

75
in mean SAT scores by m a j o r , with mean SAT scores of
chemical engineering students being greater than those of
petroleum engineering s t u d e n t s . H o w e v e r , the amount of
variation in SAT scores explained by accounting for
d i f f e r e n c e s by academic major was less than four percent in
any of the three c a s e s , implying that academic major is a
very poor predictor of SAT s c o r e s .
F u r t h e r , academic major was found not to be
s i g n i f i c a n t l y related to GPA. Tables 5-8 present regression
e q u a t i o n s that relate freshman GPA to major and other
predictors of GPA. In every m o d e l , the t statistics for the
estimated regression coefficients indicated that factors
other than major were meaningful in predicting GPA.
Given these results for SAT scores and freshman GPA as
functions of academic major, it was concluded that there was
no basis for rejecting null hypotheses H Q , and H^p* Hence,
academic major was not used as a predictor of academic
success for chemical or petroleum engineering students, and
chemical and petroleum engineering students were combined
into one sample for testing null hypotheses H^^ through H Q ^ .
Evaluation of Predictors
Null hypotheses H^^ through H^^^ addressed the ability
of readily available academic information to predict an
entering freshman's degree of academic success in chemical
or petroleum e n g i n e e r i n g . On the basis of the findings from
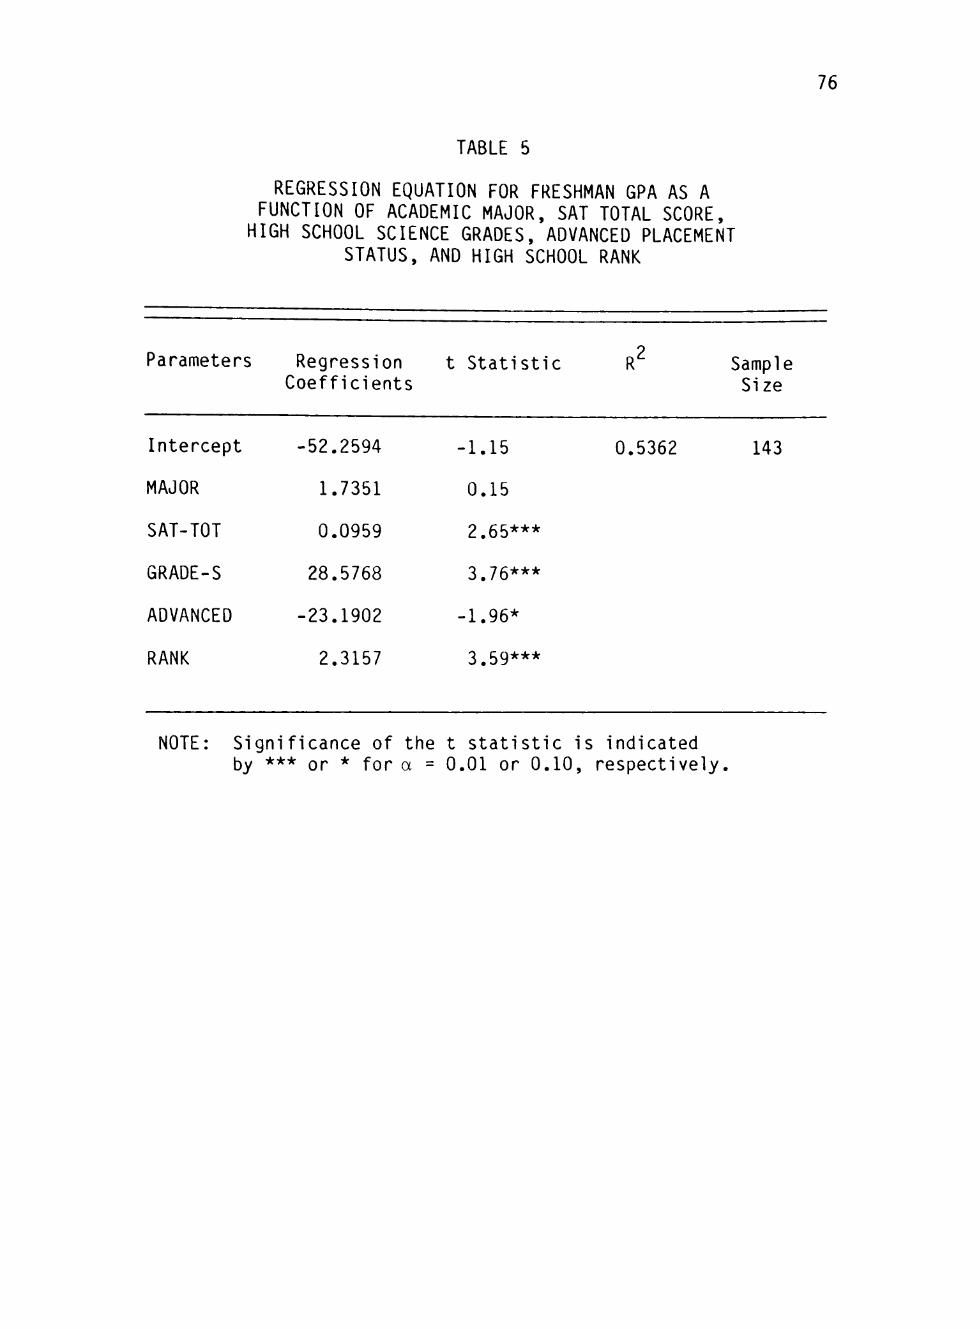
TABLE 5
REGRESSION EQUATION FOR FRESHMAN GPA AS A FUNCTION OF ACADEMIC MAJOR, SAT TOTAL SCORE,
HIGH SCHOOL SCIENCE GRADES, ADVANCED PLACEMENT STATUS, AND HIGH SCHOOL RANK
76
Parameters Regression t Statistic Coefficients
R Sample Size
Intercept
MAJOR
SAT-TOT
GRADE-S
ADVANCED
RANK
-52.2594
1.7351
0.0959
28.5768
-23.1902
2.3157
-1.15
0.15
2.65***
3.76***
-1.96*
3.59***
0.5362 143
NOTE: Significance of the t statistic is indicated by *** or * for a = 0.01 or 0.10, respectively.

TABLE 6
REGRESSION EQUATION FOR FRESHMAN GPA AS A FUNCTION OF ACADEMIC MAJOR, SAT MATHEMATICS SCORE. HIGH SCHOOL
SCIENCE GRADES, ADVANCED PLACEMENT STATUS, AND HIGH SCHOOL RANK
77
Parameters Regression t Statistic Coefficients
R' Sample Size
Intercept
MAJOR
SAT-MATH
GRADE-S
ADVANCED
RANK
-50.1522
-1.1856
0.1835
27.4846
-26.9951
2.3437
-1.16
-0.10
2.95***
3.61***
-2.46**
3.69***
0.5414 143
NOTE: Significance of the t statistic is indicated by *** or ** for a = 0.01 or 0.05, respectively.

TABLE 7
REGRESSION EQUATION FOR FRESHMAN GPA AS A FUNCTION OF ACADEMIC MAJOR, SAT TOTAL SCORE,
HIGH SCHOOL SCIENCE GRADES, AND HIGH SCHOOL MATHEMATICS GRADES
78
Parameters Regression t Statistic Coefficients
R Sample Size
Intercept
MAJOR
SAT-TOT
GRADE-S
GRADE-M
-62.2521
-4.3032
0.1342
26.1652
31.6115
-2.33**
-0.54
5.43***
3.90***
4.47***
0.4205 294
NOTE: Significance of the t statistic is indicated by *** or ** for a = 0.01 or 0.05, respectively.
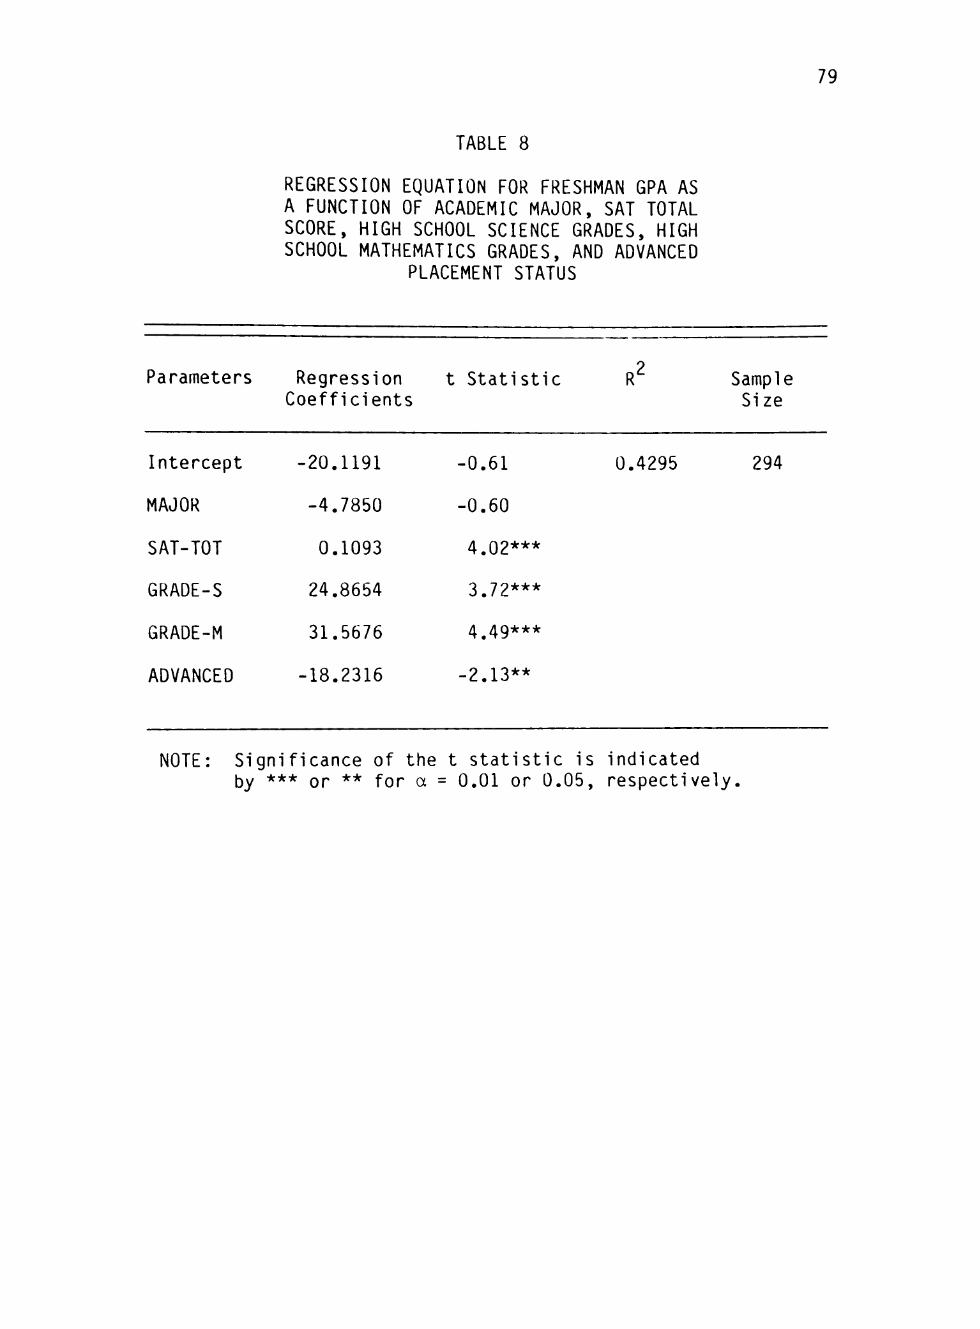
TABLE 8
REGRESSION EQUATION FOR FRESHMAN GPA AS A FUNCTION OF ACADEMIC MAJOR, SAT TOTAL SCORE, HIGH SCHOOL SCIENCE GRADES, HIGH SCHOOL MATHEMATICS GRADES, AND ADVANCED
PLACEMENT STATUS
79
Parameters Regression t Statistic Coefficients
R Sample Size
Intercept
MAJOR
SAT-TOT
GRADE-S
GRADE-M
ADVANCED
-20.1191
-4.7850
0.1093
24.8654
31.5676
-18.2316
-0.61
-0.60
4.02***
3.72***
4.49***
-2.13**
0.4295 294
NOTE: Significance of the t statistic is indicated by *** or ** for a = 0.01 or 0.05, respectively.
t e s t i n g h y p o t h e s e s H^^ and H^^, chemical and petroleum
e n g i n e e r i n g students were combined into one data set for
testing the remaining h y p o t h e s e s .
80
Tests of Null H y p o t h e s e s H^-^ through H 03 '07
Tests of null hypotheses H Q ^ through H^^ were made
through e s t i m a t i n g regression equations relating freshman
GPA to p r e d i c t o r s of academic s u c c e s s . Several m o d e l s ,
c o n s i s t i n g of various combinations of independent v a r i a b l e s ,
were estimated in order to evaluate the relationship of each
p r e d i c t o r to GPA.
The five equations shown in Tables 9-13 were used to
test null hypotheses H^^ through H Q ^ . The hypothesis tests
were based on the t statistics for the estimated regression
c o e f f i c i e n t s . Significance of a particular predictor was
indicated by a t value associated with a = 0.10 or less.
In all five e q u a t i o n s , SAT scores were found to be
s i g n i f i c a n t predictors of freshman GPA, with a higher SAT
score associated with a higher GPA. T h e r e f o r e , null
h y p o t h e s i s H^^, that SAT scores have no significant
p r e d i c t a b i l i t y of freshman GPA, was rejected.
S i m i l a r l y , high school rank was significant in all five
e q u a t i o n s , with a higher rank associated with a higher GPA.
Null hypothesis H^^, that high school rank has no
s i g n i f i c a n t p r e d i c t a b i l i t y of freshman GPA, was rejected.
Advanced placement status was also significant in all
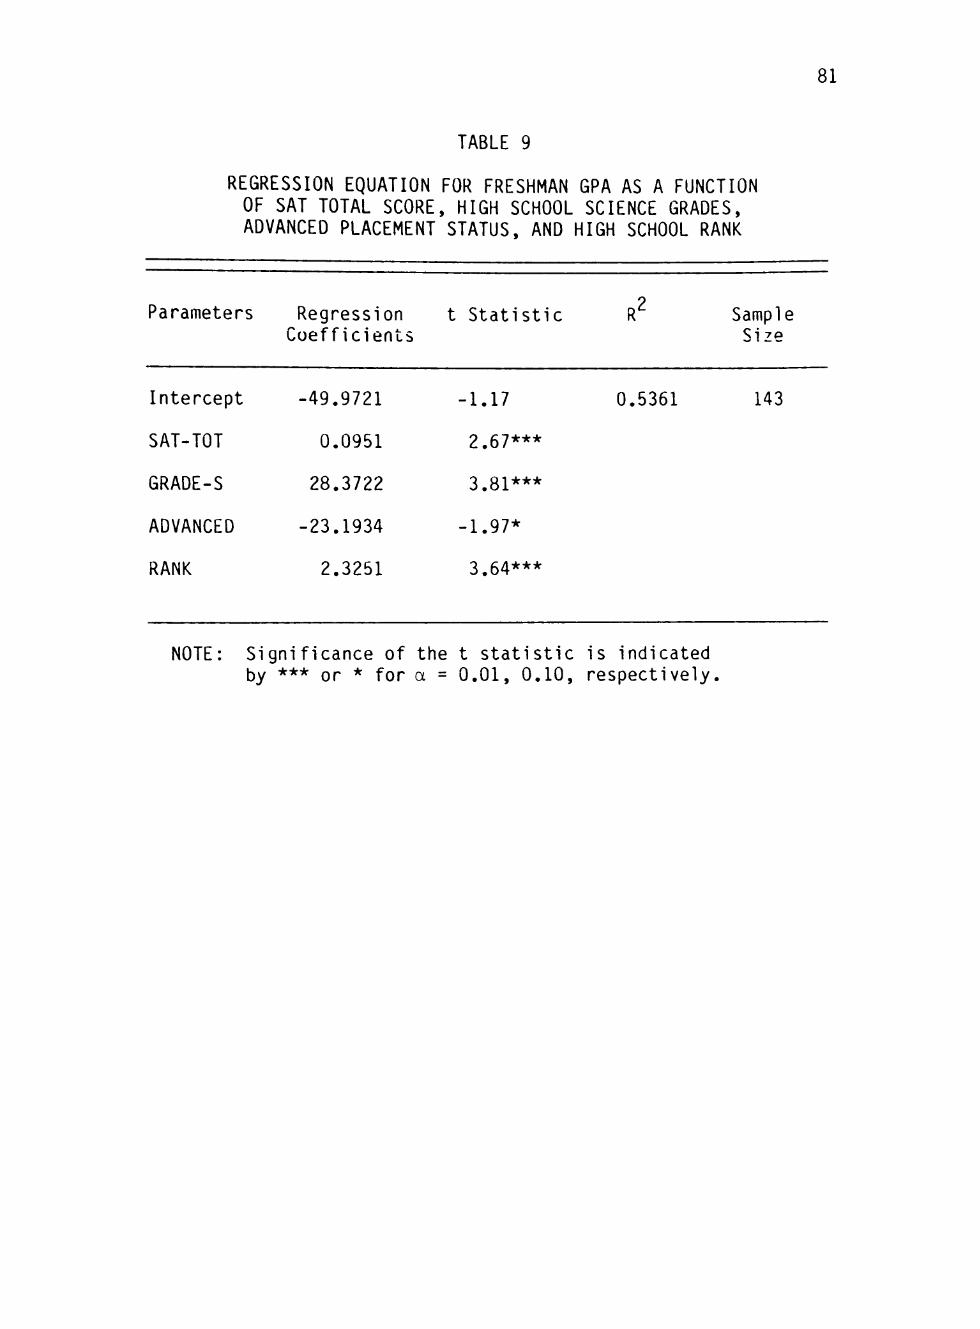
TABLE 9
REGRESSION EQUATION FOR FRESHMAN GPA AS A FUNCTION OF SAT TOTAL SCORE, HIGH SCHOOL SCIENCE GRADES, ADVANCED PLACEMENT STATUS, AND HIGH SCHOOL RANK
81
Parameters Regression t Statistic Coefficients
R' Sample Si ze
Intercept
SAT-TOT
GRADE-S
ADVANCED
RANK
-49.9721
0.0951
28.3722
-23.1934
2.3251
-1.17
2.67***
3.81***
-1.97*
3.64***
0.5361 143
NOTE: Significance of the t statistic is indicated by *** or * for a = 0.01, 0.10, respectively.
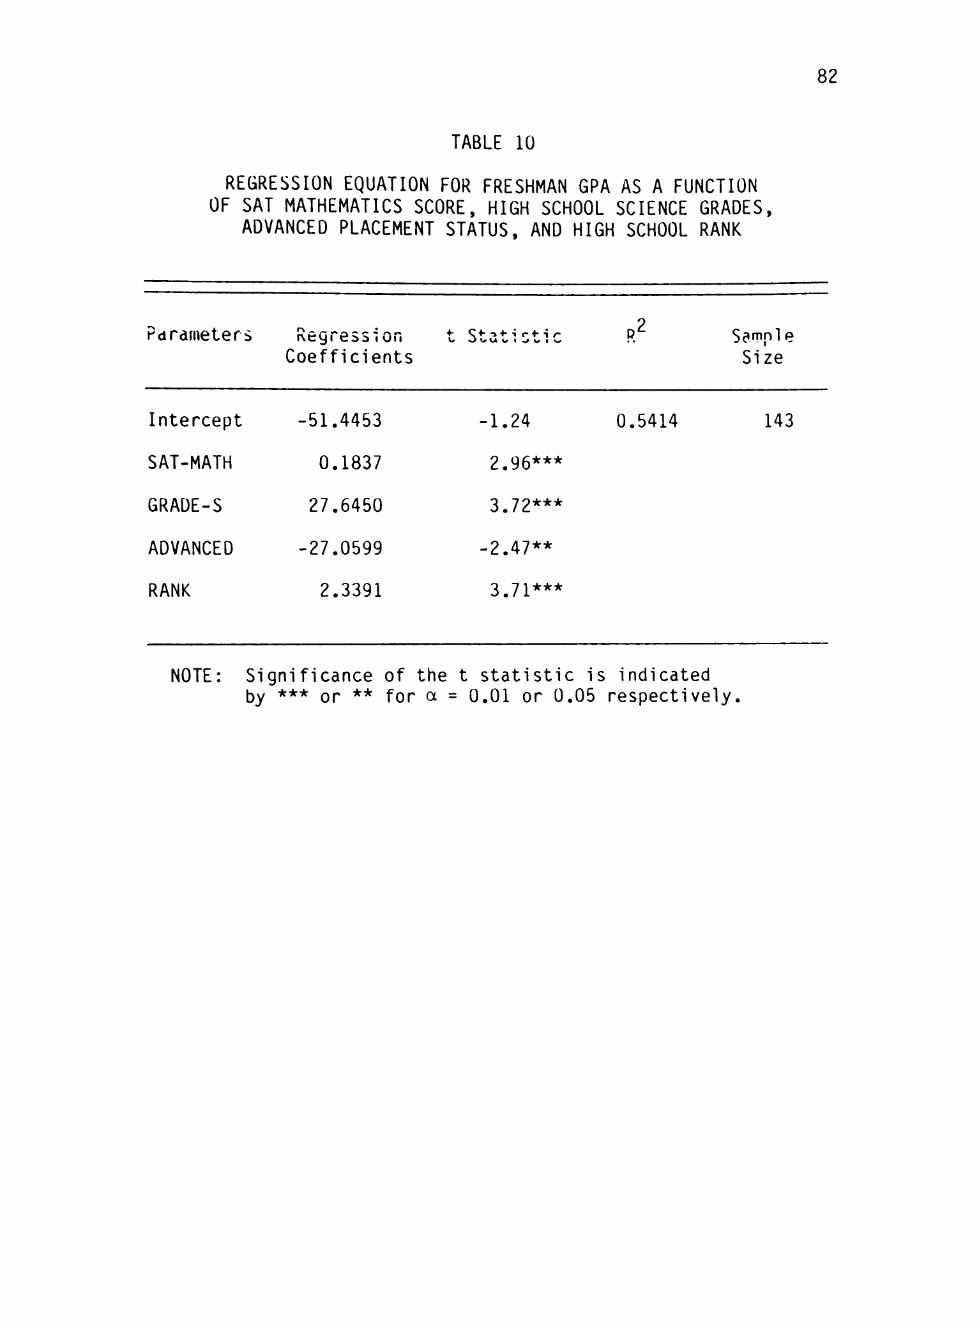
TABLE 10
REGRESSION EQUATION FOR FRESHMAN GPA AS A FUNCTION OF SAT MATHEMATICS SCORE, HIGH SCHOOL SCIENCE GRADES,
ADVANCED PLACEMENT STATUS, AND HIGH SCHOOL RANK
82
Parameters Regression t Statistic Coefficients
Samnlp Size
Intercept
SAT-MATH
GRADE-S
ADVANCED
RANK
-51.4453
0.1837
27.6450
-27.0599
2.3391
-1.24
2.96 *••
3.72***
•2.47**
3.71***
0.5414 143
NOTE: Significance of the t statistic is indicated by *** or ** for a = 0.01 or 0.05 respectively.
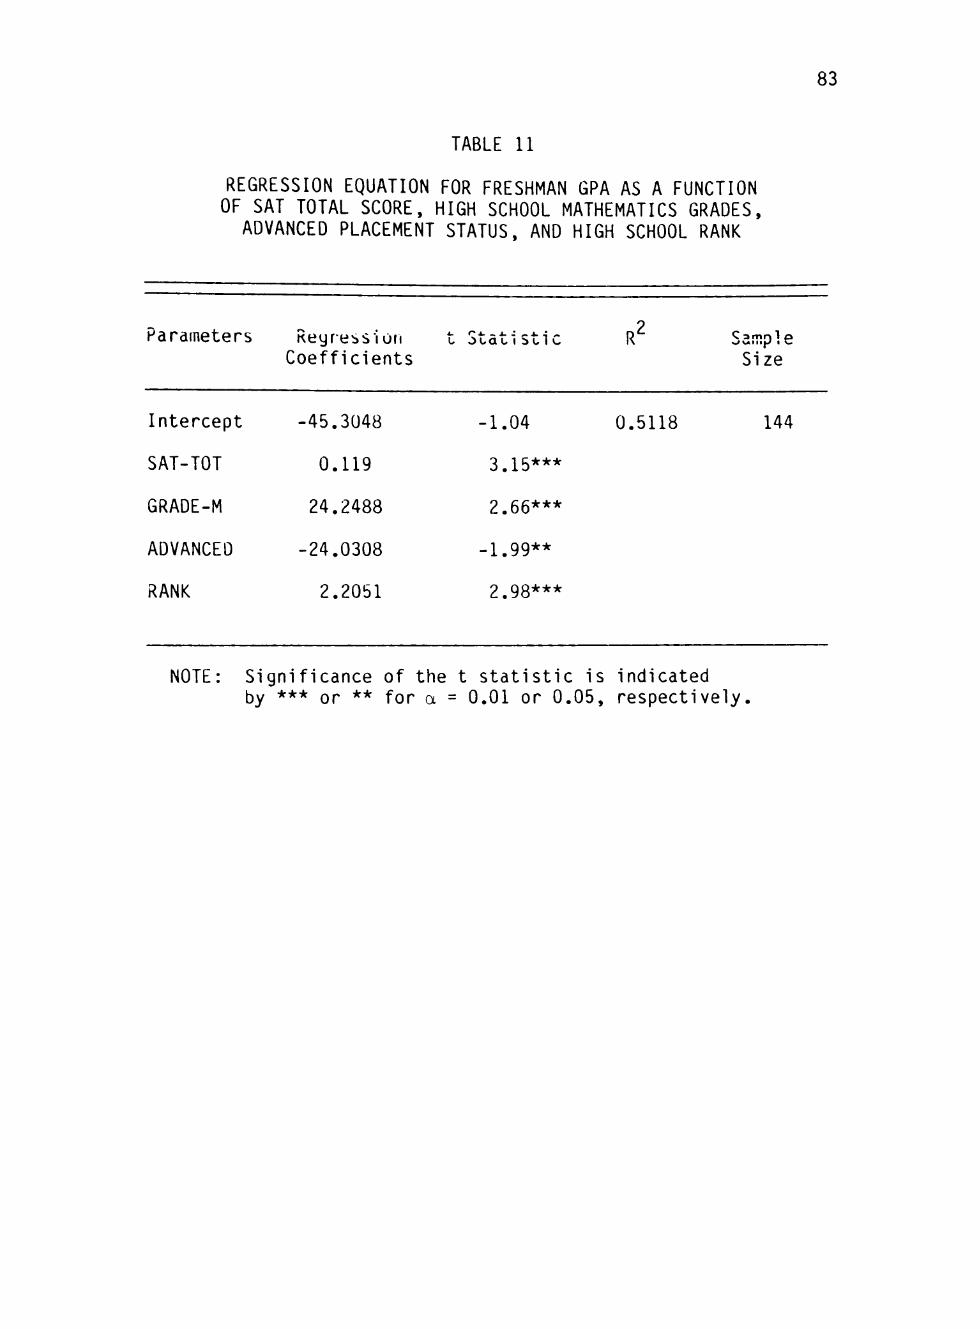
TABLE 11
REGRESSION EQUATION FOR FRESHMAN GPA AS A FUNCTION OF SAT TOTAL SCORE, HIGH SCHOOL MATHEMATICS GRADES,
ADVANCED PLACEMENT STATUS, AND HIGH SCHOOL RANK
83
Parameters
Intercept
SAT-TOT
GRADE-M
ADVANCED
RANK
Regression Coefficients
-45.3048
0.119
24.2488
-24.0308
2.2051
-1.04
3.15***
2.66***
-1.99**
2.98***
R
0.5118
Size
144
NOTE: Significance of the t statistic is indicated by *** or ** for a = 0.01 or 0.05, respectively.

84
TABLE 12
REGRESSION EQUATION FOR FRESHMAN GPA AS A FUNCTION OF SAT VERBAL SCORE, HIGH SCHOOL MATHEMATICS GRADES,
ADVANCED PLACEMENT STATUS, AND HIGH SCHOOL RANK
Parameters
Intercept
SAT-VERB
GRADE-M
ADVANCED
RANK
Regression Coefficients
-4.2099
0.1193
28.3899
-30.6019
2.3891
t Statistic
-0.10
2.06**
3.10***
-2.51**
3.17***
n2
0.4923
oamp1c Size
144
NOTE: Significance of the t statistic is indicated by *** or ** for a = 0.01 or 0.05, respectively.
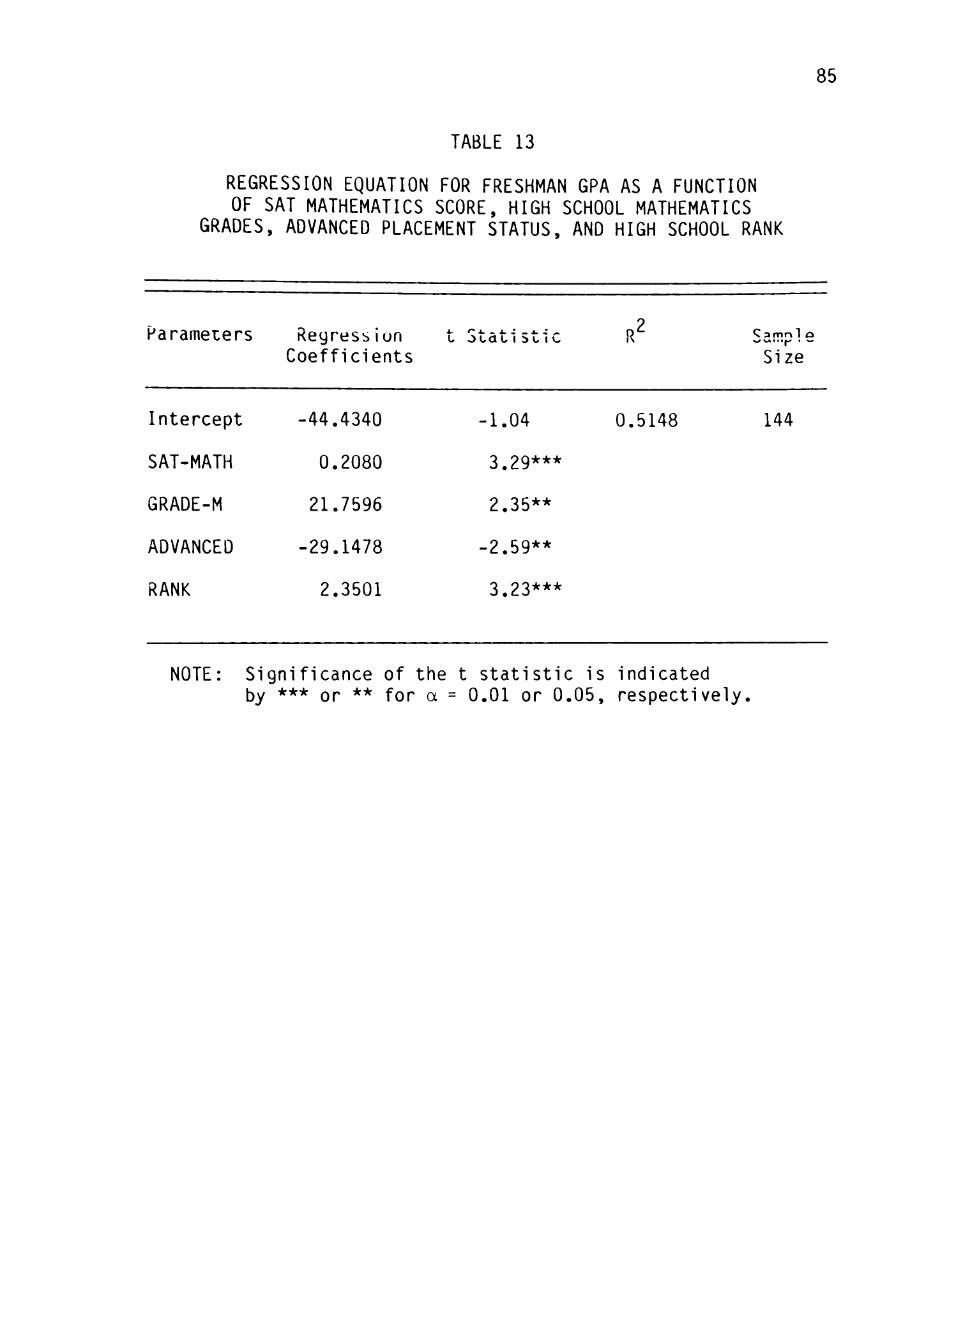
85
TABLE 13
REGRESSION EQUATION FOR FRESHMAN GPA AS A FUNCTION OF SAT MATHEMATICS SCORE, HIGH SCHOOL MATHEMATICS
GRADES, ADVANCED PLACEMENT STATUS, AND HIGH SCHOOL RANK
Parameters
Intercept
SAT-MATH
GRADE-M
ADVANCED
RANK
Regress ion Coefficients
-44.4340
0.2080
21.7596
-29.1478
2.3501
c o u d 11 ^ t. 1V.
-1.04
3.29***
2.35**
-2.59**
3.23***
R2
0.5148
Q amr> 1 o
Size
144
NOTE: Significance of the t statistic is indicated by *** or ** for a = 0.01 or 0.05, respectively.
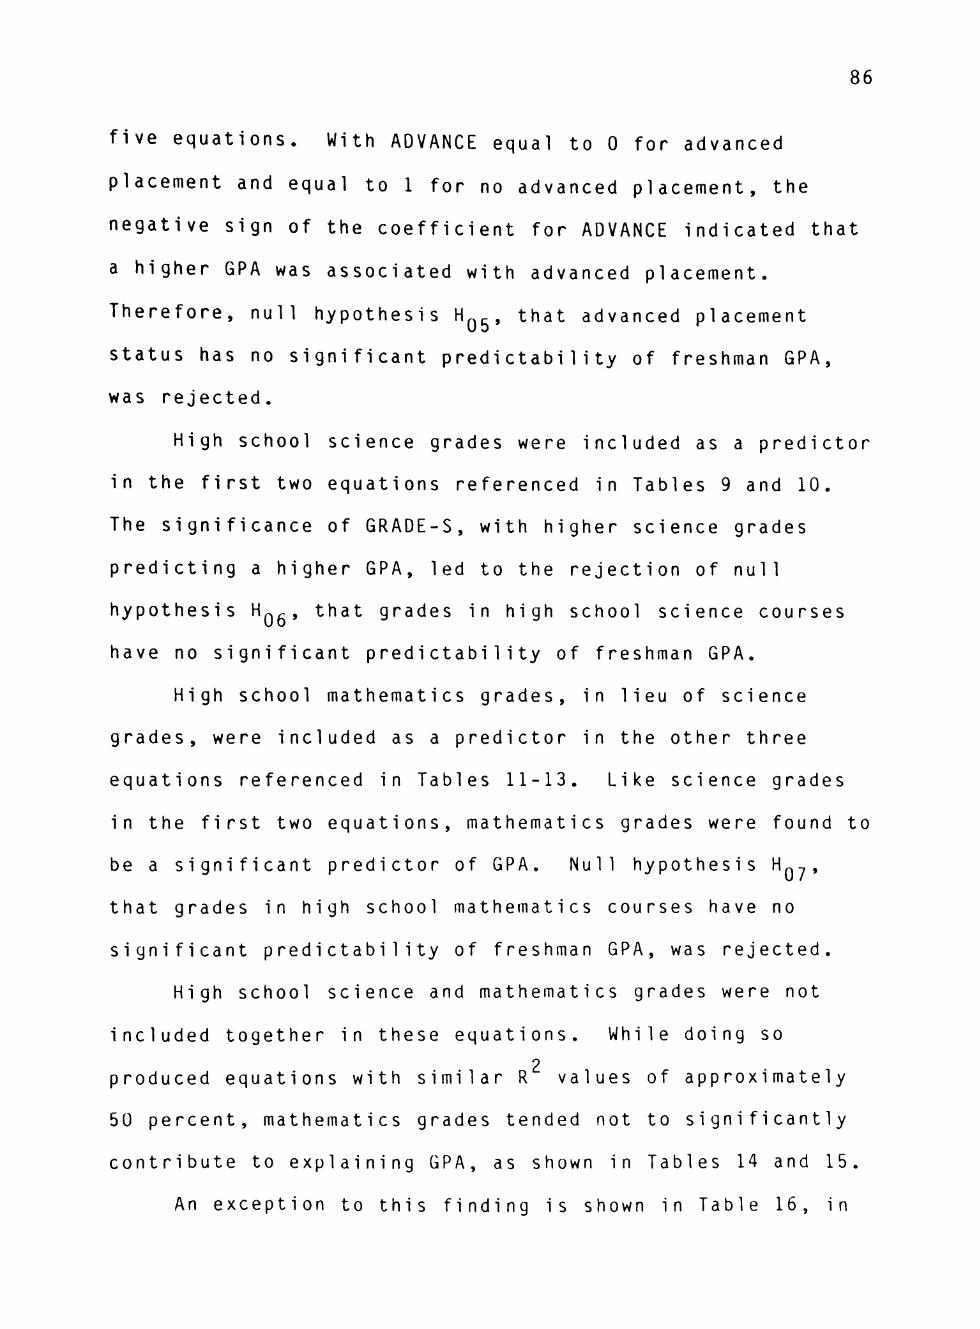
86
five e q u a t i o n s . With ADVANCE equal to 0 for advanced
p l a c e m e n t and equal to 1 for no advanced p l a c e m e n t , the
n e g a t i v e sign of the coefficient for ADVANCE indicated that
a higher GPA was associated with advanced p l a c e m e n t .
T h e r e f o r e , null hypothesis H^^, that advanced placement
status has no significant p r e d i c t a b i l i t y of freshman GPA,
was rejected.
High school science grades were included as a predictor
in the first two equations referenced in Tables 9 and 1 0 .
The s i g n i f i c a n c e of G R A D E - S , with higher science grades
p r e d i c t i n g a higher GPA, led to the rejection of null
h y p o t h e s i s H Q ^ , that grades in high school science courses
have no significant predictability of freshman GPA.
High school m a t h e m a t i c s g r a d e s , in lieu of science
g r a d e s , were included as a predictor in the other three
e q u a t i o n s referenced in Tables 1 1 - 1 3 . Like science grades
in the first two e q u a t i o n s , m a t h e m a t i c s grades were found to
be a significant predictor of GPA. Null hypothesis H^^,
that grades in high school m a t h e m a t i c s courses have no
s i g n i f i c a n t p r e d i c t a b i l i t y of freshman GPA, was rejected.
High school science and m a t h e m a t i c s grades were not
included together in these e q u a t i o n s . While doing so
2 produced equations with similar R values of approximately
50 p e r c e n t , m a t h e m a t i c s grades tended not to significantly
c o n t r i b u t e to explaining GPA, as shown in Tables 14 and 15.
An exception to this finding is shown in Table 16, in
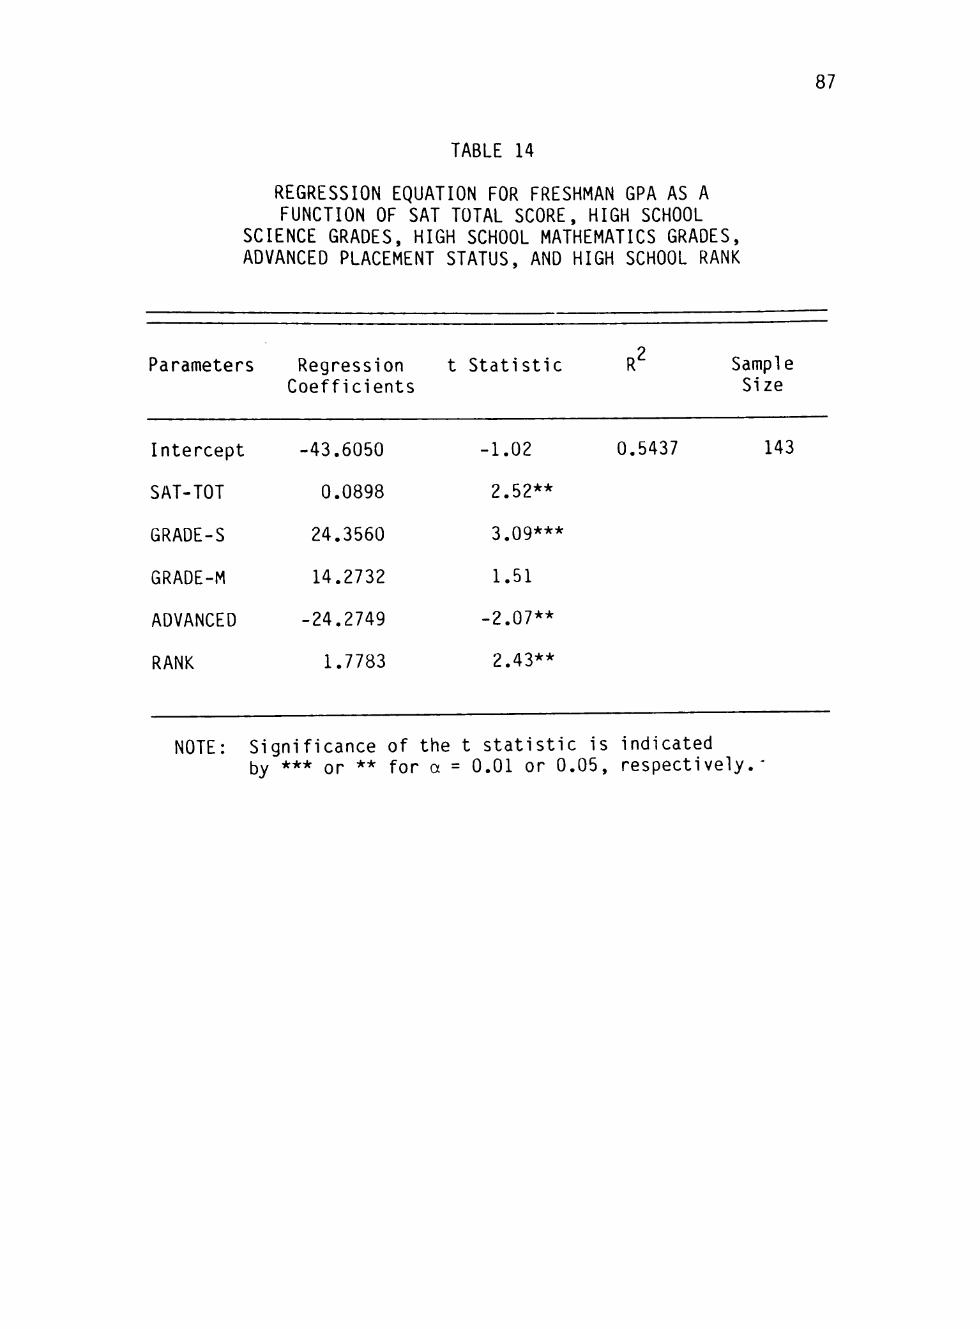
TABLE 14
REGRESSION EQUATION FOR FRESHMAN GPA AS A FUNCTION OF SAT TOTAL SCORE, HIGH SCHOOL
SCIENCE GRADES, HIGH SCHOOL MATHEMATICS GRADES, ADVANCED PLACEMENT STATUS, AND HIGH SCHOOL RANK
87
Parameters Regression t Statistic Coefficients
R Sample Size
Intercept
SAT-TOT
GRADE-S
GRADE-M
ADVANCED
RANK
-43.6050
0.0898
24.3560
14.2732
-24.2749
1.7783
-1.02
2.52**
3.09***
1.51
-2.07**
2.43**
0.5437 143
NOTE: Significance of the t statistic is indicated by *** or ** for a = 0.01 or 0.05, respectively.
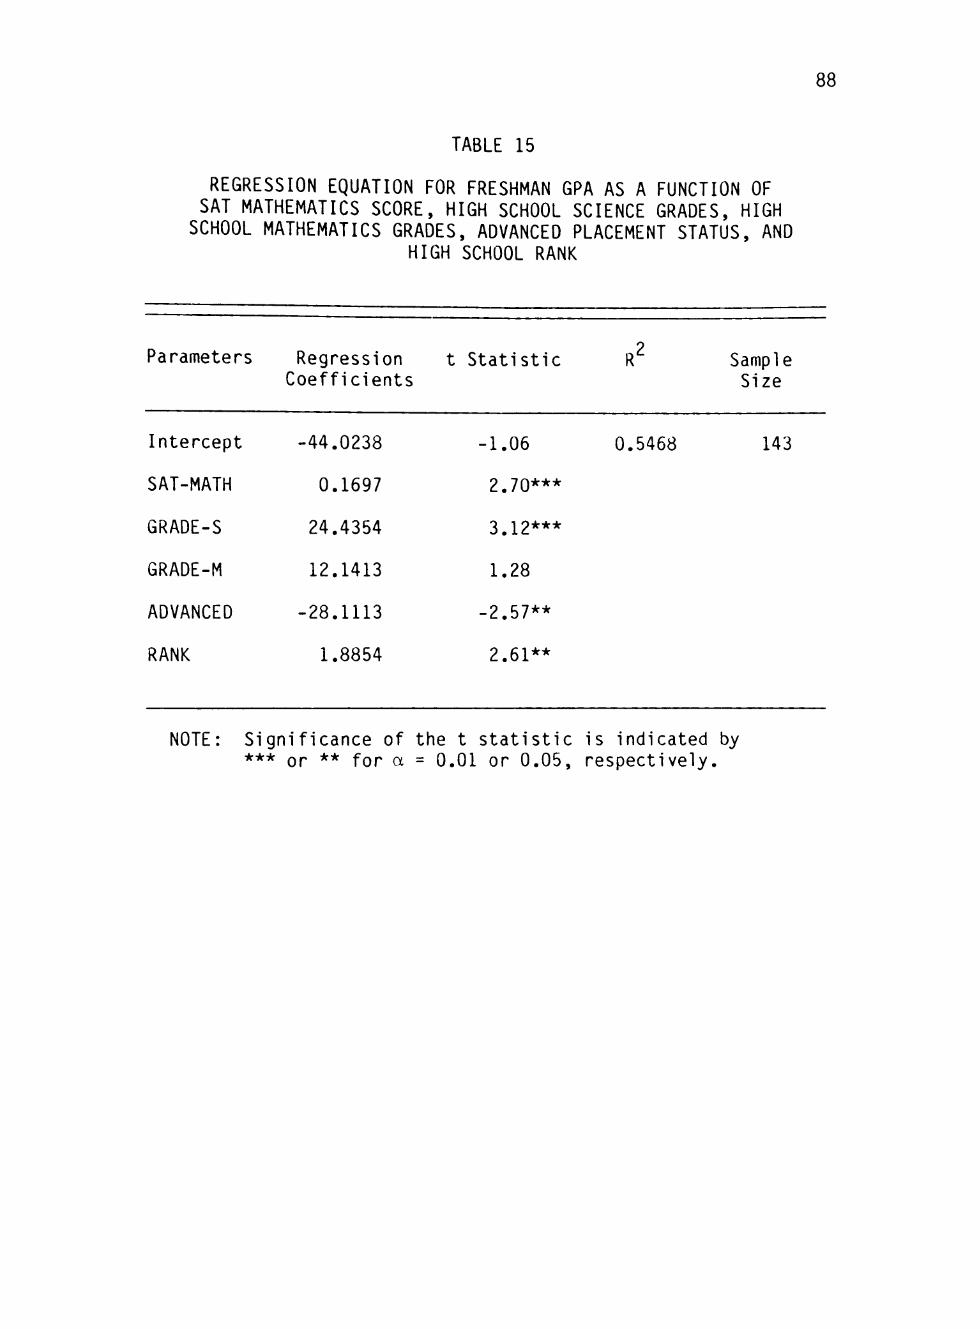
TABLE 15
REGRESSION EQUATION FOR FRESHMAN GPA AS A FUNCTION OF SAT MATHEMATICS SCORE, HIGH SCHOOL SCIENCE GRADES, HIGH
SCHOOL MATHEMATICS GRADES, ADVANCED PLACEMENT STATUS, AND HIGH SCHOOL RANK
88
Parameters Regression t Statistic Coefficients
R Sample Size
Intercept
SAT-MATH
GRADE-S
GRADE-M
ADVANCED
RANK
-44.0238
0.1697
24.4354
12.1413
-28.1113
1.8854
-1.06
2.70***
3.12***
1.28
-2.57**
2.61**
0.5468 143
NOTE: Significance of the t statistic is indicated by *** or ** for a = 0.01 or 0.05, respectively.
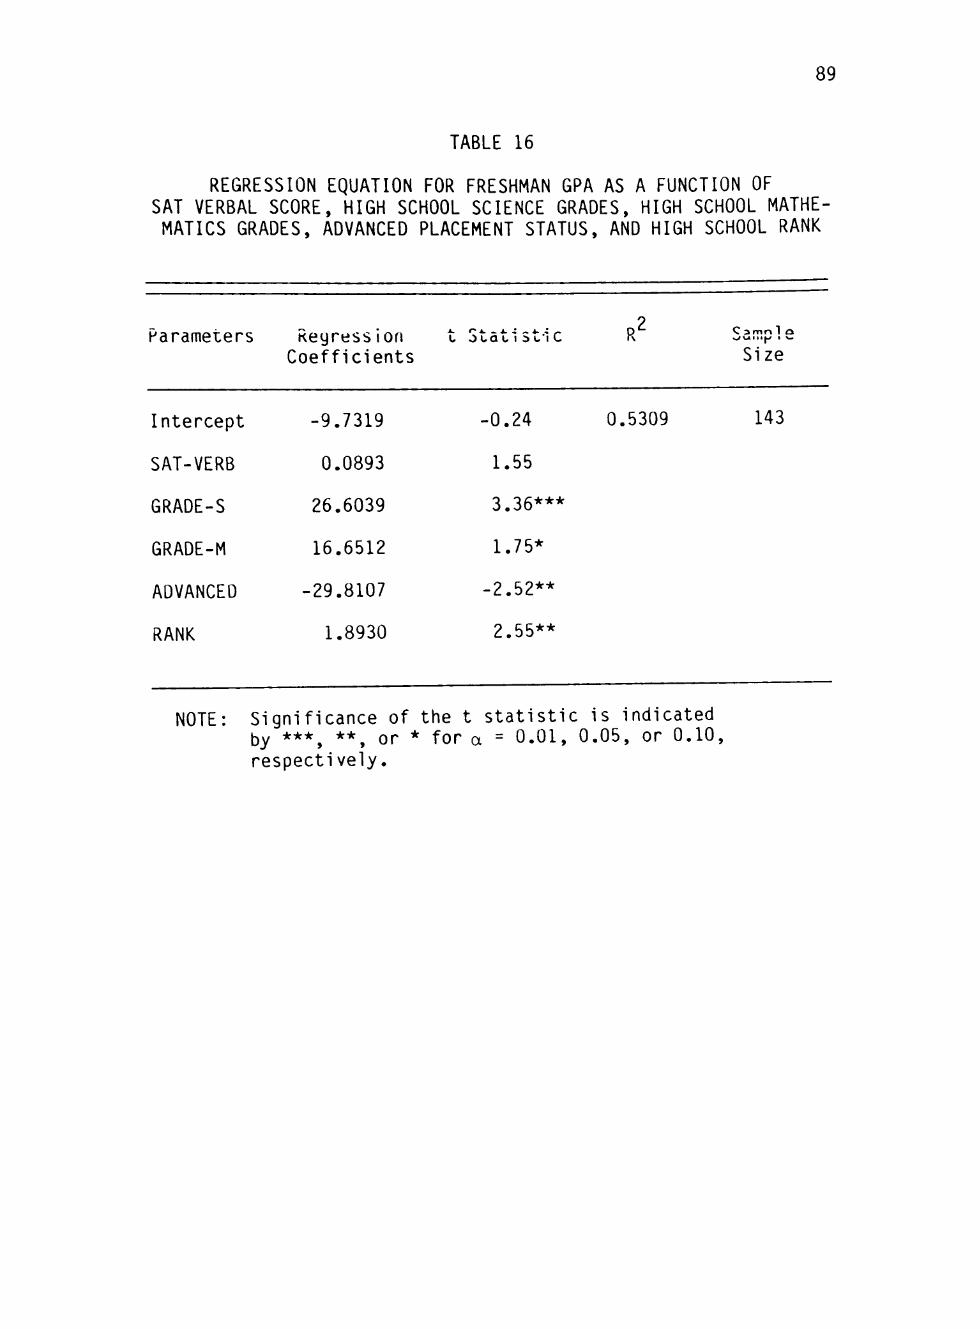
89
TABLE 16
REGRESSION EQUATION FOR FRESHMAN GPA AS A FUNCTION OF SAT VERBAL SCORE, HIGH SCHOOL SCIENCE GRADES, HIGH SCHOOL MATHEMATICS GRADES, ADVANCED PLACEMENT STATUS, AND HIGH SCHOOL RANK
Parameters
Intercept
SAT-VERB
GRADE-S
GRADE-M
ADVANCED
RANK
Regression Coefficients
-9.7319
0.0893
26.6039
16.6512
-29.8107
1.8930
L oca u1i u1C
-0.24
1.55
3.36***
1.75*
-2.52**
2.55**
R2
0.5309
C 3 m o 1 Q
Size
143
NOTE: Significance of the t statistic is indicated ^y ••• ** or * for a = 0.01, 0.05, or 0.10, respectively.
90
which both GRADE-S and GRADE-M appear along with S A T - V E R B ,
which was i n s i g n i f i c a n t in this c a s e . This result indicated
that GRADE-M did not contribute significantly to explaining
GPA, over and above the contributions of science grades and
the m a t h e m a t i c s portion of SAT score (either SAT-TOT or SAT-
M A T H ) . But if the influence on freshman GPA of a student's
m a t h e m a t i c s ability was not accounted for through the
m a t h e m a t i c s portion of SAT score, then GRADE-M was able to
c o n t r i b u t e s i g n i f i c a n t l y to explaining GPA.
To further evaluate the influence of high school
m a t h e m a t i c s grades on GPA, GRADE-M was divided into two
v a r i a b l e s called GRADE-BM and GRADE-AM, averages of grades
in basic and advanced high school mathematics c o u r s e s ,
r e s p e c t i v e l y . Basic courses included algebra I and II,
g e o m e t r y , and mechanical drawing. Advanced courses included
t r i g o n o m e t r y , math a n a l y s i s , analytical geometry, and
c a l c u l u s .
Tables 17-22 show the equations expressing GRADE-BM and
GRADE-AM as p r e d i c t o r s of GPA. Basic mathematics grades
were found to be s i g n i f i c a n t , but advanced mathematics
2 grades were not. Equations with GRADE-BM had R values
similar to those of the equations with GRADE-M (Tables 11-
o
1 3 ) , while R values for the GRADE-AM equations were lower.
These findings suggested that no explanatory power for
p r e d i c t i n g GPA is gained from categorizing high school
m a t h e m a t i c s grades by basic and advanced c o u r s e s .
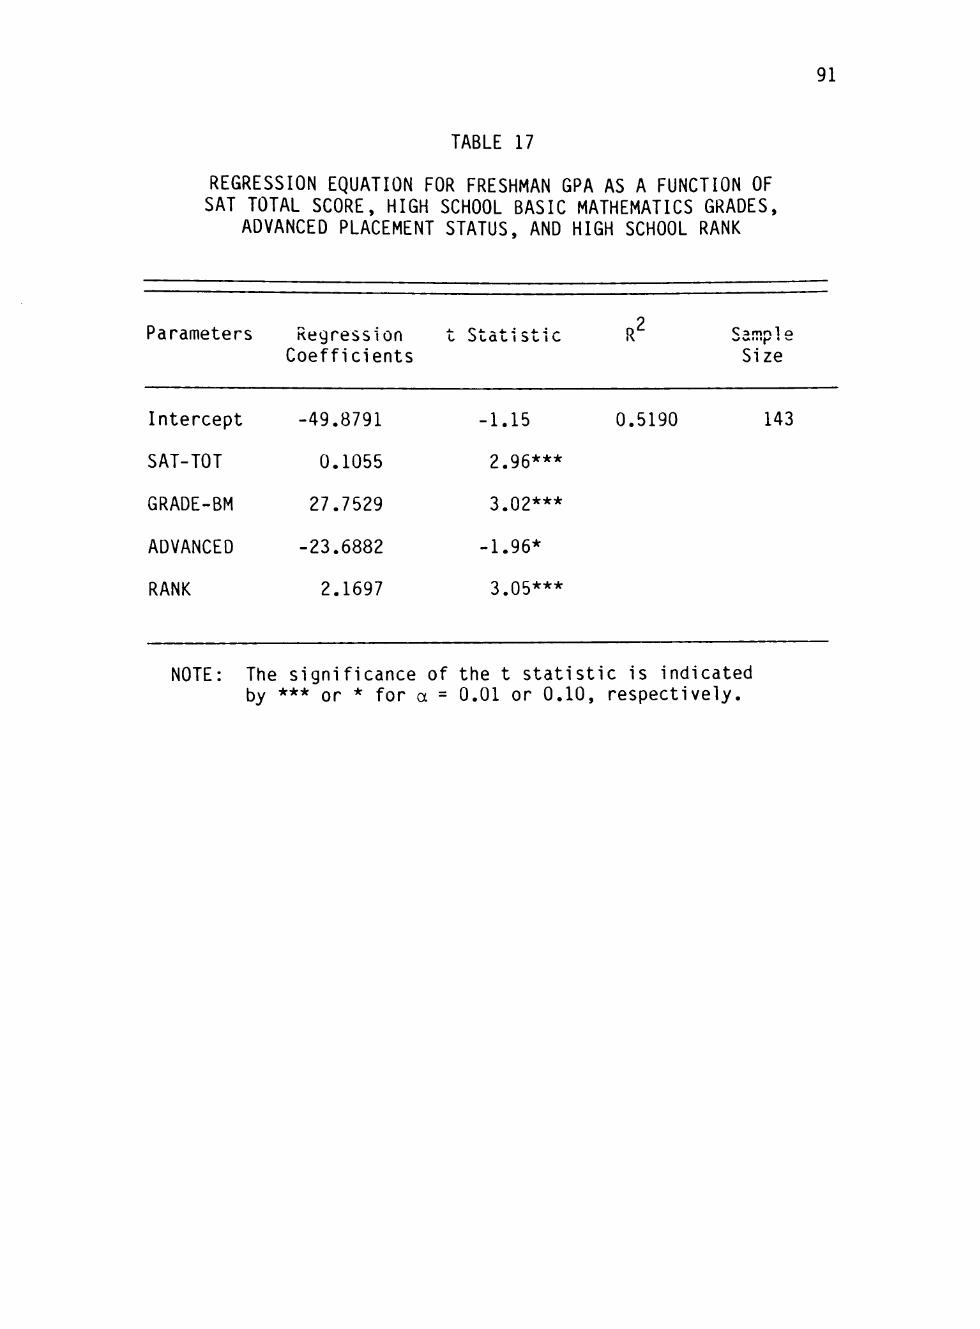
91
TABLE 17
REGRESSION EQUATION FOR FRESHMAN GPA AS A FUNCTION OF SAT TOTAL SCORE, HIGH SCHOOL BASIC MATHEMATICS GRADES,
ADVANCED PLACEMENT STATUS, AND HIGH SCHOOL RANK
Parameters Regression t Statistic Coefficients
R' Size
Intercept
SAT-TOT
GRADE-BM
ADVANCED
RANK
-49.8791
0.1055
27.7529
-23.6882
2.1697
-1.15
2.96***
3.02***
-1.96*
3.05***
0.5190 143
NOTE: The significance of the t statistic is indicated by *** or * for a = 0.01 or 0.10, respectively.
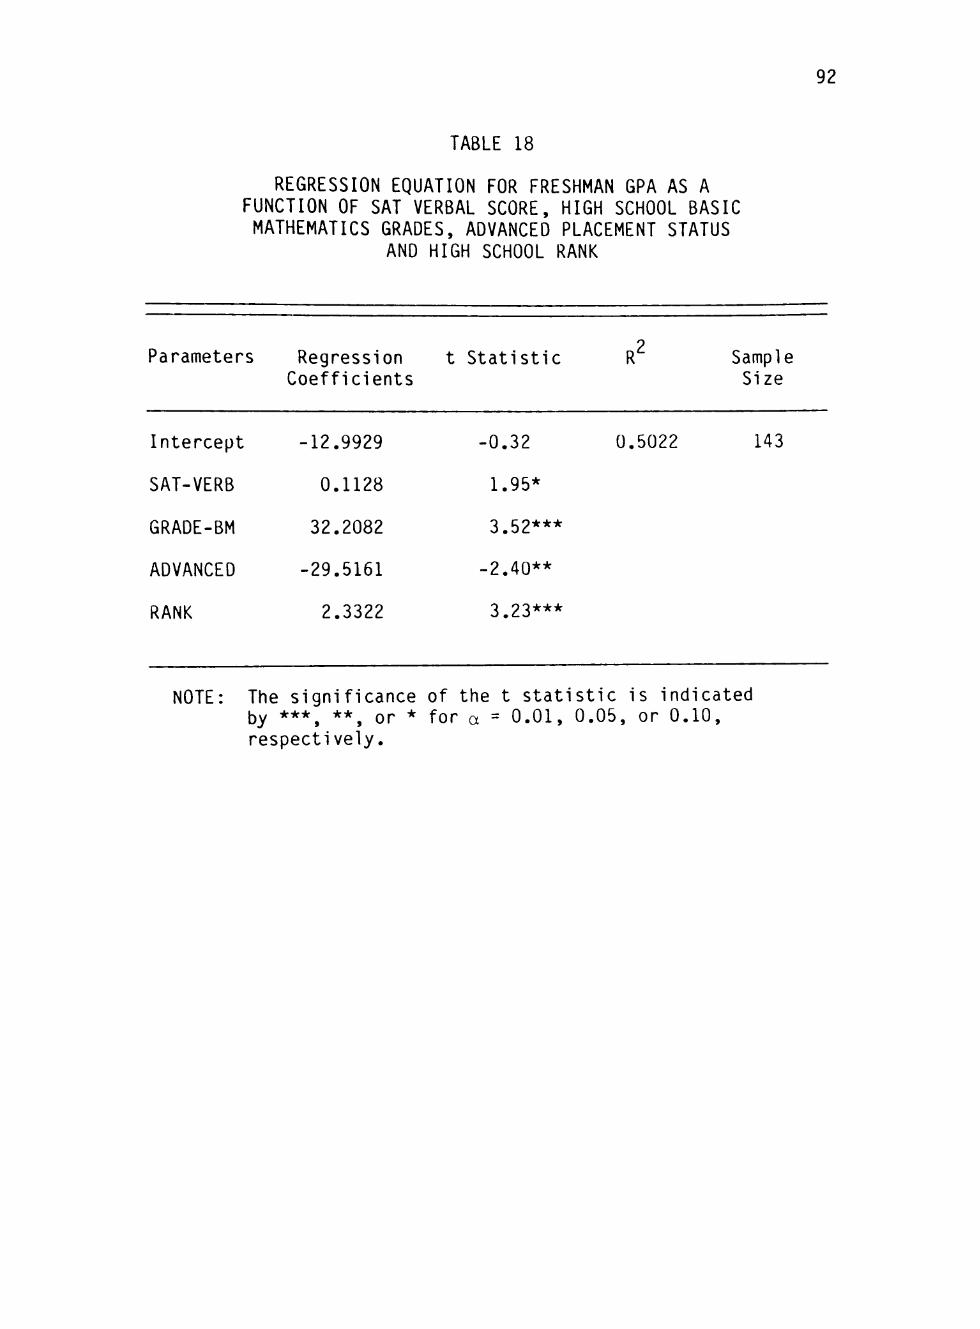
TABLE 18
REGRESSION EQUATION FOR FRESHMAN GPA AS A FUNCTION OF SAT VERBAL SCORE, HIGH SCHOOL BASIC MATHEMATICS GRADES, ADVANCED PLACEMENT STATUS
AND HIGH SCHOOL RANK
92
Parameters Regression t Statistic Coefficients
R Sample Size
Intercept
SAT-VERB
GRADE-BM
ADVANCED
RANK
-12.9929
0.1128
32.2082
-29.5161
2.3322
-0.32
1.95*
3.52***
-2.40**
3.23***
0.5022 143
NOTE: The significance of the t statistic is indicated by ••* ** or * for a = 0.01, 0.05, or 0.10, respectively.

TABLE 19
REGRESSION EQUATION FOR FRESHMAN GPA AS A FUNCTION OF SAT MATHEMATICS SCORE, HIGH SCHOOL BASIC MATHEMATICS GRADES, ADVANCED PLACEMENT STATUS, AND HIGH SCHOOL RANK
93
parameters
Intercept
SAT-MATH
GRADE-BM
ADVANCED
RANK
Regr ession Coefficients
-47.4874
0.1960
25.2467
-28.9264
2.2986
c ocac 1 ^ c 11<
-1.12
3.08***
2.70***
-2.57**
3.28***
R' Size
0.5214 143
NOTE: The significance of the t statistic is indicated by *** or ** for a = 0.01 or 0.05, respectively.

TABLE 20
REGRESSION EQUATION FOR FRESHMAN GPA AS A FUNCTION OF SAT TOTAL SCORE, HIGH SCHOOL ADVANCED MATHEMATICS GRADES,
ADVANCED PLACEMENT STATUS, AND HIGH SCHOOL RANK
94
Parameters Regression Coefficients
Intercept
SAT-TOT
GRADE-AM
ADVANCED
RANK
-80.9925
0.1398
5.8796
-18.1845
3.1984
t Statistic
-1.38
3.17 ••*
0.80
•1.25
4.03***
R
0.4636
Size
110
NOTE: The significance of the t statistic is indicated by *** for a = 0.01.
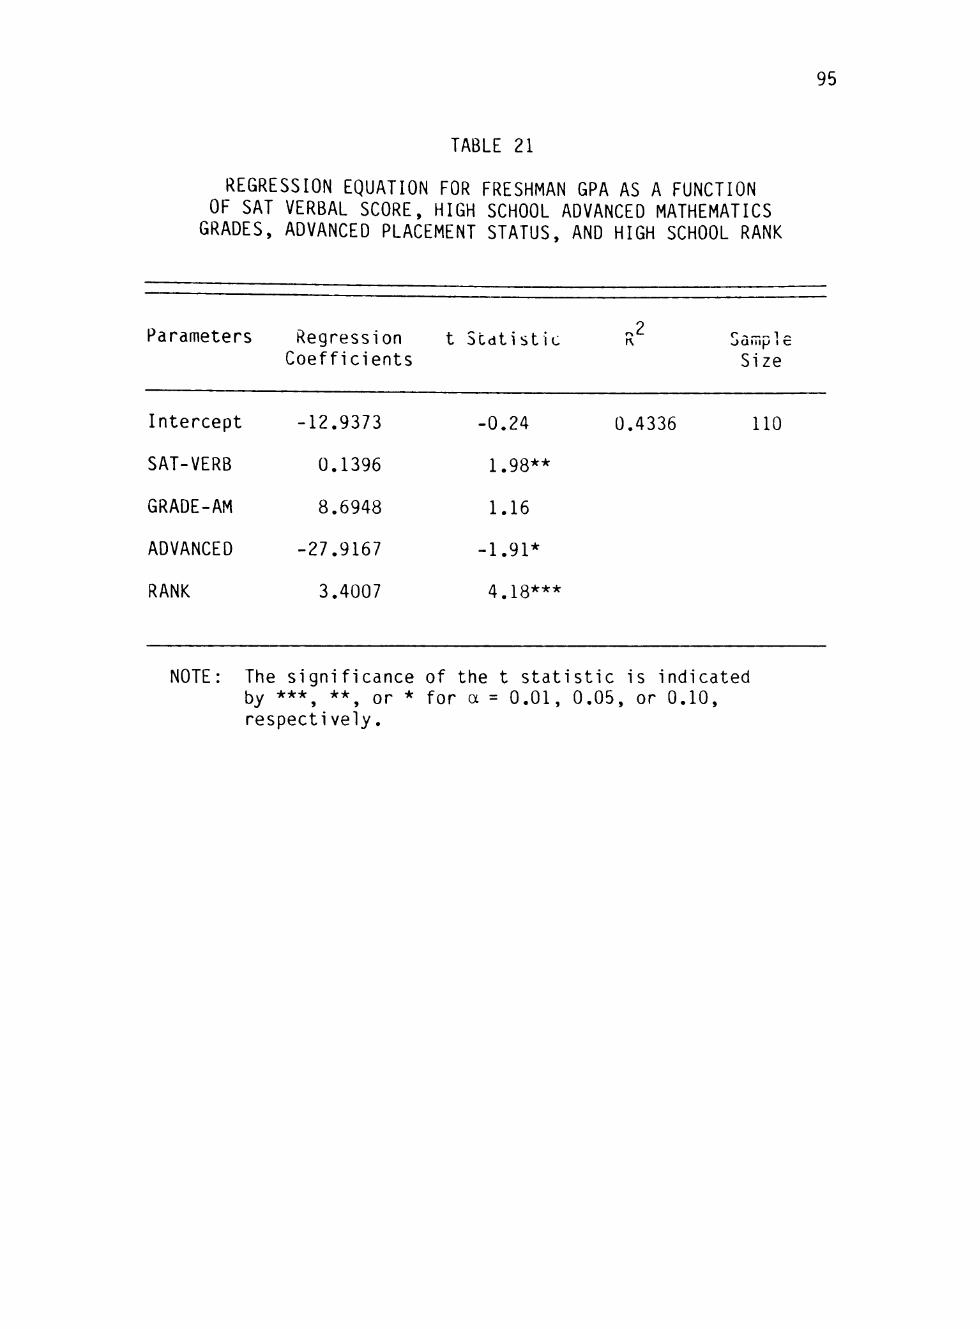
TABLE 21
REGRESSION EQUATION FOR FRESHMAN GPA AS A FUNCTION OF SAT VERBAL SCORE, HIGH SCHOOL ADVANCED MATHEMATICS
GRADES, ADVANCED PLACEMENT STATUS, AND HIGH SCHOOL RANK
95
Parameters Regression t Statistic Coefficients
Intercept
SAT-VERB
GRADE-AM
ADVANCED
RANK
-12.9373
0.1396
8.6948
-27.9167
3.4007
-0.24
1.98**
1.16
-1.91*
4.18***
0.4336
OUIII|J I c
Size
110
NOTE: The significance of the t statistic is indicated 5y *** •• or * for a = 0.01, 0.05, or 0.10, respectively.
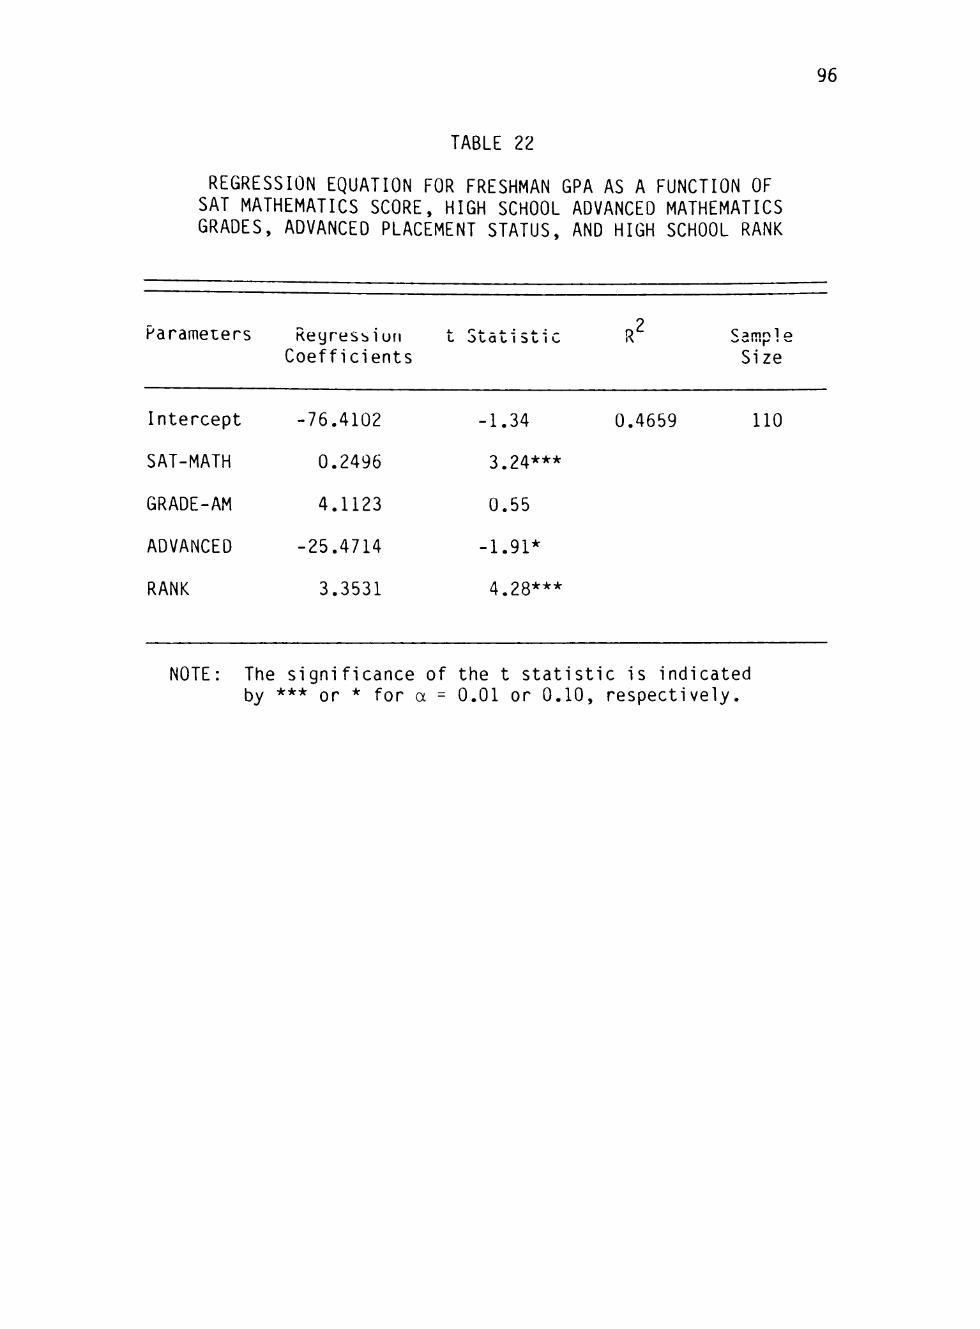
TABLE 22
REGRESSION EQUATION FOR FRESHMAN GPA AS A FUNCTION OF SAT MATHEMATICS SCORE, HIGH SCHOOL ADVANCED MATHEMATICS GRADES, ADVANCED PLACEMENT STATUS, AND HIGH SCHOOL RANK
96
Parameters Regressiun Coefficients
L o c a C I 5 C I t- R Size
Intercept
SAT-MATH
GRADE-AM
ADVANCED
RANK
-76.4102
0.2496
4.1123
-25.4714
3.3531
-1.34
3.24***
0.55
-1.91*
4.28***
0.4659 110
NOTE: The significance of the t statistic is indicated by *** or * for a = 0.01 or 0.10, respectively.

97
A n a l y s i s of Null H y p o t h e s i s H 08
Null h y p o t h e s i s H^g addressed the relationship of the
a v e r a g e a c h i e v e m e n t test score to freshman GPA. In an
attempt to test this h y p o t h e s i s , ACHIEVE was added to the
p r e d i c t o r s in several equations previously e s t i m a t e d .
When ACHIEVE was included as an independent variable in
the e q u a t i o n s in Tables 9, 10, 14, and 15, most of the t
values of the regression coefficients were rendered
i n s i g n i f i c a n t (a = 0 . 1 0 ) , as shown in Tables 2 3 - 2 6 .
2
H o w e v e r , the R values of the equations in Tables 23-26 were
not greatly less than those in Tables 9, 10, 14, and 15.
R e s u l t s such as these are typically the result of a high
degree of mu11icol 1inearity (Kmenta, 1971, pp. 3 4 7 - 4 0 5 ) .
Mu11icol 1inearity can sometimes cause this type of
problem in e s t i m a t i n g regression coefficients and their
c o r r e s p o n d i n g t s t a t i s t i c s . If an independent variable is
p e r f e c t l y c o r r e l a t e d with another independent variable or
with a linear combination of two or more other independent
v a r i a b l e s in the data sample, then there is said to be
perfect m u 1 1 i c o 1 1 i n e a r i t y , and the least squares regression
c o e f f i c i e n t s cannot be c a l c u l a t e d . As long as there is not
a high degree of c o r r e l a t i o n between a predictor and one or
more other p r e d i c t o r s , then the c o e f f i c i e n t s can be
s a t i s f a c t o r i l y e s t i m a t e d . H o w e v e r , if a high degree of
m u l t i c o l l i n e a r i t y exists in the data sample, then the
v a r i a n c e s of the estimates of the regression c o e f f i c i e n t s
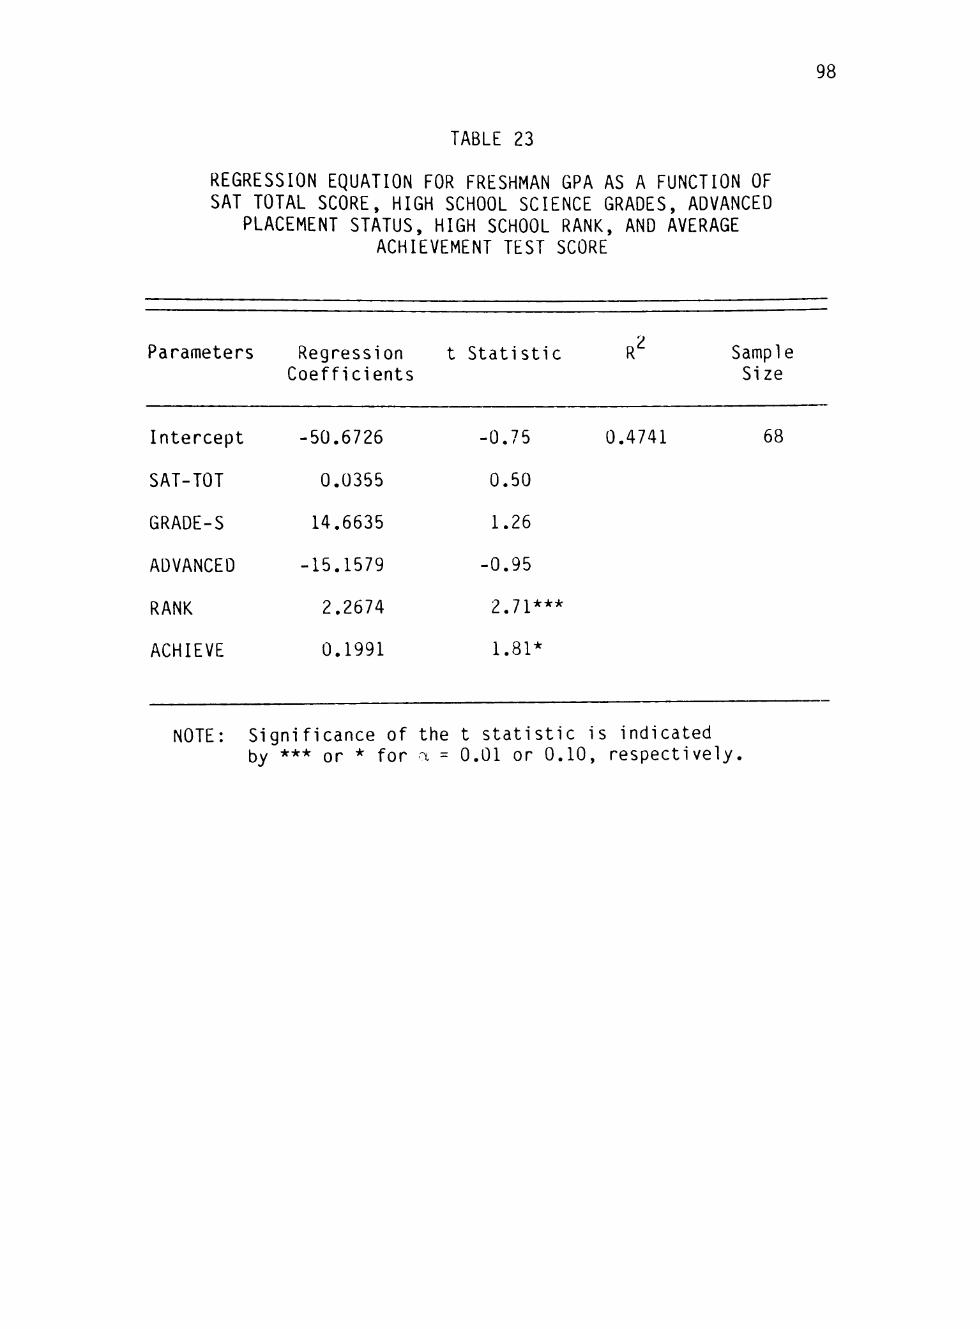
98
TABLE 23
REGRESSION EQUATION FOR FRESHMAN GPA AS A FUNCTION OF SAT TOTAL SCORE, HIGH SCHOOL SCIENCE GRADES, ADVANCED
PLACEMENT STATUS, HIGH SCHOOL RANK, AND AVERAGE ACHIEVEMENT TEST SCORE
Parameters Regression t Statistic R Sample Coefficients Size
Intercept -50.6726 -0.75 0.4741 68
SAT-TOT 0.0355 0.50
GRADE-S 14.6635 1.26
ADVANCED -15.1579 -0.95
RANK 2.2674 2.71***
ACHIEVE 0.1991 1.81*
NOTE: Significance of the t statistic is indicated by *** or * for a = 0.01 or 0.10, respectively.
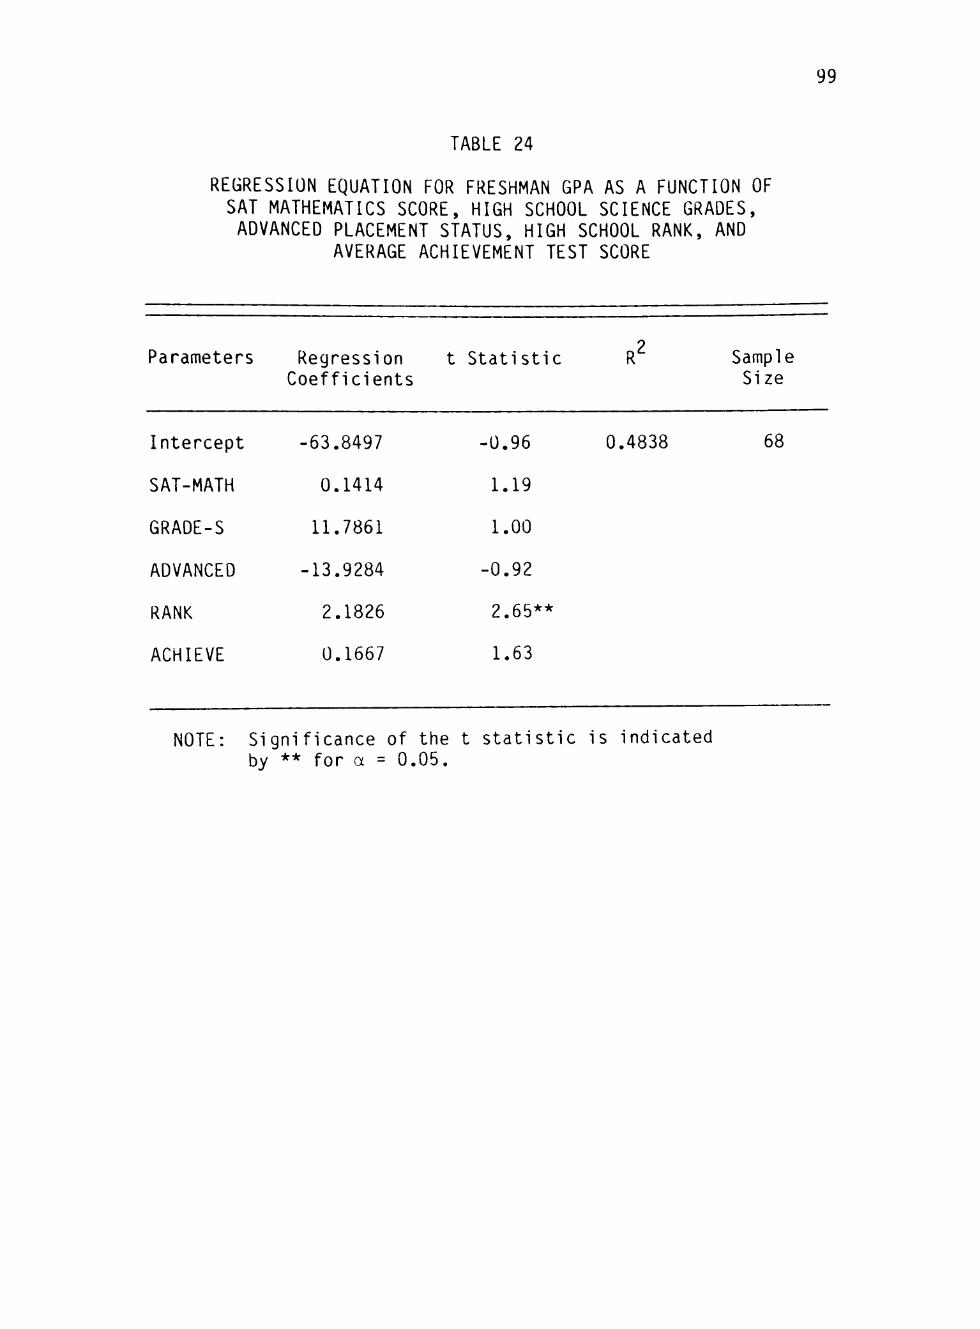
TABLE 24
REGRESSION EQUATION FOR FRESHMAN GPA AS A FUNCTION OF SAT MATHEMATICS SCORE, HIGH SCHOOL SCIENCE GRADES, ADVANCED PLACEMENT STATUS, HIGH SCHOOL RANK, AND
AVERAGE ACHIEVEMENT TEST SCORE
99
Parameters Regression Coefficients
t Statistic R Sample Size
Intercept
SAT-MATH
GRADE-S
ADVANCED
RANK
ACHIEVE
-63.8497
0.1414
11.7861
-13.9284
2.1826
0.1667
•0.96
1.19
1.00
-0.92
2.65**
1.63
0.4838 68
NOTE: Significance of the t statistic is indicated by ** for a = 0.05.

100
TABLE 25
REGRESSION EQUATION FOR FRESHMAN GPA AS A FUNCTION OF SAT TOTAL SCORE, HIGH SCHOOL SCIENCE GRADES, HIGH SCHOOL MATHEMATICS GRADES, ADVANCED PLACEMENT STATUS, HIGH SCHOOL RANK, AND AVERAGE ACHIEVEMENT TEST SCORE
2 Parameters Regression t Statistic R Sample
Size
0.4839 68 Intercept
SAT-TOT
GRADE-S
GRADE-M
ADVANCED
RANK
ACHIEVE
Coefficients
-37.7935
0.0377
10.2402
14.8311
-17.1964
1.8229
0.1641
-0.55
0.53
0.83
1.08
-1.07
1.96*
1.43
NOTE: Significance of the t statistic is indicated by * for a = 0.10.

101
TABLE 26
REGRESSION EQUATION FOR FRESHMAN GPA AS A FUNCTION OF SAT MATHEMATICS SCORE, HIGH SCHOOL SCIENCE GRADES, HIGH SCHOOL MATHEMATICS GRADES, ADVANCED PLACEMENT
STATUS, HIGH SCHOOL RANK, AND AVERAGE ACHIEVEMENT TEST SCORE
2 Parameters Regression t Statistic R Sample
Coefficients Size
Intercept -49.7713 -0.73 0.4916 68
SAT-MATH 0.1309 1.10
GRADE-S 8.2117 0.66
ADVANCED -16.2426 -1.06
RANK 1.8034 1.98*
ACHIEVE 0.1423 1.35
NOTE: Significance of the t statistic is indicated by * for a = 0.10.
102
are large relative to the c o e f f i c i e n t s . The t s t a t i s t i c s ,
which are the ratios of the coefficients to the square root
of their c o r r e s p o n d i n g v a r i a n c e s , are thus rendered
i nsi gni fi cant.
Table 27 shows correlation coefficients for pairs of
the independent v a r i a b l e s . No pair of variables exhibited a
correlation coefficient large enough in absolute value,
e.g. , 0.90, to obviously be a source of the multi
c o l l i n e a r i t y , although the coefficients of correlation of
ACHIEVE with SAT-TOT and with SAT-VERB (0.7123 and 0.7069,
r e s p e c t i v e l y ) were noticeably higher than the other
correlation c o e f f i c i e n t s in the t a b l e . Therefore, it was
considered likely that ACHIEVE was highly correlated with
some linear combination of other p r e d i c t o r s .
To investigate this possibility, the variable RANK-
which was highly significant in all equations without
A C H I E V E , as well as those in Tables 23 and 26 that included
ACHIEVE was e x c l u d e d . The results are shown in Tables 28-
3 3 . SAT-MATH, G R A D E - S , and GRADE-M were significant, as was
ACHIEVE in three c a s e s , but m u l t i c o l l i n e a r i t y was still
considered a problem in that S A T - T O T , SAT-VERB, and
A D V A N C E D , which were found to be significant predictors in
other e q u a t i o n s , were not significant whenever ACHIEVE was
included as a p r e d i c t o r . F u r t h e r m o r e , excluding RANK
2 resulted in much lower R v a l u e s , attesting to the
importance of high school rank as a predictor of GPA.
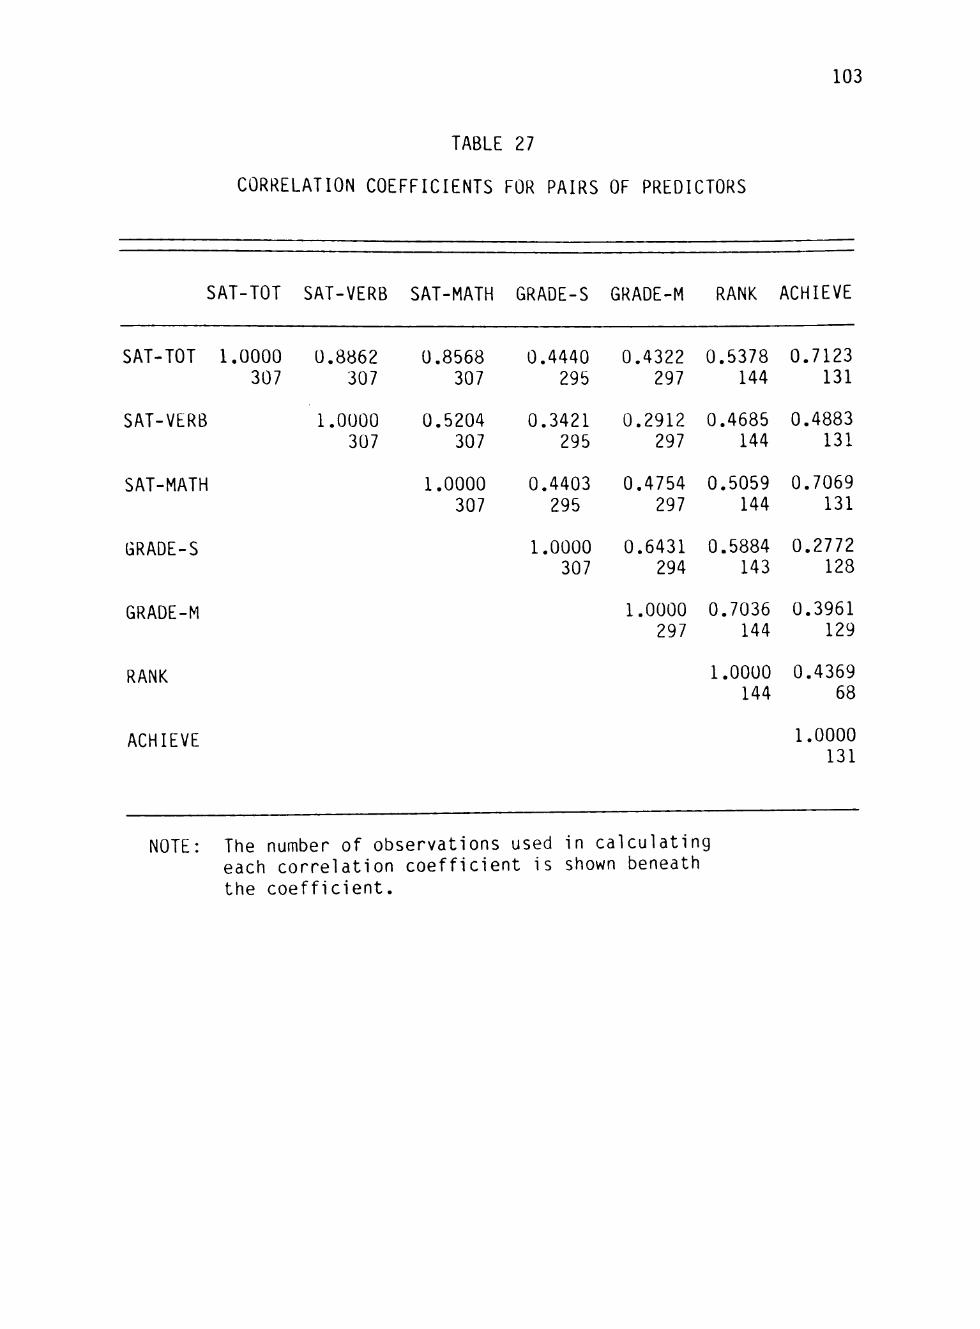
103
TABLE 27
CORRELATION COEFFICIENTS FOR PAIRS OF PREDICTORS
SAT-TOT SAT-VERB SAT-MATH GRADE-S GRADE-M RANK ACHIEVE
SAT-TOT 1.0000 0.8862 0.8568 0.4440 0.4322 0.5378 0.7123 307 307 307 295 297 144 131
SAT-VERB 1.0000 0.5204 0.3421 0.2912 0.4685 0.4883 307 307 295 297 144 131
SAT-MATH 1.0000 0.4403 0.4754 0.5059 0.7069 307 295 297 144 131
GRADE-S 1.0000 0.6431 0.5884 0.2772 307 294 143 128
GRADE-M 1.0000 0.7036 0.3961 297 144 129
RANK
ACHIEVE
1.0000 144
0.4369 68
1.0000 131
NOTE: The number of observations used in calculating each correlation coefficient is shown beneath the coefficient.
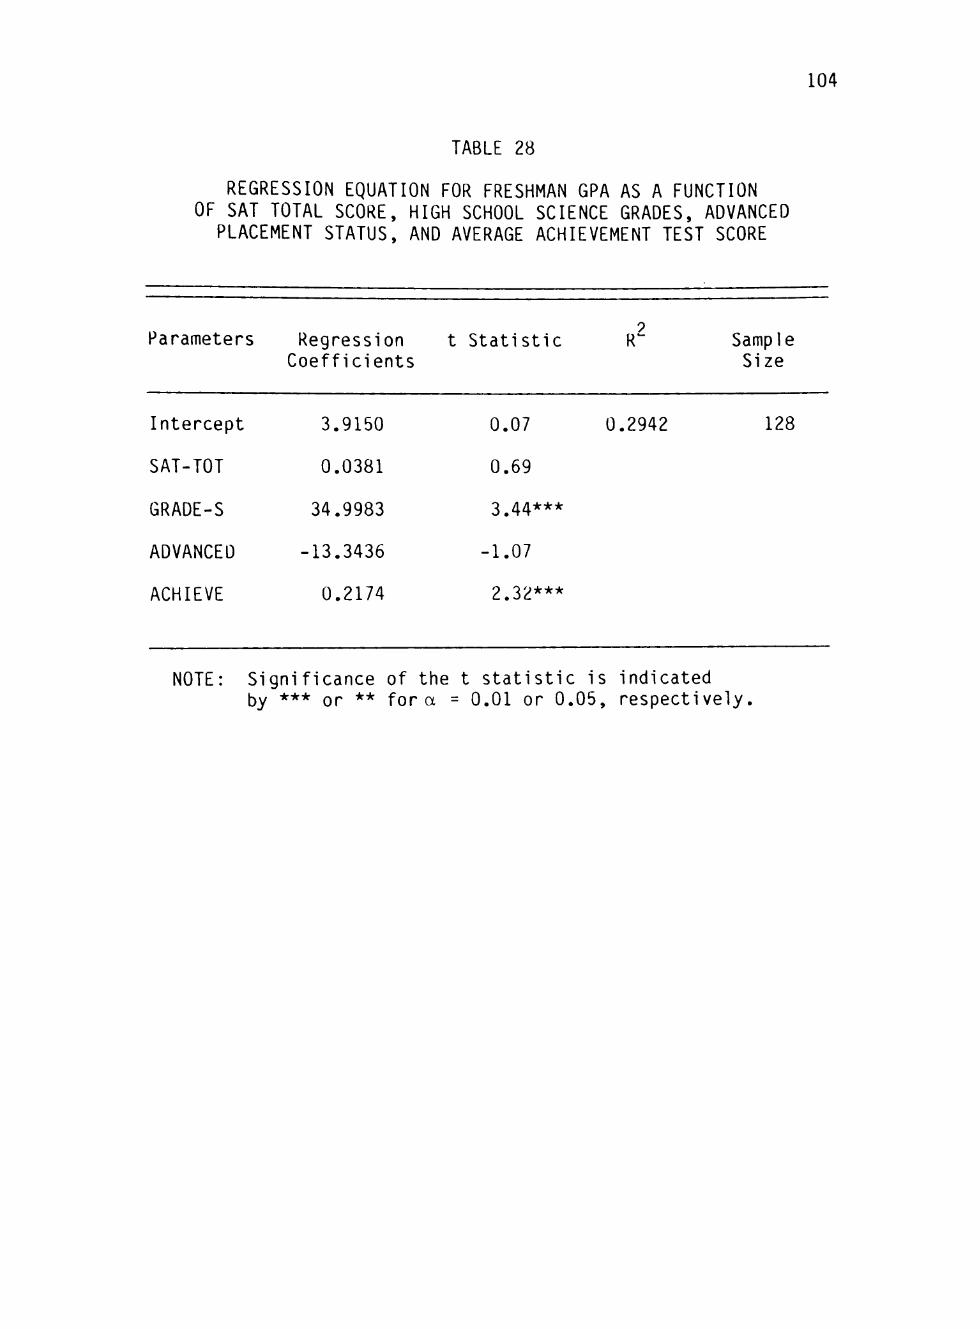
104
TABLE 28
REGRESSION EQUATION FOR FRESHMAN GPA AS A FUNCTION OF SAT TOTAL SCORE, HIGH SCHOOL SCIENCE GRADES, ADVANCED
PLACEMENT STATUS, AND AVERAGE ACHIEVEMENT TEST SCORE
Parameters Regression t Statistic R" Sample Coefficients Size
0.2942 128 Intercept
SAT-TOT
GRADE-S
ADVANCED
ACHIEVE
3.9150
0.0381
34.9983
-13.3436
0.2174
0.07
0.69
3.44***
-1.07
2.32***
NOTE: Significance of the t statistic is indicated by *** or ** for a = 0.01 or 0.05, respectively.
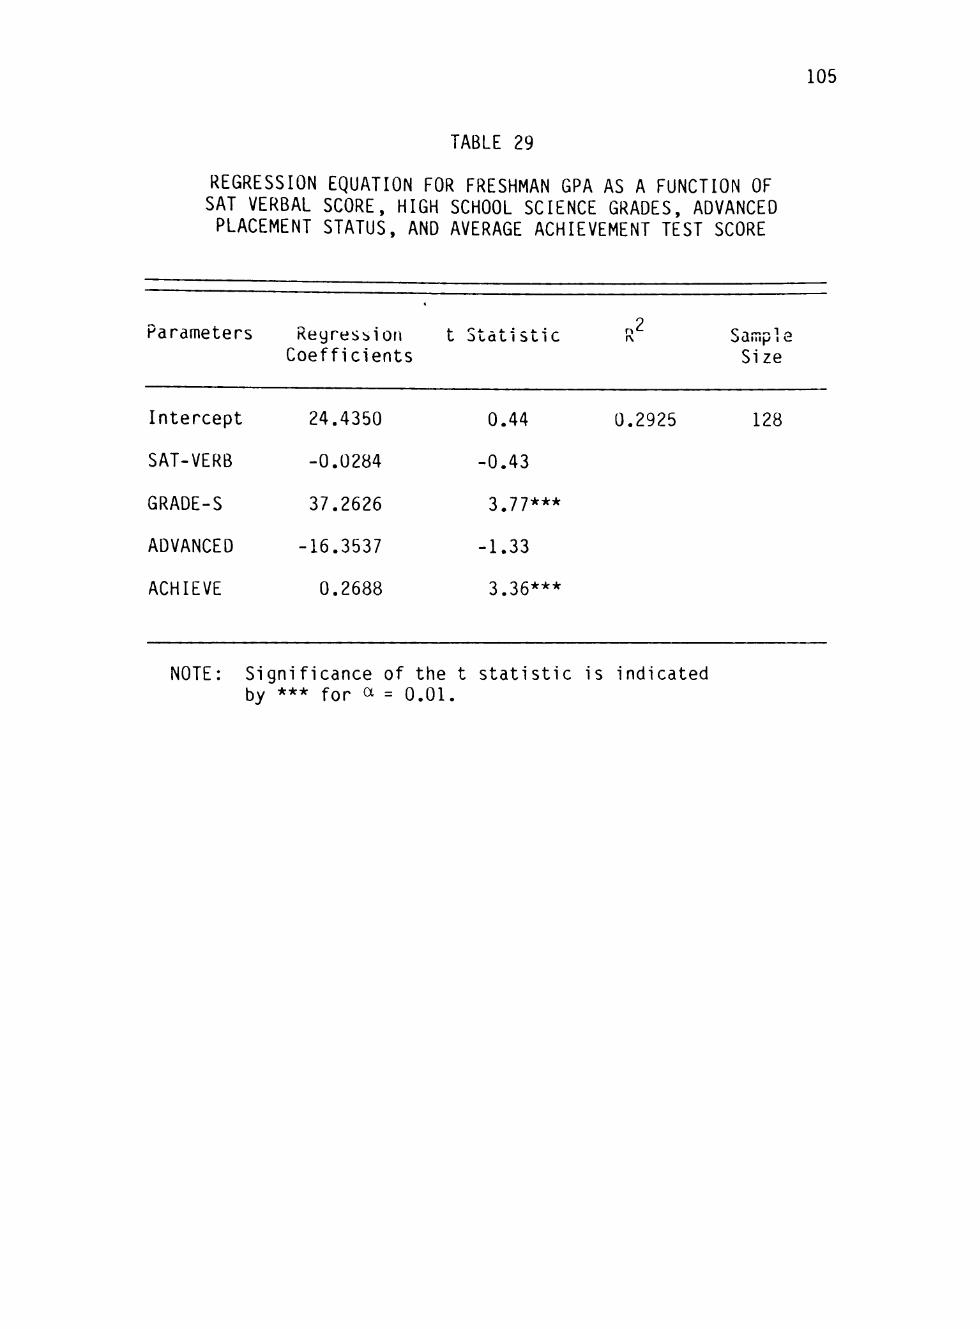
105
TABLE 29
REGRESSION EQUATION FOR FRESHMAN GPA AS A FUNCTION OF SAT VERBAL SCORE, HIGH SCHOOL SCIENCE GRADES, ADVANCED PLACEMENT STATUS, AND AVERAGE ACHIEVEMENT TEST SCORE
Parameters
Intercept
SAT-VERB
GRADE-S
ADVANCED
ACHIEVE
Regression Coefficients
24.4350
-0.0284
37.2626
-16.3537
0.2688
t Statistic
0.44
-0.43
3.77***
-1.33
3.36***
r>2
0.2925
Size
128
NOTE: Significance of the t statistic is indicated by *** for ^ = 0.01.

106
TABLE 30
REGRESSION EQUATION FOR FRESHMAN GPA AS A FUNCTION OF SAT MATHEMATICS SCORE, HIGH SCHOOL SCIENCE GRADES,
ADVANCED PLACEMENT STATUS, AND AVERAGE ACHIEVEMENT TEST SCORE
Parameters Regression t Statistic Coefficients
R C omo1 O
Size
Intercept
SAT-MATH
GRADE-S
ADVANCED
ACHIEVE
-10.7429
0.1844
30.6749
-11.6066
0.1472
-0.19
1.90*
3.00***
-0.96
1.58
0.3115 128
NOTE: Significance of the t statistic is indicated by *** or * for a = 0.01 or 0.10, respectively.

107
TABLE 31
REGRESSION EQUATION FOR FRESHMAN GPA AS A FUNCTION OF SAT TOTAL SCORE, HIGH SCHOOL MATHEMATICS GRADES,
ADVANCED PLACEMENT STATUS, AND AVERAGE ACHIEVEMENT TEST SCORE
Parameters Regression t Statistic Coefficients
R Sample Size
Intercept
SAT-TOT
GRADE-M
ADVANCED
ACHIEVE
10.5871
0.0567
41.5969
-15.1295
0.1403
0.20
1.08
4.46***
-1.25
1.52
0.3405 129
NOTE: Significance of the t statistic is indicated by *** for a = 0.01.

108
TABLE 32
REGRESSION EQUATION FOR FRESHMAN GPA AS A FUNCTION OF SAT VERBAL SCORE, HIGH SCHOOL MATHEMATICS GRADES,
ADVANCED PLACEMENT STATUS, AND AVERAGE ACHIEVEMENT TEST SCORE
Parameters Regression t Scatistic Coefficients
C -3 m o 1 o
Size
Intercept
SAT-VERB
GRADE-M
ADVANCED
ACHIEVE
38.3170
-0.0067
43.1655
-18.8813
0.2013
0.75
-0.10
4.66***
-1.59
2.49**
0.3343 129
NOTE: Significance of the t statistic is indicated by *** or ** for a = 0.01 or 0.05, respectively.
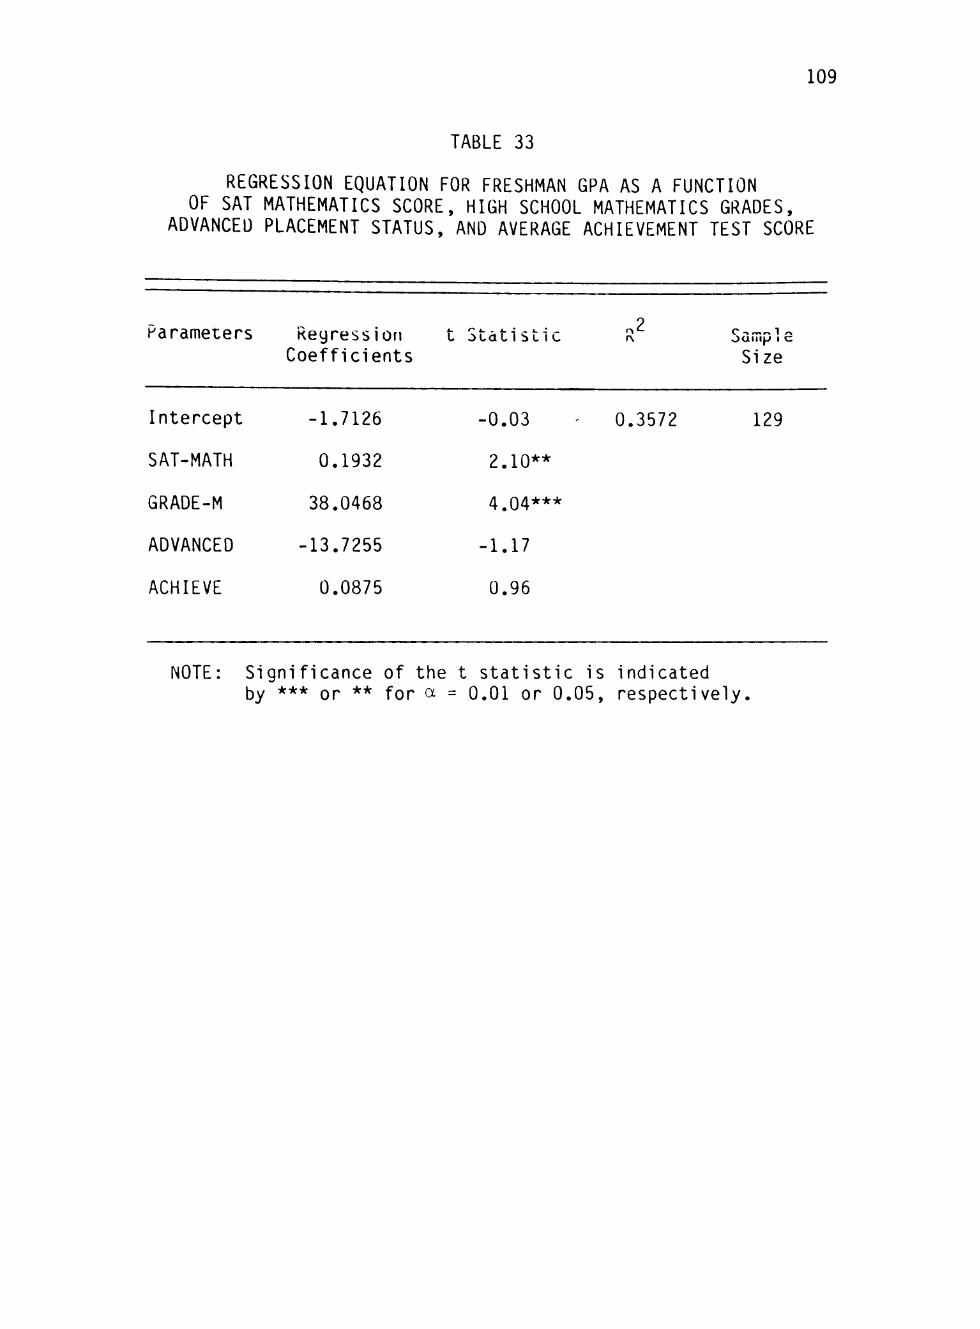
109
TABLE 33
REGRESSION EQUATION FOR FRESHMAN GPA AS A FUNCTION OF SAT MATHEMATICS SCORE, HIGH SCHOOL MATHEMATICS GRADES,
ADVANCED PLACEMENT STATUS, AND AVERAGE ACHIEVEMENT TEST SCORE
Parameters
Intercept
SAT-MATH
GRADE-M
ADVANCED
ACHIEVE
Regression Coefficients
-1.7126
0.1932
38.0468
-13.7255
0.0875
c o c a c l i>c 1 c
-0.03
2.10**
4.04***
-1.17
0.96
.2
0.3572
Size
129
NOTE: Significance of the t statistic is indicated Ijy •*• or ** for a = 0.01 or 0.05, respectively.

no
T h e r e f o r e , a v e r a g e a c h i e v e m e n t test score was not considered
to be a useful p r e d i c t o r of freshman GPA. This c o n c l u s i o n
led to the a c c e p t a n c e of null hypothesis H^o, that a v e r a g e Do
a c h i e v e m e n t test score has no significant p r e d i c t a b i l i t y of
freshman GPA. It should be noted that the failure to reject
H Q Q was due to the apparent presence of a high degree of
m u l t i c o l l i n e a r i t y w h e n e v e r ACHIEVE was included as a
p r e d i c t o r . Because of m u l t i c o l l i n e a r i t y in the data sample,
this analysis was unable to conclusively d e m o n s t r a t e that
ACHIEVE was not s i g n i f i c a n t l y related to GPA. F u r t h e r ,
including ACHIEVE with the other predictors resulted in much 2
lower R v a l u e s , as well as insignificant t statistics for
most c a s e s . T h e r e f o r e , ACHIEVE could not be considered to
be a useful p r e d i c t o r of GPA.
A n a l y s i s of Null H y p o t h e s i s H,.Q
Null h y p o t h e s i s H^JQ was concerned with the influence of
sex of freshman GPA. In no equation was SEX found to be
s i g n i f i c a n t l y related to GPA, as shown in Tables 3 4 - 3 8 .
T h e r e f o r e , null h y p o t h e s i s H^g, that sex has no significant
p r e d i c t a b i l i t y of freshman GPA, was not rejected.
Summary
T tests and linear regression equations were used to
test null hypotheses H,., and H^^. Although mean SAT scores 0 1 0 2
( t o t a l , v e r b a l , and m a t h e m a t i c s ) and mean freshman GPA
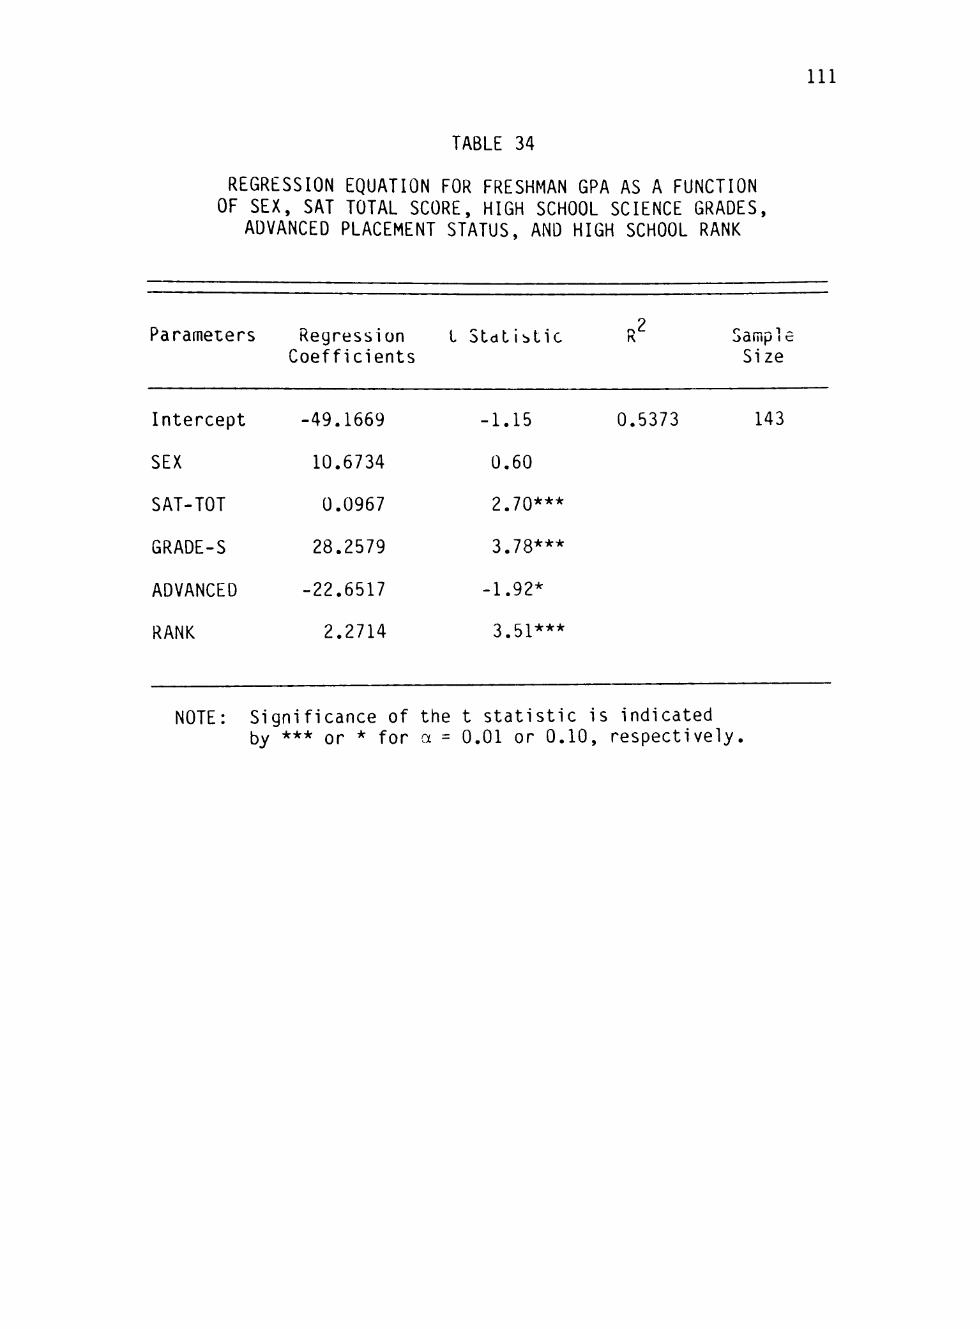
TABLE 34
REGRESSION EQUATION FOR FRESHMAN GPA AS A FUNCTION OF SEX, SAT TOTAL SCORE, HIGH SCHOOL SCIENCE GRADES,
ADVANCED PLACEMENT STATUS, AND HIGH SCHOOL RANK
111
Parameters Regression t StdUbLic Coefficients
R2 oamiJ I c
Size
Intercept
SEX
SAT-TOT
GRADE-S
ADVANCED
RANK
-49.1669
10.6734
0.0967
28.2579
-22.6517
2.2714
-1.15
0.60
2.70***
3.78***
-1.92*
3.51***
0.5373 143
NOTE: Significance of the t statistic is indicated by *** or * for a = 0.01 or 0.10, respectively.
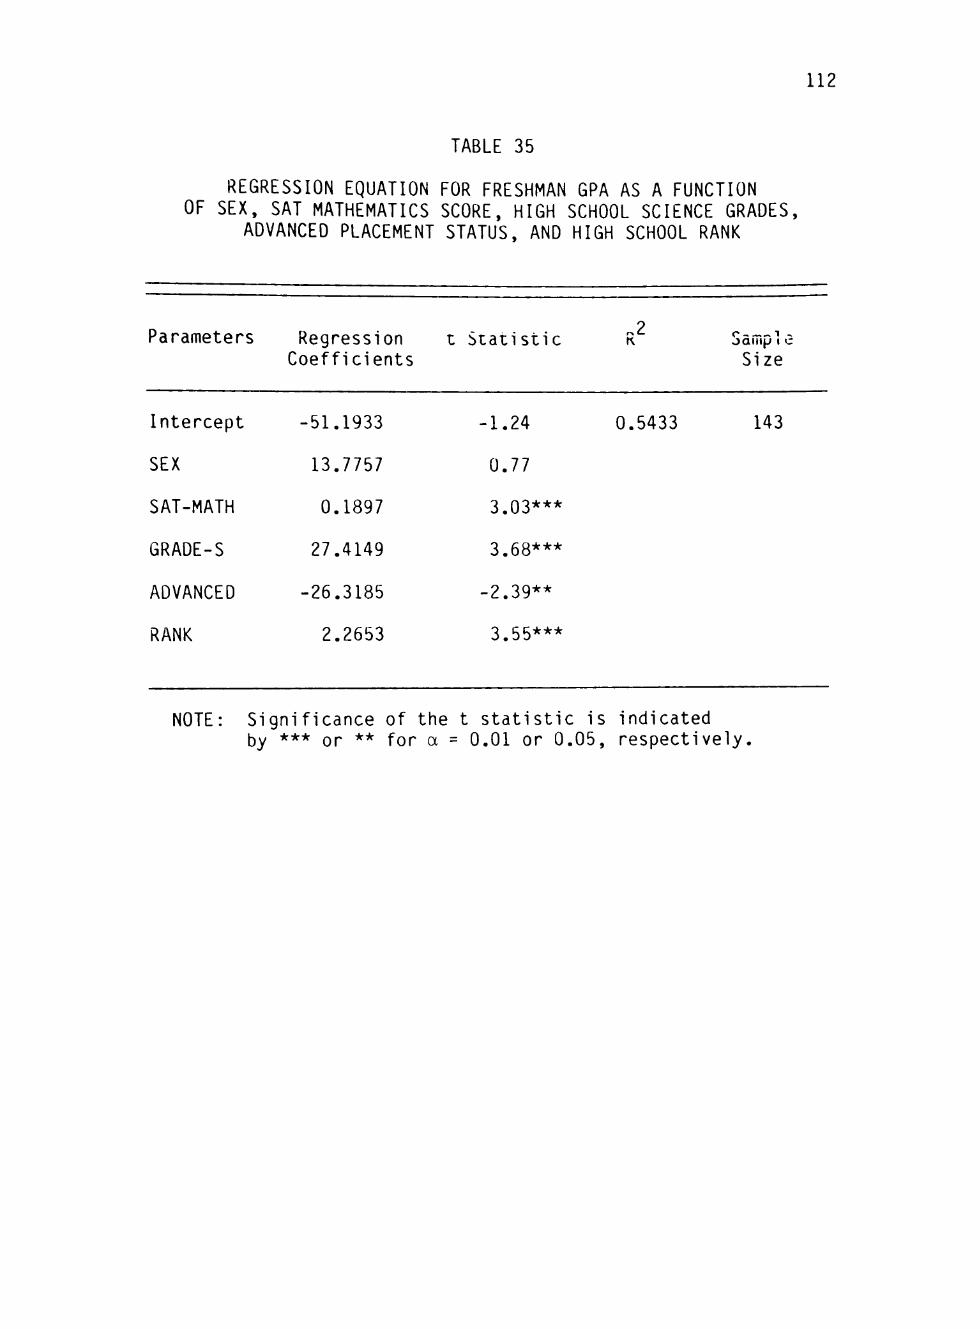
112
TABLE 35
REGRESSION EQUATION FOR FRESHMAN GPA AS A FUNCTION OF SEX, SAT MATHEMATICS SCORE, HIGH SCHOOL SCIENCE GRADES,
ADVANCED PLACEMENT STATUS, AND HIGH SCHOOL RANK
Parameters Regression t Statistic Coefficients
.2 c 1 -oaiiip I c
Size
Intercept
SEX
SAT-MATH
GRADE-S
ADVANCED
RANK
-51.1933
13.7757
0.1897
27.4149
-26.3185
2.2653
-1.24
0.77
3.03***
3.68***
-2.39**
3.55***
0.5433 143
NOTE: Significance of the t statistic is indicated by *** or ** for a = 0.01 or 0.05, respectively.
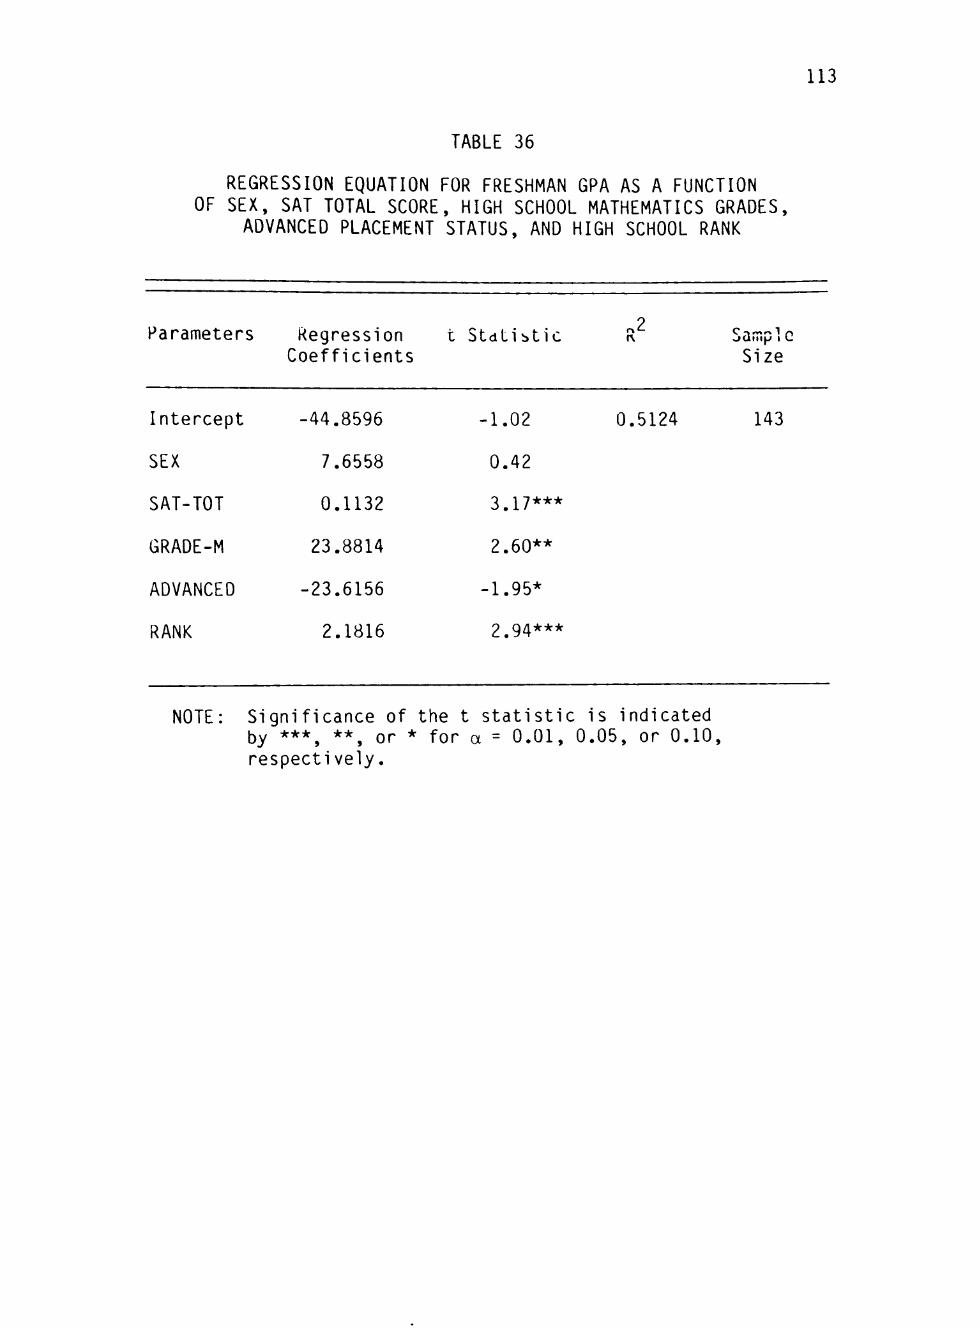
TABLE 36
REGRESSION EQUATION FOR FRESHMAN GPA AS A FUNCTION OF SEX, SAT TOTAL SCORE, HIGH SCHOOL MATHEMATICS GRADES,
ADVANCED PLACEMENT STATUS, AND HIGH SCHOOL RANK
113
Parameters Regression t StaLibtic Coefficients
OCllll|-> I t .
Size
Intercept
SEX
SAT-TOT
GRADE-M
ADVANCED
RANK
-44.8596
7.6558
0.1132
23.8814
-23.6156
2.1816
-1.02
0.42
3.17***
2.60**
-1.95*
2.94***
0.5124 143
NOTE: Significance of the t statistic is indicated by ••• ** or * for a = 0.01, 0.05, or 0.10, respectively.
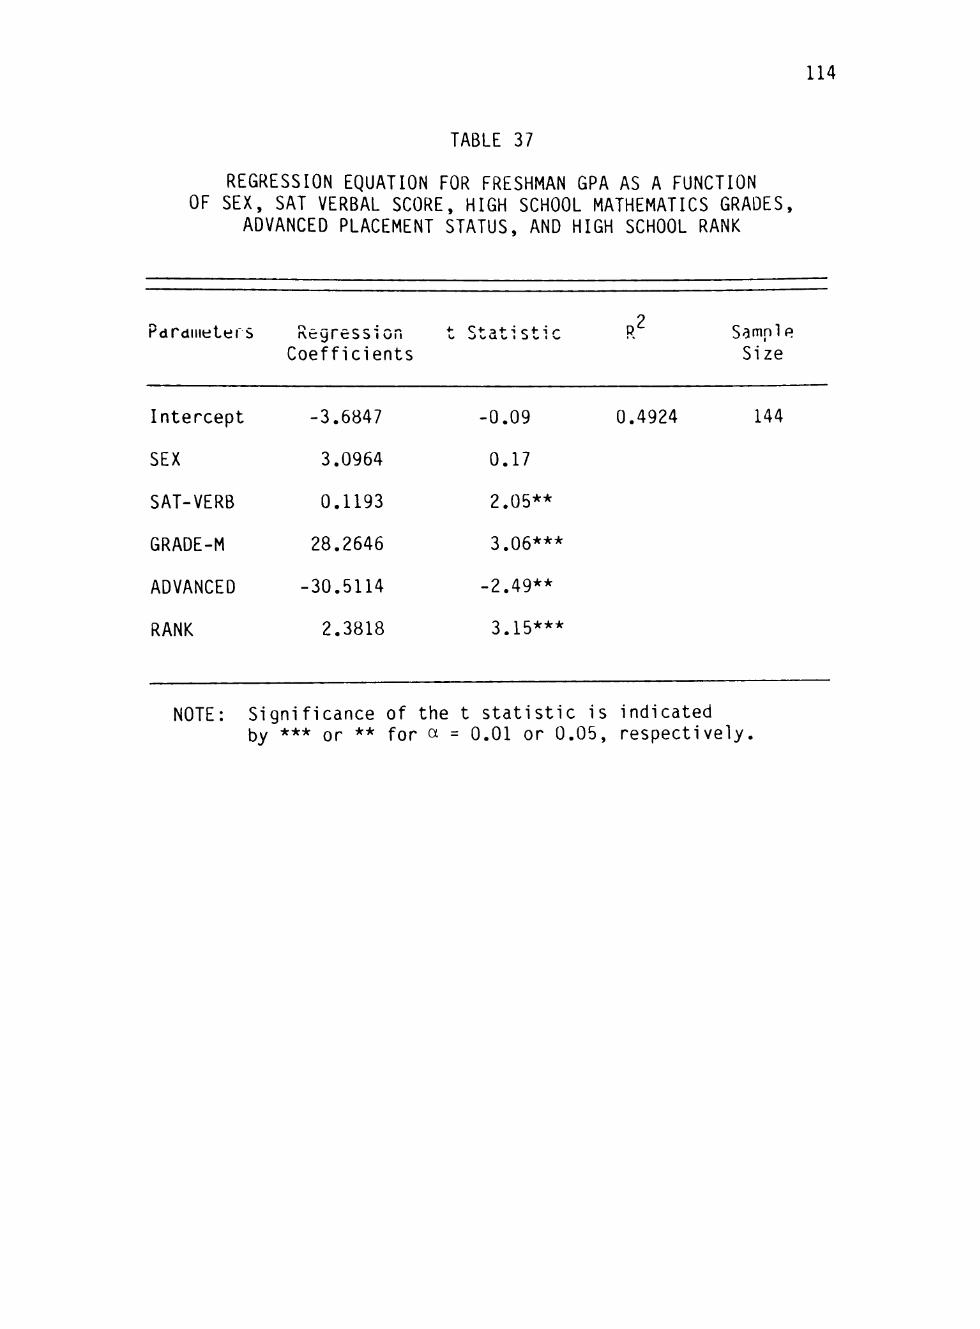
114
TABLE 37
REGRESSION EQUATION FOR FRESHMAN GPA AS A FUNCTION OF SEX, SAT VERBAL SCORE, HIGH SCHOOL MATHEMATICS GRADES,
ADVANCED PLACEMENT STATUS, AND HIGH SCHOOL RANK
Paraiiieters Regression Coefficients
*• C ^ - a • ^ • ; c • ^ - ^ r Samnle Size
Intercept
SEX
SAT-VERB
GRADE-M
ADVANCED
RANK
-3.6847
3.0964
0.1193
28.2646
-30.5114
2.3818
-0.09
0.17
2.05**
3.06***
-2.49**
3.15***
0.4924 144
NOTE: Significance of the t statistic is indicated by *** or ** for a = 0.01 or 0.05, respectively.

115
TABLE 38
REGRESSION EQUATION FOR FRESHMAN GPA AS A FUNCTION OF SEX, SAT MATHEMATICS SCORE, HIGH SCHOOL MATHEMATICS GRADES, ADVANCED PLACEMENT STATUS, AND HIGH SCHOOL RANK
Parameters Regression Coefficients
t S t a t i s t i c R Q ^ mr\ 1 mr\ 1 o
Size
Intercept
SEX
SAT-MATH
GRADE-M
ADVANCED
RANK
-44.5982
11.4827
0.2136
21.0855
-28.4679
2.3134
-1.04
0.63
3.34***
2.26**
-2.52**
3.17***
0.5161 144
NOTE: Significance of the t statistic is indicated by *** or ** for a = 0.01 or 0.05, respectively.

116
r^r, through H^^,. These tests concluded that the following 03 ^ 09
d i f f e r e d a c c o r d i n g to academic major when only that variable
was c o n s i d e r e d , no significant relationship between GPA and
m a j o r was found w h e n e v e r the influence of other p r e d i c t o r s
of GPA was taken into a c c o u n t . Although null h y p o t h e s i s
Hpj^ , stating that mean SAT scores do not differ by academic
m a j o r , was rejected, null hypothsis H^^* stating that
a c a d e m i c major has no significant predictability of freshman
GPA, was not r e j e c t e d . T h u s , chemical and petroleum
e n g i n e e r i n g students were combined into one sample for
t e s t i n g null h y p o t h e s e s H^^ through H^JQ.
R e g r e s s i o n e q u a t i o n s were used to test null h y p o t h e s e s
v a r i a b l e s , readily o b t a i n a b l e from entering s t u d e n t s '
a c a d e m i c r e c o r d s , are useful in predicting freshman GPA for
chemical or petroleum e n g i n e e r i n g s t u d e n t s :
1. SAT scores
2. High school rank relative to class size
3. Advanced placement status
4. Grades in high school science courses
5. Grades in high school m a t h e m a t i c s courses
Neither average a c h i e v e m e n t test score nor sex was found to
be a useful p r e d i c t o r of freshman GPA for chemical or
p e t r o l e u m e n g i n e e r i n g s t u d e n t s .
In addition to providing a means of testing the null
h y p o t h e s e s about the p r e d i c t o r s of GPA, development of the
r e g r e s s i o n equations provides an instrument that can be used
117
in student placement and a d v i s e m e n t . By inserting an
e n t e r i n g freshman's academic information into one or more of
the regression e q u a t i o n s , a counselor or a d m i n i s t r a t o r can
predict the student's expected degree of success in chemical
or petroleum e n g i n e e r i n g .
The best e q u a t i o n s for this purpose are those in Tables
9 and 10. These e q u a t i o n s had the highest R v a l u e s , with
all p r e d i c t o r s in the equations being significantly related
to freshman GPA. For additional validation of his
c o n c l u s i o n s , the a d m i n i s t r a t o r or counselor may wish to also
use the equations in Tables 1 1 - 1 3 , which include high school
m a t h e m a t i c s grades instead of high school science g r a d e s . A
summary of these e q u a t i o n s is shown in Appendix C.

CHAPTER V
SUMMARY, C O N C L U S I O N S , AND R E C O M M E N D A T I O N S
This chapter presents a summary of the study, the con
c l u s i o n s drawn from the r e s e a r c h , and r e c o m m e n d a t i o n s based
on findings of the study.
Summary of the Study
The variation in the U . S . and world economic demands
caused by f l u c t u a t i n g petroleum crude prices since 1973 have
caused u n p r e c e n d e d demands on e n g i n e e r i n g schools for more
g r a d u a t e s . Chemical and petroleum engineering g r a d u a t e s , in
p a r t i c u l a r , have been affected by these price i n c r e a s e s . As
a r e s u l t , the d e p a r t m e n t s of those u n i v e r s i t i e s offering
these two d i s c i p l i n e s have been severely impacted by
s h o r t a g e s of f a c u l t y , laboratory s p a c e , and s o p h i s t i c a t e d
equi p m e n t .
More s e l e c t i v e a c c e p t a n c e of students into these two
d i s c i p l i n e s seems to be a practical means of m a x i m i z i n g the
utility of e x i s t i n g instructional facilities and f a c u l t y . A
better selection p r o c e d u r e would also reduce the incidence
of failure by many students who enter either of these two
d i s c i p l i n e s . Better a d v i s e m e n t and placement of students
could be accomplished if the a c a d e m i c success of students
e n t e r i n g chemical or p e t r o l e u m e n g i n e e r i n g could be more
a c c u r a t e l y p r e d i c t e d .
118
119
P r e d i c t i o n s of success were based on the identified
c o m p e t e n c i e s required in these in two c u r r i c u l a . These
c o m p e t e n c i e s a r e :
1. K n o w l e d g e of m a t h e m a t i c s
2. P r o b l e m - s o l v i n g ability
3. C o m m u n i c a t i o n s s k i l l s , both written and oral
4. E l e m e n t a r y computer literacy
5 . Phys i cal stami na
Two c l a s s i f i c a t i o n s of predictors of success within the
bounds of a v a i l a b l e information were evaluated as m e a s u r e s
of these c o m p e t e n c i e s . The first type of predictor was the
method called " S e l f - P r e d i c t i o n . " There are many types of
tests that can be used for this m e t h o d , but they tend to
give less valid results than the second c l a s s i f i c a t i o n ,
known as "Special A n a l y s e s . "
This c l a s s i f i c a t i o n was divided into " I n t e l l e c t i v e " and
" N o n - I n t e l l e c t i v e " s e c t i o n s . The several case studies
reviewed indicated that the " N o n - I n t e l l e c t i v e " measures were
the traditional ones of student SAT or ACT score combined
with high school rank. These m e a s u r e s were the best
2
p r e d i c t o r s using R values as i n d i c a t o r s .
A c c o r d i n g l y , the traditional m e a s u r e s plus other
t r a n s c r i p t data were employed in this study as the
c o m p a r a b l e measure of competency of engineering students in
chemical and petroleum c u r r i c u l a . This measure is
r e s t r i c t e d to the c o m p e t e n c i e s of m a t h e m a t i c s , partial

120
c o m m u n i c a t i o n s s k i l l s , and partial p r o b l e m - s o l v i n g a b i l i t y .
No form of s t a n d a r d i z e d testing or commonly a v a i l a b l e data
were found to m e a s u r e the remainder of the c o m p e t e n c i e s .
This is why the best p r e d i c t i v e equations do not have higher 2
R values -- not all the required competencies are being
m e a s u r e d . T h e r e f o r e , the second purpose of this study, the
q u e s t i o n of w h e t h e r or not these competencies are already
being implanted at the high school level of study could not
be d e t e r m i n e d in f u l l .
The third purpose of this study was to d e t e r m i n e the
d e g r e e these competency measures can predict the academic
success of students in these c u r r i c u l a .
Several c o m b i n a t i o n s of relevant high school and
s t a n d a r d i z e d test scores were evaluated to d e t e r m i n e the
g r e a t e s t c o r r e l a t i o n with freshman second semester GPA. The
2 m a x i m u m R value found using these combinations was 0 . 5 4 .
T h u s , the degree of prediction for the variables a s s o c i a t e d
with competency m e a s u r e s is on the order of 73 p e r c e n t .
The following variables were found to be meaningful
p r e d i c t o r s of freshman GPA:
1 . SAT scores
2. High school rank relative to class size
3. Advanced placement status
4. Grades in high school science courses
5. Grades in high school m a t h e m a t i c s courses
The e q u a t i o n s in Tables 9 and 10 are best suited for use as

121
an e v a l u a t i o n instrument by counselors and a d m i n i s t r a t o r s in
s t u d e n t placement and advisement for chemical and p e t r o l e u m
e n g i n e e r i n g . The e q u a t i o n s in Tables 11-13 are also
a p p r o p r i a t e for this p u r p o s e .
Sex was not found to be an important factor in
p r e d i c t i n g freshman GPA. Because of insufficent sample
s i z e , m i n o r i t y ethnic group could not be evaluated as a
predi c t o r .
C o n c l u s i o n s of the Study
Null h y p o t h e s e s H^^ and H^^ were tested in order to
d e t e r m i n e w h e t h e r to evaluate chemical and petroleum
e n g i n e e r i n g students separately or as a single g r o u p .
A l t h o u g h both mean SAT scores and mean freshman GPA differed
for the two groups when academic major alone was c o n s i d e r e d ,
m a j o r was found not to be a relevant distinction w h e n e v e r
other p r e d i c t o r s were c o n s i d e r e d . T h e r e f o r e , null
h y p o t h e s i s H^, and H.^ were not rejected, and chemical and
p e t r o l e u m e n g i n e e r i n g students were combined into a single
data set for testing null h y p o t h e s e s H^^ through H ^ Q .
Null h y p o t h e s e s H^^ through H^g considered the
i m p o r t a n c e of p r e d i c t o r s that are readily obtainable from
s t u d e n t s ' academic r e c o r d s . H..^ was rejected, c o n c l u d i n g
that SAT scores ( v e r b a l , m a t h e m a t i c s , and total) are a
s i g n i f i c a n t predictor of freshman GPA. H^, was rejected,
i n d i c a t i n g that high school rank relative to class s i z e , as
122
m easured by the Educational Testing Service's standard
s c o r e , is a significant predictor of freshman GPA. H Q ^ was
r e j e c t e d , with the degree of success in high school science
c o u r s e s being a significant predictor of freshman GPA. H 06
was rejected, with the degree of success in high school
m a t h e m a t i c s courses being a significant predictor of
freshman GPA. H^^ was rejected, indicating that the degree
of success in high school mathematics courses is a
s i g n i f i c a n t predictor of freshman GPA. H^o was not
r e j e c t e d , concluding that average achievement test score is
not a useful predictor of freshman GPA. A high degree of
m u l t i - c o l l i n e a r i t y in the data sample was apparent w h e n e v e r
average achievement test score was included as a p r e d i c t o r .
H^g was not rejected, indicating that freshman GPA does not
differ significantly by sex.
General Recommendations
1. More members of ethnic groups should be considered
and selected for enrollment in chemical and petroleum
e n g i n e e r i n g p r o g r a m s . The fact that only nine out of 307
students in the sample used in this study were members of
minority ethnic groups prohibited evaluating ethnic groups
as a v a r i a b l e . This suggests the existence of either a lack
of opportunity or a lack of c o m p e t e n c i e s needed in
engi neeri ng.
2. More women should be encouraged to enter either of

123
t h e s e two s p e c i f i c f i e l d s . Since their present e n r o l l m e n t
is only on the order of 15 percent and a p p a r e n t l y levelled
at this p o i n t , further efforts should be made to allow them
to e x h i b i t their c o m p e t e n c i e s in e n g i n e e r i n g .
3. There should be a concerted effort by the leading
c o l l e g e s of e n g i n e e r i n g to heighten the awareness of high
school and junior high counselors of necessary e n g i n e e r i n g
c o m p e t e n c i e s . Formation of a task force at each u n i v e r s i t y
to p r o v i d e the necessary support to c o u n s e l o r s would be a
c o s t - e f f e c t i v e means to reduce nonsuccessful student
di sappoi n t m e n t .
R e c o m m e n d a t i o n s for Further Study
This i n v e s t i g a t i o n suggested the following recommend
a t i o n s for further study by concerned a d m i n i s t r a t o r s :
1. A study to examine the extent of correlation of GPA
and e t h n i c groups that are enrolled in chemical and7or
p e t r o l e u m e n g i n e e r i n g at the major u n i v e r s i t i e s offering
e i t h e r c u r r i c u l u m . This would require a c o o p e r a t i v e effort
among these u n i v e r s i t i e s .
2. A study to d e t e r m i n e w h e t h e r a relationship exists
between GPA of chemical and7or petroleum engineers and
i n d e p e n d e n t variables not easily o b t a i n e d , which would
b e t t e r measure e n g i n e e r i n g c o m p e t e n c i e s .
3. A study relating freshman GPA to e n g i n e e r i n g major
w i t h i n a university to d e t e r m i n e w h e t h e r course c h a r a c -

124
t e r i s t i c s indicate varying degrees of d i f f i c u l t y , or whether
i n c o n s i s t e n c i e s exist in instruction m e t h o d s .
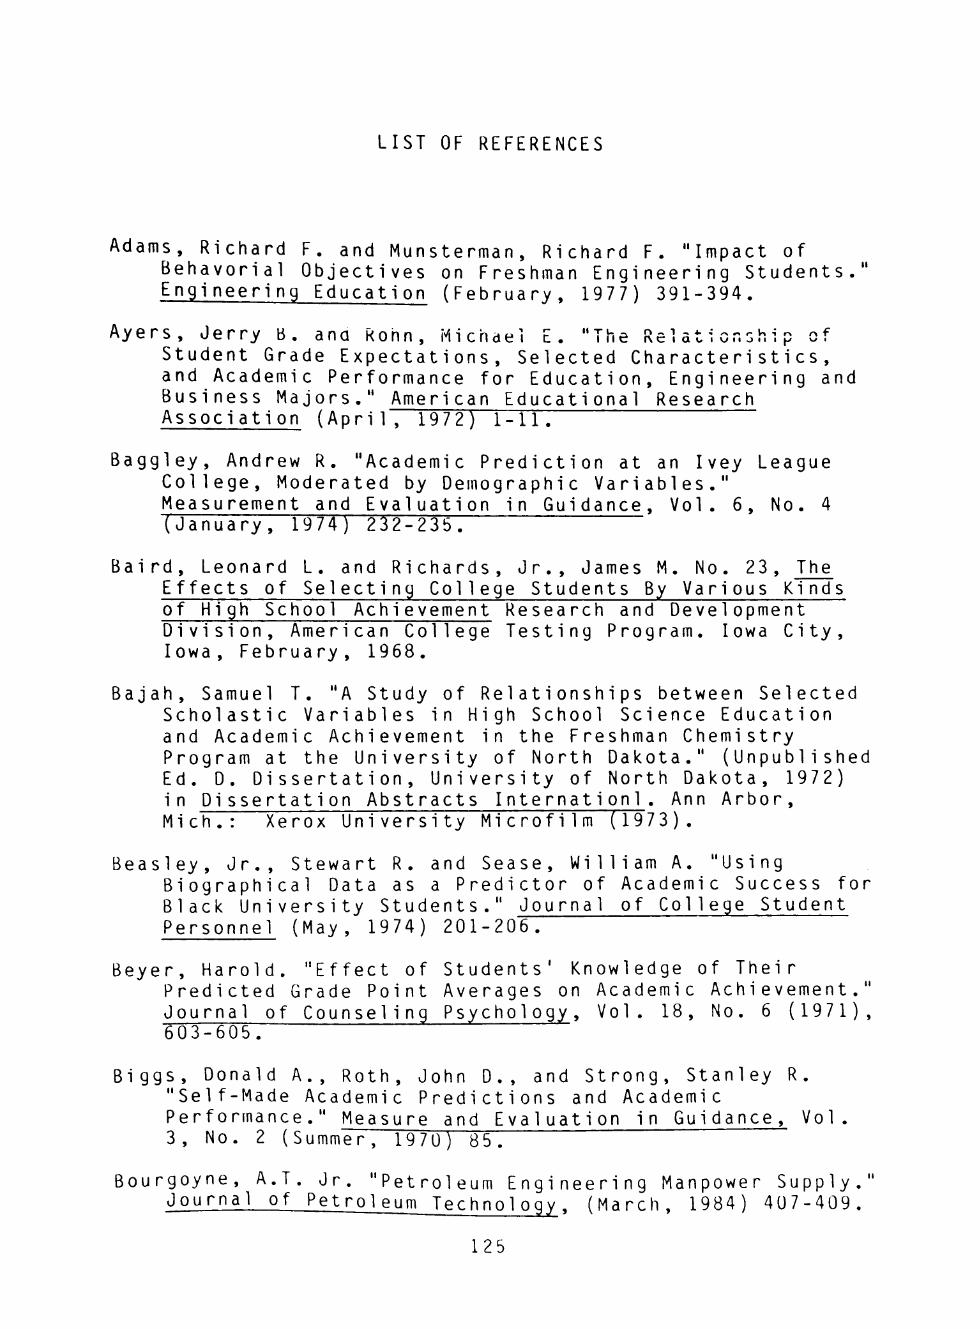
LIST OF REFERENCES
A d a m s , Richard F. and M u n s t e r m a n , Richard F. "Impact of Behavorial Objectives on Freshman Engineering S t u d e n t s . " Engineering Education (February, 1977) 3 9 1 - 3 9 4 .
II T U -,
I lie A y e r s , J e r r y B . a n a R o h n , i ^ i i c h a e i E Student Grade E x p e c t a t i o n s , Selected C h a r a c t e r i s t i c s , and Academic Performance for E d u c a t i o n , Engineering and Business M a j o r s . " American Educational Research Association (Apri1, 1972) 1-11.
B a g g l e y , Andrew R. "Academic Prediction at an Ivey League C o l l e g e , Moderated by Demographic V a r i a b l e s . " Measurement and Evaluation in G u i d a n c e , Vol. 6, No. 4 (January, 1974) 2 3 2 - 2 3 5 .
Baird, Leonard L. and R i c h a r d s , J r . , James M. No. 23, The Effects of Selecting College Students By Various Kinds of High School Achievement Research and Development D i v i s i o n , American College Testing Program. Iowa City, Iowa, February, 1968.
B a j a h , Samuel T. "A Study of Relationships between Selected Scholastic Variables in High School Science Education and Academic Achievement in the Freshman Chemistry Program at the University of North Dakota." (Unpublished Ed. D. D i s s e r t a t i o n , University of North Dakota, 1972) i n Dissertation Abstracts I n t e r n a t i o n l . Ann Arbor, M i ch . : Xerox University Microfilm (1973) .
Beasley, Jr., Stewart R. and Sease, William A. "Using Biographical Data as a Predictor of Academic Success for Black University S t u d e n t s . " Journal of College Student Personnel (May, 1974) 2 0 1 - 2 0 6 .
Beyer, Harold. "Effect of S t u d e n t s ' Knowledge of Their Predicted Grade Point Averages on Academic A c h i e v e m e n t . " Journal of Counseling P s y c h o l o g y , Vol. 18, No. 6 ( 1 9 7 1 ) , 6 0 3 - 6 0 5 .
B i g g s , Donald A., Roth, John D . , and Strong, Stanley R. "Self-Made Academic Predictions and Academic P e r f o r m a n c e . " Measure and Evaluation in G u i d a n c e , Vol. 3, No. 2 (Summer, 1970) 8 5 . ~
B o u r g o y n e , A . T . Jr. "Petroleum E n g i n e e r i n g Manpower Supply." Journal of Petroleum T e c h n o l o g y , (March, 1984) 4 0 7 - 4 0 9 .
125
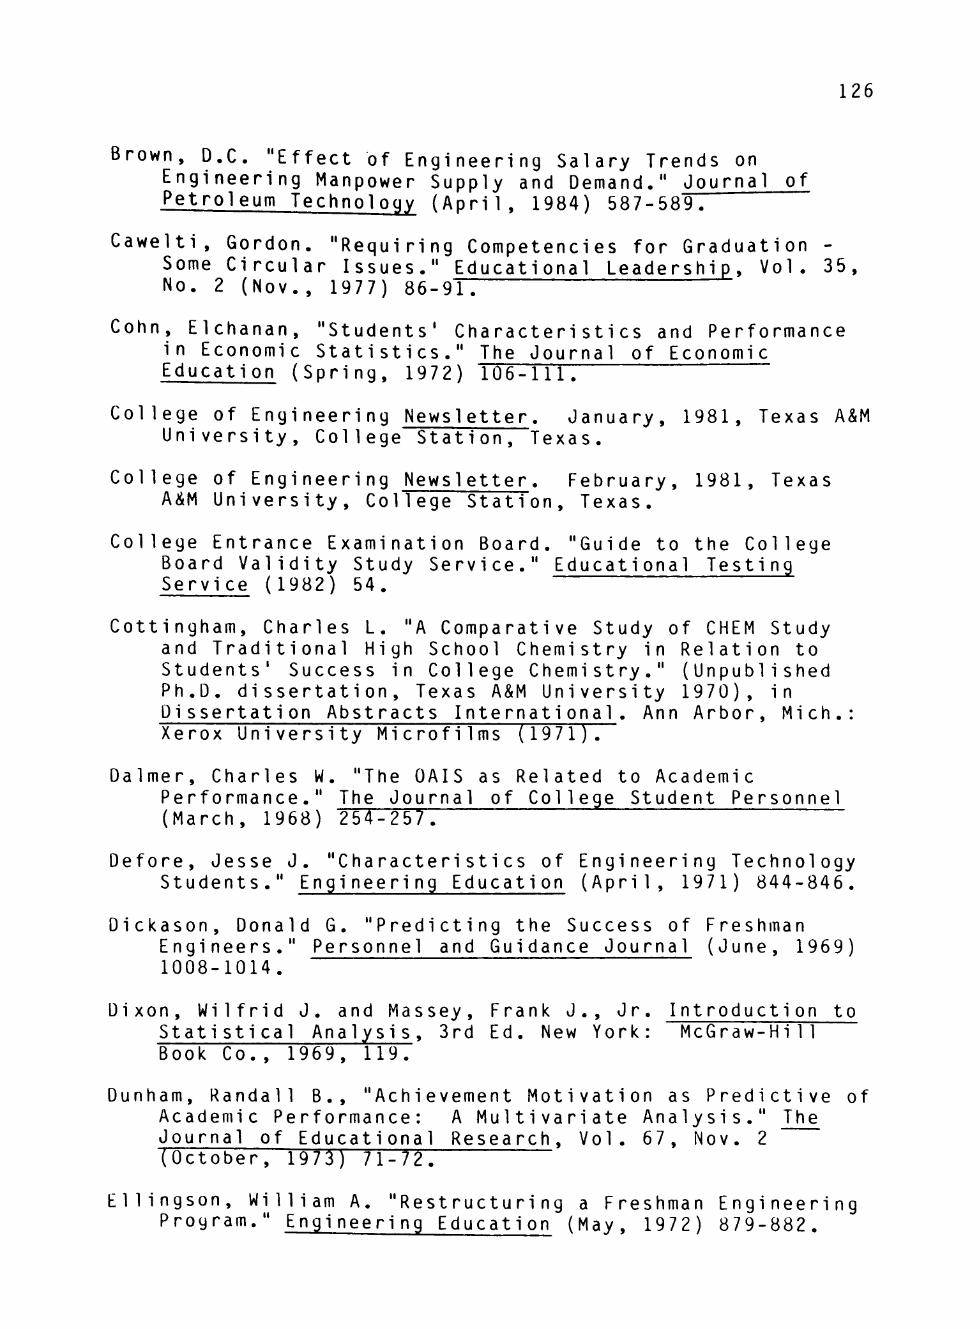
126
Brown, D.C. "Effect of Engineering Salary Trends on Engineering Manpower Supply and Demand." Journal of Petroleum Technology (April, 1984) 587-589.
C a w e l t i , Gordon. "Requiring Competencies for Graduation -Some Circular Issues." Educational Leadership, Vol. 35, No. 2 (Nov., 1977) 86-91.
Cohn, Elchanan, "Students' Characteristics and Performance in Economic Statistics." The Journal of Economic Education (Spring, 1972) 106-111.
College of Engineering Newsletter. January, 1981, Texas A&M University, College Station, Texas.
College of Engineering Newsletter. February, 1981, Texas A&M University, College Station, Texas.
College Entrance Examination Board. "Guide to the College Board Validity Study Service." Educational Testing Service (1982) 54.
Cottingham, Charles L. "A Comparative Study of CHEM Study and Traditional High School Chemistry in Relation to Students' Success in College Chemistry." (Unpublished Ph.D. dissertation, Texas A&M University 1 9 7 0 ) , in Dissertation Abstracts International. Ann Arbor, Mich.: Xerox University Microfilms (1971) .
Dalmer, Charles W. "The OAIS as Related to Academic Performance." The Journal of College Student Personnel (March, 1968) 254-257.
Defore, Jesse J. "Characteristics of Engineering Technology Students." Engineering Education (April, 1971) 8 4 4 - 8 4 6 .
Dickason, Donald G. "Predicting the Success of Freshman Engineers." Personnel and Guidance Journal (June, 1969) 1008-1014.
Dixon, Wilfrid J. and Massey, Frank J., Jr. Introduction to Stati sti cal Analysi s , 3rd Ed. New York: McGraw-Hill Book Co. , 1969, 119.
Dunham, Randall B., "Achievement Motivation as Predictive of Academic Performance: A Multivariate Analysis." The Journal of Educational Research, Vol. 67, Nov. 2 (October, 1973) 71-72.
Ellingson, William A. "Restructuring a Freshman Engineering Program." Engineering Education (May, 1972) 8 7 9 - 8 8 2 .

127
Everitt, William L. "Influence of Graduate Programs on Undergraduate Engineering Education." Engineering Education (February, 1970) 4 4 8 - 4 4 9 . —
Foster, Robert J. "Retention Characteristics of Engineering l-reshmen. Engineering Education (April, 1978) 724-728.
G a l l e s s i c h , June. "Characteristics of Engineering Students." Engineering Education (June, 1970) 980-983.
Goldman. Roy D. "Hidden Opportunities in the Prediction of College Grades for Different Subgroups." Journal of Educational Measurement Vol. 10, No. 3 (Fal 1 , 1 9 7 3 ) 205-
Goldman, Roy D., Hudson, David and Daharsh, Billie Jo. "Self-Estimated Task Persistence as a Nonlinear Predictor of College Success." Journal of Educational Psychology, Vol. 65, No. 2 (1973) 216-221.
Grant, Thomas E. and Renzullim Joseph S. "Identifying Achievement Potential in Minority Group Students." Exceptional Children (January, 1975) 255-259.
Greenwald, Stanley M. and Wecker, Irwin R. "Transfers to Engineering." Engineering Education (May, 1975) 817-820.
Grobe, Cary H. and MacDonald, Ian S. "Non-Cognitive Predictors of Geology Performance." Journal of Experimental Education (1973) 1-5.
Hall, Raymond L. and Coates, Coralie J. "Prediction of Academic Success for Special Program and Regularly Admitted College Freshmen." College and University (Fall, 1973) 14-17.
Holen, Michael C. and Newhouse, Robert C. "Student Self-Prediction of Academic Achievement." The Journal of Educational Research Vol. 69, No. 3 (1975) 219-220.
Hudek, Albert D. "The Relative Effects of PSSC Physics and Traditional Physics on Achievement in College Physics." (Unpublished Ed.D. Dissertation, University of South Dakota, 1969) in Dissertation Abstracts International. Ann Arbor, Mich.: Xerox University Microfilms (1970) .
J o n e s , W. Paul. "Sex Differences in Academic Prediction." Measurement and Evaluation in Guidance, Vol. 3, No. 2 (Summer, 19/0) 8 8 - 9 1 .
Journal of Petroleum Technology. "Salary Survey." (February, 1979) 189-191.
128
Keefer, Karl E. Characteristics of Students Who Make accurate and Inaccurate Self-Prediction of College
^^ )?o??^"^-" The Journal of Educational Research, ^^ (1971), 401-404. 64
Vol
Kerlinger, Fred N. Foundations of Behavioral Research. New York: Holt, Rinehart, and Winston, Inc., 1964.
Kmenta, Jan, Elements of Econometrics New York Publishing Co., Inc.,
McMi1 Ian 1 / - » - » 1
Lewis, John and Welch, Margaret "Predicting Achievement in an Upper-Division Bachelors Degree Nursing Major." Educational and Psychological Measurement, No. 35 (1975) 467-469. —
McMorris, Robert F. and Ambrosino, Robert J. "Self-Report Predictions: A Reminder." Journal of Educational Measurement, Vol. 10, No. 1 (Spring, 1973) 13-17.
Mager, Robert F. "Engineering of Behavior." Engineeri ng Education (March, 1969) 841-843.
Maxey, E. James and Ferguson, Richard L. "Differential Validity of the ACT Assessment for Predicting College Averages of High School Students Tested as Juniors and Seniors." Journal of College Student Personnel (May, 1976) 220-2T6:
Molnar, George E. and Delauretis. "Predicting the Curriculum Mobility of Engineering Students: A Comparison of Discriminant Procedures." Journal of Counseling Psychology, Vol. 20, No. 1 (1973) 50-59.
Moore, Richard A. "A Freshman Curriculum for Informed Career Choices." Engineering Education (December, 1969) 293-294.
Morgan, Ronald R. "Utilizaiton of Levels of Intellectual Ability as a Control Variable in Studies of Noninte11ectua 1 Factors in Academic Achievement." Educational and Psychological Measurement, No. 36 (1976) 465-472.
Morrison, Thomas L., Thomas, al. Duane and Weaver, S. Joseph. "Self-Esteem and Self-Estimates of Academic Performance." Journal of Consulting and Clinical Psychology, Vol. 41, No. 2 (1973) 412-415.
Munday, L.A. "Factors Influencing the Predictability of College Grades." American Educational Research Journal, Vol. 1 (January, 1970) 99-107.

129
Nie, Norman H. et Sciences. 2nd
al . Statistical Package for the Social ed. New York: McGraw-Hill Book Co., 1975
Nyberg, V. R. and Hasil, R. G. "SACU Test Variables as Predictors of University GPA." The Alberta Journal of Educational Research, Vol. 19, No. 4 (December, 1973) 303-308.
Office of Instructional Research. Research Report, The Accuracy of Freshman Grade Point Predictions. Lubbock, Texas, February, 1978.
SAS Institute, Inc. SAS User's Guide: Basics. Cary, N.C.: SAS Institute, Inc., 1982.
Sexton, Dennis W. and Goldman, Roy D. "High School Transcript as a Set of Nonreactive Measures for Predicting College Success and Major Field." Journal of Educational Psychology. Vol. 67, No. 1 (1975) 30-37.
Smart, John C , Elton, Charles F., and Burnett, Collins W. "Underachievers and Overachievers in Intermediate French." Report of University of Kentucky (1973) 1 - 6.
Society of Petroleum Engineers. SPE Manpower Conference, Houston (June, 1 9 7 8 ) .
Sockloff, Alan L., Ebert, R. Kurt, and Degnan, James W. "Adjustments for High School Characteristics in the Prediction of College Achievement." Educational and Psychological Measurement, No. 33 (1973) 393-396.
Sofge, Charles T. "Prediction of Performance and Satisfaction of Aeronautical Engineering Students at the Naval Postgraduate School." (Unpublished M . S . thesis. Naval Postgraduate School, 1974) National Technical Information Service. Springfield, VA.: U.S. Department of Commerce ( 1 9 7 4 ) .
Stanley, J.C. "Predicting Success of the Educationally Disadvantaged." Science, 171 (1971) 640-647.
Startzman, R.A. "Report of the Undergraduate Curriculum Study Committee." Department of Petroleum Engineering, Texas A&M University, College Station, Texas (1984) 1-10.
Steger, Joseph A., Simmons, William L., and Lavelle, Steven. "Accuracy of Prediction of Own Performance as a Function of Locus of Control." Psychological Reports, Vol. 3 3 (1973) 59-62.

130
S t e v e n s , W . F . and Cohen, J.B. "A Synergistic Approach for Freshman Engineers." Engineering Education (May, 1974) 5 7 7 - 5 7 9 . —^ ^
Tatham, Clifford B. and Tatham, E. "Academic Predictors for Black Students." Engineering and Psychological M e a s u r e m e n t , No. 34 (1974) 3 7 1 - 3 7 4 .
T e m p ^ G. "Validity of the SAT for Blacks and Whites in Ihirteen InLergrated Institutions." Journal of Educational Measurement, Vol. 8 (1971) 245-251.
Texas A&M University Undergraduate Catalog 107 Vol. 12, No. 1 (January, 1984) 170-171.
T h o m a s , C L . and Stanley, J.C. "Effectiveness of High School Grades for Predicting College Grades of Black Students: A Review and Discussion." Journal of Educational Measurement Vol. 6 (1969) 203-215.
Vacc, Nicholas A. "Cognitive Complexity in Resident Assistants and Their Accuracy in Predicting Student Academic Performance." Journal of College Student Personnel (May, 1974) 194-197.
Von Gonten, W . D . "Undergraduate and Graduate Petroleum Engineering Education in the United States." Paper presented at the Pan American Petroleum Congress, Mexico City, March 19-23, 1979.
, "Annual Review." Texas Engineering Experiment Station (1984) 1-19.
W a l k e r , Decker F. "The Hard Lot of the Professional in a Deform Movement." Educational Leadership, Vol. 35, No. 2 (Nov., 1977) 8 3 - 8 5 .
Whatley, Donivan J. and Nichols, Robert C. "Career Choices of Talented Youth." Engineering Education (April, 1969) 9 7 5 - 9 7 8 .
W o l f e , Raymond N. "Perceived Locus of Control and Prediction of Own Academic Performance." Journal of Consulting and Clinical Psychology, Vol. 38, No. 1 (1972) 8 0 - 8 3 .
APPENDIX
A. ABBREVIATIONS USED WITH STANDARDIZED TESTS
B. FRESHMAN DATA QUESTIONNAIRE AND SUMMARY
C. RECOMMENDED PREDICTION EQUATIONS
D. EVALUATION OF SAT-TOT AND RANK
131

APPENDIX A: ABBREVIATIONS USED WITH STANDARDIZED TESTS
132
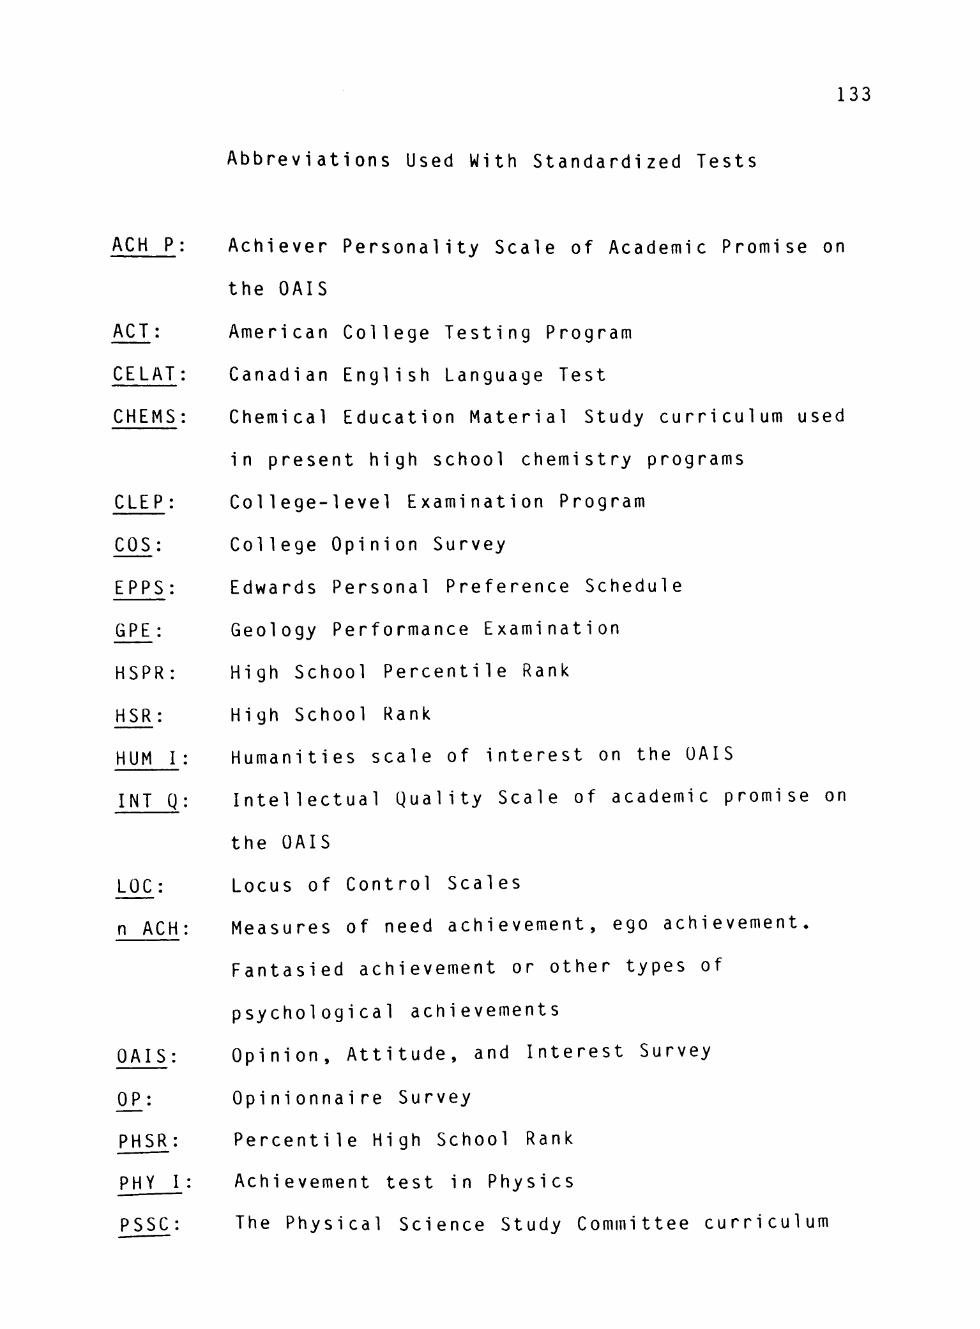
133
A b b r e v i a t i o n s Used With Standardized Tests
ACH P: Achiever Personality Scale of Academic Promise on
the OAIS
American College Testing Program
Canadian English Language Test
Chemical Education Material Study curriculum used
in present high school chemistry programs
C L E P : College-level Examination Program
A C T :
C E L A T :
C H E M S :
C O S :
E P P S :
GPE:
HSPR:
HSR:
HUM I
LOC:
n ACH
O A I S :
PHSR:
PHY I
P S S C :
College Opinion Survey
Edwards Personal Preference Schedule
Geology Performance Examination
High School Percentile Rank
High School Rank
Humanities scale of interest on the OAIS
INT Q: Intellectual Quality Scale of academic promise on
the OAIS
Locus of Control Scales
M e a s u r e s of need a c h i e v e m e n t , ego achievement.
Fantasied achievement or other types of
psychological achievements
O p i n i o n , A t t i t u d e , and Interest Survey
Opi ni onnai re Survey
Percentile High School Rank
Achievement test in Physics
The Physical Science Study Committee curriculum

134
Q E D :
SACU:
SAT
SAT-M
SAT-V
S A T T :
SOC Ai
used in present high school physics programs
Q u a n t i t a t i v e Evaluative Device
Service of Admission to College and University test
used by Canadian institutions
Scholastic Aptitude Test
Scholastic Aptitude Test - Mathematics
Scholastic Aptitude Test - Verbal
Scholastic Aptitude Test; total of M a t h e m a t i c s and
Verbal scores
Social Adjustment scale of psychological adjustment
on the OAIS
S P S : Student Profile Section of the ACT assessment

APPENDIX B: FRESHMAN DATA QUESTIONNAIRE AND SUMMARY
135
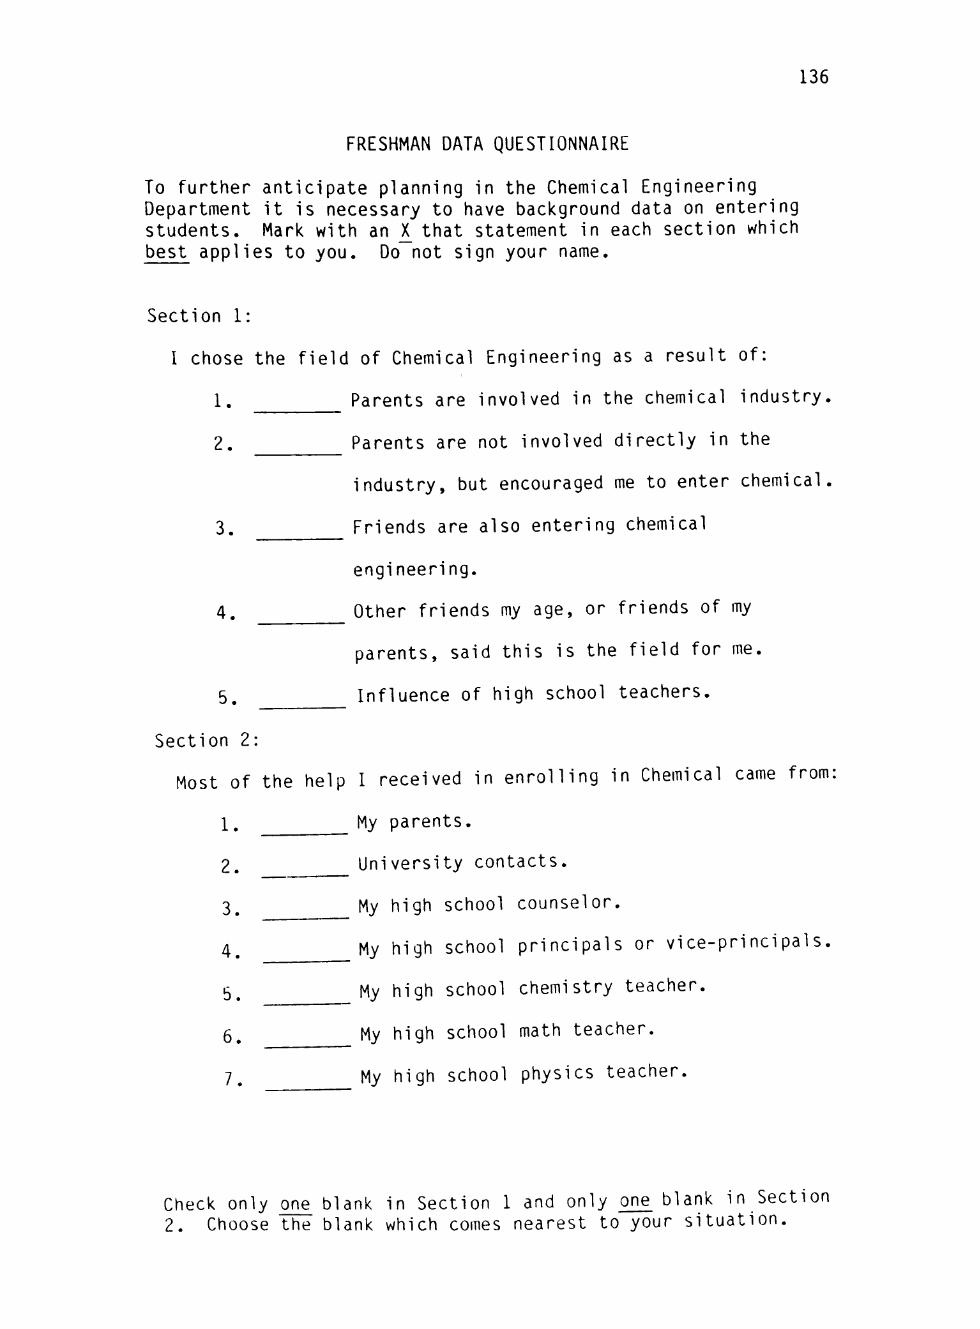
136
FRESHMAN DATA QUESTIONNAIRE
To further anticipate planning in the Chemical Engineering Department it is necessary to have background data on entering students. Mark with an X_ that statement in each section which best applies to you. Do not sign your name.
Section 1:
I chose the field of Chemical Engineering as a result of:
1. Parents are involved in the chemical industry.
2. Parents are not involved directly in the
industry, but encouraged me to enter chemical.
3. Friends are also entering chemical
engineering.
4. Other friends my age, or friends of my
parents, said this is the field for me.
5. Influence of high school teachers.
Section 2:
Most of the help I received in enrolling in Chemical came from:
1. My parents.
2. University contacts.
3. My high school counselor.
4^ My high school principals or vice-principals.
5^ My high school chemistry teacher.
5^ My high school math teacher.
7, My high school physics teacher.
Check only one blank in Section 1 and only on£ blank in Section 2. Choose the blank which comes nearest to your situation.

137
FRESHMAN DATA QUESTIONNAIRE
To further anticipate planning in the Petroleum Engineering Department it is necessary to have background data on entering students. Mark with an X_ that statement in each section which best applies to you. Do not sign your name.
Section 1:
1 cnose the field of Petroleum Engineering as a result of:
1. Parents are involved in the petroleum industry.
2. Parents are not involved directly in the
industry, but encouraged me to enter petroleum.
3. Friends are also entering petroleum engineering
4. Other friends my age, or friends of my parents,
said this is the field for me.
5. Influence of high school teachers.
Section 2:
Most of the help I received in enrolling in Petroleum came
from:
1. My parents.
2. University contacts.
3. My high school counselor.
4. My high school principals or vice-principals.
5. My high school chemistry teacher.
6. My high school math teacher.
7. My high school physics teacher.
Check only one blank in Section 1 and only one blank in Section 2. Choose the blank which comes nearest to your sitation.

138
TABLE 39
FRESHMAN DATA QUESTIONNAIRE SUMMARY FOR CHEMICAL ENGINEERING
Chemical Engineering
1978-79
1. Why Chose This Field:
Parents in Petro/Chem Parents encouragement Friends entering Friends influence Influence of HS teacher
2. Most Help in Enrolling From:
Parents University contact HS Counselor Principal Chemistry teacher Math teacher Physics teacher
No. Replies
9 14 4 7 17
Percent
17.6 27.5 7.8 13.7 33.4
18 20 3 1 7 0 2
35.2 39.2 5.9 2.0 13.7 0.0 4.0
51

139
TABLE 40
FRESHMAN DATA QUESTIONNAIRE SUMMARY FOR PETROLEUM ENGINEERING
Petroleum Engineering
1978-79
1. Why Chose This Field:
Parents in Petr7Chem Parents encouragement Friends entering Friends influence Influence of HS teacher
2. Most Help in Enrolling From:
No. Replies
35 17 2 11 12
Percen
45.5 22.1 2.6 14.3 15.5
Parents University contact HS Counselor Principal Chemistry teacher Math teacher Physics teacher
38 20 7 2 4 2 4 77
49.4 26.9 9.1 2.6 5.2 2.6 5.2

140
TABLE 41
FRESHMAN DATA QUESTIONNAIRE SUMMARY FOR CHEMICAL AND PETROLEUM ENGINEERING
1. Why Chose This Field:
Parents in Petro/Chem Parents encouragement Friends entering Friends influence Influence of HS teacher
2. Most Help in Enrolling F
Parents University contact HS Counselor Principal Chemistry teacher Math teacher Physics teacher
No.
rom:
Replies
44 31 6 18 29
56 40 10 3 11 2 6
128
Percent
34.4 24.2 4.7 14.0 22.7
43.8 31.2 7.8 2.3 8.6 1.6 4.7
APPENDIX C: RECOMMENDED PREDICTION EQUATIONS
141

142
Recommended Prediction Equations
This study used multiple linear repression analysis to
develop equations for testing the null hypotheses and for
developing an evaluation instrument for use by counselors
and administrators in advising and placing chemical and
petroleum engineering students. The multiple linear
regression equation was of the following general form:
GPA. = b^ . b^ X.^ . b2 X.2 ^ ... - b, X.,
where freshman GPA was expressed as a function of k
predictors for each student i = 1, 2, 3, ..., N for a sample
of N students. The intercept and regression coefficients
bj j, b, , b„, ..., b. were calculated using least squares
regression estimation.
The analysis led to the development of the following
equations recommended for use as an evaluation instrument:
1. Table 9
GPA = -49.9721 + 0.0951 SAT_TOT + 28.3722 GRADE_S -
23.1934 ADVANCED + 2.3251 RANK
2. Table 10
GPA = -51.4453 + 0.1837 SAT_MATH + 27.6450 GRADE_S -
27.0599 ADVANCED + 2.3391 RANK

143
3. Table 11
GPA = -45.3048 + 0.1119 SAT_TOT + 24.2488 GRADE_M -
24.0308 ADVANCED + 2.2051 RANK
4. Table 12
GPA = -44.4340 + 0.2080 SAT_MATH + 21.7596 GRADE_M -
30.6019 ADVANCED + 2.3891 RANK
5. Table 13
GPA = -44.4340 + 0.2080 SAT_MATH + 21.7596 GRADE_M -
29.1478 ADVANCED + 2.3501 RANK
When GPA is predicted with these equations, the
resulting number should be divided by 100.

APPENDIX D: EVALUATION OF SAT-TOT AND RANK
144

145
Evaluation of SAT-TOT and Rank as Exclusive Predictors of GPA
Freshman GPA was regressed as a function of SAT-TOT and
RANK, excluding other p r e d i c t o r s , in order to compare the
results of this study with other research that has used only
these two variables as predictors of GPA. Three equations
were estimated, shown in Tables 4 2 - 4 4 , relating GPA to SAT-
TOT and RANK for chemical and petroleum engineering students
combined and for the two groups separately.
These three equations were compared with the preferred
equations using SAT-TOT, shown in Tables 9 and 11. The
results indicate that, for two reasons, using only these two
variables as predictors of freshman GPA is inferior to
including other academic variables as predictors.
First, the R^ values for the three quations in Tables
42-44 are lower than the R values shown in Tables 9 and 11,
particularly in the case of chemical engineering students
alone (Table 4 3 ) . This indicates that the equations in
Tables 9 and 11 explain more of the variation in GPA than do
the equations that include only SAT-TOT and RANK.
Second, the equations for combined students (Table 42)
and petroleum engineering students (Table 44) have
intercepts that are significantly less than zero. It would
be expected that the intercept would be zero, as found with
the equations developed in this study to evaluate the
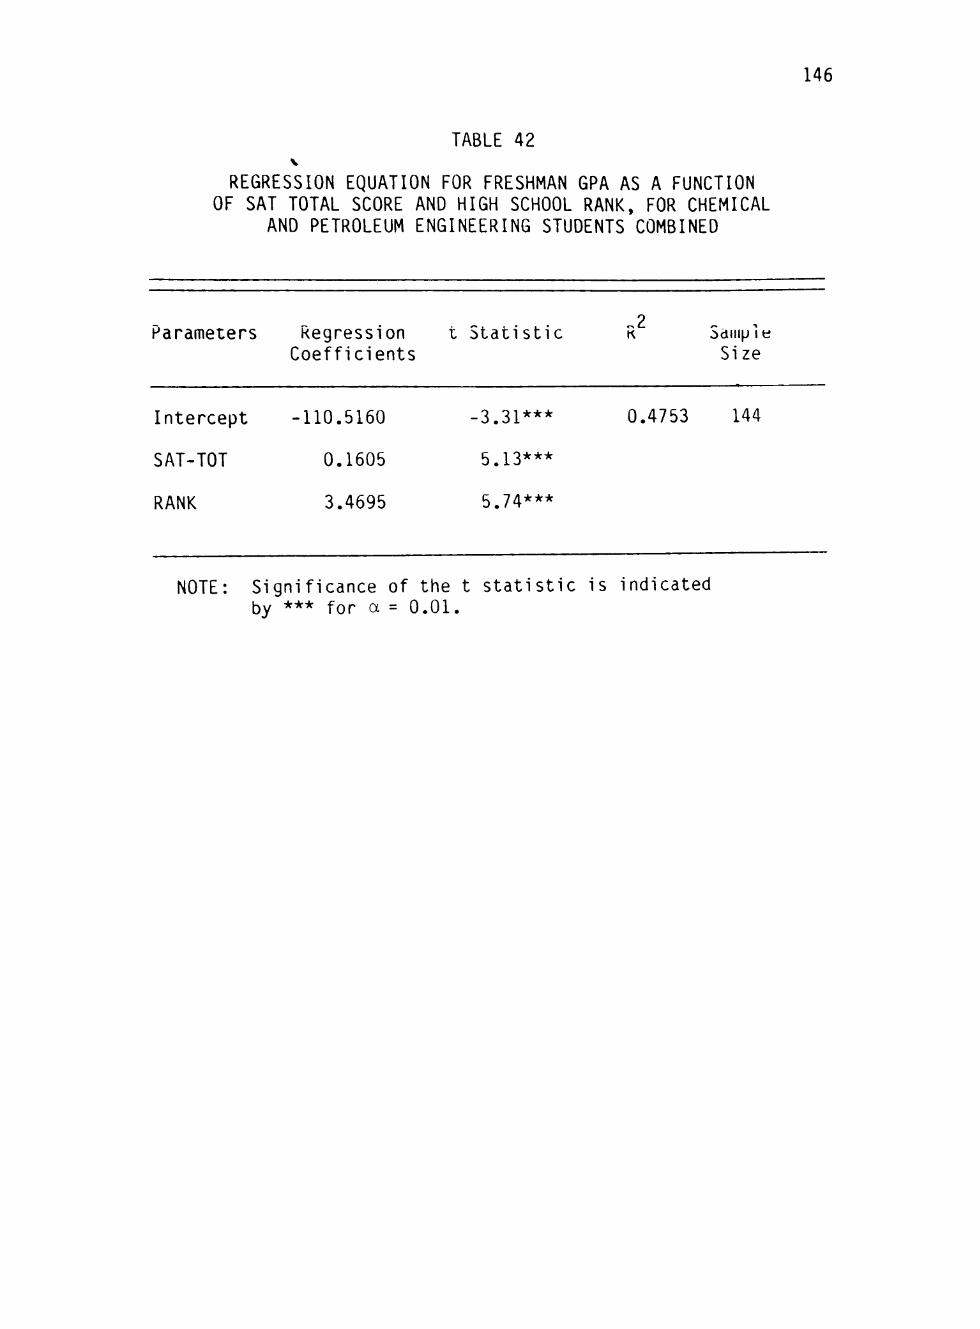
146
TABLE 42 V
REGRESSION EQUATION FOR FRESHMAN GPA AS A FUNCTION OF SAT TOTAL SCORE AND HIGH SCHOOL RANK, FOR CHEMICAL
AND PETROLEUM ENGINEERING STUDENTS COMBINED
2 Parameters Regression t Statistic R Sample
Coefficients Size
Intercept -110.5160 -3.31*** 0.4753 144
SAT-TOT 0.1605 5.13***
RANK 3.4695 5.74***
NOTE: Significance of the t statistic is indicated by *** for a = 0.01.
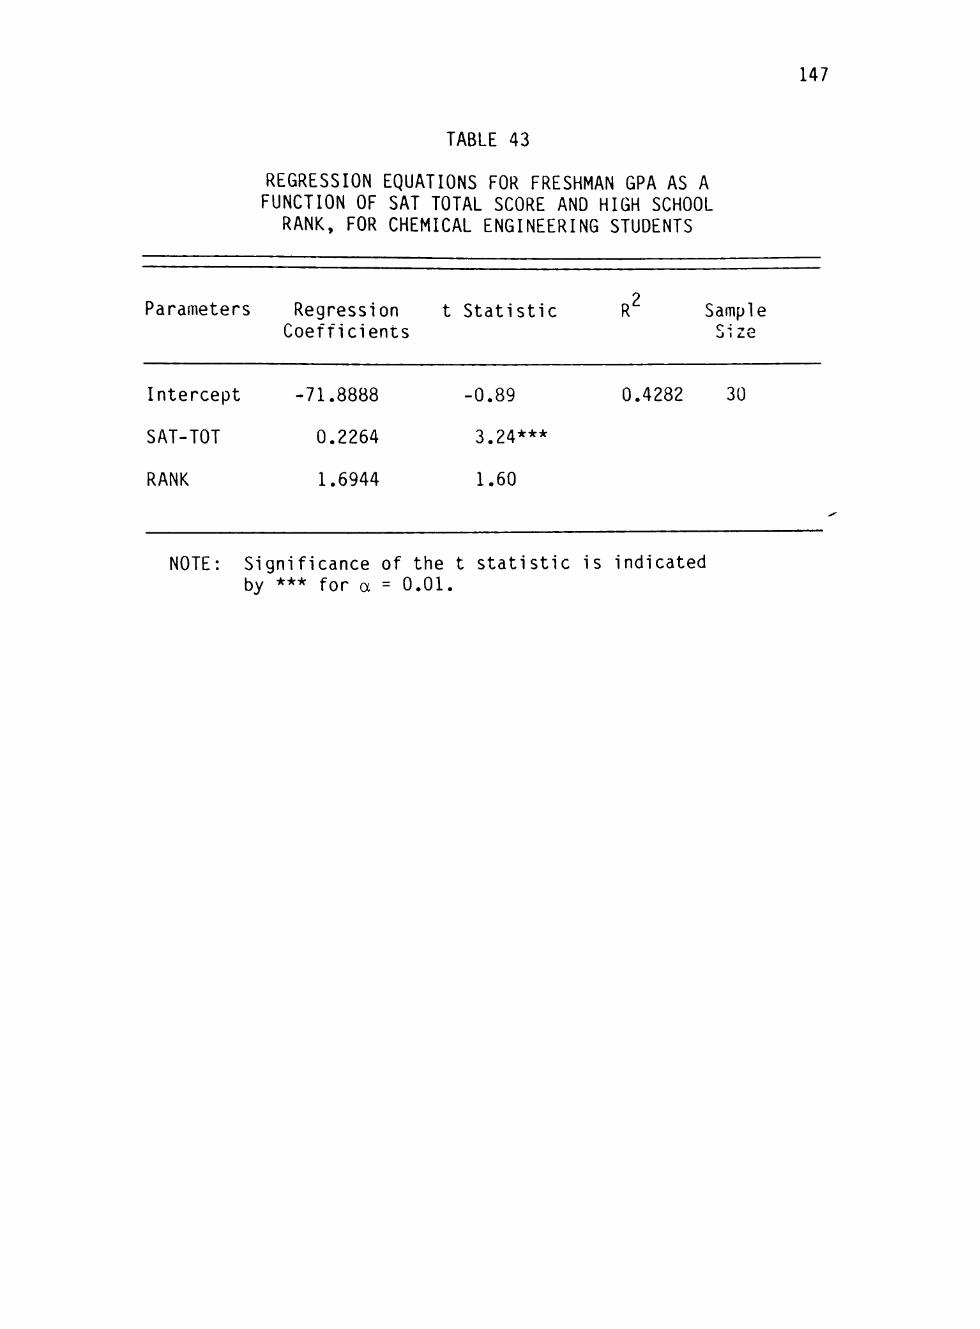
147
TABLE 43
REGRESSION EQUATIONS FOR FRESHMAN GPA AS A FUNCTION OF SAT TOTAL SCORE AND HIGH SCHOOL
RANK, FOR CHEMICAL ENGINEERING STUDENTS
o Parameters Regression t Statistic R Sample
Coefficients Size
Intercept -71.8888 -0.89 0.4282 30
SAT-TOT 0.2264 3.24***
RANK 1.6944 1.60
NOTE: Significance of the t statistic is indicated by *** for a = 0.01.

148
TABLE 44
REGRESSION EQUATION FOR FRESHMAN GPA AS A FUNCTION OF SAT TOTAL SCORE AND HIGH SCHOOL RANK, FOR PETROLEUM ENGINEERING STUDENTS
Parameters Regression t Statistic R^ Sample Coefficients Size
Intercept -140.3763 -3.73*** 0.5049 114
SAT-TOT 0.1120 3.07***
RANK 4.8046 6.37***
NOTE: Significance of the t statistic is indicated by *** for a = 0.01.
149
academic predictors of GPA (Tables 9-26 and 2 8 - 3 3 ) . The
intercept of a linear equation gives the predicted value of
the dependent variable if the values of all the predictors
in the equation are zero. In this case, the negative
intercept implies that, if SAT-TOT and RANK are zero, then
GPA is n e g a t i v e . Of course, GPA cannot be less than zero,
so this feature of these two equations is undesirable.

DATA CHARACTERISTICS
Females
Ethni c
Nonsuccesses GPA < 2.00
Sample No.
Ave. GPA
Chemi cal Eng.
10 10.8%
93 30.2%
2.85
Pet rol . Eng
14
10
42 19.6%
214 70.5%
2.57
Total
22 7.2%
14 4.6% II c pri Q • \^ ^ \^ \jk -^9
Data missing on 5.
52
307
2.65
2.9%