determination of plasma volume with indocyanine green in man
TRANSCRIPT

Vol. 53, No. 21, 1993 5-HTIc/2 Agonist in Young SHR 1579
OOI 4o0- 400- SAL -- .-(3--, SHR
~ ~ 1 I • WKY E 300. E 3 0 0
200. v 200
~- lOO, ,~ lOO. ~- ; 0 .,¢ <
0 - . . , . . . , . . 0 0 0 10 20 30 40 - 1 0 0 10 20 30 40
TIME (min) TIME (min)
C DOI
° 1 < o I ~ 30 3O
2O '< <
20 ' ~ ' ~ ' ~ 1 a , b , d <~
g,. - 1 0 0 10 20 30 40 oz. - 1 0 0 10 20 30 40 TIME (rain) TIME (rain)
FIG. 3 Effects of DOI (1.0 mg/kg i.a.) and saline (SAL) on ar ter ia l levels of plasma renin activity (PRA) and adrenocort icotropin (ACTH) in 4 week old consc ious un re s t r a ined s p o n t a n e o u s l y h y p e r t e n s i v e rats (SHR, DOI: n=7-9 and SAL: n=7-8) and Wis ta r -Kyoto (WKY, DOI: n=7-8 and SAL: n=6-7 ) n o r m o t e n s i v e c o n t r o l r a t s . (a) s ign i f i can t drug effect compared to sa l ine , by repea ted measu re s analysis of variance, p<0.05. (b) significant difference in r e s p o n s e between the strains, p<0.05, (d) s ign i f ican t d i f fe rence in the area under the curve between the strains, by unpaired t- test , p<0.05.
a f t e r DOI a d m i n i s t r a t i o n . In c o n t r a s t , l eve l s of NE and i ts i n t r a n e u r a l metabol i te , DHPG, were a f fec ted min ima l ly . DOI the re fo re does not appear to s t imula te overal l sympathoneura l act ivi ty (20). The results are c o n s i s t e n t wi th the v iew that s y m p a t h o n e u r a l a n d a d r e n o m e d u l l a r y a c t i v i t i e s can be r egu la t ed independen t ly (36).
DOI binds with high a f f i n i t y to 5-HT2 and a l so to 5 - H T 1 c r e e e p t o r s (37,38). The latter are more s imilar pharmacolog ica l ly and b i o c h e m i c a l l y to 5-HT2 than to 5-HT1 receptors (37-39). Ketanser in has much h igher a f f i n i t y to 5-HT2 than 5-HT1c receptors (39). DOI's s t imula tory e f fec t s on vascu la r smooth musc le , ar ter ia l blood pressure , PRA, sympa the t i c nerve d i scha rge and release of CRH are mediated mainly by 5-HT2and to a l esser degree by 5-HT1c receptors, since these effects of DOI or other agonis ts on 5-HT1c and 5-HT2 r ecep to r s can be a n t a g o n i z e d by r e l a t i ve ly low doses of k e t a n s e r i n (16,21,23,25). Significant involvement of 5-HT1c receptors have been s h o w n in s y m p a t h o a d r e n a l , ACTH and v a s o p r e s s i n r e s p o n s e s to s e r o t o n e r g i c s t imul i (18 ,22 ,25) . S tud ies wi th d i f f e r e n t 5-HT a g o n i s t s and a n t a g o n i s t s s t r ong ly sugges t that MAP and PRA responses to the sys t emic i n j ec t i on of

1580 5-HT1c/2 Agonist in Young SHR Vol. 53, No. 21, 1993
DOI are s t r o n g l y c o n n e c t e d and are m e d i a t e d by 5-HT2 bu t no t 5 -HT1c r e c e p t o r s t i m u l a t i o n (25) , thus the d i f f e r e n c e in these r e s p o n s e s b e t w e e n strains re f l ec t a d i f f e r ence in 5-HT2 receptor funct ion.
Responses of PRA to DOI were s ign i f i can t ly la rger in the SHR strain. P r e v i o u s s t u d i e s h a v e s u g g e s t e d t ha t PRA r e s p o n s e s a f t e r s y s t e m i c admin i s t r a t i on of 5-HT2 agon i s t s involve both cent ra l and p e r i p h e r a l 5-HT2 r e c e p t o r - m e d i a t e d mechan i sms (40,41) . Our resul ts exc lude the exp l ana t ion ba s e d on e x c e s s i v e s y m p a t h o a d r e n a l responses to DOI. The renal va scu la r bed o f S H R ' s , h o w e v e r , has been r e p o r t e d to be e x t r e m e l y s e n s i t i v e to s e r o t o n i n . It has been shown that the cons t r i c t ion of the rena l v a s c u l a t u r e in SHR's compared to WKY cont ro l s is potent ia ted to a g rea t e r degree to 5- HT than to NE, a n g i o t e n s i n I I or bar ium (42). S ince r e c e n t s t ud i e s sugges t that 5-HT2 r e c e p t o r s t imu la t i on causes increases i n P R A p r e f e r e n t i a l l y by d e c r e a s e d r e n a l p e r f u s i o n p r e s s u r e ( 4 1 ) , d i f f e r e n c e s in p e r i p h e r a l h e m o d y n a m i c act ions may cause the enhanced PRA responses in SHR's.
S i m i l a r l y , the augmen t ed MAP responses to DOI in SHR's could have any o f s e v e r a l e x p l a n a t i o n s . V a s o c o n s t r i c t i o n caused by 5-HT2 r e c e p t o r s t imu la t ion has been r epor t ed to be enhanced in i so la ted b lood ve s se l s f rom some animal models of h y p e r t e n s i o n (42,43). Ang io t ens in II c o n c e n t r a t i o n s could have con t r ibu ted , s ince t h e P R A response to DOI was enhanced in the SHR's. Blood vessel walls in SHR's could be h y p e r - r e s p o n s i v e to v a s o a c t i v e c o m p o u n d s ( a n g i o t e n s i n II and EPI) re leased into the b l o o d s t r e a m by DOI. DOI does not increase plasma arg in ine vasopress in c o n c e n t r a t i o n s e i t h e r in adul t S p r a g u e - D a w l e y rats (25) or in juven i l e SHR or WKY rats (G. Bagdy and A.F. Sved, unpubl ished data). Since the juveni le SHR's had s ign i f i can t ly h igher base l ine MAP than the WKY control rats, augmented v a s o c o n s t r i c t o r r e sponses could have been the resul t of s t ructural vascu la r adap ta t ion , too.
In conclusion, conscious, juveni le SHR's had neurochemica l e v i d e n c e of e x c e s s i v e s y m p a t h o a d r e n a l a c t i v i t y under base l ine c o n d i t i o n s . P i t u i t a r y - a d r e n o c o r t i c a l a n d a d r e n o m e d u l l a r y r e sponses of SHR's and WKY c o n t r o l ra ts were s i m i l a r a f t e r DOI admi n i s t r a t i on , whereas e x c e s s i v e p r e s so r and PRA but a t t e n u a t e d HR r e s p o n s e s were found. S ince PRA and p r e s s o r but n o t A C T H a n d E P I r e s p o n s e s a re m e d i a t e d m a i n l y by p e r i p h e r a l m e c h a n i s m s , t h e s e d i f f e r e n c e s e x c e p t of the b a r o r e c e p t o r r e f l e x HR r e s p o n s e s sugges t p e r i p h e r a l r a the r than central a l t e r a t i o n s in r e s p o n s e to DOI.
A c k n o w l e d g e m e n t s
D e t e r m i n a t i o n s of PRA were per formed in Dr. Alan Sved ' s l a b o r a t o r y in t he D e p a r t m e n t o f B e h a v i o r a l N e u r o s c i e n c e at t he U n i v e r s i t y o f P i t t s b u r g h . His a s s i s t a n c e in th i s p r o j e c t is g r e a t l y a p p r e c i a t e d . The angiotensin I antiserum was supplied by Dr. J.E. Sealey (New York, NY, USA).
Vol. 53, No. 21, 1993 5-HT1c/2 Agonist in Young SHR 1581
References
1. J. IRIUCHIJIMA, Jpn. Heart J. 1_..44350-356 (1973). 2. W.V. JUDY, A.M. WATANABE, D.P. HENRY, H.R. Jr. BESCH, W.R. MURPHY
and G. HOCKEL, Circ. Res. 3___88 II21-I129 (1976). 3. K. OKAMOTO, S. NOSAKA, Y. YAMORI and M. MATSUMOTO, Jpn. Heart J.
9 1 6 8 - 1 8 0 (1967). 4. L.P. SCHRAMM and E.S. CHORNOBOY, Am. J. Physiol. 243 R506-R511
(1982). 5. S. LUNDIN, S-E. RICKSTEIN and P. THOREN, Acta. Physiol. Scand. 120
273-281 (1984) . 6. S. LUNDIN and P. THOREN, Acta. Physiol. Scand. 1 1 5 1 1 5 - 1 2 4 (1982). 7. R. McCARTY and I.J. KOPIN, Life. Sci. 2__22 977-1005 (1978) . 8. C.H. PAK, Jpn. Heart J. 2 2 9 8 7 - 9 9 5 (1981). 9. K. SZEMEREDI, G. BAGDY, R. STULL, I.J. KOPIN and D.S. GOLDSTEIN, Life.
Sci. 4__~31063-1068 (1988) . 10. A.M. ARDEKANI, S.J. WALKER, S.J. DONOHUE, R.E. STITZEL, J.M. CONNORS
and K.E. VRANA, Life. Sci. 4__4915-925 (1989). 11. C.D. SLADEK, M.L. BLAIR, Y.H. CHEN and R.W. ROCKHOLD, Am. J. Physiol.
2 5 0 H 4 4 3 - H 4 5 2 (1986). , 12. D.M. KUHN, W.A. WOLF and W. LOVENBERG, Hypertension. 2 2 4 3 - 2 5 5
(1980). 13. G.J. WENTING, A.J. WOITTIEZ, A.J. MAN, A.J. VELD and M.A.
SCHALEKAMP, Hypertension. 6 1 0 0 - 1 0 9 (1984). 14. K. GRADIN, A. PETTERSON, T. HEDNER and B. PERSSON, J. Neural. Transm.
6___22 305-319 (1985). 15. R.H. ALPER and J.M. SNIDER, J. Pharmacoi. Exp. Ther. 2 4 3 8 2 9 - 8 3 3
(1987). 16. R.B. McCALL, B.N. PATEL and L.T. HARRIS, J. Pharmacol. Exp. Ther. 242
1152-1159 (1987) . 17. R.B. McCALL and L.T. HARRIS, Eur. J. Pharmacol. 1 5 1 1 1 3 - 1 1 6 (1988) . 18. G. BAGDY, K. SZEMEREDI, B. KANYICSKA and D.L. MURPHY, J. Pharmacol.
Exp. Ther. 2 5 0 7 2 - 7 8 (1989). 19. G. BAGDY, K. SZEMEREDI and D.L. MURPHY, J. Pharm. Pharmacol. 4.__.! 270-
272 (1989). 20. R.H. ALPER, Eur. J. Pharmacol. 1 7 5 3 2 3 - 3 3 2 (1990) . 21. A.E. CALOGERO, R. BERNARDINI, A.N. MARGIORIS, G. BAGDY, W.T.
GALLUCCI, P.J. MUNSON, L. TAMARKIN, T.P. TOMAI, L. BRADY and P.W. GOLD, Peptides 1._..00189-200 (1989).
22. G. BAGDY, A.E. CALOGERO, D.L. MURPHY and K. SZEMEREDI, Endocrinology. 1 2 5 2 6 6 4 - 2 6 6 9 (1989).
23. M.L. COHEN, W.L. BLOOMQUIST, H.D. SNODDY and R.W. FULLER, Life. Sci. 4...~51185-1189 (1989) .
24. R.H. ALPER, Neuroendocrinology 5.__.! 255-260 (1990). 25. G. BAGDY, A.F. SVED, D.L. MURPHY and K. SZEMEREDI, Eur. J. Pharmacol.
2 1 0 2 8 5 - 2 8 9 (1992) . 26. B. ARNEKLO-NOBIN, A. NOBIN, C. OWMAN and K. TORNEBRANDT, J.

1582 5-HT1c/2 Agonist in Young SHR Vol. 53, No. 21, 1993
Cardiovasc. Pharmacol. 7:Suppl 7 $52-$55 (1985). 27. J.H. MYERS, T.E. MECCA and R.C. WEBB, J. Cardiovasc. Pharmacol. 7:Suppl
7 :S44-S48 (1985). 28. J.M. VAN NUETEN, W.J. JASSENS and P.M. VANHOUTTE, Serotonin and
the Card iovascu la r System. Vanhoutte P.M. Ed. pp. 95-104, Raven Press, New York (1985).
29. G. BAGDY, K. SZEMEREDI, Z. ZUKOWSKA-GROJEC, J. HILL and D.L. MURPHY, Life. Sci. 4_._! 775-782 (1987).
30. G. EISENHOFER, D.S. GOLDSTEIN, R. STULL, H.R. KEISER, T. SUNDERLAND, D.L. MURPHY and I.J. KOPIN, Ciin. Chem. 3.__22 2030-2033 (1986).
31. M. GARTY, A. DEKA-STAROSTA, P.C. CHANG, G. EISENHOFER, Z. ZUKOWSKA-GROJEC, R. STULL, I.J. KOPIN and D.S. GOLDSTEIN, Neurochem. Res. 1.__~4523-531 (1989).
32. A. DEKA-STAROSTA, M. GARTY, Z. ZUKOWSKA-GROJEC, H.R. KEISER, I.J. KOPIN and D.S. GOLDSTEIN, Am. J. Physiol. 257 R229-236 (1989).
33. D.S. GOLDSTEIN, G. EISENHOFER, R. STULL, C.J. FOLIO, H.R. KEISER and I.J. KOPIN, J. Clin. Invest. 8___! 213-220 (1988).
34. G. EISENHOFER, D.S. GOLDSTEIN, T.G. ROPCHAK, H.Q. NGUYEN, H.R. KEISER and I.J. KOPIN, J. Auton. Nerv. Sys. 2.._441-14 (1988).
35. A.E. CALOGERO, G. BAGDY, K. SZEMEREDI, M.E. TARTAGLIA, P.W. GOLD and G.P. CHROUSOS, Endocrinology. 1 2 6 1 8 8 8 - 1 8 9 4 (1990).
36. J.B. YOUNG, R.M. ROSA and L. LANDSBERG, Am. J. Physiol, 274 E35-E40 (1984).
37. R.A. GLENNON, R. RAGHUPATHI, P. BARTYZEL, M. TEITLER and S. LEONHARDT, J. Med. Chem. 3...5.5 734-740 (1992).
38. D. HOYER, Trends. Pharmacol. Sci. 9 8 9 - 9 4 (1988). 39. D. HOYER, J. Recept. Res. 8 5 9 - 8 1 (1988). 40. K.D. MORTON, L.D. VAN de KAR, M.S. BROWNFIELD and C.L. BETHEA,
Neuroendoc r ino logy 5.._.0073-80 (1989). 41. M.H.I.I.I. ZINK, P.E. PERGOLA, J.F. DOANE, A.F. SVED and R.H. ALPER, J.
Cardiovasc. Pharmacol. 1.__551-9 (1990). 42. R.C. WEBB and P.M. VANHOUTTE, Serotonin and the Cardiovascular
System. Vanhoutte P.M. Ed. pp. 113-122, Raven Press, New York (1985).
43. T.E. MECCA and R.C. WEBB, Hypertension. 6 8 8 7 - 8 9 2 (1984).
Life Sciences, Vol. 53, pp. 1583-1589 Pergamon Press Printed in the USA
DETECTION AND EVALUATION OF PERSISTING STRESS-INDUCED HORMONAL DISTURBANCES BY A POST STRESS PROVOCATION TEST IN HUMANS
S. Porta, W. Emsenhuber, W. Petek, P. Purstner, W. H. Vogel* O. Schwaberger, P. Salwitsch and W. Korstako
Institute of Functional Pathology, Endocrinological Research Unit, University of Graz, Mozartgasse 14/2 A-8010 Graz, AUSTRIA
*Department of Pharmacology, Thomas Jefferson University Jefferson Medical College, Philadelphia, PA 19107, USA
(Received in final form September 13, 1993)
Summary
Eighteen healthy army officers were subjected after prolonged rest to exhaustive ergometric work for about 15 minutes. Before and afterwards blood was taken from the cannulated antecubital vein for determination of free and sulfoconjugated catecholamines, cortisol, glucose, and white blood cell count. One week later, the same procedure was repeated with the same subjects with the difference that the probands underwent about 2.5 hours of difficult mountain climbing and a subsequent rest of 1.5 hours before ergometry. The most important results were: 1) total and bound fractions of catecholamines showed some significant differences between the first and second ergometry due to the previous mountain climbing stress; 2) serum cortisol did not increase after the first ergometry but did so significantly after the second ergometry due to the previous stress; low cortisol is not always indicative of the absence of stress; 3) the absolute number of white blood cells increased in both situations, correlated significantly with the severity of the stress and the individual increases were more person than situation specific and; 4) blood glucose remained unaffected in both situations. We conclude that a previous stress experience can affect a second stress response and that such a post stress provocation test can uncover persistent hormonal alterations. This procedure may be useful for the evaluation of inaccessible stress situations from subsequent stress measures.
It is well known that exposure to any stressor causes a wide variety of biochemical, physiological and behavioral changes in animals and humans (1-5). However, most of these stress-induced changes have been studied and measured after longer periods of rest. In this study, we examined the effects of rest or a previous, severe stressor on the same subsequent stress test in order to evaluate the effects of rest or a previous stressor on a particular stress ex.perience. For this reason, eighteen human subjects were exposed to the same ergometry test twice; once after prolonged rest and once after strenuous mountain climbing with only a short rest period. We measured blood catecholamines (CA), cortisol (COR), glucose (GLU) and white blood cells (WBC) before and after the ergometry under both circumstances.
0024-3205/93 $6.00 + .00 Copyright © 1993 Pergamon Press Ltd All rights reserved.
1584 Persisting Stress-induced Hormonal Disturbances Vol. 53, No. 21, 1993
Material and Methods
Eighteen healthy Army Officers (average 28 to 33 years + 0.85 SEM, average weight 75.63 kg + 1.67 SEM) were tested in the barracks after routine duties and, later on, during their training for the army mountain guide examination. In the barracks, they were cannulated at about 12 o'clock by three cannulation teams and then told to relax half sitting half lying for 30 minutes. Afterwards, blood was obtained before and 5 min after cycle ergometry with electronic brakes (100 watts, with an increase of 50 watts every 3 minutes, until maximal workload was reached at 350 watts after about 15 minutes).
One week later, the candidates were tested again. In the moming, they were subjected to a 158 minute + 12 SEM exercise climbing in wet and difficult rock conditions (degree five to six of six possible degrees of difficulty) at an altitude of about 1650 m. After one hour of rest in a mountain cabin, they were cannulated at noon and relaxed again for 30 rain. Blood was taken, the same ergometric test was performed and a post stress blood was obtained.
Blood was always taken in separate tubes for determination of CA, COR GLU and WBC. Free CA (epinephrine -E, norepinephrine - NE and dopamine -DA) were determined after liquid- purification (1) by using HPLC, with a Beckman Ultrasphere XL ODS column and a Beckman Gold System R coupled to a BAS LC-4B electrochemical detector. To determine the bound (sulfatized) fraction, an aliquot of the sample was incubated with sulfatase in neutral milieu (2) and then assayed as described above. Serum COR was measured with an Abbott TDXR assay and the WBC count was performed with a Coulter Counter S - +IV R.
Data were collected i n a MS-Works R data bank, and statistical analyses were made with an IBM - PS2/50R computer using commercial ISI R software and final documentation by Harvard Graphics R software. Test used were paired T- tests and linear regression analyses.
Resulk~
Blood GLU levels were slightly but not significantly higher in the mountains (85.05 mg/dl + 5.89 SEM) than in the barracks (77.94 mg/dl 3.81 + SEM). Also, only small, insignificant increases could be seen after both ergometric tests (87.77 mg/dl + 5.09 SEM, and 79.77 mg/dl __. 5.48 SEM, respectively).
Plasma CA values are shown in Table 1.
Total or bound DA did not change but free DA increased after each ergometry test. Free NE increased during both tests but total NE increased only during the first test. In addition, total NE was higher before and after the second test as compared to the first test. Free bound and total E did not increase during ergometry but, free and total NE were higher after the second test as compared to the first test.
Fifteen minutes of exhaustive ergometry did not increase serum cortisol values after rest in the barracks (Fig. 1). After mountain climbing, values before the second ergometry were lower than in the barracks. Unlike the situation in the barracks, however, ergometric excercise in the mountains led to a twofold, highly significant increase in serum COR.
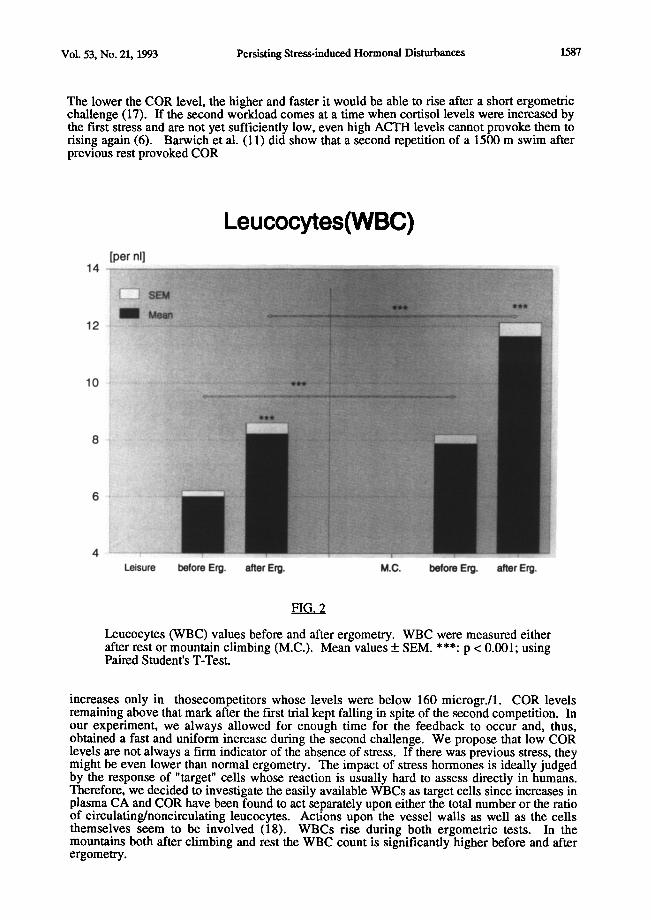
Figure 2 shows that the number of WBCs per nl increased after the first ergometry from about 6 to more than 8 ( p < 0.001). In the mountains, they were higher and increased during the second ergometry from about 8 to 12 ( p < 0.001).
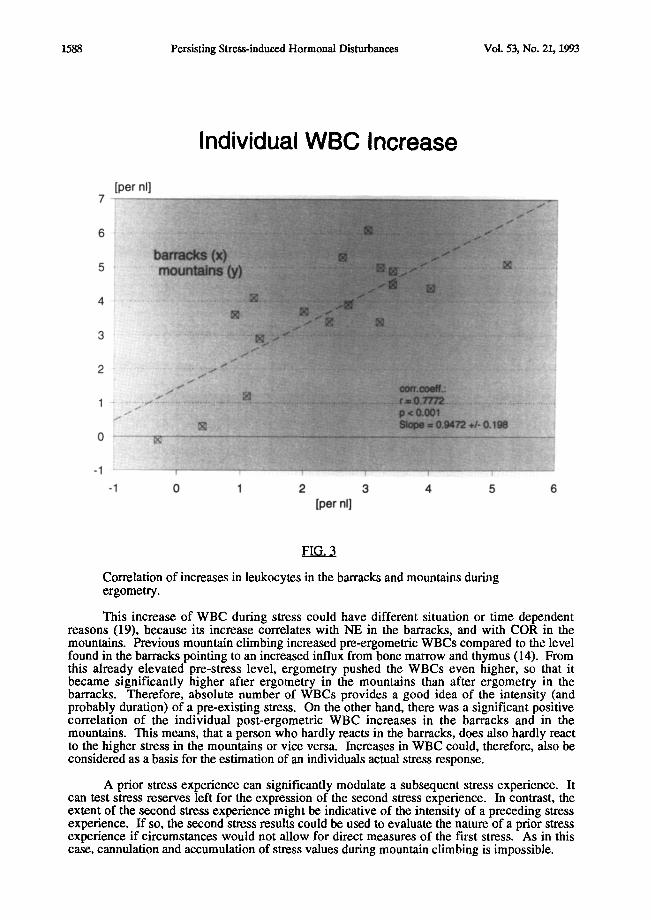
Correlation of the individual increases of WBCs in the barracks (first week) versus the mountains (second week) showed a high correlation; probands whose WBCs were

Vol. 53, No. 21, 1993 Persisting Stress-induced Hormonal Disturbances 1585
markedly increased by ergometry in the barracks also showed marked increases in the mountains and a weak response in the barracks was always followed by a less pronounced reaction in the mountains (Fig 3). WBC increases in the barracks correlated with COR increases in the mountains for the subjects (p < 0.01). No other correlations were observed among the parameters tested.
TABLE 1
CA before Ergo- after Ergo- before Ergo- after Ergo-
(n~ml) merry 1 m¢laT¢ - 1 m~ry_ 2 metrv 2
DA free 0.08+0.01 0.17+0.03" 0.08+0.01 0.235:0.03*
DA bound 4.62 5:0.59 3.70 5:0.49 4.00 5:0.51
0.69 5:0.47
DA total 4.70 5:0.59 3.87 5:0.49 4.08 -+ 0.51
4.1_5:0.43
NEfree 0.345:0.04 1.21+0.15" 0.425:0.04 1.30_+ 0.20*
NE bound 0.71 5:0.12 1.06 _+ 0.26 1.35 5:0.27
1.65 5:0.29
NE total 0.96 + 0.12 1.85 + 0.25* 1.70 + 0.28** 2.86 _+ 0.36***
E free 0.12 5:0.02 0.14 + 0.01 0.15 5:0.03 0.16 _+ 0.02***
E bound 0.28 5:0.05 0.25 + 0.04 0.28 + 0.04 0.34 5:0.05
E total 0.33 _+ 0.04 0.32 _+ 0.04 0.40 5:0.04 0.47 + 0.05***
Values represent mean values 5: SEM of 18 subjects. * p < 0.05 (before to after ergometry) ** p < 0.05 (before 1st ergometry to before 2nd ergometry) *** p < 0.05 (after 1st ergometry to after 2nd ergometry)
Discussion
Our data show that the results of a particular stress test (in this case ergometry) depend very much on the previous experience of the individual (in this case prolonged rest compared to exhaustive physical and emotional stress of dangerous mountain climbing).
Two ergometric tests were performed with the same individuals and their effects on the homeostasis of GLU, CAs, COR and WBCs were measured. The first test was preceded by rest and the second test by exhaustive mountain climbing. There was a one week interval between both tests. It is assumed that the intense nature of mountain climbing before the second test overrides daily variations experienced during this one week interval and that only mountain climbing causes the effects seen on the second ergometric test.
Ergometry did not affect GLU levels both in the barracks and in the mountains. CA were affected but the effects were only seen in total amounts or in certain fractions. Free DA and NE increased in the barracks and in the mountains whereas total NE increased only in the barracks. However, total NE and E and free E were mostly higher in the mountains. These findings are in general agreement with other studies (7,8,9,10,11,12,13). Total NE, even 1.5 hours after cessation of the climbing, was still elevated over the corresponding values in the barracks. This could be due to an increased uptake of NE during the hours of mountain climbing into the bound fraction (13, 14) and its longer half-life (12, 15, 16). While free NE seems to be a good

1586 Persisting Stress-induced Hormonal Disturbances Vol. 53, No. 21, 1993
indicator of the intensity of stress in the immediate past, bound NE seems to depict the relative baseline level on which such an event happens. Taking these two results together, one may obtain a fairly accurate picture of both the underlying and the superimposed stresses. Moreover, it is possible bound CA could probably revert back to the free form in the blood stream constituting a potential CA surge depending upon the amount of CA bound (12, 13,). The behavior of free DA after exercise is also not clear (11, 12, 13, 14). In our case, a distinct, and in the mountains an even more pronounced, increase after the standard workload
Cortisol [ug/lOOml]
26
22
18
14
l o . . . . '
Leisure before Erg. after Erg. M.C. I~fom Erg. after EN.
Serum Cortisol Values before and after Ergometry. Cortisol was determined either after rest or mountain climbing (M.C.). Mean Values + SEM. *: p < 0.05; ***: p < 0.001.
was seen, together with a slight fall in bound DA. It is tempting to speculate that the increased free DA is liberated from the bound fraction.
The major difference was seen with COR. Surprisingly, COR could be provoked by 15 minute ergometry only after mountain climbing and subsequent rest. In the barracks, the same ergometry did not increase COR levels at all. However, the easily provoked COR level in the mountains was significantly lower in the barracks. Probably, the COR concentration during the three hours of difficult mountain climbing must have been rather high and therefore was subsequently reduced to low values through its negative feedback mechanism.
Vol. 53, No. 21, 1993 Persisting Stress-induced Hormonal Disturbances 1587
The lower the COR level, the higher and faster it would be able to rise after a short ergometric challenge (17). If the second workload comes at a time when cortisol levels were increased by the first stress and are not yet sufficiently low, even high ACTH levels cannot provoke them to rising again (6). Barwich et al. (11) did show that a second repetition of a 1500 m swim after previous rest provoked COR
Leucocytes(WBC) [per nl]
14
12
10
~i!~i~iliiii!iiii
Leisure before Erg. after Erg. M.C. before Erg. after Erg.
FIG. 2
l_~ucocytes (WBC) values before and after ergometry. WBC were measured either after rest or mountain climbing (M.C.). Mean values _+ SEM. ***: p < 0.001; using Paired Student's T-Test.
increases only in thosecompetitors whose levels were below 160 microgr./1. COR levels remaining above that mark after the first trial kept falling in spite of the second competition. In our experiment, we always allowed for enough time for the feedback to occur and, thus, obtained a fast and uniform increase during the second challenge. We propose that low COR levels are not always a firm indicator of the absence of stress. If there was previous stress, they might be even lower than normal ergometry. The impact of stress hormones is ideally judged by the response of "target" cells whose reaction is usually hard to assess directly in humans. Therefore, we decided to investigate the easily available WBCs as target cells since increases in plasma CA and COR have been found to act separately upon either the total number or the ratio of circulating/noncirculating leucocytes. Actions upon the vessel walls as well as the cells themselves seem to be involved (18). WBCs rise during both ergometric tests. In the mountains both after climbing and rest the WBC count is significantly higher before and after ¢rgometry.
1588 Persisting Stress-induced Hormonal Disturbances Vol. 53, No. 21, 1993
Individual WBC Increase [per nl]
" i
6
5
3 :
1
0 ~ !i ii ii
- 1 ! i
-1 0 1 2 3 4 5 6 [per hi]
FIG. 3
Correlation of increases in leukocytes in the barracks and mountains during ergometry.
This increase of WBC during stress could have different situation or time dependent reasons (19), because its increase correlates with NE in the barracks, and with COR in the mountains. Previous mountain climbing increased pre-ergometric WBCs compared to the level found in the barracks pointing to an increased influx from bone marrow and thymus (14). From this already elevated pre-stress level, ergometry pushed the WBCs even higher, so that it became significantly higher after ergometry in the mountains than after ergometry in the barracks. Therefore, absolute number of WBCs provides a good idea of the intensity (and probably duration) of a pre-existing stress. On the other hand, there was a significant positive correlation of the individual post-ergometric WBC increases in the barracks and in the mountains. This means, that a person who hardly reacts in the barracks, does also hardly react to the higher stress in the mountains or vice versa. Increases in WBC could, therefore, also be considered as a basis for the estimation of an individuals actual stress response.
A prior stress experience can significantly modulate a subsequent stress experience. It can test stress reserves left for the expression of the second stress experience. In contrast, the extent of the second stress experience might be indicative of the intensity of a preceding stress experience. If so, the second stress results could be used to evaluate the nature of a prior stress experience if circumstances would not allow for direct measures of the first stress. As in this case, cannulation and accumulation of stress values during mountain climbing is impossible.

Vol. 53, No. 21, 1993 Persisting Stress-induced Hormonal Disturbances 1589
However, ergometry following mountain climbing in contrast to prolonged rest could be used to evaluate the stress of mountain climbing in these individuals.
In summary, to estimate the impact of repeated stress experiences, it seems practical to use both COR and free and total CA as parameters. To obtain an idea of both the underlying and superimposed stresses, the actually induced increases of both free and total CA as well as COR should be used. The increase in WBCs seems to be dependent on the severity of a specific stress but also on a particular individual; the latter can be used as a predictive test for an individual's response to stress. The correlation of all these stress data might allow to estimate the intensity of a previous, stressful situation which is not accessible to direct measurements.
Acknowledgements
The authors gratefully acknowledge the generous support and cooperation of the Austrian Armed Forces. They are especially grateful to Div. General Felber and Lieut. Col. Schackl.
References
1. F.A.J. VAN DER HORN, F. BOOMSMA, A.J. MAN IN'T VELD and M.A.D.H. SCHALEKAMP, J. Chrom. 48717-28 (1989).
2. G.A. JOHNSON, C.A. BAKER and R.T. SMITH, Life Sci. 26 1591-1598. (1980).
3. D. RATGE, A. GEHRKE, I. MELZNER and H. WISSER, Clin. Exper. Pharmacol. Physiol. 13 543- 553 (1986).
4. H. WEICKER, In: Training und Sport zur Pr~ivention und Rehabilitation in der technischen Umwelt, Ed.: I.W. Franz, H. Mellerowicz, W. Noack, pp 42-50, Springer Ver lag, Berlin, Heidelberg, New York (1985).
5. S. PORTA, W. EMSENHUBER, P. FELSNER, K. SCHAUENSTEIN and S. SUPANZ, Life Sci. 45 1763-1769 (1989).
6. J. ODIN K, E.J. VAN DER BEEK, H. VAN DEN BERG, J.J.P. BOGAARDS and J.T.N.M. THISSEN, Int. J. Sports Med. 7 352-357 (1986):.
7. T. LENZ, M. WEIB, E. WERLE, U. WALZ, U. KO HLER, J. PINTHER and H. WEICKER, Int. J. Sports Med. 9 125-131 (1988).
8. O. KUCHEL and N.T. BUU, In: Norepinephrine, Ed.: M.G. Ziegler, C.R. Lake pp 250- 270, Williams and Wilkins, Baltimore (1984).
9. R.S. SNIDER AND O. KUCHEL, Endocr. Rev., 4 291-309 (1983). 10. M. SAGNOL, J. CLAUSTRE, J.M. COTTET-EMARD, J.M. PEQUIGNOT, N.
FELLMANN, J. COUDERT and L. PEYRIN, Eur. J. Appl. Physiol., 60 91-97 (1990). 11. D. BARWICH, M. WEIB and H. WEICKER, In: Training und Sport zur Pravention und
Rehabilitation in der technischen Umwelt, Ed.: I.W. Franz, H. Mellerowicz, W. Noack, pp 481-486, Springer Ver lag, Berlin, Heidelberg, New York (1985).
12. D.A. MCCARTHY and M.M. DALE, Sports-Med., 6 333-363 (1988). 13. M. LEHMANN, E. JAKOB, U. SPORI, E. BERGDOLT and J. KEUL, Z. Kardiol. 74 32-
38 (1975). 14. M.S. SOTHMANN, A.B. GUSTAFSON and M. CHANDLER, J. Appl. Physiol. 63 (2)
654-568 (1987). 15. D.C. DALE, A.S. FAUCI, D-P. GUERRY and S.M. WOLFF, J. Clin. Invest., 56 808-813
(1975). 16. G.W. LIDDLE, In: Textbook of Endocrinology, Ed.: R.H. Williams pp 249-292, Press of
W.B. Sounders Company, Philadelphia, London, Toronto, Mexico City, Rio de Janeiro, Sydney, Tokyo (1981).

Life Sciences, Vol. 53, pp. 1591-1596 Pergamon Press Printed in the USA
S U P P R E S S I V E E F F E C T O F S O Y B E A N M I L K P R O T E I N O N E X P E R I M E N T A L L Y I N D U C E D S K I N T U M O R I N M I C E
Porn-ngarm Limtrakul ~, Maitree Suttajit l, Rie Semura, 2 Katsumasa Shimada 2 and Shigeru Yamamoto 2
~Faculty of Medicine, Chiang Mai University, Chiang Mai, Thailand. 2School of Health Sciences and Research Center of Comprehensive Medicine,
Faculty of Medicine, University of the Ryukyus, Nishihara, Okinawa, Japan.
(Received in final form September 13, 1993)
S u m m a r y
We studied the effect of soybean milk protein (SMP) in a two-stage carcinogenesis experiment on mouse skin. Mice were given soybean protein isolate (SPI) diet or SPI diet supplemented with SMP. After 4 weeks on the diets, the mice were shaved and a tumor initiator was applied. A tumor promoter was then applied twice a week on the same area of the skin throughout the experiment. After 20 weeks on the treatment, the percentage of tumor-bearing mice and the volume of tumor tended to be lower in the mice on the SMP diet than those on the SPI diet. The number of tumor was also significantly lower in the former group as compared to the latter group. There was no difference in growth between mice of the SPI and SMP groups. The results indicate the safety and the anti-carcinogenic effect of SMP in mice.
Soybean milk protein (SMP) which is 7-8% of total soybean protein consists of trypsin- inhibitor (protease inhibitor), hemaglutinin, goitrogen, lipooxygenase, 13-amylase, protease, phytase and other physiologically active substances (1). Trypsin inhibitor inhibits trypsin and hemaglutinin impairs intestinal mucosal cells and therefore SMP has been considered to be unfavorable "anti-nutrients" (1). However, protease inhibitors occurring in soybeans and from other sources have been identified as chemopreventive agents. Troll (2) observed the anti-breast cancer effect of raw whole soybean in rats. Becker et al. (3) have reported that liver cancer which was observed in 100% mice on 26% casein diet, disappeared when 5% of the casein was substituted with whole soybean protein. Various proteinase inhibitors added in diets (4-6) and water (7) or applied on animal skin (8) have anti-carcinogenic effects. Rats that have cancer are also known to have high serum proteinase inhibitors (9). The anti-carcinogenic effect of various protease inhibitors have been reviewed (10,11). These findings suggest that SMP has anti- carcinogenic effect. However during the process of the isolation of soybean protein, defatted soybean was first treated with alkaline solution and then acid solution. SPI is in the precipitate and SMP is in the supernatant of the solution. Therefore it is not clear whether there are similar anti- carcinogenic effect in SMP as in raw whole soybean or in extracted specific proteinase inhibitors.
0024-3205/93 $6.00 + .00 Copyright © 1993 Pergamon Press Ltd All rights reserved.
1592 Anti-carcinogenic Effect of Soybean Milk Protein Vol. 53, No. 21, 1993
There have been reports on the unfavorable effects of soybean trypsin inhibitor for health. Major problem is the inhibition of trypsin in intestine (1). Carcinogenic factor has also been reported. Rats maintained on diets containing trypsin inhibitor have been observed to be susceptible to pancreatic cancer (12,13). However, some researchers have reported that such effects can not be observed even with relatively high amount of trypsin inhibitor in man (14), monkey (15), dog (16,17), cow (18), pig (19), mouse (2,6) and rat (20).
In this study we tried to find whether there is an anti-tumor effect of SMP within the safe level of intake in mice, for the purpose of finding out proper utilization of SMP which is now practically discarded.
Materials and Methods
Twenty-eight male ICR mice, 4-5 weeks old, were obtained from the Animal House, Chiang Mai University, Chiang Mai, Thailand. The mice were divided into two groups and fed 20% SPI (donated by Fuji Oil Co., Osaka, Japan) diet (n=13) or 18% SPI diet supplemented with 2% SMP (donated by Fuji Oil Co., Osaka, Japan)(n=15). The SMP was prepared by the following method. Defatted soybean milk (pH 4.5) was centrifuged. The supernatant was neutralized and concentrated 20 times by ultrafiltration (MW=40,000) and then dried by spray- dryer. Other components of the diets were: 44.4% a -starch, 22.2% sucrose, 5% soybean oil, 5% mineral mixture (Oriental Yeast Co., Osaka, Japan), 1% vitamin mixture (Oriental Yeast Co., Osaka, Japan), 2% cellulose and 0.4% DL-methionine. Details of the vitamin and mineral mixtures are shown elsewhere (21).
Four weeks after the onset of the diets, two stage carcinogenesis experiment on mouse skin was performed. The back of the mice were shaved and carcinogenesis was initiated by a single application of 100/1 g of 7-12 dimethylbenzanthracene (DMBA) dissolved in 0. lml of acetone to the skin of the back. From 1 week after the initiator application, tumor promoter, 2.5 /1 g of 12-0-tetradecanoylphorbol-13-acetate (TPA) dissolved in 0. lml of acetone was applied to the same areas on the mice, twice a week. The hairs which appear on the shaved part were cut by surgical scissors every 2 weeks. The numbers of tumors Imm or more in diameter were counted weekly. Tumor promoting activity was evaluated by the percentage of tumor- bearing mice and the average number and the volume of tumors per mouse. The number of tumors on each animal was recorded once a week by a vernier caliper and the average tumor volume was calculated as [length] x [width] x [height] 7r/6. Food intake and body weight were measured weekly.
The data were analyzed by chi-square test and Student's t-test.
R e s u l t s
Fig. 1 shows the changes in body weight. Final figures of the two groups are shown in parentheses. They were not significantly different (p>0.05).
Fig. 2 shows the percentage of tumor-bearing mice. After 20 weeks on the treatment all the mice of SPI group had tumors, while 67% of the animals of the SMP group had tumors.

Vol. 53, No. 21, 1993 Anti-carcinogenic Effect of Soybean Milk Protein 1593
However the values were not significantly different (p>O.05).
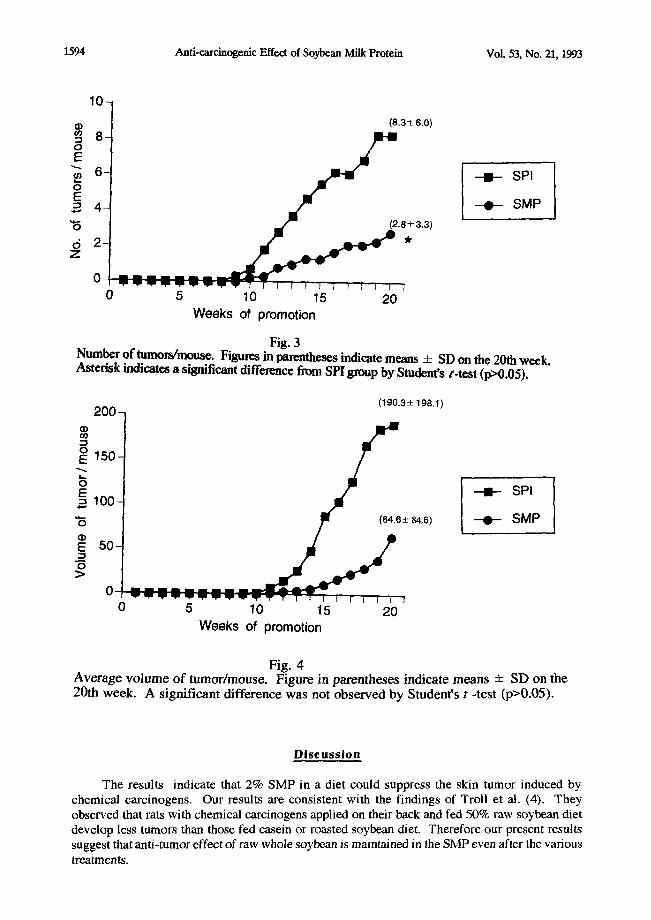
Fig. 3 shows the number of tumors per mouse. Final figures are shown in parentheses. The number was significantly lower in the whey group than in the SPI group (p<0.05).
Fig. 4 shows average volume of tumors per mouse. The final figures are shown in the parentheses. Although the average was much lower in the whey group than in the SPI group, statistical difference was not observed (p>0.05).
4 6 - (43.8 ± 4.4)
4 4 -
, ~ 4 2 - - - ! - - SP l
4o- ,.,'t/t.8±,.,) - . - SMP 3 8 -
> , 36 - o m 3 4 -
3 2 -
30 l ] I p I I ~ I r J r ] J I I I r I I r I 0 5 10 15 20
W e e k s of p r o m o t i o n
Fig. i Changes in body weight. Figures in parentheses indicate means + SD on the 20th week. A significant difference was not observed by Student's/ '-test (p>0.05).
1 0 0 -
80
~ 60 - - I E - SPI ¢.-
-~ - - - 0 - S M P 40
0 5 10 15 20
W e e k s of p r o m o t i o n
Fig. 2 Percentage o f tumor-bearing mice. The difference was not significant by chi-square test (p>0.05).
1594 Anti-carcinogenic Effect of Soybean Milk Protein Vol. 53, No. 21, 1993
10
(8.3 ± 6.0) • 8
6 ---I- SPI
- 0 - SMP
7°-" 2 " 6 0 " ~ ±3'31~" 0 5 10 15 20
Weeks of promotion
Fig. 3 Number of tumors/mouse. Figures in parentheses indicate means _+ SD on the 20th wceL Asterisk indicates a significant difference from SPI group by Student's t-test (p>0.05).
200- (190.3± 198.1)
~ 150
,oo- t . , --- 0 (84.8_+ 84.6) - - 0 - S M P
0
0 5 10 15 20 Weeks of promotion
Fig. 4 Average volume of tumor~mouse. Figure in parentheses indicate means ± SD on the 20th week. A significant difference was not observed by Student's t -test (p>0.05).
D i s c u s s i o n
The results indicate that 2% SMP in a diet could suppress the skin tumor induced by chemical carcinogens. Our results are consistent with the findings of Troll et al. (4). They observed that rats with chemical carcinogens applied on their back and fed 50% raw soybean diet develop less tumors than those fed casein or roasted soybean diet. Therefore our present results suggest that anti-tumor effect of raw whole soybean is maintained in the SMP even after the various treatments.

Vol. 53, No. 21, 1993 Anti-carclnogenic Effect of Soybean Milk Protein 1595
The addition of SMP did not impair normal growth and development as evidenced by body weight gain and food intake, although trypsin inhibitor of SNIP is regarded as an unfavorable substance and discarded as a waste product of SPI processing. Troll et al. (2) have shown that the growth of rats fed 50% raw soybean diet is similar as those fed a commercial diet. Clair et al. (6) have also reported that mice fed diets containing 0.5% pure proteinase inhibitor obtained from soybean for 65 days had similar body weight gain in comparison to those fed a commercial diet and had no hypertrophy or cancer in pancreas. No unfavorable effects of trypsin inhibitor have been reported in man (14), monkey (15), dog (16,17), cow (18) and pig (19). Even in the research of Gumbmann (13) who tried to show the carcinogenic effect of trypsin inhibitor on pancreas, body weight changes of mice fed diets containing 0, 0.1, 0.2, 0.3 or 0.6% trypsin inhibitor were similar throughout the experimental period (15 months).
Based on these results we can speculate that SMP can be beneficial as an anti-carcinogenic food or medicine. We are further studying the effect of SMP on histopathlogy of various internal organs.
R e f e r e n c e s
1) I .R. LIENER, Am. J. Clin. Nutr. 1..A_1281-298 (1962). 2) W. TROLL, R. WIESNER, C.J. SHELLABARGER, S. HOLTZMAN and
J. P. STONE, Carcinogenesis 1469-472 (1980). 3) E E BECKER, Carcinogenesis 21213-1214 (1981). 4) W. TROLL, S. BELMAN, R. WlESNER and C. J. SHELLABARGER,
Biologica Functions of Proteinases, in Z. Holzer, and H. Tschesche (Eds.), 165-170, Springer-Verlag, Berlin (1979).
5) J. YAVELOW, T.H. FINLA¥, A.R. KENNEDY and W. TROLL, Cancer Research 4._~3 2454s-2459s (1983).
6) W.H. CLAIR, P.C. BILLINGS, J.A. CAREW, K, McGANDY, P. NEWBERN and A.R. KENNEDY, Cancer Research 50580-586 (1990).
7) J.G. CORASANTI, G.H. HOBIKA and G. MARKUS, Science 2161020-1021 (1982). 8) W. TROLL, A. KLASSEN andA.JANOFF, Science 1691211-1213 (1970). 9) Y. KONDO and N. OHSAWA, Cancer Research 4..~21549-1554 (1982). 10) W. TROLL, K. FRENKEL and R. WIESNER, J.N.C.I. 7 1245-1250 (1984). l l ) EP. SCHELP and P. PONGPAEW, Int. J. Epidemiol. 1_.~7287-292 (1988). 12) E.E. MaGUINNESS, R.G. MORGAN, D.A. LEVISION, D.L. FRAPE, D. HOPWOOD
and K.G. WORMSLEY, Scand. J. Gastroenterol. 15497-502 (1980). 13) M.R. GUMBMANN, W.L. SPANGLER, G.M. DUGAN, J.J. RACK/S, and
I.E. LIENER, Qual. Plant. Plant Foods Hum. Nutr. 3__55 275-314 (1985). 14) D.E FLAVIN, Vet. Hum. Toxicol. 2._4_4 25-28 (1982). 15) L.M. AUSMAN, J.P. HARWOOD, N.W. KING, P.K. SEHGAL, R.J. NICOLOSI,
M.D. HEGSTED, I.E. LIENER, D. DONATUCCI and J. TARCZA, J. Nutr. 115 1691-1701 (1985).
16) J.R. PATTERN, E.A. RICHARDS and J. WHEELER, Proc. Soc. Exp. Biol. Med. 1 3 7 5 8 (1971).
17) J.R. PATTERN, E.A. RICHARDS and .1. WHEELER, Life Sci. 1_.9_0145-150 (1971). 18) A.D.L. GORRILL, and J.W. THOMAS, J. Nutr. 9._2_2 215-223 (1967). 19) R.D. HOOKS, V.W. HAYS, V.C. SPEER and J.E McCALL, Fed. Proc. Am. Soc.
Exp. Biol. 2 4 8 9 4 (1965)
1596 Anti-carcinogenic Effect of Soybean Milk Protein Vol. 53, No. 21, 1993
20) K. KISHI, S. TERAI, S. OOGURI, F. SHIZUKA, S. YAMAMOTO and G. INOUE, Nutr. Sci. Soy Prot. 7_ 47-52 (1986) (in Japanese).
21) S. YAMAMOTO, T. KOHRIN, M. MORI, L. ASATO, S. SHINJO, J. NAGAMINE and M.E WANG, J. Nutr. Biochcm. 3_ 279-284 (1992).

Life Sciences, Vol. 53, pp. 1597-1604 Pergamon Press Printed in the USA
DETERMINATION OF PLASMA VOLUME WITH INDOCYANINE GREEN IN MAN
M. Hailer, C. Akbulut, H. Brechtelsbauer, W. Fett, J. Briegel, U. Finsterer, and K. Peter
Departments of Anesthesiology and Physiology, Ludwig-Maximilians-University, D 81366 Mtinchen, Federal Republic of Germany
(Received in final form September 13, 1993)
Summary
We investigated the feasibility of using indocyanine green (ICG) for plasma volume (PV) determination in man. Duplicate PV measurements were carried out in 23 healthy subjects to test repeatability. ICG (0.25 mg/kg) was injected intravenously into one arm and venous blood was withdrawn from the opposite arm. Optical density of plasma samples from minute 3 to 9 was measured in a densitometer. ICG concentration at injection time was determined by monoexponentiai extrapolation. The mean (SD) difference (MD) was -23 ml (183) or -0.6% (5.7%). Linear regression revealed PV2=0.92.PV1+226 (r=0.92). The PV values corresponded well with data from other studies. In 26 surgical patients PV was determined using two methods: 1) the same as in healthy subjects and 2) using a modification of this method in whole blood (PVB). For PVB measurement blood was drawn through a cuvette-densitometer from an arterial line. Calculations were the same as in PV determination except for the use of hematocrit to achieve plasma concentrations of ICG from whole blood. In patients MD were -53 ml (144) or -1.3% (4.3) for PV and -19 ml (161) or -0.3% (5.1) for PVB. Comparing PVB and PV revealed MD = -113 ml (149) or -3.3% (4.2). The whole blood method is easier to perform and reduces blood waste to almost zero. In conclusion, ICG is a suitable tracer for PV determination.
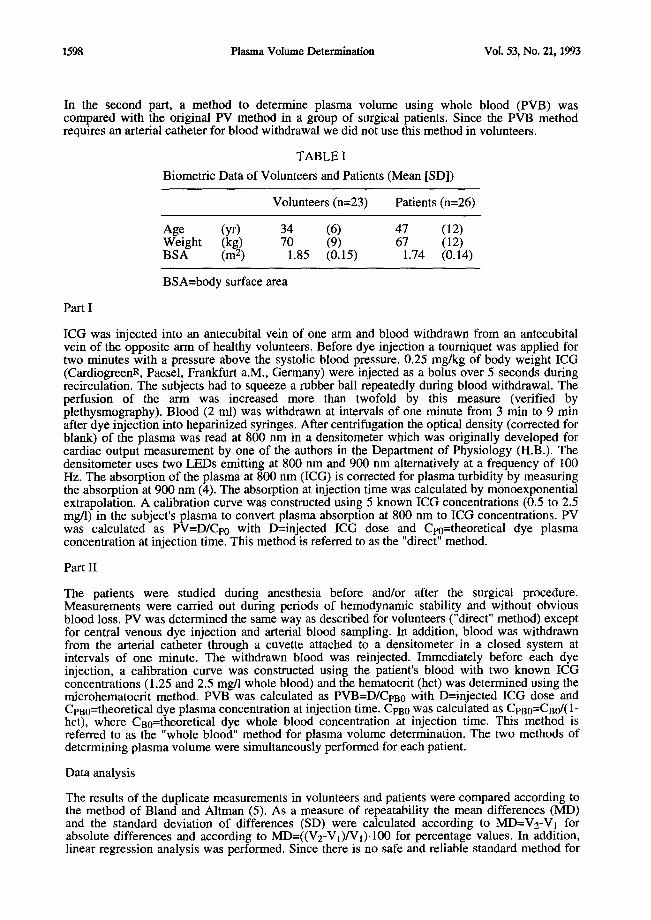
The importance of determining circulating blood, plasma, and red cell volume in critically ill patients and in research is unchallenged. Until recently, the tracers most commonly used were Evans blue (EB) and radioactively labelled serum albumin (RIHSA) for plasma volume (PV) and radiochromium labelled red cells for red cell volume. However, the disadvantages of radioactive contamination and dye accumulation, especially in repeated measurements are obvious. In addition, recent in vitro studies revealed a possible mutagenic potential for EB (1,2). In 1968 Bradley and Barr (3) reported on blood volume measurements using indocyanine green (ICG) in a limited number of patients. Our study therefore systematically investigated the feasibility of using ICG as an alternative for PV determination in humans.
Methods
The study was approved by the Institutional Review Board, with all healthy volunteers and patients giving their informed consent. The measurements were carried out in 23 volunteers and 26 patients (for biometric data see table I). The volumes were determined twice with an interval of 30 min. The first part of the study consisted of the validation of PV determination in volunteers.
Dr. M. Hailer, Department of Anesthesiology, Ludwig-Maximilians-University of Munich, Klinikum Grosshadern, D 81366 Mtinchen, F.R. Germany
0024-3205/93 $6.00 + .00 Copyright © 1993 Pergamon Press Ltd All rights reserved.
1598 Plasma Volume Determination Vol. 53, No. 21, 1993
In the second part, a method to determine plasma volume using whole blood (PVB) was compared with the original PV method in a group of surgical patients. Since the PVB method requires an arterial catheter for blood withdrawal we did not use this method in volunteers.
TABLE I
Biometric Data of Volunteers and Patients (Mean [SD])
Volunteers (n=23) Patients (n=26)
Age (yr) 34 (6) 47 (12) Weight (kg) 70 (9) 67 (12) BSA (m 2) 1.85 (0.15) 1.74 (0.14)
BSA=body surface area
Part I
ICG was injected into an antecubital vein of one arm and blood withdrawn from an antecubital vein of the opposite arm of healthy volunteers. Before dye injection a tourniquet was applied for two minutes with a pressure above the systolic blood pressure. 0.25 mg/kg of body weight ICG (CardiogreenR, Paesel, Frankfurt a.M., Germany) were injected as a bolus over 5 seconds during recirculation. The subjects had to squeeze a rubber ball repeatedly during blood withdrawal. The perfusion of the arm was increased more than twofold by this measure (verified by plethysmography). Blood (2 ml) was withdrawn at intervals of one minute from 3 min to 9 min after dye injection into heparinized syringes. After centrifugation the optical density (corrected for blank) of the plasma was read at 800 nm in a densitometer which was originally developed for cardiac output measurement by one of the authors in the Department of Physiology (H.B.). The densitometer uses two LEDs emitting at 800 nm and 900 nm alternatively at a frequency of 100 Hz. The absorption of the plasma at 800 nm (ICG) is corrected for plasma turbidity by measuring the absorption at 900 nm (4). The absorption at injection time was calculated by monoexponential extrapolation. A calibration curve was constructed using 5 known ICG concentrations (0.5 to 2.5 mg/1) in the subject's plasma to convert plasma absorption at 800 nm to ICG concentrations. PV was calculated as PV=D/Cpo with D=injected ICG dose and Cp0=theoretical dye plasma concentration at injection time. This method is referred to as the "direct" method.
Part II
The patients were studied during anesthesia before and/or after the surgical procedure. Measurements were carried out during periods of hemodynamic stability and without obvious blood loss. PV was determined the same way as described for volunteers ("direct" method) except for central venous dye injection and arterial blood sampling. In addition, blood was withdrawn from the arterial catheter through a cuvette attached to a densitometer in a closed system at intervals of one minute. The withdrawn blood was reinjected. Immediately before each dye injection, a calibration curve was constructed using the patient's blood with two known ICG concentrations (1.25 and 2.5 mg/l whole blood) and the hematocrit (hct) was determined using the microhematocrit method. PVB was calculated as PVB=D/CpB0 with D=injected ICG dose and Cpa0=theoretical dye plasma concentration at injection time. CpB0 was calculated a s C p B 0 = C B 0 / ( 1 -
hct), where Ca0=theoretical dye whole blood concentration at injection time. This method is referred to as the "whole blood" method for plasma volume determination. The two methods of determining plasma volume were simultaneously performed for each patient.
Data analysis
The results of the duplicate measurements in volunteers and patients were compared according to the method of Bland and Altman (5). As a measure of repeatability the mean differences (MD) and the standard deviation of differences (SD) were calculated according to MD=V2-VI for absolute differences and according to MD--((V2-V1)/V1)'100 for percentage values. In addition, linear regression analysis was performed. Since there is no safe and reliable standard method for
Vol. 53, No. 21, 1993 Plasma Volume Determination 1599
PV determination the results of the measurements in volunteers were compared to data obtained from the literature to validate the method. Body surface area (BSA) was calculated according to Gehan and George (6). To validate the whole blood method (part II), PVB was compared to directly measured PV in patients. Data are expressed as mean (SD).
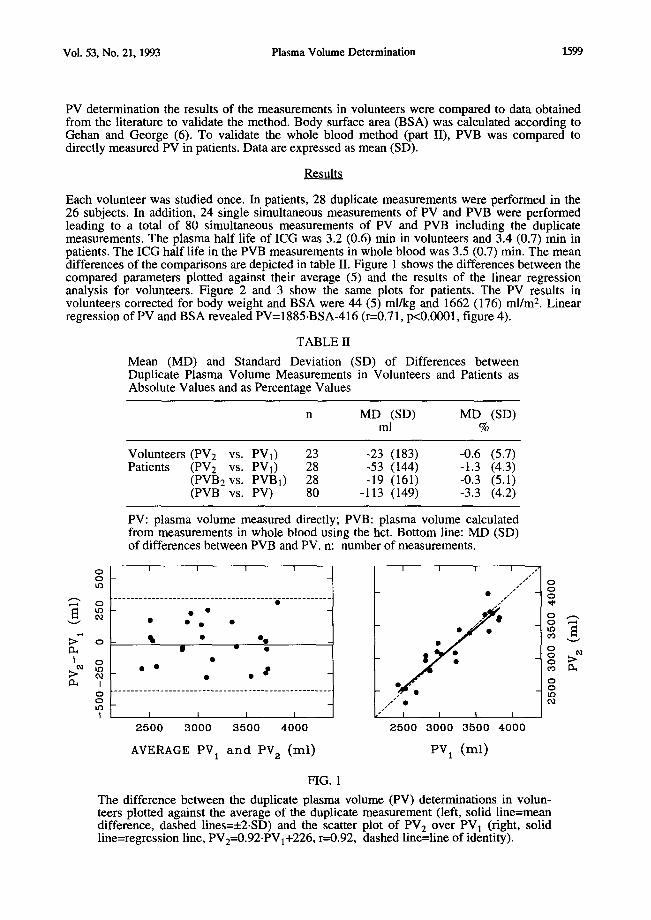
Results
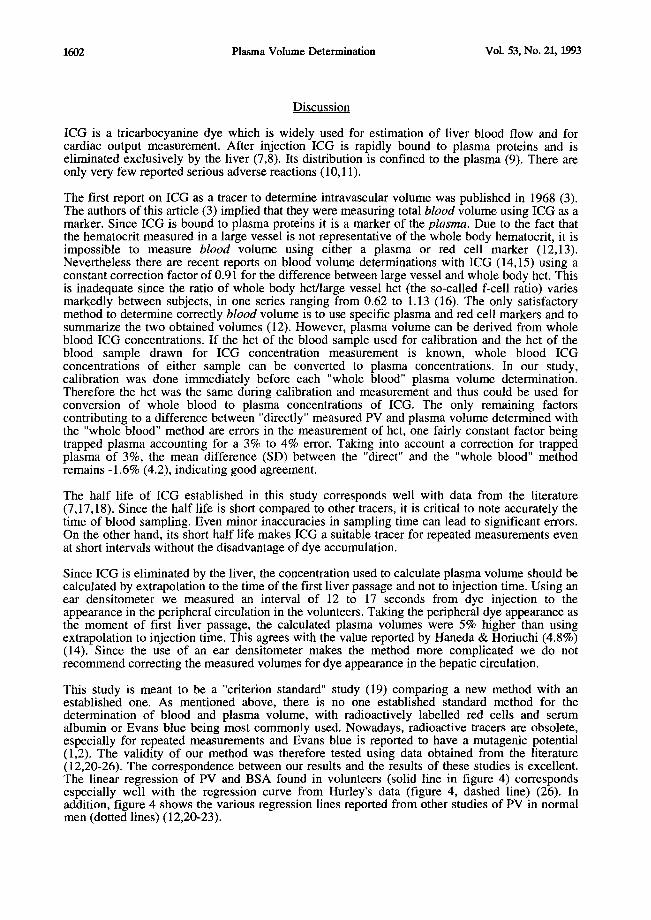
Each volunteer was studied once. In patients, 28 duplicate measurements were performed in the 26 subjects. In addition, 24 single simultaneous measurements of PV and PVB were performed leading to a total of 80 simultaneous measurements of PV and PVB including the duplicate measurements. The plasma half life of ICG was 3.2 (0.6) min in volunteers and 3.4 (0.7) min in patients. The ICG half life in the PVB measurements in whole blood was 3.5 (0.7) min. The mean differences of the comparisons are depicted in table II. Figure 1 shows the differences between the compared parameters plotted against their average (5) and the results of the linear regression analysis for volunteers. Figure 2 and 3 show the same plots for patients. The PV results in volunteers corrected for body weight and BSA were 44 (5) ml/kg and 1662 (176) ml/m 2. Linear regression of PV and BSA revealed PV= 1 8 8 5 . B S A - 4 1 6 (r=0.71, p<0.0001, figure 4).
TABLE II
Mean (MD) and Standard Deviation (SD) of Differences between Duplicate Plasma Volume Measurements in Volunteers and Patients as Absolute Values and as Percentage Values
n MD (SD) MD (SD) ml %
Volunteers (PV2 vs. PV1) 23 -23 (183) -0.6 (5.7) Patients (PV2 vs. PVI) 28 -53 (144) -1.3 (4.3)
(PVB2 vs. PVB1) 28 -19 (161) -0.3 (5.1) (PVB vs. PV) 80 -113 (149) -3.3 (4.2)
PV: plasma volume measured directly; PVB: plasma volume calculated from measurements in whole blood using the hct. Bottom line: MD (SD) of differences between PVB and PV. n: number of measurements.
0 I I I I •
tl~O / , / " O0
~" o . . . . . . . . . . . . . . . . . . . . . . . . . . . . . . . . . . . . . -~ . . . . . . . . . . . -~
>~ o • • o . • ; •
I • | •
I • • • . . . . . . . . . . . . . . . . . . . . . . . . . . . . . . . . . . . . . . . . . . . . . . . . . . o
I I I I I I
2500 3000 3500 4000 2500 3000 3500 4000
AVERAGE PV 1 a n d PV 2 (ml) PV 1 (rnl)
FIG. 1
The difference between the duplicate plasma volume (PV) determinations in volun- teers plotted against the average of the duplicate measurement (left, solid line=mean difference, dashed lines=_+2.SD) and the scatter plot of PV 2 over PV 1 (right, solid line=regression line, PV2=0.92.PVl+226, r=0.92, dashed line=line of identity).

1600 Plasma Volume Determinat ion Vol . 53, No . 21, 1993
°f ,o ° , ,
O - - - t o
I $ • • " cq
• • - ~ . . . . . . . . . . . . . . . . . . . . ." . . . . . . . . . . . . . . . . . . . . . l . . . . . . . . . . . . . . . . . . . . . . . . . . . O O t O
i I I I I 2 5 0 0 3 0 0 0 3 5 0 0 4 0 0 0
A V E R A G E P V B 1 a n d P V B 2 ( m l )
I J I I O
0 o • • ~ o • _~ o • • • o
I • • o °
~. ~ • . . •
I . . . . . . . . . . . . . . . . . . . . . . . . . . . . . . . . . . . . . . . . . . . . . . . . . . . . . . . . . . . . o _ . . . . . . . . . .
0
I I I I I 2 5 0 0 3 0 0 0 3 5 0 0 4 0 0 0
A V E R A G E P V 1 a n d P V 2 ( m l )
O O t O
O~ . . . . . . . . . . . . . . . . . . . . . . . . . . . . . . . . . . . . . . . . . . . . . o . L . . . . . . . . . . . . . . . . . . . . . . . .
~ ° " - ' - : o " . • S . ° o . . •
ml • . o % ~ ° o • • " o O o • o • ego •
~1 • oOoo ~ • ~ • -
o . . . . . . . . . . . . . . . . . . . . . . _*_*_ . . . . . . . . . . . . . . . . . . . _**_ . . . . . _ ~ . . . _ * _ . . . . . . . . . . . . . O tO
I I I I 2 5 0 0 3 0 0 0 3 5 0 0 4 0 0 0
A V E R A G E P V B a n d P V ( m l )
H G . 2
Differences between duplicate plasma volume determinations using the whole blood method (PVB], PVB2, top) and the direct method (PV], PV2, middle) in patients plotted against the average of the duplicate measurements (5). The bottom graph shows the difference between the PVB values and the directly measured PV values plotted in the same way. The solid lines represent the mean differences, the dashed lines __2-SD of the differences.
Vol. 53, No. 21, 1993 Plasma Volume Determination 1601
I I I I / /
o° PVBz=O.88 PVBl+376 /.../"
- r = 0 . 9 4 ".~'" -
~ -- 0 / / • --
oo n=e8 0 - ~ •
o o _ .,,,~/. r
~'5"'" /"
// J I I I
2500 3000 3500 4000 PVB l (ml)
I I I I / / ' i
PV2=0.88 PVI+331 .~.'" ]
o ° o °° - r = 0 . 9 6 J .
* "'" n = 2 8
°° 1 / / I i ] I |
2500 3000 3500 4000 PV 1 (ml )
I I I I / / [
o _ P v B = 0 . a 7 P v + 3 o 8 .." j
o r = 0 9 8 ,'" " ~ ] . !
o ° .... / n=80
o/I / " I I I I
2500 3000 3500 4000 PV (ml )
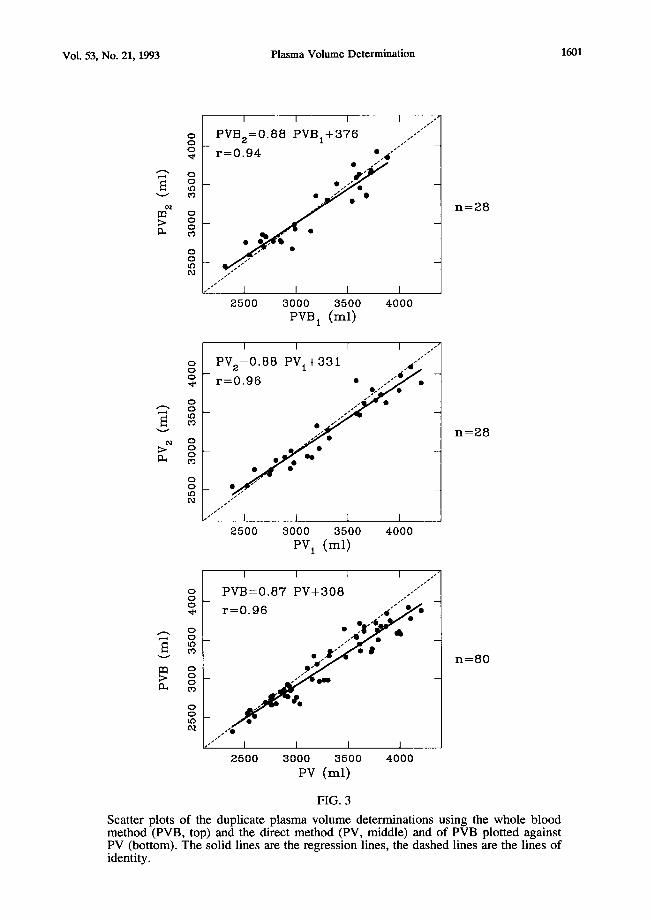
FIG. 3
Scatter plots of the duplicate plasma volume determinations using the whole blood method (PVB, top) and the direct method (PV, middle) and of PVB plotted against PV (bottom). The solid lines are the regression lines, the dashed lines are the lines of identity.
1602 Plasma Volume Determination Vol. 53, No. 21, 1993
Discussion
ICG is a tricarbocyanine dye which is widely used for estimation of liver blood flow and for cardiac output measurement. After injection ICG is rapidly bound to plasma proteins and is eliminated exclusively by the liver (7,8). Its distribution is confined to the plasma (9). There are only very few reported serious adverse reactions (10,11).
The first report on ICG as a tracer to determine intravascular volume was published in 1968 (3). The authors of this article (3) implied that they were measuring total blood volume using ICG as a marker. Since ICG is bound to plasma proteins it is a marker of the plasma. Due to the fact that the hematocrit measured in a large vessel is not representative of the whole body hematocrit, it is impossible to measure blood volume using either a plasma or red cell marker (12,13). Nevertheless there are recent reports on blood volume determinations with ICG (14,15) using a constant correction factor of 0.91 for the difference between large vessel and whole body hct. This is inadequate since the ratio of whole body hct/large vessel hct (the so-called f-cell ratio) varies markedly between subjects, in one series ranging from 0.62 to 1.13 (16). The only satisfactory method to determine correctly blood volume is to use specific plasma and red cell markers and to summarize the two obtained volumes (12). However, plasma volume can be derived from whole blood ICG concentrations. If the hct of the blood sample used for calibration and the hct of the blood sample drawn for ICG concentration measurement is known, whole blood ICG concentrations of either sample can be converted to plasma concentrations. In our study, calibration was done immediately before each "whole blood" plasma volume determination. Therefore the hct was the same during calibration and measurement and thus could be used for conversion of whole blood to plasma concentrations of ICG. The only remaining factors contributing to a difference between "directly" measured PV and plasma volume determined with the "whole blood" method are errors in the measurement of hct, one fairly constant factor being trapped plasma accounting for a 3% to 4% error. Taking into account a correction for trapped plasma of 3%, the mean difference (SD) between the "direct" and the "whole blood" method remains -1.6% (4.2), indicating good agreement.
The half life of ICG established in this study corresponds well with data from the literature (7,17,18). Since the half life is short compared to other tracers, it is critical to note accurately the time of blood sampling. Even minor inaccuracies in sampling time can lead to significant errors. On the other hand, its short half life makes ICG a suitable tracer for repeated measurements even at short intervals without the disadvantage of dye accumulation.
Since ICG is eliminated by the liver, the concentration used to calculate plasma volume should be calculated by extrapolation to the time of the first liver passage and not to injection time. Using an ear densitometer we measured an interval of 12 to 17 seconds from dye injection to the appearance in the peripheral circulation in the volunteers. Taking the peripheral dye appearance as the moment of first liver passage, the calculated plasma volumes were 5% higher than using extrapolation to injection time. This agrees with the value reported by Haneda & Horiuchi (4.8%) (14). Since the use of an ear densitometer makes the method more complicated we do not recommend correcting the measured volumes for dye appearance in the hepatic circulation.
This study is meant to be a "criterion standard" study (19) comparing a new method with an established one. As mentioned above, there is no one established standard method for the determination of blood and plasma volume, with radioactively labelled red cells and serum albumin or Evans blue being most commonly used. Nowadays, radioactive tracers are obsolete, especially for repeated measurements and Evans blue is reported to have a mutagenic potential (1,2). The validity of our method was therefore tested using data obtained from the literature (12,20-26). The correspondence between our results and the results of these studies is excellent. The linear regression of PV and BSA found in volunteers (solid line in figure 4) corresponds especially well with the regression curve from Hurley's data (figure 4, dashed line) (26). In addition, figure 4 shows the various regression lines reported from other studies of PV in normal men (dotted lines) (12,20-23).
Vol. 53, No. 21, 1993 Plasma Volume Determination 1603
f
o e
b
I I I I I I I I I 1.5 1.6 1.7 1.8 1.9 e.O 2.1 e .2 2.a
BSA (rn z)
FIG. 4
Relation between plasma volume and body surface area (BSA). PV=1885.BSA-416 (solid line). The solid curves represent the 95% confidence intervals of the regression line. The dotted lines are taken from data from the literature. The regression equations are: a) PV=1580.BSA-520, n=201 (22), b) PV=1487.BSA+68, n=30 (12), c) PV=1846.BSA-522, n=37 (20), d) PV=1630.BSA, n=40 (21), f) PV=2294.BSA-928, n=22 (23). The dashed curve (e) with the equation PV=995.e0.6085.BSA, n---481, is taken from a meta-analysis by Hurley (26).
The repeatability of the measurements was good in both volunteers and patients. The SD of MD as a measure of the methodological error was in the range of 5% which is well within the limits of other tracer methods (e.g. 6.5% for RIHSA and 17% for Evans blue (27)). The methodological error may be affected by the blood sampling technique as well as by the stability of physiologic parameters of the subjects under study. The volunteers were studied using peripheral veins for dye injection and blood sampling. The patients were all studied after induction of anesthesia but before surgical intervention; some were studied after the operative intervention while still under anesthesia. The methodological error might therefore have been smaller than estimated if the ideals of central venous dye injection, arterial blood sampling and stability of the physiological condition of the subjects were met.
In agreement with other studies (3,14,15) we found complete mixing of the dye after 3 min in all subjects. However, in a pilot study one healthy volunteer (a well trained sportsman with a bradycardia of 40 beats min-1) did not show complete mixing even after 6 min. This indicates that mixing time may vary between subjects and that especially patients with circulatory failure may have mixing times far above those reported. Using blood samples from 3 min to 9 min after dye injection may therefore lead to false results under these conditions. Looking at the data plotted on a semilogarithmic scale helps to identify the moment of complete mixing and allows the calculation of plasma volume using different blood sampling intervals.
With reference to the PV measurements in volunteers, we felt that this method was suitable for research purposes but too time-consuming and complicated for use in the clinical setting (need of a laboratory, transportation of blood samples etc.). We therefore developed the whole blood method which can be performed at the bedside and provides results within a few minutes with the aid of a pocket calculator. In addition, it reduces blood waste to almost zero (all withdrawn blood is reinjected immediately) in contrast to the PV method where about 25 mi of blood have to be discarded. The comparison of the two measurement techniques (plasma and whole blood method)

1604 Plasma Volume Determination Vol. 53, No. 21, 1993
revealed a MD of -3.3%. This difference is at least in part due to trapped plasma since we did not correct the hct values.
In conclusion, our results indicate that ICG is a safe and suitable tracer to determine PV in humans. In contrast to the results of other authors (15), PV measurements were possible and accurate using peripheral veins for dye injection and blood sampling. Thus the method is not limited to subjects with arterial and central venous catheters. Moreover, for critically ill patients with such catheters in place, the "whole blood" method is more convenient.
Acknowledgments
This study is dedicated to Gustav Paumgartner, M.D., Professor of Internal Medicine, Head of the Department of Medicine II, Ludwig-Maximilians-University of Munich, on the occasion of his 60th birthday. The authors would like to thank Hubert Schad, M.D., Professor of Physiology, Deutsches Herzzentrum Mtinchen, for his suggestions regarding the method of plasma volume determination with indocyanine green. The study contains data drawn from the doctoral thesis of C, Akbulut.
References
1. D.J. KORNBRUST and T.R. BARFKNECHT, Mutat. Res. 136 255-266 (1984). 2. H. NAKANE, J. BALZARINI, E. DE CLERCQ and K. ONO, Eur. J. Biochem. 177 91-96
(1988). 3. E.C. BRADLEY and J.W. BARR, Life Sci. _7 1001-1007 (1968). 4. N.C. NIELSEN, Scand. J. Clin. Lab. Invest. 15 613-621 (1963). 5. J.M. BLAND and D.G. ALTMAN, Lancet 1 307-310 (1986). 6. E.A. GEHAN and S.L. GEORGE, Cancer Therap. Rep. 54 225-235 (1970). 7. G. PAUMGARTNER, Schweiz. Med. Wochenschr. 105 (Suppl. 1) 1-30 (1975). 8. D.B. HUNTON, J.L. BOLLMAN and H.N. HOFFMAN, Gastroenterology 39 713-723
(1960). 9. G.R. CHERRICK, S.W. STEIN, C.M. LEEVY and C.S. DAVIDSON, J. Clin. Invest. 39
592-600 (1960). 10. R. SPEICH, B. SAESSELI, U. HOFFMANN, K.A. NEFTEL and J. REICHEN,
Ann. Intern. Med. 10__29 345-346 (1988). 11. R. BENYA, J. QUINTANA and B. BRUNDAGE, Cathet. Cardiovasc. Diagn. 17 231-233
(1989). 12. P. SAMET, H.W. FRITTS, A.P. FISHMAN and A. COURand, Medicine 36 211-235 (1957). 13. E. BROWN, J. HOPPER and R. WENNESLAND, Annu. Rev. Physiol. 19 231-254 (1957). 14. K. HANEDA and T. HORIUCHI, Tohoku J. Exp. Med. 148 49-56 (1986). 15. M.W. BUSSE, S. ZISOWSKY, S. HENSCHEN, B. PANNING and L. REILMANN,
Life Sci. 46 647-652 (1990). 16. R.R. WRIGHT, M. TONO and M. POLLYCOVE, Semin.Nucl.Med. 5 63-78 (1975). 17. D.K.F. MEIJER, B. WEERT and G.A. VERMEER, Eur. J. Clin. Pharmacol. 35 295-303
(1988). 18. J.F. MARTIN, M. MIKULECKY, T.F. BLASCHKE, J.G. WAGGONER, J. VERGALLA
and P.D. BERK, Proc. Soc. Exp. Biol. Med. 150 612-617 (1975). 19. JAMA 268 42-44 (1992). 20. A. BRASSINNE, Pathol. Biol. 16 257-271 (1968). 21. J.A. RETZLAFF, W.N. TAUXE, J.M. KIELY and C.F. STROEBEL, Blood 33 649-661
(1969). 22. R. WENNESLAND, E. BROWN, J. HOPPER, J.L. HODGES, O.E. GUTTENTAG,
K.G. SCOTT, I.N. TUCKER and B. BRADLEY, J. Clin. Invest. 38 1065-1077 (1959). 23. R.S. MOENS, R. BUSSET, R.A. COLLET and R.S. MACH, Schweiz. Med. Wochenschr. 92
1660-1667;1697-1703 (1962). 24. J.G. GIBSON and W.A. EVANS, J. Clin. Invest. 16 317-328 (1937). 25. M.I. GREGERSEN and R.A. RAWSON, Physiol.Rev. 39 307-342 (1959). 26. P.J. HURLEY, J. Nucl. Med. 16 46-52 (1975). 27. L.Y. SENN and K.E. KARLSON, Surgery 44 1095-1105 (1958).