determinants of intrabolus pressure during esophageal peristaltic bolus transport
TRANSCRIPT
Determinants of intrabolus pressure during esophageal peristaltic bolus transport
JUNLONG REN, BENSON T. MASSEY, WYLIE J. DODDST, MARK K. KERN, JAMES G. BRASSEUR, REZA SHAKER, SANDRA S. HARRINGTON, WALTER J. HOGAN, AND RONALD C. ARNDORFER Departments of Radiology and Medicine, Medical College of Wisconsin, Milwaukee, Wisconsin 53226; and Department of Mechanical Engineering, Pennsylvania State University, University Park, Pennsylvania 16802
Ren, Junlong, Benson T. Massey, Wylie J. Dodds, Mark K. Kern, James G. Brasseur, Reza Shaker, San- dra S. Harrington, Walter J. Hogan, and Ronald C. Arn- dorfer. Determinants of intrabolus pressure during esophageal peristaltic bolus transport. Am. J. Physiol. 264 (Gastrointest. Liver physiol. 27): G407-G413, 1993.-Previous manometric studies of esophageal fluid bolus transport in humans have gen- erally ignored the hydrodynamic distinction between intrabolus pressure and pressure within the lumen-occluded, contracting esophageal segment. In this study we obtained concurrent esophageal videofluoroscopic and intraluminal manometric re- cordings in supine normal volunteers using different bolus vol- umes and viscosities and abdominal compression. Intrabolus pressure increased with bolus volume, viscosity, and abdominal compression. Esophageal diameter increased with larger bolus volumes, and this increase was correlated with increases in in- trabolus pressure. Intrabolus pressure was highest in the bolus tail. Peak intraluminal pressures >20 mmHg above basal intra- bolus pressure almost invariably were associated with effective peristalsis, whereas values of this pressure differential ~20 mmHg frequently were associated with ineffective peristalsis and retrograde bolus escape. Intrabolus pressure can serve as an important indicator of the forces resisting peristaltic transport and the occurrence of ineffective bolus transport. videofluoroscopy; videofluoromanometry; esophageal peristal- sis; esophageal manometry; lower esophageal sphincter
THE MANOMETRIC EVALUATION of esophageal motility traditionally has focused on the peristaltic pressure waveform that results from the aborad sequence of esophageal muscle contraction and relaxation. Quanti- fiable characteristics of this waveform (e.g., amplitude, duration, and velocity) have been demonstrated previ- ously to be affected by alterations in certain physical bolus parameters, such as volume (7, 10, 12, 16, 18) and viscosity (9), as well as by obstruction to esophageal outflow (8, 15). More recent analyses of the relationship between intraluminal manometric findings and peristal- tic esophageal transport of a fluid bolus indicate the importance of considering separately the two pressure domains recorded by manometry: that within the fluid bolus and that within the esophageal segment whose lumen is occluded and devoid of bolus fluid as a result of esophageal contractions (2-4). Pressures within these two domains are distinct from one another and are not transmitted between domains when the esophageal lu- men is completely sealed by the oncoming contraction wave (2). Although central to an understanding of the hydrodynamic forces that determine esophageal trans- port of a fluid bolus, the domain of intrabolus pressure has been largely neglected in most previous studies. The
7 Deceased 2 August 1992.
aim of this study was to evaluate how alterations in swallowed bolus variables and esophageal outflow ob- struction could affect intrabolus pressure during peri- staltic transport through the esophagus. In addition, the relationship between the two pressure domains when peristaltic bolus transport failed was assessed. The find- ings of this study were also used to validate the predic- tions of a fluid mechanical model of esophageal bolus transport regarding intrabolus pressure profiles (2-4).
METHODS
Twenty-six healthy male subjects [ages 30.7 rf~ 8.0 (SD), range 23-50 yr] were studied with concurrent esophageal manometry and videofluoroscopy, hereafter termed videofluoromanometry. The protocol was approved by the Human Research Review Committee of the Medical College of Wisconsin. Subjects were preselected based on preliminary manometric studies indicating both normal esophageal peristalsis and increased intragastric pressure during abdominal compression.
For manometry two different catheters were used, each made from extruded multilumen polyvinyl tubing having an outer diameter of 4.5 mm. Each catheter had seven recording sites beginning 1 cm from its end and spaced every 3 cm (catheter 1) or 1 cm (catheter 2). A tantalum marker placed adjacent to each recording orifice showed its location on videofluoroscopy. The catheters were infused with bubble-free water at 0.5 ml/min by a pneumohydraulic capillary infusion pump (1). For each study, one of the two catheters was passed transnasally and positioned so that the distalmost recording site was 1 cm proximal to the manometrically located lower esophageal sphincter. The sub- jects were supine when studied, and the external pressure trans- ducers were placed at the level of the midaxillary line to mini- mize hydrostatic effects. Manometric data were recorded on a polygraph (Sensormedics, Oxnard, CA) with each channel set at a full-scale deflection of 80 mmHg and a paper speed of 25 mm/s.
Videofluoroscopy was recorded on 0.5-in. tape at 30 frames/s with a Super-VHS videocassette recorder (model AG1960, Pa- nasonic, Secaucus, NJ). A modified dual timer (Thalner Elec- tronic Laboratories, Ann Arbor, MI) encoded time in hun- dredths of a second on each video frame while sending a pulse signal at l-s intervals to a channel on the polygraph tracing (11). Fluoroscopy time was limited to 3 min.
During videofluoromanometry subjects swallowed a standard low viscosity (150 cP/sp gravity 1.8) barium preparation (Liq- uid E-Z, E-Z-EM, Westbury, NY) and/or a high viscosity (63,000 cP/sp gravity, SG 2.9) barium preparation [made by mixing powdered E-Z-EM barium with Knott’s Berry Farm strawberry syrup (13)]. Bolus volumes of 2, 5, 10, or 20 ml were used in a random sequence. During some swallows, abdominal compression was applied with a pressure cuff held in place by a binder and inflated to a pressure of 90 mmHg. This produced an intragastric pressure of 20-30 mmHg, as determined by briefly positioning the manometry catheter in the stomach at the start
0193-1857/93 $2.00 Copyright 0 1993 the American Physiological Society G407
G408 ESOPHAGEAL INTRABOLUS PRESSURE
and end of each study. During some barium swallows the fluoroscope image intensi-
fier was moved over the length of the esophagus so as to keep the tail of the barium bolus constantly in view. During other re- cording sequences, the image intensifier (g-in. magnification) was kept in a fixed position over either the proximal or the distal half of the esophagus. Because fluoroscopy time was lim- ited, not all combinations of bolus volume, bolus viscosity, and intragastric pressure were recorded in each subject.
Baseline intrabolus pressure (PBASE) at a manometric re- cording site was measured at the time when the recording site was located halfway between the bolus head and bolus tail. For six subjects, intrabolus pressure measurements were obtained, using catheter 2, during two to seven 5-ml low viscosity barium swallows at the time when the most proximal recording site was located 0.5 cm distal to the tip of the bolus tail. Thus all man- ometric recording sites were located within the bolus at that time, allowing an intrabolus pressure distribution to be deter- mined. With use of both catheters, intrabolus pressure values at adjacent manometric sites, spaced 3 or 1 cm apart, were com- pared at times when both sites were located within the bolus but outside the region of the bolus tail. Transit time was measured as the time required for the bolus tail to pass adjacent mano- metric recording sites, as observed on videofluoroscopy. Mano- metrically, transit time was taken as the time for the major upstroke of the pressure wave to move from one manometric site to the next. The duration of lower esophageal sphincter (LES) opening was also determined on videofluoroscopy. The maximal transverse esophageal diameter was measured at the level of each esophageal recording site for complete peristaltic sequences. Pooled measurements of esophageal diameters vs. baseline intrabolus pressure for multiple barium swallows in different subjects at a site 4 cm from the LES were analyzed to ascertain the pressure-diameter relationship in this region.
The peak intraluminal pressure (PAMP) and duration of the peristaltic pressure wave were measured at all manometric sites, although in some subjects P AMP was not always recorded accu- rately because of signal -clipping. For each recording site the difference between PAMP and PnAsE was measured. This pres- sure difference was correlated with whether bolus clearance was complete (i.e., the peristaltic contraction wave stripped all the
Manometry Videofluoroscopy
7.21 s
&L 11.61s
LES Opening
m 15
TIME in SECONDS
barium from the lumen) or incomplete (i.e., retrograde escape of barium occurred or distal progression of the peristaltic wave was arrested, thereby leaving barium within the lumen) at that site.
Groups of data were analyzed by multiple analysis of variance (ANOVA), paired or unpaired Student’s t tests, and regression analysis, where appropriate. Averaged values in the text are given as means t SE, unless otherwise stated.
RESULTS
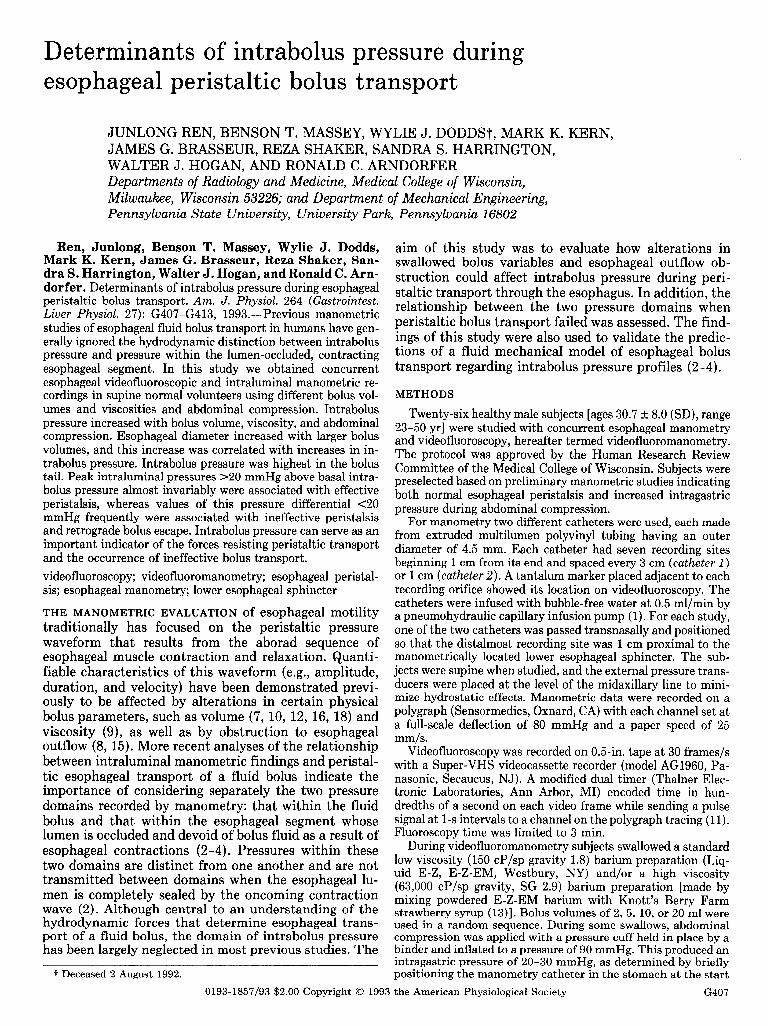
As seen in Figs. 1 and 2, videofluoromanometry allowed the determination of whether a manometric site was re- cording from the domain of intrabolus pressure or the domain of the lumen-occluded segment devoid of bolus fluid. Thus, at a given instant in time, the esophagus could be divided into a bolus segment and a no-bolus segment. As the bolus was transported distally manomet- ric sites quently
recorded first from within the bolus and . subse- from within the lumen-occluded region. During
effective bolus transport, pressures within one dom appeared to be independent of those in, the other.
.ain
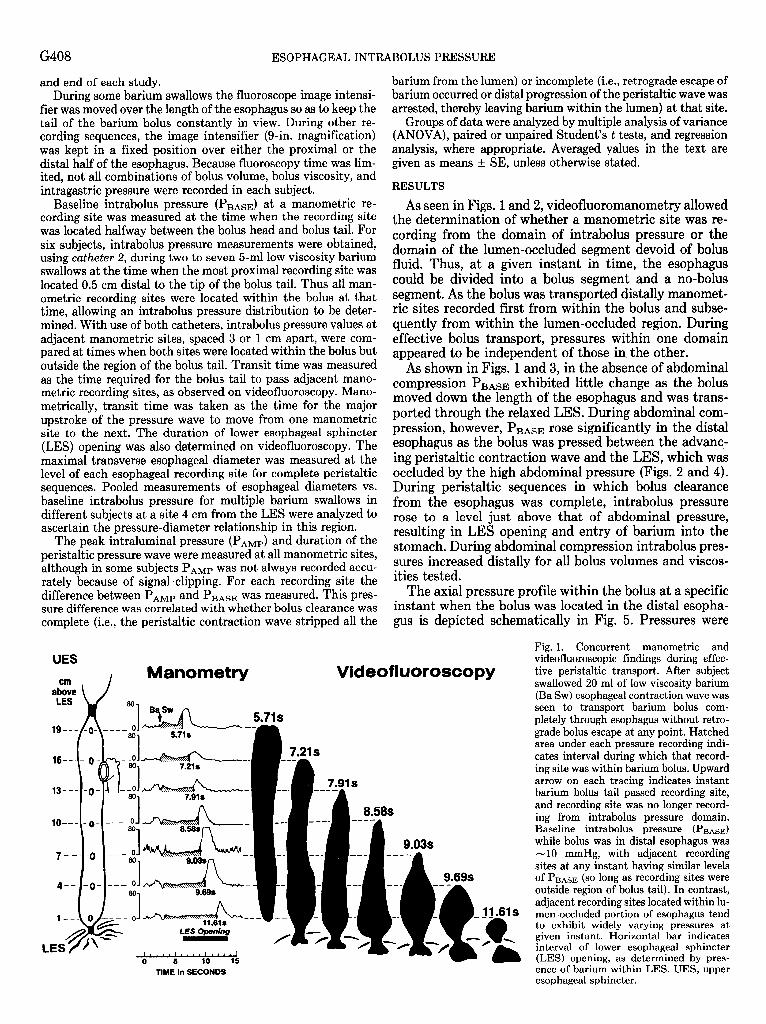
As shown in Figs. 1 and 3, in the absence of abdominal compression P BASE exhibited little change as the bolus moved down the length of the esophagus and was trans- ported through the relaxed LES. During abdominal com- pression, however, P BASE rose significantly in the distal esophagus as the bolus was pressed between the advanc- ing perista .ltic contraction wave and . the LES, which was occluded by the high abdominal pressure (Figs. 2 and 4). During peristaltic sequences in which bolus clearance from the esophagus was complete, intrabolus pressure rose to a level just above that of abdominal pressure, resulting in LES opening and entry of barium into the stomach. During abdominal compression intrabolus pres- sures increased distally for all bolus volumes and viscos- ities tested.
The axial pressure profile within the bolus at a specific instant when the bolus was located in the distal esopha- gus is depicted schematically in Fig. 5. Pressures were
9.69s
11.61s
Fig. 1. Concurrent manometric and videofluoroscopic findings during effec- tive peristaltic transport. After subject swallowed 20 ml of low viscosity barium (Ba SW) esophageal contraction wave was seen to transport barium bolus com- pletely through esophagus without retro- grade bolus escape at any point. Hatched area under each pressure recording indi- cates interval during which that record- ing site was within barium bolus. Upward arrow on each tracing indicates instant barium bolus tail passed recording site, and recording site was no longer record- ing from intrabolus pressure domain. Baseline intrabolus pressure ( PnAsE) while bolus was in distal esophagus was -10 mmHg, with adjacent recording sites at any instant having similar levels of PnAsE (so long as recording sites were outside region of bolus tail). In contrast, adjacent recording sites located within lu- men-occluded portion of esophagus tend to exhibit widely varying pressures at given instant. Horizontal bar indicates interval of lower esophageal sphincter (LES) opening, as determined by pres- ence of barium within LES. UES, upper esophageal sphincter.
ESOPHAGEAL INTRABOLUS PRESS
UES
\ Manometty Wdeofluoroscopy
cm /
I...~‘~..~‘....‘....1 0 5 10 15 20
TIME in SECONDS
similar throughout most of the bolus length, except at the manometric site located in the region of the bolus tail. At this site, intrabolus pressure was significantly elevated above that of more distally located manometric sites. Similarly, when adjacent manometric recording sites were located within the bolus but outside the region of the bolus tail, these sites recorded an intrabolus pressure that was always within l-2 mmHg of each other. Intrabolus pressures at such adjacent recording sites were similar for all bolus volumes and viscosities tested as well as for all bolus locations within the esophagus and during abdom- inal compression.
2o A 1
14 I o-o 2ml 0-0 5ml A-A lofIll
A-A 20 ml
- 04 1 2 site 7 6 5 4 3 2 1 3 v) w 2 20
n cn 3 15
Q CI C
10
5
0 site 7 6 5 4 3 2 1
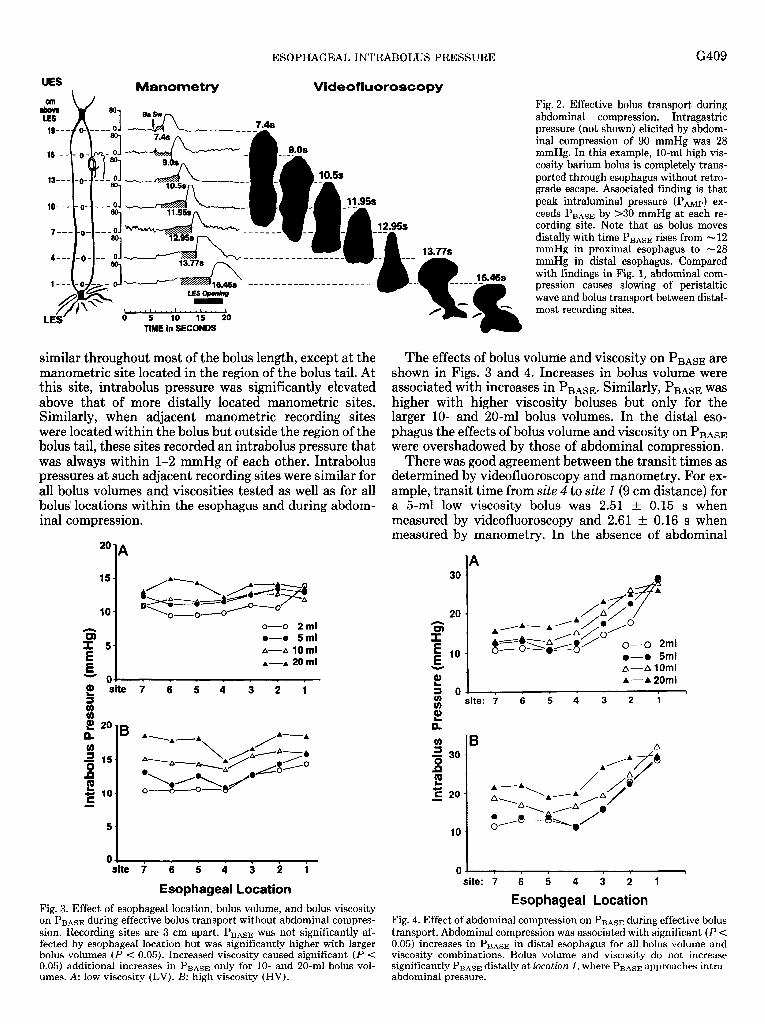
Esophageal Location Fig. 3. Effect of esophageal location, bolus volume, and bolus viscosity on PBAsE during effective bolus transport without abdominal compres- sion. Recording sites are 3 cm apart. PBAsE was not significantly af- fected by esophageal location but was significantly higher with larger bolus volumes (P < 0.05). Increased viscosity caused significant (P < 0.05) additional increases in P BASE only for lo- and 20-ml bolus VOW- umes. A: low viscosity (LV). B: high viscosity (HV).
URE
16.46s _- -
G409
Fig. 2. Effective bolus transport during abdominal compression. Intragastric pressure (not shown) elicited by abdom- inal compression of 90 mmHg was 28 mmHg. In this example, lo-ml high vis- cosity barium bolus is completely trans- ported through esophagus without retro- grade escape. Associated finding is that peak intraluminal pressure (PAMP) ex- ceeds PnAsE by >30 mmHg at each re- cording site. Note that as bolus moves distally with time PnAsE rises from - 12 mmHg in proximal esophagus to -28 mmHg in distal esophagus. Compared with findings in Fig. 1, abdominal com- pression causes slowing of peristaltic wave and bolus transport between distal- most recording sites.
The effects of bolus volume and viscosity on PBAsE are shown in Figs. 3 and 4. Increases in bolus volume were associated with increases in PBAsE. Similarly, PBAsE was higher with higher viscosity boluses but only for the larger lo- and 20-ml bolus volumes. In the distal eso- phagus the effects of bolus volume and viscosity on PnAsE were overshadowed by those of abdominal compression.
There was good agreement between the transit times as determined by videofluoroscopy and manometry. For ex- ample, transit time from site 4 to site 1 (9 cm distance) for a 5-ml low viscosity bolus was 2.51 t 0.15 s when measured by videofluoroscopy and 2.61 t 0.16 s when measured by manometry. In the absence of abdominal
20 I
G =r
I
*/A-A /A/d d
8 ,a/o’
E C&YE/ 0-0 2ml E lo l - 0 5ml * A- A 10ml s! k---A 20ml =I 0, I r 1 1 I 3 site: 7 6 5 4 3 2 1
2 e
‘0 301
s L g 20
I
0 - I 1 I 1 1 r I
site: 7 6 5 4 3 2 1
Esophageal Location
Fig. 4. Effect of abdominal compression on PnAsE during effective bolus transport. Abdominal compression was associated with significant (P < 0.05) increases in P BASE in distal esophagus for all bolus volume and viscosity combinations. Bolus volume and viscosity do not increase significantly P BASE distally at location 1, where PnAsE approaches intra- abdominal pressure.
G410 ESOPHAGEAL INTRABOLUS PRESSURE
compression transit time was similar throughout the esophagus and not significantly affected by bolus volume or viscosity (Fig. 6). However, with abdominal compres- sion transit between distal sites 2 and 1 was significantly (P < 0.05) slowed for both high and low viscosity boluses. Increased bolus volume had an additional significant slowing effect at this level with high viscosity boluses only. In accord with the longer transit time, the duration of LES opening was significantly (P < 0.05) longer during
No Bold 4 Bolus Segment .-u
I p 1
AMP I
Recording Sites (No. l-7) spaced at l-cm interval8
01 I 1 I
i 7 6 5 4 3 2 1 MANOMETRIC SITES
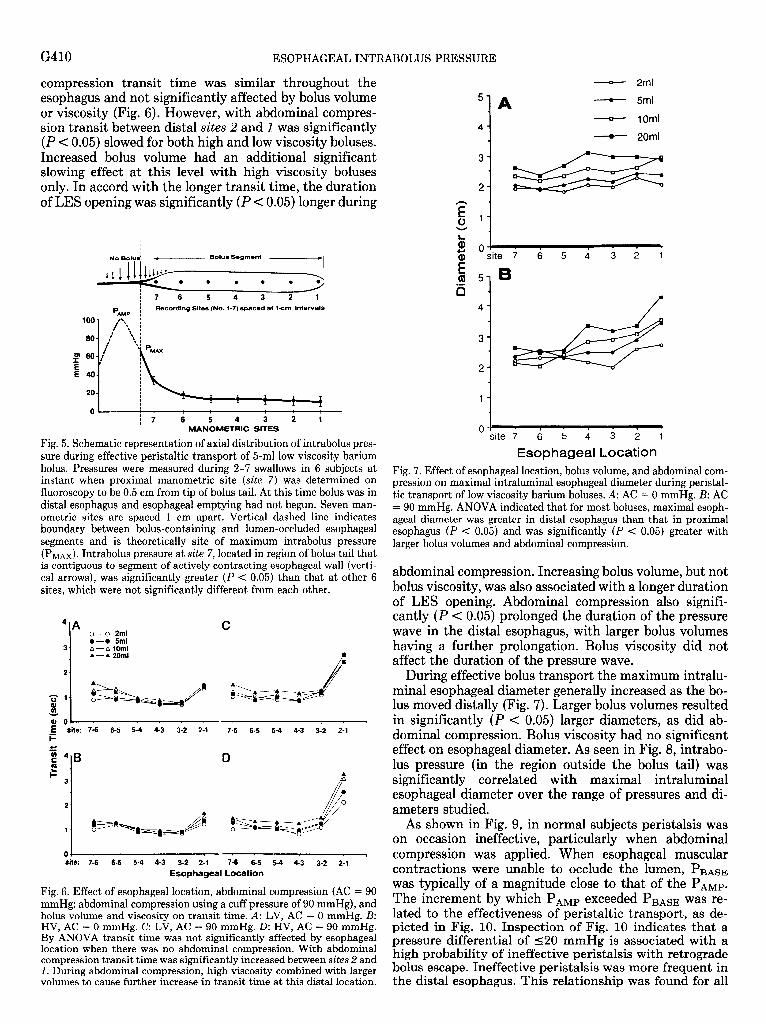
Fig. 5. Schematic representation of axial distribution of intrabolus pres- sure during effective peristaltic transport of 5ml low viscosity barium bolus. Pressures were measured during 2-7 swallows in 6 subjects at instant when proximal manometric site (site 7) was determined on fluoroscopy to be 0.5 cm from tip of bolus tail. At this time bolus was in distal esophagus and esophageal emptying had not begun. Seven man- ometric sites are spaced 1 cm apart. Vertical dashed line indicates boundary between bolus-containing and lumen-occluded esophageal segments and is theoretically site of maximum intrabolus pressure (PM&. Intrabolus pressure at site 7, located in region of bolus tail that is contiguous to segment of actively contracting esophageal wall (verti- cal arrows), was significantly greater (P < 0.05) than that at other 6 sites, which were not significantly different from each other.
4-A C . o-o 2ml
0-o Sml 3- A-A10mi
A---A 20ml a
2-
oo+ . . - . 7
E site: 7-6 6-5 54 4-3 3-2 2-l .I 7-6 6-5 54 4-3 3-2 2-1
1 site: 7-6 6k 5i 413 312 211 7i 6-5 5-4 ka ’ 3-2 2-1
Esophageal Location
Fig. 6. Effect of esophageal location, abdominal compression (AC = 90 mmHg: abdominal compression using a cuff pressure of 90 mmHg), and bolus volume and viscosity on transit time. A: LV, AC = 0 mmHg. B: HV, AC = 0 mmHg. C: LV, AC = 90 mmHg. D: HV, AC = 90 mmHg. By ANOVA transit time was not significantly affected by esophageal location when there was no abdominal compression. With abdominal compression transit time was significantly increased between sites 2 and 1. During abdominal compression, high viscosity combined with larger volumes to cause further increase in transittime at this distal location.
- 2ml
5
1
A - 5ml
__Qr_ 1Oml
4
- 20ml
3
- 1 - I - 1 ’ site 7 6 5 4 3 2 1
1 1
0-: site 7 6 5 4 3 2 1
Esophageal Location Fig. 7. Effect of esophageal location, bolus volume, and abdominal com- pression on maximal intraluminal esophageal diameter during peristal- tic transport of low viscosity barium boluses. A: AC = 0 mmHg. B: AC = 90 mmHg. ANOVA indicated that for most boluses, maximal esoph- ageal diameter was greater in distal esophagus than that in proximal esophagus (P < 0.05) and was significantly (P < 0.05) greater with larger bolus volumes and abdominal compression.
abdominal compression. Increasing bolus volume, but not bolus viscosity, was also associated with a longer duration of LES opening. Abdominal compression also signifi- cantly (P < 0.05) prolonged the duration of the pressure wave in the distal esophagus, with larger bolus volumes having a further prolongation. Bolus viscosity did not affect the duration of the pressure wave.
During effective bolus transport the maximum intralu- minal esophageal diameter generally increased as the bo- lus moved distally (Fig. 7). Larger bolus volumes resulted in significantly (P < 0.05) larger diameters, as did ab- dominal compression. Bolus viscosity had no significant effect on esophageal diameter. As seen in Fig. 8, intrabo- lus pressure (in the region outside the bolus tail) was significantly correlated with maximal intraluminal esophageal diameter over the range of pressures and di- ameters studied.
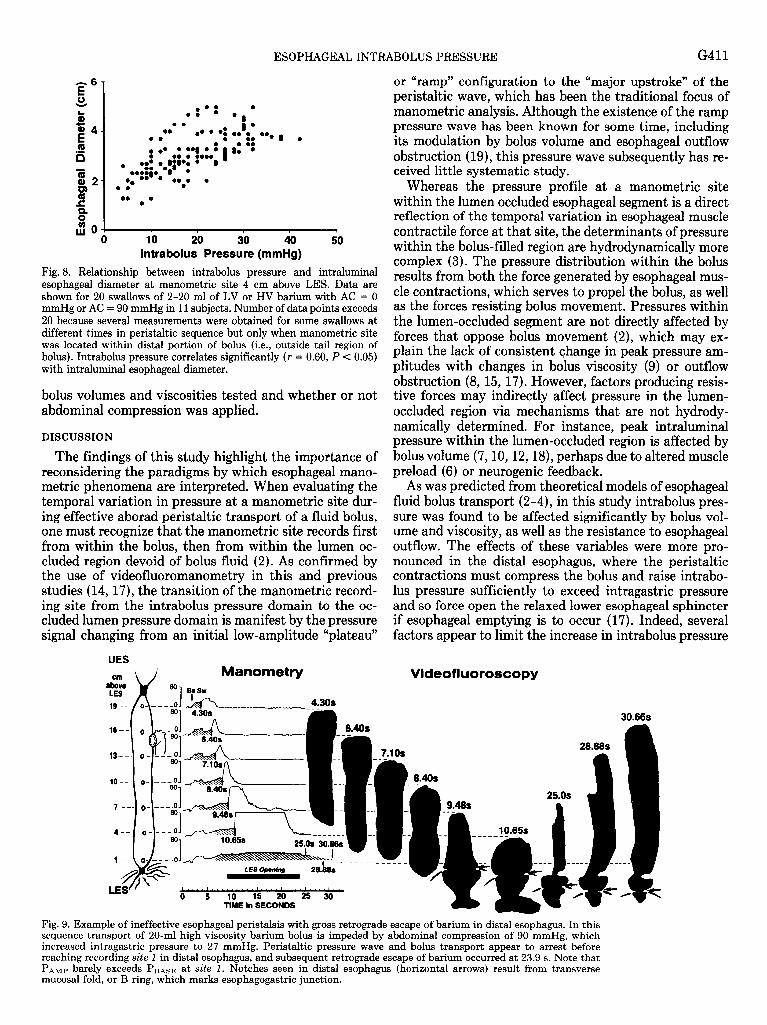
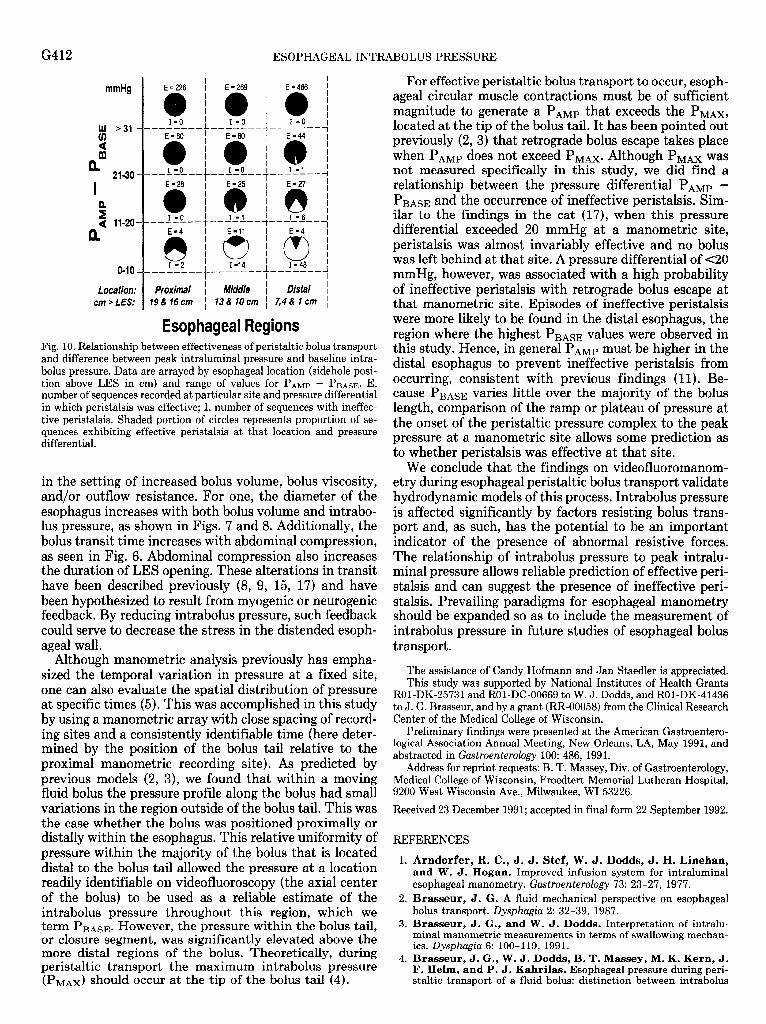
As shown in Fig. 9, in normal subjects peristalsis was on occasion ineffective, particularly when abdominal compression was applied. When esophageal muscular contractions were unable to occlude the lumen, PnAsE was typically of a magnitude close to that of the PAMP. The increment by which PAMP exceeded PBAsE was re- lated to the effectiveness of peristaltic transport, as de- picted in Fig. 10. Inspection of Fig. 10 indicates that a pressure differential of 520 mmHg is associated with a high probability of ineffective peristalsis with retrograde bolus escape. Ineffective peristalsis was more frequent in the distal esophagus. This relationship was found for all
ESOPHAGEAL INTRABOLUS PRESSURE G411
or “ramp” configuration to the “major upstroke” of the peristaltic wave, which has been the traditional focus of manometric analysis. Although the existence of the ramp pressure wave has been known for some time, including its modulation by bolus volume and esophageal outflow obstruction (ICI), this pressure wave subsequently has re- ceived little systematic study.
Whereas the pressure profile at a manometric site within the lumen occluded esophageal segment is a direct reflection of the temporal variation in esophageal muscle contractile force at that site, the determinants of pressure within the bolus-filled region are hydrodynamically more complex (3). The pressure distribution within the bolus results from both the force generated by esophageal mus- cle contractions, which serves to propel the bolus, as well as the forces resisting bolus movement. Pressures within the lumen-occluded segment are not directly affected by forces that oppose bolus movement (2), which may ex- plain the lack of consistent change in peak pressure am- plitudes with changes in bolus viscosity (9) or outflow obstruction (8, 15, 17). However, factors producing resis- tive forces may indirectly affect pressure in the lumen- occluded region via m .echanisms that are not hydrody- namically determined. For instance, peak intraluminal pressure within the lumen-occluded region is affected by bolus volume (7,10,12,18), perhaps due to altered muscle preload (6) or neurogenic feedback.
1’0 20 30 40 lntrabolus Pressure (mmHg)
50
Fig. 8. Relationship between intrabolus pressure and intraluminal esophageal diameter at manometric site 4 cm above LES. Data are shown for 20 swallows of 2-20 ml of LV or HV barium with AC = 0 mmHg or AC = 90 mmHg in 11 subjects. Number of data points exceeds 20 because several measurements were obtained for some swallows at different times in peristaltic sequence but only when manometric site was located within distal portion of bolus (i.e., outside tail region of bolus). Intrabolus pressure correlates significantly (r = 0.60, P c 0.05) with intraluminal esophageal diameter.
bolus volumes and viscosities tested abdominal compression was applied.
and whether or not
DISCUSSION
The findings of this study highlight the importance of reconsidering the paradigms by which esophageal mano- metric phenomena are interpreted. When evaluating the temporal variation in pressure at a manometric site dur- ing effective aborad peristaltic transport of a fluid bolus, one must recognize that the manometric site records first from within the bolus, then from within the lumen oc- cluded region devoid of bolus fluid (2). As confirmed by the use of videofluoromanometry in this and previous studies (14, 17), the transition of the manometric record- ing site from the intrabolus pressure domain to the oc- cluded lumen pressure domain is manifest by the pressure signal changing from an initial low-amplitude “plateau”
As was predicted from theoretica .l models of esophageal fluid bolus transport (2- 4), in this S tudy intrabolus pres- sure was ume and outflow. nounced
found to be affected significantly by bolus vol- viscosity, as well as the resistance to esophageal The effects of these vari .ables were more pro- in the distal esophagus, where the peristaltic
contractions must compress the bolus and raise intrabo- lus pressure sufficiently to exceed intragastric pressure and so force open the relaxed lower esophageal sphincter if esophageal emptying is to occur (17). Indeed, several factors appear to limit the increase in intrabolus pressure
Videofiuoroscopy cm above LES
Manometry 80 Bfsw 1 -
G412 ESOPHAGEAL INTRABOLUS PRESSURE
cm > LES: 19&16cm 1 13&10cm 1 7,4&lcm ,
Esophageal Regions Fig. 10. Relationship between effectiveness of peristaltic bolus transport and difference between peak intraluminal pressure and baseline intra- bolus pressure. Data are arrayed by esophageal location (sidehole posi- tion above LES in cm) and range of values for PAMP - PnAsE. E, number of sequences recorded at particular site and pressure differential in which peristalsis was effective; I, number of sequences with ineffec- tive peristalsis. Shaded portion of circles represents proportion of se- quences exhibiting effective peristalsis at that location and pressure differential.
in the setting of increased bolus volume, bolus viscosity, and/or outflow resistance. For one, the diameter of the esophagus increases with both bolus volume and intrabo- lus pressure, as shown in Figs. 7 and 8. Additionally, the bolus transit time increases with abdominal compression, as seen in Fig. 6. Abdominal compression also increases the duration of LES opening. These alterations in transit have been described previously (8, 9, 15, 17) and have been hypothesized to result from myogenic or neurogenic feedback. By reducing intrabolus pressure, such feedback could serve to decrease the stress in the distended esoph- ageal wall.
Although manometric analysis previously has empha- sized the temporal variation in pressure at a fixed site, one can also evaluate the spatial distribution of pressure at specific times (5). This was accomplished in this study by using a manometric array with close spacing of record- ing sites and a consistently identifiable time (here deter- mined by the position of the bolus tail relative to the proximal manometric recording site). As predicted by previous models (2, 3)) we found that within a moving fluid bolus the pressure profile along the bolus had small variations in the region outside of the bolus tail. This was the case whether the bolus was positioned proximally or distally within the esophagus. This relative uniformity of pressure within the majority of the bolus that is located distal to the bolus tail allowed the pressure at a location readily identifiable on videofluoroscopy (the axial center of the bolus) to be used as a reliable estimate of the intrabolus pressure throughout this region, which we term PBAsE. However, the pressure within the bolus tail, or closure segment, was significantly elevated above the more distal regions of the bolus. Theoretically, during peristaltic transport the maximum intrabolus pressure (PMAX) should occur at the tip of the bolus tail (4).
For effective peristaltic bolus transport to occur, esoph- ageal circular muscle contractions must be of sufficient magnitude to generate a PAMP that exceeds the PMAX, located at the tip of the bolus tail. It has been pointed out previously (2, 3) that retrograde bolus escape takes place when PAMP does not exceed PMAX. Although PMAX was not measured specifically in this study, we did find a relationship between the pressure differential PAMP - PnAsE and the occurrence of ineffective peristalsis. Sim- ilar to the findings in the cat (17), when this pressure differential exceeded 20 mmHg at a manometric site, peristalsis was almost invariably effective and no bolus was left behind at that site. A pressure differential of ~20 mmHg, however, was associated with a high probability of ineffective peristalsis with retrograde bolus escape at that manometric site. Episodes of ineffective peristalsis were more likely to be found in the distal esophagus, the region where the highest P BASE values were observed in this study. Hence, in general PAMP must be higher in the distal esophagus to prevent ineffective peristalsis from occurring, consistent with previous findings (11). Be- cause PnAsE varies little over the majority of the bolus length, comparison of the ramp or plateau of pressure at the onset of the peristaltic pressure complex to the peak pressure at a manometric site allows some prediction as to whether peristalsis was effective at that site.
We conclude that the findings on videofluoromanom- etry during esophageal peristaltic bolus transport validate hydrodynamic models of this process. Intrabolus pressure is affected significantly by factors resisting bolus trans- port and, as such, has the PO tential to be an important indicator of the presence of abnormal resistive forces. The relationship of intrabolus pressure to peak intralu- minal pressure allows reliable prediction of effective peri- stalsis and can suggest the presence of ineffective peri- stalsis. Prevailing paradigms for esophageal manometry should be expanded so as to include the measurement of intrabolus pressure in future studies of esophageal bolus transport.
The assistance of Candy Hofmann and Jan Staedler is appreciated. This study was supported by National Institutes of Health Grants
ROl-DK-25731 and ROl-DC-00669 to W, J. Dodds, and ROl-DK-41436 to J. G. Brasseur, and by a grant (RR-00058) from the Clinical Research Center of the Medical College of Wisconsin.
Preliminary findings were presented at the American Gastroentero- logical Association Annual Meeting, New Orleans, LA, May 1991, and abstracted in Gastroenterobgy 100: 486, 1991.
Address for reprint requests: B. T. Massey, Div. of Gastroenterology, Medical College of Wisconsin, Froedtert Memorial Lutheran Hospital, 9200 West Wisconsin Ave., Milwaukee, WI 53226.
Received 23 December 1991; accepted in final form 22 September 1992.
REFERENCES
1. Arndorfer, R. C., J. J. Stef, W. J. Dodds, J. H. Linehan, and W. J. Hogan. Improved infusion system for intraluminal esophageal manometry. Gmtroenterology 73: 23-27, 1977.
2. Brasseur, J. G. A fluid mechanical perspective on esophageal bolus transport. Dysphugia 2: 32-39, 1987.
3. Brasseur, J. G., and W. J. Dodds. Interpretation of intralu- minal manometric measurements in terms of swallowing mechan- ics. Dysphczgia 6: 100-119, 1991.
4. Brasseur, J. G., W. J. Dodds, B. T. Massey, M. K. Kern, J. F. Helm, and P. J. Kahrilas. Esophageal pressure during peri- staltic transport of a fluid bolus: distinction between intrabolus
ESOPHAGEAL INTRABOLUS PRESSURE G413
and contractile-segment pressure domains (Abstract). Gustroen- terology 96: 56, 1989.
5. Brasseur, J. G., M. Li, P.-Y. Hsieh, W. J. Dodds, and M. K. Kern. Computer simulations of esophageal transport integrated with concurrent videofluoroscopy and manometry (Abstract). Gastroenterology 99: 1205, 1990.
6. Cohen, S., and F. Green. The mechanics of esophageal muscle contraction. Evidence of an inotropic effect of gastrin. J. Clin. Invest. 52: 2029-2040, 1973.
7. Dodds, W. J., W. J. Hogan, D. P. Reid, E. T. Stewart, and R. C. Arndorfer. A comparison between primary esophageal peristalsis following wet and dry swallows. J. Appl. Physiol. 35: 851-857, 1973.
8. Dodds, W. J., W. J. Hogan, E. T. Stewart, J. J. Stef, and R. C. Arndorfer. Effects of increased intra-abdominal pressure on esophageal peristalsis. J. Appl. Physiol. 37: 378-383, 1974.
9. Dooley, C. P., B. Schlossmacher, and J. E. Valenzeula. Effects of alterations in bolus viscosity on esophageal peristalsis in humans. Am. J. Physiol. 254 (Gastrointest. Liver Physiol. 17): G8-Gll, 1988.
10. Hollis, J. B., and D. 0. Castell. Effect of dry swallows and wet swallows of different volume on esophageal peristalsis. J. Appl. Physiol. 38: 1161-1164, 1975.
11. Kahrilas, P. J., W. J. Dodds, and W. J. Hogan. Effect of peristaltic dysfunction on esophageal volume clearance. Gastroen- terology 94: 73-80, 1988.
12. Kaye, M. D., and R. M. Wexler. Alteration of esophageal peri- stalsis by body position. Dig. Dis. Sci. 26: 897-901, 1981.
13. Li, M., J. G. Brasseur, M. K. Kern, and W. J. Dodds. Vis- cosity measurement of barium sulfate mixtures for use in motility studies of the pharynx and esophagus. Dysphugia 7: 17-30, 1992.
14. Massey, B. T., W. J. Dodds, J. F. Helm, J. G. Brasseur, and W. J. Hogan. Abnormal esophageal motility: comparison of ra- diographic and manometric findings. Gastroenterology 101: 344- 354, 1991.
15. Mittal, R. K., J. Ren, R. W. McCallum, H. A. Shaffer, Jr., and J. Sluss. Modulation of feline esophageal contractions by bolus volume and outflow obstruction. Am. J. Physiol. 258 (Gus- trointest. Liver Physiol. 21): G208-G215, 1990.
16. Orlowski, J. M., W. J. Dodds, W. J. Hogan, and M. S. Egide. Effect of bolus volume on the variables of esophageal peristalsis (Abstract). Clin. Res. 27: 63A, 1979.
17. Ren, J., W. J. Dodds, C. H. Martin, R. 0. Dantas, R. K. Mittal, S. S. Harrington, M. K. Kern, and J. G. Brasseur. Effect of increased intra-abdominal pressure on peristalsis in fe- line esophagus. Am. J. Physiol. 261 (Gastrointest. Liver Physiol. 24): G4wG425, 1991.
18. Tachino, F., and C. S. Winans. Changes in esophageal peri- stalsis with increasing bolus volumes (Abstract). Gustroenterology 92: 1661, 1987.
19. Vantrappen, G., and J. Hellemans. Studies on the normal deglutition complex. Am. J. Dig. Dis. 12: 255-266, 1967.