detection of shifts in coral reef fish assemblage structure over 50 years at reefs of new providence...
TRANSCRIPT
Proceedings of the AcAdemy of nAturAl sciences of PhilAdelPhiA 162: 61-87 mArch 2013
Detection of shifts in coral reef fish assemblage structure over 50 years at reefs of New Providence Island, The Bahamas highlight the value of the Academy of Natural Sciences’ collections in a changing world
KAtriinA l. ilves
Department of Ichthyology, The Academy of Natural Sciences, 1900 Benjamin Franklin Parkway, Philadelphia, PA 19103-1195, USA.Phone/Fax: (1) 215 405 5080; E-mail: [email protected]
AndreA m. QuAttrini
Biology Department, Temple University, 1900 N 12th Street, Philadelphia, PA 19122, USA.
mArK W. WestneAt
Department of Zoology, Field Museum of Natural History, Chicago, IL 60605, USA.
ron i. eytAn
Department of Ecology and Evolutionary Biology, Yale University, 21 Sachem Street, #358D, New Haven, CT 06520, USA.
gordon W. chAPlin
Department of Ichthyology, The Academy of Natural Sciences, 1900 Benjamin Franklin Parkway, Philadelphia, PA 19103-1195, USA.
heidi hertler
Inter American University of Puerto Rico, Center for Environmental Education, Conservation and Research, PO Box 5100, San German PR 00683, USA.
John g. lundberg
Department of Ichthyology, The Academy of Natural Sciences, 1900 Benjamin Franklin Parkway, Philadelphia, PA 19103-1195, USA.
ABSTRACT.—Natural history collections contain historical records that present snapshots of organisms and communities, and are now more important than ever in the face of rapidly changing environments. The world’s largest collection of fishes from The Bahamas is housed at The Academy of Natural Sciences, Philadelphia. These vast Bahamas holdings primarily resulted from the collecting efforts of James Böhlke and Charles Chaplin in the 1950s-1970s. One of the many ways these historical records have been used since their collection is as baseline data for coral reef sites that were revisited decades later to answer questions about changes in coral reef fish community structure through time. Analyses of data collected from resurveys conducted in 2006 and 2010 provided evidence for a relative increase in the abundance of individuals belonging to different trophic groups and families; particularly, a relative increase in herbivores (mainly parrotfishes) and a relative decrease in planktivores. Furthermore, an interesting inverse trend was detected between two nocturnal groups of fishes, where the larger-bodied squirrelfishes increased while the smaller-bodied cardinalfishes decreased in relative abundance. These significant differences across trophic groups and families are consistent with the effects of a degraded reef habitat characterized by increased algal cover and fewer shelter spaces. Overall, these resurvey results suggest that neither the coral nor reef-fish communities reflect ‘baseline’ conditions. Continued monitoring of these assemblages using comparative data from multiple replicate samples across time periods will be needed to detect their further change or stabilization.
ISSN 0097-3157
62 K.l. ilves et. Al.
INtroduct Io N
Natural history collections represent a catalogue of biodiversity and are an invaluable resource for the study of evolution and ecology. In the bicentennial year of t he Academy of Natural Sciences, Philadelphia (ANSP), the current study documents one aspect of the importance of one of this institution’s collections – fishes of The Bahamas in ANSP Ichthyology.
t he ANSP Ichthyology collection houses the world’s largest collection of fishes from The Bahamas (Table 1). Most of the >60,000 specimens are reef fishes that were collected between 1955 and 1973 by Ichthyology c urator James Böhlke and ANSP associate Charles Chaplin, who were pioneers in the combined use of rotenone, a naturally-derived ichthyocide, and SCUBA in the earliest days of recreational diving (Böhlke 1997). Many specimens represented species that were new to science, as discovered by Böhlke who dedicated much of his career to understanding the taxonomy and systematics of c aribbean, and particularly Bahamian, reef fishes. These efforts resulted in Böhlke’s descriptions of 57 species with their type localities in The Bahamas, and a further 26 species for which the type locality is in the greater c aribbean (Eschmeyer 2012). In total, Böhlke described 143 new species from around the world, 115 from marine and 28 from freshwater environments (Eschmeyer 2012). Böhlke’s collections and work on Caribbean fishes were particularly significant with respect to descriptions of cryptic reef fishessuch as blennies and gobies, and important for studies of eel taxonomy led by ANSP ichthyologist Eugenie Böhlke, who was also an active participant in much of the Bahamas work (Smith 2002). Almost 15 years of study culminated in the 1968 publication of Böhlke and Chaplin’s landmark book “Fishes of the Bahamas and Adjacent Tropical Waters” that documented 507 species with identificationkeys, color plates, and detailed illustrations (Böhlke and Chaplin 1968). This book remains one of the best scientificguides to a regional fish fauna ever published
The original goals of Böhlke and Chaplin’s collecting and subsequent publications were to provide a scientificinventory of the Bahamian fish fauna and to further understand the taxonomy, morphology, distribution, and evolutionary relationships of these fishes, purposes for which the specimens remain in use. A perhaps unintended result of their work, however, was the provision of baseline snapshots of the reef fish assemblages at Bahamian islands. Most of these ‘historical’ collections were made prior to the escalation of major anthropogenic influences known to degrade reef environments, such as sedimentation, pollution, overfishing, development, and the effects of climate change (e.g., Gardner et al. 2005; Wilson et al.
2006; Hoegh-Guldberg et al. 2007; Weber et al. 2012). t hus, these data can be used as a close approximation to the natural state of regional reef fish assemblage structure.
t he practice of using baseline data and revisiting historically studied areas is not new. For instance, the Grinnell Resurvey Project at the Museum of Vertebrate Zoology at the University of California, Berkeley has undertaken ambitious resurveys in regions of California first studied almost 100 years ago. Insights from those 21st century resurveys include the detection of terrestrial bird and mammal range contractions or shifts over the past century that have been correlated with climate changes (e.g., Moritz et al. 2008; Tingley et al. 2009; Rubidge et al. 2012). There has also been extensive study of the effects of large-scale disturbances, such as extreme weather events, on coral and benthic invertebrate communities (e.g., Dahl and Lamberts 1977; Pearson 1981; Rogers et al. 1983; Baker et al. 2008). Furthermore, numerous resurveys of reef fish assemblages, often conducted in concert with coral surveys, have spanned multiple years and disturbances (e.g., Nagelkerken et al. 2005; Bellwood et al. 2006; Kellison et al. 2012). Despite the immense amount of ecological work focused on coral reefs and their associated fishes, the availability of reef fish data across multiple decades is exceedingly rare. To our knowledge, the only comparison of reef fish assemblage structure spanning a timeframe beyond 30 years is the study by Ilves et al. (2011).
Ilves et al. (2011) resurveyed four coral reef sites at New Providence Island, The Bahamas in 2006 to compare reef fish assemblage structure between historical (1955-1973) and recent (2006) collections, spanning a range of 33-51 years. Key findings included no significant differences in species diversity (H’, Shannon index) between time periods, significant increases in the relative proportion of individuals of herbivorous species, and in families such as parrotfishes and squirrelfishes, and a decreasing trend in the relative proportion of individuals of planktivorous species. Qualitative differences in coral health, including decreased live coral cover and an increase in algal cover were noted. c oral structure, however, was observed to be relatively intact. The finding of subtle changes in reef fish assemblages combined with the maintenance of coral structure led to the conclusion that the reef fish community was responding to a disturbance that occurred on the order of a decade.
For the years spanning 2006 and 2010 there was anecdotal evidence from locals and dive operators (e.g., S. Cove, personal communication, 2010) that reef community health at New Providence Island was improving, indicated by a perceived increase in live coral and decrease in algae. The present study reports on a further resurvey in 2010
detection of shifts in corAl reef fish AssemblAge structure At reefs of neW Providence islAnd 63
at the same reef sites around New Providence Island, t he Bahamas, sampled historically and/or in 2006 with two specific aims: (1) collect additional reef fish assemblage data at coral reef sites, and (2) assess whether (a) anecdotal evidence about the improved condition of coral reefs in this area is supported by a trend in reef fish assemblage structure towards a return to ‘historical’ conditions, or (b) patterns detected from the 2006 resurvey (Ilves et al. 2011) are reinforced and/or expanded by the addition of a new time period data point. Furthermore, this study aims to highlight the importance of the Bahamas holdings of The Academy of Natural Science’s Ichthyology collection in a comparison to seven other major US museums. Analyses of data from five sites resurveyed in 2010 yielded the same statistically significant differences reported by Ilves et al. (2011), and provided statistical support for qualitative trends apparent from the 2006 data. These results suggest that the reef fish assemblages have not recovered, and may have either reached a new assemblage state or are in continued flux.
METHo DS
Comparison of Bahamas holdings across major Ichthyology collections.—t he selection of institutions to which to compare ANSP Ichthyology Bahamas holdings was made based on the authors’ knowledge, in consulta-tion with ANSP Ichthyology collection manager M. Sabaj Pérez, of institutions likely to have significant collections from the region: Florida Museum of Natural History (UF), American Museum of Natural History (AMNH), Harvard Museum of c omparative Zoology (Mc Z), Smithsonian Institution National Museum of Natural History (USNM), Yale Peabody Museum (YPM), Field Museum of Natural History (FMNH), and California Academy of Sciences (c AS). c ollection data were either downloaded from the institution’s website or requested from the respective col-lection manager. Specimens collected from freshwater habitats were excluded, when such information was avail-able. As there are few freshwater habitats in The Bahamas, these exclusions were few in number and inadvertent in-
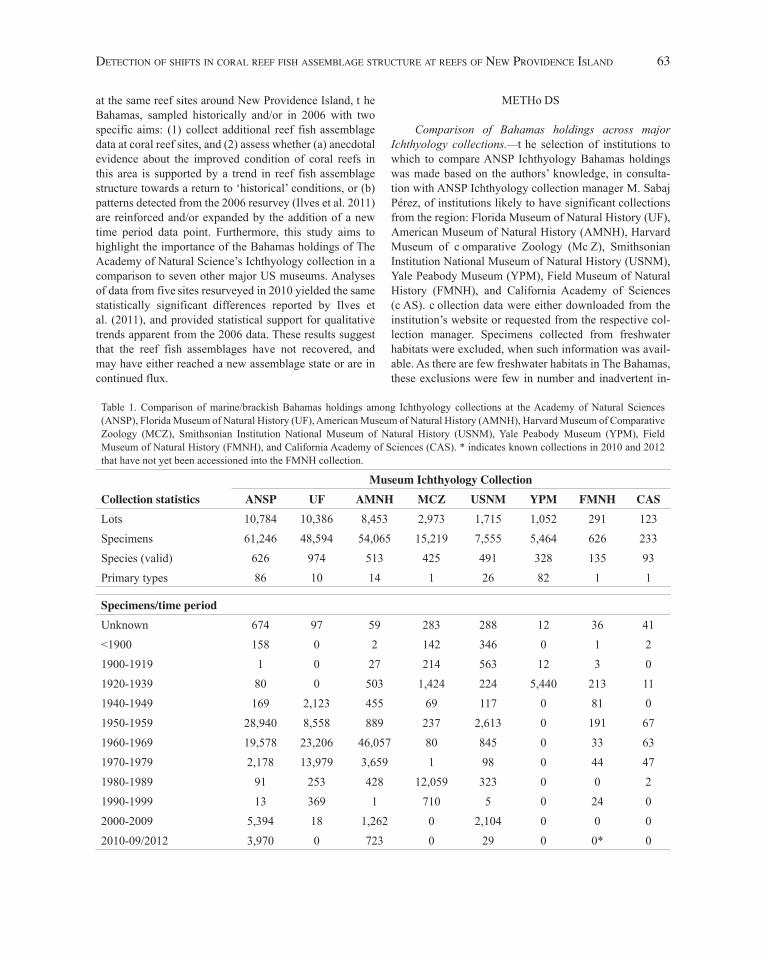
Table 1. Comparison of marine/brackish Bahamas holdings among Ichthyology collections at the Academy of Natural Sciences (ANSP), Florida Museum of Natural History (UF), American Museum of Natural History (AMNH), Harvard Museum of Comparative Zoology (MCZ), Smithsonian Institution National Museum of Natural History (USNM), Yale Peabody Museum (YPM), Field Museum of Natural History (FMNH), and California Academy of Sciences (CAS). * indicates known collections in 2010 and 2012 that have not yet been accessioned into the FMNH collection.
Museum Ichthyology CollectionCollection statistics ANSP UF AMNH MCZ USNM YPM FMNH CASLots 10,784 10,386 8,453 2,973 1,715 1,052 291 123Specimens 61,246 48,594 54,065 15,219 7,555 5,464 626 233Species (valid) 626 974 513 425 491 328 135 93Primary types 86 10 14 1 26 82 1 1
Specimens/time periodUnknown 674 97 59 283 288 12 36 41<1900 158 0 2 142 346 0 1 21900-1919 1 0 27 214 563 12 3 01920-1939 80 0 503 1,424 224 5,440 213 111940-1949 169 2,123 455 69 117 0 81 01950-1959 28,940 8,558 889 237 2,613 0 191 671960-1969 19,578 23,206 46,057 80 845 0 33 631970-1979 2,178 13,979 3,659 1 98 0 44 471980-1989 91 253 428 12,059 323 0 0 21990-1999 13 369 1 710 5 0 24 02000-2009 5,394 18 1,262 0 2,104 0 0 02010-09/2012 3,970 0 723 0 29 0 0* 0
64 K.l. ilves et. Al.
clusion of freshwater collections is unlikely to have af-fected the main findings. Species counts were conducted on refined databases where effort was made to account for misspellings and synonymy according to the c atalog of Fishes (Eschmeyer 2012). Counts of type specimens were limited to name-bearing specimens (primary types): holo-types, neotypes, syntypes, and lectotypes.
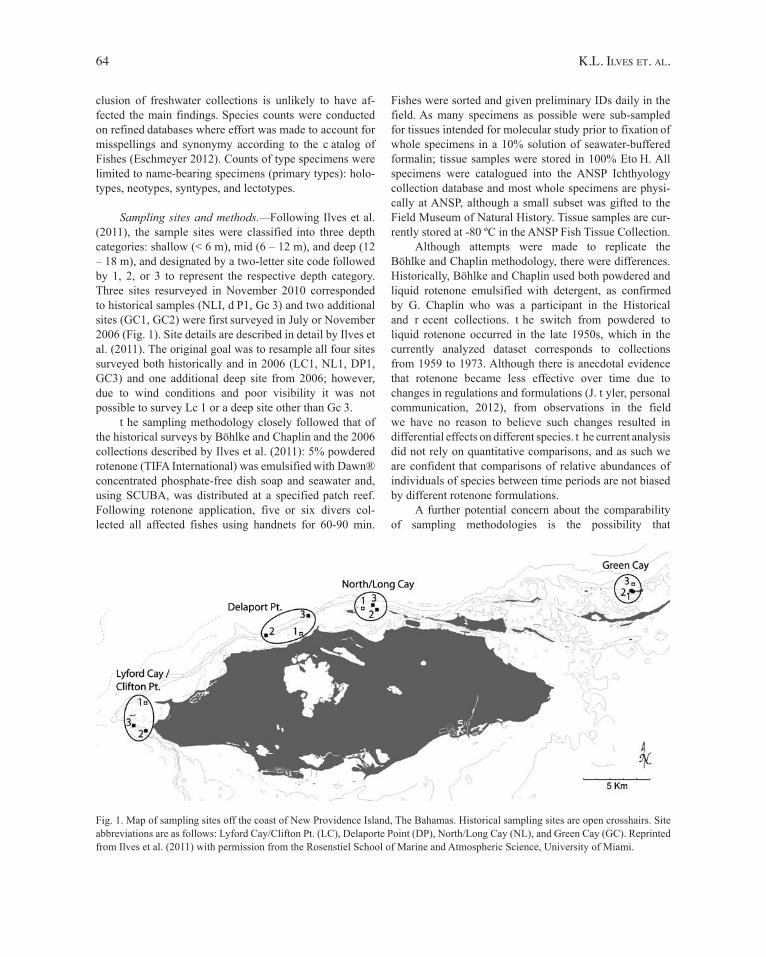
Sampling sites and methods.—Following Ilves et al. (2011), the sample sites were classified into three depth categories: shallow (< 6 m), mid (6 – 12 m), and deep (12 – 18 m), and designated by a two-letter site code followed by 1, 2, or 3 to represent the respective depth category. Three sites resurveyed in November 2010 corresponded to historical samples (NLI, d P1, Gc 3) and two additional sites (GC1, GC2) were first surveyed in July or November 2006 (Fig. 1). Site details are described in detail by Ilves et al. (2011). The original goal was to resample all four sites surveyed both historically and in 2006 (LC1, NL1, DP1, GC3) and one additional deep site from 2006; however, due to wind conditions and poor visibility it was not possible to survey Lc 1 or a deep site other than Gc 3.
t he sampling methodology closely followed that of the historical surveys by Böhlke and Chaplin and the 2006 collections described by Ilves et al. (2011): 5% powdered rotenone (TIFA International) was emulsified with Dawn® concentrated phosphate-free dish soap and seawater and, using SCUBA, was distributed at a specified patch reef. Following rotenone application, five or six divers col-lected all affected fishes using handnets for 60-90 min.
Fishes were sorted and given preliminary IDs daily in the field. As many specimens as possible were sub-sampled for tissues intended for molecular study prior to fixation of whole specimens in a 10% solution of seawater-buffered formalin; tissue samples were stored in 100% Eto H. All specimens were catalogued into the ANSP Ichthyology collection database and most whole specimens are physi-cally at ANSP, although a small subset was gifted to the Field Museum of Natural History. Tissue samples are cur-rently stored at -80 ºC in the ANSP Fish Tissue Collection.
Although attempts were made to replicate the Böhlke and Chaplin methodology, there were differences. Historically, Böhlke and Chaplin used both powdered and liquid rotenone emulsified with detergent, as confirmedby G. Chaplin who was a participant in the Historical and r ecent collections. t he switch from powdered to liquid rotenone occurred in the late 1950s, which in the currently analyzed dataset corresponds to collections from 1959 to 1973. Although there is anecdotal evidence that rotenone became less effective over time due to changes in regulations and formulations (J. t yler, personal communication, 2012), from observations in the fieldwe have no reason to believe such changes resulted in differential effects on different species. t he current analysis did not rely on quantitative comparisons, and as such we are confident that comparisons of relative abundances of individuals of species between time periods are not biased by different rotenone formulations.
A further potential concern about the comparability of sampling methodologies is the possibility that
Fig. 1. Map of sampling sites off the coast of New Providence Island, The Bahamas. Historical sampling sites are open crosshairs. Site abbreviations are as follows: Lyford Cay/Clifton Pt. (LC), Delaporte Point (DP), North/Long Cay (NL), and Green Cay (GC). Reprinted from Ilves et al. (2011) with permission from the Rosenstiel School of Marine and Atmospheric Science, University of Miami.
detection of shifts in corAl reef fish AssemblAge structure At reefs of neW Providence islAnd 65
collection practices differed between time periods. d uring historical expeditions, including some in which Böhlke was a participant, it was common to leave excess numbers of some species, particularly large and spinous taxa such as squirrelfishes, on the reef (J. Tyler, personal communication, 2012). Such sampling would certainly bias comparisons, even of relative abundances between time periods; however, G. Chaplin clearly remembers that for the Böhlke and Chaplin Bahamas expeditions the practice was to collect every specimen, or note when excess specimens were discarded. The sample data and fieldnotes also support these recollections; for example, many Historical samples included dozens of squirrelfishes. We are thus confident that the current sampling methodology is sufficiently congruent with the historical practice that comparisons of species’ relative abundances are valid.
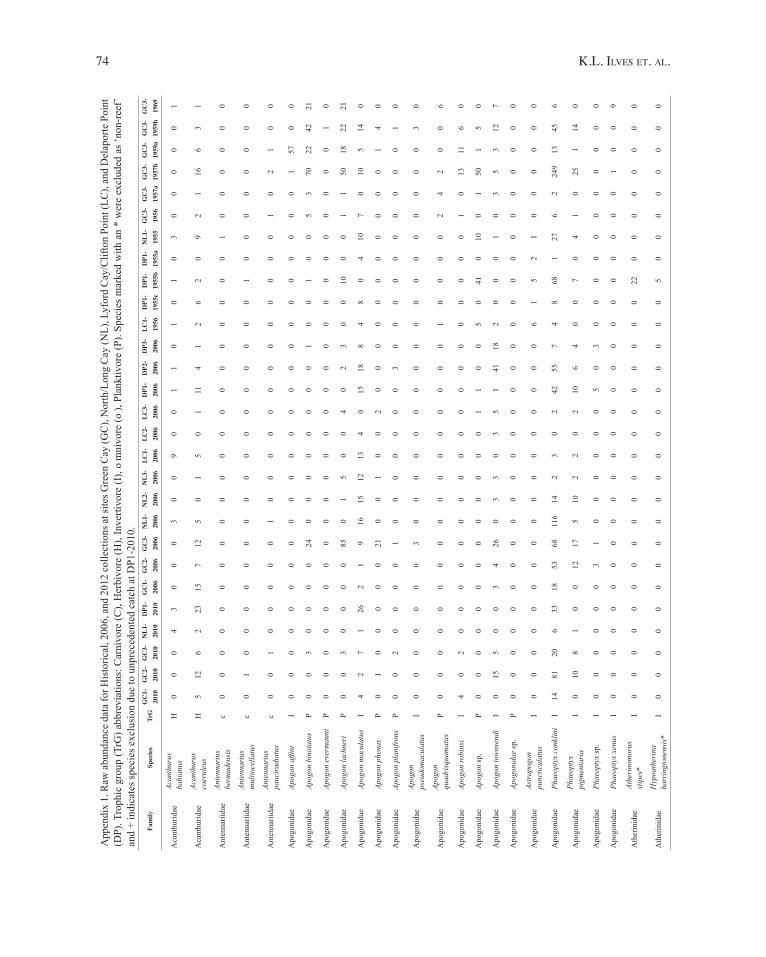
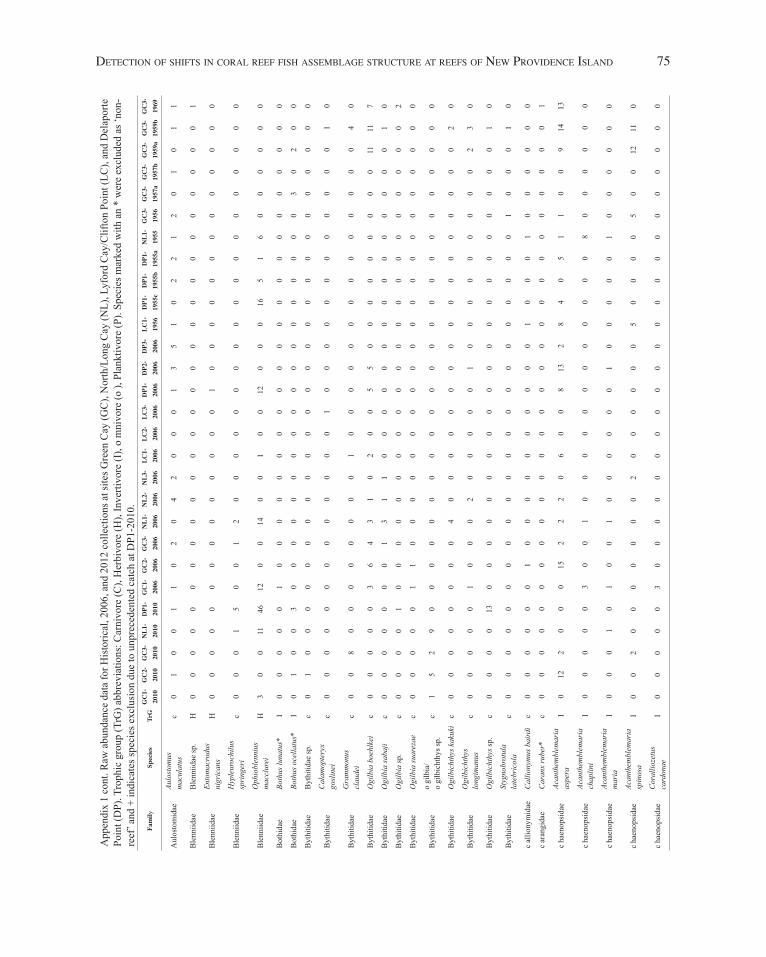
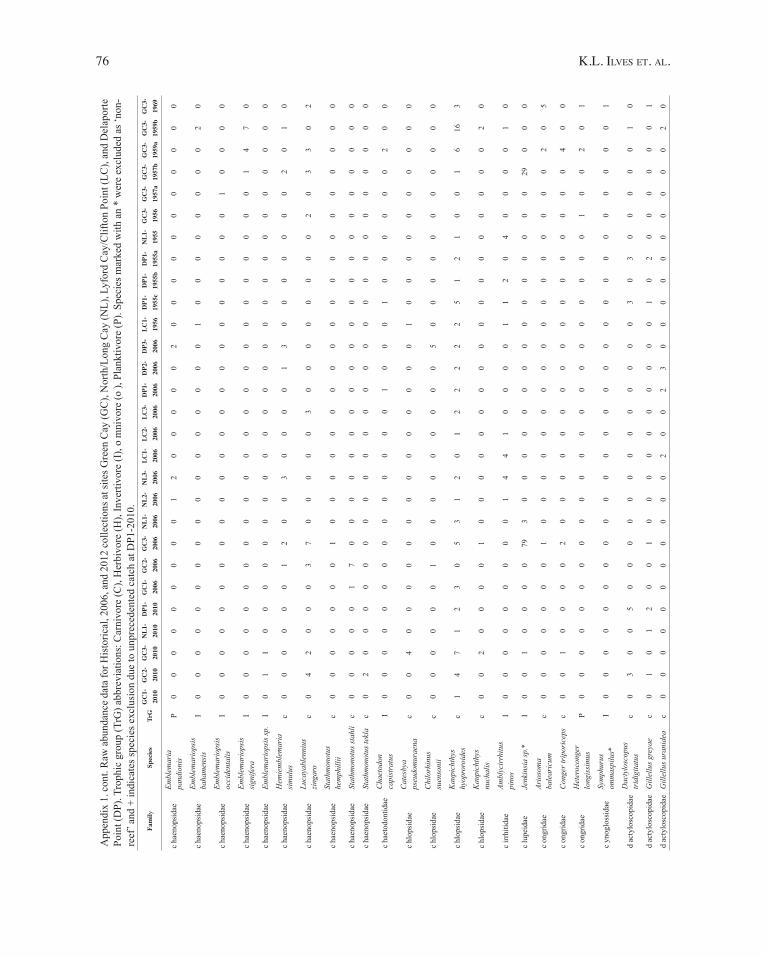
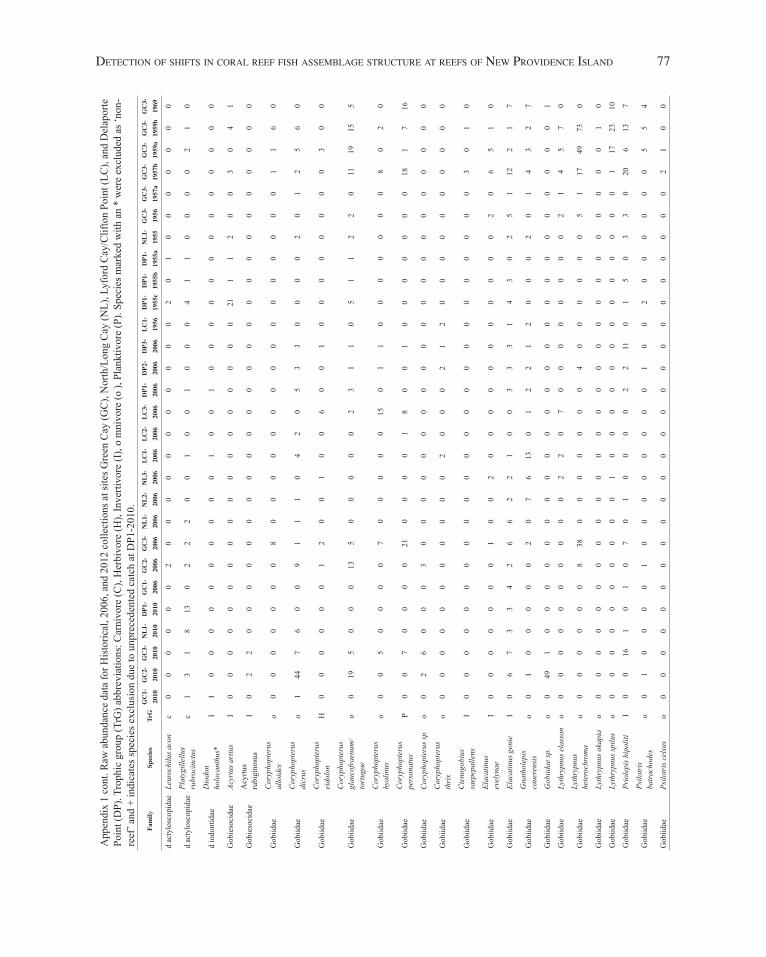
Data analysis.—Each species was classified into one of five trophic groups following Paddack et al. (2009) and Ilves et al. (2011), with the exception that the separate groups ‘carnivore’ and ‘piscivore’ were combined as ‘carnivore’ in the current study. Ilves et al. (2011) excluded potentially biased or compromised sampling events from the historical and 2006 time periods based on information in field notes, and these same events were excluded from the present analyses. t he time periods used for comparison were classified as ‘Historical’ (1955-1973), ‘2006’, ‘2010’, and ‘Recent’ (combined 2006 and 2010 data). Species that are typically considered “non-reef” [Appendix 1, following Choat and Bellwood (1991) and Ilves et al. (2011)] were excluded from all analyses. Specimens identified only to family or genus due to immature life stage and/or condition (e.g., damage, poor preservation), were excluded from multivariate assemblage structure analyses, but were included in univariate analyses of family and trophic group relative abundance. Families that represented less than 1% relative abundance across sites were grouped as ‘o ther’. Due to uncertain identificationsof brotula species belonging to Ogilbia and Ogilbichthys, all such specimens were combined into the taxon ‘Ogilbia/Ogilbichthys sp.’. Similarly, specimens identified as the gobies Coryphopterus glaucofraenum and C. tortugae, and soapfishes of the newly described Rypticus carpenteri (Baldwin and Weigt 2012) and R. subbifrenatus were combined as C. glaucofraenum/tortugae and R. carpenteri/subbifrenatus, respectively. All of those composite taxa were included in all analyses. t he glassy sweeper, Pempheris schomburgkii, was excluded from the analyzed datasets due to an unprecedented catch from the d P1 site in 2010 (>800 specimens, many of which were left on the reef) that would have biased all analyses. Finally, because no mid depth sites were sampled historically, these sites
were excluded from most analyses. t he raw collection data across all years and sites included in this study appear in Appendix 1 and are available from K.L. Ilves in spreadsheet format upon request.
EstimateS (Colwell 2009) was used to assess the adequacy of the community sample and to compare species accumulation curves across time periods. Standard diversity metrics (number of specimens, number of species, H’) and relative abundances of trophic groups and families were calculated in PRIMER 6 (Clarke and Gorley 2006). To assess differences in means between samples for H’ and relative abundance of trophic group and family, t-tests were calculated using the ‘stats’ package in R (R Development Core Team 2008). This test of differences between means is robust to violations of the normality and equal variances assumptions, and is also suitable for testing for differences when only a single sample is available for one of the populations (Simpson et al. 2003), which is the case for the 2010 deep category. Because mid depth sites were only sampled during the Recent time period, comparisons of H’ were only conducted for mid vs. shallow and mid vs. deep sites for this period. Potential differences in assemblage structure between depths and time periods were assessed using the multivariate approach of Clarke (1993) and Clarke and Warwick (2001) implemented in PRIMER 6 (Clarke and Gorley 2006). Abundances were standardized and fourth-root transformed prior to the calculation of Bray-Curtis similarity coefficien s (Bray and Curtis 1957). Multi-dimensional scaling (Md S) and hierarchical cluster analyses were performed to visualize the degree of similarity among sites and depths. Analysis of similarity (ANo SIM; Clarke 1993) was conducted to test for differences between combinations of depth (shallow, mid, deep) and time periods (Historical, 2006, 2010, Recent). Where significant differences were detected, SIMPER (similarity percentage) analysis (Clarke 1993) was used to identify the species most responsible for these differences.
r e Su Lt S
Comparison of Bahamas holdings across Ichthyology collections.—The results of the comparisons of Bahamas holdings across eight major US Ichthyology collections are presented in t able 1. d ue to the inherent vagaries of all such databases and the flux of taxonomic revisions and new species descriptions, the numbers are best regarded as approximations to actual holdings. With 10,784 lots and 61,246 specimens, the ANSP Ichthyology collection has the world’s largest holdings of fishes from The Bahamas, and the highest number of primary types from this region, with 86. In terms of species numbers, ANSP is second, with 626, to UF, with 974 (Table 1). All
66 K.l. ilves et. Al.
collections compared, however, have significant holdings apart from raw numbers. ANSP undoubtedly has the most important collection of Bahamian reef fishes; however, this collection generally lacks specimens from a wide diversity of habitats, such as pelagic and deep-sea environments for which UF and MCZ are particularly strong.
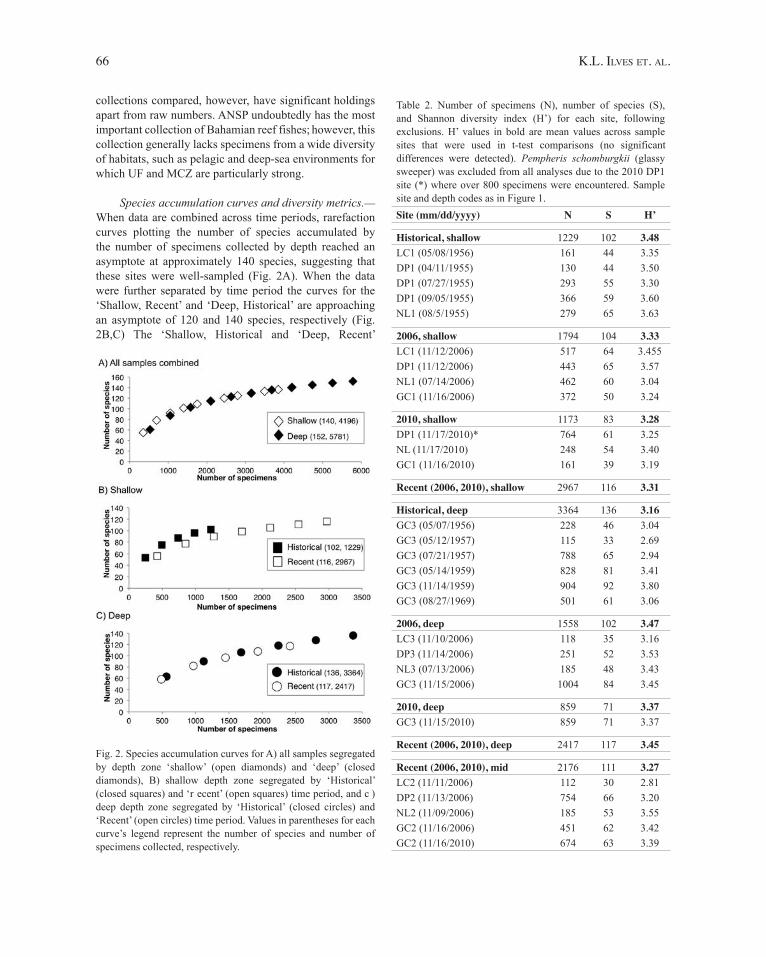
Species accumulation curves and diversity metrics.—When data are combined across time periods, rarefaction curves plotting the number of species accumulated by the number of specimens collected by depth reached an asymptote at approximately 140 species, suggesting that these sites were well-sampled (Fig. 2A). When the data were further separated by time period the curves for the ‘Shallow, Recent’ and ‘Deep, Historical’ are approaching an asymptote of 120 and 140 species, respectively (Fig. 2B,C) The ‘Shallow, Historical and ‘Deep, Recent’
Fig. 2. Species accumulation curves for A) all samples segregated by depth zone ‘shallow’ (open diamonds) and ‘deep’ (closed diamonds), B) shallow depth zone segregated by ‘Historical’ (closed squares) and ‘r ecent’ (open squares) time period, and c ) deep depth zone segregated by ‘Historical’ (closed circles) and ‘Recent’ (open circles) time period. Values in parentheses for each curve’s legend represent the number of species and number of specimens collected, respectively.
Table 2. Number of specimens (N), number of species (S), and Shannon diversity index (H’) for each site, following exclusions. H’ values in bold are mean values across sample sites that were used in t-test comparisons (no significantdifferences were detected). Pempheris schomburgkii (glassy sweeper) was excluded from all analyses due to the 2010 DP1 site (*) where over 800 specimens were encountered. Sample site and depth codes as in Figure 1.Site (mm/dd/yyyy) N S H’
Historical, shallow 1229 102 3.48LC1 (05/08/1956) 161 44 3.35DP1 (04/11/1955) 130 44 3.50DP1 (07/27/1955) 293 55 3.30DP1 (09/05/1955) 366 59 3.60NL1 (08/5/1955) 279 65 3.63
2006, shallow 1794 104 3.33LC1 (11/12/2006) 517 64 3.455DP1 (11/12/2006) 443 65 3.57NL1 (07/14/2006) 462 60 3.04GC1 (11/16/2006) 372 50 3.24
2010, shallow 1173 83 3.28DP1 (11/17/2010)* 764 61 3.25NL (11/17/2010) 248 54 3.40GC1 (11/16/2010) 161 39 3.19
Recent (2006, 2010), shallow 2967 116 3.31
Historical, deep 3364 136 3.16GC3 (05/07/1956) 228 46 3.04GC3 (05/12/1957) 115 33 2.69GC3 (07/21/1957) 788 65 2.94GC3 (05/14/1959) 828 81 3.41GC3 (11/14/1959) 904 92 3.80GC3 (08/27/1969) 501 61 3.06
2006, deep 1558 102 3.47LC3 (11/10/2006) 118 35 3.16DP3 (11/14/2006) 251 52 3.53NL3 (07/13/2006) 185 48 3.43GC3 (11/15/2006) 1004 84 3.45
2010, deep 859 71 3.37GC3 (11/15/2010) 859 71 3.37
Recent (2006, 2010), deep 2417 117 3.45
Recent (2006, 2010), mid 2176 111 3.27LC2 (11/11/2006) 112 30 2.81DP2 (11/13/2006) 754 66 3.20NL2 (11/09/2006) 185 53 3.55GC2 (11/16/2006) 451 62 3.42GC2 (11/16/2010) 674 63 3.39
detection of shifts in corAl reef fish AssemblAge structure At reefs of neW Providence islAnd 67
t able 3. r esults of Analysis of Similarity (ANo SIM) tests between depths and time periods. Significant differences (P ≤ 0.05) highlighted in with *. Historical refers to samples from 1955-1973; Recent refers to combined 2006 and 2010 samples. Number of samples compared for each category in parentheses.
Comparison |R| P
Between depths Shallow (12) vs. Mid (5) 0.519 0.001* Shallow (12) vs. Deep (11) 0.829 0.001* Mid (5) vs. Deep (11) 0.288 0.04*
Between depths, within time periods Historical: Shallow (5) vs. Deep (6) 0.963 0.002* 2006: Shallow (4) vs. Deep (4) 0.802 0.03* 2010: Shallow (3) vs. d eep (N =1) 1 0.25 Recent: Shallow (7) vs. Deep (5) 0.895 0.001*
Shallow depth, between time periods Historical (5) vs. 2006 (4) 0.3 0.02* Historical (5) vs. 2010 (3) 0.333 0.05* 2006 (4) vs. 2010 (3) 0.241 0.83 Historical (5) vs. Recent (7) 0.486 0.001*
Deep depth, between time periods Historical (6) vs. 2006 (4) 0.413 0.01* Historical (6) vs. 2010 (1) 0.067 0.571 2006 (4) vs. 2010 (1) 0.25 0.40 Historical (6) vs. Recent (5) 0.304 0.01*
Mid depth, recent time periods Mid, 2006 (4) vs. Shallow, 2006 (4) 0.375 0.03* Mid, 2006 (4) vs. Deep, 2006 (4) 0.01 0.49 Mid, 2010 (1) vs. Shallow, 2010 (3) 0.556 0.25 Mid, Recent (5) vs. Shallow, Recent (7) 0.639 0.001* Mid, r ecent (5) vs. d eep, r ecent (5) 0.064 0.25
collections have not quite reached an asymptote with respect to the number of specimens collected (Fig. 2B,C).
Diversity metrics, ANOSIM, and SIMPER results.—
d iversity metrics for the sampled sites are listed in t able 2. No significant differences in mean H’ were detected for any comparison (P > 0.5 for all; data not shown). By contrast, significant differences in community composition were detected between shallow and deep sites for all comparisons, except when the 2010 collections, which had a single deep depth sample, were analyzed in isolation (t able 3). e xamination of the Md S and cluster plots (Appendix 2) shows that all sites, including collections from 2010, group with their respective depth categories. No significant differences in community composition were detected between the 2006 and 2010 collections at shallow or deep sites (t able 3). t his similarity between the two most recent time periods provides justification for combining these collections into a ‘r ecent’ time period for further comparisons with the ‘Historical’ data.
At the shallow depth range we found significantdifferences for all comparisons between the Historical and more recent collections, (vs. 2006, vs. 2010, vs. Recent; Table 3). At the deep depth significant differences were found between the Historical and 2006 and the Historical and Recent time periods, but not between the Historical and 2010 collections (Table 3). SIMPER analysis did not clearly discriminate species that were responsible for the detected differences between depths and between time periods within depths: 100-113 and 42-46 species accounted for 90% and 50%, respectively, of the average dissimilarities between groups (data not shown; available from K.L. Ilves).
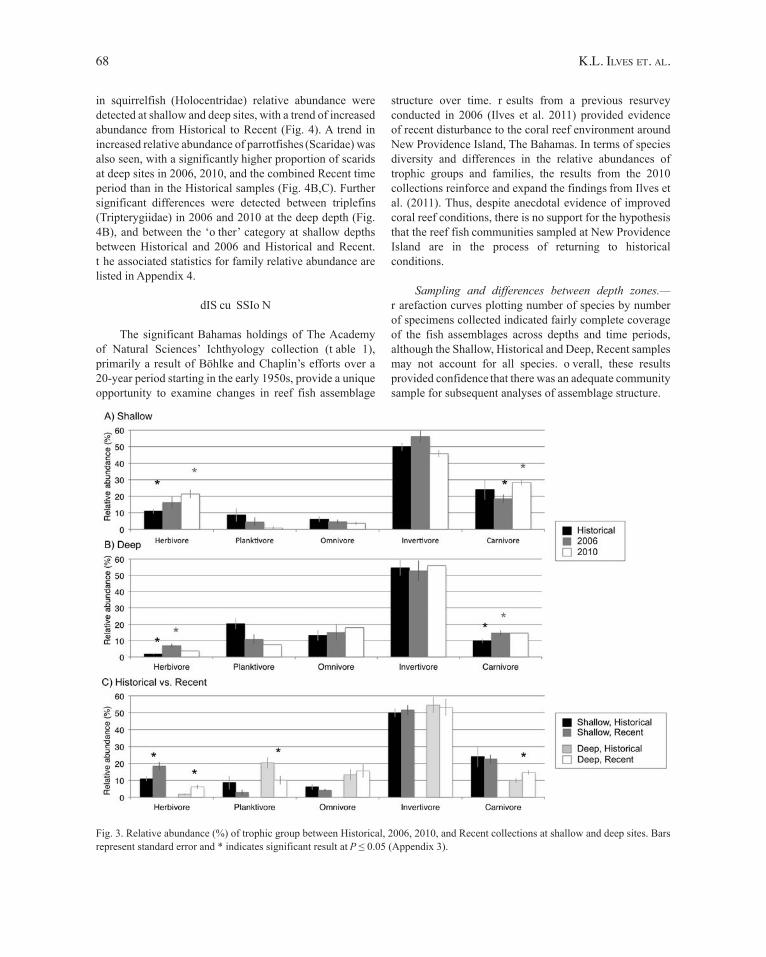
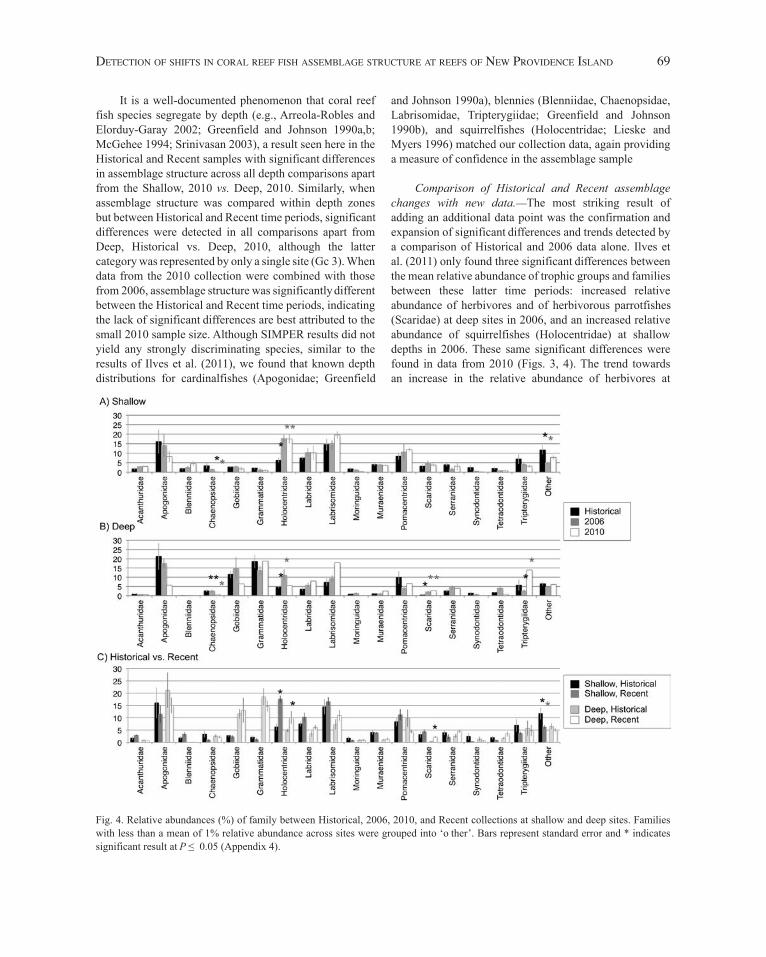
Trophic group and family relative abundance.—d ue to the significant differences in assemblage structure by depth, the relative abundances by trophic group (Fig. 3) and family (Fig. 4) were segregated into shallow and deep sites for comparisons across time periods (Historical, 2006, 2010) and (Historical, Recent). Significant differences in herbivore relative abundance were detected at shallow sites between the Historical and 2010 time periods (Fig. 3A), at deep sites between the Historical and 2006 time periods (Fig. 3B), and at both shallow and deep depths between the Historical and Recent (2006 and 2010 combined) time periods (Fig. 3C), where the proportion of herbivores increased over time. Further, planktivore relative abundance was significantly lower at deep sites in the Recent compared to the Historical time period (Fig. 3C). Finally, significant differences in the relative proportion of carnivores were detected at shallow sites between 2006 and 2010, and deep sites between Historical
and 2006 and between Historical and Recent (Fig. 3). The associated statistics for trophic group relative abundance are listed in Appendix 3.
With respect to changes in family relative abundance, the proportion of chaenopsid blennies (c haenopsidae) was significantly less in 2010 than in 2006 at shallow and deep sites (Fig. 4A,B) and also less in 2010 than in the Historical time period at deep sites (Fig. 4B). Significant differences
68 K.l. ilves et. Al.
structure over time. r esults from a previous resurvey conducted in 2006 (Ilves et al. 2011) provided evidence of recent disturbance to the coral reef environment around New Providence Island, The Bahamas. In terms of species diversity and differences in the relative abundances of trophic groups and families, the results from the 2010 collections reinforce and expand the findings from Ilves et al. (2011). Thus, despite anecdotal evidence of improved coral reef conditions, there is no support for the hypothesis that the reef fish communities sampled at New Providence Island are in the process of returning to historical conditions.
Sampling and differences between depth zones.—r arefaction curves plotting number of species by number of specimens collected indicated fairly complete coverage of the fish assemblages across depths and time periods, although the Shallow, Historical and Deep, Recent samples may not account for all species. o verall, these results provided confidence that there was an adequate community sample for subsequent analyses of assemblage structure.
in squirrelfish (Holocentridae) relative abundance were detected at shallow and deep sites, with a trend of increased abundance from Historical to Recent (Fig. 4). A trend in increased relative abundance of parrotfishes (Scaridae) was also seen, with a significantly higher proportion of scarids at deep sites in 2006, 2010, and the combined Recent time period than in the Historical samples (Fig. 4B,C). Further significant differences were detected between triplefins(Tripterygiidae) in 2006 and 2010 at the deep depth (Fig. 4B), and between the ‘o ther’ category at shallow depths between Historical and 2006 and Historical and Recent. t he associated statistics for family relative abundance are listed in Appendix 4.
dIS cu SSIo N
The significant Bahamas holdings of The Academy of Natural Sciences’ Ichthyology collection (t able 1), primarily a result of Böhlke and Chaplin’s efforts over a 20-year period starting in the early 1950s, provide a unique opportunity to examine changes in reef fish assemblage
Fig. 3. Relative abundance (%) of trophic group between Historical, 2006, 2010, and Recent collections at shallow and deep sites. Bars represent standard error and * indicates significant result at P ≤ 0.05 (Appendix 3).
detection of shifts in corAl reef fish AssemblAge structure At reefs of neW Providence islAnd 69
and Johnson 1990a), blennies (Blenniidae, Chaenopsidae, Labrisomidae, Tripterygiidae; Greenfield and Johnson 1990b), and squirrelfishes (Holocentridae; Lieske and Myers 1996) matched our collection data, again providing a measure of confidence in the assemblage sample
Comparison of Historical and Recent assemblage changes with new data.—The most striking result of adding an additional data point was the confirmation and expansion of significant differences and trends detected by a comparison of Historical and 2006 data alone. Ilves et al. (2011) only found three significant differences between the mean relative abundance of trophic groups and families between these latter time periods: increased relative abundance of herbivores and of herbivorous parrotfishes(Scaridae) at deep sites in 2006, and an increased relative abundance of squirrelfishes (Holocentridae) at shallow depths in 2006. These same significant differences were found in data from 2010 (Figs. 3, 4). The trend towards an increase in the relative abundance of herbivores at
It is a well-documented phenomenon that coral reef fish species segregate by depth (e.g., Arreola-Robles and Elorduy-Garay 2002; Greenfield and Johnson 1990a,b; McGehee 1994; Srinivasan 2003), a result seen here in the Historical and Recent samples with significant differences in assemblage structure across all depth comparisons apart from the Shallow, 2010 vs. Deep, 2010. Similarly, when assemblage structure was compared within depth zones but between Historical and Recent time periods, significantdifferences were detected in all comparisons apart from Deep, Historical vs. Deep, 2010, although the latter category was represented by only a single site (Gc 3). When data from the 2010 collection were combined with those from 2006, assemblage structure was significantly different between the Historical and Recent time periods, indicating the lack of significant differences are best attributed to the small 2010 sample size. Although SIMPER results did not yield any strongly discriminating species, similar to the results of Ilves et al. (2011), we found that known depth distributions for cardinalfishes (Apogonidae; Greenfield
Fig. 4. Relative abundances (%) of family between Historical, 2006, 2010, and Recent collections at shallow and deep sites. Families with less than a mean of 1% relative abundance across sites were grouped into ‘o ther’. Bars represent standard error and * indicates significant result at P ≤ 0.05 (Appendix 4).
70 K.l. ilves et. Al.
shallow depths in 2006 was followed in 2010. In contrast to the 2006 data alone, significant differences in herbivore relative abundances were detected between Historical and 2010 and Historical and Recent data. Furthermore, the 2010 data indicate an increased relative abundance of squirrelfishes at both shallow and deep depths.
Additional trends noted in Ilves et al.’s previous study included a decrease in planktivores and a decrease in car-dinalfishes (Apogonidae) through time at both shallow and deep sites. The addition of data from 2010 added statistical support to most of these previously qualitative observa-tions. There was a continuing trend of decreased plank-tivore abundance through time (Fig. 3), although the dif-ference was only statistically significant for a comparison of Historical and Recent collections at deep depths. This decrease in planktivores is most likely a result of a continu-ous decrease in apogonids through time. d ue to the large variance associated with the collection of apogonids their decrease was not statistically significant (Fig. 4; Appendix 4). Finally, the significant differences observed in the car-nivore trophic group, and the chaenopsid, trypterygiid, and ‘o ther’ families (Figs. 3, 4) were unexpected. Relative increases in the collection of carnivorous bythitids, labri-somids, and serranids between time periods appear to be contributing to the detection of a significant increase in carnivore relative abundance through time. An explanation for this difference is not readily clear, but may be associ-ated with the trend in decreased planktivore representation (discussed below). Similarly surprising were the inverse differences seen in chaenopsid and triplefin blennies be-tween the 2010 and other collections; however, these may be best explained by sampling artifacts with only a single deep site sampled in 2010. Likewise, the differences at the shallow depths in the ‘o ther’ grouping of families with <1% representation across all sites was primarily driven by bythitids (brotulas), which had a higher relative abun-dance in recent than in historical samples, and gobiesocids (clingfishes), which showed the opposite pattern (data not shown). We hesitate to make any conclusions about actual changes in the relative abundance of these taxa given their rarity of collection at the shallow depth zone.
Ecological context of reef fish assemblage changes from Historical to Recent.—t he coral reefs at New Providence Island appear to be in a disturbed state (Ilves et al. 2011; Jaap et al. 2008). In such disturbed habitats increases in herbivores due to an increase in food availability are well-documented (e.g., Cheal et al., 2008; Sheppard et al. 2002; Wilson et al. 2009). In relatively undisturbed reef habitats the presence of herbivores is generally considered to be beneficial for live coral reefs, as grazing reduces algal cover that may otherwise hinder
settlement and/or growth of coral colonies (e.g., Mumby et al. 2006, 2007); however, in areas where much of the coral is dead, herbivore grazing may actually precipitate a decline in coral integrity, particularly through the feeding behavior of scarids that scrape algae off coral skeletons and contribute to bioerosion of the coral structure (e.g., Carreiro-Silva et al. 2005; Graham et al. 2006; Pratchett et al. 2009). Furthermore, studies of the relationship between corals and herbivorous fishes suggest that herbivore species richness, not simply individual abundance, is important in both controlling diverse algal populations and limiting damage to the coral (Burkepile and Hay 2008, 2010).
t he current study documents a clear trend of an increasing representation of herbivores, represented by scarids (parrotfishes) (Fig. 4). There was no apparent trend for acanthurids (surgeonfishes), the other dominant herbivorous reef fish group on these reefs. These changes may indicate the reef structure, which remains mostly intact, is at risk from both continued anthropogenic effects as well as the resident fishes (i.e., herbivorous scarids). Preliminary results from benthic habitat surveys conducted concurrently with the 2010 fish surveys indicate that live coral cover at the sampled sites has either remained the same or decreased since 2006 (H. Hertler, unpublished data). c ontinued monitoring of the integrity of New Providence Island reefs and the associated fishassemblages will provide an opportunity to assess whether the communities recover from disturbance, maintain a new assemblage structure, or undergo further degradation.
Another result of particular interest is the apparent inverse trend seen in holocentrid and apogonid relative abundance (Fig. 4). Both groups are primarily nocturnal feeders that use caves and crevices for shelter during the day (Chave 1978; Gladfelter and Johnson 1983; Greenfieldand Johnson 1990a). Luckhurst and Luckhurst (1978) showed that the much larger-bodied holocentrids have longer residency times than apogonids within particular coral shelters. t hus, even though apogonids are not habitat specialists (Greenfield and Johnson 1990a), a possible explanation for the observed trends is that the smaller apogonids are out-competed for shelter space in degraded coral habitats. To our knowledge this inverse relationship between holocentrid and apogonid relative abundance has not been documented elsewhere, and it would be of great interest whether this pattern is a general trend in disturbed coral reef environments.
In conclusion, the availability of historical reference points in the Ichthyology collection at the Academy of Natural Sciences provided baseline data from which to study reef fish assemblage structure through time at reefs at New Providence Island, The Bahamas. The results from resurveys in 2006 and 2010 indicated that since the his-
detection of shifts in corAl reef fish AssemblAge structure At reefs of neW Providence islAnd 71
torical collections over 30 years ago, reef fish assemblage structure has changed in a consistent manner at four coral reef sites, with an increase in the relative abundance of her-bivores, scarids, and holocentrids, and a decrease in the relative abundance of planktivores and apogonids. The ul-timate causes of coral degradation in this region are likely a complex combination of anthropogenic effects, includ-ing pollution, such as run-off from adjacent developments in Nassau and Paradise Island, and large-scale changes in ocean temperature and chemistry resulting from climate change. t he availability of replicate samples at multiple time periods are necessary and invaluable for continued monitoring of the trajectory of these reef fish assemblages.
ACKNo WLEDGEMENTS
We thank the government of The Bahamas for their continued support of our ongoing studies of Bahamian reef fish assemblages, particularly M. Braynen, Director of Marine Resources, and R. Albury of the Fisheries Department for granting scientific research permits. We are grateful to Bahama Divers for the boat charter and SCUBA support, and especially to Captain Roscoe for his expert piloting and knowledge of the waters. Many thanks to R. and M. Ilves for their field support efforts underwater and onshore, and to M. Sabaj Pérez for remote field support and assistance with specimen cataloguing. We also appreciate the contribution of Bahamas collection data from Ichthyology collection managers G. Watkins-Colwell (YPM), K. Hartel (MCZ), R. Arrindell (AMNH), and particularly R. Robins (UF). An early version of this manuscript was improved by comments from J. t yler. t he 2010 fieldwork was funded by a Wistar-Morris grant from the Academy of Natural Sciences, and the current study was made possible by the generous support of K. Ilves at ANSP by G. c haplin and S. t eale.
LIter Ature cI ted
Arreola-Robles, J. L., and J. F. Elorduy-Garay. 2002. Reef fish diversity in the region of La Paz, Baja California Sur, Mexico. Bulletin of Marine Science 70:1-18.
Baker, A. C., P. W. Glynn, and B. Riegl. 2008. Climate change and coral reef bleaching: An ecological assessment of long-term impacts, recovery trends and future outlook. Estuarine, Coastal and Shelf Science 80:435-471.
Baldwin, C. C., and L. A. Weigt. 2012. A new species of soapfish (Teleostei: Serranidae: Rypticus), with redescription of R. subbifrenatus and comments on the use of d NA barcoding in systematic studies. Copeia 2012:23-36.
Bellwood, D.R., A. S. Hoey, J. L. Ackerman, and M. Depczynski. 2006. Coral bleaching, reef fishcommunity phase shifts and the resilience of coral reefs. Global Change Biology 12:1587-1594.
Böhlke, E. B. 1997. James Erwin Böhlke (1930-1982) and the Academy of Natural Sciences of Philadelphia. In: t . W. Pietsch and W. d . Anderson Jr. (eds.). c ollection building in ichthyology and herpetology. American Society of Ichthyologists and Herpetologists, Spec. Publ. 3, Lawrence, KS., pp. 391-405.
Böhlke, J. E., and C. C. G Chaplin. 1968. Fishes of the Bahamas and adjacent tropical waters. 1st ed. The Academy of Natural Sciences, Philadelphia, 771 pp.
Bray, J. R., and J. T. Curtis. 1957. An ordination of the upland forest communities of southern Wisconsin. Ecological Monographs 27:325-349.
Burkepile, D.E., and M. E. Hay. 2008. Herbivore species richness and feeding complementarity affect community structure and function on a coral reef. Proceedings of the National Academy of Sciences of the United States of America 105:16201-16206.
Burkepile, D.E., and M. E. Hay. 2010. Impact of herbivore identity on algal succession and coral growth on a c a-ribbean reef. Public Library of Science o ne 5: e8963.
Carreiro-Silva M., T. R. McClanahan, and W. E. Kiene. 2005. The role of inorganic nutrients and herbivory in controlling microbioerosion of carbonate substratum. Coral Reefs 24:214-221.
Chave, E. H. 1978. General ecology of six species of Hawaiian cardinalfishes. Pacific Science 32:245-27
Cheal, A.J., S. K. Wilson, M. J. Emslie, A. M. Dolman, and H. Sweatman. 2008. Responses of reef fishcommunities to coral declines on the Great Barrier Reef. Marine Ecology Progress Series 372:211-223.
Choat, J. H., and D. R. Bellwood. 1991 Reef fishes: their history and evolution. In: P. F. Sale (ed.) The ecology of fishes on coral reefs. Academic Press, Inc., New York, pp. 39-66.
Clarke, K. R. 1993. Non-parametric multivariate analyses of changes in community structure. Australian Journal of Ecology 18:117-143.
Clarke, K. R, and R. N. Gorley. 2006. Primer Version 6. User manual/tutorial. Plymouth: PRIMER-E.
Clarke, K. R., and R. M. Warwick. 2001. Change in marine communities: An approach to statistical analysis and interpretation. 2nd ed. Plymouth: PRIMER-E.
Colwell, R. K. 2009. EstimateS: statistical estimation of species richness. Version 8.2.0. User’s Guide and ap-plication published at: http://purl.oclc.org/estimates.
d ahl, A. L., and A. L. Lamberts. 1977. e nvironmental Impact on a Samoan Coral Reef: A resurvey of Mayor’s 1917 transect. Pacific Science 31:309-319
72 K.l. ilves et. Al.
Eschmeyer, W. N. 2012. Catalog of Fishes electronic version (15 Mar 2012). http://research.calacademy.org/research/ichthyology/catalog/fishcatmain.as
Gardner, t .A., I. M. c ôte, J. A. Gill, A. Grant, and A. r . Watkinson. 2005. Hurricanes and Caribbean coral reefs: impacts, recovery patterns, and role in long-term decline. Ecology 86:174-184.
Gladfelter, W. B., and W. S. Johnson. 1983. Feeding niche separation in a guild of tropical reef fishes(Holocentridae). Ecology 64:552-563.
Graham, N. A. J, S. K. Wilson, S. Jennings, N. V. C. Polunin, J. P. Bijoux, and J. Robinson. 2006. Dynamic fragility of oceanic coral reef ecosystems. Proceedings of the National Academy of Sciences of the u nited States of America 103:8425-8429.
Greenfield, D. W., and R. K. Johnson RK. 1990a. Heterogeneity in habitat choice in cardinalfishcommunity structure. Copeia 1990:1107-1114.
Greenfield DW, Johnson RK. 1990b. Community structure of western Caribbean blennioid fishes. Copeia 1990:433-448.
Hoegh-Guldberg o ., P. J. Mumby, A. J. Hooten, R. S. Steneck, P. Greenfield, E. Gomez, C. D. Harvell, P. F. Sale, A. J. Edwards, K. Caldeira, N. Knowlton, C. M. Eakin, R. Iglesias-Prieto, N. Muthiga, R. H. Bradbury, A. Dubi, and M. E. Hatziolos. 2007. Coral reefs under rapid climate change and ocean acidification. Science 318:1737-1742.
Ilves, K. L., L. L. Kellogg, A. M. Quattrini, G. W. Chaplin, H. Hertler, and J. G. Lundberg. 2011. Assessing 50-year Change in Bahamian reef fish assemblages: evidence for community response to recent disturbance? Bulletin of Marine Science 87:567-588.
Jaap, W.C., J. M. Dupont, L., Kellogg, and H. Hertler. 2008. c oral reef habitat around New Providence Island, Bahamas. Proceedings of the 11th International Coral Reef Symposium 18:752-756.
Kellison, G. T., V. McDonough, D. E. Harper, and J. T. Tilmant. 2012. Coral reef fish assemblage shifts and declines in Biscayne National Park, Florida, USA. Bulletin of Marine Science 88:147-182.
Lieske, E., and R. Myers. 1996. Coral reef fishes:Caribbean, Indian o cean, and Pacific o cean, including the Red Sea. Princeton University Press, Princeton, NJ, 400 p.
Luckhurst, B. E., and K. Luckhurst. 1978. Diurnal space utilization in coral reef fish communities. Marine Biology 49:325-332.
McGehee, M. A. 1994. Correspondence between assemblages of coral reef fishes and gradients of water motion, depth, and substrate size off Puerto Rico. Marine Ecology Progress Series 105:243-255.
Moritz, c ., J. L. Patton, c . J. c onroy, J. L. Parra, G. c .
White, and S. R. Beissinger. 2008. Impact of a century of climate change on small-mammal communities in Yosemite National Park, USA. Science 322:261-264.
Mumby, P. J., C. P. Dahlgren, A. R. Harborne, C. V. Kappel, F. Micheli, D. R. Brumbaugh, K. E. Holmes, J. M. Mendes, K. Broad, J. N. Sanchirico, K. Buch, S. Box, R. W. Stoffle, A. B. Gill. 2006. Fishing, trophic cascades, and the process of grazing on coral reefs. Science 311:98-101.
Mumby, P. J., A. R. Harborne, J. Williams, C. V. Kappel, D. R. Brumbaugh, F. Micheli, K. E. Holmes, C. P. Dahlgren, C. B. Paris, and P. G. Blackwell. 2007. t rophic cascade facilitates coral recruitment in a marine reserve. Proceedings of the National Academy of Sciences of the u nited States of America 104:8362–8367.
Nagelkerken, I., K. Vermonden, o . C. C. Moraes, A. o . Debrot, and W. P. Nagelkerken. 2005. Changes in coral reef communities and an associated reef fish species, Cephalopholis cruentata (Lacépède), after 30 years on c uraçao (Netherlands Antilles). Hydrobiologia 549:145-154.
Paddack, M.J., J. D. Reynolds, C. Aguilar, R. S. Appeldoorn, J. Beets, E. W. Burkett, P. M. Chittaro, K. Clarke, R. Esteves, A. C. Fonseca, G. E. Forrester, A. M. Friedlander, J. García-Sais, G. González-Sansón, L. K. B. Jordan, D. B. McClellan, M. W. Miller, P. P. Molloy, P. J. Mumby, I. Nagelkerken, M. Nemeth, R. Navas-Camacho, J. Pitt, N. V. C. Polunin, M. C. Reyes-Nivia, D. R. Robertson, A. Rodríguez-Ramírez, E. Salas, S. R. Smith, R. E. Spieler, M. A. Steele, I. d . Williams, c . L. Wormald, A. r . Watkinson, and I. M. Côté. 2009. Recent region-wide declines in Caribbean reef fish abundance. Current Biology 19:590-595.
Pearson, R. G. 1981. Recovery and recolonization of coral reefs. Marine Ecology Progress Series 4:105-122.
Pratchett, M.S., S. K. Wilson, N. A. J. Graham, P. L. Mun-day, G. P. Jones, and N. V. C. Polunin. 2009. Coral bleaching and consequences for motile reef organ-isms: Past, present and uncertain future effects. In: M. J. H van o ppen, and J. M. Lough (eds.). Coral bleach-ing: patterns, processes, causes and consequences. Springer-Verlag, Heidelberg, pp. 139-158.
R Development Core Team. 2008. R: a language and environment for statistical computing. Vienna: R Foundation for Statistical Computing. http://www.R-project.org
Rogers, C. S., M. Gilnack, and H. C. Fitz III. 1983. Monitoring of coral reefs with linear transects: a study of storm damage. Journal of e xperimental Marine Biology and Ecology 66:285-300.
detection of shifts in corAl reef fish AssemblAge structure At reefs of neW Providence islAnd 73
Rubidge, E. M., J. L. Patton, M. Lim, A. C. Burton, J. S. Brashares, and C. Moritz. 2012. Climate-induced range contraction drives genetic erosion in an alpine mammal. Nature Climate Change 2:285-288.
Sheppard, C. R. C., M. Spalding, C. Bradshaw, and S. Wilson. 2002. Erosion vs. recovery of coral reefs after 1998 El Niño: Chagos reefs, Indian o cean. Ambio 31:40-48.
Simpson, G. G., A. Roe, and R. C. Lewontin. 2003. Quantitative zoology (r ev ed.) d over Publications, Inc., Minneola, NY, 440 pp.
Smith, D. G. 2002. Eugenia Brandt Böhlke 1928–2001. Copiea 2002:1175-1179.
Srinivasan, M. 2003. Depth distributions of coral reef fis -es: the influence of microhabitat structure, settlement, and post-settlement processes. o ecologia 137:76-84.
Tingley, M. W., W. B. Monahan, S. R. Beissinger, and C. Moritz. 2009. Birds track their Grinnellian niche
through a century of climate change. Proceedings of the National Academy of Sciences of the u nited States of America 106 (Supp 2):19637-19643.
Weber, M., D. de Beera, C. Lott, L. Polerecky, K. Kohls, R. M. M. Abed, T. G. Ferdelman, and K. E. Fabricius. 2012. Mechanisms of damage to corals exposed to sedimentation. Proceedings of the National Academy of Sciences of the u nited States of America www.pnas.org/cgi/doi/10.1073/pnas.1100715109
Wilson, S.K., N. A. J. Graham, M. S. Pratchett, G. P. Jones, and N. V. C. Polunin. 2006. Multiple disturbances and the global degradation of coral reefs: are reef fishesat risk or resilient? Global Change Biology 12:2220-2234.
Wilson, S. K., A. M. Dolman, A. J. Cheal, M. J. Emslie, M. S. Pratchett, and H. P. A. Sweatman. 2009. Maintenance of fish diversity on disturbed coral reefs. Coral Reefs 28:3-14.
74 K.l. ilves et. Al.
App
endi
x 1.
Raw
abu
ndan
ce d
ata
for H
isto
rical
, 200
6, a
nd 2
012
colle
ctio
ns a
t site
s Gre
en C
ay (G
C),
Nor
th/L
ong
Cay
(NL)
, Lyf
ord
Cay
/Clif
ton
Poin
t (LC
), an
d D
elap
orte
Poi
nt
(DP)
. Tro
phic
gro
up (T
rG) a
bbre
viat
ions
: Car
nivo
re (C
), H
erbi
vore
(H),
Inve
rtivo
re (I
), o
mni
vore
(o),
Plan
ktiv
ore
(P).
Spec
ies
mar
ked
with
an
* w
ere
excl
uded
as
‘non
-ree
f’ an
d +
indi
cate
s spe
cies
exc
lusi
on d
ue to
unp
rece
dent
ed c
atch
at D
P1-2
010.
Fam
ilySp
ecie
sTr
GG
C1-
2010
GC
2-20
10G
C3-
2010
NL1
-20
10D
P1-
2010
GC
1-20
06G
C2-
2006
GC
3-20
06N
L1-
2006
NL2
-20
06N
L3-
2006
LC1-
2006
LC2-
2006
LC3-
2006
DP1
-20
06D
P2-
2006
DP3
-20
06LC
1-19
56D
P1-
1955
cD
P1-
1955
bD
P1-
1955
aN
L1-
1955
GC
3-19
56G
C3-
1957
aG
C3-
1957
bG
C3-
1959
aG
C3-
1959
bG
C3-
1969
Aca
nthu
ridae
Acan
thur
us
bahi
anus
H0
00
43
00
03
00
90
01
10
10
10
30
00
00
1
Aca
nthu
ridae
Acan
thur
us
coer
uleu
sH
512
62
2315
712
50
15
01
114
12
62
09
21
166
31
Ant
enna
riida
eAn
tenn
ariu
s be
rmud
ensi
sc
00
00
00
00
00
00
00
00
00
00
01
00
00
00
Ant
enna
riida
eAn
tenn
ariu
s m
ultio
cella
tus
c0
10
00
00
00
00
00
00
00
00
10
00
00
00
0
Ant
enna
riida
eAn
tenn
ariu
s pa
ucir
adia
tus
c0
01
00
00
01
00
00
00
00
00
00
01
02
10
0
Apo
goni
dae
Apog
on a
ffini
I0
00
00
00
00
00
00
00
00
00
00
00
01
570
0
Apo
goni
dae
Apog
on b
inot
atus
P0
03
00
00
240
00
00
00
01
00
10
05
370
2242
21
Apo
goni
dae
Apog
on e
verm
anni
P0
00
00
00
00
00
00
00
00
00
00
00
00
01
0
Apo
goni
dae
Apog
on la
chne
riP
00
30
00
085
01
50
04
02
30
010
00
11
5018
2221
Apo
goni
dae
Apog
on m
acul
atus
I4
27
126
21
916
1512
134
015
188
48
04
107
010
514
0
Apo
goni
dae
Apog
on p
hena
xP
01
00
00
021
00
10
02
00
00
00
00
00
01
40
Apo
goni
dae
Apog
on p
lani
frons
P0
02
00
00
10
00
00
00
30
00
00
00
00
01
0
Apo
goni
dae
Apog
on
pseu
dom
acul
atus
I0
00
00
00
30
00
00
00
00
00
00
00
00
03
0
Apo
goni
dae
Apog
on
quad
risq
uam
atus
P0
00
00
00
00
00
00
00
00
10
00
02
42
00
6
Apo
goni
dae
Apog
on ro
bins
iI
40
20
00
00
00
00
00
00
00
00
00
10
1311
60
Apo
goni
dae
Apog
on sp
.P
00
00
00
00
00
00
01
10
05
041
010
01
501
50
Apo
goni
dae
Apog
on to
wns
endi
I0
155
00
34
260
33
03
51
4118
20
00
10
35
312
7
Apo
goni
dae
Apog
onid
ae sp
.P
00
00
00
00
00
00
00
00
00
00
00
00
00
00
Apo
goni
dae
Astr
apog
on
punc
ticul
atus
I0
00
00
00
00
00
00
00
00
61
52
10
00
00
0
Apo
goni
dae
Phae
opty
x co
nklin
iI
1481
206
3318
5368
116
142
30
242
557
48
681
276
224
913
456
Apo
goni
dae
Phae
opty
x pi
gmen
tari
aI
010
81
00
1217
510
22
02
106
40
07
04
10
251
140
Apo
goni
dae
Phae
opty
x sp
.I
00
00
00
31
00
00
00
50
30
00
00
00
00
00
Apo
goni
dae
Phae
opty
x xe
nus
I0
00
00
00
00
00
00
00
00
00
00
00
01
00
9
Ath
erin
idae
Athe
rino
mor
us
stip
es*
I0
00
00
00
00
00
00
00
00
00
220
00
00
00
0
Ath
erin
idae
Hyp
oath
erin
a ha
rrin
gton
ensi
s*I
00
00
00
00
00
00
00
00
00
05
00
00
00
00
detection of shifts in corAl reef fish AssemblAge structure At reefs of neW Providence islAnd 75
App
endi
x 1
cont
. Raw
abu
ndan
ce d
ata
for H
isto
rical
, 200
6, a
nd 2
012
colle
ctio
ns a
t site
s Gre
en C
ay (G
C),
Nor
th/L
ong
Cay
(NL)
, Lyf
ord
Cay
/Clif
ton
Poin
t (LC
), an
d D
elap
orte
Po
int (
DP)
. Tro
phic
gro
up (T
rG) a
bbre
viat
ions
: Car
nivo
re (C
), H
erbi
vore
(H),
Inve
rtivo
re (I
), o
mni
vore
(o),
Plan
ktiv
ore
(P).
Spec
ies m
arke
d w
ith a
n *
wer
e ex
clud
ed a
s ‘no
n-re
ef’ a
nd +
indi
cate
s spe
cies
exc
lusi
on d
ue to
unp
rece
dent
ed c
atch
at D
P1-2
010.
Fam
ilySp
ecie
sTr
GG
C1-
2010
GC
2-20
10G
C3-
2010
NL1
-20
10D
P1-
2010
GC
1-20
06G
C2-
2006
GC
3-20
06N
L1-
2006
NL2
-20
06N
L3-
2006
LC1-
2006
LC2-
2006
LC3-
2006
DP1
-20
06D
P2-
2006
DP3
-20
06LC
1-19
56D
P1-
1955
cD
P1-
1955
bD
P1-
1955
aN
L1-
1955
GC
3-19
56G
C3-
1957
aG
C3-
1957
bG
C3-
1959
aG
C3-
1959
bG
C3-
1969
Aul
osto
mid
aeAu
lost
omus
m
acul
atus
c0
10
01
10
20
42
00
01
35
10
22
12
01
01
1
Ble
nniid
aeB
lenn
iidae
sp.
H0
00
00
00
00
00
00
00
00
00
00
00
00
00
1
Ble
nniid
aeEn
tom
acro
dus
nigr
ican
sH
00
00
00
00
00
00
00
10
00
00
00
00
00
00
Ble
nniid
aeH
yple
uroc
hilu
s sp
ring
eri
c0
00
15
00
12
00
00
00
00
00
00
00
00
00
0
Ble
nniid
aeO
phio
blen
nius
m
accl
urei
H3
00
1146
120
014
00
10
012
00
016
51
60
00
00
0
Bot
hida
eBo
thus
luna
tus*
I0
00
00
10
00
00
00
00
00
00
00
00
00
00
0
Bot
hida
eBo
thus
oce
llatu
s*I
01
00
30
00
00
00
00
00
00
00
00
03
02
00
Byt
hitid
aeB
ythi
tidae
sp.
c0
10
00
00
00
00
00
00
00
00
00
00
00
00
0
Byt
hitid
aeC
alam
opte
ryx
gosl
inei
c0
00
00
00
00
00
00
10
00
00
00
00
00
01
0
Byt
hitid
aeG
ram
mon
us
clau
dei
c0
08
00
00
00
00
10
00
00
00
00
00
00
04
0
Byt
hitid
aeO
gilb
ia b
oehl
kei
c0
00
00
36
43
10
20
05
50
00
00
00
00
1111
7
Byt
hitid
aeO
gilb
ia sa
baji
c0
00
00
00
13
11
00
00
00
00
00
00
00
01
0
Byt
hitid
aeO
gilb
ia sp
.c
00
00
10
00
00
00
00
00
00
00
00
00
00
02
Byt
hitid
aeO
gilb
ia su
arez
aec
00
00
01
10
00
00
00
00
00
00
00
00
00
00
Byt
hitid
aeo
gilb
ia/
ogi
lbic
hthy
s sp.
c1
52
90
00
00
00
00
00
00
00
00
00
00
00
0
Byt
hitid
aeO
gilb
icht
hys k
akuk
ic
00
00
00
00
40
00
00
00
00
00
00
00
00
20
Byt
hitid
aeO
gilb
icht
hys
long
iman
usc
00
00
01
00
02
00
00
01
00
00
00
00
02
30
Byt
hitid
aeO
gilb
icht
hys s
p.c
00
00
130
00
00
00
00
00
00
00
00
00
00
10
Byt
hitid
aeSt
ygno
brot
ula
late
bric
ola
c0
00
00
00
00
00
00
00
00
00
00
01
00
01
0
cal
liony
mid
aeC
allio
nym
us b
aird
ic
00
00
00
10
00
00
00
00
01
00
01
00
00
00
car
angi
dae
Car
anx
rube
r*c
00
00
00
00
00
00
00
00
00
00
00
00
00
01
cha
enop
sida
eAc
anth
embl
emar
ia
aspe
raI
012
20
00
152
22
06
00
813
28
40
51
10
09
1413
cha
enop
sida
eAc
anth
embl
emar
ia
chap
lini
I0
00
00
30
01
00
00
00
00
00
00
80
00
00
0
cha
enop
sida
eAc
anth
embl
emar
ia
mar
iaI
00
01
01
00
10
00
00
01
00
00
01
00
00
00
cha
enop
sida
eAc
anth
embl
emar
ia
spin
osa
I0
02
00
00
00
02
00
00
00
50
00
05
00
1211
0
cha
enop
sida
eC
oral
lioze
tus
car d
onae
I0
00
00
30
00
00
00
00
00
00
00
00
00
00
0
76 K.l. ilves et. Al.
App
endi
x 1.
con
t. R
aw a
bund
ance
dat
a fo
r His
toric
al, 2
006,
and
201
2 co
llect
ions
at s
ites G
reen
Cay
(GC
), N
orth
/Lon
g C
ay (N
L), L
yfor
d C
ay/C
lifto
n Po
int (
LC),
and
Del
apor
te
Poin
t (D
P). T
roph
ic g
roup
(TrG
) abb
revi
atio
ns: C
arni
vore
(C),
Her
bivo
re (H
), In
verti
vore
(I),
om
nivo
re (o
), Pl
ankt
ivor
e (P
). Sp
ecie
s mar
ked
with
an
* w
ere
excl
uded
as ‘
non-
reef
’ and
+ in
dica
tes s
peci
es e
xclu
sion
due
to u
npre
cede
nted
cat
ch a
t DP1
-201
0.
Fam
ilySp
ecie
sTr
GG
C1-
2010
GC
2-20
10G
C3-
2010
NL1
-20
10D
P1-
2010
GC
1-20
06G
C2-
2006
GC
3-20
06N
L1-
2006
NL2
-20
06N
L3-
2006
LC1-
2006
LC2-
2006
LC3-
2006
DP1
-20
06D
P2-
2006
DP3
-20
06LC
1-19
56D
P1-
1955
cD
P1-
1955
bD
P1-
1955
aN
L1-
1955
GC
3-19
56G
C3-
1957
aG
C3-
1957
bG
C3-
1959
aG
C3-
1959
bG
C3-
1969
cha
enop
sida
eEm
blem
aria
pa
ndio
nis
P0
00
00
00
00
12
00
00
02
00
00
00
00
00
0
cha
enop
sida
eEm
blem
ario
psis
ba
ham
ensi
sI
00
00
00
00
00
00
00
00
01
00
00
00
00
20
cha
enop
sida
eEm
blem
ario
psis
oc
cide
ntal
isI
00
00
00
00
00
00
00
00
00
00
00
01
00
00
cha
enop
sida
eEm
blem
ario
psis
si
gnife
raI
00
00
00
00
00
00
00
00
00
00
00
00
14
70
cha
enop
sida
eEm
blem
ario
psis
sp.
I0
11
00
00
00
00
00
00
00
00
00
00
00
00
0
cha
enop
sida
eH
emie
mbl
emar
ia
sim
ulus
c0
00
00
01
20
03
00
00
13
00
00
00
02
01
0
cha
enop
sida
eLu
caya
blen
nius
zi
ngar
oc
04
20
00
37
00
00
03
00
00
00
00
20
33
02
cha
enop
sida
eSt
athm
onot
us
hem
phill
iic
00
00
00
01
00
00
00
00
00
00
00
00
00
00
cha
enop
sida
eSt
athm
onot
us st
ahli
c0
00
00
17
00
00
00
00
00
00
00
00
00
00
0
cha
enop
sida
eSt
athm
onot
us te
kla
c0
20
00
00
00
00
00
00
00
00
00
00
00
00
0
cha
etod
ontid
aeC
haet
odon
ca
pist
ratu
sI
00
00
00
00
00
00
00
10
00
10
00
00
02
00
chl
opsi
dae
Cat
esby
a ps
eudo
mur
aena
c0
04
00
00
00
00
00
00
00
10
00
00
00
00
0
chl
opsi
dae
Chi
lor h
inus
su
enso
nii
c0
00
00
01
00
00
00
00
05
00
00
00
00
00
0
chl
opsi
dae
Kau
pich
thys
hy
opr o
roid
esc
14
71
23
05
31
20
12
22
22
51
21
00
16
163
chl
opsi
dae
Kau
pich
thys
nu
chal
isc
00
20
00
01
00
00
00
00
00
00
00
00
00
20
cirr
hitid
aeAm
blyc
irr h
itus
pino
sI
00
00
00
00
01
44
10
00
01
12
04
00
00
10
clu
peid
aeJe
nkin
sia
sp.*
I0
01
00
00
793
00
00
00
00
00
00
00
029
00
0
con
grid
aeAr
ioso
ma
bale
aric
umc
00
00
00
01
00
00
00
00
00
00
00
00
02
05
con
grid
aeC
onge
r tri
pori
ceps
c0
01
00
00
20
00
00
00
00
00
00
00
00
40
0
con
grid
aeH
eter
ocon
ger
long
issi
mus
P0
00
00
00
00
00
00
00
00
00
00
01
00
20
1
cyn
oglo
ssid
aeSy
mph
urus
om
mas
pilu
s *I
00
00
00
00
00
00
00
00
00
00
00
00
00
01
dac
tylo
scop
idae
Dac
tylo
scop
us
trid
igita
tus
c0
30
05
00
00
00
00
00
00
03
03
00
00
01
0
dac
tylo
scop
idae
Gill
ellu
s gre
yae
c0
10
12
00
10
00
00
00
00
01
02
00
00
00
1
dac
tylo
scop
idae
Gill
ellu
s ura
nide
ac
00
00
00
00
00
02
00
23
00
00
00
00
00
20
detection of shifts in corAl reef fish AssemblAge structure At reefs of neW Providence islAnd 77
App
endi
x 1
cont
. Raw
abu
ndan
ce d
ata
for H
isto
rical
, 200
6, a
nd 2
012
colle
ctio
ns a
t site
s Gre
en C
ay (G
C),
Nor
th/L
ong
Cay
(NL)
, Lyf
ord
Cay
/Clif
ton
Poin
t (LC
), an
d D
elap
orte
Po
int (
DP)
. Tro
phic
gro
up (T
rG) a
bbre
viat
ions
: Car
nivo
re (C
), H
erbi
vore
(H),
Inve
rtivo
re (I
), o
mni
vore
(o),
Plan
ktiv
ore
(P).
Spec
ies m
arke
d w
ith a
n *
wer
e ex
clud
ed a
s ‘no
n-re
ef’ a
nd +
indi
cate
s spe
cies
exc
lusi
on d
ue to
unp
rece
dent
ed c
atch
at D
P1-2
010.
Fam
ilySp
ecie
sTr
GG
C1-
2010
GC
2-20
10G
C3-
2010
NL1
-20
10D
P1-
2010
GC
1-20
06G
C2-
2006
GC
3-20
06N
L1-
2006
NL2
-20
06N
L3-
2006
LC1-
2006
LC2-
2006
LC3-
2006
DP1
-20
06D
P2-
2006
DP3
-20
06LC
1-19
56D
P1-
1955
cD
P1-
1955
bD
P1-
1955
aN
L1-
1955
GC
3-19
56G
C3-
1957
aG
C3-
1957
bG
C3-
1959
aG
C3-
1959
bG
C3-
1969
dac
tylo
scop
idae
Leur
ochi
lus a
con
c0
00
00
02
00
00
00
00
00
02
01
00
00
00
0
dac
tylo
scop
idae
Plat
ygill
ellu
s ru
broc
inct
usc
13
18
130
22
20
01
00
10
00
41
10
00
02
10
dio
dont
idae
Dio
don
holo
cant
hus*
I1
00
00
00
00
00
10
01
00
00
00
00
00
00
0
Gob
ieso
cida
eAc
yrtu
s art
ius
I0
00
00
00
00
00
00
00
00
021
11
20
03
04
1
Gob
ieso
cida
eA
cyrtu
s ru
bigi
nosu
sI
02
20
00
00
00
00
00
00
00
00
00
00
00
00
Gob
iidae
Cor
ypho
pter
us
allo
ides
o0
00
00
00
80
00
00
00
00
00
00
00
01
16
0
Gob
iidae
Cor
ypho
pter
us
dicr
uso
144
76
00
91
11
04
20
53
30
00
02
01
25
60
Gob
iidae
Cor
ypho
pter
us
eido
lon
H0
00
00
01
20
01
00
60
01
00
00
00
00
30
0
Gob
iidae
Cor
ypho
pter
us
glau
cofr
aenu
m/
tort
ugae
o0
195
00
013
50
00
00
23
11
05
11
22
011
1915
5
Gob
iidae
Cor
ypho
pter
us
hyal
inus
o0
05
00
00
70
00
00
150
11
00
00
00
08
02
0
Gob
iidae
Cor
ypho
pter
us
pers
onat
usP
00
70
00
021
00
00
18
00
10
00
00
00
181
716
Gob
iidae
Cor
ypho
pter
us sp
.o
02
60
00
30
00
00
00
00
00
00
00
00
00
00
Gob
iidae
Cor
ypho
pter
us
thri
xo
00
00
00
00
00
02
00
02
12
00
00
00
00
00
Gob
iidae
Cte
nogo
bius
sa
epep
alle
nsI
00
00
00
00
00
00
00
00
00
00
00
00
30
10
Gob
iidae
Elac
atin
us
evel
ynae
I0
00
00
00
10
02
00
00
00
00
00
02
06
51
0
Gob
iidae
Elac
atin
us g
enie
I0
67
33
42
66
22
10
03
33
14
30
25
112
21
7
Gob
iidae
Gna
thol
epis
ca
uere
nsis
o0
10
00
00
20
76
130
12
21
20
00
20
14
32
7
Gob
iidae
Gob
iidae
sp.
o0
491
00
00
00
00
00
00
00
00
00
00
00
00
1
Gob
iidae
Lyth
rypn
us e
lass
ono
00
00
00
00
00
22
07
00
00
00
00
21
45
70
Gob
iidae
Lyth
rypn
us
hete
r och
rom
ao
00
00
00
838
00
00
00
04
00
00
00
51
1749
730
Gob
iidae
Lyth
rypn
us o
kapi
ao
00
00
00
00
00
00
00
00
00
00
00
00
00
10
Gob
iidae
Lyth
rypn
us sp
ilus
o0
00
00
00
00
01
00
00
00
00
00
00
01
1723
10
Gob
iidae
Prio
lepi
s hip
oliti
I0
016
10
10
70
10
00
02
211
01
50
33
020
613
7
Gob
iidae
Psilo
tris
ba
trac
hode
so
01
00
00
10
00
00
00
01
00
20
00
00
05
54
Gob
iidae
Psilo
tris
cel
sus
o0
00
00
00
00
00
00
00
00
00
00
00
02
10
0
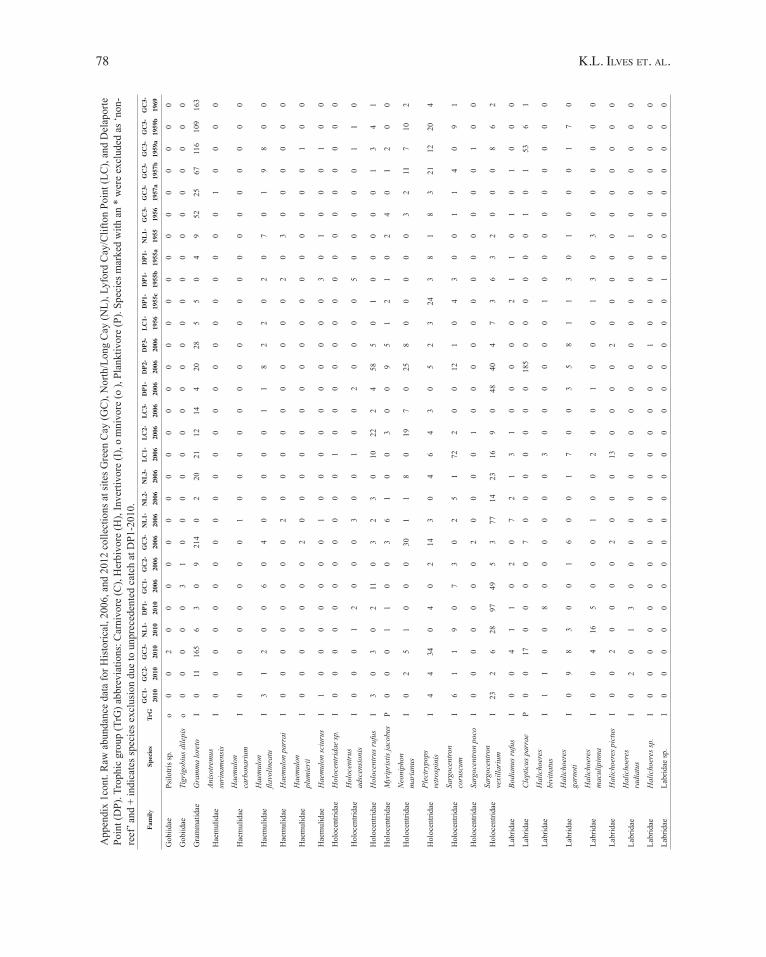
78 K.l. ilves et. Al.
App
endi
x 1c
ont.
Raw
abu
ndan
ce d
ata
for H
isto
rical
, 200
6, a
nd 2
012
colle
ctio
ns a
t site
s Gre
en C
ay (G
C),
Nor
th/L
ong
Cay
(NL)
, Lyf
ord
Cay
/Clif
ton
Poin
t (LC
), an
d D
elap
orte
Po
int (
DP)
. Tro
phic
gro
up (T
rG) a
bbre
viat
ions
: Car
nivo
re (C
), H
erbi
vore
(H),
Inve
rtivo
re (I
), o
mni
vore
(o),
Plan
ktiv
ore
(P).
Spec
ies m
arke
d w
ith a
n *
wer
e ex
clud
ed a
s ‘no
n-re
ef’ a
nd +
indi
cate
s spe
cies
exc
lusi
on d
ue to
unp
rece
dent
ed c
atch
at D
P1-2
010.
Fam
ilySp
ecie
sTr
GG
C1-
2010
GC
2-20
10G
C3-
2010
NL1
-20
10D
P1-
2010
GC
1-20
06G
C2-
2006
GC
3-20
06N
L1-
2006
NL2
-20
06N
L3-
2006
LC1-
2006
LC2-
2006
LC3-
2006
DP1
-20
06D
P2-
2006
DP3
-20
06LC
1-19
56D
P1-
1955
cD
P1-
1955
bD
P1-
1955
aN
L1-
1955
GC
3-19
56G
C3-
1957
aG
C3-
1957
bG
C3-
1959
aG
C3-
1959
bG
C3-
1969
Gob
iidae
Psilo
tris s
p.o
00
20
00
00
00
00
00
00
00
00
00
00
00
00
Gob
iidae
Tigr
igob
ius d
ilepi
so
00
00
03
10
00
00
00
00
00
00
00
00
00
00
Gra
mm
atid
aeG
ram
ma
lore
toI
011
165
63
09
214
02
2021
1214
420
285
50
49
5225
6711
610
916
3
Hae
mul
idae
Anis
otre
mus
su
rina
men
sis
I0
00
00
00
00
00
00
00
00
00
00
00
10
00
0
Hae
mul
idae
Hae
mul
on
carb
onar
ium
I0
00
00
00
01
00
00
00
00
00
00
00
00
00
0
Hae
mul
idae
Hae
mul
on
flavo
linea
tuI
31
20
06
04
00
00
01
18
22
02
07
01
98
00
Hae
mul
idae
Hae
mul
on p
arra
iI
00
00
00
00
20
00
00
00
00
02
03
00
00
00
Hae
mul
idae
Hae
mul
on
plum
ieri
iI
00
00
00
02
00
00
00
00
00
00
00
00
01
00
Hae
mul
idae
Hae
mul
on sc
iuru
sI
10
00
00
00
10
00
00
00
00
03
01
00
01
00
Hol
ocen
trida
eH
oloc
entr
idae
sp.
I0
00
00
00
00
00
10
00
00
00
00
00
00
00
0
Hol
ocen
trida
eH
oloc
entr
us
adsc
ensi
onis
I0
00
12
00
03
00
10
02
00
00
50
00
00
11
0
Hol
ocen
trida
eH
oloc
entr
us ru
fus
I3
03
02
110
32
30
1022
24
585
01
00
00
01
34
1
Hol
ocen
trida
eM
yrip
rist
is ja
cobu
sP
00
01
10
03
61
00
30
09
51
21
02
40
12
00
Hol
ocen
trida
eN
eoni
phon
m
aria
nus
I0
25
10
00
301
18
019
70
258
00
00
03
211
710
2
Hol
ocen
trida
ePl
ectr
ypop
s re
tr osp
inis
I4
434
04
02
143
04
64
30
52
324
38
18
321
1220
4
Hol
ocen
trida
eSa
rgoc
entro
n co
rusc
umI
61
19
07
30
25
172
20
012
10
43
00
11
40
91
Hol
ocen
trida
eSa
rgoc
entro
n po
coI
00
00
00
02
00
00
10
00
00
00
00
00
01
00
Hol
ocen
trida
eSa
rgoc
entro
n ve
xilla
rium
I23
26
2897
495
377
1423
169
048
404
73
63
20
00
86
2
Labr
idae
Bodi
anus
rufu
sI
00
41
10
20
72
13
10
00
00
21
10
10
10
00
Labr
idae
Cle
ptic
us p
arra
eP
00
170
00
07
00
00
00
018
50
00
00
01
01
536
1
Labr
idae
Hal
icho
eres
bi
vitta
tus
I1
10
08
00
00
00
30
00
00
01
00
00
00
00
0
Labr
idae
Hal
icho
eres
ga
rnot
iI
09
83
00
16
00
17
00
35
81
13
01
00
01
70
Labr
idae
Hal
icho
eres
m
acul
ipin
naI
00
416
50
00
10
02
00
10
00
13
03
00
00
00
Labr
idae
Hal
icho
eres
pic
tus
I0
02
00
00
20
00
130
00
02
00
00
00
00
00
0
Labr
idae
Hal
icho
eres
ra
diat
usI
02
01
30
00
00
00
00
00
00
00
01
00
00
00
Labr
idae
Hal
icho
eres
sp.
I0
00
00
00
00
00
00
00
01
00
00
00
00
00
0
Labr
idae
Labr
idae
sp.
I0
00
00
00
00
00
00
00
00
00
10
00
00
00
0
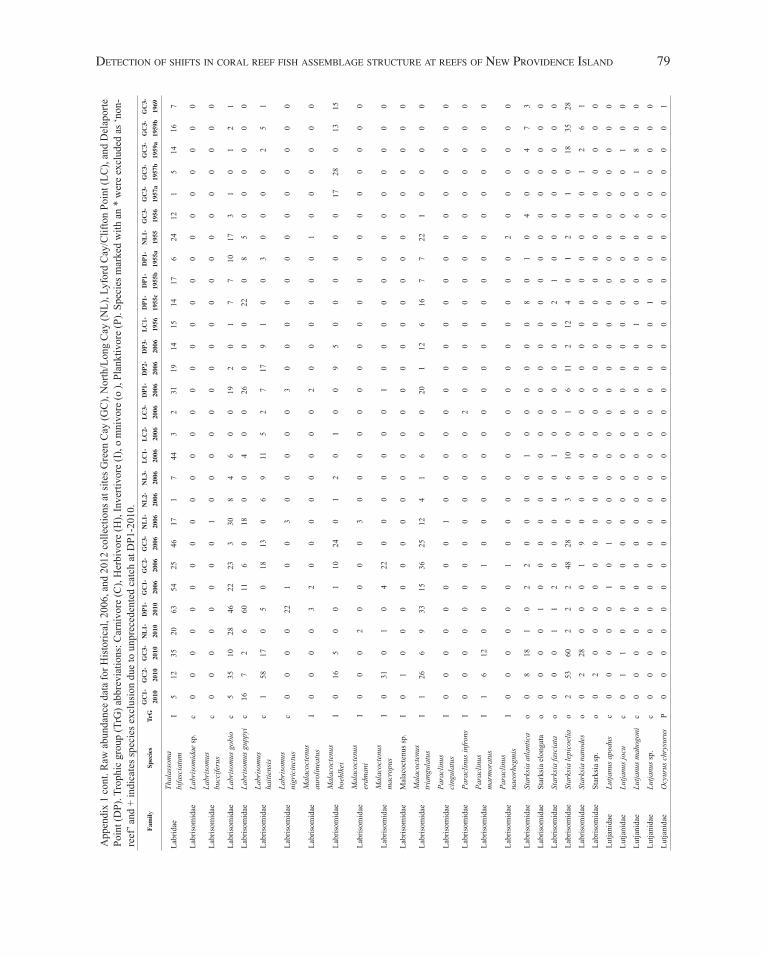
detection of shifts in corAl reef fish AssemblAge structure At reefs of neW Providence islAnd 79
App
endi
x 1
cont
. Raw
abu
ndan
ce d
ata
for H
isto
rical
, 200
6, a
nd 2
012
colle
ctio
ns a
t site
s Gre
en C
ay (G
C),
Nor
th/L
ong
Cay
(NL)
, Lyf
ord
Cay
/Clif
ton
Poin
t (LC
), an
d D
elap
orte
Po
int (
DP)
. Tro
phic
gro
up (T
rG) a
bbre
viat
ions
: Car
nivo
re (C
), H
erbi
vore
(H),
Inve
rtivo
re (I
), o
mni
vore
(o),
Plan
ktiv
ore
(P).
Spec
ies m
arke
d w
ith a
n *
wer
e ex
clud
ed a
s ‘no
n-re
ef’ a
nd +
indi
cate
s spe
cies
exc
lusi
on d
ue to
unp
rece
dent
ed c
atch
at D
P1-2
010.
Fam
ilySp
ecie
sTr
GG
C1-
2010
GC
2-20
10G
C3-
2010
NL1
-20
10D
P1-
2010
GC
1-20
06G
C2-
2006
GC
3-20
06N
L1-
2006
NL2
-20
06N
L3-
2006
LC1-
2006
LC2-
2006
LC3-
2006
DP1
-20
06D
P2-
2006
DP3
-20
06LC
1-19
56D
P1-
1955
cD
P1-
1955
bD
P1-
1955
aN
L1-
1955
GC
3-19
56G
C3-
1957
aG
C3-
1957
bG
C3-
1959
aG
C3-
1959
bG
C3-
1969
Labr
idae
Thal
asso
ma
bifa
scia
tum
I5
1235
2063
5425
4617
17
443
231
1914
1514
176
2412
15
1416
7
Labr
isom
idae
Labr
isom
idae
sp.
c0
00
00
00
00
00
00
00
00
00
00
00
00
00
0
Labr
isom
idae
Labr
isom
us
bucc
iferu
sc
00
00
00
00
10
00
00
00
00
00
00
00
00
00
Labr
isom
idae
Labr
isom
us g
obio
c5
3510
2846
2223
330
84
60
019
20
17
710
173
10
12
1
Labr
isom
idae
Labr
isom
us g
uppy
ic
167
26
6011
60
180
04
00
260
00
220
85
00
00
00
Labr
isom
idae
Labr
isom
us
haiti
ensi
sc
158
170
50
1813
06
911
52
717
91
00
30
00
02
51
Labr
isom
idae
Labr
isom
us
nigr
icin
ctus
c0
00
022
10
03
00
00
03
00
00
00
00
00
00
0
Labr
isom
idae
Mal
acoc
tenu
s au
rolin
eatu
sI
00
00
32
00
00
00
00
20
00
00
01
00
00
00
Labr
isom
idae
Mal
acoc
tenu
s bo
ehlk
eiI
016
50
01
1024
01
20
10
09
50
00
00
017
280
1315
Labr
isom
idae
Mal
acoc
tenu
s er
dman
iI
00
02
00
00
30
00
00
00
00
00
00
00
00
00
Labr
isom
idae
Mal
acoc
tenu
s m
acro
pus
I0
310
10
422
00
00
00
01
00
00
00
00
00
00
0
Labr
isom
idae
Mal
acoc
tenu
s sp.
I0
10
00
00
00
00
00
00
00
00
00
00
00
00
0
Labr
isom
idae
Mal
acoc
tenu
s tr
iang
ulat
usI
126
69
3315
3625
124
16
00
201
126
167
722
10
00
00
Labr
isom
idae
Para
clin
us
cing
ulat
usI
00
00
00
00
10
00
00
00
00
00
00
00
00
00
Labr
isom
idae
Para
clin
us in
frons
I0
00
00
00
00
00
00
20
00
00
00
00
00
00
0
Labr
isom
idae
Para
clin
us
mar
mor
atus
I1
612
00
01
00
00
00
00
00
00
00
00
00
00
0
Labr
isom
idae
Para
clin
us
naeo
rheg
mis
I0
00
00
01
00
00
00
00
00
00
00
20
00
00
0
Labr
isom
idae
Star
ksia
atla
ntic
ao
08
181
02
20
00
01
00
00
00
80
10
40
04
73
Labr
isom
idae
Star
ksia
elo
ngat
ao
00
00
10
00
00
00
00
00
00
00
00
00
00
00
Labr
isom
idae
Star
ksia
fasc
iata
o0
00
11
20
00
00
10
00
00
02
10
00
00
00
0
Labr
isom
idae
Star
ksia
lepi
coel
iao
253
602
22
4828
03
610
01
611
212
40
12
01
018
3528
Labr
isom
idae
Star
ksia
nan
odes
o0
228
00
01
90
00
00
00
00
00
00
00
01
26
1
Labr
isom
idae
Star
ksia
sp.
o0
20
00
00
00
00
00
00
00
00
00
00
00
00
0
Lutja
nida
eLu
tjanu
s apo
dus
c0
00
00
10
10
00
00
00
00
00
00
00
00
00
0
Lutja
nida
eLu
tjanu
s joc
uc
01
10
00
00
00
00
00
00
00
00
00
00
01
00
Lutja
nida
eLu
tjanu
s mah
ogon
ic
00
00
00
00
00
00
00
00
01
00
00
60
18
00
Lutja
nida
eLu
tjanu
s sp.
c0
00
00
00
00
00
00
00
00
01
00
00
00
00
0
Lutja
nida
eO
cyur
us c
hrys
urus
P0
00
00
00
00
00
00
00
00
00
00
00
00
00
1
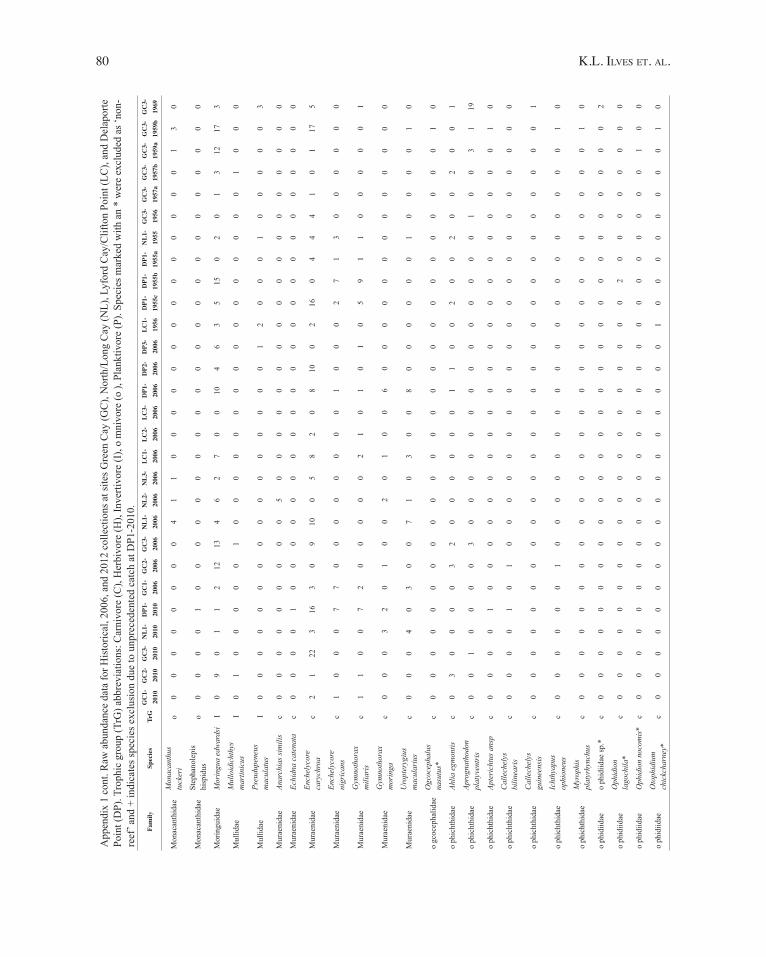
80 K.l. ilves et. Al.
App
endi
x 1
cont
. Raw
abu
ndan
ce d
ata
for H
isto
rical
, 200
6, a
nd 2
012
colle
ctio
ns a
t site
s Gre
en C
ay (G
C),
Nor
th/L
ong
Cay
(NL)
, Lyf
ord
Cay
/Clif
ton
Poin
t (LC
), an
d D
elap
orte
Po
int (
DP)
. Tro
phic
gro
up (T
rG) a
bbre
viat
ions
: Car
nivo
re (C
), H
erbi
vore
(H),
Inve
rtivo
re (I
), o
mni
vore
(o),
Plan
ktiv
ore
(P).
Spec
ies m
arke
d w
ith a
n *
wer
e ex
clud
ed a
s ‘no
n-re
ef’ a
nd +
indi
cate
s spe
cies
exc
lusi
on d
ue to
unp
rece
dent
ed c
atch
at D
P1-2
010.
Fam
ilySp
ecie
sTr
GG
C1-
2010
GC
2-20
10G
C3-
2010
NL1
-20
10D
P1-
2010
GC
1-20
06G
C2-
2006
GC
3-20
06N
L1-
2006
NL2
-20
06N
L3-
2006
LC1-
2006
LC2-
2006
LC3-
2006
DP1
-20
06D
P2-
2006
DP3
-20
06LC
1-19
56D
P1-
1955
cD
P1-
1955
bD
P1-
1955
aN
L1-
1955
GC
3-19
56G
C3-
1957
aG
C3-
1957
bG
C3-
1959
aG
C3-
1959
bG
C3-
1969
Mon
acan
thid
aeM
onac
anth
us
tuck
eri
o0
00
00
00
04
11
00
00
00
00
00
00
00
13
0
Mon
acan
thid
aeSt
epha
nole
pis
hisp
idus
o0
00
01
00
00
00
00
00
00
00
00
00
00
00
0
Mor
ingu
idae
Mor
ingu
a ed
war
dsi
I0
90
11
212
134
62
70
010
46
35
150
20
13
1217
3
Mul
lidae
Mul
loid
icht
hys
mar
tinic
usI
01
00
00
01
00
00
00
00
00
00
00
00
10
00
Mul
lidae
Pseu
dupe
neus
m
acul
atus
I0
00
00
00
00
00
00
00
01
20
00
10
00
00
3
Mur
aeni
dae
Anar
chia
s sim
ilis
c0
00
00
00
00
50
00
00
00
00
00
00
00
00
0
Mur
aeni
dae
Echi
dna
cate
nata
c0
00
01
00
00
00
00
00
00
00
00
00
00
00
0
Mur
aeni
dae
Ench
elyc
ore
cary
chro
ac
21
223
163
09
100
58
20
810
02
160
44
41
01
175
Mur
aeni
dae
Ench
elyc
ore
nigr
ican
sc
10
00
77
00
00
00
00
10
00
27
13
00
00
00
Mur
aeni
dae
Gym
noth
orax
m
iliar
isc
11
00
72
00
00
02
10
10
10
59
11
00
00
01
Mur
aeni
dae
Gym
noth
orax
m
orin
gac
00
03
20
10
02
01
00
60
00
00
00
00
00
00
Mur
aeni
dae
Uro
pter
ygiu
s m
acul
ariu
sc
00
04
03
00
71
03
00
80
00
00
01
00
00
10
ogc
ocep
halid
aeO
gcoc
epha
lus
nasu
tus *
c0
00
00
00
00
00
00
00
00
00
00
00
00
01
0
oph
icht
hida
eAh
lia e
gmon
tisc
03
00
00
32
00
00
00
11
00
20
02
00
20
01
oph
icht
hida
eAp
r ogn
atho
don
plat
yven
tris
c0
01
00
00
30
00
00
00
00
00
00
01
00
31
19
oph
icht
hida
eAp
teri
chtu
s ans
pc
00
00
10
00
00
00
00
00
00
00
00
00
00
10
oph
icht
hida
eC
alle
chel
ys
bilin
eari
sc
00
00
10
10
00
00
00
00
00
00
00
00
00
00
oph
icht
hida
eC
alle
chel
ys
guin
eens
isc
00
00
00
00
00
00
00
00
00
00
00
00
00
01
oph
icht
hida
eIc
hthy
apus
op
hion
eus
c0
00
00
01
00
00
00
00
00
00
00
00
00
01
0
oph
icht
hida
eM
yrop
his
plat
yrhy
nchu
sc
00
00
00
00
00
00
00
00
00
00
00
00
00
10
oph
idiid
aeo
phid
iidae
sp.*
c0
00
00
00
00
00
00
00
00
00
00
00
00
00
2
oph
idiid
aeO
phid
ion
lago
chila
*c
00
00
00
00
00
00
00
00
00
02
00
00
00
00
oph
idiid
aeO
phid
ion
noco
mis
*c
00
00
00
00
00
00
00
00
00
00
00
00
01
00
oph
idiid
aeO
toph
idiu
m
chic
kcha
rney
*c
00
00
00
00
00
00
00
00
01
00
00
00
00
10
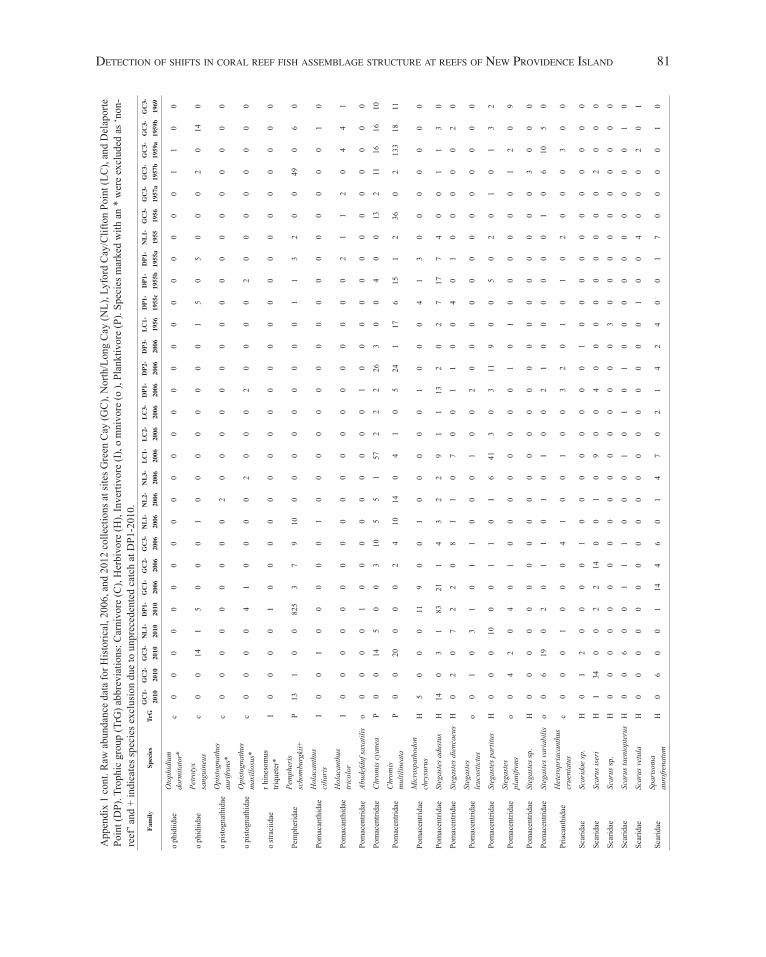
detection of shifts in corAl reef fish AssemblAge structure At reefs of neW Providence islAnd 81
App
endi
x 1
cont
. Raw
abu
ndan
ce d
ata
for H
isto
rical
, 200
6, a
nd 2
012
colle
ctio
ns a
t site
s Gre
en C
ay (G
C),
Nor
th/L
ong
Cay
(NL)
, Lyf
ord
Cay
/Clif
ton
Poin
t (LC
), an
d D
elap
orte
Po
int (
DP)
. Tro
phic
gro
up (T
rG) a
bbre
viat
ions
: Car
nivo
re (C
), H
erbi
vore
(H),
Inve
rtivo
re (I
), o
mni
vore
(o),
Plan
ktiv
ore
(P).
Spec
ies m
arke
d w
ith a
n *
wer
e ex
clud
ed a
s ‘no
n-re
ef’ a
nd +
indi
cate
s spe
cies
exc
lusi
on d
ue to
unp
rece
dent
ed c
atch
at D
P1-2
010.
Fam
ilySp
ecie
sTr
GG
C1-
2010
GC
2-20
10G
C3-
2010
NL1
-20
10D
P1-
2010
GC
1-20
06G
C2-
2006
GC
3-20
06N
L1-
2006
NL2
-20
06N
L3-
2006
LC1-
2006
LC2-
2006
LC3-
2006
DP1
-20
06D
P2-
2006
DP3
-20
06LC
1-19
56D
P1-
1955
cD
P1-
1955
bD
P1-
1955
aN
L1-
1955
GC
3-19
56G
C3-
1957
aG
C3-
1957
bG
C3-
1959
aG
C3-
1959
bG
C3-
1969
oph
idiid
aeO
toph
idiu
m
dorm
itato
r*c
00
00
00
00
00
00
00
00
00
00
00
00
11
00
oph
idiid
aePe
troty
x
sang
uine
usc
00
141
50
00
10
00
00
00
01
50
50
00
20
140
opi
stog
nath
idae
Opi
stog
nath
us
auri
frons
*c
00
00
00
00
02
00
00
00
00
00
00
00
00
00
opi
stog
nath
idae
Opi
stog
nath
us
max
illos
us*
c0
00
04
10
00
02
00
02
00
00
20
00
00
00
0
ost
raci
idae
rhi
neso
mus
tri
quet
er*
I0
00
01
00
00
00
00
00
00
00
00
00
00
00
0
Pem
pher
idae
Pem
pher
is
scho
mbu
rgki
i+P
131
00
825
37
910
00
00
00
00
01
13
20
049
06
0
Pom
acan
thid
aeH
olac
anth
us
cilia
ris
I0
01
00
00
01
00
00
00
00
00
00
00
00
01
0
Pom
acan
thid
aeH
olac
anth
us
tric
olor
I0
00
00
00
00
00
00
00
00
00
02
11
20
44
1
Pom
acen
trida
eAb
udef
duf s
axat
ilis
o0
00
01
00
00
00
00
01
00
00
00
00
00
00
0
Pom
acen
trida
eC
hrom
is c
yane
aP
00
145
00
310
55
157
22
226
30
04
00
132
1116
1610
Pom
acen
trida
eC
hrom
is
mul
tilin
eata
P0
020
00
02
410
140
41
05
241
176
151
236
02
133
1811
Pom
acen
trida
eM
icro
spat
hodo
n ch
rysu
rus
H5
00
011
90
01
00
00
01
00
04
13
00
00
00
0
Pom
acen
trida
eSt
egas
tes a
dust
usH
140
31
8321
14
32
29
11
132
02
717
74
00
11
30
Pom
acen
trida
eSt
egas
tes d
ienc
aeus
H0
20
72
20
81
10
70
01
10
04
01
00
00
02
0
Pom
acen
trida
eSt
egas
tes
leuc
ostic
tus
o0
10
31
01
10
00
10
02
00
00
00
00
00
00
0
Pom
acen
trida
eSt
egas
tes p
artit
usH
00
010
00
11
01
641
30
311
90
05
02
01
01
32
Pom
acen
trida
eSt
egas
tes
plan
ifron
so
04
20
40
10
00
00
00
01
01
00
00
00
12
09
Pom
acen
trida
eSt
egas
tes s
p.H
00
00
00
00
00
00
00
00
00
00
00
00
30
00
Pom
acen
trida
eSt
egas
tes v
aria
bilis
o0
619
02
01
10
10
10
02
10
00
00
01
06
105
0
Pria
cant
hida
eH
eter
opri
acan
thus
cr
uent
atus
c0
00
10
00
41
00
10
03
20
10
10
20
00
30
0
Scar
idae
Scar
idae
sp.
H0
12
00
00
10
00
00
00
01
00
00
00
00
00
0
Scar
idae
Scar
us is
eri
H1
340
02
214
00
10
90
04
00
00
00
00
02
00
0
Scar
idae
Scar
us sp
.H
00
00
00
00
00
00
00
00
03
00
00
00
00
00
Scar
idae
Scar
us ta
enio
pter
usH
00
60
01
11
00
01
01
01
00
00
00
00
00
10
Scar
idae
Scar
us v
etul
aH
00
00
00
00
00
00
00
00
00
10
04
00
02
01
Scar
idae
Spar
isom
a au
rofr e
natu
mH
06
00
114
46
01
47
02
14
24
00
17
00
00
10
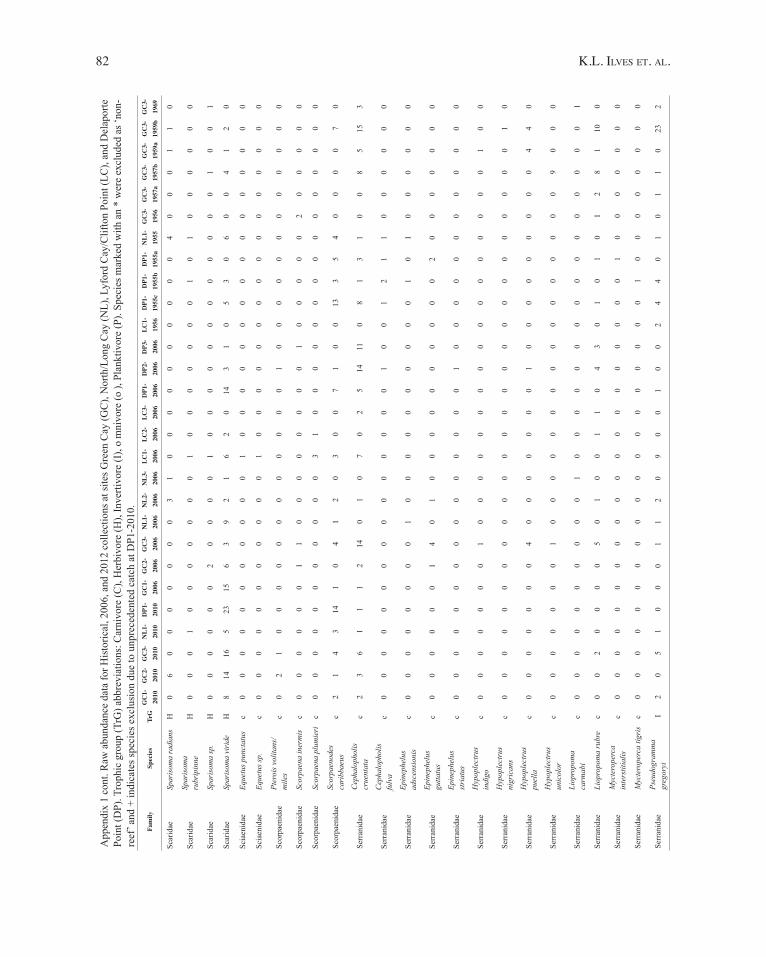
82 K.l. ilves et. Al.
App
endi
x 1
cont
. Raw
abu
ndan
ce d
ata
for H
isto
rical
, 200
6, a
nd 2
012
colle
ctio
ns a
t site
s Gre
en C
ay (G
C),
Nor
th/L
ong
Cay
(NL)
, Lyf
ord
Cay
/Clif
ton
Poin
t (LC
), an
d D
elap
orte
Po
int (
DP)
. Tro
phic
gro
up (T
rG) a
bbre
viat
ions
: Car
nivo
re (C
), H
erbi
vore
(H),
Inve
rtivo
re (I
), o
mni
vore
(o),
Plan
ktiv
ore
(P).
Spec
ies m
arke
d w
ith a
n *
wer
e ex
clud
ed a
s ‘no
n-re
ef’ a
nd +
indi
cate
s spe
cies
exc
lusi
on d
ue to
unp
rece
dent
ed c
atch
at D
P1-2
010.
Fam
ilySp
ecie
sTr
GG
C1-
2010
GC
2-20
10G
C3-
2010
NL1
-20
10D
P1-
2010
GC
1-20
06G
C2-
2006
GC
3-20
06N
L1-
2006
NL2
-20
06N
L3-
2006
LC1-
2006
LC2-
2006
LC3-
2006
DP1
-20
06D
P2-
2006
DP3
-20
06LC
1-19
56D
P1-
1955
cD
P1-
1955
bD
P1-
1955
aN
L1-
1955
GC
3-19
56G
C3-
1957
aG
C3-
1957
bG
C3-
1959
aG
C3-
1959
bG
C3-
1969
Scar
idae
Spar
isom
a ra
dian
sH
06
00
00
00
03
10
00
00
00
00
04
00
01
10
Scar
idae
Spar
isom
a ru
brip
inne
H0
00
10
00
00
00
10
00
00
00
10
10
00
00
0
Scar
idae
Spar
isom
a sp
.H
00
00
00
20
00
01
00
00
00
00
00
00
10
01
Scar
idae
Spar
isom
a vi
ride
H8
1416
523
156
39
21
62
014
31
05
30
60
04
12
0
Scia
enid
aeEq
uetu
s pun
ctat
usc
00
00
00
00
00
01
00
00
00
00
00
00
00
00
Scia
enid
aeEq
uetu
s sp.
c0
00
00
00
00
00
10
00
00
00
00
00
00
00
0
Scor
paen
idae
Pter
ois v
olita
ns/
mile
sc
02
10
00
00
00
00
00
01
00
00
00
00
00
00
Scor
paen
idae
Scor
paen
a in
erm
isc
00
00
00
11
00
00
00
00
10
00
00
20
00
00
Scor
paen
idae
Scor
paen
a pl
umie
ric
00
00
00
00
00
03
10
00
00
00
00
00
00
00
Scor
paen
idae
Scor
paen
odes
ca
ribb
aeus
c2
14
314
10
41
20
30
07
10
013
35
40
00
07
0
Serr
anid
aeC
epha
loph
olis
cr
uent
ata
c2
36
11
12
140
10
70
25
1411
08
13
10
08
515
3
Serr
anid
aeC
epha
loph
olis
fu
lva
c0
00
00
00
00
00
00
00
10
01
21
10
00
00
0
Serr
anid
aeEp
inep
helu
s ad
scen
sion
isc
00
00
00
00
10
00
00
00
00
01
01
00
00
00
Serr
anid
aeEp
inep
helu
s gu
ttatu
sc
00
00
00
14
01
00
00
00
00
00
20
00
00
00
Serr
anid
aeEp
inep
helu
s st
riat
usc
00
00
00
00
00
00
00
01
00
00
00
00
00
00
Serr
anid
aeH
ypop
lect
rus
indi
goc
00
00
00
01
00
00
00
00
00
00
00
00
01
00
Serr
anid
aeH
ypop
lect
rus
nigr
ican
sc
00
00
00
00
00
00
00
00
00
00
00
00
00
10
Serr
anid
aeH
ypop
lect
rus
puel
lac
00
00
00
04
00
00
00
01
00
00
00
00
04
40
Serr
anid
aeH
ypop
lect
rus
unic
olor
c0
00
00
00
10
00
00
00
00
00
00
00
09
00
0
Serr
anid
aeLi
opro
pom
a ca
rmab
ic
00
00
00
00
00
10
00
00
00
00
00
00
00
01
Serr
anid
aeLi
opro
pom
a ru
bre
c0
02
00
00
50
10
01
10
43
01
01
01
28
110
0
Serr
anid
aeM
ycte
rope
r ca
inte
rstit
ialis
c0
00
00
00
00
00
00
00
00
00
01
00
00
00
0
Serr
anid
aeM
ycte
rope
rca
tigri
sc
00
00
00
00
00
00
00
00
00
01
00
00
00
00
Serr
anid
aePs
eudo
gram
ma
greg
oryi
I2
05
10
00
11
20
90
01
00
24
40
10
11
023
2
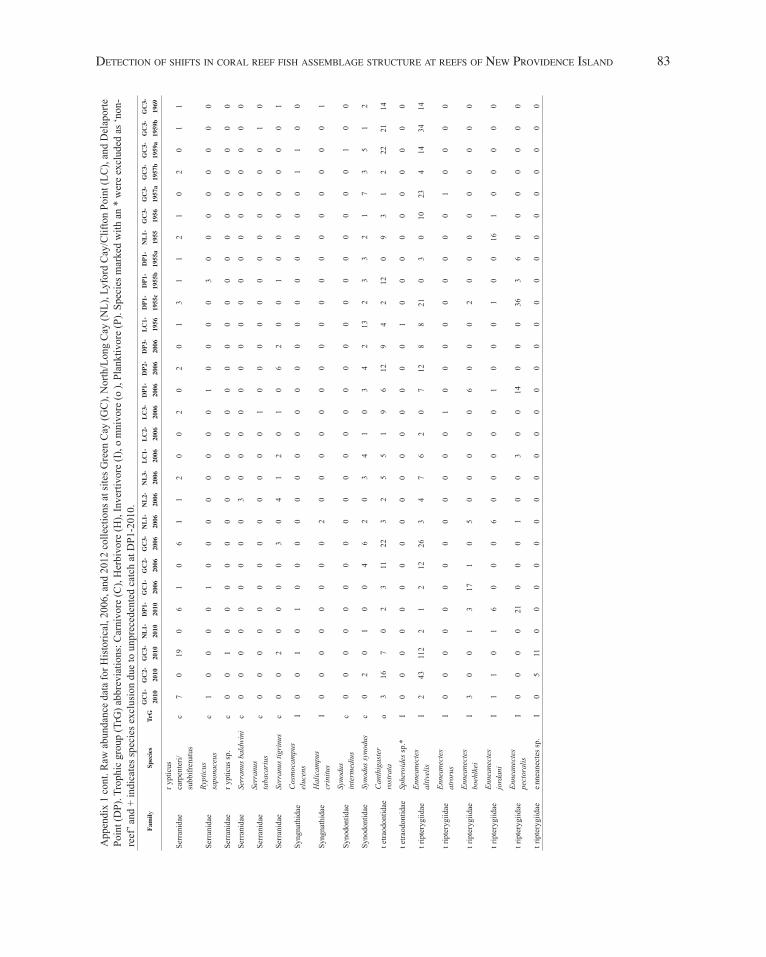
detection of shifts in corAl reef fish AssemblAge structure At reefs of neW Providence islAnd 83
App
endi
x 1
cont
. Raw
abu
ndan
ce d
ata
for H
isto
rical
, 200
6, a
nd 2
012
colle
ctio
ns a
t site
s Gre
en C
ay (G
C),
Nor
th/L
ong
Cay
(NL)
, Lyf
ord
Cay
/Clif
ton
Poin
t (LC
), an
d D
elap
orte
Po
int (
DP)
. Tro
phic
gro
up (T
rG) a
bbre
viat
ions
: Car
nivo
re (C
), H
erbi
vore
(H),
Inve
rtivo
re (I
), o
mni
vore
(o),
Plan
ktiv
ore
(P).
Spec
ies m
arke
d w
ith a
n *
wer
e ex
clud
ed a
s ‘no
n-re
ef’ a
nd +
indi
cate
s spe
cies
exc
lusi
on d
ue to
unp
rece
dent
ed c
atch
at D
P1-2
010.
Fam
ilySp
ecie
sTr
GG
C1-
2010
GC
2-20
10G
C3-
2010
NL1
-20
10D
P1-
2010
GC
1-20
06G
C2-
2006
GC
3-20
06N
L1-
2006
NL2
-20
06N
L3-
2006
LC1-
2006
LC2-
2006
LC3-
2006
DP1
-20
06D
P2-
2006
DP3
-20
06LC
1-19
56D
P1-
1955
cD
P1-
1955
bD
P1-
1955
aN
L1-
1955
GC
3-19
56G
C3-
1957
aG
C3-
1957
bG
C3-
1959
aG
C3-
1959
bG
C3-
1969
Serr
anid
aery
ptic
us
carp
ente
ri/su
bbifr
enat
usc
70
190
61
06
11
20
02
02
01
31
12
10
20
11
Serr
anid
aeRy
ptic
us
sapo
nace
usc
10
00
01
00
00
00
00
10
00
03
00
00
00
00
Serr
anid
aery
ptic
us sp
.c
00
10
00
00
00
00
00
00
00
00
00
00
00
00
Serr
anid
aeSe
rran
us b
aldw
ini
c0
00
00
00
00
30
00
00
00
00
00
00
00
00
0
Serr
anid
aeSe
rran
us
taba
cari
usc
00
00
00
00
00
00
01
00
00
00
00
00
00
10
Serr
anid
aeSe
rran
us ti
grin
usc
00
20
00
03
04
12
01
06
20
01
00
00
00
01
Syng
nath
idae
Cos
moc
ampu
s el
ucen
sI
00
10
10
00
00
00
00
00
00
00
00
00
11
00
Syng
nath
idae
Hal
icam
pus
crin
itus
I0
00
00
00
02
00
00
00
00
00
00
00
00
00
1
Syno
dont
idae
Syno
dus
inte
rmed
ius
c0
00
00
00
00
00
00
00
00
00
00
00
00
10
0
Syno
dont
idae
Syno
dus s
ynod
usc
02
01
00
46
20
34
10
34
213
23
32
17
35
12
tetra
odon
tidae
Can
thig
aste
r ro
stra
tao
316
70
23
1122
32
55
19
612
94
212
09
31
222
2114
tetra
odon
tidae
Sphe
roid
es sp
.*I
00
00
00
00
00
00
00
00
01
00
00
00
00
00
trip
tery
giid
aeEn
nean
ecte
s al
tivel
isI
243
112
21
212
263
47
62
07
128
821
03
010
234
1434
14
trip
tery
giid
aeEn
nean
ecte
s at
roru
sI
00
00
00
00
00
00
01
00
00
00
00
01
00
00
trip
tery
giid
aeEn
nean
ecte
s bo
ehlk
eiI
30
01
317
10
50
00
00
60
00
20
00
00
00
00
trip
tery
giid
aeEn
nean
ecte
s jo
rdan
iI
11
01
60
00
60
00
00
10
00
10
016
10
00
00
trip
tery
giid
aeEn
nean
ecte
s pe
ctor
alis
I0
00
021
00
01
00
30
014
00
036
36
00
00
00
0
trip
tery
giid
aeen
nean
ecte
s sp.
I0
511
00
00
00
00
00
00
00
00
00
00
00
00
0
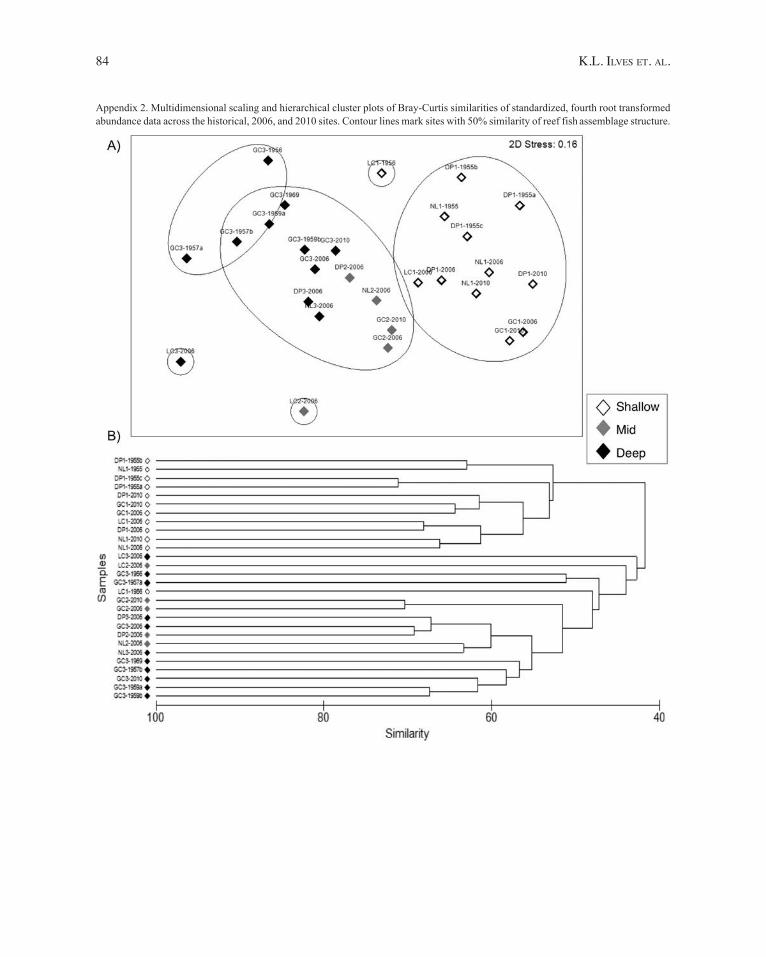
84 K.l. ilves et. Al.
Appendix 2. Multidimensional scaling and hierarchical cluster plots of Bray-Curtis similarities of standardized, fourth root transformed abundance data across the historical, 2006, and 2010 sites. Contour lines mark sites with 50% similarity of reef fish assemblage structure.
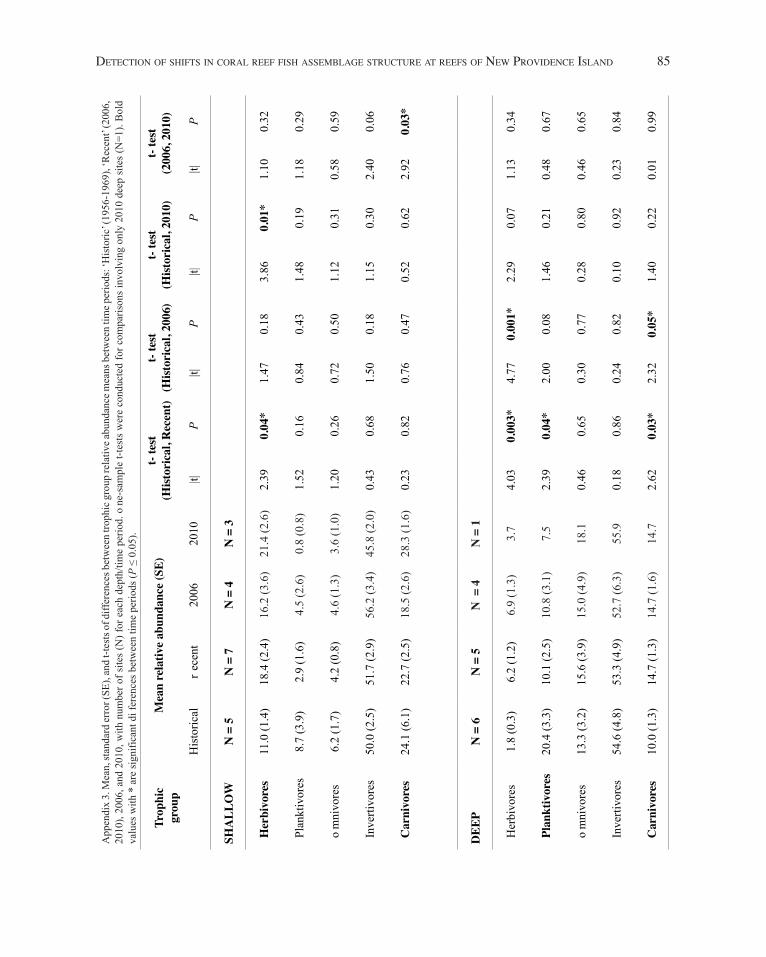
detection of shifts in corAl reef fish AssemblAge structure At reefs of neW Providence islAnd 85
App
endi
x 3.
Mea
n, st
anda
rd er
ror (
SE),
and
t-tes
ts o
f diff
eren
ces b
etw
een
troph
ic g
roup
rela
tive a
bund
ance
mea
ns b
etw
een
time p
erio
ds: ‘
His
toric
’ (19
56-1
969)
, ‘R
ecen
t’ (2
006,
20
10),
2006
, and
201
0, w
ith n
umbe
r of s
ites
(N) f
or e
ach
dept
h/tim
e pe
riod.
one
-sam
ple
t-tes
ts w
ere
cond
ucte
d fo
r com
paris
ons
invo
lvin
g on
ly 2
010
deep
site
s (N
=1).
Bol
d va
lues
with
* a
re si
gnifi
cant
dif
eren
ces b
etw
een
time
perio
ds (P
≤ 0
.05)
.
Trop
hic
grou
pM
ean
rela
tive
abun
danc
e (S
E)t-
test
(Hist
oric
al, R
ecen
t)t-
test
(Hist
oric
al, 2
006)
t- te
st(H
istor
ical
, 201
0)t-
test
(200
6, 2
010)
His
toric
alr
ecen
t20
0620
10|t|
P|t|
P|t|
P|t|
P
SHA
LLO
WN
= 5
N =
7N
= 4
N =
3
Her
bivo
res
11.0
(1.4
)18
.4 (2
.4)
16.2
(3.6
)21
.4 (2
.6)
2.39
0.04
*1.
470.
183.
860.
01*
1.10
0.32
Pla
nktiv
ores
8.7
(3.9
)2.
9 (1
.6)
4.5
(2.6
)0.
8 (0
.8)
1.52
0.16
0.84
0.43
1.48
0.19
1.18
0.29
om
nivo
res
6.2
(1.7
)4.
2 (0
.8)
4.6
(1.3
)3.
6 (1
.0)
1.20
0.26
0.72
0.50
1.12
0.31
0.58
0.59
Inv
ertiv
ores
50.0
(2.5
)51
.7 (2
.9)
56.2
(3.4
)45
.8 (2
.0)
0.43
0.68
1.50
0.18
1.15
0.30
2.40
0.06
Car
nivo
res
24.1
(6.1
)22
.7 (2
.5)
18.5
(2.6
)28
.3 (1
.6)
0.23
0.82
0.76
0.47
0.52
0.62
2.92
0.03
*
DEE
PN
= 6
N =
5N
= 4
N =
1
Her
bivo
res
1.8
(0.3
)6.
2 (1
.2)
6.9
(1.3
)3.
74.
030.
003*
4.77
0.00
1*2.
290.
071.
130.
34
Pla
nktiv
ores
20.4
(3.3
)10
.1 (2
.5)
10.8
(3.1
)7.
52.
390.
04*
2.00
0.08
1.46
0.21
0.48
0.67
om
nivo
res
13.3
(3.2
)15
.6 (3
.9)
15.0
(4.9
)18
.10.
460.
650.
300.
770.
280.
800.
460.
65
Inv
ertiv
ores
54.6
(4.8
)53
.3 (4
.9)
52.7
(6.3
)55
.90.
180.
860.
240.
820.
100.
920.
230.
84
Car
nivo
res
10.0
(1.3
)14
.7 (1
.3)
14.7
(1.6
)14
.72.
620.
03*
2.32
0.05
*1.
400.
220.
010.
99
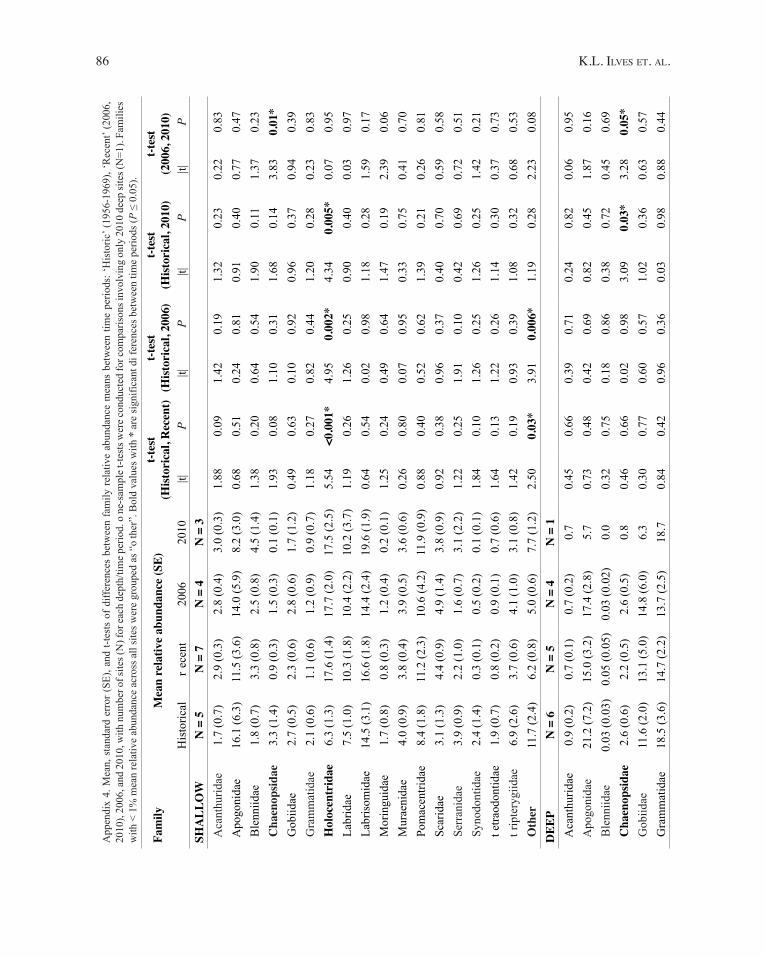
86 K.l. ilves et. Al.
App
endi
x 4.
Mea
n, s
tand
ard
erro
r (S
E), a
nd t-
test
s of
diff
eren
ces
betw
een
fam
ily r
elat
ive
abun
danc
e m
eans
bet
wee
n tim
e pe
riods
: ‘H
isto
ric’ (
1956
-196
9), ‘
Rec
ent’
(200
6,
2010
), 20
06, a
nd 2
010,
with
num
ber o
f site
s (N
) for
each
dep
th/ti
me p
erio
d. o
ne-s
ampl
e t-te
sts w
ere c
ondu
cted
for c
ompa
rison
s inv
olvi
ng o
nly
2010
dee
p si
tes (
N=1
). Fa
mili
es
with
< 1
% m
ean
rela
tive
abun
danc
e ac
ross
all
site
s wer
e gr
oupe
d as
“o
ther
”. B
old
valu
es w
ith *
are
sign
ifica
nt d
ifer
ence
s bet
wee
n tim
e pe
riods
(P ≤
0.0
5).
Fam
ilyM
ean
rela
tive
abun
danc
e (S
E)t-t
est
(Hist
oric
al, R
ecen
t)t-t
est
(Hist
oric
al, 2
006)
t-tes
t(H
istor
ical
, 201
0)t-t
est
(200
6, 2
010)
His
toric
alr
ecen
t 20
0620
10|t|
P|t|
P|t|
P|t|
PSH
ALL
OW
N =
5N
= 7
N =
4N
= 3
Aca
nthu
ridae
1.7
(0.7
)2.
9 (0
.3)
2.8
(0.4
)3.
0 (0
.3)
1.88
0.09
1.42
0.19
1.32
0.23
0.22
0.83
Apo
goni
dae
16.1
(6.3
)11
.5 (3
.6)
14.0
(5.9
)8.
2 (3
.0)
0.68
0.51
0.24
0.81
0.91
0.40
0.77
0.47
Ble
nniid
ae1.
8 (0
.7)
3.3
(0.8
)2.
5 (0
.8)
4.5
(1.4
)1.
380.
200.
640.
541.
900.
111.
370.
23 C
haen
opsid
ae3.
3 (1
.4)
0.9
(0.3
)1.
5 (0
.3)
0.1
(0.1
)1.
930.
081.
100.
311.
680.
143.
830.
01*
Gob
iidae
2.7
(0.5
)2.
3 (0
.6)
2.8
(0.6
)1.
7 (1
.2)
0.49
0.63
0.10
0.92
0.96
0.37
0.94
0.39
Gra
mm
atid
ae2.
1 (0
.6)
1.1
(0.6
)1.
2 (0
.9)
0.9
(0.7
)1.
180.
270.
820.
441.
200.
280.
230.
83 H
oloc
entr
idae
6.3
(1.3
)17
.6 (1
.4)
17.7
(2.0
)17
.5 (2
.5)
5.54
<0.0
01*
4.95
0.00
2*4.
340.
005*
0.07
0.95
Lab
ridae
7.5
(1.0
)10
.3 (1
.8)
10.4
(2.2
)10
.2 (3
.7)
1.19
0.26
1.26
0.25
0.90
0.40
0.03
0.97
Lab
risom
idae
14.5
(3.1
)16
.6 (1
.8)
14.4
(2.4
)19
.6 (1
.9)
0.64
0.54
0.02
0.98
1.18
0.28
1.59
0.17
Mor
ingu
idae
1.7
(0.8
)0.
8 (0
.3)
1.2
(0.4
)0.
2 (0
.1)
1.25
0.24
0.49
0.64
1.47
0.19
2.39
0.06
Mur
aeni
dae
4.0
(0.9
)3.
8 (0
.4)
3.9
(0.5
)3.
6 (0
.6)
0.26
0.80
0.07
0.95
0.33
0.75
0.41
0.70
Pom
acen
trida
e8.
4 (1
.8)
11.2
(2.3
)10
.6 (4
.2)
11.9
(0.9
)0.
880.
400.
520.
621.
390.
210.
260.
81 S
carid
ae3.
1 (1
.3)
4.4
(0.9
)4.
9 (1
.4)
3.8
(0.9
)0.
920.
380.
960.
370.
400.
700.
590.
58 S
erra
nida
e3.
9 (0
.9)
2.2
(1.0
)1.
6 (0
.7)
3.1
(2.2
)1.
220.
251.
910.
100.
420.
690.
720.
51 S
ynod
ontid
ae2.
4 (1
.4)
0.3
(0.1
)0.
5 (0
.2)
0.1
(0.1
)1.
840.
101.
260.
251.
260.
251.
420.
21 t
etra
odon
tidae
1.9
(0.7
)0.
8 (0
.2)
0.9
(0.1
)0.
7 (0
.6)
1.64
0.13
1.22
0.26
1.14
0.30
0.37
0.73
trip
tery
giid
ae6.
9 (2
.6)
3.7
(0.6
)4.
1 (1
.0)
3.1
(0.8
)1.
420.
190.
930.
391.
080.
320.
680.
53 O
ther
11.7
(2.4
)6.
2 (0
.8)
5.0
(0.6
)7.
7 (1
.2)
2.50
0.03
*3.
910.
006*
1.19
0.28
2.23
0.08
DEE
PN
= 6
N =
5N
= 4
N =
1 A
cant
hurid
ae0.
9 (0
.2)
0.7
(0.1
)0.
7 (0
.2)
0.7
0.45
0.66
0.39
0.71
0.24
0.82
0.06
0.95
Apo
goni
dae
21.2
(7.2
)15
.0 (3
.2)
17.4
(2.8
)5.
70.
730.
480.
420.
690.
820.
451.
870.
16 B
lenn
iidae
0.03
(0.0
3)0.
05 (0
.05)
0.03
(0.0
2)0.
00.
320.
750.
180.
860.
380.
720.
450.
69 C
haen
opsid
ae2.
6 (0
.6)
2.2
(0.5
)2.
6 (0
.5)
0.8
0.46
0.66
0.02
0.98
3.09
0.03
*3.
280.
05*
Gob
iidae
11.6
(2.0
)13
.1 (5
.0)
14.8
(6.0
)6.
30.
300.
770.
600.
571.
020.
360.
630.
57 G
ram
mat
idae
18.5
(3.6
)14
.7 (2
.2)
13.7
(2.5
)18
.70.
840.
420.
960.
360.
030.
980.
880.
44
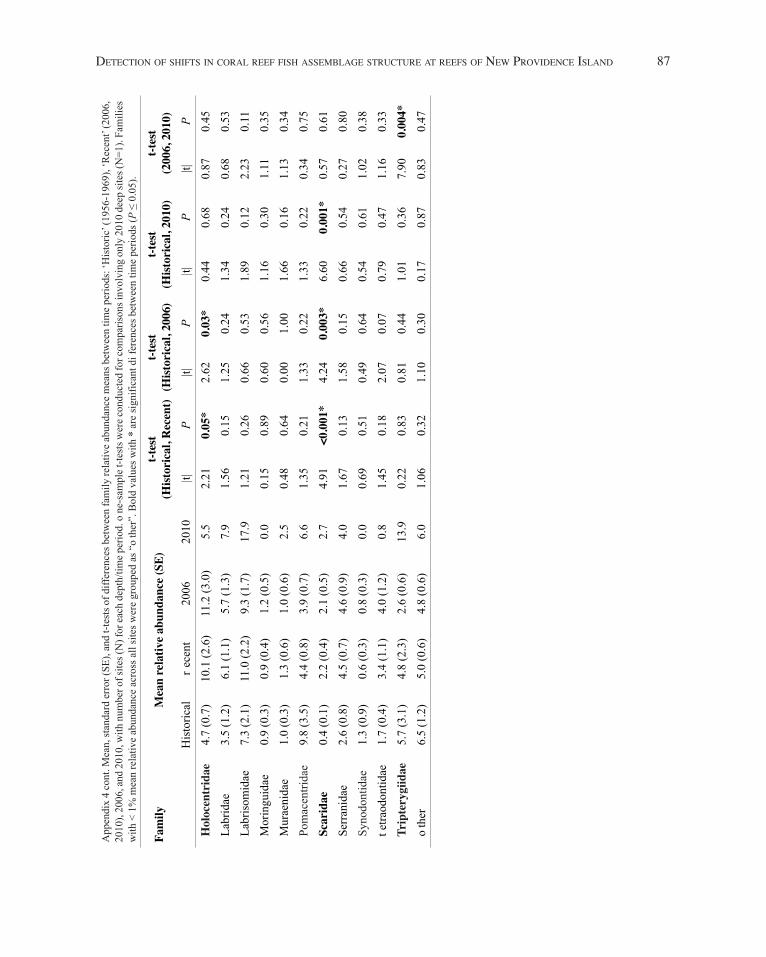
detection of shifts in corAl reef fish AssemblAge structure At reefs of neW Providence islAnd 87
App
endi
x 4
cont
. Mea
n, st
anda
rd e
rror
(SE)
, and
t-te
sts o
f diff
eren
ces b
etw
een
fam
ily re
lativ
e ab
unda
nce
mea
ns b
etw
een
time
perio
ds: ‘
His
toric
’ (19
56-1
969)
, ‘R
ecen
t’ (2
006,
20
10),
2006
, and
201
0, w
ith n
umbe
r of s
ites (
N) f
or ea
ch d
epth
/tim
e per
iod.
one
-sam
ple t
-test
s wer
e con
duct
ed fo
r com
paris
ons i
nvol
ving
onl
y 20
10 d
eep
site
s (N
=1).
Fam
ilies
w
ith <
1%
mea
n re
lativ
e ab
unda
nce
acro
ss a
ll si
tes w
ere
grou
ped
as “
oth
er”.
Bol
d va
lues
with
* a
re si
gnifi
cant
dif
eren
ces b
etw
een
time
perio
ds (P
≤ 0
.05)
.
Fam
ilyM
ean
rela
tive
abun
danc
e (S
E)t-t
est
(Hist
oric
al, R
ecen
t)t-t
est
(Hist
oric
al, 2
006)
t-tes
t(H
istor
ical
, 201
0)t-t
est
(200
6, 2
010)
His
toric
alr
ecen
t 20
0620
10|t|
P|t|
P|t|
P|t|
P H
oloc
entr
idae
4.7
(0.7
)10
.1 (2
.6)
11.2
(3.0
)5.
52.
210.
05*
2.62
0.03
*0.
440.
680.
870.
45 L
abrid
ae3.
5 (1
.2)
6.1
(1.1
)5.
7 (1
.3)
7.9
1.56
0.15
1.25
0.24
1.34
0.24
0.68
0.53
Lab
risom
idae
7.3
(2.1
)11
.0 (2
.2)
9.3
(1.7
)17
.91.
210.
260.
660.
531.
890.
122.
230.
11 M
orin
guid
ae0.
9 (0
.3)
0.9
(0.4
)1.
2 (0
.5)
0.0
0.15
0.89
0.60
0.56
1.16
0.30
1.11
0.35
Mur
aeni
dae
1.0
(0.3
)1.
3 (0
.6)
1.0
(0.6
)2.
50.
480.
640.
001.
001.
660.
161.
130.
34 P
omac
entri
dae
9.8
(3.5
)4.
4 (0
.8)
3.9
(0.7
)6.
61.
350.
211.
330.
221.
330.
220.
340.
75 S
cari
dae
0.4
(0.1
)2.
2 (0
.4)
2.1
(0.5
)2.
74.
91<0
.001
*4.
240.
003*
6.60
0.00
1*0.
570.
61 S
erra
nida
e2.
6 (0
.8)
4.5
(0.7
)4.
6 (0
.9)
4.0
1.67
0.13
1.58
0.15
0.66
0.54
0.27
0.80
Syn
odon
tidae
1.3
(0.9
)0.
6 (0
.3)
0.8
(0.3
)0.
00.
690.
510.
490.
640.
540.
611.
020.
38 t
etra
odon
tidae
1.7
(0.4
)3.
4 (1
.1)
4.0
(1.2
)0.
81.
450.
182.
070.
070.
790.
471.
160.
33 T
ript
eryg
iidae
5.7
(3.1
)4.
8 (2
.3)
2.6
(0.6
)13
.90.
220.
830.
810.
441.
010.
367.
900.
004*
oth
er6.
5 (1
.2)
5.0
(0.6
)4.
8 (0
.6)
6.0
1.06
0.32
1.10
0.30
0.17
0.87
0.83
0.47
