designing learning by teaching agents: the betty's brain system
TRANSCRIPT

Running Head: BETTY’S BRAIN 1
Designing Learning by Teaching Agents
The Betty’s Brain System
Krittaya Leelawong
1 and Gautam Biswas, Department of EECS/ISIS, Box 351824, Station
B, Vanderbilt University.
Abstract. The idea that teaching others is a powerful way to learn is intuitively compelling and supported in the
research literature. We have developed computer-based, domain-independent Teachable Agents that students
can teach using a visual representation. The students query their agent to monitor their learning and problem
solving behavior. This motivates the students to learn more so they can teach their agent to perform better. This
paper presents a teachable agent called Betty’s Brain that combines learning by teaching with self-regulated
learning feedback to promote deep learning and understanding in science domains. A study conducted in a 5th
grade science classroom compared three versions of the system: a version where the students were taught by an
agent, a baseline learning by teaching version, and a learning by teaching version where students received feed-
back on self-regulated learning strategies and some domain content. In the other two systems, students received
feedback primarily on domain content. Our results indicate that all three groups showed learning gains during a
main study where students learnt about river ecosystems, but the two learning by teaching groups performed bet-
ter than the group that was taught. These differences persisted in the transfer study, but the gap between the base-
line learning by teaching and self-regulated learning group decreased. However, there are indications that self-
regulated learning feedback better prepared students to learn in new domains, even when they no longer had
access to the self-regulation environment.
Keywords. Learning by teaching, Teachable agents, metacognitive strategies, self-regulated learning.
1 Krittaya Leelawong is now with the Computer Science Program, Division of Pure and Applied Sciences, Mahidol University, Salaya Campus, Thailand.

Running Head: BETTY’S BRAIN 2
INTRODUCTION
The idea that teaching others is a powerful way to learn is both intuitively compelling, and one that has
garnered support in the research literature (Chi et al, 1994; Palinscar & Brown, 1984; Papert, 1993).
For example, Bargh and Schul (1980) found that people who prepared to teach others to take a quiz on
a passage learned the passage better than those who prepared to take the quiz themselves. The litera-
ture on tutoring suggests a similar conclusion in that tutors have been shown to benefit as much from
tutoring as their tutees (Graesser, Person, & Magliano, 1995; Chi, Siler, Jeong, Yamauchi, & Haus-
mann, 2001). Biswas, Schwartz, & Bransford (2001) report that students preparing to teach made
statements about how the responsibility to teach forced them to gain deeper understanding of the mate-
rials. These students focused on the importance of having a clear conceptual organization of the mate-
rials. Beyond preparing to teach, actual teaching can tap into the three critical aspects of learning inte-
ractions – structuring, taking responsibility, and reflecting.
With respect to structuring, teachers provide explanations and demonstrations and they receive
questions and feedback from students that can help them to restructure the organization of their under-
standing and subsequent presentation of the material. Our studies have found that students who teach
develop a deeper understanding of the domain, and organize their ideas better than those who study the
same material and are asked to write a summary (Biswas, Schwartz, Bransford, & TAG-V, 2001). For
taking responsibility, teaching is frequently open-ended and self-directed, and teachers need to take the
responsibility of deciding which content is most relevant (Artz & Armour-Thomas, 1999). Finally, for
reflection, effective teaching requires the explicit monitoring of how well ideas are understood and
used. Studies have shown that tutors and teachers often reflect on their interactions with students dur-
ing and after the teaching process in order to better prepare for future learning sessions (Chi, et al,
2001; Lin, Schwartz, & Hatano, 2005).
Previous work on learning by teaching focused on the preparation stage, where the teachers struc-
tured their knowledge in a compact and communicable format so that they could develop important
explanatory structures in the domain (Artz & Armour-Thomas, 1999; Bransford, et al, 2000). In addi-
tion to the initial structuring of knowledge, our studies have found that for novice learners, a great deal
of learning occurs through assessment and reflection during the teaching process. The feedback the
learner receives by observing their tutee’s performance helps them discover what to prepare, and how
to structure what they have learnt to ensure their tutee understands and can apply what she has been
taught (Chi, et al, 2001; Graesser, Person, & Magliano, 1995).
This has led us to conjecture that the creation of a computer program, where students can assume
the role of “teacher,” may provide an effective and motivating environment for learning. We have de-
signed learning environments where students teach a computer agent, called a Teachable Agent (TA),
using important visual representations, such as concept maps, graphs, and matrices, that help structure
domain knowledge. We have designed and implemented TAs to help shape student thinking and to
make this thinking visible. The fact that TAs can show their reasoning based on how they have been
taught also helps students (and teachers) assess their teaching (and by implication their own learning)
(Brophy, et al., 1999; Biswas, Schwartz, Bransford, & TAG-V, 2001; Biswas, et al. 2004, 2005;
Schwartz, et al, to appear).
TAs represent knowledge structures rather than the referent domain. This is a departure from tra-
ditional simulations, which typically show the behavior of a physical system, for example, how an al-
gae bloom increases fish mortality. Instead, TAs simulate the behavior of a person’s thoughts about a
system. This is important because the goal of learning is often to simulate an expert’s reasoning

Running Head: BETTY’S BRAIN 3
processes about a domain, not the domain itself. Learning empirical facts is important, but learning to
think with the expert theory that organizes those facts is equally important. Therefore, we structured
the agents to simulate particular forms of thought that may help students structure their thinking about
a domain.
This paper extends earlier work (Leelawong, et al., 2002; Biswas, et al., 2005) by including a tho-
rough analysis of our approach to the design and implementation of Learning by Teaching systems,
and comparing it to related past work in this area. The comparisons are based on a systematic frame-
work that includes a discussion of explicit teaching activities, and how the notions of shared represen-
tations and shared responsibilities govern interactions between human student and the computer teach-
able agent in each of the systems. The reader should note that this framework and the comparisons
with other learning by teaching systems extends work presented in an earlier paper (Biswas, et al.,
2005). The earlier paper mainly described the evolution of the current Betty's Brain system from a pre-
liminary study that was reported in Leelawong, et al. (2002). An important new emphasis described
here is the incorporation of metacognition and self-regulated learning strategies (Brown, 1987; Pin-
trich and DeGroot, 1990; Zimmerman, 1986, 1989) in the interactions between the teachable agent and
the student as well as the feedback provided by the mentor agent. Further, the data collected from the
2003 study in 5th grade science classrooms are analyzed in much greater detail in this paper, and more
significant conclusions are drawn on both the differences in learning performance between three
groups of students and their learning behaviors. There is more in-depth discussion of the results in this
paper.
The rest of this paper is organized as follows. The next section describes previous work in design-
ing and developing learning by teaching systems, their shortcomings, and our approach to addressing
these shortcomings. The following section describes the design and implementation of the Betty’s
Brain system and its application to teaching middle school students about river ecosystems. This is fol-
lowed by a description of an experimental study we conducted in fifth grade science classrooms in the
Nashville Metro area. The results of the study are presented, and this is followed by a discussion, con-
clusions, and directions for further study.
PREVIOUS WORK IN DEVELOPING LEARNING BY TEACHING SYSTEMS
A number of systems have been designed in the past where students explicitly teach a computer agent,
and attempt to learn from that interaction. We contrast this work with pedagogical agents (Clarebout,
et al., 2002), where the agent is designed to be a tutor with human-like characteristics, and learning
companions (Ramirez Uresti, 2000; Ramirez Uresti & du Boulay, 2004), which are designed to play
the role of a peer, but can sometimes switch and take on the role of a tutor. Our focus is on systems
where the human student is the teacher and the computer agent is the student, and these roles do not
change through the period of the interaction. Our review of learning by teaching systems indicates that
three factors play the primary role characterizing these systems.
(i) Explicit teaching. In all of the systems, the teaching task is made explicit. In some systems,
the agent knows only what they have been taught by their student-teacher, whereas in others,
the agents pretend to learn from the students, but internally have full knowledge of the do-
main.
(ii) Shared representation. A representation scheme and corresponding data structure keeps track
of what the student-teacher has taught the agent. In some cases, the representation is explicit,
i.e., it is visible to the student and the agent. In other systems, the representation is implicit,

Running Head: BETTY’S BRAIN 4
i.e., the information is stored in an internal representation in the program, and not made avail-
able to the student in any visual or textual form. In some systems, the internal representation is
different from the representation used in the student-agent interface, and
(iii) Shared responsibility. The student is responsible for some of the teaching and problem solving
tasks, and the agent takes on other responsibilities. This supports the social aspects of learning
(Palinscar and Brown, 1984; Goos, et al., 2002), and the goal is to make the students and their
agents learn from each other through the interaction processes.
DENISE (Development Environment for an Intelligent System in Economics) is an example
learning by teaching system, where the agent has no initial knowledge and is taught explicitly about
causal relations in economics using a dialog template in a peer tutoring environment (Nichols, 1993,
1994). The agent’s interactions with the student are driven by a Socratic dialog structure. The agent
probes the student-teacher for more information on material as it is taught, but the student can take
control at any time, and specify new relationships instead of following the agent’s directive probes.
Students have access to a dictionary that contains all of the concepts they have taught the agent. They
can also query the agent about relations between concepts, but the form and content of the knowledge
structures used by the agent are not visible to the students. Ultimately, this lack of an explicit shared
representation limited the students’ learning abilities. While they found the act of teaching to be moti-
vating, many became frustrated with the system because they could not understand why the agent was
probing them about certain concepts and relations. As the session progressed, the students had difficul-
ty remembering all of the concepts and relations they had taught earlier. Palthepu, Greer, and McCalla
(1991) used a similar approach to designing a learning by teaching system where the students taught
an agent using natural language, but the semantic net-like knowledge representation created by the
system was not viewable (nor query-able) by the students. No experimental studies of student learning
conducted with this system are reported in the literature.
MCLS (Math Concept Learning System) was developed for solving simultaneous linear equations
(Michie, Patterson, & Hayes-Michie, 1989). Students taught the system by creating example solutions
to linear equations. The system used its built-in knowledge of the structure of linear equations to learn
problem solving strategies in the form of rules from the students examples using an inductive ma-
chine-learning algorithm, Iterative ID3 (Shapiro 1983). This system used a viewable knowledge repre-
sentation, but the displayed representation (rules) was different from what the student taught the agent
(example solutions). At any time, the student could assess the rules created by the system, by viewing
the rules and asking the system to solve a new problem. An experimental study compared this version
of the system to another, where the student solved simultaneous equations but did not teach (learning
by teaching versus learning by doing). The authors reported that the MCLS condition showed the
highest pre- to post-test gains, but the number of subjects in the study was small, therefore, it could not
be established whether the difference was significant.
Obayashi, Shimoda, and Yoshikawa (2000) developed a more traditional learning-by-teaching
Computer-Assisted Instruction (CAI) system, where students attended a set of lectures and then solved
a set of problems on the system. The system diagnosed students’ weaknesses in domain knowledge
from the solutions they generated. Next, each student entered a virtual discussion room, where a vir-
tual agent asked them questions that were related to the student’s weaknesses. Examples of questions
asked were “do acids act on metal?”, “how do they act?”, and “why do they act?” In the last phase of
the study, the agent answered questions that were posed by a virtual tutor. The agent’s answers were
identical to the student’s earlier answers. The human students observed their virtual agent’s perfor-
mance, as it compared its answers to the correct solutions provided by the virtual tutor. A study con-

Running Head: BETTY’S BRAIN 5
ducted by the authors reported that the group that used the learning-by-teaching CAI system scored
significantly higher than the group that used a text-page version of the system without the virtual
agent. The participants also reported higher levels of motivation and effectiveness of learning when
using the virtual-agent version of the system.
Chan and Chou (1997) conducted a preliminary study to compare different approaches of intelli-
gent learning environments that included peers. The study, constructed around two types of agents, a
tutor and a peer, required students to construct and to debug Lisp programs. The peer was a human or
a software agent. The tutor was designed to be a traditional intelligent tutoring system (Wenger,
1987). The pre-post experimental study conducted by the authors showed that in two situations, one
where a real student acted as the tutor and a second which used reciprocal tutoring methods showed
the best score improvements. The surprising result was that the students who were asked to learn by
themselves performed better than the learning-by-teaching group. Further analysis revealed that the
learning by teaching group was just given debugging tasks during the study. Unlike the other groups,
they were not asked to perform code generation tasks so they did not get to use the code editor, which
was found to be very helpful in learning Lisp syntax and program structure. As a result, these students
were less prepared to tackle the questions on code generation in the post test.
Ramirez Uresti and du Boulay (2004) developed a system called LECOBA, where students
learned from tutor agents, and then solved problems either by themselves or with a learning compa-
nion agent. In experiments they studied students’ learning with weak and strong companion agents,
and with strong or weak motivational prompts to the students to interact with the agents. They be-
lieved that the students who were in the Weak companion/Strong motivational prompts condition
would have the most opportunities to learn by teaching. In contrast, they believed that the students in
the Strong companion/Weak prompts (i.e., not strongly encouraged to interact with their agents) would
let their agents take on most of the problem solving tasks and become passive learners. Students in all
four conditions showed learning gains from pre to post tests, but there were no significant differences
in learning gains between the four conditions. They did find some evidence that teaching or giving
suggestions to the agents benefitted students’ learning. Also, students in the motivated group seemed
to have significantly more interactions with their agents (expected), and also ended up solving a larger
number of problems. However, students’ did not like it when their agents rejected the material that
they tried to teach or provide as suggestions to their agents.
In all of the above studies, the shared responsibilities of teaching, learning, and monitoring what
was being learned seemed to have a positive influence on students’ learning and motivation to learn.
The question-answer mechanism in the Virtual Classroom, the derivation of a general rule from stu-
dent examples by the MCLS system, the reverse Socratic interactions in DENISE and the (Palthepu,
Greer, & McCalla, 1991) system, and the interactions with learning companions in LECOBA (Rami-
rez Uresti & du Boulay, 2004) were judged to be useful by the students, and they stated that it encour-
aged them to generate self-explanations. The negative result on the learning-by-teaching system re-
ported in (Chan & Chou, 1997) and to some extent in the LECOBA system may be explained by the
absence of explicit shared representations and responsibilities during the teaching and learning tasks
(e.g., generating and debugging program code together, versus just debugging agent-generated code).
This may be the reason for the students’ lower performances.
An explicit viewable shared representation of the knowledge being taught to the computer agent
also proved to be important in driving the learning process. The positive results obtained by Obayashi,
Shimoda, and Yoshikawa (2000) may be attributed to the fact that the agent’s knowledge was always
available to the student-teacher, and the content was exactly the student’s answers to prior questions.

Running Head: BETTY’S BRAIN 6
A similar conclusion can be drawn for the MCLS system, where the rules generated by the agent,
could be viewed by the students and used for solving other problems. On the other hand, students
could not view the knowledge structures created by the agent in the DENISE system, and this caused
frustration because, after some time, the students found it difficult to understand their agent’s beha-
vior.
To summarize, the previous work in computer-based learning by teaching systems partially dem-
onstrated the effectiveness of explicit teaching tasks with shared representations and shared responsi-
bilities in facilitating learning and motivation. The use of explicit shared representations may provide
the social interaction framework that promotes shared responsibility. Students get a chance to observe
and analyze how their teachable agents apply the learnt knowledge to solve problems, and, in this
process, they may learn to monitor their own knowledge. We exploit this framework in designing a
more comprehensive learning by teaching system that emphasizes shared representation and shared re-
sponsibility as students teach a computer agent.
IMPLEMENTING TEACHABLE-AGENTS: THE BETTY’S BRAIN SYSTEM
Two principles drive the design and implementation of our Teachable Agent learning environments.
The first one ensures that students’ activities in the learning environment cover the three distinct phas-
es of the teaching process, i.e., (i) preparing to teach, (ii) teaching and interacting with the teachable
agent, and (iii) monitoring and reflecting on what the agent has learned and using this information to
make preparations to teach further (Colton & Sparks-Langer, 1993). The second ensures that interac-
tions between the student and their TA are based on an explicit shared representation and shared re-
sponsibility. In addition, since our target participants are middle school students who lack teaching ex-
perience and domain knowledge in the particular field of study, the system provides graphical inter-
faces for creating the knowledge structures for the domain, and additional support in the form of scaf-
folds to help students through each of the stages of their teaching and learning processes.
The interface to the TA system that is the focus of this paper, Betty’s Brain, is shown in Figure 1.
The current version of the system is designed to teach middle school science students about river eco-
systems. Betty, shown as a cartoon face on the left bottom of the screen, is taught using a concept map
representation (Novak, 1996). Learning by teaching is implemented as three primary components: (i)
teach Betty using a concept map, (ii) query Betty with your own questions to see how much she has
understood, and (iii) quiz Betty with a provided test to see how well she does on questions the student
may not have considered. These activities are usually embedded within a larger narrative (e.g., teach
Betty so she can pass a test to join a science club) (Biswas, et al. 2005).
<<Figure 1 here>>
An example concept map appears in the concept map-editor pane in Figure 1. The map represents
the entities or concepts, such as fish and algae, and their relations, (e.g., fish are a type of animals, ani-
mals breathe dissolved oxygen, plants produce dissolved oxygen, and algae are a type of plants) that stu-
dents have taught Betty about river ecosystems. Concept-map creation is facilitated by a graphical editor
(see concept map editor control panel) and a point and click interface. To add a new concept students
click on the “Teach Concept” box, and type in the name of the concept in the dialog box that appears on
the editor pane. To create a link between two concepts, students click the “Teach Link” button, and then
drag the pointer from a start node to a destination node. A link appears along with a dialog box and stu-
dents then enter specific details about the relation into this box. Relations can (i) hierarchical type-of, (ii)
descriptive, and (iii) causal. For causal relations, students have to specify if the relation implies an in-

Running Head: BETTY’S BRAIN 7
crease or a decrease in the destination concept. For example, animals breathe dissolved oxygen is a
causal relation, which causes dissolved oxygen to decrease. Whereas students can create three different
kinds of relations, the study of causal relations in building a model of interdependence among entities in
a river ecosystem is the focus of this work.
Once taught, Betty uses qualitative reasoning methods (Forbus 1984) to reason through chains of
links (Leelawong, et al. 2000, Biswas, et al., 2005). We describe the qualitative reasoning and explana-
tion mechanisms in greater detail in the next section. The student can click on the “Ask” button to bring
up a template and ask questions, such as “if macroinvertebrates increase what happens to bacteria?” In
response to this query, Betty reasons using the concept map, and generates an answer, such as “An in-
crease in macroinvertebrates causes no change in bacteria.” If the student requests an explanation by
clicking on the “Explain” button, Betty explains her answer using a combination of speech, text, and
animation mechanisms that highlight the causal paths in the map that she employs to generate her an-
swer.
A set of quizzes created by the system designers and classroom teachers provides a dynamic as-
sessment mechanism that allows students to assess how well Betty, and, they themselves have learned
about the domain. Students ask Betty to take a quiz by clicking on the “Quiz” button. Betty takes the
quiz, and her answers are graded by the Mentor agent, Mr. Davis. Betty (and the student) are shown
the results on a pane at the bottom of the screen. The Mentor also provides hints (“Tips from Mr. Da-
vis”) to help students debug and make corrections in their concept map. The current version of the
Betty’s Brain system has three quizzes and each quiz has 5 to 6 questions. The first set of quiz ques-
tions deal with the primary entities in the river ecosystem, i.e., fish, macroinvertebrates, and algae, and
the oxygen cycle that connects these three sets of entities. The second set of quiz questions focus on
the food chain, and the third set are directed to the waste cycle, which involves bacteria decomposing
organic waste produced by fish and dead plants to produce nutrients. The map the students build be-
comes progressively more complex as more concepts and links are added, and so do the quiz questions
and the reasoning mechanism for generating answers. For the more complex questions, students (and
Betty) have to reason through multiple chains of links and aggregate information to derive answers.
Students typically work sequentially through quizzes 1 to 3, but are provided the flexibility of going
back and forth among the quizzes if they need to.
To learn and teach Betty so she may answer the quiz questions correctly, students have access to
a variety of online resources, such as (i) domain resources organized as searchable hypertext so students
can look up information as they teach Betty, (ii) a concept map tutorial that provides students informa-
tion on causal structures, and how to reason with these structures, and (iii) a Mentor agent, Mr. Davis,
who provides feedback about learning, teaching, and domain knowledge (“Ask Mr. Davis”) when the
student requests it.
The graphical user interface allows students to move seamlessly from one phase to another as
they are involved in learning, teaching the agent, and monitoring and reflecting on the agent’s and
their own performance (Leelawong, et al., 2002; Davis, et al., 2003). In addition, it plays the role of
an easy to use visual programming language that alleviates the students’ programming tasks in creat-
ing the concept map structure to teach their agent. The Betty’s Brain system is implemented in Java
(Java 2 SDK v1.4.2) with a Microsoft’s text-to-speech engine (Microsoft Speech SDK v5.1) in con-
junction with Java-Speech Application-Program-Interface for Windows platforms (Cloud Garden
v1.3).

Running Head: BETTY’S BRAIN 8
Qualitative Reasoning with the Concept Map
Betty uses a qualitative reasoning mechanism on the concept map that the student has taught her to an-
swer questions of the type “If concept A changes what happens to concept B?” She can provide de-
tails of how she got her answer if she is asked to “Explain” her reasoning.
The reasoning mechanism uses a simple chaining procedure to deduce the relationship between a
set of linked concepts. To derive the chain of events, i.e., the effect of an increase or a decrease in
concept A on Concept B, Betty propagates the effect of the change in concept A through all of its out-
going causal links (i.e., follow the link from concept A to all its adjacent concepts) by pairwise propa-
gation using the relations described in Table 1. This process is repeated for the next set of concepts,
which now have an assigned increase/decrease value. Repeated application of this step in a breadth-
first manner creates a chain of events that defines the effect of the change in the source concept (A) on
the destination concept (B).
Table 1
The pair-wise effects – Change in Concept B given a change in concept A
Link Relation
Ch
an
ge
in E
nti
ty
+L + +S S L
+L +L +L + L L
+ +L + +S S L
+S + +S +S S S
S S S +S +S +
L S +S + +L
L L L + +L +L
If the number of incoming causal links on an incoming node along the propagation path is more
than one, the forward propagation stops until all incoming links are resolved. To derive the result
from two incoming links, we use the combination algebra defined in Table 2. A “?” in Table 2 implies
an inconclusive change (attributed to the ambiguity of qualitative arithmetic).
Table 2
Aggregating results from two paths
Path 1 +L + +S –S –L
Path
2
+L +L +L +L + +S ?
+ +L +L + +S ? S
+S +L + + ? S
–S + +S ? L
+S ? S L L
–L ? S L L L
If the number of incoming links is three or more, we count the number of changes that fall into
the six categories: large ( L), moderate ( ), and small decrease ( S) and small (+S), moderate (+), and
large (+L) increase. The subscripts S and L in Tables 1 and 2 stand for small and large, respectively.
Combine the corresponding (i.e., small, medium, and large) changes; always subtract the smaller
number from the larger. For example, if there is one arc that says small decrease ( S), and two incom-
ing arcs that say small increase (+S), the result is derived to be a small increase (+S). To compute the
overall effect, if the resultant value set has all increases or all decreases, we select the largest change.
Figure 2: Betty’s Agent Architec-ture

Running Head: BETTY’S BRAIN 9
Otherwise, we start at the smallest level of change and combine with the next higher level in succes-
sion using the relations defined in Table 2. The overall qualitative reasoning mechanism is a simplified
implementation of Qualitative Process Theory (Forbus, 1984).
To illustrate the reasoning process, we outline the explanation that Betty generates when she is
asked to answer a question: “If macroinvertebrates increase what happens to bacteria?” using the
concept map shown in Figure 1. The qualitative reasoning mechanism employs a breadth-first search
to find all paths that lead from the source concept to the destination concept. For the given query Betty
finds two paths, one from macroinvertebrates → animals → waste → bacteria, and a second one from
macroinvertebrates → animals → dissolved oxygen → bacteria in the student’s concept map. She
uses the relations specified in Table 1 to determine that an increase in macroinvertebrates causes an
increase in bacteria along the first path, and an increase in macroinvertebrates causes a decrease in
bacteria along the second path. Using Table 2, she then derives the result by aggregation, and this
produces the answer that “bacteria do not change.”
When asked to explain her answer, Betty breaks down her explanation into chunks to make it eas-
ier for the student to understand her reasoning processes. She first summarizes her answer, e.g., “If A
increases I think B decreases.” Then she works backwards, explaining each path to the destination
node (i.e., B) individually, and then describing to the student how she aggregates the answers derived
from each path. For the example above, Betty first explains that there are two paths from macroinver-
tebrates to bacteria. She follows that by describing the chain of events for each path as individual
steps in her explanation, and then explains the aggregation process as the final step of the explanation.
Preliminary experiments showed that students find it easier to follow the reasoning process and the
explanation, if it is put together in this way (Davis, et al., 2003). She reports these findings verbally,
and illustrates the process in the concept map by animation. The system also includes a “Talk Log”
button. The Talk Log keeps a record of all previous conversations, and students can access them at any
time, to review previous dialogs.
Metacognitive Strategies and Self-Regulation to support Learning
Cognitive science researchers have established that metacognition and self-regulation play an important
role in developing effective learners in the classroom and beyond (Bransford, Brown, & Cocking, 2000;
Brown 1987; Butler & Winne, 1995; McAlpine et al., 1999; Zimmerman, 1989). In the learning context,
self-regulated learning (SRL) describes a set of comprehensive skills that start with setting goals for
learning new materials and applying them to problem solving tasks, deliberating about strategies to ena-
ble this learning, monitoring one’s learning progress, and then revising one’s knowledge, beliefs, and
strategies as new materials and strategies are learnt. In conjunction with these higher level cognitive ac-
tivities, social interactions and motivation also play an important role in the self-regulation process
(Goos, et al., 2002; Weinert & Kluwe, 1987).
We believe that the two interacting factors of our TA implementations: (i) the visual shared repre-
sentation that the students use to teach their agents, and (ii) shared responsibility that targets the positive
effects of social interactions to learning are particularly supportive of self regulation. These manifest as a
joint effort between the students and their TA. The student has the responsibility for teaching the TA (the
TA knows no more and no less than what the student teaches it), whereas the TA takes on the responsi-
bility for answering questions and taking tests. The shared representation plus the agent’s ability to an-
swer questions independently results in situations where the “self-monitoring” task is shared between the
agent, who does the reasoning and problem solving, and the student as teacher, who is responsible for as-
sessment and evaluation of performance. This reduction in cognitive load helps students self-assess their

Running Head: BETTY’S BRAIN 10
knowledge by “projection,” and the combination of this projective assessment plus the motivation to
make their agent “succeed” prompts the student to learn more and teach their agent again so she may
perform even better.
Other considerations, such as the fact that middle-school students are both novice learners and no-
vice teachers in the domain have led us to design “scaffolds” that aid students in their learning, teaching,
and monitoring tasks. The system includes extensive resources from which the students can learn domain
knowledge (Biswas, et al., 2005). Students can also seek help from the Mentor agent, Mr. Davis, who
answers general questions on learning, teaching, and self-regulation strategies. Mr. Davis also provides
the outcome feedback when Betty takes a quiz. The agent tracks the students and Betty’s performance,
and occasionally intervenes with specific help.
Betty’s persona in the SRL version incorporates self-regulation (Biswas, et al. 2005) and metacog-
nitive strategies (Biswas, et al., 2005; Schwartz, et al., to appear). Table 3 provides a summary of some
of her self-regulation characteristics that drive her interactions with the student. For example, when the
student is building the concept map, she occasionally responds by demonstrating reasoning through
chains of events. She may query the user, and sometimes remark (right or wrong) that her answer “does
not seem to make sense”. The idea of these spontaneous prompts is to get the student to reflect on what
they are teaching, and perhaps, like a good teacher check on their tutee’s learning progress. At other
times, Betty may directly suggest to the students that they need to query her to ensure that she can reason
correctly with the current concept map. At times, Betty refuses to take a quiz, because she feels that she
has not been taught enough, or that the student has not given her sufficient practice by asking queries.
The Mentor and Betty’s interactions are driven by an activity-tracking system that derives “pat-
terns of behavior” from the students’ activities on the system and Betty’s performance on the quizzes
(see Table 3). One of the primary considerations in designing the Self Regulation patterns and feed-
back is to help students move away from directed monitoring and feedback to more self-guided moni-
toring that governs their learning and revision tasks. We believe the push toward “self-monitoring”
aided by “other-monitoring” is the key to preparing students for future learning.
EXPERIMENTAL STUDY AND RESULTS
One of the primary goals of our experimental study was to demonstrate that learning-by-teaching with
metacognitive support for self-regulated learning helps students develop better learning strategies, and
prepares them better for future learning on related topics, even when this learning happens outside of the
TA environment. To accomplish this, the SRL version of the Betty’s Brain environment described in
the previous section was compared against two other versions of the system. One was the control con-
dition, where the students were taught by a pedagogical agent (i.e., non learning by teaching condi-
tion). In the second condition, the student taught Betty, but received no metacognitive feedback from
Betty or the Mentor (barebones learning by teaching system). However, in both the control condition
and the barebones learning by teaching system, the Mentor provided corrective feedback after Betty
took a quiz. We describe the three systems in more detail below.
Learning by Being Taught (ITS) System: This system represented our control condition to help es-
tablish the differences between learning by teaching and learning by being taught. We called the ITS
system because the system resembled a pedagogical agent (Clarebout, et al., 2002). The students were
directed by Mr. Davis, the Mentor, to construct concept maps that correctly answered three sets of quiz
questions. Students had access to online resources to learn about the domain as they built their concept
maps. The query feature was also available to them so they could debug their concept maps as they

Running Head: BETTY’S BRAIN 11
built them. Mr. Davis responded to queries, and provided students with the answer and an explanation
of how the answer was generated if the students requested it. When students submitted their maps for a
quiz, Mr. Davis graded the quiz and provided corrective feedback that was based on errors in the quiz
answers (Tan, Biswas, & Schwartz, 2006). His suggestions centered on how students should correct
their concept map to improve their performance in the quiz. For example, if the student’s answer to the
following question, “if bacteria increase what happens to dissolved oxygen?” was incorrect, the Men-
tor feedback was: “To answer this question correctly, there must be some way that bacteria affects dis-
solved oxygen. Look at the resources to describe the link between bacteria and dissolved oxygen.” The
Mentor provided separate feedback for each quiz question that had an incorrect answer.
Barebones Learning by Teaching (LBT) system: Students were asked to teach Betty by creating a
concept map so she could pass a test and join the high school science club. The students had access to
the online resources, they could query Betty to see how well she was learning, and they could ask Bet-
ty to take quizzes with Mr. Davis at any time during the teaching process. After Betty took a quiz, Mr.
Davis graded the quiz, and provided Betty and her student-teacher with the same corrective feedback
as in the ITS version of the system. When students asked Betty a question, she responded with the an-
swer, and provided an explanation, when asked, much like in the ITS system.
Learning by Teaching with Self Regulated Learning (SRL) system: This system represented our
experimental condition. Like the LBT system, students were asked to teach Betty by creating a con-
cept map so she could pass the test and join the high school science club. The students had access to
the same domain resources as the ITS and LBT groups. The query feature and the quizzes were also
identical for all three groups with the only difference that Betty answered questions and took the quiz
in the SRL and LBT conditions. In the ITS system, the Mentor answered queries posed by the stu-
dents, and graded the quiz that the student submitted as their own work.
The primary differences between the SRL system and the other systems can be characterized by:
(i) Betty’s interactions with her student-teacher, and (ii) the feedback from the Mentor after Betty took
a quiz. As discussed earlier, Betty was more responsive during the teaching process and her interac-
tions with the student were guided by the self-regulation features listed in Table 3. If she did not do
well on a quiz, she would request her student teacher to look up the resources, learn more, and then
teach her more so she could do better the next time. She suggested that she would learn better if her
student teacher asked her questions to check if she understood what she been taught. Most important,
Betty insisted that she be asked questions to check whether she had learnt the material correctly. Oth-
erwise she refused to take the quiz by stating: “Hey, you haven’t taught me anything new since my last
quiz. My score will surely be the same. Teach me something, and ask me some questions to make sure
I understand, before you send me to take another quiz.”
The Mentor agent, Mr. Davis, also provided guidance that was framed in self regulation prin-
ciples as opposed to the corrective feedback provided by the LBT and ITS systems. For example,
when Betty could not answer all of the quiz questions correctly, the Mentor made a number of sugges-
tions to Betty and her student-teacher:
“Betty, to do well on this quiz you must understand the causal relationships that make up the
chain of events that happen in the river. A chain of direct relationships produces a chain of events.
Paying attention in class leads to better understanding and better understanding produces better
grades is an example of a chain of events.

Running Head: BETTY’S BRAIN 12
Betty, below is a part of the chain of events you need to know to answer the quiz 2 questions cor-
rectly. Your tutor will have to figure out how to use these hints to teach you with the concept map, but
you can help your tutor by giving explanations for your answers to the quiz questions. Remember it is
a good idea for your tutor to get an explanation from you for the first question on this quiz. Check
back here after you take the quiz again for more parts of the chain.
Fish live in the river, and while they help algae by exhaling carbon dioxide, algae also depend on
fish and macroinvertebrates in another way. Fish make their waste in the river, and this waste plays
an important role in the interdependence between fish and algae.
Also, don't forget to look at the resources if you need more information.”
Table 3
Self Regulation Patterns and Feedback Self-Regulation
Feature
Related Task
or Activity Teachable Agent and Mentor feedback
Monitoring
Knowledge Query
Agents encourage student to ask questions. Agent answers ques-
tions and provides explanations. Suggests general debugging strat-
egies.
Monitoring
Knowledge Quiz
TA and Mentor ask students to reflect on the questions not ans-
wered correctly to determine what to learn. Mentor discourages
students from using trial and error methods to get a particular an-
swer right. Mentor advises students to reason using chains of
events.
Formative
Self-Assessment
Query and
Quiz
Students can ask agent to explain their answers. Provides a colla-
borative environment for self-assessment.
Goal Setting Ask Mentor When asked, Mentor gives advice on what to study and how to
study.
Keeping records and
monitoring Quiz
TA keeps track off and makes student aware of changes in quiz
performance.
Seeking
Information
Look up on-
line resources
Ask Mentor
Resources structured to help student access information by topic.
Mentor provides help when asked.
Social interactions
(seeking assistance)
from peers
All TA behaves more like an enthusiastic peer than a passive tutee.
Makes suggestions on strategies that may improve her performance
Social interactions
(seeking assistance)
from Mentors
Mentor
When asked, Mentor volunteers advice on how to be a better learn-
er, a better teacher, and learn from the resources. Mentor also pro-
vides situation-specific advice after TA has taken a quiz.
The feedback includes metacognitive hints about how to be a better learner and monitor Betty’s
(and, therefore, one’s own) learning progress. Further, the feedback is focused more on learning about
chain of events related to interdependence among entities in the river ecosystem. In contrast, the ITS
and LBT feedback was directed at the errors in the students’ concept maps. As illustrated earlier, this
feedback often pointed to missing concepts or missing and erroneous links in the students’ maps. We
note later in our experimental evaluation that this led the SRL group to struggle initially, since they
were asked to focus more on “how to learn,” whereas the feedback provided to the ITS and LBT
groups pointed to localized changes in their concept maps to get the quiz answers right.
Running Head: BETTY’S BRAIN 13
Experimental Procedure
Two sections of a fifth grade classroom in a Nashville Metro school was divided into three equal
groups of 15 students each using a stratified sampling method based on standard achievement scores in
mathematics and language. The students worked on a pretest with six questions before they were sepa-
rately introduced to their particular versions of the system. The three groups worked for five 45-
minute sessions over a period of two weeks to create their concept maps on river ecosystems. All
groups had access to the same online resources while they worked on the system.
At the end of the five sessions, every student took a post-test that was identical to the pretest. Two
other delayed posttests were conducted about seven weeks after the initial experiment: (i) a memory
test, where students were asked to recreate their ecosystem concept maps from memory (there was no
help or intervention when performing this task), and (ii) a preparation for future learning transfer test,
where they were asked to construct a concept map and answer questions about the land-based nitrogen
cycle in two sessions. Students had not been taught about the nitrogen cycle in class, so they had to
learn on their own from the resources provided with the learning environment.
Hypotheses and Measures
As discussed earlier, our primary goals were to study the (i) differences in learning between students
who taught and those who were taught, and (ii) effectiveness of metacognitive and self-regulated feed-
back in preparing students for future learning. We hypothesized that the learning by teaching groups
(SRL and LBT) would do better in learning domain content in the main and transfer studies than the
ITS group. We further hypothesized that the metacognitive feedback provided to the SRL group in the
main study would make them better learners than the LBT group. We also hypothesized that the SRL
group would develop better learning behaviors than the ITS and LBT groups in the main study, and
this behavior would persist in the preparation for future learning study even when the scaffolds and
feedback were removed.
Student learning in the main study was measured by (a) pre-post test gains, (b) and progression in
the students’ concept map scores from session to session. The memory test conducted just before the
transfer test, showed how many concepts and links from the original ecosystem concept map students
were able to reproduce after seven weeks. The PFL test was conducted on a domain that the students
had not studied before. Student learning was measured by computing the scores. We also analyzed
students’ learning behaviors by looking at their activity patterns in the main and the transfer study. The
experimental results are discussed in the next section.
All of the data required for the analysis, i.e., the students’ activities on the system as well as their
concept maps at the end of each session was extracted from log files. The concept map score included
the number of “expert” and “relevant” concepts and links in the students’ maps. Concepts and links
were labeled as “expert” if they were in the expert map. Concepts and links that were not in the expert
map, but were discussed in the resources and corresponded to a correct understanding of the domain
were graded as “relevant.” The number of valid concepts (links) in a student’s map was the sum of the
expert and relevant concepts (links). Valid Concept map scores at the end of each session were record-
ed as the number of expert concepts and links and valid concepts and links in the students’ maps.2
2 Invalid and irrelevant concepts and links in the main and PFL study are not discussed in this paper. The accuracy of the memory test map is defined as the difference between valid and invalid concepts and valid and invalid links. Lee-

Running Head: BETTY’S BRAIN 14
In addition to the concept map scores, we recorded students’ interactions with the system by
counting the number of quiz attempts, queries asked, and resource accesses they made per session.
Quiz attempts are linked to self-assessment, queries to self-monitoring, and resource accesses to seek-
ing information from external content. We computed the average number of quiz requests, queries
asked, and resource accesses for each group across all sessions in the main study and the transfer test.
We should clarify that neither Betty nor Mr. Davis directly prompt the students to ask queries,
read the resources, or take the quiz. As we stated earlier, Mr. Davis provides feedback on errors and
omissions in the students’ concept maps in the ITS and LBT conditions. In the SRL condition Mr.
Davis makes suggestions, such as asking the student to look up the resources on the topic (e.g., photo-
synthesis, waste cycle) that they are teaching Betty or to ask Betty questions to see if she understands
what they have taught her. He does not require that students perform these actions. Therefore, we be-
lieve that the data we have analyzed is not directly biased by Mr. Davis' feedback.
Results
Learning Domain Content. The change in pre- to the post-test scores, the students’ concept map
scores at the end of each session during the main study were analyzed along with the scores in Know-
ledge Retention and Preparation for Future Learning tests.
Pretest and Posttest Results
The pre- and posttest contained 6 questions. The first three questions asked students to define and ex-
plain in their own words the concepts of interdependence, balance, and chain of events as they per-
tained to an ecosphere. An ecosphere is a small sealed glass container that contains water, a few small
stones, a plastic branch, algae, macroinvertebrates, and some bacteria. For these three questions, stu-
dents received full credit (4 points) if they provided a general definition for the concept. They received
partial credit if they could explain the concept by relevant examples. Question 4 had two parts in mul-
tiple choice format. Part 1 asked the students to pick the answer that correctly described the role of
macroinvertebrates in the ecosphere, and part 2 asked a similar question for bacteria. Multiple choice
questions were graded as correct (full score, i.e., 2 points each) or incorrect (no score). For Questions
5 and 6 students were asked to order a given a set of events into a causal chain of events corresponding
to a particular scenario in the ecosphere. Question 5 asked about the sequence of events that would be
observed in the ecosphere if extra algae were added to the system. Question 6 asked for the sequence
of events that would be observed when the ecosphere was exposed to an excessive amount of light for
10 days. Students received full credit (8 points) for coming up with the right sequence of events, and
partial credit if some but not all of the events were in the right sequence.
All three groups showed pre-to-post gain in the total quiz score (p < 0.01). When one compared
the scores for individual questions, the improvement in scores was statistically significant only for
Questions 1 (definition of interdependence) and 4 (role of bacteria and macroinvertebrates in the river
ecosystem) [Mann Whitney, U = 681, p < 0.01 and U = 644.5, p < .005, respectively]. There was a
ceiling effect for questions 5 and 6 (the average score for these questions on the pre- and posttests
were 85% or higher), which may explain why these pre to post test differences for these questions
were not significant. Pairwise comparisons of pre-to-post test score gains between groups did not show
significant differences for any of the six questions. The results indicate that all students learnt domain
lawong (2005) analyzes data on invalid and irrelevant concepts and links in the students main and PFL study concept maps.

Running Head: BETTY’S BRAIN 15
content during the main study, and no significant differences in learning were observed between the
groups.
Concept Map and Quiz Scores across sessions: Main study
GLM MANOVA run on the number of expert concepts and links and valid concepts and links in the
students’ concept maps by group and session showed that all three groups showed improvements in
their concept maps as the session progressed (see Figures 2 and 3). The students’ concept map scores
at the end of the 5th main study session are summarized in Table 4. The results of the tests for signi-
ficance are summarized in Table 5.
<<Insert Figures 2 and 3 here>>
The LBT and SRL groups had a significantly larger number of expert and valid concepts, as well
as valid links in their final concept maps than the ITS group (Tukey HSD, p < 0.05). In addition, the
ratio of expert to valid concepts and the ratio of expert to valid links (Figure 4) for the ITS group are
significantly higher (> 90% for expert concepts and > 70% for expert links) than the LBT and SRL
groups (F (4, 38) = 3.7, p < .05 and F (4, 38) = 6.3, p < .001, respectively; Tukey HSD, p ≤ .05). We believe
that this implies that the two learning by teaching conditions (LBT and SRL) took a more comprehen-
sive approach in their own learning because they were teaching Betty. The ITS group had a narrow fo-
cus, which was building maps that answered the quiz questions correctly. Therefore, their concept
maps were mainly made up of the expert concepts and links. The LBT and SRL students seemed to
take on the task of teaching Betty well. Therefore, they not only wanted her to get the quiz answers
right, but they also tried to teach her more to help her prepare for her future test. To teach her more,
they seem to have put in more effort to learn about river ecosystems for themselves. We also observed
during the study that initially all three groups relied heavily on the quiz questions to determine what
concepts to include in their maps. Since all three groups had equal access to the quiz questions, it is
unlikely that the LBT and SRL group were at a disadvantage in identifying the expert concepts. It
seems the cover story and the act of teaching resulted in the LBT and SRL groups interpreting their
own learning task differently from the ITS group. These differences may be attributed to the focus on
performance by the ITS group versus the focus on mastery goals by the LBT and SRL groups (e.g.,
Ames & Archer, 1988).
When it came to feedback, the ITS and LBT groups received corrective feedback (how to correct
their concept maps to get quiz answers right) from the Mentor after a quiz, whereas the SRL group re-
ceived more metacognitive feedback (how to be a better learner). One may conclude that the lack of
domain-specific feedback may have hurt the SRL group performance, but the differences in feedback
did not produce significant learning differences between the SRL and LBT groups in the main study.
Table 4
Concept Map score by Group at the end of the main study
Expert Concepts
(Mean, SD)
Expert Links
(Mean, SD)
Valid Concepts
(Mean, SD)
Valid Links
(Mean, SD)
ITS 9.88 (1.54) 9.18(3.56) 11.65(3.76) 13.24(3.88)
LBT 11.41(1.18)a 10.24(4.97) 18.12(5.42)
a 21.94(3.65)
a
SRL 11.18(1.33) a 7.88(3.66) 19.00(4.51)
a 19.47(4.67)
a
asignificantly better that ITS, p < 0.01

Running Head: BETTY’S BRAIN 16
Table 5
Significance Levels of Concept-Map Measure Comparisons (GLM MANOVA tests) in the main study
Expert Concepts Expert Links Valid Concepts Valid Links
Time F (4, 38) = 48.8
p < .0005
F (4, 38) = 59.5
p < .0005
F (4, 38) = 40.3
p < .0005
F (4, 38) = 98.4
p < .0005
Time * Group F (8, 76) = 2.7
p < .05
F (8, 76) = 1.1
p = .40
F (8, 76) = 30.7
p < .001
F (8, 76) = 2.8
p < .01
ITS & LBT Tukey: p ≤ .05 Tukey: p > .05 Tukey: p ≤ .05 Tukey: p ≤ .05
ITS & SRL Tukey: p ≤ .05 Tukey: p > .05 Tukey: p ≤ .05 Tukey: p ≤ .05
SRL & LBT Tukey: p > .05 Tukey: p > .05 Tukey: p > .05 Tukey: p > .05
<<Insert Figure 4 here>>
Knowledge Retention
After a seven week delay, students were asked to recreate their main study concept maps from memo-
ry. They used the concept map editor to create their maps but did not have access to the resources, the
quiz, and the query features from the Betty’s Brain or the ITS environments. Table 6 summarizes the
results. The SRL group recalled more concepts and links than the ITS and LBT groups, but these dif-
ferences were not statistically significant. The surprising result was that the students converted a num-
ber of causal links in the main study to descriptive links in the memory test (the Converted Links col-
umn). This indicates that students’ understanding of the importance of causal links in defining a chain
of events was incomplete. This was further supported by the lack of significant improvement from pre-
to post- on the question for defining a chain of events. With appropriate scaffolds in the main study,
such as the query feature, the quiz questions, and the feedback provided, students did create more
causal links. This also happened in the transfer test, where the quiz and query features were available,
but there was no feedback from the Mentor. In the future, we will conduct more detailed experiments
to determine if students really understand and are able to use of the causal concept map structure.
Table 6
Memory Test Concept Map Comparisons
Main Study Memory Test
Valid Concepts
(Mean, SD) Valid Links (Mean, SD)
Valid Concepts (Mean, SD)
Valid Links (Mean, SD)
Converted
Links (Mean, SD)
ITS 11.65(3.76) 13.24(3.88) 8.2(1.95) 2.13(1.34) 4.4 (2.88)
LBT 18.1(5.42) 21.94(3.65) 10.2(2.32) 2.13(1.46) 7.0 (2.92)
SRL 19.0(4.51) 19.47(4.67) 10.6(1.74) 3.01(1.50) 5.3(1.92)
Figure 5 plots the accuracy of recalled concepts and links in the students’ knowledge retention
maps. Accuracy was computed as the difference between valid concepts (links) and invalid (incorrect)
concepts (links) in the students’ concept maps. For this data the SRL group performed marginally bet-

Running Head: BETTY’S BRAIN 17
ter than the LBT group, and the SRL and LBT groups performed better than the ITS group, but the dif-
ferences were not statistically significant.
<<insert Figure 5 here>>
Summary
The main study concept map scores confirm that students in all three conditions learned about river
ecosystems, and the repeated measures analysis indicates that the students’ learning improved over
time. Post hoc analysis showed significant differences between the ITS and the two learning by teach-
ing groups (LBT and SRL) in the number of expert concepts, and valid concepts and links in the river
ecosystem map. The knowledge retention test confirmed that the three systems provided equal oppor-
tunities for learning domain content in the main study. The more important question is how did their
ability to learn transfer to other domains? Our speculation that the learning by teaching conditions led
to the students focusing more on mastery goals, whereas the ITS condition led to the students focusing
more on performance goals may provide the answer to this question.
The Preparation for Future Learning (PFL) Test
After the Knowledge retention test, students were asked to create concept maps to answer questions
about the land-based Nitrogen cycle, a topic that they had not studied in their science class. All stu-
dents worked on this test for two sessions on a version of the system that resembled the ITS system.
The quiz structure was different from the main study. There was one quiz with three questions, all of
which required long chains of reasoning. There were no scaffolding questions that provided hints to
the students about intermediate concepts in the chain of events. The students had access to online re-
sources, and the Mentor graded the quiz answers whenever a quiz request was made. No other feed-
back was provided to the students.
From the data collected in the transfer study, we computed the concept map scores just like we
did in the main study. The number of expert concepts and links and the number of valid concepts and
links in the students’ final Nitrogen cycle maps are shown in Table 7. We did not run repeated meas-
ures ANOVA on the transfer test data because this data was sparse. This would not have happened if
we had given students more time to work on the transfer test (maybe 4-5 sessions). This is one reason
we did not run a combined MANOVA analysis for the main and transfer study data. Another reason is
that the two studies were in very different domains, and students worked under different conditions in
the transfer study (all of them used the ITS system and they did not get any feedback from the Mentor
agent). As a result, we have toned down our conclusions on the transfer study results, and that is re-
flected in this paper.
The SRL group had more expert links than the ITS and LBT groups (statistically significant, p <
0.05). They also had more expert concepts, but the differences were not statistically significant. Even
when one looks at the average number of expert links in the students’ maps ( 1), the number is small
compared to the total number in the expert map (= 21). When one looks at the valid links, the SRL and
LBT groups had significantly more valid links than the ITS group (Mann Whitney U test, p < 0.05).
The LBT group had more valid concepts than the ITS and SRL groups, but only the pairwise differ-
ences between the SRL and ITS groups and LBT and ITS groups were significant at the p < 0.05 level
(Mann Whitney U test). Overall, the two learning by teaching groups outperformed the ITS group but
the differences between the LBT and SRL groups were small.

Running Head: BETTY’S BRAIN 18
Table 7
Results of the Transfer Study
Number of concepts in expert map = 14; number of links = 21
Student Map In-
cluded:
SRL
Mean (sd)
LBT
Mean (sd)
ITS
Mean (sd)
Expert Concepts 4.62 (0.7) 4.56 (0.4) 3.47 (0.4)
Expert Links 0.62a,b
(0.3) 0.31 (0.2) 0.33 (0.1)
Valid Concepts 7.77 (3.0) 8.38a (3.2) 5.36 (3.0)
Valid Links 6.40a (1.0) 6.14
a (1.0) 3.37 (0.7)
a Significantly greater than ITS, p < .05
b Significantly greater than LBT, p < .05
Learning Behaviors: Main and PFL study. We characterized students’ learning behaviors using
three activities: (i) resource accesses (number of times per session in Table 8 and average time per ses-
sion in Figure 6), (ii) queries asked, and (iii) the number of times students asked to take a quiz in the
ITS condition, or asked Betty to take a quiz in the LBT and SRL systems. The average time per ses-
sion that students in each group spent reading the online resources is illustrated in Figure 6. We use
this measure as an indicator of their effort to learn about river ecosystems on their own (as opposed to
being told). There were no significant effects of time of measurement and no significant interaction
effect of time of measurement and group. However, the ITS and LBT groups spent more time reading
resources (statistically significant, p < 0.01) than the SRL group.
<<insert Figure 6 here>>
The number of causal queries per session, an indication of students’ efforts to monitor their own
learning and debug their concept maps, is shown for the three groups in Figure 7. The effect of time
of measurement (the number of queries increase with time) and the interaction effect of time and
group of measurement were both significant (F (4, 38) = 5.4, p < .001 and F (8, 76) = 3.6, p < .001, respec-
tively). The post hoc results showed that the SRL group asked more causal questions than the other
two groups (Tukey HSD, p .05).
<<insert Figure 7 here>>
We used the number of explanation requests following queries (Figure 7) as further indication of
the students’ efforts at self-monitoring during the map building task. The explanation mechanism illu-
strated reasoning through chains of events, and the aggregation of inferences along multiple paths be-
tween the source and destination nodes. Analysis of the data showed that the effect of time was signif-
icant (F (4, 38) = 9.3, p < .0005), but the interaction effect of time and group was not significant (F (8, 76)
= 1.6, p = 0.13). The post hoc pairwise analysis of between groups did not produce significant differ-
ences. All three groups made more use of the explanation feature in later sessions. The students may
have found the explanation mechanism to be useful in understanding the reasoning steps as the con-
cept maps became more complex.
Running Head: BETTY’S BRAIN 19
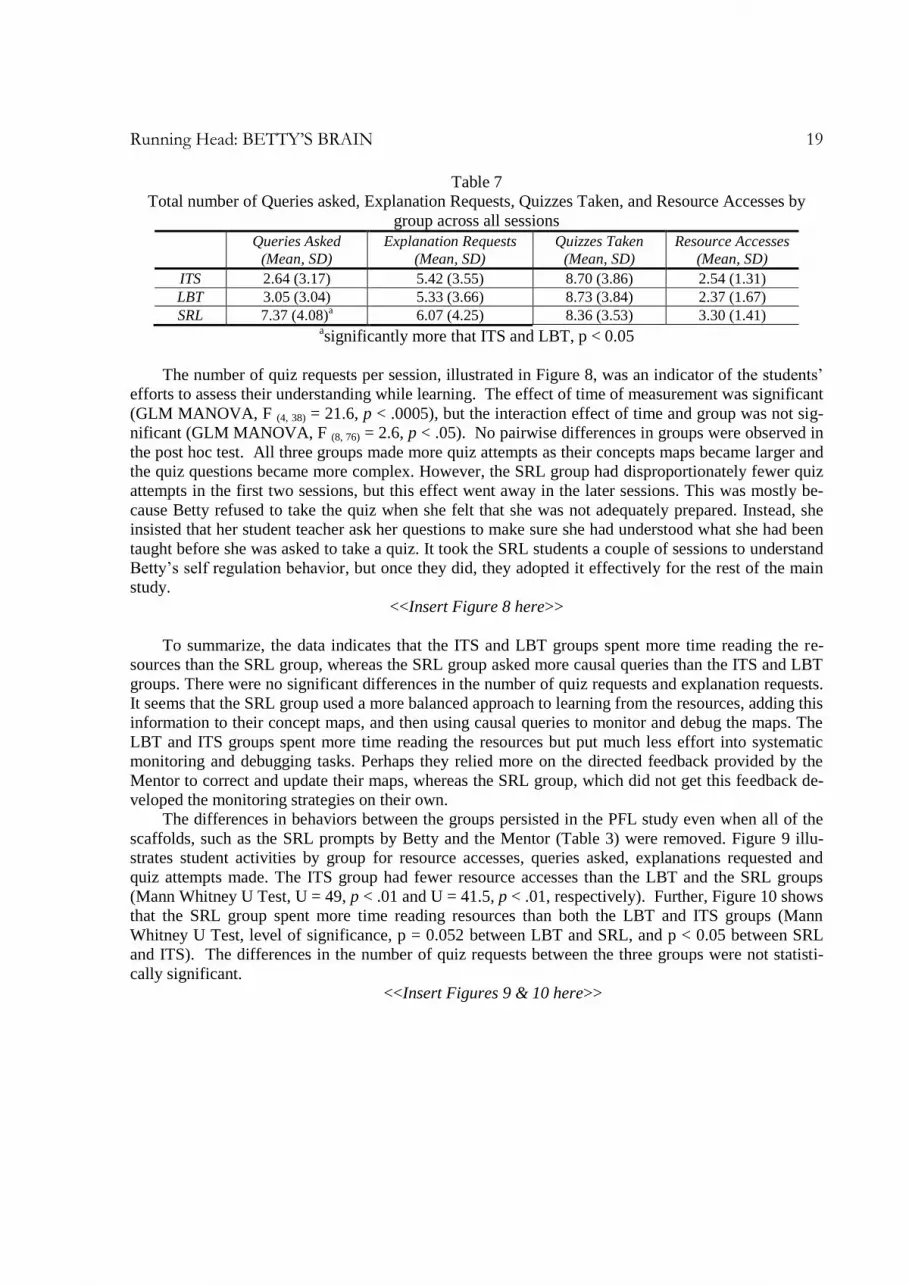
Table 7
Total number of Queries asked, Explanation Requests, Quizzes Taken, and Resource Accesses by
group across all sessions
Queries Asked
(Mean, SD)
Explanation Requests
(Mean, SD)
Quizzes Taken
(Mean, SD)
Resource Accesses
(Mean, SD)
ITS 2.64 (3.17) 5.42 (3.55) 8.70 (3.86) 2.54 (1.31)
LBT 3.05 (3.04) 5.33 (3.66) 8.73 (3.84) 2.37 (1.67)
SRL 7.37 (4.08)a 6.07 (4.25) 8.36 (3.53) 3.30 (1.41)
asignificantly more that ITS and LBT, p < 0.05
The number of quiz requests per session, illustrated in Figure 8, was an indicator of the students’
efforts to assess their understanding while learning. The effect of time of measurement was significant
(GLM MANOVA, F (4, 38) = 21.6, p < .0005), but the interaction effect of time and group was not sig-
nificant (GLM MANOVA, F (8, 76) = 2.6, p < .05). No pairwise differences in groups were observed in
the post hoc test. All three groups made more quiz attempts as their concepts maps became larger and
the quiz questions became more complex. However, the SRL group had disproportionately fewer quiz
attempts in the first two sessions, but this effect went away in the later sessions. This was mostly be-
cause Betty refused to take the quiz when she felt that she was not adequately prepared. Instead, she
insisted that her student teacher ask her questions to make sure she had understood what she had been
taught before she was asked to take a quiz. It took the SRL students a couple of sessions to understand
Betty’s self regulation behavior, but once they did, they adopted it effectively for the rest of the main
study.
<<Insert Figure 8 here>>
To summarize, the data indicates that the ITS and LBT groups spent more time reading the re-
sources than the SRL group, whereas the SRL group asked more causal queries than the ITS and LBT
groups. There were no significant differences in the number of quiz requests and explanation requests.
It seems that the SRL group used a more balanced approach to learning from the resources, adding this
information to their concept maps, and then using causal queries to monitor and debug the maps. The
LBT and ITS groups spent more time reading the resources but put much less effort into systematic
monitoring and debugging tasks. Perhaps they relied more on the directed feedback provided by the
Mentor to correct and update their maps, whereas the SRL group, which did not get this feedback de-
veloped the monitoring strategies on their own.
The differences in behaviors between the groups persisted in the PFL study even when all of the
scaffolds, such as the SRL prompts by Betty and the Mentor (Table 3) were removed. Figure 9 illu-
strates student activities by group for resource accesses, queries asked, explanations requested and
quiz attempts made. The ITS group had fewer resource accesses than the LBT and the SRL groups
(Mann Whitney U Test, U = 49, p < .01 and U = 41.5, p < .01, respectively). Further, Figure 10 shows
that the SRL group spent more time reading resources than both the LBT and ITS groups (Mann
Whitney U Test, level of significance, p = 0.052 between LBT and SRL, and p < 0.05 between SRL
and ITS). The differences in the number of quiz requests between the three groups were not statisti-
cally significant.
<<Insert Figures 9 & 10 here>>

Running Head: BETTY’S BRAIN 20
We could not perform statistical tests on the number of causal queries asked and the average
number of explanation requests by group because this data was skewed by a large number of zeros,
i.e.., a number of students asked no queries and very few students used the Explain feature. Instead we
report the number of students who used each of these features at least once in Table 8. 69% of the
students in the SRL group asked causal queries as opposed to 56% for the LBT group and only 40%
for the ITS group. The corresponding numbers for explanation requests were 46%, 25%, and 20%, re-
spectively. Like the main study, the SRL group made more attempts to monitor their learning using
the query and explanation features. The LBT group was intermediate. If the students had more time on
the PFL test, the differences would very likely have been much larger. These results indicate that the
strategies taught to the SRL group persisted in environments where the scaffolds were absent.
Table 8: Number and Percentage of Students who asked Causal Queries and made Explanation
Requests
Variable ITS LBT SRL
Count Percent Count Percent Count Percent
Number of Causal Queries 6 40% 9 56% 9 69%
Number of Explanation Requests 3 20% 4 25% 6 46%
In summary, the SRL group demonstrated better learning strategies than the LBT and ITS groups
in the PFL study. Since they were dealing with a domain they had not encountered before, the SRL
group spent more time reading resources to learn about the domain. The monitoring and debugging
behavior persisted in the PFL study even without the feedback prompts from the main study. Further,
most of the students in this group persevered till the end, whereas a number of students in the LBT and
ITS groups just gave up after the first PFL session (this explains the large number of 0’s in the number
of causal queries asked).
DISCUSSION
This study compared students’ learning performance and learning behaviors along two dimen-
sions: (i) learning by teaching versus learning by being taught, and (ii) directed corrective feedback
versus guided metacognitive feedback. An important component of the study looked for the effect of
self regulated learning feedback on preparation for future learning.
Differences between Learning-by-being-Taught and Learning-by-Teaching
The findings indicated that students in the two learning-by-teaching conditions made a greater
effort and had better success in learning on their own from the text resources so they could teach Betty
well. This was demonstrated by the greater number of valid concepts and links in the LBT and SRL
student concept maps in the main and transfer study in comparison to students in the ITS condition
(statistically significant). Students in the ITS group apparently put less effort in learning from the re-
sources and monitoring their own learning in a systematic way. Their primary focus was on passing
the quizzes. This difference again manifested in the PFL study where the LBT and SRL students spent
more time in reading resources to learn the new domain. Overall the main study concept maps created
by the LBT and SRL groups were significantly better than the ones created by the ITS group, and this
difference carried over to the PFL study concept maps.
As expected, students in the SRL group demonstrated better self-regulated and self-monitoring
behaviors in the main study, where they received metacognitive feedback. However, this behavior al-
so carried over to the PFL study, where all of the feedback and scaffolds were removed. Overall, the

Running Head: BETTY’S BRAIN 21
SRL group spent more time reading resources, made more attempts to debug their maps by asking
causal queries, and made more attempts to take quizzes in the PFL study, where they had to learn a
complex domain that they had not encountered before. Our observations during the study and from in-
formation we gathered in exit interviews indicated that a number of students in the ITS group (about
33%) gave up after the first session in the transfer study, but all of the SRL students continued to work
on the difficult PFL task till the end. In exit interviews, students who worked with Betty expressed the
desire to continue to work on the system if we would let them, while the students who were taught by
the mentor made it clear that they did not want to continue.
Effects of Self-Regulated Learning on Students’ learning behaviors
Our hypothesis was that students in the SRL condition would adopt the metacognitive and self-
regulated learning strategies they were taught in the main study, and would use these strategies to
achieve better learning in the PFL study even though the scaffolds and feedback prompts were re-
moved. Analysis of the behavior data indicates that the SRL students demonstrated good learning
strategies. The balanced approach to information seeking, self-assessment, and monitoring was ob-
served in the main and PFL studies. There were significant differences in time spent reading resources,
number of quiz attempts, and number of causal queries asked between the SRL and ITS groups in the
PFL study. On the other hand, significant behavior differences were not observed between the SRL
and LBT groups in the PFL study. Also, there were no significant differences in the quality of the con-
cept maps created by the two learning by teaching groups in the main and PFL studies.
Limitations of Current Study
We believe that one of the primary reasons for not seeing greater differences between the three
groups in the PFL study was that students were given just two sessions to learn a new domain and
translate their understanding into a concept map representation. In contrast, they worked on their main
study concept maps for five sessions. The lack of scaffolds in the PFL study, such as the absence of
quiz questions that covered intermediate concepts and feedback from the Mentor after the students
took a quiz may explain why the students’ concept maps only had a small number of concepts and
links (see Table 7). The lack of pre- to posttest gains on the “chain of events” question also raises
doubts about how well students understood how to reason with long chains of events. Last, this study
was run in two 5th grade science classrooms with a total of 45 students. The smaller sample size may
have been partly responsible for the lack of statistical significance in our results. In many cases, the
strong requirements for ANOVA were not satisfied, and the weaker Mann-Whitney tests had to be
used in its place.
CONCLUSIONS
Our study of student performance and learning behaviors over time leads us to believe that com-
bining the learning by teaching paradigm with an appropriate mix of directed and guided feedback will
lead to the design of powerful constructivist learning environments that help novice students become
independent learners who are better prepared for future learning tasks. The directed feedback in the
ITS and LBT systems enhanced student learning performance in the early sessions of the main study.
This advantage disappeared in later sessions as the students in the SRL group learnt to use strategies
demonstrated by the guided metacognitive feedback in their learning and self-monitoring tasks. In the
transfer test, the benefits of the guided learning became even more visible as the SRL students were
able to transfer their metacognitive strategies to a new learning environment, where most of the scaf-
folds to aid the learning task were removed.

Running Head: BETTY’S BRAIN 22
An important takeaway message from these results is that directed feedback may be more useful
in the early stages of the learning process to help students make initial progress on a new learning task.
As time progresses, to promote more exploratory and constructivist learning, the feedback can shift
from directed to metacognitive strategies that guide students in their information seeking,, monitoring,
assessment, and reflection tasks. More recent experimental studies (e.g., Wagster, et al., 2007) have
addressed the limitations of the current study discussed above, and we are beginning to see significant
differences in learning performance and learning behaviors between the SRL and the other groups in
the main and PFL studies.
In other directions, we are expanding the scope of Betty’s reasoning mechanisms so she can rea-
son a temporal behavior and dynamic processes. We are looking at ways in which the Teachable
Agent architecture can be combined with exploratory simulation environments to provide rich learning
environments for complex phenomena in science (Tan, et al., 2007).
ACKNOWLEDGEMENTS
This work has been supported by a NSF ROLE Award #0231771. The help provided by other
members of the Teachable Agents group, Dan Schwartz, John Bransford, Joan Davis, Nancy Vye, Ka-
dira Belynne, Bilikiss Adebiyi, and are gratefully acknowledged. The authors also thank the three ano-
nymous reviewers, whose constructive comments have greatly improved the paper.
REFERENCES
Ames, C. and J. Archer (1988). “Achievement Goals in the Classroom: Students’ Learning Strategies
and Motivation Processes,” Journal of Educational Psychology 80(3): 260-267.
Artzt, A. F. and E. Armour-Thomas (1999). "Cognitive Model for Examining Teachers' Instructional
Practice in Mathematics: A Guide for Facilitating Teacher Reflection." Educational Studies in Ma-
thematics 40(3): 211-235.
Bargh, J. A. and Y. Schul (1980). "On the cognitive benefits of teaching." Journal of Educational Psy-
chology 72(5): 593-604.
Biswas, G., Schwartz, D. L., Bransford, J. D., & TAG-V. (2001). Technology support for complex
problem solving: From SAD Environments to AI. In K. Forbus & P. Feltovich (Eds.), Smart ma-
chines in education. Menlo Park, CA: AAAI/MIT Press, 71-98.
Biswas, G., K. Leelawong, K. Belynne, K. Viswanath, N. Vye, D. Schwartz, and J. Davis. (2004). In-
corporating Self Regulated Learning Techniques into Learning by Teaching Environments. The
Twenty Sixth Annual Meeting of the Cognitive Science Society, Chicago, Illinois, Lawrence Erl-
baum, 120-125.
Biswas, G., Schwartz, D. L., Leelawong, K., Vye, N., & TAG-V. (2005). Learning by teaching: A new
paradigm for educational software. Applied Artificial Intelligence, 19(3): 363-392.
Bransford, J. D., A. L. Brown, and Cocking, R.R., eds. (2000). How People Learn. Washington, D.C.,
National Academy Press.
Brown, A.L. (1987). Metacognition, Executive Control, Self-Regulation and other more Mysterious
Mechanisms. In F.E. Weinert and R.H. Kluwe (eds.) Metacognition, Motivation, and Understand-
ing, Lawrence Erlbaum Associates, Hillsdale, NJ, pp. 65-116, 1987.

Running Head: BETTY’S BRAIN 23
Butler, D. L. and P. H. Winne (1995). "Feedback and Self-Regulated Learning: A Theoretical Synthe-
sis." Review of Educational Research 65(3): 245-281.
Chan, T.-W. and C.-Y. Chou (1997). "Exploring the Design of Computer Supports for Reciprocal Tu-
toring." International Journal of Artificial Intelligence in Education 8: 1-29.
Chi, M. T. H., N. De Leeuw, et al. (1994). "Eliciting self-explanations." Cognitive Science 18: 439-
477.
Chi, M. T. H., S. A. Siler, et al. (2001). "Learning from Human Tutoring." Cognitive Science 25(4):
471-533.
Clarebout, G., J. Elen, W.L. Johnson, and E. Shaw (2002). “Animated Pedagogical Agents: An Oppor-
tunity to be Grasped?” Journal of Educational Multimedia and Hypermedia vol. 11, pp. 267-286.
Colton, A. B. and G. M. Sparks-Langer (1993). "A Conceptual Framework to Guide the Development
of Teacher Reflection and Decision Making." Journal of Teacher Education 44(1): 45-54.
Davis, J., K. Leelawong, K. Belynne, B. Bodenheimer, G. Biswas, N. Vye, J. Bransford. (2003). Intel-
ligent User Interface Design for Teachable Agent Systems. International Conference on Intelligent
User Interfaces, Miami, Florida, The Association for Computing Machinery, 26-34.
Forbus, K. (1984). Qualitative Process Theory, Artificial Intelligence, 24: 85-168.
Goos, M., Galbraith, P., and Renshaw, P. (2002). Socially Mediated Metacognition: Creating Colla-
borative Zones of Proximal Development in Small Group Problem Solving, Educational Studies in
Mathematics, vol. 49, pp. 193-223, 2002.
Graesser, A. C., N. Person, et al. (1995). "Collaborative dialog patterns in naturalistic one on one tu-
toring." Applied Cognitive Psychologist 9: 359-387.
Kuipers, B. (1994). Qualitative Reasoning: Modeling and Simulation with Incomplete Knowledge.
Cambridge, MA, MIT Press.
Leelawong, K., J. Davis, et al. (2002). The Effects of Feedback in Supporting Learning by Teaching in
a Teachable Agent Environment. The Fifth International Conference of the Learning Sciences,
Seattle, Washington, 245-252.
Leelawong, K., Y. Wang, et al. (2001). Qualitative reasoning techniques to support learning by teach-
ing: The Teachable Agents project. Fifteenth International Workshop on Qualitative Reasoning,
San Antonio, Texas, AAAI Press, 73-80.
Lin, X. D., Schwartz, D. L., and Hatano, G. (2005). Towards teachers’ adaptive metacognition. Edu-
cational Psychologist 40(4): 245-255.
McAlpine, L., Weston, C., Beauchamp, J., Wiseman, C., & Beauchamp, C. (1999). Building a Meta-
cognitive Model of Reflection. Higher Education, vol. 37(2): 105-131.
Michie, D., A. Paterson, and Hayes-Michie (1989). Learning by Teaching. Second Scandinavian Con-
ference on Artificial Intelligence (SCAI) Tampere, Finland, IOS Press, 307-331.
Nichols, D. M. (1993). Intelligent Student Systems: an application of viewpoints to intelligent learn-
ing environments. Computing Department,, Lancaster University, UK.

Running Head: BETTY’S BRAIN 24
Nichols, D. M. (1994). Issues in Designing Learning by Teaching Systems. Proceedings of the East-
West International Conference on Computer Technologies in Education (EW-ED'94), Crimea,
Ukraine, 176-181.
Novak, J. D. (1996). Concept Mapping as a tool for improving science teaching and learning. Improv-
ing Teaching and Learning in Science and Mathematics. D. F. Treagust, R. Duit and B. J. Fraser.
London, Teachers College Press: 32-43.
Obayashi, F., H. Shimoda, et al. (2000). “Construction and Evaluation of CAI System Based on Learn-
ing by Teaching to Virtual Student”. World Multiconference on Systemics, Cybernetics and Infor-
matics, Orlando, Florida, 3: 94-99.
Palincsar, A. S. and A. L. Brown (1984). "Reciprocal teaching of comprehension-fostering and com-
prehension -monitoring activities." Cognition and instruction 1: 117-175.
Palthepu, S., J. E. Greer, and G. McCalla (1991). Learning by teaching. The International Conference
on Learning Sciences, Illinois, USA, L. Birnbaum (ed.), American Association for Advancement of
Computing in Education.
Papert, S. (1993). The Children's Machine: Rethinking school in the age of the computer. New York,
NY, Basic Books.
Pintrich, P. R. and E. V. DeGroot (1990). "Motivational and self-regulated learning components of
classroom academic performance." Journal of Educational Psychology, 82(1): 33-40.
Ramírez Uresti, J. A. (2000). Should I Teach My Computer Peer? Some Issues in Teaching a Learning
Companion. Proceedings of the 5th International Conference on Intelligent Tutoring Systems,
Montréal, Canada, Springer-Verlag, 103-112.
Ramirez Uresti, J.A. and B. du Boulay (2004). “Expertise, Motivation, and Teaching in Learning by
Teaching Systems, International Journal of Artificial Intelligence in Education 14: 67-106.
Schwartz, D.L., K.B. Pilner, G. Biswas, K. Leelawong, and J.P. Davis (in press). Animation of
Thought: Interactivity in the Teachable Agent Paradigm..Learning with Animation: Research and
Implications for Design, Lowe, R. and Schnotz, W., eds., Cambridge Univ. Press, to appear. (avail-
able at AAALab.Stanford.Edu).
Shapiro, A. (1983). The Role of Structured Induction in Expert Systems. Machine Intelligence Unit.
Edinburgh, UK, University of Edinburgh.
Tan, J., Biswas, G. & Schwartz, D. (2006). Feedback for Metacognitive Support in Learning by
Teaching Environments, The 28th Annual Meeting of the Cognitive Science Society, Vancouver,
Canada,. 828-833.
Tan, J., Skirvin, N., Biswas, G. & Catley, K., (2007). Providing Guidance and Opportunities for Self-
Assessment and Transfer in a Simulation Environment for Discovery Learning. 29th Annual Meet-
ing of the Cognitive Science Society, Nashville, TN, pp. 1539-1544.
Wagster, J., Tan, J., Wu, Y., Biswas, G. & Schwartz, D. (2007). Do Learning by Teaching Environ-
ments with Metacognitive Support Help Students Develop Better Learning Behaviors?, The 29th
Annual Meeting of the Cognitive Science Society, Nashville, Tennessee, pp. 695-700.

Running Head: BETTY’S BRAIN 25
Weinert, F.E., and Kluwe, R. (1987). Metacognition, motivation, and understanding, Lawrence Erl-
baum Associates, Hillsdale, NJ.
Zimmerman, B. J. (1986). "Development of self-regulated learning: Which are the key subprocesses?"
Contemporary Educational Psychology 16: 307-313.
Zimmerman, B. J. (1989). "A Social Cognitive View of Self-Regulated Academic Learning." Journal
of Educational Psychology 81(3): 329-339.

Running Head: BETTY’S BRAIN 26
Figure 1: Interface of SRL Betty's Brain
Average Number of Expert Links
0.00
3.00
6.00
9.00
12.00
15.00
18.00
1 2 3 4 5
Sessions
Averag
es
.
ITS
LBT
SRL
Average Number of Expert Concepts
0.00
2.00
4.00
6.00
8.00
10.00
12.00
1 2 3 4 5
Sessions
Averag
es .
ITS
LBT
SRL
Figure 2: Average number of Expert Concepts and Links in student maps at the end of each session in the main study (error bars represent the 95% confidence levels of the difference between means) As a comparison, number of concepts in expert map
= 12, number of links = 15.

Running Head: BETTY’S BRAIN 27
Average Number of Valid Concepts
0.00
5.00
10.00
15.00
20.00
25.00
1 2 3 4 5
Sessions
Averag
es .
ITS
LBT
SRL
Average Number of Valid Links
0.00
5.00
10.00
15.00
20.00
25.00
1 2 3 4 5
Sessions
Averag
es .
ITS
LBT
SRL
Figure 3: Average number of Valid Concepts and Links in student maps at the end of each session in the main study (error bars represent the 95%
confidence levels of the difference between means).
Figure 4: Ratio of the Number of Expert Concepts to Valid Concepts and
Links in Students’ Concept Maps at the end of each session of the Main Study
(Error bars represent the 95% confidence intervals of the differences between
means.)
Ratio of Expert to Valid Links
0.00%
10.00%
20.00%
30.00%
40.00%
50.00%
60.00%
70.00%
80.00%
90.00%
1 2 3 4 5
Sessions
Perc
en
tag
es
ITS
LBT
SRL
Ratio of Expert to Valid Concepts
50.00%
60.00%
70.00%
80.00%
90.00%
100.00%
1 2 3 4 5
Sessions
Per
rcen
tag
es
ITS
LBT
SRL

Running Head: BETTY’S BRAIN 28
Average Memory Score
0
2
4
6
8
10
12
14
Concept-Memory
Scores
Link-Memory Scores
Sco
res
. ITS
LBT
SRL
Figure 5: Accuracy of concepts and links retained by the students in the memo-ry test. (Error bars represent 95% confidence levels of the difference in means).
Resource-Access Time
0:00:00
0:02:00
0:04:00
0:06:00
0:08:00
0:10:00
0:12:00
0:14:00
0:16:00
0:18:00
1 2 3 4 5
Sessions
Tim
e
ITS
LBT
SRL
Figure 6: Average Amount of Time spent reading Resources (Error bars
represent the 95% confidence intervals of the differences between means.)

Running Head: BETTY’S BRAIN 29
Average Number of Quiz Requests
0.00
3.00
6.00
9.00
12.00
15.00
18.00
21.00
1 2 3 4 5
Sessions
Avera
ges ITS
LBT
SRL
Figure 8: Average Number of Quiz Requests by group and session in the Main study
(Error bars represent the 95% confidence intervals of the differences between means.)
Figure 7: Average Number of Causal Queries and Explanation Requests by
group and session in the main study (Error bars represent the 95% confidence
intervals of the differences between means)
Average Number of Causal Queries
0.00
3.00
6.00
9.00
12.00
15.00
18.00
1 2 3 4 5
Sessions
Nu
mb
ers
of
Req
uests
ITS
LBT
SRL
Average Number of Explanation Requests
0.00
0.50
1.00
1.50
2.00
2.50
3.00
3.50
1 2 3 4 5
Sessions
Avera
ges ITS
LBT
SRL

Running Head: BETTY’S BRAIN 30
Figure 10: Average Amount of Time spent reading Resources in the PFL Test by group (Error bars represent the 95% confidence intervals of the differences be-
tween means.)
Time Spent Accessing Resources
0:00:00
0:05:00
0:10:00
0:14:59
2
Session
Tim
e
ITS
LBT
SRL
Figure 9: Average Number of Resource, Query, and Explanation Request and Quiz Activities during the second session of the Transfer Test (Error bars represent the 95% confidence intervals of the differences between means.)
Transfer-Test Log Analysis
0.00
2.00
4.00
6.00
8.00
10.00
12.00
14.00
Numbers of Resource
Accesses
Number of Causal
Queries
Number of
Explanation Requests
Numbers of Quiz
Requests
Activities
Avera
ges ITS
LBT
SRL