design method for geotextile tubes considering strain – formulation and verification by laboratory...
TRANSCRIPT

Design method for geotextile tubes considering strain –
Formulation and verification by laboratory tests using photogrammetry
S. Cantré*, F. Saathoff
Chair of Geotechnics and Coastal Engineering, University of Rostock,
Justus-von-Liebig-Weg 6, 18059 Rostock, Germany
Abstract
Geotextile tubes are usually made of at least one layer of high-strength woven geotextiles. However, if only
highly elastic materials are used, experience shows –comprehensibly– that the designed geometry and stresses,
derived from standard formulations or special computer software, both using small strain membrane theory,
essentially differ from reality. Therefore, an extended formulation, considering large strains, was developed
within the scope of a study on the structural and hydraulic design of geosynthetic dewatering tubes at the
University of Rostock. The solution was evaluated using a sensitivity analysis and verified in laboratory
experiments, where small-scale tubes were surveyed using a low-budget, high-precision photogrammetric
measurement technique. The new design method proved to produce good results. It should be used if the
construction is indeed a long tube and if the limit strain of the geotextile tubes exceeds 10% strain. Finally, the
results were compared to the existing methods for the structural design of geosynthetic applications, adding to
the discussion about attenuation factors in geotextile tube dewatering projects. For short-term applications
without refilling of the partly dewatered tubes, the product of attenuation and safety factors will usually not
exceed a value of two.
Keywords: Geotextile tubes, dimensioning, strains, laboratory testing, low-cost photogrammetry
1. Introduction
Geosynthetic containers have been increasingly used in hydraulic engineering (Alvarez et al. 2007, Shin and Oh
2007, Saathoff et al. 2007, Yan and Chu 2010) and sludge dewatering (Koerner and Koerner 2006,
Muthukumaran and Ilamparuthi 2006) projects during the past two decades. They come in a large variety of
shapes and sizes, starting from simple sandbags to large tubes of more than 100 m in length.
The existing mechanical dimensioning methods for geotextiles used as geotextile tubes are based on the
plane strain membrane theory (Liu 1981, Namias 1985, Leshchinsky et al. 1996, Plaut and Suherman 1998,
Ghavanloo and Daneshmand 2009). The linear membrane theory is based on Hook’s linear elastic material law
and a linear geometric deformation behaviour, generally applying to small deformations. If large deformations
are considered, the requirement of a linear constitutive law has to be dismissed. Therefore there is a need to
develop a design method for such materials.
Most geotextiles have non-linear material characteristics. It is known, that they possess thermo-visco-elasto-
plastic properties, which depend on direction and normal stress (Perkins 2000). These properties are usually
ignored in dimensioning processes using small strain solutions, while they have to be considered for large
strains. Therefore, an adequate solution needs to be formulated.
In this paper, the calculation methods of Namias (1985) and Plaut and Suherman (1998) are extended to
incorporate elastic strains. The solution was validated in laboratory experiments. The presented calculation
method is limited to tubes on rigid ground, which are filled on site. The plain strain state is still assumed.
However, for the plane strain state to be valid, geotextile tubes need to be long tubes, which is why a special
length-to-width ratio has been defined.
*Corresponding author. Tel.: +49 (0)381 4983704; fax: +49 (0)381 4983702
E-mail addresses: [email protected] (Dr. S. Cantré), [email protected] (Prof. F. Saathoff)

2. Structural analysis of geotextile tubes
The design of hydraulically filled geotextile tubes is theoretically based on the surface tension of a water drop.
Calculation methods were originally developed to design membrane containers for both the storage (Timoshenko
1940, Namias 1985) and the transport of fluids (Wang 1984, Szyszkowski and Glockner 1987, Zhao 1995).
Based on the earliest publications on this topic, a design method for geotextile tubes was derived in the 1970s
(Liu 1981). This approach has been developed constantly, particularly regarding different loading conditions
(Plaut and Suherman 1998, Plaut and Klusman 1999), and eventually even finite element methods were applied
to analyse stacked tubes and three-dimensional systems (Seay and Plaut 1998, Huong 2001, Freeman 2002,
Cantré 2002, Kim 2003, Kim et al. 2004, Zhang and Tan 2006).
During the hydraulic tube filling process the filling material can be seen as an ideal fluid with the density
> 1g/cm3. During dewatering and consolidation the filling material solidifies, which may lead to an influence
in friction between filling material and geosynthetic shell. The relatively thin geosynthetic shell may be seen as a
membrane of equal density in a mathematical model. Regarding geotextile tubes as cylindrical membrane
structures in plane strain, the axial forces and the strains in both in-plane directions can be determined
considering Young’s modulus and Poisson’s ratio.
For large deformations, existing non-linearities need to be considered. For this, simple iterative methods can
be used or the differential equations for large deformations can be solved with boundary methods (Chen and
Zheng 2003) or finite element methods (Ibrahimbegovic and Gruttmann 1993).
In this paper the systems are limited to tubes resting on rigid ground which are filled on site. The maximum
membrane forces then occur during the filling process (Cantré 2002, Zhang and Tan 2006), and both the friction
forces and the solidification of the filling materials during dewatering can be ignored in the static analysis
(constant membrane forces). Model simplifications cause errors, which can be reduced if fine-grained filling
materials with low settling velocities are assumed. Then, the filling material can be considered a fluid over a
longer period of time.
2.1 Basic design method after Plaut and Suherman
The design method was developed using the solution of Plaut and Suherman (1998). For detailed information on
the basic solution, see the original publication. Only the governing equations are repeated here for a better
understanding. Fig. 1 shows the nomenclature of the geometry and forces at a differential membrane element.
The governing equations to determine the geometry and forces in the tube’s cross-section are the following:
( )bot atm
dT P P Y
dS
[1]
cos
dX
dS ; sin
dY
dS ; 0
dT
dS [2] [3] [4]
where T = tensile normal stress [kN/m], = tangential angle with respect to the
horizontal line [°], S = circumferential coordinate [m], Pbot = pressure at the bottom
of the tube [kPa], Patm = atmospheric pressure [kPa], = unit weight of the filling
material [kN/m³], Y = vertical coordinate (height) [m], X = horizontal coordinate
[m].
Fig.1: Cross-section and forces at the differential element after Plaut and Suherman (1998)

All values describing the geometry and membrane forces of the filled tube can be derived from the solution of
these differential equations. All values are defined as dimensionless reduced quantities in the X-Y plane referred
to the circumference C and – for stresses and pressures only – the density . These constants are also used as
boundary conditions. All dimensionless values are written in lower-case characters.
An integration parameter k was derived by Namias (1985) to solve the elliptic integrals E and K which result
from the rearrangement of the governing equations. This parameter depends on the unknown membrane force t
and can be determined using equation [5].
2 ( ) ( ) 1 0p E k K k [5]
where p = dimensionless pressure [ ], K(k) = complete elliptic integral of the first
kind, E(k) = complete elliptic integral of the second kind, k = integration parameter
[ ] (for more information see Plaut and Suherman 1998).
Therefore a third boundary condition is needed, e.g. the pressure at the top of the tube (Ptop) or the planned tube
height (H).
2.2 Recent design practice and problems
For the design process of geotextile tubes filled ashore on rigid ground, two commercial software products can
be used: GeoCoPS 3.0 (Leshchinsky and Leshchinsky 1996, Adama, 2009) and the combination of SOFFTWIN
and SOFFTCON (Palmerton 1998a/b). Because of the simplifications of the long tube used in these programs
(membrane theory and plane strain state), the ends of the tubes have to be considered separately.
Unfortunately the terms “geosynthetic tube” and “geotextile tube” are used for a large range of geosynthetic
container shapes. If a geosynthetic container with a small length-to-width ratio is called a tube, there will be
errors during the dimensioning process. Using the dimensioning methods presented here, the considerable
influence of the tube ends on the geometry and stresses are ignored. The mechanical influence of the ends of a
“short tube” together with an anisotropic geotextile, however, may even cause axial strains that exceed those in
circumferential direction (see Okamura et al. 2006).
3. Structural analysis considering strains
3.1 Theoretical background
High-strength geotextiles with low breaking elongation can be considered using the existing design methods.
Simple membrane theory describes the problem relatively well. Observations in projects using nonwovens with
large breaking elongation showed, however, that these geotextiles do not correspond to the computed results
very well, neither with respect to the designed cross-section nor the (elastic) strains. Therefore, geosynthetic
constitutive laws need to be included in the calculations. To calculate the tube geometry and the membrane
stresses within the tube, the method of Plaut and Suherman (1998) is extended by a nonlinear-elastic material
behaviour of the geosynthetics. For this, the small strain, large deformation theory was used, deliberately
ignoring visco-plastic influences and temperature-dependent properties.
With circumferential strains permitted, the circumference –previously assumed constant– changes, as do the
dimensionless values (including the tangential membrane force). The fit of circumference and tension force is
solved iteratively. First the membrane force T0 is computed using a predetermined circumference L0 (equation
[6]). The length modification using the constitutive law follows and then the new circumference L1 is calculated
(equation [7]). The incremental force between two iterations is used as the stop criterion.
2
0T t C [6]
0 1i iC C [7]
where T = membrane force [kN/m], t = non-dimensional membrane force [ ]; C0 = initial
circumference [m]; = density of the filling material [g/cm³], i = strain at interval i [%], i =
iteration index.
It is assumed that strains only appear along the “free” circumference C’ = C – B’, being the part of the tube’s
surface with no contact to the ground (although the consideration of strains along C is also possible). Only elastic

deformations are considered and the strains are considered to be constant (equation [9]), resulting from the
assumption of a constant circumferential stress. The governing differential equations [1] to [4] are extended by
equations [8] and [9].
2
0 0
1dS dC dC C
dT dT dT dE
[8]
0
d
dS
[9]
where = Poisson ratio [ ] and E = Young’s modulus [kN/m²].
Finally, equation [7] can be written as
0 0 1 0 1' 'i i i i iC C C B C C . [10]
where Ci = cross section in iteration step i [m]; C0 = circumference, unloaded [m]; B’i-1 = contact
width with the ground from previous iteration step [m]; C’i-1 = free circumference from previous
iteration step [m].
As a standard method to consider nonlinear-elastic material behaviour, an incremental approach was chosen
based on Kmiecik et al. (1993). Within each load increment the material behaviour is assumed to be linear-
elastic. The implementation of this method is described below.
Fig. 2: Stress-strain diagram and discretized points; list for computation
3.2 Programming
The solution was programmed using a standard programming language (MS Visual Basic 6.0). The equations of
Plaut and Suherman for a single, unloaded tube were implemented using three iteration methods:
- Solving the elliptic integrals of the linear-elastic membrane problem.
- Iterative determination of the stress-strain equilibrium.
- Incremental calculation of the material behaviour.
Since the complexity of the problem is of medium proportions and because of the high quality of recent
consumer PCs, simple numerical approaches can be used which lead to reasonable calculation times. After
inserting the initial boundary values, the other initial values are calculated. A secant method (regula falsi, Kerner
1987) was applied to iteratively determine the integration parameter k (solution from elliptic integrals E, K). The
method always converges and it can be quite fast if the start values are well chosen. Here, k is defined within the
open interval ]0,1[. For small boundary values of P and H, k approaches 1; otherwise, k approaches 0. The use of
a single initial estimation for k usually leads to a large computing time, especially if the chosen initial value
differs considerably from the solution. Therefore several explicit values were calculated and used as interval
boundaries to keep the computing time below ½ second (Pentium 4, 3.06 GHz, 512 MB RAM). The iteration
method leads to an accuracy level in the range of 10-5
k within the non-dimensional pressure interval ptop = [10-

5… 100]. The four elliptic integrals of the first and second kind are solved using Simpson’s rule. 250 net points
are needed to confirm a sufficient accuracy (10-10
k).
Then the strain analysis is performed. The tangential tensile force (t and T0) and the strain can be computed
directly from k (Plaut and Suherman 1998). During each iteration step the circumference changes according to
the strain. As a stop criterion the incremental force was chosen (ti - ti-1 < 10-5
, see Fig. 3). Linear elastic
geotextiles are considered using their Young’s modulus E and thickness. Nonlinear-elastic geotextile properties
are described incrementally based on a stress-strain relationship derived from tensile tests (e.g. a list of stress-
strain pairs as input, Fig. 2). In the presented solution up to 50 increments of constant Ei are used. The actual
circumference is computed iteratively using the basic equation [10]. For any number of linear intervals of the
stress-strain curve the new circumference is computed using equation [11].
0 1 1
1
' 'm
i i j i i
j
C C C C
[11]
where 1 2
01- ; 1... , 0j j
j
j
T Tj m T
E
(strain of bulk linear T--curve),
2
0
1
1- ; 1... , 0i mi
m
T Ti n T
E
(strain from final interval), j = control index for bulk
linear sections, and m = iteration index for strain sections in each iteration step i.
The bulk linear Young’s modulus is computed using equation [12].
1
1
j j
j
j j
T TE
[12]
The algorithm implemented in the program is shown in Fig. 3.
Initial values
L0, , and Ptop or H
Calculate first-stage values,
dimensionless
with respect to L0
Calculate the integration
parameter k (using the regula
falsi) until deviation < 10-12
Solve elliptic integrals with
Simpson‘s rule (N=250)
Calculate the tension force t
ti – ti-1< 10-5
Use variables and
constants from
data base
Elasticity properties
input manually or load from file
Calculate strains and the new
circumference in the plane
strain state
Calculate results,
display results
yes
no
Fig. 3: Computation algorithm

3.3 Sensitivity analysis
Based on the parameters circumference (C0), strain (), tangential tension (T), pressure (P), and height (H), the
influence of small parameter variations on the computed results were evaluated. The three initial parameters
Young’s modulus (E), density (), and circumference (C0) were varied ceteris paribus for different boundary
conditions, defined by default values of the pressure, or height. The basic settings for the parameter analysis
were chosen as follows:
- Young’s modulus E [kN/m²] 105
- Thickness d [mm] 1
- Poisson ratio [ ] 0.5
- Initial circumference C0 [m] 1 … 30
- Initial density Susp. [g/cm³] 1
- Pressure Ptop [kPa] 10
- Planned height H [m] 0.75 D0.
The variation of initial values is given in Table 1. The values were chosen in the range of practical applications.
The initial values were varied by 0.1%, 1% and 10% and their influence on the computed values was determined.
Table 1: Variation of values for the sensitivity analysis
Variable constant E for L0 = 1 E for L0 = 30 0 = 1 0 = 30 L0
Pressure Ptop 103 - 109 5*104 - 1010 0.8 – 2.0 0.8 – 2.0 1 - 37
Height 103 - 109 5*104 - 1010 0.8 – 2.0 0.8 – 2.0 1 - 37
As an example, the influence of circumferential deviations during calculation of the tension force is presented in
Fig. 4 for both constant pressure and height. The deviations of the circumference at constant pressure affect the
tension forces disproportionately, while the proportionality of the deviations at a given height strongly depends
on the chosen circumference. The larger the circumference, the smaller are the deviation consequences with
respect to C0. The dependency progression of circumference and pressure for a given height is of particular
interest. If both elasticity and pressure are given constant, the geometrical and force equilibrium for a defined
height can only be achieved after pressure progression, due to material expansion and an increase in the
circumference.
The sensitivity analysis shows that the program provides realistic results. In the three design cases studied
with respect to Ptop and H, deviations of the circumference have the largest disproportionate effect. In the case of
a given Ptop, the elastic modulus also plays a major role; this causes an extreme enlargement for elastic tubes,
because a tube with a much larger circumference is filled. However, with respect to H the density of the
suspension has a big influence on forces and strains. Table 2 summarizes the proportionalities for the constant
height H.
Table 2: Deviation of the calculation results due to the deviation of initial values (H = L0/*0,75)
Calculation Results
Initial Values F Ptop C T
E L0 = 1 m (fix) ~1 < 0.1a < 0.4a < 0.1a < 0.2a
L0 = 30 m (fix) < 1b < 0.2a < 1a < 0.2a < 0.2a
L0 = 1 m (fix) ~1 < 0.002b ~1 < 0.003b ~1
L0 = 30 m (fix) < 0.6c ~0.13 < 0.25c ~0.2 ~0.95
L0 L0 = variable < 2.2c < 0.6b < 4c < 1c < 2c
astrongly decreasing for decreasing elasticity
bslightly increasing for increasing initial values
cslightly decreasing for increasing initial values
(1 = proportionate, < 1 = subproportionate, > 1 = disproportionate)
(Bold: critical; bold&italic: critical only within a small range)

Fig. 4: Tensile force versus circumference (left: Ptop = constant, right: H = L0/*0.75)
4. Comparison with experimental data
An exact match of experimentally determined and numerically computed results is hardly possible. The
deviations of the parameters affecting the results are usually too large on both sides. Moreover, it is difficult to
decide which of the two methods describes the actual state more accurately (Monschau 1996). However, if the
results match well, both methods are usually assumed to be of high quality.
4.1 Experimental setup
The experimental data was derived in the laboratory using small-scale tubes (length 200 cm, diameter 20 cm).
Four different tube materials were used to represent the properties of different geotextiles:
(1) A non-permeable LDPE tube representing rigid geosynthetics (impermeable reference).
(2) A non-permeable latex tube to represent highly elastic geosynthetics (impermeable reference).
(3) A thin but strong woven textile (W2) representing rigid geotextiles.
(4) A thin flexible nonwoven (NW2) representing elastic nonwoven geotextiles.
The LDPE and latex tubes were filled with plain water while W2 and NW2 tubes were filled with a
soil/water mixture. Due to the small model size, all tube materials were very thin, which is why a contact-free

measurement system was chosen to measure the cross-sectional geometry and strains. The highly accurate low-
budget photogrammetric system (Fig. 5) included four digital cameras (1) to capture approximately half of a
tube’s (3) circumference during filling and dewatering while resting on a plane table (4). The photogrammetric
evaluation was performed using the bundle-block analysis software AUSTRALIS 6.0 while the actual strain
measurement based on the derived surface point data was programmed separately. A detailed description of the
measurement and evaluation system is presented in Thomas and Cantré (2009).
Fig. 5: Experimental Setup for the deformation analysis of (non-) permeable dewatering tubes in laboratory scale after
Thomas and Cantré (2009). 1: model tube; 2. reference coordinates; 3. plane table; 4. cameras.
Similar photogrammetric systems were used to measure strains on large NASA balloons (Welch et al. 2005) and
membrane roof structures (Lin et al. 2008). In the latter study, the accuracy of the photogrammetric network was
estimated close to ± 1.4 mm with a camera-to-object distance of 10 m. In the present study the camera-to-object
distance was approximately 1.5 m and the object accuracy was determined to be 0.025 mm, which is
approximately ten times more precise. This accuracy was necessary to detect strain differences of 1% strain
between every two measuring points (marker distance 40 mm).
Fig. 6: Cross sectional geometry: Calculated (with and without strain) and measured

4.2 Comparison of geometry measurements and calculations
The measured and calculated cross-sectional geometries match very well, especially in those experiments with
particularly accurate pressure values and elastic properties. A total number of 2285 diagrams were created using
a custom routine to compare the measured and calculated geometry (Fig. 6). The tube height H was chosen as a
reference value to describe the match of measured and calculated data. For all experiments both the absolute
deviation of the measured and computed height and their standard deviation were determined (Fig. 7).
Fig. 7: Average percentage deviations of the measured and calculated height
The best fit was derived during the initial filling stage. For NW2 the calculation overestimates the height only at
very high internal pressures. The largest average deviations were found for the highly elastic Latex material.
Here, particularly in the range of small internal pressures, the calculation overestimates the tube height by up to
7% (Fig. 7), although the tensile properties had been determined with the smallest deviation among the four
materials used.
Some of the deviations between measured and computed values can be explained with the use of a constant
Poisson ratio because for large deformations, the Poisson ratio is usually not constant. This may be considered
within the program algorithm; however, a strain-dependent Poisson ratio is usually not provided by the
geosynthetics manufacturers. In most cases, a mean value within the region of the expected strains should
comply.
4.3 Comparing strain measurements and calculations
The strains were evaluated according to different boundary conditions. To compare the measured and calculated
values, the average strain of each pressure step (mean value of all cross-sections) was plotted against the
pressure at the tube bottom. During the initial filling stage the average strain of the LDPE film experiments
deviate around +/- 0.3% strain (Fig. 8a). The deviations occur in the elastic region up to Pbot = 6 kPa. There is a
good match between computed and measured strains. The nonwoven NW2 showed a deviation of up to 3%
strain. The deviation decreases with increasing strains. In the region of Pbot ≈ 5 kPa, the occurring strains are
underestimated by the calculation algorithm. For Pbot > 7.5 kPa, however, the congruity is very good (Fig. 8b).
The deviation at low internal pressures may be due to the constant Poisson ratio. In reality, the influence of
lateral strain with small loads is considerably lower.
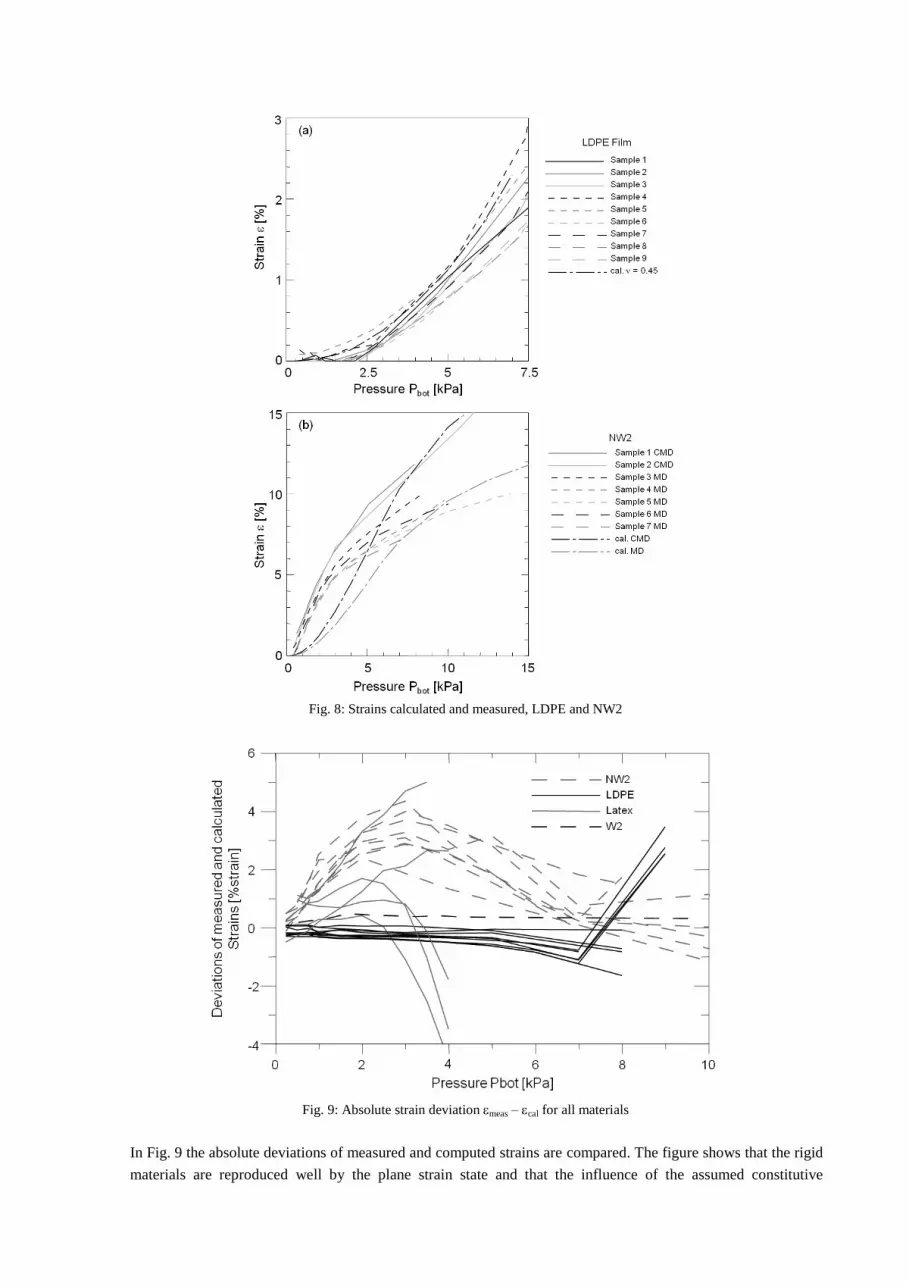
Fig. 8: Strains calculated and measured, LDPE and NW2
Fig. 9: Absolute strain deviation meas – cal for all materials
In Fig. 9 the absolute deviations of measured and computed strains are compared. The figure shows that the rigid
materials are reproduced well by the plane strain state and that the influence of the assumed constitutive

equations on the computed strains is very strong, at least for the NW2 and Latex materials. While the relative
deviations are very large for NW2, they are comparably small in the Latex material despite the large absolute
strain values. As is known from the sensitivity analysis, a 3% strain deviation has only little influence on the rest
of the computed magnitudes. Thus the dimensioning method can be considered very accurate despite the
deviations described.
5. Aspects for the structural design considering strains
5.1 Current design concept
The current design concept to determine the required tensile strength of geotextile tubes in Europe is based on
the limit state concept of the Eurocode (EC1 Actions on structures, EC7 Geotechnical design). In Germany, the
design of geosynthetic structures in ground engineering is implemented through EBGEO (2009), where the
acceptable tensile strength TR,D is determined by dividing the short-term strength by attenuation factors A1…4,
Adyn, Aadd (for additional influences), and a safety factor R (equation [13]).
,
,
1 2 3 4
R k
R D
R dyn add
TT
A A A A A A
[13]
For tube projects, the design tensile force is usually determined using a membrane approach, often by using one
of the computer programs GeoCoPS or SOFFTWIN (Adama, 2009, Palmerton, 1998a) and then applying the
above safety concept.
5.2 About the consideration of the long-term tensile strength in dewatering projects
There is a frequent discussion regarding whether the long-term tensile strength is necessary in the design of
geotextile tubes for dewatering purposes. Because of the dewatering process, the confined volume and thus the
tensile forces in the geosynthetic may reduce quickly. The following considerations add to the discussion.
If the filling material dewaters quickly and the geosynthetic filter is highly permeable, the filling-pressure-
induced stresses in the tube decrease very quickly. If the tube is only filled once, the influences of creep and both
chemical and biological impacts on the stability can be ignored. For highly permeable filling materials there is
usually no need for repeated filling, because the quick dewatering process leads to a filling ratio close to capacity
during the initial filling stage. Therefore, the design strength may be chosen close to the short-term strength.
However, if the tubes are sewn together, the seam strength is the limiting value. In this context, the authors hold
the opinion that, even if manufacturers propose better values, the design seam strength should be limited to 75%
of the minimal short-term geosynthetic strength. Using typical manufacturer values and the above explanations,
this may lead to an overall attenuation factor of < 2.
This process is different for very fine-grained materials that dewater with extensive filter cake formation or
that reduce the permeability of the geotextile through clogging and blocking phenomena. Table 3 contains an
example of the tensile stress reduction during the first four hours of the dewatering process with a fine-grained,
organic dredged material from Rostock, Germany (SM) and a nonwoven geosynthetic (NW1, O90 = 80 µm,
kv = 60 mm/s). For the example calculation a tube with a circumference of 10 m was assumed. The dewatering
data was derived from a pressure filtration experiment (Cantré, 2008). Two configurations were assumed: a 90%
filling of the tube (filling ratio) and a maximum filling height of 0.75 D (75% of the theoretical diameter).
Because of the low filtration velocity, the internal pressure needs several hours to reduce to a state with a
significant membrane stress reduction. However, this process is typically much faster than the loss of
geosynthetic strength caused by creep or degradation processes.
A refilling of the tubes can be useful if fine-grained materials with high initial water contents are dewatered.
Then the durability factors A1 and A4 should be considered. However, these factors may be reduced in
coordination with the geosynthetics manufacturer, because in dewatering projects the durability only refers to
several weeks or months, instead of several decades. Even for a permanent use of the tubes as a wrapping of
contaminated materials, creep and degradation processes do not play a major role, because the tension forces
inside the geosynthetic remain comparably small after dewatering. Finally, a design strength can be determined
that is also considerably smaller than the geosynthetic long-term strength.

Table 3: Example for the change of tension force by pressure reduction – results from pressure filtration tests
Case 1: L0 = 10 m; SM NW1, 50 kPa, 5 liters; filling ratio 90% (H = 0.68 D)
Time [h] v [cm/h] Q [m²/h] TC [kN/m] Dev. TC [%] F [%]
0 0 19.5 0 90
1 0.4 4E-2 18.7 -4.1 89.5
2 0.3 3E-2 18.2 -6.5 89.2
3 0.5 2.5E-2 17.7 -9.2 88.9
4
0.2 2E-2 17.4 -10.8 88.7
Case 2: L0 = 10 m; SM NW1, 50 kPa, 5 liters; H = 0.75 D (F = 94%)
Time [h] v [cm/h] Q [m²/h] TC [kN/m] Dev. TC [%] H [m]
0 0 29.0 0 10/*0,75
1 0.4 4E-2 27.5 -5.2 2.361
2 0.3 3E-2 26.5 -8.7 2.342
3 0.25 2.5E-2 25.7 -11.4 2.326
4 0.2 2E-2 25.1 -13.6 2.313
5.3 Considering longitudinal seams
With the strain measurements and calculations, it was proved that both the largest strains and the stresses occur
at the lower part of the tube where the largest curvature is located. For the first filling stage the strain differences
are, however, only in the range of a few per cent, which is unproblematic. For repeated filling, the sides of the
tube are stressed further, since the bending stiffness of the dewatered filling material has to be overcome. This
increases the strain differences between maximum and medium strain considerably. Therefore, seams and other
flaws should not be positioned at the sides of the tube. It is proposed to position the longitudinal seams – if any
exist – at the bottom so that the friction or adhesion (in the case of a membrane layer underneath) between the
geotextile and the ground reduce the membrane stress. Analogous considerations were made during the planning
of the artificial reef in Narrowneck, Australia (Saathoff et al. 2007). Should the seam be positioned at one side of
the tube, an additional safety factor should be used for the refilling stage. This factor needs to be developed in
the future within an analysis of the influence of the bending stiffness of different filling materials.
5.4 Design for large strains within the geotextile
Highly elastic geosynthetics can be designed using the methods explained above. However, only the tube’s
cross-section is considered. Based on practical experience, Lawson (2006) suggests adding a general strain value
of 11% during the design of geotextile tubes. This, however, is a very inexact method and it may lead to an
incorrect design – see the sensitivity analysis above. A general strain value of 11% would lead to a 16% increase
in the cross-sectional area at a planned height of 0.75 D. This may be an important planning parameter when
optimizing the size and number of tubes needed for a particular project.
At least some values of the geotextiles’ stress-strain relation are usually known, so the occurring strain can be
calculated with the newly developed method. The Poisson ratio, needed for calculations in the plane strain state,
needs to be determined or at least well estimated. If nonwovens are used as tubes for dewatering projects instead
of high-strength wovens, the predetermination of occurring strains is inevitable.
A drawback of the proposed design method is the limitation to the plane strain state. While modelling
succeeds very well for small-scale tubes, for continuous tubes with large diameters and biaxial elasticity,
considerable longitudinal strains and thus buckling phenomena can be foreseen. For isotropic geosynthetics,
however, the method is sufficiently exact.
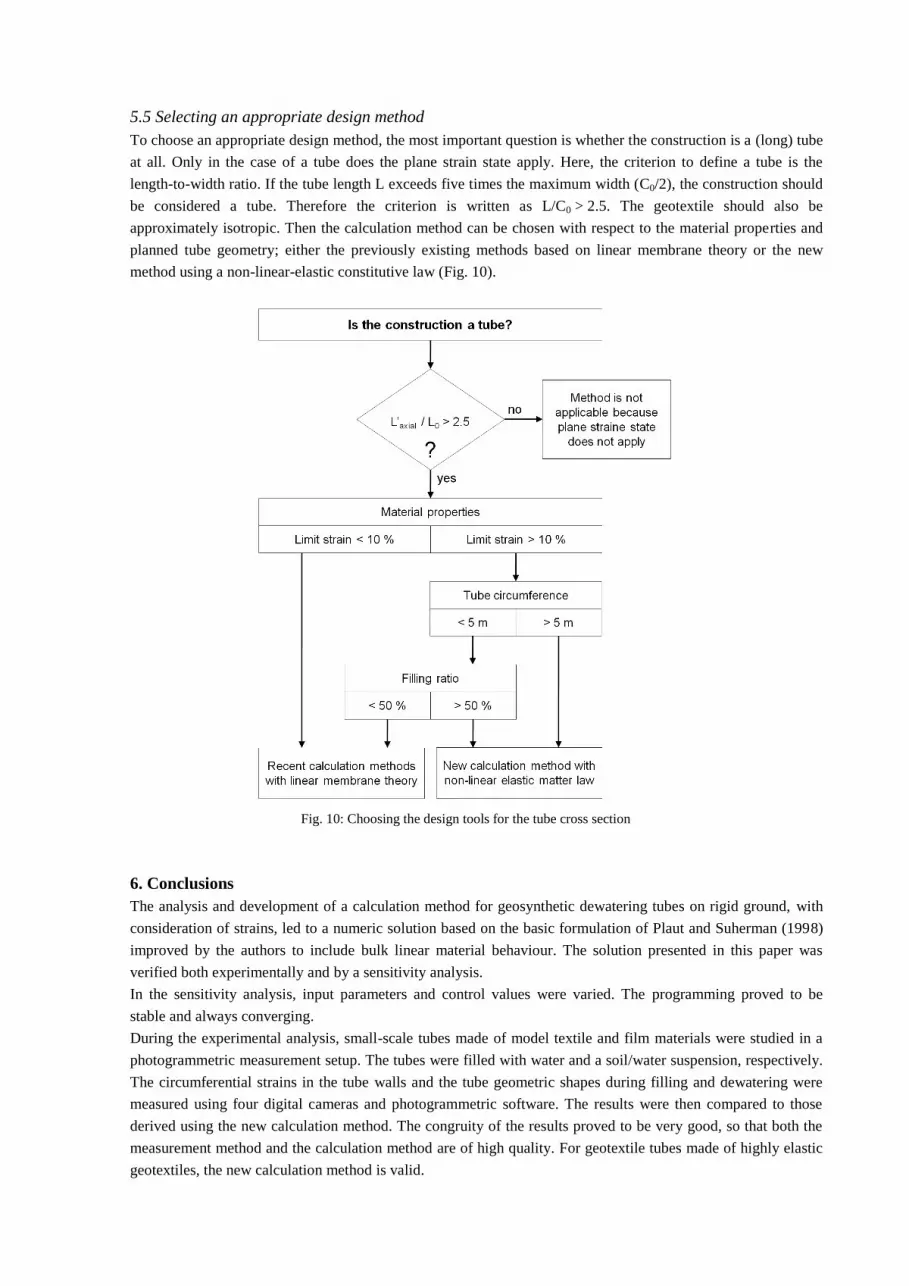
5.5 Selecting an appropriate design method
To choose an appropriate design method, the most important question is whether the construction is a (long) tube
at all. Only in the case of a tube does the plane strain state apply. Here, the criterion to define a tube is the
length-to-width ratio. If the tube length L exceeds five times the maximum width (C0/2), the construction should
be considered a tube. Therefore the criterion is written as L/C0 > 2.5. The geotextile should also be
approximately isotropic. Then the calculation method can be chosen with respect to the material properties and
planned tube geometry; either the previously existing methods based on linear membrane theory or the new
method using a non-linear-elastic constitutive law (Fig. 10).
Fig. 10: Choosing the design tools for the tube cross section
6. Conclusions
The analysis and development of a calculation method for geosynthetic dewatering tubes on rigid ground, with
consideration of strains, led to a numeric solution based on the basic formulation of Plaut and Suherman (1998)
improved by the authors to include bulk linear material behaviour. The solution presented in this paper was
verified both experimentally and by a sensitivity analysis.
In the sensitivity analysis, input parameters and control values were varied. The programming proved to be
stable and always converging.
During the experimental analysis, small-scale tubes made of model textile and film materials were studied in a
photogrammetric measurement setup. The tubes were filled with water and a soil/water suspension, respectively.
The circumferential strains in the tube walls and the tube geometric shapes during filling and dewatering were
measured using four digital cameras and photogrammetric software. The results were then compared to those
derived using the new calculation method. The congruity of the results proved to be very good, so that both the
measurement method and the calculation method are of high quality. For geotextile tubes made of highly elastic
geotextiles, the new calculation method is valid.

Finally, some practical conclusions were derived from the tube analysis. The maximum strains proved to be
located at the lower side of the tube, a fact that should be considered when positioning longitudinal seams. The
design methods all rely on the linear membrane theory in the plane strain state. Therefore, the definition of the
tubes should be clarified within the respective literature with a specific length-to-width ratio. Only if the
structure is actually a long tube (L/C0 > 2.5) and the geotextile is close to an isotropic one, does the plane strain
state apply. Otherwise, the actual tube geometry and strains (in the field) cannot be calculated correctly with the
methods at hand. The choice of attenuation factors for the selection of geotextiles for dewatering projects is
dependent on the duration of the filling process including a potential refilling procedure. Due to the relatively
short loading time for the design strength needed to meet the maximum pumping pressure, the attenuation factor
for single dewatering tubes should not exceed a value of two.
Notation
Values and Factors
A = Attenuation factor
B’ = Contact width with the ground [m] (dimensionless: b’)
C = Circumference of the tube [m]
C’ = Free circumference of the tube C – B’ [m]
D = Theoretical diameter of the tube [m] (dimensionless: d)
E = Young’s modulus [kN/m²]
E(k), F(k) = Elliptic Integrals
F = Filling ratio
H = Tube height [m] (dimensionless: h)
k = Integration coefficient for the elliptic integrals [ ]
kV = Permeability normal to the plane [mm/s]
L = Length of the tube [m]
O90 = Characteristic opening size [µm]
P = Pressure at the bottom of the tube [kPa] (dimensionless: p)
S = Circumferential coordinate [m] (dimensionless: s)
T = Tensile normal stress, Membrane force [kN/m] (dimensionless: t)
Y = Vertical coordinate (height) [m] (dimensionless: y)
X = Horizontal coordinate [m] (dimensionless: x)
= Strain [%]
= Unit weight of the filling material [kN/m³]
R = Safety factor
= Tangential angle with respect to the horizontal line
= Poisson ratio [ ]
= Density of the filling material [g/cm³]
Indices
add = Additional
atm = Atmospheric (e.g. atmospheric pressure)
0 = Initial state
bot = Bottom (e.g. bottom pressure)
dyn = Dynamic
i = Iteration step
j = Control variable for bulk linear sections
m = Number of known strain parts in each iteration step i
top = Top of the tube (e.g. pressure at the top of the tube)
R = Resistance

k = Characteristic value
D = Design value
Abbreviations
NW1, NW2 = Nonwoven test materials
W2 = Woven test material
References
Adama Engineering, 2009. GeoCoPS (3.0). Software for the design of geosynthetic tubes.
http://reslope.com/geocopsindex.htm (last visited 2009-11-18).
Alvarez, E., Rubio, R, Ricalde, H., 2007. Beach restoration with geotextile tubes as submerged breakwaters in Yucatan,
Mexico. In: Geotextiles and Geomembranes 25(4-5), 233-241
AUSTRALIS 6.0 (Photogrammetric software). University of Melbourne, 2002.
Cantré, S., 2002: Geotextile tubes - Analytical design aspects. In: Geotextiles and Geomembranes, 20(5), 305–319.
Cantré, S., 2008. Ein Beitrag zur Bemessung geotextiler Schläuche für die Entwässerung von Baggergut. Ph.D. Dissertation.
University of Rostock. 171 pages. ISBN: 987-3-86009-032-9.
Chen, S.-L., Zheng, Z.-L., 2003. Large deformation of circular membrane under the concentrated force. In: Applied
Mathematics and Mechanics (English Edition), 24(1), 28–31.
EBGEO, 2009. Empfehlungen für den Entwurf und die Berechnung von Erdkörpern mit Bewehrungen aus Geokunststoffen.
German Geotechnical Society. Draft 2009
Freeman, M., 2002. Experiments and Analysis of Water-filled Tubes Used as Temporary Flood Barriers. Master Thesis.
Blacksburg. Virginia Polytechnical Institute and State University
Ghavanloo, E., Daneshmand, F., 2009. Tow-dimensional analytical analysis of equilibrium shape of inflated geomembrane
tube resting on rigid foundation with arbitrary shape. Geotextiles and Geomembranes 27 (4-5), 210–219
Huong, T.Ch., 2001. Two-dimensional analysis of water-filled geomembrane tubes used as temporary flood-fighting devices.
Master Thesis. Blacksburg. Virginia Polytechnic Institute and State University
Ibrahimbegovic, A.; Gruttmann, F., 1993. Consistent finite element formulation of nonlinear membrane shell theory with
particular reference to elastic rubber like material. In: Finite elements in analysis and design, 13(1), 75–86
Kerner, I.O., 1987. Numerische Mathematik mit Kleinstrechnern. Dresden: Studienbücherei (Mathematics for Teachers 18).
Kim, M., 2003. Two-dimensional analysis of four types of water-filled geomembrane tubes as temporary flood-fighting
devices. Dissertation. Blacksburg. Virginia Polytechnic Institute and State University.
Kim, M., Freeman, M., FitzPatrick, B.T., Nevius, D.B., Plaut, R.H., Filz, G.M., 2004. Use of an apron to stabilize
geomembrane tubes for fightign floods. In: Geotextiles and Geomembranes 22(4), 239-254
Kmiecik, M., 1993. Nichtlineare Berechnung ebener Flächentragwerke. Berlin: Verlag für Bauwesen.
Koerner, G.R, Koerner, R.M., 2006. Geotextile tube assessment using a hanging bag test. In: Geotextiles and Geomembranes
24(2), 129-137
Lawson, C.R., 2006. Geotextile containment for hydraulic and environmental engineering. In: Proceedings of the 8th
International Conference on Geosynthetics. Rotterdam: Millpress, 9–48.
Leshchinsky, D., Leshchinsky, O.; Ling, H.I.; Gilbert, P.A., 1996. Geosynthetic tubes for confining pressurized slurry: Some
design aspects. In: Journal of Geotechnical and Geoenvironmental Engineering, 122(8), 682–690.
Leshchinsky, D., Leshchinsky, O., 1996. Geosynthetic Confined Pressurized Slurry (GeoCoPS): Supplemental Notes for
Version 1.0. USACE, Vicksburg (Report TR CPAR-GL-96-1).
Lin, S.-Y., Mills, J.P., Gosling, P.D., 2008. Videogrammetric monitoring of as-built membrane roof structures. In: The
Photogrammetric Record 23(122), 128-147.
Liu, G.S., 1981. Design Criteria of Sand Sausages for Beach Defences. In: Proceedings, Congress - International Association
for Hydraulic Research, 123–131.
Monschau, H.-G., 1996. Über die kombinierte experimentelle/numerische Beanspruchungsanalyse dünner Schalentragwerke.
Dissertation, University of Wuppertal, Dep. of Civil Engineering.
Muthukumaran, A.E., Ilamparuthi, K., 2006. Laboratory studies on geotextile filters as used in geotextile tube dewatering. In:
Geotextiles and Geomembranes 24(4), 210-219
Namias, V., 1985. Load-supporting fluid-fluid cylindrical membranes. In: TRANS. ASME J. APPL. MECH., 52(4), 913–
918.
Okamura, A., Azuma, K., Kurata, M., Saeki, H., Nishigata, T., 2006. Experiment on “geotextile tube dehydration method”
with nonwoven fabric tube for acceleration of dehydration work. In: Proceedings of the 8th International Conference on
Geosynthetics. Rotterdam: Millpress, 507–510.
Palmerton, J.B., 1998a. SOFFTWIN. Design software for geosynthetic tubes (Structural analysis).
Palmerton, J.B., 1998b. SOFFTCON. Design software for geosynthetic tubes (Consolidation analysis).
Perkins, S.W., 2000. Constitutive modeling of geosynthetics. In: Geotextiles and Geomembranes, 18(5), 273–292.
Plaut, R.H., Klusman, C.R., 1999. Two-dimensional analysis of stacked geosynthetic tubes on deformable foundations. In:
Thin-Walled Structures, 34(3), 179–194.
Plaut, R.H., Suherman, S., 1998. Two-dimensional analysis of geosynthetic tubes. In: Acta Mechanica, 129(3-4), 207–218.
Saathoff, F., Oumeraci, H., Restall, S.J., 2007. Australian and German experiences on the use of geotextile containers. In:
Geotextiles and Geomembranes, 25, 251–263.
Seay, P.A., Plaut, R.H., 1998. Three-dimensional behavior of geosynthetic tubes. In: Thin-Walled Structures, 32(4), 263–
274.
Shin, E.C., Oh, Y.I., 2007. Coastal erosion prevention by geotextile tube technology. In: Geotextiles and Geomembranes,
25(4-5), 264-277
Szyszkowski, W.; Glockner, P.G., 1987. On the Statics of Axisymmetric Floating Membrane Storage Vessels. In:
International Journal of Non-Linear Mechanics, 22(5), 339–348.
Thomas, H., Cantré, S., 2009. Applications of Low-Budget Photogrammetry in the Geotechnical Laboratory. In: The
Photogrammetric Record. 24(128), 332 - 350
Timoshenko, S.P., 1940. Theory of Plates and Shells. 1. Ed. New York: McGraw-Hill.
Wang, C.Y., 1984. Filling of a Long Membrane Container. In: Journal of structural mechanics, 12(1), 1–11.
Welch, J.V., Wang, S., Blandino, J.R., McEvoy, K., 2005. Super pressure balloon non-linear structural analysis and
correlation using Photogrammetric measurements. In: Collection of Technical Papers – AIAA 5th ATIO and the AIAA
16th Lighter-than-Air Systems Technology Conference and Balloon Systems Conference, 3, 1436–1454.
Yan, S.W., Chu, J., 2010. Construction of an offshore dike using slurry filled geotextile mats, Geotextiles and
Geomembranes (2010), doi:10.1016/j.geotexmem.2009.12.004
Zhang, W., Tan, J., 2006. 2-D finite element analysis and stability calculation of geotextile tubes. In: Proceedings of the 8th
International Conference on Geosynthetics. Rotterdam: Millpress, 769–772.
Zhao, R., 1995. A complete linear theory for a two-dimensional floating and liquid-filled membrane structure in waves. In:
Journal of Fluids & Structures, 9(8), 937–956.
Published in Geotextiles and Geomembranes 29(3):201-210. © 2010 Elsevier Ltd. DOI:10.1016/j.geotexmem.2010.10.009