depression biases the recognition of emotionally neutral faces
TRANSCRIPT
www.elsevier.com/locate/psychres
Psychiatry Research 128 (2004) 123–133
Depression biases the recognition of emotionally neutral faces
Jukka M. Leppanena,*, Maarten Mildersb, J. Stephen Bellc,Emma Terrierec, Jari K. Hietanena
aHuman Information Processing Laboratory, Department of Psychology, FIN-33014 University of Tampere, FinlandbDepartment of Psychology, University of Aberdeen, Aberdeen AB24 2UB, UK
cRoyal Cornhill Hospital, Block A, Clerkseat Building, Aberdeen AB25 2ZH, UK
Received 26 June 2003; received in revised form 26 January 2004; accepted 28 May 2004
Abstract
Functional abnormalities in emotion-related brain systems have been implicated in depression, and depressed patients may
therefore attribute emotional valence to stimuli that are normally interpreted as emotionally neutral. The present study examined
this hypothesis by comparing recognition of different facial expressions in patients with moderate to severe depression.
Eighteen depressed patients and 18 matched healthy controls made a forced-choice response to briefly presented neutral, happy,
and sad faces. Recognition accuracy and response time were measured. Twelve patients were retested after showing signs of
symptom remission. Depressed patients and controls were equally accurate at recognizing happy and sad faces. Controls also
recognized neutral faces as accurately as happy and sad faces, but depressed patients recognized neutral faces less accurately
than either happy or sad faces. Depressed patients were also particularly slow to recognize neutral faces. The impairment in
processing of neutral faces was still evident after symptom remission. Error analyses showed that depressed patients attributed
not only sadness, but also happiness (in remission), to neutral faces. These results suggest that, unlike healthy subjects,
depression-prone individuals do not seem to perceive neutral faces as unambiguous signals of emotional neutrality.
D 2004 Elsevier Ireland Ltd. All rights reserved.
Keywords: Affective disorders; Depression; Facial expressions; Recognition time; Recognition accuracy
1. Introduction of faces in occipitotemporal cortex (fugiform gyrus
People can judge emotions from facial expres-
sions with a high degree of agreement (Ekman,
1982). In recent years, researchers have begun to
reveal the neural basis of this ability (see Adolphs,
2001; Haxby et al., 2002). The existing studies
suggest that structures involved in the visual analysis
0165-1781/$ - see front matter D 2004 Elsevier Ireland Ltd. All rights re
doi:10.1016/j.psychres.2004.05.020
* Corresponding author. Tel.: +358-3-215-6111; fax: +358-3-
215-7345.
E-mail address: [email protected] (J.M. Leppanen).
and superior temporal sulcus) work together with
emotion-related brain structures (amygdala, insula,
orbitofrontal cortex, and right somatosensory cortex)
in the recognition of facial expressions. Adolphs
(2001), for instance, suggested that after initial
perceptual processing of faces in visual cortices,
information is fed into emotion-related brain struc-
tures. These emotion-related structures, in turn, feed
back onto visual cortices and modulate the percep-
tual representation of the facial expression there.
Visual processing of facial expressions, thus, reflects
top-down influences from emotion-related brain
served.
J.M. Leppanen et al. / Psychiatry Research 128 (2004) 123–133124
structures (cf. Adolphs et al., 2000). This hypothesis
raises an interesting question: Do affective disorders
and their putative association with changes in the
tonic and phasic activity in emotion-related brain
systems (e.g., Davidson, 1998) affect the processing
of facial expressions?
Depression involves several types of emotional
abnormalities, most notably increased propensity to
negative affective reactions and anhedonia; that is,
loss of capacity to experience pleasure (e.g., Drevets,
2001). Brain-imaging and post-mortem studies have
shown evidence for abnormalities in brain functions
and structure of depressed patients. Depression is
associated with (a) elevated resting levels of cerebral
blood flow and glucose metabolism in the amygdala;
(b) abnormal structure and physiological activity in
certain areas of the prefrontal cortex, which are
supposed to modulate (attenuate) maladaptive amyg-
dalar responses; and (c) impaired functioning of the
brain reward system, which includes dopaminergic
projections from the ventral tegmental area (for a
review, see Drevets, 2001).
Changes in amygdalar functions have, thus, been
implicated in the pathoneurophysiology of depres-
sion. Interestingly, several studies in healthy subjects
have suggested that the amygdala has a role in the
processing of emotionally expressive faces. Most
studies have implicated the role for the processing
of fearful (e.g., Adolphs et al., 1995, 1999; Morris et
al., 1996) and sad (Blair et al., 1999) facial expres-
sions. However, there is evidence that the amygdala
may also participate in the processing of happy faces
(Breiter et al., 1996). It has been suggested that the
main function of the amygdala may be related to the
allocation of processing resources to any types of
stimuli that have some biologically relevant, but
unclear predictive value (i.e., ambiguous stimuli,
Whalen, 1998). The amygdala activation increases
vigilance and, consequently, facilitates further pro-
cessing of ambiguous stimuli (Whalen, 1998). One
implication of the elevated physiological activity of
the amygdala in depression might be that emotion-
ally neutral social cues (e.g., neutral faces) are
interpreted as having emotional meaning (cf. Dre-
vets, 2001). Impaired functioning of the reward
system in depression may, in turn, impede the
processing of emotionally positive signals (e.g.,
Sloan et al., 1997).
Numerous behavioral studies have examined the
impact of depression on the recognition of facial
expressions. Depressed subjects were found to recog-
nize expressions both more slowly and less accurately
than healthy controls (Feinberg et al., 1986; Zuroff
and Colussy, 1986; Cooley and Nowicki, 1989; Per-
sad and Polivy, 1993). However, some studies have
shown recognition deficits only for specific types of
facial expressions, such as happiness (Mandal and
Bhattacharya, 1985) or happiness, interest, and sad-
ness (Rubinow and Post, 1992). In addition, other
studies failed to find evidence for any deficits in the
recognition of facial expressions among clinically
depressed patients (Archer et al., 1992; Gaebel and
Wolwer, 1992). In the majority of the studies cited
above, emotion recognition was examined by asking
subjects to categorize pictures of facial expressions on
the basis of their emotional content (e.g., is the face
happy, neutral, or sad?). Besides studies using this
methodology, depressed patients have also been stud-
ied by asking them to rate how intensely pictures of
facial expressions displayed different emotional states
(Gur et al., 1992; Bouhuys et al., 1995, 1996, 1997;
Hale, 1998; Hale et al., 1998; Bouhuys et al., 1999).
Hale (1998) found a significant (positive) correlation
between judgments of negative emotions in facial
expressions and severity of depressive symptoms.
This suggests that depression results in an increased
tendency to perceive negative emotional states in
others. It has also been shown that depressed patients
judged facial expressions to express less positive
emotions than did healthy controls (Hale et al.,
1998). Gur et al. (1992) reported a similar negative
bias in that depressed patients were more likely than
controls to incorrectly attribute sadness to neutral
faces and neutral emotional state to happy faces.
In the present study, we were particularly inter-
ested in the recognition of neutral faces in depres-
sion. Previous research has been primarily focused
on the effects of depression on the recognition of
emotional instead of neutral facial expressions. Yet,
studies in healthy subjects suggest that neutral faces
are recognized in a similar way to other facial
expressions; i.e., categorically (Etcoff and Magee,
1992; Young et al., 1997). Etcoff and Magee (1992)
showed that on a stimulus continuum ranging from
an intensely expressed emotion (e.g., sadness) to a
neutral face, there was a sharp boundary after which

J.M. Leppanen et al. / Psychiatry Research 128 (2004) 123–133 125
subjects began to categorize the seen face as neutral. It
was noteworthy that even faces displaying small
amounts of emotion were categorized as neutral. These
findings indicate that there is a sharp boundary beyond
which emotional expressions become too weak to have
emotional signal value and are perceived as neutral
(Etcoff and Magee, 1992). However, there are indica-
tions that, in certain subject groups, even completely
expressionless faces are not perceived as neutral.
Instead, they may elicit emotion-related responses. It
has been shown, for example, that neutral faces evoke
amygdalar activity in socially phobic patients (Bir-
baumer et al., 1998) and normal 11-year-old children
(Thomas et al., 2001). The children who showed
amygdala activation to neutral faces also were defi-
cient in correctly recognizing these faces as neutral in a
behavioral test (Thomas et al., 2001). Because depres-
sion is associated with elevated tonic levels of activity
in the amygdala, an impaired ability to modulate
emotional responses (Drevets, 2001), and a tendency
to attribute sadness to neutral faces (Gur et al., 1992), it
is hypothesized here that depressed patients may have
difficulties in the recognition of neutral facial expres-
sions as signs of emotional neutrality. If so, one might
expect relatively slow as well as inaccurate recognition
of neutral faces in depressed patients. We tested this
hypothesis by examining the speed and accuracy in
recognizing neutral faces in depressed patients and
healthy controls.
It must be noted that longer recognition times and
decreased accuracy in recognizing neutral faces in
depressed patients compared with healthy controls
would not directly indicate impaired processing of
neutral faces in depression. Instead, it may reflect a
general degradation in performance that is manifested
in many types of cognitive tasks (Williams et al.,
1988). However, this type of general degradation
would not explain disproportionately impaired recog-
nition of neutral faces.
If patients with depression indeed attribute emo-
tional meaning to neutral faces, the next question is
whether they are biased towards positive or nega-
tive emotions? The mood congruency hypothesis
(e.g., Bower, 1981) suggests that depressed mood
may enhance the processing of mood congruent
material and impair the processing of mood incon-
gruent material. This may imply a pronounced
tendency to attribute negative emotions (Gur et
al., 1992; Hale, 1998) and a reduced tendency to
attribute positive emotions (Hale et al., 1998) to
neutral faces in depressed patients. It may also
imply that depressed patients recognize expressions
of negative emotions more accurately and expres-
sion of positive emotions less accurately than con-
trols (Mandal and Bhattacharya, 1985). Yet, a
substantial number of studies have shown no evi-
dence for mood congruency effects on the recogni-
tion accuracy of facial expressions (Archer et al.,
1992; Persad and Polivy, 1993; Mikhailova et al.,
1996; Zuroff and Colussy, 1986). Because this issue
is not entirely clear, we decided to further investi-
gate the possibility of mood congruency effects.
First, we examined whether depressed patients are
prone to attribute negative emotions to neutral faces
(i.e., to mistake neutral faces for sad). Second, we
tested whether depression affects the speed and
accuracy of the recognition of happy and sad faces.
It is known that, in healthy subjects, happy facial
expressions are recognized faster and more accu-
rately than sad facial expressions (e.g., Feyereisen
et al., 1986; Kirita and Endo, 1995). This positivity
advantage is, however, sensitive to emotional con-
text, and it has been shown to disappear after
experimentally induced negative emotion in healthy
subjects (Leppanen and Hietanen, 2003; see also
Stenberg et al., 1998). If depression enhances the
processing of sadness and impairs the processing of
happiness, the advantage of happy faces over sad
faces should diminish or disappear in depressed
patients.
Finally, we examined whether the possible effects
of depression on the processing of neutral, happy, and
sad faces were also evident following remission of
the depressive symptoms. One might expect that
these effects are diminished in remission because
successful treatment of depression normalizes the
activity of emotion-related brain structures (e.g.,
amygdala; see Drevets, 2001). On the other hand,
certain emotion-related structures (prefrontal cortex)
show reductions in grey matter volume (Drevets,
2001). These findings suggest that the possible effects
of depression on the processing of emotional infor-
mation may be permanent trait features and, thus,
independent of mood state. If the change in the
processing of emotional information is permanent, it
would perhaps help to explain why recovered patients
J.M. Leppanen et al. / Psychiatry Research 128 (2004) 123–133126
are vulnerable to experience another depressive epi-
sode. The few studies that re-tested recognition of
facial expressions in remission have produced
conflicting results. Mikhailova et al. (1996) reported
improved recognition of happy and sad expressions,
but poorer recognition of neutral expressions in
remission. Bouhuys et al. (1996), in turn, found no
changes in perceived sadness with remission. To test
whether recovery from depression affects the recog-
nition of neutral, happy, and sad facial expressions,
a subgroup of the original patient group was re-
tested after they had shown signs of considerable
improvement.
Table 1
Demographic information, BDI scores, and PANAS scores for
depressed patients and non-depressed controls (standard deviations
are shown in parentheses)
Variable Depressed Controls t df P
Sex 11F/7M 11F/7M
Age 45.1 (9.9) 44.7 (9.9) 0.1 34 n.s.
Education 13.0 (2.7) 13.2 (2.7) 0.2 34 n.s.
BDI 36.8 (9.6) 11.1 (8.4) 8.5 34 < 0.001
PA 25.2 (7.0) 31.7 (5.0) 3.2 34 < 0.005
NA 19.7 (9.2) 11.8 (2.6) 3.5 34 < 0.002
2. Methods
2.1. Participants
Eighteen depressed patients (11 females) partici-
pated in this study. The age of the patients varied
from 23 to 59 years, with a mean of 45 years. The
mean level of education in the patient sample was 13
years.
The patients were recruited from Royal Cornhill
Hospital, Aberdeen, Scotland. All patients gave in-
formed consent to participate in this study, which had
been approved by the Grampian Research Ethics
Committee. The participating patients had all been
diagnosed as suffering from moderate to severe de-
pression. This diagnosis was confirmed for the pur-
pose of this study by one of the authors (E.T.) on the
basis of ICD-10 criteria (World Health Organization,
1992). Exclusion criteria were a history of severe
alcohol or drug abuse; dementia or other neurological
disorders; or psychiatric disorders, in addition to
depression, sufficient to justify a comorbid diagnosis.
During the study all patients were taking standard
antidepressant medications, consisting of selective
serotonin re-uptake inhibitors, tricyclic antidepres-
sants, selective noradrenaline re-uptake inhibitors,
noradrenaline and serotonin selective inhibitors, or
5-HT2 antagonists. The doses followed the recom-
mendation by the British National Formulary. One
patient underwent electroconvulsive therapy (ECT) at
the time of the first assessment, but this patient was
not reassessed. None of those patients who were re-
tested in remission had received ECT.
A group of 18 healthy controls with no history of
neurological or psychiatric disorders were recruited
from the Subject Panel of the Department of Psychol-
ogy, University of Aberdeen. The controls were
matched with the patients for sex, age, and level of
education (see Table 1).
2.2. Stimuli and material
Pictures of four male and four female models with
happy, sad, and emotionally neutral facial expres-
sions were selected from Ekman and Friesen’s
(1976) Pictures of Facial Affect. The pictures were
digitized for computer presentation. Adobe Photo-
shopk 4.0. was used to convert the pictures to 256
(bits) gray-scale images. Stimulus presentation, tim-
ing, and data collection were controlled by the
SuperLab program running on a Toshiba Satellite
4090XCDT laptop computer with 366-MHz Pentium
II processor. The stimuli were presented on the laptop
screen (14-in., 1024� 768-pixel display) and sub-
tended 5.6�8.4j when viewed from a distance of 80
cm. A button box panel with three choice buttons was
placed in front of the subject to collect the behavioral
responses.
Beck’s Depression Inventory (BDI, Beck et al.,
1961) and the ‘‘present moment’’ version of the
Positive and Negative Affect Scale (PANAS; Watson
et al., 1988) were used as self-report measures of
depression and positive (PA) as well as negative (NA)
affect.
2.3. Procedure
The subjects were tested individually in a quiet
room. A single trial consisted of the following

Table 2
Percentages of responses as a function of facial expression and
response category for depressed (D) and non-depressed control (C)
participants (standard deviations are shown in parentheses)
Response
J.M. Leppanen et al. / Psychiatry Research 128 (2004) 123–133 127
sequence of events: First, a fixation signal (‘‘ + ’’)
was presented in the middle of the computer screen
for 500 ms. Immediately following the disappear-
ance of the fixation signal, a picture of a facial
expression was shown for 200 ms, followed by a
blank screen. The subjects were asked to identify
which of the three emotions (happy, neutral, sad)
was presented on the screen, and to press an
appropriate button on the button box as quickly
and accurately as possible. The buttons on the panel
were labeled from left to right in two different
orders: sad–neutral–happy and happy–neutral–sad,
balanced across the subjects. After the subject’s
response, a 1500-ms intertrial interval preceded the
start of the next trial. The pictures were presented in
a random order except that there were never more
than three consecutive presentations of the same
emotion category. Each facial expression was shown
four times, making a total of 96 trials (32 for each
emotion category).
A test session started with 18 practice trials fol-
lowed by 96 experimental trials. The subjects were
allowed a short pause at the halfway point of the
experiment. After the facial expression recognition
test, the subjects completed the BDI and the PANAS.
The whole session lasted 30–40 min.
2.4. Data analysis
The percentages of correct responses (hits) and
false alarms were calculated for each facial expression
category for each subject. Recognition times were
calculated by measuring the time interval from the
onset of the face stimulus to the button press. Incor-
rect responses and responses with reaction times more
than two standard deviations below or above the
individual mean were removed from the recognition
time analysis. Two-tailed tests were used for all
statistical comparisons.
Facial expression Happy Neutral SadD C D C D C
Happy 87.5
(13.4)
92.2
(8.4)
10.6
(12.8)
6.4
(6.6)
1.9
(3.2)
1.4
(3.9)
Neutral 2.1
(4.2)
1.2
(2.2)
74.1
(12.1)
90.8
(8.3)
23.8
(12.1)
8.0
(7.0)
Sad 3.1
(6.2)
1.0
(2.1)
8.3
(8.8)
9.6
(8.4)
88.6
(13.7)
89.4
(8.4)
Percentages of responses that differ significantly between groups are
printed in bold.
3. Results
As Table 1 shows, the depressed subjects scored
significantly higher on the BDI than did the controls,
t(34) = 8.5, P < 0.001. The patients and controls also
differed in the predicted way on the PANAS, in that
patients had rated lower positive (PA) affects,
t(34) = 3.2, P < 0.005, and higher negative (NA)
affects, t(34) =3.5, P < 0.002.
3.1. Facial expression recognition in acute depression
3.1.1. Recognition accuracy
Table 2 presents mean percentages of responses as
a function of stimulus and response category. The
mean percentages of correct responses (hits) can be
read from the diagonal, and different types of false
alarms from scores below or above the diagonal.
The percentages of hits were entered into a 2
(group: depressed/control)�3 (facial expression: hap-
py/neutral/sad) ANOVA (split-plot design), which
revealed a significant main effect of group, F(1,
34) = 9.1, P < 0.006, a significant main effect of
facial expression, F(2, 68) = 5.9, P < 0.005, and a
significant group by facial expression interaction,
F(2, 68) = 6.2, P < 0.004. The interaction was broken
down by analyzing the group differences for each
facial expression separately (t-tests). The depressed
patients did not differ significantly from the controls
in the percentage of hits to happy and sad faces
(P’s > 0.21), but they showed a significantly lower
percentage of hits to neutral faces than did the
controls, t(34) = 4.8, P < 0.001. It is also noteworthy
that, when the percentages of hits were analyzed
within each group, the patients recognized neutral
faces significantly less often than both happy and sad
faces (P’s < 0.01) while the controls recognized neu-
tral faces just as accurately as happy and sad faces
(P’s > 0.45).
J.M. Leppanen et al. / Psychiatry Research 128 (2004) 123–133128
False alarms were analyzed by comparing the
proportion of a certain type of (false) responses to
different target faces (e.g., happy responses to neutral
faces/happy responses to sad faces). Thus, three 2
(group: depressed/control)� 2 (target face that was
falsely identified: e.g., neutral falsely identified as
happy and sad falsely identified as happy) ANOVAs
were run. There were no main or interaction effects
for false happy and neutral responses (all P’s>0.15).
By contrast, for false sad responses, there was a
significant main effect of target face, F(1, 34) = 71.4,
P < 0.001, a significant main effect of group, F(1,
34) = 20.3, P < 0.001, as well as a significant group
by face interaction, F(1, 34) = 20.6, P < 0.001. These
effects were explained by the fact that false sad
responses were more frequent to neutral than to
happy faces and by the fact that the groups did not
differ in percentage of false sad responses to happy
faces (P>0.66), while the patients responded sad to
neutral faces markedly more often than did the
controls, t(34) = 4.8, P < 0.001. There was a signifi-
cant, positive, correlation between BDI score and the
proportion of false sad responses to neutral faces
when patients and controls were considered together,
r(36) = 0.60, p < 0.001, but this largely reflected the
fact that the controls had lower BDI scores as well as
lower numbers of neutral-as-sad errors than the
patients. Within the patient group, there were no
significant correlations between self-reported depres-
sion severity, as measured by the BDI, or current
mood ratings, as measured by the PANAS, and
proportions of false responses and hits to neutral
faces.
3.1.2. Recognition time
Recognition times based on hits are shown in
Table 3. A 2 (group)� 3 (facial expression) ANOVA
yielded a significant main effect of group, F(1,
Table 3
The mean recognition times as a function of facial expression for
depressed and non-depressed control participants (standard devia-
tions are shown in parentheses)
Facial expression
Group Happy Neutral Sad
Depressed 933 (200) 1056 (208) 1005 (246)
Control 776 (132) 812 (115) 838 (135)
34) = 11.2, P < 0.01. This showed that the recognition
times were longer for the depressed patients than for
the controls. There was also a significant main effect of
facial expression, F(2, 68) = 13.3, P < 0.001, and a
significant group by facial expression interaction,
F(2, 68) = 4.0, P < 0.05. The interaction was broken
down by running two separate one-way ANOVAs to
analyze the pattern of recognition times within each
subject group. Between-group comparisons of the
recognition times for individual facial expressions
would have been futile because of the systematically
longer recognition times for the patients. The main
effect of facial expression was significant for the
patients, F(2, 34) = 8.2, P < 0.01, and for the controls,
F(2, 34) = 10.6, P < 0.001. Paired comparisons (t-tests)
indicated that the patients recognized neutral faces
significantly more slowly than happy faces, t(17) =
3.6, P <0.01, and almost significantly slower than sad
faces, t(17) = 1.8, P= 09. They also recognized happy
faces faster than sad faces, t(17) = 2.5, P < 0.05. The
controls recognized neutral faces almost significantly
more slowly than happy faces, t(17) = 2.1, P= 0.05,
but, unlike the patients, they recognized neutral faces
significantly faster than sad faces, t(17) = 2.3, P < 0.05.
The controls also recognized happy faces faster than
sad faces, t(17) = 5.5, P < 0.001.
3.2. Facial expression recognition in remission
Twelve patients (five males) showing considerable
symptom remission, according to clinical evaluation of
their consultant psychiatrist, were retested with exactly
the same emotion recognition test as described above.
The control subjects who were matched to these
patients were re-tested after the same time interval as
the patients. The mean interval was 6.0 months (S.D. =
3.5) for the patients and 5.9 months (S.D. = 3.5) for the
controls. The patients showed a significant decrease in
self-reported depressive symptoms (BDI) during re-
mission (mean = 35.0, S.D. = 9.3, in acute state vs.
mean = 25.8, S.D. = 14.9, in remission, t(11) = 2.7,
P < 0.05). The scores on the PA and NA scales also
showed changes in the predicted direction, but these
changes failed to reach significance (PA: mean = 26.5,
S.D. = 7.4 in acute state vs. mean = 31.3, S.D. = 8.1, in
remission, P= 0.09; NA: mean = 20.2, S.D. = 8.6, in
acute state vs. mean = 16.8, S.D. = 8.7, in remission,
P= 0.23). For the retested controls, the BDI scores of
J.M. Leppanen et al. / Psychiatry Research 128 (2004) 123–133 129
the first assessment (mean = 8.5, S.D. = 8.2) and the
second assessment (mean = 6.0, S.D. = 5.0) differed
slightly, but not significantly (P>0.19). The controls’
PA scores of the first and second assessment (mean =
30.3, S.D. = 4.9, and mean = 29.5, S.D. = 4.9, respec-
tively) and their NA scores of the first and second
assessment (mean = 11.8, S.D. = 2.2, and mean = 11.5,
S.D. = 1.6, respectively) showed very little change
(P’s>0.64).
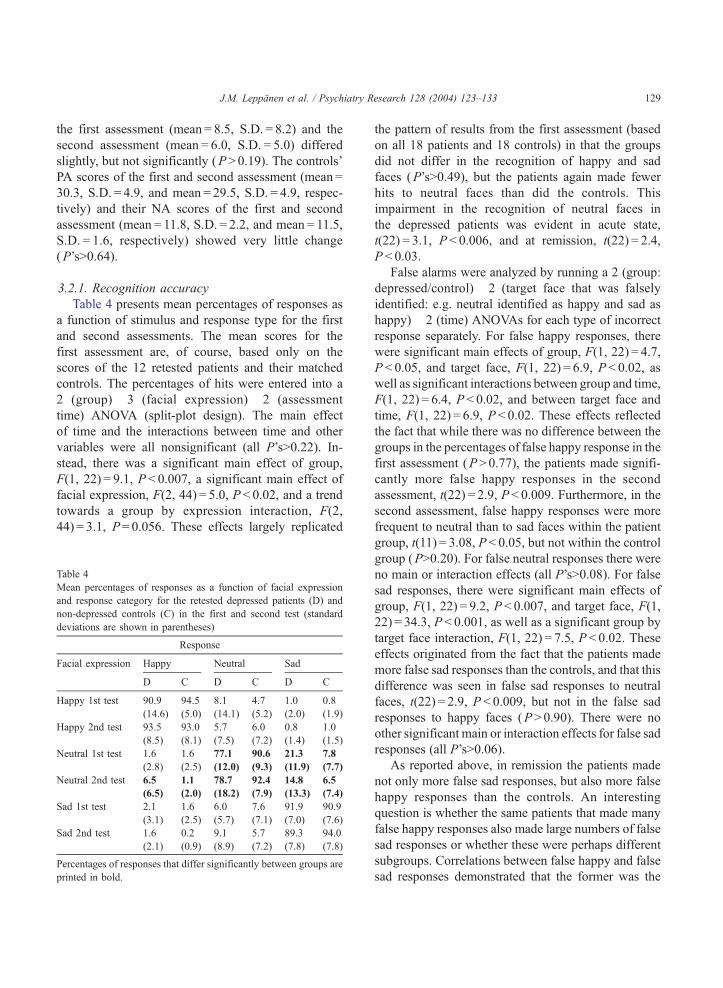
3.2.1. Recognition accuracy
Table 4 presents mean percentages of responses as
a function of stimulus and response type for the first
and second assessments. The mean scores for the
first assessment are, of course, based only on the
scores of the 12 retested patients and their matched
controls. The percentages of hits were entered into a
2 (group)� 3 (facial expression)� 2 (assessment
time) ANOVA (split-plot design). The main effect
of time and the interactions between time and other
variables were all nonsignificant (all P’s>0.22). In-
stead, there was a significant main effect of group,
F(1, 22) = 9.1, P < 0.007, a significant main effect of
facial expression, F(2, 44) = 5.0, P < 0.02, and a trend
towards a group by expression interaction, F(2,
44) = 3.1, P= 0.056. These effects largely replicated
Table 4
Mean percentages of responses as a function of facial expression
and response category for the retested depressed patients (D) and
non-depressed controls (C) in the first and second test (standard
deviations are shown in parentheses)
Response
Facial expression Happy Neutral Sad
D C D C D C
Happy 1st test 90.9
(14.6)
94.5
(5.0)
8.1
(14.1)
4.7
(5.2)
1.0
(2.0)
0.8
(1.9)
Happy 2nd test 93.5
(8.5)
93.0
(8.1)
5.7
(7.5)
6.0
(7.2)
0.8
(1.4)
1.0
(1.5)
Neutral 1st test 1.6
(2.8)
1.6
(2.5)
77.1
(12.0)
90.6
(9.3)
21.3
(11.9)
7.8
(7.7)
Neutral 2nd test 6.5
(6.5)
1.1
(2.0)
78.7
(18.2)
92.4
(7.9)
14.8
(13.3)
6.5
(7.4)
Sad 1st test 2.1
(3.1)
1.6
(2.5)
6.0
(5.7)
7.6
(7.1)
91.9
(7.0)
90.9
(7.6)
Sad 2nd test 1.6
(2.1)
0.2
(0.9)
9.1
(8.9)
5.7
(7.2)
89.3
(7.8)
94.0
(7.8)
Percentages of responses that differ significantly between groups are
printed in bold.
the pattern of results from the first assessment (based
on all 18 patients and 18 controls) in that the groups
did not differ in the recognition of happy and sad
faces (P’s>0.49), but the patients again made fewer
hits to neutral faces than did the controls. This
impairment in the recognition of neutral faces in
the depressed patients was evident in acute state,
t(22) = 3.1, P < 0.006, and at remission, t(22) = 2.4,
P < 0.03.
False alarms were analyzed by running a 2 (group:
depressed/control)� 2 (target face that was falsely
identified: e.g. neutral identified as happy and sad as
happy)� 2 (time) ANOVAs for each type of incorrect
response separately. For false happy responses, there
were significant main effects of group, F(1, 22) = 4.7,
P < 0.05, and target face, F(1, 22) = 6.9, P < 0.02, as
well as significant interactions between group and time,
F(1, 22) = 6.4, P < 0.02, and between target face and
time, F(1, 22) = 6.9, P < 0.02. These effects reflected
the fact that while there was no difference between the
groups in the percentages of false happy response in the
first assessment (P>0.77), the patients made signifi-
cantly more false happy responses in the second
assessment, t(22) = 2.9, P < 0.009. Furthermore, in the
second assessment, false happy responses were more
frequent to neutral than to sad faces within the patient
group, t(11) = 3.08, P < 0.05, but not within the control
group (P>0.20). For false neutral responses there were
no main or interaction effects (all P’s>0.08). For false
sad responses, there were significant main effects of
group, F(1, 22) = 9.2, P < 0.007, and target face, F(1,
22) = 34.3, P < 0.001, as well as a significant group by
target face interaction, F(1, 22) = 7.5, P < 0.02. These
effects originated from the fact that the patients made
more false sad responses than the controls, and that this
difference was seen in false sad responses to neutral
faces, t(22) = 2.9, P < 0.009, but not in the false sad
responses to happy faces (P>0.90). There were no
other significant main or interaction effects for false sad
responses (all P’s>0.06).
As reported above, in remission the patients made
not only more false sad responses, but also more false
happy responses than the controls. An interesting
question is whether the same patients that made many
false happy responses also made large numbers of false
sad responses or whether these were perhaps different
subgroups. Correlations between false happy and false
sad responses demonstrated that the former was the
J.M. Leppanen et al. / Psychiatry Research 128 (2004) 123–133130
case. Within the patient group, the percentages of false
sad responses in remission correlated significantly with
the percentage of false happy responses in remission,
r(12) = 0.67, P < 0.02. Although the patients’ self-
reported depression severity (BDI) and mood ratings
(PANAS) had improved in remission, there were no
significant correlations between the magnitude of
changes in these self-ratings and the amount of changes
in the percentages of false happy responses to neutral
faces, false sad responses to neutral faces, or hits to
neutral faces within the patient group.
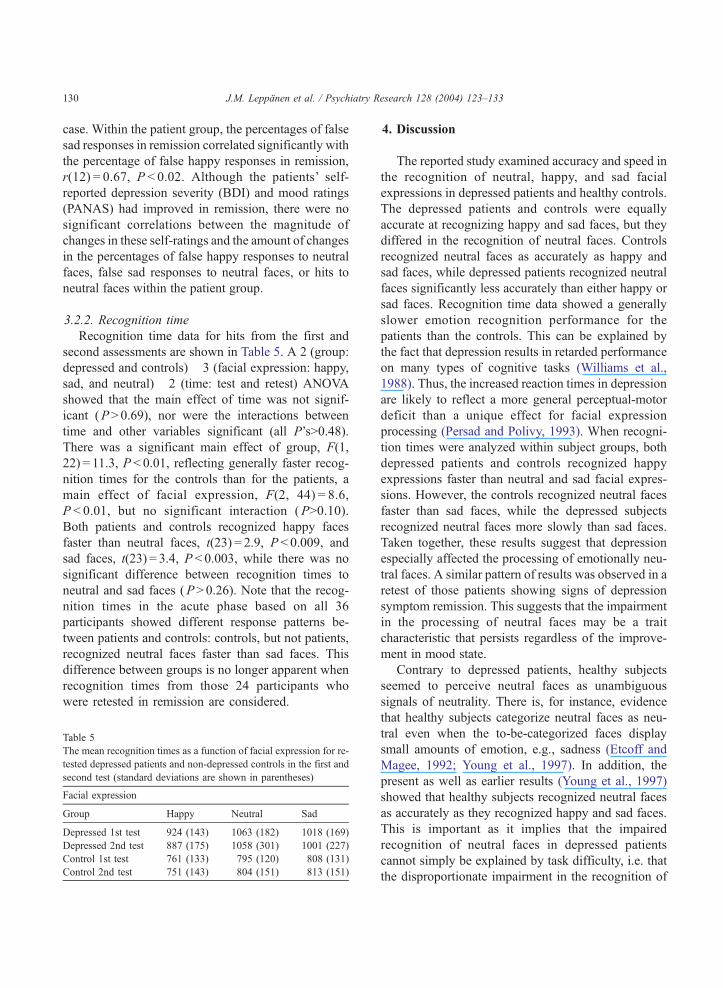
3.2.2. Recognition time
Recognition time data for hits from the first and
second assessments are shown in Table 5. A 2 (group:
depressed and controls)� 3 (facial expression: happy,
sad, and neutral)� 2 (time: test and retest) ANOVA
showed that the main effect of time was not signif-
icant (P>0.69), nor were the interactions between
time and other variables significant (all P’s>0.48).
There was a significant main effect of group, F(1,
22) = 11.3, P < 0.01, reflecting generally faster recog-
nition times for the controls than for the patients, a
main effect of facial expression, F(2, 44) = 8.6,
P < 0.01, but no significant interaction (P>0.10).
Both patients and controls recognized happy faces
faster than neutral faces, t(23) = 2.9, P < 0.009, and
sad faces, t(23) = 3.4, P < 0.003, while there was no
significant difference between recognition times to
neutral and sad faces (P>0.26). Note that the recog-
nition times in the acute phase based on all 36
participants showed different response patterns be-
tween patients and controls: controls, but not patients,
recognized neutral faces faster than sad faces. This
difference between groups is no longer apparent when
recognition times from those 24 participants who
were retested in remission are considered.
Table 5
The mean recognition times as a function of facial expression for re-
tested depressed patients and non-depressed controls in the first and
second test (standard deviations are shown in parentheses)
Facial expression
Group Happy Neutral Sad
Depressed 1st test 924 (143) 1063 (182) 1018 (169)
Depressed 2nd test 887 (175) 1058 (301) 1001 (227)
Control 1st test 761 (133) 795 (120) 808 (131)
Control 2nd test 751 (143) 804 (151) 813 (151)
4. Discussion
The reported study examined accuracy and speed in
the recognition of neutral, happy, and sad facial
expressions in depressed patients and healthy controls.
The depressed patients and controls were equally
accurate at recognizing happy and sad faces, but they
differed in the recognition of neutral faces. Controls
recognized neutral faces as accurately as happy and
sad faces, while depressed patients recognized neutral
faces significantly less accurately than either happy or
sad faces. Recognition time data showed a generally
slower emotion recognition performance for the
patients than the controls. This can be explained by
the fact that depression results in retarded performance
on many types of cognitive tasks (Williams et al.,
1988). Thus, the increased reaction times in depression
are likely to reflect a more general perceptual-motor
deficit than a unique effect for facial expression
processing (Persad and Polivy, 1993). When recogni-
tion times were analyzed within subject groups, both
depressed patients and controls recognized happy
expressions faster than neutral and sad facial expres-
sions. However, the controls recognized neutral faces
faster than sad faces, while the depressed subjects
recognized neutral faces more slowly than sad faces.
Taken together, these results suggest that depression
especially affected the processing of emotionally neu-
tral faces. A similar pattern of results was observed in a
retest of those patients showing signs of depression
symptom remission. This suggests that the impairment
in the processing of neutral faces may be a trait
characteristic that persists regardless of the improve-
ment in mood state.
Contrary to depressed patients, healthy subjects
seemed to perceive neutral faces as unambiguous
signals of neutrality. There is, for instance, evidence
that healthy subjects categorize neutral faces as neu-
tral even when the to-be-categorized faces display
small amounts of emotion, e.g., sadness (Etcoff and
Magee, 1992; Young et al., 1997). In addition, the
present as well as earlier results (Young et al., 1997)
showed that healthy subjects recognized neutral faces
as accurately as they recognized happy and sad faces.
This is important as it implies that the impaired
recognition of neutral faces in depressed patients
cannot simply be explained by task difficulty, i.e. that
the disproportionate impairment in the recognition of
J.M. Leppanen et al. / Psychiatry Research 128 (2004) 123–133 131
neutral expressions reflects the fact that neutral
expressions are the most difficult to recognize.
The depressed patients showed a high incidence of
false sad responses to neutral faces in both the acute
state and in remission. This result is consistent with
that reported by Gur et al. (1992), who showed that
depressed patients tended to mistake neutral faces for
sad. The high incidence of false sad responses in the
patients is also consistent with the data showing that
depression is associated with an increased tendency to
attribute negative emotions to schematic expressive
faces (Hale, 1998; Bouhuys et al., 1999). Contrary to
these results, Mikhailova et al. (1996) found no
difference between depressed patients in the acute
stage and nondepressed controls in their accuracy in
the recognition of neutral faces. However, in that
study, recognition of neutral expressions by patients
in remission was worse than in the acute stage, while
recognition of happy and sad expressions improved.
Since the participants in the study of Mikhailova et al.
study made forced choice responses, fewer hits to
neutral expressions must mean more false sad or false
happy responses, in line with our findings at remis-
sion, but the authors provided no details on these
incorrect responses.
Apart from the high incidence of false sad res-
ponses to neutral faces, the present results provided no
support for the mood congruency hypothesis. Specif-
ically, the recognition time and accuracy data showed
no evidence for enhanced recognition of sad faces and
impeded recognition of happy faces in the depressed
patients. This result may not be so surprising, since
apart from a few exceptions (e.g., Mandal and Bhat-
tacharya, 1985), previous studies are generally in line
with the present results. Namely, depressed patients
have not been found to recognize sad faces more
accurately (Zuroff and Colussy, 1986; Archer et al.,
1992; Gur et al., 1992; Persad and Polivy, 1993;
Mikhailova et al., 1996) and happy faces less accu-
rately (Archer et al., 1992; Gaebel and Wolwer, 1992;
Gur et al., 1992) than controls. Impaired recognition
of happy faces in depressed patients has been found in
some studies (Rubinow and Post, 1992; Persad and
Polivy, 1993; Mikhailova et al., 1996), but these
effects are likely to reflect a general deficit affecting
all expressions rather than a disproportionate impair-
ment in the recognition of happy faces. Reaction times
in the present study showed that the recognition of
happy faces was faster than the recognition of sad
faces in both groups. One could have expected that
this happy face advantage would be diminished or
removed in depressed patients, but this was not found.
Inspection of the mean reaction times suggests that the
magnitude of the happiness advantage was compara-
ble between the subject groups. This is rather surpris-
ing since experimentally induced negative emotion
has been shown to remove the happy face advantage
in healthy subjects (Leppanen and Hietanen, 2003).
On the other hand, the fact that the effects of exper-
imentally induced negative emotion and depression
are not parallel may simply suggest that depression
cannot be simulated by mood induction.
Our data also provide some evidence for the
persistency of the observed impairment in the pro-
cessing of neutral faces. Despite the clinical signs of
remission and a significant decrease in self-reported
depressive symptoms (BDI), there was no evidence
for a significant improvement in the processing of
neutral faces. The pattern of less accurate recognition
of neutral compared with other facial expressions in
the patients was similar during acute depression and
symptom remission. Although these results are tenta-
tive because of the fairly small number of subjects,
they suggest that the impairment in the processing of
neutral faces reflects a mood-state-independent bias in
emotional processing in depression-prone individuals
(i.e., a trait effect). Consistent with this interpretation,
depressed patients show abnormal activity in emotion-
related brain structures that does not completely
normalize in symptom remission (Drevets, 2001). In
addition, depressed patients show evidence for per-
manent abnormalities (i.e., reductions in grey matter
volume) in certain prefrontal cortex structures that are
assumed to participate in the modulation of emotional
responses (Drevets, 2001).
Interestingly, the patients made more false happy
responses than the controls in the second assessment,
while there was no group difference in false happy
responses in the first assessment. To the best of our
knowledge, this kind of a positive bias in judgments
of facial expressions has not been previously
reported in depressed patients. Importantly, the ten-
dency to mistake neutral faces as sad and the
tendency to mistake neutral faces as happy were
not independent. There was a strong positive corre-
lation within the patients between the percentages of

J.M. Leppanen et al. / Psychiatry Research 128 (2004) 123–133132
false happy responses to neutral faces and false sad
responses to neutral faces. These results suggest that
depression-prone individuals attribute not only neg-
ative but also positive valence to signals that are
normally regarded as neutral. The fact that false
happy responses were more evident in remission
than in acute depression suggests that the valence
of the emotions falsely attributed to neutral faces
(i.e., positive/negative) may partly depend on the
ongoing affective state. However, the absence of a
correlation in the patient group between changes in
BDI and PANAS ratings from acute phase to remis-
sion and changes in judgment of neutral faces
indicated that there may be no simple linear rela-
tionship between self-reported mood and the valence
attributed to neutral faces.
What is still unclear is whether the observed
tendency towards assigning emotional signals to neu-
tral expressions in the depressed patients reflects a
response bias, that is, an elevated tendency to emit or
endorse negative (or positive) responses, or an inter-
pretation bias. Studies in anxious participants have
tried to disentangle these two options by using indi-
rect measures of bias. However, studies in depressed
patients have so far largely ignored the distinction
between response versus interpretation bias (Lawson
and MacLeod, 1999), and this clearly is an important
issue for future research.
In conclusion, it seems that clinical depression
does not affect the recognition of happy and sad faces
as much as it affects the recognition of neutral faces.
So far, researchers have been primarily interested in
studying the effects of depression on the processing of
emotional instead of neutral facial expressions. The
present study was based on earlier findings suggesting
that healthy subjects recognize neutral faces in the
same way that they recognize other facial expressions
(i.e., categorically), but that depression may impair
this ability. Consistent with this hypothesis, it was
shown that healthy subjects recognized neutral faces
as accurately as prototypical facial expressions of
happiness and sadness, while depressed patients
showed a clear impairment in the recognition of
neutral facial expressions. This impairment was also
evident during symptom remission. Together, these
results support the hypothesis that depressed individ-
uals may interpret emotionally neutral social cues as
emotionally meaningful (Drevets, 2001).
Acknowledgments
We thank staff and patients from Royal Cornhill
Hospital Aberdeen for their co-operation. The study
was supported by the Finnish Psychological Society
(Anna S. Elonen grant) and Academy of Finland
(project #50898).
References
Adolphs, R., 2001. The neurobiology of social cognition. Current
Opinion in Neurobiology 11, 231–239.
Adolphs, R., Tranel, D., Damasio, H., Damasio, A.R., 1995.
Fear and the human amygdala. Journal of Neuroscience 15,
5879–5891.
Adolphs, R., Tranel, D., Hamann, S., Young, A.W., Calder, A.J.,
Phelps, E.A., Anderson, A., Lee, G.P., Damasio, A.R., 1999.
Recognition of facial emotion in nine individuals with bilateral
amygdala damage. Neuropsychologia 37, 1111–1117.
Adolphs, R., Damasio, H., Tranel, D., Cooper, G., Damasio, A.R.,
2000. A role of somatosensory cortices in the visual recognition
of emotion as revealed by three-dimensional lesion mapping.
Journal of Neuroscience 20, 2683–2690.
Archer, J., Hay, D.C., Young, A.W., 1992. Face processing in psy-
chiatric conditions. British Journal of Clinical Psychology 31,
45–61.
Beck, A.T., Ward, C.H., Mendelson, M., Mock, J., Erbaugh, J.,
1961. An inventory for measuring depression. Archives of Gen-
eral Psychiatry 4, 561–571.
Birbaumer, N., Grodd, W., Diedrich, O., Klose, U., Erb, M., Lotze,
M., Schneider, F., Weiss, U., Flor, H., 1998. fMRI reveals amyg-
dala activation to human faces in social phobics. NeuroReport 9,
1223–1226.
Blair, R.J.R, Morris, J.S., Frith, C.D., Perrett, D.I., Dolan, R.J.,
1999. Dissociable neural responses to facial expressions of sad-
ness and anger. Brain 122, 883–893.
Bouhuys, A.L., Bloem, G.M., Groothuis, T.G.G., 1995. Induction
of depressed and elated mood by music influences the percep-
tion of facial emotional expressions in healthy subjects. Journal
of Affective Disorders 33, 215–226.
Bouhuys, A.L., Geerts, E., Mersch, P.P.A., Jenner, J.A., 1996. Non-
verbal interpersonal sensitivity and persistence of depression:
perception of emotions in schematic faces. Psychiatry Research
64, 193–203.
Bouhuys, A.L., Geerts, E., Mersch, P.P.A., 1997. Relationship be-
tween perception of facial emotions and anxiety in clinical de-
pression: does anxiety-related perception predict persistence of
depression? Journal of Affective Disorders 43, 213–223.
Bouhuys, A.L., Geerts, E., Gordijn, M.C.M., 1999. Gender-specific
mechanisms associated with outcome of depression: perception
of emotions, coping and interpersonal functioning. Psychiatry
Research 85, 247–261.
Bower, G.H., 1981. Mood and memory. American Psychologist 36,
129–148.
J.M. Leppanen et al. / Psychiatry Research 128 (2004) 123–133 133
Breiter, H.C., Etcoff, N.L., Whalen, P.J., Kennedy, W.A., Rauch,
S.L., Buckner, R.L., Strauss, M.M., Hyman, S.E., Rosen,
B.R., 1996. Response and habituation of the human amygdala
during visual processing of facial expression. Neuron 17,
875–887.
Cooley, E.L., Nowicki, S., 1989. Discrimination of facial expres-
sions of emotion by depressed subjects. Genetic, Social, and
General Psychology Monographs 115, 451–465.
Davidson, R.J., 1998. Affective style and affective disorders: per-
spectives from affective neuroscience. Cognition and Emotion
12, 307–330.
Drevets, W.C., 2001. Neuroimaging and neuropathological studies
of depression: implications for the cognitive-emotional fea-
tures of mood disorders. Current Opinion in Neurobiology
11, 240–249.
Ekman, P., 1982. Emotion in the Human Face. Cambridge Univer-
sity Press, New York.
Ekman, P., Friesen, W.V., 1976. Pictures of Facial Affect. Consult-
ing Psychologists Press, Palo Alto, CA.
Etcoff, N.L., Magee, J.J., 1992. Categorical perception of facial
expression. Cognition 44, 227–240.
Feinberg, T.E., Rifkin, A., Schaffer, C., Walker, E., 1986. Facial
discrimination and emotional recognition in schizophrenia
and affective disorders. Archives in General Psychiatry 43,
276–279.
Feyereisen, P., Malet, C., Martin, Y., 1986. Is the faster processing
of expressions of happiness modality-specific? In: Ellis, H.D.,
Jeeves, M.A., Newcombe, F., Young, A. (Eds.), Aspects of
Face Processing. Martinus Nijhoff Publishers, Boston, pp.
349–355.
Gaebel, W., Wolwer, W., 1992. Facial expression and emotional
face recognition in schizophrenia and depression. European
Archives of Psychiatry and Clinical Neuroscience 242, 46–52.
Gur, R.C., Erwin, R.J., Gur, R.E., Zwil, A.S., Heimberg, C.,
Kraemer, H.C., 1992. Facial emotion discrimination: II. Be-
havioral findings in depression. Psychiatry Research 42,
241–251.
Hale, W.W., 1998. Judgment of facial expressions and depression
persistence. Psychiatry Research 80, 265–274.
Hale, W.W., Jansen, J.H.C., Bouhuys, A.L., van den Hoofdakker,
R.H., 1998. The judgment of facial expressions by depressed
patients, their partners and controls. Journal of Affective Disor-
ders 47, 63–70.
Haxby, J.V., Hoffman, E.A., Gobbini, M.I., 2002. Human neural
systems for face recognition and social communication. Biolog-
ical Psychiatry 51, 59–67.
Kirita, T., Endo, M., 1995. Happy face advantage in recognizing
facial expressions. Acta Psychologica 89, 149–163.
Lawson, C., MacLeod, C., 1999. Depression and the interpretation
of ambiguity. Behaviour Research and Therapy 37, 463–474.
Leppanen, J.M., Hietanen, J.K., 2003. Affect and face perception:
odors modulate the recognition advantage of happy faces. Emo-
tion 3, 315–326.
Mandal, M.K., Bhattacharya, B.B., 1985. Recognition of facial
affect in depression. Perceptual and Motor Skills 61, 13–14.
Mikhailova, E.S., Vladimirova, T.V., Iznak, A.F., Tsusulkovskaya,
E.J., Sushko, N.V., 1996. Abnormal recognition of facial expres-
sions of emotions in depressed patients with major depression
disorder and schizotypal personality disorder. Biological Psychi-
atry 40, 697–705.
Morris, J.S., Frith, C.D., Perrett, D.I., Rowland, D., Young, A.W.,
Calder, A.J., Dolan, R.J., 1996. A differential neural response in
the human amygdala to fearful and happy facial expressions.
Nature 383, 12–15.
Persad, S.M., Polivy, J., 1993. Differences between depressed and
nondepressed individuals in the recognition of and response to
facial emotional cues. Journal of Abnormal Psychology 102,
358–368.
Rubinow, D.R., Post, R.M., 1992. Impaired recognition of affect in
facial expression in depressed patients. Biological Psychiatry
31, 947–953.
Sloan, D.M., Strauss, M.E., Quirk, S.W., Sajatovic, M., 1997. Sub-
jective and expressive emotional responses in depression. Jour-
nal of Affective Disorders 46, 135–141.
Stenberg, G., Wiking, S., Dahl, M., 1998. Judging words at face
value: interference in word processing reveals automatic pro-
cessing of affective facial expressions. Cognition and Emotion
12, 755–782.
Thomas, K.M., Drevets, W.C., Whalen, P.J., Eccard, C.H., Dahl,
R.E., Ryan, N.D., Casey, B.J., 2001. Amygdala response to
facial expressions in children and adults. Biological Psychiatry
49, 309–316.
Watson, D., Clark, L.A., Tellegen, A., 1988. Development and
validation of brief measures of positive and negative affect:
the PANAS scale. Journal of Personality and Social Psychology
54, 1063–1070.
Whalen, P.J., 1998. Fear, vigilance, and ambiguity: initial neuro-
imaging studies of the human amygdala. Current Directions in
Psychological Science 7, 177–188.
Williams, J.M.G., Watts, F.N., MacLeod, C., Mathews, A., 1988.
Cognitive psychology and emotional disorders. John Wiley &
Sons, Chichester.
World Health Organization, 1992. The ICD-10 Classification of
Mental and Behavioural Disorders: Clinical Descriptions and
Diagnostic Guidelines. WHO, Geneva.
Young, A.W., Rowland, D., Calder, A.J., Etcoff, N.L., Seth, A.,
Perrett, D.I., 1997. Facial expression megamix: tests of dimen-
sional and category accounts for emotion recognition. Cognition
63, 271–313.
Zuroff, D.C., Colussy, S.A., 1986. Emotion recognition in schizo-
phrenic and depressed inpatients. Journal of Clinical Psychology
42, 411–417.