depositary receipts: concept, evolution and recent trends
TRANSCRIPT
Depositary Receipts: Concept, Evolution and Recent Trends
Manoj Kumar1
1 Manoj Kumar is a faculty member at Kirloskar Institute of Advanced Management Studies, Harihar. He holds a doctorate from the Shailesh J Mehta School of Management, Indian Institute of Technology, Powai, Bombay. He can be contacted at: [email protected]
Abstract
The trend towards the internationalisation of financial markets has gained impetus during the last two decades, driven mainly by the sophistication in IT and capital market participants (borrowers, investors and financial intermediaries), greater co-operation between financial regulators, the lowering of capital barriers across national boundaries and the liberalisation of capital markets in emerging economies. Many companies are looking beyond their domestic financial markets to develop an investor base and to raise international capital. By the end of December 2001, there were 2465 foreign companies listed on the major stock exchanges of the world. A vast majority of foreign firms choose to cross-list their stock through the use of depositary receipts (DRs), which have become the popular mode of financing. The 1990s saw an increased flow of DR programmes, especially from the emerging markets. In April 1992, the government permitted Indian companies to raise equity capital by issuing DR programmes in the international financial markets and of all the emerging markets, India has the maximum number of DR programmes. This paper aims at understanding the conceptual framework of DR programmes and studying the evolution of DR markets, including the introduction and development of DR programmes issued by Indian firms.
Introduction
The trend towards the internationalisation of financial markets has gained impetus during the last two
decades, driven mainly by the sophistication in IT and capital market participants (borrowers, investors
and financial intermediaries), greater co-operation between financial regulators, the lowering of capital
barriers across national boundaries and the liberalisation of capital markets in emerging economies2.
Many companies are looking beyond their domestic financial markets to develop an investor base and to
raise international capital3. By the end of December 2001, there were 2465 foreign companies listed on
the major stock exchanges of the world. A vast majority of foreign firms choose to cross-list their stock
through the use of depositary receipts (DRs), which have become the popular mode of financing. The
1990s saw an increased flow of DR programmes, especially from the emerging markets. In April 1992,
the government permitted Indian companies to raise equity capital by issuing DR programmes in the
international financial markets and of all the emerging markets, India has the maximum number of DR
programmes.
This paper aims at understanding the conceptual framework of DR programmes and studying the
evolution of DR markets, including the introduction and development of DR programmes issued by
Indian firms. The remaining paper is organized as follows: Section I provides a conceptual framework
for the DR programs. Section II traces the historical evolution and growth of DR markets, including the
developments pertaining to the Indian DR programs. Finally, summary and conclusions of this chapter
are presented in the Section III.
I. Conceptual Framework
We initiate our discussion by explaining the structure, issuing process and trading mechanism for a
typical DR program. Next, the various types of DR programs are explained.
1.1 Structure, Issuing Process and Trading Mechanism
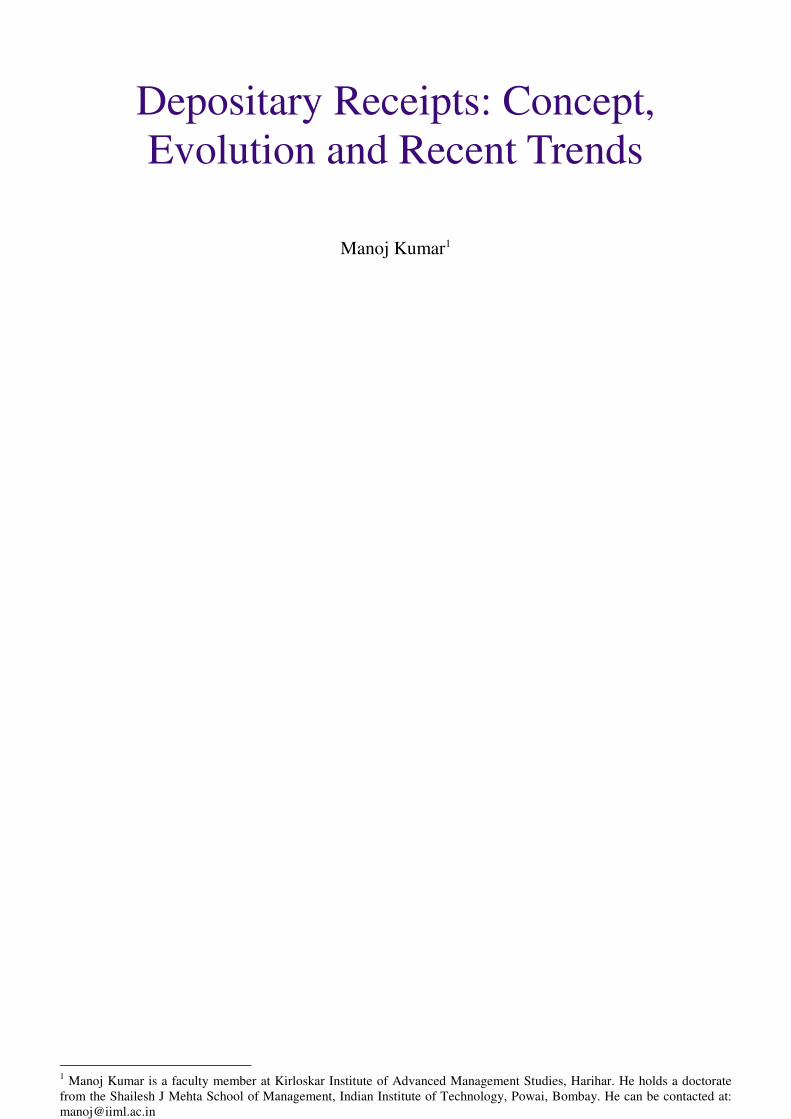
A depositary receipt is a negotiable instrument denominated in US dollars or Euro (or in a currency other
than the domestic currency of the issuer company), which is issued to the investors in one or more
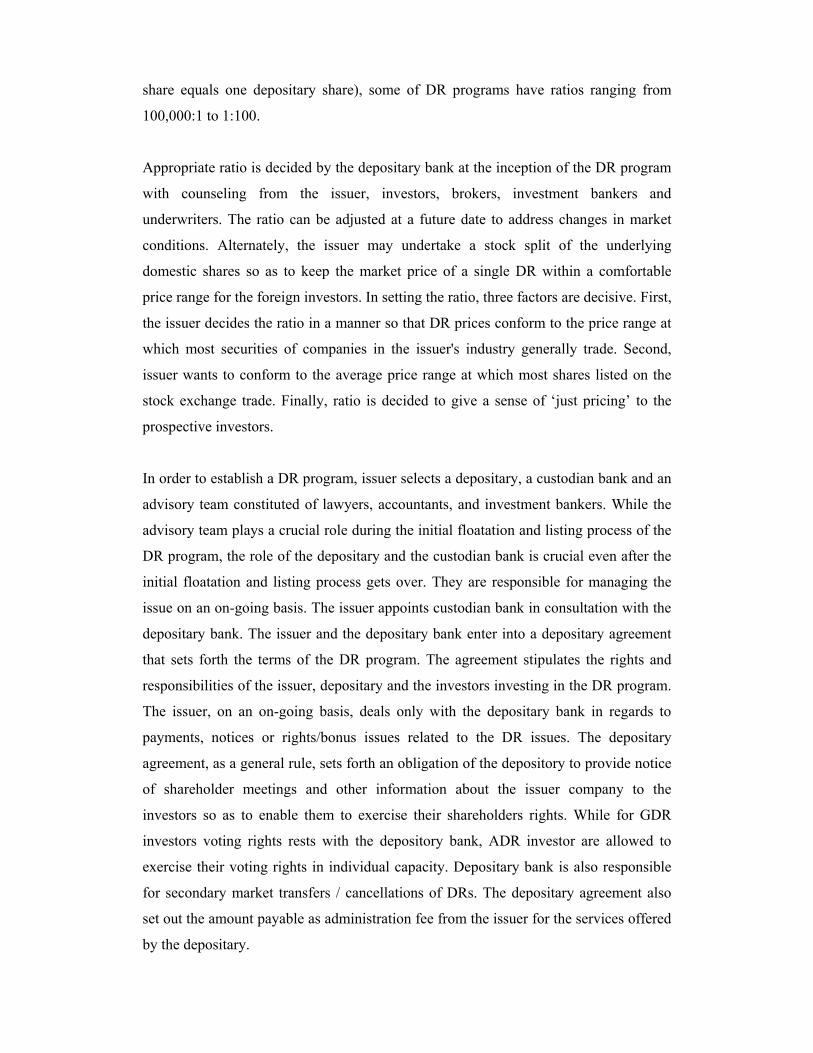
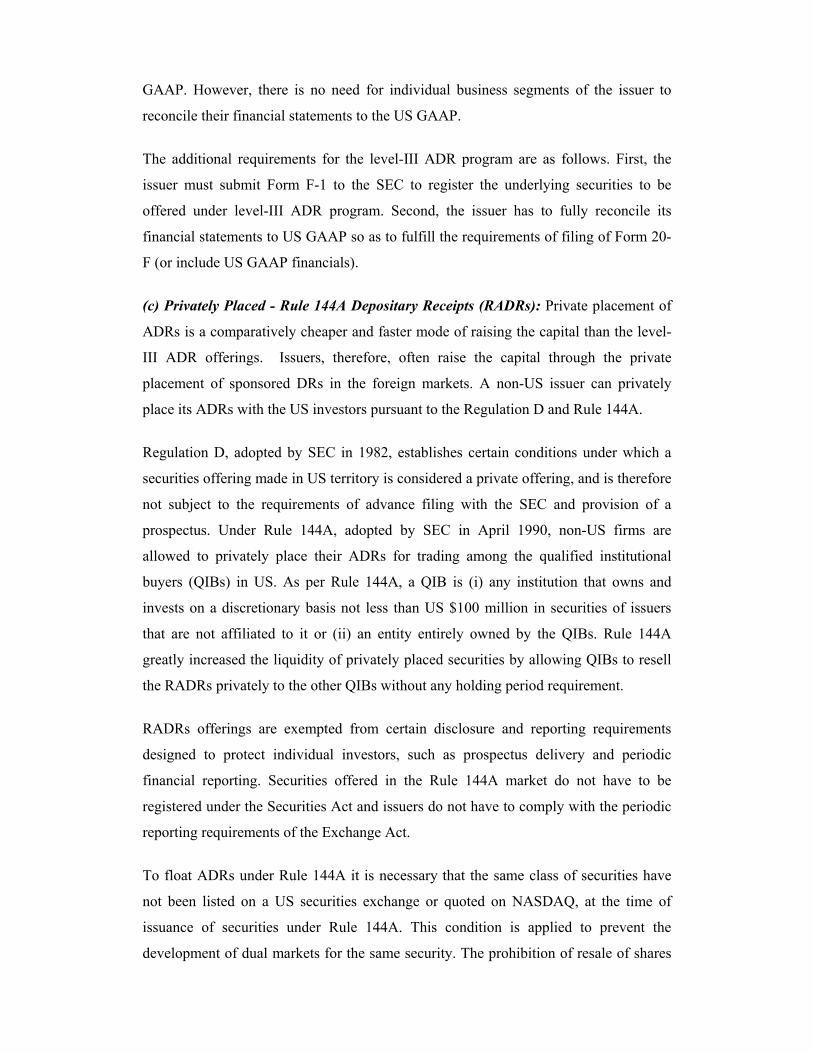
foreign countries. Figure 2.1 depicts the mechanism for floatation of a DR program. DRs are issued by
the overseas depositary bank (henceforth also referred to as depositary) to the international investors
either against the issuer’s local currency shares registered in depositary’s name in the shareholder books
of the company or against the physical delivery of local currency shares of the issuer company to the
depositary or, more commonly, to a domestic custodian bank appointed by the depositary. The
depositary in respect of a DR program is located in a foreign country, where as the custodian is located
in a home country of the issuer company (henceforth also referred to as issuer).
2 ‘Emerging economies’ or ‘Emerging markets’ or ‘Emerging countries’ or ‘Developing markets’ mainly cover countries that the World Bank, the International Finance Corporation (IFC)and the United Nations have determined to have a low or middle-income economy (with per capita income less than $9,361 in1998). Stock markets in these countries have not yet developed to the same levels of sophistication and market capitalisation as in a number of developed countries. By the end of 1999, the IFC identified 81 countries to be emerging economies. (Source: IFC, 2000)
Figure 1
Typical Structure of a DR Program
Note: The Bank of New York, Citicorp and J.P. Morgan are the major depositary banks. Source: Desai and D’Souza (1998)
Each DR represents a certain number of underlying local currency equity shares of the
issuer traded in the home market of the issuer. The depositary sets the ratio of a single
DR to per local currency equity share of the issuer. This ratio can be less than, equal to
or greater than 1 based on the market value of the local currency shares of the issuer
and is decided in a manner so as to make the price of a single DR trade in a range
comfortable to the foreign investors.
When each underlying domestic share in the home country is priced considerably low
in terms of its equivalent value in dollars, then each DR may represent several
underlying domestic shares. However, if each underlying domestic share is priced
equivalent to several hundred dollars, then each DR may be only a fraction of a normal
share. While most DR programs have been established with a 1:1 ratio (one underlying
Issuer Company’s Home Country Issuer Company Underlying Shares Local Bank
(Custodian)
Foreign Country Money Dividend Depositary Bank Listing of DRs on Stock Exchanges Foreign gn Stock Exchange
DRs Money Dividend Euroclear / Clearstream International / Depositary Trust Company
Clearing House
Foreign Investors
share equals one depositary share), some of DR programs have ratios ranging from
100,000:1 to 1:100.
Appropriate ratio is decided by the depositary bank at the inception of the DR program
with counseling from the issuer, investors, brokers, investment bankers and
underwriters. The ratio can be adjusted at a future date to address changes in market
conditions. Alternately, the issuer may undertake a stock split of the underlying
domestic shares so as to keep the market price of a single DR within a comfortable
price range for the foreign investors. In setting the ratio, three factors are decisive. First,
the issuer decides the ratio in a manner so that DR prices conform to the price range at
which most securities of companies in the issuer's industry generally trade. Second,
issuer wants to conform to the average price range at which most shares listed on the
stock exchange trade. Finally, ratio is decided to give a sense of ‘just pricing’ to the
prospective investors.
In order to establish a DR program, issuer selects a depositary, a custodian bank and an
advisory team constituted of lawyers, accountants, and investment bankers. While the
advisory team plays a crucial role during the initial floatation and listing process of the
DR program, the role of the depositary and the custodian bank is crucial even after the
initial floatation and listing process gets over. They are responsible for managing the
issue on an on-going basis. The issuer appoints custodian bank in consultation with the
depositary bank. The issuer and the depositary bank enter into a depositary agreement
that sets forth the terms of the DR program. The agreement stipulates the rights and
responsibilities of the issuer, depositary and the investors investing in the DR program.
The issuer, on an on-going basis, deals only with the depositary bank in regards to
payments, notices or rights/bonus issues related to the DR issues. The depositary
agreement, as a general rule, sets forth an obligation of the depository to provide notice
of shareholder meetings and other information about the issuer company to the
investors so as to enable them to exercise their shareholders rights. While for GDR
investors voting rights rests with the depository bank, ADR investor are allowed to
exercise their voting rights in individual capacity. Depositary bank is also responsible
for secondary market transfers / cancellations of DRs. The depositary agreement also
set out the amount payable as administration fee from the issuer for the services offered
by the depositary.
The issuer represented by its directors, officers, US agents, underwriters, experts, legal
advisors, auditors and accountants involved in preparation of the registration statement
has liabilities under the US securities laws for false or misleading statements in or
omissions from its filings to SEC. Besides, individuals are also held personally liable
for false or misleading statements in or omissions from the filings for which they are
responsible. Preparation of the filing includes (a) ‘due diligence’ investigation, usually
conducted by the outside legal advisor; (b) audit of the financial information provided
by the accounting firm; and (c) outside experts’ conclusions.
The roles of different market intermediaries involved in issuing and listing of a DR
program are as follows:
(a) Issuer Company is responsible for (i) preparing the issue proposal, (ii) determining
the financial objectives, (iii) obtaining the required approvals from Board of
Directors, shareholders and regulators as may be needed, (iv)deciding the type of
DR program to be issued, (v) providing financial information to accountants, and
(vi) developing investor relations plan.
(b) Lead Manager (Investment Banker) is responsible for (i) marketing the issue to the
investors; (ii) conducting the road show; (iii) advising the issuing company on the
type of DR program, pricing of the security; (iv) obtaining CUSIP or ISIN4
number; (v) obtaining DTC, Euroclear, Clearstream International, and PORTAL
eligibility as may be needed; and (vi) appointing the legal advisers so as to ensure
the accuracy of the information in the prospectus.
(c) Co-Managers / Underwriters assist the lead manager in fulfilling its obligations to
the issuer company. Underwriters subscribe to the unsubscribed portion of the
issue or else buy the portion of DRs to further sell it to the investors.
(d) Depositary is the bank authorized by the issuer company to issue DRs against the
equity shares of the issuer company deposited with domestic custodian. It is the
4 CUSIP stands for Committee on Uniform Securities Identification Procedure, set up by the American Bankers Association to create identifying numbers for all securities trading in the U.S. The assignment of CUSIP numbers is by a subsidiary of Standard & Poor, the rating agency. Every security, mutual fund, option, warrants, bond, common share has its own 9-digit CUSIP number that appears on the certificate of ownership. Recently, because of the volume of issues, some numbers now are letters. The last digit is a "check digit" which can be used to verify the others. The CUSIP for IBM is 59200102. ISIN (International Securities Identification Numbers) is international system that corresponds to CUSIP. It uses a 12- digit number, not letters, and is used by the European settlement systems, CLEARSTREAM INTERNATIONAL (Luxembourg) and EUROCLEAR (a Brussels-based subsidiary of Morgan Guaranty).
overseas agent of the issuer company who issues the DRs to the investors in lieu of
shares allotted to him/her. The physical possession of the shares rests with the
domestic custodian although the ownership of the shares vests with the DR
investors. Banks such as the Bank of New York, Citibank and J.P. Morgan have
been acting as the depositaries in many DR programs. The legal relationship
between the DR investor and the depository bank is that of trust. The depository is
the registered owner of the shares and its name appears in the ‘Register of
Members’ of the issuer company. The most important role of a depositary bank is
that of stock transfer agent and registrar. Therefore all major depositary banks
maintain the sophisticated stock transfer systems. Depositary bank is responsible
for (i) advising the structure of DR program; (ii) appointing the custodian; (iii)
assisting in complying to the regulatory requirements for floating DR program; (iv)
coordinating with lawyers, accountants and investment bankers to ensure that all
program implementation steps are completed; (v) preparing and issuing the DR
certificates; (vi) enlisting the market makers (vii) faxing the announcement of
program establishment to brokers and traders; and (viii) acting as the liaison
between the issuer, the securities markets participants, and the DR holders once a
depositary receipt facility is established.
(e) Brokers are responsible for (i) submitting the required forms to become a market
maker in a DR program; (ii) making securities available to the investors; and (iii)
executing and settling the trades.
(f) Custodian is the banking company situated in the issuer’s home country appointed
as a custodian of the underlying shares of the issuer company. Custodian is
responsible for (i) holding the underlying shares in the account of depositary; (ii)
communicating with depositary on corporate actions and related issues; and (iii)
transmitting dividend payments to the investors through depositary.
(g) Investor Relations Firm is responsible for (i) developing a long-term investor
relationship program with specific and measurable goals and objectives; and (ii)
placing tombstone advertisement for announcing establishment of the program.
(h) Legal Advisors assist the issuing company, lead manager, co-managers and the
underwriters in the preparation of the prospectus, depository agreement, indemnity
agreement and subscription agreement. They are also responsible for filing the
appropriate statements for registration and/or establishing exemptions from certain
procedures.
(i) Auditors must be appointed by the issuing company. Typically, it is one amongst
the big international accounting firms. They prepare the auditor’s report for
inclusion in the prospectus, provide requisite consent and comfort letters and
reconcile the issuing company’s accounts with International Accounting Standards
(IAS) or US Generally Accepted Accounting Principles (GAAP). They also
participate in the due diligence meetings for enabling the issuing company to
comply with proper disclosures relating to the issue.
(j) Listing Agent is often an investment or merchant bank, stockbroker, accountancy
or law firm, or other financial adviser. Normally the lead manager will also act as
the listing agent, but it is not uncommon to appoint a separate listing agent. All
companies seeking the listing of DRs in Europe have to appoint a listing agent,
which must be authorised by the listing authority to participate in securities issues.
The listing agent, who must meet certain qualifications, provides the link between
the company, depositary and the listing authority. The listing agent should be
appointed at an early stage in the process of listing, as his responsibilities include:
assessing the company’s suitability for a listing in LSE or LxSE; advising on all
aspects of the listing rules; reviewing the prospectus; appointing legal advisers to
ensure the information in the prospectus is accurate and that investors have all the
information they require to make an informed decision; confirming to the listing
authority that all the requirements of its listing rules have been met; and
communicating with the listing authority and seeking approval of the prospectus.
Launching a DR program is a time consuming process, more so, if the issue is a level–
III ADR program. Establishing a level-II or a level-III DR program requires a period of
18-30 weeks as against a period of 11-13 weeks for a level–I or the GDR issue. Table
1 depicts the activities and an indicative timeframe for launching a typical GDR
program.
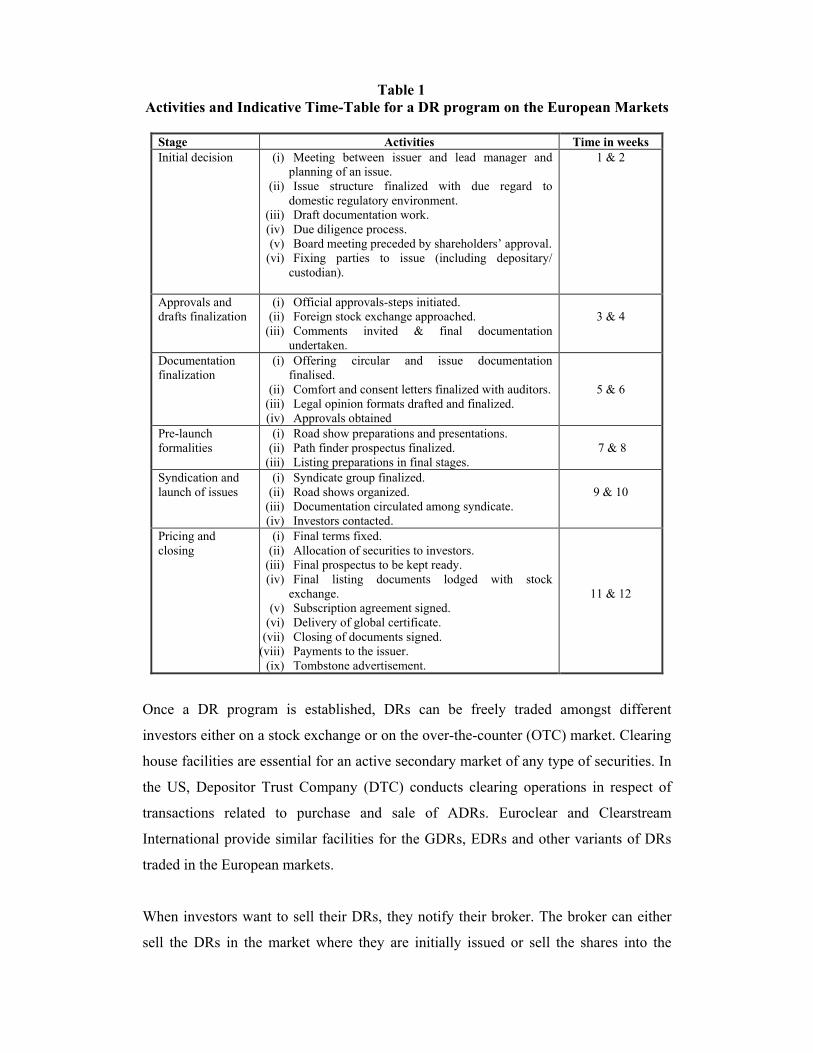
Table 1 Activities and Indicative Time-Table for a DR program on the European Markets
Stage Activities Time in weeks Initial decision (i) Meeting between issuer and lead manager and
planning of an issue. (ii) Issue structure finalized with due regard to
domestic regulatory environment. (iii) Draft documentation work. (iv) Due diligence process. (v) Board meeting preceded by shareholders’ approval.
(vi) Fixing parties to issue (including depositary/ custodian).
1 & 2
Approvals and drafts finalization
(i) Official approvals-steps initiated. (ii) Foreign stock exchange approached.
(iii) Comments invited & final documentation undertaken.
3 & 4
Documentation finalization
(i) Offering circular and issue documentation finalised.
(ii) Comfort and consent letters finalized with auditors. (iii) Legal opinion formats drafted and finalized. (iv) Approvals obtained
5 & 6
Pre-launch formalities
(i) Road show preparations and presentations. (ii) Path finder prospectus finalized.
(iii) Listing preparations in final stages.
7 & 8
Syndication and launch of issues
(i) Syndicate group finalized. (ii) Road shows organized.
(iii) Documentation circulated among syndicate. (iv) Investors contacted.
9 & 10
Pricing and closing
(i) Final terms fixed. (ii) Allocation of securities to investors.
(iii) Final prospectus to be kept ready. (iv) Final listing documents lodged with stock
exchange. (v) Subscription agreement signed.
(vi) Delivery of global certificate. (vii) Closing of documents signed.
(viii) Payments to the issuer. (ix) Tombstone advertisement.
11 & 12
Once a DR program is established, DRs can be freely traded amongst different
investors either on a stock exchange or on the over-the-counter (OTC) market. Clearing
house facilities are essential for an active secondary market of any type of securities. In
the US, Depositor Trust Company (DTC) conducts clearing operations in respect of
transactions related to purchase and sale of ADRs. Euroclear and Clearstream
International provide similar facilities for the GDRs, EDRs and other variants of DRs
traded in the European markets.
When investors want to sell their DRs, they notify their broker. The broker can either
sell the DRs in the market where they are initially issued or sell the shares into the
issuer company’s home market. Secondary market trading in DRs is constituted of two
types of market transactions, viz., the intra-market transaction and the cross-border
transaction.
The intra-market transactions follow the settlement procedures setout for the trading in
domestic securities of the country where DRs are issued. In a typical intra-market
transaction, DR certificates are transferred from the seller’s account to the buyer’s
account. A high liquidity level is necessary for intra-market transaction to get executed.
Most secondary market transactions in ADRs are settled via intra-market trading due to
the high liquidity levels in the ADR markets.
In a cross-border transaction, brokers, either through their own international offices or
through a local broker in the issuer company’s home market, will sell the shares back
into the home market. In order to settle the trade, the broker will surrender the DRs to
the depository bank with instructions to deliver the shares to the buyer in the home
market. The depository bank will cancel the DRs and instruct the custodian to release
the underlying shares and deliver them to the local broker who purchased the shares.
The broker will arrange for the foreign currency to be converted into the appropriate
currency (US dollars or Euro) for payment to the DR holder.
The cross-border transactions in DRs are, typically, executed to take advantage of the
price differentials between the DR prices and the prices of equivalent underlying
domestic shares. Besides, lack of liquidity in DR markets also prompts the cross-border
transactions. Most transactions in the Indian GDRs are executed as cross-border
transactions.
1.2 Types of Depositary Receipt Programs
Issuer Company has the option of issuing one or more types of the available choices of
DR programs. A broader classification of DR programs is on the basis of the countries
where DR programs are issued and or listed. While American Depositary Receipts
(ADRs) are issued and or listed only in the US markets, Global Depositary Receipts
(GDRs) are simultaneously issued and or listed in the more than one market, typically
in the European and US markets. DR programs can also be classified into the following
four categories based on the regulatory complexity of the issuance process, purpose and
the post issuance reporting requirements of the program (Table 2).
(a) Unsponsored American Depositary Receipts.
(b) Sponsored American Depositary Receipts.
(c) Privately Placed Depositary Receipts.
(d) Global Depositary Receipts and Its Variants.
(a) Unsponsored American Depositary Receipts: These are issued by one or more
depositaries in response to market demand but without a formal agreement with the
issuer company. Unsponsored DRs are created in order to satisfy the investors’ demand
for the securities of a particular foreign company. When investors show their buying
interest in the shares of a particular foreign company, broker(s) purchase those shares
listed on the company's home market and request the delivery of the shares to the
depositary bank’s custodian operating in that country. The broker then converts the US
dollars or Euro received from the investor into the corresponding foreign currency in
order to make payment for the purchased shares from the company’s home market. On
the same day custodian notifies the depositary bank that the delivery of the shares has
been received. Upon such notification, DRs are issued and delivered to the initiating
broker(s), who then delivers the DRs to the investor. If the DR facility is established
without the active participation of the issuer company, then the fee payable to the
depositary bank is borne by the holders of unsponsored DRs.
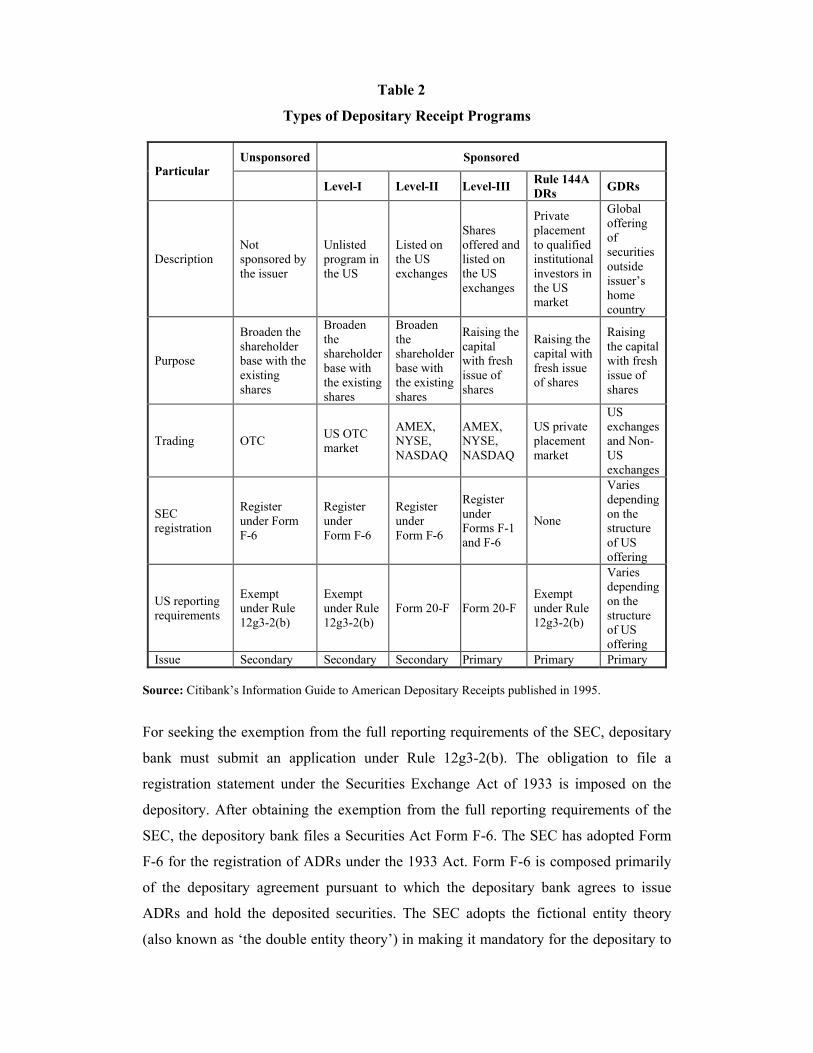
Table 2
Types of Depositary Receipt Programs
Unsponsored Sponsored Particular
Level-I Level-II Level-III Rule 144A DRs GDRs
Description Not sponsored by the issuer
Unlisted program in the US
Listed on the US exchanges
Shares offered and listed on the US exchanges
Private placement to qualified institutional investors in the US market
Global offering of securities outside issuer’s home country
Purpose
Broaden the shareholder base with the existing shares
Broaden the shareholder base with the existing shares
Broaden the shareholder base with the existing shares
Raising the capital with fresh issue of shares
Raising the capital with fresh issue of shares
Raising the capital with fresh issue of shares
Trading OTC US OTC market
AMEX, NYSE, NASDAQ
AMEX, NYSE, NASDAQ
US private placement market
US exchanges and Non-US exchanges
SEC registration
Register under Form F-6
Register under Form F-6
Register under Form F-6
Register under Forms F-1 and F-6
None
Varies depending on the structure of US offering
US reporting requirements
Exempt under Rule 12g3-2(b)
Exempt under Rule 12g3-2(b)
Form 20-F Form 20-F Exempt under Rule 12g3-2(b)
Varies depending on the structure of US offering
Issue Secondary Secondary Secondary Primary Primary Primary Source: Citibank’s Information Guide to American Depositary Receipts published in 1995.
For seeking the exemption from the full reporting requirements of the SEC, depositary
bank must submit an application under Rule 12g3-2(b). The obligation to file a
registration statement under the Securities Exchange Act of 1933 is imposed on the
depository. After obtaining the exemption from the full reporting requirements of the
SEC, the depository bank files a Securities Act Form F-6. The SEC has adopted Form
F-6 for the registration of ADRs under the 1933 Act. Form F-6 is composed primarily
of the depositary agreement pursuant to which the depositary bank agrees to issue
ADRs and hold the deposited securities. The SEC adopts the fictional entity theory
(also known as ‘the double entity theory’) in making it mandatory for the depositary to
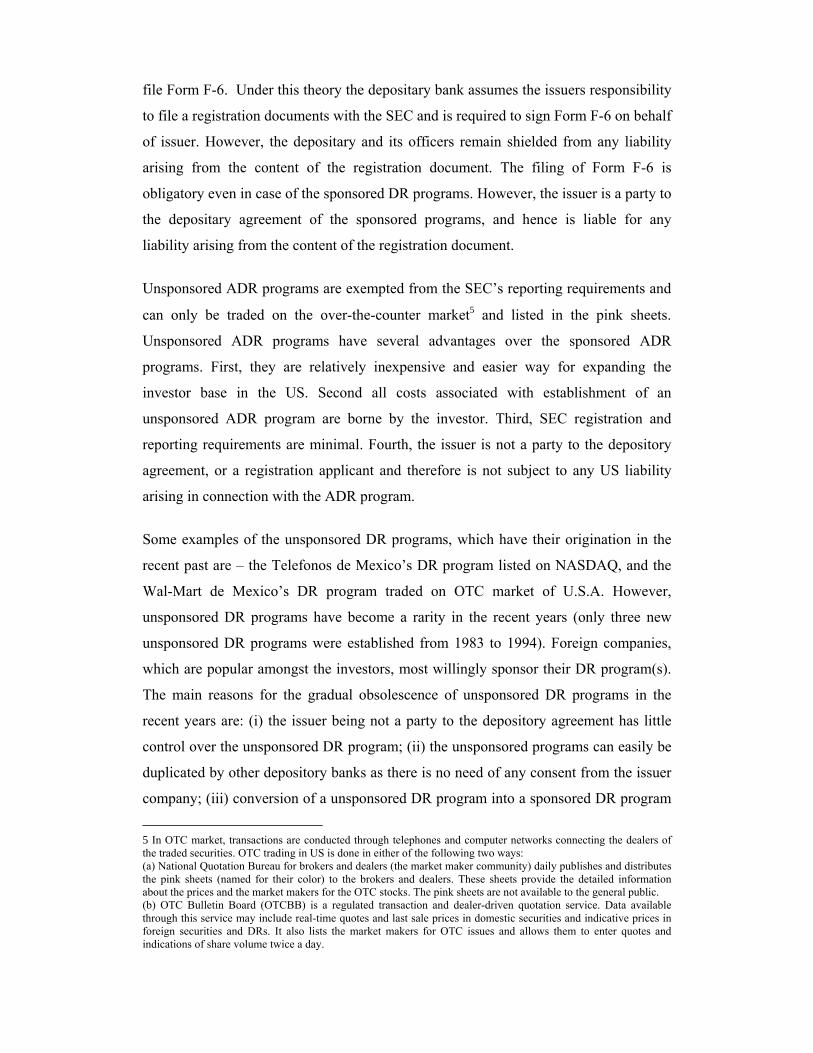
file Form F-6. Under this theory the depositary bank assumes the issuers responsibility
to file a registration documents with the SEC and is required to sign Form F-6 on behalf
of issuer. However, the depositary and its officers remain shielded from any liability
arising from the content of the registration document. The filing of Form F-6 is
obligatory even in case of the sponsored DR programs. However, the issuer is a party to
the depositary agreement of the sponsored programs, and hence is liable for any
liability arising from the content of the registration document.
Unsponsored ADR programs are exempted from the SEC’s reporting requirements and
can only be traded on the over-the-counter market5 and listed in the pink sheets.
Unsponsored ADR programs have several advantages over the sponsored ADR
programs. First, they are relatively inexpensive and easier way for expanding the
investor base in the US. Second all costs associated with establishment of an
unsponsored ADR program are borne by the investor. Third, SEC registration and
reporting requirements are minimal. Fourth, the issuer is not a party to the depository
agreement, or a registration applicant and therefore is not subject to any US liability
arising in connection with the ADR program.
Some examples of the unsponsored DR programs, which have their origination in the
recent past are – the Telefonos de Mexico’s DR program listed on NASDAQ, and the
Wal-Mart de Mexico’s DR program traded on OTC market of U.S.A. However,
unsponsored DR programs have become a rarity in the recent years (only three new
unsponsored DR programs were established from 1983 to 1994). Foreign companies,
which are popular amongst the investors, most willingly sponsor their DR program(s).
The main reasons for the gradual obsolescence of unsponsored DR programs in the
recent years are: (i) the issuer being not a party to the depository agreement has little
control over the unsponsored DR program; (ii) the unsponsored programs can easily be
duplicated by other depository banks as there is no need of any consent from the issuer
company; (iii) conversion of a unsponsored DR program into a sponsored DR program
5 In OTC market, transactions are conducted through telephones and computer networks connecting the dealers of the traded securities. OTC trading in US is done in either of the following two ways: (a) National Quotation Bureau for brokers and dealers (the market maker community) daily publishes and distributes the pink sheets (named for their color) to the brokers and dealers. These sheets provide the detailed information about the prices and the market makers for the OTC stocks. The pink sheets are not available to the general public. (b) OTC Bulletin Board (OTCBB) is a regulated transaction and dealer-driven quotation service. Data available through this service may include real-time quotes and last sale prices in domestic securities and indicative prices in foreign securities and DRs. It also lists the market makers for OTC issues and allows them to enter quotes and indications of share volume twice a day.
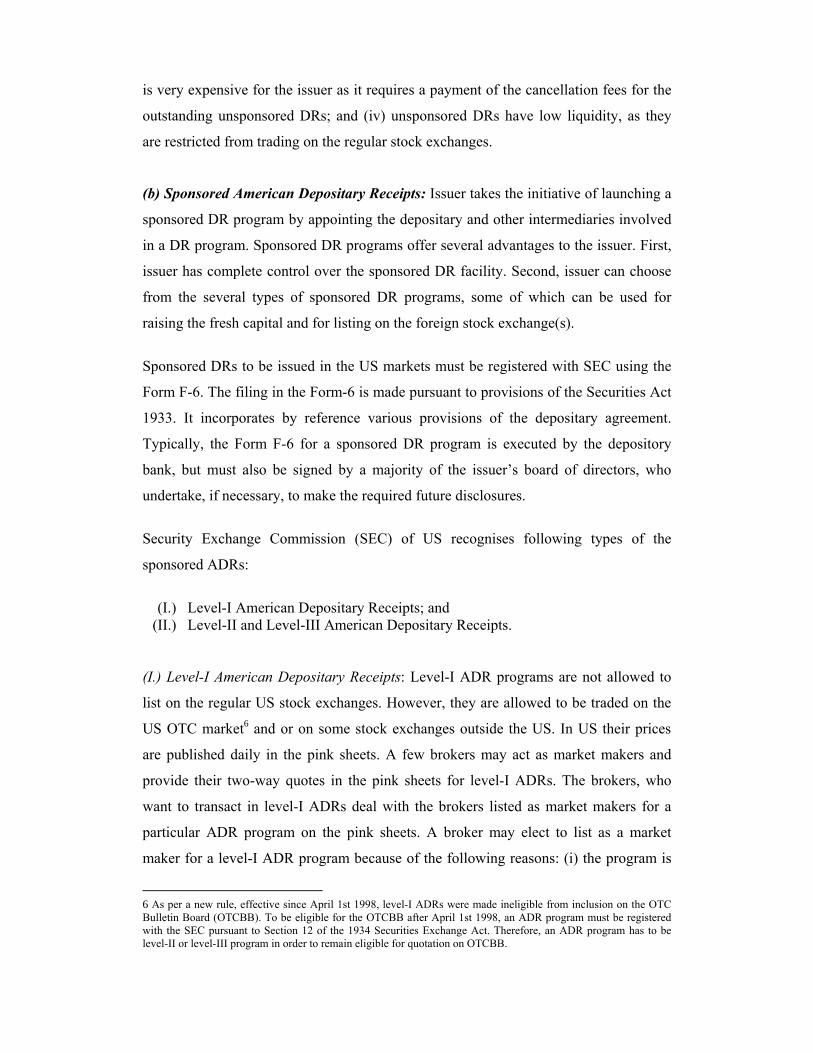
is very expensive for the issuer as it requires a payment of the cancellation fees for the
outstanding unsponsored DRs; and (iv) unsponsored DRs have low liquidity, as they
are restricted from trading on the regular stock exchanges.
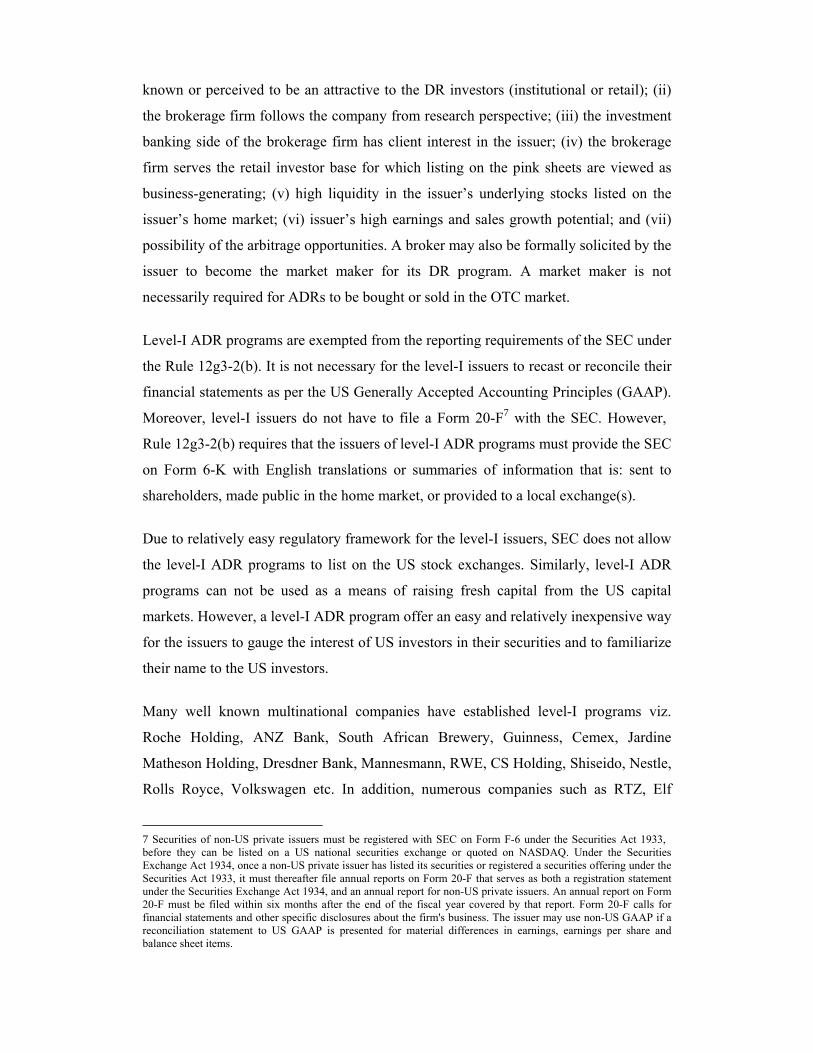
(b) Sponsored American Depositary Receipts: Issuer takes the initiative of launching a
sponsored DR program by appointing the depositary and other intermediaries involved
in a DR program. Sponsored DR programs offer several advantages to the issuer. First,
issuer has complete control over the sponsored DR facility. Second, issuer can choose
from the several types of sponsored DR programs, some of which can be used for
raising the fresh capital and for listing on the foreign stock exchange(s).
Sponsored DRs to be issued in the US markets must be registered with SEC using the
Form F-6. The filing in the Form-6 is made pursuant to provisions of the Securities Act
1933. It incorporates by reference various provisions of the depositary agreement.
Typically, the Form F-6 for a sponsored DR program is executed by the depository
bank, but must also be signed by a majority of the issuer’s board of directors, who
undertake, if necessary, to make the required future disclosures.
Security Exchange Commission (SEC) of US recognises following types of the
sponsored ADRs:
(I.) Level-I American Depositary Receipts; and
(II.) Level-II and Level-III American Depositary Receipts.
(I.) Level-I American Depositary Receipts: Level-I ADR programs are not allowed to
list on the regular US stock exchanges. However, they are allowed to be traded on the
US OTC market6 and or on some stock exchanges outside the US. In US their prices
are published daily in the pink sheets. A few brokers may act as market makers and
provide their two-way quotes in the pink sheets for level-I ADRs. The brokers, who
want to transact in level-I ADRs deal with the brokers listed as market makers for a
particular ADR program on the pink sheets. A broker may elect to list as a market
maker for a level-I ADR program because of the following reasons: (i) the program is
6 As per a new rule, effective since April 1st 1998, level-I ADRs were made ineligible from inclusion on the OTC Bulletin Board (OTCBB). To be eligible for the OTCBB after April 1st 1998, an ADR program must be registered with the SEC pursuant to Section 12 of the 1934 Securities Exchange Act. Therefore, an ADR program has to be level-II or level-III program in order to remain eligible for quotation on OTCBB.
known or perceived to be an attractive to the DR investors (institutional or retail); (ii)
the brokerage firm follows the company from research perspective; (iii) the investment
banking side of the brokerage firm has client interest in the issuer; (iv) the brokerage
firm serves the retail investor base for which listing on the pink sheets are viewed as
business-generating; (v) high liquidity in the issuer’s underlying stocks listed on the
issuer’s home market; (vi) issuer’s high earnings and sales growth potential; and (vii)
possibility of the arbitrage opportunities. A broker may also be formally solicited by the
issuer to become the market maker for its DR program. A market maker is not
necessarily required for ADRs to be bought or sold in the OTC market.
Level-I ADR programs are exempted from the reporting requirements of the SEC under
the Rule 12g3-2(b). It is not necessary for the level-I issuers to recast or reconcile their
financial statements as per the US Generally Accepted Accounting Principles (GAAP).
Moreover, level-I issuers do not have to file a Form 20-F7 with the SEC. However,
Rule 12g3-2(b) requires that the issuers of level-I ADR programs must provide the SEC
on Form 6-K with English translations or summaries of information that is: sent to
shareholders, made public in the home market, or provided to a local exchange(s).
Due to relatively easy regulatory framework for the level-I issuers, SEC does not allow
the level-I ADR programs to list on the US stock exchanges. Similarly, level-I ADR
programs can not be used as a means of raising fresh capital from the US capital
markets. However, a level-I ADR program offer an easy and relatively inexpensive way
for the issuers to gauge the interest of US investors in their securities and to familiarize
their name to the US investors.
Many well known multinational companies have established level-I programs viz.
Roche Holding, ANZ Bank, South African Brewery, Guinness, Cemex, Jardine
Matheson Holding, Dresdner Bank, Mannesmann, RWE, CS Holding, Shiseido, Nestle,
Rolls Royce, Volkswagen etc. In addition, numerous companies such as RTZ, Elf
7 Securities of non-US private issuers must be registered with SEC on Form F-6 under the Securities Act 1933, before they can be listed on a US national securities exchange or quoted on NASDAQ. Under the Securities Exchange Act 1934, once a non-US private issuer has listed its securities or registered a securities offering under the Securities Act 1933, it must thereafter file annual reports on Form 20-F that serves as both a registration statement under the Securities Exchange Act 1934, and an annual report for non-US private issuers. An annual report on Form 20-F must be filed within six months after the end of the fiscal year covered by that report. Form 20-F calls for financial statements and other specific disclosures about the firm's business. The issuer may use non-US GAAP if a reconciliation statement to US GAAP is presented for material differences in earnings, earnings per share and balance sheet items.
Aquitaine, Glaxo Wellcome, Western Mining, Hanson, Medeva, Bank of Ireland,
Astra, Telebrás and Ashanti Gold Fields Company Ltd. started with a level-I program
and have upgraded to a level-II or level-III program.
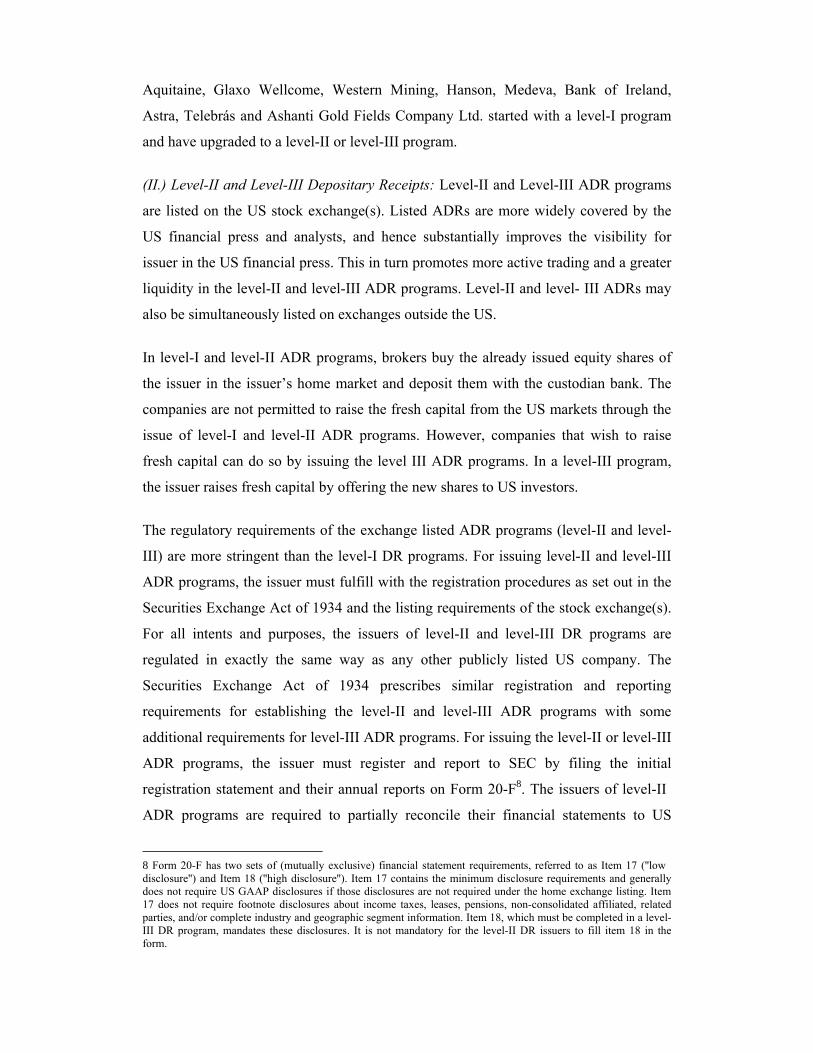
(II.) Level-II and Level-III Depositary Receipts: Level-II and Level-III ADR programs
are listed on the US stock exchange(s). Listed ADRs are more widely covered by the
US financial press and analysts, and hence substantially improves the visibility for
issuer in the US financial press. This in turn promotes more active trading and a greater
liquidity in the level-II and level-III ADR programs. Level-II and level- III ADRs may
also be simultaneously listed on exchanges outside the US.
In level-I and level-II ADR programs, brokers buy the already issued equity shares of
the issuer in the issuer’s home market and deposit them with the custodian bank. The
companies are not permitted to raise the fresh capital from the US markets through the
issue of level-I and level-II ADR programs. However, companies that wish to raise
fresh capital can do so by issuing the level III ADR programs. In a level-III program,
the issuer raises fresh capital by offering the new shares to US investors.
The regulatory requirements of the exchange listed ADR programs (level-II and level-
III) are more stringent than the level-I DR programs. For issuing level-II and level-III
ADR programs, the issuer must fulfill with the registration procedures as set out in the
Securities Exchange Act of 1934 and the listing requirements of the stock exchange(s).
For all intents and purposes, the issuers of level-II and level-III DR programs are
regulated in exactly the same way as any other publicly listed US company. The
Securities Exchange Act of 1934 prescribes similar registration and reporting
requirements for establishing the level-II and level-III ADR programs with some
additional requirements for level-III ADR programs. For issuing the level-II or level-III
ADR programs, the issuer must register and report to SEC by filing the initial
registration statement and their annual reports on Form 20-F8. The issuers of level-II
ADR programs are required to partially reconcile their financial statements to US
8 Form 20-F has two sets of (mutually exclusive) financial statement requirements, referred to as Item 17 (''low disclosure'') and Item 18 (''high disclosure''). Item 17 contains the minimum disclosure requirements and generally does not require US GAAP disclosures if those disclosures are not required under the home exchange listing. Item 17 does not require footnote disclosures about income taxes, leases, pensions, non-consolidated affiliated, related parties, and/or complete industry and geographic segment information. Item 18, which must be completed in a level-III DR program, mandates these disclosures. It is not mandatory for the level-II DR issuers to fill item 18 in the form.
GAAP. However, there is no need for individual business segments of the issuer to
reconcile their financial statements to the US GAAP.
The additional requirements for the level-III ADR program are as follows. First, the
issuer must submit Form F-1 to the SEC to register the underlying securities to be
offered under level-III ADR program. Second, the issuer has to fully reconcile its
financial statements to US GAAP so as to fulfill the requirements of filing of Form 20-
F (or include US GAAP financials).
(c) Privately Placed - Rule 144A Depositary Receipts (RADRs): Private placement of
ADRs is a comparatively cheaper and faster mode of raising the capital than the level-
III ADR offerings. Issuers, therefore, often raise the capital through the private
placement of sponsored DRs in the foreign markets. A non-US issuer can privately
place its ADRs with the US investors pursuant to the Regulation D and Rule 144A.
Regulation D, adopted by SEC in 1982, establishes certain conditions under which a
securities offering made in US territory is considered a private offering, and is therefore
not subject to the requirements of advance filing with the SEC and provision of a
prospectus. Under Rule 144A, adopted by SEC in April 1990, non-US firms are
allowed to privately place their ADRs for trading among the qualified institutional
buyers (QIBs) in US. As per Rule 144A, a QIB is (i) any institution that owns and
invests on a discretionary basis not less than US $100 million in securities of issuers
that are not affiliated to it or (ii) an entity entirely owned by the QIBs. Rule 144A
greatly increased the liquidity of privately placed securities by allowing QIBs to resell
the RADRs privately to the other QIBs without any holding period requirement.
RADRs offerings are exempted from certain disclosure and reporting requirements
designed to protect individual investors, such as prospectus delivery and periodic
financial reporting. Securities offered in the Rule 144A market do not have to be
registered under the Securities Act and issuers do not have to comply with the periodic
reporting requirements of the Exchange Act.
To float ADRs under Rule 144A it is necessary that the same class of securities have
not been listed on a US securities exchange or quoted on NASDAQ, at the time of
issuance of securities under Rule 144A. This condition is applied to prevent the
development of dual markets for the same security. The prohibition of resale of shares
to non-QIBs expires after three years, and the shares can then be traded on the broader
level-I OTC market. The seller of the RADRs must take reasonable steps to ensure that
purchaser is aware of seller’s reliance on the exemption from the registration
requirements of the Securities Act. Rule 144A also requires that the security holder and
holder’s prospective purchaser must have the right to obtain from foreign private issuer,
at the request of the holder, a reasonably current brief statement of the issuer’s
business, products and services; and the issuer’s most recent balance sheet, profit and
loss statements, retained earnings statements, and similar financial statements for the
prior two years. This information need not be prepared in accordance with US GAAP.
The process of doing private a placement involves the drafting of an offering circular
that in general has the same content as a prospectus. It is to provide information about
the company and the issuing securities. As the offering circular is not subject to the
SEC registration, the disclosure of the financial information provided therein must
comply only with accounting principles of the issuer’s home country and is primarily
product of negotiations of the issuer and the investment banker. Typically, the issuer
includes in the offering circular a set of financial statements which, although are
prepared in accordance with the accounting principles of the issuer’s home country, are
“Americanized” in terms of style and presentation. In addition, the issuer may provide
reconciliation to the US GAAP of the most significant financial data.
RADRs are traded by US market makers on a private screen-based listing service
system known as PORTAL9 administered by the National Association of Securities
Dealers (NASD). Secondary trading of the Rule 144A securities involves substantial
paperwork, associated with the necessity of proving eligibility of securities for the Rule
144A exemption and eligibility of the buyers to participate in the transactions. Rule
144A allows the issuer to raise only a relatively small amount of money (US $30-$50
millions). However, issuing of RADRs allows foreign issuers to assess investor appetite
for their securities before listing or publicly offering their DRs to the full spectrum of
US investors.
An issuer may have non-US tranche of its RADR program privately placed in the US
markets. While the US portion is structured as a private offering in accordance with 9 PORTAL is an acronym for Private Offerings, Re-sales and Trading through Automated Linkages
Rule 144A, the non–US tranche may be sold to non-US investors in reliance with
Regulation S of the Securities Act.
Regulation S, adopted by SEC in 1990, specifically allows an issuer to make a private
offering in the US concurrently with an offering not registered under the Securities Act
outside US. Regulation S clarifies the conditions under which an issue is considered to
be made outside the US, and hence not subjected to SEC regulations.
An issue is considered to be made outside the US when the following three conditions
are met: (i) the buyer is outside US territory; (ii) the securities are not offered or
advertised in the US; and (iii) during a specific period (up to one year depending on
how much interest there is in the securities in the US) the securities are not offered,
advertised or sold to US investors directly or indirectly, with the exception of QIBs.
The GDR structures described later have been developed to enable the non-US issuer to
make a global offering in reliance on Regulation S.
In early 1990s SEC created a regulation that allows a non-US issuer to establish a
registered and non-restricted level-I ADR program along with the RADRs for the same
class of underlying stock. This facility is termed as "side-by-side".
(d) Global Depositary Receipts and Its Variants: During 1990s, the surge in capital
raised through DR programs prompted the emerging markets issuers to create several
innovative DR programs. Emerging markets issuers realized that there are numerous
advantages of floating DR programs on the less stringent European markets or
elsewhere. Floating a GDR program on the European market is easier and faster than
floating an ADR program on the US market. Issuer does not have to fulfill the onerous
regulatory requirements of SEC. This prompted the development of GDR programs and
their several variants, for example, Euro Depositary Receipt (EDR), Retail Depositary
Receipt (RDR) and Singapore Depositary Receipt (SDR) programs (Kulikov, 2000).
Citibank introduced the first GDR program in December 1990 for the Samsung
International, a Korean company.
GDRs allow an issuer to raise capital simultaneously in multiple markets through a
global offering. GDR issues have a wider geographical coverage vis-à-vis an ADR or
an EDR or SDR issue. A GDR offering allows the issuer to broaden shareholder base
by simultaneously accessing the several capital markets outside their home market. In
past GDR issues have concurrently been done in Europe and America. A number of
GDR programs are listed at LSE and LxSE. While individual and institutional investors
invest in ADRs, only the latter buy GDRs. Some GDR programs have a parallel 144A
facility. If there is no 144A facility, the 40-day rule applies that enables US investors to
invest in any DR issue done outside US. The 40-day rule provides that if a foreign issue
is "seasoned", then US investors can purchase it on the foreign market. The big hurdle
is whether the foreign market allows foreigners to invest.
GDRs are traded over-the-counter, by telephone or by screen, although many GDR
programs are also listed in London or Luxembourg exchanges. Most GDR offerings
consist of a US tranche that may be a level-III ADR program or privately placed RADR
program. The non-US tranche is sold outside the US (typically in the European
markets) in accordance with Regulation S.
There are many variations for structuring GDR issues. For example, global offerings
have used GDRs that are listed on the NYSE and there have been several GDR
offerings with no US component. The flexibility of the GDR structure has made it a
popular and rapidly growing capital-raising tool. GDRs can be issued in either the
public or private markets in the US or other countries. The links that exist between
Euroclear and Clearstream International in Europe and DTC in the US allow for
efficient and trouble-free settlement of securities between these two major markets.
Several region-specific DR programs have also evolved during the 1990s. An issuer
can establish a DR program that taps only Singapore, European, Asian and/or Latin
American investors and does not offer shares in the US. Such DRs allow the issuers to
choose the investor base they wish to access. SDRs are traded on the Singapore Stock
Exchange. They enable the issuers to establish their presence in the Singapore capital
market. SDRs also position an issuer to benefit from future growth in the Asia/Pacific
region. Daimler-Benz AG was the first company to establish a SDR program in May
1994.
Similarly, EDRs are designed to attract new capital and investors from within the Euro
community. EDRs are priced in euros and all distributions (dividends, stock splits, and
rights issues) are made in euros. The potential market for EDRs includes: institutional
investors diversifying holdings from EU issuers into favorable global sectors; and
individual investors adopting an equity culture, and seeking global renowned issuers.
EDRs can be listed or traded on exchanges such as London, Luxembourg, Paris,
Frankfurt, Brussels, Amsterdam and Vienna.
Lately many new stock exchanges have started listing DR programs viz., Berlin,
Frankfurt, Munich, Toronto, Budapest, Brussels, Johannesburg and Amsterdam. There
are other stock exchanges that are giving a serious consideration for allowing the
foreign companies to list their DRs on these exchanges viz., Hong Kong, Shanghai,
ShenZen and Bombay Stock Exchange.
II. Evolution and Growth of DR Markets
In this section, we first present a historical perspective of growth and evolution of DR
markets in the international arena. Next, we discuss the Indian DR programs and
provide the regulatory framework for Indian firms to issue and list their DR programs
on the foreign markets. Important statistics and major trends for the Indian DR
programs are also covered.
2.1 International Scenario Initial DR programs were originally developed to address the concerns of US investors,
interested in investing internationally. Prior to the introduction of ADRs, US investors
were reluctant to invest directly in offshore securities because of the cumbersome
buying and settlement procedures. In 1927, Morgan Guarantee Trust of New York
(predecessor of current bank J.P. Morgan) created the first ever ADR program for a UK
retailer ‘Selfridge Provincial Stores Limited’. Another 17 ADR programs were opened
around that time and three of them still survive viz., BAT Industries, Cortlaulds plc,
and The General Electric Company. Introduction of ADRs eased the process of
investing in the UK stocks for the US investors.
The early growth, wherein 18 ADR programs were established, came to an abrupt halt
at the time when stock markets crashed in 1929. Following the recovery from market
crash, the Great Depression of 1933 adversely affected the demand for fresh capital. By
the time the demand for fresh capital again started to pick up, the outbreak of World
War II led to the institution of extensive capital controls, in 1939. These controls made
it illegal to sell domestic securities to foreigners, as well as to buy foreign securities.
Therefore, until early 1950s no fresh ADR programs were established.
In its present form ADRs came into existence in 1955, when the SEC introduced its
Form S-12 for registering all ADR programs. Australian and South African mining
companies were the first to introduce DRs in a form as they exist today. Subsequently
several Japanese firm also issued ADRs during 1960s. In 1970s and 1980s several more
firms from other countries also adopted the DR route for raising capital and/or listing in
major capital markets. During 1970s and 1980s a few countries also allowed the
domestic companies to directly sell and list their equity stocks on the foreign markets.
During 1990s there was a spurt in number of DR programs (also an increase in number
of cross-listed equity issues) due to the following reasons. First, the regulatory changes
introduced by SEC during 1990s attracted fresh foreign issuers to the US markets.
Under Rule 144A, institutional buyers were exempted from a requirement to hold
privately placed securities for two years before trading them. This increased the
liquidity and marketability of privately-placed ADRs (Mullin, 1993). Second, London
Stock Exchange (LSE) in 1994 introduced regulations which enable foreign-issuers to
list sterling denominated DR programs on the exchange. Subsequently, the mandatory
requirement for all foreign-issuers to list their DR programs on LSE was also removed.
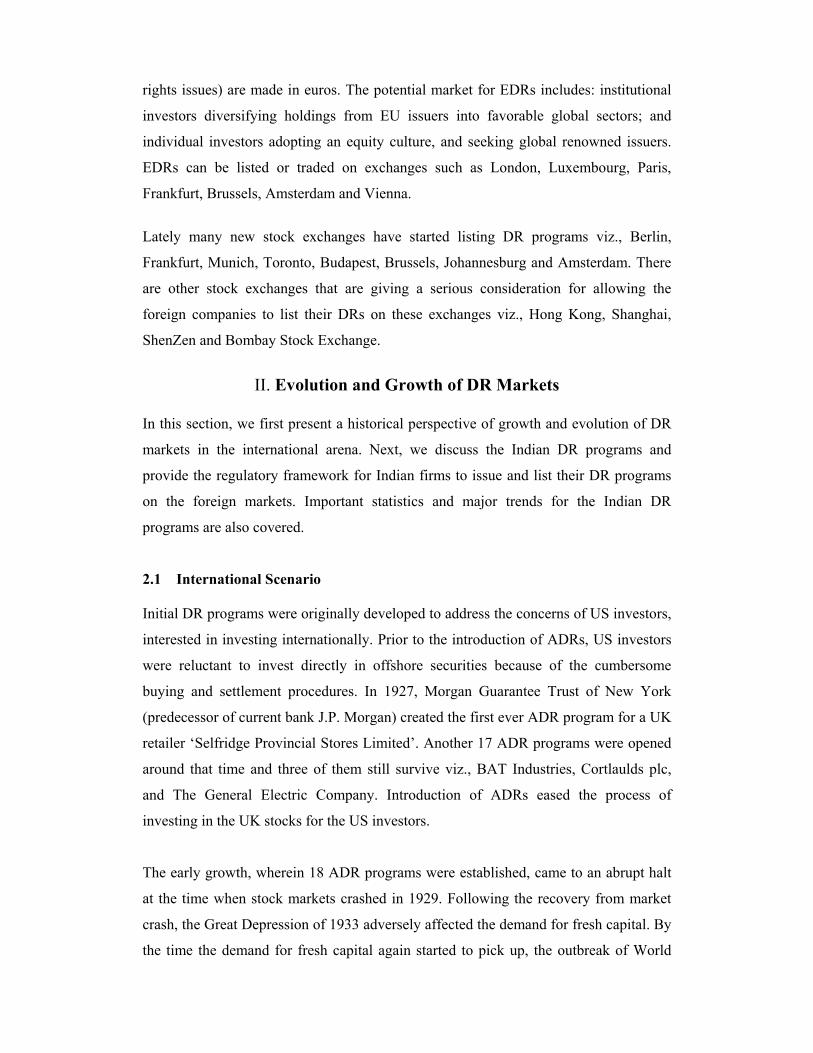
Third, the massive wave of privatizations of public enterprises during
1990s also contributed to growth in number of international offerings (Figure 2).
Among the 650 major privatizations during 1990s, about 150 involved an equity issue
on non-domestic markets, yielding an approximately $52 billions Government revenue
(Source: Privatisation International).
The following facts are indicative of the growth experienced by DR market during
1990s (BONY, 2000, 2001, and 2002):
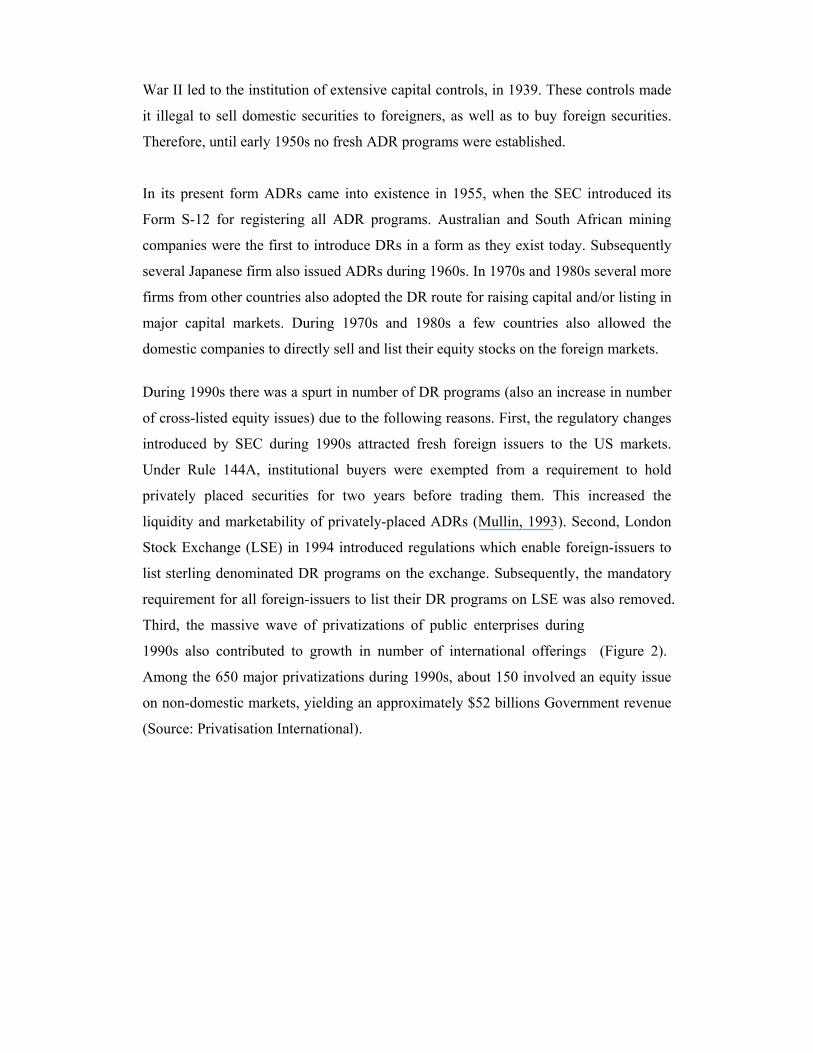
(a) US investment in the foreign equity has increased from US $279 billions during
1991 to US $1943 billion during 2001 (Figure 3).
(b) The number of ADR programs listed on three major stock exchanges of US,
viz., NYSE, NASDAQ and AMEX has increased from 215 in 1992 to 623 in
2001 (Figure 4). Similarly, the total number of DR programs has grown from
924 in 1992 to over 1558 programs in December 2001. The number of countries
that have issued their DR programs has gone up from 24 in 1990 to 78 in 2001.
Till 1981 there were only five countries, viz., Hong Kong, South Africa, Japan,
Australia and the United Kingdom that had any DR program.
(c) The total annual trading volumes in listed DRs increased from $125 billions in
1992 to $1185 billions in 2000 at compound annual growth rate of 32.5 percent
(Figure 5). Though annual trading during 2001 has fallen to $752 dollars due
to the recessionary phase in the world economy.
(d) Number of public DR programs has increased from an annual average of 47
programs during the 1992-1995 to 63 programs during 1996-2001. Similarly the
average annual dollar amount raised through public DR programs has increased
from $8572 millions during 1992-1995 to $13995 millions during 1996-2001.
(e) Total global market capitalization of companies that have DR programs exceeds
$6 trillion at the close of 1999.
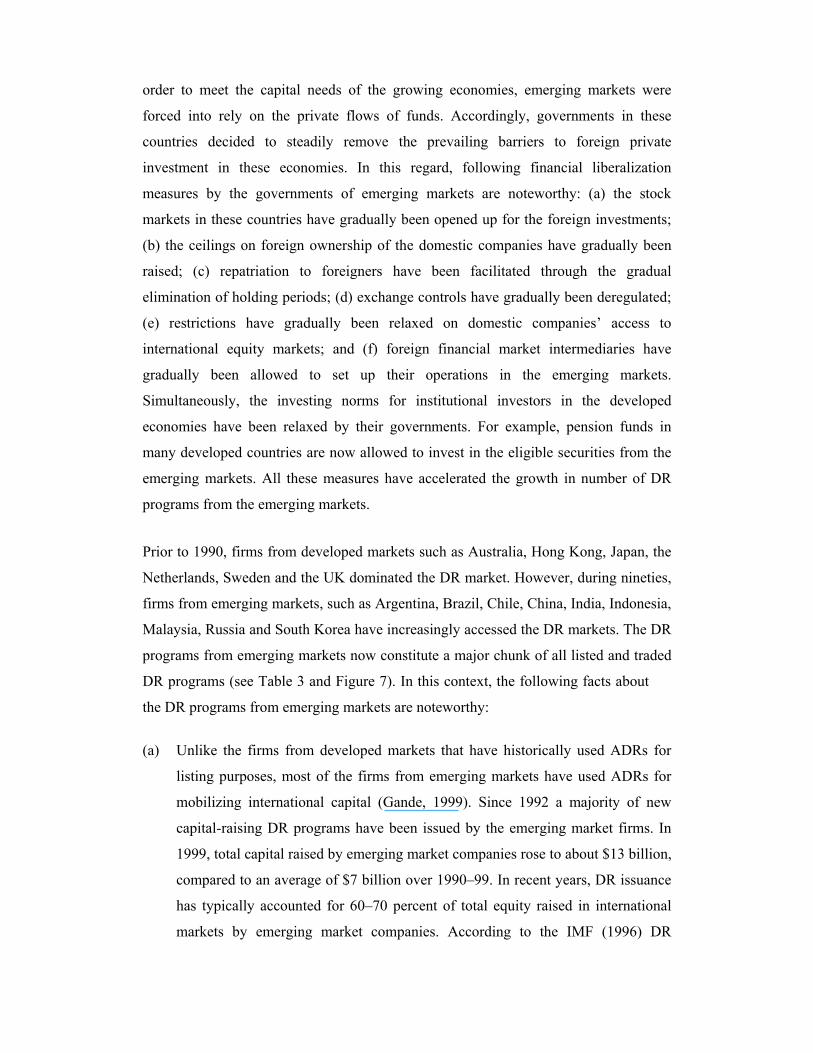
(f) There is an upward trend in the percentage of equity value traded in form of DR
programs in the foreign markets (Figure 6).
Figure 2 Privatization Deals on Global vs. Domestic Markets (1977-1997)
International Privatization Offerings, Domestic Privatization Offerings
Note: Data in this chart refer to privatization in OECD and non-OECD countries. Source: Privatisation International Yearbook 1999 (Annual supplement to Privatisation International,
London.)
Figure 3 US Investment in Foreign Equities (US $ Billions)
0500
10001500200025003000
1991
1993
1995
1997
1999
2001
2003P
US Investment in Foreign Equities
Note: 2002P and 2003P signifies that figure for these two years are provisional Source: Federal Reserve, “Flow of Funds Accounts of the United States” 3Q 99
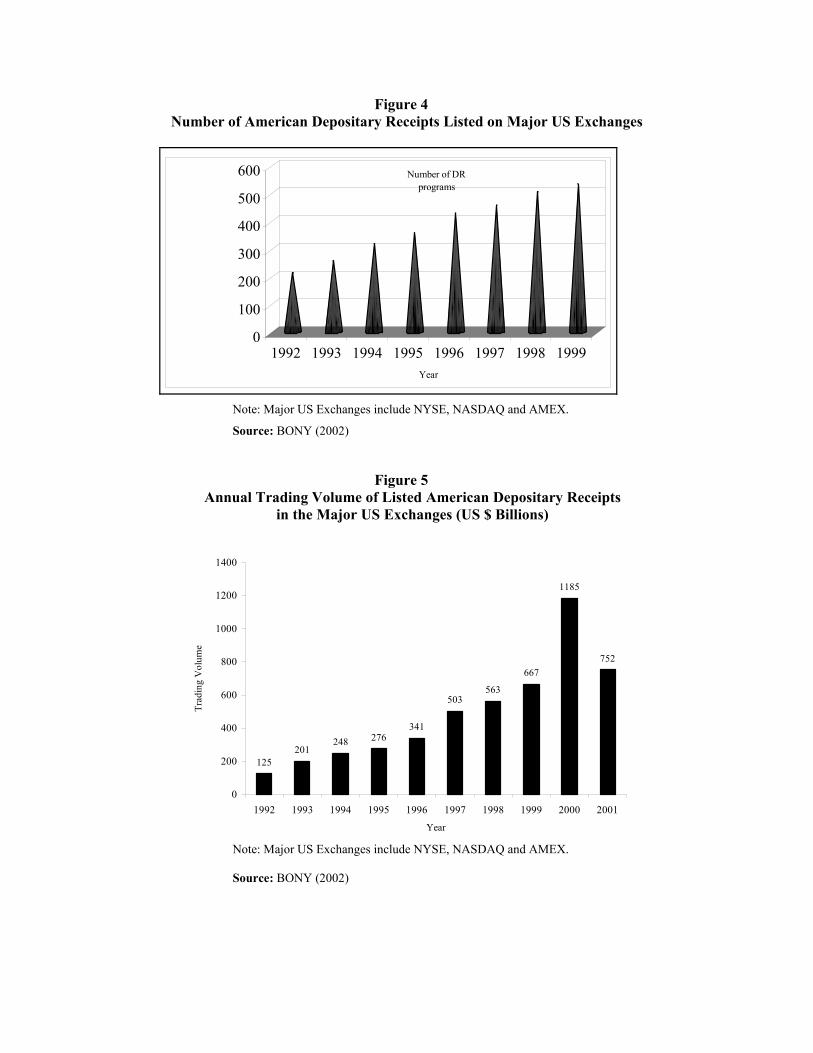
Figure 4
Number of American Depositary Receipts Listed on Major US Exchanges
0
100
200
300
400
500
600 Number of DR programs
1992 1993 1994 1995 1996 1997 1998 1999Year
Note: Major US Exchanges include NYSE, NASDAQ and AMEX.
Source: BONY (2002)
Figure 5 Annual Trading Volume of Listed American Depositary Receipts
in the Major US Exchanges (US $ Billions)
201248 276
341
503563
667
1185
752
125
0
200
400
600
800
1000
1200
1400
1992 1993 1994 1995 1996 1997 1998 1999 2000 2001
Year
Trad
ing
Vol
ume
Note: Major US Exchanges include NYSE, NASDAQ and AMEX.
Source: BONY (2002)
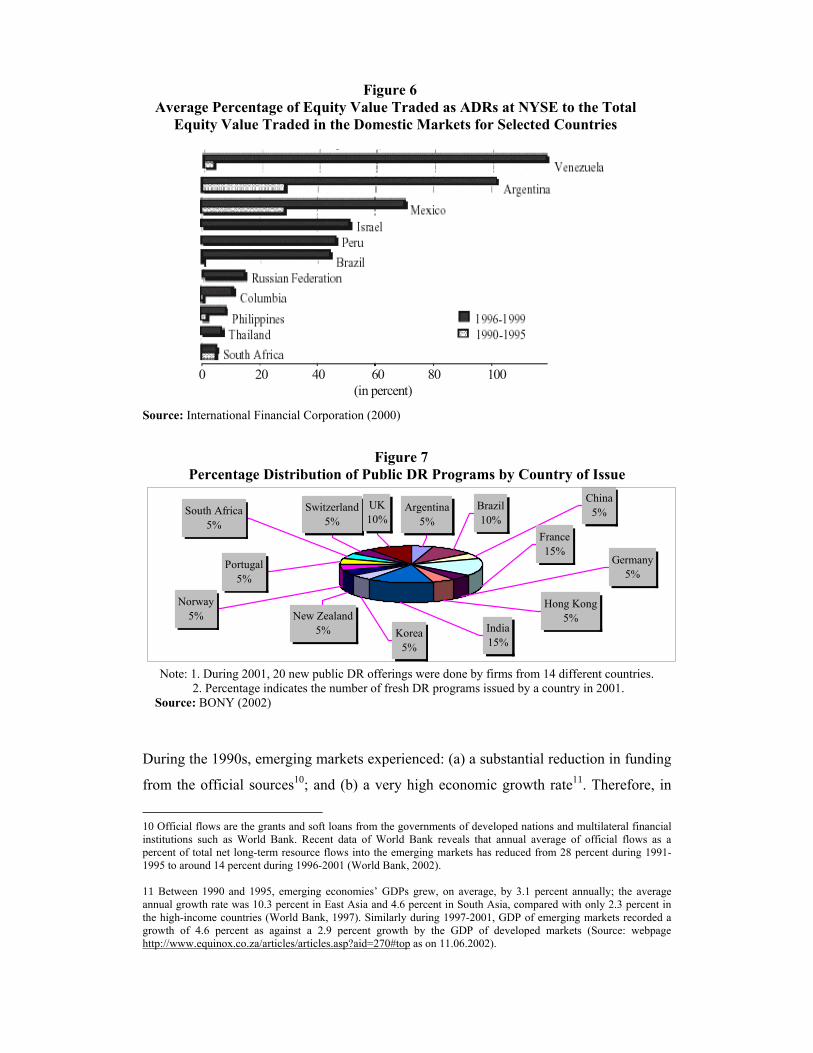
Figure 6 Average Percentage of Equity Value Traded as ADRs at NYSE to the Total
Equity Value Traded in the Domestic Markets for Selected Countries
0 20 40 60 80 100 (in percent) Source: International Financial Corporation (2000)
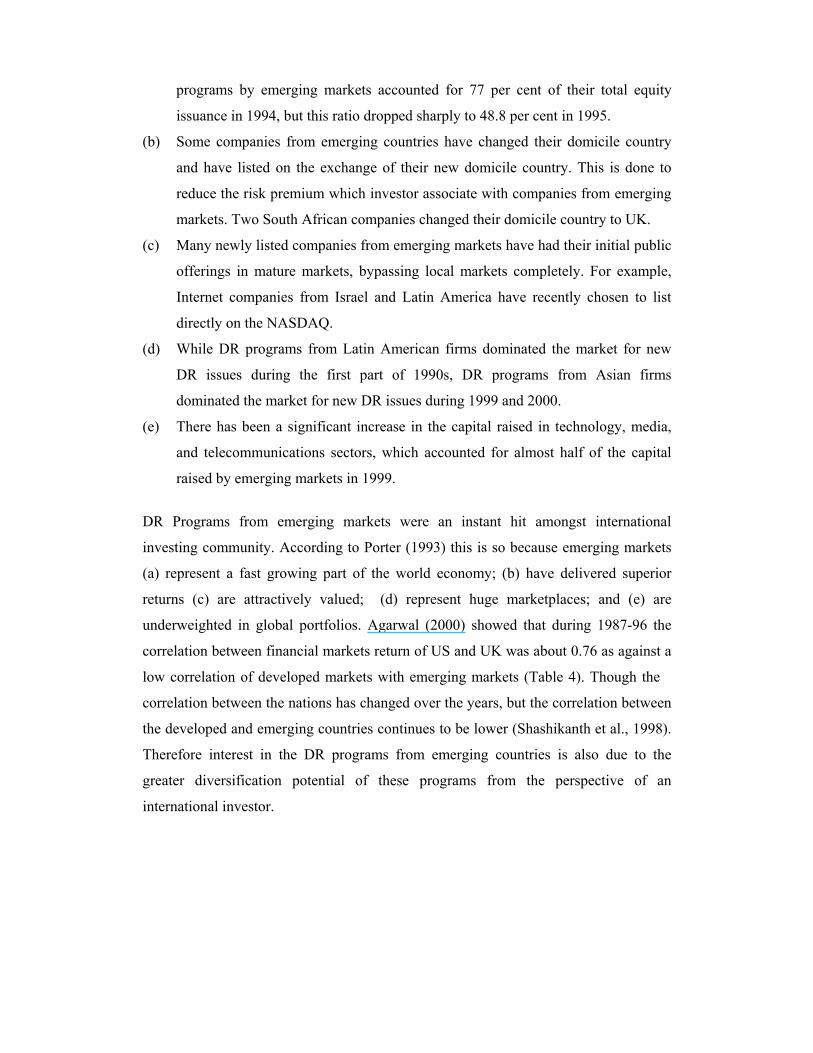
Figure 7 Percentage Distribution of Public DR Programs by Country of Issue
Germany5%
Hong Kong5%
India15%
Korea5%
New Zealand5%
Norway5%
Portugal5%
South Africa5%
Switzerland5%
UK10%
Argentina5%
Brazil10%
China5%
France15%
Note: 1. During 2001, 20 new public DR offerings were done by firms from 14 different countries. 2. Percentage indicates the number of fresh DR programs issued by a country in 2001.
Source: BONY (2002)
During the 1990s, emerging markets experienced: (a) a substantial reduction in funding
from the official sources10; and (b) a very high economic growth rate11. Therefore, in
10 Official flows are the grants and soft loans from the governments of developed nations and multilateral financial institutions such as World Bank. Recent data of World Bank reveals that annual average of official flows as a percent of total net long-term resource flows into the emerging markets has reduced from 28 percent during 1991-1995 to around 14 percent during 1996-2001 (World Bank, 2002). 11 Between 1990 and 1995, emerging economies’ GDPs grew, on average, by 3.1 percent annually; the average annual growth rate was 10.3 percent in East Asia and 4.6 percent in South Asia, compared with only 2.3 percent in the high-income countries (World Bank, 1997). Similarly during 1997-2001, GDP of emerging markets recorded a growth of 4.6 percent as against a 2.9 percent growth by the GDP of developed markets (Source: webpage http://www.equinox.co.za/articles/articles.asp?aid=270#top as on 11.06.2002).
order to meet the capital needs of the growing economies, emerging markets were
forced into rely on the private flows of funds. Accordingly, governments in these
countries decided to steadily remove the prevailing barriers to foreign private
investment in these economies. In this regard, following financial liberalization
measures by the governments of emerging markets are noteworthy: (a) the stock
markets in these countries have gradually been opened up for the foreign investments;
(b) the ceilings on foreign ownership of the domestic companies have gradually been
raised; (c) repatriation to foreigners have been facilitated through the gradual
elimination of holding periods; (d) exchange controls have gradually been deregulated;
(e) restrictions have gradually been relaxed on domestic companies’ access to
international equity markets; and (f) foreign financial market intermediaries have
gradually been allowed to set up their operations in the emerging markets.
Simultaneously, the investing norms for institutional investors in the developed
economies have been relaxed by their governments. For example, pension funds in
many developed countries are now allowed to invest in the eligible securities from the
emerging markets. All these measures have accelerated the growth in number of DR
programs from the emerging markets.
Prior to 1990, firms from developed markets such as Australia, Hong Kong, Japan, the
Netherlands, Sweden and the UK dominated the DR market. However, during nineties,
firms from emerging markets, such as Argentina, Brazil, Chile, China, India, Indonesia,
Malaysia, Russia and South Korea have increasingly accessed the DR markets. The DR
programs from emerging markets now constitute a major chunk of all listed and traded
DR programs (see Table 3 and Figure 7). In this context, the following facts about
the DR programs from emerging markets are noteworthy:
(a) Unlike the firms from developed markets that have historically used ADRs for
listing purposes, most of the firms from emerging markets have used ADRs for
mobilizing international capital (Gande, 1999). Since 1992 a majority of new
capital-raising DR programs have been issued by the emerging market firms. In
1999, total capital raised by emerging market companies rose to about $13 billion,
compared to an average of $7 billion over 1990–99. In recent years, DR issuance
has typically accounted for 60–70 percent of total equity raised in international
markets by emerging market companies. According to the IMF (1996) DR
programs by emerging markets accounted for 77 per cent of their total equity
issuance in 1994, but this ratio dropped sharply to 48.8 per cent in 1995.
(b) Some companies from emerging countries have changed their domicile country
and have listed on the exchange of their new domicile country. This is done to
reduce the risk premium which investor associate with companies from emerging
markets. Two South African companies changed their domicile country to UK.
(c) Many newly listed companies from emerging markets have had their initial public
offerings in mature markets, bypassing local markets completely. For example,
Internet companies from Israel and Latin America have recently chosen to list
directly on the NASDAQ.
(d) While DR programs from Latin American firms dominated the market for new
DR issues during the first part of 1990s, DR programs from Asian firms
dominated the market for new DR issues during 1999 and 2000.
(e) There has been a significant increase in the capital raised in technology, media,
and telecommunications sectors, which accounted for almost half of the capital
raised by emerging markets in 1999.
DR Programs from emerging markets were an instant hit amongst international
investing community. According to Porter (1993) this is so because emerging markets
(a) represent a fast growing part of the world economy; (b) have delivered superior
returns (c) are attractively valued; (d) represent huge marketplaces; and (e) are
underweighted in global portfolios. Agarwal (2000) showed that during 1987-96 the
correlation between financial markets return of US and UK was about 0.76 as against a
low correlation of developed markets with emerging markets (Table 4). Though the
correlation between the nations has changed over the years, but the correlation between
the developed and emerging countries continues to be lower (Shashikanth et al., 1998).
Therefore interest in the DR programs from emerging countries is also due to the
greater diversification potential of these programs from the perspective of an
international investor.
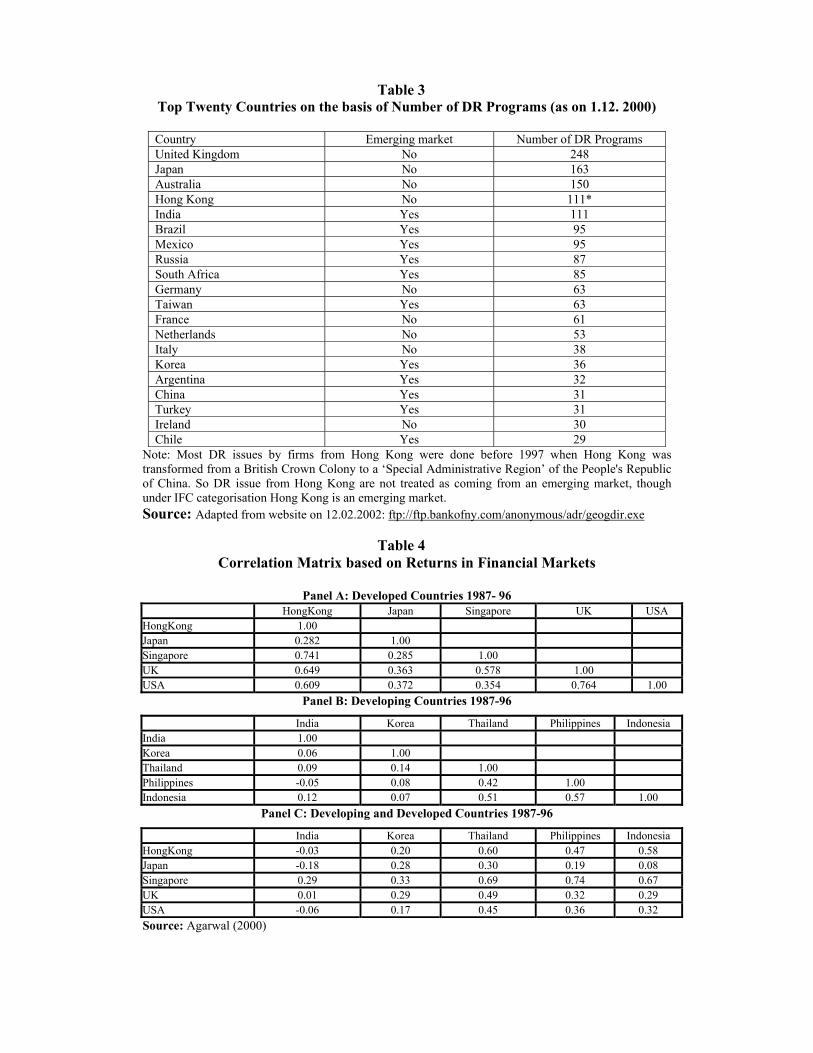
Table 3 Top Twenty Countries on the basis of Number of DR Programs (as on 1.12. 2000)
Country Emerging market Number of DR Programs United Kingdom No 248 Japan No 163 Australia No 150 Hong Kong No 111* India Yes 111 Brazil Yes 95 Mexico Yes 95 Russia Yes 87 South Africa Yes 85 Germany No 63 Taiwan Yes 63 France No 61 Netherlands No 53 Italy No 38 Korea Yes 36 Argentina Yes 32 China Yes 31 Turkey Yes 31 Ireland No 30 Chile Yes 29
Note: Most DR issues by firms from Hong Kong were done before 1997 when Hong Kong was transformed from a British Crown Colony to a ‘Special Administrative Region’ of the People's Republic of China. So DR issue from Hong Kong are not treated as coming from an emerging market, though under IFC categorisation Hong Kong is an emerging market. Source: Adapted from website on 12.02.2002: ftp://ftp.bankofny.com/anonymous/adr/geogdir.exe
Table 4 Correlation Matrix based on Returns in Financial Markets
Panel A: Developed Countries 1987- 96
HongKong Japan Singapore UK USA HongKong 1.00 Japan 0.282 1.00 Singapore 0.741 0.285 1.00 UK 0.649 0.363 0.578 1.00 USA 0.609 0.372 0.354 0.764 1.00
Panel B: Developing Countries 1987-96
India Korea Thailand Philippines Indonesia India 1.00 Korea 0.06 1.00 Thailand 0.09 0.14 1.00 Philippines -0.05 0.08 0.42 1.00 Indonesia 0.12 0.07 0.51 0.57 1.00
Panel C: Developing and Developed Countries 1987-96
India Korea Thailand Philippines Indonesia HongKong -0.03 0.20 0.60 0.47 0.58 Japan -0.18 0.28 0.30 0.19 0.08 Singapore 0.29 0.33 0.69 0.74 0.67 UK 0.01 0.29 0.49 0.32 0.29 USA -0.06 0.17 0.45 0.36 0.32 Source: Agarwal (2000)
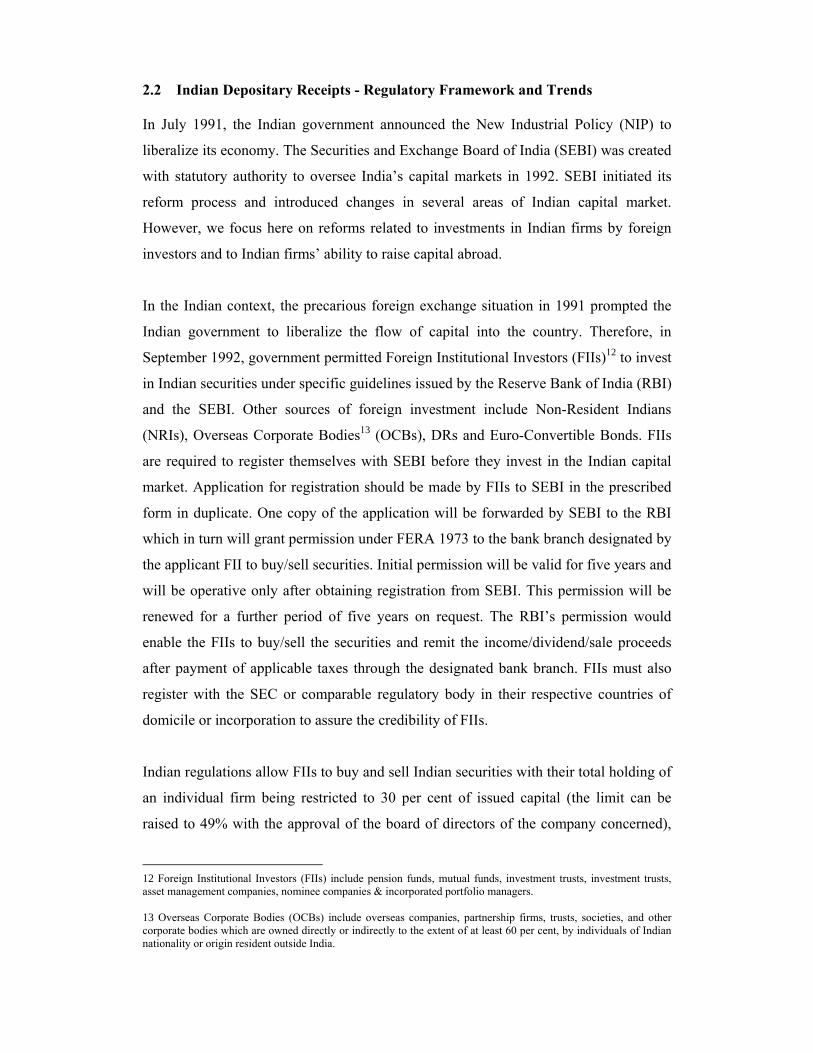
2.2 Indian Depositary Receipts - Regulatory Framework and Trends In July 1991, the Indian government announced the New Industrial Policy (NIP) to
liberalize its economy. The Securities and Exchange Board of India (SEBI) was created
with statutory authority to oversee India’s capital markets in 1992. SEBI initiated its
reform process and introduced changes in several areas of Indian capital market.
However, we focus here on reforms related to investments in Indian firms by foreign
investors and to Indian firms’ ability to raise capital abroad.
In the Indian context, the precarious foreign exchange situation in 1991 prompted the
Indian government to liberalize the flow of capital into the country. Therefore, in
September 1992, government permitted Foreign Institutional Investors (FIIs)12 to invest
in Indian securities under specific guidelines issued by the Reserve Bank of India (RBI)
and the SEBI. Other sources of foreign investment include Non-Resident Indians
(NRIs), Overseas Corporate Bodies13 (OCBs), DRs and Euro-Convertible Bonds. FIIs
are required to register themselves with SEBI before they invest in the Indian capital
market. Application for registration should be made by FIIs to SEBI in the prescribed
form in duplicate. One copy of the application will be forwarded by SEBI to the RBI
which in turn will grant permission under FERA 1973 to the bank branch designated by
the applicant FII to buy/sell securities. Initial permission will be valid for five years and
will be operative only after obtaining registration from SEBI. This permission will be
renewed for a further period of five years on request. The RBI’s permission would
enable the FIIs to buy/sell the securities and remit the income/dividend/sale proceeds
after payment of applicable taxes through the designated bank branch. FIIs must also
register with the SEC or comparable regulatory body in their respective countries of
domicile or incorporation to assure the credibility of FIIs.
Indian regulations allow FIIs to buy and sell Indian securities with their total holding of
an individual firm being restricted to 30 per cent of issued capital (the limit can be
raised to 49% with the approval of the board of directors of the company concerned),
12 Foreign Institutional Investors (FIIs) include pension funds, mutual funds, investment trusts, investment trusts, asset management companies, nominee companies & incorporated portfolio managers. 13 Overseas Corporate Bodies (OCBs) include overseas companies, partnership firms, trusts, societies, and other corporate bodies which are owned directly or indirectly to the extent of at least 60 per cent, by individuals of Indian nationality or origin resident outside India.
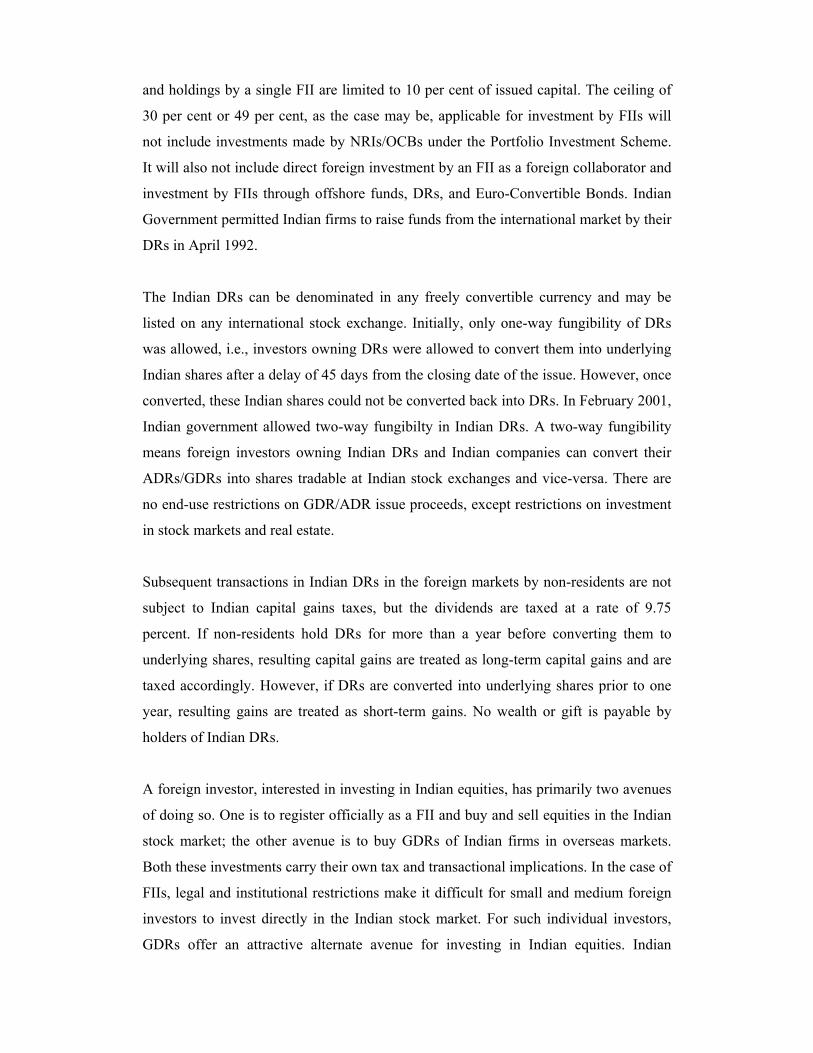
and holdings by a single FII are limited to 10 per cent of issued capital. The ceiling of
30 per cent or 49 per cent, as the case may be, applicable for investment by FIIs will
not include investments made by NRIs/OCBs under the Portfolio Investment Scheme.
It will also not include direct foreign investment by an FII as a foreign collaborator and
investment by FIIs through offshore funds, DRs, and Euro-Convertible Bonds. Indian
Government permitted Indian firms to raise funds from the international market by their
DRs in April 1992.
The Indian DRs can be denominated in any freely convertible currency and may be
listed on any international stock exchange. Initially, only one-way fungibility of DRs
was allowed, i.e., investors owning DRs were allowed to convert them into underlying
Indian shares after a delay of 45 days from the closing date of the issue. However, once
converted, these Indian shares could not be converted back into DRs. In February 2001,
Indian government allowed two-way fungibilty in Indian DRs. A two-way fungibility
means foreign investors owning Indian DRs and Indian companies can convert their
ADRs/GDRs into shares tradable at Indian stock exchanges and vice-versa. There are
no end-use restrictions on GDR/ADR issue proceeds, except restrictions on investment
in stock markets and real estate.
Subsequent transactions in Indian DRs in the foreign markets by non-residents are not
subject to Indian capital gains taxes, but the dividends are taxed at a rate of 9.75
percent. If non-residents hold DRs for more than a year before converting them to
underlying shares, resulting capital gains are treated as long-term capital gains and are
taxed accordingly. However, if DRs are converted into underlying shares prior to one
year, resulting gains are treated as short-term gains. No wealth or gift is payable by
holders of Indian DRs.
A foreign investor, interested in investing in Indian equities, has primarily two avenues
of doing so. One is to register officially as a FII and buy and sell equities in the Indian
stock market; the other avenue is to buy GDRs of Indian firms in overseas markets.
Both these investments carry their own tax and transactional implications. In the case of
FIIs, legal and institutional restrictions make it difficult for small and medium foreign
investors to invest directly in the Indian stock market. For such individual investors,
GDRs offer an attractive alternate avenue for investing in Indian equities. Indian
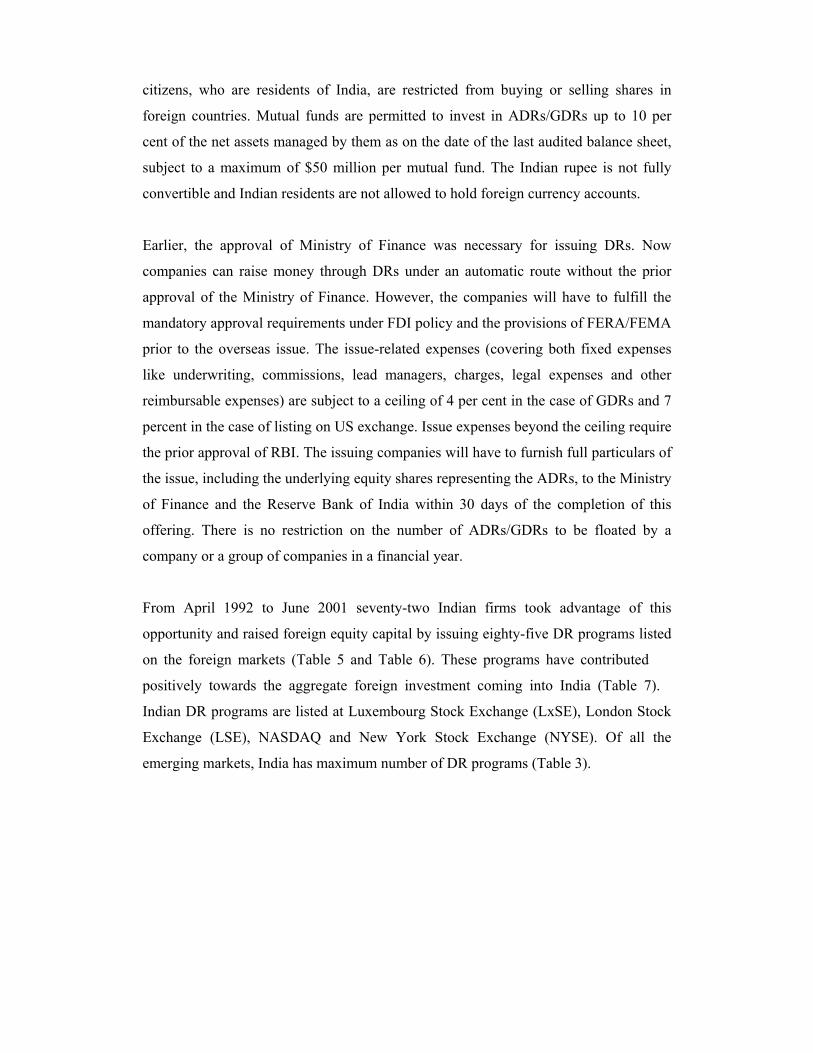
citizens, who are residents of India, are restricted from buying or selling shares in
foreign countries. Mutual funds are permitted to invest in ADRs/GDRs up to 10 per
cent of the net assets managed by them as on the date of the last audited balance sheet,
subject to a maximum of $50 million per mutual fund. The Indian rupee is not fully
convertible and Indian residents are not allowed to hold foreign currency accounts.
Earlier, the approval of Ministry of Finance was necessary for issuing DRs. Now
companies can raise money through DRs under an automatic route without the prior
approval of the Ministry of Finance. However, the companies will have to fulfill the
mandatory approval requirements under FDI policy and the provisions of FERA/FEMA
prior to the overseas issue. The issue-related expenses (covering both fixed expenses
like underwriting, commissions, lead managers, charges, legal expenses and other
reimbursable expenses) are subject to a ceiling of 4 per cent in the case of GDRs and 7
percent in the case of listing on US exchange. Issue expenses beyond the ceiling require
the prior approval of RBI. The issuing companies will have to furnish full particulars of
the issue, including the underlying equity shares representing the ADRs, to the Ministry
of Finance and the Reserve Bank of India within 30 days of the completion of this
offering. There is no restriction on the number of ADRs/GDRs to be floated by a
company or a group of companies in a financial year.
From April 1992 to June 2001 seventy-two Indian firms took advantage of this
opportunity and raised foreign equity capital by issuing eighty-five DR programs listed
on the foreign markets (Table 5 and Table 6). These programs have contributed
positively towards the aggregate foreign investment coming into India (Table 7).
Indian DR programs are listed at Luxembourg Stock Exchange (LxSE), London Stock
Exchange (LSE), NASDAQ and New York Stock Exchange (NYSE). Of all the
emerging markets, India has maximum number of DR programs (Table 3).
Table 6 depicts the time-pattern and geography of Indian foreign listings from May
1992 to June 2001. Initial DR programs by the Indian firms were listed at the LxSE due
to the mild securities’ regulations and the easy listing norms of the Luxembourg
market. The choice of LxSE for initial foreign listings by Indian firms were in
consonance Foerster and Karolyi (1993)’s assertion that initial foreign listings by firms
of any country are accomplished on markets which are easier to enter. In second phase
many Indian firms listed their DR programs at the LSE. Since 1999, most fresh Indian
DR programs are being accomplished at the stringent US stock exchanges. While the
listings on US market require stringent disclosures and recasting of firms’ financial
statements as per US GAAP, listings on LxSE and LSE comes much easier without any
additional disclosures and recasting of the financial accounts.
The temporal shift in choice of foreign listing venues by the Indian firms could be
attributed to prescription of higher mandatory levels of financial disclosures and
transparency for the Indian firms by the SEBI. During the early nineties, most Indian
firms did not have level of financial transparency as desired by the US GAAP and SEC.
Therefore, initially Indian firms refrained from listing on the US exchanges. However,
during the course of 1990s, Indian financial market regulators introduced several
reforms to improve the level of financial transparency of the Indian firms. These
financial sector reforms positively influenced the capability of Indian firms to tap the
US markets. Therefore, of late, many Indian firms have listed their DR programs on the
US exchanges also. Amongst the US exchanges, it is the NYSE which is most stringent
in its listing norms. Listing on NASDAQ is easier compared to the listing on the
NYSE. So initial Indian firms tapping the US markets listed on NASDAQ. However,
subsequently a few Indian firms have also listed on the NYSE. Lately, some of the
Indian firms have also delisted their GDR programs from the LSE and LxSE due to the
poor liquidity on these exchanges and have instead, listed their fresh DR programs on
the US exchanges14. Overall, it seems that gradually US exchanges are becoming more
favourable destination for fresh DR listings by the Indian firms. This observation is in
consonance with the Pagano et al. (2002)’s finding that European exchanges have been
losing out to US exchanges in attracting the fresh foreign listings.
14 Dr Reddy’s Laboratories, MTNL, VSNL have delisted their GDR programs.
Table 6 and Figure 8 depicts that there have been three periods characterised by
high foreign listing activity by the Indian firms. In 1994 alone, forty-one DR listings
were accomplished. Similarly, year 1996 and 2000 are marked with a large number of
DR listings by the Indian firms. Figure 2.8 simultaneously depicts the closing value of
the BSE SENSEX on a particular day and the number of Indian DR programs listed on
that day. India entered the international arena in May 1992, with the first GDR issue by
Reliance Industries Limited on LxSE. In November 1992, Grasim Industries also issued
their GDR program on the LxSE. Then, the GDR markets witnessed a lull till 1993-end
in the wake of the securities scam and the consequent fall in the domestic markets.
The lull period during 1993 was followed by a surge in number of Indian GDR
programs during 1994 and again during 1996. Patil (1994) associated the bunching of
Indian GDR issues during the above periods to the pent up overseas demand for Indian
papers and the existing costly procedure of flotation in the domestic market. A high
degree of foreign listing activity by the Indian firms during 1994 and 1996 was also
attributable to the (a) increased allocation of investible funds by the international
investors to the emerging markets like India; and (c) desire of many Indian firms to
raise the funds during the boom phase of the domestic markets so as to get a better
pricing for their DR programs.
There were infrequent fresh DR listings by the Indian firms during 1995, mainly due to
the uncertain domestic political environment. Similarly, there was a two-year lull
period in foreign listings activity during 1997 and 1998 owing to the economic crises in
the South-east Asian markets.
Foreign listing activity by Indian firms regained momentum during 1999 with the
successful ADR issue by Infosys Technologies Limited. During 2000, there was a spurt
in number of Indian foreign listings because of the fresh policy initiatives by Indian
government, which simplified approval mechanisms for software, information
technology, telecommunication, biotechnology and pharmaceutical firms for issuing
DR programs in the foreign markets. These firms used the foreign listings to (a) attain a
better valuation for their firms; and (b) meet their requirements of large amount of
funds, not easily available from the Indian markets.
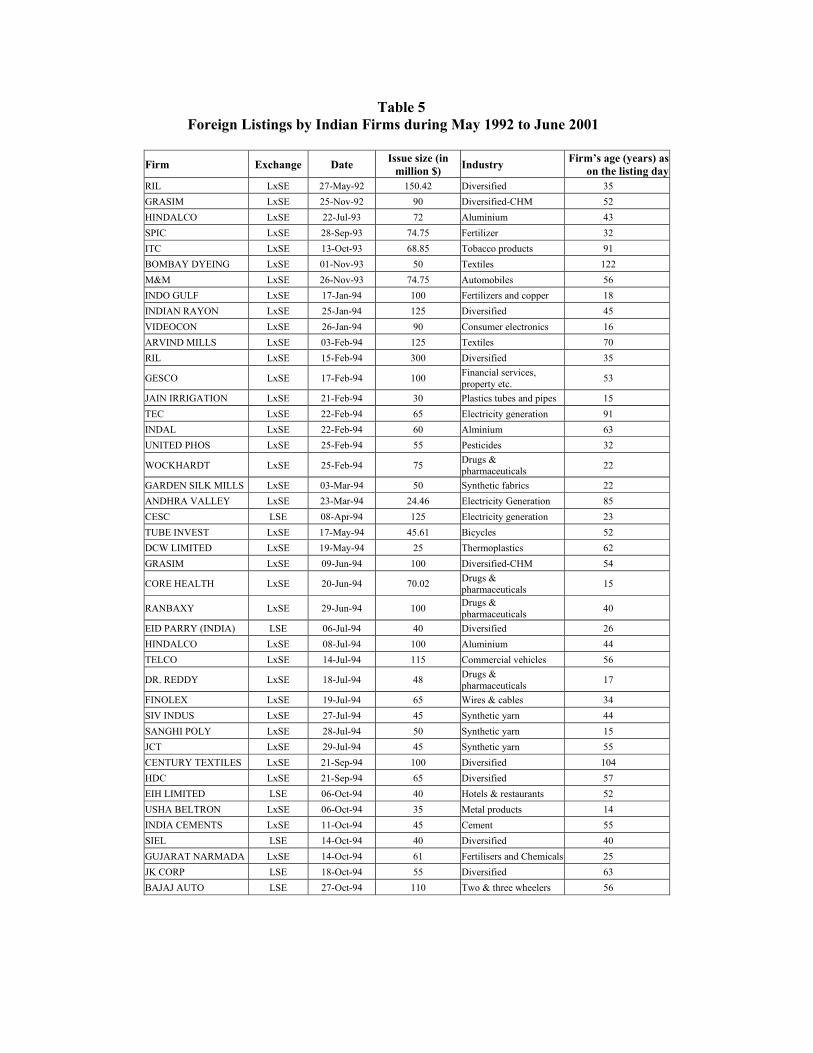
Table 5
Foreign Listings by Indian Firms during May 1992 to June 2001
Firm Exchange Date Issue size (in million $) Industry Firm’s age (years) as
on the listing dayRIL LxSE 27-May-92 150.42 Diversified 35 GRASIM LxSE 25-Nov-92 90 Diversified-CHM 52 HINDALCO LxSE 22-Jul-93 72 Aluminium 43 SPIC LxSE 28-Sep-93 74.75 Fertilizer 32 ITC LxSE 13-Oct-93 68.85 Tobacco products 91 BOMBAY DYEING LxSE 01-Nov-93 50 Textiles 122 M&M LxSE 26-Nov-93 74.75 Automobiles 56 INDO GULF LxSE 17-Jan-94 100 Fertilizers and copper 18 INDIAN RAYON LxSE 25-Jan-94 125 Diversified 45 VIDEOCON LxSE 26-Jan-94 90 Consumer electronics 16 ARVIND MILLS LxSE 03-Feb-94 125 Textiles 70 RIL LxSE 15-Feb-94 300 Diversified 35
GESCO LxSE 17-Feb-94 100 Financial services, property etc. 53
JAIN IRRIGATION LxSE 21-Feb-94 30 Plastics tubes and pipes 15 TEC LxSE 22-Feb-94 65 Electricity generation 91 INDAL LxSE 22-Feb-94 60 Alminium 63 UNITED PHOS LxSE 25-Feb-94 55 Pesticides 32
WOCKHARDT LxSE 25-Feb-94 75 Drugs & pharmaceuticals 22
GARDEN SILK MILLS LxSE 03-Mar-94 50 Synthetic fabrics 22 ANDHRA VALLEY LxSE 23-Mar-94 24.46 Electricity Generation 85 CESC LSE 08-Apr-94 125 Electricity generation 23 TUBE INVEST LxSE 17-May-94 45.61 Bicycles 52 DCW LIMITED LxSE 19-May-94 25 Thermoplastics 62 GRASIM LxSE 09-Jun-94 100 Diversified-CHM 54
CORE HEALTH LxSE 20-Jun-94 70.02 Drugs & pharmaceuticals 15
RANBAXY LxSE 29-Jun-94 100 Drugs & pharmaceuticals 40
EID PARRY (INDIA) LSE 06-Jul-94 40 Diversified 26 HINDALCO LxSE 08-Jul-94 100 Aluminium 44 TELCO LxSE 14-Jul-94 115 Commercial vehicles 56
DR. REDDY LxSE 18-Jul-94 48 Drugs & pharmaceuticals 17
FINOLEX LxSE 19-Jul-94 65 Wires & cables 34 SIV INDUS LxSE 27-Jul-94 45 Synthetic yarn 44 SANGHI POLY LxSE 28-Jul-94 50 Synthetic yarn 15 JCT LxSE 29-Jul-94 45 Synthetic yarn 55 CENTURY TEXTILES LxSE 21-Sep-94 100 Diversified 104 HDC LxSE 21-Sep-94 65 Diversified 57 EIH LIMITED LSE 06-Oct-94 40 Hotels & restaurants 52 USHA BELTRON LxSE 06-Oct-94 35 Metal products 14 INDIA CEMENTS LxSE 11-Oct-94 45 Cement 55 SIEL LSE 14-Oct-94 40 Diversified 40 GUJARAT NARMADA LxSE 14-Oct-94 61 Fertilisers and Chemicals 25 JK CORP LSE 18-Oct-94 55 Diversified 63 BAJAJ AUTO LSE 27-Oct-94 110 Two & three wheelers 56
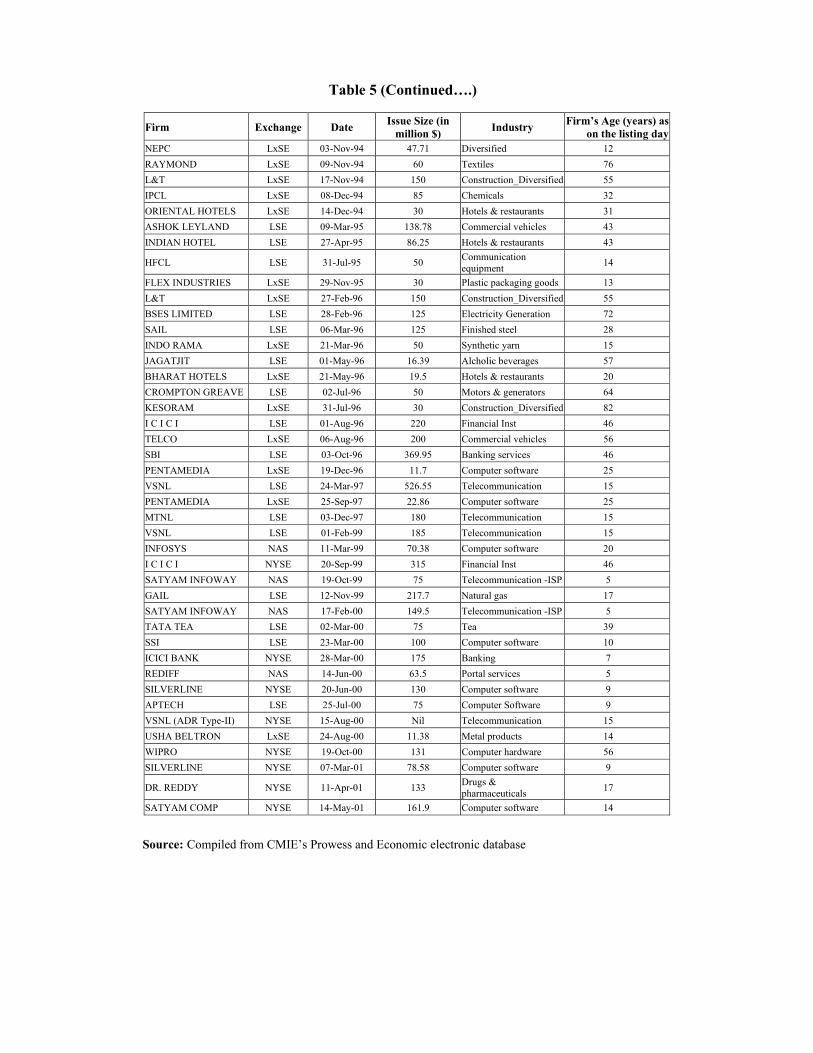
Table 5 (Continued….)
Firm Exchange Date Issue Size (in million $) Industry Firm’s Age (years) as
on the listing dayNEPC LxSE 03-Nov-94 47.71 Diversified 12 RAYMOND LxSE 09-Nov-94 60 Textiles 76 L&T LxSE 17-Nov-94 150 Construction_Diversified 55 IPCL LxSE 08-Dec-94 85 Chemicals 32 ORIENTAL HOTELS LxSE 14-Dec-94 30 Hotels & restaurants 31 ASHOK LEYLAND LSE 09-Mar-95 138.78 Commercial vehicles 43 INDIAN HOTEL LSE 27-Apr-95 86.25 Hotels & restaurants 43
HFCL LSE 31-Jul-95 50 Communication equipment 14
FLEX INDUSTRIES LxSE 29-Nov-95 30 Plastic packaging goods 13 L&T LxSE 27-Feb-96 150 Construction_Diversified 55 BSES LIMITED LSE 28-Feb-96 125 Electricity Generation 72 SAIL LSE 06-Mar-96 125 Finished steel 28 INDO RAMA LxSE 21-Mar-96 50 Synthetic yarn 15 JAGATJIT LSE 01-May-96 16.39 Alcholic beverages 57 BHARAT HOTELS LxSE 21-May-96 19.5 Hotels & restaurants 20 CROMPTON GREAVE LSE 02-Jul-96 50 Motors & generators 64 KESORAM LxSE 31-Jul-96 30 Construction_Diversified 82 I C I C I LSE 01-Aug-96 220 Financial Inst 46 TELCO LxSE 06-Aug-96 200 Commercial vehicles 56 SBI LSE 03-Oct-96 369.95 Banking services 46 PENTAMEDIA LxSE 19-Dec-96 11.7 Computer software 25 VSNL LSE 24-Mar-97 526.55 Telecommunication 15 PENTAMEDIA LxSE 25-Sep-97 22.86 Computer software 25 MTNL LSE 03-Dec-97 180 Telecommunication 15 VSNL LSE 01-Feb-99 185 Telecommunication 15 INFOSYS NAS 11-Mar-99 70.38 Computer software 20 I C I C I NYSE 20-Sep-99 315 Financial Inst 46 SATYAM INFOWAY NAS 19-Oct-99 75 Telecommunication -ISP 5 GAIL LSE 12-Nov-99 217.7 Natural gas 17 SATYAM INFOWAY NAS 17-Feb-00 149.5 Telecommunication -ISP 5 TATA TEA LSE 02-Mar-00 75 Tea 39 SSI LSE 23-Mar-00 100 Computer software 10 ICICI BANK NYSE 28-Mar-00 175 Banking 7 REDIFF NAS 14-Jun-00 63.5 Portal services 5 SILVERLINE NYSE 20-Jun-00 130 Computer software 9 APTECH LSE 25-Jul-00 75 Computer Software 9 VSNL (ADR Type-II) NYSE 15-Aug-00 Nil Telecommunication 15 USHA BELTRON LxSE 24-Aug-00 11.38 Metal products 14 WIPRO NYSE 19-Oct-00 131 Computer hardware 56 SILVERLINE NYSE 07-Mar-01 78.58 Computer software 9
DR. REDDY NYSE 11-Apr-01 133 Drugs & pharmaceuticals 17
SATYAM COMP NYSE 14-May-01 161.9 Computer software 14
Source: Compiled from CMIE’s Prowess and Economic electronic database
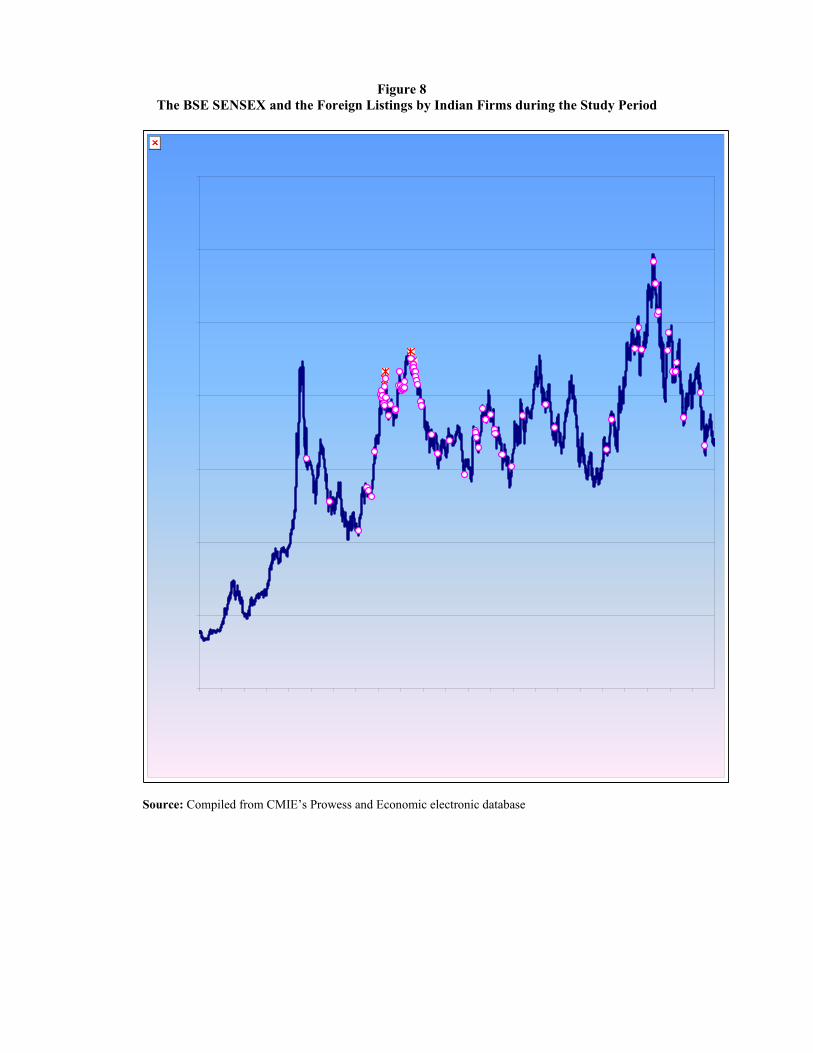
Figure 8 The BSE SENSEX and the Foreign Listings by Indian Firms during the Study Period
Source: Compiled from CMIE’s Prowess and Economic electronic database
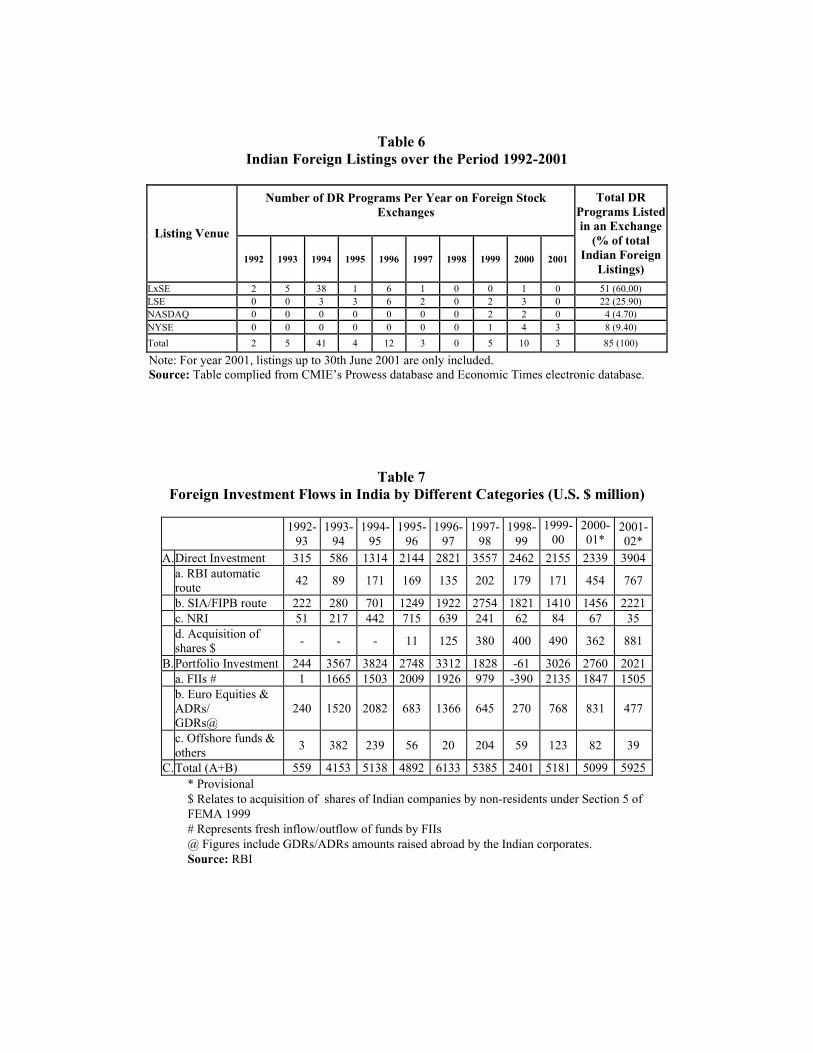
Table 6 Indian Foreign Listings over the Period 1992-2001
Number of DR Programs Per Year on Foreign Stock
Exchanges
Listing Venue
1992 1993 1994 1995 1996 1997 1998 1999 2000 2001
Total DR Programs Listed in an Exchange
(% of total Indian Foreign
Listings) LxSE 2 5 38 1 6 1 0 0 1 0 51 (60.00) LSE 0 0 3 3 6 2 0 2 3 0 22 (25.90) NASDAQ 0 0 0 0 0 0 0 2 2 0 4 (4.70) NYSE 0 0 0 0 0 0 0 1 4 3 8 (9.40) Total 2 5 41 4 12 3 0 5 10 3 85 (100)
Note: For year 2001, listings up to 30th June 2001 are only included. Source: Table complied from CMIE’s Prowess database and Economic Times electronic database.
Table 7 Foreign Investment Flows in India by Different Categories (U.S. $ million)
1992- 93
1993- 94
1994- 95
1995- 96
1996- 97
1997- 98
1998- 99
1999- 00
2000-01*
2001-02*
A. Direct Investment 315 586 1314 2144 2821 3557 2462 2155 2339 3904
a. RBI automatic route 42 89 171 169 135 202 179 171 454 767
b. SIA/FIPB route 222 280 701 1249 1922 2754 1821 1410 1456 2221 c. NRI 51 217 442 715 639 241 62 84 67 35
d. Acquisition of shares $ - - - 11 125 380 400 490 362 881
B. Portfolio Investment 244 3567 3824 2748 3312 1828 -61 3026 2760 2021 a. FIIs # 1 1665 1503 2009 1926 979 -390 2135 1847 1505
b. Euro Equities & ADRs/ GDRs@
240 1520 2082 683 1366 645 270 768 831 477
c. Offshore funds & others 3 382 239 56 20 204 59 123 82 39
C. Total (A+B) 559 4153 5138 4892 6133 5385 2401 5181 5099 5925 * Provisional $ Relates to acquisition of shares of Indian companies by non-residents under Section 5 of FEMA 1999 # Represents fresh inflow/outflow of funds by FIIs @ Figures include GDRs/ADRs amounts raised abroad by the Indian corporates. Source: RBI
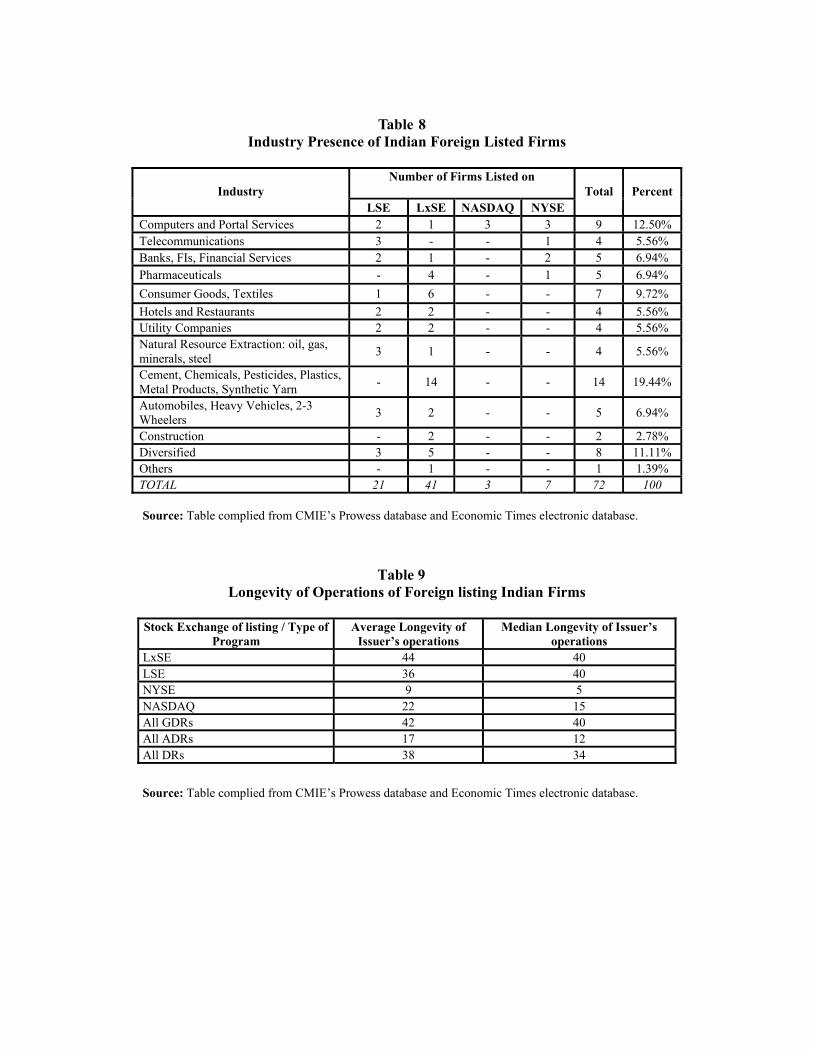
Table 8 Industry Presence of Indian Foreign Listed Firms
Number of Firms Listed on
Industry LSE LxSE NASDAQ NYSE
Total Percent
Computers and Portal Services 2 1 3 3 9 12.50% Telecommunications 3 - - 1 4 5.56% Banks, FIs, Financial Services 2 1 - 2 5 6.94% Pharmaceuticals - 4 - 1 5 6.94% Consumer Goods, Textiles 1 6 - - 7 9.72% Hotels and Restaurants 2 2 - - 4 5.56% Utility Companies 2 2 - - 4 5.56% Natural Resource Extraction: oil, gas, minerals, steel 3 1 - - 4 5.56%
Cement, Chemicals, Pesticides, Plastics, Metal Products, Synthetic Yarn - 14 - - 14 19.44%
Automobiles, Heavy Vehicles, 2-3 Wheelers 3 2 - - 5 6.94%
Construction - 2 - - 2 2.78% Diversified 3 5 - - 8 11.11% Others - 1 - - 1 1.39% TOTAL 21 41 3 7 72 100 Source: Table complied from CMIE’s Prowess database and Economic Times electronic database.
Table 9 Longevity of Operations of Foreign listing Indian Firms
Stock Exchange of listing / Type of
Program Average Longevity of
Issuer’s operations Median Longevity of Issuer’s
operations LxSE 44 40 LSE 36 40 NYSE 9 5 NASDAQ 22 15 All GDRs 42 40 All ADRs 17 12 All DRs 38 34
Source: Table complied from CMIE’s Prowess database and Economic Times electronic database.
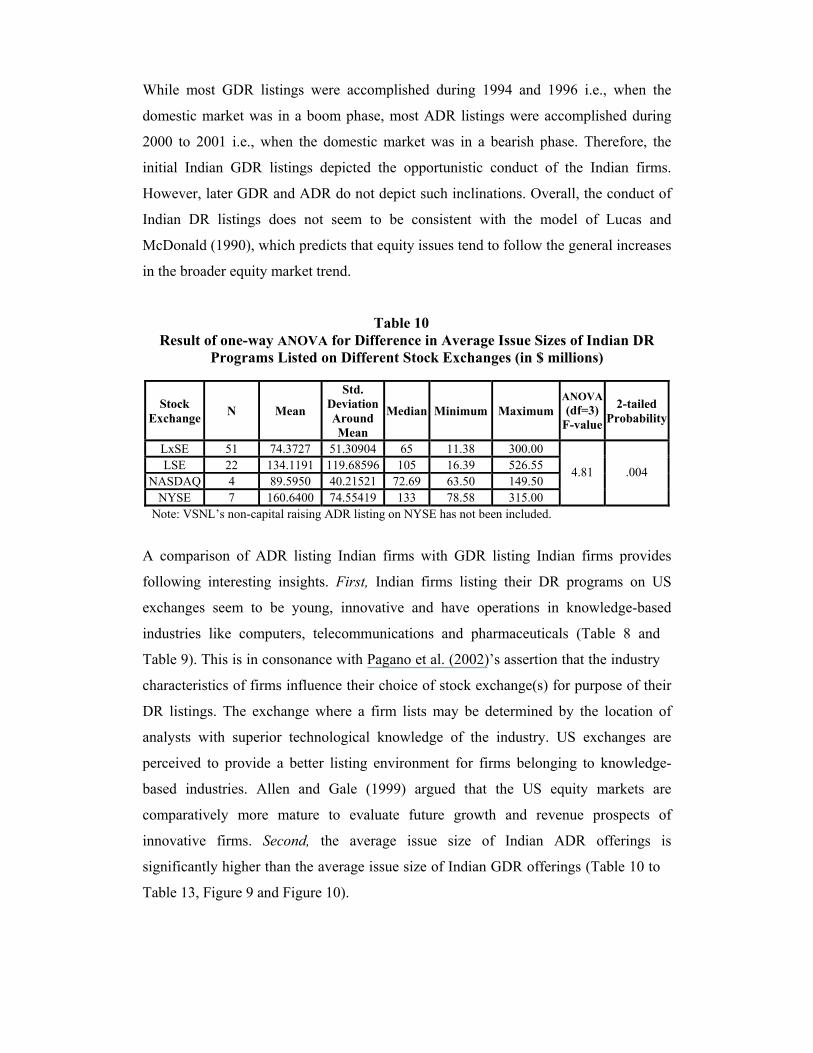
While most GDR listings were accomplished during 1994 and 1996 i.e., when the
domestic market was in a boom phase, most ADR listings were accomplished during
2000 to 2001 i.e., when the domestic market was in a bearish phase. Therefore, the
initial Indian GDR listings depicted the opportunistic conduct of the Indian firms.
However, later GDR and ADR do not depict such inclinations. Overall, the conduct of
Indian DR listings does not seem to be consistent with the model of Lucas and
McDonald (1990), which predicts that equity issues tend to follow the general increases
in the broader equity market trend.
Table 10 Result of one-way ANOVA for Difference in Average Issue Sizes of Indian DR
Programs Listed on Different Stock Exchanges (in $ millions)
Stock Exchange N Mean
Std. DeviationAround Mean
Median Minimum MaximumANOVA (df=3)
F-value
2-tailed Probability
LxSE 51 74.3727 51.30904 65 11.38 300.00 LSE 22 134.1191 119.68596 105 16.39 526.55
NASDAQ 4 89.5950 40.21521 72.69 63.50 149.50 NYSE 7 160.6400 74.55419 133 78.58 315.00
4.81 .004
Note: VSNL’s non-capital raising ADR listing on NYSE has not been included.
A comparison of ADR listing Indian firms with GDR listing Indian firms provides
following interesting insights. First, Indian firms listing their DR programs on US
exchanges seem to be young, innovative and have operations in knowledge-based
industries like computers, telecommunications and pharmaceuticals (Table 8 and
Table 9). This is in consonance with Pagano et al. (2002)’s assertion that the industry
characteristics of firms influence their choice of stock exchange(s) for purpose of their
DR listings. The exchange where a firm lists may be determined by the location of
analysts with superior technological knowledge of the industry. US exchanges are
perceived to provide a better listing environment for firms belonging to knowledge-
based industries. Allen and Gale (1999) argued that the US equity markets are
comparatively more mature to evaluate future growth and revenue prospects of
innovative firms. Second, the average issue size of Indian ADR offerings is
significantly higher than the average issue size of Indian GDR offerings (Table 10 to
Table 13, Figure 9 and Figure 10).
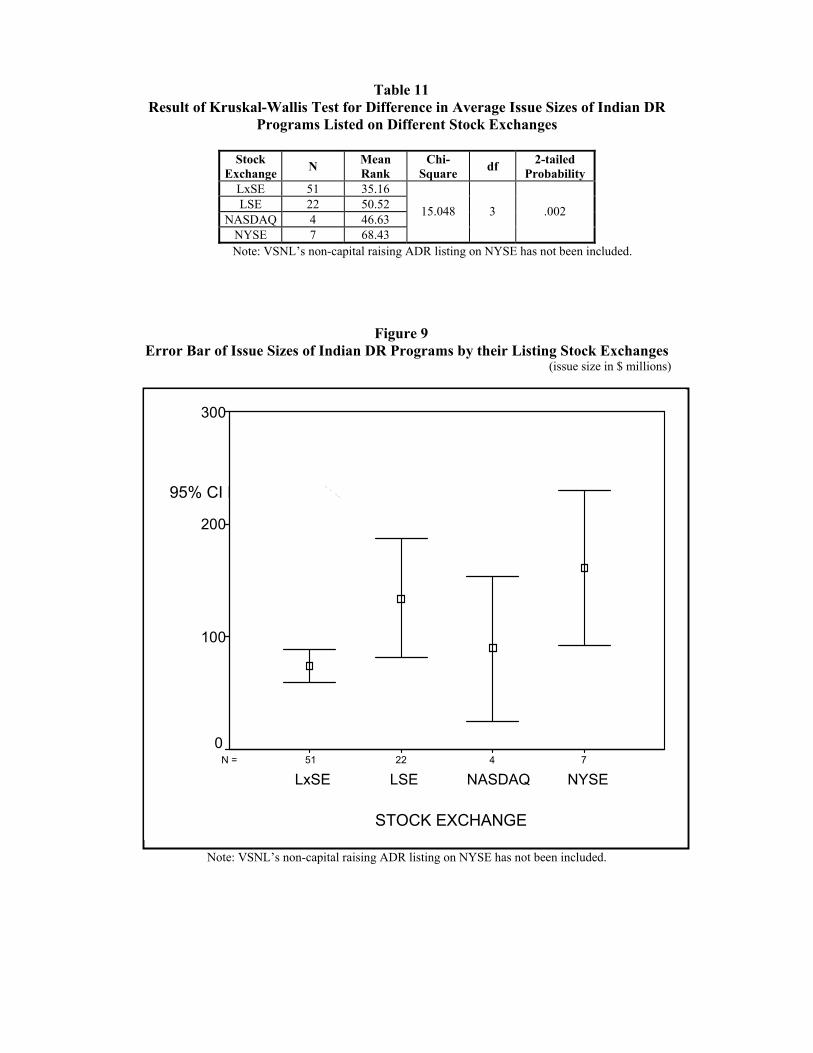
Table 11 Result of Kruskal-Wallis Test for Difference in Average Issue Sizes of Indian DR
Programs Listed on Different Stock Exchanges
Stock Exchange N Mean
Rank Chi-
Square df 2-tailed Probability
LxSE 51 35.16 LSE 22 50.52
NASDAQ 4 46.63 NYSE 7 68.43
15.048 3 .002
Note: VSNL’s non-capital raising ADR listing on NYSE has not been included.
Figure 9 Error Bar of Issue Sizes of Indian DR Programs by their Listing Stock Exchanges
(issue size in $ millions)
Note: VSNL’s non-capital raising ADR listing on NYSE has not been included.
7 42251 N =
STOCK EXCHANGE
NYSE NASDAQLSELxSE
95% CI DR ISSUE SIZE
300
200
100
0
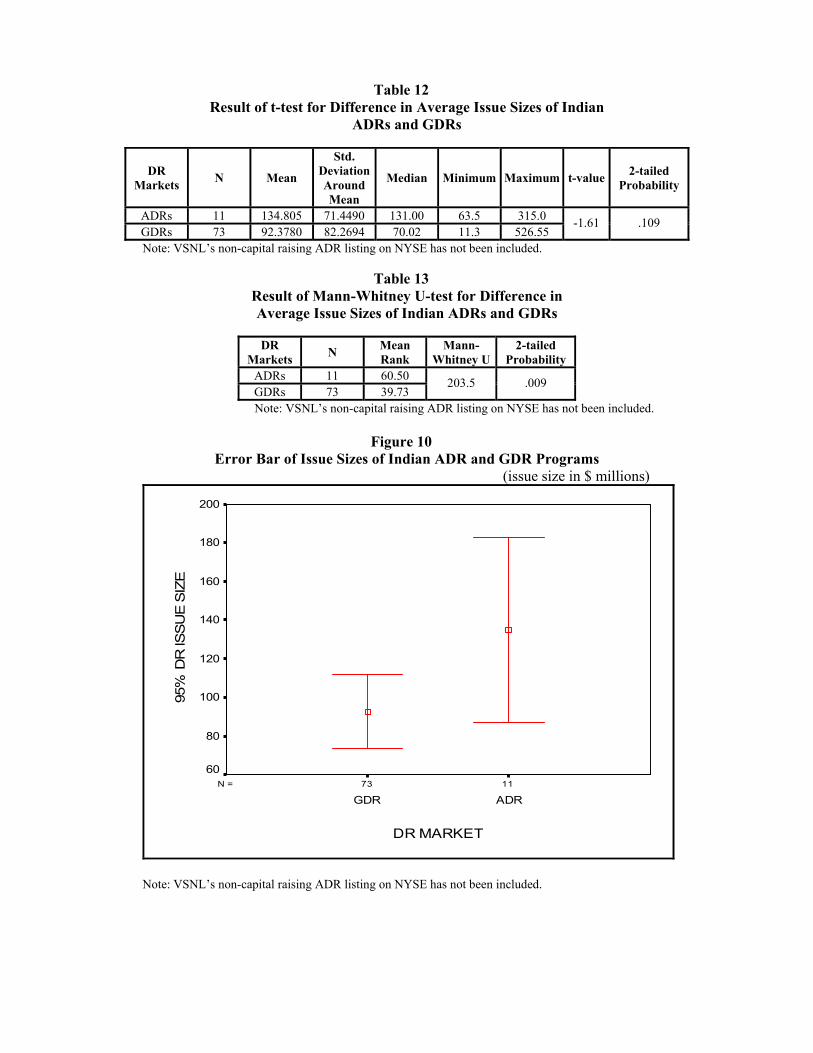
Table 12 Result of t-test for Difference in Average Issue Sizes of Indian
ADRs and GDRs
DR Markets N Mean
Std. DeviationAround Mean
Median Minimum Maximum t-value 2-tailed Probability
ADRs 11 134.805 71.4490 131.00 63.5 315.0 GDRs 73 92.3780 82.2694 70.02 11.3 526.55
-1.61 .109
Note: VSNL’s non-capital raising ADR listing on NYSE has not been included.
Table 13 Result of Mann-Whitney U-test for Difference in Average Issue Sizes of Indian ADRs and GDRs
DR
Markets N Mean Rank
Mann-Whitney U
2-tailed Probability
ADRs 11 60.50 GDRs 73 39.73
203.5 .009
Note: VSNL’s non-capital raising ADR listing on NYSE has not been included.
Figure 10 Error Bar of Issue Sizes of Indian ADR and GDR Programs
(issue size in $ millions)
1173N =
DR MARKET
ADRGDR
95%
DR
ISS
UE
SIZ
E
200
180
160
140
120
100
80
60
Note: VSNL’s non-capital raising ADR listing on NYSE has not been included.
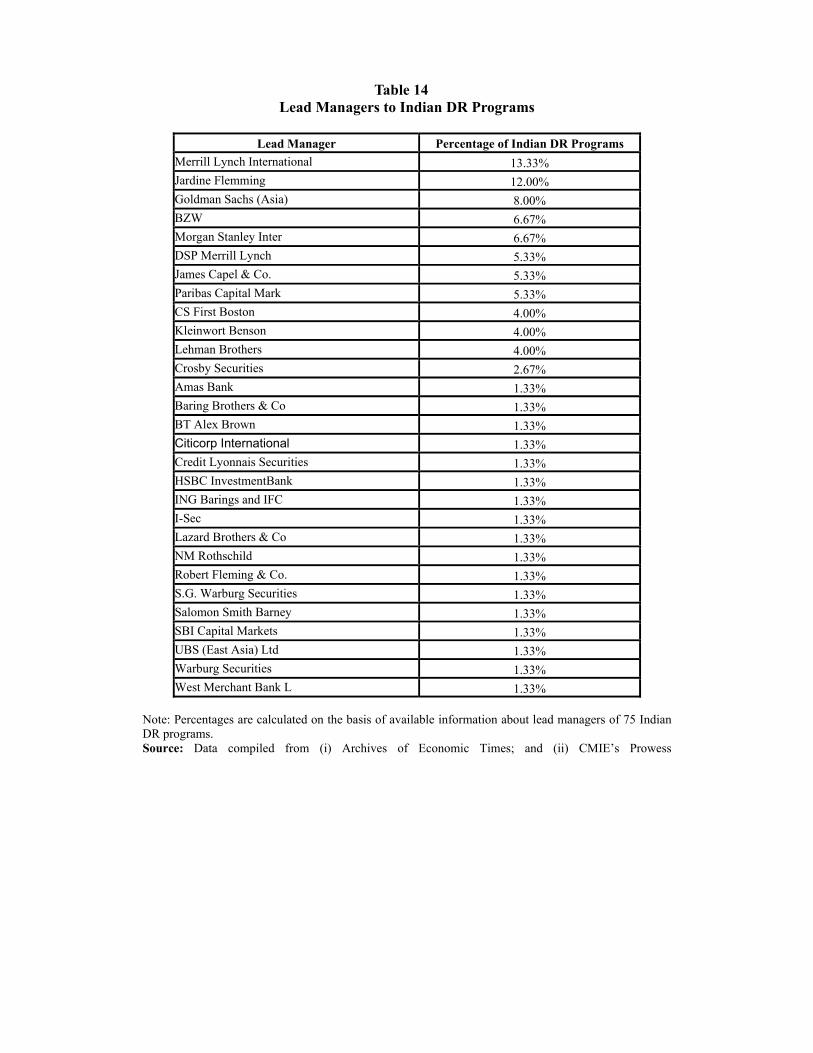
Table 14 Lead Managers to Indian DR Programs
Lead Manager Percentage of Indian DR Programs
Merrill Lynch International 13.33% Jardine Flemming 12.00% Goldman Sachs (Asia) 8.00% BZW 6.67% Morgan Stanley Inter 6.67% DSP Merrill Lynch 5.33% James Capel & Co. 5.33% Paribas Capital Mark 5.33% CS First Boston 4.00% Kleinwort Benson 4.00% Lehman Brothers 4.00% Crosby Securities 2.67% Amas Bank 1.33% Baring Brothers & Co 1.33% BT Alex Brown 1.33% Citicorp International 1.33% Credit Lyonnais Securities 1.33% HSBC InvestmentBank 1.33% ING Barings and IFC 1.33% I-Sec 1.33% Lazard Brothers & Co 1.33% NM Rothschild 1.33% Robert Fleming & Co. 1.33% S.G. Warburg Securities 1.33% Salomon Smith Barney 1.33% SBI Capital Markets 1.33% UBS (East Asia) Ltd 1.33% Warburg Securities 1.33% West Merchant Bank L 1.33%
Note: Percentages are calculated on the basis of available information about lead managers of 75 Indian DR programs. Source: Data compiled from (i) Archives of Economic Times; and (ii) CMIE’s Prowess
Table 14 depicts that a few readily recognizable international investment bankers lead
managed the majority of Indian overseas listings. Top three investment bankers viz.,
Merrill Lynch, Jardine Flemming and Goldman Sachs lead managed one-third of Indian
overseas listings. Amongst the Indian investment bankers, only the DSP in
collaboration with Merrill Lynch has achieved some reasonable success by lead
managing 5 percent of Indian overseas listings issued by the Indian firms. Indian firms
employ international investment bankers to lead manage their overseas listings in order
to be benefited from the experience of these investment bankers in managing
international offerings.
The secondary market price behaviour of any kind of issued securities is of interest to
the financial intermediaries, investors, regulators and the issuers. To capture the price
behaviour of Indian DRs, Skindia Finance15 constituted an index, popularly known as
the 'Skindia Index'. The base date of Skindia Index is Jan 02, 1995 and the base value
was set at 1000.
This index is used as a standard at the Institute of International Finance (IIF) in
Washington and is quoted in all the leading newspapers such as Times of India,
Business Standard, Economic Times, Financial Express, Observor, Indian Express,
India Inc (New Jersey, US), etc. It also appears daily on the Bloomberg, Knight Ridder,
Press Trust of India (PTI) and DART.
Figure 11 and Figure 12 depicts the movement of Skindia Index and the BSE
Sensex. Clearly, the price movement of Indian DRs has been similar to the price
movement of the Indian stocks on the Indian stock exchanges. This is further
reaffirmed by a high correlation of 0.55 (significant at 1%) between the daily closing
values of the Skindia Index and BSE Sensex from 2nd Jan 1995 to 10th April 2003.
Overall Indian DRs have generally been well received by the international investors. So
in future it is expected that more Indian firms will tap the foreign markets with DR
programs for meeting their capital requirements.
15 Skindia Finance Pvt Ltd is a Mumbai based international broking firm.
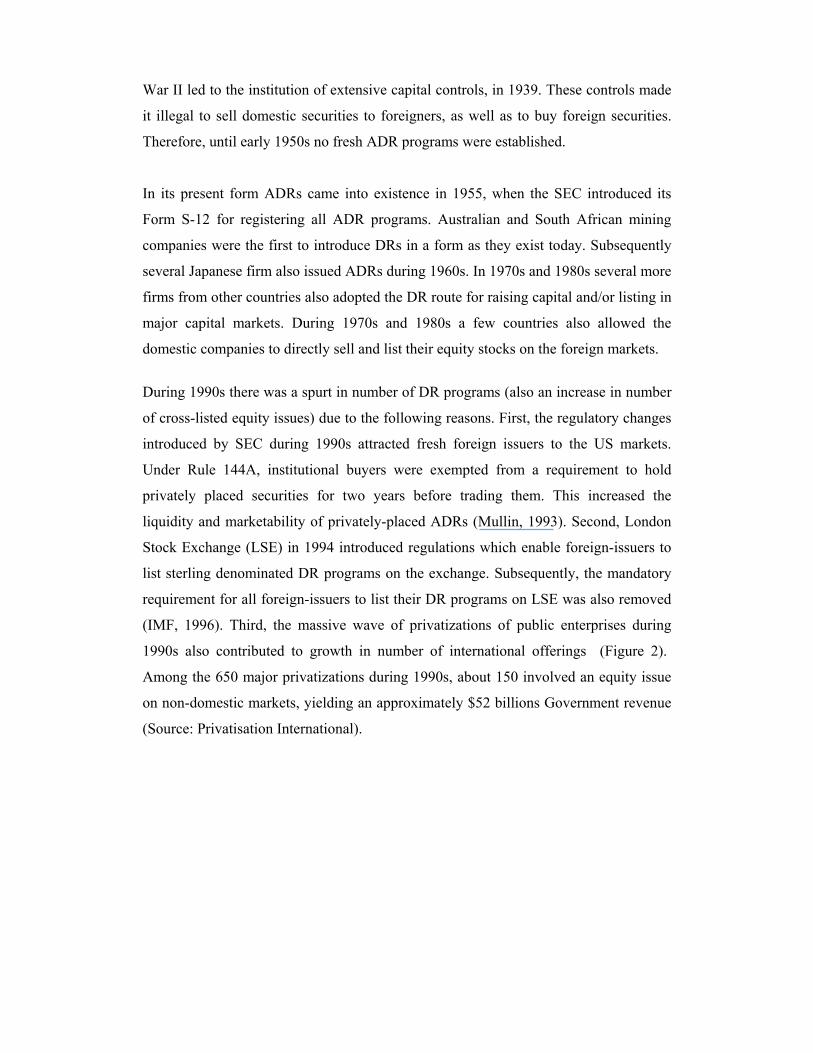
War II led to the institution of extensive capital controls, in 1939. These controls made
it illegal to sell domestic securities to foreigners, as well as to buy foreign securities.
Therefore, until early 1950s no fresh ADR programs were established.
In its present form ADRs came into existence in 1955, when the SEC introduced its
Form S-12 for registering all ADR programs. Australian and South African mining
companies were the first to introduce DRs in a form as they exist today. Subsequently
several Japanese firm also issued ADRs during 1960s. In 1970s and 1980s several more
firms from other countries also adopted the DR route for raising capital and/or listing in
major capital markets. During 1970s and 1980s a few countries also allowed the
domestic companies to directly sell and list their equity stocks on the foreign markets.
During 1990s there was a spurt in number of DR programs (also an increase in number
of cross-listed equity issues) due to the following reasons. First, the regulatory changes
introduced by SEC during 1990s attracted fresh foreign issuers to the US markets.
Under Rule 144A, institutional buyers were exempted from a requirement to hold
privately placed securities for two years before trading them. This increased the
liquidity and marketability of privately-placed ADRs (Mullin, 1993). Second, London
Stock Exchange (LSE) in 1994 introduced regulations which enable foreign-issuers to
list sterling denominated DR programs on the exchange. Subsequently, the mandatory
requirement for all foreign-issuers to list their DR programs on LSE was also removed
(IMF, 1996). Third, the massive wave of privatizations of public enterprises during
1990s also contributed to growth in number of international offerings (Figure 2).
Among the 650 major privatizations during 1990s, about 150 involved an equity issue
on non-domestic markets, yielding an approximately $52 billions Government revenue
(Source: Privatisation International).
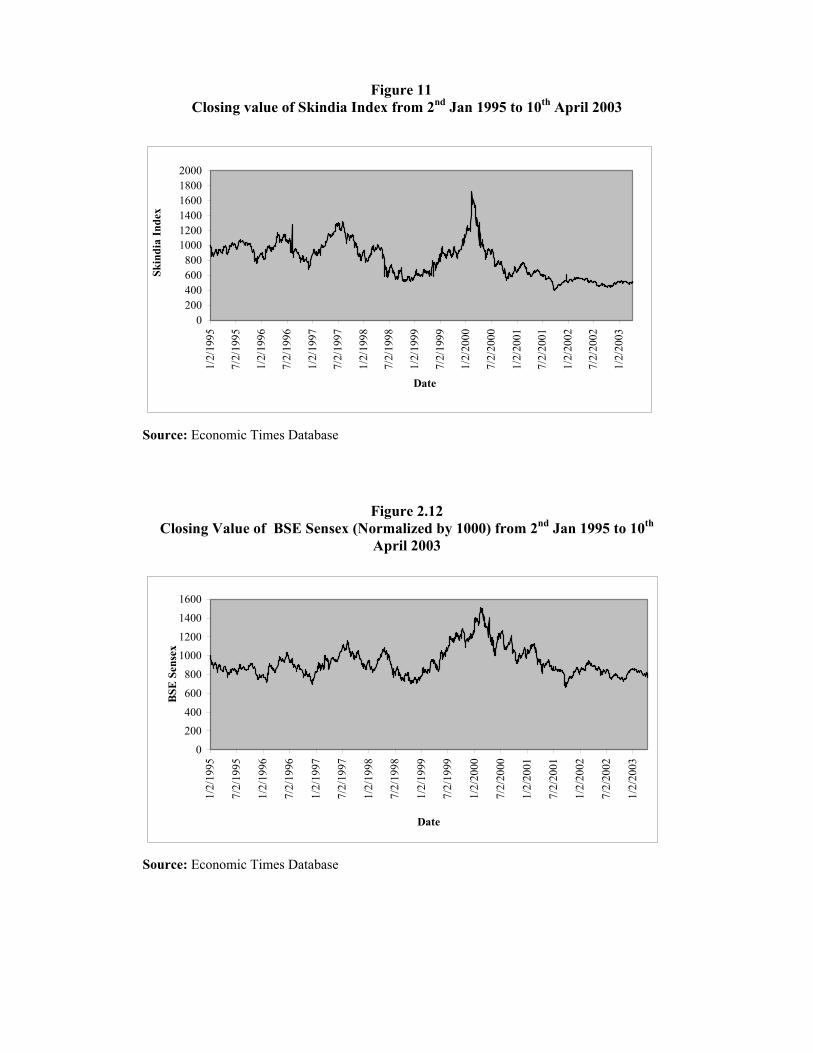
Figure 11 Closing value of Skindia Index from 2nd Jan 1995 to 10th April 2003
0200400600800
100012001400160018002000
1/2/
1995
7/2/
1995
1/2/
1996
7/2/
1996
1/2/
1997
7/2/
1997
1/2/
1998
7/2/
1998
1/2/
1999
7/2/
1999
1/2/
2000
7/2/
2000
1/2/
2001
7/2/
2001
1/2/
2002
7/2/
2002
1/2/
2003
Date
Skin
dia
Inde
x
Source: Economic Times Database
Figure 2.12 Closing Value of BSE Sensex (Normalized by 1000) from 2nd Jan 1995 to 10th
April 2003
0
200400
600
800
10001200
1400
1600
1/2/
1995
7/2/
1995
1/2/
1996
7/2/
1996
1/2/
1997
7/2/
1997
1/2/
1998
7/2/
1998
1/2/
1999
7/2/
1999
1/2/
2000
7/2/
2000
1/2/
2001
7/2/
2001
1/2/
2002
7/2/
2002
1/2/
2003
Date
BSE
Sen
sex
Source: Economic Times Database
process of investing for the international investors to invest in these economies. This in
turn accelerated the growth in number of DR programs from the emerging economies.
Several regional specific variants of basic DR program, for example; EDRs, SDRs were
successfully introduced during 1990s.
Prior to 1990, firms from developed markets such as Australia, Hong Kong, Japan, the
Netherlands, Sweden and the UK dominated the DR market. However, during nineties,
firms from emerging markets, such as Argentina, Brazil, Chile, China, India, Indonesia,
Malaysia, Russia and South Korea have increasingly accessed the DR markets. The DR
programs from emerging markets now constitute a major chunk of all listed and traded
DR programs.
Of all the emerging markets, India has largest number of DR programs. Indian
Government permitted Indian firms to raise funds from the international market by their
DRs in April 1992. From April 1992 to June 2001 seventy-two Indian firms took
advantage of this opportunity and raised foreign equity capital by issuing eighty-five
DR programs listed on the foreign markets. The underwriting and lead managing of
these programs is concentrated in the hands of a few prominent international
investment bankers.
Initial DR programs by the Indian firms were listed at the LxSE due to the mild
securities’ regulations and the easy listing norms of the Luxembourg market.
Subsequently, Indian firms have also listed their DR programs on the LSE, NASDAQ
and NYSE. While the listings on US market require stringent disclosures and recasting
of firms’ financial statements as per US GAAP, listings on LxSE and LSE comes much
easier without any additional disclosures and recasting of the financial accounts.
During the early nineties, most Indian firms did not have level of financial transparency
as desired by the US GAAP and SEC. Therefore, initially Indian firms refrained from
listing on the US exchanges. However, during the course of 1990s, Indian financial
market regulators introduced several reforms to improve the level of financial
transparency of the Indian firms. These reforms positively influenced the capability of
Indian firms to tap the US markets. Therefore, of late, many Indian firms have listed
their DR programs on the US exchanges also.
A comparison of ADR listing Indian firms with GDR listing Indian firms provides
following interesting insights. First, while most ADR listing Indian firms operate in the
knowledge-based and or high-tech industries, most GDR listing Indian firms operate in
the traditional industries. Second, at an average ADR listing Indian firms tend to be
younger than the GDR listing Indian firms. Third, the average issue size of Indian ADR
offerings is significantly higher than the average issue size of Indian GDR offerings.
In the past, Indian DR programs have generally been well received by the international
investors. So in future it is expected that more Indian firms will tap the foreign markets
with DR programs for meeting their capital requirements.
References: Agarwal, R. N. (2000). Financial Integration and Capital Markets in Developing Countries:
A study of Growth, Volatility and Efficiency in the Indian Capital Market. Discussion paper no:21, Institute of Economic Growth, New Delhi. Allen, F. & Gale, D. (1999). Diversity of Opinion and Financing of New Technologies. Journal of Financial Intermediation, 8, 68-89. BONY (2000). DR Market Statistics. Downloaded from the Bank of New York website on 15.05.2002: http://www.adrbny.com/. BONY (2001). DR Market Statistics. Downloaded from the Bank of New York website on 15.05.2002: http://www.adrbny.com/. BONY (2002). DR Market Statistics. Downloaded from the Bank of New York website on 15.05.2002: http://www.adrbny.com/. Desai, N. M. & D'Souza, D. (1998). Legal and Tax Considerations Confronting Indian
companies Issuing GDRs/ADRs. Working Paper :17, Nishith Desai Associates, Bombay. Foerster S.R. & Karolyi G.A. (1993). International Listings of Stocks: The Case of Canada and the U.S. Journal of International Business Studies, 24, 763-784. Gande, A. (1999). Raising International Capital Through ADRs: Evidence from Emerging
Markets. Working paper no: 98-15, Owen Graduate School of Management, Nashville, TN. IFC (2000). Emerging Stock Markets Factbook 2000, New York: Standard & Poors. IMF (1996). International Monetary Fund, Balance of Payments Statistics Yearbook, IMF, Washington, DC. Kulikov, D. G. (2000). American Depository Receipts as a Way for Russian Companies to
Enter the U.S. Capital Market. Available on internet (12.12.2000): http://www.lawfirm.ru/text/art/1-6.shtml Lucas, D. J. & McDonald, R. (1990). Equity Issues and Stock Price Dynamics. Journal of
Finance, 46, 1523-1537. Mullin, J. (1993). Emerging Equity Markets in the Global Economy. Quarterly Review (from
Federal Reserve Bank of New York), June, 54-83 Pagano, M., Roell, A. A., & Zechner, J. (2002). The Geography of Equity Listing: Why Do Companies List Abroad? Journal of Finance, Forthcoming December 2002. Patil, R. H. (1994). Capital Market Developments. The Journal of the Indian Institute of
Bankers, 65 (3), July-September, 106-110,139. Porter, M. T. (1993). Closed-End Emerging Country Funds. In KH Park and W.Van Agtmael (Ed.), The World's Emerging Stock Market, Chicago: Probus Publishers.

Shashikanth, U. & Ramesh, B. (1998). Are Emerging market Correlations Stable? The ICFAI
Journal of Applied Finance, July, p 68.