demystifying the diagnosis of socio-economic transformation of smartphone users
TRANSCRIPT

Demystifying
the diagnosis
of
Socio
Economic
Transformation
of
Smartphone
Users
Fergusson College, Pune
Department of Statistics

Demystifying the Diagnosis of Socio-Economic Transformation of Smartphone Users
An Interdisciplinary approach to the technology of New Media.
Fergusson College, Pune-04
Dhammaratna Jawale
Avijit Das
Karishma Deshpande
Shrey Gupta
Samruddhi Joshi
Prof. Deepa Kulkarni
Project Guide and Batch-in-
charge
Prof. S. S. Shende
Head of the Department of
Statistics

1
Acknowledgement.................................................................................02
Certificate................................................................................................03
Introduction...........................................................................................04
Motivation..............................................................................................06
Abstract...................................................................................................08
Conversion of Problems into Statistical Language...............................09
Tools Used...............................................................................................10
Methodology...........................................................................................11
Analysis :
Exploratory Data
Analysis...........................................................................................12
Statistical Data
Analysis........................................................................................18
Limitation and Scope...............................................................................33
Conclusion...............................................................................................34
Appendix :
Table of socio-Economic
Classes..............................................................................................38
Sample
Questionnaire.................................................................................39
Bibliography............................................. ............................................. ............... 45
Index

2
ACKNOWLEDGEMENT
We, the students of T.Y.B.Sc.-Statistics, Fergusson college would like to express
our sincere appreciation to all those who provided us with the opportunity to complete this report.
We would like to express our deepest gratitude to our guide and mentor, Prof. Deepa S. Kulkarni
for her patient guidance, valuable and constructive suggestions for this research work .We
appreciate her willingness for assisting in keeping our progress on schedule.
We would also like to extend our special thanks to Head of Department of Statistics,
Prof . Subhash S. Shende and Prof. Charuta Dabir for their enthusiastic encouragement and useful
critique for this project work.
Our very grateful thanks to Head of Department of Sociology Prof. Sunita Gupta for
motivating us and clearing doubts related to the social aspects involved in the project. We would
also like to thank our trusted adviser and resource person Prof. Ajit Gagare, Department of
Communication Studies, University of Pune, for mentoring us throughout this research work.
We would like to thank Mr. Baburao Salve, Mr. Ashok Jawale, Mr. Mayur Girhe
Mr.Vinay Sonawane for invaluable feedback and help in the methodological issues of our project.
Finally we would like to express our gratitude to our family and friends for offering us
with tremendous support, Mr. Nandakishor Joshi for data collection process, Ms. Sachi Somani
for project presentation and all those who contributed to this project during the process of data
collection by filling up the questionnaire with their co-operation and patience.

FERGUSSON COLLEGE, PUNE
Department of Statistics
This is to certify that
Mr./Miss. …………………………………………………,
Roll No. …..., student of Fergusson College, studying in T.Y.B.Sc.-Statistics,
has successfully completed his/her annual research work entitled as
‘Demystifying the diagnosis of Socio-Economic Transformation of
Smartphone Users’
And has satisfactorily reached the goals of the proposed work
as per laid down by the University of Pune.
Date:
Prof. Deepa Kulkarni, Prof. S. S. Shende,
Batch-in-charge and Research guide Head of The Department of Statistics

4
INTRODUCTION
“An invasion of armies can be resisted but not an idea whose time has come.”
- Victor Hugo.
The human wants are unlimited and change from time to time due to constant growth
in technology and this want consequently brings a transformation in the society over time.
The World Bank pronounced the mobile network as the biggest ‘machine’ the world has ever
seen. For the first time, even the underprivileged and people from the lower strata in India
could connect to the wealthiest and most highly placed. Before the Smartphone such
connections were often difficult or impossible. For India, the mobile phone was the most
widely shared item of luxury and indulgence the country had ever seen. It quickly became not
a luxury but a necessity for tens of millions of people-the single largest category of consumer
goods in the country.
These smart phones not only offer some of the same features that a personal
computer would, but they also provide a very high level of entertainment. Even with all the
capabilities that smart phones offer they still require a great level of understanding and
responsibility. Because of its portability, people seem to be more comfortable using smart
phone as a primary communication device than desktop or home phone.
With huge powerful applications, smart phones allow its users to stay in touch
with their work and extend their social connection in many ways. Many of the smart phones
applications available today has a huge impact on groups of people who take advantage of it.
Because of the requirement of the economy, many businessmen prefer to have a smart phone
which allows them to keep connect with their business clients, checking e-mail, texting or
browsing web while they are on the road.
The Android Market currently offers around 100,000 applications and over
two-billion downloads to date1. These applications include many different things from games,
videos, and music. There was a time when smart phones were primarily used to meet
business needs but today people also use them for entertainment purposes as well.
1 Lilly’s Report,2010 (USA)

5
The goal of this survey is to explore this above mentioned social and
economic transformations in the society due to this new idea, this new transformation which
is influenced by the increasing use of smart phones, which gave power of information into the
tiny palms of a person. As shown in the famous BBC TV series ‘SHERLOCK’, the villain
Prof. Moriarty uses his high-featured Smartphone Applications to unlock many confidential
records, codes and draws the whole country to his knees. Although it was purely a piece of
fiction, we have seen in real world, what happens when the power and ability to control
information came to the hands of Mr. Julian Assange, founder of WikiLeaks2.
Considering so many facts like these, we concentrated on the changes and
transformations due to Smartphone taken through our lives and how they are going to results
in something new, say Digital Revolution, which will surely redefine the lifestyles and
livings of upcoming generations.
Why Interdisciplinary?
Interdisciplinary research (IDR) is a mode of research by teams or individuals
that integrates information, data, techniques, tools, perspectives, concepts, and/or theories
from two or more disciplines or bodies of specialized knowledge to advance fundamental
understanding or to solve problems whose solutions are beyond the scope of a single
discipline or area of research practice. Since social behaviour is something that has a wide
dimension, we decided to club the social and economic parameters. Therefore it was
necessary to use the interdisciplinary approach to arrive at a balanced result for our project.
2 WikiLeaks is an international, online, non-profit, journalistic organisation which publishes secret information,
news leaks, and classified media from anonymous sources.

1
MOTIVATION
India’s Smartphone user population is growing exponentially. The 27 million
Smartphone users in Urban India constitute 9% of the entire mobile user base. With 900
million mobile phone users (according to TRAI) India is considered to be one of the fastest
growing cellular markets and every handset maker is trying to offer the full suite of products
ranging from basic phones to the high end feature loaded smart phones. The mobile phone
industry in India is likely to contribute US$ 400 billion to the country’s gross domestic
product (GDP) and has the potential to generate about 4.1 million additional jobs by 2020.
The smart phones of today have so many features that the owners of them can hardly seem to
put them down just for a second. It has in fact become an addiction. Because of its portability,
people seem to be more comfortable using smart phone as a primary communication device
than desktop or home phone. Furthermore, it is an efficient and discreet way to communicate
with friends and family members.
In assessing the positive impact of smart phones on our society, there are two major areas
which have vastly affected by smart phones, and they are business and socialization. The
purpose of this project is to help others understand the direction of Smartphone technology,
the ways Smartphone technology changes society; understand the impact of change and
manner in which we live our lives.
Power In Your Hand
1) There is now an application which helps fishermen as well. The services provided by the
application include tracking potential fishing zones, ocean state forecast such as length of the
waves in the sea and weather conditions. The hand-held device would also provide market
information, news and government schemes meant for fisher folk.
2) Another application which was developed by the son of a famous Panwala serving in the
streets of Mumbai enables users of the application to place orders for the pan through the
application.
3) An uneducated girl who used to give Mehndi classes, now with the help of her brother is
empowered to give assignments to her students with the help of the famous instant messaging
application ‘Whatsapp’ and has expanded her income to a threefold.

2
The world has now become one small global village. Due to its flexible web access, mobile
applications offer much more convenience in helping anyone achieve their business and
expansion goals. Such has been the impact of Smartphone and so we decided to take up this
topic for our research work. While dealing with our research goals we found so many other
interesting things on which we can work through statistical analysis to analyze the data in
order to explore the social and economical transformation of the early Smartphone user.
In our day to day life we all come across so many situations where we can say that this tiny
palm device has become such an organ like thing of our body. So we thought to explore this
situation and its consequences over human. For instance take a bus-stop, a railway station, a
cinema hall, a garden or any public place we can see how much people got addicted to their
Smartphone.
All this real life situations and scenarios inspired and motivated us to take this topic as our
annual research project. In the process we met so many persons using their Smartphone in
critically different ways and this gives us immense satisfaction for our topic.

8
ABSTRACT
Project Title:
Demystifying the diagnosis of Socio-Economic
Transformation of Smartphone Users.
An Interdisciplinary Approach To The Technology Of New Media.
Since the Smartphone have become the new ‘must haves’, our project was centred
on the changes that these devices have had on its users and the society. Our aim was to check
whether smart phones have played a vital role in influencing the social characteristics to
communicate with the society. And to check, if people, who have opted for buying a
Smartphone to keep up with the technology, are actually making use of applications such as
Mobile banking, Online shopping, etc., which have been created to make life easier. If yes,
then, to substantiate if the Smartphone user is giving enough time to the society and the
world as the Smartphone user does not feel the need to interact or go out for even the smallest
of things as he has the necessary power to do any given task in his own hands. To do so we
collected a sample from 305 people. For analysing the primary data we have used Chi-Square
test of independence of two attributes, Paired t-test for before and after scenarios, tests of
proportion etc. Parallely by dividing the samples into four different Socio-Economic Classes
as ‘A>B>C>D’, we went through a comparative analysis of these classes according to their
usage behaviour.

9
CONVERSION OF PROBLEMS INTO STATISTICAL LANGUAGE
The following statistical methods are used in data analysis:
1) Paired t -test: ( one sample )
Used to test whether SMARTPHONE had an effect on various parameters (namely
time spent on phone call, number of phone calls, use of internet, mobile banking habits,
etc. ).
2) Chi-square test for independence of two attributes:
Used to test independence of various pairs of attributes like relationship status with
quality time given to family, Relationship status with physical presence in social
meetings, Relationship status with time spent on phone calls, Socio economic class with
use of mobile banking and online shopping.
3) Testing Population Proportion:
Used for checking Proportion of people who opted for Smartphone for purpose of
keeping up with the technology are actually making optimal use of it by using
applications such as mobile banking and shopping is less than 0.5.
4) Shapiro-Wilk Test:
This test was used to check the normality of various variables such as age, price
etc. We perform this test on the IBM-SPSS software. The said test was also used to draw
Normal Q-Q plot of these variables.
5) Kruskal Wallis test:
Used to check whether the socio economic class has played an influential role in
the purchasing price range of their Smartphone.

10
TOOLS USED
For the analysis of data in our project we have used the following statistical tools,
MS- excel :
A worksheet where we input the
collected data through the survey. We have used this
worksheet as it is very user friendly. The data which
was input in MS excel was later exported to SPSS, a
more advanced package used for comparative study
between different variables and attributes. We have
also used it for proportion tests.
SPSS software : (Statistical Package for Social Studies)
A widely known and accepted
statistical package to conduct analysis for
testing various claims. We have used this
package for Shapiro Wilk’s test for normality of
our data, to draw frequency tables, to draw and
study normal q-q plots and box plots, etc
R-package :
It is a statistical package introduced to us in this
academic year. We have used it for non parametric tests such as
Kruskal Wallis for testing the equality of several means and Chi
square test for testing the independence of two attributes.

11
METHODOLOGY
After reading a great deal of news articles and books like Cellphone Nation and The
New Digital Age, left us curious to know more about the mystery behind the transformation due
to Smartphones and the reasons that have made them a rage among the people around the world.
We decided to study this in detail and started working accordingly.
The first step involved in our project was framing of the questionnaire. Divided into three
sections, our questionnaire comprised of 36 questions. The first section included personal
information and Smartphone related specifications like model, manufacturer, operating system
etc. As we wanted to compare the daily use by a person before and after buying the Smartphone ,
the second section comprised of all the before and after questions like number of calls, text
message, call time per day through an ordinary phone and the through the Smartphone they use
currently.
The third section included general questions related to Smartphones like motivation to
buy a Smartphone, use of certain applications, and this section also included questions where
people had to give their views and prejudices about influence of Smartphones, like ability to give
quality time to family, improvement of personal, business contacts, decrease in social interaction
etc. The second step was data collection and sampling method. Our sampling was conditional,
i.e. the people who own a Smartphone and have previously used an ordinary phone were our
sample and it was open for the age group above 15.We targeted public places and each group
member obtained an average of 60 samples.
The next step was the analysis of the collected data. In the exploratory analysis we
represented our data and the related information in the form of bar diagrams and pie charts. In
the statistical analysis part we wanted to test certain claims for which we made use of chi-square
test for independence of two attributes, paired t test, test for proportion and kruskal wallis test.
We then quoted the conclusions collectively.
We also prepared a table to estimate the Socio-economic class (see appendix) based
on the occupation and education of the person. These classes were divided into grades A, B, C
and D according to their status.

12
5%
46%
17%
4%2%4%2%
8%
5%7%
MANUFACTURER
NOKIA SAMSUNGMICROMAX BLACKBERRYLG/ GOOGLE APPLEHTC SONYKARBONN OTHERS
Exploratory Data Analysis
Pie charts and bar diagrams
OS Frequency Percent
ANDROID 257 84.3
APPLE 10 3.3
WINDOWS 14 4.6
SYMBIAN 11 3.6
BLACKBERRY 11 3.6
OTHERS 2 .7
Total 305 100.0
MANUFACTURER Frequency Percent
NOKIA 15 4.9
SAMSUNG 141 46.2
MICROMAX 52 17.0
BLACKBERRY 11 3.6
LG/ GOOGLE 5 1.6
APPLE 11 3.6
HTC 7 2.3
SONY 26 8.5
KARBONN 15 4.9
OTHERS 22 7.2
Total 305 100.0
84%
3%4% 4% 4%
1%
OPERATING SYSTEMS
ANDROID APPLE WINDOWS
SYMBIAN BLACKBERRY OTHERS

13
45%
29%
10%
1% 7%
2% 3% 2% 1%
Dream Phone's Manufacturer
APPLE SAMSUNG SONY
MICROMAX NOKIA LG/GOOGLE
HTC BLACKBERRY OTHERS
0%
10%
20%
30%
40%
50%
60%
70%
80%
90%
100%
A B C D
SES wise preference to payment mode
CC/DC
NET BANKING
COD
Dream Smartphone’s Manufacturer
Frequency Percent
(missing) 50 16.4
APPLE 116 38.0
SAMSUNG 74 24.3
SONY 25 8.2
MICROMAX 2 .7
NOKIA 17 5.6
LG/GOOGLE 6 2.0
HTC 7 2.3
BLACKBERRY 6 2.0
OTHERS 2 .7
Total 305 100.0

14
0
20
40
60
80
100
120
Before After
Number of calls
0 to 5
5 to 10
10 to 15
15 and above
0
10
20
30
40
50
60
70
80
90
Before After
Time on calls
less than 5
5 to 15
15 to 30
30 to 60
60 and above
Graphical Comparison of ‘Before’ & ‘After’ Scenarios
1. Comment &
Interpretation :
This bar graph gives us the
information about the time spent
on calls per day (in minutes),
before and after buying a
Smartphone. From the Graph, it
can be concluded that the number
of people who spoke for more than
60min. daily has increased
significantly. On the contrary the
number of people belonging to the
first 3 categories has decreased. In
this case we can say that since the
introduction of Smartphones,
users spend more time on calls
per day.
2. Comment &
Interpretation:
This bar graph gives us the
comparison of number of calls made
before and after buying a Smartphone.
Although there is decrease in the
number of people in the first two
categories, the last two categories
seemed to have gained more number
of people. In this situation, we can say
that the Smartphone users still
prefer speaking over the phone with
their closed ones and with business
contacts even though instant
messaging and free calling
applications exists.

15
0
20
40
60
80
100
120
140
Before After
Number of SMS
0 to 5
5 to 15
15 to 50
50 and above
0
50
100
150
200
250
Before After
Use of Internet
Never
Monthly
Weekly
Daily
3. Comment &
Interpretation :
This bar graph gives us information
about the number of text messages
before and after buying a Smartphone.
From the graph it can be seen that
there is no change in the number of
people who used to send fewer than 5
texts daily .There is slight decrease in
next two categories whereas the
number of people who sent more than
50 texts daily is on a rise. In this case,
the and fourth categories imply to us
that there are still people who opt
for SMS packs when they can
actually use instant messaging
applications to serve the same
purpose.
4. Comment &
Interpretation:
This bar graph gives us the
information about usage of the
internet before and after buying a
Smartphone .From the graph it is
clear that large number of people
who didn’t use internet on their
ordinary phones earlier, have started
using it after buying a Smartphone.
The first category also includes
people who didn’t have internet on
their earlier handsets but now they
are acquainted with it. Out of the
305 samples taken, more than 200
people use internet on daily basis
since the availability of
Smartphones.

16
0
50
100
150
200
250
300
Before After
Mobile Banking
Never
Rarely
Frequently
0
50
100
150
200
250
300
Before After
Social Network
0 to 10
10 to 20
20 and above
5. Comment &
Interpretation:
The bar graph informs us about
the browsing time on internet (in
minutes) before and after buying a
Smartphone. From the above graph
we conclude that there are more
number of internet users. The
number of people who spend more
than 60 min. browsing is on a rise.
The browsing includes all the
activities and applications through
the internet which the Smartphone
enables to its user. In a nutshell, we
can say that there is a drastic
increasing trend of browsing time
after the introduction of
Smartphone in our lives.
6. Comment &
Interpretation:
This bar diagram informs us about
the usage of mobile banking before
and after buying a Smartphone. Due to
the unavailability of the internet on a
few ordinary phones, people couldn’t
use this application .Now when they
are capable of using it; people are not
in the favour of this application due to
reasons like unreliability, poor internet
connectivity etc. At the same time,
mobile banking application is a
boon for the people who want to
keep up with technology and save
their time. However there is less
number of people who frequent this
application.
0
50
100
150
200
250
Before After
Browsing Time
0 to 15
15 to 30
30 to 60
More than 60

17
0
50
100
150
200
250
300
Before After
News Portal
never
daily
weekly
7. Comment & Interpretation:
This Bar graph compares the
number of statuses and images
uploaded on social networking sites
(via Phone) before and after buying
a Smartphone. From the graph it
can be seen that the number of
people who weekly updated their
images and statuses in the second
and third category have increased.
However, more than half of the
sample population still doesn’t
make any uploads at all or lesser
than 10 per week.
8. Comment &
Interpretation:
This Bar diagram compares the
usage of the News portal application
before and after buying a Smartphone.
There is a significant increase in the
number of people who check online
news daily and weekly .It can be
concluded that there are many people
who want to stay up-to-date through
these applications in Smartphones.
As the first category also includes the
people who didn’t have this application
on their earlier phones are now making
optimum use of it.
0
50
100
150
200
250
300
Before After
Social Network
0 to 10
10 to 20
20 and above

18
Statistical Data Analysis: Paired t-test (one sample)
Let Xi: Time spent on phone calls per day using basic phone.
Yi: Time spent on phone calls per day using Smartphone.
µd: Average time difference between basic phone and Smartphone.
To test:
H0: µd =0 (i.e. average time difference is zero) Vs
H1: µd < 0 (i.e. average time difference has decreased)
Test statistic:
𝑡𝑐𝑎𝑙 =𝑑
𝑠 𝑛 Follows t- distribution with (n-1) degrees of freedom
𝑡𝑐𝑎𝑙 = −3.690045666
𝑡304;0.05=1.649881428
Decision rule:
Reject H0 at 100𝛼 % level of significance if 𝑡𝑐𝑎𝑙 < −𝑡𝑛−1;𝛼 ; otherwise we may accept H0.
Decision:
As 𝑡𝑐𝑎𝑙 < −𝑡304;0.05 ;
We reject H0 at 5 % level of significance.
Conclusion:
The average time spent on phone calls per day has decreased after the introduction of
Smartphone. Therefore, we have deduced that because of applications such as instant
messaging like Whatsapp and free calling like Viber and Line there has been a reduction in
the time spent on phone calls.
• Average time spent on phone calls per day has decreased after the introduction of Smartphone.Claim 1

19
Let Xi : Number of phone calls per day using basic phone
Yi : Number of phone calls per day using Smartphone.
µd : Average number of call difference between basic phone and Smartphone.
To Test:
H0: µd =0(i.e. average number of call difference is zero) Vs
H1: µd < 0 (i.e. average number of calls has decreased)
Test statistic:
𝑡𝑐𝑎𝑙 =𝑑
𝑠 𝑛 Follows t- distribution with (n-1) degrees of freedom
𝑡𝑐𝑎𝑙 = 5.340764909
𝑡304;0.05=1.649881428
Decision rule:
Reject H0 at 100𝛼 % level of significance if 𝑡𝑐𝑎𝑙 < −𝑡𝑛−1;𝛼 ; Otherwise we may accept H1.
Decision:
As 𝑡𝑐𝑎𝑙 > −𝑡304;0.05;
We accept H0 at 5 % level of significance.
Conclusion:
The average number of phone calls is same in both, before and after scenarios. Thus we
conclude that though there are a few interesting applications in Smartphone, the calls related to
business and emergencies are usually done through the conservative phone calls. Considering
the previous test with this one we can positively say that these applications are preferred for
making longer conversation to cut down the rate of costs, which is a definite incentive to
youngsters and for friends and families living overseas.
• Average number of phone calls per day has decreased after the introduction of Smartphone.Claim 2

20
Let Xi: Use of internet on the basic phone .
Yi: Use of internet on the Smartphone.
µd: Average difference between basic phone and Smartphone internet usage.
To Test:
H0: µd =0 (i.e. average difference between usage of internet is zero) Vs
H1: µd> 0 (i.e. average difference in usage of internet has increased)
Test statistic:
𝑡𝑐𝑎𝑙 =𝑑
𝑠 𝑛 Follows t- distribution with (n-1) degrees of freedom.
𝑡𝑐𝑎𝑙 =20.27225637
𝑡304;0.05=1.649881428
Decision rule:
Reject H0 at 100𝛼 % level of significance if 𝑡𝑐𝑎𝑙 > 𝑡𝑛−1;𝛼 ; otherwise we may accept H0.
Decision:
As 𝑡𝑐𝑎𝑙 > 𝑡304;0.05
We reject H0 at 5 % level of significance.
Conclusions:
The use of internet after the introduction of Smartphone has increased tremendously. It was an
expected outcome as in the basic phones internet facility wasn’t very user friendly unlike the
Smartphones. Smartphone has certainly given its users an edge and have changed the whole
perception of mobile phones. They have done the work of a catalyst, thereby helping the
mobile industry reach great heights.
• Average Internet use has increased after the introduction of Smartphone.Claim 3

21
Let Xi: Time spent on browsing on basic phone per day.
Yi: Time spent on browsing on Smartphone per day.
µd: Average time difference of browsing between basic phone and Smartphone.
To Test:
H0: µd =0 (i.e. average time difference on browsing is zero) Vs
H1: µd> 0 (i.e. average time difference has increased)
Test statistic:
𝑡𝑐𝑎𝑙 =𝑑
𝑠 𝑛 Follows t- distribution with (n-1) degrees of freedom
𝑡𝑐𝑎𝑙 = 19.47134335
𝑡304;0.05=1.649881428
Decision rule:
Reject H0 at 100𝛼 % level of significance if 𝑡𝑐𝑎𝑙 > 𝑡𝑛−1;𝛼 ; otherwise we may accept H0.
Decision:
As 𝑡𝑐𝑎𝑙 > 𝑡304;0.05
We reject H0 at 5 % level of significance.
Conclusion:
The average time spent on internet per day has increased. Just like the previous case, because of
its user friendly interface Smartphone has enabled the user for making optimal use of the
internet. With various new applications to attract the young and the old alike, Smartphones
have made the use of internet not a want but a need.
• Average time spent on browsing per day has increased after the introduction of Smartphone.Claim 4

22
Let Xi: Use of mobile banking on the basic phone.
Yi: Use of mobile banking on the Smartphone.
µd: Average difference between basic phone and Smartphone mobile banking usage.
To Test:
H0: µd =0 (i.e. average difference between usage of mobile banking is zero) Vs
H1: µd>0 (i.e. average difference in usage of mobile banking has increased)
Test statistic:
𝑡𝑐𝑎𝑙 =𝑑
𝑠 𝑛 Follows t- distribution with (n-1) degrees of freedom
𝑡𝑐𝑎𝑙 = 10.16735948
𝑡304;0.05=1.649881428
Decision rule:
Reject H0 at 100𝛼 % level of significance if 𝑡𝑐𝑎𝑙 > 𝑡𝑛−1;𝛼 ; otherwise we may accept H0.
Decision:
As 𝑡𝑐𝑎𝑙 > 𝑡304;0.05
We reject H0 at 5 % level of significance.
Conclusion:
The use of mobile banking after the introduction of Smartphones has increased. It has
provided a simple and fast interface to help its users. Before Smartphones mobile banking
was done with the help of SMS also; which was chargeable and slow. But now various
established banks have taken the effort to develop their own applications which has given the
term mobile banking a whole new dimension.
• Use of Mobile Banking has increased after the introduction of Smartphone.Claim 5

23
Let Xi: Number of images and status uploaded on social network before using Smartphone.
Yi: Number of images and status uploaded on social network using Smartphone.
µd: Average difference between uploads before using Smartphone and while using Smartphone.
To Test:
H0: µd =0 (i.e. average difference is zero) Vs
H1: µd> 0 (i.e. average difference has increased)
Test statistic:
𝑡𝑐𝑎𝑙 =𝑑
𝑠 𝑛 Follow t- distribution with (n-1) degrees of freedom
𝑡𝑐𝑎𝑙 = 12.39277712
𝑡304;0.05=1.649881428
Decision rule:
Reject H0 at 100𝛼 % level of significance if 𝑡𝑐𝑎𝑙 > 𝑡𝑛−1;𝛼 ; otherwise we may accept H0.
Decision:
As 𝑡𝑐𝑎𝑙 > 𝑡304;0.05
We reject H0 at 5 % level of significance as 𝑡𝑐𝑎𝑙 > 𝑡304;0.05
Conclusions:
The number of images and status uploads has increased on the Smartphone. Social
networking sites have seen the potential of the Smartphones and have therefore created their
own applications so as to foster rapid growth in the ever increasing competition. The number
of pictures and status uploads have increased because of the convenience that Smartphones
provides its users. People have become more extrovert and feel the need to share everything
about themselves with the help of these applications created by the social networking sites.
• Number of image+status uploads on Social-Networking sites has increased on Smartphone.Claim 6

24
Let Xi: Checking online news portals using basic phone.
Yi: Checking online news portals using Smartphone.
µd: Average difference between news portals checked using basic phone and Smartphone.
To Test:
H0: µd =0 (i.e. average difference is zero) Vs
H1: µd < 0 (i.e. average difference has decreased)
Test statistic:
𝑡𝑐𝑎𝑙 =𝑑
𝑠 𝑛 Follows t- distribution with (n-1) degrees of freedom
𝑡𝑐𝑎𝑙 = 15.4615815
𝑡304;0.05=1.649881428
Decision rule:
Reject H0 at 100𝛼 % level of significance if 𝑡𝑐𝑎𝑙 > 𝑡𝑛−1;𝛼 ; otherwise we may accept H0.
Decision:
As 𝑡𝑐𝑎𝑙 > 𝑡304;0.05,
We reject H0 at 5 % level of significance.
Conclusions:
The checking of online news portals has increased after the introduction of Smartphones.
Online news portals have in a way become a replacement for the conventional newspapers.
Users do not have to go through many pages; they can check the story of their interest and
choose editorials according to their preference.
• Use of Online News Portals has increased on Smartphone.Claim 7

25
Chi-Square(Χ2) Test For Independence Of Two Attributes
Distribution of person according to relational status and time spent on phone calls per day:
Status
Time on
Phone calls(in min.)
Single Committed Married
Less than 5 29 4 10
5 to 15 34 8 15
15 to 30 44 5 20
30 to 60 26 2 27
60 and above 42 10 29
Let H0: Relationship status and time spent on phone calls per day are independent.
H1: Relationship status and time spent on phone calls per day are not independent
Result table : ( imported from R-package)
From this table 𝜒𝑐𝑎𝑙2 = 13.822, p-value= 0.087 & 𝛼=0.05
Decision rule :
Reject H0 at 100𝛼 % level of significance if p-value <𝛼; otherwise we may accept H0.
Decision:
As p-value>𝛼, We accept H0 at 5 % level of significance.
Conclusion: Relationship status and time spent on phone calls are independent.
• Relationship status Vs Time spent on phone calls.Test 1
Large Sample
Test Statistic DF p-value | Effect Size est. Lower (%) Upper (%)
Chi Squared 13.822 8 0.087 | Cramer's V 0.151 0 (2.5) 0.196
(97.5)
26
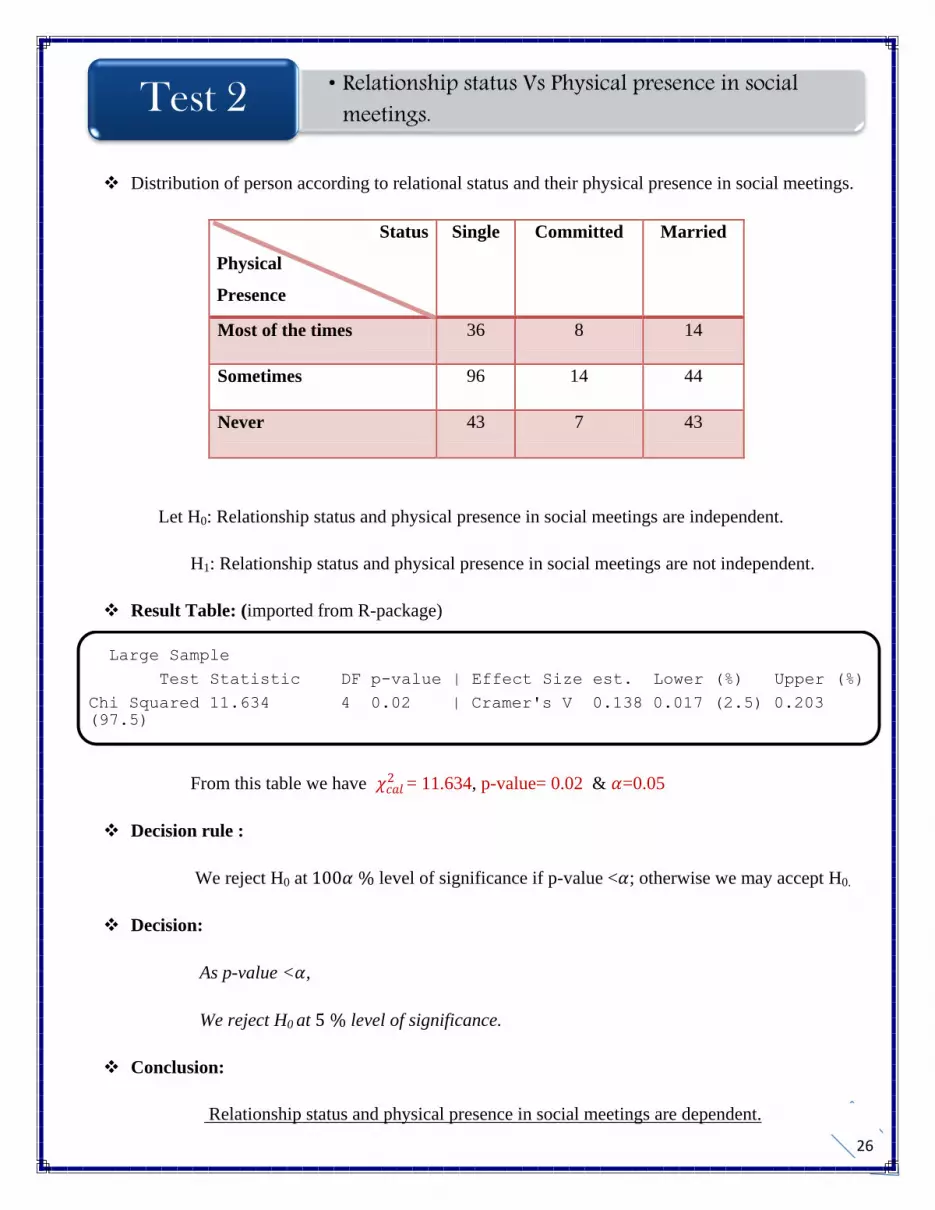
Distribution of person according to relational status and their physical presence in social meetings.
Status
Physical
Presence
Single Committed Married
Most of the times 36 8 14
Sometimes 96 14 44
Never 43 7 43
Let H0: Relationship status and physical presence in social meetings are independent.
H1: Relationship status and physical presence in social meetings are not independent.
Result Table: (imported from R-package)
From this table we have 𝜒𝑐𝑎𝑙2 = 11.634, p-value= 0.02 & 𝛼=0.05
Decision rule :
We reject H0 at 100𝛼 % level of significance if p-value <𝛼; otherwise we may accept H0.
Decision:
As p-value <𝛼,
We reject H0 at 5 % level of significance.
Conclusion:
Relationship status and physical presence in social meetings are dependent.
• Relationship status Vs Physical presence in social meetings.Test 2
Large Sample
Test Statistic DF p-value | Effect Size est. Lower (%) Upper (%)
Chi Squared 11.634 4 0.02 | Cramer's V 0.138 0.017 (2.5) 0.203
(97.5)

27
Distribution of person according to relational status and quality time to their family.
Status
Quality
Time to family (in min.)
Single Committed Married
Yes 71 15 49
No 51 5 24
Partially 53 12 28
Let H0: Relationship status and quality time given to their family are independent.
H1: Relationship status and quality time given to their family are not independent.
Result Table: (imported from R-package)
From this table 𝜒𝑐𝑎𝑙2 = 4.038, p-value= 0.401 & 𝛼=0.05
Decision rule:
We reject H0 at 100𝛼 % level of significance if p-value <𝛼; otherwise we may accept H0.
Decision:
As p-value >𝛼, We accept H0 at 5 % level of significance.
Conclusion:
Relationship status and quality time given to their family are independent.
• Relationship status Vs Quality time to family.Test 3
Large Sample
Test Statistic DF p-value | Effect Size est. Lower (%) Upper (%)
Chi Squared 4.038 4 0.401 | Cramer's V 0.081 0 (2.5) 0.137
(97.5)

28
Distribution of Smartphone users according to their socio-economic status and their use with mobile
banking(*) and/or online shopping (**).
Socio-economic Status
Use with
MB* and/or OS
**
A B C D
Yes 67 27 27 3
No 89 56 31 11
Let H0: Socio-economic status and Use of Mobile Banking and/or online Shopping are independent.
H1: Socio-economic status and Use of Mobile Banking and/or online Shopping are not independent.
Result Table: (imported from R-package)
From this table 𝜒𝑐𝑎𝑙2 = 6.252, p-value= 0.1 & 𝛼=0.05
Decision rule : Reject H0 at 100𝛼 % level of significance if p-value <𝛼; otherwise we may accept H0.
Decision:
As p-value > 𝛼,
We accept H0 at 5 % level of significance.
Conclusion:
Socio-economic status and Use of Mobile Banking and/or online Shopping are independent.
• Socio-Economic status Vs Use with MB* and/or OS**Test 4
Large Sample
Test Statistic DF p-value | Effect Size est. Lower (%) Upper (%)
Chi Squared 6.252 3 0.1 | Cramer's V 0.143 0 (2.5) 0.237
(97.5)

29
TEST OF PROPORTION
Let P: Proportion of people using mobile banking and shopping on their Smartphone in population.
n: Number of people who bought the Smartphone for purpose of keeping up with the technology.
X: Number of people using mobile banking and shopping on their Smartphone.
p = X
n : Proportion of people using mobile banking and shopping on their Smartphone in our sample.
P0 = 0.5 (Specified value of P)
To Test:
H0: P = 0.5 (i.e. Proportion of people using mobile banking and shopping on their
Smartphone in population is 0.5)
H1: P < 0.5 (i.e. Proportion of people using mobile banking and shopping on their
Smartphone in population is less than 0.5)
Test statistics:
Zcal =p−P0
P0Q0
n
Under H0, Z follows standard Normal (i.e. N (0, 1))
As n = 187 , p = 0.422459 , P0 = 0.5 , and Q0 = 1− P0 = 0.5
Zcal = −2.120689 ; Z0.05 = 1.64
Decision rule: Reject H0 at 100𝛼 % level of significance if Zcal < − Z0.05, otherwise we may accept
H1.
Decision: As Zcal < − Z0.05, We reject H0 at 5 % level of significance
Conclusion: Proportion of people using mobile banking and shopping on their Smartphone in
population is less than 0.5.
•Proportion of people who opted for Smartphone for purpose of keeping up with the technology are actually making optimal use of it by using applications such as mobile banking and shopping is less than 0.5.
Claim 1

30
Let P: Population proportion of committed people who are most of the time present physically in social
meetings .
n: Number of committed people in the sample .
X: Number of committed people who are present mostly physically in social meetings.
p = X
n : Sample proportion of committed people who are present mostly physically in social meetings .
. P0 = 0.5 (Specified value of P)
To Test:
H0: P = 0.5 (i.e. Proportion of committed people using Smartphone who are present mostly
physically is 0.5) Vs
H1: P > 0.5 (i.e. Proportion of committed people using Smartphone who are present mostly
physically is greater than 0.5)
Test statistics :
Zcal =p−P0
P0Q0
n
Under H0, Z follows standard Normal (i.e. N (0, 1))
As n = 187 , p = 0.275862 , P0 = 0.5 , and Q0 = 1− P0 = 0.5
Zcal = −2.414040 ; Z0.05 = 1.64
Decision rule:
Reject H0 at 100𝛼 % level of significance if Zcal > Z0.05, otherwise we may accept H0.
Decision:
As Zcal < Z0.05, We accept H0 at 5 % level of significance.
Conclusion: Proportion of committed people using Smartphone are most of the time present
physically in social meetings in population is 0.5.
• Proportion of committed people who are most of the time present physically in social meeting is greater than 0.5Claim 2

31
BOX PLOT OF PRICE VARIABLE: ( source- SPSS )
As we can see from the box plot, the first and third quartile( i.e. Q1, Q3 resp.) are not equidistant from
second quartile i.e. Q2.
Hence the price variable is not following Normal Distribution.
Confirmatory test to check the normality of price variable.
Shapiro-Wilk test using SPSS. (Table Source-SPSS)
From the table we can see that ( in Shapiro-Wilk column)
As sig. value < 0.05,
We can conclude that the price variable is not following Normal Distribution.
Thus we used Non-parametric test i.e. Kruskal Wallis test.
• The socio-economic class has played an influential role in the purchasing price range of their smartphone ( i.e. Average of purchasing price corresponding to different socio-economic status differ significantly.)
Claim
Tests of Normality
Kolmogorov-Smirnova Shapiro-Wilk
Statistic df Sig. Statistic df Sig.
Price .153 305 .000 .848 305 .000

32
KRUSKAL WALLIS TEST
To Test:
H0: A = B = C = D (i.e. Average of purchasing price corresponding to different socio-economic
status are same.) Vs
H1: Not all are same.
Result Table: ( imported from R-package )
From the table we have Hcal = 6.083, pvalue = 0.108 and = 0.05
Decision rule :
Reject H0 if pvalue < , otherwise we may accept H0.
Decision:
As pvalue >,
We accept H0 at 5% level of significance.
Conclusion:
The socio-economic class of a person has not played an influential role in the purchasing price
range of their Smartphone.
Large Sample
Test Statistic DF p-value
Kruskal-W (nominal rows) 97.164 102 0.617
Kruskal-W (nominal cols) 6.083 3 0.108

33
LIMITATIONS AND SCOPE
There were two conditions to take the sample-
The subjects should be using a Smartphone currently.
The subjects should have used a basic phone previously.
Therefore, it was a bit tedious to find such samples.
We were unable to cover all the social parameters such as caste and religion due to
some restrictions and its complexity.
Due to personal reasons certain subjects hesitated to give true information on a few
topics such as relationship status, annual family income, etc.
We have made the effort to project which manufacturers are going to take lead in the
Indian market considering the recent trends according to IDC.
The actual number of samples taken by us in the survey conducted was 320, but due
to insufficient and incomplete data, we had to forego few samples.

34
Conclusions and Discussion
Given below is the general data that has been analyzed by us with the help of the
survey conducted:
Conclusions Based on Tests
[A] Paired t-test for testing the changes after being introduction
of Smartphone:
The average time spent on phone calls per day has decreased after the introduction of
Smartphone. Therefore, we have deduced that because of applications such as instant
messaging like Whatsapp and free calling like Viber and Line there has been a reduction
in the time spent on phone calls.
The average number of phone calls is same in both, before and after scenarios. Thus we
conclude that though there are a few interesting applications in Smartphone, the calls
related to business and emergencies are usually done through the normal phone calls.
Considering the previous test with this one we can positively say that these applications
are preferred for making longer conversation to cut down the rate of costs, which is a
definite incentive to youngsters and for friends and families living overseas.
The use of internet after the introduction of Smartphone has increased tremendously. It
was an expected outcome as in the basic phones internet facility wasn’t very user friendly
unlike the Smartphones. Smartphone has certainly given its users an edge and have
changed the whole perception of mobile phones. They have done the work of a catalyst,
thereby helping the mobile industry reach great heights.
The average time spent on internet per day has increased. Just like the previous case,
because of its user friendly interface smartphone has enabled the user for making optimal
use of the internet. With various new applications to attract the young and the old alike,
smartphones have made the use of internet not just a want but a need.

35
The use of mobile banking after the introduction of Smartphones has increased. It has
provided a simple and fast interface to help its users. Before Smartphones mobile banking
was done with the help of SMS also; which was chargeable and slow. But now various
established banks have taken the effort to develop their own applications which has given
the term mobile banking a whole new dimension.
The number of images and status uploads has increased on the Smartphone. Social
networking sites have seen the potential of the Smartphones and have therefore created
their own applications so as to foster rapid growth in the ever increasing competition. The
number of pictures and status uploads have increased because of the convenience that
Smartphones provides its users. People have become more extrovert and feel the need to
share everything about themselves with the help of these applications created by the
social networking sites.
The checking of online news portals has increased after the introduction of Smartphones.
Online news portals have in a way become a replacement for the conventional
newspapers. Users do not have to go through many pages; they can check the story of
their interest and choose editorials according to their preference.
[B] Chi-square test for independence of two attributes:
Relationship status and time spent on phone calls are independent. We expected the result
to be dependant in case of people who are married and committed. But in our test, the
result was not according to our expectations.
Relationship status and physical presence in social meetings is dependant. We expected
the people who are committed and married to have only physical presence in social
meetings and our claim was proven right.
Relationship status and quality time given to their family are independent. Our claim was
that married and committed people do not give enough time to their family but through

36
our samples we came to the conclusion that they are independent in terms of relationship
status.
Socio-economic status and use of mobile banking and/or online shopping
are independent. We expected the people from the higher socio-economic status to use
the facilities of mobile banking and online shopping more than those in the lower socio-
economic status, but according to our survey it does not testify our claim.
[C] Test of proportion:
Proportion of people who opted for Smartphone for purpose of keeping up with the
technology are actually making optimal use of it by using applications such as mobile
banking and shopping is less than 0.5.According to our survey people chose to buy
smartphones for keeping up with technology, we noticed that most of them do not use
applications like mobile banking and online shopping and then we decided to check this
with the test of proportions and we found that it was true, with more than half of the
sample not using such applications.
Proportion of committed people using Smartphone are present mostly physically in
social meetings is 0.5. We expected that we would get a higher percentage of committed
people to be present physically but our test doesn’t testify to our claim.
[D] Kruskal Wallis Test:
The socio-economic class has not played an influential role in the purchasing price range
of their smartphone. Our claim was that it would play an influential role with the average
of purchasing price corresponding to different socio-economic status significantly. But
our survey proved otherwise.

37
General conclusions:
About 70% of sample claim that they do not trust the information given on the internet,
but while installing an application people in general do not feel it is necessary to read the
terms and conditions.
About 45% of the users feel that they are obliged to be in contact with a few far off
friends and relatives due to applications such as Whats’app which updates all the contacts
in the application. It does not give a sense of privacy to its users.
About 37% of the Smartphone users in our sample use their phone for online ticket
booking purposes. It is easier and convenient than waiting in queues.
Because of the Smartphone revolution only 41% of our samples prefer to meet personally
with their closed ones to stay in touch. Thus we deduce that Smartphones has made
people not a social being who would like to interact and go about meeting new people.
More than 75% of our sample believes that mobile TV application isn’t a suitable
replacement for the actual TV set. This proves that not all conventional things can be
replaced.
Around 70% of our sample feels that Smartphones have reduced meeting people in
person. Smartphones sure do bring people who are far closer, but at the same time it
creates a distance between people who are in the same place.
About 57% of the sample feels that due to Smartphones quality time spent with the
family is somehow lost. Some mostly agree and others partially agree to this. Instead of
giving time to family people, both children and adults spend their time engrossed in their
phones.
In our survey there was question pertaining to the purpose of buying a Smartphone, the
people who chose it for business purposes were then given a question whether
Smartphones have helped them to increase their contacts, the result was an extremely
positive one: where all i.e100% of the people agreed that their contacts had indeed been
increased with the help of Smartphones.
Around 61% of the samples were motivated to buy their Smartphone for the purpose of
keeping up with technology. Out of which 72% use applications like navigation; this is an
indicator of the vast amount of technology of the New Media.

38
APPENDIX
Socio-economic status table:
We have referred MACRO project and developed our own Socio-economic status table
based on the occupation and education of our sample. These two parameters are likely to
produce best result for socio-economic class of the sample.
Level of significance ( ) is taken as 0.05 for all the calculations purpose.
Sample Questionnaire:
For our data collection purpose we have used number of well framed questionnaires and
filled them by the samples. The questionnaire consists of 3 sections; first section for basic
information, second section is for the information about before Smartphone and after
Smartphone usage by sample and the last one is for general questions. One sample
questionnaire is given below in the next and last part of appendix.

FERGUSSON COLLEGE, PUNE
DDDeeepppaaarrrtttmmmeeennnttt ooofff SSStttaaatttiiissstttiiicccsss
Appeal:
We, the students of T.Y.B.Sc. (Statistics) are conducting this
research survey as a part of our practical project-work. Please co-
operate with us by filling the following questionnaire.
Basic Information:
Gender : Male Female
Age : ______
Status :
Single
Committed
Married
Annual family Income: (in lacs.)
Up to 2
2 to 5
5 to 10
10 and above
Number of Family members: ______
Are you currently a student?
Yes No
Are you financially dependent?
Yes No
If YES, then please answer the following about your Chief Wage Earner.
If NO, then please answer the following about yourself.

2 | P a g e
Occupation: (please tick the appropriate box)
Unskilled worker/ Petty trader/Farmer -
Self employed/Clerical/Salesman -
Shop owners/Small Scale Business
/Supervisory levels/Teachers (up to 10th STD) -
Jr.Officers/Jr. Executives/Professor/Doctors/Journalist -
Sr. Officers/Sr. Executives/Large Scale Business -
Education:
Schooling up to 9th -
10th to 12th -
Under graduate -
Graduate/Post graduate -
Above Post graduate/Research -
Device Information Table: (Please give the following details about your Smartphone.)
Manufacturer Model name/no.
Operating System
Multiple SIM user
Purchasing year & month
Price (In Rs.)
Android Apple Windows Symbian Blackberry Other
Yes No
*******

3 | P a g e
Section – 1
(* Before: responses using non-Smartphone (basic phone) &
* After: responses using Smartphone. )
Characteristics Choices Before After
1. Average time spent on phone calls per day (in min).
Less than 5 5 to 15 15 to 30 30 to 60 60 and above
2. Average numbers of phone calls per day. 0 to 5 5 to 10 10 to 15 15 and above
3. Average numbers of phone messages (SMS) per
day.
0 to 5 5 to 15 15 to 50 50 and above
4. Use of Internet service on your mobile phone. Never Daily Weekly Monthly
5. Average time spent on browsing on your phone
per day.(in min)
0 to 15 15 to 30 30 to 60 More than 60
6. Use of mobile banking on your phone. Never Rarely Frequently
7. Number of images+status uploaded on social network per week.
0 to 10 10 to 20 20 and above
8. How frequently you check online news portals using your phone.
Never Daily Weekly

4 | P a g e
Section – 2
1) Motivation to purchase Smartphone: (Multiple ticks allowed)
Peer group influence -
Status symbol -
Business purpose -
Gifted/passed on to me -
To keep up with the technology -
User friendly -
2) When did you buy your first Smartphone? ……………….(Year)
3) How many numbers of SMARTPHONES have you owned till date? ..........................
4) Are you using mobile banking on your phone?
Yes No
If No, why?
No trust -
Unreliable internet connectivity -
Complicated procedure -
Other (please specify)……………………………..
5) Do you use Smartphone for shopping purposes
Yes No
If Yes,
A. Which online shopping platform do you prefer the most?
Flipkart
Myntra
Snapdeal
Jabong
E-bay
Other (please specify)……………………………………….
B. Which mode of payment do you use for online shopping?
Cash on delivery
Net banking
Credit card/Debit card

5 | P a g e
6) For finding unknown location do you prefer navigation system on your Smartphone?
Yes No
If No, Why?
Not trustworthy
Not aware
Other (Please specify)…………………………
7) Are you forced to be in contact with a few unwanted friends/ relatives due to
introduction of certain application on your Smartphone? (eg. Whatsapp)
Yes No
8) Do you use your Smartphone for online ticket booking purposes?
Yes No
If YES, which online ticket booking service do you use on your Smartphone?
Transportation
Movies or events
Other (Please specify).....................................
9) How do you prefer staying in touch with your closed ones?
Meeting personally
Speaking over the phone
Instant messaging / messaging/E-mail
10) Do you think that mobile TV application is a suitable replacement for TV?
Yes No
11) Has use of Smartphone made your presence only physical in the social meetings?
Most of the times
Sometimes
Never
12) Do you think that Smartphone has reduced meeting people in person?
Yes No

6 | P a g e
13) Do you agree that you are not able to give quality time to your family after being
introduced to the new virtual world (Smartphone application)?
Yes No partially
14) Has Smartphone improved your
PERSONAL RELATIONS
BUSINESS CONTACTS
SOCIAL INTERACTIONS
YES
NO
YES
NO
YES
NO
15) Do you take a moment to read all the terms and conditions before installing an
application?
Yes No Sometimes
16) Your frequent USE OF SMARTPHONE is for :
Entertainment -
Constructive purpose -
Both -
17) Do you trust the information given on the internet?
Yes No Partially
18) Which is your dream-Smartphone, if budget doesn’t matter?
(Please specify the name of model of Smartphone.)
………………………………………………
Any comments about the questionnaire.
…………………………………………………………………………………………
…………………………………………………………………………………………
…………………………………………………………………………………………
…………………………………………………………………………………………
Thank you for your valuable time!

45
BIBLIOGRAPHY Books :
1) The New Digital Age
- Authors: Eric Schmidt (Exec. Chairman of Google) &
Jared Cohen (Director, Google Ideas)
- Publication Company: John Murray
2) Cellphone Nation
- Authors: Robin Jeffrey &
Assa Doron
- Publication Company: Hachette
3) Fundamentals of Applied Statistics
- Authors: S. C. Gupta &
V. K. Kapoor
- Publication Company: Sulatanchand and Sons
4) Media in our Everyday Life.
- Publication Company-Pearson
E-BOOK:
1) A Handbook of Statistical Analysis using SPSS by Sabine Landau and Brian S. Everitt
Publication: Chapman and hall/crc
2) Lilly’s Report, 2010 (USA).
AUDIO-VISUAL AIDS:
1) Video tutorials SPSS Statistics Essential Training by www.lynda.com
2) A presentation on Introduction to Statistics and Quantitative Research Methods by
Fraser Health.

46
3) A presentation on Measuring Socio-Economic Status by Behavioral and Social
Sciences Research.
WEBSITES:
1) https://statistics.laerd.com/ ( The ultimate IBM® SPSS® guides. Perfect
for statistics courses, dissertations, theses and research projects.)
2) http://www.in.idc.asia/ (IDC-International Data Corporation )
3) http://gadgets.ndtv.com/
4) http://www.wikipedia.org/
5) http://www.youtube.com/
6) http://www.flipkart.com/
NEWSPAPERS AND MAGAZINES ARTICLES:
1) Articles related to Manufacturer and OS of Smartphone market shares in Times of
India, Indian Express, The Economist, The Hindu, Sakaal, Lokmat etc.
2) Articles in ‘EYE’ magazine.
3) Articles in ‘DIGIT’ magazine.
4) Articles in ‘OXYGEN’ weekly supplement.
‘Science direct’
The world's leading source for scientific,
technical, and medical full text resource to
accelerate the research by exploring more than 2500 peer-reviewed journals and almost
20,000 books.