demography of threatened tree species in vietnam
TRANSCRIPT

Demography of threatened tree species in Vietnam

P.D. Chien Demography of threatened tree species in Vietnam ISBN-10: 90-393-4407-8 ISBN-13: 978-90-393-4407-1 NUR 904 @ 2006 P.D. Chien Printed by: Print Partners Ipskamp, Enschede Cover design: Marjolein Kortbeek Photos: P.D. Chien All rights reserved. No part of this publication, apart from bibliographic data and brief quotations in critical reviews, may be reproduced, re-recorded or published in any form including photocopy, microfilm, electronic or electromagnetic record, without written permission.
Demography of threatened tree species in Vietnam
Demografie van bedreigde boomsoorten in Vietnam
(met een samenvatting in het Nederlands)
ðộng thái quần thể các loài cây bị ñe dọa ở Việt Nam
(phần tóm tắt bằng tiếng Việt Nam)
Proefschrift
ter verkrijging van de graad van doctor van de Universiteit Utrecht
op gezag van de rector magnificus, prof.dr. W.H. Gispen, ingevolge het besluit van het college voor promoties
in het openbaar te verdedigen op woensdag 29 november 2006 des middags te 12:45 uur
door
Pham Duc Chien geboren op 15 september 1967 te Thai Binh, Vietnam
Promotor: Prof. Dr. M.J.A. Werger, Utrecht University Prof. Dr. Nguyen Hoang Nghia, Forest Science Institute of Vietnam
Co-promotor: Dr. P.A. Zuidema, Utrecht University
The investigations reported in this thesis were carried out within the framework of the Tropenbos-Vietnam Programme and the Plant Ecology and Biodiversity Group at Utrecht University. This study was financially supported by Tropenbos International and the Forest Science Institute of Vietnam.

To Ha and Duy

Contents Chapter 1 General introduction 9 Chapter 2 Vietnamese forestry, biodiversity and threatened 19 tree species
With M.J.A. Werger & N.H. Nghia
Chapter 3 Conservation prospects for threatened Vietnamese 57 tree species: results from a demographic study
With P.A. Zuidema & N.H. Nghia; submitted
Chapter 4 Population viability analysis of threatened tree species 83 in Vietnam
with P.A. Zuidema; submitted Chapter 5 What dimension to use for matrix dimension of tree? 107 recommendations based on a validation of age estimate by tree ring analysis
with P.A. Zuidema; submitted Chapter 6 General discussion and summary 125
Samenvatting (summary in Dutch) 137 Tóm tắt kết quả nghiên cứu (summary in Vietnamese) 145 Acknowledgements 155 Curriculum vitae 157
Chapter 1
General introduction
Forest status in the tropics
Tropical forests are characterized by a very high plant diversity: covering less than
10% of the land areas, they posses more than 50% of all known plant species on
earth (Wilson 1995, Mayaux et al. 2005). In a single ha of these forests, as many as
300 tree species can coexist (Gentry 1998b), although a large difference may occur
between continents and regions (Givnish 1999, ter Steege et al. 2000). Yet, during
the past decades, tropical forests have severely declined, with around 6 million ha lost
and more than 2 million ha visibly degrading each year (Achard et al. 2002). The main
causes for the loss of tropical forests are agricultural expansion, over-harvesting,
development of plantations, mining operation, industry, urbanization and road
building (Geist & Lambin 2002). As a result, an unknown, but large number of
species has become extinct, while many others run the risk of extinction (Frankham
et al. 2002, World Conservation Union ‘IUCN’ 2006). Among tropical areas, South-
East Asia has the highest relative rate of deforestation (Achard et al. 2002, Brook et
al. 2006), also is facing a serious problem of species extinction (Sodhi et al. 2004,
IUCN 2006).
Tropical forests in Vietnam
Three quarters of Vietnam is composed of hills and mountains, which was originally
covered by tropical forests (Trung 1998). Being a venue of plant species emigrated
from three flora areas: the Himalaya-Yunnam-Guizhou flora in the North-West, the
India-Myanmar flora in the West, and the Malaysia-Indonesian flora in the South and
South-East, Vietnam harbours a very high number of plant species (Trung 1998,
Chan et al. 1999, Lap 1999) (for details see Chapter 2). Nevertheless, due to many
reasons, such as rapid changes in land use, over-harvesting and long wars, the forests
of Vietnam have severely declined, both in quantity and quality (Dang et al. 2001, for
details see Chapter 2). Consequently, many species of Vietnam run the risk of
extinction (Nghia 2005), of which around 150 are critically endangered and vulnerable
(IUCN 2006). As threatened tree species often occur in small and isolated
populations (Ministry of Science, Technology and Environment ‘MSTE’ 1996, cf.
Ouborg 1993), they are very vulnerable to local extinction due to demographic
stochasticity or lack of genetic variation (Menges 1992; Lande 1993; Oostermeijer et al. 2003). On the other hand, tropical trees are often slow-growing, long-lived species,
Chapter 1
10
taking a long time to reach the age of reproduction (Chambers et al. 1998, Fichtler et
al. 2003, Laurance et al. 2004), and this makes it difficult to determine whether the
population is growing or declining in size (Kwit et al. 2004). It is therefore necessary
to carry out a demographic study for these species in order to decide on actions
before they have declined below the critical level.
The context of this study
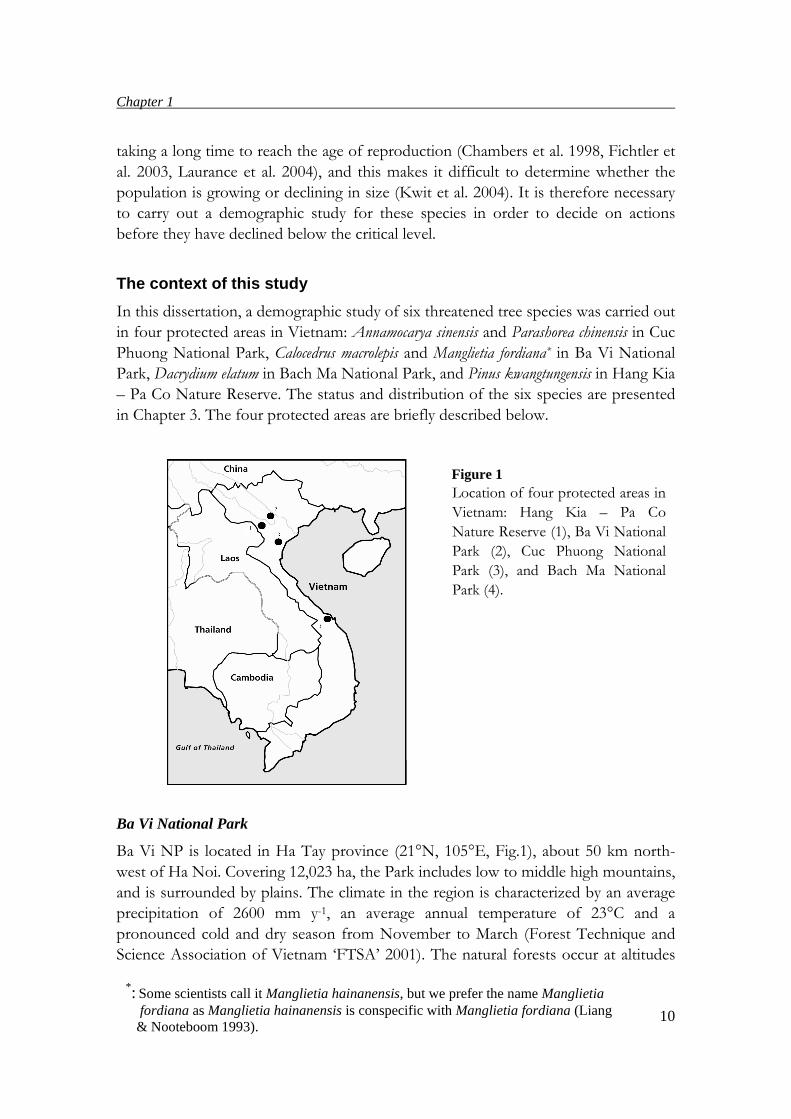
In this dissertation, a demographic study of six threatened tree species was carried out
in four protected areas in Vietnam: Annamocarya sinensis and Parashorea chinensis in Cuc
Phuong National Park, Calocedrus macrolepis and Manglietia fordiana* in Ba Vi National
Park, Dacrydium elatum in Bach Ma National Park, and Pinus kwangtungensis in Hang Kia
– Pa Co Nature Reserve. The status and distribution of the six species are presented
in Chapter 3. The four protected areas are briefly described below.
Ba Vi National Park
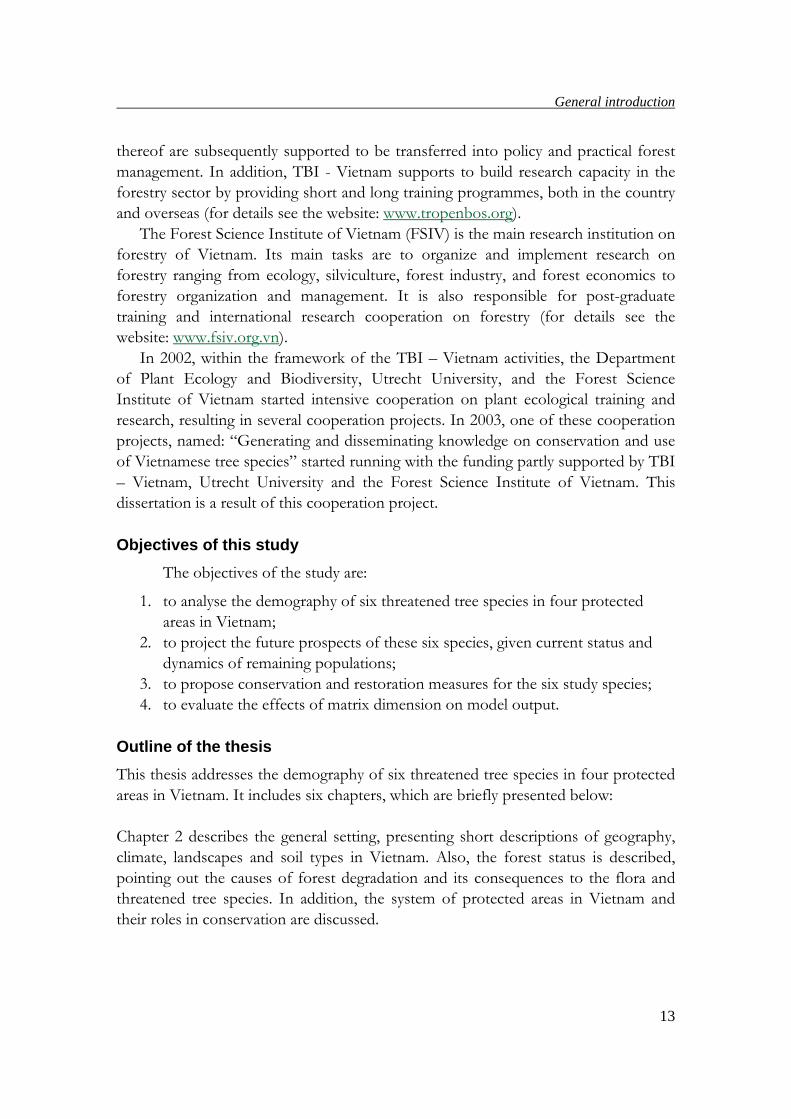
Ba Vi NP is located in Ha Tay province (21°N, 105°E, Fig.1), about 50 km north-
west of Ha Noi. Covering 12,023 ha, the Park includes low to middle high mountains,
and is surrounded by plains. The climate in the region is characterized by an average
precipitation of 2600 mm y-1, an average annual temperature of 23°C and a
pronounced cold and dry season from November to March (Forest Technique and
Science Association of Vietnam ‘FTSA’ 2001). The natural forests occur at altitudes
Figure 1 Location of four protected areas in
Vietnam: Hang Kia – Pa Co
Nature Reserve (1), Ba Vi National
Park (2), Cuc Phuong National
Park (3), and Bach Ma National
Park (4).
*: Some scientists call it Manglietia hainanensis, but we prefer the name Manglietia fordiana as Manglietia hainanensis is conspecific with Manglietia fordiana (Liang & Nooteboom 1993).
General introduction
11
above 600 m above sea level (a.s.l.), but not at lower elevation due to a long period of overexploitation and agricultural practice (FTSA 2001). The natural forests are very
diverse in species and structure, and can be distinguished into three main types at
increasing elevation: Tropical evergreen broad-leaved rain forests, Subtropical
evergreen broad-leaved rain forests, and Subtropical evergreen broad-leaved and
coniferous forests (FTSA 2001)
The buffer zone of the Park is inhabited by 47,000 inhabitants of whom nearly
half belong to ethnic minorities. Most local people are poor as their incomes are
mainly derived from forests and poor practice of agriculture (FTSA 2001).
Bach Ma National Park
Bach Ma NP covers 22,030 ha in Central Vietnam (16°N, 105°E, Fig.1). Due to a
complex terrain, the annual precipitation of the region strongly varies among places,
ranging from 3000 in the lower parts to over 8000 mm yr-1 at altitudes above 700 m
a.s.l., with the rainy season from September to February (FTSA 2001, Keo 2003). The
average temperature in the rainy season is around 20ºC compared to 25ºC in the dry
season (FTSA 2001). The Park has two main patterns of forests in relation to
elevation. The evergreen tropical forest covers areas below 900 m of which around
2700 ha are considered intact forests, but the rest is secondary forest as a result of a
long time of overexploitation and wars. From 900 m a.s.l. to the highest mountain
(1450 m a.s.l.), there is evergreen subtropical forest (FTSA 2001, Keo 2003)
There are more than 63,000 inhabitants living in the buffer zone of the Park, and
most of them are King People. The main incomes of the inhabitants are from
agriculture and forest products. Their standard of living is in general very low (FTSA
2001).
Cuc Phuong National Park
The Park is located on the boundary intersection of three provinces: Hoa Binh, Ninh
Binh and Thanh Hoa (20°N, 105°E, Fig.1). Its area is 22,200 ha. The average
elevation of the Park is from 300-400 m, while the peak (May Bac) reaches to 648 m
a.s.l. (Thu & Can 1999). The climate of the region is characterized by an average
annual temperature of 21°C, and the average rainfall of 2150 mm y-1. Most the rainfall
falls in the summer, from March to November (FSTA 2001). Three main types of the
forests can be distinguished in the Park (FSTA 2001). The forests covering the valleys
and foot hills are characterized by 3 layers of tree species, a layer of shrubs and a layer
of fern and grass. The forests on mountain slopes include 2 layers of tree species and
1 layer of shrubs. The forests at the top of mountains have only two distinct layers: a
layer of small tree species and shrubs, and the under storey.
Chapter 1
12
There are more than 50,000 inhabitants living in the buffer zone of the Park, and
most of them are ethnic minorities. Their main livelihoods are agricultural practice,
and extraction of forest products from the park. The standard of living of the local
people is very low (FTSA 2001).
Hang Kia - Pa Co Nature Reserve
The Reserve comprises 7,091 ha in the high mountain area of Hoa Binh province
(20°N, 104°E, Fig.1). With an average altitude of 1200 m a.s.l., the Reserve has a
complex terrain of limestone mountains alternated by valleys (Hoa Binh Community
‘HBC’ 1993, Nghia 2000). The Reserve lies in the subtropical climate zone,
characterized by two pronounced seasons: hot and cold. The average temperature of
the hot season (March – September) is around 20ºC as against 3 to 10ºC for the cold
season. The average rainfall is 1900 mm y-1, and most falls in the hot season (HBC
1993).
The Reserve has more than 4,000 inhabitants living in the core, and 6,000 others
living in the buffer zone. Most local people are ethnic minorities, whose standard of
living is very low compared with other regions of the country (HBC 1993).
Particularly, most people living in the core are H-Mong, whose livelihoods are mainly
based on shifting cultivation, and forest extraction. They are now experimenting with
permanent agriculture, but still extract products from the forests (HBC 1993).
The present study
This research project formed part of the Tropenbos International - Vietnam
Programme in cooperation with Utrecht University and the Forest Science Institute
of Vietnam.
Tropenbos International (TBI) is a non-governmental organization funded by the
Dutch Government. The main objective of TBI is to improve conservation status
and sustainable use of tropical rain forests by generating and developing applicable
methodologies and making these locally available. TBI also aims to strengthen the
local research capacity of the tropical countries by cooperation and training. To do
so, TBI has carried out multi-disciplinary research programmes in cooperation with
research institutions, government agencies and other stakeholders of tropical
countries, e.g. Guyana, Colombia, Suriname, Ghana, Indonesia, and Vietnam (for
details see the website: www.tropenbos.org).
Tropenbos International - Vietnam (TBI – Vietnam) was established in 2001 with
the main research site is in Central Vietnam. The main activities of TBI - Vietnam are
to support the establishment of the National Forest Research Strategy of Vietnam. It
also helps to generate and disseminate information, methodologies and technologies
in support of the conservation and sustainable use of Vietnamese forests. The results
General introduction
13
thereof are subsequently supported to be transferred into policy and practical forest
management. In addition, TBI - Vietnam supports to build research capacity in the
forestry sector by providing short and long training programmes, both in the country
and overseas (for details see the website: www.tropenbos.org).
The Forest Science Institute of Vietnam (FSIV) is the main research institution on
forestry of Vietnam. Its main tasks are to organize and implement research on
forestry ranging from ecology, silviculture, forest industry, and forest economics to
forestry organization and management. It is also responsible for post-graduate
training and international research cooperation on forestry (for details see the
website: www.fsiv.org.vn).
In 2002, within the framework of the TBI – Vietnam activities, the Department
of Plant Ecology and Biodiversity, Utrecht University, and the Forest Science
Institute of Vietnam started intensive cooperation on plant ecological training and
research, resulting in several cooperation projects. In 2003, one of these cooperation
projects, named: “Generating and disseminating knowledge on conservation and use
of Vietnamese tree species” started running with the funding partly supported by TBI
– Vietnam, Utrecht University and the Forest Science Institute of Vietnam. This
dissertation is a result of this cooperation project.
Objectives of this study
The objectives of the study are:
1. to analyse the demography of six threatened tree species in four protected areas in Vietnam;
2. to project the future prospects of these six species, given current status and dynamics of remaining populations;
3. to propose conservation and restoration measures for the six study species; 4. to evaluate the effects of matrix dimension on model output.
Outline of the thesis
This thesis addresses the demography of six threatened tree species in four protected
areas in Vietnam. It includes six chapters, which are briefly presented below:
Chapter 2 describes the general setting, presenting short descriptions of geography,
climate, landscapes and soil types in Vietnam. Also, the forest status is described,
pointing out the causes of forest degradation and its consequences to the flora and
threatened tree species. In addition, the system of protected areas in Vietnam and
their roles in conservation are discussed.
Chapter 1
14
Chapter 3 analyses the demography of six threatened tree species in Vietnam. A
demographic field study in four protected areas provides the basic data for
constructing matrix models, which are used to project the population performances
of the six species and to determine the most important life stages for the population
growth rates. Based on these results, conservation measures are suggested.
Chapter 4 uses population viability analysis (PVA) to project the development of the
study populations in the future. By applying stochastic matrix models, the
development of study populations under the influence of the environmental and
demographic stochasticity is estimated and discussed.
Chapter 5 analyses methods to estimate tree ages using matrix models. By comparing
tree ages obtained from annual rings with those obtained from matrix models,
suitable matrix dimensions for estimating ages, population growth rates and elasticity
are discussed.
Chapter 6 summarizes the main results of the thesis and provides a general
discussion.
Acknowledgements
I thank Marinus Werger and Pieter Zuidema for valuable comments on a draft
version of this chapter.
References
Achard, F., H. D. Eva, H. J. Stibig, P. Mayaux, J. Gallego, T. Richards, and J. P.
Malingreau. 2002. Determination of deforestation rates of the world’s humid
tropical forests. Science 297: 999-1002.
Brook, B. W, C. J. A. Bradshaw , L. P. Koh, and N. S. Sodhi. 2006. Momentum
drives the crash: Mass extinction in the tropics. Biotropica 38: 302-305.
Chambers, J. Q., H. Higuchi, and J. P. Schimel. 1998. Ancient trees in Amazonia.
Nature 391: 135-136. *Chan, L. T., T. Ty, N. H. Tu, H. Nhung, D. T. Phuong, and T. T. Van. 1999. Some
basis characters of Vietnam flora. Science and Technics Publishing House. Ha
Noi. *Dang, N. V., T. D. Mai, H. C. Chu, T. D. Huy, and N. H. Kinh. 2001. Forestry in
Vietnam (1945-2000), development progress and experienced lessons.
Agricultural Publishing House. Ha Noi.
Fichtler, E., D. A. Clark, and M. Worbes. 2003. Age and long-term growth of trees
General introduction
15
in an old-growth tropical rain forest, based on anayses of tree rings and C-14.
Biotropica 35: 306-317. *Forest Techniques and Science Association of Vietnam (FTSA). 2001. National parks in
Vietnam. Agricultural Publishing House. Ha Noi.
Frankham, R., J. D. Ballou, and D. A. Briscoe. 2002. Introduction to Conservation
Genetics. Cambridge University Press, Cambridge, UK.
Geist, H. J., and E. F. Lambin. 2002. Proximate causes and underlying driving forces
of tropical deforestation. BioScience 52: 143-150.
Gentry, A. H. 1988b. Tree species richness in Amazonian forests. Proceedings of the
National Academy of Science 85: 156-159.
Givnish, T. J. 1999. On the causes of gradients in tropical tree diversity. Journal of
Ecology 87: 193-210. *Hoa Binh Community (HBC). 1993. Establishment of Hang Kia – Pa Co Nature
Reserve Area. *Keo, H. V. 2003. Research on ecological - characteristics and reproductive
capability by cutting of Dacrydium elatum (Roxb.) Wallich ex Hooker) in Bach
Ma National Park. PhD thesis. Hue Science University, Hue.
Kwit, C., C. C. Horvitz, and W. J. Platt. 2004. Conserving slow-growing, long-lived
tree species: Input from the demography of a rare understory Conifer, Taxus
floridana. Conservation Biology 18: 432-443. *Lap, V. T. 1999. Natural Geography of Vietnam. Education Publishing House.
Ha Noi.
Lande, R. 1993. Risks of population extinction from demographic and environmental
stochasticity and random catastrophes. The American Naturalist 142: 911-927.
Laurance, W. F., H. E. M. Nascimento, S. G. Laurance, R. Condit, S. D’Angelo, and
A. Andrade. 2004. Inferred longevity of Amazonian rainforest trees based on a
long-term demographic study. Forest Ecology and Management 190: 131-143.
Liang, C. B., and H. P. Nooteboom. 1993. Notes on Magnoliaceae III: The Magnoliaceae
of China. Annals of the Missouri Botanical Garden 80: 999-1104.
Mayaux, P., P. Holmgren, F. Achard, H. Eva, H-J Stibig, and A. Branthomme. 2005.
Tropical forest cover change n the 1990s and options for future monitoring.
Philosophical Transactions of the Royal Society B 360: 373-384.
Menges, E . S. 1992. Stochastic modeling of extinction in plant population. Pages
253-276 in P. L. Fiedler and S. K. Jain, editors. Conservation Biology: the
Theory and Practice of Nature Conservation, Presentation and Management.
Chapman and Hall, New York. *Ministry of Science, Technology and Environment (MSTE). 1996. Red Data Book of
Vietnam. Volume 2 - Plant. Science and Techniques Publishing House, Ha Noi.
Nghia, N. H. 2000. Some threatened tree species of Vietnam. Agricultural Publishing
House, Ha Noi. *Nghia, N. H. 2005. Results from research on conservation of forest plant genetic
resources. Pages 2-12 in MARD, editor. Paper for the Conference of forest
science and technology for 20 years under renovation, 8-9/4/2005. Ha Noi.
Chapter 1
16
Oostermeijer, J. G. B., S. H. Luijten, and J. C. M. Den Nijs. 2003. Intergrating
demographic and genetic approaches in plant conservation. Biological
Conservation 113: 389-398.
Ouborg, N. J. 1993. Isolation, population size and extinction: the classical and
metapopulation approaches applied to vascular plants along the Dutch Rhine-
system. Oikos 66: 298-308.
Sodhi, N. S., L. P. Koh., B. W. Brook, and P. K. L. Ng. 2004. Southeast Asian
biodiversity: an impending disaster. Trends in Ecology and Evolution 19: 654-
660.
ter Steege, H., D. Sabatier, H. Castellanos, T. Van Andel, J. F. Duivenvoorden, A.
de Oliveira, R. Ek, R. Lilwah, P. Maas, and S. Mori. 2000. An analysis
of the floristic composition and diversity of Amazonian forests including those of
the Guiana Shield. Journal of Ecology 16: 801-828. *Thu, N. B., and V. V. Can. 1999. Cho Dai tree (Annamocarya sinensis). Agricultural
Publishing House, Ha Noi. *Trung, T. V. 1998. Ecosystems of tropical forests in Vietnam. Science and Technics
Publishing House. Ha Noi.
Wilson, E. O. 1995. The diversity of life. Harvard University Press, Cambridge.
World Conservation Union (IUCN). 2006. The IUCN Red List of Threatened Species.
Available from http://www.redlist.org/info/tables/table6a (access August 2006).
Note: * The initial titles in Vietnamese were translated into English.

General introduction
17
Chapter 1
18
Chapter 2 Vietnamese forestry, biodiversity and
threatened tree species
With M.J.A. Werger & N.H. Nghia
Introduction
A successful conservation strategy requires a good understanding of the natural and
social conditions and their relations to the strategy’s objectives. This is particularly
important for the tropical countries, where the forests are very diverse in species and
complex in structures, but being lost at an alarming rate (Wilson 1988, Whitmore
1997, Sodhi et al. 2004). Tropical countries, on the other hand, have among the
world’ highest population (people) growth rates, which are the most crucial
underlying cause of deforestation (Laurance 1999, Wright & Muller-Landau 2006).
In this chapter, we present several natural conditions of Vietnam, a tropical
country located in South-East Asia. We also discuss the plant biodiversity, forest
status, protected areas and the relationship among people, forests and threatened tree
species with recommendations for a better conservation.
Geographical location
Vietnam is located in Southeast Asia, sharing boundaries with China (1400 km) in the
North, with Laos (2067 km) and Cambodia (1080 km) in the West and having the
East Sea in the East. The country has a total land area of 330,991 square km, and
stretches over 3,200 km between the latitudes of 8°30’ and 23°22’ N, and between the
longitudes of 102°10’ and 109°24’ E (Thao 1998, Lap 1999). Three quarters of the
country is composed of hills and mountains with the highest peaks reaching over
3,000 m above sea level (a.s.l.) (Government of the Socialist Republic of Vietnam and
the Global Environment Facility Project ‘GoVN’ 1994, Nhat 2001).
The country is S-shaped in outline. It has two wide deltas, one in the south along
Mekong River and one in the north along the Red River. The Middle of the country
is almost completely occupied by the Truong Son Range, there being only a narrow
strip of coastal plains (Thao 1998, Lap 1999). The Truong Son Range is divided into
the North and the South of Truong Son by the Hai Van Pass. The Central Highlands
lie at the South of the Middle, sharing boundaries with Cambodia in the west, with
Southern Truong Son in the East and with the South-east region in the South (Soil
Chapter 2
20
Science Association of Vietnam ‘SSA’ 1996). At its narrowest point in the Middle, the
country is only 50 km across, while at its widest in the North, it is about 600 km.
Most of the country drains directly into the East Sea, but the western parts of the
Central Highlands drain into the Mekong basin of Cambodia and then into the East
Sea (GoVN 1994, Trung 1998).
Climate
Vietnam basically has a tropical climate as it lies inside the Northern Tropical Zone.
However, due to a varying monsoon regime and a complex terrain, the climate of
Vietnam differs with latitude and altitude (Trung 1998, Lap 1999).
Sunshine regime
Situated in the Northern Tropical Zone, Vietnam receives a great amount of
sunshine, though it differs from the South to the North. Each year, the South
receives around 2000 to 3000 hrs of sunshine with mean cumulated intensity of 160
kcal cm-2 yr-1, while the North has only 1400 to 2000 hrs and an intensity of between
110 to 140 kcal cm-2 yr-1 (Toan 1998, Lap 1999). Due to the complex terrain, the
sunshine regime also differs per area. For instance, the North-East and Northern
Truong Son Range annually receive around 1600 to 1800 hrs, while the South-East
receives around 2600 to 3000 hrs (Lap 1999).
Monsoons
Three monsoonal systems affect the rainfall pattern in Vietnam. From September to
April, the winter monsoon originating from Siberia, blows over a huge continental
area (China), carries cold and dry air that causes cold and dry weather in the North of
Vietnam (Toan 1998, Trung 1998, Lap 1999). This wind may also reach Vietnam via
the East Sea, and then carries humidity from the sea, and produces drizzle in the
North from December to January (Trung 1998). From May to October, there are two
monsoonal systems affecting the country. The South-west Pacific monsoon blows to
the country via Cambodia and Laos. When meeting the Truong Son Range, it causes
a lot of rainfall in the west of the Range, but dry and hot weather in the East,
particularly from June to August. The provinces of the Middle are strongly affected
by this monsoon (Trung 1998, Lap 1999). In contrast, the South-east monsoon from
the East Sea brings a lot of rainfall to the whole country. This monsoon may mitigate
the unfavourable effects of the South-west monsoon as it brings a cool and rainy
weather (Lap 1999).
Apart from the three monsoons mentioned above, the country is under the
influence of typhoons bearing from the East Sea from July to November. The
typhoons often bring strong wind and heavy rains, and may cause a severe flooding
Vietnamese forestry, biodiversity and threatened tree species
21
along the coastline, particularly in the middle of the country (GoVN 1994, Thin 2000,
Nhat 2001).
Temperature
The temperature of Vietnam is generally high, but varies with seasons, latitudes and
altitudes.
In the winter, the North and the Northern Middle (as far south as the Hai Van
Pass) are cold as they are affected by the winter monsoon. However, the rest of the
country does not have the winter weather due to the weak influence of this wind. The
mean temperature of the coldest month (January) in Ha Noi (the North) is 16.4°C,
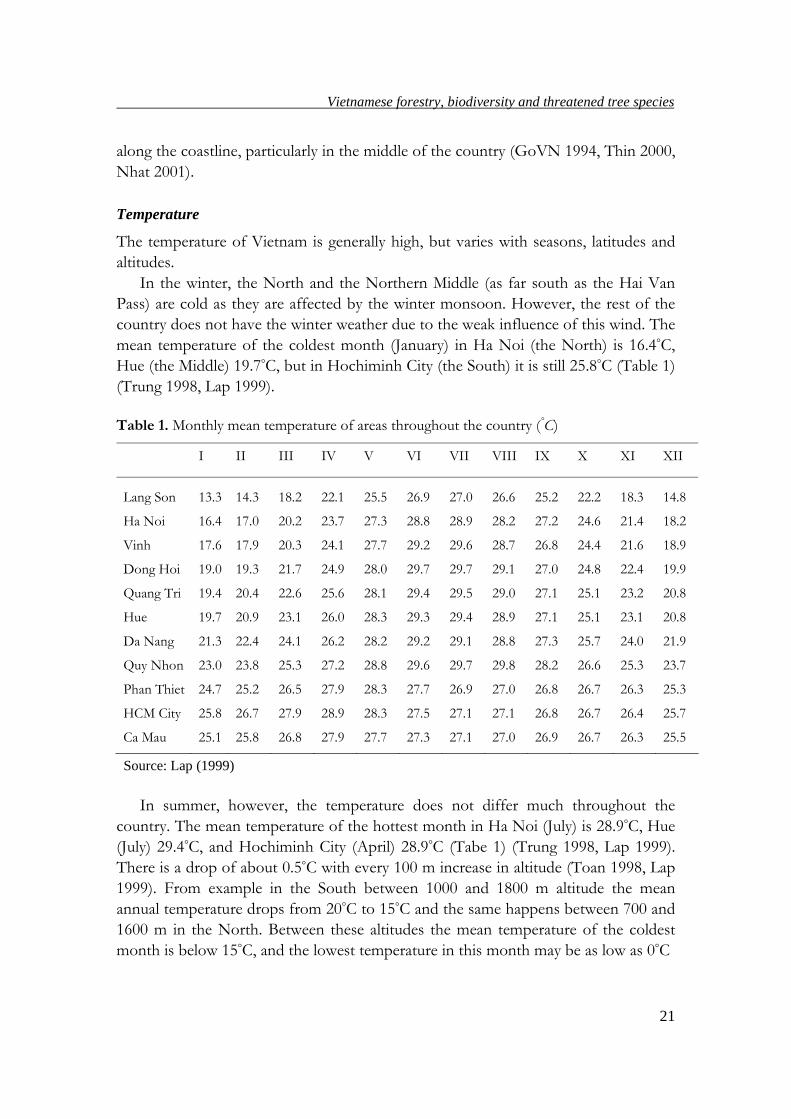
Hue (the Middle) 19.7°C, but in Hochiminh City (the South) it is still 25.8°C (Table 1)
(Trung 1998, Lap 1999).
Table 1. Monthly mean temperature of areas throughout the country (°C)
I II III IV V VI VII VIII IX X XI XII
Lang Son 13.3 14.3 18.2 22.1 25.5 26.9 27.0 26.6 25.2 22.2 18.3 14.8
Ha Noi 16.4 17.0 20.2 23.7 27.3 28.8 28.9 28.2 27.2 24.6 21.4 18.2
Vinh 17.6 17.9 20.3 24.1 27.7 29.2 29.6 28.7 26.8 24.4 21.6 18.9
Dong Hoi 19.0 19.3 21.7 24.9 28.0 29.7 29.7 29.1 27.0 24.8 22.4 19.9
Quang Tri 19.4 20.4 22.6 25.6 28.1 29.4 29.5 29.0 27.1 25.1 23.2 20.8
Hue 19.7 20.9 23.1 26.0 28.3 29.3 29.4 28.9 27.1 25.1 23.1 20.8
Da Nang 21.3 22.4 24.1 26.2 28.2 29.2 29.1 28.8 27.3 25.7 24.0 21.9
Quy Nhon 23.0 23.8 25.3 27.2 28.8 29.6 29.7 29.8 28.2 26.6 25.3 23.7
Phan Thiet 24.7 25.2 26.5 27.9 28.3 27.7 26.9 27.0 26.8 26.7 26.3 25.3
HCM City 25.8 26.7 27.9 28.9 28.3 27.5 27.1 27.1 26.8 26.7 26.4 25.7
Ca Mau 25.1 25.8 26.8 27.9 27.7 27.3 27.1 27.0 26.9 26.7 26.3 25.5
Source: Lap (1999)
In summer, however, the temperature does not differ much throughout the
country. The mean temperature of the hottest month in Ha Noi (July) is 28.9°C, Hue
(July) 29.4°C, and Hochiminh City (April) 28.9°C (Tabe 1) (Trung 1998, Lap 1999).
There is a drop of about 0.5°C with every 100 m increase in altitude (Toan 1998, Lap
1999). From example in the South between 1000 and 1800 m altitude the mean
annual temperature drops from 20°C to 15°C and the same happens between 700 and
1600 m in the North. Between these altitudes the mean temperature of the coldest
month is below 15°C, and the lowest temperature in this month may be as low as 0°C
Chapter 2
22
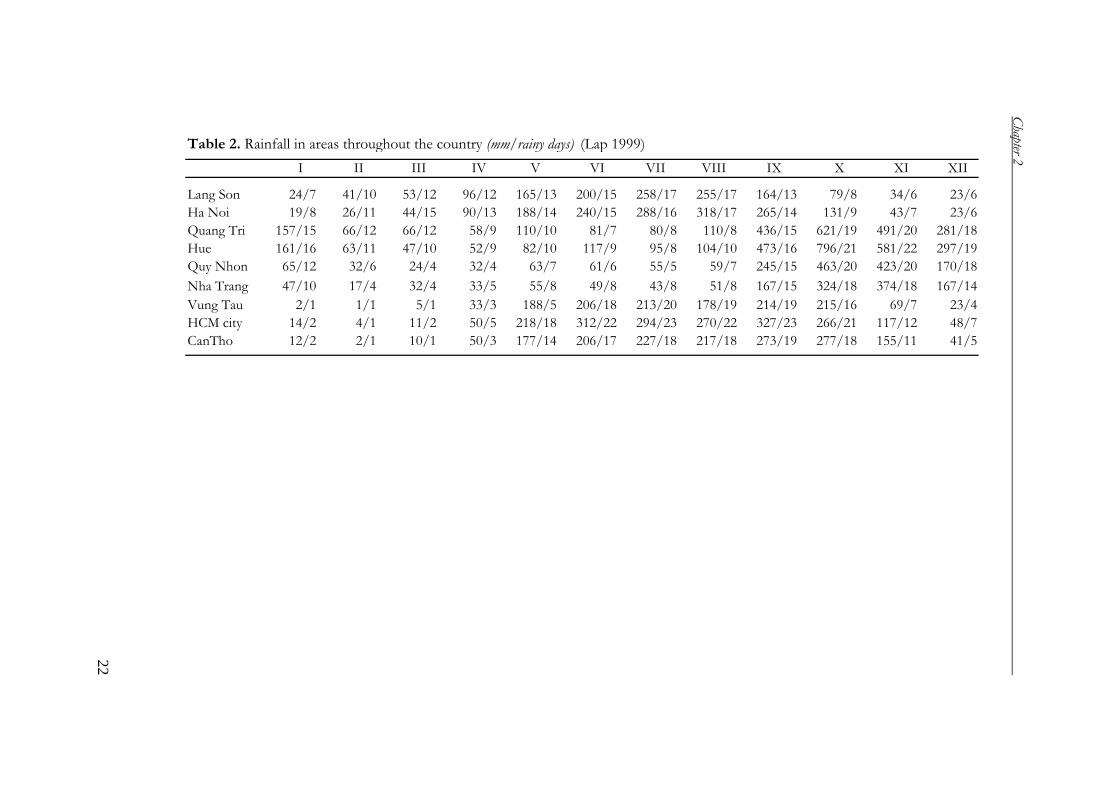
Table 2. Rainfall in areas throughout the country (mm/rainy days) (Lap 1999)
I II III IV V VI VII VIII IX X XI XII
Lang Son 24/7 41/10 53/12 96/12 165/13 200/15 258/17 255/17 164/13 79/8 34/6 23/6
Ha Noi 19/8 26/11 44/15 90/13 188/14 240/15 288/16 318/17 265/14 131/9 43/7 23/6
Quang Tri 157/15 66/12 66/12 58/9 110/10 81/7 80/8 110/8 436/15 621/19 491/20 281/18
Hue 161/16 63/11 47/10 52/9 82/10 117/9 95/8 104/10 473/16 796/21 581/22 297/19
Quy Nhon 65/12 32/6 24/4 32/4 63/7 61/6 55/5 59/7 245/15 463/20 423/20 170/18
Nha Trang 47/10 17/4 32/4 33/5 55/8 49/8 43/8 51/8 167/15 324/18 374/18 167/14
Vung Tau 2/1 1/1 5/1 33/3 188/5 206/18 213/20 178/19 214/19 215/16 69/7 23/4
HCM city 14/2 4/1 11/2 50/5 218/18 312/22 294/23 270/22 327/23 266/21 117/12 48/7
CanTho 12/2 2/1 10/1 50/3 177/14 206/17 227/18 217/18 273/19 277/18 155/11 41/5
Vietnamese forestry, biodiversity and threatened tree species
23
(Trung 1998). From 1600 to 2600 m in the South and from 1600 to 2400 m in the
North the annual mean temperature drops from 15°C to 10°C, and in the coldest
month the temperature is less than 10°C with the minimum temperature below 0°C.
At higher altitudes, it is cold throughout the year, and there is sometimes snow in the
winter (Trung 1998).
Rainfall
In general, Vietnam has a high annual rainfall and it varies with latitude, altitude and
seasonally. The annual rainfall of Ha Noi (the North Delta) is 1676 mm yr-1,
Hochiminh City (the South Delta) 1931 mm, and Quy Nhon (a delta of the Middle)
1692 mm yr-1 (Table 2, Lap 1999). The high mountains, which trap monsoons, often
have a high rainfall, such as Sapa (Hoang Lien Son Mountains) 2833 mm yr-1, and
Hon Ba (Truong Son Mountains) 3751 mm yr-1 (Lap 1999). Particularly at Bach Ma
(Truong Son Mountains) the annual rainfall is very high: more than 8000 mm yr-1 at
higher 700 m a.s.l. (FTSA 2001, Keo 2003). In contrast, areas behind these mountains
may have little rainfall. For instance, Phan Rang (edge of the southern Truong Son)
has only 653 mm yr1 and Ky Son (edge of the northern Truong Son) has 643 mm yr-1
(Lap 1999).
The rainfall in Vietnam is concentrated in a rainy season that comprises about 70
to 80% of the precipitation of the whole year. The rainy season lasts from May to
November in the North, the Central Highlands and the South, and from August to
February in the Middle (Lap 1999). On the other hand, the dry season is often
characterized by some periods of no rain (Trung 1998, Lap 1999).
Humidity
The humidity of Vietnam is high as the country receives high annual rainfall, and the
North is often more humid than the South (Trung 1998). The humidity of the North
is around 80 to 85%, while the South is about 78 to 83%. In the North, the most
humid period is from March to April (87%) and the driest period is from November
to December (81%). In the South, the humidity is high (82% - 88%) in the rainy
season (May to October), and dry (70% - 80%) in the dry season (February to April).
The Middle is a combination of the North and the South, it is dry (73% - 82%) from
May to July, and humid (86% - 91%) from August to April (Trung 1998, Lap 1999).
Climate zones
In short, Vietnam has 3 main kinds of climate in 3 main zones through the country
(SSA 1996, Thao 1998, Lap 1999).
Chapter 2
24
- The Northern climate: From the boundary between Vietnam and China to the Ca River
there is a tropical monsoon climate with 4 distinct seasons. The summer is hot and
rainy, the winter is cold and dry (SSA 1996, Thao 1998, Lap 1999).
- The Middle climate: From the Ca River along the Truong Son Range to Mui Dinh
(except the Central Highlands) there is also a tropical climate, which is a combination
of the Northern and the Southern climate. In this zone the rainy season comes late
(from August to November). This zone is also strongly affected by the hot and dry
South-west monsoon, and by the typhoons from the sea (SSA 1996, Thao 1998, Lap
1999).
- The Southern climate: The South Delta, the Central Highlands and the Edge of
Southern Truong Son have a typical tropical climate. In this zone the temperature is
high all the year round, and it has only the dry and the rainy seasons, in which the
rainy season occupies more than 90% of the total annual rainfalls (SSA 1996, Thao
1998, Lap 1999).
Apart from the 3 main climate zones above, Vietnam also has both subtropical
and temperate climates as one third of the country is mountainous with altitudes of
above 500 m a.s.l. (Trung 1998, Lap 1999, Thin 2000). The areas from 1000 to 1800
m a.s.l. in the South and from 700 to 1600 m a.s.l. in the North are under the
influence of a subtropical climate. The region has a low annual temperature and a
distinct winter. From 1800 to 2600 m a.s.l. in the South and from 1600 to 2400 m
a.s.l. in the North there is a humid temperature climate. It is very cold in winter, but
cool in summer, and the minimum temperature may be as low as 0°C. At still higher
altitudes, there is a cold temperature climate, and it is cold all year round. There is
sometimes snow in winter (Trung 1998). Geology, terrain and soils Geology
The geology of Vietnam is under the influence of 2 main land blocks, the Indonesian
Land Block covering the South, the Middle and an edge of the North-west (Muong
Te and Dien Bien Phu), while the Southern Chinese Land Block affected the North
to the Ma River (Thao 1998).
In the North rock from the Cambric to Mesozoic eras is widely distributed, while
pre-Cambric rock only occurs along the Red River. Under the North Delta the rock is
Neogenic and is covered by recent alluvium (Thao 1998, Lap 1999).
The rest of the country is divided geologically into two parts. From Tam Ky -
Phuoc Son to the North the rock is mainly Paleozoic and Mesozoic. The South,
however, mostly has pre-Cambric rock. In the Central Highlands (which belong to
Vietnamese forestry, biodiversity and threatened tree species
25
the South), there was strong of volcanic activity at the end of the Neogen Period, and
from this result the fertile red soils in these areas (Thao 1998).
Apart from the sedimentary rocks discussed above, magmatic rock is widely
distributed (particularly Granite) from North to South. They are mainly pre-Cambric,
but also Paleozoic, Mesozoic and Kainozoic. Pre-Cambric granite is common in the
East of the Central Highlands and some other areas of the Middle such as Quang
Ngai, Binh Dinh provinces. Mesozoic and Kainozoic granite occur throughout the
country (Thao 1998, Lap 1999).
Terrain
The terrain of Vietnam is complicated and varies from the North to the South and
from the West to the East (Thao 1998, Lap 1999). According to Lap (1999), Vietnam
has five main kinds of terrain: Hills and mountains, Karstic landscapes, valleys and
hollows, alluvial plains and coastal areas, and they show a complicated distribution
throughout the country.
- North-western Zone: This area contains the Hoang Lien Son Range, which is an
extension of the Chinese Hengduan Mountains and constitutes the highest part of the
country. It is a large area, including the provinces of Ha Giang, Tuyen Quang, Yen
Bai, North-western Ha Tay, Hoa Binh, Lai Chau, Son La, western Ninh Binh and
Thanh Hoa (Nhat 2001). The topography is very complex as it ranges from very high
and steep mountains, highlands and hills to valleys and hollows (Lap 1999, Thin
2000). The mean altitude of the mountain ranges is around 2000 m a.s.l. The main
direction of the mountain ranges is from north-west to south-east (SSA 1996).
- North-eastern Zone: Sharing boundaries with the Hoang Lien Son Range and the Red
River Delta, the topography of this area is less complex than the North-western
Zone, as it includes mainly low mountains alternating with hills, valleys and plains.
The altitude of the zone decreases gradually from the north-west to the south-east
(SSA 1996, Nhat 2001). The mountains and hills of the region were formed like an
arc, in which mountains from the border (Vietnam – China) converge towards the
Tam Dao Mountains. This type of topography increases the capacity of receiving the
influence of the winter monsoon from China (SSA 1996).
- Red River and Mekong River Deltas: These Deltas were filled up by Quaternary
sediments from the Red and Mekong River. The terrain of these regions is generally
simple as it is low and flat. There are several depressions such as Nam Ha, Ninh Binh
(in the North), Dong Thap Muoi and U Minh (in the South), and also several higher
tongues of land made up by alluvial deposits (Lap 1999).
- Northern Truong Son Zone: From the Ca River to the Hai Van Pass runs the Northern
Truong Son Range in the Middle of the country. The range includes high mountains
Chapter 2
26
with steep slopes in the east, and gentle slopes in the west (SSA 1996, Lap 1999).
There are also narrow plains with alternating depressions and sand dunes. These
plains are strongly separated from one another by mountainous spurs where the
Truong Son Range reaches the sea (Lap 1999).
- Southern Truong Son Zone: Beginning at Hai Van Pass and sharing a boundary with the
Central Highlands, the Southern Truong Son Range extends along the coastline and
then to the East Sea in Binh Thuan province (SSA 1996, Lap 1999). The topography
of the region is complex with high and steep mountains, narrow plains and sand
fields, again separated by spurs of the Truong Son Mountains (SSA 1996).
- Central Highlands: From the borders with Laos and Cambodia in the west to the
Southern Truong Son Range in the east, the Central Highlands comprises the
highlands of Kon Tum, Dac Lac, Da Lat, Lam Dong and Snaro (SSA 1996). The
altitude of the Central Highlands ranges from 500 m a.s.l. (Kon Tum) to more than
2000 m (Da Lat). However, the terrain of the Central Highlands is general flat and
simple, and it slopes gently from the north-east or the north to the south-west or the
south (SSA 1996, Lap 1999).
Soils
Affected by a monsoon tropical climate and a complex topography, Vietnam has a
diverse system of soil types, ranging from the Ferralsols distributed widely in
mountains and hills, Luvisols in highlands, Fluvisols in deltas to Arenosols and the
Salic Fluvisols in the coastal areas (Binh 1996, SSA 1996, Thao 1998, Lap 1999).
However, several main soil types and their distribution can be classified as follows:
- Plinthic Ferrasols: Formed in a humid tropical climate, these soils occupy around
47% of the total land area of the country (Lap 1999). They occur from 8°5 N to 22°5
N and at altitude lower than 600 m (in the North), 800 m (in the Middle) and 1000 m
(in the South) (Binh1996, Sam & Binh 2001). These soils are often acid, and reserved
for forestry and agro-forestry production (Lap 1999).
- Luvisols: These soils cover of around 1% of the total land area, and occur in the
Central Highlands, the South-east and in Karstic terrains in several provinces of the
North such as Cao Bang, Hoa Binh, Son La and Lai Chau (Lap 1999).
- Rhodic Ferralsols: These soils cover around 2,680,000 ha of the total land area and
occur mostly in the Central Highlands and some other provinces, e.g. Quang Tri,
Nghe An and Thanh Hoa (Lap 1999).
- Acrisols: Compared with other kinds of soils, the Acrisols are unfertile as they were
affected by a strong progression of leaching and erosion (Binh 1996, Lap 1999).
Vietnamese forestry, biodiversity and threatened tree species
27
These soils cover around 7.5% of the total land area and mainly occur in the North
and South deltas and the highlands (Lap 1999).
- Humic Ferralsols: These soils occur in low mountains of the country over around
10.25% of the total land area. These soils are often humid and fertile and to be the
habitat of the evergreen forests (Lap 1999).
- Fluvisols: These soils occupy around 24% of the total land area of the country, and
occur mainly in deltas and valleys (Binh 1996, SSA 1996, Lap 1999). These soils are
very important for the country as they are the base for most cultivation and
inhabitation of people (Lap 1999).
- Salic Fluvisols: These soils occur along the entire coastline of the country. The total
area of these soils is around 4.4% of the total land area of Vietnam (SSA 1996, Lap
1999).
Biogeography
The basis of the flora of Vietnam and the whole of Indochina was laid a long time
ago. Schmid (1962) and Vidal (1973) stated that many species of the Lycopodiales,
Equisetalis and Pteridospermae occurred in the Paleozoic Era, when the land blocks
of Annamia (in the North) and Sinien (in the South) emerged. In the late-Paleozoic
and the Mesozoic Era, the flora contained species of the class of the Psilotophyta and
particularly of the Cycadales (Schmid 1962). However, the present flora of Vietnam
and Indochina developed mainly in the Kainozoic Era (Schmid 1962, Vidal 1973).
During this period also many taxa immigrated into the area (Trung 1998).
Immigration of taxa from adjacent areas into Indochina and subsequent radiation
of species was facilitated as the area lies on or near the contact zones of three major
earth plates: the huge Eurasiatic plate with smaller, adjacent South China and
Indochina plates, the Indian plate and the smaller, adjacent Birma-Siam plate, and the
South-East Asian (Sunda) plate. Furthermore, the mainly North-South running
mountain ranges facilitated the migration of taxa. The availability of different source
floras and the occurrence of dispersal tracks make the Indochinese area plant
geographically very interesting. The mixture of taxa with different geographic
affinities, the evolution of new taxa in the area, and the persistence of geographically
restricted, relic taxa add to its attractiveness (cf. Willis & McElwain 2002).
Basically, Vietnam’s flora includes species from the Northern Vietnam-Southern
China Flora (indigenous and endemic species), the Himalaya-Yunnan-Guizhou flora
in the North-West, the India-Myanmar flora in the West, and the Malaysia-
Indonesian flora in the South and South-East (Fig. 1) (Trung 1998, Chan et al. 1999,
Lap 1999).
Chapter 2
28
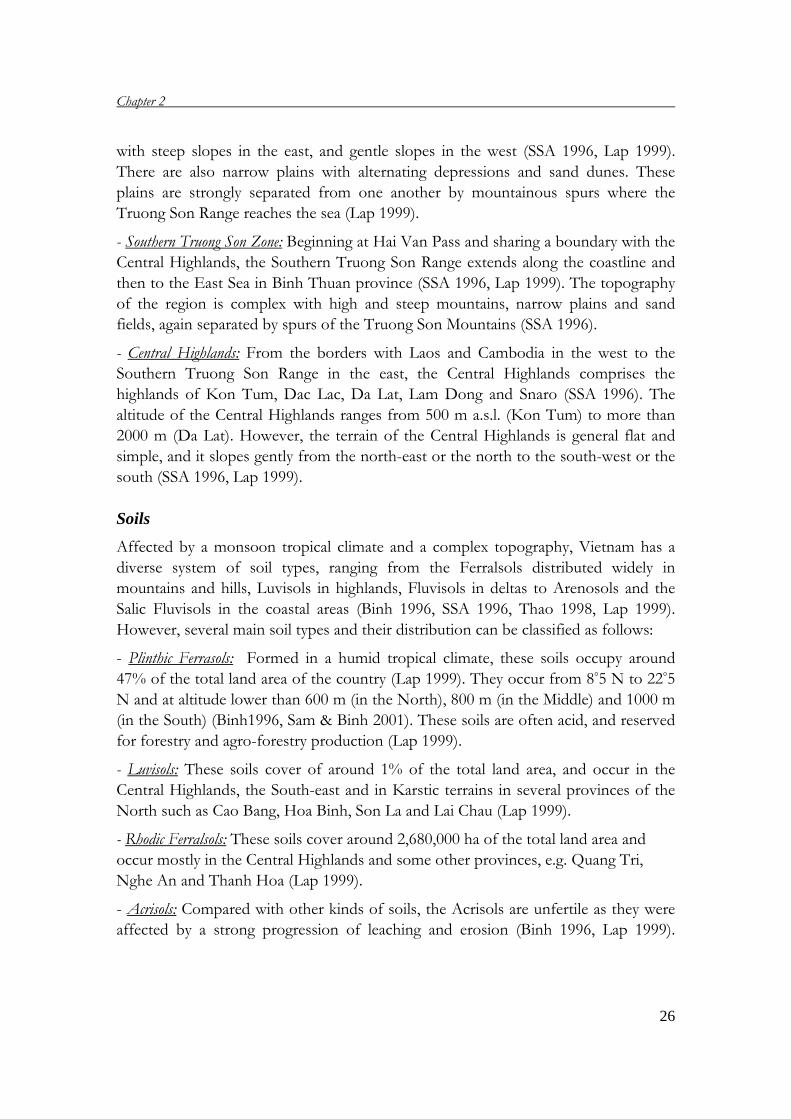
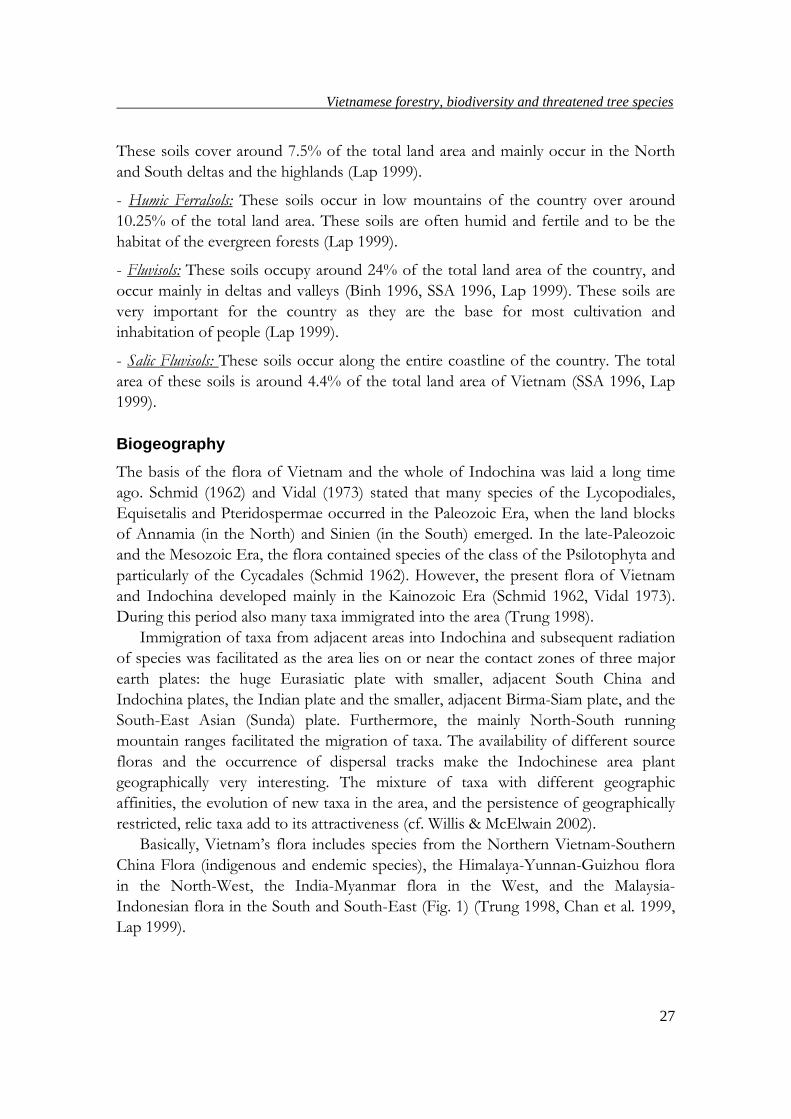
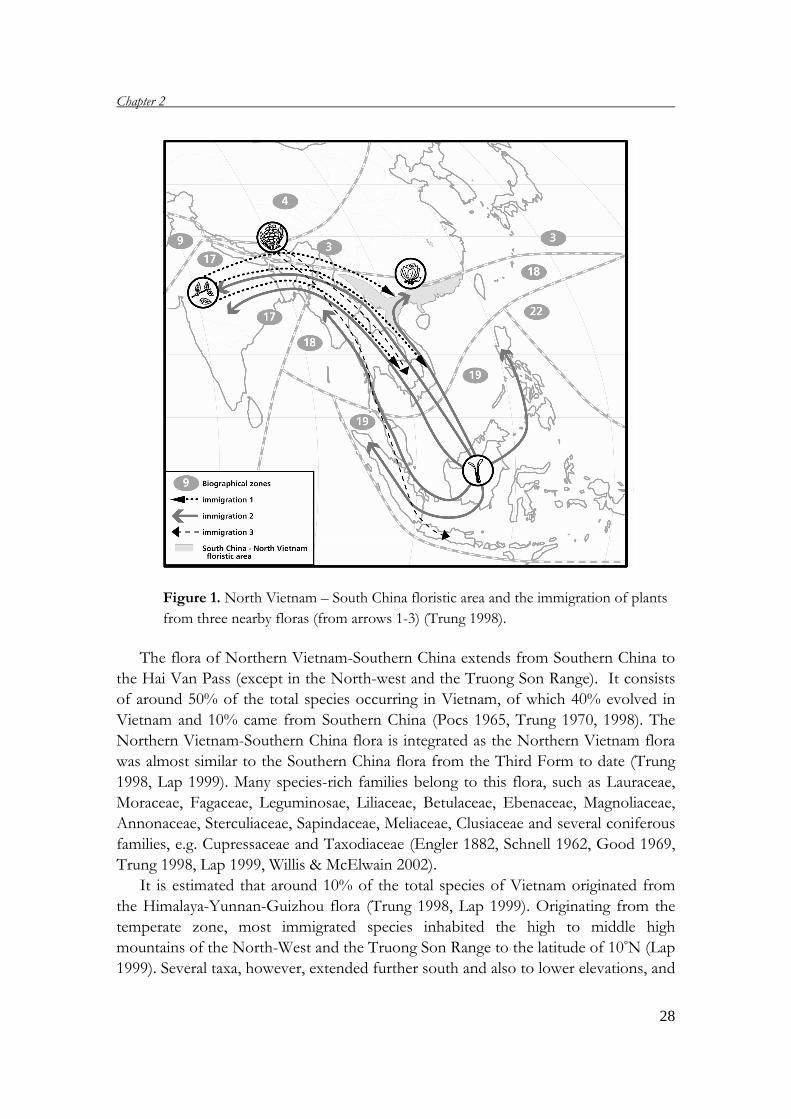
Figure 1. North Vietnam – South China floristic area and the immigration of plants
from three nearby floras (from arrows 1-3) (Trung 1998).
The flora of Northern Vietnam-Southern China extends from Southern China to
the Hai Van Pass (except in the North-west and the Truong Son Range). It consists
of around 50% of the total species occurring in Vietnam, of which 40% evolved in
Vietnam and 10% came from Southern China (Pocs 1965, Trung 1970, 1998). The
Northern Vietnam-Southern China flora is integrated as the Northern Vietnam flora
was almost similar to the Southern China flora from the Third Form to date (Trung
1998, Lap 1999). Many species-rich families belong to this flora, such as Lauraceae,
Moraceae, Fagaceae, Leguminosae, Liliaceae, Betulaceae, Ebenaceae, Magnoliaceae,
Annonaceae, Sterculiaceae, Sapindaceae, Meliaceae, Clusiaceae and several coniferous
families, e.g. Cupressaceae and Taxodiaceae (Engler 1882, Schnell 1962, Good 1969,
Trung 1998, Lap 1999, Willis & McElwain 2002).
It is estimated that around 10% of the total species of Vietnam originated from
the Himalaya-Yunnan-Guizhou flora (Trung 1998, Lap 1999). Originating from the
temperate zone, most immigrated species inhabited the high to middle high
mountains of the North-West and the Truong Son Range to the latitude of 10°N (Lap
1999). Several taxa, however, extended further south and also to lower elevations, and
Vietnamese forestry, biodiversity and threatened tree species
29
as a consequence developed more subtropical and tropical species (Trung 1998).
Many species in this group are Gymnospermae, such as Pinus merkusii, Pinus kesiya,
Keteleeria davidiana, Fokiena hodginsii, Calocedrus macrolepis, Tsuga yunnanensis, Abies pindrow,
Cryptomeria japonica. However, the deciduous broad-leaved species of the families
Fagaceae, Betulaceae, Aceraceae, Oleaceae, Juglandaceae, Ericaceae and Vacciniaceae
are also found in this region (Schnell 1962, Good 1969, Trung 1998, Lap 1999).
From the west, the India-Myanmar flora contributed around 14% of the total
species number of the Vietnam’s flora. Taxa with this affinity mainly occur in the
North-West, the Truong Son Range and the Central Highlands of the country (Trung
1998, Lap 1999). The most common family in this group is Combretaceae with the
genera Terminalia, Anogeissus, Finetia and Combretum. They drop their leaves in the
dry season (Trung 1998). Also the species of Lagerstroemia (Lythraceae), Tetrameles
nudiflora (Datiscaceae), and Gossampinus malabaricus (Bombacaceae) belong to this
group (Good 1969, Trung 1998).
Around 15% of the flora of Vietnam has affinities to the Malaysia-Indonesian
flora (Schnell 1962, Good 1969, Trung 1998, Lap 1999). In this group, the species of
the Dipterocarpaceae (both evergreen and deciduous species) occur mainly in the
Central Highlands and the Truong Son Range. The deciduous species can be found in
the Central Highlands, where the climate has a distinct dry season, and the evergreen
species occur in tropical humid forests (Lap 1999). However, Lap (1999) reported
that the species may occur to as north as 20°N, and several species of
Dipterocarpaceae, such as Dipterocarpus tonkinensis, occur in the evergreen forests in
Phu Tho and Yen Bai provinces (the North).
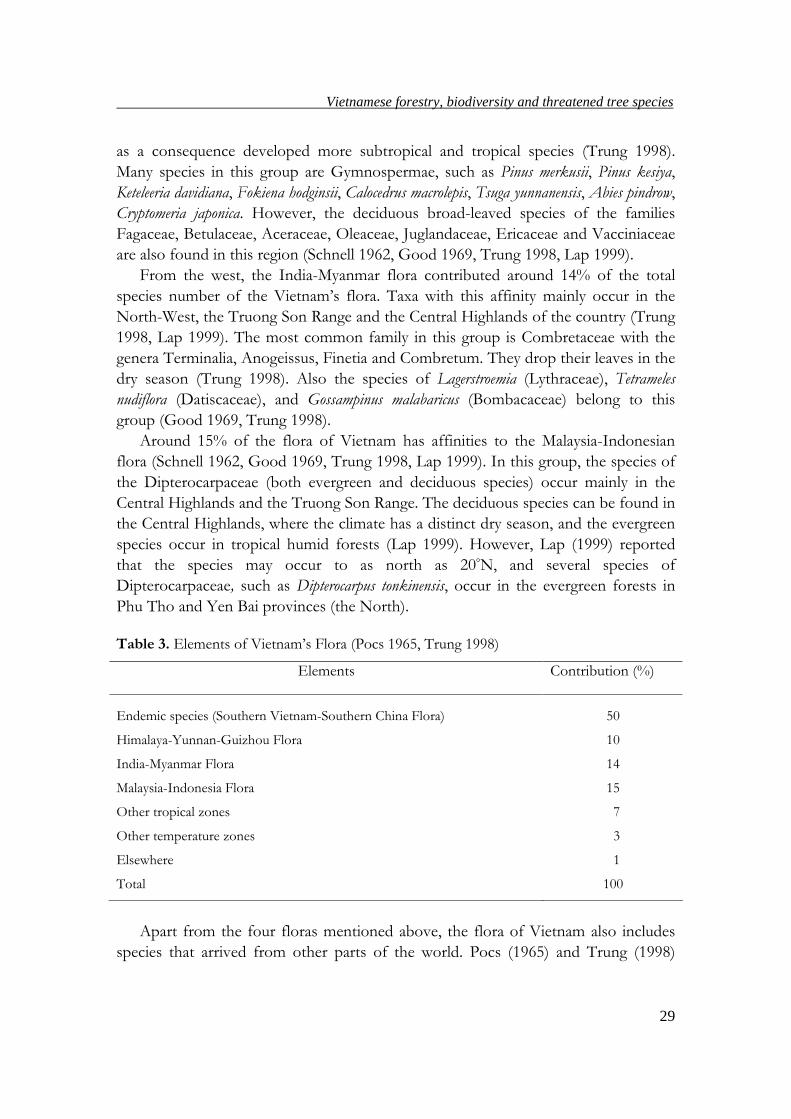
Table 3. Elements of Vietnam’s Flora (Pocs 1965, Trung 1998)
Elements Contribution (%)
Endemic species (Southern Vietnam-Southern China Flora) 50
Himalaya-Yunnan-Guizhou Flora 10
India-Myanmar Flora 14
Malaysia-Indonesia Flora 15
Other tropical zones 7
Other temperature zones 3
Elsewhere 1
Total 100
Apart from the four floras mentioned above, the flora of Vietnam also includes
species that arrived from other parts of the world. Pocs (1965) and Trung (1998)
Chapter 2
30
estimate their number at around 7% of its total species from other tropical zones, 3%
from other temperate zones, and 1% from elsewhere (Table 3).
In plant geographical classifications all of Indochina including Vietnam and
Thailand, are part of the Paleotropical Kingdom, the Indo-Malaysian Subkingdom,
and the (Continental) South-east Asian Region (Schmithusen 1968, Good 1969,
Walter & Straka 1970). Depending on the taxonomic classification favoured by the
authors, the area has no or a few, small endemic families, but it contains more than
250 endemic genera, mostly small in species numbers and with a localized distribution
(Good 1969, Takhtajan 1971).
Biogeographical zones of Vietnam are recognized on the basic of natural
geography, topography and species composition of the region (GoVN 1994, Thin
2000). In general, 3 main biogeographical zones are distinguished: The first zone
covers the North-West and the Truong Son Range (until the latitude of 10°N). In this
zone, most plant species occurring in the mountains are of Himalaya-Yunnan-
Guizhou flora affinity, while the species growing in lower areas are mostly of India-
Myanmar flora affinity (Trung 1998). From the North-East to the latitude of 16°N we
find a biogeographical zone, where most species belong to the endemic Southern
Vietnam-Southern China floral element (Trung 1998). This zone is the habitat of
Erythrophloem fordii, which is strictly endemic here (Trung 1998). However, in this zone
we also find several species of Malaysia-Indonesian floral affinity (Lap 1999). From
the South to the latitude of 18°N is the zone of Malaysia-Indonesian floral affinity.
There are many species of Dipterocarpaceae occurring in this zone (Trung 1998).
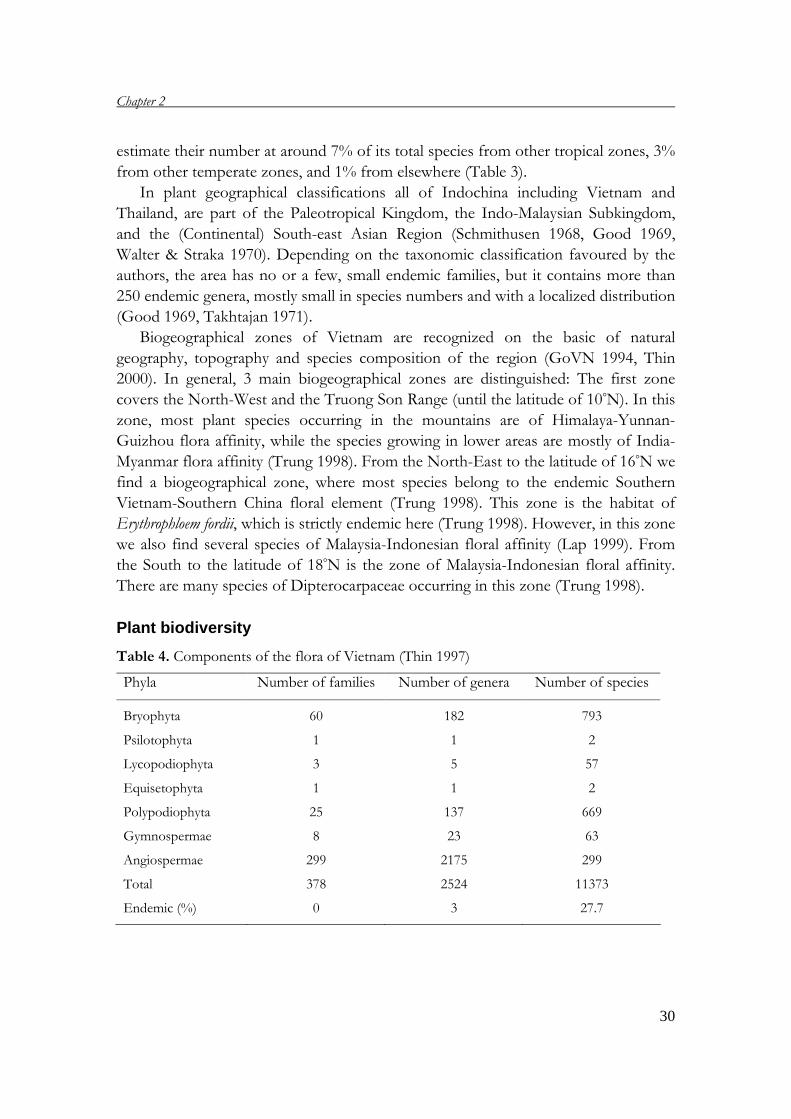
Plant biodiversity
Table 4. Components of the flora of Vietnam (Thin 1997)
Phyla Number of families Number of genera Number of species
Bryophyta 60 182 793
Psilotophyta 1 1 2
Lycopodiophyta 3 5 57
Equisetophyta 1 1 2
Polypodiophyta 25 137 669
Gymnospermae 8 23 63
Angiospermae 299 2175 299
Total 378 2524 11373
Endemic (%) 0 3 27.7
Vietnamese forestry, biodiversity and threatened tree species
31
Vietnam possesses a very abundant and diverse flora, of which around 30% of its
total species are endemic (Thin 1997, Trung 1998). Vietnam is estimated to have
from 12,000 to 15,000 plant species, according to different scientists. GoVN (1994)
reports that Vietnam has more than 12,000 plant species, of which 7,000 have been
identified. In the 3 phyla Pteridophyta, Gymnospermae and Angiospermae 11,000
species belonging to 2500 genera were identified (Ly 1993). Subsequently, Thin
(1997) indicates that Vietnam has 11,373 plant species, 27.7% of which are endemic,
belonging to 2524 genera, 378 families and 7 phyla (Table 4). He also predicts that
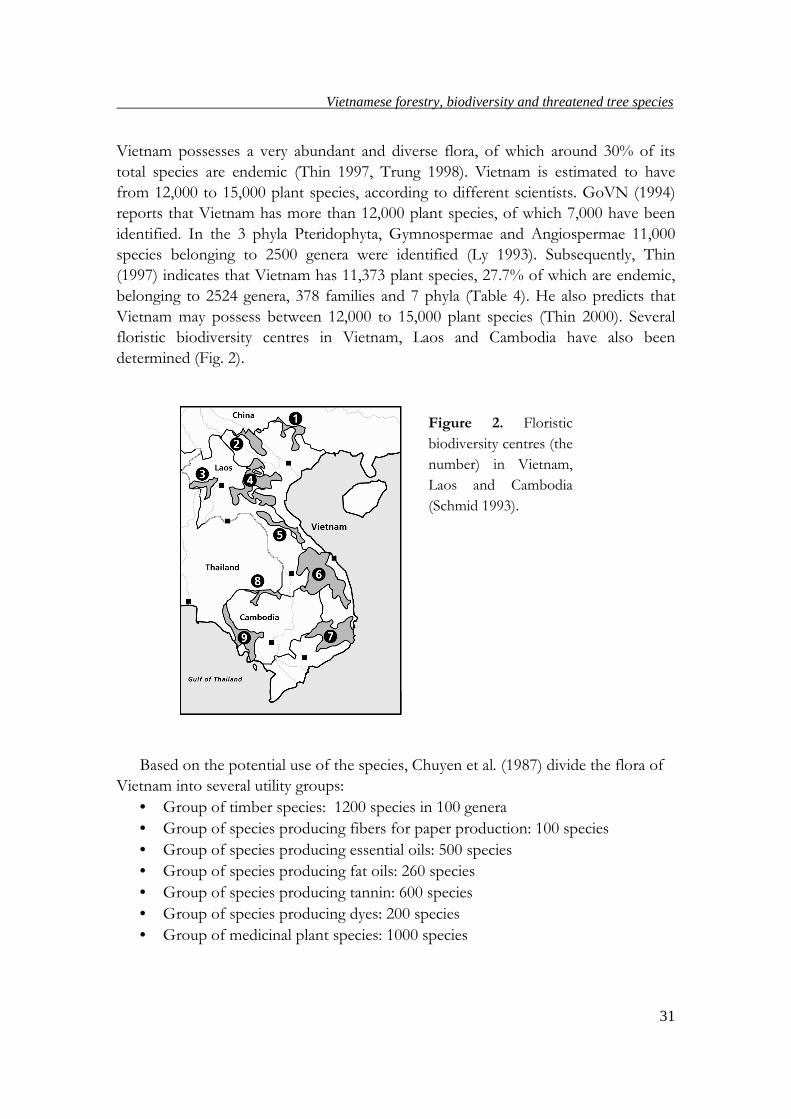
Vietnam may possess between 12,000 to 15,000 plant species (Thin 2000). Several
floristic biodiversity centres in Vietnam, Laos and Cambodia have also been
determined (Fig. 2).
Based on the potential use of the species, Chuyen et al. (1987) divide the flora of
Vietnam into several utility groups:
• Group of timber species: 1200 species in 100 genera • Group of species producing fibers for paper production: 100 species • Group of species producing essential oils: 500 species • Group of species producing fat oils: 260 species • Group of species producing tannin: 600 species • Group of species producing dyes: 200 species • Group of medicinal plant species: 1000 species
Figure 2. Floristic
biodiversity centres (the
number) in Vietnam,
Laos and Cambodia
(Schmid 1993).
Chapter 2
32
However, the number of species in each group will probably increase as more
research is carried out. For instance, Chi (1997) determines that there are 3200
medicinal plant species, rather than the 1000 species as given by Chuyen et al. (1987).
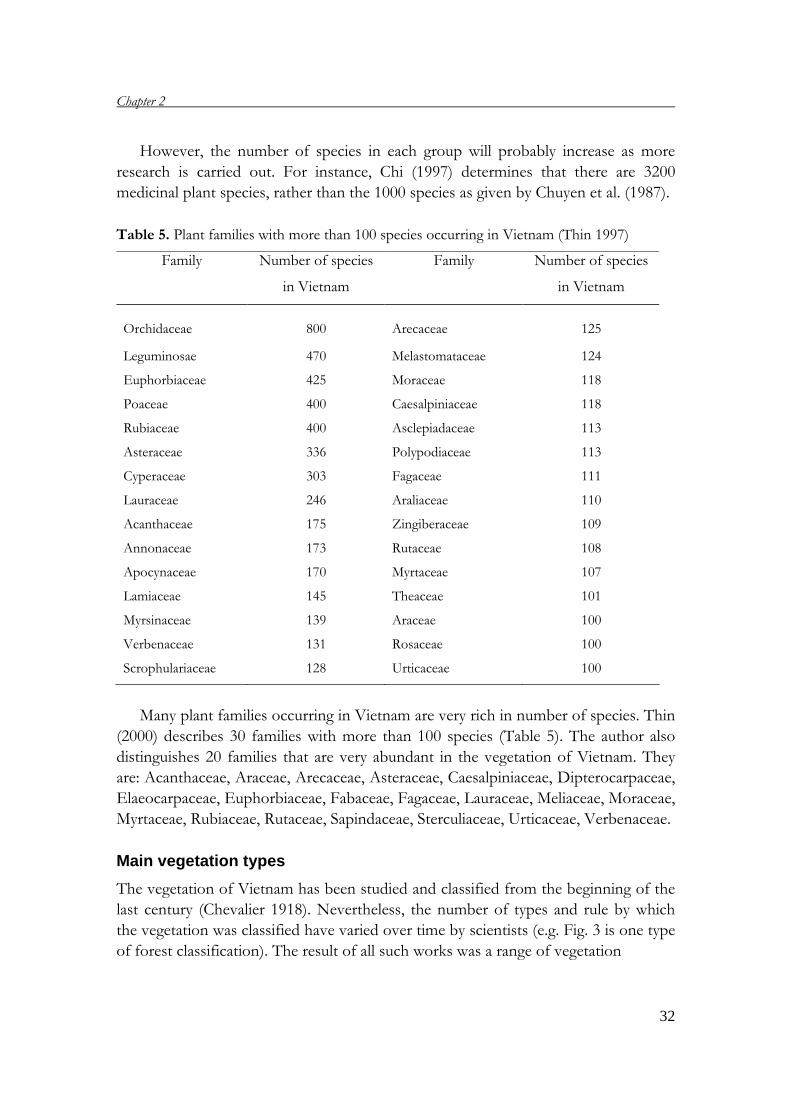
Table 5. Plant families with more than 100 species occurring in Vietnam (Thin 1997)
Family Number of species
in Vietnam
Family Number of species
in Vietnam
Orchidaceae 800 Arecaceae 125
Leguminosae 470 Melastomataceae 124
Euphorbiaceae 425 Moraceae 118
Poaceae 400 Caesalpiniaceae 118
Rubiaceae 400 Asclepiadaceae 113
Asteraceae 336 Polypodiaceae 113
Cyperaceae 303 Fagaceae 111
Lauraceae 246 Araliaceae 110
Acanthaceae 175 Zingiberaceae 109
Annonaceae 173 Rutaceae 108
Apocynaceae 170 Myrtaceae 107
Lamiaceae 145 Theaceae 101
Myrsinaceae 139 Araceae 100
Verbenaceae 131 Rosaceae 100
Scrophulariaceae 128 Urticaceae 100
Many plant families occurring in Vietnam are very rich in number of species. Thin
(2000) describes 30 families with more than 100 species (Table 5). The author also
distinguishes 20 families that are very abundant in the vegetation of Vietnam. They
are: Acanthaceae, Araceae, Arecaceae, Asteraceae, Caesalpiniaceae, Dipterocarpaceae,
Elaeocarpaceae, Euphorbiaceae, Fabaceae, Fagaceae, Lauraceae, Meliaceae, Moraceae,
Myrtaceae, Rubiaceae, Rutaceae, Sapindaceae, Sterculiaceae, Urticaceae, Verbenaceae.
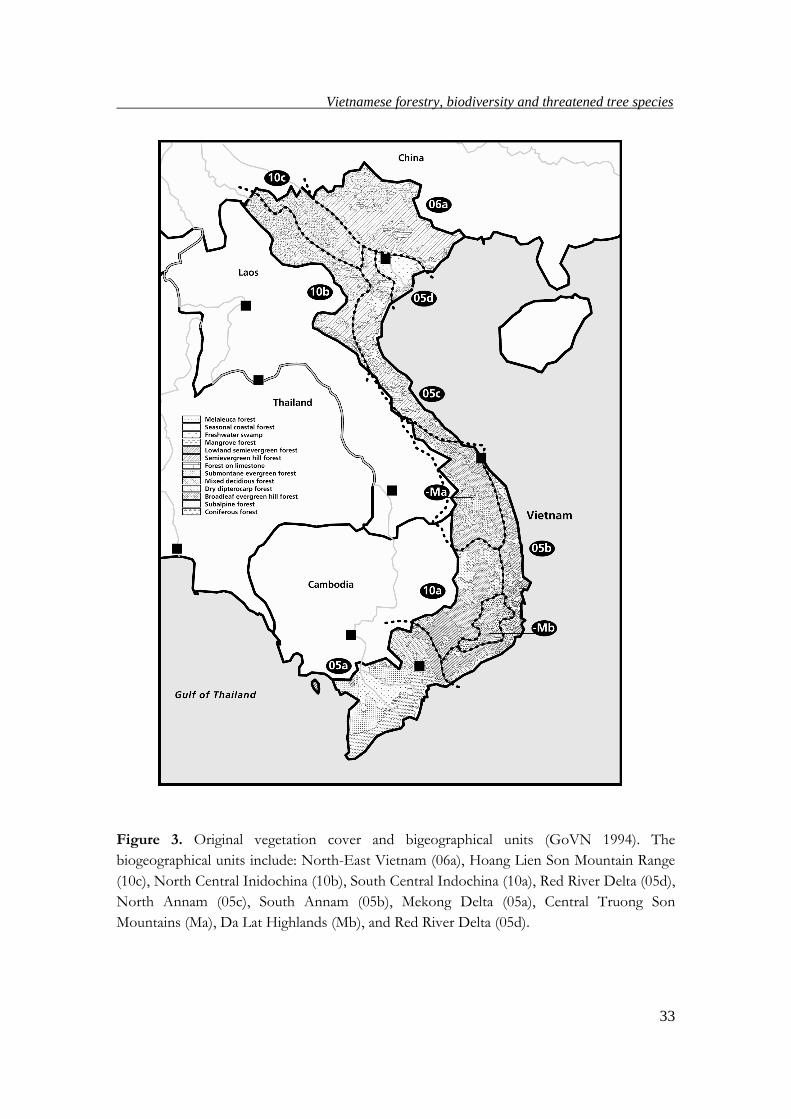
Main vegetation types
The vegetation of Vietnam has been studied and classified from the beginning of the
last century (Chevalier 1918). Nevertheless, the number of types and rule by which
the vegetation was classified have varied over time by scientists (e.g. Fig. 3 is one type
of forest classification). The result of all such works was a range of vegetation
Vietnamese forestry, biodiversity and threatened tree species
33
Figure 3. Original vegetation cover and bigeographical units (GoVN 1994). The
biogeographical units include: North-East Vietnam (06a), Hoang Lien Son Mountain Range
(10c), North Central Inidochina (10b), South Central Indochina (10a), Red River Delta (05d),
North Annam (05c), South Annam (05b), Mekong Delta (05a), Central Truong Son
Mountains (Ma), Da Lat Highlands (Mb), and Red River Delta (05d).
Chapter 2
34
classifications for Vietnam with several overlapping and/or similar forest types
identified. However, the main types of vegetation of Vietnam can be distinguished as
follows:
Tropical evergreen broad-leaved forest
This kind of forest is found widely throughout the country at elevations below 700 m
a.s.l. in the North and below 1000 m a.s.l. in the South (Chan & Dung 1992, Trung
1998). In the distribution area of this vegetation type the mean annual temperature
ranges from 20 to 25°C. The annual precipitation is more than 1200 mm, with 2-3 dry
months (with rainfall less than 50 mm per month) (Trung 1998). This forest type is
very diverse and complex in structure with a great number of tree, vine, epiphyte and
shrub species. It has 2-5 vegetation layers: a layer of emergents, the main canopy
storey, the subcanopy layer, the shrub understorey and the forest floor layer. The
emergents may reach up to 25-30 m in height (Chan & Dung 1992, Trung 1998).
Tropical semi-deciduous broad-leaved forest
The occurrence of this forest type is concentrated in Northern Vietnam and the
Central Highlands at the same elevation as the tropical evergreen broad-leaved forest
(Chan & Dung 1992, Linh 1996, Trung 1998). In the distribution of this vegetation
type the mean annual temperature is 20 to 25°C, with the temperature of the coldest
month 15-20°C. Annual rainfall is high, from 1200 to 2500 mm, but 4-6 months are
considered dry, and 1 month usually has no rain at all (Trung 1998). The forest
structure is also complex and diverse. Deciduous trees occupy about 25 to 75% of
the timber trees in this forest type (Chan & Dung 1992, Linh 1996).
Tropical deciduous broad-leaved forest
This type is distributed naturally at an elevation of less than 700 m a.s.l. in the North
and below 1000 m a.s.l. in the South. This kind of forest has a simple structure with 2
main layers of timber trees. The percentage of deciduous trees is estimated at more
than 75% (Chan & Dung 1992). In these areas, the rainfall is low: it may be as low as
600 mm per year. The dry season may last from 4 to 6 months, with at least 1 month
of no rain at all (Trung 1998).
Subtropical evergreen forest
This forest is distributed naturally at altitudes above 700m a.s.l. in the North and
above 1000 m a.s.l. in the South (Chan & Dung 1992, Hung 1996). Occurring at high
elevations, this type of forest is under the influence of subtropical climate. The mean
Vietnamese forestry, biodiversity and threatened tree species
35
annual temperature ranges from 15 to 20°C. The annual rainfall is still high,
fluctuating from 1200 to 2500 mm (Chan & Dung 1992). Like temperate forest, the
subtropical evergreen forest has a simple structure of 2 main layers of timber trees.
The overall species richness is less than in the tropical evergreen forest (Chan &
Dung 1992).
Limestone forest
This forest grows on the limestone substrate (calcareous soil), which extends over a
large Karstic area of the North and a smaller area of Northern Middle of Vietnam
(GoVN 1994, Truong 1996). The area of limestone forest is estimated at about 5.4%
of the total forested land (Phon et al. 2001, Dung 2005). In fact, these forests are
subtypes of the closed evergreen and semi-deciduous broad-leaved forests. The flora
is diverse and includes a large number of coniferous and broad-leaved species (Chan
& Dung 1992, Truong 1996, Dung 2005). Growing on infertile soil and under hard
climatic conditions, the forest structure is simple, with 1-2 layers of slow-growing tree
species (GoVN 1994, Truong 1996, Phuong 2000). This forest type has recently been
severely degraded by uncontrolled logging, wildfire and slash and burn cultivation,
and needs to be protected and reserved (GoVN 1994, Phon et al. 2001).
Coniferous forest
This forest occurs in the North and the Central Highlands, at elevations of over 1000
m a.s.l. where the climate is cool in summer and cold in winter (Chan & Dung 1992,
Truong 1996). These areas are comparatively dry as annual precipitation is only from
600 to 1200 mm (Chan & Dung 1992). The dry season is long, lasting from 4 to 6
months, with 1 month without any rain (Trung 1998). The forest structure is often
simple and the forest is dominated by 2 species, Pinus merkusii and P. kesiya (Chan &
Dung 1992). However, more recently, large areas of plantations of P. merkusii, P.
kesiya, P. massoniana and P. caribaea have been established at lower elevations (Truong
1996).
Mangrove forest
These forests grow in tidal areas along the coast of the country, especially in estuaries
(Chan & Dung 1992, Sam et al. 2005). This type of forest is most prevalent in the
South, but also occurs as shorter and simpler forest in the North (GoVN 1994). The
structure of the forest is simple as it often has 1 layer (Chan & Dung 1992, Truong
1996). However, this type of forest has dramatically been destroyed and replaced by
farming and land reclamation (GoVN 1994, Sam et al. 2005)
Bamboo forest
Chapter 2
36
These forests are distributed throughout the country and emerge after harvesting of
the natural forests or after slash and burn cultivation (Chan & Dung 1992). The total
area of bamboo forests of Vietnam is estimated at 1,489,000 ha, of which 1,415,500
ha are natural bamboo forests (both monoculture and mixture) and 73,500 ha are
plantations. The bamboo species of Vietnam are diverse as they contain about 29
genera and 140 species (Dung & Lam 2005). This type of forests occurs as pure
patches or as mixtures with tree species (Lam 2005).
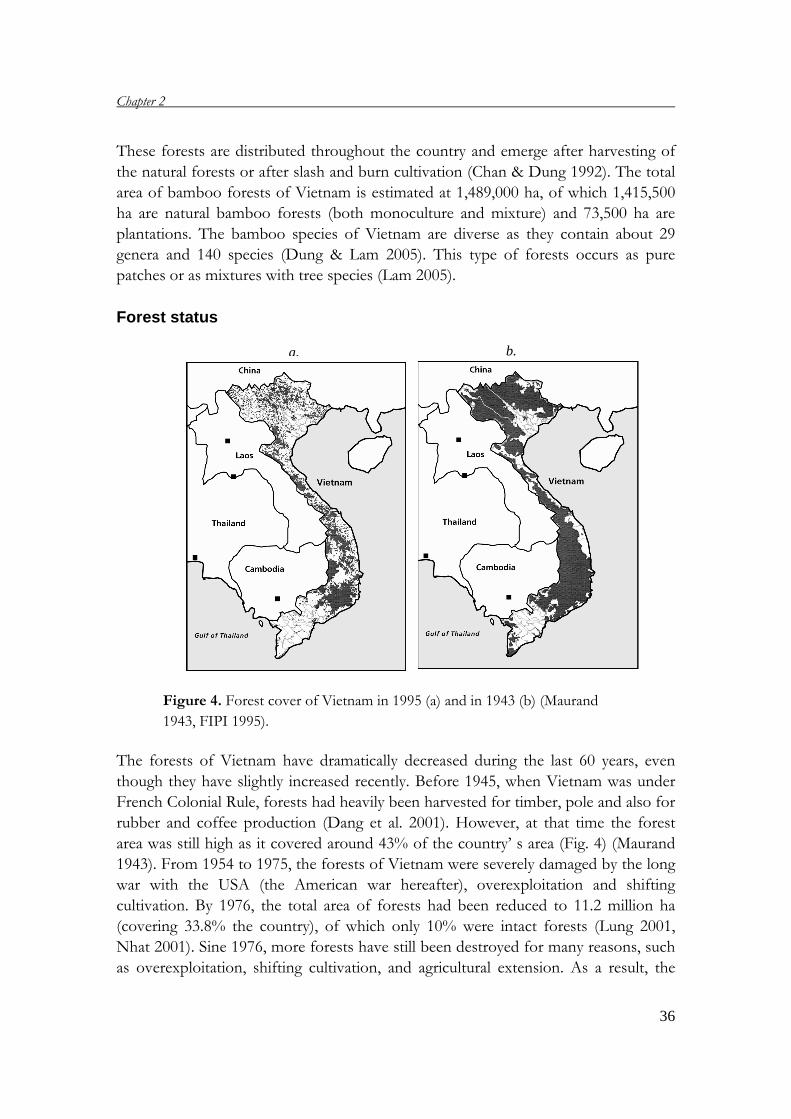
Forest status
Figure 4. Forest cover of Vietnam in 1995 (a) and in 1943 (b) (Maurand
1943, FIPI 1995).
The forests of Vietnam have dramatically decreased during the last 60 years, even
though they have slightly increased recently. Before 1945, when Vietnam was under
French Colonial Rule, forests had heavily been harvested for timber, pole and also for
rubber and coffee production (Dang et al. 2001). However, at that time the forest
area was still high as it covered around 43% of the country’ s area (Fig. 4) (Maurand
1943). From 1954 to 1975, the forests of Vietnam were severely damaged by the long
war with the USA (the American war hereafter), overexploitation and shifting
cultivation. By 1976, the total area of forests had been reduced to 11.2 million ha
(covering 33.8% the country), of which only 10% were intact forests (Lung 2001,
Nhat 2001). Sine 1976, more forests have still been destroyed for many reasons, such
as overexploitation, shifting cultivation, and agricultural extension. As a result, the
a. b.
Vietnamese forestry, biodiversity and threatened tree species
37
forest cover declined to an estimated 30% in 1985, and 28% in 1995 (Fig. 4) (Lung
2001). In 1998, the 5 Million ha Reforestation Program was launched with a target to
plant 5 million ha of forests by 2010, restoring the forest cover to 43% (Forestry
Department 2001). The program aims not only to reforest, but also to protect
existing natural forests. As a result, the forest cover of Vietnam has gradually
increased. In 2003, the forested area of Vietnam was 12,094,518 ha, of which
10,004,709 ha were natural forests and 2,089,809 ha were plantation forests, resulting
in a forest cover of 36.1% (Hung 2004).
However, the quality of forests is still low as most of the forests are poor in
timber volume and lack valuable species as a result of a long time of overexploitation
and random logging (Thin 1997, Dang et al. 2001). It is reported that natural forests
rich in timber resources cover only 1.4 million ha (13%) while poor and young forests
comprise around 6 million ha (55%). The amount of plantation forests has sharply
increased (Hung 2004), but the quality also still low. Most plantations are even age
and to be established by exotic species (e.g. Pinus spp, Eucalyptus spp, Acacia spp). In
general, the plantations have low growth rate (about 8-10 m3 ha-1 year-1), and they
mainly support small and medium sized stems (Dang et al. 2001).
There are many reasons for the rapid loss of forests in Vietnam, but the American
war played a major role (Quy 1985, Bouny 2006). From 1954 to 1975, the American
Army used around 74 million liters of herbicides (Agent Orange) in order to defoliate
dense forest areas (Quy 1985, Bouny 2006). Around 13 million tons of bombs (some
what between two and four times the bombs’ tonnage of the whole Second World
War) were dropped on Vietnam, most of which severely impacted the forested areas
(Quy 1985, Bouny 2006). As a result, more than 2 million ha of natural forests, of
which 500,000 ha of closed upland forests and 30,000 ha of mangroves were
completely destroyed (Westing 1971, Quy 1985, Truong 1996).
Overexploitation is also an important reason for the decrease in forest resources
in Vietnam. During the American war, many large forest areas were heavily logged to
support people and the war effort. Subsequently, to rebuild the country after the war,
around 1.3-1.4 million m3 of timber and 100,000 tons of bamboo were exploited
annually (Nhat 2001). As a developing country with 80% of the population being
farmers, Vietnam needs a huge amount of firewood. Annually, from 22 to 23 million
tons of firewood are harvested (Dang et al. 2001, Nhat 2001). In addition, illegal
logging is a serious problem as it has annually destroyed around 30,000 ha of forests
in several last decades (GoVN 1994).
The population of Vietnam has increased quickly, and this has also a dramatic
impact on the forests. At the beginning of the last century, the population of Vietnam
was about 15 million. However, this number had doubled by 1940, in just 30-40
years. From 1960 onwards, the population has doubled every 25 years (Dang et al.
2001). In 1999, the population of Vietnam was 77,263,000 people, with a density of
Chapter 2
38
233 people per sq.km, 5 times higher than the average density of the world (Toan
1998, Dang et al. 2001). Such a large population puts the forest under heavy pressure,
not only through practices of shifting cultivation, but also by transforming forested
land into agriculture production fields (Toan 1998, Nhat 2001).
The impact of shifting cultivation on forests may be sustainable if the local
population density is low (Sam 1996, Nhat 2001). To produce enough food for self
sufficiency, people just cultivate a limited area for a while, and then leave it for a
reasonable time before going to use it again. So, the field has enough time to renew a
cover and for the soil to rejuvenate, and people do not need to greatly extend the area
for cultivation, so that they do not cause much further loss of forests. However, if the
density of the population increases, the rate of forest destruction will exceed the rate
of recovery (GoVN 1994, Nhat 2001). Forests therefore will be rapidly lost when the
population density is extremely high, and people have to keep clearing new forests for
cultivation of agricultural crops (Sam 1996).
Vietnam has several million people whose lives are based on shifting cultivation.
In the North, around 1.4 million people are reported to practice shifting cultivation.
The population densities of the mountainous areas are now very high, in many places
up to100 people per sq.km (Dang et al. 2001). The government has introduced
policies and encouraged rural people to convert to permanent agriculture. However,
more attention should be paid to this point in order to better preserve the forests
(Dang et al. 2001).
Transformation of forested land into agricultural fields has decreased the forest
cover quickly as a huge number of people from the delta areas moved to live in
mountainous areas (GoVN 1994). For instance, before 1975 around 1 million people
of the North moved from the Red River delta (very high population density) to
mountainous areas (Dang et al. 2001). From 1975 to 1995, the Central Highlands
received around 650,000 people under the policy of a relocation scheme, as well as
around 334,000 free moving people (Dang et al. 2001). The big movement of people
has quickly changed the forests. They cleared forests to cultivate agricultural crops.
They also uncontrollably harvested timber, firewood, food and other forest products.
Particularly, in the Central Highlands and the South-East, large areas of natural
forests have been cleared for planting industrial trees such as rubber and coffee.
Along the coast line and estuaries of the country, especially in Minh Hai province (in
the South), certain areas of mangroves have been cleared to form farms for shrimp
production and other seafood (GoVN 1994, Nhat 2001).
Recently, the country has been moving towards a market-economy, which may
have a negative impact on forests (Nhat 2001). To increase yield from forests and
plantations, many exotic and hybrid species have been imported. These species may
invade the habitat of the native forests, and also bring new pests and diseases, that
Vietnamese forestry, biodiversity and threatened tree species
39
may damage indigenous species (Nhat 2001, Socialist Republic of Vietnam ‘SRVN’
2003).
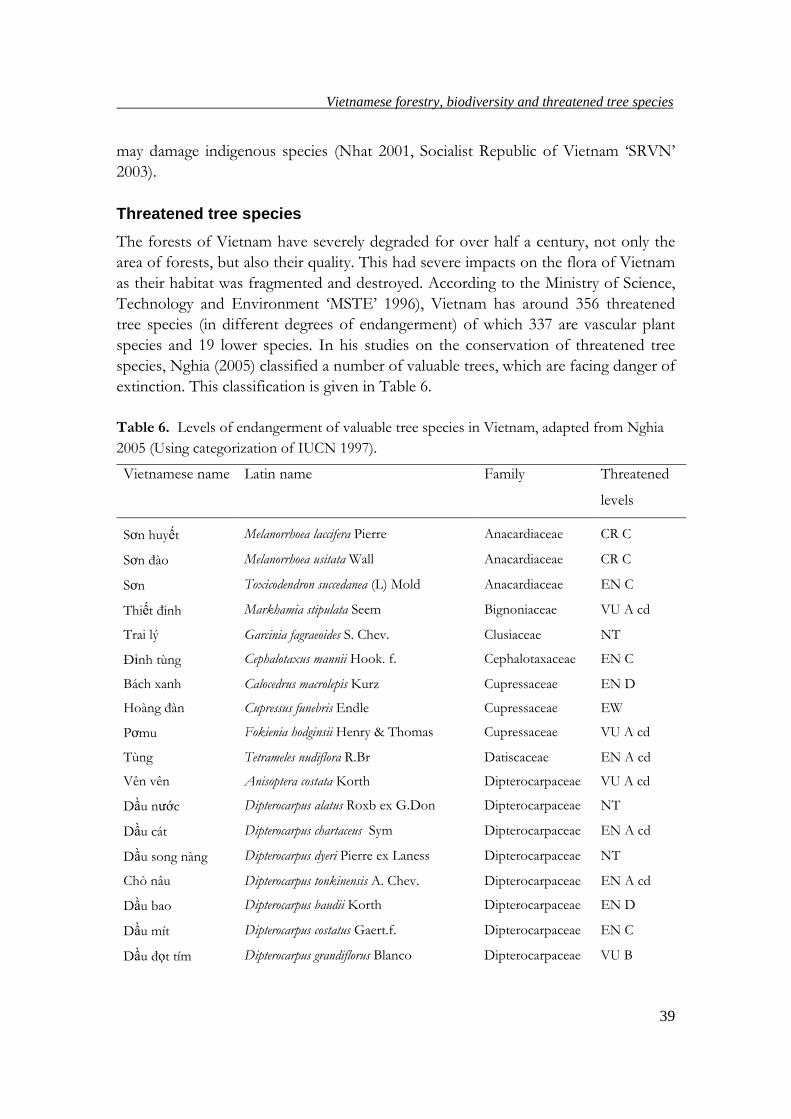
Threatened tree species
The forests of Vietnam have severely degraded for over half a century, not only the
area of forests, but also their quality. This had severe impacts on the flora of Vietnam
as their habitat was fragmented and destroyed. According to the Ministry of Science,
Technology and Environment ‘MSTE’ 1996), Vietnam has around 356 threatened
tree species (in different degrees of endangerment) of which 337 are vascular plant
species and 19 lower species. In his studies on the conservation of threatened tree
species, Nghia (2005) classified a number of valuable trees, which are facing danger of
extinction. This classification is given in Table 6.
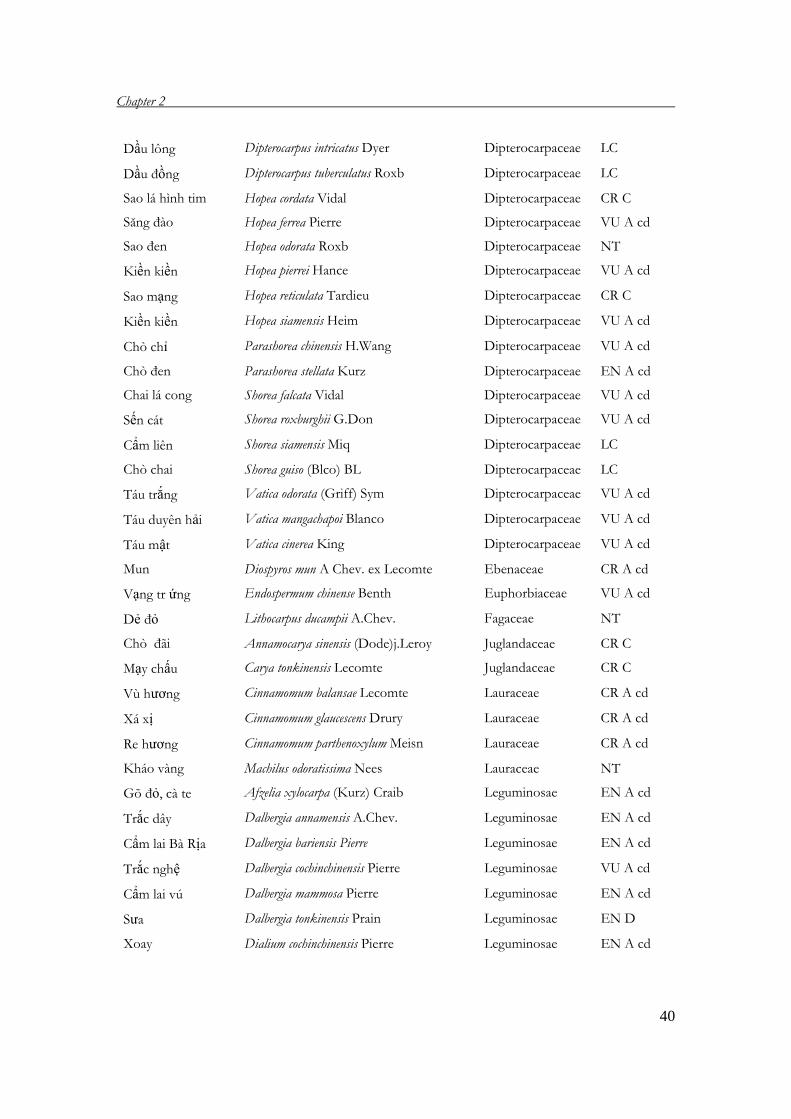
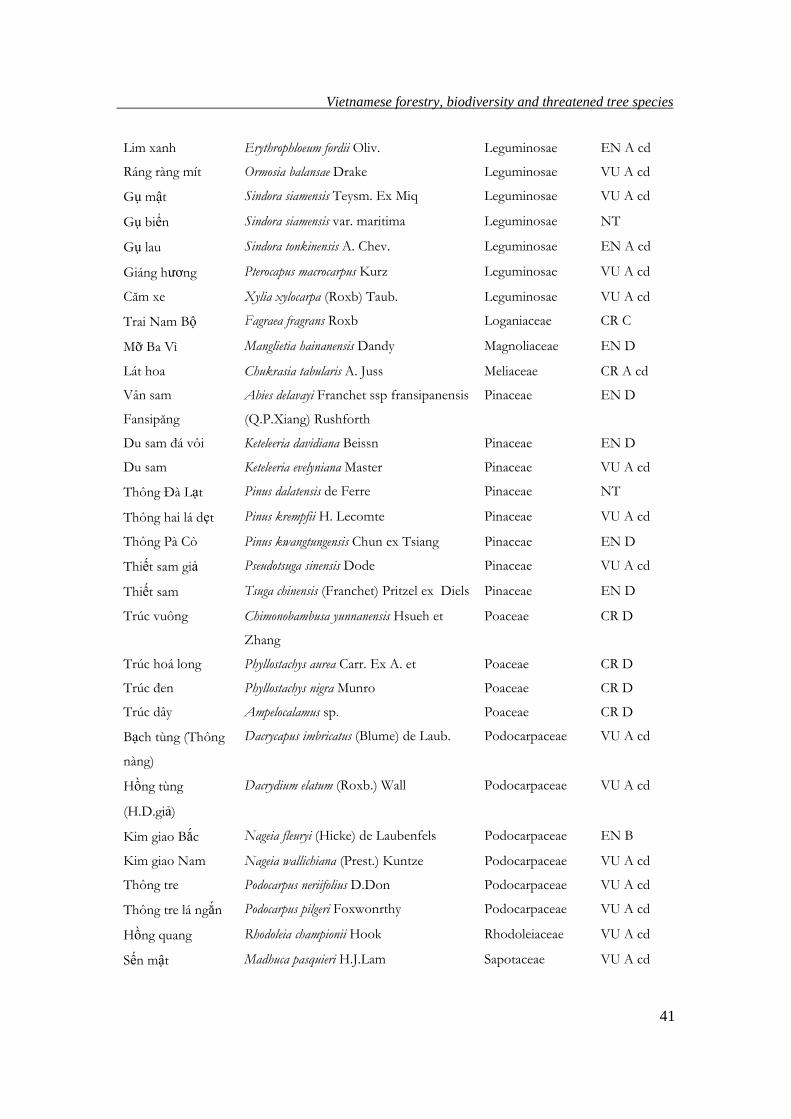
Table 6. Levels of endangerment of valuable tree species in Vietnam, adapted from Nghia
2005 (Using categorization of IUCN 1997).
Vietnamese name Latin name Family Threatened
levels
Sơn huyết Melanorrhoea laccifera Pierre Anacardiaceae CR C
Sơn ñào Melanorrhoea usitata Wall Anacardiaceae CR C
Sơn Toxicodendron succedanea (L) Mold Anacardiaceae EN C
Thiết ñinh Markhamia stipulata Seem Bignoniaceae VU A cd
Trai lý Garcinia fagraeoides S. Chev. Clusiaceae NT
ðỉnh tùng Cephalotaxus mannii Hook. f. Cephalotaxaceae EN C
Bách xanh Calocedrus macrolepis Kurz Cupressaceae EN D
Hoàng ñàn Cupressus funebris Endle Cupressaceae EW
Pơmu Fokienia hodginsii Henry & Thomas Cupressaceae VU A cd
Tùng Tetrameles nudiflora R.Br Datiscaceae EN A cd
Vên vên Anisoptera costata Korth Dipterocarpaceae VU A cd
Dầu nước Dipterocarpus alatus Roxb ex G.Don Dipterocarpaceae NT
Dầu cát Dipterocarpus chartaceus Sym Dipterocarpaceae EN A cd
Dầu song nàng Dipterocarpus dyeri Pierre ex Laness Dipterocarpaceae NT
Chò nâu Dipterocarpus tonkinensis A. Chev. Dipterocarpaceae EN A cd
Dầu bao Dipterocarpus baudii Korth Dipterocarpaceae EN D
Dầu mít Dipterocarpus costatus Gaert.f. Dipterocarpaceae EN C
Dầu ñọt tím Dipterocarpus grandiflorus Blanco Dipterocarpaceae VU B
Chapter 2
40
Dầu lông Dipterocarpus intricatus Dyer Dipterocarpaceae LC
Dầu ñồng Dipterocarpus tuberculatus Roxb Dipterocarpaceae LC
Sao lá hình tim Hopea cordata Vidal Dipterocarpaceae CR C
Săng ñào Hopea ferrea Pierre Dipterocarpaceae VU A cd
Sao ñen Hopea odorata Roxb Dipterocarpaceae NT
Kiền kiền Hopea pierrei Hance Dipterocarpaceae VU A cd
Sao mạng Hopea reticulata Tardieu Dipterocarpaceae CR C
Kiền kiền Hopea siamensis Heim Dipterocarpaceae VU A cd
Chò chỉ Parashorea chinensis H.Wang Dipterocarpaceae VU A cd
Chò ñen Parashorea stellata Kurz Dipterocarpaceae EN A cd
Chai lá cong Shorea falcata Vidal Dipterocarpaceae VU A cd
Sến cát Shorea roxburghii G.Don Dipterocarpaceae VU A cd
Cẩm liên Shorea siamensis Miq Dipterocarpaceae LC
Chò chai Shorea guiso (Blco) BL Dipterocarpaceae LC
Táu trắng Vatica odorata (Griff) Sym Dipterocarpaceae VU A cd
Táu duyên hải Vatica mangachapoi Blanco Dipterocarpaceae VU A cd
Táu mật Vatica cinerea King Dipterocarpaceae VU A cd
Mun Diospyros mun A Chev. ex Lecomte Ebenaceae CR A cd
Vạng tr ứng Endospermum chinense Benth Euphorbiaceae VU A cd
Dẻ ñỏ Lithocarpus ducampii A.Chev. Fagaceae NT
Chò ñãi Annamocarya sinensis (Dode)j.Leroy Juglandaceae CR C
Mạy chấu Carya tonkinensis Lecomte Juglandaceae CR C
Vù hương Cinnamomum balansae Lecomte Lauraceae CR A cd
Xá xị Cinnamomum glaucescens Drury Lauraceae CR A cd
Re hương Cinnamomum parthenoxylum Meisn Lauraceae CR A cd
Kháo vàng Machilus odoratissima Nees Lauraceae NT
Gõ ñỏ, cà te Afzelia xylocarpa (Kurz) Craib Leguminosae EN A cd
Trắc dây Dalbergia annamensis A.Chev. Leguminosae EN A cd
Cẩm lai Bà Rịa Dalbergia bariensis Pierre Leguminosae EN A cd
Trắc nghệ Dalbergia cochinchinensis Pierre Leguminosae VU A cd
Cẩm lai vú Dalbergia mammosa Pierre Leguminosae EN A cd
Sưa Dalbergia tonkinensis Prain Leguminosae EN D
Xoay Dialium cochinchinensis Pierre Leguminosae EN A cd
Vietnamese forestry, biodiversity and threatened tree species
41
Lim xanh Erythrophloeum fordii Oliv. Leguminosae EN A cd
Ráng ràng mít Ormosia balansae Drake Leguminosae VU A cd
Gụ mật Sindora siamensis Teysm. Ex Miq Leguminosae VU A cd
Gụ biển Sindora siamensis var. maritima Leguminosae NT
Gụ lau Sindora tonkinensis A. Chev. Leguminosae EN A cd
Giáng hương Pterocapus macrocarpus Kurz Leguminosae VU A cd
Căm xe Xylia xylocarpa (Roxb) Taub. Leguminosae VU A cd
Trai Nam Bộ Fagraea fragrans Roxb Loganiaceae CR C
Mỡ Ba Vì Manglietia hainanensis Dandy Magnoliaceae EN D
Lát hoa Chukrasia tabularis A. Juss Meliaceae CR A cd
Vân sam
Fansipăng
Abies delavayi Franchet ssp fransipanensis
(Q.P.Xiang) Rushforth
Pinaceae EN D
Du sam ñá vôi Keteleeria davidiana Beissn Pinaceae EN D
Du sam Keteleeria evelyniana Master Pinaceae VU A cd
Thông ðà Lạt Pinus dalatensis de Ferre Pinaceae NT
Thông hai lá dẹt Pinus krempfii H. Lecomte Pinaceae VU A cd
Thông Pà Cò Pinus kwangtungensis Chun ex Tsiang Pinaceae EN D
Thiết sam giả Pseudotsuga sinensis Dode Pinaceae VU A cd
Thiết sam Tsuga chinensis (Franchet) Pritzel ex Diels Pinaceae EN D
Trúc vuông Chimonobambusa yunnanensis Hsueh et
Zhang
Poaceae CR D
Trúc hoá long Phyllostachys aurea Carr. Ex A. et Poaceae CR D
Trúc ñen Phyllostachys nigra Munro Poaceae CR D
Trúc dây Ampelocalamus sp. Poaceae CR D
Bạch tùng (Thông
nàng)
Dacrycapus imbricatus (Blume) de Laub. Podocarpaceae VU A cd
Hồng tùng
(H.D.giả)
Dacrydium elatum (Roxb.) Wall Podocarpaceae VU A cd
Kim giao Bắc Nageia fleuryi (Hicke) de Laubenfels Podocarpaceae EN B
Kim giao Nam Nageia wallichiana (Prest.) Kuntze Podocarpaceae VU A cd
Thông tre Podocarpus neriifolius D.Don Podocarpaceae VU A cd
Thông tre lá ngắn Podocarpus pilgeri Foxwonrthy Podocarpaceae VU A cd
Hồng quang Rhodoleia championii Hook Rhodoleiaceae VU A cd
Sến mật Madhuca pasquieri H.J.Lam Sapotaceae VU A cd
Chapter 2
42
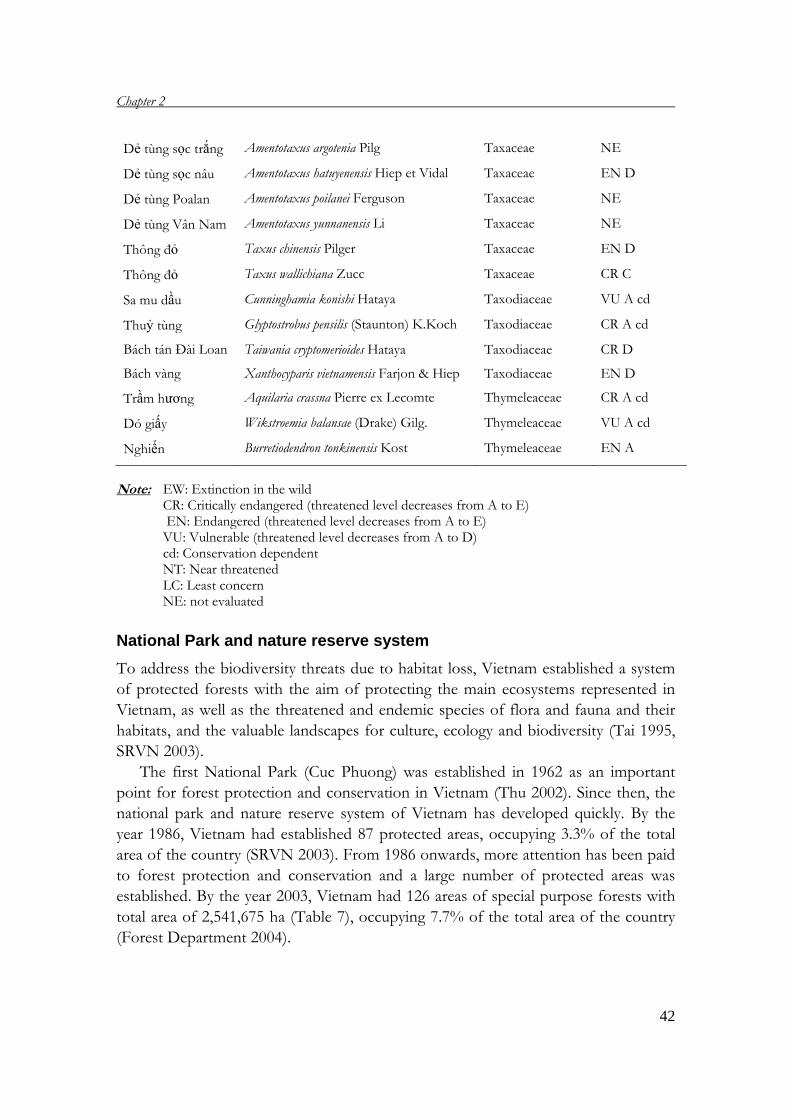
Dẻ tùng sọc trắng Amentotaxus argotenia Pilg Taxaceae NE
Dẻ tùng sọc nâu Amentotaxus hatuyenensis Hiep et Vidal Taxaceae EN D
Dẻ tùng Poalan Amentotaxus poilanei Ferguson Taxaceae NE
Dẻ tùng Vân Nam Amentotaxus yunnanensis Li Taxaceae NE
Thông ñỏ Taxus chinensis Pilger Taxaceae EN D
Thông ñỏ Taxus wallichiana Zucc Taxaceae CR C
Sa mu dầu Cunninghamia konishi Hataya Taxodiaceae VU A cd
Thuỷ tùng Glyptostrobus pensilis (Staunton) K.Koch Taxodiaceae CR A cd
Bách tán ðài Loan Taiwania cryptomerioides Hataya Taxodiaceae CR D
Bách vàng Xanthocyparis vietnamensis Farjon & Hiep Taxodiaceae EN D
Trầm hương Aquilaria crassna Pierre ex Lecomte Thymeleaceae CR A cd
Dó giấy Wikstroemia balansae (Drake) Gilg. Thymeleaceae VU A cd
Nghiến Burretiodendron tonkinensis Kost Thymeleaceae EN A
Note: EW: Extinction in the wild CR: Critically endangered (threatened level decreases from A to E) EN: Endangered (threatened level decreases from A to E) VU: Vulnerable (threatened level decreases from A to D) cd: Conservation dependent NT: Near threatened LC: Least concern NE: not evaluated
National Park and nature reserve system
To address the biodiversity threats due to habitat loss, Vietnam established a system
of protected forests with the aim of protecting the main ecosystems represented in
Vietnam, as well as the threatened and endemic species of flora and fauna and their
habitats, and the valuable landscapes for culture, ecology and biodiversity (Tai 1995,
SRVN 2003).
The first National Park (Cuc Phuong) was established in 1962 as an important
point for forest protection and conservation in Vietnam (Thu 2002). Since then, the
national park and nature reserve system of Vietnam has developed quickly. By the
year 1986, Vietnam had established 87 protected areas, occupying 3.3% of the total
area of the country (SRVN 2003). From 1986 onwards, more attention has been paid
to forest protection and conservation and a large number of protected areas was
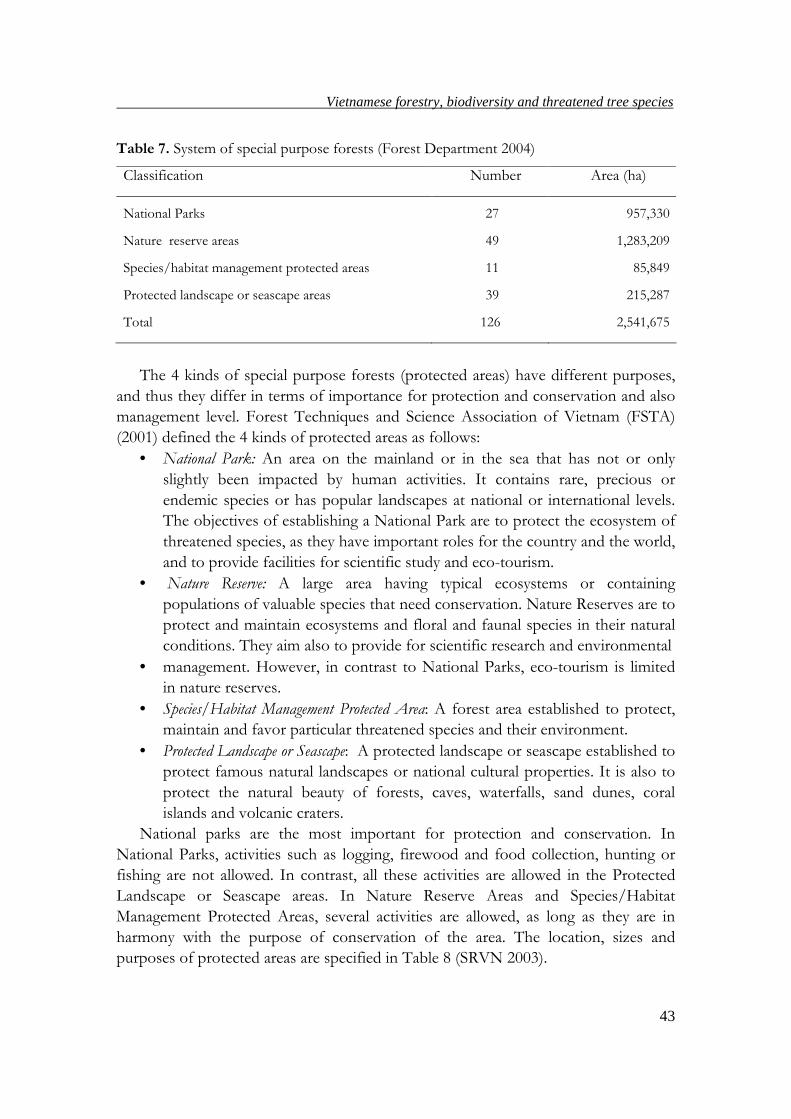
established. By the year 2003, Vietnam had 126 areas of special purpose forests with
total area of 2,541,675 ha (Table 7), occupying 7.7% of the total area of the country
(Forest Department 2004).
Vietnamese forestry, biodiversity and threatened tree species
43
Table 7. System of special purpose forests (Forest Department 2004)
Classification Number Area (ha)
National Parks 27 957,330
Nature reserve areas 49 1,283,209
Species/habitat management protected areas 11 85,849
Protected landscape or seascape areas 39 215,287
Total 126 2,541,675
The 4 kinds of special purpose forests (protected areas) have different purposes,
and thus they differ in terms of importance for protection and conservation and also
management level. Forest Techniques and Science Association of Vietnam (FSTA)
(2001) defined the 4 kinds of protected areas as follows:
• National Park: An area on the mainland or in the sea that has not or only
slightly been impacted by human activities. It contains rare, precious or
endemic species or has popular landscapes at national or international levels.
The objectives of establishing a National Park are to protect the ecosystem of
threatened species, as they have important roles for the country and the world,
and to provide facilities for scientific study and eco-tourism.
• Nature Reserve: A large area having typical ecosystems or containing populations of valuable species that need conservation. Nature Reserves are to
protect and maintain ecosystems and floral and faunal species in their natural
conditions. They aim also to provide for scientific research and environmental
• management. However, in contrast to National Parks, eco-tourism is limited in nature reserves.
• Species/Habitat Management Protected Area: A forest area established to protect,
maintain and favor particular threatened species and their environment.
• Protected Landscape or Seascape: A protected landscape or seascape established to
protect famous natural landscapes or national cultural properties. It is also to
protect the natural beauty of forests, caves, waterfalls, sand dunes, coral
islands and volcanic craters.
National parks are the most important for protection and conservation. In
National Parks, activities such as logging, firewood and food collection, hunting or
fishing are not allowed. In contrast, all these activities are allowed in the Protected
Landscape or Seascape areas. In Nature Reserve Areas and Species/Habitat
Management Protected Areas, several activities are allowed, as long as they are in
harmony with the purpose of conservation of the area. The location, sizes and
purposes of protected areas are specified in Table 8 (SRVN 2003).
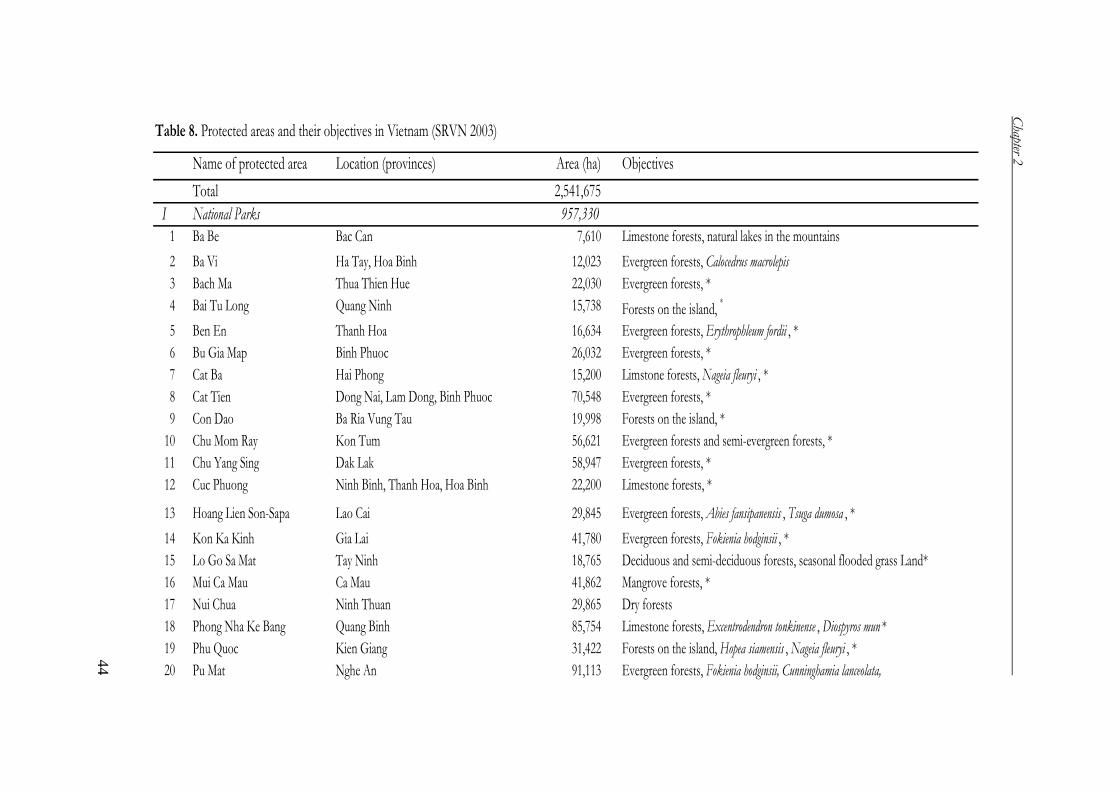
Chapter 2
44
Table 8. Protected areas and their objectives in Vietnam (SRVN 2003)
Name of protected area Location (provinces) Area (ha) Objectives
Total 2,541,675
I National Parks 957,330
1 Ba Be Bac Can 7,610 Limestone forests, natural lakes in the mountains
2 Ba Vi Ha Tay, Hoa Binh 12,023 Evergreen forests, Calocedrus macrolepis
3 Bach Ma Thua Thien Hue 22,030 Evergreen forests, *
4 Bai Tu Long Quang Ninh 15,738 Forests on the island, *
5 Ben En Thanh Hoa 16,634 Evergreen forests, Erythrophleum fordii , *
6 Bu Gia Map Binh Phuoc 26,032 Evergreen forests, *
7 Cat Ba Hai Phong 15,200 Limstone forests, Nageia fleuryi , *
8 Cat Tien Dong Nai, Lam Dong, Binh Phuoc 70,548 Evergreen forests, *
9 Con Dao Ba Ria Vung Tau 19,998 Forests on the island, *
10 Chu Mom Ray Kon Tum 56,621 Evergreen forests and semi-evergreen forests, *
11 Chu Yang Sing Dak Lak 58,947 Evergreen forests, *
12 Cuc Phuong Ninh Binh, Thanh Hoa, Hoa Binh 22,200 Limestone forests, *
13 Hoang Lien Son-Sapa Lao Cai 29,845 Evergreen forests, Abies fansipanensis , Tsuga dumosa , *
14 Kon Ka Kinh Gia Lai 41,780 Evergreen forests, Fokienia hodginsii , *
15 Lo Go Sa Mat Tay Ninh 18,765 Deciduous and semi-deciduous forests, seasonal flooded grass Land*
16 Mui Ca Mau Ca Mau 41,862 Mangrove forests, *
17 Nui Chua Ninh Thuan 29,865 Dry forests
18 Phong Nha Ke Bang Quang Binh 85,754 Limestone forests, Excentrodendron tonkinense , Diospyros mun *
19 Phu Quoc Kien Giang 31,422 Forests on the island, Hopea siamensis , Nageia fleuryi , *
20 Pu Mat Nghe An 91,113 Evergreen forests, Fokienia hodginsii, Cunninghamia lanceolata,
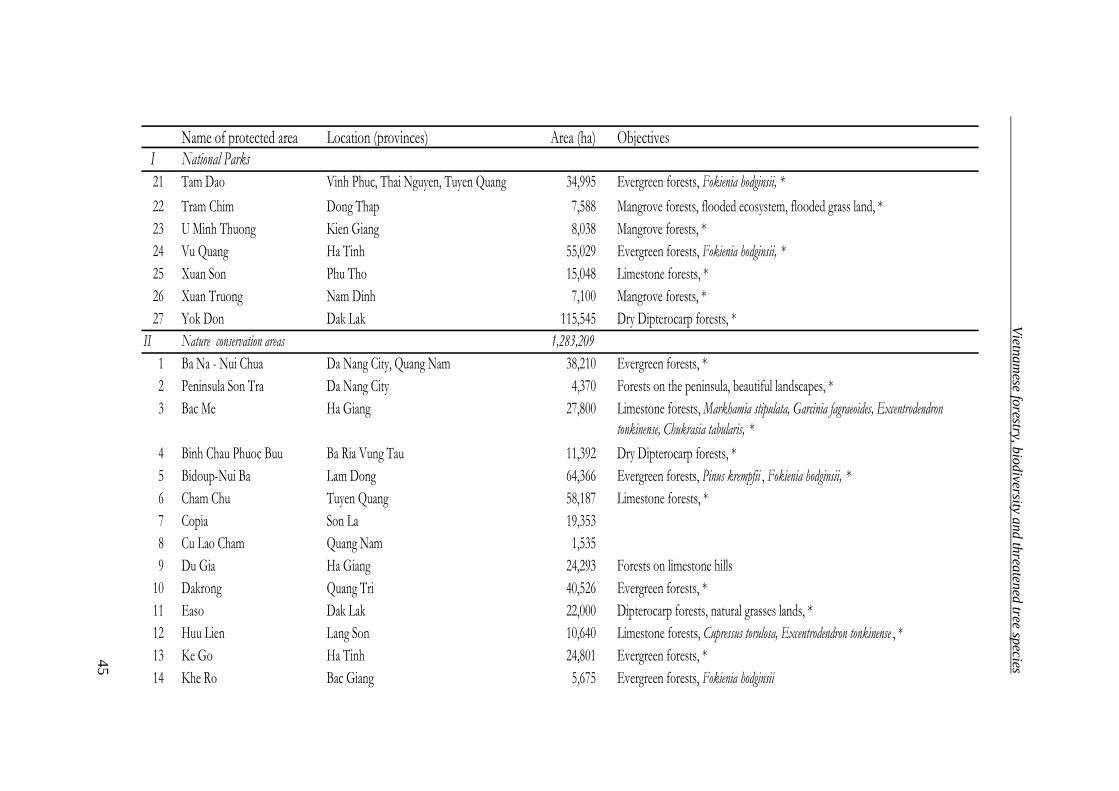
Vietnam
ese forestry, biodiversity and threatened tree species
45
Name of protected area Location (provinces) Area (ha) ObjectivesI National Parks
21 Tam Dao Vinh Phuc, Thai Nguyen, Tuyen Quang 34,995 Evergreen forests, Fokienia hodginsii, *
22 Tram Chim Dong Thap 7,588 Mangrove forests, flooded ecosystem, flooded grass land, *
23 U Minh Thuong Kien Giang 8,038 Mangrove forests, *
24 Vu Quang Ha Tinh 55,029 Evergreen forests, Fokienia hodginsii, *
25 Xuan Son Phu Tho 15,048 Limestone forests, *
26 Xuan Truong Nam Dinh 7,100 Mangrove forests, *
27 Yok Don Dak Lak 115,545 Dry Dipterocarp forests, *
II Nature conservation areas 1,283,209
1 Ba Na - Nui Chua Da Nang City, Quang Nam 38,210 Evergreen forests, *
2 Peninsula Son Tra Da Nang City 4,370 Forests on the peninsula, beautiful landscapes, *
3 Bac Me Ha Giang 27,800 Limestone forests, Markhamia stipulata, Garcinia fagraeoides, Excentrodendron
tonkinense, Chukrasia tabularis, *
4 Binh Chau Phuoc Buu Ba Ria Vung Tau 11,392 Dry Dipterocarp forests, *
5 Bidoup-Nui Ba Lam Dong 64,366 Evergreen forests, Pinus krempfii , Fokienia hodginsii, *
6 Cham Chu Tuyen Quang 58,187 Limestone forests, *
7 Copia Son La 19,353
8 Cu Lao Cham Quang Nam 1,535
9 Du Gia Ha Giang 24,293 Forests on limestone hills
10 Dakrong Quang Tri 40,526 Evergreen forests, *
11 Easo Dak Lak 22,000 Dipterocarp forests, natural grasses lands, *
12 Huu Lien Lang Son 10,640 Limestone forests, Cupressus torulosa, Excentrodendron tonkinense , *
13 Ke Go Ha Tinh 24,801 Evergreen forests, *
14 Khe Ro Bac Giang 5,675 Evergreen forests, Fokienia hodginsii
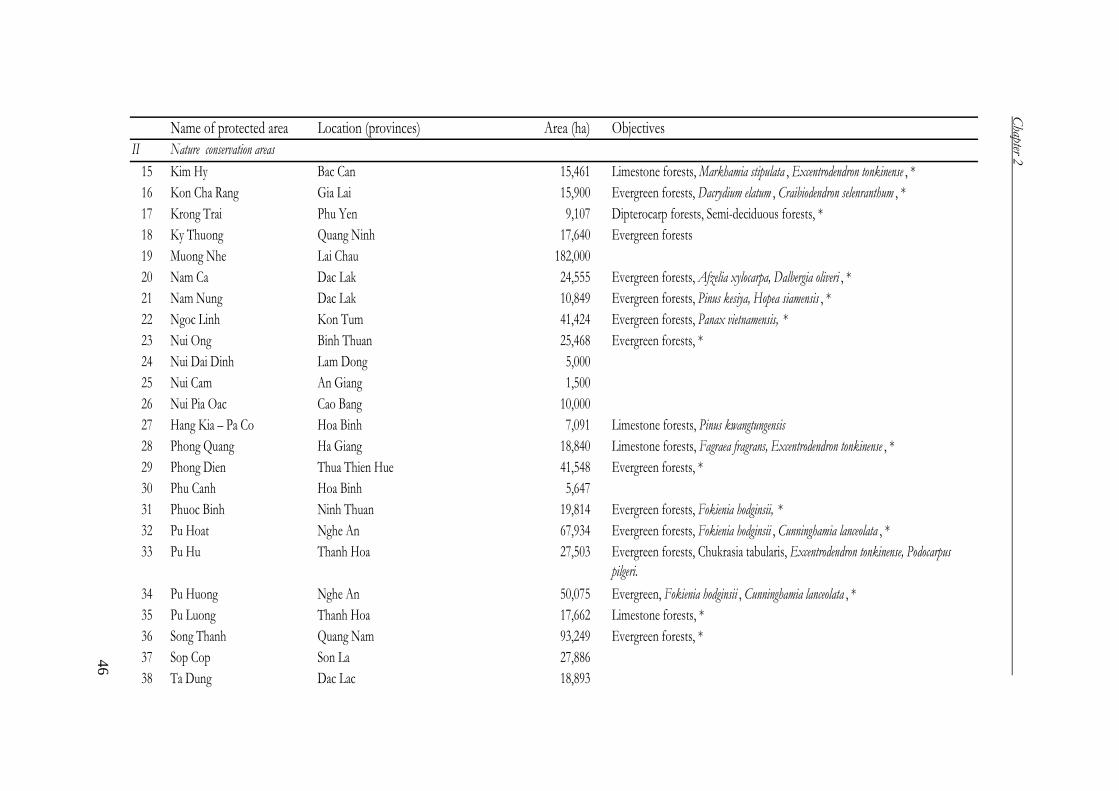
Chapter 2
46
Name of protected area Location (provinces) Area (ha) Objectives
II Nature conservation areas
15 Kim Hy Bac Can 15,461 Limestone forests, Markhamia stipulata , Excentrodendron tonkinense , *
16 Kon Cha Rang Gia Lai 15,900 Evergreen forests, Dacrydium elatum , Craibiodendron selenranthum , *
17 Krong Trai Phu Yen 9,107 Dipterocarp forests, Semi-deciduous forests, *
18 Ky Thuong Quang Ninh 17,640 Evergreen forests
19 Muong Nhe Lai Chau 182,000
20 Nam Ca Dac Lak 24,555 Evergreen forests, Afzelia xylocarpa, Dalbergia oliveri , *
21 Nam Nung Dac Lak 10,849 Evergreen forests, Pinus kesiya, Hopea siamensis , *
22 Ngoc Linh Kon Tum 41,424 Evergreen forests, Panax vietnamensis, *
23 Nui Ong Binh Thuan 25,468 Evergreen forests, *
24 Nui Dai Dinh Lam Dong 5,000
25 Nui Cam An Giang 1,500
26 Nui Pia Oac Cao Bang 10,000
27 Hang Kia – Pa Co Hoa Binh 7,091 Limestone forests, Pinus kwangtungensis
28 Phong Quang Ha Giang 18,840 Limestone forests, Fagraea fragrans, Excentrodendron tonkinense , *
29 Phong Dien Thua Thien Hue 41,548 Evergreen forests, *
30 Phu Canh Hoa Binh 5,647
31 Phuoc Binh Ninh Thuan 19,814 Evergreen forests, Fokienia hodginsii, *
32 Pu Hoat Nghe An 67,934 Evergreen forests, Fokienia hodginsii , Cunninghamia lanceolata , *
33 Pu Hu Thanh Hoa 27,503 Evergreen forests, Chukrasia tabularis, Excentrodendron tonkinense, Podocarpus
pilgeri.
34 Pu Huong Nghe An 50,075 Evergreen, Fokienia hodginsii , Cunninghamia lanceolata , *
35 Pu Luong Thanh Hoa 17,662 Limestone forests, *
36 Song Thanh Quang Nam 93,249 Evergreen forests, *
37 Sop Cop Son La 27,886
38 Ta Dung Dac Lac 18,893
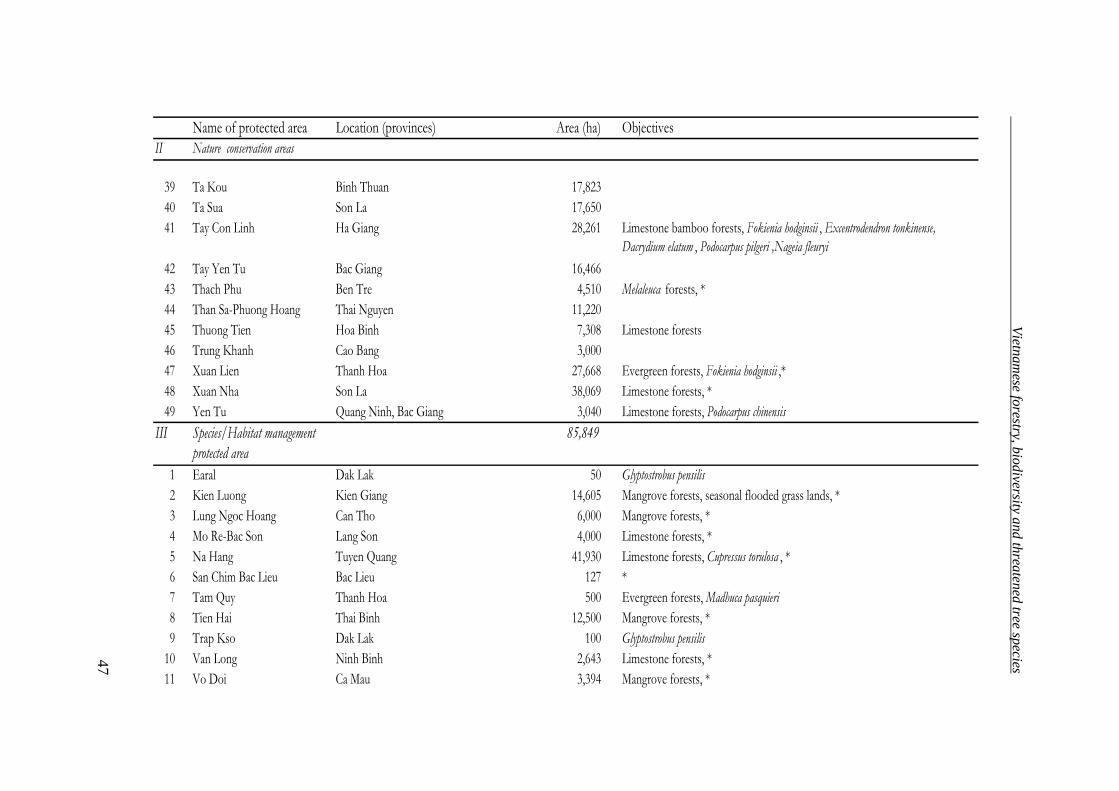
Vietnam
ese forestry, biodiversity and threatened tree species
47
Name of protected area Location (provinces) Area (ha) Objectives
II Nature conservation areas
39 Ta Kou Binh Thuan 17,823
40 Ta Sua Son La 17,650
41 Tay Con Linh Ha Giang 28,261 Limestone bamboo forests, Fokienia hodginsii , Excentrodendron tonkinense,
Dacrydium elatum , Podocarpus pilgeri ,Nageia fleuryi
42 Tay Yen Tu Bac Giang 16,466
43 Thach Phu Ben Tre 4,510 Melaleuca forests, *
44 Than Sa-Phuong Hoang Thai Nguyen 11,220
45 Thuong Tien Hoa Binh 7,308 Limestone forests
46 Trung Khanh Cao Bang 3,000
47 Xuan Lien Thanh Hoa 27,668 Evergreen forests, Fokienia hodginsii ,*
48 Xuan Nha Son La 38,069 Limestone forests, *
49 Yen Tu Quang Ninh, Bac Giang 3,040 Limestone forests, Podocarpus chinensis
III Species/Habitat management
protected area
85,849
1 Earal Dak Lak 50 Glyptostrobus pensilis
2 Kien Luong Kien Giang 14,605 Mangrove forests, seasonal flooded grass lands, *
3 Lung Ngoc Hoang Can Tho 6,000 Mangrove forests, *
4 Mo Re-Bac Son Lang Son 4,000 Limestone forests, *
5 Na Hang Tuyen Quang 41,930 Limestone forests, Cupressus torulosa , *
6 San Chim Bac Lieu Bac Lieu 127 *
7 Tam Quy Thanh Hoa 500 Evergreen forests, Madhuca pasquieri
8 Tien Hai Thai Binh 12,500 Mangrove forests, *
9 Trap Kso Dak Lak 100 Glyptostrobus pensilis
10 Van Long Ninh Binh 2,643 Limestone forests, *
11 Vo Doi Ca Mau 3,394 Mangrove forests, *
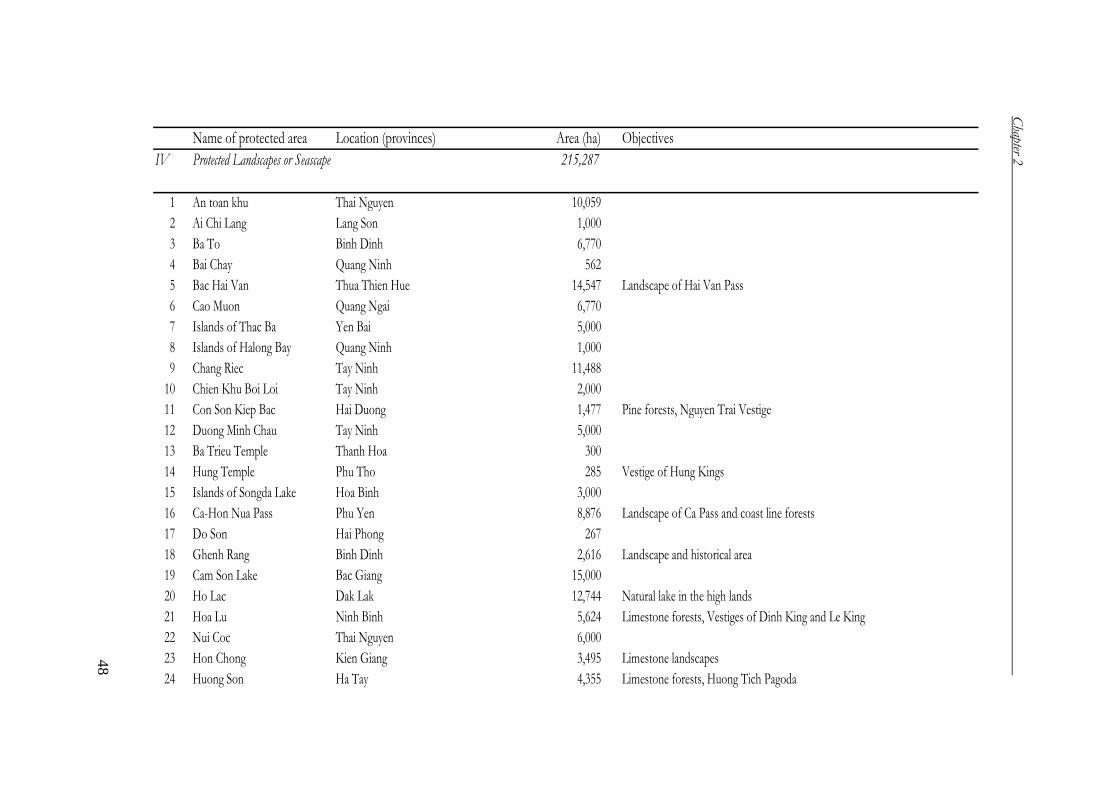
Chapter 2
48
Name of protected area Location (provinces) Area (ha) Objectives
IV Protected Landscapes or Seascape 215,287
1 An toan khu Thai Nguyen 10,059
2 Ai Chi Lang Lang Son 1,000
3 Ba To Binh Dinh 6,770
4 Bai Chay Quang Ninh 562
5 Bac Hai Van Thua Thien Hue 14,547 Landscape of Hai Van Pass
6 Cao Muon Quang Ngai 6,770
7 Islands of Thac Ba Yen Bai 5,000
8 Islands of Halong Bay Quang Ninh 1,000
9 Chang Riec Tay Ninh 11,488
10 Chien Khu Boi Loi Tay Ninh 2,000
11 Con Son Kiep Bac Hai Duong 1,477 Pine forests, Nguyen Trai Vestige
12 Duong Minh Chau Tay Ninh 5,000
13 Ba Trieu Temple Thanh Hoa 300
14 Hung Temple Phu Tho 285 Vestige of Hung Kings
15 Islands of Songda Lake Hoa Binh 3,000
16 Ca-Hon Nua Pass Phu Yen 8,876 Landscape of Ca Pass and coast line forests
17 Do Son Hai Phong 267
18 Ghenh Rang Binh Dinh 2,616 Landscape and historical area
19 Cam Son Lake Bac Giang 15,000
20 Ho Lac Dak Lak 12,744 Natural lake in the high lands
21 Hoa Lu Ninh Binh 5,624 Limestone forests, Vestiges of Dinh King and Le King
22 Nui Coc Thai Nguyen 6,000
23 Hon Chong Kien Giang 3,495 Limestone landscapes
24 Huong Son Ha Tay 4,355 Limestone forests, Huong Tich Pagoda
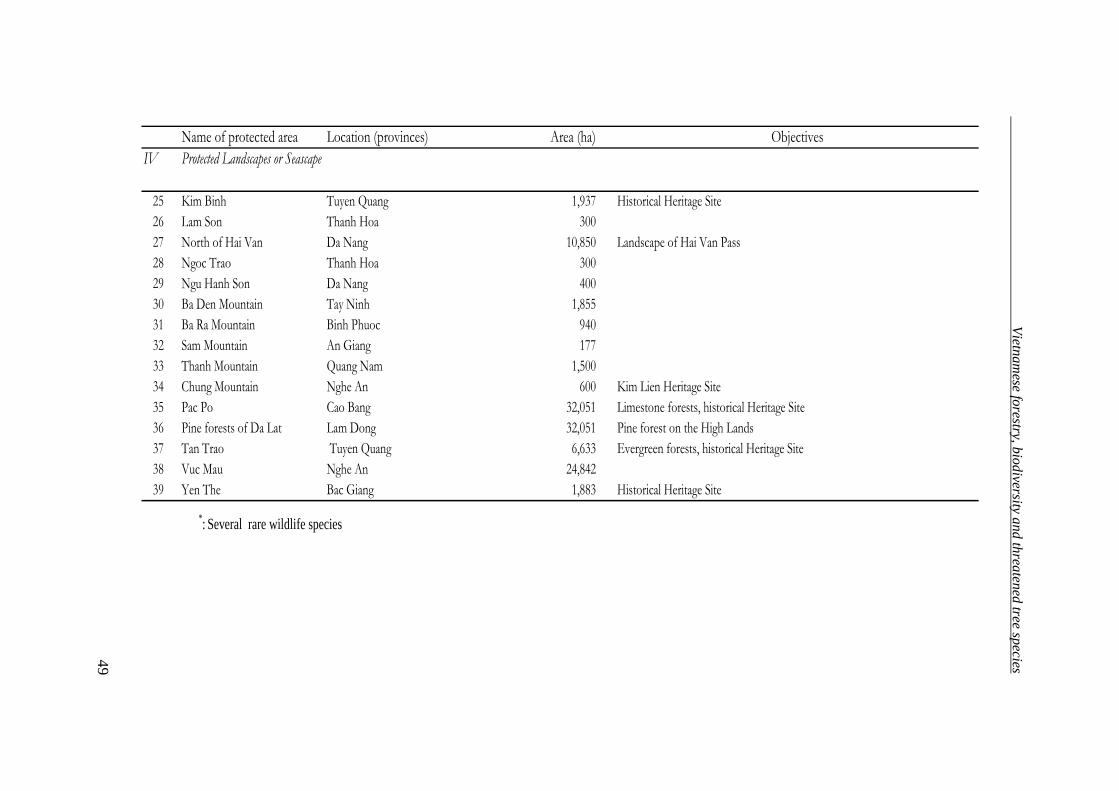
Vietnam
ese forestry, biodiversity and threatened tree species
49
Name of protected area Location (provinces) Area (ha) Objectives
IV Protected Landscapes or Seascape
25 Kim Binh Tuyen Quang 1,937 Historical Heritage Site
26 Lam Son Thanh Hoa 300
27 North of Hai Van Da Nang 10,850 Landscape of Hai Van Pass
28 Ngoc Trao Thanh Hoa 300
29 Ngu Hanh Son Da Nang 400
30 Ba Den Mountain Tay Ninh 1,855
31 Ba Ra Mountain Binh Phuoc 940
32 Sam Mountain An Giang 177
33 Thanh Mountain Quang Nam 1,500
34 Chung Mountain Nghe An 600 Kim Lien Heritage Site
35 Pac Po Cao Bang 32,051 Limestone forests, historical Heritage Site
36 Pine forests of Da Lat Lam Dong 32,051 Pine forest on the High Lands
37 Tan Trao Tuyen Quang 6,633 Evergreen forests, historical Heritage Site
38 Vuc Mau Nghe An 24,842
39 Yen The Bac Giang 1,883 Historical Heritage Site
*: Several rare wildlife species
Chapter 2
50
The establishment of 126 protected areas covering more than 2.5 million ha has
required a substantial effort (SRVN 2003). However, this system still has several
problems and needs to be improved in order to protect and conserve effectively
forests, landscapes and biodiversity.
The protected area in Vietnam is not as large enough for an effective strategy of
protection and conservation and several protected areas are too small for
conservation purposes (FSTA 2001). The total protected area in Vietnam was around
8% of the country in 2003 (Forest Department 2004). This is low compared to
neighboring countries such as Cambodia (18.05%), Lao (11,6%), Thailand (13.01%)
and Indonesia (11.62%) (IUCN 1997). It is also below the minimum of 10%
recommended by IUCN (1997). Recently, Vietnam has developed the watershed
protection regime for several important basins, which may help protect forests and
threatened tree species in those areas (Taylor & Wright 2001). However, in order to
protect and effectively conserve threatened species and landscapes, the country still
needs not only to increase the number of protected areas, but also to expand some
small protected areas, and ensure that protected areas are indeed properly protected.
In most protected areas, basic research such as on taxonomy of the species,
inventories of biodiversity or surveys of threatened species are still insufficient (FSTA
2001). Control of human activities in protected areas has proved difficult due to a
large number of local people, who rely on the forests for a living (Quy 1985). They
practice agriculture in the forests, also extract timber from the forests, collect fire
wood, medicinal plants and other forest products, hunt and fish. In addition, a
movement from the neighboring areas to protected areas has increased the
population density, which makes protection and conservation more difficult. For
instance, many people have moved to Ba Be National Park, Nam Cat Tien National
Park and Yokdon National Park (Tai 1995).
To reduce the pressure of a high human population density on protected areas,
local people from the cores (restricted zones) have been moved to the buffer zones,
as implemented in Cuc Phuong National Park in 1987 (Thu 2002). Other national
parks are also divided into two parts, in which the cores are strictly protected, but
local people can live and practice agriculture in the buffer zones. However, this is not
sufficient to provide a sustainable strategy of protection and conservation if the living
standard of local people is not improved. Local people should be taught new
methods of cultivation and production or should be provided with other ways to
improve their living conditions.
Several other problems are also affecting protected areas. Investment from the
Government for protection and conservation is limited. Lack of funds and useful
equipment for implementing protection and conservation is common in protected
areas (Tai 1995, FTSA 2001). Human resources are also limited: The capacity of staff
to implement protected and conservation projects is limited both by insufficient
Vietnamese forestry, biodiversity and threatened tree species
51
number of people and by the lack of qualification, experience or skills of the staff
(Tai 1995). To improve this situation, protected areas should seek additional funding
from donors, particularly international donors. The staff should also be increased
both in quantity and quality in order to implement sustainable protection and
conservation activities.
In summary, Vietnam is characterized by a monsoonal climate and a complex
terrain. Vietnam possesses a very diverse forest vegetation, ranging from mangrove,
limestone, and tropical-rain forests to subtropical, bamboo and coniferous forests.
Being a venue of plants emigrated from the three floras nearby, Vietnam also harbors
a huge number of plant species. Nevertheless, due to many reasons, the forests of
Vietnam have severely reduced for last decades, leading to a threat of extinction risks
for many species. Recently, by a great effort, Vietnam has established a good system
of protected areas, and increased the forest cover in the whole country. To effectively
conserve threatened species, however, more attention is required, not only to protect
and increase the forest cover, but also to study and improve the situations of these
species.
Acknowledgements
We are grateful to Pieter Zuidema, Maureen Marray, Niels Anten and Pham Quang
Vinh for valuable discussion and comments on this chapter. We also acknowledge
Marjolein Kortbeek for preparing maps for figures.
References *Binh, N. N. 1996. Forest soils in Vietnam. Agricultural Publishing House. Ha Noi. Bouny, A. 2006. Spraying of Agent Orange by US Army in Vietnam and its
consequences. Available from http://www.stopusa.be/scrips/texte.php (access
September 2006). *Chan, L. M., and V. V. Dung. 1992. Forest tree textbook. Vietnam Forestry University.
Xuan Mai. *Chan, L. T., T. Ty, N. H. Tu, H. Nhung, D. T. Phuong, and T. T. Van. 1999. Some
basis characters of Vietnam flora. Science and Technics Publishing House. Ha
Noi.
Chevalier, A. 1918. Premier inventaire des bois et autres produits forestiers du Tonkin. *Chi, V. V. 1988. Dictionary of medicinal plant species in Vietnam. World Publishing
House. Ha Noi. *Chuyen, V. V., L. T. Chan, and T. Hop. 1987. Geography of plant families in Vietnam.
Science and Technics Publishing House. Ha Noi. *Dang, N. V., T. D. Mai, H. C. Chu, T. D. Huy, and N. H. Kinh. 2001. Forestry in
Chapter 2
52
Vietnam (1945-2000), development progress and experienced lessons.
Agricultural Publishing House. Ha Noi. *Dung, N. H. 2005. Forest resource in limestone mountains and management plan. Pages
3-29 in MARD, editor. Paper for the Conference of forest science and
technology for 20 years under renovation, 8-9/4/2005. Ha Noi. *Dung, V. V., and L. V. Lam. 2005. Resource of bamboo in Vietnam. Pages 301-311
in in MARD, editor. Paper for the Conference of forest science and technology
for 20 years under renovation, 8-9/4/2005. Ha Noi.
Engler, A. 1882. Versuch einer Entwicklungsgeschichte der Pflazenwelt. Engelmann,
Leipzig. *Forest Department. 2004. Forest development in period of 2006-2010. Journal of
Agriculture and Rural Development 12: 13-17. *Forest Inventory and Planning Institute (FIPI) 1995. Forest cover and its change in the
period of 1991-1995. *Forest Techniques and Science Association of Vietnam (FTSA). 2001. National parks in
Vietnam. Agricultural Publishing House. Ha Noi.
Good, R. 1969. The geography of the flowering plants. Longmans. London.
Government of the Socialist Republic of Vietnam and the Global Environment Facility
Project (GoVN). 1994. Biodiversity action plan for Vietnam. Ha Noi.
Hung, N. D. 1996. The flora and fauna resource in the forests of Vietnam. Pages 75-91
in M. L. Quang, editor. Vietnamese studies. Ha Noi. *Hung, T. V. 2004. Forestry research for the coming time. Journal of Agriculture and
Rural Development 12: 26-29. *Keo, H. V. 2003. Research on ecological - characteristics and reproductive capability
by cutting of Dacrydium elatum (Roxb.) Wallich ex Hooker) in Bach Ma National
Park. PhD thesis. Hue Science University, Hue.
*Lam, L. V. 2005. Taxonomy of bamboo subfamilies in Vietnam. Pages 312-321 in
MARD, editor. Paper for the Conference of forest science and technology for
20 years under renovation, 8-9/4/2005. Ha Noi. *Lap, V. T. 1999. Natural Geography of Vietnam. Education Publishing House. Ha Noi.
Laurance, W. F. 1999. Reflections on the tropical deforestation crisis.
Biological Conservation 91: 109-117.
Linh, V. B. 1996. Dry open Dipterocarpus in Vietnam. Pages 53-68 in M. L. Quang,
editor. Vietnamese studies. Ha Noi. *Lung, N. N. 2001. The status of forest resources in Vietnam: matter of environment,
economy, society and resolutions. Journal of Agriculture and Rural
Development 12: 891-893. *Ly, T. D. 1993. 1900 valuable plant species in Vietnam. World Publishing House. Ha
Noi.
Maurand, P. 1943. L’Indochine forestiere. BEI, Ha Noi. *Ministry of Science, Technology and Environment (MSTE). 1996. Red Data Book of
Vietnam. Volume 2 - Plant. Science and Techniques Publishing House, Ha
Noi.
Vietnamese forestry, biodiversity and threatened tree species
53
Nghia, N. H. 2000. Some threatened tree species of Vietnam. Agricultural Publishing
House, Ha Noi. *Nghia, N. H. 2005. Results from research on conservation of forest plant genetic
resources. Pages 2-12 in MARD, editor. Paper for the Conference of forest
science and technology for 20 years under renovation, 8-9/4/2005. Ha Noi. *Nhat, P. 2001. Lectures on biodiversity. Vietnam Forestry University. Xuan Mai. *Phon, N. H., N. H. Dung, and V. V. Dung. 2001. The limestone forests in
Vietnam – strategy for management, protection and development. Journal of
Agriculture and Rural Development 8: 577-579.
Pocs, T. 1965. Prodrome de la bryoflore du Vietnam. Revue Bryologigue 38: 53-61.
Quy, V. 1985. Rare species and protection measures proposed for Vietnam. Page 98-
102 in J. W. Thorsell, editor. Conserving Asia’s Natural Heritage. Ha Noi.
Sam, D. D. 1996. Forest land in relation to forest vegetation cover. Pages 39-51 in M. L.
Quang, editor. Vietnamese studies. Ha Noi. *Sam, D. D., and N. N. Binh. 2001. Evaluation of productive potential of forest soils in
Vietnam. Statistical Publishing House. Ha Noi. *Sam, D. D., N. N. Binh, N. D. Que, and V. T. Phuong. 2005. Overview of mangrove
forests in Vietnam. Agricultural Publishing House. Ha Noi.
Schmid, M. 1962. Contribution a l’etude de la vegetation du Vietnam: Le massif Sud
Annamitique et les regions limitrophes. These de doctorat presentee a l’Universite
de Paris.
Schmid, M. 1993. Vietnam, Kampuchea and Laos. Pages 85-89 in D. J. Campbell and
H. D. Hammond, editors. Floristic inventory of tropical countries. NYBG and
WWF.
Schmithusen, J. 1968. Allgemeine Vegetationsgeographie. De Gruyter, Berlin.
Schnell, R. 1962. Remerques preliminaires sur quelques problemes phytogeographiques
du sud –est Asiatique. Revue Generale de Botanique 69: 301-368. *Socialist Republic of Vietnam (SRVN). 2003. Management strategy for the system of
nature conservation areas in Vietnam to 2010. Ha Noi.
Sodhi, N. S., L. P. Koh., B. W. Brook, and P. K. L. Ng. 2004. Southeast Asian
biodiversity: an impending disaster. Trends in Ecology and Evolution 19: 654-
660. *Soil Science Association of Vietnam (SSA). 1996. Soils of Vietnam. Agricultural
Publishing House. Ha Noi. *Tai, N. M. 1995. System of national parks and nature reserve areas in Vietnam. Pages
67-75 in FSTA, editor. National parks and nature reserve areas in Vietnam.
Agriculture Publishing House. Ha Noi.
Takhtajan, A. 1971. Flowering plants – origin and dispersal. Oliver & Boyd, Edinburgh.
Taylor, P., G. Wright. 2001. Establishing river basin organisations in Vietnam: Red River,
Dong Nai River and Lower Mekong Delta. Water Science and Technology 43:
273-281. *Thao, L. B. 1998. Vietnam: territory and geographical areas. World Publishing House.
Ha Noi.
Chapter 2
54
*Thin, N. N. 1997. Manual for biodiversity research. Agricultural Publishing House. Ha
Noi. *Thin, N. N. 2000. Biodiversity and resources of plant heredity. National University
Press. Ha Noi. *Thu, N. B. 2002. System of nature reserve areas in Vietnam – Status and Demand
that needs to be changed. Journal of Agriculture and Rural Development 7:
627-628. *Toan, D. N. 1998. Economical geography of Vietnam. University of National
Economy. Ha Noi. *Trung, T. V. 1970. Forest vegetation cover of Vietnam. Science and Technics Publishing
House. Ha Noi. *Trung, T. V. 1998. Ecosystems of tropical forests in Vietnam. Science and Technics
Publishing House. Ha Noi.
Truong, N. V. 1996. The forest. Pages 5-38 in M. L. Quang, editor. Vietnamese studies.
Ha Noi.
Vidal, J. F. 1973. Flore du Vietnam. Ha Noi.
Walter, H., and H. Straka. 1970. Arealkunde. Ulmer, Stuttgart.
Westing, A. H. 197. Ecological effects of military defoliation on the forests of South
Vietnam. BioScience 21: 893-898.
Whitmore, T. C. 1997. Tropical forest disturbance, disappearance, and species loss. Pages
3-12 in W. R. Laurance and R. O. Bierregaard, editors. Tropical Forest Remnants:
Ecology, Management and Conservation of Fragmented Communities. University
of Chicago Press, Chicago.
Willis, K. J., J. C. McElwain. 2002. The evolution of plants. Oxford Univ. Press, Oxford.
Wilson, E. O. 1988. Biodiversity. National Academy of Sciences, Washington, DC.
World Conservation Union (IUCN). 1997. The IUCN Red List of Threatened Plants.
Gland, Switzerland.
Wright, S. J, and HC Muller-Landau. 2006. The uncertain future of tropical forest
species. Biotropica 38: 443-445. Note: * The initial titles in Vietnamese were translated into English.

Vietnamese forestry, biodiversity and threatened tree species
55
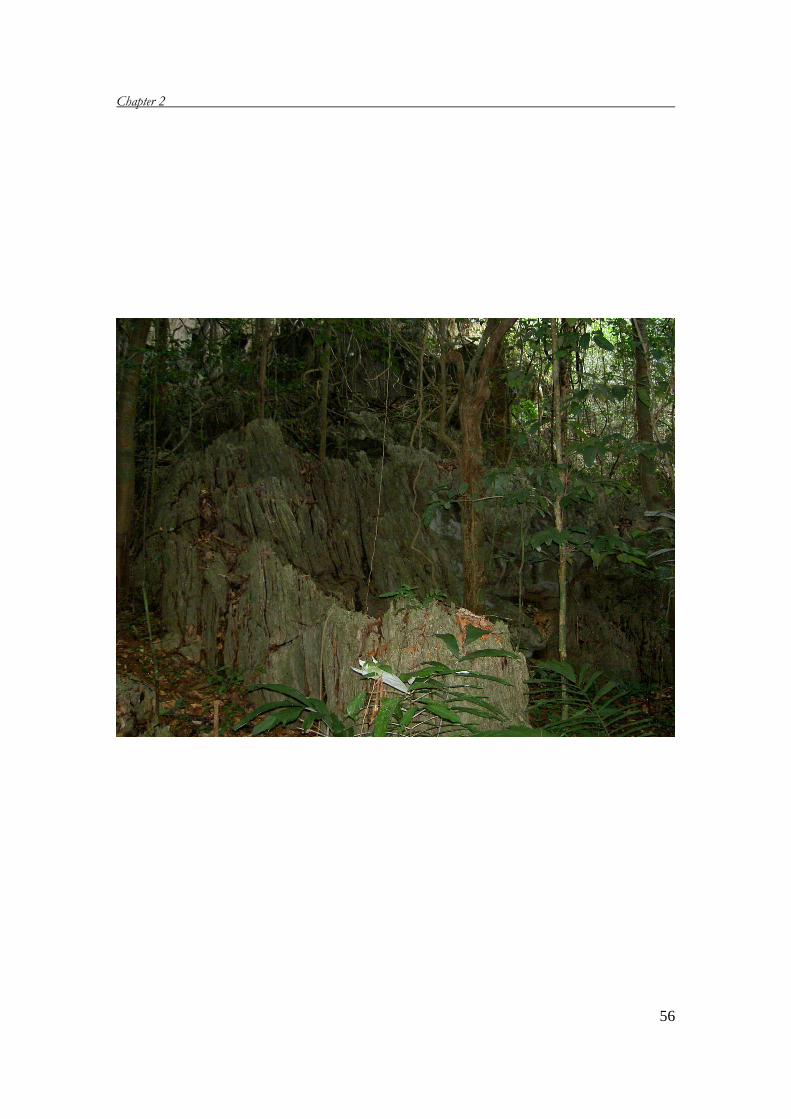
Chapter 2
56
Chapter 3
Conservation prospects for threatened Vietnamese tree species: results from a demographic study With P.A. Zuidema & N.H. Nghia
Abstract
Effective conservation of threatened tree species requires information on the future prospects of populations that obtained from demographic studies. We investigated the demography of six threatened tree species in four protected areas in Vietnam: the broad-leaved Annamocarya sinensis, Manglietia fordiana and Parashorea chinensis, and the coniferous Calocedrus macrolepis, Dacrydium elatum and Pinus kwangtungensis. In a two-year field study, we quantified recruitment, growth and survival, and used these data to build matrix projection models. Recruitment of new seedlings was found for both study years and over all research plots, indicating that all six species were regenerating naturally. Furthermore, the continuous and inverse J-shaped population structures of all species also suggest abundant and continuous natural regeneration.
To evaluate whether natural recruitment is sufficient, we calculated three parameters. First, asymptotic growth rates (λ) obtained from matrix models were slightly below 1 (0.97-0.99) for all species, but a significant population decline was only found for two of the six species. Second, projected population growth rates for the next 50-100 y also suggested slight population decline (0-3%/y) for five of the six species. Third, we evaluated whether lifetime production of seedlings by an adult tree is sufficient to replace itself – a prerequisite for population maintenance. For three of the six species lifetime recruitment was sufficient, but the three other species required extremely long (480-1000 y) reproductive period to produce sufficient recruits to replace themselves. Combining the three parameters, we concluded that the future prospect for populations of Dacrydium and Parashorea is good, that for Annamocarya, Manglietia and Pinus is worrisome, while Calocedrus takes an intermediate position.
We suggest that conservation measures include strict protection of juvenile and adult trees, as these are most important for population maintenance (high elasticity values). Other effective conservations include: improving growth of seedlings and juvenile trees, enriching populations with planted seedlings obtained from controlled germination and – for Calocedrus and Pinus species with very low population sizes (<500) – restoring habitat to increase populations. Finally, we argue that – as long-lived species are slow in responding to conservation measures – these measures should be taken before populations decline below critical levels. Key words: Threatened tree species, protected area, matrix population models, elasticity analysis, conservation strategy, Annamocarya, Calocedrus, Dacrydium, Manglietia, Parashorea, Pinus.
Chapter 3
58
Introduction
Tropical and subtropical forest area has declined at an alarming rate over the past
decades (Achard et al. 2002), particularly in Southeast Asia (Whitmore 1997, Sodhi et
al. 2004). As a consequence, many tree species have lost a substantial part of their
habitat and have become rare, either due to their restricted distribution or their low
abundance. This is illustrated by the large amount of critically endangered (477),
endangered (333) and vulnerable (962) tree species in Southeast Asia (World
Conservation Union ‘IUCN’ 2006). The survival of such endangered species is
strongly depending on protected areas (Bawa & Ashton 1991). But, within protected
areas, isolated populations of endangered species may also be vulnerable to local
extinction due to demographic stochasticity or lack of genetic variation (Menges
1992, Lande 1993, Oostermeijer et al. 2003). It is therefore important to evaluate the
viability of remaining populations of threatened tree species, by answering questions
such as: Are they growing or declining? What factors determine their fate? What
processes or stages in the life cycle are most important for the survival of the
population? To answer these questions, studies on spatial distribution, densities, or
genetic variation or cultivation of the species are not sufficient as they do not provide
information on likely population changes in time (Schemske et al. 1994, Dowe et al.
1997, Keith 2000). Demographic (or population dynamics) studies - on the other
hand – do provide such information, and have shown to be useful to evaluate
viability of threatened populations, e.g., using matrix population models (Harvey
1985, Lande 1988, Silvertown et al. 1996, Menges 2000).
In this paper, we present a study on the demography of threatened tree species in
Vietnam, a country where natural forest cover declined from 43% natural forest
cover in 1943 to 30 % in 2003 (Hung 2004). We studied six threatened tree species in
four protected areas. All species are included in Vietnam’s Red List: four are endemic
to Vietnam and Southern China, and two others are relict species that occur in only a
fraction of their historical geographical range (Ministry of Science, Technology and
Environment ‘MSTE’ 1996, Nghia 2000). To our knowledge, this is the first study
that evaluates conservation prospects of Southeast Asian tree species using
demographic analyses.
We addressed the following questions: (i) Are populations of our study species
naturally regenerating? To answer this, we carried out a 2 year demographic field
study, in which we examined recruitment and evaluated population structures. (ii)
What is the future prospect for these species? To this end, we constructed population
transition matrices for all six species, and calculated population growth rates, survival
curves and ages. (iii) What are the most important processes or stages in the life cycle
of the species that should be the focus for conservation measures? This question was
answered by calculating elasticity values from matrix models (de Kroon et al. 2000),
and comparing these among vital rates (survival, growth and fecundity) and species.
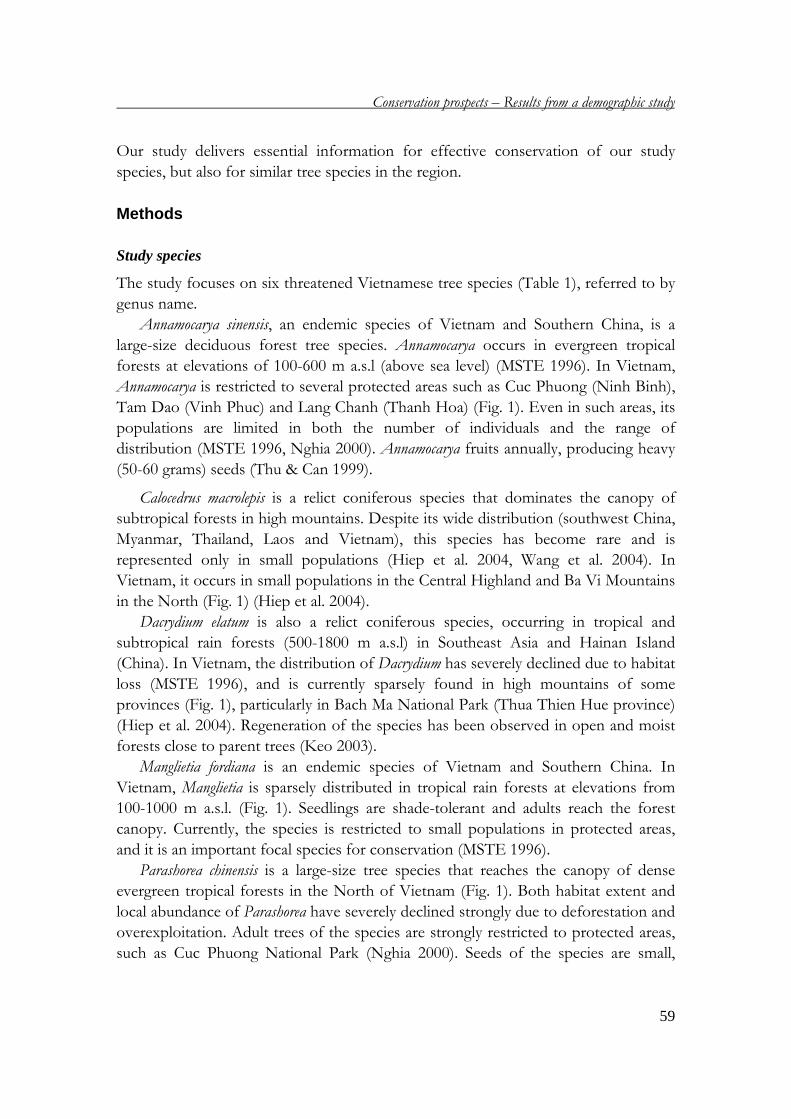
Conservation prospects – Results from a demographic study
59
Our study delivers essential information for effective conservation of our study
species, but also for similar tree species in the region.
Methods Study species
The study focuses on six threatened Vietnamese tree species (Table 1), referred to by
genus name.
Annamocarya sinensis, an endemic species of Vietnam and Southern China, is a
large-size deciduous forest tree species. Annamocarya occurs in evergreen tropical
forests at elevations of 100-600 m a.s.l (above sea level) (MSTE 1996). In Vietnam,
Annamocarya is restricted to several protected areas such as Cuc Phuong (Ninh Binh),
Tam Dao (Vinh Phuc) and Lang Chanh (Thanh Hoa) (Fig. 1). Even in such areas, its
populations are limited in both the number of individuals and the range of
distribution (MSTE 1996, Nghia 2000). Annamocarya fruits annually, producing heavy
(50-60 grams) seeds (Thu & Can 1999).
Calocedrus macrolepis is a relict coniferous species that dominates the canopy of
subtropical forests in high mountains. Despite its wide distribution (southwest China,
Myanmar, Thailand, Laos and Vietnam), this species has become rare and is
represented only in small populations (Hiep et al. 2004, Wang et al. 2004). In
Vietnam, it occurs in small populations in the Central Highland and Ba Vi Mountains
in the North (Fig. 1) (Hiep et al. 2004).
Dacrydium elatum is also a relict coniferous species, occurring in tropical and
subtropical rain forests (500-1800 m a.s.l) in Southeast Asia and Hainan Island
(China). In Vietnam, the distribution of Dacrydium has severely declined due to habitat
loss (MSTE 1996), and is currently sparsely found in high mountains of some
provinces (Fig. 1), particularly in Bach Ma National Park (Thua Thien Hue province)
(Hiep et al. 2004). Regeneration of the species has been observed in open and moist
forests close to parent trees (Keo 2003).
Manglietia fordiana is an endemic species of Vietnam and Southern China. In
Vietnam, Manglietia is sparsely distributed in tropical rain forests at elevations from
100-1000 m a.s.l. (Fig. 1). Seedlings are shade-tolerant and adults reach the forest
canopy. Currently, the species is restricted to small populations in protected areas,
and it is an important focal species for conservation (MSTE 1996).
Parashorea chinensis is a large-size tree species that reaches the canopy of dense
evergreen tropical forests in the North of Vietnam (Fig. 1). Both habitat extent and
local abundance of Parashorea have severely declined strongly due to deforestation and
overexploitation. Adult trees of the species are strongly restricted to protected areas,
such as Cuc Phuong National Park (Nghia 2000). Seeds of the species are small,
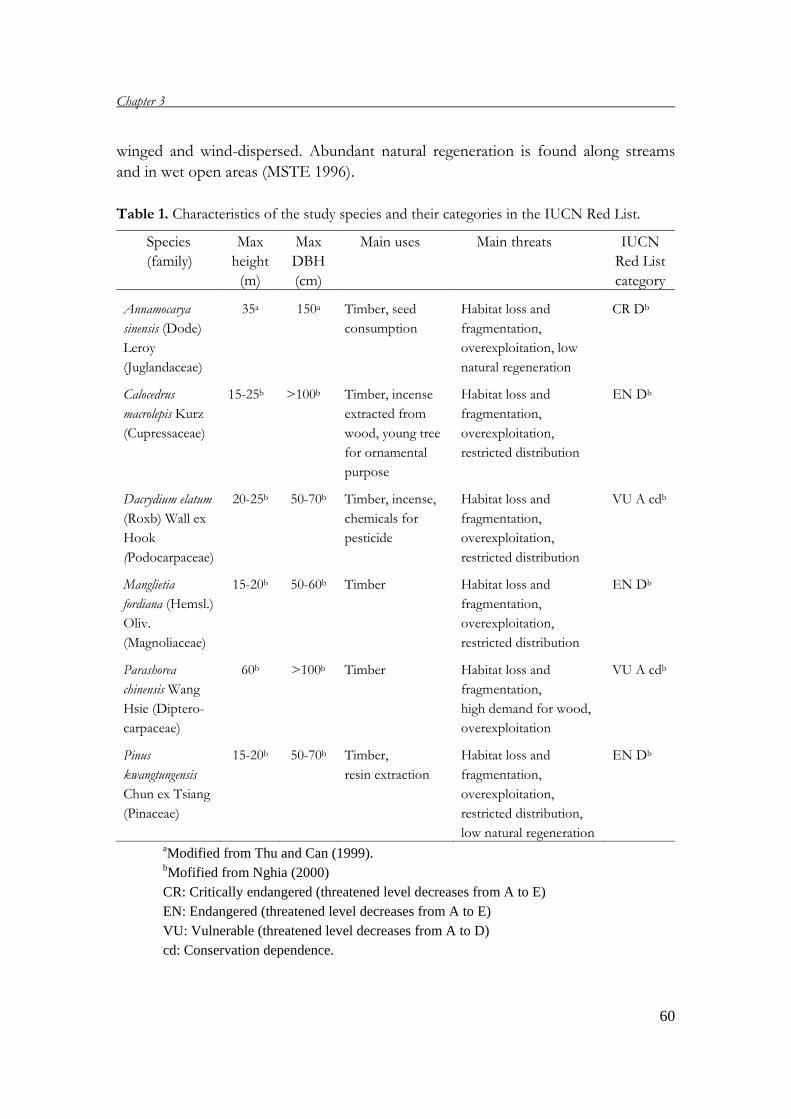
Chapter 3
60
winged and wind-dispersed. Abundant natural regeneration is found along streams
and in wet open areas (MSTE 1996).
Table 1. Characteristics of the study species and their categories in the IUCN Red List.
Species
(family)
Max
height
(m)
Max
DBH
(cm)
Main uses Main threats IUCN
Red List
category Annamocarya
sinensis (Dode)
Leroy
(Juglandaceae)
35a 150a Timber, seed
consumption
Habitat loss and
fragmentation,
overexploitation, low
natural regeneration
CR Db
Calocedrus
macrolepis Kurz
(Cupressaceae)
15-25b >100b Timber, incense
extracted from
wood, young tree
for ornamental
purpose
Habitat loss and
fragmentation,
overexploitation,
restricted distribution
EN Db
Dacrydium elatum
(Roxb) Wall ex
Hook
(Podocarpaceae)
20-25b 50-70b Timber, incense,
chemicals for
pesticide
Habitat loss and
fragmentation,
overexploitation,
restricted distribution
VU A cdb
Manglietia
fordiana (Hemsl.)
Oliv.
(Magnoliaceae)
15-20b 50-60b Timber
Habitat loss and
fragmentation,
overexploitation,
restricted distribution
EN Db
Parashorea
chinensis Wang
Hsie (Diptero-
carpaceae)
60b >100b Timber
Habitat loss and
fragmentation,
high demand for wood,
overexploitation
VU A cdb
Pinus
kwangtungensis
Chun ex Tsiang
(Pinaceae)
15-20b 50-70b Timber,
resin extraction
Habitat loss and
fragmentation,
overexploitation,
restricted distribution,
low natural regeneration
EN Db
aModified from Thu and Can (1999). bMofified from Nghia (2000) CR: Critically endangered (threatened level decreases from A to E) EN: Endangered (threatened level decreases from A to E) VU: Vulnerable (threatened level decreases from A to D) cd: Conservation dependence.
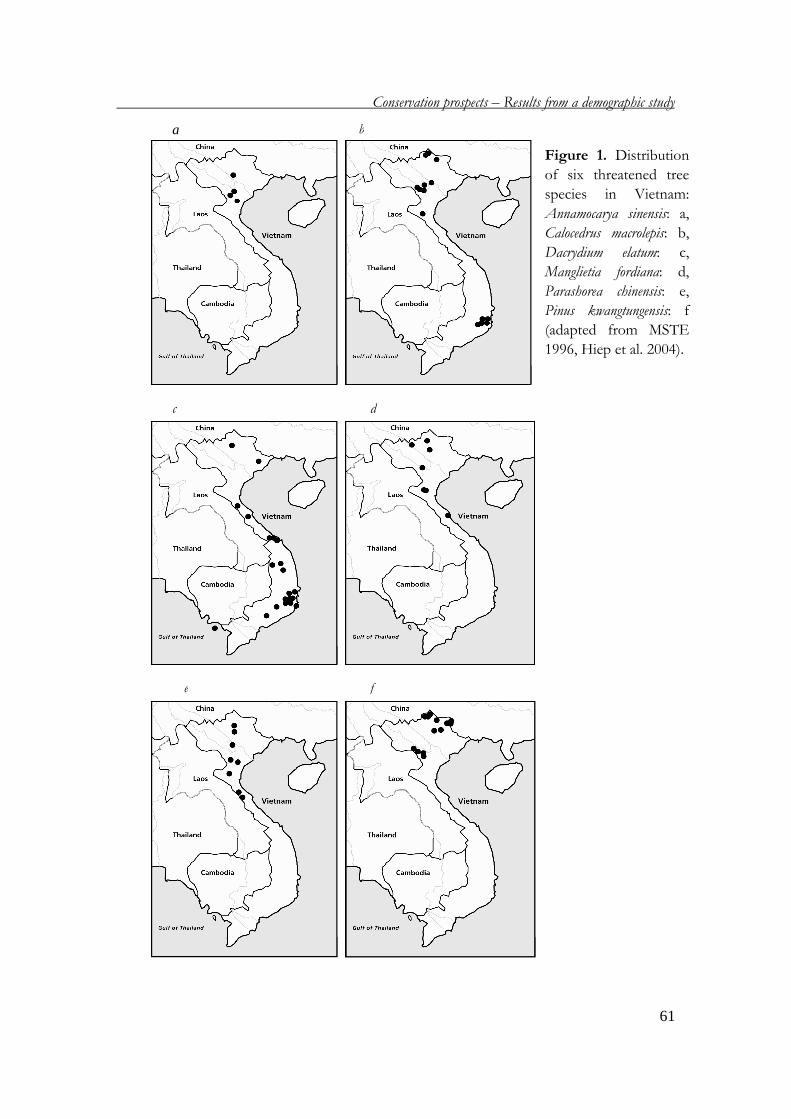
Conservation prospects – Results from a demographic study
61
b a
c d
e f
Figure 1. Distribution
of six threatened tree
species in Vietnam:
Annamocarya sinensis: a,
Calocedrus macrolepis: b,
Dacrydium elatum: c,
Manglietia fordiana: d,
Parashorea chinensis: e,
Pinus kwangtungensis: f
(adapted from MSTE
1996, Hiep et al. 2004).
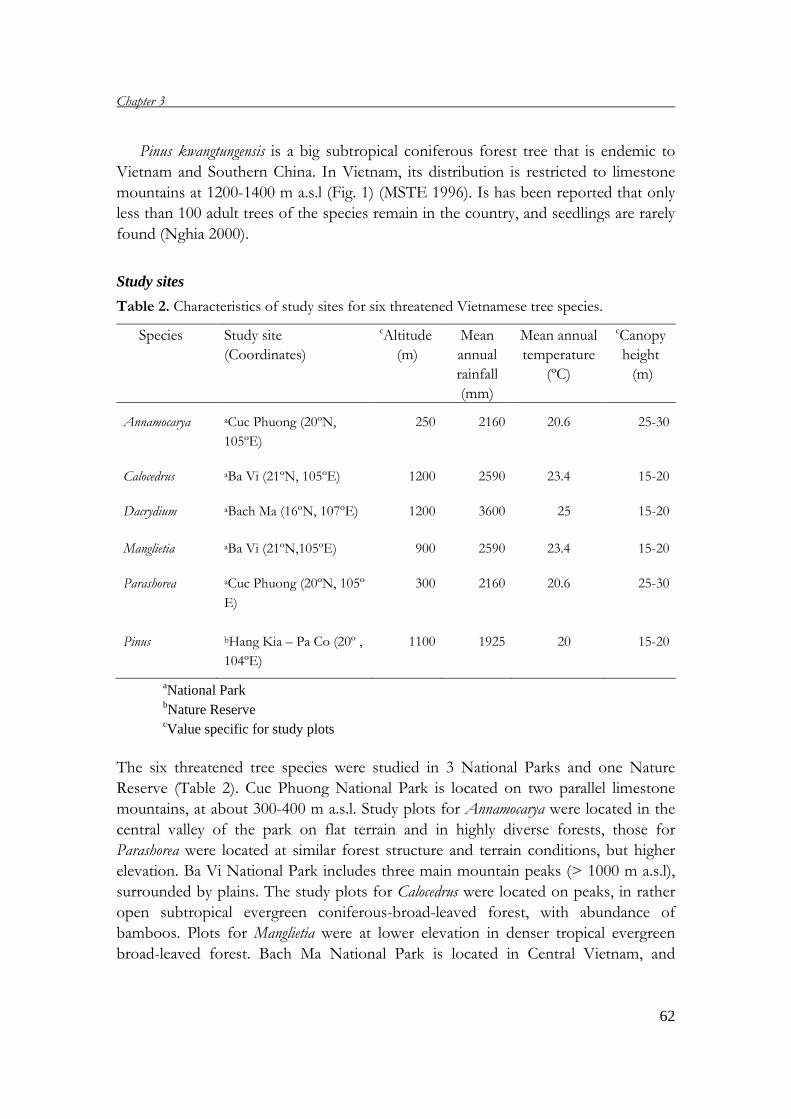
Chapter 3
62
Pinus kwangtungensis is a big subtropical coniferous forest tree that is endemic to
Vietnam and Southern China. In Vietnam, its distribution is restricted to limestone
mountains at 1200-1400 m a.s.l (Fig. 1) (MSTE 1996). Is has been reported that only
less than 100 adult trees of the species remain in the country, and seedlings are rarely
found (Nghia 2000).
Study sites
Table 2. Characteristics of study sites for six threatened Vietnamese tree species.
Species Study site
(Coordinates)
cAltitude
(m)
Mean
annual
rainfall
(mm)
Mean annual
temperature
(ºC)
cCanopy
height
(m)
Annamocarya aCuc Phuong (20ºN,
105ºE)
250 2160 20.6 25-30
Calocedrus aBa Vi (21ºN, 105ºE) 1200 2590 23.4 15-20
Dacrydium aBach Ma (16ºN, 107ºE) 1200 3600 25 15-20
Manglietia aBa Vi (21ºN,105ºE) 900 2590 23.4 15-20
Parashorea aCuc Phuong (20ºN, 105º
E)
300 2160 20.6 25-30
Pinus bHang Kia – Pa Co (20º ,
104ºE)
1100 1925 20 15-20
aNational Park bNature Reserve cValue specific for study plots
The six threatened tree species were studied in 3 National Parks and one Nature
Reserve (Table 2). Cuc Phuong National Park is located on two parallel limestone
mountains, at about 300-400 m a.s.l. Study plots for Annamocarya were located in the
central valley of the park on flat terrain and in highly diverse forests, those for
Parashorea were located at similar forest structure and terrain conditions, but higher
elevation. Ba Vi National Park includes three main mountain peaks (> 1000 m a.s.l),
surrounded by plains. The study plots for Calocedrus were located on peaks, in rather
open subtropical evergreen coniferous-broad-leaved forest, with abundance of
bamboos. Plots for Manglietia were at lower elevation in denser tropical evergreen
broad-leaved forest. Bach Ma National Park is located in Central Vietnam, and
Conservation prospects – Results from a demographic study
63
includes forests at different elevations (100-1200 m a.s.l). The study plots for
Dacrydium were established at 1000-1200 m a.s.l in evergreen subtropical forest. Hang
Kia - Pa Co Nature Reserve is located on the high limestone mountains of Hoa Binh
province, and experiences a subtropical climate with hot and cold seasons. The study
plots were covered by subtropical coniferous-broad-leaved forests, in which Pinus is
one of the dominant canopy tree species.
Data collection
In the study sites, permanent plots were established in 2003: 3 plots (2.5 ha/plot) for
Annamocarya, 2 plots (2.5 ha/plot) for Calocedrus, 3 plots (2 ha/plot) for Dacrydium, 2
plots (3 ha/plot) for Manglietia, 3 plots (4 ha/plot) for Parashorea, and 3 plots (2
ha/plot) for Pinus. At first measurement, all juvenile and adult trees (diameter at
breast height, DBH > 5 cm) of the study species in the plots were searched, tagged
and measured. Remeasurements were carried out in 2004 and 2005. At each
measurement, DBH, total height, and height to the first branch of the trees were
measured. Mortality and reproductive status of individuals were also recorded.
Within the plots, subplots (20x20 m) were randomly established to study seedlings
and saplings (< 5 cm DBH). Per species a total 20-60 subplots were established,
depending on seedling density. At first measurement in 2003, all seedlings and
saplings of the study species in the subplots were searched, tagged and measured.
Measured parameters were total height and diameter at ground level (or DBH if
possible). Remeasurements were conducted in 2004 and 2005. Mortality and
recruitment of seedlings and saplings were recorded during remeasurements.
Data analysis
As the demographic parameters were collected at different plots and years, survival
and growth rates were tested for differences between plots and years, using analysis
of variance (ANOVA), linear, non-linear or logistic regression models. In case of no
significant difference, data were pooled for constructing transition matrices.
We related height growth of seedlings and seedling height, using the linear
regressions, and used logistic regressions to relate seedling survival probability to
height.
Growth of the tree diameter is typically non-linearly related to the initial diameter,
with high growth rates for intermediate-sized trees. Therefore, diameter growth was
related to DBH, using Hossfeld IV equation (Zeide 1993):
b*c*DBH(c-1) [b + (DBHc/a)]2
(1) ∆DBH =
Chapter 3
64
where ∆DBH is DBH growth rate (cm y-1), and a, b and c are fitted parameters. We
used non-linear regression analysis with a least-square loss function to fit this
function through observed data on DBH growth and DBH.
The relation between reproductive status and DBH was analysed using logistic
regression.
Transition matrix construction and analysis
We used the Lefkovitch matrix model (Caswell 2001) to project population dynamics
of our study species. These models use the equation: n(t+1) = An(t), where n(t) and
n(t+1) are population structures at time t and t+1, and A is a square matrix
containing transition probabilities among categories during one time step. For our
study, the time step was 1 year. When the multiplication of A and n(t) is repeated
many times, the relative structure and growth rate of the population will become
stable. When a stable size distribution is reached, the dominant eigenvalue (λ) and the
right eigenvector of matrix A are equal to the growth rate and the stable stage
distribution of the population, respectively.
The populations of the six study species were divided into 14 to 18 size
categories, depending on the abundance and size structure of each population
(Appendix 1). For all species, the four smallest categories were based on seedling
height and the remaining on DBH. Elements (aij) of matrix A can be grouped into
growth, stasis or fecundity. Growth elements (G, elements in the sub-diagonal of the
matrix) that represent the probability of an individual to grow from one category to
the next, were calculated as Gi = σi x γi, where γi is the probability that a surviving individual in category i moves to i+1, σi is the survival probability in category i. The
value of γi was calculated as gi / ci, in which gi is the height or DBH growth rate for category i (in cm yr-1) and ci the category width (in cm height or DBH). Stasis
elements (P, in the diagonal of the matrix) presenting the probability that an
individual survives and stays at the same category, were calculated as Pi = σi - Gi.
Fecundity elements (F, the upper row, except for the top-left element) represent the
number of seedlings produced by an adult individual. We assumed that all
reproductive individuals had the same reproductive output (number of seedlings).
Therefore, F was calculated as Fi = σi x Prob{f}i x fi, where Prob{f}i is probability of
being reproductive for individuals in category i, and fi was calculated by dividing the
abundance of new seedlings (per ha, per year), by that of reproductive trees.
We estimated the similarity between the stable stage structures resulting from the
matrix models and the observed population structures using the similarity index PS
(Horvitz & Schimske 1995). PS = ∑(min[opsi, ssdi] x 100, where opsi, is vector of
observed population structures, and ssdi is the vector of stable size distribution. Both
vectors were scaled to sum to one. High values of PS indicate high values of
similarity.
Conservation prospects – Results from a demographic study
65
Dominant eigenvalues (λ) were calculated for all six matrix models (Caswell 2001).
If λ > 1, populations are project to grow, whilst they decrease for λ < 1. To examine
whether λ is significantly different from unity, we calculated the 95% confident limits
of λ with the series approximation approach (Caswell 2001), and using sensitivity and
variance of vital rates (survival, growth and reproduction) respectively. As we lacked
information on variation in reproductive output among individuals, this was not
taken into account in the calculation, thus probably leading to a slight
underestimation of the confidence interval. Transient dynamics of the populations
were analysed by multiplying population structure with the transition matrices. This
was done for 50 and 100 years, for all six species. Based on the relative increase in the
population over these periods, we then calculated the annual growth rate and
compared these values to the value of λ.
The elasticity of λ to vital rates (survival, growth and reproduction) is the
proportional change in λ due to a proportional change in a vital rate (de Kroon et al.
2000), and that it indicates the importance of vital rates to λ. We calculated the
elasticity of λ to vital rates using the approach of Caswell (2001) and Zuidema and
Franco (2001). It should be noted that vital rate elasticities differ from those for
matrix elements in that they may be negative (if an increase in a certain vital rate leads
to a reduction in λ) and that they do not sum to one (Caswell 2001).
Lastly, using the transition matrices, we constructed survival curves for each of
the six study species following the approach of Cochran and Ellner (1992). We also
calculated the age at which reproductive size is reached by calculating the conditional
age (τ in Cochran & Ellner 1992) of entering the first reproductive size category. Results Size distribution and natural regeneration
The six study species differed considerably in maximum DBH. The largest trees of
Dacrydium, Manglietia and Pinus were just over 60 cm DBH, those of Calocedrus 85 cm
DBH, while those of Annamocary and Parashorea reached more than 100 cm DBH.
The variation in maximum size corresponds to differences in forest structure:
Annamocarya and Parashorea occur in forests at low elevation with high canopy height
(25-30 m), while the other study species are typically found in forests with lower
canopy at higher elevations (Table 2).
Population structures of the six study species showed inverse J-shaped curves
(Fig. 2), with most individuals present in the seedling and juvenile categories.
Although the abundance differed strongly between species, all population structures
showed a continuous abundance of individuals without any clear ‘bottleneck’ (Fig. 2).
This result suggests that there is continuous regeneration for all study species.
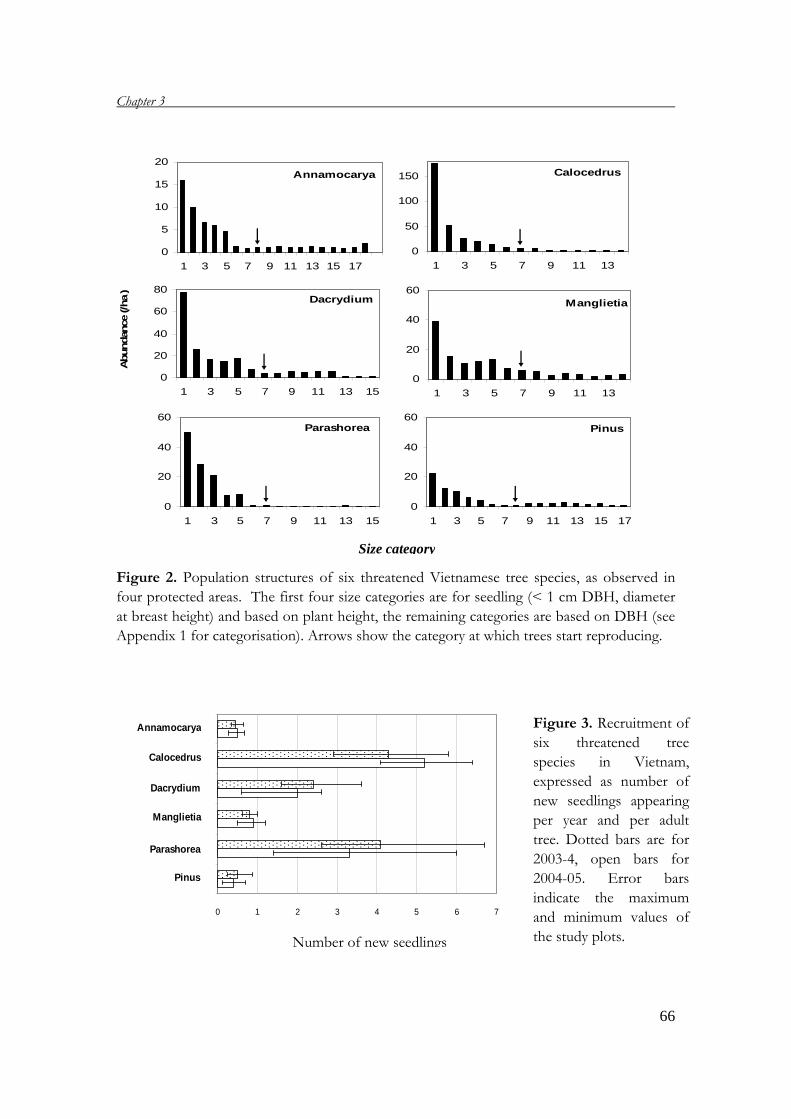
Chapter 3
66
Figure 2. Population structures of six threatened Vietnamese tree species, as observed in
four protected areas. The first four size categories are for seedling (< 1 cm DBH, diameter
at breast height) and based on plant height, the remaining categories are based on DBH (see
Appendix 1 for categorisation). Arrows show the category at which trees start reproducing.
Annamocarya
0
5
10
15
20
1 3 5 7 9 11 13 15 17
Calocedrus
0
50
100
150
1 3 5 7 9 11 13
Dacrydium
0
20
40
60
80
1 3 5 7 9 11 13 15
Parashorea
0
20
40
60
1 3 5 7 9 11 13 15
Pinus
0
20
40
60
1 3 5 7 9 11 13 15 17
Abundan
ce (/h
a)
Manglietia
0
20
40
60
1 3 5 7 9 11 13
Size category
Number of new seedlings
0 1 2 3 4 5 6 7
Annamocarya
Calocedrus
Dacrydium
Manglietia
Pinus
Parashorea
Figure 3. Recruitment of
six threatened tree
species in Vietnam,
expressed as number of
new seedlings appearing
per year and per adult
tree. Dotted bars are for
2003-4, open bars for
2004-05. Error bars
indicate the maximum
and minimum values of
the study plots.
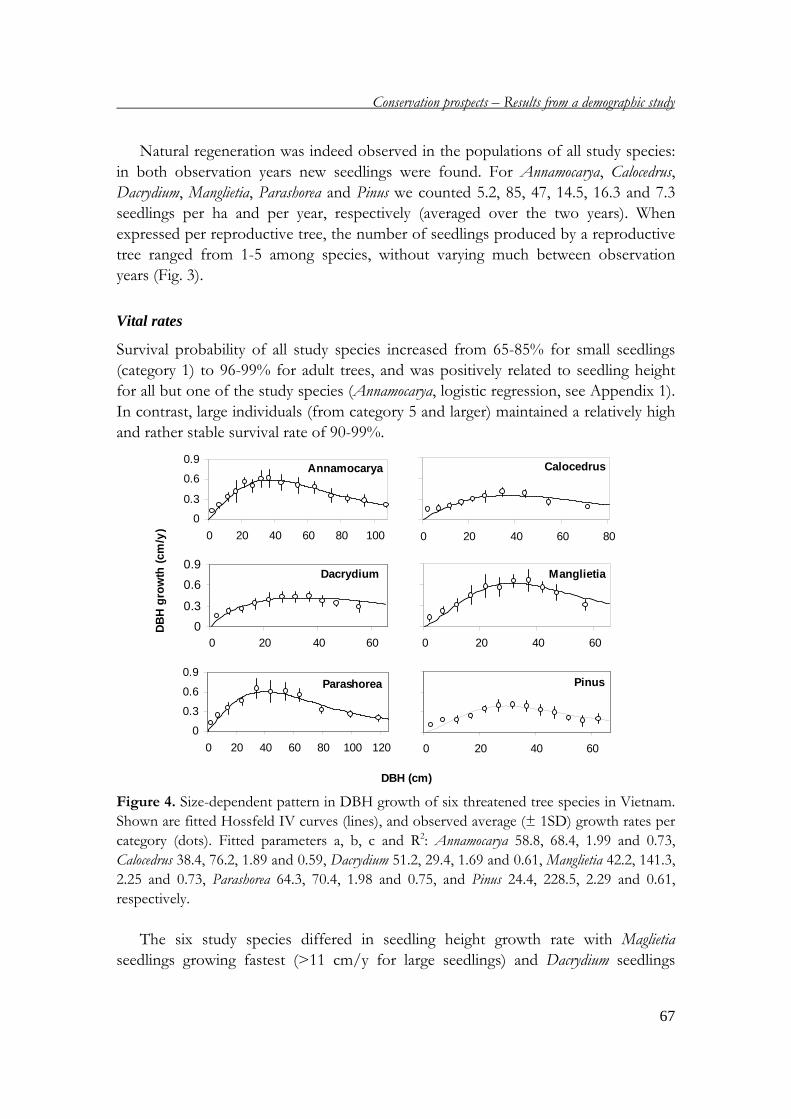
Conservation prospects – Results from a demographic study
67
Natural regeneration was indeed observed in the populations of all study species:
in both observation years new seedlings were found. For Annamocarya, Calocedrus,
Dacrydium, Manglietia, Parashorea and Pinus we counted 5.2, 85, 47, 14.5, 16.3 and 7.3
seedlings per ha and per year, respectively (averaged over the two years). When
expressed per reproductive tree, the number of seedlings produced by a reproductive
tree ranged from 1-5 among species, without varying much between observation
years (Fig. 3).
Vital rates
Survival probability of all study species increased from 65-85% for small seedlings
(category 1) to 96-99% for adult trees, and was positively related to seedling height
for all but one of the study species (Annamocarya, logistic regression, see Appendix 1).
In contrast, large individuals (from category 5 and larger) maintained a relatively high
and rather stable survival rate of 90-99%.
Figure 4. Size-dependent pattern in DBH growth of six threatened tree species in Vietnam.
Shown are fitted Hossfeld IV curves (lines), and observed average (± 1SD) growth rates per
category (dots). Fitted parameters a, b, c and R2: Annamocarya 58.8, 68.4, 1.99 and 0.73,
Calocedrus 38.4, 76.2, 1.89 and 0.59, Dacrydium 51.2, 29.4, 1.69 and 0.61, Manglietia 42.2, 141.3,
2.25 and 0.73, Parashorea 64.3, 70.4, 1.98 and 0.75, and Pinus 24.4, 228.5, 2.29 and 0.61,
respectively.
The six study species differed in seedling height growth rate with Maglietia
seedlings growing fastest (>11 cm/y for large seedlings) and Dacrydium seedlings
Annamocarya
0
0.3
0.6
0.9
0 20 40 60 80 100
Calocedrus
0 20 40 60 80
Dacrydium
0
0.3
0.6
0.9
0 20 40 60
Manglietia
0 20 40 60
Parashorea
0
0.3
0.6
0.9
0 20 40 60 80 100 120
Pinus
0 20 40 60
DBH (cm)
DB
H g
row
th (
cm/y
)
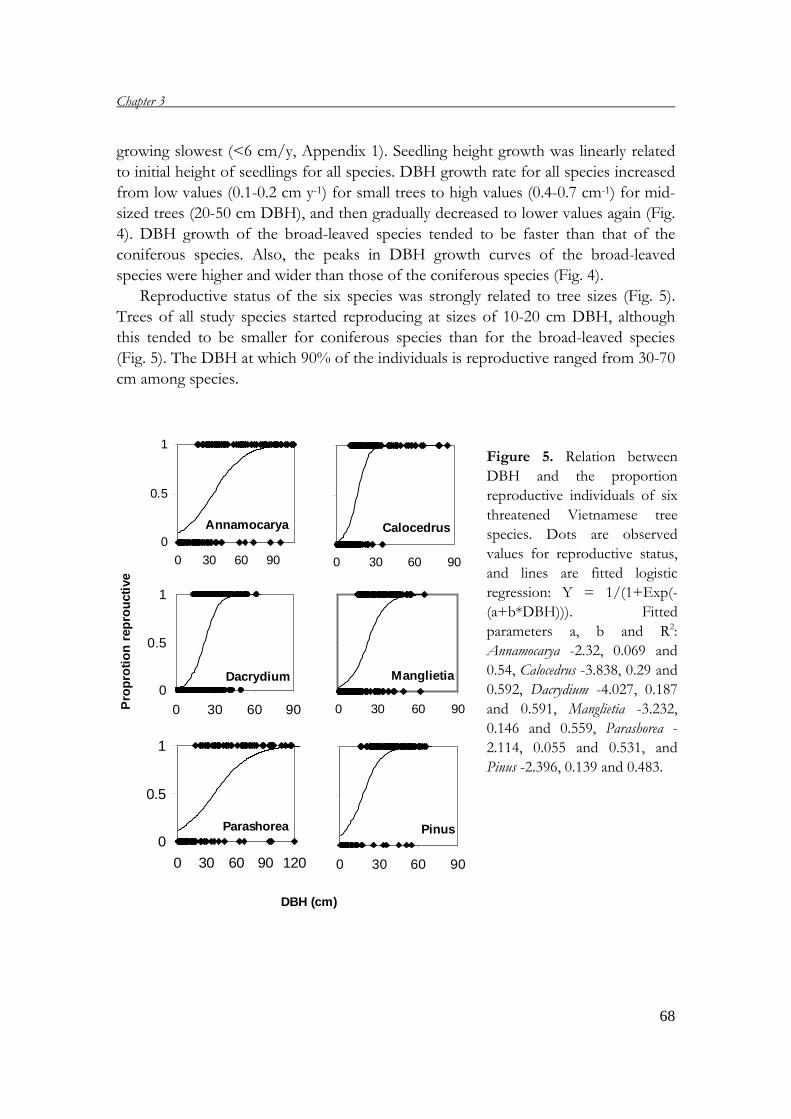
Chapter 3
68
growing slowest (<6 cm/y, Appendix 1). Seedling height growth was linearly related
to initial height of seedlings for all species. DBH growth rate for all species increased
from low values (0.1-0.2 cm y-1) for small trees to high values (0.4-0.7 cm-1) for mid-
sized trees (20-50 cm DBH), and then gradually decreased to lower values again (Fig.
4). DBH growth of the broad-leaved species tended to be faster than that of the
coniferous species. Also, the peaks in DBH growth curves of the broad-leaved
species were higher and wider than those of the coniferous species (Fig. 4).
Reproductive status of the six species was strongly related to tree sizes (Fig. 5).
Trees of all study species started reproducing at sizes of 10-20 cm DBH, although
this tended to be smaller for coniferous species than for the broad-leaved species
(Fig. 5). The DBH at which 90% of the individuals is reproductive ranged from 30-70
cm among species.
Annamocarya0
0.5
1
0 30 60 90
Dacrydium0
0.5
1
0 30 60 90
Manglietia
0 30 60 90
Parashorea0
0.5
1
0 30 60 90 120
Calocedrus
0 30 60 90
Pro
pro
tio
n r
epro
uct
ive
DBH (cm)
Pinus
0 30 60 90
Figure 5. Relation between
DBH and the proportion
reproductive individuals of six
threatened Vietnamese tree
species. Dots are observed
values for reproductive status,
and lines are fitted logistic
regression: Y = 1/(1+Exp(-
(a+b*DBH))). Fitted
parameters a, b and R2:
Annamocarya -2.32, 0.069 and
0.54, Calocedrus -3.838, 0.29 and
0.592, Dacrydium -4.027, 0.187
and 0.591, Manglietia -3.232,
0.146 and 0.559, Parashorea -
2.114, 0.055 and 0.531, and
Pinus -2.396, 0.139 and 0.483.
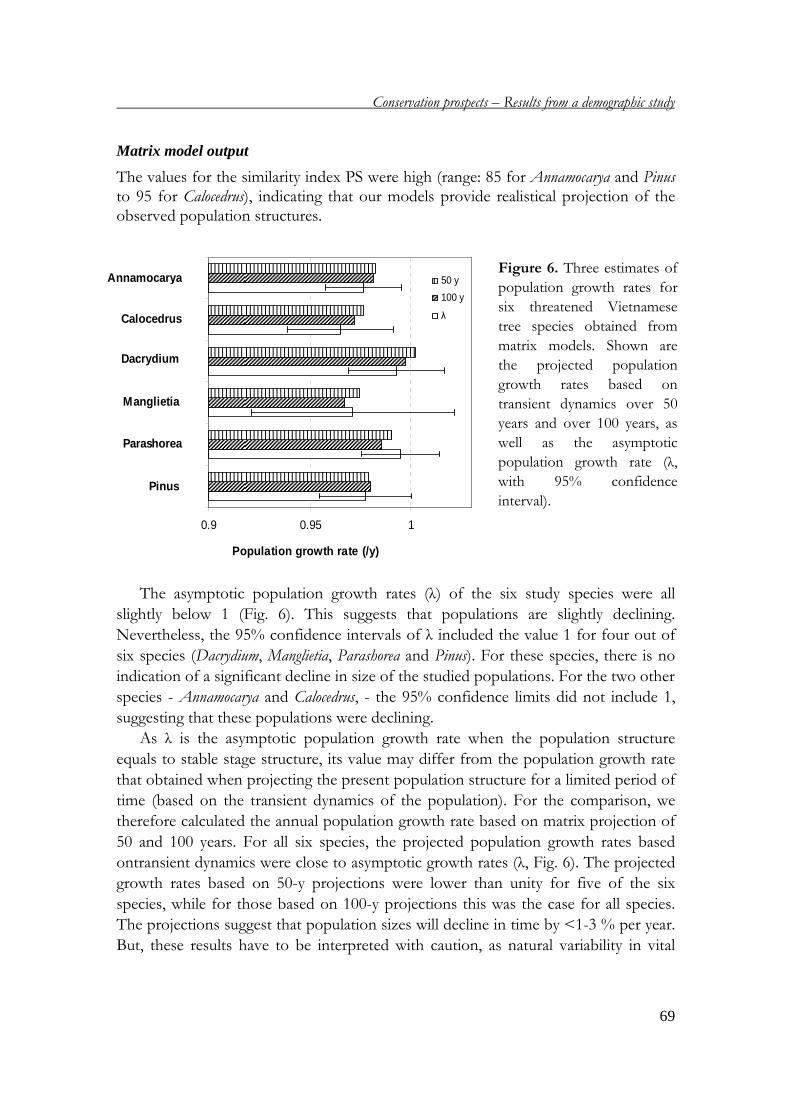
Conservation prospects – Results from a demographic study
69
Matrix model output
The values for the similarity index PS were high (range: 85 for Annamocarya and Pinus to 95 for Calocedrus), indicating that our models provide realistical projection of the observed population structures.
The asymptotic population growth rates (λ) of the six study species were all
slightly below 1 (Fig. 6). This suggests that populations are slightly declining.
Nevertheless, the 95% confidence intervals of λ included the value 1 for four out of
six species (Dacrydium, Manglietia, Parashorea and Pinus). For these species, there is no
indication of a significant decline in size of the studied populations. For the two other
species - Annamocarya and Calocedrus, - the 95% confidence limits did not include 1,
suggesting that these populations were declining.
As λ is the asymptotic population growth rate when the population structure
equals to stable stage structure, its value may differ from the population growth rate
that obtained when projecting the present population structure for a limited period of
time (based on the transient dynamics of the population). For the comparison, we
therefore calculated the annual population growth rate based on matrix projection of
50 and 100 years. For all six species, the projected population growth rates based
ontransient dynamics were close to asymptotic growth rates (λ, Fig. 6). The projected
growth rates based on 50-y projections were lower than unity for five of the six
species, while for those based on 100-y projections this was the case for all species.
The projections suggest that population sizes will decline in time by <1-3 % per year.
But, these results have to be interpreted with caution, as natural variability in vital
0.9 0.95 1
50 y
100 y
λ
Population growth rate (/y)
Annamocarya
Calocedrus
Dacrydium
Manglietia
Parashorea
Pinus
Figure 6. Three estimates of
population growth rates for
six threatened Vietnamese
tree species obtained from
matrix models. Shown are
the projected population
growth rates based on
transient dynamics over 50
years and over 100 years, as
well as the asymptotic
population growth rate (λ,
with 95% confidence
interval).
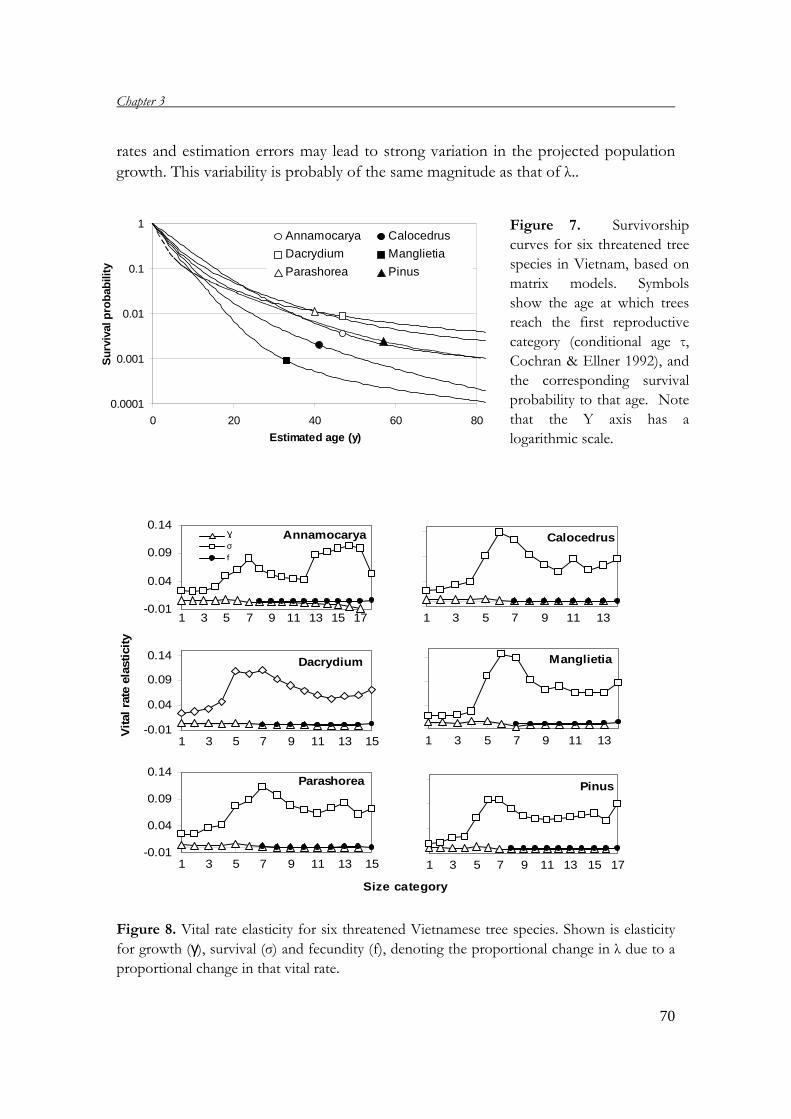
Chapter 3
70
rates and estimation errors may lead to strong variation in the projected population
growth. This variability is probably of the same magnitude as that of λ..
Figure 8. Vital rate elasticity for six threatened Vietnamese tree species. Shown is elasticity
for growth (γ), survival (σ) and fecundity (f), denoting the proportional change in λ due to a proportional change in that vital rate.
0.0001
0.001
0.01
0.1
1
0 20 40 60 80
Estimated age (y)
Su
rviv
al p
rob
abili
ty
Annamocarya Calocedrus
Dacrydium Manglietia
Parashorea Pinus
Figure 7. Survivorship
curves for six threatened tree
species in Vietnam, based on
matrix models. Symbols
show the age at which trees
reach the first reproductive
category (conditional age τ,
Cochran & Ellner 1992), and
the corresponding survival
probability to that age. Note
that the Y axis has a
logarithmic scale.
Annamocarya
-0.01
0.04
0.09
0.14
1 3 5 7 9 11 13 15 17
Ŵ
σ
f
Calocedrus
1 3 5 7 9 11 13
Dacrydium
-0.01
0.04
0.09
0.14
1 3 5 7 9 11 13 15
Manglietia
1 3 5 7 9 11 13
Parashorea
-0.01
0.04
0.09
0.14
1 3 5 7 9 11 13 15
Pinus
1 3 5 7 9 11 13 15 17
Vit
al r
ate
elas
tici
ty
Size category
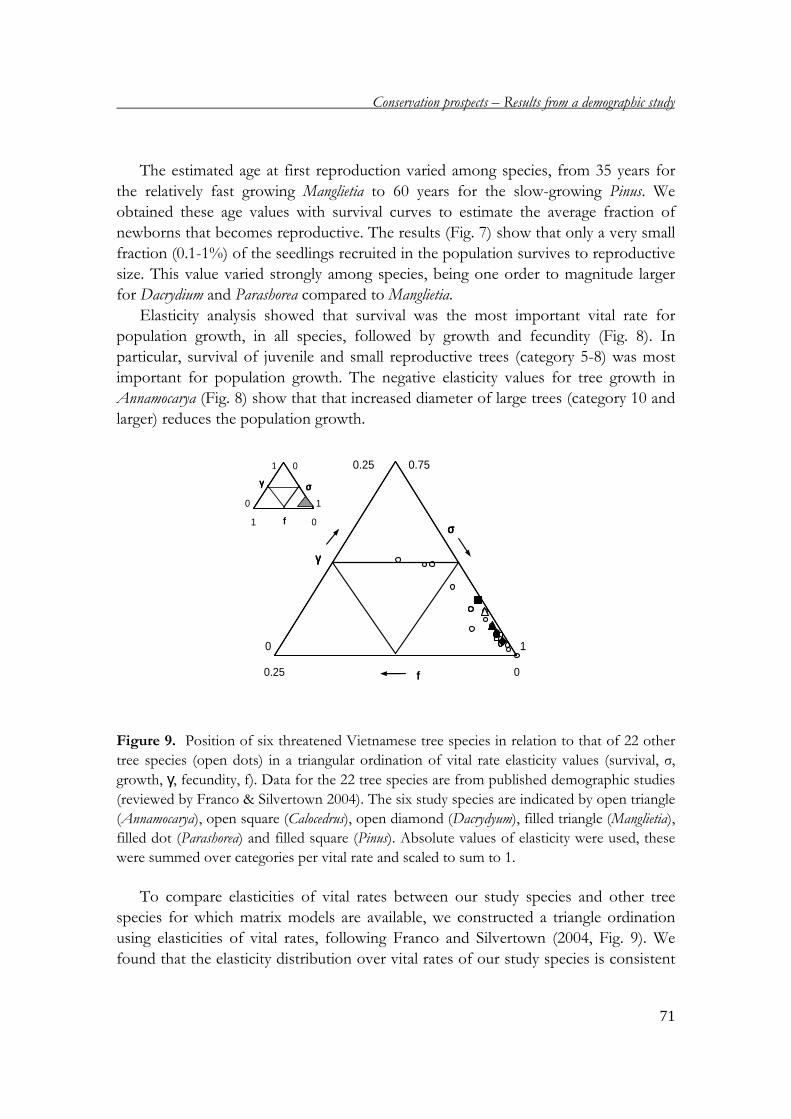
Conservation prospects – Results from a demographic study
71
The estimated age at first reproduction varied among species, from 35 years for
the relatively fast growing Manglietia to 60 years for the slow-growing Pinus. We
obtained these age values with survival curves to estimate the average fraction of
newborns that becomes reproductive. The results (Fig. 7) show that only a very small
fraction (0.1-1%) of the seedlings recruited in the population survives to reproductive
size. This value varied strongly among species, being one order to magnitude larger
for Dacrydium and Parashorea compared to Manglietia.
Elasticity analysis showed that survival was the most important vital rate for
population growth, in all species, followed by growth and fecundity (Fig. 8). In
particular, survival of juvenile and small reproductive trees (category 5-8) was most
important for population growth. The negative elasticity values for tree growth in
Annamocarya (Fig. 8) show that that increased diameter of large trees (category 10 and
larger) reduces the population growth.
01 f
γγγγ σσσσ
1 0
0 1
00.25 f
γγγγ
σσσσ
0.25
1
0.75
0
Figure 9. Position of six threatened Vietnamese tree species in relation to that of 22 other
tree species (open dots) in a triangular ordination of vital rate elasticity values (survival, σ,
growth, γ, fecundity, f). Data for the 22 tree species are from published demographic studies (reviewed by Franco & Silvertown 2004). The six study species are indicated by open triangle
(Annamocarya), open square (Calocedrus), open diamond (Dacrydyum), filled triangle (Manglietia),
filled dot (Parashorea) and filled square (Pinus). Absolute values of elasticity were used, these
were summed over categories per vital rate and scaled to sum to 1.
To compare elasticities of vital rates between our study species and other tree
species for which matrix models are available, we constructed a triangle ordination
using elasticities of vital rates, following Franco and Silvertown (2004, Fig. 9). We
found that the elasticity distribution over vital rates of our study species is consistent
Chapter 3
72
with that for other tree species, represented by points close to the survival vertex of
the triangle, indicating strong importance of survival for population maintenance.
Nevertheless, our study species had relatively high elasticity for survival and low for
fecundity.
Discussion Differences between species
Although our study species are all non-pioneer trees that reach the forest canopy as
adult, they show differences in performance and population dynamics. These
differences are probably partly caused by variation among habitats. The relatively
slow DBH growth of Calocedrus, Dacrydium and Pinus is probably related to the typical
mountain microclimate of these species with shallow soils and periodical low
temperature. These coniferous species also demonstrate rather constant growth rates
over their size range, compared to the peaked growth-diameter relation of the broad-
leaved species (Fig. 4). High juvenile growth is probably possible due to typically
open structure of high elevation forests.
Natural regeneration and future prospects of populations
Ultimately the prospect of population survival depends on whether populations are
regenerating naturally, and whether this is sufficient to maintain populations. We
found that all six species were regenerating naturally in all sites and in both
observation years. Our results are consistent with those of previous studies on
recruitment for some of the study species (Thu & Can 1999, Nghia 2000, Keo 2003).
Another indication of natural regeneration was observed in population structures: all
species showed continuous and inverse J-shaped size distributions, without signs of
regeneration bottlenecks (e.g., Peres et al. 2003). Such size distributions are typically
found for forest tree species with good recruitment (Poorter et al.1996, Newbery &
Gartlan 1996, Zuidema & Boot 2002). Clearly, unfavourable recruitment conditions
outside protected areas due to harvest pressure or anthropogenic disturbances, may
lead to population structures that differ from the ones we observed inside parks.
To find out whether natural regeneration is sufficient for population maintenance
we calculated three measures. First, we used the common asymptotic growth rate of
population, λ. The value of λ was below 1 for all species, but only significantly for
two species. For these two species, the real confidence interval is likely larger as
variability in vital rates has been underestimated due to lacking information on
variation in seed production. Thus, there is a possibility that population growth rates
for these species are not different from unity. The confidence intervals we calculated
Conservation prospects – Results from a demographic study
73
may be relatively high as the sampled populations are rather small (less than 450
individuals), which is unavoidable in studies on threatened tree species (Bierzychudek
1999, Coulson et al. 2001). In addition, the accuracy of λ and its confidence interval is
likely limited by the short study period that did not capture the range of temporal
variability that determines long-term dynamics of tree populations (Menges 1990,
Enright & Watson 1991, Bierzychudek 1999, Van Mantgem & Stephenson 2005).
Second, we estimated population growth based on transient dynamics (Fox &
Gurevitch 2000, Van Mantgem & Stephenson 2005). These population growth rates
are close to the values of λ. This comparison is useful as it shows the extent to which
the differences between observed and stable population structures determine
population growth rates. If differences are large, transient dynamics are characterized
by strong fluctuations, and resulting population growth rates differ much form λ. In
our analyses the differences were small (high values for similar index PS), and these
differences did not lead to strong deviation between the two estimates for population
growth rate. Population growth rates based on transient dynamics consistently
suggested population declines for all six species, except for Dacrydium (Fig. 6).
However, as these measures lack confidence intervals, growth rates could also have
been higher due to variation among individuals and uncertainty in parameter
estimation.
Finally, the third measure of future population growth that we applied did not use
the population growth rate, but combined information on recruitment and ages to
check whether an adult tree produces sufficient seedlings to replace itself. For
example, in Manglietia, survival to adult size amounts to 0.1% (Fig. 7), implying that
an adult tree should produce 1000 seedlings in its entire reproductive life to replace
itself. At the rate of less than one seedling per year that we observed (Fig. 3), this
takes over 1000 years. In a similar way, we calculated the required reproductive life
span for the other species: this was 480 y for Annamocarya, 70 for Calocedrus, 52 for
Dacrydium, 25 for Parashorea and 580 for Pinus. For Annamocarya, Manglietia and Pinus,
these reproductive periods are far longer than maximum ages estimated from matrix
models (ranging from 150 to 250 y, P.D.C., unpublished data). Clearly, these
calculations are based on the recruitment rates estimated over the two-year study
period and assume that there are no strong fluctuations in recruitment over time. For
instance, years with exceptional seed production could strongly reduce the required
reproductive period. To our knowledge, most of our study species are fruiting
annually, and we are not aware of strongly inter-annual variation in recruitment for
any of the species (Nghia 2000).
We combined the results obtained from the three measures (Table 3) to draw
conclusions on future prospects for populations of our study species. It appeared that
there was little consistency among the measures. This discrepancy underscores the
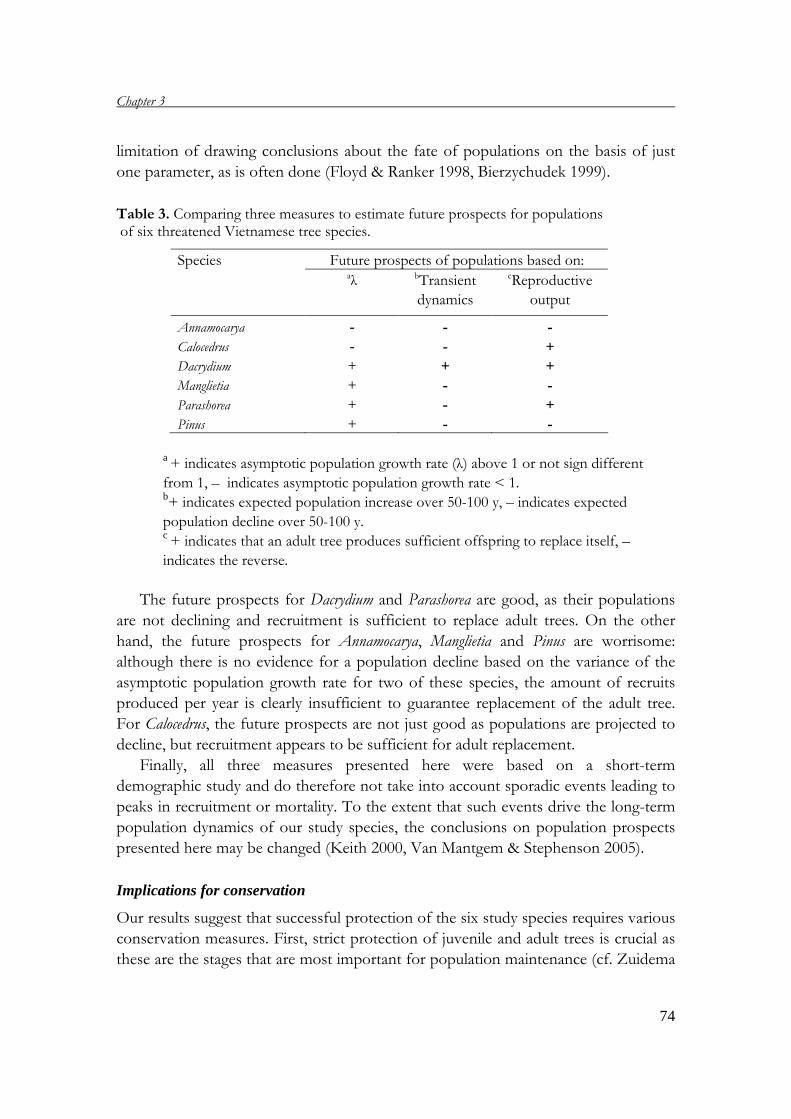
Chapter 3
74
limitation of drawing conclusions about the fate of populations on the basis of just
one parameter, as is often done (Floyd & Ranker 1998, Bierzychudek 1999).
Table 3. Comparing three measures to estimate future prospects for populations of six threatened Vietnamese tree species.
a + indicates asymptotic population growth rate (λ) above 1 or not sign different
from 1, – indicates asymptotic population growth rate < 1. b+ indicates expected population increase over 50-100 y, – indicates expected
population decline over 50-100 y. c + indicates that an adult tree produces sufficient offspring to replace itself, –
indicates the reverse.
The future prospects for Dacrydium and Parashorea are good, as their populations
are not declining and recruitment is sufficient to replace adult trees. On the other
hand, the future prospects for Annamocarya, Manglietia and Pinus are worrisome:
although there is no evidence for a population decline based on the variance of the
asymptotic population growth rate for two of these species, the amount of recruits
produced per year is clearly insufficient to guarantee replacement of the adult tree.
For Calocedrus, the future prospects are not just good as populations are projected to
decline, but recruitment appears to be sufficient for adult replacement.
Finally, all three measures presented here were based on a short-term
demographic study and do therefore not take into account sporadic events leading to
peaks in recruitment or mortality. To the extent that such events drive the long-term
population dynamics of our study species, the conclusions on population prospects
presented here may be changed (Keith 2000, Van Mantgem & Stephenson 2005).
Implications for conservation
Our results suggest that successful protection of the six study species requires various
conservation measures. First, strict protection of juvenile and adult trees is crucial as
these are the stages that are most important for population maintenance (cf. Zuidema
Species Future prospects of populations based on:
aλ bTransient
dynamics
cReproductive
output
Annamocarya - - - Calocedrus - - + Dacrydium + + + Manglietia + - - Parashorea + - + Pinus + - -
Conservation prospects – Results from a demographic study
75
& Boot 2002, Franco & Silvertown 2004, Kwit et al. 2004). Preventing damage and
logging within and outside protected areas therefore is of high priority. Second,
growth of seedlings and juvenile trees may be improved (e.g., by controlled liberation)
in order to increase population growth. Although elasticity analyses suggest that the
effect of such measures is limited in comparison to maximizing tree survival, seedling
and tree growth can probably be altered more than tree survival, and with less
difficulty (Batista et al. 1998, Zuidema & Boot 2002, Kwit et al. 2004). A third
conservation measure is enrichment of populations with seedlings grown under
controlled conditions. If germination success under controlled conditions is higher
than that under natural conditions, seeds can be collected from the same natural
populations which are enriched with seedlings. This measure is particularly important
for species with an apparent insufficient recruitment (Annamocarya, Manglietia and
Pinus). Finally, for species with small remaining populations such as Calocedrus and
Pinus (populations of <500 trees, MSTE 1996, P.D.C., personal observation), the
expansion of habitat area through nature restoration would be an effective measure.
Declines in population sizes of tree species are slow, as they are long-lived. As a
consequence, there is more time for taking conservation measures, but slow dynamics
also imply that it takes long before such measures result in population increase.
Taking action before populations have declined to critical levels is therefore
important, as well as close monitoring of population size and recruitment.
Acknowledgements
We are very grateful to Le Van Binh, Vu Van Can, Tran Quang Chuc, Le Phuong
Trieu, Bui Van Duong, Duong Ngoc Anh, Luu Cu, Nguyen Van The, Dinh Duc
Huu, Le Van Thu, Bui Cong Vinh and others for their assistance with the field work.
We thank the managers of the four protected areas for their permission and help
during our studies. We specially acknowledge Marinus Werger and Francis Putz for
helpful comments on the paper, and Marjolein Kortbeek for preparing maps for
figures. This study was financially supported by Tropenbos International Vietnam,
Utrecht University, and the Forest Science Institute of Vietnam.
Chapter 3
76
References
Achard, F., H. D. Eva, H. J. Stibig, P. Mayaux, J. Gallego, T. Richards, and J. P.
Malingreau. 2002. Determination of deforestation rates of the world’s humid
tropical forests. Science 297: 999-1002.
Batista, W. B., W. J. Platt, and R. E. Macchiavelli. 1998. Demography of a shade-tolerant
tree (Fagus grandifolia) in a hurricane-disturbed forest. Ecology 79: 38-53.
Bawa, K. S., and P. S. Ashton. 1991. Conservation of rare trees in tropical rain forests: a
genetic perspective. Pages 62-71 in D. A. Falk and K. E. Holsinger, editors.
Genetics and conservation of rare plants. Oxford University Press, Oxford.
Bierzychudek, P. 1999. Looking backwards: Assessing the projections of a transition
matrix model. Ecological Application 9: 1278-1287.
Caswell, H. 2001. Matrix Population Models. 2nd edition. Sinauer Associates, Sunderland,
Massachusetts.
Cochran, E. M., and S. Ellner. 1992. Simple methods for calculating age-based life
history parameters for stage-structured populations. Ecological Monographs 62:
345-364.
Coulson, T., G. M. Mace, E. Hudson, and H. Possingham. 2001. The use and abuse of
population viability analysis. Trends in Ecology & Evolution 16: 219-221.
Dowe, J. L., J. Benzie, and E. Ballment. 1997. Ecology and genetics of Carpoxylon
macrospermum H. Wendl. & Drude (Arecaceae), an endangered palm from
Vanuatu. Biological Conservation 79: 205-216.
Enright, N. J., and A. D. Watson. 1991. A matrix population-model analysis for the
tropical tree, Araucaria-cunninghamii. Australian Journal of Ecology 16: 507-520.
Floyd, S. K., and T. A. Ranker. 1998. Analysis of a transition matrix model for Guara
neomexicana spp. coloradensis (Onagraceae) reveals spatial and emporal demographic
variability. International Journal of Plant Sciences 159: 583-563.
Fox, G. A., and J. Gurevitch. 2000. Population numbers count: Tools for near-term
demographic analysis. American Naturalist 156: 242-256.
Franco, M., and J. Silvertown. 2004. Comparative demography of plants based upon
elasticities of vital rates. Ecology 85: 531-538.
Harvey, H. F. 1985. Population biology and the conservation of rare species. Pages 111-
123 in J. White, editor. Studies in plant demography: Fetschrift for John L.
Harper. Academic Press, Inc., Orlando, Florida.
Hiep, N. T., P. K. Loc, N. D. T. Luu, P. I. Thomas, A, Farjon, L, Averyanov, and J.
Regalado Jr. 2004. Vietnam Conifers Conservation Status Review. Labour and
Society Publishing House, Ha Noi.
Horvitz, C. C., and D. W. Schemske. 1995. Spatiotemporal variation in demographic
transitions of a tropical understory herb - projection matrix analysis. Ecological
Monographs 65: 155-192. *Hung, T. V. 2004. Forestry research for the coming time. Journal of Agriculture and
Rural Development 12: 26-29.
Keith, D.A. 2000. Sampling designs, field techniques and analytical methods for
Conservation prospects – Results from a demographic study
77
systematic plant populations surveys. Ecology, Management and Restoration 1:
125-139. *Keo, H. V. 2003. Research on ecological - characteristics and reproductive capability by
cutting of Dacrydium elatum (Roxb.) Wallich ex Hooker) in Bach Ma National
Park. PhD thesis. Hue Science University, Hue.
de Kroon. H., J. van Groenendael, and J. Ehrlen. 2000. Elasticities: a review of methods
and model limitations. Ecology 81: 607-618.
Kwit, C., C. C. Horvitz, and W. J. Platt. 2004. Conserving slow-growing, long-lived tree
species: Input from the demography of a rare understory Conifer, Taxus floridana.
Conservation Biology 18: 432-443.
Lande, R. 1988. Genetic and demography in biological conservation. Science 241: 1455-
1460.
Lande, R. 1993. Risks of population extinction from demographic and environmental
stochasticity and random catastrophes. The American Naturalist 142: 911-927.
Menges, E. S. 1990. Population viability analysis for an endangered plant. Conservation
Biology 4: 52-62.
Menges, E . S. 1992. Stochastic modeling of extinction in plant population. Pages 253-
276 in P. L. Fiedler and S. K. Jain, editors. Conservation Biology: the Theory and
Practice of Nature Conservation, Presentation and Management. Chapman and
Hall, New York.
Menges, E. S. 2000. Population viability analyses in plants: challenges and opportunities.
Trends in Ecology & Evolution 15: 51-56.
*Ministry of Science, Technology and Environment (MSTE). 1996. Red Data Book of
Vietnam. Volume 2 - Plant. Science and Techniques Publishing House, Ha Noi.
Newbery, D. McC., and J. S. Gartlan. 1996. A structural analysis of rain forest at Korup
and Douala-Edea, Cameroon. Proc. R. Soc. Edinburgh, Se. B., 104: 177-224.
Nghia, N. H. 2000. Some threatened tree species of Vietnam. Agricultural Publishing
House, Ha Noi.
Oostermeijer, J. G. B., S. H. Luijten, and J. C. M. Den Nijs. 2003. Intergrating
demographic and genetic approaches in plant conservation. Biological
Conservation 113: 389-398.
Peres, C. A., C. Baider., P. A. Zuidema, L. H. O. Wadt, K. A. Kainer, D. A. P. Gomes-
Silva, R. P. Salomao, L. L. Simoes, E. R. N. Franciosi, F. C. Valverde, R. Gribel,
G. H. Shepard Jr, M. Kanashiro, P. Coventry, D. W. Yu, A. R. Watkinson, and R.
P. Freckleton. 2003. Demograhic threats to the sustainability of Brazil nut
exploitation. Science 302: 2112-2114.
Poorter, L., F. Bongers., R. S. A. R. van Rompaey, and M. de Klerk. 1996. Regeneration
of canopy tree species at five sites in West African moist forest. Forest Ecology
and Management 84: 61-69.
Schemske, D., B. B. Husband, M. Ruckelshaus, C. Goodwillie, I. Parker, and G. Bishop.
1994. Evaluating approaches to the conservation of rare and endangered plants.
Ecology 75: 584-606.
Silvertown, J., M. Franco, and E. Menges. 1996. Interpretation of elasticity matrices as an
Chapter 3
78
aid to the management of plant populations for conservation. Conservation
Biology 10: 591-597.
Sodhi, N. S., L. P. Koh., B. W. Brook, and P. K. L. Ng. 2004. Southeast Asian
biodiversity: an impending disaster. Trends in Ecology and Evolution 19: 654-
660. *Thu, N. B., and V. V. Can. 1999. Cho Dai tree (Annamocarya sinensis). Agricultural
Publishing House, Ha Noi.
Van Mantgem P. J., and N. L. Stephenson. 2005. The accuracy of matrix population
model projections for coniferous trees in the Sierra Nevada, California. Journal of
Ecology 93: 737-747.
Wang, D-L., Z-C. Li, G. Hao, T-Y. Chiang, and X-J. Ge. 2004. Genetic diversity of
Calocedrus macrolepis (Cupressaceae) in southwestern China. Biochemical
Systematic and Ecology 32: 797-807.
Whitmore, T. C. 1997. Tropical forest disturbance, disappearance, and species loss. Pages
3-12 in W. R. Laurance and R. O. Bierregaard, editors. Tropical Forest Remnants:
Ecology, Management and Conservation of Fragmented Communities. University
of Chicago Press, Chicago.
World Conservation Union (IUCN). 2006. The IUCN Red List of Threatened Species.
Available from http://www.redlist.org/info/tables/table6a (access May 2006).
Zeide, B. 1993. Analysis of Growth Equation. Forest Science 39: 594-616.
Zuidema, P. A., and M. Franco. 2001. Integrating vital rate variability into perturbation
analysis: an evaluation for matrix population models of six plant species. Journal
of Ecology 89: 995-1005.
Zuidema, P. A., and R. G. A. Boot. 2002. Demography of the Brazil nut tree (Bertholletia
excelsa) in the Bolivian Amazon: impact of seed extraction on recruitment and
population dynamics. Journal of Tropical Ecology 18: 1-31.
Note: * Initial titles in Vietnamese were translated into English.
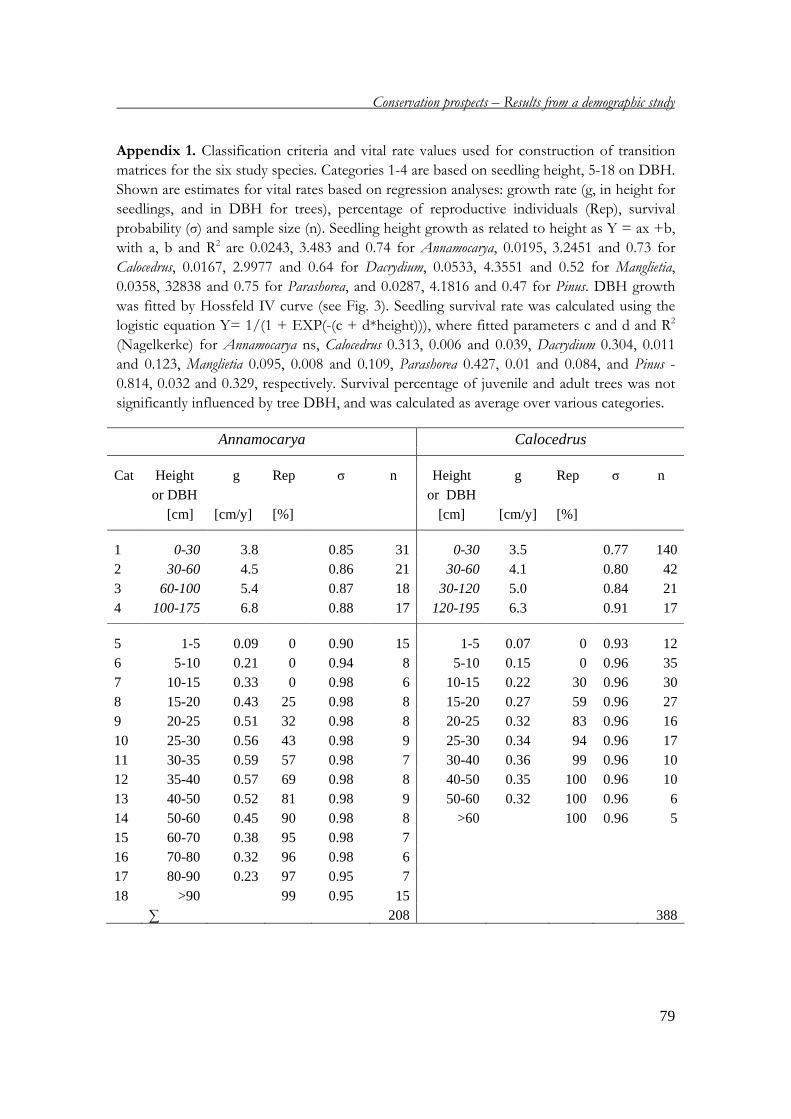
Conservation prospects – Results from a demographic study
79
Appendix 1. Classification criteria and vital rate values used for construction of transition
matrices for the six study species. Categories 1-4 are based on seedling height, 5-18 on DBH.
Shown are estimates for vital rates based on regression analyses: growth rate (g, in height for
seedlings, and in DBH for trees), percentage of reproductive individuals (Rep), survival
probability (σ) and sample size (n). Seedling height growth as related to height as Y = ax +b,
with a, b and R2 are 0.0243, 3.483 and 0.74 for Annamocarya, 0.0195, 3.2451 and 0.73 for
Calocedrus, 0.0167, 2.9977 and 0.64 for Dacrydium, 0.0533, 4.3551 and 0.52 for Manglietia,
0.0358, 32838 and 0.75 for Parashorea, and 0.0287, 4.1816 and 0.47 for Pinus. DBH growth
was fitted by Hossfeld IV curve (see Fig. 3). Seedling survival rate was calculated using the
logistic equation Y= 1/(1 + EXP(-(c + d*height))), where fitted parameters c and d and R2
(Nagelkerke) for Annamocarya ns, Calocedrus 0.313, 0.006 and 0.039, Dacrydium 0.304, 0.011
and 0.123, Manglietia 0.095, 0.008 and 0.109, Parashorea 0.427, 0.01 and 0.084, and Pinus -
0.814, 0.032 and 0.329, respectively. Survival percentage of juvenile and adult trees was not
significantly influenced by tree DBH, and was calculated as average over various categories.
Annamocarya Calocedrus Cat Height
or DBH g Rep σ n Height
or DBH g Rep σ n
[cm] [cm/y] [%] [cm] [cm/y] [%] 1 0-30 3.8 0.85 31 0-30 3.5 0.77 140 2 30-60 4.5 0.86 21 30-60 4.1 0.80 42 3 60-100 5.4 0.87 18 30-120 5.0 0.84 21 4 100-175 6.8 0.88 17 120-195 6.3 0.91 17 5 1-5 0.09 0 0.90 15 1-5 0.07 0 0.93 12 6 5-10 0.21 0 0.94 8 5-10 0.15 0 0.96 35 7 10-15 0.33 0 0.98 6 10-15 0.22 30 0.96 30 8 15-20 0.43 25 0.98 8 15-20 0.27 59 0.96 27 9 20-25 0.51 32 0.98 8 20-25 0.32 83 0.96 16 10 25-30 0.56 43 0.98 9 25-30 0.34 94 0.96 17 11 30-35 0.59 57 0.98 7 30-40 0.36 99 0.96 10 12 35-40 0.57 69 0.98 8 40-50 0.35 100 0.96 10 13 40-50 0.52 81 0.98 9 50-60 0.32 100 0.96 6 14 50-60 0.45 90 0.98 8 >60 100 0.96 5 15 60-70 0.38 95 0.98 7 16 70-80 0.32 96 0.98 6 17 80-90 0.23 97 0.95 7 18 >90 99 0.95 15 ∑ 208 388
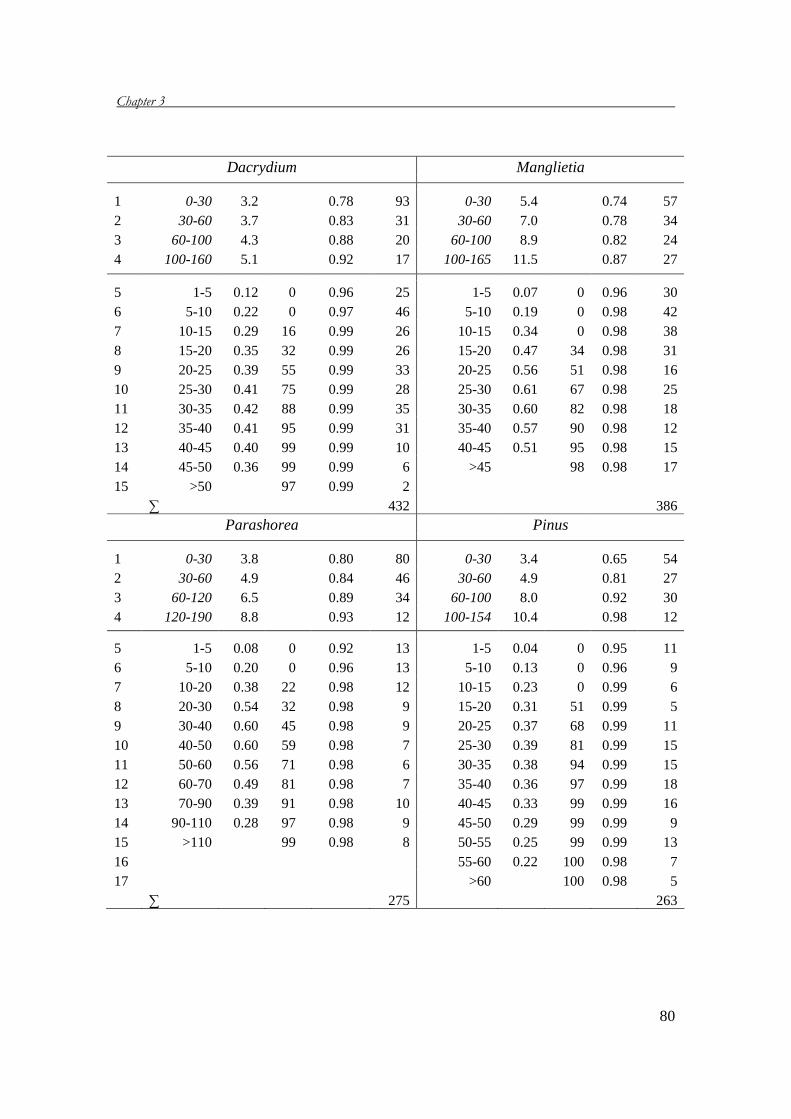
Chapter 3
80
Dacrydium Manglietia 1 0-30 3.2 0.78 93 0-30 5.4 0.74 57 2 30-60 3.7 0.83 31 30-60 7.0 0.78 34 3 60-100 4.3 0.88 20 60-100 8.9 0.82 24 4 100-160 5.1 0.92 17 100-165 11.5 0.87 27 5 1-5 0.12 0 0.96 25 1-5 0.07 0 0.96 30 6 5-10 0.22 0 0.97 46 5-10 0.19 0 0.98 42 7 10-15 0.29 16 0.99 26 10-15 0.34 0 0.98 38 8 15-20 0.35 32 0.99 26 15-20 0.47 34 0.98 31 9 20-25 0.39 55 0.99 33 20-25 0.56 51 0.98 16 10 25-30 0.41 75 0.99 28 25-30 0.61 67 0.98 25 11 30-35 0.42 88 0.99 35 30-35 0.60 82 0.98 18 12 35-40 0.41 95 0.99 31 35-40 0.57 90 0.98 12 13 40-45 0.40 99 0.99 10 40-45 0.51 95 0.98 15 14 45-50 0.36 99 0.99 6 >45 98 0.98 17 15 >50 97 0.99 2 ∑ 432 386
Parashorea Pinus 1 0-30 3.8 0.80 80 0-30 3.4 0.65 54 2 30-60 4.9 0.84 46 30-60 4.9 0.81 27 3 60-120 6.5 0.89 34 60-100 8.0 0.92 30 4 120-190 8.8 0.93 12 100-154 10.4 0.98 12 5 1-5 0.08 0 0.92 13 1-5 0.04 0 0.95 11 6 5-10 0.20 0 0.96 13 5-10 0.13 0 0.96 9 7 10-20 0.38 22 0.98 12 10-15 0.23 0 0.99 6 8 20-30 0.54 32 0.98 9 15-20 0.31 51 0.99 5 9 30-40 0.60 45 0.98 9 20-25 0.37 68 0.99 11 10 40-50 0.60 59 0.98 7 25-30 0.39 81 0.99 15 11 50-60 0.56 71 0.98 6 30-35 0.38 94 0.99 15 12 60-70 0.49 81 0.98 7 35-40 0.36 97 0.99 18 13 70-90 0.39 91 0.98 10 40-45 0.33 99 0.99 16 14 90-110 0.28 97 0.98 9 45-50 0.29 99 0.99 9 15 >110 99 0.98 8 50-55 0.25 99 0.99 13 16 55-60 0.22 100 0.98 7 17 >60 100 0.98 5 ∑ 275 263

Conservation prospects – Results from a demographic study
81
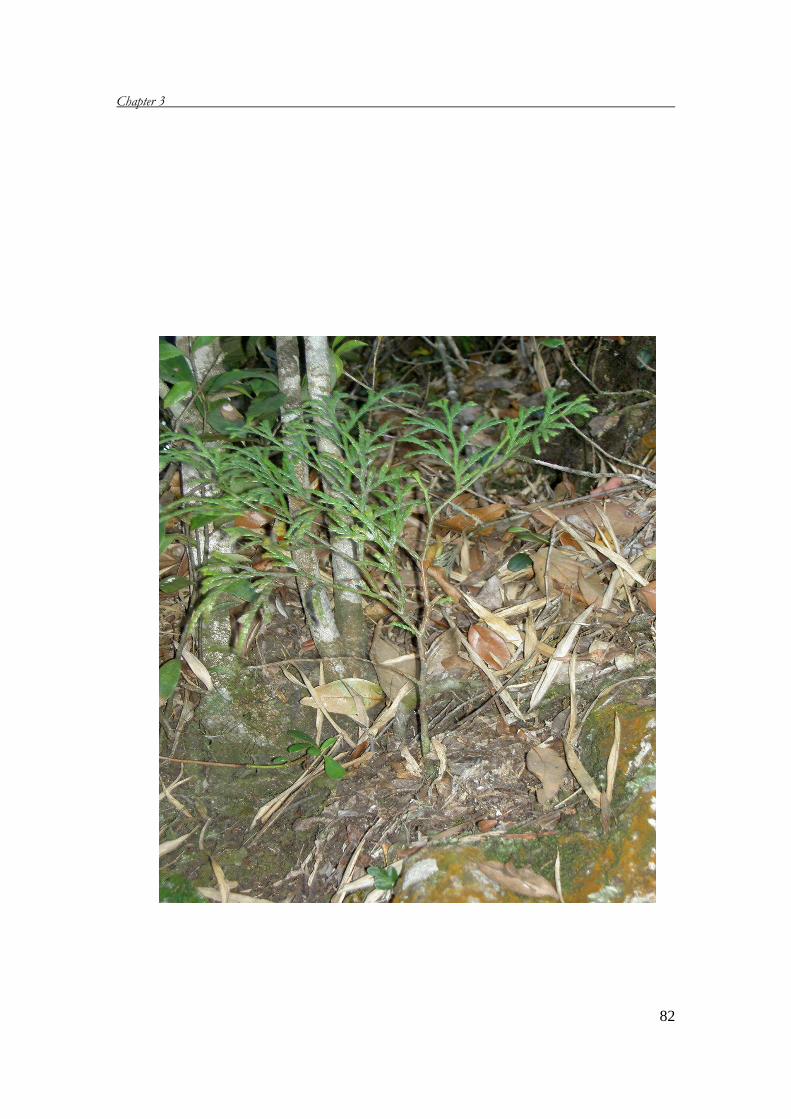
Chapter 3
82
Chapter 4
Population viability analysis of threatened tree species in Vietnam With P.A. Zuidema
Abstract
Population viability analysis is a good tool to estimate the impact of stochastic factors on
the persistence of threatened tree species. We used population viability analysis to
investigate the impact of demographic and environmental stochasticity on population
development and extinction risk for six threatened tree species in Vietnam (Annamocarya
sinensis, Calocedrus macrolepis, Dacrydium elatum, Manglietia fordiana, Parashorea chinensis, and
Pinus kwangtungensis). We carried out a two-year field study, in which we quantified the
vital rates (survival, growth, reproduction and recruitment) and their variation, and used
those to construct stochastic matrix models. We also included in the models the variation
in DBH growth rate, which was estimated from ring indices of trees. To consider how
sensitive the extinction risk is to changes in mean and variation of vital rates, and initial
population size, we changed the inputs of the stochastic models by 1%, and compared
the results.
Stochastic variation in vital rates due to environmental stochasticity decreased
population sizes, leading to increasing extinction risk. Of the two components of
environmental stochasticity, temporal variation has less impact on extinction risk than
small-scale variation. Demographic stochasticity decreased the time to extinction, but by
chance it could slightly reduce full extinction risk from around 7% for Pinus to 49% for
Manglietia at 300 y. Extinction risk was more sensitive to changes in the means of vital
rates and initial population size than to changes in variation of vital rates. Among the
vital rates, survival was the most important to estimate extinction risk. This implies that
reliable estimates of mean vital rates are crucial for obtaining reliable extinction rates.
The future prospects of Dacrydium and Parashorea are good, as their populations are
expected not to face extinction in 300 y. That of the other species, however, is worse as
they are predicted to face extinction in around 100 y. We suggest that effective
conservation should be implemented for these species before population sizes drop
below critical levels.
Key words: Threatened tree species, demographic stochasticity, environmental
stochasticity, stochastic matrix models, extinction risk.
Chapter 4
84
Introduction
Conservation of threatened tree species is a focal concern for conservationists and
managers. As these species often have small and/or isolated populations, they are
likely to face extinction due to unpredictable elements such as demographic and
environmental stochasticity (Menges 1998, Menges & Quintana-Ascencio 2003,
Munzbergova 2006). Demographic stochasticity is the variation in population
dynamics that is generated by independent stochastic contribution from each
individual of the population to the next generation (Engen et al. 1998, Menges 2000).
Demographic stochasticity does not strongly impact on population development of
abundant species, but it can severely increase the extinction risk for rare species
(Menges 1998). Environmental stochasticity, on the other hand, is related to variation
in demographic parameters (e.g. survival, growth and reproduction) due to
environmental variation. Natural catastrophes can be considered as especially
extreme, episodic or discrete types of environmental stochasticity (Menges 2000).
Environmental stochasticity can strongly increase the extinction risk for both
abundant and rare species (Menges 1998). In order to protect and effectively
conserve threatened tree species, it is therefore important to estimate the effect of
demographic and environmental stochasticity on the extinction risks for these
species.
Population viability analysis (PVA) is a useful tool for estimating extinction risks,
and for prioritizing conservation needs for threatened species (Shaffer 1990, Clark et
al. 1991, Boyce 1992, Possingham et al. 1993, Carroll et al. 1996, Menges 1998, 2000,
Brook et al. 2000b, Chapman et al. 2001, Beissinger & McCullough 2002, Morris &
Doak 2002, Garcia 2003, Kaye & Pyke 2003, Reed et al. 2003, Boyce et al. 2006). By
taking into account the combined impacts of unpredictable factors (e.g. demographic,
environmental and genetic stochasticity) and deterministic elements (e.g. habitat loss,
overexploitation, fragmentation), PVA provides a stochastic projection of population
size over time (Miller & Lacy 1999, Chapman et al. 2001, Beissinger & McCullough
2002). Most commonly PVAs are conducted using simulation models that
incorporate deterministic matrices with demographic and environmental stochasticity
(Burgman et al. 1993, Akçakaya et al. 1997, Menges 2000). Currently, several software
packages [e.g. VORTEX (Lacy 1993), RAMAS/Stage (Ferson 1994), ALEX
(Possingham & Davies 1995), RAMAS/Metapop (Akçakaya 1997), MATLAB (Math
Works 1999)] have been developed and applied, leading to an increase in using PVAs
in conservation science (Fieberg & Ellner 2001).
As most PVAs for tree species are based on studies on a few populations and
short periods (e.g. several years), the data collected are not likely to be sufficient,
particularly for threatened tree species (Groom & Pascual 1998, Menges 2000). Poor
data can cause difficulties in parameter estimation, which in turn leads to unreliable
estimates of extinction risk (Beissinger & Westphal 1998). In order to improve the
Population viability analysis
85
accuracy of prediction, high quality of data is required. However, this can not always
be achieved as field study for PVAs is often time consuming and expensive (Menges
2000). Alternatively, we could focus efforts on the most important factors for precise
predictions. It is therefore important to evaluate the role of parameters in the
estimate of extinction risk.
In this study, we present PVAs for six threatened tree species in protected areas in
Vietnam. All six species have severely declined in both distribution and population
sizes due to overexploitation and habitat loss. Population sizes of these species in
protected areas range from 300 to 2500 individuals (> 5 cm DBH- diameter at breast
height). All six species are considered as threatened species in the Red List of
Vietnam (Ministry of Science, Technology and Environment ‘MSTE’ 1996, Nghia
2000).
Our main goal was to estimate population development and the time to extinction
for the six threatened tree species under the influence of demographic and
environmental stochasticity. We also considered the effects of parameter and
variation estimation on the estimates of extinction risk. Specifically, we addressed the
following questions: (a) How do demographic and environmental stochasticity affect
population development of the study species? To answer this question, we used
transition matrices incorporating demographic and environmental stochasticity to
estimate population sizes over time for these species. (b) What are the future
prospects for the study species? From the results generated from the stochastic
matrix models above, we estimated the extinction probability over 300 y. (c) How
sensitive are fluctuations in the mean and the variation of vital rates? To this end, we
changed the inputs of the PVAs, and compared the outcomes of the models. Our
results contribute information on the relationship of means and variances of vital
rates with population development, and with the extinction risk for the threatened
tree species.
Methods
Species and sites
We studied six threatened Vietnamese tree species: three are broad-leaved
(Annamocarya sinensis, Manglietia fordiana and Parashorea chinensis) and three others are
coniferous (Calodecrus macrolepis, Dacrydium elatum and Pinus kwangtungensis). From now
onwards, the species will be indicated by their genus names only. All species are long-
lived tree species and reach the canopy as adult. The broad-leaved species are
distributed in tropical forests at low altitudes, whereas the conifers occur in
subtropical forests at higher elevation (for details see Chapter 3). The populations of
the six species have been reduced in both density and distribution range due to
Chapter 4
86
overexploitation and habitat loss (Ministry of Science, Technology and Environment
‘MSTE’ 1996), and all are included in the Vietnam Red List as threatened species
(Nghia 2000).
The study was carried out in four protected areas in Vietnam. Study plots for
Annamocarya and Parashorea were located in tropical rain forests of Cuc Phuong
National Park. In Ba Vi National Park, plots for Calocedrus were constructed on peak
areas, in rather open subtropical forest, whereas those for Manglietia were located at
lower elevation in dense tropical forest. Plots for Dacrydium were established at 1000-
1200 m a.s.l. in evergreen subtropical forest of Bach Ma National Park, and those for
Pinus were constructed at the same elevation in subtropical forest of Hang Kia – Pa
Co Nature Reserve (for details see Chapter 3).
Data collection
To quantify the vital rates (annual rates of survival, seedling height growth, tree
diameter growth and fecundity) of the six study species, we established 2-3
permanent plots (2-4 ha/plot) for each species in the protected areas in 2003, and
performed measurements in 2003, 2004 and 2005. We measured DBH (diameter at
breast height) of all juvenile and adult trees (DBH ≥ 1 cm), total height of seedlings
(DBH ≤ 1 cm), and recorded mortality and reproductive status of individuals and
seedling recruitment in the study plots (for details see Chapter 3).
We obtained data on the population sizes of the six study species in the four
protected areas using information from previous studies (Huy & Cu 1990, Huyen
1997, Thu & Can 1999, Nghia 2000, Keo 2003, Can 2005) and our field trips to check
the distribution areas and densities of these species. Our estimates for the number of
mature individuals (>5 cm DBH) of these species in protected areas were:
Annamocarya: 850, Calocedrus: 450, Dacrydium: 2500, Manglietia: 700, Parashorea: 300, and
Pinus 400. We then converted these estimates to values of the entire populations,
using the observed structures in the study plots.
We also obtained diameter growth rates from wood cores taken from 30-40 trees
(DBH > 30 cm) per species for four species (Annamocarya, Calocedrus, Dacrydium and
Pinus) (for details see Chapter 5). Ring width data were used to quantify temporal
variation in diameter growth.
Matrix model construction
We used Lefkovitch matrix models (Caswell 2001) as the basis for our Population
Viability Analysis. The models use the equation: n(t+1) = An(t), where n(t) and
n(t+1) are population structures at time t and t+1, and A is a square matrix
containing transition probabilities among categories during one time step.
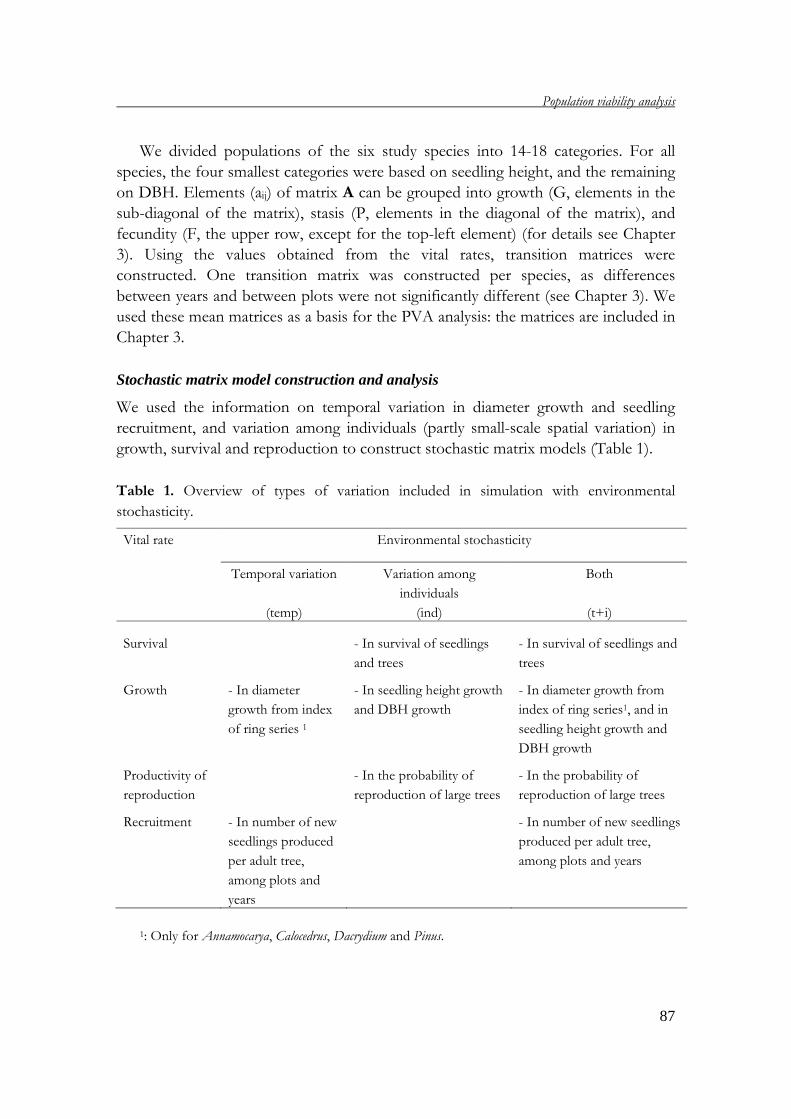
Population viability analysis
87
We divided populations of the six study species into 14-18 categories. For all
species, the four smallest categories were based on seedling height, and the remaining
on DBH. Elements (aij) of matrix A can be grouped into growth (G, elements in the
sub-diagonal of the matrix), stasis (P, elements in the diagonal of the matrix), and
fecundity (F, the upper row, except for the top-left element) (for details see Chapter
3). Using the values obtained from the vital rates, transition matrices were
constructed. One transition matrix was constructed per species, as differences
between years and between plots were not significantly different (see Chapter 3). We
used these mean matrices as a basis for the PVA analysis: the matrices are included in
Chapter 3.
Stochastic matrix model construction and analysis
We used the information on temporal variation in diameter growth and seedling
recruitment, and variation among individuals (partly small-scale spatial variation) in
growth, survival and reproduction to construct stochastic matrix models (Table 1).
Table 1. Overview of types of variation included in simulation with environmental
stochasticity. Vital rate Environmental stochasticity
Temporal variation
(temp)
Variation among
individuals
(ind)
Both
(t+i)
Survival - In survival of seedlings
and trees
- In survival of seedlings and
trees
Growth - In diameter
growth from index
of ring series 1
- In seedling height growth
and DBH growth
- In diameter growth from
index of ring series1, and in
seedling height growth and
DBH growth
Productivity of
reproduction
- In the probability of
reproduction of large trees
- In the probability of
reproduction of large trees
Recruitment - In number of new
seedlings produced
per adult tree,
among plots and
years
- In number of new seedlings
produced per adult tree,
among plots and years
1: Only for Annamocarya, Calocedrus, Dacrydium and Pinus.
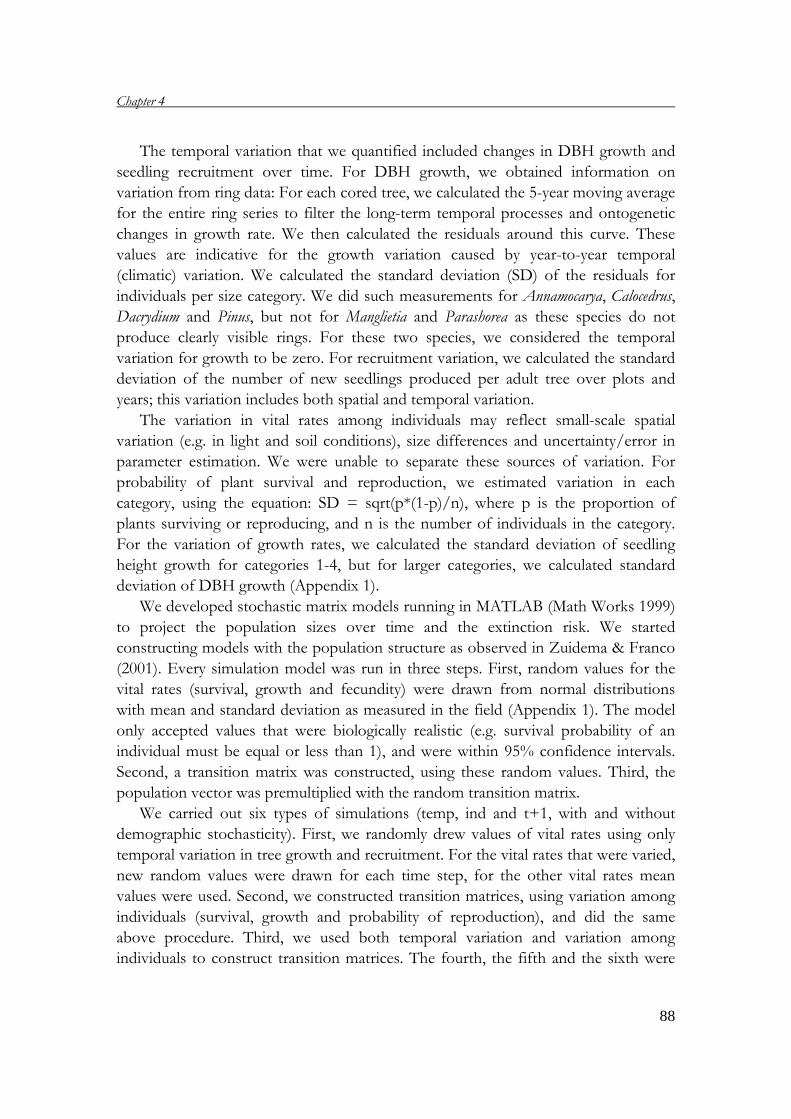
Chapter 4
88
The temporal variation that we quantified included changes in DBH growth and
seedling recruitment over time. For DBH growth, we obtained information on
variation from ring data: For each cored tree, we calculated the 5-year moving average
for the entire ring series to filter the long-term temporal processes and ontogenetic
changes in growth rate. We then calculated the residuals around this curve. These
values are indicative for the growth variation caused by year-to-year temporal
(climatic) variation. We calculated the standard deviation (SD) of the residuals for
individuals per size category. We did such measurements for Annamocarya, Calocedrus,
Dacrydium and Pinus, but not for Manglietia and Parashorea as these species do not
produce clearly visible rings. For these two species, we considered the temporal
variation for growth to be zero. For recruitment variation, we calculated the standard
deviation of the number of new seedlings produced per adult tree over plots and
years; this variation includes both spatial and temporal variation.
The variation in vital rates among individuals may reflect small-scale spatial
variation (e.g. in light and soil conditions), size differences and uncertainty/error in
parameter estimation. We were unable to separate these sources of variation. For
probability of plant survival and reproduction, we estimated variation in each
category, using the equation: SD = sqrt(p*(1-p)/n), where p is the proportion of
plants surviving or reproducing, and n is the number of individuals in the category.
For the variation of growth rates, we calculated the standard deviation of seedling
height growth for categories 1-4, but for larger categories, we calculated standard
deviation of DBH growth (Appendix 1).
We developed stochastic matrix models running in MATLAB (Math Works 1999)
to project the population sizes over time and the extinction risk. We started
constructing models with the population structure as observed in Zuidema & Franco
(2001). Every simulation model was run in three steps. First, random values for the
vital rates (survival, growth and fecundity) were drawn from normal distributions
with mean and standard deviation as measured in the field (Appendix 1). The model
only accepted values that were biologically realistic (e.g. survival probability of an
individual must be equal or less than 1), and were within 95% confidence intervals.
Second, a transition matrix was constructed, using these random values. Third, the
population vector was premultiplied with the random transition matrix.
We carried out six types of simulations (temp, ind and t+1, with and without
demographic stochasticity). First, we randomly drew values of vital rates using only
temporal variation in tree growth and recruitment. For the vital rates that were varied,
new random values were drawn for each time step, for the other vital rates mean
values were used. Second, we constructed transition matrices, using variation among
individuals (survival, growth and probability of reproduction), and did the same
above procedure. Third, we used both temporal variation and variation among
individuals to construct transition matrices. The fourth, the fifth and the sixth were
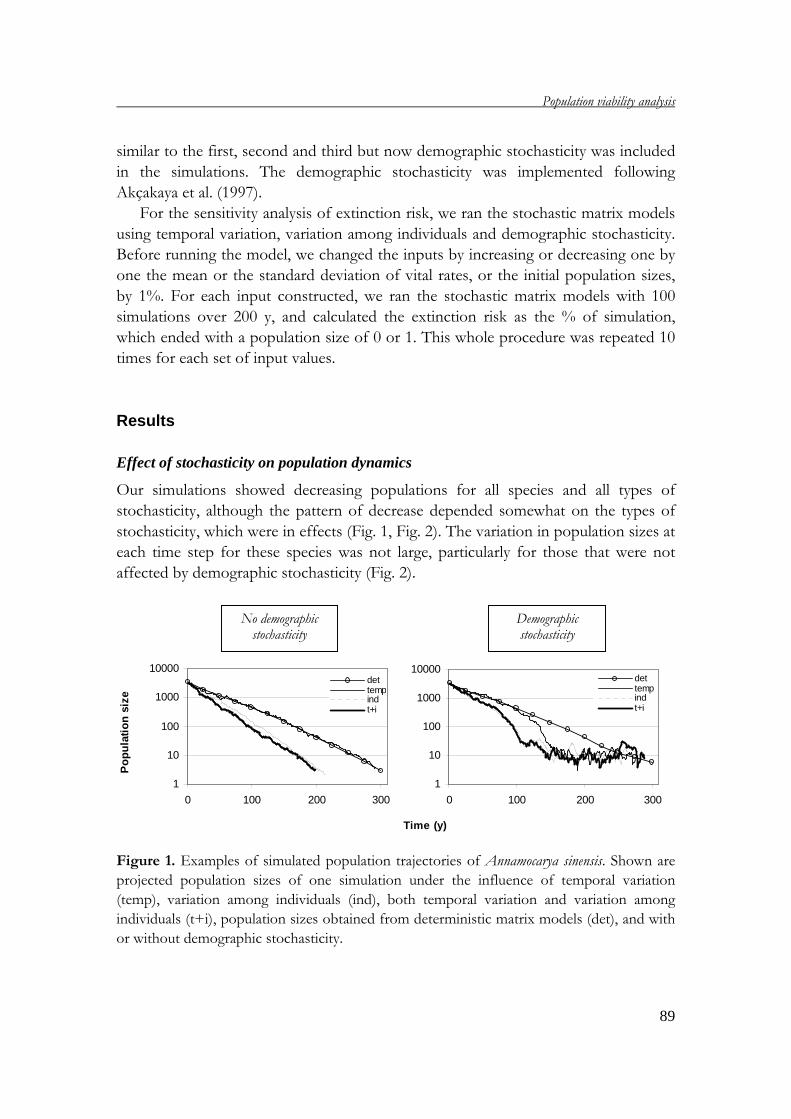
Population viability analysis
89
similar to the first, second and third but now demographic stochasticity was included
in the simulations. The demographic stochasticity was implemented following
Akçakaya et al. (1997).
For the sensitivity analysis of extinction risk, we ran the stochastic matrix models
using temporal variation, variation among individuals and demographic stochasticity.
Before running the model, we changed the inputs by increasing or decreasing one by
one the mean or the standard deviation of vital rates, or the initial population sizes,
by 1%. For each input constructed, we ran the stochastic matrix models with 100
simulations over 200 y, and calculated the extinction risk as the % of simulation,
which ended with a population size of 0 or 1. This whole procedure was repeated 10
times for each set of input values.
Results Effect of stochasticity on population dynamics
Our simulations showed decreasing populations for all species and all types of
stochasticity, although the pattern of decrease depended somewhat on the types of
stochasticity, which were in effects (Fig. 1, Fig. 2). The variation in population sizes at
each time step for these species was not large, particularly for those that were not
affected by demographic stochasticity (Fig. 2). Figure 1. Examples of simulated population trajectories of Annamocarya sinensis. Shown are
projected population sizes of one simulation under the influence of temporal variation
(temp), variation among individuals (ind), both temporal variation and variation among
individuals (t+i), population sizes obtained from deterministic matrix models (det), and with
or without demographic stochasticity.
No demographic stochasticity
Demographic stochasticity
1
10
100
1000
10000
0 100 200 300
dettempindt+i
1
10
100
1000
10000
0 100 200 300
dettempindt+i
Time (y)
Po
pu
lati
on
siz
e
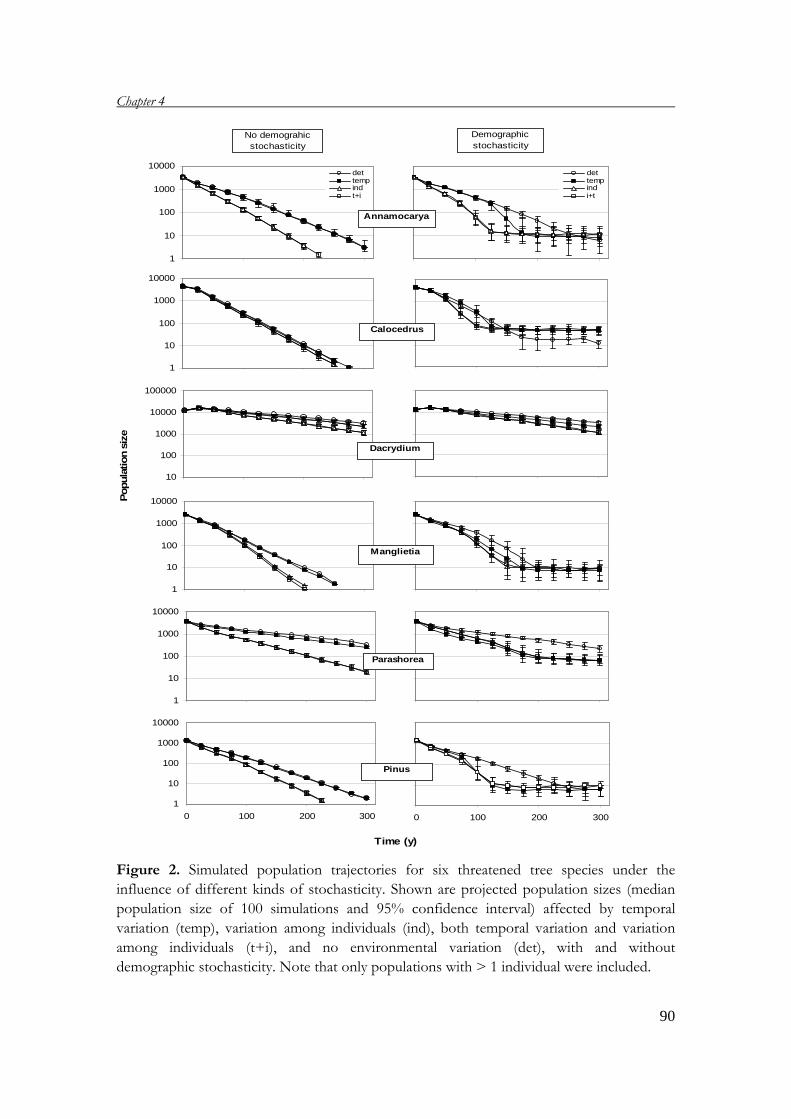
Chapter 4
90
Figure 2. Simulated population trajectories for six threatened tree species under the
influence of different kinds of stochasticity. Shown are projected population sizes (median
population size of 100 simulations and 95% confidence interval) affected by temporal
variation (temp), variation among individuals (ind), both temporal variation and variation
among individuals (t+i), and no environmental variation (det), with and without
demographic stochasticity. Note that only populations with > 1 individual were included.
Time (y)
Pop
ula
tion
size
1
10
100
1000
10000
Calocedrus
No demograhic stochasticity
Demographic stochasticity
10
100
1000
10000
100000
1
10
100
1000
10000
Parashorea
0 100 200 300
1
10
100
1000
10000
0 100 200 300
Pinus
1
10
100
1000
10000
Manglietia
Dacrydium
1
10
100
1000
10000dettempindt+i
dettempindi+t
Annamocarya
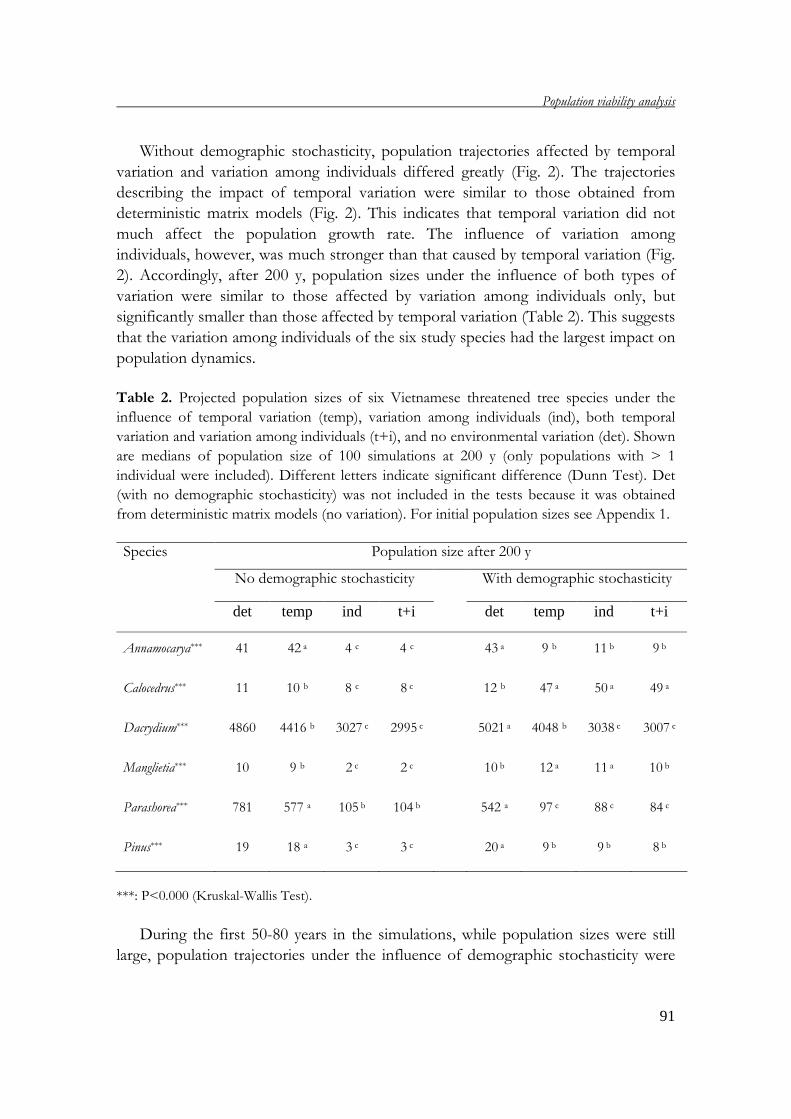
Population viability analysis
91
Without demographic stochasticity, population trajectories affected by temporal
variation and variation among individuals differed greatly (Fig. 2). The trajectories
describing the impact of temporal variation were similar to those obtained from
deterministic matrix models (Fig. 2). This indicates that temporal variation did not
much affect the population growth rate. The influence of variation among
individuals, however, was much stronger than that caused by temporal variation (Fig.
2). Accordingly, after 200 y, population sizes under the influence of both types of
variation were similar to those affected by variation among individuals only, but
significantly smaller than those affected by temporal variation (Table 2). This suggests
that the variation among individuals of the six study species had the largest impact on
population dynamics.
Table 2. Projected population sizes of six Vietnamese threatened tree species under the
influence of temporal variation (temp), variation among individuals (ind), both temporal
variation and variation among individuals (t+i), and no environmental variation (det). Shown
are medians of population size of 100 simulations at 200 y (only populations with > 1
individual were included). Different letters indicate significant difference (Dunn Test). Det
(with no demographic stochasticity) was not included in the tests because it was obtained
from deterministic matrix models (no variation). For initial population sizes see Appendix 1.
Species Population size after 200 y
No demographic stochasticity With demographic stochasticity
det temp ind t+i det temp ind t+i
Annamocarya*** 41 42
a 4 c
4 c 43
a 9 b
11 b
9 b
Calocedrus*** 11 10 b
8 c
8 c
12 b 47 a
50 a 49 a
Dacrydium*** 4860 4416 b
3027 c
2995 c
5021 a 4048 b
3038 c
3007 c
Manglietia*** 10 9 b 2 c 2 c
10 b 12 a
11 a
10 b
Parashorea***
781 577 a
105 b
104 b
542 a
97 c
88 c
84 c
Pinus***
19 18 a
3 c
3 c
20 a
9 b
9 b
8 b
***: P<0.000 (Kruskal-Wallis Test).
During the first 50-80 years in the simulations, while population sizes were still
large, population trajectories under the influence of demographic stochasticity were
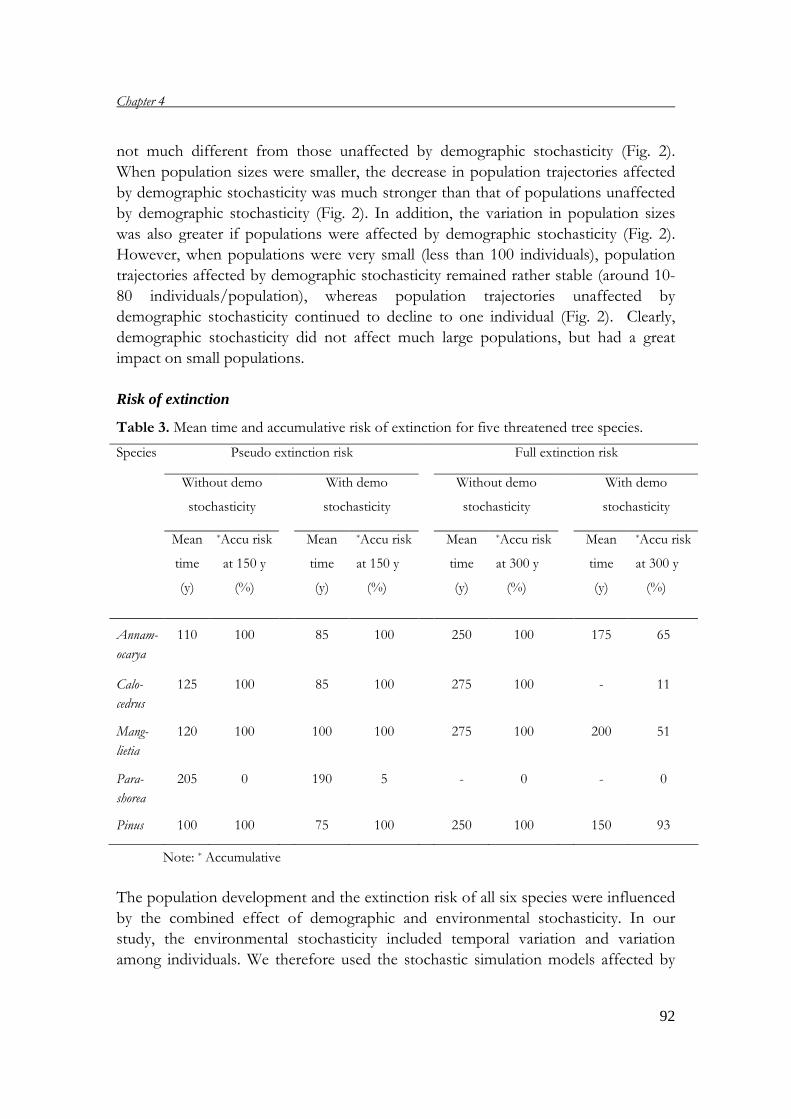
Chapter 4
92
not much different from those unaffected by demographic stochasticity (Fig. 2).
When population sizes were smaller, the decrease in population trajectories affected
by demographic stochasticity was much stronger than that of populations unaffected
by demographic stochasticity (Fig. 2). In addition, the variation in population sizes
was also greater if populations were affected by demographic stochasticity (Fig. 2).
However, when populations were very small (less than 100 individuals), population
trajectories affected by demographic stochasticity remained rather stable (around 10-
80 individuals/population), whereas population trajectories unaffected by
demographic stochasticity continued to decline to one individual (Fig. 2). Clearly,
demographic stochasticity did not affect much large populations, but had a great
impact on small populations.
Risk of extinction
Table 3. Mean time and accumulative risk of extinction for five threatened tree species.
Species Pseudo extinction risk Full extinction risk
Without demo
stochasticity
With demo
stochasticity
Without demo
stochasticity
With demo
stochasticity
Mean
time
(y)
*Accu risk
at 150 y
(%)
Mean
time
(y)
*Accu risk
at 150 y
(%)
Mean
time
(y)
*Accu risk
at 300 y
(%)
Mean
time
(y)
*Accu risk
at 300 y
(%)
Annam- 110 100 85 100 250 100 175 65
ocarya
Calo- 125 100 85 100 275 100 - 11
cedrus Mang- 120 100 100 100 275 100 200 51
lietia Para- 205 0 190 5 - 0 - 0
shorea Pinus 100 100 75 100 250 100 150 93
Note: * Accumulative
The population development and the extinction risk of all six species were influenced
by the combined effect of demographic and environmental stochasticity. In our
study, the environmental stochasticity included temporal variation and variation
among individuals. We therefore used the stochastic simulation models affected by
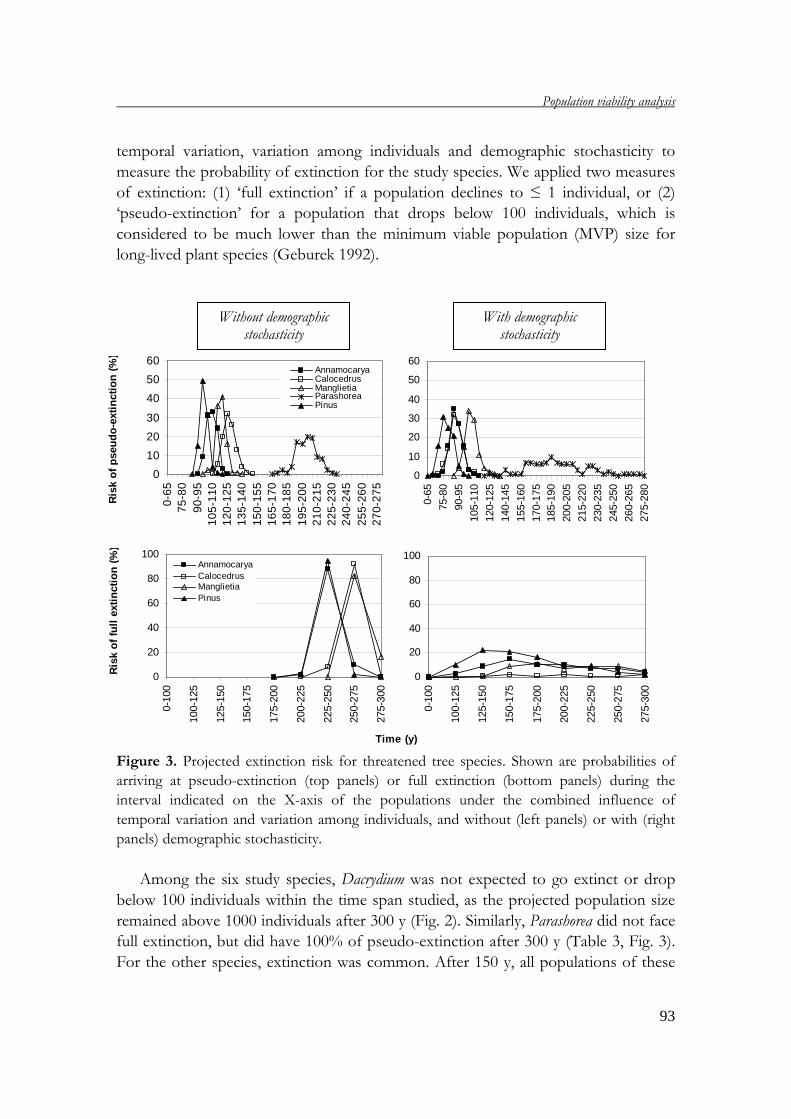
Population viability analysis
93
temporal variation, variation among individuals and demographic stochasticity to
measure the probability of extinction for the study species. We applied two measures
of extinction: (1) ‘full extinction’ if a population declines to ≤ 1 individual, or (2)
‘pseudo-extinction’ for a population that drops below 100 individuals, which is
considered to be much lower than the minimum viable population (MVP) size for
long-lived plant species (Geburek 1992).
Figure 3. Projected extinction risk for threatened tree species. Shown are probabilities of
arriving at pseudo-extinction (top panels) or full extinction (bottom panels) during the
interval indicated on the X-axis of the populations under the combined influence of
temporal variation and variation among individuals, and without (left panels) or with (right
panels) demographic stochasticity.
Among the six study species, Dacrydium was not expected to go extinct or drop
below 100 individuals within the time span studied, as the projected population size
remained above 1000 individuals after 300 y (Fig. 2). Similarly, Parashorea did not face
full extinction, but did have 100% of pseudo-extinction after 300 y (Table 3, Fig. 3).
For the other species, extinction was common. After 150 y, all populations of these
Without demographic stochasticity
With demographic stochasticity
0
20
40
60
80
100
0-10
0
100-
125
125-
150
150-
175
175-
200
200-
225
225-
250
250-
275
275-
300
Ris
k o
f fu
ll e
xtin
ctio
n (
%)
Time (y)
0
20
40
60
80
100
0-10
0
100-
125
125-
150
150-
175
175-
200
200-
225
225-
250
250-
275
275-
300
AnnamocaryaCalocedrusManglietiaPinus
Ris
k o
f p
seu
do
-ext
inct
ion
(%
)
0
10
20
30
40
50
60
0-65
75-8
090
-95
105-
110
120-
125
135-
140
150-
155
165-
170
180-
185
195-
200
210-
215
225-
230
240-
245
255-
260
270-
275
AnnamocaryaCalocedrusManglietiaParashoreaPinus
0
10
20
30
40
50
60
0-65
75-8
0
90-9
5
105-
110
120-
125
140-
145
155-
160
170-
175
185-
190
200-
205
215-
220
230-
235
245-
250
260-
265
275-
280
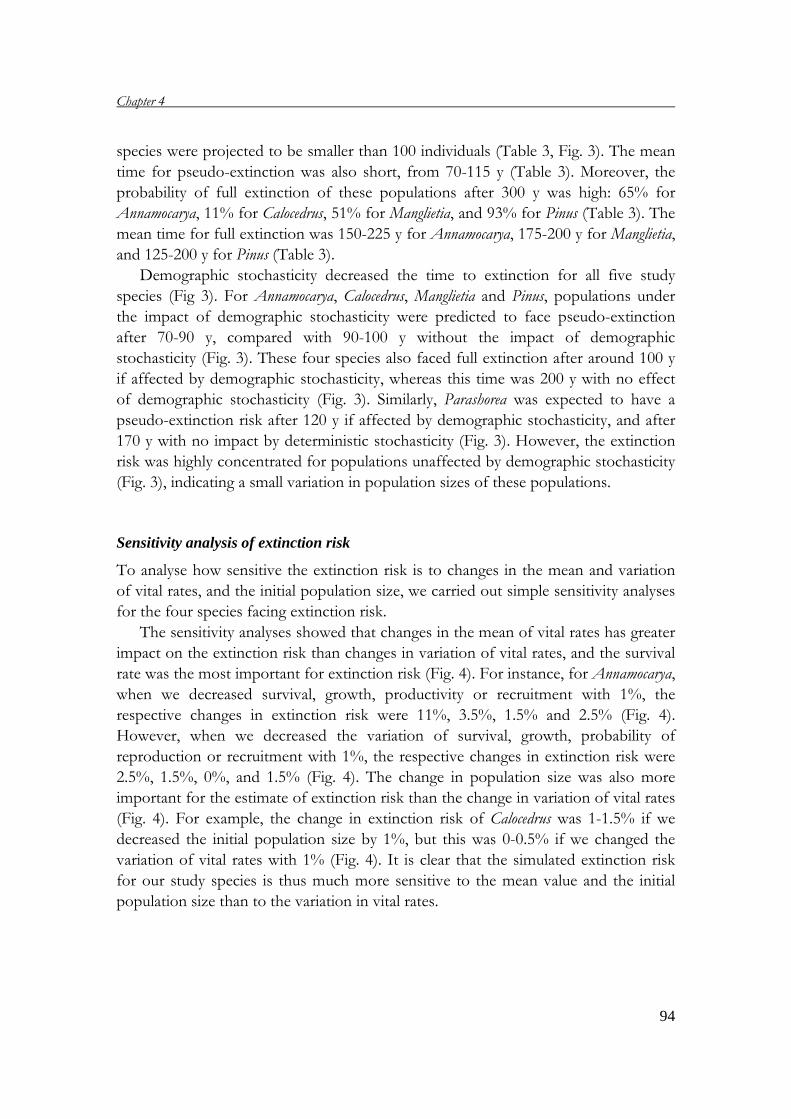
Chapter 4
94
species were projected to be smaller than 100 individuals (Table 3, Fig. 3). The mean
time for pseudo-extinction was also short, from 70-115 y (Table 3). Moreover, the
probability of full extinction of these populations after 300 y was high: 65% for
Annamocarya, 11% for Calocedrus, 51% for Manglietia, and 93% for Pinus (Table 3). The
mean time for full extinction was 150-225 y for Annamocarya, 175-200 y for Manglietia,
and 125-200 y for Pinus (Table 3).
Demographic stochasticity decreased the time to extinction for all five study
species (Fig 3). For Annamocarya, Calocedrus, Manglietia and Pinus, populations under
the impact of demographic stochasticity were predicted to face pseudo-extinction
after 70-90 y, compared with 90-100 y without the impact of demographic
stochasticity (Fig. 3). These four species also faced full extinction after around 100 y
if affected by demographic stochasticity, whereas this time was 200 y with no effect
of demographic stochasticity (Fig. 3). Similarly, Parashorea was expected to have a
pseudo-extinction risk after 120 y if affected by demographic stochasticity, and after
170 y with no impact by deterministic stochasticity (Fig. 3). However, the extinction
risk was highly concentrated for populations unaffected by demographic stochasticity
(Fig. 3), indicating a small variation in population sizes of these populations.
Sensitivity analysis of extinction risk
To analyse how sensitive the extinction risk is to changes in the mean and variation
of vital rates, and the initial population size, we carried out simple sensitivity analyses
for the four species facing extinction risk.
The sensitivity analyses showed that changes in the mean of vital rates has greater
impact on the extinction risk than changes in variation of vital rates, and the survival
rate was the most important for extinction risk (Fig. 4). For instance, for Annamocarya,
when we decreased survival, growth, productivity or recruitment with 1%, the
respective changes in extinction risk were 11%, 3.5%, 1.5% and 2.5% (Fig. 4).
However, when we decreased the variation of survival, growth, probability of
reproduction or recruitment with 1%, the respective changes in extinction risk were
2.5%, 1.5%, 0%, and 1.5% (Fig. 4). The change in population size was also more
important for the estimate of extinction risk than the change in variation of vital rates
(Fig. 4). For example, the change in extinction risk of Calocedrus was 1-1.5% if we
decreased the initial population size by 1%, but this was 0-0.5% if we changed the
variation of vital rates with 1% (Fig. 4). It is clear that the simulated extinction risk
for our study species is thus much more sensitive to the mean value and the initial
population size than to the variation in vital rates.
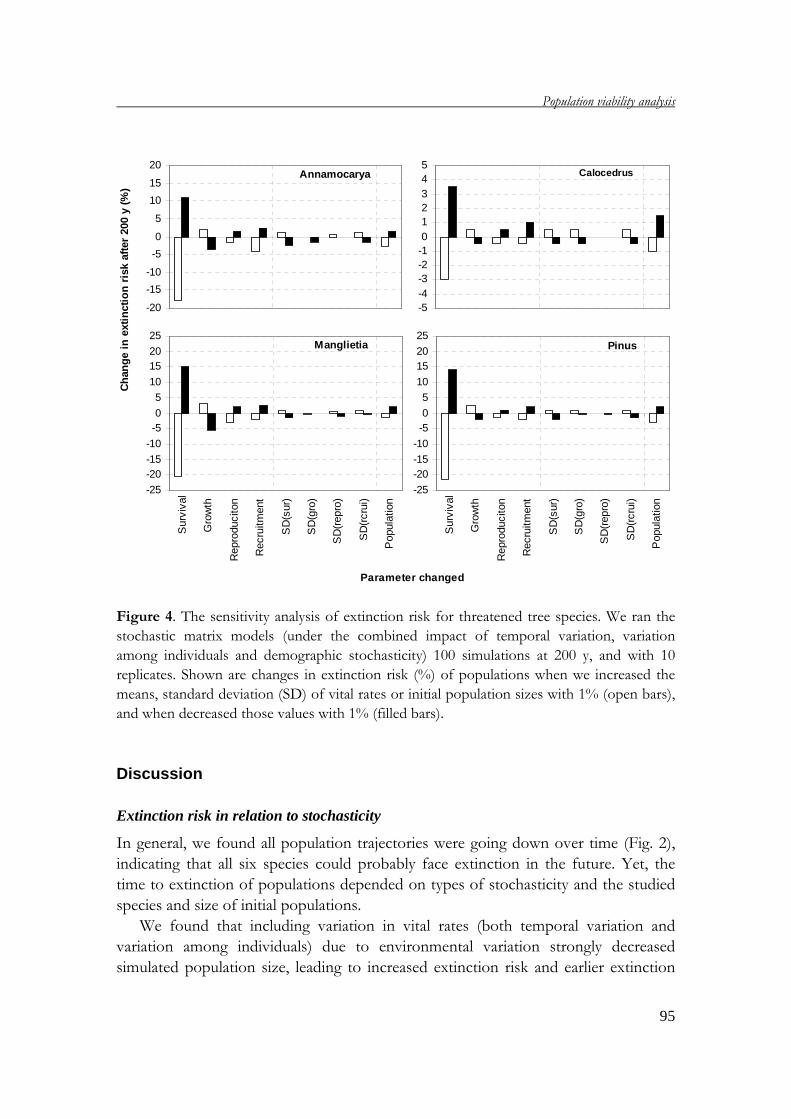
Population viability analysis
95
Figure 4. The sensitivity analysis of extinction risk for threatened tree species. We ran the
stochastic matrix models (under the combined impact of temporal variation, variation
among individuals and demographic stochasticity) 100 simulations at 200 y, and with 10
replicates. Shown are changes in extinction risk (%) of populations when we increased the
means, standard deviation (SD) of vital rates or initial population sizes with 1% (open bars),
and when decreased those values with 1% (filled bars).
Discussion Extinction risk in relation to stochasticity
In general, we found all population trajectories were going down over time (Fig. 2),
indicating that all six species could probably face extinction in the future. Yet, the
time to extinction of populations depended on types of stochasticity and the studied
species and size of initial populations.
We found that including variation in vital rates (both temporal variation and
variation among individuals) due to environmental variation strongly decreased
simulated population size, leading to increased extinction risk and earlier extinction
Annamocarya
-20
-15
-10
-5
0
5
10
15
20Calocedrus
-5-4-3-2-1012345
Manglietia
-25
-20-15
-10
-50
5
10
1520
25
Sur
viva
l
Gro
wth
Rep
rodu
cito
n
Rec
ruitm
ent
SD
(sur
)
SD
(gro
)
SD
(rep
ro)
SD
(rcr
ui)
Pop
ulat
ion
Pinus
-25
-20-15
-10
-50
5
10
1520
25
Sur
viva
l
Gro
wth
Rep
rodu
cito
n
Rec
ruitm
ent
SD
(sur
)
SD
(gro
)
SD
(rep
ro)
SD
(rcr
ui)
Pop
ulat
ion
Ch
ang
e in
ext
inct
ion
ris
k af
ter
200
y (%
)
Parameter changed
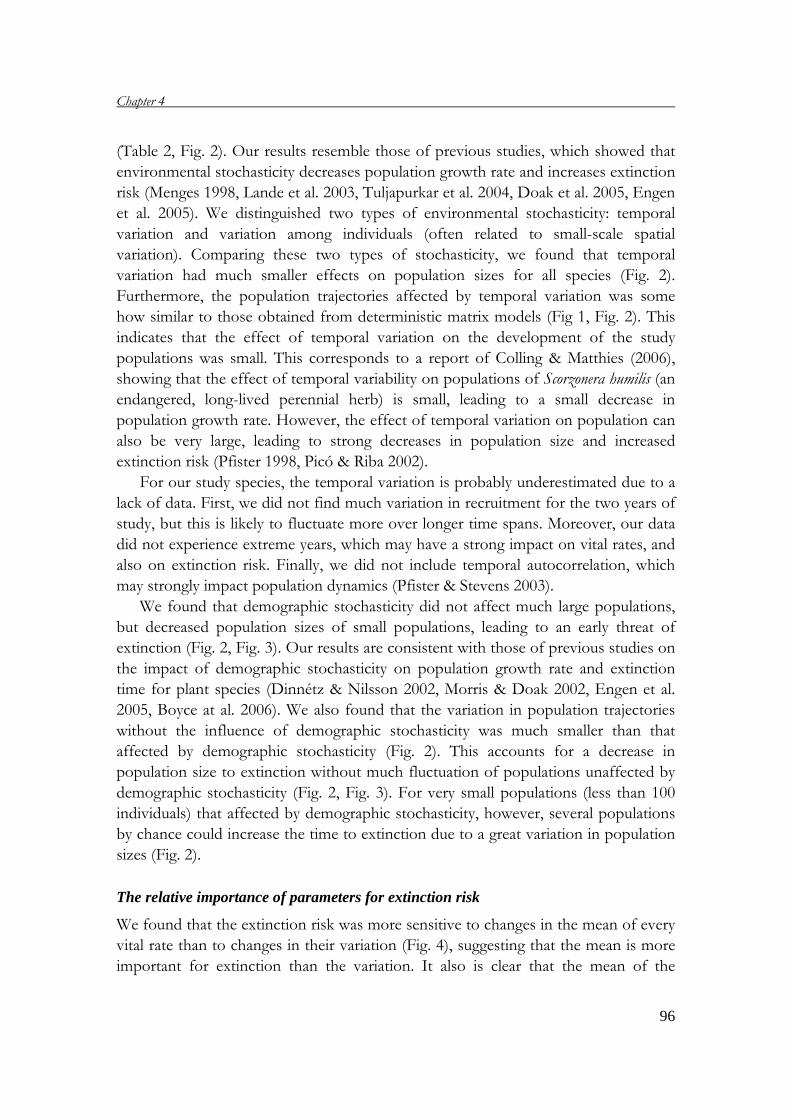
Chapter 4
96
(Table 2, Fig. 2). Our results resemble those of previous studies, which showed that
environmental stochasticity decreases population growth rate and increases extinction
risk (Menges 1998, Lande et al. 2003, Tuljapurkar et al. 2004, Doak et al. 2005, Engen
et al. 2005). We distinguished two types of environmental stochasticity: temporal
variation and variation among individuals (often related to small-scale spatial
variation). Comparing these two types of stochasticity, we found that temporal
variation had much smaller effects on population sizes for all species (Fig. 2).
Furthermore, the population trajectories affected by temporal variation was some
how similar to those obtained from deterministic matrix models (Fig 1, Fig. 2). This
indicates that the effect of temporal variation on the development of the study
populations was small. This corresponds to a report of Colling & Matthies (2006),
showing that the effect of temporal variability on populations of Scorzonera humilis (an
endangered, long-lived perennial herb) is small, leading to a small decrease in
population growth rate. However, the effect of temporal variation on population can
also be very large, leading to strong decreases in population size and increased
extinction risk (Pfister 1998, Picó & Riba 2002).
For our study species, the temporal variation is probably underestimated due to a
lack of data. First, we did not find much variation in recruitment for the two years of
study, but this is likely to fluctuate more over longer time spans. Moreover, our data
did not experience extreme years, which may have a strong impact on vital rates, and
also on extinction risk. Finally, we did not include temporal autocorrelation, which
may strongly impact population dynamics (Pfister & Stevens 2003).
We found that demographic stochasticity did not affect much large populations,
but decreased population sizes of small populations, leading to an early threat of
extinction (Fig. 2, Fig. 3). Our results are consistent with those of previous studies on
the impact of demographic stochasticity on population growth rate and extinction
time for plant species (Dinnétz & Nilsson 2002, Morris & Doak 2002, Engen et al.
2005, Boyce at al. 2006). We also found that the variation in population trajectories
without the influence of demographic stochasticity was much smaller than that
affected by demographic stochasticity (Fig. 2). This accounts for a decrease in
population size to extinction without much fluctuation of populations unaffected by
demographic stochasticity (Fig. 2, Fig. 3). For very small populations (less than 100
individuals) that affected by demographic stochasticity, however, several populations
by chance could increase the time to extinction due to a great variation in population
sizes (Fig. 2).
The relative importance of parameters for extinction risk
We found that the extinction risk was more sensitive to changes in the mean of every
vital rate than to changes in their variation (Fig. 4), suggesting that the mean is more
important for extinction than the variation. It also is clear that the mean of the
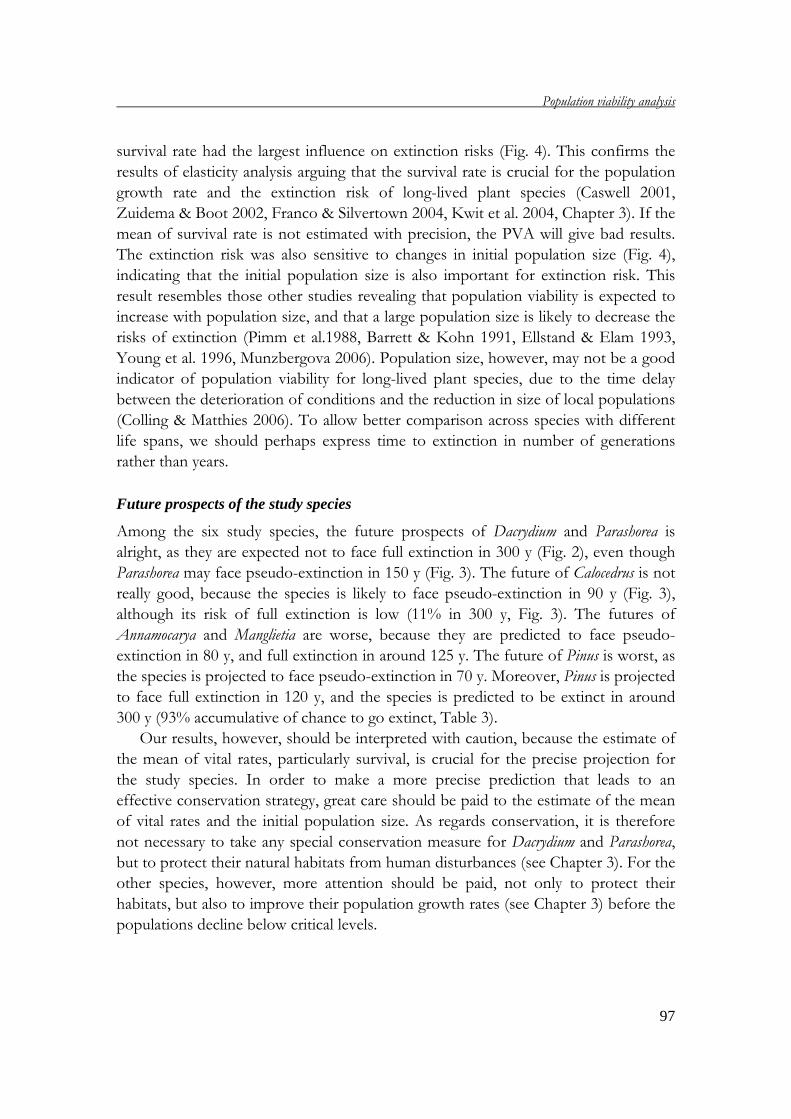
Population viability analysis
97
survival rate had the largest influence on extinction risks (Fig. 4). This confirms the
results of elasticity analysis arguing that the survival rate is crucial for the population
growth rate and the extinction risk of long-lived plant species (Caswell 2001,
Zuidema & Boot 2002, Franco & Silvertown 2004, Kwit et al. 2004, Chapter 3). If the
mean of survival rate is not estimated with precision, the PVA will give bad results.
The extinction risk was also sensitive to changes in initial population size (Fig. 4),
indicating that the initial population size is also important for extinction risk. This
result resembles those other studies revealing that population viability is expected to
increase with population size, and that a large population size is likely to decrease the
risks of extinction (Pimm et al.1988, Barrett & Kohn 1991, Ellstand & Elam 1993,
Young et al. 1996, Munzbergova 2006). Population size, however, may not be a good
indicator of population viability for long-lived plant species, due to the time delay
between the deterioration of conditions and the reduction in size of local populations
(Colling & Matthies 2006). To allow better comparison across species with different
life spans, we should perhaps express time to extinction in number of generations
rather than years.
Future prospects of the study species
Among the six study species, the future prospects of Dacrydium and Parashorea is
alright, as they are expected not to face full extinction in 300 y (Fig. 2), even though
Parashorea may face pseudo-extinction in 150 y (Fig. 3). The future of Calocedrus is not
really good, because the species is likely to face pseudo-extinction in 90 y (Fig. 3),
although its risk of full extinction is low (11% in 300 y, Fig. 3). The futures of
Annamocarya and Manglietia are worse, because they are predicted to face pseudo-
extinction in 80 y, and full extinction in around 125 y. The future of Pinus is worst, as
the species is projected to face pseudo-extinction in 70 y. Moreover, Pinus is projected
to face full extinction in 120 y, and the species is predicted to be extinct in around
300 y (93% accumulative of chance to go extinct, Table 3).
Our results, however, should be interpreted with caution, because the estimate of
the mean of vital rates, particularly survival, is crucial for the precise projection for
the study species. In order to make a more precise prediction that leads to an
effective conservation strategy, great care should be paid to the estimate of the mean
of vital rates and the initial population size. As regards conservation, it is therefore
not necessary to take any special conservation measure for Dacrydium and Parashorea,
but to protect their natural habitats from human disturbances (see Chapter 3). For the
other species, however, more attention should be paid, not only to protect their
habitats, but also to improve their population growth rates (see Chapter 3) before the
populations decline below critical levels.
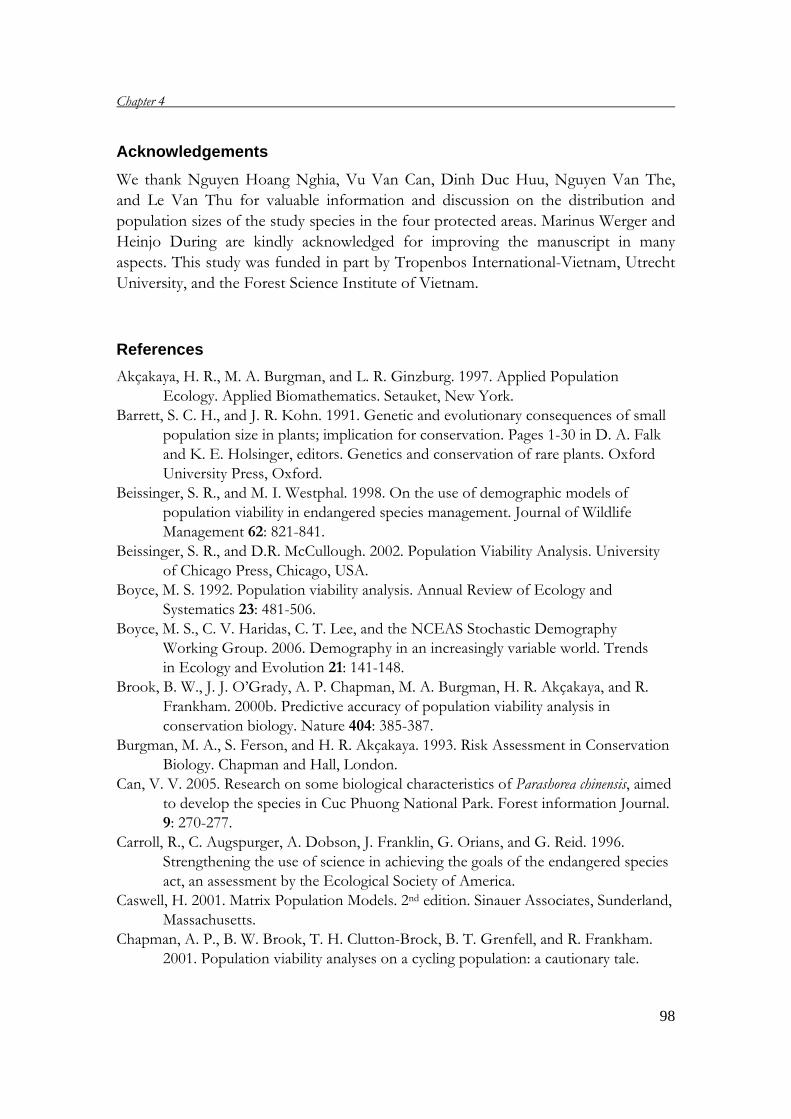
Chapter 4
98
Acknowledgements
We thank Nguyen Hoang Nghia, Vu Van Can, Dinh Duc Huu, Nguyen Van The,
and Le Van Thu for valuable information and discussion on the distribution and
population sizes of the study species in the four protected areas. Marinus Werger and
Heinjo During are kindly acknowledged for improving the manuscript in many
aspects. This study was funded in part by Tropenbos International-Vietnam, Utrecht
University, and the Forest Science Institute of Vietnam.
References
Akçakaya, H. R., M. A. Burgman, and L. R. Ginzburg. 1997. Applied Population
Ecology. Applied Biomathematics. Setauket, New York.
Barrett, S. C. H., and J. R. Kohn. 1991. Genetic and evolutionary consequences of small
population size in plants; implication for conservation. Pages 1-30 in D. A. Falk
and K. E. Holsinger, editors. Genetics and conservation of rare plants. Oxford
University Press, Oxford.
Beissinger, S. R., and M. I. Westphal. 1998. On the use of demographic models of
population viability in endangered species management. Journal of Wildlife
Management 62: 821-841.
Beissinger, S. R., and D.R. McCullough. 2002. Population Viability Analysis. University
of Chicago Press, Chicago, USA.
Boyce, M. S. 1992. Population viability analysis. Annual Review of Ecology and
Systematics 23: 481-506.
Boyce, M. S., C. V. Haridas, C. T. Lee, and the NCEAS Stochastic Demography
Working Group. 2006. Demography in an increasingly variable world. Trends
in Ecology and Evolution 21: 141-148.
Brook, B. W., J. J. O’Grady, A. P. Chapman, M. A. Burgman, H. R. Akçakaya, and R.
Frankham. 2000b. Predictive accuracy of population viability analysis in
conservation biology. Nature 404: 385-387.
Burgman, M. A., S. Ferson, and H. R. Akçakaya. 1993. Risk Assessment in Conservation
Biology. Chapman and Hall, London.
Can, V. V. 2005. Research on some biological characteristics of Parashorea chinensis, aimed
to develop the species in Cuc Phuong National Park. Forest information Journal.
9: 270-277.
Carroll, R., C. Augspurger, A. Dobson, J. Franklin, G. Orians, and G. Reid. 1996.
Strengthening the use of science in achieving the goals of the endangered species
act, an assessment by the Ecological Society of America.
Caswell, H. 2001. Matrix Population Models. 2nd edition. Sinauer Associates, Sunderland,
Massachusetts.
Chapman, A. P., B. W. Brook, T. H. Clutton-Brock, B. T. Grenfell, and R. Frankham.
2001. Population viability analyses on a cycling population: a cautionary tale.
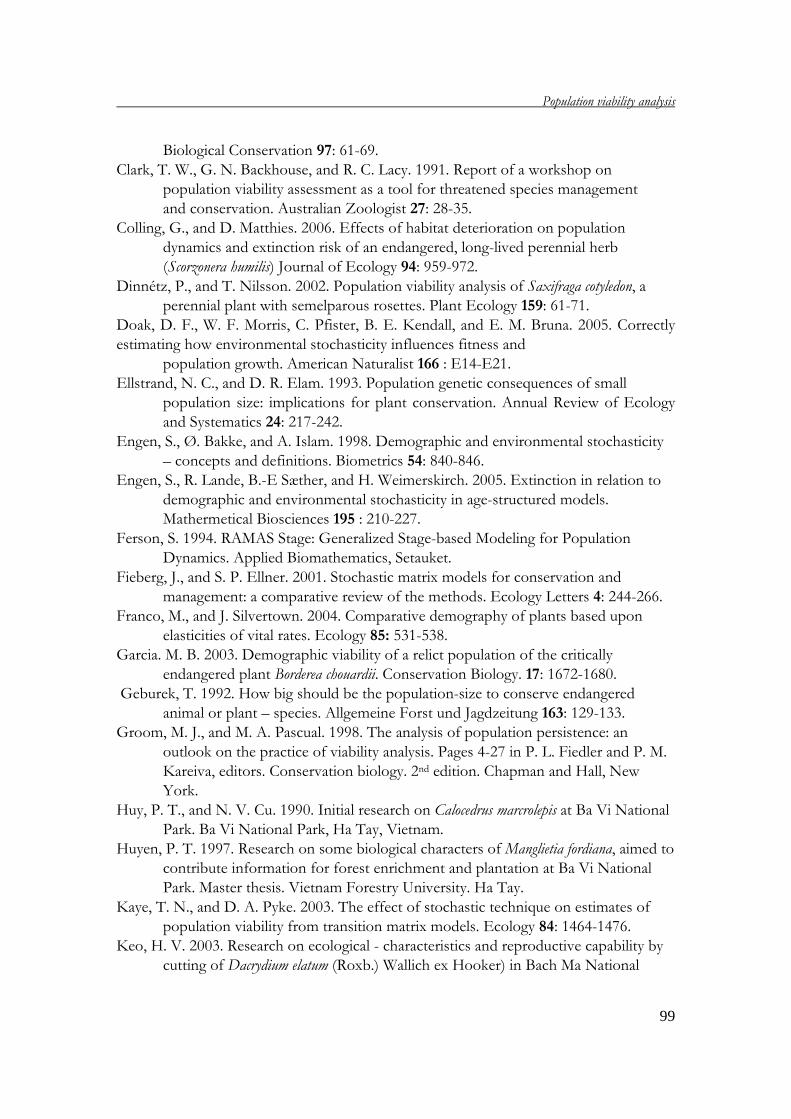
Population viability analysis
99
Biological Conservation 97: 61-69.
Clark, T. W., G. N. Backhouse, and R. C. Lacy. 1991. Report of a workshop on
population viability assessment as a tool for threatened species management
and conservation. Australian Zoologist 27: 28-35.
Colling, G., and D. Matthies. 2006. Effects of habitat deterioration on population
dynamics and extinction risk of an endangered, long-lived perennial herb
(Scorzonera humilis) Journal of Ecology 94: 959-972.
Dinnétz, P., and T. Nilsson. 2002. Population viability analysis of Saxifraga cotyledon, a
perennial plant with semelparous rosettes. Plant Ecology 159: 61-71.
Doak, D. F., W. F. Morris, C. Pfister, B. E. Kendall, and E. M. Bruna. 2005. Correctly
estimating how environmental stochasticity influences fitness and
population growth. American Naturalist 166 : E14-E21.
Ellstrand, N. C., and D. R. Elam. 1993. Population genetic consequences of small
population size: implications for plant conservation. Annual Review of Ecology
and Systematics 24: 217-242.
Engen, S., Ø. Bakke, and A. Islam. 1998. Demographic and environmental stochasticity
– concepts and definitions. Biometrics 54: 840-846.
Engen, S., R. Lande, B.-E Sæther, and H. Weimerskirch. 2005. Extinction in relation to
demographic and environmental stochasticity in age-structured models.
Mathermetical Biosciences 195 : 210-227.
Ferson, S. 1994. RAMAS Stage: Generalized Stage-based Modeling for Population
Dynamics. Applied Biomathematics, Setauket.
Fieberg, J., and S. P. Ellner. 2001. Stochastic matrix models for conservation and
management: a comparative review of the methods. Ecology Letters 4: 244-266.
Franco, M., and J. Silvertown. 2004. Comparative demography of plants based upon
elasticities of vital rates. Ecology 85: 531-538.
Garcia. M. B. 2003. Demographic viability of a relict population of the critically
endangered plant Borderea chouardii. Conservation Biology. 17: 1672-1680.
Geburek, T. 1992. How big should be the population-size to conserve endangered
animal or plant – species. Allgemeine Forst und Jagdzeitung 163: 129-133.
Groom, M. J., and M. A. Pascual. 1998. The analysis of population persistence: an
outlook on the practice of viability analysis. Pages 4-27 in P. L. Fiedler and P. M.
Kareiva, editors. Conservation biology. 2nd edition. Chapman and Hall, New
York.
Huy, P. T., and N. V. Cu. 1990. Initial research on Calocedrus marcrolepis at Ba Vi National
Park. Ba Vi National Park, Ha Tay, Vietnam.
Huyen, P. T. 1997. Research on some biological characters of Manglietia fordiana, aimed to
contribute information for forest enrichment and plantation at Ba Vi National
Park. Master thesis. Vietnam Forestry University. Ha Tay.
Kaye, T. N., and D. A. Pyke. 2003. The effect of stochastic technique on estimates of
population viability from transition matrix models. Ecology 84: 1464-1476.
Keo, H. V. 2003. Research on ecological - characteristics and reproductive capability by
cutting of Dacrydium elatum (Roxb.) Wallich ex Hooker) in Bach Ma National
Chapter 4
100
Park. PhD thesis. Hue Science University, Hue.
Kwit, C., C. C. Horvitz, and W. J. Platt. 2004. Conserving slow-growing, long-lived tree
species: Input from the demography of a rare understory Conifer, Taxus floridana.
Conservation Biology 18: 432-443.
Lacy, R. C. 1993. VORTEX: a computer simulation model for population viability
analysis. Wildlife Research 20: 45-65.
Lande, R., S. Engen, and B.-E. Sæther. 2003. Stochastic Population Dynamics in Ecology
and Conservation. Oxford University Press, Oxford.
Math Work, Inc. 1999. MATLAB: the language of Technical Computing. Prentice Hall,
Upper Saddle River, New Jersey, USA.
Menges, E. S. 1998. Evaluating extinction risks in plant populations. Pages 59-65 in P. L.
Fiedler and P. M. Kareiva, editors. Conservation biology for the coming decade.
Chapman and Hall, New York, USA.
Menges, E. S. 2000. Application of population viability analysis in plant conservation.
Ecological Bulletins 48: 73-84.
Menges, E. S., and P. F. Quintana-Ascencio. 2003. Modeling the effects of disturbance,
spatial variation and environmental heterogeneity on population viability of
plants. Pages 288-311 in C. A. Brigham and M. W. Schwartz, editors. Population
viability in plants. Springer-Verlag, Heidelberg, Germany.
Miller, P. S., and R. C. Lacy. 1999. Vortex: A Stochastic Simulation of the Extinction
process. Version 8 User’s Manual. IUCN/SSC CBSG, Apple Valley, MN USA.
Ministry of Science, Technology and Environment (MSTE). 1996. Red Data Book of
Vietnam. Volume 2 – Plant. Science and Technics Publishing House, Ha Noi.
Morris, W. F., and D. F. Doak. 2002. Quantitative conservation biology: theory and
practice of population viability analysis. Sinauer Associates, Sunderland,
Massachusetts.
Munzbergova, Z. 2006. Effect of population size on the prospect of species survival.
Folia Geobotanica 41: 137-150.
Nghia. N. H. 2000. Some threatened tree species of Vietnam. Agricultural Publishing
House, Ha Noi.
Pfister, C. A. 1998. Patterns of variance in stage-structured populations: evolutionary
predictions and ecological implications. Proceedings of the National Academy
of Sciences of the United States of America 95: 213-218.
Pfister, C. A., and F. R. Stevens. 2003. Individual variation and environmental
stochasticity: implications for matrix model predictions. Ecology 84: 496-510.
Picó, X., and M. Riba. 2002. Regional-scale demography of Ramonda myconi: remnant
population dynamics in a preglacial relict species. Plant Ecology 161: 1-13.
Pimm, S. L., H. L. Jones, and J. Diamond. 1988. On the risk of extinction. American
Naturalist 132: 757-785.
Possingham, H. P., D. B. Lindenmayer, and T. W. Norton. 1993. A framework for
the improved management of threatened species based on population viability
analysis, PVA. Pacific Conservation Biology 1: 39-45.
Possingham, H. P., and I. Davies. 1995. ALEX: a model for the viability of spatially
Population viability analysis
101
structured populations. Biological Conservation 73: 143-150.
Reed, D. H., J. J. O’Grady, B. W. Brook, J. D. Ballou, and R. Frankham. 2003. Estimates
of minimum viable population sizes for vertebrates and factors influencing those
estimates. Biological Conservation 113: 23-34.
Shaffer, M. L. 1990. Population viability analysis. Conservation Biology 4: 39-40.
Thu, N. B., and V. V. Can. 1999. Cho Dai tree (Annamocarya sinensis). Agricultural
Publishing House, Ha Noi.
Tuljapurkar, S., C. C. Horvitz, and J. B. Pascarella. 2004. The many growth rates and
elasticities of populations in random environments. American Naturalist 164:
821-823.
Young, A., T. Boyle, and T. Brown. 1996. The population genetic consequences of
habitat fragmentation for plants. Trends in Ecology and Evolution 11: 413-418.
Zuidema, P. A., and M. Franco. 2001. Integrating vital rate variability into perturbation
analysis: an evaluation for matrix population models of six plant species. Journal
of Ecology 89: 995-1005.
Zuidema, P. A., and R. G. A. Boot. 2002. Demography of the Brazil nut tree (Bertholletia
excelsa) in the Bolivian Amazon: impact of seed extraction on recruitment and
population dynamics. Journal of Tropical Ecology 18: 1-31.
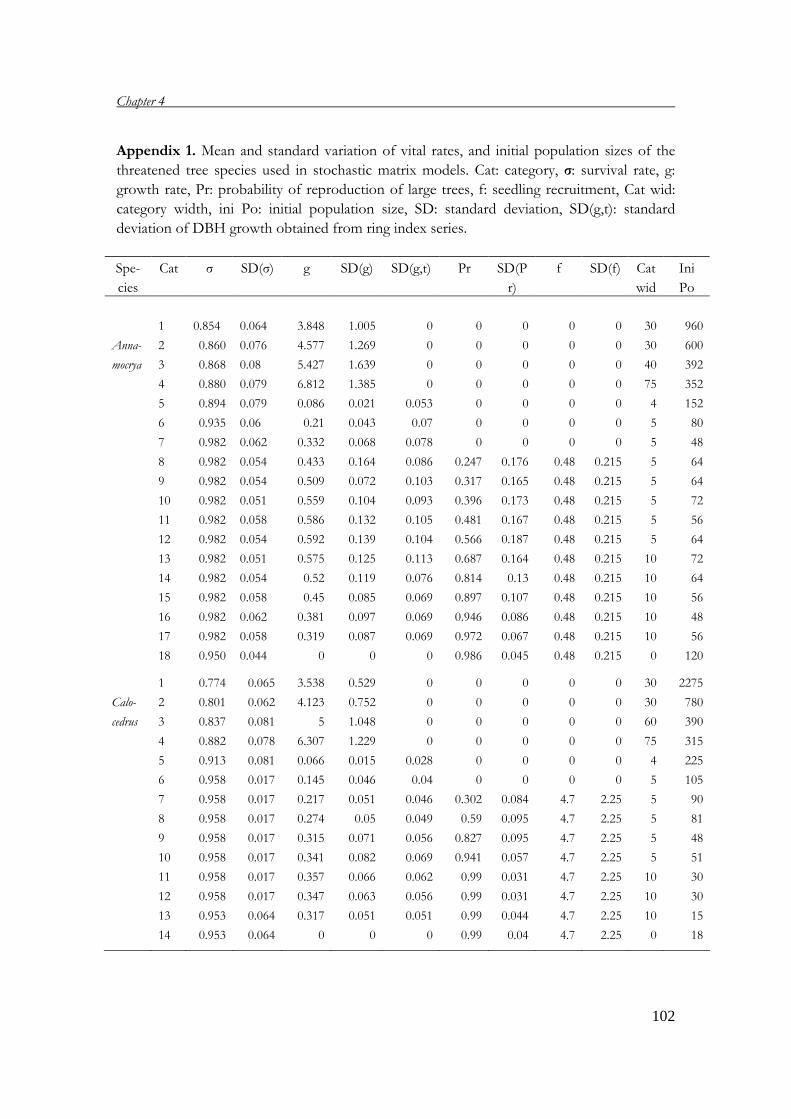
Chapter 4
102
Appendix 1. Mean and standard variation of vital rates, and initial population sizes of the
threatened tree species used in stochastic matrix models. Cat: category, σ: survival rate, g:
growth rate, Pr: probability of reproduction of large trees, f: seedling recruitment, Cat wid:
category width, ini Po: initial population size, SD: standard deviation, SD(g,t): standard
deviation of DBH growth obtained from ring index series.
Spe-
cies
Cat σ SD(σ) g SD(g) SD(g,t) Pr SD(P
r)
f SD(f) Cat
wid
Ini
Po
1 0.854
0.064 3.848 1.005 0 0 0 0 0 30 960
Anna- 2 0.860 0.076 4.577 1.269 0 0 0 0 0 30 600
mocrya 3 0.868 0.08 5.427 1.639 0 0 0 0 0 40 392
4 0.880 0.079 6.812 1.385 0 0 0 0 0 75 352
5 0.894 0.079 0.086 0.021 0.053 0 0 0 0 4 152
6 0.935 0.06 0.21 0.043 0.07 0 0 0 0 5 80
7 0.982 0.062 0.332 0.068 0.078 0 0 0 0 5 48
8 0.982 0.054 0.433 0.164 0.086 0.247 0.176 0.48 0.215 5 64
9 0.982 0.054 0.509 0.072 0.103 0.317 0.165 0.48 0.215 5 64
10 0.982 0.051 0.559 0.104 0.093 0.396 0.173 0.48 0.215 5 72
11 0.982 0.058 0.586 0.132 0.105 0.481 0.167 0.48 0.215 5 56
12 0.982 0.054 0.592 0.139 0.104 0.566 0.187 0.48 0.215 5 64
13 0.982 0.051 0.575 0.125 0.113 0.687 0.164 0.48 0.215 10 72
14 0.982 0.054 0.52 0.119 0.076 0.814 0.13 0.48 0.215 10 64
15 0.982 0.058 0.45 0.085 0.069 0.897 0.107 0.48 0.215 10 56
16 0.982 0.062 0.381 0.097 0.069 0.946 0.086 0.48 0.215 10 48
17 0.982 0.058 0.319 0.087 0.069 0.972 0.067 0.48 0.215 10 56
18 0.950 0.044 0 0 0 0.986 0.045 0.48 0.215 0 120
1 0.774 0.065 3.538 0.529 0 0 0 0 0 30 2275
Calo- 2 0.801 0.062 4.123 0.752 0 0 0 0 0 30 780
cedrus 3 0.837 0.081 5 1.048 0 0 0 0 0 60 390
4 0.882 0.078 6.307 1.229 0 0 0 0 0 75 315
5 0.913 0.081 0.066 0.015 0.028 0 0 0 0 4 225
6 0.958 0.017 0.145 0.046 0.04 0 0 0 0 5 105
7 0.958 0.017 0.217 0.051 0.046 0.302 0.084 4.7 2.25 5 90
8 0.958 0.017 0.274 0.05 0.049 0.59 0.095 4.7 2.25 5 81
9 0.958 0.017 0.315 0.071 0.056 0.827 0.095 4.7 2.25 5 48
10 0.958 0.017 0.341 0.082 0.069 0.941 0.057 4.7 2.25 5 51
11 0.958 0.017 0.357 0.066 0.062 0.99 0.031 4.7 2.25 10 30
12 0.958 0.017 0.347 0.063 0.056 0.99 0.031 4.7 2.25 10 30
13 0.953 0.064 0.317 0.051 0.051 0.99 0.044 4.7 2.25 10 15
14 0.953 0.064 0 0 0 0.99 0.04 4.7 2.25 0 18
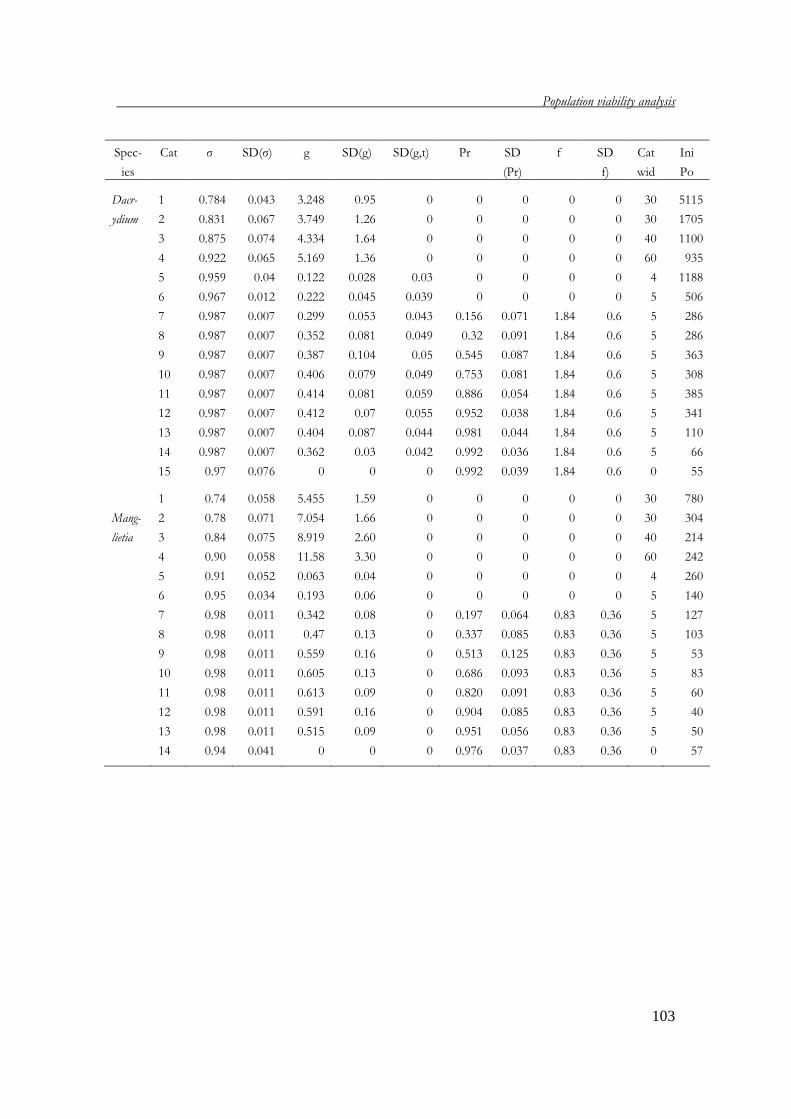
Population viability analysis
103
Spec-
ies
Cat σ SD(σ) g SD(g) SD(g,t) Pr SD
(Pr)
f SD
f)
Cat
wid
Ini
Po
Dacr- 1 0.784 0.043 3.248 0.95 0 0 0 0 0 30 5115
ydium 2 0.831 0.067 3.749 1.26 0 0 0 0 0 30 1705
3 0.875 0.074 4.334 1.64 0 0 0 0 0 40 1100
4 0.922 0.065 5.169 1.36 0 0 0 0 0 60 935
5 0.959 0.04 0.122 0.028 0.03 0 0 0 0 4 1188
6 0.967 0.012 0.222 0.045 0.039 0 0 0 0 5 506
7 0.987 0.007 0.299 0.053 0.043 0.156 0.071 1.84 0.6 5 286
8 0.987 0.007 0.352 0.081 0.049 0.32 0.091 1.84 0.6 5 286
9 0.987 0.007 0.387 0.104 0.05 0.545 0.087 1.84 0.6 5 363
10 0.987 0.007 0.406 0.079 0.049 0.753 0.081 1.84 0.6 5 308
11 0.987 0.007 0.414 0.081 0.059 0.886 0.054 1.84 0.6 5 385
12 0.987 0.007 0.412 0.07 0.055 0.952 0.038 1.84 0.6 5 341
13 0.987 0.007 0.404 0.087 0.044 0.981 0.044 1.84 0.6 5 110
14 0.987 0.007 0.362 0.03 0.042 0.992 0.036 1.84 0.6 5 66
15 0.97 0.076 0 0 0 0.992 0.039 1.84 0.6 0 55
1 0.74 0.058 5.455 1.59 0 0 0 0 0 30 780
Mang- 2 0.78 0.071 7.054 1.66 0 0 0 0 0 30 304
lietia 3 0.84 0.075 8.919 2.60 0 0 0 0 0 40 214
4 0.90 0.058 11.58 3.30 0 0 0 0 0 60 242
5 0.91 0.052 0.063 0.04 0 0 0 0 0 4 260
6 0.95 0.034 0.193 0.06 0 0 0 0 0 5 140
7 0.98 0.011 0.342 0.08 0 0.197 0.064 0.83 0.36 5 127
8 0.98 0.011 0.47 0.13 0 0.337 0.085 0.83 0.36 5 103
9 0.98 0.011 0.559 0.16 0 0.513 0.125 0.83 0.36 5 53
10 0.98 0.011 0.605 0.13 0 0.686 0.093 0.83 0.36 5 83
11 0.98 0.011 0.613 0.09 0 0.820 0.091 0.83 0.36 5 60
12 0.98 0.011 0.591 0.16 0 0.904 0.085 0.83 0.36 5 40
13 0.98 0.011 0.515 0.09 0 0.951 0.056 0.83 0.36 5 50
14 0.94 0.041 0 0 0 0.976 0.037 0.83 0.36 0 57
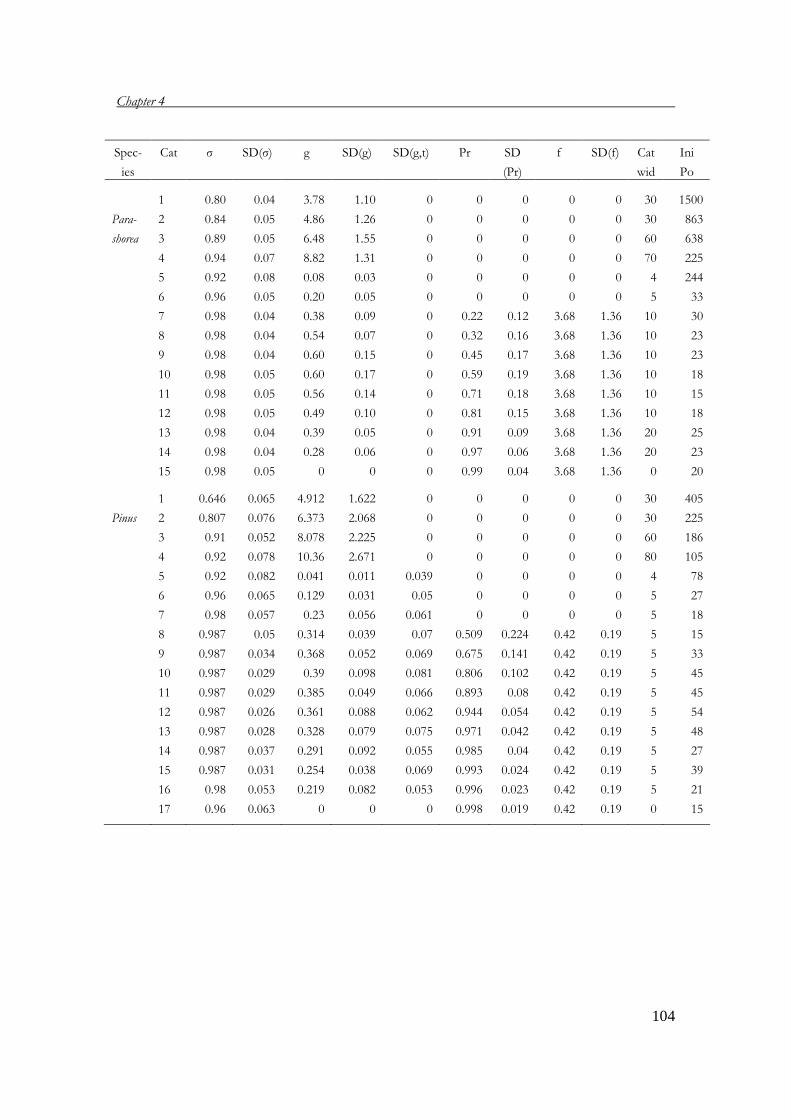
Chapter 4
104
Spec-
ies
Cat σ SD(σ) g SD(g) SD(g,t) Pr SD
(Pr)
f SD(f) Cat
wid
Ini
Po
1 0.80 0.04 3.78 1.10 0 0 0 0 0 30 1500
Para- 2 0.84 0.05 4.86 1.26 0 0 0 0 0 30 863
shorea 3 0.89 0.05 6.48 1.55 0 0 0 0 0 60 638
4 0.94 0.07 8.82 1.31 0 0 0 0 0 70 225
5 0.92 0.08 0.08 0.03 0 0 0 0 0 4 244
6 0.96 0.05 0.20 0.05 0 0 0 0 0 5 33
7 0.98 0.04 0.38 0.09 0 0.22 0.12 3.68 1.36 10 30
8 0.98 0.04 0.54 0.07 0 0.32 0.16 3.68 1.36 10 23
9 0.98 0.04 0.60 0.15 0 0.45 0.17 3.68 1.36 10 23
10 0.98 0.05 0.60 0.17 0 0.59 0.19 3.68 1.36 10 18
11 0.98 0.05 0.56 0.14 0 0.71 0.18 3.68 1.36 10 15
12 0.98 0.05 0.49 0.10 0 0.81 0.15 3.68 1.36 10 18
13 0.98 0.04 0.39 0.05 0 0.91 0.09 3.68 1.36 20 25
14 0.98 0.04 0.28 0.06 0 0.97 0.06 3.68 1.36 20 23
15 0.98 0.05 0 0 0 0.99 0.04 3.68 1.36 0 20
1 0.646 0.065 4.912 1.622 0 0 0 0 0 30 405
Pinus 2 0.807 0.076 6.373 2.068 0 0 0 0 0 30 225
3 0.91 0.052 8.078 2.225 0 0 0 0 0 60 186
4 0.92 0.078 10.36 2.671 0 0 0 0 0 80 105
5 0.92 0.082 0.041 0.011 0.039 0 0 0 0 4 78
6 0.96 0.065 0.129 0.031 0.05 0 0 0 0 5 27
7 0.98 0.057 0.23 0.056 0.061 0 0 0 0 5 18
8 0.987 0.05 0.314 0.039 0.07 0.509 0.224 0.42 0.19 5 15
9 0.987 0.034 0.368 0.052 0.069 0.675 0.141 0.42 0.19 5 33
10 0.987 0.029 0.39 0.098 0.081 0.806 0.102 0.42 0.19 5 45
11 0.987 0.029 0.385 0.049 0.066 0.893 0.08 0.42 0.19 5 45
12 0.987 0.026 0.361 0.088 0.062 0.944 0.054 0.42 0.19 5 54
13 0.987 0.028 0.328 0.079 0.075 0.971 0.042 0.42 0.19 5 48
14 0.987 0.037 0.291 0.092 0.055 0.985 0.04 0.42 0.19 5 27
15 0.987 0.031 0.254 0.038 0.069 0.993 0.024 0.42 0.19 5 39
16 0.98 0.053 0.219 0.082 0.053 0.996 0.023 0.42 0.19 5 21
17 0.96 0.063 0 0 0 0.998 0.019 0.42 0.19 0 15

Population viability analysis
105
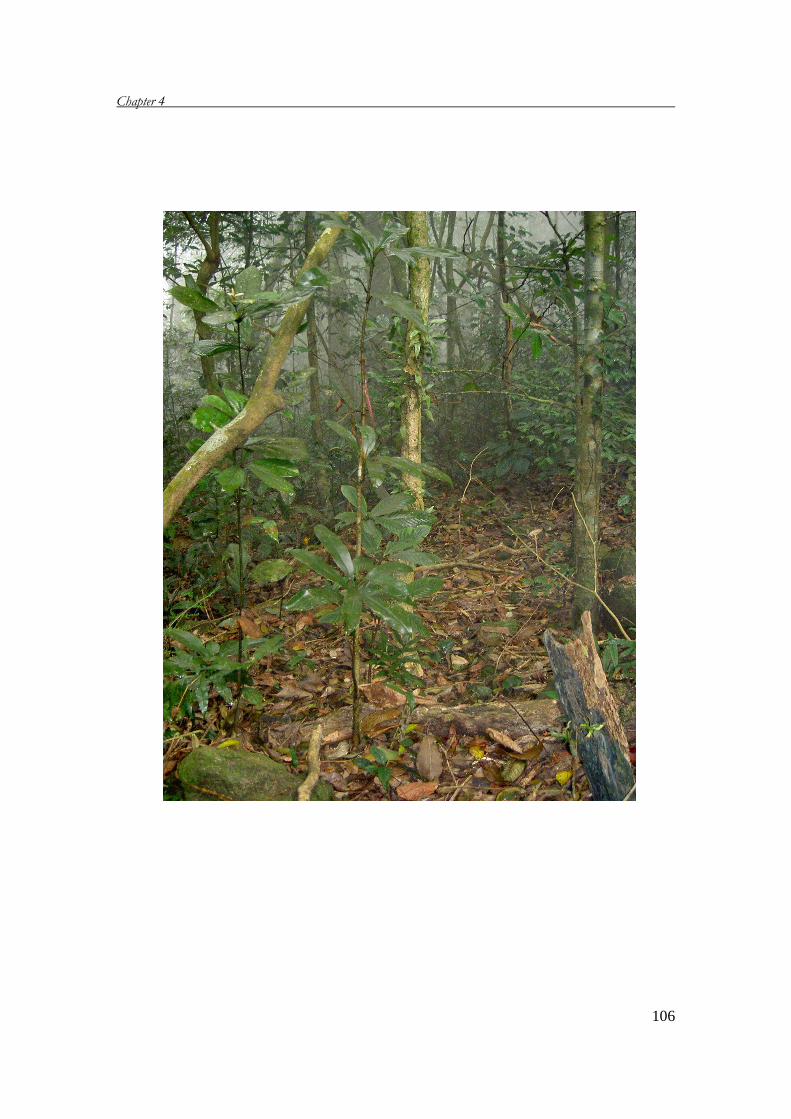
Chapter 4
106
Chapter 5
What dimension to use for matrix models of trees? Recommendations based on a validation of age estimate by tree ring analysis
With P. A. Zuidema
Abstract
The choice of the number of categories in constructing matrix models is an important
one, as it has consequences for model output (population growth rate (λ), elasticity of λ
and ages of trees). We validated the output of matrix models of four Vietnamese tree
species by comparing age estimates obtained from matrix models with varying amount of
categories with ring counts. Our study species were Annamocarya sinensis, Calocedrus
macrolepis, Dacrydium elatum and Pinus kwangtungensis. We carried out a two-year field study,
in which we quantified the probability of survival, growth and reproduction, and used
those to construct matrix models with different sizes. We then estimated λ, elasticity of λ
and ages of trees for each matrix model. We also carried out a dendrochronological
study, in which ring data were collected for estimating tree ages.
Age estimates strongly increased when the number of categories was increased. The
population growth rate slight decreased (by 0.1-1.2%) with increased matrix size, from a
small matrix with broad categories (10 cm DBH) to a very large matrix with narrow
categories (1.25 cm DBH). The elasticity of λ to stasis and fecundity (matrix elements)
decreased with increasing matrix sizes, while the elasticity value for progression (matrix
element) increased. However, the elasticity of λ to vital rates (growth, survival and
reproduction) was much less sensitive to changes in matrix sizes compared to matrix
elements.
Our results showed that the width of categories for which matrix age estimates best
correspond to observed (ring) ages equals 2.5 cm DBH for Annamocarya sinensis, 1.5 cm
for Calocedrus macrolepis, 1.5 cm for Dacrydium elatum and 3 cm for Pinus kwangtungensis.
We argue that narrow categories (1.5-3 cm DBH) are used in matrix models of trees
to obtain best estimates of tree age, population growth rate and elasticity.
Key words: Matrix dimension, population growth rate, elasticity, tree ages.
Chapter 5
108
Introduction
Matrix population models are widely used in demographic analyses as they are easily
constructed and provide clearly interpretable output (Caswell 2001). To date, matrix
models have been constructed for a large number of species, including birds (Saether
& Bakke 2000), mammals (Heppell et al. 2000) and plants (Franco & Silvertown
2004). To construct a matrix population model, individuals are classified into discrete
classes according to their age (often applied to animals) or size (often applied to
plants) (Caswell 2001). The main outputs of matrix models are the asymptotic
population growth rate (λ) and the elasticity of λ to different life history transitions
(Caswell 2001). These two parameters are used to evaluate the population
performance and the most important life stages for the population growth rate, and
to suggest effective conservation actions (Ratsirarson et al. 1996, Benton & Grant
1999, Contreras & Valverde 2002, Zuidema & Boot 2002, Kwit et al. 2004). In
addition, size-classified matrix models can be used to estimate ages of trees using
algorithms developed by Cochran & Ellner (1992) (Zagt 1997, Zuidema 2000,
Caswell 2001, Barot et al. 2002). For tree species, this method allows to estimate ages
without using annual rings or other dating techniques (Martinez-Ramos & Alvarez-
Buylla 1998).
An important choice in the construction of size-structured matrix models is the
dimension (or size) of the transition matrix, i.e. the number of size categories in
which the population is divided. For transition matrices in which the values of the
elements are observed transitions from one to another category, or based on the
average of growth and survival in a category, choosing wide or narrow categories has
implications for the errors of distribution and sampling (Vandermeer 1978, Moloney
1986). If a transition matrix has few and wide categories, the error of distribution may
be large, as individuals within a category behave very differently (Vandermeer 1978,
Moloney 1986). In a transition matrix with many narrow categories the error of
sampling is large as the number of individuals used to calculate transition is low
(Vandermeer 1978, Moloney 1986). If transitions are calculated using overall relations
of growth and survival vs. size, instead of observed transitions or averages of growth
and survival, these errors are not applicable, but also in these models, the number of
categories influences model output. In large transition matrices, population growth
rate and the elasticities of λ to stasis and fecundity are generally smaller, while
elasticity for progression increases (Zagt 1997, Zuidema 2000, Yearsley & Fletcher
2002, Ramula & Lehtilä 2005).
Different criteria have been proposed to determine matrix dimension.
Vandermeer (1978) and Moloney (1986) developed a mathematical method to classify
individuals into stage classes by minimizing both errors of distribution and sampling.
Other studies suggested that the stage classification should be based upon biological
criteria that maximize differences in vital rates among categories (Caswell 2001,
What matrix dimension to use
109
Zuidema & Boot 2002). Recently, Ramula & Lehtilä (2005), argued that constructing
small matrices is more suitable, particularly for woody species, as this saves time and
money required for obtaining demographic data.
In spite of the ample debate on choosing matrix model size, so far no validation
has been carried out to determine what is the optimal matrix dimension. One way to
determine the most suitable number of categories is to correlate age estimates from
matrix models to those from annual rings, which are obtained from a
dendrochronological study or other ageing methods.
In this paper, we validate tree ages obtained from matrix models of different
dimension for four Vietnamese tree species. Specially, we address the following
questions: (1) What is the effect of matrix dimension on tree age estimates? (2) What
matrix dimension best corresponds with independently obtained tree ages? (3) What
is the effect of matrix dimension on population growth rate and elasticity? To answer
these, we carried out a 2-year demographic study and constructed stage-based
transition matrices with different dimensions for four study species. From these
matrices, we calculated tree ages, population growth rates and elasticities. We also
carried out a dendrochronological study to determine actual ages of the individual
trees. Based on the comparison between the matrix outputs and the results obtained
from ring counts, recommendations for applying matrix dimension are proposed.
Methods Study species
We studied four Vietnamese tree species: Annamocarya sinensis, Calocedrus macrolepis,
Dacrydium elatum, and Pinus kwangtungensis (hereafter referred to their genus names). All
four species are long-lived, and reach the forest canopy when being mature. Three
species (Calocedrus, Dacrydium and Pinus) are conifers while Annamocarya is a broad-
leaved deciduous species. The coniferous species grow in subtropical forests in high
mountains, whilst the broad-leaved species occurs in lowland tropical forests. Several
characteristics of the four species and their field sites are described in Table 1 (more
details in Chapter 3).
Study sites
The study was carried out in four protected areas in Vietnam (Table 1). The structure
of the coniferous forests (e.g., canopy layers, species diversity) is simpler than that of
the lowland forests, where Annamocarya occurs. The canopy the coniferous forest is
also lower and more open than the canopy of Annamocarya forest.
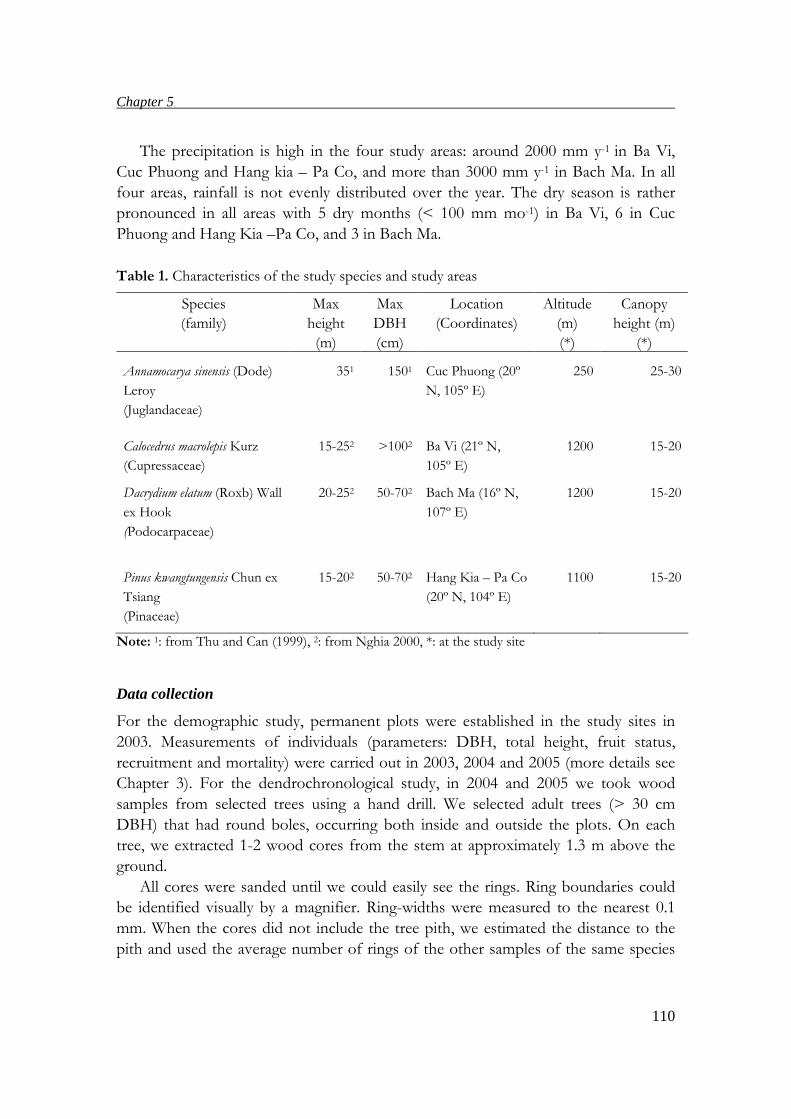
Chapter 5
110
The precipitation is high in the four study areas: around 2000 mm y-1 in Ba Vi,
Cuc Phuong and Hang kia – Pa Co, and more than 3000 mm y-1 in Bach Ma. In all
four areas, rainfall is not evenly distributed over the year. The dry season is rather
pronounced in all areas with 5 dry months (< 100 mm mo-1) in Ba Vi, 6 in Cuc
Phuong and Hang Kia –Pa Co, and 3 in Bach Ma.
Table 1. Characteristics of the study species and study areas
Species
(family)
Max
height
(m)
Max
DBH
(cm)
Location
(Coordinates)
Altitude
(m)
(*)
Canopy
height (m)
(*)
Annamocarya sinensis (Dode)
Leroy
(Juglandaceae)
351 1501 Cuc Phuong (20º
N, 105º E)
250 25-30
Calocedrus macrolepis Kurz
(Cupressaceae)
15-252 >1002 Ba Vi (21º N,
105º E)
1200 15-20
Dacrydium elatum (Roxb) Wall
ex Hook
(Podocarpaceae)
20-252 50-702 Bach Ma (16º N,
107º E)
1200 15-20
Pinus kwangtungensis Chun ex
Tsiang
(Pinaceae)
15-202 50-702 Hang Kia – Pa Co
(20º N, 104º E)
1100 15-20
Note: 1: from Thu and Can (1999), 2: from Nghia 2000, *: at the study site
Data collection
For the demographic study, permanent plots were established in the study sites in
2003. Measurements of individuals (parameters: DBH, total height, fruit status,
recruitment and mortality) were carried out in 2003, 2004 and 2005 (more details see
Chapter 3). For the dendrochronological study, in 2004 and 2005 we took wood
samples from selected trees using a hand drill. We selected adult trees (> 30 cm
DBH) that had round boles, occurring both inside and outside the plots. On each
tree, we extracted 1-2 wood cores from the stem at approximately 1.3 m above the
ground.
All cores were sanded until we could easily see the rings. Ring boundaries could
be identified visually by a magnifier. Ring-widths were measured to the nearest 0.1
mm. When the cores did not include the tree pith, we estimated the distance to the
pith and used the average number of rings of the other samples of the same species
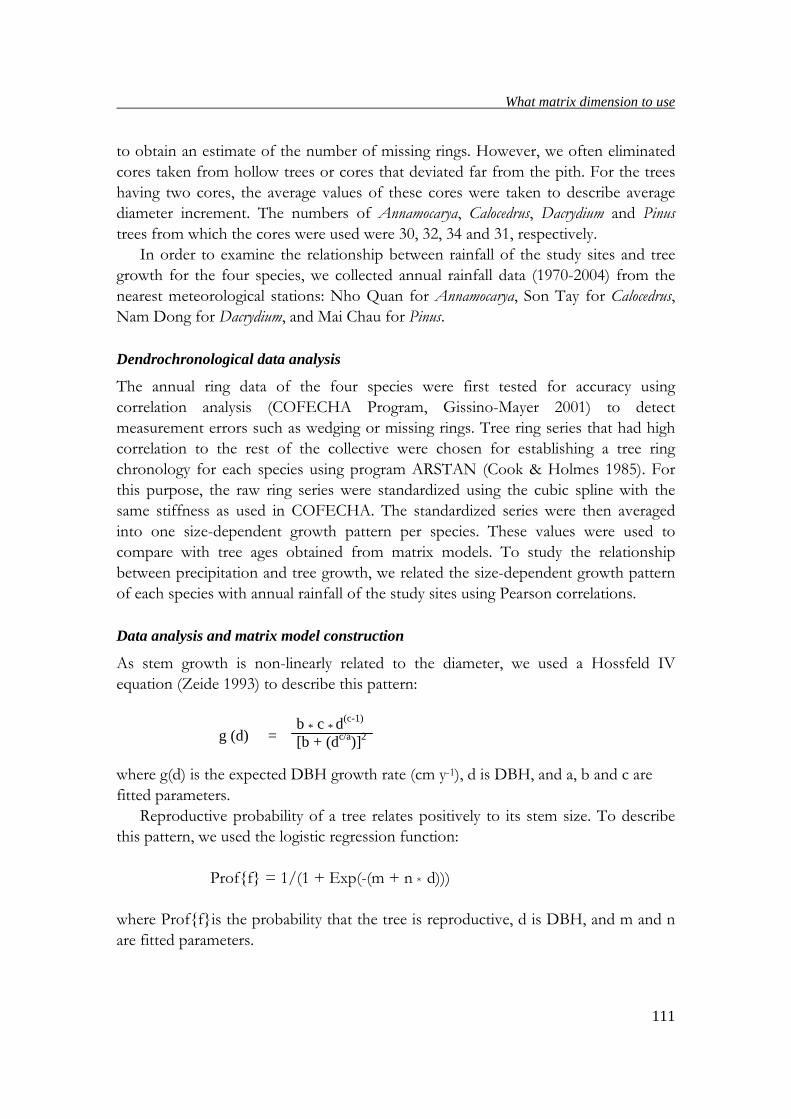
What matrix dimension to use
111
to obtain an estimate of the number of missing rings. However, we often eliminated
cores taken from hollow trees or cores that deviated far from the pith. For the trees
having two cores, the average values of these cores were taken to describe average
diameter increment. The numbers of Annamocarya, Calocedrus, Dacrydium and Pinus
trees from which the cores were used were 30, 32, 34 and 31, respectively.
In order to examine the relationship between rainfall of the study sites and tree
growth for the four species, we collected annual rainfall data (1970-2004) from the
nearest meteorological stations: Nho Quan for Annamocarya, Son Tay for Calocedrus,
Nam Dong for Dacrydium, and Mai Chau for Pinus.
Dendrochronological data analysis
The annual ring data of the four species were first tested for accuracy using
correlation analysis (COFECHA Program, Gissino-Mayer 2001) to detect
measurement errors such as wedging or missing rings. Tree ring series that had high
correlation to the rest of the collective were chosen for establishing a tree ring
chronology for each species using program ARSTAN (Cook & Holmes 1985). For
this purpose, the raw ring series were standardized using the cubic spline with the
same stiffness as used in COFECHA. The standardized series were then averaged
into one size-dependent growth pattern per species. These values were used to
compare with tree ages obtained from matrix models. To study the relationship
between precipitation and tree growth, we related the size-dependent growth pattern
of each species with annual rainfall of the study sites using Pearson correlations.
Data analysis and matrix model construction
As stem growth is non-linearly related to the diameter, we used a Hossfeld IV
equation (Zeide 1993) to describe this pattern:
where g(d) is the expected DBH growth rate (cm y-1), d is DBH, and a, b and c are
fitted parameters.
Reproductive probability of a tree relates positively to its stem size. To describe
this pattern, we used the logistic regression function:
Prof{f} = 1/(1 + Exp(-(m + n * d)))
where Prof{f}is the probability that the tree is reproductive, d is DBH, and m and n
are fitted parameters.
g (d) = b * c * d
(c-1)
[b + (dc/a)]2
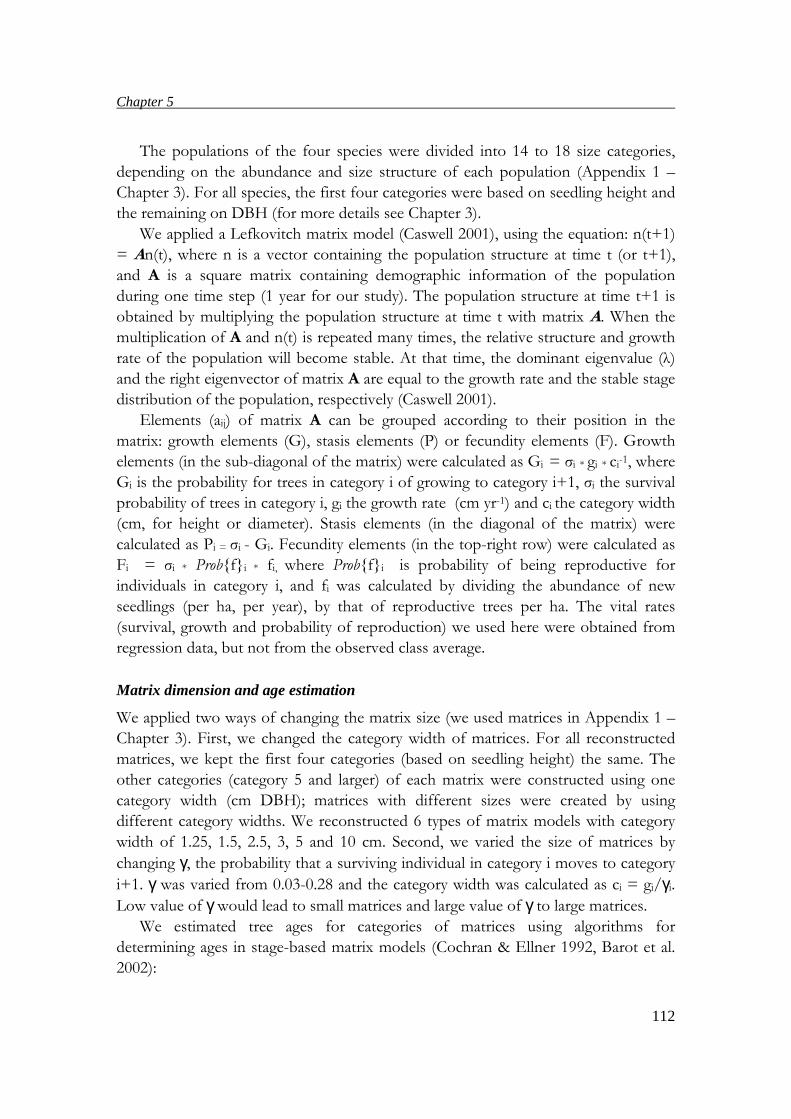
Chapter 5
112
The populations of the four species were divided into 14 to 18 size categories,
depending on the abundance and size structure of each population (Appendix 1 –
Chapter 3). For all species, the first four categories were based on seedling height and
the remaining on DBH (for more details see Chapter 3).
We applied a Lefkovitch matrix model (Caswell 2001), using the equation: n(t+1)
= An(t), where n is a vector containing the population structure at time t (or t+1),
and A is a square matrix containing demographic information of the population
during one time step (1 year for our study). The population structure at time t+1 is
obtained by multiplying the population structure at time t with matrix A. When the
multiplication of A and n(t) is repeated many times, the relative structure and growth
rate of the population will become stable. At that time, the dominant eigenvalue (λ)
and the right eigenvector of matrix A are equal to the growth rate and the stable stage
distribution of the population, respectively (Caswell 2001).
Elements (aij) of matrix A can be grouped according to their position in the
matrix: growth elements (G), stasis elements (P) or fecundity elements (F). Growth
elements (in the sub-diagonal of the matrix) were calculated as Gi = σi * gi * ci-1, where
Gi is the probability for trees in category i of growing to category i+1, σi the survival
probability of trees in category i, gi the growth rate (cm yr-1) and ci the category width
(cm, for height or diameter). Stasis elements (in the diagonal of the matrix) were
calculated as Pi = σi - Gi. Fecundity elements (in the top-right row) were calculated as
Fi = σi * Prob{f}i * fi, where Prob{f}i is probability of being reproductive for
individuals in category i, and fi was calculated by dividing the abundance of new
seedlings (per ha, per year), by that of reproductive trees per ha. The vital rates
(survival, growth and probability of reproduction) we used here were obtained from
regression data, but not from the observed class average.
Matrix dimension and age estimation
We applied two ways of changing the matrix size (we used matrices in Appendix 1 –
Chapter 3). First, we changed the category width of matrices. For all reconstructed
matrices, we kept the first four categories (based on seedling height) the same. The
other categories (category 5 and larger) of each matrix were constructed using one
category width (cm DBH); matrices with different sizes were created by using
different category widths. We reconstructed 6 types of matrix models with category
width of 1.25, 1.5, 2.5, 3, 5 and 10 cm. Second, we varied the size of matrices by
changing γ, the probability that a surviving individual in category i moves to category i+1. γ was varied from 0.03-0.28 and the category width was calculated as ci = gi/γi. Low value of γ would lead to small matrices and large value of γ to large matrices.
We estimated tree ages for categories of matrices using algorithms for
determining ages in stage-based matrix models (Cochran & Ellner 1992, Barot et al.
2002):
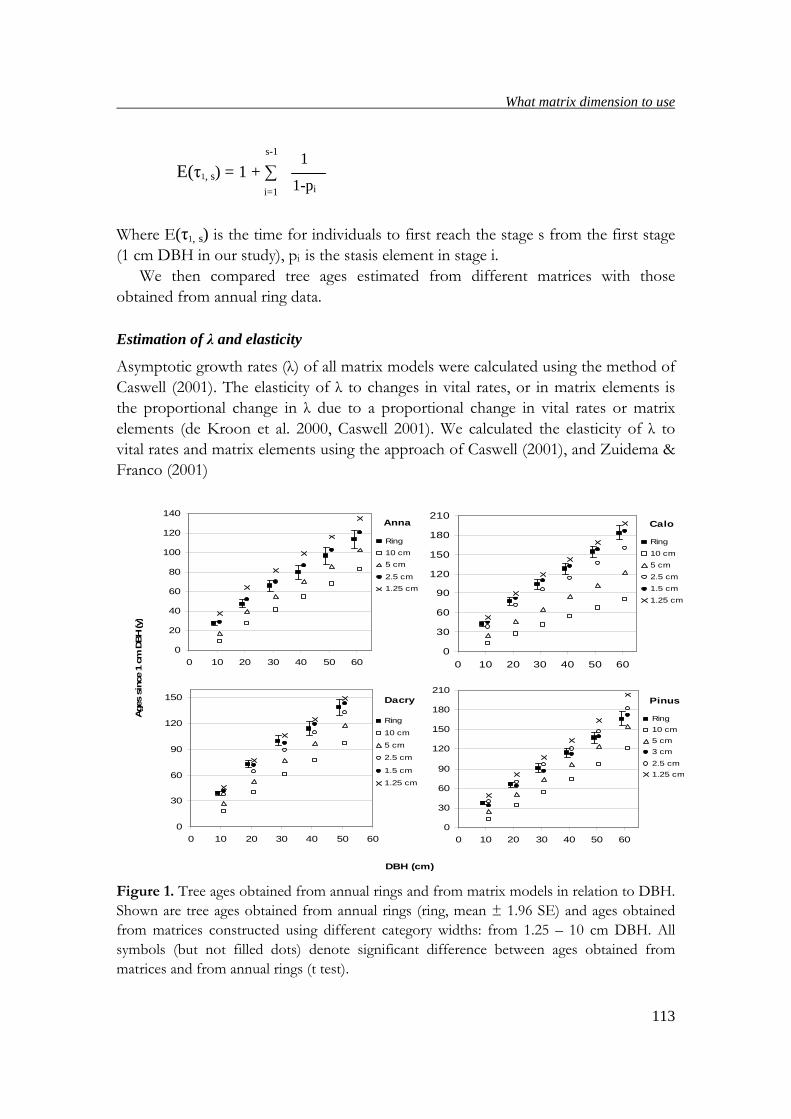
What matrix dimension to use
113
E(τ1, s) = 1 + ∑
Where E(τ1, s) is the time for individuals to first reach the stage s from the first stage (1 cm DBH in our study), pi is the stasis element in stage i.
We then compared tree ages estimated from different matrices with those
obtained from annual ring data.
Estimation of λ and elasticity
Asymptotic growth rates (λ) of all matrix models were calculated using the method of
Caswell (2001). The elasticity of λ to changes in vital rates, or in matrix elements is
the proportional change in λ due to a proportional change in vital rates or matrix
elements (de Kroon et al. 2000, Caswell 2001). We calculated the elasticity of λ to
vital rates and matrix elements using the approach of Caswell (2001), and Zuidema &
Franco (2001)
Figure 1. Tree ages obtained from annual rings and from matrix models in relation to DBH.
Shown are tree ages obtained from annual rings (ring, mean ± 1.96 SE) and ages obtained
from matrices constructed using different category widths: from 1.25 – 10 cm DBH. All
symbols (but not filled dots) denote significant difference between ages obtained from
matrices and from annual rings (t test).
1
1-pi i=1
s-1
Anna
0
20
40
60
80
100
120
140
0 10 20 30 40 50 60
Ring
10 cm
5 cm
2.5 cm
1.25 cm
Calo
0
30
60
90
120
150
180
210
0 10 20 30 40 50 60
Ring
10 cm
5 cm
2.5 cm
1.5 cm
1.25 cm
Dacry
0
30
60
90
120
150
0 10 20 30 40 50 60
Ring
10 cm
5 cm
2.5 cm
1.5 cm
1.25 cm
Pinus
0
30
60
90
120
150
180
210
0 10 20 30 40 50 60
Ring
10 cm
5 cm
3 cm
2.5 cm
1.25 cm
Ages
sin
ce 1
cm
DBH (y)
DBH (cm)
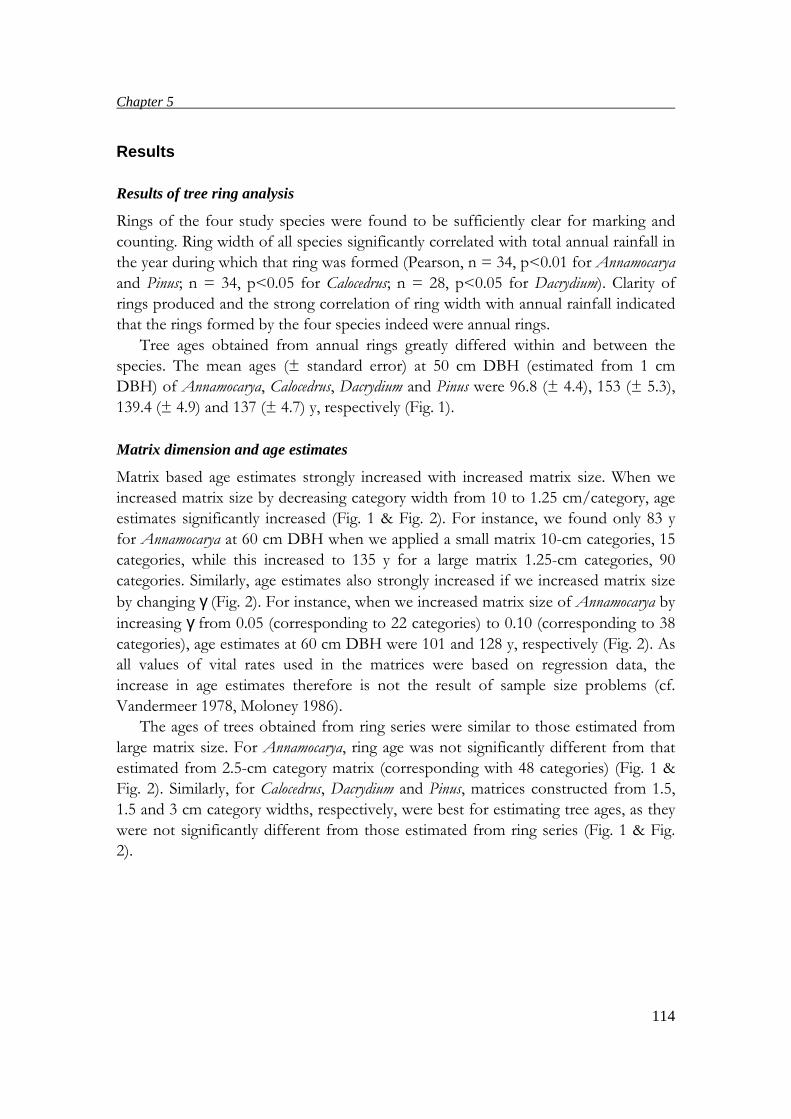
Chapter 5
114
Results Results of tree ring analysis
Rings of the four study species were found to be sufficiently clear for marking and
counting. Ring width of all species significantly correlated with total annual rainfall in
the year during which that ring was formed (Pearson, n = 34, p<0.01 for Annamocarya
and Pinus; n = 34, p<0.05 for Calocedrus; n = 28, p<0.05 for Dacrydium). Clarity of
rings produced and the strong correlation of ring width with annual rainfall indicated
that the rings formed by the four species indeed were annual rings.
Tree ages obtained from annual rings greatly differed within and between the
species. The mean ages (± standard error) at 50 cm DBH (estimated from 1 cm
DBH) of Annamocarya, Calocedrus, Dacrydium and Pinus were 96.8 (± 4.4), 153 (± 5.3),
139.4 (± 4.9) and 137 (± 4.7) y, respectively (Fig. 1).
Matrix dimension and age estimates
Matrix based age estimates strongly increased with increased matrix size. When we
increased matrix size by decreasing category width from 10 to 1.25 cm/category, age
estimates significantly increased (Fig. 1 & Fig. 2). For instance, we found only 83 y
for Annamocarya at 60 cm DBH when we applied a small matrix 10-cm categories, 15
categories, while this increased to 135 y for a large matrix 1.25-cm categories, 90
categories. Similarly, age estimates also strongly increased if we increased matrix size
by changing γ (Fig. 2). For instance, when we increased matrix size of Annamocarya by increasing γ from 0.05 (corresponding to 22 categories) to 0.10 (corresponding to 38 categories), age estimates at 60 cm DBH were 101 and 128 y, respectively (Fig. 2). As
all values of vital rates used in the matrices were based on regression data, the
increase in age estimates therefore is not the result of sample size problems (cf.
Vandermeer 1978, Moloney 1986). The ages of trees obtained from ring series were similar to those estimated from
large matrix size. For Annamocarya, ring age was not significantly different from that
estimated from 2.5-cm category matrix (corresponding with 48 categories) (Fig. 1 &
Fig. 2). Similarly, for Calocedrus, Dacrydium and Pinus, matrices constructed from 1.5,
1.5 and 3 cm category widths, respectively, were best for estimating tree ages, as they
were not significantly different from those estimated from ring series (Fig. 1 & Fig.
2).
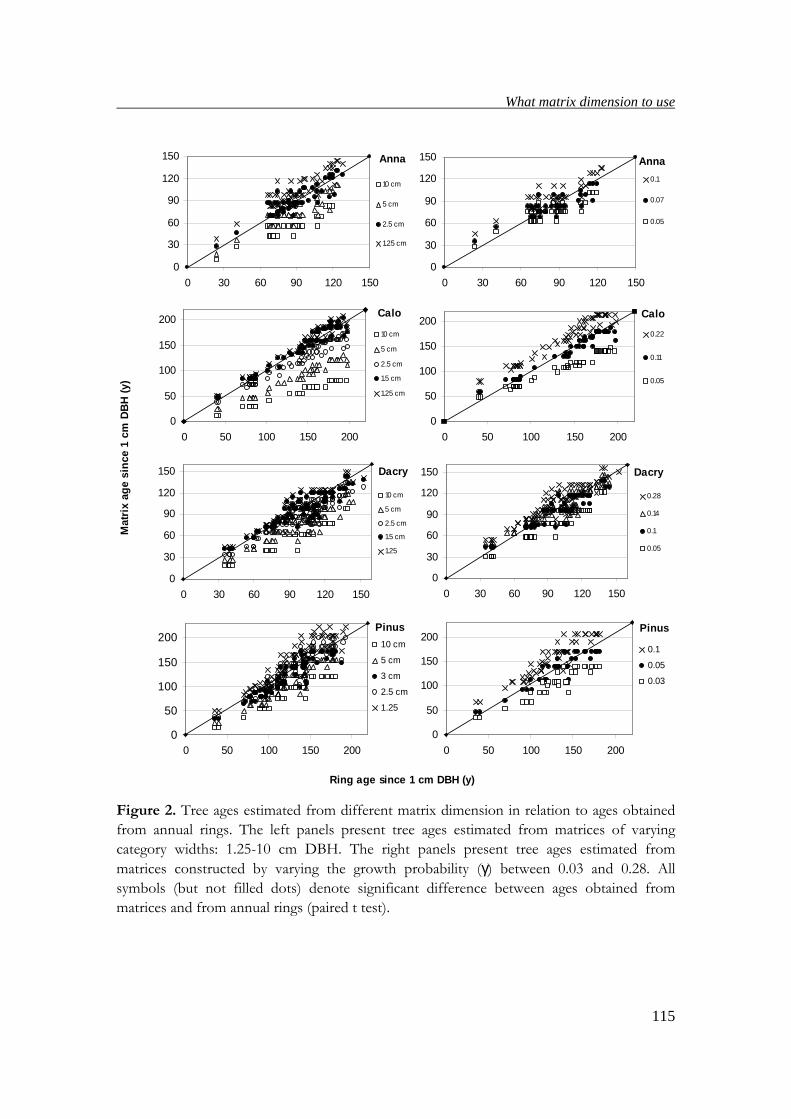
What matrix dimension to use
115
Figure 2. Tree ages estimated from different matrix dimension in relation to ages obtained
from annual rings. The left panels present tree ages estimated from matrices of varying
category widths: 1.25-10 cm DBH. The right panels present tree ages estimated from
matrices constructed by varying the growth probability (γ) between 0.03 and 0.28. All symbols (but not filled dots) denote significant difference between ages obtained from
matrices and from annual rings (paired t test).
Anna
0
30
60
90
120
150
0 30 60 90 120 150
10 cm
5 cm
2.5 cm
1.25 cm
Anna
0
30
60
90
120
150
0 30 60 90 120 150
0.1
0.07
0.05
Calo
0
50
100
150
200
0 50 100 150 200
10 cm
5 cm
2.5 cm
1.5 cm
1.25 cm
Calo
0
50
100
150
200
0 50 100 150 200
0.22
0.11
0.05
Dacry
0
30
60
90
120
150
0 30 60 90 120 150
10 cm
5 cm
2.5 cm
1.5 cm
1.25
Dacry
0
30
60
90
120
150
0 30 60 90 120 150
0.28
0.14
0.1
0.05
Pinus
0
50
100
150
200
0 50 100 150 200
10 cm
5 cm
3 cm
2.5 cm
1.25
Pinus
0
50
100
150
200
0 50 100 150 200
0.1
0.05
0.03
Mat
rix
age
sin
ce 1
cm
DB
H (
y)
Ring age since 1 cm DBH (y)
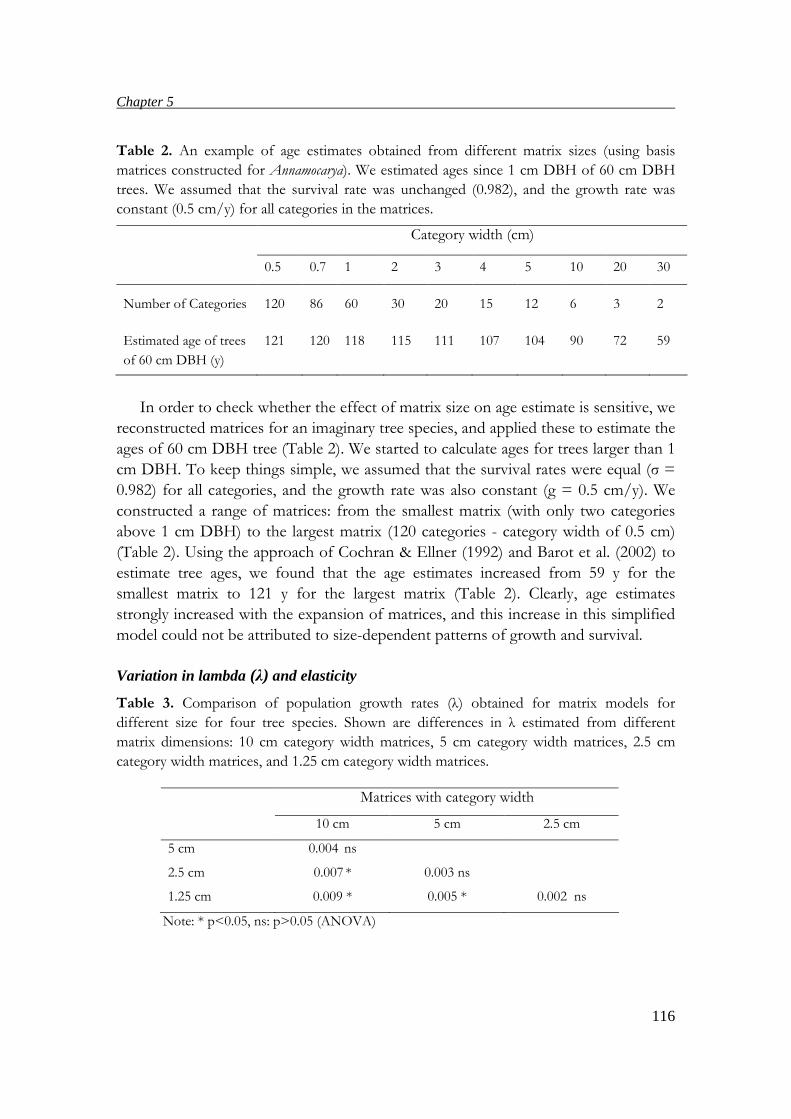
Chapter 5
116
Table 2. An example of age estimates obtained from different matrix sizes (using basis
matrices constructed for Annamocarya). We estimated ages since 1 cm DBH of 60 cm DBH
trees. We assumed that the survival rate was unchanged (0.982), and the growth rate was
constant (0.5 cm/y) for all categories in the matrices.
Category width (cm)
0.5 0.7 1 2 3 4 5 10 20 30
Number of Categories 120 86 60 30 20 15 12 6 3 2
Estimated age of trees
of 60 cm DBH (y)
121 120 118 115 111 107 104 90 72 59
In order to check whether the effect of matrix size on age estimate is sensitive, we
reconstructed matrices for an imaginary tree species, and applied these to estimate the
ages of 60 cm DBH tree (Table 2). We started to calculate ages for trees larger than 1
cm DBH. To keep things simple, we assumed that the survival rates were equal (σ =
0.982) for all categories, and the growth rate was also constant (g = 0.5 cm/y). We
constructed a range of matrices: from the smallest matrix (with only two categories
above 1 cm DBH) to the largest matrix (120 categories - category width of 0.5 cm)
(Table 2). Using the approach of Cochran & Ellner (1992) and Barot et al. (2002) to
estimate tree ages, we found that the age estimates increased from 59 y for the
smallest matrix to 121 y for the largest matrix (Table 2). Clearly, age estimates
strongly increased with the expansion of matrices, and this increase in this simplified
model could not be attributed to size-dependent patterns of growth and survival.
Variation in lambda (λ) and elasticity
Table 3. Comparison of population growth rates (λ) obtained for matrix models for
different size for four tree species. Shown are differences in λ estimated from different
matrix dimensions: 10 cm category width matrices, 5 cm category width matrices, 2.5 cm
category width matrices, and 1.25 cm category width matrices.
Matrices with category width
10 cm 5 cm 2.5 cm
5 cm 0.004 ns
2.5 cm 0.007 * 0.003 ns
1.25 cm 0.009 * 0.005 * 0.002 ns
Note: * p<0.05, ns: p>0.05 (ANOVA)
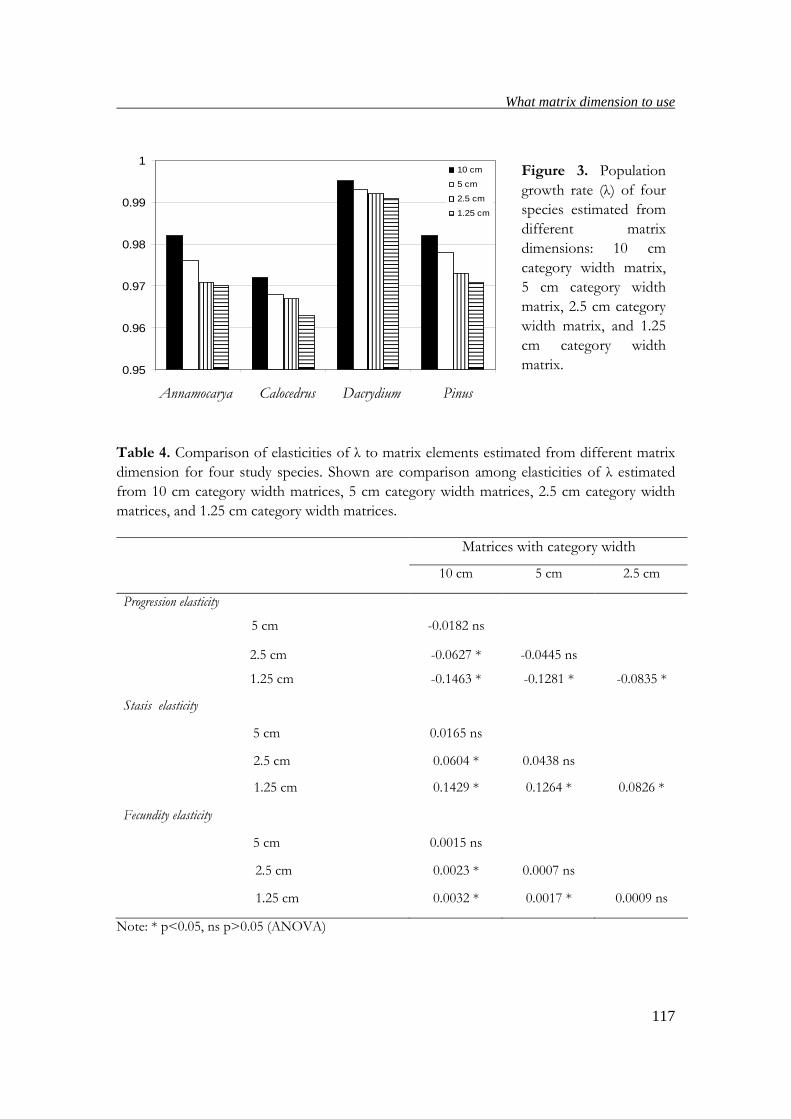
What matrix dimension to use
117
0.95
0.96
0.97
0.98
0.99
110 cm
5 cm
2.5 cm
1.25 cm
Annamocarya Calocedrus Dacrydium Pinus
Table 4. Comparison of elasticities of λ to matrix elements estimated from different matrix
dimension for four study species. Shown are comparison among elasticities of λ estimated
from 10 cm category width matrices, 5 cm category width matrices, 2.5 cm category width
matrices, and 1.25 cm category width matrices.
Matrices with category width
10 cm 5 cm 2.5 cm
Progression elasticity
5 cm -0.0182 ns
2.5 cm -0.0627 * -0.0445 ns
1.25 cm -0.1463 * -0.1281 * -0.0835 *
Stasis elasticity
5 cm 0.0165 ns
2.5 cm 0.0604 * 0.0438 ns
1.25 cm 0.1429 * 0.1264 * 0.0826 *
Fecundity elasticity
5 cm 0.0015 ns
2.5 cm 0.0023 * 0.0007 ns
1.25 cm 0.0032 * 0.0017 * 0.0009 ns
Note: * p<0.05, ns p>0.05 (ANOVA)
Figure 3. Population
growth rate (λ) of four
species estimated from
different matrix
dimensions: 10 cm
category width matrix,
5 cm category width
matrix, 2.5 cm category
width matrix, and 1.25
cm category width
matrix.
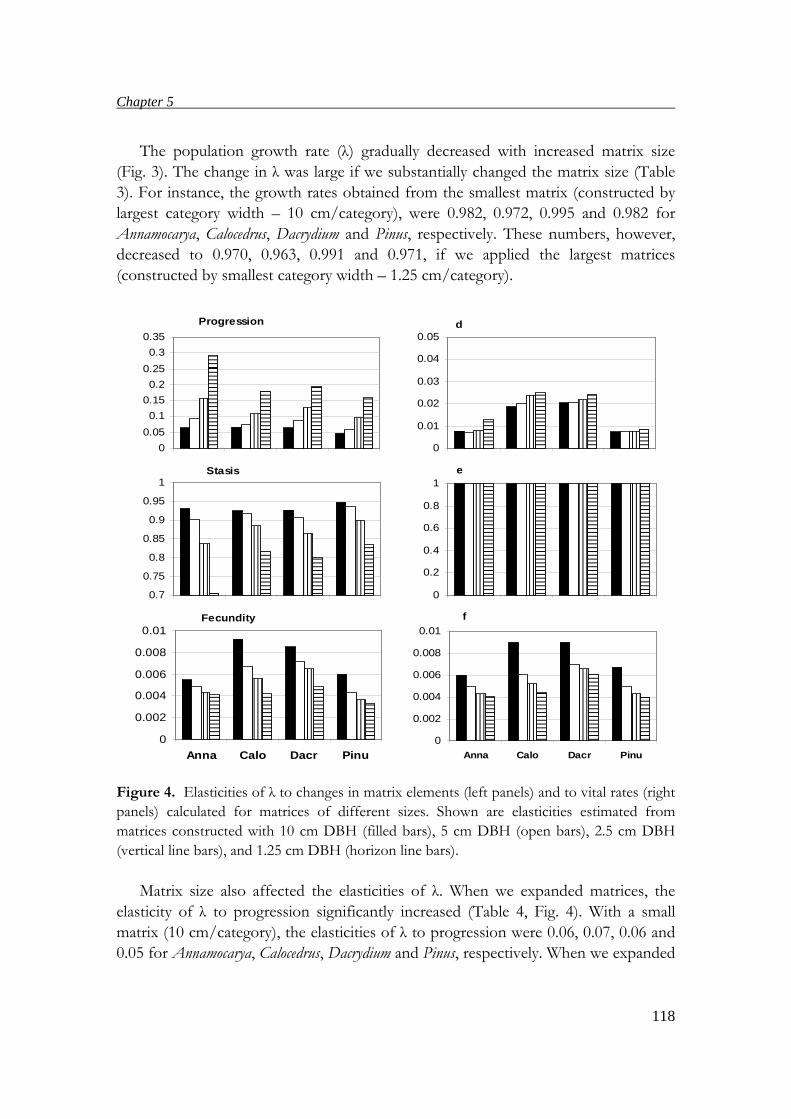
Chapter 5
118
The population growth rate (λ) gradually decreased with increased matrix size
(Fig. 3). The change in λ was large if we substantially changed the matrix size (Table
3). For instance, the growth rates obtained from the smallest matrix (constructed by
largest category width – 10 cm/category), were 0.982, 0.972, 0.995 and 0.982 for
Annamocarya, Calocedrus, Dacrydium and Pinus, respectively. These numbers, however,
decreased to 0.970, 0.963, 0.991 and 0.971, if we applied the largest matrices
(constructed by smallest category width – 1.25 cm/category).
Figure 4. Elasticities of λ to changes in matrix elements (left panels) and to vital rates (right
panels) calculated for matrices of different sizes. Shown are elasticities estimated from
matrices constructed with 10 cm DBH (filled bars), 5 cm DBH (open bars), 2.5 cm DBH
(vertical line bars), and 1.25 cm DBH (horizon line bars).
Matrix size also affected the elasticities of λ. When we expanded matrices, the
elasticity of λ to progression significantly increased (Table 4, Fig. 4). With a small
matrix (10 cm/category), the elasticities of λ to progression were 0.06, 0.07, 0.06 and
0.05 for Annamocarya, Calocedrus, Dacrydium and Pinus, respectively. When we expanded
0
0.05
0.1
0.15
0.2
0.25
0.3
0.35
0.7
0.75
0.8
0.85
0.9
0.95
1
0
0.002
0.004
0.006
0.008
0.01
Anna Calo Dacr Pinu
Progression
Stasis
Fecundity
0
0.01
0.02
0.03
0.04
0.05
0
0.2
0.4
0.6
0.8
1
0
0.002
0.004
0.006
0.008
0.01
Anna Calo Dacr Pinu
d
e
f
What matrix dimension to use
119
matrices by reducing the category width to 1.25 cm/category, the elasticities of λ to
progression strongly increased to 0.29, 0.18, 0.19 and 0.16 for Annamocarya, Calocedrus,
Dacrydium and Pinus, respectively (Fig. 4). In contrast, as the elasticities of λ to matrix
elements are scaled to sum to 1, the elasticities of λ to stasis were strongly decreased
with expanded matrices (Table 4, Fig. 4). The elasticities of λ to stasis of Annamocarya,
Calocedrus, Dacrydium and Pinus were 0.93, 0.92, 0.92 and 0.95, when we applied small
matrix (10 cm/category), but these numbers were 0.71, 0.82, 0.80 and 0.84 if we
applied larger matrix (1.25 cm/category). The elasticities of fecundity also decreased
with increasing matrix dimension, but these absolute changes were very small in
comparison with those of stasis and progression (Fig. 4).
Matrix size did not affect much the elasticity of λ to vital rates. When we
expanded matrix size, the elasticities of λ to growth (vital rate) increased whereas the
elasticity of λ to reproduction decreased. However, we did not find substantial change
in elasticity of λ to growth with expanded matrices (Fig. 4). We also found that these
changes were very small in comparison with those obtained from matrix elements
(progression and stasis) (Fig. 4). We found some changes in elasticity of λ to
reproduction due to a change in matrix dimension (Fig. 4), but these absolute changes
were even smaller than those of growth rate (Fig. 4). On the other hand, we found
that the elasticity values for survival always equaled 1 despite changes in matrix size
(Fig. 4). This is because λ is a homogeneous function of degree 1 of survival (σ)
(Franco & Silvertown 2004). The results reveal that matrix dimension was important
for the estimates of elasticities of λ to changes in matrix elements, but not in vital
rates.
Discussion
Causes of variation in age estimates
We found that age estimates were strongly increased when expanding the number of
categories in transition matrices. This was consistently found for all four species (Fig.
1 & Fig. 2). Similar results on estimating ages of Bertholletia excelsa and Chlorocardium
rodiei by matrix models can be found in Zuidema (2000). The impact of matrix size on
age estimates can be explained by several reasons. Firstly, low age estimates for small
matrices with wide categories can probably be explained as ages are strongly
determined by individuals that by chance pass rapidly through the whole life cycle.
For instance, if categories have a width of 10 cm DBH, an individual in the category
1-10 cm DBH, could by chance reach the category 60-70 cm DBH within 5 years.
With wide categories, many trees will stay long in a size class, but these individuals
will experience a higher accumulative probability of death before reaching 60 cm
DBH. With narrow categories, more slow growing individuals pass from one category
Chapter 5
120
to the next, which may help to increase the average age in each category, leading to an
increase in the total life span. Secondly, the increase in age estimates due to narrow
categories may partly be affected by the divergence of tree ages at a certain size class,
caused by stochastic effects. In the actual population, there is a similar potential of
divergence in age, produced by differences among individuals in annual growth rates
and the autocorrelation in growth. With the small effect of stochasticity on narrow
categories, the variation on growth rate will therefore decrease, leading to an increase
in age estimates.
Consequences of matrix dimension for λ and elasticity
Although the population growth rates (λ) tended to decrease with the expansion of
matrices (Fig. 3), the changes were not substantial with small to medium changes in
matrix dimension, even when we doubled the matrix sizes (Table 3). Our results are
consistent with findings of some previous studies. Zuidema (2000) found that λ for
Bertholletia excelsa and Chlorocardium rodiei was not strongly affected by changing matrix
size. Ramula & Lehtilä (2005) also indicated that λ for woody species did not change
much with a doubling of the matrix size, from 3x3 to 6x6.
However, we also found that the change in λ was large when we substantially
changed the matrix size (Table 3). For instance, if we increased matrix sizes by four
times (by decreasing the initial category width by four times – from 10 to 2.5 cm), λ
was substantially changed (Table 3). According to Ramula & Lehtilä (2005), if the
observed stage frequencies of populations are very close to the stable stage
distribution (the right eigenvector of the matrix, W), λ does not strongly change due
to the changing in matrix size. In our case, however, the observed population
structures of the study species were a bit far from the stable stage structures (PS
index from 85-95, Chapter 3), which may lead to a change in λ due to a change in
matrix size. In addition, the changing in matrix size may also cause a change in vital
rates, leading to a difference in λ (Ramula & Lehtilä 2005). This is particularly
sensitive for fast growing tree species with high value of reproduction because in
large-stage matrices, they tend to reproduce sooner with highly reproductive values
compared with that from the narrow-stage matrices.
When matrix size increased, the elasticity of λ to stasis and fecundity decreased,
whereas the elasticity of λ to progression increased (Table 4, Fig. 4). Similar results
can be found in a series of studies on the impact of matrix size on elasticities of λ
(Enright et al. 1995, Ramula & Lehtilä 2005). The change in elasticity corresponding
with the change in matrix dimension can be explained by the fact that during the
same period of time, more individuals from one category moving to the next in large
matrices than in small matrices. This may lead to an increase in elasticity of λ to
progression in large matrices. At the same time stasis values in large matrices are
small and thus their elasticities decrease.
What matrix dimension to use
121
In contrast to elasticities of elements, those for vital rates (growth and survival)
did not greatly depend on matrix dimension (Fig. 4). On the other hand, the elasticity
of λ to reproduction decreased with increased matrix dimension (Fig. 4).
Nevertheless, these changes were very small, so that they did not substantially
contribute to the value of elasticity. Our results confirm the findings of Zuidema
(2000) indicating that the elasticity of λ to vital rates is not greatly affected by matrix
dimension.
Recommendations for choosing matrix dimension
We found that age estimates were sensitive to matrix sizes, and large matrices yielded
high ages, whereas small ages were obtained from small matrices. We also found that
very large or very small matrices were not suitable for estimating tree ages as the
estimated ages significantly differed from those obtained from ring series (Fig 1, Fig.
2). From our results, matrices with category width of 1.5-4 cm DBH yielded best age
estimates (Fig 1, Fig. 2). Because we did not use standard errors for ages estimated
from matrices when comparing those with ring ages, the suitable category width
therefore could probably be larger a bit than those we found. In short, we suggest
that very large or very small matrices should not be used for estimating tree ages.
The population growth rate did not change much if we doubled matrix size. We
also found that the matrix size (category width equals 5-8 times of juvenile growth
rates) were suitable for age estimates, therefore we could then double the size of
these matrices without substantial changes in λ. These matrices therefore are
suggested to be applied for estimating λ. For the estimate of elasticity, on the other
hand, we argue that we should use vital rates instead of matrix elements, as these are
less affected by matrix dimension.
Acknowledgements
We would like to thank Roel Brienen and Maria Schipper for helpful discussion on
data analyses. Marinus Werger, Heinjo During and Feike Schieving are kindly
acknowledged for valuable discussion and comments on a version draft of this
Chapter. The study was in part funded by Tropenbos International -Vietnam, Utrecht
University and the Forest Science Institute of Vietnam.
Chapter 5
122
References
Barot, S., J. Gignoux, and S. Legendre. 2002. Stage-classified matrix models and age
estimates. OIKOS 96: 56-61.
Benton, T. G., and A. Grant. 1999. Elasticity analysis as an important tool in
evolutionary and population ecology. Trends in Ecology Evolution 14: 467-471.
Boucher, D. H. 1997. General patterns of age-by-stage distributions. Journal of Ecology
85: 235-240.
Brienen, R. 2005. Tree rings in the tropics: a study on growth and ages of Bolivian rain
forest trees. Utrecht University, PROMAB scientific series 10.
Caswell, H. 2001. Matrix Population Models. 2nd edition. Sinauer Associates, Sunderland,
Massachusetts.
Cochran, E. M., and S. Ellner. 1992. Simple methods for calculating age-based life
history parameters for stage-structured populations. Ecological Monographs 62:
345-364.
Contreras, C., and T. Valverde. 2002. Evaluation of the conservation status of a rare
cactus (Mammillaria crucigera) through the analysis of its population dynamics.
Journal of arid environments 51: 89-102.
Cook, E. R., and R. L. Holmes. 1985. Users manual for program ARSTAN. Palisades,
NY, Lamont-Doherty Earth Observatory.
Enright, N. J., M. Franco, Na J. Silvertown. 1995. Comparing plant life histories
using elasticity analysis: the importance of life span and the number of life-cycle
stages. Oecologia 104: 79-84.
Franco, M., and J. Silvertown. 2004. Comparative demography of plants based upon
elasticities of vital rates. Ecology 85: 531-538.
Grissino-Mayer, H. R. 2001. Evaluating crossdating accuracy: A manual and tutorial
for the computer program cofecha. Tree-ring bulletin 57: 205-221.
Heppell, S. S., H. Caswell, and L. B. Crowder. 2000. Life histories and elasticity patterns:
perturbation analysis for species with minimal demographic data. Ecology 81:
654-665.
Kwit, C., C. C. Horvitz, and W. J. Platt. 2004. Conserving slow-growing, long-lived
tree species: Input from the demography of a rare understory Conifer, Taxus
floridana. Conservation Biology 18: 432-443.
Martinez-Ramos M, ER. Alvarez-Buylla. 1998. How old are tropical rain forest trees?
Trends in Plant Science 3:400-405
Moloney, K. A. 1986. A generalized algorithm for determining category size. Oecologia
69: 176-180.
Nghia, N. H. 2000. Some threatened tree species of Vietnam. Agricultural Publishing
House, Ha Noi.
Ramula, S., and K. Lehtilä. 2005. Matrix dimensionality in demographic analyses of
plants: when to use smaller matrices? OIKOS 111: 563-573.
Ratsirarson, J., J. A. Silander JR, and A. F. Richard. 1996. Conservation and management
of a threatened Madagascar palm species, Neodypsis decaryi, Jumelle. Conservation
What matrix dimension to use
123
Biology 10: 40-52
Saether, B. E., and O. Bakke. 2000. Avian life history variation and contribution of
demographic traits to the population growth rate. Ecology 81: 642-653.
Silvertown, J., M. Franco, I. Pisanty, and A. Mendoza. 1993. Comparative plant
demography: relative importance of life-cycle components to the finite rate of
increase in woody and herbaceous perennials. Journal of Ecology 81: 465-476.
Thu, N. B., and V. V. Can. 1999. Cho Dai tree (Annamocarya sinensis). Agricultural
Publishing House, Ha Noi.
Vandermeer, J. 1978. Choosing category size in a stage projection matrix. Oecologia
32: 79-84.
Yearsley, J. M., and D. Fletcher. 2002. Ivalence relationships between stage-structured
population models. Mathematical Bioscience 179: 131-143.
Zagt, R. J. 1997. Tree demography in the tropical rainforest of Guyana. Utrecht
University, Utrecht.
Zeide, B. 1993. Analysis of Growth Equation. Forest Science 39: 594-616.
Zuidema, P. A. 2000. Demography of exploited tree species in the Bolivian Amazon.
Utrecht University, PROMAB scientific series 2.
Zuidema, P. A., and M. Franco. 2001. Integrating vital rate variability into perturbation
analysis: an evaluation for matrix population models of six plant species. Journal
of Ecology 89: 995-1005.
Zuidema, P. A., and R. G. A. Boot. 2002. Demography of the Brazil nut tree (Bertholletia
excelsa) in the Bolivian Amazon: impact of seed extraction on recruitment and
population dynamics. Journal of Tropical Ecology 18: 1-31.
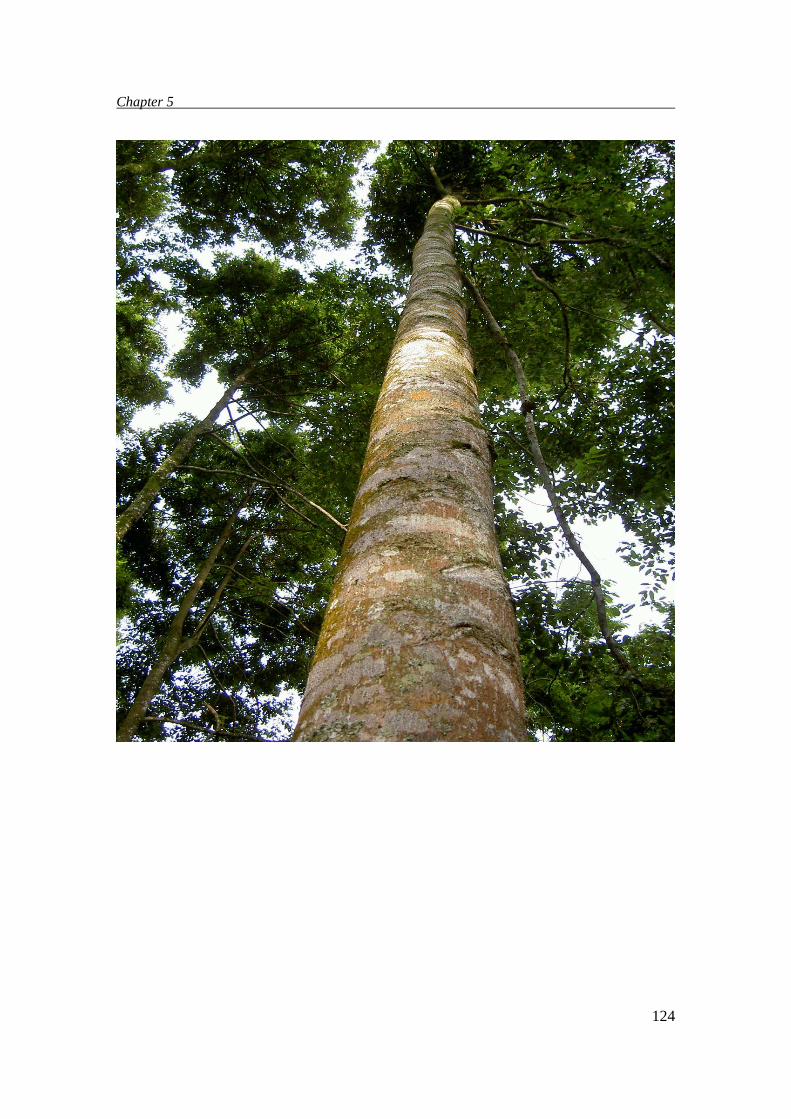
Chapter 5
124
Chapter 6
General discussion and summary
Forests and threatened tree species in Vietnam
Affected by a tropical climate and a complex terrain, forest types of Vietnam are very
diverse, ranging from tropical rainforest, mangrove forest and limestone forest to
conifer and subtropical forests (Chapter 2). Vietnam is also a venue of plant species
that migrated from three different floras nearby, which makes the flora of Vietnam
very diverse in species (including more than 12000 plant species) (Thin 1997, Trung
1998).
The forests of Vietnam have severely declined in both quantity and quality over
the last decades for many reasons, such as long wars, shifting cultivation,
transformation of forests and forest land to agricultural fields, and overexploitation
(Chapter 2). The cover of natural forests for the whole country was estimated at 43%
in 1945, but it was reduced to around 27% in 1980 (Hung 2004). Recently, after a
great effort from the Government, the forest cover increased to 36 % in 2003,
including around 30% of natural forests and 6% of plantations (Forest Department
2004). However, the quality of the natural forests is generally low, as a result of a long
period of degradation. The quality of plantation forests is also poor, and it needs to
be improved both in species and silvicultural measures (Chapter 2). Clearly, great
effort is required in order to improve both the quantity and quality of forests.
South-East Asia is facing the highest rate of deforestation, which, if not stopped
or slowed down, would lead to the loss of three quarters of forest cover in 100 y, and
up to 42% of its biodiversity (Sodhi et al. 2004). Being a country in the region,
Vietnam also has a large number of species suffering extinction risk due to a severe
loss of forests over last decades. According to the World Conservation Union
‘IUCN’ (2006), Vietnam currently has 261 endangered tree species, of which 148 are
critically endangered and vulnerable. Populations of threatened tree species have
severely declined in both densities and habitats, and many of them mainly depend on
protected areas (Bawa & Ashton 1991). Furthermore, populations of these species are
often small and/or isolated, and are likely to be vulnerable to local extinction due to
demographic and environmental stochasticity or lack of genetic variation (Menges
1992, Lande 1993, Oostermeijer et al. 2003).
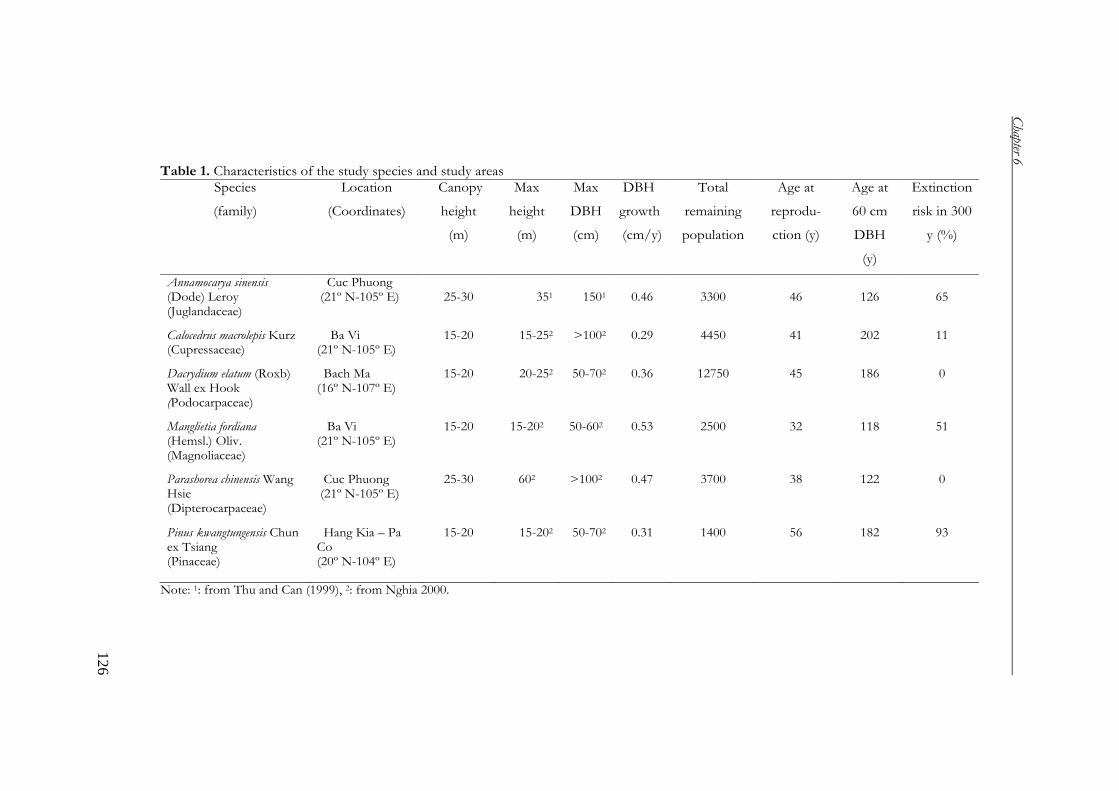
Chapter 6
126
Table 1. Characteristics of the study species and study areas Species
(family)
Location
(Coordinates)
Canopy
height
(m)
Max
height
(m)
Max
DBH
(cm)
DBH
growth
(cm/y)
Total
remaining
population
Age at
reprodu-
ction (y)
Age at
60 cm
DBH
(y)
Extinction
risk in 300
y (%)
Annamocarya sinensis (Dode) Leroy (Juglandaceae)
Cuc Phuong (21º N-105º E)
25-30
351
1501
0.46
3300
46
126
65
Calocedrus macrolepis Kurz (Cupressaceae)
Ba Vi (21º N-105º E)
15-20 15-252 >1002 0.29 4450 41
202
11
Dacrydium elatum (Roxb) Wall ex Hook (Podocarpaceae)
Bach Ma (16º N-107º E)
15-20 20-252 50-702 0.36
12750 45 186 0
Manglietia fordiana (Hemsl.) Oliv. (Magnoliaceae)
Ba Vi (21º N-105º E)
15-20 15-202 50-602 0.53 2500 32 118 51
Parashorea chinensis Wang Hsie (Dipterocarpaceae)
Cuc Phuong (21º N-105º E)
25-30 602 >1002 0.47 3700 38 122 0
Pinus kwangtungensis Chun ex Tsiang (Pinaceae)
Hang Kia – Pa Co (20º N-104º E)
15-20 15-202 50-702 0.31 1400 56 182 93
Note: 1: from Thu and Can (1999), 2: from Nghia 2000.
General discussion and summary
127
Regarding the importance of forests and biodiversity for the human beings,
Vietnam has early developed a system of protected areas throughout the country.
Currently, Vietnam has 126 protected areas, covering around 8% of the area of the
country (Forest Department 2004). In addition, forests covering important
watersheds are also under the protection regime. This increases the chance to reserve
threatened tree species, as well as the vegetation cover in these areas.
However, in order to protect and effectively conserve threatened species, the
protected areas of Vietnam still need to be improved both in quantity and quality.
The proportion of protected areas in the country area is still lower than the minimum
rate recommended by IUCN (1997). Furthermore, the area of several protected areas
is small (Chapter 2), which is not effective for conservation of threatened species. It
is therefore important for Vietnam not only to increase the number of protected
areas, but also to expand their sizes.
In addition, in most protected areas, basic studies on taxonomy, biodiversity and
demography of endangered species are still few. Clearly, great effort should be paid to
gather information that assists in effectively protecting and conserving threatened
species. This dissertation was therefore carried out with the goal of contributing to
the information basis for conservation of threatened tree species.
Demography of six threatened tree species
In order to conserve threatened tree species, we need to understand the natural
dynamics of their populations. Is there natural recruitment in populations? If yes,
whether that recruitment is sufficient for replacing adult trees? Are populations
growing or declining? What is the most important life stage for the persistence of
populations?
To answer these questions, we carried out a two-year field study to collect
demographic data for six threatened tree species in four protected areas (Table 1). We
quantified the vital rates (survival, growth and fecundity) for the six species, and used
these to estimate matrix elements (stasis, growth and fecundity), which were used to
construct (deterministic) matrix models (Chapter 3). We used the output of the
matrix models that indicates the population growth rate (λ) to project the future
prospects of the species. When λ is more than 1, the population is growing, but if λ is
less than 1, it is declining. On the other hand, the model output also indicates the
importance of life stages to the population growth rate (elasticity analysis), which is
used to suggest effective strategies for conservation (Benton & Grant 1999, Contreras
& Valverde 2002, Zuidema & Boot 2002, Kwit et al. 2003).
We used two ways to project the future prospects for our species (Chapter 3).
First, we used the asymptotic population growth rate (λ). For four species: Dacrydium,
Manglietia, Parashorea and Pinus, we found no evidence of increasing or declining
population. The populations of these species are therefore expected to be stable
Chapter 6
128
overtime. Nevertheless, our models projected the populations of Annamocarya and
Calocedrus were declining over time. Second, we combined information on recruitment
and ages to check whether the species can produce sufficient seedlings in order to
replace adult trees. For example for Manglietia, we found that only 0.1% of new
seedlings would survive to reproductive size. That means an adult tree should
produce 1000 seedlings in its entire reproductive life to replace itself. If an adult tree
produces less than one seedling per year, as we observed, it takes over 1000 y. This
reproductive time is much more than the maximum age estimated for the species. In
a similar way, we calculated the ability to produce sufficient seedlings for other
species. We found that only Calocedrus, Dacrydium and Parashorea could sufficiently
produce seedlings. In contrast, the other species (Annamocarya, Manglietia and Pinus)
did not produce effective recruitment for the replacement of adult trees.
The output of the matrix models also indicated that among vital rates, survival of
individuals, particularly for juvenile and adult trees, was most important for the
population growth rate. Growth and fecundity, on the other hand, were less
important for the persistence of the species (Chapter 3).
In short, by applying population matrix models in our demographic study, we
projected that the populations of Annamocarya and Calocedrus were declining, but not
for the other species. We also found that Annamocarya, Manglietia and Pinus could not
produce enough seedlings to replace adult trees. In addition, the survival was found
to be most important for the persistence of populations. These results importantly
contribute to the basis information for making an effective conservation strategy for
the threatened tree species.
Using stochastic matrix models to analyse the demography of threatened tree species
Population growth rates obtained from standard matrix models are interpreted with
the assumption that vital rates do not change over time. Clearly, this is not realistic as
populations are affected with time by unpredictable factors such as demographic and
environmental stochasticity (Menges & Quintana-Ascencio 2003, Munzbergova
2006). Demographic stochasticity is the variation in population dynamics caused by
independent stochastic contribution from each individual of the population to the
next generation (Engen et al. 1998, Menges 2000). Environmental stochasticity, on
the other hand, is related to variation in demographic parameters (e.g. survival,
growth and reproduction) due to variation in the environment (Menges 2000).
Demographic and environmental stochasticity can severely change the population
growth rate, leading to changes in the extinction risk of populations, particularly in
the case of threatened species (Menges 1998). Furthermore, stochastic phenomena
such as drought, flood, hurricane or wildfire could destroy populations, even of
redundant species (Menges 2000). It is therefore not possible to reliably project the
General discussion and summary
129
long future prospects for populations and the time for which they go extinct, if using
only matrix models. However, we can deal with this problem by using stochastic
matrix models as those allow to project population growth rates under the influence
of stochasticity.
We applied stochastic matrix models to investigate the impact of stochastic
factors on population development and extinction risk for the six threatened tree
species. We included both environmental and demographic stochasticity in the
stochastic matrix models. For the variation affected by the environment, we
estimated variation in vital rates (survival, growth, reproduction, and fecundity),
which we obtained and quantified from the two-year field study. This variation may
reflect small-scale spatial variation (e.g. in light and soil conditions), size differences
and uncertainty in parameter estimation (Chapter 4). We also included temporal
variation in growth based on ring indices of trees (Chapter 5).
Our models showed that the environmental stochasticity decreases population
sizes and increases extinction risks for all study species. Compared with the temporal
variation, the variation among individuals (or spatial variation) was more important
for the population development, and for the risk of extinction. On the other hand,
demographic stochasticity, in general, decreased the time to extinction for the species,
but by chance might also decrease the extinction risk for some populations (Chapter
4). In addition, we also found that the risk of extinction was more sensitive to
changes in the mean of vital rates, particularly the survival, than to changes in their
variation (Chapter 4). This suggests that more attention should be paid to the
estimate of this vital rate in order to get more reliable results from population viability
analysis.
From the results obtained from the stochastic matrix models, we projected that
Dacrydium and Parashoea did not face extinction within 300 y, even though the
population of Parashorea might drop below 100 individuals after 150 y. However, the
populations of the other species (Annamocarya, Calocedrus, Manglietia and Pinus) were
projected to drop below 100 individuals after 80-90 y. Moreover, the extinction risk
for Annamocarya, Calocedrus, Manglietia and Pinus was projected to be 65%, 11%, 51%
and 93%, respectively, within 300 y (Table1, Chapter 4).
Population viability analysis (PVA) is widely used to estimate population dynamics
and the extinction risk for threatened species, and also suggest effective conservation
actions (Boyce 1992, Kaye & Pyke 2003, Boyce et al. 2006). By taking into account
the combined impacts of unpredictable factors such as demographic, environmental
and genetic stochasticity and deterministic elements such as habitat loss,
overexploitation and fragmentation, PVA provides a stochastic projection of
population dynamics over time (Chapman et al. 2001, Beissinger & McCullough
2002). In our study, the results obtained from the stochastic models are also more
reliable than those obtained from the deterministic models. That is because the
Chapter 6
130
population is analyzed under the influence of environmental and demographic
stochasticity. The population growth rate is therefore not stable, but fluctuates
following the magnitude of variation. As a result, from stochastic matrix models, but
not from deterministic matrix models, we can reliably predict population size and
extinction risk for the study species over a long period of time (e.g. over 300 y).
However, using stochastic matrix models also means that we need more data
from demographic and environmental stochasticity, which is often time consuming
and expensive. Furthermore, parameterization is more complex than that in
deterministic models, and constructing stochastic matrix models also is more
complicated than doing so with deterministic matrix models. Therefore, based on the
purposes of the study, one could choose the most suitable approach to get effective
results.
Future prospects and conservation measures for threatened tree species
Combining the results obtained from Chapter 3 & 4, we can distinguish three groups
of species with different future prospects. First, the future prospects of Dacrydium and
Parashorea look good. The population growth rate suggests stable population size over
time (Chapter 3). In addition, the recruitment of the two species was sufficient for the
replacement of large trees (Chapter 3). Furthermore, remaining populations of these
two species are not expected go extinct within a long period of time (in 300 y,
Chapter 4). Second, for Manglietia and Pinus, our models did not find significant
declines in their population sizes over time, but seedling recruitment appears to be
insufficient to replace adult trees (Chapter 3). The future prospects of these species
therefore may not be good due to lacking recruitment. This is consistent with the
output of the population viability analysis (PVA, Chapter 4) that populations of these
two species have a high chance (51-93%) to disappear within 300 y. Third, the future
prospects of Calocedrus and Annamocarya are worrisome as the projected population
growth rates indicates the population declines (Chapter 3). In addition, we found that
the population sizes of the two species could drop below 100 individuals in just 80-
110 y, and the species could face extinction within 125 y (Chapter 4). In short, by
combining the results obtained from deterministic and stochastic matrix models, we
project that future prospects of Dacrydium and Parashorea are good, while that for the
other species are not.
Our results suggest that successful protection and conservation of the six
threatened tree species require various conservation measures. First, for all species,
strict protection of populations, particularly for juvenile and adult trees should be
implemented, as these stages are most important for the maintenance of their
populations (Chapter 3). Any human disturbance and logging within and if possible
near the protected areas should be forbidden. On the other hand, great effort should
General discussion and summary
131
be paid to reverse population decline into population increment for the four species,
which are projected to face extinction (Annamocarya, Calocedrus, Manglietia and Pinus,
Chapter 4). We argue that growth of seedlings and juveniles may be improved using
silvicultural measures such as controlled liberation, which in turn can probably
increase the growth rate of the populations. Though results from elasticity analyses
suggest that the effect of such measures is limited in comparison to maximizing tree
survival, growth of seedlings and trees can probably be altered more than tree
survival, and with less difficulty (Batista et al. 1998, Zuidema & Boot 2002, Kwit et al.
2004, Chapter 3). Another important conservation measure is enrichment of
populations with seedlings produced under controlled conditions. If germination
success under controlled conditions is higher than that under natural conditions,
seeds can be collected from the same natural populations which are then enriched
with seedlings. This enrichment is particularly important for the species (Annamocarya,
Manglietia and Pinus), which were found to produce insufficient numbers of seedlings
for the maintenance of their populations (Chapter 3). Compared to survival rate,
recruitment contributes less to the population growth rate (elasticity analysis, Chapter
3), but improved recruitment can probably be implemented with much less difficulty.
Finally, for species with small populations such as Calocedrus and Pinus (Chapter 3 &
4), the expansion of their habitat area through nature restoration would be an
effective conservation measure.
To what extent are the results of the study for the six species relevant to the
hundreds of other threatened tree species in Vietnam? With some caution, our results
can be applied to other threatened tree species with similar life history and similar
status of the remaining populations. As population dynamics of long-lived tree
species are to large extent governed in a similar way (see comparison of elasticity
patterns in Chapter 3), some general guidelines for conservation threatened tree
species can be formulated. First, because small and fragmented habitats increase
extinction risks for plant species, it is necessary to increase the size of protected areas,
and to stop activities causing fragmentation within these areas. Second, strict
protection, particularly for juvenile and adult trees, should be implemented in
protected areas, meaning that any human disturbance and logging should be strictly
forbidden. Third, the improvement of seedling and juvenile growth (e.g. by
controlled libration) can also help to improve population growth rates. Fourth,
enrichment is also a good conservation measure in case germination of seeds under
controlled conditions is better than under natural conditions. Fifth, for the threatened
tree species that presently remain in small and/or isolated populations, expansion of
their habitat area through natural restoration would be a crucial conservation
measure.
Declines in population sizes of threatened tree species may be slow as they are
long-lived. Consequently, there appears to be more time for taking conservation
Chapter 6
132
measures for these species, but slow dynamics also imply that it takes long before
such measures result in population increase. We therefore argue that taking action
before populations have declined to critical levels is important, as well as close
monitoring of population size and seedling recruitment.
Acknowledgements
I would like to thank Marinus Werger, Pieter Zuidema and Nguyen Hoang Nghia for
their helpful comments on the chapter.
References
Bawa, K. S., and P. S. Ashton. 1991. Conservation of rare trees in tropical rain forests: a
genetic perspective. Pages 62-71 in D. A. Falk and K. E. Holsinger, editors.
Genetics and conservation of rare plants. Oxford University Press, Oxford.
Batista, W. B., W. J. Platt, and R. E. Macchiavelli. 1998. Demography of a shade-tolerant
tree (Fagus grandifolia) in a hurricane-disturbed forest. Ecology 79: 38-53.
Benton, T. G., and A.Grant. 1999. Elasticity analysis as an important tool in evolutionary
and population ecology. Trends in Ecology and Evolution 14: 467-471.
Beissinger, S. R., and D.R. McCullough. 2002. Population Viability Analysis. University
of Chicago Press, Chicago, USA.
Boyce, M. S. 1992. Population viability analysis. Annual Review of Ecology and
Systematics 23: 481-506.
Boyce, M. S., C. V. Haridas, C. T. Lee, and the NCEAS Stochastic Demography
Working Group. 2006. Demography in an increasingly variable world. Trends
in Ecology and Evolution 21: 141-148.
Caswell, H. 2001. Matrix Population Models. 2nd edition. Sinauer Associates, Sunderland,
Massachusetts. *Chan, L. T., T. Ty, N. H. Tu, H. Nhung, D. T. Phuong, and T. T. Van. 1999. Some
basis characters of Vietnam flora. Science and Technics Publishing House. Ha
Noi.
Chapman, A. P., B. W. Brook, T. H. Clutton-Brock, B. T. Grenfell, and R. Frankham.
2001. Population viability analyses on a cycling population: a cautionary tale.
Biological Conservation 97: 61-69.
Contreras, C., and T. Valverde. 2002. Evaluation of the conservation status of a rare
cactus (Mammillaria crucigera) through the analysis of its population dynamics.
Journal of Arid Environments 51 (1): 89-101.
Engen, S., Ø. Bakke, and A. Islam. 1998. Demographic and environmental stochasticity
– concepts and definitions. Biometrics 54: 840-846. *Forest Department. 2004. Development of forestry in the period of 2006-2010. Journal
of Agriculture and Rural Development 12: 13-17.
General discussion and summary
133
*Hung, T. V. 2004. Forestry research for the coming time. Journal of Agriculture and
Rural Development 12: 26-29.
Kaye, T. N., and D. A. Pyke. 2003. The effect of stochastic technique on estimates of
population viability from transition matrix models. Ecology 84: 1464-1476.
Kwit, C., C. C. Horvitz, and W. J. Platt. 2004. Conserving slow-growing, long-lived tree
species: Input from the demography of a rare understory Conifer, Taxus floridana.
Conservation Biology 18: 432-443.
Lande, R. 1993. Risks of population extinction from demographic and environmental
stochasticity and random catastrophes. The American Naturalist 142: 911-927. *Lap, V. T. 1999. Natural Geography of Vietnam. Education Publishing House. Ha Noi.
Menges, E . S. 1992. Stochastic modeling of extinction in plant population. Pages 253-
276 in P. L. Fiedler and S. K. Jain, editors. Conservation Biology: the Theory and
Practice of Nature Conservation, Presentation and Management. Chapman and
Hall, New York.
Menges, E. S. 1998. Evaluating extinction risks in plant populations. Pages 59-65 in P. L.
Fiedler and P. M. Kareiva, editors. Conservation biology for the coming decade.
Chapman and Hall, New York, USA.
Menges, E. S. 2000. Population viability analyses in plants: challenges and opportunities.
Trends in Ecology & Evolution 15: 51-56.
Menges, E. S., and P. F. Quintana-Ascencio. 2003. Modeling the effects of disturbance,
spatial variation and environmental heterogeneity on population viability of
plants. Pages 288-311 in C. A. Brigham and M. W. Schwartz, editors. Population
viability in plants. Springer-Verlag, Heidelberg, Germany. *Ministry of Science, Technology and Environment (MSTE). 1996. Red Data Book of
Vietnam. Volume 2 – Plant. Science and Technics Publishing House, Ha Noi.
Munzbergova, Z. 2006. Effect of population size on the prospect of species survival.
Folia Geobotanica 41: 137-150.
Nghia, N. H. 2000. Some threatened tree species of Vietnam. Agricultural Publishing
House, Ha Noi.
Oostermeijer, J. G. B., S. H. Luijten, and J. C. M. Den Nijs. 2003. Intergrating
demographic and genetic approaches in plant conservation. Biological
Conservation 113: 389-398.
Sodhi, N. S., L. P. Koh., B. W. Brook, and P. K. L. Ng. 2004. Southeast Asian
biodiversity: an impending disaster. Trends in Ecology and Evolution 19: 654-
660. *Thin, N. N. 1997. Manual for biodiversity research. Agricultural Publishing House. Ha
Noi. *Thu, N. B., and V. V. Can. 1999. Cho Dai tree (Annamocarya sinensis). Agricultural
Publishing House, Ha Noi. *Trung, T. V. 1998. Ecosystems of tropical forests in Vietnam. Science and Technics
Publishing House. Ha Noi.
World Conservation Union (IUCN). 1997. The IUCN Red List of Threatened Plants.
Gland, Switzerland.

Chapter 6
134
World Conservation Union (IUCN). 2006. The IUCN Red List of Threatened Species.
vailable from http://www.redlist.org/info/tables/table6a (access August 2006).
Zuidema, P. A., and R. G. A. Boot. 2002. Demography of the Brazil nut tree (Bertholletia
xcelsa) in the Bolivian Amazon: impact of seed extraction on recruitment and
opulation dynamics. Journal of Tropical Ecology 18: 1-31.
Note: * Initial titles in Vietnamese were translated into English.

General discussion and summary
135
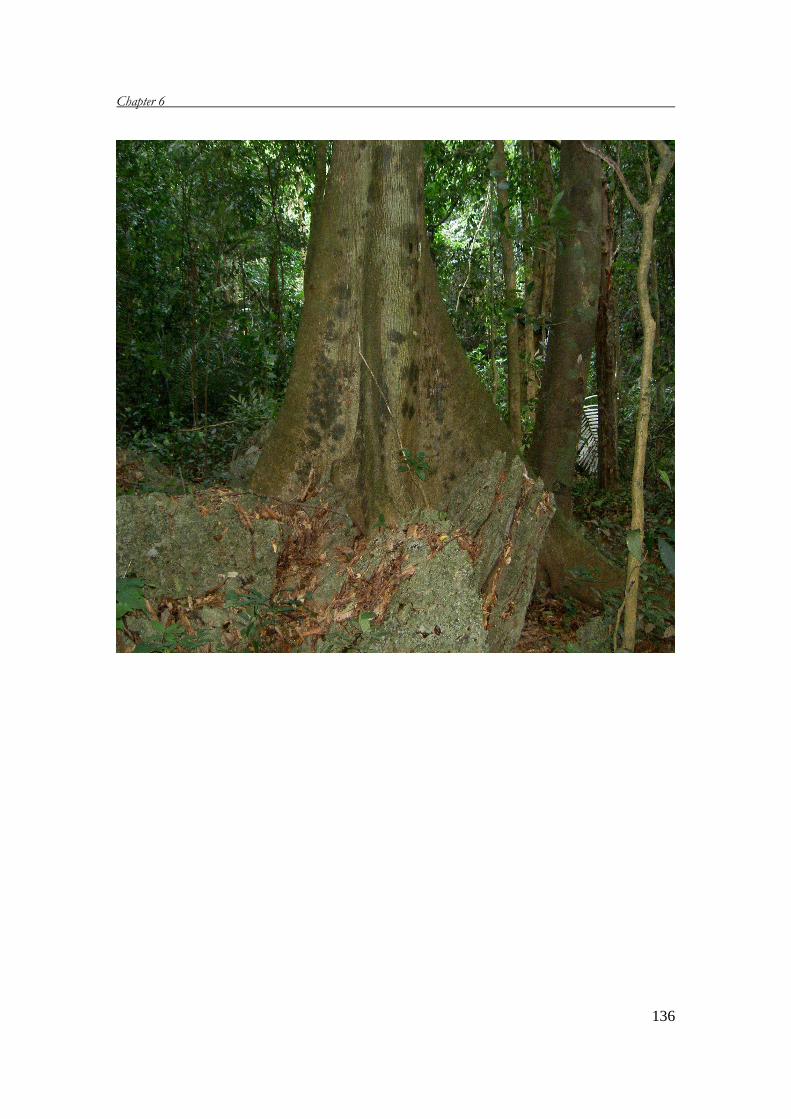
Chapter 6
136
Samenvatting Bossen en bedreigde boomsoorten in Vietnam Er zijn veel verschillende bostypen in Vietnam, omdat het land een tropisch klimaat heeft en topografisch zeer gevariëerd is. Er zijn tropische regenbossen, mangrovebossen, bossen op kalksteen, naaldbossen en subtropische bossen (Hoofdstuk 2). Vietnam ligt ook op een kruispunt van migratiewegen van drie verschillende flora’s en dat draagt er toe bij dat de flora van Vietnam heel rijk is (meer dan 12000 soorten). De afgelopen decennia zijn de bossen in Vietnam door allerlei oorzaken sterk in omvang en kwaliteit verminderd (Hoofdstuk 2). In 1945 werd geschat dat 45 % van het land met natuurlijke bossen bedekt was, maar in 1980 was dat nog maar 27 %. Sindsdien heeft de regering veel in herbebossingsactiviteiten geïnvesteerd en in 2003 was de bosbedekking weer tot 36 % toegenomen, waarvan 6 % plantagebossen. De kwaliteit van al deze bossen is echter nogal laag en behoeft verbetering in termen van soortensamenstelling en bosbeheer (Hoofdstuk 2). De snelheid van ontbossing is wereldwijd het hoogst in Zuid-Oost Azië: het huidige tempo zou er toe leiden dat over 100 jaar driekwart van het bosareaal is verdwenen tezamen met 42 % van de huidige biodiversiteit (Sodhi et al. 2004). In Vietnam lopen ook veel boomsoorten het risico uit te sterven als gevolg van de bosvernietiging. Volgens de lijst van de International Union for the Conservation of Nature (2006) telt Vietnam op het ogenblik 261 bedreigde boomsoorten, waarvan er 148 sterk bedreigd zijn. De populaties van deze soorten zijn sterk achteruit gegaan, geschikte groeiplaatsen voor veel soorten zijn vrijwel alleen nog in beschermde gebieden te vinden en, omdat de populaties klein en geïsoleerd zijn kunnen ze lokaal, als gevolg van demografische toevalsprocesses of milieu-fluctuaties, of door gebrek aan genetische variatie, gemakkelijk uitsterven. Vietnam heeft een netwerk van 126 beschermde gebieden, verspreid over het hele land. Tezamen beslaan ze 8 % van het land, maar dat is volgens IUCN-normen te weinig. Daarenboven zijn bossen in belangrijke afwateringsgebieden ook beschermd. Maar de oppervlakte van veel beschermde gebieden is klein, zodat het belangrijk is om in Vietnam niet alleen het beschermde areaal uit te breiden, maar ook de gebieden zelf groter te maken. Er is nog weinig onderzoek gedaan naar de biodiversiteit in beschermde gebieden en naar de demografie van bedreigde soorten. Deze informatie is echter nodig om een effectieve bescherming mogelijk te maken. Het onderzoek dat in deze dissertatie beschreven wordt, wil een dergelijke bijdrage leveren.
Samenvatting
138
Demografie van zes bedreigde boomsoorten Om bedreigde boomsoorten te kunnen beschermen moeten we allereerst verschillende aspecten van de popultiedynamica van die soorten kennen, bijvoorbeeld of er natuurlijke verjonging optreedt en of die voldoende is om de volwassen bomen te vervangen, of de populaties groeien of afnemen, en wat de meest kritische levensstadia in de levenscyclus zijn. Om dit soort vragen te beantwoorden heb ik gedurende twee jaren van veldwerk demografische data van zes bedreigde boomsoorten in vier beschermde gebieden verzameld. Ik heb de ‘vital rates’ (overleving, groei en vruchtbaarheid) voor de populaties van de zes soorten berekend en die gebruikt om de elementen (stasis, groei en vruchtbaarheid) van de matrixmodellen te kwantificeren (Hoofdstuk 3). De matrixmodellen leverden me de geschatte groeisnelheden (λ) van de populaties en die heb ik gebruikt om de toekomstige ontwikkelingen van de populaties te taxeren. Als λ groter is dan 1 groeit de populatie, maar als λ kleiner is dan 1 neemt de populatie af. Uit de modelberekeningen blijkt ook in welke mate de verschillende levensstadia de groeisnelheid van de populatie beïnvloeden (‘elasticiteitsanalyse’). Op grond daarvan is het mogelijk om effectieve strategieën voor de bescherming van de soorten te formuleren. Ik heb twee methodes gebruikt om de toekomstige ontwikkeling van de zes soorten in te schatten (Hoofdstuk 3). Eerst heb ik groeisnelheid van de populatie berekend voor de populaties van alle zes soorten. Bij vier soorten, Dacrydium, Manglietia, Parashorea en Pinus, vond ik geen aanwijzingen voor een af- of toenemende populatiegrootte. De populaties van deze soorten lijken dus stabiel. Maar de populatiegrootte van Annamocarya en Calocedrus lijken af te nemen. Vervolgens gebruikte ik de gegevens over verjonging en leeftijden om na te gaan of de soorten voldoende jonge planten produceren om de oude te vervangen. Bij Manglietia vond ik bijvoorbeeld, dat de kans dat een kiemplant overleeft tot reproducerende boom slechts 0,1 % bedraagt. Dat betekent dat een volwassen boom tijdens zijn gehele reproductieve levensstadium dus 1000 kiemplanten zou moet produceren om zichzelf te vervangen. Maar als zo’n boom, zoals ik waarnam, nog minder dan 1 kiemplant per jaar levert, dan heeft hij gemiddeld dus 1000 jaar nodig om zichzelf te vervangen. Dit is veel langer dan de maximum leeftijd van zo’n boom. Ik vond dat alleen Calocedrus, Dacrydium en Parashorea voldoende kiemplanten produceerden. De andere drie soorten produceerden er niet genoeg om de volwassen bomen te vervangen. Op grond van de matrixmodellen kon ik ook concluderen dat de groei van populaties het sterkst wordt bepaald door de overleving van jonge en volwassen bomen. Andere 'vital
Samenvatting
139
rates' (boomgroei en vruchtbaarheid) waren minder kritiek voor het voortbestaan van populaties van deze soorten (Hoofdstuk 3). Dus uit de matrixmodellen bleek dat de populaties van Annamocarya en Calocedrus afnamen, en dat Annamocarya, Manglietia en Pinus niet genoeg kiemplanten produceerden om de oude bomen te vervangen. Een adequate beschermingsstrategie voor de soorten moet met deze kennis rekening houden. Het gebruik van stochastische matrixmodellen voor de analyse van de demografie van bedreigde boomsoorten De groeisnelheden van populaties zijn over lange tijdsintervallen niet noodzakelijk constant. Op onvoorspelbare wijze kunnen ze door demografische of milieugebeurtenissen stochastisch beïnvloed worden. Demografische stochasticiteit betreft de variatie in populatiedynamiek, die door de onafhankelijke bijdrage van elk individu in de populatie veroorzaakt wordt. Milieu-stochasticiteit betreft onvoorspelbare variatie in de populatiedynamica als gevolg van fluctuaties in het milieu, bijvoorbeeld door stormen, brand of droge jaren. Deze twee stochastische invloeden kunnen in belangrijke mate de groeisnelheden van populaties beïnvloeden en bij bedreigde soorten het risico van uitsterven veranderen. Daarom kan men op grond van deterministische matrixmodelberekeningen (die geen rekening houden met stochasticiteit) de lange termijn toekomst van een soort eigenlijk niet op een betrouwbare manier taxeren. Maar het gebruik van stochastische matrixmodellen biedt hier uitkomst. Ik gebruikte deze methode om het risico van uitsterven voor de zes onderzochte soorten te berekenen, waarbij ik zowel demografische als milieu-stochasticiteit in aanmerking nam. Als een maat voor de variatie in het milieu gebruikte ik de variatie in de ‘vital rates’ (overleving, groei, reproductie en vruchtbaarheid) die ik op grond van de gegevens van twee jaar veldwerk had verkregen. Deze variatie tussen bomen weerspiegelt de klienschalige ruimtelijke variatie in milieu-omstandigheden, grootteverschillen, en schattingsonnauwkeurigheden Hoofdstuk 4). Ik heb ook nog de boomgroeivariatie in de tijd meegenomen, zoals die blijkt uit jaarringonderzoek. Mijn modelberekeningen lieten zien dat milieustochasticiteit leidt tot een afname van berekende populatiegrootte en een hogere uitsterfrisico. Dit was het geval voor alle soorten. Individuele variatie (ofwel ruimtelijke variatie) was in grotere mate verantwoordelijk voor dit effect dan variatie in de tijd. Demografische stochasticiteit verkortte de gemiddelde tijd totdat populaties uitstierven, maar leidde aan de andere kant ook tot een verlaagde kans op uitsterven (Hoofdstuk 4). Ik
Samenvatting
140
vond ook dat het uitsterfrisico gevoeliger was voor veranderingen in de gemiddelde waarden van de ‘vital rates’ dan voor veranderingen in de variatie van die 'vital rates'. Dit was vooral het geval voor de factor overleving. Hieruit blijkt dat men die factor zo nauwkeurig mogelijk moet bepalen om betrouwbare schattingen van de levensvatbaarheid van populaties te verkrijgen. Mijn resultaten uit de stochastische modellen lieten zien, dat Dacrydium en Parashorea niet binnen 300 jaar zouden uitsterven, zelfs al zou de populatiegrootte van Parashorea binnen 150 jaar tot minder 100 individuen afnemen. Naar verwachting zullen de populaties van de andere soorten echter in 80-90 jaar tot minder dan 100 individuen teruglopen. De uitsterfrisico’s van Annamocarya, Calocedrus, Manglietia en Pinus zijn respectievelijk 65, 11, 51 en 93 % (Hoofdstuk 4). Stochastische modelberekeningen, die overigens algemeen gebruikt worden in zogenaamde ‘population viability analyses’, geven ook in mijn geval veel betrouwbaarder resulaten dan deterministische modelberekeningen, juist omdat de verschillende vormen van stochasticiteit in de berekeningen meegenomen worden. Maar gebruik van deze methode betekent ook dat men meer gegevens over demografische en milieu-stochasticiteit moet verzamelen en dat is tijdrovend en duur. Ook zijn deze modellen complexer dan deterministische modellen. Vooruitzichten en beschermingsmaatregelen voor de bedreigde soorten Op grond van de resultaten in de Hoofdstukken 3 en 4 kunnen we 3 soortengroepen onderscheiden wat betreft hun vooruitzichten. De vooruitzichten voor Dacrydium en Parashorea zijn goed. De groeisnelheden van hun populaties zijn stabiel en de verjonging is voldoende om oude bomen te vervangen. Ook zullen naar verwachting de bestaande populaties van deze twee soorten binnen de komende 300 jaar niet uitsterven. Voor Manglietia en Pinus heb ik geen afnemende populatiegroeisnelheden gevonden, maar hun verjonging lijkt onvoldoende. Door gebrek aan verjonging lijkt de toekomst van de populaties van deze twee soorten niet goed. en de populaties hebben 51 – 93 % kans om binnen de komende 300 jaar uit te sterven. De toekomst van Calocedrus en Annamocarya is ronduit zorgelijk, want hun populatiegroeisnelheden nemen af, hun populaties kunnen binnen 80 – 110 jaar tot minder dan 100 individuen gekrompen zijn en ze kunnen naar verwachting beide binnen 125 jaar uitgestorven zijn. De gecombineerde resultaten van de deterministische en de stochastische modelberekeningen voorspellen dus geen goeds voor deze twee soorten. Mijn resultaten suggereren dat er verschillende beschermingsmaatregelen nodig zijn voor deze zes soorten. Op de eerste plaats moeten populaties strikt beschermd worden, met
Samenvatting
141
name de jonge en volwassen bomen (zie Hoofdstuk 3). Verstoring door menselijk gebruik en houtkap in, en indien mogelijk, ook nabij deze populaties moet worden verboden. Ook moet men bij de vier soorten die met uitsterven bedreigd worden proberen de afname van de populatiegrootten om te zetten in een toename. Ik denk dat de groei van kiemplanten en jonge boompjes door silviculturele maatregelen, zoals ‘vrijstelling’, bevorderd kan worden en daardoor kan de groeisnelheid van de populatie toenemen. Hoewel mijn elasticiteitsanalysen suggereren dat het effect van zulke maatregelen beperkter is dan dat van het maximaliseren van de overleving van bomen, komt het mij voor dat men de groei van kiemplanten en bomen gemakkelijker kan doen toenemen dan de overleving van bomen. Nog een belangrijke beschermingsmaatregel is het verrijken van de bestaande populaties met kiemplanten die onder gecontroleerde omstandigheden zijn geproduceerd. Als men betere kieming krijgt onder gecontroleerde dan onder natuurlijke omstandigheden moet men in de natuurlijke populaties zaden verzamelen, kiemplanten produceren en die in de populaties inbrengen. Dit is vooral belangrijk voor Annamocarya, Manglietia en Pinus, die immers te weinig kiemplanten blijken te produceren (Hoofdstuk 3). Hoewel verjonging minder aan de groeisnelheid van de populatie bleek bij te dragen dan een hogere overlevingskans, is het waarschijnlijk veel gemakkelijker om de verjonging te laten toenemen. Tenslotte zouden het groei-areaal van de kleine populaties van Calocedrus en Pinus vergroot moeten worden door natuurherstel. In hoeverre zijn de resultaten voor deze zes soorten van belang voor de honderden andere bedreigde boomsoorten van Vietnam? Met de nodige voorzichtigheid kunnen mijn resultaten voor andere soorten met een overeenkomstige levenswijze en overeenkomstige populatiedynamica gebruikt worden. Omdat de populatiedynamica van lang-levende boomsoorten toch grotendeels door dezelfde factoren wordt aangestuurd, kan ik een aantal algemene richtlijnen formuleren. Ten eerste, omdat kleine en gefragmenteerde standplaatsen het risico op uitsterven doen toenemen, is het nodig dat de oppervlakte van beschermde gebieden wordt vergroot en dat activiteiten die fragmentatie veroorzaken worden tegengegaan. Ten tweede, in beschermde gebieden zullen populaties van bedreigde soorten strikt moeten worden beschermd, met name de jonge en volwassen bomen. Dit houdt in dat verstoring door houtkap en andere menselijke activiteiten strikt moet worden tegengegaan. Ten derde, door 'vrijstelling' van kiemplanten en jonge boompjes kan hun groei worden verhoogd, hetgeen bijdraagt aan een hogere groeisnelheid van populaties. Ten vierde, ‘verrijking’ is een goede beschermingsmaatregel als kieming onder gecontroleerde omstandigheden succesrijker is dan onder natuurlijke omstandigheden. Ten vijfde, de habitats van de bedreigde soorten met kleine en geïsoleerde populaties moeten door natuurbouw groter gemaakt worden.

Samenvatting
142
De afname van populatiegrootten van bedreigde boomsoorten is, omdat bomen doorgaans nogal lang leven, een langzaam proces. Daarom lijkt het alsof er genoeg tijd is om beschermende maatregelen te nemen. Maar zulke maatregelen hebben ook pas op de lange duur effect. Daarom pleit ik ervoor maatregelen te nemen voordat de populaties tot kritisch lage aantallen individuen zijn gekrompen. En ik adviseer ook populatiegrootten en verjonging nauwkeurig te monitoren.
Tóm tắt các kết quả nghiên cứu chính
Luận văn phân tích ñộng thái quần thể của sáu loài cây bị ñe doạ ở trên ba vườn quốc gia và một khu bảo tồn thiên nhiên của Việt Nam, với các mục tiêu nghiên cứu:
1. Phân tích ñộng thái quần thể của sáu loài cây bị ñe doạ; 2. Dự ñoán triển vọng của sáu loài cây dựa trên hiện trạng và ñộng thái quần thể của
loài; 3. Khuyến nghị các biện pháp bảo tồn cho các loài; 4. ðánh giá ảnh hưởng của kích thước ma trận quần thể tới các kết quả thu ñược từ
mô hình. Luận văn ñược trình bày trong sáu chương. Chương 1 là phần giới thiệu chung. Chương 2 trình bày một số ñặc ñiểm về rừng Việt Nam, ña dạng sinh học và các loài cây bị ñe doạ tuyệt chủng. Chương 3 trình bày kết quả nghiên cứu về ñộng thái quần thể của sáu loài cây. Chương 4 phân tích khả năng tồn tại và phát triển của quần thể sáu loài. Chương 5 xem xét ảnh hưởng của kích thước ma trận quần thể tới các kết quả thu ñược từ mô hình. Chương 6 trình bày tóm lược các kết quả nghiên cứu và thảo luận chung. Các kết quả nghiên cứu chính của Luận văn ñược tóm tắt như sau: Rừng Việt Nam và các loài cây b ị ñe doạ
Do ảnh hưởng bởi chế ñộ khí hậu nhiệt ñới gió mùa và một ñịa hình phức tạp, Việt Nam có các loại hình rừng phong phú, từ rừng mưa nhiệt ñới, rừng ngập mặn, rừng núi ñá vôi tới rừng cận nhiệt ñới và cây lá kim (Chương 2). Việt Nam cũng sở hữu một hệ thực vật rất ña dạng về loài, ước tính trên 12000 loài (Thìn 1997, Trừng 1998). ðó là do Việt Nam nằm ở một vị trí ñịa lý ñặc biệt, là nơi tập trung của các loài thực vật bản ñịa và các loài di cư từ ba hệ thực vật xung quanh: hệ thực vật Himalaya-Yunnam-Guizhou ở phía tây bắc, hệ thực vật India-Myanmar ở phía tây, và hệ thực vật Malaysia-Indonesian ở phía nam và ñông nam (Chương 2). Rừng Việt Nam ñã bị suy giảm nghiêm trọng cả về số lượng và chất lượng trong vài thập kỷ vừa qua. ðộ che phủ của rừng tự nhiên trên cả nước bị giảm từ 43% năm 1945 xuống còn khoảng 27% vào năm 1980 (Hùng 2004). Nguyên nhân chính của việc suy thoái và mất rừng là do chiến tranh, do việc chuyển hoá rừng và ñất rừng sang sản xuất nông nghiệp, do khai thác lạm dụng và du canh (Chương 2). Những năm gần ñây, sau những cố gắng rất lớn của Chính phủ trong các chương trình trồng, phục hồi và bảo vệ rừng, ñộ che phủ của rừng Việt Nam ñã tăng lên 36% vào năm 2003, bao gồm khoảng 30% rừng
Tóm tắt các kết quả nghiên cứu
146
tự nhiên và 6% rừng trồng (Cục Lâm Nghiệp 2004). Tuy nhiên, do bị ảnh hưởng bởi quá trình suy thoái dài, chất lượng rừng tự nhiên của Việt Nam nhìn chung là thấp. Diện tích rừng trồng ñã tăng lên ñáng kể trong những năm qua, nhưng chất lượng cũng vẫn còn thấp, cần ñược bổ sung thêm về thành phần loài cũng như cần tiếp tục phát triển và hoàn thiện các biện pháp kỹ thuật lâm sinh và các loại hình rừng trồng (Chương 2). ðông Nam Á ñang phải ñối mặt với tỷ lệ mất rừng cao nhất thế giới. Nếu nạn phá rừng không ñược ngăn chặn, khu vực có thể sẽ mất ñi ba phần tư diện tích rừng cùng với khoảng 40% số loài hiện có trong vòng 100 năm tới (Sodhi et al. 2004). Là một nước nằm trong khu vực, Việt Nam cũng có nhiều loài cây bị de doạ tuyệt chủng do bị ảnh hưởng của quá trình suy thoái và mất rừng trong những năm qua. Theo Hiệp hội bảo tồn thế giới (IUCN 2006), Việt Nam hiện có khoảng 260 loài cây bị ñe doạ trong ñó 150 loài ñang hoặc sẽ bị nguy cấp tuyệt chủng. Quần thể của các loài cây bị ñe doạ bị suy giảm mạnh cả về mật ñộ và khu phân bố. Sự tồn tại của các loài này phụ thuộc rất nhiều vào các khu rừng ñược bảo vệ (Bawa & Ashton 1991). Mặt khác, do quần thể các loài bị ñe doạ thường nhỏ và bị chia cắt nên rất dễ bị tổn thương và cũng dễ bị ñối mặt với hiểm hoạ tuyệt chủng do sự thay ñổi bất thường của môi trường và sự suy thoái từ chính quần thể (Menges 1992, Lande 1993, Oostermeijer et al. 2003). Nhận biết rõ tầm quan trọng của rừng và ña dạng sinh học ñối với ñời sống con nguời và sự phát triển của ñất nước, Việt Nam ñã sớm xây dựng một hệ thống các khu rừng ñặc dụng và bảo tồn trên khắp cả nước. Hiện tại, Việt Nam có 126 khu rừng ñặc dụng và bảo tồn, chiếm khoảng 8% diện tích cả nước (Cục Phát triển Lâm nghiệp 2004). Thêm vào ñó, rừng và thảm thực vật ở một số lưu vực sông quan trọng cũng ñược bảo vệ và phát triển. ðiều này góp phần tăng cơ hội bảo tồn cho các loài cây bị ñe doạ cũng như ña dạng sinh học ở khu vực. Tuy nhiên, ñể bảo tồn một cách hiệu quả các loài cây bị ñe doạ, các khu rừng ñặc dụng và bảo tồn cần ñược cải thiện hơn về cả số lượng và chất lượng. Tỷ lệ diện tích các khu rừng này so với tổng diện tích lãnh thổ còn thấp hơn so với mức chung do IUCN (1997) quy ñịnh. Mặt khác, diện tích một số khu bảo tồn còn khá nhỏ (Chương 2) nên có thể làm giảm tính năng bảo tồn của khu. Do vậy, trong những năm tới, ñất nước không những cần xây dựng thêm các khu bảo tồn mới mà việc mở rộng các khu bảo tồn nhỏ cũng là một nhiệm vụ quan trọng. Trong rất nhiều các khu rừng ñặc dụng và bảo tồn, các nghiên cứu cơ bản về phân loại thực vật, ña dạng sinh học và ñộng thái quần thể các loài bị ñe doạ còn khá hạn chế. Do vậy, một công việc rất cần thiết là tiến hành các nghiên cứu làm cơ sở cho việc xây dựng các kế hoạch bảo tồn. Nghiên cứu ñược trình bày trong Luận văn này thực hiện một phần
Tóm tắt các kết quả nghiên cứu
147
mục tiêu trên, nhằm cung cấp thông tin góp phần xây dựng chiến lược bảo tồn hiệu quả các loài cây bị ñe doạ. ðộng thái qu ần thể của các loài cây b ị ñe doạ
Muốn xây dựng một kế hoạch bảo tồn hiệu quả cho các loài cây bị ñe doạ, chúng ta cần hiểu rõ ñộng thái quần thể của chúng. Các quần thể có khả năng tái sinh tự nhiên không, và nếu có thì số lượng cây con sinh ra có ñáp ứng ñược cho sự tồn tại và phát triển của quần thể không? Quần thể của loài ñang phát triển hay ñang suy thoái? Giai ñoạn nào trong quá trình sinh trưởng và phát triển của các cá thể là quan trọng nhất cho sự tồn tại và phát triển của quần thể? ðể làm sáng tỏ các câu hỏi trên, chúng tôi tiến hành các nghiên cứu về ñộng thái quần thể của sáu loài cây bị ñe doạ trên ba vườn quốc gia và một khu bảo tồn thiên nhiên ở Việt Nam: Chò ñãi và Chò chỉ ở Vườn quốc gia Cúc Phương, Bách xanh và Mỡ Ba Vì ở Vườn quốc gia Ba Vì, Tùng Bạch Mã ở Vườn quốc gia Bạch Mã, và Thông Pà Cò ở Khu bảo tồn Hang Kia – Pà Cò. Tại các ô ñịnh vị ñược thiết lập trên khu phân bố của các loài cây nghiên cứu, các chỉ tiêu về sinh trưởng, tỷ lệ sống, khả năng tái sinh của loài ñược thu thập. Các số liệu sau ñó ñược xử lý, tính toán và sử dụng ñể xây dựng các mô hình ma trận quần thể (mô hình không biến ñổi) cho các loài cây nghiên cứu (Chương 3). Một kết quả quan trọng thu ñược từ mô hình là tốc ñộ tăng trưởng của quần thể (λ), ñược sử dụng ñể dự ñoán tương lai cho quần thể. Nếu λ lớn hơn 1, quần thể ñang sinh trưởng và phát triển tốt. Ngược lại, nếu λ nhỏ hơn 1, quần thể ñang bị suy thoái và có thể dẫn ñến bị tuyệt chủng. Một kết quả có ý nghĩa khác của mô hình là cho chúng ta biết tầm quan trọng của các giai ñoạn trong chu kỳ sống của các cá thể ñối với sự tồn tại và phát triển của quần thể. Dựa vào các kết quả thu ñược từ mô hình, các chiến lược bảo tồn hiệu quả ñược xây dựng (Benton & Grant 1999, Contreras & Valverde 2002, Zuidema & Boot 2002, Kwit et al. 2003). Chúng tôi kết hợp hai phương pháp ñể dự ñoán triển vọng cho các loài nghiên cứu (Chương 3). Thứ nhất, chúng tôi xem xét tốc ñộ tăng trưởng của quần thể (λ) thu ñược từ mô hình ma trận xây dựng cho các loài. ðối với bốn loài Tùng Bạch Mã, Mỡ Ba Vì, Chò chỉ và Thông Pà Cò, chúng tôi không tìm thấy dấu hiệu chứng tỏ rằng quần thể của các loài ñang bị suy giảm rõ rệt. Ngược lại, kết quả từ mô hình cho thấy rằng quần thể của Chò ñãi và Bách xanh ñang bị suy giảm. Số lượng cá thể trong quần thể của Chò ñãi và Bách xanh ñang bị giảm dần theo thời gian. Thứ hai, chúng tôi xem xét khả năng tái sinh của quần thể và tuổi sinh sản của các cá thể ñể tính toán xem số lượng cây con sinh ra có ñáp ứng ñược cho sự tồn tại và phát triển của quần thể hay không. Ví dụ, ñối với loài Mỡ Ba Vì, chỉ có khoảng 0.1% các cây con sinh ra ñược ước tính có thể tồn tại tới lúc trưởng thành. ðiều này có nghĩa là một cây từ lúc trưởng thành tới khi chết cần phải sinh ra 1000 cây con ñể có thể tự thay thế bản thân nó. Nếu một cây trưởng thành chỉ sinh ñược trung
Tóm tắt các kết quả nghiên cứu
148
bình 1 cây con trong 1 năm thì phải cần tới 1000 năm mới có ñủ số cây con ñể thay thế. ðiều này là không thể vì tuổi của Mỡ Ba Vì cao nhất mà chúng tôi tính toán ñược là khoảng 200 tuổi (Chương 5). Bằng cách tương tự, chúng tôi tính toán khả năng tái sinh của của quần thể cho các loài còn lại. Chúng tôi thấy rằng chỉ có Tùng Bạch Mã, Bách xanh và Chò chỉ là có thể ñáp ứng ñược yêu cầu này. Tuy nhiên, ba loài cây còn lại (Chò ñãi, Mỡ Ba Vì và Thông Pà Cò) số cây con sinh ra không ñủ ñể thay thế các cây trưởng thành của quần thể. Kết quả thu ñược từ mô hình cũng chỉ ra rằng tỷ lệ sống của các cá thể, ñặc biệt là ñối với cây nhỡ và cây trưởng thành, là quan trọng nhất cho sự tồn tại và phát triển của quần thể. Tuy nhiên, các ñặc tính khác của thể là tốc ñộ sinh trưởng và tái sinh của các cá thể có có tác ñộng ít hơn tới quá trình sinh trưởng và phát triển của quần thể (Chương 3). Tóm lại, bằng việc ứng dụng mô hình ma trận trong nghiên cứu ñộng thái quần thể của các loài cây bị ñe doạ, chúng tôi dự ñoán rằng quần thể của Chò ñãi và Bách xanh ñang bị suy giảm. Với các loài còn lại, chúng tôi không tìm thấy dấu hiệu rõ rệt về sự suy giảm của các quần thể. Tuy nhiên, khi xét về khả năng tái sinh của các loài, chúng tôi thấy rằng số lượng cây con sinh ra của Chò ñãi, Mỡ Ba Vì và Thông Pà Cò không ñáp ứng ñược cho sự tồn tại và phát triển của quần thể. Kết quả thu ñược từ mô hình cũng cho thấy rằng tỷ lệ sống của các cá thể mà ñặc biệt là ñối với cây nhỡ và cây trưởng thành là quan trọng nhất ñối với sự tồn tại và phát triển của quần thể. Những kết quả này làm cơ sở cho việc xây dựng các phương án bảo tồn cho các loài cây bị ñe doạ. Sử dụng mô hình ma tr ận biến ñổi trong phân tích ñộng thái qu ần thể các loài cây b ị ñe doạ
Mô hình ma trận quần thể trình bày ở trên ñược ứng dụng cùng với giả thiết là tốc ñộ sinh trưởng, tỷ lệ sống và khả năng tái sinh của các cá thể trong quần thể không thay ñổi theo thời gian. Hiển nhiên, giả thiết này sẽ không hợp lý cho những dự ñoán về một tương lai dài của quần thể, vì quần thể luôn bị ảnh hưởng bởi những biến ñộng không thể ñoán trước của môi trường tự nhiên và của chính quần thể (Menges & Quintana-Ascencio 2003, Munzbergova 2006). Biến ñộng (không thể ñoán trước) của quần thể là những biến ñổi về ñộng thái của quần thể gây ra bởi những biến ñổi ñộc lập của từng cá thể làm ảnh hưởng tới kích thước quần thể tương lai (Engen et al. 1998, Menges 2000). Bên cạnh ñó, biến ñộng (không thể ñoán trước) của môi trường cũng sẽ gây ra những biến ñổi (không thể ñoán trước) về tỷ lệ sống, tốc ñộ sinh trưởng và khả năng tái sinh của các cá thể, và do ñó ảnh hưởng tới quá trình sinh trưởng và tồn tại của quần thể (Menges 2000). Những biến ñộng của quần thể và môi trường có thể làm ảnh hưởng mãnh liệt tới tốc ñộ tăng trưởng của quần thể và nguy cơ tuyệt chủng của các loài, ñặc biệt là các loài bị ñe doạ (Menges 1998). Hơn thế nữa, các biến ñộng mãnh liệt của tự nhiên như hạn hán, lũ lụt, giông bão hay lửa rừng có thể làm tổn hại nghiêm trọng hoặc làm tiêu huỷ toàn bộ quần
Tóm tắt các kết quả nghiên cứu
149
thể của loài, kể cả ñối với các loài giầu cá thể (Menges 2000). Do vậy, sẽ khó ñưa ra dự ñoán chính xác cho tương lai của loài nếu chỉ sử dụng mô hình ma trận quần thể không biến ñổi. Tuy nhiên, chúng ta sẽ có câu trả lời chính xác hơn nếu ứng dụng mô hình ma trận quần thể thay ñổi, vì các mô hình này cho phép xác ñịnh tốc ñộ tăng trưởng của quần thể dưới tác ñộng của sự biến ñổi của môi trường và của chính quần thể. Chúng tôi ứng dụng mô hình ma trận quần thể biến ñổi ñể xem xét ảnh hưởng của các biến ñộng của môi trường và của quần thể tới sự tồn tại và phát triển của sáu loài cây nghiên cứu. Với những biến ñổi của quần thể do tác ñộng của môi trường, chúng tôi ước lượng sự biến ñộng về tỷ lệ sống, sinh trưởng và tái sinh của quần thể từ các số liệu thu thập ngoài thực ñịa. Những biến ñộng này phản ánh những tác ñộng khác nhau gây ra bởi vị trí không gian khác nhau (ví dụ khác nhau về ñiều kiện ánh sáng, ñiều kiện ñất ñất) giữa các cá thể (Chương 4). Chúng tôi cũng xem xét ảnh hưởng của thời gian tới các biến ñộng của quần thể thông quan sự biến ñộng về sinh trưởng ñường kính thu ñược từ các vòng năm của cây (Chương 5) và sự biến ñộng về số lượng cây con tái sinh giữa các năm (Chương 3). Kết quả thu ñược từ mô hình chỉ ra rằng những biến ñộng của môi trường làm giảm số lượng cá thể của quần thể, do ñó làm tăng nguy cơ tuyệt chủng của quần thể. So sánh với biến ñộng do thời gian gây ra, biến ñộng về không gian (biến ñộng giữa các cá thể) có ảnh hưởng lớn tới sự suy thoái của quần thể. Biến ñộng của chính quần thể cũng gây ảnh hưởng tới sự tồn tại và phát triển của quần thể. Tuy rằng biến ñộng này không ảnh hưởng nhiều tới các quần thể lớn, nhưng nó làm giảm thời gian dẫn tới tuyệt chủng ñối với các quần thể nhỏ. Tuy nhiên, loại biến ñộng này cũng có thể làm giảm nguy cơ tuyệt chủng cho một số quần thể (may mắn) do cơ hội ñược tăng số cá thể trong quần thể (Chương 4). Chúng tôi cũng thấy rằng nguy cơ tuyệt chủng của quần thể bị ảnh hưởng rất lớn bởi các tham số: tỷ lệ sống (ñặc biệt là ñối với các cây nhỡ và cây trưởng thành), tốc ñộ sinh trưởng và tái sinh của các cá thể. Tuy nhiên, sự biến ñộng của các tham số này ảnh hưởng ít hơn tới nguy cơ tuyệt chủng của loài (Chương 4). ðiều này cho thấy chúng ta cần quan tâm hơn tới việc thu thập và tính toán các tham số, ñặc biệt là tỷ lệ sống của các cá thể ñể có thể thu ñược những kết quả chính xác hơn từ mô hình ma trận quần thể biến ñổi. Từ kết quả thu ñược chúng tôi dự ñoán rằng Tùng Bạch Mã và Chò chỉ không bị ñối mặt với nguy cơ tuyệt chủng trong vòng 300 năm tới, tuy rằng quần thể Chò chỉ có thể bị giảm xuống dưới 100 cá thể trong vòng khoảng 150 năm tới. Tuy nhiên, tương lai của các loài còn lại không có nhiều hứa hẹn, vì các quần thể ñược dự ñoán sẽ giảm xuống dưới 100 cá thể trong khoảng 100 năm tới. ðặc biệt, mức ñộ tuyệt chủng ñối với Chò ñãi, Bách xanh, Mỡ Ba Vì và Thông Pà Cò ñược dự ñoán lần lượt là 65%, 11%, 51% và 93% trong khoảng thời gian 300 năm tới (Chương 4).
Tóm tắt các kết quả nghiên cứu
150
Phân tích khả năng tồn tại và phát triển của quần thể (PVA) ñược sử dụng rộng rãi trên thế giới ñể ñánh giá ñộng thái quần thể và hiểm hoạ tuyệt chủng của các loài bị ñe doạ, và cũng là cơ sở ñể xây dựng những kế hoạch bảo tồn hiệu quả (Boyce 1992, Kaye & Pyke 2003, Boyce et al. 2006). Bằng cách xem xét ảnh hưởng tổng hợp của các biến ñộng (không ñoán ñược) của môi trường và quần thể và các yếu tố xác ñịnh như mất nơi cư trú, chia cắt nơi cư trú hoặc bị khai thác lạm dụng, PVA cung cấp những thông tin có ñộ tin cậy cao về tương lai của loài (Chapman et al. 2001, Beissinger & McCullough 2002). Trong nghiên cứu của chúng tôi, kết quả thu ñược từ mô hình ma trận biến ñổi có ñộ tin cậy cao hơn so với kết quả thu ñược từ mô hình ma trận bình thường (không biến ñổi). ðó là vì ñộng thái của quần thể ñược phân tích dưới sự tác ñộng của những biến ñộng của môi trường và quần thể. Tốc ñộ tăng trưởng của quần thể do ñó không bất biến theo thời gian mà thay ñổi tuỳ theo mức ñộ tác ñộng từ các yếu tố môi trường và quần thể. Do ñó, từ mô hình ma trận quần thể biến ñổi chúng ta có thể dự ñoán kích thước của quần thể và hiểm hoạ tuyệt chủng ñối với loài cho một tương lai dài (ví dụ cho thời gian 300 năm tới). Tuy nhiên, nếu sử dụng mô hình ma trận quần thể biến ñộng, chúng ta cần phải có số liệu về ảnh hưởng của sự biến ñổi của môi trường và của chính quần thể tới ñộng thái quần thể. Việc thu thập các loại số liệu này thường tốn nhiều thời gian và công sức. Hơn thế nữa, việc tính toán các tham số ñể xây dựng mô hình quần biến ñổi cũng phức tạp hơn nhiều so với khi xây dựng mô hình bình thường (bất biến). Do vậy, tuỳ vào mục tiêu ñặt ra cho nghiên cứu mà chọn loại mô hình hợp lý. Tương lai c ủa các loài cây b ị ñe doạ và các bi ện pháp b ảo tồn
Dựa vào kết quả thu ñược, chúng tôi có thể phân các loài nghiên cứu thành ba nhóm với triển vọng khác nhau. Thứ nhất, với hai loài Tùng Bạch Mã và Chò chỉ, kết quả từ mô hình cho thấy tương lai của hai loài khá tốt do tốc ñộ tăng trưởng quần thể khá ổn ñịnh và khả năng tái sinh của hai loài có thể ñáp ứng ñược cho sự tồn tại và phát triển của quần thể (Chương 3). Thêm vào ñó, hai loài ñược dự ñoán không bị ñe doạ bởi nguy cơ tuyệt chủng trong tương lai 300 năm tới (Chương 4). Thứ hai, với hai loài Mỡ Ba Vì và Thông Pà Cò, tuy chúng tôi không thấy dấu hiệu về sự suy giảm rõ rệt của quần thể hai loài nhưng cả hai ñều không ñảm bảo khả năng tái sinh ñể thay thế cho cây trưởng thành. Do vậy, triển vọng của hai loài cây này không ñược tốt như Tùng Bạch Mã và Chò chỉ (Chương 3). ðiều này cũng phù hợp với kết quả thu ñược từ Chương 4 cho thấy là hai loài có thể phải ñối mặt với khả năng tuyệt chủng rất cao (51-93%) trong vòng 300 năm tới. Thứ ba, triển vọng của hai loài Chò ñãi và Bách xanh không tốt vì quần thể hai loài ñược dự ñoán ñang bị suy giảm (Chương 3). Bên cạnh ñó, quần thể của hai loài ñược dự ñoán sẽ giảm xuống dưới 100 cá thể trong khoảng thời gian từ 80-110 năm tới, và hai loài có thể ñối mặt với nguy cơ tuyệt chủng chỉ trong vòng 125 năm tới (Chương 4). Tóm lại, các kết quả thu ñược từ các mô hình quần cho thấy rằng triển vọng của Tùng Bạch Mã và
Tóm tắt các kết quả nghiên cứu
151
Chò chỉ là khá tốt. Ngược lại, tương lai của các loài khác không ñược tốt vì quần thể của các loài này ñang bị suy giảm và có thể ñối mặt với nguy cơ tuyệt chủng trong tương lai. Từ kết quả nghiên cứu trên cho thấy cần có biện pháp tổng hợp ñể bảo tồn hiệu quả các loài cây bị ñe doạ. Thứ nhất, với tất cả các loài cần phải bảo vệ nghiêm ngặt các cá thể của quần thể, ñặc biệt là ñối với những cây nhỡ và cây trưởng thành vì chúng ñóng vai trò rất quan trọng ñối với sự tồn tại và phát triển của quần thể (Chương 3). Do vậy, cần nghiêm cấm triệt ñể hoạt ñộng khai thác hoặc các hoạt ñộng gây ra tác ñộng tiêu cực tới quần thể của loài. Với bốn loài (Chò ñãi, Bách xanh, Mỡ Ba Vì và Thông Pà Cò) bị dự ñoán là ñối mặt với nguy cơ tuyệt chủng (Chương 4), cần áp dụng thêm các biện pháp hữu hiệu ñể làm tăng tốc ñộ tăng trưởng của quần thể. Chúng tôi thấy rằng việc cải thiện tốc ñộ sinh trưởng của cây con và cây nhỡ bằng các giải pháp lâm sinh như giải phóng không gian sinh dưỡng sẽ góp phần làm tăng tốc ñộ tăng trưởng của quần thể. Mặc dù ảnh hưởng của sinh trưởng cá thể tới sự tồn tại của quần thể là nhỏ hơn so với việc tăng tỷ lệ sống của cá thể, nhưng có thể thực hiện dễ hơn rất nhiều so với việc tăng tỷ lệ sống cho cá thể (Batista et al. 1998, Zuidema & Boot 2002, Kwit et al. 2004, Chapter 3). Một biện pháp bảo tồn quan trọng nữa là việc làm giàu quần thể bằng cây con ñược gieo tạo tại vườn ươm. Nếu quá trình hình thành cây con từ hạt ñạt tỷ lệ thấp dưới tán rừng, nguồn hạt này có thể ñược thu thập và dùng ñể gieo tạo cây con ở vườn ươm, và sau ñó những cây con này ñược ñưa trở lại làm giàu quần thể của loài. Phương pháp này rất quan trọng ñối với Chò ñãi, Mỡ Ba Vì và Thông Pà Cò, những loài mà khả năng tái sinh không ñủ ñáp ứng ñể thay thế cho các cây trưởng thành (Chương 3). So với việc tăng tỷ lệ sống của cá thể, việc làm giàu rừng có tác dụng ít hơn tới tốc ñộ tăng trưởng của quần thể nhưng việc làm này cũng dễ thực hiện hơn nhiều so với việc làm tăng tỷ lệ sống của các cá thể. Cuối cùng, với các loài có quần thể nhỏ như Bách xanh và Thông Pà Cò (Chương 3 & 4), việc mở rộng khu phân bố của loài thông qua các biện pháp phục hồi tự nhiên sẽ là một biện pháp bảo tồn hiệu quả. Với một số lưu ý, các kết quả nghiên cứu cho sáu loài có thể áp dụng cho các loài cây bị ñe doạ khác với l ịch sử phát triển quần thể tương ñồng và có sự giống nhau về hiện trạng các quần thể hiện có. Vì ñộng thái quần thể của các loài cây có vòng ñời dài có nhiều ñặc ñiểm giống nhau (Chương 3), chúng tôi khuyến nghị một số giải pháp bảo tồn chung cho các loài cây bị ñe doạ. Thứ nhất, vì các khu bảo tồn nhỏ, bị chia cắt sẽ tăng nguy cơ tuyệt chủng cho các loài, do vậy cần phải mở rộng các khu này cũng như nghiêm cấm các hoạt ñộng gây chia cắt khu. Thứ hai, cần bảo vệ nghiêm ngặt các cá thể của quần thể, ñặc biệt là những cây nhỡ và cây trưởng thành. Do ñó, những hoạt ñộng khai thác cũng như các hoạt ñộng mà có ảnh hưởng tiêu cực tới sự phát triển của quần thể phải ñược nghiêm cấm triệt ñể. Thứ ba, cải thiện khả năng sinh trưởng của cây con và cây nhỡ của quần thể (ví dụ bằng cách mở rộng không gian sinh dưỡng) cũng góp phần làm tăng tốc ñộ tăng trưởng của quần thể. Thứ tư, làm giàu rừng cũng là một giải pháp bảo tồn hữu hiệu trong
Tóm tắt các kết quả nghiên cứu
152
trường hợp mà quá trình hình thành cây con với sự trợ giúp của con người tốt hơn nhiều so với tự nhiên. Thứ năm, với các loài cây có quần thể nhỏ và/hoặc bị chia cắt, việc mở rộng khu phân bố loài thông qua việc phục hồi tự nhiên là một phương án bảo tồn hiệu quả. Do những loài cây bị ñe doạ có vòng ñời dài, sự suy giảm của quần thể và thời gian dẫn tới tuyệt chủng của chúng có thể kéo dài. ðiều này dẫn tới việc chúng ta có nhiều thời gian ñể tiến hành các giải pháp bảo tồn cho các loài, nhưng nó cũng có nghĩa là cần có thời gian ñể các giải pháp bảo tồn phát huy tác dụng. Do vậy, chúng tôi khuyến nghị cần thực hiện các giải pháp bảo tồn hiệu quả trước khi quần thể suy giảm tới mức báo ñộng, và cũng rất quan trọng trong việc giám sát sự biến ñộng về kích thước cũng như khả năng tái sinh của quần thể.
Tài li ệu tham kh ảo (References in Chapter 6)

Tóm tắt các kết quả nghiên cứu
153

Tóm tắt các kết quả nghiên cứu
154

155
Acknowledgements
The study in this thesis is a part of a joint research project among Tropenbos
International, Utrecht University and the Forest Science Institute of Vietnam. During
my study, many people have generously supported me in many different ways. I
would like to mention some people here in a limited space, but I sincerely thank all of
them.
In Vietnam, firstly, I like to thank my promotor Nguyen Hoang Nghia for giving me
the opportunity to be involved in this research project. To you, also many thanks for
providing me useful discussion and comments on both my field work and my
manuscript. I also want to thank Le Van Binh, Vu Van Can, Tran Quang Chuc, Le
Phuong Trieu, Dinh Duc Huu, Nguyen Van The, Le Van Thu, Nguyen Cong Vinh,
Le Van Duong, Nguyen Van Ban, Pham Quang Vinh and others for their
indispensable assistance for the field work and helpful information and discussion. I
am grateful to the managers and the staff of the four protected areas for permission
and help during my study.
In the Netherlands, at first, I want to thank my promotor Marinus Werger and my
co-promotor Pieter Zuidema. I greatly appreciate your effort to get me admitted as a
PhD student at the Plant Ecology and Biodiversity Group, Utrecht University and
under your supervision. Your valuable advice and guidance, helpful discussion and
correction on my manuscript have helped me not only to complete my thesis, but
also to improve my academic knowledge in general and particularly that on
demography. Thank you very much for your great help and all things you have done
for me. I am also grateful to Heinjo During, Feike Schieving, Niels Anten and Maria
Schipper for the fruitful discussion and advice, to Sander for computer software
assistance, and to Marjolein for preparing maps and the thesis cover. During my stay
at Utrecht University for more than one year, I have learnt a lot of scientific and daily
life knowledge and received a lot of enthusiastic help and encouragement from many
people from the Plant Ecology and Biodiversity Group. I want to thank all of you,
Peter, Yusuke, Galia, Yun, Roel, Maria, Onno, Hans, Olaf, Roy, Paddy, Marijke,
Sylvia, Danae, Binh, Juliana, Toshihiro, Sonja, Henri and Betty. Many thanks also to
Petra, Helen, Piet, Bertus, Henny, Anita and many other people for their help in
many administrative affairs.
Finally, I am grateful to my family for the support and the interest in my study. I am
also much indebted with Cao Anh Lieu, who is at home to look after our children,
and to encourage me during my study and for all my life.

156
157
Curriculum vitae
P.D. Chien was born in 1967 in Thai Binh, Vietnam. In 1989, he attended the
Forestry University of Vietnam in Xuan Mai, Ha Tay. During this study he
specialized in ecology and silviculture. In 1994, he graduated from the university with
a Bachelor degree of Science. In the same year, he started working for the Forest
Science Institute of Vietnam as a forestry researcher. He carried out several research
projects related to ecology and silviculture in Vinh Phuc province and some other
areas of the country. In1999, he continued his study at the University of Queensland,
where he specially focused on ecology. He obtained his Master degree of Natural
Resource Studies at the University of Queensland in 2000. From 2001 onwards, he
continued working at the Forest Science Institute of Vietnam and participated in
several research projects. One of these was his PhD research project that formed part
of the Tropenbos International – Vietnam Programme in cooperation with Utrecht
University and the Forest Science Institute of Vietnam. In 2003 he was admitted as a
PhD student at the Plant Ecology and Biodiversity Group, Faculty of Science,
Utrecht University. He investigated the demography of threatened tree species in
Vietnam.