delta-2017-proceedings.pdf - nigerian metallurgical
TRANSCRIPT

Page 1 of 366
S/N Paper No Paper Title Author(s) 1 NMS 2017-TP001 Influence of Local Paddok Processing Operation on Farin Lamba
Cassiterite to Conventional Wilfley Gravity Processing Method Alabi O. O., Borode J. O., Oloruntoba D. T. and Abere V.
2 NMS 2017-TP002 Improvement and Performance Evaluation of Jaw-Type Rock
Crushing Machine
C. Ocheri, J. B. Agboola and C. N.
Mbah
3 NMS 2017-TP003 Effect of Selected Casting Parameters on Mechanical Properties of Aluminum Scrap using Centrifugal Casting Machine
A. S. Abdulrahman, J. K. Muwo, M. B. Adeyemi, E. Mudiare and O. A.
Ajibuwa
4 NMS 2017-TP004 Froth Flotation of Itakpe Iron Ore Dumped Tailings at Varied Agitation Time: Research and Development for Economic
Sustainability
Gbadamosi, Y. E., Alabi, O. O., Olatunji, T. A., and Ola-Omole, O.
O.
5 NMS 2017-TP005 Susceptibility of Akure South Mineral to Magnetic and Gravity Separation: A Research Geared towards Sustainability via Exploration
and Exploitation of Solid Minerals
Olatunji, T. A., Alabi, O. O., Gbadamosi, Y. E., and Ola-Omole
O. O.
6 NMS 2017-TP006 Effect of Zinc Powder addition to Villa Gloss and Silka Lux Marine
Enamel Paints on Corrosion Resistance of Mild Steel
Ayoola, W. A., Bodude, M. A.,
Onovo, H., Oyetunji, A. and Odukoya, L.
7 NMS 2017-TP007 Micro-Hardness Behaviour of Steel Substrate Electroplated with
Silicon Based Zinc Oxide
Oloruntoba, D. T., Aribo, S. and
Alabi, O. O.
8 NMS 2017-TP008 Structural Modification of Aluminium Bronze (Cu-10%Al) Using Nickel
Nwaeju, C. C., Edoziuno, F. O., and Okoubulu, B. A.
9 NMS 2017-TP009 Corrosion of Roofing Sheets in a Simulated Environment J. E. O. Ovri
10 NMS 2017-TP010 Anti-Corrosion of Co-Deposition of Zn-ZnO-Ant Hill Particulate
Composite Coating on Mild Steel
V. S. Aigbodion, I .Y. Suleiman, C.
Ocheri and C. A. Nwasike
11 NMS 2017-TP011 Reappraisal of Coal Energy for Effective Value Chain Management in
Metal Industry
Adiyono Ojonye and Ocheri C.
12 NMS 2017-TP012 Effects of Particle Size, Clay and Moisture Contents on the Properties
of Synthetic Moulding Sand
Edoziuno, F. O., Oyibo, A. O., and
Odo, J. U.
13 NMS 2017-TP013 Investigating the Mechanical Properties of a Carburized Mild Steel
(0.17%C) by Varying Temperature and Time Using Charcoal
O. E Obolo, A. A. Barnabas, S.
Umar and L. Jafar
14 NMS 2017-TP014 Empirical Analysis of Factors Affecting Oil and Gas Pipeline
Corrosion in Nigerian Niger Delta Using Artificial Neural Network
B. N. Nwankwojike, F. I. Abam and
M. Obaseki
15 NMS 2017-TP015 Potentials of Bitumen-Palm Kernel Oil Esters as Quenchant for Steel
Hardening
B. N. Nwankwojike, F. I. Abam and
O. C. Okwonna
16 NMS 2017-TP016 Inhibitive Potentials of Bitter Kola Stem (BKS) on Mild Steel in Acidic Media
A. A. Adediran, O. Olawale, S. I. Talabi and O. Y. Busari
17 NMS 2016-C017 Development of a Suitable Mathematical Model for Prediction of
Percent Elongation of Stainless Steel Weld Joints
Okonji P. O., Akaluzia R. O and 1Utu O. G.
18 NMS 2017-TP018 Foundry Entrepreneurship: A Catalyst for Rural Development
Apata A. O., Alao A. O. and Ogbodo J. N.
19 NMS 2017-TP019 Characterisation of Udane-Obiomi, Emewe-Efoppa and Okobo Coal
Reserves in Nigeria for Different Applications.
Olugbile, O. O., and Ayoola, W. A.
20 NMS 2017-TP020 Technological Innovations in the Nigerian Metal Industry for National Economic Revitalization
Igbaroola B. M., Oladele O. E. and Adegun M. H.
21 NMS 2017-TP021 Materials Integrity of Aluminium Production by Recycling for
Nigerian Economic Recovery
A. Adewale, A. Abraham and C.
Oganbule
22 NMS 2017-TP022 The Nexus between Corrosion of Petroleum Pipelines in Nigeria Niger
Delta and the Recessed National Economy
Alo T. and Afolabi T.
23 NMS 2017-TP023 Developed Value Chain Management Model for Steel Manufacturing
Sector
Adiyono O., Ocheri C, and Mbah C.
N.
24 NMS 2017-TP024 Comparison of Mechanical Properties of Locally Made and Imported Carbon Steel Reinforcement Rods (ASTM: A36)
Utu O. G., Ofuyekpone O., Edibo S.
25 NMS 2017-TP025 Effect of CO2 and H2SO4 on the Corrosion Susceptibility of API 5L
X60 Steel Pipe
H. E. Mgbemere, A. B. Okoubulu,
C. O. Omeike and C. C. Nwaeju
26 NMS 2017-TP026 The Influence of Welding Parameters on the Corrosion Resistance of Mild Steel Welded Joint Exposed to Sodium Chloride (NaCl)
Environment
Ngozi Grace Emordi
27 NMS 2017-TP027
Metals: Indispensable Medical Implant Materials
C. S. Obayi, P.S. Nnamchi, A. D.
Omah, C. C. Daniel-Mkpume, S. I. Neife, P. O. Offor and B. A.
Okorie
28 NMS 2017-TP028 Evaluation of a Modified Jominy End Quench Machine D. I. Asariya and A. S. Asipita
29 NMS 2017-TP029 Modifications of Roll Pass Design to Minimize Roll
Breakage in Light Section and Bar Mill of Ajaokuta Steel Plant
Isezuo, L. O., Agboola J. O., and
Ocheri C.
30 NMS 2017-TP030 The Suitability of Periwinkle Shell as Energizer in Case Hardening of Agbo N. A., Dauda E. T., Ause T.,
Page 2 of 366
0.08% Mild Steel using Coconut Shell as Carburizer at 900oC
and Oyeladun O. A. W.
31
NMS 2017-TP031
Quality Assurance of Metal Production in Nigeria: An Imperative for
Sustainable National Economic Development
Bwala Markus, Adegun Miracle
Hope and Bamidele E.A.
32 NMS 2017-TP032 Welding Procedure Qualification of a Gas Pipeline
A. John, M. A. Adegbite, G. O. Amadi, J. O. Umukoro and I. Bright
33
NMS 2017-TP033
Effect of Mango Leaf Extract on the Corrosion Resistance of
Thermally Conditioned Al-Si-Mg Alloy in Simulated Seawater
Environment
O. B. Umaru, I. Y. Suleiman, M.
Abdulwahab and U. Mukhtar
34
NMS 2017-TP034
Enhancement of Itakpe Iron Ore Concentrate Quality using Existing
Plant Facilities
B. I. Nnagha and M. K. Olasupo
35
NMS 2017-TP035
Effect of Guava Leaf Extract on the Hardness and Corrosion
Resistance of Thermally Conditioned Al-Si-Mg Alloy
M. Abdulwahab, A. Kasim, F.
Asuke, J. O. Gaminana and M. Adediran
36
NMS 2017-TP036
University-Industry Paternership for Technological Advancement and
Economic Development: Nigeria Metals Industry as Paradigm
John Ade Ajayi, M. A. Adegbite
and F. Joseph
37 NMS 2017-TP037
Modeling of Residual Stresses in Single -V Butt Weldment of Low Carbon Steels Using Ansys Multiphysics
Madaki K. M., Dauda E. T. and Kassim A.
38
NMS 2017-TP038
Analysis of Discontinuity Spacing of a Dolomite Deposit in Ekpeshi
South- West Nigeria
Z. F. Ajibade and T. O. Oluwadero
39 NMS 2017-TP039
Recent Developments in Techniques for Evaluation of Preferential Weld Corrosion under Hydrodynamic Conditions
M. A. Adegbite, A. John and John Ade Ajayi
40
NMS 2017-TP039
Research and Development for Sustainability and National Economic
Recovery
S. E. Okundaye, N. A. Musa, and I.
A. Duigwu
Page 3 of 366
Paper: NMS 2017-TP001
Influence of Local Paddok Processing Operation on Farin Lamba Cassiterite to
Conventional Wilfley Gravity Processing Method
Alabi Oladunni Oyelola1, Borode Joseph Olatunde
1, Oloruntoba Daniel Toyin
1, Abere Victor
2
1Metallurgical and Materials Engineering Department,
Federal University of Technology Akure, Ondo State, P.M.B. 704, Nigeria 2National Metallurgical Development Centre, P.M.B. 2116, Jos, Plateau State
Corresponding Author: [email protected]
Abstract
This study scientifically investigated the influence of local paddock processing, and the use of
conventional Wilfley shaking tabling methods. Farin - Lamba cassiterite assaying of 12.3% SnO2 with
major impurities as silica at 72.62% SiO2, 7.26% Fe2O3 was evaluated to produce upgraded cassiterite in
both cases at 52.31% SnO2 grade, with fairly reduced impurities assaying 17.6%SiO2, 2.33% Fe2O3 at a
recovery of 96%. While, the result of conventional Wilfley shaking tabling process shows an upgraded
cassiterite of 86.09% SnO2 grade, with very low silica at assay of 9.32% SiO2 and 2.03% Fe2O3 at a
recovery of 91.83% with most impurities reporting to the tailing. Based on this result, it was concluded
that the processing of Farin - Lamba cassiterite using conventional wilfley shaking tabling method is
more appropriate than the use of local paddock processing method.
Keywords: Influence, Paddock, Operation, Cassiterite, Wilfley, Gravity
1. Introduction
Nigeria is endowed with diverse mineral resources of very good grade and substantially large quantities to
sustain industries. Technological development of metal production can serves as a panacea for national
security and economic recovery, as well as earn foreign exchange and create jobs. Among the solid
mineral resources are Cassiterite, Columbite, Lead/Zinc, Gold, Barite, Gypsum, Bitumen, Coal, Clay,
Tantalite, Gold and a host of others (Ayeni et al., 2011). Tin Ore (cassiterite) with the largest deposit in
Jos, Plateau State was once the hub of a mining industry which fed European demand for tin through
much of the 20th century but little can be exploited now (Foraminira, 2017). Tin mining in Plateau began
in October 1904 when the British colonial government sent a mineral-survey team to assess the mineral
deposits within the region. In accordance to Naijapals (2017), tin deposits were discovered in the Jos-
Plateau area and foreign companies were allowed by the colonial regime to operate in the territory and
mine the resources, using mechanized equipment which helped to curb the risks and prevent the death of
the mine workers.
It is a well-known fact that Solid minerals contributed greatly to the economic development of Nigeria
before her independence in 1960, when Nigeria was known for the production of coal as an energy source
for electricity, railways and also for export. Tin, Columbite, Lead and Zinc were exported. Nigeria was
the largest producer of Columbite at one point. The earnings from solid minerals were used to develop
roads, education, hospitals and in fact developed the petroleum industry (Bridge, 2008).
Page 4 of 366
However, the decline of the solid minerals industry started with the discovery of oil to an extent that
Nigeria became a mono product economy and vulnerable to international oil politics. The domineering
role of oil did not allow past governments to attend to global challenges that evolved in the development
of solid minerals (Alison, 2009). On the other hand, Mining continues to play a key role in the
development of Africa‘s economies. Countries like South Africa, Ghana and Tanzania, remain critically
dependent on the earnings of solid minerals. As a result, countries introduced liberal reforms to meet
intense competition to attract investment funds. Ghana for example undertook significant reforms both in
legal and institutional frame-work and to the general organization of the sector. The result has been
growth in mining investment. Tanzania is now a leading destination for exploration funds due to the
deliberate government attention to the development of mining. Burkina Faso and Mali have also become
strong mining countries (Bridge, 2008). The developing countries especially in Africa and Latin America
turned to Solid Minerals exploration as a solution to sustained economic growth. Nigeria‘s economy
which is largely dependent on a mono-product (petroleum) became vulnerable to fluctuations in oil prices
with the attendant shocks on the economy. This informed the Federal Government‘s decision to diversify
the nation‘s economic base from oil to the non-oil sectors including the development of solid minerals
resources (Bridge, 2008). One of such minerals that have been identified for development is cassiterite
(tin ore).
1.2 Cassiterite
Cassiterite or tin oxide also called tinstone, is heavy, colourless when pure, but brown or black when iron
impurities are present. (FMRL, 2017). Cassiterite is processed pyromettallurgycally to extract tin metal.
Tin metal finds application in platting, production of tin oxide used in paint, paper and ink industries,
production of tin oxide resistors, electric lead wires; tin piping and valves which maintain purity in water
and beverages. Molten tin is the base for (float) plate-glass production. Cassiterite has been an important
ore of tin for ones and is still the greatest source of tin today. Most sources of cassiterite today are not
primary deposits but alluvial deposits containing weathered grains (Amethyst, 2014). Cassiterite is widely
distributed in small amounts but were produced on a commercial scale in only a few localities. Most of
the world‘s supply of tin ore now comes from the Malay states, Bolivia, Indonesia, Belgian, Congo and
Nigeria (Abubakar et al, 2009; Alison, 2009).
1.3 Beneficiation of Cassiterite
The process of removing unwanted ore constituents in order to prepare it for subsequent processing stages
is called beneficiation (Will, 2006). Beneficiation is carried out in a mill, which is usually located near the
mine site in order to reduce costs of transportation. Beneficiation consists of three stages: preparation, in
which the ore is comminuted by crushing and grinding; concentration, in which the desired ore mineral is
separated from gangue; and finally dewatering of the concentrate (Sulaiman, 1991, Mustafa and
Cetinttosten, 2017). Concentration can be performed in various ways: gravity separation, magnetic
separation and flotation (Ripley et al. 1995, 911metallurgist, 2017).
1.4 Gravity Concentration of Cassiterite
Physical characteristics of cassiterite, that is, its high relative density in relation to its gangue constituents
makes it an ideal mineral for the application of gravity-separation techniques (Adeleke, 1999). The
gravity technique is applied to the recovery of cassiterite which basically falls into two categories such as
soft-rock, and hard-rock deposits (Alabi, et al., 2015). Soft-rock deposits are mainly alluvial deposits,
which account for 70 to 80 per cent of the world reserves, and the beneficiation processes are relatively
simple because of the high degree of liberation of the particles. For alluvial deposits, the simplest and
probably the earliest method of recovery and concentration were by means of panning and other hand-
Page 5 of 366
washing devices (paddock). On an average, a worker using this method could treat about 1 m3 of material
in 8 hours. For hard-rock ores, liberation of the cassiterite from the associated gangue minerals is
achieved by conventional crushing and grinding (Falcon, 1982, Gallach, 2016)
Gravity separation processes such as by shaking table, can only perform effectively for ore at certain size
ranges approximately between 105 to 600 µm (Ismail et al. 2011, Md Muzayin, and Nazwin, 2001). Out
of the gravitational methods, the use of shaking tables (such as the Wilfley shaking table) is considered an
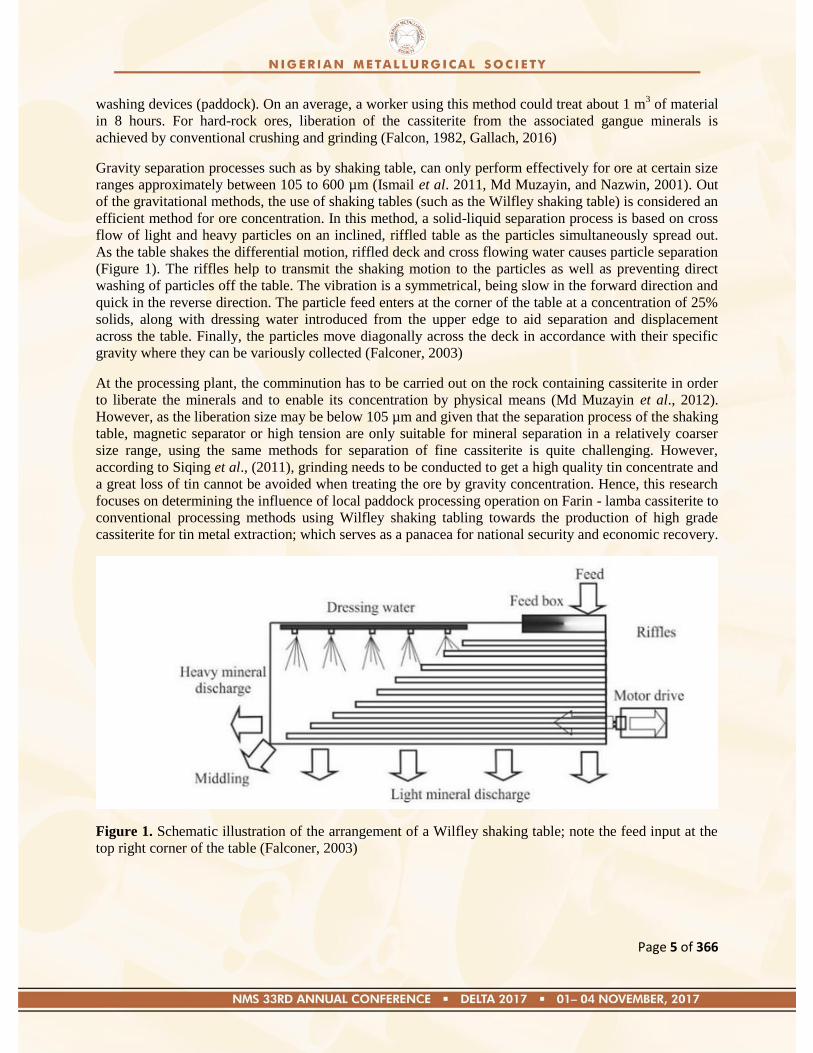
efficient method for ore concentration. In this method, a solid-liquid separation process is based on cross
flow of light and heavy particles on an inclined, riffled table as the particles simultaneously spread out.
As the table shakes the differential motion, riffled deck and cross flowing water causes particle separation
(Figure 1). The riffles help to transmit the shaking motion to the particles as well as preventing direct
washing of particles off the table. The vibration is a symmetrical, being slow in the forward direction and
quick in the reverse direction. The particle feed enters at the corner of the table at a concentration of 25%
solids, along with dressing water introduced from the upper edge to aid separation and displacement
across the table. Finally, the particles move diagonally across the deck in accordance with their specific
gravity where they can be variously collected (Falconer, 2003)
At the processing plant, the comminution has to be carried out on the rock containing cassiterite in order
to liberate the minerals and to enable its concentration by physical means (Md Muzayin et al., 2012).
However, as the liberation size may be below 105 µm and given that the separation process of the shaking
table, magnetic separator or high tension are only suitable for mineral separation in a relatively coarser
size range, using the same methods for separation of fine cassiterite is quite challenging. However,
according to Siqing et al., (2011), grinding needs to be conducted to get a high quality tin concentrate and
a great loss of tin cannot be avoided when treating the ore by gravity concentration. Hence, this research
focuses on determining the influence of local paddock processing operation on Farin - lamba cassiterite to
conventional processing methods using Wilfley shaking tabling towards the production of high grade
cassiterite for tin metal extraction; which serves as a panacea for national security and economic recovery.
Figure 1. Schematic illustration of the arrangement of a Wilfley shaking table; note the feed input at the
top right corner of the table (Falconer, 2003)
Page 6 of 366
MATERIALS AND METHOD
2.1 Materials
The following materials were used at the course of this research work; 1000Kg of homogenized as mined
(Run of Mines) cassiterite, sourced from 20 different mining pits located in Farin - lamba town in Jos
North Local Government of Plateau State, Nigeria. On a coordinate of 080 34‘ 07‘‘ longitude and 09
0 16‘
25‘‘ latitude at an elevation of 246m and land mass of about 1023 meters square of mine site.
2.2 Methods
Two different methods were adopted during this comparative research work which are the local Paddock
method and Wilfley shaking tabling method. Representative sample was picked from the mine and was
characterized using Energy dispersive X – Ray florescent spectrometer (ED - XRFS) at the Spectrum
Mineral Rayfield, Jos.
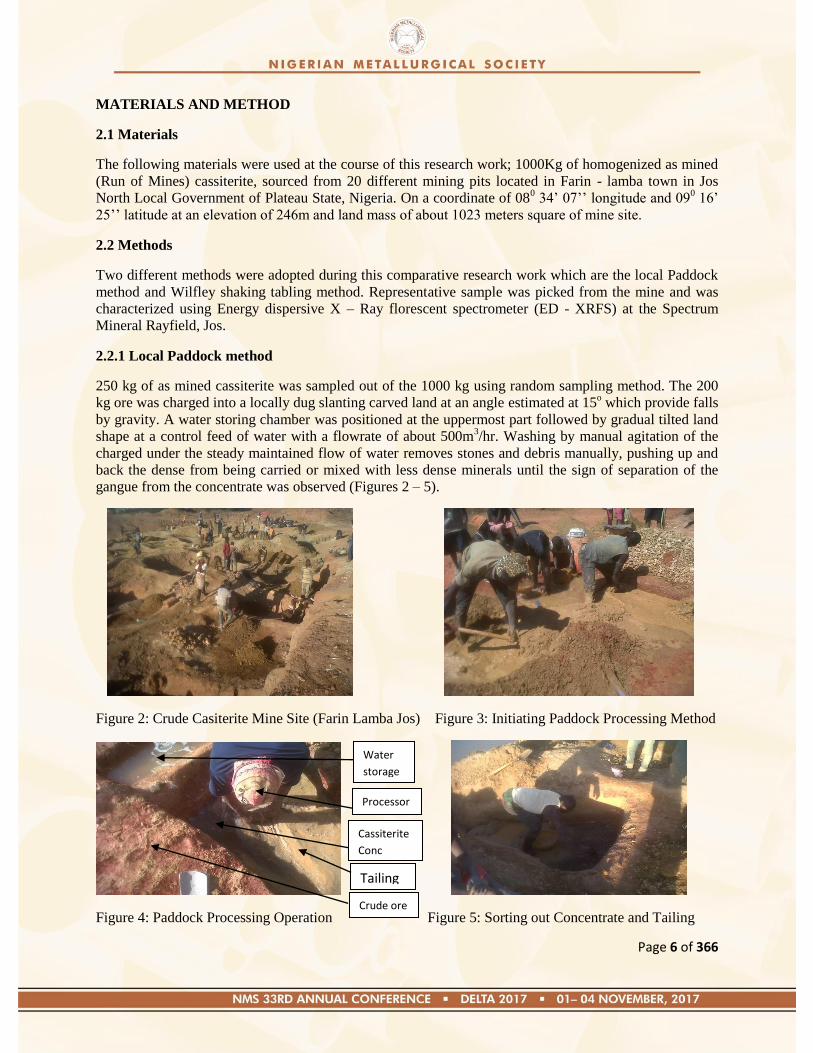
2.2.1 Local Paddock method
250 kg of as mined cassiterite was sampled out of the 1000 kg using random sampling method. The 200
kg ore was charged into a locally dug slanting carved land at an angle estimated at 15o which provide falls
by gravity. A water storing chamber was positioned at the uppermost part followed by gradual tilted land
shape at a control feed of water with a flowrate of about 500m3/hr. Washing by manual agitation of the
charged under the steady maintained flow of water removes stones and debris manually, pushing up and
back the dense from being carried or mixed with less dense minerals until the sign of separation of the
gangue from the concentrate was observed (Figures 2 – 5).
Figure 2: Crude Casiterite Mine Site (Farin Lamba Jos) Figure 3: Initiating Paddock Processing Method
Figure 4: Paddock Processing Operation Figure 5: Sorting out Concentrate and Tailing
Water
storage
Processor
Cassiterite
Conc
Tailing
Crude ore
Page 7 of 366
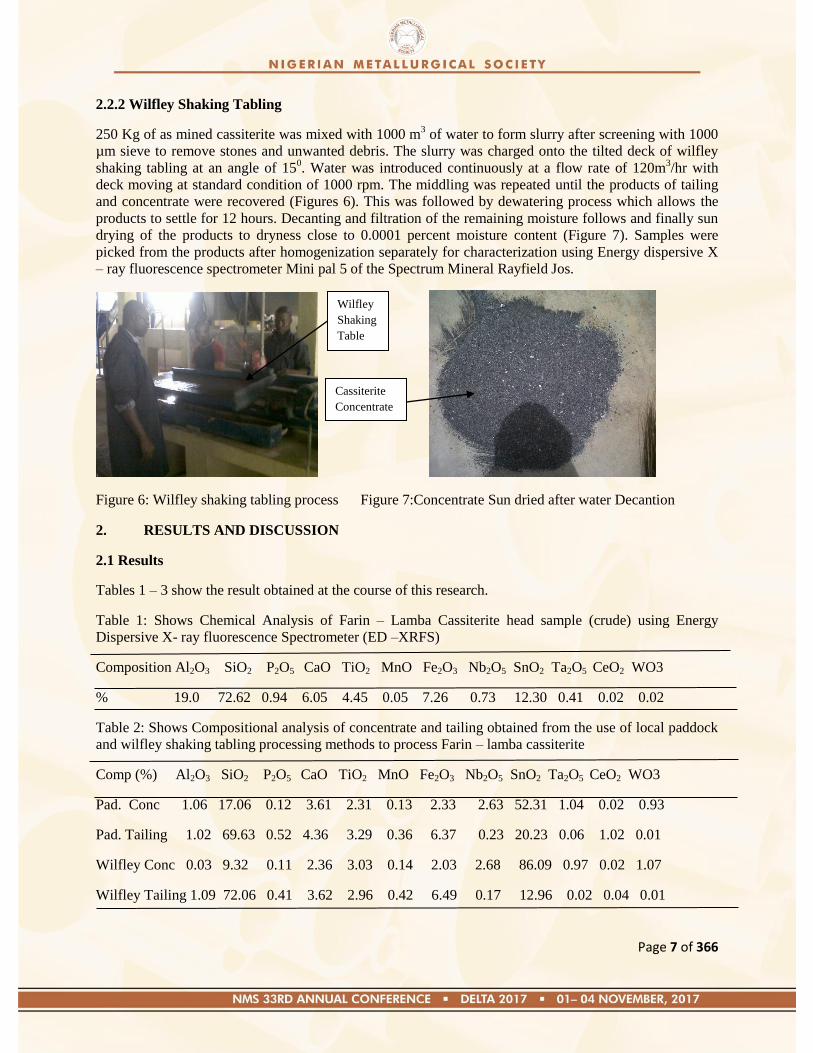
2.2.2 Wilfley Shaking Tabling
250 Kg of as mined cassiterite was mixed with 1000 m3 of water to form slurry after screening with 1000
µm sieve to remove stones and unwanted debris. The slurry was charged onto the tilted deck of wilfley
shaking tabling at an angle of 150. Water was introduced continuously at a flow rate of 120m
3/hr with
deck moving at standard condition of 1000 rpm. The middling was repeated until the products of tailing
and concentrate were recovered (Figures 6). This was followed by dewatering process which allows the
products to settle for 12 hours. Decanting and filtration of the remaining moisture follows and finally sun
drying of the products to dryness close to 0.0001 percent moisture content (Figure 7). Samples were
picked from the products after homogenization separately for characterization using Energy dispersive X
– ray fluorescence spectrometer Mini pal 5 of the Spectrum Mineral Rayfield Jos.
Figure 6: Wilfley shaking tabling process Figure 7:Concentrate Sun dried after water Decantion
2. RESULTS AND DISCUSSION
2.1 Results
Tables 1 – 3 show the result obtained at the course of this research.
Table 1: Shows Chemical Analysis of Farin – Lamba Cassiterite head sample (crude) using Energy
Dispersive X- ray fluorescence Spectrometer (ED –XRFS)
Composition Al2O3 SiO2 P2O5 CaO TiO2 MnO Fe2O3 Nb2O5 SnO2 Ta2O5 CeO2 WO3
% 19.0 72.62 0.94 6.05 4.45 0.05 7.26 0.73 12.30 0.41 0.02 0.02
Table 2: Shows Compositional analysis of concentrate and tailing obtained from the use of local paddock
and wilfley shaking tabling processing methods to process Farin – lamba cassiterite
Comp (%) Al2O3 SiO2 P2O5 CaO TiO2 MnO Fe2O3 Nb2O5 SnO2 Ta2O5 CeO2 WO3
Pad. Conc 1.06 17.06 0.12 3.61 2.31 0.13 2.33 2.63 52.31 1.04 0.02 0.93
Pad. Tailing 1.02 69.63 0.52 4.36 3.29 0.36 6.37 0.23 20.23 0.06 1.02 0.01
Wilfley Conc 0.03 9.32 0.11 2.36 3.03 0.14 2.03 2.68 86.09 0.97 0.02 1.07
Wilfley Tailing 1.09 72.06 0.41 3.62 2.96 0.42 6.49 0.17 12.96 0.02 0.04 0.01
Wilfley
Shaking
Table
Cassiterite
Concentrate
Page 8 of 366
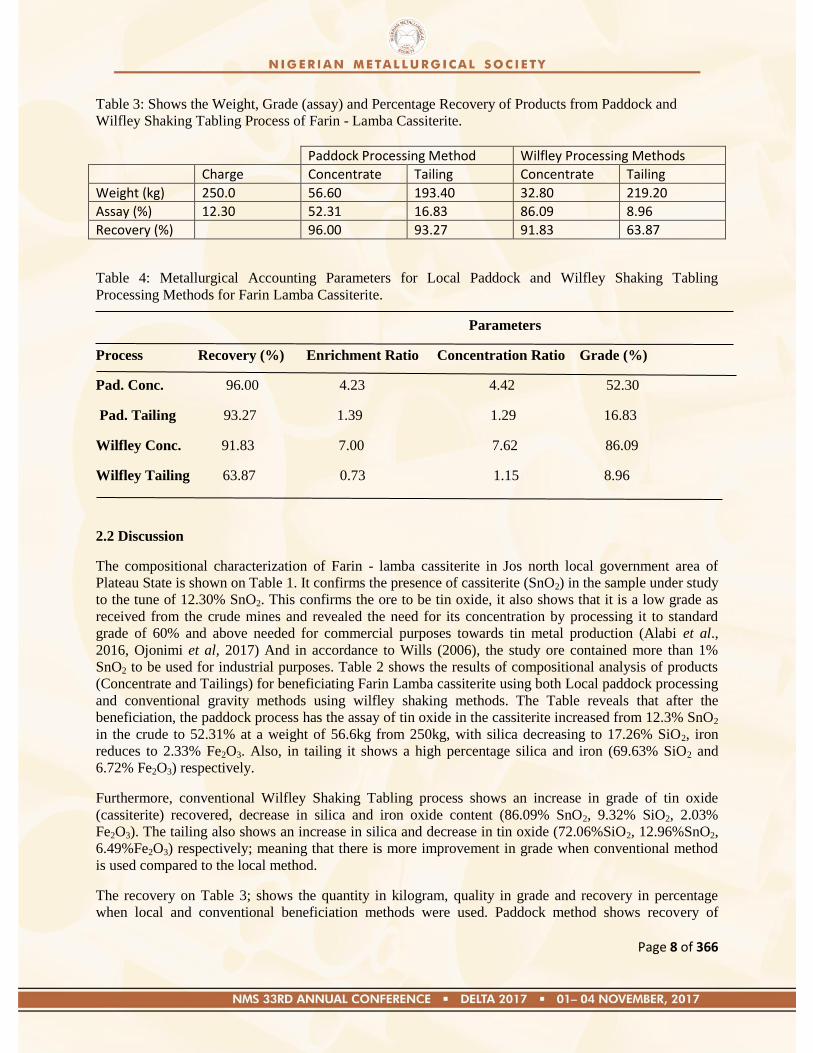
Table 3: Shows the Weight, Grade (assay) and Percentage Recovery of Products from Paddock and
Wilfley Shaking Tabling Process of Farin - Lamba Cassiterite.
Paddock Processing Method Wilfley Processing Methods
Charge Concentrate Tailing Concentrate Tailing
Weight (kg) 250.0 56.60 193.40 32.80 219.20
Assay (%) 12.30 52.31 16.83 86.09 8.96
Recovery (%) 96.00 93.27 91.83 63.87
Table 4: Metallurgical Accounting Parameters for Local Paddock and Wilfley Shaking Tabling
Processing Methods for Farin Lamba Cassiterite.
Parameters
Process Recovery (%) Enrichment Ratio Concentration Ratio Grade (%)
Pad. Conc. 96.00 4.23 4.42 52.30
Pad. Tailing 93.27 1.39 1.29 16.83
Wilfley Conc. 91.83 7.00 7.62 86.09
Wilfley Tailing 63.87 0.73 1.15 8.96
2.2 Discussion
The compositional characterization of Farin - lamba cassiterite in Jos north local government area of
Plateau State is shown on Table 1. It confirms the presence of cassiterite (SnO2) in the sample under study
to the tune of 12.30% SnO2. This confirms the ore to be tin oxide, it also shows that it is a low grade as
received from the crude mines and revealed the need for its concentration by processing it to standard
grade of 60% and above needed for commercial purposes towards tin metal production (Alabi et al.,
2016, Ojonimi et al, 2017) And in accordance to Wills (2006), the study ore contained more than 1%
SnO2 to be used for industrial purposes. Table 2 shows the results of compositional analysis of products
(Concentrate and Tailings) for beneficiating Farin Lamba cassiterite using both Local paddock processing
and conventional gravity methods using wilfley shaking methods. The Table reveals that after the
beneficiation, the paddock process has the assay of tin oxide in the cassiterite increased from 12.3% SnO2
in the crude to 52.31% at a weight of 56.6kg from 250kg, with silica decreasing to 17.26% SiO2, iron
reduces to 2.33% Fe2O3. Also, in tailing it shows a high percentage silica and iron (69.63% SiO2 and
6.72% Fe2O3) respectively.
Furthermore, conventional Wilfley Shaking Tabling process shows an increase in grade of tin oxide
(cassiterite) recovered, decrease in silica and iron oxide content (86.09% SnO2, 9.32% SiO2, 2.03%
Fe2O3). The tailing also shows an increase in silica and decrease in tin oxide (72.06%SiO2, 12.96%SnO2,
6.49%Fe2O3) respectively; meaning that there is more improvement in grade when conventional method
is used compared to the local method.
The recovery on Table 3; shows the quantity in kilogram, quality in grade and recovery in percentage
when local and conventional beneficiation methods were used. Paddock method shows recovery of
Page 9 of 366
96.00% with a grade of 52.3%SnO2. While, Wilfley Shaking Tabling shows recovery of 91.83% with a
grade of 86.09% SnO2.
Table 4 gives the metallurgical accounting parameter of the process with Wilfley Shaking Tabling
showing concentration ratio, enrichment ratio, grade and recovery of 7.62, 7.0, 86.09% and 91.83% while
paddock process shows 4.42, 4.23, 52.3% and 96.0% respectively. This result further revealed that wilfley
shaking tabling process provided a better result compared to the Local Paddock process of Farin Lamba
cassiterite.
Overall, it is clear that the quality produced by the conventional Wilfley Shaking Tabling is higher than
that of Local Paddock Processing method and according to Alabi, (2016) this is more justified.
3. CONCLUSION
Comparative study of the Paddock and Wilfley methods of processing cassiterite have been carried out
and the following conclusions were drawn:
1. Farin Lamba cassiterite consist of tin oxide to the tune of 12.3%SnO2 and some other impurities
as constituent like iron and silica which are the ore‘s major impurities.
2. Concentration of Farin Lamba cassiterite using conventional Wilfley Shaking Tabling method
gave 86.09% SnO2 grade and 91.83% as recovery is better exploited than the use of Local
Paddock Processing method that gave 52% SnO2 grade and recovery of 96.00%.
REFERENCES
911metallurgists, (2017) Principle guide to mineral process engineering,
www.linkedin.com/company/911metallurgist, 2.19am, 7/8/2017.
Abubakre O. K, Sule Y. O and Muriana R.A (2009)‗Exploring the Potentials of Tailings of Bukuru
Cassiterite Deposit for the Production of Iron Ore Pellets, Journal of Minerals & Materials
Characterization & Engineering, Vol. 8, No.5, pp 359-366, 2009
Adekeye, J.I.D. (1999). Solid Minerals Development: Nigeria‟s Economic Mirage. Earth Sciences
Research Communications 1(1): pp. 10 – 24. Published by Research Communications, Lagos.
Alabi O. O. (2016), ‗Comparative Analysis of Ajabanako Iron Ore Deposit Kogi State, Nigeria Using
Magnetic, Gravity and Froth Floatation Methods‟. Nigerian Journal of Engineering. Vol. 23, No 1, pp.
58-66.
Alabi O. O, Yaro S.A., Thomas D. G. and Asuke F. (2015), „Susceptibility of Gyel Columbite Mineral to
Magnetic and Gravity Separation Methods‟. Nigerian Journal of Engineering. Vol 22, No 1, pp. 42-48.
Alison-Madueke, D. (2009). Opportunities in Nigeria‟s Minerals Sector. Ministry of Mines and Steel
Development, Abuja, Nigeria, 22nd April 2009
Amethyst Galleries, Inc., (2014). The Mineral Cassiterite (Mining Booklet).
Ayeni, F.A., Madugu, I. A. , (2011),‟Secondary Recovery of Columbite from tailing dump in Nigerian Jos
mines field; Journal for Minerals and material Characterization and Engineering;Vol.11,No 6, pp587 –
592,2012.
Page 10 of 366
Ayeni. F.A., Alabi, O.O., Ola, S. O. (1999),‟The beneficiation of tailings of an old mining site at Rayfield,
Jos Plateau State‟. Proceedings of the 16th Nigerian Metallurgical Society Annual Conference, Abuja; pp
67 – 75.
Bridge, G. (2008). Economic geography: natural resources. In: International Encyclopaedia of
HumanGeography.Eds. Kitchin and Thrift. Elsevier.
Falcon, L.M. (1982). ‖The gravity recovery of cassiterite‖ Journal of the South African Institute of
Mining and Metallurgy. 112 – 117
Falconer, A. (2003) Gravity separation: Old technique/New technique. Phys. Sep. Sci. Eng. 12, 31–48.
Foraminifera Market Research Ltd (2017) „Tin Ore Cassiterite Export In Nigeria‟ The Feasibility
Report.
Gallach, C. (2016), Sustainable Development Goals (2015 – 2030). Retrieved from
www.unwebservice.com on 4th April, 2016
http://www.naijapals.com/Tin (cassiterite) and Columbite Production, Nigeria (Gistmania Naijapals,
2017)
Ismail, I., Md Muzayin, A., and Salmah, B. (2011). Sulfide Mineral Separation Study from Rahman
Hydraulic Tin Bhd Mine. Ipoh: Mineral Research Centre.Vol.1;pp 23-29.
Md Muzayin, A., and Nazwin, A. (2001). Preliminary Process for Upgrading Wolframit and Cassiterite
Content from Sg Ayam Mine Sample, Kemaman Terengganu. Ipoh: Mineral Research Centre.
Md Muzayin, A., Ismail, I., and Salmah, B. (2012). Characterization Study on Mineral Liberation and
Cassiterite Concentration Processes for Complex Ore Samples from Induk Timur Tin Mine, Kemaman,
Terengganu Darul Iman. Ipoh: Mineral Research Centre.
Mustafa Cirak and cetinttosten (2017), ―Optimization of Coagulation Flocculation Process for Treatment
of a Colloidal Suspension Containing Dolomite, Clay and Borax‖; International Journal of Mineral
processing (Elsevier), Vol 159; 30-41.
Ojonimi I.T., Alabi O.O., Idakwo S.O (2017), ‗Sustainable Development of Nigeria‘s Solid Minerals
Sector: The Metals Recycling Perspective‘. Nigerian Mining and Geosciences Society.Vol. 1; Pp. 1-11.
Ripley, E. A., Redmann, R. E., & Crowder, A. A. (1995). Environmental effects of mining. St. Luice:
Lucie Press CRC. 356 pp 27
Siqing, L., Ye, C., Xiong, T., and Peng, L. 2011. ―Beneficiation of a Fine-sized Cassiterite Bearing
Magnetite Ore.‖ Journal of Minerals & Metallurgical Processing 28 (2): 88-93
Sulaiman, M. Y. (1991). An overview of the rare-earth mineral processing industry in Malaysia.
Materials Science Forum, 70–72, 389–396.
Page 11 of 366
Paper: NMS 2017-TP002
Improvement and Performance Evaluation of Jaw-Type Rock
Crushing Machine
C. Ocheri, J. B. Agboola and C. N. Mbah
Department of Metallurgical and Materials Engineering, University of Nigeria, Nsukka, Nigeria
Department of Metallurgical and Materials Engineering, Federal University of Technology, Minna,
Nigeria
Dept. of Metallurgical and Materials Engineering, Enugu State University of Science and Technology,
Nigeria
Corresponding Author: C. Ocheri Tel: 08068433419 E-mail: [email protected]
ABSTRACT
A major challenge of the imported rock crusher is the persistent failure of the eccentric shaft due
to intermittent and cyclic shock loads. The aim of this research is to improve on the existing
imported machine by using locally available and cost effective material to develop a technically
efficient, and easily operated jaw type rock crushing machine. To achieve this aim, the effect of
shaft eccentricity on the lifespan of the jaw crushing machine was evaluated and an optimal
design of the eccentric shaft was developed. The performance of the machine was evaluated by
crushing various types of rocks and the crushing time recorded for various materials. The
average material crushed was 425 kg granite, 514 kg lime stone and 569 kg marble per hour. The
cost of fabricating the equipment was 34,496 Naira ($100.00) which is cheaper in comparison to
similar machine imported from abroad. The machine can be used in rural areas where there is no
electricity and is environmentally friendly for its lack of gas emission.
Keywords: Jaw–type, Rock Crushing Machine, Shaft eccentricity
1.0 Introduction
A crusher is a device that is designed to reduce large solid raw material into smaller sizes.
Crushers are commonly classified by the degree to which they fragment the starting material.
Raw material from mines is processed first in primary crushers. The input of primary crushers is
relatively wider and the output products are coarser in size. Examples are Jaw crusher, Gyratory
crusher, Impact Crushers, etc. The crushed rocks from primary crusher are sent to the secondary
crushers for further size reduction. Examples of secondary crushers are reduction gyratory
crusher, Cone crusher, disk crushers etc. Fine crushers have relatively small openings and are
used to crush the feed material into more uniform and finer product.
Jaw-Type Rock Crushing Machine is required in reducing the sizes of crushed
boulders to aggregate sizes that are suitable (100 mm to 140 mm diameter) for
feeding secondary crushers and mills (like, cone crushers, roller mill and ball mill).
One of the challenges associated with the imported jaw type crusher machine is the
persistent failure of the eccentric shafts due to intermittent and cyclic shock loads

Page 12 of 366
(Babu et al. 2013; Culpepper et al. 2005). The aim of this work is to evaluate the
effect of shaft eccentricity on the life span of jaw-type rock crushing machine and
to develop optimal design of the eccentric shaft so as to arrest its frequent failure.
The shaft is made of hardened steel (medium carbon steel) usually from forged material. It has
an eccentric lobe on the shaft (see figure1). The line of action of its loading does not coincide
with the axis of the shaft (eccentric loading).
Figure1: Eccentric Shaft
The offset of the eccentric shaft determines the effectiveness and durability of the shaft. It also
determines the throw of the moveable jaw. The higher the throw, the more effective in crushing.
However, higher throw with high speed causes breakage of the shaft and under throw reduces its
efficiency. The motor drives the belt pulley and the belt pulley in turn drives the eccentric shaft
to rotate, and make the moving jaw approach and leave the fixed jaw periodically, to crush and
grind the materials repeatedly, after which the material drop gradually and finally discharged
from the discharge opening ( see figure 2).
Figure 2: Cross section of jaw crusher assembly
During operation, two forces come into action i.e. horizontal compressive force (Fc) and the
vertical upward and downward stroke or force (Fs) (see figure 3).

Page 13 of 366
Figure 3: Forces in Operation during Crushing
The eccentric lobes impart motion data are:
0o – 90
o Horizontal stroke (opening)
90o – 180
o Vertical stroke upward (‗y‘ mm maximum displacement)
180o – 270
o Horizontal/impart stroke (crushing stroke)
270o – 360
o Vertical stroke downward (returning to starting point)
Figures 4 and 5 shows the displacement positions at various points. At point B, C, and D, the
displacements are at maximum of ‗y‘ mm, the maximum crushing impart takes place at point D
(where we have the crushing stroke). Finally, the lobe returns to its starting point at point
A.
Figure 4: Linear displacement versus angular displacement of the eccentric shaft lobe.
Page 14 of 366
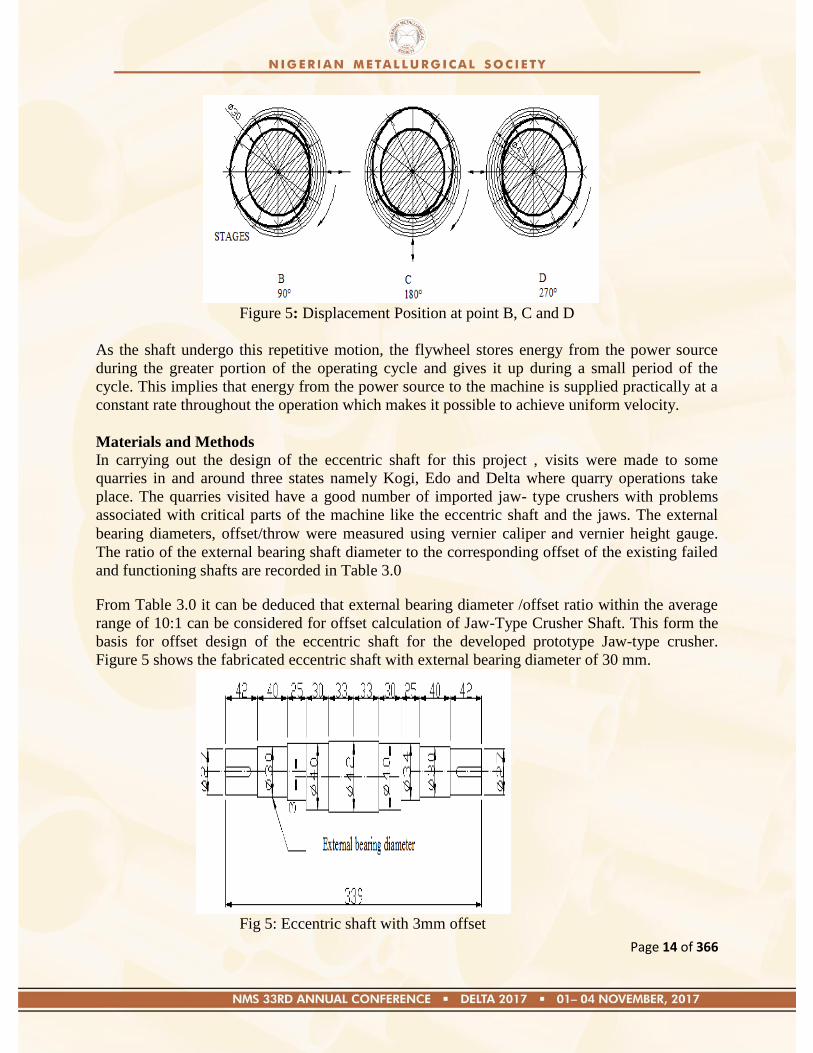
Figure 5: Displacement Position at point B, C and D
As the shaft undergo this repetitive motion, the flywheel stores energy from the power source
during the greater portion of the operating cycle and gives it up during a small period of the
cycle. This implies that energy from the power source to the machine is supplied practically at a
constant rate throughout the operation which makes it possible to achieve uniform velocity.
Materials and Methods
In carrying out the design of the eccentric shaft for this project , visits were made to some
quarries in and around three states namely Kogi, Edo and Delta where quarry operations take
place. The quarries visited have a good number of imported jaw- type crushers with problems
associated with critical parts of the machine like the eccentric shaft and the jaws. The external
bearing diameters, offset/throw were measured using vernier caliper and vernier height gauge.
The ratio of the external bearing shaft diameter to the corresponding offset of the existing failed
and functioning shafts are recorded in Table 3.0
From Table 3.0 it can be deduced that external bearing diameter /offset ratio within the average
range of 10:1 can be considered for offset calculation of Jaw-Type Crusher Shaft. This form the
basis for offset design of the eccentric shaft for the developed prototype Jaw-type crusher.
Figure 5 shows the fabricated eccentric shaft with external bearing diameter of 30 mm.
Fig 5: Eccentric shaft with 3mm offset
Page 15 of 366
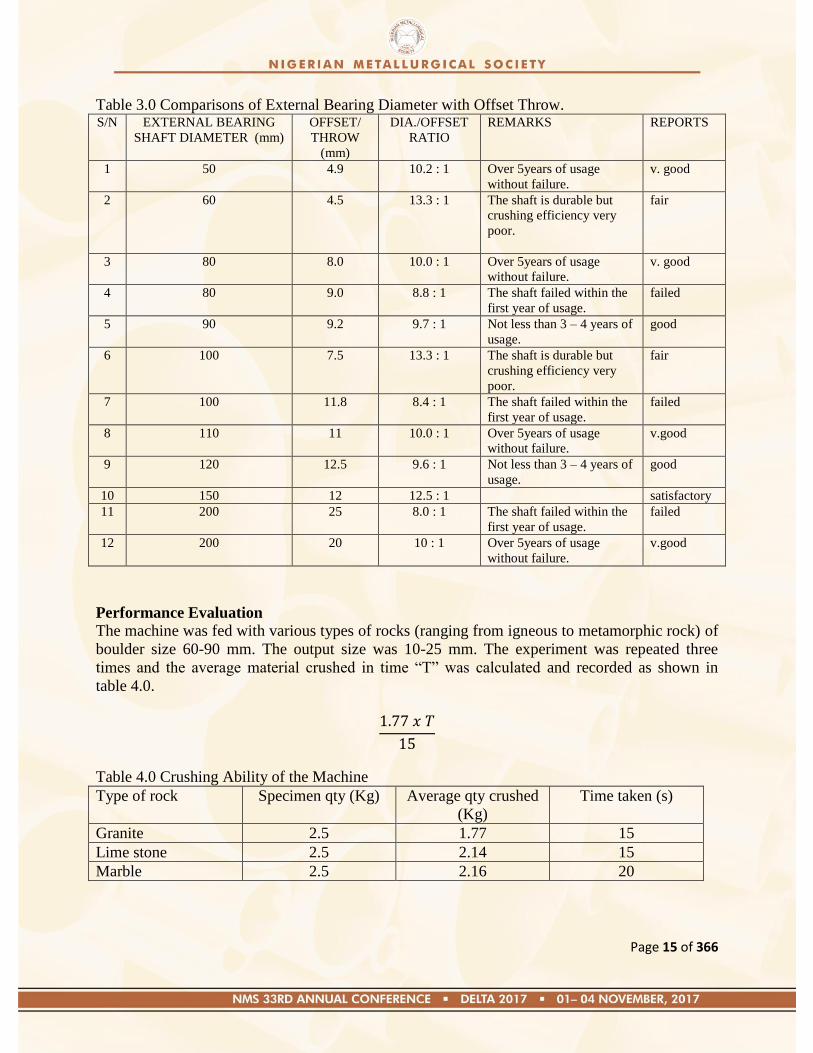
Table 3.0 Comparisons of External Bearing Diameter with Offset Throw. S/N EXTERNAL BEARING
SHAFT DIAMETER (mm)
OFFSET/
THROW
(mm)
DIA./OFFSET
RATIO
REMARKS REPORTS
1 50 4.9 10.2 : 1 Over 5years of usage
without failure.
v. good
2 60 4.5 13.3 : 1 The shaft is durable but
crushing efficiency very
poor.
fair
3 80 8.0 10.0 : 1 Over 5years of usage
without failure.
v. good
4 80 9.0 8.8 : 1 The shaft failed within the
first year of usage.
failed
5 90 9.2 9.7 : 1 Not less than 3 – 4 years of
usage.
good
6 100 7.5 13.3 : 1 The shaft is durable but
crushing efficiency very
poor.
fair
7 100 11.8 8.4 : 1 The shaft failed within the
first year of usage.
failed
8 110 11 10.0 : 1 Over 5years of usage
without failure.
v.good
9 120 12.5 9.6 : 1 Not less than 3 – 4 years of
usage.
good
10 150 12 12.5 : 1 satisfactory
11 200 25 8.0 : 1 The shaft failed within the
first year of usage.
failed
12 200 20 10 : 1 Over 5years of usage
without failure.
v.good
Performance Evaluation
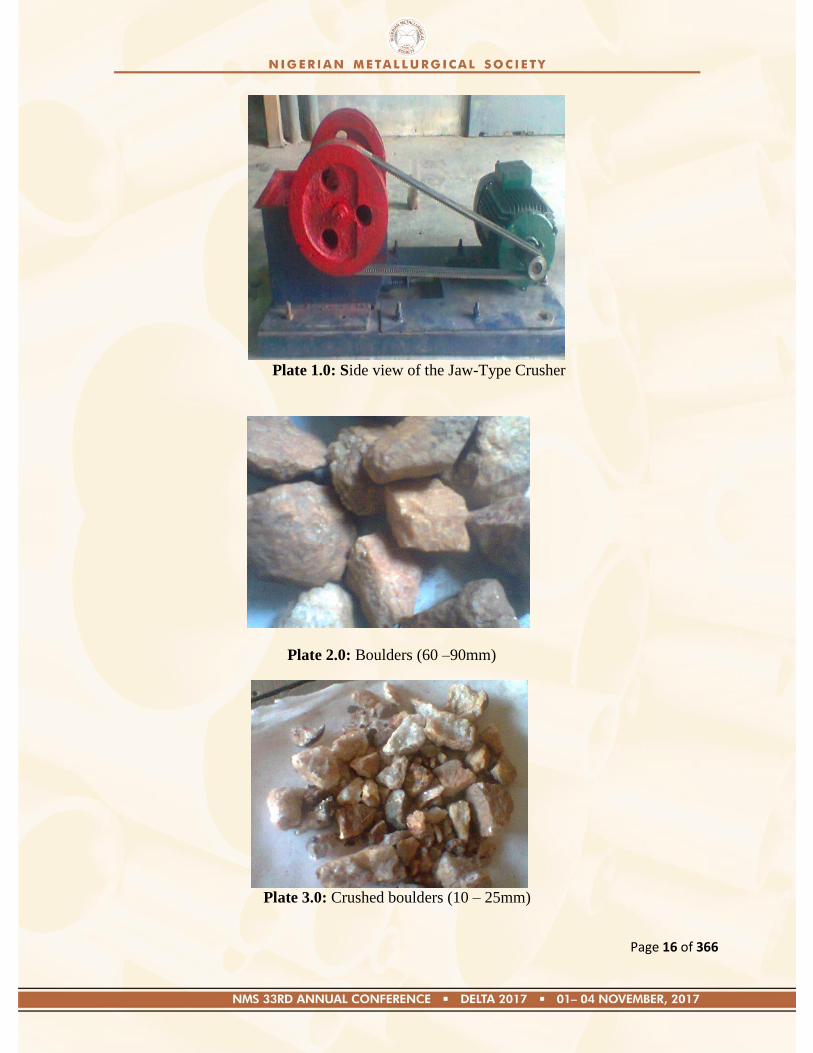
The machine was fed with various types of rocks (ranging from igneous to metamorphic rock) of
boulder size 60-90 mm. The output size was 10-25 mm. The experiment was repeated three
times and the average material crushed in time ―T‖ was calculated and recorded as shown in
table 4.0.
Table 4.0 Crushing Ability of the Machine
Type of rock Specimen qty (Kg) Average qty crushed
(Kg)
Time taken (s)
Granite 2.5 1.77 15
Lime stone 2.5 2.14 15
Marble 2.5 2.16 20
Page 16 of 366
Plate 1.0: Side view of the Jaw-Type Crusher
Plate 2.0: Boulders (60 –90mm)
Plate 3.0: Crushed boulders (10 – 25mm)
Page 17 of 366
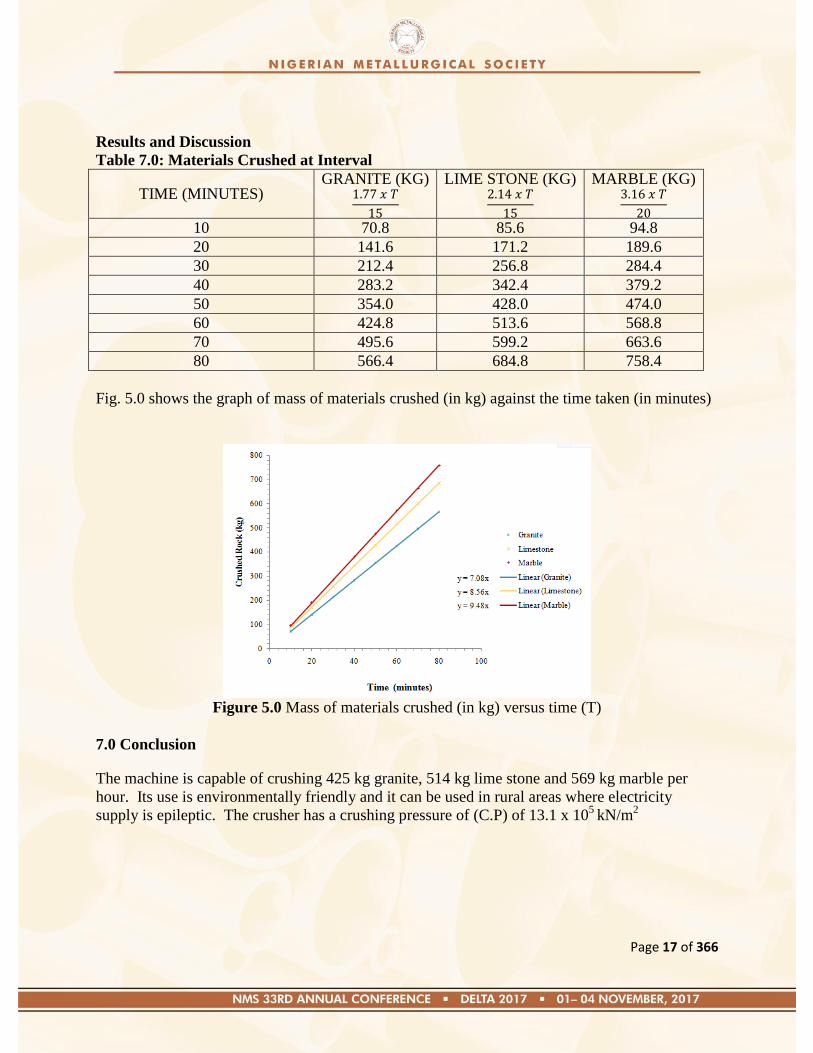
Results and Discussion
Table 7.0: Materials Crushed at Interval
TIME (MINUTES) GRANITE (KG)
LIME STONE (KG)
MARBLE (KG)
10 70.8 85.6 94.8
20 141.6 171.2 189.6
30 212.4 256.8 284.4
40 283.2 342.4 379.2
50 354.0 428.0 474.0
60 424.8 513.6 568.8
70 495.6 599.2 663.6
80 566.4 684.8 758.4
Fig. 5.0 shows the graph of mass of materials crushed (in kg) against the time taken (in minutes)
Figure 5.0 Mass of materials crushed (in kg) versus time (T)
7.0 Conclusion
The machine is capable of crushing 425 kg granite, 514 kg lime stone and 569 kg marble per
hour. Its use is environmentally friendly and it can be used in rural areas where electricity
supply is epileptic. The crusher has a crushing pressure of (C.P) of 13.1 x 10⁵
kN/m2
Page 18 of 366
References
1. Babu A. N., Srinuvas P. and Ahmed M. Y. (2013): Design and Optimization of Eccentric
Shaft of Pilger Milling Machine. International Journal of Advanced Trends in Computer
Science and Engineering. Vol. 2, No. 1, pp. 608 – 612.
2. Bhatt N. D. (2010): Engineering Drawing: Plane and Solid Geometry (In First Angle
Projection Method), Fiftieth Reversed and Enlarged Edition, pp 511-538.
3. Culpepper M. L., Kartik M. V. and Dibiasio C. (2005): Design of Integrated Eccentric
Mechanisms and Exact Constraint Fixtures for Micron-Level Repeatability and Accuracy.
Precision Engineering. Vol. 29, pp. 65 – 80.
4. Egesi N. and Tse C. A. (2011): Dimension Stone: Exploration, Evaluation and Exploitation
in Southwest Parts of Oban Massif South-eastern Nigeria. Journal of Geology and Mining
Research, Vol. 3, No. 4, pp. 115-122.
5. Elisante E. (2009): Simplification of Jaw crusher for Artisanal Aggregates Miners. Journal of
Engineering and Technology Research Vol.1, No.6, pp. 102-108.
6. Guimaraes M. S., Valdes J. R., Palomino A. M. and Santamarina J. C. (2007): Aggregate
Production: Fines Generation during Rock Crushing. International Journal of Mineral
Processing. Vol. 81, pp. 237-247.
7. Morrell S. (2009): Predicting the Overall Specific Energy Requirement of Crushing, High Pressure Grinding Roll and Tumbling Mill Circuits. Minerals Engineering, Vol. 22, pp. 544–
549.
8. Numbi B. P., Zhang P. and Xia X. (2014): Optimal Energy Management for a Jaw Crushing
Process in Deep Mines. Energy, Vol. 68, pp. 337-348.
9. Olaleye B. M. (2010): Influence of Some Rock Strength Properties on Jaw Crusher
Performance in Granite Quarry, Mining Science and Technology, Vol. 20, pp204–208.
10. Refahi A., Mohandesi J. A., and B. Rezai (2009): Comparison Between Bond Crushing
Energy and Fracture Energy of Rocks in a Jaw Crusher using Numerical Simulation.The
Journal of The Southern African Institute of Mining and Metallurgy, 109, pp. 709-717.
11. Shigley E. F. and Mischke C.R. (2001): Mechanical Engineering Design: Flexible
Mechanical Element, Sixth Edition, pp. 1049- 1076.
12. Shrivastava A. K. and Sharma A. K. (2012): A Review on Study of Jaw Crusher.
International Journal of Modern Engineering Research. 2(3)3, pp. 885-888.
Page 19 of 366
Paper: NMS 2017-TP003
Effect of Selected Casting Parameters on Mechanical Properties of Aluminum Scrap using
Centrifugal Casting Machine
A. S. Abdulrahman1, J. K. Muwo
2, M. B. Adeyemi
2, E. Mudiare
1, O. A. Ajibuwa
1
1Department of Materials and Metallurgical Engineering, Federal University of Technology,
Minna, Nigeria. 2Department of Mechanical Engineering, Federal University of Technology, Minna, Nigeria
Abstract
Many cast aluminum alloy component today fall below the expectation of the end users, which can be attributed to
the composition of aluminum alloy used or casting process employed in their production. This paper investigates the
effect of mould spinning speed and delay time of pouring molten metal on mechanical properties (hardness, tensile
strength and microstructure) of cast aluminum scrap, using centrifugal casting machine. The cast sample was
analyzed for its Micro-constituent and Mechanical tests were conducted for all the samples, based on their
conditions of cast. The result shows that there was significant increase in hardness as the speed of the mould
increases. At zero second delay time, hardness values of 75.35 HV and 147.74HV were observed for 100 rpm and
400rpm mould speed respectively. The mould speed of 400rpm at zero second delay time yielded highest tensile
strength of 153MPa, fracture stress of 86MPa and percentage elongation of 5.2% compared to normal sand cast of
hardness 90.54HV, tensile strength 107.50MPa, and fracture stress 61.49 MPa and percentage elongation 3.9%.
Keywords: Aluminum scrap, Hardness, Casting speed, Centrifugal casting, Tensile strength
1.0 Introduction
The properties of commercial aluminum alloys depend on the amount of all alloying elements in them, and in
casting, properties could largely be influenced by the casting techniques employed [1]. The aluminum scrap used for
this research has Al, Zn, Fe, Cu and Si as the major alloying elements that possess properties such as high strength,
ductile, excellent corrosion resistance and weldability. To achieve sound casting, parameters like metal composition,
pouring temperature, fluidity, pouring rate, rate of cooling are of great importance [2, 3]. Properties affected could
include: toughness, hardness, tensile strength, percentages elongation and percentage reduction in area. Casting is
the pouring of molten metal into a mould having a cavity of the shape desired to be produced and allowing the
molten metal to solidify inside the cavity of the mould [4]. The solidified object after removal of gate and risers is
called casting [5]. Casting is basically classified into two processes, namely: Expendable-mould casting process,
which includes sand casting, plaster mould casting, ceramic mould casting, investment casting. And multiple-use
mould casting process, which includes die casting, permanent mould casting, centrifugal casting, squeeze casting
etc.
The casting process employed for this research was centrifugal casting method. Centrifugal casting is a pressure
casting method which increased gravity force is applied to molten metal by rotating or spinning the mold assembly.
In this casting method, the centrifugal forces is being generated on the molten metal to position properly the molten
metal within the mould by the spinning of the mould [6, 7]. The process yield products of better physical properties
when compare with the products of statics casting, due to the close grain structure of centrifugal casting process.
Centrifugal castings are classified into three categories.
i. True centrifugal casting
ii. Semi –centrifugal casting
iii. Centrifuging
Merits of Centrifugal Casting Process
1. The cast has no porosity defects

Page 20 of 366
2. From the point of view of dense and strength, these casting have been proved as strong as forging
3. The needs for large gates, feeders and cores are also eliminated
4. Close control of mechanical properties is achieved.
5. Two materials can be cast be introducing second materials during the casting process etc. [8, 9].
The machines used for centrifugal casting process are classified base on their orientation of the mould about its own
axis. The major mould axes of orientation are horizontal or vertical, which can be termed horizontal centrifugal
casting machine and vertical centrifugal casting machine respectively [10].
In the same vein, for this research, a vertical centrifugal investment casting machine was employed, to improve
investment casting that brought about the invention of simple spin machine with radially symmetric shell. The
strength of investment casting is increased by allowing the metal to move into the most obscure section of the shell
as result of the rotational process [11].
Feature of a vertical centrifugal casting machine used The figure below show the prototype of a vertical centrifugal casting machine used for this research.
Figure 1: Schematic Diagram of a Centrifugal Casting Machine
Basically it has the following essential features;
i. Metallic mould (permanent mould)
ii. Turn table (rotating disc)
iii. Machine shaft or gear system
iv. Belt drive
v. Electric motor and
vi. Spur (funnel)
2.0 Experimental procedure (Method)
Figure 2 gives the summary of the experimental procedure in determining the effect of selected casting parameters
on mechanical properties of aluminum scrap using centrifugal casting machine.
2.1Casting The casting procedure in centrifugal process includes, rotation of mould at a known speed (for this research its
ranges from 100 - 400 rpm), melting of scrap or worn aluminum scrap, pouring the molten metal into the mould (for
this paper was at 710 ), proper solidification rate (machine allow to run 10 minutes after pouring the molten metal )
and ejection of the casting from the mould.
Page 21 of 366
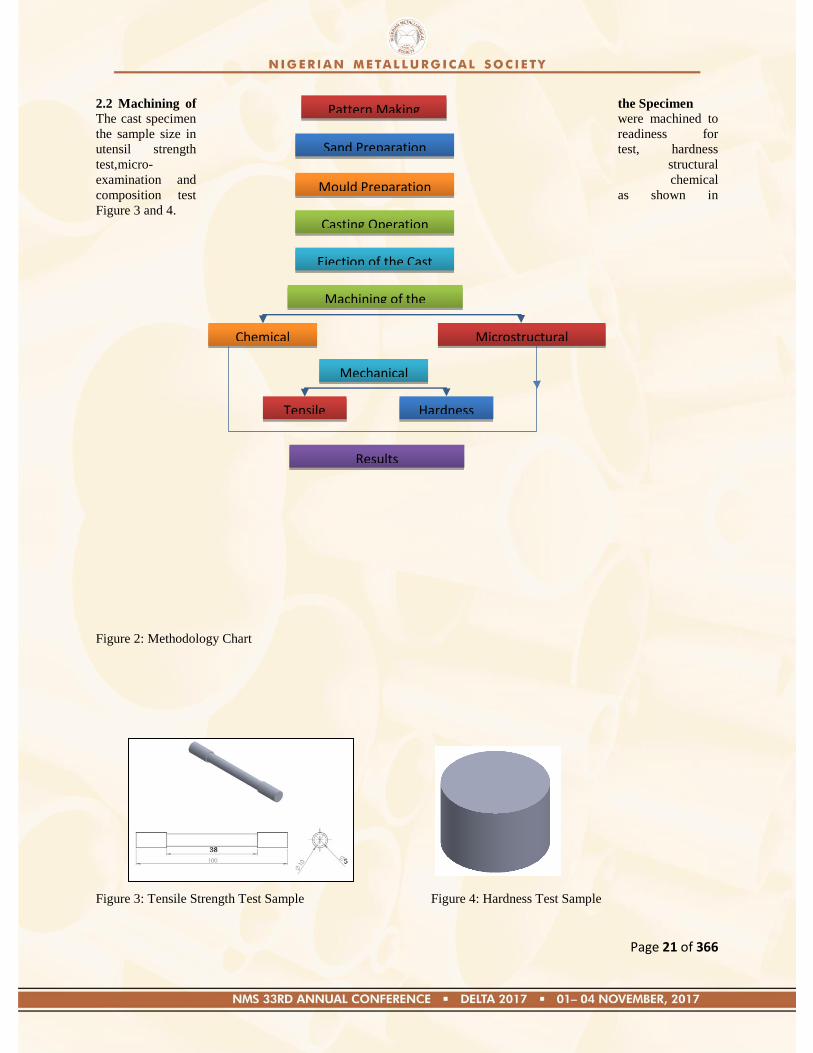
2.2 Machining of the Specimen
The cast specimen were machined to
the sample size in readiness for
utensil strength test, hardness
test,micro- structural
examination and chemical
composition test as shown in
Figure 3 and 4.
Figure 2: Methodology Chart
Figure 3: Tensile Strength Test Sample Figure 4: Hardness Test Sample
Pattern Making
Sand Preparation
Mould Preparation
Casting Operation
Ejection of the Cast
Machining of the
Mechanical
Microstructural Chemical
Tensile Hardness
Results

Page 22 of 366
2.3.0 Mechanical Properties
The mechanical properties of interest for this work includes; tensile strength, hardness, microstructural
examinations, percentages elongation and percentage reduction in area.
2.3.1 Theory on Hardness Test
The hardness testing machine was employed for this research, to test various samples of casting aluminum scrap
using different casting parameters (i.e. mould spinning speed and delay time) is Vickers diamond hardness testing
machine, this test gives a reliable and accurate method of testing the hardness of metals,particularly where a high
degree of hardness is concerned. It uses a pyramid- shaped diamond with an angle of 1360, which is pressed unto the
surface with loads selected from 500 Nm, the particular load used depending on the hardness ranges of the material
being tested. The diamond makes a small square impression and the vicker pyramid hardness number is found from
tables after the reading across the corners of this impression has being obtained by a microscope fixed to the
machine. This method is very suitable for testing finished work, as the impression made is very minute and does not
mar the surface of the component.
2.3.2 Tensile Strength
The tensile test gives information on the strength and ductility of a material under uniaxial tensile stress. The
information provided by this test is useful in quality control, comparison of material, alloy development and
designed under certain circumstances.
The test is carried out in a testing machine on a specimen previously made from the material to be tested.
2.4.0 Concepts of Stress and Strain.
2.4.1 Stress
When any solid body is subjected to external forces, there are set up within the body resisting forces called stress.
The force per unit area called unit stress, and the unit is N/mm2. Given by the relation
1
Where;
= stress
= Original cross-sectional area before any load is applied
F = Instantaneous load applied perpendicular to the specimen cross-sectional area
2.4.2 Strain
Generally, materials are not perfectly rigid [12]. Under the action of forces, they under goes changes in shape and
size. Though the deformation depends on the material and amount of external load applied, some deformation being
small cannot be seen with naked eyes, but through use of measuring instruments like: extensometer, electronic strain
gauge which can measure extension of small magnitude.
Given by the relation
Where:
= Engineering strain
= Length before any load is applied
= Instantaneous length
Change in length
2.4.3 Stress –Strain Relation
The degree to which a material deforms or strains depends on the magnitude of an imposed stress. The stress – strain
relation of any material is obtained by conducting tensile test in the laboratory on standard specimen [12, 13].
Different material behaves differently. The ends of a typical tensile test specimen are gripped into universal testing
machine, well computerized to measure the extension over the length.
The length over which extension is measured is called ―gauge length‖. The load is applied gradually and at regular
interval of loads, extension is determined. After certain load extension increases at faster rate and now load is
increased gradually till the specimen break [14].
2.4.4 Percentage Elongation and Percentage Reduction in Area
The percentage elongation and percentage reduction in area are terms used to evaluate the ductility of material.
Ductility of a material is a measure of degree of plastic deformation that has been sustained at fracture.

Page 23 of 366
Percentage Elongation: is the ratio of the final extension at fracture to original length expressed as percentage.
3
Where;
= fractured length and
= Original gauge length
Percentage Reduction in Area: is the ratio of maximum change in the cross-sectional area to original cross
sectional area, expressed as percentage.
4
Where;
= Original cross–sectional area
= Cross–sectional area at the point of fracture
2.5.0 Plasticity Region of Stress –Strain Curve
The theory of plasticity deals with the behavior of materials at strains where Hooke‘s law is no longer obeyed .A
number of aspects of plastic deformation make the mathematical formation of a theory of plasticity more difficult
than the description of the reversible like elastic solid. Elastic deformation depends only on the initial and final
conditions of stress and strain, while the plastic strain is affected by the loading path by which the final state is
achieved [14, 15]. However, in plastic deformation, there is no easily measured constant relating stress and strain, as
with young modulus for elastic deformation. E=
Plastic deals with estimating the maximum load which can be applied to a body without causing excessive yielding.
2.5.1 True Stress -True StrainT
Engineering stress-strain curve does not give a true indication of the deformation behaviours of a material. Because
it depends on the original dimension of the specimen, and these dimensions‘ changes continuously during the test.
Thus, measures of stress and strain which depends on the instantaneously dimension are required.
2.5.2 True Stress
The ratio of load at any instant to the cross-sectional area over which it acts is known as true stress. Given by the
relation.
= [ ] 5
Where;
T = True stress
o = Engineering stress
e = Engineering strain
2.5.3 True StrainT
Is the change in length per original length at any instant during testing.
Given by the relation
T = [ ] 6
T =True Strain
e=Engineering Strain
2.5.4 Power law Relation
True stress–strain curve is usually called a flow curve because it gives the stress required to cause the metal to move
plastically to any given strain (on test. The mathematical relation that express this, is known as power law
7
Where;
T = True stress
T = True strain
K = Constant
n = the strain hardening coefficient.
2.6.0 Metallographic Examination
Grain size and microstructure can affect the mechanical properties of metals. A casting with a fine grain size is
usually desirable because it may increase corrosion resistance and limit fatigue [14].

Page 24 of 366
2.6.1 Procedure
Micro structural test piece of 20mm of diameter x 30mm long was cut from each of the cast made and step below
were followed;
i. Grinding is done using a rotating disc covered with silicon carbide paper and water, paper of various grit is
used.
ii. Light pressure is applied on the centre of the sample piece during grinding, until all the blemished have
been removed and the sample surface becomes very flat.
iii. Wash the sample in water and move to next grit, orienting the starches from the previous grade normal to
the rotational direction.
iv. Repeat the grinding procedure until the final grinding operation. After that, wash the sample thoroughly,
followed by cleaning using alcohol and dry the sample.
v. Polishing is done using rotating disc, covered with soft cloth impregnated with diamond particles and
lubricant.
vi. Wash the sample under running tap water followed by cleaning with alcohol, immerse the sample in
ultrasonic cleaner for one minute and then dry the sample.
vii. Repeat the same procedure for final polishing.
viii. Examine your sample by using metallurgy microscope
3.0 Results and Discussion
The cast products after ejection from the mould are taken for investigations to study the effect of casting parameter
on mechanical properties. Table 1 shows how each sample cast can be identified, considering the speeds of the
mould and the delay times in machine operation.
Table1: Identification of cast products by class
Class Speed of mould (rpm) Delay time (secs)
A 100 0
B 200 0
C 300 0
D 400 0
E 100 10
F 200 10
G 300 10
H 400 10
I A.C -
A.C -As cast.
The table 2 shows the chemical composition of aluminum scrap used for this research. And the major alloying
elements in this metal are Al, Fe, Zn, Cu and Si that has properties of high strength, ductile, weldability etc.
Table 2:. Percentage Composition of Aluminium-scrapused
Metal Al Fe Si Zn Mn Ti Cl K Ca Cr Ni Cu Ag Pb
Percentage
(%)
93.28 0.75 0.32 0.816 0.243 0.058 0.19 0.16 0.30 0.026 0.105 0.65 0.50 0.077
Source: National Geological Survey Agency Kaduna, Nigeria
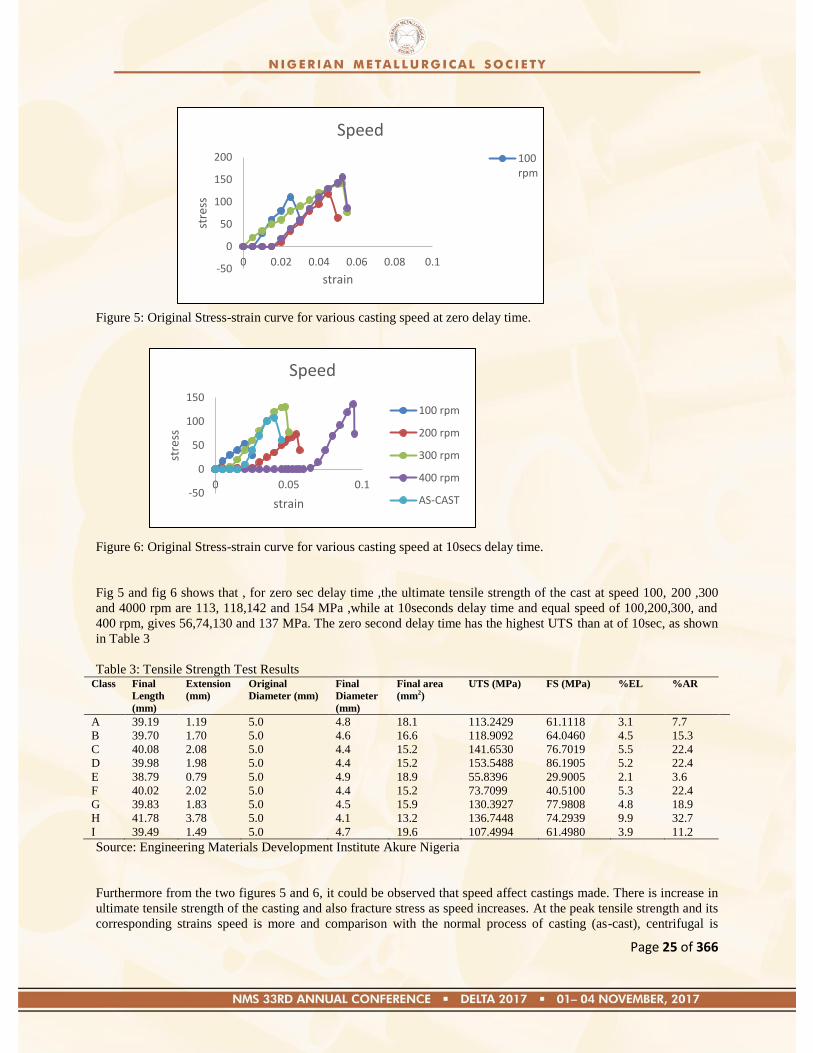
3.1 Stress –Strain In figure 5, the strength of the cast samples is similar at small strain (less than 0.02) for casting made at zero second
delay time. However, significant differences occurred beyond the 0.02 strain. While when the delay time is 10secs
fig. 6 differences were observed even at a lower value of strain, showing that, delay in pouring molten metal into the
mould can affect the strength of the cast.
Page 25 of 366
Figure 5: Original Stress-strain curve for various casting speed at zero delay time.
Figure 6: Original Stress-strain curve for various casting speed at 10secs delay time.
Fig 5 and fig 6 shows that , for zero sec delay time ,the ultimate tensile strength of the cast at speed 100, 200 ,300
and 4000 rpm are 113, 118,142 and 154 MPa ,while at 10seconds delay time and equal speed of 100,200,300, and
400 rpm, gives 56,74,130 and 137 MPa. The zero second delay time has the highest UTS than at of 10sec, as shown
in Table 3
Table 3: Tensile Strength Test Results Class Final
Length
(mm)
Extension
(mm)
Original
Diameter (mm)
Final
Diameter
(mm)
Final area
(mm2)
UTS (MPa) FS (MPa) %EL %AR
A 39.19 1.19 5.0 4.8 18.1 113.2429 61.1118 3.1 7.7
B 39.70 1.70 5.0 4.6 16.6 118.9092 64.0460 4.5 15.3
C 40.08 2.08 5.0 4.4 15.2 141.6530 76.7019 5.5 22.4
D 39.98 1.98 5.0 4.4 15.2 153.5488 86.1905 5.2 22.4
E 38.79 0.79 5.0 4.9 18.9 55.8396 29.9005 2.1 3.6
F 40.02 2.02 5.0 4.4 15.2 73.7099 40.5100 5.3 22.4
G 39.83 1.83 5.0 4.5 15.9 130.3927 77.9808 4.8 18.9
H 41.78 3.78 5.0 4.1 13.2 136.7448 74.2939 9.9 32.7
I 39.49 1.49 5.0 4.7 19.6 107.4994 61.4980 3.9 11.2
Source: Engineering Materials Development Institute Akure Nigeria
Furthermore from the two figures 5 and 6, it could be observed that speed affect castings made. There is increase in
ultimate tensile strength of the casting and also fracture stress as speed increases. At the peak tensile strength and its
corresponding strains speed is more and comparison with the normal process of casting (as-cast), centrifugal is
-50
0
50
100
150
200
0 0.02 0.04 0.06 0.08 0.1
stre
ss
strain
Speed
100rpm
-50
0
50
100
150
0 0.05 0.1
stre
ss
strain
Speed
100 rpm
200 rpm
300 rpm
400 rpm
AS-CAST
Page 26 of 366
better. This shows that strength of the material casting, using centrifugal process can be improved through
increasing the speed of the machine. Percentage elongation and percentage reduction in area which are terms used to
evaluate the ductility of material can be seen from table 3 that there is progressive improvement in casting as the
speed improves and delay time decreases. For instance, at the speed of 100rmp and zero sec delay has % EL of 3.1%
while at the speed 400rmp and delay time zero has %EL of 5.2 % respectively.
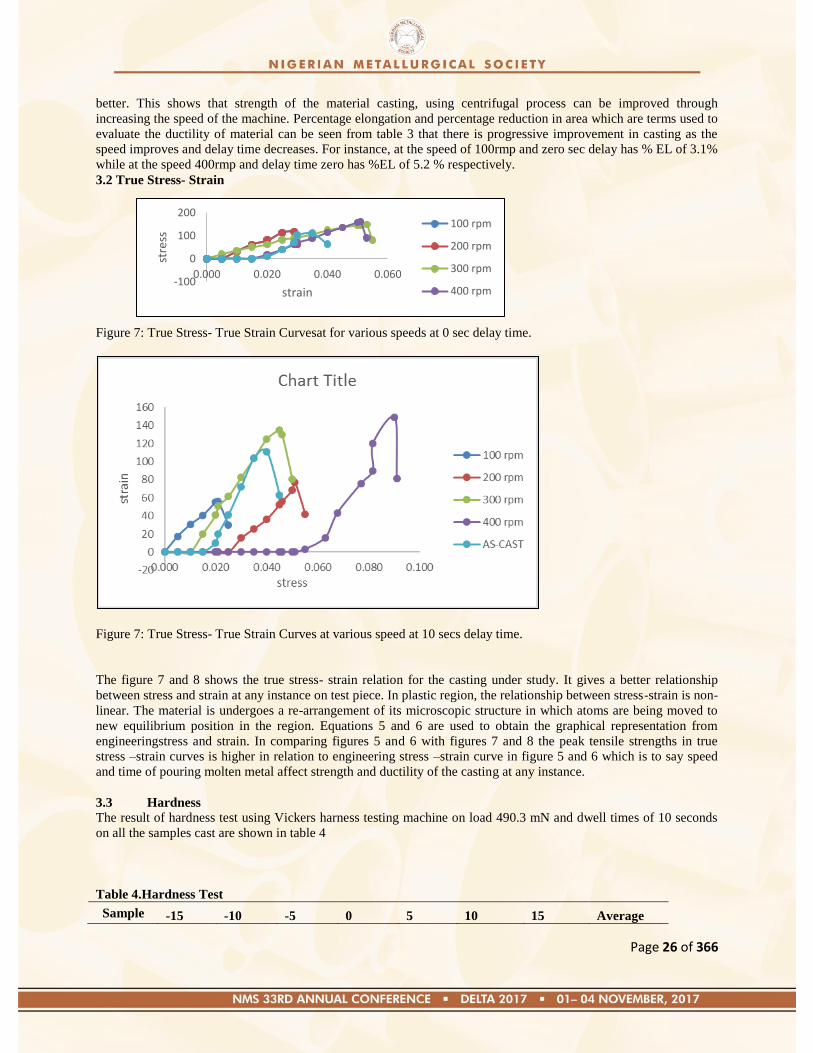
3.2 True Stress- Strain
Figure 7: True Stress- True Strain Curvesat for various speeds at 0 sec delay time.
Figure 7: True Stress- True Strain Curves at various speed at 10 secs delay time.
The figure 7 and 8 shows the true stress- strain relation for the casting under study. It gives a better relationship
between stress and strain at any instance on test piece. In plastic region, the relationship between stress-strain is non-
linear. The material is undergoes a re-arrangement of its microscopic structure in which atoms are being moved to
new equilibrium position in the region. Equations 5 and 6 are used to obtain the graphical representation from
engineeringstress and strain. In comparing figures 5 and 6 with figures 7 and 8 the peak tensile strengths in true
stress –strain curves is higher in relation to engineering stress –strain curve in figure 5 and 6 which is to say speed
and time of pouring molten metal affect strength and ductility of the casting at any instance.
3.3 Hardness
The result of hardness test using Vickers harness testing machine on load 490.3 mN and dwell times of 10 seconds
on all the samples cast are shown in table 4
Table 4.Hardness Test
Sample -15 -10 -5 0 5 10 15 Average
-100
0
100
200
0.000 0.020 0.040 0.060
stre
ss
strain
100 rpm
200 rpm
300 rpm
400 rpm
Page 27 of 366
A 56.75 78.35 83.30 101.40 72.85 75.50 59.30 75.35
B 95.10 86.60 85.65 104.50 95.20 86.15 83.00 90.89
C 112.95 96.70 118.60 113.00 138.15 91.05 104.00 110.64
D 115.40 152.00 176.85 166.15 143.15 147.15 133.45 147.74
E 62.35 82.35 75.45 57.65 61.20 55.90 58.40 64.76
F 79.05 83.30 92.65 59.35 65.25 66.30 73.30 74.17
H 85.10 85.20 101.65 63.45 67.45 68.15 74.35 77.91
G 99.65 87.15 103.40 117.00 80.60 69.95 103.75 94.50
I 79.60 110.80 93.70 96.50 77.50 94.60 81.05 90.54
Source: Engineering Materials Development Institute Akure Nigeria
From the Table4, the maximum and minimum hardness value recorded along the vertical and horizontal directions
for zero seconds delay times are 57 HV and 147HV,while that of 10 seconds delay times are 56HV and 117HV,
these corresponding to the 100and 400rpm respectively. Showing that speed of centrifugal casting machine
improves the hardness of the cast product.
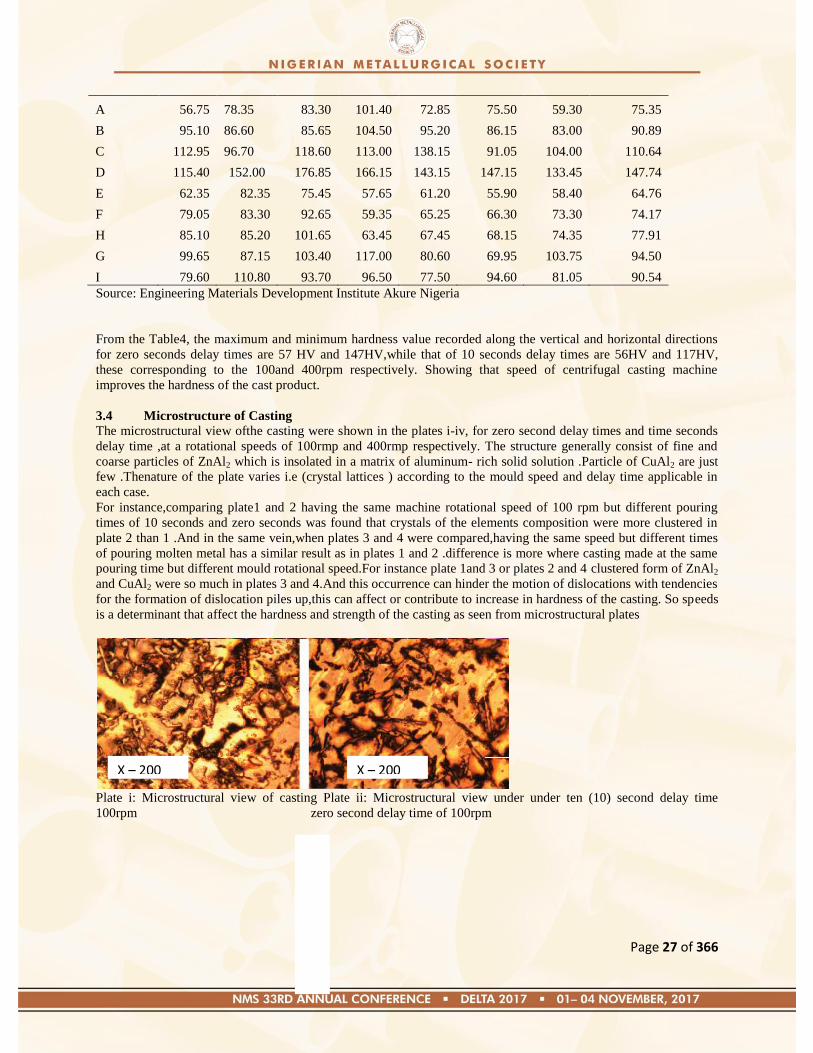
3.4 Microstructure of Casting
The microstructural view ofthe casting were shown in the plates i-iv, for zero second delay times and time seconds
delay time ,at a rotational speeds of 100rmp and 400rmp respectively. The structure generally consist of fine and
coarse particles of ZnAl2 which is insolated in a matrix of aluminum- rich solid solution .Particle of CuAl2 are just
few .Thenature of the plate varies i.e (crystal lattices ) according to the mould speed and delay time applicable in
each case.
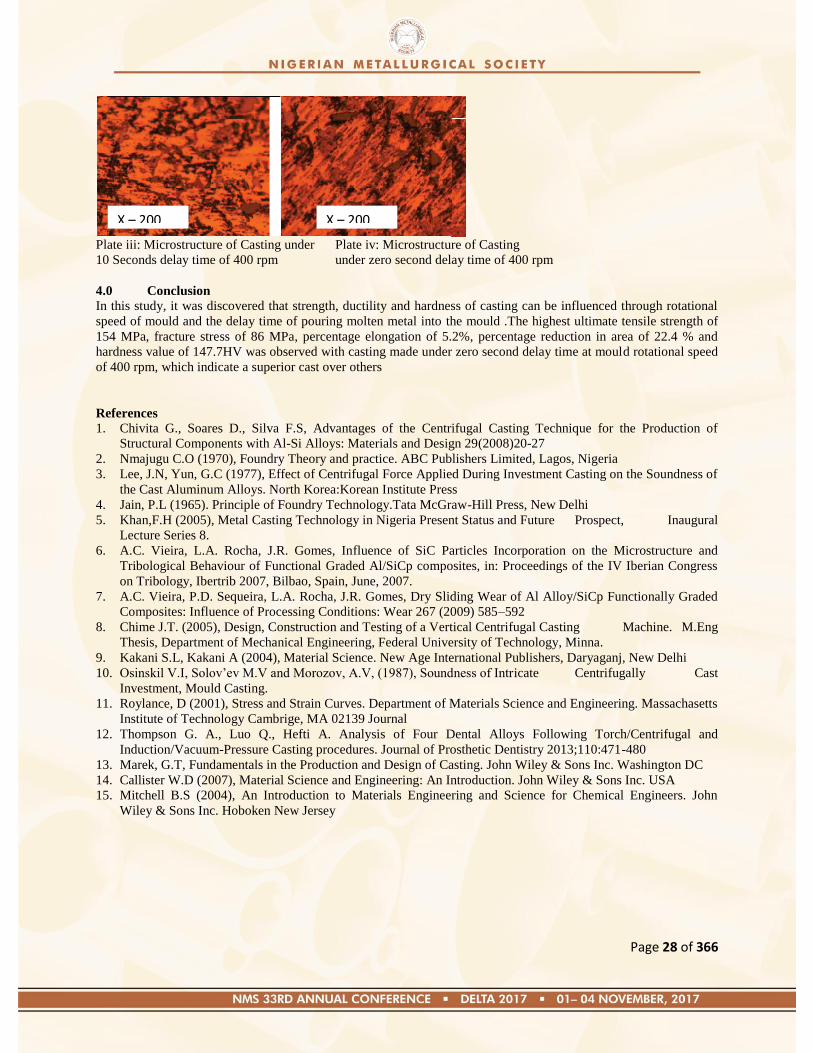
For instance,comparing plate1 and 2 having the same machine rotational speed of 100 rpm but different pouring
times of 10 seconds and zero seconds was found that crystals of the elements composition were more clustered in
plate 2 than 1 .And in the same vein,when plates 3 and 4 were compared,having the same speed but different times
of pouring molten metal has a similar result as in plates 1 and 2 .difference is more where casting made at the same
pouring time but different mould rotational speed.For instance plate 1and 3 or plates 2 and 4 clustered form of ZnAl2
and CuAl2 were so much in plates 3 and 4.And this occurrence can hinder the motion of dislocations with tendencies
for the formation of dislocation piles up,this can affect or contribute to increase in hardness of the casting. So speeds
is a determinant that affect the hardness and strength of the casting as seen from microstructural plates
Plate i: Microstructural view of casting Plate ii: Microstructural view under under ten (10) second delay time
100rpm zero second delay time of 100rpm
X – 200
X – 200 X – 200
Page 28 of 366
Plate iii: Microstructure of Casting under Plate iv: Microstructure of Casting
10 Seconds delay time of 400 rpm under zero second delay time of 400 rpm
4.0 Conclusion
In this study, it was discovered that strength, ductility and hardness of casting can be influenced through rotational
speed of mould and the delay time of pouring molten metal into the mould .The highest ultimate tensile strength of
154 MPa, fracture stress of 86 MPa, percentage elongation of 5.2%, percentage reduction in area of 22.4 % and
hardness value of 147.7HV was observed with casting made under zero second delay time at mould rotational speed
of 400 rpm, which indicate a superior cast over others
References 1. Chivita G., Soares D., Silva F.S, Advantages of the Centrifugal Casting Technique for the Production of
Structural Components with Al-Si Alloys: Materials and Design 29(2008)20-27
2. Nmajugu C.O (1970), Foundry Theory and practice. ABC Publishers Limited, Lagos, Nigeria
3. Lee, J.N, Yun, G.C (1977), Effect of Centrifugal Force Applied During Investment Casting on the Soundness of
the Cast Aluminum Alloys. North Korea:Korean Institute Press
4. Jain, P.L (1965). Principle of Foundry Technology.Tata McGraw-Hill Press, New Delhi
5. Khan,F.H (2005), Metal Casting Technology in Nigeria Present Status and Future Prospect, Inaugural
Lecture Series 8.
6. A.C. Vieira, L.A. Rocha, J.R. Gomes, Influence of SiC Particles Incorporation on the Microstructure and
Tribological Behaviour of Functional Graded Al/SiCp composites, in: Proceedings of the IV Iberian Congress
on Tribology, Ibertrib 2007, Bilbao, Spain, June, 2007.
7. A.C. Vieira, P.D. Sequeira, L.A. Rocha, J.R. Gomes, Dry Sliding Wear of Al Alloy/SiCp Functionally Graded
Composites: Influence of Processing Conditions: Wear 267 (2009) 585–592
8. Chime J.T. (2005), Design, Construction and Testing of a Vertical Centrifugal Casting Machine. M.Eng
Thesis, Department of Mechanical Engineering, Federal University of Technology, Minna.
9. Kakani S.L, Kakani A (2004), Material Science. New Age International Publishers, Daryaganj, New Delhi
10. Osinskil V.I, Solov‘ev M.V and Morozov, A.V, (1987), Soundness of Intricate Centrifugally Cast
Investment, Mould Casting.
11. Roylance, D (2001), Stress and Strain Curves. Department of Materials Science and Engineering. Massachasetts
Institute of Technology Cambrige, MA 02139 Journal
12. Thompson G. A., Luo Q., Hefti A. Analysis of Four Dental Alloys Following Torch/Centrifugal and
Induction/Vacuum-Pressure Casting procedures. Journal of Prosthetic Dentistry 2013;110:471-480
13. Marek, G.T, Fundamentals in the Production and Design of Casting. John Wiley & Sons Inc. Washington DC
14. Callister W.D (2007), Material Science and Engineering: An Introduction. John Wiley & Sons Inc. USA
15. Mitchell B.S (2004), An Introduction to Materials Engineering and Science for Chemical Engineers. John
Wiley & Sons Inc. Hoboken New Jersey
X – 200
X – 200 X – 200
Page 29 of 366
Paper: NMS 2017-TP004
Froth Flotation of Itakpe Iron Ore Dumped Tailings at Varied Agitation Time:
Research and Development for Economic Sustainability
Gbadamosi, Y. E., Alabi, O. O., Olatunji, T. A., and Ola-Omole, O. O.
Metallurgical and Materials Engineering Department, School of Engineering and Engineering Technology,
Federal University of Technology, P.M.B. 704, Akure Ondo State, Nigeria Correspondence Authors: [email protected], [email protected]
Abstract
This study investigates the effect of varied agitation time on the beneficiation of Itakpe iron ore dumped tailings through froth flotation technique. The samples were sourced from different tailing dump sites of National Iron Ore Mining Company (NIOMCO) in Itakpe, Kogi State, Nigeria and properly homogenized. Chemical characterization of collected head sample using Energy Dispersive X-Ray Fluorescence Spectrometry (ED-XRFS) revealed 27.71% Fe2O3, 70.1% SiO2, and other trace compounds. Particle size analysis of 100 g head sample carried out over the range of +500 μm and -63 μm revealed the liberation size to be -250+180 μm, after which the crude was crushed and milled to 100% passing -250+180 μm. The pulverize sample was homogenized and prepared towards froth floatation process. 250 g each of the homogenized samples were frothed in a Denver D-12 Flotation Cell using froth floatation reagents, varying agitation time at an interval of 60 seconds. The efficiency of the process was determined by characterizing the froth and depressed at the varying time using ED-XRFS. Optimum iron recovery was achieved at an agitation time of was at 120 seconds. Keywords: Itakpe, Iron ore tailing, Froth, Depressed, Agitation time 1. Introduction
Itakpe iron ore deposit is a magnetite-hematite mineralization consisting of 14 ore layers of economic
value ranging in grade predominantly from 14.8%Fe to 41%Fe with an overall average grade of 36%Fe
(NIOMCO, 1980). It is located at Latitude 07°36’20”N and Longitude 6°18’35” E in Okehi Local
Government Area of Kogi state, Nigeria (NIOMCO, 1980). Exploitation is by open-pit mining method,
and so far, two production benches are being advanced. The iron ore is currently being processed using
magnetic and gravity methods of mineral processing and flotation plant is being constructed for future
beneficiation of the iron ore (NIOMCO, 1980).
This beneficiation company was established on the 19th of September, 1979, when the Federal
Government promulgated Decree No. 60 which dissolved the already set up Nigerian Steel Development
Authority to establish six companies among which we have the Associated Ores Mining Company
Limited (AOMC) which was renamed as NIOMCO in the year 1987 whose responsibility is to explore,
exploit and process mineral raw materials required for steel making. The capacity of NIOMCO is placed
at 2.15 million tonnes per year of 63 to 64% Fe grade concentrate being supplied to Ajaokuta Steel
Company Limited (ASCL) and 500 000 tonnes at 67/68% Fe grade super concentrate to Delta Steel
Page 30 of 366
Company Limited (DSC) (Min. & Ind., 1987). The Itakpe iron ore deposit has a reserve of about 200
million tonnes with an average iron ore content of 36%. This has to be beneficiated at a rate of 8 million
tonnes per year to produce 64% Fe concentrate as sinter material for the Ajaoukuta blast furnace and
68% Fe concentrate as pellet feed for the direct reduction plant at Aladja, all in Nigeria. At this
production rate (8 million tonnes per year), large quantities of tailings were obtained as waste product
of the beneficiated iron ore (Adepoju and Olaleye, 2001; Alabi O.O., 2006).
The aim of this research is to upgrade the iron ore dumped tailings of National Iron Ore Mining Company
(NIOMCO) Itakpe, Kogi State, Nigeria using froth flotation method and evaluate the effect(s) of time
variation on the recovery of valuable mineral. Furthermore, this will help facilitate the use of the gangue
obtained as back fill towards promotion of land reclamation in mining sites.
1.1 Froth Flotation Method
This technique utilizes the physico-chemical property (hydrophobicity or hydrophilicity) of minerals to
facilitate separation from one another via a fluid medium (Kawatra et al., 2001). This is mostly used to
get rid of silicates from most iron ores. Froth Floatation occurs in two forms; Direct Froth Flotation and
Indirect/Reverse Froth Flotation. In Direct Flotation, silicates are depressed while the iron bearing
minerals are activated and frothed while in Reverse Flotation, silicates are activated and frothed while
the iron bearing minerals are depressed (Alabi O.O., 2006). This selective alteration of physico-chemical
property of constituent minerals is achievable via chemicals/reagents such as;
Frothers – aids formation of air bubbles;
Collectors – aids hydrophobicity and allows mineral particles to attach to air bubbles;
pH modifier – improves the acidity or alkalinity level in the slurry to that required for optimum reagent
performance;
Depressants – helps to inhibit or retard the flotation of a desired mineral; and
Activators – attaches onto the mineral surface thereby providing sites for the adsorption of the collector
species on the mineral surface. (Araujo et al., 2005; Filippov et al., 2010c)
2. Materials and Method
2.1 Material Sourcing
Samples of the iron ore dumped tailings were sourced from different tailing dump sites at National Iron
Ore Mining Company (NIOMCO) Itakpe, Kogi State, Nigeria, homogenized and weighed as 50 kg. 5 kg of
the crude was sampled out via cone and quartering sampling method, homogenized and prepared
towards chemical analysis and particle size analysis.
2.2 Particle Size Analysis
Fractional sieve analysis of 100 g head sample was carried out using sieves of size range of 500 μm to -
63 μm of √ series to evaluate the liberation size of the valuable mineral (Wills, 2006). The sample was
charged into the upper sieve and the sieve sets were agitated for 30 minutes using an Automated

Page 31 of 366
Endecott test sieve shaker model EFL2mk11 (5471). The undersize particles falls through successive
sieves until they were retained on a sieve having apertures which are slightly smaller than the diameter
of the particles (Wills, 2006). The set of sieves were separated and the weight retained of each sieves
was recorded. The data obtained were used to compute the sieve analysis table (Table 2.0) and log-log
graph of % cumulative passing and retained against sieve sizes. Chemical analysis of each sieve size
fractions was also carried out and result obtained revealed a liberation size of -250+180 μm.
2.3 Sample Preparation
2 kg crude sample was sampled out via cone and quartering sampling technique, crushed using Denver
Laboratory Jaw Crusher, Model BDA 15561 and pulverized using Bico Ball Milling Machine, Model 69012
(USA) to 100 % passing the liberation size; -250+180 m. The pulverized sample was homogenized and
prepared towards froth floatation.
2.4 Froth Flotation
The laboratory scale experiment was conducted using Denver D-12 Flotation Cell. At a mixture ratio of
1:4, 250 g each of the pulverized crude sample alongside 1000 mls of water was charged into the
flotation tank and kept in suspension by the impeller, rotating at a speed of 1200 rpm to form a slurry
under which the following was taken into consideration; pH – 5.0, 0.5g Collector - Potassium Amyl
Xanthate (PAX), 0.5g Activator - CuSO4, 0.5g Depressant - Corn Starch, 0.5g Frother - Senfroth while the
agitation time followed this order 60, 120, 180, 240 and 300 seconds for each 250 g sample. Cleaning
took 5 minutes and re-cleaning took 2 minutes (Chunks, 1998). The froth and depressed samples were
dried in a Carbolite - muffle laboratory oven at 105 0C for 2 hours after which the samples were weighed
and analyzed using ED-XRF spectrometer. The results obtained are as shown in Table 3 – 4. The
percentage recovery of Fe2O3 using froth floatation was evaluated using the standard equation as shown
in equation 1.0 (Wills, 2006).
% Recovery =
× 100………………………………….. 1.0
C = Mass of Concentrate
c = Assay of valuable mineral in the concentrate
F = Mass of Feed
f = Assay of valuable mineral in the feed
3. Results and Discussion
3.1 Results
Table 1-4, shows the result obtained at the cause of this research work.
Page 32 of 366
Table 1: Chemical Composition of Crude Itakpe Iron Ore Dumped Tailings and Processed Samples
Sample /
Assay (%) SiO2 K2O CaO V205 MnO Fe2O3 CuO ZnO
Crude 70.1 0.967 0.559 0.008 0.068 27.71 0.034 0.006
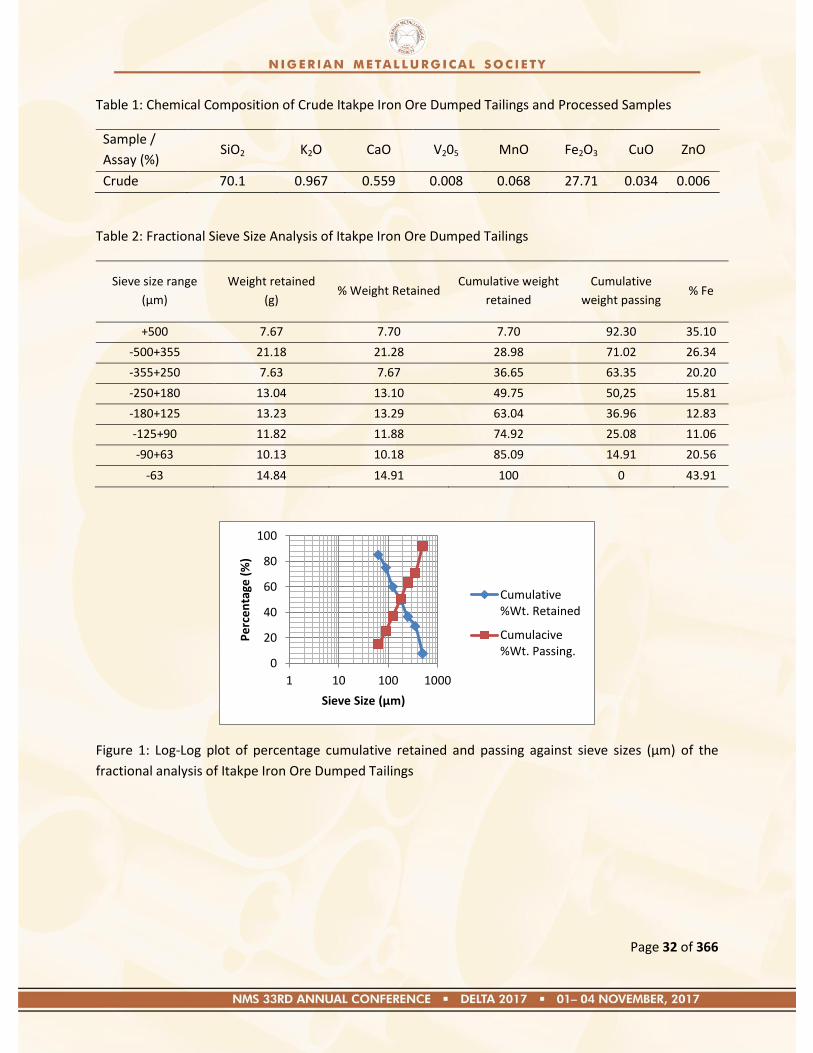
Table 2: Fractional Sieve Size Analysis of Itakpe Iron Ore Dumped Tailings
Sieve size range
(μm)
Weight retained
(g) % Weight Retained
Cumulative weight
retained
Cumulative
weight passing % Fe
+500 7.67 7.70 7.70 92.30 35.10
-500+355 21.18 21.28 28.98 71.02 26.34
-355+250 7.63 7.67 36.65 63.35 20.20
-250+180 13.04 13.10 49.75 50,25 15.81
-180+125 13.23 13.29 63.04 36.96 12.83
-125+90 11.82 11.88 74.92 25.08 11.06
-90+63 10.13 10.18 85.09 14.91 20.56
-63 14.84 14.91 100 0 43.91
Figure 1: Log-Log plot of percentage cumulative retained and passing against sieve sizes (μm) of the
fractional analysis of Itakpe Iron Ore Dumped Tailings
0
20
40
60
80
100
1 10 100 1000
Pe
rce
nta
ge (
%)
Sieve Size (µm)
Cumulative%Wt. Retained
Cumulacive%Wt. Passing.
Page 33 of 366
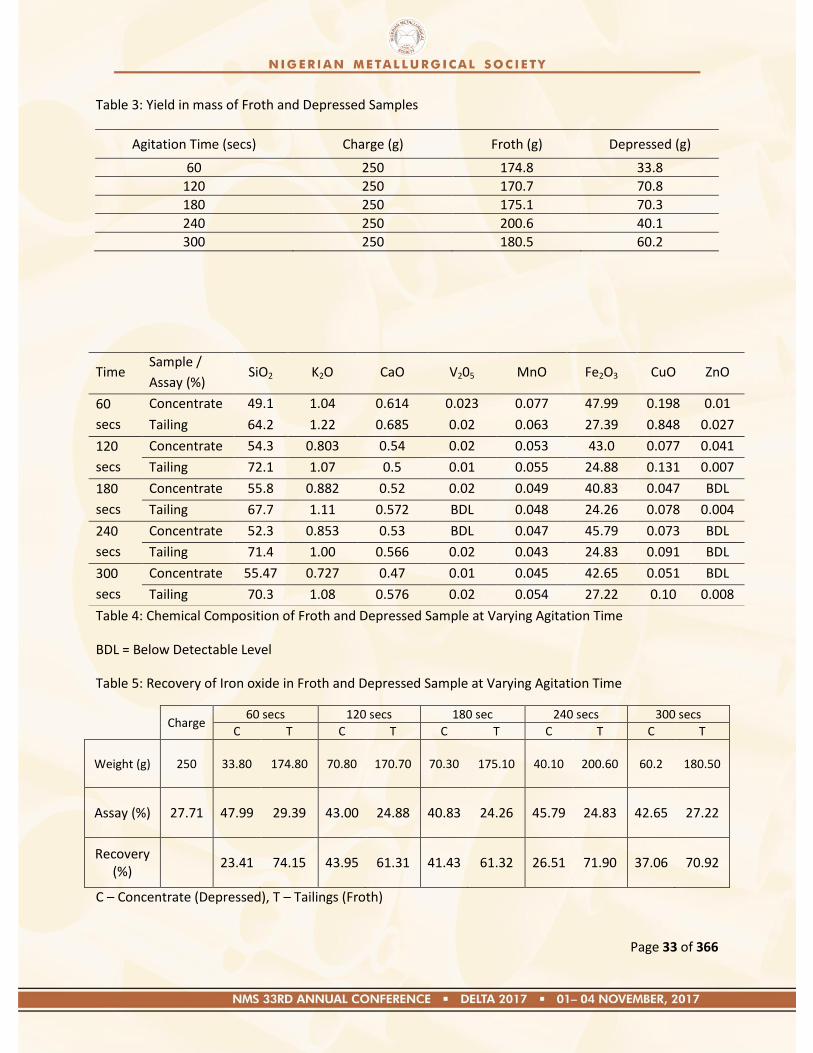
Table 3: Yield in mass of Froth and Depressed Samples
Agitation Time (secs) Charge (g) Froth (g) Depressed (g)
60 250 174.8 33.8
120 250 170.7 70.8
180 250 175.1 70.3
240 250 200.6 40.1
300 250 180.5 60.2
Table 4: Chemical Composition of Froth and Depressed Sample at Varying Agitation Time
BDL = Below Detectable Level
Table 5: Recovery of Iron oxide in Froth and Depressed Sample at Varying Agitation Time
Charge 60 secs 120 secs 180 sec 240 secs 300 secs
C T C T C T C T C T
Weight (g) 250 33.80 174.80 70.80 170.70 70.30 175.10 40.10 200.60 60.2 180.50
Assay (%) 27.71 47.99 29.39 43.00 24.88 40.83 24.26 45.79 24.83 42.65 27.22
Recovery (%)
23.41 74.15 43.95 61.31 41.43 61.32 26.51 71.90 37.06 70.92
C – Concentrate (Depressed), T – Tailings (Froth)
Time Sample /
Assay (%) SiO2 K2O CaO V205 MnO Fe2O3 CuO ZnO
60
secs
Concentrate 49.1 1.04 0.614 0.023 0.077 47.99 0.198 0.01
Tailing 64.2 1.22 0.685 0.02 0.063 27.39 0.848 0.027
120
secs
Concentrate 54.3 0.803 0.54 0.02 0.053 43.0 0.077 0.041
Tailing 72.1 1.07 0.5 0.01 0.055 24.88 0.131 0.007
180
secs
Concentrate 55.8 0.882 0.52 0.02 0.049 40.83 0.047 BDL
Tailing 67.7 1.11 0.572 BDL 0.048 24.26 0.078 0.004
240
secs
Concentrate 52.3 0.853 0.53 BDL 0.047 45.79 0.073 BDL
Tailing 71.4 1.00 0.566 0.02 0.043 24.83 0.091 BDL
300
secs
Concentrate 55.47 0.727 0.47 0.01 0.045 42.65 0.051 BDL
Tailing 70.3 1.08 0.576 0.02 0.054 27.22 0.10 0.008
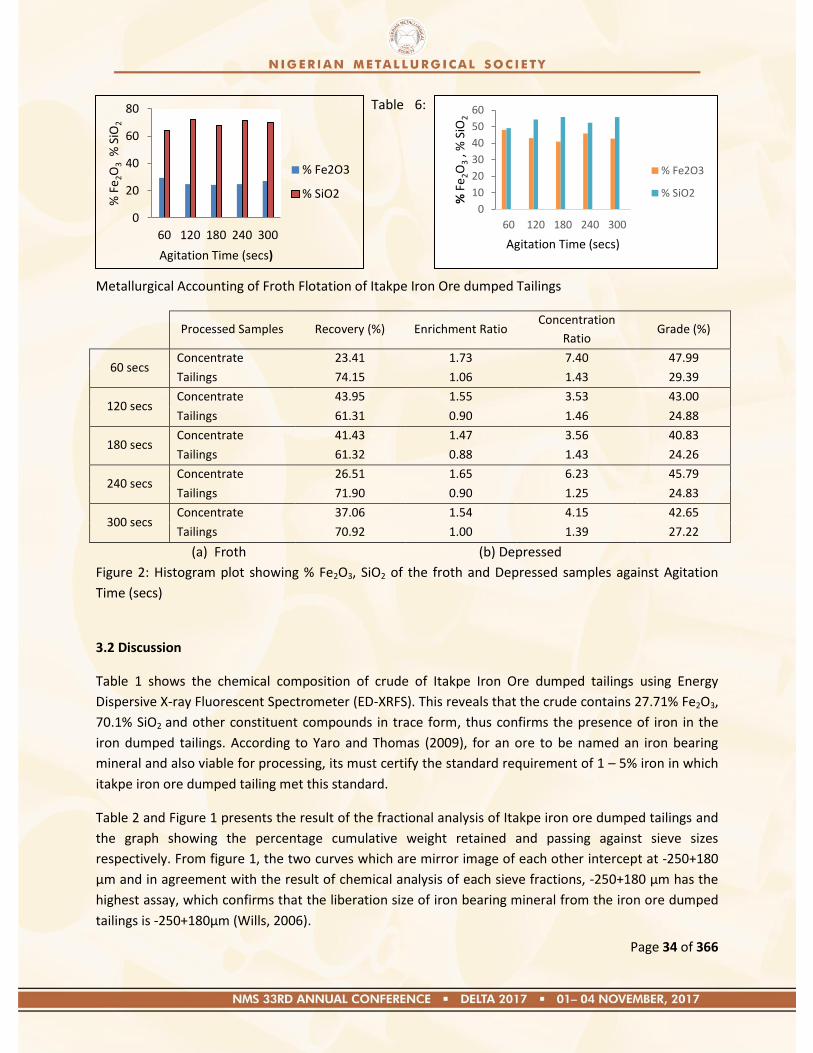
Page 34 of 366
0
20
40
60
80
60 120 180 240 300
% F
e2O
3 %
SiO
2
Agitation Time (secs)
% Fe2O3
% SiO20
10
20
30
40
50
60
60 120 180 240 300
% F
e2O
3 ,
% S
iO2
Agitation Time (secs)
% Fe2O3
% SiO2
Table 6:
Metallurgical Accounting of Froth Flotation of Itakpe Iron Ore dumped Tailings
Processed Samples Recovery (%) Enrichment Ratio Concentration
Ratio Grade (%)
60 secs Concentrate 23.41 1.73 7.40 47.99
Tailings 74.15 1.06 1.43 29.39
120 secs Concentrate 43.95 1.55 3.53 43.00
Tailings 61.31 0.90 1.46 24.88
180 secs Concentrate 41.43 1.47 3.56 40.83
Tailings 61.32 0.88 1.43 24.26
240 secs Concentrate 26.51 1.65 6.23 45.79
Tailings 71.90 0.90 1.25 24.83
300 secs Concentrate 37.06 1.54 4.15 42.65
Tailings 70.92 1.00 1.39 27.22
(a) Froth (b) Depressed
Figure 2: Histogram plot showing % Fe2O3, SiO2 of the froth and Depressed samples against Agitation
Time (secs)
3.2 Discussion
Table 1 shows the chemical composition of crude of Itakpe Iron Ore dumped tailings using Energy
Dispersive X-ray Fluorescent Spectrometer (ED-XRFS). This reveals that the crude contains 27.71% Fe2O3,
70.1% SiO2 and other constituent compounds in trace form, thus confirms the presence of iron in the
iron dumped tailings. According to Yaro and Thomas (2009), for an ore to be named an iron bearing
mineral and also viable for processing, its must certify the standard requirement of 1 – 5% iron in which
itakpe iron ore dumped tailing met this standard.
Table 2 and Figure 1 presents the result of the fractional analysis of Itakpe iron ore dumped tailings and
the graph showing the percentage cumulative weight retained and passing against sieve sizes
respectively. From figure 1, the two curves which are mirror image of each other intercept at -250+180
μm and in agreement with the result of chemical analysis of each sieve fractions, -250+180 μm has the
highest assay, which confirms that the liberation size of iron bearing mineral from the iron ore dumped
tailings is -250+180μm (Wills, 2006).
Page 35 of 366
Table 3, Table 4 and Table 5 present the yield in mass, assay and % recovery of froth and depressed
samples at varying agitation time respectively. From the results, it was observed that the highest yield in
mass of depressed (concentrate) given as 70.8 g assaying 43.0% Fe2O3 was at an agitation time of 120
secs with recovery of 43.95 %. Thus, more of the iron oxide was recovered from the crude into the
depressed at an agitation time of 120 secs while keeping all other parameters constant. Furthermore, it
was also observed that at any agitation time the yield in mass of froth realized was more than that of
depressed at any agitation time. Figure 2.0 shows variation of % Fe2O3 and SiO2 of the froth and
depressed samples at different agitation time. This further showed that the optimum % Fe2O3 was
recovered in the depressed at an agitation time of 120 secs while the highest % SiO2 was recovered in
the froth at an agitation time of 180 secs.
Table 6; presents the metallurgical accounting of froth flotation of Itakpe iron ore dumped tailings which
reveals the metallurgical performance of the separation method at varied agitation time. It was
observed that the concentration ratio and grade of concentrate are inversely related to the % recovery
for all agitation time. However, on account of enrichment and concentration ratio being parameters
used to assess the separation efficiency of a separation method (Wills, 2006), it can be deduced that
maximum separation efficiency was achieved at an agitation time of 60 secs having enrichment and
concentration ratio of 1.73 and 7.40 respectively. The concentrate obtained assayed 47.99% Fe2O3 at a
recovery of 23.41%. Furthermore, optimum separation efficiency taking into consideration the optimum
assay and recovery of concentrate was achieved at an agitation time of 120 secs having an enrichment
and concentration ratio of 1.55 and 3.53 respectively.
Conclusion
The Itakpe Iron Ore Dumped Tailings which assayed 27.71 % Fe2O3 has been successfully upgraded to
43.0 % Fe2O3 via reverse froth flotation method at an agitation time of 120 seconds while keeping other
parameters constant leaving out a silica rich tailing of 72.1% SiO2. On account of this, a keen interest
should be directed towards exploitation of Itakpe Iron Ore dumped tailings via reverse froth flotation
technique so as to judiciously re-separate the valuable mineral from the tailings and also re-extract iron
from the concentrate product. Furthermore, the silica rich tailings gotten after beneficiation can be used
as backfill for mining sites, thus consequently promoting land reclamation.
References
Adepoju, S. O. and Olaleye, B. M., (2001). Gravity concentration of silica sand from Itakpe iron
Ore tailings by tabling operation. Nigerian Journal of Engineering Management. Vol. 2, No. 2, 51-
55.
Alabi,O.O (2016), Beneficiation of Ajabanoko Iron Ore Deposit, Kogi State, Nigeria using Magnetic
Methods. International Journal of Civil, Mechanical and Science, Vol 2, Issue 2, 91-93
Araujo, A.C., Viana, P.R.M., Peres, A.E.C., (2005). Reagents in iron ores flotation. Miner.
Page 36 of 366
Eng.18, 219–224.
Chunk K. Obasi (1998), Mineralogical Characteristics and genetic significance of Hematite in
the Itakpe Iron Ore deposit, Okene, Nigeria. Journal of Mining and Geology, 342,149-154
Filippov, L.O., Filippova, I.V., Severov, V.V., (2010c). Reverse cationic flotation of iron ores —
floatability of amphiboles at depression of iron oxides by starch. Proceedings of the
XXV International Mineral Processing Congress 2010, IMPC 2010, 3, pp. 1869–1878.
Kawatra, S. K., and Eisele, T. C. (2001), Coal Desulfurization: High-Efficiency Preparation
Methods, Taylor and Francis, New York, 360 pages Min and Ind in Nigeria (1981)
NIOMC Project Report (1980) Vol. 2, 1 - 10
Weiss N. L. (1995). Mineral Processing handbook by Society of Mining Engineers of The American
Institute of Mining, Metallurgical and Petroleum Engineers, 62-76
Wills B.A, (2006) Mineral Processing Technology, 6th Edn. Pergamon Press, Oxford. 144-246
Yaro S.A. and Thomas, D.G., (2009). Chemical and Mineralogical Characteristics of Kotonkarfe
Iron ore Journal of Engineering and Technology (Jet) Bayero University, Kano.4 (1), 65-71
Page 37 of 366
Paper: NMS 2017-TP005
Susceptibility of Akure South Mineral to Magnetic and Gravity Separation: A Research
Geared towards Sustainability via Exploration and Exploitation of Solid Minerals
Olatunji, T. A., Alabi, O. O., Gbadamosi, Y. E., and Ola-omole O. O.
Metallurgical and Materials Engineering Department,
School of Engineering and Engineering Technology,
Federal University of Technology, P.M.B. 704, Akure Ondo State, Nigeria
Correspondence Authors: [email protected], [email protected]
Abstract
Akure South Mineral in its crude was characterized using Energy Dispersive X-ray Fluorescent
Spectrometer (ED-XRFS) and assayed 17.55% Fe2O3, 63.7% SiO2 and other trace compounds. The
susceptibility of this mineral to magnetic and gravity separation was also investigated. The samples were
sourced from three different deposit regions in Akure South Local Government Area of Ondo State,
Nigeria. The samples collected homogenized after which fractional sieve analysis of the crude mineral
using sieve range of 500 m to -63 m was carried out to determine size distribution and liberation size. 2
kg of the crude was sampled out and pulverized to 100% passing -180+125 m which is the determined
liberation size. The pulverized sample was homogenized and prepared towards susceptibility test. 100 g
of the pulverized sample was subjected to sink and float method of gravity separation using bromoform as
the separating medium and the resulting products (sink and float) were chemically analyzed using ED-
XRFS. Concentration criterion using bromoform was evaluated as 1.74. 200 g sample was also subjected
to magnetic separation using hand induced magnet. The results obtained revealed that Akure South
mineral is susceptible to magnetic separation and fairly to gravity separation. Chemical analysis of the
processed samples further revealed that the crude (17.55% Fe2O3) was successfully upgraded via
magnetic separation to 33.01% Fe2O3 at a recovery of 22.78 % and via gravity separation to 18.54%
Fe2O3 at a recovery of 54.0%.
Keywords: Susceptibility, Mineral, Magnetic, Gravity, Bromoform
1.0 Introduction
The predominance of vast varieties of solid minerals distributed in all geopolitical zones of Nigeria is
without doubt so evident, some of which includes; quartz, tantalite, columbite, haematite, wolframite,
sphalerites, galena, feldspar, ilmenite, and so on (Nelukhare, 2002). On the premise of the existence of
these minerals, it is expected that Nigeria as a nation should be able to harness these resources towards
improving her Gross Domestic Product (GDP). Raphel (1982) observed that deposits of minerals play
significant role in the productive capacity of a country and also noted that the availability of mineral can
influence the nature of industrialization and consequently the nation‘s economy. Sachs (1997) also
observed that the measure of a country‘s economy is not based on the number of resources present but a
measure of how judiciously these resources are harnessed towards economic sustainability and
improvement of her Gross Domestic Product (GDP).
However, this seems not to be the case since most government revenues are generated solely from
proceeds of crude oil and unfortunately the solid minerals sector which is expected to contribute at most
10% to the GDP by 2020 currently averages only 0.46% (Cyril, 2015). Thus, the need to diversify the
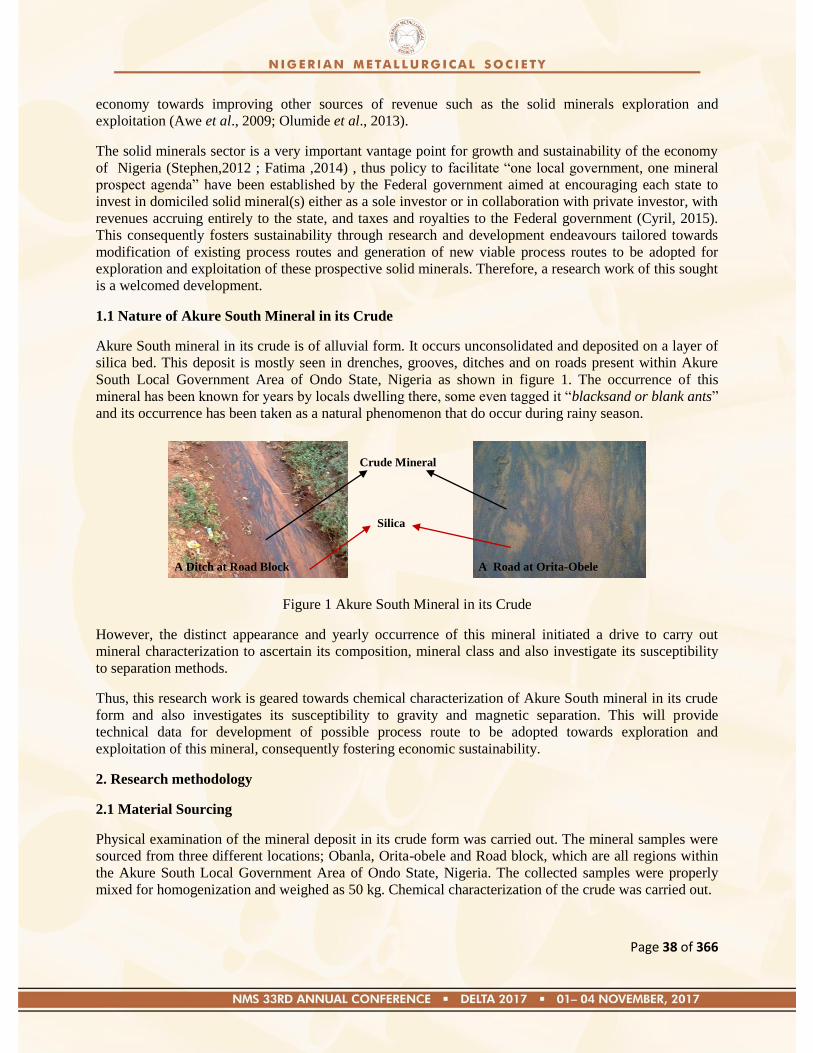
Page 38 of 366
economy towards improving other sources of revenue such as the solid minerals exploration and
exploitation (Awe et al., 2009; Olumide et al., 2013).
The solid minerals sector is a very important vantage point for growth and sustainability of the economy
of Nigeria (Stephen,2012 ; Fatima ,2014) , thus policy to facilitate ―one local government, one mineral
prospect agenda‖ have been established by the Federal government aimed at encouraging each state to
invest in domiciled solid mineral(s) either as a sole investor or in collaboration with private investor, with
revenues accruing entirely to the state, and taxes and royalties to the Federal government (Cyril, 2015).
This consequently fosters sustainability through research and development endeavours tailored towards
modification of existing process routes and generation of new viable process routes to be adopted for
exploration and exploitation of these prospective solid minerals. Therefore, a research work of this sought
is a welcomed development.
1.1 Nature of Akure South Mineral in its Crude
Akure South mineral in its crude is of alluvial form. It occurs unconsolidated and deposited on a layer of
silica bed. This deposit is mostly seen in drenches, grooves, ditches and on roads present within Akure
South Local Government Area of Ondo State, Nigeria as shown in figure 1. The occurrence of this
mineral has been known for years by locals dwelling there, some even tagged it ―blacksand or blank ants‖
and its occurrence has been taken as a natural phenomenon that do occur during rainy season.
Figure 1 Akure South Mineral in its Crude
However, the distinct appearance and yearly occurrence of this mineral initiated a drive to carry out
mineral characterization to ascertain its composition, mineral class and also investigate its susceptibility
to separation methods.
Thus, this research work is geared towards chemical characterization of Akure South mineral in its crude
form and also investigates its susceptibility to gravity and magnetic separation. This will provide
technical data for development of possible process route to be adopted towards exploration and
exploitation of this mineral, consequently fostering economic sustainability.
2. Research methodology
2.1 Material Sourcing
Physical examination of the mineral deposit in its crude form was carried out. The mineral samples were
sourced from three different locations; Obanla, Orita-obele and Road block, which are all regions within
the Akure South Local Government Area of Ondo State, Nigeria. The collected samples were properly
mixed for homogenization and weighed as 50 kg. Chemical characterization of the crude was carried out.
Crude Mineral
Silica
A Ditch at Road Block A Road at Orita-Obele

Page 39 of 366
2.2 Particle Size Analysis
Fractional Sieve Analysis technique was adopted to ascertain the size distribution and also the liberation
size of the mineral. 100 g of the crude was charged into the upper sieve of sieve sets ranging from 500 –
63 m utilizing the √ series (Wills, 2006). The sieve sets were agitated for 30 minutes using an
Automated Endecott test sieve shaker model EFL2mk11 (5471) such that the undersize falls through
successive sieves until they are retained on a sieve having an aperture lesser than the particle diameter
(Wills, 2006). After agitation, the sieves were separated and the weight retained on each sieves were
recorded and tabulated as shown in Table 3.2.
2.3 Sample Preparation
From the fractional sieve size analysis of the crude a liberation size of -180+125m was chosen taking
into consideration the influence of particle size and density on separation efficiency (Wills, 2016). 2 kg of
the crude mineral was sampled out via cone and quartering method and pulverized using Bico Ball
Milling Machine, Model 69012 (USA) to 100 % passing -180+125 m. The pulverized sample was
homogenized and prepared towards the research work. The sampled mineral was divided into two
portions, one portion to be subjected to sink and float method of gravity separation using bromoform (S.G
= 2.64) as the separating medium while the other portion was subjected to magnetic separation using a
hand induced magnet (Alabi, 2015).
2.4 Gravity Susceptibility Test
50 ml of bromoform solution was measured into a 100 ml Pyrex measuring cylinder, followed by a
charge of 100 g of the mineral sample. This was agitated using a spatula for one minute after which the
mixture was allowed to settle into three strata; the sink, separating medium and the float. The float and the
sink were discharged separately, rinsed properly with distilled water, oven dried and subjected to density,
specific gravity testing and chemical analysis. Equation 1.0 was applied to evaluate the concentration
criterion for bromoform solution. The estimated value must satisfy the condition CC ≥ 2.5 for an ore to be
susceptible to gravity method of mineral separation (Wills, 2006). Results of this test are presented in
Tables 3.1 – 3.2.
Concentration Criterion (CC) =
……………………….. (1.0)
Dh – specific gravity of heavy minerals
Dl – specific gravity of light minerals
Df – specific gravity of separating medium
(Wills, 2006)
2.5 Magnetic Susceptibility Test
200 g of the mineral sample was flatly spread on a pyrite sample dish. Hand induced magnet of
dimensions 100 mm × 50 mm and 10 mm thickness was passed manually over the spread mineral at 10
mm height (Alabi, 2016). The resulting effect is such that minerals which are magnetic in nature gets
attracted leaving behind the non-magnetic minerals of the mineral sample.

Page 40 of 366
2.6 Specific Gravity and Density Determination
The specific gravity and density of the crude and processed samples were determined.
Specific Gravity Determination
Specific gravity is determined on the premise of the amount of fluid displaced by a solid when suspended
in a fluid medium (Alabi, O.O. et al., 2017). 4 ml of water was measured into a 10 ml Pyrex measuring
cylinder and recorded as the initial water volume, followed by a charge of 10 g of the crude mineral
sample. A rise in the level of water was observed and recorded as the final water volume. The specific
gravity is evaluated using the standard equation as shown in equation 1.1.
Specific Gravity (S.G.) =
– ……………………………………………. (1.1)
M – Mass of sample in grams
V1 – Initial volume of fluid in ml
V2 – Final volume of fluid in ml
S.Gf – Specific Gravity of fluid
(Alabi, O.O. et al., 2017)
The above procedure was repeated for the processed samples (sink, float, magnetic and nonmagnetic
sample). The results of this test are presented in Table 3.4.
Density Determination
Density was evaluated using a 150 ml capacity density bottle called Densimeter. The densimeter was
weighed and recorded, after which it was filled with water and its mass when filled with water was also
recorded. The densimeter was emptied and dried properly.
10 g of the crude sample was weighed and charged into the densimeter. The mass of the densimeter and
the sample was measured and recorded, after which it was filled with water, corked and agitated for 30
seconds. The mass of the mixture (water and sample) and the densimeter was measured and recorded. The
data collected were used to calculate the density of the crude sample using the standard expression as
shown in equation 1.2.
ρ =
( ) ( ) ………………………………………………….. (1.2)
Df – Density of fluid used
M1 – Mass of bottle + stopper in grams
M2 – Mass of bottle + stopper + dry sample in grams
M3 – Mass of bottle + stopper + dry sample + water in grams
M4 – Mass of bottle + stopper + water in grams
ρ- Density of solid in grams per cubic meter
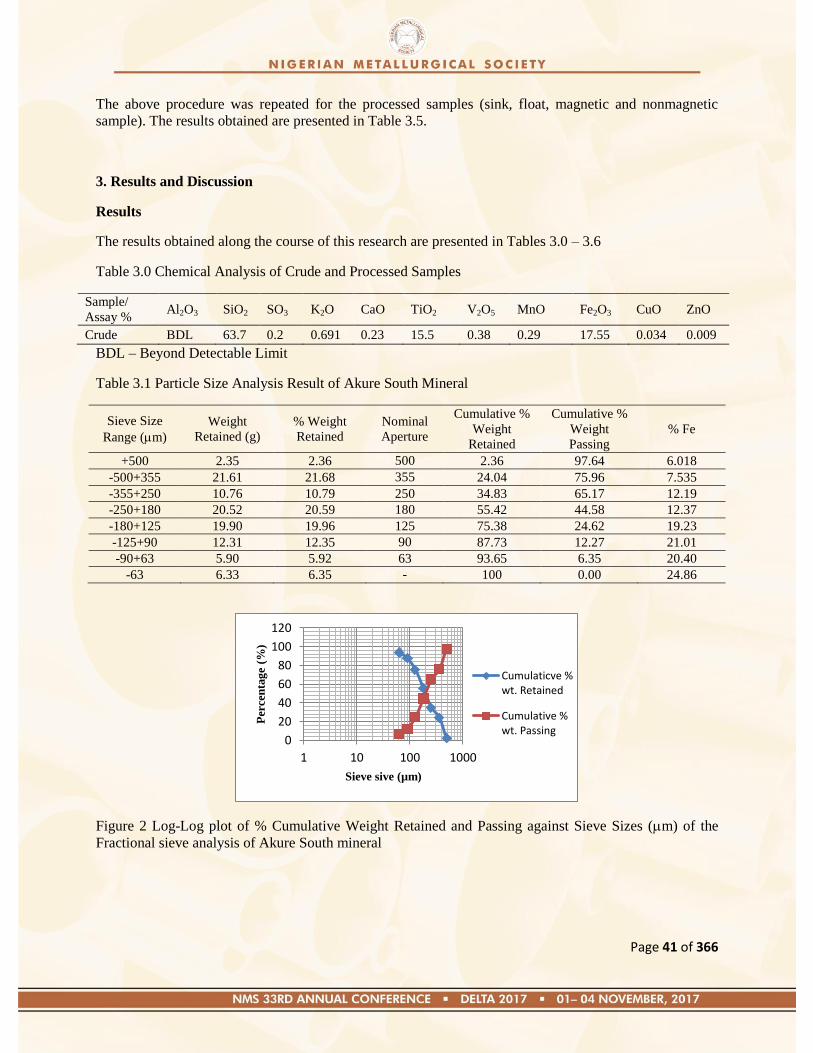
Page 41 of 366
The above procedure was repeated for the processed samples (sink, float, magnetic and nonmagnetic
sample). The results obtained are presented in Table 3.5.
3. Results and Discussion
Results
The results obtained along the course of this research are presented in Tables 3.0 – 3.6
Table 3.0 Chemical Analysis of Crude and Processed Samples
Sample/
Assay % Al2O3 SiO2 SO3 K2O CaO TiO2 V2O5 MnO Fe2O3 CuO ZnO
Crude BDL 63.7 0.2 0.691 0.23 15.5 0.38 0.29 17.55 0.034 0.009
BDL – Beyond Detectable Limit
Table 3.1 Particle Size Analysis Result of Akure South Mineral
Sieve Size
Range (m)
Weight
Retained (g)
% Weight
Retained
Nominal
Aperture
Cumulative %
Weight
Retained
Cumulative %
Weight
Passing
% Fe
+500 2.35 2.36 500 2.36 97.64 6.018
-500+355 21.61 21.68 355 24.04 75.96 7.535
-355+250 10.76 10.79 250 34.83 65.17 12.19
-250+180 20.52 20.59 180 55.42 44.58 12.37
-180+125 19.90 19.96 125 75.38 24.62 19.23
-125+90 12.31 12.35 90 87.73 12.27 21.01
-90+63 5.90 5.92 63 93.65 6.35 20.40
-63 6.33 6.35 - 100 0.00 24.86
Figure 2 Log-Log plot of % Cumulative Weight Retained and Passing against Sieve Sizes (m) of the
Fractional sieve analysis of Akure South mineral
0
20
40
60
80
100
120
1 10 100 1000
Per
cen
tag
e (%
)
Sieve sive (µm)
Cumulaticve %wt. Retained
Cumulative %wt. Passing
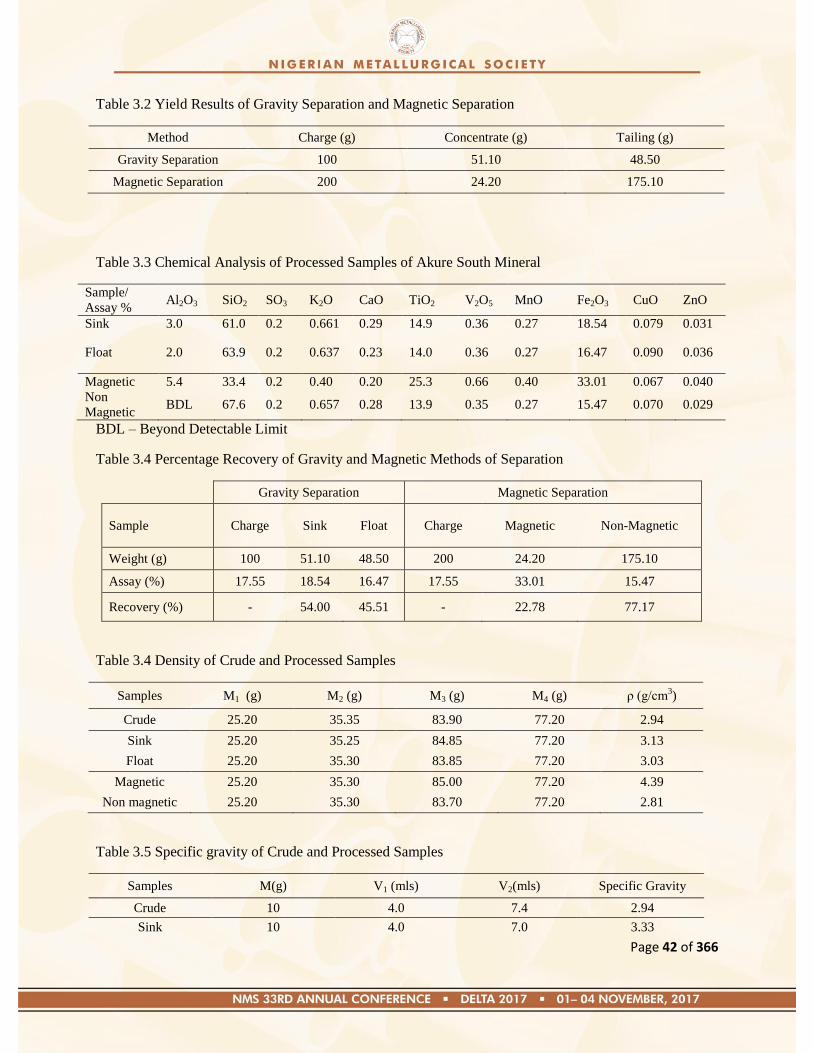
Page 42 of 366
Table 3.2 Yield Results of Gravity Separation and Magnetic Separation
Method Charge (g) Concentrate (g) Tailing (g)
Gravity Separation 100 51.10 48.50
Magnetic Separation 200 24.20 175.10
Table 3.3 Chemical Analysis of Processed Samples of Akure South Mineral
Sample/
Assay % Al2O3 SiO2 SO3 K2O CaO TiO2 V2O5 MnO Fe2O3 CuO ZnO
Sink 3.0 61.0 0.2 0.661 0.29 14.9 0.36 0.27 18.54 0.079 0.031
Float 2.0 63.9 0.2 0.637 0.23 14.0 0.36 0.27 16.47 0.090 0.036
Magnetic 5.4 33.4 0.2 0.40 0.20 25.3 0.66 0.40 33.01 0.067 0.040
Non
Magnetic BDL 67.6 0.2 0.657 0.28 13.9 0.35 0.27 15.47 0.070 0.029
BDL – Beyond Detectable Limit
Table 3.4 Percentage Recovery of Gravity and Magnetic Methods of Separation
Gravity Separation Magnetic Separation
Sample Charge Sink Float Charge Magnetic Non-Magnetic
Weight (g) 100 51.10 48.50 200 24.20 175.10
Assay (%) 17.55 18.54 16.47 17.55 33.01 15.47
Recovery (%) - 54.00 45.51 - 22.78 77.17
Table 3.4 Density of Crude and Processed Samples
Samples M1 (g) M2 (g) M3 (g) M4 (g) ρ (g/cm3)
Crude 25.20 35.35 83.90 77.20 2.94
Sink 25.20 35.25 84.85 77.20 3.13
Float 25.20 35.30 83.85 77.20 3.03
Magnetic 25.20 35.30 85.00 77.20 4.39
Non magnetic 25.20 35.30 83.70 77.20 2.81
Table 3.5 Specific gravity of Crude and Processed Samples
Samples M(g) V1 (mls) V2(mls) Specific Gravity
Crude 10 4.0 7.4 2.94
Sink 10 4.0 7.0 3.33
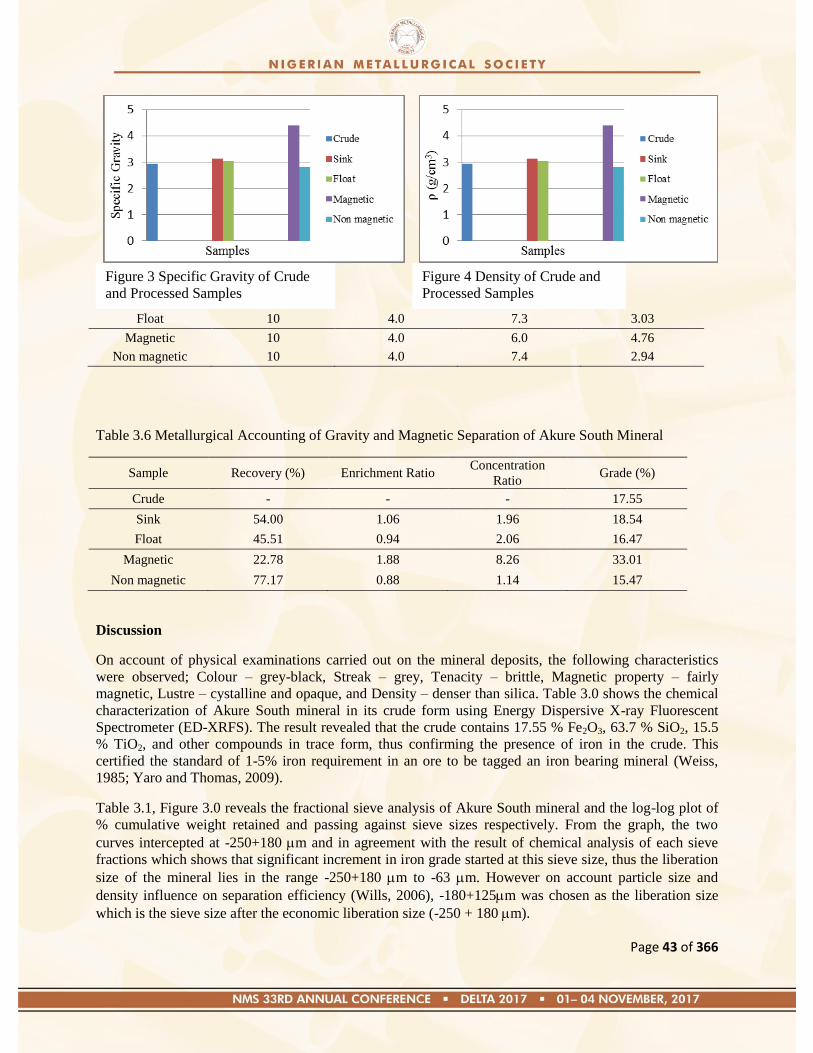
Page 43 of 366
Float 10 4.0 7.3 3.03
Magnetic 10 4.0 6.0 4.76
Non magnetic 10 4.0 7.4 2.94
Table 3.6 Metallurgical Accounting of Gravity and Magnetic Separation of Akure South Mineral
Sample Recovery (%) Enrichment Ratio Concentration
Ratio Grade (%)
Crude - - - 17.55
Sink 54.00 1.06 1.96 18.54
Float 45.51 0.94 2.06 16.47
Magnetic 22.78 1.88 8.26 33.01
Non magnetic 77.17 0.88 1.14 15.47
Discussion
On account of physical examinations carried out on the mineral deposits, the following characteristics
were observed; Colour – grey-black, Streak – grey, Tenacity – brittle, Magnetic property – fairly
magnetic, Lustre – cystalline and opaque, and Density – denser than silica. Table 3.0 shows the chemical
characterization of Akure South mineral in its crude form using Energy Dispersive X-ray Fluorescent
Spectrometer (ED-XRFS). The result revealed that the crude contains 17.55 % Fe2O3, 63.7 % SiO2, 15.5
% TiO2, and other compounds in trace form, thus confirming the presence of iron in the crude. This
certified the standard of 1-5% iron requirement in an ore to be tagged an iron bearing mineral (Weiss,
1985; Yaro and Thomas, 2009).
Table 3.1, Figure 3.0 reveals the fractional sieve analysis of Akure South mineral and the log-log plot of
% cumulative weight retained and passing against sieve sizes respectively. From the graph, the two
curves intercepted at -250+180 m and in agreement with the result of chemical analysis of each sieve
fractions which shows that significant increment in iron grade started at this sieve size, thus the liberation
size of the mineral lies in the range -250+180 m to -63 m. However on account particle size and
density influence on separation efficiency (Wills, 2006), -180+125m was chosen as the liberation size
which is the sieve size after the economic liberation size (-250 + 180 m).
Figure 3 Specific Gravity of Crude
and Processed Samples
Figure 4 Density of Crude and
Processed Samples

Page 44 of 366
Table 3.2, 3.3 and 3.4 shows the yield in terms of mass, assay and percentage recovery respectively of the
processed samples obtained from the susceptibility of Akure south mineral to gravity and magnetic
method of mineral separation. The sink and float method of gravity separation gave mass of sink
(concentrate) and float (tailings) to be 51.10 g and 48. 50 g assaying 18.54% Fe2O3 and 16.47 % Fe2O3
with recovery of 54.0% and 45.51% respectively, while the hand induced magnet method of magnetic
separation gave concentrate of 24.20 g and tailing of 175.10 g assaying 33.01% Fe2O3 and 15.47% Fe2O3
with recovery of 22.78% and 77.17% respectively. From this result, it can be deduced that the quantity by
mass of concentrate and % recovery of both separation methods are inversely related to assay of the
concentrate (Weiss, 1995). However, magnetic separation gave the highest assay of 30.01% Fe2O3 at low
yield of 24.20 g and % recovery of 22.78% compared to that of gravity separation. In other words, the
concentrate obtained via magnetic has higher grade than that obtained via gravity separation (Wills,
2006). Thus, for selection of process route, if high % recovery at low grade is of priority, gravity
separation method can be adopted while if high grade at low recovery and yield is of priority, magnetic
separation can be opted for to beneficiate this mineral deposit.
Table 3.5 – 3.6 shows the evaluated density (g/cm3) and specific gravity of the crude and processed
samples. The variation in density and specific gravity values is vividly represented in figure 3 and 4. The
density and specific gravity of the crude are 2.94 g/cm3 and 2.94 respectively. The variation in the density
and specific gravity of the sink and float given as; 3.13 g/cm3 ; 3.33, and 3.03g/cm
3 ; 3.03 respectively,
depicts that separation has occurred, though only slight variation exist. This is due to the presence of
valuable and non-valuable mineral in the float and sinks respectively. The evaluated concentration
criterion using bromoform as separating medium is 1.74; which does not satisfies the condition CC ≥
±2.5. This further certified that separation efficiency via gravity method of mineral separation is low due
to decreasing quotient (Wills, 2006). The variation in the density and specific gravity of the magnetic and
nonmagnetic mineral given as; 4.39 g/cm3; 4.94, 2.81 g/cm
3; 2.91 respectively, depicts that separation has
occurred extensively. This is due to the weak magnetic property of the valuable mineral which makes its
susceptible to attraction when exposed to magnetic field from a hand induced magnet. Thus, more of the
valuable mineral report in the magnetic sample while the gangue which is nonmagnetic in nature is left
behind in the sample (Alabi, 2016).
Table 3.7 shows the metallurgical accounting of gravity and magnetic separation of Akure South mineral.
The result revealed that the % recovery, grade, enrichment ratio and concentration ratio of the
concentrates obtained (Sink and Magnetic) differs extensively. The concentrate obtained via gravity
separation method assaying 18.54% Fe2O3 at a recovery of 54.0% has enrichment and concentration ratio
of 1.06 and 1.96 respectively, while the concentrate obtained via magnetic separation method assaying
33.01% Fe2O3 at a recovery of 22.78% has enrichment and concentration ratio of 1.88 and 8.26. Thus, it
can be deduced that the concentration ratio and grade of concentrate for both separation methods have an
inverse relationship with % recovery. However, on account of the enrichment and concentration ratio
being parameters used to assess the separation efficiency of a separation method (Wills, 2006), it can be
deduced that magnetic method of separation is more efficient than gravity method of separation of Akure
South mineral.
4.0 Conclusion
In conclusion, the crude Akure South mineral is an iron bearing mineral assaying 17.55% Fe2O3 and has
been upgraded to 33.01% Fe2O3 and 18.54% Fe2O3 via hand induced magnet method of magnetic
separation and the sink and float method of gravity separation respectively, thus certifying that Akure
South mineral is susceptible to magnetic separation at low recovery but fairly to gravity separation at high
recovery. On premise of these findings, a keen interest should be developed towards investigating the
geological nature and deposit of this mineral. Furthermore, subsequent research on developing a

Page 45 of 366
technically feasible process route to beneficiate this mineral deposit should be carried out utilizing the
technical data gathered along the course of this research, consequently fostering economic sustainability.
References
Alabi O.O., Yaro S.A., Thomas D.G. and Asuke F. (2015). Susceptibility of Gyel Columbite Mineral to
Magnetic and Gravity Separation Methods. Nigerian Journal of Engineering, Vol. 22, No. 1, pp. 42 – 48.
Alabi, O.O. (2016). Beneficiation of Ajabanoko Iron Ore Deposit Kogi State, Nigeria Using Magnetic
Separation. International Journal of Civil, Mechanical and Energy Science, Vol. 2, Issue-2, pp. 91-93.
Alabi O.O., Oyedepo O.J., and Abere V.D. (2017). Investigation on the Suitability of Fobur Granite in
Jos, Plateau State, Nigeria for Road Construction. Journal of Applied Science and Environmental
Management, Vol. 21 (4), pp. 709-716.
Awe, A. A. and Ajayi, S.O. (2009). Diversification of Nigerian Revenue Base for Economic
Development: ―The Contribution of the Non-Oil Sector‖.
Cyril Azobu (2015). ―Developing the Solid Minerals Sector: Quick Wins for the New Government‖;
http://www.mondaq.com/Nigeria/x/406402/Mining/Development+The+Solid+Minerals+Sector+Quick+
Wins+for+the+New+Government
Fatma, Sule (2014). ―News Agency of Nigeria (NAN) News Analysis: Developing Solid Minerals Sector
to Enhance Economic Growth‖, NAN Features/vol. 8/No. 3/2014 (Jan.3).
Nelukhare, J. I. (2002): An Inventory of Mineral Resources, available in Nigeria for Industrial Utilization,
review of Mineral Raw Materials for Nigeria industries
Olumide, S. A., Akongwale, S. and Udefuna, P. N. (2013): Economic Diversification in Nigeria: Any
Role for Solid Mineral Development? Published by MCSER-CEMAS Sapienza University of Rome, Vol.
4 No. 6, pp. 691.
Raphel Amit and ModecaiAvriel (1982). Prospectives on Resource Policy Modelling: Energy and
Minerals, Cambrigde, MA: Ballinger, pp. 487.
Sachs, J. D. and Warner, A. M. (1997): ―National Resources and Economic Growth‖ Discussion Paper.
Harvard institute of International Development
Stephen J. Mallo (2012). The Nigerian Mining Sector: An Overview. Continental J. Applied Sciences 7
(1): 34 – 45.
Weiss, N.L. (1985). Mineral Processing Handbook. Society of Mining Engineers of The American
Institute of Mining, Metallurgical and Petroleum Engineers, Vol. 1, pp. 62-76.
Wills, B.A. and Napier-Munn, T.J. (2006). ―Mineral Processing Technology”, 7th edition, Elsevier
Science & Technology Books, Amsterdam, pp. 225.
Yaro, S.A. and Thomas, D.G. (2009). Chemical Mineralogical Characteristics of Kotonkarfe Iron Ore.
Journal of Engineering and Technology (JET), Bavero University, Kano, 4 (1), pp. 65-71.
Page 46 of 366
Paper: NMS 2017-TP006
Effect of Zinc Powder addition to Villa Gloss and Silka Lux Marine Enamel Paints on
Corrosion Resistance of Mild Steel
Ayoola, W. A.a, Bodude, M. A.
b and Onovo, H.
c, Oyetunji, A.
d and Odukoya, L.
e
a,b,c Metallurgical and Materials Engineering, University of Lagos, Akoka-Yaba, Lagos State, Nigeria d Metallurgical and Materials Engineering, Federal University of Technology Akure, Nigeria
eDepartment of Mechtronic, Lagos State Polytechnic, Lagos State, Nigeria
Corresponding author: [email protected]
Abstract
The most common method of protecting steels and other engineering materials from corrosion is by
painting or coating. Development in the paint industries suggests that the modern paints exhibit improved
corrosion resistance over their predecessors. However, anti-corrosion properties of the paints can further
be optimised when adequate proportion of the paint constituents are used. Effect of zinc powder addition
to Villa Gloss and Silka Lux Marine Enamel paints on corrosion resistance of mild steel was studied. The
results indicate that zinc powder addition between 15 and 25 % significantly reduce the corrosion rate and
thus increased the inhibition efficiency of mild steel immersed in seawater. The corrosion rate stabilises at
approximately 0.10 mmpy when zinc powder added was above 15 %, independent of the exposure time.
Potentiodynamic anodic polarization curves of the samples immersed in seawater show that sample with
25 % zinc powder addition exhibited highest corrosion potential and the least corrosion current.
Microstructural analysis of the samples also revealed the presence of pit corrosion at the surfaces of the
samples and their geometry, volume fraction and distribution vary with the zinc powder addition.
Keywords: Zinc powder, Potentiodynamic anodic polarization, sea water, corrosion rate
1.0) Introduction
Painting or coating of all kinds are often used to provide interior and exterior decoration, which makes the
environment appealing. Painting is a major method of protecting metal surfaces from different types of
corrosion and it application is comparatively easy with no limitation on the size of the steelwork or
materials that can be treated. Hence, painting of all kinds is very attractive and convenient means of
corrosion control. Besides decoration and corrosion prevention purposes, painting of surfaces can also
serve purposes such as light reflectivity, camouflaging surfaces and heat absorber 1.
Paintings of steelwork and other surfaces are very useful. However, deterioration and degradation of
paints set-in over time and thus corrosion of surfaces is inevitable. Commonest among the causes of
earlier corrosion are deficient surface preparation, insufficient coating thickness, incorrect formulation of
paint by the manufacturer, inadequate skill of the painter, wrong choice of paints, drastically change in
environmental conditions, mechanical and human physical damage 2.
Incorrect formulation of paint by manufacturer seems to be a major challenge in corrosion prevention.
This is because all other causes of corrosion can be corrected prior to paint application but wrong
formulation required new production. The principal indigents of paints are pigments, fillers, co-reactant
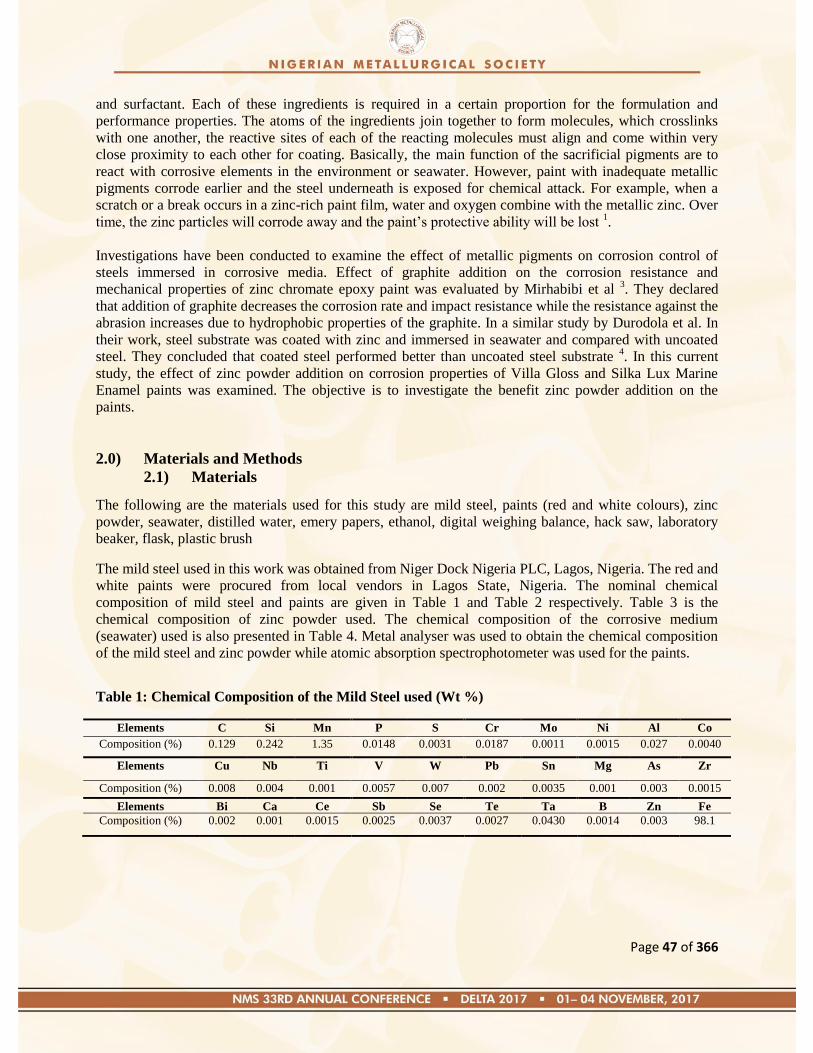
Page 47 of 366
and surfactant. Each of these ingredients is required in a certain proportion for the formulation and
performance properties. The atoms of the ingredients join together to form molecules, which crosslinks
with one another, the reactive sites of each of the reacting molecules must align and come within very
close proximity to each other for coating. Basically, the main function of the sacrificial pigments are to
react with corrosive elements in the environment or seawater. However, paint with inadequate metallic
pigments corrode earlier and the steel underneath is exposed for chemical attack. For example, when a
scratch or a break occurs in a zinc-rich paint film, water and oxygen combine with the metallic zinc. Over
time, the zinc particles will corrode away and the paint‘s protective ability will be lost 1.
Investigations have been conducted to examine the effect of metallic pigments on corrosion control of
steels immersed in corrosive media. Effect of graphite addition on the corrosion resistance and
mechanical properties of zinc chromate epoxy paint was evaluated by Mirhabibi et al 3. They declared
that addition of graphite decreases the corrosion rate and impact resistance while the resistance against the
abrasion increases due to hydrophobic properties of the graphite. In a similar study by Durodola et al. In
their work, steel substrate was coated with zinc and immersed in seawater and compared with uncoated
steel. They concluded that coated steel performed better than uncoated steel substrate 4. In this current
study, the effect of zinc powder addition on corrosion properties of Villa Gloss and Silka Lux Marine
Enamel paints was examined. The objective is to investigate the benefit zinc powder addition on the
paints.
2.0) Materials and Methods
2.1) Materials
The following are the materials used for this study are mild steel, paints (red and white colours), zinc
powder, seawater, distilled water, emery papers, ethanol, digital weighing balance, hack saw, laboratory
beaker, flask, plastic brush
The mild steel used in this work was obtained from Niger Dock Nigeria PLC, Lagos, Nigeria. The red and
white paints were procured from local vendors in Lagos State, Nigeria. The nominal chemical
composition of mild steel and paints are given in Table 1 and Table 2 respectively. Table 3 is the
chemical composition of zinc powder used. The chemical composition of the corrosive medium
(seawater) used is also presented in Table 4. Metal analyser was used to obtain the chemical composition
of the mild steel and zinc powder while atomic absorption spectrophotometer was used for the paints.
Table 1: Chemical Composition of the Mild Steel used (Wt %)
Elements C Si Mn P S Cr Mo Ni Al Co
Composition (%) 0.129 0.242 1.35 0.0148 0.0031 0.0187 0.0011 0.0015 0.027 0.0040
Elements Cu Nb Ti V W Pb Sn Mg As Zr
Composition (%) 0.008 0.004 0.001 0.0057 0.007 0.002 0.0035 0.001 0.003 0.0015
Elements Bi Ca Ce Sb Se Te Ta B Zn Fe
Composition (%) 0.002 0.001 0.0015 0.0025 0.0037 0.0027 0.0430 0.0014 0.003 98.1
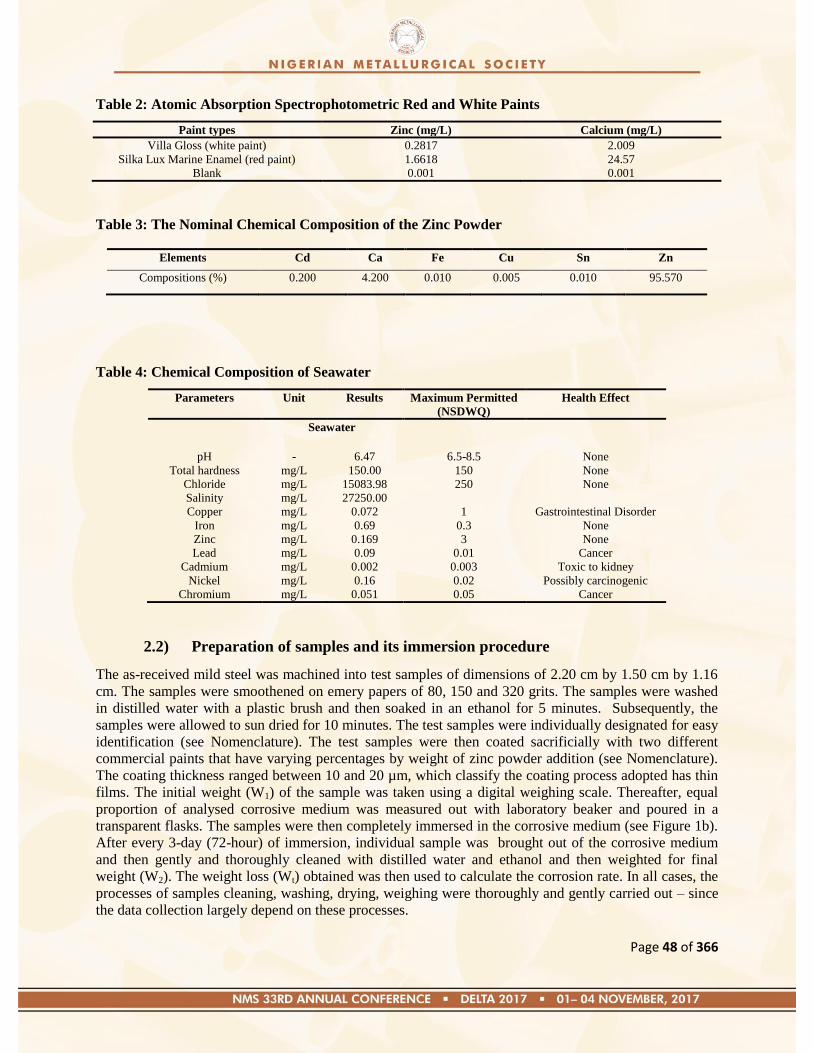
Page 48 of 366
Table 2: Atomic Absorption Spectrophotometric Red and White Paints
Paint types Zinc (mg/L) Calcium (mg/L)
Villa Gloss (white paint) 0.2817 2.009
Silka Lux Marine Enamel (red paint) 1.6618 24.57
Blank 0.001 0.001
Table 3: The Nominal Chemical Composition of the Zinc Powder
Elements Cd Ca Fe Cu Sn Zn
Compositions (%) 0.200 4.200 0.010 0.005 0.010 95.570
Table 4: Chemical Composition of Seawater
Parameters Unit Results Maximum Permitted
(NSDWQ)
Health Effect
Seawater
pH - 6.47 6.5-8.5 None
Total hardness mg/L 150.00 150 None
Chloride mg/L 15083.98 250 None
Salinity mg/L 27250.00
Copper mg/L 0.072 1 Gastrointestinal Disorder
Iron mg/L 0.69 0.3 None
Zinc mg/L 0.169 3 None
Lead mg/L 0.09 0.01 Cancer
Cadmium mg/L 0.002 0.003 Toxic to kidney
Nickel mg/L 0.16 0.02 Possibly carcinogenic
Chromium mg/L 0.051 0.05 Cancer
2.2) Preparation of samples and its immersion procedure
The as-received mild steel was machined into test samples of dimensions of 2.20 cm by 1.50 cm by 1.16
cm. The samples were smoothened on emery papers of 80, 150 and 320 grits. The samples were washed
in distilled water with a plastic brush and then soaked in an ethanol for 5 minutes. Subsequently, the
samples were allowed to sun dried for 10 minutes. The test samples were individually designated for easy
identification (see Nomenclature). The test samples were then coated sacrificially with two different
commercial paints that have varying percentages by weight of zinc powder addition (see Nomenclature).
The coating thickness ranged between 10 and 20 µm, which classify the coating process adopted has thin
films. The initial weight (W1) of the sample was taken using a digital weighing scale. Thereafter, equal
proportion of analysed corrosive medium was measured out with laboratory beaker and poured in a
transparent flasks. The samples were then completely immersed in the corrosive medium (see Figure 1b).
After every 3-day (72-hour) of immersion, individual sample was brought out of the corrosive medium
and then gently and thoroughly cleaned with distilled water and ethanol and then weighted for final
weight (W2). The weight loss (Wt) obtained was then used to calculate the corrosion rate. In all cases, the
processes of samples cleaning, washing, drying, weighing were thoroughly and gently carried out – since
the data collection largely depend on these processes.
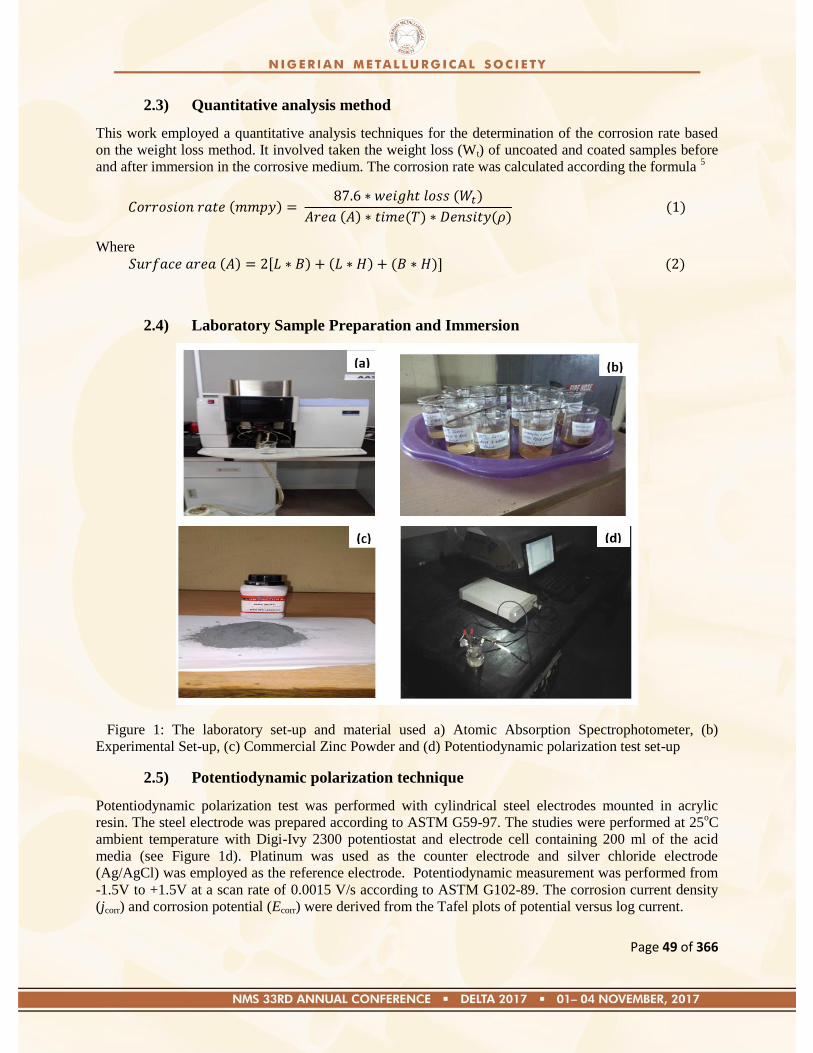
Page 49 of 366
2.3) Quantitative analysis method
This work employed a quantitative analysis techniques for the determination of the corrosion rate based
on the weight loss method. It involved taken the weight loss (Wt) of uncoated and coated samples before
and after immersion in the corrosive medium. The corrosion rate was calculated according the formula 5
( ) ( )
( ) ( ) ( ) ( )
Where ( ) [ ) ( ) ( )] ( )
2.4) Laboratory Sample Preparation and Immersion
Figure 1: The laboratory set-up and material used a) Atomic Absorption Spectrophotometer, (b)
Experimental Set-up, (c) Commercial Zinc Powder and (d) Potentiodynamic polarization test set-up
2.5) Potentiodynamic polarization technique
Potentiodynamic polarization test was performed with cylindrical steel electrodes mounted in acrylic
resin. The steel electrode was prepared according to ASTM G59-97. The studies were performed at 25oC
ambient temperature with Digi-Ivy 2300 potentiostat and electrode cell containing 200 ml of the acid
media (see Figure 1d). Platinum was used as the counter electrode and silver chloride electrode
(Ag/AgCl) was employed as the reference electrode. Potentiodynamic measurement was performed from
-1.5V to +1.5V at a scan rate of 0.0015 V/s according to ASTM G102-89. The corrosion current density
(jcorr) and corrosion potential (Ecorr) were derived from the Tafel plots of potential versus log current.
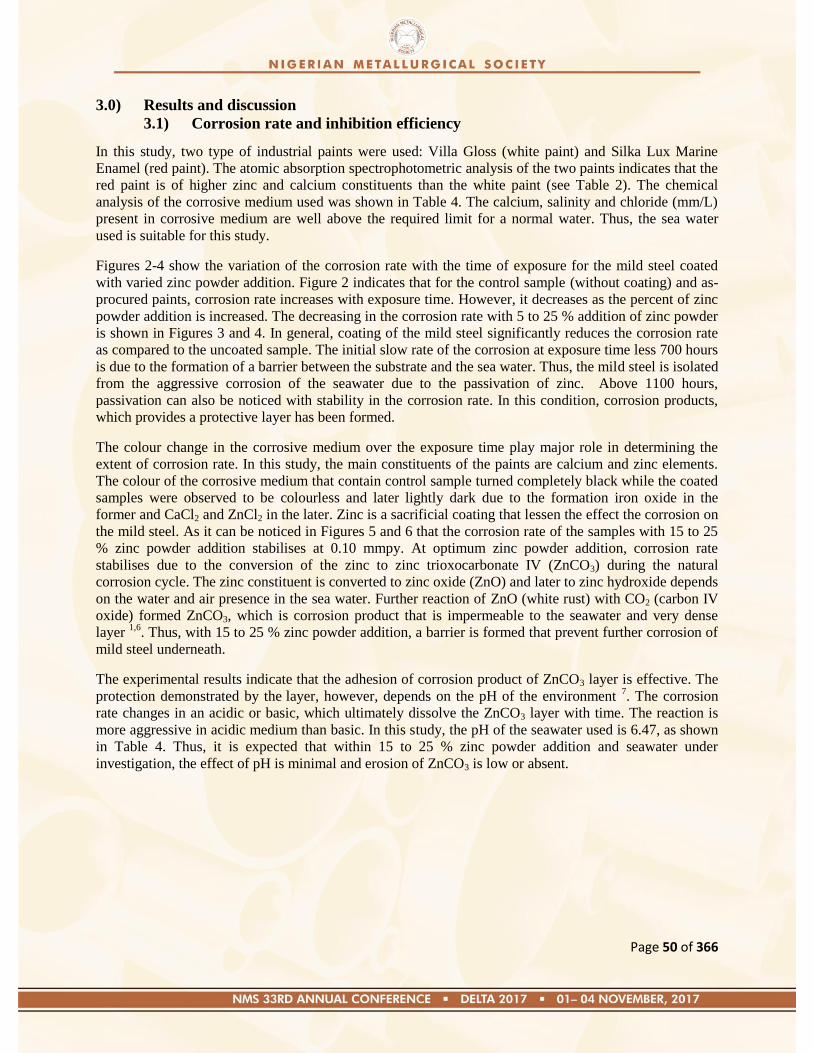
Page 50 of 366
3.0) Results and discussion
3.1) Corrosion rate and inhibition efficiency
In this study, two type of industrial paints were used: Villa Gloss (white paint) and Silka Lux Marine
Enamel (red paint). The atomic absorption spectrophotometric analysis of the two paints indicates that the
red paint is of higher zinc and calcium constituents than the white paint (see Table 2). The chemical
analysis of the corrosive medium used was shown in Table 4. The calcium, salinity and chloride (mm/L)
present in corrosive medium are well above the required limit for a normal water. Thus, the sea water
used is suitable for this study.
Figures 2-4 show the variation of the corrosion rate with the time of exposure for the mild steel coated
with varied zinc powder addition. Figure 2 indicates that for the control sample (without coating) and as-
procured paints, corrosion rate increases with exposure time. However, it decreases as the percent of zinc
powder addition is increased. The decreasing in the corrosion rate with 5 to 25 % addition of zinc powder
is shown in Figures 3 and 4. In general, coating of the mild steel significantly reduces the corrosion rate
as compared to the uncoated sample. The initial slow rate of the corrosion at exposure time less 700 hours
is due to the formation of a barrier between the substrate and the sea water. Thus, the mild steel is isolated
from the aggressive corrosion of the seawater due to the passivation of zinc. Above 1100 hours,
passivation can also be noticed with stability in the corrosion rate. In this condition, corrosion products,
which provides a protective layer has been formed.
The colour change in the corrosive medium over the exposure time play major role in determining the
extent of corrosion rate. In this study, the main constituents of the paints are calcium and zinc elements.
The colour of the corrosive medium that contain control sample turned completely black while the coated
samples were observed to be colourless and later lightly dark due to the formation iron oxide in the
former and CaCl2 and ZnCl2 in the later. Zinc is a sacrificial coating that lessen the effect the corrosion on
the mild steel. As it can be noticed in Figures 5 and 6 that the corrosion rate of the samples with 15 to 25
% zinc powder addition stabilises at 0.10 mmpy. At optimum zinc powder addition, corrosion rate
stabilises due to the conversion of the zinc to zinc trioxocarbonate IV (ZnCO3) during the natural
corrosion cycle. The zinc constituent is converted to zinc oxide (ZnO) and later to zinc hydroxide depends
on the water and air presence in the sea water. Further reaction of ZnO (white rust) with CO2 (carbon IV
oxide) formed ZnCO3, which is corrosion product that is impermeable to the seawater and very dense
layer 1,6
. Thus, with 15 to 25 % zinc powder addition, a barrier is formed that prevent further corrosion of
mild steel underneath.
The experimental results indicate that the adhesion of corrosion product of ZnCO3 layer is effective. The
protection demonstrated by the layer, however, depends on the pH of the environment 7. The corrosion
rate changes in an acidic or basic, which ultimately dissolve the ZnCO3 layer with time. The reaction is
more aggressive in acidic medium than basic. In this study, the pH of the seawater used is 6.47, as shown
in Table 4. Thus, it is expected that within 15 to 25 % zinc powder addition and seawater under
investigation, the effect of pH is minimal and erosion of ZnCO3 is low or absent.
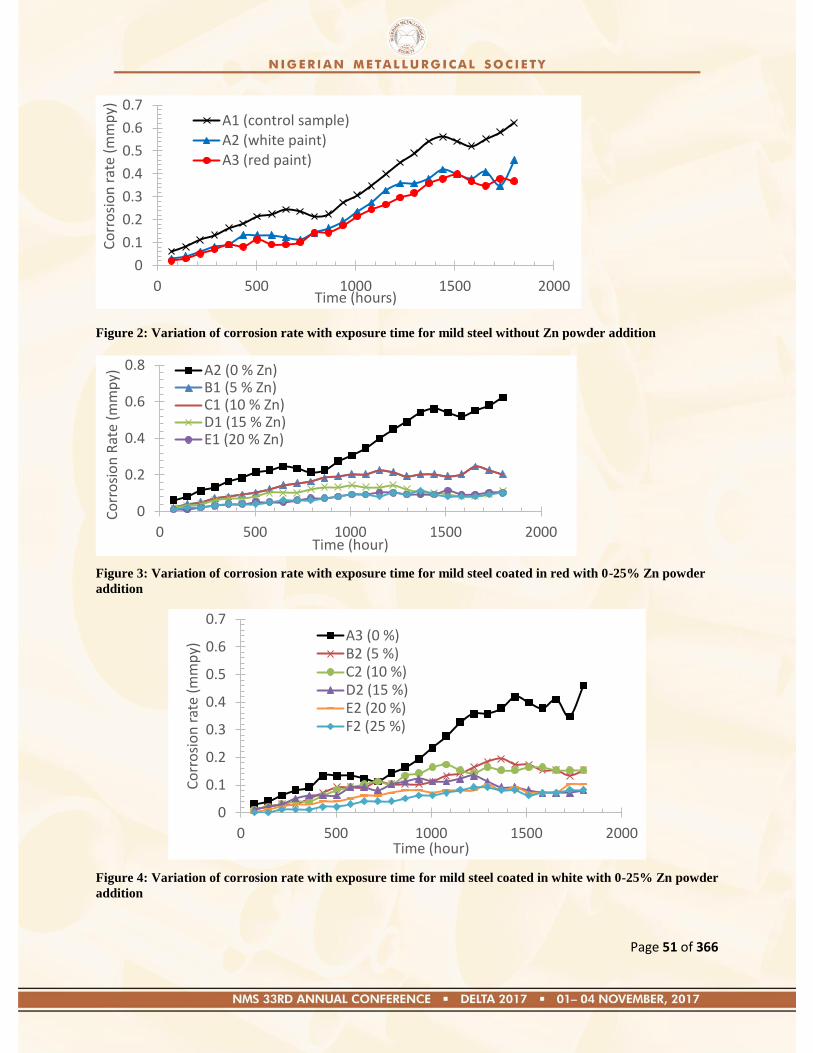
Page 51 of 366
Figure 2: Variation of corrosion rate with exposure time for mild steel without Zn powder addition
Figure 3: Variation of corrosion rate with exposure time for mild steel coated in red with 0-25% Zn powder
addition
Figure 4: Variation of corrosion rate with exposure time for mild steel coated in white with 0-25% Zn powder
addition
0
0.1
0.2
0.3
0.4
0.5
0.6
0.7
0 500 1000 1500 2000
Co
rro
sio
n r
ate
(mm
py)
Time (hours)
A1 (control sample)A2 (white paint)A3 (red paint)
0
0.2
0.4
0.6
0.8
0 500 1000 1500 2000
Co
rro
sio
n R
ate
(mm
py)
Time (hour)
A2 (0 % Zn)B1 (5 % Zn)C1 (10 % Zn)D1 (15 % Zn)E1 (20 % Zn)
0
0.1
0.2
0.3
0.4
0.5
0.6
0.7
0 500 1000 1500 2000
Co
rro
sio
n r
ate
(mm
py)
Time (hour)
A3 (0 %)B2 (5 %)C2 (10 %)D2 (15 %)E2 (20 %)F2 (25 %)
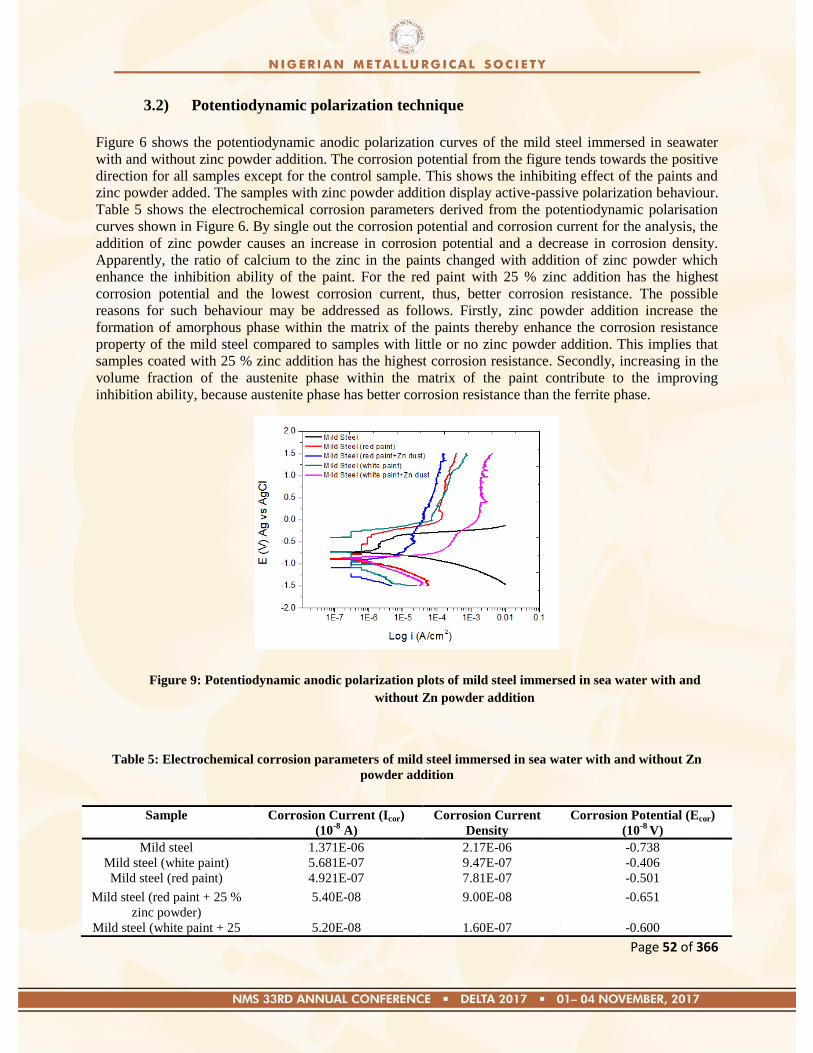
Page 52 of 366
3.2) Potentiodynamic polarization technique
Figure 6 shows the potentiodynamic anodic polarization curves of the mild steel immersed in seawater
with and without zinc powder addition. The corrosion potential from the figure tends towards the positive
direction for all samples except for the control sample. This shows the inhibiting effect of the paints and
zinc powder added. The samples with zinc powder addition display active-passive polarization behaviour.
Table 5 shows the electrochemical corrosion parameters derived from the potentiodynamic polarisation
curves shown in Figure 6. By single out the corrosion potential and corrosion current for the analysis, the
addition of zinc powder causes an increase in corrosion potential and a decrease in corrosion density.
Apparently, the ratio of calcium to the zinc in the paints changed with addition of zinc powder which
enhance the inhibition ability of the paint. For the red paint with 25 % zinc addition has the highest
corrosion potential and the lowest corrosion current, thus, better corrosion resistance. The possible
reasons for such behaviour may be addressed as follows. Firstly, zinc powder addition increase the
formation of amorphous phase within the matrix of the paints thereby enhance the corrosion resistance
property of the mild steel compared to samples with little or no zinc powder addition. This implies that
samples coated with 25 % zinc addition has the highest corrosion resistance. Secondly, increasing in the
volume fraction of the austenite phase within the matrix of the paint contribute to the improving
inhibition ability, because austenite phase has better corrosion resistance than the ferrite phase.
Figure 9: Potentiodynamic anodic polarization plots of mild steel immersed in sea water with and
without Zn powder addition
Table 5: Electrochemical corrosion parameters of mild steel immersed in sea water with and without Zn
powder addition
Sample Corrosion Current (Icor)
(10-8
A)
Corrosion Current
Density
Corrosion Potential (Ecor)
(10-8
V)
Mild steel 1.371E-06 2.17E-06 -0.738
Mild steel (white paint) 5.681E-07 9.47E-07 -0.406
Mild steel (red paint) 4.921E-07 7.81E-07 -0.501
Mild steel (red paint + 25 %
zinc powder)
5.40E-08 9.00E-08 -0.651
Mild steel (white paint + 25 5.20E-08 1.60E-07 -0.600
Page 53 of 366
Conclusion
This study has shown that
Addition of zinc powder to the locally procured Villa Gloss and Silka Lux Marine
Enamel paints improved the corrosion resistance of the mild steel.
The corrosion rate stabilised at approximately 0.10 mmpy when zinc powder added was
above 15 %. This result was achieved independent of the exposure time.
Zinc powder addition to both paints was beneficiary to the corrosion potential and
corrosion current.
References
1. Program, T. & Shipyard, F. O. R. PREPARATION TRAINING PROGRAM FOR SHIPYARD A
project of the National Shipbuilding Research Program.
2. Zheludkevich, M. L., Serra, R., Montemor, M. F., Salvado, I. M. M. & Ferreira, M. G. S.
Corrosion protective properties of nanostructured sol – gel hybrid coatings to AA2024-T3. 200,
3084–3094 (2006).
3. Mirhabibi, A. R., Chizari, K., Edrisi, M., Aghababazadeh, R. & Rand, B. THE EFFECT OF
CARBON ADDITION ON CORROSION RESISTANCE OF MARINE. 2–9
4. Durodola, B. M., Olugbuyiro, J. A. O. Moshood, S. A., Fayomi O. S. I. & Popoola, A. P. I. Study
of Influence of Zinc Plated Mild Steel Deterioration in Seawater Environment. Int. J. Electrochem.
Sci 6, 5605 – 5616 (2011).
5. Abdel-samad, A., Soud, Y. & Zaki, M. Influence of paint on steel corrosion for marine
applications. J. od Surf. Eng. Mater. Adv. Technol. 4, 189–195 (2014).
6. Langill, T. J., Ph, D. & Suite, E. I. A. Painting over hot dip galvanised steel.
7. Mahdavian, M. & Attar, M. M. Electrochemical behaviour of some transition metal
acetylacetonate complexes as corrosion inhibitors for mild steel. 51, 409–414 (2009).
% zinc powder)
Page 54 of 366
Paper: NMS 2017-TP007
Micro-Hardness Behaviour of Steel Substrate Electroplated with Silicon Based Zinc Oxide
Oloruntoba, D. T., Aribo, S. and Alabi, O. O.
Department of Metallurgical and Materials Engineering, Federal University of Technology, Akure.
PMB 704 Akure. [email protected]
Correspondence: [email protected], +2348033636164
ABSRACT
The use of crop residue or waste like rice husk ash is considered as reinforcing particles for the
electroplating process of zinc on low carbon steel to enhance its micro-hardness behavior. The zinc bath
formulation was prepared with content containing zinc oxides (ZnO), sodium cyanide (NaCN), sodium
hydroxide (NaOH), aluminium sulphate (Al2O3), sodium fluoride (NaF), dextrose and distilled water. The
electroplating of the mild steel was done by adding to the zinc bath varying amount of rice husk ash of 5
g, 10 g, 20 g, 25 g and 30 g for 30 minutes at 2 volts. Two zinc bars were used as anode and the low
carbon steel attached to the cathode arm during the plating process. The surface morphologies of coated
steel samples were examined through an optical microscope. The micro-hardness behaviour was analysed
using Vickers hardness. The micro-hardness of the low carbon steel increased from 208.2HV to 213.9HV
in the presence of large of amount of rice husk ash.
Key words: zinc bath, zinc oxide, rice-husk ash, electroplating, microhardness
1. Introduction
Steel is an engineering material that is produced by Pyrometallurgical process in a blast furnace (Dmitriev
et al., 2013). The process involves the application of large amount of energy into alloy system and makes
the steel to be thermodynamically unstable (Smil, 2016). Every material always seeks to gain stability by
minimization of energy which leads to corrosion of the material (Roberge, 2012). Engineering materials
disintegrate in diver‘s ways that can latter result in service failure (Oloruntoba and Popoola, 2015). A
material which is designated to be utilised for specific task should possess enough properties to avoid
premature failure in service. Mild steels are metallic materials that are most commonly used; they are
usually exposed to water or the atmosphere during application (Fayomi et al., 2012). Also corrodes in
chloride environment and some other environment (Chinwko et al., 2014). Metal ions from mild steel go
into solution at anodic areas in an amount chemically equivalent to the reactions at cathodic areas which
enhance its high susceptibility to localized corrosion attack. In the acidic media, the reactions proceed
rapidly from the anodic regions causing mild steel surface degradation This reaction is rapid by the lack
of pronounced polarization which results in damage of surface bond (Ehteram and Aish, 2008; Fayomi et
al., 2012). There is limitation in the use of mild steel for industrial application due to its low hardness and
poor tribological behaviour (Fayomi et al., 2012).
The steel coated with zinc shows that zinc protect steel as it is more reactive than iron in the reactivity
series but it could only protect it over a period of time. It is discovered that silicon possesses its properties
as a refractory material which could make effect in the reaction to provide a good surface hardness,
resistance to stress corrosion cracking and also high-temperature oxidation resistance and to corrosion by
oxidizing acids in order to extend the material longevity. Currently, Rice Husks are the raw materials for
the production of a series of silicon-based materials, including silicon carbide, silica, silicon nitride,
silicon tetrachloride, pure silicon, and zeolite (Sun and Gong, 2001)(Sun and Gong, 2001).
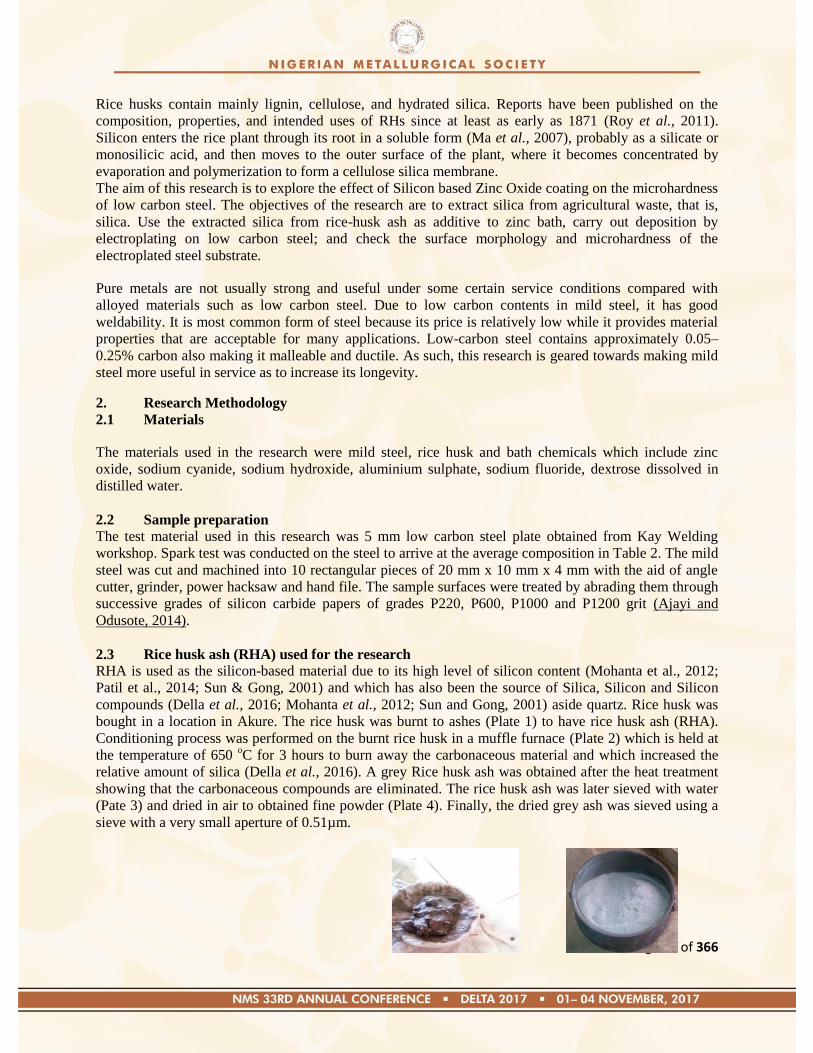
Page 55 of 366
Rice husks contain mainly lignin, cellulose, and hydrated silica. Reports have been published on the
composition, properties, and intended uses of RHs since at least as early as 1871 (Roy et al., 2011).
Silicon enters the rice plant through its root in a soluble form (Ma et al., 2007), probably as a silicate or
monosilicic acid, and then moves to the outer surface of the plant, where it becomes concentrated by
evaporation and polymerization to form a cellulose silica membrane.
The aim of this research is to explore the effect of Silicon based Zinc Oxide coating on the microhardness
of low carbon steel. The objectives of the research are to extract silica from agricultural waste, that is,
silica. Use the extracted silica from rice-husk ash as additive to zinc bath, carry out deposition by
electroplating on low carbon steel; and check the surface morphology and microhardness of the
electroplated steel substrate.
Pure metals are not usually strong and useful under some certain service conditions compared with
alloyed materials such as low carbon steel. Due to low carbon contents in mild steel, it has good
weldability. It is most common form of steel because its price is relatively low while it provides material
properties that are acceptable for many applications. Low-carbon steel contains approximately 0.05–
0.25% carbon also making it malleable and ductile. As such, this research is geared towards making mild
steel more useful in service as to increase its longevity.
2. Research Methodology
2.1 Materials
The materials used in the research were mild steel, rice husk and bath chemicals which include zinc
oxide, sodium cyanide, sodium hydroxide, aluminium sulphate, sodium fluoride, dextrose dissolved in
distilled water.
2.2 Sample preparation
The test material used in this research was 5 mm low carbon steel plate obtained from Kay Welding
workshop. Spark test was conducted on the steel to arrive at the average composition in Table 2. The mild
steel was cut and machined into 10 rectangular pieces of 20 mm x 10 mm x 4 mm with the aid of angle
cutter, grinder, power hacksaw and hand file. The sample surfaces were treated by abrading them through
successive grades of silicon carbide papers of grades P220, P600, P1000 and P1200 grit (Ajayi and
Odusote, 2014).
2.3 Rice husk ash (RHA) used for the research
RHA is used as the silicon-based material due to its high level of silicon content (Mohanta et al., 2012;
Patil et al., 2014; Sun & Gong, 2001) and which has also been the source of Silica, Silicon and Silicon
compounds (Della et al., 2016; Mohanta et al., 2012; Sun and Gong, 2001) aside quartz. Rice husk was
bought in a location in Akure. The rice husk was burnt to ashes (Plate 1) to have rice husk ash (RHA).
Conditioning process was performed on the burnt rice husk in a muffle furnace (Plate 2) which is held at
the temperature of 650 oC for 3 hours to burn away the carbonaceous material and which increased the
relative amount of silica (Della et al., 2016). A grey Rice husk ash was obtained after the heat treatment
showing that the carbonaceous compounds are eliminated. The rice husk ash was later sieved with water
(Pate 3) and dried in air to obtained fine powder (Plate 4). Finally, the dried grey ash was sieved using a
sieve with a very small aperture of 0.51µm.

Page 56 of 366
Plate 1: The burning process Plate 2: Conditioning Plate 3: Sieving with water Plate 4: The rice husk ash in
in the muffle furnace using cloth gray colour
2.4 Chemicals for zinc electroplating
Chemicals used in the electroplating to achieve the coatings were bought from Pascal Scientific Materials
located in Akure while the distilled water was bought from Chemistry Laboratory, FUTA. The chemicals
were prepared by mixing the bath formulation shown in the Table 1.
Table 1: Chemical composition of the zinc bath (Oloruntoba and Popoola, 2015) Chemical Quantities/litre
Zinc Oxides 50g
Sodium Cyanide 120g
Sodium Hydroxide 20g
Aluminium Sulphate 10g
Sodium Fluoride 10g
Dextrose 2g
Distilled water 1 litre
Current density 1-2 A/dm2
Voltage 2V
Temperature 25 – 50 0C
Plating time 30 mins
Filtration Periodical
2.5 Pre-plating operation
Pre-cleaning process was carried out which is called pickling. The steel samples were prepared for
electroplating operation by dipping each sample into dilute sulfuric acid which was prepared by
measuring and mixing 27g of dilute hydrogen tri-oxo sulphate(VI) acid (H2SO4) with 1000 ml of distilled
water known as acid pickling which removed the surface oxide scale form the surfaces of the samples
(Hacias, 2000). Each sample was dipped into the solution for 3 minutes.
2.6 Zinc electroplating set up
Zinc electroplating set up involved:
a. The electroplating tank: the tank contained electrolytes, the anodes and cathode
b. The electrodes included
i. Cathode: This was made the substrate (low carbon steel) being coated, also the negative
electrode. With the aid of copper wire and copper rod, the substrate was connected to
cathode terminal of the rectifier.
ii. Anode: This is made the zinc electrode which is called the sacrificial anode; it releases
electrons to the substrate. In this project, two zinc electrodes were used.
c. Electrolyte: This contained chemical bath formulation in Table 1 which produced the conducting
solution shown in Plate 5.
d. Voltage Rectifier: The voltage rectifier was used to rectify the voltage to maintain 2.0 V for the
deposition (Plate 6).
Page 57 of 366
Plate 5: The yellow bath solution Plate 6: Zinc electroplating set up
2.7 Surface Macrograph Examination
The surface examination of the zinc electroplated samples was carried out on an optical metallurgical
microscope. The optical image was taking at x50 magnification.
2.8 Micro-hardness examination
Vickers macro-hardness machine was used to determine the micro hardness of the coated samples. The
micro-hardness was examined at Engineering Materials Development Institute, Akure.
3. Result
3.1 Elemental composition of the samples
The elemental composition of the low carbon steel which was used for this research was carried out by
Ametek materials analysis division in Lagos. And the composition was gotten after conducting spark test.
Table 2: Elemental composition of mild steel used in this experiment
3.2 Electroplating result
Table 3: Weight, Thickness and Weight deposited (g/cm2) plated Zn0-RHA on low carbon steel at
constant plating time and voltage for varying rice husk ash weight
ZnO-0RHA ZnO-5RHA
ZnO-
10RHA ZnO-15RHA
ZnO-
20RHA ZnO-25RHA ZnO-30RHA
Surface Area (mm) 499.5687 565.5142 569.0305 545.443 552.8753 576.6732 571.7845
Initial weight (g) 5.9715 7.054 7.54 6.9925 7.1401 7.3316 7.3292
Final weight (g) 5.9763 7.0583 7.54 6.9935 7.1519 7.3327 7.3308
RHA weight (g) 0 5 10 15 20 25 30
Coating weight (g) 0.0048 0.0043 0 0.001 0.0118 0.0011 0.0016
Coating weight per
unit area (g/cm2) 9.60829E-06 7.6037E-06 0 1.83337E-06 2.1343E-05 1.90749E-06 2.79826E-06
Coating
thickness(µm) 1.35 1.07 0 0.26 3.00 2.68 3.92
Voltage (v) 2 2 2 2 2 2 2
Plating time (min) 30 30 30 30 30 30 30
Element C Si Mn P S Cr Cu Ni Fe
Weight(%) 0.0826 0.148 0.335 0.0165 0.0161 0.0166 0.0435 0.0204 Balanced
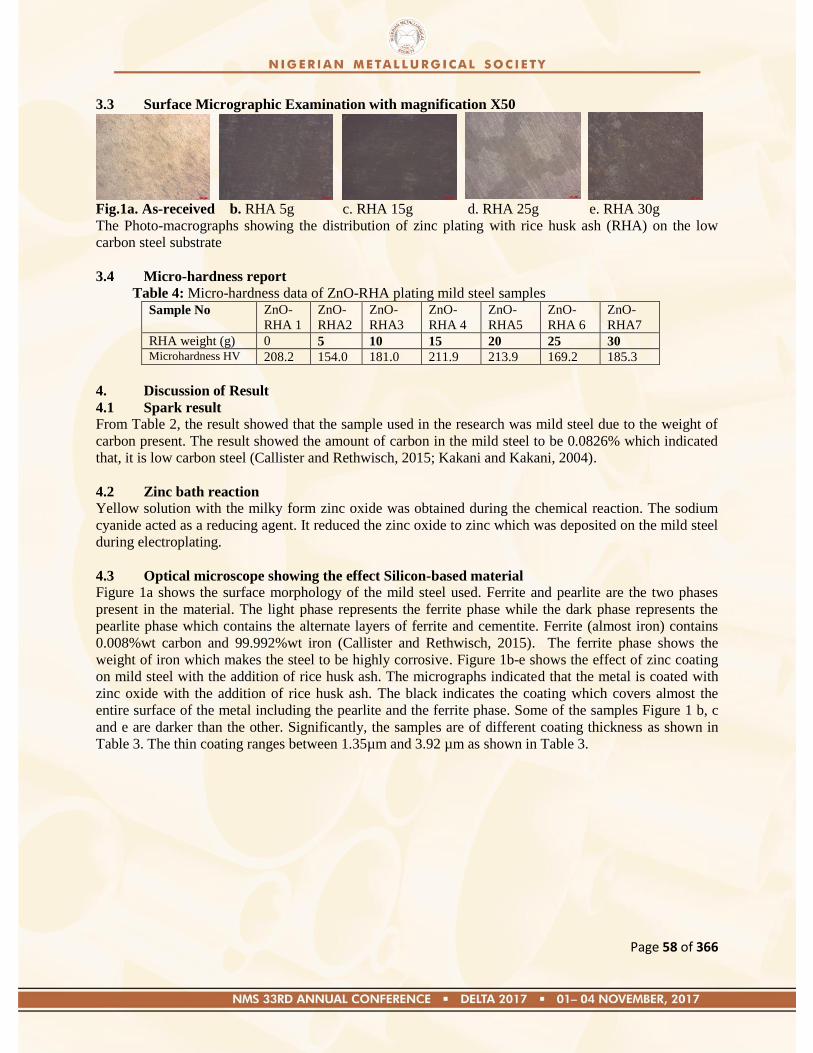
Page 58 of 366
3.3 Surface Micrographic Examination with magnification X50
Fig.1a. As-received b. RHA 5g c. RHA 15g d. RHA 25g e. RHA 30g
The Photo-macrographs showing the distribution of zinc plating with rice husk ash (RHA) on the low
carbon steel substrate
3.4 Micro-hardness report
Table 4: Micro-hardness data of ZnO-RHA plating mild steel samples Sample No ZnO-
RHA 1
ZnO-
RHA2
ZnO-
RHA3
ZnO-
RHA 4
ZnO-
RHA5
ZnO-
RHA 6
ZnO-
RHA7
RHA weight (g) 0 5 10 15 20 25 30 Microhardness HV 208.2 154.0 181.0 211.9 213.9 169.2 185.3
4. Discussion of Result
4.1 Spark result
From Table 2, the result showed that the sample used in the research was mild steel due to the weight of
carbon present. The result showed the amount of carbon in the mild steel to be 0.0826% which indicated
that, it is low carbon steel (Callister and Rethwisch, 2015; Kakani and Kakani, 2004).
4.2 Zinc bath reaction
Yellow solution with the milky form zinc oxide was obtained during the chemical reaction. The sodium
cyanide acted as a reducing agent. It reduced the zinc oxide to zinc which was deposited on the mild steel
during electroplating.
4.3 Optical microscope showing the effect Silicon-based material
Figure 1a shows the surface morphology of the mild steel used. Ferrite and pearlite are the two phases
present in the material. The light phase represents the ferrite phase while the dark phase represents the
pearlite phase which contains the alternate layers of ferrite and cementite. Ferrite (almost iron) contains
0.008%wt carbon and 99.992%wt iron (Callister and Rethwisch, 2015). The ferrite phase shows the
weight of iron which makes the steel to be highly corrosive. Figure 1b-e shows the effect of zinc coating
on mild steel with the addition of rice husk ash. The micrographs indicated that the metal is coated with
zinc oxide with the addition of rice husk ash. The black indicates the coating which covers almost the
entire surface of the metal including the pearlite and the ferrite phase. Some of the samples Figure 1 b, c
and e are darker than the other. Significantly, the samples are of different coating thickness as shown in
Table 3. The thin coating ranges between 1.35µm and 3.92 µm as shown in Table 3.
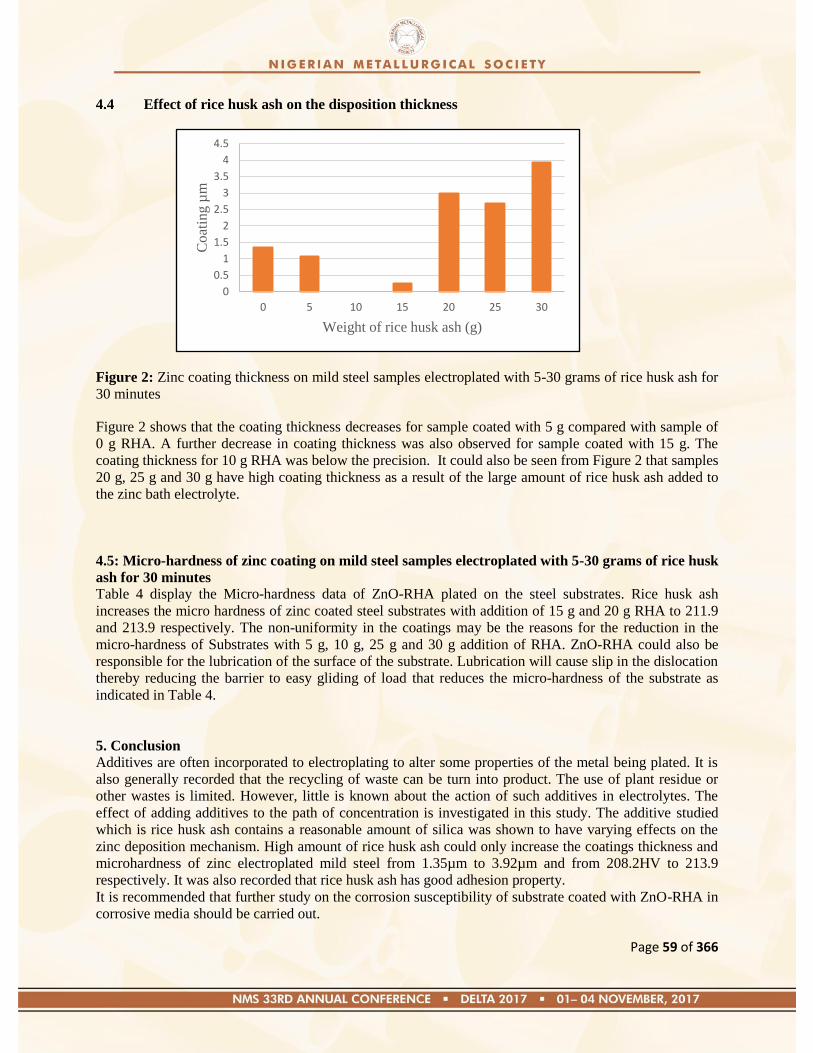
Page 59 of 366
4.4 Effect of rice husk ash on the disposition thickness
Figure 2: Zinc coating thickness on mild steel samples electroplated with 5-30 grams of rice husk ash for
30 minutes
Figure 2 shows that the coating thickness decreases for sample coated with 5 g compared with sample of
0 g RHA. A further decrease in coating thickness was also observed for sample coated with 15 g. The
coating thickness for 10 g RHA was below the precision. It could also be seen from Figure 2 that samples
20 g, 25 g and 30 g have high coating thickness as a result of the large amount of rice husk ash added to
the zinc bath electrolyte.
4.5: Micro-hardness of zinc coating on mild steel samples electroplated with 5-30 grams of rice husk
ash for 30 minutes Table 4 display the Micro-hardness data of ZnO-RHA plated on the steel substrates. Rice husk ash
increases the micro hardness of zinc coated steel substrates with addition of 15 g and 20 g RHA to 211.9
and 213.9 respectively. The non-uniformity in the coatings may be the reasons for the reduction in the
micro-hardness of Substrates with 5 g, 10 g, 25 g and 30 g addition of RHA. ZnO-RHA could also be
responsible for the lubrication of the surface of the substrate. Lubrication will cause slip in the dislocation
thereby reducing the barrier to easy gliding of load that reduces the micro-hardness of the substrate as
indicated in Table 4.
5. Conclusion
Additives are often incorporated to electroplating to alter some properties of the metal being plated. It is
also generally recorded that the recycling of waste can be turn into product. The use of plant residue or
other wastes is limited. However, little is known about the action of such additives in electrolytes. The
effect of adding additives to the path of concentration is investigated in this study. The additive studied
which is rice husk ash contains a reasonable amount of silica was shown to have varying effects on the
zinc deposition mechanism. High amount of rice husk ash could only increase the coatings thickness and
microhardness of zinc electroplated mild steel from 1.35µm to 3.92µm and from 208.2HV to 213.9
respectively. It was also recorded that rice husk ash has good adhesion property.
It is recommended that further study on the corrosion susceptibility of substrate coated with ZnO-RHA in
corrosive media should be carried out.
0
0.5
1
1.5
2
2.5
3
3.5
4
4.5
0 5 10 15 20 25 30
Co
atin
g µ
m
Weight of rice husk ash (g)
Page 60 of 366
References
Ajayi, O.M., Odusote, J.K., 2014. rt ic le in Pr es rt ic le in Pr es s. J. Electrochem. Sci. Eng. 4, 1–8.
doi:10.5599/jese.2014.0046
Callister, D.W.J., Rethwisch, G.D., 2015. Material Science and Engineering: An Introduction, Eighth. ed,
John Wiley & Sons Inc. New York. doi:10.1017/CBO9781107415324.004
Chinwko, E.C., Odio, B.O., Chukwuneke, J.L., Sinebe, J.E., 2014. Investigation Of The Effect Of
Corrosion On Mild Steel In Five Different Environments. Int. J. Sci. Technol. Res. Vol. 3, 306–310.
Della, V.P., Kühn, I., Hotza, D., 2016. Processing and Characterization of Active Silica Obtained from
Rice Husk Ash 1–5.
Dmitriev, A.N., Vitkina, G.Y., Chesnokov, Y.A., Petukhov, R.V., 2013. Iron Ore Materials and Coke
Quality Characteristics and Quantitative Indicators of Blast Furnace Smelting, IFAC Proceedings
Volumes. IFAC. doi:10.3182/20130825-4-US-2038.00025
Ehteram, A., Aish, H., 2008. Corrosion Behavior of Mild Steel in Hydrochloric Acid Solutions. Int. J.
Electrochem. Sci. 3, 806–818.
Fayomi, O.S., Loto, C.A., Popoola, A.P.I., 2012. CORROSION STUDY AND SURFACE
CHARACTERIZATION OF ZINC (Zn) AND ZINC-ALUMINIUM (Zn-Al) DEPOSITIONS ON
MILD STEEL IN SALINE ENVIRONMENT. TSHWANE Univ. Technol.
doi:10.1017/CBO9781107415324.004
Hacias, K., 2000. Metal surface treatments, pickling, in: Kirk-Othmer Encyclopedia of Chemical
Technology. pp. 1–3.
Kakani, S.L., Kakani, A., 2004. Material Science. Mater. Sci. Fourth Edi, 657. doi:10.1063/1.3050638
Ma, J.F., Yamaji, N., Mitani, N., Tamai, K., Konishi, S., Fujiwara, T., Katsuhara, M., Yano, M., 2007. An
efflux transporter of silicon in rice. Nature 448, 209–212. doi:10.1038/nature05964
Mohanta, K., Kumar, D., Parkash, O., 2012. Properties and Industrial Applications of Rice husk : A
review. Int. J. Emerg. Technol. Adv. Eng. 2, 86–90.
Oloruntoba, D.T., Popoola, A.P.I., 2015. Effect of coating on induced thermal and tensile stress on the
fracture of exhaust pipe material. Eng. Fail. Anal. 56, 562–572.
doi:10.1016/j.engfailanal.2014.09.005
Patil, R., Dongre, R., Meshram, J., 2014. Preparation of Silica Powder from Rice Husk. IOSR J. Appl.
Chem. 2014, 26–29.
Roberge, P., 2012. Handbook of Corrosion Engineering, in: McGraw-Hill Education.
Roy, P., Orikasa, T., Okadome, H., Nakamura, N., Shiina, T., 2011. Processing conditions, rice
properties, health and environment. Int. J. Environ. Res. Public Health 8, 1957–1976.
doi:10.3390/ijerph8061957
Smil, V., 2016. Chapter 2 – Rise of Modern Ferrous Metallurgy, 1700–1850: Coke, Blast Furnaces, and
Expensive Steel, in: Still the Iron Age. pp. 19–34. doi:10.1016/B978-0-12-804233-5.00002-6
Sun, L., Gong, K., 2001. Silicon-Based Materials from Rice Husks and Their Applications. Ind. Eng.
Chem. Res. 40, 5861–5877. doi:10.1021/ie010284b
Page 61 of 366
Paper: NMS 2017-TP008
Structural Modification of Aluminium Bronze (Cu-10%Al) Using Nickel
Nwaeju, C. C. 1, Edoziuno,
F. O.
2, and Okoubulu, B. A.
3
1Department of Metallurgical and Materials Engineering, Nnamdi Azikiwe University, Awka. Nigeria
2Department of Metallurgical Engineering, Delta State Polytechnic, Ogwashi-Uku, Nigeria
3Department of Metallurgical and Materials Engineering, University of Lagos, Nigeria
Corresponding Author: [email protected], +2348066974899
ABSTRACT
This research was undertaken to investigate the effect of nickel macro-addition on the structure and
mechanical properties of aluminium bronze. Sand casting method was used in the production of a dual-
phase aluminium bronze alloy with pre-selected composition of 10% Al-content. The properties studied
were tensile strength, yield strength, percentage elongation using universal tensile testing machine
(SRNO0723), impact strength using charpy machine (U1820) and hardness using Brinell hardness tester
model B 3000(H). The tests were conducted according to BS 131-240 standards. The specimens were
prepared by doping 1.0 -10wt% of nickel into Cu-10%Al alloy at 1.0 percent interval. Microstructural
analysis was conducted using L2003A reflected light metallurgical bench microscope and PHENOM
ProX scanning electron microscope. Results obtained showed that optimally improved mechanical
properties were achieved at 4wt% nickel addition with respect to ultimate tensile strength and
%elongation. Hardness on the other hand, decreased with increase in nickel content while impact
strength increased with increase in composition of nickel from 1-10wt%. Microstructural analysis
revealed the presence of primary α-phase, -phase (intermetallic phases) and fine stable reinforcing kappa
phase and these phases gave rise to the enhanced mechanical properties. This research have established
that aluminium bronze doped with nickel increased the tensile strength, ductility, and impact strength and
reduces hardness and is therefore recommended for applications in automobiles and allied engineering
industry.
Keywords: microstructure, nickel additives, aluminium bronze, mechanical properties
1. Introduction
Aluminium bronze is very useful in a great number of engineering structures with a variety of the alloy
finding its applications in different industries [1]. Aluminium–bronze alloys are copper based alloys
containing aluminium as the major alloying element usually in the range 5%-14% in the base alloy [2].
Other alloying elements such as nickel, iron, manganese, silicon, etc. are sometimes intentionally
introduced into aluminium bronze depending on the intended property modification and applications.
Presence of aluminium increases the mechanical properties of the alloy by the establishment of FCC
phase which could improve the casting and high temperature properties of the alloy [3]. Other alloying
elements improve the mechanical properties such as strength, toughness, resistance to corrosion and
magnetic behaviour, and modify the microstructure. For instance nickel improves the corrosion resistance
while iron is a grain refiner [4]. The relatively high strength of aluminium bronze compared with other
copper alloys makes it suitable for the production of forgings, plates, sheets, extruder rods, and sections
[5]. Its excellent corrosion resistance property makes it recommendable as an important engineering
material for highly stressed components in corrosive environment [6]. Aluminium bronze is available
both in wrought and cast forms and is readily weldable and fabricated into components such as pipes and
pressure vessel.

Page 62 of 366
The binary phase diagram of copper-aluminium is complex, but for the commercially important binary
alloys the most important reaction is the eutectoid (phase transformation of one solid into two solids)
which occurs at 565oC [7]. It can be categorized into three distinct series as can be seen from the
equilibrium diagram of copper-aluminium system Figure 1. They constitute the α-series, the α + series
and α + γ2 series; possessing properties that can be obtained by suitable alloying and heat treatment which
has opened immense possibilities for its application in various engineering field [8]. From the
equilibrium diagram in Figure 1, it could be seen that the - structure is stable only at high temperature
and undergoes α + γ2 transformation at about 565oC. -phase gives high hardness combined with
relatively high mechanical properties under normal condition, but severity of cooling results in the
formation of -phase martensitic structure which has lower elongation. The α/ alloys have favourable
combination of strength and corrosion resistance. The eutectoid structure of α + γ2 which has a lower
electrochemical potential corrodes at high rate and it has to be avoided. The decomposition of to α + γ2
which occurs during slow cooling or reheating in the temperature range between 550oC and 350
oC, has to
be avoided [9].
Copper-Aluminium
Fig: 1.1 Cu-Al phase diagram. (Source: Copper Development Association. (1992). Equilibrium
Diagrams.CDA Publication No.94, p. 17.)
The role of alloying elements is to stabilize -phase and effectively permit slower cooling. When these
alloying elements are present at certain composition level, they modified the structure of aluminium
bronze and instead of normal α + structure and α+ κ structure with small but tolerable amounts of -
structure formed. The complex aluminium bronze alloy which is notable for their high strength, corrosion
and erosion resistance can be cast easily without the influence of the eutectoid structure [9]. Hence, this
research work focuses on macro-addition of nickel to molten Cu-10%Al in order to improve and modify
the structure and mechanical properties of aluminium bronze. Nickel, positively affects the mechanical
and corrosion properties of alloy. For instance, addition of nickel to copper alloy, improves its strength
and durability and also resistance to corrosion and erosion cavitation [10]. Nickel is the most frequent
alloying element in aluminium bronze. Its addition has a strong influence in the stabilization of -
structure [11].

Page 63 of 366
2. Materials and Method
2.1 Materials and equipment
The under listed materials and equipment were used for the research work; pure copper scrap (99.9%),
pure aluminium scrap, nickel granules, weighing balance, crucible furnace, venier calliper, bench vice,
lathe machine, electric grinding machine, hack-saw, stainless steel crucible pot, mixer, scooping spoon,
electric blower, rammer, moulding box, impact testing machine (U1820), hardness testing machine (A
3000 H), universal tensile testing machine (model SRNO0723), emery papers of different grits, air drying
machine, metallurgical bench microscope (L 2003A) with digital camera and PHENOM ProX scanning
electron microscope.
2.2 Method
The methodology adopted to carry out these research essentially involved alloy preparation by melting
and casting techniques. The alloying element (nickel) was added separately in concentration of 1-10% by
weight to molten Cu-10%Al alloy, stirred and sand cast. Subsequently, specimens obtained from the
casting were subjected to machining and mechanical test such as ultimate tensile strength, impact
strength, yield strength, hardness and ductility. The microstructures of the samples were also studied
using, metallurgical microscope and scanning electron microscope.
2.2.1 Experimental procedure
(a) Alloy preparation: The sequence of operations followed to obtain the studied specimens and
mechanical test samples include; the use of calculated quantities of pure copper scrap, aluminium scrap,
nickel granules. The materials were weighed out in their appropriate proportions respectively using a
weighing balance. Sand mould was prepared and used for the casting of the specimens. Meanwhile,
impurities such as metals, hard lumps, stones etc. were removed from the moulding sand using 500μm
and 400μm sieves to obtained fine and uniformly distributed grain size. The sand was mixed well in a
sand mixing machine with the addition of a little quantity of water to ensure uniform distribution of the
ingredients. The foundry floor was cleared of dirty and floor board was put in place. Some moulding
sands were sprinkled on the floorboard surface and then patterns were introduced. Sand was introduced
and rammed; the ingate runner and risers, plumbago (painting materials), rammers etc. were used to
prepare the mould. The patterns were removed and the cavities created were repaired. The pattern
removal was done slowly to prevent mould damage. After the pattern was removed and mould repaired,
ash was then sprinkled on the cavities to enhance easy flow of the molten metal inside.
The furnace used for the melting operation is a crucible furnace with a crucible steel pot of maximum
controlled temperature of about 1750oC. Prior to charging of metal into the furnace, the crucible pot was
removed and properly cleaned to avoid contamination by other material inclusion.
(b) Melting and Casting of alloys: This operation was carried out to produce eleven separate specimens
for the research work. The bailout crucible furnace with steel crucible pot was pre-heat for about
10minuties. For the control sample, 163.44g of Cu and 17.18g of Al were measured out. Copper was
charged into the furnace pre-set at 1100oC and heated till it melted. Aluminium was then allowed to
dissolve in the molten copper for 6minutes and stirred properly to ensure homogeneity. The alloying
element (nickel) were then introduced separately into the melt (Cu-10%Al) based on the compositions,
after the control sample had been cast. The melt was manually stirred intermittently in order to ensure
homogeneity and facilitate uniform distribution of the alloying element. Then molten metal was poured
into the mould cavities and allowed to solidify for about 3minutes before shakeout from the mould.
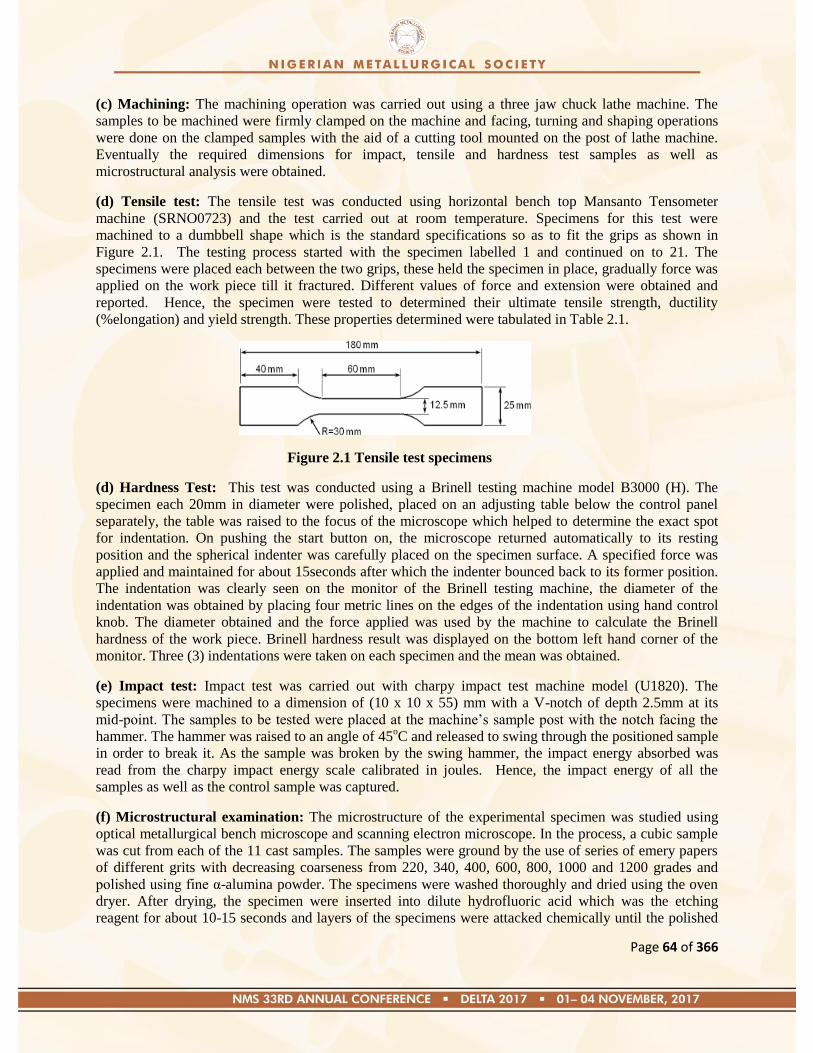
Page 64 of 366
(c) Machining: The machining operation was carried out using a three jaw chuck lathe machine. The
samples to be machined were firmly clamped on the machine and facing, turning and shaping operations
were done on the clamped samples with the aid of a cutting tool mounted on the post of lathe machine.
Eventually the required dimensions for impact, tensile and hardness test samples as well as
microstructural analysis were obtained.
(d) Tensile test: The tensile test was conducted using horizontal bench top Mansanto Tensometer
machine (SRNO0723) and the test carried out at room temperature. Specimens for this test were
machined to a dumbbell shape which is the standard specifications so as to fit the grips as shown in
Figure 2.1. The testing process started with the specimen labelled 1 and continued on to 21. The
specimens were placed each between the two grips, these held the specimen in place, gradually force was
applied on the work piece till it fractured. Different values of force and extension were obtained and
reported. Hence, the specimen were tested to determined their ultimate tensile strength, ductility
(%elongation) and yield strength. These properties determined were tabulated in Table 2.1.
Figure 2.1 Tensile test specimens
(d) Hardness Test: This test was conducted using a Brinell testing machine model B3000 (H). The
specimen each 20mm in diameter were polished, placed on an adjusting table below the control panel
separately, the table was raised to the focus of the microscope which helped to determine the exact spot
for indentation. On pushing the start button on, the microscope returned automatically to its resting
position and the spherical indenter was carefully placed on the specimen surface. A specified force was
applied and maintained for about 15seconds after which the indenter bounced back to its former position.
The indentation was clearly seen on the monitor of the Brinell testing machine, the diameter of the
indentation was obtained by placing four metric lines on the edges of the indentation using hand control
knob. The diameter obtained and the force applied was used by the machine to calculate the Brinell
hardness of the work piece. Brinell hardness result was displayed on the bottom left hand corner of the
monitor. Three (3) indentations were taken on each specimen and the mean was obtained.
(e) Impact test: Impact test was carried out with charpy impact test machine model (U1820). The
specimens were machined to a dimension of (10 x 10 x 55) mm with a V-notch of depth 2.5mm at its
mid-point. The samples to be tested were placed at the machine‘s sample post with the notch facing the
hammer. The hammer was raised to an angle of 45oC and released to swing through the positioned sample
in order to break it. As the sample was broken by the swing hammer, the impact energy absorbed was
read from the charpy impact energy scale calibrated in joules. Hence, the impact energy of all the
samples as well as the control sample was captured.
(f) Microstructural examination: The microstructure of the experimental specimen was studied using
optical metallurgical bench microscope and scanning electron microscope. In the process, a cubic sample
was cut from each of the 11 cast samples. The samples were ground by the use of series of emery papers
of different grits with decreasing coarseness from 220, 340, 400, 600, 800, 1000 and 1200 grades and
polished using fine α-alumina powder. The specimens were washed thoroughly and dried using the oven
dryer. After drying, the specimen were inserted into dilute hydrofluoric acid which was the etching
reagent for about 10-15 seconds and layers of the specimens were attacked chemically until the polished
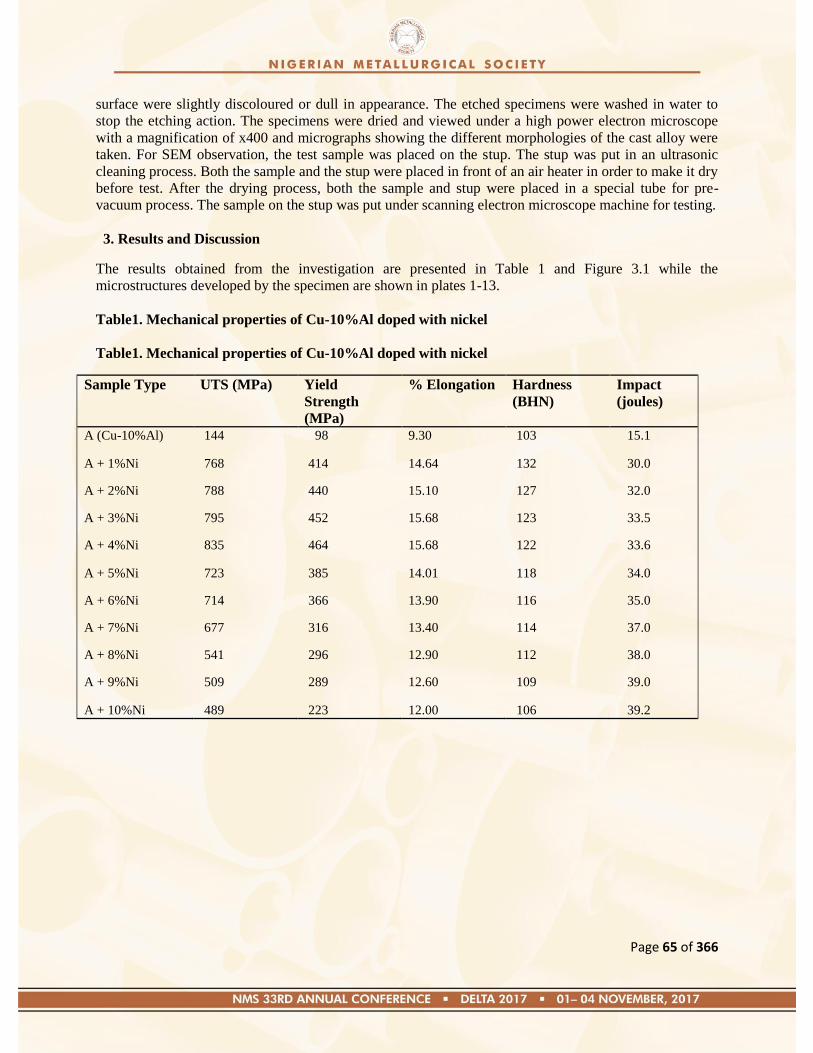
Page 65 of 366
surface were slightly discoloured or dull in appearance. The etched specimens were washed in water to
stop the etching action. The specimens were dried and viewed under a high power electron microscope
with a magnification of x400 and micrographs showing the different morphologies of the cast alloy were
taken. For SEM observation, the test sample was placed on the stup. The stup was put in an ultrasonic
cleaning process. Both the sample and the stup were placed in front of an air heater in order to make it dry
before test. After the drying process, both the sample and stup were placed in a special tube for pre-
vacuum process. The sample on the stup was put under scanning electron microscope machine for testing.
3. Results and Discussion
The results obtained from the investigation are presented in Table 1 and Figure 3.1 while the
microstructures developed by the specimen are shown in plates 1-13.
Table1. Mechanical properties of Cu-10%Al doped with nickel
Table1. Mechanical properties of Cu-10%Al doped with nickel
Sample Type UTS (MPa) Yield
Strength
(MPa)
% Elongation Hardness
(BHN)
Impact
(joules)
A (Cu-10%Al) 144 98 9.30 103 15.1
A + 1%Ni 768 414 14.64 132 30.0
A + 2%Ni 788 440 15.10 127 32.0
A + 3%Ni 795 452 15.68 123 33.5
A + 4%Ni 835 464 15.68 122 33.6
A + 5%Ni 723 385 14.01 118 34.0
A + 6%Ni 714 366 13.90 116 35.0
A + 7%Ni 677 316 13.40 114 37.0
A + 8%Ni 541 296 12.90 112 38.0
A + 9%Ni 509 289 12.60 109 39.0
A + 10%Ni 489 223 12.00 106 39.2
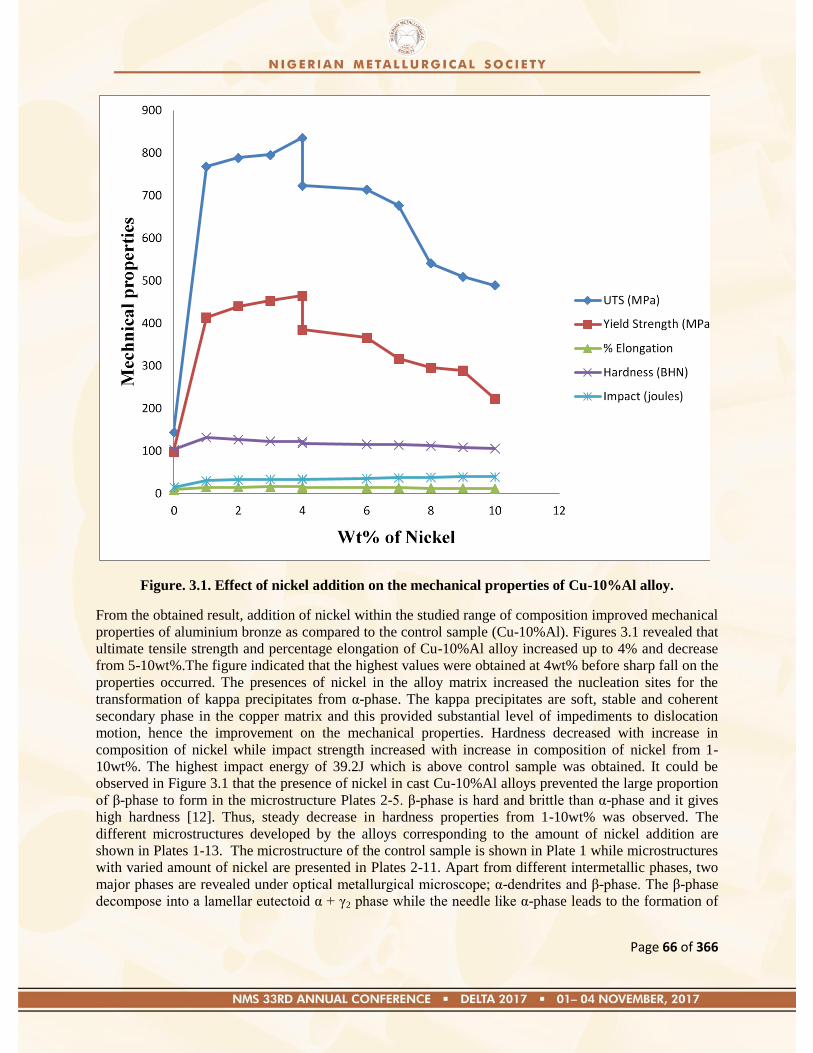
Page 66 of 366
Figure. 3.1. Effect of nickel addition on the mechanical properties of Cu-10%Al alloy.
From the obtained result, addition of nickel within the studied range of composition improved mechanical
properties of aluminium bronze as compared to the control sample (Cu-10%Al). Figures 3.1 revealed that
ultimate tensile strength and percentage elongation of Cu-10%Al alloy increased up to 4% and decrease
from 5-10wt%.The figure indicated that the highest values were obtained at 4wt% before sharp fall on the
properties occurred. The presences of nickel in the alloy matrix increased the nucleation sites for the
transformation of kappa precipitates from α-phase. The kappa precipitates are soft, stable and coherent
secondary phase in the copper matrix and this provided substantial level of impediments to dislocation
motion, hence the improvement on the mechanical properties. Hardness decreased with increase in
composition of nickel while impact strength increased with increase in composition of nickel from 1-
10wt%. The highest impact energy of 39.2J which is above control sample was obtained. It could be
observed in Figure 3.1 that the presence of nickel in cast Cu-10%Al alloys prevented the large proportion
of -phase to form in the microstructure Plates 2-5. -phase is hard and brittle than α-phase and it gives
high hardness [12]. Thus, steady decrease in hardness properties from 1-10wt% was observed. The
different microstructures developed by the alloys corresponding to the amount of nickel addition are
shown in Plates 1-13. The microstructure of the control sample is shown in Plate 1 while microstructures
with varied amount of nickel are presented in Plates 2-11. Apart from different intermetallic phases, two
major phases are revealed under optical metallurgical microscope; α-dendrites and -phase. The -phase
decompose into a lamellar eutectoid α + γ2 phase while the needle like α-phase leads to the formation of
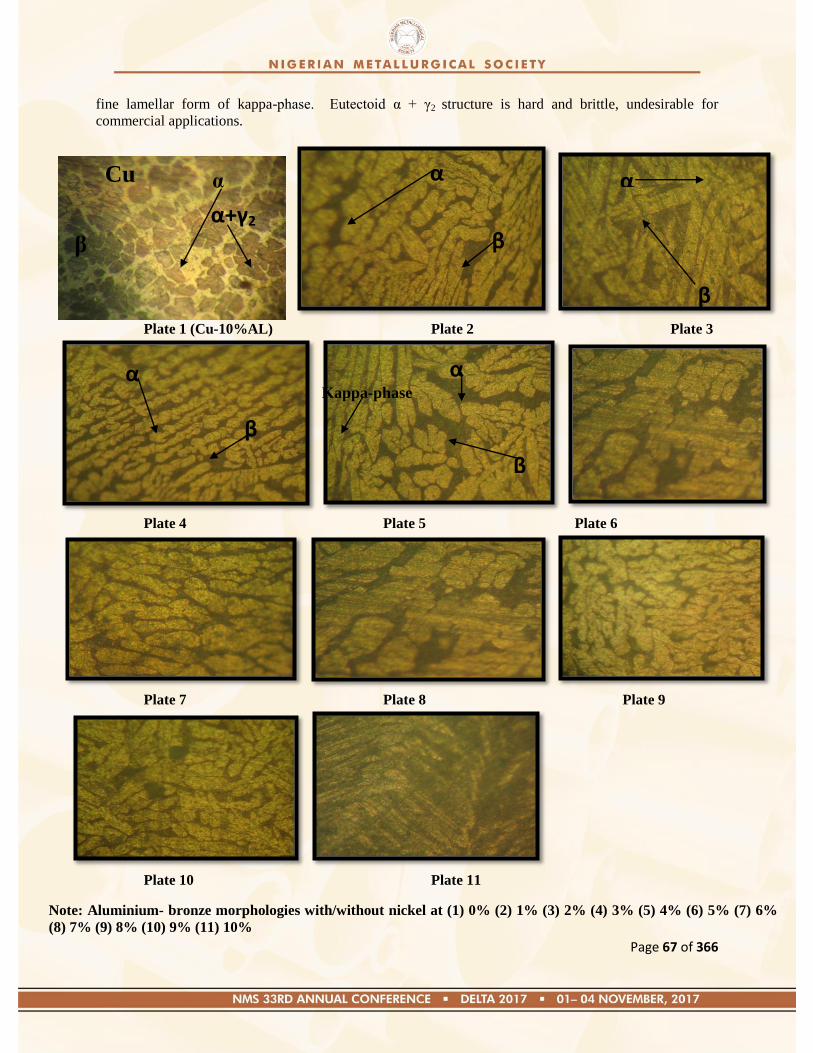
Page 67 of 366
fine lamellar form of kappa-phase. Eutectoid α + γ2 structure is hard and brittle, undesirable for
commercial applications.
Plate 1 (Cu-10%AL) Plate 2 Plate 3
Plate 4 Plate 5 Plate 6
Plate 7 Plate 8 Plate 9
Plate 10 Plate 11
Note: Aluminium- bronze morphologies with/without nickel at (1) 0% (2) 1% (3) 2% (4) 3% (5) 4% (6) 5% (7) 6%
(8) 7% (9) 8% (10) 9% (11) 10%
α+γ2
Cu α
β
α
β
α
β
α
β
α
β
Kappa-phase
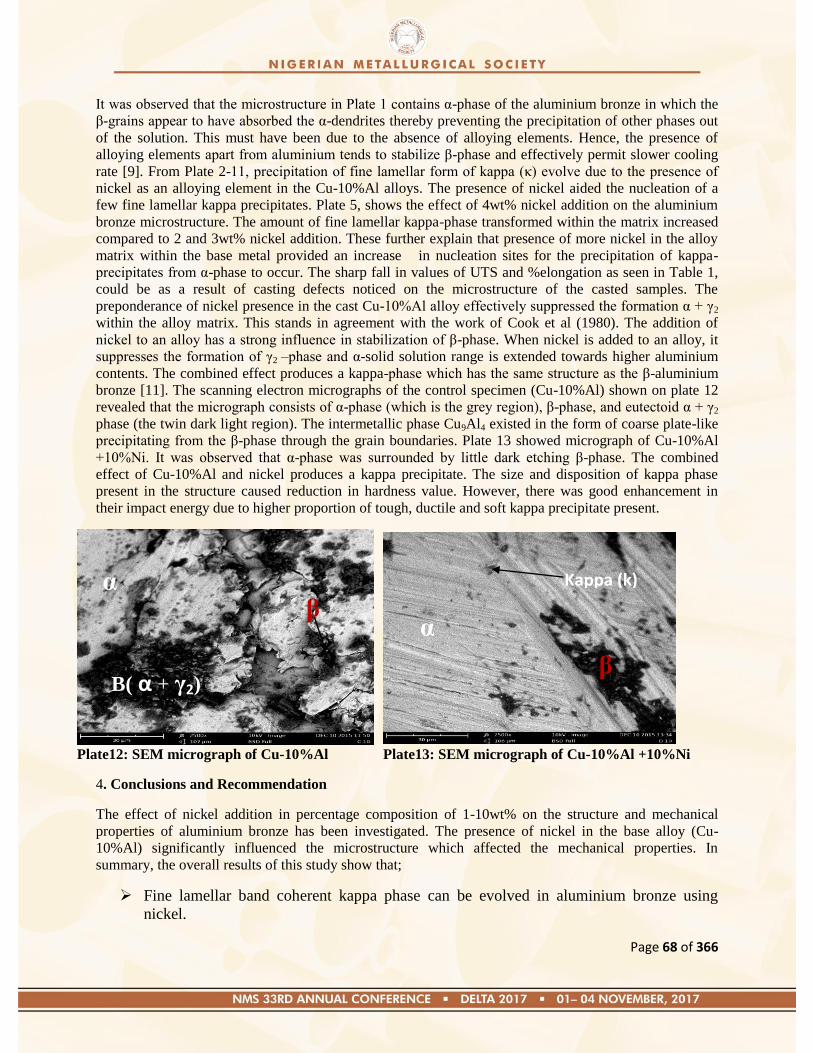
Page 68 of 366
It was observed that the microstructure in Plate 1 contains α-phase of the aluminium bronze in which the
-grains appear to have absorbed the α-dendrites thereby preventing the precipitation of other phases out
of the solution. This must have been due to the absence of alloying elements. Hence, the presence of
alloying elements apart from aluminium tends to stabilize -phase and effectively permit slower cooling
rate [9]. From Plate 2-11, precipitation of fine lamellar form of kappa (κ) evolve due to the presence of
nickel as an alloying element in the Cu-10%Al alloys. The presence of nickel aided the nucleation of a
few fine lamellar kappa precipitates. Plate 5, shows the effect of 4wt% nickel addition on the aluminium
bronze microstructure. The amount of fine lamellar kappa-phase transformed within the matrix increased
compared to 2 and 3wt% nickel addition. These further explain that presence of more nickel in the alloy
matrix within the base metal provided an increase in nucleation sites for the precipitation of kappa-
precipitates from α-phase to occur. The sharp fall in values of UTS and %elongation as seen in Table 1,
could be as a result of casting defects noticed on the microstructure of the casted samples. The
preponderance of nickel presence in the cast Cu-10%Al alloy effectively suppressed the formation α + γ2
within the alloy matrix. This stands in agreement with the work of Cook et al (1980). The addition of
nickel to an alloy has a strong influence in stabilization of -phase. When nickel is added to an alloy, it
suppresses the formation of γ2 –phase and α-solid solution range is extended towards higher aluminium
contents. The combined effect produces a kappa-phase which has the same structure as the -aluminium
bronze [11]. The scanning electron micrographs of the control specimen (Cu-10%Al) shown on plate 12
revealed that the micrograph consists of α-phase (which is the grey region), -phase, and eutectoid α + γ2
phase (the twin dark light region). The intermetallic phase Cu9Al4 existed in the form of coarse plate-like
precipitating from the -phase through the grain boundaries. Plate 13 showed micrograph of Cu-10%Al
+10%Ni. It was observed that α-phase was surrounded by little dark etching -phase. The combined
effect of Cu-10%Al and nickel produces a kappa precipitate. The size and disposition of kappa phase
present in the structure caused reduction in hardness value. However, there was good enhancement in
their impact energy due to higher proportion of tough, ductile and soft kappa precipitate present.
Plate12: SEM micrograph of Cu-10%Al Plate13: SEM micrograph of Cu-10%Al +10%Ni
4. Conclusions and Recommendation
The effect of nickel addition in percentage composition of 1-10wt% on the structure and mechanical
properties of aluminium bronze has been investigated. The presence of nickel in the base alloy (Cu-
10%Al) significantly influenced the microstructure which affected the mechanical properties. In
summary, the overall results of this study show that;
Fine lamellar band coherent kappa phase can be evolved in aluminium bronze using
nickel.
B( α + γ2)
α
β
α
Kappa (k)
β
Page 69 of 366
Increasing Ni content of the alloy up to 10% increased impact strength and decreased
hardness property.
The microstructure displayed were primary α-phase, eutectoid α+γ2-phase as well as
retained -phase. Alloying aluminium bronze with nickel led to microstructural
alterations which significantly depends on the type and parameter employed. For
instance, nickel presence in aluminium bronze system induced a stable reinforcing kappa
phase by nucleation mechanism which resulted in the enhancement of mechanical
properties.
Optimum UTS and ductility are attainable with 4wt% nickel addition to aluminium alloy.
Aluminium bronze alloyed with nickel at selected composition is therefore
recommendable for applications in automobiles and allied engineering industry.
Acknowledgement
The authors are grateful to the management and the research staff of the Standard Organization of Nigeria
(SON), Enugu and the Federal University of Technology, Owerri (FUTO) for their technical assistance.
References
[1] Copper Development Association (CDA) (1986). Aluminium bronze alloys for industry. Copper
Development Publication. No 83 pp 1-19
[2] Meigh H.J. (2007). Cast aluminium bronze properties, processes and structure: Institute of
Materials, London,pp.404.
[3] Kear G., Barkeer B.D., Stokes K.R., and Walsh F.C. (2007). Electrochemistry of non-age 90-
10 Copper-nickel alloy (UNSC70610)./ Eletrochemica Age, Vol.52, Issue 7, Pp. 2343-2351.
[4] Wharton, J. A. Barik, R. C. Kear, G. Wood, R. K. Stokes, K. R. and Walsh, F. C. (2005). The
corrosion resistance of nickel- aluminium bronze in seawater. Journals of Corrosion Science,
Vol. 47, No.12, p. 3336-3367.
[5] Pisarek, B. P. (2007). The crystallization of aluminium bronze with addition of Si, Cr, Mo,
and/ or W. Archives of materials science and engineering, Vol.28, Issue 8, pp 461-466.
[6] Copper Development Association. (1992). Equilibrium diagra ; Selected copper alloy
diagrams illustrating the major types of phase transformation. CDA Pubilications No.94
pp.17-19
[7] Hudson, N. C. And Wilson, C.V. (1966). Handbook of Metal Industry, p.1-6.
[8] Vaidyanath L. R. (1980). The manufacture of aluminium bronze casting. Journal Institute of
Metals. Pp 1-14.
[9] The copper –nickel alloys. Engineering Properties and Applications. WW 1981, pp 12
[10] Cook, M. Fentiman, W. P and Davis, E. (1980). Journals of Institute of Metals- (51-56). P.
419-429
[11] Aluminium Bronze Family: www.morganbronze.com
[12] Rowlands, J. C. (1962). Handbook of Corrosion Science, p. 89-94.
Page 70 of 366
Paper: NMS 2017-TP009
Corrosion of Roofing Sheets in a Simulated Environment
J. E. O. Ovri
Department of Materials and Metallurgical Engineering, Federal University of Technology, Owerri
ABSTRACT
An acid rain condition was simulated by mixing 0.5MHCl, 0.5 MH2S04 and 0.5MHNO3. Selected roofing
sheets (galvanized steel, aluminum/zinc alloy(Cameroon zinc) and Aluminum alloy (Alumaco) were
exposed to the simulated environment and to the various acids. The corrosion in these environments were
monitored for 28-day at an interval of 7-day using the weight loss method. The results obtained indicated
that the corrosion rates for the roofing sheets for the various environments were: galvanized steel (5.32 -
19.71mpy (HCL),9.85-39.77 mpy(H2S04), 9.03-13.69 mpy (HNO3), and 5.72-22.33 mpy (simulated
environment), aluminum/zinc alloy,6.42-17.32 mpy (HCL), 4.04-7.71 mpy (H2S04), 7.82-7.94
mpy(HN03), 3.10-3.14 mpy (simulated environment) and aluminum alloy (Alumaco ),4.57-15.49 (HCL),
2.57-3.46 mpy(H2S04), 4.79 -6.35mpy(HNO3) and 2.32-3.45mpy (simulated environment). The
galvanized steel corroded more in the simulated environment (5.72-22.33 mpy), closely followed by the
aluminum/ zinc alloy which had 3.10-3.14 mpy.The aluminum alloy had the least corrosion 2.32-3.45
mpy. It could be concluded that the aluminum alloy appeared to be a more attractive material for roofing
in the simulated environment which replicates an acid rain condition.
Keywords: Acid rain, Simulated, Aluminum/Zinc alloy, Weight loss, Environment.
1.0 Introduction
Acid rain occurs when sulphur dioxide (S02) and nitrogen oxide (N02) react with oxygen in the
air in the presence of water to form carbonic acid (H2C03) and nitrous oxide (HN02-). These fall
on the surface of roofing materials and have devastating effects. The pH of these acids are
generally lower than 5. The acid rain has in addition to the nitrous and the sulphurous oxides
contains heavy metals, carbon monoxide, and photochemical oxidants. A synergistic damaging
effects is produced by the reactions between these materials. Recall that an electrolyte is required
for corrosion to occur, roofing sheets therefore, corrode under acidic water and or condensation
that can‘t run off or become trapped. The greenhouse gases (methane, C0, C02,S03, S02, and
N02) are the main pollutants with respect (Ovri and Iroh, 2013) to corrosion. The reaction
between the pollutants and roofing sheets is complex and involved variables such as the
pollutants‘s concentration and the climatic conditions and the exposed surface of the roofing
sheet. Once the pollutant gets to the surface of the roofing sheet, the interaction will depend on
the amount, duration of exposure, reactivity of the various materials (gases, moistures etc).
Acid rain is a major environmental problem in the Niger Delta of Nigeria. This is more serious
during the raining session when the humidity is high and with the presence of the greenhouse
gases, there is an increase in the corrosion of roof sheets. The effects of acid rain on corrugated
iron sheet has been documented by ( Barton, 1997, Graedel and Schwartz, 1997 and

Page 71 of 366
Haynic,1982). The effect of gas flaming on roofing sheets in a gaseous and non-gaseous flaring
areas has been documented by( Ovri and Iroh, 2013).
This investigation is aimed at providing a data base for roofing sheets commonly used in the
Niger Delta areas of Nigeria. These areas are often plagued with acid rain. The roofing sheets
investigated were, (i) galvanized steel, (ii) Aluminum roofing sheet (Alumaco) and Aluminum /
zinc alloy roofing sheet ( Cameroon roofing sheet). The relative corrosion resistance of these
roofing sheets in the various environments were evaluated and recommendations made on the
most suitable sheets for these environments. The results of this investigation will be invaluable
to engineers, designers, Architects and builders.
2.0. Experimental procedures
2.1 Materials and Methods
2.1.1 Materials
2.1.1.1 Roofing Sheets
The roofing sheets were obtained from the open building materials market in Owerri, Imo State.
These were: (i) galvanized steel sheets,
(ii) Aluminum/ Zinc alloy (Cameroon roofing sheets), and
(iii) Aluminum roofing sheet (Alumaco).They were all in the form of corrugated sheets.
2.1.1.2: Coupons Preparation.
From each roofing sheets 60 coupons of dimensions 40mm x30mmx0.25mm were cut using a
hacked saw. A hole of 3mm diameter was drilled on each coupon for suspension in the various
environments. The chemical composition of the roofing sheets are given in Table 1.
Table 1: Chemical Composition of the Roofing Sheets. Roofing sheets Elements (Wt%)
Fe
C
Si
Mn
P
Mo Cu
Al
Ti
V
Sn
S
Cr Ni Co Nb W
Galvanized Steel 99.06 0.073 0.063 0.153 0.031 - 0.03 0.078 0.002 0.021 0.047
0.030
0.046 0.009 0.013 0.117 0.1
19
Aluminum/Zinc
Alloy
0.317 - 0.064 0.020 - - 0.22 99.14 0.25 0.012 0.002
(Zn)
- - - - - -
Aluminum Alloy 0.50 - 0.12 0.23 - - 0.07 96.43 0.02 0.015 0.06
(Zn)
0.006
(Ca)
0.02 0.34 - - -
2.1.2 : Environments
Four environments were used during the study. These were:
(i) 0.5 MH2SO4 ( Tetra-sulphate(iv)acid) to provide the sulphate ions.
(ii) 0.5 MHCL (Hydrochloric acid) to provide the chloride ions.
(iii) 0.5 MHNO3(Tri-oxonitrate(v) acid) to provide the nitrate ions.
(iv) Mixture of 0.5MH2SO4, 0.5MHCL and 0.5MHNO3 to provide the simulated
environment.
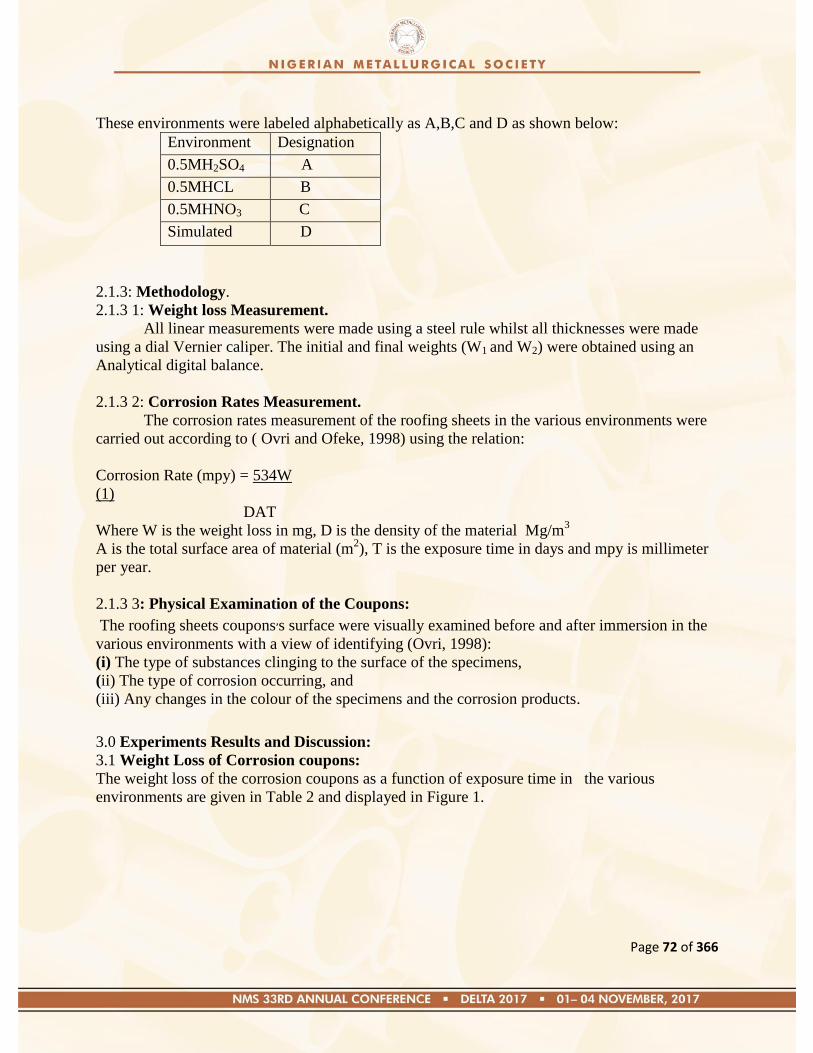
Page 72 of 366
These environments were labeled alphabetically as A,B,C and D as shown below:
Environment Designation
0.5MH2SO4 A
0.5MHCL B
0.5MHNO3 C
Simulated D
2.1.3: Methodology.
2.1.3 1: Weight loss Measurement.
All linear measurements were made using a steel rule whilst all thicknesses were made
using a dial Vernier caliper. The initial and final weights (W1 and W2) were obtained using an
Analytical digital balance.
2.1.3 2: Corrosion Rates Measurement.
The corrosion rates measurement of the roofing sheets in the various environments were
carried out according to ( Ovri and Ofeke, 1998) using the relation:
Corrosion Rate (mpy) = 534W
(1)
DAT
Where W is the weight loss in mg, D is the density of the material Mg/m3
A is the total surface area of material (m2), T is the exposure time in days and mpy is millimeter
per year.
2.1.3 3: Physical Examination of the Coupons:
The roofing sheets coupons’s surface were visually examined before and after immersion in the
various environments with a view of identifying (Ovri, 1998):
(i) The type of substances clinging to the surface of the specimens,
(ii) The type of corrosion occurring, and
(iii) Any changes in the colour of the specimens and the corrosion products.
3.0 Experiments Results and Discussion:
3.1 Weight Loss of Corrosion coupons:
The weight loss of the corrosion coupons as a function of exposure time in the various
environments are given in Table 2 and displayed in Figure 1.
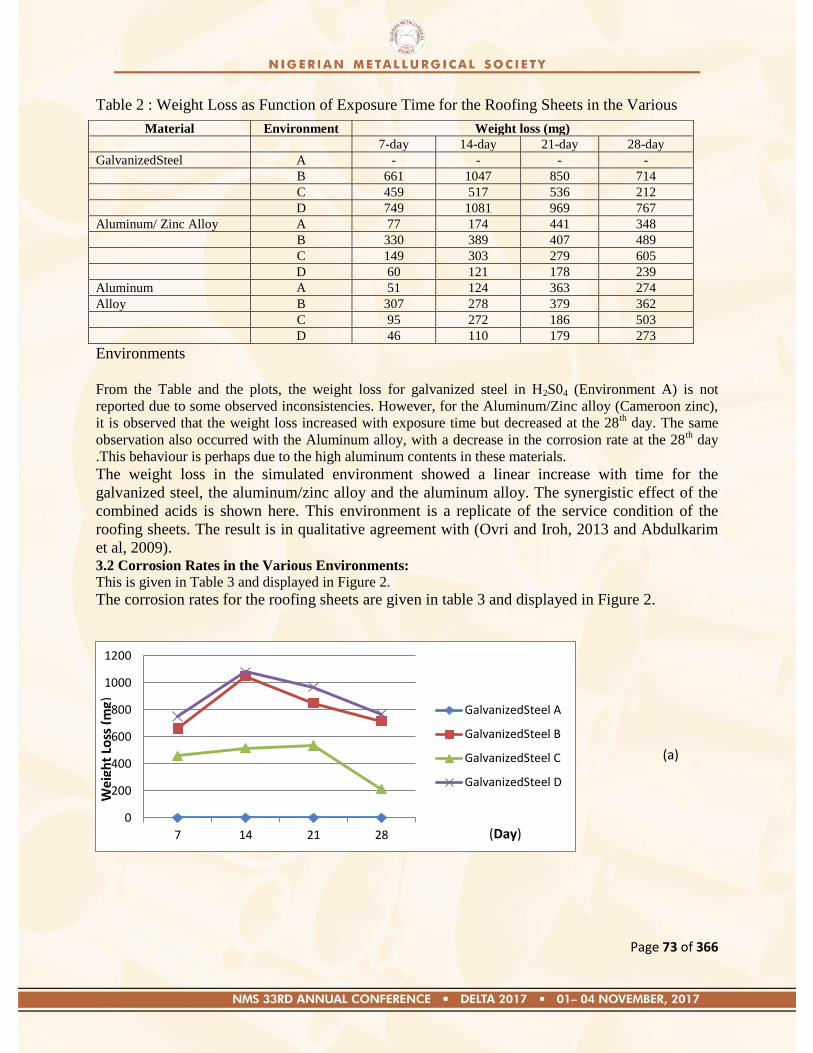
Page 73 of 366
Table 2 : Weight Loss as Function of Exposure Time for the Roofing Sheets in the Various
Environments
From the Table and the plots, the weight loss for galvanized steel in H2S04 (Environment A) is not
reported due to some observed inconsistencies. However, for the Aluminum/Zinc alloy (Cameroon zinc),
it is observed that the weight loss increased with exposure time but decreased at the 28th day. The same
observation also occurred with the Aluminum alloy, with a decrease in the corrosion rate at the 28th day
.This behaviour is perhaps due to the high aluminum contents in these materials.
The weight loss in the simulated environment showed a linear increase with time for the
galvanized steel, the aluminum/zinc alloy and the aluminum alloy. The synergistic effect of the
combined acids is shown here. This environment is a replicate of the service condition of the
roofing sheets. The result is in qualitative agreement with (Ovri and Iroh, 2013 and Abdulkarim
et al, 2009). 3.2 Corrosion Rates in the Various Environments: This is given in Table 3 and displayed in Figure 2.
The corrosion rates for the roofing sheets are given in table 3 and displayed in Figure 2.
0
200
400
600
800
1000
1200
7 14 21 28
GalvanizedSteel A
GalvanizedSteel B
GalvanizedSteel C
GalvanizedSteel D
Material Environment Weight loss (mg)
7-day 14-day 21-day 28-day
GalvanizedSteel A - - - -
B 661 1047 850 714
C 459 517 536 212
D 749 1081 969 767
Aluminum/ Zinc Alloy A 77 174 441 348
B 330 389 407 489
C 149 303 279 605
D 60 121 178 239
Aluminum A 51 124 363 274
Alloy B 307 278 379 362
C 95 272 186 503
D 46 110 179 273
(Day)
(a)
Wei
ght
Loss
(m
g)
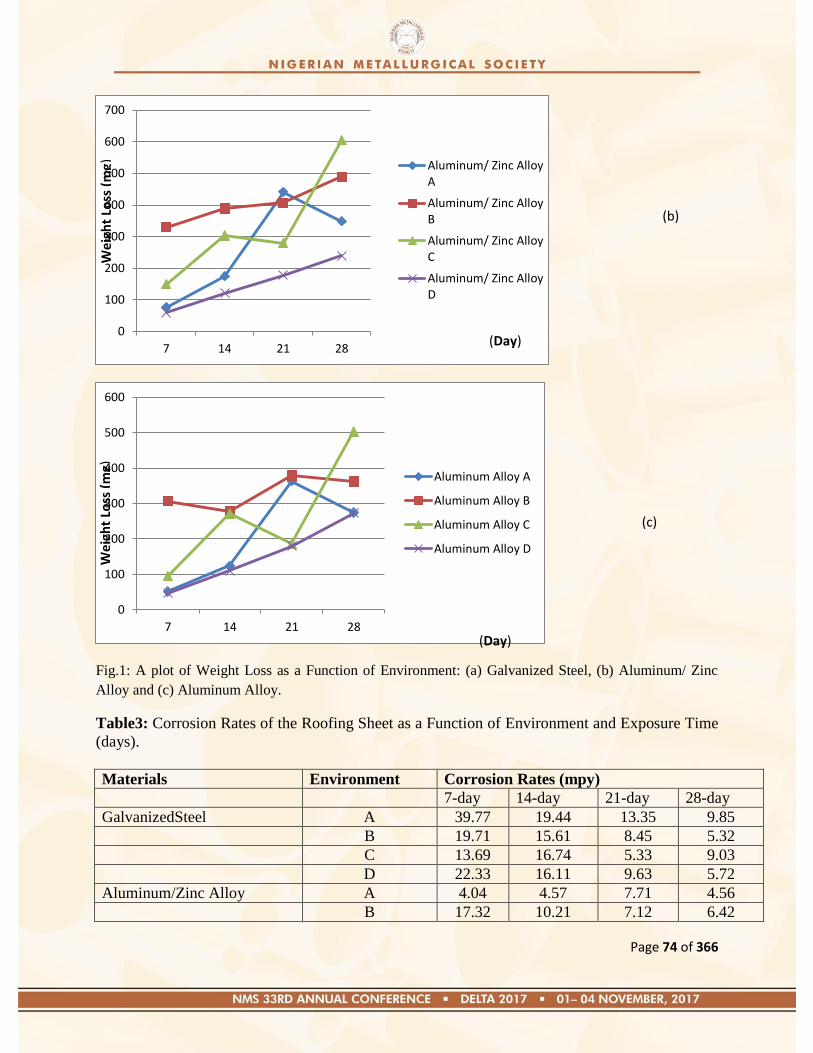
Page 74 of 366
Fig.1: A plot of Weight Loss as a Function of Environment: (a) Galvanized Steel, (b) Aluminum/ Zinc
Alloy and (c) Aluminum Alloy.
Table3: Corrosion Rates of the Roofing Sheet as a Function of Environment and Exposure Time
(days).
Materials Environment Corrosion Rates (mpy)
7-day 14-day 21-day 28-day
GalvanizedSteel A 39.77 19.44 13.35 9.85
B 19.71 15.61 8.45 5.32
C 13.69 16.74 5.33 9.03
D 22.33 16.11 9.63 5.72
Aluminum/Zinc Alloy A 4.04 4.57 7.71 4.56
B 17.32 10.21 7.12 6.42
0
100
200
300
400
500
600
700
7 14 21 28
Aluminum/ Zinc AlloyA
Aluminum/ Zinc AlloyB
Aluminum/ Zinc AlloyC
Aluminum/ Zinc AlloyD
0
100
200
300
400
500
600
7 14 21 28
Aluminum Alloy A
Aluminum Alloy B
Aluminum Alloy C
Aluminum Alloy D
(Day)
(Day)
We
igh
t Lo
ss (
mg)
(c)
(b)
Wei
ght
Loss
(m
g)
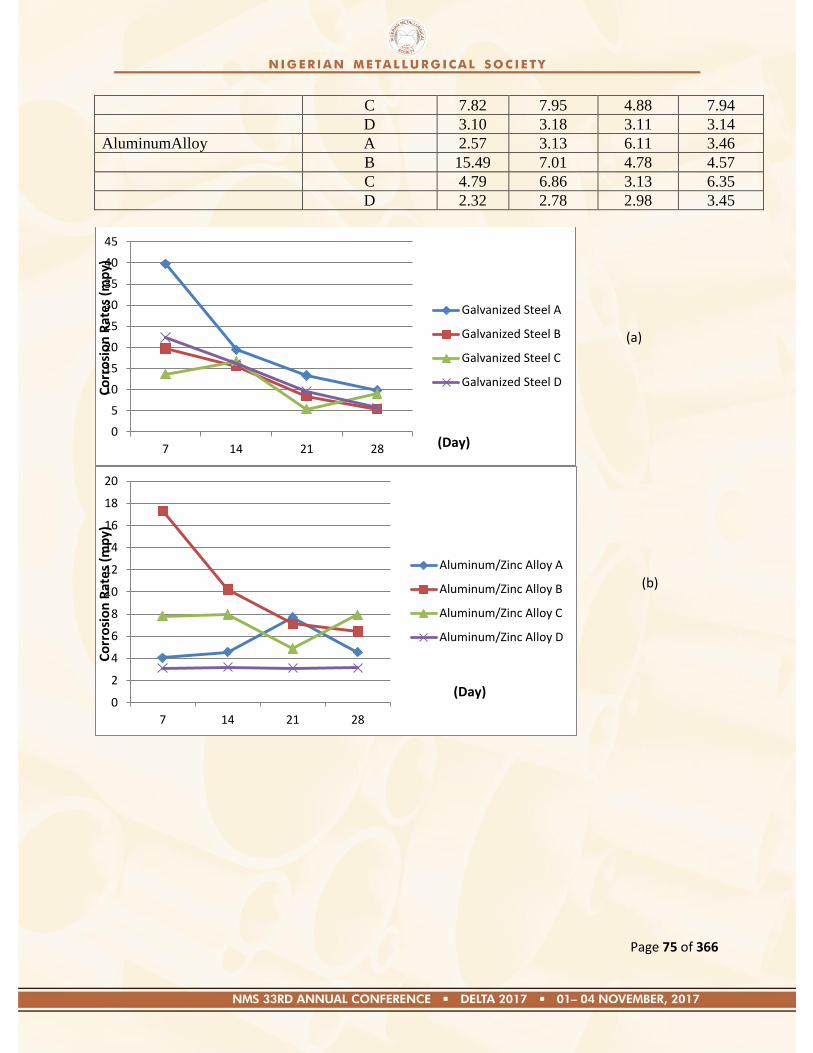
Page 75 of 366
C 7.82 7.95 4.88 7.94
D 3.10 3.18 3.11 3.14
AluminumAlloy A 2.57 3.13 6.11 3.46
B 15.49 7.01 4.78 4.57
C 4.79 6.86 3.13 6.35
D 2.32 2.78 2.98 3.45
0
5
10
15
20
25
30
35
40
45
7 14 21 28
Galvanized Steel A
Galvanized Steel B
Galvanized Steel C
Galvanized Steel D
0
2
4
6
8
10
12
14
16
18
20
7 14 21 28
Aluminum/Zinc Alloy A
Aluminum/Zinc Alloy B
Aluminum/Zinc Alloy C
Aluminum/Zinc Alloy D
(a)
(Day)
Co
rro
sio
n R
ate
s (m
py)
(b)
(Day)
Co
rro
sio
n R
ate
s (m
py)
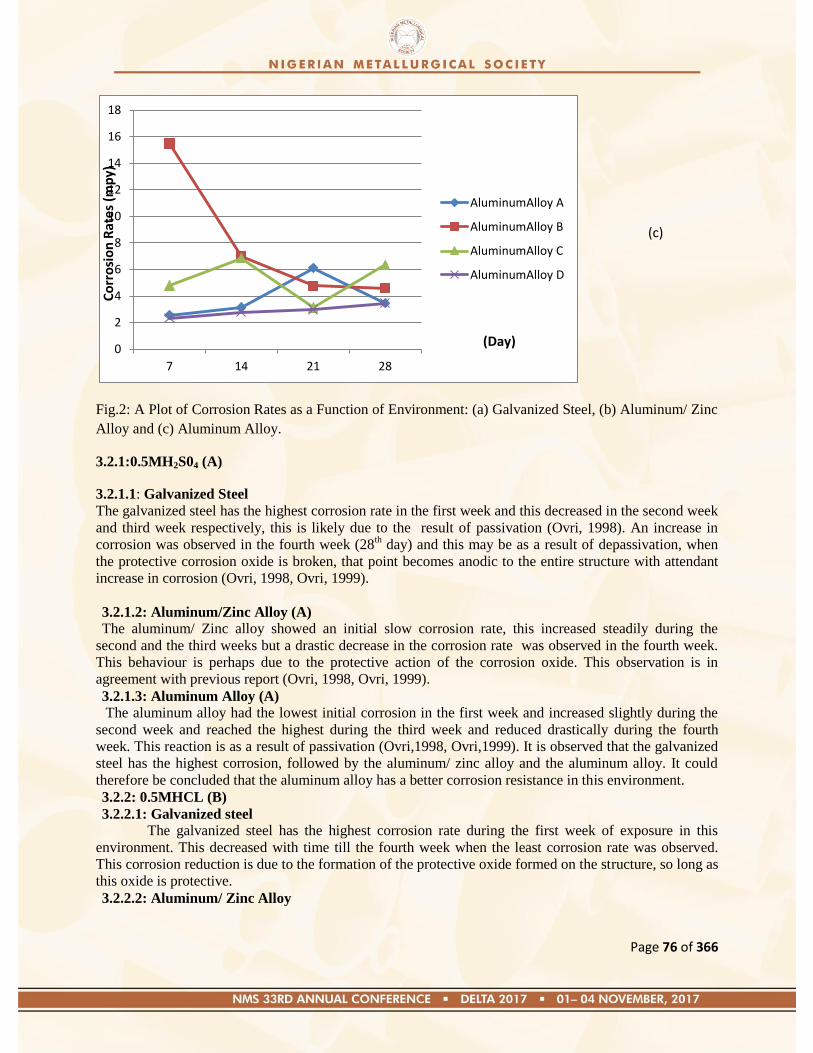
Page 76 of 366
Fig.2: A Plot of Corrosion Rates as a Function of Environment: (a) Galvanized Steel, (b) Aluminum/ Zinc
Alloy and (c) Aluminum Alloy.
3.2.1:0.5MH2S04 (A)
3.2.1.1: Galvanized Steel
The galvanized steel has the highest corrosion rate in the first week and this decreased in the second week
and third week respectively, this is likely due to the result of passivation (Ovri, 1998). An increase in
corrosion was observed in the fourth week (28th day) and this may be as a result of depassivation, when
the protective corrosion oxide is broken, that point becomes anodic to the entire structure with attendant
increase in corrosion (Ovri, 1998, Ovri, 1999).
3.2.1.2: Aluminum/Zinc Alloy (A)
The aluminum/ Zinc alloy showed an initial slow corrosion rate, this increased steadily during the
second and the third weeks but a drastic decrease in the corrosion rate was observed in the fourth week.
This behaviour is perhaps due to the protective action of the corrosion oxide. This observation is in
agreement with previous report (Ovri, 1998, Ovri, 1999).
3.2.1.3: Aluminum Alloy (A)
The aluminum alloy had the lowest initial corrosion in the first week and increased slightly during the
second week and reached the highest during the third week and reduced drastically during the fourth
week. This reaction is as a result of passivation (Ovri,1998, Ovri,1999). It is observed that the galvanized
steel has the highest corrosion, followed by the aluminum/ zinc alloy and the aluminum alloy. It could
therefore be concluded that the aluminum alloy has a better corrosion resistance in this environment.
3.2.2: 0.5MHCL (B)
3.2.2.1: Galvanized steel
The galvanized steel has the highest corrosion rate during the first week of exposure in this
environment. This decreased with time till the fourth week when the least corrosion rate was observed.
This corrosion reduction is due to the formation of the protective oxide formed on the structure, so long as
this oxide is protective.
3.2.2.2: Aluminum/ Zinc Alloy
0
2
4
6
8
10
12
14
16
18
7 14 21 28
AluminumAlloy A
AluminumAlloy B
AluminumAlloy C
AluminumAlloy D
(Day)
Co
rro
sio
n R
ate
s (m
py)
(c)
Page 77 of 366
The initial corrosion is slightly lower than that of the galvanized steel. This decrease with time
(second and third week) but slightly increase during the fourth week and this is due to depassivation of
the protective corrosion oxide (Ovrl, 1999).
3.2.2.3: Aluminum Alloy(B)
The initial corrosion rate is also lower and steadily decreased with time. This decrease in corrosion is
due in part to the protective corrosion product formed on the structure. It could be inferred that the
aluminum alloy provides a better corrosion resistance in this environment, followed by the aluminum/
zinc alloy.
3.2.3.4: 0.5 MHNO3 (C)
3.2.3.1: Galvanized Steel
The galvanized steel has a higher initial corrosion and increased during the second week and
decreased during the third week due in part to passivation. The corrosion rate increased during the fourth
week.
3.2.3.2: Aluminum Alloy (C)
The corrosion rates are generally lower than the aluminum/zinc and galvanized steel. The
corrosion rate increased during the second week and decreased dramatically during the third week and
increased during the fourth week. The aluminum alloy appeared to provide good corrosion resistance in
this environment.
3.3: Simulated Environment
This environment provides a near condition in which the roofing sheets are used. The synergistic
actions of the acids are shown here.
3.3.1: Galvanized Steel (D)
The corrosion of the galvanized steel is generally higher, decreasing with exposure times due
perhaps to passivation effects.The galvanized steel is similar to the standard steel grade 1020 with a
carbon content of about 0.0734%. This carbon content will give a purely ferritic structure with little
pearlite. Ferrite is a very corrosive phase, and its present will act as an anode to the entire structure. This
perhaps explained the high corrosion of the steel in this environment.
3.3.2: Aluminum/ Zinc Alloy (D)
The corrosion rates of the aluminum/ zinc alloy is essentially constant in this environment (the
lowest being 3.10 and highest 3.18 mpy). This material has a high aluminum content of approximately
99.14% Al. With this high aluminum content coupled with the zinc coating, it is expected that this
material would possess good corrosion resistance. Other materials present like silicon (0.0644%),
manganese, chromium, titanium will improve corrosion resistance.
3.3.3: Aluminum Alloy(D)
The corrosion rates are given in Table 3 and displayed in Figure 2, shows that the corrosion rates is
generally lower and increased marginally with time. A slightly higher corrosion rate was obtained in the
fourth week, which is likely due to depassivation (as a result of the breakdown of the protective corrosion
oxide). The aluminum content of this material is lower than that of the aluminum/ zinc alloy (96.43%).
The high corrosion resistance of this material is perhaps due to the alloying elements present in this
material which are generally higher than those of the aluminum/ zinc alloy. The galvanized steel has
higher corrosion, followed by the aluminum/zinc alloy and the aluminum alloy has the least corrosion in
this medium. It would therefore be concluded that the aluminum alloy is the most suitable material for
this environment.
4.0: Physical Examination Results
The physical examination results are given in Table 4 and all the observed features for each material and
environments are given.
Page 78 of 366
Table 4: Physical Examination Results for the Roofing Sheets
Environment Galvanized Steel Aluminum/Zinc Aluminum Alloy
H2S04 (A) Totally dissolved Localized Pitting Very dull Surface
HCL (B) Weight loss with thick
brownish deposits
Roughening of the surface,
Grey deposits
More roughing of the
surface with grey
deposits
HNO3 ( C) Totally Dissolved Increase localized pitting Peeling of coating
Simulated Total wear of the surface,
heavy rust (uniform
corrosion)
Very dull surface with grey
deposits
Dull surface, increased
roughing almost looking
like pits.
5.0: Conclusions
The following conclusions could be drawn from this investigation:
(1) Galvanized Steel, Aluminum/Zinc and Aluminum alloys had higher corrosion rates in the
H2SO4 evironment than in the HCL,HNO3 and the simulated environments.
(2) Galvanized Steel corroded more in the simulated environment whilst the Aluminum alloy
had the least corrosion followed by the Aluminum/Zinc alloy. The Aluminum alloy is preferred
as the most suitable material for these environments.
(3) The Aluminum alloy appeared to be more corrosion resistant in all the environments
investigated and it is therefore recommended for use in these environments.
(4) The Synergistic effects of mixing acids improved the corrosion resistance for the
Aluminum/Zinc and the Aluminum alloys whilst the Galvanized steel corrosion rates were
increased.
(5) The physical examination of the various roofing sheets showed that corrosion were more
severe in galvanized steel in the H2SO4 and HNO3 and less for the simulated environment.
localized pitting were observed for the Aluminum/Zinc and Aluminum alloys for the acids whilst
a dull and grey deposits where found for the simulated environment.
Acknowledgement
The author wish to acknowledge the assistance of Miss Chioma Okechukwu for providing some
of the experimental data.
References.
(1)Abdulkarim, B.I, Yusuf, A. A. and Kamoru, A. S., (2004). ―Corrosion Resistance of
Commercial Roofing Sheets to Acid Rain Water in Eleme, Rivers State Nigeria‖ Int. Journ.
Chem. Techn. Res., Vol. 1, No. 4, PP 802 – 806.
(2)ASTM International, (2009) ―Standard Practice for Laboratory Immersion of Corrosion
Testing of Metals‖ American Society for Testing and Materials, Philadelphia.
(3)Barton, K., (1997): Protection Against Atmospheric Corrosion Theories Methods, Vol. 3,
John Wiley and Sons, London.
(4)Branko, N. P., (2015): Corrosion Engineering Principles and Solved Problems, Elsevier, B.V.
(5) Bushman, J. B., (2000): Corrosion and Cathodic Protection, Bushman and Associates Inc,
Medina Ohio, U.S.A, P89-150.
Page 79 of 366
(6) Chukwuocha, E. and Owate, I. O. (2002): ―Corrosion Resistance of Metals‖ Journ. Appl.
Sci. and Environ. Mag., University of PortHarCourt, Vol. 6, No. 2, PP 33-35.
(7) Ehterain, A.N. and Aisha, H. A., (2008): ―Corrosion Behaviour of Mild Steel in Hydrochloric
Acid Solution‖, Int. Journ. Electochem. Sci., 3 ,PP 806-818.
(8) Einar, B., (2004): Corrosion and Protection, Springer Vertag, London Limited, PP 89-237.
(9) Heinler, B. and Vannerberg, N., (2003) ―A Microscopic Study of Steel Surfaces Exposed to a
Humid Sulphur Dioxide Containing Atmosphere‖ Corrosion Science, P579.
(10) Micafferty, E., (2005): Corrosion Science, 47, P3202.
(11)Nwoko, V. O. and Umoru, L. E., (1998): ―Corrosion of Mild Steel in Some Environments‖
Journ. Corr. Sci. Vol.1, PP 61-65.
(12) Oforka, N.C.,Wogu, C. I. and Abiola, O. K., (2004): ― Inhibition of Acid Corrosion of
Galvanized Steel by I – phenyl- 3 –Methlpyrazol – 5 –one‖, Journ. Corr. Sci. Tech. 3, PP 101 -
103.
(13) Osarolube, E., Owate, I. O. and Oforka, N. C., (2004): ―The Influence of Acidic
Concentration on Corrosion of Copper and Zinc‖ Journ. Corr. Sci. Techn. 1.1, PP 66-69.
(14) Ovri, J. E. O., (1998): ―Corrosion of Mild Steel in Concrete in Acidic and Fresh Water
Environments‖ Journ. Corr. Sci. Vol. PP 1-9.
(15) Ovri, J. E. O., (1998): ―Corrosion Resistance of MgMnZn Ferrite in Hostile Environments‖
-libid-,PP 65-71
(16) Ovri, J. E. O. and Iroh, M., (2013): ―Corrosion Effect of Gas Flaring on Roofing Sheets in
Imo State, Nigeria‖ Inter. Journ. Eng.Sci. (IJES), Vol. 2 Issue 1, PP 339 -346.
(17) Ovri, J.E.O. and Ofeke,B.G.,(1998): ―The Corrosion Behaviour of Mild Steel in a Marine
Environment‖ J.Sci. Engr. Tech. 5 (2), June, pp1117-1129.
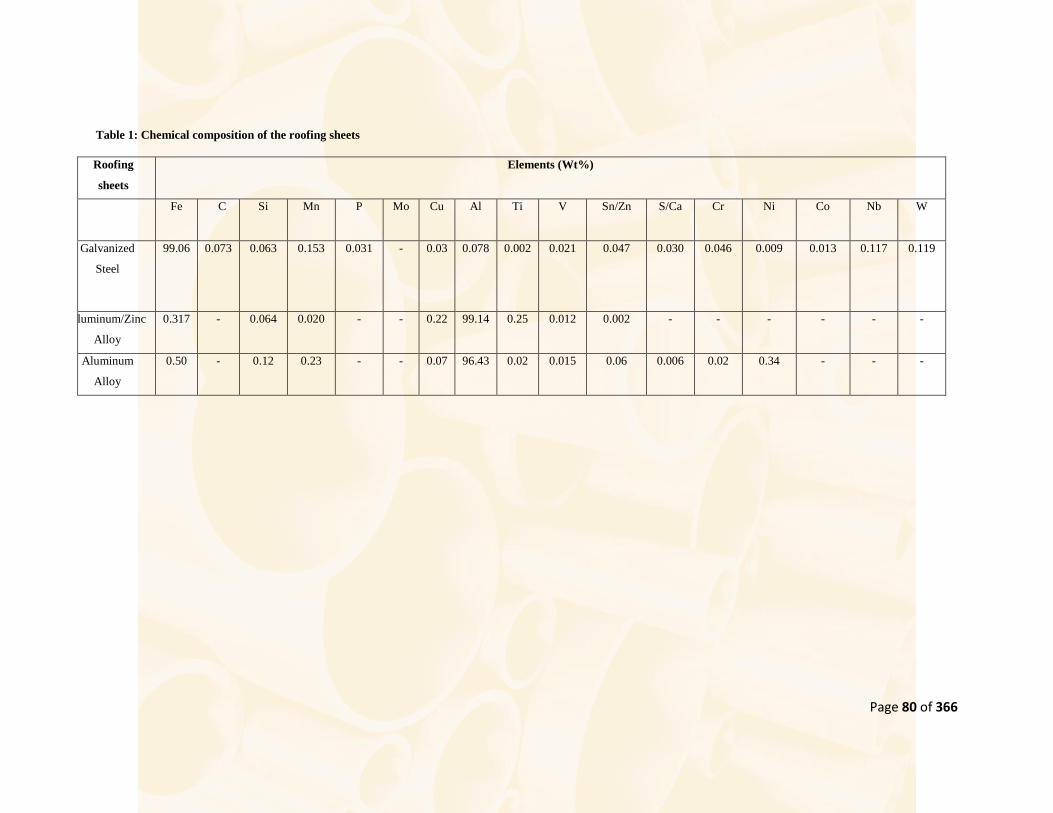
Page 80 of 366
Table 1: Chemical composition of the roofing sheets
Roofing
sheets
Elements (Wt%)
Fe
C
Si
Mn
P
Mo Cu
Al
Ti
V
Sn/Zn
S/Ca
Cr Ni Co Nb W
Galvanized
Steel
99.06 0.073 0.063 0.153 0.031 - 0.03 0.078 0.002 0.021 0.047
0.030
0.046 0.009 0.013 0.117 0.119
Aluminum/Zinc
Alloy
0.317 - 0.064 0.020 - - 0.22 99.14 0.25 0.012 0.002 - - - - - -
Aluminum
Alloy
0.50 - 0.12 0.23 - - 0.07 96.43 0.02 0.015 0.06 0.006 0.02 0.34 - - -
Page 81 of 366
Paper: NMS 2017-TP010
Anti-Corrosion of Co-Deposition of Zn-ZnO-Ant Hill Particulate Composite Coating on
Mild Steel
V. S. Aigbodion, I .Y. Suleiman, C. Ocheri, C. A. Nwasike
Department of Metallurgical and Materials Engineering, University of Nigeria, Nsukka, Nigeria
Abstract
In this work Co-deposition of Zn-ZnO-Ant hill powder composite coating on mild steel was
reported. The Ant hill powder was varies from 0 to 25g. The coating thickness,
microstructure, hardness values, wear rate and potentiodynamic polarization in simulated sea
water were determined. The hardness values, wear and corrosion rate were enhances.
Maximium corrosion protection efficiency of 92.86% was obtained at Zn-ZnO-25gAnt hill
addition. The work has established that Zn-ZnO-Ant hill powder composite coating on mild
steel is promising.
Keywords: Ant hill, Corrosion, Co-deposition, Microstructure and Wear
1.0 INTRODUCTION
The corrosion of Pipelines is a major challenge in the petroleum industry. Huge amount of
money is used to prevent corrosion problem worldwide. The petroleum industry used
different corrosion prevention method to combat this problem. Such of the method are:
Cathodic protection, coating, materials selection and design [1-5]. Among these method
coating is one of the older method of corrosion prevention method. Before now most of the
surface coatings were used to combat the effect of external corrosion [6]. Recently
development in the field of surface coating is co-deposition. Co-deposition can be used to
combat both internal and external corrosion.
Many researchers have worked on these noble area: Among the researches are: Tolumoye et
al [7] studied co-deposition of Zn-Ni-SiO2 composites coating on mild steel, Tamilselvi et
al[8] reported on nano SiO2 incorporated nano Zinc phosphate coatings on mild steel at
low temperature for better corrosion protection. Praveen et al[9] reported on Co-
deposition of Zinc metal matrix with ZnO composite using electrolytic chloride based
coating. The corrosion resistance of electrolytic Zinc-coating on mild steel in seawater was
investigated by Durodola et al[10]. Popoola and Co-Worker [11] reported on the surface
modification of Zn-ZnO-SiO2 nano composite coating on mild steel. Ghaziof and Gao[12]
reported on Zn-Ni-Al2O3 nanocomposite coatings on mild steel using a novel sol enhanced
electroplating method. Fayomi et al [13] reported on the microstructural, mechanical and
anti-corrosion properties of nanocomposite Zn–Al coating containing SnO2 nanoparticles
prepared from sulphates electrolyte by electrodeposition. From the above literature review it
was clear that the use of Zinc plating is promising. Also the possible use of Ant hill powder
has not be giving much attention for the Co-deposition of mild steel.
Page 82 of 366
2.0 MATERIALS AND METHOD
2.1Materials
Mild steel with compositions commonly used in the construction of Pipeline was used in this
work [1]. The mild was grounded and polished and cut to a dimension of 20mm by 20mm.
Other materials used for the purpose of this work include: pure zinc plate anode, anti-hill
powder, orange juice as additive, pure zinc powder, Zinc Chloride, Ammonia Chloride,
Boric Acid, Thiourea, Zinc oxide.
2.2 Method
2.2.1 Co-Deposition process
Distilled water and analytical grade chemicals were used to prepare the bath composition
(see Table 1). The various compositions were dissolved in one litre of distilled water; the
solution was stirred for an hour. 500ml of the prepared solution was poured into a 500ml
beaker and the solution was stirred with a magnetic stirrer.
Table 1: Bath Composition
Composition Mass concentration g/L
Zinc Chloride 100
Ammonia Chloride 30
Boric Acid 10
Thiourea 5
Zinc oxide
10
Ant-hill 0-25
The plating sample (cathode) and the Zinc (anode) were connected to a Direct Current
(DC) power source using a rectifier. A voltage of 5volts and current 0.5Amperes was used for
the Co-deposition. The coating formulation of Zn-ZnO-xAnt hill powder(x=0, 5, 10, 15, 20,
25) was used. The Co-deposition was done for 20 minutes. After plating the samples were
removed and rinsed in distilled water and dried.
2.2.2 Characterization of the Electrodeposited Samples
The thicknesses of the coated samples were determined using coating thickness gauge
machine model BC-770. The morphology of the samples was determined by Scanning
Electron Microscope (SEM) Model: VEGA 3 TESCAN complemented by energy dispersive
spectrometer (EDS).
The corrosion test was conducted on electrochemical tester Model: CHI604E. The test was
conducted in accordance with ASTM G199 - 09(2014 Standard Guide for Electrochemical
Measurement. An electrochemical cell of the simulated sea water solution as electrolyte,
consisting of three electrodes, the working electrode (sample), counter electrode (graphite
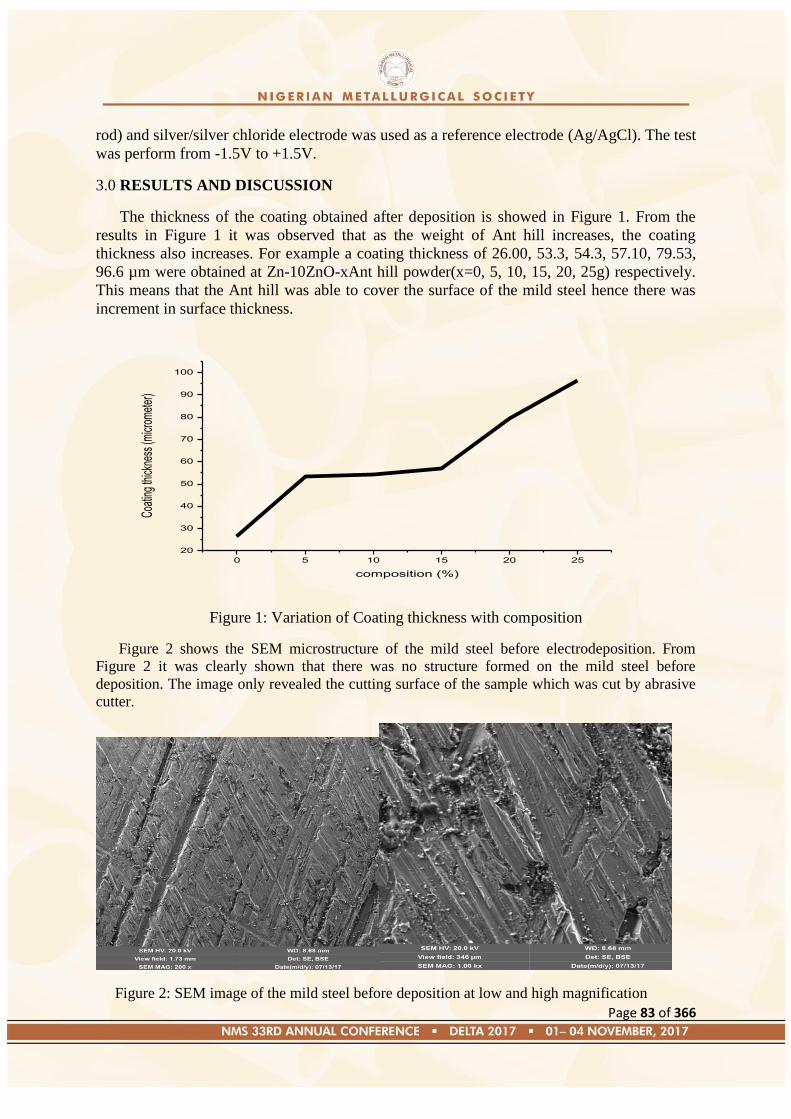
Page 83 of 366
rod) and silver/silver chloride electrode was used as a reference electrode (Ag/AgCl). The test
was perform from -1.5V to +1.5V.
3.0 RESULTS AND DISCUSSION
The thickness of the coating obtained after deposition is showed in Figure 1. From the
results in Figure 1 it was observed that as the weight of Ant hill increases, the coating
thickness also increases. For example a coating thickness of 26.00, 53.3, 54.3, 57.10, 79.53,
96.6 µm were obtained at Zn-10ZnO-xAnt hill powder(x=0, 5, 10, 15, 20, 25g) respectively.
This means that the Ant hill was able to cover the surface of the mild steel hence there was
increment in surface thickness.
Figure 1: Variation of Coating thickness with composition
Figure 2 shows the SEM microstructure of the mild steel before electrodeposition. From
Figure 2 it was clearly shown that there was no structure formed on the mild steel before
deposition. The image only revealed the cutting surface of the sample which was cut by abrasive
cutter.
Figure 2: SEM image of the mild steel before deposition at low and high magnification
0 5 10 15 20 25
20
30
40
50
60
70
80
90
100
Coat
ing
thick
ness
(micr
omet
er)
composition (%)
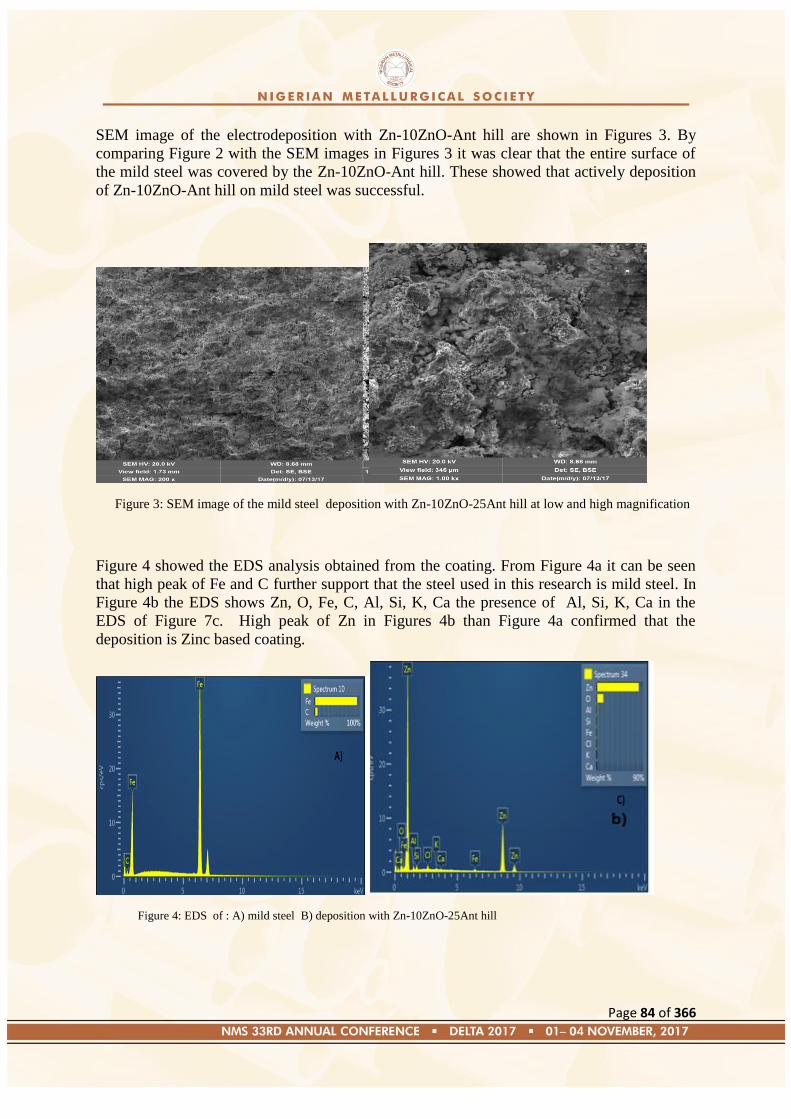
Page 84 of 366
SEM image of the electrodeposition with Zn-10ZnO-Ant hill are shown in Figures 3. By
comparing Figure 2 with the SEM images in Figures 3 it was clear that the entire surface of
the mild steel was covered by the Zn-10ZnO-Ant hill. These showed that actively deposition
of Zn-10ZnO-Ant hill on mild steel was successful.
Figure 3: SEM image of the mild steel deposition with Zn-10ZnO-25Ant hill at low and high magnification
Figure 4 showed the EDS analysis obtained from the coating. From Figure 4a it can be seen
that high peak of Fe and C further support that the steel used in this research is mild steel. In
Figure 4b the EDS shows Zn, O, Fe, C, Al, Si, K, Ca the presence of Al, Si, K, Ca in the
EDS of Figure 7c. High peak of Zn in Figures 4b than Figure 4a confirmed that the
deposition is Zinc based coating.
Figure 4: EDS of : A) mild steel B) deposition with Zn-10ZnO-25Ant hill
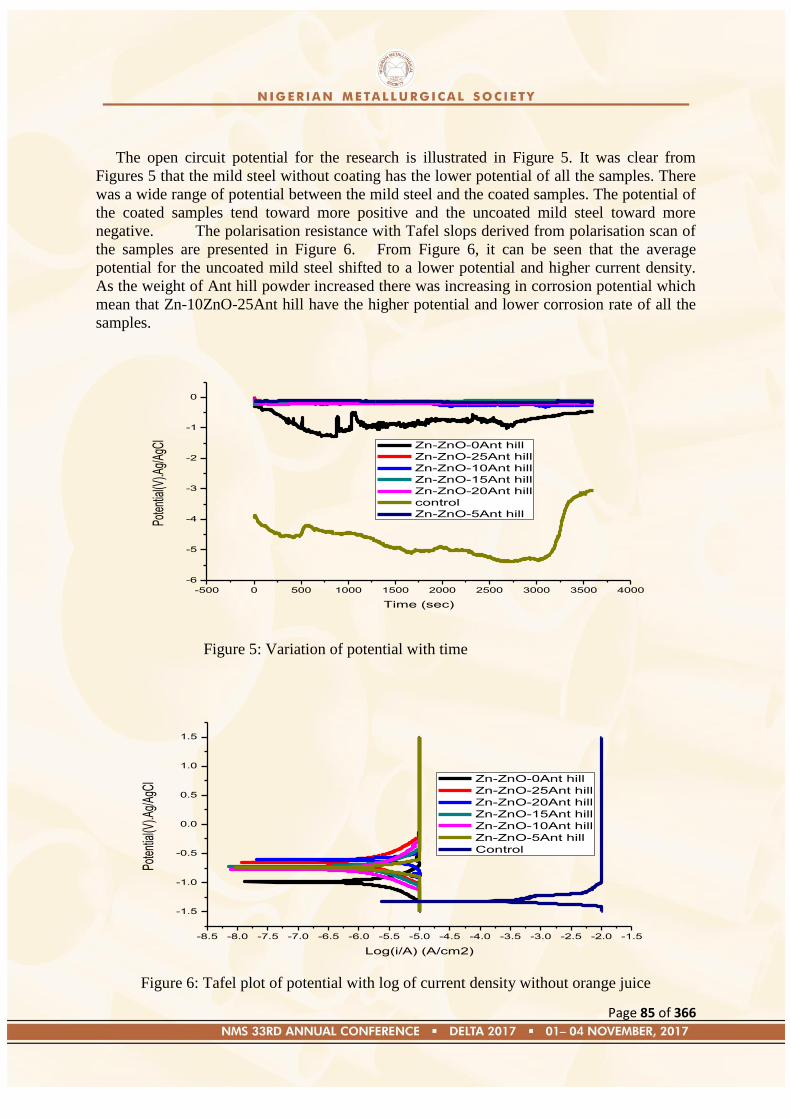
Page 85 of 366
The open circuit potential for the research is illustrated in Figure 5. It was clear from
Figures 5 that the mild steel without coating has the lower potential of all the samples. There
was a wide range of potential between the mild steel and the coated samples. The potential of
the coated samples tend toward more positive and the uncoated mild steel toward more
negative. The polarisation resistance with Tafel slops derived from polarisation scan of
the samples are presented in Figure 6. From Figure 6, it can be seen that the average
potential for the uncoated mild steel shifted to a lower potential and higher current density.
As the weight of Ant hill powder increased there was increasing in corrosion potential which
mean that Zn-10ZnO-25Ant hill have the higher potential and lower corrosion rate of all the
samples.
Figure 5: Variation of potential with time
Figure 6: Tafel plot of potential with log of current density without orange juice
-500 0 500 1000 1500 2000 2500 3000 3500 4000
-6
-5
-4
-3
-2
-1
0
Pote
ntia
l(V).A
g/Ag
Cl
Time (sec)
Zn-ZnO-0Ant hill
Zn-ZnO-25Ant hill
Zn-ZnO-10Ant hill
Zn-ZnO-15Ant hill
Zn-ZnO-20Ant hill
control
Zn-ZnO-5Ant hill
-8.5 -8.0 -7.5 -7.0 -6.5 -6.0 -5.5 -5.0 -4.5 -4.0 -3.5 -3.0 -2.5 -2.0 -1.5
-1.5
-1.0
-0.5
0.0
0.5
1.0
1.5
Pote
ntia
l(V).A
g/Ag
Cl
Log(i/A) (A/cm2)
Zn-ZnO-0Ant hill
Zn-ZnO-25Ant hill
Zn-ZnO-20Ant hill
Zn-ZnO-15Ant hill
Zn-ZnO-10Ant hill
Zn-ZnO-5Ant hill
Control
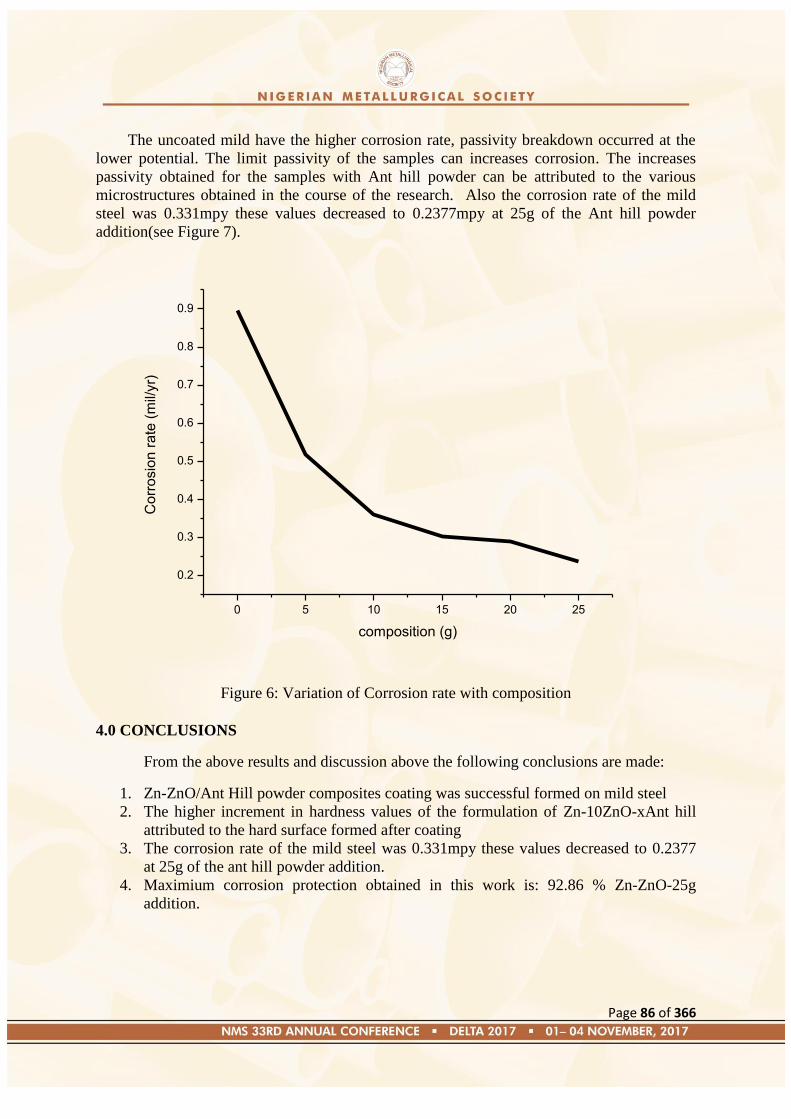
Page 86 of 366
The uncoated mild have the higher corrosion rate, passivity breakdown occurred at the
lower potential. The limit passivity of the samples can increases corrosion. The increases
passivity obtained for the samples with Ant hill powder can be attributed to the various
microstructures obtained in the course of the research. Also the corrosion rate of the mild
steel was 0.331mpy these values decreased to 0.2377mpy at 25g of the Ant hill powder
addition(see Figure 7).
Figure 6: Variation of Corrosion rate with composition
4.0 CONCLUSIONS
From the above results and discussion above the following conclusions are made:
1. Zn-ZnO/Ant Hill powder composites coating was successful formed on mild steel
2. The higher increment in hardness values of the formulation of Zn-10ZnO-xAnt hill
attributed to the hard surface formed after coating
3. The corrosion rate of the mild steel was 0.331mpy these values decreased to 0.2377
at 25g of the ant hill powder addition.
4. Maximium corrosion protection obtained in this work is: 92.86 % Zn-ZnO-25g
addition.
0 5 10 15 20 25
0.2
0.3
0.4
0.5
0.6
0.7
0.8
0.9
Co
rro
sio
n r
ate
(m
il/yr)
composition (g)
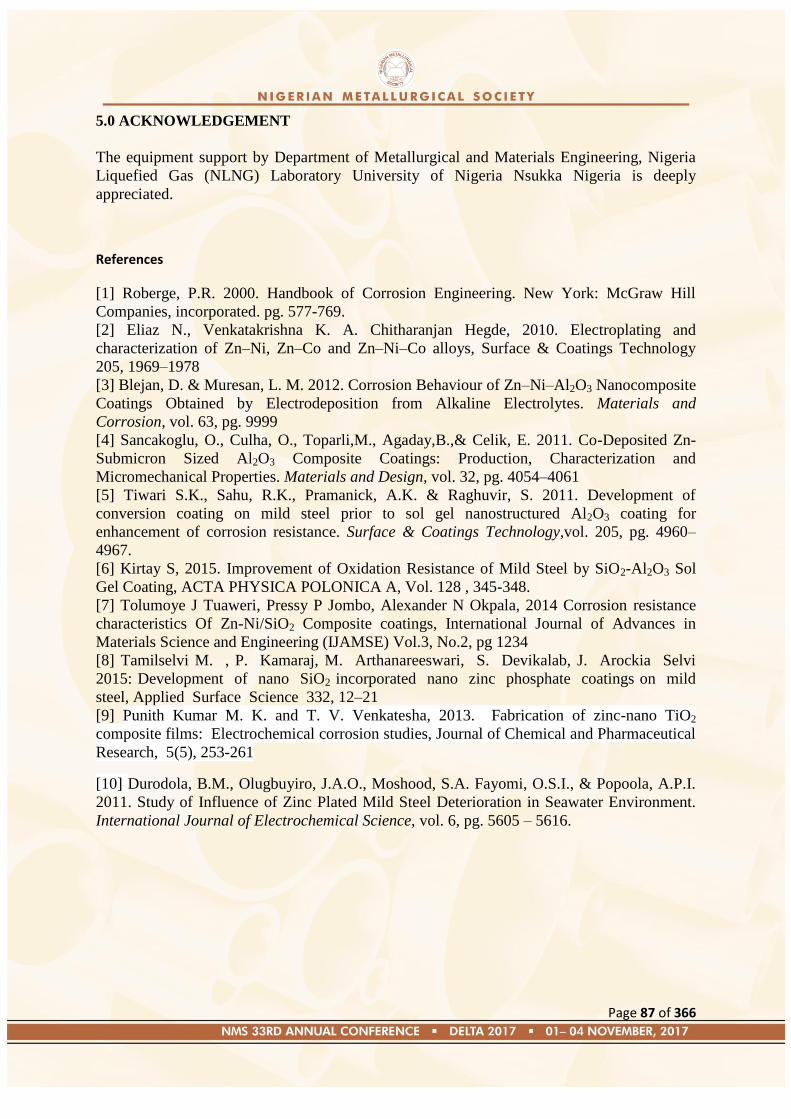
Page 87 of 366
5.0 ACKNOWLEDGEMENT
The equipment support by Department of Metallurgical and Materials Engineering, Nigeria
Liquefied Gas (NLNG) Laboratory University of Nigeria Nsukka Nigeria is deeply
appreciated.
References
[1] Roberge, P.R. 2000. Handbook of Corrosion Engineering. New York: McGraw Hill
Companies, incorporated. pg. 577-769.
[2] Eliaz N., Venkatakrishna K. A. Chitharanjan Hegde, 2010. Electroplating and
characterization of Zn–Ni, Zn–Co and Zn–Ni–Co alloys, Surface & Coatings Technology
205, 1969–1978
[3] Blejan, D. & Muresan, L. M. 2012. Corrosion Behaviour of Zn–Ni–Al2O3 Nanocomposite
Coatings Obtained by Electrodeposition from Alkaline Electrolytes. Materials and
Corrosion, vol. 63, pg. 9999
[4] Sancakoglu, O., Culha, O., Toparli,M., Agaday,B.,& Celik, E. 2011. Co-Deposited Zn-
Submicron Sized Al2O3 Composite Coatings: Production, Characterization and
Micromechanical Properties. Materials and Design, vol. 32, pg. 4054–4061
[5] Tiwari S.K., Sahu, R.K., Pramanick, A.K. & Raghuvir, S. 2011. Development of
conversion coating on mild steel prior to sol gel nanostructured Al2O3 coating for
enhancement of corrosion resistance. Surface & Coatings Technology,vol. 205, pg. 4960–
4967.
[6] Kirtay S, 2015. Improvement of Oxidation Resistance of Mild Steel by SiO2-Al2O3 Sol
Gel Coating, ACTA PHYSICA POLONICA A, Vol. 128 , 345-348.
[7] Tolumoye J Tuaweri, Pressy P Jombo, Alexander N Okpala, 2014 Corrosion resistance
characteristics Of Zn-Ni/SiO2 Composite coatings, International Journal of Advances in
Materials Science and Engineering (IJAMSE) Vol.3, No.2, pg 1234
[8] Tamilselvi M. , P. Kamaraj, M. Arthanareeswari, S. Devikalab, J. Arockia Selvi
2015: Development of nano SiO2 incorporated nano zinc phosphate coatings on mild
steel, Applied Surface Science 332, 12–21
[9] Punith Kumar M. K. and T. V. Venkatesha, 2013. Fabrication of zinc-nano TiO2
composite films: Electrochemical corrosion studies, Journal of Chemical and Pharmaceutical
Research, 5(5), 253-261
[10] Durodola, B.M., Olugbuyiro, J.A.O., Moshood, S.A. Fayomi, O.S.I., & Popoola, A.P.I.
2011. Study of Influence of Zinc Plated Mild Steel Deterioration in Seawater Environment.
International Journal of Electrochemical Science, vol. 6, pg. 5605 – 5616.

Page 88 of 366
[11] Popoola A.P.I., V.S. Aigbodion, O.S.I. Fayomi, 2016, Surface characterization,
mechanical properties and corrosion behaviour of ternary based Zn-ZnO-SiO2 composite
coating of mild steel, J of Alloys and Comp. 654, 561-566
[12] Ghaziof S and W. Gao, 2015, Mechanical and Chemical Properties of Zn-Ni-Al2O3
Nanocomposite Coatings, International Journal of Chemical, Molecular, Nuclear, Materials
and Metallurgical Engineering Vol:9, No:8, 945-49
[13] Fayomi O.S.I., A.P.I. Popoola V.S. Aigbodion, 2015. Investigation on microstructural,
anti-corrosion and mechanical properties of doped Zn–Al–SnO2 metal matrix composite
coating on mild steel, Journal of Alloys and Compounds 623, 328–334 [14] Hassan.S.B and Aigbodion, 2014 Effect coal ash on some refractory properties of alumino-
silicate (Kankara) clay for furnace lining, Egyptain journal of basic and applied sciences, 1 0 7-1 1 4
Page 89 of 366
Paper: NMS 2017-TP011
Reappraisal of Coal Energy for Effective Value Chain Management in Metal Industry
Adiyono Ojonye1 and Ocheri C.2
1Department of Mechanical Engineering
Federal Polytechnic, Ekowe. Bayelsa State 2Department of Metallurgical and Materials Engineering
,
University of Nigeria, Nsukka
E-mail: [email protected], [email protected]
ABSTRACT
Coal is an energy resources composed of organic materials associated with ash forming
inorganic minerals. It may be broadly classified into coking and non–coking coals. All coking
coals possess the properties of softening to a plastic mass on carbonization, followed by
decomposition, swelling with evolution of gases and finally re-solidifying (accompanied by
contraction) to form a coherent porous coke structure. Coal is known as source of energy
which could be used for power generation and transmission for the nation to meet the power
need of the Country. Coal should be given the necessary attention for achieving this purpose.
Adequate power supply is an unavoidable prerequisite to any nation‘s development, and
electricity generation, transmission and distribution are critical key factors in metal industry
value chain management. In the prevailing circumstances in Nigeria where coal is available
in some locations in Nigeria a creative and innovative steps should be applied to solving the
power problem by using coal as a pointer for addressing the power supply problem. Nigeria is
expected to generate 60,000 megawatts of electricity by 2020. Coal fired plants should
contribute 30% Bello 1993) of this amount, which infer increasing power generation from
coal fired plants from 0 to 18,000megawatts. This paper discusses chemical composition of
coal, coal as source of energy for generation, transmission and distribution of power, as well
as power utilization in the upstream/downstream activities in the metal industry. It further
discusses the major challenges in this sector and solutions were preferred on how best to
solve the challenges for greater efficiency.
Key words: Coal Energy, Power, Generation, Transmission and Distribution, value chain
1.0 Introduction
Energy utilization in the metal industry value chain activities which plays a very crucial role
should be appraised from time to time. In a developing country like Nigeria, energy has
become a teething issue that must be addressed for a rapid economic recovery. Coal, an
arthernetive energy source can still be encouraged for improved and greater power generation
in the country. In the 80s, it was established that about 401 million tonnes of coals in Nigeria
were available (Adigwe 1983). The issue of coke-able coals has therefore also attracted
considerable metallurgical research, (Adigwe 1983) discovered that it is possible to reduce
the objection of the medium – rank Lafia – Obi (coking coal) high sulphur content, moisture
content and ash content from 44 % to only 10% (9)
Further work was set in motion to control
the sulphur content as being investigated by (Afonja 1983). He further showed that Enugu
coal estimated at 64.3 million tonnes reserves, characteristically of the low ash content can be
Page 90 of 366
upgraded to 30% in convection modern preparation with imported high rank coal. The drive
would be to blend the imported coals with upgraded Lafia coal. Since its inception in 1979,
the Research Centre of Nigerian Metallurgical Development Centre (NMDC), Jos has been
conducting applied research to ensure the inclusion of an appreciable percentage of locally
available coals in metallurgical coke making at the AjaokutaSteel Plant. Samples from
Enugu, Okaba and Lafia coal deposits were extensively investigated and their results
documented.
2.0 COAL CHEMICAL COMPOSITION (COAL GRADE)
Coals are selected by grade, which takes cognizance of the chemical quality in respect
of ash, sulphur, phosphorus, alkaline and chloride contents. Coal may be satisfactory for
specific use if is possible to formulate a blend with other coals or materials such that the final
charge lies with the limits specified Coal was formed from plant remains that were protected
by water and mud against oxidization and biodegradation, thus trapping atmospheric carbon
in the ground. Over time, the chemical and physical properties of the remains are changed by
geological action to create a solid material. Coal, a fossil fuel, is the largest source of energy
for the generation of electricity worldwide, as well as one of the largest worldwide source of
carbon dioxide emissions. Gross carbon dioxide emissions from coal usage are slightly more
than those from petroleum and about double the amount from natural gas. Coal is extracted
from the ground by mining, either underground or in open pits. The classification of coal is
generally based on the content of volatiles. However, the exact classification varies between
countries
2.1 Source of Coal
The Coal Handling Plant takes care of the preparation of coal into blend in order to be
used. Coal is the major source of fuel used in the converter, and other important furnaces e.g
Coke Oven battery. The coals are prepared in order to become useable coke in the Blast
furnace. Coal is an organic fossil fuel that has been formed over a long period of time in
million years. It can be subjected to high temperature and high pressure and it also associate
with the ash forming mineral matter,
2.2 Coal can be divided into two groups:-
Coking coal and Non –coking Coal
(a)The Coking Coal: These are coals when heated to a temperature of 350-500oC, it often
undergo plasticity transient stage and they are fixed together to form a semicoal of porous
permeable structure. Upon heating to high temperature of about 1000oC the coals become
strong.
(b) Non- Coking Coal: Does not often undergo permeable plasticity transient when it is
being
heated to high temperature. The transformation start from vegetable matter when they
subjected to either high or low temperature it turns to brown coal –lignite- sub-bismuthmious
coal high volatile-bismultmious medium volatile bismuthmiuos low volatile
bismultmiousanthrasite.
But from peat sub-bismultious this coal are called non –coking coal which ,include
anthrasite , which always increase with increase in temperature. Hydrogen and oxygen
decreases with increase in temperature.
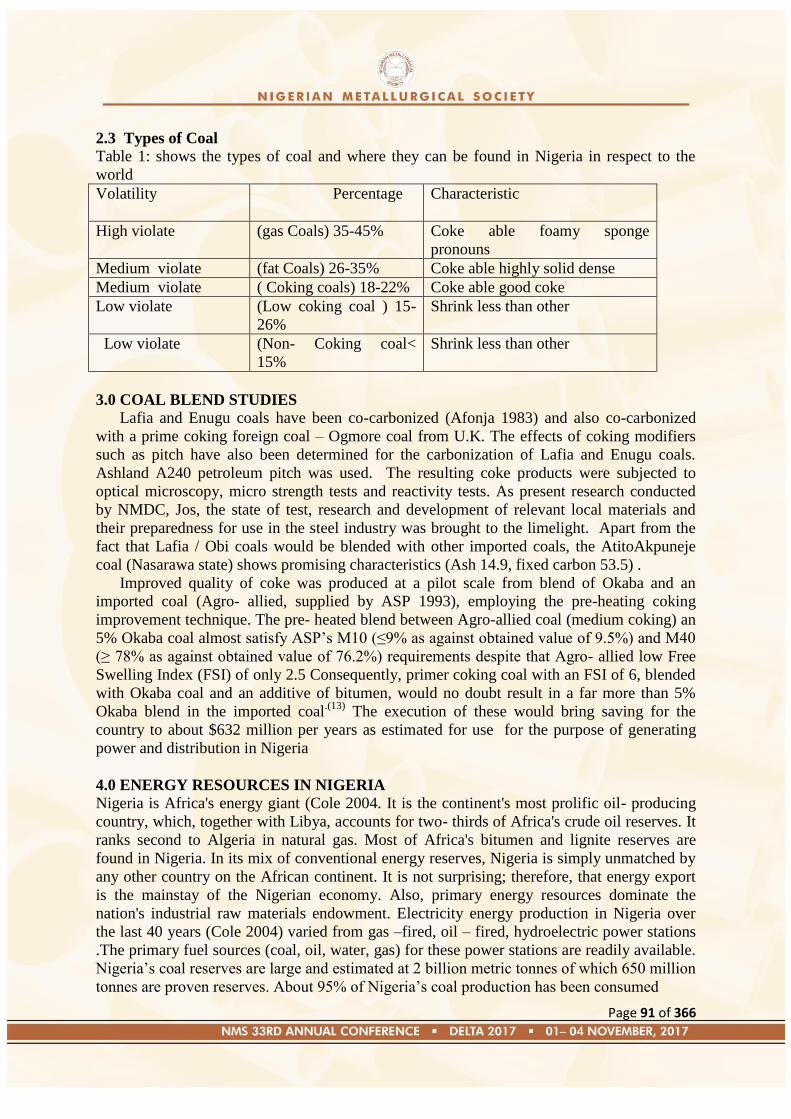
Page 91 of 366
2.3 Types of Coal
Table 1: shows the types of coal and where they can be found in Nigeria in respect to the
world
Volatility Percentage Characteristic
High violate (gas Coals) 35-45% Coke able foamy sponge
pronouns
Medium violate (fat Coals) 26-35% Coke able highly solid dense
Medium violate ( Coking coals) 18-22% Coke able good coke
Low violate (Low coking coal ) 15-
26%
Shrink less than other
Low violate (Non- Coking coal<
15%
Shrink less than other
3.0 COAL BLEND STUDIES
Lafia and Enugu coals have been co-carbonized (Afonja 1983) and also co-carbonized
with a prime coking foreign coal – Ogmore coal from U.K. The effects of coking modifiers
such as pitch have also been determined for the carbonization of Lafia and Enugu coals.
Ashland A240 petroleum pitch was used. The resulting coke products were subjected to
optical microscopy, micro strength tests and reactivity tests. As present research conducted
by NMDC, Jos, the state of test, research and development of relevant local materials and
their preparedness for use in the steel industry was brought to the limelight. Apart from the
fact that Lafia / Obi coals would be blended with other imported coals, the AtitoAkpuneje
coal (Nasarawa state) shows promising characteristics (Ash 14.9, fixed carbon 53.5) .
Improved quality of coke was produced at a pilot scale from blend of Okaba and an
imported coal (Agro- allied, supplied by ASP 1993), employing the pre-heating coking
improvement technique. The pre- heated blend between Agro-allied coal (medium coking) an
5% Okaba coal almost satisfy ASP‘s M10 (≤9% as against obtained value of 9.5%) and M40
(≥ 78% as against obtained value of 76.2%) requirements despite that Agro- allied low Free
Swelling Index (FSI) of only 2.5 Consequently, primer coking coal with an FSI of 6, blended
with Okaba coal and an additive of bitumen, would no doubt result in a far more than 5%
Okaba blend in the imported coal.(13)
The execution of these would bring saving for the
country to about $632 million per years as estimated for use for the purpose of generating
power and distribution in Nigeria
4.0 ENERGY RESOURCES IN NIGERIA
Nigeria is Africa's energy giant (Cole 2004. It is the continent's most prolific oil- producing
country, which, together with Libya, accounts for two- thirds of Africa's crude oil reserves. It
ranks second to Algeria in natural gas. Most of Africa's bitumen and lignite reserves are
found in Nigeria. In its mix of conventional energy reserves, Nigeria is simply unmatched by
any other country on the African continent. It is not surprising; therefore, that energy export
is the mainstay of the Nigerian economy. Also, primary energy resources dominate the
nation's industrial raw materials endowment. Electricity energy production in Nigeria over
the last 40 years (Cole 2004) varied from gas –fired, oil – fired, hydroelectric power stations
.The primary fuel sources (coal, oil, water, gas) for these power stations are readily available.
Nigeria‘s coal reserves are large and estimated at 2 billion metric tonnes of which 650 million
tonnes are proven reserves. About 95% of Nigeria‘s coal production has been consumed

Page 92 of 366
locally; mainly for railway transportation, electricity production and industrial heating in
cement production.
Natural gas is a natural occurring gaseous mixture of hydrocarbons gases found in
underground reservoirs. It consists mainly of methane (70% - 95%). With small percentage of
ethane, propane, butane, pentane and other heavier hydrocarbons with some impurities such
as water vapour, sulphides, carbon dioxides, etc. (Cole 2004) Apart from the export potential
of the Nigerian gas, local demand opportunities are power generation, cement industry, iron
and steel plants. The largest single consumer of natural gas in Nigeria is PHCN and it
accounts for about 70% used to operate electricity generating gas plants at Afam, Ughelli,
Sapele and Egbin.
5.0 ENERGY DEMAND AND SUPPLY SCENARIO
Electricity plays a very important role in the socio-economic and technological development
of every nation. The electricity demand in Nigeria far outstrips the supply and the supply is
epileptic in nature. The country is faced with acute electricity problems, which is hindering
its development notwithstanding the availability of vast natural resources in the country. The
Energy Commission of Nigeria (ECN) was established by Act No. 62 of 1979, as amended
by Act No. 32 of 1988 and Act No. 19 of 1989, with the statutory mandate for the strategic
planning and co-ordination of national policies in the field of energy in all its ramifications.
By this mandate, the Commission which is the apex government organ empowered to carry
out overall energy sector planning and policy co-ordination. As part of its contribution to
these solution of the problems of the electricity sector along the line of its mandate, the ECN
has been collaborating with the International Atomic Energy Agency (IAEA) under an IAEA
regional project titled ―Sustainable Energy Development for Sub-Saharan Africa
(RAF/0/016)‖.
The project entails capacity building for energy planning and the determination of the actual
energy demand and the strategies for supply for each participating country over a 30-year
time horizon. The implementation of the project requires the establishment of a Working
Team (WT) and a Country Study Team (CST) both of which include the major public and
private stakeholders in the energy sector of the country. The working team consists of
technical experts that directly implement the project and reports to the CST, which serves as
the steering committee for the project on a regular basis. Members of the WT were trained on
the use of the IAEA models and have computed the Nigeria energy demand and supply
projections covering the 2005-2030. The project involves the use of the following IAEA
Energy Modelling tools:
• Model for the Analysis of Energy Demand (MAED)
• Model for the Energy Supply Strategy Alternatives and their General Environmental Impact
(MESSAGE).
6.0 ENERGY DEMAND PROJECTION
The energy demand projections were computed using MAED with the key drivers of energy
demand, namely demography, socio-economy and technology. The application of MAED
requires detailed information on demography, economy, energy intensities and energy
efficiencies. This information is first assembled for a base year which is used as the reference
year for perceiving the evolution of the energy system in the future. Selection of the base year
is made on the basis of availability of data, assessment that the data are representative of the
economic and energy situation of the country. MAED allows the breakdown of the country‘s
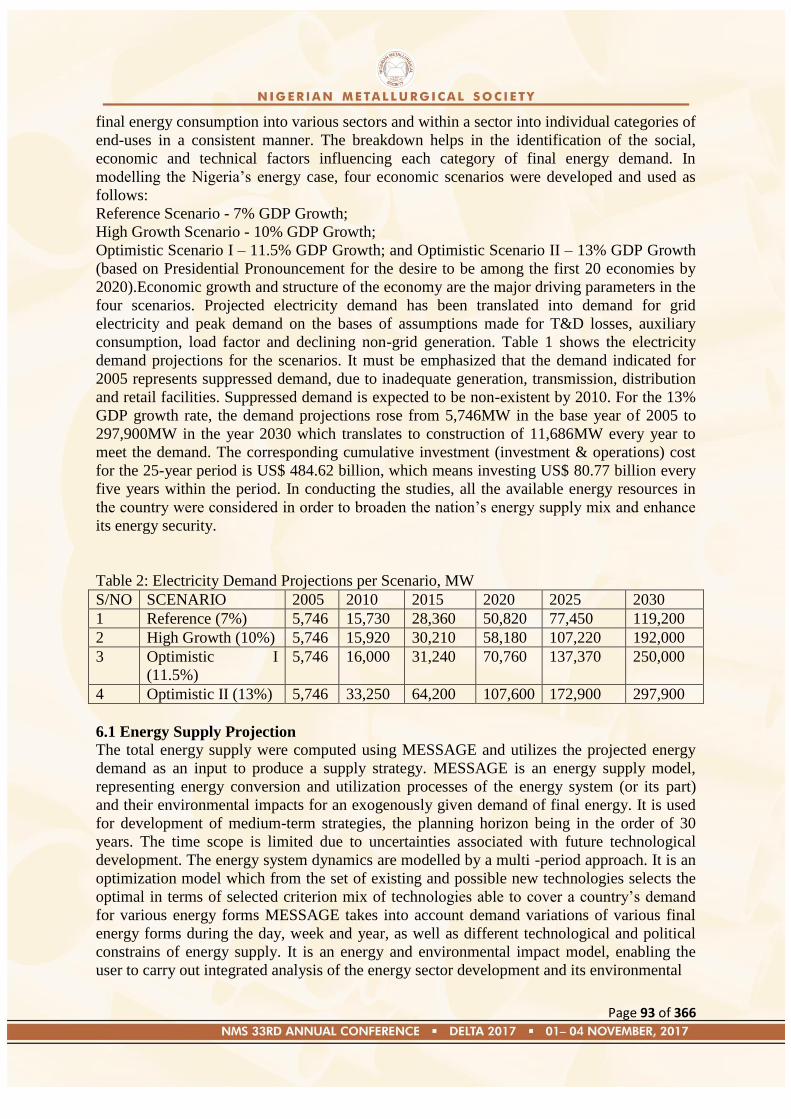
Page 93 of 366
final energy consumption into various sectors and within a sector into individual categories of
end-uses in a consistent manner. The breakdown helps in the identification of the social,
economic and technical factors influencing each category of final energy demand. In
modelling the Nigeria‘s energy case, four economic scenarios were developed and used as
follows:
Reference Scenario - 7% GDP Growth;
High Growth Scenario - 10% GDP Growth;
Optimistic Scenario I – 11.5% GDP Growth; and Optimistic Scenario II – 13% GDP Growth
(based on Presidential Pronouncement for the desire to be among the first 20 economies by
2020).Economic growth and structure of the economy are the major driving parameters in the
four scenarios. Projected electricity demand has been translated into demand for grid
electricity and peak demand on the bases of assumptions made for T&D losses, auxiliary
consumption, load factor and declining non-grid generation. Table 1 shows the electricity
demand projections for the scenarios. It must be emphasized that the demand indicated for
2005 represents suppressed demand, due to inadequate generation, transmission, distribution
and retail facilities. Suppressed demand is expected to be non-existent by 2010. For the 13%
GDP growth rate, the demand projections rose from 5,746MW in the base year of 2005 to
297,900MW in the year 2030 which translates to construction of 11,686MW every year to
meet the demand. The corresponding cumulative investment (investment & operations) cost
for the 25-year period is US$ 484.62 billion, which means investing US$ 80.77 billion every
five years within the period. In conducting the studies, all the available energy resources in
the country were considered in order to broaden the nation‘s energy supply mix and enhance
its energy security.
Table 2: Electricity Demand Projections per Scenario, MW
S/NO SCENARIO 2005 2010 2015 2020 2025 2030
1 Reference (7%) 5,746 15,730 28,360 50,820 77,450 119,200
2 High Growth (10%) 5,746 15,920 30,210 58,180 107,220 192,000
3 Optimistic I
(11.5%)
5,746 16,000 31,240 70,760 137,370 250,000
4 Optimistic II (13%) 5,746 33,250 64,200 107,600 172,900 297,900
6.1 Energy Supply Projection
The total energy supply were computed using MESSAGE and utilizes the projected energy
demand as an input to produce a supply strategy. MESSAGE is an energy supply model,
representing energy conversion and utilization processes of the energy system (or its part)
and their environmental impacts for an exogenously given demand of final energy. It is used
for development of medium-term strategies, the planning horizon being in the order of 30
years. The time scope is limited due to uncertainties associated with future technological
development. The energy system dynamics are modelled by a multi -period approach. It is an
optimization model which from the set of existing and possible new technologies selects the
optimal in terms of selected criterion mix of technologies able to cover a country‘s demand
for various energy forms MESSAGE takes into account demand variations of various final
energy forms during the day, week and year, as well as different technological and political
constrains of energy supply. It is an energy and environmental impact model, enabling the
user to carry out integrated analysis of the energy sector development and its environmental
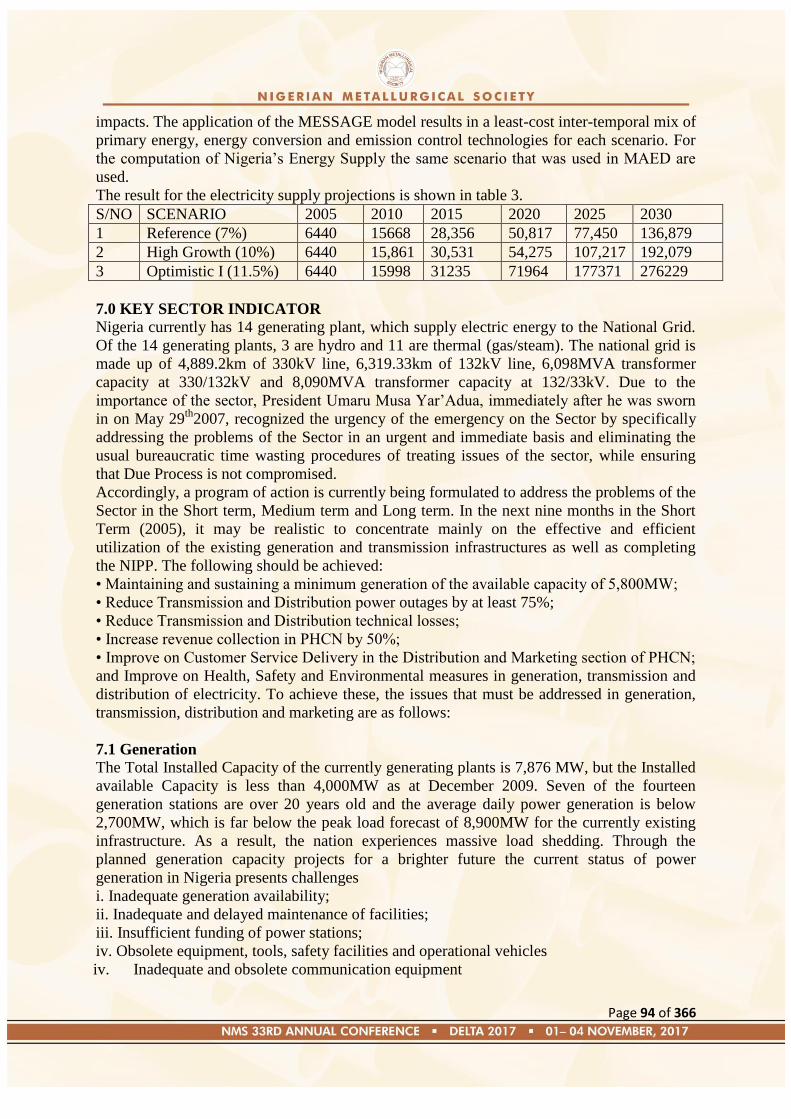
Page 94 of 366
impacts. The application of the MESSAGE model results in a least-cost inter-temporal mix of
primary energy, energy conversion and emission control technologies for each scenario. For
the computation of Nigeria‘s Energy Supply the same scenario that was used in MAED are
used.
The result for the electricity supply projections is shown in table 3.
S/NO SCENARIO 2005 2010 2015 2020 2025 2030
1 Reference (7%) 6440 15668 28,356 50,817 77,450 136,879
2 High Growth (10%) 6440 15,861 30,531 54,275 107,217 192,079
3 Optimistic I (11.5%) 6440 15998 31235 71964 177371 276229
7.0 KEY SECTOR INDICATOR
Nigeria currently has 14 generating plant, which supply electric energy to the National Grid.
Of the 14 generating plants, 3 are hydro and 11 are thermal (gas/steam). The national grid is
made up of 4,889.2km of 330kV line, 6,319.33km of 132kV line, 6,098MVA transformer
capacity at 330/132kV and 8,090MVA transformer capacity at 132/33kV. Due to the
importance of the sector, President Umaru Musa Yar‘Adua, immediately after he was sworn
in on May 29th
2007, recognized the urgency of the emergency on the Sector by specifically
addressing the problems of the Sector in an urgent and immediate basis and eliminating the
usual bureaucratic time wasting procedures of treating issues of the sector, while ensuring
that Due Process is not compromised.
Accordingly, a program of action is currently being formulated to address the problems of the
Sector in the Short term, Medium term and Long term. In the next nine months in the Short
Term (2005), it may be realistic to concentrate mainly on the effective and efficient
utilization of the existing generation and transmission infrastructures as well as completing
the NIPP. The following should be achieved:
• Maintaining and sustaining a minimum generation of the available capacity of 5,800MW;
• Reduce Transmission and Distribution power outages by at least 75%;
• Reduce Transmission and Distribution technical losses;
• Increase revenue collection in PHCN by 50%;
• Improve on Customer Service Delivery in the Distribution and Marketing section of PHCN;
and Improve on Health, Safety and Environmental measures in generation, transmission and
distribution of electricity. To achieve these, the issues that must be addressed in generation,
transmission, distribution and marketing are as follows:
7.1 Generation
The Total Installed Capacity of the currently generating plants is 7,876 MW, but the Installed
available Capacity is less than 4,000MW as at December 2009. Seven of the fourteen
generation stations are over 20 years old and the average daily power generation is below
2,700MW, which is far below the peak load forecast of 8,900MW for the currently existing
infrastructure. As a result, the nation experiences massive load shedding. Through the
planned generation capacity projects for a brighter future the current status of power
generation in Nigeria presents challenges
i. Inadequate generation availability;
ii. Inadequate and delayed maintenance of facilities;
iii. Insufficient funding of power stations;
iv. Obsolete equipment, tools, safety facilities and operational vehicles
iv. Inadequate and obsolete communication equipment

Page 95 of 366
vi. Lack of exploration to tap all sources of energy form the available resources; and
vii. Low staff morale.
The transmission system in Nigeria system does not cover every part of the country. It
currently has the capacity to transmit a maximum of about 4,000 MW and it is technically
weak thus very sensitive to major disturbances. In summary, the major problems identified
are:
i. It is funded solely by the Federal government whose resource allocation cannot adequately
meet all the requirements;
ii. It is yet to cover many parts of the country
iii. It‘s current maximum electricity wheeling capacity is 4,000 MW which is awfully below
the required national needs;
iv. Some sections of the grid are outdated with inadequate redundancies as opposed to the
required mesh arrangement;
v. The Federal government lack the required fund to regular expand, update, modernize and
maintain the network;
vi. There is regular vandalization of the lines, associated with low level of surveillance and
security on all electrical infrastructure;
vii. The technologies used generally deliver very poor voltage stability and profiles;
viii. There is a high prevalence of inadequate working tools and vehicles for operating and
maintaining the network;
ix. There is a serious lack of required modern technologies for communication and
monitoring;
x. The transformers deployed are overloaded in most service areas;
xi. In adequate of spare-parts for urgent maintenance; and
xii. Poor technical staff recruitment, capacity building and training programme.
7.2 Distribution and Marketing
In most locations in Nigeria, the distribution network is poor, the voltage profile is poor and
the billing is inaccurate. As the department, which inter-faces with the public, the need to
ensure adequate network coverage and provision of quality power supply in addition to
efficient marketing and customer service delivery cannot be over emphasize. In summary
some of the major problems identified are:
i. Weak and Inadequate Network Coverage;
ii. Overloaded Transformers and bad Feeder Pillars;
iii. Substandard distribution lines;
iv. Poor Billing System;
v. Unwholesome practices by staff and very poor Customer relations;
vi. Inadequate logistic facilities such as tools and working vehicles;
vii. Poor and obsolete communication equipment;
viii. Low staff morale and lack of regular training; and
ix. Insufficient funds for maintenance activities.
8.0 POWER SECTOR NATIONAL POLICY
A liaison office in the Corporate Headquarters of the PHCN which coordinates activities of
the unbundled companies pending their full privatization was also set up, with a plan that by
December 2006, all these 19 companies would take off and PHCN would be phased out.
Page 96 of 366
Presently, a Chief Executive Officer can operate independent of any other unbundled
company heads each unbundled company. They all, including the Coordinator in the liaison
office, receive funds for their day-to-day operations from the market operator who disburses
the funds according to certain laid down criteria. Each company is also empowered, through
with limitations to operate as a commercial company. It is currently planned that each of the
successor companies shall operate as a fully commercialized company. The PHCN structure
shall also be retained to oversee the activities of the Managing Director/CEOs of the
successor companies.
This structure should operate for a limited period of 5 years, which should be adequate time
to enable the companies to be privatized. In addition, to restructuring NEPA Government
through the NIPP and PHCN also made attempts to develop the infrastructure in generation,
transmission and distribution on fast track basis. The aim was to improve power supply to
consumers. In order to achieve that, the Federal government in collaboration with state
Government embarked on the implementation of new generation, new gas pipelines, a new
transmission and new distribution networks in 2005, using the excess crude account. The
projects were estimated to cost N1.23 Trillion out of which about N361 billion was released.
9.0 IMPORTANCE OF ENERGY IN THE UPSTREAM/DOWNSTREAM SECTORS
IN THE METAL INDUSTRY
Power is very important to industrial development in Nigeria. Most of the vibrant industries
that existed when Nigeria had steady power supply and cheap fossil energy do no longer exist
today. Most of them closed down when the cost of energy and supply of both electric and
petroleum products became erratic. Today most companies like Dunlop and Unilever have
relocated to either South Africa or Ghana. Commercial foundries, metal industries and many
textile companies closed. Small businesses are equally affected: welders, miners, building
contractors, mechanics, furniture, printers name them are not finding things easy. The
availability of cheap energy and constant power supply will lead to multiplicity of industries
and generate employment for the youth. Operators in the metal industry are complaining
daily of erratic and high energy cost (Paul. A. Ihom 2012)
10.0 MAJOR CHALLENGES
From the above brief presentation, the following are some of the most critical challenges of
the power sector responsible for the generation short falls, transmission bottlenecks, and
distribution problems in Nigeria:
i. Poor utilization of existing assets and deferred maintenance;
ii. Delays in the implementation of new projects;
iii. Lack of sustained, sound and practicable relationship between the Federal Government
and other stakeholders particularly the JV international oil companies and the Independent
Power Producers (IPP);
iv. Inadequate attention to coal importance and utilization
v. Erratic supply of domestic gas resources for power generation;
vi. The National Grid is yet to cover many parts of the country;
vii. Vulnerable and overloaded existing transmission system;
viii. Poor voltage profile to the tail-end consumer;
ix. Current maximum electricity wheeling capacity is 4,000 MW which is awfully below the
required national needs;
x. Some sections of the National Grid are outdated with equipment in a state of poor and
inadequate maintenance;

Page 97 of 366
xi. The Federal Government being the only provider of funds to expand to the National Grid
did not commit the required funds to regularly expand, update, modernize and maintain the
sector;
xii. Regular vandalization of the gas lines, and cable lines, associated with low level of the
surveillance and security on all electrical infrastructures;
xiii. High prevalence of inadequate working tools, vehicles and spare-parts for operating and
maintaining the power system;
xiv. There is a serious lack of required modern technologies or communication and
monitoring of the generation, transmission and distribution infrastructure;
xv. Low customer satisfaction (load shedding, poor voltage profile, inaccurate billing,
difficulties in paying bills, no-notice disconnections, etc);
xvi. Poor technical staff recruitment, capacity building and training programme; and
xvii. Inappropriate tariff that would enable the utility to get adequate funds to maintain and
expand the infrastructure.
11.0 WAY FORWARD
To address the challenges listed above, a drastic and innovative strategy is required, most
especially as energy generation, transmission and distribution in Nigeria for appropriate
development is a priority issue, in value chain management in the metal industry. .
11.1 Planning and Operations
A comprehensive review of the operation and management of Power Sector targeted at
efficiency and effectiveness is required. In that respect, the following should be undertaken:
i The coal deposits in the Country should be looked at again with a view to supporting the
generation of electricity through coal generating plant where the raw materials are available.
ii. A detailed national load demand study should be carried out with a view to providing
reliable information on the current practical and detailed power requirements and a futuristic
forecast for the next 25 years. (The World Bank is currently supporting some work on this);
iii. A detailed and practicable Power generation, transmission and distribution master plan for
Nigeria for today and the next 25 years should be produced;
iv. A detailed cost implication on a phased development and operating the power supply
system on state-by-state basis is required;
iv. Strategic roles of the States and Local Governments in the implication of the National
Master plan must be explicitly stated;
v. A cost sharing formula for all tiers of Government to fully participate in the development
of national power supply must evolve;
vi. The institutional arrangement on how the Power Sector will function with the Federal
Government as the central implementation organ, working in tandem with the States and
Local Governments should evolve; and vii. The clear roles of the States in the energy sector,
specifically required to serve as the state monitoring facility on resource contributions,
utilization and system efficiency should be strategize.
11.2 Funding
To demonstrate the urgency and resource requirements on power supply which give the
additional power and resources required in countries that could be defined as less fortunate
with resources compared with Nigeria. While the Per Capita power generation ranges from
3kW to 6.6kW in those countries, the corresponding figure for Nigeria is 0.05. This is
Page 98 of 366
literally shameful and unacceptable. It can be estimated that the average cost for adding a
Mega Watt of electricity is US$1.5million. The government should therefore demonstrate the
need to release funds for the reactivation of the machineries, equipment and purchasing of
other supporting mechanism for use at the moribund coal powered plant for the purpose of
generating power.
This demonstrates the resources required in power supply to develop and particularly
industrialized any country on a sustainable manner, are large. Based on this index, it therefore
can be estimated that from the staggering current generation capacity of about 3,000MW in
the country, Nigeria would have to invest a whopping US$150 billion (N18 trillion) to
generate additional 100,000MW, to attain the required for full industrialization of our
economy by 2020 which was computed by the Energy Commission of Nigeria using a growth
rate of 13%. The financial requirement is phenomenal. The combined determination of Mr.
President to declare a state of Emergency on power supply in the country, and the
administration‘s firm commitments of industrializing Nigeria by 2020 must be taken very
seriously. However, it is worth nothing closely that the Federal Government has, since
independence, remained the major financier of power supply in Nigeria. This might have
followed a political history of the country since independence, where the Military
Governments that dominated the administration, institutionalized the concept of establishing
and developing the power sector as the sole responsibility of the Federal Government.
Furthermore, under the military traditions, the Military Head of State ((Federal government)
had always directly appointed the State Governors and had dictated resource allocations to
the States from the Federation Accounts and literally also tele-guided the implementation of
most capital projects executed in the States. This scenario under a democratic system of
Government as currently practiced in Nigeria is not feasible. A deliberate and proactive
strategy is required to ensure that all tiers of Government fully participate in this National
Priority sector. It is therefore opined that, in view of the vision for power to be provided on a
sustained stable basis to the entire nation, all tiers of Government, similar to the strategy
deployed on the provision of roads/highways network that we currently operate in the
country. The concept being proposed is that, in view of the large investment required for the
development of the Generation, Transmission and Distribution networks, States and Local
Government should contribute a certain percentage of the total cost similar to the concept on
road-network where all tiers of Government participate in development, maintenance and
repairs.
12.0 CONCLUSION
Coal production in the Nigerian coal industry increased annually from 583,487 tonnes to a
peak of 905,397 tonnes before the independence. After 1959, production decreased
significantly each year, until today no production is recorded on book. Several factors
contributed to its failure, prominent among them is poor technical method chosen to operate
with. This trend showed a decrease in the coal production and how it has affected other
sectors of the economy. There is high need for government to map out strategies
which would be applicable to rejuvenating this industry. This include intensifying the
drive for coal exploration and production activities, completing the privatization of the
coal sector, incentives to indigenous and foreign entrepreneurs so as to attract investment in
coal exploration and production, fast-tracking the passage of the new minerals and mining
bill at the parliament, continuing the exploration and concession of the coal deposits for open
biddings to investors and ensuring transparency in the acquisition of mining titles. These are
Page 99 of 366
just but few measures in addition to what we ought to do to revive the coal industry which
has collapsed wholly. The abundant coal deposit underneath various seams of most lands in
Nigeria should not be allowed to be wasted or remain untapped. The time is set to arise and
derive the energy which is in our coal. The tapped coal could also be used for the generation,
transmission and distribution of electricity with a view to enhancing activities in the
upstream/downstream sectors of the metal industry.
REFERENCES
[1]Adigwe, J.F.C.(1983) ― Raw Materials for Nigerian Iron and Steel Industry‖ Paper
presented at the 1st National conference of NMS at Delta Steel Aladja, pg18-20
[2]Afonja .A.A ―(1983) A study of the Potential of Nigeria Coals for Metallurgical Coking‖
Paper presented at 1st National Conference of NMS at Delta Steel Aladja.
[3] Bello A.O. (1993) ―Selection of coals for Making High Quality Metallurgical Coke‖ A
paper presented at a seminar organized by the Nigerian Metallurgical Society at Ajaokuta
Steel Company Limited , pg 1-10
[4]Bello A.O.(1986) ― Metallurgical Coke its production and Quality. Challenges of
Hydropower Development in Nigeria by Imo E. Ekpo.
[5]Chikuni * Peter O. Oluseyi and $ P.Govender: # University of Nigeria, Nsukka, **
Polytechnic
[6]Cole, A. O.(2004) ―Restructuring the Electric Power Utility industry in Nigeria‖, Proc.
20th National Conference of the Nigerian Society of Engineers (Electrical Division),
October6-7, 2004, pp.1-6.
Conventional Energy Sources in Nigeria: A Statistical Approach by # OgbonnayaI.Okoro, E.
Economy‖, International Journal of Sustainable Energy, vol. 25, No. 1, 2006, pp. 23-31.
[7]Igwe B.U.N (1986) ―Towards a Comprehensive Nigeria Mineral Policy‖ Proceedings of
Annual Conference of the Nigerian Metallurgical Society – Pg 28
[8]Magazine article; African Business, No. 323, August-September 2006.4.
[9]Matching Electricity Supply with Demand in Nigeria by A. S. Sambo of Namibia,
Windhoek, Namibia *University of Lagos, Nigeria
[10]Paul.A.Ihom(2012) ―Renewable Energy Development: Nigeria‖s Unttapped Secret for
Metal Industry and Rural Area Development‖ Proceedings of the 28th
NMS conference,
Pp80.
Page 100 of 366
Paper: NMS 2017-TP012
Effects of Particle Size, Clay and Moisture Contents on the Properties of Synthetic Moulding Sand
1Edoziuno, F. O., 2Oyibo, A. O., and 3Odo, J. U. 1Department of Metallurgical Engineering, Delta State Polytechnic, Ogwashi-Uku, Nigeria.
2Department of Welding and Fabrication Engineering Technology, Delta State Polytechnic, Ogwashi-Uku, Nigeria.
3Department of Metallurgical & Materials Engineering, Nnamdi Azikiwe University, Awka. Nigeria. Corresponding Author: [email protected], +2348063422650
ABSTRACT The effects of grain size, clay and moisture contents on the moulding properties of River Niger sand (Onitsha deposit) bonded with Ukpor clay has been investigated in this research. The samples were prepared by washing and sorting to remove impurities and other foreign objects. Weighed samples were sieved and mixed in a Ridsdale laboratory sand mixer. American Foundrymen’s Society (AFS) standard test specimens (50mm diameter by 50mm height) were prepared using Ridsdale laboratory sand rammer and moulding properties such as green compression strength, dry compression strength, green shear strength, dry shear strength, green permeability and mouldability were measured using universal sand strength testing machine, electric permeability meter and mouldability tester. Results obtained showed that particle sizes 355μm and 500μm produced maximum green and dry compression strengths. The green Permeability number reduced steadily from 8.00 to 6.80 as the grain sizes decreased from 1000μm to 125μm, while the mouldability increased as the sand grains become finer. There was a remarkable increase in green and dry strengths as the quantity of binder was increased from 10% to 12%, further increase in the quantity of binder from 12% to 22% yielded gradual increase in the strengths. The green permeability showed a steady decrease from 11.00 to 7.00 as the quantity of clay was increased from 10% to 22%. Moisture contents of 4%, 5% and 6% produced maximum values for green strengths, dry strengths and green permeability number respectively. Percentage mouldability was highest (98.80%) at 3% moisture content and very low above 5% moisture content. The results of moulding sand tests obtained indicated that the sand could be used in the production of cast iron and non-ferrous alloys castings.
Keywords: Sandcasting, synthetic moulding sand, grain size, sieve analysis.
1. Introduction
Sand is the principal moulding material in the foundry shop used for all types of castings, whether the cast metal and alloy are ferrous or non-ferrous. This is because moulding sand possesses the properties desirable for foundry purposes. (Jain, 2006). Moulding sands, also known as foundry sands, are defined by eight characteristics namely: refractoriness, chemical inertness, permeability, surface finish, cohesiveness, flowability, collapsibility, and availability/cost. Foundry sands are composed almost entirely of silica (SiO2) in the form of quartz. The degree of the above qualities can also be adjusted, as desired, by varying the composition or the ingredients and additives to the sand.

Page 101 of 366
Silica sand is found on a beach and is also the most commonly used foundry sand. It is made by either crushing sand stone or taken from naturally occurring locations, such as beaches and river beds. The fusion point of pure silica is 1760oC, however most sands used for moulding purposes have a lower melting point due to impurities. For high melting point casting, such as steels, a minimum of 98% pure silica sand must be used but for lower melting metals, such as cast iron and non–ferrous metals, a lower purity sand; between 94 and 98% pure silica, can be used (Brown, 1994; Mclaws, 1971).
The principal ingredients of moulding sand are: silica sand grains, clay (bond) and moisture. Each constituent is important in determining the properties of moulding sand .The silica sand grains are of paramount importance in moulding sand because they impact refractoriness, chemical resistivity, and permeability to the moulding sand. They are specified according to the average size and shape (AFS, 1968). The finer the grains or particle size the more intimate will be the contact and the lower the permeability. Clay on the other hand, impacts the necessary bonding strength to the moulding sand so that after ramming, the mould does not lose its shape. However, increasing the quantity of clay will reduce the permeability of the moulding sand. Clay acquires its bonding action only in the presence of requisite amount of moisture. When water is added to clay, it penetrates the mixture and makes it plastic.
Moulding sand is classified as either natural or synthetic sand. The natural moulding sand is taken from beach, river bed or dug out from pits, and it contains the binder which is used in the as received condition with a little addition of water. It contains from 5 – 20% binder and about 5 – 8% water may be added to it. The synthetic moulding sand on the other hand, is synthesized in the foundry shop by combining a relatively clay free sand with selected clay binder like bentonite. Water and other additives are added as required. With natural moulding sand there is limitation to the extent of control and adjustment on the particle size distribution, bonding material and moisture, with synthetic sand the three major constituents are carefully selected to give desired properties within acceptable limits (Ademoh and Ahmed, 2008; Edoziuno et al, 2017). This makes it mandatory that optimum effects of the sand grains (particle size) type and nature of binder used and the clay and moisture contents on the properties of synthetic moulding sand be investigated to ascertain the best compositional mix for such synthetic moulding sand produced with available local ingredients.
Moulding sand must be permeable to allow the steam and other gases to pass through the sand mould. The permeability of sand depends upon its grain size, grain shape, moisture, and clay contents of the moulding sand. If the sand is too fine the porosity will be low (Jain, 2006). It has also been demonstrated that the quality of casting is influenced significantly by moulding sand properties such as green compressive strength, dry strength, permeability, mould hardness, compatibility and shatter index. All these listed properties are invariably dependent on such parameters as the quality and nature of binder used, amount of water and sand grain size. (Ayoola et al, 2013). Foundry sands are manufactured within strict particle size distribution to tailor the properties of the material to the intended casting process (Sobcezak and Purgert, 2002).
2. Materials and Methods
2.1 Materials and equipment
The local materials used to compose the synthetic moulding sand were green silica sand from the Onitsha bank of river Niger and Ukpor clay. The instruments used included set of standard test sieves mounted on a sieve shaker, standard sand rammer (Serial No: 845), motor driven universal
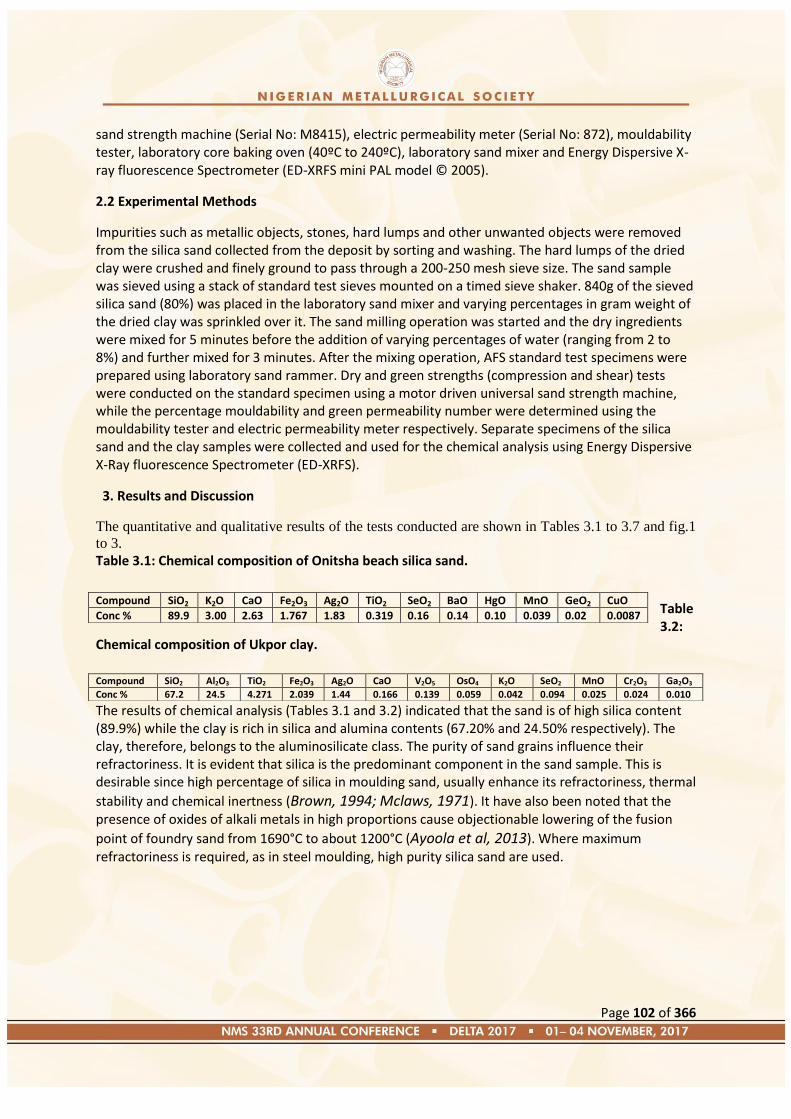
Page 102 of 366
sand strength machine (Serial No: M8415), electric permeability meter (Serial No: 872), mouldability tester, laboratory core baking oven (40ºC to 240ºC), laboratory sand mixer and Energy Dispersive X-ray fluorescence Spectrometer (ED-XRFS mini PAL model © 2005).
2.2 Experimental Methods
Impurities such as metallic objects, stones, hard lumps and other unwanted objects were removed from the silica sand collected from the deposit by sorting and washing. The hard lumps of the dried clay were crushed and finely ground to pass through a 200-250 mesh sieve size. The sand sample was sieved using a stack of standard test sieves mounted on a timed sieve shaker. 840g of the sieved silica sand (80%) was placed in the laboratory sand mixer and varying percentages in gram weight of the dried clay was sprinkled over it. The sand milling operation was started and the dry ingredients were mixed for 5 minutes before the addition of varying percentages of water (ranging from 2 to 8%) and further mixed for 3 minutes. After the mixing operation, AFS standard test specimens were prepared using laboratory sand rammer. Dry and green strengths (compression and shear) tests were conducted on the standard specimen using a motor driven universal sand strength machine, while the percentage mouldability and green permeability number were determined using the mouldability tester and electric permeability meter respectively. Separate specimens of the silica sand and the clay samples were collected and used for the chemical analysis using Energy Dispersive X-Ray fluorescence Spectrometer (ED-XRFS).
3. Results and Discussion
The quantitative and qualitative results of the tests conducted are shown in Tables 3.1 to 3.7 and fig.1
to 3.
Table 3.1: Chemical composition of Onitsha beach silica sand.
Table 3.2:
Chemical composition of Ukpor clay.
The results of chemical analysis (Tables 3.1 and 3.2) indicated that the sand is of high silica content (89.9%) while the clay is rich in silica and alumina contents (67.20% and 24.50% respectively). The clay, therefore, belongs to the aluminosilicate class. The purity of sand grains influence their refractoriness. It is evident that silica is the predominant component in the sand sample. This is desirable since high percentage of silica in moulding sand, usually enhance its refractoriness, thermal
stability and chemical inertness (Brown, 1994; Mclaws, 1971). It have also been noted that the presence of oxides of alkali metals in high proportions cause objectionable lowering of the fusion
point of foundry sand from 1690°C to about 1200°C (Ayoola et al, 2013). Where maximum refractoriness is required, as in steel moulding, high purity silica sand are used.
Compound SiO2 K2O CaO Fe2O3 Ag2O TiO2 SeO2 BaO HgO MnO GeO2 CuO
Conc % 89.9 3.00 2.63 1.767 1.83 0.319 0.16 0.14 0.10 0.039 0.02 0.0087
Compound SiO2 Al2O3 TiO2 Fe2O3 Ag2O CaO V2O5 OsO4 K2O SeO2 MnO Cr2O3 Ga2O3
Conc % 67.2 24.5 4.271 2.039 1.44 0.166 0.139 0.059 0.042 0.094 0.025 0.024 0.010
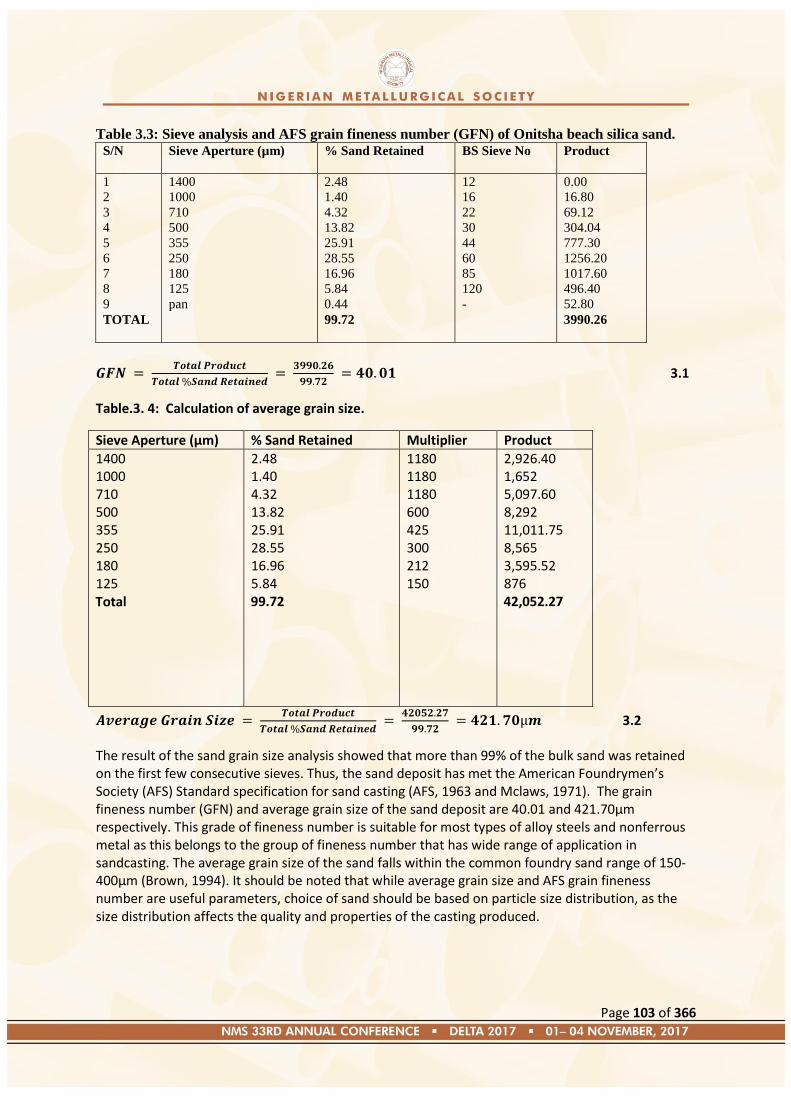
Page 103 of 366
Table 3.3: Sieve analysis and AFS grain fineness number (GFN) of Onitsha beach silica sand. S/N Sieve Aperture (µm) % Sand Retained BS Sieve No Product
1
2
3
4
5
6
7
8
9
TOTAL
1400
1000
710
500
355
250
180
125
pan
2.48
1.40
4.32
13.82
25.91
28.55
16.96
5.84
0.44
99.72
12
16
22
30
44
60
85
120
-
0.00
16.80
69.12
304.04
777.30
1256.20
1017.60
496.40
52.80
3990.26
3.1
Table.3. 4: Calculation of average grain size.
Sieve Aperture (μm) % Sand Retained Multiplier Product
1400 1000 710 500 355 250 180 125 Total
2.48 1.40 4.32 13.82 25.91 28.55 16.96 5.84 99.72
1180 1180 1180 600 425 300 212 150
2,926.40 1,652 5,097.60 8,292 11,011.75 8,565 3,595.52 876 42,052.27
3.2
The result of the sand grain size analysis showed that more than 99% of the bulk sand was retained on the first few consecutive sieves. Thus, the sand deposit has met the American Foundrymen’s Society (AFS) Standard specification for sand casting (AFS, 1963 and Mclaws, 1971). The grain fineness number (GFN) and average grain size of the sand deposit are 40.01 and 421.70μm respectively. This grade of fineness number is suitable for most types of alloy steels and nonferrous metal as this belongs to the group of fineness number that has wide range of application in sandcasting. The average grain size of the sand falls within the common foundry sand range of 150-400μm (Brown, 1994). It should be noted that while average grain size and AFS grain fineness number are useful parameters, choice of sand should be based on particle size distribution, as the size distribution affects the quality and properties of the casting produced.
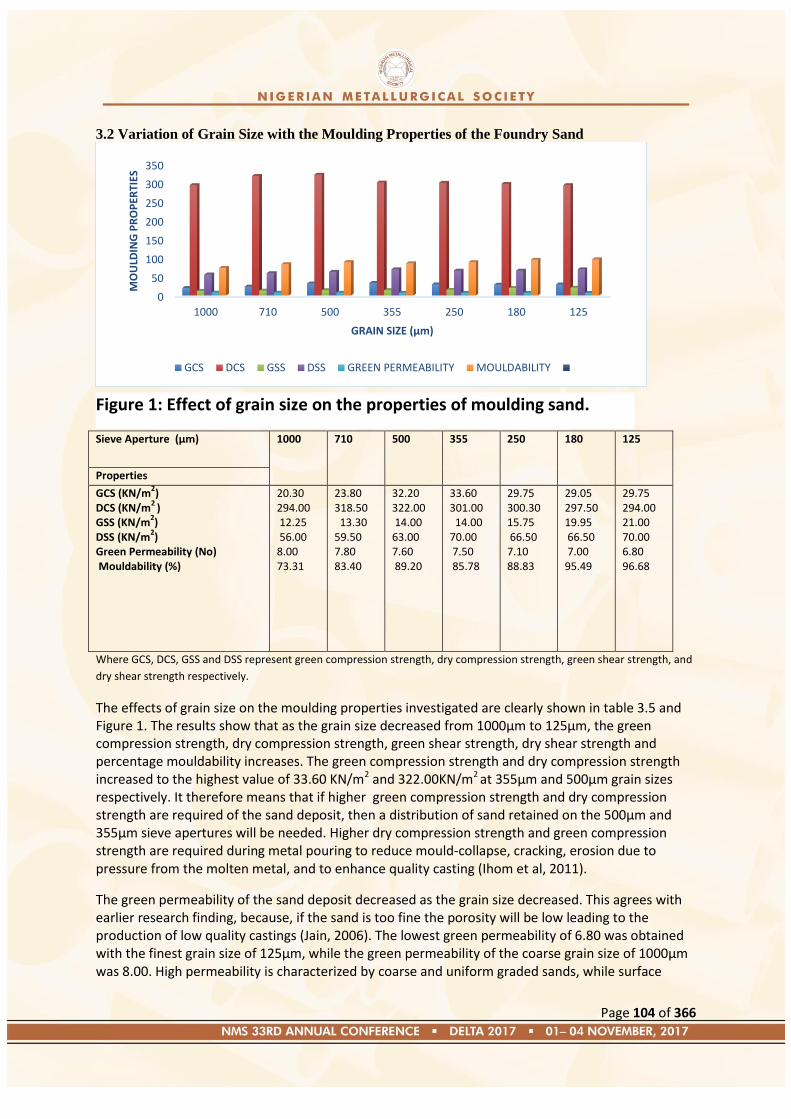
Page 104 of 366
3.2 Variation of Grain Size with the Moulding Properties of the Foundry Sand
Table.3.5: Effects of grain size on the properties of moulding sand.
Sieve Aperture (μm) 1000 710 500 355 250 180 125
Properties
GCS (KN/m2) 20.30 23.80 32.20 33.60 29.75 29.05 29.75
DCS (KN/m2
)
GSS (KN/m
2)
DSS (KN/m2)
Green Permeability (No) Mouldability (%)
294.00 12.25 56.00 8.00 73.31
318.50 13.30 59.50 7.80 83.40
322.00 14.00 63.00 7.60 89.20
301.00 14.00 70.00 7.50 85.78
300.30 15.75 66.50 7.10 88.83
297.50 19.95 66.50 7.00 95.49
294.00 21.00 70.00 6.80 96.68
Where GCS, DCS, GSS and DSS represent green compression strength, dry compression strength, green shear strength, and
dry shear strength respectively.
The effects of grain size on the moulding properties investigated are clearly shown in table 3.5 and Figure 1. The results show that as the grain size decreased from 1000μm to 125μm, the green compression strength, dry compression strength, green shear strength, dry shear strength and percentage mouldability increases. The green compression strength and dry compression strength increased to the highest value of 33.60 KN/m2 and 322.00KN/m2 at 355μm and 500μm grain sizes respectively. It therefore means that if higher green compression strength and dry compression strength are required of the sand deposit, then a distribution of sand retained on the 500μm and 355μm sieve apertures will be needed. Higher dry compression strength and green compression strength are required during metal pouring to reduce mould-collapse, cracking, erosion due to pressure from the molten metal, and to enhance quality casting (Ihom et al, 2011).
The green permeability of the sand deposit decreased as the grain size decreased. This agrees with earlier research finding, because, if the sand is too fine the porosity will be low leading to the production of low quality castings (Jain, 2006). The lowest green permeability of 6.80 was obtained with the finest grain size of 125μm, while the green permeability of the coarse grain size of 1000μm was 8.00. High permeability is characterized by coarse and uniform graded sands, while surface
0
50
100
150
200
250
300
350
1000 710 500 355 250 180 125
MO
ULD
ING
PR
OP
ERTI
ES
GRAIN SIZE (µm)
GCS DCS GSS DSS GREEN PERMEABILITY MOULDABILITY
Figure 1: Effect of grain size on the properties of moulding sand.
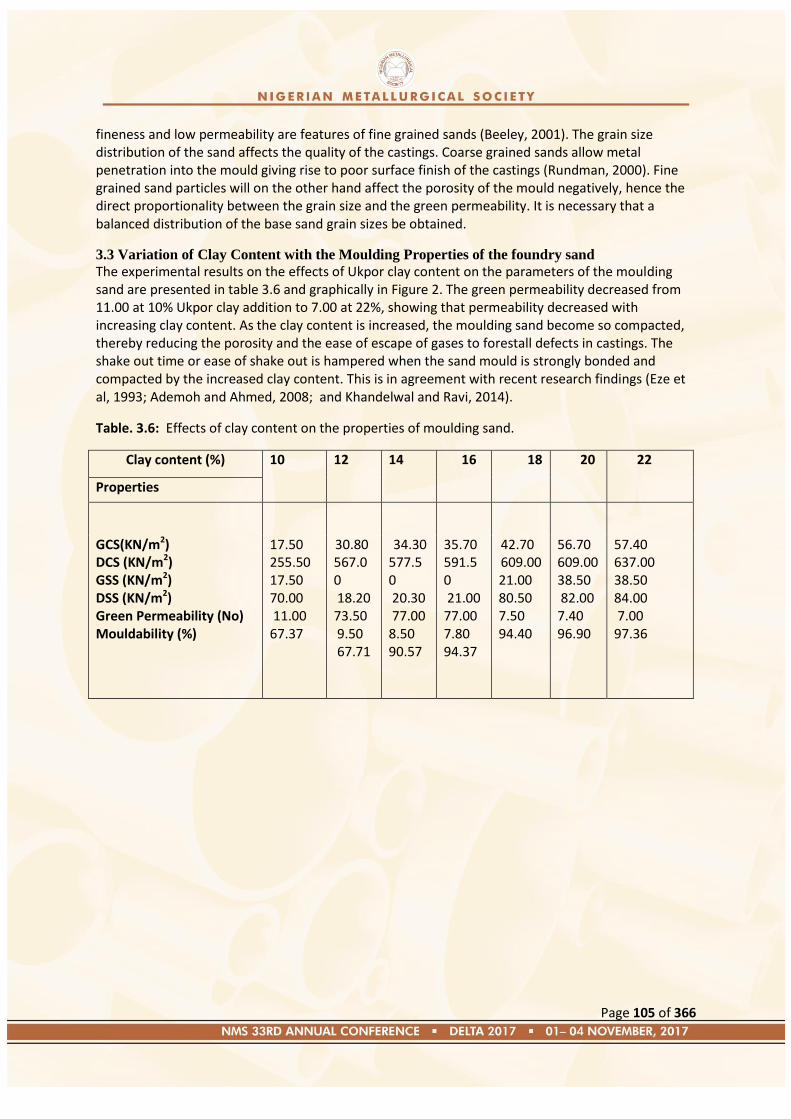
Page 105 of 366
fineness and low permeability are features of fine grained sands (Beeley, 2001). The grain size distribution of the sand affects the quality of the castings. Coarse grained sands allow metal penetration into the mould giving rise to poor surface finish of the castings (Rundman, 2000). Fine grained sand particles will on the other hand affect the porosity of the mould negatively, hence the direct proportionality between the grain size and the green permeability. It is necessary that a balanced distribution of the base sand grain sizes be obtained.
3.3 Variation of Clay Content with the Moulding Properties of the foundry sand
The experimental results on the effects of Ukpor clay content on the parameters of the moulding sand are presented in table 3.6 and graphically in Figure 2. The green permeability decreased from 11.00 at 10% Ukpor clay addition to 7.00 at 22%, showing that permeability decreased with increasing clay content. As the clay content is increased, the moulding sand become so compacted, thereby reducing the porosity and the ease of escape of gases to forestall defects in castings. The shake out time or ease of shake out is hampered when the sand mould is strongly bonded and compacted by the increased clay content. This is in agreement with recent research findings (Eze et al, 1993; Ademoh and Ahmed, 2008; and Khandelwal and Ravi, 2014).
Table. 3.6: Effects of clay content on the properties of moulding sand.
Clay content (%) 10
12
14
16
18
20
22
Properties
GCS(KN/m2) DCS (KN/m2) GSS (KN/m2) DSS (KN/m2) Green Permeability (No) Mouldability (%)
17.50 255.50 17.50 70.00 11.00 67.37
30.80 567.00 18.20 73.50 9.50 67.71
34.30 577.50 20.30 77.00 8.50 90.57
35.70 591.50 21.00 77.00 7.80 94.37
42.70 609.00 21.00 80.50 7.50 94.40
56.70 609.00 38.50 82.00 7.40 96.90
57.40 637.00 38.50 84.00 7.00 97.36
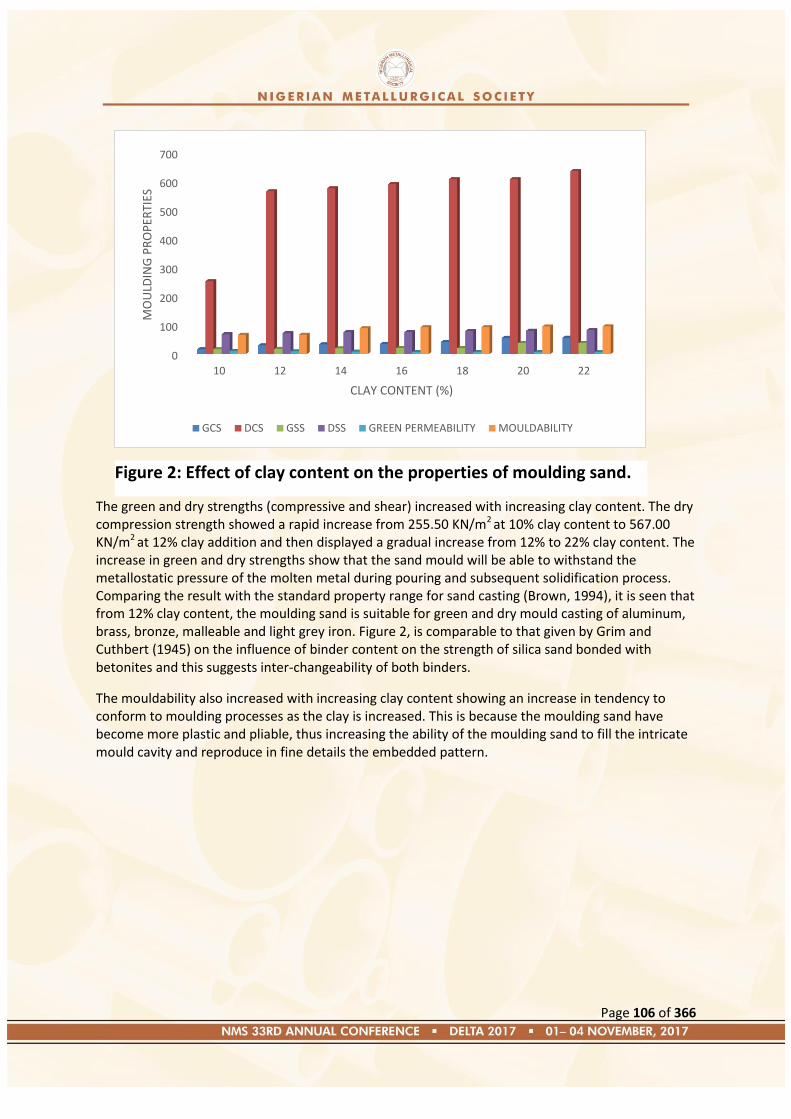
Page 106 of 366
The green and dry strengths (compressive and shear) increased with increasing clay content. The dry compression strength showed a rapid increase from 255.50 KN/m2 at 10% clay content to 567.00 KN/m2 at 12% clay addition and then displayed a gradual increase from 12% to 22% clay content. The increase in green and dry strengths show that the sand mould will be able to withstand the metallostatic pressure of the molten metal during pouring and subsequent solidification process. Comparing the result with the standard property range for sand casting (Brown, 1994), it is seen that from 12% clay content, the moulding sand is suitable for green and dry mould casting of aluminum, brass, bronze, malleable and light grey iron. Figure 2, is comparable to that given by Grim and Cuthbert (1945) on the influence of binder content on the strength of silica sand bonded with betonites and this suggests inter-changeability of both binders.
The mouldability also increased with increasing clay content showing an increase in tendency to conform to moulding processes as the clay is increased. This is because the moulding sand have become more plastic and pliable, thus increasing the ability of the moulding sand to fill the intricate mould cavity and reproduce in fine details the embedded pattern.
0
100
200
300
400
500
600
700
10 12 14 16 18 20 22
MO
ULD
ING
PR
OP
ERTI
ES
CLAY CONTENT (%)
GCS DCS GSS DSS GREEN PERMEABILITY MOULDABILITY
Figure 2: Effect of clay content on the properties of moulding sand.
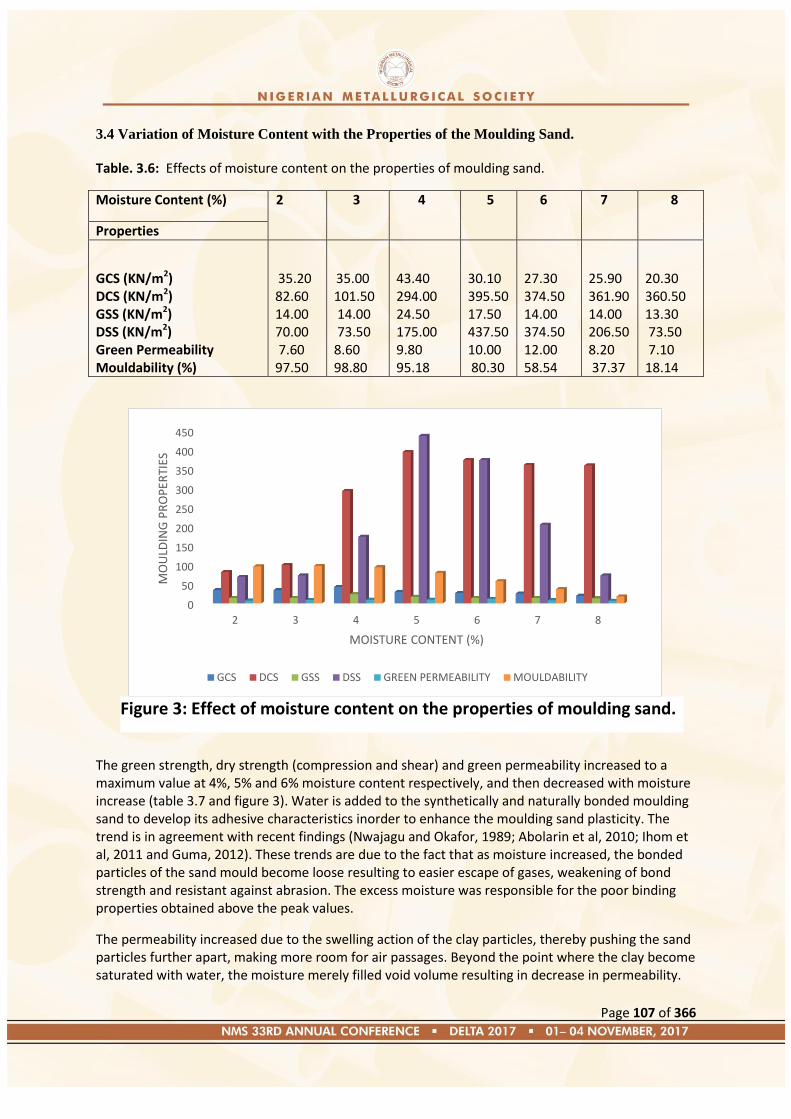
Page 107 of 366
3.4 Variation of Moisture Content with the Properties of the Moulding Sand.
Table. 3.6: Effects of moisture content on the properties of moulding sand.
Moisture Content (%) 2
3
4
5
6
7
8
Properties
GCS (KN/m2) DCS (KN/m2) GSS (KN/m2) DSS (KN/m2) Green Permeability Mouldability (%)
35.20 82.60 14.00 70.00 7.60 97.50
35.00 101.50 14.00 73.50 8.60 98.80
43.40 294.00 24.50 175.00 9.80 95.18
30.10 395.50 17.50 437.50 10.00 80.30
27.30 374.50 14.00 374.50 12.00 58.54
25.90 361.90 14.00 206.50 8.20 37.37
20.30 360.50 13.30 73.50 7.10 18.14
The green strength, dry strength (compression and shear) and green permeability increased to a maximum value at 4%, 5% and 6% moisture content respectively, and then decreased with moisture increase (table 3.7 and figure 3). Water is added to the synthetically and naturally bonded moulding sand to develop its adhesive characteristics inorder to enhance the moulding sand plasticity. The trend is in agreement with recent findings (Nwajagu and Okafor, 1989; Abolarin et al, 2010; Ihom et al, 2011 and Guma, 2012). These trends are due to the fact that as moisture increased, the bonded particles of the sand mould become loose resulting to easier escape of gases, weakening of bond strength and resistant against abrasion. The excess moisture was responsible for the poor binding properties obtained above the peak values.
The permeability increased due to the swelling action of the clay particles, thereby pushing the sand particles further apart, making more room for air passages. Beyond the point where the clay become saturated with water, the moisture merely filled void volume resulting in decrease in permeability.
0
50
100
150
200
250
300
350
400
450
2 3 4 5 6 7 8
MO
ULD
ING
PR
OP
ERTI
ES
MOISTURE CONTENT (%)
GCS DCS GSS DSS GREEN PERMEABILITY MOULDABILITY
Figure 3: Effect of moisture content on the properties of moulding sand.

Page 108 of 366
The mouldability increased to 98.80% at 3% moisture content then steadily decreased as the moisture increased. Above 5% moisture addition the moulding sand exhibited a very low percentage mouldability. At this point the clay have swollen and become saturated with water that it could not conform to moulding processes any longer. Therefore, the most favourable moisture content for River Niger sand (Onitsha deposit) bonded with 16% Ukpor clay content is within the range of 4% and 5%. This result agrees with the conclusion made by Nwajagu and Okafor (1989) and Guma (2012).
4. Conclusion and Recommendations
4.1. Conclusion
The effect of grain size, clay and moisture contents on the moulding properties of foundry sand has been studied in this work and the following conclusions are made: Synthetic moulding sand produced from Ukpor clay and river Niger sand (Onitsha deposit) is
suitable for dry mould casting of ferrous and non-ferrous alloys.
The grain size analysis showed that more than 99% of the bulk sand was retained on the first
few consecutive sieves. Thus, the sand deposit met the AFS standard specification for foundry
sand. The grain fineness number (GFN) and average grain size of the sand deposit also fall
within the recommended range for wide application in sand casting.
The results of chemical analysis for the silica sand and the clay samples indicated that both
have the required purity for enhanced refractoriness, thermal stability and chemical inertness
of moulding sand.
If desirable moulding properties are required, a balanced distribution of sand retained on the 500μm and 355μm sieve apertures should be used since these grain sizes produced better combinations for all the moulding sand properties tested.
Ukpor clay as a binder for River Niger sand (Onitsha deposit) is suitable for both dry and green mould casting of ferrous and nonferrous alloys from a minimum of 12% clay content to about 20% clay content.
Moisture content of River Niger sand (Onitsha deposit) bonded with Ukpor clay should be maintained between 4 to 5% to obtain a better combination of moulding sand properties.
4.2. Recommendations
In the course of this investigation, some pertinent recommendations are made and further research areas have been identified.
It is recommended that Onitsha deposit of river Niger sand and Ukpor clay be used as
components for synthetic moulding sand preparation.
Foundry moulds produced from this synthetic moulding sand should be employed in the dry
mould casting of both ferrous and non-ferrous alloys components.
Mechanical tests should be carried out on the ferrous and non-ferrous alloy components cast
with this locally produced synthetic moulding sand to determine the effects of the moulding
sand on the components‘ mechanical properties.

Page 109 of 366
Acknowledgement
The authors wish to sincerely appreciate the technical assistance of National Metallurgical Development Centre (NMDC), Jos and Engr. Nicholas Agbo of the Defence Industry Corporation of Nigeria (DICON), Kaduna.
REFERENCES
Abolarin, M.S., Lawal, S.A., Salawu, A.A., (2010). Effect of Moisture Content on the Moulding Properties of River Niger Sand using Tudun-wada Clay as a Binder. AU J.T. vol. 13, No. 3, pp. 170-174.
Ademoh, N.A., Ahmed, A.T. (2008). Estimation of the Effect of Kaolin Clay Addition on the Mechanical Properties of Foundry Moulding Sand Bonded with Grade 3 and 4 Nigerian Gun Arabic (Acacia Species). Middle East Journal of Scientific Research, vol.3, No.3, pp. 126-133.
American Foundrymen’s Society, AFS. (1963). Foundry Sand Handbook; the American Foundrymen’s Society. Des Plaines, Illinois, 7th ed., pp. 1-216.
American Foundrymen’s Society, (1968). Moulding Methods and Materials, AFS Handbook, Pp.1-286.
Ayoola, W.A., Adeosun, S.O., Oyetunji, A., (2013). Investigation into Foundry Properties of Oshogbo and Saki Silica Sand Deposits. Annals of Faculty of Engineering Hunedoara- International Journal of Engineering, Vol. 11 (3), pp. 213-218.
Beeley, P.R., (2001). Foundry Technology, Butterworth-Heinmann, ch.4, pp.178-236.
Brown, J.R., (1994). Foseco Ferrous Foundryman Handbook, Butterworth-Heinemann Publishers, Oxford, PP. 3-6, 15-17, 27-85.
Edoziuno, F.O.,Oyibo, A.O.,and Nwaeju, C.C. (2017). Preparation of Synthetic Moulding Sand Using Local Raw Materials. International Journal of Advanced Engineering and Technology, vol.1(1), pp.28-31.
Eze, E.O., Alli, A., Thompson, E.O., (1993). Foundry Qualities and Application of Local Synthetic Sand Mixtures. Applied Clay Science, Vol.7, Issue.6, Pp.493-507.
Guma, T.N. (2012). Characteristics Foundry Properties of Kaduna River Sand. International Journal of Engineering and Science, Vol.1, Issue.6, pp.3-8.
Grim, R.E, Cuthberth, L.F., (1945) Illinois State Geological Survey Report 103. Journal of America Ceramic Society, vol. 28, no.3.
Ihom, P.A., Agunsoye, J., Anbua, E.E., Ogbodo, J.N., (2011). Effects of Moisture Content on the Foundry Properties of Yola Natural Sand. Leonardo Electronic Journal of Practices and Technologies, Issue 19, July-December, pp.85-96.
Jain, P.L., (2006): Principles of Foundry Technology, Tata McGraw-Hill Publishing Company Ltd, New Delhi, Ch3, pp. 55-151.
Khandelwal, H., Ravi, B., (2014). Effect of Binder Composition on the Shrinkage of Chemically Bonded Sand Cores. Materials and Manufacturing Processes, Vol.0,Pp.1-6.

Page 110 of 366
Mclaws, I.J. (1971). Uses and Specifications of Silica Sand. Research Council of Alberta, Report 71-4, pp. 21-28.
Nwajagu, CO. And Okafor, I.C.I., (1989). A study of the Moulding Properties of Sand Bonded by Ukpor Clay. Applied clay Sciences, vol. 4(3), pp. 211-223.
Rundman, K.B., (2000). Metal Casting Reference Book for MY4130 pp.11-16.
Sobcezak J. and Purgert, R.M., (2002). The Use of Fly Ash as an Aggregate for Foundry Sand Mould and Core Production. Technical Report of U.S. Department of Energy (DOE), Federal Energy Technology Centre, PP. 1-56.
Page 111 of 366
Paper: NMS 2017-TP013
Investigating the Mechanical Properties of a Carburized Mild Steel (0.17%C) by Varying
Temperature and Time Using Charcoal
O. E Obolo, A. A. Barnabas, S. Umar and L. Jafar
Metallurgical and Materials Engineering Dept., Federal University of Technology PMB 704,
Akure, Ondo State, Nigeria.
[email protected], [email protected]
+2348138629292
ABSTRACT
In this study, the limitation of surface carburizing for mild steel was investigated. The
microstructure, mechanical properties of mild steel subjected to packed carburization treatment
using wood-charcoal obtained from the local market and granulated into powder as the
carburizer and BaCO3 was purchased as energizer to speed up the carburization process, has been
investigated taken different temperatures. The BaCO3 and charcoal were mixed in ratio 40:60.
The procured mild steel samples were placed in a thick bed of carburizer kept in a stainless
steel crucible and fully covered with stainless steel plate, heated in muffle furnace at carburizing
temperatures of 750°C, 800°C,850°C,900°C,and 950°C for varying times ranging from 60minutes
to 240 minutes for each carburising temperature, cooled in still air, followed by reheating the
samples to 750°C for one hour for all the carburized samples to obtain grain refinement,
quenched in oil, later heated to 350°C for one hour, cooled in air to remove internal stresses set
up during rapid cooling from the hardening temperature. To see the effects of the carburizing in
changing the material properties, the microstructures and standard tests along the cross
sectional area of the specimens were carried out, and data were obtained. It was clearly shown
that the mechanical properties of mild steels were found to be strongly influenced by the process
of carburization, carburizing temperature and soaking time at carburizing temperature. In
general, hardness and tensile strength increase with increase in the carburization temperature.
Keywords; Hardness, Carburization, Mild Steel
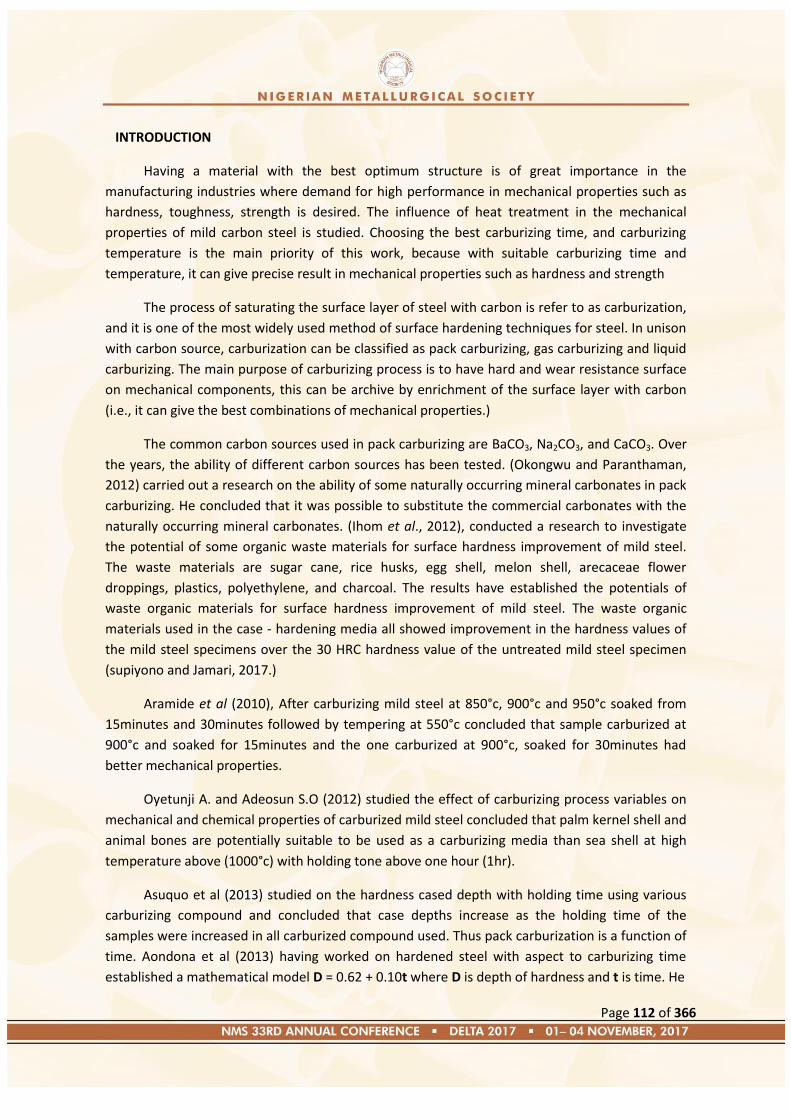
Page 112 of 366
INTRODUCTION
Having a material with the best optimum structure is of great importance in the
manufacturing industries where demand for high performance in mechanical properties such as
hardness, toughness, strength is desired. The influence of heat treatment in the mechanical
properties of mild carbon steel is studied. Choosing the best carburizing time, and carburizing
temperature is the main priority of this work, because with suitable carburizing time and
temperature, it can give precise result in mechanical properties such as hardness and strength
The process of saturating the surface layer of steel with carbon is refer to as carburization,
and it is one of the most widely used method of surface hardening techniques for steel. In unison
with carbon source, carburization can be classified as pack carburizing, gas carburizing and liquid
carburizing. The main purpose of carburizing process is to have hard and wear resistance surface
on mechanical components, this can be archive by enrichment of the surface layer with carbon
(i.e., it can give the best combinations of mechanical properties.)
The common carbon sources used in pack carburizing are BaCO3, Na2CO3, and CaCO3. Over
the years, the ability of different carbon sources has been tested. (Okongwu and Paranthaman,
2012) carried out a research on the ability of some naturally occurring mineral carbonates in pack
carburizing. He concluded that it was possible to substitute the commercial carbonates with the
naturally occurring mineral carbonates. (Ihom et al., 2012), conducted a research to investigate
the potential of some organic waste materials for surface hardness improvement of mild steel.
The waste materials are sugar cane, rice husks, egg shell, melon shell, arecaceae flower
droppings, plastics, polyethylene, and charcoal. The results have established the potentials of
waste organic materials for surface hardness improvement of mild steel. The waste organic
materials used in the case - hardening media all showed improvement in the hardness values of
the mild steel specimens over the 30 HRC hardness value of the untreated mild steel specimen
(supiyono and Jamari, 2017.)
Aramide et al (2010), After carburizing mild steel at 850°c, 900°c and 950°c soaked from
15minutes and 30minutes followed by tempering at 550°c concluded that sample carburized at
900°c and soaked for 15minutes and the one carburized at 900°c, soaked for 30minutes had
better mechanical properties.
Oyetunji A. and Adeosun S.O (2012) studied the effect of carburizing process variables on
mechanical and chemical properties of carburized mild steel concluded that palm kernel shell and
animal bones are potentially suitable to be used as a carburizing media than sea shell at high
temperature above (1000°c) with holding tone above one hour (1hr).
Asuquo et al (2013) studied on the hardness cased depth with holding time using various
carburizing compound and concluded that case depths increase as the holding time of the
samples were increased in all carburized compound used. Thus pack carburization is a function of
time. Aondona et al (2013) having worked on hardened steel with aspect to carburizing time
established a mathematical model D = 0.62 + 0.10t where D is depth of hardness and t is time. He
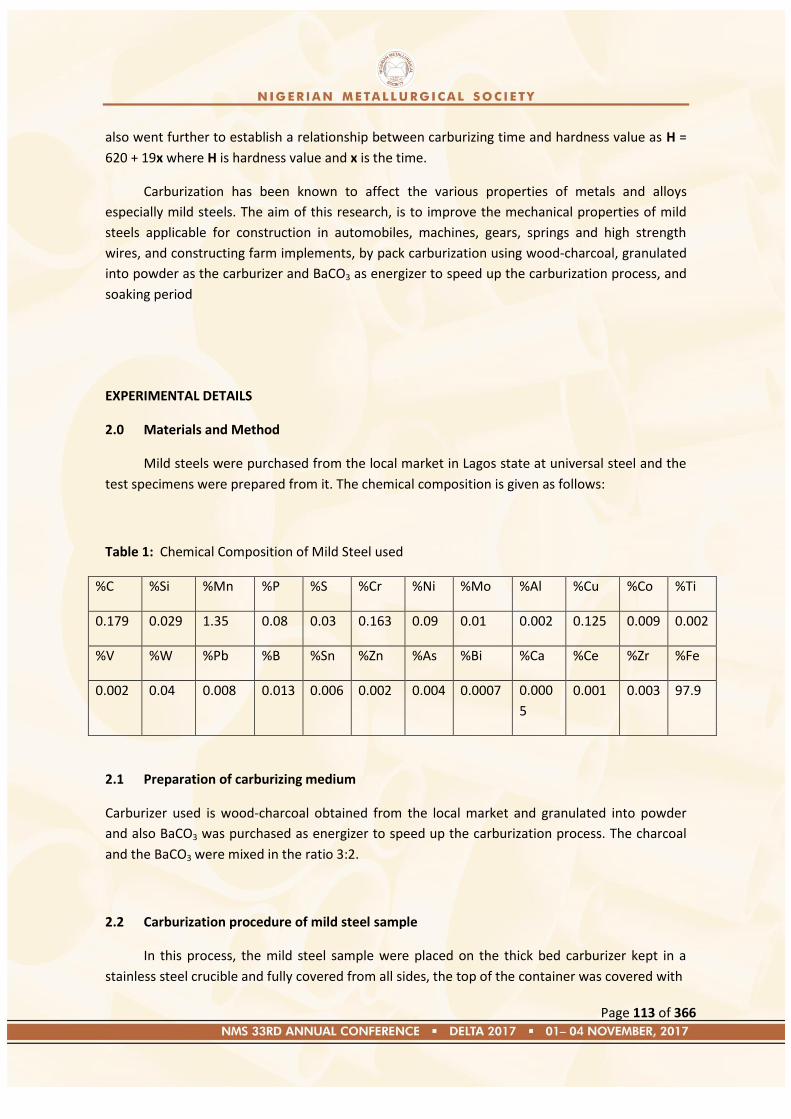
Page 113 of 366
also went further to establish a relationship between carburizing time and hardness value as H =
620 + 19x where H is hardness value and x is the time.
Carburization has been known to affect the various properties of metals and alloys
especially mild steels. The aim of this research, is to improve the mechanical properties of mild
steels applicable for construction in automobiles, machines, gears, springs and high strength
wires, and constructing farm implements, by pack carburization using wood-charcoal, granulated
into powder as the carburizer and BaCO3 as energizer to speed up the carburization process, and
soaking period
EXPERIMENTAL DETAILS
2.0 Materials and Method
Mild steels were purchased from the local market in Lagos state at universal steel and the
test specimens were prepared from it. The chemical composition is given as follows:
Table 1: Chemical Composition of Mild Steel used
%C %Si %Mn %P %S %Cr %Ni %Mo %Al %Cu %Co %Ti
0.179 0.029 1.35 0.08 0.03 0.163 0.09 0.01 0.002 0.125 0.009 0.002
%V %W %Pb %B %Sn %Zn %As %Bi %Ca %Ce %Zr %Fe
0.002 0.04 0.008 0.013 0.006 0.002 0.004 0.0007 0.000
5
0.001 0.003 97.9
2.1 Preparation of carburizing medium
Carburizer used is wood-charcoal obtained from the local market and granulated into powder
and also BaCO3 was purchased as energizer to speed up the carburization process. The charcoal
and the BaCO3 were mixed in the ratio 3:2.
2.2 Carburization procedure of mild steel sample
In this process, the mild steel sample were placed on the thick bed carburizer kept in a
stainless steel crucible and fully covered from all sides, the top of the container was covered with
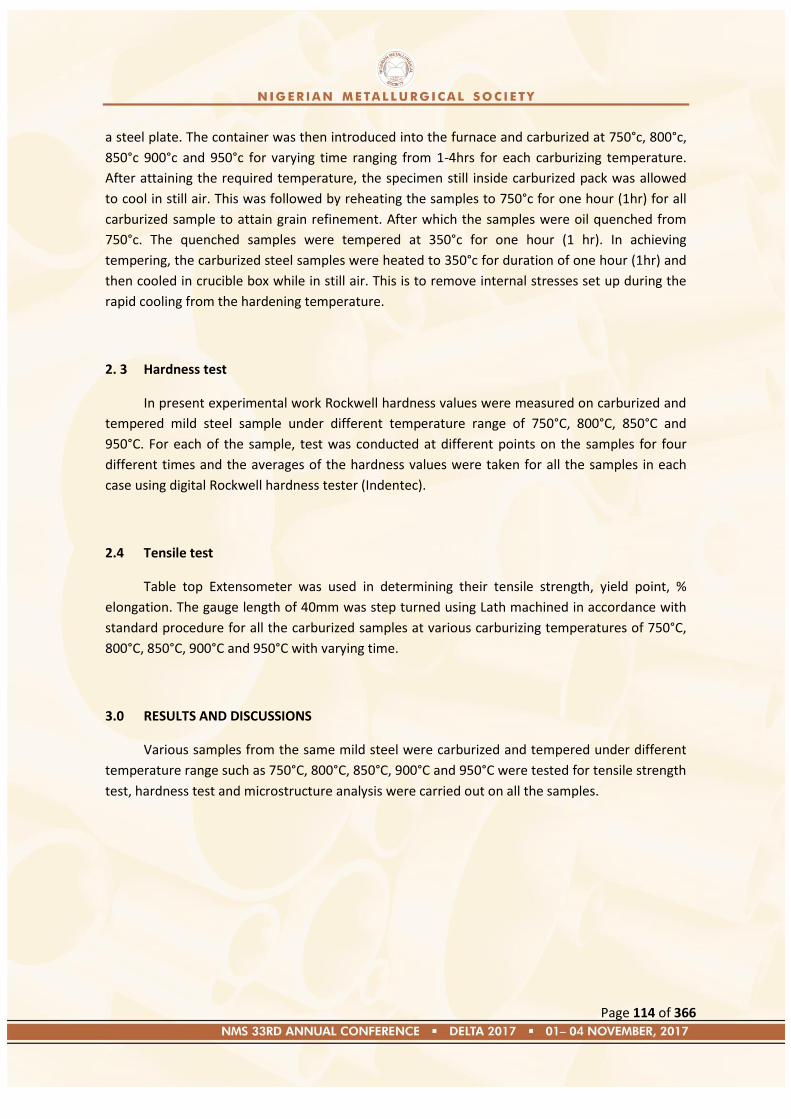
Page 114 of 366
a steel plate. The container was then introduced into the furnace and carburized at 750°c, 800°c,
850°c 900°c and 950°c for varying time ranging from 1-4hrs for each carburizing temperature.
After attaining the required temperature, the specimen still inside carburized pack was allowed
to cool in still air. This was followed by reheating the samples to 750°c for one hour (1hr) for all
carburized sample to attain grain refinement. After which the samples were oil quenched from
750°c. The quenched samples were tempered at 350°c for one hour (1 hr). In achieving
tempering, the carburized steel samples were heated to 350°c for duration of one hour (1hr) and
then cooled in crucible box while in still air. This is to remove internal stresses set up during the
rapid cooling from the hardening temperature.
2. 3 Hardness test
In present experimental work Rockwell hardness values were measured on carburized and
tempered mild steel sample under different temperature range of 750°C, 800°C, 850°C and
950°C. For each of the sample, test was conducted at different points on the samples for four
different times and the averages of the hardness values were taken for all the samples in each
case using digital Rockwell hardness tester (Indentec).
2.4 Tensile test
Table top Extensometer was used in determining their tensile strength, yield point, %
elongation. The gauge length of 40mm was step turned using Lath machined in accordance with
standard procedure for all the carburized samples at various carburizing temperatures of 750°C,
800°C, 850°C, 900°C and 950°C with varying time.
3.0 RESULTS AND DISCUSSIONS
Various samples from the same mild steel were carburized and tempered under different
temperature range such as 750°C, 800°C, 850°C, 900°C and 950°C were tested for tensile strength
test, hardness test and microstructure analysis were carried out on all the samples.
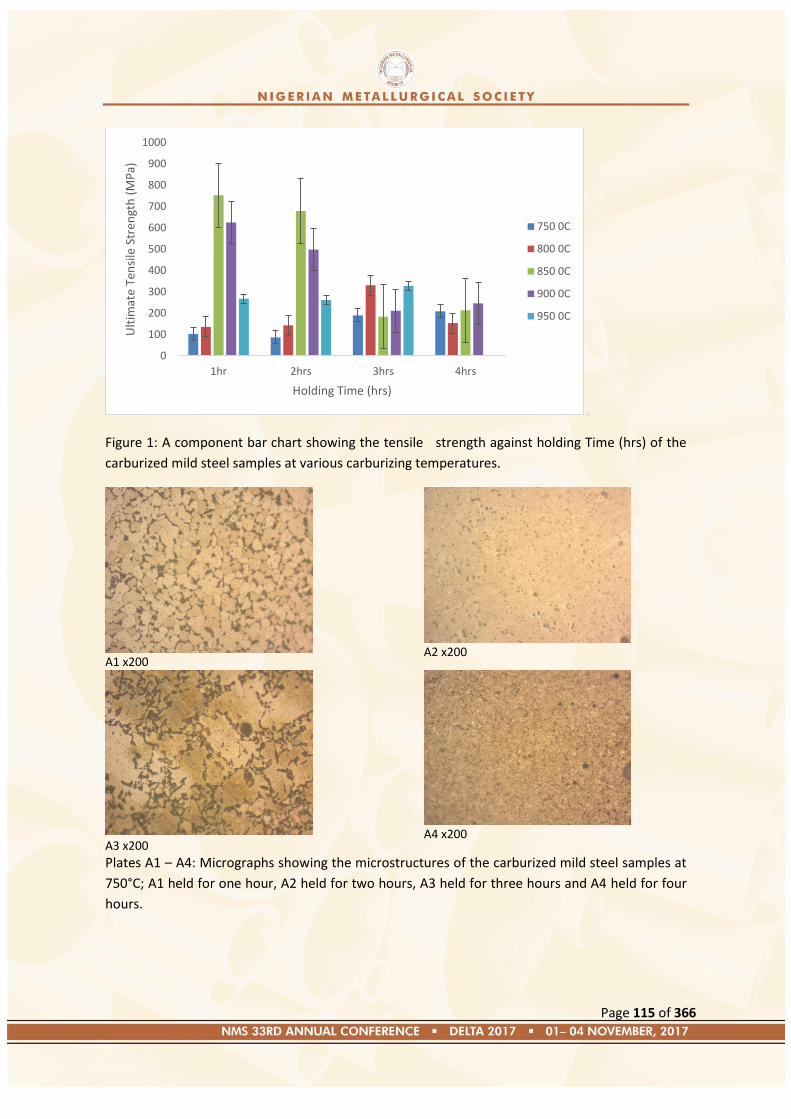
Page 115 of 366
Figure 1: A component bar chart showing the tensile strength against holding Time (hrs) of the
carburized mild steel samples at various carburizing temperatures.
A1 x200
A2 x200
A3 x200
A4 x200
Plates A1 – A4: Micrographs showing the microstructures of the carburized mild steel samples at
750°C; A1 held for one hour, A2 held for two hours, A3 held for three hours and A4 held for four
hours.
0
100
200
300
400
500
600
700
800
900
1000
1hr 2hrs 3hrs 4hrs
Ult
imat
e Te
nsi
le S
tren
gth
(M
Pa)
Holding Time (hrs)
750 0C
800 0C
850 0C
900 0C
950 0C
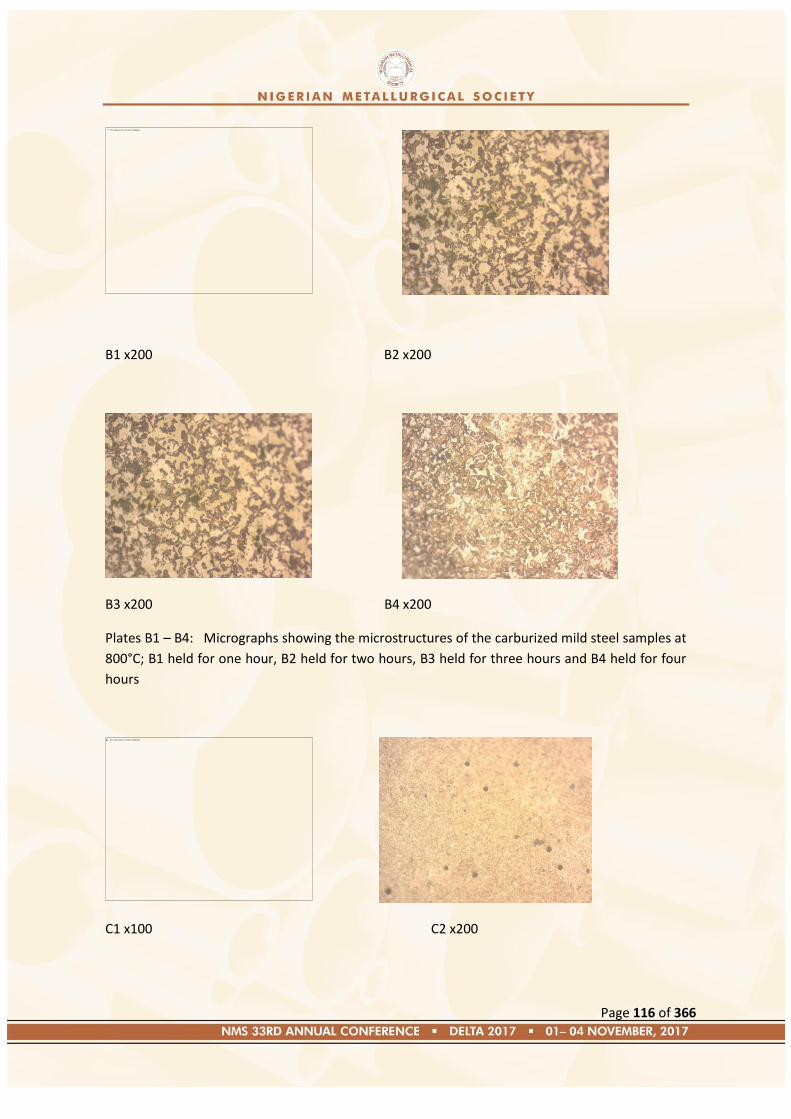
Page 116 of 366
B1 x200 B2 x200
B3 x200 B4 x200
Plates B1 – B4: Micrographs showing the microstructures of the carburized mild steel samples at
800°C; B1 held for one hour, B2 held for two hours, B3 held for three hours and B4 held for four
hours
C1 x100 C2 x200

Page 117 of 366
C3 x200 C4 x200
Plates C1- C 4: Micrographs showing the microstructures of the carburized mild steel samples at
850°C; C1 held for one hour, C2 held for two hours, C3 held for three hours and C4 held for four
hours.
D1 x100 D2 x200
Plates D1 – D4: Micrographs showing the microstructures of the carburized mild steel samples at
900°C; D1 held for one hour, D2 held for two hours, D3 held for three hours and D4 held for four
hours.
D3 x100
D4 x200
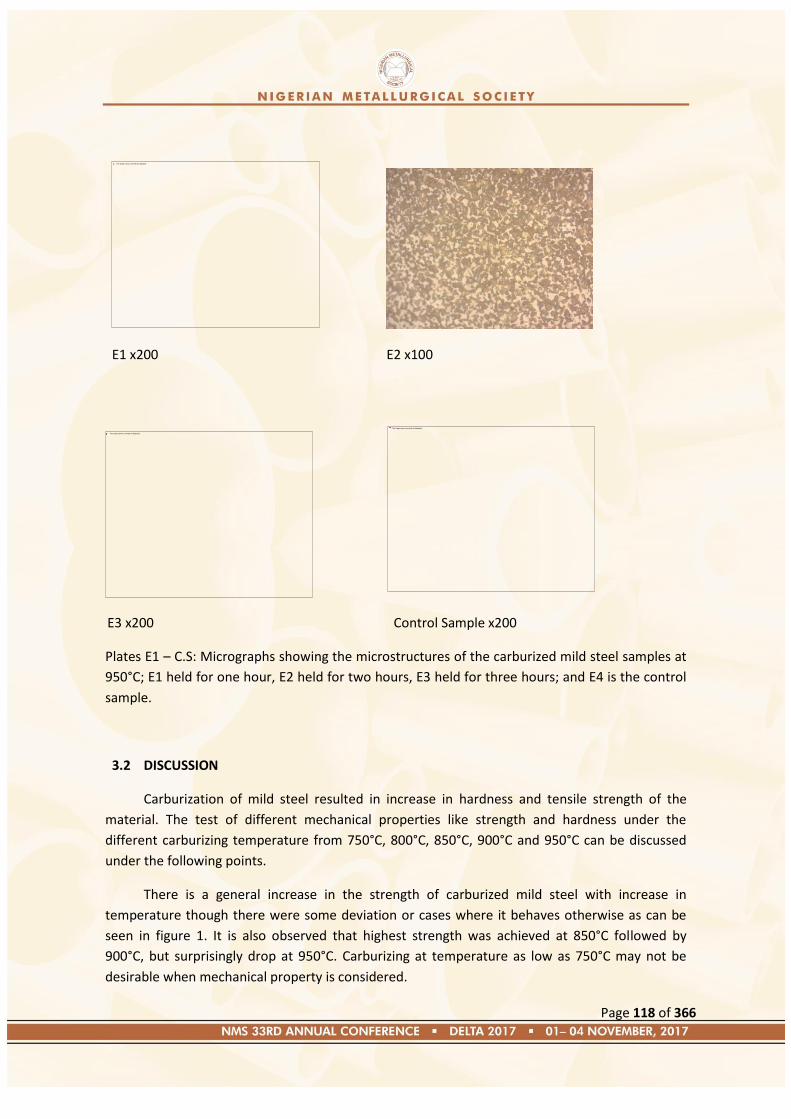
Page 118 of 366
E1 x200 E2 x100
E3 x200 Control Sample x200
Plates E1 – C.S: Micrographs showing the microstructures of the carburized mild steel samples at
950°C; E1 held for one hour, E2 held for two hours, E3 held for three hours; and E4 is the control
sample.
3.2 DISCUSSION
Carburization of mild steel resulted in increase in hardness and tensile strength of the
material. The test of different mechanical properties like strength and hardness under the
different carburizing temperature from 750°C, 800°C, 850°C, 900°C and 950°C can be discussed
under the following points.
There is a general increase in the strength of carburized mild steel with increase in
temperature though there were some deviation or cases where it behaves otherwise as can be
seen in figure 1. It is also observed that highest strength was achieved at 850°C followed by
900°C, but surprisingly drop at 950°C. Carburizing at temperature as low as 750°C may not be
desirable when mechanical property is considered.
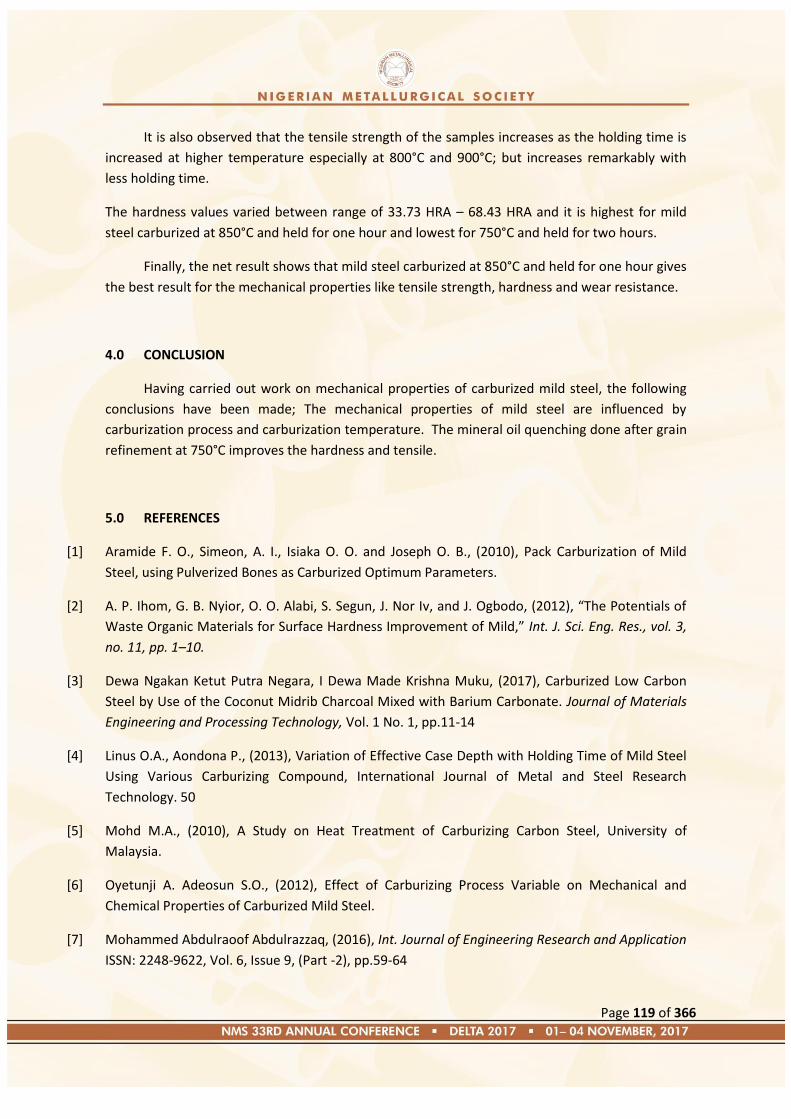
Page 119 of 366
It is also observed that the tensile strength of the samples increases as the holding time is
increased at higher temperature especially at 800°C and 900°C; but increases remarkably with
less holding time.
The hardness values varied between range of 33.73 HRA – 68.43 HRA and it is highest for mild
steel carburized at 850°C and held for one hour and lowest for 750°C and held for two hours.
Finally, the net result shows that mild steel carburized at 850°C and held for one hour gives
the best result for the mechanical properties like tensile strength, hardness and wear resistance.
4.0 CONCLUSION
Having carried out work on mechanical properties of carburized mild steel, the following
conclusions have been made; The mechanical properties of mild steel are influenced by
carburization process and carburization temperature. The mineral oil quenching done after grain
refinement at 750°C improves the hardness and tensile.
5.0 REFERENCES
[1] Aramide F. O., Simeon, A. I., Isiaka O. O. and Joseph O. B., (2010), Pack Carburization of Mild
Steel, using Pulverized Bones as Carburized Optimum Parameters.
[2] A. P. Ihom, G. B. Nyior, O. O. Alabi, S. Segun, J. Nor Iv, and J. Ogbodo, (2012), “The Potentials of
Waste Organic Materials for Surface Hardness Improvement of Mild,” Int. J. Sci. Eng. Res., vol. 3,
no. 11, pp. 1–10.
[3] Dewa Ngakan Ketut Putra Negara, I Dewa Made Krishna Muku, (2017), Carburized Low Carbon
Steel by Use of the Coconut Midrib Charcoal Mixed with Barium Carbonate. Journal of Materials
Engineering and Processing Technology, Vol. 1 No. 1, pp.11-14
[4] Linus O.A., Aondona P., (2013), Variation of Effective Case Depth with Holding Time of Mild Steel
Using Various Carburizing Compound, International Journal of Metal and Steel Research
Technology. 50
[5] Mohd M.A., (2010), A Study on Heat Treatment of Carburizing Carbon Steel, University of
Malaysia.
[6] Oyetunji A. Adeosun S.O., (2012), Effect of Carburizing Process Variable on Mechanical and
Chemical Properties of Carburized Mild Steel.
[7] Mohammed Abdulraoof Abdulrazzaq, (2016), Int. Journal of Engineering Research and Application
ISSN: 2248-9622, Vol. 6, Issue 9, (Part -2), pp.59-64
Page 120 of 366
[8] I K t. Suarsana and I G.N. Santhiarsa, (2017), Utilization SiCw and Al2O3 Particles on Aluminium
Matrix in Improving Strength and Hardness Composite Materials. Journal of Materials
Engineering and Processing Technology, Vol. 1 No. 1, pp.19-23
[9] Supriyono and Jamasri, (2017), Holding Time Effect of Pack Carburizing on Fatigue Characteristic
of V-Notch Shaft Steel Specimens
[10] D. A. Okongwu and V. Paranthaman, (1987), “Assessment of The Efficacy of Some Carbonate
Minerals as Energizersing Pack Carburisation of Mild Steel,” Niger. J. Technol., vol. 11, no. 1.
[11] Mohd M.A., (2010), A Study on Heat Treatment of Carburizing Carbon Steel, University of
Malaysia.
[12] Linus O.A., Aondona P., (2013), Variation of Effective Case Depth with Holding Time of Mild Steel
Using Various Carburizing Compound, International Journal of Metal and Steel Research
Technology.
[13] Mohammed A.A., (2016), Investigation the Mechanical Properties of Carburized Low Carbon
Steel. Int. Journal of Engineering Research and Application. ISSN: 2248-9622, Vol. 6, Issue 9, (Part
-2), pp.59-64.
[14] J. K. Ahmad, (2015), “Carburizing of steel,” Int. J. Mater. Sci. Appl., vol. 4, pp. 11–14.
Page 121 of 366
Paper: NMS 2017-TP014
Empirical Analysis of Factors Affecting Oil and Gas Pipeline Corrosion in Nigerian
Niger Delta Using Artificial Neural Network
1B. N. Nwankwojike,
1F. I. Abam
and
2M. Obaseki
1Department of Mechanical Engineering, Michael Okpara University of Agriculture, Umudike
2Department of Mechanical Engineering, University of Port Harcourt, Port Harcourt
[email protected]; [email protected]; [email protected]
Abstract
This study appraised the significance of all the factors affecting corrosion of oil and gas pipeline in
Niger Delta region of Nigerian using artificial neutral network (ANN) technique in order to ascertain
the root cause of incessant unexpected pipe failure in this region. Operational and process data of
sixty oil and gas transmission pipelines used by six oil and gas companies from 2000 to 2010 for
onshore and offshore applications at different oil and gas fields located in this region were sampled
and used for both ANN model development and parametric analysis. Results revealed that the
predictions of ANN simulation developed in this study which approximates the actual corrosion rates
by over 99% are greater than those of conventional De-Waard based simulations presently used by
most Nigerian oil and gas companies. Thus, the inadequate prediction of oil and gas pipeline
corrosion rate resulting to incessant unexpected pipeline failure in this region. Parametric analysis of
the model showed that corrosion rate of carbon steel pipelines used for oil and gas transportation in
this region varies linearly with temperature, flow pressure, CO2 partial pressure, pipe length and pH
value while the effects of the pipe age, flow velocity, density, viscosity, chloride sand flow and pipe
diameter are non-linear. The used of models/simulations whose predictions are relatively less than the
actual corrosion rate of oil and gas pipeline by Nigerian oil and gas companies in order to eliminate
catastrophic pipeline failure and its resulting oil spillage/environmental degradation in this region.
1.0 Introduction
Pipelines used in oil and gas sector can be made of metallic alloys or plastics but carbon steel pipes
remains the best means of transporting oil and gas due to its favourable thermo-mechanical properties
(Akano et al, 2017). However, apart from design/structural, limitations and mechanical damages that
are avoidable, carbon steel pipes used in oil and gas sector are prone to corrosion which is apparently
impossible to prevent due to prevailing aqueous environment of this sector (IIman and Kusmono,
2014). Thus, various means of appraisal and prediction of corrosion mechanisms/rate in oil and gas
pipeline such as inspection, monitoring and computer modeling techniques are highly valued even
though forensic evaluations/mitigation method (coating-painting and cathodic protection) remains an
integral part of combating this menace. Although inspections and monitoring using high-resolution
magnetic flux, sensors or ultrasonic tools can provide valuable information regarding past and present
exposure conditions, these methods can neither predict the remaining life of the pipe nor provide in-
depth evaluation of mechanisms of corrosion growth directly except computer or simulation models
can do this (Giulia et al, 2014). However, unexpected pipe failure and high maintenance cost resulting
from replacement of pipes that are not due for replacement still persists in Niger Delta region of
Nigeria, despite numerous simulation models developed analyzing oil and gas pipeline behavior under
corrosion. This is because none of existing modified De-Waard based simulations used by most oil
companies in this region accounts for all relevant variables that influence corrosion of carbon steel
pipeline. In addition, some of the simulations considered response variables of pipeline corrosion such
as defect depth and length as predictors, thereby hindering analysis/prediction of corrosion rate before
the process starts. This adversely affects decision during system design which results to
uncontrollable life cycle cost.
Page 122 of 366
DeWaard and Milliams (1975), modeled rate of oil and gas pipeline corrosion as a function of
temperature and CO2 partial pressure which was later improved to accounts for flow velocity and
diameter of pipe by DeWaard and Lotz (1995). Ossai, (2012) improved on the previous by
introducing pH value of the pipe‘s environment. Nesic et al. (2005) is limited to prediction of internal
corrosion rate of oil and gas pipes as a function of hydrogen sulphide (H2S), water entrainment in
multiphase flow and corrosion inhibition of crude oil component making it unreliable for holistic
management of corrosion in this sector. Also, the neuro-fuzzy model of Akano et al (2017), which
established corrosion rate as a function of pipe burial depth, soil type, pH, temperature and moisture
content is limited lithospheric application. Although, the function developed for predicting corrosion
rate of oil and gas pipeline by Norsok (2005), considered the effects of temperature, CO2 partial
pressure, pH and shear stress of the pipe, the temperature range assumed in this work is not realistic in
all environment and flow parameters of the fluid transported were not considered. Thus, Iyasele and
Ntunde (2016), modified Norsok M-506 algorithm to include the effects of heat capacity, fluid
density, fluid velocity, internal diameter, heat transfer coefficient, inlet temperature, surrounding
temperature, total pipe length, pipe thickness, system pressure, oil flow rate, imitator efficiency, and
water volume flow rate without considering effects sand deposits and pipe age. Netto et al (2005) and
Gatekeeper (2014) showed that sand flow rate increases localized corrosion growth in oil and gas
pipeline while Woldeyohannes and Majid (2011) revealed that pipeline age affects its performance.
Thus, the high rate of unpredictable pipe failure resulting to incessant accident/loss of life,
products wastes, environmental pollution and high operational cost pipeline facilities in this
region.
Therefore, the need for the best means of quantifying the combined effects of all the predicting factors
affecting oil and gas pipeline corrosion in this region to enable effective assessment of the
significance of each predictor‘s influence on the pipe‘s corrosion rate as it interacts with others. Most
modern parametric investigations such as this that are not easily expressed in a traditional computer
algorithm using rule-based programming usually lend themselves to artificial neural network (ANN)
modeling because of its outstanding feature of fitting complex nonlinear interactions between systems
inputs and outputs (Bassam et al, 2009). Although, the recent efforts of Kexi et al (2012), Mohammed
et al (2014), Din et al (2015), and others in the development of models for effective prediction of
pipeline corrosion rate using ANN technique cannot be overemphasized, none of them
comprehensively considered all the predicting factors of this corrosion process in Niger Delta region.
In addition, application of model for predicting rate of corrosion in structural steel tower developed by
Din et al (2015) is limited because its prediction capability depends on corrosion indicators and
precision of measuring devices (defect depth, defect length, width, orientation, and odometer) instead
of its origin. Hence, the objective of this study is to appraise the significant of factors affecting
corrosion rate of carbon steel pipeline used oil and gas transmission in Niger Delta using artificial
neutral network
2.0 Methodology
The study involves application of neutral network method in fitting a mathematical function relating
corrosion rate with all the factors affecting corrosion of carbon steel pipeline used for oil and gas
transportation in Niger Delta and using it for parametric evaluation of the factors in order to determine
the significance/nature of their effect in this process. Factors investigated includes pipe age (A yrs),
diameter (D mm) and length (L mm), temperature (T 0C), CO2 partial pressure (PCO2bar), flow
velocity of the fluid (V m/s) and sand (SF m/s), fluid pressure (P bar),, density ( kg/m3) and viscosity
( cP), environmental pH (pH) and chloride content (Cl mg/kg). Operational/process data (Table 1
and 2) of sixty pipelines with insignificant data outliers were selected for this investigation. The pipes
were used by six oil and gas companies between 2000 and 2010 at different oil and gas fields at
Akwa-Ibom, Bayelsa, Cross River, Edo, Delta, and Rivers states of Nigeria. The ANN
function/simulation was developed and analyzed using MATLAB2014b from a neural network
architecture design (Fig. 1) which uses feed forward and back propagation training algorithms (Fig. 2)
for generating and comparing predictions with given/target actual corrosion rates by backtracking and
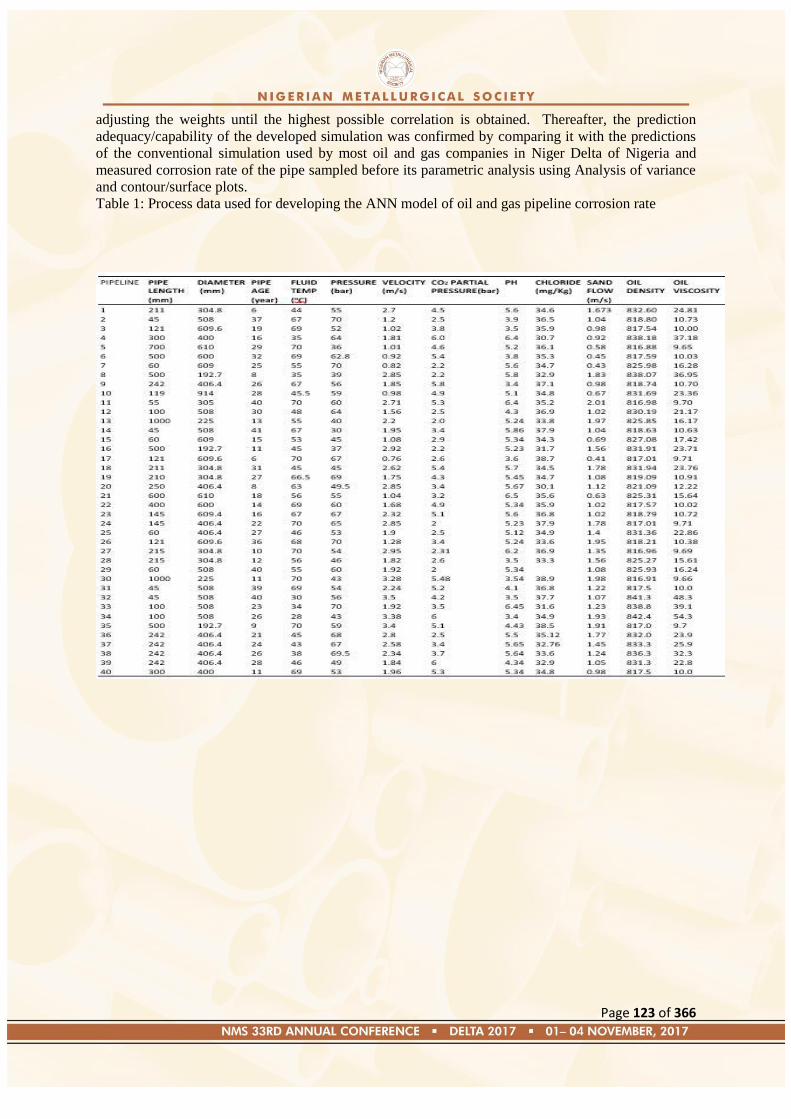
Page 123 of 366
adjusting the weights until the highest possible correlation is obtained. Thereafter, the prediction
adequacy/capability of the developed simulation was confirmed by comparing it with the predictions
of the conventional simulation used by most oil and gas companies in Niger Delta of Nigeria and
measured corrosion rate of the pipe sampled before its parametric analysis using Analysis of variance
and contour/surface plots.
Table 1: Process data used for developing the ANN model of oil and gas pipeline corrosion rate
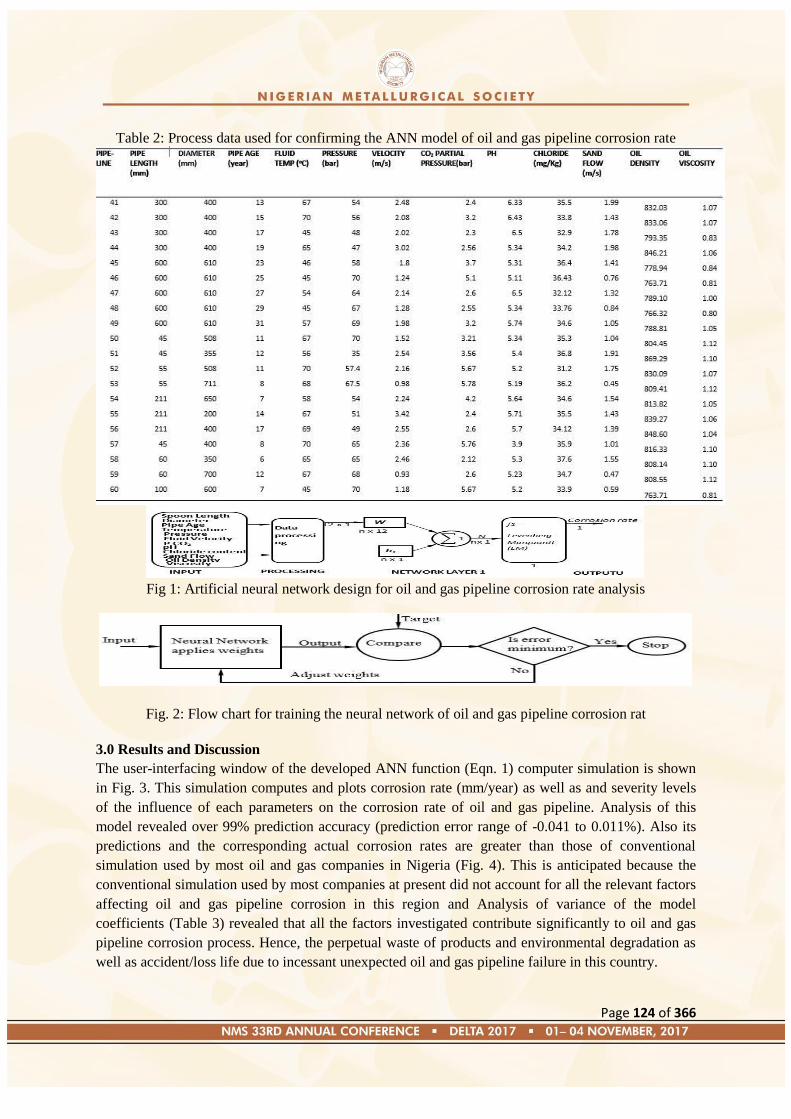
Page 124 of 366
Table 2: Process data used for confirming the ANN model of oil and gas pipeline corrosion rate
Fig 1: Artificial neural network design for oil and gas pipeline corrosion rate analysis
Fig. 2: Flow chart for training the neural network of oil and gas pipeline corrosion rat
3.0 Results and Discussion
The user-interfacing window of the developed ANN function (Eqn. 1) computer simulation is shown
in Fig. 3. This simulation computes and plots corrosion rate (mm/year) as well as and severity levels
of the influence of each parameters on the corrosion rate of oil and gas pipeline. Analysis of this
model revealed over 99% prediction accuracy (prediction error range of -0.041 to 0.011%). Also its
predictions and the corresponding actual corrosion rates are greater than those of conventional
simulation used by most oil and gas companies in Nigeria (Fig. 4). This is anticipated because the
conventional simulation used by most companies at present did not account for all the relevant factors
affecting oil and gas pipeline corrosion in this region and Analysis of variance of the model
coefficients (Table 3) revealed that all the factors investigated contribute significantly to oil and gas
pipeline corrosion process. Hence, the perpetual waste of products and environmental degradation as
well as accident/loss life due to incessant unexpected oil and gas pipeline failure in this country.
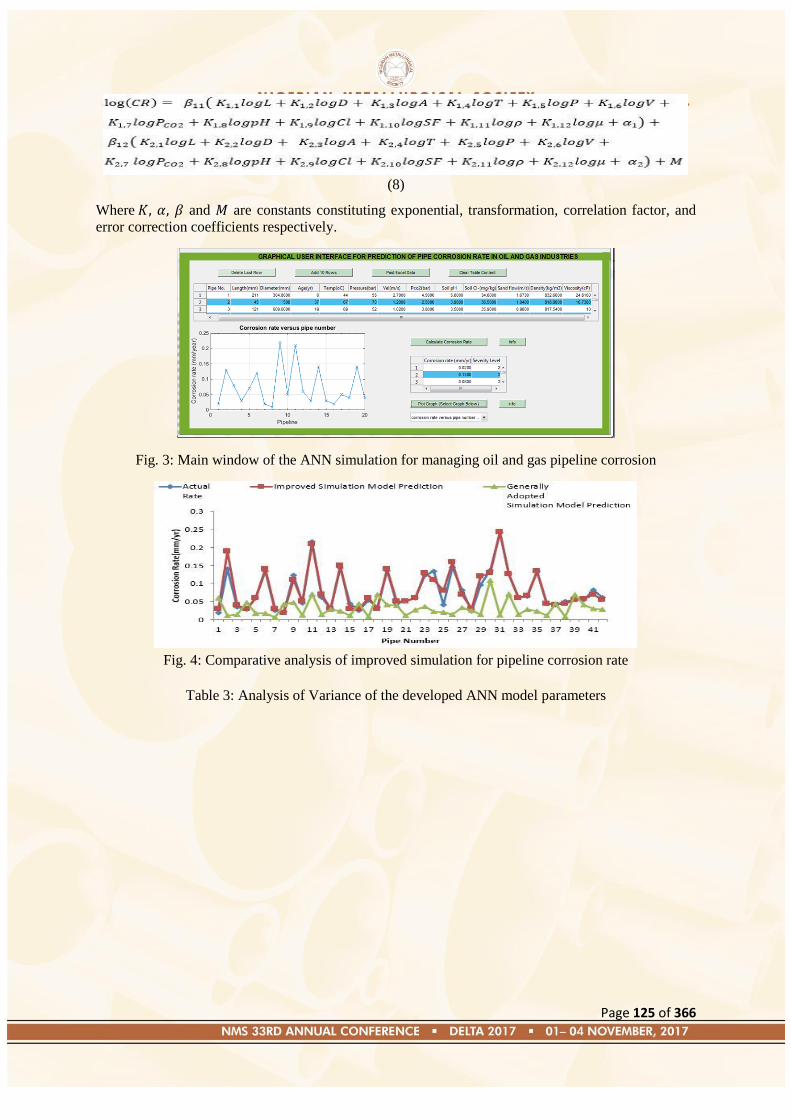
Page 125 of 366
(8)
Where and are constants constituting exponential, transformation, correlation factor, and
error correction coefficients respectively.
Fig. 3: Main window of the ANN simulation for managing oil and gas pipeline corrosion
Fig. 4: Comparative analysis of improved simulation for pipeline corrosion rate
Table 3: Analysis of Variance of the developed ANN model parameters
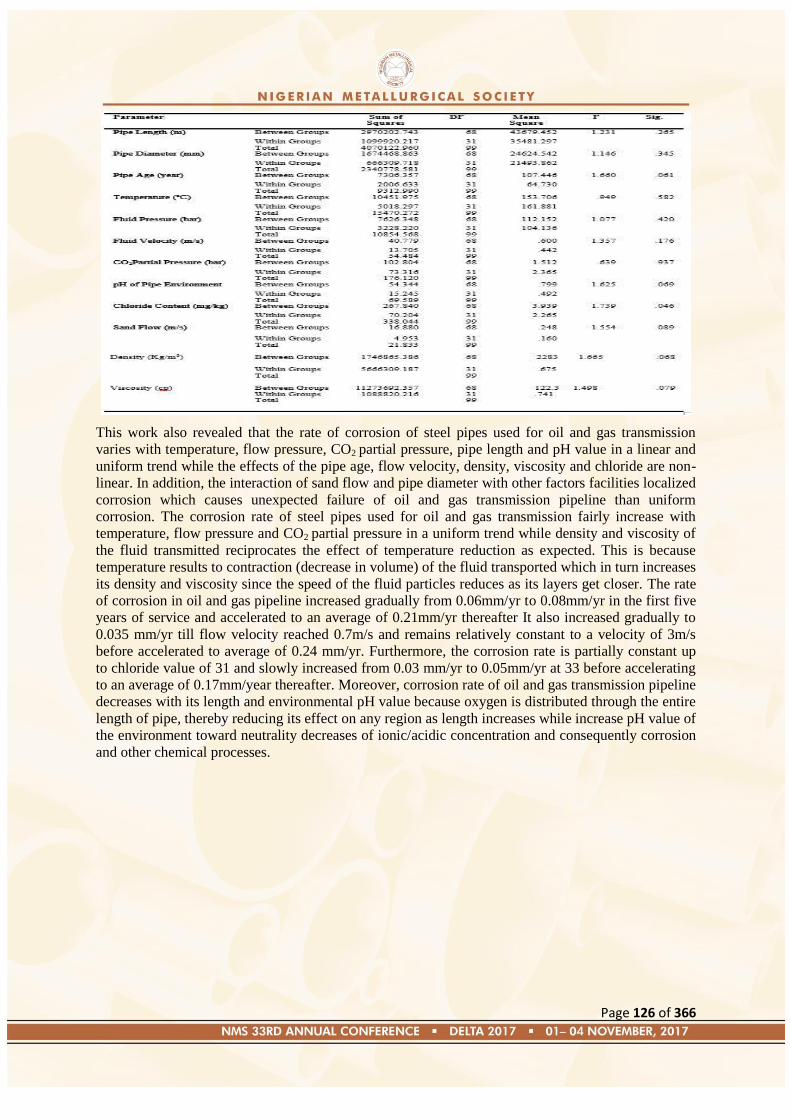
Page 126 of 366
This work also revealed that the rate of corrosion of steel pipes used for oil and gas transmission
varies with temperature, flow pressure, CO2 partial pressure, pipe length and pH value in a linear and
uniform trend while the effects of the pipe age, flow velocity, density, viscosity and chloride are non-
linear. In addition, the interaction of sand flow and pipe diameter with other factors facilities localized
corrosion which causes unexpected failure of oil and gas transmission pipeline than uniform
corrosion. The corrosion rate of steel pipes used for oil and gas transmission fairly increase with
temperature, flow pressure and CO2 partial pressure in a uniform trend while density and viscosity of
the fluid transmitted reciprocates the effect of temperature reduction as expected. This is because
temperature results to contraction (decrease in volume) of the fluid transported which in turn increases
its density and viscosity since the speed of the fluid particles reduces as its layers get closer. The rate
of corrosion in oil and gas pipeline increased gradually from 0.06mm/yr to 0.08mm/yr in the first five
years of service and accelerated to an average of 0.21mm/yr thereafter It also increased gradually to
0.035 mm/yr till flow velocity reached 0.7m/s and remains relatively constant to a velocity of 3m/s
before accelerated to average of 0.24 mm/yr. Furthermore, the corrosion rate is partially constant up
to chloride value of 31 and slowly increased from 0.03 mm/yr to 0.05mm/yr at 33 before accelerating
to an average of 0.17mm/year thereafter. Moreover, corrosion rate of oil and gas transmission pipeline
decreases with its length and environmental pH value because oxygen is distributed through the entire
length of pipe, thereby reducing its effect on any region as length increases while increase pH value of
the environment toward neutrality decreases of ionic/acidic concentration and consequently corrosion
and other chemical processes.
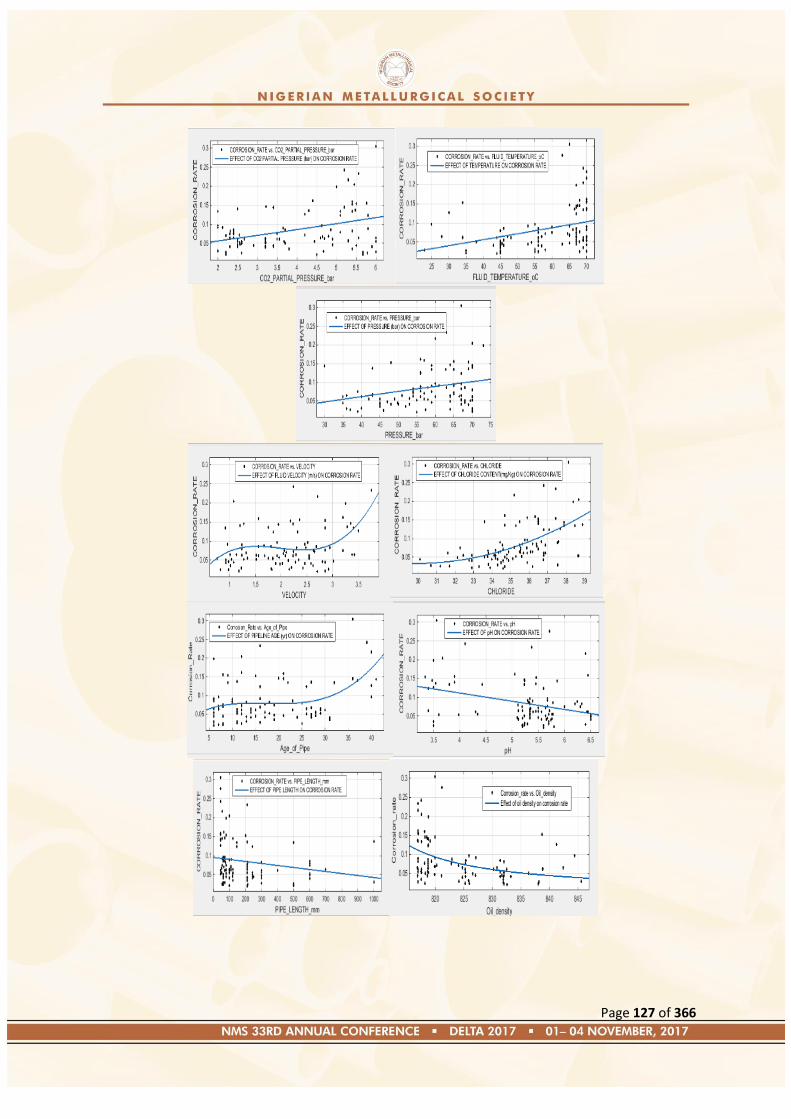
Page 127 of 366
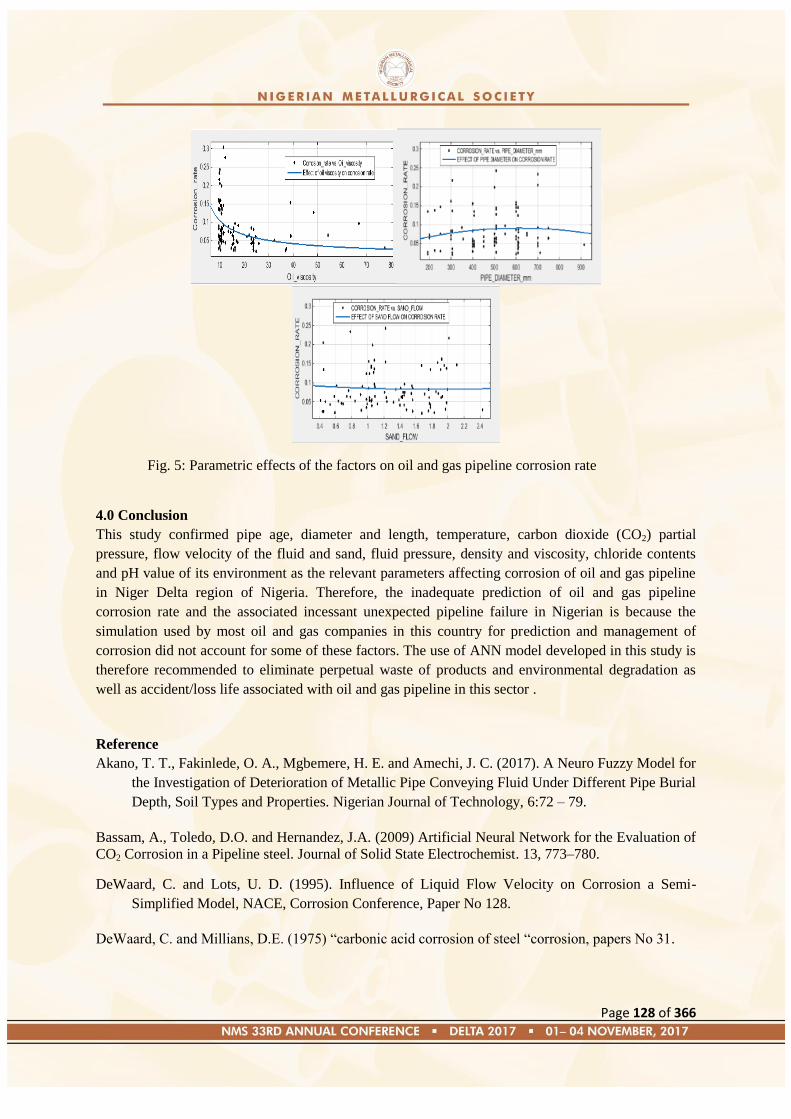
Page 128 of 366
Fig. 5: Parametric effects of the factors on oil and gas pipeline corrosion rate
4.0 Conclusion
This study confirmed pipe age, diameter and length, temperature, carbon dioxide (CO2) partial
pressure, flow velocity of the fluid and sand, fluid pressure, density and viscosity, chloride contents
and pH value of its environment as the relevant parameters affecting corrosion of oil and gas pipeline
in Niger Delta region of Nigeria. Therefore, the inadequate prediction of oil and gas pipeline
corrosion rate and the associated incessant unexpected pipeline failure in Nigerian is because the
simulation used by most oil and gas companies in this country for prediction and management of
corrosion did not account for some of these factors. The use of ANN model developed in this study is
therefore recommended to eliminate perpetual waste of products and environmental degradation as
well as accident/loss life associated with oil and gas pipeline in this sector .
Reference
Akano, T. T., Fakinlede, O. A., Mgbemere, H. E. and Amechi, J. C. (2017). A Neuro Fuzzy Model for
the Investigation of Deterioration of Metallic Pipe Conveying Fluid Under Different Pipe Burial
Depth, Soil Types and Properties. Nigerian Journal of Technology, 6:72 – 79.
Bassam, A., Toledo, D.O. and Hernandez, J.A. (2009) Artificial Neural Network for the Evaluation of
CO2 Corrosion in a Pipeline steel. Journal of Solid State Electrochemist. 13, 773–780.
DeWaard, C. and Lots, U. D. (1995). Influence of Liquid Flow Velocity on Corrosion a Semi-
Simplified Model, NACE, Corrosion Conference, Paper No 128.
DeWaard, C. and Millians, D.E. (1975) ―carbonic acid corrosion of steel ―corrosion, papers No 31.
Page 129 of 366
Din, M. M., Norafida, I., Azalan Md. Z., Norhazilan, Md. N., Maheyzah, Md. S and Rosilawati Md.
Rasol (2015). An Artificial Neural Network Modeling for Pipeline Corrosion Growth
Prediction. ARPN Journal of Engineering and Applied Sciences, 10:512-519.
Gatekeeper (2014). Corrosion Modeling: Influencing Factors. A Technical Newsletter for the Oil and
Gas Industries.www.gateinc.com.
Giulia D. M., Roberta, V., Manuela, G. and Giovanna G. (2014). A Neural Network Predictive
Model of Pipeline Internal Corrosion Profile. International Conference on Systems Information
Modeling and Simulation.
IIman M. N. and Kusmono (2014) Analysis of Internal Corrosion in Subsea oil Pipeline: Case Studies
in Engineering Failure Analysis Vol. 2. 1-8.
Iyasele, E. O. and Ntunde, D. I. (2016). Algorithm for Determining the Corrosion Rate of Oil
Pipelines using Modified Norsork M-506 Model: A Case Study. Umudike Journal of Engineering and
Technology (UJET), Vol.2, No.2, pp 170-181.
Kexi L., Quanke Y., Xia W. and Wenlong J. (2012). A Numerical Corrosion Rate Prediction Method
for Direct Assessment of Wet Gas Gathering Pipelines Internal Corrosion. Energies (5), pp. 3892-
3907
Mohammed S. E., Ahmed S., Tarek Z., Farid M. and Laya P. (2014). Artificial neural network models
for predicting condition of offshore oil and gas pipelines. Automation in Construction. Vol. 45, pp.
50-65
Norsok, (2005). Norsok standard M – 506: CO2 Corrosion Prediction Model Strand veien.
Netto, T. A., Ferraz, S. F, and Estefen, U. S. (2005). The Effect of Corrosion defects on the Burst
Pressure of Pipelines. Journal of Constructional Steel Research 61 pp1185-1204
Ossai, C. (2012). Predictive Modeling of Wellhead Corrosion Due to Operating Conditions: A Field
Data Approach. International Scholarly Research Network, ISRN Corrosion, Volume 2012, Article ID
237025.
Woldeyohannes, A. D. and Majid, M. A. (2011) Effect of Age of Pipes on Performance of Natural
Gas Transmission Pipeline Network System. Journal of Applied Science 11(9): 1612-1617.
Page 130 of 366
Paper: NMS 2017-TP015
Potentials of Bitumen-Palm Kernel Oil Esters as Quenchant for Steel Hardening
B. N. Nwankwojike, F. I. Abam and O. C. Okwonna
Department of Mechanical Engineering, Michael Okpara University of Agriculture, Umudike
[email protected]; [email protected]; [email protected]
ABSTRACT
The potentials of using bitumen-palm kernel oil esters as quenching media on medium and high
carbon steel was investigated for a more efficient production of engineering and industrial materials
that requires steel as its major raw material since steel and steel industry is one of the catalysts for a
number of industries such as the automobile, shipbuilding, containers, railroads, constructions and a
lot of domestic appliances which will complement each other in economic growth. The samples were
austenitized at various temperatures (8500C to 950
0C). Tensile strength, impact strength and
hardness test were used to measure the quenching strength of the media. The microstructures and
mechanical properties were used to determine the severity of the palm kernel ester. From the results
obtained, it shows that the hardness values for both 0.56%C and 0.76%C-Steel were higher (502
and 513 HV) than the as received values (321 and 406 HV) which shows better improvement as a
result of formation of bainite structure and diffusion of carbon precipitates in the steel samples. The
research carried out showed that palm kernel oil-bitumen can be used as quenching media in
austempering process.
Keywords: Austempering, bainite structure, bitumen, palm kernel oil, steel hardening
1. INTRODUCTION
A decline in the use of other metals has prompted increase in the usage of steel for industrial and
economic growth. It equally plays a vital role in engineering applications because of high range of
physical and structural properties obtainable by changing in carbon content and heat treatment
practice. It has found industrial application due to its low monetary value, high strength, and
durability (Feng and Tahir, 2008). Some engineering components need higher hardness value so as to
find application in components meant for heavy duty activities. This level of hardness involves
heating the alloy to a particular temperature, holding at that temperature then cooling rapidly in a
media (Hassan et.al, 2009). The hardness achieved due to the rapid cooling results from the phase
transformation to austenite and low temperature transformation of austenite to martensite (Rajan et.al.,
1988; Keenha, 2004). Report (Hassan and Aigbodion, 2013) has shown that steel is an iron and iron
carbide component (carbon ranging from 0.015% to 2.14%) with other alloying constituents such as
manganese, silicon, sulphur, phosphorus. There are several methods of making steel, the more
important of which are the Bessemer process, the open hearth process, the electric arc furnaces
process and the direct reduction process. They are based on the same principle, which involves
removing all the impurities from molten pig iron by oxidation and addition of known quantities of
carbon and other elements to obtain desired composition. Pig iron, scrap iron and scrap steel are the
raw material that is used for making steel (Osei, 2004). The various types of steel include mild steel
(0.15-0.30%C), medium carbon steel (0.35-0.65%C), high carbon steel (>0.65%C) and stainless steel.
Austempering is a hardenability process that includes austenitizing, followed by cooling to prevent
formation of pearlite at a temperature above the martensite formation temperature and then holding
until the desired microstructure is formed. Heat treatments can be applied to steel not only to harden it
but also to improve its strength, toughness or ductility in order to change the original coarse grain

Page 131 of 366
structure of the steel. Austempering is one of the quench hardening methods applied to alloys so as
to improve the mechanical properties of the alloy.
The austempering media often used in the industries are molten bath, air, oil, brine e.t.c. Mineral oil
and salt bath have been found to have the best cooling results, but they are expensive, toxic and non-
biodegradable. A lot of researchers have carried out research on austempering of steel using various
austempering media. Dauda et.al (2015) studied the effectiveness of the palm kernel oil, cotton seed
oil and olive oil as quenching medium in the hardening process of steel. Results from the research
show that palm kernel oil and olive oil gave a lower steel hardness value compared to as-received
steel thereby rendering the quenchant undesirable for hardening. The strength stability of medium
carbon steel plays an important role in automobile industries. Medium and hard steels can be heat
treated to produce steels with various degrees of hardness through heating of the steel to a hot region
and cooling slowly. Palm kernel seed oil is plant oil gotten from the kernel part of the oil palm (elaeis
guineenis). Palm kernel seed oil is semi-solid at room temperature and more saturated than palm oil. It
does not contain trans-fatty acids/cholesterol. The saponification value of palm kernel seed oil is
183.92mgKOH/g while the iodine value of kernel seed oil is 63.59mgl2/g. Bitumen is a black/brown
viscous liquid (thermoplastic in nature) consisting mainly of hydrocarbons and their derivatives,
which can dissolve in carbondisulphide (Hassan and Aigbodion, 2009). The softening point of
bitumen can help remove the bacteria in palm kernel seed oil thereby making palm kernel seed oil and
bitumen blend a good austempering media. Furthermore, all other properties of bitumen can combine
well with palm kernel seed oil. Palm kernel oil esters have great potentials in the cosmetic and
pharmaceutical industries due to the excellent wetting behavior of the esters without the oily feel.
Bitumen will be added to palm kernel seed oil in order to eliminate the bacteria found in palm kernel
seed oil so as to reduce distortion or decline in the life span of the material. This research is to explore
the potentials of using palm kernel seed oil-bitumen as a quenching media.
2. EXPERIMENTAL AND DATA ANALYSIS PROCEDURE
Medium carbon steel was used as test samples to evaluate palm kernel seed oil-bitumen blend as
austempering media. The chemical composition of the alloys is shown in Table 1. The equipment
used during the experiment were: electrically heated furnace with temperature 12000C, medium
sized kerosene stove and pot for heating the palm kernel seed oil-bitumen blend, struner‘s hot
mounting press for mounting all metallographic samples, laboratory mercury thermometer,
pendulum type Charpy impact testing machine (Denilson model), TEC-C- 100 tensile testing
machine, Avery hardness machine, Heat treatment furnace, weighing balance, starter pH meter,
H2SO4 and HCl, tensometer, lathe machine and, metallurgical microscope.
Table 1: Chemical composition of the steel and ductile cast iron
Element C Mn Si S P Fe
0.76%C 0.76 1.11 0.33 0.03 0.05 Fe
0.56%C 0.56 0.96 0.26 0.05 0.33 Fe
Palm kernel seeds were purchased from local palm processors in Ekwuluobia, Anambra state.
Palm kernel oil was extracted from the palm kernel seeds using the traditional method of heating.
Bitumen was purchased from C & O civil engineering laboratory Awka, Anambra state.
Laboratory thermometer was placed into the steel pot containing the kernel seed oil-bitumen
blend and heated to its boiling temperature. Bitumen was added in a small quantity to avoid
under reaction or over reaction. The ratio of the addition was 8:1. Eqn. (1) depicts the reaction
between palm kernel seed oil and bitumen. The alloys were machined to impact and tensile samples
dimensions with their various specifications as 10 × 10 × 55 mm with a 2.5mm notch (for impact
test) and 70 × 10 mm (for tensile strength). One sample each from the alloys was taken from the
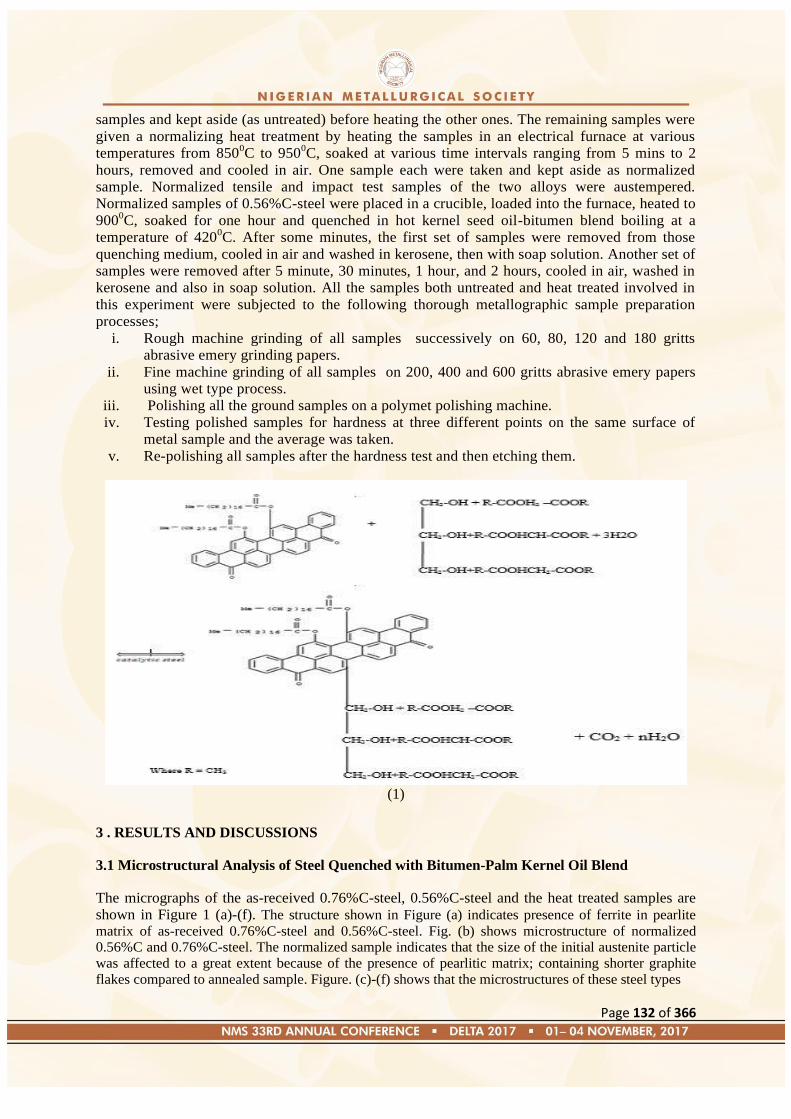
Page 132 of 366
samples and kept aside (as untreated) before heating the other ones. The remaining samples were
given a normalizing heat treatment by heating the samples in an electrical furnace at various
temperatures from 8500C to 950
0C, soaked at various time intervals ranging from 5 mins to 2
hours, removed and cooled in air. One sample each were taken and kept aside as normalized
sample. Normalized tensile and impact test samples of the two alloys were austempered.
Normalized samples of 0.56%C-steel were placed in a crucible, loaded into the furnace, heated to
9000C, soaked for one hour and quenched in hot kernel seed oil-bitumen blend boiling at a
temperature of 4200C. After some minutes, the first set of samples were removed from those
quenching medium, cooled in air and washed in kerosene, then with soap solution. Another set of
samples were removed after 5 minute, 30 minutes, 1 hour, and 2 hours, cooled in air, washed in
kerosene and also in soap solution. All the samples both untreated and heat treated involved in
this experiment were subjected to the following thorough metallographic sample preparation
processes;
i. Rough machine grinding of all samples successively on 60, 80, 120 and 180 gritts
abrasive emery grinding papers.
ii. Fine machine grinding of all samples on 200, 400 and 600 gritts abrasive emery papers
using wet type process.
iii. Polishing all the ground samples on a polymet polishing machine.
iv. Testing polished samples for hardness at three different points on the same surface of
metal sample and the average was taken.
v. Re-polishing all samples after the hardness test and then etching them.
(1)
3 . RESULTS AND DISCUSSIONS
3.1 Microstructural Analysis of Steel Quenched with Bitumen-Palm Kernel Oil Blend
The micrographs of the as-received 0.76%C-steel, 0.56%C-steel and the heat treated samples are
shown in Figure 1 (a)-(f). The structure shown in Figure (a) indicates presence of ferrite in pearlite
matrix of as-received 0.76%C-steel and 0.56%C-steel. Fig. (b) shows microstructure of normalized
0.56%C and 0.76%C-steel. The normalized sample indicates that the size of the initial austenite particle
was affected to a great extent because of the presence of pearlitic matrix; containing shorter graphite
flakes compared to annealed sample. Figure. (c)-(f) shows that the microstructures of these steel types
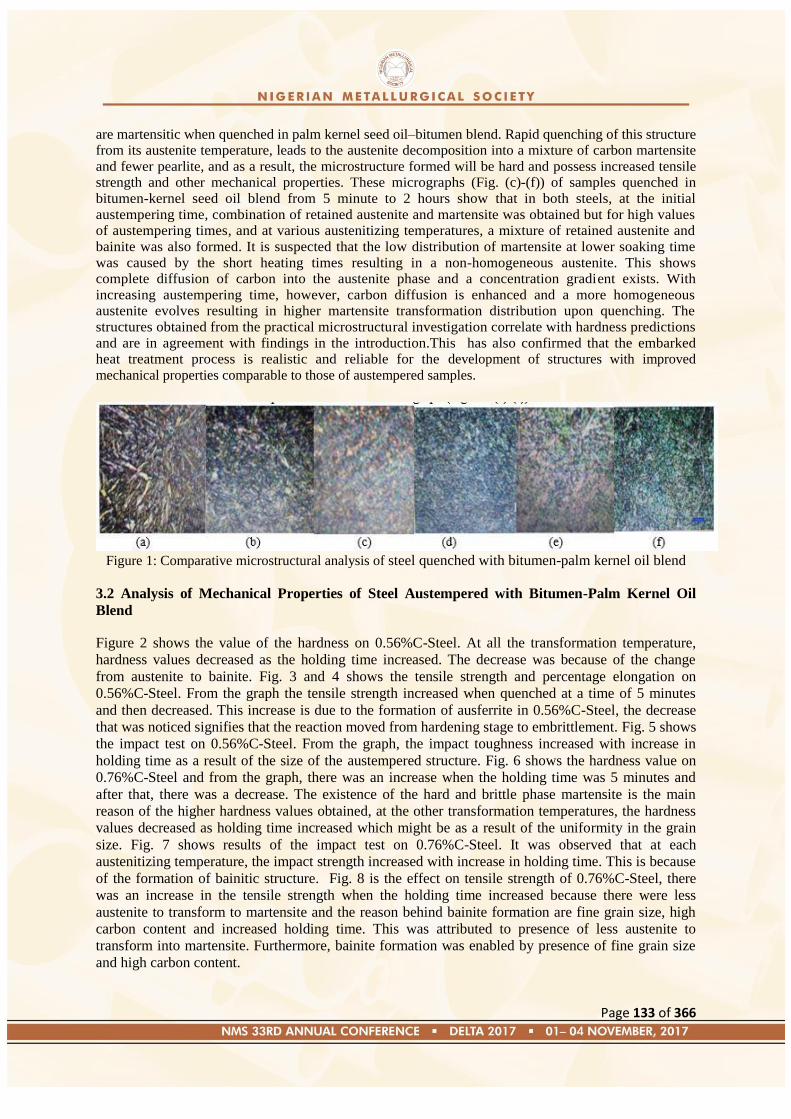
Page 133 of 366
are martensitic when quenched in palm kernel seed oil–bitumen blend. Rapid quenching of this structure
from its austenite temperature, leads to the austenite decomposition into a mixture of carbon martensite
and fewer pearlite, and as a result, the microstructure formed will be hard and possess increased tensile
strength and other mechanical properties. These micrographs (Fig. (c)-(f)) of samples quenched in
bitumen-kernel seed oil blend from 5 minute to 2 hours show that in both steels, at the initial
austempering time, combination of retained austenite and martensite was obtained but for high values
of austempering times, and at various austenitizing temperatures, a mixture of retained austenite and
bainite was also formed. It is suspected that the low distribution of martensite at lower soaking time
was caused by the short heating times resulting in a non-homogeneous austenite. This shows
complete diffusion of carbon into the austenite phase and a concentration gradient exists. With
increasing austempering time, however, carbon diffusion is enhanced and a more homogeneous
austenite evolves resulting in higher martensite transformation distribution upon quenching. The
structures obtained from the practical microstructural investigation correlate with hardness predictions
and are in agreement with findings in the introduction.This has also confirmed that the embarked
heat treatment process is realistic and reliable for the development of structures with improved
mechanical properties comparable to those of austempered samples.
Figure 1: Comparative microstructural analysis of steel quenched with bitumen-palm kernel oil blend
3.2 Analysis of Mechanical Properties of Steel Austempered with Bitumen-Palm Kernel Oil
Blend
Figure 2 shows the value of the hardness on 0.56%C-Steel. At all the transformation temperature,
hardness values decreased as the holding time increased. The decrease was because of the change
from austenite to bainite. Fig. 3 and 4 shows the tensile strength and percentage elongation on
0.56%C-Steel. From the graph the tensile strength increased when quenched at a time of 5 minutes
and then decreased. This increase is due to the formation of ausferrite in 0.56%C-Steel, the decrease
that was noticed signifies that the reaction moved from hardening stage to embrittlement. Fig. 5 shows
the impact test on 0.56%C-Steel. From the graph, the impact toughness increased with increase in
holding time as a result of the size of the austempered structure. Fig. 6 shows the hardness value on
0.76%C-Steel and from the graph, there was an increase when the holding time was 5 minutes and
after that, there was a decrease. The existence of the hard and brittle phase martensite is the main
reason of the higher hardness values obtained, at the other transformation temperatures, the hardness
values decreased as holding time increased which might be as a result of the uniformity in the grain
size. Fig. 7 shows results of the impact test on 0.76%C-Steel. It was observed that at each
austenitizing temperature, the impact strength increased with increase in holding time. This is because
of the formation of bainitic structure. Fig. 8 is the effect on tensile strength of 0.76%C-Steel, there
was an increase in the tensile strength when the holding time increased because there were less
austenite to transform to martensite and the reason behind bainite formation are fine grain size, high
carbon content and increased holding time. This was attributed to presence of less austenite to
transform into martensite. Furthermore, bainite formation was enabled by presence of fine grain size
and high carbon content.
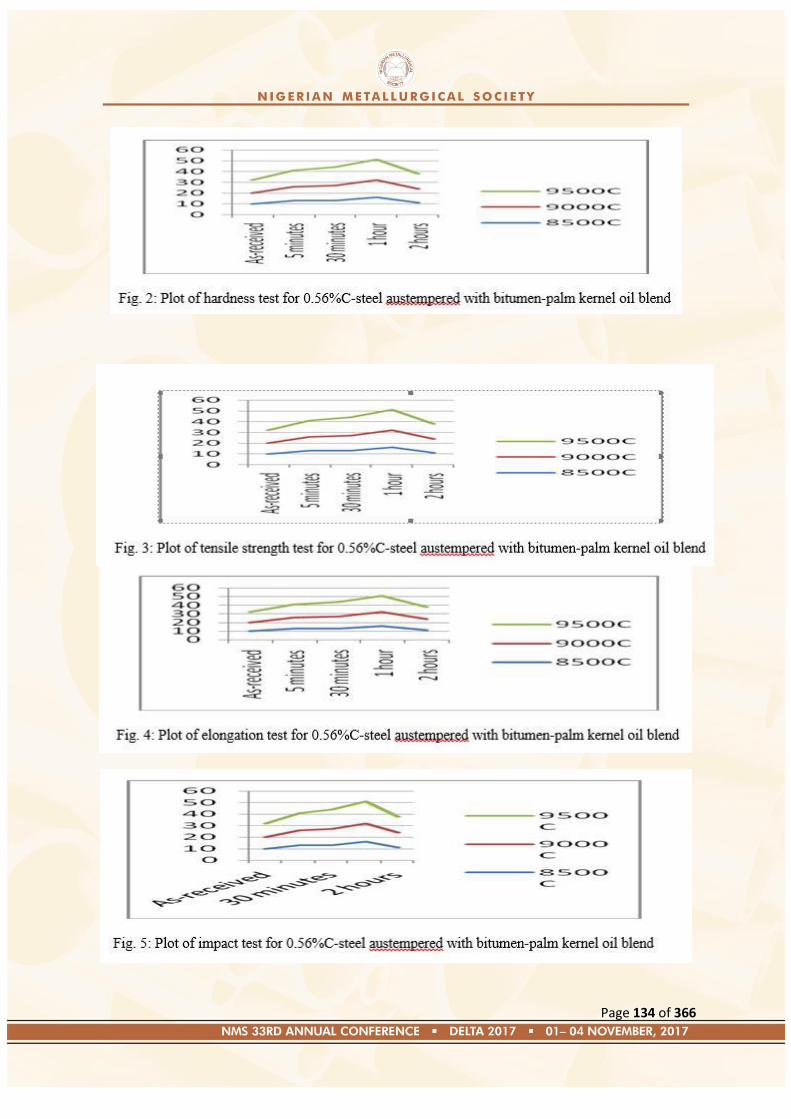
Page 134 of 366
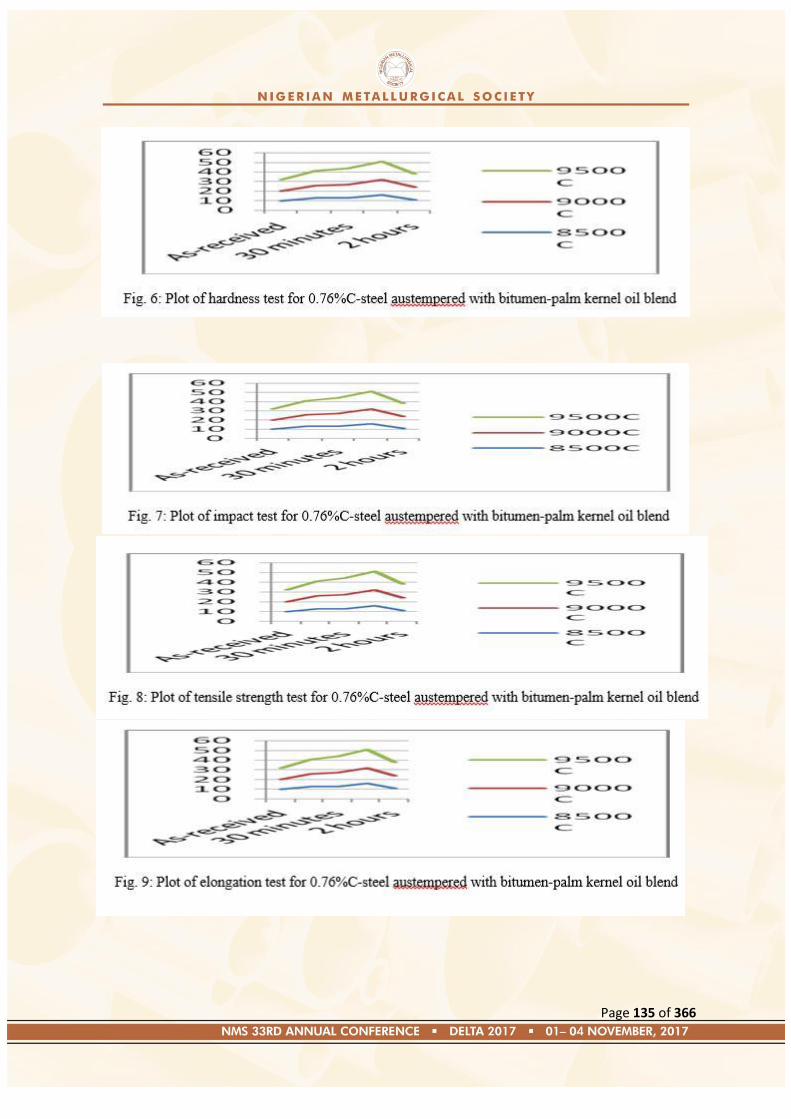
Page 135 of 366
Page 136 of 366
4. CONCLUSION
The strength of the palm kernel oil esters as quenching media in the hardening process of medium
carbon and high carbon steel has been assessed using hardness values, percentage elongation, tensile
strength and impact energy. From the analysis of the results obtained, the following conclusions can
be drawn:
1. Palm kernel oil-bitumen can be used for hardening of steel because the values
obtained were higher than the as-received values.
2. palm kernel oil + bitumen is cost effective since it was locally sourced hence local
heat treatment industries in the area of austempering should adopt this method, this
will equally help boost the local heat treatment industries because they will need less
capitals for production of parts involving steel than importing those quenchants and
once those parts are produced, Nigerian economy will rise once they are exported
REFERENCES
Dauda M, Kuburi I.S, Obada D.O, Mustapha R.I Effects of various quenching media on mechanical
properties of annealed 0.509Wt%C-0.178Wt%Mn Steel, Nigerian Journal of Technology, Vol 34
Number 3,2015, pp506-512
Feng, C and Tahir, I.K. The effect of quenching medium on the wear behavior of a Ti-6Al-4V Alloy.
J-mater. Sci. Vol 43, number 2: pp788-92, 2008.
Hassan, S. B, Balogun, S.O and Aigbodion V.S. hardening characteristics of medium carbon steel
using fresh cassava liquid extract as quenchants, journal of metallurgy and materials engineering Vol
4, Number 2, 2009, pp55-61.
Keenha E. Effect of Microstructure on Mechanical properties of high strength steel weld metals, PhD
thesis, Chalmers University of technology, 2004.
Osei Y.A. New School Chemistry for senior secondary school. Khana publishers, 3rd
edition pp 445-
448, 2004.
Rajan, T.V, Sharma, C.P; and Sharma, A. Heat treatment-principles and techniques, prentice-Hall of
India private limited, New Delhi, India 1988.
Page 137 of 366
Paper: NMS 2017-TP016
Inhibitive Potentials of Bitter Kola Stem (BKS) on Mild Steel in Acidic Media
A. A. Adediran*1
, O. Olawale1, S. I. Talabi
2 and O. Y. Busari
2
1Department of Mechanical Engineering, College of Science and Engineering, Landmark University,
Omu-Aran, Kwara State. 2Department of Materials and Metallurgical Engineering, University of Ilorin, Kwara State, Nigeria
Corresponding Author: *[email protected] (+2348032458545), [email protected],
[email protected], [email protected]
ABSTRACT
This paper deals with the inhibitive potentials of bitter kola stem extract (BKS) on the
deterioration of mild steel in 1 M HCl and 1 M H2SO4 using gravimetric method. Coupons of
dimension 5.0 cm x 4.0 cm were immersed in test solutions of uninhibited acid and also in
those containing various amount of BKS (10, 25 and 40 %v/v) at 30 oC and 60
oC
respectively. The results showed that the extract addition reduced mild steel corrosion in the
acidic media. The inhibitive efficiency of 92.07 % was attained at 40 %v/v in 1 M H2SO4 at
30 oC temperature, while the efficiency of 89.19 % was realized at the same concentration in
1 M HCl at 60 oC temperature. Hence, BKS can be considered as a good and safe inhibitor
against mild steel corrosion in both acidic media.
Keywords: Bitter Kola Stem, Inhibition, Corrosion, Weight loss, Mild Steel
INTRODUCTION
The search for an efficient inhibitor against corrosion in different aggressive media has in
recent times taken a new dimension owing to clarion call for green technology. Inhibitors are
mostly used to create corrosion resistance in acid descaling bathes to prevent not only metal
dissolution but also acid consumption. They protect the metals by efficiency adsorbing on its
surface and blocking the active sites for metal dissolution and hydrogen evolution, thereby
hindering overall metal corrosion in aggressive environments (Bhat et al., 2011). Green
corrosion inhibitors such as extracts from many plants had been investigated and reported by
several authors as being biodegradable and not containing heavy metals or other toxic
compounds. In addition, plant products are organic in nature, and contain certain
photochemical including tannins, flavonoids, saponins, organic and amino acids, alkaloids,
and pigments which could be extracted by simple less expensive procedures. Extracts from
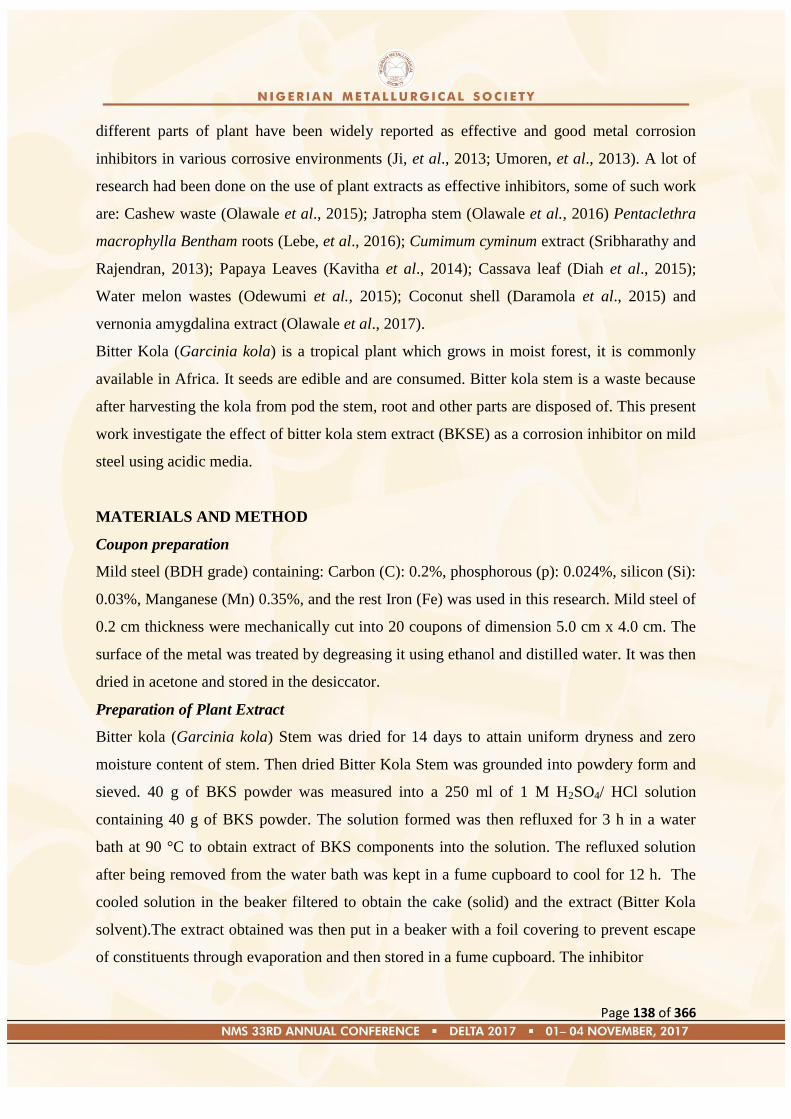
Page 138 of 366
different parts of plant have been widely reported as effective and good metal corrosion
inhibitors in various corrosive environments (Ji, et al., 2013; Umoren, et al., 2013). A lot of
research had been done on the use of plant extracts as effective inhibitors, some of such work
are: Cashew waste (Olawale et al., 2015); Jatropha stem (Olawale et al., 2016) Pentaclethra
macrophylla Bentham roots (Lebe, et al., 2016); Cumimum cyminum extract (Sribharathy and
Rajendran, 2013); Papaya Leaves (Kavitha et al., 2014); Cassava leaf (Diah et al., 2015);
Water melon wastes (Odewumi et al., 2015); Coconut shell (Daramola et al., 2015) and
vernonia amygdalina extract (Olawale et al., 2017).
Bitter Kola (Garcinia kola) is a tropical plant which grows in moist forest, it is commonly
available in Africa. It seeds are edible and are consumed. Bitter kola stem is a waste because
after harvesting the kola from pod the stem, root and other parts are disposed of. This present
work investigate the effect of bitter kola stem extract (BKSE) as a corrosion inhibitor on mild
steel using acidic media.
MATERIALS AND METHOD
Coupon preparation
Mild steel (BDH grade) containing: Carbon (C): 0.2%, phosphorous (p): 0.024%, silicon (Si):
0.03%, Manganese (Mn) 0.35%, and the rest Iron (Fe) was used in this research. Mild steel of
0.2 cm thickness were mechanically cut into 20 coupons of dimension 5.0 cm x 4.0 cm. The
surface of the metal was treated by degreasing it using ethanol and distilled water. It was then
dried in acetone and stored in the desiccator.
Preparation of Plant Extract
Bitter kola (Garcinia kola) Stem was dried for 14 days to attain uniform dryness and zero
moisture content of stem. Then dried Bitter Kola Stem was grounded into powdery form and
sieved. 40 g of BKS powder was measured into a 250 ml of 1 M H2SO4/ HCl solution
containing 40 g of BKS powder. The solution formed was then refluxed for 3 h in a water
bath at 90 °C to obtain extract of BKS components into the solution. The refluxed solution
after being removed from the water bath was kept in a fume cupboard to cool for 12 h. The
cooled solution in the beaker filtered to obtain the cake (solid) and the extract (Bitter Kola
solvent).The extract obtained was then put in a beaker with a foil covering to prevent escape
of constituents through evaporation and then stored in a fume cupboard. The inhibitor
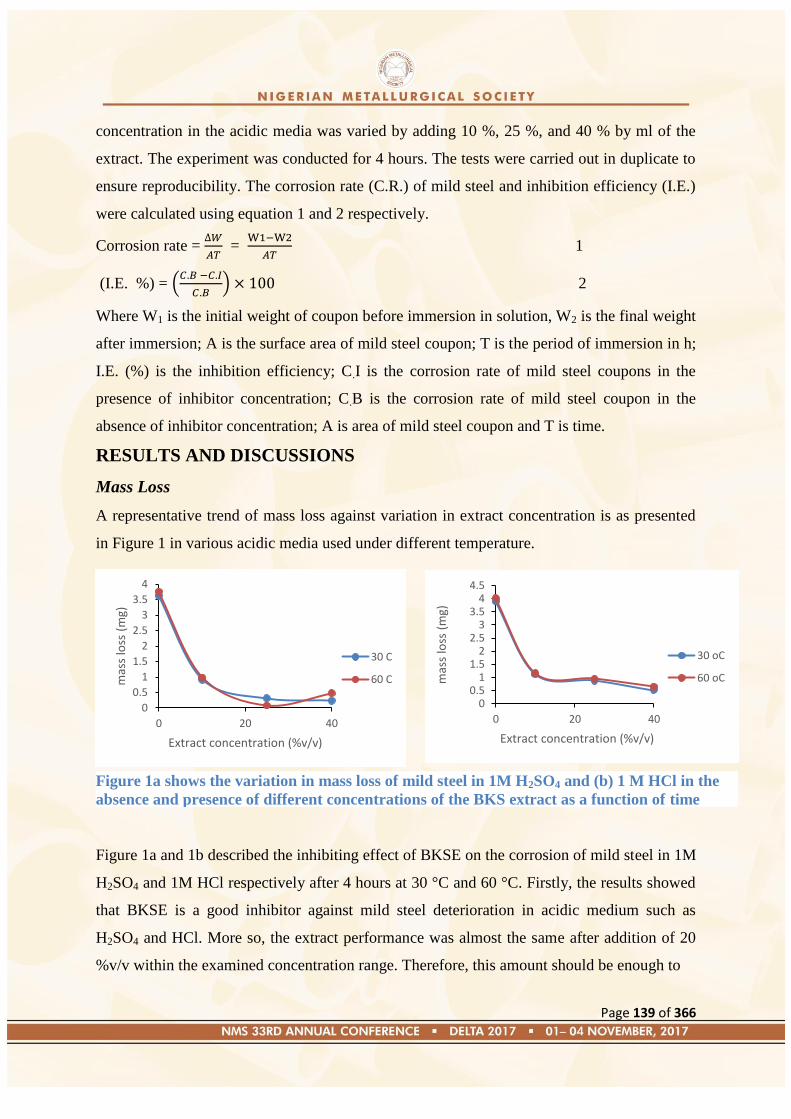
Page 139 of 366
concentration in the acidic media was varied by adding 10 %, 25 %, and 40 % by ml of the
extract. The experiment was conducted for 4 hours. The tests were carried out in duplicate to
ensure reproducibility. The corrosion rate (C.R.) of mild steel and inhibition efficiency (I.E.)
were calculated using equation 1 and 2 respectively.
Corrosion rate =
=
1
(I.E. %) = (
) 2
Where W1 is the initial weight of coupon before immersion in solution, W2 is the final weight
after immersion; A is the surface area of mild steel coupon; T is the period of immersion in h;
I.E. (%) is the inhibition efficiency; C.I is the corrosion rate of mild steel coupons in the
presence of inhibitor concentration; C.B is the corrosion rate of mild steel coupon in the
absence of inhibitor concentration; A is area of mild steel coupon and T is time.
RESULTS AND DISCUSSIONS
Mass Loss
A representative trend of mass loss against variation in extract concentration is as presented
in Figure 1 in various acidic media used under different temperature.
Figure 1a and 1b described the inhibiting effect of BKSE on the corrosion of mild steel in 1M
H2SO4 and 1M HCl respectively after 4 hours at 30 °C and 60 °C. Firstly, the results showed
that BKSE is a good inhibitor against mild steel deterioration in acidic medium such as
H2SO4 and HCl. More so, the extract performance was almost the same after addition of 20
%v/v within the examined concentration range. Therefore, this amount should be enough to
00.5
11.5
22.5
33.5
44.5
0 20 40
mas
s lo
ss (
mg)
Extract concentration (%v/v)
30 oC
60 oC
0
0.5
1
1.5
2
2.5
3
3.5
4
0 20 40
mas
s lo
ss (
mg)
Extract concentration (%v/v)
30 C
60 C
Figure 1a shows the variation in mass loss of mild steel in 1M H2SO4 and (b) 1 M HCl in the
absence and presence of different concentrations of the BKS extract as a function of time
Page 140 of 366
inhibit mild steel corrosion in corrosion media. Secondly, the slight increased in temperature
(60 °C) does not significantly affect the inhibitor performance. This observation provide the
assurance that slight temperature variation will not negate the extract‘s ability to limit
corrosion rate of mild steel in the corrosive environment.
Figure 2. Inhibition efficiency against extract concentration in: (a) 1 M H2SO4 (b)1 M HCl at
30 and 60 oC
Phytochemical Analysis
The phytochemical properties of Bitter Kola Stem plant extract were determined to check for
the presence of inhibitive functional groups and the results obtained are shown in Table 1.
Table 1: Phytochemical constituents
S/N Functional group Relative presence
1 Alkaloids ++
2 Saponins +
3 Tannins ++
4 Flavonoids ++++
The result shows the presence of alkaloids, tannins, flavonoids, saponins functional groups
which accounts for the inhibitive behaviour of BKS extract in the acidic media (Rani and
Bharathi, 2012).
CONCLUSION
Bitter Kola Stem extract is a good green inhibitor for limiting the corrosion of mild steel in
acidic medium such as H2SO4 and HCl. An inhibition efficiency of 92.07 % in 1 M H2SO4
and 86.51 % in 1 M HCl was obtained in these experiment. However, the inhibitive
efficiency of BKSE slightly decreased at 60 °C compared to 30 °C (i.e. from 92 % to 89 % in
H2SO4 and 87 % to 85 % in HCl). Nevertheless, these results provide assurance that slight
temperature variation will not significantly affect its performance.
Page 141 of 366
REFERENCES
Bhat, S, Sharma, V.K, Thomas, S, Anto, P.F, and Singh, S.K. (2011). Material Performance,
Vol. 50, pp. 50-53.
Ji G, Shukla, S.K, Dwivedi, P, Sundaram, S, Ebenso, E.E, Prakash R., (2012). Parthenium
hysterophorus Plant Extract as an Efficient Green Corrosion Inhibitor for Mild Steel in
Acidic Environment. Int. J. Electrochem. Sci. Vol. 7, pp. 9933-9945.
Diah R. G, Emriadi, A. A. and Mai E. (2015). Water extracts of cassava leaf as corrosion
inhibitor for mild steel in sulfuric acid solution. Journal of Chemical and Pharmaceutical
Research. Vol. 7(12), pp. 398-405.
Sribharathy, S., and Rajendran, S., (2013). Cuminum cyminum Extracts as eco-friendly
corrosion inhibitor for Mild Steel in Seawater. Research Article. pp. 1-7, Article ID:
370802, Hindawi Publishing Corporation.
Lebe, N., Georoge, N., Justus, N., Nneka, E, and Peter, E., (2016). Aqueous Extracts of
Pentaclethra macrophylla Bentham Roots as eco-friendly Corrosion Inhibition for Mild
Steel in 0.5 M KOH Medium. International Journal of Materials and Chemistry, Vol.
6(1), pp. 12-18. doi: 10.5923/j.ijmc.20160601.03.
Kavitha, N; Manjula,P and Anandha Kumar, N. (2014) Syneristic effect of Papaya leaves
extract –Zn 2+
in corrosion inhibition of Mild steel in Aqueous medium. Research Journal
of Chemical Science. Vol. 4 (8), pp. 88-93.
Odewunmi, N.A, Umorem, S.A., and Gasem, Z.M. (2015). Watermelon waste products as
Green Corrosion Inhibitors for Mild Steel in HCl Solution. Journal of Environmental
Chemical Engineering, Vol.,3 (1), pp. 286-296.
Daramola, O.O, Adediran, A.A, Fadumiye, A.T. (2015). Evaluation of the Mechanical
Properties and Corrosion behaviour of Coconut shell ash reinforced aluminium (6063)
alloy composites. Leornado Electronic Journal and Practices Technologies, Vol. 27,
pp.107-119
Olawale, O, Adediran, A.A., Talabi, S.I., Nwokocha, G. C., Ameh, A. O. (2017). Inhibitory
action of Vernonia amygdalina extract (VAE) on the corrosion of carbon steel in acidic
medium. J. Electrochem. Sci. Eng. 7(3), 145-152; doi: http://dx.doi.org/10.5599/jese.353
Amitha Rani, B.E and Bharathi Bai, J. B., (2012). Green inhibitors for protection of metals
and alloys. International Journal of corrosion, volume 2012, 1, Doi:10.1155/2012/380217

Page 142 of 366
Olawale, O, Bello, J.O. and Akinbami, P. (2015). A Study on Corrosion Inhibitor of Mild
Steel in Hydrochloric Acid using Cashew Waste. International Journal of Modern
Engineering Research.Vol.,5(8), pp: 25-30.
Olawale, O, Oyawale, F.A, Adediran, A.A, Obafemi, A.S., (2016). Corrosion Inhibition of
Mild Steel in Seawater using Jatropha Stem. Analele Universitatii ―Eftimie Murgu‖
Resita. Vol, 23,(1), pp. 228-238.
Umoren, S.A, Gasem, Z.M, Obot, I.B, (2013). Natural products for materials protection:
inhibition of mild steel corrosion by date palm seed extracts in acid media, Industrial &
Engineering Chemistry Research, Vol. 52, pp. 14855–65
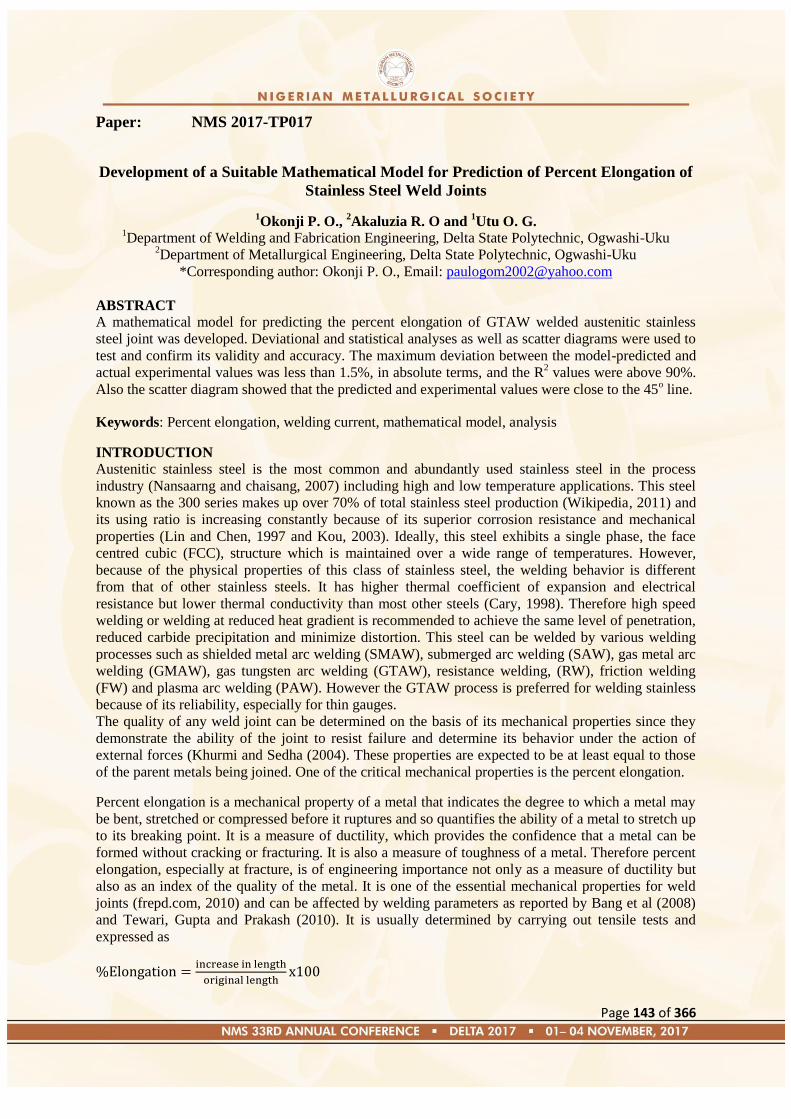
Page 143 of 366
Paper: NMS 2017-TP017
Development of a Suitable Mathematical Model for Prediction of Percent Elongation of
Stainless Steel Weld Joints
1Okonji P. O.,
2Akaluzia R. O and
1Utu O. G.
1Department of Welding and Fabrication Engineering, Delta State Polytechnic, Ogwashi-Uku
2Department of Metallurgical Engineering, Delta State Polytechnic, Ogwashi-Uku
*Corresponding author: Okonji P. O., Email: [email protected]
ABSTRACT
A mathematical model for predicting the percent elongation of GTAW welded austenitic stainless
steel joint was developed. Deviational and statistical analyses as well as scatter diagrams were used to
test and confirm its validity and accuracy. The maximum deviation between the model-predicted and
actual experimental values was less than 1.5%, in absolute terms, and the R2 values were above 90%.
Also the scatter diagram showed that the predicted and experimental values were close to the 45o line.
Keywords: Percent elongation, welding current, mathematical model, analysis
INTRODUCTION
Austenitic stainless steel is the most common and abundantly used stainless steel in the process
industry (Nansaarng and chaisang, 2007) including high and low temperature applications. This steel
known as the 300 series makes up over 70% of total stainless steel production (Wikipedia, 2011) and
its using ratio is increasing constantly because of its superior corrosion resistance and mechanical
properties (Lin and Chen, 1997 and Kou, 2003). Ideally, this steel exhibits a single phase, the face
centred cubic (FCC), structure which is maintained over a wide range of temperatures. However,
because of the physical properties of this class of stainless steel, the welding behavior is different
from that of other stainless steels. It has higher thermal coefficient of expansion and electrical
resistance but lower thermal conductivity than most other steels (Cary, 1998). Therefore high speed
welding or welding at reduced heat gradient is recommended to achieve the same level of penetration,
reduced carbide precipitation and minimize distortion. This steel can be welded by various welding
processes such as shielded metal arc welding (SMAW), submerged arc welding (SAW), gas metal arc
welding (GMAW), gas tungsten arc welding (GTAW), resistance welding, (RW), friction welding
(FW) and plasma arc welding (PAW). However the GTAW process is preferred for welding stainless
because of its reliability, especially for thin gauges.
The quality of any weld joint can be determined on the basis of its mechanical properties since they
demonstrate the ability of the joint to resist failure and determine its behavior under the action of
external forces (Khurmi and Sedha (2004). These properties are expected to be at least equal to those
of the parent metals being joined. One of the critical mechanical properties is the percent elongation.
Percent elongation is a mechanical property of a metal that indicates the degree to which a metal may
be bent, stretched or compressed before it ruptures and so quantifies the ability of a metal to stretch up
to its breaking point. It is a measure of ductility, which provides the confidence that a metal can be
formed without cracking or fracturing. It is also a measure of toughness of a metal. Therefore percent
elongation, especially at fracture, is of engineering importance not only as a measure of ductility but
also as an index of the quality of the metal. It is one of the essential mechanical properties for weld
joints (frepd.com, 2010) and can be affected by welding parameters as reported by Bang et al (2008)
and Tewari, Gupta and Prakash (2010). It is usually determined by carrying out tensile tests and
expressed as

Page 144 of 366
Some scholars, Zou et al (2004), Quan et al (2008), Kahraman et al (2010) and Nnuka et al, while
working on different materials and processes established that increase in welding current results in
decrease in percent elongation. Studies have shown that welding current is the most influential
parameter since the amount of welding heat developed depends on it, for any giving size of filler
metal and electrode, thus it controls the depth of fusion, electrode feed rate and depth of penetration
(Jah and Jah, 2014 and Okonji, Nnuka and Odo, 2015). It is therefore crucial for welders to apply the
correct amount of current during welding to ensure good quality and minimize the problem of
distortion on the welded material.
This work is aimed at developing a suitable mathematical model for predicting the percent elongation
for AISI 304L austenitic stainless steel grade weld joint.
Experimental work
Austenitic stainless steel sheets of type AISE 304L measuring 400x50x3mm were welded to produce
square butt weld joints with edge preparation. The chemical composition of the AISI stainless steel
and the filler metals are shown in Table 1. The welding process was carried out with a manually
operated air-cooled welding machine (Precision TIG 225) to produce a square butt weld joint. High
purity argon gas was used for shielding and purging at the rates of 12 and 7.5 litres per minute
respectively. Using a post-flow timer the post-weld shielding gas flow was 10 minutes. The welding
consisted of two runs, the root and cap, in the 1G position using 308 filler metal (2.0mm) and five
welding currents ranging from 91-95 amperes at one ampere interval. During the welding operation
the heat input was varied by varying the welding current (other parameters were held permanent)
according to the equation
Where
H = Heat input (KJ/min)
I = Welding current (ampere)
E = Arc voltage (Volts)
S = Welding Speed (mm/min)
Table 1. Composition of Base metal and Filler Metal Material C Si Mn P S Cr Ni Mo Cu V Al Sn N Ti
Base
metal
0.02 0.42 0.05 0.031 0.001 18.8 7.18 0.008 0.029 0.079 0.013 0.004 0.042 0.005
Filler
metal
0.013 0.43 1.86 0.023 0.002 19.85 9.95 0.05 0.07
Tensile Test
The welded coupons were cut to size using power hacksaw and subjected to longitudinal tensile test
using a tensile testing machine, model 316Q with 300KN maximum load. The test was carried out
following the ASTM E8 Standard procedure for all-weld tensile test. The coupons were fitted into the
jaws of the testing machine and subjected to tensile test stress until they fractured. The result is shown
in Table 2.
Table 2. Percent Elongation Filler metal type
(ER308L)
Welding current (ampere)
91 92 93 94 95
%Elongation 27.388 27.684 28.729 29.084 30.436
DEVELOPMENT OF MATHEMATICAL MODEL
The data for the formulation of this model was obtained from Table 2.
Model Formulation
For the development of this model for the prediction of percent elongation (PEl), as a function of
welding current (I), a procedure based on regression was employed and expressed as
( ), where Y = PEl

Page 145 of 366
Applying a first order response yields the following relationship
The coefficients represent the free term and the linear term, respectfully, of the regression.
The values of coefficients a and b were calculated by regression analysis using the following
equations:
( ), (1)
(2)
Taking the actual response to be σ and the predicted Y, the standard deviation of prediction, є will be
given by
є2 = Σ(Y-σ)
2 (3)
n
nє2 = K = Σ(Y-σ)
2 = Σ(Y-a-bI)
2 (4)
Differentiating with respect to a, we have
( ) (5)
(6)
(7)
Differentiating with respect to b, we have
( ) or 2
2 (8)
Multiplying (6) by ΣI gives
( )2 (9)
Multiplying (8) by n gives
2 (10)
( ) ( ) yields
[( )2 2
ΣYΣI - nΣYI
(ΣI)2 –nΣI
2 (11)
n = number of welding currents
The values of the coefficients were calculated using Texas Instrument, TI-84 Plus using the data from
Table 1, resulting in:
a = -41.049
b = -0.750
Inserting the values of the coefficients into equation (1) yields the following:
Y = 0.750I – 41.049 (12)
Boundary and Initial Conditions
The welding process, including the cooling, was carried out under the atmospheric conditions and the
values of welding current and percent elongation used are as shown in Table 2. The materials used
were AISI 304L grade of stainless steel, ER309L filler metal(2mm diameter), 2% thoriated non-
consumable electrode (2mm diameter) and high purity (99.99%) argon as shielding. The weld metal
was cooled with natural air, no pressure and no force (tension or compression) were applied to the
heat affected zone (HAZ) during or after the welding process. Also the sides and shapes of the
coupons were symmetries.
Model Validation
The developed model was validated using deviational and statistical analyses as well as scatter
diagrams.
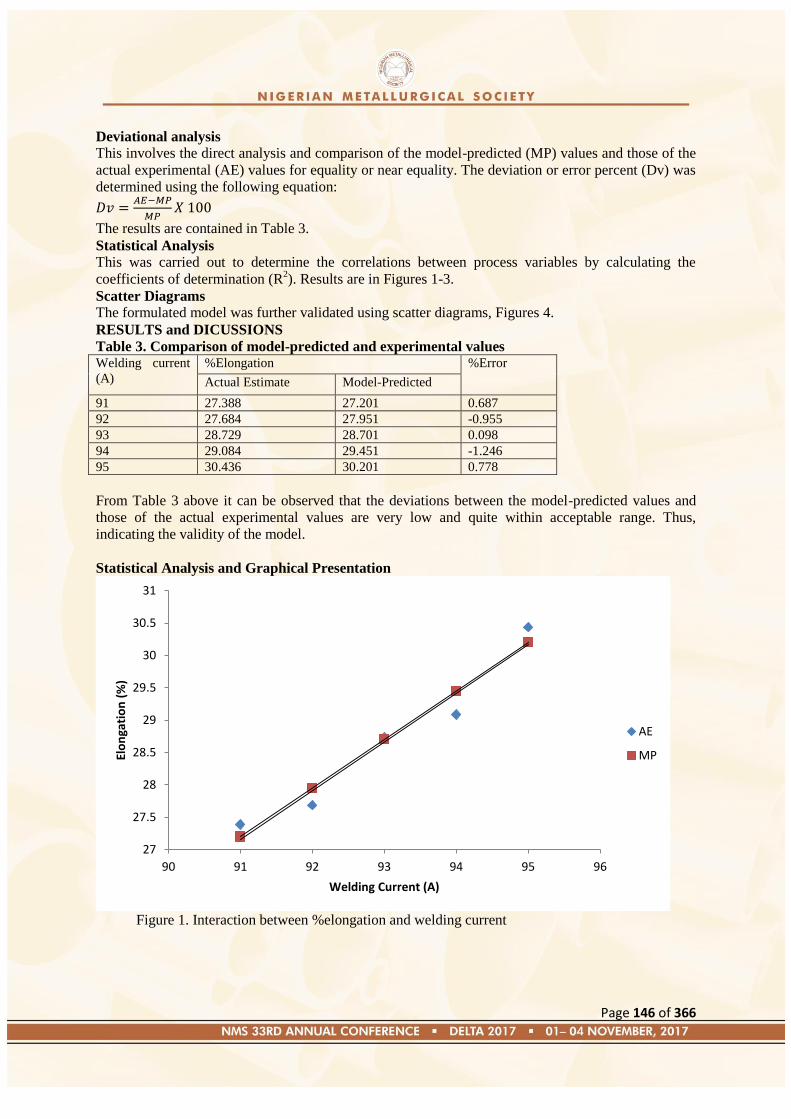
Page 146 of 366
Deviational analysis
This involves the direct analysis and comparison of the model-predicted (MP) values and those of the
actual experimental (AE) values for equality or near equality. The deviation or error percent (Dv) was
determined using the following equation:
The results are contained in Table 3.
Statistical Analysis
This was carried out to determine the correlations between process variables by calculating the
coefficients of determination (R2). Results are in Figures 1-3.
Scatter Diagrams
The formulated model was further validated using scatter diagrams, Figures 4.
RESULTS and DICUSSIONS
Table 3. Comparison of model-predicted and experimental values Welding current
(A)
%Elongation %Error
Actual Estimate Model-Predicted
91 27.388 27.201 0.687
92 27.684 27.951 -0.955
93 28.729 28.701 0.098
94 29.084 29.451 -1.246
95 30.436 30.201 0.778
From Table 3 above it can be observed that the deviations between the model-predicted values and
those of the actual experimental values are very low and quite within acceptable range. Thus,
indicating the validity of the model.
Statistical Analysis and Graphical Presentation
Figure 1. Interaction between %elongation and welding current
27
27.5
28
28.5
29
29.5
30
30.5
31
90 91 92 93 94 95 96
Elo
nga
tio
n (
%)
Welding Current (A)
AE
MP
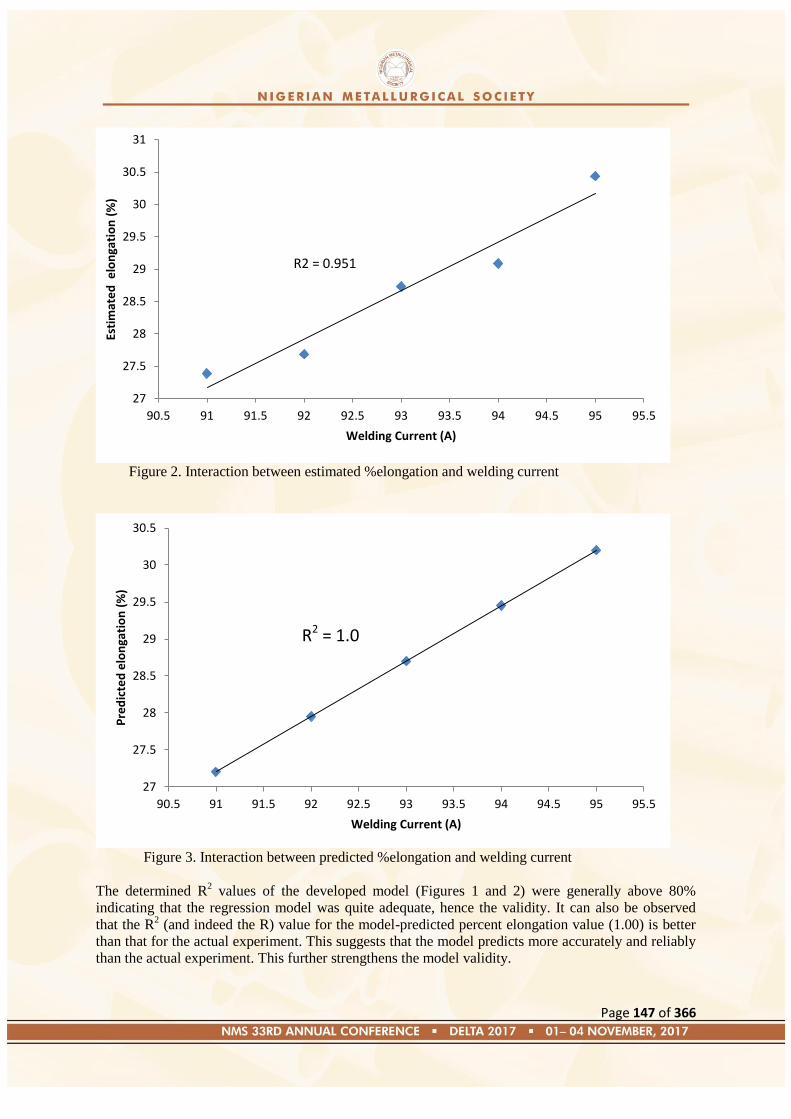
Page 147 of 366
Figure 2. Interaction between estimated %elongation and welding current
Figure 3. Interaction between predicted %elongation and welding current
The determined R2 values of the developed model (Figures 1 and 2) were generally above 80%
indicating that the regression model was quite adequate, hence the validity. It can also be observed
that the R2 (and indeed the R) value for the model-predicted percent elongation value (1.00) is better
than that for the actual experiment. This suggests that the model predicts more accurately and reliably
than the actual experiment. This further strengthens the model validity.
27
27.5
28
28.5
29
29.5
30
30.5
31
90.5 91 91.5 92 92.5 93 93.5 94 94.5 95 95.5
Esti
mat
ed
elo
nga
tio
n (
%)
Welding Current (A)
R2 = 0.951
27
27.5
28
28.5
29
29.5
30
30.5
90.5 91 91.5 92 92.5 93 93.5 94 94.5 95 95.5
Pre
dic
ted
elo
nga
tio
n (
%)
Welding Current (A)
R2 = 1.0
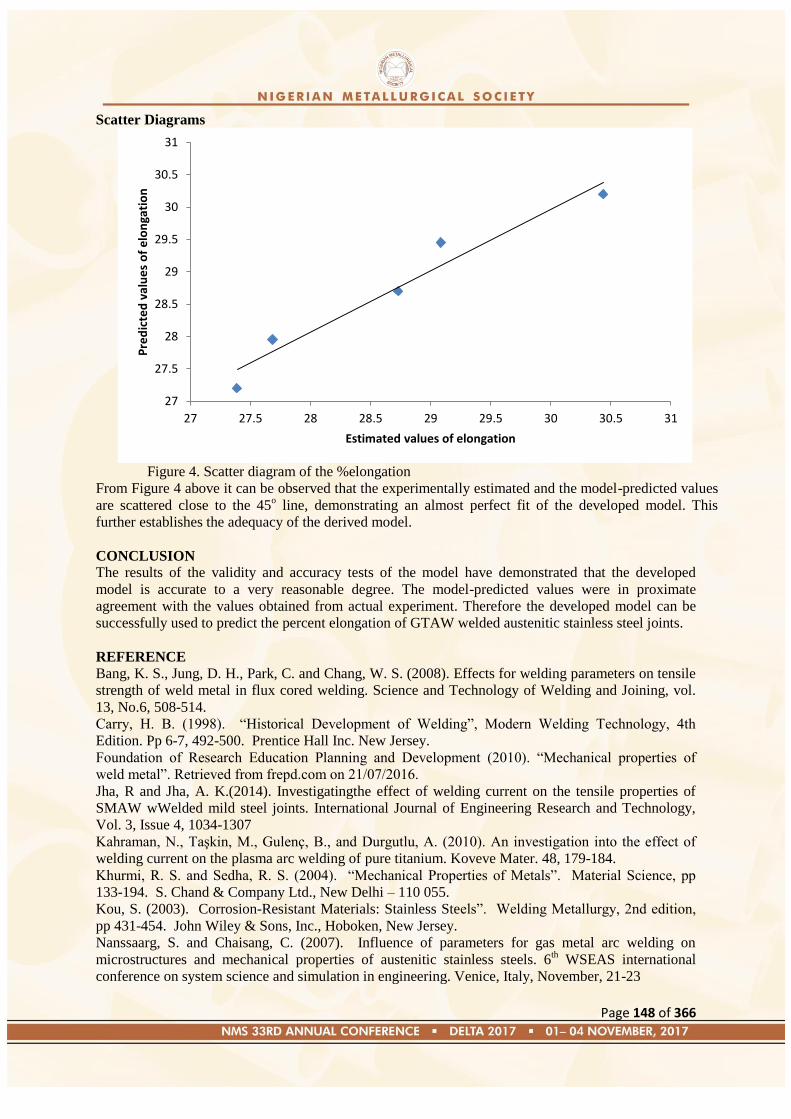
Page 148 of 366
Scatter Diagrams
Figure 4. Scatter diagram of the %elongation
From Figure 4 above it can be observed that the experimentally estimated and the model-predicted values
are scattered close to the 45o line, demonstrating an almost perfect fit of the developed model. This
further establishes the adequacy of the derived model.
CONCLUSION
The results of the validity and accuracy tests of the model have demonstrated that the developed
model is accurate to a very reasonable degree. The model-predicted values were in proximate
agreement with the values obtained from actual experiment. Therefore the developed model can be
successfully used to predict the percent elongation of GTAW welded austenitic stainless steel joints.
REFERENCE
Bang, K. S., Jung, D. H., Park, C. and Chang, W. S. (2008). Effects for welding parameters on tensile
strength of weld metal in flux cored welding. Science and Technology of Welding and Joining, vol.
13, No.6, 508-514.
Carry, H. B. (1998). ―Historical Development of Welding‖, Modern Welding Technology, 4th
Edition. Pp 6-7, 492-500. Prentice Hall Inc. New Jersey.
Foundation of Research Education Planning and Development (2010). ―Mechanical properties of
weld metal‖. Retrieved from frepd.com on 21/07/2016.
Jha, R and Jha, A. K.(2014). Investigatingthe effect of welding current on the tensile properties of
SMAW wWelded mild steel joints. International Journal of Engineering Research and Technology,
Vol. 3, Issue 4, 1034-1307
Kahraman, N., Taşkin, M., Gulenç, B., and Durgutlu, A. (2010). An investigation into the effect of
welding current on the plasma arc welding of pure titanium. Koveve Mater. 48, 179-184.
Khurmi, R. S. and Sedha, R. S. (2004). ―Mechanical Properties of Metals‖. Material Science, pp
133-194. S. Chand & Company Ltd., New Delhi – 110 055.
Kou, S. (2003). Corrosion-Resistant Materials: Stainless Steels‖. Welding Metallurgy, 2nd edition,
pp 431-454. John Wiley & Sons, Inc., Hoboken, New Jersey.
Nanssaarg, S. and Chaisang, C. (2007). Influence of parameters for gas metal arc welding on
microstructures and mechanical properties of austenitic stainless steels. 6th WSEAS international
conference on system science and simulation in engineering. Venice, Italy, November, 21-23
27
27.5
28
28.5
29
29.5
30
30.5
31
27 27.5 28 28.5 29 29.5 30 30.5 31
Pre
dic
ted
val
ue
s o
f e
lon
gati
on
Estimated values of elongation
Page 149 of 366
Nnuka, E. E., Okonji, P. O., Nwoye C. I. and Akaluzia, R. O. (2015). Effect of welding current and
filler metal types on percent elongation of GTAW austenitic stainless steel weld joints. European
Journal of Material Science, Vol. 2, No. 2, 1-6.
Okonji, P. O., Nnuka, E. E. and Odo, J. E. (2015). Effect of welding current and filler metal types on
the macrostructure and tensile strength of GTAW welded stainless steel joints, Vol 1, Issue 1, 9-12.
Quan, Y. J., Chen, Z. H., Gong, X. S.and Yu, Z. H. (2008). Effect of heat input on microstructure and
tensile properties of laser welded magnesium alloy. Materials Characterisation, 59 (10), 1491-1497
Tewari, S. P., Gupta, A. and Prakash, J (2010). Effect of welding parameters on the weldability of
materials. International Journal of Engineering Science and Technology, Vol 2, No 4, 512-516
Wikipedia (2010). ―Stainless steel". Retrieved from http://en.wikipedia.org/wiki/stainless_steel on
21/7/2016.
Zou Gui-sheng, Wu Ai-ping, Ren Jai-lie. Yang Jun and Zhao Wen-qing (2004). Effect of heat input
on microstructure and properties of welded joint in magnesium alloy AZ31B. Transactions of
Nonferrous Metals Society of China, 14 (1) 58
Page 150 of 366
Paper: NMS 2017-TP018
Foundry Entrepreneurship: A Catalyst for Rural Development
Apata A. O.,1 Alao A. O.2 and Ogbodo J. N.3 1Department of Metallurgical and Materials Engineering, Federal Polytechnic Idah Nigeria.
2Department of Foundry Technology, Federal Polytechnic Idah, Nigeria 3Metallurgical Unit, Scientific Equipment Development Institute Enugu Nigeria.
[email protected],[email protected] 3 [email protected]
ABSTRACT
This paper has attempted to set out the key issues related to foundry entrepreneurship in the
context of its relationship with rural development. The analysis is then broadened to understand the
determinants of rural entrepreneurship and the environment conducive to its development.
Consequently the policies that are necessary to make this environment favorable have been
discussed in detail. The generic constraints that are faced by rural enterprises have been listed out.
The conclusion is that to accelerate economic development in rural areas such as Idah, it is necessary
to promote foundry entrepreneurship. Entrepreneurial orientation in rural areas is based on
stimulating local entrepreneurial talent and subsequent growth of indigenous companies. This in
turn would create jobs and add economic value to a region and at the same time will keep scarce
resources within the community.
Keywords: Poverty, Poverty alleviation, Foundry, Rural Entrepreneurship, Rural development
1.0. INTRODUCTION
More than 1.3 billion people in this world live in extreme poverty, that is, one in every five
person.(United Nations Report, 1997 and 2000) As the world’s economies become more
interdependent, solving a problem as big and as difficult as poverty demands international alliances.
According to the International Fund for Agricultural Development (IFAD), the Millennium
Development Goals set forth by the United Nations are a guiding light for international cooperation
for development, in particular the target to halve the proportion of hungry and extremely poor
people by 2015. But the starting point to achieve this target must be the recognition that poverty is
predominantly rural. Three quarters of the world’s poor, about 900 million people, live in rural areas
where they depend on agriculture and related activities for their livelihoods. The reality is that the
Millennium poverty target cannot be met unless the world addresses rural poverty.
The World Bank‘s new strategy launched in 2002, called ‗Reaching the Rural Poor‘ focuses on
improving the lives of those living in rural areas. Ian Johnson, the Vice-President for Sustainable
Development states that this strategy is contributing to the increase of productivity in rural areas,
which will have a very positive impact on other sectors of the national economy. Petrin (1994) affirms
that rural development is now being linked more and more to entrepreneurship. Entrepreneurship

Page 151 of 366
stands as a vehicle to improve the quality of life for individuals, families and communities and to
sustain a healthy economy and environment (Isibor, 2014).
1.1 PROBLEM STATEMENT
Poverty as an issue has become a global phenomenon ravaging the city and rural dwellers in
different measures. The effect is more pronounced in the rural area than the urban centers where
accessibility to modern infrastructure and urbanization had watered down its influence. However
with the increasing awareness of entrepreneurship development as a panacea to this phenomenon,
the employment of indigenous materials in foundry would not only engender capacity building but
would in the long run maintain the local industries in a sustainable manner. Apart from creating
employment opportunities and therefore empowering the inhabitants, the rural-urban drift which
causes a strain on the cities would be considerably curtailed
1.2 Foundry Processing
Foundry is an establishment where ferrous and non-ferrous are first of all melted by the application of
heat and made to solidify in the mould to yield solid mass.
Types of Foundries
There are many ways of classifying foundries:
i Types of metal cast
a. Ferrous foundry- Ferrous metals such as iron and steel, cast iron.
b. Non-Ferrous foundry such as aluminum, lead, copper, magnesium and their alloys are cast.
ii Types of Mould:
a. Sand casting- Sand mould
b. Die casting- Metal mould
c. Investment casting- Consumable mould
d. Centrifugal casting- Agitating mould.
iii Types of production practiced:
a. Jobbing foundries producing purely on customer‘s request
b. Captive foundries- Producing for and serving as an integral part of a manufacturing
establishment.
Small scale foundries require N1.480, 000.00-N28, 000,000.00 million. It could be a cottage industry
run by members of the family. This type of foundry is highly recommended for rural area.
This paper deals with the following three issues.
1) Firstly, it sets out the reasons why promoting entrepreneurship as a force
of economic change must take place if many rural communities are to survive.
2) Secondly, it deals with what policies are necessary in order to create an
environment in rural areas conducive to entrepreneurship.
3) And thirdly, it considers the generic constraints that are faced by
entrepreneurs in rural areas and the initiatives that can assist their development.
Page 152 of 366
2. THE CONCEPT AND DETERMINANTS OF ENTREPRENEURSHIP In order to understand the role played by entrepreneurs in developing an economy it is first important
to understand the concept of entrepreneurship. (Petrin, 1992) While choosing a definition for
entrepreneurship most appropriate to the rural area context, it is important to bear in mind the skills
that will be needed to improve the quality of life for individuals, and to sustain a healthy economy and
environment. Hence, the most appropriate definition is a combination of three, wherein,
entrepreneurship can be defined as a force that mobilizes other resources to meet unmet market
demand. Jones and Sakong, 1980 defined entrepreneurship as the ability to create and build something
from practically nothing. (Timmons, 1989; Stevenson, et al, 1985) the process of creating value by
pulling together a unique package of resources to exploit an opportunity.
The need to understand the determinants of entrepreneurship is as important as understanding its
concept. The origins and determinants of entrepreneurship span a wide spectrum of theories and
explanations (Brock and Evans, 1989). However, it is generally accepted that policy measures can
influence the level of entrepreneurship (Storey, 1994).
Development of entrepreneurs and of entrepreneurship can be stimulated through a set of supporting
institutions and through deliberate innovative action which stimulates changes and fully supports
capable individuals or groups. Therefore, policies and programs designed specifically for
entrepreneurship promotion can greatly affect the supply of entrepreneurs and thus indirectly
represent an important source of entrepreneurship.
This view has important implications for entrepreneurship development in rural areas. If currently
entrepreneurial activities in a given rural area are not thriving it does not mean that entrepreneurship
is something inherently alien to rural areas. While this feeling could have some legacy due to the
slower pace of changes occurring in rural areas compared to urban ones, proper action can make a lot
of difference with respect to entrepreneurial behavior of people living in rural areas.
3. EXPECTED ROLE BY FOUNDRY ENTREPRENEURS IN RURAL DEVELOPMENT
Entrepreneurial activity and new firm formation are unquestionably considered engines of economic
growth and innovation (Baumol, 1990). As such, they are among the ultimate determinants of the
large regional differences in economic performance. The importance of new firm formation for
growth has been recognized since Schumpeter (1934). According to the Global Entrepreneurship
Monitor Report (2000), about 70 percent of an area‘s economic performance is dependent upon how
entrepreneurial the area‘s economy is.
Foundry entrepreneurship in rural areas is based on stimulating local entrepreneurial talent and
subsequent growth of indigenous companies. This in turn would create jobs and add economic value
to a region, and at the same time it will keep scarce resources within the community. According to
Petrin (1992), to accelerate economic development in rural areas, it is necessary to build up the
critical mass of first generation entrepreneurs.
Lyson (1995) echoes the prospects of small-enterprise framework as a possible rural development
strategy for economically disadvantaged communities and provides this description of the nature of
small-scale flexibly specialized firms: “First, these businesses would provide products for local
consumption that are not readily available in the mass market.. Second, small-scale technically
sophisticated enterprises would be able to fill the niche markets in the national economy that are
too small for mass producers. Third, small, craft-based, flexibly specialized enterprises can alter
production quickly to exploit changing market conditions.”
Page 153 of 366
According to a study conducted in the United States it has been found that rural poverty has become
as intense as that found in the inner cities, and has stubbornly resisted a variety of attempts at
mitigation through economic development policies. The latest strategy for addressing this problem is
the encouragement of emerging ―home-grown‖ enterprises in rural communities. The expectation is
that these new ventures-a) will provide jobs or at least self-employment; b) will remain in the areas
where they were spawned as they grow; c) and will export their goods and services outside the
community, attracting much-needed income. (Lyons, 2002)
It is important to stress here that rural entrepreneurship in its substance does not differ from
entrepreneurship in urban areas. Entrepreneurship in rural areas is finding a unique blend of resources,
either inside or outside of agriculture. The economic goals of an entrepreneur and the social goals of
rural development are more strongly interlinked than in urban areas. For this reason entrepreneurship
in rural areas is usually community based, has strong extended family linkages and a relatively large
impact on a rural community.
4. POLICY IMPLICATIONS FOR RURAL FOUNDRY ENTREPRENEURSHIP
Studies have shown that SMEs in rural areas in the UK (particularly remote rural areas) have
outperformed their urban counterparts in terms of employment growth (Keeble et al, 1992,). Behind
each of the success stories of rural entrepreneurship there is usually some sort of institutional
support. Lu Rongsen (1998), in a study in Western Sichuan highlights the important factors
responsible for the rapid development of enterprises in the area. These include- uniqueness of the
products in so far as they are based on mountain-specific, local natural resources; development of
infrastructure; strong and integrated policy support from government; and a well-planned marketing
strategy and link-up with larger companies and organizations for marketing nation-wide and abroad.
According to Petrin (1994), the creation of such an environment starts at the national level with the
foundation policies for macro-economic stability and for well-defined property rights as well as
international orientation. The policies and programs targeted specifically to the development of
entrepreneurship do not differ much with respect to location. In order to realize their
entrepreneurial ideas or to grow and sustain in business, they all need access to capital, labor,
markets and good management skills. What differs is the availability of markets for other inputs.
The inputs into an entrepreneurial process- capital, management, technology, buildings,
communications and transportation infrastructure, distribution channels and skilled labor, tend to
be easier to find in urban areas. Professional advice is also hard to come by. Consequently,
entrepreneurial behavior, which is essentially the ability to spot unconventional market
opportunities, is most lacking in those rural areas where it is most needed i.e., where the scarcity of
'these other inputs' is the highest.
Rural entrepreneurship is more likely to flourish in those rural areas where the two approaches to
rural development, the ‘bottom up’ and the ‘top down’, complement each other. The ‘top down’
approach gains effectiveness when it is tailored to the local environment that it intends to support.
The second prerequisite for the success of rural entrepreneurship, the ‘bottom up’ approach, is that,
ownership of the initiative remains in the hands of members of the local community. The regional

Page 154 of 366
development agencies that fit both criteria can contribute much to rural development through
entrepreneurship.
A study conducted by Smallbone and North (1997), reveals that firms that demonstrated the highest
level of innovative behavior were growing in terms of sales and also generating employment,
although it is important to stress that the relationship between innovation and growth is an inter-
dependent and mutually reinforcing one, rather than a simple cause and effect relationship.
Petrin (1994) maintains that policy implications for rural entrepreneurship development can be:
1) Sound national economic policy with respect to agriculture, including recognition of the vital
contribution of entrepreneurship to rural economic development;
2) Policies and special programs for the development and channeling of entrepreneurial talent;
3) Entrepreneurial thinking about rural development, not only by farmers but also by everyone and
every rural development organization.
5. PROBLEMS FACED BY RURAL ENTREPRENEURS
UNDP’s regional program for the Former Soviet Union (FSU) has summarized the problems faced by
rural SMEs and the suggested initiatives which may be undertaken to solve these issues. Table 1 is
illustrative of this:
Table 1. Problem and suggested initiatives for SMEs
PROBLEMS SUGGESTED INITIATIVES
Technical Assistance:
. High costs
. Few support institutions
. Preparation and training of national trainers
/ counselors;
. Application of successful experiences;
. Promotion and development of institutions
for support services of technical kind.
Entrepreneurial Attitude:
. Tendency towards isolation
. Lack of organization and integration. Little
willingness to undertake associative
entrepreneurial projects.
. Entrepreneurial training and preparations;
. Dissemination of successful associative
experiences;
. Support to, and co-operation with, existing
business / entrepreneurial associations;
Page 155 of 366
. Training and preparation of enterprising
young people.
Financing:
. Limited access to financing, both for start-ups
and expanding enterprises;
. Lack of endorsement and guarantees.
. Association – grouping;
. Assistance in establishment of credit schemes
targeting SMEs (mutual guarantee schemes
etc).
Policy and Enabling Environment:
. Excessive regulations and formalities;
. Political and economic instability.
. Identification of specific obstacles and
bottlenecks;
. Recommendations for change and
improvement within these areas;
. Adaptation and adjustment of legal
framework.
Gender Imbalances:
. Difficulties for women to startup businesses;
. Difficulties for women entrepreneurs to get
access to support and finance services.
. Entrepreneurial training and preparation;
. Sharing of experiences and best practices for
women entrepreneurs;
. Assistance in establishment of micro credit
schemes geared towards women.
Qualification of Human Resources:
. Little specialization and training;
. Low level of productivity
. Low valuation and encouragement to work
. Skills training
. Managerial training
. Improvement of the work environment,
organizational climate.
Market:
. Low share in the domestic market and almost
no share in external markets;
. Problems in acquisition of inputs;
. Lack of expertise in the area of domestic and
. Entrepreneurial training and preparation;
. Counseling and advisory services by qualified
personnel;
. Information links, regional and international
networks;
. Establishment of business / entrepreneur
Page 156 of 366
external marketing;
. Lack of insight into product differentiation
and other competitiveness issues.
associations;
. Vertical integration (possible labor
specialization)
CONCLUSION
World-wide the last three decades have seen major shifts in rural economies. Rural enterprises are
important generators of employment and economic growth internationally. It is important to stress
that rural entrepreneurship in its substance does not differ from entrepreneurship in urban areas.
Entrepreneurship in rural areas is finding a unique blend of resources, either inside or outside of
agriculture.
This paper has attempted to understand the role played by rural enterprises in economic
development and how governing bodies can help to foster its growth. The promotion of foundry
entrepreneurship and the understanding where entrepreneurship comes from is as equally
important as understanding the concept of entrepreneurship. The environment which is considered
most favorable for their growth forms the basis for the development of policies for foundry
entrepreneurship development. Policy implications for rural foundry entrepreneurship development
can be summarized as: (a) Sound national economic policy with respect to foundry, including
recognition of the vital contribution of entrepreneurship to rural economic development; (b) Policies
and special programs for the development and channeling of foundry entrepreneurial talent; (c)
Entrepreneurial thinking about rural development by everyone and every rural development
organization; d)And institutions supporting the development of rural entrepreneurship as well as
strategic development alliances.
However, despite their phenomenal growth rural enterprises have common systemic constraints to
their development. Governments and donors can help to address these constraints by facilitating
efficient and unbiased financial markets; a suitable business environment; education, training, and
competitive capacity; and access to information, networks and the global market place.
REFERENCES
Baumol, William (1990), Entrepreneurship: Productive, Unproductive and Destructive, Journal of
Political Economy 98: 893-921.
Brock, W.A. and Evans, D.S. (1989), Small Business Economics, Small Business Economics1 (1): 7-20.
Human Development Report (1997).United Nations Development Program.
International Fund for Agricultural Development (IFAD), (2002). Strategic Framework for IFAD 2002-
2006.Retrieved on June 18, 2005 from the World Wide Web: http://www.ifad.org

Page 157 of 366
Isibor A.O., (2014). Entrepreneurship Education for National Development, Home Economists
Perspective. Journal of vocational and Technical EducatorsVol 4 No 1: 107-115.
Kayne, J., (2000).Rural Entrepreneurship Initiative September. Kauffman Center for Entrepreneurial
Leadership: 8.
Lyons,T.S.,(2002). Building social capital for rural enterprise development: Three case studies in the
United States. Journal of Developmental Entrepreneurship,
Lyson,T.A., (1995). Down and Out in Rural America: The status of Blacks and Hispanics in the 1980s.
In L.J. Beaulieu and D.Mulkey,eds., Investing in people: the human capital needs of rural America. (pp
167-82). Boulder,CO: Westview Press,1995.
Petrin, T. (1992). “Partnership and Institution Building as Factors in Rural Development”. Paper
presented at the Sixth Session of the FAO/ECA Working Party on Women and the Agricultural Family
in Rural Development, Innsbruck, Austria, 13-16 October.
Petrin, T. (1994). “Entrepreneurship as an economic force in rural development.” Keynote paper
presented at the Seventh FAO/REU International Rural Development Summer School, Herrsching,
Germany, 8 - 14 September 1994.
Rongsen, L., (1998). “Enterprises in Mountain-specific Products in Western Sichuan, China”.In
ADB/TA 3150-PRC: A Study on Ways to Support Poverty Reduction Projects, Final Report, October
2000.(pp 7)
Schumpeter, J. (1934), The Theory of Economic Development, Harvard University Press, Cambridge,
Mass.
Smallbone,D. &North,D.(1997). Innovation, SMEs and Rural economic development: some policy
issues. Centre for Enterprise and Economic Development Research (CEEDR).
Stevenson, H.H, et al.(1985). “New Business Ventures and the Entrepreneur.” Homewood, IL: Irwin.
Storey, D.J. (1999). Six steps to heaven: evaluating the impact of public policies to support small
business in developed economies, in: D.L. Sexton and H. Landström (eds.), Handbook of
Entrepreneurship (176-194). Oxford: Blackwell.
United Nations Development Program,(2000). Regional program for the Former Soviet Union in
Asian Development Bank. “International Agro industry and Rural Enterprise Development
Approaches and Experience.” A Study on Ways to Support Poverty Reduction Projects/Final Report.

Page 158 of 366
Vaessen P, and Keeble D, (1995). “Growth-oriented SMEs in unfavorable regional
environments”,Regional Studies, (pp 29- 48).
World Bank, (2002). Reaching the Rural Poor- a renewed strategy for rural development. Retrieved
on June 3, 2005 from the World Wide Web: http://www-wds.worldbank.org/
Page 159 of 366
Paper: NMS 2017-TP019
Characterisation of Udane-Obiomi, Emewe-Efoppa and Okobo Coal Reserves in
Nigeria for Different Applications
Olugbile, O. O., and Ayoola, W. A.
Department of Metallurgical and Materials Engineering, University of Lagos, Nigeria
Abstract Coal is one of the most important consistent fossil fuels available in the Nigeria. Over a decade, coal
has become the largest source of primary fossil fuel energy utilization for electric power generation
and feedstock for chemicals, fuels and steel production. To understand the behaviour of coal as a
source of fuel for energy consumption, characterizing and understanding its physical properties is of
paramount importance. Hence, this study comprises the physico-chemical, thermal and mechanical
properties of Udane-Biomi, Emewe-Efoppa and Okobo coal samples from Kogi state, Nigeria. The
results of the proximate analysis of the coals show higher ash content for Udane-Biomi (75.23%)
compared to Emewe-Efoppa (6.86 %) and Okobo (3.32 %) coal deposits. The fuel ratio computed
from free carbon and volatile matter were higher in Emewe-Efoppa and Okobo coal samples than
Udane-Biomi coal sample. The results of the Net Calorific Values (NCV) obtained from Bomb
Calorimetry test indicate that Emewe-Efoppa coal (6,035.74 Kcal/Kg) and Okobo coal (6,035.74
Kcal/Kg) are eight times higher than Udane-Biomi coal (783 Kcal/kg). The chemical composition of
the coals gotten from the ultimate analysis test shows that the carbon content (87.89 – 89.56 %) of the
three coal samples is similar. The sulphur and nitrogen contents in all coals are approximately the
same and significantly low. Based on the analyses of the results obtained, Emewe-Efoppa and Okobo
coals may be used for different purposes such as power generation, fuels, feedstock for chemicals and
Udane-Biomi coal is best for cement production because of high ash content.
Keywords: Udane-Obiomi, Emewe-Efoppa, Okobo, hardness, ultimate analysis, proximate analysis
1.0) Introduction
Worldwide, coals are used for various purposes such as generation of electricity, iron and steel
making, cement production, paper manufacturing and chemical and pharmaceutical productions [1].
However, the application of coals in manufacturing industries depend on its types, grades and quality,
which are determined by the temperature and pressure and by the length of time of its formation [2].
Basically, there are two classes of coals: low rank coals (consists of lignite and subbituminous) and
hard coals (bituminous and anthracite). Low rank coals are characterised with high moisture content
and hard coal with high carbon/energy content. Both low rank and hard coals can be used in railway
transportation, power generation, and cement manufacturing plants because high quality coals is not
pre-requisite. Thus, little or no laboratory analysis may be required after exploration and prior to the
coal usage. However, in iron and steel making industries, smokeless fuel manufacturing industries and
town gas supply, high quality coal is needed. This implies that there is a need for coal analysis to meet
the desire objectives. Nigeria has a developing country needs a high quality coal for technological
advancement in the field of iron and steel making industries. However, studies have shown that
Nigeria coals are more of low rank coals [2]–[4] than hard coals. Hence, quest for continuous research
for high quality coals is imperative.
Page 160 of 366
Olaleye (2003) investigated some notable Nigerian coal deposits. He observed that the quality of the
coals studied is comparable with other sub-bituminous coals in coal-producing countries of the world,
due to its low ash, sulphur and moisture contents and medium to high calorific value. All the coals
investigated were declared as low rank. Ndagana et al., (2014) also demonstrated that Okaba is sub-
bituminous coal, hence, a low rank coal. Ernest and Onyeka (2016) investigated Coals from different
parts of the countries (Enugu, Benue and Delta States). They concluded that the Enugu and Benue
coal samples are sub-bituminous while the Delta coal sample is lignite.
There is a need to further examining Nigerian coal deposit for the industrial applications, especially
for the iron and steel production. In this study, three types of coals from Udane-Obiomi, Emewe-
Efoppa and Okobo coal reserves were analysis to suggest the possible applications.
2.0) MATERIALS AND METHODS
2.1) Materials Coal samples were obtained from three different locations in Kogi State, Nigeria, which include
Udane-Biomi, Emewe-Efoppa and Okobo coal reserves. The samples were stored in appropriately
labelled air-tight containers to retain their as-received conditions. A known weight of each pulverized
sample of coal from each of the sites was taken for different analyses.
2.2) Methods
2.2.1) Coal preparation
Manual method with the aid of hammer was used for crushing and milling of the coal samples to meet
International Organisation for Standardisation (ISO) 13909-44:2001 specifications. Subsequently,
sieving of the coal samples was carried out with an automatic sieve shaker to a size 212 µm. Prior to
each test, a known weight of each of the samples was air-dried with an electrothermal blast drying
box at 40 °C. This is to bring the moisture content of the samples to approximate equilibrium with the
laboratory atmosphere in order to minimize gain or loss during sampling operations in according with
American Society for Testing and Materials (ASTM[5]) D-2013 and ISO 1988. All the tests were
repeated three times to enhance the reliability of the results.
2.2.2) Proximate Analysis
The proximate analysis of Odagbo, Okobo and Ibobo coal reserves was carried out according to
American Society for Testing and Materials (ASTM) D3173, D3174 and D3175 for Moisture Content
(MC), Volatile Matter (VM) and Ash Content (AC), respectively. Loss of weight during air drying
was determined and recorded at intervals of 30-minute. To avoid systematic bias of sampling, coning
and quartering method of dividing samples was used according to ASTM D-346 standard. The free
(fixed) carbon was determined as in formula (1). Parr Formula 2 was used to determine the Mineral
Matter [5].
( ) ( )
( ) ( )
2.2.3) Ultimate Analysis
The nominal chemical composition of the coal samples was carried out at Pedagogic Consulting
Lagos, Nigeria. Leibig-Pregle chamber containing magnesium percolate and sodium hydroxide was
used. ASTM D5373-02, ASTM D4239-02 and ASTM D5142-02 methods were used for the
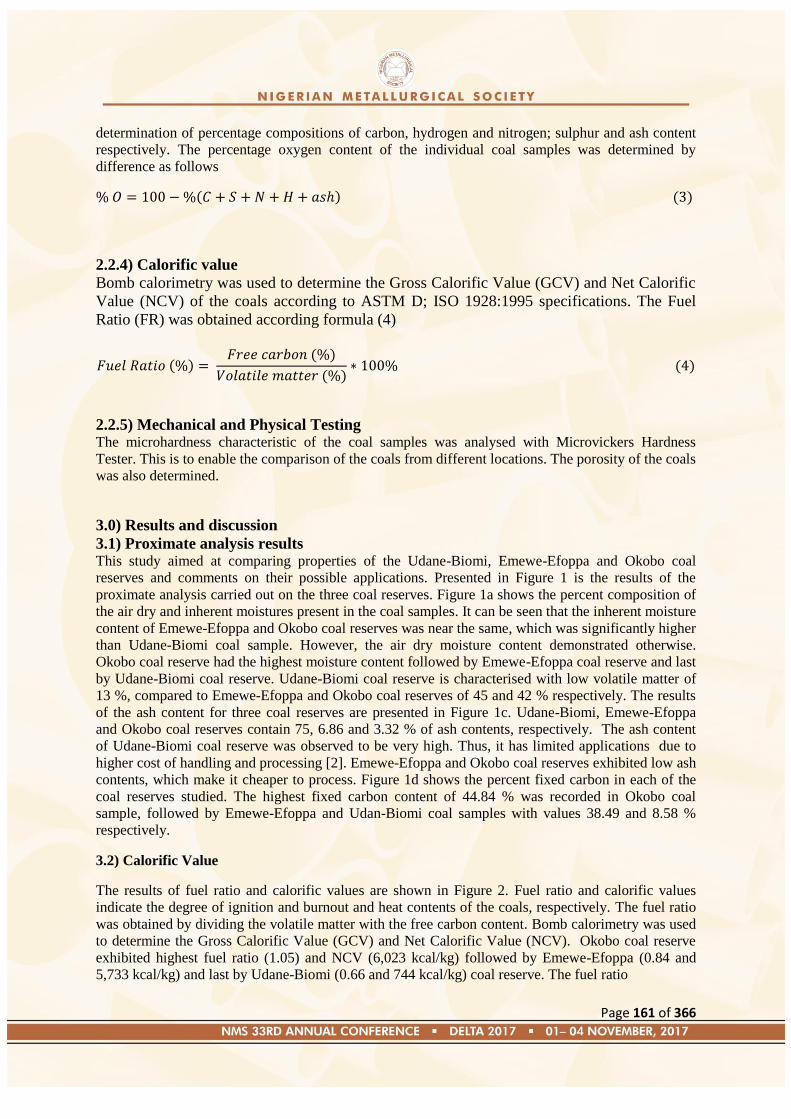
Page 161 of 366
determination of percentage compositions of carbon, hydrogen and nitrogen; sulphur and ash content
respectively. The percentage oxygen content of the individual coal samples was determined by
difference as follows
( ) ( )
2.2.4) Calorific value
Bomb calorimetry was used to determine the Gross Calorific Value (GCV) and Net Calorific
Value (NCV) of the coals according to ASTM D; ISO 1928:1995 specifications. The Fuel
Ratio (FR) was obtained according formula (4)
( ) ( )
( ) ( )
2.2.5) Mechanical and Physical Testing The microhardness characteristic of the coal samples was analysed with Microvickers Hardness
Tester. This is to enable the comparison of the coals from different locations. The porosity of the coals
was also determined.
3.0) Results and discussion
3.1) Proximate analysis results This study aimed at comparing properties of the Udane-Biomi, Emewe-Efoppa and Okobo coal
reserves and comments on their possible applications. Presented in Figure 1 is the results of the
proximate analysis carried out on the three coal reserves. Figure 1a shows the percent composition of
the air dry and inherent moistures present in the coal samples. It can be seen that the inherent moisture
content of Emewe-Efoppa and Okobo coal reserves was near the same, which was significantly higher
than Udane-Biomi coal sample. However, the air dry moisture content demonstrated otherwise.
Okobo coal reserve had the highest moisture content followed by Emewe-Efoppa coal reserve and last
by Udane-Biomi coal reserve. Udane-Biomi coal reserve is characterised with low volatile matter of
13 %, compared to Emewe-Efoppa and Okobo coal reserves of 45 and 42 % respectively. The results
of the ash content for three coal reserves are presented in Figure 1c. Udane-Biomi, Emewe-Efoppa
and Okobo coal reserves contain 75, 6.86 and 3.32 % of ash contents, respectively. The ash content
of Udane-Biomi coal reserve was observed to be very high. Thus, it has limited applications due to
higher cost of handling and processing [2]. Emewe-Efoppa and Okobo coal reserves exhibited low ash
contents, which make it cheaper to process. Figure 1d shows the percent fixed carbon in each of the
coal reserves studied. The highest fixed carbon content of 44.84 % was recorded in Okobo coal
sample, followed by Emewe-Efoppa and Udan-Biomi coal samples with values 38.49 and 8.58 %
respectively.
3.2) Calorific Value
The results of fuel ratio and calorific values are shown in Figure 2. Fuel ratio and calorific values
indicate the degree of ignition and burnout and heat contents of the coals, respectively. The fuel ratio
was obtained by dividing the volatile matter with the free carbon content. Bomb calorimetry was used
to determine the Gross Calorific Value (GCV) and Net Calorific Value (NCV). Okobo coal reserve
exhibited highest fuel ratio (1.05) and NCV (6,023 kcal/kg) followed by Emewe-Efoppa (0.84 and
5,733 kcal/kg) and last by Udane-Biomi (0.66 and 744 kcal/kg) coal reserve. The fuel ratio
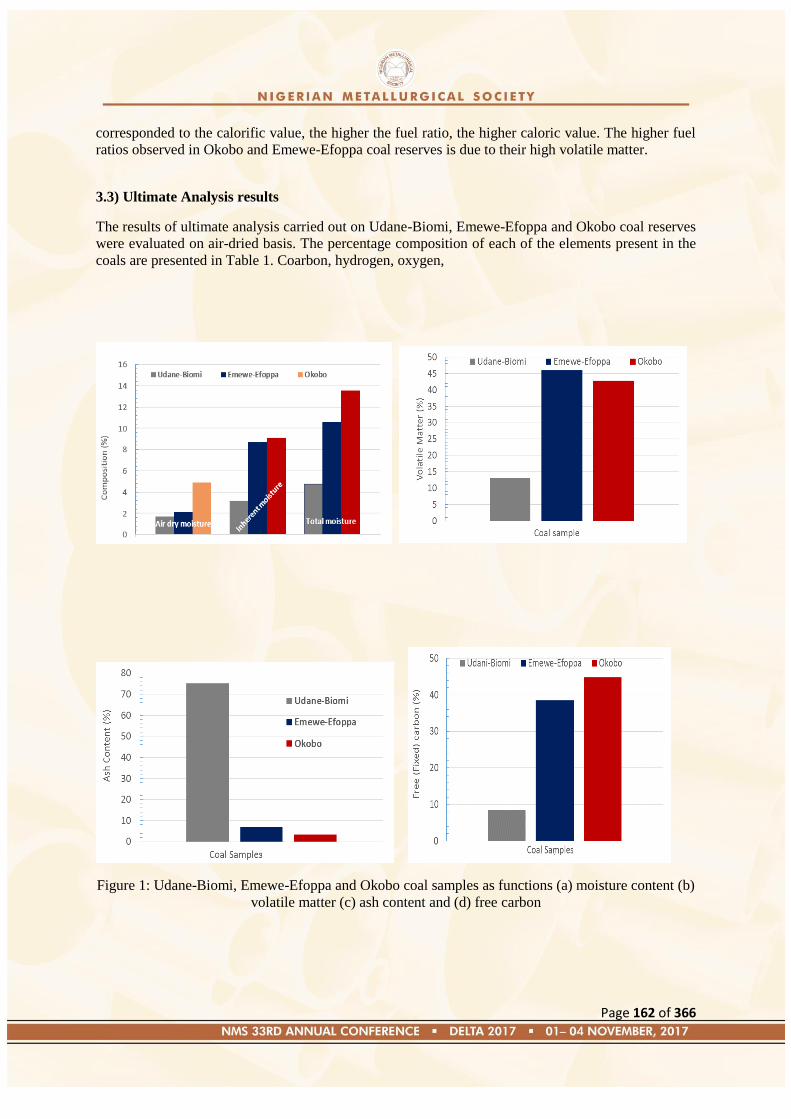
Page 162 of 366
corresponded to the calorific value, the higher the fuel ratio, the higher caloric value. The higher fuel
ratios observed in Okobo and Emewe-Efoppa coal reserves is due to their high volatile matter.
3.3) Ultimate Analysis results
The results of ultimate analysis carried out on Udane-Biomi, Emewe-Efoppa and Okobo coal reserves
were evaluated on air-dried basis. The percentage composition of each of the elements present in the
coals are presented in Table 1. Coarbon, hydrogen, oxygen,
Figure 1: Udane-Biomi, Emewe-Efoppa and Okobo coal samples as functions (a) moisture content (b)
volatile matter (c) ash content and (d) free carbon
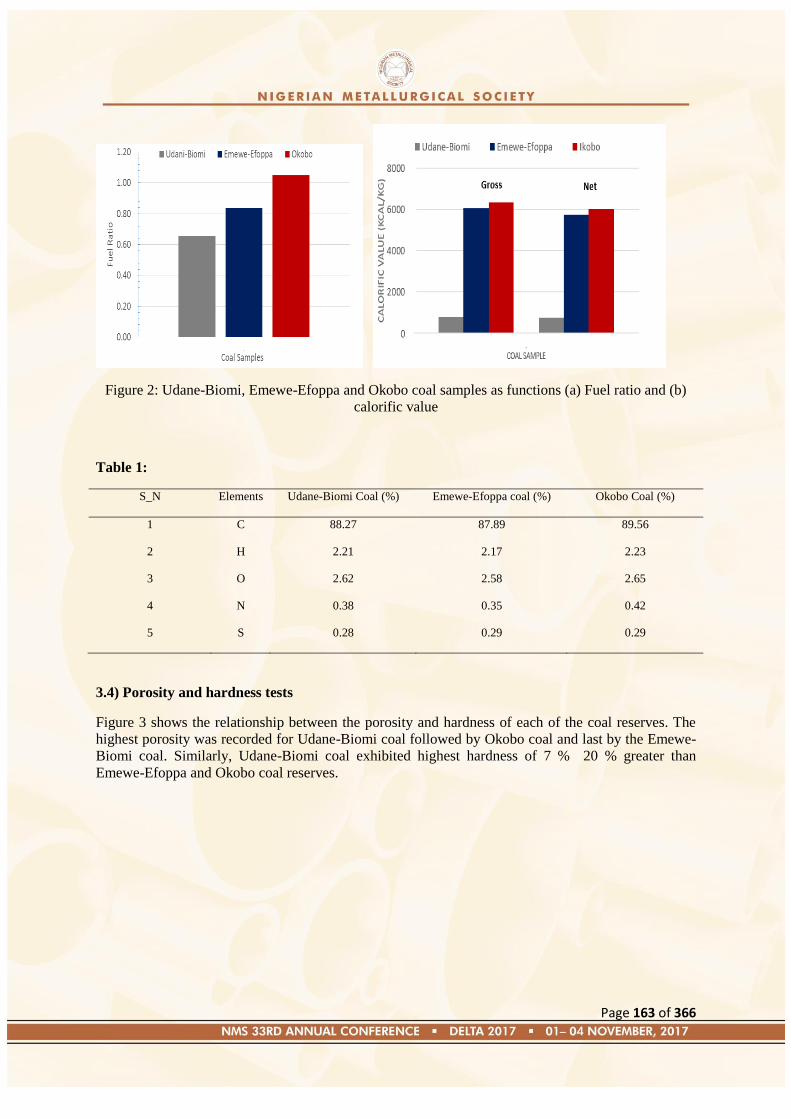
Page 163 of 366
Figure 2: Udane-Biomi, Emewe-Efoppa and Okobo coal samples as functions (a) Fuel ratio and (b)
calorific value
Table 1:
S_N Elements Udane-Biomi Coal (%) Emewe-Efoppa coal (%) Okobo Coal (%)
1 C 88.27 87.89 89.56
2 H 2.21 2.17 2.23
3 O 2.62 2.58 2.65
4 N 0.38 0.35 0.42
5 S 0.28 0.29 0.29
3.4) Porosity and hardness tests
Figure 3 shows the relationship between the porosity and hardness of each of the coal reserves. The
highest porosity was recorded for Udane-Biomi coal followed by Okobo coal and last by the Emewe-
Biomi coal. Similarly, Udane-Biomi coal exhibited highest hardness of 7 % 20 % greater than
Emewe-Efoppa and Okobo coal reserves.
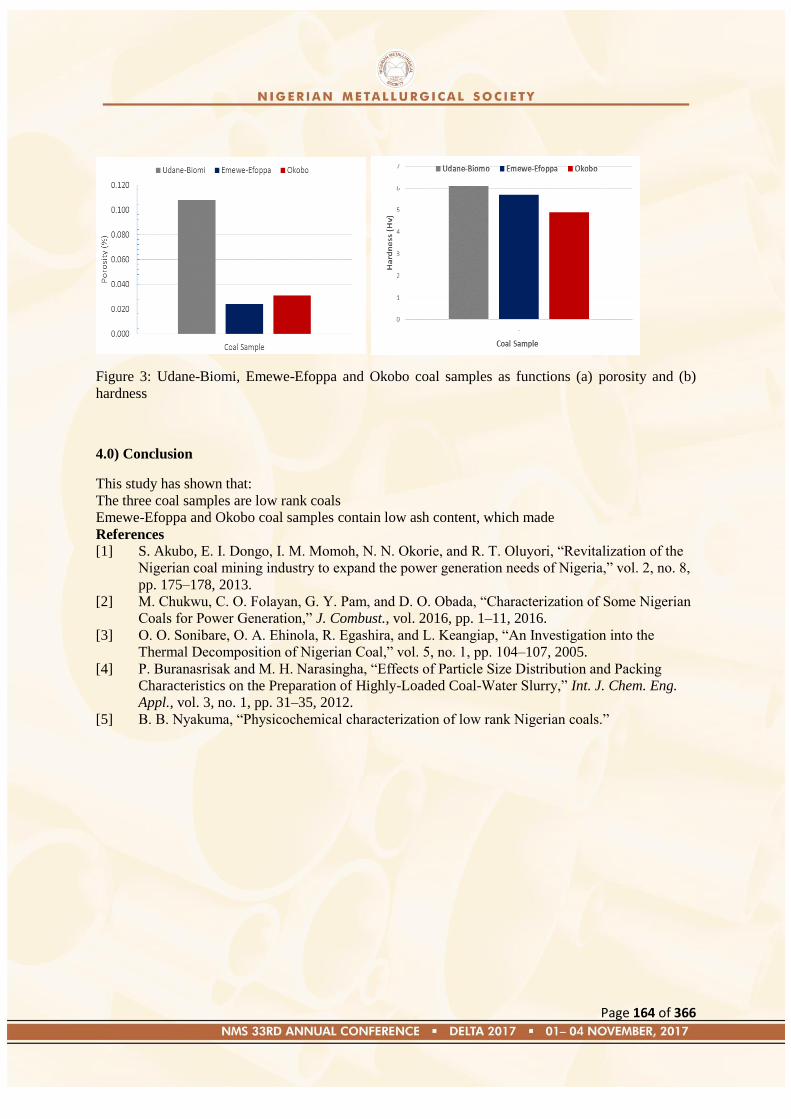
Page 164 of 366
Figure 3: Udane-Biomi, Emewe-Efoppa and Okobo coal samples as functions (a) porosity and (b)
hardness
4.0) Conclusion
This study has shown that:
The three coal samples are low rank coals
Emewe-Efoppa and Okobo coal samples contain low ash content, which made
References
[1] S. Akubo, E. I. Dongo, I. M. Momoh, N. N. Okorie, and R. T. Oluyori, ―Revitalization of the
Nigerian coal mining industry to expand the power generation needs of Nigeria,‖ vol. 2, no. 8,
pp. 175–178, 2013.
[2] M. Chukwu, C. O. Folayan, G. Y. Pam, and D. O. Obada, ―Characterization of Some Nigerian
Coals for Power Generation,‖ J. Combust., vol. 2016, pp. 1–11, 2016.
[3] O. O. Sonibare, O. A. Ehinola, R. Egashira, and L. Keangiap, ―An Investigation into the
Thermal Decomposition of Nigerian Coal,‖ vol. 5, no. 1, pp. 104–107, 2005.
[4] P. Buranasrisak and M. H. Narasingha, ―Effects of Particle Size Distribution and Packing
Characteristics on the Preparation of Highly-Loaded Coal-Water Slurry,‖ Int. J. Chem. Eng.
Appl., vol. 3, no. 1, pp. 31–35, 2012.
[5] B. B. Nyakuma, ―Physicochemical characterization of low rank Nigerian coals.‖
Page 165 of 366
Paper: NMS 2017-TP020
Technological Innovations in the Nigerian Metal Industry for
National Economic Revitalization
*Igbaroola B. M., Oladele O. E. and Adegun M. H.
Department of Metallurgical and Materials Engineering, Federal University of Technology, Akure
*Correspondent Author: E-mail: [email protected] Telephone: +234(0) 813 849 5572
ABSTRACT
Technological innovations are driven by huge investments in research and development. They also
promote great entrepreneurship spirit. These are the bedrocks on which prosperous economies are
built. The low input of the Nigerian Iron and Steel Industry to the National economy is as a result of
technological innovations deficit in the industry which are attributed to lack of sufficient funds into
the industry, ill equipped tertiary institutions and research institutes, lack of synergy between the
government, industry and the academia and the poor political will of the government. This is the
thrust for this paper which aims at proffering appropriate solutions to technological innovations deficit
in Nigeria as this has direct impact on the national economy. It is recommended that the government
should demonstrate much greater commitment than before through consistent funding scheme which
will be transparently operated and channeled towards research and development in the metal industry
particularly iron and steel sub sector. This will provide the necessary vehicle for industrial
transformation and economic recovery.
1.0 INTRODUCTION
Technological innovations are crucial for long-term economic development. The 17 Sustainable
Development Goals (SDGs) of the 2030 Agenda for Sustainable Development adopted by world
leaders at an historic UN Summit officially came into force (Nations, 2015). The ninth goal of
the United Nations is aimed at building resilient infrastructure, promote sustainable
industrialization and foster innovation. The Economic Recovery and growth plan policy that was
launched by the President of the Federal Republic of Nigeria, General Muhammadu Buhari which
was designed to help diversify, sustain the economy and enhance all-inclusive growth in
manufacturing, agriculture, solid mineral services to reduce dependency on oil as major income
earner of the government is in tandem with the ninth goal of the United Nations (Otaru, 2010).
Globally, the steel industry is found to be in the middle of the manufacturing value chain and can
be used as a way to accelerate the development of the national economy, by adjusting the scale of
input and output. In dire need of infrastructure, the potential of Nigeria‘s steel industry remains
under exploited as stakeholders chart path to growth. For Nigeria, the monolithic structure of the
economy, strong appetite for imported products, lack of funds for research and development in the
metal industry, the ill equipped laboratories in both tertiary institutions and research institutes, the
absence of synergy between the government, industry and academia and the lack of political will
on the government‘s part continue to affect technological innovations in the Nigeria metal
industry. (Adekoya, 2016)
Page 166 of 366
The aim of this paper is to encourage technological innovations and substantially increase the
number of research and development in the Nigeria metal industry especially in the iron and steel
sub-sector as this will provide the necessary vehicle for industrial transformation and economic
recovery. Let us now examine this paper‘s title: Technological innovations in the Nigerian Metal
Industry for National economic revitalization: Technological Innovation: comprises activities that
contribute to the research, development and design of new products, services or techniques to
improve existing products and generates new technological knowledge. National Economy: the
economy of a nation; specifically: the economy of a nation as a whole that is an economic unit
and is usually held to have a unique existence greater than the sum of the individual units within
it. Revitalization: Revitalization means to give life to, to stimulate activity in; to give vigor to.
―Re‖ implies again. So, revitalize is to give life to again or to give vigor to again.
This paper shall be structured into three parts. The nexus between technological innovation
and the economy will be discussed. This will be followed by technological innovations in the
Nigeria metal industry vis a vis the Nigeria iron and steel industry. This is then capped up
with technological innovations in the Nigeria iron and steel industry and its implication on the
National economy.
2.0 THE NEXUS BETWEEN TECHNOLOGICAL INNOVATIONS AND THE
ECONOMY
Economists have long noted the role that technology plays in economic progress. We measure
technology and innovation according to three main metrics – research and development effort,
scientific and research talent, and the level of innovation – and then combine them in a new,
comprehensive Global Technology Index. In the survey of the percentages of economic output
countries devoted to R&D investment, U.S. ranks sixth. Israel is in first place, followed by
Sweden, Finland, Japan, and Switzerland, which make up the top five (Florida, 2011).
In the survey of scientific and engineering researchers per capita, The United States ranks
seventh. Finland takes the top spot, followed by Sweden, Japan, Singapore, and Denmark.
Norway, Australia, Canada, and New Zealand round out the top ten. In the survey of innovations,
measured as patents per capita. Now, the United States takes first place, followed by Japan,
Switzerland, Finland, and Israel. Sweden, Germany, Canada, Denmark, and Hong Kong round out
the top ten. (Florida, 2011).
By combining all three of these measures, we end up with an overall Global Technology Index, a
broad assessment of the technological and innovative capabilities of the world‘s leading nations.
The United States ranks third. Finland takes the top spot, followed by Japan. Israel‘s fourth place
finish may come as a surprise to some. But as Dan Senor and Saul Singer argue in Start-up
Nation, Israel has relentlessly pursued an economic development strategy based on launching
innovative firms. Israel has the highest concentration of engineers in the world—135 per 10,000
people, compared to 85 per 10,000 people in the United States (Florida, 2011).
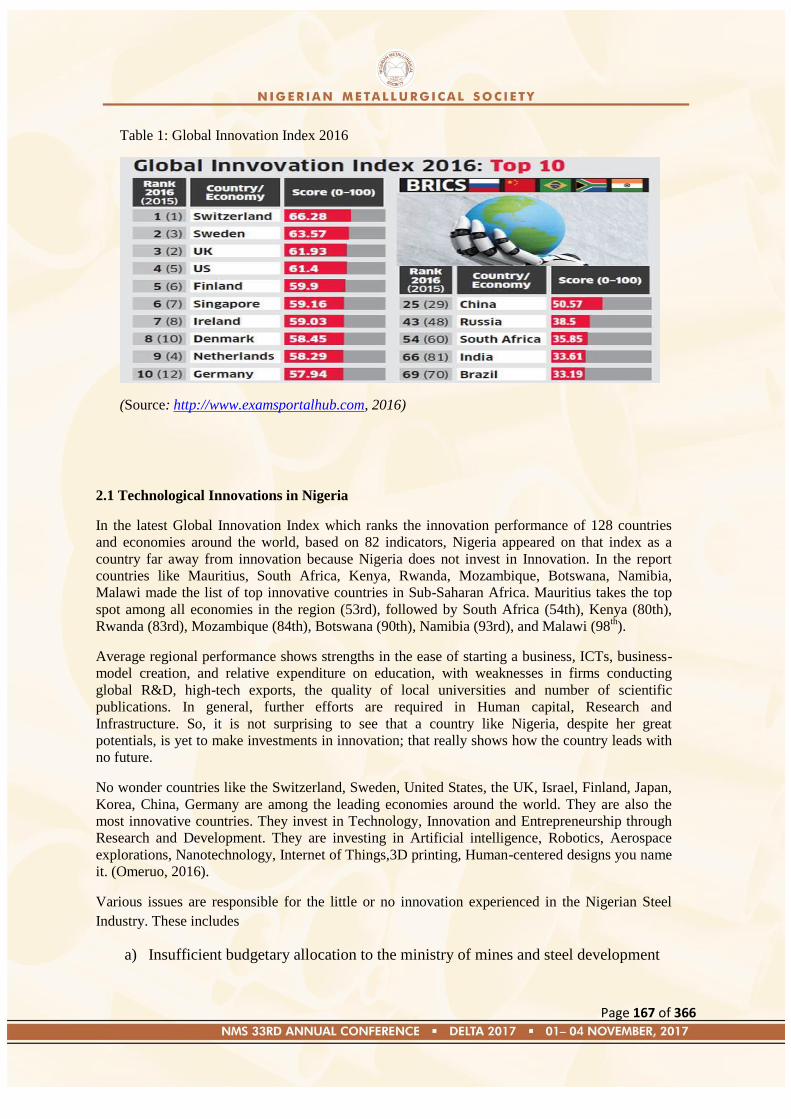
Page 167 of 366
Table 1: Global Innovation Index 2016
(Source: http://www.examsportalhub.com, 2016)
2.1 Technological Innovations in Nigeria
In the latest Global Innovation Index which ranks the innovation performance of 128 countries
and economies around the world, based on 82 indicators, Nigeria appeared on that index as a
country far away from innovation because Nigeria does not invest in Innovation. In the report
countries like Mauritius, South Africa, Kenya, Rwanda, Mozambique, Botswana, Namibia,
Malawi made the list of top innovative countries in Sub-Saharan Africa. Mauritius takes the top
spot among all economies in the region (53rd), followed by South Africa (54th), Kenya (80th),
Rwanda (83rd), Mozambique (84th), Botswana (90th), Namibia (93rd), and Malawi (98th).
Average regional performance shows strengths in the ease of starting a business, ICTs, business-
model creation, and relative expenditure on education, with weaknesses in firms conducting
global R&D, high-tech exports, the quality of local universities and number of scientific
publications. In general, further efforts are required in Human capital, Research and
Infrastructure. So, it is not surprising to see that a country like Nigeria, despite her great
potentials, is yet to make investments in innovation; that really shows how the country leads with
no future.
No wonder countries like the Switzerland, Sweden, United States, the UK, Israel, Finland, Japan,
Korea, China, Germany are among the leading economies around the world. They are also the
most innovative countries. They invest in Technology, Innovation and Entrepreneurship through
Research and Development. They are investing in Artificial intelligence, Robotics, Aerospace
explorations, Nanotechnology, Internet of Things,3D printing, Human-centered designs you name
it. (Omeruo, 2016).
Various issues are responsible for the little or no innovation experienced in the Nigerian Steel
Industry. These includes
a) Insufficient budgetary allocation to the ministry of mines and steel development

Page 168 of 366
b) Lack of modern equipment and facilities in university laboratories for students to
acquaint themselves to modern technology
c) Poor Training of staffs in the industry below international standard.
d) Low investment of the private sector in R&D activities in the steel industry.
e) Poor Government – Industry – Academia collaboration
2.2 Technological innovations in Nigerian Metal Industry
The Nigerian metal industry has been less active based on innovations, research and
developments. Various works have been done to improve the strength of most metals such as steel
and aluminum by alloying them with ceramics, fibers and also other metals. Their findings if put
to good use by the industry can lead to a breakthrough in the discovery of new materials that ticks
all the boxes when it comes to engineering applications. Some of the innovations include;
a) High Strength Low Alloy Metals: These metals are stronger than ordinary metals,
and are well suitable in applications that exert significant amounts of stress often
at low temperatures. High-strength steels can be used to increase the fuel
efficiency of cars by reducing the weight of its parts. These steels are also used in
trucks, cranes, and bridges.
b) Efficient Electrical metals: These metals (aluminum) can reduce the losses in
electric motors and converters, and thus contribute towards energy savings
c) Improved Heat Resistance: Steel products that are more heat resistant are suitable
in the manufacture of machines that operate at high temperatures. By allowing
thermal engines, for example, to operate at higher temperatures, these steels can
result in improved energy efficiency. Moreover, since a given amount of steel
used in these applications yields higher performance, the resource-savings are
beneficial to the environment.
d) Corrosion-Resistant Metals: Metal products like steel and aluminum have become
increasingly resistant to corrosion, thanks to developments in coating. The
industry strives to maintain steel‘s attractiveness as a material used in the
automotive and other applications by developing steels that are resistant to wear,
have long-lasting stability, and have tailored surface hardness. Corrosion-resistant
metals also extend the lifetime of the product. This reduces disposal requirements
and, thus, improves the environmental impact of a given product (OECD, 2015).
2.3 Technological innovations in the Iron and Steel Subsector
A predecessor to the Bessemer process was already used as early as the second century BC. There
can be a significant time lapse between the idea, the invention of a new technology, the
corresponding patent application and grant, the first implementation and the diffusion of the
technology across plants companies and countries. The innovation process entails not only
breakthrough technologies but also incremental innovations that help refine the original invention.
In the case of the steelmaking process, most of the innovations have been incremental in nature
over the last few decades, since the introduction of methods during the 1960s that radically
changed the way steel is produced. Sometimes a number of related inventions are also needed
before an idea can be feasibly turned into an invention and implemented (OECD, 2015).
In addition, in the case of steel technologies, high entry barriers, the industrial structure, high sunk costs and high barriers to exit result in a relatively high technological path dependency that

Page 169 of 366
contributes to a considerable lapse of time between innovations, the introduction of the
technology and technology dissemination. For example, the change in technological paradigm
with the replacement of open hearth furnaces (OHF) by basic oxygen furnaces (BOF), and later
the introduction of the electric arc furnace (EAF), have been particularly challenging for
established firms at the time of the technological shifts. The BOF and EAF replaced the OHF
rapidly as the need for faster production and better quality of steel became necessary. However,
incumbent companies in the steel market then had already made substantial investments in their
OHF plants making it difficult to embrace the new innovation. These advances at the
technological frontier are important drivers of industry restructuring and can result in higher
productivity growth (OECD, 2015).
3.0 TECHNOLOGICAL INNOVATIONS IN THE IRON AND STEEL SUBSECTOR
AND THE NIGERIAN ECONOMY
It is generally known that present material civilization has been largely due to man‘s knowledge
and application of metals. Without metals, there would be no railways, aero-planes, automobiles,
ships, turbines, electric motors and generally no electrical power. It is also widely recognized that
central to all these metallic inventions, innovations and motive power, is the particular class of
metal known as ―STEEL‖. The present economic situation of Nigeria is in a state of disarray and
the Nigerian Steel Industry has only been able to do little to help due to little or no technological
innovation in the industry. However, having solved the problems of insufficient budgetary
allocation to the ministry of mines and steel development, lack of modern equipment and facilities
in university laboratories, poor training of staffs, low investment of the private sector in R&D
activities in the steel industry and poor Government – Industry – Academia collaboration,
technological innovations can thrive in the Nigerian metal industry. It is envisaged that with more
innovations in the steel industry, the Nigerian economy can be revitalized.
Primary steel sector industries are fundamentally different from other industrial establishments in
many respects. They are basically strategic industries that serve the long term industrial needs of a
nation through their unique role as feeder channels to myriads of other key establishments. No
serious programme of industrialization can be contemplated without a strong steel base, at least a
steel base that would grow with the visualized scope of general industrialization over a set period.
The Nigerian Steel Industry with the necessary innovations can serve as a base for
industrialization in the country.
The steel industry is believed to have great effects that will permeate all sectors of the Nigerian
economy such as the industrial, agricultural, transport and construction sectors. For instance,
innovations in the production of new grade of steels would make Nigeria a major producer in
industrial machineries, auto-electrical spare-parts, shipbuilding, railways and carriages. Ajaokuta
Steel Company alone is expected to attract over a hundred downstream industries. Thus the
revenue gotten from the exchange will go a long way in helping declining economy to regain its
effectiveness.
Innovations in the Steel industry will bring about technology transfer to the country. This will
open a new vista for our technological take-off. It is expected that when the innovations become
functional, foreign investors would be attracted to participate in the steel development. Indeed,
nothing can expedite and actualize the much talked about technology transfer to developing
countries especially Nigeria like the take-off of the Ajaokuta Steel Company Limited and other
steel industries (Ocheri et al., 2017).

Page 170 of 366
The role of the innovations steel industry in transformation of the agricultural sector from the
mere production of raw materials to the conversion of the raw materials to intermediate or
finished products for export has already been identified. The general decline in the agricultural
sector is arguably due to the absence of a viable steel industry. Design and fabrication of various
agricultural implements and machineries would help improve the agricultural sector of the
Nigerian economy. New grades of steels which are not toxic to the human body can also be
produced and used in the food processing industry.
It is expected that innovation in the Nigerian steel industry will no doubt generate enormous
foreign exchange through export. It is also envisaged that the products of the steel companies
would be exported to the West African sub-region and other African countries. This would
increase the Gross Domestic Product (GDP) of the nation and also put Nigeria on the global map
of steel producers in the world.
Innovation in the steel industry has the prospect of creating employments for a large number of
the nation‘s labor force. It is expected that technological innovations will lead to a bigger steel
industry and more steel companies will spring up as a result of the available technological know-
how. This will create employment opportunities for millions of Nigerians indirectly through the
upstream and downstream industries. This will further help to alleviate the ridiculous
unemployment problem of the nation (Ocheri et al., 2017
4.0 CONCLUSION
This paper has addressed the problems facing technological innovations in the Nigerian metal
industry. It can be said that the present decline experienced in the Nigerian Economy is as a result
of the over-dependence on crude oil. The asking price of crude oil has decreased greatly to about
$50 per barrel as of July 2017 compared to the highest of about $132 per barrel attained in July
2008. It is obvious that the so called crude oil isn‘t bringing in much revenue as it does before.
However, with good investments into innovations in the steel industry, the steel industry could
realize large long-term economic benefits from investments such as new technologies and
improved production processes, foreign exchange, employment opportunities, technology transfer
and industrialization which would result in increased efficiency and productivity growth. It is
believed that with all these put in place; the Nigerian economy would go back to being the best in
Africa and one of the best in the world.
REFERENCES
Adebayo, A. (2016). Tackling challenges in Steel Sector. Retrieved August 27, 2017, from
Pressreader: https://www.pressreader.com/nigeria/daily-trust/20160108/281908772130372
Adekoya, F. (2016). Fixing the missing link in Nigeria's steel industry. Retrieved August 27, 2017,
from The Guardian: guardian.ng/Sunday-magazine/fixing-the-missing-link-in-nigerias-steel-
industry/amp
Florida, R. (2011). The World‟s Leading Nations for Innovation and Technology. Retrieved August
27, 2017, from Citylab: https://www.citylab.com/life/2011/10/worlds-leading-nations-
innovation-and-technology/224/
Page 171 of 366
JOFRE, S. & Andersen, P. (2008). Exploring the Role of Knowledge and Technology Transfer in
Innovation Systems. Europe, INNOVA
Laitner, J., M. Ruth and E. Worrell (2001), ―Incorporating the Productivity Benefits into the
Assessment of Cost Effective Energy Savings Potential Using Conservation Supply Curves‖,
Conference Paper, ACEEE's 2001 Summer Study on Energy Efficiency in Industry
Proceedings, 1, Issue 8.
Lundvall, B. (1992). Towards a Theory of Innovation and Interactive Learning. National Systems of
Innovation: Pinter Publishers, London, UK.
Nations, U. (2015). Sustainable development goals. Retrieved August 26, 2017, from United Nations:
http://www.un.org/sustainabledevelopment/infrastructure-industrialization/
Ocheri C, Ajani O.O, Daniel A, and Agbo N, (2017) ―The Steel Industry: A Stimulus to National
Development‖. Journal of Powder Metallurgy and Mining. Vol 6.
OECD (2015), ―Upgrading in GVCs: The role of innovation‖, internal working document,
Directorate for Science, Technology and Industry, DSTI/IND (2015)4.
Omeruo, K. (2016). Nigeria Innovation Summit:Solving Nigeria‟s Economic Challenges Through
Technology and Innovation. Retrieved August 27, 2017, from Techtrendsng:
http://www.techtrendsng.com/nigeria-innovation-summitsolving-nigerias-economic-
challenges-through-technology-and-innovation/
Otaru, O. (2010). NaijaBiz. Retrieved August 26, 2017, from Naijabizcomm.com:
http://naijabizcom.com/2010/12/24/solid-minerals-investment-opportunities-in-nigeria/
Page 172 of 366
Paper: NMS 2017-TP021
Materials Integrity of Aluminium Production by Recycling for
Nigerian Economic Recovery
*A. Adewale, A. Abraham and C. Oganbule
Department of Metallurgical and Materials Engineering, Federal University of Technology,
Akure, Ondo State, Nigeria.
* [email protected] +234 (0)703 827 0018
ABSTRACT
The aluminum extraction section of the nonferrous sub-sector of the Nigerian metals industries is still
a project. There is a growing range of application of aluminum and its alloy in areas such as structural
application (reinforcing bars, frames and windows), automobile application (automobile reinforcing
frame), aerospace (landing gear of aircraft), power transmission, beverage cans and cooking utensils.
This has made the majority of aluminum production in Nigeria based on recycling of aluminum scrap.
The material integrity of the recycled aluminum product is critical because of its service application
especially when compared with those produced from primary source of extraction. The objective of
this paper is therefore to challenge the psyche of stake holders in the aluminum recycling business to
appreciate the fact that technically, recycled aluminum production, if properly handled to uphold its
integrity may be used as safe substitute for primarily produced aluminum. Furthermore, the
production of aluminum by recycling has proven to be economic because the process saves about 95%
energy and reduces CO2 emission. Hence the paper recommends the formal integration of the
aluminum recycling business by the Nigerian government by supporting it with policies that
encourage recycling rather than disposal of especially aluminum containing products.
1. INTRODUCTION
The United Nations‘ 2030 agenda for sustainable development in 2015 have highlighted the
promotion of sustained and inclusive economic growth, full and productive employment and decent
work for all as well as building resilient infrastructure, promoting inclusive and sustainable
industrialization and fostering of innovation as two of the seventeen (17) sustainable development
goals. Congruently, the Economic Recovery and Growth Plan (RGP) of the Nigerian Ministry of
budget planning have outline six priority sectors of the Nigerian economy for the diversification and
consequent recovery of the economy which include: agriculture, manufacturing, solid minerals,
services, construction and real estate, and oil and gas. Hence the theme of this conference is parallel to
achieving both the United Nations‘ Sustainable Development Goals and the diversification plan of the
Page 173 of 366
Ministry of Budget and National Planning. The theme of this conference: ―Metal Production: A
Panacea for National Security and Economic Recovery‖ is therefore in tandem with the SDG of the
United Nations and the RGP of the Nigerian Ministry of Budget and Planning.
The primary production of Aluminum has not fully achieved considering that the aluminum smelting
plant at Ikot Abasi is yet to kick start production. This has made aluminum production in Nigeria
solely on the recycling of scrap aluminum, hence the topic: ―Materials Integrity of Aluminum
Production by Recycling for Nigerian Economic Recovery‖. Let‘s first define the key words in the
topic for this paper: material integrity and economic recovery. Materials integrity; these are changes
that occur from the original shape, form, context, content, structure and substance of a record in the
specific physical property of material from which it was created. Damage to the material integrity of
record (tearing, blotting, melting) usually also damage the evidential integrity of the record. Economic
recovery; this is the phase of economic boom and bust following a receding during which an economy
regains and exceeds peak employment and output levels achieved prior to downturn. A recovery
period is typically characterized by abnormally high levels of growth in real GDP, employment,
corporate profits, and other indicators. This is a turning point from Contraction to Expansion. This
often results in increase in consumer confidence.
As world population increases and the world economy expand, so does the demand for natural
resources. An accurate assessment of the Nation‘s mineral resources must include not only the
resources available in the ground but also those that become available through recycling. Recycling
has been labeled the most successful environmental initiative in human history. By changing the way
resources flow through our society and communities, we can reap substantial environmental,
economic, and social benefits. We save energy, water, resources, and land fill space. We reduce
pollution of air, land, and water by using recycled materials. (C.A.O. Agbo 2011, Patricia A. Plunkert,
2000)
The scope of this paper shall encompass the following: Secondary metal processing: aluminum
recycling, and integrity of the recycled aluminum product. This will be followed by the establishment
of the link between the production of aluminum by recycling and its role in the economic recovery
plan. The paper is capped the importance of the formulation and/or strengthening of policies that will
ensure that the production of aluminum by recycling is of standard specification and will contribute
positively to the recovery of the Nigerian economy.
2. ALUMINUM RECYCLING IN NIGERIA AND ITS CHALLENGES.
Secondary metal processing may be described as the processing of metal-containing materials to
recover and reuse the metal. The specifics of the recovery process vary depending on the type of
metal being processed, especially between ferrous and non-ferrous industries. Processes may even
vary among facilities processing the same type of metal. However, the processes used by the different
industries to recover metals may be grouped or classified by one of the following five general
processes namely: raw materials handling, scrap pretreatment, metals melting, metal refining and
metal forming.
Page 174 of 366
Material handling operations include receiving, unloading, storing, and conveying the metal-
containing materials and the materials required for metal processing (i.e., scrap metal, fluxes, alloys,
fuels, and casting materials). The scrap pretreatment process prepares the scrap for melting and
involves sorting and processing metal-containing scrap to separate the metal of interest from
unwanted materials and contaminants such as dirt, oil, plastics, and paint. Scrap pretreatment also
involves the preliminary separation of the metal of interest from other metals contained in the scrap.
Melting is performed primarily to separate the metals of interest from their metallic compounds,
although impurities and contaminants remaining after the pretreatment operation may also be
removed. Refining may take place in the melting furnace, or it may be performed in holding furnaces
or other heated vessels separate from the melting furnace. After refining, the metal may be formed to
make bars and ingots, or it may be formed to make a final product.
However, the Nigerian scrap metal industry is faced with some challenges that threaten its continued
lucrativeness. Critics claim government policy towards the industry, including levies, is crippling
potential. The business needs a conducive environment to thrive and attract more investors in the
country. As with many industries in Nigeria, lack of infrastructure is a binding constraint. There are
not too many factories for the processing of these materials into finished products. The transportation
system for these materials is poor which increases the cost of production. Despite its challenges, many
have found a steady business with room to grow. These challenges can be overcome when the right
policies are formulated and enforced in order to ensure the smooth running of the Nigerian scrap
metal industry since the local aluminum production have largely been due to recycling of scrap
Furthermore aluminum scrap recycling is challenged in Nigeria in that aluminum contains hundreds
of different alloys which pose a difficulty in separation of one alloy from the other. When scrap
aluminum is melted a large amount of primary aluminum had to be added in other to create a right
mixture for various applications such as window frames and related products. The production of
primary aluminum from bauxite is extremely energy intensive which is yet to be achieved sustainably
in Nigeria. So if new window frames are produced from old ones without the need for the addition of
primary aluminum will not only save a considerable large amount of material but also a large amount
of energy. A reduction in energy cost for aluminum recycling would translate into a reduction in
production cost as well as increase in profit for the producers.
3. INTEGRITY OF RECYCLED ALUMINIUM PRODUCT
Assessing product integrity require some major mechanical properties evaluation like fatigue life,
fracture toughness, impact, creep, stress corrosion cracking (in a case of incoherency in environment
of service application). These and many more can be estimated through tensile test, impact test and/or
creep test, to estimate stress intensity factor in a plain strain condition. As mentioned earlier, main
difficulty in the production of aluminum alloys from scrap is to achieve the proper chemical
composition of a melt with a minimum addition of primary aluminum and alloying elements.
Technically, the problem is in the missing technology (an economically acceptable, chemically based
refining process) for reducing the concentration of the critical alloying elements, such as copper, iron,
manganese, silicon and zinc, in a melt batch produced from various sorts of scrap. Once the
Page 175 of 366
concentration of these critical elements in a melt is above the concentration limit for a particular alloy,
the only practical solution would be their dilution by primary metal.
Another technical solution is to avoid an incorrect melt composition by carefully predicting and
assuring the chemical composition of the batch in a pre-melting stage of casting. In principle, there is
also the third solution: to convince the customers to accept the so-called "recycling-friendly wrought
alloys" – in other words, the alloys with broad compositional-tolerance limits and, consequently, to
some extent, a different quality-to-cost ratio. This could be an important future trend in developing
new wrought alloys, working hand in hand with customers in the implementation of their
requirements for scrap-friendly compositions, but for the existing alloys and existing customer
demands such an approach has definitely quite a limited potential and it is also too risky (Varu`an
Kevorkijan, 2012).
From a field experience, producers of aluminum by recycling largely depend on scrap scavengers and
the ―experience‖ of their workers to sort the scavenged scraps prior to bailing, charging, melting and
casting. This rather primitive production process will most likely compromise the integrity eventual
recycled aluminum especially when the service requirement is put into consideration. Advances in
technology exist to overcome the challenge of scrap sorting and optimum scrap charging in order to
achieve the required casting. Such technologies include: shredding machines, magnetic drums and the
use of X-ray to detect and distinguish different alloy compositions of aluminum. The adaptation of
these technologies in the Nigerian aluminum recycling business will help in sustaining the integrity of
recycled aluminum while bearing the economic implications in mind.
4.0 ALUMINIUM SCRAPS RECYCLING FOR ECONOMIC RECOVERY
Comprehensive and ongoing surveys of the industry have quantified the benefits of aluminum
recycling. The production of primary aluminum, when all the electrical generation, transmission
losses, and transportation fuels have been accounted for, requires ~45 kWh of energy and emits ~12
kg of CO2 for each kilogram of metal. By contrast, the recycling of aluminum requires only ~2.8 kWh
of energy and emits only ~0.6 kg of CO2 for each kilogram of metal. Thus, ~95% of the energy and
~95% of the environmental emissions are saved when the metal is recycled. But despite the enormous
environmental and economic benefit of aluminum recycling, Nigeria is yet to fully key into this, as
wastes aluminum products still dot the streets of Nigeria blocking drainages and preventing the free
flow of water, especially during rainy season.
Aluminum recycling is a very lucrative business and there is a huge market for its end products.
Running an aluminum recycling plant is cheaper and uses less energy, especially when compared to
the manufacturing or extraction of the metal from its ore or raw state. The aluminum recycling
business is a trending business with more potential in the future because as people become more eco-
conscious and the government implements policies targeted at environmental protection, the business
will grow spontaneously. As a metal recycling entrepreneur, one is contributing his/her quota in the
campaign for natural resources conservation. One will also reduce environmental degradation,
pollution and greenhouse gas emissions as the production of metal from virgin ore releases far greater
amount of greenhouse gas when compared with recycled metal. When the recycling company is up
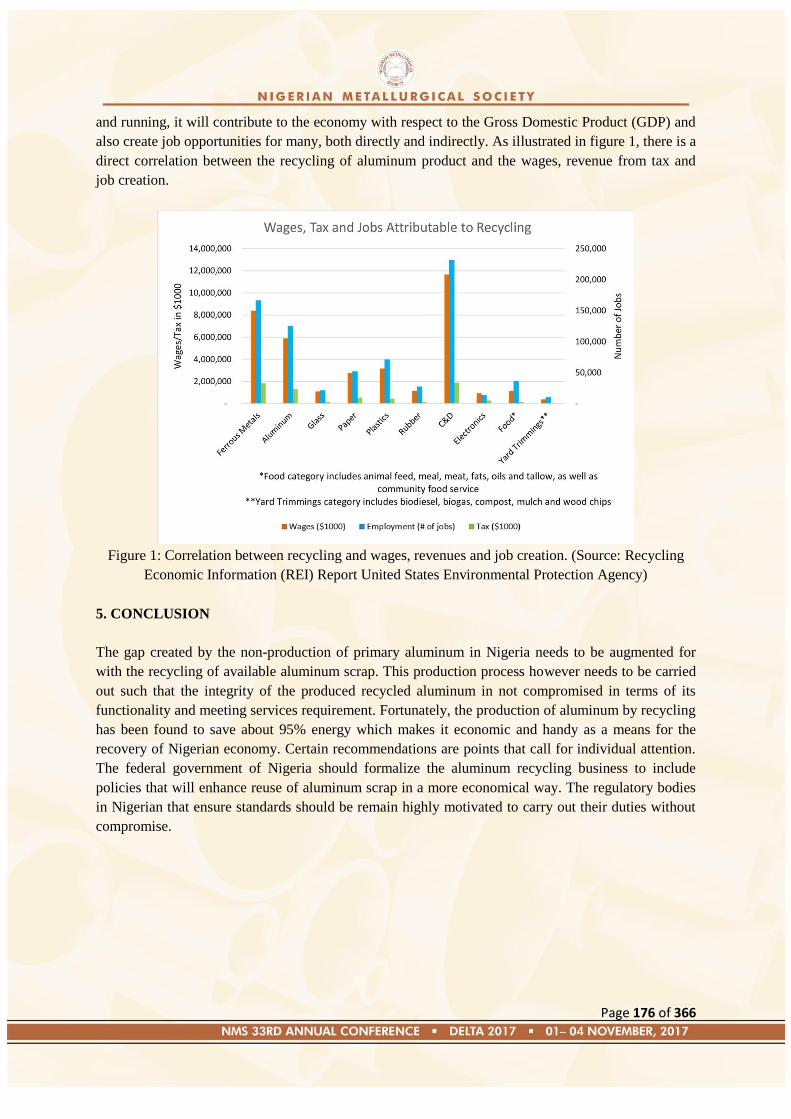
Page 176 of 366
and running, it will contribute to the economy with respect to the Gross Domestic Product (GDP) and
also create job opportunities for many, both directly and indirectly. As illustrated in figure 1, there is a
direct correlation between the recycling of aluminum product and the wages, revenue from tax and
job creation.
Figure 1: Correlation between recycling and wages, revenues and job creation. (Source: Recycling
Economic Information (REI) Report United States Environmental Protection Agency)
5. CONCLUSION
The gap created by the non-production of primary aluminum in Nigeria needs to be augmented for
with the recycling of available aluminum scrap. This production process however needs to be carried
out such that the integrity of the produced recycled aluminum in not compromised in terms of its
functionality and meeting services requirement. Fortunately, the production of aluminum by recycling
has been found to save about 95% energy which makes it economic and handy as a means for the
recovery of Nigerian economy. Certain recommendations are points that call for individual attention.
The federal government of Nigeria should formalize the aluminum recycling business to include
policies that will enhance reuse of aluminum scrap in a more economical way. The regulatory bodies
in Nigerian that ensure standards should be remain highly motivated to carry out their duties without
compromise.

Page 177 of 366
REFRENCES
1. Aluminum Association Inc., [undated], In-depth “information/recycling process”: web
site at http://www.aluminum.org/Content/NavigationMenu/The_Industry/recycling/In-
depth_information/In-depth_information.htm. (Accessed March 31, 2004.)
2. Aluminum Association Inc., (2012). ―Aluminum recycling casebook”. Washington D.C.,
3. C.A.O. Agbo (2011). “Recycle materials potential of imported used vehicles in Nigeria”.
Nigerian Journal of Technology. Vol. 3 no. 3
4. Das S. K. (2006), ―Emerging Trends in Aluminum Recycling: Reasons and Responses”,
in: T. J. Galloway, TMS (The Minerals, Metals & Materials Society). San Antonio,
Texas, p. 911-916.
5. Dibya J P., Kazuhisa I. and Riken Homma (2014). ‖Solid Waste as a Potential
Construction Material for Cost-Efficient Housing in India‖. 3rd
World Conference on
Applied Sciences, Engineering & Technology pp.27-29.
6. Economic Recovery definition website at
http://www.google.com.ng/searcheconomicrecovery. (Accessed in August 14, 2017)
7. Materials integrity definition https://www.en.ng.wikipedia./materialsintegrity. . (Accessed
in August 14, 2017)
8. Ministry of Budget & National Planning (2017), “Economic recovery & growth plan
2017-2020”
9. Peterson, R D., (2003), ―The secondary metal supplier and metal quality, in Crepeau,
P.N., ed., light metals―, San diego, Calif., March 2-6, 2003,
10. Proceedings: warrendale, Pa., ―The Minerals, Metals & Materials Society‖, p. 1075-
1081.Platts Metals week, 2001, Platts Metals weeks annual price averages for 2000: Platts
Metals week, v. 72, no. 6, February 5, p. 18.
11. Reuter, M. A., Schaik, A.V, O. Ignatenko, G. J., (2006) ‘‘Minerals Engineering‟‟ 19 pp.
433-449.
12. Schaik A. V, Reuter M. A., (2004) ‘‘ Resources Conservation & Recycling‟‟ 40 pp. 301-
328.
13. United Nations (2015). ―Transforming Our World: The 2030 Agenda for Sustainable
Development.”
14. Varu`an Kevorkijan (2012). “Challenges and advantages of recycling Wrought
aluminium alloys from lower grades of metallurgically clean scrap.” Materials and
technology 47 (1)
Page 178 of 366
Paper: NMS 2017-TP022
The Nexus between Corrosion of Petroleum Pipelines in Nigeria Niger Delta and the
Recessed National Economy
*ALO T. and AFOLABI T.
Department of Metallurgical and Materials Engineering, Federal University of Technology,
Akure, Ondo State, Nigeria.
* [email protected] +234 (0)814 071 0538
ABSTRACT
Corrosion weakens the structural integrity of a pipeline and make it an unsafe vehicle for transporting
potentially hazardous materials. Issues relating to petroleum pipeline corrosion and control with
particular regard to Nigeria Niger Delta has been discussed. The thrust of this paper is on the effect of
corrosion of petroleum pipelines and the cost implications on the economy. Preventing pipelines from
deteriorating and failing will save money, preserve the environment and protect public safety.
Unprotected pipelines, whether buried in the ground, exposed to the atmosphere, or submerged in
water, are susceptible to corrosion. However, technology exists to extend pipeline structural life
indefinitely if applied correctly and maintained consistently. Oil Pipeline sabotage on the other hand
have also greatly hampered economics of scale accrued from oil exploration in the Niger Delta. This
paper therefore recommends that relevant stake holders take decisive action to provide a lasting
solution to the issue of pipeline sabotage in the Nigerian Niger Delta.
1. INTRODUCTION
The petroleum industry in Nigeria is the largest on the African Continent. As at 2016, Nigeria‘s
petroleum industry contributes about 90% to its economy. The petroleum sector is important as the
government revenues and foreign exchange relies on this sector. The demand of the central
government annual developmental income is dependent on the oil and gas industry in Nigeria. This
places enormous pressure on the production companies (mostly foreign players) to strive for
maximising saleable output, if they are to also make a profit return to their home headquarters. Thus,
emphasis is placed on production, thereby stretching installed equipment to limits. With time, these
show degrading tendencies, from the chemical contact with the metals and erosive wear due to the
flow. Problems of pipeline corrosion in Nigeria are traceable in most cases to neglect in terms of poor
quality maintenance, and less to the often mouthed community vandalism (Kingsford et.al, 2006). The
environmental impact of such neglect is a concern to the government. Engineers and scientists now
place emphasis on different methods to control or eliminate corrosion problems on installed oil and
gas pipelines.
Page 179 of 366
Pipelines play an extremely important role throughout the world as a means of transporting gases and
liquids over long distances from their sources to the ultimate consumers. A buried operating pipeline
is rather unobtrusive and rarely makes its presence known except at valves, pumping or compressor
stations, or terminals. Since the late 1920s, virtually all oil and gas pipelines have been made of
welded steel. Corrosion causes, effects, prevention, monitoring, inspection and their relative cost are
not theoretically quantified nor practically quantified in door. It involves coming up with reliable data
which therefore requires undoubtedly, a lot of field survey. The production platform currently
produces about 7500 barrels of oil per day. The Niger Delta is located in Southern Nigeria and is
world's third largest wetland. It is characterized by significant biological diversity and contains the
bulk of Nigeria's proven oil and gas reserves. The region has about 606 oilfields with 355 situated
onshore and 251 offshore. There are about 5,284 oil wells drilled and 527 flow stations for crude oil
processing, with more than 7,000 km of oil and gas pipelines traversing the entire area and seven
export terminals. The land area within which the network of transport pipelines are located is
estimated at 31,000km2. There are ten gas plants and about 30 marginal oil fields farmed out, through
the network of pipelines, to local companies and for export. Three of Nigeria's four refineries, Port-
Harcourt I & II and Warri, are located in the region, while the fourth is located in Kaduna, Northern
Nigeria. (John A. Beavers and Neil G. Thompson, 2006)
The scope of this paper shall encompass shall encompass the following: Corrosion of oil pipeline in
the Nigerian Niger Delta and its economic implication, effect of the corrosion of oil pipeline in
Nigeria Niger delta on the national economy and the prevention and control of pipeline in the
Nigerian Niger Delta.
2. CORROSION OF OIL PIPELINE IN THE NIGERIA NIGER DELTA AND
ECONOMIC IMPLICATION
There have been a number of studies conducted by researchers on causes of oil pipeline failures in the
oil and gas industry. Ikporukpo,1998, examined the causes of pipeline leaks versus pipeline ruptures
and the proportion for each. Moffat and Linden(1995), compiled background research and
information that is associated with oil pipeline failures, it shows that for crude oil pipelines, the causes
of failures appeared to be fairly random in nature, and that no trends were apparent. They stated for
sour gas pipelines, internal corrosion is the major cause of failure. External corrosion failures have
declined in recent years, possibly as the result of improved coatings and increased inspection. Of the
sour line failures, about 86% were leaks and 14% were ruptures. Corrosion is the predominant cause
of leaks. They used the latest technology in the fields of internal electronic inspection, metallurgy,
coatings, cathodic protection, and chemical inhibition. Nwankwo et al and Odusola extensively
studied the effects of internal corrosion failures for natural gas pipelines which have generally been
increasing. Some "other" category which include high vapour pressure liquids, low vapour pressure
liquids, fuel gas, and all others showed failure rates to be relatively few and the causes to be relatively
random.
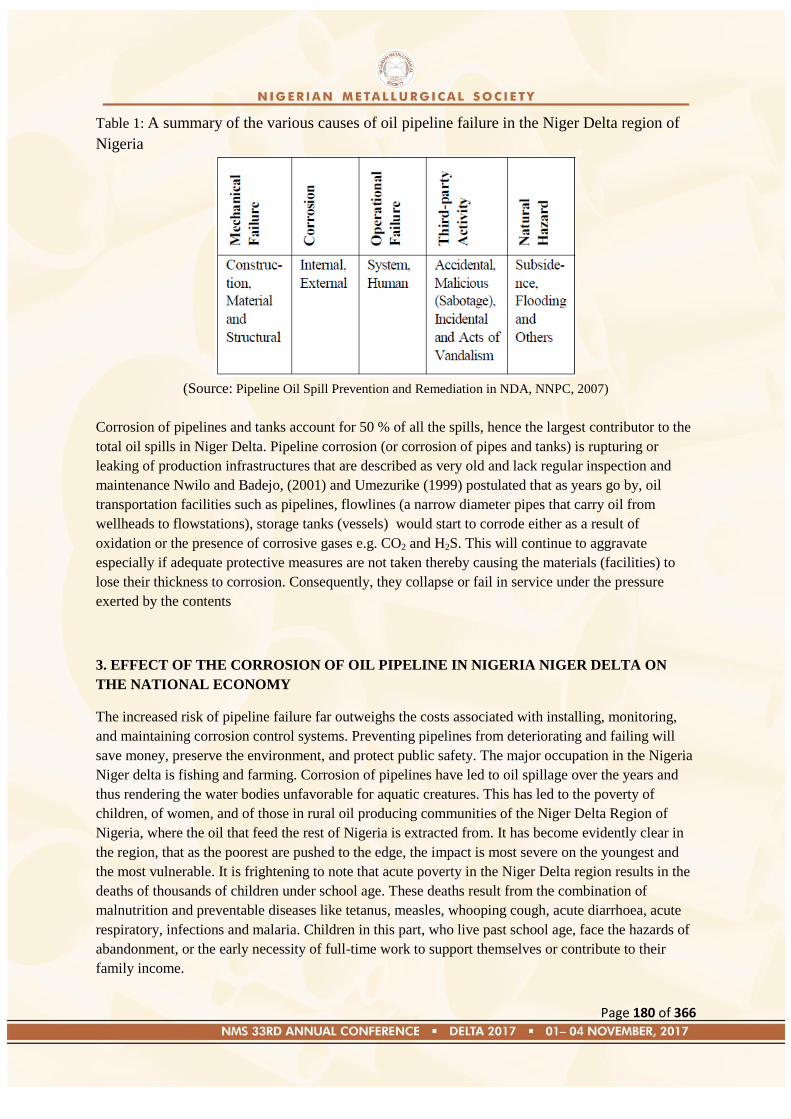
Page 180 of 366
Table 1: A summary of the various causes of oil pipeline failure in the Niger Delta region of
Nigeria
(Source: Pipeline Oil Spill Prevention and Remediation in NDA, NNPC, 2007)
Corrosion of pipelines and tanks account for 50 % of all the spills, hence the largest contributor to the
total oil spills in Niger Delta. Pipeline corrosion (or corrosion of pipes and tanks) is rupturing or
leaking of production infrastructures that are described as very old and lack regular inspection and
maintenance Nwilo and Badejo, (2001) and Umezurike (1999) postulated that as years go by, oil
transportation facilities such as pipelines, flowlines (a narrow diameter pipes that carry oil from
wellheads to flowstations), storage tanks (vessels) would start to corrode either as a result of
oxidation or the presence of corrosive gases e.g. CO2 and H2S. This will continue to aggravate
especially if adequate protective measures are not taken thereby causing the materials (facilities) to
lose their thickness to corrosion. Consequently, they collapse or fail in service under the pressure
exerted by the contents
3. EFFECT OF THE CORROSION OF OIL PIPELINE IN NIGERIA NIGER DELTA ON
THE NATIONAL ECONOMY
The increased risk of pipeline failure far outweighs the costs associated with installing, monitoring,
and maintaining corrosion control systems. Preventing pipelines from deteriorating and failing will
save money, preserve the environment, and protect public safety. The major occupation in the Nigeria
Niger delta is fishing and farming. Corrosion of pipelines have led to oil spillage over the years and
thus rendering the water bodies unfavorable for aquatic creatures. This has led to the poverty of
children, of women, and of those in rural oil producing communities of the Niger Delta Region of
Nigeria, where the oil that feed the rest of Nigeria is extracted from. It has become evidently clear in
the region, that as the poorest are pushed to the edge, the impact is most severe on the youngest and
the most vulnerable. It is frightening to note that acute poverty in the Niger Delta region results in the
deaths of thousands of children under school age. These deaths result from the combination of
malnutrition and preventable diseases like tetanus, measles, whooping cough, acute diarrhoea, acute
respiratory, infections and malaria. Children in this part, who live past school age, face the hazards of
abandonment, or the early necessity of full-time work to support themselves or contribute to their
family income.

Page 181 of 366
One result is an appalling increase in the number of children living on the street. Prostitution among
young girls is rampant, whom rich oil workers (black and whites) seek out in the belief that they are
likely to be free of infection. Most of these girls exchanged sex for gifts, mainly of clothing, school
fees and support for their very large family members. Children remain the most vulnerable victims in
the cycle of poverty, dependent on forces beyond their control-poor family, neglected community and
economic factors for the provision of food, education, health, and shelter. Children are the foundation
of tomorrow‘s Nigeria, and their needs, which are possible here but are criminally denied them should
not be ignored or given peripheral attention by both government and multinational oil extracting
corporation who has not only milled their environment dry, but are polluting them to death. It is
centrally important to deal with them today. What neglect and abandonment has done to children in
the Nigeria Delta region, it first did to their mothers and fathers.
The people of the Niger Delta and their communities have been reduced to scavengers in midst of
their wealth. We can also understand that the problem facing the people of Niger Delta communities,
the problem of unemployment, lack of health facilities road and the means of transportation. Again it
is both sad and unfortunate that successive governments who have ruled the country have more often
than not treated the Niger Delta area as a colony fit only for what can be taken out of it from this
background. It is important that something urgent must be done to alleviate the pains, suffering and
the agony of the people of Niger Delta. One thing is clear, man cannot live his life to the fullest
potential in a degraded environment.
4. PREVENTION AND CONTROL OF PIPELINE CORROSION IN NIGERIA NIGER
DELTA.
The integrity of pipelines is assured by providing sufficient wall thickness, suitable material, quality
control and by adopting suitable corrosion protection system. Oil field structures particularly pipelines
and flowlines are susceptible to corrosion (internal and external) which leads to oil spills. Therefore,
the control of corrosion is paramount in order to avoid or at least minimize the incidents of oil spill.
4.1 Internal Corrosion Protection
Three-phase Well fluids carrying pipelines/flowlines containing both water and corrosive gases such
as CO2, H2S etc are particularly susceptible to internal corrosion, hence the occurrence of oil spill.
Internal corrosion is influenced by temperature, corrosive gas content, water chemistry, flow velocity,
oil/water wetting and composition/surface condition of the steel pipe (Samant, 2003; Iyasara, 2007) .
A small change in one of these parameters can change the corrosion rate drastically due to changes in
the properties of the thin layer of corrosion products that accumulate on the steel surfaces. When
corrosion products are not deposited on the steel surface, very high corrosion rates of several
millimeters per year (mm/y) can occur. For effective control and prevention of internal corrosion in
oil/gas facilities especially pipelines and flowlines, the following measures must be taken: corrosion
inhibition (chemical injection), pigging, pH stabilization and microbial treatment.
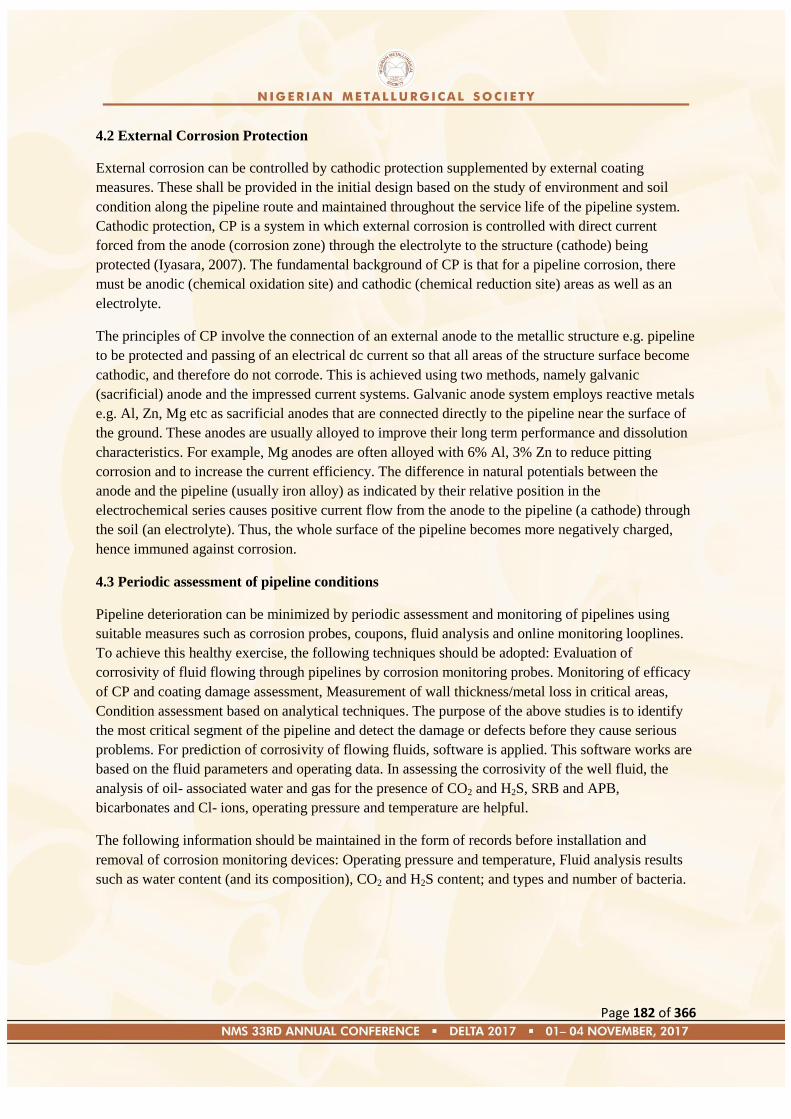
Page 182 of 366
4.2 External Corrosion Protection
External corrosion can be controlled by cathodic protection supplemented by external coating
measures. These shall be provided in the initial design based on the study of environment and soil
condition along the pipeline route and maintained throughout the service life of the pipeline system.
Cathodic protection, CP is a system in which external corrosion is controlled with direct current
forced from the anode (corrosion zone) through the electrolyte to the structure (cathode) being
protected (Iyasara, 2007). The fundamental background of CP is that for a pipeline corrosion, there
must be anodic (chemical oxidation site) and cathodic (chemical reduction site) areas as well as an
electrolyte.
The principles of CP involve the connection of an external anode to the metallic structure e.g. pipeline
to be protected and passing of an electrical dc current so that all areas of the structure surface become
cathodic, and therefore do not corrode. This is achieved using two methods, namely galvanic
(sacrificial) anode and the impressed current systems. Galvanic anode system employs reactive metals
e.g. Al, Zn, Mg etc as sacrificial anodes that are connected directly to the pipeline near the surface of
the ground. These anodes are usually alloyed to improve their long term performance and dissolution
characteristics. For example, Mg anodes are often alloyed with 6% Al, 3% Zn to reduce pitting
corrosion and to increase the current efficiency. The difference in natural potentials between the
anode and the pipeline (usually iron alloy) as indicated by their relative position in the
electrochemical series causes positive current flow from the anode to the pipeline (a cathode) through
the soil (an electrolyte). Thus, the whole surface of the pipeline becomes more negatively charged,
hence immuned against corrosion.
4.3 Periodic assessment of pipeline conditions
Pipeline deterioration can be minimized by periodic assessment and monitoring of pipelines using
suitable measures such as corrosion probes, coupons, fluid analysis and online monitoring looplines.
To achieve this healthy exercise, the following techniques should be adopted: Evaluation of
corrosivity of fluid flowing through pipelines by corrosion monitoring probes. Monitoring of efficacy
of CP and coating damage assessment, Measurement of wall thickness/metal loss in critical areas,
Condition assessment based on analytical techniques. The purpose of the above studies is to identify
the most critical segment of the pipeline and detect the damage or defects before they cause serious
problems. For prediction of corrosivity of flowing fluids, software is applied. This software works are
based on the fluid parameters and operating data. In assessing the corrosivity of the well fluid, the
analysis of oil- associated water and gas for the presence of CO2 and H2S, SRB and APB,
bicarbonates and Cl- ions, operating pressure and temperature are helpful.
The following information should be maintained in the form of records before installation and
removal of corrosion monitoring devices: Operating pressure and temperature, Fluid analysis results
such as water content (and its composition), CO2 and H2S content; and types and number of bacteria.
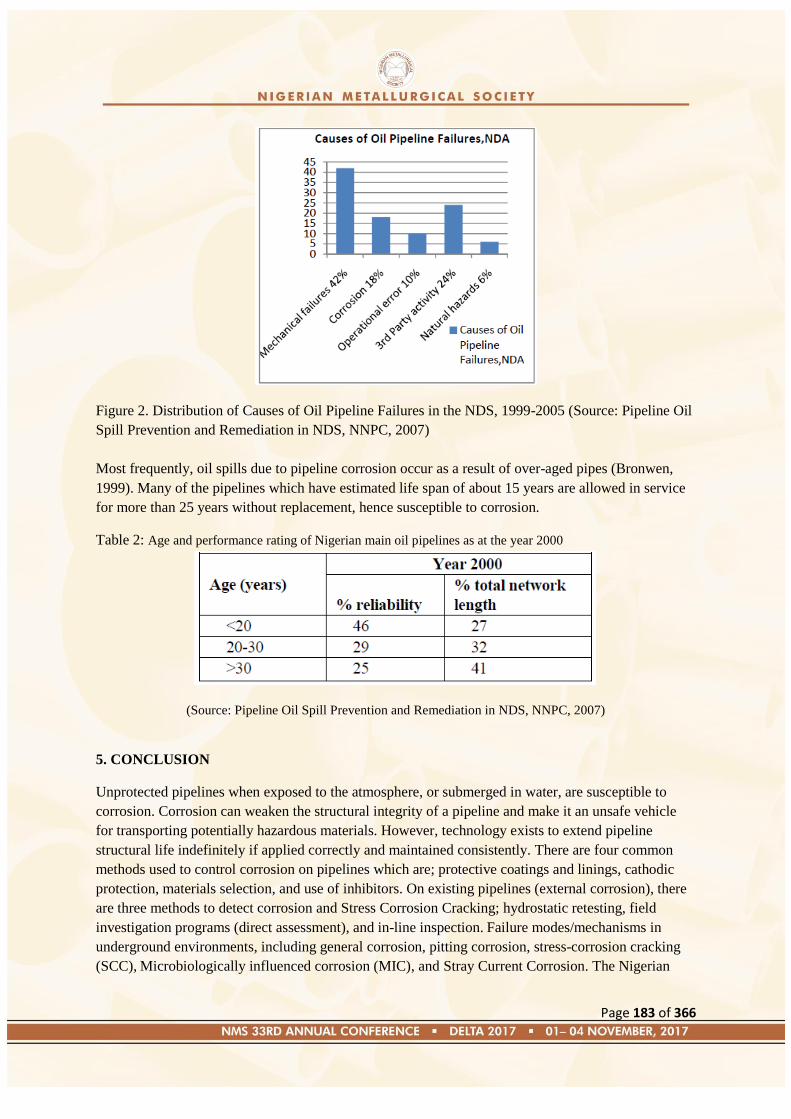
Page 183 of 366
Figure 2. Distribution of Causes of Oil Pipeline Failures in the NDS, 1999-2005 (Source: Pipeline Oil
Spill Prevention and Remediation in NDS, NNPC, 2007)
Most frequently, oil spills due to pipeline corrosion occur as a result of over-aged pipes (Bronwen,
1999). Many of the pipelines which have estimated life span of about 15 years are allowed in service
for more than 25 years without replacement, hence susceptible to corrosion.
Table 2: Age and performance rating of Nigerian main oil pipelines as at the year 2000
(Source: Pipeline Oil Spill Prevention and Remediation in NDS, NNPC, 2007)
5. CONCLUSION
Unprotected pipelines when exposed to the atmosphere, or submerged in water, are susceptible to
corrosion. Corrosion can weaken the structural integrity of a pipeline and make it an unsafe vehicle
for transporting potentially hazardous materials. However, technology exists to extend pipeline
structural life indefinitely if applied correctly and maintained consistently. There are four common
methods used to control corrosion on pipelines which are; protective coatings and linings, cathodic
protection, materials selection, and use of inhibitors. On existing pipelines (external corrosion), there
are three methods to detect corrosion and Stress Corrosion Cracking; hydrostatic retesting, field
investigation programs (direct assessment), and in-line inspection. Failure modes/mechanisms in
underground environments, including general corrosion, pitting corrosion, stress-corrosion cracking
(SCC), Microbiologically influenced corrosion (MIC), and Stray Current Corrosion. The Nigerian
Page 184 of 366
ecomomy can be revitalized if the corrosion mechansims can be used to propect the life span of the
petroleum pipeline.
External corrosion can be tackled by improved coatings and cathodic protection e.g. use of
polyethylene and multilayer coatings have longer life. Early detection of coating degradation is an
important strategy and pipes should be subjected to hydrostatic testing. Internal corrosion can be
prevented by dehydration of gases and periodic pigging of lines to remove accumulated water and
deposits. There is urgent need for the multinational companies and the government to collaborate with
communities to carry out remediation programme as quickly as possible to clean up the backlog of
spill sites in Ogoniland. The oil companies must demonstrate a cordial working relationship with the
local people. There is urgent need for the government to expedite action and put necessary measure
in place to control and prevent oil theft for illegal refining, sabotage and to carry out regular
maintenance and replacement of ageing oil pipelines which causes environmental pollution. The oil
companies and the government to provide socioeconomic activities including health care
programmes, economic and social empowerment scheme.
REFERENCES
1. G.H. Koch, M.P.H. Brongers, N.G. Thompson, Y.P. Virmani, and J.H. Payer (2002),
―Corrosion Cost and Prevention Strategies in the United States,‖ FHWA-RD-01-156
2. Ikporukpo, Chris, (1998); Environmental impact assessment and human concern in the
petroleum industry: Nigeria's experience, 9th International Conference on the Petroleum
Industry and the Nigerian Environment, Abuja, pp.766 - 782.
3. John A. Beavers and Neil G. Thompson, 2006; External Corrosion of Oil and Natural Gas
Pipelines, ASM Handbook Volume 13C, Corrosion: Environments and Industries (ASM
International) pp.1015 - 1025 (11)
4. Moffat, Daniel and Linden, Olofu, (1995); Perception and reality: Assessing priorities for
sustainable development in the Niger Delta, AMBIO: Journal of Human Environment,
Vol. 24, and Nos. 7-8, pp.527-538.
5. Nwankwo, D. I., Chukwu, L. O., and Brown, C. O., (1998); The impact of oil pollution
on the hydrochemistry and biota of the tidal creeks and canals in Ondo State, 9th
International Conference on the Petroleum Industry and the Nigerian Environment,
Abuja, pp.538-576.
6. Odusola, A.F., (1996); Community Participation in Environmental Assessment; In
Environmental Policy Planning, P.C. Egbon and B. Morvaridi Eds., National Centre for
Economic Management and Administration (NCEMA), Ibadan, pp.152-174
7. Office of Pipeline Safety, Department of Transportation, http://ops.dot.gov/stats, May 22,
2000
8. OGJ Special Report, Oil Gas J., Aug 23,1999
9. Oteh C.O., Eze R. C., (2012); Vandalization of Oil Pipelines in the Niger Delta Region of
Nigeria and Poverty: An Overview, Studies in Sociology of Science Vol. 3, No. 2, 2012,
pp. 13-21

Page 185 of 366
10. ―Pipeline Safety—The Office of Pipeline Safety Is Changing How It Oversees the
Pipeline Industry,‖ No. GAO/RCED-00-128, Report to Ranking Minority Member,
Committee on Commerce, House of Representatives, May 2000
11. P.J. Katchmar, ―OPS Overview & Regulation Update,‖ Rocky Mountain Short Course, Jan 27, 2000
12. T. Kingsford Jack, Musa Osumah (2006),A Note on Pipeline Corrosion in the Nigerian
Oil and Gas Industry, Vol. 1, Issue 4, pp.2072-2073
13. U.S. Department of Transportation, Pipeline and Hazardous Materials Safety
Administration, ops.dot.gov/stats/stats.htm, report as of Oct 30, 2000
Page 186 of 366
Paper: NMS 2017-TP023
Developed Value Chain Management Model for Steel Manufacturing Sector
1*
Adiyono O., 2Ocheri C,
3Mbah C. N.
1Department of Mechanical Engineering, Federal Polytechnic Ekowe Bayelsa State
2Department of Metallurgical and Materials Engineering
, University of Nigeria, Nsukka
3Department of Metallurgical and Materials Engineering, Enugu State University of Science and
Technology, Enugu State
*[email protected] Tel:08089732656
ABSTRACT
In this paper a value chain model was developed for metal industry with five primary activities
and four supporting activities. The value chain model developed is extended to a metal industry
due to expansions of metal industry has become a continual process for their growth and
survival. This is developed with a view to considering five primary activities and six support
activities.
Keywords: Value chain model, Metal industry, primary activities, supporting activities and
steel manufacturing sector
1.0 INTRODUCTION
Value chain is defined as ―a chain of value added activities; products pass through the activities
in
a chain, gaining value at each stage‖. Michael E Porter (1985) first introduced the value chain
concept in his book ―Competitive Advantage: Creating and Sustaining Superior Performance‖.
The concept of value chain is used to an individual organizations supply chain networks. It
needs
addition of value for each and every activity through which the product/service moves
through
the product life cycle.
Porter developed a general-purpose value chain that manufacturing companies can use to
examine all of their activities, and to see how they are connected. The value chain
activities of an organization determine the costs, thus affects the profits. The value chain tool is
useful to analyse the sources to improve the value of any organization. Value chain focuses on
systems, and how business inputs are changed into business outputs purchased by
customers. The value chain developed by Porter is shown in Figure 1.
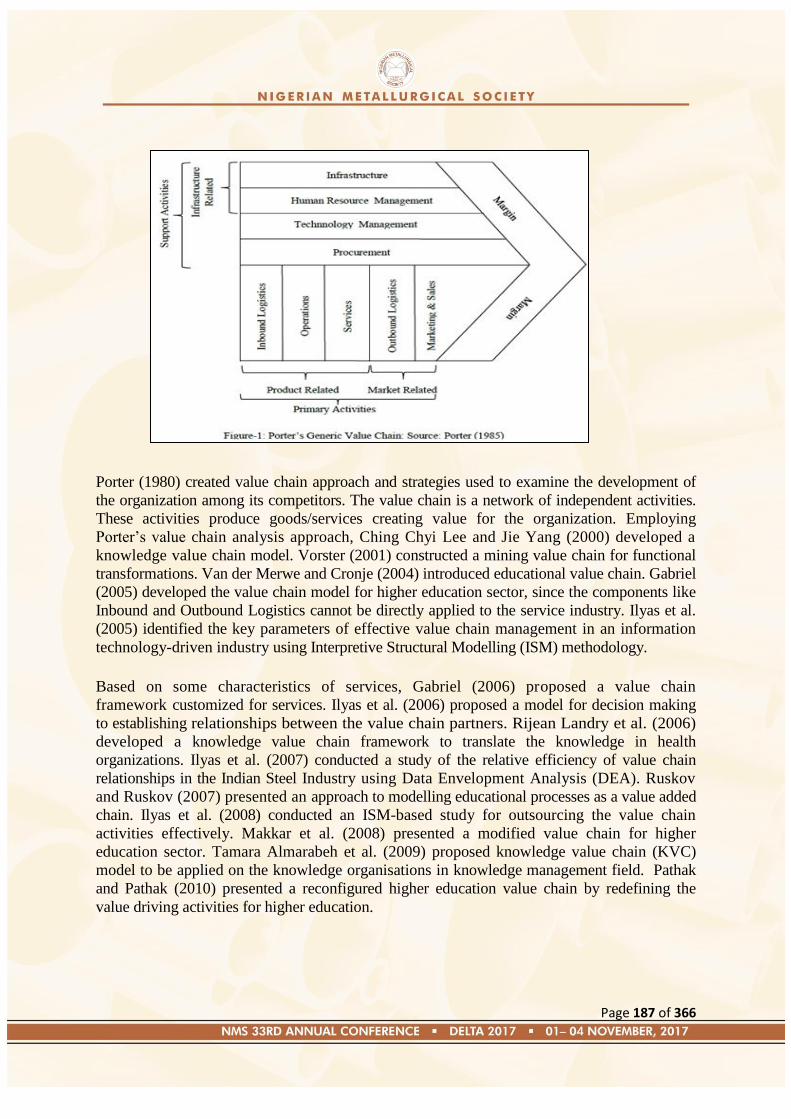
Page 187 of 366
Porter (1980) created value chain approach and strategies used to examine the development of
the organization among its competitors. The value chain is a network of independent activities.
These activities produce goods/services creating value for the organization. Employing
Porter‘s value chain analysis approach, Ching Chyi Lee and Jie Yang (2000) developed a
knowledge value chain model. Vorster (2001) constructed a mining value chain for functional
transformations. Van der Merwe and Cronje (2004) introduced educational value chain. Gabriel
(2005) developed the value chain model for higher education sector, since the components like
Inbound and Outbound Logistics cannot be directly applied to the service industry. Ilyas et al.
(2005) identified the key parameters of effective value chain management in an information
technology-driven industry using Interpretive Structural Modelling (ISM) methodology.
Based on some characteristics of services, Gabriel (2006) proposed a value chain
framework customized for services. Ilyas et al. (2006) proposed a model for decision making
to establishing relationships between the value chain partners. Rijean Landry et al. (2006)
developed a knowledge value chain framework to translate the knowledge in health
organizations. Ilyas et al. (2007) conducted a study of the relative efficiency of value chain
relationships in the Indian Steel Industry using Data Envelopment Analysis (DEA). Ruskov
and Ruskov (2007) presented an approach to modelling educational processes as a value added
chain. Ilyas et al. (2008) conducted an ISM-based study for outsourcing the value chain
activities effectively. Makkar et al. (2008) presented a modified value chain for higher
education sector. Tamara Almarabeh et al. (2009) proposed knowledge value chain (KVC)
model to be applied on the knowledge organisations in knowledge management field. Pathak
and Pathak (2010) presented a reconfigured higher education value chain by redefining the
value driving activities for higher education.
Page 188 of 366
Peter H. Antoniou et al. (2011) illustrated a model with certain attributes for evaluating the value
chains. Wang Aimin and Li Sunxi (2011) built a model of Value Chain Management (VCM)
based on Customer Relationship Management (CRM). Khaled Abed Hutaibat (2011) proposed
a value chain model for the Higher Education context. Chien-Liang Kuo et al. (2011) used the
concepts of value chain and value co-creation in developing a framework for service trade
mode selection.
Claudine Soosay et al. (2012) conducted a study using Sustainable Value Chain Analysis
(SVCA) for identifying areas for improvement. Leopoldo Laborda Castillo and Daniel
Sotelsek Salem (2012) proposed various models using DEA approach for examining the
technical efficiency of value chains. Anni-Kaisa Kahkonen and Katrina Lintukangas
(2012) analysed supply Management role in value thinking of a firm. Seyed Mohammad
Adeli et al. (2012) described charity value chain. The framework is strongly related to Gabriel‘s
(2006) proposed service chain framework. Mahsa Dorri et al. (2012) made a review of previous
researches done on value chain in higher education sector and analysed the results. Vesa
Karvonen et al. (2012) proposed a tuned value chain model for a research institute.
Rupa Rathee et al. (2013) reviewed and discussed various models of value chain in
higher education proposed by previous researchers. Abid Sultan and Dr.Saurabh (2013)
presented various sources along the value chain of an organization for achieving sustainable
development.
Daiva Rapcevicience (2014) developed a value chain model for public sector service. V.V.Devi
Prasad Kotni (2014) proposed models for fresh fish value chain and cost effective value chain
for fresh fish.
There is a limited research regarding in developing value chain model for steel manufacturing
sector. In view of this a value chain model was developed for steel manufacturing sector using
a case of an integrated steel plant.
2.0 DEVELOPED VALUE CHAIN MANAGEMENT MODEL FOR STEEL
MANUFACTURING SECTOR
In integrated steel plants steel is manufactured from the basic raw materials like iron ore,
coking coal and fluxes like lime stone and dolomite. The main production units are raw
material handling plant, coke ovens, sinter plant, refractory material plant, blast furnace, steel
melt shops, light and medium merchant mills, wire rod mills, medium section and structural
mills, special bar & structural mills. In addition to these main production units, there are
several auxiliary units like power plant, engineering shops, oxygen plant, etc.
Hot metal produced at blast furnaces is converted into steel through the process of
removing impurities in the metal by oxidation. This steel is further refined in the
secondary refining facilities provided in the steel melt shop. Blooms are produced at steel
melt shop, which are converted into various finished products like wire rod coils, rebars,
rounds, structural, squares etc. in various rolling mills. These products are called as long
products used in construction and infrastructure building and manufacturing sectors.
The value chain model developed is to discuss five primary activities and four supporting
activities as explained above which can be used as a generic one. This model cannot be used
directly in steel manufacturing sector due to expansions of steel plants has become a continual
process for their growth and survival. Due to nature of the activities, a different version of the
value chain for steel manufacturing sector is developed with five primary activities and six

Page 189 of 366
supporting activities. The shape of the Value Chain for Steel Manufacturing Sector
(VACSMS). The VACSMS is shown in Fig-2 and a brief description on each of the activity
given in it is as follows:
3.0 Ajaokuta Steel Company:
The Ajaokuta Steel company is an integrated steel plant design on the blast furnace route to
iron production with initial capacity of 1.3 million tons of liquid steel per annum with built in
capacity for possible future expansion to 2.5 million tons per annum in the first phase and up
to 5.2 million tons per annum in the second phase. The Ajaokuta Steel Company, the engine
of industrial emancipation of Nigeria consists of the following process units:
-oven and by product plant
nit
Blast furnace operational route requires continuous operation for at least 5 years and this
presupposes stock piles of raw materials to support this period of production. The basic raw
materials in tonnes required for the blast furnace at Ajaokuta for a year were as follows:
Iron ore (52 per iron content): 2.2x10⁶
Coking coal: 1.2x10⁶
Limestone and dolomite: 660,000
Refractory clay: 63,000

Page 190 of 366
3.0.1Ajaokuta projected product mix:
This consisted of Rounds, ribbed bars, Angles, plates, strips, channels, Beams and Tees,
Billets (1000x100) mm2
3.0.2Projected Ajaokuta blast furnace slag Applications:
Slag from the Blast Furnace was to be used in road surfacing, aggregate for concrete,
fertilizer for farmers, rock wool raw materials, cement and others. It is therefore pertinent to
develop a value chain management model for such an integrated steel manufacturing
company
4.0. Value Chain - Primary Activities
Primary activities are those activities, directly involved in the conversion process of basic raw
materials into final output/products including the receipt of basic raw materials from
suppliers and marketing of output/ products to customers. They are grouped into two types of
activities related to product and market. Product related activities are the activities,
performed by the organization to add value to the product and services itself. Market
related activities are the activities, performed by the organization to transfer the finished
product or services to the customers.
4.0.1 Inbound Logistics
These include receiving the basic raw materials required for the steel making process,
stacking and reclaiming the materials, and distribution of materials to various departments
etc. Inbound Logistics activities can be included to primary activities.
4.0.2. Operations/Production Management
These include raw material handling and processing (receiving and handling of major
raw materials like coking coal, iron ore, fluxes, boiler coal etc., crushing, lump ore
crushing and screening); making of coke, sinter, lime and calcined dolomite, pitch bonded
magnesia bricks; production of iron, steel, wire rods, TMT bars, rounds, squares, structural
(angles, channels and beams); blooms, billets etc. and preparation and repair of rolls.
Generation of air, steam, electricity, gaseous oxygen, gaseous nitrogen, gaseous argon, liquid
oxygen, liquid nitrogen, liquid argon, plant air, dry air, chilled water etc.
Generation of crude coke oven gas, Blast Furance gas, granulated slag; making ammonium
sulphate, crude tar, crude benzol, and cleaned coke oven gas etc.
Manufacturing of spares and components to meet the plant requirements; carrying out the
major repairs of equipment in plant units; vibration and condition monitoring of equipment;
repair of electrical and electronics equipment (control panels, electrical meters, PLCs etc.) etc.
Planning and monitoring production, equipment design support by plant design.
Operation/Production Management activities can be included to primary activities.
4.0.3. Outbound Logistics
These include planning and dispatch, distribution management, transportation, warehousing, and
order fulfilment. Outbound Logistics activities can be included to primary activities.
4.0.4. Marketing and Sales
These include product management; price management; placement (distribution) management;
promotion management; domestic sales (project sales, actual user sales, retail sales); export
sales; sale of special steels; by products sales; planning and dispatch; pricing and policy;
contracts; customer relations management etc. Marketing and Sales activities can be included
to primary activities.

Page 191 of 366
4.5. Service after sales
These include commercial terms; quality aspects; delivery aspects; pre/post sales contact;
complaint settlement procedure. Service after sales activities can be included to primary
activities.
Value Chain - Support activities
Support activities are those activities, not directly involved in the conversion process but
support the primary activities in their functions. These activities are classified as:
5.0. Materials Management
5.0.1 Vendor Development
These include registration; categorization; performance rating & continuous monitoring;
encouraging local SSI‘s; regular interaction with local SSI‘s etc.
5.0.2. Purchase
These include identifying sources for various materials; selection of suppliers; taking requests
from plant units (indents); processing of indents; procurement of raw materials, components
and parts, machinery and spares, consumables, stationery, servicing; ensure supply of materials
etc.
5.0.3. Logistics
These include utilization of port facilities; handling of vessels at ports etc.
5..0.4 Stores
These include receipt of raw materials at ports and spares & consumables; custody of spares
and consumables; stock control; issue of spares & consumables to various departments;
disposal of non-moving spares & consumables; transport contract; discrepancy receipt &
inventory control etc.
6.0. Technology Development
These include quality assurance and technology development (QA&TD); research and
development (R&D); processes automation etc.
6.0.1 Human Resource Management
These include corporate coordination (manpower planning, recruitment, executive
establishment, rules & policies, welfare, parliament cell); Human resources - non works
(human resource development, non-works personnel, mines, industrial relations, and
sports); Human resources - plant (plant personnel); Management services (quality circles,
suggestion schemes, awards, incentive schemes); Corporate social responsibility; Medical;
Town administration; Administration (general administration, law, hospitality, RTI, Liaison
Office, Agro Forestry); Human Resources Development (training, management
development, Hindi cell, HR Information systems).
6.0.2 Services Management
These include corporate offices (CMD and Directors‘ offices), corporate strategic
management, corporate communications, company affairs, information technology (process
control, materials management system, marketing system, payroll system and financial
accounting system).

Page 192 of 366
6.0.3. Finance Management
These include treasury management, budgeting, costing, corporate accounts, raw
material accounts, sales finance, operations & general accounts and works accounts, central
excise and insurance, pay sections (payments to present employees i.e. employees on rolls and
payments to retired and expired employees), stores accounts, purchase bills (payments to
indigenous and imported materials), project accounts, mines accounts, internal audit and stock
verification.
6.0.4 Projects Management
These include the activities of Design & Engineering for the existing plant and the activities of
Design & Engineering, Project Contracts, Construction and Project Monitoring for
plant expansion.
7.0 Existing plant
7.0.1 Design & Engineering
These include conceptual planning, basic engineering and detailed engineering,
implementation of automation to improve production, implementation of major
Additions, Modifications, Replacements (AMR) & Non AMR schemes in the plant,
Modifications/alterations for debottlenecking, improvements during operation of the plant.
7.0.2 Plant expansion
7.0.3. Design & Engineering
These include preparation/scrutiny of project reports; engaging consultants wherever
required; obtaining various clearances/approvals of PIB, MOEF, GOI etc.; executing the
expansion from concept to commissioning (preparation & scrutiny of basic engineering
concepts; preparation, scrutiny & finalisation of technical specifications; issue of NIT &
receipt of bids; conducting techno-commercial discussions & finalising techno-
economic recommendations; detailed engineering; active involvement in order placement
and finalisation of the contract specifications; design supervision; liaison with statutory
bodies; indexing, storage & retrieval of technical documents).
7.0.4. Project Contracts
These include preparation of special conditions of contract (SCC), general conditions of
contract (GCC), payment terms of contract; issue of notice inviting tenders (NIT);
enlistment of contractors; preparation & issue of tender documents to tenderers; scrutiny
& evaluation of commercial offers; preparation of contract documents; handling arbitration
cases.
7.0.5 Construction
These include executing the contract; construction supervision to ensure quality; accounting
of materials & processing bills of contractors for payment; implementing statutory
obligations; ensure adherence of safety practices; processing gate passes, work permits, shut
downs etc.
7.0.6 Project Monitoring
These include submission of timely feedback information to management on progress, delays
and critical activities of project; preparation of various reports to the management related to
status of approval of various projects, erection, testing & commissioning by indicating critical
areas over progress of project; furnish periodical reports on actual expenditure with respect to
estimates.
Page 193 of 366
7.0.7 Value Chain - Margin
The organization incurs certain costs for creating value for its final products/services. The
margin is the difference between the sum of all the values created at the activities in the value
chain and the total cost incurred by the organization to create such values.
8.0 Conclusion
The developed value chain management model for steel manufacturing sector is useful for
integrated steel plant with five primary activities and six supporting activities. In the
primary activities operations is proposed as operations/production management under
product related activities and services is excluded from product related activities and
included in market related activities as service after sales. In the support activities
procurement is proposed as materials management and infrastructure is proposed as services
management. Finance is separated from infrastructure and shown as a separate support
activity as finance management. Projects management which is important activity in the
expansion of integrated steel plants is added as a support activity. This study can be extended
to identifying critical activities of proposed value chain model for steel manufacturing sector
and evaluating its overall assessment.
References
[1]Adigwe, J, C.F (1983) Raw Materials for the Nigerian Iron and Steel Industry. First
National Conference on Steel, Ovwian-Aladja.
[2]Anni-Kaisa Kahkonen, Katrina Lintukangas (2012), ―Supply management as a value
creatingelement in a firm‖, International Journal of Value Chain Management, 2012, Vol.
6, No. 4, pp.358-374.
[3]Abid Sultan and Dr.Saurabh (2013), ―Achieving sustainable development through
value chains‖,International Journal of Managing Value and Supply Chains (IJMVSC),
Vol.4, No.2, June 2013,pp.39-46.
[4]Ching Chyi Lee and Jie Yang (2000), ―Knowledge Value chain‖, Journal of
Management Development, Vol.19, No.9, pp.783-793.
[5] Chien-Liang Kuo, Fu-Ren Lin and Ming-Yen Wu (2011), ―A Proposed Framework for
Service TradeMode Selection: The Value Chain and Value Co-creation Perspectives‖, The
Economic Geography of Globalization, Prof. Piotr Pachura (Ed.), ISBN: 978-953-307-502-0,
InTech.
[6] Claudine Soosay, Andrew Fearne and Benjamin Dent (2012), ―Sustainable value chain
analysis - a case study of Oxford Landing from ‗vine to dine‘ ‖, Supply Chain Management: An
International Journal, Vol.17, No.1, pp.68-77.
[7]Daiva Rapceviciene (2014), ―Modelling a Value Chain in Public Sector‖, Social
Transformationsin Contemporary Society, Vol.2, pp.42-49.
[8] Editorial Comments, Journal of Metals, A publication of the Metallurgical Society of
American Institute of Mining, Metallurgical, Petroleum and Geological Engineers (AIME)
10, (1984).
[9]Gabriel, E. (2005), ―An assessment of value co-creation and delivery systems in the higher
education sector of Tanzania: A case of CBE, TIA & IFM‖, The African Journal of Finance
andManagement, Vol.13, No.2, pp.60-79.

Page 194 of 366
[10]Gabriel, E. (2006), ―Value Chain for Services - A new dimension of Porter‘s Value
Chain‖. The IMS International Journal, Vol.34, pp.1-30.
[11]Obikwelu, D.O.N. (1989).Viability of Local Clays for the Iron and Steel Industry, Paper
presented at the National Seminar Organized by the Raw Materials Research and
Development Councils (RMRDC),
[12] Obikwelu D.O.N. (1988).The Nigerian Steel Industry-Problems and Prospects.
Proceedings of the National Seminar held at The Nigerian Institute of Policy and Strategic
Studies (NIPSS). ed.
[13]Steel Business Digest Quarterly Publication, Delta Steel Company Ltd 1, Jan – Dec.
(1993).
Page 195 of 366
Paper: NMS 2017-TP024
Comparison of Mechanical Properties of Locally Made and Imported Carbon Steel
Reinforcement Rods (ASTM: A36)
Utu O. G1., Ofuyekpone O.
2*, Edibo S.
3
1Welding and Fabrication Engineering Department. Delta State Polytechnic, Ogwashi-Uku.
2,3Metallurgical Engineering Department. Delta State Polytechnic, Ogwashi-Uku.
* [email protected], Tel.: +2348034119210
Abstract
Investigation of the mechanical properties of locally made and imported carbon steel reinforcement
rods (ASTM: A36) was carried out. The results showed that locally produced steel products showed
better mechanical properties when compared to the imported steel products. The ultimate tensile
strength values are705N/mm2 for Sample A, 602N/mm
2 for Sample B, 614N/mm
2 and 693N/mm
2 for
Samples C and D respectively. The yield strength values 520N/mm2 for Sample A, 482N/mm
2 for
Sample B, 496N/mm2 for Sample C and 508N/mm
2 for Sample D. The % elongation values samples
are 18.33% for Samples A, 30.00% for Sample B, 25.00% for Sample C and 21.67% for Sample D.
The charpy impact test values are 57J for Sample A, 192J for Sample B, 162J and 66J for Samples C
and D respectively. While the hardness numbers values are 49.00BHN for Sample A, 34.75BHN for
Sample B, 38.25BHN for Sample C and 41.50BHN for Samples D respectively. Thus, the steel
product, sample B appeared to be the best steel sample since it showed better mechanical properties
when compared to the other steel products during period of investigation.
Keywords: strength, Hardness, Carbon Steel rods (ASTM: A36), Energy Absorbed, % Elongation.
Notations:
UTS = Ultimate tensile strength. YS = Yield Strength.
%EL = Percentage Elongation. IT = Impact Test (joules).
BHN = Brinell hardness Tester. ASTM = American Society of Testing and
Materials
1.0 Introduction
Most Engineering failures are frequently caused by misuse of materials. When a plastic tea spoon
buckles as it is being used, when a building collapses or when an aircraft is grounded because cracks
have appeared in the tail plane, it is likely the engineer who designed them used the wrong materials
or did not understand the properties of those materials used [1]
.There are more than 50,000 materials
available to the engineer. In addition, hundreds of new materials appear on the market each month.
Each of these materials has its characteristics, applications, advantages, limitations and cost. Thus, the
task of knowing the properties and behaviour of types of available materials becomes enormous and
challenging [2]
.
Adequate knowledge, therefore, of materials and their properties will no doubt help engineers and
designers to avoid mistakes that may lead to engineering failures. Admittedly, some materials are not
used widely because of availability, initial properties, cost or service performance. Others, like iron
and steel, paper, concrete, wood (timber) etc., find extensive uses. Often, materials are reinforced to

Page 196 of 366
make them stronger when improved strength is the major goal. The reinforcing components must have
a large aspect ratio. This means that its length-diameter ratio must be high so that the load is
transferred across potential points of fracture. This is why steel rods are placed in concrete structures
as reinforcing components [2]
. Unreinforced concrete, although has great compressive strength, is very
weak in tension. It is this lack of tensile strength that leads to the necessity for reinforcement, which
carries the tensile forces present in the structure. Although, a variety of materials such as glass fibres
and plastic filaments have been used as reinforcement, most concrete members are reinforced with
steel in the form of bars, wire mesh and strands because of their high strength, ductility and stiffness.
Steel reinforcement imparts great strength and toughness to concrete. Reinforcement also reduces
creep and minimizes the width of cracks [2]
. Steel serves as a suitable reinforcement material because
its coefficient of thermal expansion (5.8 x 10⁻⁶
0C
-1 to 6.4 x10
-60C
-1) is nearly the same as that of
concrete (5 x 10⁻⁶ 0
C-1
to 7 x 10⁻⁶ 0
C-1
).
Plain carbon steel is by far the most widely used kind of steel. The properties of carbon steel depend
primarily on the amount of carbon it contains. Most carbon steel has a carbon content of less than 1%.
Carbon steel is made into a wide range of products, including structural beams, car bodies, kitchen
appliances and cans. The three types of plain carbon steel are low carbon steel, medium carbon steel,
high carbon steel, and as their names suggest, all these types of plain carbon steel differs in the
amount of carbon they contain [3]
. Plain carbon steel is a type of steel having a maximum carbon
content of 1.5% along with small percentages of silica, sulphur, phosphorus and manganese [4]
.
Generally, with an increase in the carbon content from 0.01 to 1.5% in the alloy, its strength and
hardness increase but still such an increase beyond 1.5% causes appreciable reduction in the ductility
and malleability of the steel.It is evident that hardness, brittleness and ductility are very important
properties as they determine the way these different carbon content steels are used. The microstructure
of slowly cooled mild steel, for instance, with 0.2% carbon. Consists of about 75% of proeutectoid
ferrite that forms above the eutectoid temperature and about 25% of pearlite (pearlite and ferrite being
microstructure components of steel). When the carbon content in the steel is increased, the amount of
pearlite increases until the fully pearlitic structure of a composition of 0.8% carbon is obtained
Beyond 0.8%, high carbon steel contains proeutectoid cementite in addition to pearlite [5]
. However, in
slowly cooled carbon steels, the overall hardness and ductility of the steel are determined by the
relative proportions of the soft, ductile ferrite and the hard cementite. The cementite content increases
with increasing carbon content, resulting in an increase of hardness and a decrease of ductility, on
transition from low carbon to high carbon steels [5]
.
Different materials possess different properties in varying degree and therefore behave in different
ways under given conditions. These properties includes; mechanical properties, electrical properties,
thermal properties, chemical properties, magnetic properties and physical properties [6, 7]
. A design
engineer is interested in the behaviour of materials under load which is mechanical in nature, for the
design of machines and structures. Any material subjected to a load either deforms, yields, or breaks,
depending upon the magnitude of the load. Engineers are basically interested in knowing how a
particular material will behave under applied load, i.e. the mechanical properties [8]
.
Before choosing the materials of construction for an off-shore structure, ship, submersible, ocean-
floor installation, buildings, bridges, rail ways or instrument package, many factors must be
considered. Among these are the initial costs of the materials, their efficiency in the intended design,
and the predicted lifetime of the materials. Many materials when fabricated into a system deteriorate
in service in unexpected manners, unlike their predicted behaviour established in laboratory saline
solutions [9]
.
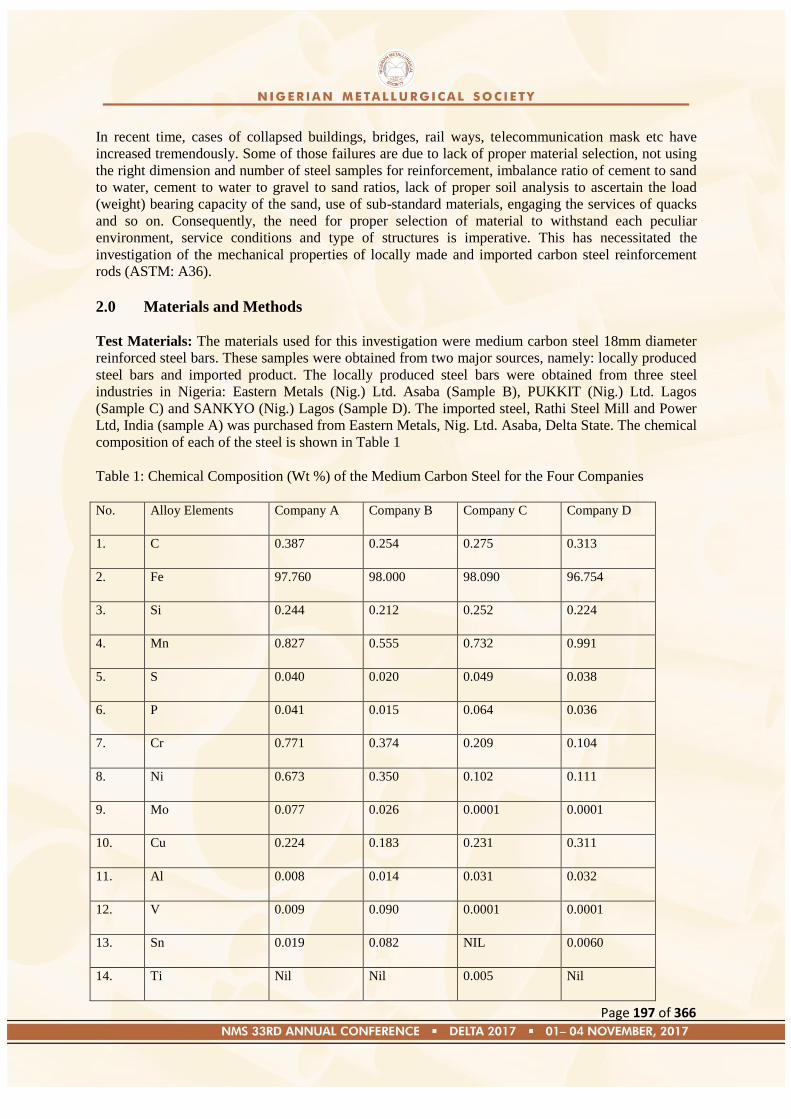
Page 197 of 366
In recent time, cases of collapsed buildings, bridges, rail ways, telecommunication mask etc have
increased tremendously. Some of those failures are due to lack of proper material selection, not using
the right dimension and number of steel samples for reinforcement, imbalance ratio of cement to sand
to water, cement to water to gravel to sand ratios, lack of proper soil analysis to ascertain the load
(weight) bearing capacity of the sand, use of sub-standard materials, engaging the services of quacks
and so on. Consequently, the need for proper selection of material to withstand each peculiar
environment, service conditions and type of structures is imperative. This has necessitated the
investigation of the mechanical properties of locally made and imported carbon steel reinforcement
rods (ASTM: A36).
2.0 Materials and Methods
Test Materials: The materials used for this investigation were medium carbon steel 18mm diameter
reinforced steel bars. These samples were obtained from two major sources, namely: locally produced
steel bars and imported product. The locally produced steel bars were obtained from three steel
industries in Nigeria: Eastern Metals (Nig.) Ltd. Asaba (Sample B), PUKKIT (Nig.) Ltd. Lagos
(Sample C) and SANKYO (Nig.) Lagos (Sample D). The imported steel, Rathi Steel Mill and Power
Ltd, India (sample A) was purchased from Eastern Metals, Nig. Ltd. Asaba, Delta State. The chemical
composition of each of the steel is shown in Table 1
Table 1: Chemical Composition (Wt %) of the Medium Carbon Steel for the Four Companies
No. Alloy Elements Company A Company B Company C Company D
1. C 0.387 0.254 0.275 0.313
2. Fe 97.760 98.000 98.090 96.754
3. Si 0.244 0.212 0.252 0.224
4. Mn 0.827 0.555 0.732 0.991
5. S 0.040 0.020 0.049 0.038
6. P 0.041 0.015 0.064 0.036
7. Cr 0.771 0.374 0.209 0.104
8. Ni 0.673 0.350 0.102 0.111
9. Mo 0.077 0.026 0.0001 0.0001
10. Cu 0.224 0.183 0.231 0.311
11. Al 0.008 0.014 0.031 0.032
12. V 0.009 0.090 0.0001 0.0001
13. Sn 0.019 0.082 NIL 0.0060
14. Ti Nil Nil 0.005 Nil
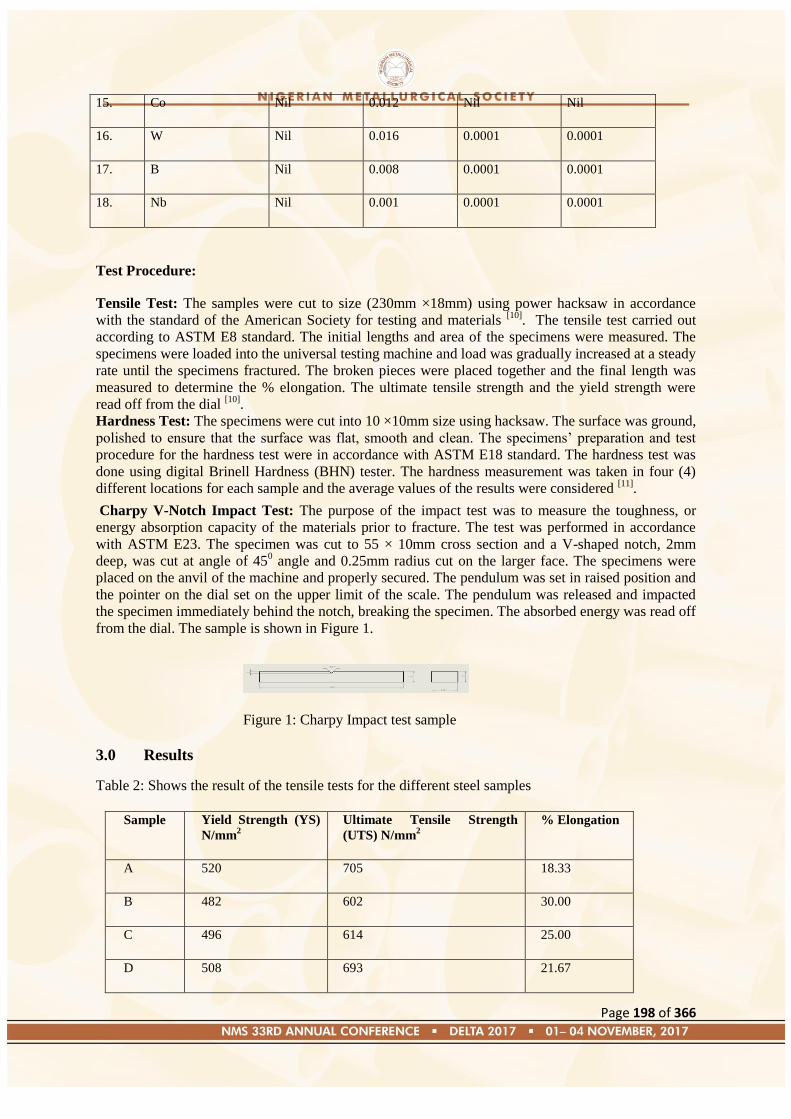
Page 198 of 366
15. Co Nil 0.012 Nil Nil
16. W Nil 0.016 0.0001 0.0001
17. B Nil 0.008 0.0001 0.0001
18. Nb Nil 0.001 0.0001 0.0001
Test Procedure:
Tensile Test: The samples were cut to size (230mm ×18mm) using power hacksaw in accordance
with the standard of the American Society for testing and materials [10]
. The tensile test carried out
according to ASTM E8 standard. The initial lengths and area of the specimens were measured. The
specimens were loaded into the universal testing machine and load was gradually increased at a steady
rate until the specimens fractured. The broken pieces were placed together and the final length was
measured to determine the % elongation. The ultimate tensile strength and the yield strength were
read off from the dial [10]
.
Hardness Test: The specimens were cut into 10 ×10mm size using hacksaw. The surface was ground,
polished to ensure that the surface was flat, smooth and clean. The specimens‘ preparation and test
procedure for the hardness test were in accordance with ASTM E18 standard. The hardness test was
done using digital Brinell Hardness (BHN) tester. The hardness measurement was taken in four (4)
different locations for each sample and the average values of the results were considered [11]
.
Charpy V-Notch Impact Test: The purpose of the impact test was to measure the toughness, or
energy absorption capacity of the materials prior to fracture. The test was performed in accordance
with ASTM E23. The specimen was cut to 55 × 10mm cross section and a V-shaped notch, 2mm
deep, was cut at angle of 450 angle and 0.25mm radius cut on the larger face. The specimens were
placed on the anvil of the machine and properly secured. The pendulum was set in raised position and
the pointer on the dial set on the upper limit of the scale. The pendulum was released and impacted
the specimen immediately behind the notch, breaking the specimen. The absorbed energy was read off
from the dial. The sample is shown in Figure 1.
Figure 1: Charpy Impact test sample
3.0 Results
Table 2: Shows the result of the tensile tests for the different steel samples
Sample Yield Strength (YS)
N/mm2
Ultimate Tensile Strength
(UTS) N/mm2
% Elongation
A 520 705 18.33
B 482 602 30.00
C 496 614 25.00
D 508 693 21.67
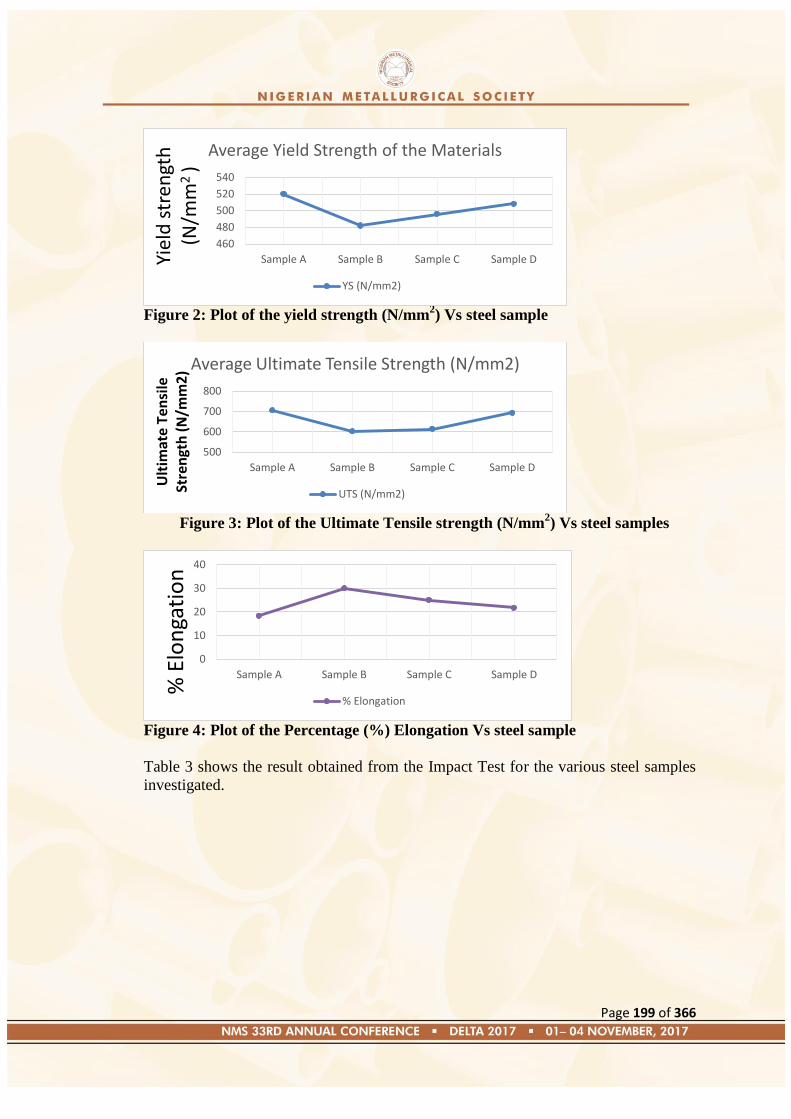
Page 199 of 366
Figure 2: Plot of the yield strength (N/mm
2) Vs steel sample
Figure 3: Plot of the Ultimate Tensile strength (N/mm
2) Vs steel samples
Figure 4: Plot of the Percentage (%) Elongation Vs steel sample
Table 3 shows the result obtained from the Impact Test for the various steel samples
investigated.
460
480
500
520
540
Sample A Sample B Sample C Sample DYiel
d s
tren
gth
(N
/mm
2 )
Average Yield Strength of the Materials
YS (N/mm2)
500
600
700
800
Sample A Sample B Sample C Sample D
Ult
imat
e T
ensi
le
Stre
ngt
h (
N/m
m2
) Average Ultimate Tensile Strength (N/mm2)
UTS (N/mm2)
0
10
20
30
40
Sample A Sample B Sample C Sample D
% E
lon
gati
on
% Elongation
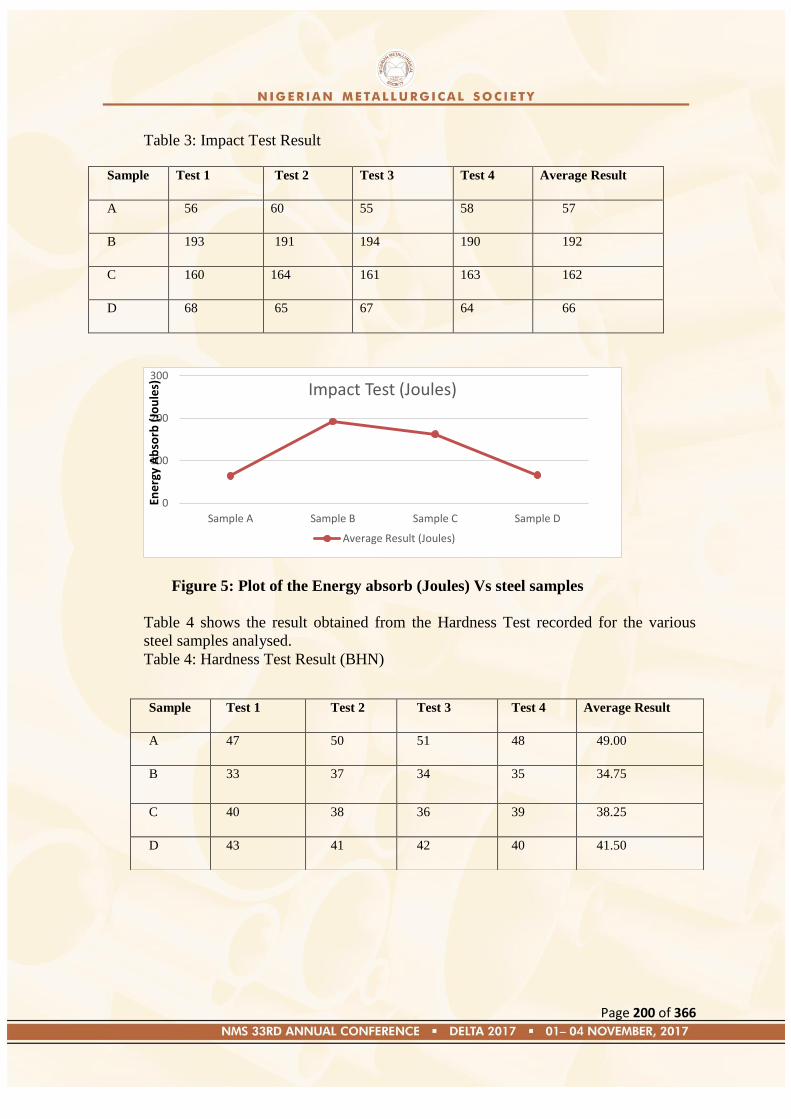
Page 200 of 366
Table 3: Impact Test Result
Sample
Test 1 Test 2
Test 3 Test 4 Average Result
A 56 60 55 58 57
B 193 191 194 190 192
C 160 164 161 163 162
D 68 65 67 64 66
Figure 5: Plot of the Energy absorb (Joules) Vs steel samples
Table 4 shows the result obtained from the Hardness Test recorded for the various
steel samples analysed.
Table 4: Hardness Test Result (BHN)
0
100
200
300
Sample A Sample B Sample C Sample D
Ene
rgy
Ab
sorb
(Jo
ule
s)
Impact Test (Joules)
Average Result (Joules)
Sample
Test 1 Test 2
Test 3 Test 4 Average Result
A 47 50 51 48 49.00
B 33 37 34 35 34.75
C 40 38 36 39 38.25
D 43 41 42 40 41.50
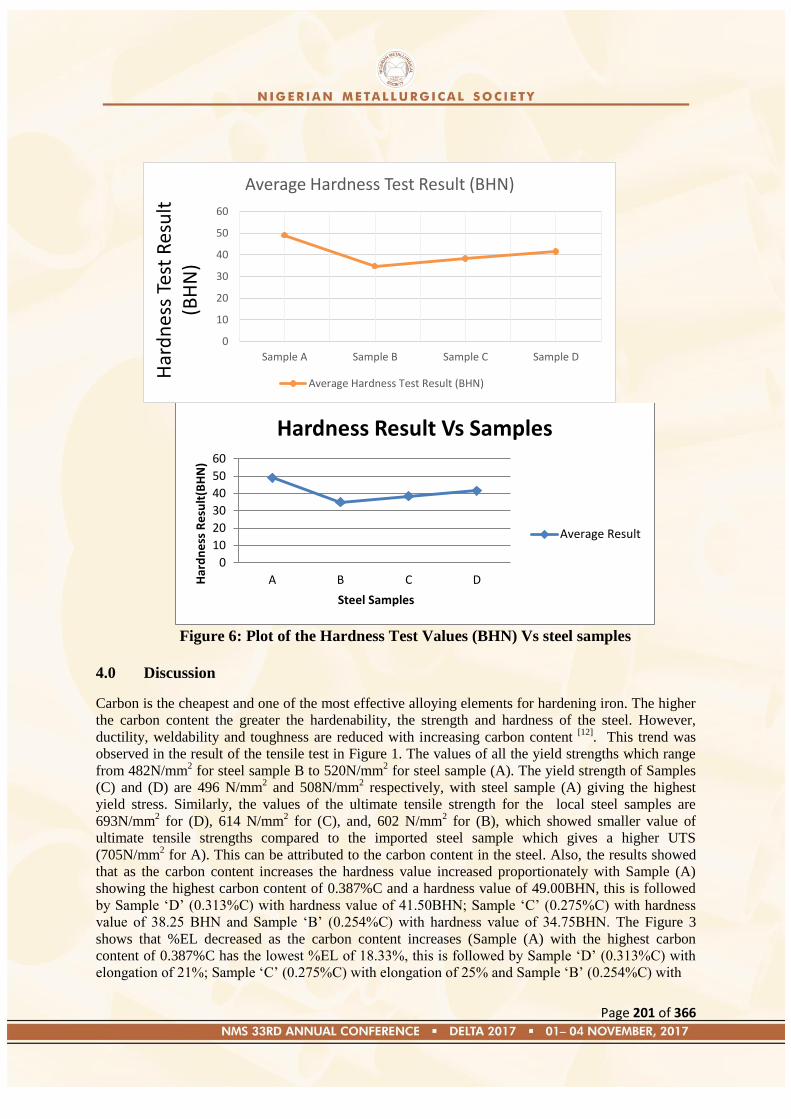
Page 201 of 366
Figure 6: Plot of the Hardness Test Values (BHN) Vs steel samples
4.0 Discussion
Carbon is the cheapest and one of the most effective alloying elements for hardening iron. The higher
the carbon content the greater the hardenability, the strength and hardness of the steel. However,
ductility, weldability and toughness are reduced with increasing carbon content [12]
. This trend was
observed in the result of the tensile test in Figure 1. The values of all the yield strengths which range
from 482N/mm2 for steel sample B to 520N/mm
2 for steel sample (A). The yield strength of Samples
(C) and (D) are 496 N/mm2 and 508N/mm
2 respectively, with steel sample (A) giving the highest
yield stress. Similarly, the values of the ultimate tensile strength for the local steel samples are
693N/mm2 for (D), 614 N/mm
2 for (C), and, 602 N/mm
2 for (B), which showed smaller value of
ultimate tensile strengths compared to the imported steel sample which gives a higher UTS
(705N/mm2 for A). This can be attributed to the carbon content in the steel. Also, the results showed
that as the carbon content increases the hardness value increased proportionately with Sample (A)
showing the highest carbon content of 0.387%C and a hardness value of 49.00BHN, this is followed
by Sample ‗D‘ (0.313%C) with hardness value of 41.50BHN; Sample ‗C‘ (0.275%C) with hardness
value of 38.25 BHN and Sample ‗B‘ (0.254%C) with hardness value of 34.75BHN. The Figure 3
shows that %EL decreased as the carbon content increases (Sample (A) with the highest carbon
content of 0.387%C has the lowest %EL of 18.33%, this is followed by Sample ‗D‘ (0.313%C) with
elongation of 21%; Sample ‗C‘ (0.275%C) with elongation of 25% and Sample ‗B‘ (0.254%C) with
0
10
20
30
40
50
60
Sample A Sample B Sample C Sample D
Har
dn
ess
Test
Res
ult
(B
HN
) Average Hardness Test Result (BHN)
Average Hardness Test Result (BHN)
0
10
20
30
40
50
60
A B C DHar
dn
ess
Re
sult
(BH
N)
Steel Samples
Hardness Result Vs Samples
Average Result
Page 202 of 366
elongation of 30%. This reasonable elongation exhibited by sample B may be attributed to the small
carbon content when compared with the carbon content of the other samples, and also, due to the
presence of some alloying elements such as Ni, Mn etc. in the steel samples in proportions that favour
ductility [13]
. In the same vein, the energy absorbed increased as the carbon content decreases with
sample B having the highest impact value of 192J. This is followed by sample C with impact value of
162J, and sample D having a value of 66J, while sample A recorded the least energy absorbed with a
value of 57J. Thus, the higher the %El the more the energy absorbed.
5.0 Conclusion The results showed that Sample B, a local steel sample, proved to be the best steel sample, since they
show reasonable mechanical properties.
6.0 References
[1] Ashby, M., F. Jones, and R.H. David, Engineering Materials I: An Introduction to their
Properties and Applications; Butter Worth Heinemann, MG Book Ltd, Cornwall, Great
Britain, 2nd Edition, pp.3–14, 1990
[2] Vlack, L.H.V. (1982). Materials for the Engineer, Materials for Engineering: Concept and
Application, Addison – Westley Publishing Company Reading, Massachusetts; pp.4, 1982
[3] Raghavan, V. (ed) (1989). Material Science and Engineering, Prentice– Hall 4th edition of
India, New Delhi, pp.396.
[4] Higgins, R.A. (2004). Engineering metallurgy, Applied Physical Metallurgy. Viva
Publishing company, New Delhi.
[5] Kasahara, K. and Kajiyama, F. (1985). Role of Sulphate Reducing Bacteria in the Localized
Corrosion of Buried Pipes, in Biologically Induced Corrosion, Editor S.C. Dexter,
Proceedings of the International Conference on Biologically Induced Corrosion, NACE.
[6] ASM Metal Handbook (2002). Volume 1, Properties and Selection: Irons, Steels, and High
Performance Alloys, Carbon and Low Alloys, Physical properties of carbon and low Alloy
steel,‖ ASM international, Materials Park, OH.
[7] ASM Metal Handbook (2002). Volume 1, Properties and Selection: Irons, Steels, and High
Performance Alloys, Physical properties of carbon and low Alloy steel, Service
characteristics of carbon and low Alloy steels, Elevated temperature properties of Ferritic
steels, Factors affecting mechanical properties. ASM international, Materials Park, OH.
[8] Khurmi, R.S and Sedha, R.S. (2010). Materials Science a Textbook for B.E/B. Tech
Student of Different Technical Universities & for A.M.I.E courses. S. Chad & Company,
New Delhi.
[9] Riley, J. P. and Chester, R. (1971). Introduction to marine chemistry. London, Academic
Press.
[10] ASTM Standards, A706 (1990). Metals, Test Methods and Analytical Procedures, Metals –
Mechanical Testing; Elevated and Low – Temperature Tests; Metallography; Section 03:
volume 01.

Page 203 of 366
[11] Seidu, S.O. and Kutelu, B.J. (2013). Effect of heat treatment on corrosion of welded low
carbon steel in acid and salt environments, Journal of minerals and materials
characterization and Engineering; Vol. 1, No.3, pp.95-100.
[12] Kutz, M. (2002). Role of Alloying Elements in Steel, Hand Book of Materials Selection,
Kutz Myer Associates, John Wiley and Sons Inc., pp. 45 – 65.
[13] Grong, K. B. (1986). Effect of Alloying Elements in Steel, pp. 27 – 48.
http://www.chasealloys.co.uk/steel/alloying-elements-in-steel/. [Accessed 26th May, 2015]
Page 204 of 366
Paper: NMS 2017-TP025
Effect of CO2 and H2SO4 on the Corrosion Susceptibility of API 5L X60 Steel Pipe
Henry E. Mgbemere, Augustine B. Okoubulu, Collins O. Omeike, Nwaeju C. Cynthia
Department of Metallurgical and Materials Engineering, University of Lagos
Email address: [email protected]
Abstract
API 5L X60 steel pipes are used to transport oil and gas products across all parts of Nigeria. These
pipes most times come in contact with gases like carbon dioxide and hydrochloric acid. In this
research, sectioned parts of the steel containing varying concentrations of H2SO4 at a constant
pressure (1 bar) of CO2 have been investigated with respect to their corrosion susceptibility. The
results indicate that the corrosion rate increased with increasing concentration of the acid from 0.127
mm/year to 42.1 mm/yr at 1M concentration. The hardness values decreased with increasing
concentration of the acid from 40.7 HRA without the acid to 34.77 HRA for 1M concentration. The
micrograph obtained from the immersed sample indicated that pitting corrosion among other types of
corrosion was the mechanism of corrosion.
Keywords: Corrosion susceptibility; API 5L; CO2 and H2SO4; Pitting
1.0 Introduction
Carbon steels are one of the most used steel types in Nigeria for structural applications although they
have limited corrosion resistance. They are readily available, have good structural integrity and are
cheap compared to other grades of steel (Turkustani et al., 2010, Ramesh et.al., 2003). The
specifications of steels with appropriate thickness used in the production of pipes are classified based
on the American Petroleum Institute (API). A series of tests which depends on the application are
conducted on these steels before they are put to use. The inherent instability of metallic materials
when exposed to the environment is due to the fact that they want to return to their natural states
(Jones and Denny, 1996). This makes it very difficult to prevent corrosion in metals especially those
used to transport oil and gas related products.
CO2 corrosion has been well studied because crude oil and natural gas from either gas or oil reservoirs
usually contain some level of the gas. When the conditions are appropriate, this normally causes CO2
corrosion that result in the failure of transmission pipelines and other critical facilities which can
cause shutdown in production. CO2 gas has the ability to dissolve and go into solution which can
subsequently react with water to produce carbonic acid. It can also react with the iron to give iron
carbonate which precipitates on the steel surface and offers some form of protection. Acids like
H2SO4, HCl etc. do come in contact with these steel products and so there is need to understand their
corrosion potentials. The combination of H2S and CO2 in pipelines which carry crude and other oil
and gas installation facilities lead to different types and degrees of corrosion (Choi et al., 2010). There
are some reports in the literature concerning corrosion from these gases either alone or in
combination.
Page 205 of 366
Afolabi et al., (2007) studied the corrosion behaviour and stress corrosion cracking of low and
medium carbon steels immersed in cassava and cocoa extracts. They reported that medium carbon
steel is more susceptible to corrosion than low carbon steel. Choi & Ling, (2010) used 1018 carbon
steel in 1 wt. % NaCl solution at room temperature to study the effect of low levels of hydrogen
sulphide on CO2 scale formation in CO2/H2S environments. They reported that adding 100 ppm of
H2S to CO2 induced fast deterioration in the material. Iron sulphide and iron carbonate films
precipitated due to local super-saturation above the steel surface. API S-135 steel subjected to
saturated CO2 environment above 100oC failed through stress corrosion cracking but at low
temperatures, cracks were not observed which implies that only general corrosion is taking place.
Farelas and Ramirez (2010) investigated CO2 corrosion inhibition of carbon steels using bis-
imidazoline compounds using electrochemical impedance spectroscopy and linear polarisation
resistance. The contact between carbon steel and dilute sulphuric acid leads to a reaction on the metal
surface in which ferrous ions are formed on the anode while hydrogen is on the cathode (Singh et al.,
2011). The corrosion rate depends on the amount of carbon present and overall chemical composition
(Damon 1941). Veloz and Gonzalez, 2002 studied carbon steel corrosion in buffered acetic acid
solutions with chlorides and H2S. The results from potentiodynamic tests indicate that the anodic
slopes did not change considerably with H2S while there was accelerated reduction reaction at the
cathode.
When carbon dioxide, hydrogen sulphide and water come in contact, they pose serious corrosion
problems in oil and gas industry. Most of these corrosion experiments have been carried out outside
Nigeria and we know that environment under which an experiment was conducted do affect the
results. The objective of this research therefore is to have a better understanding of the corrosion that
will take place when carbon steel in form of API 5X steel is subjected to an environment containing
different concentrations of H2SO4 and CO2.
2.0 Materials and Methods
The type of carbon steel used in this research is the API 5L X60 steel and it was sourced from a local
market at Owode-Onirin in Lagos. The CO2 gas used was obtained from Vital Gas Limited in Sango-
Ota, Ogun State with the following specifications: 400 ppm with molecular mass 44.01 g/mol and a
density of 1.977*10-3
g/cm3 at 1 atmosphere pressure. The H2SO4 (Qatar Acids Company, Doha
Qatar) was purchased from Uche Chemicals in Bariga, Lagos with a concentration of 18.4 M. It has
the following specifications: a density of 1.84 g/cm3, a melting temperature of 283 K and is miscible
in water. 0, 0.5 M and 1 M concentrations of the acid were prepared for the experiment. Laboratory
flasks, grease, hose were also used in setting up the experiment.
The chemical composition analysis of the sample was carried out using an Optical emission
spectrometer. The steel bar was cut to specification (10 mm*10 mm) and immersed in quick-fit flasks
containing different concentrations of the acid. 1 bar of CO2 gas was then introduced from the gas
cylinder into the flasks. The experimental set-up is shown in Figure 1.
Page 206 of 366
Figure 1: Experimental setup showing the introduction of CO2 gas into the flasks
To ensure that the set-up was air-tight, grease was applied on the apertures and they were covered.
The set-up was then allowed to stay for 60 days before the samples were tested. A sectioned sample
which was not subjected to the corrosion test was used as the control sample. A Linear polarisation
resistance tester (Gamry Instrument Potentistat, Versastat 4) was used to measure the corrosion
resistance in the samples. Samples to be used to study the morphology were first ground and later
polished. After the polishing process, they were chemically etched with Nital (100 ml ethanol + 10 ml
Nitric acid). The measurements were made using a scanning electron microscope (JSM-IT300HR,
Jeol USA) with an EDX attachment EDX 3600B spectrometer (JED-2300/2300F, Jeol USA).
Samples for hardness tests were measured using a Rockwell hardness tester (MRB-250, Sangli, India)
with a hardened spherical ball indenter. A load of 588.6 N was placed on the sample and the degree of
displacement was used.
3.0 Results and Discussion
Chemical composition
The chemical composition analysis of the samples before and after immersion in solution showing the
elements present are shown in Table 1. The amount of some elements like C, Mn, Fe decreased after
the immersion while it increased for elements like Si, P, Al, Ti, Mo, Sn etc. This could be due to
corrosion which depletes these elements. The increase in some elements may be attributed to either
the formation of new products or that the spectrometer could not identify all the elements during the
initial measurements.
Table 1: Chemical composition analysis of the API 5L X60 steel (wt. %) before and after immersion
in the CO2-H2SO4 solution
Element C Si S P Mn Ni Cr Cu Al Ti V Fe W Mo Sn
Content
(wt.%)
before
immersion
0.192 0.149 0.005 0.026 1.324 0.018 0.014 0.019 0.01 0.001 0.063 98.18 - - -
Content
(wt.%)
after immersion
- 1.345 0.017 0.117 0.38 0.161 6E-
04 0.285 0.904 0.719
9E-
04 95.06 0.106 0.411 0.489
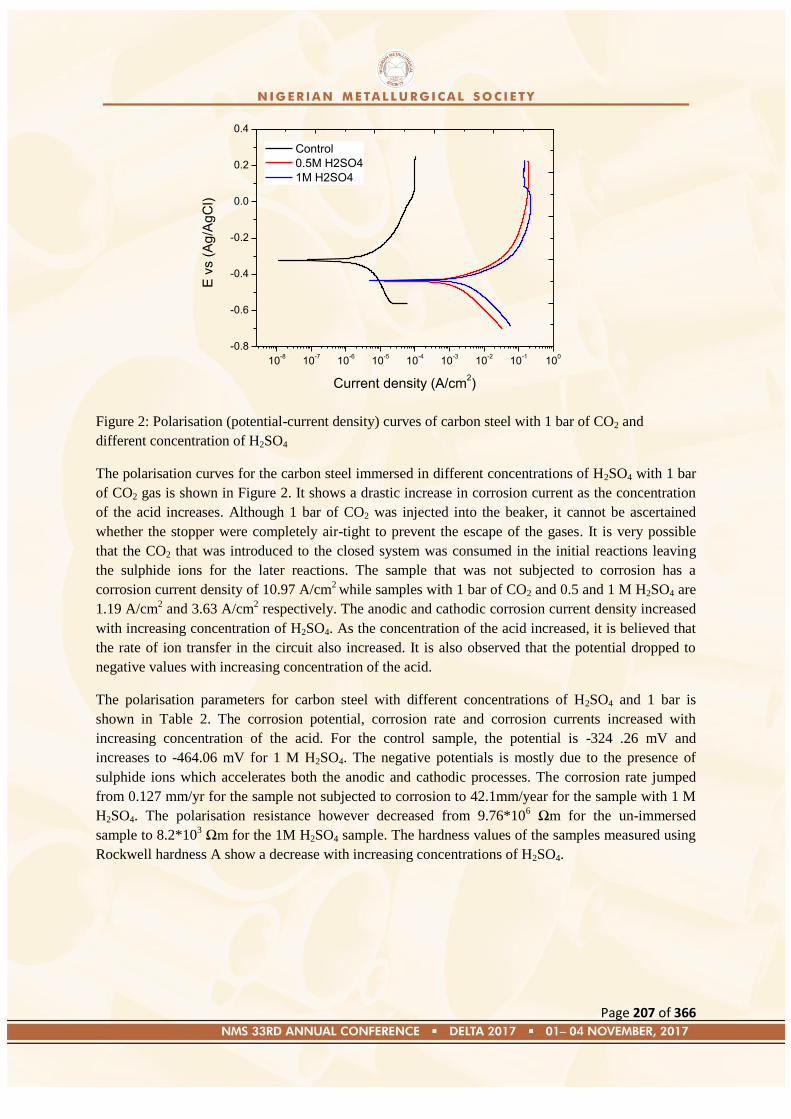
Page 207 of 366
10-8
10-7
10-6
10-5
10-4
10-3
10-2
10-1
100
-0.8
-0.6
-0.4
-0.2
0.0
0.2
0.4
E v
s (
Ag
/Ag
Cl)
Current density (A/cm2)
Control
0.5M H2SO4
1M H2SO4
Figure 2: Polarisation (potential-current density) curves of carbon steel with 1 bar of CO2 and
different concentration of H2SO4
The polarisation curves for the carbon steel immersed in different concentrations of H2SO4 with 1 bar
of CO2 gas is shown in Figure 2. It shows a drastic increase in corrosion current as the concentration
of the acid increases. Although 1 bar of CO2 was injected into the beaker, it cannot be ascertained
whether the stopper were completely air-tight to prevent the escape of the gases. It is very possible
that the CO2 that was introduced to the closed system was consumed in the initial reactions leaving
the sulphide ions for the later reactions. The sample that was not subjected to corrosion has a
corrosion current density of 10.97 A/cm2 while samples with 1 bar of CO2 and 0.5 and 1 M H2SO4 are
1.19 A/cm2 and 3.63 A/cm
2 respectively. The anodic and cathodic corrosion current density increased
with increasing concentration of H2SO4. As the concentration of the acid increased, it is believed that
the rate of ion transfer in the circuit also increased. It is also observed that the potential dropped to
negative values with increasing concentration of the acid.
The polarisation parameters for carbon steel with different concentrations of H2SO4 and 1 bar is
shown in Table 2. The corrosion potential, corrosion rate and corrosion currents increased with
increasing concentration of the acid. For the control sample, the potential is -324 .26 mV and
increases to -464.06 mV for 1 M H2SO4. The negative potentials is mostly due to the presence of
sulphide ions which accelerates both the anodic and cathodic processes. The corrosion rate jumped
from 0.127 mm/yr for the sample not subjected to corrosion to 42.1mm/year for the sample with 1 M
H2SO4. The polarisation resistance however decreased from 9.76*106 Ωm for the un-immersed
sample to 8.2*103 Ωm for the 1M H2SO4 sample. The hardness values of the samples measured using
Rockwell hardness A show a decrease with increasing concentrations of H2SO4.
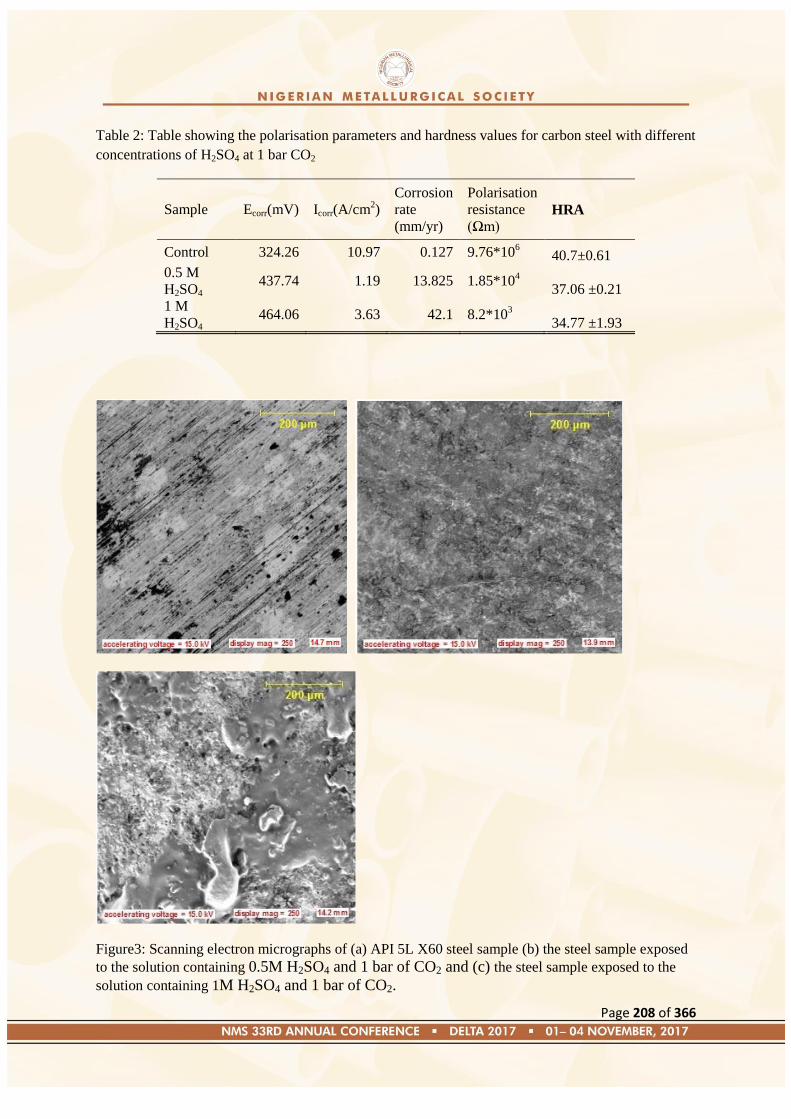
Page 208 of 366
Table 2: Table showing the polarisation parameters and hardness values for carbon steel with different
concentrations of H2SO4 at 1 bar CO2
Sample Ecorr(mV) Icorr(A/cm2)
Corrosion
rate
(mm/yr)
Polarisation
resistance
(Ωm) HRA
Control 324.26 10.97 0.127 9.76*106 40.7±0.61
0.5 M
H2SO4 437.74 1.19 13.825 1.85*10
4
37.06 ±0.21
1 M
H2SO4 464.06 3.63 42.1 8.2*10
3
34.77 ±1.93
Figure3: Scanning electron micrographs of (a) API 5L X60 steel sample (b) the steel sample exposed
to the solution containing 0.5M H2SO4 and 1 bar of CO2 and (c) the steel sample exposed to the
solution containing 1M H2SO4 and 1 bar of CO2.
Page 209 of 366
The microstructures of the un-immersed steel sample, steel sample exposed to a solution
containing 0.5M H2SO4 and 1 bar of CO2 and that exposed to a solution containing 1M H2SO4
and 1 bar of CO2 are shown in Figure 3. The microstructure of the sample that was not immersed has
some bright and dark features and some pores. The surfaces of the samples that were subjected to
H2SO4 and CO2 corrosion indicate that some corrosion products are in the surface. The higher the
concentration of the acid, the more pronounced is the appearance of the products. In the sample with
0.5 M of the acid, very tiny holes can be observed which is made clear in the sample with 1 M of the
acid. In addition to the corrosion products on the surface, there was also the presence of big holes. The
holes are an indication of pitting on the material which H2SO4 is greatly known for (Ajeel et al, 2012).
Low pH and lack of an inhibitor of a solution can lead to pitting in a steel surface with sulphide ions
(Veloz and Gonzalez, 2002). The presence of sulphide ions and possibly elemental sulphur also
initiates pitting corrosion
4.0 Conclusion
In this work, a section of an API 5L X60 steel pipe has been subjected to different concentrations of
H2SO4 while the CO2 content was kept constant at 1 bar for 50 days. As the concentration of the acid
increased from 0.5 M to 1 M H2SO4, the hardness values decreased from 40.7 to 34.7 while the rate of
corrosion in the steel increased. This is evidenced by the deteriorating conditions of the steel sections
after the test. The microstructural analyses on the samples indicate that the dominant form of
corrosion is pitting corrosion.
References
1. Afolabi A.S (2007) Corrosion and Stress Corrosion Behaviours of Low and Medium
Carbon Steels in Agro-Fluid Media, Leonard Electronic Journal of Practices and
Technologies Vol. 6 Issue 10 Pg. 55-56
2. Ajeel S.A., Waadulah H.M., Sultan D.A. (2012) Effects of H2SO4 and HCl
Concentration on the Corrosion Resistance of Protected Low Carbon Steel, Al-Rafidian
Engineering Vol.20 No. 6
3. Choi Y, Nesic S and Ling S (2010) Effect of H2S on the CO2 corrosion of carbon steel in
acidic solutions, Electrochimica Acta 56 (2011) 1752-1760.
4. Damon G.H.(1941) Effect of Carbon Content on the Corrodibility of Steel in Sulphuric
Acid, Ind.Eng.Chem Pp 67-69.
5. Farelas F, Ramirez A (2010) Carbon Dioxide Corrosion Inhibition of Carbon Steels
Through Bis-imidazoline and Imidazoline compounds studied by EIS, International
Journal of Electrochemical Science Vol.5
6. Jones, Denney A.(1996) Principles and Prevention of Corrosion, 2nd
edition. Upper
Saddle River, NJ: Prentice Hall.
7. Ramesh S., Rajeswari S. and Maruthamuthu S. (2003). Materials Letters, 57, 4547
8. Singh A.K., Shukla S.K., Quraishi M.A.(2011) Corrosion Behaviour of Mild Steel in
Sulphuric Acid Solution in the presence of Ceftazidime, International Journal of
Electrochemical Science Vol.6, 5802-5814.

Page 210 of 366
9. Turkustani A.M., Arab S.T., Al-Reheli A.A(2010) Corrosion and Corrosion Inhibition of
Mild Steel in H2SO4 Solutions by Zizyphus Spina-Christi as Green Inhibitor, International
Journal of Chemistry Vol. 2 No.2, ISSN 1916-9698 E-ISSN 1916-9701.
10. Veloz M.A., Gonzalez (2012) Electrochemical Study of Carbon Steel Corrosion in
buffered acetic acid solutions with chlorides and H2S, Electrochimica Acta Vol.48, Issue
2, Pg 135-144.
Page 211 of 366
Paper: NMS 2017-TP026
The Influence of Welding Parameters on the Corrosion Resistance of Mild Steel Welded
Joint Exposed to Sodium Chloride (NaCl) Environment
Engr. (Mrs.) Ngozi Grace Emordi
Department of Metallurgical Engineering, Delta State Polytechnic, Ogwashi-Uku.
ABSTRACT
An investigation of the influence of welding parameters on the corrosion resistance of mild steel
welded joint exposed to Sodium Chloride (NaCl) environment has been conducted. In order to
achieve this , 14 rectangular pieces (flat plates) of mild steel and welded using the following welding
parameters, low welding current, high welding current, short arc length, long arc length, using of mild
steel electrode E6011, using low hydrogen electrode E7018 and the model sample and exposed to a
sodium chloride environment (NaCl) by complete immersion. Then the weight loss of exposed
samples were taken at intervals of ten days for sixty days and then recorded. The results obtained
when compared with the control sample showed that the weight loss of the different samples
increased when high current was used in welding metals the weak joint formed when low current was
used caused pits initiated caused surface discontinuities and posed a threat to the strength of the metal
joint. It was also observed that mild steel would produce weak joints while low hydrogen electrode
welds has a high resistance to cracking which would cause enduring strength.
1.0 INTRODUCTION
During the fabrication process, welding is the most commonly used method of joining items together.
The welding process generally involves welding, subsequent cooling and the result of this thermal
cycle is distortion if the welding item is free to move or residual stress if the item is securely held.
Welding technology has obtained access virtually to every branch of manufacturing; to name a few;
ships; rail road equipment; building construction; boilers; launch vehicles; pipe lines; nuclear power
plants; air crafts; auto mobiles; pipe lines. Welding technology needs constant up grading and with the
wide spread applications of welding (Opkhanna, 2006).To consistently produce high quality of welds,
arc welding requires an experienced welding personnel. One reason for this is to properly select
welding parameter for a given task for a good weld quality which identified by its micro-structure and
amount of spatter, and relied on the correct bead geometry size. Therefore, the use of the control
system in arc welding can eliminate much of the ―guess work‖ often employed by welders to specify
welding parameter for a given task (Opkhanna, 2006) .Nearly 90% of welding in the world is carried
out by one of the other arc welding process therefore, it is imperative to discuss the effects of welding
parameters on the weldability of the materials during the arc welding.
In nature every metal interact with its operating environment. Metals in refined form excluding the
precious metal such as gold are therefore inherently unstable. This instability is the driving force for
the phenomenon known as corrosion, such that corrosion may be said to be nature‘s way of returning
these metals to their thermodynamically stable form.
Consequent on this, various investigations have been carried out in recent times to ascertain the
presence, causes, effects and means of controlling corrosion and if possible prevent it from occurring
(Ofeke, 1994).

Page 212 of 366
In the bid to find lasting solutions to some of the catastrophic failures of mild steel welded joint using
different variables affecting welding quality in arc welding a lot of research has been carried out by
different researchers (Khanna, 2006). The general objective of the research is to investigate the effect
of welding parameters on the strength and corrosion of mild steel welded joint exposed to sodium
chloride (NaCl) environment.
1.1 OBJECTIVE
The general objective of the research is to investigate the influence of welding parameters on the
corrosion resistance of mild steel welded joint exposed to sodium chloride (NaCl) environment.
2.0 WELDING PARAMETERS
Welding Current
This is the most influential variable in arc welding process which controls the electrode burn off rate,
the depth of fusion and geometry of the weldments.
Welding voltage
This is the electrical potential difference between the tip of the welding wire and surface of the molten
weld pool. It determines the shape of the fusion zone and weld reinforcement. High welding voltage
produces wider, flatter and less deep penetrating welds than low welding voltage.
Welding speed
Speed of welding is defined as the rate of travel of the electrode along the seam or the rate of the
travel of the work under the electrode under the electrode along the seam. Increasing the speed of
travel and maintaining constant arc voltage and current will reduce the width of the bead and also
increase penetration until an optimum speed is reached at which penetration will be maximum.
Increasing the speed beyond this optimum will result in decreasing penetration (Ibrahim, 2007).
In arc welding process increase in welding speed causes:
Decrease in heat input per unit length of the weld.
Decrease in electrode burn off rate.
Decrease in the weld reinforcement.
If the welding speed decreases beyond a certain point, the penetration also will decrease due to
pressure of the large amount of weld pool beneath the electrode, which will cushion the arc
penetrating force.(Welding handbook).
3.0 MATERIALS AND METHOD
3.1
14 pieces of mild steel ( flat plate); E6011 mild steel electrode; E7018 low hydrogen electrode;
Sodium Chloride (NaCl).
3.2 SAMPLES PREPARATION The mild steel was cut into 14 smaller rectangular samples and then welded together. They were
grouped into 7 sets labeled sample A to G in accordance to the different welding parameters with
sample G being the control. As shown in the table below.
3.3 ENVIRONMENT PREPARATION Solution of sodium Chloride was prepared using 500g of NaCl was mixed with 1 litre of deionized
water.
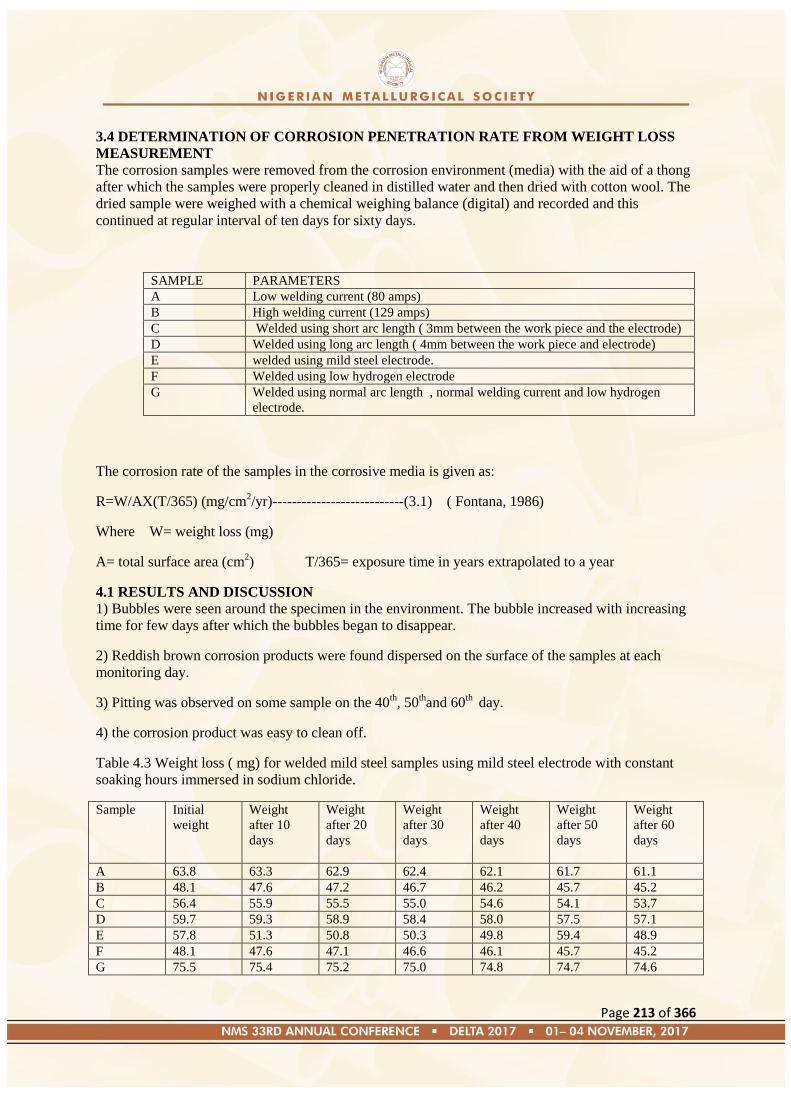
Page 213 of 366
3.4 DETERMINATION OF CORROSION PENETRATION RATE FROM WEIGHT LOSS
MEASUREMENT
The corrosion samples were removed from the corrosion environment (media) with the aid of a thong
after which the samples were properly cleaned in distilled water and then dried with cotton wool. The
dried sample were weighed with a chemical weighing balance (digital) and recorded and this
continued at regular interval of ten days for sixty days.
SAMPLE PARAMETERS
A Low welding current (80 amps)
B High welding current (129 amps)
C Welded using short arc length ( 3mm between the work piece and the electrode)
D Welded using long arc length ( 4mm between the work piece and electrode)
E welded using mild steel electrode.
F Welded using low hydrogen electrode
G Welded using normal arc length , normal welding current and low hydrogen
electrode.
The corrosion rate of the samples in the corrosive media is given as:
R=W/AX(T/365) (mg/cm2/yr)---------------------------(3.1) ( Fontana, 1986)
Where W= weight loss (mg)
A= total surface area (cm2) T/365= exposure time in years extrapolated to a year
4.1 RESULTS AND DISCUSSION
1) Bubbles were seen around the specimen in the environment. The bubble increased with increasing
time for few days after which the bubbles began to disappear.
2) Reddish brown corrosion products were found dispersed on the surface of the samples at each
monitoring day.
3) Pitting was observed on some sample on the 40th, 50
thand 60
th day.
4) the corrosion product was easy to clean off.
Table 4.3 Weight loss ( mg) for welded mild steel samples using mild steel electrode with constant
soaking hours immersed in sodium chloride.
Sample Initial
weight
Weight
after 10
days
Weight
after 20
days
Weight
after 30
days
Weight
after 40
days
Weight
after 50
days
Weight
after 60
days
A 63.8 63.3 62.9 62.4 62.1 61.7 61.1
B 48.1 47.6 47.2 46.7 46.2 45.7 45.2
C 56.4 55.9 55.5 55.0 54.6 54.1 53.7
D 59.7 59.3 58.9 58.4 58.0 57.5 57.1
E 57.8 51.3 50.8 50.3 49.8 59.4 48.9
F 48.1 47.6 47.1 46.6 46.1 45.7 45.2
G 75.5 75.4 75.2 75.0 74.8 74.7 74.6
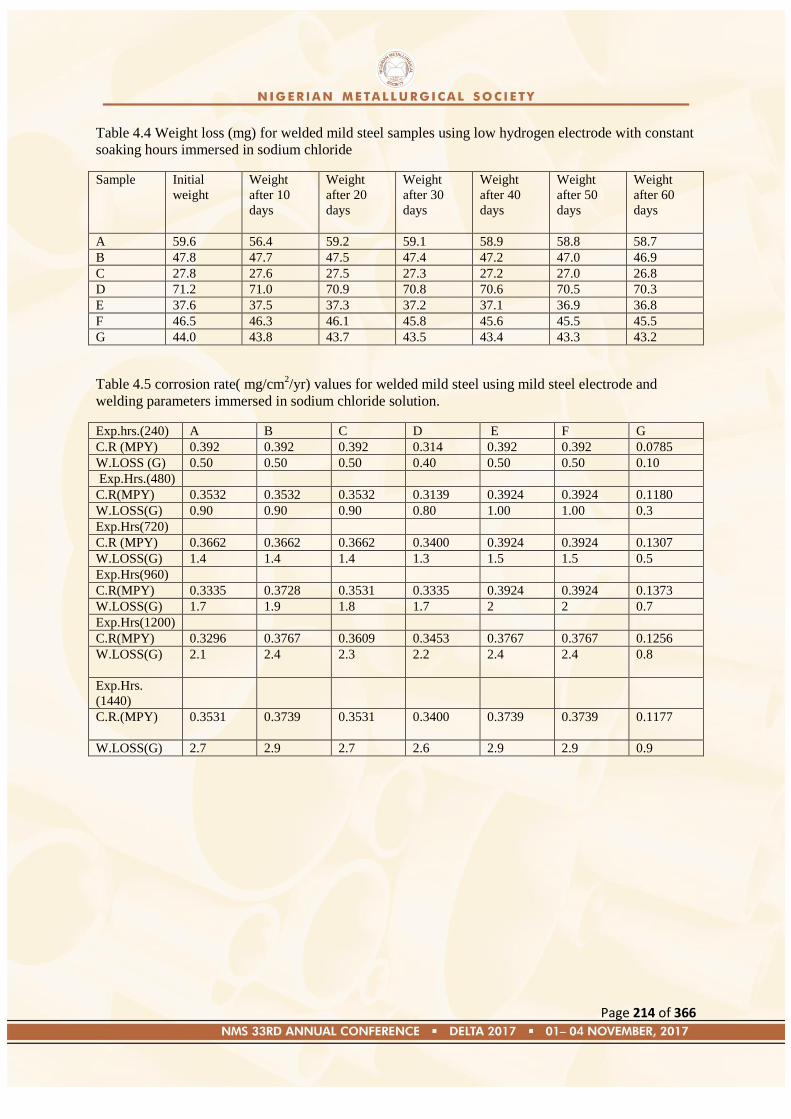
Page 214 of 366
Table 4.4 Weight loss (mg) for welded mild steel samples using low hydrogen electrode with constant
soaking hours immersed in sodium chloride
Sample Initial
weight
Weight
after 10
days
Weight
after 20
days
Weight
after 30
days
Weight
after 40
days
Weight
after 50
days
Weight
after 60
days
A 59.6 56.4 59.2 59.1 58.9 58.8 58.7
B 47.8 47.7 47.5 47.4 47.2 47.0 46.9
C 27.8 27.6 27.5 27.3 27.2 27.0 26.8
D 71.2 71.0 70.9 70.8 70.6 70.5 70.3
E 37.6 37.5 37.3 37.2 37.1 36.9 36.8
F 46.5 46.3 46.1 45.8 45.6 45.5 45.5
G 44.0 43.8 43.7 43.5 43.4 43.3 43.2
Table 4.5 corrosion rate( mg/cm2/yr) values for welded mild steel using mild steel electrode and
welding parameters immersed in sodium chloride solution.
Exp.hrs.(240) A B C D E F G
C.R (MPY) 0.392 0.392 0.392 0.314 0.392 0.392 0.0785
W.LOSS (G) 0.50 0.50 0.50 0.40 0.50 0.50 0.10
Exp.Hrs.(480)
C.R(MPY) 0.3532 0.3532 0.3532 0.3139 0.3924 0.3924 0.1180
W.LOSS(G) 0.90 0.90 0.90 0.80 1.00 1.00 0.3
Exp.Hrs(720)
C.R (MPY) 0.3662 0.3662 0.3662 0.3400 0.3924 0.3924 0.1307
W.LOSS(G) 1.4 1.4 1.4 1.3 1.5 1.5 0.5
Exp.Hrs(960)
C.R(MPY) 0.3335 0.3728 0.3531 0.3335 0.3924 0.3924 0.1373
W.LOSS(G) 1.7 1.9 1.8 1.7 2 2 0.7
Exp.Hrs(1200)
C.R(MPY) 0.3296 0.3767 0.3609 0.3453 0.3767 0.3767 0.1256
W.LOSS(G) 2.1 2.4 2.3 2.2 2.4 2.4 0.8
Exp.Hrs.
(1440)
C.R.(MPY)
0.3531
0.3739 0.3531 0.3400 0.3739 0.3739 0.1177
W.LOSS(G) 2.7 2.9 2.7 2.6 2.9 2.9 0.9
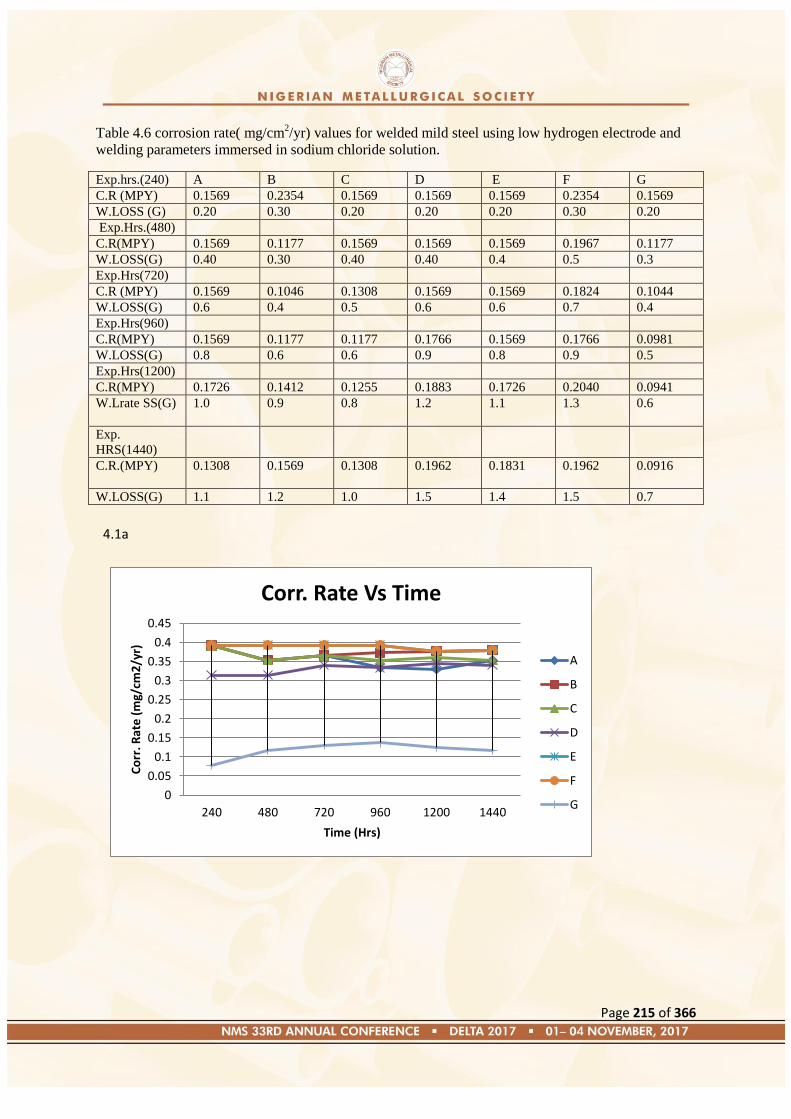
Page 215 of 366
Table 4.6 corrosion rate( mg/cm2/yr) values for welded mild steel using low hydrogen electrode and
welding parameters immersed in sodium chloride solution.
Exp.hrs.(240) A B C D E F G
C.R (MPY) 0.1569 0.2354 0.1569 0.1569 0.1569 0.2354 0.1569
W.LOSS (G) 0.20 0.30 0.20 0.20 0.20 0.30 0.20
Exp.Hrs.(480)
C.R(MPY) 0.1569 0.1177 0.1569 0.1569 0.1569 0.1967 0.1177
W.LOSS(G) 0.40 0.30 0.40 0.40 0.4 0.5 0.3
Exp.Hrs(720)
C.R (MPY) 0.1569 0.1046 0.1308 0.1569 0.1569 0.1824 0.1044
W.LOSS(G) 0.6 0.4 0.5 0.6 0.6 0.7 0.4
Exp.Hrs(960)
C.R(MPY) 0.1569 0.1177 0.1177 0.1766 0.1569 0.1766 0.0981
W.LOSS(G) 0.8 0.6 0.6 0.9 0.8 0.9 0.5
Exp.Hrs(1200)
C.R(MPY) 0.1726 0.1412 0.1255 0.1883 0.1726 0.2040 0.0941
W.Lrate SS(G) 1.0 0.9 0.8 1.2 1.1 1.3 0.6
Exp.
HRS(1440)
C.R.(MPY)
0.1308
0.1569 0.1308 0.1962 0.1831 0.1962 0.0916
W.LOSS(G) 1.1 1.2 1.0 1.5 1.4 1.5 0.7
4.1a
0
0.05
0.1
0.15
0.2
0.25
0.3
0.35
0.4
0.45
240 480 720 960 1200 1440
Co
rr. R
ate
(m
g/cm
2/y
r)
Time (Hrs)
Corr. Rate Vs Time
A
B
C
D
E
F
G
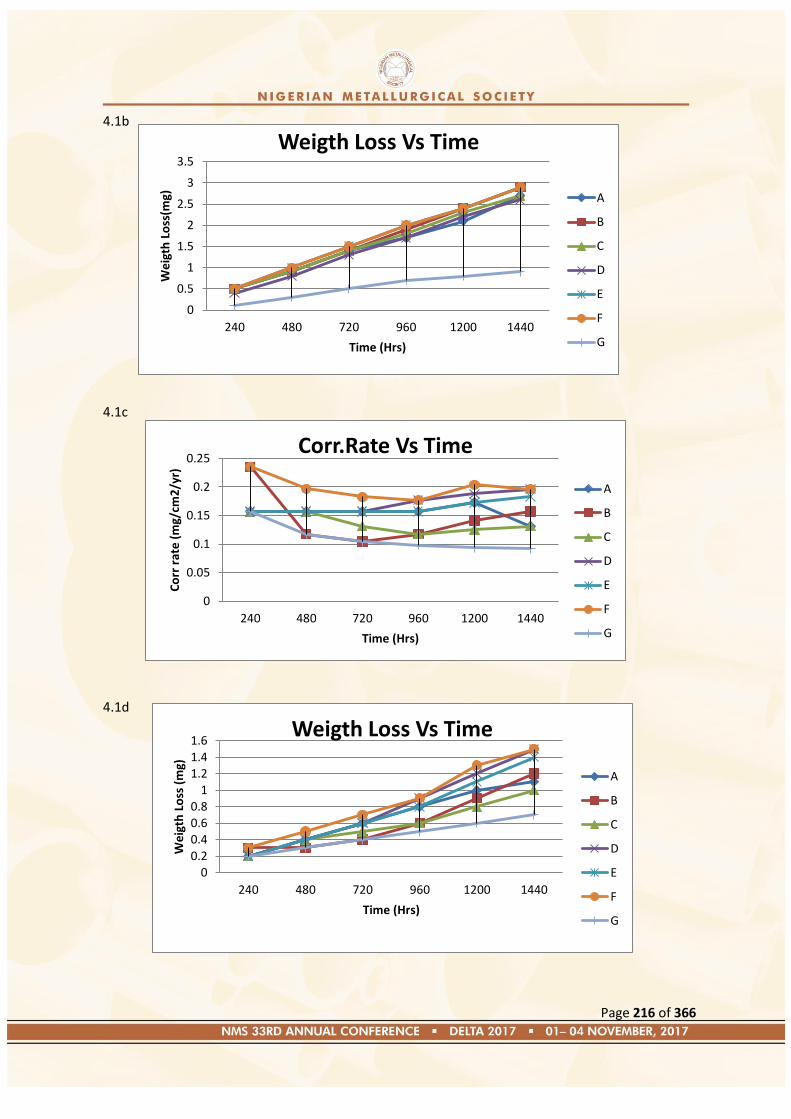
Page 216 of 366
4.1b
4.1c
4.1d
0
0.5
1
1.5
2
2.5
3
3.5
240 480 720 960 1200 1440
We
igth
Lo
ss(m
g)
Time (Hrs)
Weigth Loss Vs Time
A
B
C
D
E
F
G
0
0.05
0.1
0.15
0.2
0.25
240 480 720 960 1200 1440
Co
rr r
ate
(m
g/cm
2/y
r)
Time (Hrs)
Corr.Rate Vs Time
A
B
C
D
E
F
G
00.20.40.60.8
11.21.41.6
240 480 720 960 1200 1440
We
igth
Lo
ss (
mg)
Time (Hrs)
Weigth Loss Vs Time
A
B
C
D
E
F
G

Page 217 of 366
4.2 DISCUSSION OF RESULTS
Figure 4.1a , 4.1b, 4.1c and 4.1d show the graph of weight loss(g) and corrosion rate (mpy) and
(mm/y) respectively against time of exposure(hrs.) respectively. We will observe that the weight for
sample A, B, C, D, E, F, increased rapidly when compared to the control sample G which increased
gradually. This behavior can be attributed to the use of improper welding parameters such as high or
low welding current; long or short arc length; which leads to much beads and much spatters and in
turn lead to weak weld due to lack of penetration.
CONCLUSION
From the result obtained within the experimental errors, the following conclusions were made
1. Weight loss increased when high current is used to weld metals
2. The weak joint formed when low current causes pit which initiates surface
discontinuities and poses a threat to the strength of the joint.
3. Introduction of spatters on the welded joint when long arc length is used will increase
fatigue rate due to rough surface.
4. Mild steel electrode will produce weak joint which can failure when used during
construction
5. Low hydrogen electrode weld metal has a high resistance to cracking which will
cause enduring strength.
REFERENCES
Adegbite,M. 2005, ―Corrosion of Stainless Steels‖ Archlink NAWES Official Magazine.
Adebiyi , K.A , Hammed, K.A, and Ajayi, E.O. (2003) ― Predictive model for evaluating corrosion
rate of mild steel in six environment‖, LAUTECH Journal of Engineering and technology. In
Jekayinfa, S.O, (Eds), Effect of cassava fluid on corrosion performance of mild steel, Vol. 52,pp.286-
292.
Md. Ibrahim Khan, (2007). Welding science and technology,New Age International
Publishers,Editon, pp. 170.
Onyekpe, B.O.(2002). ‗‘ The Essentials of Metallurgy and Materials in Engineering‘‘ Ambik Press,
Benin City.
O.P. Khana, A. (2006). Textbook of Welding Technology, Dhanpat Rai Publication td, p 3
Page 218 of 366
Paper: NMS 2017-TP027
Metals: Indispensable Medical Implant Materials
C. S. Obayi1, P.S. Nnamchi
1, A. D. Omah
1, C. C. Daniel-Mkpume
1,
S. I. Neife2, P. O. Offor
1 and B. A. Okorie
1
1 Department of Metallurgical & Materials Engineering, University of Nigeria, Nsukka, Nigeria
2Department of Mechanical & Mechatronics Engineering, Federal University Ndufu Alike, Ebonyi
State.
Corresponding Author: [email protected]
Abstract
Metals have remained indispensable materials in many structural applications including medical
applications, a multibillion dollar industry. This is because metals possess attributes of high strength,
ductility, fracture toughness and fatigue resistance. Metals are suitable and indispensable materials for
orthopaedic load-bearing application and fixation devices such as joint replacement, bone plates and
screws, as well as dental implants, pacer and suture wires, and cardiovascular stents. This paper
surveyed the medical uses of metals in many areas of medicine and showed that metals have been
used and are still being used substantially to sustain life. Unfortunately, metal production in Nigeria is
still at its lowest level. The development and production of high-purity medical-grade metals will
enable Nigeria to tap from this multibillion dollar health industry; reduce the suffering of Nigerian
patients who are tricked into buying inferior implants abroad and reduce the number of deaths arising
from implant complications in Nigerian hospitals.
Keywords: Metals, biomaterials, implant, medical applications
1.0 Introduction
Due to their appropriate mechanical properties, metals stand out as one of the most useful materials in
engineering applications. Metals are preferred materials of choice in many structural and load-bearing
applications because they possess attributes of high strength, ductility, stiffness, fracture toughness
and fatigue resistance [1, 2, 3]. Metals also possess good thermal and electrical conductivities. Some
metals possess special property of having light weight while some are non-toxic physiological
elements found in the human body. Metals can be easily fabricated into simple and complex shapes
using well-established and available fabrication techniques such as casting, forging, extrusion,
drawing and machining.
The above favourable properties make metals indispensable in a wide variety of medical implant
applications. Materials, which could be synthetic or natural materials in contact with biological
systems for the purpose of treating diseases and easing suffering, are referred to as biomaterials [4].
Biomaterials, which could be metals, ceramics, polymers and composites, are used for making
medical implants/devices that can replace a part or function of the body. Thus, a biomaterial is a
component of a medical device [5]. As early as the 18th century, metals were used as biomaterials
when iron (Fe), gold (Au), silver (Ag), lead (Pb) and platinum (Pt) were used as suture wires [6, 7].
Metals still account for a substantial percentage of clinically used materials and for many applications,
represent the only current viable reconstructive strategy [7]. Currently, there are millions of patients
who have metallic implants and millions more who will need these devices in the near future [7].
Metallic biomaterials sustain life. The major metallic elements with which we have been formed from
Page 219 of 366
creation such as Fe, Mg, K, Na, Cu, Zn, Mn, are retained in our bodies and deficiency of any of these
in our bodies results into health problems [8].
The high strength and fracture resistance of metallic biomaterials ensure their reliable long-term
performance in major load-bearing situations in fields of orthopaedic medicine and dentistry. Metals
are suitable candidates for orthopaedic load-bearing application and fixation devices such as joint
replacement, bone plates and screws, suture wires, as well as dental implants [6, 7]. Metals are equally
used in forming cardiovascular devices such heart valves, blood conduits and other components of
heart assist devices, vascular stents and neurovascular implants (aneurysm clips) [9]. In addition, the
good electrical conductivity of metals favours their use for neuromuscular stimulation devices, the
most common being cardiac pacemakers [9].
However, metal applications in medicine have some challenges. One of the major challenges is their
susceptibility to corrosion in body fluids. Electrochemical reactions take place on metallic surfaces in
the human body [10]. The chemical environment of body fluid is highly aggressive for many metals
and alloys, due to the presence of high chloride ions concentration and their ability to induce localized
corrosion. Another drawback, especially in orthopaedic applications, is that most metals have high
elastic modulus. This causes mismatch of Young‘s modulus between the metal and the existing bone,
leading to stress shielding effect, which has been identified as a major cause of implant loosening and
failure [11]. Further to this, is the problem of inadequate bonding between the bone and the surface
of a metallic prosthesis which affects the survival of metallic bone implant.
The demand for metallic implants to maintain quality of life has been expanding in recent years due
to increase in incidence of oral and bone diseases and increase in population of the elderly
worldwide. This paper is aimed at surveying the medical uses of metals in medicine and to show that
metals are indispensable materials used in sustaining life.
2.0 Metallic biomaterials.
2.1 Characteristics of metallic implant materials.
The major issue in the application of biomaterials is that they must satisfy the functionality demands
defined by the human body as working environment. A metallic implant material should have the
following essential characteristics: excellent biocompatibility with no adverse tissue reactions, high
corrosion resistance in body fluid, suitable mechanical properties, high wear resistance and Osseo-
integration (specific for orthopaedic implants) [12].
2.1.1Biocompatibility
The term ―biocompatibility‖ is used to describe the interaction between a biomaterial and a biological
system. It is defined as the ability of a material to perform with an appropriate host response in a
specific application [13]. Biocompatibility is the ability of an implant to exist in contact with tissues
of the human body without causing an unacceptable degree of harm to the body. Since a metallic
biomaterial is selected and designed to be in intimate contact with living tissue, it is important that the
implanted material is non-toxic and does not induce any measurable harm to the host. Since no metal
is completely non-toxic, metallic implant should contain non-toxic alloying elements or highly
corrosion resistant elements or elements that naturally exist in the human body. The elements
commonly found in the human body include O, C, H, N, Ca P, K, S, Na, Cl, Mg, Fe [14]. O, C, H, N
constitutes roughly 96% of the body weight while approximately 4% of the body mass results from
bone minerals (Ca, Mg, P) and major electrolytes (Na, K, Cl) found in the blood and extracellular
fluid [12].
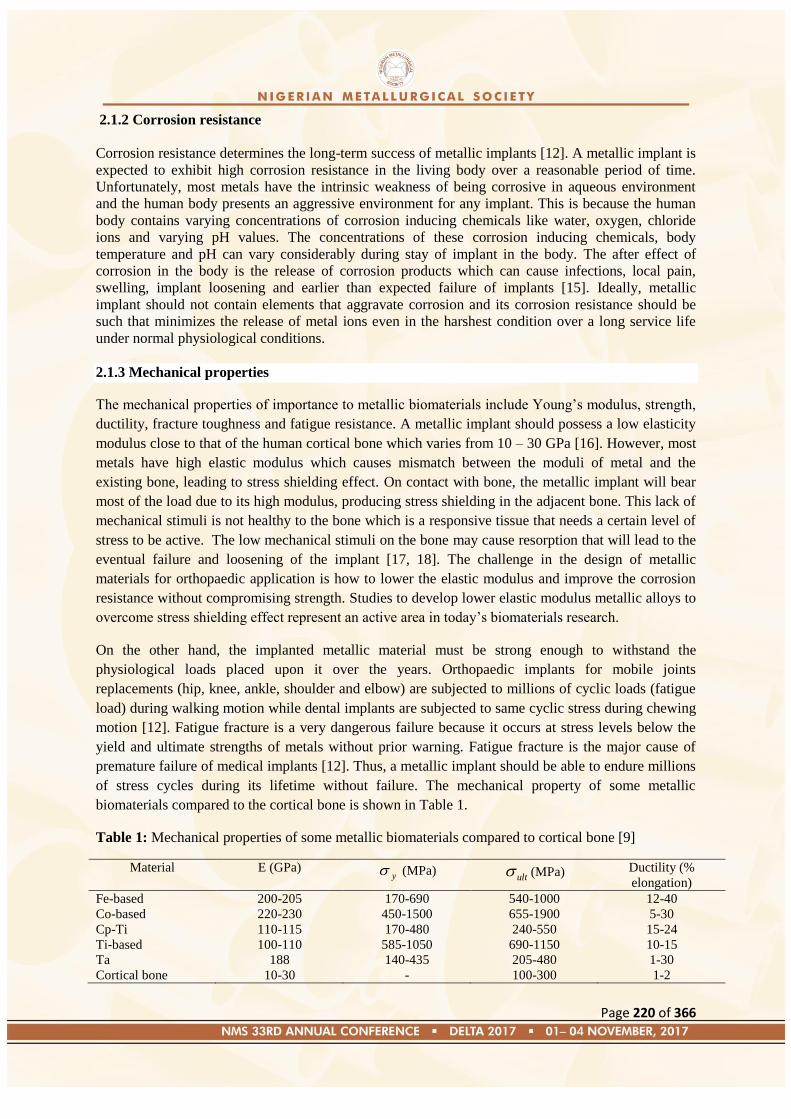
Page 220 of 366
2.1.2 Corrosion resistance
Corrosion resistance determines the long-term success of metallic implants [12]. A metallic implant is
expected to exhibit high corrosion resistance in the living body over a reasonable period of time.
Unfortunately, most metals have the intrinsic weakness of being corrosive in aqueous environment
and the human body presents an aggressive environment for any implant. This is because the human
body contains varying concentrations of corrosion inducing chemicals like water, oxygen, chloride
ions and varying pH values. The concentrations of these corrosion inducing chemicals, body
temperature and pH can vary considerably during stay of implant in the body. The after effect of
corrosion in the body is the release of corrosion products which can cause infections, local pain,
swelling, implant loosening and earlier than expected failure of implants [15]. Ideally, metallic
implant should not contain elements that aggravate corrosion and its corrosion resistance should be
such that minimizes the release of metal ions even in the harshest condition over a long service life
under normal physiological conditions.
2.1.3 Mechanical properties
The mechanical properties of importance to metallic biomaterials include Young‘s modulus, strength,
ductility, fracture toughness and fatigue resistance. A metallic implant should possess a low elasticity
modulus close to that of the human cortical bone which varies from 10 – 30 GPa [16]. However, most
metals have high elastic modulus which causes mismatch between the moduli of metal and the
existing bone, leading to stress shielding effect. On contact with bone, the metallic implant will bear
most of the load due to its high modulus, producing stress shielding in the adjacent bone. This lack of
mechanical stimuli is not healthy to the bone which is a responsive tissue that needs a certain level of
stress to be active. The low mechanical stimuli on the bone may cause resorption that will lead to the
eventual failure and loosening of the implant [17, 18]. The challenge in the design of metallic
materials for orthopaedic application is how to lower the elastic modulus and improve the corrosion
resistance without compromising strength. Studies to develop lower elastic modulus metallic alloys to
overcome stress shielding effect represent an active area in today‘s biomaterials research.
On the other hand, the implanted metallic material must be strong enough to withstand the
physiological loads placed upon it over the years. Orthopaedic implants for mobile joints
replacements (hip, knee, ankle, shoulder and elbow) are subjected to millions of cyclic loads (fatigue
load) during walking motion while dental implants are subjected to same cyclic stress during chewing
motion [12]. Fatigue fracture is a very dangerous failure because it occurs at stress levels below the
yield and ultimate strengths of metals without prior warning. Fatigue fracture is the major cause of
premature failure of medical implants [12]. Thus, a metallic implant should be able to endure millions
of stress cycles during its lifetime without failure. The mechanical property of some metallic
biomaterials compared to the cortical bone is shown in Table 1.
Table 1: Mechanical properties of some metallic biomaterials compared to cortical bone [9]
Material E (GPa) y (MPa)
ult (MPa) Ductility (%
elongation)
Fe-based 200-205 170-690 540-1000 12-40
Co-based 220-230 450-1500 655-1900 5-30
Cp-Ti 110-115 170-480 240-550 15-24
Ti-based 100-110 585-1050 690-1150 10-15
Ta 188 140-435 205-480 1-30
Cortical bone 10-30 - 100-300 1-2
Page 221 of 366
2.1.4 Wear resistance
Wear is an unavoidable problem in any mobile joint replacement [12]. The low wear resistance or
high coefficient of friction results in implant loosening. Wear debris are found to be biologically
active and make a severe inflammatory response that lead to the destruction of the healthy bone which
supports the actual implant. Corrosion caused by friction is a big concern since it releases non-
compatible metallic ions. Therefore, metallic joint implants should exhibit high fatigue fracture,
excellent corrosion and wear resistances.
2.1.5 Osseo-integration
Osseo-integration is a fundamental requirement of materials for orthopaedic implant application.
Osseo-integration is defined as the process of formation of new bone and bone healing [19]. The
incapability of an implant surface to join with the adjacent bone and other tissues due to micro-
motions, result in formation of a fibrous tissue around the implant and promote loosening of the
prostheses [49]. Thus, materials with a proper surface are extremely essential for the implant to
integrate well with the surrounding bone. Many methods of surface modifications are being
exploited to obtain direct bonding between the bone and metallic prosthesis for longer service life.
2.2 Classes and areas of applications of metals in medical implants
2.2.1 Classes of metals used in medical implant applications
The most widely used metallic biomaterials for medical implants can categorized into four based on
the alloying elements: stainless steels, Co-based alloys, titanium-based alloys and others [12]. These
metals were initially developed for industrial purposes, but due to their excellent mechanical
properties and relatively high corrosion resistance, which results in very small release of harmful
toxins when exposed to body fluids, they have found applications in medical fields [2]. Metallic
implant materials are made from high-purity metals and they are manufactured following strictly
regulated world standards. The table below shows the relative mechanical and biological
characteristics of these metal alloys used in medicine.
Table 2: Relative characteristics of major metal alloys used in medicine [2]
Characteristics Stainless steels Cobalt alloys Titanium alloys
Stiffness High Medium Low
Strength Medium Medium High
Corrosion resistance Low Medium High
Biocompatibility Low Medium High
2.2.1.1 Stainless steels
Stainless steels are an iron-based alloys that contain high percentage of chromium (11-30wt. % Cr)
and varying amounts of nickel [20]. Stainless steels can be grouped according to chemical
composition or into four families based on microstructural characteristics of the alloys as martensitic,
ferritic, austenitic or duplex (austenitic + ferritic) [20]. The first three groups except duplex stainless
steel find applications in medical devices. However, austenitic type 316L stainless steel is the most
popular due to its resistance to corrosion, together with a wide range of physical (non-magnetic) and
mechanical properties (moderate strength and good ductility) coupled with inert, easy-to-clean
Page 222 of 366
surfaces [2]. Stainless steel 316L is suitable for use only in temporary implant devices, such as
fracture plates, screws, and hip nails.
The chemical composition of type 316L (ASTM F138, F139) austenitic stainless steel where ―L‖
denotes low carbon content is as follows: 0.030% C, 1.0%Si, 2.0% Mn, 0.045% P, 0.030%
S, 12.0 – 15.0% Ni, 16.0 – 18.0% Cr and 2.0 – 3.0% Mo, balance Fe [4]. The high percentage of Cr in
stainless steel is responsible for its corrosion resistance in the body environment. Chromium has great
affinity for oxygen, which enables the formation of a protective, adherent, coherent and self-healing
chromium-based oxide film (Cr2O3) on the entire outer surface [11, 12]. Nickel and molybdenum are
responsible for further improvement in corrosion resistance and mechanical properties of stainless
steel [20]. Unfortunately, Nickel is highly toxic to the human body [21] and there are current research
efforts aimed at removing or substituting Ni with a non-toxic alloying element.
The major limitations of austenitic stainless steels are their higher sensitivity towards pitting corrosion
and stress corrosion cracking. Pitting corrosion causes deep pits on the metal surface. The addition of
molybdenum as an alloying element in stainless steel reduces both the number and size of nucleations
and metastable pits by strengthening the passive film.
2.2.1.2 Co-based alloys
The most popular Cobalt-based alloy is cobalt-chromium (Co-Cr) alloy. Co is alloyed with other
elements like Molybdenum (Mo), Nickel (Ni), Tungsten (W), and Iron (Fe), to produce medical grade
Co-based alloys of varying compositions such as Co-Cr-Mo, Co-Cr-Ni-Mo, Co-Cr-W-Ni, Co-Cr-Ni-
Mo-Fe and Co-Ni-Cr-Mo-W-Fe [2, 12]. These alloying elements play different roles in the alloy. Cr,
Mo and Ni are responsible for corrosion resistance while W plays the role of solid-solution
strengthening and controlling the distribution and size of carbides. However, W can impair the
corrosion resistance and corrosion fatigue of Co-based alloys, thereby making Co-based alloys
containing W and Fe unsuitable for permanent implant application.
.
Cobalt-based alloys are generally non-magnetic, corrosion and heat resistant, wear resistant and
exhibit high strength even at elevated temperature [22]. Co-Cr based alloys exhibit corrosion
resistance when compared to stainless steels in chloride-rich environment [10]. This characteristic
emanates from the high Cr content which results in the spontaneous formation of a passive Cr oxide
(Cr2O3) layer within the physiological environment [11, 23, 24]. Co-Cr alloys also display superior
mechanical properties over stainless steels due to the crystallographic nature of Co. The superior wear
(formation of extremely hard carbides) and fatigue resistances over that of Fe-based alloys originate
from the hexagonal closed packed (HCP) and face-centred (FCC) structures of Co-Cr alloys [10]. The
use of Cobalt alloys in medical applications is limited by the difficulty in fabrication. However,
continuous work has led to the development of specialized casting methods and recently to selective
laser sintering [2, 25].
2.2.1.3 Titanium-based alloys
Titanium (Ti) is a low density element and in its elemental form it has a HCP structure called α phase.
Ti undergoes allotropic transformation at 883°C, changing from its HCP structure (α phase) to a BCC
crystal structure called phase, which is maintained up to its high melting point temperature at
Page 223 of 366
1668°C. Ti can be strengthened substantially by alloying and deformation processing [12]. Ti alloys
can be grouped into four: α alloys, near-α alloys, α- alloys and alloys based on the microstructure
of Ti after processing (alloying or deformation) [12].
Since Ti has intrinsic excellent corrosion resistance due to the formation of adhesive TiO2, the
primary purpose of alloying is to enhance mechanical properties, unlike in stainless steels and Co-Cr
alloys where the main purpose of alloying is to increase corrosion resistance. The transformation
temperature between α-HCP and -BCC phases is very important and sensitive to alloying element
additions in Ti, which are classified as α and stabilizers. While α stabilizing elements increase the
transformation temperature, stabilizers lower it. The α and stabilizers can be substitutional or
interstitials or even neutral elements. α-phase stabilizers include Al, O, N, C, B, Ga, Ge, rare-earth
elements while -stabilizers are H, Mo, V, Nb, Ta, Fe, W, Cr, Si, Ni, Co, Cu, Pd, Mn [8]. The
elements that play neutral role with little stabilizing effects are Zr, Hf and Sn. The phase in Ti alloys
tends to exhibit a much lower modulus than α phase.
Ti alloys have low elastic modulus that is about half of that of stainless steels and Co-Mo alloys.
When compared with stainless steels and Co-Cr alloys, Ti alloys have lower elastic modulus, higher
specific strength, superior biocompatibility and enhanced corrosion resistance, but poor wear
resistance (inferior tribological properties). Ti alloys are also non-magnetic and have the capability of
osseointegration. The popular Ti alloys applied in medicine include commercial pure Ti (Cp-Ti), α+
Ti-6Al-4V, NiTi (nitinol) and the more recent developed metastable alloys [20].
The major limitation of poor wear resistance of Ti alloys makes them unsuitable for load bearing
articulating surfaces without some type of surface modification to give greater wear resistance.
Surface modification can be achieved via ion implantation (N+) or TiN film application using physical
vapour deposition (PVD). It is also possible to combine Co alloy or a ceramic (Al2O3 or ZrO2) with a
Ti alloy system.
2.2.1.3 Other metals
Other metals used for medical purposes include tantalum (Ta), gold (Au), zirconium (Zr), platinum
(Pt), dental amalgams, Magnesium (Mg) and other special metals. Porous tantalum is corrosion
resistant and biocompatible and is used in biological fixation of tantalum-made medical implants to
bone in orthopaedic procedures. Gold and gold alloys are useful metals in dentistry as a result of their
durability, stability, and corrosion resistance. Zr, like Ti, is a highly reactive metal and forms dense
cohesive and hard surface oxide (ZrO2) spontaneously and can be used to form a good wear resistant
surface on metallic implants. Platinum is a noble metal used for making electrodes for electrical
stimulation and sensing purposes (neuro-muscular stimulation). Dental amalgams are metals used in
dentistry for direct filling of teeth and they are alloys made of liquid mercury and silver, tin, copper
[26].
2.2.2 Areas of applications of metals in medicine
Metals have a significant place in the biomaterials market. According to Global Biomedical Metal
Market report [27], the global demand for biomedical metals reached US$14.52 billion in 2013. With
a growth of approximately 7% annually in the next years, the market is expected to approach
US$18.96 billion by 2017 and to increase to US$26.54 billion by 2022.
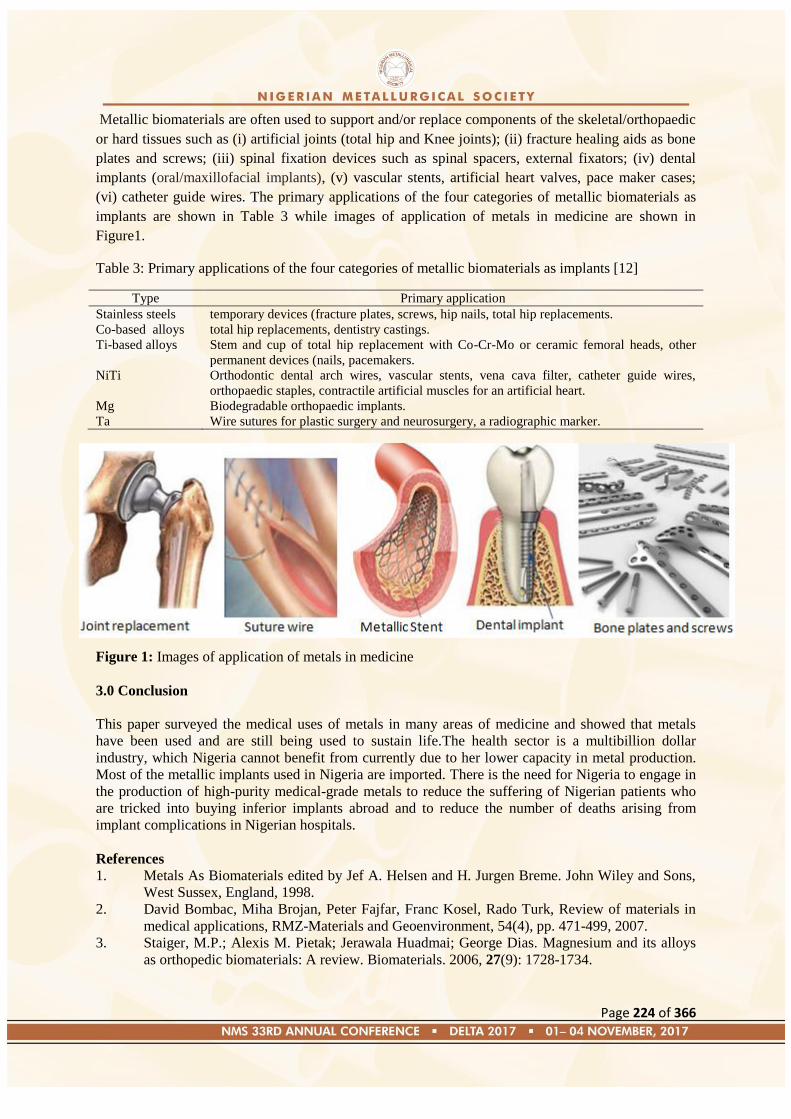
Page 224 of 366
Metallic biomaterials are often used to support and/or replace components of the skeletal/orthopaedic
or hard tissues such as (i) artificial joints (total hip and Knee joints); (ii) fracture healing aids as bone
plates and screws; (iii) spinal fixation devices such as spinal spacers, external fixators; (iv) dental
implants (oral/maxillofacial implants), (v) vascular stents, artificial heart valves, pace maker cases;
(vi) catheter guide wires. The primary applications of the four categories of metallic biomaterials as
implants are shown in Table 3 while images of application of metals in medicine are shown in
Figure1.
Table 3: Primary applications of the four categories of metallic biomaterials as implants [12]
Type Primary application
Stainless steels temporary devices (fracture plates, screws, hip nails, total hip replacements.
Co-based alloys total hip replacements, dentistry castings.
Ti-based alloys Stem and cup of total hip replacement with Co-Cr-Mo or ceramic femoral heads, other
permanent devices (nails, pacemakers.
NiTi Orthodontic dental arch wires, vascular stents, vena cava filter, catheter guide wires,
orthopaedic staples, contractile artificial muscles for an artificial heart.
Mg Biodegradable orthopaedic implants.
Ta Wire sutures for plastic surgery and neurosurgery, a radiographic marker.
Figure 1: Images of application of metals in medicine
3.0 Conclusion
This paper surveyed the medical uses of metals in many areas of medicine and showed that metals
have been used and are still being used to sustain life.The health sector is a multibillion dollar
industry, which Nigeria cannot benefit from currently due to her lower capacity in metal production.
Most of the metallic implants used in Nigeria are imported. There is the need for Nigeria to engage in
the production of high-purity medical-grade metals to reduce the suffering of Nigerian patients who
are tricked into buying inferior implants abroad and to reduce the number of deaths arising from
implant complications in Nigerian hospitals.
References
1. Metals As Biomaterials edited by Jef A. Helsen and H. Jurgen Breme. John Wiley and Sons,
West Sussex, England, 1998.
2. David Bombac, Miha Brojan, Peter Fajfar, Franc Kosel, Rado Turk, Review of materials in
medical applications, RMZ-Materials and Geoenvironment, 54(4), pp. 471-499, 2007.
3. Staiger, M.P.; Alexis M. Pietak; Jerawala Huadmai; George Dias. Magnesium and its alloys
as orthopedic biomaterials: A review. Biomaterials. 2006, 27(9): 1728-1734.
Page 225 of 366
4. Ratner, B.D., Scholen F., Hoffman, A., Lemons, J.: Biomaterials Science: An Introduction to
Materials in Medicine, Elsevier Science & Technology Books, ISBN:978-0-125-82463-7,
2013.
5. Handbook of Biomaterials Evaluation: Scientific, Technical and Clinical Testing of Implant
Materials. Taylor & Francis, London, Uk, 1999, P. 719.
6. Park JB, Lakes RS. Biomaterials : an introduction. New York: Springer; New York, NY,
USA, 2007; p. 561.
7. Bhat, S.V. Biomaterials; Kluwer Academic Publishers: Boston, MT, USA, 2002: 265.
8. Cleopas. A. Loto, The foundation and the fundamental pillar of world technological
civilization and economic development, Covenant University Public Lecture Series, Volume
17, 25th October, 2007.
9. Robert M. Pillar, Biomedical Materials, R. Narayan (ed.), Springer + Business Media, LLC,
2009, DOI: 10.1007/978-0-387-84872-3_2.
10. Patrik Schmutz, Ngoc-Chang Quach-Vu, Isabel Gerber, Metallic Medical Implants:
Electrochemical Characterization of Corrosion Processes, The Electrochemical Society
Interface, 2008.
11. M. Navarro, A.Michiardi, O. Castano, J.A. Planell, Biomaterials in orthopaedics, J. R. Soc.
Interface. 5(27) 1137-1158), 2008.
12. Qizhi Chen, George A. Thouas, Metallic implant biomaterials, Materials Science and
Engineering R 87, 1-57, 2015.
13. Williams, D. F. Definitions in Biomaterials. Proceedings of a Consensus Conference of the
European Society for Biomaterials).Chester, England, March 3-5 1986, (Vol. 4). New York:
Elsevier, 1987.
14. R.R. Seeley, T.D. Stephens, P. Rate, Anatomy and Physiology, McGraw Hill, New York,
2006.
15. Burak Dikici, Ziya Esen, Ozgur Duygulu, Serap Gungor, Corrosion of Metallic Biomaterials,
in Advances in Metallic Biomaterials, Mitsuo Niinomi, Takayuki Narushima, Masaaki Nakai (ed.) Springer Series in Biomaterials Science and Engineering , vol. 3, 2015, pp 275-303.
16. Long M, Rack HJ. Titanium alloys in total joint replacement--a materials science perspective,
Biomaterials. 19(18):1621-1639, 1998.
17. Huiskes, R., Weinans, H., Rietbergen, B. V. 1992 The relationship between stress shielding
and bone resorption around total hip stems and the effects of flexible materials. Clin. Orthop.
Relat. Res. 274, 124–134.
18. Bauer, T. W., Schils, J. 1999. The pathology of total joint arthroplasty. II. Mechanisms of
implant failure. Skeletal Radiol. 28, 483–497. (Doi: 10.1007/s002560050552).
19. Marjan Bahrami Nasab, Mohd Roshdi Hassan, Barkawi Bin Sahari, Metallic Biomaterials of
Knee and Hip - A Review. Trends Biomater. Artif. Organs 24 (2), pp. 69-82, 2010.
20. Metallic materials, J.R. Davies (Ed.), Handbook of Materials for Medical Devices, ASM
International, Materials Park, Ohio, 2003, pp. 21-50.
21. Muñoz A, Costa M, Elucidating the mechanisms of nickel compound uptake: a review of
particulate and nano-nickel endocytosis and toxicity Toxicol. Appl. Pharmacol. 260 (1), 1-16,
2012.
22. Davids, J.R. (1998): Metals Handbook. ASM International.
23. C. Valero Vidal, A. Igual Muñoz, Effect of thermal treatment and applied potential on the
electrochemical behaviour of CoCrMo biomedical alloy. Electrochimica Acta 54, 1798–1809,
2009.
24. Oztürk, O., U. Türkan, A.E. Eroglu, Metal ion release from nitrogen ion implanted CoCrMo
orthopedic implant material. Surface & Coatings Technology, 200(20-21): p. 5687-5697,
2006.

Page 226 of 366
25 Shetty, R.H., Ottersberg, WI-I. (1995): Metals in Orthopedic Surgery. Encyclopedic
Handbook of Biomaterials and Bioengineering. Editors: Wise, D., Trantolo, J.D., Altobelli,
E.D., Yaszemski, J.M., Gresser, J.D., Schwartz, E.R., Marcel Dekker, ISBN: 978-0-824-
79649-5.
26. Phillip‘s Science of Dental Materials, in Anusavice KJ, ed. Dental Amalgam: Structures and
Properties, chap 17, 10th Edition, 1996.
27. Global Biomedical Metal Market, Acmite Market Intelligence, Ratingen, Germany, 2014.
Page 227 of 366
Paper: NMS 2017-TP028
Evaluation of a Modified Jominy End Quench Machine
D. I. Asariya and A. S. Asipita
Department of Metallurgical Engineering, Federal University of Technology, Minna.
Abstract
The Jominy end quench machine was designed, constructed and operated. The jominy end
samples were made from medium carbon steel all having the same properties. The jominy
samples were heated to a temperature of 830oC and quenched in water, tiger nut juice and palm
wine. The cooling rate of each quenchant on each sample was determined by the use of
thermometer. Hardenability test was carried out on each sample at different distance from the
quenched end. The microstructure of each sample was investigated using optical microscope.
The result shows that each of the quenching medium has different effect on hardenability of the
sample. The formation of martensite at the quenched end is much due to rapid cooling that
occurred at that point during the cooling process. However, the hardness value of the sample
decreases with distance from the quenched end for all the samples. At a distance of 5mm from
the quenched end, the sample quenched in water gives the best hardness of 46.0HRC, followed
by the sample quenched in palm wine, 45.3HRC and the least is the sample quenched in tiger
nut juice 43.7 HRC. The constructed jominy end quench machine has improvement of power
utilization, water management and cooling rate measurement.
Keywords: Hardenability, Quenching, Heat treatment, Jominy end quenching machine
1.0 Introduction
Most parts produce from steel in one way or the other are heat treated to enhance
hardness, toughness, corrosion resistance or uniformity of properties before they are
put into service. Generally, heat treatment uses phase transformation during heating
and cooling to change a microstructure in a solid state. In heat treatment, the
processing is most often entirely thermal and modifies only structure (Victor, 2014)
Heat treatment is the controlled heating and cooling of metal to alter their physical
and mechanical or chemical properties without changing the product shape. It is done
in order to improve the flexibility of soft tissues, eliminate toxic substances and to
make the material composition and general quality of the metal piece uniform. One of
the methods to determine the outcome of hardenability of a metal is through Jominy
test; other methods are Grossman critical radius method and chemical composition
cased on original work (Grossman, 1942).
Quenching of carbon steel is a heat treating process whereby carbon steel is heated above
critical temperature to austenising temperature and holding this temperature to a certain
soaking period of time before rapidly immersing it into a quenching medium (Canale et al,
2005).

Page 228 of 366
To select any component to be heat treated, it is very essential for the hardenability to be
known. Hardenability is the property of steel that determines the depth of the hardness zone
induced by quenching from the austenising temperature (Prabhudav, 1998). The knowledge of
hardenability of steel aids in the selection of appropriate alloy combination, it also helps to
minimise thermal stress which may result to distortion and possible crack. Hardenability is
also sensitive to the size of a component.
From the metallurgical point of view, hardenability can loosely be defined as the ability of
steel alloy to develop a desired hardness from the surface to the core by forming a martensite
under specified quenching conditions (Daniel, 2010). There are factors that influence the
hardenability of steel alloys. Among which according to Grum and Zupancic are:
i. Shape and size (geometry) of the work piece
ii. Quenching conditions (cooling rate of quenching medium); and
iii. Chemical composition of the steel (carbon and alloy content).
Thus, a piece of steel requires a rapid cooling rate in order to achieve high hardening depth
because of the formation of a large amount of martensite. In the hardenability tests the
cooling media, temperature, and thermal effects between the environment and the sample all
play very important roles (Grum and Zupanic 2001).
There is a need to use Jominy end quenching machine to estimate the quenching severity of
quenching media aside the measuring the hardenability of some of the engineering materials.
The use of environmentally friendly quenching fluids other than water will also be looked
into in determining the hardenability of steel and other relevant factors.
Furthermore, utilization of energy is a priority in today‘s society, and so, the use of low
energy to power the jominy end quenching machine will also be addressed
Hardenability is a very important property of steel in heat treatment. It gives the depth at
which given a steel should be quenched. It also determine the maximum hardness that can be
achieved on a steel service of large cross sectional bars subjected to drastic quenching in
different quenching media. That‘s to say, the selection base on strength is based on
hardenability.
Hardenability affects the cracking tendency after welding of steel components. Hardenability
calculation can be used to predict the formation of compressive and residual stress after
quenching in load bearing and fatigue resistant steel.
.
2.0 Materials and method
2.1 Materials and Equipment
The following are the materials used in cost of this research. However, some of the materials
are with specifications are: quenching media, carbon steel, Jominy end machine, Rockwell
hardness testing machine and X-ray machine, thermometer, heater, thermostat, water pump.
2.2 Method
2.2.1 Design of Tanks The boiling tank, quenching tank and the returning tank are made up of stainless steel, the
volume of each tank was calculated from the equation;

Page 229 of 366
Where,
h = height of each tank
r = radius of each tank
V= volume of each tank
2.2.2 Design of Water heater The rating of the heating element determines the time taken to boil certain volume/mass of
quenchant.
From equation 2.2, the time taken to boil a quenchant will be;
( )( )
(
⁄ )
Where,
VL =Volume of liquid
T2 = Boiling Temperature
T1 = Initial Temperature
ELR= Electrical Rating of the element
Mw= Mass of the liquid (determined by scale)
2.2.3 Specimen Frame
It is used for supporting the test specimen vertically in which the lower end of the specimen
is of a distance of 13 mm above the orifice of the liquid -quenching device that the sprayed jet
of water through the nozzle will form an umbrella shape by touching just the tip end of the
specimen.
2.2.4 The Nozzle
The nozzle is made up of galvanised steel the diameter of the nozzle was calculated from
equation 2.3. The size of the diameter of the nozzle in respect to the specimen makes the
quenching liquid to form an umbrella shape when it is sprayed at the lower end of the
specimen. Care was taken to prevent the splash of the quenching liquid on the remaining part
of the specimen other than the lower end. The size of the diameter of the specimen can be
determined from the equation:
√
Page 230 of 366
Where
Q = the discharge
d = the diameter
V= the velocity
2.3 Machine mode of operation
All the valves in the jominy end machine were closed before carrying out the operation, the
boiling tank was filled with quenching fluid; the heater was turned on and set to appropriate
temperature by the use of one of the thermometers. The Jominy specimen, cylindrical carbon
steel, 25.4 mm (1.0 in.) in diameter and 100 mm (4 in.) long was placed in the furnace and
heated to an austenising temperature (8300C). The two control valves and the valve
connecting the quenching tank with the returning tank were opened before putting on the
pump; this enables water to flow from the quenching tank to the boiler tank via the returning
tank, the upper control valve was used to control the flow rate of the quenchant to a desired
level.
The Jominy specimen was removed from the furnace after reaching a required austenising
temperature and it was placed quickly on the specimen frame .A thermocouple sensor was
placed on the heated jominy specimen and the temperature at time 0.00 second was recorded.
Then, the water pump was switched on and the water flow distance and the lower end is
quenched by a jet of water of specified flow rate and temperature. Thus, the cooling rate is a
maximum at the quenched end and diminishes with position from this point along the length
of the specimen. The temperature drop at an interval of 1 minute was recorded for each
different sample using different quenching media and the each was, until the each sample
temperature dropped to a temperature of 45oC and the pump was switched off and also, the
water pump was switched off.
After the samples have been cooled to room temperature, it was taken off from the quench
hanger and carried for hardness test. Shallow flats of 0.2 mm deep are ground along the
specimen length and Rockwell hardness measurements was made for the first 52 mm along
one flat ; for the first 12.8 mm , hardness readings were taken at 1.6 mm intervals, and for the
remaining 38.4 mm , every 3.2 mm. A hardenability curve was produced when hardness is
plotted as a function of position from the quenched end.
2.4 Hardness test
In carrying out the hardness test, a diamond indenter was used. The diamond cone was
pressed with a minor force of 98.1 (10Kkp), the depth of the indentation at that preliminary
point was the reference point. Then, the test force was increase by 1373N (140kp) which
acted as a major force. An overall force of 150 Kp was acting on the indenter and the force
was held for a period of 15 seconds and the force was then removed. The Hardness value in
HRC was read from a dial mounted on the machine..
2.1 Metallographic Test
Metallographic examination was carried out on each sample of the Jominy specimen. The
standard technique for the sample preparation for the microstructure observation was used
each of the sample was mounted on Bakelite and silicon carbide abrasive pepper ranging from
240 to 600 grit sizes was used to polish the samples on a rotating disc after which the samples
were cleaned and polished using 2% Nital (2% Nitric acid, HN03, in ethyl alcohol.) as etchant
for about 20-30 seconds in order to develop the structure. The photograph of the structure
obtained is shown on Figure 3.2.
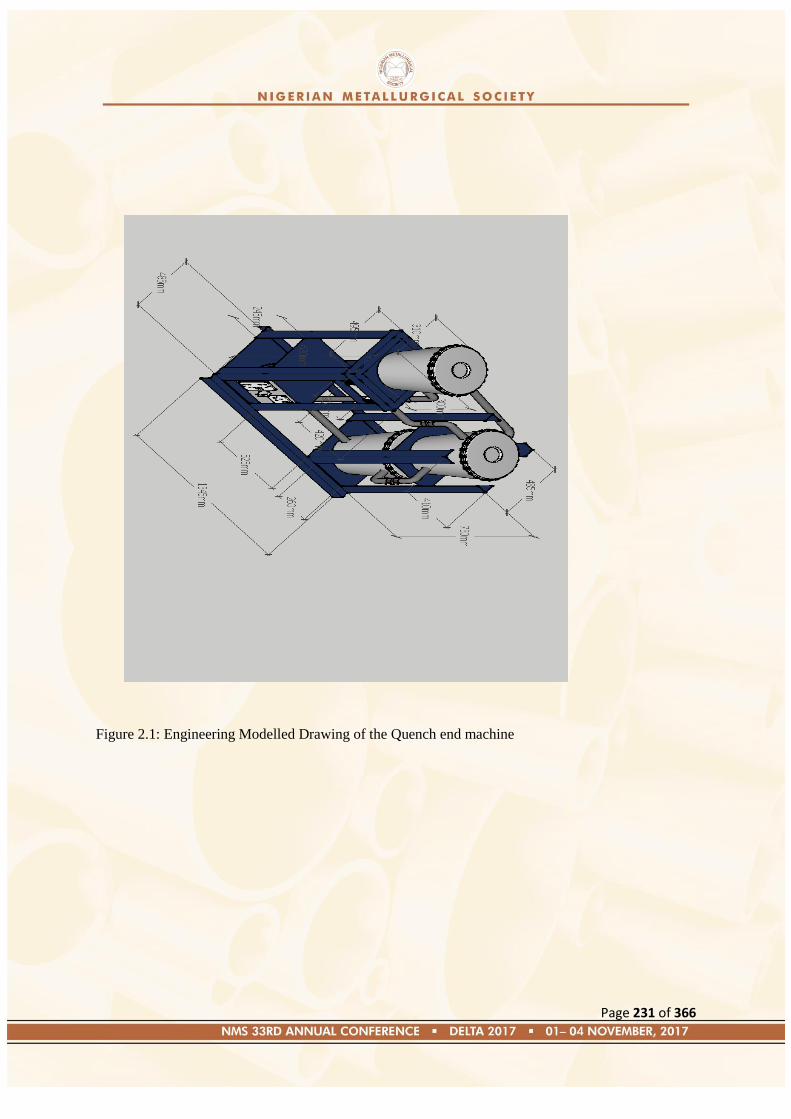
Page 231 of 366
Figure 2.1: Engineering Modelled Drawing of the Quench end machine
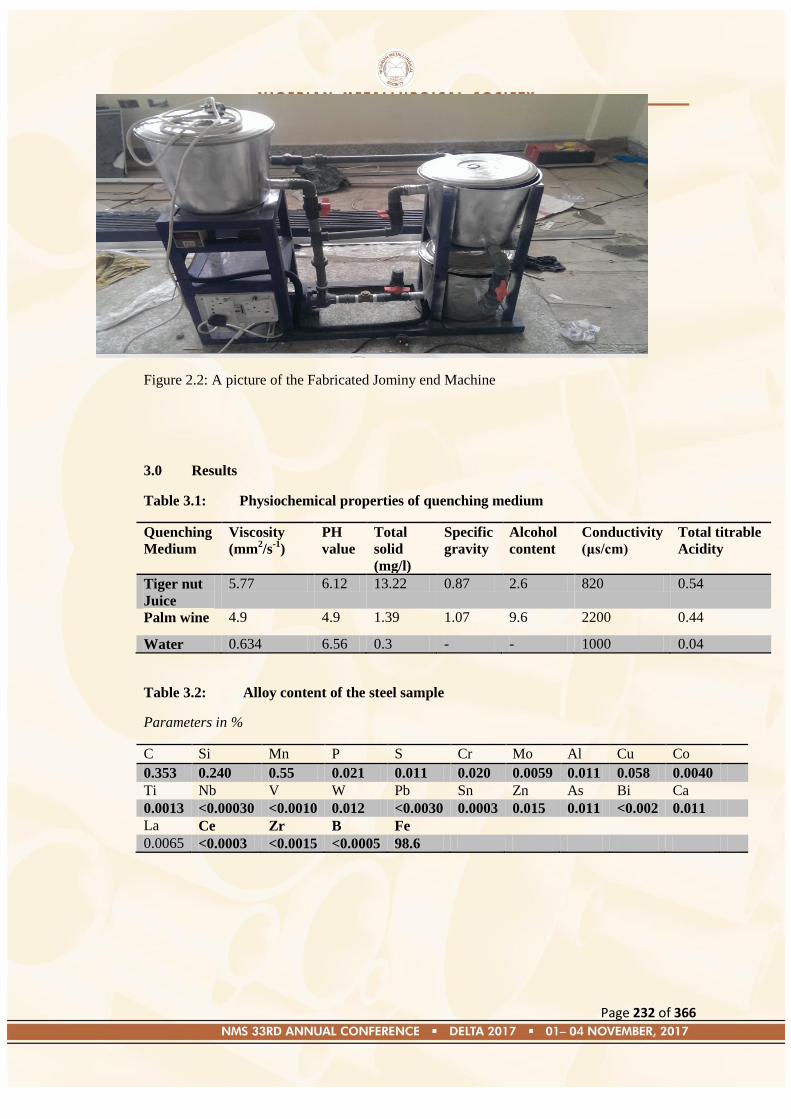
Page 232 of 366
Figure 2.2: A picture of the Fabricated Jominy end Machine
3.0 Results
Table 3.1: Physiochemical properties of quenching medium
Quenching
Medium
Viscosity
(mm2/s
-1)
PH
value
Total
solid
(mg/l)
Specific
gravity
Alcohol
content
Conductivity
(μs/cm)
Total titrable
Acidity
Tiger nut
Juice
5.77 6.12 13.22 0.87 2.6 820 0.54
Palm wine 4.9 4.9 1.39 1.07 9.6 2200 0.44
Water 0.634 6.56 0.3 - - 1000 0.04
Table 3.2: Alloy content of the steel sample
Parameters in %
C Si Mn P S Cr Mo Al Cu Co
0.353 0.240 0.55 0.021 0.011 0.020 0.0059 0.011 0.058 0.0040
Ti Nb V W Pb Sn Zn As Bi Ca
0.0013 <0.00030 <0.0010 0.012 <0.0030 0.0003 0.015 0.011 <0.002 0.011
La Ce Zr B Fe
0.0065 <0.0003 <0.0015 <0.0005 98.6
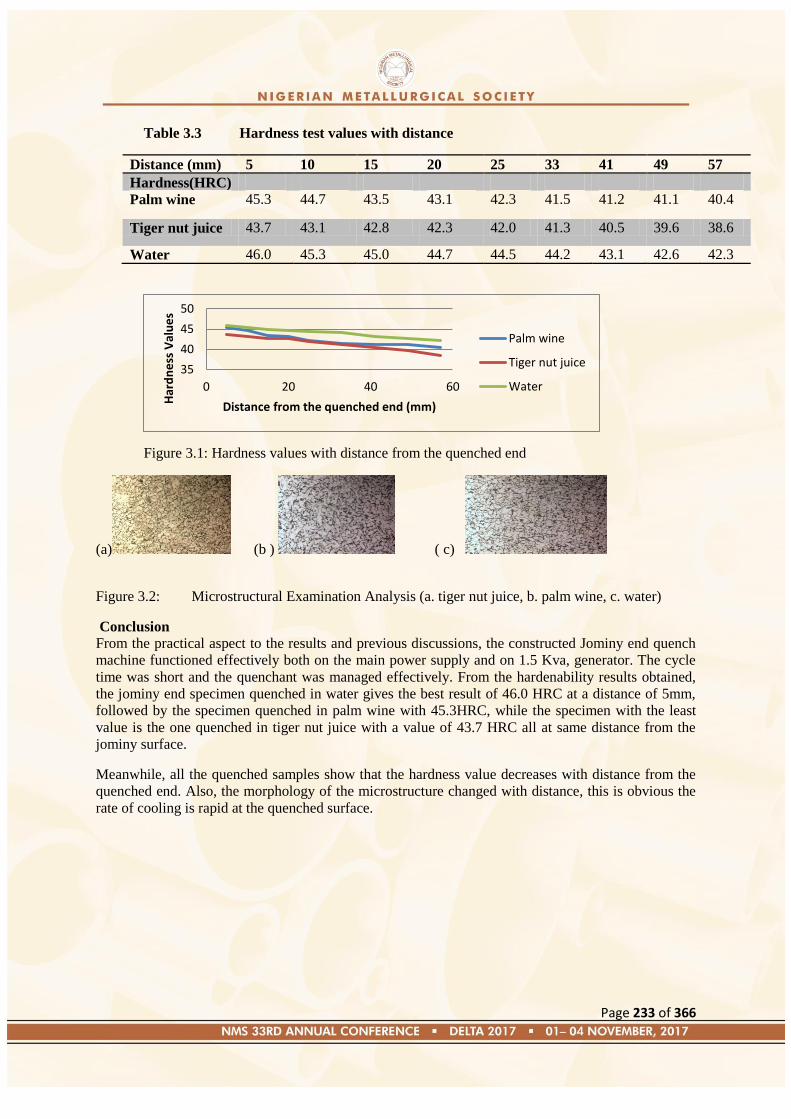
Page 233 of 366
Table 3.3 Hardness test values with distance
Distance (mm) 5 10 15 20 25 33 41 49 57
Hardness(HRC)
Palm wine 45.3 44.7 43.5 43.1 42.3 41.5 41.2 41.1 40.4
Tiger nut juice 43.7 43.1 42.8 42.3 42.0 41.3 40.5 39.6 38.6
Water 46.0 45.3 45.0 44.7 44.5 44.2 43.1 42.6 42.3
Figure 3.1: Hardness values with distance from the quenched end
(a) (b ) ( c)
Figure 3.2: Microstructural Examination Analysis (a. tiger nut juice, b. palm wine, c. water)
Conclusion
From the practical aspect to the results and previous discussions, the constructed Jominy end quench
machine functioned effectively both on the main power supply and on 1.5 Kva, generator. The cycle
time was short and the quenchant was managed effectively. From the hardenability results obtained,
the jominy end specimen quenched in water gives the best result of 46.0 HRC at a distance of 5mm,
followed by the specimen quenched in palm wine with 45.3HRC, while the specimen with the least
value is the one quenched in tiger nut juice with a value of 43.7 HRC all at same distance from the
jominy surface.
Meanwhile, all the quenched samples show that the hardness value decreases with distance from the
quenched end. Also, the morphology of the microstructure changed with distance, this is obvious the
rate of cooling is rapid at the quenched surface.
35
40
45
50
0 20 40 60
Har
dn
ess
Val
ue
s
Distance from the quenched end (mm)
Palm wine
Tiger nut juice
Water
Page 234 of 366
Reference
Bates C.E and Totten G.E. (1992). Application of quench factor analysis to predict hardness under
laboratory production condition. The first international conference on quenching and control
of distortion, Chicago, Illinois.
Canale F.C, Fernandes, M.R., Augustino, S.C., Totten, G.C, and Farah, A.F. (2005). Oxidation of
vegetable oil and its impact on quenching performance, International jourmal on materials
and product technology. International jourmal on materials and product technology, 24(1, 2 ,
3, 4), 101-125.
Carner Simsir and Hakan Gur. (2010). A simulation of quenching process for predicting temperature,
Microstructure and residual stresses. Journal of mechanical engineering., 56(2), 93-103.
Chavez, J. (2001). The effect of surface condition and high temperature oxidation on quenching
performance of 4140 steel in mineral oil in manufacturing engineering. Journal of Worcester
polytechnic institute, 9(29), 8.
Daniel, H. (2010). Oil qunching Handbook. Illinois: The Herring group inc.
Grossman, M. (1942, July 3). Patent No. US2559016A. USA.
Janez Grum and Martin Zupancic. (2015). Lesser shock Processing as a method of decreasing fatique
of a die-casting die made of maraging steel. International Journal of microstructure and
Material properties, 3(2-3), 271-281.
Prabhudav, K. (1988). Handbook on heat treatment of steels. New Delhi: McGraw Hill.
Shuhui, M. (2002). ). Characterisation of the performance of a mineral bases quenching oil using
CHTE quench probe system.A thesis, Worcester polytechnic institute . Worcester: WPI.
Victor, A. (1999). Metal cutting mechanics. Moscow: CRC Press.

Page 235 of 366
Paper: NMS 2017-TP029
Modifications of Roll Pass Design to Minimize Roll
Breakage in Light Section and Bar Mill of Ajaokuta Steel Plant
Isezuo, L. O., Agboola J. O., and Ocheri C.
Light Section Mill (LSM), Ajaokuta Steel Company Limited, Ajaokuta
Dept. of Metallurgical and Materials Engineering, Federal University of Technology Minna
Dept. of Metallurgical and Materials Engineering, University of Nigeria, Nsukka
Corresponding Author: ISEZUO, Lawrence Onimisi,
[email protected], [email protected], [email protected] , Phone: 08036605764 , 08032484138, 08068433419
ABSTRACT
Flexible roll pass design was developed for the modification of Light Section and Bar Mill of
Ajaokuta Steel Plant for rolling profile Ø12 mm of round and ribbed bar from 120 x 120 x
12000 mm billet and to minimize roll breakage especially at the roughing group of stands.
Detailed re-designing of grooves dimensions, rolling speed, effective diameter of the rolls,
temperature distribution, rolling pressure, rolling load and work done by the rolls at each
working stand were carried out. Data from grooves dimensions were used as guide for cutting
the grooves on the barrel of the rolls. Heat regime of the rolling stock was specified based on
chemical characteristic of the billet. The redistribution of deformation reduced the work load
on the stands, especially at stand number 3 of roughing group of stand; thus reducing the
tendency for roll breakage as analysed. From the results obtained it was discovered that
productivity decreases by 4.46%. The decline in productivity per hour could be attributed to
the volumetric differences between the stock of size 100 x 100 x 12000 mm and that of 120 x
120 x12000 mm which were rolled to profile 12 mm from both stock with same rolling
speed.
Keywords: Modification, Roll pass Design, Breakage and Light Section and Bar Mill
1.0 INTRODUCTION
Rolling is a metal forming process and is defined as an operation that involves plastic
deformation of metal. This is achieved by passing the metal between two rolls rotating in
opposite direction (Linchevsky, Sobolersky and Kalmenv., 1983).
Steel rolling consist of passing the material, usually termed as the stock, between two rolls
driven at the same peripheral speed in opposite directions (i.e. one clockwise and other is
anti-clockwise). They are spaced in such a way, that the distance between them is somewhat
less than the thickness of the section or stock entering them. In these circumstances the roll
grip the material and deliver it in reduced thickness, increased length and probably somewhat
increased width (Mukherjee, 2014). It is one of the most widely used metal forming
processes; around 90% of world steel, aluminium and copper produced annually are rolled to
different shapes and section for various usage. (Encyclopaedia Britannica, 2012).
Rolling operations are carried out with a device called rolling mill. The rolls may have flat or
grooved periphery which depends on the type and shape of section intended to produce and

Page 236 of 366
are mounted in housing. This assembly is referred to as rolling stand. A rolling mill may
consist of one or more stands. A stand with two rolls is called two-high mill while that of
three or four rolls are refers to as three or four high mill respectively. This work is concern
only with two-high mill operation.
Roll pass design (RPD) is a careful and conscious analysis for the determination of the stages
involved when a stock (billet) is subjected to rolling operation with a view of attaining a
desired profile size. These consist of calculations of roll groove/pass design parameters,
pressures on the rolls, analysis of the metal deformations and all other parameters within the
specifications of the operating rolling mill.
The light section and bar mills in Ajaokuta Steel Plant (ASP) was operated using imported
billet of size 100 x 100 x 12000 mm from Ukraine. Delta Steel Company (DSC) produces
billet of size 120 x 120 x 12000 mm from indigenous iron ore from National Iron Ore Mining
Company Itakpe, using continuous casting method.
As a result of local content drive, the rolling mills in Ajaokuta Steel Plant, light section and
bar mill (LSM) and wire rod mill (WRM) was modified from using billet of size 100 x 100 x
12000 mm to accommodate billet of 120 x 120 x 12000 mm produced at DSC Aladja, since is
available thereby reducing the number of billets imported from overseas.
Billet of size 120 x 120 x 12000 mm was rolled in WRM successfully but that of LSM
persists with a peculiar problem of roll breakage on stand number 3 at roughing group of
stands. It was observed that the deformation of metal stock is mainly concentrated in this vary
stand of the roughing group of stands; instead of even distribution of deformation along the
whole group of stands. This result into high rolling pressure and load at stands number 3 of
roughing group of stands that culminate into the breakage of roll at this stand.
2.0 BASIC ROLLING THEORY
Rolling practice is based on the plasticity of metal. It is similar to other metal working
processes like forging or pressing. In all these, a common phenomenon is the force (or
pressure), which is compressively applied on the plastic metal to deform it. The applied force
changes the shape of the metal in its direction.
However, metal also flows in other directions of least resistance. Moreover in rolling the
metal piece experience both vertical and horizontal stresses due to compressive load, hence
elongation factor is highly emphasized with relatively less lateral spread. Consequently
rolling brings about large increase in length of the metal but lesser increase in the width.
Alternatively, in forging metal mainly spread sideways. However, they are characterized by
metal volume constancy (Iyida, 1988).

Page 237 of 366
Figure 1.0: Basic Features of a Simple Rolling Process. (Saral., 2014)
A basic feature in a simple rolling process is shown in figure 1.0. A and B are the rolls which
provide the rolling pressure (compressive force) on the plastic metal stock C. The resistance
deformation brings about reduction in the height of the metal stock and increases in both
length and breath, with length increasing extensively. The changes in these orthogonal
directions of the metal must however, conform to the constancy of volume, which is
prevalent during rolling process.
To grip the metal effectively, the rolls must turn in opposite directions as indicated by the
arrows. As such, the metal moves forward. The angle (α) is the grip or bite angle, which
increases with the increase in the original height (Ho) of the stock and as well increases with
the reduction of rolls diameter. It has a maximum angle of 24o (Iyida, 1988) for effective
rolling process. In rolling, the dynamic of the stock is such that there is no relative slip
between the rolling stock and the rotating rolls. Hence, the speed of the motor shaft, which
powers the rolls, has direct link with the rotational speed of the rolls through the reducer. In
turn, this rotational speed of the rolls give rise to the linear speed of the rolling stock in the
finishing stand, otherwise known as the rolling speed. This is usually specified by the roll
pass designer for each range of profile (Iyida, 1988).
3.0 MATERIALS AND DESIGN METHOD
3.1 Stock Material
The in-put material is billet of size (120 120 12000) mm
Density of iron 7.87 103 Kgm
-3 (Ijomah, 1991)
Weight of the input material is about 1.36ton by calculation.
3.2 Design Consideration
3.2.1 Determination of Number of Stands The design procedures were based on Russian National Standard: GOST No. 2590-71. In
designing groove for rolling bar 12 mm profile in light section and bar mill using billet of
size indicated above. The following data were taken in to consideration:
[(H-h)/2]
H0
B
A
α
h C Tx Fx
F T
D
Page 238 of 366
Mean elongation coefficient is chosen from table 2.8 as 1.29. So the equation 2.15 becomes;
n = [(Log A0 – Log An) Log γm]. Where,
n is the total number of stand to engage in rolling
A0 is the cross- sectional area of the stock,
A0 = (120 120) mm2; = 14400 mm
2
An is the cross-sectional area of the final out put profile with diameter of 12 mm is
determined as; An = [(л 122) 4] mm
2; An = 113.10 mm
2
γm is the mean elongation with value of 1.29.
n = (log 14400 – log 113.1) log 1.29; thus, n = 19.
Therefore, 19 numbers of working stands would be engaged for production of profile 12 mm
in light section and bar mill from billet dimension 120 120 12000 mm or 120 120 900
mm.
3.2.2 Determination of Total Elongation
Total elongation is defined as ratio of the cross sectional area of the starting material to the
final area of cold profile;
Total elongation (γT) = [Ao Af]
γT = (14400 113.1), γT = 127.321
The actual mean elongation (γm) is defined as x√ (γT);
γm = 19√ (127.321), γm = 1.291
Elongation at stand 7; γ7 = (14400 2099.8), γ7 = 6.8578
Elongation at stand 13; γ13 = (14400 400.25), γ13 = 35.9775
3.2.3 Distribution Coefficient of Elongation γ Along the Stand
The coefficient of elongation is distributed along the rolling stands is shown in Table 3.1
below. It is guided by mean elongation, coefficient of elongation from Table 2.0 and cross-
sectional area of the input and output profile. Table 3.1 shows coefficient of elongation γ
distribution
Table 3.1: Coefficient of Elongation γ Distribution along the Rolling Stands No. of
Stand
Roughing Group of
Stand
Stand No. Intermediate Group of
Stand
Stand No. Finishing Group of Stand
1 γ1 = 1.2233 8 γ8 = 1.402 14 γ14 = 1.23446
2 γ2 = 1.2027 9 γ9 = 1.229 15 γ15 = 1.284 3 γ3 = 1.474 10 γ10 = 1.28844 16 γ16 = 1.214
4 γ4 = 1.225 11 γ11 = 1.34613 17 γ17 = 1.261
5 γ5 = 1.36 12 γ12 =1.317 18 γ18 = 1.231 6 γ6 = 1.426 13 γ13 = 1.33294 19 γ19 = 1.181
7 γ7 = 1.331
3.2.3 Selection of Type (shape) of the Roll Passes
The following type and shape of roll pass are used in this work.
(a) Cogging down passes, this is use for the initial reduction of the cross-sectional
area of the stock; in stand one and two. Box type is used.
(b) Roughing passes, this is use to reduce the cross-sectional area of the rolled
section. Type of roughing pass use in the stand 3 is rhombus and box type in stand
4.
(c) Leader passes is next to roughing pass, this is use to give the shape and size that
would be roll within stands 5 to 13. Gothic-oval pass are used for stand with odd
number and flat-oval pass are used for stand with even number.

Page 239 of 366
(d) Finishing pass is use to produce the final shape and size. Stand number 15 and 17
would be rib-oval system, while stand number 19 would be round oval type. Flat-
oval system would be used for stand with even number.
3.2.4 Determination of Dimensions of Hot Stock and Roll Groove for Finishing Group of
Stands
3.2.4.1 Stand 19 Round Pass
Absolute spread ∆b is defined as:
∆b = 0.8/D1/; to obtain the correct dimension of the breath of the groove, the tolerance /D1/ =
0.1; then ∆b = 0.08 mm.
The total spread of the stock is defined as: B19 = 1.01dc + 0.8/D1/. Where dc = 11.9 mm. Thus
the width of the groove, B19 = 12.1 mm.
Collar gap at stand 19; S19 = 1.6 mm. The radius of the groove at stand 19: R19 is obtained by
the formula given:
R19 = [(B192 + S19
2 + (4 r
2(h19))) – ((4 r(h19)) ( (S19 Sin α) + (B19 Cos α)))] [(8 r(h19)) –
(4 ( S19 Sin α + B19 Cos α))]; where radius of hot stock; R(h19) = 6.01 mm as earlier
calculated. R19 = 6.27 mm; 6.30 mm.
R19 = 6.30 mm; A19 = 113.47 mm2; B19 = 12.10 mm; S19 = 1.6 mm; h19 = 12.02 mm; α = 45
o;
relief curve radius r19 = 2 mm.
3.3 Strain Rate
The behaviour of the elements of the stock with rolls at each stands in roughing zone were
evaluated by the rate at which the stock is being strained during hot rolling by varying angle
of bite from 1o to 45
o at an interval of 2
o, while assuming no slipping friction by using
equation 2.43: Ԑn = (2 * V * sin α) / [hn + (DW * (1 – cos α))]. Where; Ԑn = strain rate (s-1
)
at stand n;
V = Rolling speed in ms-1
hn = Final thickness of the stock at exit side of the stand in meter;
DW = Working or effective diameter of the roll in meter and,
α = Angle of bite in degree.
For each stand table of variations of strain rate and angle of bite were obtained. From the
strain rate graph, it increased as the angle of bite increases. A point is reached where the
strain rate converges with the increasing angle of bite. This point indicates the maximum
angle of bite for an effective rolling operation. Above this angle of bite, it can no longer grip
or bite by the rolls. Figure 3.1 -3.7 shows the values of the rolling variables within the
roughing group of stands and Figures 3.3 to 3.4 show the variation of strain rate graph for
stands number 3 and 4 respectively.
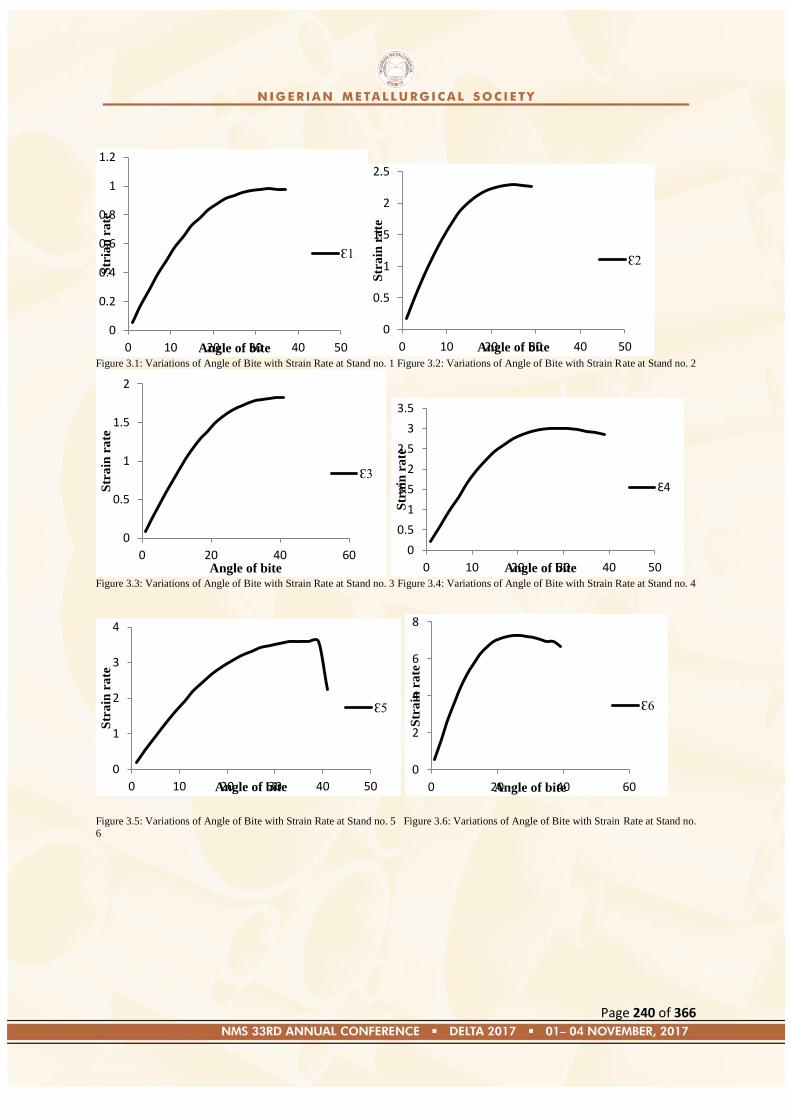
Page 240 of 366
Figure 3.1: Variations of Angle of Bite with Strain Rate at Stand no. 1 Figure 3.2: Variations of Angle of Bite with Strain Rate at Stand no. 2
Figure 3.3: Variations of Angle of Bite with Strain Rate at Stand no. 3 Figure 3.4: Variations of Angle of Bite with Strain Rate at Stand no. 4
Figure 3.5: Variations of Angle of Bite with Strain Rate at Stand no. 5 Figure 3.6: Variations of Angle of Bite with Strain Rate at Stand no.
6
0
0.2
0.4
0.6
0.8
1
1.2
0 10 20 30 40 50
Str
ian
ra
te
Angle of bite
Ԑ1
0
0.5
1
1.5
2
2.5
0 10 20 30 40 50
Str
ain
ra
te
Angle of bite
Ԑ2
0
0.5
1
1.5
2
0 20 40 60
Str
ain
ra
te
Angle of bite
Ԑ3
0
0.5
1
1.5
2
2.5
3
3.5
0 10 20 30 40 50
Str
ain
ra
te
Angle of bite
Ԑ4
0
1
2
3
4
0 10 20 30 40 50
Str
ain
ra
te
Angle of bite
Ԑ5
0
2
4
6
8
0 20 40 60
Str
ain
ra
te
Angle of bite
Ԑ6
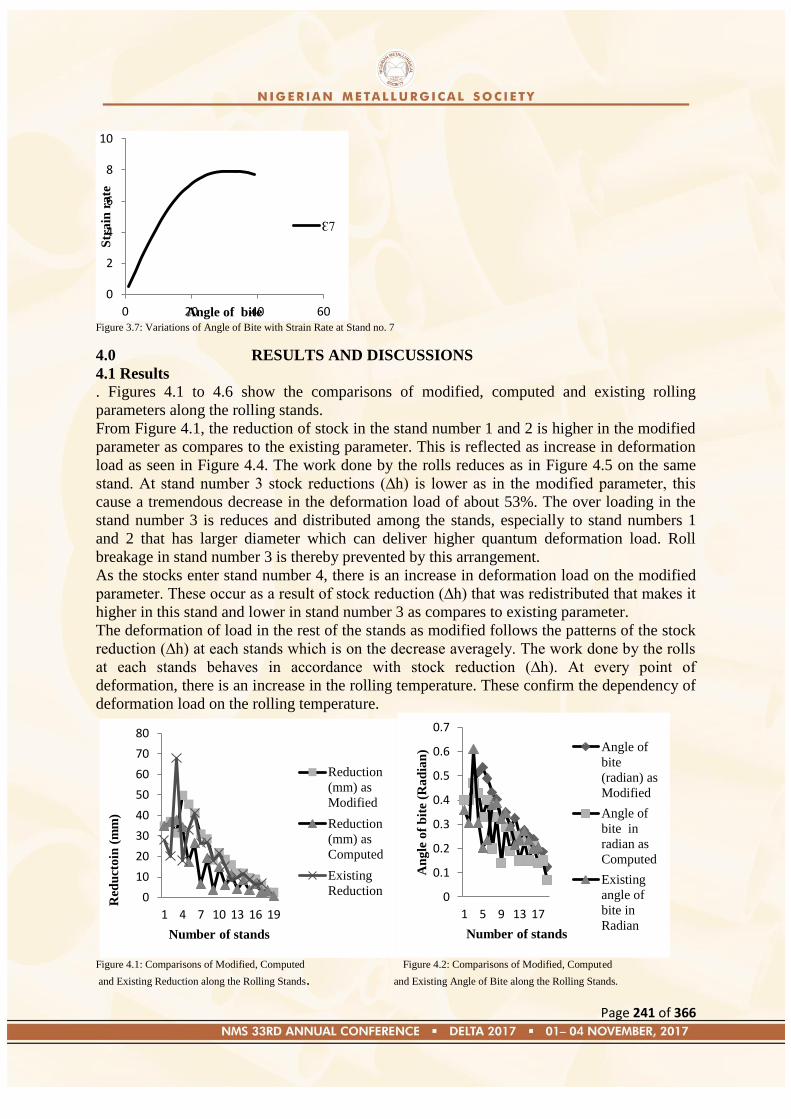
Page 241 of 366
Figure 3.7: Variations of Angle of Bite with Strain Rate at Stand no. 7
4.0 RESULTS AND DISCUSSIONS
4.1 Results
. Figures 4.1 to 4.6 show the comparisons of modified, computed and existing rolling
parameters along the rolling stands.
From Figure 4.1, the reduction of stock in the stand number 1 and 2 is higher in the modified
parameter as compares to the existing parameter. This is reflected as increase in deformation
load as seen in Figure 4.4. The work done by the rolls reduces as in Figure 4.5 on the same
stand. At stand number 3 stock reductions (∆h) is lower as in the modified parameter, this
cause a tremendous decrease in the deformation load of about 53%. The over loading in the
stand number 3 is reduces and distributed among the stands, especially to stand numbers 1
and 2 that has larger diameter which can deliver higher quantum deformation load. Roll
breakage in stand number 3 is thereby prevented by this arrangement.
As the stocks enter stand number 4, there is an increase in deformation load on the modified
parameter. These occur as a result of stock reduction (∆h) that was redistributed that makes it
higher in this stand and lower in stand number 3 as compares to existing parameter.
The deformation of load in the rest of the stands as modified follows the patterns of the stock
reduction (∆h) at each stands which is on the decrease averagely. The work done by the rolls
at each stands behaves in accordance with stock reduction (∆h). At every point of
deformation, there is an increase in the rolling temperature. These confirm the dependency of
deformation load on the rolling temperature.
Figure 4.1: Comparisons of Modified, Computed Figure 4.2: Comparisons of Modified, Computed
and Existing Reduction along the Rolling Stands. and Existing Angle of Bite along the Rolling Stands.
0
2
4
6
8
10
0 20 40 60
Str
ain
ra
te
Angle of bite
Ԑ7
0
10
20
30
40
50
60
70
80
1 4 7 10 13 16 19
Red
uct
oin
(m
m)
Number of stands
Reduction
(mm) as
Modified
Reduction
(mm) as
Computed
Existing
Reduction 0
0.1
0.2
0.3
0.4
0.5
0.6
0.7
1 5 9 13 17
An
gle
of
bit
e (R
ad
ian
)
Number of stands
Angle of
bite
(radian) as
Modified
Angle of
bite in
radian as
Computed
Existing
angle of
bite in
Radian
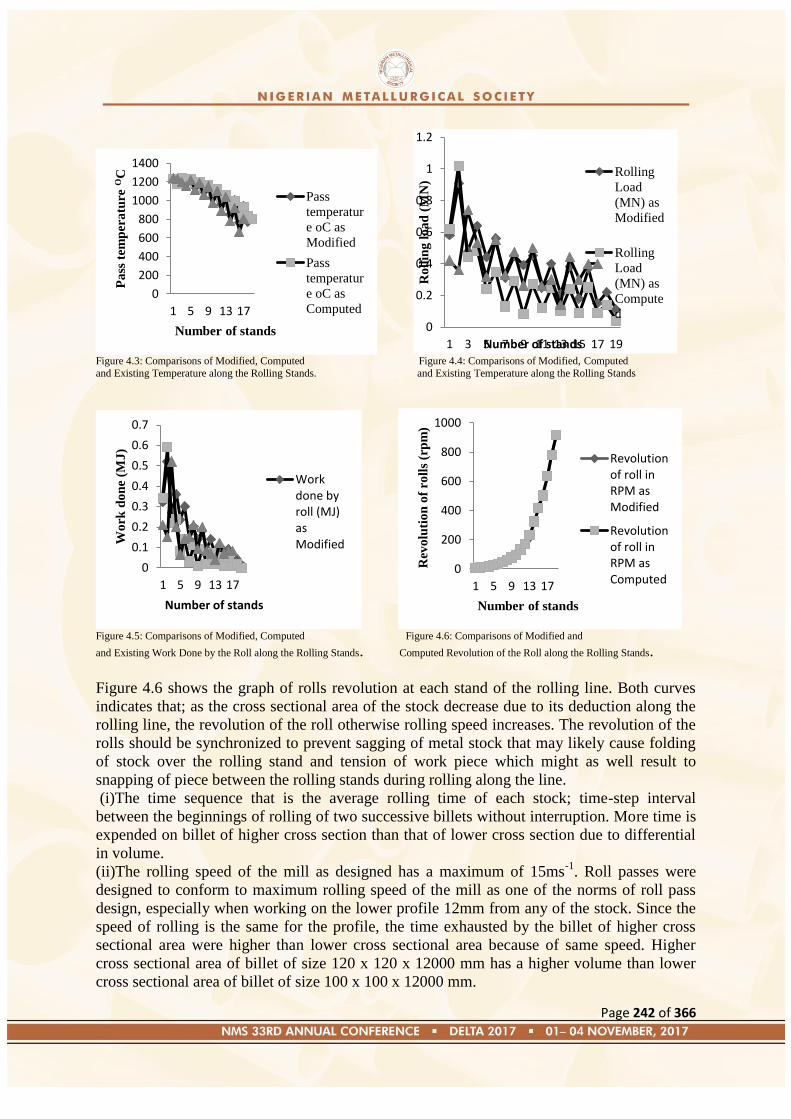
Page 242 of 366
Figure 4.3: Comparisons of Modified, Computed Figure 4.4: Comparisons of Modified, Computed
and Existing Temperature along the Rolling Stands. and Existing Temperature along the Rolling Stands
Figure 4.5: Comparisons of Modified, Computed Figure 4.6: Comparisons of Modified and
and Existing Work Done by the Roll along the Rolling Stands. Computed Revolution of the Roll along the Rolling Stands.
Figure 4.6 shows the graph of rolls revolution at each stand of the rolling line. Both curves
indicates that; as the cross sectional area of the stock decrease due to its deduction along the
rolling line, the revolution of the roll otherwise rolling speed increases. The revolution of the
rolls should be synchronized to prevent sagging of metal stock that may likely cause folding
of stock over the rolling stand and tension of work piece which might as well result to
snapping of piece between the rolling stands during rolling along the line.
(i)The time sequence that is the average rolling time of each stock; time-step interval
between the beginnings of rolling of two successive billets without interruption. More time is
expended on billet of higher cross section than that of lower cross section due to differential
in volume.
(ii)The rolling speed of the mill as designed has a maximum of 15ms-1
. Roll passes were
designed to conform to maximum rolling speed of the mill as one of the norms of roll pass
design, especially when working on the lower profile 12mm from any of the stock. Since the
speed of rolling is the same for the profile, the time exhausted by the billet of higher cross
sectional area were higher than lower cross sectional area because of same speed. Higher
cross sectional area of billet of size 120 x 120 x 12000 mm has a higher volume than lower
cross sectional area of billet of size 100 x 100 x 12000 mm.
0
200
400
600
800
1000
1200
1400
1 5 9 13 17
Pa
ss t
emp
era
ture
OC
Number of stands
Pass
temperatur
e oC as
Modified
Pass
temperatur
e oC as
Computed
0
0.2
0.4
0.6
0.8
1
1.2
1 3 5 7 9 11 13 15 17 19
Ro
llin
g l
oa
d (
MN
)
Number of stands
Rolling
Load
(MN) as
Modified
Rolling
Load
(MN) as
Compute
d
0
0.1
0.2
0.3
0.4
0.5
0.6
0.7
1 5 9 13 17
Wo
rk d
on
e (M
J)
Number of stands
Workdone byroll (MJ)asModified
0
200
400
600
800
1000
1 5 9 13 17
Rev
olu
tio
n o
f ro
lls
(rp
m)
Number of stands
Revolutionof roll inRPM asModified
Revolutionof roll inRPM asComputed

Page 243 of 366
Higher productivity can be achieved when using billet of cross section area of size 120 x 120
x 12000 mm, if the mill rolling speed is work on and increases to 17ms-1
. Such increment
could raise the rate of productivity to 84.88 ton/hr at the rolling speed of 17 ms-1
for the same
profile 12 mm. This will justify the aim of modification of light section and bar mill of
Ajaokuta Steel Plant.
5.0 Conclusion
From the results obtained, it was observed that redistribution of reduction (∆h) along the
rolling line leads to an increase in the number of rolling stands that were engaged in rolling
profile 12 mm from billet of size 120 x 120 x 12000 mm. This brings the total number of
stand to 19. The modified rolling parameter indicates that deformation load is in direct
dependent on the magnitude of stock reduction (∆h) and proper rolling temperature.
Deformation load and work done by the rolls at stand number 3 in the modified rolling
parameter is lower as compares to the existing one. These indicate that roll breakage were
avoided in the modified rolling parameter.
6.0 Recommendations The modifications of roll pass design to minimize roll breakage in Light Section and Bar Mill
of Ajaokuta Steel Plant was successfully carried out and from the findings therefore,
recommend the following :- (i)That the Plant is to roll billet of cross sectional size of 120 x 120 x 12000 mm
(ii)Continuous casting mould for billet of cross sectional area of 100 x 100 x 12000 mm
should be integrated in addition to existing technology at Delta Steel Company Limited to
accommodate the billets from the Light Section and Bar Mill of Ajaokuta Steel Plant
(iii)The rolling speed for the working stands in Light Section and Bar Mill should be
upgraded from the present maximum speed of 15 ms-1
to speed of 17 ms-1
for effectively
rolling of billets of cross sectional area 120 x 120 x 12000 mm.
7.0 References
[1]Ajaokuta Steel Plant, (1980). Technological Instruction for Light Section and Bar Mill,
Steel Plant Achieve, Ajaokuta Kogi State, Nigeria: Tyazhpromoexport, TI-066-83.
[2] Davies, D. J & Oelmann, L. A. (1983). The structure, Properties and Heat Treatment of
metals, 128 Long Acre, London WC2E 9AN: Pitman Books Limited.
[3] Encyclopaedia Britannica, (2012). Chicago, USA: (Ultimate References Suite).
[4]Hӓndemark, M. (2014). Improved Roll Pass Design for Long Product, WICON Rolling
Library: [email protected]. Retrieved from http://
www.danielicorp.com
[5]Iyida, B. U. (1988). Unpublished Project on Roll Pass Design and Rationalization. Pp8-10,
Ajaokuta Branch, Kogi State: Nigeria Society of Engineer‘s Library.
[6]Ijomah, M. N. C. (1991). Element of Corrosion and Protection Theory, 14, Meniru Street,
Awkunanaw, Enugu Nigeria: Auto-Century Publishing Company Limited.
[7]Khanna,O. P. (1999). Material Science and Metallurgy, 22, Ansari Rd, Daryaganu, New
Delhi-110002, India: Dhanpat Rai Publications Ltd.

Page 244 of 366
[8]Lakhtin, Yu. M. (1990). Engineering Physical Metallurgy and Heat Treatment, Moscow,
Russian Federation: Mir Publishers.
[9]Linchevsky, B., Sobolersky, A. & Kalmenv, A. (1983). Iron and Steel Making, Moscow
Russian Federation: Mir Publication.
[10]Mukherjee, A. (2014). Roll Pass Design Evaluation using software application:
[email protected]. Retrieved from http:// www.iim.dehil.com
[11]Pavlov, I.M, Gallai, Y.S & Astohov, I.G. (1957). Practical Course on Roll Pass Design;
Pp 114-127; 142-153: 200-225, Moscow, Russian Federation: Metaloisdata
Publisher (Russian Version).
[12]Rajan, T.V., Sharma, C.P & Sharma, A. (1988). Heat Treatment Principle and
Techniques, M-97 Connaughat Circus, New Delhi-110001: Prentice-Hall of India
Private Limited.
Page 245 of 366
Paper: NMS 2017-TP030
The Suitability of Periwinkle Shell as Energizer in Case Hardening of 0.08% Mild Steel
using Coconut Shell as Carburizer at 900oC
1Agbo N. A.,
2Dauda E. T.,
2Ause T., and
3Oyeladun O. A. W.
1Research &Development Centre, Defence Industries Corporation of Nigeria(DICON), Kaduna.
2Department of Metallurgical and Materials Engineering, Ahamadu Bello University, Zaira
3Department of Mineral and Petroleum Resources Engineering, Kaduna Polytechnic, Kaduna
Abstract
Suitability of pulverized coconut shell charcoal and periwinkle shell for carburizing 0.08%C
mild steel was investigated in order to optimize the carburizing parameters in the pack
carburizing surface hardening process. The carburizing parameters evaluated are carburizing
time, carburizing materials (ratio 75wt% pulverized coconut shell charcoal to 25wt%
pulverized periwinkle shell) and case depth. The results obtained shown that effective case
depth and hardness values increased exponentially by increasing carburization temperature
and time. Optimum hardness values were obtained at carburizing temperature of 900oC,
carburizing time of 2 hours, carbon potential ratio of 75wt% pulverized coconut shell
charcoal to 25wt% pulverized periwinkle shell with effective case depth of 2.0 mm, hardness
values of 500Hv. It has been established that pulverized coconut shell charcoal and
pulverized periwinkle shell can be effective used as carburizing materials in the ratio of
75wt% pulverized coconut shell charcoal to 25wt% pulverized periwinkle shell.
Key words: carburizing, energizer, hardness value, case hardening, case depth, coconut shell
charcoal, periwinkle shell
1.0 Introduction
The service conditions of many steel components such as cams, gears and shafts necessitated
the steel possess both hard, wear resistance surfaces and at the same time, tough and shock-
resistance. In plain carbon steel, these two different sets of properties exist only in alloys of
different carbon content. A low-carbon steel, containing approximately 0.1% carbon, will be
Page 246 of 366
tough but soft, while a high-carbon steel of 0.8% or more carbon will be hard when suitably
heat-treated but will also be relatively brittle. (Akinluwade et al, 2012).
There are two major processes through which such an alteration of the surface layers of steel
components may be carried out, namely, (i) processes which impact surface hardness by
changing the microstructure of the surface skin without changing the chemical composition
of the surface. Such steel must not have a carbon content of less than 0.4% for them to be
amenable to hardening by any of flame, induction, laser, and electron beam hardening (ii)
processes which impact surface hardness by changing the surface chemistry of the steel by
diffusing carbon, nitrogen or both carbon and nitrogen into its surface (Asuquo and Ihom,
2013). To achieve the latter, a low-carbon steel with suitable core properties and then case-
hardening using any casehardening process such as carburizing, nitriding, cyaniding,
diffusion coating, and hard surfacing.
Carburizing is a process of adding carbon to steel surface. This is done by exposing the part
to carbon rich atmosphere at an elevated temperature and allow diffusion to transfer the
carbon atoms in the steel (Metals Handbook, 1981). This diffusion works on the principle of
differential concentration. The types of carburization processes are:
Solid carburization,
Liquid carburization,
Gaseous carburization,
Vacuum carburization,
Plasma carburization and
Salt bath carburization
The solid or pack carburization involves heating the steels parts embedded in powdery
mixture of 85% coal and 15% BaCO3 at a temperature in the range 900 – 950 degree Celsius.
The residual air in the box combines with carbon to produce CO gas. Carbon monoxide gas is
unstable at the process temperature and thus decomposes upon contacting the iron surface by
the following reactions (Metals Handbook, 1981).
( )
( )
Page 247 of 366
The atomic carbon enters the steel through the following reaction.
( ) ( )
(4)
Where Fe(C) is carbon dissolved in austenite. This atomic and nascent carbon is absorbed by
the steel surface, and subsequently it diffuses towards the centre of steel sample. CO2 thus
formed react with the carbon (C) of the carburizing medium to produce CO, and thus, the
cycle of the reaction continues. Charcoal is the basic source of carbon during solid
carburization (Metals Handbook, 1981). As entrapped air inside the box may be less to
produce enough CO2 particularly in the beginning of the carburization, it is thus common
practice to add energizer (usually BaCO3) which decomposes during the heating up period as:
(5)
The CO2 thus formed then react with the carbon of the carburizer to produce CO gas. Thus,
BaCO3 makes CO2 available at an early stage of carburization and hence it is called
energizer. The case depth increases with rise in carburization temperature and time. The steel
surface absorbs carbon at a faster rate and the rate at which it can diffuse inside, thus
producing super saturated case which may produce cracks during quenching. In solid
carburization, it is difficult to control exactly the case depth because of many factors
affecting it, such as density of packing, amount of air present inside the box, reactivity of
carburizer, etc. (Metals Handbook, 1981).
2.0 Materials and Methods
2.1 Materials
The materials that were used for the work included, bright mild steel (BSM) grade rods of 14
mm diameter obtained from Universal Steel Ikeja, Lagos State. Periwinkle shell obtained
from Port Harcourt, Rivers State. The coconut shell was collected from coconut sellers in
Kaduna State. The periwinkle shells and coconut shell were pulverized. XRF and XRD
results from Agbo et al, 2016 was adopted.
Equipment that were used in this work are:
Digital weighing balance,
Tong,
Sieving Machine (Model S750)
Page 248 of 366
Dergussa Durferit electric furnace with maximum temperature of 1000°C made in
Germany,
Micro vickers Hardness Tester model -MVl-PC serial number 07/2012-1320 maximum
capacity -500gf made by fuel instruments & Engineers PVT. Ltd of Maharashtra
(India).
Optical Emission Spectrometer model PDA:7000,
X-ray Diffractometer made by PAN Analytical BV of Netherland,
X-ray Fluorescence Machine Model Mini PAL 4
Lathe Machine made by H.ErnaultSomua model j350.
TSA Carbon and Sulphur Analyzer.
2.2 Methods
The 14mm diameter rods from Universal Steel were cut into 18 pieces of 100mm length.
Each of the specimens went through carburization and test specimens for analysis were
subjected to hardness test
The 18 test samples made were subjected to carburization treatment. The samples were
placed on the thick bed of carburizer containing the various wt % of coconut shell powder
and periwinkle shell powder in a stainless-steel container and fully covered from all sides, the
top of the container covered with a steel plate. The container was then placed into the muffle
furnace and maintained at 900oC carburization temperatures and times of 1hour, 2 hours and
3 hours. The container was removed and cooled in air on the floor. The carburized samples
were removed from the container and allowed to cool.
Steel rod of 55mm long was used for the experiment. The carburized steel rods were prepared
and polished for hardness measurements on a Vickers Hardness Tester. Hardness
measurements on all the specimens were carried out on Micro vickers Hardness Tester model
- MVl-PC. In order to determine the Vickers hardness (HV) according to ISO 6507, the
diamond pyramid-shaped indenter (with interfacial angle of 136°) was pressed into the
specimen with a defined test load of 0.3 Kgf. The Vickers hardness (HV) results from the
quotient of the applied test force, F N and the surface area of the residual indent on the
specimen. To calculate the surface area of the residual pyramidal indentation, the average of
the two diagonals (d1 and d2 in mm) was used. This was repeated for each the specimen.
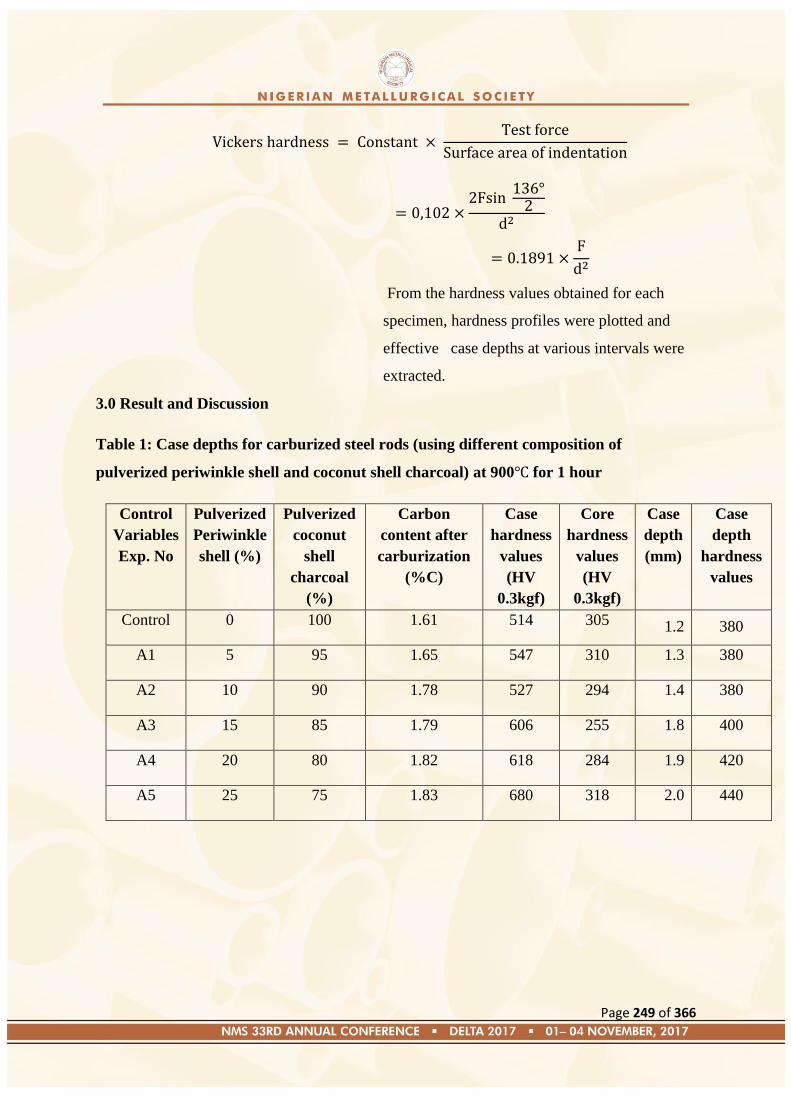
Page 249 of 366
From the hardness values obtained for each
specimen, hardness profiles were plotted and
effective case depths at various intervals were
extracted.
3.0 Result and Discussion
Table 1: Case depths for carburized steel rods (using different composition of
pulverized periwinkle shell and coconut shell charcoal) at 900 for 1 hour
Control
Variables
Exp. No
Pulverized
Periwinkle
shell (%)
Pulverized
coconut
shell
charcoal
(%)
Carbon
content after
carburization
(%C)
Case
hardness
values
(HV
0.3kgf)
Core
hardness
values
(HV
0.3kgf)
Case
depth
(mm)
Case
depth
hardness
values
Control 0 100 1.61 514 305 1.2 380
A1 5 95 1.65 547 310 1.3 380
A2 10 90 1.78 527 294 1.4 380
A3 15 85 1.79 606 255 1.8 400
A4 20 80 1.82 618 284 1.9 420
A5 25 75 1.83 680 318 2.0 440
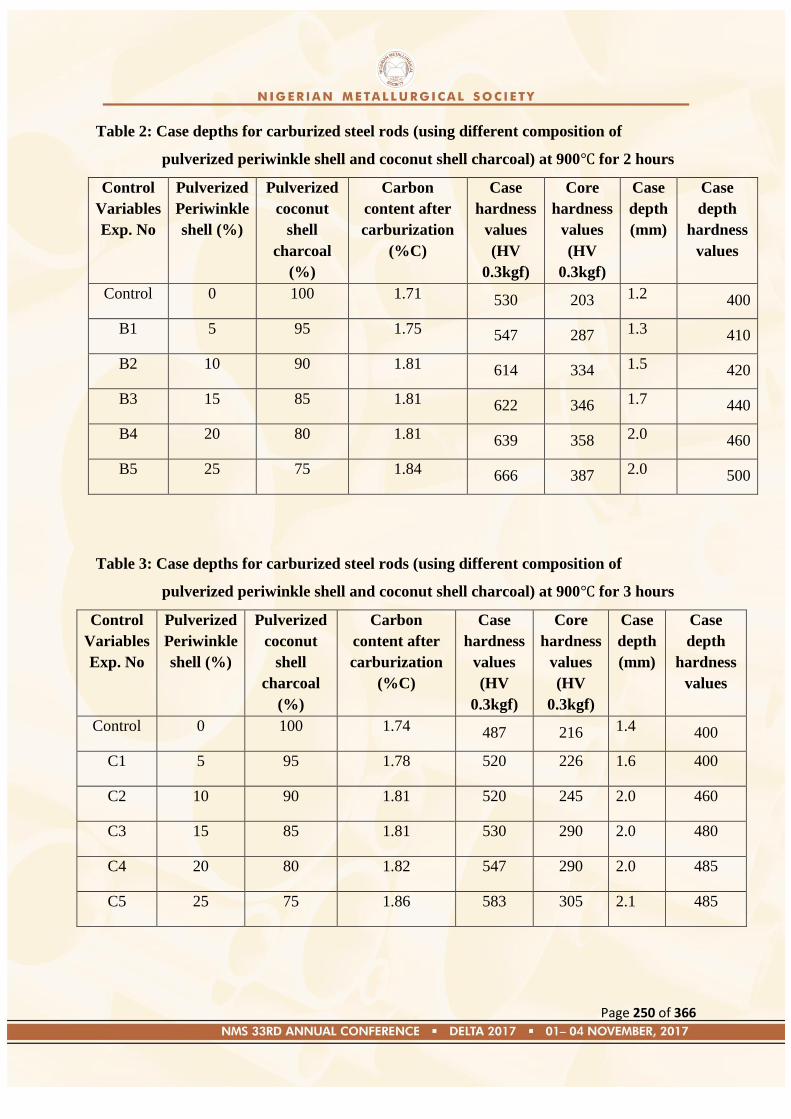
Page 250 of 366
Table 2: Case depths for carburized steel rods (using different composition of
pulverized periwinkle shell and coconut shell charcoal) at 900 for 2 hours
Control
Variables
Exp. No
Pulverized
Periwinkle
shell (%)
Pulverized
coconut
shell
charcoal
(%)
Carbon
content after
carburization
(%C)
Case
hardness
values
(HV
0.3kgf)
Core
hardness
values
(HV
0.3kgf)
Case
depth
(mm)
Case
depth
hardness
values
Control 0 100 1.71 530 203 1.2 400
B1 5 95 1.75 547 287 1.3 410
B2 10 90 1.81 614 334 1.5 420
B3 15 85 1.81 622 346 1.7 440
B4 20 80 1.81 639 358 2.0 460
B5 25 75 1.84 666 387 2.0 500
Table 3: Case depths for carburized steel rods (using different composition of
pulverized periwinkle shell and coconut shell charcoal) at 900 for 3 hours
Control
Variables
Exp. No
Pulverized
Periwinkle
shell (%)
Pulverized
coconut
shell
charcoal
(%)
Carbon
content after
carburization
(%C)
Case
hardness
values
(HV
0.3kgf)
Core
hardness
values
(HV
0.3kgf)
Case
depth
(mm)
Case
depth
hardness
values
Control 0 100 1.74 487 216 1.4 400
C1 5 95 1.78 520 226 1.6 400
C2 10 90 1.81 520 245 2.0 460
C3 15 85 1.81 530 290 2.0 480
C4 20 80 1.82 547 290 2.0 485
C5 25 75 1.86 583 305 2.1 485
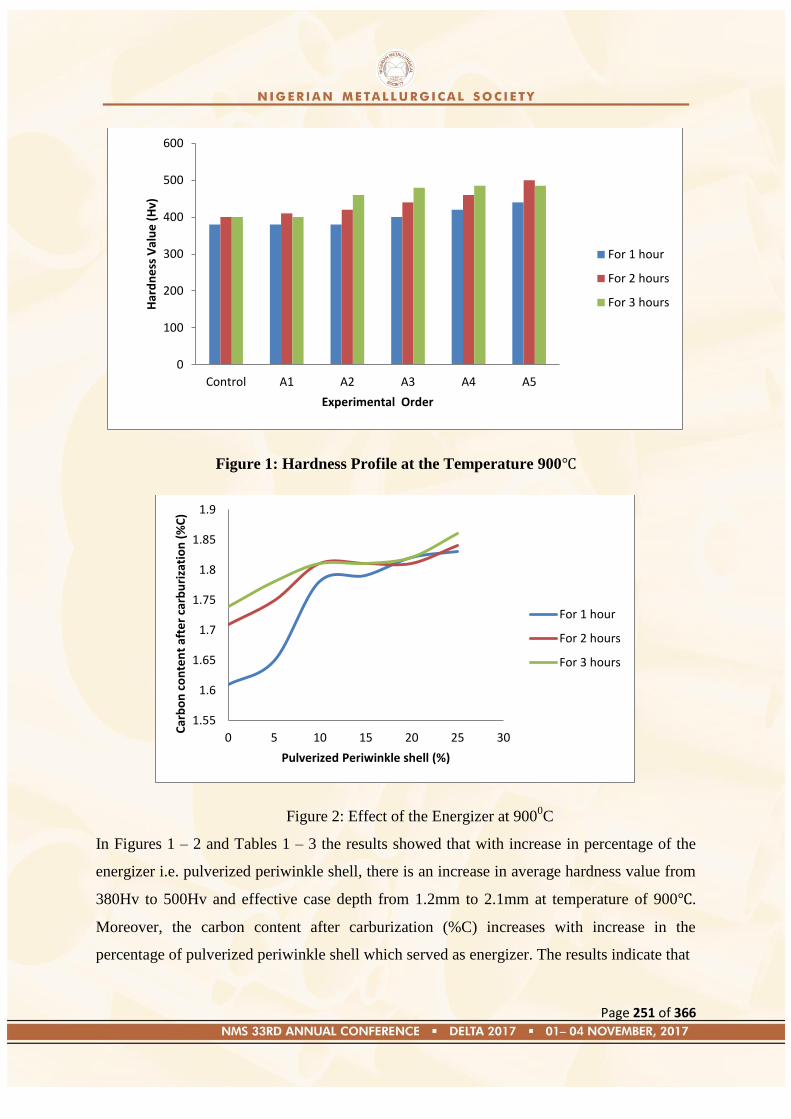
Page 251 of 366
Figure 1: Hardness Profile at the Temperature 900
Figure 2: Effect of the Energizer at 9000C
In Figures 1 – 2 and Tables 1 – 3 the results showed that with increase in percentage of the
energizer i.e. pulverized periwinkle shell, there is an increase in average hardness value from
380Hv to 500Hv and effective case depth from 1.2mm to 2.1mm at temperature of 900 .
Moreover, the carbon content after carburization (%C) increases with increase in the
percentage of pulverized periwinkle shell which served as energizer. The results indicate that
0
100
200
300
400
500
600
Control A1 A2 A3 A4 A5
Har
dn
ess
Val
ue
(H
v)
Experimental Order
For 1 hour
For 2 hours
For 3 hours
1.55
1.6
1.65
1.7
1.75
1.8
1.85
1.9
0 5 10 15 20 25 30
Car
bo
n c
on
ten
t af
ter
carb
uri
zati
on
(%
C)
Pulverized Periwinkle shell (%)
For 1 hour
For 2 hours
For 3 hours
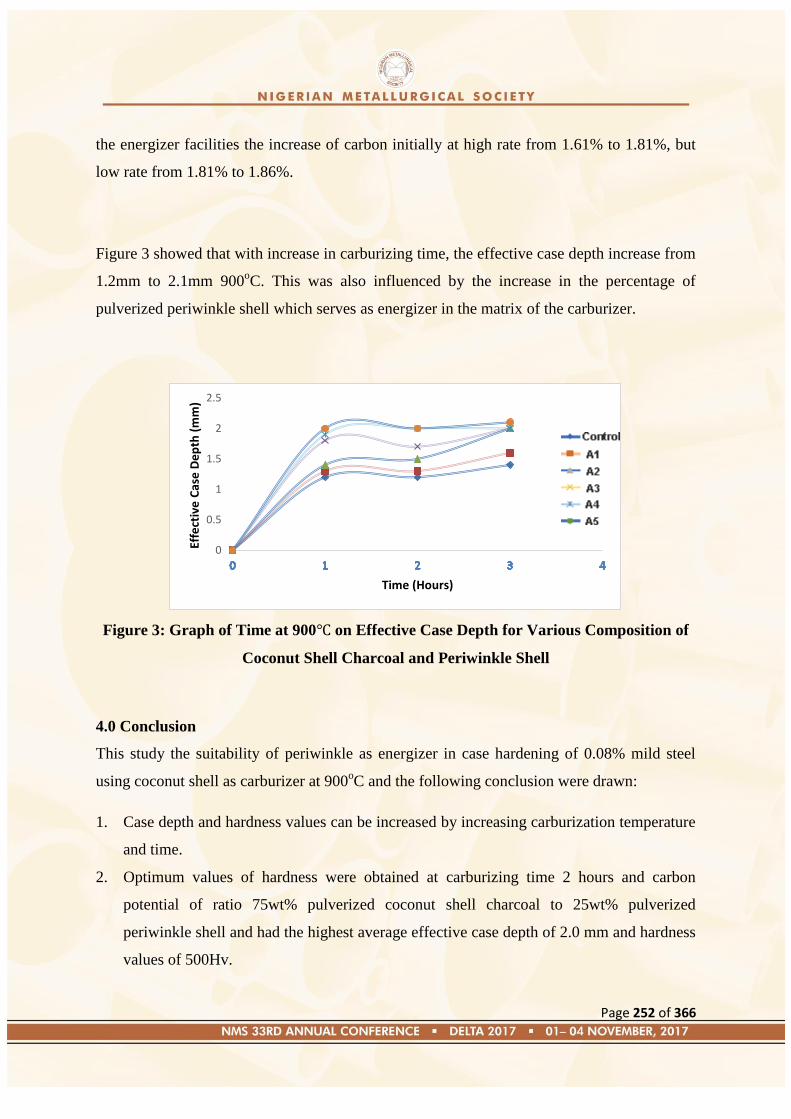
Page 252 of 366
the energizer facilities the increase of carbon initially at high rate from 1.61% to 1.81%, but
low rate from 1.81% to 1.86%.
Figure 3 showed that with increase in carburizing time, the effective case depth increase from
1.2mm to 2.1mm 900oC. This was also influenced by the increase in the percentage of
pulverized periwinkle shell which serves as energizer in the matrix of the carburizer.
Figure 3: Graph of Time at 900 on Effective Case Depth for Various Composition of
Coconut Shell Charcoal and Periwinkle Shell
4.0 Conclusion
This study the suitability of periwinkle as energizer in case hardening of 0.08% mild steel
using coconut shell as carburizer at 900oC and the following conclusion were drawn:
1. Case depth and hardness values can be increased by increasing carburization temperature
and time.
2. Optimum values of hardness were obtained at carburizing time 2 hours and carbon
potential of ratio 75wt% pulverized coconut shell charcoal to 25wt% pulverized
periwinkle shell and had the highest average effective case depth of 2.0 mm and hardness
values of 500Hv.
0
0.5
1
1.5
2
2.5
Effe
ctiv
e C
ase
De
pth
(m
m)
Time (Hours)
Page 253 of 366
References
Agbo N. A., Dauda E. T., Ause T., Aigbodion V and Oyeladun O. A. W. (2016) Effect of
Concentration of Coconut Shell Charcoal and Periwinkle Shell on the Hardness Profile
on 0.08% Carburized Mild Steel (NMS Conference, kaduna 2016)
Akinluwade, K. J., Adetunji, A. R., Adeoye, M. O., Umoru, L. E., Kalu, P. N., Taiwo, A. T.
and Adewoye, O. O (2012): Development of an Environmentally Friendly in-situ
Pack- Cyaniding TechniqueJournal of Minerals & Materials Characterization &
Engineering, Vol. 11, No.1, pp.21-30.
AsuquoL. O. and Ihom .P. A. (2013): Variation Of Effective Case Depth With Holding
Time Of Mild Steel Using Various Carburising Compounds, International Journal of
Metal and Steel Research Technology Vol. 1, No. 2, August 2013, PP: 12 -18
Metals Handbook (1981): Heat-treating, Volume 4, American Society of Metals (ASM), 9th
edition, 425.

Page 254 of 366
Paper: NMS 2017-TP031
Quality Assurance of Metal Production in Nigeria: An Imperative for Sustainable
National Economic Development
*Bwala Markus, Adegun Miracle Hope and Bamidele E.A.
Nigerian Institute of Mining and Geosciences
PMB 2813, Jos, Plateau State, Nigeria.
*Tel: +234(0) 803 452 2140 E-mail: [email protected]
ABSTRACT
The United Nations seventeen (17) Sustainable Development Goals (UNSDGs) are aimed at
ending poverty, protecting the earth and ensuring that all people enjoy peace and prosperity
by the year 2030.
Undoubtedly, without qualitative metal production, these goals are unattainable.
Unfortunately, the Nigerian metals industry is in comatose status. The gigantic Iron and Steel
and Aluminium industries set up by the Federal Government are non-functional. Since nature
abhors vacuum, the Nigerian metals industry has become ―all-comers‖ industry driven by
profit motivated private individuals and companies whose products do not usually meet
international standards. This fact has untold effects on the recessed national economy. This is
the trust for the paper which discusses metal production as a vehicle for revitalizing Nigeria
recessed economy. The roles of metals in economic development and quality assurance in
metal production. The paper then attempted to chart a way forward.
1.0 INTRODUCTION
The major focus of the Sustainable Development Goals (SDGs) can be summarized as
eradication of poverty and hunger, provision of good health, fight inequalities, injustice, to
tackle climate change, and development of infrastructures and industries. These goals can be
narrow down to mankind sustainability. In achieving these goals, the root causes of poverty
and global needs must be addressed. How can poverty and hunger be eradicated without
providing jobs? How can we have favourable climate without making the environment
friendly? How can we have industries without raw materials to consume for production or
equipment and machines for production? All these point to the fact that an indispensable and
irreplaceable material is needed of which others things revolved. This indispensable material
is metal. Its production is the bedrock for man sustenance. It is not surprising that the theme
for the 33rd
conference and Annual General Meeting of the Nigerian Metallurgical Society:
―Metal Production: A Panacea for National Security and Economic Recovery‖ is therefore in
tandem with the SDGs of the United Nations.

Page 255 of 366
Metal is influential in more aspects of our lives than we are aware of. It is used across the
globe for a variety of purposes due to its functionality, adaptability, machinability and
strength. Mankind would not exist comfortably today if it were not for the development of
metals. Metal is an instrumental material in the international progression of infrastructure,
economy, transportation, sustainability, health and entertainment. Metal is so important that
the development of a country economy depends on its production and or consumption. Metals
are produced primarily from their ores and secondarily by recycling of metal scraps. In metal
production, the extent to which a metal industry can grow depends on the quality of its
products. Quality in metal production is so important because it will determine the
performance of such metal during service. Recently, Nigeria witness the collapse of some
buildings, the chief cause of this was attributed to the utilization of low quality metals for
such construction. This disastrous occurrence can be prevented only when quality metals are
used for construction and other service application. Hence, there is need for quality in metal
production to be assured.
The paper titled ―Quality Assurance in Metal Product in Nigeria: An Imperative for
Sustainable National Economic Development‖ is aim at pushing the Nigeria to action on the
need to revitalize the nation from the economic recession by producing quality metal of
international standards which will be able to compete with similar products in the
international market. For a metal industry to ensure that quality is assured in its products, the
industry must ensure that the various process involved in metal production is such that it will
not depreciate the estimated or expected quality of the metal and also innovative and need-
driven research targeting at improving production process should be embarked on. When
these are done, then the nation can expect development. The scope of this paper shall
encompass the significant of metal production as an indispensable solution to the economic
crisis in Nigeria.
2.0 METAL PRODUCTION: AN INDISPENSABLE SOLUTION TO RECESSION IN
NIGERIA
Metals are primarily produced by extracting it from its ores and secondarily by recycling its
scraps gathered from domestic waste and manufacturing undersize. Metals are used for
construction, structural, architectural and manufacturing purposes. This is due to their
inherent properties such as high strength, rigidity, ductility, durability and good
machinability. The most common metals are iron and its alloy, aluminium, copper and its
alloy, brass, nickel and its alloy, zinc, tin, lead. Iron and aluminium are the most produced
metal in the world due to their abundance in the earth crust and application. However, steel,
an alloy of iron is produced more than aluminium because of the relative ease of forming it
alloys and it engineering applications especially in construction and manufacturing.
Metal production has serves as a means of sustaining the nation economy over the years. A
nation that produces metal will definitely have a buoyant economy because the production of
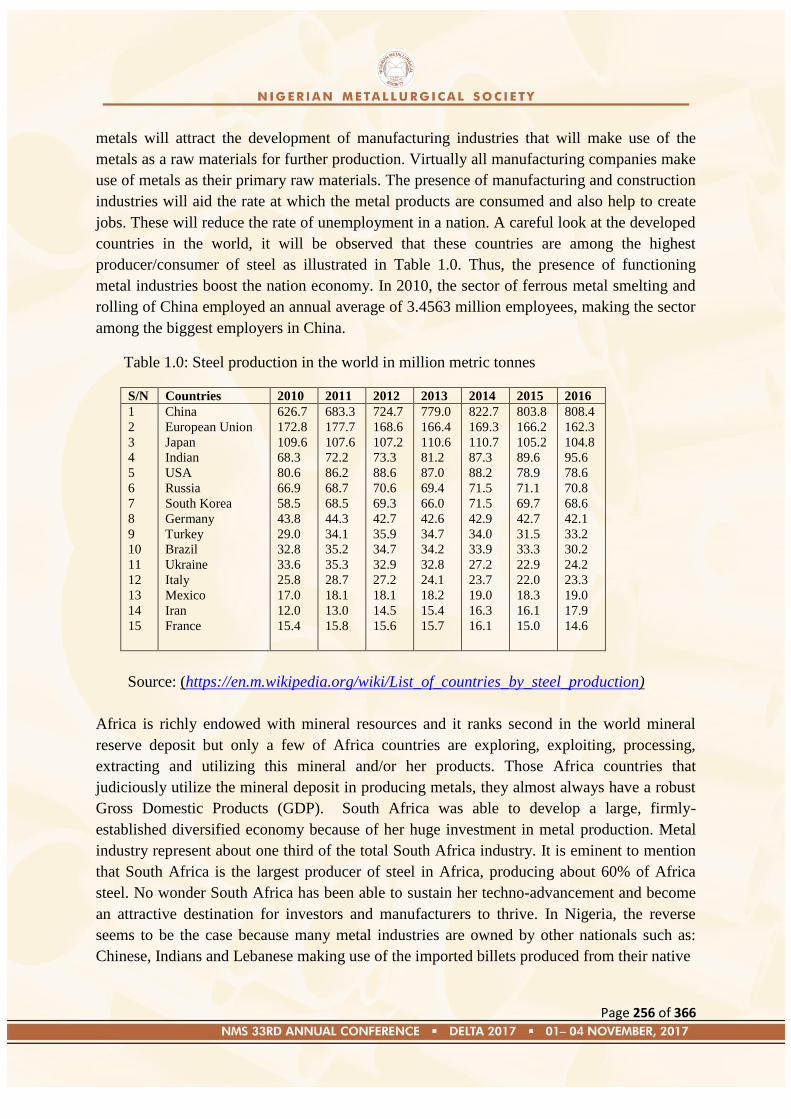
Page 256 of 366
metals will attract the development of manufacturing industries that will make use of the
metals as a raw materials for further production. Virtually all manufacturing companies make
use of metals as their primary raw materials. The presence of manufacturing and construction
industries will aid the rate at which the metal products are consumed and also help to create
jobs. These will reduce the rate of unemployment in a nation. A careful look at the developed
countries in the world, it will be observed that these countries are among the highest
producer/consumer of steel as illustrated in Table 1.0. Thus, the presence of functioning
metal industries boost the nation economy. In 2010, the sector of ferrous metal smelting and
rolling of China employed an annual average of 3.4563 million employees, making the sector
among the biggest employers in China.
Table 1.0: Steel production in the world in million metric tonnes
S/N Countries 2010 2011 2012 2013 2014 2015 2016
1
2
3
4
5
6
7
8
9
10
11
12
13
14
15
China
European Union
Japan
Indian
USA
Russia
South Korea
Germany
Turkey
Brazil
Ukraine
Italy
Mexico
Iran
France
626.7
172.8
109.6
68.3
80.6
66.9
58.5
43.8
29.0
32.8
33.6
25.8
17.0
12.0
15.4
683.3
177.7
107.6
72.2
86.2
68.7
68.5
44.3
34.1
35.2
35.3
28.7
18.1
13.0
15.8
724.7
168.6
107.2
73.3
88.6
70.6
69.3
42.7
35.9
34.7
32.9
27.2
18.1
14.5
15.6
779.0
166.4
110.6
81.2
87.0
69.4
66.0
42.6
34.7
34.2
32.8
24.1
18.2
15.4
15.7
822.7
169.3
110.7
87.3
88.2
71.5
71.5
42.9
34.0
33.9
27.2
23.7
19.0
16.3
16.1
803.8
166.2
105.2
89.6
78.9
71.1
69.7
42.7
31.5
33.3
22.9
22.0
18.3
16.1
15.0
808.4
162.3
104.8
95.6
78.6
70.8
68.6
42.1
33.2
30.2
24.2
23.3
19.0
17.9
14.6
Source: (https://en.m.wikipedia.org/wiki/List_of_countries_by_steel_production)
Africa is richly endowed with mineral resources and it ranks second in the world mineral
reserve deposit but only a few of Africa countries are exploring, exploiting, processing,
extracting and utilizing this mineral and/or her products. Those Africa countries that
judiciously utilize the mineral deposit in producing metals, they almost always have a robust
Gross Domestic Products (GDP). South Africa was able to develop a large, firmly-
established diversified economy because of her huge investment in metal production. Metal
industry represent about one third of the total South Africa industry. It is eminent to mention
that South Africa is the largest producer of steel in Africa, producing about 60% of Africa
steel. No wonder South Africa has been able to sustain her techno-advancement and become
an attractive destination for investors and manufacturers to thrive. In Nigeria, the reverse
seems to be the case because many metal industries are owned by other nationals such as:
Chinese, Indians and Lebanese making use of the imported billets produced from their native
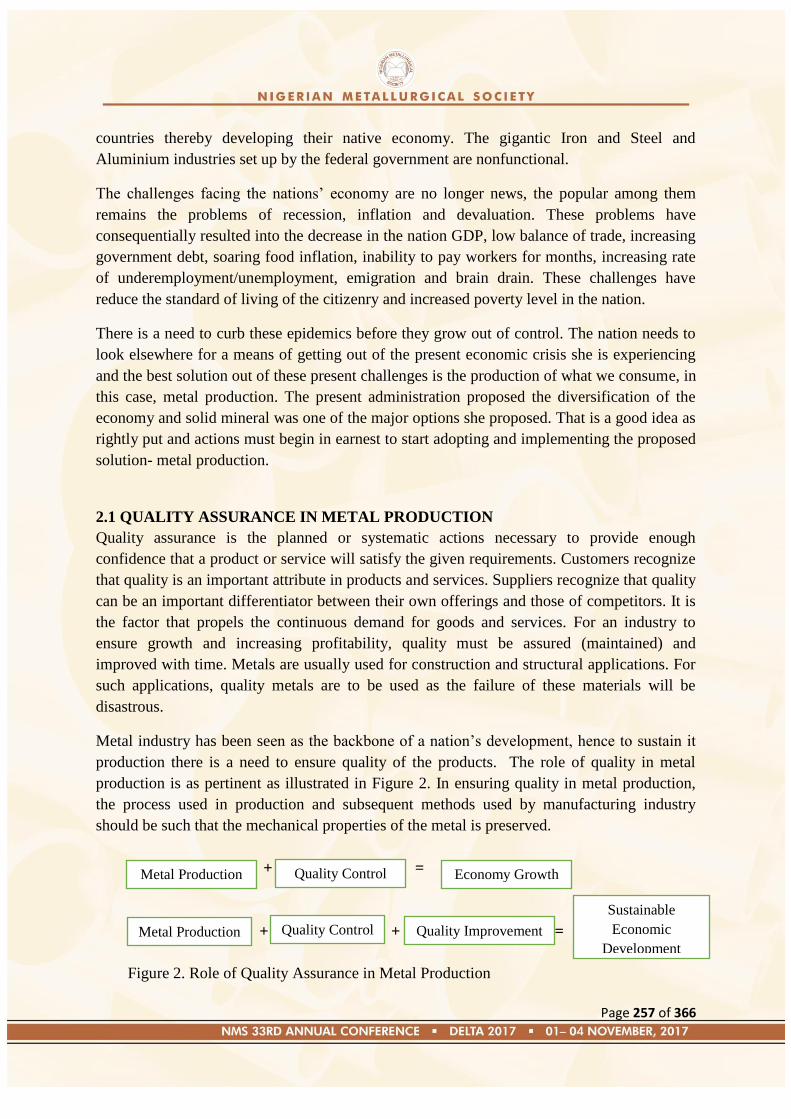
Page 257 of 366
countries thereby developing their native economy. The gigantic Iron and Steel and
Aluminium industries set up by the federal government are nonfunctional.
The challenges facing the nations‘ economy are no longer news, the popular among them
remains the problems of recession, inflation and devaluation. These problems have
consequentially resulted into the decrease in the nation GDP, low balance of trade, increasing
government debt, soaring food inflation, inability to pay workers for months, increasing rate
of underemployment/unemployment, emigration and brain drain. These challenges have
reduce the standard of living of the citizenry and increased poverty level in the nation.
There is a need to curb these epidemics before they grow out of control. The nation needs to
look elsewhere for a means of getting out of the present economic crisis she is experiencing
and the best solution out of these present challenges is the production of what we consume, in
this case, metal production. The present administration proposed the diversification of the
economy and solid mineral was one of the major options she proposed. That is a good idea as
rightly put and actions must begin in earnest to start adopting and implementing the proposed
solution- metal production.
2.1 QUALITY ASSURANCE IN METAL PRODUCTION
Quality assurance is the planned or systematic actions necessary to provide enough
confidence that a product or service will satisfy the given requirements. Customers recognize
that quality is an important attribute in products and services. Suppliers recognize that quality
can be an important differentiator between their own offerings and those of competitors. It is
the factor that propels the continuous demand for goods and services. For an industry to
ensure growth and increasing profitability, quality must be assured (maintained) and
improved with time. Metals are usually used for construction and structural applications. For
such applications, quality metals are to be used as the failure of these materials will be
disastrous.
Metal industry has been seen as the backbone of a nation‘s development, hence to sustain it
production there is a need to ensure quality of the products. The role of quality in metal
production is as pertinent as illustrated in Figure 2. In ensuring quality in metal production,
the process used in production and subsequent methods used by manufacturing industry
should be such that the mechanical properties of the metal is preserved.
+ =
+ + =
Figure 2. Role of Quality Assurance in Metal Production
Metal Production Quality Control Economy Growth
Metal Production Quality Control Quality Improvement
Sustainable
Economic
Development

Page 258 of 366
The question then remains, how can quality be improved in metal production? Improving
quality in metal production can be achieved by researching on other efficient and economical
means of producing metals such that the mechanical properties are improve on. Innovative
methods of production should be researched and processed; procedure that controls the
process-variables during production which yields best properties should be formulated and
adopted. Also, the quality control sector of the industry should ensure that only products
measuring up to the requirements of the International Standard Organization and Standard
Organization Nigeria should be allowed in the market.
3.0 ROLE OF METALS IN ECONOMIC DEVELOPMENT OF NIGERIA
The true wealth of a nation is measured by the overall ability to provide for the citizenry a
sustainable and comfortable standard of living and the standard of living of any nation can be
accurately gauged by reference to the level of production and/or level of consumption of
metal products. Judging from developed countries, the metal industries are generally
important in mankind sustainability, human civilization and infrastructural development. It is
evidence that metal plays a significant roles in their civilization and economy development. It
is observed that three (3) crucial reasons are responsible for why metal industry is the
fundamental sector for which the industrialization and urbanization of a nation rest upon.
3.1. Mankind Sustainability
The first two goals of the Sustainable Development Goals (MDGs) are to eradicate extreme
poverty and hunger. The eighth and ninth are: promoting inclusive and sustainable economic
growth, employment and decent work for all; and building resilient infrastructure, promoting
sustainable industrialization and fostering innovation. The others revolved around man well-
being (health and good climate). Metal production is a key to achieving these goals. The
metal industry is capable of attracting industrialization which will foster techno-economic
advancement and create new jobs. Poverty and hunger are thereby eradicated from the nation.
The steel sector in the developed nations is the highest employer of labour of the entire
economic sector mainly due to their work multiplier effect. The G-8 countries are among the
highest producer of steel, hence they were able to sustain their economy. In the United States
alone, the steel industry employs more than 160,000 skilled workers. China, the most
populous country in the world was able to sustain her increasing population because of her
leading role in metal steel production. What does this say for economies of Nigeria? A
thriving metal industry points to a thriving economy.
3.2. Civilization
Civilization is the sum total of all progress made by man in every sphere of action and from
every point of view in so as the progress helps towards the perfecting of individuals. Metals
provide the foundation for our modern way of life. Man has witness tremendous development

Page 259 of 366
in technology and the ages of this development were named after the material developed
ranging from the Stone Age, Bronze Age, Iron Age, Nuclear Age and the Computer Age.
Man civilization was marked by the discovery of copper and how it can be made harder by
alloying (Bronze Age). The Iron Age marks the development of industries and the genesis of
construction. Sophisticated equipment and machines were made. The Nuclear Age and the
Computer Age only innovate the Iron Age. The world was able to become a global village
because innovative research were made on how metals can be utilized for simple but
sophisticated component. We need metals to generate electricity, to produce automobiles,
buildings, machines, and home appliances. Metal is an optimum choice for a variety of
reasons. Aside from the appreciable properties of metals, the fabrication is not complex and
its maintenance is easier, since it is more durable in service. The recyclability rate of metals
also plays a role in making environmentally friendly. A nation that produce metal will
definitely have socio-technological development and civilization.
3.3. Infrastructure
If metal did not exist, neither would bridges nor amazing story buildings and other
infrastructures exist. Metal especially steel is a vital component for construction, structural
and architectural applications. In the United States alone, there are more than 1,056
suspension bridges. Some of the largest and most inhabited buildings include the Chrysler
Building, Sears Tower, U.S. Steel Tower, Tapei 101 and the tallest building in the world the
Burj Khalifa of Dubai. These structures and buildings would not stand at all as they do if it
were not for the strength of steel. Not only does this help to consume metal produced but also
serves as tourist centre and a means generating revenue (economy development). Without
metal, such spanning and functional roadways, buildings and skyscrapers are other forms of
infrastructure would be limited in their capabilities and strength, if not completely impossible
to construction the first place - thanks to metal.
Metal plays an important role in techno-economic development of a nation. For Nigeria to
attain her desired development and to accomplish the SDGs, the nation must begin the
production of quality metal. Metal production will on its own accord attract investors and
manufacturing industries. Then the nation can begin enjoy the desired development and
economy buoyancy.
4.0 THE WAY FORWARD
―If you want to build high, you must dig deep.”- Stephen Oswald
For the Nigerian metal industry to stand the test of time from competitions from other metal
producing countries, there is a need for the metal industry to have a feasible and
economically viable, well formulated and articulately blueprint. Using the nation first stanza
of the national anthem, the blueprint must encompass
Page 260 of 366
(i) ―Arise o compatriot, Nigeria call obey…” There should be an inner momentum- a
political will that will be propelling the citizen towards the need to arise and eat this frog.
One of the Newton‘s law postulates that ―every object will remain in it state of rest unless
being acted by an external force‖. Having this drive will aid the quest for the nation to
urgently arise not just to start producing any metal but metals of high quality.
(ii) ―…to serve our father land, with love and strength and faith…‖ There should be a
selfless desire to serve the nation and this will apply to every sphere of leadership. The
progress of the metal industry should be of interest in every aspect of production, only then
can quality be assured.
(iii) “…the labour of our heroes pass, shall never be in vain…” There should be deep
willingness to sustain and expand production. The stakeholders‘ orientation should be to
improve the process and quality of products.
(iv) “…to serve with heart and mind”. There should be a commitment to contribute to the
sustenance and continuous productivity of the metal industry. A tangible quota of the nation‘s
budget should be allocated for research and development of the metal industry.
(v) “…one nation bound in freedom, peace and unity”. There should be oneness among
the stakeholders involved. This implies that there should be synergy among the government,
academics and metal industries. Government should provide allocations for production and
need-driven research, the academia should embark on innovative research that will engender
quality improvement in the metal industry.
"Where there is a will, there is a way”. Reviving the nation metal industry and ensuring
quality products is a collective rescue mission, and the nation must arise to the task. Having
the above in the blueprint is a prospective progress in the nation‘s development and also the
emancipation of the Nigeria metal industry to be able to compete globally.
5.0 CONCLUSION
This paper has discussed the role of metal industry, which is a flag ship industry as a vital
sector of the nation economy. It has also revealed that any nation that will develop will have
to invest in metal production. Therefore, the Nigeria governments must see to the
revitalization of metal industry by giving it urgent and special attention so as to revamp the
dying metal industry and to save the nation from the present economic crisis.
Also, in order for the nation to experience a sustainable and effective development in the
metals industry, quality products must be assured. To achieve this, innovative and need-
driven research should be encouraged to develop high performing products of high strength,
durable, corrosion resistance and light weight products which will meet the demands of the
new era industries and end users. Only then can the nation‘s product be of demand.
Page 261 of 366
References
Ajayi J.A, (1998). Materials and Metallurgical Engineering: Nigeria‘s Link to Technological
Development in the Next Millennium. Lecture delivered at the National Association of
Metallurgical and Materials Engineering Students week, Obafemi Awolowo Branch, Ile Ife,
Nigeria. p. 4
Ajayi J. A, Adegbite M. A and Iyanda A.R. (2014).Sustainable Iron and Steel Production in Nigeria:
The Techno-Economic Backbone of the National Development. pp. 1-6
Balogun S., Esezobor D., Adeosun S. and Sekunowo O. (2009). Challenges of Producing Quality
Construction Steel Bars in West Africa: Case Study of Nigeria Steel Industry. Journal of Minerals
& Materials Characterization & Engineering. Vol. 8, No.4, pp 283-292
Dametew A.W, Kitaw D., and Ebinger O. (2017). The Role of TQM and JIT for Basic Metal industries
Global Competitiveness. Industrial and Engineering Management. doi: 10.4172/2169-
0316.1000212, online version.
Ifaturoti E. A., (1995). Stable Administration and Mineral Resources Development. Nigerian Mining
and Geosciences Society Newsmagazine, Vol. 94, No. 2, pp. 10-23.
Obikwelu D. O.N. and Nebo C.O. (2012). A Critical look at the Nigerian Steel Industry – A Dark Page
on the History of Nigeria and the Metallurgical Profession. Plenary Paper Presented at 28th
Annual Conference and Annual General Meeting of the Nigerian Metallurgical Society (NMS),
Abuja. Pp. 1-12
Rose K.H., (2005). Project Quality Management: Why, What and How. Fort Lauderdale, Florida: J.
Ross Publishing. p. 41. ISBN 1-932159-48-7
Tervonen P., Pahkala N., and Haapasalo H. (2009). Development of TQM in Steel Manufacturers‘
Production. Ibima business review. Vol. 1, p. 14
Umar S. B., Ali M., and Mohammed S.C. (2011). A Review of Nigerian Metallic Minerals for
Technological Development. Natural Resources, vol. 2, pp.87-91. doi: 10.4236/nr.2011.22011
(http://www.scirp.org/journal/nr)
Zhang Changfu. (2012). The Role of the Iron and Steel Industry in China‘s Future Economic
Development. A Speech Delivered at the ―LCA and Steel‖ Seminar on July 19, 2012
Zhihai Z., 2000. ―Quality Management Approach in China‖. The TQM magazine, vol. 12, No. 2, pp
92-105
https://en.m.wikipedia.org/wiki/Quality_management (date assessed August 17, 2017)
https://en.m.wikipedia.org/wiki/List_of_countries_by_steel_production (date assessed August 17,
2017)
www.emeraldinsight.com/doi/abs/10.1108/09544780010318343 (date assessed August 17, 2017)
http//www.worldsteel.org/media-centre/press-release/2017/world-steel-in-figures-2017.html (date
assessed August 17, 2017)
www.ng.undp.org/content/nigeria/en/home/post-2015/sdg-overview.html (date accessed August 28,
2017)
Page 262 of 366
Paper: NMS 2017-TP032
Welding Procedure Qualification of a Gas Pipeline
*A. John, M. A. Adegbite, G. O. Amadi, J. O. Umukoro and I. Bright
Department of Welding Engineering and Offshore Technology,
Petroleum Training Institute, Effurun, Delta State, Nigeria.
*Corresponding Author: [email protected]
ABSTRACT
This report presents the welding procedure qualification report and the non-destructive testing
approach for the installation of 2‖ pipeline supplying gas to a generator set in Excravos, Delta State.
The aim of the project was to evaluate the suitability of using a 2‖ pipeline system for supplying gas
to a power generating set as required by ASME SECTION IX/API 1104. Mechanical tests and Non-
destructive examinations of the welded coupons were conducted and the results obtained show defect-
free weldments. The welding procedure therefore, satisfies the prescribed acceptance criteria.
Key words: Welding, Quality, Testing, Pipeline, ASME/API
Introduction
Welding is a joining process that produces a merger of materials by heating, applying pressure, or
both. In essence, the welding process fuses the surfaces of two distinct materials to form a single unit.
It encompasses a broad range of joining techniques that include fusion welding, solid state welding,
weld-bonding, diffusion welding, brazing, and soldering.
Welding is a precise, reliable, cost-effective, and ―high-tech‖ method for joining materials. No other
joining method is as widely used by manufacturers to join metals and alloys efficiently and to add
value to their products. Most of the familiar objects in modern society, from buildings and bridges, to
vehicles, computers (PC boards), and medical devices, heavy-duty welding of steel plates for
shipbuilding to the repair of industrial boilers could not be produced without the use of welding.
Experience has shown that it is usual for pipes to be either tacked or clamped together before carrying
out welding in order to maintain alignment. As the welding proceeds, distortions and contraction are
certain to take place and over a number of joints, can amount to inches over the span of the pipe. It is
also observed that many distinct factors influences the strength of welds and the material around
them, including the welding method, the amount and concentration of energy input, the weldability of
the base material, filler material, flux material, the design of the joint, and the interactions among all
these factors.

Page 263 of 366
Therefore, the process of qualifying the welder is to ensure that the welder and the welding procedure
are compatible. This process inspect the welder under test conditions to weld an item using a specified
welding position, with specified consumables and materials, travel speed and amps and volts. The
audit of the welder to pass the test may include x-ray; visual or mechanical testing and will prove the
capability of the welder to perform in the field in accordance with the required specification.
Welding inspection is usually carried out to ensure that the fabrication process has been conducted in
accordance to specification. This may include checking the welder has been qualified, the welding
procedure and parameters are correct for the material being welded, the consumable has been
prepared correctly, and a range of other checks that need to be carried out to ensure quality control in
the process. Welding inspection also requires the traceability and documentation to be completed. In
light of this, any welding project that is carried out without adhering to lay down welding
specification and procedures, the weld could fail easily leading to severe consequence to the operators
of the facility.
The aim of this work is to present a welding procedure qualification job executed for the construction
and installation of a 2‖ pipeline for supplying gas from a platform to the generator house in Escravos.
As a consequence, the Department of Welding Engineering and Offshore Technology, Petroleum
Training Institute, Effurun, Delta State, Nigeria was commissioned to conduct tests on samples cut off
from welded pipe coupons, in order to certify the Welding Procedure Specification, (W.P.S – 001), in
accordance with the requirements of API 1104/AWS D1.1 and ASME SECT IX standard.
Welding Procedure Qualification
2.1 Test Procedure
The following standard test/investigation procedures were employed for the exercise:
(a) Visual Inspection. (b) Tensile Test (Reduced Section).
(c) Guided Bend Test.
(d) Nick Break Test.
(e) Hardness Test.
2.2 Visual Inspection
Based on the governing standard code, for acceptable qualification, weld shall meet the following
requirement:
1. The weld shall be free of cracks
2. All craters shall be filled to the full cross section of the weld

Page 264 of 366
3. The face of the weld shall be flush with the surface of the base metal, and the weld
shall merge smoothly with the base metal. Undercut shall not exceed 1mm. weld
reinforcement shall not exceed 3mm.
4. The root of the weld shall be inspected and there shall be no evidence of cracks,
incomplete fusion, or inadequate joint penetration. A concave root surface is
allowed within the limits shown below, provided the total weld thickness is equal
to or greater than that of the base metal.
In light of the above, a close look at the specimen cut out from the 2‖ Carbon Steel Pipe shows a very
smooth surface. No corrosion or pitting effect on the material. Therefore, the material meets the
requirements of the Governing Code ASME IX /ASME B31.3
2.3 Tensile Test
2.3.1 Sample Preparation
Two (2) specimens were taken from the Pipe at various locations:
- Location 1 - at 1 O‘clock - One Tensile piece
- Location 2 - at 7 O‘clock - One Tensile piece
The surface of the specimens was grinded, milled and polished to specification in accordance with
ASME IX / ASME B31.3 PART QW 462 standard as presented in Figure 1 and 2.
2.3.2 Testing
The Tensile Test was conducted using CRC-EVANS MODEL RC-30-SA6 Tensile tester. The results
are presented in Chapter Four.
2.4 Guided Bend Test
2.4.1 Sample Preparation
Four (2) specimens were taken from the pipe at various locations:
- Location 1 - at 1 O‘clock - Face Bend
- Location 2 - at 7 O‘clock - Root Bend
The surface of the specimens was prepared to specification in accordance with the requirement of
ASME IX / API 1104 Standard as presented in Figure 1 and 2.
2.4.2 Testing
A standard Guided Bend Testing machine was used and the specimens were tested in accordance with
ASME IX / API 1104 Standard. Results are as presented in Chapter 3.
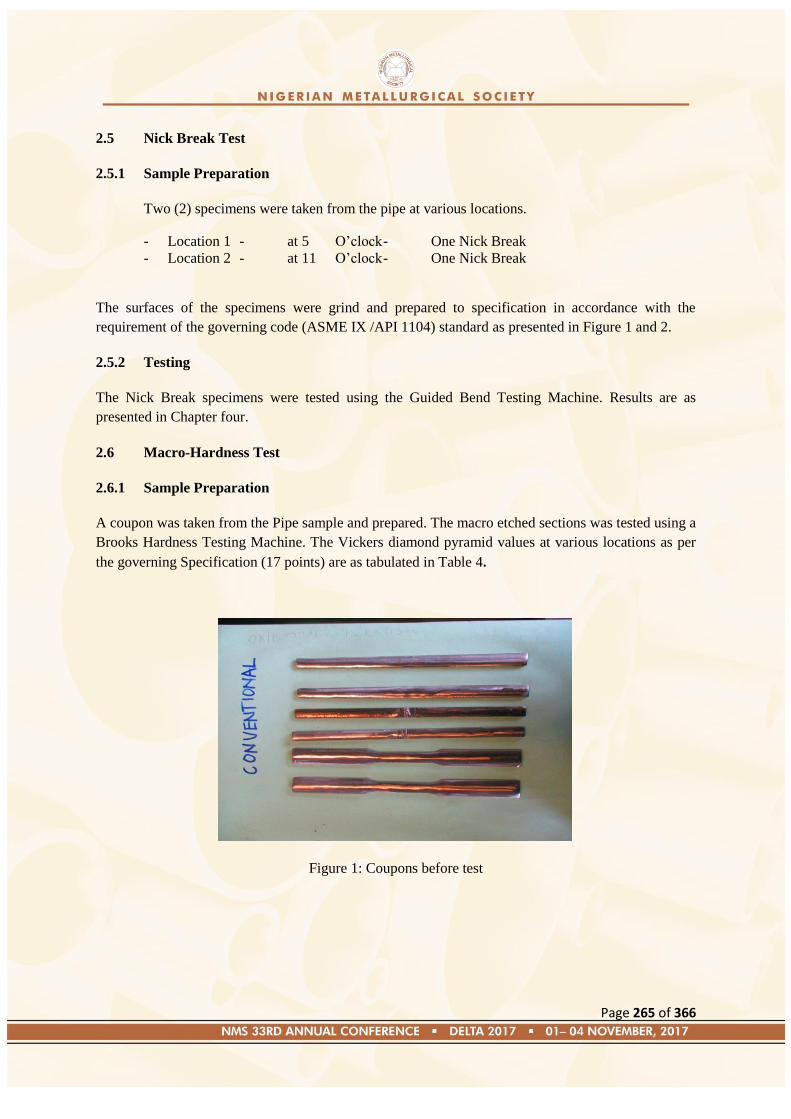
Page 265 of 366
2.5 Nick Break Test
2.5.1 Sample Preparation
Two (2) specimens were taken from the pipe at various locations.
- Location 1 - at 5 O‘clock - One Nick Break
- Location 2 - at 11 O‘clock - One Nick Break
The surfaces of the specimens were grind and prepared to specification in accordance with the
requirement of the governing code (ASME IX /API 1104) standard as presented in Figure 1 and 2.
2.5.2 Testing
The Nick Break specimens were tested using the Guided Bend Testing Machine. Results are as
presented in Chapter four.
2.6 Macro-Hardness Test
2.6.1 Sample Preparation
A coupon was taken from the Pipe sample and prepared. The macro etched sections was tested using a
Brooks Hardness Testing Machine. The Vickers diamond pyramid values at various locations as per
the governing Specification (17 points) are as tabulated in Table 4.
Figure 1: Coupons before test
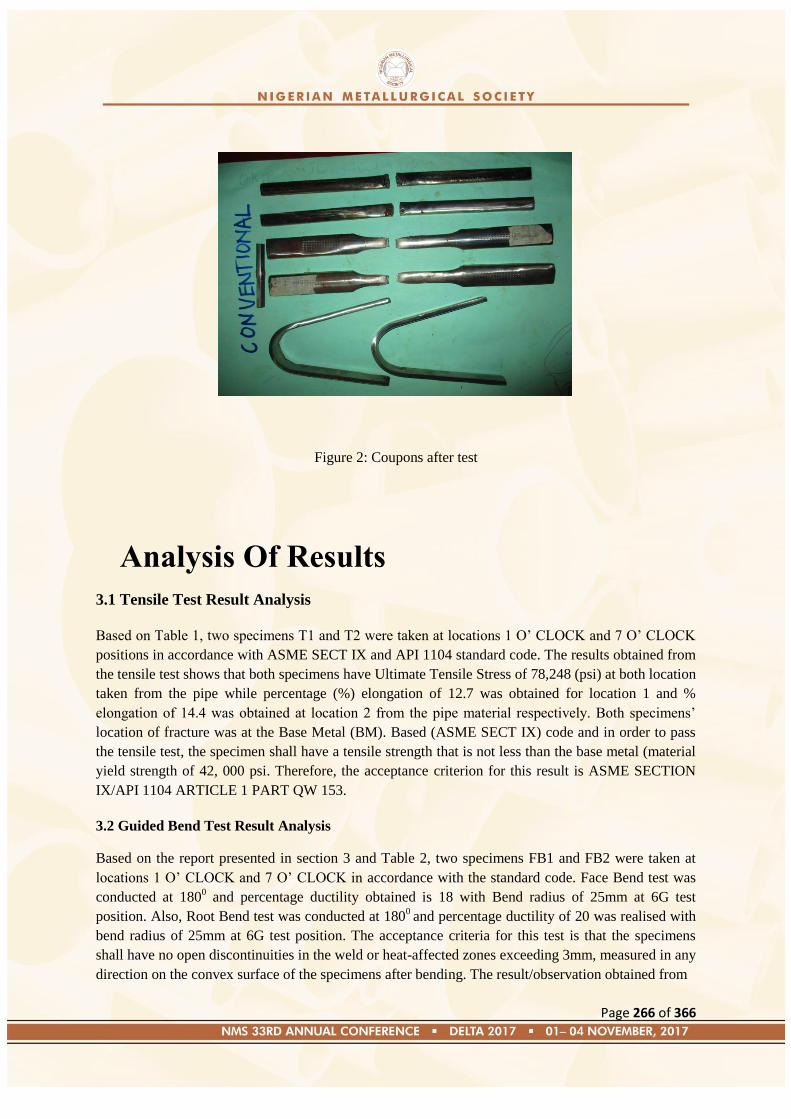
Page 266 of 366
Figure 2: Coupons after test
Analysis Of Results
3.1 Tensile Test Result Analysis
Based on Table 1, two specimens T1 and T2 were taken at locations 1 O‘ CLOCK and 7 O‘ CLOCK
positions in accordance with ASME SECT IX and API 1104 standard code. The results obtained from
the tensile test shows that both specimens have Ultimate Tensile Stress of 78,248 (psi) at both location
taken from the pipe while percentage (%) elongation of 12.7 was obtained for location 1 and %
elongation of 14.4 was obtained at location 2 from the pipe material respectively. Both specimens‘
location of fracture was at the Base Metal (BM). Based (ASME SECT IX) code and in order to pass
the tensile test, the specimen shall have a tensile strength that is not less than the base metal (material
yield strength of 42, 000 psi. Therefore, the acceptance criterion for this result is ASME SECTION
IX/API 1104 ARTICLE 1 PART QW 153.
3.2 Guided Bend Test Result Analysis
Based on the report presented in section 3 and Table 2, two specimens FB1 and FB2 were taken at
locations 1 O‘ CLOCK and 7 O‘ CLOCK in accordance with the standard code. Face Bend test was
conducted at 1800 and percentage ductility obtained is 18 with Bend radius of 25mm at 6G test
position. Also, Root Bend test was conducted at 1800 and percentage ductility of 20 was realised with
bend radius of 25mm at 6G test position. The acceptance criteria for this test is that the specimens
shall have no open discontinuities in the weld or heat-affected zones exceeding 3mm, measured in any
direction on the convex surface of the specimens after bending. The result/observation obtained from

Page 267 of 366
the test revealed defect free weld for all the specimens and therefore accepted based on ASME
SECTION IX/API 1104 ARTICLE 1 PART QW 163
3.3 Nick Break Test Result Analyses
Based on Table 3 and information presented section 3, two specimens NB1 and NB2 were
taken at locations 5 O‘ CLOCK and 11 O‘ CLOCK in accordance with the standard code.
The test/result show no presence of discontinuities and result accepted based on ASME
SECTION IX/API 1104 SECTION 5.6.3.3.
3.4 Macro-Hardness Test Result Analyses
Based on the result obtained from the MACRO HARDNESS TEST, the results obtained are placed in
Table .4. The numbers of indentation and their corresponding hardness number were derived are also
presented. It shows that the range of the specimen‘s hardness conformed with API 1104/ASME SECT
IX.
Conclusions
Mechanical test were conducted on samples of coupons cut off from welded pipe in order to certify
the welding procedure specification (WPS – 001) in accordance with the requirement of API
1104/AWS D1.1 standard. This was achieved due to the selection of the right tests and inspection
methods on the specimens, used of certified welding personnel and ensuring that the operations were
guided by relevant codes and standards. The entire job was executed in a safe operating condition and
recorded neither accident nor incident to personnel and equipment.
REFERENCE
1. ASME B 31.3 - Code for Pressure Piping
2. AME IX, 2010 Edition July 1st, 2010 - Qualification Standard for Welding and Brazing
Procedures, Welders, Brazers and Welding and Brazing Operators.
3. API 1104 - Welding of Pipelines and Related Facilities.
4. Goel, N. (2009) Guide to Understanding Welding Procedure Specification (WPS),
Procedure Qualification Record (PQR), and Welder Performance Qualification Record
(WPQR).
5. Pellegrino B. A. and Nugent M. (2012) Nondestructive Testing Technologies and
Applications for Detecting, Sizing and Monitoring Corrosion/Erosion Damage in Oil &
Gas Assets, NACE International Corrosion conference and exposition, C2012-0001147
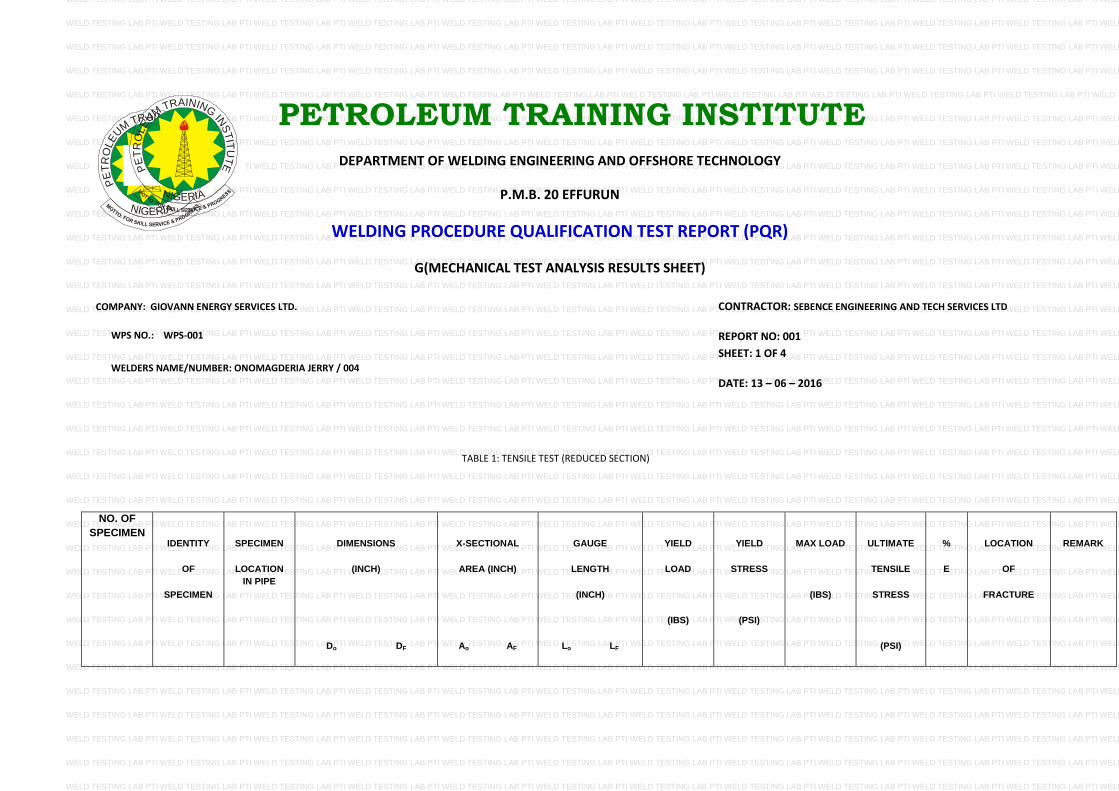
Page 268 of 366
WELD TESTING LAB PTI WELD TESTING LAB PTI WELD TESTING LAB PTI WELD TESTING LAB PTI WELD TESTING LAB PTI WELD TESTING LAB PTI WELD TESTING LAB PTI WELD TESTING LAB PTI WELD TESTING LAB PTI WELD TESTING LAB PTI WELD TESTING LAB PTI WELD TESTING
WELD TESTING LAB PTI WELD TESTING LAB PTI WELD TESTING LAB PTI WELD TESTING LAB PTI WELD TESTING LAB PTI WELD TESTING LAB PTI WELD TESTING LAB PTI WELD TESTING LAB PTI WELD TESTING LAB PTI WELD TESTING LAB PTI WELD TESTING LAB PTI WELD TESTING
WELD TESTING LAB PTI WELD TESTING LAB PTI WELD TESTING LAB PTI WELD TESTING LAB PTI WELD TESTING LAB PTI WELD TESTING LAB PTI WELD TESTING LAB PTI WELD TESTING LAB PTI WELD TESTING LAB PTI WELD TESTING LAB PTI WELD TESTING LAB PTI WELD TESTING
WELD TESTING LAB PTI WELD TESTING LAB PTI WELD TESTING LAB PTI WELD TESTING LAB PTI WELD TESTING LAB PTI WELD TESTING LAB PTI WELD TESTING LAB PTI WELD TESTING LAB PTI WELD TESTING LAB PTI WELD TESTING LAB PTI WELD TESTING LAB PTI WELD TESTING
WELD TESTING LAB PTI WELD TESTING LAB PTI WELD TESTING LAB PTI WELD TESTING LAB PTI WELD TESTINLAB PTI WELD TESTING LAB PTI WELD TESTING LAB PTI WELD TESTING LAB PTI WELD TESTING LAB PTI WELD TESTING LAB PTI WELD TESTING LAB PTI WELD TESTING
WELD TESTING LAB PTI WELD TESTING LAB PTI WELD TESTING LAB PTI WELD TESTING LAB PTI WELD TESTING LAB PTI WELD TESTING LAB PTI WELD TESTING LAB PTI WELD TESTING LAB PTI WELD TESTING LAB PTI WELD TESTING LAB PTI WELD TESTING LAB PTI WELD TESTING
WELD TESTING LAB PTI WELD TESTING LAB PTI WELD TESTING LAB PTI WELD TESTING LAB PTI WELD TESTING LAB PTI WELD TESTING LAB PTI WELD TESTING LAB PTI WELD TESTING LAB PTI WELD TESTING LAB PTI WELD TESTING LAB PTI WELD TESTING LAB PTI WELD TESTING
WELD TESTING LAB PTI WELD TESTING LAB PTI WELD TESTING LAB PTI WELD TESTING LAB PTI WELD TESTING LAB PTI WELD TESTING LAB PTI WELD TESTING LAB PTI WELD TESTING LAB PTI WELD TESTING LAB PTI WELD TESTING LAB PTI WELD TESTING LAB PTI WELD TESTING
WELD TESTING LAB PTI WELD TESTING LAB PTI WELD TESTING LAB PTI WELD TESTING LAB PTI WELD TESTING LAB PTI WELD TESTING LAB PTI WELD TESTING LAB PTI WELD TESTING LAB PTI WELD TESTING LAB PTI WELD TESTING LAB PTI WELD TESTING LAB PTI WELD TESTING
WELD TESTING LAB PTI WELD TESTING LAB PTI WELD TESTING LAB PTI WELD TESTING LAB PTI WELD TESTING LAB PTI WELD TESTING LAB PTI WELD TESTING LAB PTI WELD TESTING LAB PTI WELD TESTING LAB PTI WELD TESTING LAB PTI WELD TESTING LAB PTI WELD TESTING
WELD TESTING LAB PTI WELD TESTING LAB PTI WELD TESTING LAB PTI WELD TESTING LAB PTI WELD TESTING LAB PTI WELD TESTING LAB PTI WELD TESTING LAB PTI WELD TESTING LAB PTI WELD TESTING LAB PTI WELD TESTING LAB PTI WELD TESTING LAB PTI WELD TESTING
WELD TESTING LAB PTI WELD TESTING LAB PTI WELD TESTING LAB PTI WELD TESTING LAB PTI WELD TESTING LAB PTI WELD TESTING LAB PTI WELD TESTING LAB PTI WELD TESTING LAB PTI WELD TESTING LAB PTI WELD TESTING LAB PTI WELD TESTING LAB PTI WELD TESTING
WELD TESTING LAB PTI WELD TESTING LAB PTI WELD TESTING LAB PTI WELD TESTING LAB PTI WELD TESTING LAB PTI WELD TESTING LAB PTI WELD TESTING LAB PTI WELD TESTING LAB PTI WELD TESTING LAB PTI WELD TESTING LAB PTI WELD TESTING LAB PTI WELD TESTING
WELD TESTING LAB PTI WELD TESTING LAB PTI WELD TESTING LAB PTI WELD TESTING LAB PTI WELD TESTING LAB PTI WELD TESTING LAB PTI WELD TESTING LAB PTI WELD TESTING LAB PTI WELD TESTING LAB PTI WELD TESTING LAB PTI WELD TESTING LAB PTI WELD TESTING
WELD TESTING LAB PTI WELD TESTING LAB PTI WELD TESTING LAB PTI WELD TESTING LAB PTI WELD TESTING LAB PTI WELD TESTING LAB PTI WELD TESTING LAB PTI WELD TESTING LAB PTI WELD TESTING LAB PTI WELD TESTING LAB PTI WELD TESTING LAB PTI WELD TESTING
WELD TESTING LAB PTI WELD TESTING LAB PTI WELD TESTING LAB PTI WELD TESTING LAB PTI WELD TESTING LAB PTI WELD TESTING LAB PTI WELD TESTING LAB PTI WELD TESTING LAB PTI WELD TESTING LAB PTI WELD TESTING LAB PTI WELD TESTING LAB PTI WELD TESTING
WELD TESTING LAB PTI WELD TESTING LAB PTI WELD TESTING LAB PTI WELD TESTING LAB PTI WELD TESTING LAB PTI WELD TESTING LAB PTI WELD TESTING LAB PTI WELD TESTING LAB PTI WELD TESTING LAB PTI WELD TESTING LAB PTI WELD TESTING LAB PTI WELD TESTING
WELD TESTING LAB PTI WELD TESTING LAB PTI WELD TESTING LAB PTI WELD TESTING LAB PTI WELD TESTING LAB PTI WELD TESTING LAB PTI WELD TESTING LAB PTI WELD TESTING LAB PTI WELD TESTING LAB PTI WELD TESTING LAB PTI WELD TESTING LAB PTI WELD TESTING
WELD TESTING LAB PTI WELD TESTING LAB PTI WELD TESTING LAB PTI WELD TESTING LAB PTI WELD TESTING LAB PTI WELD TESTING LAB PTI WELD TESTING LAB PTI WELD TESTING LAB PTI WELD TESTING LAB PTI WELD TESTING LAB PTI WELD TESTING LAB PTI WELD TESTING
WELD TESTING LAB PTI WELD TESTING LAB PTI WELD TESTING LAB PTI WELD TESTING LAB PTI WELD TESTING LAB PTI WELD TESTING LAB PTI WELD TESTING LAB PTI WELD TESTING LAB PTI WELD TESTING LAB PTI WELD TESTING LAB PTI WELD TESTING LAB PTI WELD TESTING
WELD TESTING LAB PTI WELD TESTING LAB PTI WELD TESTING LAB PTI WELD TESTING LAB PTI WELD TESTING LAB PTI WELD TESTING LAB PTI WELD TESTING LAB PTI WELD TESTING LAB PTI WELD TESTING LAB PTI WELD TESTING LAB PTI WELD TESTING LAB PTI WELD TESTING
WELD TESTING LAB PTI WELD TESTING LAB PTI WELD TESTING LAB PTI WELD TESTING LAB PTI WELD TESTING LAB PTI WELD TESTING LAB PTI WELD TESTING LAB PTI WELD TESTING LAB PTI WELD TESTING LAB PTI WELD TESTING LAB PTI WELD TESTING LAB PTI WELD TESTING
WELD TESTING LAB PTI WELD TESTING LAB PTI WELD TESTING LAB PTI WELD TESTING LAB PTI WELD TESTING LAB PTI WELD TESTING LAB PTI WELD TESTING LAB PTI WELD TESTING LAB PTI WELD TESTING LAB PTI WELD TESTING LAB PTI WELD TESTING LAB PTI WELD TESTING
WELD TESTING LAB PTI WELD TESTING LAB PTI WELD TESTING LAB PTI WELD TESTING LAB PTI WELD TESTING LAB PTI WELD TESTING LAB PTI WELD TESTING LAB PTI WELD TESTING LAB PTI WELD TESTING LAB PTI WELD TESTING LAB PTI WELD TESTING LAB PTI WELD TESTING
WELD TESTING LAB PTI WELD TESTING LAB PTI WELD TESTING LAB PTI WELD TESTING LAB PTI WELD TESTING LAB PTI WELD TESTING LAB PTI WELD TESTING LAB PTI WELD TESTING LAB PTI WELD TESTING LAB PTI WELD TESTING LAB PTI WELD TESTING LAB PTI WELD TESTING
WELD TESTING LAB PTI WELD TESTING LAB PTI WELD TESTING LAB PTI WELD TESTING LAB PTI WELD TESTING LAB PTI WELD TESTING LAB PTI WELD TESTING LAB PTI WELD TESTING LAB PTI WELD TESTING LAB PTI WELD TESTING LAB PTI WELD TESTING LAB PTI WELD TESTING
WELD TESTING LAB PTI WELD TESTING LAB PTI WELD TESTING LAB PTI WELD TESTING LAB PTI WELD TESTING LAB PTI WELD TESTING LAB PTI WELD TESTING LAB PTI WELD TESTING LAB PTI WELD TESTING LAB PTI WELD TESTING LAB PTI WELD TESTING LAB PTI WELD TESTING
WELD TESTING LAB PTI WELD TESTING LAB PTI WELD TESTING LAB PTI WELD TESTING LAB PTI WELD TESTING LAB PTI WELD TESTING LAB PTI WELD TESTING LAB PTI WELD TESTING LAB PTI WELD TESTING LAB PTI WELD TESTING LAB PTI WELD TESTING LAB PTI WELD TESTING
WELD TESTING LAB PTI WELD TESTING LAB PTI WELD TESTING LAB PTI WELD TESTING LAB PTI WELD TESTING LAB PTI WELD TESTING LAB PTI WELD TESTING LAB PTI WELD TESTING LAB PTI WELD TESTING LAB PTI WELD TESTING LAB PTI WELD TESTING LAB PTI WELD TESTING
WELD TESTING LAB PTI WELD TESTING LAB PTI WELD TESTING LAB PTI WELD TESTING LAB PTI WELD TESTING LAB PTI WELD TESTING LAB PTI WELD TESTING LAB PTI WELD TESTING LAB PTI WELD TESTING LAB PTI WELD TESTING LAB PTI WELD TESTING LAB PTI WELD TESTING
WELD TESTING LAB PTI WELD TESTING LAB PTI WELD TESTING LAB PTI WELD TESTING LAB PTI WELD TESTING LAB PTI WELD TESTING LAB PTI WELD TESTING LAB PTI WELD TESTING LAB PTI WELD TESTING LAB PTI WELD TESTING LAB PTI WELD TESTING LAB PTI WELD TESTING
WELD TESTING LAB PTI WELD TESTING LAB PTI WELD TESTING LAB PTI WELD TESTING LAB PTI WELD TESTING LAB PTI WELD TESTING LAB PTI WELD TESTING LAB PTI WELD TESTING LAB PTI WELD TESTING LAB PTI WELD TESTING LAB PTI WELD TESTING LAB PTI WELD TESTING
WELD TESTING LAB PTI WELD TESTING LAB PTI WELD TESTING LAB PTI WELD TESTING LAB PTI WELD TESTING LAB PTI WELD TESTING LAB PTI WELD TESTING LAB PTI WELD TESTING LAB PTI WELD TESTING LAB PTI WELD TESTING LAB PTI WELD TESTING LAB PTI WELD TESTING
WELD TESTING LAB PTI WELD TESTING LAB PTI WELD TESTING LAB PTI WELD TESTING LAB PTI WELD TESTING LAB PTI WELD TESTING LAB PTI WELD TESTING LAB PTI WELD TESTING LAB PTI WELD TESTING LAB PTI WELD TESTING LAB PTI WELD TESTING LAB PTI WELD TESTING
PE
TR
OLE
U
M TRAINING INS
TIT
UT
E
NIGERIA
PE
TR
OLE
U
M TRAINING INS
TIT
UT
E
NIGERIA
PETROLEUM TRAINING INSTITUTE
DEPARTMENT OF WELDING ENGINEERING AND OFFSHORE TECHNOLOGY
P.M.B. 20 EFFURUN
WELDING PROCEDURE QUALIFICATION TEST REPORT (PQR)
G(MECHANICAL TEST ANALYSIS RESULTS SHEET)
COMPANY: GIOVANN ENERGY SERVICES LTD. CONTRACTOR: SEBENCE ENGINEERING AND TECH SERVICES LTD
REPORT NO: 001
SHEET: 1 OF 4
DATE: 13 – 06 – 2016
NO. OF
SPECIMEN
IDENTITY
OF
SPECIMEN
SPECIMEN
LOCATION
IN PIPE
DIMENSIONS
(INCH)
Do DF
X-SECTIONAL
AREA (INCH)
Ao AF
GAUGE
LENGTH
(INCH)
Lo LF
YIELD
LOAD
(IBS)
YIELD
STRESS
(PSI)
MAX LOAD
(IBS)
ULTIMATE
TENSILE
STRESS
(PSI)
%
E
LOCATION
OF
FRACTURE
REMARK
TABLE 1: TENSILE TEST (REDUCED SECTION)
WPS NO.: WPS-001
WELDERS NAME/NUMBER: ONOMAGDERIA JERRY / 004
MATERIAL SPEC API 5L X-52

Page 269 of 366
2
T1
1
O’CLOCK
T0 – 0.2913
W0 – 0.8543
TF – 0.2008
WF– 0.5780
0.2489 0.1086 3.1496 3.6017 14,876 59,731 19,476 78,248 12.7 BM Accepted
T2
7
O’CLOCK
T0 – 0.2914
W0 – 0.8543
TF – 0.2165
WF – 0.5748
0.2489 0.1244 3.1496 3.6811 14,867 59,731 19,476 78,248 14.4 BM Accepted
AVERAGE
59,731 78,248 13.55 Accepted
We certify that the statements in this record are correct and that the test specimens were prepared,
welded and tested in accordance with the requirements of ASME IX / API 1104 Standard.
TEST CONDUCTED BY: CONTRACTOR: SEBENZ ENGINEERING AND TECH SERVICES LTD CLIENT: GIOVANN ENERGY SERVICES LTD
NAME:……………………….. NAME: ……………………………. NAME: ……………………….….. APPROVED BY: _____________________
ENGR. J.O. UMUKORO
SIGN: ……………………….… SIGN: ……………………………… SIGN: …………………………….. DWEOT,
P.T.I., Effurun
DATE: ………………………… DATE: ……………….…………… DATE: ……………….……………
ACCEPTANCE CRITERIA
ASME SECTION IX / API1104
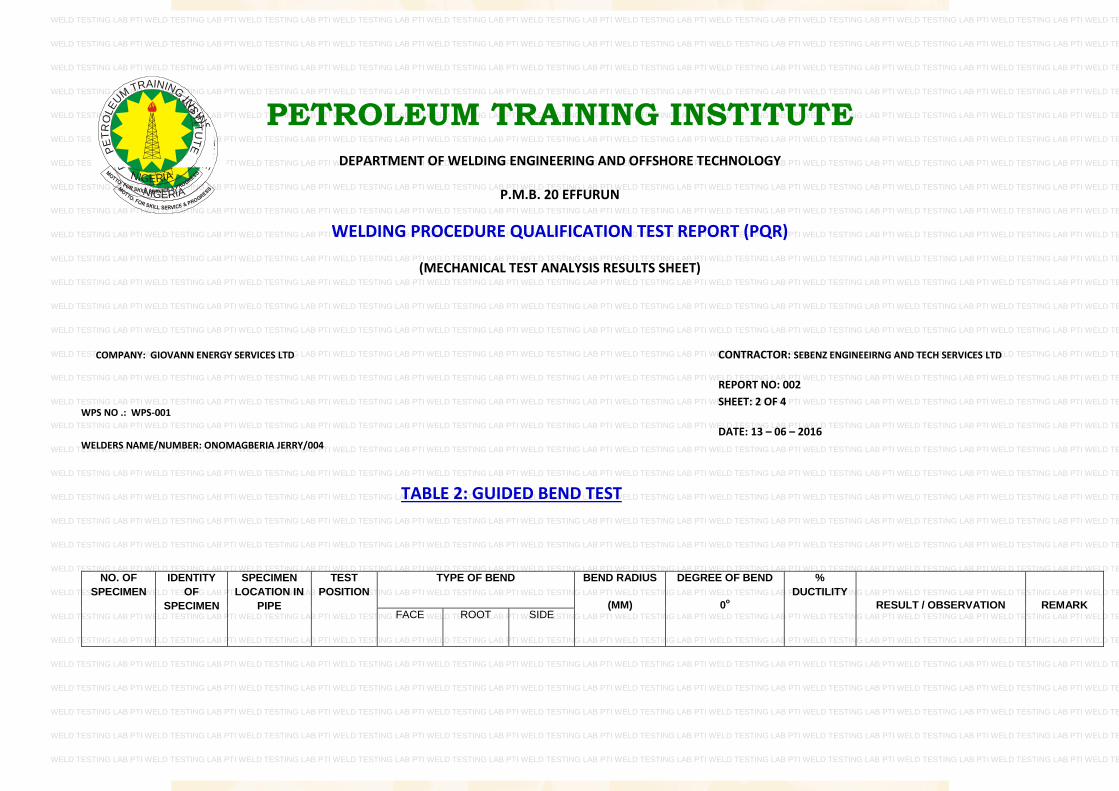
Page 270 of 366
WELD TESTING LAB PTI WELD TESTING LAB PTI WELD TESTING LAB PTI WELD TESTING LAB PTI WELD TESTING LAB PTI WELD TESTING LAB PTI WELD TESTING LAB PTI WELD TESTING LAB PTI WELD TESTING LAB PTI WELD TESTING LAB PTI WELD TESTING LAB PTI WELD TESTING
WELD TESTING LAB PTI WELD TESTING LAB PTI WELD TESTING LAB PTI WELD TESTING LAB PTI WELD TESTING LAB PTI WELD TESTING LAB PTI WELD TESTING LAB PTI WELD TESTING LAB PTI WELD TESTING LAB PTI WELD TESTING LAB PTI WELD TESTING LAB PTI WELD TESTING
WELD TESTING LAB PTI WELD TESTING LAB PTI WELD TESTING LAB PTI WELD TESTING LAB PTI WELD TESTING LAB PTI WELD TESTING LAB PTI WELD TESTING LAB PTI WELD TESTING LAB PTI WELD TESTING LAB PTI WELD TESTING LAB PTI WELD TESTING LAB PTI WELD TESTING
WELD TESTING LAB PTI WELD TESTING LAB PTI WELD TESTING LAB PTI WELD TESTING LAB PTI WELD TESTING LAB PTI WELD TESTING LAB PTI WELD TESTING LAB PTI WELD TESTING LAB PTI WELD TESTING LAB PTI WELD TESTING LAB PTI WELD TESTING LAB PTI WELD TESTING
WELD TESTING LAB PTI WELD TESTING LAB PTI WELD TESTING LAB PTI WELD TESTING LAB PTI WELD TESTING LAB PTI WELD TESTING LAB PTI WELD TESTING LAB PTI WELD TESTING LAB PTI WELD TESTING LAB PTI WELD TESTING LAB PTI WELD TESTING LAB PTI WELD TESTING
WELD TESTING LAB PTI WELD TESTING LAB PTI WELD TESTING LAB PTI WELD TESTING LAB PTI WELD TESTING LAB PTI WELD TESTING LAB PTI WELD TESTING LAB PTI WELD TESTING LAB PTI WELD TESTING LAB PTI WELD TESTING LAB PTI WELD TESTING LAB PTI WELD TESTING
WELD TESTING LAB PTI WELD TESTING LAB PTI WELD TESTING LAB PTI WELD TESTING LAB PTI WELD TESTING LAB PTI WELD TESTING LAB PTI WELD TESTING LAB PTI WELD TESTING LAB PTI WELD TESTING LAB PTI WELD TESTING LAB PTI WELD TESTING LAB PTI WELD TESTING
WELD TESTING LAB PTI WELD TESTING LAB PTI WELD TESTING LAB PTI WELD TESTING LAB PTI WELD TESTING LAB PTI WELD TESTING LAB PTI WELD TESTING LAB PTI WELD TESTING LAB PTI WELD TESTING LAB PTI WELD TESTING LAB PTI WELD TESTING LAB PTI WELD TESTING
WELD TESTING LAB PTI WELD TESTING LAB PTI WELD TESTING LAB PTI WELD TESTING LAB PTI WELD TESTING LAB PTI WELD TESTING LAB PTI WELD TESTING LAB PTI WELD TESTING LAB PTI WELD TESTING LAB PTI WELD TESTING LAB PTI WELD TESTING LAB PTI WELD TESTING
WELD TESTING LAB PTI WELD TESTING LAB PTI WELD TESTING LAB PTI WELD TESTING LAB PTI WELD TESTING LAB PTI WELD TESTING LAB PTI WELD TESTING LAB PTI WELD TESTING LAB PTI WELD TESTING LAB PTI WELD TESTING LAB PTI WELD TESTING LAB PTI WELD TESTING
WELD TESTING LAB PTI WELD TESTING LAB PTI WELD TESTING LAB PTI WELD TESTING LAB PTI WELD TESTING LAB PTI WELD TESTING LAB PTI WELD TESTING LAB PTI WELD TESTING LAB PTI WELD TESTING LAB PTI WELD TESTING LAB PTI WELD TESTING LAB PTI WELD TESTING
WELD TESTING LAB PTI WELD TESTING LAB PTI WELD TESTING LAB PTI WELD TESTING LAB PTI WELD TESTING LAB PTI WELD TESTING LAB PTI WELD TESTING LAB PTI WELD TESTING LAB PTI WELD TESTING LAB PTI WELD TESTING LAB PTI WELD TESTING LAB PTI WELD TESTING
WELD TESTING LAB PTI WELD TESTING LAB PTI WELD TESTING LAB PTI WELD TESTING LAB PTI WELD TESTING LAB PTI WELD TESTING LAB PTI WELD TESTING LAB PTI WELD TESTING LAB PTI WELD TESTING LAB PTI WELD TESTING LAB PTI WELD TESTING LAB PTI WELD TESTING
WELD TESTING LAB PTI WELD TESTING LAB PTI WELD TESTING LAB PTI WELD TESTING LAB PTI WELD TESTING LAB PTI WELD TESTING LAB PTI WELD TESTING LAB PTI WELD TESTING LAB PTI WELD TESTING LAB PTI WELD TESTING LAB PTI WELD TESTING LAB PTI WELD TESTING
WELD TESTING LAB PTI WELD TESTING LAB PTI WELD TESTING LAB PTI WELD TESTING LAB PTI WELD TESTING LAB PTI WELD TESTING LAB PTI WELD TESTING LAB PTI WELD TESTING LAB PTI WELD TESTING LAB PTI WELD TESTING LAB PTI WELD TESTING LAB PTI WELD TESTING
WELD TESTING LAB PTI WELD TESTING LAB PTI WELD TESTING LAB PTI WELD TESTING LAB PTI WELD TESTING LAB PTI WELD TESTING LAB PTI WELD TESTING LAB PTI WELD TESTING LAB PTI WELD TESTING LAB PTI WELD TESTING LAB PTI WELD TESTING LAB PTI WELD TESTING
WELD TESTING LAB PTI WELD TESTING LAB PTI WELD TESTING LAB PTI WELD TESTING LAB PTI WELD TESTING LAB PTI WELD TESTING LAB PTI WELD TESTING LAB PTI WELD TESTING LAB PTI WELD TESTING LAB PTI WELD TESTING LAB PTI WELD TESTING LAB PTI WELD TESTING
WELD TESTING LAB PTI WELD TESTING LAB PTI WELD TESTING LAB PTI WELD TESTING LAB PTI WELD TESTING LAB PTI WELD TESTING LAB PTI WELD TESTING LAB PTI WELD TESTING LAB PTI WELD TESTING LAB PTI WELD TESTING LAB PTI WELD TESTING LAB PTI WELD TESTING
WELD TESTING LAB PTI WELD TESTING LAB PTI WELD TESTING LAB PTI WELD TESTING LAB PTI WELD TESTING LAB PTI WELD TESTING LAB PTI WELD TESTING LAB PTI WELD TESTING LAB PTI WELD TESTING LAB PTI WELD TESTING LAB PTI WELD TESTING LAB PTI WELD TESTING
WELD TESTING LAB PTI WELD TESTING LAB PTI WELD TESTING LAB PTI WELD TESTING LAB PTI WELD TESTING LAB PTI WELD TESTING LAB PTI WELD TESTING LAB PTI WELD TESTING LAB PTI WELD TESTING LAB PTI WELD TESTING LAB PTI WELD TESTING LAB PTI WELD TESTING
WELD TESTING LAB PTI WELD TESTING LAB PTI WELD TESTING LAB PTI WELD TESTING LAB PTI WELD TESTING LAB PTI WELD TESTING LAB PTI WELD TESTING LAB PTI WELD TESTING LAB PTI WELD TESTING LAB PTI WELD TESTING LAB PTI WELD TESTING LAB PTI WELD TESTING
WELD TESTING LAB PTI WELD TESTING LAB PTI WELD TESTING LAB PTI WELD TESTING LAB PTI WELD TESTING LAB PTI WELD TESTING LAB PTI WELD TESTING LAB PTI WELD TESTING LAB PTI WELD TESTING LAB PTI WELD TESTING LAB PTI WELD TESTING LAB PTI WELD TESTING
WELD TESTING LAB PTI WELD TESTING LAB PTI WELD TESTING LAB PTI WELD TESTING LAB PTI WELD TESTING LAB PTI WELD TESTING LAB PTI WELD TESTING LAB PTI WELD TESTING LAB PTI WELD TESTING LAB PTI WELD TESTING LAB PTI WELD TESTING LAB PTI WELD TESTING
WELD TESTING LAB PTI WELD TESTING LAB PTI WELD TESTING LAB PTI WELD TESTING LAB PTI WELD TESTING LAB PTI WELD TESTING LAB PTI WELD TESTING LAB PTI WELD TESTING LAB PTI WELD TESTING LAB PTI WELD TESTING LAB PTI WELD TESTING LAB PTI WELD TESTING
WELD TESTING LAB PTI WELD TESTING LAB PTI WELD TESTING LAB PTI WELD TESTING LAB PTI WELD TESTING LAB PTI WELD TESTING LAB PTI WELD TESTING LAB PTI WELD TESTING LAB PTI WELD TESTING LAB PTI WELD TESTING LAB PTI WELD TESTING LAB PTI WELD TESTING
WELD TESTING LAB PTI WELD TESTING LAB PTI WELD TESTING LAB PTI WELD TESTING LAB PTI WELD TESTING LAB PTI WELD TESTING LAB PTI WELD TESTING LAB PTI WELD TESTING LAB PTI WELD TESTING LAB PTI WELD TESTING LAB PTI WELD TESTING LAB PTI WELD TESTING
WELD TESTING LAB PTI WELD TESTING LAB PTI WELD TESTING LAB PTI WELD TESTING LAB PTI WELD TESTING LAB PTI WELD TESTING LAB PTI WELD TESTING LAB PTI WELD TESTING LAB PTI WELD TESTING LAB PTI WELD TESTING LAB PTI WELD TESTING LAB PTI WELD TESTING
WELD TESTING LAB PTI WELD TESTING LAB PTI WELD TESTING LAB PTI WELD TESTING LAB PTI WELD TESTING LAB PTI WELD TESTING LAB PTI WELD TESTING LAB PTI WELD TESTING LAB PTI WELD TESTING LAB PTI WELD TESTING LAB PTI WELD TESTING LAB PTI WELD TESTING
WELD TESTING LAB PTI WELD TESTING LAB PTI WELD TESTING LAB PTI WELD TESTING LAB PTI WELD TESTING LAB PTI WELD TESTING LAB PTI WELD TESTING LAB PTI WELD TESTING LAB PTI WELD TESTING LAB PTI WELD TESTING LAB PTI WELD TESTING LAB PTI WELD TESTING
WELD TESTING LAB PTI WELD TESTING LAB PTI WELD TESTING LAB PTI WELD TESTING LAB PTI WELD TESTING LAB PTI WELD TESTING LAB PTI WELD TESTING LAB PTI WELD TESTING LAB PTI WELD TESTING LAB PTI WELD TESTING LAB PTI WELD TESTING LAB PTI WELD TESTING
WELD TESTING LAB PTI WELD TESTING LAB PTI WELD TESTING LAB PTI WELD TESTING LAB PTI WELD TESTING LAB PTI WELD TESTING LAB PTI WELD TESTING LAB PTI WELD TESTING LAB PTI WELD TESTING LAB PTI WELD TESTING LAB PTI WELD TESTING LAB PTI WELD TESTING
WELD TESTING LAB PTI WELD TESTING LAB PTI WELD TESTING LAB PTI WELD TESTING LAB PTI WELD TESTING LAB PTI WELD TESTING LAB PTI WELD TESTING LAB PTI WELD TESTING LAB PTI WELD TESTING LAB PTI WELD TESTING LAB PTI WELD TESTING LAB PTI WELD TESTING
PE
TR
OLE
U
M TRAINING INS
TIT
UT
E
NIGERIA
PE
TR
OLE
U
M TRAINING INS
TIT
UT
E
NIGERIA
PETROLEUM TRAINING INSTITUTE
DEPARTMENT OF WELDING ENGINEERING AND OFFSHORE TECHNOLOGY
P.M.B. 20 EFFURUN
WELDING PROCEDURE QUALIFICATION TEST REPORT (PQR)
(MECHANICAL TEST ANALYSIS RESULTS SHEET)
COMPANY: GIOVANN ENERGY SERVICES LTD CONTRACTOR: SEBENZ ENGINEEIRNG AND TECH SERVICES LTD
REPORT NO: 002
SHEET: 2 OF 4
DATE: 13 – 06 – 2016
NO. OF
SPECIMEN
IDENTITY
OF
SPECIMEN
SPECIMEN
LOCATION IN
PIPE
TEST
POSITION
TYPE OF BEND BEND RADIUS
(MM)
DEGREE OF BEND
0o
%
DUCTILITY
RESULT / OBSERVATION
REMARK FACE ROOT SIDE
TABLE 2: GUIDED BEND TEST
WPS NO .: WPS-001
WELDERS NAME/NUMBER: ONOMAGBERIA JERRY/004

Page 271 of 366
2
FB1 1 O’CLOCK 6G YES - - 25 180 18.0 VERY GOOD, DEFECT FREE ACCEPTED
FB2 7 O’CLOCK 6G - YES - 25 180 20.0 VERY GOOD, DEFECT FREE ACCEPTED
We certify that the statements in this record are correct and that the test specimens were prepared,
welded and tested in accordance with the requirements of ASME-IX / API 1104 Standard.
TEST CONDUCTED BY: CONTRACTOR: SEBENZ ENGINEEIRNG AND TECH SERVICES LTD. CLIENT: GIOVANN ENERGY SERVICES LTD
NAME: ……………………….. NAME: ……………………………. NAME: ……………………….….. APPROVED BY: _____________________
ENGR. J.O. UMUKORO
SIGN: ……………………….… SIGN: …………………………….. SIGN: …………………………….. HEAD DWEOT,
P.T.I., Effurun
DATE: ………………………… DATE: ……………….…………… DATE: ……………….……………
ACCEPTANCE CRITERIA
ASME SECTION IX / API 1104
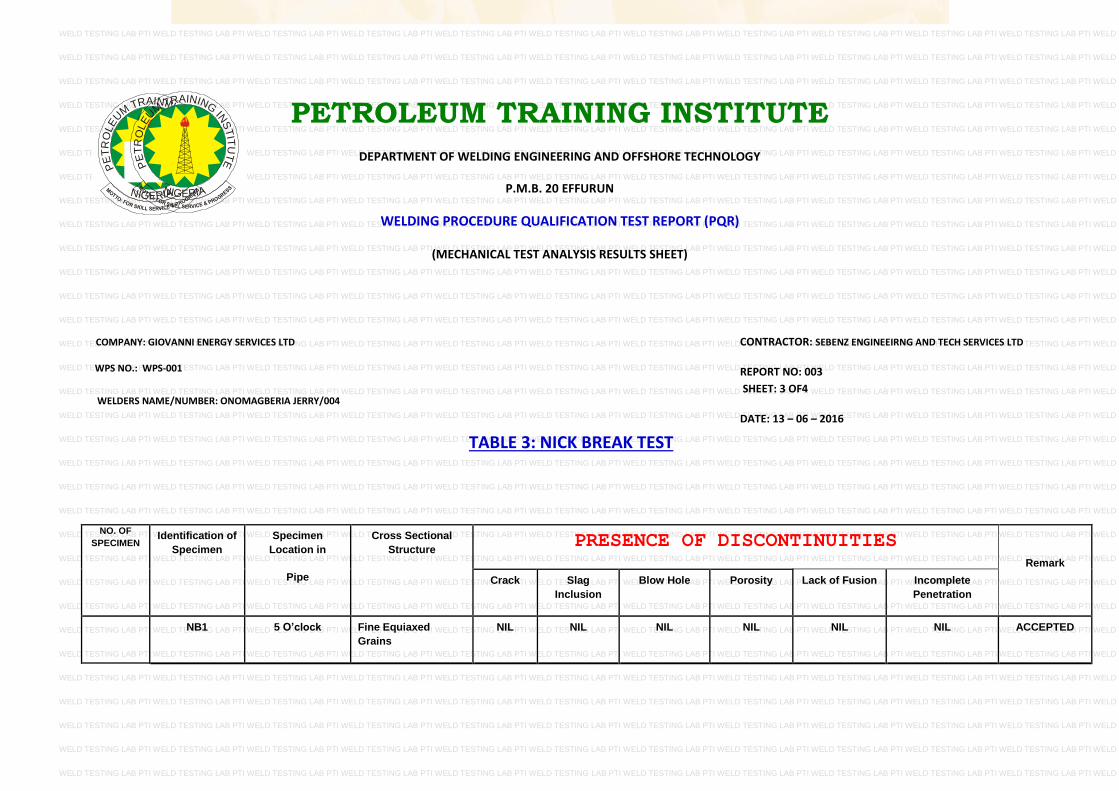
Page 272 of 366
WELD TESTING LAB PTI WELD TESTING LAB PTI WELD TESTING LAB PTI WELD TESTING LAB PTI WELD TESTING LAB PTI WELD TESTING LAB PTI WELD TESTING LAB PTI WELD TESTING LAB PTI WELD TESTING LAB PTI WELD TESTING LAB PTI WELD TESTING LAB PTI WELD TESTING
WELD TESTING LAB PTI WELD TESTING LAB PTI WELD TESTING LAB PTI WELD TESTING LAB PTI WELD TESTING LAB PTI WELD TESTING LAB PTI WELD TESTING LAB PTI WELD TESTING LAB PTI WELD TESTING LAB PTI WELD TESTING LAB PTI WELD TESTING LAB PTI WELD TESTING
WELD TESTING LAB PTI WELD TESTING LAB PTI WELD TESTING LAB PTI WELD TESTING LAB PTI WELD TESTING LAB PTI WELD TESTING LAB PTI WELD TESTING LAB PTI WELD TESTING LAB PTI WELD TESTING LAB PTI WELD TESTING LAB PTI WELD TESTING LAB PTI WELD TESTING
WELD TESTING LAB PTI WELD TESTING LAB PTI WELD TESTING LAB PTI WELD TESTING LAB PTI WELD TESTING LAB PTI WELD TESTING LAB PTI WELD TESTING LAB PTI WELD TESTING LAB PTI WELD TESTING LAB PTI WELD TESTING LAB PTI WELD TESTING LAB PTI WELD TESTING
WELD TESTING LAB PTI WELD TESTING LAB PTI WELD TESTING LAB PTI WELD TESTING LAB PTI WELD TESTING LAB PTI WELD TESTING LAB PTI WELD TESTING LAB PTI WELD TESTING LAB PTI WELD TESTING LAB PTI WELD TESTING LAB PTI WELD TESTING LAB PTI WELD TESTING
WELD TESTING LAB PTI WELD TESTING LAB PTI WELD TESTING LAB PTI WELD TESTING LAB PTI WELD TESTING LAB PTI WELD TESTING LAB PTI WELD TESTING LAB PTI WELD TESTING LAB PTI WELD TESTING LAB PTI WELD TESTING LAB PTI WELD TESTING LAB PTI WELD TESTING
WELD TESTING LAB PTI WELD TESTING LAB PTI WELD TESTING LAB PTI WELD TESTING LAB PTI WELD TESTING LAB PTI WELD TESTING LAB PTI WELD TESTING LAB PTI WELD TESTING LAB PTI WELD TESTING LAB PTI WELD TESTING LAB PTI WELD TESTING LAB PTI WELD TESTING
WELD TESTING LAB PTI WELD TESTING LAB PTI WELD TESTING LAB PTI WELD TESTING LAB PTI WELD TESTING LAB PTI WELD TESTING LAB PTI WELD TESTING LAB PTI WELD TESTING LAB PTI WELD TESTING LAB PTI WELD TESTING LAB PTI WELD TESTING LAB PTI WELD TESTING
WELD TESTING LAB PTI WELD TESTING LAB PTI WELD TESTING LAB PTI WELD TESTING LAB PTI WELD TESTING LAB PTI WELD TESTING LAB PTI WELD TESTING LAB PTI WELD TESTING LAB PTI WELD TESTING LAB PTI WELD TESTING LAB PTI WELD TESTING LAB PTI WELD TESTING
WELD TESTING LAB PTI WELD TESTING LAB PTI WELD TESTING LAB PTI WELD TESTING LAB PTI WELD TESTING LAB PTI WELD TESTING LAB PTI WELD TESTING LAB PTI WELD TESTING LAB PTI WELD TESTING LAB PTI WELD TESTING LAB PTI WELD TESTING LAB PTI WELD TESTING
WELD TESTING LAB PTI WELD TESTING LAB PTI WELD TESTING LAB PTI WELD TESTING LAB PTI WELD TESTING LAB PTI WELD TESTING LAB PTI WELD TESTING LAB PTI WELD TESTING LAB PTI WELD TESTING LAB PTI WELD TESTING LAB PTI WELD TESTING LAB PTI WELD TESTING
WELD TESTING LAB PTI WELD TESTING LAB PTI WELD TESTING LAB PTI WELD TESTING LAB PTI WELD TESTING LAB PTI WELD TESTING LAB PTI WELD TESTING LAB PTI WELD TESTING LAB PTI WELD TESTING LAB PTI WELD TESTING LAB PTI WELD TESTING LAB PTI WELD TESTING
WELD TESTING LAB PTI WELD TESTING LAB PTI WELD TESTING LAB PTI WELD TESTING LAB PTI WELD TESTING LAB PTI WELD TESTING LAB PTI WELD TESTING LAB PTI WELD TESTING LAB PTI WELD TESTING LAB PTI WELD TESTING LAB PTI WELD TESTING LAB PTI WELD TESTING
WELD TESTING LAB PTI WELD TESTING LAB PTI WELD TESTING LAB PTI WELD TESTING LAB PTI WELD TESTING LAB PTI WELD TESTING LAB PTI WELD TESTING LAB PTI WELD TESTING LAB PTI WELD TESTING LAB PTI WELD TESTING LAB PTI WELD TESTING LAB PTI WELD TESTING
WELD TESTING LAB PTI WELD TESTING LAB PTI WELD TESTING LAB PTI WELD TESTING LAB PTI WELD TESTING LAB PTI WELD TESTING LAB PTI WELD TESTING LAB PTI WELD TESTING LAB PTI WELD TESTING LAB PTI WELD TESTING LAB PTI WELD TESTING LAB PTI WELD TESTING
WELD TESTING LAB PTI WELD TESTING LAB PTI WELD TESTING LAB PTI WELD TESTING LAB PTI WELD TESTING LAB PTI WELD TESTING LAB PTI WELD TESTING LAB PTI WELD TESTING LAB PTI WELD TESTING LAB PTI WELD TESTING LAB PTI WELD TESTING LAB PTI WELD TESTING
WELD TESTING LAB PTI WELD TESTING LAB PTI WELD TESTING LAB PTI WELD TESTING LAB PTI WELD TESTING LAB PTI WELD TESTING LAB PTI WELD TESTING LAB PTI WELD TESTING LAB PTI WELD TESTING LAB PTI WELD TESTING LAB PTI WELD TESTING LAB PTI WELD TESTING
WELD TESTING LAB PTI WELD TESTING LAB PTI WELD TESTING LAB PTI WELD TESTING LAB PTI WELD TESTING LAB PTI WELD TESTING LAB PTI WELD TESTING LAB PTI WELD TESTING LAB PTI WELD TESTING LAB PTI WELD TESTING LAB PTI WELD TESTING LAB PTI WELD TESTING
WELD TESTING LAB PTI WELD TESTING LAB PTI WELD TESTING LAB PTI WELD TESTING LAB PTI WELD TESTING LAB PTI WELD TESTING LAB PTI WELD TESTING LAB PTI WELD TESTING LAB PTI WELD TESTING LAB PTI WELD TESTING LAB PTI WELD TESTING LAB PTI WELD TESTING
WELD TESTING LAB PTI WELD TESTING LAB PTI WELD TESTING LAB PTI WELD TESTING LAB PTI WELD TESTING LAB PTI WELD TESTING LAB PTI WELD TESTING LAB PTI WELD TESTING LAB PTI WELD TESTING LAB PTI WELD TESTING LAB PTI WELD TESTING LAB PTI WELD TESTING
WELD TESTING LAB PTI WELD TESTING LAB PTI WELD TESTING LAB PTI WELD TESTING LAB PTI WELD TESTING LAB PTI WELD TESTING LAB PTI WELD TESTING LAB PTI WELD TESTING LAB PTI WELD TESTING LAB PTI WELD TESTING LAB PTI WELD TESTING LAB PTI WELD TESTING
WELD TESTING LAB PTI WELD TESTING LAB PTI WELD TESTING LAB PTI WELD TESTING LAB PTI WELD TESTING LAB PTI WELD TESTING LAB PTI WELD TESTING LAB PTI WELD TESTING LAB PTI WELD TESTING LAB PTI WELD TESTING LAB PTI WELD TESTING LAB PTI WELD TESTING
WELD TESTING LAB PTI WELD TESTING LAB PTI WELD TESTING LAB PTI WELD TESTING LAB PTI WELD TESTING LAB PTI WELD TESTING LAB PTI WELD TESTING LAB PTI WELD TESTING LAB PTI WELD TESTING LAB PTI WELD TESTING LAB PTI WELD TESTING LAB PTI WELD TESTING
WELD TESTING LAB PTI WELD TESTING LAB PTI WELD TESTING LAB PTI WELD TESTING LAB PTI WELD TESTING LAB PTI WELD TESTING LAB PTI WELD TESTING LAB PTI WELD TESTING LAB PTI WELD TESTING LAB PTI WELD TESTING LAB PTI WELD TESTING LAB PTI WELD TESTING
WELD TESTING LAB PTI WELD TESTING LAB PTI WELD TESTING LAB PTI WELD TESTING LAB PTI WELD TESTING LAB PTI WELD TESTING LAB PTI WELD TESTING LAB PTI WELD TESTING LAB PTI WELD TESTING LAB PTI WELD TESTING LAB PTI WELD TESTING LAB PTI WELD TESTING
WELD TESTING LAB PTI WELD TESTING LAB PTI WELD TESTING LAB PTI WELD TESTING LAB PTI WELD TESTING LAB PTI WELD TESTING LAB PTI WELD TESTING LAB PTI WELD TESTING LAB PTI WELD TESTING LAB PTI WELD TESTING LAB PTI WELD TESTING LAB PTI WELD TESTING
WELD TESTING LAB PTI WELD TESTING LAB PTI WELD TESTING LAB PTI WELD TESTING LAB PTI WELD TESTING LAB PTI WELD TESTING LAB PTI WELD TESTING LAB PTI WELD TESTING LAB PTI WELD TESTING LAB PTI WELD TESTING LAB PTI WELD TESTING LAB PTI WELD TESTING
WELD TESTING LAB PTI WELD TESTING LAB PTI WELD TESTING LAB PTI WELD TESTING LAB PTI WELD TESTING LAB PTI WELD TESTING LAB PTI WELD TESTING LAB PTI WELD TESTING LAB PTI WELD TESTING LAB PTI WELD TESTING LAB PTI WELD TESTING LAB PTI WELD TESTING
WELD TESTING LAB PTI WELD TESTING LAB PTI WELD TESTING LAB PTI WELD TESTING LAB PTI WELD TESTING LAB PTI WELD TESTING LAB PTI WELD TESTING LAB PTI WELD TESTING LAB PTI WELD TESTING LAB PTI WELD TESTING LAB PTI WELD TESTING LAB PTI WELD TESTING
WELD TESTING LAB PTI WELD TESTING LAB PTI WELD TESTING LAB PTI WELD TESTING LAB PTI WELD TESTING LAB PTI WELD TESTING LAB PTI WELD TESTING LAB PTI WELD TESTING LAB PTI WELD TESTING LAB PTI WELD TESTING LAB PTI WELD TESTING LAB PTI WELD TESTING
WELD TESTING LAB PTI WELD TESTING LAB PTI WELD TESTING LAB PTI WELD TESTING LAB PTI WELD TESTING LAB PTI WELD TESTING LAB PTI WELD TESTING LAB PTI WELD TESTING LAB PTI WELD TESTING LAB PTI WELD TESTING LAB PTI WELD TESTING LAB PTI WELD TESTING
WELD TESTING LAB PTI WELD TESTING LAB PTI WELD TESTING LAB PTI WELD TESTING LAB PTI WELD TESTING LAB PTI WELD TESTING LAB PTI WELD TESTING LAB PTI WELD TESTING LAB PTI WELD TESTING LAB PTI WELD TESTING LAB PTI WELD TESTING LAB PTI WELD TESTING
PE
TR
OLE
UM TRAINING INS
TIT
UT
E
NIGERIA
PE
TR
OLE
U
M TRAINING INS
TIT
UT
E
NIGERIA
PETROLEUM TRAINING INSTITUTE
DEPARTMENT OF WELDING ENGINEERING AND OFFSHORE TECHNOLOGY
P.M.B. 20 EFFURUN
WELDING PROCEDURE QUALIFICATION TEST REPORT (PQR)
(MECHANICAL TEST ANALYSIS RESULTS SHEET)
COMPANY: GIOVANNI ENERGY SERVICES LTD CONTRACTOR: SEBENZ ENGINEEIRNG AND TECH SERVICES LTD
REPORT NO: 003
SHEET: 3 OF4
DATE: 13 – 06 – 2016
NO. OF
SPECIMEN Identification of
Specimen
Specimen
Location in
Pipe
Cross Sectional
Structure PRESENCE OF DISCONTINUITIES
Remark
Crack Slag
Inclusion
Blow Hole Porosity Lack of Fusion Incomplete
Penetration
NB1 5 O’clock Fine Equiaxed
Grains
NIL NIL NIL NIL NIL NIL ACCEPTED
TABLE 3: NICK BREAK TEST
WPS NO.: WPS-001
WELDERS NAME/NUMBER: ONOMAGBERIA JERRY/004

Page 273 of 366
2 NB2 11 O’clock Fine Equiaxed
Grains
NIL NIL NIL NIL NIL NIL ACCEPTED
We certify that the statements in this record are correct and that the test specimens were prepared,
welded and tested in accordance with the requirements of ASME IX / B31.3 Standard.
TEST CONDUCTED BY: CONTRACTOR: SEBENZ ENGINEEIRNG AND TECH SERVICES LTD. CLIENT: GIOVANN ENERGY SERVICES
NAME: ……………………….. NAME: ……………………………. NAME: ……………………….….. APPROVED BY: _____________________
ENGR. J.O. UMUKORO
SIGN: ……………………….… SIGN: ……………………………… SIGN: …………………………….. HEAD DWEOT,
P.T.I., Effurun
DATE: ………………………… DATE: ……………………..……… DATE: ……………….……………
ACCEPTANCE CRITERIA
ASME-IX / API 1104
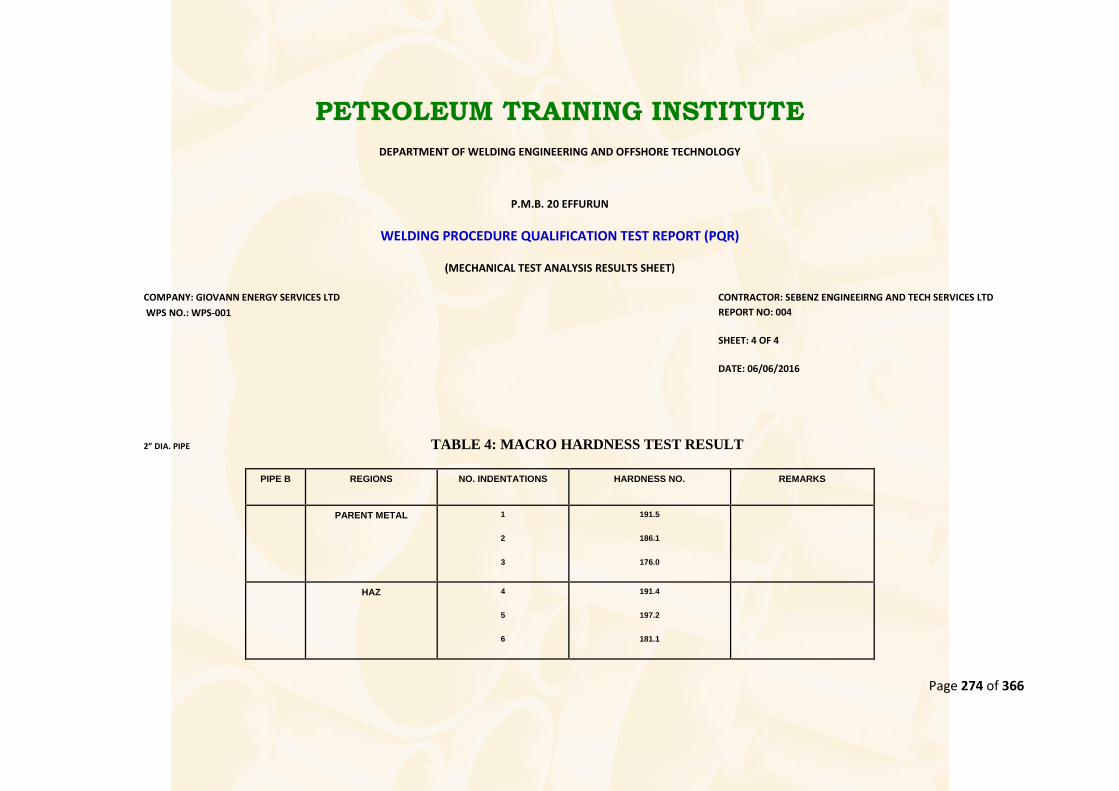
Page 274 of 366
PETROLEUM TRAINING INSTITUTE
DEPARTMENT OF WELDING ENGINEERING AND OFFSHORE TECHNOLOGY
P.M.B. 20 EFFURUN
WELDING PROCEDURE QUALIFICATION TEST REPORT (PQR)
(MECHANICAL TEST ANALYSIS RESULTS SHEET)
COMPANY: GIOVANN ENERGY SERVICES LTD CONTRACTOR: SEBENZ ENGINEEIRNG AND TECH SERVICES LTD
REPORT NO: 004
SHEET: 4 OF 4
DATE: 06/06/2016
2” DIA. PIPE TABLE 4: MACRO HARDNESS TEST RESULT
PIPE B REGIONS NO. INDENTATIONS HARDNESS NO. REMARKS
PARENT METAL 1
2
3
191.5
186.1
176.0
HAZ 4
5
6
191.4
197.2
181.1
WPS NO.: WPS-001
WELDERS NAME/NUMBER: ONOMAGBERIA JERRY/004

Page 275 of 366
WELD 7
8
9
10
11
166.9
191.6
154.3
150.4
166.9
HAZ 12
13
14
158.3
191.4
202.9
PARENT METAL 15
16
17
208.9
180.8
175.9
We certify that the statements in this record are correct and that the test specimens were prepared,
welded and tested in accordance with the requirements of API 1104Standard.
TEST CONDUCTED BY: CONTRACTOR: NIGERIA GAS COMPANY LTD CLIENT: YONKYS YA – STAR LTD
NAME: ……………………………. NAME: ……………………………. NAME: ……………………….….. APPROVED BY: _____________________
ENGR. J.O. UMUKORO
SIGN: ……………………………....... SIGN: …………………………….. SIGN: …………………………….. DWEOT
P.T.I., Effurun.,
DATE: ……………………..……....... DATE: ……………….……………................................DATE: ……........………….……………
ACCEPTANCE CRITERIA
API 1104/ISO 13847
Page 276 of 366
Paper: NMS 2017-TP033
Effect of Mango Leaf Extract on the Corrosion Resistance of Thermally Conditioned
Al-Si-Mg Alloy in Simulated Seawater Environment
O. B. Umaru*1, I. Y. Suleiman
2, M. Abdulwahab
3 and U. Mukhtar
4
1,4Department of Mechanical/Production Engineering, Abubakar Tafawa Balewa University, Bauchi,
Nigeria 2Department of Metallurgical and Materials Engineering, University of Nigeria, Nsukka
3Department of Metallurgical and Materials Engineering, Ahmadu Bello University,
Zaria, Nigeria
Abstract
Effect of mango leaf extract on the corrosion resistance of thermally conditioned Al-Si-Mg
alloy with carbonized melon peel in seawater environment was investigated using weight loss
method. Aluminium alloy of composition 92.69%Al-7%Si-0.3%Mg with a little addition of
sodium (0.01%) to modify the alloy was produced and cast into cylindrical test bars of
dimension 22mm by 300mm was cut into coupon size of (10 x 20 mm) dimension for
corrosion test. The alloys were buried in carbonized melon peel and solution heat treated to
540oC for 1 hour, quenched in warm water (65
oC) and aged at 180
oC for 2-5hours at one hour
interval respectively before normalizing. The mango leaf was characterized by FTIR method.
The inhibitor concentration and time were varied in the range of 0.2-0.8 % v/v at 0.2 % v/v
interval and 2 to 8 days min at 2 days interval at room temperature respectively.
Microstructures of the composites were studied via Scanning Electron Microscopy (SEM).
The coupon was inhibited in the presence of in the presence of mango leaf extract and was
attributed to adsorption of compounds/elements of the extract onto the surface of the alloy at
room temperature which prevents the breakdown of the passive film; hence higher corrosion
resistance of the Al-Si-Mg alloy was obtained. The Scanning Electron Microscopic analysis
showed the grains of the samples as very fine which implies an increase in the hardness
value. The results obtained revealed that Mango leaf extract is an effective corrosion inhibitor
for Al-Si-Mg alloy in simulated seawater environment with an optimum concentration of
0.8% v/v at room temperature.
Keyword: Seawater, Aluminium alloy, Inhibitor efficiency, Corrosion
1. Introduction
Aluminum is the second most abundant metallic and structural element in the earth‘s crust. It is
mostly extracted by the chemical refinement of bauxite using the Bayer process to form
Aluminumoxide (alumina) from which (99.9% pure) aluminum is extracted by the Hall-Heroult
method [1]. Aluminum is commonly alloyed with elements likemagnesium (Mg), silicon (Si), copper
(Cu), manganese (Mn), Nickel (Ni), iron (Fe), and zinc (Zn), to improve its mechanical properties.
Silicon imparts to Al-Si-Mg alloy good fluidity, resistance to hot cracking and thermal expansion,
while magnesium improves it strength to weight ratio and yield stress by combining with Silicon to
form the age-hardening phase (Mg2Si) which precipitate from a supersaturated solid solution during
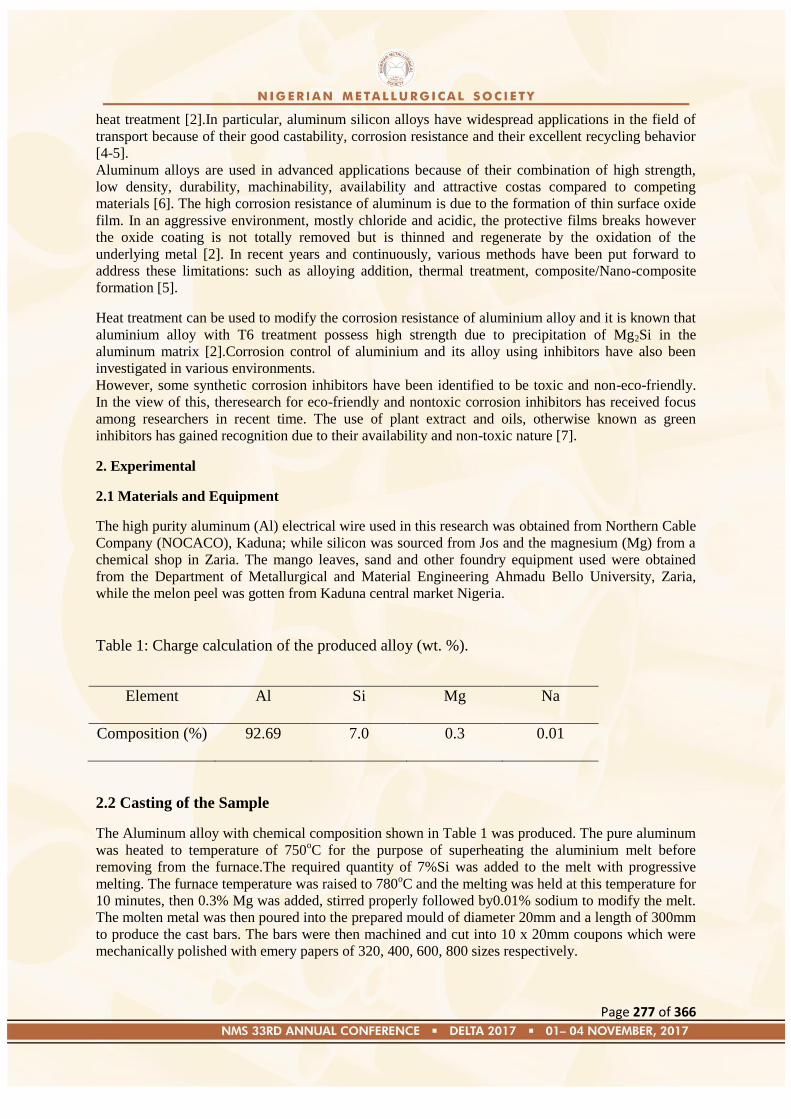
Page 277 of 366
heat treatment [2].In particular, aluminum silicon alloys have widespread applications in the field of
transport because of their good castability, corrosion resistance and their excellent recycling behavior
[4-5].
Aluminum alloys are used in advanced applications because of their combination of high strength,
low density, durability, machinability, availability and attractive costas compared to competing
materials [6]. The high corrosion resistance of aluminum is due to the formation of thin surface oxide
film. In an aggressive environment, mostly chloride and acidic, the protective films breaks however
the oxide coating is not totally removed but is thinned and regenerate by the oxidation of the
underlying metal [2]. In recent years and continuously, various methods have been put forward to
address these limitations: such as alloying addition, thermal treatment, composite/Nano-composite
formation [5].
Heat treatment can be used to modify the corrosion resistance of aluminium alloy and it is known that
aluminium alloy with T6 treatment possess high strength due to precipitation of Mg2Si in the
aluminum matrix [2].Corrosion control of aluminium and its alloy using inhibitors have also been
investigated in various environments.
However, some synthetic corrosion inhibitors have been identified to be toxic and non-eco-friendly.
In the view of this, theresearch for eco-friendly and nontoxic corrosion inhibitors has received focus
among researchers in recent time. The use of plant extract and oils, otherwise known as green
inhibitors has gained recognition due to their availability and non-toxic nature [7].
2. Experimental
2.1 Materials and Equipment
The high purity aluminum (Al) electrical wire used in this research was obtained from Northern Cable
Company (NOCACO), Kaduna; while silicon was sourced from Jos and the magnesium (Mg) from a
chemical shop in Zaria. The mango leaves, sand and other foundry equipment used were obtained
from the Department of Metallurgical and Material Engineering Ahmadu Bello University, Zaria,
while the melon peel was gotten from Kaduna central market Nigeria.
Table 1: Charge calculation of the produced alloy (wt. %).
Element
Al Si Mg Na
Composition (%)
92.69
7.0 0.3 0.01
2.2 Casting of the Sample
The Aluminum alloy with chemical composition shown in Table 1 was produced. The pure aluminum
was heated to temperature of 750oC for the purpose of superheating the aluminium melt before
removing from the furnace.The required quantity of 7%Si was added to the melt with progressive
melting. The furnace temperature was raised to 780oC and the melting was held at this temperature for
10 minutes, then 0.3% Mg was added, stirred properly followed by0.01% sodium to modify the melt.
The molten metal was then poured into the prepared mould of diameter 20mm and a length of 300mm
to produce the cast bars. The bars were then machined and cut into 10 x 20mm coupons which were
mechanically polished with emery papers of 320, 400, 600, 800 sizes respectively.

Page 278 of 366
2.3 Fourier transforms infrared spectroscopy (FTIR) analysis of Mango leaf extract
The extract was exposed under range of infrared (IR) beams. The transmittance and reflectance of the
ray was translated into an infrared absorption plot consisting of reversed peak. The spectra pattern
was match according to the infrared absorption table to identify the functional groups present.
2.4 Carbonization of the melon peel
Melon peel was carbonized at 600oC in a close crucible in the blast furnace and X-ray florescence test
(XRF) analysis was done on it at the National Geological survey agency (Ministry of Mines and Steel
Development), Kaduna state, Nigeria.The result of the XRF analysis of the carbonized melon peel
obtained is shown in Table 2.
Table 2: Chemical analysis of carbonized melon peel
Oxides SiO2 P2O5 SO3 K2O CaO TiO2 MnO Fe2O3 ZnO MgO Na2O Al2O3
w% 75.3 9.87 0.63 4.70 2.11 0.16 0.367 1.30 0.476 0.37 0.53 2.67
2.5 Inhibitor preparation
The mango leaves used for this research was dried and grinded using an industrial scale grinder to
powder form.The dried powdered mango leave was run through wire mesh sifter using standard test
sieve BSS 52 as per 460 into fine powdered samples and to separate the shaft of the leaves. 50g of the
powdered sample was weighed and taken to the Faculty of Pharmaceutical Sciences, Ahmadu Bello
University, Zaria for extraction.
2.6 Heat treatment
20 samples of the coupons were heat treated under carbonized melon peel at a temperature of 540oC
for 1hour in an electric heat treatment furnace and then rapidly quenched in warm water (65oC). The
quenched samples were then aged at 180oC for 2-5hours at one hour interval respectively before
cooling in air.
2.7 Corrosion test
Sets of simulated seawater solution containing 35g of NaCl in 1000ml of water were produced. Four
set of coupons with different ageing time were suspended into a beaker containing 200ml of the
solution with aid of a thread. The weight losses of the coupons were taken at interval of two days, for
8days. The experiment was first conducted at room temperature without inhibitor (control) in the
simulated seawater and then in solution containing mango leaf extract with varying concentration of
0.2, 0.4, 0.6, and 0.8% v/v. The coupons were then removed from the solution at 2 days interval
progressively for 8 days washed with brush in distilled water and weighed. The weight loss, corrosion
rate, inhibitor efficiency and degree of surface coverage were calculated and recorded.
2.8 Corrosion rate determination
The corrosion rate was determined by finding the difference between the initial and final weight of the
coupons after 48hours interval using the following relationship.
Weightloss (W) =Wo– Wf……………………….…….……………………………1
The corrosion rate was determined in mils per year using the relationship
(mpy)………………………………………………………………….2

Page 279 of 366
Where
W =weight loss (mg).
p =density of material (g/cm3)
A =exposed surface area (in2).
t= is the exposure time (hour).
2.9 Inhibition Efficiency (IE)
The efficiency of the inhibitor was calculated according to the following equation
……………………………………………………………….3
Where
IE = efficiency of the inhibitor( %)
Ro= Corrosion rate of metal without inhibitor
Ri = Corrosion rate of metal in the presence of inhibitor
2.10 Surface Coverage (Ɵ)
This was calculated using the relation
………………………………………………………………...4
Where
= surface coverage
Ro= Corrosion rate of metal without inhibitor
Ri = Corrosion rate of metal in the presence of inhibitor
2.11 Microstructure and Surface morphology examination
The samples for microstructure extermination were cut from the alloy and ground with grit paper of
grades 320,400,600,800 respectively using water as coolant. The samples were then polished using
one-micro size alumina powder suspended in distilled water, followed by etching in Keller‘s reagent.
The optical microscope (OPM) and scanning electron microscope (SEM) was used for microstructural
observation.
3. Discussion of results
3.1 Fourier Transformation Infrared Spectroscopy (FTIR) Analysis of Mango leaf extract
The FTIR analysis was carried on the guava leave extract to reveal the functional group present in the
extract. It also shows their respective frequencies which is as a result the absorption of infrared of the
functional group. The FTIR result of Figure 1 confirmed the presence of OH, C=O, C=C and O=C-O-
C which shows major peaks at 4021.71, 3851.97 and 3390.01 cm-1
respectively. The adsorption of
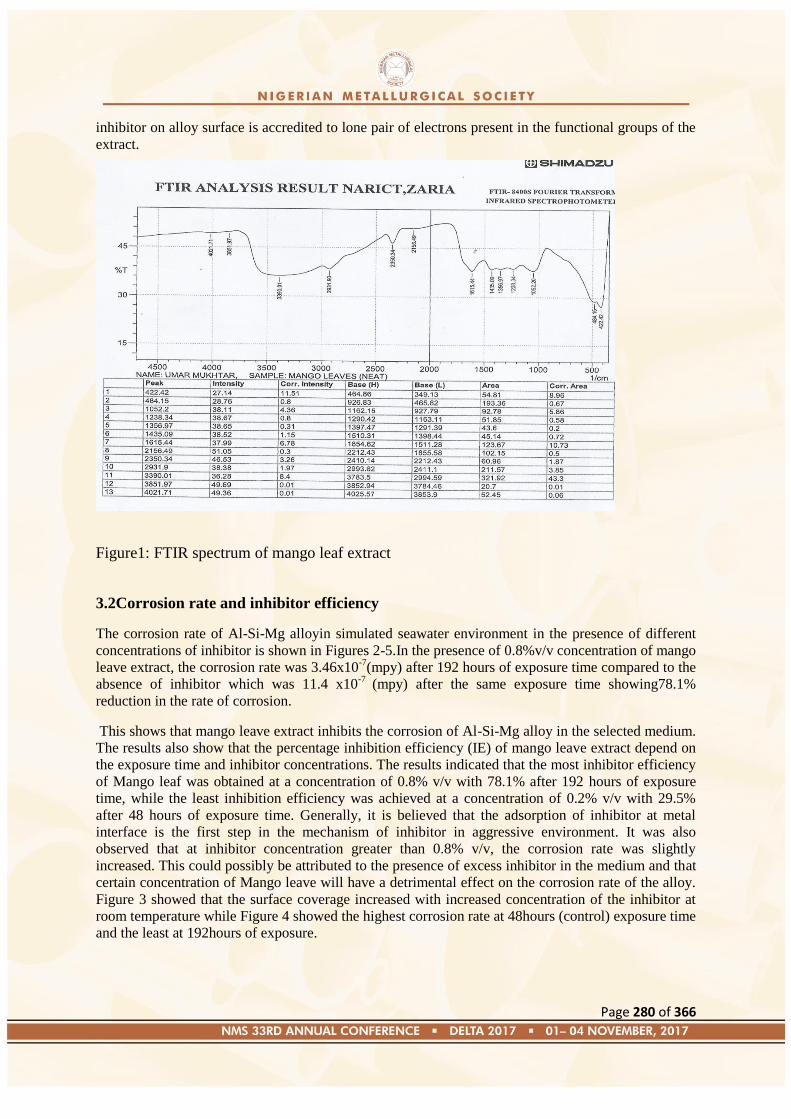
Page 280 of 366
inhibitor on alloy surface is accredited to lone pair of electrons present in the functional groups of the
extract.
Figure1: FTIR spectrum of mango leaf extract
3.2Corrosion rate and inhibitor efficiency
The corrosion rate of Al-Si-Mg alloyin simulated seawater environment in the presence of different
concentrations of inhibitor is shown in Figures 2-5.In the presence of 0.8%v/v concentration of mango
leave extract, the corrosion rate was 3.46x10⁻⁷
(mpy) after 192 hours of exposure time compared to the
absence of inhibitor which was 11.4 x10⁻⁷
(mpy) after the same exposure time showing78.1%
reduction in the rate of corrosion.
This shows that mango leave extract inhibits the corrosion of Al-Si-Mg alloy in the selected medium.
The results also show that the percentage inhibition efficiency (IE) of mango leave extract depend on
the exposure time and inhibitor concentrations. The results indicated that the most inhibitor efficiency
of Mango leaf was obtained at a concentration of 0.8% v/v with 78.1% after 192 hours of exposure
time, while the least inhibition efficiency was achieved at a concentration of 0.2% v/v with 29.5%
after 48 hours of exposure time. Generally, it is believed that the adsorption of inhibitor at metal
interface is the first step in the mechanism of inhibitor in aggressive environment. It was also
observed that at inhibitor concentration greater than 0.8% v/v, the corrosion rate was slightly
increased. This could possibly be attributed to the presence of excess inhibitor in the medium and that
certain concentration of Mango leave will have a detrimental effect on the corrosion rate of the alloy.
Figure 3 showed that the surface coverage increased with increased concentration of the inhibitor at
room temperature while Figure 4 showed the highest corrosion rate at 48hours (control) exposure time
and the least at 192hours of exposure.
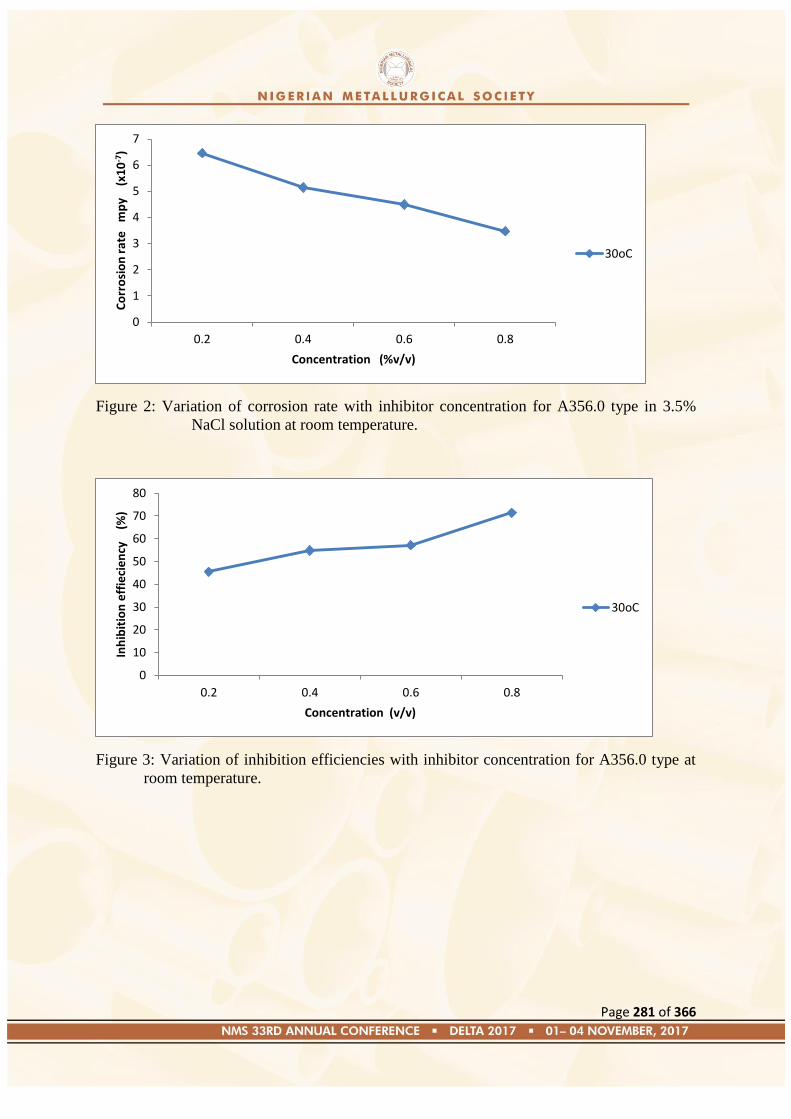
Page 281 of 366
Figure 2: Variation of corrosion rate with inhibitor concentration for A356.0 type in 3.5%
NaCl solution at room temperature.
Figure 3: Variation of inhibition efficiencies with inhibitor concentration for A356.0 type at
room temperature.
0
1
2
3
4
5
6
7
0.2 0.4 0.6 0.8
Co
rro
sio
n r
ate
m
py
(x
10
-7)
Concentration (%v/v)
30oC
0
10
20
30
40
50
60
70
80
0.2 0.4 0.6 0.8
Inh
ibit
ion
eff
ieci
en
cy
(%
)
Concentration (v/v)
30oC
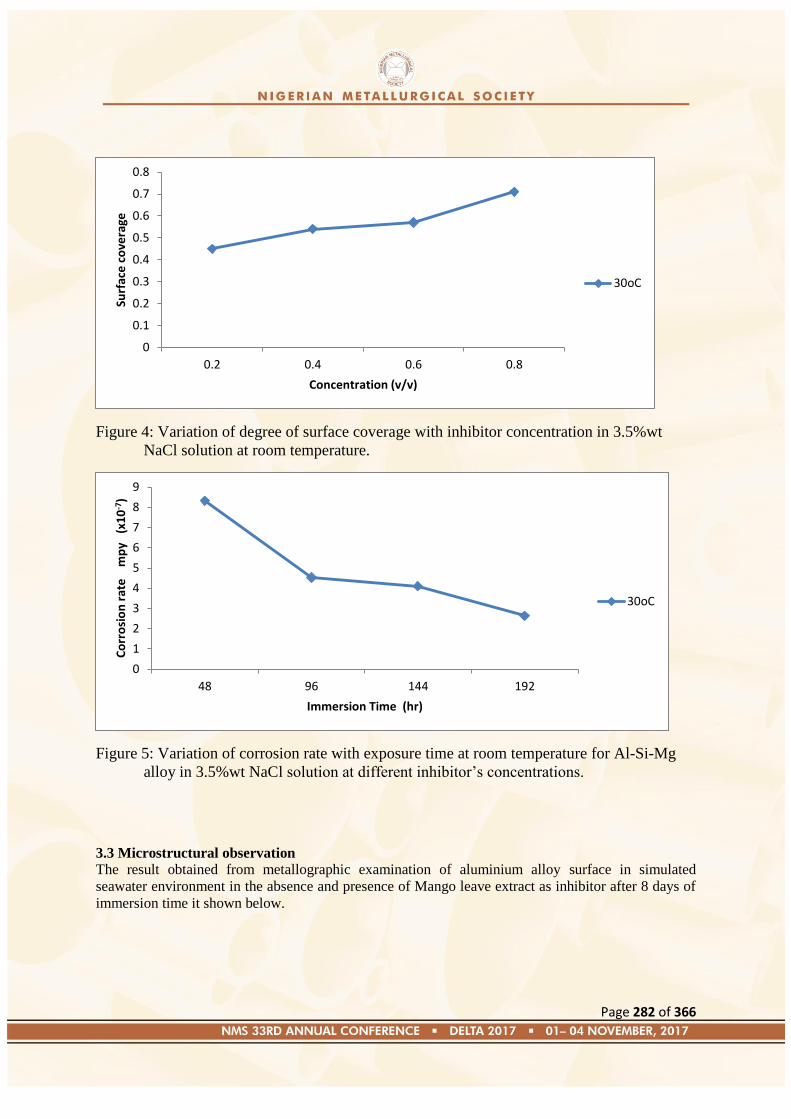
Page 282 of 366
Figure 4: Variation of degree of surface coverage with inhibitor concentration in 3.5%wt
NaCl solution at room temperature.
Figure 5: Variation of corrosion rate with exposure time at room temperature for Al-Si-Mg
alloy in 3.5%wt NaCl solution at different inhibitor‘s concentrations.
3.3 Microstructural observation
The result obtained from metallographic examination of aluminium alloy surface in simulated
seawater environment in the absence and presence of Mango leave extract as inhibitor after 8 days of
immersion time it shown below.
0
0.1
0.2
0.3
0.4
0.5
0.6
0.7
0.8
0.2 0.4 0.6 0.8
Surf
ace
co
vera
ge
Concentration (v/v)
30oC
0
1
2
3
4
5
6
7
8
9
48 96 144 192
Co
rro
sio
n r
ate
m
py
(x1
0-7
)
Immersion Time (hr)
30oC
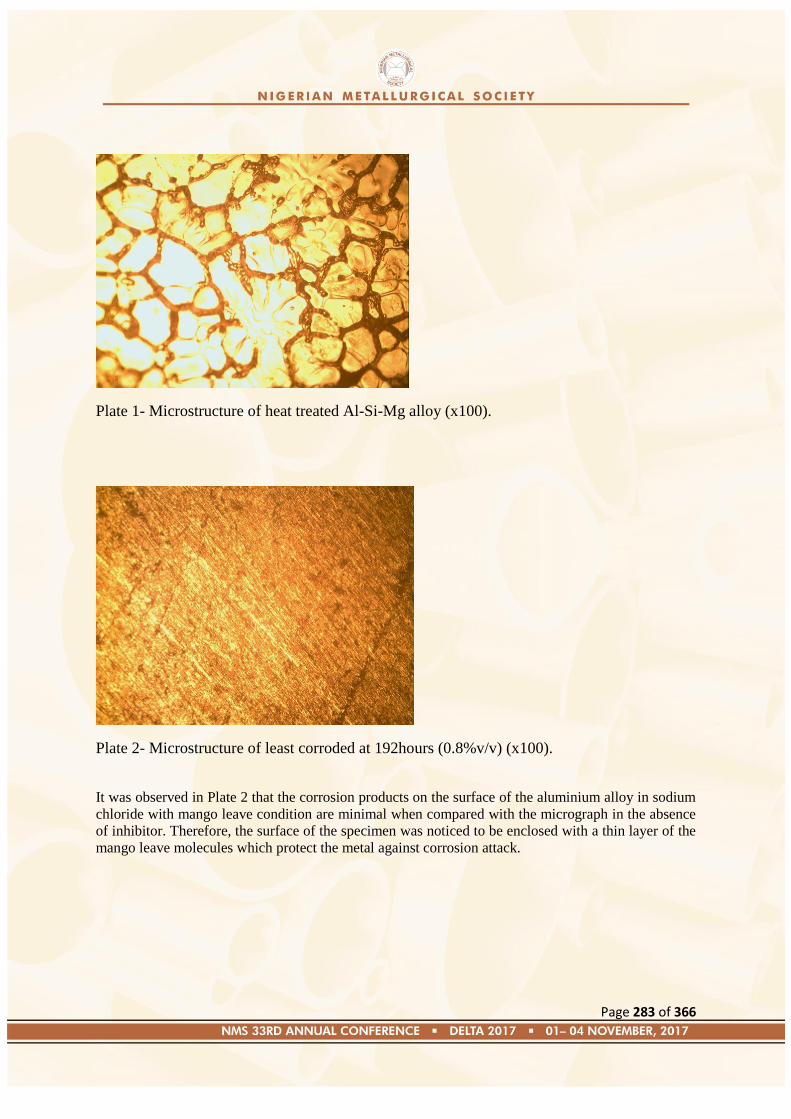
Page 283 of 366
Plate 1- Microstructure of heat treated Al-Si-Mg alloy (x100).
Plate 2- Microstructure of least corroded at 192hours (0.8%v/v) (x100).
It was observed in Plate 2 that the corrosion products on the surface of the aluminium alloy in sodium
chloride with mango leave condition are minimal when compared with the micrograph in the absence
of inhibitor. Therefore, the surface of the specimen was noticed to be enclosed with a thin layer of the
mango leave molecules which protect the metal against corrosion attack.

Page 284 of 366
Plate 3- Most corroded at 192hours control (x100).
Several pits and cracks can be seen in Plate 3 compared to the inhibited sample which is due to the
chloride ions attack on the surface of the sample. Flakes showing corrosion products like metal and it
oxides can also be observed.
Plate 4 show the surface morphology of Al-Si-Mg Alloy in 4 hours of ageing time indicating that the
grains of the sample consists of very fine grains which implies an increase in property.
4. Conclusions
The experimental investigation of the use of mango leaf extract as corrosion inhibitor on the
performance of thermally aged Al-Si-Mg alloy with melon peel in simulated seawater environment
led to the following conclusions:
From the weight loss method analyzed,
1. The highest percentage inhibition efficiency for Al-Si-Mg alloy in simulated sea
water environment is 78.1%.
2. The optimum concentration of Mango leaf extract to be used as corrosion inhibitor
is 0.8% v/v at room temperature.
3. The inhibition efficiency of Mango leaf extract for Al-Si-Mg alloy in simulated
seawater environment increases with exposure time and inhibitor concentration.
4. The inhibition characteristic of Mango leaf could be attributed to the adsorption of
the extract onto the surface of the alloy which prevents the breakdown of the
passive film. Therefore higher corrosion resistance of Al-Si-Mg alloy.
5. The inhibitor efficiency of mango leaf extract in 3.5wt% NaCl solution increased
with increasing concentration of inhibitor over the range (0.2 to 0.8% v/v) at
room temperature.
6. Microstructural examination observed that the uninhibited aluminium sample i.e.
most corroded showed several pits and cracks compared to the inhibited sample.
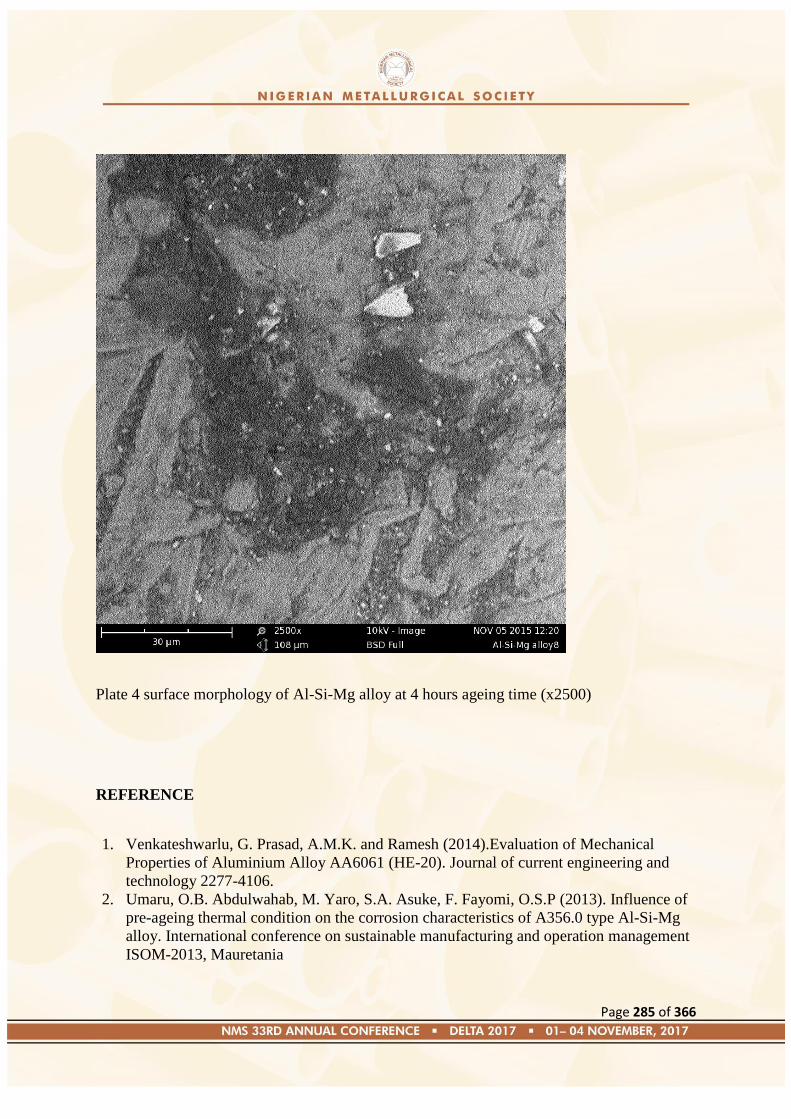
Page 285 of 366
Plate 4 surface morphology of Al-Si-Mg alloy at 4 hours ageing time (x2500)
REFERENCE
1. Venkateshwarlu, G. Prasad, A.M.K. and Ramesh (2014).Evaluation of Mechanical
Properties of Aluminium Alloy AA6061 (HE-20). Journal of current engineering and
technology 2277-4106.
2. Umaru, O.B. Abdulwahab, M. Yaro, S.A. Asuke, F. Fayomi, O.S.P (2013). Influence of
pre-ageing thermal condition on the corrosion characteristics of A356.0 type Al-Si-Mg
alloy. International conference on sustainable manufacturing and operation management
ISOM-2013, Mauretania

Page 286 of 366
3. Maltian Merlin and GianlucaGaragnani (2009).Mechanical and Microstructural
Characteristics of A356 Casting Realized with full and empty core.Metallurgical Science
and Technology Vol. 27-1 Ed 2009.
4. .Abdulwahab .M. and Popoola A.P.I. (2013) Effect of Isothermal Treatment on
Microstructure of Sodium-Modified A356.0-type Al-Si-Mg Alloy. Digest Journal
ofNanomaterials and Biostructures Vol.8 No.3.p.929-936.
5. Mohammed R.A,Abdulwahab M.,Madugu I.A., Gaminana J.O., Asuke F (2013)
Inhibitive Effect by Natural CyperusEsculentusL.oil on the corrosion of A356.0 type
Al-Si-Mg alloy in simulated seawater environment. Journal of Materials and Science
4(1) 93-98
6. Froyen, L. And Verlinder, B (1994).Aluminum matrix composite Materials.European
Aluminum Association.
7. Agarwal P., Landolt D. Corrosion Inhibitors, Corrosion Science, 260 (1998).673-691.
Page 287 of 366
Paper: NMS 2017-TP034
Enhancement of Itakpe Iron Ore Concentrate Quality using Existing Plant Facilities
B. I. NNAGHA Sole Administrator,
National Iron Ore Mining Company,
Itakpe, Kogi State.
ENGR. M. K. OLASUPO DGM (Operations), Beneficiation Department,
National Iron Ore Mining Company,
Itakpe, Kogi State.
Abstract
National Iron Ore Mining Company (NIOMCO) was primarily designed to supply Ajaokuta Steel
Company (ASCO) with 0 – 1.6mm sized iron ore concentrate of 63/64% Fe grade and minus 80
microns sized 67/68% Iron Ore Superconcentrate to Delta Steel Company (DSC). However, due to
the protracted delay in the completion of ASCO blast furnace and the non-completion of NIOMCO
Superconcentrate Plant specially designed for DSC, the need arose for NIOMCO to fast-track the
enhancement of the available 63/64% Fe concentrate for DSC‟s use.
From the Concentrate production flowsheet, it was noted that 80% of Iron recovery comes from
Gravity Separation Stage (Humphrey Spirals), while the remaining 20% would be recovered from
Magnetic Stage. Effort was therefore targeted on the gravity stage for this improvement of the 63/64%
Concentrate grade. The original settings of Gravity (Spirals) for 63/64% Fe Concentrate production
were readjusted into several alternative settings of the three stages of roughing, cleaning and
recleaning spirals. The samples of head spirals, concentrate and rejects of each settings were
process-controlled and monitored by chemical analyses to arrive at the right settings for enhancement
that eventually achieved acceptable grade of 65/66% Fe which became acceptable for use at the DSC
Plant.
Other factors taken into consideration were percentage solid, enrichment ratio, material balance and
more importantly iron ore recovery to control and minimize the quantity of iron that is being lost into
final reject. Enhanced concentrate of 65/66% Fe was used by DSC to produce world standard quality
billets that were supplied to the inland rolling mills at Jos, Oshogbo and Katsina.
Keywords: Enhancing, Spirals, Grade, DSC, Percentage solid.
1.0 INTRODUCTION
The National Iron Ore Mining Company (NIOMCO) was primarily designed to supply Ajaokuta Steel
Company (ASCO) with 0 – 1.6mm sized iron ore concentrate of 63/64% Fe grade size and also Delta

Page 288 of 366
Steel Company (DSC) with minus 80 microns sized Superconcentrate of 67/68% Fe for DSC Pellet
Plant.
Enhancement of 63/64% Fe grade to 65/66% Fe grade concentrate was conceptualized by NIOMCO
as a result of the protracted delay in the completion of the ASCO‘s Blast Furnace Plant as well as the
non-completion of NIOMCO‘s Superconcentrate Plant specially designed to produce 67/68%
Superconcentrate for DSC‘s Pellet Plant.
Mineralogic and petrographic tests on the Itakpe Iron Ore reveals the repartition of the ores into three
metallurgical types namely; hematite ores (36.2%), magnetite ores (26.8%) and hematite-magnetite
combinations (37%).
The basic objectives of the Itakpe Iron Ore beneficiation are to eliminate quartz and silicates, reduce
the alkaline components as well as to lower the phosphorus and sulphur contents.
The Plant‘s flowsheet was arrived at following initial pilot scale beneficiation tests at Machaol
Breherme Research Institute in Former USSR and NMDC, Nigeria, which led to the establishment of
the ore composition, grindability, liberation of size and dressability as well as the recommendation of
a combined gravity and magnetic flowsheet. Further pilot studies carried out by SOFREMINES
Consultants, utilized Humphrey Spirals, Reichert Cone and shaking table as well as use of magnetic
separators with further application of froth flotation for grade enhancement at the BRGM Research
Laboratories in Orleans, France.
A good iron recovery concentrate sinter feed assaying 63 to 64% was obtained after grinding to
1.6mm. Also, a good iron recovery of superconcentrate pellet feed assaying 68% after regrinding to
minus 0.08mm of the previous concentrate, using reverse flotation. The success of the pilot scale tests
led to the construction of the Beneficiation Plant with four (4) concentrate production lines and a
Superconcentrate production line out of which three (3) concentrate production lines were completed
to produce over 600,000 tonnes of 63/64% Fe concentrate.
2.0 BENEFICIATION PLANT EQUIPMENT/OPERATION
i) Grinding Section comprises a 54‖ by 74‖ 2000 tph gyratory crusher and a secondary 400 tph
jaw crusher from where minus 200mm products are transported to the blending storage yard.
The yards comprise two homogenization stockpiles, each capable of holding 275,000 metric
tons of crushed materials by means of a stacker while ore reclaiming is carried out with a
reclaimer filled with two bucket wheels. Through the belt conveyor system, the crushed ore is
transported to the 2,500T capacity repartition bin which is equipped with three ore feeders,
each of which feeds one of the three production lines. The 4th concentrate production line is
only partly completed.
ii) Grinding Section comprises three treatment lines, each of which consist of a semi-autogenous
grinding mill (2.4 meters in length, 7.2 metres in diameter) with a 2,700kW driving motor, a
nominal feed capacity of 292 tph.
iii) Screening Section comprises 14m2 screens with cut at 1.6mm.
iv) Cycloning Section comprises classifying hydrocyclone and thickening hydrocyclones.
v) Gravity Concentration Section comprises three stages of twin 5 turn spirals (156 twin spiral
per treatment line).
vi) Magnetic Separation Section comprises two stages of Low Intensity Magnetic Separators
(LIMS).
vii) Solid – water Section comprises eleven horizontal vacuum 20m2 belt filters equipped with 2
types of vacuum pumps, one for concentrate filtration, the other for tailings filtration.
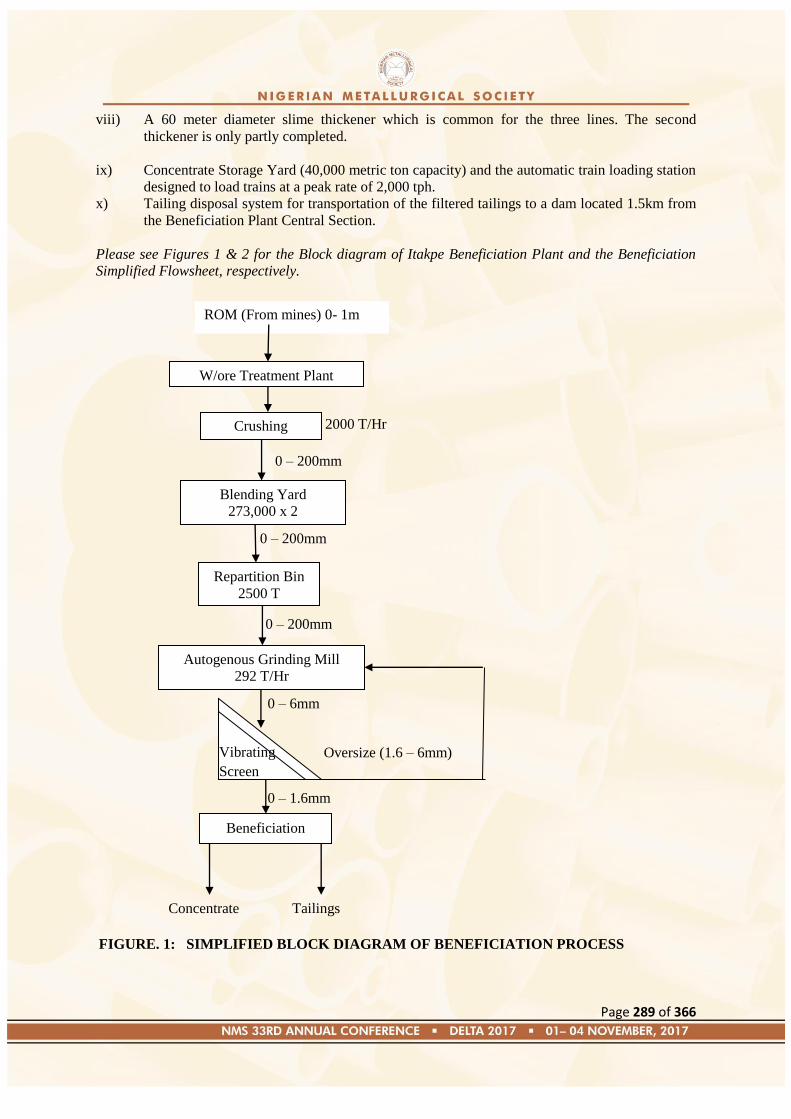
Page 289 of 366
viii) A 60 meter diameter slime thickener which is common for the three lines. The second
thickener is only partly completed.
ix) Concentrate Storage Yard (40,000 metric ton capacity) and the automatic train loading station
designed to load trains at a peak rate of 2,000 tph.
x) Tailing disposal system for transportation of the filtered tailings to a dam located 1.5km from
the Beneficiation Plant Central Section.
Please see Figures 1 & 2 for the Block diagram of Itakpe Beneficiation Plant and the Beneficiation
Simplified Flowsheet, respectively.
FIGURE. 1: SIMPLIFIED BLOCK DIAGRAM OF BENEFICIATION PROCESS
W/ore Treatment Plant
ROM (From mines) 0- 1m
Crushing
Blending Yard
273,000 x 2
Repartition Bin
2500 T
2000 T/Hr
0 – 200mm
0 – 200mm
0 – 200mm
Autogenous Grinding Mill
292 T/Hr
Beneficiation
Concentrate Tailings
Oversize (1.6 – 6mm)
0 – 1.6mm
0 – 6mm
Vibrating
Screen
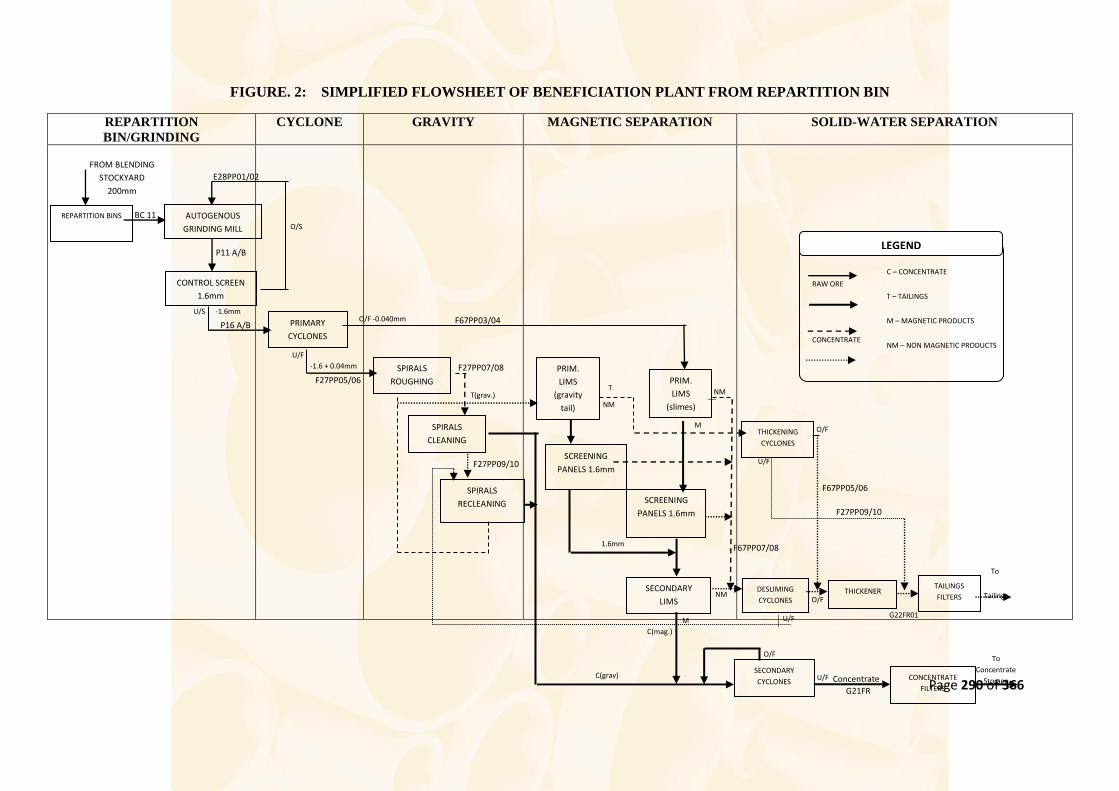
Page 290 of 366
FIGURE. 2: SIMPLIFIED FLOWSHEET OF BENEFICIATION PLANT FROM REPARTITION BIN
REPARTITION
BIN/GRINDING
CYCLONE GRAVITY MAGNETIC SEPARATION SOLID-WATER SEPARATION
RAW ORE
CONCENTRATE
REPARTITION BINS AUTOGENOUS
GRINDING MILL
CONTROL SCREEN
1.6mm
PRIMARY
CYCLONES
SPIRALS
ROUGHING
SPIRALS
CLEANING
SPIRALS
RECLEANING
PRIM.
LIMS
(gravity
tail)
SCREENING
PANELS 1.6mm
PRIM.
LIMS
(slimes)
SECONDARY
LIMS
SCREENING
PANELS 1.6mm
THICKENING
CYCLONES
DESLIMING
CYCLONES THICKENER
TAILINGS
FILTERS
SECONDARY
CYCLONES CONCENTRATE
FILTERS
FROM BLENDING
STOCKYARD
200mm
To
Tailings
Disposal
To
Concentrate
Storage
1.6mm
Concentrate U/F
O/F
U/F M
NM
U/F
O/F
1.6mm
NM
M
NM
T T(grav.)
C(grav)
C(mag.)
-1.6 + 0.04mm
U/F
O/F -0.040mm
O/S
6.0+1.6mm
-1.6mm U/S
C – CONCENTRATE
T – TAILINGS
M – MAGNETIC PRODUCTS
NM – NON MAGNETIC PRODUCTS
LEGEND
O/F
BC 11
P11 A/B
E28PP01/02
P16 A/B
F27PP05/06
F27PP07/08
F27PP09/10
F67PP03/04
F67PP05/06
F67PP07/08
G21FR
F27PP09/10
G22FR01
G22FR02

Page 291 of 366
3.0 THEORETICAL DEVELOPMENT
Each spiral unit comprises two intertwined channels of five turns each built up from fifteen
identical 120 degree segments. Each channel is complete with independent feed and tailings
boxes.
SPIRAL PORTS AND SPLITTERS
A 60mm diameter concentrate port is provided in each 120 degrees spiral segment. This can be
fitted with a stainless steel blanking disc or a close fitting adjustable splitter. In addition, gauges
are provided to check settings whilst the spirals are in operation.
CONCENTRATE COLLECTOR PIPE
Each double start spiral unit incorporates an axial collector pipe serving the associated thirty
concentrate ports.
WASH WATER SYSTEM
Wash water is dehauled, via a pocket on the feed box to the top of a subsidiary open channel
which is formed in each spiral segment to follow the inner contour of the main spiral channels.
From there it is progressively transferred to the pulp stream by a regularly spaced series of open
notches which require no adjustment and are not prone to blockage by foreign bodies.
OPERATION
The general range of operating conditions listed below cover a fairly wide range of uses and a
starting point for optimization per start of spiral performance which can be selected from within
these parameters.
Pulp volume - 2.7 – 5 m3/hr
Pulp Density - 30 – 45 solids by weight
Wash water - 5 – 15 litres/min
Splitter opening and settings are arranged to cut a reasonable width of concentrate band at a
limited number of points. This is to improve grade and stability of operations. The actual number
of ports in use will vary with feed grade. For example on a 40% Fe hematite roughing operation,
every other port may be used, whereas roughing in a low grade ore may only require four or five
ports to be open. Ports Nos 1 and 14 are never used and port No. 15 on a five-torn spiral can be
used to cut a middling for recirculation.
Table 1 below shows port setting.
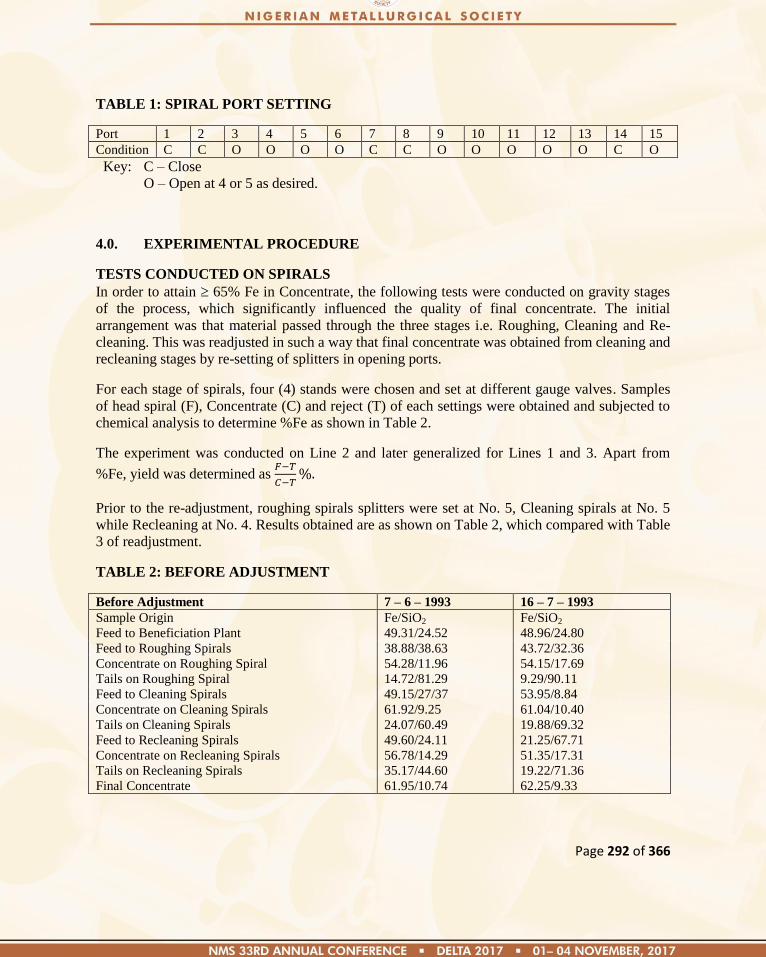
Page 292 of 366
TABLE 1: SPIRAL PORT SETTING
Port 1 2 3 4 5 6 7 8 9 10 11 12 13 14 15
Condition C C O O O O C C O O O O O C O
Key: C – Close
O – Open at 4 or 5 as desired.
4.0. EXPERIMENTAL PROCEDURE
TESTS CONDUCTED ON SPIRALS
In order to attain 65% Fe in Concentrate, the following tests were conducted on gravity stages
of the process, which significantly influenced the quality of final concentrate. The initial
arrangement was that material passed through the three stages i.e. Roughing, Cleaning and Re-
cleaning. This was readjusted in such a way that final concentrate was obtained from cleaning and
recleaning stages by re-setting of splitters in opening ports.
For each stage of spirals, four (4) stands were chosen and set at different gauge valves. Samples
of head spiral (F), Concentrate (C) and reject (T) of each settings were obtained and subjected to
chemical analysis to determine %Fe as shown in Table 2.
The experiment was conducted on Line 2 and later generalized for Lines 1 and 3. Apart from
%Fe, yield was determined as
Prior to the re-adjustment, roughing spirals splitters were set at No. 5, Cleaning spirals at No. 5
while Recleaning at No. 4. Results obtained are as shown on Table 2, which compared with Table
3 of readjustment.
TABLE 2: BEFORE ADJUSTMENT
Before Adjustment 7 – 6 – 1993 16 – 7 – 1993
Sample Origin Fe/SiO2 Fe/SiO2
Feed to Beneficiation Plant 49.31/24.52 48.96/24.80
Feed to Roughing Spirals 38.88/38.63 43.72/32.36
Concentrate on Roughing Spiral 54.28/11.96 54.15/17.69
Tails on Roughing Spiral 14.72/81.29 9.29/90.11
Feed to Cleaning Spirals 49.15/27/37 53.95/8.84
Concentrate on Cleaning Spirals 61.92/9.25 61.04/10.40
Tails on Cleaning Spirals 24.07/60.49 19.88/69.32
Feed to Recleaning Spirals 49.60/24.11 21.25/67.71
Concentrate on Recleaning Spirals 56.78/14.29 51.35/17.31
Tails on Recleaning Spirals 35.17/44.60 19.22/71.36
Final Concentrate 61.95/10.74 62.25/9.33
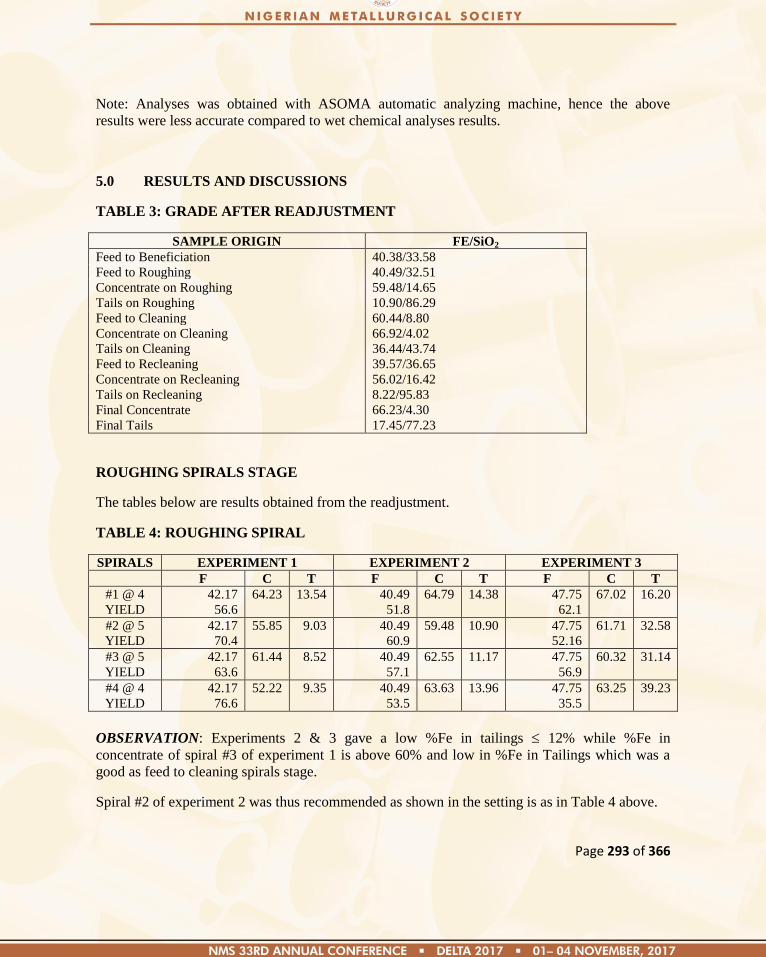
Page 293 of 366
Note: Analyses was obtained with ASOMA automatic analyzing machine, hence the above
results were less accurate compared to wet chemical analyses results.
5.0 RESULTS AND DISCUSSIONS
TABLE 3: GRADE AFTER READJUSTMENT
SAMPLE ORIGIN FE/SiO2
Feed to Beneficiation 40.38/33.58
Feed to Roughing 40.49/32.51
Concentrate on Roughing 59.48/14.65
Tails on Roughing 10.90/86.29
Feed to Cleaning 60.44/8.80
Concentrate on Cleaning 66.92/4.02
Tails on Cleaning 36.44/43.74
Feed to Recleaning 39.57/36.65
Concentrate on Recleaning 56.02/16.42
Tails on Recleaning 8.22/95.83
Final Concentrate 66.23/4.30
Final Tails 17.45/77.23
ROUGHING SPIRALS STAGE
The tables below are results obtained from the readjustment.
TABLE 4: ROUGHING SPIRAL
SPIRALS EXPERIMENT 1 EXPERIMENT 2 EXPERIMENT 3
F C T F C T F C T
#1 @ 4
YIELD
42.17
56.6
64.23 13.54 40.49
51.8
64.79 14.38 47.75
62.1
67.02 16.20
#2 @ 5
YIELD
42.17
70.4
55.85 9.03 40.49
60.9
59.48 10.90 47.75
52.16
61.71 32.58
#3 @ 5
YIELD
42.17
63.6
61.44 8.52 40.49
57.1
62.55 11.17 47.75
56.9
60.32 31.14
#4 @ 4
YIELD
42.17
76.6
52.22 9.35 40.49
53.5
63.63 13.96 47.75
35.5
63.25 39.23
OBSERVATION: Experiments 2 & 3 gave a low %Fe in tailings 12% while %Fe in
concentrate of spiral #3 of experiment 1 is above 60% and low in %Fe in Tailings which was a
good as feed to cleaning spirals stage.
Spiral #2 of experiment 2 was thus recommended as shown in the setting is as in Table 4 above.
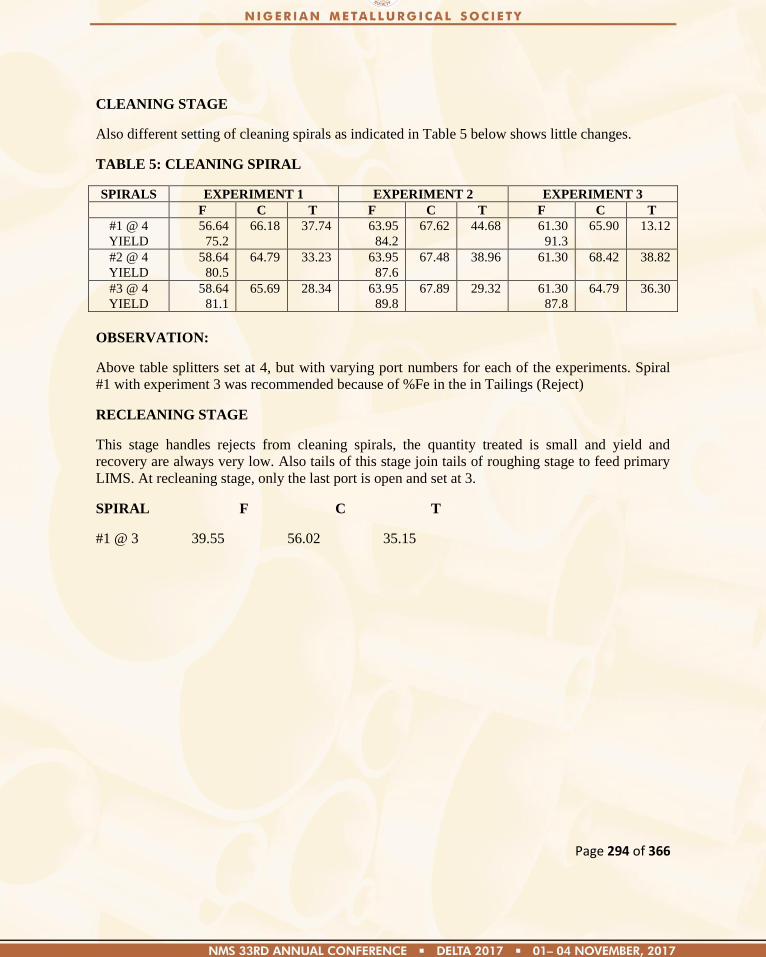
Page 294 of 366
CLEANING STAGE
Also different setting of cleaning spirals as indicated in Table 5 below shows little changes.
TABLE 5: CLEANING SPIRAL
SPIRALS EXPERIMENT 1 EXPERIMENT 2 EXPERIMENT 3
F C T F C T F C T
#1 @ 4
YIELD
56.64
75.2
66.18 37.74 63.95
84.2
67.62 44.68 61.30
91.3
65.90 13.12
#2 @ 4
YIELD
58.64
80.5
64.79 33.23 63.95
87.6
67.48 38.96 61.30
68.42 38.82
#3 @ 4
YIELD
58.64
81.1
65.69 28.34 63.95
89.8
67.89 29.32 61.30
87.8
64.79 36.30
OBSERVATION:
Above table splitters set at 4, but with varying port numbers for each of the experiments. Spiral
#1 with experiment 3 was recommended because of %Fe in the in Tailings (Reject)
RECLEANING STAGE
This stage handles rejects from cleaning spirals, the quantity treated is small and yield and
recovery are always very low. Also tails of this stage join tails of roughing stage to feed primary
LIMS. At recleaning stage, only the last port is open and set at 3.
SPIRAL F C T
#1 @ 3 39.55 56.02 35.15
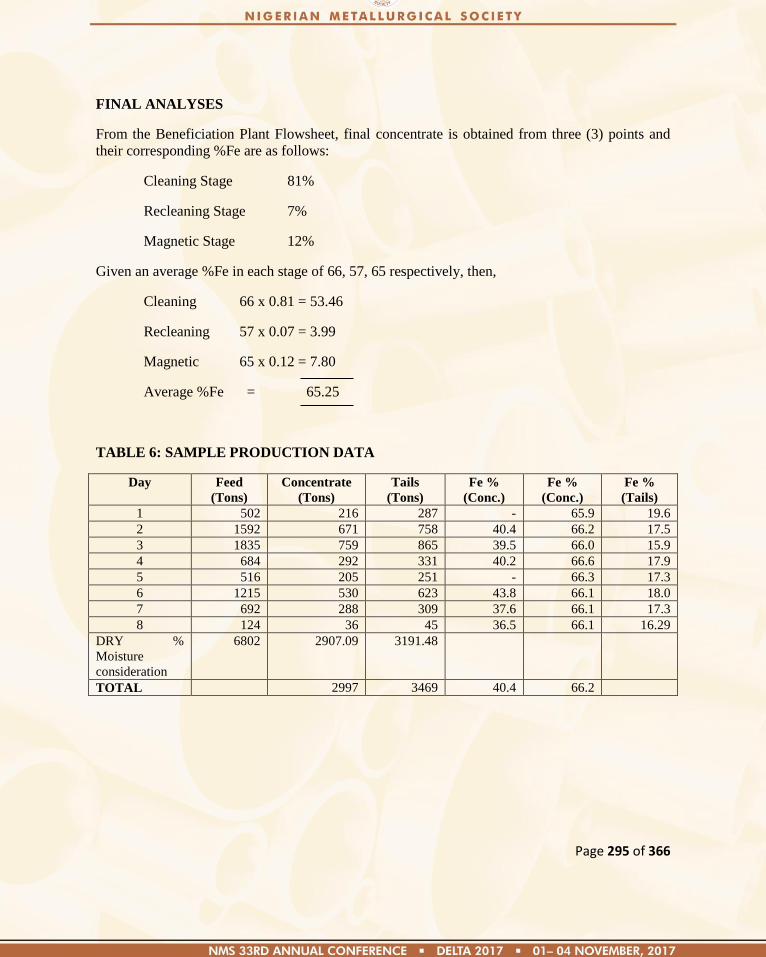
Page 295 of 366
FINAL ANALYSES
From the Beneficiation Plant Flowsheet, final concentrate is obtained from three (3) points and
their corresponding %Fe are as follows:
Cleaning Stage 81%
Recleaning Stage 7%
Magnetic Stage 12%
Given an average %Fe in each stage of 66, 57, 65 respectively, then,
Cleaning 66 x 0.81 = 53.46
Recleaning 57 x 0.07 = 3.99
Magnetic 65 x 0.12 = 7.80
Average %Fe = 65.25
TABLE 6: SAMPLE PRODUCTION DATA
Day Feed
(Tons)
Concentrate
(Tons)
Tails
(Tons)
Fe %
(Conc.)
Fe %
(Conc.)
Fe %
(Tails)
1 502 216 287 - 65.9 19.6
2 1592 671 758 40.4 66.2 17.5
3 1835 759 865 39.5 66.0 15.9
4 684 292 331 40.2 66.6 17.9
5 516 205 251 - 66.3 17.3
6 1215 530 623 43.8 66.1 18.0
7 692 288 309 37.6 66.1 17.3
8 124 36 45 36.5 66.1 16.29
DRY %
Moisture
consideration
6802 2907.09 3191.48
TOTAL 2997 3469 40.4 66.2
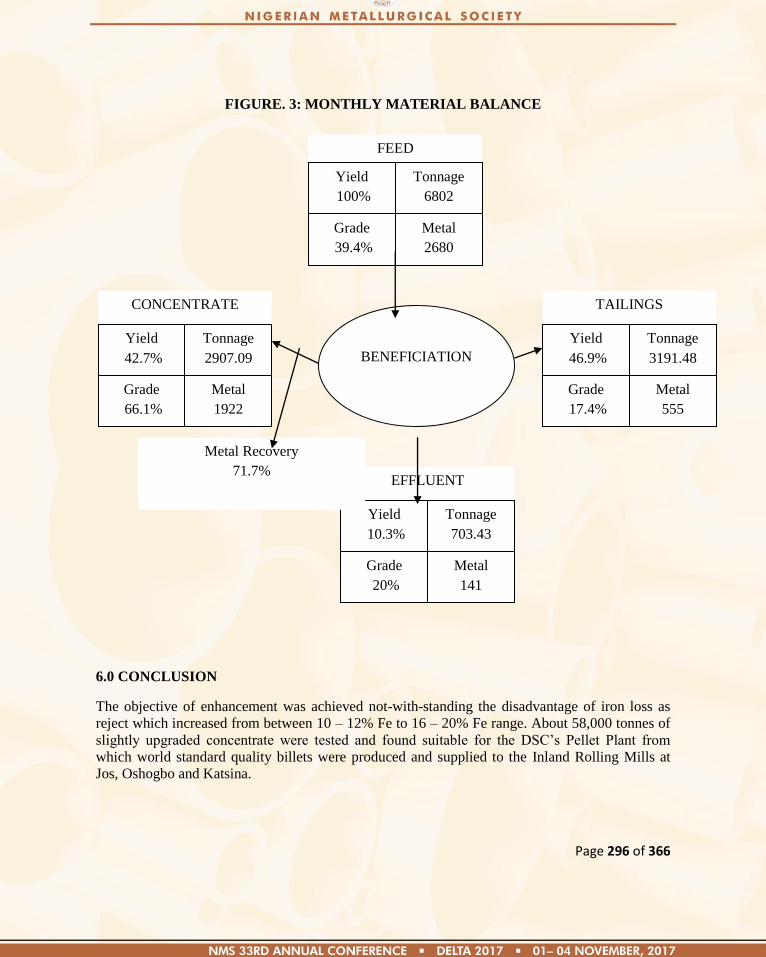
Page 296 of 366
FIGURE. 3: MONTHLY MATERIAL BALANCE
6.0 CONCLUSION
The objective of enhancement was achieved not-with-standing the disadvantage of iron loss as
reject which increased from between 10 – 12% Fe to 16 – 20% Fe range. About 58,000 tonnes of
slightly upgraded concentrate were tested and found suitable for the DSC‘s Pellet Plant from
which world standard quality billets were produced and supplied to the Inland Rolling Mills at
Jos, Oshogbo and Katsina.
FEED
Yield
100%
Tonnage
6802
Grade
39.4%
Metal
2680
CONCENTRATE
Yield
42.7%
Tonnage
2907.09
Grade
66.1%
Metal
1922
TAILINGS
Yield
46.9%
Tonnage
3191.48
Grade
17.4%
Metal
555
EFFLUENT
Yield
10.3%
Tonnage
703.43
Grade
20%
Metal
141
BENEFICIATION
Metal Recovery
71.7%
Page 297 of 366
Paper: NMS 2017-TP035
Effect of Guava Leaf Extract on the Hardness and Corrosion Resistance of
Thermally Conditioned Al-Si-Mg Alloy
M. Abdulwahab*, A. Kasim, F. Asuke, J. O. Gaminana and M. Adediran Department of Metallurgical and Materials Engineering, Ahmadu Bello University,
Zaria, Nigeria
*Email address: [email protected]
Abstract
The corrosion resistance of thermally conditioned Al-Si-Mg alloy with carbonized melon peel in
seawater environment was investigated in the presence and absence of guava leaf extract/ NaCl
solution. The research was carried out using different inhibitor concentrations of 0.2, 0.4, 0.6 and
0.8% v/v, and exposure time of 8 days at room temperature while in absence of the inhibitor, the
alloys were heat treated in the presence of carbonized melon peel, aged and immersed in
simulated sea water for a period of 10 days. The gravimetric based on mass loss (weight loss)
method was adopted for the study. The study was aided using Fourier Transformation Infrared
(FTIR) analysis, X-ray florescence (XFR), thermal ageing treatment and hardness test. The result
obtained revealed that Guava leaf extract is an effective corrosion inhibitor for thermally
conditioned Al-Si-Mg alloy in simulated seawater environment at 0.6v/v concentration with 4
hours ageing time. Furthermore, the corrosion rate decreases with exposure time which is
probably due to the deposition of corrosion products which tend to shield the corroding surface
from further corrosion attack, there by depressing the corrosion rate. Equally the inhibitor
efficiencies of guava leaf extract for Al-Si-Mg alloy in simulated seawater environment is
51.81% and the inhibition is attributed to absorption of the Guava leaf extract onto the surface of
the alloy which prevents the breakdown of the passive film, hence higher corrosion resistance of
the Al-Si-Mg alloy. Equally, the hardness values increase with ageing time up to 4 hours of
ageing and slightly decrease. The Scanning Electron Microscopic analysis also indicates that the
grains of the sample consist of very fine grains which implies increased in the hardness value.
Keyword: Al-Si-Mg alloy, Seawater, Aluminium alloy, Inhibitor efficiency,
Corrosion
1. Introduction
Aluminum and its alloys are widely used for different applications in the industries and marine
environment because of their excellent properties such as strength, lightness, corrosion resistance,
Page 298 of 366
electrical and thermal conductivity (Fontana, 1987). The corrosion resistance of Al has
contributed to the presence of thin protective surface oxide film, when aluminum surface is
exposed to the atmosphere, a thin invisible oxide (Al2O3) skin form, which protects the metal
from corrosion in many environments. This film protect the metal from further oxidation unless
this coating is destroyed, the material remains fully protected against corrosion (Abdulwahab et
al. 2011).
Corrosion of metals and alloys, which is the deterioration or disintegration of materials due to
their reaction with the environment, has continued to receive attention in the technological world
(Madugu and Abdulwahab, 2007). In economic terms, the problem of metallic corrosion is of
significant and it has been estimated that approximately five percent of an industrialized nations
income is spent on corrosion prevention and maintenance or replacement of products lost or
contaminated as a result of corrosion reactions.
Although, in recent years, various methods have been put forward to address this limitations such
as alloying addition, thermal treatment, composite/nano-composite formation. Equally, corrosion
resistance of aluminum and its alloys using inhibitors have also been investigated in various
environments (Oguize, 2007). Inhibitors decrease or prevent the reaction of metal in a media.
They reduce the corrosion rate by adsorption of ions/molecules onto metal surface. The types are
organic and inorganic inhibitors. Corrosion inhibitors are often added in industrial processes to
secure metal dissolution from acid and alkaline solutions; hence the use of inhibitors is one of the
best options for protecting metals against corrosion (Oguzie, 2007, Adindu and Oguize, 2017).
Though many synthetic compounds showed good anti-corrosive activity, most of them are highly
toxic to both human beings and environment. These inhibitors may cause reversible (temporary)
or irreversible (permanent) damage to organ system viz, kidneys or liver, or to disturb a
biochemical process or an enzyme system at some site in the body.As a result, the use of naturally
occurring plant extracts as inhibitors is particularly interesting and economical because they are
cheap, ecologically friendly and hazard free (Obot and Obi-Egbedi, 2010). Heat treatment can
also be used to modify the corrosion resistance of Al alloy, it is known that Al alloy with T6
treatment possess high strength and their increase in strength is due to precipitation of Mg2Si in
the aluminum matrix. In this work, an attempt was made to evaluate the corrosion inhibition of
Al-Si-Mg alloy in guava leaf extract/simulated sea water environment using the weight loss
measurement and isothermal treatment of the alloy was equally examined.
Table 1: Charge calculation of the produced alloy
Element
Al Si Mg Na
Composition (%)
92.69
7.0 0.3 0.01
Page 299 of 366
2. Methodology
2.1 Sample production
The aluminum alloy of chemical composition shown in Table 1 was produced using sand
casting method at the foundry shop of Metallurgical and Materials Engineering
Department, Ahmadu Bello University, Zaria; Nigeria.The melting was carried out using
charcoal fired crucible furnace. High purity aluminum electrical wires were charged in a
refractory crucible furnace, heated to temperature of 750oC and the alloying elements
(0.3%Mg and 7%Si) were added. The temperature was raise to 800oCfor superheating to
occur as to achieve good fluidity. Elemental sodium (0.01%Na) was added and the melt
was thoroughly stirred in order to ensure a uniform distribution of alloying elements and
prevent the elements from settling at the bottom due to their higher density before pouring
into the mould cavity. After casting, the samples were machined and cutinto corrosion test
coupons of dimension 10 x 10 mm.
2.2 Guava Leaf Extraction
The guava leaf used for this research was obtained from Basawa, Zaria-Nigeria, shade-dried and
ground to powder. The extract was then collected using ethanol via the soxhlate extraction
technique and transferred into an evaporating dish in order for the solvent to evaporate over water
bath at a temperature of 40oC. Thereafter, the extract (without solvent) was collected from the
evaporating dish using a laboratory spoon.
2.3 Fourier transform infrared spectroscopy (FTIR) analysis of guava leaf extract
The extract was then exposed under range of infrared (IR) beams. The transmittance and
reflectance of the ray was translated into an infrared absorption plot consisting of reversed peak.
The spectra pattern was match according to the infrared absorption table to identify the functional
group present.
2.4 Carbonization of the melon peel
Melon peel was carbonized at 600oC in a close crucible placed in a blast furnace and X-
ray florescence test (XRF) analysis was done on it, at the National Geological Survey
Agency, Kaduna State, Nigeria. The result of the XRF analysis of the carbonized melon
peel obtained is shown in Table 2.
Table 2 Chemical analysis of carbonized melon peel using XRF
OXIDES % composition
SiO2 75.3
P2O5 9.87
SO3 0.63
K2O 4.70
CaO 2.11
Page 300 of 366
TiO2 0.16
V2O5 0.006
MnO 0.367
Fe2O3 1.30
ZnO 0.476
BaO 0.098
MgO 0.37
Na2O 0.53
Al2O3 2.67
LiO 1.41
2.5 Heat Treatment
Some samples of the alloy were buried in carbonized melon peel and heat treated to a temperature
of 540oC for 1hr in an electric heat treatment furnace and then rapidly quenched in warm water
(65oC). The quenched samples were then aged at 180
oC for 2-5hours at one hour interval
respectively
2.6 Hardness Measurement
The hardness measurement was done using Rockwell hardness tester. The minor load 10kg and
major load 60kg was used. The surface of the test sample was thoroughly cleaned by removing
dirt, scratches, and oil. The samples were then placed on the anvils, which act as support for the
test samples. A minor load of 10kg was applied to the sample in a controlled manner without
inducing impact or vibration and zero datum position was established and the major load of 60kg
was then applied and the readings recorded. Three reading were taken for each sample with the
average value taken as the hardness value.
2.7 Corrosion test for samples without inhibitor
The simulated seawater solution was prepared by dissolving 35g of NaCl and 1000ml of distilled
water. Five set of coupons with different ageing time were suspended into a beaker containing
200ml of the solution with aid of a threads. The coupons were than retrieved from the solution at
two days interval progressively for 10 days. They were scrubbed with brush, washed, dried,
reweighed and recorded. The weight loss and corrosion rates were then determined.
2.8 Corrosion test for samples with inhibitor
The experiment was conducted at room temperature. Five beakers containing sodium chloride
solution with the inhibitor and one without the inhibitor (use as control) were suspended. The
solution was stirred vigorously to have a uniform solution and to dissolve the sodium chloride
completely in the solution. The solution was then shared into five beakers each at 200ml.

Page 301 of 366
Inhibitors were add to four of the beaker at the concentration rate of 0.2v/v, 0.4v/v, 0.6v/v, 0.8v/v
and the one remaining was used as control. In each beaker, four initially weighed samples each of
different ageing time of 2hrs, 3hrs, 4hrs and 5hrs were inserted. The samples of each ageing hours
were removed after 48 hours (two days). The whole experiment took eight days (192 hours) to
complete. At each time the sample was washed with brush and rinsed with water, dried and re
weighted and the weight loss recorded.
2.10 Corrosion Rate Determination
The corrosion rate or the rate of material removal as a consequence of the chemical action is an
important corrosion parameter. This may be expressed as the corrosion penetration rate (CPR), or
the thickness loss of material per unit of time. The corrosion rate was determined in mils per year:
Corrosionrate, MPY =
1
Where,
MPY = Mils per year
D = Density of the materials (g/cm3)
A = Total surface area of the materials (in2)
T = Time of exposure (hours)
The CPR is conveniently expressed in terms of either mils per year
(mpy) or Millimeter per year (mm/yr.). In the first case, k= 534 to give CPR in mpy (where 1 mill =
0.001mm).
2.11 Inhibitor efficiency determination
The efficiency of inhibitor was calculated using the formula below:
Inhibitor Efficiency =
100 2
Where;
Ca = Corrosion rate in the absence of inhibitor, and
Cp = Corrosion rate in the presence of inhibitor.
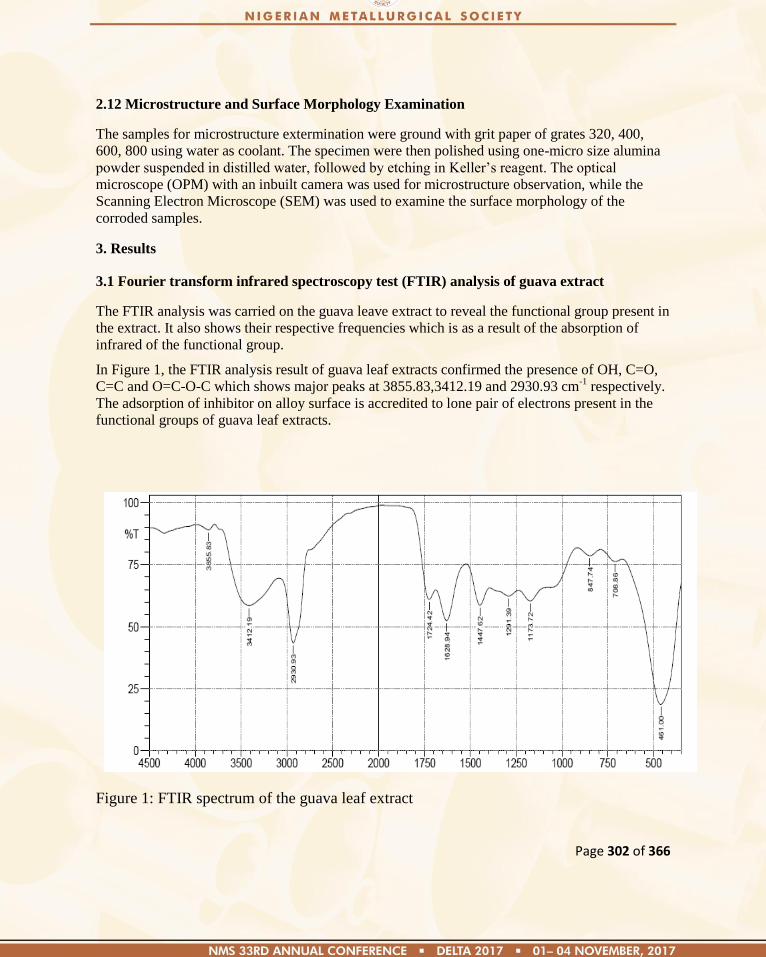
Page 302 of 366
2.12 Microstructure and Surface Morphology Examination
The samples for microstructure extermination were ground with grit paper of grates 320, 400,
600, 800 using water as coolant. The specimen were then polished using one-micro size alumina
powder suspended in distilled water, followed by etching in Keller‘s reagent. The optical
microscope (OPM) with an inbuilt camera was used for microstructure observation, while the
Scanning Electron Microscope (SEM) was used to examine the surface morphology of the
corroded samples.
3. Results
3.1 Fourier transform infrared spectroscopy test (FTIR) analysis of guava extract
The FTIR analysis was carried on the guava leave extract to reveal the functional group present in
the extract. It also shows their respective frequencies which is as a result of the absorption of
infrared of the functional group.
In Figure 1, the FTIR analysis result of guava leaf extracts confirmed the presence of OH, C=O,
C=C and O=C-O-C which shows major peaks at 3855.83,3412.19 and 2930.93 cm-1
respectively.
The adsorption of inhibitor on alloy surface is accredited to lone pair of electrons present in the
functional groups of guava leaf extracts.
Frequency (cm-1)
Figure 1: FTIR spectrum of the guava leaf extract

Page 303 of 366
Table 3: Frequencies and peaks of infrared absorption bands of functional groups in
guava leaf extract
N/S
Frequency
(cm-1
)
Intensity
Assignment
1 3855.83 W OH stretch
2 3412.19 s, broad OH stretch
3 2930.93 s, sharp OH stretch
4 1724.42 S C=O stretch
5 1628.94 vw-m C=C stretch
6 1447.67 M -CH(CH3)2
7 1291.39 M O=C-O-C
stretch
8 1173.72 s-vs O=C-O-C
stretch
9 847.74 S C-H bend
10 708.86 S C-H bend
11 461 S C-I stretch
Intensity abbreviations: vw = very weak, w = weak, m = medium, s = strong, vs = very
strong
3.2 Hardness measurement
The hardness measurement for the Al-Si-Mg alloys after been homogenized for five hours at
180oC and slow cooled to room temperature is shown in Table 4
Table 4: Hardness value of Al-Si-Mg alloy in the as-cast and age hardened
conditions
Ageing time (hour) HRF
As-received 6.2
2 6.8
3 7.0
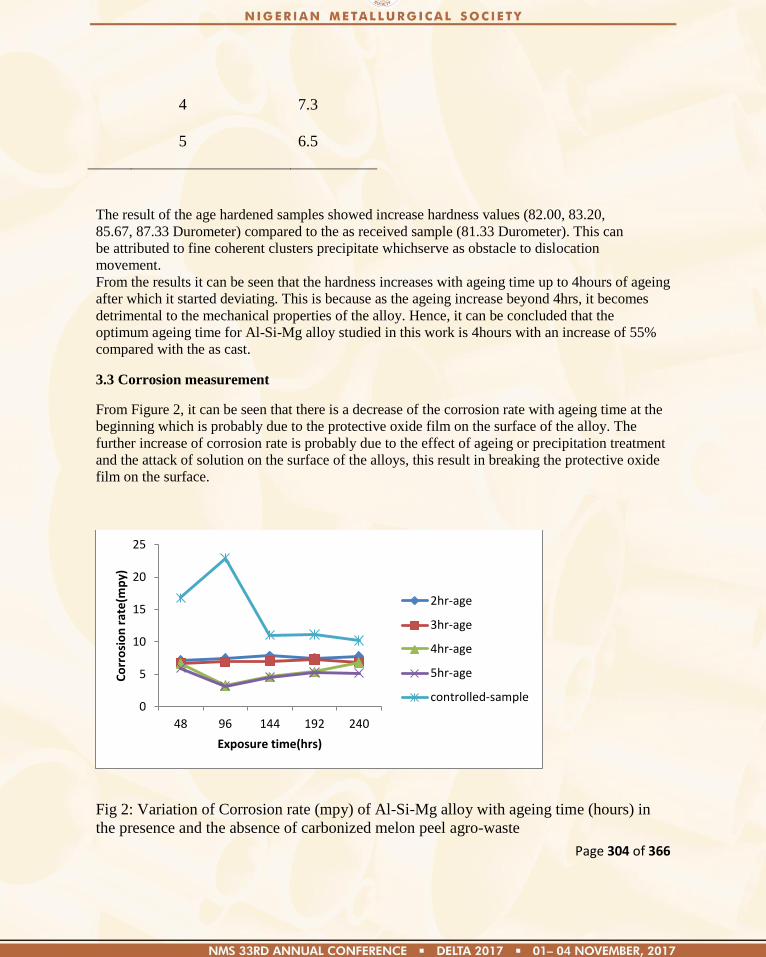
Page 304 of 366
4 7.3
5 6.5
The result of the age hardened samples showed increase hardness values (82.00, 83.20,
85.67, 87.33 Durometer) compared to the as received sample (81.33 Durometer). This can
be attributed to fine coherent clusters precipitate whichserve as obstacle to dislocation
movement.
From the results it can be seen that the hardness increases with ageing time up to 4hours of ageing
after which it started deviating. This is because as the ageing increase beyond 4hrs, it becomes
detrimental to the mechanical properties of the alloy. Hence, it can be concluded that the
optimum ageing time for Al-Si-Mg alloy studied in this work is 4hours with an increase of 55%
compared with the as cast.
3.3 Corrosion measurement
From Figure 2, it can be seen that there is a decrease of the corrosion rate with ageing time at the
beginning which is probably due to the protective oxide film on the surface of the alloy. The
further increase of corrosion rate is probably due to the effect of ageing or precipitation treatment
and the attack of solution on the surface of the alloys, this result in breaking the protective oxide
film on the surface.
Fig 2: Variation of Corrosion rate (mpy) of Al-Si-Mg alloy with ageing time (hours) in
the presence and the absence of carbonized melon peel agro-waste
0
5
10
15
20
25
48 96 144 192 240
Co
rro
sio
n r
ate
(mp
y)
Exposure time(hrs)
2hr-age
3hr-age
4hr-age
5hr-age
controlled-sample
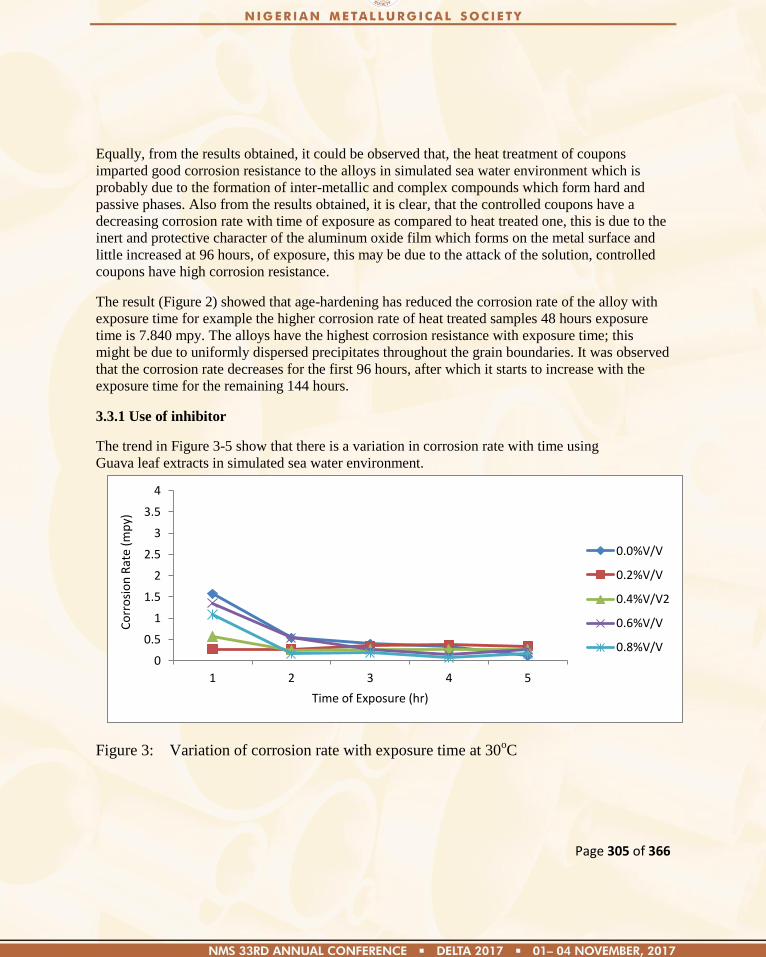
Page 305 of 366
Equally, from the results obtained, it could be observed that, the heat treatment of coupons
imparted good corrosion resistance to the alloys in simulated sea water environment which is
probably due to the formation of inter-metallic and complex compounds which form hard and
passive phases. Also from the results obtained, it is clear, that the controlled coupons have a
decreasing corrosion rate with time of exposure as compared to heat treated one, this is due to the
inert and protective character of the aluminum oxide film which forms on the metal surface and
little increased at 96 hours, of exposure, this may be due to the attack of the solution, controlled
coupons have high corrosion resistance.
The result (Figure 2) showed that age-hardening has reduced the corrosion rate of the alloy with
exposure time for example the higher corrosion rate of heat treated samples 48 hours exposure
time is 7.840 mpy. The alloys have the highest corrosion resistance with exposure time; this
might be due to uniformly dispersed precipitates throughout the grain boundaries. It was observed
that the corrosion rate decreases for the first 96 hours, after which it starts to increase with the
exposure time for the remaining 144 hours.
3.3.1 Use of inhibitor
The trend in Figure 3-5 show that there is a variation in corrosion rate with time using
Guava leaf extracts in simulated sea water environment.
Figure 3: Variation of corrosion rate with exposure time at 30oC
0
0.5
1
1.5
2
2.5
3
3.5
4
1 2 3 4 5
Co
rro
sio
n R
ate
(mp
y)
Time of Exposure (hr)
0.0%V/V
0.2%V/V
0.4%V/V2
0.6%V/V
0.8%V/V
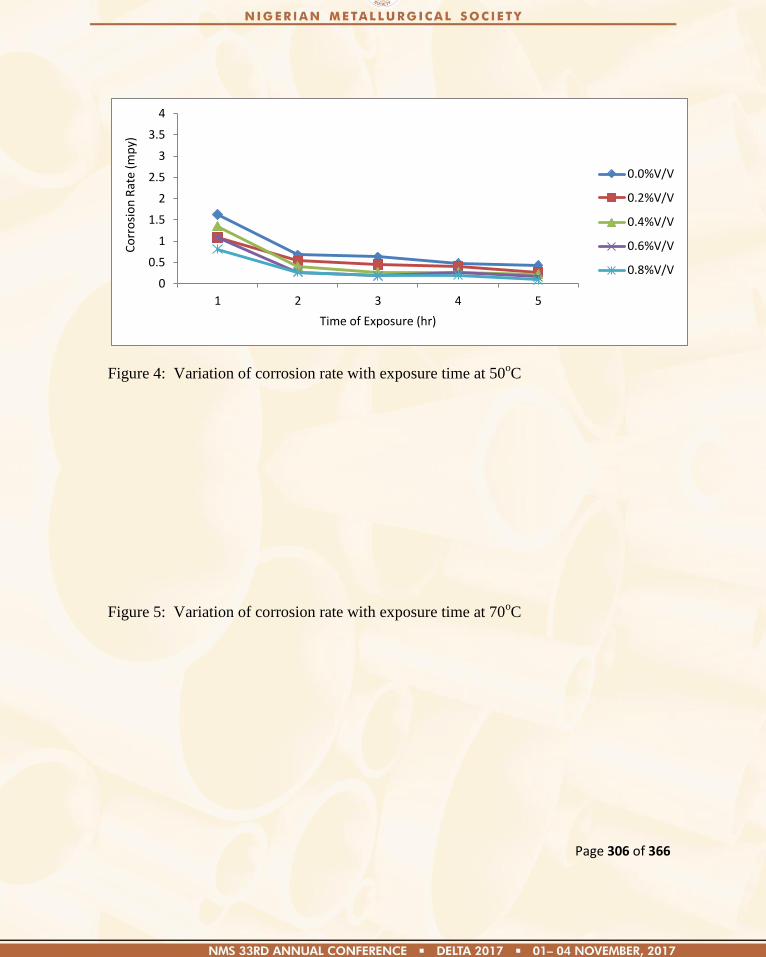
Page 306 of 366
Figure 4: Variation of corrosion rate with exposure time at 50oC
Figure 5: Variation of corrosion rate with exposure time at 70oC
0
0.5
1
1.5
2
2.5
3
3.5
4
1 2 3 4 5
Co
rro
sio
n R
ate
(mp
y)
Time of Exposure (hr)
0.0%V/V
0.2%V/V
0.4%V/V
0.6%V/V
0.8%V/V
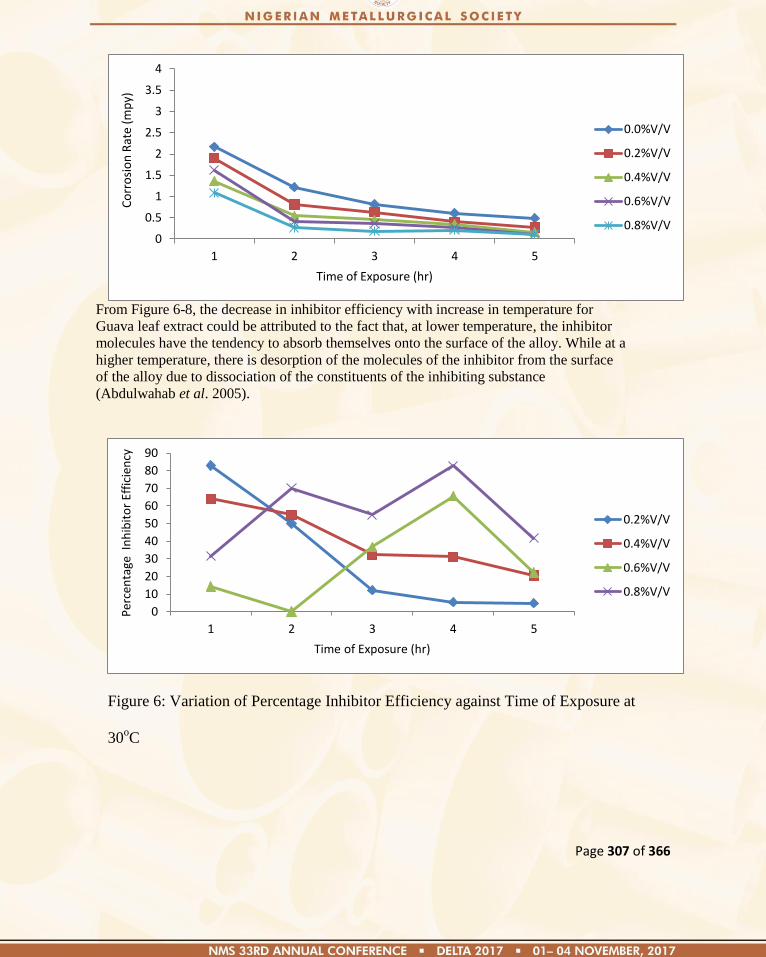
Page 307 of 366
From Figure 6-8, the decrease in inhibitor efficiency with increase in temperature for
Guava leaf extract could be attributed to the fact that, at lower temperature, the inhibitor
molecules have the tendency to absorb themselves onto the surface of the alloy. While at a
higher temperature, there is desorption of the molecules of the inhibitor from the surface
of the alloy due to dissociation of the constituents of the inhibiting substance
(Abdulwahab et al. 2005).
Figure 6: Variation of Percentage Inhibitor Efficiency against Time of Exposure at
30oC
0
10
20
30
40
50
60
70
80
90
1 2 3 4 5
Per
cen
tage
In
hib
ito
r Ef
fici
ency
Time of Exposure (hr)
0.2%V/V
0.4%V/V
0.6%V/V
0.8%V/V
0
0.5
1
1.5
2
2.5
3
3.5
4
1 2 3 4 5
Co
rro
sio
n R
ate
(mp
y)
Time of Exposure (hr)
0.0%V/V
0.2%V/V
0.4%V/V
0.6%V/V
0.8%V/V
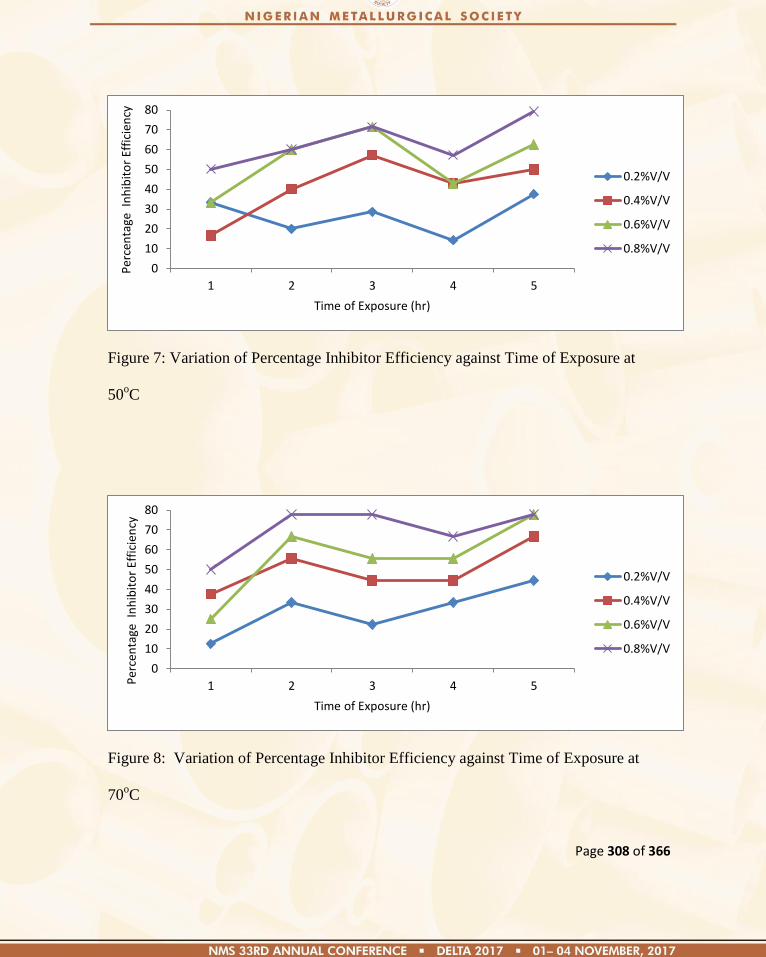
Page 308 of 366
Figure 7: Variation of Percentage Inhibitor Efficiency against Time of Exposure at
50oC
Figure 8: Variation of Percentage Inhibitor Efficiency against Time of Exposure at
70oC
0
10
20
30
40
50
60
70
80
1 2 3 4 5
Per
cen
tage
In
hib
ito
r Ef
fici
ency
Time of Exposure (hr)
0.2%V/V
0.4%V/V
0.6%V/V
0.8%V/V
0
10
20
30
40
50
60
70
80
1 2 3 4 5Per
cen
tage
In
hib
ito
r Ef
fici
ency
Time of Exposure (hr)
0.2%V/V
0.4%V/V
0.6%V/V
0.8%V/V
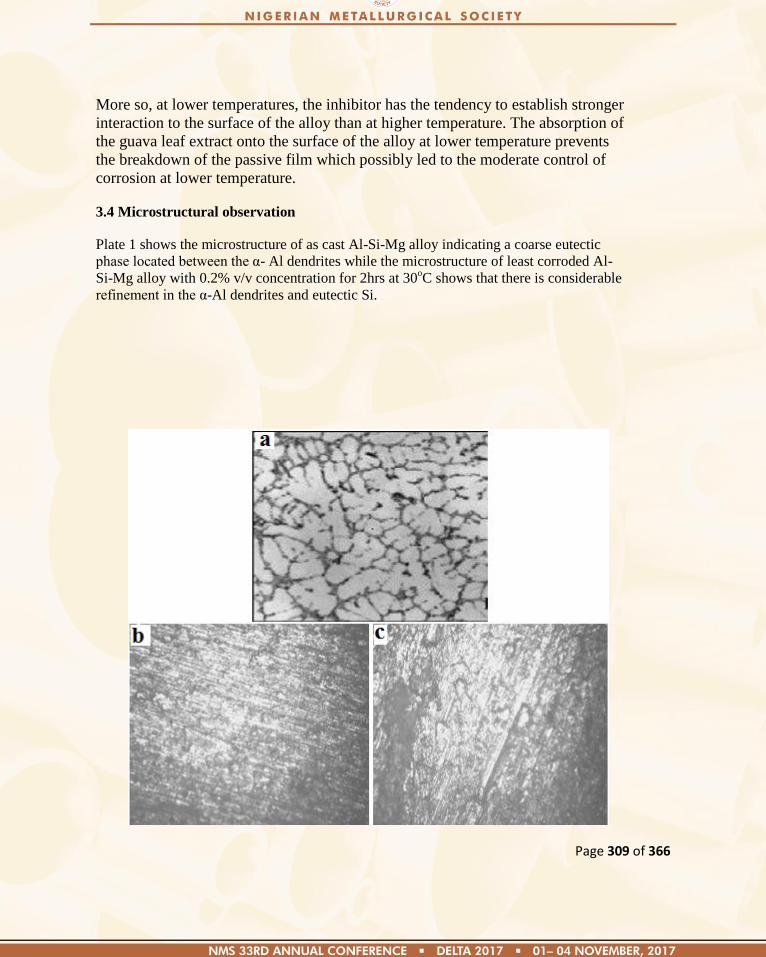
Page 309 of 366
More so, at lower temperatures, the inhibitor has the tendency to establish stronger
interaction to the surface of the alloy than at higher temperature. The absorption of
the guava leaf extract onto the surface of the alloy at lower temperature prevents
the breakdown of the passive film which possibly led to the moderate control of
corrosion at lower temperature.
3.4 Microstructural observation
Plate 1 shows the microstructure of as cast Al-Si-Mg alloy indicating a coarse eutectic
phase located between the α- Al dendrites while the microstructure of least corroded Al-
Si-Mg alloy with 0.2% v/v concentration for 2hrs at 30oC shows that there is considerable
refinement in the α-Al dendrites and eutectic Si.

Page 310 of 366
Plate 1: Microstructures of as-cast (a), least corroded (b) and most corroded
(c) Al-Si-Mg alloy (x100)
The microstructure of most corroded Al-Si-Mg alloy with 0.8% v/v concentration for 5hrs
at 70oC shows a corrosion attack from the transverse edges that run along grain boundaries
parallel to the alloy surface.
Plate 2: SEM microstructure showing the surface morphology of Al-Si-Mg Alloy at 4 hr
ageing times (x2500)
Plate 2 shows the surface morphology of Al-Si-Mg Alloy in 4 hours of ageing time indicating that
the grains of the sample consists of very fine grains which implies an increase in hardness value.
4. Conclusions
From the results of this study, it can be concluded that:
Page 311 of 366
1. The alloys corrode in simulated sea water and thermal ageing has an effect on the
corrosion resistance of the Al-Si-Mg alloy as shown by the effect of carbonized melon
peels agro waste which decreased the corrosion rate of the alloy.
2. The optimum concentration of Guava leaf extract that can be used as corrosion inhibitor
for Al-Si-Mg alloy in stimulated sea water environment is 0.6% v/v at 30oC.
3. The highest percentage inhibitor efficiency for Al-Si-Mg alloy in simulated sea water
environment is 82.78%, 79.20% and 77.78% at 30oC, 50
oC and 70
oC of temperatures
respectively.
4. The inhibitor efficiency of Guava leaf extract for Al-Si-Mg alloy in stimulated sea water
environment decreases at higher temperatures.
5. The result obtained show that the inhibition could be attributed to absorption of the
Guava leaf extract onto the surface of the alloy at lower temperature which prevents the
breakdown of the passive film, hence higher corrosion resistance of the Al-Si-Mgalloy.
6. The microstructure revealed that the inhibited Al-Si-Mg alloy has more corrosion attack
as the temperature increases.
Reference
1. Fontana and Greene (1987): Corrosion Engineering, Third Edition, M c Graw-Hill
Book Company. Printed and Bound by B and Jo Enterprise, Pte Ltd, Singapore. Pp.
536-556
2. Abdulwahab, M, Madugu, I.A, Yaro, S.A, Popoola A.P.I (2011): Degradation
Behavior of High Chromium Sodium-Modified A356.0-Type Al-Si-Mg Alloy in
Simulated Seawater Environment, Journal of Minerals & Materials Characterization&
Engineering, Vol. 10, No.6, Pp.535-551.
3. Madugu, I.A and Abdulwahab, M (2007): The Mechanical Properties of As-cast Al-
Si-Fe-Mn alloy, Nigeria Journal of Research and Production, 10(2): Pp. 72-80.
4. Oguzie, E.E. (2007): Corrosion Inhibition Of Aluminium in Acidic and Alkaline
Media By Sansevieria Trifasciata Extract, Corrosion Science, Vol. 49, No. 3, Pp.
1527–1539.
5. Adindu C. B. and Oguzie E.E. (2017): Investigating the extract constituents and
corrosion inhibiting ability of Sida acuta leaves. World Newa of Natural Science 13:
63-68.
6. Obot, I.B and Obi-Egbedi. N.O, (2010): An Interesting and Efficient Green Corrosion
Inhibitor for Aluminium from Extracts of Chlomolaena Odorata L. In Acidic
Solution, Journal of Applied Electrochemistry, Vol. 40, No. 11, Pp. 1977–1983.
7. Abdulwahab, M., Kasim, A., Bello, K. A., Gaminana, J. O. (2012): Corrosion
Inhibition of Multi-component Aluminium Alloy in Hydrochloric Acid Solution by
Aqueous Extracts of Bitter leaf (Verninia amygdalina) powder. Advanced Materials
Research: Advances in Materials and System Technologies III, 367: 319-325.
Page 312 of 366
Paper: NMS 2017-TP036
University-Industry Paternership for Technological Advancement and Economic
Development: Nigeria Metals Industry as Paradigm
*1Engr. Prof John Ade Ajayi,
2M. A. Adegbite and
3F. Joseph
1Department of Metallurgical and Materials Engineering,
Federal University of Technology, Akure Akure, Nigeria. 2Petroleum Training Institute, Effurun, Delta State, Nigeria
3Department of Mechanical Engineering, Covenent University, Ota, Ogun State
*E-mail: [email protected] GSM: +234 803 409 9639
ABSTRACT
The world has become a global village. Nigeria is one of the countries that adopted the
seventeen (17) United Nations Sustainable Development Goals (UNSDGs). UNSD goals
Nos 4, 8 and 9 on quality education; decent work and economic growth; industry,
innovation and infrastructure respectively are pertinent to the Economic Recovery and
Growth Agenda (ERGA) of the Nigerian Government. ERGA notwithstanding, there is
like a recurring decimal, an unanswered national question: What is the cause of
continuous underdevelopment in Nigeria and what is the way out? This is the thrust for
this paper which discusses the underperforming of the Nigerian university system vis a
vis the features of entrepreneurial 21st Century University; and the imperative of
university-industry partnership with particular reference to the Nigerian Metallurgical
Industry. This is followed by x-raying Bayh-Dole Act of 1980 which illustrates how
university research enhances infrastructural and industrial development of the United
States of America. It is recommended that the Nigerian Metallurgical Society (NMS) in
collaboration with the Nigerian Society of Engineers (NSE) and the Council for the
Regulation of Engineers (COREN) come up with a bill for university-industry
collaboration for mutual technological advancement and economic development.
Keywords: university, industry, technology, economic, partnership.
1.0 INTRODUCTION
We know from history that civilization which lasted for any length of time were those
that were able to successfully crush oppositions whenever they arouse. Many oppositions
came in different forms and it takes different times but it must come. The West has this
Page 313 of 366
understanding and, in fact, projected ahead for solutions for a few of the possibilities.
Some people just have to be in the business of thinking for the government. Plato, the
great Greek philosopher, mentioned this as an important structure of the society. Western
civilization takes this idea seriously, so they value their academics. They commissioned
them to engage in research, provide support and expect recommendations on issues such
as the best ways to continue to promote Western values, lead the rest of the world, and
envisage possible threats and how to combat them. This has been the pattern for decades.
In the 10th Century, knowledge was created for knowledge sake. The emphasis was on
philosophy- a way of thinking critically and comprehensively. Thereafter came medicine
and law. Then came industrial revolution and technology. The great institutions in the
world now train students who are immediately employable and can create wealth. Their
emphasis is on science, technology and entrepreneurship.
The world has become a global village. On September 25, 2015 countries of the world
adopted a set of seventeen (17) goals to end poverty, protect the planet and ensure
prosperity for all over the next fifteen (15) years (that is, 2030) as part of a new
sustainable development agenda. These goals, called United Nations Sustainable
Development Goals (UNSDGs) build on the successes of the United Nations Millennium
Development Goals (UNMDGs). They include new area such as economic inequality,
innovation, sustainable consumption, peace and justice. UNSD goals Nos 4, 8, 9, 12 and
17 which are quality education; development and economic growth; industry, innovation
and infrastructure; responsible consumption and production; and partnership respectively
are pertinent to the Economic Recovery and Growth Agenda (ERGA) of the Federal
Government of Nigeria.
The theme for the 33rd
Conference and Annual General Meeting of this Nigerian
Metallurgical Society is apt: ―Metal Production: A panacea for national economic
recovery.‖ The title of this paper, ―University–industry partnership for technological
advancement and economic development: Nigerian Metals Industry as a Paradigm,‖ is in
tandem with the sub-theme of the paper titled: ‖Research and development for
sustainability.‖ It is a well-known fact that economic development and technological
advancement are two sides of the same coin. The latter is usually a product of
collaboration between industry and the university with the government being the prime
mover.
This paper covers the following grounds. The features of an entrepreneurial 21st Century
university, university-industry partnership, Nigerian Metals Industry–University
partnership and lessons from Bayle-Dole Act of the United State of America.
2.0 FEATURES OF THE 21ST
CENTURY ENTREPRENEURIAL UNIVERSITY
―The business of life is to move forward.‖- Samuel Johnson
The right mind-set and altitudinal virtues required for development of any nation remains
the responsibility of the educational system particularly the university. The university of
the 21st Century has graduated from an ivory tower to an entrepreneurial institution

Page 314 of 366
Which links academia with industry. No nation attains an enviable developmental height
without mobilizing science, technology and innovation (STI). The question is – how are
these terms: science, technology and innovation related? To be a fruitful researcher,
elements of creativity is involved. Science deals with human understanding of the real
world about them, the inherent properties of space, matter, energy and the interaction
with one another. Invention is usually a product of research. To protect invention which
is an intellectual property, we resort to patenting. An invention can engender technology
and technology can engender innovation. Innovation can engender entrepreneurship.
Thus, the seven-related features of an entrepreneurial university of the 21st Century are:
creativity, research, invention, patent, technology, innovation and entrepreneurship.
Many of us are familiar with these seven (7) terms. But how many of know/understand
their interrelationship? ―Curiosity is the mother of all learning.‘- Plato. Man is a curious
and creative being. Out of curiosity, he creates new ideas, concepts, and new things
through research. Research is the basis for knowledge and it is the touch that illuminates
the world. No nation, however poor, that will progress and develop can afford not to
effectively support research. Invention is the discovery of new processes, ideas or tools.
Invention is proprietary, meaning that only a new or previously unknown discovery can
be called invention. Patenting an invention requires priority, meaning that no one else
must have come up with same (or similar) idea at any previous time. Patenting involves
an exhaustive scrutiny of an idea novel qualities and an evaluation of its potential uses by
experienced specialists from various fields.
Technology is the product of well-articulated research. It is the application of scientific
knowledge and skills to the setting up, creating, improving and expanding the
productivity facility. It is the practical knowledge which is necessary to manufacture
products. It is a body of processes or methods which are used to produce goods.
Technology pertains to people, process and product. Technology consists of four
components: hardware, know-how, organization and the end product. Hardware: For
instance, a specific configuration of machine and equipment to manufacture a product or
provide a service. Know-how: Scientific and technical know-how, qualification and
empirical knowledge Organization: the arrangement which combines hardware, know-
how and operational management methods. The end product: that is the item or service.
Technology divides the nations of the world into two: developed and
underdeveloped/developing. Technology affects the value of Gross Domestic Product
(GDP), Gross National Product (GNP) and standard of living of nations of the world.
Innovation is generation of new knowledge which has economic and social benefits.
Innovations and inventions are interwoven. Innovations have often served as a point of
departure for new inventions as it usually deals with known parameters, qualities and
quantities. Innovations would therefore not occur without some previous inventive
discovery, even though they can come full circle to inspire new invention. The idea of
innovation is a broad one. This paper accentuates on technological innovation which
originates from a basic idea or the recognition of a social need. It is concretized as a
prototype and polished through research and development before it is manufactured.
Page 315 of 366
Entrepreneurship can be described as combination of resources (human, natural and
financial) to start an enterprise. The entrepreneur has been described as one who starts an
enterprise, the one who forms new industry. It is one who shoulders the risk and
uncertainty of using economic resources in a new way, and the one who with right
motivation, energy and ability to build something by his or her own efforts. Management
ability is an essential ingredient for an entrepreneur. We shall concern ourselves with
technological entrepreneurship which is a way of life that springs from fundamental
education and research programmes. Technological entrepreneurship is a combiner of
resources. Ways by which technological entrepreneurship can be enhanced in developing
nations like Nigeria include the following: First, expand the necessary institutes and
universities, fund research activity in technological entrepreneurship and the management
of innovation. Second, teach the fundamental of entrepreneurship and intrapreneurship to
students across all majors, establish a general curriculum requirement in this area. Third,
expand opportunities for students to create innovation by increasing the number of hands-
on courses such as introduction to engineering design, invention studio and
multidisciplinary design laboratory; programmes such as product design and innovation
such as car product. Fourth, provide opportunities for students in settings whose
technology is being commercialized such as an entrepreneurial faculty project and
internship.
The basic function of the university are three-fold: to generate knowledge (by way of
research); to disseminate knowledge (by way of teaching); and to apply knowledge (by
way of community service/public service). The 21st Century University should have the
fourth functional dimension-entrepreneurship which is anchored by STEM. By STEM,
we refer to the whole gamut of disciplines covering science, technology, engineering and
mathematics. These skills include numeracy and ability to understand and analyze
empirical data including critical analysis; and mathematical principles; ability to apply a
systematic and critical assessment of complex problems with an emphasis of solving
them and applying the theoretical knowledge of the subject to practical problems. STEM
also entails ability to communicate scientific issues to stakeholders and others; ingenuity,
logical reasoning and practical intelligence. As generally understood, the core STEM
disciplines include mathematics, computer science, architecture, electrical, electronics,
communication and chemical engineering. Across the world, China leads the pack in
terms of the number of STEM graduates produced annually, with 4.7 million; India, 2.6
million, USA, 568,000; Russian, 561,000; Iran, 335,000; Indonesia, 206,000 and Japan,
195,000. By contrast, out of 1.8million graduates that enter the job market annually in
Nigeria, only 20% (360,000) are from STEM disciplines. This perhaps explain why we
have a backlog of 53 million unemployed, some will say unemployable graduates. Thus,
Entrepreneurial University is the University of the 21st Century.
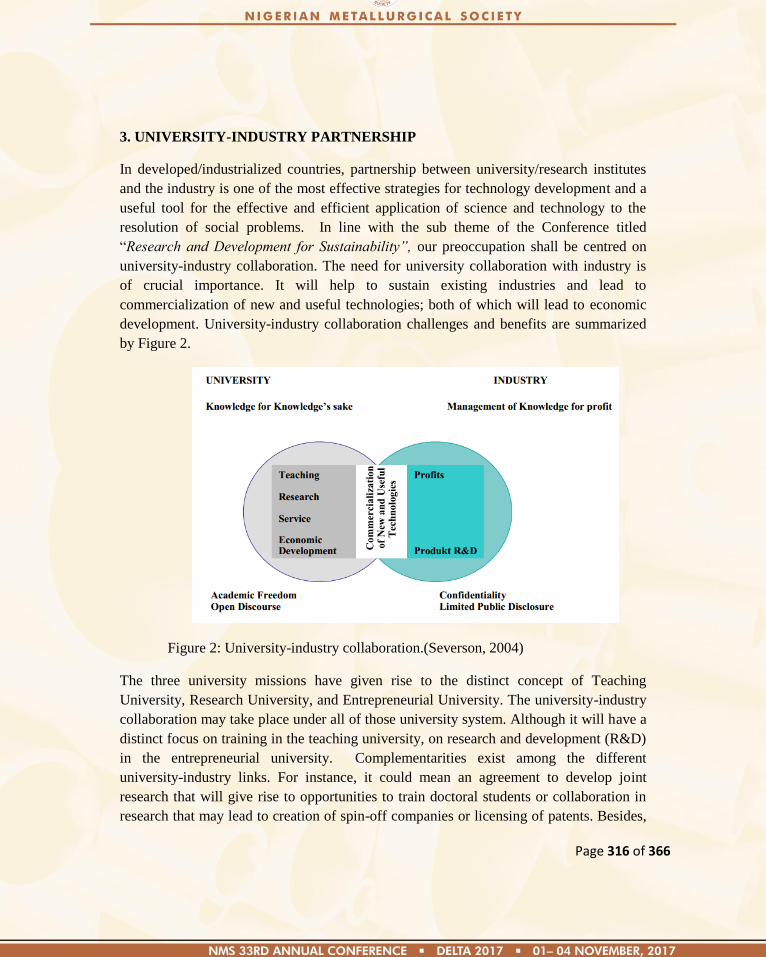
Page 316 of 366
3. UNIVERSITY-INDUSTRY PARTNERSHIP
In developed/industrialized countries, partnership between university/research institutes
and the industry is one of the most effective strategies for technology development and a
useful tool for the effective and efficient application of science and technology to the
resolution of social problems. In line with the sub theme of the Conference titled
―Research and Development for Sustainability”, our preoccupation shall be centred on
university-industry collaboration. The need for university collaboration with industry is
of crucial importance. It will help to sustain existing industries and lead to
commercialization of new and useful technologies; both of which will lead to economic
development. University-industry collaboration challenges and benefits are summarized
by Figure 2.
Figure 2: University-industry collaboration.(Severson, 2004)
The three university missions have given rise to the distinct concept of Teaching
University, Research University, and Entrepreneurial University. The university-industry
collaboration may take place under all of those university system. Although it will have a
distinct focus on training in the teaching university, on research and development (R&D)
in the entrepreneurial university. Complementarities exist among the different
university-industry links. For instance, it could mean an agreement to develop joint
research that will give rise to opportunities to train doctoral students or collaboration in
research that may lead to creation of spin-off companies or licensing of patents. Besides,

Page 317 of 366
a university can act as an important economic development which can be christened
developmental universities- which collaborate with external agents including firms, not
necessarily with a focus on commercialization and profit making but rather with the
broader purpose of contributing to social and economic development.
Collaboration between industries and universities is of crucial importance for skills
development (education and training); the generation, acquisition, and adoption of
knowledge (innovation and technology transfer); and the promotion of entrepreneurship
(start-ups and spin-offs). The benefits of university-industry linkages are wide-reading;
they can coordinate research and development (R&D) investment, and exploit synergies
and complementarities of scientific and technological capabilities. They can expand the
relevance of research carried out in public institutions for the commercialization of public
research and development (R&D) outcomes and increase the mobility of labour between
public and private sectors.
UNESCO in February 1994 launched university-industry-science partnership
(UNISPAR) in Africa. The main objective of the programme is to facilitate indigenous
technology development through transfer of research results from university to industry.
Policy makes across countries now seek to stimulate universities to become more
entrepreneurial, engaging more actively with productive sector in order generate
employment and grow the economy. As universities become more involved in promoting
economic development, there is a push from various government for more relevant
research and training by encouraging stronger and sustainable linkages between
universities and the industry.
The Federal Universities of Technology Act CAP. F23LFN 2004 is an example of such
envisioned university-industry linkage. In the Act, the Universities of Technologies are
mandated to identify technological problems and needs of Nigeria and find solutions to
them within the context of overall national development. This can only be achieved
through effective partnership between industries and the universities. Unfortunately, the
focus of the universities for now is mainly the training of workforce with less emphasis
on directly impacting on national economic development.
4. NIGERIAN METALS INDUSTRY AND THE UNIVERSITY
At the onset of independence, industries were streaming into Nigeria. Academia were
consulted for industrial research and policy formulation. Then came the incursion of the
military in government and the discovery of oil. The untold consequences of these led to

Page 318 of 366
participation of the citizenry in industrialization, mining and agricultural activities.
Napoleon Bonaparte once saw the large expanse of China and exclaimed thus:
“Here lies a sleeping giant
Let him alone,
For if he wakes up,
He will shake the world.”
While China has since woken up from its technological slumber, Nigeria has been
regrettably labelled the sleeping giant of Africa. As the most populous black nation on
earth is a sleeping giant, so is her metallurgical industry which is the basis of national
industrialization. It is usually convenient to group engineering materials into four: metals,
ceramics, polymers and composites. Thus at a glance, we can see that metals are subset of
engineering materials. However, special attention is paid to metals by nations that desire
to develop because they are indispensable in all areas of technological advancement and
industrial development. A perusal at the Periodic Table shows that about 2/3 of the 110
elements in the Table are metals- ferrous and non-ferrous. The well-being and standard of
living of any nation can be accurately gauged with respect to its level of production
and/or consumption of metals especially iron and steel. Thus, various stages of human
civilization: Stone Age, Bronze Age, Iron Age, Nuclear Age are characteristically named
after minerals/metals and metal products. Even the ICT Age we are in now are made
possible by metal and metal products
4.1 The Comatose Nigerian Metallurgical Industry
The Nigerian metal subsector of the economy is in comatose status and this has
contributed to the distressed national economy. The nation has been unable to produce
liquid steel in spite of the abundance of mineral resources within her boarder. The
Ajaokuta Steel Complex and the Aladja Steel Company together with the three inland
rolling mills at Jos, Kastina and Osogbo are still effigies of their old selves. Inadequate
attention is also paid to the non-ferrous subsector of the metal industry. The aluminium
smelting company at Ikot Abasi is yet to produce commercial aluminium products which
are crucial importance to the Nigerian economy. What prevent us from producing lead
and zinc from the galena/sphalerite deposits in Nigeria? Why can we not have copper
production plant from malachite and azurite deposits in Nigeria? Why are the major
recycling of metals plants in Nigeria in the hand of the foreigners? Of what industrial
and economic importance are the research we carried out on welding, foundry, corrosion,
composites and industrial finishing to mention a few? The need for technological
innovation in the Nigerian Metals Industry is rather glaring but where will the
technological innovation come from?
Page 319 of 366
4.2 Nigerian Metal Industry-University Collaboration
The universities in the advanced nations now focus on Science, Technology, Engineering
and Mathematics (STEM) which synergies with global trend in Science, Technology and
Innovation. That is why the great institution of the world now go beyond tripartite
functions of the university: teaching, research and public service. The have transformed
into entrepreneurial and developmental universities which produce graduates who are
immediately employable, can create wealth; and solve societal problems.
Unfortunately, this is not the case in Nigeria as many Nigerian universities including
universities of technology are under-performing which stems from under planning, under
funding, under staffing, under-equipping and under spacing. Contemporary Nigerian
universities are under performing in need- driven, innovative and technology research
that can positively impact the economy. The intellectual amnesia of the Nigerian
universities is reflected by its low ranking among global universities.
It is worrisome that the standard of Metallurgical and Materials Engineering in Nigerian
universities is abysmally low. This has direct effect on the Nigerian Metals Industry.
There must be sincere and deliberate effort to invigorate the engineering faculties/schools
of the Nigerian universities with special attention given to the Confluence of all
engineering disciplines -Metallurgical and Materials Engineering.
4.3: The Government as the Catalyst of University – Metallurgical Industry
Collaboration
There is the need for intellectual revolution engendered by re-invigorating the academia
in Nigeria.
(i) What type of government can bring about the positive change?
Government renowned for transformational leadership rather than
transactional leadership.
(ii) What change will the government bring about in the university? Transition
from intellectual amnesia to intellectual soundness. “On earth, the
greatest thing is man, in man, the greatest thing is the mind.” Sir William
Hamilton
(iii) What changes will take place when the government facilitates university-
metallurgical industry collaboration from industrial comatose to industrial
revolution? When sound academics are involved in policy formulation,
implementation and appraisal; human capacity building; research and
development both for Government and the metals industry, great things
Page 320 of 366
will follow including technological advancement, industrial revolution and
economic development.
4.4 USA Bayh-Dole Act of 1980
4.4.1 Prior to the Enactment of Bayh-Dole Act.
(i) The United States of America experienced double digit inflation and double
digit unemployment.
(ii) Expert predicted that US would lose its leadership in technology to Japan and
Germany
(iii)USA universities performed research and development (R&D) but few
inventions were commercialized.
(iv) The America tax payers were not getting the full benefit from billion dollars
invested in cutting-edge research.
4.4.2 The Kernels of Bayh-Dole Act
In 1980, Bayh-Dole Act was enacted by the USA congress. The Act illustrates how
university research enhances infrastructural and industrial development of the United
States of America. Under the Act, the universities and some companies are allowed to
own invention they make with Federal funding. The universities are highly encouraged to
partner with industries to translate research results into products that will benefit the
public. Resulting university license and the concomitant profits are invested in more
research, rewarding university scientist and researchers and supplying the cycle of
invention.
4.4.3 Since the Enactment of Bayh-Dole Act of 1980 in the USA
(i) American universities have spun off more than 4,000 companies
(ii) New companies mean more tax for government from which more funds are
transferred to the universities
(iii)From 2012 alone, 591 new products originating from the university research
were introduced to the market
(iv) In 2012 alone, USD 36.8 billion of net profit sale were generated and start-up
companies start by 70 academic institutions employed 15,741 full time
employees.
The Bayh-Dole Act is good for the American national economy and also good for state
and local economies. The majority of start-up companies born from university
technologies are located around the university.
Page 321 of 366
4.4.4 Lessons from USA Bayh-Dole Act of 1980
There are many mutual benefits of university-industry partnership and they include the
following:
(i) University-industry collaboration engenders sustenance of the existing
industries and commercialization of new and useful technologies. These can lead
to a lot of socioeconomic benefits
(ii) There is potential financial rewards of patents and licenses that will result
from the commercialization of academic research
(iii)The collaboration can stipulate companies‘ internal research and development
programmes.
A similar bill to Bayh-Dole Act of 1980 for university-industry partnership should be
sponsored by the Nigerian Metallurgical Society (NMS) in collaboration with the
Nigerian Society of Engineers (NSE) and the Council for the Regulation of Engineers
(COREN) for Nigerian technological advancement and economic development. After all,
we have been asked to think globally and act locally. The question is, what is the position
of things with the Nigerian Metallurgical Bill and what about its Regulation?
5. CONCLUSION
The world has become a global village and nations of the world, Nigeria inclusive now
have common agenda in form of seventeen (17) United Nations Sustainable Development
Goals (UNSDGs). Goals 4, 8 and 9 in particular are in consonance with the Economic
Recovery and Growth Agenda (ERGA) of the present Administration. The question is,
why is Nigeria continuously experiencing underdevelopment and what is the way
forward? This is the preoccupation of this paper which centres on: Features of
Entrepreneurial 21st Century University, university-industry partnership and Nigerian
Metals Industry-university collaboration.
The fact that Nigerian university system is underperforming and the need for it to be
transformed from intellectual amnesia to intellectual soundness has been discussed.
When the university system becomes entrepreneurial, it should then be involved in policy
formulation, implementation and appraisal; human capacity building and high level
manpower development; and research development.
It has been also been discussed that the present national industrial comatose status can
lead to industrial revolution if there is university-industry partnership with particular
Page 322 of 366
reference to the Nigerian Metallurgical Industry. We have observed that the university-
industry collaboration would lead to the sustenance of existing industries on one hand
and the commercialization of new and useful technologies on the other hand.
The Government effort in establishing TETfund is commendable. A further step should
be taken by the Nigerian Metallurgical Society (NMS) in collaboration with Nigerian
Society of Engineers (NSE) and the Council for the Regulation of Engineers (COREN) to
contextually sponsor a bill similar to the USA Bayh-Dole Act of 1980 which illustrates
how university research enhances infrastructural and industrial development of the
United State of America. After all, we have been asked to think globally and act locally!
REFERENCES
Ajayi, John Ade: ―Knowing the Truth that Sets Free.‖ Favourank Multipurpose
Enterprise, Ibadan, Nigeria: 2007
Akeredolu-Ale, E.O.:―The Underdevelopment of Indigenous Entrepreneurs in Nigeria.‖
University Press, Ibadan, Nigeria: 1995
Anon: GOA Report ―Technology Transfer Administration of the Bayh-Dole Act by
Research Universities.‖ May 7, 1998; www.autm.net
Anon: ―Osinbajo Inaugurates Presidential Council on SDGs.‖ Punch, Saturday
September 11, 2017
Brundenius, C., Lunvall, B.A., Sutz, J. (2009): ―The Role of Universities in Innovation
Systems of Developing Countries: Developmental University Systems - Empirical,
Analytical and Nominative Perspectives,‖ in Handbook of innovative Systems and
Developing Countries edited by B.A. Lunvall, K.J Joseph, C. Chaminade and J. Vang,
pp.11-25. Cheltenaham, UK: Edward Edgas.
Mailafia, O.: ―Science, Engineering and Mathematics, No Arabic, Please!, Vanguard July
18, 2017
Nyeyere, J (2013): ―Higher Education Research Science and Technology Transfer: A
Look at the Policy Strides Made in East Africa, SA – eDUC Journal, vol. 10, No. 1

Page 323 of 366
Severson James A. “Models of University-Industry Cooperation.” University of
Washington, December 13, 2004:
https://sangakukan.jp/journal/journal_contents/2005/02/articles/002-06shiryo_e.pdf
Page 324 of 366
Paper: NMS 2017-TP037
Modeling of Residual Stresses in Single -V Butt Weldment of Low Carbon Steels
Using Ansys Multiphysics
1Madaki K. M.,
2Dauda E. T. and
2Kassim A.
1National Agency for Science and Engineering Infrastructure Idu Industrial Area Abuja
2Department of metallurgical and Materials Engineering, Ahmadu Bello University, Zaria
Abstract
Residual stress distributions in the longitudinal and transverse directions on a 10mm thick
arc welded mild steel plate was determined by using both experimental and numerical
methods. Stress measurements were carried out using X-ray diffractometer and finite
element method. Welding simulation procedure is developed using the FE-software
ANSYS in order to predict residual stresses. ANSYS 12.0 software was used to model
the geometry and simulation carried out to verify the results of the XRD. The results
obtained showed that as the welding distance increased, the temperature difference
between the experimental and finite element analysis (FEA) increased. It was also
observed that sample type and welding direction played a vital role in this research. As
the welding speed increased, the induced residual stress decreased because less heat was
absorbed by the base material and decreased residence time of the arc. Higher Von Mises
stress was also observed in the fusion zone and heat affected zone region which
experienced plastic deformation. The FEM residual stress predictions shows good
agreement with the residual stress obtained from XRD analysis.
Keywords: Residual stress, welding, finite element method, temperature.
Page 325 of 366
1.0 Introduction
Welding has been one of the most effective methods for joining metals. Its applications in
ship and bridge buildings, constructions, aerospace, nuclear, oil and gas platform, pipes
and vessels, steel structures and the likes cannot be overemphasized. Welding can be
performed in different environments such as air, underwater and space. It is widely used
by metalworkers in the fabrication, maintenance, and repair of parts and structures. There
are numerous advantages of the welding process as compared to other joining techniques;
these include excellent mechanical properties of the welded joints, air and water tightness
and good joining efficiency. Some of the problems that accompany welding include
distortion, slag inclusions, undercuts, residual stresses, lack of penetration and
misalignment in welded structures, which reduce the fatigue life of the structures.
Residual stresses generated during welding may hamper the functional efficiency of a
component, leading to failure of engineering structures. It may also lead to brittle fracture
of the welded structure causing enormous damage to resources and loss of human life
(Rozza, 2012; Alam, 2005; Parmar, 1999).
Residual stress is defined as ―the stress resident inside a component or structure after all
applied forces have been removed‖. Compressive residual stress acts by pushing the
material together, while tensile residual stress pulls the material apart. Mathematically,
compressive stress is negative and tensile stress is positive. Stresses can also be
characterized as normal stresses that act perpendicular to the face of a material and shear
stresses that act parallel to the face of a material (Belassel, 2012).
Residual stresses are the major constituents of a stress field around a crack which may
lead to cracking. For example, tensile residual stresses reduce fatigue strength and
corrosion resistance while compressive residual stresses diminish the stability limit.
Furthermore, while tensile residual stresses may initiate the failure due to fracture, the
compressive residual stresses near a weld can reduce the capacity of the structural
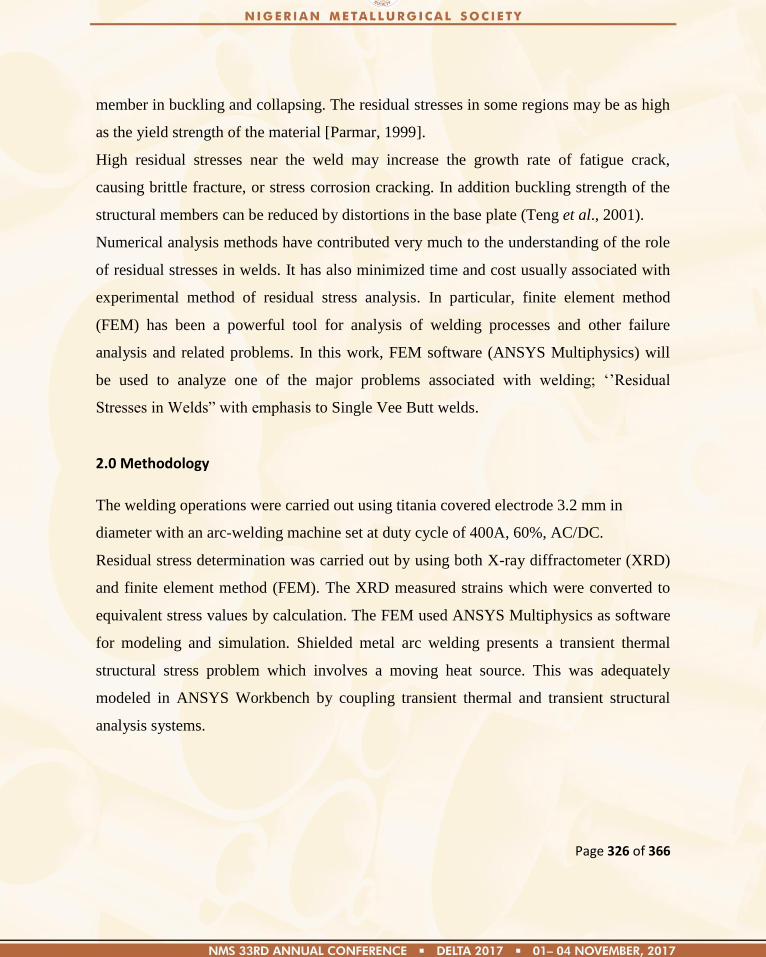
Page 326 of 366
member in buckling and collapsing. The residual stresses in some regions may be as high
as the yield strength of the material [Parmar, 1999].
High residual stresses near the weld may increase the growth rate of fatigue crack,
causing brittle fracture, or stress corrosion cracking. In addition buckling strength of the
structural members can be reduced by distortions in the base plate (Teng et al., 2001).
Numerical analysis methods have contributed very much to the understanding of the role
of residual stresses in welds. It has also minimized time and cost usually associated with
experimental method of residual stress analysis. In particular, finite element method
(FEM) has been a powerful tool for analysis of welding processes and other failure
analysis and related problems. In this work, FEM software (ANSYS Multiphysics) will
be used to analyze one of the major problems associated with welding; ‗‘Residual
Stresses in Welds‖ with emphasis to Single Vee Butt welds.
2.0 Methodology
The welding operations were carried out using titania covered electrode 3.2 mm in
diameter with an arc-welding machine set at duty cycle of 400A, 60%, AC/DC.
Residual stress determination was carried out by using both X-ray diffractometer (XRD)
and finite element method (FEM). The XRD measured strains which were converted to
equivalent stress values by calculation. The FEM used ANSYS Multiphysics as software
for modeling and simulation. Shielded metal arc welding presents a transient thermal
structural stress problem which involves a moving heat source. This was adequately
modeled in ANSYS Workbench by coupling transient thermal and transient structural
analysis systems.

Page 327 of 366
2.1 Work material and preparation
The work materials used were mild steel plates of slightly different compositions
designated A,B and C. The work pieces measuring 70mm x100mm x10mm specification
were cut from supplied mild steel plates. Part of the 70mm edge was further beveled to an
angle of 300.Single V- butt joints were created by bringing pairs of the work pieces one at
a time to form an angle of 600, 2mm depth and 2mm root gap. The work pieces were
tacked from edge to edge to obtain good alignment while welding. The work pieces were
then annealed to 9200C in a heat treatment furnace, and soaked for 70 minutes to make
them stress free at the beginning of the experiment.
2.2 Welding Procedure
Welding was carried out with the plates properly clamped to avoid misalignment during
the welding process. An electrode was used to weld from the left to right end of the plate
using a weave weld touching both sides of the steel materials
By using the time and distance travelled by the electrode during the welding process, the
welding speed was calculated. The temperature measurement was implemented using K-
type thermocouples by attaching it to the welding plate and the reading taken from an
indicator.
3.0 Results and Discussion
Table 3.1: Residual stresses obtained using XRD for all the three test sample
Residual Stresses (MPa)
Sample A Sample B Sample
C
1. X direction 352 to 20.73 124 to -260 136 to -
44.5
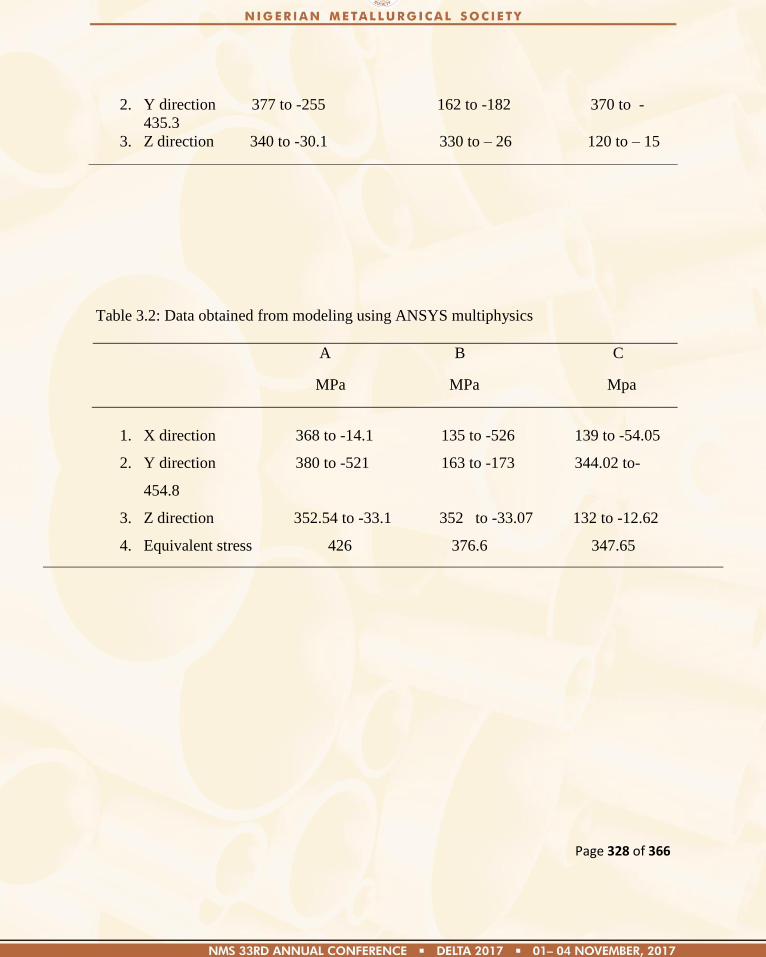
Page 328 of 366
2. Y direction 377 to -255 162 to -182 370 to -
435.3
3. Z direction 340 to -30.1 330 to – 26 120 to – 15
Table 3.2: Data obtained from modeling using ANSYS multiphysics
A B C
MPa MPa Mpa
1. X direction 368 to -14.1 135 to -526 139 to -54.05
2. Y direction 380 to -521 163 to -173 344.02 to-
454.8
3. Z direction 352.54 to -33.1 352 to -33.07 132 to -12.62
4. Equivalent stress 426 376.6 347.65
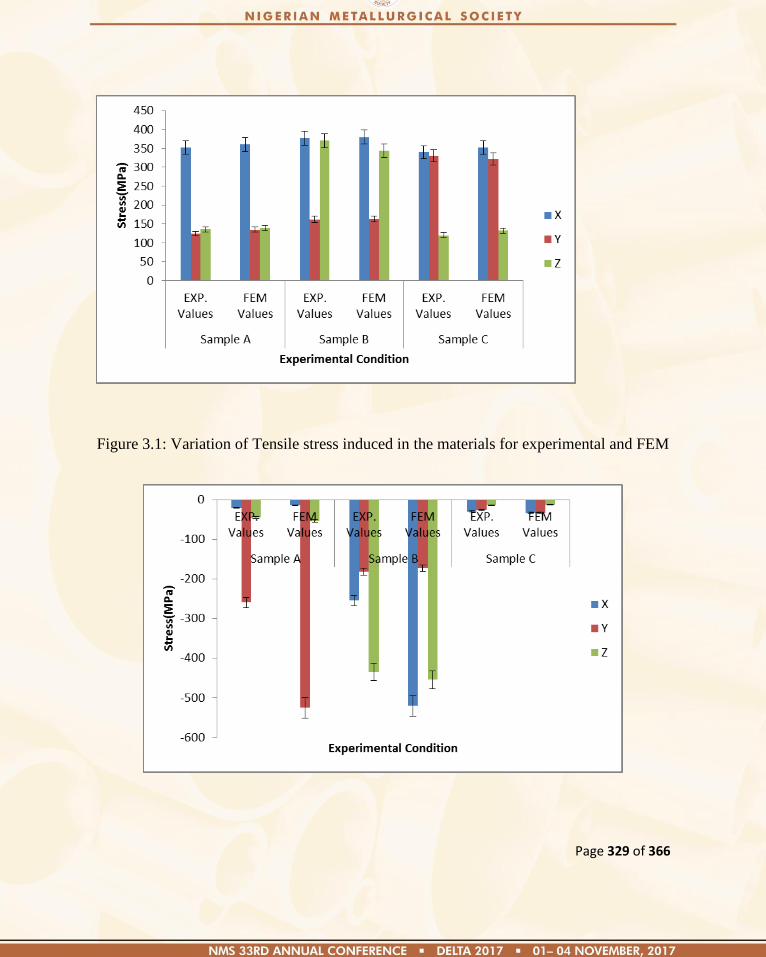
Page 329 of 366
Figure 3.1: Variation of Tensile stress induced in the materials for experimental and FEM
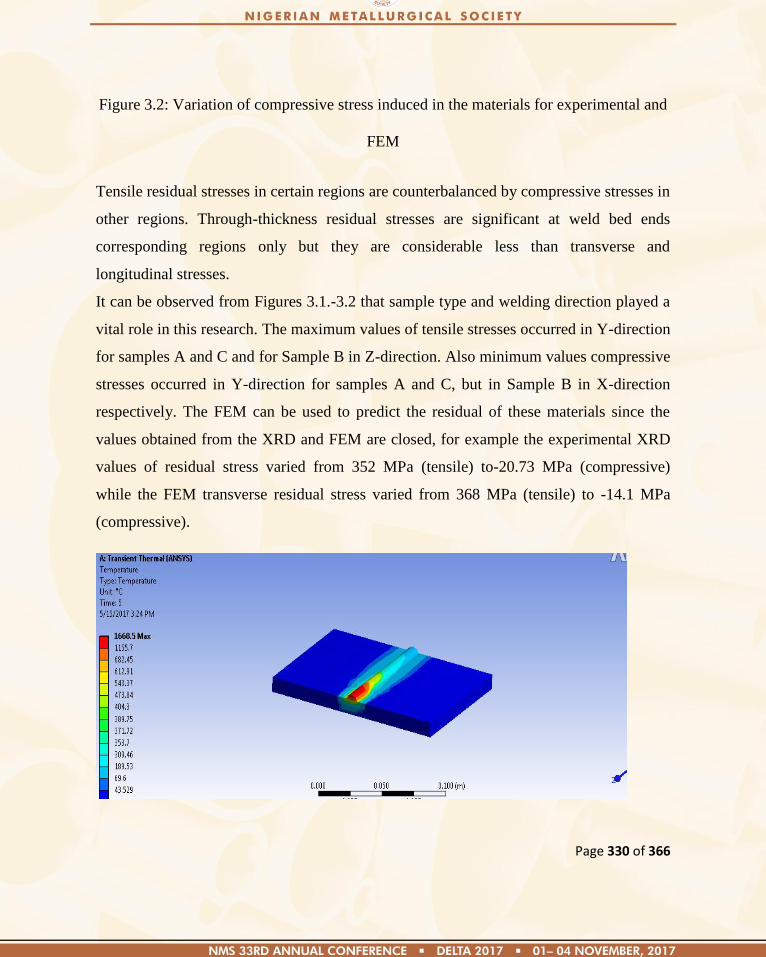
Page 330 of 366
Figure 3.2: Variation of compressive stress induced in the materials for experimental and
FEM
Tensile residual stresses in certain regions are counterbalanced by compressive stresses in
other regions. Through-thickness residual stresses are significant at weld bed ends
corresponding regions only but they are considerable less than transverse and
longitudinal stresses.
It can be observed from Figures 3.1.-3.2 that sample type and welding direction played a
vital role in this research. The maximum values of tensile stresses occurred in Y-direction
for samples A and C and for Sample B in Z-direction. Also minimum values compressive
stresses occurred in Y-direction for samples A and C, but in Sample B in X-direction
respectively. The FEM can be used to predict the residual of these materials since the
values obtained from the XRD and FEM are closed, for example the experimental XRD
values of residual stress varied from 352 MPa (tensile) to-20.73 MPa (compressive)
while the FEM transverse residual stress varied from 368 MPa (tensile) to -14.1 MPa
(compressive).
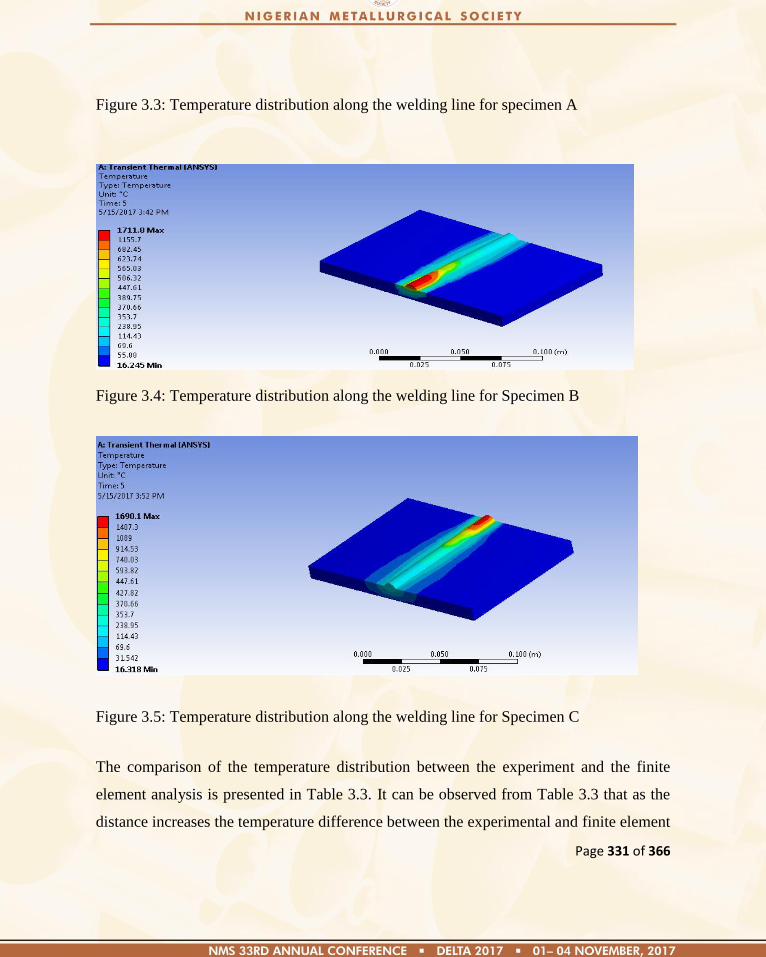
Page 331 of 366
Figure 3.3: Temperature distribution along the welding line for specimen A
Figure 3.4: Temperature distribution along the welding line for Specimen B
Figure 3.5: Temperature distribution along the welding line for Specimen C
The comparison of the temperature distribution between the experiment and the finite
element analysis is presented in Table 3.3. It can be observed from Table 3.3 that as the
distance increases the temperature difference between the experimental and finite element
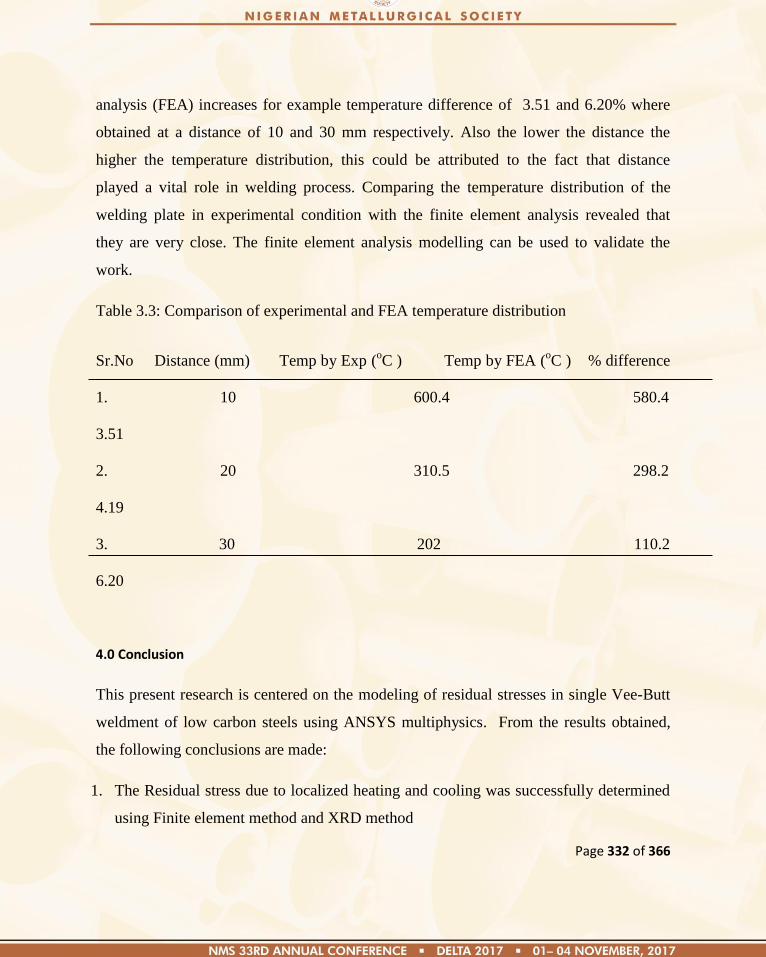
Page 332 of 366
analysis (FEA) increases for example temperature difference of 3.51 and 6.20% where
obtained at a distance of 10 and 30 mm respectively. Also the lower the distance the
higher the temperature distribution, this could be attributed to the fact that distance
played a vital role in welding process. Comparing the temperature distribution of the
welding plate in experimental condition with the finite element analysis revealed that
they are very close. The finite element analysis modelling can be used to validate the
work.
Table 3.3: Comparison of experimental and FEA temperature distribution
Sr.No Distance (mm) Temp by Exp (oC ) Temp by FEA (
oC ) % difference
1. 10 600.4 580.4
3.51
2. 20 310.5 298.2
4.19
3. 30 202 110.2
6.20
4.0 Conclusion
This present research is centered on the modeling of residual stresses in single Vee-Butt
weldment of low carbon steels using ANSYS multiphysics. From the results obtained,
the following conclusions are made:
1. The Residual stress due to localized heating and cooling was successfully determined
using Finite element method and XRD method
Page 333 of 366
2. In comparing the FEM and experimental method, analyses showed that FEM can be
used to predict the residual in a material.
References
Alam, M.S. (2005). ―Structural Integrity and Fatigue Crack Propagation Life Assessment
of Welded and Weld-Repaired Structure‖. Doctoral Thesis Report, Louisiana State
University, Pp. 75-83.
Belassel, M., Pineault, J.A. and Brauss, M.E. (2012).―Residual Stress Measurement using
X- Ray Diffraction Techniques, Guidelines and Normative Standards‖. SAE 2012
World Congress and Exhibition, Detroit, Michigan.
Parmar, R.S. (1999).―Welding Engineering and Technology‖. 1st edition, Khanna
Publishers,Delhi, ISBN: 81-7409-028-2.
Rozza, S.M. (2012), ―Automatic Welding Table‖. Bachelor Thesis; Faculty of Material
Science and Engineering, German University in Cairo.Pp. 15-17.
Teng, Tso-Liang, C.-P.Fung, P. H. Chang and W.-C.Yang, (2001), ―Analysis of Residual
Stresses and Distortions in T-joint Fillet Welds‖.International Journal of
Pressure Vessels and Piping, No.78, pp. 523-538.
Page 334 of 366
Paper: NMS 2017-TP038
Analysis of Discontinuity Spacing of a Dolomite Deposit in Ekpeshi South- West
Nigeria
Z. F. Ajibade* and T. O. Oluwadero
Department of Petroleum Engineering and Geosciences,
Petroleum Training Institute, Effurun Nigeria
Abstract
Discontinuity spacing is one of the important geometrical properties of discontinuities in
rock mass which is simply the distance between adjacent discontinuities. Ekpeshi is
located in Akoko-Edo local government area of Edo-State in South Western Nigeria with
Igarra as Local government headquarters. The Precambrian basement complex in Igarra
is made up of a metasupracrustal suite comprsing of quartztes, quartz-
chists,mentaconglomerates, marble and calc-silicate rocks. Within this area is the Igarra
schist belt. (Anifowose, 2008). Discontinuity survey are carried out in the field with the
aid of Scanline, compass clinometers and global positioning system(GPS) to estimate
possible distributions of geometry parameters of the dolomite deposits. Discontinuity
spacing and frequency data obtained in the Ekpeshi dolomite deposit were examined by
plotting histograms for the two parameters which shows that discontinuity spacing follow
negative exponential as already established by many previous works. A relationship was
established between mean discontinuity frequency and Rock quality designation (RQD)
as ( ) ( ) and this enable the usage of different threshold values of
t in addition to the 0.10m convention in terms of RQD
1.0 Introduction
A rock mass is only as strong as the weaknesses that it contains (Hoek and Bray, 1981).
Those weaknesses, called discontinuities, must be carefully mapped and analyzed in
order to predict the stability of blocks within the rock mass.
1.1 Spacing and Frequency
Page 335 of 366
Spacing is the perpendicular distance between adjacent discontinuities, and is usually
expressed as the mean spacing of a particular set of joints. The spacing of discontinuities
determines the sizes of the blocks making up the rock mass. The mechanism of
deformation and failure can vary with the ratio of discontinuity spacing to excavation
size. Engineering properties such as cavability, fragmentation characteristics and rock
mass permeability also vary with discontinuity spacing. It is to be expected that, like all
other characteristics of a given rock mass, discontinuity spacing will not have uniquely
defined values but, rather, will take a range of values, possibly according to some form of
statistical distribution. Priest and Hudson (1976) made measurements on a number of
sedimentary rock masses in the United Kingdom and found that, in each case, the
discontinuity spacing histogram gave a probability density distribution that could be
approximated by the negative exponential distribution. Thus the frequency, f (x), of a
given discontinuity spacing value, x, is given by the function
f (x) = e− x.
................. 1
where ≈1/
‾ x is the mean discontinuity frequency of a large discontinuity population
and _x is the mean spacing. Priest and Hudson‘s findings have since been verified for a
wider range of igneous, sedimentary and metamorphic rocks, although other
distributions, most notably the log-normal distribution, have been found to provide better
fits to some sets of data. Which distribution applies has been found to depend on the rock
type and the spacing range recorded. If there have been enough geological events to
create a number of discontinuity sets and a small total spacing, the spacings are likely to
follow a negative exponential distribution. If only a few geological events have caused
fracturing, existing discontinuity sets have become healed, or the recorded spacings were
censored by omitting discontinuities of below a particular size, a larger total spacing and
a log-normal distribution may result (Brown, 2003). In classifying rock masses for
engineering purposes, it is common practice to quote values of Rock Quality Designation
(RQD), a concept introduced by Deere (1968) in an attempt to quantify discontinuity
spacing. RQD is determined from drill core the lengths of the pieces of core may be
measured from tip to tip, along the core centre line, or as the fully circular lengths of
core. There are good reasons for using the centre line method (Brown, 2003; Goodman,
1993). Priest and Hudson (1976) found that an estimate of RQD could be obtained from
discontinuity spacing measurements made on core or an exposure using the equation.
Discontinuity spacing is a factor used in many rock mass classification schemes. A
Page 336 of 366
relationship has been established between mean discontinuity frequency and Rock
Quality designation (RQD) as
RQD = 100e− t(1+ t)
............................... 2
Priest and Hudson [1976] also proposed that the use of this equation in conjunction with
scanline surveys on freshly exposed faces is more appropriate than the determination of
RQD from diamond core. This is because core logging may tend to underestimate RQD
values due to the formation of induced fractures during the drilling process.
1.2 Rock Quality Designation Index (RQD)
The Rock Quality Designation index (RQD) was developed by Deere (Deere et al. 1967)
to provide a quantitative estimate of rock mass quality from drill core logs. RQD is
defined as the percentage of intact core pieces longer than 100 mm (4 inches) in the total
length of core. The core should be at least NW size (54.7 mm or 2.15 inches in diameter)
and should be drilled with a double-tube core barrel. The following mathematical
expression explains in summary the index.
Σ
............................................................................................................. 3
where xi are the lengths of individual pieces of core in a drill run having lengths of 0.1 m
or greater and L is the total length of the drill run.
The correct procedures for measurement of the length of core pieces and the calculation
of RQD are summarised in Palmström (1982) suggested that, when no core is available
but discontinuity traces are visible in surface exposures or exploration adits, the RQD
may be estimated from the number of discontinuities per unit volume. The suggested
relationship for clay-free rock masses is:
RQD = 115 - 3.3 Jv ............................................................................................................4
where Jv is the sum of the number of joints per unit length for all joint (discontinuity)
sets known as the volumetric joint count.

Page 337 of 366
2.0 Discontinuity Spacing in The Study Area
Ekpeshi is located in Akoko-Edo local government area of Edo-State in South West
Nigeria with Igarra as Local government headquarters. The Precambrian basement
complex in Igarra is made up of a metasupracrustal suite comprising of quartztes, quartz-
chists,mentaconglomerates, marble and calc-silicate rocks. Within this area is the Igarra
schist belt.
A detailed study (Odeyemi, 1988) shows that the said schist belt can be classified into
four groups.
(a) Quartz –biotite scist with interacted quartz-pebble conglomerate
(b) Calc-silicate gneiss and marble
(c) Polymict metaconglomerate; and
(d) Phyllites metaconglomerate
Figure 1: Geological and location of Ikpeshi, Edo State.
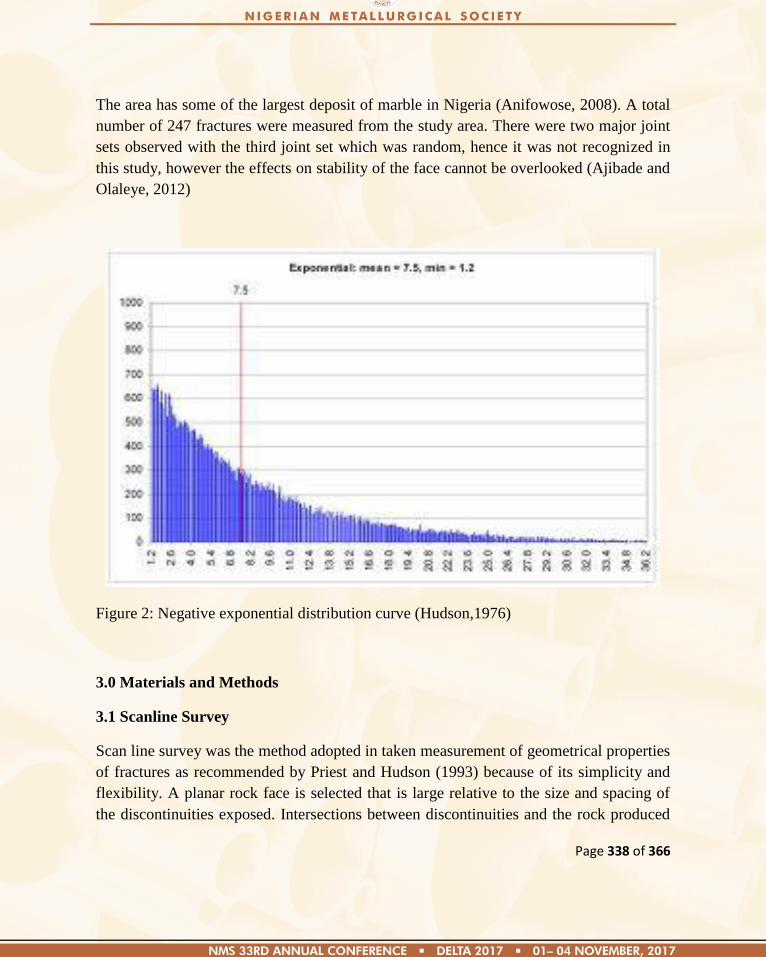
Page 338 of 366
The area has some of the largest deposit of marble in Nigeria (Anifowose, 2008). A total
number of 247 fractures were measured from the study area. There were two major joint
sets observed with the third joint set which was random, hence it was not recognized in
this study, however the effects on stability of the face cannot be overlooked (Ajibade and
Olaleye, 2012)
Figure 2: Negative exponential distribution curve (Hudson,1976)
3.0 Materials and Methods
3.1 Scanline Survey
Scan line survey was the method adopted in taken measurement of geometrical properties
of fractures as recommended by Priest and Hudson (1993) because of its simplicity and
flexibility. A planar rock face is selected that is large relative to the size and spacing of
the discontinuities exposed. Intersections between discontinuities and the rock produced
Page 339 of 366
linear traces, which provide an essentially two- dimensional sample of the rock structure.
The orientation of a discontinuity in space is described by the dip of the line of steepest
declination measured from horizontal, and by the dip direction measured clockwise from
true north. Example: dip / dip direction (000/000
0). The measuring tape was pinned to the
surface of the rocks in a linear form and all discontinuities intersecting the scan lines
were measured using compass clinometers and the spacing distance measured with the
aid of measuring tape. Direction cosine method and Microsoft excel 2007 were used for
statistical analyses while Dips soft ware was used for contour of the joint sets.
Table 1: Summary of orientation data for joint set 1 fracture on Ekpeshi quarry
face
Direction cosine li
(sin dip dir* cos dip)
mi
(cos dip dir.cos dip)
ni
(sin dip)
Sum -31.45 mi = 90.43 ni = 26.28
Arithmetic Mean =( /N) -0.314536 0.903999 0.263554
Vector Mean =( /N/R) -0.317 0.911 0.265
Using direction cosine equations
R (Resultant vector) = 0.992
Κ (Fisher‘s constant) = 139
μ (Mean orientation) = 74/160
Table 1 shows the summary of orientation data for joint set 1 fracture on Ekpeshi quarry
face
Table 2: Summary of orientation data for joint set 2 fracture on Ekpeshi quarry face1
Direction cosine li
(sin dip dir* cos dip)
mi
(cos dip dir.cos dip)
ni
(sin dip)
Sum 45.41 mi = 5.84 ni = 16.32
Arithmetic Mean =( /N) 0.926 0.119 0.333
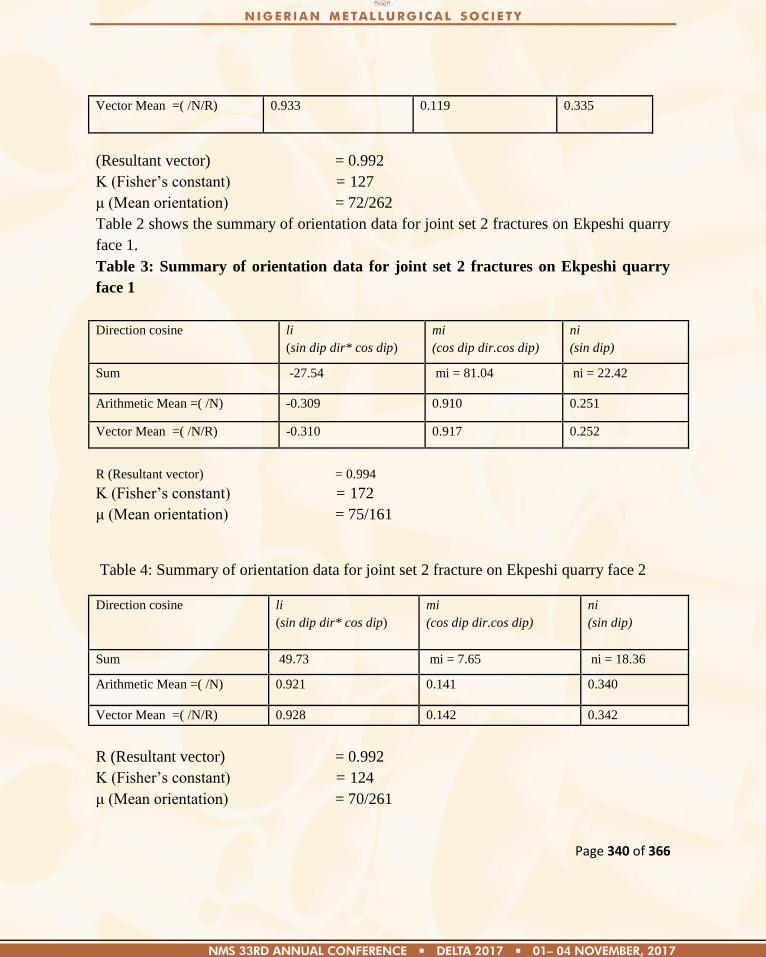
Page 340 of 366
Vector Mean =( /N/R) 0.933 0.119 0.335
(Resultant vector) = 0.992
Κ (Fisher‘s constant) = 127
μ (Mean orientation) = 72/262
Table 2 shows the summary of orientation data for joint set 2 fractures on Ekpeshi quarry
face 1.
Table 3: Summary of orientation data for joint set 2 fractures on Ekpeshi quarry
face 1
Direction cosine li
(sin dip dir* cos dip)
mi
(cos dip dir.cos dip)
ni
(sin dip)
Sum -27.54 mi = 81.04 ni = 22.42
Arithmetic Mean =( /N) -0.309 0.910 0.251
Vector Mean =( /N/R) -0.310 0.917 0.252
R (Resultant vector) = 0.994
Κ (Fisher‘s constant) = 172
μ (Mean orientation) = 75/161
Table 4: Summary of orientation data for joint set 2 fracture on Ekpeshi quarry face 2
Direction cosine li
(sin dip dir* cos dip)
mi
(cos dip dir.cos dip)
ni
(sin dip)
Sum 49.73 mi = 7.65 ni = 18.36
Arithmetic Mean =( /N) 0.921 0.141 0.340
Vector Mean =( /N/R) 0.928 0.142 0.342
R (Resultant vector) = 0.992
Κ (Fisher‘s constant) = 124
μ (Mean orientation) = 70/261
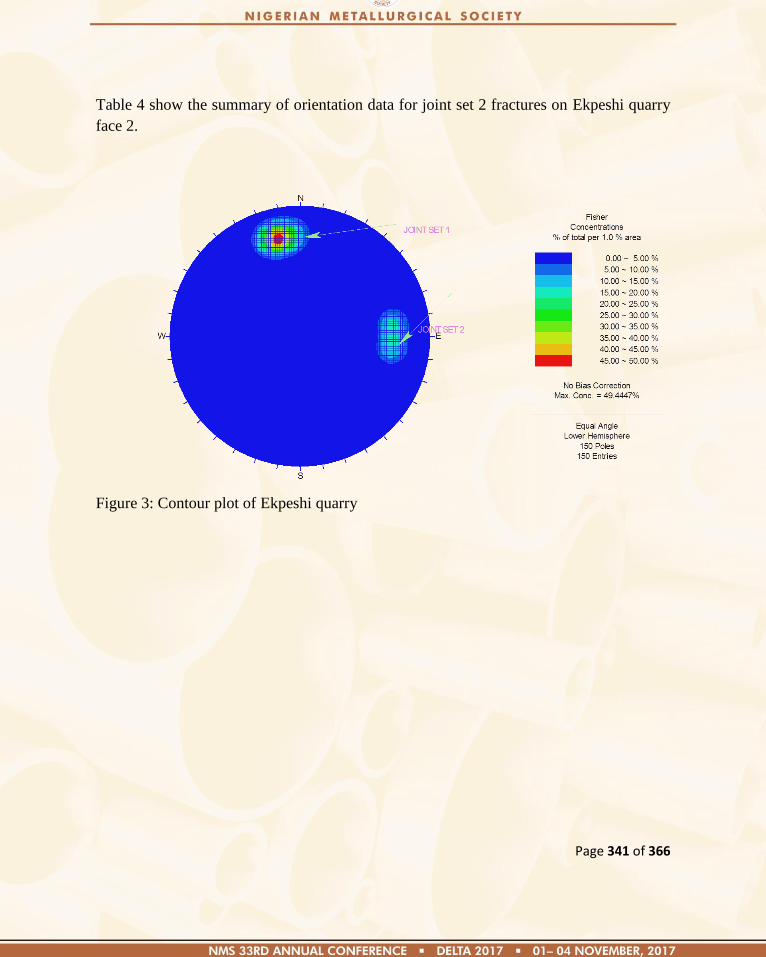
Page 341 of 366
Table 4 show the summary of orientation data for joint set 2 fractures on Ekpeshi quarry
face 2.
Figure 3: Contour plot of Ekpeshi quarry

Page 342 of 366
Figure 4: Plot of Ekpeshi quarry face 1 showing poles, planes and cut face
BENEFICIATION
1
1
1m
2
2
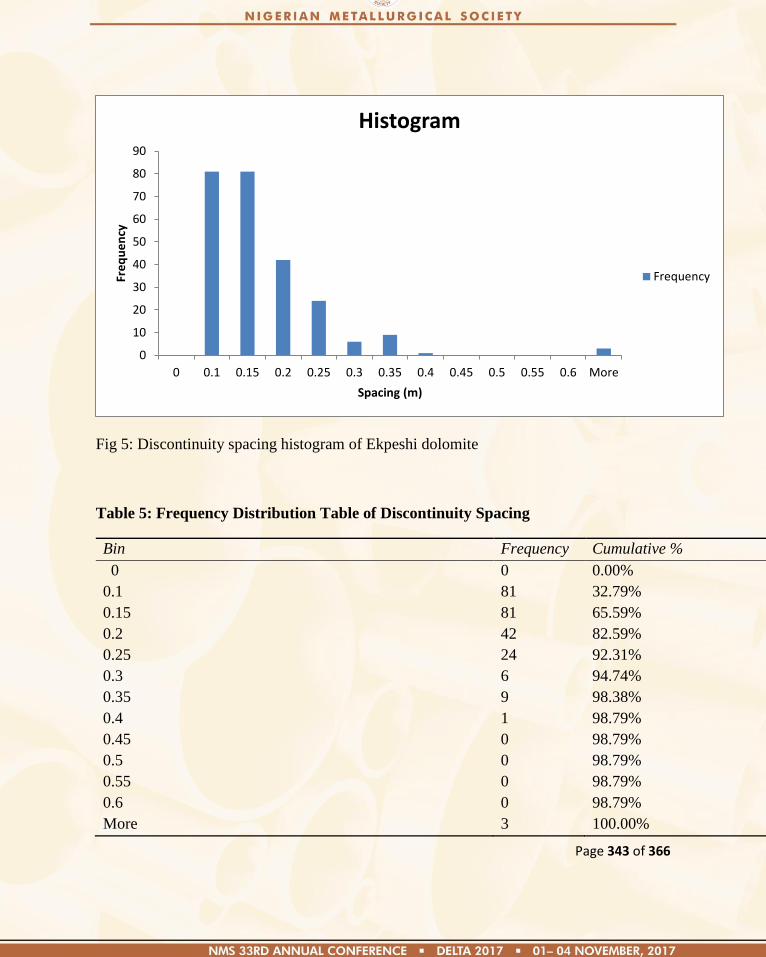
Page 343 of 366
Fig 5: Discontinuity spacing histogram of Ekpeshi dolomite
Table 5: Frequency Distribution Table of Discontinuity Spacing
Bin Frequency Cumulative %
0 0 0.00%
0.1 81 32.79%
0.15 81 65.59%
0.2 42 82.59%
0.25 24 92.31%
0.3 6 94.74%
0.35 9 98.38%
0.4 1 98.79%
0.45 0 98.79%
0.5 0 98.79%
0.55 0 98.79%
0.6 0 98.79%
More 3 100.00%
0
10
20
30
40
50
60
70
80
90
0 0.1 0.15 0.2 0.25 0.3 0.35 0.4 0.45 0.5 0.55 0.6 More
Fre
qu
en
cy
Spacing (m)
Histogram
Frequency
Page 344 of 366
Table 6: Statistical Analysis of Discontinuity Data
Mean 0.157165992
Standard Error 0.006511664
Median 0.12
Mode 0.1
Standard Deviation 0.102338832
Sample Variance 0.010473237
Kurtosis 25.40110648
Skewness 4.205307257
Range 0.81
Minimum 0.05
Maximum 0.86
Sum 38.82
Count 247
Largest(1) 0.86
Smallest(1) 0.05
4.0 Discussion of Results
There are two joint sets with very close spacing observed. The longitude and latitude of
the locations are E06011‘.661
‖ and N07 09
‘.634
‖, the cut face orientation is 76/162. The
computation of mean orientation was calculated using direction cosine method and
kinematic analyses of the joint set for different types of failure was carried out and has
Page 345 of 366
already been published in the work of Ajibade and Olaleye (2012). The mean orientation
of the joint sets are 72/161 and 70/261 for joint sets 1 and 2 respectively.
From the data obtained at the case study, discontinuity spacings were plotted in the form
of a histogram, using a discontinuity spacing class interval of 0.05m as shown in Fig. 5.
This Figure was plotted solely by using the sum of all the scan line data obtained from
investigation site. It shows that the curve nearly follows a negative exponential
distribution. Both the mean and standard deviation are almost equal as shown in the data
in Table 5. The reason for non-perfect nature of the negative exponential curve, and small
variations between the Standard Deviation and the Mean is explained in the work of
Wines and Lilly (2002) as due to smaller number of samples. The RQD of the case study
was determined using equation 4 as suggested by Palmström (1982) where core sample is
not available. The result of the RQD is 94.21 %. The theoretical RQD calculated from
frequency is 91.62%.The RQD obtained from discontinuity frequency when compared
with actual RQD calculated from the spacing values gives maximum error of 2.8%. Since
the histogram plot follows negative exponential distribution it shows that the
discontinuity spacing is made up of evenly spaced, clustered space and randomly spaced
distributions. The results simply buttress existing and previous work of Priest and
Hudson (1976), Wines and Lilly (2002). Different threshold values of t rather than the
conventional 0.1m can be used since relationship has been established between
theoretical RQD*
which is frequency based and measured RQD as indicated in equations
1 and 2.
5.0 Conclusion
The possible distribution of discontinuity spacing along a straight line in a dolomite
quarry at Ekpeshi was considered. Analysis of results carried out agreed with the work of
Priest and Hudson (1976) that a negative exponential distribution of discontinuity spacing
values is a good approximation to the true distribution patterns. The maximum error
proposed by Priest and Hudson (1976) between theoretical RQD* and actual RQD is 5%.
The results of this work shows 2.8% which is within the allowable error limits.
It is suggested that discontinuity survey should be carried out on different types of rock.
Although more work has been done on discontinuity spacing, the applicability of such
studies to mine design should be well researched in the future.
Page 346 of 366
Acknowledgement: I wish to acknowledge both the management and staff of Freedom
Groups for allowing me to use their quarry for this work.
References
1. Ajibade Z.F and Olaleye, B.M (2012): Analyses of Fractures Orientations of Ekpeshi
Dolomite Deposit, South-West, Nigeria .Journal of Emerging Trends in Engineering
and Applied Sciences (JETEAS). UK. Vol. 3 No.2, Pp 330-338
2. Anifowose A.Y.B Odeyemi I.B. and Bamisaye C.A. (2008) Establishing a solid
mineral database for a part of South-western Nigeria Geospatial World
(www.gisdevelopment.net) p.1
3. Brown E.T. (2003): Block caving Geomechanics. Julius Kruttschnit mineral research
centre (JKRMC): Brisbane 516 pp
4. Deere, D.U. and Deere, D.W. (1988): The rock quality designation (RQD) index in
practice. In Rock classification systems for engineering purposes, (ed. L.Kirkaldie),
ASTM Special Publication 984, pp. 91-101, Philadelphia: Am. Soc. Test. Mat.
5. Goodman, R.E., (1989): Introduction to Rock Mechanics (2nd edition): Wiley, New
York.562p
6. Hoek, E., and Bray, J.W. (1981): Rock Slope Engineering (3rd
edition): The
Institution of Mining and Metallurgy, London. 358pp
7. Odeyemi, I.B (1988): Lithosgraphic and structural relationships off the Upper
Precambrian metasediments in Igarra area, western Nigeria. In: P.O. Oluyede, W.C.
Mbonu, A.E. Ogezi, I.G. Egbuniwe, A.C. Ajibade and A.C. Umeji (eds). Precambrian
Geology of Nigeria. Geology Survey of Nigeria, Kaduna, pp. 41-58
8. Palmström, A. (1982): The volumetric joint count - a useful and simple measure of
the degree of rock jointing. Proc. 4th congr. Int. Assn Engng Geol., Delhi 5, pp 221-
228
9. Priest, S.D. (1993): Discontinuity Analyses for Rock Engineering, Chapman and
Hall, London, 473 p
10. Priest, S.D. and Hudson, J.A. (1976). Discontinuity Spacings in Rock, Int. J. Rock
Mech. Min. Sci. and Geomech. Vol 18, pp. 135-148.
11. Wines D.R., and Lilly P.A (2002): Measurement of rock mass discontinuity spacing
and frequency in part of the Fimiston Pit operation in Kalgoorlie, Western Australia:
a case study. , International Journal of Rock Mechanics &. Mining Sciences vol. 39,
pp.589-602
Page 347 of 366
Paper: NMS 2017-TP039
Recent Developments in Techniques for Evaluation of Preferential Weld Corrosion
under Hydrodynamic Conditions
*1M. A. Adegbite,
1A. John and
2John Ade Ajayi
1Department of Welding Engineering and Offshore Technology,
Petroleum Training Institute, Effurun, Delta State.
2Department of Metallurgical and Materials Engineering,
Federal University of Technology, Akure, Ondo State.
Abstract
Preferential weld corrosion (PWC) remains one of the challenges in oil and gas production and
water injection pipeline systems, resulting in the risk of premature failure. The aim of this work
was to investigate the suitability of the submerged jet impingement method for the study of flow
enhanced preferential weld corrosion and inhibitor evaluation in a typical offshore production
system. The novel aspect of the work was the construction of the jet impingement target, which
was made of sections from different weld regions, machined from welded X65 pipeline steel. The
galvanic currents flowing between the weld segments in each hydrodynamic region were
recorded simultaneously using zero-resistance ammeters and their self-corrosion rates were
evaluated from linear polarization resistance measurements. The role of hydrodynamics and the
influence of typical oilfield corrosion inhibitors on this form of corrosion are discussed.
Keywords: carbon-dioxide corrosion, corrosion inhibitor, electrochemical measurements,
preferential weld corrosion, submerged jet impingement
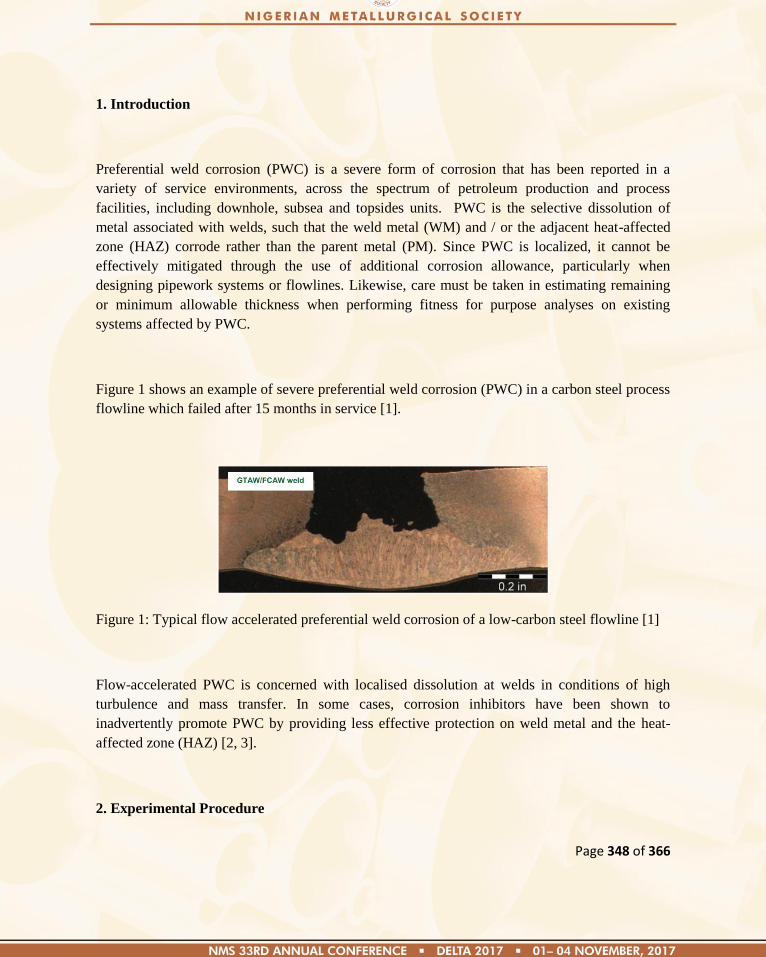
Page 348 of 366
1. Introduction
Preferential weld corrosion (PWC) is a severe form of corrosion that has been reported in a
variety of service environments, across the spectrum of petroleum production and process
facilities, including downhole, subsea and topsides units. PWC is the selective dissolution of
metal associated with welds, such that the weld metal (WM) and / or the adjacent heat-affected
zone (HAZ) corrode rather than the parent metal (PM). Since PWC is localized, it cannot be
effectively mitigated through the use of additional corrosion allowance, particularly when
designing pipework systems or flowlines. Likewise, care must be taken in estimating remaining
or minimum allowable thickness when performing fitness for purpose analyses on existing
systems affected by PWC.
Figure 1 shows an example of severe preferential weld corrosion (PWC) in a carbon steel process
flowline which failed after 15 months in service [1].
Figure 1: Typical flow accelerated preferential weld corrosion of a low-carbon steel flowline [1]
Flow-accelerated PWC is concerned with localised dissolution at welds in conditions of high
turbulence and mass transfer. In some cases, corrosion inhibitors have been shown to
inadvertently promote PWC by providing less effective protection on weld metal and the heat-
affected zone (HAZ) [2, 3].
2. Experimental Procedure
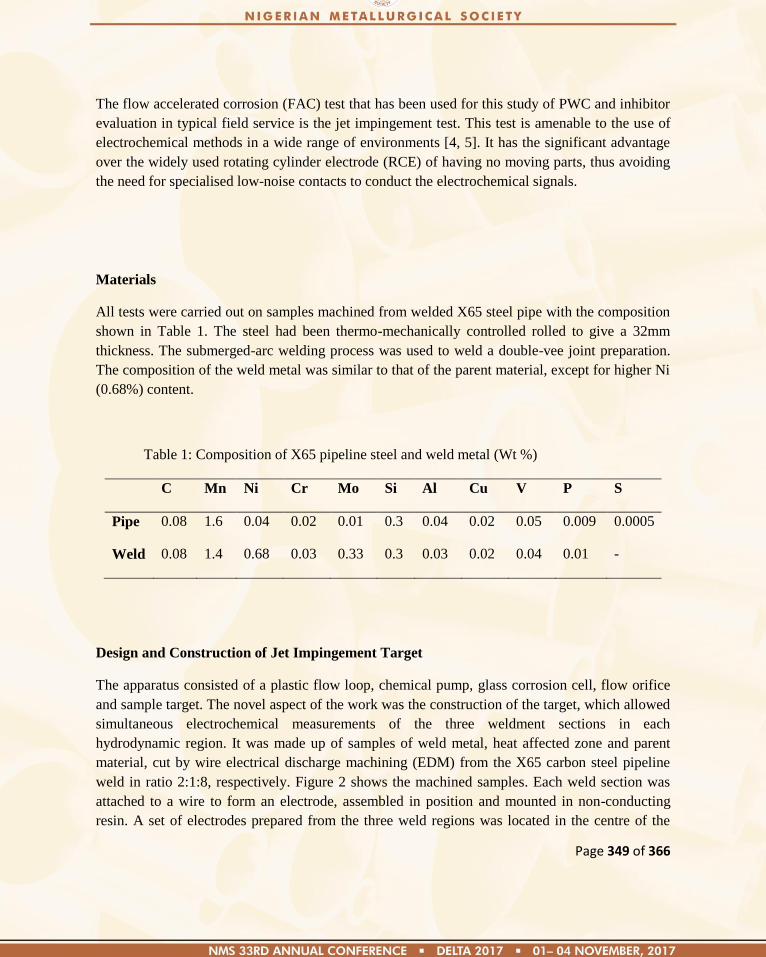
Page 349 of 366
The flow accelerated corrosion (FAC) test that has been used for this study of PWC and inhibitor
evaluation in typical field service is the jet impingement test. This test is amenable to the use of
electrochemical methods in a wide range of environments [4, 5]. It has the significant advantage
over the widely used rotating cylinder electrode (RCE) of having no moving parts, thus avoiding
the need for specialised low-noise contacts to conduct the electrochemical signals.
Materials
All tests were carried out on samples machined from welded X65 steel pipe with the composition
shown in Table 1. The steel had been thermo-mechanically controlled rolled to give a 32mm
thickness. The submerged-arc welding process was used to weld a double-vee joint preparation.
The composition of the weld metal was similar to that of the parent material, except for higher Ni
(0.68%) content.
Table 1: Composition of X65 pipeline steel and weld metal (Wt %)
C Mn Ni Cr Mo Si Al Cu V P S
Pipe 0.08 1.6 0.04 0.02 0.01 0.3 0.04 0.02 0.05 0.009 0.0005
Weld 0.08 1.4 0.68 0.03 0.33 0.3 0.03 0.02 0.04 0.01 -
Design and Construction of Jet Impingement Target
The apparatus consisted of a plastic flow loop, chemical pump, glass corrosion cell, flow orifice
and sample target. The novel aspect of the work was the construction of the target, which allowed
simultaneous electrochemical measurements of the three weldment sections in each
hydrodynamic region. It was made up of samples of weld metal, heat affected zone and parent
material, cut by wire electrical discharge machining (EDM) from the X65 carbon steel pipeline
weld in ratio 2:1:8, respectively. Figure 2 shows the machined samples. Each weld section was
attached to a wire to form an electrode, assembled in position and mounted in non-conducting
resin. A set of electrodes prepared from the three weld regions was located in the centre of the
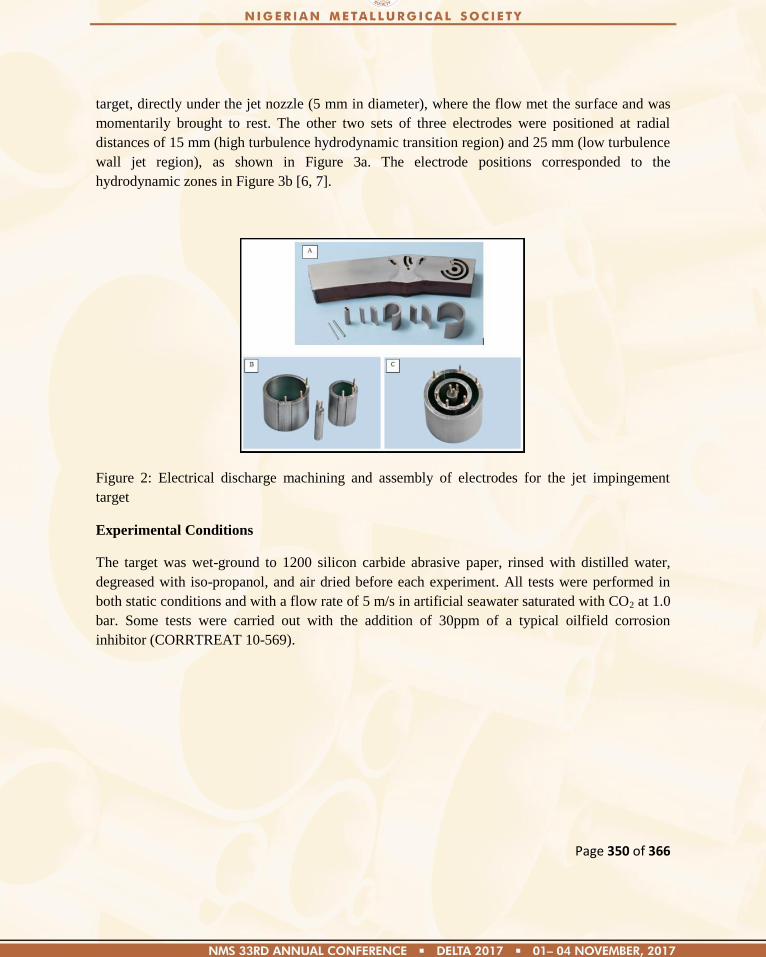
Page 350 of 366
target, directly under the jet nozzle (5 mm in diameter), where the flow met the surface and was
momentarily brought to rest. The other two sets of three electrodes were positioned at radial
distances of 15 mm (high turbulence hydrodynamic transition region) and 25 mm (low turbulence
wall jet region), as shown in Figure 3a. The electrode positions corresponded to the
hydrodynamic zones in Figure 3b [6, 7].
Figure 2: Electrical discharge machining and assembly of electrodes for the jet impingement
target
Experimental Conditions
The target was wet-ground to 1200 silicon carbide abrasive paper, rinsed with distilled water,
degreased with iso-propanol, and air dried before each experiment. All tests were performed in
both static conditions and with a flow rate of 5 m/s in artificial seawater saturated with CO2 at 1.0
bar. Some tests were carried out with the addition of 30ppm of a typical oilfield corrosion
inhibitor (CORRTREAT 10-569).
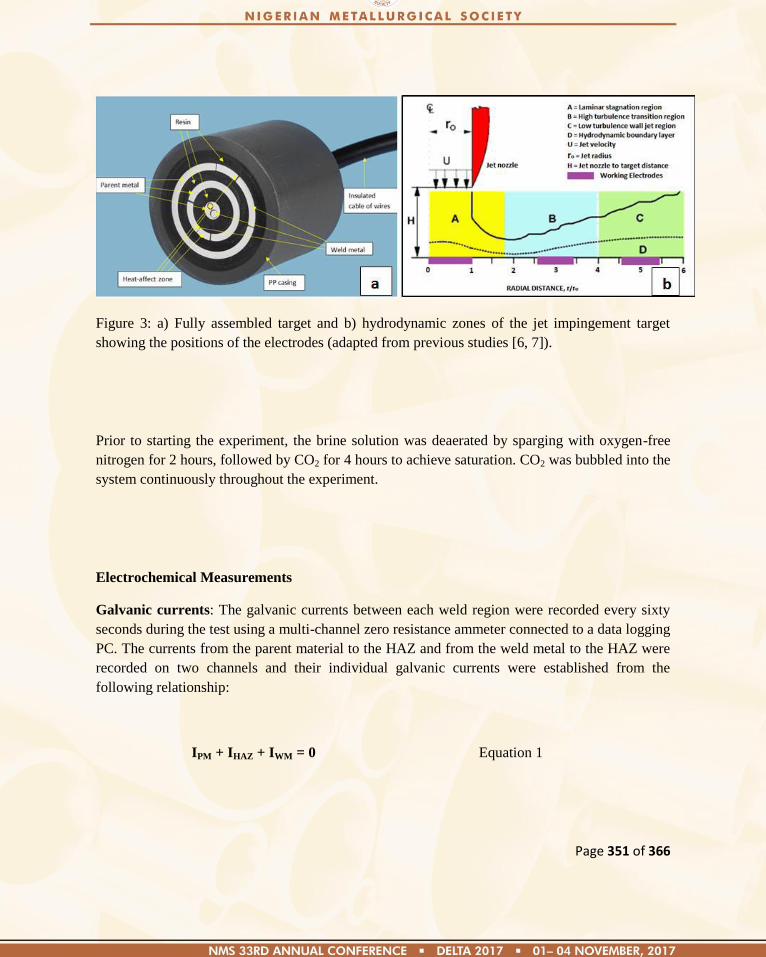
Page 351 of 366
Figure 3: a) Fully assembled target and b) hydrodynamic zones of the jet impingement target
showing the positions of the electrodes (adapted from previous studies [6, 7]).
Prior to starting the experiment, the brine solution was deaerated by sparging with oxygen-free
nitrogen for 2 hours, followed by CO2 for 4 hours to achieve saturation. CO2 was bubbled into the
system continuously throughout the experiment.
Electrochemical Measurements
Galvanic currents: The galvanic currents between each weld region were recorded every sixty
seconds during the test using a multi-channel zero resistance ammeter connected to a data logging
PC. The currents from the parent material to the HAZ and from the weld metal to the HAZ were
recorded on two channels and their individual galvanic currents were established from the
following relationship:
IPM + IHAZ + IWM = 0 Equation 1
Page 352 of 366
Self-Corrosion Rates: The self-corrosion rates of the three weld regions were measured by
uncoupling each electrode in turn and carrying out linear polarization resistance measurements
(LPR) using a platinum gauze secondary electrode, a standard calomel reference electrode and a
low noise potentiostat. The uncoupled electrode quickly established its open circuit potential and
the potential was then scanned 10 mV above and below this value, at a scan rate of 10 mV per
minute, and the current response was recorded. The polarization resistance, Rp, was obtained
from the best-fit gradient of the potential/current graph and the corrosion current, ICORR, was
calculated from the equation:
ICORR = B / Rp Equation 2
where B is the LPR constant for the material and its environment, taken as 13 mV 13
. Because of
the very small potential perturbation applied, the polarization resistance method can be repeated
over long periods without changing the behaviour of the steel significantly from its freely
corroding condition.
The total corrosion rates of the three weld regions were found from the sum of their self-corrosion
and galvanic corrosion rates.
3. Results and Discussion
A brief overview of the results is outlined below for weldment regions positioned in the high
turbulence transition zone (radial distance r/ro = 3) of the jet impingement target. The wall shear
stress on the surface of the target at this zone, evaluated for a jet flow rate of 5 m/s, was 72 N/m2.
As the test proceeded the seawater temperature stabilized at 52oC, due to Joule heating in the
recirculating pump, making the test conditions representative of typical oilfield conditions.
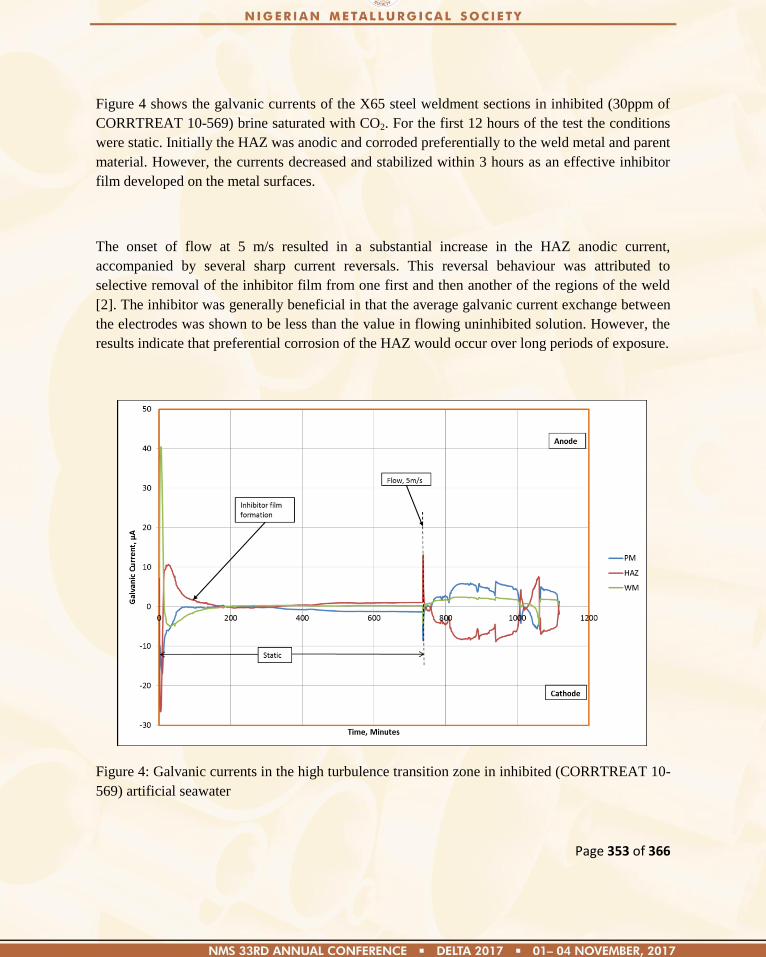
Page 353 of 366
Figure 4 shows the galvanic currents of the X65 steel weldment sections in inhibited (30ppm of
CORRTREAT 10-569) brine saturated with CO2. For the first 12 hours of the test the conditions
were static. Initially the HAZ was anodic and corroded preferentially to the weld metal and parent
material. However, the currents decreased and stabilized within 3 hours as an effective inhibitor
film developed on the metal surfaces.
The onset of flow at 5 m/s resulted in a substantial increase in the HAZ anodic current,
accompanied by several sharp current reversals. This reversal behaviour was attributed to
selective removal of the inhibitor film from one first and then another of the regions of the weld
[2]. The inhibitor was generally beneficial in that the average galvanic current exchange between
the electrodes was shown to be less than the value in flowing uninhibited solution. However, the
results indicate that preferential corrosion of the HAZ would occur over long periods of exposure.
Figure 4: Galvanic currents in the high turbulence transition zone in inhibited (CORRTREAT 10-
569) artificial seawater
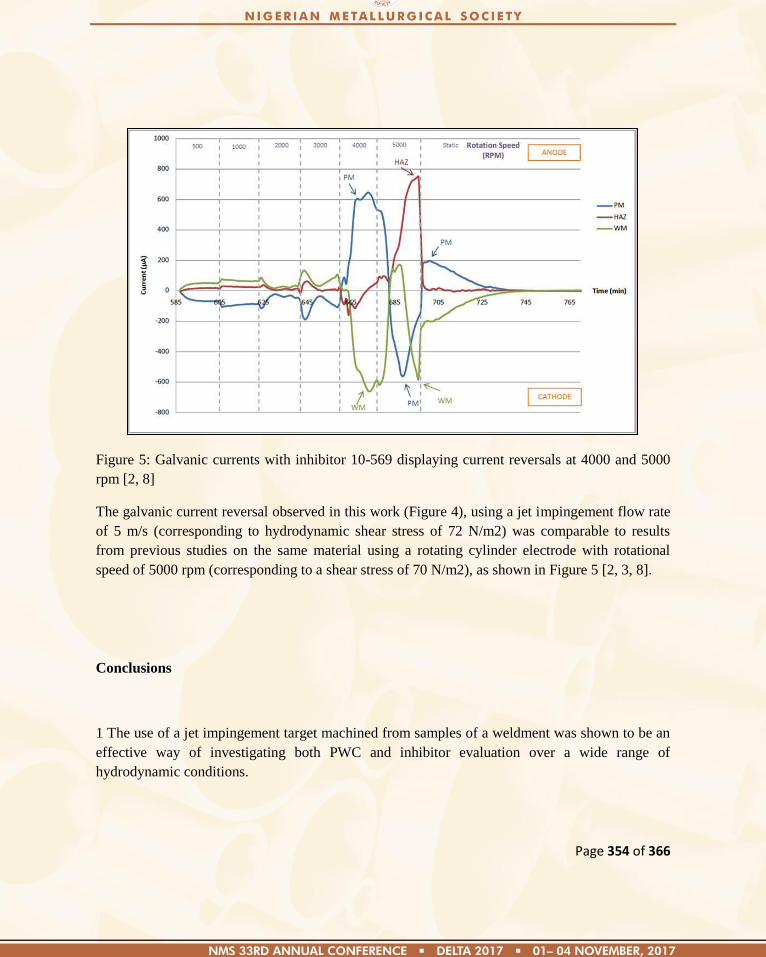
Page 354 of 366
Figure 5: Galvanic currents with inhibitor 10-569 displaying current reversals at 4000 and 5000
rpm [2, 8]
The galvanic current reversal observed in this work (Figure 4), using a jet impingement flow rate
of 5 m/s (corresponding to hydrodynamic shear stress of 72 N/m2) was comparable to results
from previous studies on the same material using a rotating cylinder electrode with rotational
speed of 5000 rpm (corresponding to a shear stress of 70 N/m2), as shown in Figure 5 [2, 3, 8].
Conclusions
1 The use of a jet impingement target machined from samples of a weldment was shown to be an
effective way of investigating both PWC and inhibitor evaluation over a wide range of
hydrodynamic conditions.
Page 355 of 366
2 Under certain specific flow conditions in inhibited seawater, current reversals were observed
that would result in PWC after long term exposure. The current reversals are explained by
selective removal of the inhibitor from one region of the weldment.
3 The results obtained with the jet impingement target compare favourably with those reported
for the same steel weldment measured using a rotating cylinder electrode.
References
[1] S.P.V. Mahajanam, M.W. Joosten, Guidelines for Filler-Material Selection To Minimize
Preferential Weld Corrosion in Pipeline Steels, SPE Projects, Facilities & Construction. 6 (2011)
5-12.
[2] M. Martinez, K. Alawadhi, M. Robinson, G. Nelson, A. MacDonald, Control of Preferential
Weld Corrosion of X65 Pipeline Steel In Flowing Brines Containing Carbon Dioxide, NACE -
International Corrosion Conference Series. Paper 11268 (2011).
[3] K. Alawadhi, M.J. Robinson, Preferential weld corrosion of X65 pipeline steel in flowing
brines containing carbon dioxide, Corrosion Engineering Science and Technology. 46 (2011)
318-329.
[4] G. Schmitt, M. Bakalli, A critical review of measuring techniques for corrosion rates under
flow conditions, NACE - International Corrosion Conference Series (2006) 065931-0659327.
[5] K.D. Efird, Flow Accelerated Corrosion Testing Basics, NACE - International Corrosion
Conference Series (2006) 066891-0668916.
[6] K.D. Efird, E.J. Wright, J.A. Boros, T.G. Hailey, Correlation of steel corrosion in pipe flow
with jet impingement and rotating cylinder tests, Corrosion. 49 (1993) 992-1003.
[7] E.A.M. Hussain, M.J. Robinson, Erosion-corrosion of Duplex Stainless Steel in Flowing
Seawater Containing Sand Particles, Corrosion Science. 49 (2007) 1737-1754.
[8] K. Alawadhi, M. Robinson, A. Chalmers, I.G. Winning, Inhibition of weld corrosion in
flowing brines containing carbon dioxide, NACE - International Corrosion Conference Series.
(2008) 086221-0862214.
Page 356 of 366
Paper: NMS 2017-TP040
RESEARCH AND DEVELOPMENT FOR SUSTAINABILITY AND NATIONAL
ECONOMIC RECOVERY
S. E. Okundaye*, N. A. Musa**, I. A. Duigwu*
*Department of Project Management Technology, Federal University of Technology, Minna.
**Department of Mechanical Engineering, Federal University of Technology, Minna
Corresponding Author E-mail Address: [email protected] GSM No. : 08033631288
ABSTRACT
The Holy Bible made us to understand one thing that God created everything and saw everything
that He had made, and, behold, it was very good (Genesis 1: 31). What this passage is telling us is
that nations of the world, including Nigeria has been blessed with the necessary resources (both
human and natural) needed to develop their respective domains. All that was needed is for the
respective nation to add value to the human and natural resources. It is a fact that value can only
be added through research and development. Most science and technological change result from
an organized and well funded research and development plans. Any country that does not invest
in organized research and development will continue to depend on the technologically advanced
countries of the world for finished goods and services. One major area that should be properly
addressed now if we as a NATION are to sustain the tempo of our economic growth is to
vigorously embark on an effective and well organized research and development strategies. In
line with the aforementioned, this paper discusses the Structure of Nigeria‘s Economy, the
various Economic Rolling Plans, the recent Economic Recovery and Growth Plan (ERGP), which
was launched this year and Research and Development as a concept. Conclusively, it is worth
stressing that for Nigeria to optimize local content and empower local businesses, as well as
achieve a 7% growth rate by 2020, there is the need to embark on an effective Research and
Development programmes within the five broad technological areas: design and manufacturing,
materials processing for manufacturing, telecommunications/microelectronics,
biotechnology/bioengineering, and research utilization and recovery.
Keywords: Research, Development, Sustainability, National Economic Recovery

Page 357 of 366
1. INTRODUCTION
The economics of the various nations are passing through a difficult economic phase. Nigeria
specifically is confronted with myriad of developmental challenges and we are here today to see
how we can proffer solutions to some of these challenges by strategizing and accepting the fact
that metal production is a panacea for national security and economic recovery. Successive
governments in Nigeria since the 70‘s had tried to put in the country‘s developmental
plans/guidelines to diversify the economic base of the country from the dependency on oil which
accounted for over 90% of Nigeria‘s foreign exchange earnings in the last three decades (National
Committee on Foundry Development, 1993). As Obadan (2010) and Okundaye (2015) opined;
the state of the Nigerian economy has continued to reflect the paradox of poverty and misery in
the midst of plenty. Nigeria is richly blessed with abundant natural resource base, in the form of
large oil and gas reserves, fertile agricultural land and good climate and large untapped solid
mineral deposits. The determination of the various governments of Nigeria to achieve a
technologically stable economy had led to the formulation of several rolling plans and roadmaps,
starting with the Structural Adjustment Programme (SAP) down to the recent one which was
launched by President Muhammadu Buhari in April, this year. Recently, it was announced that
Nigeria had gotten out of economic recession. It is therefore our responsibility as professionals to
contribute our quota towards the sustainability of the economic recovery and growth of the
Nigeria‘s economy. Achieving a transformation agenda for sustainable development constitutes
major challenge in Nigeria. Indeed, meeting the various development challenges in the area of
critical infrastructure, poverty reduction, food security, health, water and sanitation. human
capital development, wealth creation, environmental problems in the Niger Delta, national
security and intelligence, productivity and international competitiveness, requires strengthened
capabilities in the engineering and technological innovations as well as research which virtually
cut across most of the critical areas enumerated. These are monumental challenges given the fact
that Nigeria is yet to learn from the experiences of the Newly Industrialized Countries (NICs) and
from the experiences of developing countries that have achieved economic prosperity. Nigeria
has to seriously address those key issues that have shaped the development paradigms in these
countries. The problem is that at the moment engineering and technology are not making the
desired contributions that are necessary for achieving sustainable development. Some of the new
technological regimes needed to meet the challenges are in the areas of:
a. Research and Development
b. Engineering and Technology Education
c. Infrastructure and Telecommunication Technology
d. Capacity Building
e. Policy orientations and Advocacy
However, discussion will be on Research and Development.
2.0 THE STRUCTURE OF NIGERIA’S ECONOMY
Nigeria‘s economic structure is largely oil-based. The economy has stumbled for years due to
political unrest, corruption and poor fiscal policies. However, since the restoration of democracy
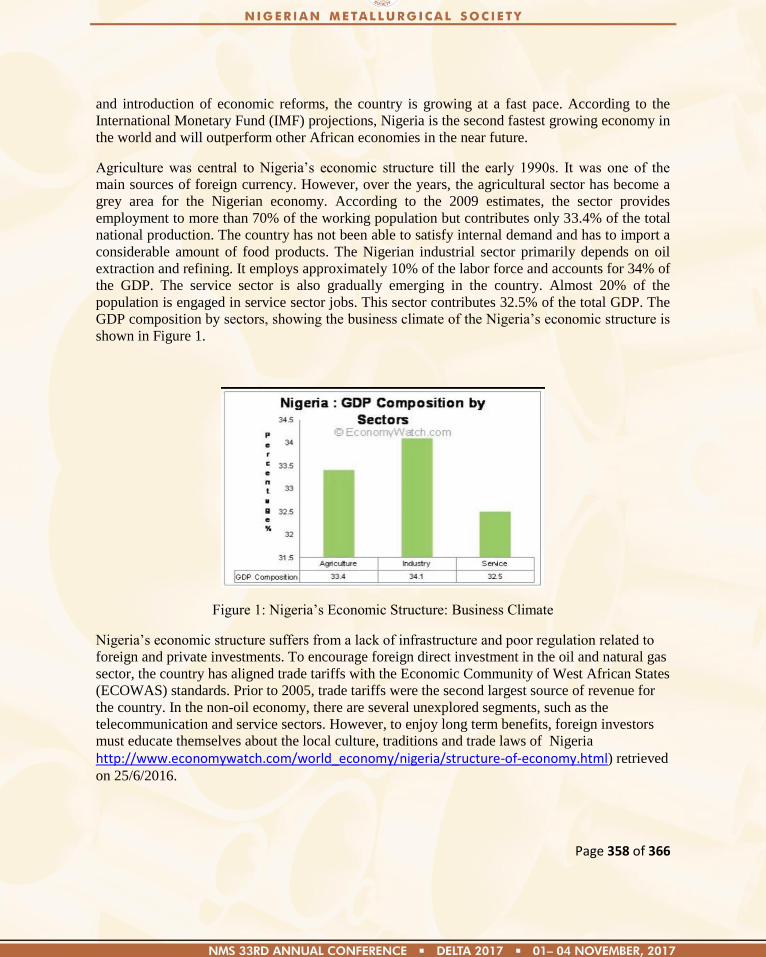
Page 358 of 366
and introduction of economic reforms, the country is growing at a fast pace. According to the
International Monetary Fund (IMF) projections, Nigeria is the second fastest growing economy in
the world and will outperform other African economies in the near future.
Agriculture was central to Nigeria‘s economic structure till the early 1990s. It was one of the
main sources of foreign currency. However, over the years, the agricultural sector has become a
grey area for the Nigerian economy. According to the 2009 estimates, the sector provides
employment to more than 70% of the working population but contributes only 33.4% of the total
national production. The country has not been able to satisfy internal demand and has to import a
considerable amount of food products. The Nigerian industrial sector primarily depends on oil
extraction and refining. It employs approximately 10% of the labor force and accounts for 34% of
the GDP. The service sector is also gradually emerging in the country. Almost 20% of the
population is engaged in service sector jobs. This sector contributes 32.5% of the total GDP. The
GDP composition by sectors, showing the business climate of the Nigeria‘s economic structure is
shown in Figure 1.
Figure 1: Nigeria‘s Economic Structure: Business Climate
Nigeria‘s economic structure suffers from a lack of infrastructure and poor regulation related to
foreign and private investments. To encourage foreign direct investment in the oil and natural gas
sector, the country has aligned trade tariffs with the Economic Community of West African States
(ECOWAS) standards. Prior to 2005, trade tariffs were the second largest source of revenue for
the country. In the non-oil economy, there are several unexplored segments, such as the
telecommunication and service sectors. However, to enjoy long term benefits, foreign investors
must educate themselves about the local culture, traditions and trade laws of Nigeria
http://www.economywatch.com/world_economy/nigeria/structure-of-economy.html) retrieved
on 25/6/2016.
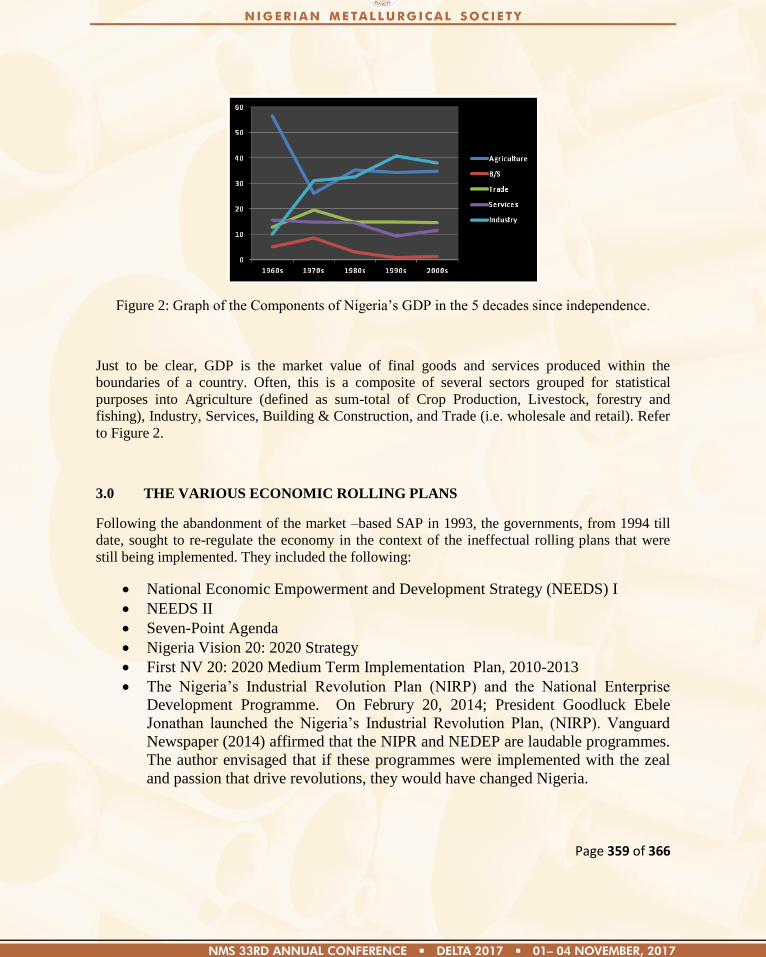
Page 359 of 366
Figure 2: Graph of the Components of Nigeria‘s GDP in the 5 decades since independence.
Just to be clear, GDP is the market value of final goods and services produced within the
boundaries of a country. Often, this is a composite of several sectors grouped for statistical
purposes into Agriculture (defined as sum-total of Crop Production, Livestock, forestry and
fishing), Industry, Services, Building & Construction, and Trade (i.e. wholesale and retail). Refer
to Figure 2.
3.0 THE VARIOUS ECONOMIC ROLLING PLANS
Following the abandonment of the market –based SAP in 1993, the governments, from 1994 till
date, sought to re-regulate the economy in the context of the ineffectual rolling plans that were
still being implemented. They included the following:
National Economic Empowerment and Development Strategy (NEEDS) I
NEEDS II
Seven-Point Agenda
Nigeria Vision 20: 2020 Strategy
First NV 20: 2020 Medium Term Implementation Plan, 2010-2013
The Nigeria‘s Industrial Revolution Plan (NIRP) and the National Enterprise
Development Programme. On Februry 20, 2014; President Goodluck Ebele
Jonathan launched the Nigeria‘s Industrial Revolution Plan, (NIRP). Vanguard
Newspaper (2014) affirmed that the NIPR and NEDEP are laudable programmes.
The author envisaged that if these programmes were implemented with the zeal
and passion that drive revolutions, they would have changed Nigeria.

Page 360 of 366
3.1 The Economic Recovery and Growth Plan (ERGP).
On Wednesday, 5th. April, 2017; President Muhammadu Buhari renewed his administration‘s
commitment to delivering on the electoral promises of the ruling All Progressives Congress
(APC), with the launch of the Economic Recovery and Growth Plan (ERGP). He said the rolling
plan (2017-2020), which was unveiled at the Council Chamber of the Presidential Villa in Abuja,
will not only take Nigeria out of recession but place the economy on the path of growth. (THE
NATION, 2017). Buhari (2017) said and I quote: “We are determined to change Nigeria from
an import-dependent country to a producing nation. We must become a nation where we grow
what we eat and consume what we produce. We must strive to have a strong Naira and
productive economy. The Plan I am launching today therefore sets out what we, as Government,
are committed to do, to create the enabling environment for business to thrive”.
Some targets of the Economic Roadmap are as follows:
Take Nigeria out of recession and place economy on the path of growth.
Roll all sectoral plans for agriculture and food security, energy and transport
infrastructure, industrialization and social investments into one.
Build on the Strategic Implementation Plan ( SIP).
Achieve a 7% growth rate by 2020.
Optimize local content and empower local businesses.
The aim of ERGP is to build on the Strategic Implementation Plan (SIP) and sets out an
ambitious roadmap to return the economy to growth; and to achieve a seven percent growth rate
by 2020 by optimizing local content and empowering local businesses. ―We seek not just to take
the Nigerian economy out of recession but to place it on a path of sustained, inclusive and
diversified growth‖ (Buhari, 2017).
4.0 RESEARCH AND DEVELOPMENT
Online encyclopedia Wikipedia defines research as a search for knowledge, or as any systematic
investigation with an open mind, to establish novel facts, usually using scientific method. A broad
definition of research is given by Shuttleworth (2008) that research includes any gathering of
data, information and facts for the advancement of knowledge. According to Creswell (2008),
―Research is a process of steps used to collect and analyze information to increase our
understanding of a topic or issue‖. From the foregoing, the concept research can be explained as a
systematic inquiry or process of searching for a solution to an identified problem. Such problem
generates the desire to critically examine it so that solution can be synthesized. It has generally
been accepted that ―technology‖ refers to the ability to manufacture (add value) goods and also to
the development of skills, means, arts, craftsmanship or knowledge that will lead to better and
happier societies (Oaikhinan, 2000).

Page 361 of 366
Technology is the means for changing and controlling the environment based on the knowledge
of its characteristics and understanding of its functions. It arose from man‘s effort to solve
problems, change something or satisfy a perceived need. Problems encountered by man in his
daily life were first solved by trial and error. Then in a bid to improve the solutions and also out
of curiosity, man questioned his results and observations and this process led to the development
of science. The relationship between science and technology is a progressive one. Problems
generated by technology are solved by science and this gives rise to improvement in technology
or entirely new technology. This led to research.
Modern technology is based on Newtonian dynamics and deals with the fundamental qualities of
mass, length and time. All other dimensions are derived from these. Culture on the other hand is
the state of manners, taste and intellectual development at a given time and place. The culture of a
people at any point or time is greatly influenced by their previous history, economic condition,
value systems and political environment.
For any practice to be indigenous, it must interact fully with the culture and be fully assimilated.
Any technology, no matter its origin, can become indigenous to a place once it has been
understood and assimilated to the extent that it can be continuously modified and improved by the
people to suit their purpose without external assistance. This will be the concept in which
indigenous technology will be discussed. It should be noted that when we use the term technology
in this discussion, we are using a generic term because each manufacturing process involves one
or more technologies. It is more convenient for our discussion to use technology to cover all such
cases. It could be said that while there is a reasonably well-defined science structure in the federal
government for support of scientific research, a technology structure is non-existent. Research
and Technology should be adapted into the Engineering and Technology Education for
diversifying our economy in a form, I will like to term ―Offensive technical or organizational
change‖. In this case, a policy should be adopted to take a proactive stance, in which with-
survival, initiates a systematic search for better ways of doing things. For example initiating
research and development into, and economic evaluation of say coal and limestone for Ajaokuta
Steel Project, Ajaokuta will constitute an offensive strategy. Changing a certain technique of
production e.g. modification of the original roll guides in light of available materials will
constitute technical change. Such undertakings will naturally impel the setting in place of a
design unit (Roll Pass Design). The need for better guides as well as requirements for other
products will eventually necessitate a better trained and better equipped and organized unit. This
is an organizational change. This could also be brought about in an ―offensive‖ way by looking
forward, drawing up strategies and tactics for the present and future and preparing appropriate
organizational entities through training to effect corporate strategy and the set goals.
It is therefore possible to pursue offensively through investment research and development
training and in-house technical efforts. For this premise, therefore, our contentment is that natural
technological trajectories will yield higher ‗payoffs‘, when actively probed, pursued and
exploited - in other words, identifiable trajectories. ―In this perspective, an explicitly offensive
research and technology policy, co-ordinated with investment, and aiming at rapid advancement
along these natural trajectories, could make a lot of sense (Okundaye, 1992).
The newly industrialized countries are at a different stage in relation to their development in their
use of science, engineering and technology – much of the analysis over the past 35 years have

Page 362 of 366
missed an important point. It has explained the way in which developing countries assimilated
technology through importing machinery, through licensing agreements, and through the
production activities of multinational firms.
All these are important, but I would submit one other very important source of assimilating
foreign technology which is missed - simple imitation and copying (Okundaye, 2015). Imitation
or reverse engineering demands in itself a strong indigenous technological capability. Okundaye
(1992) made the point that improvement and learning in developing countries can be engendered
by innovative activities -- other than the traditional Research Development. These sub- RD
activities could become progenitors of future research departments.
The widening economic gap between nations is increasingly being linked to engineering and
technology. To be effective, engineering and technology need to maintain relevance and have a
sufficient resource base. In order to maintain relevance and garner support from influential
sectors, Engineering and Technology R&D agenda need to be locally articulated, so as to
effectively contribute to economic development and influence emerging national policies.
A fundamental need for development of Engineering and Technology R&Ds. is to have
partnerships for exchange of researchers, ideas, and support facilities. The universities,
polytechnics and research institutes should enhance their relevance to society by developing
partnerships with the local community, industry, and national research facilities. The tertiary
institutions should be open to meet the needs of the local industries and should also update their
research programs to meet the needs of the local industries and should also update their research
programs to meet the practical needs of society. However, these linkages should not be limited to
national, but should also extend it to include regional and international elements. For sustainable
engineering and technology research and development partnerships, linkages must be established
between various sectors. Such interactions should involve, among others, exchange programs,
cooperation between industries and educational institutions, linkages in research facilities, and
identification of other mechanisms and sources of assistance and support. According to Onwualu
(2011), some ingredients considered for meaningful partnerships are presented as follows:
i) Exchange programs
Exchange should be articulated in a variety of ways and at different levels (local, national, and
international). However, its focus should be on promotion of the technological and active
participation in up—to—date scientific investigations that have direct consequences on the social
well—being and national economy.
An excellent exchange program may include the following:
exchange of experts/scientists
collaborative training for R&D programs
access to international facilities
intra— and extra—African student, postdoctoral, and faculty exchanges
active participation in international training workshop and technology fairs.
ii) University/Polytechnic—Industry links
Linkages between industry and universities are very crucial for sustainable development. Such
linkages should be based on partnerships in which mutual support for specific programs can be
identified and implemented. For instance, some of the R&D activities of local industries could be
hosted at universities or research institutes.

Page 363 of 366
Examples of such partnerships are as follows:
industrial chairs
internships
joint research programs
sandwich degree programs
sharing of laboratory facilities/infrastructure.
Other issues that need to be addressed in this context include the promotion of local industries
and economy, provision of technical assistance to existing small and medium enterprises (SMEs),
and promotion of the emerging and creation of new SMEs.
iii)University/Polytechnic— National/International facilities links
Establishment of links between university and national/international facilities is envisioned to
constitute viable partnerships that could address local and regional issues and lead to economic
gains. However, most often developing these links requires identification and promotion of
existing and emerging centers of excellence, whose missions involve fostering stronger R&D
partnerships.
In simple terms, development or growth that can be sustainable, that will last i.e. meeting today‘s
needs without destroying or diminishing the future generation‘s ability to survive or meet their
needs. According to Agberagba(2011), sustainable development is a developmental path along
which the maximization of human well being of today‘s generation does not lead to decline in the
future well being. Sustainable development entails balancing the goals of social, economic and
technological programmes. Therefore as the call for Sustainable Development echoes nationally
and globally, and knowing that research and development will play a vital role in economic
recovery and growth, it is therefore right to say that the higher education system will be ideally
positioned to drive the process (Agberagba, 2011) opined. This feat can only be achieved through
an organized research and development (Okundaye, 2006; Ibhadhode, 2006; Ajuwa,2011;
Adewuyi, 2014).
6.0 CONCLUSION
In conclusion, perhaps it is worth stressing that for Nigeria to optimize local content and
empower local businesses, as well as achieve a 7% growth rate by 2020, there is the need to
embark on an effective Research and Development programmes within the five broad
technological areas: manufacturing and design, materials processing for manufacturing,
telecommunications/microelectronics, biotechnology/bioengineering and research utilization and
recovery. The development of industrial raw-materials including solid minerals, iron ores,
bauxite, coal,calcium carbonate, calcite etc. as well as the human resources which are abound in
the country is largely a metallurgical problem, the solution of which essentially demands varying
degrees of research and manufacturing processes. Metal production through effective research
being the basis for rapid industrial development that took place in the last three centuries, but
even today, such developments are still possible; so let us look inward and develop research; for

Page 364 of 366
this is the ONLY way we can fully take the Nigerian economy out of recession and place it on a
path of sustained, inclusive and diversified growth which can create the platform for us as a
nation to join the club of secured and developed economies and be among the 20 largest
economies of the world by the year 2020. Concerted efforts must be made to ensure that
challenges in all the areas of the Vision are seriously addressed, especially in area of research and
development, which is critical to other components of the Nigerian Economy. Nigeria should toe
the developmental steps taken by Brazil, India, Malaysia, Mexico and other newly industrialized
nations (NIN). It is on this line that I will urge our metallurgists and metallurgical engineers and
policy makers to cross fertilize ideas and appreciate their expected role and responsibility in
achieving the desired goals of Vision 2020.
REFERENCES
Adewuyi, B. (2014):Sustaining the Development of Auto Industry in Nigeria: Auto Parts
Production. Paper presented at the 30th. Annual Conference & AGM of the Nigerian
Metallurgical Society, held at Abuja on 29th. -1
st. Nov.
Agberagba, V.I. (2011): Engineering Technology Education and Sustainable Development. Paper
presented at the 1st. International Conference on Engineering and Technology (IEC
2011), held at Auchi Polytechnic, Auchi on the Ist.- 4th. Nov.
Ajuwa, I.C. (2011): Research and Development as a Strategy for Tackling Developmental
Challenges in Sub-Saharan Economies. Lead Paper presented at the 1st. International
Conference on Engineering and Technology (IEC 2011), held at Auchi Polytechnic,
Auchi. on the Ist.- 4th. Nov.
Buhari, M. (2017). Our Anti-Recession, Growth Battle Strategy. THE NATION. Thursday, April
6.
Creswell, J.W. (2008): Educational Research: Planning, Conducting and Evaluating Quantitative
and Qualitative Research (3rd
. ed.) Upper saddle River: Pearson.
http://www.economywatch.com/worldeconomy/nigeria/structure - of-economy. html.Retrieved on 25/6/2016
Ibhadode A.O.A (2006). The Instrumentality of Manufacturing in Translating Poverty to
Prosperity. An Inaugural Lecture Series 82, University of Benin City, May 18th.
Nigerian Vanguard (2014). Nigeria‘s Industrial Revolution Plan. Editorial Comments
Oaikhinan E.P (2000). Technology Acquisition and Management. Lagos, Epina Technology
Transfer Limited.
Obadan M.I. (2010). Nigeria at 50 and its National Economic Development Paradigms: The
Benefit of Hindsight. A lecture delivered at the occasion of Nigeria‘s 50th Independence
Anniversary at the Auchi Polytechnic, Auchi on Sept., 2nd
.
Okundaye, S.E. (2015). Developing the Foundry Industry for Sustainable Economy In Nigeria.
Book of Readings. 1st. International Engineering Conference (IEC 2015 held at the
School of Engineering & Engineering Technology, Federal University of Technology,
Minna, Niger State. Pp 439-444.
Okundaye S.E. (2006). Small-Scale Foundry: A Vital Downstream Industry for Technological
Self Reliance, Maiden Seminar, School of Engineering, Auchi Polytechnic, Auchi,
Nigeria, September 11-12.

Page 365 of 366
Okundaye, S.E. (1992). Research & Technology Adaptation in Technical Education for Rapid
Development. Journal of Technical Education Review (JOTER). Vol .III No 3. April Pp.
67- 87.
Onwualu P.A.(2011). Tackling Development Challenges Through Sustainable Engineering and
Technology: An Appraisal of the Nigerian Situation. 1st International Engineering
Conference on 1st – 4
th November, 2011.
The Holy Bible (1998) Genesis Chapter One Verse 31