deliverable d 2.1 description of microstructures and evolutions
TRANSCRIPT

1 / 34
D 2.1 / v 1.6 / First issue / PU (Public)
Deliverable D 2.1
Description of microstructures and evolutions
Document type Deliverable D 2.1
Document Version / Status 1.6
Primary Authors Thorsten Tonnesen, [email protected], RWTH
Distribution Level PU (Public)
Project Acronym ATHOR
Project Title Advanced THermomechanical multiscale mOdelling of Refractory linings
Grant Agreement Number 764987
Project Website www.etn-athor.eu
Project Coordinator Marc Huger, [email protected], UNILIM
Document Contributors
Marc Huger, [email protected], UNILIM
Thorsten Tonnesen, [email protected], RWTH
Dietmar Gruber, [email protected], MUL
Jacek Szczerba, [email protected], AGH
Diana Vitiello, [email protected], UNILIM
Robert Kaczmarek, [email protected], UNLIM
Camille Reynaert, [email protected], AGH
Ilona Kieliba, [email protected], RWTH
Vahid Tadaion, [email protected], RWTH
Sina Darban, [email protected], AGH
Efstathios Kyrilis, [email protected], RWTH
History of Changes
Version Date Author (Organization) Change Page
1.0 22/06/2020
Diana Vitiello(UNILIM), Robert Kaczmarek(UNILIM), Ilona Kieliba(RWTH), Vahid Tadion(RWTH), Efstathios Kyrilis(RWTH), Camille Reynaert(AGH), Sina Darban(AGH) and Glyn Derrick(UNILIM)
Sections of text added, general formatting All
1.1 03/07/2020 Camille Reynaert(AGH) and Sina Darban(AGH)
Reorganisation of corrosion sections 4-10
1.2 06/07/2020 Glyn Derrick(UNILIM) General formatting and English correction All
1.3 10/07/2020 Glyn Derrick(UNILIM) Corrections accepted All
1.4 08/03/2021 Marc Huger (UNILIM) and Glyn Derrick (UNILIM)
Scientific review All
1.5 07/04/2021
Diana Vitiello (UNILIM),
Camille Reynaert(AGH) and
Vahid Tadion(RWTH)
Corrections All
1.6 07/05/2021
Vahid Tadion(RWTH), Sina Darban(AGH), Efstathios Kyrilis(RWTH),
and Ilona Kieliba(RWTH),
Corrections 3, 4, 12, 18, 19, 26-29
2 / 34
D 2.1 / v 1.6 / First issue / PU (Public)
TABLE OF CONTENTS
1 INTRODUCTION ........................................................................................................................................................................ 2
2 FIRED ALUMINA-SPINEL BRICKS .......................................................................................................................................... 2
2.1 Technical information about the product ........................................................................................................................ 2
2.2 Initial characterisation of the product .............................................................................................................................. 3
2.3 Characterization after heat treatment .............................................................................................................................. 4
2.4 Characterization after corrosion ....................................................................................................................................... 4
3 RESIN BONDED ALUMINA-CARBON BRICKS ....................................................................................................................... 8
3.1 Technical information about the product ........................................................................................................................ 8
3.2 Characterization in the initial state ................................................................................................................................... 8
3.3 Characterization after corrosion ..................................................................................................................................... 10
4 ALUMINA-SPINEL MODEL CASTABLES .............................................................................................................................. 13
4.1 Technical information about the product ...................................................................................................................... 13
4.2 Characterization after thermal treatment / sintering ..................................................................................................... 13
4.3 Characterization after thermal fatigue ........................................................................................................................... 14
4.4 Characterization after corrosion ..................................................................................................................................... 15
5 VERMICULITE BRICKS .......................................................................................................................................................... 19
5.1 Technical information about the product ...................................................................................................................... 19
5.2 Characterization in the initial state ................................................................................................................................. 19
5.3 Characterization after thermal treatment ....................................................................................................................... 21
6 INSULATING FIRECLAY BRICKS .......................................................................................................................................... 24
6.1 Technical information about the product ...................................................................................................................... 24
6.2 Characterization in the initial state ................................................................................................................................. 24
6.3 Characterization after thermal treatment ....................................................................................................................... 26
7 FUSED SILICA REFRACTORY CASTABLE .......................................................................................................................... 28
7.1 Technical information about the product ...................................................................................................................... 28
7.2 Characterization in the initial state ................................................................................................................................. 29
7.3 Characterization after thermal treatment ....................................................................................................................... 30
8 CONCLUSION ......................................................................................................................................................................... 33
9 REFERENCES ......................................................................................................................................................................... 34
1 Introduction As an output of WP2 dedicated to “Advanced characterization of raw materials, refractories and joints”, this report will review the results of task 2.1 focused on microstructure investigations (by XRD, HT-XRD, SEM, EDS, EBSD) of the studied materials, in their different states (including corrosion). The aim here was to build a better understanding of the relationships existing between microstructure (and its evolution) and thermomechanical properties (described later within other Deliverables).
2 Fired Alumina-Spinel bricks
2.1 Technical information about the product
Alumina-Spinel bricks are mainly used in the steel ladle lining (outside of the slag line). Alumina is used due to its high melting point and the addition of spinel (with a slightly higher melting point) within the matrix is known to improve resistance to corrosion and reduce the penetration of basic slag. Alumina spinel refractories are carbon-free, thus they do not contribute to carbon pick-up by liquid steel during handling. Hence, this material can be used for steel grades with a highly restricted quantity of carbon.
3 / 34
D 2.1 / v 1.6 / First issue / PU (Public)
Alumina spinel bricks investigated in this report, have previously been prefired at temperatures exceeding the application temperature. Therefore, no significant microstructural evolutions are expected.
2.2 Initial characterisation of the product
The microstructure of alumina spinel brick, has been described in detail [1], the details of which can be found in the following sub-sections.
2.2.1 Density-porosity
Alumina spinel brick has an open porosity of 19.7 % and an apparent density of 3.01 g/cm3. Both values have been measured using Archimedes principle.
2.2.2 Mineral phases
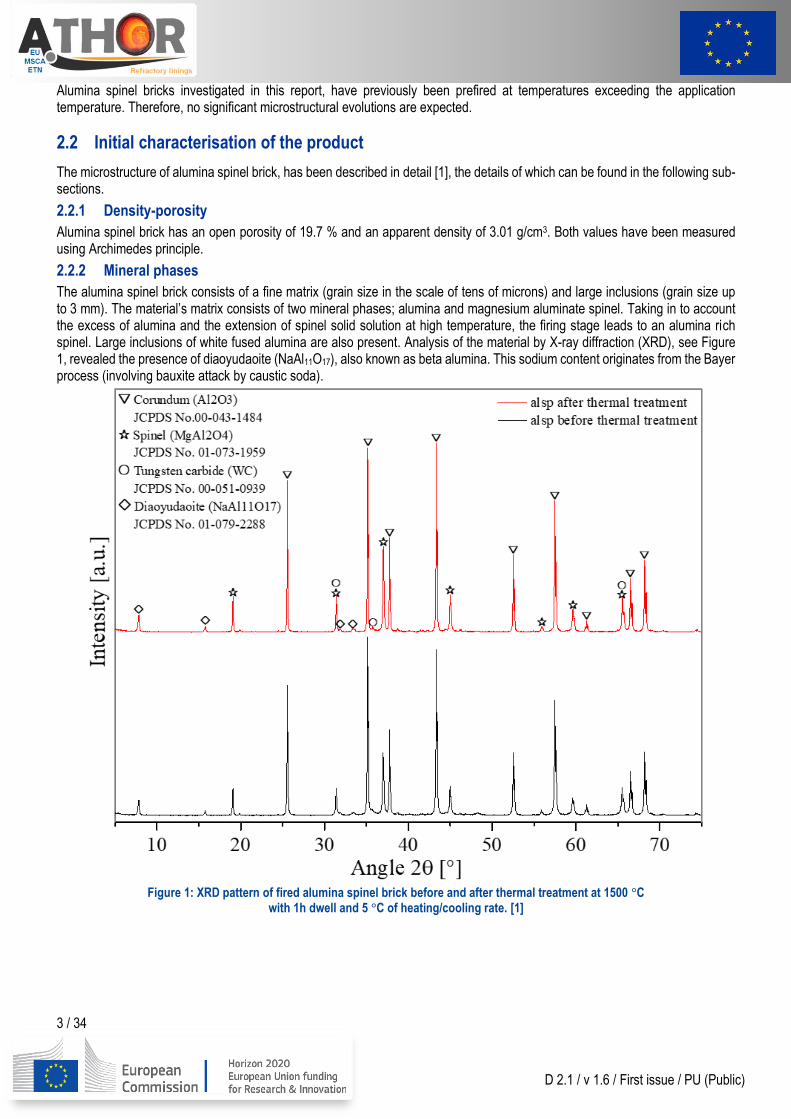
The alumina spinel brick consists of a fine matrix (grain size in the scale of tens of microns) and large inclusions (grain size up to 3 mm). The material’s matrix consists of two mineral phases; alumina and magnesium aluminate spinel. Taking in to account the excess of alumina and the extension of spinel solid solution at high temperature, the firing stage leads to an alumina rich spinel. Large inclusions of white fused alumina are also present. Analysis of the material by X-ray diffraction (XRD), see Figure 1, revealed the presence of diaoyudaoite (NaAl11O17), also known as beta alumina. This sodium content originates from the Bayer process (involving bauxite attack by caustic soda).
Figure 1: XRD pattern of fired alumina spinel brick before and after thermal treatment at 1500 °C
with 1h dwell and 5 °C of heating/cooling rate. [1]
4 / 34
D 2.1 / v 1.6 / First issue / PU (Public)
2.2.3 Microstructure
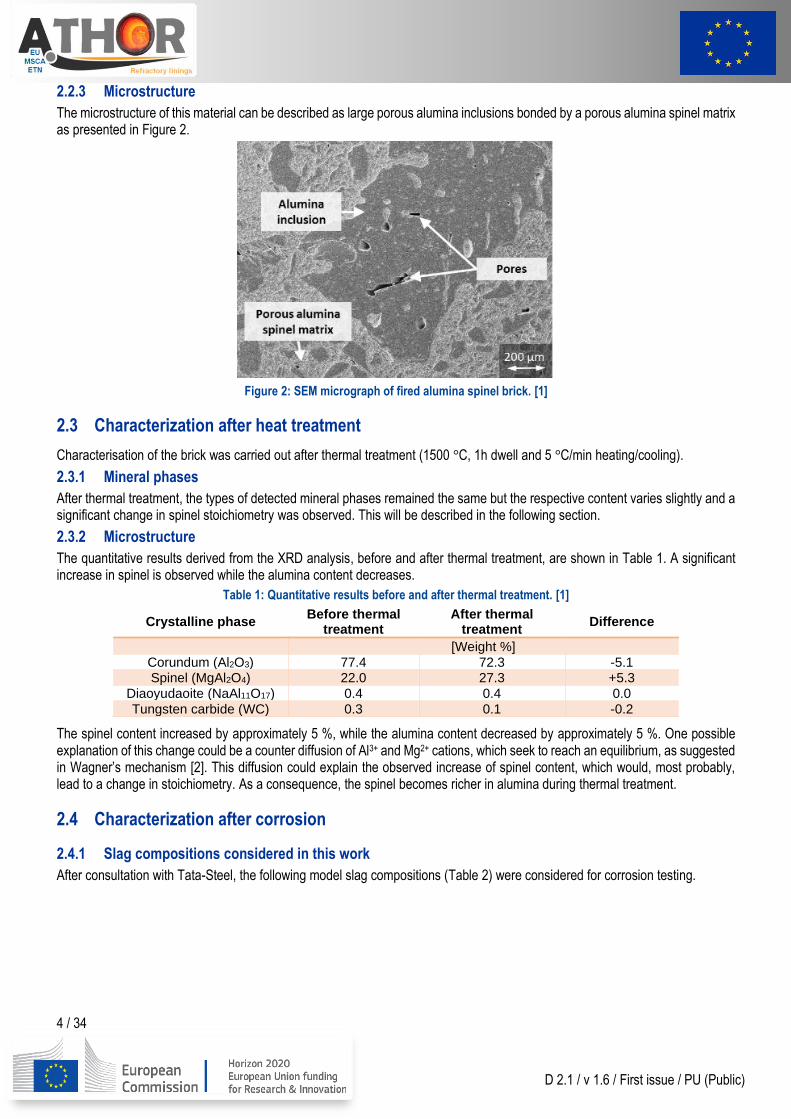
The microstructure of this material can be described as large porous alumina inclusions bonded by a porous alumina spinel matrix as presented in Figure 2.
Figure 2: SEM micrograph of fired alumina spinel brick. [1]
2.3 Characterization after heat treatment
Characterisation of the brick was carried out after thermal treatment (1500 °C, 1h dwell and 5 °C/min heating/cooling).
2.3.1 Mineral phases
After thermal treatment, the types of detected mineral phases remained the same but the respective content varies slightly and a significant change in spinel stoichiometry was observed. This will be described in the following section.
2.3.2 Microstructure
The quantitative results derived from the XRD analysis, before and after thermal treatment, are shown in Table 1. A significant increase in spinel is observed while the alumina content decreases.
Table 1: Quantitative results before and after thermal treatment. [1]
Crystalline phase Before thermal
treatment After thermal
treatment Difference
[Weight %]
Corundum (Al2O3) 77.4 72.3 -5.1 Spinel (MgAl2O4) 22.0 27.3 +5.3
Diaoyudaoite (NaAl11O17) 0.4 0.4 0.0
Tungsten carbide (WC) 0.3 0.1 -0.2
The spinel content increased by approximately 5 %, while the alumina content decreased by approximately 5 %. One possible explanation of this change could be a counter diffusion of Al3+ and Mg2+ cations, which seek to reach an equilibrium, as suggested in Wagner’s mechanism [2]. This diffusion could explain the observed increase of spinel content, which would, most probably, lead to a change in stoichiometry. As a consequence, the spinel becomes richer in alumina during thermal treatment.
2.4 Characterization after corrosion
2.4.1 Slag compositions considered in this work
After consultation with Tata-Steel, the following model slag compositions (Table 2) were considered for corrosion testing.
5 / 34
D 2.1 / v 1.6 / First issue / PU (Public)
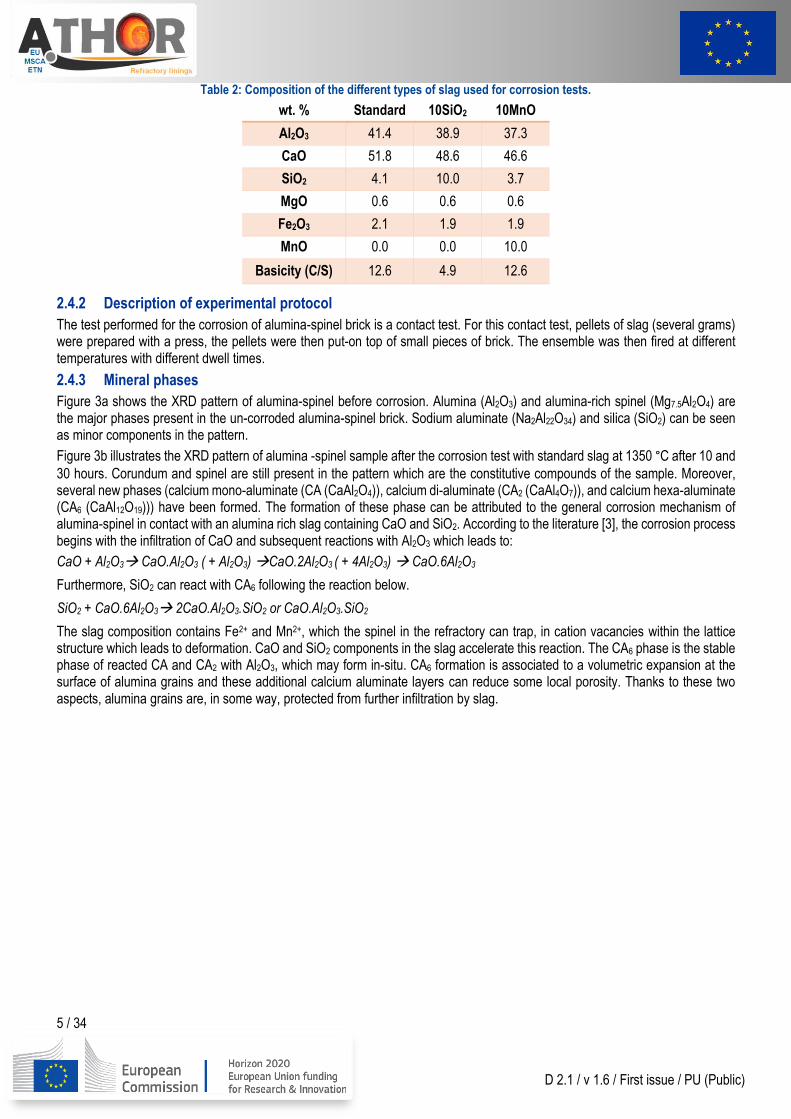
Table 2: Composition of the different types of slag used for corrosion tests.
wt. % Standard 10SiO2 10MnO
Al2O3 41.4 38.9 37.3
CaO 51.8 48.6 46.6
SiO2 4.1 10.0 3.7
MgO 0.6 0.6 0.6
Fe2O3 2.1 1.9 1.9
MnO 0.0 0.0 10.0
Basicity (C/S) 12.6 4.9 12.6
2.4.2 Description of experimental protocol
The test performed for the corrosion of alumina-spinel brick is a contact test. For this contact test, pellets of slag (several grams) were prepared with a press, the pellets were then put-on top of small pieces of brick. The ensemble was then fired at different temperatures with different dwell times.
2.4.3 Mineral phases
Figure 3a shows the XRD pattern of alumina-spinel before corrosion. Alumina (Al2O3) and alumina-rich spinel (Mg7.5Al2O4) are the major phases present in the un-corroded alumina-spinel brick. Sodium aluminate (Na2Al22O34) and silica (SiO2) can be seen as minor components in the pattern.
Figure 3b illustrates the XRD pattern of alumina -spinel sample after the corrosion test with standard slag at 1350 °C after 10 and
30 hours. Corundum and spinel are still present in the pattern which are the constitutive compounds of the sample. Moreover, several new phases (calcium mono-aluminate (CA (CaAl2O4)), calcium di-aluminate (CA2 (CaAl4O7)), and calcium hexa-aluminate (CA6 (CaAl12O19))) have been formed. The formation of these phase can be attributed to the general corrosion mechanism of alumina-spinel in contact with an alumina rich slag containing CaO and SiO2. According to the literature [3], the corrosion process begins with the infiltration of CaO and subsequent reactions with Al2O3 which leads to:
CaO + Al2O3→ CaO.Al2O3 ( + Al2O3) →CaO.2Al2O3 ( + 4Al2O3) → CaO.6Al2O3
Furthermore, SiO2 can react with CA6 following the reaction below.
SiO2 + CaO.6Al2O3→ 2CaO.Al2O3.SiO2 or CaO.Al2O3.SiO2
The slag composition contains Fe2+ and Mn2+, which the spinel in the refractory can trap, in cation vacancies within the lattice structure which leads to deformation. CaO and SiO2 components in the slag accelerate this reaction. The CA6 phase is the stable phase of reacted CA and CA2 with Al2O3, which may form in-situ. CA6 formation is associated to a volumetric expansion at the surface of alumina grains and these additional calcium aluminate layers can reduce some local porosity. Thanks to these two aspects, alumina grains are, in some way, protected from further infiltration by slag.

6 / 34
D 2.1 / v 1.6 / First issue / PU (Public)
Figure 3: XRD pattern of an Al-MA brick (a) un-corroded sample (b) corroded with standard slag.
2.4.4 Microstructure
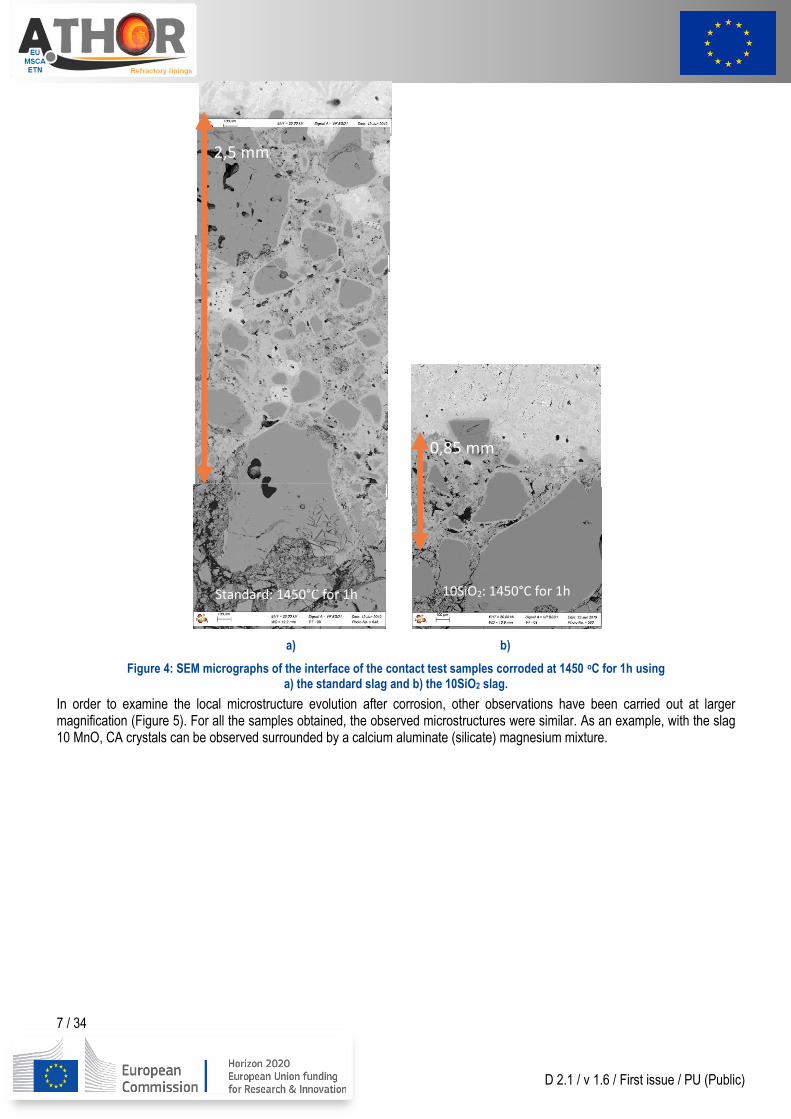
In order to examine the depth of infiltration after corrosion, Figure 4 shows clearly, at a macroscopic level, the interface between the initial state of the material and the area which has been infiltrated by the slag. The depth of infiltration depends on the slag used. The sample corroded by the standard slag (Figure 4a), has been infiltrated three times more than the sample corroded by the 10SiO2 slag (Figure 4b). However, it was not possible to determinate the infiltration in the sample corroded by the 10MnO slag as the slag flowed out of the sample.
7 / 34
D 2.1 / v 1.6 / First issue / PU (Public)
a) b)
Figure 4: SEM micrographs of the interface of the contact test samples corroded at 1450 oC for 1h using a) the standard slag and b) the 10SiO2 slag.
In order to examine the local microstructure evolution after corrosion, other observations have been carried out at larger magnification (Figure 5). For all the samples obtained, the observed microstructures were similar. As an example, with the slag 10 MnO, CA crystals can be observed surrounded by a calcium aluminate (silicate) magnesium mixture.
2,5 mm
Standard: 1450°C for 1h
0,85 mm
10SiO2: 1450°C for 1h
8 / 34
D 2.1 / v 1.6 / First issue / PU (Public)
a) b)
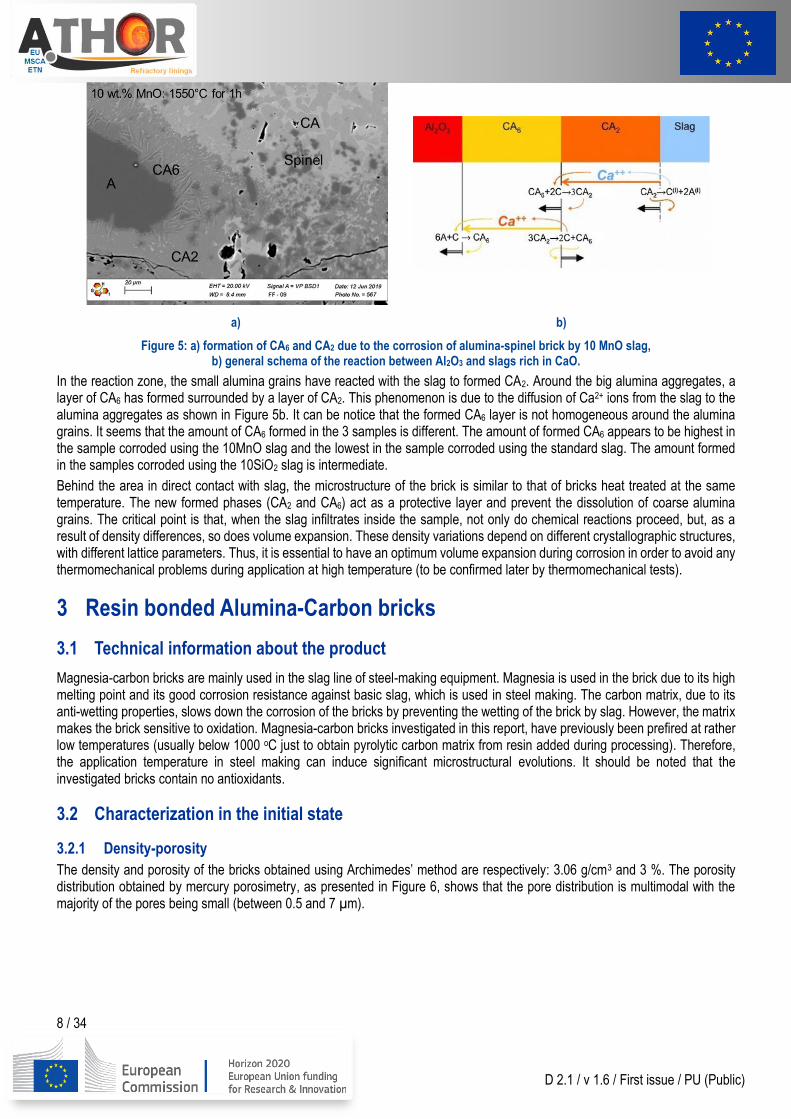
Figure 5: a) formation of CA6 and CA2 due to the corrosion of alumina-spinel brick by 10 MnO slag, b) general schema of the reaction between Al2O3 and slags rich in CaO.
In the reaction zone, the small alumina grains have reacted with the slag to formed CA2. Around the big alumina aggregates, a layer of CA6 has formed surrounded by a layer of CA2. This phenomenon is due to the diffusion of Ca2+ ions from the slag to the alumina aggregates as shown in Figure 5b. It can be notice that the formed CA6 layer is not homogeneous around the alumina grains. It seems that the amount of CA6 formed in the 3 samples is different. The amount of formed CA6 appears to be highest in the sample corroded using the 10MnO slag and the lowest in the sample corroded using the standard slag. The amount formed in the samples corroded using the 10SiO2 slag is intermediate.
Behind the area in direct contact with slag, the microstructure of the brick is similar to that of bricks heat treated at the same temperature. The new formed phases (CA2 and CA6) act as a protective layer and prevent the dissolution of coarse alumina grains. The critical point is that, when the slag infiltrates inside the sample, not only do chemical reactions proceed, but, as a result of density differences, so does volume expansion. These density variations depend on different crystallographic structures, with different lattice parameters. Thus, it is essential to have an optimum volume expansion during corrosion in order to avoid any thermomechanical problems during application at high temperature (to be confirmed later by thermomechanical tests).
3 Resin bonded Alumina-Carbon bricks
3.1 Technical information about the product
Magnesia-carbon bricks are mainly used in the slag line of steel-making equipment. Magnesia is used in the brick due to its high melting point and its good corrosion resistance against basic slag, which is used in steel making. The carbon matrix, due to its anti-wetting properties, slows down the corrosion of the bricks by preventing the wetting of the brick by slag. However, the matrix makes the brick sensitive to oxidation. Magnesia-carbon bricks investigated in this report, have previously been prefired at rather low temperatures (usually below 1000 oC just to obtain pyrolytic carbon matrix from resin added during processing). Therefore, the application temperature in steel making can induce significant microstructural evolutions. It should be noted that the investigated bricks contain no antioxidants.
3.2 Characterization in the initial state
3.2.1 Density-porosity
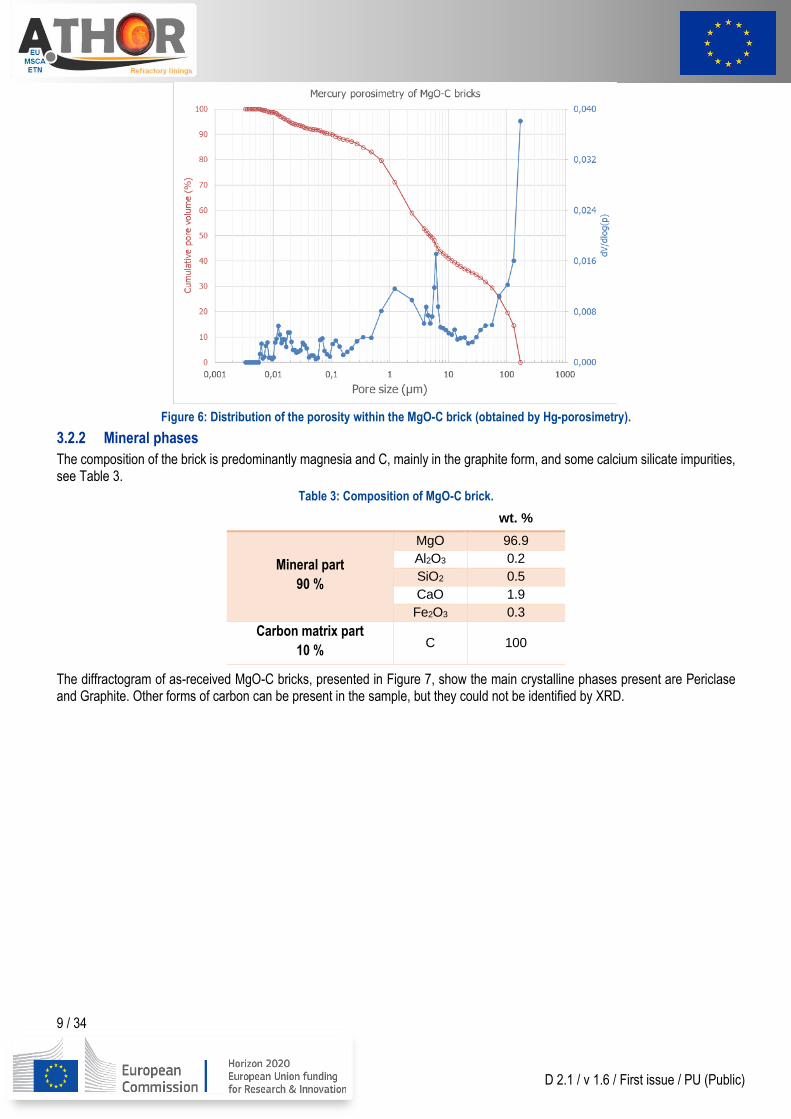
The density and porosity of the bricks obtained using Archimedes’ method are respectively: 3.06 g/cm3 and 3 %. The porosity distribution obtained by mercury porosimetry, as presented in Figure 6, shows that the pore distribution is multimodal with the majority of the pores being small (between 0.5 and 7 µm).
9 / 34
D 2.1 / v 1.6 / First issue / PU (Public)
Figure 6: Distribution of the porosity within the MgO-C brick (obtained by Hg-porosimetry).
3.2.2 Mineral phases
The composition of the brick is predominantly magnesia and C, mainly in the graphite form, and some calcium silicate impurities, see Table 3.
Table 3: Composition of MgO-C brick.
wt. %
Mineral part
90 %
MgO 96.9
Al2O3 0.2
SiO2 0.5
CaO 1.9
Fe2O3 0.3
Carbon matrix part
10 % C 100
The diffractogram of as-received MgO-C bricks, presented in Figure 7, show the main crystalline phases present are Periclase and Graphite. Other forms of carbon can be present in the sample, but they could not be identified by XRD.
10 / 34
D 2.1 / v 1.6 / First issue / PU (Public)
Figure 7: XRD pattern of as-received MgO-C bricks.
3.2.3 Microstructure
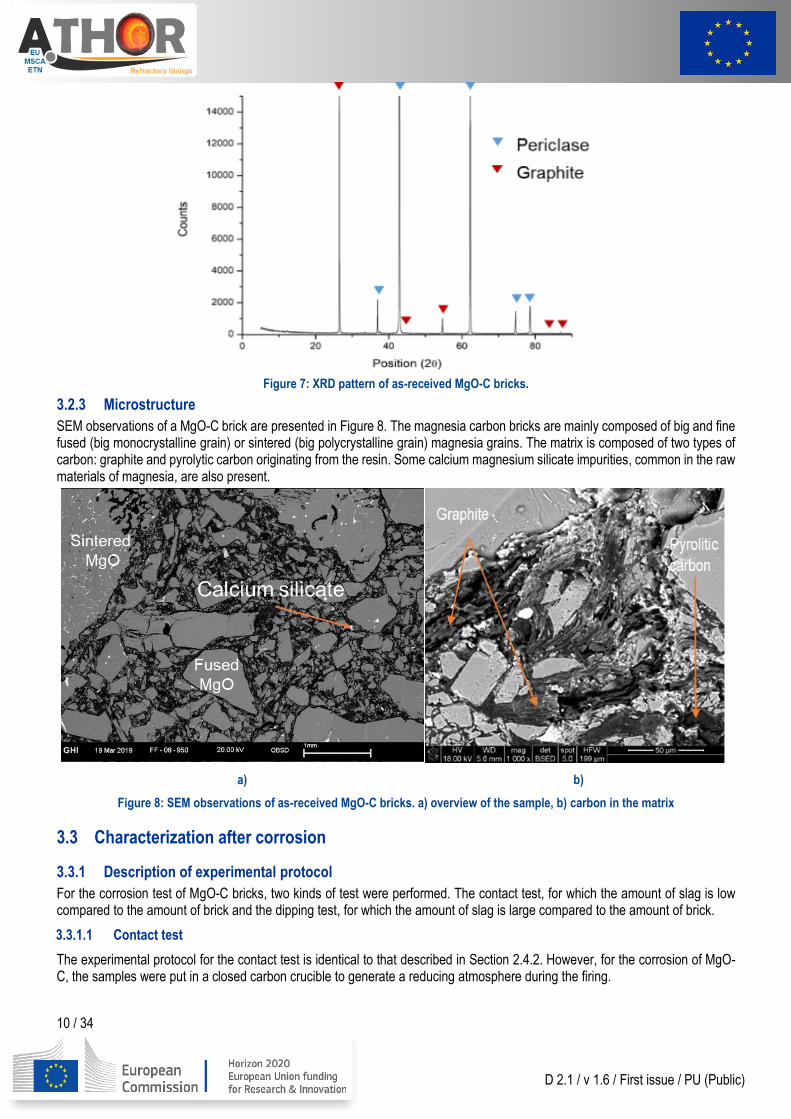
SEM observations of a MgO-C brick are presented in Figure 8. The magnesia carbon bricks are mainly composed of big and fine fused (big monocrystalline grain) or sintered (big polycrystalline grain) magnesia grains. The matrix is composed of two types of carbon: graphite and pyrolytic carbon originating from the resin. Some calcium magnesium silicate impurities, common in the raw materials of magnesia, are also present.
a) b)
Figure 8: SEM observations of as-received MgO-C bricks. a) overview of the sample, b) carbon in the matrix
3.3 Characterization after corrosion
3.3.1 Description of experimental protocol
For the corrosion test of MgO-C bricks, two kinds of test were performed. The contact test, for which the amount of slag is low compared to the amount of brick and the dipping test, for which the amount of slag is large compared to the amount of brick.
3.3.1.1 Contact test
The experimental protocol for the contact test is identical to that described in Section 2.4.2. However, for the corrosion of MgO-C, the samples were put in a closed carbon crucible to generate a reducing atmosphere during the firing.
11 / 34
D 2.1 / v 1.6 / First issue / PU (Public)
3.3.1.2 Dipping test
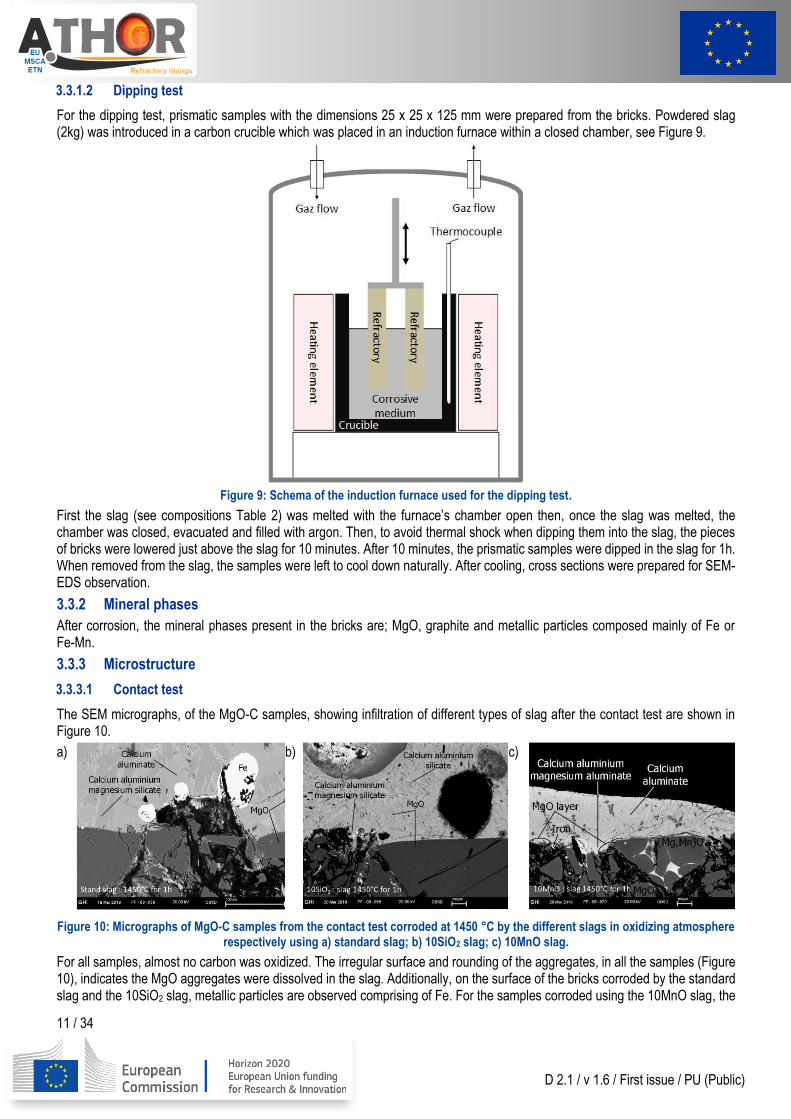
For the dipping test, prismatic samples with the dimensions 25 x 25 x 125 mm were prepared from the bricks. Powdered slag (2kg) was introduced in a carbon crucible which was placed in an induction furnace within a closed chamber, see Figure 9.
Figure 9: Schema of the induction furnace used for the dipping test.
First the slag (see compositions Table 2) was melted with the furnace’s chamber open then, once the slag was melted, the chamber was closed, evacuated and filled with argon. Then, to avoid thermal shock when dipping them into the slag, the pieces of bricks were lowered just above the slag for 10 minutes. After 10 minutes, the prismatic samples were dipped in the slag for 1h. When removed from the slag, the samples were left to cool down naturally. After cooling, cross sections were prepared for SEM-EDS observation.
3.3.2 Mineral phases
After corrosion, the mineral phases present in the bricks are; MgO, graphite and metallic particles composed mainly of Fe or Fe-Mn.
3.3.3 Microstructure
3.3.3.1 Contact test
The SEM micrographs, of the MgO-C samples, showing infiltration of different types of slag after the contact test are shown in Figure 10.
a)
b)
c)
Figure 10: Micrographs of MgO-C samples from the contact test corroded at 1450 °C by the different slags in oxidizing atmosphere respectively using a) standard slag; b) 10SiO2 slag; c) 10MnO slag.
For all samples, almost no carbon was oxidized. The irregular surface and rounding of the aggregates, in all the samples (Figure 10), indicates the MgO aggregates were dissolved in the slag. Additionally, on the surface of the bricks corroded by the standard slag and the 10SiO2 slag, metallic particles are observed comprising of Fe. For the samples corroded using the 10MnO slag, the
12 / 34
D 2.1 / v 1.6 / First issue / PU (Public)
observed metallic particles comprise of Fe and Mn. These particles result from the carbothermal reduction of C with MgO followed by the re-oxidation of the Mg gas formed during the former reaction. More details of this process are given in the deliverable D2.2.
Some slag infiltration can be observed at the boundary of the MgO grain. Furthermore, the formation of an MgO layer was observed at the surface of the sample corroded using the 10MnO slag at 1450 °C and 1550 °C. No significant differences were observed between the sample corroded at 1450 °C and 1550 °C.
3.3.3.2 Dipping test
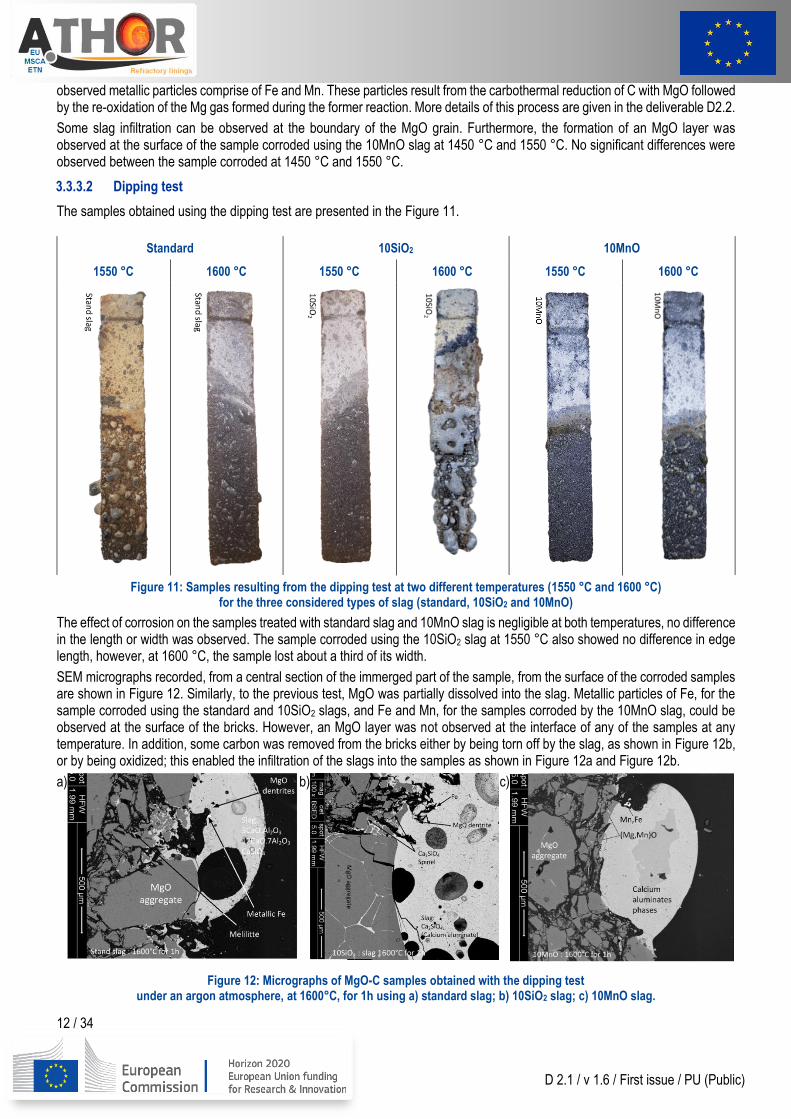
The samples obtained using the dipping test are presented in the Figure 11.
Figure 11: Samples resulting from the dipping test at two different temperatures (1550 °C and 1600 °C) for the three considered types of slag (standard, 10SiO2 and 10MnO)
The effect of corrosion on the samples treated with standard slag and 10MnO slag is negligible at both temperatures, no difference in the length or width was observed. The sample corroded using the 10SiO2 slag at 1550 °C also showed no difference in edge length, however, at 1600 °C, the sample lost about a third of its width.
SEM micrographs recorded, from a central section of the immerged part of the sample, from the surface of the corroded samples are shown in Figure 12. Similarly, to the previous test, MgO was partially dissolved into the slag. Metallic particles of Fe, for the sample corroded using the standard and 10SiO2 slags, and Fe and Mn, for the samples corroded by the 10MnO slag, could be observed at the surface of the bricks. However, an MgO layer was not observed at the interface of any of the samples at any temperature. In addition, some carbon was removed from the bricks either by being torn off by the slag, as shown in Figure 12b, or by being oxidized; this enabled the infiltration of the slags into the samples as shown in Figure 12a and Figure 12b.
a)
b)
c)
Figure 12: Micrographs of MgO-C samples obtained with the dipping test under an argon atmosphere, at 1600°C, for 1h using a) standard slag; b) 10SiO2 slag; c) 10MnO slag.
Standard 10SiO2 10MnO
1550 °C 1600 °C 1550 °C 1600 °C 1550 °C 1600 °C
13 / 34
D 2.1 / v 1.6 / First issue / PU (Public)
An MgO layer can be observed in the sample corroded using the 10MnO slag from the contact test (Figure 10c)) but not from the dipping test. This is due to the difference in the quantity of the slag used in each test. The quantity of slag used for the contact test is small, it quickly reaches saturation. MgO could no longer dissolve into the slag and so the MgO layer remains as the surface of the sample. For the dipping test, the slag never reaches saturation and so the MgO layer is continuously dissolved.
4 Alumina-Spinel model castables
4.1 Technical information about the product
Spinel containing castables are being increasingly used in industrial steel applications, especially in steel ladles, mainly due to their eco-friendliness and the growing need of ultralow carbon metallurgy. To achieve the desired properties for the specific application in the steel ladle refractory lining, spinel is introduced via two main routes. Pre-formed spinel alumina-based castables, exhibiting a suitable combination of high volumetric stability and improved thermo-mechanical properties, are predominantly used in the steel ladle bottom as the precast blocks. Whereas in situ spinel forming castables, demonstrating better corrosion resistance and considerable volumetric change at high temperatures, are preferentially applied in steel ladle site walls and impact areas.
In order to understand complex behaviour of spinel containing castables, eight model alumina-spinel castables were designed and investigated within the ATHOR project. These castable formulations were modified with the intention of examining the influence of four design parameters; the cement type (Calcium Aluminate Cement, CAC vs. novel Calcium Magnesium Aluminate cement, CMA), the aggregate type (sintered tabular alumina vs fused alumina), the total spinel content and the type of reactive alumina.
4.2 Characterization after thermal treatment / sintering
4.2.1 Description of experimental protocol
All alumina-spiel castables, after the casting and curing procedure, were dried at 110 °C for 24h and sintered at 1600 °C with a 2 hour dwell. The open porosity and apparent density values were measured by Archimedes principle after sintering. Detailed microstructural characterisation was carried out with scanning electron microscope (SEM) from Zeiss equipped with an Energy Dispersive X-ray spectroscopy (EDX) detector for element analyses.
4.2.2 Microstructure
The open porosity of the investigated model castables was in the range of 20.5 and 23.5 %. The lowest obtained value was achieved for the castable based on fused aggregates and the highest for the castable with spinel introduced only via CMA addition. The apparent density oscillated between 3.00 and 3.17 g/cm3, where the minimum value was obtained from the castable with spinel introduced only via CMA addition and the maximum value from the castable based on fused aggregate.
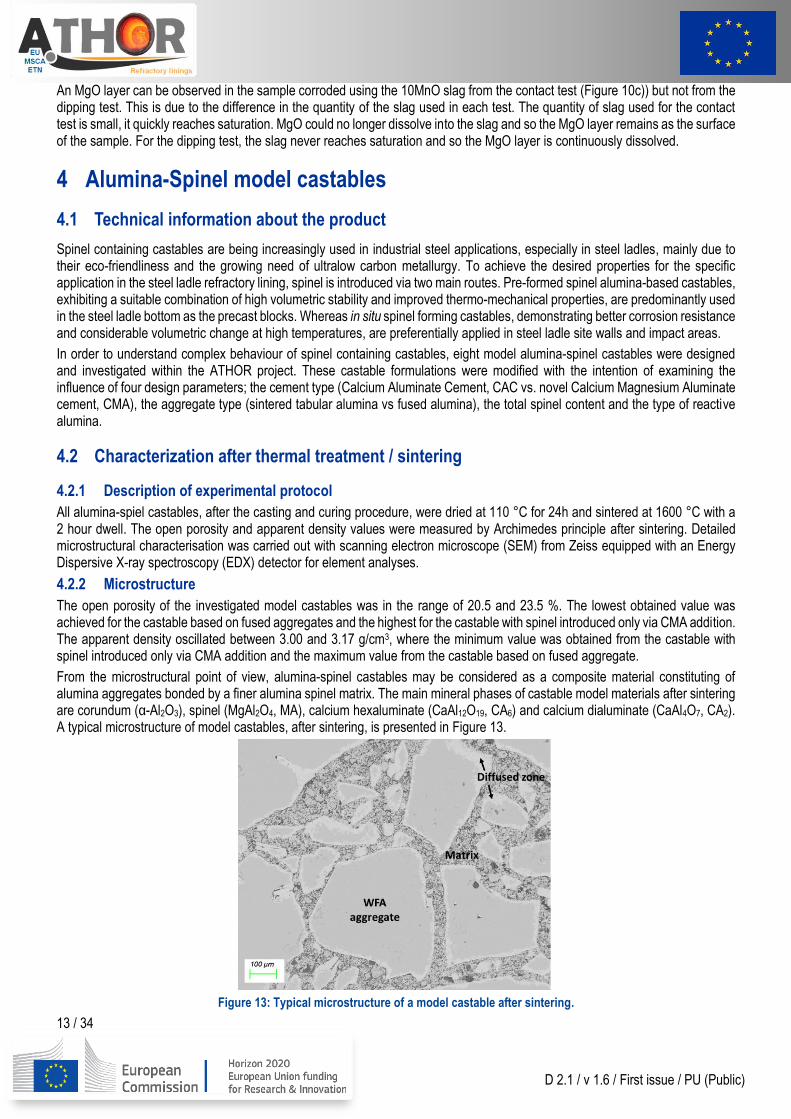
From the microstructural point of view, alumina-spinel castables may be considered as a composite material constituting of alumina aggregates bonded by a finer alumina spinel matrix. The main mineral phases of castable model materials after sintering are corundum (α-Al2O3), spinel (MgAl2O4, MA), calcium hexaluminate (CaAl12O19, CA6) and calcium dialuminate (CaAl4O7, CA2). A typical microstructure of model castables, after sintering, is presented in Figure 13.
Figure 13: Typical microstructure of a model castable after sintering.
14 / 34
D 2.1 / v 1.6 / First issue / PU (Public)
White Fused Alumina (WFA) aggregates are embedded in a fine matrix containing mainly calcium aluminate phases from the bonding agent and spinel, which is introduced in order to enhance thermo-mechanical properties and corrosion resistance. Due to prolonged high temperature treatment, diffusion and solid-state reactions taking place at the matrix-grain boundary interface, new phase formation is observed close to the grain boundaries. As can be seen in Figure 14, the main phase forming at the interface is the calcium hexaluminate CA6, which is known to crystalise in hexagonal structure with a platelet-like morphology.
Figure 14: CA6 formation at the boarder of the WFA aggregates.
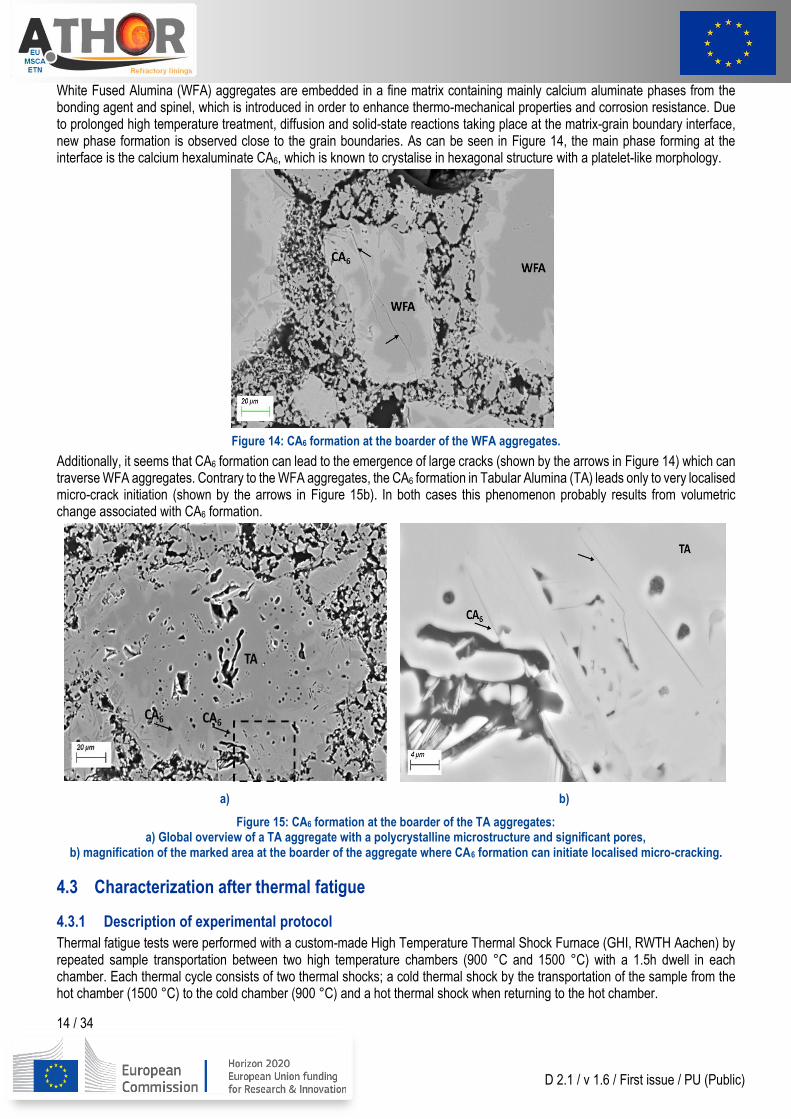
Additionally, it seems that CA6 formation can lead to the emergence of large cracks (shown by the arrows in Figure 14) which can traverse WFA aggregates. Contrary to the WFA aggregates, the CA6 formation in Tabular Alumina (TA) leads only to very localised micro-crack initiation (shown by the arrows in Figure 15b). In both cases this phenomenon probably results from volumetric change associated with CA6 formation.
a) b)
Figure 15: CA6 formation at the boarder of the TA aggregates: a) Global overview of a TA aggregate with a polycrystalline microstructure and significant pores,
b) magnification of the marked area at the boarder of the aggregate where CA6 formation can initiate localised micro-cracking.
4.3 Characterization after thermal fatigue
4.3.1 Description of experimental protocol
Thermal fatigue tests were performed with a custom-made High Temperature Thermal Shock Furnace (GHI, RWTH Aachen) by repeated sample transportation between two high temperature chambers (900 °C and 1500 °C) with a 1.5h dwell in each chamber. Each thermal cycle consists of two thermal shocks; a cold thermal shock by the transportation of the sample from the hot chamber (1500 °C) to the cold chamber (900 °C) and a hot thermal shock when returning to the hot chamber.
15 / 34
D 2.1 / v 1.6 / First issue / PU (Public)
4.3.2 Microstructure
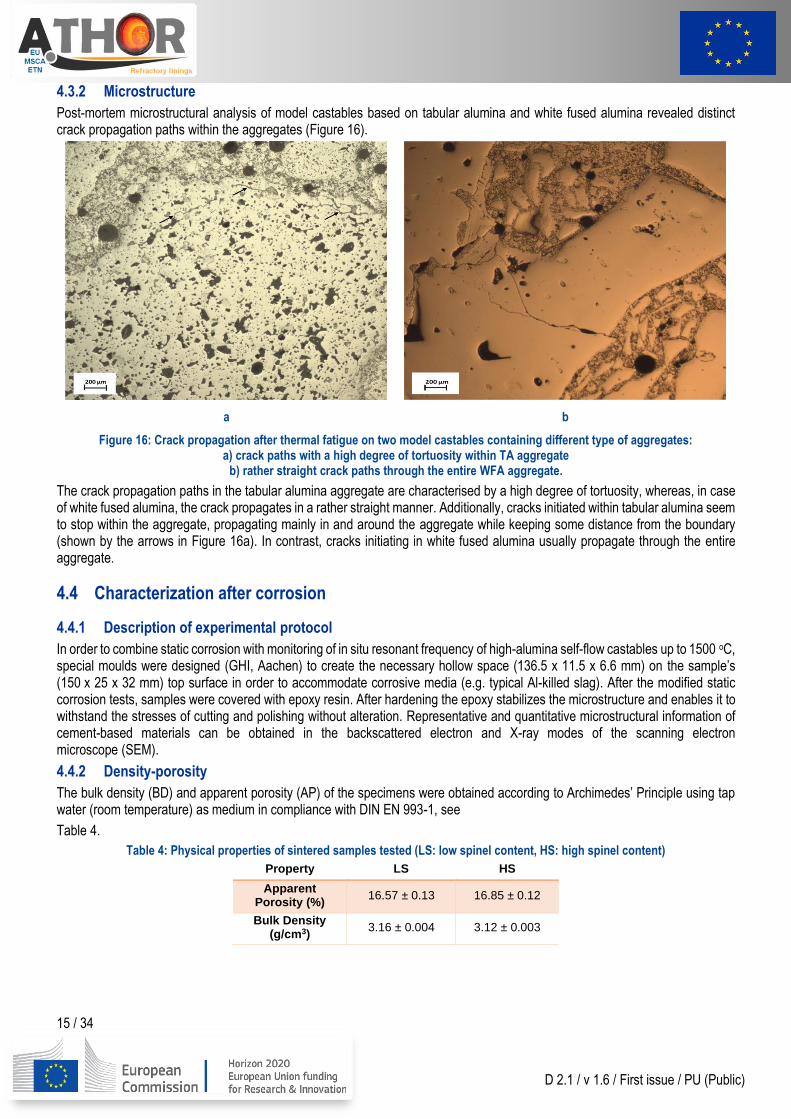
Post-mortem microstructural analysis of model castables based on tabular alumina and white fused alumina revealed distinct crack propagation paths within the aggregates (Figure 16).
a b
Figure 16: Crack propagation after thermal fatigue on two model castables containing different type of aggregates: a) crack paths with a high degree of tortuosity within TA aggregate
b) rather straight crack paths through the entire WFA aggregate.
The crack propagation paths in the tabular alumina aggregate are characterised by a high degree of tortuosity, whereas, in case of white fused alumina, the crack propagates in a rather straight manner. Additionally, cracks initiated within tabular alumina seem to stop within the aggregate, propagating mainly in and around the aggregate while keeping some distance from the boundary (shown by the arrows in Figure 16a). In contrast, cracks initiating in white fused alumina usually propagate through the entire aggregate.
4.4 Characterization after corrosion
4.4.1 Description of experimental protocol
In order to combine static corrosion with monitoring of in situ resonant frequency of high-alumina self-flow castables up to 1500 oC, special moulds were designed (GHI, Aachen) to create the necessary hollow space (136.5 x 11.5 x 6.6 mm) on the sample’s (150 x 25 x 32 mm) top surface in order to accommodate corrosive media (e.g. typical Al-killed slag). After the modified static corrosion tests, samples were covered with epoxy resin. After hardening the epoxy stabilizes the microstructure and enables it to withstand the stresses of cutting and polishing without alteration. Representative and quantitative microstructural information of cement-based materials can be obtained in the backscattered electron and X-ray modes of the scanning electron microscope (SEM).
4.4.2 Density-porosity
The bulk density (BD) and apparent porosity (AP) of the specimens were obtained according to Archimedes’ Principle using tap water (room temperature) as medium in compliance with DIN EN 993-1, see
Table 4.
Table 4: Physical properties of sintered samples tested (LS: low spinel content, HS: high spinel content)
Property LS HS
Apparent Porosity (%)
16.57 ± 0.13 16.85 ± 0.12
Bulk Density (g/cm3)
3.16 ± 0.004 3.12 ± 0.003
16 / 34
D 2.1 / v 1.6 / First issue / PU (Public)
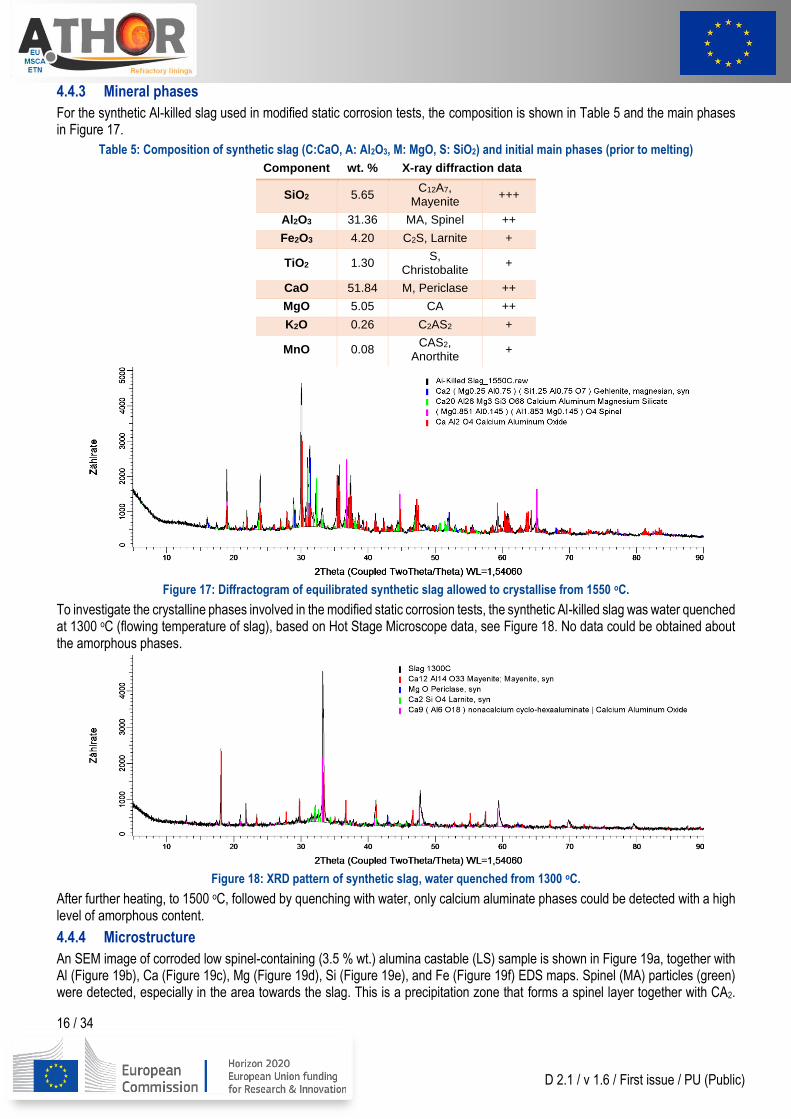
4.4.3 Mineral phases
For the synthetic Al-killed slag used in modified static corrosion tests, the composition is shown in Table 5 and the main phases in Figure 17.
Table 5: Composition of synthetic slag (C:CaO, A: Al2O3, M: MgO, S: SiO2) and initial main phases (prior to melting)
Component wt. % X-ray diffraction data
SiO2 5.65 C12A7,
Mayenite +++
Al2O3 31.36 MA, Spinel ++
Fe2O3 4.20 C2S, Larnite +
TiO2 1.30 S,
Christobalite +
CaO 51.84 M, Periclase ++
MgO 5.05 CA ++
K2O 0.26 C2AS2 +
MnO 0.08 CAS2,
Anorthite +
Figure 17: Diffractogram of equilibrated synthetic slag allowed to crystallise from 1550 oC.
To investigate the crystalline phases involved in the modified static corrosion tests, the synthetic Al-killed slag was water quenched at 1300 oC (flowing temperature of slag), based on Hot Stage Microscope data, see Figure 18. No data could be obtained about the amorphous phases.
Figure 18: XRD pattern of synthetic slag, water quenched from 1300 oC.
After further heating, to 1500 oC, followed by quenching with water, only calcium aluminate phases could be detected with a high level of amorphous content.
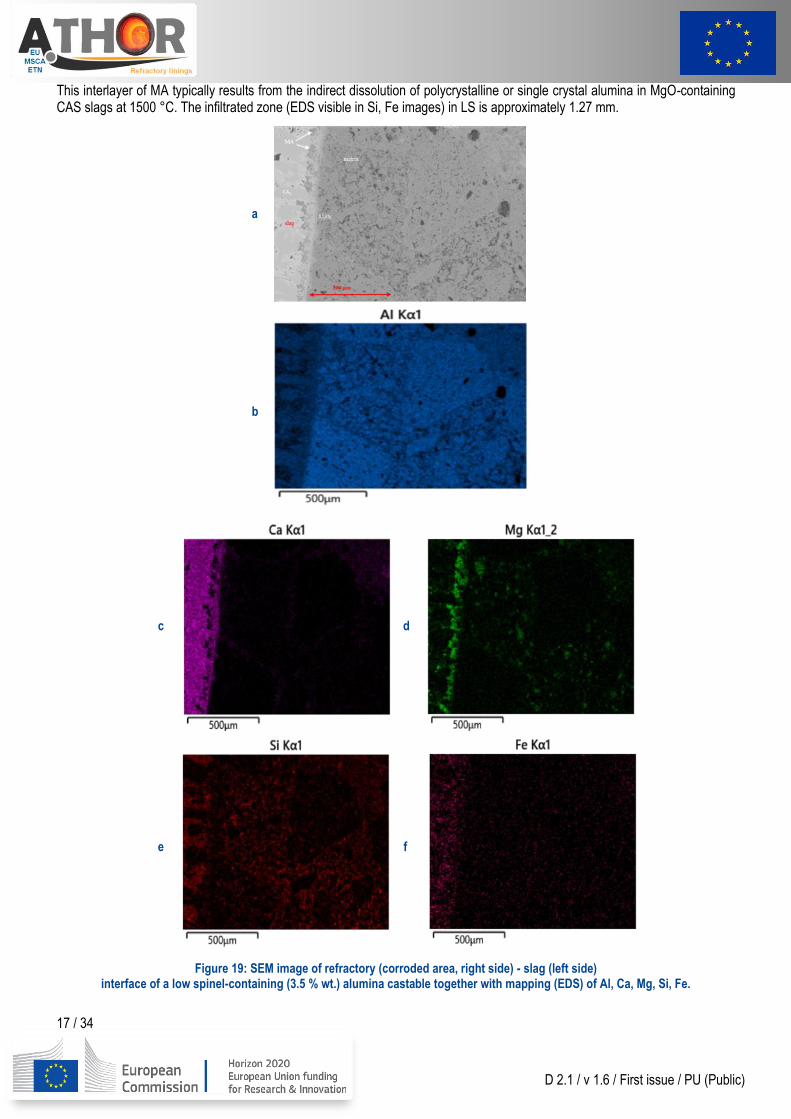
4.4.4 Microstructure
An SEM image of corroded low spinel-containing (3.5 % wt.) alumina castable (LS) sample is shown in Figure 19a, together with Al (Figure 19b), Ca (Figure 19c), Mg (Figure 19d), Si (Figure 19e), and Fe (Figure 19f) EDS maps. Spinel (MA) particles (green) were detected, especially in the area towards the slag. This is a precipitation zone that forms a spinel layer together with CA2.
17 / 34
D 2.1 / v 1.6 / First issue / PU (Public)
This interlayer of MA typically results from the indirect dissolution of polycrystalline or single crystal alumina in MgO-containing CAS slags at 1500 °C. The infiltrated zone (EDS visible in Si, Fe images) in LS is approximately 1.27 mm.
a
b
c
d
e
f
Figure 19: SEM image of refractory (corroded area, right side) - slag (left side) interface of a low spinel-containing (3.5 % wt.) alumina castable together with mapping (EDS) of Al, Ca, Mg, Si, Fe.
18 / 34
D 2.1 / v 1.6 / First issue / PU (Public)
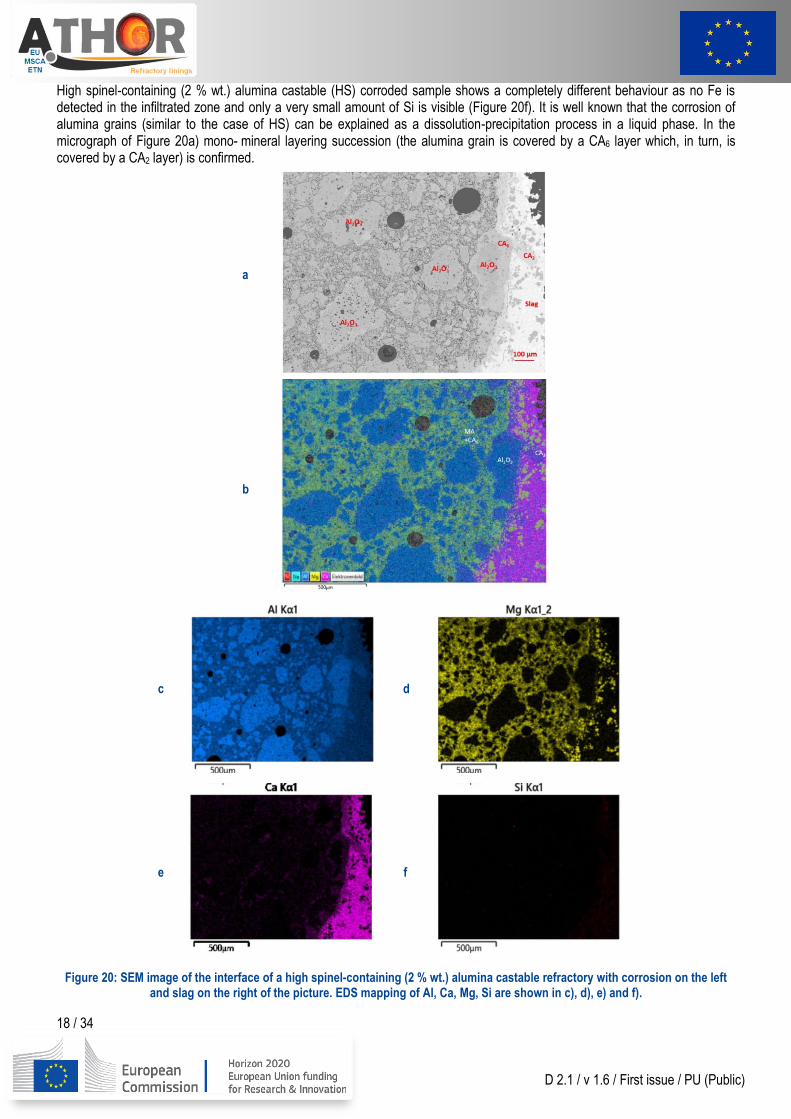
High spinel-containing (2 % wt.) alumina castable (HS) corroded sample shows a completely different behaviour as no Fe is detected in the infiltrated zone and only a very small amount of Si is visible (Figure 20f). It is well known that the corrosion of alumina grains (similar to the case of HS) can be explained as a dissolution-precipitation process in a liquid phase. In the micrograph of Figure 20a) mono- mineral layering succession (the alumina grain is covered by a CA6 layer which, in turn, is covered by a CA2 layer) is confirmed.
a
b
c
d
e
f
Figure 20: SEM image of the interface of a high spinel-containing (2 % wt.) alumina castable refractory with corrosion on the left and slag on the right of the picture. EDS mapping of Al, Ca, Mg, Si are shown in c), d), e) and f).
19 / 34
D 2.1 / v 1.6 / First issue / PU (Public)
In short, alumina from the refractory reacts with lime from the slag producing CA6 and CA2. CA6 completely covers the alumina grain (Figure 19, labels in red colour) forming an impenetrable layer inhibiting further slag infiltration.
5 Vermiculite bricks
5.1 Technical information about the product
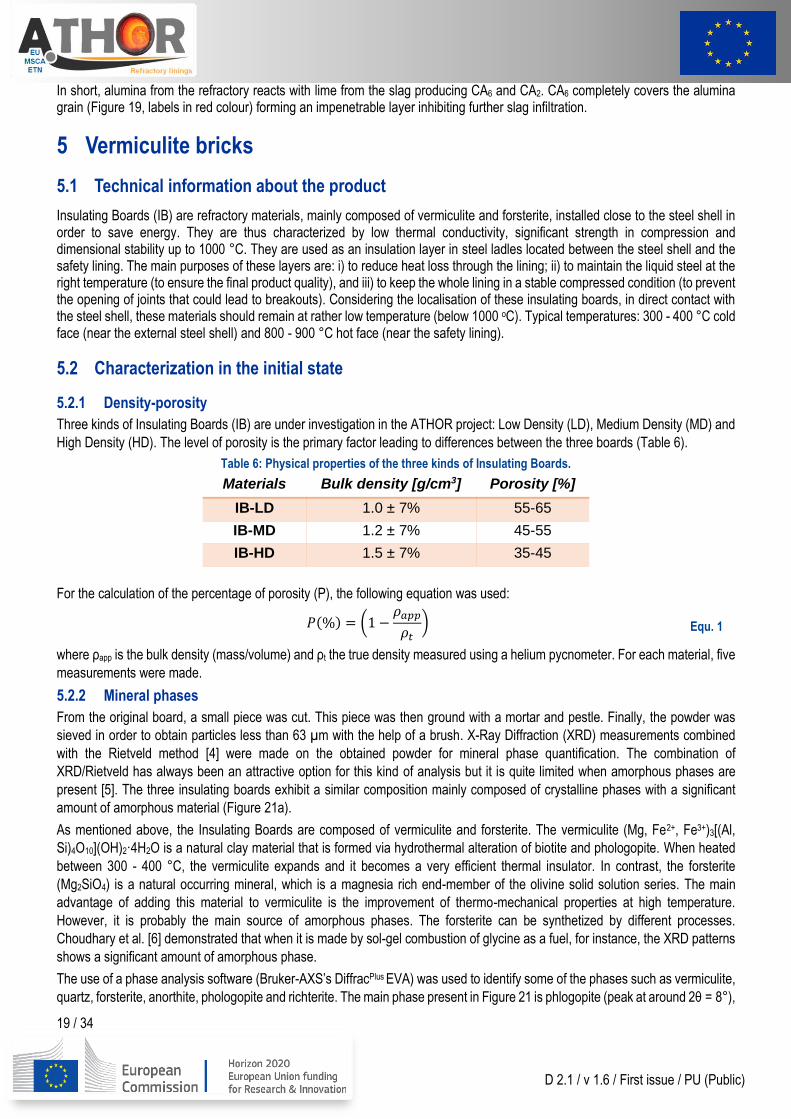
Insulating Boards (IB) are refractory materials, mainly composed of vermiculite and forsterite, installed close to the steel shell in order to save energy. They are thus characterized by low thermal conductivity, significant strength in compression and dimensional stability up to 1000 °C. They are used as an insulation layer in steel ladles located between the steel shell and the safety lining. The main purposes of these layers are: i) to reduce heat loss through the lining; ii) to maintain the liquid steel at the right temperature (to ensure the final product quality), and iii) to keep the whole lining in a stable compressed condition (to prevent the opening of joints that could lead to breakouts). Considering the localisation of these insulating boards, in direct contact with the steel shell, these materials should remain at rather low temperature (below 1000 oC). Typical temperatures: 300 - 400 °C cold face (near the external steel shell) and 800 - 900 °C hot face (near the safety lining).
5.2 Characterization in the initial state
5.2.1 Density-porosity
Three kinds of Insulating Boards (IB) are under investigation in the ATHOR project: Low Density (LD), Medium Density (MD) and
High Density (HD). The level of porosity is the primary factor leading to differences between the three boards (Table 6).
Table 6: Physical properties of the three kinds of Insulating Boards.
Materials Bulk density [g/cm3] Porosity [%]
IB-LD 1.0 ± 7% 55-65
IB-MD 1.2 ± 7% 45-55
IB-HD 1.5 ± 7% 35-45
For the calculation of the percentage of porosity (P), the following equation was used:
𝑃(%) = (1 −𝜌𝑎𝑝𝑝
𝜌𝑡) Equ. 1
where ρapp is the bulk density (mass/volume) and ρt the true density measured using a helium pycnometer. For each material, five
measurements were made.
5.2.2 Mineral phases
From the original board, a small piece was cut. This piece was then ground with a mortar and pestle. Finally, the powder was
sieved in order to obtain particles less than 63 µm with the help of a brush. X-Ray Diffraction (XRD) measurements combined
with the Rietveld method [4] were made on the obtained powder for mineral phase quantification. The combination of
XRD/Rietveld has always been an attractive option for this kind of analysis but it is quite limited when amorphous phases are
present [5]. The three insulating boards exhibit a similar composition mainly composed of crystalline phases with a significant
amount of amorphous material (Figure 21a).
As mentioned above, the Insulating Boards are composed of vermiculite and forsterite. The vermiculite (Mg, Fe2+, Fe3+)3[(Al,
Si)4O10](OH)2·4H2O is a natural clay material that is formed via hydrothermal alteration of biotite and phologopite. When heated
between 300 - 400 °C, the vermiculite expands and it becomes a very efficient thermal insulator. In contrast, the forsterite
(Mg2SiO4) is a natural occurring mineral, which is a magnesia rich end-member of the olivine solid solution series. The main
advantage of adding this material to vermiculite is the improvement of thermo-mechanical properties at high temperature.
However, it is probably the main source of amorphous phases. The forsterite can be synthetized by different processes.
Choudhary et al. [6] demonstrated that when it is made by sol-gel combustion of glycine as a fuel, for instance, the XRD patterns
shows a significant amount of amorphous phase.
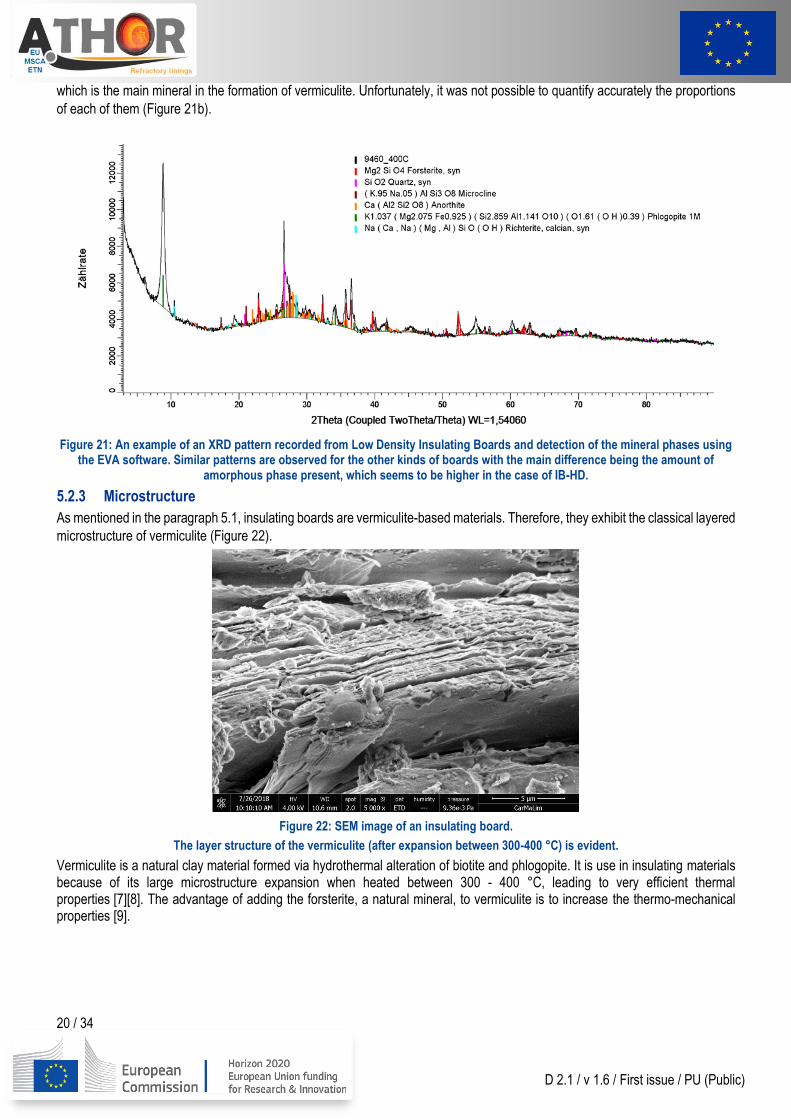
The use of a phase analysis software (Bruker-AXS’s DiffracPlus EVA) was used to identify some of the phases such as vermiculite,
quartz, forsterite, anorthite, phologopite and richterite. The main phase present in Figure 21 is phlogopite (peak at around 2θ = 8°),
20 / 34
D 2.1 / v 1.6 / First issue / PU (Public)
which is the main mineral in the formation of vermiculite. Unfortunately, it was not possible to quantify accurately the proportions
of each of them (Figure 21b).
Figure 21: An example of an XRD pattern recorded from Low Density Insulating Boards and detection of the mineral phases using the EVA software. Similar patterns are observed for the other kinds of boards with the main difference being the amount of
amorphous phase present, which seems to be higher in the case of IB-HD.
5.2.3 Microstructure
As mentioned in the paragraph 5.1, insulating boards are vermiculite-based materials. Therefore, they exhibit the classical layered
microstructure of vermiculite (Figure 22).
Figure 22: SEM image of an insulating board.
The layer structure of the vermiculite (after expansion between 300-400 °C) is evident.
Vermiculite is a natural clay material formed via hydrothermal alteration of biotite and phlogopite. It is use in insulating materials because of its large microstructure expansion when heated between 300 - 400 °C, leading to very efficient thermal properties [7][8]. The advantage of adding the forsterite, a natural mineral, to vermiculite is to increase the thermo-mechanical properties [9].
21 / 34
D 2.1 / v 1.6 / First issue / PU (Public)
5.3 Characterization after thermal treatment
5.3.1 Description of experimental protocol
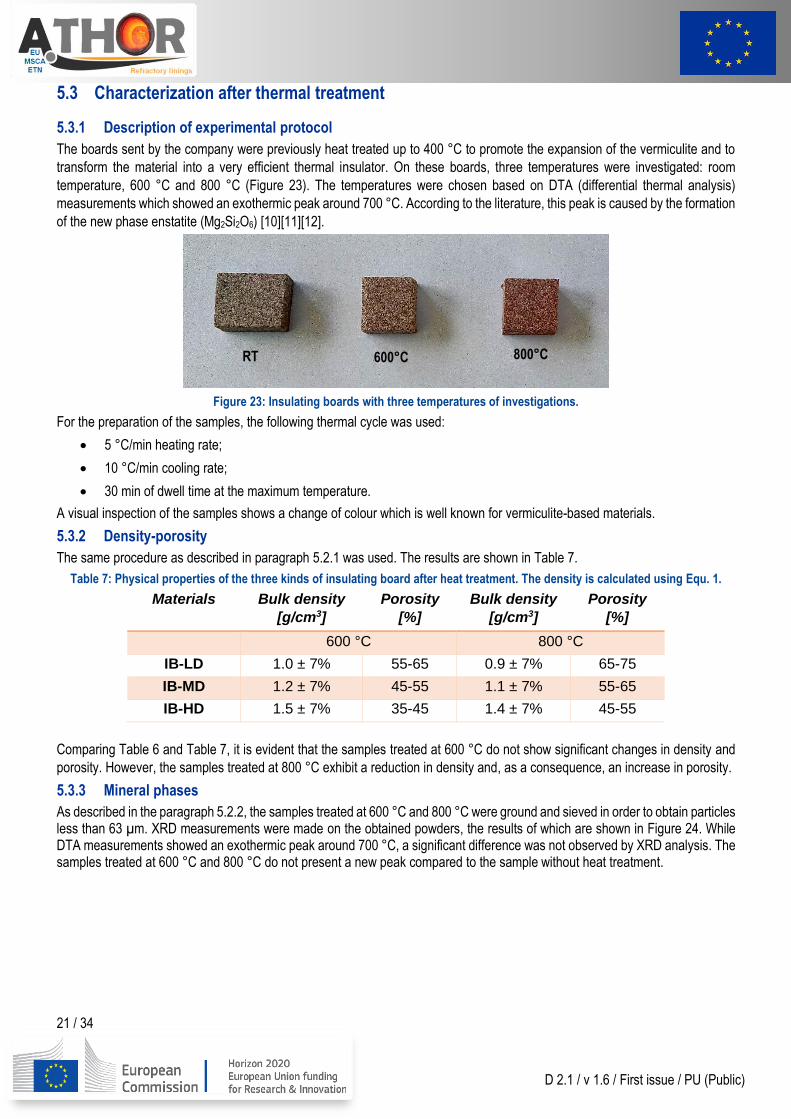
The boards sent by the company were previously heat treated up to 400 °C to promote the expansion of the vermiculite and to
transform the material into a very efficient thermal insulator. On these boards, three temperatures were investigated: room
temperature, 600 °C and 800 °C (Figure 23). The temperatures were chosen based on DTA (differential thermal analysis)
measurements which showed an exothermic peak around 700 °C. According to the literature, this peak is caused by the formation
of the new phase enstatite (Mg2Si2O6) [10][11][12].
Figure 23: Insulating boards with three temperatures of investigations.
For the preparation of the samples, the following thermal cycle was used:
• 5 °C/min heating rate;
• 10 °C/min cooling rate;
• 30 min of dwell time at the maximum temperature.
A visual inspection of the samples shows a change of colour which is well known for vermiculite-based materials.
5.3.2 Density-porosity
The same procedure as described in paragraph 5.2.1 was used. The results are shown in Table 7.
Table 7: Physical properties of the three kinds of insulating board after heat treatment. The density is calculated using Equ. 1.
Materials Bulk density
[g/cm3]
Porosity
[%]
Bulk density
[g/cm3]
Porosity
[%]
600 °C 800 °C
IB-LD 1.0 ± 7% 55-65 0.9 ± 7% 65-75
IB-MD 1.2 ± 7% 45-55 1.1 ± 7% 55-65
IB-HD 1.5 ± 7% 35-45 1.4 ± 7% 45-55
Comparing Table 6 and Table 7, it is evident that the samples treated at 600 °C do not show significant changes in density and
porosity. However, the samples treated at 800 °C exhibit a reduction in density and, as a consequence, an increase in porosity.
5.3.3 Mineral phases
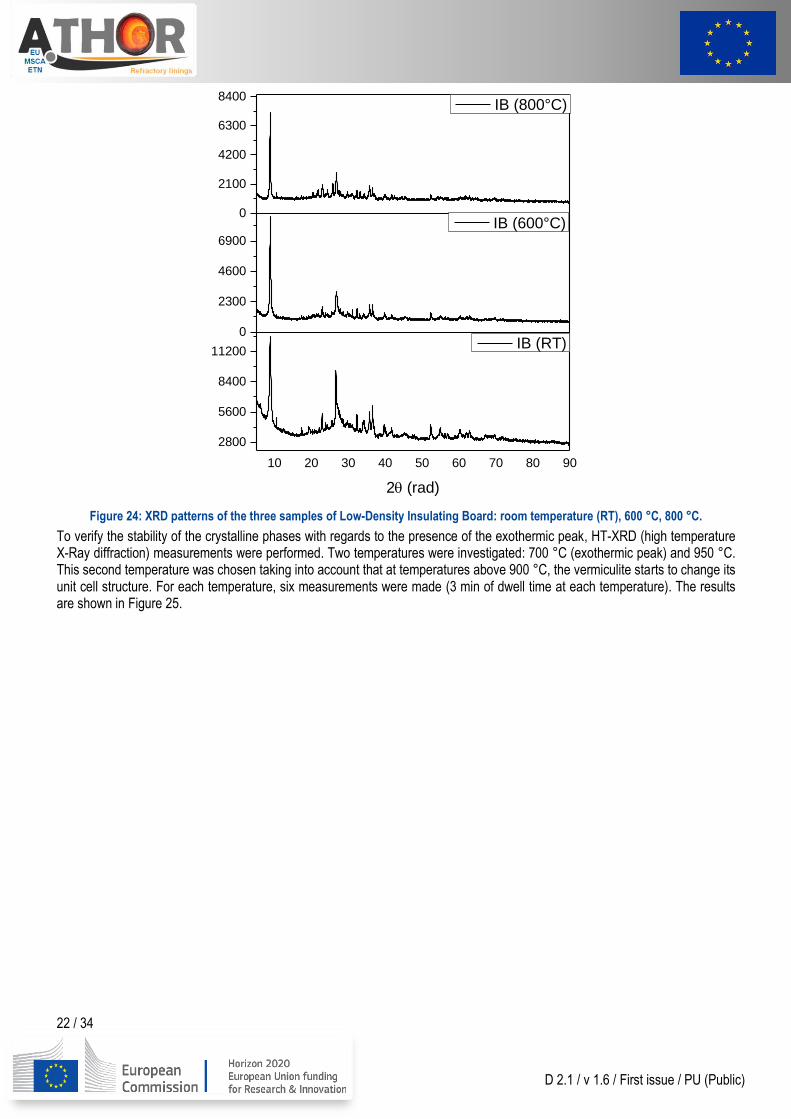
As described in the paragraph 5.2.2, the samples treated at 600 °C and 800 °C were ground and sieved in order to obtain particles less than 63 µm. XRD measurements were made on the obtained powders, the results of which are shown in Figure 24. While DTA measurements showed an exothermic peak around 700 °C, a significant difference was not observed by XRD analysis. The samples treated at 600 °C and 800 °C do not present a new peak compared to the sample without heat treatment.
RT 600°C 800°C
22 / 34
D 2.1 / v 1.6 / First issue / PU (Public)
Figure 24: XRD patterns of the three samples of Low-Density Insulating Board: room temperature (RT), 600 °C, 800 °C.
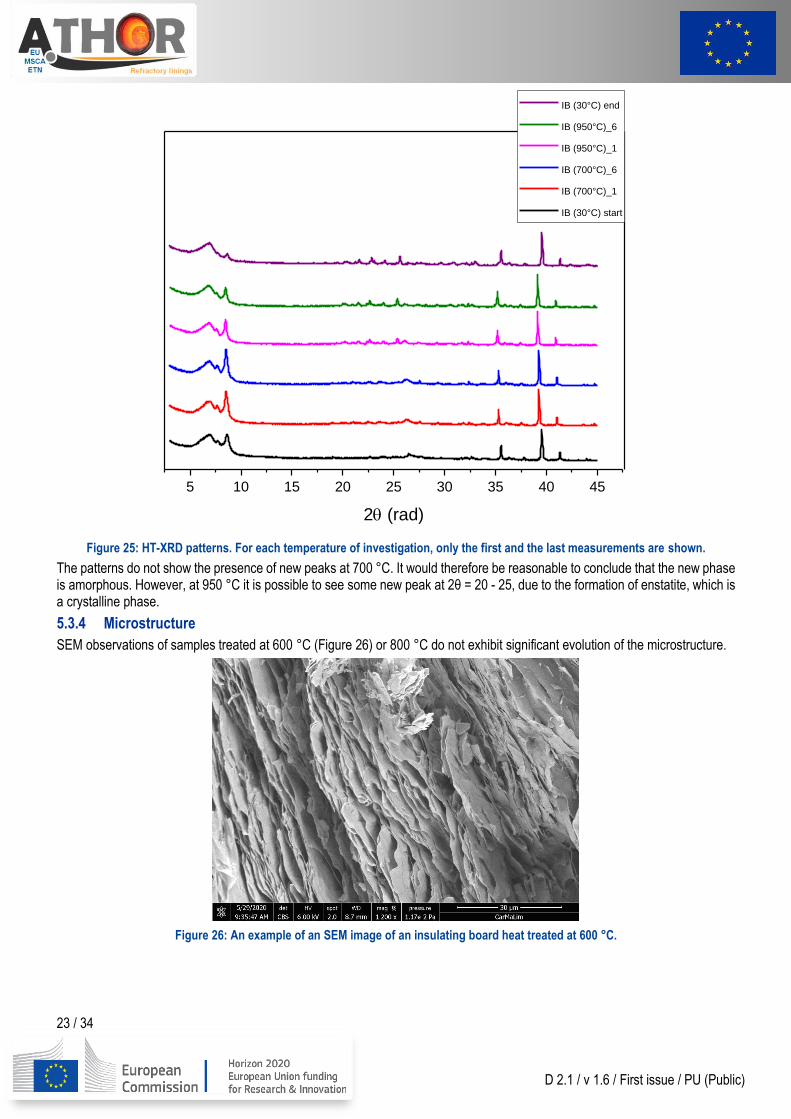
To verify the stability of the crystalline phases with regards to the presence of the exothermic peak, HT-XRD (high temperature X-Ray diffraction) measurements were performed. Two temperatures were investigated: 700 °C (exothermic peak) and 950 °C. This second temperature was chosen taking into account that at temperatures above 900 °C, the vermiculite starts to change its unit cell structure. For each temperature, six measurements were made (3 min of dwell time at each temperature). The results are shown in Figure 25.
10 20 30 40 50 60 70 80 90
2800
5600
8400
11200
0
2300
4600
6900
0
2100
4200
6300
8400
2 (rad)
IB (RT)
IB (600°C)
IB (800°C)
23 / 34
D 2.1 / v 1.6 / First issue / PU (Public)
Figure 25: HT-XRD patterns. For each temperature of investigation, only the first and the last measurements are shown.
The patterns do not show the presence of new peaks at 700 °C. It would therefore be reasonable to conclude that the new phase is amorphous. However, at 950 °C it is possible to see some new peak at 2θ = 20 - 25, due to the formation of enstatite, which is a crystalline phase.
5.3.4 Microstructure
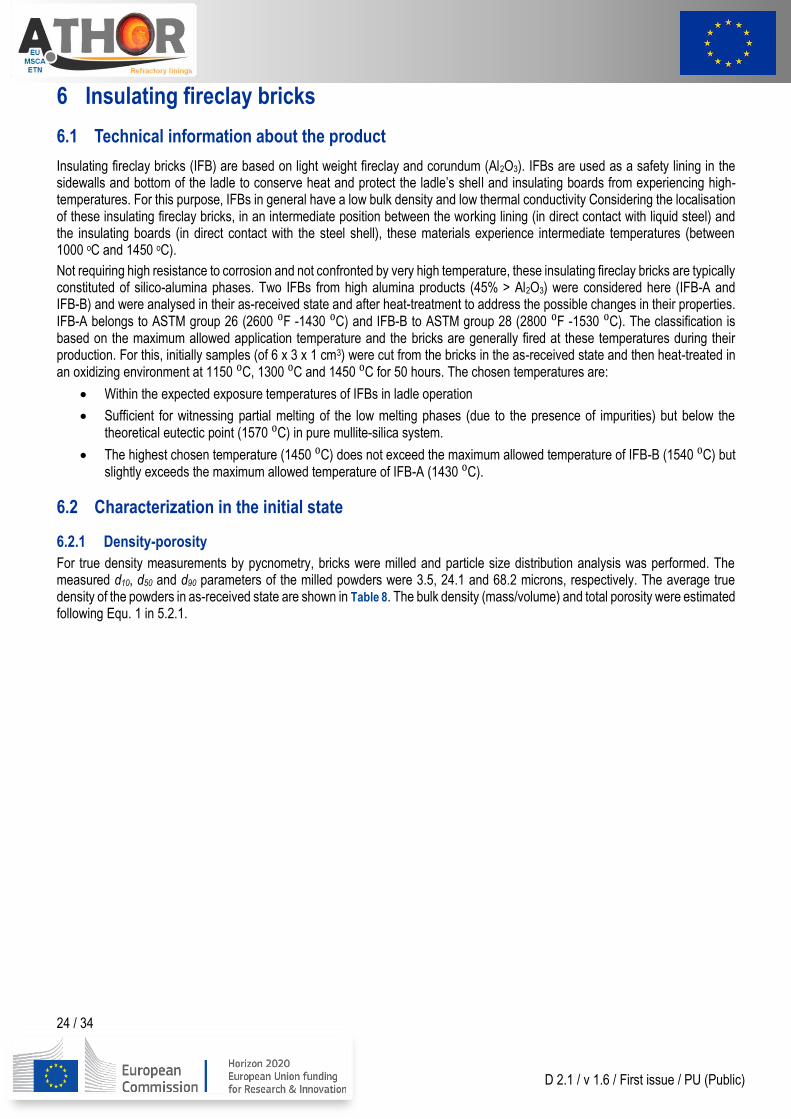
SEM observations of samples treated at 600 °C (Figure 26) or 800 °C do not exhibit significant evolution of the microstructure.
Figure 26: An example of an SEM image of an insulating board heat treated at 600 °C.
5 10 15 20 25 30 35 40 45
2 (rad)
IB (30°C) end
IB (950°C)_6
IB (950°C)_1
IB (700°C)_6
IB (700°C)_1
IB (30°C) start
24 / 34
D 2.1 / v 1.6 / First issue / PU (Public)
6 Insulating fireclay bricks
6.1 Technical information about the product
Insulating fireclay bricks (IFB) are based on light weight fireclay and corundum (Al2O3). IFBs are used as a safety lining in the sidewalls and bottom of the ladle to conserve heat and protect the ladle’s shell and insulating boards from experiencing high-temperatures. For this purpose, IFBs in general have a low bulk density and low thermal conductivity Considering the localisation of these insulating fireclay bricks, in an intermediate position between the working lining (in direct contact with liquid steel) and the insulating boards (in direct contact with the steel shell), these materials experience intermediate temperatures (between 1000 oC and 1450 oC).
Not requiring high resistance to corrosion and not confronted by very high temperature, these insulating fireclay bricks are typically constituted of silico-alumina phases. Two IFBs from high alumina products (45% > Al2O3) were considered here (IFB-A and IFB-B) and were analysed in their as-received state and after heat-treatment to address the possible changes in their properties. IFB-A belongs to ASTM group 26 (2600 ⁰F -1430 ⁰C) and IFB-B to ASTM group 28 (2800 ⁰F -1530 ⁰C). The classification is based on the maximum allowed application temperature and the bricks are generally fired at these temperatures during their production. For this, initially samples (of 6 x 3 x 1 cm3) were cut from the bricks in the as-received state and then heat-treated in an oxidizing environment at 1150 ⁰C, 1300 ⁰C and 1450 ⁰C for 50 hours. The chosen temperatures are:
• Within the expected exposure temperatures of IFBs in ladle operation
• Sufficient for witnessing partial melting of the low melting phases (due to the presence of impurities) but below the theoretical eutectic point (1570 ⁰C) in pure mullite-silica system.
• The highest chosen temperature (1450 ⁰C) does not exceed the maximum allowed temperature of IFB-B (1540 ⁰C) but slightly exceeds the maximum allowed temperature of IFB-A (1430 ⁰C).
6.2 Characterization in the initial state
6.2.1 Density-porosity
For true density measurements by pycnometry, bricks were milled and particle size distribution analysis was performed. The measured d10, d50 and d90 parameters of the milled powders were 3.5, 24.1 and 68.2 microns, respectively. The average true density of the powders in as-received state are shown in Table 8. The bulk density (mass/volume) and total porosity were estimated following Equ. 1 in 5.2.1.
25 / 34
D 2.1 / v 1.6 / First issue / PU (Public)
Table 8: Physical properties of the studied IFBs in as-received state.
IFB-A IFB-B
True Density [g/cm3] 2.95 ± 0.08% 3.26 ± 0.09%
Bulk Density [g/cm3] 0.78 ± 1.6% 0.88 ± 0.5%
Total porosity [%] 73.6 ± 1.4% 72.6 ± 1.3%
IFB-A has a lower true and bulk density than IFB-B by 10.5 % ± 0.2 % and 12.8 % ± 7.2 %, respectively. The calculated total porosities are similar for the two materials. Thus, the difference in density is likely related to the composition of the materials which is addressed in the following sections.
6.2.2 Mineral phases
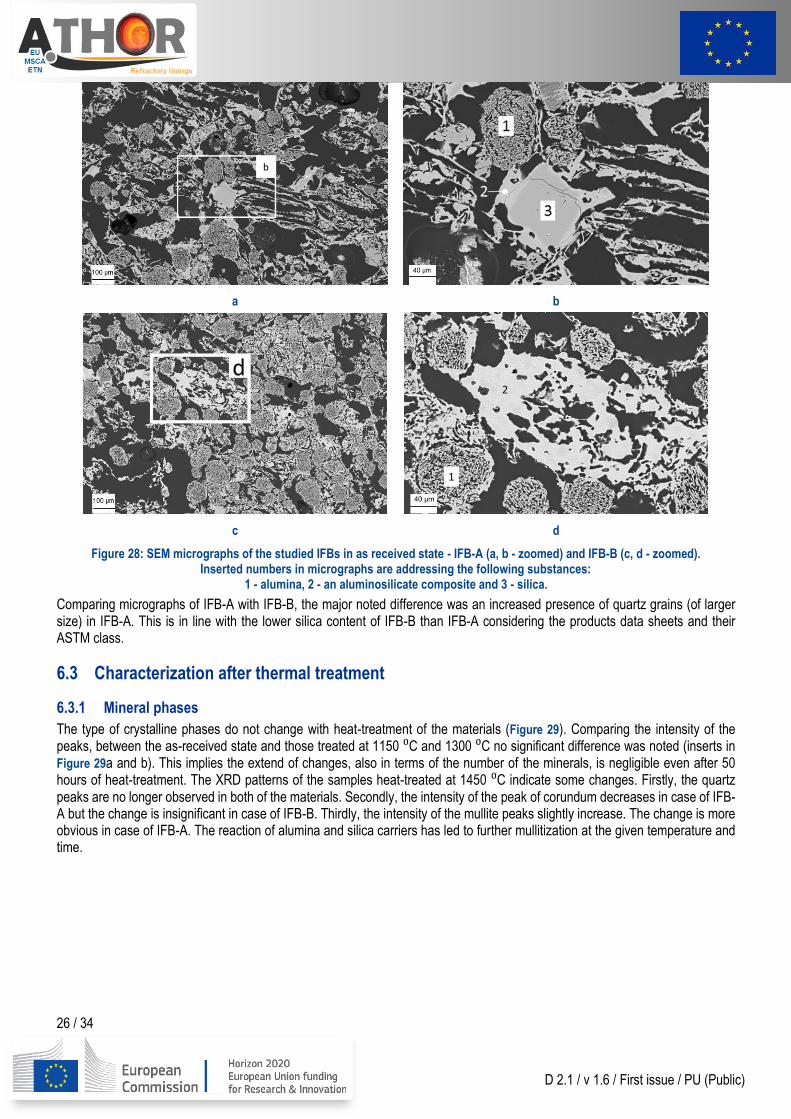
The major mineral phases in both materials are corundum (Al2O3) and mullite(3Al2O3∙2SiO2), to a lesser extent free silica in the form of quartz and cristobalite were identified (Figure 27). The XRD patterns of materials in as-received state suggest presence of some amorphous content in both materials. This complicates the exact quantification of the number of crystalline phases in the samples, however the intensity of the peaks could be used for rough comparisons. The presence of higher amount of corundum and mullite, and lower amount of quartz in IFB-B in comparison to IFB-A can be inferred from inserted graphs (Figure 27). The higher amount of corundum and mullite (as alumina carriers) in IFB-B, is consistent with the higher amount of alumina in IFB-B following the ASTM class and technical data sheet of the product.
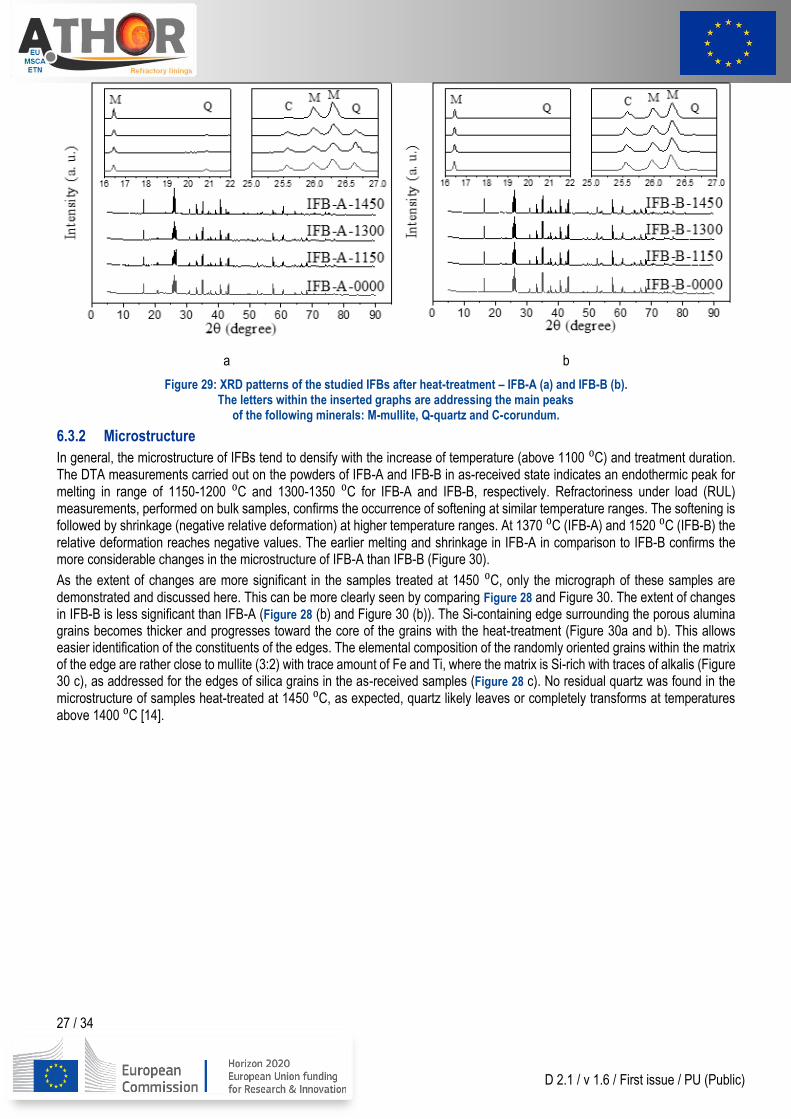
Figure 27: XRD patterns of the studied IFBs in as-received state. The letters within the inserted graphs are addressing the main
peaks of the following minerals: M-mullite, Q-quartz and C-corundum.
In the as-received state, the microstructure of both materials is mainly composed of fine grains and pores, in contrast to the microstructure of dense refractories where large grains (aggregates in millimetre-scale) are frequent. Instead, pores and cavities (dark background - resin-filled, Figure 28) are dominant.
Alumina grains mainly have a porous structure sometimes with a Si-containing edge. The elemental composition of the edges suggests presence of traces of various impurities, including but not limited to alkalis like, Na, K (Figure 28c and d). Quartz particles are not as frequent as alumina but, wherever they are found in the microstructure, they have an Al-containing edge and are accompanied with an aluminosilicate composite (Figure 28c). This composite consists of dense, hair-like and randomly oriented grains in a dense matrix. The size of these grains is too small to be accurately analysed with EDS, but possibly could be mullite which has nucleated and grown from an Al-rich siliceous matrix, as has been previously reported [13].
26 / 34
D 2.1 / v 1.6 / First issue / PU (Public)
a b
c d
Figure 28: SEM micrographs of the studied IFBs in as received state - IFB-A (a, b - zoomed) and IFB-B (c, d - zoomed). Inserted numbers in micrographs are addressing the following substances:
1 - alumina, 2 - an aluminosilicate composite and 3 - silica.
Comparing micrographs of IFB-A with IFB-B, the major noted difference was an increased presence of quartz grains (of larger size) in IFB-A. This is in line with the lower silica content of IFB-B than IFB-A considering the products data sheets and their ASTM class.
6.3 Characterization after thermal treatment
6.3.1 Mineral phases
The type of crystalline phases do not change with heat-treatment of the materials (Figure 29). Comparing the intensity of the peaks, between the as-received state and those treated at 1150 ⁰C and 1300 ⁰C no significant difference was noted (inserts in Figure 29a and b). This implies the extend of changes, also in terms of the number of the minerals, is negligible even after 50 hours of heat-treatment. The XRD patterns of the samples heat-treated at 1450 ⁰C indicate some changes. Firstly, the quartz peaks are no longer observed in both of the materials. Secondly, the intensity of the peak of corundum decreases in case of IFB-A but the change is insignificant in case of IFB-B. Thirdly, the intensity of the mullite peaks slightly increase. The change is more obvious in case of IFB-A. The reaction of alumina and silica carriers has led to further mullitization at the given temperature and time.
27 / 34
D 2.1 / v 1.6 / First issue / PU (Public)
a b
Figure 29: XRD patterns of the studied IFBs after heat-treatment – IFB-A (a) and IFB-B (b). The letters within the inserted graphs are addressing the main peaks
of the following minerals: M-mullite, Q-quartz and C-corundum.
6.3.2 Microstructure
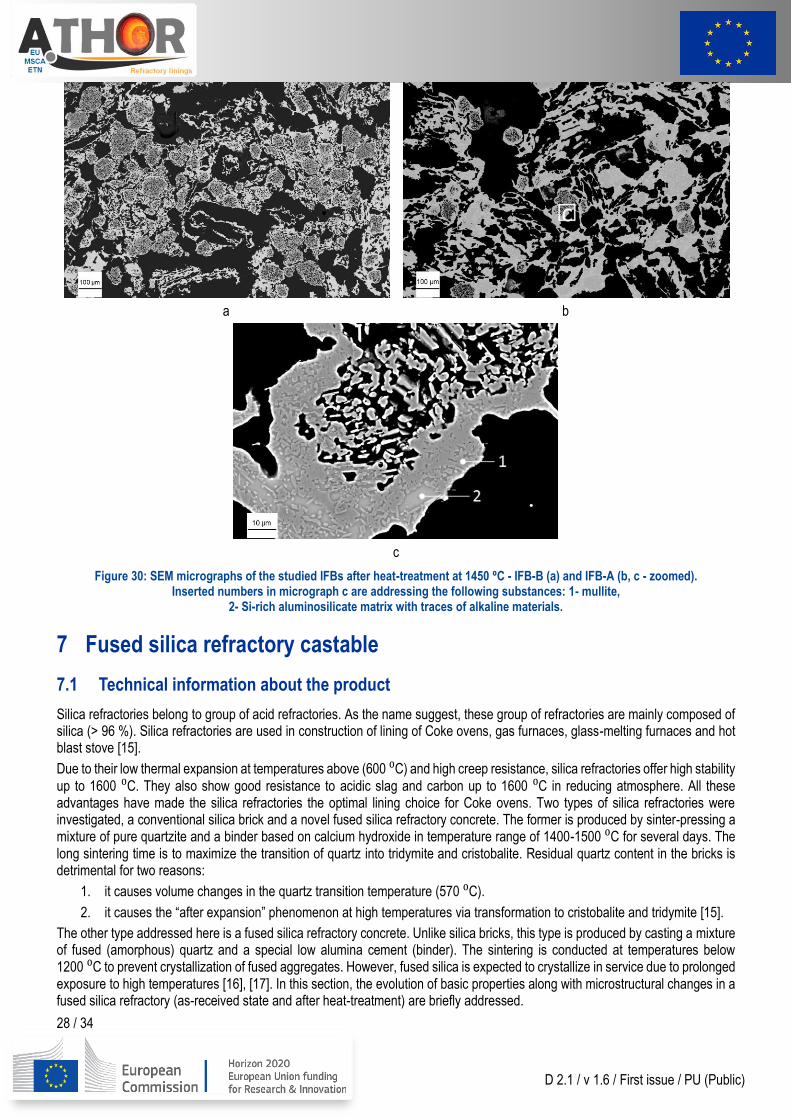
In general, the microstructure of IFBs tend to densify with the increase of temperature (above 1100 ⁰C) and treatment duration. The DTA measurements carried out on the powders of IFB-A and IFB-B in as-received state indicates an endothermic peak for melting in range of 1150-1200 ⁰C and 1300-1350 ⁰C for IFB-A and IFB-B, respectively. Refractoriness under load (RUL) measurements, performed on bulk samples, confirms the occurrence of softening at similar temperature ranges. The softening is followed by shrinkage (negative relative deformation) at higher temperature ranges. At 1370 ⁰C (IFB-A) and 1520 ⁰C (IFB-B) the relative deformation reaches negative values. The earlier melting and shrinkage in IFB-A in comparison to IFB-B confirms the more considerable changes in the microstructure of IFB-A than IFB-B (Figure 30).
As the extent of changes are more significant in the samples treated at 1450 ⁰C, only the micrograph of these samples are demonstrated and discussed here. This can be more clearly seen by comparing Figure 28 and Figure 30. The extent of changes in IFB-B is less significant than IFB-A (Figure 28 (b) and Figure 30 (b)). The Si-containing edge surrounding the porous alumina grains becomes thicker and progresses toward the core of the grains with the heat-treatment (Figure 30a and b). This allows easier identification of the constituents of the edges. The elemental composition of the randomly oriented grains within the matrix of the edge are rather close to mullite (3:2) with trace amount of Fe and Ti, where the matrix is Si-rich with traces of alkalis (Figure 30 c), as addressed for the edges of silica grains in the as-received samples (Figure 28 c). No residual quartz was found in the microstructure of samples heat-treated at 1450 ⁰C, as expected, quartz likely leaves or completely transforms at temperatures above 1400 ⁰C [14].
28 / 34
D 2.1 / v 1.6 / First issue / PU (Public)
a b
c
Figure 30: SEM micrographs of the studied IFBs after heat-treatment at 1450 ⁰C - IFB-B (a) and IFB-A (b, c - zoomed). Inserted numbers in micrograph c are addressing the following substances: 1- mullite,
2- Si-rich aluminosilicate matrix with traces of alkaline materials.
7 Fused silica refractory castable
7.1 Technical information about the product
Silica refractories belong to group of acid refractories. As the name suggest, these group of refractories are mainly composed of silica (> 96 %). Silica refractories are used in construction of lining of Coke ovens, gas furnaces, glass-melting furnaces and hot blast stove [15].
Due to their low thermal expansion at temperatures above (600 ⁰C) and high creep resistance, silica refractories offer high stability
up to 1600 ⁰C. They also show good resistance to acidic slag and carbon up to 1600 ⁰C in reducing atmosphere. All these advantages have made the silica refractories the optimal lining choice for Coke ovens. Two types of silica refractories were investigated, a conventional silica brick and a novel fused silica refractory concrete. The former is produced by sinter-pressing a mixture of pure quartzite and a binder based on calcium hydroxide in temperature range of 1400-1500 ⁰C for several days. The long sintering time is to maximize the transition of quartz into tridymite and cristobalite. Residual quartz content in the bricks is detrimental for two reasons:
1. it causes volume changes in the quartz transition temperature (570 ⁰C).
2. it causes the “after expansion” phenomenon at high temperatures via transformation to cristobalite and tridymite [15].
The other type addressed here is a fused silica refractory concrete. Unlike silica bricks, this type is produced by casting a mixture of fused (amorphous) quartz and a special low alumina cement (binder). The sintering is conducted at temperatures below 1200 ⁰C to prevent crystallization of fused aggregates. However, fused silica is expected to crystallize in service due to prolonged exposure to high temperatures [16], [17]. In this section, the evolution of basic properties along with microstructural changes in a fused silica refractory (as-received state and after heat-treatment) are briefly addressed.
29 / 34
D 2.1 / v 1.6 / First issue / PU (Public)
7.2 Characterization in the initial state
7.2.1 Density-porosity
In as-received state, silica brick, hereafter referred as SB, has a bulk and true density of 1.86 and 2.29 g/cm3, respectively. In the case of the fused silica refractory concrete, hereafter referred as FS, the bulk and true density are 1.81 and 2.25 g/cm3, respectively. Both of the values are slightly lower in FS than SB. The deviation can be explained by considering the production route and the raw materials used. SB was shaped by sinter-pressing while FS was casted. The sintering temperature and time are also several magnitudes higher in case of SB as mentioned earlier. As well as this, the main constituting component of FS is fused quartz (true density: 2.20 g/cm3) while SB is composed of cristobalite (true density: 2.33 g/cm3) and tridymite (true density 2.25 g/cm3).
7.2.2 Mineral phases
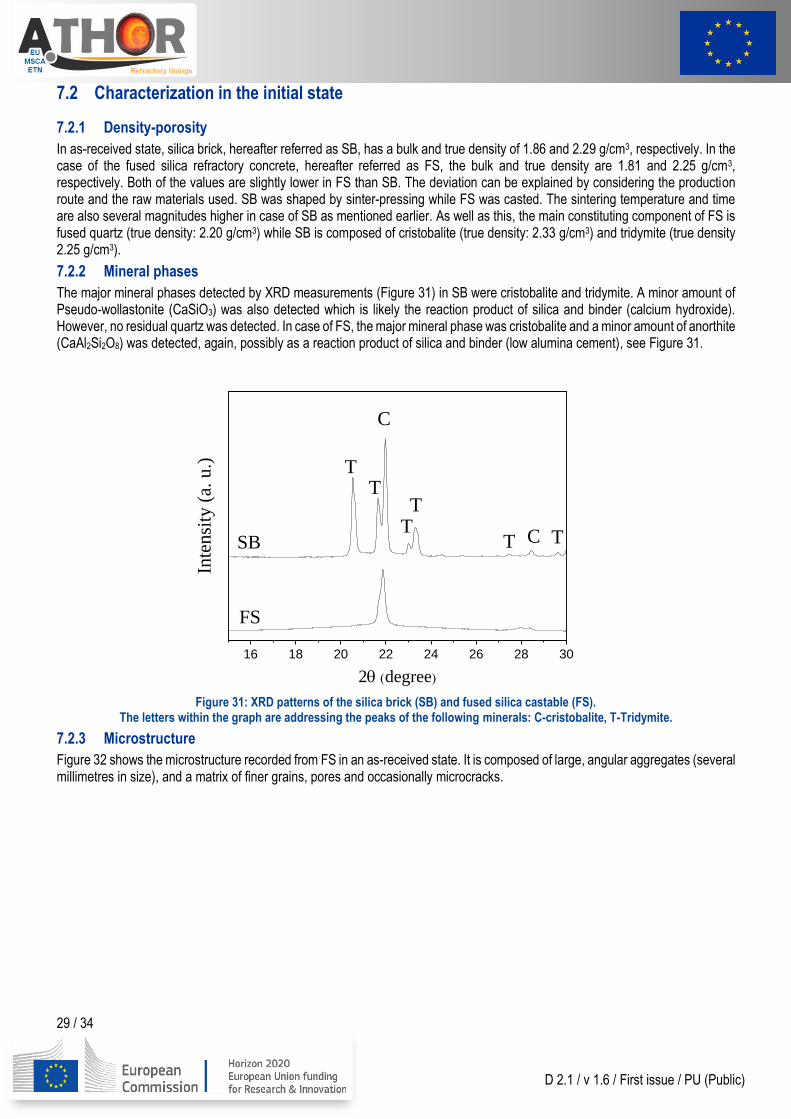
The major mineral phases detected by XRD measurements (Figure 31) in SB were cristobalite and tridymite. A minor amount of Pseudo-wollastonite (CaSiO3) was also detected which is likely the reaction product of silica and binder (calcium hydroxide). However, no residual quartz was detected. In case of FS, the major mineral phase was cristobalite and a minor amount of anorthite (CaAl2Si2O8) was detected, again, possibly as a reaction product of silica and binder (low alumina cement), see Figure 31.
Figure 31: XRD patterns of the silica brick (SB) and fused silica castable (FS).
The letters within the graph are addressing the peaks of the following minerals: C-cristobalite, T-Tridymite.
7.2.3 Microstructure
Figure 32 shows the microstructure recorded from FS in an as-received state. It is composed of large, angular aggregates (several millimetres in size), and a matrix of finer grains, pores and occasionally microcracks.
16 18 20 22 24 26 28 30
Inte
nsi
ty (
a. u
.)
2 (degree)
C
C
T
TTT
TT
FS
SB
30 / 34
D 2.1 / v 1.6 / First issue / PU (Public)
Figure 32: SEM micrograph of FS in as-received state.
7.3 Characterization after thermal treatment
7.3.1 Density-porosity
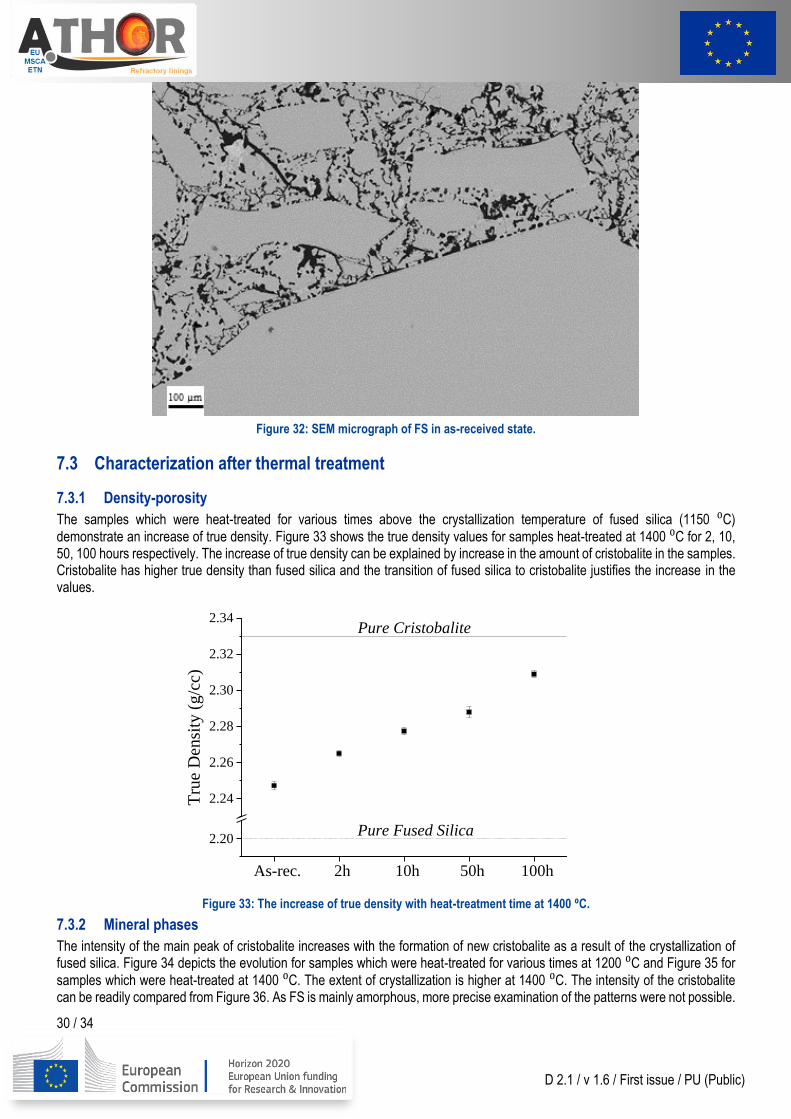
The samples which were heat-treated for various times above the crystallization temperature of fused silica (1150 ⁰C)
demonstrate an increase of true density. Figure 33 shows the true density values for samples heat-treated at 1400 ⁰C for 2, 10, 50, 100 hours respectively. The increase of true density can be explained by increase in the amount of cristobalite in the samples. Cristobalite has higher true density than fused silica and the transition of fused silica to cristobalite justifies the increase in the values.
Figure 33: The increase of true density with heat-treatment time at 1400 ⁰C.
7.3.2 Mineral phases
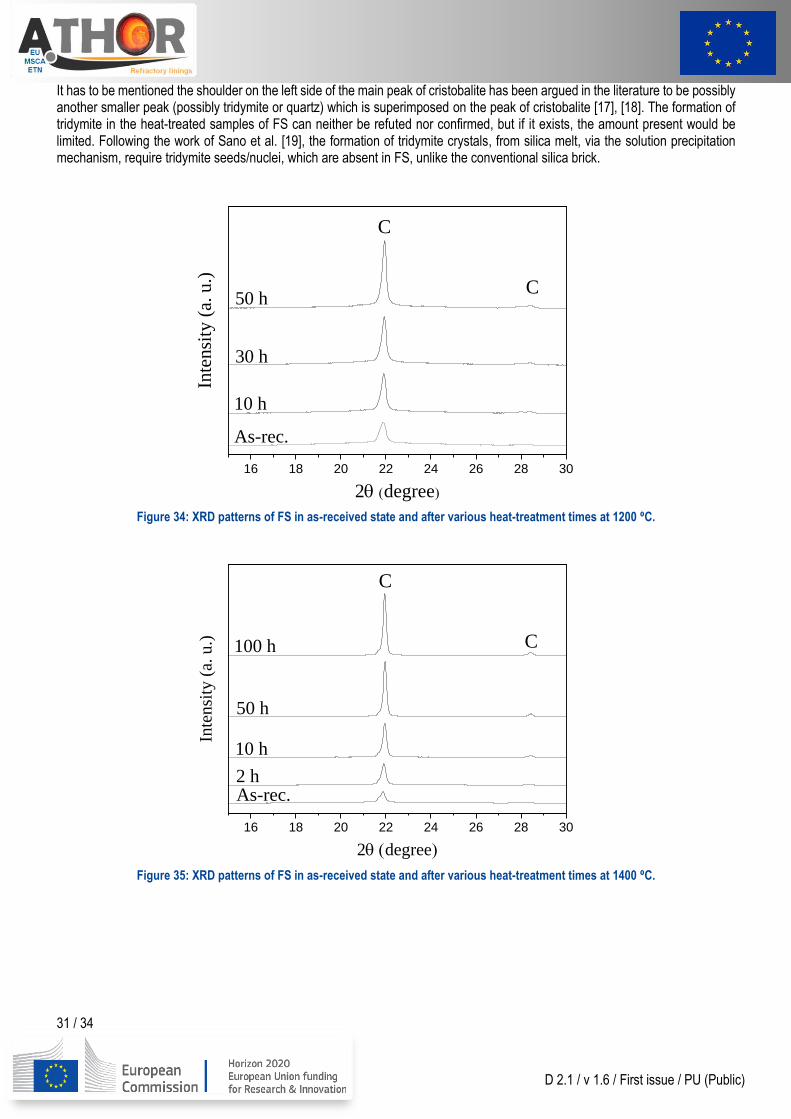
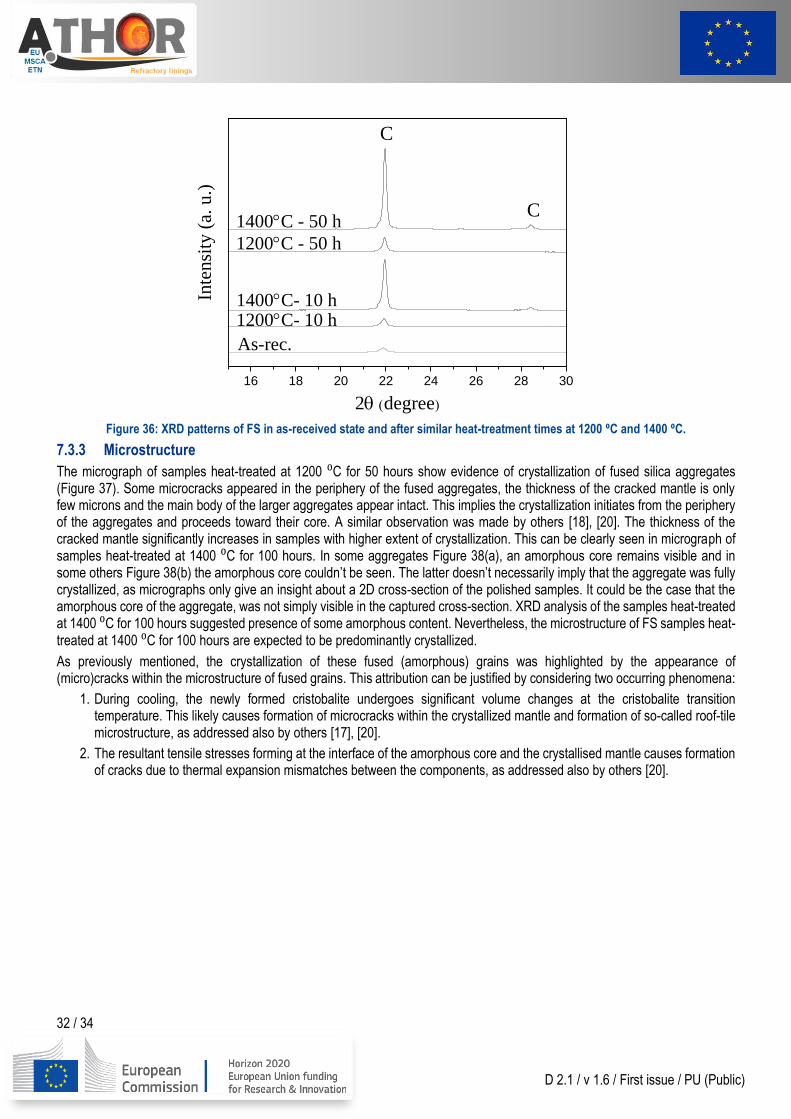
The intensity of the main peak of cristobalite increases with the formation of new cristobalite as a result of the crystallization of fused silica. Figure 34 depicts the evolution for samples which were heat-treated for various times at 1200 ⁰C and Figure 35 for
samples which were heat-treated at 1400 ⁰C. The extent of crystallization is higher at 1400 ⁰C. The intensity of the cristobalite can be readily compared from Figure 36. As FS is mainly amorphous, more precise examination of the patterns were not possible.
As-rec. 2h 10h 50h 100h
2.20
2.24
2.26
2.28
2.30
2.32
2.34
Tru
e D
ensi
ty (
g/c
c)
Pure Cristobalite
Pure Fused Silica
31 / 34
D 2.1 / v 1.6 / First issue / PU (Public)
It has to be mentioned the shoulder on the left side of the main peak of cristobalite has been argued in the literature to be possibly another smaller peak (possibly tridymite or quartz) which is superimposed on the peak of cristobalite [17], [18]. The formation of tridymite in the heat-treated samples of FS can neither be refuted nor confirmed, but if it exists, the amount present would be limited. Following the work of Sano et al. [19], the formation of tridymite crystals, from silica melt, via the solution precipitation mechanism, require tridymite seeds/nuclei, which are absent in FS, unlike the conventional silica brick.
Figure 34: XRD patterns of FS in as-received state and after various heat-treatment times at 1200 ⁰C.
Figure 35: XRD patterns of FS in as-received state and after various heat-treatment times at 1400 ⁰C.
16 18 20 22 24 26 28 30
Inte
nsi
ty (
a. u
.)
2 (degree)
C
C
As-rec.
10 h
30 h
50 h
16 18 20 22 24 26 28 30
Inte
nsi
ty (
a. u
.)
2 (degree)
C
C100 h
50 h
10 h
2 hAs-rec.
32 / 34
D 2.1 / v 1.6 / First issue / PU (Public)
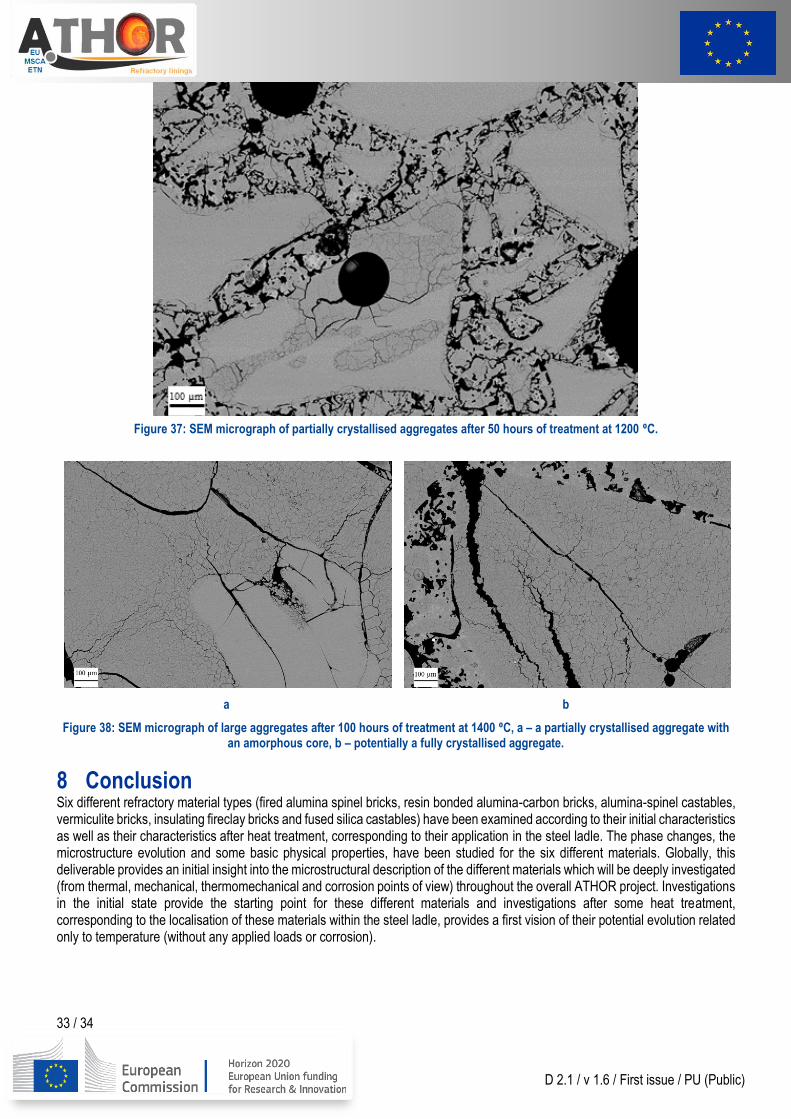
Figure 36: XRD patterns of FS in as-received state and after similar heat-treatment times at 1200 ⁰C and 1400 ⁰C.
7.3.3 Microstructure
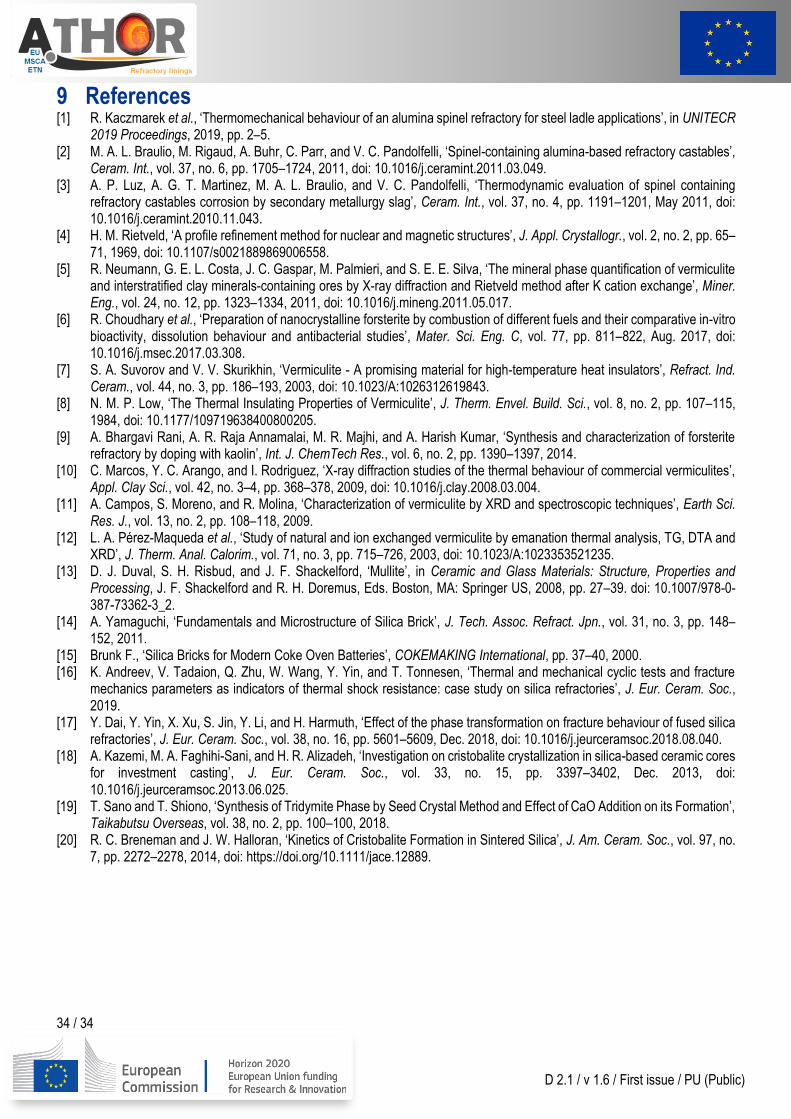
The micrograph of samples heat-treated at 1200 ⁰C for 50 hours show evidence of crystallization of fused silica aggregates (Figure 37). Some microcracks appeared in the periphery of the fused aggregates, the thickness of the cracked mantle is only few microns and the main body of the larger aggregates appear intact. This implies the crystallization initiates from the periphery of the aggregates and proceeds toward their core. A similar observation was made by others [18], [20]. The thickness of the cracked mantle significantly increases in samples with higher extent of crystallization. This can be clearly seen in micrograph of samples heat-treated at 1400 ⁰C for 100 hours. In some aggregates Figure 38(a), an amorphous core remains visible and in some others Figure 38(b) the amorphous core couldn’t be seen. The latter doesn’t necessarily imply that the aggregate was fully crystallized, as micrographs only give an insight about a 2D cross-section of the polished samples. It could be the case that the amorphous core of the aggregate, was not simply visible in the captured cross-section. XRD analysis of the samples heat-treated at 1400 ⁰C for 100 hours suggested presence of some amorphous content. Nevertheless, the microstructure of FS samples heat-treated at 1400 ⁰C for 100 hours are expected to be predominantly crystallized.
As previously mentioned, the crystallization of these fused (amorphous) grains was highlighted by the appearance of (micro)cracks within the microstructure of fused grains. This attribution can be justified by considering two occurring phenomena:
1. During cooling, the newly formed cristobalite undergoes significant volume changes at the cristobalite transition temperature. This likely causes formation of microcracks within the crystallized mantle and formation of so-called roof-tile microstructure, as addressed also by others [17], [20].
2. The resultant tensile stresses forming at the interface of the amorphous core and the crystallised mantle causes formation of cracks due to thermal expansion mismatches between the components, as addressed also by others [20].
16 18 20 22 24 26 28 30
Inte
nsi
ty (
a. u
.)
2 (degree)
C
C
As-rec.
1400°C- 10 h1200°C- 10 h
1200°C - 50 h
1400°C - 50 h
33 / 34
D 2.1 / v 1.6 / First issue / PU (Public)
Figure 37: SEM micrograph of partially crystallised aggregates after 50 hours of treatment at 1200 ⁰C.
a b
Figure 38: SEM micrograph of large aggregates after 100 hours of treatment at 1400 ⁰C, a – a partially crystallised aggregate with an amorphous core, b – potentially a fully crystallised aggregate.
8 Conclusion Six different refractory material types (fired alumina spinel bricks, resin bonded alumina-carbon bricks, alumina-spinel castables, vermiculite bricks, insulating fireclay bricks and fused silica castables) have been examined according to their initial characteristics as well as their characteristics after heat treatment, corresponding to their application in the steel ladle. The phase changes, the microstructure evolution and some basic physical properties, have been studied for the six different materials. Globally, this deliverable provides an initial insight into the microstructural description of the different materials which will be deeply investigated (from thermal, mechanical, thermomechanical and corrosion points of view) throughout the overall ATHOR project. Investigations in the initial state provide the starting point for these different materials and investigations after some heat treatment, corresponding to the localisation of these materials within the steel ladle, provides a first vision of their potential evolution related only to temperature (without any applied loads or corrosion).
34 / 34
D 2.1 / v 1.6 / First issue / PU (Public)
9 References [1] R. Kaczmarek et al., ‘Thermomechanical behaviour of an alumina spinel refractory for steel ladle applications’, in UNITECR
2019 Proceedings, 2019, pp. 2–5. [2] M. A. L. Braulio, M. Rigaud, A. Buhr, C. Parr, and V. C. Pandolfelli, ‘Spinel-containing alumina-based refractory castables’,
Ceram. Int., vol. 37, no. 6, pp. 1705–1724, 2011, doi: 10.1016/j.ceramint.2011.03.049. [3] A. P. Luz, A. G. T. Martinez, M. A. L. Braulio, and V. C. Pandolfelli, ‘Thermodynamic evaluation of spinel containing
refractory castables corrosion by secondary metallurgy slag’, Ceram. Int., vol. 37, no. 4, pp. 1191–1201, May 2011, doi: 10.1016/j.ceramint.2010.11.043.
[4] H. M. Rietveld, ‘A profile refinement method for nuclear and magnetic structures’, J. Appl. Crystallogr., vol. 2, no. 2, pp. 65–71, 1969, doi: 10.1107/s0021889869006558.
[5] R. Neumann, G. E. L. Costa, J. C. Gaspar, M. Palmieri, and S. E. E. Silva, ‘The mineral phase quantification of vermiculite and interstratified clay minerals-containing ores by X-ray diffraction and Rietveld method after K cation exchange’, Miner. Eng., vol. 24, no. 12, pp. 1323–1334, 2011, doi: 10.1016/j.mineng.2011.05.017.
[6] R. Choudhary et al., ‘Preparation of nanocrystalline forsterite by combustion of different fuels and their comparative in-vitro bioactivity, dissolution behaviour and antibacterial studies’, Mater. Sci. Eng. C, vol. 77, pp. 811–822, Aug. 2017, doi: 10.1016/j.msec.2017.03.308.
[7] S. A. Suvorov and V. V. Skurikhin, ‘Vermiculite - A promising material for high-temperature heat insulators’, Refract. Ind. Ceram., vol. 44, no. 3, pp. 186–193, 2003, doi: 10.1023/A:1026312619843.
[8] N. M. P. Low, ‘The Thermal Insulating Properties of Vermiculite’, J. Therm. Envel. Build. Sci., vol. 8, no. 2, pp. 107–115, 1984, doi: 10.1177/109719638400800205.
[9] A. Bhargavi Rani, A. R. Raja Annamalai, M. R. Majhi, and A. Harish Kumar, ‘Synthesis and characterization of forsterite refractory by doping with kaolin’, Int. J. ChemTech Res., vol. 6, no. 2, pp. 1390–1397, 2014.
[10] C. Marcos, Y. C. Arango, and I. Rodriguez, ‘X-ray diffraction studies of the thermal behaviour of commercial vermiculites’, Appl. Clay Sci., vol. 42, no. 3–4, pp. 368–378, 2009, doi: 10.1016/j.clay.2008.03.004.
[11] A. Campos, S. Moreno, and R. Molina, ‘Characterization of vermiculite by XRD and spectroscopic techniques’, Earth Sci. Res. J., vol. 13, no. 2, pp. 108–118, 2009.
[12] L. A. Pérez-Maqueda et al., ‘Study of natural and ion exchanged vermiculite by emanation thermal analysis, TG, DTA and XRD’, J. Therm. Anal. Calorim., vol. 71, no. 3, pp. 715–726, 2003, doi: 10.1023/A:1023353521235.
[13] D. J. Duval, S. H. Risbud, and J. F. Shackelford, ‘Mullite’, in Ceramic and Glass Materials: Structure, Properties and Processing, J. F. Shackelford and R. H. Doremus, Eds. Boston, MA: Springer US, 2008, pp. 27–39. doi: 10.1007/978-0-387-73362-3_2.
[14] A. Yamaguchi, ‘Fundamentals and Microstructure of Silica Brick’, J. Tech. Assoc. Refract. Jpn., vol. 31, no. 3, pp. 148–152, 2011.
[15] Brunk F., ‘Silica Bricks for Modern Coke Oven Batteries’, COKEMAKING International, pp. 37–40, 2000. [16] K. Andreev, V. Tadaion, Q. Zhu, W. Wang, Y. Yin, and T. Tonnesen, ‘Thermal and mechanical cyclic tests and fracture
mechanics parameters as indicators of thermal shock resistance: case study on silica refractories’, J. Eur. Ceram. Soc., 2019.
[17] Y. Dai, Y. Yin, X. Xu, S. Jin, Y. Li, and H. Harmuth, ‘Effect of the phase transformation on fracture behaviour of fused silica refractories’, J. Eur. Ceram. Soc., vol. 38, no. 16, pp. 5601–5609, Dec. 2018, doi: 10.1016/j.jeurceramsoc.2018.08.040.
[18] A. Kazemi, M. A. Faghihi-Sani, and H. R. Alizadeh, ‘Investigation on cristobalite crystallization in silica-based ceramic cores for investment casting’, J. Eur. Ceram. Soc., vol. 33, no. 15, pp. 3397–3402, Dec. 2013, doi: 10.1016/j.jeurceramsoc.2013.06.025.
[19] T. Sano and T. Shiono, ‘Synthesis of Tridymite Phase by Seed Crystal Method and Effect of CaO Addition on its Formation’, Taikabutsu Overseas, vol. 38, no. 2, pp. 100–100, 2018.
[20] R. C. Breneman and J. W. Halloran, ‘Kinetics of Cristobalite Formation in Sintered Silica’, J. Am. Ceram. Soc., vol. 97, no. 7, pp. 2272–2278, 2014, doi: https://doi.org/10.1111/jace.12889.