delhi-sdr-initial pages
TRANSCRIPT
Contents 5
Core Committee
DELHI
Prof. V.L. Chopra Chairman
MemberPlanning Commission
Shri A.N.P. Sinha Member
Principal Adviser (SP/PC/ Education)Planning Commission
Shri Rakesh Mehta Member
Chief Secretary, Govt. of NCT Delhi
Dr. Sharad Pant Member Secretary
Dy. Adviser (SP)Planning Commission
Representative of Partner Institutions
1. M/s. MG School of Communications Management,
New Delhi (Coordinator)
2. Institute of Human Development, New Delhi
3. Indian Council of Agriculture Research, New Delhi
4. Institute of Applied Manpower Research, New Delhi
5. Indian Council of Forestry Research & Education, Dehradun
6. Wildlife Institute of India, Dehradun
7. National Council of Applied Economic Research, New Delhi
8. Water & Power Consultancy Services (India) Ltd., New Delhi
9. Voluntary Health Association of India, New Delhi
DELHI DEVELOPMENT REPORT6
Partner Agencies and Project Team
M.G. School of Communications Management
Mr. Vinay Shankar (Project Leader and Editor)
Mr. Neeraj Daftuar
Mr. Baikunth Behari
Mr. T.N. Srivastava
Dr. Dilip Biswas
Mr. Jagdish Sagar
Mr. K.P. Singh
Dr. Ashok Jain
Mr. P.S. Saran
Mr. R.P. Sharma
Mr. J. Sanyal
Water and Power Consultancy Services Ltd.
Mr. R.K. Aggarwal
Mr. V.K. Mathur
Mr. M.A. Khan
Indian Council of Forest Research and Education, Dehradun
Mr. S.S. Negi
Mr. A.S. Rawat
Wildlife Institute of India, Dehradun
Dr. V.B. Mathur
Dr. Ashish David
Institute of Human Development
Dr. Vandana Parashar
Dr. Anuradha De
Dr. Preet Rastogi
Dr. T. Ravi
Voluntary Health Association of India
Dr. P.C. Bhatnagar
Institute of Applied Manpower Research
Ms. Madhu Srivastava
Mr. M.C. Verma
Contents 7
={ÉÉvªÉIÉ
ªÉÉäVÉxÉÉ +ɪÉÉäMÉú
¦ÉÉ®úiÉDEPUTY CHAIRMANPLANNING COMMISSIONINDIA
B¨É. BºÉ. +ɽþ±ÉÖ́ Éɇ±ÉªÉÉ
MONTEK SINGH AHLUWALIA
MESSAGE
An important Tenth Plan initiative of the Planning Commission was
to sponsor preparation of the State Development Reports. Much of the
work done for this assignment was given to national level institutes. This
exercise was undertaken in recognition of the fact that economic
circumstances and performance of individual States varied and it was
necessary to examine development challenges for individual states in the
light of State specific constraints. The basic idea is to produce quality
reference documents on development profiles of individual States and the
possible strategies for accelerating growth, and reducing poverty and
inequality.
The Delhi Development Report reviews the experience of NCT
Delhi and highlights issues critical for the State's development in the
years ahead. I hope its publication will stimulate debate on the growth
strategies appropriate for NCT Delhi. I am sure the roadmap indicated in
the report will stimulate broader awareness of the critical policy issues
facing the State, and assist the State to move to a higher growth path
and achieve all round human and economic development.
The Planning Commission's endeavour will be rewarded if the
report helps the State to achieve a higher rate of growth with an equitable
distribution of the resulting benefits to the people of NCT Delhi.
(M.S. AHLUWALIA)
ª É É ä V É x É É ¦ É ´ É x É , º É Æ º É n ù ¨ É É M É Ç , x É< Ç ‡ n ù ± ± É Ò&110001 n Ú ù ® ú ¦ É É ¹ É % 23096677 ] 23096688 ¡ è òCº É % 23096699
Yojana Bhawan, Parliament Street, New Delhi : 110001 Phones: 23096677, 23096688 Fax : 23096699, E-mail : [email protected]
March 26, 2008

Contents 9
GOVT. OF NATIONAL CAPITAL TERRITORY OF DELHIDELHI SECRETARIAT, I.P. ESTATE, NEW DELHI-110002
DO.NO. : 221/PRNCM/08Dated: 12-03-08
SHEILA DIKSHITCHIEF MINISTER
FOREWORD
Delhi Development Report is the latest in their series of SDRs preparedby Planning Commission. It gives me great pleasure to acknowledge the roleof Planning Commission as philosopher, friend and guide on developmentalissues. I hope the Delhi Development Report will help to enhance thisrelationship.
Government of Delhi is committed towards making Delhi a world-classcity having development with a human face. While bringing out Delhi's firstHuman Development Report, a set of Delhi Development Goals were drawnup, implementation of which, we believe, will facilitate inclusive growth inDelhi. Towards this end, we will also use the Delhi Development Report.
The Government of Delhi’s association with the Planning Commissiontowards preparation of Delhi Development Report was in the form of a CoreCommittee wherein Delhi was a member. I understand that the workshopheld last year, to give final touches to the Delhi Development Report, was afruitful one where officials of Government of Delhi participated in largenumbers and also gave qualitative inputs.
We, in the Government of Delhi look forward to this Delhi DevelopmentReport for helping all concerned in understanding the status of differentsectors of development and taking up follow up action for all rounddevelopment of Delhi.
(SHEILA DIKSHIT)
PHONE : OFF. 23392020, 23392030 • FAX : 23392111

Contents 11
|ÉÉä. ´ÉÒ. B±É. SÉÉä{Éc÷É
PROF. V. L. CHOPRA
MESSAGE
To meet the requirements of the Central Plan Scheme "50th Year
Initiative for Planning", the Planning Commission has launched
preparation of Development Report of each State of the Indian Union.
These SDRs attempt to compile quality reference documents on the
profile and strategy of the State for accelerating the pace of development.
These reports will be helpful to both the Centre and State machineries
engaged in steering the plan process of the State on a higher and
equitable growth path.
The NCT Delhi Development Report has been prepared by the
Planning Commission with the assistance of M.G. School of
Communications Management (MGSCM), New Delhi. A core committee
identified and reviewed the dimensions of various developmental issues
and helped to chart out the scope and coverage of State Development
Report for NCT Delhi. The efforts made by MGSCM in coordinating and
preparing the final report deserve to be specially noted.
This report will be an important value document and will impart value
for development practitioners interested in the State and act as a road
map for accelerated growth in the future.
I am thankful to the Govt. of NCT Delhi for their sustained support
and cooperation to the team members in preparing this report. The
efforts invested by the State Plan Adviser, and the officers of the State
Plan Division in liaising with the State Government agencies are
appreciated.
(V. L. CHOPRA)
nÚù®ú¦ÉÉ¹É % 23096708 ]äõ±ÉÒ¡èòCºÉ % 23096586Phone: 23096708 Telefax : 23096586, e-mail : [email protected]
ºÉnùºªÉ
ªÉÉäVÉxÉÉ +ɪÉÉäMÉú
ªÉÉäVÉxÉÉ ¦É´ÉxÉ
xÉ<Ç ‡nù±±ÉÒ&110 001MEMBER
PLANNING COMMISSIONYOJANA BHAWANNEW DELHI-110 001
Date: 1st July, 2008

Contents 13
|ÉvÉÉxÉ ºÉ±ÉɽþEòÉ®ú
¦ÉÉ®úiÉ ºÉ®úEòÉ®
ªÉÉäVÉxÉÉ +ɪÉÉäMÉú
Principal AdviserGovernment of IndiaPlanning CommissionNew Delhi-110 001
Telphone: 011-23096610Fax: 23096584
E-mail: [email protected]
B.BxÉ.{ÉÒ. ‡ºÉx½þÉ, ¦ÉÉ.|É.ºÉä.
A.N.P. SINHA, IAS
INTRODUCTION
The State Development Report has to be seen in the context of planning process.The Eleventh Plan for Delhi is of special significance since Commonwealth Gamesto be held in 2010 provides an opportunity for making Delhi a World Class City. TheChallenge is greater since multiplicity of agencies are responsible for itsdevelopment. These agencies have to evolve a common vision and harmoniousplan of action for sensitive convergence and synergy in efforts so that the identifiedplans and projects are synchronised and completed in time. Moreover, developmentalefforts should benefit all citizens, rich or poor, and make Delhi an inclusive city.
2. In this context, the City Development Plan (CDP) of Delhi also deserves amention. The CDP facilitates identification of projects within the framework of MasterPlan for Delhi 2021. It contains a vision for development and strategies focused onGrowth and Management of Urban Infrastructure and Basic Services for the UrbanPoor, Reliable and Affordable Transport, Safeguarding of City Environment,Protection of Heritage Areas, Preservation of Water Bodies, Redevelopment of InnerCity Areas, etc. Projects worth Rs.53,166 crore have been identified which includeshort term (2007-12) Rs.24,140 crore, medium term (2012-17) Rs.15,721 crore andlong term (2017-21) Rs. l3,305 crore.
3. Resources are no longer a problem for the State. Its Annual Plan size hasincreased from Rs. 5200 cr in 2006-07 to Rs. 9000 cr in 2007-08 and further to Rs.10,000 cr in 2008-09. The 11th Plan outlay is projected at about Rs. 55,000 cr asagainst the 10th Plan expenditure of about Rs. 23,000 cr. In fact, its resourcepotential permits a more ambitious Plan. Further, the scope for PPP in leveragingprivate investments in Delhi is very large. However, the administrative machineryhas to be geared and procedures streamlined for absorption of such magnitude ofresources.
4. The Development Plan of Delhi has to focus on Development of YamunaRiver Front to global excellence including Rejuvenation of River, Expeditiouscompletion of Renuka Dam in HP for drinking water and self-cleaning velocity ofwater in Yamuna, Ensuring Adequate Power, Efficient and Integrated Multi ModalTransport System, Treatment and Recycling of Waste Water, Cleaning & Greeningof drains, Developing Delhi as a Knowledge Hub etc. Modern Land and Property
DELHI DEVELOPMENT REPORT14
management using GIS, earmarking adequate land for public purposes/projects alsoneed urgent attention. Implementation of reforms identified under JNNURM is animperative which would make the city sustainable and competitive.
5. We need to put in place the Yamuna Development Authority which isautonomous, creative and empowered and can engage internationally reputedprofessional to prepare a Master Plan to build modern Delhi around the Yamunawhich is ecologically and financially viable and sustainable.
6. Attaining the monitorable targets identified for the 11th Plan such as InfantMortality Rate, Maternal Mortality Rate, Malnutrition among Children, Anaemia amongWomen, Sex ratio, Dropout Rate in Elementary Education, etc. would need gearingup Government machinery and focused strategies.
7. Much concern has been expressed about the low sex ratio: 838 for Delhi inthe age group of 0-6 as against the National Average of 927. Delhi Government hasalready launched some major initiatives. But Delhi needs to take bigger measures ina Mission Mode, so that the target of 890 for the Eleventh Plan is exceeded. In factDelhi should become a model for other States with low sex ratio.
8. Delhi is a historical city whose remnants are spread right from Mehrauli toShahjahanabad. Accordingly, policies, strategies and appropriate action plans needto be prepared by all agencies to conserve and develop the civic and urban heritage,architecturally significant landmarks, living monuments, memorials and historicalgardens, city wall, gates, bridges, vistas, public places, edicts and the ridge.
9. For making Delhi, the Nation Capital, an inclusive city, where people from allover the country are drawn, suitable policy and plans are required. The chronic issueof unauthorised colonies also need to be addressed in a sustainable manner.
10. The NCR Planning Board has played a significant role in development ofinfrastructure in the National Capital Region by promoting projects of regionalimportance covering a wide spectrum—roads, water supply, power, sewerage, solidwaste disposal; land development etc. The Board, however, has to play a muchbigger and vital role in the development of NCR as a Region of a global excellencesince Delhi & NCR are inter-dependant and need to be developed as an integratedorganic entity. Early completion of East and West Expressways, Integrated MultiModel Transport System (covering Road, Rail, Metro), planned development oftownships and facilities etc. need urgent attention.
11. Lastly, Mughals built Old Delhi and Britishers built Lutyen's Delhi. Let usbuild a Delhi of 21st Century.
A.N.P. SinhaPr. Adviser,
Planning Commission
Contents 15
Acknowledgements
DELHI
Preparation of State Development Report for the
States of India in line with World Development Report
is a unique idea which was not only conceived by the
Planning Commission but also given concrete shape by
them through liberal funding. This report analyses the
status of various sectors of the economy, the trend of
development, resource endowment and presents a
detailed profile of the leading sectors of the economy.
On the basis of the identified goals the Report also
attempts to set out policy actions and a vision to
achieve the desired outcomes.
We are extremely grateful to Dr. V.L. Chopra,
Member, Planning Commission and Chairman of the
Core Committee for providing valuable suggestions at
every review meeting. We sincerely record our deep
sense of gratitude to Shri A.N.P. Sinha, Principal
Adviser, Planning Commission for his support, valuable
guidance and suggestions.
The report has also greatly benefited from the
comments of the Chief Secretary and Principal Secretary
/Secretaries of the respective departments of the
Government of NCT of Delhi during the final workshop
organised on July 11, 2007 in Delhi. We are thankful to
Shri Harish Chandra, Dr. Sharad Pant and a number of
officers from the Planning Commission for organising
the workshop and enabling us to benefit from the
valuable discussions. We are also grateful for the
comments and feedback obtained from the numerous
participants including academicians, professionals and
government officials at the workshop.
We are also thankful to the members of partner
institutions who have been very cooperative in
coordination of this study and provided rich
information and valuable recommendation in their
respective chapters.
We also take this opportunity to thank Shri Harish
Chandra, Adviser, Shri J.P. Vijay, Director and various
officials of Planning Commission, Dr. B.K. Sharma,
Director, Shri Deepak Sen Gupta, Joint Director, and
various officials of Government of NCT of Delhi for
their unstinted help and cooperation.
In the course of preparation of the report generous
help and assistance were rendered by a large number of
people, both at official and non-official level, and we
thank all of them for their help.
Vinay Shankar
(Project Leader)

Contents 17
Contents
DELHI
The Core Committee, including Partner Agencies and Project Team . . . . . . . . . . . . . . . . . 5
Message from Deputy Chairman, Planning Commission . . . . . . . . . . . . . . . . . . . . . . . . . . . 7
Foreword from Chief Minister, Delhi . . . . . . . . . . . . . . . . . . . . . . . . . . . . . . . . . . . . . . . . . . 9
Message by Member, Planning Commission . . . . . . . . . . . . . . . . . . . . . . . . . . . . . . . . . . . 11
Introduction by Principal Advisor, Planning Commission . . . . . . . . . . . . . . . . . . . . . . . . . 13
Acknowledgements . . . . . . . . . . . . . . . . . . . . . . . . . . . . . . . . . . . . . . . . . . . . . . . . . . . . . . . . 15
List of Tables, Figures and Annexures . . . . . . . . . . . . . . . . . . . . . . . . . . . . . . . . . . . . . . . 25
Executive Summary . . . . . . . . . . . . . . . . . . . . . . . . . . . . . . . . . . . . . . . . . . . . . . . . . . . . . . 31
1. Profile of the State . . . . . . . . . . . . . . . . . . . . . . . . . . . . . . . . . . . . . . . . . . . 59
1.1 History
1.2 Phases in Development of Modern Delhi
1.3 Geography
1.4 Climate
1.5 Area of NCTD
1.6 Civic Administrative Division
1.7 Demography
1.8 Economy of NCTD
1.9 Development Disparities
1.10 Education
1.11 Medical Facilities
1.12 Physical Infrastructure
1.13 Energy
1.14 Water
1.15 Environment
1.16 Industrial Effluent
1.17 National Capital Region (NCR)
1.18 Flora and Fauna
1.19 Culture
DELHI DEVELOPMENT REPORT18
2. Economy and Fiscal Management . . . . . . . . . . . . . . . . . . . . . . . . . . . . . . . 73
2.1 General
2.2 Rate of Economic Growth
2.3 Per Capita NSDP
2.4 Structure of the Economy
2.5 Primary Sector
2.6 Secondary Sector
2.7 Services Sector
2.8 Labour Supply and Employment
2.9 Special Provisions for Delhi
2.10 Revenue Receipts
2.11 Tax Receipts
2.12 Own Non-Tax Revenue
2.13 Central Transfers
2.14 Expenditure
2.15 Plan Expenditure
2.16 Non-Plan Expenditure
2.17 Expenditure on General Services
2.18 Expenditure on Social and Economic Services
2.19 Assignment to Local Bodies
2.20 Revenue Surplus
2.21 Fiscal Deficit and Debt
2.22 Concluding Remarks
3. Urban Development . . . . . . . . . . . . . . . . . . . . . . . . . . . . . . . . . . . . . . . . . . 93
3.1 Housing
3.2 Land Development and Management
3.3 Sanitation
3.4 Housing and Urban Policy
3.5 Data Base Development and Management
4. Infrastructure Development . . . . . . . . . . . . . . . . . . . . . . . . . . . . . . . . . . 111
4.1 General Features of Delhi Power Situation
4.2 Review of Policies, Programmes and Projects
4.3 Current State of the Sector
4.4 Implementation of the Reform Package and Prospects of Achieving Financial Viability
4.5 Areas of Strengths, Weaknesses and Where Intervention is Needed
4.6 Introduction
4.7 Traffic Characteristics and Overall Transportation Scenario
4.8 Status of Roads and Their Development So Far
4.9 Limitations of the Existing Road System
4.10 Sanctioned Road Development Projects and Their Present Status, Planning for
Completion and Projects in the Pipeline
4.11 Development of Roads Leading to and Bypassing Delhi
4.12 New Expressways
4.13 Institutional Measures
4.14 Phasing of Projects
4.15 Multiplicity of Authority in the Road Sector and its effect on Development
4.16 Institutional Framework
Contents 19
4.17 Policy and Planning Group
4.18 Maintenance of Roads, Signages, Street Lighting and Sanitation
4.19 Pollution
4.20 Maintenance of Roads
4.21 Status of Railways and Their Development So Far
4.22 Railway Services in Delhi can be categorised as under
4.23 Sanctioned Railway Projects and Their Present Status
4.24 Traffic Management
4.25 Salient Features of the Report of the Committee on Sustainable Transport
4.26 Further Recommendations
4.27 Integration Issues
4.28 Vision for the State and Policy Action Required for Achieving the Same
4.29 What Ails Delhi Roads
4.30 Current Status and Resource Assessment
4.31 Vision 2021
4.32 Policy Interventions and Recommendations
4.33 Conclusion
4.34 Introduction
4.35 Telecommunication Policy
4.36 Major Telecom Services
4.37 Teledensity Status
4.38 Broadband Service
4.39 Telecom Regulatory Authority
4.40 Private Sector Participation
4.41 Long Term Goal
4.42 E-governance Schemes
4.43 Policy Formulation
4.44 Private Sector Participation
4.45 Long Term Goal
4.46 e-Governance
4.47 Suggestions
5. Environment Management . . . . . . . . . . . . . . . . . . . . . . . . . . . . . . . . . . . . 179
5.1 Land Use
5.2 Water Supply and Sanitation Wastewater Management
5.3 Solid Wastes Management
5.4 Air Quality
5.5 Cleaning the River Yamuna
5.6 Storm Water & Flood Control
6. Public Distribution System . . . . . . . . . . . . . . . . . . . . . . . . . . . . . . . . . . . 197
6.1 Evolution of PDS
6.2 Public Distribution System in Delhi
6.3 Targeted Public Distribution (TPDS)
6.4 Other Schemes
6.5 Circle Advisory Committee
6.6 Grievances related to PDS
6.7 Initiatives for Improving Efficiency
6.8 Futuristic Approach
DELHI DEVELOPMENT REPORT20
6.9 Right to Information
6.10 Role of Civil Society
6.11 Some Suggestions
7. Forest, Tree Crop Management, Greening of Delhi . . . . . . . . . . . . . . 215
7.1 Introduction
7.2 Green Cover and its Current Status
7.3 Greening of Delhi—Vision 2015
7.4 Policy Framework
7.5 Conclusion
8. Wildlife Management and Biodiversity Conservation . . . . . . . . . . . . . 235
8.1 Introduction
8.2 Status of Wildlife
8.3 Multi-Agency Programmes And Areas
8.4 Appraisal of Policy and Programmes
8.5 Recommendations for Department of Forest and Wildlife
9. Education Status Report of Delhi . . . . . . . . . . . . . . . . . . . . . . . . . . . . . 253
9.0 Introduction
9.1 Trends in Literacy Rates in Delhi since Independence
9.2 Delhi Education Scenario
9.3 Possible Causes behind Poor Achievement
9.4 Initiatives in Improving the Education Scenario in Delhi
9.5 Strategies, Choices and Issues in the field of Education for Delhi of tomorrow
9.6 Issues in Education—Delhi
10. Health and Family Welfare, RCH, Ayush and Nutrition . . . . . . . . . . 277
10.1 Background
10.2 Peculiarities of Delhi—The Capital State
10.3 Health Care Delivery System in Delhi
10.4 Growth of Medical Institutions in Delhi since 1992
10.5 Life Expectancy at Birth
10.6 Other Indicators for Health in the Society that Ultimately Influence the Longevity
10.7 Fertility, Birth Rates and Maternal Health
10.8 Natural Growth Rate
10.9 Sex Ratio
10.10 Morbidity Patterns
10.11 Some Programmes related with Health Problems in Delhi
10.12 Water Borne Diseases
10.13 Polio
10.14 Vector Borne Diseases in NCT of Delhi
10.15 Dengue
10.16 Maternal and Child Health Programmes
10.17 HIV/AIDS
10.18 Non-Communicable Diseases (NCDs)
10.19 Accidents and Trauma
10.20 Other Health Determinants
Contents 21
10.21 Water Supply and Sanitation
10.22 Environmental Pollution
10.23 Private Sector in Health Care
10.24 Drug Policy
10.25 Delhi Prohibition of Smoking and Non-Smoker Health Protection Act, 1996
10.26 Resource Allocation for Health
10.27 Access and Utilisation of Health Services
10.28 Health Care Expenditures
10.29 Vulnerable Areas of Delhi
10.30 Vulnerable Populations of Delhi
10.31 The Way Forward
10.32 Suggestions for Improving Health Status of People in Delhi
11. Tourism including Health Tourism . . . . . . . . . . . . . . . . . . . . . . . . . . . . 299
11.0 Methodology
11.1 National Tourism Scene (Ninth Five Year Plan)
11.2 Policy Framework for the Ninth Plan
11.3 Tourism Scene (Tenth Five Year Plan)
11.4 Global Status and Trends
11.5 Tenth Plan Objective Improving and Expanding Product Development
11.6 The Path Ahead
11.7 Status of Department of Tourism Delhi Administration
11.8 Plan Outlay and Expenditure during 10th Five Year Plan
11.9 Analysis of the Functioning of the Tourism Department
11.10 Constraints Identified by Tourism Department
11.11 A Broad Picture of Tourism in Delhi
11.12 Tourism Data Relating to Tourist Facilities in Delhi
11.13 Tourism Services Providers
11.14 Opportunities in Delhi Tourism Sector
11.15 The Tourism Product that Need to be Developed for Achieving Growth in the
Tourism Industry in Delhi
11.16 The Way Forward
11.17 The Vision for Delhi Tourism
12. Employment and Integrated Rural Development . . . . . . . . . . . . . . . . . 321
12.1 Introduction
12.2 Employment Generation Strategy and Employment Elasticity
12.3 Specific Employment/Labour Force Situation of Delhi
12.4 Unemployment
12.5 Alternative Estimates of Educated Unemployment
12.6 Rural/Urban Development Plan
13. Science & Technology-IT and Biotechnology . . . . . . . . . . . . . . . . . . . . 335
13.1 Framework
13.2 Organisation of S&T Activities
13.3 Description of S&T-IT&BT Programmes in Delhi
13.4 Financial resources
13.5 Assessment
13.6 Suggested Vision and Initiatives
DELHI DEVELOPMENT REPORT22
14. Labour Management and Manpower Planning . . . . . . . . . . . . . . . . . . . 341
14.1 Literacy
14.2 Financial Provisions for Education Sector
14.3 Manpower Planning
14.4 General Remarks
15. Women and Vulnerable Groups . . . . . . . . . . . . . . . . . . . . . . . . . . . . . . . 351
15.0 Introduction
15.1 Women’s Issues
15.2 Socially Disadvantaged Groups
15.3 Child Labour
15.4 Vulnerabilities Stemming from Disability
15.5 Migrants
15.6 Housing Vulnerability/Shelterless
15.7 Public Transportation
15.8 Unorganised Workers
15.9 Old Age and Other Health Vulnerabilities
15.10 Child Abuse and Violence against Children
15.11 Some Recommendations
16. Industrial Development, Village & Small Industries
Village & Small Industries . . . . . . . . . . . . . . . . . . . . . . . . . . . . . . . . . . . . 369
16.1 Introduction
16.2 Industrial Base and Structure
16.3 Industrial Support System
16.4 Industrial Policy
16.5 Prospects and Potential for Industry
16.6 Unorganised Sector and, Khadi and Village Industries in Delhi
16.7 Characteristics of Unorganised Enterprises in Delhi
17. Institutional Reforms and Governance . . . . . . . . . . . . . . . . . . . . . . . . . 397
17.1 Concept
17.2 Link between Governance and Development
17.3 Actors in Governance
17.4 Characteristics of Good Governance
17.5 Improving Governance
17.6 Governance in NCTD
17.7 Evolution of Governance in NCTD
17.8 Urban Process: Organisations and Functions
17.9 Unique Features of NCT Delhi
17.10 Measures Initiated to Improve Governance in NCTD
17.11 Bhagidari
17.12 Vigilance
17.13 Improve Governance, Bring Openness and Transparency
17.14 Municipal Corporation of Delhi
17.15 New Delhi Municipal Council (NDMC)
17.16 Conclusion
Contents 23
18. Conclusions and Recommendations . . . . . . . . . . . . . . . . . . . . . . . . . . . . 415
18.0 General
18.2 Fiscal and Financial Management
18.3 Urban Development Housing and Utilisation of URIF, Slums etc.
18.4 Infrastructure
18.5 Environment
18.6 Public Distribution System
18.7 Forest, Tree Crop Management, Greening, etc.
18.8 Wild Life Management
18.9 Education
18.10 Health
18.11 Tourism
18.12 Employment, Rural Development and Poverty Alleviation:
18.13 Science & Technology
18.14 Labour
18.15 Social Development and Vulnerable Groups
18.16 Industrial Development
18.17 Agriculture and Allied Activities
18.18 Institutional Reforms and Governance

Contents 25
List of Tables, Figuresand Annexures
Tables
2.1 Sectoral Composition of NSDP of NCT ofDelhi 1960-61 to 2004-05 at Current Prices . . . . . . . . . . . .74
2.2 Sectoral Composition of GDP:1960-61 to 2004-05 (at Current Prices) . . . . . . . . . . . . . . .74
2.3 Revenue Receipts of Delhi: 1994-95 to 2004-05 . . . . . . . . 77
2.4 Expenditure of the GNCT of Delhi:1994-95 to 2004-05 . . . . . . . . . . . . . . . . . . . . . . . . . . . . . . .80
2.5 Plan Expenditure: 1994-95 to 2004-05 . . . . . . . . . . . . . . . .81
2.6 Non-Plan Expenditure: 1994-95 to 2004-05 . . . . . . . . . . . .81
2.7 Interest Receipts and Payments:1995-96 to 2004-05 . . . . . . . . . . . . . . . . . . . . . . . . . . . . . . .82
2.8 Revenue Surplus/Fiscal Deficit of Delhi:1995-96 to 2004-05 . . . . . . . . . . . . . . . . . . . . . . . . . . . . . . .83
2.9 Debt Position of Delhi: 1995-2005(As on 31 March of each year) . . . . . . . . . . . . . . . . . . . . . .84
3.1 Settlement–Wise Projected PopulationUpto the Year 2021 . . . . . . . . . . . . . . . . . . . . . . . . . . . . . . .93
3.2 JJ Clusters and Households in NCT Delhi . . . . . . . . . . . . .94
3.3 Facilities in Slum and JJ Clusters in Delhi . . . . . . . . . . . . . . 95
3.3 Slum Population (In Four LargestMetropolitan Cities of India, 2001) . . . . . . . . . . . . . . . . . .96
3.4 Ownership of Houses . . . . . . . . . . . . . . . . . . . . . . . . . . . . . 98
3.5 Availability of Urbanisable Land in Nct-Delhi . . . . . . . . . . . 99
3.6 Zone-wise Estimated Holding Capacity ofExisting Urban Area . . . . . . . . . . . . . . . . . . . . . . . . . . . . 100
3.7 Quantum of Municipal Solid Waste (Tonnes/Day) . . . . 101
3.8 Projected Composition of TotalMunicipal Solid Waste for 2021 . . . . . . . . . . . . . . . . . . . . 101
3.9 Existing Land Fill Sites for Waste Management . . . . . . . 102
3.10 Proposed Sanitary Land Sites . . . . . . . . . . . . . . . . . . . . . . 102
3.11 Existing and Prop Compost/Incineration Plants . . . . . . 102
4.1 Maximum Load Demand Met . . . . . . . . . . . . . . . . . . . . . 111
4.2 Consumption, Requirement and Shedding . . . . . . . . . . . 111
4.3 Distribution Transformer Failures . . . . . . . . . . . . . . . . . . 112
4.4 Recent Consumption Trends . . . . . . . . . . . . . . . . . . . . . . 112
4.5 Delhi Consumer Profile . . . . . . . . . . . . . . . . . . . . . . . . . . 113
4.6 Consumer Category-Wise Sale of Energyin 2004-05 As Per DERC . . . . . . . . . . . . . . . . . . . . . . . . . 114
4.7 Distribution Loss at 11 KV Level in DVB Period . . . . . . 114
4.8 Distribution Loss at 11 KV level in Bestand Worst Districts . . . . . . . . . . . . . . . . . . . . . . . . . . . . . 115
4.9 Share of Local Generation in Total Supply . . . . . . . . . . . . 115
4.10 Commercial Performance of DESU/DVB . . . . . . . . . . . . 116
4.11 Pre-Reforms Tariff Increases forDomestic Consumers . . . . . . . . . . . . . . . . . . . . . . . . . . . 117
4.12 Increasing Scale of Operations . . . . . . . . . . . . . . . . . . . . 117
4.13 AT&C Loss Reduction Targets for Bidding . . . . . . . . . . . 121
4.14 AT&C Loss Reduction Targets Accepted . . . . . . . . . . . . 121
4.15 Transitional Assistance Committed . . . . . . . . . . . . . . . . 121
4.16 Plant Load Factor . . . . . . . . . . . . . . . . . . . . . . . . . . . . . . . 124
4.17 Capital Investment in Distribution System . . . . . . . . . . . 128
4.18 Shedding: All Causes, in Million Units (MU) . . . . . . . . 129
4.19 Failure of Distribution Transformersafter Privatisation (All Discoms) . . . . . . . . . . . . . . . . . . 129
4.20 Projected and Actual Tariff Increases . . . . . . . . . . . . . . . 131
4.21 AT&C Loss Reduction . . . . . . . . . . . . . . . . . . . . . . . . . . . 131
4.22 Distribution of Motor Vehicles in Delhi . . . . . . . . . . . . . 136
4.23 Growth of Roads in Delhi . . . . . . . . . . . . . . . . . . . . . . . . 139
4.24 Growth of Vehicles on Delhi Roads . . . . . . . . . . . . . . . . 139
4.25 Overall Increase in the Number ofVehicles on Delhi Roads . . . . . . . . . . . . . . . . . . . . . . . . . 139
4.26 Proposed Rail Network Development Plan in Delhi(As per RITES Report of March 1999) . . . . . . . . . . . . . . 149
4.27 Perspective for Future Needs:Travel Demand by 2021 . . . . . . . . . . . . . . . . . . . . . . . . . . 153
4.28 Rate of Water Supply . . . . . . . . . . . . . . . . . . . . . . . . . . . . 155
4.29 Installed Capacity and the Sources of Raw Water . . . . . . 156
4.30 Current Water Treatment Capacity . . . . . . . . . . . . . . . . . 156
DELHI
DELHI DEVELOPMENT REPORT26
4.31 Revised Tariff Calculations . . . . . . . . . . . . . . . . . . . . . . . 159
4.32 Population and Water Demand . . . . . . . . . . . . . . . . . . . . 161
4.33 Yamuna Water is Shared Amongst . . . . . . . . . . . . . . . . . 161
4.34 Annual Utilisable Flow envisaged in the MoU . . . . . . . . 161
4.35 Sonia Vihar WTP and Water Obtained . . . . . . . . . . . . . . 162
4.36 Total Availability of Potable Water to 842 mgdonly by March 2007 . . . . . . . . . . . . . . . . . . . . . . . . . . . . . 163
4.37 DJB to Produce 921 mgd of Potable Water by 2011 . . . . 164
4.38 Increase in the InstalledCapacity 921 mgd to 941 mgd . . . . . . . . . . . . . . . . . . . . 165
4.39 Need for Policy Action . . . . . . . . . . . . . . . . . . . . . . . . . . . 166
4.40 Teledensity Status . . . . . . . . . . . . . . . . . . . . . . . . . . . . . . 171
5.1 Changing Land Use in NCT of Delhi . . . . . . . . . . . . . . . 179
5.2 Forest Cover–Percentage of Total Geographical Area . . . 180
5.3 Population Growth and Land Requirement inNCT of Delhi . . . . . . . . . . . . . . . . . . . . . . . . . . . . . . . . . . 181
5.4 Growth of Registered Vehicles in Delhi . . . . . . . . . . . . . 188
5.5 Vehicular Pollution Control Measures Taken in Delhi . . 190
6.1 Year-wise MSP, CIP and Range of Open MarketPrices for Wheat and Rice . . . . . . . . . . . . . . . . . . . . . . . . 197
6.2 Salient Features of RPDS and TPDS . . . . . . . . . . . . . . . . 198
6.3 Fair Price Shops and Licensed KeroseneOil Shops Operating in Delhi . . . . . . . . . . . . . . . . . . . . . 200
6.4 Issue of Ration Cards . . . . . . . . . . . . . . . . . . . . . . . . . . . 200
6.5 Scale of Entitlement . . . . . . . . . . . . . . . . . . . . . . . . . . . . . 201
6.6 Scale of Distribution of Cereals . . . . . . . . . . . . . . . . . . . . 201
6.7 Scale of Distribution of Cereals inDelhi 2003-04 and 2004-05 . . . . . . . . . . . . . . . . . . . . . . . 201
6.8 Poverty Line in Delhi . . . . . . . . . . . . . . . . . . . . . . . . . . . . 202
6.9 Features of TPDS in Delhi . . . . . . . . . . . . . . . . . . . . . . . . 203
6.10 Latest Lifting Figures for the Year2005-06 up to January 2006 . . . . . . . . . . . . . . . . . . . . . . 203
Lifting of Wheat & Rice . . . . . . . . . . . . . . . . . . . . . . . . . . 203
6.11 Report of APL Renewal and Distributionas on 27.3.2006 . . . . . . . . . . . . . . . . . . . . . . . . . . . . . . . . 205
6.12 Prices of Commodities Issued to theCardholders & FPS under PDS . . . . . . . . . . . . . . . . . . . . 208
6.13 Institution and Disposal of Cases sinceInception up to March 2005 . . . . . . . . . . . . . . . . . . . . . . 210
7.1 The Ridges in Delhi . . . . . . . . . . . . . . . . . . . . . . . . . . . . . 217
7.2 Species in the Ridge . . . . . . . . . . . . . . . . . . . . . . . . . . . . . 218
7.3 Recorded Forest Area of Delhi . . . . . . . . . . . . . . . . . . . . 220
7.4 Forest Cover of Delhi . . . . . . . . . . . . . . . . . . . . . . . . . . . . 221
7.5 Tree Cover of Delhi . . . . . . . . . . . . . . . . . . . . . . . . . . . . . 221
7.6 District-wise Forest Cover of Delhi . . . . . . . . . . . . . . . . 221
7.7 Achievements and Targets of Greening Agencies . . . . . . 224
7.8 Nine New City Forests . . . . . . . . . . . . . . . . . . . . . . . . . . 224
7.9 Changing Land Use Pattern . . . . . . . . . . . . . . . . . . . . . . . 226
7.10 Alarming Situation . . . . . . . . . . . . . . . . . . . . . . . . . . . . . . 226
7.11 List of Pollution Hardy Species . . . . . . . . . . . . . . . . . . . . 227
8.1 Approved Plan Outlay 10thFive Year Plan (2002-2007) . . . . . . . . . . . . . . . . . . . . . . . 247
8.2 Additional Posts Required . . . . . . . . . . . . . . . . . . . . . . . . 249
8.3 Approved Plan Outlay for 10th Plan Period . . . . . . . . . . . 250
9.1 Education Levels of Population in 7+ Age Groupin Urban Delhi and India, 1999 . . . . . . . . . . . . . . . . . . . . 254
9.2 Population Statistics for Delhi . . . . . . . . . . . . . . . . . . . . 255
9.3 Schools in Delhi . . . . . . . . . . . . . . . . . . . . . . . . . . . . . . . 255
9.4 Changes in Number of Schools . . . . . . . . . . . . . . . . . . . 256
9.5 Enrolment in Different Stages in Delhi . . . . . . . . . . . . . . 256
9.6 Share of Enrolment in Private Schools in Delhi, 1997 . . 257
9.7 Share of Enrolment in Private Schools in Delhi, 1997 . . 257
9.8 Enrolment in Government andPrivate Delhi Schools in 2003 . . . . . . . . . . . . . . . . . . . . . 257
9.9 Enrolment of Children (All Communities andScheduled Castes), 1998-99 . . . . . . . . . . . . . . . . . . . . . . 258
9.10 Pass Percentage in Class X and XII CBSE Boards . . . . . . 259
9.11 Pass Percentage in Class X and XII CBSE Boards forGovernment School Students . . . . . . . . . . . . . . . . . . . . . 259
9.12 Number of Students Appearing forClass X and XII CBSE Boards . . . . . . . . . . . . . . . . . . . . . 260
9.13 No. of Schools Functioning (DOE) inVarious Premises . . . . . . . . . . . . . . . . . . . . . . . . . . . . . . . 262
9.14 Variations in Overcrowding in MCD Zones . . . . . . . . . . 263
9.15 Courses Offered under Vocational Educationand Pre-Vocational levels . . . . . . . . . . . . . . . . . . . . . . . . . 267
9.16 Intake Capacity of Technical Institutions . . . . . . . . . . . . 269
9.17 Activity-wise Workers . . . . . . . . . . . . . . . . . . . . . . . . . . . 270
10.1 Growth of Medical Institutions in Delhi since 1992 . . . . 278
10.2 Death Rate (per thousand) . . . . . . . . . . . . . . . . . . . . . . . 279
10.3 Infant Mortality Rate by Sex . . . . . . . . . . . . . . . . . . . . . . 280
10.4 Infant Mortality Rate by Residence . . . . . . . . . . . . . . . . . 280
10.5 Trends of Various Health Indices inDelhi over the Years . . . . . . . . . . . . . . . . . . . . . . . . . . . . . 281
10.6 Demographic Indices . . . . . . . . . . . . . . . . . . . . . . . . . . . . 281
10.7 Birth Rate . . . . . . . . . . . . . . . . . . . . . . . . . . . . . . . . . . . . . 281
10.8 Natural Growth Rate . . . . . . . . . . . . . . . . . . . . . . . . . . . . 282
List of Tables, Figures and Annexures 27
10.9 Sex Ratio (0-6years) in Four Metro Cities . . . . . . . . . . . 283
10.10 Number of Female Births per 1000 Male Births . . . . . . 283
10.11 Incidence of Cholera Cases and Deaths . . . . . . . . . . . . . 284
10.12 Incidence of Gastro–Enteritis Cases and Deaths . . . . . . 284
10.13 Number of Polio Cases . . . . . . . . . . . . . . . . . . . . . . . . . . 284
10.14 Incidence and Deaths due to Malariaand Dengue Cases in Delhi . . . . . . . . . . . . . . . . . . . . . . . 285
10.15 Deaths in Road Accidents in Delhi . . . . . . . . . . . . . . . . . 287
10.16 Distribution of Households bySource of Drinking Water, 2001 . . . . . . . . . . . . . . . . . . . 288
10.17 Outlay under Health Sector (Delhi) . . . . . . . . . . . . . . . . 289
10.18 Per Capita Expenditure on Health (Delhi) . . . . . . . . . . . 290
10.19 Delhi: Health Indicators . . . . . . . . . . . . . . . . . . . . . . . . . . 291
10.20 Delhi: Weaker Sections . . . . . . . . . . . . . . . . . . . . . . . . . . 292
10.21 Per cent of Female Illiteracy andGirls Married Below 18 Years of Age . . . . . . . . . . . . . . . 292
11.1 Eighth Plan Expenditure—Tourism . . . . . . . . . . . . . . . . . 300
11.2 Contribution of Travel and Tourism toGDP and Employment . . . . . . . . . . . . . . . . . . . . . . . . . . . 302
11.3 International Tourist Arrivals . . . . . . . . . . . . . . . . . . . . . . 303
11.4 Contribution of Travel & Tourism toExports & Receipts . . . . . . . . . . . . . . . . . . . . . . . . . . . . . 303
11.5 International and Domestic Tourism . . . . . . . . . . . . . . . 304
11.6 Financial Outlay of the Tourism Department . . . . . . . . . 310
11.7 Plan Outlay and Expenditureduring 10th Five Year Plan . . . . . . . . . . . . . . . . . . . . . . . . 311
11.8 A Broad Picture of Tourism in Delhi . . . . . . . . . . . . . . . . 313
11.9 Business Tourism and International Conferencesand Conventions . . . . . . . . . . . . . . . . . . . . . . . . . . . . . . . 315
12.1 Sector wise Employment Elasticities . . . . . . . . . . . . . . . 322
12.2 Labour Force Participation Rate (LFPR) . . . . . . . . . . . . . 323
12.3 Distribution of Work Force by Type of Activity . . . . . . . 324
12.4 Status-wise Distribution of Work Force in Delhi . . . . . . 324
12.5 Labour Force Participation Rates of Age Group15 years and above by Sex and Residential Status . . . . . . 325
12.6 Distribution of Labour Force Participation byAge group, Sex and Residential status . . . . . . . . . . . . . . 325
12.7 Rates of LFPRs by Age Groups and Sex . . . . . . . . . . . . . 326
12.8 State/UT-wise Labour Force Participation Rates . . . . . . 326
12.9 Unemployment Rates as Percentageof Population Estimates . . . . . . . . . . . . . . . . . . . . . . . . . 327
12.10 Proportion of Unemploymentby Age Groups and Sex . . . . . . . . . . . . . . . . . . . . . . . . . . 327
12.11 Proportion of Unemploymentby Age Groups and Residential Status . . . . . . . . . . . . . . 327
12.12 Distribution of Unemployed Personsby Levels of Education Attained . . . . . . . . . . . . . . . . . . . 328
12.13 Employment Exchange Registrantsby Levels of Education . . . . . . . . . . . . . . . . . . . . . . . . . . . 329
12.14 Provision of Funds in IDRV . . . . . . . . . . . . . . . . . . . . . . . 330
12.15 The Courses Conducted by Society forPromotion of Self-Employment . . . . . . . . . . . . . . . . . . . 332
12.16 Outlays in the 10th Five Year Plan andAnnual Plan 2007–2008 of Select EmploymentOriented Programmes . . . . . . . . . . . . . . . . . . . . . . . . . . . 334
13.1 An Organisational Overview . . . . . . . . . . . . . . . . . . . . . . 336
13.2 Tenth Plan Allocations for S&T-IT&BT . . . . . . . . . . . . . 338
14.1 Literacy Rates in Select High-performingStates/Union Territories . . . . . . . . . . . . . . . . . . . . . . . . . 341
14.2 Enrollment in Govt., Govt.-Aidedand Unaided Schools . . . . . . . . . . . . . . . . . . . . . . . . . . . . 342
14.3 Total Enrolment in General Educationby Levels, in Delhi and India, 2000-01 . . . . . . . . . . . . . . 343
14.4 Total Enrolment of Boys in General Educationby Level in Delhi and India, 2000-01 . . . . . . . . . . . . . . . . 343
14.5 Total Enrolment of Girls in General Educationby Level in Delhi and India, 2000-01 . . . . . . . . . . . . . . . . 343
14.6 Financial outlays for Tenth Five-Year Planand Annual Plan 2007-08 . . . . . . . . . . . . . . . . . . . . . . . . . 344
15.1 Some Gender Development Indicatorsfor the Districts of Delhi: Total (Rural +Urban) . . . . . . 353
15.2 Crime Incidence for Districts of Delhi, 2001 . . . . . . . . . 355
15.3 Categories of Crimes against Women:Districts of Delhi (2001) . . . . . . . . . . . . . . . . . . . . . . . . 355
15.4 Disposal of IPC Casesby Police during 2001 (Delhi) . . . . . . . . . . . . . . . . . . . . . 356
15.5 Disposal of IPC Casesby Court during 2001 (Delhi) . . . . . . . . . . . . . . . . . . . . . 356
15.6 Scheduled Castes in Delhi, 2001 . . . . . . . . . . . . . . . . . . . 356
15.7 Percentage of Scheduled Castes in Total Population . . . . 357
15.8 Comparative Sex Ratios for Delhi - 2001 . . . . . . . . . . . . 357
15.9 Percentage Distribution of Social Categoriesin Delhi’s Population . . . . . . . . . . . . . . . . . . . . . . . . . . . . 357
15.10 Class-wise Distribution of Employmentin Delhi Government: Shares of SC and ST . . . . . . . . . . 358
15.11 Estimated Disabled Persons in Delhi . . . . . . . . . . . . . . . 360
15.12 Number of Physically or MentallyChallenged Persons of age 5 years and aboveby usual Activity Status . . . . . . . . . . . . . . . . . . . . . . . . . . 361
15.13 Number of Institutions and Beneficiaries in Delhi . . . . . 361
15.14 Composition of Delhi’s Populationand Immigrants: 1951-1991 . . . . . . . . . . . . . . . . . . . . . . 361
15.15 Distribution of In-migrants fromdifferent Regions/States to Delhi, 1991 . . . . . . . . . . . . . 362
DELHI DEVELOPMENT REPORT28
15.16 Urban Settlement Pattern in 1999-2000 . . . . . . . . . . . . . 362
15.17 Per Capita Investment in Delhiand Neighbouring States . . . . . . . . . . . . . . . . . . . . . . . . . 363
15.18 Status-wise Distribution of Workforce – DELHI . . . . . . 365
15.19 Classification of Workers by Major Activity Group . . . . 366
15.20 Old Age Population in Delhi . . . . . . . . . . . . . . . . . . . . . . 366
15.21 District-wise Incidence of Crimes CommittedAgainst Children during 2002 . . . . . . . . . . . . . . . . . . . . . 368
16.1 Contribution by Delhi toIndian Industry (Factory Sector) . . . . . . . . . . . . . . . . . . . 369
16.2 Inter-Regional Disparity in Levels ofIndustrialisation: 1970-71 to 2002-03 . . . . . . . . . . . . . . 370
16.3 Contribution of Manufacturing to GSDP . . . . . . . . . . . . 371
16.4 Changing Industrial Base of Delhi: 1980-81 and1997-98 (All Figures as Percentages to RespectiveAll-Industries Totals) . . . . . . . . . . . . . . . . . . . . . . . . . . . . 372
16.5 Industrial Concentration in Delhi . . . . . . . . . . . . . . . . . . 372
16.6 Comparison of the Industrial Base of Delhiwith All-India: 2002-03(All Figures as Percentages toRespective All-Industries Totals) . . . . . . . . . . . . . . . . . . 373
16.7 Regional Specialisation in Industry: 2002-03 . . . . . . . . . 374
16.8 Decomposition of Industrial Growth:1980-81 to 1997-98 . . . . . . . . . . . . . . . . . . . . . . . . . . . . . 375
16.9 Structural Ratios and Co-efficient: 2002-03 . . . . . . . . . . 377
16.10 Wage Rate, Labour Productivity,and Efficiency Wage: 1980-81 to 2001-02 . . . . . . . . . . . 377
16.11 Share of Different States in the TotalUnorganised Enterprises, Employmentand Value Added (2001) . . . . . . . . . . . . . . . . . . . . . . . . . 386
16.12 State-wise Location Quotients ofOverall MSE, i.e., Combined Manufacturingand Service Enterprises . . . . . . . . . . . . . . . . . . . . . . . . . . 387
16.13 State-wise Location Quotients ofUnorganised anufacturing and Service Sub-Sectors . . . . 388
16.14 Enterprises by Status of Registration and Sector . . . . . . 389
16.15 Percentage Distribution of Manufacturing EnterprisesBy Growth Status (Over a Period of Last 3 Years) . . . . . 389
16.16 Per Thousand of Enterprises Engagedin Other Economic Activities UndertakenDuring Last 365 Days . . . . . . . . . . . . . . . . . . . . . . . . . . . 389
16.17 Per Thousand Distribution of ManufacturingEnterprises by Type of Contract Separately by State . . . . 390
16.18 Percentage Distribution of Enterprisesby Type of Location – Unorganised Manufacturing . . . . 390
16.19 Problems Faced by Enterprises . . . . . . . . . . . . . . . . . . . . 390
16.20 Percentage Distribution of ManufacturingEnterprises Reporting Problems otherthan the Common . . . . . . . . . . . . . . . . . . . . . . . . . . . . . . 390
16.21 Percentage Distribution Enterprises Receiving Assistance 390
16.22 Status of Registration in Service Sector Enterprises . . . . 391
16.23 Percentage Distribution of Enterprisesby Nature of Operation . . . . . . . . . . . . . . . . . . . . . . . . . . 391
16.24 Percentage Distribution of Enterprisesby Type of Location Unorganised Service . . . . . . . . . . . . 391
16.25 Percentage Distribution of EnterprisesReceiving Assistance from State . . . . . . . . . . . . . . . . . . . 392
16.26 Per Thousand of Enterprises Engaged in Other EconomicActivities Undertaken During Last 365 Days . . . . . . . . . 392
16.27 Percentage Distribution of ManufacturingEnterprises by Growth Status (Over A Periodof Last 3 Years 1999-2000 To 2001-2002) . . . . . . . . . . . 392
16.28 Per thousand Distribution of Enterprisesby Problems Faced and Type of Enterprisein Unorganised Sector in All-India and Delhi . . . . . . . . . 392
17.1 Evolution of Governance . . . . . . . . . . . . . . . . . . . . . . . . . 400
17.2 Major Organisations Providing Various Servicesin the NCT of Delhi (2000) . . . . . . . . . . . . . . . . . . . . . . 400
17.3 Issues Taken Up under Bhagidari Scheme . . . . . . . . . . . . 403
17.4 Social Audit . . . . . . . . . . . . . . . . . . . . . . . . . . . . . . . . . . . 406
Figures
3.1 District Map of Delhi Showing SelectedResettlement Sites . . . . . . . . . . . . . . . . . . . . . . . . . . . . . . . . 97
3.2 Recycling and Movement of Waste Throughthe Various People Involved in the Waste Trade . . . . . . . 103
3.3 . . . . . . . . . . . . . . . . . . . . . . . . . . . . . . . . . . . . . . . . . . . . . 105
4.1 Per Capita Consumption (kWh per annum) . . . . . . . . . . 111
4.2 Load, Consumption and System Capacity . . . . . . . . . . . . 112
4.3 Maximum and Minimum Load, 2004-05 . . . . . . . . . . . . 112
4.4 Delhi Demand on 7-1-05 . . . . . . . . . . . . . . . . . . . . . . . . . 113
4.5 Distribution Loss at 11 KV Level in DVB Period . . . . . . 115
4.6 DESU/DVB T&D Losses . . . . . . . . . . . . . . . . . . . . . . . . 116
4.7 Financial Restructuring of DVB . . . . . . . . . . . . . . . . . . . 120
4.8 Delhi Generation Performance . . . . . . . . . . . . . . . . . . . . . 125
6.1 Overall Allocation of Foodgrains (in ’000 tonnes)September 2004 to March 2005 . . . . . . . . . . . . . . . . . . . 198
6.2 . . . . . . . . . . . . . . . . . . . . . . . . . . . . . . . . . . . . . . . . . . . . . 199
6.3 A) Category Wise Distribution ofFoodgrains (per cent) 2003-2004 . . . . . . . . . . . . . . . . . . 201
B) Category Wise Distributionof Foodgrains (per cent) 2004-2005 . . . . . . . . . . . . . . . 201
6.4 District-wise APL Card Renewal (Per cent) . . . . . . . . . . 206
6.5 Disposal of Cases since Inceptionup to March 2005 of State Commission . . . . . . . . . . . . . 210
7.1 District Map of Delhi . . . . . . . . . . . . . . . . . . . . . . . . . . . . 215
List of Tables, Figures and Annexures 29
7.2 Forest Map of Delhi . . . . . . . . . . . . . . . . . . . . . . . . . . . . . 220
7.3 Details of the Forest Area . . . . . . . . . . . . . . . . . . . . . . . . 221
7.4 Distribution of Forest Cover . . . . . . . . . . . . . . . . . . . . . . 221
7.5 Cultivation Techniques of Bamboo . . . . . . . . . . . . . . . . . 229
7.6 Mine Area before Afforestation . . . . . . . . . . . . . . . . . . . . 230
7.7 Mine Area after Afforestation . . . . . . . . . . . . . . . . . . . . . 231
8.1 Salient Forest/Wildlife Conservation Sitesin NCT in Delhi . . . . . . . . . . . . . . . . . . . . . . . . . . . . . . . . 236
8.2 Number of Wildlife OffenceCases Detected in Delhi . . . . . . . . . . . . . . . . . . . . . . . . . 242
8.3 Forest Department Approved Outlay (AO),Revised Outlay (RO) and Expenditure (EXP) . . . . . . . . 245
8.4 Ratio of FD Approved Outlay and Expenditureto Total Approved Outlay and Expenditure . . . . . . . . . . . 245
8.5 Ratio of Revised Outlay and Expenditure ofForest Department . . . . . . . . . . . . . . . . . . . . . . . . . . . . . . 246
8.6 Utilisation Ratios of Expenditure andallocation for Development of Forestsincluding consolidation . . . . . . . . . . . . . . . . . . . . . . . . . . 246
8.7 Utilisation Ratio of Revenue Funds forStrengthening of Administration Management,Infrastructure, Training of Personnel andPublicity Measures for Forest and Forestry . . . . . . . . . . . 248
8.8 Utilisation Ratio of Capital and RevenueAllocations for Development of WildlifeSanctuary & Strengthening of Wildlife Section . . . . . . . . 249
9.1 Literacy Rates in Delhi . . . . . . . . . . . . . . . . . . . . . . . . . . . 254
9.2 Illiterate Population in Delhi . . . . . . . . . . . . . . . . . . . . . . 254
9.3 Educational Attainments of DisadvantagedGroups in Delhi, 1999 . . . . . . . . . . . . . . . . . . . . . . . . . . . 255
10.1 Growth of Beds Capacity since 1982 . . . . . . . . . . . . . . . 279
10.2 Agency-wise Distribution of Hospital Beds . . . . . . . . . . 279
10.3 Sex Ratio (Over All), Delhi, 2001 . . . . . . . . . . . . . . . . . . 282
10.4 Sex Ratio by Residence, 2001 . . . . . . . . . . . . . . . . . . . . . 282
10.5 Sex Ratio (0-6 Years) . . . . . . . . . . . . . . . . . . . . . . . . . . . . 283
16.1 Relative Importance of Manufacturingin the Gross State Domestic Produt of Delhi . . . . . . . . . 371
16.2 Capital Intensity and Productivity-Comparisonbetween Delhi and All-India . . . . . . . . . . . . . . . . . . . . . . 376
16.3 Wage Rates, Labour Productivity and Efficiency Wages 1980-81 to 2001-02 . . . . . . . . . . . . . . . . . . . . . . . . . . . . . . . . . . 378
16.4 Input Cost and Value Added-Comparisonbetween Delhi and All-India . . . . . . . . . . . . . . . . . . . . . . 378
16.5 Profitability-Comparison between Delhi,Industrialised States, and All-India . . . . . . . . . . . . . . . . . 379
16.6 TFP Growth—Comparison between Delhi,Industrialised States, and All-India . . . . . . . . . . . . . . . . . 379
Annexures
A-2.1 GSDP of Some States at 1993-94 Prices . . . . . . . . . . . . . . .86
A-2.2 Per Capita NSDP of Some States at 1993-94 Prices . . . . . .87
A-2.3 Sectoral Composition of NSDP of Some States:1960-61 to 2000-01 At Current Prices . . . . . . . . . . . . . . . .88
A-2.4 Tax Revenue of GNCT of Delhi: 1993-94 to 2004-05 . . . .89
A-2.5 Non-Tax Revenue of the GNCT ofDelhi 1994-95 to 2004-05 . . . . . . . . . . . . . . . . . . . . . . . . . . 89
A-2.6 Tax-GSDP Ratio of Some States: 1994-95 to 2004-05 . . .90
A-2.7 Arrears of Tax Revenue: 1995-96 to 2004-05 . . . . . . . . . . . 90
A-2.8 Components of Revenue Expenditure:1994-95 to 2004-05 . . . . . . . . . . . . . . . . . . . . . . . . . . . . . . .91
A-2.9 Components of Capital Expenditure:1994-95 to 2003-04 . . . . . . . . . . . . . . . . . . . . . . . . . . . . . . .91
A-4.1 Composition of Delhi Jal Board . . . . . . . . . . . . . . . . . . . 176
A-4.2 Organisational Setup of DJB . . . . . . . . . . . . . . . . . . . . . . 177
A-4.3 Zonal Boundaries of DJB & Location of WTPs . . . . . . . . 178
A.6.1 Organisational Structure . . . . . . . . . . . . . . . . . . . . . . . . . 213
A-9.1 Gender-wise Student Enrolment inDelhi during 1999-2000 . . . . . . . . . . . . . . . . . . . . . . . . . 271
A-9.2 Management-wise Secondary andSenior Secondary Level Board Results . . . . . . . . . . . . . . . 271
A-9.3 Number of Students Appearing forClass X and XII CBSE Boards . . . . . . . . . . . . . . . . . . . . . 271
A-9.4 An Estimate of Schools Availability (in number) . . . . . . 272
A-9.5 INTAKE/ADMITTED/PASSED/PLACED . . . . . . . . . . . 273
A-17.1 Organisations Participating in Bhagidari Scheme . . . . . . 411
A-17.2 Details of the Bhagidari Scheme . . . . . . . . . . . . . . . . . . . 412

Executive Summary
DELHI
1. Profile of Delhi
Delhi, located in an area which is agriculturally very
fertile, has developed, in the northern part of the country,
as the biggest market for agricultural as well as other
goods. It is a historical city and has numerous
architectural monuments of ages down its history. Its
service sector has grown very fast. It is the capital of the
largest democracy of the world. People from all parts of
the country reside here and it has an international
community in the foreign missions. It is thus a very
cosmopolitan place where people may feel comfortable
irrespective of their background—religious, social, cultural,
and economic.
1.1 Rapid Growth
Delhi attracts people for work, trade and commerce,
tourism, education etc., from all over the country,
especially from the neighbouring states. Delhi has become
the most densely populated city with a population density
of 9224 per sq. km. compared to an average all-India
density of 324. The area under agriculture has been
reducing at a very high rate because of rapidly growing
population caused by huge immigration from all over the
country, especially the states to the east of Delhi and even
from Bangladesh. As the discussion in Chapters 1 and 2,
dealing with Profile of the State and Economy and Fiscal
Management shows, the growth of the economy of Delhi
has been rapid and places Delhi in the category of the
developed states. But it must not be forgotten that wide
disparities are reflected in the social and economic status
of the population with many layers having differential
access to facilities in the areas of health, education,
housing, transport etc. There is scope for improvement in
almost every sector. Simultaneously, the high rate of
immigration and the rapid economic growth seem to have
led Delhi to the limits of the “Carrying Capacity” when
viewed from the point of view of resources such as land
and infrastructure.
1.2 Status of Delhi
Because of its unique position and the requirements of
the various roles that it has to perform, Delhi has been
given the status of a Union Territory. In order to satisfy
the democratic aspiration of self governance, striking a
balance, it has been provided with an elected legislature
and a government headed by a Chief Minister. Thus, while
National Capital Territory of Delhi (NCTD) has very many
features of a State it is not a State and its powers are
curtailed, in relation to a normal State, as mentioned
below:
1.2.1 “Law and Order” and “land” are within the
jurisdiction of the Government of India. Accordingly,
NCTD has no power to make laws relating to public
order, police and offences and those relating to land.
1.2.2 Even in respect of other subjects the Parliament
has overriding powers to make laws.
1.2.3 The Lt. Governor is a powerful institution and
ensures that the governance runs smoothly.
1.2.4 The advice of the Council of Ministers to the
Lieutenant Governor is not binding.
1.2.5 A Bill of Amendment relating to financial matters
shall not be introduced in the Assembly except on the
recommendations of the Lt. Governor.
1.2.6 The annual budget is to be laid before the
Legislative Assembly by the Lt. Governor with the
previous sanction of the President.
1.3 Multiplicity of Public Agencies
The MCD covers a very large proportion of the area of
Delhi. It is an elected and a very powerful body and
DELHI DEVELOPMENT REPORT32
performs all civic functions. The area where the
Government of India is housed is covered by the NDMC.
Cantonment Board is responsible for the remainder. Delhi
Development Authority is responsible for the planned
development of Delhi and exercises influential voice in
land use and development of housing. Apart from DDA,
Central Government Departments too perform a number
of functions. Thus there is the Government of India, the
Government of NCTD, the Municipal Corporation of
Delhi, the New Delhi Municipal Committee, the
Cantonment Board, the Delhi Development Authority and
other agencies under the Government of India and the
Government of NCTD all working within the same
geographical area. They are all very powerful legal entities.
Frequently, situations arise in which, it seems, a function/
task is to be performed by more than one agency.
Moreover, developmental activities need inputs from
many of these bodies that are independent. The public
agencies operating in the NCTD find themselves seriously
constrained in implementing their programmes/projects as
consultation with and concurrence of a large number of
bodies becomes unavoidable. The citizen is confused
about the agency that should be approached for a
particular service or grievance. It also enables the agencies
to pass the buck to other agencies for failure or inefficient
or ineffective implementation of programmes.
1.4 Delhi: One of the Finest Cities of the Country
Despite the unique character of Delhi and limitations
as mentioned above in this chapter, Delhi has been
developing in to one of the finest cities in the country.
The parameters briefly discussed below corroborate this
view.
1.4.1 It is a cosmopolitan city and provides equality of
opportunity to people irrespective of social, regional and
religious differences and, therefore, attracts people from
all over the country because of the opportunities that this
city offers in the field of education, health, employment
and enterprise etc.
1.4.2 The growth of population is so rapid that despite
the availability of land, which appeared plentiful soon
after Independence when the expansion phase began,
looks too inadequate now and the city’s infrastructure is
unable to keep pace with its expanding population.
1.4.3 Delhi has a developed economy with services
sector being dominant, the secondary sector way behind
and agricultural being negligible. It had the second
highest per capita NSDP at Rs. 48974 in 2001-02 and a
very low poverty ratio. However, wide disparities are
reflected in the social and economic status of the
population with many layers having differential access to
various facilities.
1.4.4 In the sphere of education it has a high literacy
rate and the standards of higher education are believed by
many to be the best in the country. It ranks not higher
than fourth among the States in the matter of literacy
mainly because of continuous migration of the poor in
search of employment from all parts of the country.
1.4.5 Of the metropolitan towns, Delhi has the least
percentage of its population living in slums.
1.4.6 Delhi has initiated measures to deal with the
problem of transport and the Metro Rail project has
started making its impact felt.
1.4.7 The over all birth rate in Delhi is substantially
lower than the national average and the life expectancy at
birth is 68.6 years against the national average of 60.7
years.
1.4.8 It is a green city having 12.5 trees per ha, as
against the national average of 12.
1.4.9 Being a service industry centric city, the labour
relations in Delhi are harmonious.
2. Fiscal and Financial Management
2.1 Areas of concern are the rising debt burden and
the consequent fiscal deficit. Tax-GSDP ratio has to be
improved. For this, mounting tax arrears have to be
reduced, and it has to be ensured that there is no further
addition to these arrears in future.
2.2 Despite the Union Government and local bodies taking
the responsibilities of activities on which other states are
required to spend their resources, the revenue expenditure of
NCT has been steadily increasing in recent years.
2.3 The NCT of Delhi has been consistently having
surplus on revenue account. But, its fiscal deficit has also
been consistently going up, being 2.91 per cent of GSDP
in 2003-04 against a low of 1.39 per cent in 1997-98.
2.4 Public debt of the NCT has been growing—from
2.42 per cent at the end of March 1995 to 17.08 per cent
of the GSDP at the end of March 2004. The NCT borrows
from the Central government and gives loans to its own
public sector undertakings and other bodies. It is a net
creditor, unlike many states.
2.5 The various bodies getting funds are defaulting on
repayment. Since some of these are providing essential
social and economic services, these cannot be closed down
but have to be supported until some viable alternative is
found. This is a matter of concern.
EXECUTIVE SUMMARY 33
3. Urban Development
3.1 A number of features of the National Capital
Territory of Delhi are unique in that it is almost entirely
urbanised. Substantial population lives in the unplanned
clusters, and unauthorised colonies. The majority of Delhi
population is immigrant and employment in the primary
sector including agriculture and mining has dwindled to
negligible levels.
3.2 In 2004 only 23.6 per cent of the population was
living in planned colonies, 64.5 per cent in Jhuggi and
Jhopri (JJ) clusters, slum designated areas and
unauthorised colonies and the remaining 11.9 per cent in
rural and urban villages. The contribution to housing
stock through institutional agencies was only 53 per cent
(this excludes squatter housing) in 1991. DDA, the nodal
agency for providing housing units, till March 2003, had
allotted a total of 0.33 million flats. The component of
housing through non institutional sources viz.,
unauthorised colonies, squatter/JJ clusters, etc. is
significant.
3.3 Slums/Informal Sector Housing: The slum
population in Delhi was about 26.0 per cent in 2001, least
of the metropolitan cities. Greater Mumbai (34.3 per cent)
was followed by Kolkata (32.90 per cent) and Chennai
(28.1 per cent). In JJ clusters/squatter settlements a
population of 30 lakh was living in about 6 lakh house
holds (1997).
The Municipal Corporation of Delhi (MCD) initiated
the process of relocating the slum dwellers in early 1991.
The relocation sites are generally located at the
peripheries of Delhi. These sites have been selected with a
vision of having a density of 200 dwelling units per acre
with a plot size of 18.00 sq.m for each eligible family and
12.5 sq.m for each ineligible family.
3.4 Housing
3.4.1 The dwellings have been categorised as
independent houses, flats, Basti and under “others”.
3.4.2 An analysis of housing data for 1991 indicates
that in Delhi 68.1 per cent of the houses are owned by
the residents and 28.61 are rented. Status of 3.29 per cent
of the houses was not known.
3.4.3 About 44 per cent of the dwelling units have
only one room, 27 per cent two rooms and 15.5 per cent
three rooms each. Larger accommodation accounts for
only 12.4 per cent of the total dwelling units.
3.4.4 In 2001 Delhi’s backlog of dwelling units stood
at 4 lakh comprising 1 lakh net shortage and the rest by
way of dilapidated and Kutchha structures requiring
replacement.
3.4.5 An analysis of data on housing indicates that 58
per cent of the houses are in good condition, 36.65 per
cent are livable and 5.35 per cent are in dilapidated
condition.
3.5 Land Availability
3.5.1 According to the MPD 2021 the land that can be
urbanised in the NCT Delhi is 97190.90 ha or 65.54 per
cent of its total geographical area of 148,300 ha. The
population holding capacity of the existing urban areas of
Delhi is 122 lakh which is adequate to accommodate the
(2001) population. However, further urban extension in
about 27,000 hectares will be required to accommodate
the population in the future.
3.6 Housing Policy
The long term goal of the NHP is to eradicate
houselessness, improve the housing conditions of the
inadequately housed and provide a minimum level of
basic services and amenities to all; for this purpose
provide land and legal and infrastructure support to
enable the private sector to make heavy investments. No
fresh encroachments are to be permitted on public land,
and past encroachments which had been in existence prior
to 31 January 1990 will not be removed without providing
alternatives.
3.7 Master Plan 2021
3.7.1 The Delhi Master Plan 2021 has adopted the
following vision:
“Vision-2021 is to make Delhi a global metropolis
and a world-class city, where all the people would be
engaged in productive work with a better quality of
life, living in a sustainable environment.”
3.7.2 This will, amongst other things, necessitate
planning and action to meet the challenge of population
growth and in-migration into Delhi; provision of adequate
housing, particularly for the weaker sections of the
society; addressing the problems of small enterprises,
particularly in the unorganised informal sector; dealing
with the issue of slums, upgradation of old and
dilapidated areas of the city; provision of adequate
infrastructure services; conservation of the environment;
preservation of Delhi’s heritage and blending it with the
new and complex modern patterns of development; and
doing all this within a framework of sustainable
development, public-private and community participation
DELHI DEVELOPMENT REPORT34
and a spirit of ownership and a sense of belonging among
its citizens.
3.8 Data Base Development and Management
Data on housing in Delhi by agencies involved remains
uncoordinated. The process of data collection is not
within any regulatory framework. Such a framework needs
to be developed for India and, until it is developed, the
broad guidelines provided by the United Nations Human
Settlements Programme may be adopted.
3.9 National Capital Region
3.9.1 The present National Capital Region (NCR)
comprises of a total area of 33,578 sq. km. including areas
of Delhi (1483 sq. kms), Haryana (13413 sq. kms.), Uttar
Pradesh (10853 sq. kms.), and Rajasthan (7829 sq. kms).
3.9.2 The National Capital Region (NCR) Planning
Board prepared draft Regional Plan-2021 for NCR. After
inviting objections/suggestions from public under Section
12 of the NCR Planning Board Act, 1985 on draft
Regional Plan-2021, final Plan was approved in 28th
meeting of the Board held on 9th July 2005 and was
notified on 17th September 2005.
3.9.3 The Plan aims to promote growth and balanced
development of the whole region through providing
economic base in the identified major settlements (Metro
Centres/Regional Centres) for absorbing economic
development impulse of Delhi, efficient transport network,
development of physical infrastructure, rational land use
pattern, improved environment and quality of life.
3.9.4 NCR has been divided in to “policy zones” on
the bases of needs of cities that have developed in the
areas near Delhi, highways planned and/or implemented
and development of infrastructure.
There will be a hierarchy of settlements such as 5
Metro Centres (Ghaziabad-Loni complex, Gurgaon-
Manesar complex, Sonepat-Kundli complex, Faridabad-
Ballabhgarh complex and Noida) and one Regional Centre
(Bahadurgarh). The settlements will be categorised on the
basis of their population size starting with a village having
a population of less than five thousand and ending with
metro centres having a million plus population.
3.9.5 Economic Activity and Fiscal Policy in the NCR
The fiscal policy in the NCR have the following
objectives:
i) Facilitate value-added high-tech service sector in
Delhi in the context of its emergence as a global
city in the world economy.
ii) Adopt investment strategies to restrict less
desirable economic activities by not allowing new
industrial areas, wholesale trade areas and office
spaces in NCT-Delhi.
iii) Allow only hi-tech industries in NCT-Delhi.
iv) Restrict the number and size of the government
offices/PSUs in NCT-Delhi.
v) Shift space extensive/hazardous wholesale trades
outside NCT-Delhi.
vi) Develop model industrial Estates/Special
Economic Zones (SEZs) outside NCT-Delhi.
vii) Achieve uniformity in the tax regime, i.e., Sales
Tax, VAT etc.
Plans have been prepared in the all the relevant sectors
for integrated development, namely transport, power,
water, sewerage, solid waste management, drainage and
irrigation, telecommunication, shelter, social infrastructure,
tourism & heritage, environment and disaster management.
rural development, and land use.
3.9.6 Development Strategies, Management Structure
and Resource Mobilisation
i) Plan of action for implementation of policies and
proposals prepared along with its phasing and
dovetailing the costs with five-year plans.
ii) Agencies to implement the policies and proposals
of Regional Plan-2021 identified in the Plan.
iii) Strengthening of NCR Planning Board proposed
to expedite the implementation, efficient
coordination and creation of appropriate data base
and its regular updations.
iv) Public, private partnership proposed to be
promoted.
3.9.7 Recommendation
a) The powers of the NCR Board relate to
preparation and implementation of plans. The
State Government have a vital role as most of the
items are within their jurisdiction. There is a
pressing need for unified or coordinated
administrative structure to deal effectively with
problems of implementation of the plans and
decisions of the NCR Planning Board relating to
the economic and fiscal policy and governance
including maintenance of public order, policing
and judicial administration, and
b) There is need to give high priority to the housing
sector.
EXECUTIVE SUMMARY 35
4. Infrastructure
4.1 Transport
4.1.1 Roads
a) Limitations: The main limitations relating to roads
include inadequate design, absence of clearly defined road
hierarchy and lack of access control, inadequate provision
of land to take care of, haphazard growth, poor
maintenance, encroachments and hawking on carriage
way, poor traffic management, inadequate integration of
rail and road services and the environmental degradation
resulting from the same, lack of road user discipline, huge
amount of traffic using Delhi road system for passing
through and absence of bye passes, satellite towns have
instead of easing pressure added to it and poor project
implementation.
b) State of Maintenance of Roads: It is stated that there
are difficulties in keeping the roads in good condition
such as:
i) Heavy traffic movement on roads all through the
day and night leaving no time for maintenance.
ii) Unsatisfactory quality of bitumen.
iii) Unsatisfactory quality of stones extracted from
quarries.
c) The Main Features of Road Improvement Plan:
• Providing an institutional framework for
development, management and operation of an
integrated multi-modal transport system.
• Measures to deal with identified deficiencies.
• Using improvements in technology for road
surfaces such as improved wearing coats and
plastic roads, fiber reinforced concrete surface and
concrete roads depending on the circumstances.
• A separate Road Maintenance Corporation is to
be set up generating its own resources.
• Road safety education should be provided in
schools.
• Preparation and implementation of strategic
action plans for special areas.
• Implementation of urban transport information
system which will proivde updated inputs of
actual traffic flows to enable proper planning.
• Providing special attention to slow green modes
of transport namely, cycles and pedestrians.
4.1.2 Railways
The Railway services to Delhi primarily consist of
national network services to all major cities of India,
commuter services to surrounding towns and local
services for the citizens of Delhi. All these services are
unable to cope with the traffic offered and extensive
capacity generation and inputs are essential. The
upgradation and expansion plans of the railways include
additional passenger terminals, upgradation of stations at
New Delhi, Delhi main and Hazrat Nizamuddin,
construction of separate freight corridors from Delhi to
Kolkata/Mumbai, strengthening of rail corridors to
neighbouring towns. Revitalisation of Ring Railway is an
essential component of Delhi’s transport scenario by
augmenting capacity, increasing EMU services to suit
commuter timings and coordinating feeder bus linkages at
ring railway stations
4.1.3 Vision of Transport Facilities
The vision is to provide safe, eco-friendly, cost-effective
and efficient modes of transportation through a well-
integrated multi-modal transport system for a well-
managed, clean and dynamic model capital city.
The policy action required would include, among other
measures, upgradation and strengthening of road system,
provision of metro system to cater for demand upto 2021,
an integrated rail bus transit to neighbouring towns,
augmentation of bus system, high capacity bus system on
selected corridors (100 kms), introduction of electric
trolley bus, and provision of LRT in walled city.
4.1.4 Even though schemes are being planned and
implemented, the travelling time is going on increasing.
This is because of a very rapid growth of population and
even greater rate of increase of vehicles on Delhi roads.
Both of these causes need to be addressed.
4.2 Power
4.2.1 Current Issues
Delhi faces considerable power shortage. It is necessary
to enhance Delhi’s core generation capacity and the
government’s inability to either do or facilitate this in over
five years since the unbundling. Questions arise about
further heavy public investment from Plan funds when the
principal buyers are now the privately managed Discoms
and some degree of market risk is involved. Alternatives
to bring in private investment need to be considered. The
Government’s current policy is understood to be on these
lines, and action in respect of Bawana site is reportedly
being initiated, but time has slipped by.
DELHI DEVELOPMENT REPORT36
4.2.2 Quality of Service
Delhi has consistently ranked high in the CRISIL/ICRA
ratings of state-wise power sector performance
commissioned by the Ministry of Power. There has been
some genuine improvement but there is still a long way
to go, and a need to introduce SAIDI and SAIFI
measurement with effective third-party monitoring.
4.2.3 AT&C Loss Reduction
On this fundamental parameter, reforms are on track.
4.2.4 Tariff Orders and Issues Arising
DERC stated that repayment of the initial loan and of
transitional assistance would not be recoverable from the
ARRs. However, the Discoms were able to refinance and
prepay the former and the government converted the
latter in to equity, rescuing Transco’s balance sheet.
DERC has also departed from the Transfer Scheme and
Policy Directions in other ways, including notably its
appropriation of the Holding Company’s arrears to
Transco’s ARR. In addition, though they won appellate
success on the issue of depreciation rate, the Discom
investors had a legitimate issue in DERC’s disregard for
their stated requirements of compliance with accounting
standards obligatory under Company law.
The reform package was thus impacted by the tariff issue,
which led DERC to leave a large uncovered ‘regulatory
asset’, though since amortised on the strength of loss
reduction. But such ‘back loading’ increases, rather than
reducing, the burden on the consumer in the long term.
4.2.5 Strengths
Successful restructuring has created scope for private
sector investment not only in the distribution sector itself
but also in generation. There is every prospect of the
sector becoming substantially self-sustaining.
4.2.6 Weaknesses
The two main weaknesses are the failure to create
strong feelings of consumer satisfaction, and the
continuing tariff issue.
Nevertheless, all three Discoms have generally met the
committed loss reduction targets and two of them have
exceeded their targets; they and Transco are entitled to their
legitimate costs. They should not be left grounds to allege
that they have not been able actually to get the fixed return.
4.2.7 Interventions Required
DERC should complete its exercise of finalising a
multi-year tariff expeditiously. The consumer mix data
provided by Discoms after unbundling seems to require
further regulatory scrutiny. It should also focus effectively
on consumer satisfaction, and impose and monitor
objective performance criteria like SAIDI and SAIFI. Steps
to promote local generation should be expedited.
4.3 Drinking Water
4.3.1 The main features in this sector are given below:
i) Nearly 31 per cent of the population living in JJ
clusters, unauthorised colonies and villages of
various categories and does not have access to the
piped water supply and sewerage system.
ii) The Delhi Jal Board (DJB) has adopted the norm
of water supply as 275 lpcd at the source of
production.
iii) South and Southwest zones suffer on account of
water shortage.
iv) A significant portion of the water supply network
of 9000 kms is 40-50 years old and the total
distribution losses are about 40 per cent of the
total water supplied. DJB has the target to bring
down the leakage losses to 20 per cent.
v) There are about 1 million connections where the
supply is to be metered. DJB proposes to involve
consumers as well as private players to ensure
that the work of installation of all the 0.53
million meters is completed by May 2006.
vi) The water tariff, which was heavily subsidised,
has been revised and still continues to be
subsidised.
vii) Rapid urbanisation of Delhi has put tremendous
pressure on the groundwater table. DJB has
initiated a scheme of rainwater harvesting in
Delhi under which DJB provides financial
assistance up to 50 per cent of the total cost of
structures.
viii) Under Bhagidari Scheme in the water sector,
RWAs and various associations are actively
participating with DJB in a number of activities.
ix) DJB is planning to switchover to 24 hours supply
system in phases through private firms and utility
operators.
x) DJB has adopted universally proven state-of-art
technologies at its WTPs. It is one of the few
public utilities to undertake extensive work of
GIS mapping of its various utilities. DJB has also
initiated action to obtain ISO-9002 certification.
EXECUTIVE SUMMARY 37
4.3.2 Policy Interventions and Recommendations(Drinking Water)
i) Measures including water conservation, loss
reduction, dual plumbing, water recycling need to
be strengthened and implemented rigorously.
ii) There is significant reduction in river-flows
during the lean periods. The proposals for
construction of the reservoirs on Yamuna river
need to be considered urgently and implemented.
iii) The Ministry of Water Resources should intervene
and resolve the matter of availability of raw water
for Sonia Vihar Water Treatment Plant.
iv) The withdrawal of ground water should be
regulated. Central Ground Water Authority may
consider delegating necessary powers to bring the
management and development of groundwater
under DJB.
v) A decentralised approach for treating sewage may
be more economic. The treated water from such
STPs may be used for horticulture, parks and
greening of Delhi.
vi) All the works and other measures in hand to
augment and conserve water should be completed
on priority.
vii) On the lines of Mumbai, wastewater from the
high rise building should be treated insitu to the
prescribed standards and reused for air
conditioning and other industrial applications.
viii) Public awareness and education through the
Bhagidari Scheme should be encouraged for
conserving and managing potable water optimally.
ix) Delhi may have to depend on Yamuna only to
meet the demand projected in the Master Plan
Document-2021. An additional quantity of 350
cusec needs to be made available by the Upper
Yamuna River Board (UYRB) during the lean
period.
x) There is need to construct dams to minimise the
shortfall during the lean periods. UYRB should be
persuaded to treat the allocation of Yamuna water
for consumptive use only.
4.4 Telecommunication
4.4.1 Telecommunication has made commendable
progress in all services. The number of Telephone
subscribers (Fixed + Mobile) has increased from 3.17
million in March 2002 to 7.98 million in March 2005 in
Delhi representing a growth rate of more than 35 per
cent. This leads to a Telephone Density of more than 50
per 100 population. The major growth has come from
mobile telephones. There is a good competition with 6
service providers for mobile telephones in Delhi. There
are about 100,000 PCOs (Public Call Office or Payphone)
in Delhi. Internet service is also quite popular with a
number of Service providers giving this service.
4.4.2 Broadband service is a recent phenomenon in
India and Delhi. Government has recently announced a
Broadband Policy. Broadband service provides “Triple
Play” i.e., voice (telephony), data, and video which may
include TV and video-on-demand. Broadband service will
lead to great opportunity in tele-education, e-health, e-
governance, entertainment, tele-working (home working)
etc. Tele-working leads to less strain on transport system
and is eco-friendly.
4.4.3 Telecom technology is fast changing and it is
difficult to assess resource requirement on long term
basis. There is likely to be no problem on this score since
the capital required (a few thousand crore Rupees per
year) are arranged by service providers out of their
revenue earnings and market borrowings.
4.4.4 Introduction of private sector has led to good
competition in telecom sector. This has led to a) faster
growth, b) lower tariff c) improved quality of service and
d) new types of applications and service. TRAI (Telecom
Regulatory Authority of India) and TDSAT (Telecom
Dispute Settlement and Appellate Tribunal) have been set
up under the TRAI Act 1997 to fix tariff, regulate the
telecom sector and provide for dispute settlement
mechanism.
4.4.5 Vision should include broadband to all
households and mobile phone to all who need it.
4.4.6 Central government is the main policymaking
authority for telecom but state government must make
policies to facilitate proper and fast growth of telecom
infrastructure.
5. Environment
5.1 Pollution
a) The unprecedented growth of Delhi has an adverse
impact on the environment. Motor vehicles are the
biggest source of air pollution. The number of
registered working factories has doubled between
1981 and 2000; so has the industrial production.
The industrial census of 1988 gives a figure of
76559 industrial units in Delhi—many in residential
or non-conforming areas.
DELHI DEVELOPMENT REPORT38
b) The problem of toxic gases and discharge of
liquid wastes has been a problem leading to air
and water pollution. The standards prescribed by
the regulatory agencies have not always been
enforced. Recent interventions by the Supreme
Court have led to some improvement but these
would continue to be problem areas.
5.2 Depletion of Flora and Fauna
The flora and fauna of Delhi have depleted to a very great
extent. The ridge, which used to be the habitat of many
species of plant and animal life, has had unprecedented
human intrusions in the last century. The technological
changes as also the exposure to foreign countries have
brought tremendous changes in the lifestyles of people,
working to the degradation of the environment.
5.3 Changing Land Use
Till 1990-91, agricultural lands represented 49 per cent
of the total area while non-agricultural land constituted 50
per cent of the total. However, by 2000-01, agricultural
lands had fallen to 32 per cent of total area while non-
agricultural land had risen to 68 per cent of the total.
Diversion of agricultural land has serious environmental
impact for the environment and ecology and needs to be
curbed.
5.4 Pollution of River Yamuna
i) The increasing population has resulted in
increased demand for water and the entire water
of Yamuna is diverted to supply water to Delhi.
But that is not sufficient and there is heavy
extraction of ground water with the result that
the ground water level has been falling. In the
chapter dealing with the subject of drinking
water, measures to address these problems have
been discussed. As if this was not bad enough,
the ground water is getting polluted. Strict
control and enforcement of the relevant laws and
rules for protecting ground water are necessary.
ii) Many localities are not connected to the sewers
that carry waste water to the Sewage Treatment
Plants (STPs). This is reflected in the form of gap
between the waste water generated and that
treated in STPs. Such waste water is being
discharged into the river Yamuna, which in dry
months carries negligible fresh water. Yamuna is,
therefore, highly polluted. There is need to
ensure that all the wastewater including sewage is
taken to the STPs where there should be enough
capacity to treat before the water is discharged in
to the river.
iii) Among the measures needed are rational pricing
of water, rainwater harvesting, participatory and
integrated water resource and waste water
management.
iv) The Hon’ble Supreme Court, in its order dated 4
August 2004, expressed concern regarding
deteriorating water quality in the river Yamuna
and inadequacy of various measures so far taken
to improve the situation. Pursuant to the Court
order, a High Powered Committee was constituted
to determine the quantum of water/waste water
generation, sources of pollution and to suggest
the mode and manner of improving the quality in
the river. The Committee has drawn up an Action
Plan, the components of which include the
following.
For improvement in water quality, the discharge of
water in the river should be adequate and continuous. To
this end, the riparian states need to contribute their share
for maintaining a minimum flow in the river stretch.
Based on the recommendation of a minimum flow of 10
cumecs earlier made, the Committee has determined the
shares of different states in the raw water to be released
in the river:
• 4.54 cumecs should continue to be released by
the Government of Haryana at Tajewala.
• More than 10 cumecs should continue to be
released by the Government of Haryana through
Munak escape.
• 4 cumecs being released by the Government of
Haryana at Najafgarh drain outfall should be
continued.
• Adequate water and waste water handling
capacities including refurbishment of trunk
sewerage and treatment system.
• Laying of sewer lines in the unsewered areas of
Delhi.
• Removal of slum clusters on the river bed.
• Treatment of industrial effluents.
• Utilisation of treated effluents, and
• Removal of coliform in the sewage treatment
plants.
The Action Plan needs to be implemented effectively.
5.5 Solid Waste Management
The need to plan properly for Solid Waste
Management—domestic, industrial and biomedical—and
EXECUTIVE SUMMARY 39
implement those plans is realised. Plans are being
prepared. Action points include waste inventorisation,
waste minimisation, private sector participation and public
participation. It is also important to choose the right
technological option for disposal of waste. MPD-2021 also
makes provision for the land required for the Waste water
and solid waste management. There is need to implement
them efficiently.
5.6 Air Quality
Air quality is of particular concern during winter as
ground-based temperature inversions are a regular feature
that restricts mixing height to low levels. Lower
temperatures, calm conditions, lower mixing height, and
temperature inversions during winter restrict and confine
pollutant dispersion and dispersal. Winter evenings have
higher pollution build-up because of frequent calm
conditions with temperature inversions resulting in poor
natural ventilation and high emission loads due to evening
traffic peaks.
Amongst the various types of industries that
mushroomed in the city, the most polluting ones were stone
crushers, hot mix plants, potteries, induction furnaces etc.,
besides the above important industrial air pollution sources,
coal-fired boilers, foundries, forging units, etc., also
contributed significantly to air pollution. In addition,
significant pollution was also caused by a large number of
Diesel Generating (DG) sets, which were installed in various
commercial and industrial establishments. The erratic power
supply caused phenomenal increase in the number and use
of DG sets. In addition to these industries, emission from
thermal power plants located in the heart of the city also
adds to air pollution.
The main concern in the domestic sector is the use of
inefficient and highly polluting fuels in the poorer
households/urban slums, leading to deterioration in the
indoor air quality and health.
The CO, CO2, SPM emissions from fuel use are fairly
significant and are inadequately dispersed. This brings
about high exposure and risk to the slum dwellers.
Pollutants from slow combustion of miscellaneous
combustible materials by domestic and commercial
sources account for eight per cent of the total pollution.
Sulphur dioxide is the major pollutant emitted. Moreover,
since these emissions take place at low heights, the
problems due to domestic burning need proper attention
in order to avoid any undesirable health effects.
Steps required to deal with pollution from vehicles,
small industries and other sources have been detailed in
the chapter.
6. Public Distribution System
The salient features of the Public Distribution Scheme
and the measures taken by the government of the NCTD
have been stated in the chapter on PDS. Here it will be
sufficient to deal with the grievances and the remedial
measures that may be considered.
6.1 Grievances Related to PDS
i) One of the significant objectives of PDS was to
ensure Micro Level Food Security. The CAG
report revealed that inefficient targeting has
affected targeted PDS.
ii) Low availability of food grains through PDS
assumes importance in the face of acute nutritional
inadequacy in diet and very low per capita calorie
intake of BPL population in the country.
iii) One of the major problems with the functioning
of PDS is the problem of identification of the
right target group. There is no availability of
authentic data for classification of population in
APL, BPL and other relevant categories. There
still exists a gap between the targeted number of
beneficiaries vis-à-vis actual beneficiaries.
Approximately only about 57 per cent of the BPL
households are covered by it TPDS.
iv) Due to callous attitude and low profit associated
with PDS, FPS owners resort to illegal and
inappropriate means and ways like:
• Excess issuances of ration cards to increase
margins.
• Many FPSs have large number of ghost cards in
order to get more quantity of food grains and earn
huge profit by selling them in the open market.
v) As a result of low annual turnover some of FPS
owners indulge in leakage of commodities and
diversion of subsidised grains available with them.
vi) Irregularities in opening and closing of FPS.
vii) Harassment to the card holders.
viii) Entries of the commodity sold to the beneficiary
is not made.
ix) Commodities sold are not weighed properly.
x) Over charging from consumers.
xi) Good quality commodities replaced by poor
quality food grains/kerosene.
xii) Lacunae in the licensing and selection of FPS.
Marked irregularities have been found in
allotment of license to FPS.
DELHI DEVELOPMENT REPORT40
xiii) Inaccessible location of FPS from the BPL or
Antyodaya beneficiaries.
xiv) A significant portion of subsidised food grains
and other essential commodities do not reach the
beneficiaries due to their diversion.
xv) Mechanism of allotment of FPS license has also
been made more stringent. The Chairman of
Selection Committee is D.C. (Revenue) who is
from the other department and hence selection is
more transparent and based on merit.
xvi) Attempts are made to address these grievances
from time to time, but the problems remain.
Measures such as awareness generation,
involvement of the people and the civil society at
large, transparency in PDS, vigilance committees,
and improved governance are some of the
methods that have been tried.
6.2 Suggestions
6.2.1 Reward/Recognition
• Reward for the meritorious and honest officers
who are vigilant and care for people’s needs.
• Recognition or annual award for the FSPs so that
more and more shop owners would try to follow
the system.
6.2.2 Legalised Ways to Make Profit
• As there are low margins in the running of FPS,
there should be legalised and genuine ways to
earn profit for an honest business.
• There can be a provision for the supply of other
essential items like tea, soap, matchbox etc., be
made available through FPS.
• There can be various Tax exemption provisions in
procurement and distribution of other essential
commodities to encourage the concept of
providing complete service to people.
6.2.3 Quantity/Quality/Timeliness of Food Grains
• A timely arrival of food grains at FPS can ensure
timely distribution of essential commodities. It is
interesting to note that most of the people get
their wages/salaries in first seven days of the
month so the system should be such that it
ensures the supply of food grains during that
period. Failing which people will buy from the
commercial outfits leading to non-lifting of the
quota and diversion of supply to blank marketers.
• The supply should be in adequate quantity
keeping in mind the number of consumers
registered with the FPS owners. Inadequate
quantity of food grains leads to shaking of the
trust of the consumer in the FPS owner and
hence the whole Public Distribution System.
6.2.4 Licence to FPS
• The mechanism of allotment of FPS licence
should be made more stringent. People from
economically weaker section should be given
opportunity.
• Last but not the least, people’s participation
should be sought for successful functioning of
PDS. Voluntary organisations should also actively
be involved for better functioning of the system.
A vigilant and cooperative public will go a long
way in making this system more viable and
effective.
• The department is considering these proposals for
reward/recognition to the honest officials, and the
FPS licensees who adopt fair practices and
legalised way to make profit.
• Strict instruction/monitoring is done on quantity/
quality/timeliness of food grains.
7. Forest, Tree Crop Management, Greening, etc.
7.1 Current Status
NCT of Delhi has three main physiographical
segments, viz., Flood Plains of Yamuna, about the Ridge,
and the Plains. Agriculture is practised extensively along
the stretch of river. Most of the native vegetation has
been cleared for the purpose of farming and the areas,
which are not fit for agriculture, are used as grazing
grounds when the floodwater recedes. The riverine
ecosystem is under major threat.
On Delhi Ridge, planting was confined initially to
indigenous species and Prosopis juliflora was introduced
later, which showed good drought resistance and
gradually the ridge has been covered with this species.
Although the capital has more trees per ha, than the
national average the tree cover is unevenly distributed and
is progressively declining. Delhi has 121 sq. km of forest
cover and 40 sq. km of tree cover, which constitutes only
10.2 per cent of geographical area under green cover
much less than 33 per cent as envisaged by National
Forest Policy, 1988. More than 70 per cent of the forest
cover is in south and southwest Delhi alone. The rest of
EXECUTIVE SUMMARY 41
Delhi has very little green cover and enormous
biodiversity has been lost.
7.2 Initiatives Taken
The following initiatives have been taken in the past to
manage hotspots impacting Delhi’s dwindling flora.
• A large portion of the ridge was declared a
protected zone. Subsequently, large chunks of
land on the ridge have also been notified Reserve
Forest. Another development was the
establishment of Asola Wildlife Sanctuary in 1991
to enhance the protection and conservation of the
city’s floral and faunal diversity.
• Delhi Tree Preservation Act 1994 laid down heavy
penalties on individuals, institutions and
organisations for tree felling.
• Greening Delhi Action Plan is launched every year
to undertake additional plantation. A task force
under the chairmanship of the Conservator of
Forests, Government of NCT, Delhi was
constituted. The plantation scales in the recent
past have increased from around one-lakh
seedlings per year in mid-90s to about 11 lakh
presently.
7.3 Impediments
• Forests and tree cover in Delhi have always
remained vulnerable to developmental activities.
• Inadequate coordination among agencies like
forest department, CPWD, DDA and MCD
further aggravates the existing threats.
7.4 Agencies—Their Role in Plantation
i) An area of 8,422 hectares, marked as green, is
managed by a large number of government and
non-government agencies.
ii) The Forest Department is carrying out a number
of activities for the development of forests
including enrichment planting in ridge area to
augment the natural regeneration. It has
identified about 1,400 acres in different zones to
develop into mini forests in addition to the ridge.
iii) DDA has a greening project. It is working in
collaboration with the Department of Botany,
Delhi University to develop a biodiversity park
along the Yamuna river-bed in North Delhi. It has
fixed a target of planting 1.68 lakhs trees during
2004-05.
iv) The Municipal Corporation of Delhi (MCD)
undertakes plantation in various areas such as
schools, parks, bus stands and along roadsides. It
has also set a target of planting 1.6 lakhs saplings
in the current year.
v) The New Delhi Municipal Committee (NDMC)
undertakes tree plantation along the wide roads,
residential areas, parks etc. It has proposed to
plant 10,000 trees during 2004-05.
vi) Other agencies also are involved in plantation
work. Residents Welfare Associations (RWAs),
Market Traders Associations (MTAs), Non-
governmental organisations and schools have
planted 90 lakhs seedlings in the last four years.
Apart from this, 1500 Eco-clubs have been
established in various schools/colleges of Delhi.
7.5 Greening of Delhi—Vision 2015
Delhi should be one of the green and clean capitals of
the world with high aesthetic value, providing its people a
safe and healthy environment and setting up an example
of a modern metropolis. The following strategic actions
should be taken up in this regard:
7.5.1 Expanding Green area—Afforestation of all
available areas should be undertaken. The feasibility of
acquiring a two km wide area on both sides of Yamuna
and a 2 km wide strip of available land along the border
of the state of Haryana for developing it into a green belt
should be examined. It would serve the dual purpose of
protecting the flood plains from further encroachment and
degradation as well as help in recharge of ground water.
7.5.2 To protect Delhi from desertification from
southwest direction, massive afforestation on private and
public lands needs to be undertaken.
7.5.3 The existing tree cover should be protected and
maintained by strictly enforcing the provisions of The
Delhi Preservation of Tree Act, 1994.
7.5.4 Delhi Ridge should be preserved by adopting
suitable combinations in which trees, shrubs and herbs
co-exist as multi-layered vegetation. Assisted natural
regeneration cum enrichment planting can be useful in
conserving and protecting the biodiversity of this region.
7.5.5 Information of green cover and forests should be
maintained in Geographical Information System format for
which a suitably equipped Cell may be set up.
8. Wild Life Management
The fast pace of urbanisation leaves very little scope
for wild life to thrive and it has been dwindling rapidly.
DELHI DEVELOPMENT REPORT42
However, efforts must be made to conserve whatever is
possible under the circumstances. Efforts at increasing
awareness about the importance of wild life conservation
need to be made. Delhi is being used as a transit point for
the illegal trade in wildlife products. There is need for
increased vigil and action on part of the concerned
authorities. A multi-pronged approach is required to
manage the problematic species Macaca mulatta and captive
elephants.
9. Education
9.1 Elementary Education
The literacy rate in Delhi is 82 per cent, male having
87.4 per cent and their female counterpart has a literacy
rate of 75 per cent. The share of illiterate people in urban
Delhi is 13.7 per cent which is much better compared to
the urban India average (20.2 per cent). It has been
estimated that 25 per cent of Delhi population lives in
slums (2000). These people mainly belong to minority
groups, scheduled castes and are mostly casual labourers.
The educational attainment rate for these people is very
poor. More than 20 per cent of those enrolled at primary
stage belong to the disadvantaged communities, but at the
secondary stage this proportion is reduced to 14 per cent.
The enrolment figures over last 25 years has seen an
increasing trend.
The private schools play a significant role in managing
school education. The share of private sector in schooling
in Delhi increases sharply at the secondary and higher
secondary stages while the government school is
dominant in primary and middle stages.
The number of out of school children has been
significant—6.39 per cent of total 6-10 children and 7.12
per cent of total 11-14 children were out of school in
2003. Compared with private schools, the government
school performance is poor. There also exists slight
gender discrimination in the percentage share of boys and
girls appearing for class X examination, as girls comprised
around 46 per cent of the students who appeared for class
X exam. This bias is reduced slightly at the class XII level,
with their share improving to 47 per cent of the total. It is
perhaps not fair to compare results of government and
private schools.
Another important aspect related to education is that
emergence of unrecognised sector. In addition, taking
private tuition, some from schoolteachers but largely from
the educated unemployed, has become a common
phenomenon among all income groups. These are the
available alternatives for the parents to support their
children’s education.
9.2 Causes behind Poor Achievement
A major reason for so many children still being out of
school is shortage in schooling facilities. This includes
shortage of schools, of infrastructural facilities in existing
schools and of teachers.
The schools are often very crowded. Not only are
primary schools not enough to enrol all children, the
facilities for upper primary education are insufficient.
There is one more issue that needs to be addressed at
primary level that is of fees.
The availability of teachers at Delhi schools varies
according to the administration. The teacher-pupil ratio at
the primary stage at MCD schools is 1:52 while it is much
better at 1:34 for DOE (Directorate of Education), Govt.
of Delhi schools. A major problem in improving quality of
teaching was the absence of indicators of teaching quality.
Poor teaching and poor achievement at earlier levels is
often the main reason for poor retention. To introduce
teacher accountability, continuous and comprehensive
evaluation of students is carried out three to four times in
a year and performance of students is linked to teachers
who are teaching them different subjects.
The secondary schools sometimes run in tin sheds or
tents (21 schools function from tents and 94 from SPS/
tents). Other basic facilities like toilets, drinking water,
electricity supply are also often in short supply for all
schools. Buildings are poorly maintained; piles of paper,
broken desks and chairs are common occurrences. The
basic facilities reported by the average government school
student were very poor. It must be noted that the poorest
facilities were found in east, north east and north west
Delhi schools. Here the pressure on school facilities from
a rapidly increasing slum population appears most acute.
Facilities are also generally poorer the lower the level of
schooling, i.e., upper primary was worse off than
secondary and the latter was worse off than senior
secondary schools.
For dealing with the major problems of poor retention
and poor learning achievements higher budgetary
allocations are necessary, but are not enough. Solving
these problems is much more complicated.
9.3 Initiatives Taken in Delhi
About 3000 learning centres run by various NGOs
bring out an appropriate level of competancy among the
out-of-school children by putting them through condensed
courses and then get them admitted into appropriate
grades in formal schools. Nearly a lakh of out of school
children are in these centres. A major problem faced by
EXECUTIVE SUMMARY 43
these learning centres is that sufficient schools or
classrooms have not come up. So the problem of
mainstreaming remains. The government is also
experimenting with the concept of mobile learning
centres.
Delhi government has also sought cooperation from
private sector as well in its attempt to improve school
availability. The private unaided schools in Delhi are also
non-profit organisations. Delhi High Court had ordered
that they are to reserve 20 per cent of the seats for the
economically disadvantaged children—and grant them
freeship.
Other measures include continuous and comprehensive
evaluation of schools, computerising information system
(web based MIS), improvement of retention and learning
achievements by implementing different projects which
make the schools enjoyable to the children, community
participation, sports and other activities. Efforts has also
be taken for provision of education for disabled children.
Several projects are being implemented in the
government schools to make schools enjoyable and
meaningful. YUVA has been introduced in government
schools with twin objectives—to make sure that the
school is a safer and happier place for the students and
that they are taught to be responsible adults. So it would
give basic education on all subjects like HIV-AIDS, career
counseling etc. Project RAKSHA was launched to teach
self defense skills to the girl students. In primary schools
a hot cooked midday meal is served in all schools.
Initiatives have been taken to encourage the
community to participate in developmental activities such
as Dakhila Abhiyan, awareness programmes related to
Polio, Dengue, participation in bhagidari melas and
workshop, maintenance of schools through Vidyalaya
Kalyan Samiti (VKS).
9.4 Strategies, Choices and Issues
9.4.1 Vocational Education
Under the Revised National Policy on Education, the
priority has been assigned to vocational education.
Presently 16 Vocational courses are being taught in 197
Government and 7 Government Aided Senior Secondary
Schools scattered over Delhi. The enrolment under
vocational education programme is nearly 10657 students
in Government-aided Schools. However in percentage
term the figure is very low. Government is, now,
conducting several studies to evaluate vocational courses.
Attempt has made to train the teachers after 10 years.
Vocationalisation also lacks planning for selection of
courses and training. It needs proper continuous and
comprehensive research.
9.4.2 Higher Education
The government has encouraged and promoted private
initiative in the field of higher education through
affiliation to GGSIP. Eighty five per cent seats are reserved
for students of Delhi in the institutes under GGSIP
located in NCT of Delhi. It is proposed to initiate courses
in emerging disciplines like Biotechnology, Genetics Plant
Molecular Biology, Environment studies etc in the colleges
fully funded by Delhi Government. The University of
Delhi has included in its curriculum a good number of
vocational courses.
The directorate of higher education has prepared a
comprehensive policy for higher education for next five
years which includes opening of new Degree Colleges in
various localities of Delhi, and it also proposes to open
Indira Gandhi Institute of Technology under GGSIP seeing
the regional balance in north west India—only seven per
cent intake facilities in north–west region comprising
Chandigarh, Haryana, HP, Delhi, Rajasthan, and J&K in
total technical intake of the country.
The issues related to better management of higher
education such as strengthening of the Directorate of
Higher education, directing colleges for proper utilisation of
funds, financial audits for their proper uses, acquisition of
new sites for opening of various colleges, opening of more
new hostels for girls are addressed in new policy. In
addition to these, to encourage meritorious students
studying in Government colleges and to motivate intelligent
and serious students of general stream education i.e.,
Science, Commerce, and Arts, in a three years Degree
Course with two segments viz., Honours and General Pass
courses a cash award of Rs. 5000 each is proposed.
9.4.3 Technical Education
The efforts in the direction of expansion of technical
colleges are reflected in the shape of upcoming new
colleges. Aspects such as upkeep and maintenance of
buildings, equipment, furniture, environment etc., of the
institute, restructuring of the curriculum in coordination
with the industry are also being addressed. There should
be provision to arrange for industrial visits/industrial
training for the trainees/students, to generate revenue for
the institute by obtaining job works, services, consultancy
etc., from industry/market, to explore the possibilities of
more gainful employment for the students/trainees, to
conduct short-term courses/seminars/workshops for the
employees of industry and the entrepreneurs to associate
DELHI DEVELOPMENT REPORT44
the alumni/ex students in getting constructive feedback
for the improvement of training standard.
9.5 Issues in Delhi
Some of the suggestions to improve Delhi education
scenario in general are :
i) In the coming years, the economy of Delhi
would be dominated by the services. Therefore,
the steps should be initiated to introduce more
and more courses as per the demand of job
market, as the education directly and through its
multiplier effect, is a dominant player in the
economic activities and thereby growth of the
state as well as the country.
ii) It is time that government gave appropriate
weightage to both the general as well as
vocational education as per the requirement of
emerging industries.
iii) The privatisation as well as internationalisation
of education is increasing at all levels starting
from pre-school. The state should remain the
pioneer and prime mover and should hold the
responsibility of monitoring and controlling of
quality magnitude and degree of commercialisa-
tion.
iv) Uncovered areas and irregular settlements,
especially of migrants, without a neighbourhood
school need to be provided with schooling
facilities on priority.
v) In an attempt to reach the hitherto unreached
groups of children, particularly those at
construction sites, the government is
experimenting with the concept of mobile
learning centres.
vi) The government has sought cooperation from
private sector in its attempt to improve school
availability. The private unaided schools in Delhi
are required to reserve 20 per cent of the seats
for the economically disadvantaged children –
and grant them freeship.
vii) So far the Boards results were the only
accountability measure for teachers, and gave a
performance appraisal for teachers who taught in
class X or XII. Learning level and teaching quality
in other classes have no similar measures. For
this purpose the directorate took a major step to
reform the examination system. In addition to the
3 terminal tests, 4 additional tests were
introduced for students of class 3 to class 12.
viii) Web based MIS has been developed to store data
on schools, students and teachers. Information is
easily accessible not only for the planners but
also the other stakeholders. All postings and
transfers are carried out electronically. Budgetary
allocations and sanctions are also issued
electronically.
ix) Initiatives taken to invite the community to
participate in activities such as Dakhila Abhiyan,
awareness programmes related to polio, dengue,
participation in bhagidari melas and workshop,
maintenance of schools through Vidyalaya
Kalyan Samiti (VKS) need to be strengthened.
x) Programmes aimed at improving quality of
education include covering all government
schools with computer education, setting up
special schools for the talented children need to
be intensified.
xi) There are also correspondence courses at school
level and special programmes for the benefit of
the school drop-outs, housewives, etc. They
need to be expanded.
xii) At the post senior-secondary level, there are
several technical institutions providing degree or
diploma or even shorter courses with a certificate.
xiii) The private sector contribution in various forms
of training and skill development is not fully
documented. However, some private institutions
are run by fly-by-night operators, which give a
bad name to all others. Though long-term
courses (Degree/Diploma) are regulated by the
AICTE, there is no law like the Delhi School
Education Act for full reporting of new technical
training institutions, for short or medium term
courses.
xiv) There is need for a comprehensive survey of
training providers. The training providers need
some regulatory framework which has legal
backing so as to ensure high standards of
training and protect the trainees from
exploitation.
xv) Under the Revised National Policy on Education,
the priority has been assigned to vocational
education. But, the enrolment under vocational
education programme is very low. Vocational
education needs proper, continuous and
comprehensive research including the aspect of
its integration with training and hands on
experience on the job itself.
EXECUTIVE SUMMARY 45
xvi) For higher education Delhi is considered to be
the most preferred destination. The city is home
to several renowned universities, which attract
students from all parts of the globe. Still Delhi
government has taken initiative to establish a
new university and it included Guru Govind
Singh Indraprastha University (GGSIP) in the list
of universities. The government has encouraged
and promoted the private initiative in the field of
higher education through affiliation to GGSIP. In
order to keep pace with the changing industry
environment the government propose to initiate
courses like Biotechnology, Plant genetics and
Molecular Biology, Environment studies etc., in
the colleges fully funded by Delhi Government.
To keep pace with the growing demands of the
present day situation, the university of Delhi has
included in its curriculum vocational courses.
xvii) The Directorate of Higher Education has
prepared a comprehensive policy for higher
education for next five years which includes
opening of new Degree Colleges in various
localities of Delhi and of Indira Gandhi Institute
of Technology under GGSIP.
xviii) The issues related to better management of higher
education such as strengthening of the Directorate
of Higher Education, directing colleges for proper
utilisation of funds, financial audits for their proper
uses, acquisition of new sites for opening of
various colleges, opening of more new hostels for
girls are addressed in new policy. In addition to
these to encourage meritorious students studying
in Government colleges and to motivate intelligent
and serious students of general stream education
i.e., Science, Commerce, and Arts, in a three years
Degree Course with two segments viz., Honours
and General Pass courses a cash award of Rs. 5000
each is proposed.
10. Health
10.1 Current Status
i) Delhi has done well in family welfare with birth
rate being 18.1 against the national average of
25.4.
ii) Sex ratio at birth i.e., 820 females birth/1000
male births suggests the prevalence of sex
selective abortion. This needs to be probed.
iii) Communicable diseases are still a major cause of
morbidity. However, this trend is rapidly
changing and is expected to reverse within the
new next few years.
iv) Delhi represents a widely varying populace and
correspondingly a widely varying disease pattern
ranging from lifestyle diseases on the one hand
to the infective and malnutrition related diseases
on the other.
v) Many urbanised villages lack basic infrastructure
and proper planning of the residential areas
leading to unhealthy overcrowding with
unhealthy surroundings.
vi) The life expectancy at birth for Delhi’s
population is 68.6 years compared to an all India
average of 60.7 years.
vii) Delhi has a fairly well established healthcare
infrastructure for its people with one of the
highest bed capacity (1.98 beds/1000 persons)
compared to the national average of about 0.7
beds per 1000 persons. The per capita public
expenditure at Rs. 436 in 2001-02 is more than
double of the all-India average of Rs. 180. But
this is inadequate since most people depend on
the government hospitals and dispensaries.
viii) Delhi has a fairly well established representation
of the private entrepreneurs in health sector.
Their range of practice varies from individual
practice and small nursing homes to large
charitable and corporate hospitals. However,
these excellent medical facilities are beyond the
reach of the common man.
ix) The state has constantly allocated more than 7
per cent of the Plan outlay to the health sector
and has utilised more than 80 per cent of the
outlay.
x) Infant mortality rate has significantly come down
from 45 per 1000 to 29 per 1000 between 1990
and 2001.
xi) Tuberculosis is still a major public health
problem in Delhi.
xii) Cholera and gastro-enteritis occurrence is not
uncommon.
xiii) Delhi is prone to malaria and dengue.
xiv) As far as immunisation of children is concerned,
as per NFHS-33, 63.2 per cent children received
complete immunisation.
xv) Delhi falls under low prevalence state for HIV/
AIDS. However, 42,000 HIV positive cases are
estimated till January 2006, a total of 2759 cases
DELHI DEVELOPMENT REPORT46
were reported till August 2006 while 322 deaths
were reported till January 2006.
xvi) Incidence of cancer, diabetes and fatal traffic
accidents etc., are also seen more in the urban
population. Delhi with 93 per cent urban
population is more vulnerable to such diseases.
xvii) There is a multiplicity of agencies operating their
healthcare outlets in different areas or for
defined subset of populations in different areas
like Delhi Government, MCD, NDMC, CGHS,
DGHS, ESI, and Army etc., leading to some
overlaps/duplications of services with wastage of
efforts and resources on one-hand and deficient
services on the other.
10.2 Recommendations
i) There are multiple agencies operating the health
care outlets leading to duplication of services,
wastage of efforts and resources and deficient
services. Exercise to optimise the use of
available resources needs to be taken.
ii) Qualified hospital administrators need to be posted
in government hospitals to improve their services.
iii) Integration of the local area family practitioners
with the government hospitals and dispensaries
in the area for two-way referrals needs to be
promoted.
iv) Development of high-class healthcare infrastructure
in NCR towns should be encouraged.
v) In the localities deficient in potable water supply
system, sewerage/sanitation system and electric
supply infrastructure, their improvement will
minimise incidence of morbidity and mortality.
vi) Greater attention needs to be given to health
education of public with emphasis on preventive
aspects.
vii) Health related topics should be included in
school and college curricula.
viii) Strict enforcement of laws for control of food/
water borne infections and adulterations is
necessary.
ix) Health Insurance sector base and corporate
support to their employees for medical check
ups and treatments need to be widened.
x) Well-equipped and dedicated trauma centers
along the main highways entering Delhi need to
be set up.
xi) Industries need to be shifted to outskirts to
reduce health hazards, accidents, pollution and
traffic congestion.
xii) The hazard caused by stray dogs and animals
needs to be addressed to minimise traffic
hazards/accidents and need for anti-rabies
vaccine.
xiii) The values for various parameters like the gender,
educational levels, residence type, region, religion,
caste, community, socioeconomic status,
occupation, etc., are not available and studies
need to be undertaken accordingly.
xiv) Policies and programmes should be oriented to
the realisation of the ‘Vision’ of the Chief
Minister to make Delhi as a ‘role model’ for
healthcare infrastructure.
11. Tourism
11.1 A Brief Picture of the Delhi Tourism Scene
(a) Tourist Traffic Trends
Global trends indicate an annual growth of 4.5 per cent
for international tourism in the 2002-2012 period. In
India the growth trend is higher at 9.7 per cent in the
next ten years. Growth in domestic tourism is likely to be
at a higher rate and will impact future growth. In Delhi
the Commonwealth games 2010 provides a special
opportunity to development as a destination.
Delhi accounts for 30.8 per cent of international
arrivals. It accounts for 51 per cent (1.35 million) of total
arrivals of international tourists. This has been showing a
downward trend (it was 62 per cent earlier). It accounts
for only 0.5 per cent of domestic tourists (most of them
are pilgrim tourists).
(b) Hotel Rooms
i) Delhi has 9841 classified rooms—nearly half in
the five star category.
ii) Almost an equal number are in the unclassified
category.
iii) There is an obvious imbalance in the categories
and classification spread in the tourist
accomodation.
iv) Growth in demand has led to recent scarcity of
hotel rooms to the tune of 3,000 rooms.
(c) Tourist Transport
i) Tourist transport needs to be strengthened by
improving tourist transport facilities.
EXECUTIVE SUMMARY 47
ii) Existing infrastructure can be improved by better
traffic movement, flyovers, etc.
iii) Improved services—Radio taxis, Volvo buses,
easier interstate movement.
iv) Metro will improve overall connectivity but have
limited impact on tourist movement.
(d) Tourist Traffic Providers
Travel agents, tour operators, guides, need to improve
their quality of service and reliability.
(e) Role of Department of Tourism, DTTDC
However, Delhi Tourism Department has a very
limited role in creating an impact on tourism in the state.
Funds and resources are disproportionately low for the
objectives indentified. DTTDC’s role as an implementing
agency is diluted by other activities eg., liquor trade,
flyover construction.
11.2 Policy Since the Tenth Plan
The Tenth Five Year Plan provided a significant shift in
policy by giving higher priority to this sector and offered
increased opportunity for private investment and
participation in tourism development. The new policy is
based on “Tourism for All” and is covered under
‘Bhagidari’. It is a government led, private sector driven
community welfare approach. It seeks to promote Delhi as
a World Class Heritage City for which special initiatives
are proposed in developing Tourism in the following
areas:
i) Cultural/Heritage Tourism
ii) Business Tourism
iii) Convention and Conference Tourism (MICE)
iv) Ethnic handicrafts, fashion, cuisine
v) Leisure Tourism—shopping, golf, adventure
vi) Medical/Health Tourism
vii) Develop Delhi as a hub for Tourism in North
India.
11.3 Human Resource Development
Efforts are being made to enlarge training facilities to
produce the needed skilled manpower for the jobs that get
created with the growth of tourism.
11.4 Suggestions—Way Forward for Delhi Tourism
a) A new mindset for Tourism Development is
needed. It means that–
i) Tourism must be seen as “the industry of
industry” to fully realise the socioeconomic
benefits.
ii) A statutory Tourism Board will make for
more effective implementation and management
of Tourism in the state.
iii) An empowered body such as a Tourism
Board can effect better “Convergence” with
important state agencies such as NDMC,
DMC, DDA, Police, Transport etc.
iv) It can also coordinate more effectively with
Airport Authority, Railway, ASI etc.
b) Delhi can become a world class Heritage City by
developing “integrated tourism zones”—keeping
tourism needs in mind and creating a unique
tourism experience at each location as identified:
i) Red Fort/Chandni Chowk.
ii) Purana Quila/Pragati Maidan/Humayun’s
Tomb.
iii) Rajiv Chowk, India Gate, Rashtrapati Bhawan.
iv) Qutub Minar, Mehrauli heritage area, Garden
of Five Senses.
v) Create tourism-friendly transport and other
services linking them to Airport, Hotels,
Railway stations, and Road transport.
c) Create a world class convention facility with all
the related infrastructure and systems including
administrative and manpower support.
d) Develop Delhi as a destination for Medical
Tourism—Task Force recommendations or
“Chemical Establishment Act”, medical visa,
health insurance and linkages with tourism
marketing need to be acted on.
e) Develop leisure and entertainment facilities at
selected locations:
i) Shopping—handicrafts, fashion goods,
jewellery.
ii) Parks, gardens, water bodies, golf courses.
iii) Food and ethnic cuisine.
iv) Festivals and special events.
f) Create effective linkages with NCR and nearby
destinations particularly Agra so as to prolong
stay by tourists.
DELHI DEVELOPMENT REPORT48
12. Employment, Rural Development andPoverty Alleviation
a) Main Features of the employment situation are:
i) The employment base in Delhi is almost entirely
composed of services of various kinds and
manufacturing.
ii) It has a low workforce participation rate of 33.5
per cent as against 39.2 per cent at the national
level.
iii) Males account for 86 per cent of labour force as a
whole with urban areas indicating as high as 91
per cent share of the males. Majority workforce is
in the regular/wage-employed category for
females the figure is over 77 per cent.
iv) The largest sector of activity on the basis of
workforce numbers is the service group, trade
and hotels etc., followed by public administration.
Services are followed by manufacturing.
v) The construction sector accounts for less than 6
per cent of total workforce.
vi) Delhi has an overall unemployment rate of 12.5
per cent, higher than the national level with very
high unemployment rates for females in the age
group 20-24 and 25-29 years.
vii) The male unemployment rates are very high for
the age groups 15-19 and 20-24 years. These are
much higher than the countrywide picture.
viii) In Delhi, the phenomenon of ‘discouraged
workers’ could possibly reduce the workforce
participation rate and ultimately the rate of
migration into Delhi itself.
ix) Educated unemployed form a large proportion of
the unemployed.
x) The simple rate of growth of the registered
unemployed persons has been 2.5 per cent a
year—majority of them is increasingly from the
educated category.
b) Suggestions: The above deficiencies in the
employment situation need to be carefully examined and a
plan prepared to take effective remedial measures. The
employment situation reflects the state of health of the
economy of the area and if the aspiration is to have Delhi
as a capital which may be counted among the best capitals
in the world, the situation will have to be addressed on
priority.
13. Science and Technology
13.1 Categories of Activities
The activities in this sector can be divided into three
categories:
a) Category 1: Science & Technology (S&T)-
Information Technology (IT) and Biotechnology
(BT) Education including technical training. It
includes School level Science (including IT),
vocational training in high technology (including
IT related CAD/ CAM), popularisation of IT and
lately also higher education in Science, IT and
Biotechnology.
b) Category 2: Research and Development in S&T-
IT&BT.
c) Category 3: Use of S&T-IT&BT in socio-economic
sectors
It includes use of Information Technology (IT) in
governance and health delivery, software industry and
promotion of IT and Biotechnology related enterprise.
S&T component is also reflected in programmes for
development of rural areas, in energy supply, small-scale
industry development and environmental protection.
13.2 Channels of Activities
Activities are channeled through three main agencies;
the departments and institutions under the GNCTD
(Government of Delhi), laboratories of Central
Government agencies including Universities and IIT and
private sector including NGO.
• Government of the National Capital Territory of
Delhi (GNCTD), MCD and NDMC are active in
Category 1 and Category 3 programmes. Category
2, namely R&D is mainly performed by the
laboratories of the Central Government and
Universities and IIT located in the NCTD. The
thrust of S&T activities supported by the State
Government is on IT and science education in
schools, IT in governance, IT and BT embedded
in its industrial and rural development
programmes.
• Private sector is active in IT and Biotechnology
marketing and consultancy as also lately in
software industry through the IT Park being set
up by the Delhi Metro Rail Corporation and in
Biotechnology R&D Centre at South Campus of
the University of Delhi.
EXECUTIVE SUMMARY 49
• NGO participation is in science education,
environment awareness, and water conservation
and in rural development through Bhagidari is
also note worthy.
13.3 Recommendations
a) The vision from the point of Science and
Technology should be to make the economy of
National Capital Region of Delhi a knowledge
intensive economy.
b) One of the areas of thrust is to upgrade the
technical competence of human resource in the
use of modern techniques such as CAD/CAM and
IT enabling them to work in industrial complexes.
c) Manufacturing units being private sector
ventures, the technical training and facilities need
to be matched with the demand profiles of the
manufacturing units. It would be appropriate to
associate the companies with the training
programmes
d) Improvement of rural parts of Delhi by applying
so called rural technologies developed in
laboratories is another development goal receiving
attention in the development plans of Delhi
e) The maximum concentration of villages is in the
Mehrauli sub-division of Delhi (28 villages).
Linking technology suppliers/sources and the
rural populations is critical for such programmes.
Some business and management schools are
located in and around rural areas and can become
effective link institutions. Business and
management schools need to be utilised for
coordinated implementation including the
activities of NGOs.
f) It is recognised that knowledge industries are
highly competitive and market niche of these
units will have to be carefully developed. Exercise
in this direction through industry involvement is
necessary.
g) Substantive investment is envisaged for
introduction of IT in government departments.
There is a desire in the plan to strengthen
government-citizen interface. The Delhi
Government has made progress towards
computerisation of its administration.
h) The next critical issue is the easy accessibility of
information to the citizens. It is necessary to
establish effective and sustainable network of
access centres. These can be set up as micro
enterprises. The example of the entrepreneurial
model of AISECT (All India Society for
Electronics and Computer Technology) that has
already spread all over the country with
maximum concentration in semi urban and rural
areas of Madhya Pradesh and Chhattisgarh is
worth emulating. AISECT model has been
recognised by the Indian Innovation Award as the
largest network with potential of wider
applicability. This model can be effectively used in
the National Capital Region.
i) Setting up of IT and Biotechnology industrial
units in Delhi are important new initiatives
towards knowledge based industries. These are
best established through industry–academic
linkages making full use of Delhi’s strong
conglomeration of post graduate science and
engineering education (including Biotechnology
and IT) and of R&D laboratories supported by
the state and the Centre.
14. Labour
14.1 Labour Situation
The main features of the labour situation in Delhi are:
a) The proportion of employment in the organised
sector is much higher than the national average.
b) Most activities are still in the unorganised sector
without proper reporting.
c) The employment exchanges have failed to satisfy
both the employers and potential employees. The
organised sector has its own recruitment
mechanisms.
d) Both the employees and the training providers are
more and more in the private sector.
e) The job opportunities in Delhi have not only
continued to grow, they have also changed and
become more complex.
f) Requirement of any skill or education level is met
by outsiders coming to Delhi in search of
employment.
g) The casual workers in Delhi’s small industries/
enterprises came from outside without much of
skills and learned the crafts on-the-job.
14.2 Skill Development and Training
a) In an open economy like Delhi, the classical
DELHI DEVELOPMENT REPORT50
methods of manpower balancing as part of
manpower planning are not practical. It is also
not practical to decide the length of the course,
subject matter, the skill sets and the teachers at
the government level in a centralised fashion.
b) Delhi’s economy lies mainly in the service sector
whose needs are not known in advance. The
government institutes have found it difficult to
change courses/curricula to meet such short-term
needs of potential employers.
c) In the case of Information Technology enabled
services private training providers did the job
under some kind of supervision of the Ministry of
IT and the government accepted a variety of
courses with different lengths, different quality/
levels and different subject matters in the private
unorganised sector. Likewise, there is enormous
scope for innovation and participation by private
sector to develop and organise a variety of
courses.
d) The providers of the training in the private sector
are in a position to develop some skills of use to
the employers; they need to be encouraged.
e) In this regard ideas like Skill Development Fund
have been mooted but none has come into
existence so far.
f) However, government must ensure proper
supervision over such training providers so that
fresh migrants or weaker sections of society are
protected against potential exploitation.
14.3 Labour Management
a) Labour management especially that of skilled/
educated labour force or those engaged in
services outside the government has not been a
problem in the city.
b) The behaviour of trade unions in large
manufacturing enterprises, i.e., blue-collar
workers has been always different from that in
the service sector and educated people. Formal
Trade Unions have not had much impact on
workers in Delhi after a large number of
manufacturing enterprises, especially the bigger
ones shifted out of Delhi.
c) The unorganised sector manufacturing, by
definition, is not unionised but such workers face
potential exploitation such as low wages and long
hours of work.
d) The scheme of the NDA government for
providing social security to unorganised sector
workers became a non-starter.
e) The government needs to provide some form of
social security to such workers.
15. Women and Vulnerable Groups
15.1 Sources of Vulnerability
Vulnerabilities are derived from a host of parameters
including social, physical, gender related, economic,
financial, infrastructural, health-related, legal, political or
institutional. Powerlessness, income and structural
poverty, and social exclusion are the characteristics
associated with vulnerabilities.
15.2 Categories of Vulnerable Groups
Ten different segments are categorised as vulnerable
groups that include women, socially disadvantaged
groups, child labour and street children, the disabled and
challenged, migrants, shelterless, those affected by the
inadequacy of public transportation, unorganised workers
(such as street vendors, sex and domestic workers), the
elderly, and children facing violence and abuse.
15.2.1 Socially Deprived Sections
The socially deprived sections belonging to Scheduled
Castes and Other Backward Castes face social
discrimination and educational differentiation in terms of
access and retention. There are a number of
socioeconomic reasons. The initial unequal resource
position perpetuates imbalance and disparity in their
access to other infrastructure. In the labour market, they
tend to find place in the lower echelons of the job
hierarchies.
15.2.2 Children
a) Substantial numbers of children in the capital
work as service providers, helpers, assistants,
vendors and so on.
b) The poor, slum dwellers, pavement dwellers,
shelterless, orphans, and street children are all
vulnerable, easily exploitable and voiceless.
c) The concerns of many of these workers are akin
to the plight of the unorganised workers who are
unprotected by legal provisions and have no
security as workers.
d) These children are deprived of childhood and
avenues to develop themselves.
EXECUTIVE SUMMARY 51
e) The girl child is often left in charge of the
younger siblings in order to relieve her mother
for labour market participation at the cost of her
own all round growth.
f) The street children are exposed to and
unprotected from abuse of various kinds, with the
girls susceptible to finding themselves as part of
trafficking and sex worker chains.
15.2.3 The Disabled
a) The challenges posed by disability, both physical
and mental, render persons vulnerable.
b) The lack of understanding regarding these adds to
the difficulties of the challenged in negotiating
the institutional and infrastructural constraints
present.
c) The incorporation of the disabled in the 2001
Census was a landmark that provided one crucial
tool to make their presence and needs visible.
15.2.4 Migrants
a) Migration into the capital-state from various parts
has assumed a problem of tremendous
magnitude.
b) The migrants are able to find some paid
employment, howsoever low paying and insecure.
c) There are however, no provisions for them by the
state administrative authorities in terms of
housing, water, toilets, electricity and so on, leave
alone the needs of their families.
d) Commonly housed in some slum squatter
settlement, these families have to face many
difficulties.
e) The attempt to clean the city and remove the
slums by relocation and rehabilitation without
adequate transportation facilities curtails the
workers from negotiating between their
residences and workplaces.
f) There is need to reexamine the demand pattern
for bus routes after resettlement of large slums as
well as industrial complexes subsequent to
closure of polluting industries.
15.2.5 Unorganised Sector Workers
a) The vulnerability of the unorganised sector
workers arises out of the ambiguity in their legal
status as no overt recognition of their work/
activity exists.
b) These workers go through undue suffering.
c) The lack of recognition as sex workers and the
taboo attached to the service provider while the
demander is often unaffected, makes the women/
sex worker vulnerable. The recognition of the sex
worker to some extent has occurred in the
context of the drive for protection against HIV/
AIDS.
15.2.6 Vulnerable Groups Not Covered Above
a) The elderly and the aged who are left alone in the
city after children have gone for greener pastures
or due to the death of the other family members,
are vulnerable on account of the insecurity
stemming from their loneliness and their health
needs.
b) Abuse and violence forms another deplorable
dimension of vulnerability faced by children in the
capital. From heinous crimes like rape and murder
to kidnapping and abduction, there seems to be a
growing incidence of crimes against children.
c) The pedestrian in the wake of the flyovers and
high speed roads that have come up faces great
difficulty and feels unsafe while wanting to cross
the road.
d) In the context of transportation, the shrinking
spaces for the manually driven handcarts, cycle
rickshaws and bicycles make things difficult for
the class.
15.3 Women’s Issues
The issues pertaining to women in Delhi in the context
of vulnerability go beyond the poor and the needy and
cover even the prosperous and better-off populations.
There are various indicators to establish women’s
vulnerability. Declining sex ratio highlights the lower
significance given to the girl child.
16. Industrial Development
16.1 Contribution of Primary, Secondary andTertiary Sectors to Economy of NCTD
a) The contribution of the primary sector has rapidly
declined and has become negligible. The share of
manufacturing in the 80s and the first half of the
90s has declined from about 20 per cent to about
12 per cent. However, the contribution of Tertiary
Sector has been rapidly rising and is dominant in
the economy of NCTD.
DELHI DEVELOPMENT REPORT52
b) The share of registered sub-sector (39.8 per cent)
in total manufacturing in 2002-03 was well below
its share for the nation as a whole at 66.1 per cent.
16.2 Contribution by Industry Groups
a) The top two industry groups alone (Electricity
and Textile Products) contribute more than one-
half to net value added. The composition of the
industrial base of Delhi, evaluated in terms of
share in employment, suggests a similar pattern
of greater concentration.
b) In 2002-03 Delhi was heavily over-represented in
publishing, printing, wearing apparel, radio, TV,
communication equipment etc., and furniture and
manufacturing etc.
c) Industry groups that are gravely under-represented
include coke, refined petroleum products etc.,
tobacco products, other non-metallic mineral
products, textile products, basic metals, and wood
and wood products except furniture.
d) Delhi has the most specialised industrial structure
as compared with the 14 major states. The
specialisation index estimated for Delhi suggests
an increasing degree of specialisation
e) The highest contributor to net value added was
textile products (17.5 per cent) followed by
machinery and equipment (12.0 per cent), paper
and paper products (6.7), food products (6.4),
and basic chemicals (4.4 per cent).
f) The concentration ratios derived in respect of
both the top 3 and 5 industry groups suggest that
there was clearly an increase in concentration,
with the top two industry groups alone
(Electricity and Textile Products) contributing
more than one-half to net value added.
g) The Hirschman-Herfindahl indices derived for
both the reference years also clearly indicate
greater concentration in terms of share in NVA.
16.3 Industrial Structure
a) The industry-mix and competitive effects operated
very differently in the 90s. Out of the 22 industry
groups only nine had a positive industry mix
effect and even more significantly, only 3 groups
experienced a positive competitive effect.
b) Examination of some of the ratios and technical
coefficients underlying the overall industrial
(factory) structure indicates that the region does
not seem to be suffering from locational
disadvantages (relative to the country at large)
associated with high levels capital use.
c) In 2002-03, the capital intensity for the region
(average for all industries factory sector) was
lower than the national average.
d) Decomposing employment growth indicates that
in the 1980s nine industry groups experienced
industry-mix and competitive effects that were
both positive. These were beverages, tobacco and
related products, textile products, leather and
leather products, basic chemicals and chemical
products, rubber and plastic products, machinery
and equipment, repair of capital goods, generation
and distribution of gas, steam etc., and storage
and warehousing services.
e) The industry-mix and competitive effects operated
very differently after the 1980s. Out of the 22
industry groups, only nine—NIC codes 24, 26,
30, 31, 34, 38, 39, 41-43, and 74—had a positive
industry mix effect and even more significantly,
only 3 groups—NIC codes 26, 40, and 41-43—
experienced a positive competitive effect. Only
two groups—textile products, and generation and
distribution of gas, steam etc.—had both effects
as positive.
f) Examination of some of the ratios and technical
coefficients underlying the overall industrial
(factory) structure indicates that the region does
not seem to be suffering from locational
disadvantages (relative to the country at large)
associated with high levels capital use.
g) The capital intensity for the region (average for
all industries factory sector) was lower than the
national average.
h) The capital-output ratio was also lower within the
region, being only slightly above half of the
national ratio. Not more than five industry
groups—NIC codes 16, 17, 19, 28, and 29—had
capital-output ratios higher than the respective
groups at the national level and of these only the
last two were among the major industries within
the region.
i) The average wage rate of labour went up in
absolute terms. This increase, however, was
commensurate with that for the entire industrial
system (factory sector) of the country at large.
j) Labour productivity also increased for Delhi
during this period as it did at the all-India level.
EXECUTIVE SUMMARY 53
k) Delhi’s industries utilised a greater amount of
input per unit of output relative to the industries
at the all India level. Only industry groups—NIC
code 15, 19, 23, 29, 32, 34, 35, 36, and
‘Others’—all had input use levels lower than their
counter parts at the national level. Of these,
industry groups food products and beverages, and
machinery and equipment n.e.c. were among the
more important in Delhi’s industrial sector.
l) There was less generation of value added per unit
of output by the regional industrial system as
compared to the nation. Industry groups—NIC
code 17, 19, 23, 24, 26, 29, 32, 33, 34, 36, and
‘Others’—had higher value added per unit of
output values than that for all-India.
m) The profitability of Delhi’s industrial system,
measured as profits per unit of value of output,
was below that of the three industrialised states—
Maharashtra, Gujarat, and Tamil Nadu—for most
of the eighties and then, though fluctuating,
became comparable with them. The profit ratio
for Delhi was actually the highest for about half
of the remaining period.
n) The movement of the Index of total factor
productivity was broadly similar between the
nation and the region over the decade of the
eighties but became differentiated from the
beginning of the nineties. From the mid-90s, total
factor productivity of Delhi’s industries grew at
rates faster than that of the nation and even that
experienced by the three developed industrial
states. Delhi’s industrial system seems to be
becoming relatively more efficient than the rest of
the country in terms of factor use.
o) There are 2.30 lakhs (NSSO 56 round) enterprises
engaged in activities pertaining to unorganised
manufacturing and 2.2 lakhs enterprises in
unorganised service sector together making 4.5
lakh enterprises in unorganised manufacturing
and service sector in Delhi.
16.4 Productivity and Other Indicators
a) The capital-output ratio was also lower within the
region, being only slightly above half of the
national ratio. Not more than five industry groups
had capital-output ratios higher than the
respective groups at the national level and of
these only the last two were among the major
groups within the region.
b) The average wage rate of labour went up in
absolute terms over the period 1980-81 to 2001-
02, this increase being commensurate with that
for the entire industrial system (factory sector) of
the country at large.
c) Labour productivity also increased for Delhi
during this period as it did at the all-India level.
d) Delhi’s industries utilised a greater amount of
input per unit of output relative to the industries
at the all India level. In 2002-03, only 8 industry
groups had input use levels lower than their
counter parts at the national level. Of these,
industry groups food products and beverages, and
machinery and equipment were among the more
important groups in Delhi’s industrial sector.
e) There was less generation of value added per unit
of output by the regional industrial system as
compared to the nation. In 2002-03, 10 industry
groups had higher value added per unit of output
values than that for all-India.
f) The profitability of Delhi’s industrial (factory)
sector was below that of the nation for much of
the decade of the eighties but moved up above
all-India levels for the remainder of the period,
except for 1995-96 and 1996-97.
16.5 Priorities
a) Though manufacturing accounts for about 12 per
cent of Delhi’s GSDP and about 40 per cent of
the total work force, the priority given to the
industrial sector in the Five Year Plans is
extremely low. In the Tenth Plan, the share of
industry in the outlay decreased by nearly half to
a mere 0.43 per cent of total outlays as compared
to its expenditure share in the Ninth Plan.
b) In terms of expenditure priorities, industry
dropped to rank 19 out of a total of 31 sectors.
The all-States average outlay on industry for the
Tenth Plan is 3.2 per cent—nearly eight times
that for Delhi.
16.6 Environmental Factors Impact on Industry
a) The closure of many polluting and hazardous
industrial units and the Relocation Scheme for
non-conforming units, though reducing
environmental pollution levels, may be expected
to have had an adverse impact on industrial
growth and employment within Delhi.
DELHI DEVELOPMENT REPORT54
b) The contribution of industrial sources of pollution
(including Thermal Power Plants) to ambient air
has come down from 56 per cent in 1970-71 to
20 per cent in 2000-01, and with the coming into
operation of all the 15 CETPs the contribution of
this sector to both air and water pollution levels
would be heavily reduced.
c) Under these circumstances there is some
justification for the ongoing effort for
regularisation of other industries situated in
residential/non-conforming areas.
d) Corrective measures incorporating a system of
suitable incentives and disincentives are required
in relation to such industries in order to ensure
shifting and relocation of industries failing to
meet the broadened parameters in terms of
environmental and other norms.
e) The Master Plan for Delhi rules out large and
heavy industries. The share of manufacturing in
GSDP has come down from 20 per cent in the
mid-90s to around 12 per cent.
16.7 Problems and Policies
The major problems faced by small and tiny
enterprises are power cuts, and shortage of capital.
Another problem is perceived competition from larger
units.
16.8 Policy Intervention Required
Policy Intervention is required to achieve the
following ends:
a) Delhi does not become structurally disadvantaged
in that its industries loose out in competition
with other similar industries in other states.
b) The industrial base of Delhi broadens and
becomes more diversified thus ensuring a higher
level of resilience of the regional economy.
c) Strengthening of inter-regional and inter-industry
linkages.
d) Delhi specialises in ‘growth’ industries that will
result in higher overall growth.
e) Delhi does not specialise in cyclically sensitive
industries that are particularly sensitive to cyclical
swings.
f) To the extent possible, that the prevalent terms
of trade do not become detrimental to its current
exports and imports.
16.9 Measures Proposed
a) Ad hoc licensing of industrial units should be
avoided and policy measures introduced to ensure
the dispersal of existing industries as well as their
modernisation and technological upgradation.
b) The importance of unorganised sector in small-
scale industry should be recognised so that proper
policies as per their need could be designed.
c) There is need to review the credit policies for
small scale units falling into the unorganised
sector and to resolve the issue of power cuts.
d) There is necessity to save the small-scale sector from
competition from larger units by providing them
facilities for technical upgradation and marketing.
e) Corrective measures incorporating a system of
suitable incentives and disincentives are required
to ensure shifting and relocation of industries
failing to meet the broadened parameters in
terms of environmental and other norms.
f) The ongoing effort for regularisation of other
industries situated in residential/non-conforming
areas should ensure that they are non-polluting
and non-hazardous. Regularisation would avoid
loss of output, employment, under-utilisation
of capacity, entrepreneurial confidence and
productivity.
17. Institutional Reforms and Governance
17.1 Evolution of Institutions of Governance
a. The Institutions of Governance of NCTD have
evolved in the context of the conflicts inherent in
the situation of Delhi and the need to reconcile
them. On the one hand, Delhi being the capital of
the country, its governance cannot be left at the
mercy of the Government of NCTD which, if
given the status of a normal State Government,
would be prone to be swayed by narrow state
interests rather than the broad national interests.
On the other hand, democratic aspirations of
millions of people residing in Delhi for self
governance cannot be ignored. Hence initially a
strong MCD came into being. MCD did not
perform all the functions of the state government
and there was the institution of the Lt. Governor.
In due course an elected assembly was
introduced. It had a cabinet headed by Chief
Minister and it comprised other ministers. Law
and order and the subject of land are with the
EXECUTIVE SUMMARY 55
Union Government. MCD enjoys very considerable
autonomy and many of the functions normally
performed by state governments are assigned to
the MCD. Since NCTD is a UT with features of a
State, the Lt. Governor is a very powerful
institution. This arrangement has certain
consequences. First, there are authorities and
institutions, working under the control of
different constitutional and legal authorities.
Many of these authorities have overlapping
functions and are dependent for inputs and help
from others for discharging their responsibilities.
Any issue cutting across a number of authorities
would need enormous coordination and
consequently time and human resources. For
example, responsibility of education is of the
state government, but the schools are run by the
MCD, land is with the DDA, Sarva Shiksha
Abhiyan would be with the state government.
Similar would be the situation in the matter of
housing, slums, road construction and
maintenance, transport and so on. The situation
gives rise to conflicts between and among
institutions and affords them the opportunity to
shirk responsibility for deficient performance.
17.2 Pursuit of Excellence in Governance—A Vision
The Government of Delhi has adopted a vision to
facilitate the pursuit of excellence in governance through
improvements in Government structures and processes.
17.2.1 Means Used
a) The means used to achieve the improvements
consist of:
i) Promote role of civil society, people’s
participation and decentralisation through the
introduction of Bhagidari Scheme within the
government departments and its agencies
including those under the Union Government
ii) Institute Preventive Vigilance
iii) Introduction of:
• E-governance for the citizens of Delhi
and creation of a dynamic websites of
Departments/Agencies.
• Right of the citizen to information.
• Mechanism to redress public grievances
of which establishment of Public
Grievances Commission are the main
elements.
iv) Civil Service Reforms
v) Procedural Reform
vi) Synergy and Coordination
vii) Empowerment of the weak
b) Bhagidari Scheme
The Bhagidari Programme envisages voluntary
participation of the citizens. Efforts have been made to
make it well structured and sustainable. Nine
organisations and 64 of their activities have been covered.
A ‘Bhagidari Cell’ has been created in the Chief Minister’s
office. A detailed plan of ‘Citizen-Government Interface’
has been prepared. It has been decentralised at the
Revenue District level.
In consultation with the Asian Centre for Organisation
Research and Development, (ACORD), the ‘Large Group
Interactive Events’ (LGIE) a model was developed to train
citizen-groups and government officials to agree on
solutions and their implementation.
The programme has shown encouraging results leading
to the formation of more than 1200 citizen groups that
have not only been successful in addressing their day-to-
day problems, but have also been providing help to public
utility departments in maintenance and upgradation of
services.
c) Decentralisation
Administrative Decentralisation
With a view to making the access of the citizen to the
government easier, in 1996 the exercise of decentralising
the DC office was done by setting up 27 SDM offices and
9 DC offices.
d) Vigilance
The Central Vigilance Commissioner has jurisdiction
over personnel of the NCTD.
The Delhi Lokayukta & Upalokayukta Act, 1995
provides a forum for attending to complaints against public
functionaries to eradicate the vice of corruption,
favouritism, abuse of position and power and present
cleaner image. The Act takes within its ambit the Ministers
including the Chief Minister, Members of Legislative
Assembly, Members of Municipal Corporation etc.
e) Preventive Vigilance—Opennessand Transparency
The Government of NCT of Delhi has initiated the
following actions with emphasis on “preventive vigilance”.
DELHI DEVELOPMENT REPORT56
• E-governance for the Citizens of Delhi: The
government has set up a dynamic website of
Departments/Agencies to provide on line services
including services on e-applications and making
on line complaint. The citizen can also check the
status of the complaint, send a reminder and send
suggestions.
However, introduction of e-governance requires
the re-engineering of the processes in the
government and its agencies and of the structure
of the system of keeping and maintaining the
record. A plan needs to be prepared after detailed
study of the working of the various departments
to take e-governance to its logical consequence of
easy interaction between the citizen and the
government.
• Right to Information: The Delhi Right to
Information Act, 2001 makes provision for
securing information as a matter of right. It
provides for right to appeal in Public Grievances
Commission.
• Public Grievances Commission: The Government
has set up a Public Grievance Commission, which
attends to complaints received against the
departments of Government of Delhi, its local
bodies, undertakings, autonomous institutions/
undertakings etc.
• Citizen’s Charter: The citizens’ charter
programme has been adopted in the NCTD.
These charters are required to spell out the
standards of services and time limits within which
the public can reasonably expect the disposal of
the requests made by them to the government.
Delhi Government has brought out 73 such
citizens’ charters. Coupled with the enactment of
the Right to Information and putting in to place
the mechanism of dealing with public grievances,
the framework of providing the basic information
to the public and to open the vistas of
transparency and accountability in the systems
has been created.
17.3 Measures to Improve Governance inMunicipal Corporation of Delhi
a) The Municipal Corporation of Delhi provides civic
services to some of the most densely populated
areas in the world covering both rural and urban
areas. The measures initiated are briefly
mentioned below:
b) The entire MCD area is divided into 12 zones to
make access easier.
c) Citizen Service Bureau:
The concept behind establishing Citizen Service Bureau
is to provide all municipal services under one roof. MCD
has started a unique and path breaking IT initiative with
the objective to deliver electronically its services to
citizens of Delhi through a Citizen Service Bureau set up,
one in each Zone and one at Town Hall.
17.4 New Delhi Municipal Council (NDMC)
a) NDMC is a municipality with a difference and
also performs the role of a mini-government. It is
perhaps the only municipality in the country that
supplies electricity and water and its discretionary
functions encompass promotion of sports, art,
music and culture, maintenance of libraries, and
care for the old, mentally and hearing impaired.
The area of NDMC includes the seat of Central
Government, Rashtrapati Bhawan, the Prime Minister’s
office and residence, Central Government office, Foreign
Missions, residences of Ministers, Members of Parliament,
Diplomats and Central Government employees.
b) Measures taken to improve governance include:
• Citizens’ Charter: The NDMC had issued the first
charter in 1997 and has issued the new one in
February 2005. It is a measure towards
transparency and efficient and timely provision of
services.
• Information and Facilitation Centre: NDMC has
set up an Information and Facilitation Centre and
opened two Palika Suvidha Kendras where
citizens can pay their taxes, fees etc., obtain
birth/death certificates, book Barat Ghars and
register their complaints relating to civic services.
• Annual Administrative Report: The NDMC
publishes an Annual Administrative Report
enabling those interested in getting to know the
work done in the year gone by and the
programme for the coming year.
17.5 Delhi Development Authority
a) Delhi Development Authority was constituted by
promulgating the Delhi Development Act, 1957
with the primary objective of ensuring the
development of Delhi in accordance with a plan.
The planned development of Delhi is the main
function of DDA. The Master Plan for Delhi-2021
EXECUTIVE SUMMARY 57
has been prepared and brought in to force. It
addresses the issues related to the use of land
and property. It is hoped that the Master Plan will
enable the realisation of the vision of a world
class capital for Delhi.
b) Despite very impressive achievements of DDA, it
has an image of being an organisation that needs
to improve its sensitivity to the needs of its
clients, efficiency and public perception about
integrity of the organisation. The organisation is
actively engaged in taking a host of measures
among which transparency and automation are
basic which if successful can make a qualitative
impact.
17.6 Transparency and Automation in DDA
To minimise downtime, it has introduced systemic
automation in the following departments:
• Land Disposal.
• Housing.
• Launching of a Website. This is dynamic and
provides information on various aspects like
housing, land, master plan, environment etc. The
results of housing and land and tender notices are
displayed. Senior officers are reachable through
e-mail. Different forms are available on the
website which can be down loaded.
• Land Record.
• Normal administrative functions such as payroll,
receipt and dispatch, legal cases monitoring
system etc. A training programme for computer
literacy seeks to train the staffing in the use of
computers.
• Vigilance department takes action to see that
there are no unwarranted irregularities and also
handle complaints that could tarnish the image of
the DDA.
17.7 Conclusion
Any fast expanding city has to struggle on a continuing
basis to find solutions to new problems that keep on arising,
some of them totally unforeseen. In the case of Delhi, the
growth of the city could already have reached the limits of
“carrying capacity”. Many of the resultant problems are
known and some unanticipated problems may arise.
The experience in Delhi has been that the authorities
have been unable to anticipate many major problems and
have reacted only after they have arisen. This is indicative of
serious deficiency in the institutional arrangement prevalent
in Delhi. The deficiencies have been pointed out in the
report. However, proposing a well studied, analysed solution
is outside the scope of this study. It must be stated,
however, that developing a more effective and efficient
institutional arrangement in the very complex situation of
Delhi is an extremely difficult task. But an effort at the
highest levels by the government must be made. The Union
Government and the Planning Commission in cooperation
with the GNCTD need to have this issue studied in all its
dimensions and make suitable changes.
Another issue is that of uncontrolled growth of the
population of the city by immigration. Migration coupled
with high rates of growth of Delhi’s economy may already
have taken the NCTD to the limits of its growth
consistent with a good quality of life for its residents.
India is a country where the Constitution guarantees the
fundamental rights of movement and residence to every
citizen and this right cannot be denied. Hence the issue of
migration needs to be handled with the greatest
sensitivity. However, it cannot brook any delay and needs
attention of the Union Government, the Government of
the NCTD and the State Governments involved in the
National Capital Region.
If these two issues can be resolved satisfactorily, the
vision of Delhi being a “global metropolis and world class
city” is realisable.

Chapter 1
Profile of the State
DELHI
Dilli jo ek shahar tha alam me intikhab
Rahte the jahan muntakhib hi rozgar ke
Jisko falak ne loot ke barbad kar diya
Ham rahne wale hain usi ujade dayar ke
Mir “taqi’Mir
1.1 History
Development and devastation has been the destiny of
Delhi1 during the best part of the last millennium. Many a
time, it was re-built and re-christened with a new
magnificence and many a time, it was depredated and
destroyed by invaders. The anguish expressed by Mir in
the cited couplet was only one such occasion when he fled
from Delhi and had to introduce himself to a new
audience in another seat of culture—Lucknow—in the
middle of eighteenth century following the invasion of
Nadir Shah. But it was not the last time that this
happened to Delhi. There were a few more occasions soon
thereafter. But what is astonishing is that despite the fate
suffered by this splendid city, it had been the chosen
capital of most empire builders who ruled from northern
India. The last two great empires—the Mughal and the
British—established their rule, not from Delhi, but from
Agra and Calcutta respectively. But the magnetic charm,
as also its location, was such that they shifted their capital
to Delhi. The Mughals ruled from Agra for almost
hundred years; so did the British from Calcutta for almost
a century and a half. But as soon as conditions stabilised
and they felt secure, the capital was shifted to Delhi. A
new city was built with a new grandeur and magnificence,
unseen and unheard of at any earlier time. It is a different
story that the Mughals lost their empire building capacity
and their glory soon after or that the British packed off
from India in a short span of less than four decades. But
the charm of the city continues, and brings millions of
people to it from the country and from all over the world,
some for temporary sojourn, and others for permanent
abode in search of employment or personal glory.
Delhi has a unique history, seldom experienced by any
other national capital in modern times. For long intervals,
it was abandoned and existed as any other town, though
an important one. Between the period of Delhi Sultanate
and the Mughal rule, it was not a capital town for a long
period. Even during the period of Sultanate, the site
shifted within the area presently demarcated and known
as Delhi. Thus Delhi of the period of Slave Dynasty was
not the same place as the Delhi of the Tughlaqs.
Shahjahan selected a new site for his Delhi and gave it the
name of Shahjahanbad. Even though it remained the
capital of the Mughals and the principal seat of their
empire for almost one hundred and fifty years, after the
demise of Aurangzeb, it gradually lost its importance as
new centres of power developed. New satrapies developed
new townships, though none of them could come
anywhere near the splendour of Delhi even during the
years of its decline. This splendour was not merely the
many buildings of magnificence built by Shahjahan, or the
township, but in the unique culture that blossomed in a
multi-religious and multi-racial society which survives.
And then, after the events of 1857, it formally ceased to
be the capital of the empire or a country. As if this was
not enough, it was reduced to the status of a provincial
town. Though the extent of destruction was not as much
as it used to be during the times of invasions from the
north-west, the local population suffered a great deal—
psychologically as also due to loss of wealth, status, and
trade.
1. The name of the city still continues to be “Dilli” in Hindi. However, it got changed to Dehli and then to Delhi sometimes in the later part of the 19th century.How did it happen is difficult to say.

DELHI DEVELOPMENT REPORT60
1.2 Phases in Development of Modern Delhi
Broadly, there are three distinct phases in the
development of modern Delhi. The first phase may be
taken to start from the time the Mughal rule formally
ended in Delhi after the events of 1857, and the British
became the masters. This was also the phase in which
Delhi became the provincial town of the Punjab. The
second phase commenced from the time of the building of
Lutyens’ New Delhi, after it was declared the capital of
India. Development was confined to the construction of a
new township for the rulers, and those who supported
them. The area north of Delhi Gate soon came to be
known as old Delhi, and still continues to be so called.
The third phase commenced with Independence when
New Delhi became the national capital. This has been a
period of rapid expansion all around, so much so that a
number of towns in the nearby area have also expanded
to provide living space for the ever-growing population,
and to accommodate the ever increasing government and
non-government offices. The concept of a National Capital
Region has evolved to meet the various needs of the
growing metropolis. Some of the towns of the nearby
states have been included in the national capital region as
a strategy to relieve the pressure on the limited resources
and infrastructure facilities available in Delhi.
The political set-up necessary for the administration of
national capitals has been a subject of great deliberation
in democracies. How much power should be given to the
local or regional administrations and how much of it to be
retained at the national level to ensure the smooth
functioning of the national government has engaged the
attention of the political functionaries, irrespective of the
ideologies or the political shape of the national
government. Some countries have special arrangements
for the administration of their national capitals—
Washington in the U.S.A., Canberra in Australia, Brasilia
in Brazil, to mention a few. The sub-national governments
do not have any say or control on their administrative
affairs. The national government exercises control and
supervision over the administration of the capital town;
the administrative machinery—political and bureaucratic—
is accountable, directly or indirectly, to it. The local
government, whether municipal or otherwise, manages
day-to-day affairs; important policy issues require
directions, and even approval from the national
government. Such an arrangement has been dictated by a
variety of factors, not the least being a situation of
confrontation when different political parties rule at the
national level and in the representative political
institutions of the national capital towns. These towns
have the offices and residences of the functionaries of
various international organisations, embassies, presidents,
prime ministers and a host of other government
functionaries; their functioning can be paralysed by
deliberate or apathetic actions of the local government.
The decision to shift the national capital from Calcutta to
Delhi in the early twentieth century was also prompted by
the need to have an administration independent of the
provincial control. Delhi was separated from the province
of the Punjab, and was given the status of the Chief
Commissioner’s province. A new site was selected for the
development of the national capital on Raisina hills, away
from Shahjahanabad, as also from other townships
developed by earlier rulers of Delhi. The planning and
development of the new township took nearly two
decades, and was given the name of New Delhi to
distinguish it from the earlier towns. After Independence,
Delhi has seen many experiments of political governance,
and though the present set-up has been in operation for
more than a decade, there is already a clamour for change,
and a demand for full statehood at par with other states.
During this period the two major political parties which
have wielded power at the local and the national level
have not been able to find an acceptable solution to the
problem of governance of the national capital. The dual
control has continued with certain subjects coming
exclusively in the domain of the national government.
The Constitution of India had then four broad
categories of states when it came in force on 26 January
1950. The erstwhile princely states, after their merger in
the Indian Union were placed in two categories—Part B
and Part C; the Provinces of the British Indian Empire were
given the status of Part A States while centrally
administered areas were included in the category of Part D
States. Delhi, even though, it was not a princely state, was
placed in the category of Part C State and was governed
under the provisions of Government of Part C States Act,
1951. Even among the Part C States, it had a special status.
It did not enjoy the same legislative and executive powers
envisaged under this enactment as did the other Part C
States. Thus, while the Legislative Assemblies of other Part
C States had the legislative powers mentioned in the State
and Concurrent list of the Seventh Schedule of the
Constitution, the Legislative Assembly of Delhi was
deprived of the powers to legislate on matters relating to
public order; police including railway police; the
constitution and powers of municipal corporations and
other local authorities; improvement trusts; water supply,
drainage, electricity, transport and other public utility
authorities in Delhi or New Delhi; land and buildings
vested or in possession of the Union in Delhi or in New
Delhi with all powers appurtenant thereto including the
Chapter 1 •
PROFILE OF THE STATE 61
powers to collect rents, transfer and alienation; offences
against laws with respect to any of the matters reserved for
the Union; jurisdiction and powers of all courts in these
matters ; and fees in respect of any of these matters except
fees taken in a court.
Apart from the curtailment in the legislative powers of
the Legislative Assembly of Delhi in the matter of
legislation, there are a few other aspects, common to the
governance of all Part C States. Firstly, the Chief
Commissioner, appointed by the President, could preside
over the meetings of the Council of Ministers headed by
the Chief minister. Secondly, while the bills passed by the
Legislative Assembly required the assent of the President
who had the powers to refuse assent, annual financial
statement or the budget, as it is commonly known, was
required to have prior approval of the President, before it
could be introduced in the Legislative Assembly. Thirdly,
in case of difference of opinion between the Chief
Commissioner and any of his Ministers, the matter had to
be referred to the President for his decision. If the matter,
in the opinion of the Chief Commissioner required urgent
action, he was authorised to take such action or give
necessary directions. Fourthly, every decision taken by a
Minister or the Council of Ministers on any matter
relating to New Delhi required concurrence of the Chief
Commissioner. In any case of difference of opinion, the
Chief Commissioner was authorised to take action in
respect of administration of New Delhi as he deemed fit.
The sum and substance of this arrangement was that
the Union government had overriding control in the
governance of Delhi. The democratic institutions created
by the Act and the Constitution had very limited powers
in certain specific areas; matters of substance were directly
administered by the Union government. This anomalous
position of Delhi, even among Part C States, continued till
1 November 1956, when the second phase in the
constitutional development of Delhi started with the
implementation of the recommendations of the State
Reorganisation Commission (SRC).
The SRC had in view only two types of arrangements
for the governance of the vast areas of the country—
States, and the centrally administered areas. It was
contended before the SRC that the development of the
capital was ‘hampered by the division of responsibility
between the Centre and the State Government.’ There
was a ‘marked deterioration in the administrative
standards in Delhi since dual control was introduced in
1951.’ The State government also complained about the
inadequacy of powers vested in it. In the memorandum
submitted to the SRC, the State government stated that
the existing arrangements for Delhi being a Part C State
cannot last long as there was no future for Part C States.
The SRC also noted that the existing arrangements of
dual control over the administration of the federal capital
did not work smoothly. However, the Commission’s
recommendations on the administrative arrangements for
Delhi were guided by two considerations—it was the seat
of the Union government, and that it was basically a city
unit with an urban population of more than 82 per cent.
After considering the arrangements for the administration
of the national capitals in France and England, the
Commission observed:
Apart from reasons which are peculiar to each country or
city, there are some general considerations necessitating
special arrangements in respect of national capitals.
Capital cities possess, or come to possess, some degree of
political and social predominance. They are seats of
national governments, with considerable property
belonging to these governments. Foreign diplomatic
missions and international agencies are located in these
capitals. They also become centers of national culture and
art. So far as federal capitals are concerned, there is also
an additional consideration. Any constitutional division of
powers, if it is applicable to units functioning in the seats
of national governments, is bound to give rise to
embarrassing situations. Practice in other countries,
administrative necessity and the desirability of avoiding
conflicting jurisdictions, all point to the need for effective
control by national governments over federal capitals.
(Government of India: Report of the State
Reorganisation Commission, 1955, p.158)
While taking a view on the administrative set-up for
Delhi, SRC relied on the reasons which prompted the
shifting of capital from Calcutta to Delhi in 1912. It
further observed:
It may be recalled that the desirability of excluding the
seat of the Central Government from the jurisdiction of a
provincial government was one of the main
considerations which led to the transfer of the Imperial
capital from Calcutta in 1912. It was then considered
essential that the Supreme Government should not be
associated with any particular Provincial Government
and it was also felt that the removal of the Central
government from Calcutta would materially facilitate the
growth of local-self government on sound and safe lines.
(Ibid. pp. 158-9)
The SRC recommended that the national capital should
be centrally administered area under the effective control
of the Union government. Separation of New Delhi from
old Delhi was ruled out. It stated that, “ From the point
of view of the law and order, the social life of the people,
DELHI DEVELOPMENT REPORT62
trade and commerce and common public utility services,
old Delhi and New Delhi now constitute one integrated
unit and it will be wholly unrealistic to draw a line
between the two.” (Ibid p.160) Recommendations of the
SRC were accepted by the Union government, and Delhi
was declared a Union Territory to be administered by the
Chief Commissioner. It ceased to have a Legislative
Assembly, but a Municipal Corporation was constituted
under the Delhi Municipal Corporation Act, 1957, which
partially fulfilled the democratic aspirations of people.
Democratic governance was sought to be restored through
the Constitution (Fourteenth) Amendment Act, 1962, in
some of the Union Territories by insertion of Article 239A
but Delhi was not included in it. The Government of
Union Territories Act, 1963 provided for the setting up of
Legislative Assemblies and the Council of Ministers for
the Union Territories of Himachal Pradesh, Manipur,
Tripura, Goa, Daman and Diu, and Pondicherry, and
giving them more or less the same status and powers
which were earlier given to Part C States. But for people
of Delhi, the only representative body was the Municipal
Corporation of Delhi. They did have representation in
both the Houses of Parliament, unlike the residents of
Washington D.C. who were disenfranchised for a long
time and did not have any representation in the federal
legislature.
The status of Delhi as a Union Territory without any
popular representation continued till 1966, when an
entirely new arrangement was introduced through the
Delhi Administration Act, 1966. This marks the third
phase in the constitutional development of Delhi. The
position of Delhi did not change as a Union Territory, but
a provision was made for a Metropolitan Council with 56
elected members and five nominated members. The
nomination was to be done by the Central government
but persons in the service of the Government were barred
from the nomination. This Council did not have any
legislative functions. Its sole job was to discuss, and to
make recommendations on the following matters:
a. Proposals for undertaking legislation on any
matter enumerated in the State list and
Concurrent list of the Seventh Schedule of the
Constitution, in so far as it was applicable to the
Union Territory of Delhi.
b. Proposals for extension to Delhi of any enactment
in force in a State relatable to any matter
enumerated in the State or Concurrent list.
c. Proposals for legislation referred to it by the
Administrator.
d. The estimated receipt and expenditure pertaining
to Delhi to be credited to or debited from the
Consolidated Fund of India, as also the receipt
and expenditure of the Delhi Development
Authority.
e. Matters of administration involving general policy
and development of Delhi.
f. Any other matter referred to it by the
Administrator.
It was contemplated as a deliberative forum where the
popular view on any matter pertaining to Delhi could find
expression. Political aspects of any policy could be gauged
before these could be considered for adoption and
implementation.
In addition to Metropolitan Council, provisions were
also made for the constitution of an Executive Council
with four members, one of whom was to be designated as
the Chief Executive Councilor. The function of the
Executive Council was to assist and advise the
Administrator on matters related to the State and
Concurrent list. As in the case of the abolished Part C
State, the control of the Administrator in running the
affairs of Delhi was ensured through a number of
provisions. The Administrator was to preside over the
meetings of the Council. In case of any difference of
opinion with any Councilor or the Council, the matter
was to be referred for a decision to the President of India.
In urgent matters, the Administrator had the authority to
act at his own discretion. What constituted ‘urgent
matters’ was again left to the discretion of the
Administrator to decide, and his decision on this was
final. In addition, the Administrator was made responsible
for the maintenance of law and order, including the
organisation and discipline of the police force. The
Administrator could act at his discretion ‘with respect to
such other matters’ as may be specified by the President
from time to time. In regard to matters relating to New
Delhi, the concurrence of the Administrator was
mandatory. Again, matters which related to New Delhi
were left to the Administrator to decide at his discretion.
Virtually it was a return to the position of a Part C State
without any legislative powers, and a separate
Consolidated Fund for the Union Territory. Popular
representatives were provided a forum but had little say in
the governance of Delhi.
This position continued for nearly a quarter of a
century. During this period, a number of Union
territories, much smaller in terms of area, population and
resources, were granted statehood. To start with,
Chapter 1 •
PROFILE OF THE STATE 63
Manipur, Tripura, and Himachal Pradesh were made
states in the early 70s. Another set of Union Territories—
Goa, Mizoram, and Arunachal Pradesh—attained
statehood in the mid-80s. The question of granting full
statehood for Delhi again surfaced. The Union
government constituted the Sarkaria (later Balkrishna)
Committee to go into this issue. An amendment to the
Constitution—the 69 th amendment—was made in
1991and a new Article 239AA was inserted to make
special provisions with respect to Delhi. The position
obtaining in the erstwhile Part C States was more or less
restored, except that now some provisions were
incorporated in the Constitution itself. Thus:
a. The Union Territory of Delhi was renamed as the
National Capital Territory of Delhi.
b. The Administrator was formally designated as the
Lieutenant Governor.
c. Entries 1 (public order), 2 (police), and 18 (land)
of List II—State List—were specifically excluded
from the purview of the Legislative Assembly of
the NCT, as also Entries 64, 65, and 66 in so far
as these related to the excluded Entries.
d. Laws made by the Union Parliament on subjects
included in the State List have supremacy, except
in cases where a law has been passing by the
Legislative Assembly subsequent to the passing
by the Parliament, and has received the assent by
the President. Parliament also has the powers to
pass any law on matters included in the State List
e. Lieutenant Governor has been given the powers
to promulgate ordinance, when the Legislative
assembly is not in session.
f. President has the power to take action in case of
failure of constitutional machinery.
g. The size of the Council of Ministers has been
restricted to 10 per cent of the total membership
of the House.
h. The Chief Minister and other Ministers are
appointed by the President.
Delhi Administration Act, 1991 lays down the detailed
provisions for the governance of Delhi based on the 69th
amendment to the Constitution. The Assembly has 70
members, and thus can have seven Ministers including the
Chief Minister. A significant feature of the Act is that the
annual financial statement or the budget, as it is popularly
known, requires the previous sanction of the President
before it is presented to the Assembly. Lieutenant
Governor can reserve any bill, passed by the Assembly, for
the assent of the President. In any case, he has been
prohibited from giving assent to bills relating to certain
matters and has to reserve them for the consideration of
the President. These relate to salaries and allowances of
the Members, Deputy Speaker and Speaker of the
Assembly, the salaries and allowances of the Ministers,
official language of the NCT of Delhi, and matters relating
to the High Court, apart from any other matters which
the President may by order, direct to be reserved for his
consideration.
The present arrangement has been in operation for
more than a decade and a half. During this period, three
general elections have taken place to elect members to
Delhi Legislative Assembly. The two major political
parties had the opportunity to head the administration
during this period. The demand for full statehood surfaces
from time to time, as the present arrangements put lot of
constraint on the efficient functioning of the local
administration. It is certainly better than what obtained
between 1951 and 1956, when even as a Part C State, the
working of the major utilities like power, water and
transport were controlled and managed by the Union
government, despite the existence of an elected Legislative
Assembly and a Council of Ministers. Delhi Administration
now controls the public utilities on which it did not have
any control till 1991.
1.3 Geography
The NCTD is situated in the north of India (Latitude
28’35’N, Longitude 77’12’E) 160 km south of the
Himalayas at an elevation of 216 m above mean sea level.
The River Yamuna, a tributary of the Ganges forms the
eastern boundary of the city. Delhi is situated between the
Great Indian Desert (Thar Desert) of Rajasthan to the
west, the central hot plains to the south, and the cooler,
hilly region to the north and east.
1.4 Climate
The region has a tropical steppe climate. The general
prevalence of Continental air leads to relatively dry
conditions with extremely hot summers. Monthly mean
temperatures range from 14.30C in January (minimum
30C) to 34.50C in June (maximum 470C). The annual
mean temperature is 25.30C (WMO, 1971). The main
seasonal climatic influence is the monsoon, typically from
June to October. The mean annual rainfall total is 715
mm. Maximum rainfall occurs in July (211 mm). The
heavy rains of the monsoon act as a “scrubber”. North-
westerly winds usually prevail; however, in June and July
south-easterly predominates. Wind speeds are typically
DELHI DEVELOPMENT REPORT64
higher in the summer and monsoon periods; in winter,
calms are frequent (20 per cent of the time).
A regular pre-monsoon feature is the andhi (dust
storm) where westerly winds from the Great Indian
Desert deposit large concentrations of suspended
particulate matter (SPM) into Delhi’s atmosphere.
Alliteratively, pre-monsoon calms often lead to increased
pollution loads due to lack of mixing/dilution. Ground-
based temperature inversions are a regular feature. These
restrict mixing height to low levels thus limiting pollutant
dispersal.
1.5 Area of NCTD
Delhi had a much larger area during the time of the
Mughals. At the time of acquisition of Delhi Territory
from the Marathas by the East India Company in 1803
under the Treaty of Arjungaon, it consisted of the Delhi
and Hissar divisions. Shahjahanabad (area around Red
Fort) was the chief city. It was divided into the districts of
Haryana, Rohtak, Panipat, Gurgaon, and Delhi. Later, in
1848 and 1853, 193 miles from Meerut and Bulandshahar
were added to the territory on the eastern side of the river
Yamuna. These were also known as Eastern Parganah.2
After the events of 1857, Delhi was merged with the
province of the Punjab. It was only in 1912, when Delhi
was declared as national capital, that it was separated
from the Punjab, and became an Imperial enclave.
According to one account3, it had an area of 1240 sq.
miles. How this area got reduced, one does not know, but
presently it has an area of 1483 sq. kms.
Delhi was a single district Union Territory till the mid-
90s. After the constitutional changes of the early 90s, the
NCT was divided into nine districts. These districts are
North, South, East, West, New Delhi, Central, North-
west, South-west, and North-east. All districts, except
New Delhi and Central Delhi, have rural areas in their
administrative jurisdiction. Districts have been further
sub-divided into sub-divisions. Presently, there are 27
sub-divisions and an equal number of tehsils. The number
of tehsils was only two in 1991. The number of villages in
Delhi are 165, according to 2001 census, while the
number of deserted villages is 10. There has been a steady
decline in the number of villages as also the rural area
during the last half a century. In 1951, the number of
inhabited villages was 304, and in 1991, these were 199.
Consequently, the rural area has also declined from
797.66 sq. kms. in 1991 to 558.32 sq. kms. according to
estimates of the Delhi Directorate of Census Operations.
Rural areas of Delhi are divided in five community
development blocks for development purposes. These are:
Alipur, Kanjhiwala (Nangloi), Najafgarh, Mehrauli, and
Shahdara. Despite the shrinking rural area, Delhi has been
able to increase its forest cover from 26 sq. kms, which
was almost constant till 1999-2000, to 88 sq. kms. in
2000-01, as reported by the Forest Survey of India.
1.6 Civic Administrative Division
For civic administration, Delhi is divided in three
distinct areas, each working independently of the other.
These are Delhi Municipal Corporation (known as MCD),
New Delhi Municipal Committee (NDMC), and the Delhi
Cantonment Board (DCB). The area falling within the
jurisdiction of DCB and the NDMC is 43 and 42.73 sq.
kms. respectively. The rest of the NCT is covered by the
MCD, which includes the rural areas. There are no
panchayats in the NCT of Delhi. Civic functions include
construction, maintenance and improvement of streets;
sanitation and public health; maintenance of vital
statistics; suppression of public nuisances; public safety;
regulation of slaughter houses, trade and occupations;
regulation of construction of buildings; and framing of
improvement schemes. These civic functions are common
to MCD and NDMC, though provided in two different
legislations enacted separately for the two civic bodies,
and termed as obligatory functions. In addition, the
obligatory functions of the NDMC also include the
establishment, maintenance and aid to primary schools;
maintenance, expansion and upgradation of existing
hospitals; laying out or maintenance of parks, gardens or
recreation grounds, and maintenance of monuments
vested in the local authority. These local bodies may also
perform certain other functions termed as ‘discretionary’,
subject to any general or special orders of the Central or
NCT government. These are: establishment and
maintenance of (and aid to) libraries, museums, art
galleries, botanical or zoological collections, stadia,
gymanasia, akharas, and places of sports and games; relief
to destitute and disabled persons; construction and
maintenance of poor houses, rest houses, infirmaries,
children’s home; houses for the deaf and dumb and for
disabled and handicapped persons; shelter for destitutes
and dumb persons, and asylum for persons of unsound
mind. There are a host of other functions like
construction and maintenance of warehouses and
godowns; establishment and maintenance of veterinary
2. This account is based on Narayani Gupta. Delhi Between Two Empires 1803-1931. Oxford. p.13.
3. Jain, A.K. Delhi-Governance, Planning and Development, mimeograph, p.2. He does not give any information, how and when the area of Delhi got reduced insubsequent years.
Chapter 1 •
PROFILE OF THE STATE 65
hospitals; management of cottage industries, handicraft
centers and sales emporia etc. included in this list, which
are not strictly municipal functions. The Central
government has greater direct control over the NDMC
than on MCD because of the spatial importance of the area
due to its immediate proximity to the seat of governance.
The MCD is basically an elected body; the minimum
number of elected councilors could be 80 and the
maximum could be 134. Revision in the number of seats
has to be done after every decennial census. In addition,
there is a provision for nominated and ex-officio
members. All members of the Lok Sabha elected from
Delhi are members of the Corporation. Persons elected as
members of Rajya Sabha and registered as voters in Delhi
are also members of the MCD. One-fifth of the members
of the Delhi Legislative Assembly, as nominated by the
Speaker of the Assembly, are also members of the MCD.
However, their tenure is only for one year and the
Speaker has to ensure that every member of the Assembly
is nominated as a member of the Corporation at least
once in a period of five years. There is a provision for the
nomination of ten other members by the Administrator
(the Lt. Governor) as members of the Corporation, but
they do not have any right to vote in the meetings of the
Corporation. Chairpersons of the Rural Areas Committee,
Special and adhoc Committees, and Standing Committees
are also members of the Corporation if they are not
councilors. In contrast, the NDMC is a body of eleven
members, all nominated by the Central government. The
Chairperson is a serving officer of the Government having
the rank of Joint Secretary of the Government of India or
above. It has three members of the Legislative Assembly
of Delhi representing constituencies falling partly or
wholly in the New Delhi area. Five members are to be
nominated from the officers of the Central government or
the Government or their undertakings. The remaining two
members are nominated by the Central government in
consultation with the Chief Minister from amongst the
professionals and social scientists. The management of the
civic affairs in the New Delhi area, which has the
Ministries and the principal offices and residences of the
Ministers, Members of Parliament, diplomats, and officers
of the Central Government has been kept outside the
domain of the Delhi Government. The idea is to avoid any
conflict in the day-to-day functioning.
The two civic bodies have also been given the powers
to raise revenue by imposing property tax; taxes on
vehicles and animals; theatre tax; taxes on advertisements
other than those published in the newspapers; and duty
on transfer of property. The Commissioner of the MCD is
appointed by the Central government, while other
functionaries may be appointed by the MCD itself. The
two democratic bodies—Delhi Government and MCD,
barring the area coming under the domain of NDMC and
Cantonment Board—have more or less the same
jurisdiction, as MCD covers the rural areas also. While
efforts have been made to avoid any overlapping of areas
of responsibilities by delineation of functions and powers
of taxation at the two levels by Central government
legislation, it is not unusual for the differences and
conflicts to crop up, especially when the two bodies are
under the control of different political parties. Providing
civic services in a large area—urban and rural even though
small—serving a population of more than 15 millions is a
stupendous task. Decentralisation, and dispersal of MCD
offices in different parts of the city has helped the local
population significantly, as they do not have to travel long
distances. But the problem of management and
supervision at the local level still remains; as many issues
have to be decided by the Council itself. Local specific
issues get meshed up with larger issues, and search for a
uniform approach for the entire area sometimes leads to
unintended neglect of local problems. Municipal
administration needs effective democratic decentralisation,
so that civic services can be efficiently managed. The other
two civic bodies—the Delhi Cantonment Board and
NDMC—cater to the needs of smaller areas and therefore
are more effective and efficient.
1.7 Demography
There has been a phenomenal growth in the
population of Delhi during the last century (Annex A-
1.1). There was a setback, after the happenings of 1857,
when a large segment of population had to leave Delhi
following the repressive measures taken by the British,
and closure and disruption of economic activities. Delhi
was reduced to the position of a provincial town as the
new capital was Calcutta. It took sometime to recover,
and it was only in the last quarter of the eighteenth
century that the population started showing the
tendencies of natural growth. Even then the Census of
1901 registered a population of a little over four lakhs
with an urban component of 52.76 per cent. (Annex A-
1.1) The next decade only saw a marginal decennial
growth of 2 per cent. It was only after the Delhi Durbar in
1911, which announced the shifting of national capital
from Calcutta that significant increase in the population of
Delhi started. From a mere two per cent decennial
growth, it became more than 27 per cent in the next
decade, and when the seat of Government shifted to
Raisina hills in 1931, the decennial growth recorded was
around 47 per cent. The partition, and Independence
DELHI DEVELOPMENT REPORT66
further accelerated the growth, and the population crossed
a million. In fact, the rate of growth recorded by the
Census of 1951 was more than 90 per cent over the
previous decade, largely due to large-scale migration from
what now constitutes Pakistan. Since then the decennial
rate of growth has been hovering between 46 per cent and
61 per cent. The last census recorded a total population of
more than 13.7 million, as against a figure of little over 4
lakhs, exactly a hundred years ago.
Such a large growth has not been entirely due to
natural reasons. Large migrations have been responsible
for such a phenomenal increase. Apart from sudden influx
in the late 40s due to partition of the country, the
immigration now is perennial. A study conducted by
Singh4 in the 60s showed that the immigration accounted
for nearly 33 per cent increase in the population of Delhi
during the previous decade. More than 85 per cent
migrants came from the states of Rajasthan, Punjab, and
Uttar Pradesh. And if Rajasthan is excluded, the two
states of Punjab and U.P. would account for about 75 per
cent. More than 60 per cent people came from the rural
areas. Delhi Government has started collecting and
compiling information about immigration. According to
this data, the natural increase accounts for a little over 2
per cent per annum; the bulk of increase is due to
immigration, and it is increasing every year. Most people
come for better social and economic opportunities. The
educational standards at the school and college level have
been declining for quite some time in some states, and
this brings thousands of students to the national capital
every year. The declining employment opportunities in the
organised and unorganised sectors in the neighbouring
states have also contributed to the persistent flow of
jobseekers in and around Delhi, as these areas have
witnessed the highest rate of economic growth.
The high rate of growth of population, largely due to
migration, is accompanied with one of the lowest sex
ratio—the ratio of female population to per one thousand
of male population. It is 821 for Delhi as against the all-
India figure of 933 reported in the 2001 census, itself a
cause of concern. Even though it has shown considerable
improvements over the position obtaining in the pre-
Independence period, it bears out the impact that
continuous influx of people has made in the demographic
profile of the capital. The male population has grown at a
much faster pace than the female population throughout
the previous century. Men come for jobs alone, and once
they have a foothold, the womenfolk move in, and since
this has been happening continuously, this accounts for
the wide variance in the relative rate of growth.
Delhi has the highest density of population in India at
9340 per square kilometer, compared to the average all-
India density of 324.5 What is more important is that the
density has gone up by almost 50 per cent during the last
decade. The urban population constitutes 93 per cent of
the total population of Delhi, but the urban area is only
60 per cent. This means that the density in the urban
areas would be much higher, even after the increase in the
urban area by 300 square kilometer during the last
decade. The urban density works out to 14630 per square
kilometer. The density in the rural areas at around 1630
per square kilometer is not small. The North-east,
Central, East, and West districts have a very high density,
and there has been a phenomenal increase in the density
of North-east, East and West districts. Density has been
increasing despite the growth of satellite towns around
Delhi; this should be a cause of concern for the city
planners.
1.8 Economy of NCTD
Delhi presents the picture of a developed economy,
compared to one found in a developed country. The gross
state domestic product (GSDP) has recorded a growth of
8.8 per cent since 1993-94 and 2004-05 at 1993-94
prices.6 This is significantly higher than the growth of
gross domestic product (GDP) at 6.8 per cent during the
same period at the same price level. The annual
compound growth rate in the per capita income has been
at the rate of 4.29 per cent per annum, compared to all-
India growth rate of 3.97 per cent during the same period.
The per capita net state domestic product (NSDP) of
Delhi at Rs.53976 in 2004-05 at current prices is only
marginally lower than that of Goa, and the Union
Territories of Chandigarh and Pondicherry. In fact,
Pondicherry has recorded a higher per capita NSDP than
Delhi only in 2004-05. It would rank as a lower middle-
income state from the World Bank standards, even
without adjustments for the purchasing power parity.
There are quite a few states in India which have a per
capita NSDP of 25 per cent or less than that of Delhi;
Bihar being the lowest in the ladder with a per capita
NSDP of a little over 10 per cent of what has already been
achieved in Delhi. In fact, the per capita NSDP of Bihar,
compared to some other states, shows the huge gap in
4. Singh, A.M. Neighbourhood and Social Networks in Urban India, p.31.
5. Government of NCT of Delhi. Economic Survey of Delhi, 2001-02.
6. Government of NCT of Delhi. Economic Survey of Delhi, 2001-02.
Chapter 1 •
PROFILE OF THE STATE 67
the levels of development of different regions in the
country.
The high per capita NSDP is accompanied with a very
low poverty ratio in Delhi as reported in the 1999-2000
survey conducted by the Planning Commission (Annex A-
1.2). There has been a steady decline in the number of
persons living below the poverty line since 1973-74; the
earliest year for which the data on the extent of
prevalence of poverty in the rural and urban areas was
compiled state-wise, including the Union Territories. In
1973-74, the number of persons living below the poverty
line was 24.44 per cent in rural areas of Delhi. More than
half the population—52.23 per cent—in the urban areas
was living below poverty line. As the rural component of
the population has always been very small, nearly fifty per
cent of the population has been poor. There has been a
drastic change in the position since then. Every survey,
conducted usually after every five years, shows a gradual
decline. Persons living below the poverty line are now
only 8.23 per cent of the population—0.4 per cent in rural
areas and 9.42 per cent in urban areas, according to 1999-
2000 survey conducted by NSSO. It is in sharp contrast to
the position obtaining in other states, where the
percentage of those living below poverty line is much
higher in rural areas. This is largely due to the fact that
Delhi has a small rural area and a small rural population,
and secondly, the migration from other states is
concentrated in urban areas. This has to be seen against
the backdrop of an all-India poverty level of 26.10 per
cent. In 1973-74, the all-India poverty level was 54.88 per
cent, only five per cent higher than the level prevailing in
Delhi at that time. Only Goa, Chandigarh, Punjab,
Himachal Pradesh, and Jammu and Kashmir presently
have a lower poverty ratio. Of these, the latter two are
special category states while Chandigarh is a Union
Territory, and all of them, except Punjab, have a much
smaller population than Delhi.
The developed nature of the economy is also manifest
in the changes that have taken place in the sectoral
composition of NSDP. The primary sector has been
shrinking; its contribution to GSDP, at current prices, has
come down from 3.85 per cent in 1993-94 to 1 per cent in
2004-05. It provided employment to 1.54 per cent of the
workers in 1900-2000, according to NSSO 55th Round
Survey. The tertiary sector has grown in importance,
contributing about 80 per cent of the GSDP. It also
provides employment to nearly 70 per cent of the
workers. The contribution of the secondary sector has also
come down from over 25 per cent in 1993-94 to about 19
per cent in 2004-05 and provides employment to nearly
29 per cent of the workers. It is likely to go down, as
Supreme Court has ordered the shifting of industrial units
from some areas. The dependence of the national capital
territory for supplies of essential commodities emanating
from the agriculture and industry will continue to
increase. In years to come, the economic activity will be
supported by the service sector with a minuscule
contribution made by the primary sector, and a very low
contribution from the secondary sector.
1.9 Development Disparities
Development has many aspects. High rate of economic
growth or per capita income do not tell the whole story.
Averages are dubious and conceal the abysmally low level
at which people are forced to live. The low level of
poverty, based on certain level of per capita expenditure,
does not indicate the deprivations to which a large
segment of the population in Delhi, not to speak of
country as a whole, is subjected. Nearly half the
population of urban Delhi lives in slums, jhuggi-jhopdi
clusters, or in unauthorised colonies. The persistent influx
of population into Delhi makes it difficult for the planners
to provide safe and developed habitations with all the
basic facilities. Delhi presents a picture of extra-ordinary
affluence at some places and utter deprivation in some
other areas, with more of the latter. Theories of a dual
economy or dual society with rural-urban divide or two
different social or economic strata do not hold good here.
There are many layers and levels of development, and
social opportunities in terms of education, health,
housing, etc. have developed to suit them.
1.10 Education
Elementary and higher education provide opportunities
for upward mobility for those who have the capability.
The per capita expenditure on education was Rs.1148,
considerably higher than the all-India figure of Rs.705 in
2004-05. The literacy rate has gone up from 38.4 per cent
in 1951 to 81.8 per cent in 2001. About 75 per cent of
women and 87 per cent of men are literate, according to
the 2001 census. Yet Delhi ranks fourth among the States
in this area; Kerala, Mizoram, and Goa, registering a
higher rate. But literacy by itself is no indication of the
enhancement of capability. Delhi is still far behind in
terms of 12-year schooling for every child, though it may
be ahead of most states, and the all-India average. Product
differentiation is high and starts manifesting itself from
the pre-primary level; prices reflect, though not always,
what is available in the schools in terms of quality. There
are international public schools, and primary and middle
schools run by the MCD and NDMC, and in between a
host of private schools with varying degree of quality and
DELHI DEVELOPMENT REPORT68
prices. Majority of the population has to depend on the
municipal schools, which are poorly equipped due to lack
of adequate budgetary support. Delhi attracts the best
pupils in schools and colleges from all over the country.
Competition for an entry in the schools and colleges is
stiff, and those who find a place are not many, compared
to the over all student population. Vast majority of
students at school level pass out from the government
system, and form the backbone of the society. The gap in
the quality of education imparted has been increasing over
the years, and unless something is done and resources are
diverted to improve it, Delhi will have a different set of
problems of managing and administering people who have
no contributions to make to the society in any sphere of
life.
1.11 Medical Facilities
Delhi compares well with the best in the country in
the matter of medical facilities. It has also started
attracting foreigners, including some from developed
countries, for surgical operations and medical care. The
cost of care is much less than what obtains in some of the
developed countries, and waiting time is small. But what
is affordable to the better-off sections of society in Delhi
or the foreigners is out of reach for the vast majority of
the population, which depends on the health and medical
infrastructure of the government hospitals and
dispensaries. The per capita public expenditure at Rs.568
in 2004-05 is more than double of the all-India average of
around Rs.164. But this highlights the inadequacy at both
levels, and is no cause for satisfaction. Delhi has about
33030 hospital beds. Of these, more than one-third are in
the private nursing homes, well out of the reach of the
common man. There are more than 560 private nursing
homes as against 86 government hospitals and nearly
1200 dispensaries, which include the maternity homes,
maternity and child welfare centers, primary health
centres, polyclinic and sub-centres. In recent years, Delhi
Government has taken steps to improve the health
infrastructure by adding new hospital blocks to existing
hospitals, constructing new hospitals well dispersed in
different parts of the capital, opening new centers for
treatment of some diseases, and super speciality and
research centers.
1.12 Physical Infrastructure
Development of physical infrastructure has not kept
pace with the economic opulence and the excessive influx
of population, since Delhi became the capital of the
country. For a casual visitor—native or foreigner—it is
immediately visible in the chaotic urban transport
services. But for the bullock cart, Delhi has all sorts of
transport vehicles—horse driven carts, carts pulled by
men, cycle-rickshaws, three wheeler and four wheeler
tempos, cars and buses—all driving on the same roads.
The mix of fast driving mechanical vehicles, and the slow
animal or men pulled vehicles, creates traffic hazards on
the ever-shrinking road space. The numbers of motor
vehicles have more than doubled since 1990-91, but the
road space has increased by a mere 50 per cent during
this period. There are nearly a million and a half cars and
jeeps, three million scooters and motor cycles, and 25,000
buses. The number of motor vehicles has gone up from
192 per thousand populations in 1990-91 to 282 in 2004-
2005. The man and animal driven vehicles have also
doubled during the same period. The number of light
commercial vehicles—cars and jeeps—as also the buses
have gone up by two and half times. These have added to
the ever increasing traffic congestion in almost all the
cross-sections of Delhi and adjoining areas. It is not
unusual to find the road space between one red light and
another red light on the same road occupied by the buses
leaving little space for the movement of other mechanical
and non-mechanical transport. In fact, the daily use of
Delhi roads is not confined to residents of Delhi alone.
There is regular commuting between Delhi and the
neighbouring towns in a big way adding further to the
congestion of roads. All these vehicles are not reflected in
the vehicle population of Delhi, as these are registered in
the towns of adjoining states.
While the problem of congestion and shrinking road
space has been there for the last many years, it was
handled as a peak hour traffic management problem. It is
only in recent years that concrete steps have been taken to
look into the supply bottlenecks. This has been done,
firstly, by constructing a series of flyovers on those inter-
sections of the roads where traffic intensity is high. This
has not only added to the road space, but has given relief
to cross-section traffic and reduced congestion and waiting
time at these places. Construction of the metro is the
second step expected to reduce the pressure on the roads.
This would divert the traffic, to a great extent, from the
scooters/motor cycles and buses and, to a smaller extent
from the cars, to the under-ground rail system. However,
there will be a need to integrate it with the passenger
road system of Delhi so that it is more efficient,
economical and convenient for the Delhi commuters.
Linking of the metro and bus schedules with a common
time-table, and a combined fare and ticketing system for
regular commuters would help them in changing over
from the personalised or public transport system to the
new arrangements. This would necessitate the creation
Chapter 1 •
PROFILE OF THE STATE 69
of a single authority for planning and management. It
may require a new set of rules and regulations, either
by amending the existing legislation or by a new
enactment.
The problem of road congestion is aggravated by the
unauthorised parking of the motor vehicles on roads.
While the numbers of vehicles have been increasing every
year, very little space has been allocated for the parking of
vehicles. Commercial and business areas are cluttered
with vehicles; open space for movement of men and
material has completely disappeared. Even the roads in
market areas like Karol Bagh, Lajpat Nagar, Yusuf Sarai,
etc. have little space for movement of traffic. What is
disconcerting is that the use of road space for parking is
officially recognised by diverting the traffic to other lanes
or by converting the two way traffic into one way.7
Underground and multi-storey parking facilities need to
be developed for decongestion of road space. It is as
important as building of flyovers on intersections. Even
the roads and lanes in the residential areas are not free
from this menace. As land is expensive, more and more
area is used for provision of the living space. Road space
is free and is therefore used for parking.
1.13 Energy
A persistent problem faced by the Delhites is the
availability of energy—in terms of quantity and quality—
for domestic, commercial, industrial, agricultural and
other uses. Scheduled and unscheduled disruptions are an
everyday affair, and it is not unusual to see residents and
commercial establishments using generators and inverters
to supplement energy supply during the period of non-
availability. While the expenditure on the energy sector
has been, on an average, more than 20 per cent of the
total plan outlay of Delhi during the last 25 years, there
has not been any visible relief to the population. One
reason has been the increasing demand for energy with
the expansion in population, economic activity, and
affluence. Fans and ordinary coolers have given way to air
conditioners and central cooling and heating systems, not
only in commercial and industrial establishments, but also
in a growing number of residential accommodations. But
the mismatch in the supply and demand has been
accentuated by mismanagement. The institutional changes
made in the management by converting a municipal
unit—Delhi State Electricity Undertaking—into a State
unit, the Delhi Vidyut Board (DVB), did not make any
impact. Low plant load factor, where generation was done
by DVB, and high transmission and distribution losses
continued. In fact, transmission and distribution losses
continued to go up from 22.6 per cent in 1991-92 to
around 44 per cent in 2001-02. Financial performance of
the DVB, like other State Electricity Boards, continued to
deteriorate, affecting its ability to make fresh investments
and meet new challenges.
Reforms in the power sector have been initiated by the
Delhi government on the same pattern as recommended
for other states. In essence, it involved the setting up of a
regulatory commission at the state level, the separation of
the generation, transmission and distribution functions,
and their eventual privatisation. The industry should pay
for itself. Subsidies, if any, for any sector should be
transparent and should be quantified, and where the state
decides to subsidise any group of consumers, it should
pay for it. Tariff has to be periodically revised by the
regulatory commission, so that the interest of the
consumer is protected from the mismanagement and
inefficiency of the generators, transmitters and
distributors. At the same time, the economic interest of
power producers and service providers should be
protected. Delhi has already started implementing the
recommended reforms. Delhi Electricity Reforms Act was
passed and the Delhi Vidyut Board was dissolved with
effect from 1st July 2002. Its place has been taken by six
companies—one each for generation and transmission,
three for power distribution and a holding company. The
generation and transmission of power is still in the public
sector while distribution has been privatised. An
electricity regulatory commission has been set up. A
number of companies are now distributing power in
Delhi, each responsible for a specified area in Delhi. A
time schedule has been worked out for reducing the
transmission and distribution losses, and the tariffs and
subsidies have accordingly been fixed by the regulatory
commission. However, the transmission and distribution
losses still continue to be quite high, though some
improvement has been visible during the last couple of
years.
1.14 Water
Water is an essential requirement for the sustenance of
any people in any area. Shortage of water like that of food
is not immediately felt as people share voluntarily the
available quantity, or they abide by the restrictions
imposed on the quantum of supply through the public
distribution system. However, shortage of water does have
7. Thus, Arya Samaj Road near the Ajmal Khan Road inter section in the Karol Bagh area used to have two way traffic, but a section of it has now beenconverted to one way traffic leading to diversion to nearby narrow lanes. Three-fourth of the road in this inter-section is officially used for car parking.
DELHI DEVELOPMENT REPORT70
an impact on personal hygiene, cleanliness and sanitation,
public and private. And, in turn, it affects the public
health system as reflected in the spread of water borne
diseases. The population of Delhi has been increasing
every year, but not the sources of water supply. The per
capita supply decrease with the addition of new persons
every day. The existing sources are not adequate to meet
the increasing requirements. The sub-surface or ground
water is tapped but the availability here is also limited.
While 96 per cent of the households have access to safe
drinking water, the quantum will continue to be a matter
for concern. At present, the average per capita supply of
water is only 70 per cent of the prescribed norm. Even
this supply is not evenly distributed throughout Delhi.
Cantonment and NDMC areas get a very high level of
supply, while Mehrauli, Najafgarh, and Narela get a very
low level of supply. New sources of water supply need to
be identified to augment the supply in the deficit areas as
also to meet the growing requirements.
1.15 Environment
The unplanned and unprecedented growth of Delhi has
its impact on the environment. The quality of life has
deteriorated to an abysmally low level during the last few
decades, due to water and air pollution and ever
increasing and uncontrolled noise level. In addition, there
is the problem of solid waste management and garbage
disposal which also affects the immediate physical
environment of the residents. Persistent campaigning by
the non-governmental organisations and the intervention
of the Supreme Court from time to time has helped in
improving the environment. The mandatory switch from
diesel and petrol to the use of gas as fuel by the buses
and other commercial vehicles for locomotion alone has
contributed to improvement in the quality of air in Delhi.
Industries have been another major source of water and
air pollution. Some of these are located in residential area.
On orders of the Supreme Court, Delhi government has
started taking action and relocating them. These measures
would go a long way in the betterment of the quality of
life in Delhi.
1.16 Industrial Effluent
The liquid waste discharged by the industrial units is
another area of great concern. The 48 kilometre stretch of
the Yamuna in Delhi is highly polluted—largely by the
industrial waste water discharged by producing industrial
units. The Central Pollution Board has prescribed
standards for each industry in terms of neutralisation of
acidity, removal of oil and grease and total suspended
particles. The units are required to install Effluent
Treatment Plants to ensure that the specified standards
are maintained and that water is treated before it is
discharged into water bodies or percolates down to the
ground water. However, small units have found it difficult
to adhere to it, and the problem persists. It also affects
the sources of drinking water supply in Delhi.
Delhi has a small geographical area of 1483 square
kilometres. It has had a long history, and unlike the many
new capitals around the world which have come up after
the formation of the nation, Delhi has been in existence
even before the concept of nationhood took shape. During
the pre-British times it had a larger expanse. Motor
vehicles and modern industrial units were unknown. Now
scientific and technological developments leading to
development of modern transport, industry, and
communication systems have altered the scene. At the
same time, the area has got reduced from what it was
earlier. The boundaries are water-tight and can not be
altered by an executive fiat. Modern industrial units had
started getting established during the British times leading
to rapid expansion in the post-Independence period. Like
in any other state, the emphasis has been on
development, and development meant largely the setting
up of industrial units. No thought was given, or perhaps,
it did not occur to anyone that Delhi, being the seat of
national government, would have a process of natural
expansion unmatched by other provincial towns.
Industrial units have occupied valuable scarce space, and
have created problems of congestion, pollution, crime and
a host of other avoidable problems. They have also been
partially responsible for the on-going influx of people
looking for economic opportunities. This has become the
bane of Delhi. Even now, there is a need for rethinking in
this sphere. If Delhi has to be preserved, many activities
will have to be stopped, and over a period of time, they
have to be shifted out of Delhi. The process has to be as
painless as possible so that there is least resistance from
the local population
1.17 National Capital Region (NCR)
The development of satellite towns around Delhi have
created administrative problems which are outside the
purview of the NCR Planning Board. Ghaziabad, Noida,
Gurgaon, Sahibabad, Faridabad, Ballabhgarh, Palwal, and
even Sonipat have become contiguous towns, or an
extension of Delhi. Traffic, land-use, civic services,
policing, and law and order, crimes in these areas are
common problems; but these are the concerns of the
participating states. There is no common administrative
unit for all these towns. It is not unusual for a
participating state to have a view different from that of
Chapter 1 •
PROFILE OF THE STATE 71
Delhi or another participating state. This has tremendous
impact on policing, crime control and investigation, law
and order, traffic control, judicial administration, etc. The
problems become further compounded when the
participating states are ruled by different political parties
as is happening now. Perceptions change, with each one
moving in different directions. Consultations take time,
and valuable time is lost in the process. There is a need to
have a common administrative unit for all these
contiguous towns so that administrative machinery is
made responsible to one administrative set up at the
bureaucratic and political level.
1.18 Flora and Fauna
Economic development and prosperity are not unmixed
blessings. The last century has been a saga of destructive
creation. The flora and fauna of Delhi has, more or less,
disappeared. The ridge and the surrounding areas, till the
time of Independence, had been abode of a rich variety of
wild animals. Nilgais, chinkara, and blackbuck roamed in
the dry scrub jungles of Delhi. The forest areas were
avoided because of the presence of hyenas, wolves and
leopards. It was not unusual to find wild boar, hares and
foxes around. But there has been a sea change in the
scenario during last half a century. And this has not been
entirely due to changing climatic conditions. As Ranjit Lal8
observes, “More dangerous perhaps than summer’s wrath
and monsoon’s infections, has been the city’s own assault
on its own green areas and woodlands in the last half of
the twentieth century. As the city expanded explosively
and land prices rocketed, the green areas were the first to
be sacrificed. Both by the authorities and the residents.
Officially sacrosanct green zones have been destroyed by
road widening schemes, construction, encroachments,
wood poaching and castle grazing.”
1.19 Culture
The cultural life of Delhi has also undergone a
complete transformation. Delhi is no more a haven for
Mir, Zauq or Ghalib. Mushairas are rare. Persian and Urdu
have made way for Punjabi and Hindi, as also English
among the elite of the city. Evenings are spent around
television or cinema halls, or performances organised in
the many auditoria that have come up in Delhi. There is
theatre, classical dance, and classical music—Hindustani
and Carnatic. Not to speak of the performances organised
by foreign troupes visiting the country. There are art
galleries; variety of artists display their creations. A whole
lot of professionalism has developed around these
activities; for some this is a major source of livelihood.
And yet there is something which has not changed. As
Dalrymple states:
Indraprastha had fallen; six hundred years of Muslim
domination had come and gone; a brief interruption by
the British was almost forgotten. But Shive, the oldest
living God in the world, was still worshipped; Sanskrit—
which predates any other living tongue by a millennia—
was still read, still spoken. Moreover, the sadhus and
rishis—familiar figures from the Mahabharat –remained
today, still following the rigorous laws of India’s most
ancient vocation; giving up everything to wander the face
of earth in search of enlightenment, renouncing the
profane in the hope of a brief glimpse of the sacred. In
these wet and disheveled figures sitting cross-legged
under the neem and banyan trees of the river bank lay
what most certainly be the most remarkable Delhi’s
survival of all.
(William Dalrymple: City of Djinns, p.338)
During the course of last hundred years, tremendous
changes have taken place all over the world. Science and
technology have transformed the world we live in. In
many countries, the signs of utter poverty and squalor are
no more visible. Delhi has also been a part of this process
of change. For once during the last one hundred and fifty
years, there has been an era of peace. Delhi has been free
from foreign invasions and internal trouble. There has
been no destruction or loot from the marauders. The
process of development started has gone on unhindered.
But development has some pernicious aspects. Some
prosper; many are thrown to the periphery. Something
like that has been happening; and it is this which has to
be corrected and avoided in the coming years.
8. Ranjit Lal. “The Flora and The Fauna”, in B.P. Singh and P. Varma (eds.) The Millenium Book on Delhi.
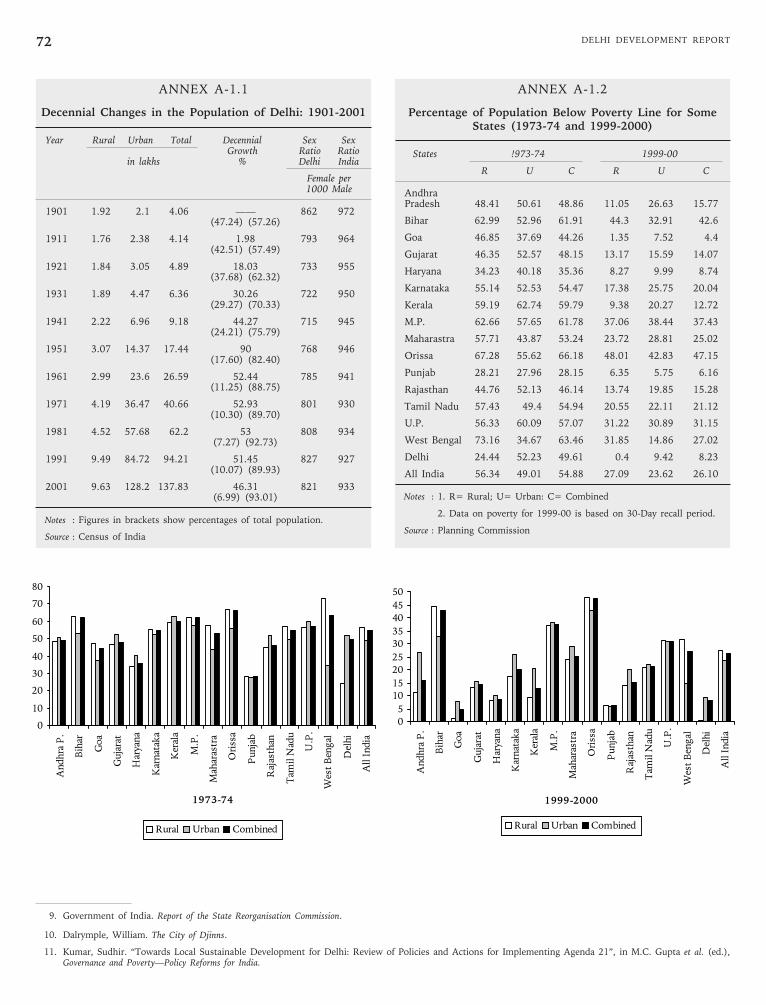
DELHI DEVELOPMENT REPORT72
ANNEX A-1.1
Decennial Changes in the Population of Delhi: 1901-2001
Year Rural Urban Total Decennial Sex SexGrowth Ratio Ratio
in lakhs % Delhi India
Female per1000 Male
1901 1.92 2.1 4.06 —— 862 972(47.24) (57.26)
1911 1.76 2.38 4.14 1.98 793 964(42.51) (57.49)
1921 1.84 3.05 4.89 18.03 733 955(37.68) (62.32)
1931 1.89 4.47 6.36 30.26 722 950(29.27) (70.33)
1941 2.22 6.96 9.18 44.27 715 945(24.21) (75.79)
1951 3.07 14.37 17.44 90 768 946(17.60) (82.40)
1961 2.99 23.6 26.59 52.44 785 941(11.25) (88.75)
1971 4.19 36.47 40.66 52.93 801 930(10.30) (89.70)
1981 4.52 57.68 62.2 53 808 934(7.27) (92.73)
1991 9.49 84.72 94.21 51.45 827 927(10.07) (89.93)
2001 9.63 128.2 137.83 46.31 821 933(6.99) (93.01)
Notes : Figures in brackets show percentages of total population.
Source : Census of India
ANNEX A-1.2
Percentage of Population Below Poverty Line for SomeStates (1973-74 and 1999-2000)
States !973-74 1999-00
R U C R U C
AndhraPradesh 48.41 50.61 48.86 11.05 26.63 15.77
Bihar 62.99 52.96 61.91 44.3 32.91 42.6
Goa 46.85 37.69 44.26 1.35 7.52 4.4
Gujarat 46.35 52.57 48.15 13.17 15.59 14.07
Haryana 34.23 40.18 35.36 8.27 9.99 8.74
Karnataka 55.14 52.53 54.47 17.38 25.75 20.04
Kerala 59.19 62.74 59.79 9.38 20.27 12.72
M.P. 62.66 57.65 61.78 37.06 38.44 37.43
Maharastra 57.71 43.87 53.24 23.72 28.81 25.02
Orissa 67.28 55.62 66.18 48.01 42.83 47.15
Punjab 28.21 27.96 28.15 6.35 5.75 6.16
Rajasthan 44.76 52.13 46.14 13.74 19.85 15.28
Tamil Nadu 57.43 49.4 54.94 20.55 22.11 21.12
U.P. 56.33 60.09 57.07 31.22 30.89 31.15
West Bengal 73.16 34.67 63.46 31.85 14.86 27.02
Delhi 24.44 52.23 49.61 0.4 9.42 8.23
All India 56.34 49.01 54.88 27.09 23.62 26.10
Notes : 1. R= Rural; U= Urban: C= Combined
2. Data on poverty for 1999-00 is based on 30-Day recall period.
Source : Planning Commission
9. Government of India. Report of the State Reorganisation Commission.
10. Dalrymple, William. The City of Djinns.
11. Kumar, Sudhir. “Towards Local Sustainable Development for Delhi: Review of Policies and Actions for Implementing Agenda 21”, in M.C. Gupta et al. (ed.),Governance and Poverty—Policy Reforms for India.
0
10
20
30
40
50
60
70
80
Andhra
P.
Bih
ar
Goa
Guja
rat
Har
yana
Kar
nat
aka
Ker
ala
M.P
.
Mah
aras
tra
Ori
ssa
Punja
b
Raj
asth
an
Tam
il N
adu
U.P
.
Wes
t B
engal
Del
hi
All I
ndia
1973-74
Rural Urban Combined
0
5
10
15
20
25
30
35
40
45
50
Andhra
P.
Bih
ar
Goa
Guja
rat
Har
yana
Kar
nat
aka
Ker
ala
M.P
.
Mah
aras
tra
Ori
ssa
Punja
b
Raj
asth
an
Tam
il N
adu
U.P
.
Wes
t B
engal
Del
hi
All I
ndia
1999-2000
Rural Urban Combined
Chapter 2
Economy and Fiscal Management
DELHI
2.1 General
National capitals are the centres of economic activities
in most countries. Formulation, adoption, and execution
of economic policies are, by and large, the prerogative of
the national governments in federations. Investors are
attracted to them as they generally have a well-developed
infrastructure, essential for any development activity.
Proximity to the seat of the national government ensures
smooth sailing in matters where government clearances
and authorisations are essential. A national capital, with
few exceptions, is the largest city in terms of area and
population. These provide a ready market for any type of
goods and services. Unless otherwise restricted, sheer
presence of a large population, and an elite class,
enhances the economic activity which leads to a rate of
growth, not experienced in other parts of the country even
with better endowment of resources, natural and others.
ECONOMY
2.2 Rate of Economic Growth
Delhi has been among some of the fastest growing
states in the country. The net state domestic product grew
at the rate of 5.1 per cent during the decade of the 60s. It
was much higher than the all-India rate of growth of 3 per
cent during the same period. Only four states recorded a
higher rate of growth during this decade—Punjab (5.6),
Haryana (5.5), Himachal Pradesh (5.6), and Orissa (9.7).
In the decade of 70s, there was a further improvement in
economic performance; the rate of growth, at 6.2 per cent,
was not only the highest among states, but was much
higher than the all-India trend growth rate of 3.6 per cent.
This trend continued in the 80s; the average annual rate
of growth of gross state domestic product (GSDP) reached
was 7.6 per cent compared to the all-India rate of growth
of 5.6 per cent. It continued to maintain, on an average,
the same rate of growth in the decade of the 90s, though
there have been wide fluctuations from year to year. In
the first five years of the present century, the average rate
of growth has been around 8.8 per cent, as against an
average growth of 6 per cent in the GDP. The rate of
growth has been one of the highest among states and
union territories (Annex A-2.1).
2.3 Per Capita NSDP
High rate of economic growth over the years is
reflected in a disproportionately high share of Delhi in
the GDP. In 2000-01, the share of Delhi was 4.8 per cent
in the GDP at factor cost. It has, however, declined to
3.18 per cent in 2004-05. Delhi accounted for a mere
1.34 per cent of the total population of the country,
despite the phenomenal rate of growth recorded during
the last half of the century, largely due to migration from
other states. The per capita NSDP was Rs. 53976 in
2004-05, a little less than two and a half times the
average per capita GDP for the country at factor cost and
at current prices. It was more than nine times that of
Bihar, four times that of Jharkhand, U.P, Chattisgarh,
and M.P. (Annex A-2.2). In the first five years of the
present decade, the average annual rate of growth in the
per capita NSDP was 7.9 per cent. Among the states,
only Goa had a higher per capita NSDP, and among the
Union Territories, only Chandigarh and Pondicherry had
a higher per capita NSDP in 2004-05. If Delhi had
witnessed only the natural growth in population, its per
capita NSDP could have been much higher than any state
or Union Territory in the country.
2.4 Structure of the Economy
Sectoral composition of NSDP reflects the structural
changes that characterise the economy of Delhi. The State
has a small geographical area; rural area has been
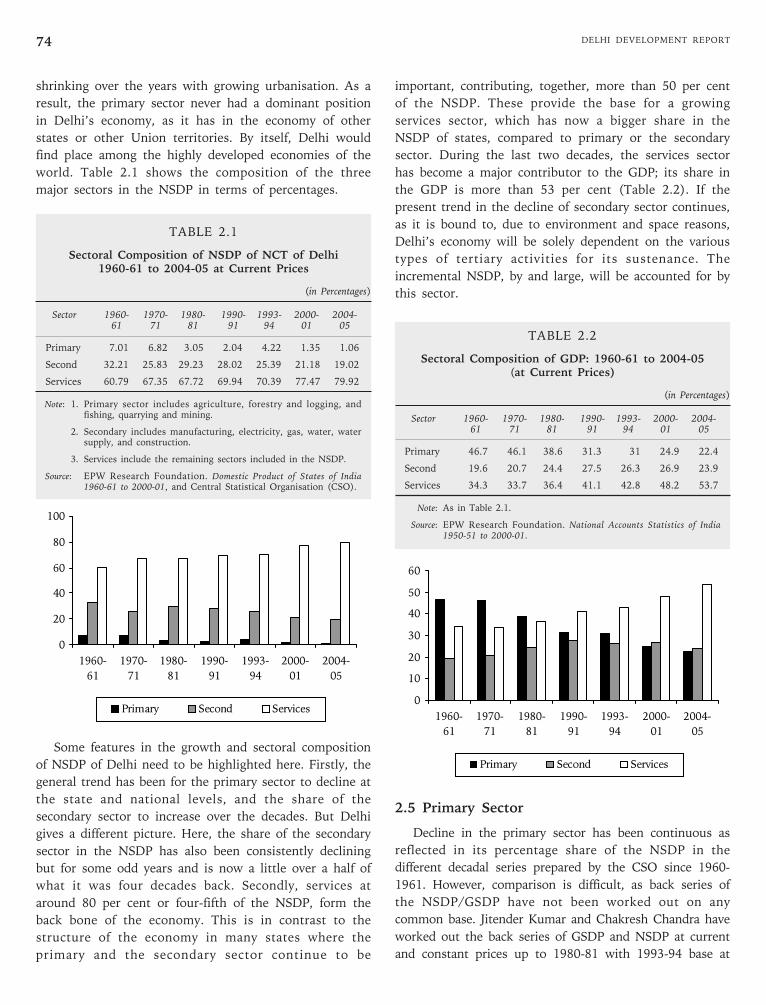
DELHI DEVELOPMENT REPORT74
shrinking over the years with growing urbanisation. As a
result, the primary sector never had a dominant position
in Delhi’s economy, as it has in the economy of other
states or other Union territories. By itself, Delhi would
find place among the highly developed economies of the
world. Table 2.1 shows the composition of the three
major sectors in the NSDP in terms of percentages.
TABLE 2.1
Sectoral Composition of NSDP of NCT of Delhi1960-61 to 2004-05 at Current Prices
(in Percentages)
Sector 1960- 1970- 1980- 1990- 1993- 2000- 2004-61 71 81 91 94 01 05
Primary 7.01 6.82 3.05 2.04 4.22 1.35 1.06
Second 32.21 25.83 29.23 28.02 25.39 21.18 19.02
Services 60.79 67.35 67.72 69.94 70.39 77.47 79.92
Note: 1. Primary sector includes agriculture, forestry and logging, andfishing, quarrying and mining.
2. Secondary includes manufacturing, electricity, gas, water, watersupply, and construction.
3. Services include the remaining sectors included in the NSDP.
Source: EPW Research Foundation. Domestic Product of States of India1960-61 to 2000-01, and Central Statistical Organisation (CSO).
Some features in the growth and sectoral composition
of NSDP of Delhi need to be highlighted here. Firstly, the
general trend has been for the primary sector to decline at
the state and national levels, and the share of the
secondary sector to increase over the decades. But Delhi
gives a different picture. Here, the share of the secondary
sector in the NSDP has also been consistently declining
but for some odd years and is now a little over a half of
what it was four decades back. Secondly, services at
around 80 per cent or four-fifth of the NSDP, form the
back bone of the economy. This is in contrast to the
structure of the economy in many states where the
primary and the secondary sector continue to be
important, contributing, together, more than 50 per cent
of the NSDP. These provide the base for a growing
services sector, which has now a bigger share in the
NSDP of states, compared to primary or the secondary
sector. During the last two decades, the services sector
has become a major contributor to the GDP; its share in
the GDP is more than 53 per cent (Table 2.2). If the
present trend in the decline of secondary sector continues,
as it is bound to, due to environment and space reasons,
Delhi’s economy will be solely dependent on the various
types of tertiary activities for its sustenance. The
incremental NSDP, by and large, will be accounted for by
this sector.
TABLE 2.2
Sectoral Composition of GDP: 1960-61 to 2004-05(at Current Prices)
(in Percentages)
Sector 1960- 1970- 1980- 1990- 1993- 2000- 2004-61 71 81 91 94 01 05
Primary 46.7 46.1 38.6 31.3 31 24.9 22.4
Second 19.6 20.7 24.4 27.5 26.3 26.9 23.9
Services 34.3 33.7 36.4 41.1 42.8 48.2 53.7
Note: As in Table 2.1.
Source: EPW Research Foundation. National Accounts Statistics of India1950-51 to 2000-01.
2.5 Primary Sector
Decline in the primary sector has been continuous as
reflected in its percentage share of the NSDP in the
different decadal series prepared by the CSO since 1960-
1961. However, comparison is difficult, as back series of
the NSDP/GSDP have not been worked out on any
common base. Jitender Kumar and Chakresh Chandra have
worked out the back series of GSDP and NSDP at current
and constant prices up to 1980-81 with 1993-94 base at
0
20
40
60
80
100
1960-
61
1970-
71
1980-
81
1990-
91
1993-
94
2000-
01
2004-
05
Primary Second Services 0
10
20
30
40
50
60
1960-
61
1970-
71
1980-
81
1990-
91
1993-
94
2000-
01
2004-
05
Primary Second Services
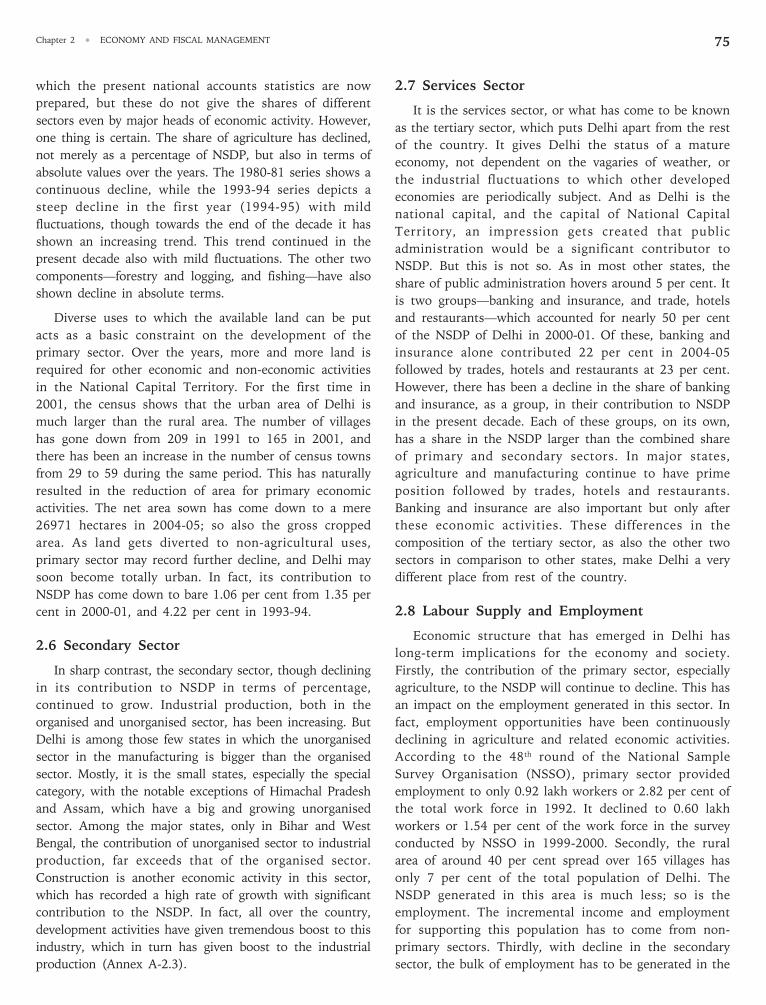
Chapter 2 • ECONOMY AND FISCAL MANAGEMENT 75
which the present national accounts statistics are now
prepared, but these do not give the shares of different
sectors even by major heads of economic activity. However,
one thing is certain. The share of agriculture has declined,
not merely as a percentage of NSDP, but also in terms of
absolute values over the years. The 1980-81 series shows a
continuous decline, while the 1993-94 series depicts a
steep decline in the first year (1994-95) with mild
fluctuations, though towards the end of the decade it has
shown an increasing trend. This trend continued in the
present decade also with mild fluctuations. The other two
components—forestry and logging, and fishing—have also
shown decline in absolute terms.
Diverse uses to which the available land can be put
acts as a basic constraint on the development of the
primary sector. Over the years, more and more land is
required for other economic and non-economic activities
in the National Capital Territory. For the first time in
2001, the census shows that the urban area of Delhi is
much larger than the rural area. The number of villages
has gone down from 209 in 1991 to 165 in 2001, and
there has been an increase in the number of census towns
from 29 to 59 during the same period. This has naturally
resulted in the reduction of area for primary economic
activities. The net area sown has come down to a mere
26971 hectares in 2004-05; so also the gross cropped
area. As land gets diverted to non-agricultural uses,
primary sector may record further decline, and Delhi may
soon become totally urban. In fact, its contribution to
NSDP has come down to bare 1.06 per cent from 1.35 per
cent in 2000-01, and 4.22 per cent in 1993-94.
2.6 Secondary Sector
In sharp contrast, the secondary sector, though declining
in its contribution to NSDP in terms of percentage,
continued to grow. Industrial production, both in the
organised and unorganised sector, has been increasing. But
Delhi is among those few states in which the unorganised
sector in the manufacturing is bigger than the organised
sector. Mostly, it is the small states, especially the special
category, with the notable exceptions of Himachal Pradesh
and Assam, which have a big and growing unorganised
sector. Among the major states, only in Bihar and West
Bengal, the contribution of unorganised sector to industrial
production, far exceeds that of the organised sector.
Construction is another economic activity in this sector,
which has recorded a high rate of growth with significant
contribution to the NSDP. In fact, all over the country,
development activities have given tremendous boost to this
industry, which in turn has given boost to the industrial
production (Annex A-2.3).
2.7 Services Sector
It is the services sector, or what has come to be known
as the tertiary sector, which puts Delhi apart from the rest
of the country. It gives Delhi the status of a mature
economy, not dependent on the vagaries of weather, or
the industrial fluctuations to which other developed
economies are periodically subject. And as Delhi is the
national capital, and the capital of National Capital
Territory, an impression gets created that public
administration would be a significant contributor to
NSDP. But this is not so. As in most other states, the
share of public administration hovers around 5 per cent. It
is two groups—banking and insurance, and trade, hotels
and restaurants—which accounted for nearly 50 per cent
of the NSDP of Delhi in 2000-01. Of these, banking and
insurance alone contributed 22 per cent in 2004-05
followed by trades, hotels and restaurants at 23 per cent.
However, there has been a decline in the share of banking
and insurance, as a group, in their contribution to NSDP
in the present decade. Each of these groups, on its own,
has a share in the NSDP larger than the combined share
of primary and secondary sectors. In major states,
agriculture and manufacturing continue to have prime
position followed by trades, hotels and restaurants.
Banking and insurance are also important but only after
these economic activities. These differences in the
composition of the tertiary sector, as also the other two
sectors in comparison to other states, make Delhi a very
different place from rest of the country.
2.8 Labour Supply and Employment
Economic structure that has emerged in Delhi has
long-term implications for the economy and society.
Firstly, the contribution of the primary sector, especially
agriculture, to the NSDP will continue to decline. This has
an impact on the employment generated in this sector. In
fact, employment opportunities have been continuously
declining in agriculture and related economic activities.
According to the 48th round of the National Sample
Survey Organisation (NSSO), primary sector provided
employment to only 0.92 lakh workers or 2.82 per cent of
the total work force in 1992. It declined to 0.60 lakh
workers or 1.54 per cent of the work force in the survey
conducted by NSSO in 1999-2000. Secondly, the rural
area of around 40 per cent spread over 165 villages has
only 7 per cent of the total population of Delhi. The
NSDP generated in this area is much less; so is the
employment. The incremental income and employment
for supporting this population has to come from non-
primary sectors. Thirdly, with decline in the secondary
sector, the bulk of employment has to be generated in the
DELHI DEVELOPMENT REPORT76
tertiary sector, and that too in the unorganised sector.
According to the 55th round of NSSO survey, the number
of workers in employment was 39 lakh, of which two-
thirds were in the tertiary sector, and another 11 lakh
were employed in the secondary sector. The employment
in the organised sector has been declining slowly. It was
8.45 lakh in March 1998 or nearly 20 per cent of the total
employment. It has come down to 8.39 lakh in March
2004. Even though the decline has not been statistically
significant, it only reflects the trend. Around 75 per cent
of the employment is in the public sector, while the
remaining 25 per cent is generated in the private sector.
Employment opportunities in the organised sector have
more or less remained constant even though Delhi’s
economy has been recording a very high rate of economic
growth. Fourthly, the percentage of persons employed has
declined from 33.04 per cent in the 48th round NSSO
survey to 29.3 per cent in the 55th round survey in 1999-
2000. The subsequent survey (59th Round Jan. 2003 to
Dec. 2003) shows only marginal improvement by one per
cent. During the same period, the number of unemployed
person in the labour force increased from 5.67 per cent in
1992 to 12.57 per cent in 1999-2000 according to these
two NSSO surveys. However, in the 2003 survey, the
number of unemployed persons has declined to 4.63 per
cent. The percentage of total labour force to estimated
total population has also declined from 35 per cent in
1992 to 32 per cent in 2003. Fifthly, the damocles sword
hanging on some of the existing industrial units required
to either shift to some other area or close down would
further affect the employment scenario, and also the
income-generation from this sector in Delhi. During the
decade of the nineties, the annual addition to the register
of educated unemployed has been more than 2 per cent.
There were around a million persons registered as
unemployed with more than 75 per cent falling in the
category of educated unemployed with educational
qualifications of matriculation and above. However, there
was a sudden and drastic change in the position of
unemployed persons in Delhi. There was a decline of
more than 42 per cent in the number of persons in the
register of unemployed in Delhi in 2004. If this trend
continues, Delhi would soon become, if not already one, a
full employment economy.
FISCAL MANAGEMENT
2.9 Special Provisions for Delhi
The National Capital Territory of Delhi did not have
any legislature before the fiscal year 1991-92. The revenue
and expenditure formed part of the Consolidated Fund of
India. The Metropolitan Council constituted under section
3 of the Delhi Administration Act, 1966, had the right to
discuss and make recommendations to Central
government on the estimated receipts and expenditure of
the Union Territory of Delhi to be made from the
Consolidated Fund of India. The legislative powers
including the powers to consider and pass the budget of
Delhi vested in the Parliament. The responsibility for
fiscal management rested with the Union Government,
and not on the Union Territory. The sixty-ninth
amendment to the Constitution, which became effective
from 1st February 1992, made a provision for a Legislative
Assembly for Delhi. The Government of National Capital
Territory of Delhi Act, 1991, passed, in pursuance to the
constitutional amendment, made some fundamental
changes in the financial arrangement. The state legislature
has been given the same powers in financial matters, as
have been enshrined in the Constitution, for the states,
except for land, law and order, and police which rest with
the Government of India. However, unlike the position
obtaining in the states, the annual financial statement or
the budget of Delhi requires prior approval of not only the
Lt. Governor but also the President of India before it can
be presented to the State legislature for consideration and
passing. Provisions for setting up of a Consolidated Fund
and a Contingency Fund of the Capital have been made.
The receipts are now credited to the Consolidated Fund,
and expenditure is made from it. Effective responsibility
for fiscal management is now with the Government of the
NCT. However, financial powers of the Delhi Government
are not analogous to that of the states. The NCT finances
have to function under the over all control of the Central
government; and even though it places some restrictions
on the freedom of action, it has also helped the NCT to
emerge as a fiscally strong entity.
Special provisions made in the Constitution for the
National Capital Territory of Delhi has given it a special
status distinct from the states and other Union Territories.
One such provision, already mentioned, is that prior
approval of the President of India, which means the Union
Ministry of Home, is mandatory before the budget of the
NCT could be introduced in the legislature. In the case of
states, the approval of the Governor is sufficient before it is
placed before the State legislature for consideration and
passing. Secondly, Parliament has overriding powers of
legislation, in terms of article 239AB (3)(b) and (c) of the
Constitution, with respect to any matter for the NCT as a
whole or part thereof. The law enacted by Parliament has
supremacy over any law passed by the NCT legislature.
However, if on any subject, the NCT passes a legislation,
which is subsequent to one passed by the Parliament on
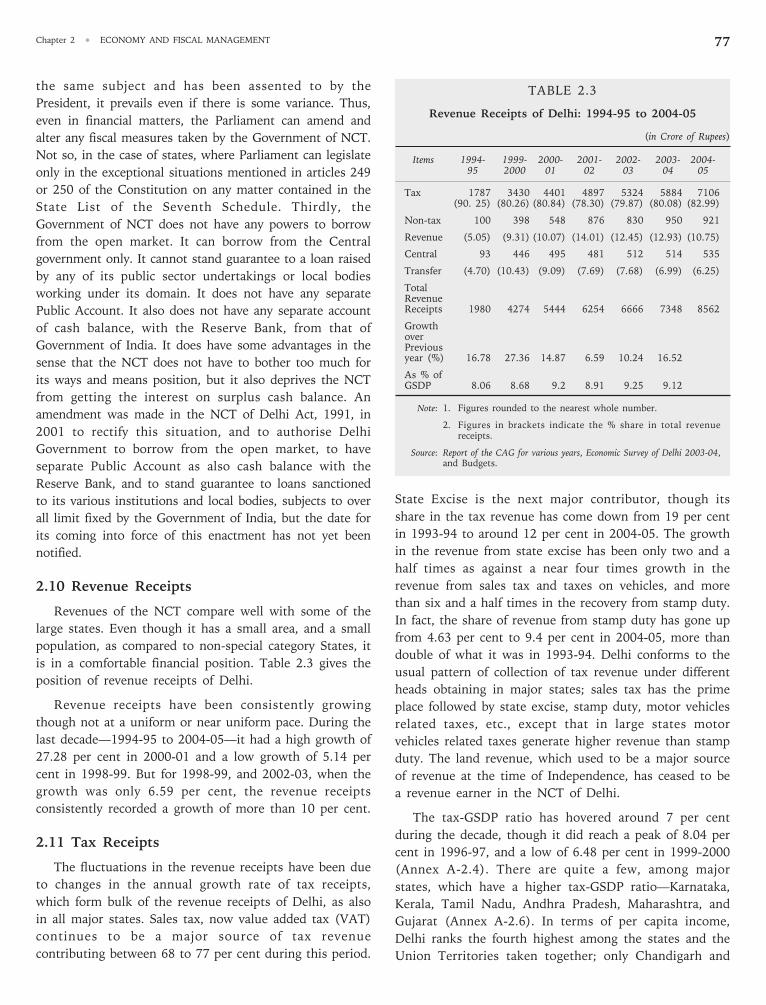
Chapter 2 • ECONOMY AND FISCAL MANAGEMENT 77
the same subject and has been assented to by the
President, it prevails even if there is some variance. Thus,
even in financial matters, the Parliament can amend and
alter any fiscal measures taken by the Government of NCT.
Not so, in the case of states, where Parliament can legislate
only in the exceptional situations mentioned in articles 249
or 250 of the Constitution on any matter contained in the
State List of the Seventh Schedule. Thirdly, the
Government of NCT does not have any powers to borrow
from the open market. It can borrow from the Central
government only. It cannot stand guarantee to a loan raised
by any of its public sector undertakings or local bodies
working under its domain. It does not have any separate
Public Account. It also does not have any separate account
of cash balance, with the Reserve Bank, from that of
Government of India. It does have some advantages in the
sense that the NCT does not have to bother too much for
its ways and means position, but it also deprives the NCT
from getting the interest on surplus cash balance. An
amendment was made in the NCT of Delhi Act, 1991, in
2001 to rectify this situation, and to authorise Delhi
Government to borrow from the open market, to have
separate Public Account as also cash balance with the
Reserve Bank, and to stand guarantee to loans sanctioned
to its various institutions and local bodies, subjects to over
all limit fixed by the Government of India, but the date for
its coming into force of this enactment has not yet been
notified.
2.10 Revenue Receipts
Revenues of the NCT compare well with some of the
large states. Even though it has a small area, and a small
population, as compared to non-special category States, it
is in a comfortable financial position. Table 2.3 gives the
position of revenue receipts of Delhi.
Revenue receipts have been consistently growing
though not at a uniform or near uniform pace. During the
last decade—1994-95 to 2004-05—it had a high growth of
27.28 per cent in 2000-01 and a low growth of 5.14 per
cent in 1998-99. But for 1998-99, and 2002-03, when the
growth was only 6.59 per cent, the revenue receipts
consistently recorded a growth of more than 10 per cent.
2.11 Tax Receipts
The fluctuations in the revenue receipts have been due
to changes in the annual growth rate of tax receipts,
which form bulk of the revenue receipts of Delhi, as also
in all major states. Sales tax, now value added tax (VAT)
continues to be a major source of tax revenue
contributing between 68 to 77 per cent during this period.
State Excise is the next major contributor, though its
share in the tax revenue has come down from 19 per cent
in 1993-94 to around 12 per cent in 2004-05. The growth
in the revenue from state excise has been only two and a
half times as against a near four times growth in the
revenue from sales tax and taxes on vehicles, and more
than six and a half times in the recovery from stamp duty.
In fact, the share of revenue from stamp duty has gone up
from 4.63 per cent to 9.4 per cent in 2004-05, more than
double of what it was in 1993-94. Delhi conforms to the
usual pattern of collection of tax revenue under different
heads obtaining in major states; sales tax has the prime
place followed by state excise, stamp duty, motor vehicles
related taxes, etc., except that in large states motor
vehicles related taxes generate higher revenue than stamp
duty. The land revenue, which used to be a major source
of revenue at the time of Independence, has ceased to be
a revenue earner in the NCT of Delhi.
The tax-GSDP ratio has hovered around 7 per cent
during the decade, though it did reach a peak of 8.04 per
cent in 1996-97, and a low of 6.48 per cent in 1999-2000
(Annex A-2.4). There are quite a few, among major
states, which have a higher tax-GSDP ratio—Karnataka,
Kerala, Tamil Nadu, Andhra Pradesh, Maharashtra, and
Gujarat (Annex A-2.6). In terms of per capita income,
Delhi ranks the fourth highest among the states and the
Union Territories taken together; only Chandigarh and
TABLE 2.3
Revenue Receipts of Delhi: 1994-95 to 2004-05
(in Crore of Rupees)
Items 1994- 1999- 2000- 2001- 2002- 2003- 2004-95 2000 01 02 03 04 05
Tax 1787 3430 4401 4897 5324 5884 7106(90. 25) (80.26) (80.84) (78.30) (79.87) (80.08) (82.99)
Non-tax 100 398 548 876 830 950 921
Revenue (5.05) (9.31) (10.07) (14.01) (12.45) (12.93) (10.75)
Central 93 446 495 481 512 514 535
Transfer (4.70) (10.43) (9.09) (7.69) (7.68) (6.99) (6.25)
TotalRevenueReceipts 1980 4274 5444 6254 6666 7348 8562
GrowthoverPreviousyear (%) 16.78 27.36 14.87 6.59 10.24 16.52
As % ofGSDP 8.06 8.68 9.2 8.91 9.25 9.12
Note: 1. Figures rounded to the nearest whole number.
2. Figures in brackets indicate the % share in total revenuereceipts.
Source: Report of the CAG for various years, Economic Survey of Delhi 2003-04,and Budgets.
DELHI DEVELOPMENT REPORT78
Pondicherry among the Union Territories and Goa among
the states have a higher per capita income. But these are
very small units, in terms of population and area. Delhi,
which should compare well with major states than any
Union Territory, has a comparatively low tax-GSDP ratio,
if one keeps in view the basic structure of its economy.
There are two other points, apart from the high per capita
income, which distinguish it from major states. Delhi has
a very high urban population, nearly 93 per cent, in
comparison to other states. Rural areas are
indistinguishable from the urban areas and are as
monetised as urban areas. They form part of the tax net.
This is not so in the case of even large states where rural
population forms a high component of the total
population and primary sector, mainly agriculture,
continues to be a very significant contributor to the
GSDP. Part of the GSDP generated can, therefore,
legitimately escape from the tax net. Secondly, Delhi has a
much lower poverty ratio—persons living below the
poverty line—compared to other states, suggesting a
pattern of distribution of income in which a higher
percentage of population has the purchasing power and
therefore can contribute to tax revenue. If these factors
are taken into account, Delhi has a much lower tax
burden than some of the low- income states.
Tax-buoyancy is another indicator of the fiscal
performance of a state (Annex A-2.4). During the decade
of 1993-94 to 2002-03, the tax buoyancy of Delhi has
been in the range of 0.9 to 1.09. The highest—1.09—was
achieved in 1995-96, while the lowest of 0.9 occurred
three years later in 1998-99. However, there has been
tremendous improvement in the collection of taxes in
2004-05, largely due to reduction in the arrears, and this
has resulted in higher tax buoyancy. For a fiscal
administrator, this could be a matter of satisfaction that
the collection of taxes is keeping pace with the
incremental income, or not lagging far behind. But there
are many states in India, where tax buoyancy is much
higher even with lower per capita income. In terms of
structure of economy or employment in the organised
sector, these states are no better, when compared with
Delhi. A part of the explanation can be had from the
mounting arrears of tax revenue. (Annex A-2.7) These
stood at 9364.77 crore in 2003-04; a staggering 159.15
per cent of the total tax revenue collected in that year.
However, in 2004-05, as stated earlier, the arrears of tax
revenue were 121.54 per cent of the taxes collected that
year. All these arrears are on account of sales tax alone. In
2003-04, the collection of the sales tax was Rs. 4435.17
crore, while the arrears for the same year were 1036.17
crore or 23.38 per cent of the sales tax collected in that
year. In the previous year i.e., 2002-03, the arrears on
account of sales tax were 34.2 per cent of the total
amounted collected in that year. This has been the highest
arrear in comparison to demand during the last five years.
However, there was no addition to arrears in 2004-05; the
increase in the revenue of the sales tax (VAT) was mainly
on account of the recovery of the past arrears. It shows
that if the arrears alone are not allowed to mount, there
would be tremendous improvement in the tax buoyancy
and tax-GSDP ratio.
2.12 Own Non-Tax Revenue
Non-tax revenue has two components; own non-tax
revenue, and transfers from the Central Government, other
than share in Central taxes (Annex A-2.5) However, in the
case of Delhi, the share of Delhi in Central taxes is
transferred to it in the form of grants-in-aid, and is
therefore clubbed with non-tax revenue. Own non-tax
revenue generally comprises of interest, dividends, revenue
from forestry and wild life, royalty on mineral resources,
irrigation dues, included in a host of other state activities
classified as general, economic and social services. In Delhi,
there is a very small area under forests; it is not a source of
revenue. There are hardly any minerals or irrigation
sources, which could be tapped as a source of revenue.
2.12.1 Interest Receipts
The major source of non-tax revenue is the receipts
from interest on loans given to local bodies and state
public sector undertakings. These constituted 89.21 per
cent of the total non-tax revenue in 2004-05. Interest
receipts were only Rs. 5.52 crore in 1996-97, and
constituted less than 10 per cent of the total non-tax
receipts. The phenomenal increase in the receipts on
account of interest has been, firstly, due to increasing
budgetary support to local bodies, statutory corporations
and local bodies by granting them loans. Secondly, in
most cases, the receipts are mainly in the form of book
entry where interest receipts are converted into loan to
the same institution at specified rate of interest prevailing
at that time. The conversion of interest due into loan
every year notionally increases the interest receipts. This
process started from 1997-98; interest receipts stood at
Rs. 822 crore out of a total non-tax revenue of Rs. 921
crore in 2004-05.
2.12.2 Receipts from General Services
General services are the other important group from
which a significant amount of non-tax revenue is
collected. It used to be the most important among group
of services, which contributed nearly 64 per cent of the
Chapter 2 • ECONOMY AND FISCAL MANAGEMENT 79
non-tax revenue in 1995-96. Its share was only 5.23 per
cent of the non-tax revenue in 2004-05. There have been
year-to-year fluctuations in the amount collected; and it
has not been able to attain the peak of Rs.53 crore
recorded in 1999-2000. General services comprise police,
jails, printing and stationery, and various other
administrative services. The scope of any significant
revenue from these services is always very limited. Most
states get revenue from lotteries, but it also has a very
high expenditure component in the form of prizes. In any
case, Delhi has no lottery.
2.12.3 Receipts from Social Services
In the social service group, education, medical and
public health, housing, urban development, labour and
employment, water supply, and sanitation etc., are
included. These are basically expenditure items, but some
revenue is also collected from some of the services
provided under these heads, but this is quite insignificant.
It was only Rs. 27.73 crore in 2004-05 and accounted for
3.01 per cent of own non-tax receipts. The bulk of the
revenue under this group is collected from public health,
education, and labour and employment. Even though
there is a clamour for collection of, at least, the
maintenance cost of the social services, there is little
possibility as most of these services cater to the basic
needs of low-income families. Health, housing, elementary
education, sanitation and water supply are, in any case, a
part of the national programmes, and these have to be
provided even to those who can not afford to pay for
them.
2.12.4 Receipts from Economic Services
Revenue from economic services was Rs. 19.77 crore
or 2.14 per cent of the own non-tax revenue in 2004-05.
It has never been an important source of revenue, as most
heads on which revenue is collected in other states are
virtually non-existent in Delhi. In most states, economic
services make a significant contribution to non-tax
revenues. Royalty from minerals, sale of minor forest
produce and timber, irrigation dues etc., are the important
source of revenue. Small amounts are generated from
animal husbandry, fisheries, dairy development etc. There
is hardly any revenue earning forest area in Delhi. Nor are
there any minerals. The small revenue generated under
this group is from small and village industries, as it
includes mining and quarrying activities. Major and minor
irrigation projects also contribute a small amount to the
state exchequer. Even though the share of economic
services in the non-tax revenue has come down to 1.24
per cent, these two sectors have continued to contribute a
major portion of the revenue under this group. However,
looking to over all revenue receipts from other heads,
these will continue to pale into insignificance.
2.13 Central Transfers
The 69th amendment to the Constitution has given a
special status to Delhi, but this special status is among
the Union Territories. Delhi is not a state; as such central
transfers to Delhi are in the form of grants-in-aid to the
revenues of the NCT administration. Basically there are
three types of grants given to the government of NCT.
These are: grants for the state plan schemes; grants for
the centrally sponsored and central sector schemes; and
statutory grants. While grants for the first two heads vary
from year to year depending on the size of the plan, and
the need and ability of the NCT to draw funds under
various centrally sponsored and central sector schemes,
statutory grants are, more or less, fixed for a period as
would be discernible from the devolution during the last
few years. These may be based on the NCT’s share on the
shareable tax revenue of the Central government accruing
from the state, but instead of the share being fixed in
terms of percentages, as is done by the Finance
Commission for allocating shares vertically between the
Centre and the states on the one hand, and horizontally
between the states, the quantum has been fixed. This has
deprived the NCT of the buoyancy, that is generally
available in the Central taxes The Finance Commission
makes recommendations for the states for a period of five
years; Union Territories are not covered by it as
administration of Union territories, including management
of their finances, is basically the responsibility of the
Central government.
A consequence of the approach adopted by the Central
government on statutory grants is that there has been
only marginal increase in the Central transfers during the
last few years. In the decade of the nineties, grants were
fixed afresh every year, and therefore it was possible to
add on to the figures of the previous years. Thus, there
was an increase of 31.02 per cent in 1995-96, 67.85 per
cent in 1996-97, 91.84 per cent in 1997-98, and 32.42 per
cent in 1999-2000 over the previous years. In comparison
to trends recorded in the nineties, there was a growth of
only 10.97 per cent in 2000-01 and a decline of 2.86 per
cent in 2001-02. However, in 2002-03, there has been an
increase of 6.5 per cent, but these are almost at the same
level in 2003-04. There was a marginal increase in the
central transfers from Rs. 514.02 crore to Rs. 535.11
crore in 2004-05. As stated, the growth in the level of
grants has been on account of a marginally higher support
to state plan schemes, and centrally sponsored schemes.
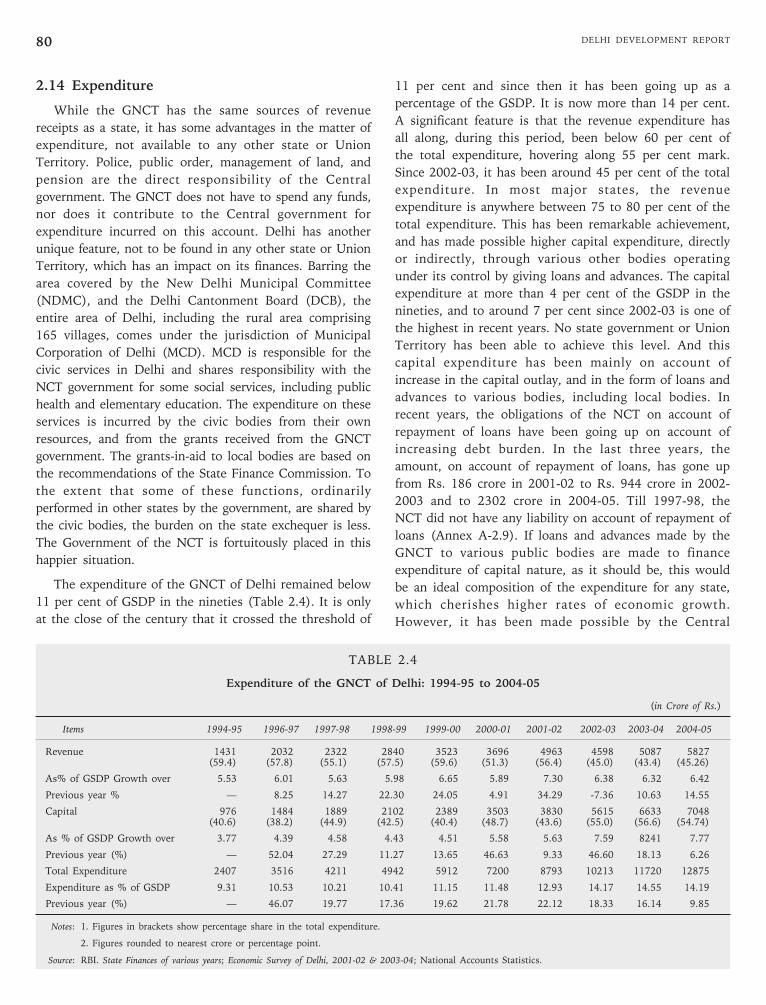
DELHI DEVELOPMENT REPORT80
2.14 Expenditure
While the GNCT has the same sources of revenue
receipts as a state, it has some advantages in the matter of
expenditure, not available to any other state or Union
Territory. Police, public order, management of land, and
pension are the direct responsibility of the Central
government. The GNCT does not have to spend any funds,
nor does it contribute to the Central government for
expenditure incurred on this account. Delhi has another
unique feature, not to be found in any other state or Union
Territory, which has an impact on its finances. Barring the
area covered by the New Delhi Municipal Committee
(NDMC), and the Delhi Cantonment Board (DCB), the
entire area of Delhi, including the rural area comprising
165 villages, comes under the jurisdiction of Municipal
Corporation of Delhi (MCD). MCD is responsible for the
civic services in Delhi and shares responsibility with the
NCT government for some social services, including public
health and elementary education. The expenditure on these
services is incurred by the civic bodies from their own
resources, and from the grants received from the GNCT
government. The grants-in-aid to local bodies are based on
the recommendations of the State Finance Commission. To
the extent that some of these functions, ordinarily
performed in other states by the government, are shared by
the civic bodies, the burden on the state exchequer is less.
The Government of the NCT is fortuitously placed in this
happier situation.
The expenditure of the GNCT of Delhi remained below
11 per cent of GSDP in the nineties (Table 2.4). It is only
at the close of the century that it crossed the threshold of
TABLE 2.4
Expenditure of the GNCT of Delhi: 1994-95 to 2004-05
(in Crore of Rs.)
Items 1994-95 1996-97 1997-98 1998-99 1999-00 2000-01 2001-02 2002-03 2003-04 2004-05
Revenue 1431 2032 2322 2840 3523 3696 4963 4598 5087 5827(59.4) (57.8) (55.1) (57.5) (59.6) (51.3) (56.4) (45.0) (43.4) (45.26)
As% of GSDP Growth over 5.53 6.01 5.63 5.98 6.65 5.89 7.30 6.38 6.32 6.42
Previous year % — 8.25 14.27 22.30 24.05 4.91 34.29 -7.36 10.63 14.55
Capital 976 1484 1889 2102 2389 3503 3830 5615 6633 7048(40.6) (38.2) (44.9) (42.5) (40.4) (48.7) (43.6) (55.0) (56.6) (54.74)
As % of GSDP Growth over 3.77 4.39 4.58 4.43 4.51 5.58 5.63 7.59 8241 7.77
Previous year (%) — 52.04 27.29 11.27 13.65 46.63 9.33 46.60 18.13 6.26
Total Expenditure 2407 3516 4211 4942 5912 7200 8793 10213 11720 12875
Expenditure as % of GSDP 9.31 10.53 10.21 10.41 11.15 11.48 12.93 14.17 14.55 14.19
Previous year (%) — 46.07 19.77 17.36 19.62 21.78 22.12 18.33 16.14 9.85
Notes: 1. Figures in brackets show percentage share in the total expenditure.
2. Figures rounded to nearest crore or percentage point.
Source: RBI. State Finances of various years; Economic Survey of Delhi, 2001-02 & 2003-04; National Accounts Statistics.
11 per cent and since then it has been going up as a
percentage of the GSDP. It is now more than 14 per cent.
A significant feature is that the revenue expenditure has
all along, during this period, been below 60 per cent of
the total expenditure, hovering along 55 per cent mark.
Since 2002-03, it has been around 45 per cent of the total
expenditure. In most major states, the revenue
expenditure is anywhere between 75 to 80 per cent of the
total expenditure. This has been remarkable achievement,
and has made possible higher capital expenditure, directly
or indirectly, through various other bodies operating
under its control by giving loans and advances. The capital
expenditure at more than 4 per cent of the GSDP in the
nineties, and to around 7 per cent since 2002-03 is one of
the highest in recent years. No state government or Union
Territory has been able to achieve this level. And this
capital expenditure has been mainly on account of
increase in the capital outlay, and in the form of loans and
advances to various bodies, including local bodies. In
recent years, the obligations of the NCT on account of
repayment of loans have been going up on account of
increasing debt burden. In the last three years, the
amount, on account of repayment of loans, has gone up
from Rs. 186 crore in 2001-02 to Rs. 944 crore in 2002-
2003 and to 2302 crore in 2004-05. Till 1997-98, the
NCT did not have any liability on account of repayment of
loans (Annex A-2.9). If loans and advances made by the
GNCT to various public bodies are made to finance
expenditure of capital nature, as it should be, this would
be an ideal composition of the expenditure for any state,
which cherishes higher rates of economic growth.
However, it has been made possible by the Central
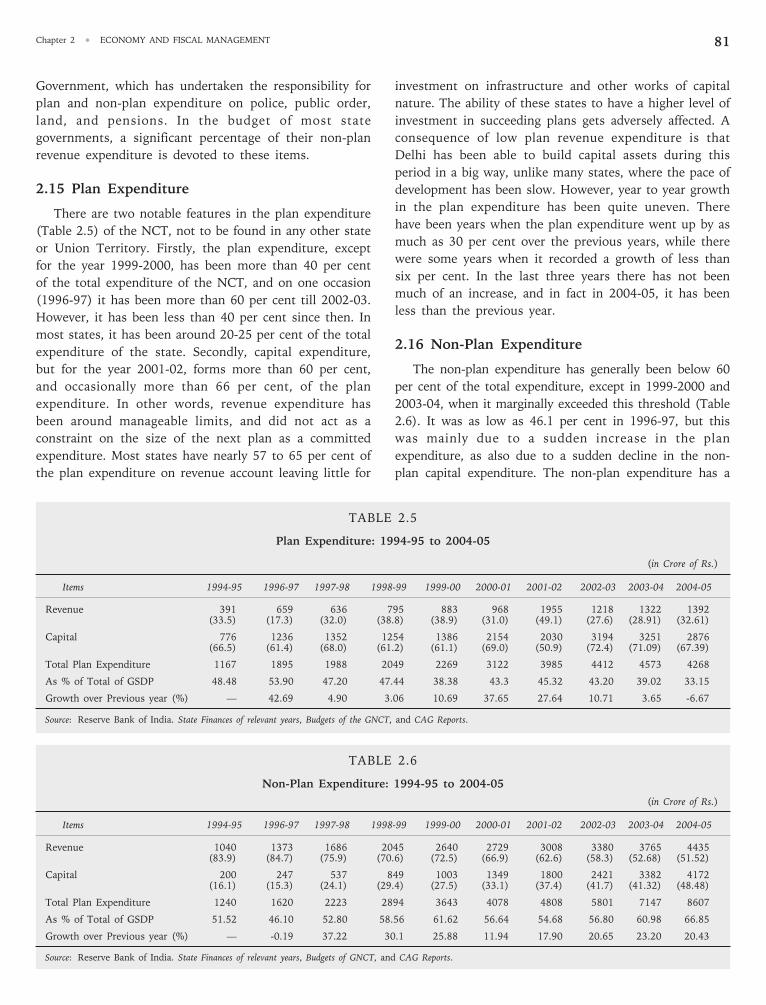
Chapter 2 • ECONOMY AND FISCAL MANAGEMENT 81
Government, which has undertaken the responsibility for
plan and non-plan expenditure on police, public order,
land, and pensions. In the budget of most state
governments, a significant percentage of their non-plan
revenue expenditure is devoted to these items.
2.15 Plan Expenditure
There are two notable features in the plan expenditure
(Table 2.5) of the NCT, not to be found in any other state
or Union Territory. Firstly, the plan expenditure, except
for the year 1999-2000, has been more than 40 per cent
of the total expenditure of the NCT, and on one occasion
(1996-97) it has been more than 60 per cent till 2002-03.
However, it has been less than 40 per cent since then. In
most states, it has been around 20-25 per cent of the total
expenditure of the state. Secondly, capital expenditure,
but for the year 2001-02, forms more than 60 per cent,
and occasionally more than 66 per cent, of the plan
expenditure. In other words, revenue expenditure has
been around manageable limits, and did not act as a
constraint on the size of the next plan as a committed
expenditure. Most states have nearly 57 to 65 per cent of
the plan expenditure on revenue account leaving little for
investment on infrastructure and other works of capital
nature. The ability of these states to have a higher level of
investment in succeeding plans gets adversely affected. A
consequence of low plan revenue expenditure is that
Delhi has been able to build capital assets during this
period in a big way, unlike many states, where the pace of
development has been slow. However, year to year growth
in the plan expenditure has been quite uneven. There
have been years when the plan expenditure went up by as
much as 30 per cent over the previous years, while there
were some years when it recorded a growth of less than
six per cent. In the last three years there has not been
much of an increase, and in fact in 2004-05, it has been
less than the previous year.
2.16 Non-Plan Expenditure
The non-plan expenditure has generally been below 60
per cent of the total expenditure, except in 1999-2000 and
2003-04, when it marginally exceeded this threshold (Table
2.6). It was as low as 46.1 per cent in 1996-97, but this
was mainly due to a sudden increase in the plan
expenditure, as also due to a sudden decline in the non-
plan capital expenditure. The non-plan expenditure has a
TABLE 2.5
Plan Expenditure: 1994-95 to 2004-05
(in Crore of Rs.)
Items 1994-95 1996-97 1997-98 1998-99 1999-00 2000-01 2001-02 2002-03 2003-04 2004-05
Revenue 391 659 636 795 883 968 1955 1218 1322 1392(33.5) (17.3) (32.0) (38.8) (38.9) (31.0) (49.1) (27.6) (28.91) (32.61)
Capital 776 1236 1352 1254 1386 2154 2030 3194 3251 2876(66.5) (61.4) (68.0) (61.2) (61.1) (69.0) (50.9) (72.4) (71.09) (67.39)
Total Plan Expenditure 1167 1895 1988 2049 2269 3122 3985 4412 4573 4268
As % of Total of GSDP 48.48 53.90 47.20 47.44 38.38 43.3 45.32 43.20 39.02 33.15
Growth over Previous year (%) — 42.69 4.90 3.06 10.69 37.65 27.64 10.71 3.65 -6.67
Source: Reserve Bank of India. State Finances of relevant years, Budgets of the GNCT, and CAG Reports.
TABLE 2.6
Non-Plan Expenditure: 1994-95 to 2004-05
(in Crore of Rs.)
Items 1994-95 1996-97 1997-98 1998-99 1999-00 2000-01 2001-02 2002-03 2003-04 2004-05
Revenue 1040 1373 1686 2045 2640 2729 3008 3380 3765 4435(83.9) (84.7) (75.9) (70.6) (72.5) (66.9) (62.6) (58.3) (52.68) (51.52)
Capital 200 247 537 849 1003 1349 1800 2421 3382 4172(16.1) (15.3) (24.1) (29.4) (27.5) (33.1) (37.4) (41.7) (41.32) (48.48)
Total Plan Expenditure 1240 1620 2223 2894 3643 4078 4808 5801 7147 8607
As % of Total of GSDP 51.52 46.10 52.80 58.56 61.62 56.64 54.68 56.80 60.98 66.85
Growth over Previous year (%) — -0.19 37.22 30.1 25.88 11.94 17.90 20.65 23.20 20.43
Source: Reserve Bank of India. State Finances of relevant years, Budgets of GNCT, and CAG Reports.
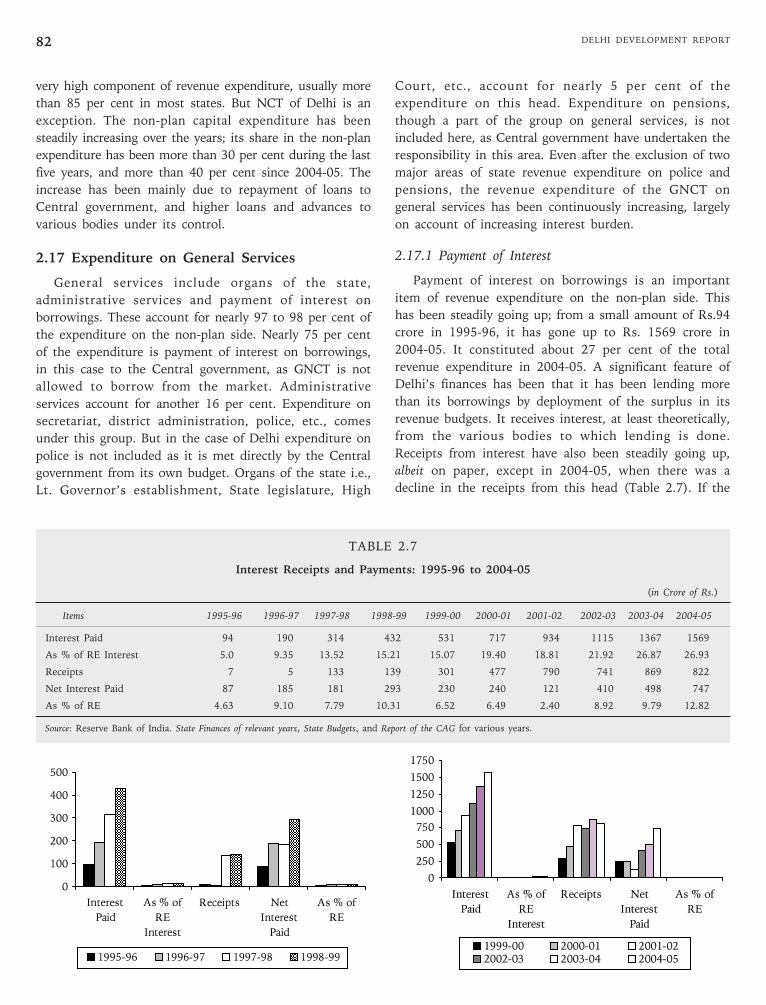
DELHI DEVELOPMENT REPORT82
very high component of revenue expenditure, usually more
than 85 per cent in most states. But NCT of Delhi is an
exception. The non-plan capital expenditure has been
steadily increasing over the years; its share in the non-plan
expenditure has been more than 30 per cent during the last
five years, and more than 40 per cent since 2004-05. The
increase has been mainly due to repayment of loans to
Central government, and higher loans and advances to
various bodies under its control.
2.17 Expenditure on General Services
General services include organs of the state,
administrative services and payment of interest on
borrowings. These account for nearly 97 to 98 per cent of
the expenditure on the non-plan side. Nearly 75 per cent
of the expenditure is payment of interest on borrowings,
in this case to the Central government, as GNCT is not
allowed to borrow from the market. Administrative
services account for another 16 per cent. Expenditure on
secretariat, district administration, police, etc., comes
under this group. But in the case of Delhi expenditure on
police is not included as it is met directly by the Central
government from its own budget. Organs of the state i.e.,
Lt. Governor’s establishment, State legislature, High
Court, etc., account for nearly 5 per cent of the
expenditure on this head. Expenditure on pensions,
though a part of the group on general services, is not
included here, as Central government have undertaken the
responsibility in this area. Even after the exclusion of two
major areas of state revenue expenditure on police and
pensions, the revenue expenditure of the GNCT on
general services has been continuously increasing, largely
on account of increasing interest burden.
2.17.1 Payment of Interest
Payment of interest on borrowings is an important
item of revenue expenditure on the non-plan side. This
has been steadily going up; from a small amount of Rs.94
crore in 1995-96, it has gone up to Rs. 1569 crore in
2004-05. It constituted about 27 per cent of the total
revenue expenditure in 2004-05. A significant feature of
Delhi’s finances has been that it has been lending more
than its borrowings by deployment of the surplus in its
revenue budgets. It receives interest, at least theoretically,
from the various bodies to which lending is done.
Receipts from interest have also been steadily going up,
albeit on paper, except in 2004-05, when there was a
decline in the receipts from this head (Table 2.7). If the
TABLE 2.7
Interest Receipts and Payments: 1995-96 to 2004-05
(in Crore of Rs.)
Items 1995-96 1996-97 1997-98 1998-99 1999-00 2000-01 2001-02 2002-03 2003-04 2004-05
Interest Paid 94 190 314 432 531 717 934 1115 1367 1569
As % of RE Interest 5.0 9.35 13.52 15.21 15.07 19.40 18.81 21.92 26.87 26.93
Receipts 7 5 133 139 301 477 790 741 869 822
Net Interest Paid 87 185 181 293 230 240 121 410 498 747
As % of RE 4.63 9.10 7.79 10.31 6.52 6.49 2.40 8.92 9.79 12.82
Source: Reserve Bank of India. State Finances of relevant years, State Budgets, and Report of the CAG for various years.
0
250
500
750
1000
1250
1500
1750
Interest
Paid
As % of
RE
Interest
Receipts Net
Interest
Paid
As % of
RE
1999-00 2000-01 2001-022002-03 2003-04 2004-05
0
100
200
300
400
500
Interest
Paid
As % of
RE
Interest
Receipts Net
Interest
Paid
As % of
RE
1995-96 1996-97 1997-98 1998-99
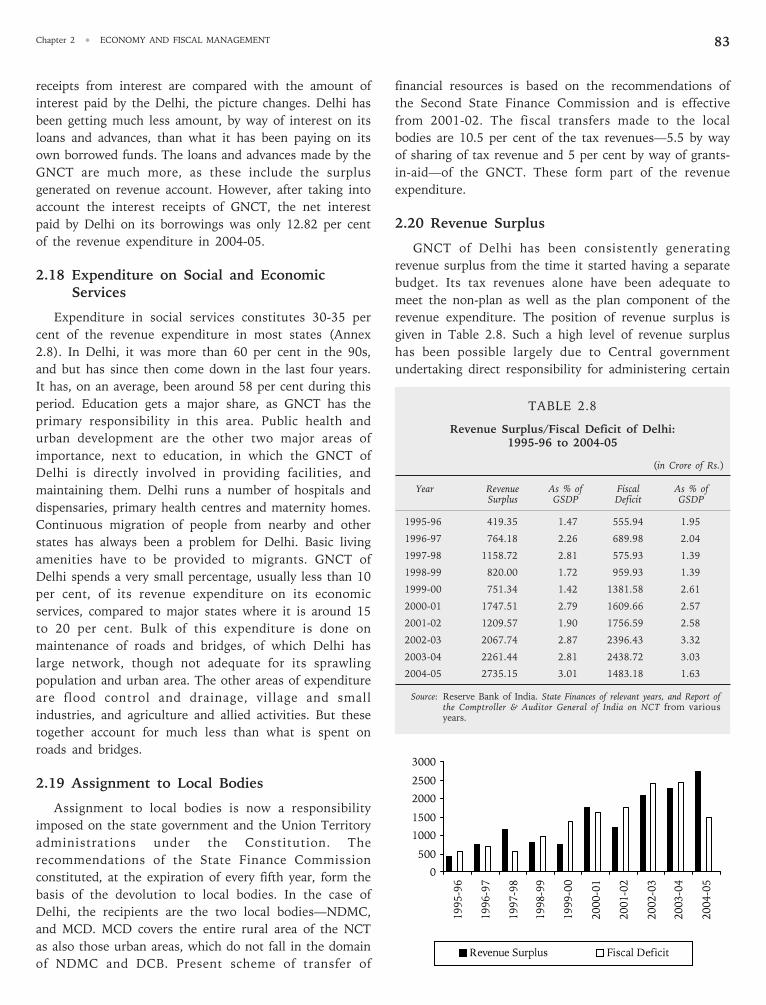
Chapter 2 • ECONOMY AND FISCAL MANAGEMENT 83
receipts from interest are compared with the amount of
interest paid by the Delhi, the picture changes. Delhi has
been getting much less amount, by way of interest on its
loans and advances, than what it has been paying on its
own borrowed funds. The loans and advances made by the
GNCT are much more, as these include the surplus
generated on revenue account. However, after taking into
account the interest receipts of GNCT, the net interest
paid by Delhi on its borrowings was only 12.82 per cent
of the revenue expenditure in 2004-05.
2.18 Expenditure on Social and EconomicServices
Expenditure in social services constitutes 30-35 per
cent of the revenue expenditure in most states (Annex
2.8). In Delhi, it was more than 60 per cent in the 90s,
and but has since then come down in the last four years.
It has, on an average, been around 58 per cent during this
period. Education gets a major share, as GNCT has the
primary responsibility in this area. Public health and
urban development are the other two major areas of
importance, next to education, in which the GNCT of
Delhi is directly involved in providing facilities, and
maintaining them. Delhi runs a number of hospitals and
dispensaries, primary health centres and maternity homes.
Continuous migration of people from nearby and other
states has always been a problem for Delhi. Basic living
amenities have to be provided to migrants. GNCT of
Delhi spends a very small percentage, usually less than 10
per cent, of its revenue expenditure on its economic
services, compared to major states where it is around 15
to 20 per cent. Bulk of this expenditure is done on
maintenance of roads and bridges, of which Delhi has
large network, though not adequate for its sprawling
population and urban area. The other areas of expenditure
are flood control and drainage, village and small
industries, and agriculture and allied activities. But these
together account for much less than what is spent on
roads and bridges.
2.19 Assignment to Local Bodies
Assignment to local bodies is now a responsibility
imposed on the state government and the Union Territory
administrations under the Constitution. The
recommendations of the State Finance Commission
constituted, at the expiration of every fifth year, form the
basis of the devolution to local bodies. In the case of
Delhi, the recipients are the two local bodies—NDMC,
and MCD. MCD covers the entire rural area of the NCT
as also those urban areas, which do not fall in the domain
of NDMC and DCB. Present scheme of transfer of
financial resources is based on the recommendations of
the Second State Finance Commission and is effective
from 2001-02. The fiscal transfers made to the local
bodies are 10.5 per cent of the tax revenues—5.5 by way
of sharing of tax revenue and 5 per cent by way of grants-
in-aid—of the GNCT. These form part of the revenue
expenditure.
2.20 Revenue Surplus
GNCT of Delhi has been consistently generating
revenue surplus from the time it started having a separate
budget. Its tax revenues alone have been adequate to
meet the non-plan as well as the plan component of the
revenue expenditure. The position of revenue surplus is
given in Table 2.8. Such a high level of revenue surplus
has been possible largely due to Central government
undertaking direct responsibility for administering certain
TABLE 2.8
Revenue Surplus/Fiscal Deficit of Delhi:1995-96 to 2004-05
(in Crore of Rs.)
Year Revenue As % of Fiscal As % ofSurplus GSDP Deficit GSDP
1995-96 419.35 1.47 555.94 1.95
1996-97 764.18 2.26 689.98 2.04
1997-98 1158.72 2.81 575.93 1.39
1998-99 820.00 1.72 959.93 1.39
1999-00 751.34 1.42 1381.58 2.61
2000-01 1747.51 2.79 1609.66 2.57
2001-02 1209.57 1.90 1756.59 2.58
2002-03 2067.74 2.87 2396.43 3.32
2003-04 2261.44 2.81 2438.72 3.03
2004-05 2735.15 3.01 1483.18 1.63
Source: Reserve Bank of India. State Finances of relevant years, and Report ofthe Comptroller & Auditor General of India on NCT from variousyears.
0
500
1000
1500
2000
2500
3000
1995-96
1996-97
1997-98
1998-99
1999-00
2000-01
2001-02
2002-03
2003-04
2004-05
Revenue Surplus Fiscal Deficit
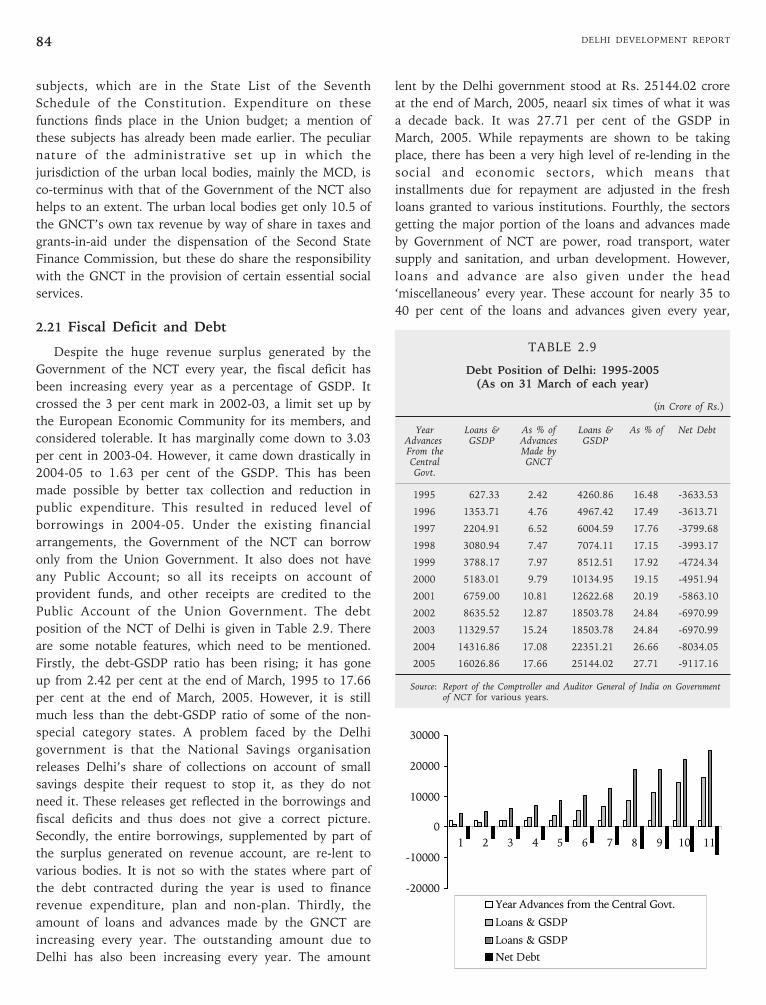
DELHI DEVELOPMENT REPORT84
subjects, which are in the State List of the Seventh
Schedule of the Constitution. Expenditure on these
functions finds place in the Union budget; a mention of
these subjects has already been made earlier. The peculiar
nature of the administrative set up in which the
jurisdiction of the urban local bodies, mainly the MCD, is
co-terminus with that of the Government of the NCT also
helps to an extent. The urban local bodies get only 10.5 of
the GNCT’s own tax revenue by way of share in taxes and
grants-in-aid under the dispensation of the Second State
Finance Commission, but these do share the responsibility
with the GNCT in the provision of certain essential social
services.
2.21 Fiscal Deficit and Debt
Despite the huge revenue surplus generated by the
Government of the NCT every year, the fiscal deficit has
been increasing every year as a percentage of GSDP. It
crossed the 3 per cent mark in 2002-03, a limit set up by
the European Economic Community for its members, and
considered tolerable. It has marginally come down to 3.03
per cent in 2003-04. However, it came down drastically in
2004-05 to 1.63 per cent of the GSDP. This has been
made possible by better tax collection and reduction in
public expenditure. This resulted in reduced level of
borrowings in 2004-05. Under the existing financial
arrangements, the Government of the NCT can borrow
only from the Union Government. It also does not have
any Public Account; so all its receipts on account of
provident funds, and other receipts are credited to the
Public Account of the Union Government. The debt
position of the NCT of Delhi is given in Table 2.9. There
are some notable features, which need to be mentioned.
Firstly, the debt-GSDP ratio has been rising; it has gone
up from 2.42 per cent at the end of March, 1995 to 17.66
per cent at the end of March, 2005. However, it is still
much less than the debt-GSDP ratio of some of the non-
special category states. A problem faced by the Delhi
government is that the National Savings organisation
releases Delhi’s share of collections on account of small
savings despite their request to stop it, as they do not
need it. These releases get reflected in the borrowings and
fiscal deficits and thus does not give a correct picture.
Secondly, the entire borrowings, supplemented by part of
the surplus generated on revenue account, are re-lent to
various bodies. It is not so with the states where part of
the debt contracted during the year is used to finance
revenue expenditure, plan and non-plan. Thirdly, the
amount of loans and advances made by the GNCT are
increasing every year. The outstanding amount due to
Delhi has also been increasing every year. The amount
lent by the Delhi government stood at Rs. 25144.02 crore
at the end of March, 2005, neaarl six times of what it was
a decade back. It was 27.71 per cent of the GSDP in
March, 2005. While repayments are shown to be taking
place, there has been a very high level of re-lending in the
social and economic sectors, which means that
installments due for repayment are adjusted in the fresh
loans granted to various institutions. Fourthly, the sectors
getting the major portion of the loans and advances made
by Government of NCT are power, road transport, water
supply and sanitation, and urban development. However,
loans and advance are also given under the head
‘miscellaneous’ every year. These account for nearly 35 to
40 per cent of the loans and advances given every year,
TABLE 2.9
Debt Position of Delhi: 1995-2005(As on 31 March of each year)
(in Crore of Rs.)
Year Loans & As % of Loans & As % of Net DebtAdvances GSDP Advances GSDPFrom the Made byCentral GNCTGovt.
1995 627.33 2.42 4260.86 16.48 -3633.53
1996 1353.71 4.76 4967.42 17.49 -3613.71
1997 2204.91 6.52 6004.59 17.76 -3799.68
1998 3080.94 7.47 7074.11 17.15 -3993.17
1999 3788.17 7.97 8512.51 17.92 -4724.34
2000 5183.01 9.79 10134.95 19.15 -4951.94
2001 6759.00 10.81 12622.68 20.19 -5863.10
2002 8635.52 12.87 18503.78 24.84 -6970.99
2003 11329.57 15.24 18503.78 24.84 -6970.99
2004 14316.86 17.08 22351.21 26.66 -8034.05
2005 16026.86 17.66 25144.02 27.71 -9117.16
Source: Report of the Comptroller and Auditor General of India on Governmentof NCT for various years.
-20000
-10000
0
10000
20000
30000
1 2 3 4 5 6 7 8 9 10 11
Year Advances from the Central Govt.
Loans & GSDP
Loans & GSDP
Net Debt
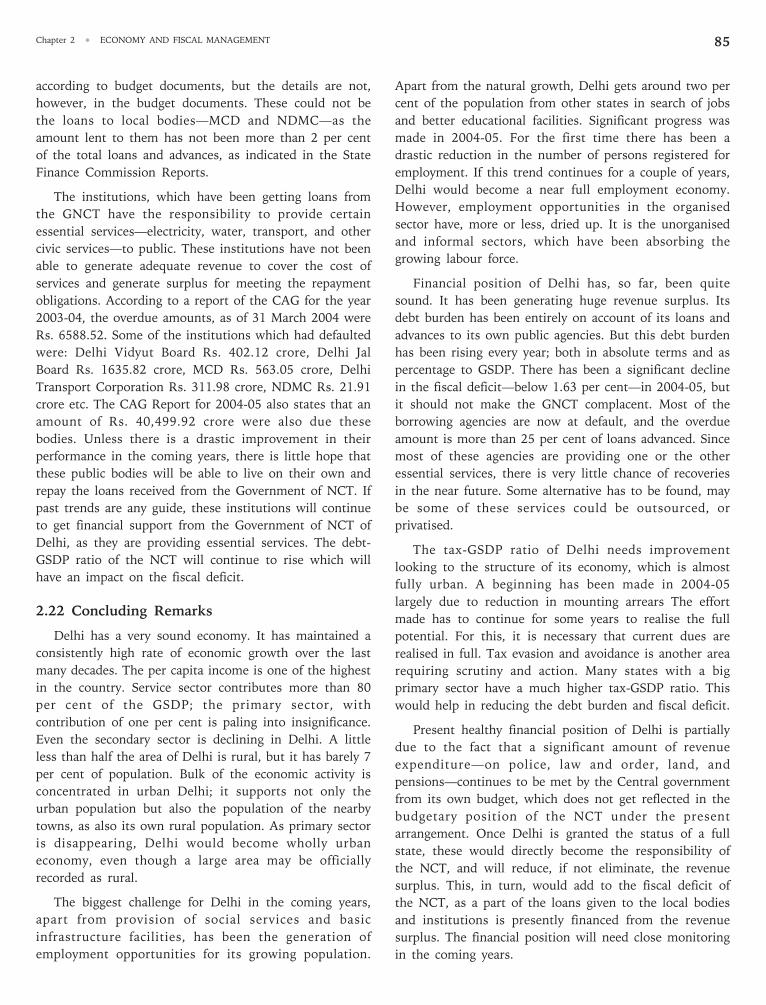
Chapter 2 • ECONOMY AND FISCAL MANAGEMENT 85
according to budget documents, but the details are not,
however, in the budget documents. These could not be
the loans to local bodies—MCD and NDMC—as the
amount lent to them has not been more than 2 per cent
of the total loans and advances, as indicated in the State
Finance Commission Reports.
The institutions, which have been getting loans from
the GNCT have the responsibility to provide certain
essential services—electricity, water, transport, and other
civic services—to public. These institutions have not been
able to generate adequate revenue to cover the cost of
services and generate surplus for meeting the repayment
obligations. According to a report of the CAG for the year
2003-04, the overdue amounts, as of 31 March 2004 were
Rs. 6588.52. Some of the institutions which had defaulted
were: Delhi Vidyut Board Rs. 402.12 crore, Delhi Jal
Board Rs. 1635.82 crore, MCD Rs. 563.05 crore, Delhi
Transport Corporation Rs. 311.98 crore, NDMC Rs. 21.91
crore etc. The CAG Report for 2004-05 also states that an
amount of Rs. 40,499.92 crore were also due these
bodies. Unless there is a drastic improvement in their
performance in the coming years, there is little hope that
these public bodies will be able to live on their own and
repay the loans received from the Government of NCT. If
past trends are any guide, these institutions will continue
to get financial support from the Government of NCT of
Delhi, as they are providing essential services. The debt-
GSDP ratio of the NCT will continue to rise which will
have an impact on the fiscal deficit.
2.22 Concluding Remarks
Delhi has a very sound economy. It has maintained a
consistently high rate of economic growth over the last
many decades. The per capita income is one of the highest
in the country. Service sector contributes more than 80
per cent of the GSDP; the primary sector, with
contribution of one per cent is paling into insignificance.
Even the secondary sector is declining in Delhi. A little
less than half the area of Delhi is rural, but it has barely 7
per cent of population. Bulk of the economic activity is
concentrated in urban Delhi; it supports not only the
urban population but also the population of the nearby
towns, as also its own rural population. As primary sector
is disappearing, Delhi would become wholly urban
economy, even though a large area may be officially
recorded as rural.
The biggest challenge for Delhi in the coming years,
apart from provision of social services and basic
infrastructure facilities, has been the generation of
employment opportunities for its growing population.
Apart from the natural growth, Delhi gets around two per
cent of the population from other states in search of jobs
and better educational facilities. Significant progress was
made in 2004-05. For the first time there has been a
drastic reduction in the number of persons registered for
employment. If this trend continues for a couple of years,
Delhi would become a near full employment economy.
However, employment opportunities in the organised
sector have, more or less, dried up. It is the unorganised
and informal sectors, which have been absorbing the
growing labour force.
Financial position of Delhi has, so far, been quite
sound. It has been generating huge revenue surplus. Its
debt burden has been entirely on account of its loans and
advances to its own public agencies. But this debt burden
has been rising every year; both in absolute terms and as
percentage to GSDP. There has been a significant decline
in the fiscal deficit—below 1.63 per cent—in 2004-05, but
it should not make the GNCT complacent. Most of the
borrowing agencies are now at default, and the overdue
amount is more than 25 per cent of loans advanced. Since
most of these agencies are providing one or the other
essential services, there is very little chance of recoveries
in the near future. Some alternative has to be found, may
be some of these services could be outsourced, or
privatised.
The tax-GSDP ratio of Delhi needs improvement
looking to the structure of its economy, which is almost
fully urban. A beginning has been made in 2004-05
largely due to reduction in mounting arrears The effort
made has to continue for some years to realise the full
potential. For this, it is necessary that current dues are
realised in full. Tax evasion and avoidance is another area
requiring scrutiny and action. Many states with a big
primary sector have a much higher tax-GSDP ratio. This
would help in reducing the debt burden and fiscal deficit.
Present healthy financial position of Delhi is partially
due to the fact that a significant amount of revenue
expenditure—on police, law and order, land, and
pensions—continues to be met by the Central government
from its own budget, which does not get reflected in the
budgetary position of the NCT under the present
arrangement. Once Delhi is granted the status of a full
state, these would directly become the responsibility of
the NCT, and will reduce, if not eliminate, the revenue
surplus. This, in turn, would add to the fiscal deficit of
the NCT, as a part of the loans given to the local bodies
and institutions is presently financed from the revenue
surplus. The financial position will need close monitoring
in the coming years.
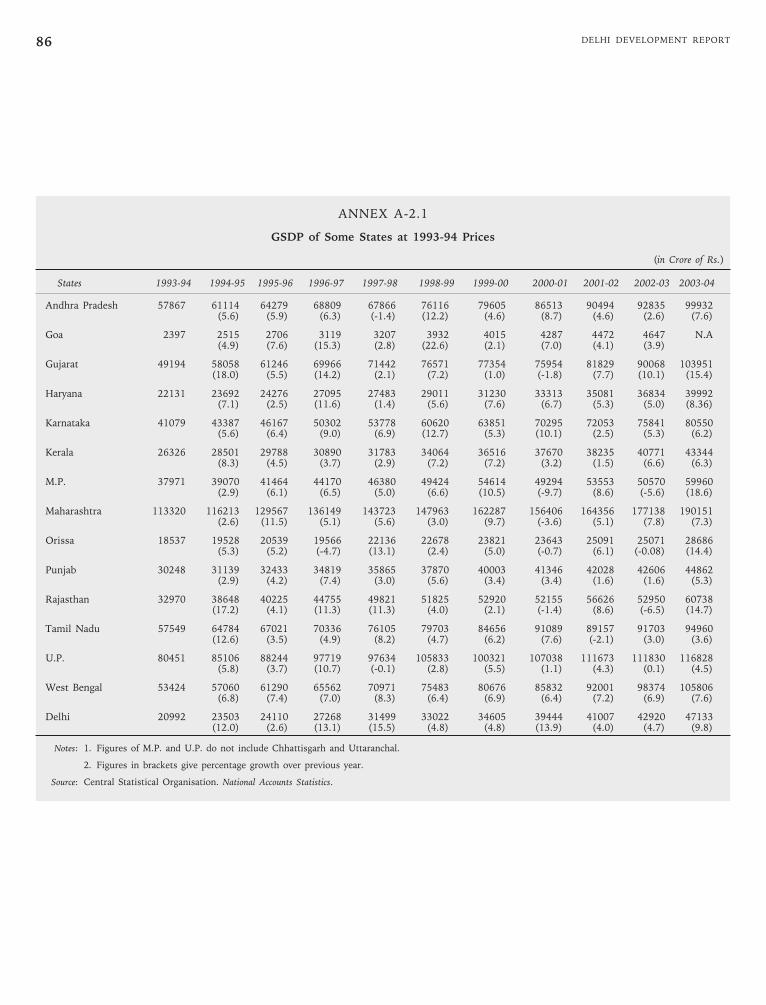
DELHI DEVELOPMENT REPORT86
ANNEX A-2.1
GSDP of Some States at 1993-94 Prices
(in Crore of Rs.)
States 1993-94 1994-95 1995-96 1996-97 1997-98 1998-99 1999-00 2000-01 2001-02 2002-03 2003-04
Andhra Pradesh 57867 61114 64279 68809 67866 76116 79605 86513 90494 92835 99932(5.6) (5.9) (6.3) (-1.4) (12.2) (4.6) (8.7) (4.6) (2.6) (7.6)
Goa 2397 2515 2706 3119 3207 3932 4015 4287 4472 4647 N.A(4.9) (7.6) (15.3) (2.8) (22.6) (2.1) (7.0) (4.1) (3.9)
Gujarat 49194 58058 61246 69966 71442 76571 77354 75954 81829 90068 103951(18.0) (5.5) (14.2) (2.1) (7.2) (1.0) (-1.8) (7.7) (10.1) (15.4)
Haryana 22131 23692 24276 27095 27483 29011 31230 33313 35081 36834 39992(7.1) (2.5) (11.6) (1.4) (5.6) (7.6) (6.7) (5.3) (5.0) (8.36)
Karnataka 41079 43387 46167 50302 53778 60620 63851 70295 72053 75841 80550(5.6) (6.4) (9.0) (6.9) (12.7) (5.3) (10.1) (2.5) (5.3) (6.2)
Kerala 26326 28501 29788 30890 31783 34064 36516 37670 38235 40771 43344(8.3) (4.5) (3.7) (2.9) (7.2) (7.2) (3.2) (1.5) (6.6) (6.3)
M.P. 37971 39070 41464 44170 46380 49424 54614 49294 53553 50570 59960(2.9) (6.1) (6.5) (5.0) (6.6) (10.5) (-9.7) (8.6) (-5.6) (18.6)
Maharashtra 113320 116213 129567 136149 143723 147963 162287 156406 164356 177138 190151(2.6) (11.5) (5.1) (5.6) (3.0) (9.7) (-3.6) (5.1) (7.8) (7.3)
Orissa 18537 19528 20539 19566 22136 22678 23821 23643 25091 25071 28686(5.3) (5.2) (-4.7) (13.1) (2.4) (5.0) (-0.7) (6.1) (-0.08) (14.4)
Punjab 30248 31139 32433 34819 35865 37870 40003 41346 42028 42606 44862(2.9) (4.2) (7.4) (3.0) (5.6) (3.4) (3.4) (1.6) (1.6) (5.3)
Rajasthan 32970 38648 40225 44755 49821 51825 52920 52155 56626 52950 60738(17.2) (4.1) (11.3) (11.3) (4.0) (2.1) (-1.4) (8.6) (-6.5) (14.7)
Tamil Nadu 57549 64784 67021 70336 76105 79703 84656 91089 89157 91703 94960(12.6) (3.5) (4.9) (8.2) (4.7) (6.2) (7.6) (-2.1) (3.0) (3.6)
U.P. 80451 85106 88244 97719 97634 105833 100321 107038 111673 111830 116828(5.8) (3.7) (10.7) (-0.1) (2.8) (5.5) (1.1) (4.3) (0.1) (4.5)
West Bengal 53424 57060 61290 65562 70971 75483 80676 85832 92001 98374 105806(6.8) (7.4) (7.0) (8.3) (6.4) (6.9) (6.4) (7.2) (6.9) (7.6)
Delhi 20992 23503 24110 27268 31499 33022 34605 39444 41007 42920 47133(12.0) (2.6) (13.1) (15.5) (4.8) (4.8) (13.9) (4.0) (4.7) (9.8)
Notes: 1. Figures of M.P. and U.P. do not include Chhattisgarh and Uttaranchal.
2. Figures in brackets give percentage growth over previous year.
Source: Central Statistical Organisation. National Accounts Statistics.
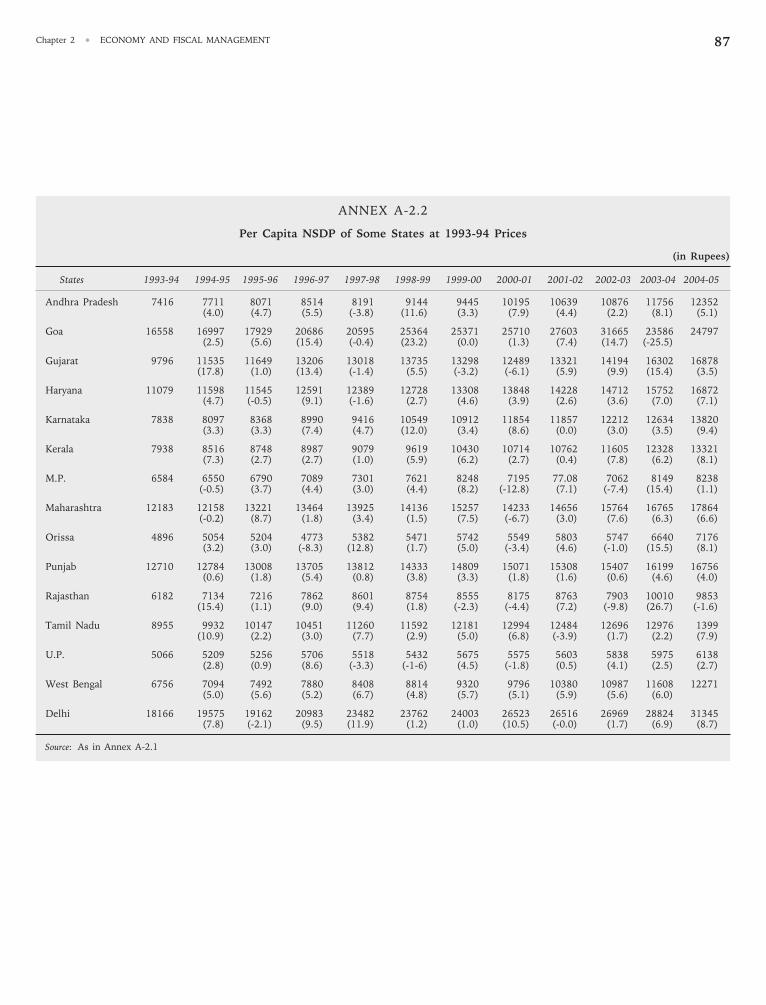
Chapter 2 • ECONOMY AND FISCAL MANAGEMENT 87
ANNEX A-2.2
Per Capita NSDP of Some States at 1993-94 Prices
(in Rupees)
States 1993-94 1994-95 1995-96 1996-97 1997-98 1998-99 1999-00 2000-01 2001-02 2002-03 2003-04 2004-05
Andhra Pradesh 7416 7711 8071 8514 8191 9144 9445 10195 10639 10876 11756 12352(4.0) (4.7) (5.5) (-3.8) (11.6) (3.3) (7.9) (4.4) (2.2) (8.1) (5.1)
Goa 16558 16997 17929 20686 20595 25364 25371 25710 27603 31665 23586 24797(2.5) (5.6) (15.4) (-0.4) (23.2) (0.0) (1.3) (7.4) (14.7) (-25.5)
Gujarat 9796 11535 11649 13206 13018 13735 13298 12489 13321 14194 16302 16878(17.8) (1.0) (13.4) (-1.4) (5.5) (-3.2) (-6.1) (5.9) (9.9) (15.4) (3.5)
Haryana 11079 11598 11545 12591 12389 12728 13308 13848 14228 14712 15752 16872(4.7) (-0.5) (9.1) (-1.6) (2.7) (4.6) (3.9) (2.6) (3.6) (7.0) (7.1)
Karnataka 7838 8097 8368 8990 9416 10549 10912 11854 11857 12212 12634 13820(3.3) (3.3) (7.4) (4.7) (12.0) (3.4) (8.6) (0.0) (3.0) (3.5) (9.4)
Kerala 7938 8516 8748 8987 9079 9619 10430 10714 10762 11605 12328 13321(7.3) (2.7) (2.7) (1.0) (5.9) (6.2) (2.7) (0.4) (7.8) (6.2) (8.1)
M.P. 6584 6550 6790 7089 7301 7621 8248 7195 77.08 7062 8149 8238(-0.5) (3.7) (4.4) (3.0) (4.4) (8.2) (-12.8) (7.1) (-7.4) (15.4) (1.1)
Maharashtra 12183 12158 13221 13464 13925 14136 15257 14233 14656 15764 16765 17864(-0.2) (8.7) (1.8) (3.4) (1.5) (7.5) (-6.7) (3.0) (7.6) (6.3) (6.6)
Orissa 4896 5054 5204 4773 5382 5471 5742 5549 5803 5747 6640 7176(3.2) (3.0) (-8.3) (12.8) (1.7) (5.0) (-3.4) (4.6) (-1.0) (15.5) (8.1)
Punjab 12710 12784 13008 13705 13812 14333 14809 15071 15308 15407 16199 16756(0.6) (1.8) (5.4) (0.8) (3.8) (3.3) (1.8) (1.6) (0.6) (4.6) (4.0)
Rajasthan 6182 7134 7216 7862 8601 8754 8555 8175 8763 7903 10010 9853(15.4) (1.1) (9.0) (9.4) (1.8) (-2.3) (-4.4) (7.2) (-9.8) (26.7) (-1.6)
Tamil Nadu 8955 9932 10147 10451 11260 11592 12181 12994 12484 12696 12976 1399(10.9) (2.2) (3.0) (7.7) (2.9) (5.0) (6.8) (-3.9) (1.7) (2.2) (7.9)
U.P. 5066 5209 5256 5706 5518 5432 5675 5575 5603 5838 5975 6138(2.8) (0.9) (8.6) (-3.3) (-1-6) (4.5) (-1.8) (0.5) (4.1) (2.5) (2.7)
West Bengal 6756 7094 7492 7880 8408 8814 9320 9796 10380 10987 11608 12271(5.0) (5.6) (5.2) (6.7) (4.8) (5.7) (5.1) (5.9) (5.6) (6.0)
Delhi 18166 19575 19162 20983 23482 23762 24003 26523 26516 26969 28824 31345(7.8) (-2.1) (9.5) (11.9) (1.2) (1.0) (10.5) (-0.0) (1.7) (6.9) (8.7)
Source: As in Annex A-2.1
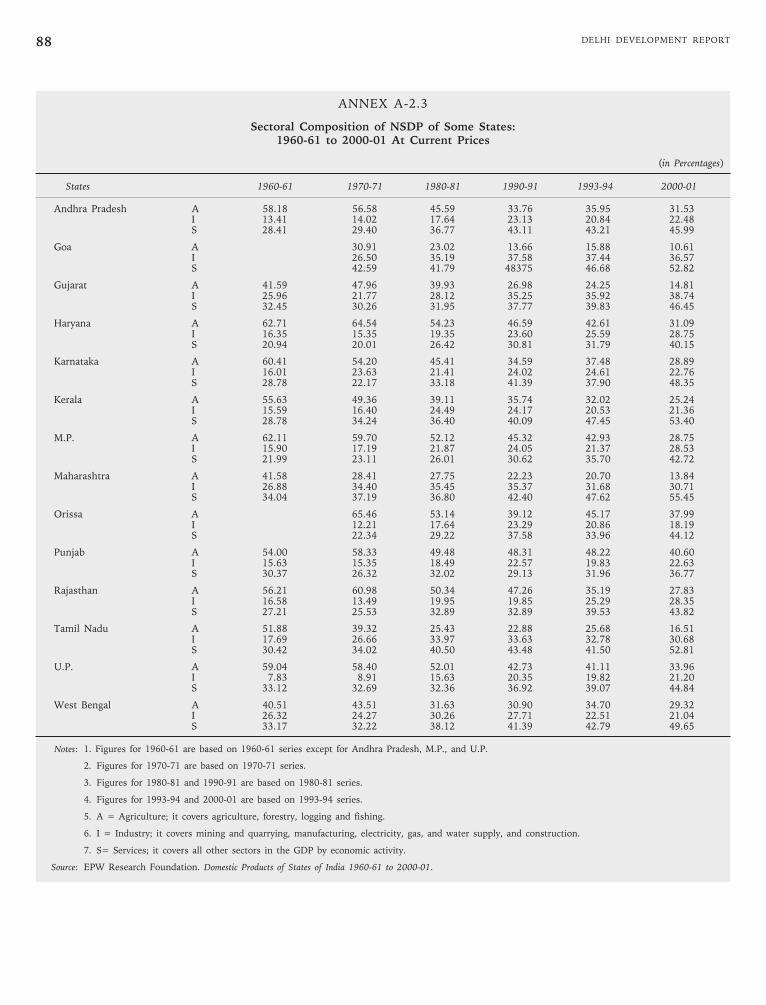
DELHI DEVELOPMENT REPORT88
ANNEX A-2.3
Sectoral Composition of NSDP of Some States:1960-61 to 2000-01 At Current Prices
(in Percentages)
States 1960-61 1970-71 1980-81 1990-91 1993-94 2000-01
Andhra Pradesh A 58.18 56.58 45.59 33.76 35.95 31.53I 13.41 14.02 17.64 23.13 20.84 22.48S 28.41 29.40 36.77 43.11 43.21 45.99
Goa A 30.91 23.02 13.66 15.88 10.61I 26.50 35.19 37.58 37.44 36.57S 42.59 41.79 48375 46.68 52.82
Gujarat A 41.59 47.96 39.93 26.98 24.25 14.81I 25.96 21.77 28.12 35.25 35.92 38.74S 32.45 30.26 31.95 37.77 39.83 46.45
Haryana A 62.71 64.54 54.23 46.59 42.61 31.09I 16.35 15.35 19.35 23.60 25.59 28.75S 20.94 20.01 26.42 30.81 31.79 40.15
Karnataka A 60.41 54.20 45.41 34.59 37.48 28.89I 16.01 23.63 21.41 24.02 24.61 22.76S 28.78 22.17 33.18 41.39 37.90 48.35
Kerala A 55.63 49.36 39.11 35.74 32.02 25.24I 15.59 16.40 24.49 24.17 20.53 21.36S 28.78 34.24 36.40 40.09 47.45 53.40
M.P. A 62.11 59.70 52.12 45.32 42.93 28.75I 15.90 17.19 21.87 24.05 21.37 28.53S 21.99 23.11 26.01 30.62 35.70 42.72
Maharashtra A 41.58 28.41 27.75 22.23 20.70 13.84I 26.88 34.40 35.45 35.37 31.68 30.71S 34.04 37.19 36.80 42.40 47.62 55.45
Orissa A 65.46 53.14 39.12 45.17 37.99I 12.21 17.64 23.29 20.86 18.19S 22.34 29.22 37.58 33.96 44.12
Punjab A 54.00 58.33 49.48 48.31 48.22 40.60I 15.63 15.35 18.49 22.57 19.83 22.63S 30.37 26.32 32.02 29.13 31.96 36.77
Rajasthan A 56.21 60.98 50.34 47.26 35.19 27.83I 16.58 13.49 19.95 19.85 25.29 28.35S 27.21 25.53 32.89 32.89 39.53 43.82
Tamil Nadu A 51.88 39.32 25.43 22.88 25.68 16.51I 17.69 26.66 33.97 33.63 32.78 30.68S 30.42 34.02 40.50 43.48 41.50 52.81
U.P. A 59.04 58.40 52.01 42.73 41.11 33.96I 7.83 8.91 15.63 20.35 19.82 21.20S 33.12 32.69 32.36 36.92 39.07 44.84
West Bengal A 40.51 43.51 31.63 30.90 34.70 29.32I 26.32 24.27 30.26 27.71 22.51 21.04S 33.17 32.22 38.12 41.39 42.79 49.65
Notes: 1. Figures for 1960-61 are based on 1960-61 series except for Andhra Pradesh, M.P., and U.P.
2. Figures for 1970-71 are based on 1970-71 series.
3. Figures for 1980-81 and 1990-91 are based on 1980-81 series.
4. Figures for 1993-94 and 2000-01 are based on 1993-94 series.
5. A = Agriculture; it covers agriculture, forestry, logging and fishing.
6. I = Industry; it covers mining and quarrying, manufacturing, electricity, gas, and water supply, and construction.
7. S= Services; it covers all other sectors in the GDP by economic activity.
Source: EPW Research Foundation. Domestic Products of States of India 1960-61 to 2000-01.
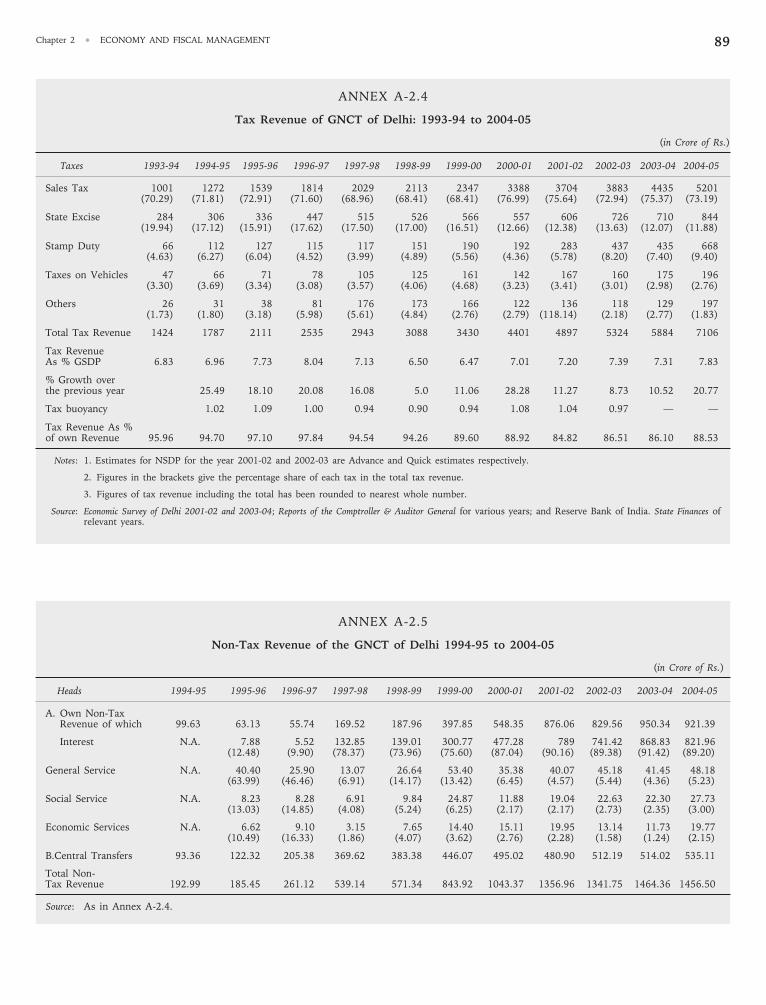
Chapter 2 • ECONOMY AND FISCAL MANAGEMENT 89
ANNEX A-2.4
Tax Revenue of GNCT of Delhi: 1993-94 to 2004-05
(in Crore of Rs.)
Taxes 1993-94 1994-95 1995-96 1996-97 1997-98 1998-99 1999-00 2000-01 2001-02 2002-03 2003-04 2004-05
Sales Tax 1001 1272 1539 1814 2029 2113 2347 3388 3704 3883 4435 5201(70.29) (71.81) (72.91) (71.60) (68.96) (68.41) (68.41) (76.99) (75.64) (72.94) (75.37) (73.19)
State Excise 284 306 336 447 515 526 566 557 606 726 710 844(19.94) (17.12) (15.91) (17.62) (17.50) (17.00) (16.51) (12.66) (12.38) (13.63) (12.07) (11.88)
Stamp Duty 66 112 127 115 117 151 190 192 283 437 435 668(4.63) (6.27) (6.04) (4.52) (3.99) (4.89) (5.56) (4.36) (5.78) (8.20) (7.40) (9.40)
Taxes on Vehicles 47 66 71 78 105 125 161 142 167 160 175 196(3.30) (3.69) (3.34) (3.08) (3.57) (4.06) (4.68) (3.23) (3.41) (3.01) (2.98) (2.76)
Others 26 31 38 81 176 173 166 122 136 118 129 197(1.73) (1.80) (3.18) (5.98) (5.61) (4.84) (2.76) (2.79) (118.14) (2.18) (2.77) (1.83)
Total Tax Revenue 1424 1787 2111 2535 2943 3088 3430 4401 4897 5324 5884 7106
Tax RevenueAs % GSDP 6.83 6.96 7.73 8.04 7.13 6.50 6.47 7.01 7.20 7.39 7.31 7.83
% Growth overthe previous year 25.49 18.10 20.08 16.08 5.0 11.06 28.28 11.27 8.73 10.52 20.77
Tax buoyancy 1.02 1.09 1.00 0.94 0.90 0.94 1.08 1.04 0.97 — —
Tax Revenue As %of own Revenue 95.96 94.70 97.10 97.84 94.54 94.26 89.60 88.92 84.82 86.51 86.10 88.53
Notes: 1. Estimates for NSDP for the year 2001-02 and 2002-03 are Advance and Quick estimates respectively.
2. Figures in the brackets give the percentage share of each tax in the total tax revenue.
3. Figures of tax revenue including the total has been rounded to nearest whole number.
Source: Economic Survey of Delhi 2001-02 and 2003-04; Reports of the Comptroller & Auditor General for various years; and Reserve Bank of India. State Finances ofrelevant years.
ANNEX A-2.5
Non-Tax Revenue of the GNCT of Delhi 1994-95 to 2004-05
(in Crore of Rs.)
Heads 1994-95 1995-96 1996-97 1997-98 1998-99 1999-00 2000-01 2001-02 2002-03 2003-04 2004-05
A. Own Non-TaxRevenue of which 99.63 63.13 55.74 169.52 187.96 397.85 548.35 876.06 829.56 950.34 921.39
Interest N.A. 7.88 5.52 132.85 139.01 300.77 477.28 789 741.42 868.83 821.96(12.48) (9.90) (78.37) (73.96) (75.60) (87.04) (90.16) (89.38) (91.42) (89.20)
General Service N.A. 40.40 25.90 13.07 26.64 53.40 35.38 40.07 45.18 41.45 48.18(63.99) (46.46) (6.91) (14.17) (13.42) (6.45) (4.57) (5.44) (4.36) (5.23)
Social Service N.A. 8.23 8.28 6.91 9.84 24.87 11.88 19.04 22.63 22.30 27.73(13.03) (14.85) (4.08) (5.24) (6.25) (2.17) (2.17) (2.73) (2.35) (3.00)
Economic Services N.A. 6.62 9.10 3.15 7.65 14.40 15.11 19.95 13.14 11.73 19.77(10.49) (16.33) (1.86) (4.07) (3.62) (2.76) (2.28) (1.58) (1.24) (2.15)
B.Central Transfers 93.36 122.32 205.38 369.62 383.38 446.07 495.02 480.90 512.19 514.02 535.11
Total Non-Tax Revenue 192.99 185.45 261.12 539.14 571.34 843.92 1043.37 1356.96 1341.75 1464.36 1456.50
Source: As in Annex A-2.4.
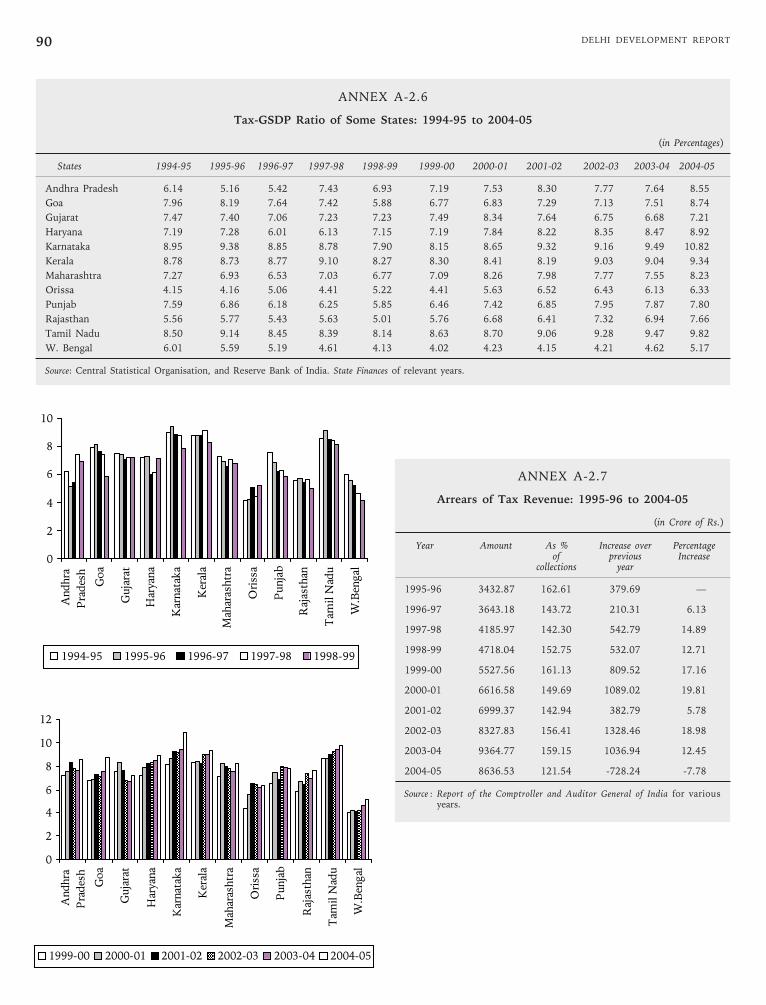
DELHI DEVELOPMENT REPORT90
ANNEX A-2.6
Tax-GSDP Ratio of Some States: 1994-95 to 2004-05
(in Percentages)
States 1994-95 1995-96 1996-97 1997-98 1998-99 1999-00 2000-01 2001-02 2002-03 2003-04 2004-05
Andhra Pradesh 6.14 5.16 5.42 7.43 6.93 7.19 7.53 8.30 7.77 7.64 8.55
Goa 7.96 8.19 7.64 7.42 5.88 6.77 6.83 7.29 7.13 7.51 8.74
Gujarat 7.47 7.40 7.06 7.23 7.23 7.49 8.34 7.64 6.75 6.68 7.21
Haryana 7.19 7.28 6.01 6.13 7.15 7.19 7.84 8.22 8.35 8.47 8.92
Karnataka 8.95 9.38 8.85 8.78 7.90 8.15 8.65 9.32 9.16 9.49 10.82
Kerala 8.78 8.73 8.77 9.10 8.27 8.30 8.41 8.19 9.03 9.04 9.34
Maharashtra 7.27 6.93 6.53 7.03 6.77 7.09 8.26 7.98 7.77 7.55 8.23
Orissa 4.15 4.16 5.06 4.41 5.22 4.41 5.63 6.52 6.43 6.13 6.33
Punjab 7.59 6.86 6.18 6.25 5.85 6.46 7.42 6.85 7.95 7.87 7.80
Rajasthan 5.56 5.77 5.43 5.63 5.01 5.76 6.68 6.41 7.32 6.94 7.66
Tamil Nadu 8.50 9.14 8.45 8.39 8.14 8.63 8.70 9.06 9.28 9.47 9.82
W. Bengal 6.01 5.59 5.19 4.61 4.13 4.02 4.23 4.15 4.21 4.62 5.17
Source: Central Statistical Organisation, and Reserve Bank of India. State Finances of relevant years.
ANNEX A-2.7
Arrears of Tax Revenue: 1995-96 to 2004-05
(in Crore of Rs.)
Year Amount As % Increase over Percentageof previous Increase
collections year
1995-96 3432.87 162.61 379.69 —
1996-97 3643.18 143.72 210.31 6.13
1997-98 4185.97 142.30 542.79 14.89
1998-99 4718.04 152.75 532.07 12.71
1999-00 5527.56 161.13 809.52 17.16
2000-01 6616.58 149.69 1089.02 19.81
2001-02 6999.37 142.94 382.79 5.78
2002-03 8327.83 156.41 1328.46 18.98
2003-04 9364.77 159.15 1036.94 12.45
2004-05 8636.53 121.54 -728.24 -7.78
Source : Report of the Comptroller and Auditor General of India for variousyears.
0
2
4
6
8
10
Andhra
Pra
des
h
Goa
Guja
rat
Har
yana
Kar
nat
aka
Ker
ala
Mah
aras
htr
a
Ori
ssa
Punja
b
Raj
asth
an
Tam
il N
adu
W.B
engal
1994-95 1995-96 1996-97 1997-98 1998-99
0
2
4
6
8
10
12
Andhra
Pra
des
h
Goa
Guja
rat
Har
yana
Kar
nat
aka
Ker
ala
Mah
aras
htr
a
Ori
ssa
Punja
b
Raj
asth
an
Tam
il N
adu
W.B
engal
1999-00 2000-01 2001-02 2002-03 2003-04 2004-05
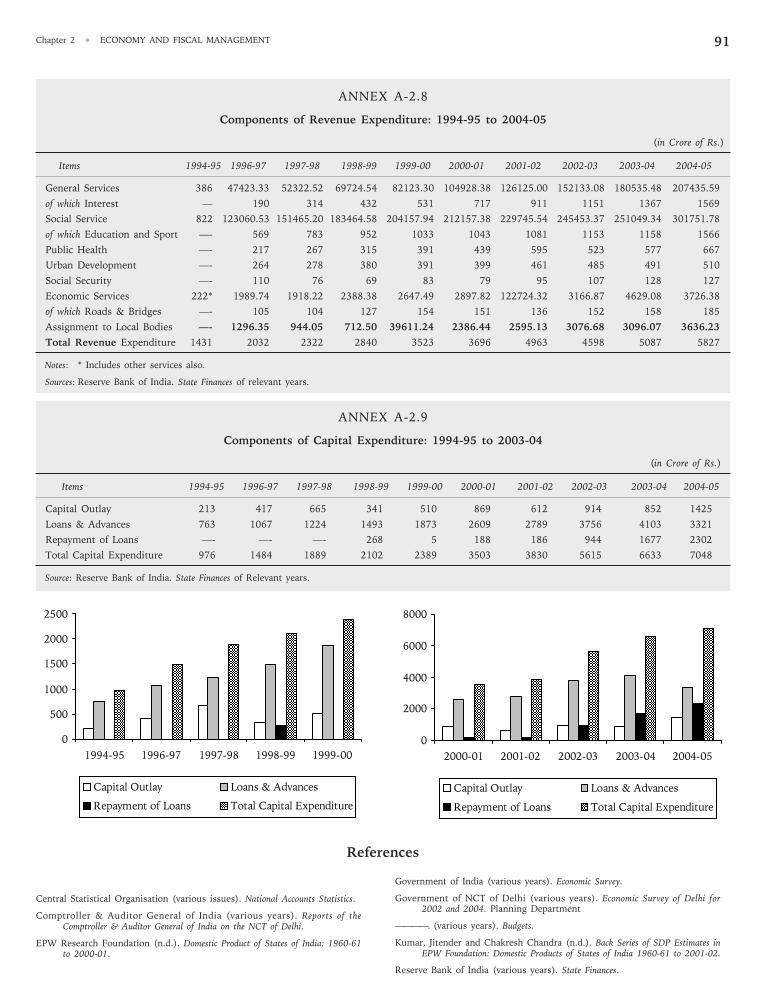
Chapter 2 • ECONOMY AND FISCAL MANAGEMENT 91
ANNEX A-2.8
Components of Revenue Expenditure: 1994-95 to 2004-05
(in Crore of Rs.)
Items 1994-95 1996-97 1997-98 1998-99 1999-00 2000-01 2001-02 2002-03 2003-04 2004-05
General Services 386 47423.33 52322.52 69724.54 82123.30 104928.38 126125.00 152133.08 180535.48 207435.59
of which Interest — 190 314 432 531 717 911 1151 1367 1569
Social Service 822 123060.53 151465.20 183464.58 204157.94 212157.38 229745.54 245453.37 251049.34 301751.78
of which Education and Sport —- 569 783 952 1033 1043 1081 1153 1158 1566
Public Health —- 217 267 315 391 439 595 523 577 667
Urban Development —- 264 278 380 391 399 461 485 491 510
Social Security —- 110 76 69 83 79 95 107 128 127
Economic Services 222* 1989.74 1918.22 2388.38 2647.49 2897.82 122724.32 3166.87 4629.08 3726.38
of which Roads & Bridges —- 105 104 127 154 151 136 152 158 185
Assignment to Local Bodies —- 1296.35 944.05 712.50 39611.24 2386.44 2595.13 3076.68 3096.07 3636.23
Total Revenue Expenditure 1431 2032 2322 2840 3523 3696 4963 4598 5087 5827
Notes: * Includes other services also.
Sources: Reserve Bank of India. State Finances of relevant years.
ANNEX A-2.9
Components of Capital Expenditure: 1994-95 to 2003-04
(in Crore of Rs.)
Items 1994-95 1996-97 1997-98 1998-99 1999-00 2000-01 2001-02 2002-03 2003-04 2004-05
Capital Outlay 213 417 665 341 510 869 612 914 852 1425
Loans & Advances 763 1067 1224 1493 1873 2609 2789 3756 4103 3321
Repayment of Loans —- —- —- 268 5 188 186 944 1677 2302
Total Capital Expenditure 976 1484 1889 2102 2389 3503 3830 5615 6633 7048
Source: Reserve Bank of India. State Finances of Relevant years.
Central Statistical Organisation (various issues). National Accounts Statistics.
Comptroller & Auditor General of India (various years). Reports of theComptroller & Auditor General of India on the NCT of Delhi.
EPW Research Foundation (n.d.). Domestic Product of States of India: 1960-61to 2000-01.
Government of India (various years). Economic Survey.
Government of NCT of Delhi (various years). Economic Survey of Delhi for2002 and 2004. Planning Department
————. (various years). Budgets.
Kumar, Jitender and Chakresh Chandra (n.d.). Back Series of SDP Estimates inEPW Foundation: Domestic Products of States of India 1960-61 to 2001-02.
Reserve Bank of India (various years). State Finances.
References
0
500
1000
1500
2000
2500
1994-95 1996-97 1997-98 1998-99 1999-00
Capital Outlay Loans & Advances
Repayment of Loans Total Capital Expenditure
0
2000
4000
6000
8000
2000-01 2001-02 2002-03 2003-04 2004-05
Capital Outlay Loans & Advances
Repayment of Loans Total Capital Expenditure

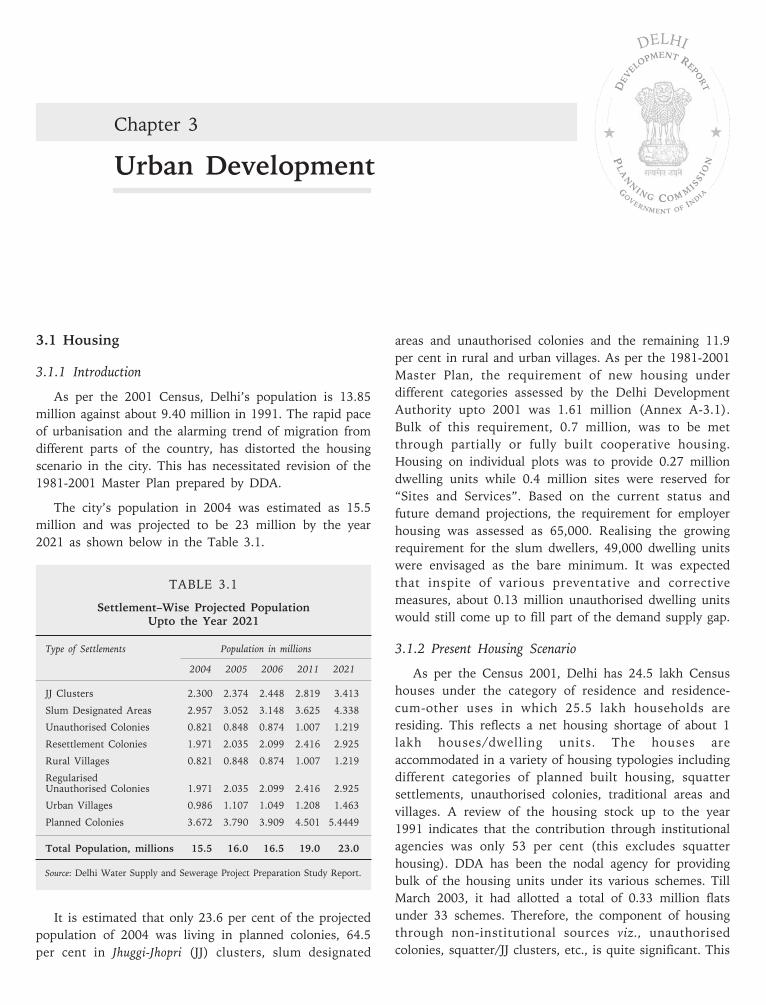
3.1 Housing
3.1.1 Introduction
As per the 2001 Census, Delhi’s population is 13.85
million against about 9.40 million in 1991. The rapid pace
of urbanisation and the alarming trend of migration from
different parts of the country, has distorted the housing
scenario in the city. This has necessitated revision of the
1981-2001 Master Plan prepared by DDA.
The city’s population in 2004 was estimated as 15.5
million and was projected to be 23 million by the year
2021 as shown below in the Table 3.1.
TABLE 3.1
Settlement–Wise Projected PopulationUpto the Year 2021
Type of Settlements Population in millions
2004 2005 2006 2011 2021
JJ Clusters 2.300 2.374 2.448 2.819 3.413
Slum Designated Areas 2.957 3.052 3.148 3.625 4.338
Unauthorised Colonies 0.821 0.848 0.874 1.007 1.219
Resettlement Colonies 1.971 2.035 2.099 2.416 2.925
Rural Villages 0.821 0.848 0.874 1.007 1.219
RegularisedUnauthorised Colonies 1.971 2.035 2.099 2.416 2.925
Urban Villages 0.986 1.107 1.049 1.208 1.463
Planned Colonies 3.672 3.790 3.909 4.501 5.4449
Total Population, millions 15.5 16.0 16.5 19.0 23.0
Source: Delhi Water Supply and Sewerage Project Preparation Study Report.
It is estimated that only 23.6 per cent of the projected
population of 2004 was living in planned colonies, 64.5
per cent in Jhuggi-Jhopri (JJ) clusters, slum designated
Chapter 3
Urban Development
DELHI
areas and unauthorised colonies and the remaining 11.9
per cent in rural and urban villages. As per the 1981-2001
Master Plan, the requirement of new housing under
different categories assessed by the Delhi Development
Authority upto 2001 was 1.61 million (Annex A-3.1).
Bulk of this requirement, 0.7 million, was to be met
through partially or fully built cooperative housing.
Housing on individual plots was to provide 0.27 million
dwelling units while 0.4 million sites were reserved for
“Sites and Services”. Based on the current status and
future demand projections, the requirement for employer
housing was assessed as 65,000. Realising the growing
requirement for the slum dwellers, 49,000 dwelling units
were envisaged as the bare minimum. It was expected
that inspite of various preventative and corrective
measures, about 0.13 million unauthorised dwelling units
would still come up to fill part of the demand supply gap.
3.1.2 Present Housing Scenario
As per the Census 2001, Delhi has 24.5 lakh Census
houses under the category of residence and residence-
cum-other uses in which 25.5 lakh households are
residing. This reflects a net housing shortage of about 1
lakh houses/dwelling units. The houses are
accommodated in a variety of housing typologies including
different categories of planned built housing, squatter
settlements, unauthorised colonies, traditional areas and
villages. A review of the housing stock up to the year
1991 indicates that the contribution through institutional
agencies was only 53 per cent (this excludes squatter
housing). DDA has been the nodal agency for providing
bulk of the housing units under its various schemes. Till
March 2003, it had allotted a total of 0.33 million flats
under 33 schemes. Therefore, the component of housing
through non-institutional sources viz., unauthorised
colonies, squatter/JJ clusters, etc., is quite significant. This
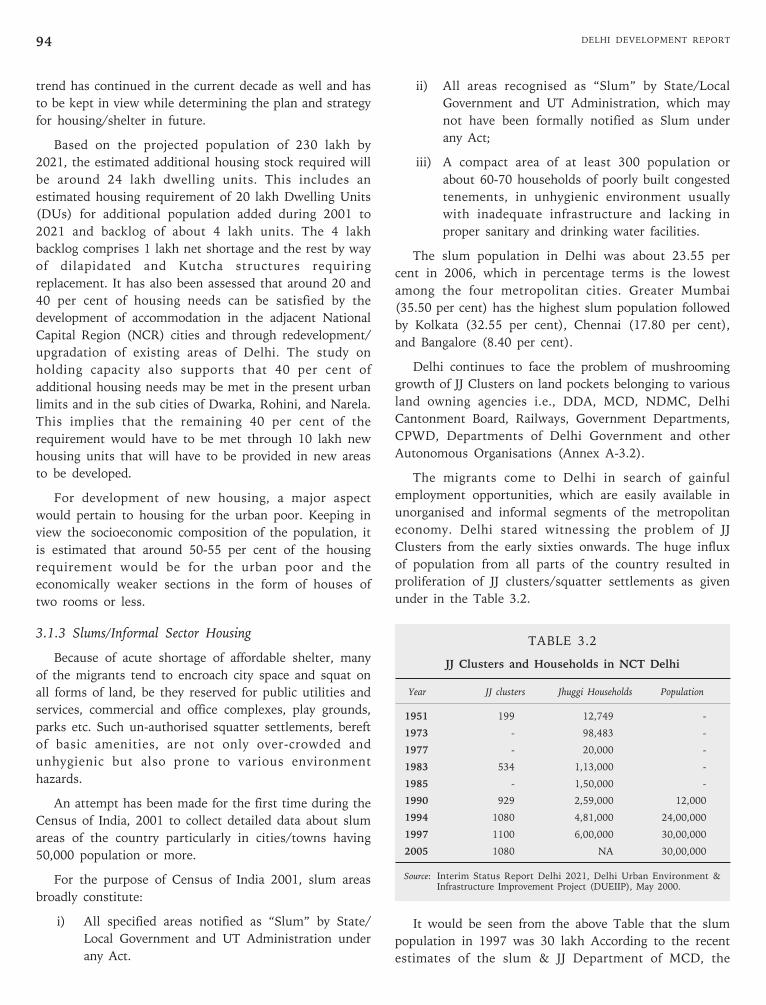
DELHI DEVELOPMENT REPORT94
ii) All areas recognised as “Slum” by State/Local
Government and UT Administration, which may
not have been formally notified as Slum under
any Act;
iii) A compact area of at least 300 population or
about 60-70 households of poorly built congested
tenements, in unhygienic environment usually
with inadequate infrastructure and lacking in
proper sanitary and drinking water facilities.
The slum population in Delhi was about 23.55 per
cent in 2006, which in percentage terms is the lowest
among the four metropolitan cities. Greater Mumbai
(35.50 per cent) has the highest slum population followed
by Kolkata (32.55 per cent), Chennai (17.80 per cent),
and Bangalore (8.40 per cent).
Delhi continues to face the problem of mushrooming
growth of JJ Clusters on land pockets belonging to various
land owning agencies i.e., DDA, MCD, NDMC, Delhi
Cantonment Board, Railways, Government Departments,
CPWD, Departments of Delhi Government and other
Autonomous Organisations (Annex A-3.2).
The migrants come to Delhi in search of gainful
employment opportunities, which are easily available in
unorganised and informal segments of the metropolitan
economy. Delhi stared witnessing the problem of JJ
Clusters from the early sixties onwards. The huge influx
of population from all parts of the country resulted in
proliferation of JJ clusters/squatter settlements as given
under in the Table 3.2.
TABLE 3.2
JJ Clusters and Households in NCT Delhi
Year JJ clusters Jhuggi Households Population
1951 199 12,749 -
1973 - 98,483 -
1977 - 20,000 -
1983 534 1,13,000 -
1985 - 1,50,000 -
1990 929 2,59,000 12,000
1994 1080 4,81,000 24,00,000
1997 1100 6,00,000 30,00,000
2005 1080 NA 30,00,000
Source: Interim Status Report Delhi 2021, Delhi Urban Environment &Infrastructure Improvement Project (DUEIIP), May 2000.
It would be seen from the above Table that the slum
population in 1997 was 30 lakh According to the recent
estimates of the slum & JJ Department of MCD, the
trend has continued in the current decade as well and has
to be kept in view while determining the plan and strategy
for housing/shelter in future.
Based on the projected population of 230 lakh by
2021, the estimated additional housing stock required will
be around 24 lakh dwelling units. This includes an
estimated housing requirement of 20 lakh Dwelling Units
(DUs) for additional population added during 2001 to
2021 and backlog of about 4 lakh units. The 4 lakh
backlog comprises 1 lakh net shortage and the rest by way
of dilapidated and Kutcha structures requiring
replacement. It has also been assessed that around 20 and
40 per cent of housing needs can be satisfied by the
development of accommodation in the adjacent National
Capital Region (NCR) cities and through redevelopment/
upgradation of existing areas of Delhi. The study on
holding capacity also supports that 40 per cent of
additional housing needs may be met in the present urban
limits and in the sub cities of Dwarka, Rohini, and Narela.
This implies that the remaining 40 per cent of the
requirement would have to be met through 10 lakh new
housing units that will have to be provided in new areas
to be developed.
For development of new housing, a major aspect
would pertain to housing for the urban poor. Keeping in
view the socioeconomic composition of the population, it
is estimated that around 50-55 per cent of the housing
requirement would be for the urban poor and the
economically weaker sections in the form of houses of
two rooms or less.
3.1.3 Slums/Informal Sector Housing
Because of acute shortage of affordable shelter, many
of the migrants tend to encroach city space and squat on
all forms of land, be they reserved for public utilities and
services, commercial and office complexes, play grounds,
parks etc. Such un-authorised squatter settlements, bereft
of basic amenities, are not only over-crowded and
unhygienic but also prone to various environment
hazards.
An attempt has been made for the first time during the
Census of India, 2001 to collect detailed data about slum
areas of the country particularly in cities/towns having
50,000 population or more.
For the purpose of Census of India 2001, slum areas
broadly constitute:
i) All specified areas notified as “Slum” by State/
Local Government and UT Administration under
any Act.
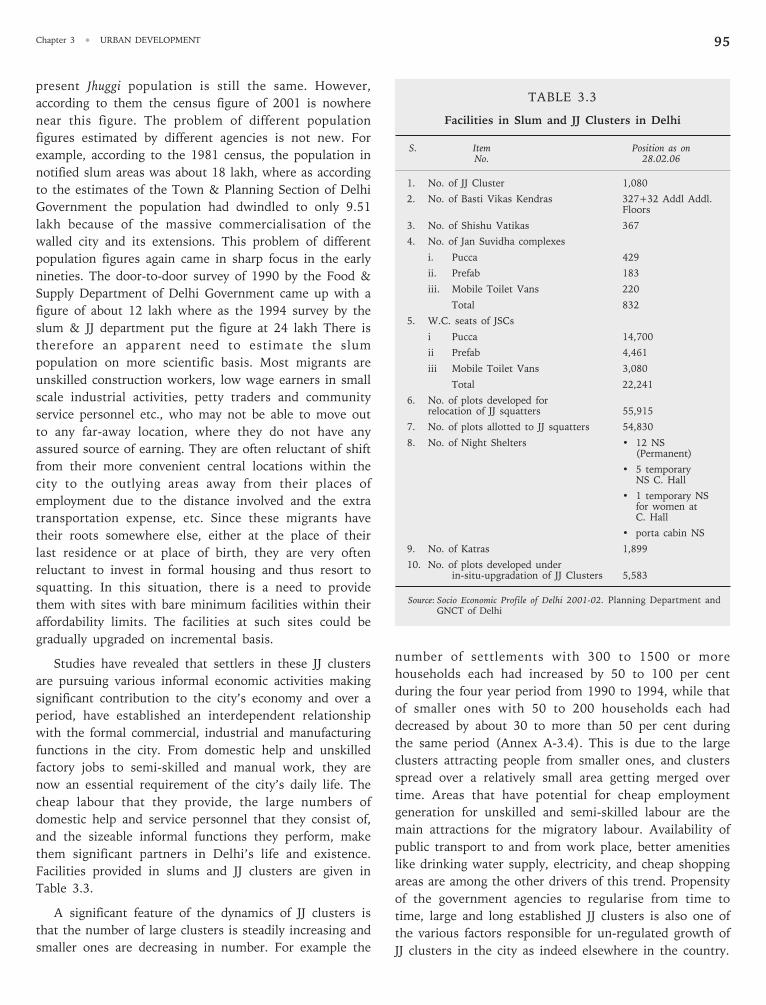
95Chapter 3 • URBAN DEVELOPMENT
present Jhuggi population is still the same. However,
according to them the census figure of 2001 is nowhere
near this figure. The problem of different population
figures estimated by different agencies is not new. For
example, according to the 1981 census, the population in
notified slum areas was about 18 lakh, where as according
to the estimates of the Town & Planning Section of Delhi
Government the population had dwindled to only 9.51
lakh because of the massive commercialisation of the
walled city and its extensions. This problem of different
population figures again came in sharp focus in the early
nineties. The door-to-door survey of 1990 by the Food &
Supply Department of Delhi Government came up with a
figure of about 12 lakh where as the 1994 survey by the
slum & JJ department put the figure at 24 lakh There is
therefore an apparent need to estimate the slum
population on more scientific basis. Most migrants are
unskilled construction workers, low wage earners in small
scale industrial activities, petty traders and community
service personnel etc., who may not be able to move out
to any far-away location, where they do not have any
assured source of earning. They are often reluctant of shift
from their more convenient central locations within the
city to the outlying areas away from their places of
employment due to the distance involved and the extra
transportation expense, etc. Since these migrants have
their roots somewhere else, either at the place of their
last residence or at place of birth, they are very often
reluctant to invest in formal housing and thus resort to
squatting. In this situation, there is a need to provide
them with sites with bare minimum facilities within their
affordability limits. The facilities at such sites could be
gradually upgraded on incremental basis.
Studies have revealed that settlers in these JJ clusters
are pursuing various informal economic activities making
significant contribution to the city’s economy and over a
period, have established an interdependent relationship
with the formal commercial, industrial and manufacturing
functions in the city. From domestic help and unskilled
factory jobs to semi-skilled and manual work, they are
now an essential requirement of the city’s daily life. The
cheap labour that they provide, the large numbers of
domestic help and service personnel that they consist of,
and the sizeable informal functions they perform, make
them significant partners in Delhi’s life and existence.
Facilities provided in slums and JJ clusters are given in
Table 3.3.
A significant feature of the dynamics of JJ clusters is
that the number of large clusters is steadily increasing and
smaller ones are decreasing in number. For example the
number of settlements with 300 to 1500 or more
households each had increased by 50 to 100 per cent
during the four year period from 1990 to 1994, while that
of smaller ones with 50 to 200 households each had
decreased by about 30 to more than 50 per cent during
the same period (Annex A-3.4). This is due to the large
clusters attracting people from smaller ones, and clusters
spread over a relatively small area getting merged over
time. Areas that have potential for cheap employment
generation for unskilled and semi-skilled labour are the
main attractions for the migratory labour. Availability of
public transport to and from work place, better amenities
like drinking water supply, electricity, and cheap shopping
areas are among the other drivers of this trend. Propensity
of the government agencies to regularise from time to
time, large and long established JJ clusters is also one of
the various factors responsible for un-regulated growth of
JJ clusters in the city as indeed elsewhere in the country.
TABLE 3.3
Facilities in Slum and JJ Clusters in Delhi
S. Item Position as onNo. 28.02.06
1. No. of JJ Cluster 1,080
2. No. of Basti Vikas Kendras 327+32 Addl Addl.Floors
3. No. of Shishu Vatikas 367
4. No. of Jan Suvidha complexes
i. Pucca 429
ii. Prefab 183
iii. Mobile Toilet Vans 220
Total 832
5. W.C. seats of JSCs
i Pucca 14,700
ii Prefab 4,461
iii Mobile Toilet Vans 3,080
Total 22,241
6. No. of plots developed forrelocation of JJ squatters 55,915
7. No. of plots allotted to JJ squatters 54,830
8. No. of Night Shelters • 12 NS(Permanent)
• 5 temporaryNS C. Hall
• 1 temporary NSfor women atC. Hall
• porta cabin NS
9. No. of Katras 1,899
10. No. of plots developed underin-situ-upgradation of JJ Clusters 5,583
Source: Socio Economic Profile of Delhi 2001-02. Planning Department andGNCT of Delhi
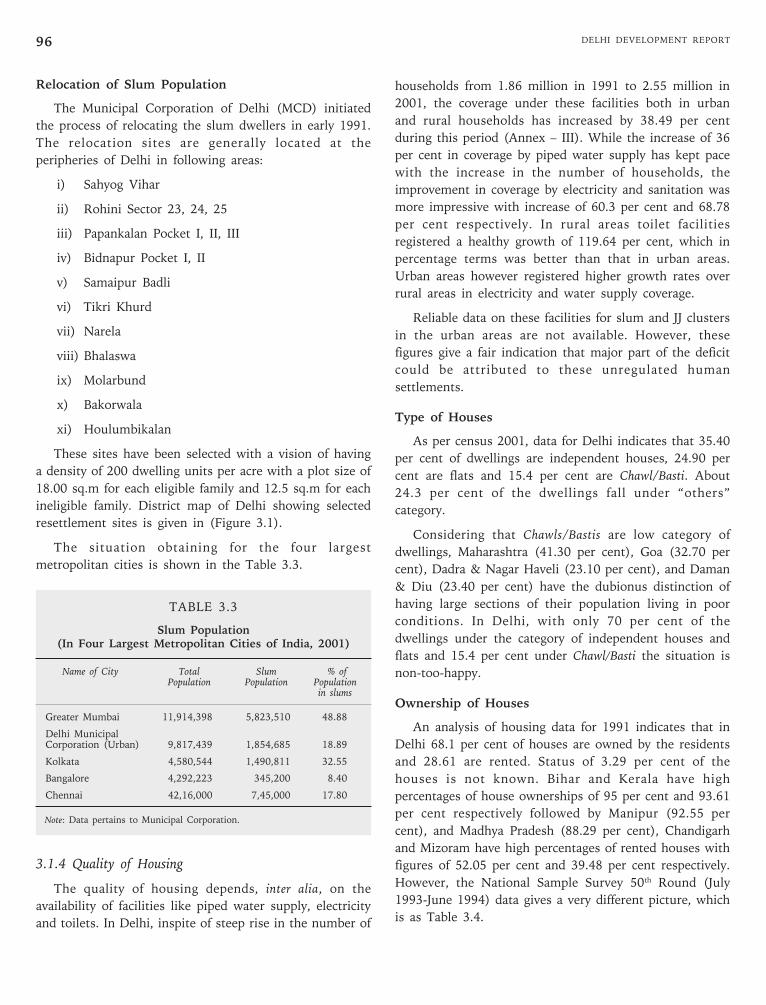
DELHI DEVELOPMENT REPORT96
Relocation of Slum Population
The Municipal Corporation of Delhi (MCD) initiated
the process of relocating the slum dwellers in early 1991.
The relocation sites are generally located at the
peripheries of Delhi in following areas:
i) Sahyog Vihar
ii) Rohini Sector 23, 24, 25
iii) Papankalan Pocket I, II, III
iv) Bidnapur Pocket I, II
v) Samaipur Badli
vi) Tikri Khurd
vii) Narela
viii) Bhalaswa
ix) Molarbund
x) Bakorwala
xi) Houlumbikalan
These sites have been selected with a vision of having
a density of 200 dwelling units per acre with a plot size of
18.00 sq.m for each eligible family and 12.5 sq.m for each
ineligible family. District map of Delhi showing selected
resettlement sites is given in (Figure 3.1).
The situation obtaining for the four largest
metropolitan cities is shown in the Table 3.3.
TABLE 3.3
Slum Population(In Four Largest Metropolitan Cities of India, 2001)
Name of City Total Slum % ofPopulation Population Population
in slums
Greater Mumbai 11,914,398 5,823,510 48.88
Delhi MunicipalCorporation (Urban) 9,817,439 1,854,685 18.89
Kolkata 4,580,544 1,490,811 32.55
Bangalore 4,292,223 345,200 8.40
Chennai 42,16,000 7,45,000 17.80
Note: Data pertains to Municipal Corporation.
3.1.4 Quality of Housing
The quality of housing depends, inter alia, on the
availability of facilities like piped water supply, electricity
and toilets. In Delhi, inspite of steep rise in the number of
households from 1.86 million in 1991 to 2.55 million in
2001, the coverage under these facilities both in urban
and rural households has increased by 38.49 per cent
during this period (Annex – III). While the increase of 36
per cent in coverage by piped water supply has kept pace
with the increase in the number of households, the
improvement in coverage by electricity and sanitation was
more impressive with increase of 60.3 per cent and 68.78
per cent respectively. In rural areas toilet facilities
registered a healthy growth of 119.64 per cent, which in
percentage terms was better than that in urban areas.
Urban areas however registered higher growth rates over
rural areas in electricity and water supply coverage.
Reliable data on these facilities for slum and JJ clusters
in the urban areas are not available. However, these
figures give a fair indication that major part of the deficit
could be attributed to these unregulated human
settlements.
Type of Houses
As per census 2001, data for Delhi indicates that 35.40
per cent of dwellings are independent houses, 24.90 per
cent are flats and 15.4 per cent are Chawl/Basti. About
24.3 per cent of the dwellings fall under “others”
category.
Considering that Chawls/Bastis are low category of
dwellings, Maharashtra (41.30 per cent), Goa (32.70 per
cent), Dadra & Nagar Haveli (23.10 per cent), and Daman
& Diu (23.40 per cent) have the dubionus distinction of
having large sections of their population living in poor
conditions. In Delhi, with only 70 per cent of the
dwellings under the category of independent houses and
flats and 15.4 per cent under Chawl/Basti the situation is
non-too-happy.
Ownership of Houses
An analysis of housing data for 1991 indicates that in
Delhi 68.1 per cent of houses are owned by the residents
and 28.61 are rented. Status of 3.29 per cent of the
houses is not known. Bihar and Kerala have high
percentages of house ownerships of 95 per cent and 93.61
per cent respectively followed by Manipur (92.55 per
cent), and Madhya Pradesh (88.29 per cent), Chandigarh
and Mizoram have high percentages of rented houses with
figures of 52.05 per cent and 39.48 per cent respectively.
However, the National Sample Survey 50th Round (July
1993-June 1994) data gives a very different picture, which
is as Table 3.4.
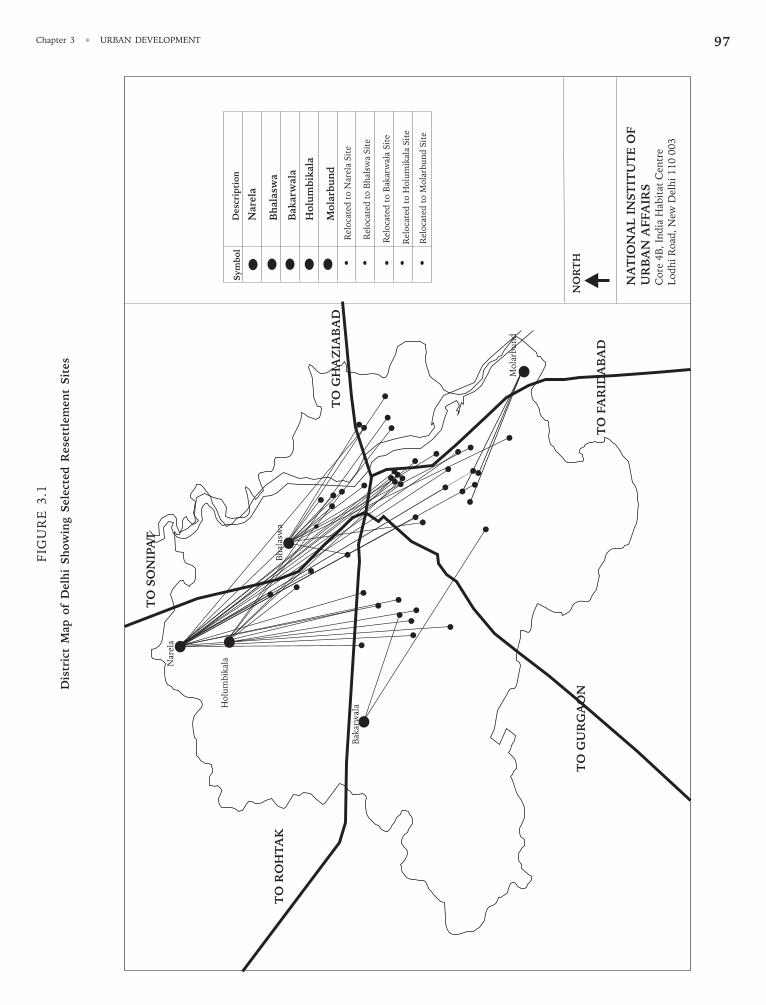
97Chapter 3 • URBAN DEVELOPMENTF
IGU
RE
3.1
Dis
tric
t M
ap
of
Delh
i S
how
ing S
ele
cted
Rese
ttle
men
t S
ites
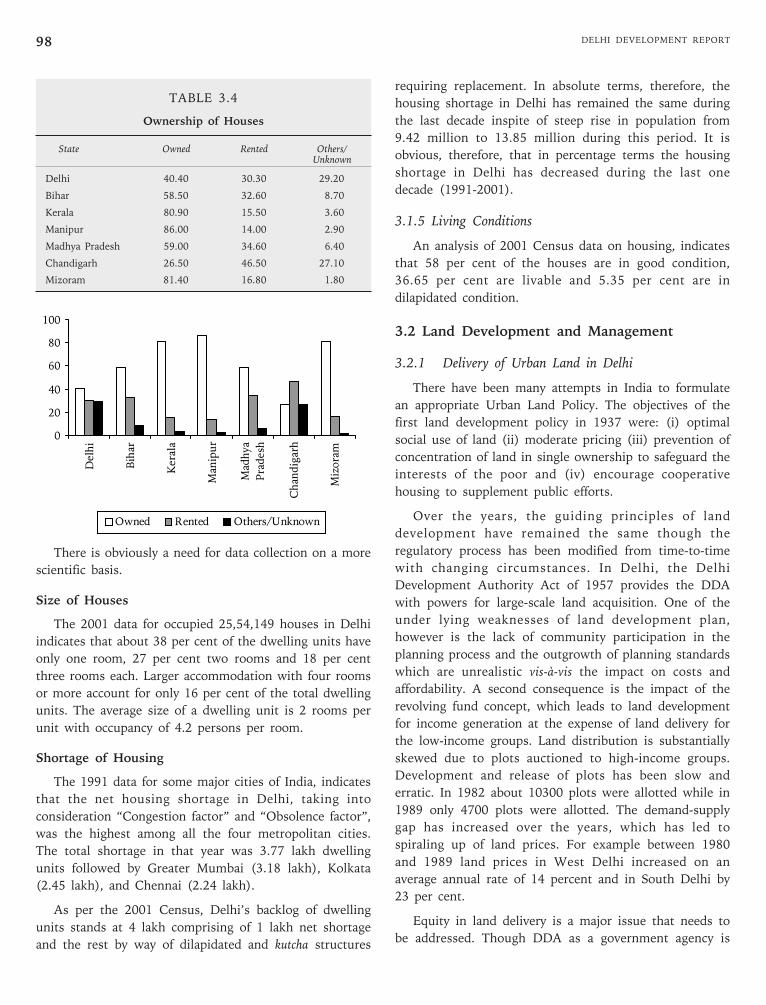
DELHI DEVELOPMENT REPORT98
TABLE 3.4
Ownership of Houses
State Owned Rented Others/Unknown
Delhi 40.40 30.30 29.20
Bihar 58.50 32.60 8.70
Kerala 80.90 15.50 3.60
Manipur 86.00 14.00 2.90
Madhya Pradesh 59.00 34.60 6.40
Chandigarh 26.50 46.50 27.10
Mizoram 81.40 16.80 1.80
There is obviously a need for data collection on a more
scientific basis.
Size of Houses
The 2001 data for occupied 25,54,149 houses in Delhi
indicates that about 38 per cent of the dwelling units have
only one room, 27 per cent two rooms and 18 per cent
three rooms each. Larger accommodation with four rooms
or more account for only 16 per cent of the total dwelling
units. The average size of a dwelling unit is 2 rooms per
unit with occupancy of 4.2 persons per room.
Shortage of Housing
The 1991 data for some major cities of India, indicates
that the net housing shortage in Delhi, taking into
consideration “Congestion factor” and “Obsolence factor”,
was the highest among all the four metropolitan cities.
The total shortage in that year was 3.77 lakh dwelling
units followed by Greater Mumbai (3.18 lakh), Kolkata
(2.45 lakh), and Chennai (2.24 lakh).
As per the 2001 Census, Delhi’s backlog of dwelling
units stands at 4 lakh comprising of 1 lakh net shortage
and the rest by way of dilapidated and kutcha structures
requiring replacement. In absolute terms, therefore, the
housing shortage in Delhi has remained the same during
the last decade inspite of steep rise in population from
9.42 million to 13.85 million during this period. It is
obvious, therefore, that in percentage terms the housing
shortage in Delhi has decreased during the last one
decade (1991-2001).
3.1.5 Living Conditions
An analysis of 2001 Census data on housing, indicates
that 58 per cent of the houses are in good condition,
36.65 per cent are livable and 5.35 per cent are in
dilapidated condition.
3.2 Land Development and Management
3.2.1 Delivery of Urban Land in Delhi
There have been many attempts in India to formulate
an appropriate Urban Land Policy. The objectives of the
first land development policy in 1937 were: (i) optimal
social use of land (ii) moderate pricing (iii) prevention of
concentration of land in single ownership to safeguard the
interests of the poor and (iv) encourage cooperative
housing to supplement public efforts.
Over the years, the guiding principles of land
development have remained the same though the
regulatory process has been modified from time-to-time
with changing circumstances. In Delhi, the Delhi
Development Authority Act of 1957 provides the DDA
with powers for large-scale land acquisition. One of the
under lying weaknesses of land development plan,
however is the lack of community participation in the
planning process and the outgrowth of planning standards
which are unrealistic vis-à-vis the impact on costs and
affordability. A second consequence is the impact of the
revolving fund concept, which leads to land development
for income generation at the expense of land delivery for
the low-income groups. Land distribution is substantially
skewed due to plots auctioned to high-income groups.
Development and release of plots has been slow and
erratic. In 1982 about 10300 plots were allotted while in
1989 only 4700 plots were allotted. The demand-supply
gap has increased over the years, which has led to
spiraling up of land prices. For example between 1980
and 1989 land prices in West Delhi increased on an
average annual rate of 14 percent and in South Delhi by
23 per cent.
Equity in land delivery is a major issue that needs to
be addressed. Though DDA as a government agency is
0
20
40
60
80
100
Delhi
Bihar
Kerala
Man
ipur
Mad
hya
Pradesh
Chan
digarh
Mizoram
Owned Rented Others/Unknown
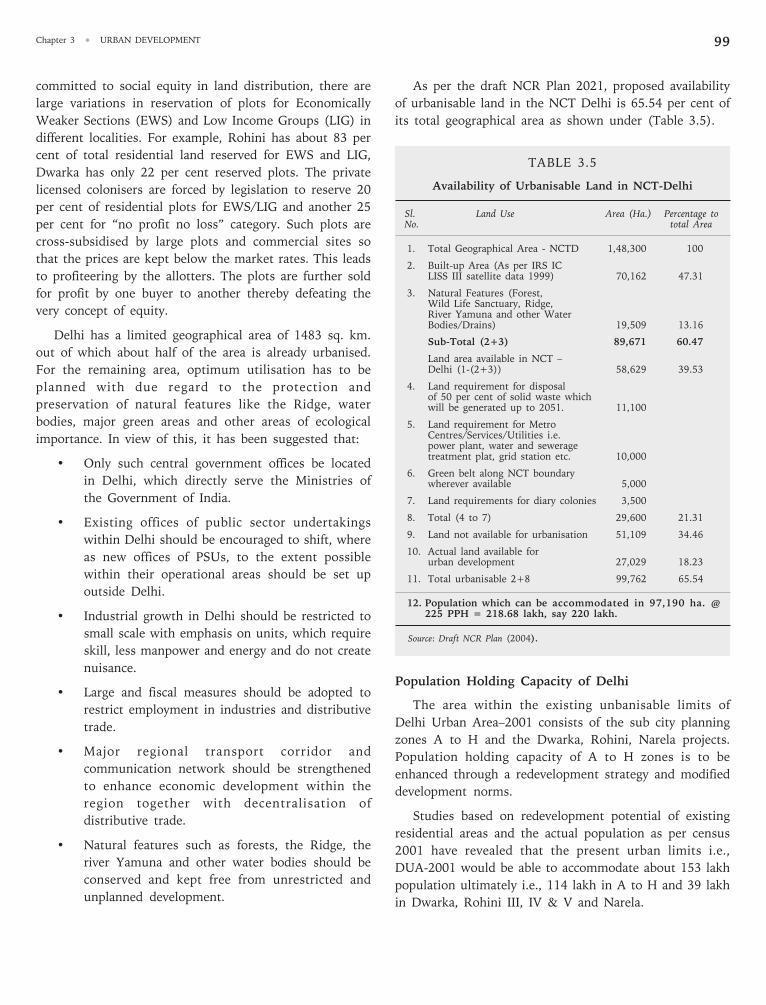
99Chapter 3 • URBAN DEVELOPMENT
As per the draft NCR Plan 2021, proposed availability
of urbanisable land in the NCT Delhi is 65.54 per cent of
its total geographical area as shown under (Table 3.5).
TABLE 3.5
Availability of Urbanisable Land in NCT-Delhi
Sl. Land Use Area (Ha.) Percentage toNo. total Area
1. Total Geographical Area - NCTD 1,48,300 100
2. Built-up Area (As per IRS ICLISS III satellite data 1999) 70,162 47.31
3. Natural Features (Forest,Wild Life Sanctuary, Ridge,River Yamuna and other WaterBodies/Drains) 19,509 13.16
Sub-Total (2+3) 89,671 60.47
Land area available in NCT –Delhi (1-(2+3)) 58,629 39.53
4. Land requirement for disposalof 50 per cent of solid waste whichwill be generated up to 2051. 11,100
5. Land requirement for MetroCentres/Services/Utilities i.e.power plant, water and seweragetreatment plat, grid station etc. 10,000
6. Green belt along NCT boundarywherever available 5,000
7. Land requirements for diary colonies 3,500
8. Total (4 to 7) 29,600 21.31
9. Land not available for urbanisation 51,109 34.46
10. Actual land available forurban development 27,029 18.23
11. Total urbanisable 2+8 99,762 65.54
12. Population which can be accommodated in 97,190 ha. @225 PPH = 218.68 lakh, say 220 lakh.
Source: Draft NCR Plan (2004).
Population Holding Capacity of Delhi
The area within the existing unbanisable limits of
Delhi Urban Area–2001 consists of the sub city planning
zones A to H and the Dwarka, Rohini, Narela projects.
Population holding capacity of A to H zones is to be
enhanced through a redevelopment strategy and modified
development norms.
Studies based on redevelopment potential of existing
residential areas and the actual population as per census
2001 have revealed that the present urban limits i.e.,
DUA-2001 would be able to accommodate about 153 lakh
population ultimately i.e., 114 lakh in A to H and 39 lakh
in Dwarka, Rohini III, IV & V and Narela.
committed to social equity in land distribution, there are
large variations in reservation of plots for Economically
Weaker Sections (EWS) and Low Income Groups (LIG) in
different localities. For example, Rohini has about 83 per
cent of total residential land reserved for EWS and LIG,
Dwarka has only 22 per cent reserved plots. The private
licensed colonisers are forced by legislation to reserve 20
per cent of residential plots for EWS/LIG and another 25
per cent for “no profit no loss” category. Such plots are
cross-subsidised by large plots and commercial sites so
that the prices are kept below the market rates. This leads
to profiteering by the allotters. The plots are further sold
for profit by one buyer to another thereby defeating the
very concept of equity.
Delhi has a limited geographical area of 1483 sq. km.
out of which about half of the area is already urbanised.
For the remaining area, optimum utilisation has to be
planned with due regard to the protection and
preservation of natural features like the Ridge, water
bodies, major green areas and other areas of ecological
importance. In view of this, it has been suggested that:
• Only such central government offices be located
in Delhi, which directly serve the Ministries of
the Government of India.
• Existing offices of public sector undertakings
within Delhi should be encouraged to shift, where
as new offices of PSUs, to the extent possible
within their operational areas should be set up
outside Delhi.
• Industrial growth in Delhi should be restricted to
small scale with emphasis on units, which require
skill, less manpower and energy and do not create
nuisance.
• Large and fiscal measures should be adopted to
restrict employment in industries and distributive
trade.
• Major regional transport corridor and
communication network should be strengthened
to enhance economic development within the
region together with decentralisation of
distributive trade.
• Natural features such as forests, the Ridge, the
river Yamuna and other water bodies should be
conserved and kept free from unrestricted and
unplanned development.
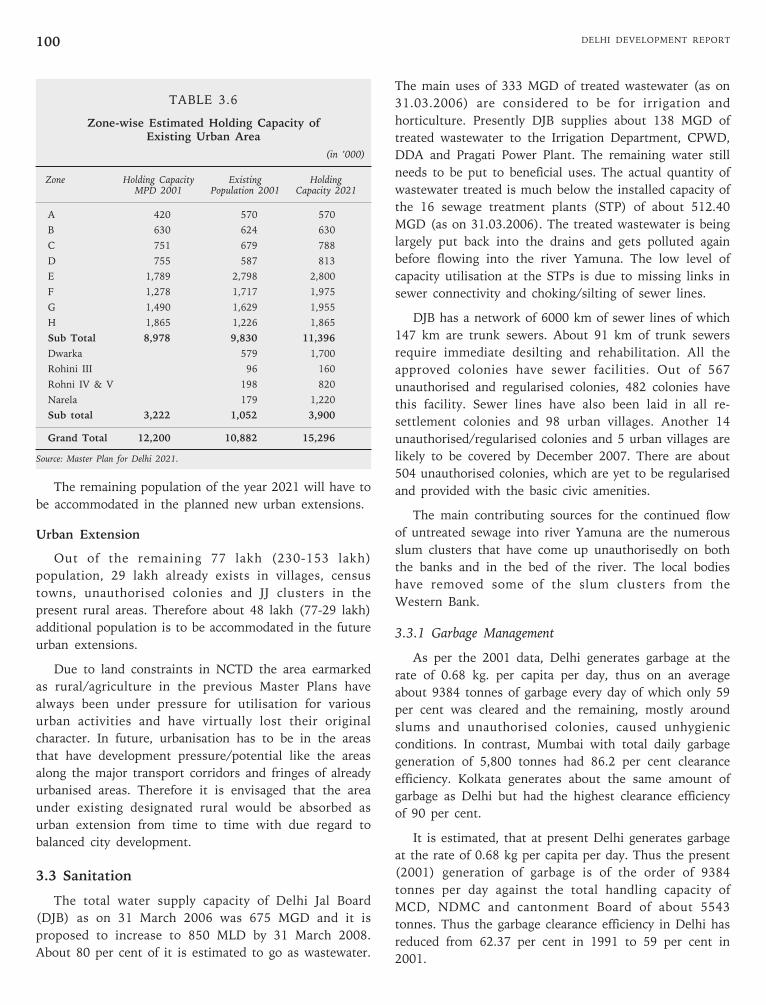
DELHI DEVELOPMENT REPORT100
TABLE 3.6
Zone-wise Estimated Holding Capacity ofExisting Urban Area
(in ’000)
Zone Holding Capacity Existing HoldingMPD 2001 Population 2001 Capacity 2021
A 420 570 570
B 630 624 630
C 751 679 788
D 755 587 813
E 1,789 2,798 2,800
F 1,278 1,717 1,975
G 1,490 1,629 1,955
H 1,865 1,226 1,865
Sub Total 8,978 9,830 11,396
Dwarka 579 1,700
Rohini III 96 160
Rohni IV & V 198 820
Narela 179 1,220
Sub total 3,222 1,052 3,900
Grand Total 12,200 10,882 15,296
Source: Master Plan for Delhi 2021.
The remaining population of the year 2021 will have to
be accommodated in the planned new urban extensions.
Urban Extension
Out of the remaining 77 lakh (230-153 lakh)
population, 29 lakh already exists in villages, census
towns, unauthorised colonies and JJ clusters in the
present rural areas. Therefore about 48 lakh (77-29 lakh)
additional population is to be accommodated in the future
urban extensions.
Due to land constraints in NCTD the area earmarked
as rural/agriculture in the previous Master Plans have
always been under pressure for utilisation for various
urban activities and have virtually lost their original
character. In future, urbanisation has to be in the areas
that have development pressure/potential like the areas
along the major transport corridors and fringes of already
urbanised areas. Therefore it is envisaged that the area
under existing designated rural would be absorbed as
urban extension from time to time with due regard to
balanced city development.
3.3 Sanitation
The total water supply capacity of Delhi Jal Board
(DJB) as on 31 March 2006 was 675 MGD and it is
proposed to increase to 850 MLD by 31 March 2008.
About 80 per cent of it is estimated to go as wastewater.
The main uses of 333 MGD of treated wastewater (as on
31.03.2006) are considered to be for irrigation and
horticulture. Presently DJB supplies about 138 MGD of
treated wastewater to the Irrigation Department, CPWD,
DDA and Pragati Power Plant. The remaining water still
needs to be put to beneficial uses. The actual quantity of
wastewater treated is much below the installed capacity of
the 16 sewage treatment plants (STP) of about 512.40
MGD (as on 31.03.2006). The treated wastewater is being
largely put back into the drains and gets polluted again
before flowing into the river Yamuna. The low level of
capacity utilisation at the STPs is due to missing links in
sewer connectivity and choking/silting of sewer lines.
DJB has a network of 6000 km of sewer lines of which
147 km are trunk sewers. About 91 km of trunk sewers
require immediate desilting and rehabilitation. All the
approved colonies have sewer facilities. Out of 567
unauthorised and regularised colonies, 482 colonies have
this facility. Sewer lines have also been laid in all re-
settlement colonies and 98 urban villages. Another 14
unauthorised/regularised colonies and 5 urban villages are
likely to be covered by December 2007. There are about
504 unauthorised colonies, which are yet to be regularised
and provided with the basic civic amenities.
The main contributing sources for the continued flow
of untreated sewage into river Yamuna are the numerous
slum clusters that have come up unauthorisedly on both
the banks and in the bed of the river. The local bodies
have removed some of the slum clusters from the
Western Bank.
3.3.1 Garbage Management
As per the 2001 data, Delhi generates garbage at the
rate of 0.68 kg. per capita per day, thus on an average
about 9384 tonnes of garbage every day of which only 59
per cent was cleared and the remaining, mostly around
slums and unauthorised colonies, caused unhygienic
conditions. In contrast, Mumbai with total daily garbage
generation of 5,800 tonnes had 86.2 per cent clearance
efficiency. Kolkata generates about the same amount of
garbage as Delhi but had the highest clearance efficiency
of 90 per cent.
It is estimated, that at present Delhi generates garbage
at the rate of 0.68 kg per capita per day. Thus the present
(2001) generation of garbage is of the order of 9384
tonnes per day against the total handling capacity of
MCD, NDMC and cantonment Board of about 5543
tonnes. Thus the garbage clearance efficiency in Delhi has
reduced from 62.37 per cent in 1991 to 59 per cent in
2001.
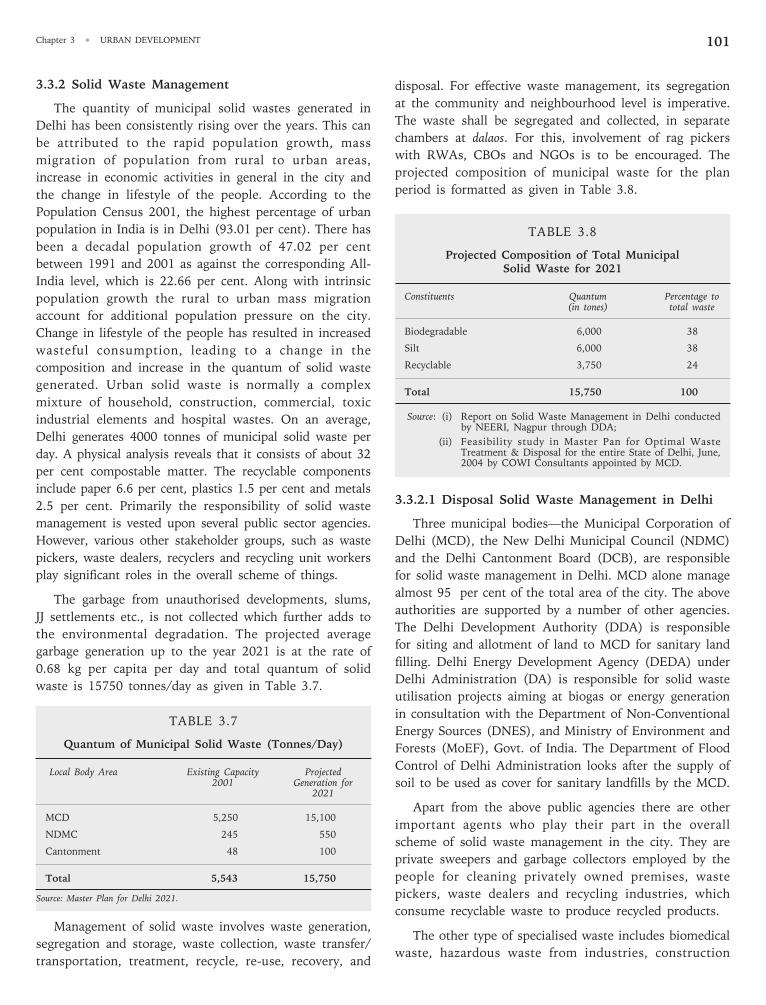
101Chapter 3 • URBAN DEVELOPMENT
3.3.2 Solid Waste Management
The quantity of municipal solid wastes generated in
Delhi has been consistently rising over the years. This can
be attributed to the rapid population growth, mass
migration of population from rural to urban areas,
increase in economic activities in general in the city and
the change in lifestyle of the people. According to the
Population Census 2001, the highest percentage of urban
population in India is in Delhi (93.01 per cent). There has
been a decadal population growth of 47.02 per cent
between 1991 and 2001 as against the corresponding All-
India level, which is 22.66 per cent. Along with intrinsic
population growth the rural to urban mass migration
account for additional population pressure on the city.
Change in lifestyle of the people has resulted in increased
wasteful consumption, leading to a change in the
composition and increase in the quantum of solid waste
generated. Urban solid waste is normally a complex
mixture of household, construction, commercial, toxic
industrial elements and hospital wastes. On an average,
Delhi generates 4000 tonnes of municipal solid waste per
day. A physical analysis reveals that it consists of about 32
per cent compostable matter. The recyclable components
include paper 6.6 per cent, plastics 1.5 per cent and metals
2.5 per cent. Primarily the responsibility of solid waste
management is vested upon several public sector agencies.
However, various other stakeholder groups, such as waste
pickers, waste dealers, recyclers and recycling unit workers
play significant roles in the overall scheme of things.
The garbage from unauthorised developments, slums,
JJ settlements etc., is not collected which further adds to
the environmental degradation. The projected average
garbage generation up to the year 2021 is at the rate of
0.68 kg per capita per day and total quantum of solid
waste is 15750 tonnes/day as given in Table 3.7.
TABLE 3.7
Quantum of Municipal Solid Waste (Tonnes/Day)
Local Body Area Existing Capacity Projected2001 Generation for
2021
MCD 5,250 15,100
NDMC 245 550
Cantonment 48 100
Total 5,543 15,750
Source: Master Plan for Delhi 2021.
Management of solid waste involves waste generation,
segregation and storage, waste collection, waste transfer/
transportation, treatment, recycle, re-use, recovery, and
disposal. For effective waste management, its segregation
at the community and neighbourhood level is imperative.
The waste shall be segregated and collected, in separate
chambers at dalaos. For this, involvement of rag pickers
with RWAs, CBOs and NGOs is to be encouraged. The
projected composition of municipal waste for the plan
period is formatted as given in Table 3.8.
TABLE 3.8
Projected Composition of Total MunicipalSolid Waste for 2021
Constituents Quantum Percentage to(in tones) total waste
Biodegradable 6,000 38
Silt 6,000 38
Recyclable 3,750 24
Total 15,750 100
Source: (i) Report on Solid Waste Management in Delhi conductedby NEERI, Nagpur through DDA;
(ii) Feasibility study in Master Pan for Optimal WasteTreatment & Disposal for the entire State of Delhi, June,2004 by COWI Consultants appointed by MCD.
3.3.2.1 Disposal Solid Waste Management in Delhi
Three municipal bodies—the Municipal Corporation of
Delhi (MCD), the New Delhi Municipal Council (NDMC)
and the Delhi Cantonment Board (DCB), are responsible
for solid waste management in Delhi. MCD alone manage
almost 95 per cent of the total area of the city. The above
authorities are supported by a number of other agencies.
The Delhi Development Authority (DDA) is responsible
for siting and allotment of land to MCD for sanitary land
filling. Delhi Energy Development Agency (DEDA) under
Delhi Administration (DA) is responsible for solid waste
utilisation projects aiming at biogas or energy generation
in consultation with the Department of Non-Conventional
Energy Sources (DNES), and Ministry of Environment and
Forests (MoEF), Govt. of India. The Department of Flood
Control of Delhi Administration looks after the supply of
soil to be used as cover for sanitary landfills by the MCD.
Apart from the above public agencies there are other
important agents who play their part in the overall
scheme of solid waste management in the city. They are
private sweepers and garbage collectors employed by the
people for cleaning privately owned premises, waste
pickers, waste dealers and recycling industries, which
consume recyclable waste to produce recycled products.
The other type of specialised waste includes biomedical
waste, hazardous waste from industries, construction
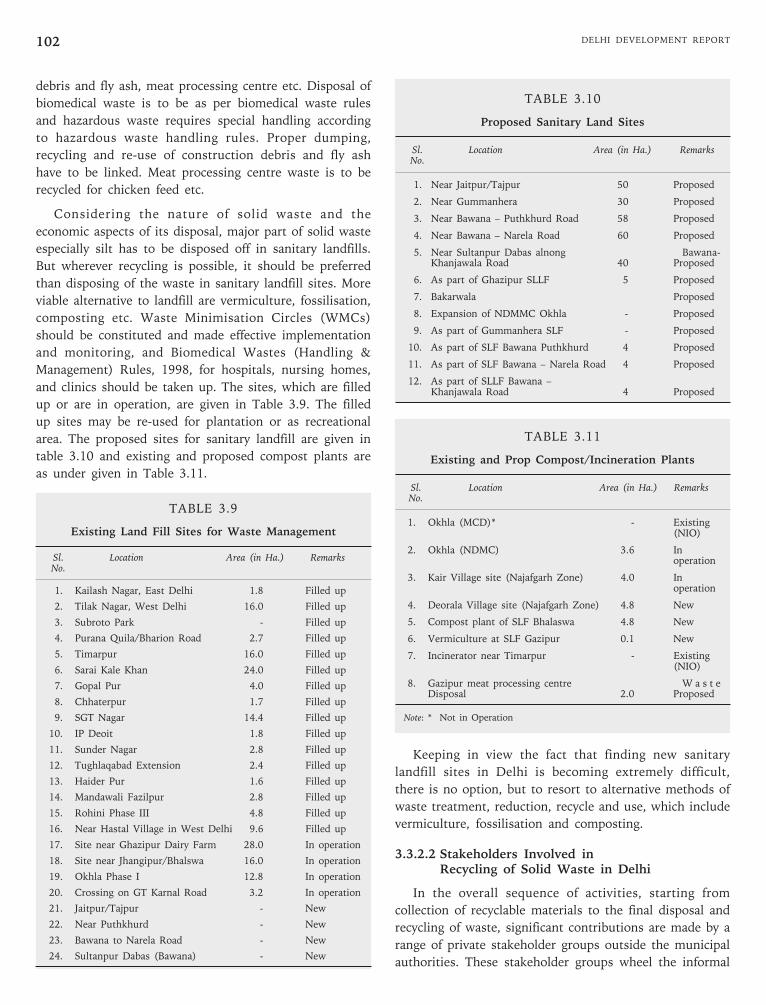
DELHI DEVELOPMENT REPORT102
debris and fly ash, meat processing centre etc. Disposal of
biomedical waste is to be as per biomedical waste rules
and hazardous waste requires special handling according
to hazardous waste handling rules. Proper dumping,
recycling and re-use of construction debris and fly ash
have to be linked. Meat processing centre waste is to be
recycled for chicken feed etc.
Considering the nature of solid waste and the
economic aspects of its disposal, major part of solid waste
especially silt has to be disposed off in sanitary landfills.
But wherever recycling is possible, it should be preferred
than disposing of the waste in sanitary landfill sites. More
viable alternative to landfill are vermiculture, fossilisation,
composting etc. Waste Minimisation Circles (WMCs)
should be constituted and made effective implementation
and monitoring, and Biomedical Wastes (Handling &
Management) Rules, 1998, for hospitals, nursing homes,
and clinics should be taken up. The sites, which are filled
up or are in operation, are given in Table 3.9. The filled
up sites may be re-used for plantation or as recreational
area. The proposed sites for sanitary landfill are given in
table 3.10 and existing and proposed compost plants are
as under given in Table 3.11.
TABLE 3.9
Existing Land Fill Sites for Waste Management
Sl. Location Area (in Ha.) RemarksNo.
1. Kailash Nagar, East Delhi 1.8 Filled up
2. Tilak Nagar, West Delhi 16.0 Filled up
3. Subroto Park - Filled up
4. Purana Quila/Bharion Road 2.7 Filled up
5. Timarpur 16.0 Filled up
6. Sarai Kale Khan 24.0 Filled up
7. Gopal Pur 4.0 Filled up
8. Chhaterpur 1.7 Filled up
9. SGT Nagar 14.4 Filled up
10. IP Deoit 1.8 Filled up
11. Sunder Nagar 2.8 Filled up
12. Tughlaqabad Extension 2.4 Filled up
13. Haider Pur 1.6 Filled up
14. Mandawali Fazilpur 2.8 Filled up
15. Rohini Phase III 4.8 Filled up
16. Near Hastal Village in West Delhi 9.6 Filled up
17. Site near Ghazipur Dairy Farm 28.0 In operation
18. Site near Jhangipur/Bhalswa 16.0 In operation
19. Okhla Phase I 12.8 In operation
20. Crossing on GT Karnal Road 3.2 In operation
21. Jaitpur/Tajpur - New
22. Near Puthkhurd - New
23. Bawana to Narela Road - New
24. Sultanpur Dabas (Bawana) - New
TABLE 3.10
Proposed Sanitary Land Sites
Sl. Location Area (in Ha.) RemarksNo.
1. Near Jaitpur/Tajpur 50 Proposed
2. Near Gummanhera 30 Proposed
3. Near Bawana – Puthkhurd Road 58 Proposed
4. Near Bawana – Narela Road 60 Proposed
5. Near Sultanpur Dabas alnong Bawana-Khanjawala Road 40 Proposed
6. As part of Ghazipur SLLF 5 Proposed
7. Bakarwala Proposed
8. Expansion of NDMMC Okhla - Proposed
9. As part of Gummanhera SLF - Proposed
10. As part of SLF Bawana Puthkhurd 4 Proposed
11. As part of SLF Bawana – Narela Road 4 Proposed
12. As part of SLLF Bawana –Khanjawala Road 4 Proposed
TABLE 3.11
Existing and Prop Compost/Incineration Plants
Sl. Location Area (in Ha.) RemarksNo.
1. Okhla (MCD)* - Existing(NIO)
2. Okhla (NDMC) 3.6 Inoperation
3. Kair Village site (Najafgarh Zone) 4.0 Inoperation
4. Deorala Village site (Najafgarh Zone) 4.8 New
5. Compost plant of SLF Bhalaswa 4.8 New
6. Vermiculture at SLF Gazipur 0.1 New
7. Incinerator near Timarpur - Existing(NIO)
8. Gazipur meat processing centre W a s t eDisposal 2.0 Proposed
Note: * Not in Operation
Keeping in view the fact that finding new sanitary
landfill sites in Delhi is becoming extremely difficult,
there is no option, but to resort to alternative methods of
waste treatment, reduction, recycle and use, which include
vermiculture, fossilisation and composting.
3.3.2.2 Stakeholders Involved inRecycling of Solid Waste in Delhi
In the overall sequence of activities, starting from
collection of recyclable materials to the final disposal and
recycling of waste, significant contributions are made by a
range of private stakeholder groups outside the municipal
authorities. These stakeholder groups wheel the informal
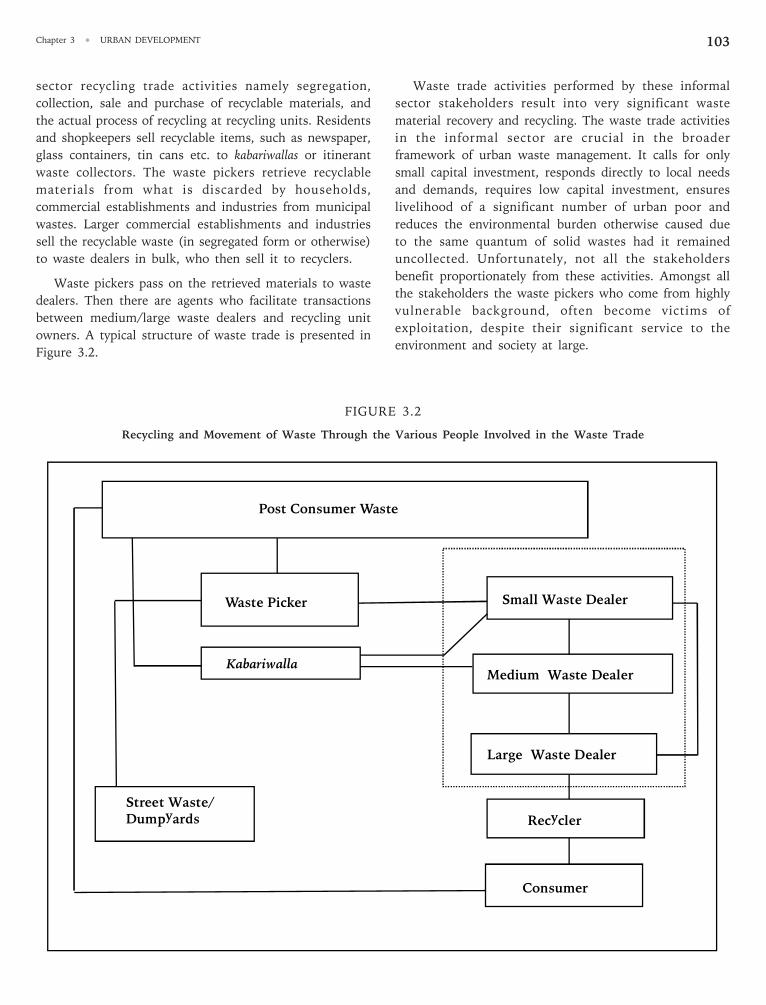
103Chapter 3 • URBAN DEVELOPMENT
sector recycling trade activities namely segregation,
collection, sale and purchase of recyclable materials, and
the actual process of recycling at recycling units. Residents
and shopkeepers sell recyclable items, such as newspaper,
glass containers, tin cans etc. to kabariwallas or itinerant
waste collectors. The waste pickers retrieve recyclable
materials from what is discarded by households,
commercial establishments and industries from municipal
wastes. Larger commercial establishments and industries
sell the recyclable waste (in segregated form or otherwise)
to waste dealers in bulk, who then sell it to recyclers.
Waste pickers pass on the retrieved materials to waste
dealers. Then there are agents who facilitate transactions
between medium/large waste dealers and recycling unit
owners. A typical structure of waste trade is presented in
Figure 3.2.
Waste trade activities performed by these informal
sector stakeholders result into very significant waste
material recovery and recycling. The waste trade activities
in the informal sector are crucial in the broader
framework of urban waste management. It calls for only
small capital investment, responds directly to local needs
and demands, requires low capital investment, ensures
livelihood of a significant number of urban poor and
reduces the environmental burden otherwise caused due
to the same quantum of solid wastes had it remained
uncollected. Unfortunately, not all the stakeholders
benefit proportionately from these activities. Amongst all
the stakeholders the waste pickers who come from highly
vulnerable background, often become victims of
exploitation, despite their significant service to the
environment and society at large.
FIGURE 3.2
Recycling and Movement of Waste Through the Various People Involved in the Waste Trade
Post Consumer Waste
Small Waste Dealer
Medium Waste Dealer
Large Waste Dealer
Recycler
Consumer
Waste Picker
Kabariwalla
Street Waste/Dumpyards
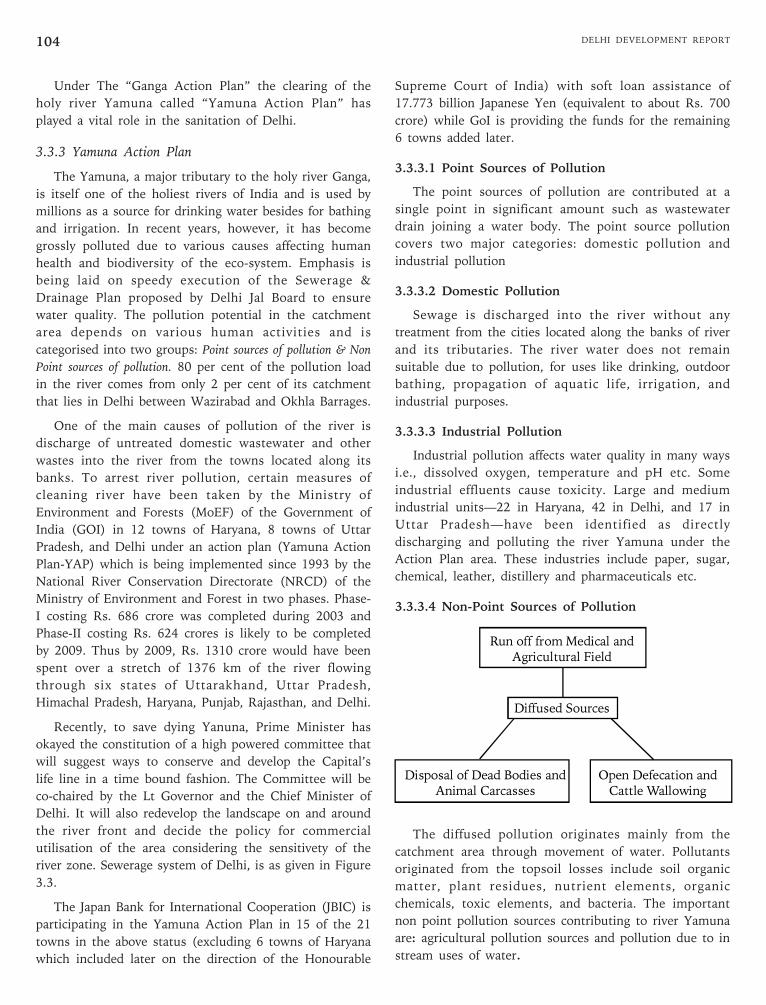
DELHI DEVELOPMENT REPORT104
Under The “Ganga Action Plan” the clearing of the
holy river Yamuna called “Yamuna Action Plan” has
played a vital role in the sanitation of Delhi.
3.3.3 Yamuna Action Plan
The Yamuna, a major tributary to the holy river Ganga,
is itself one of the holiest rivers of India and is used by
millions as a source for drinking water besides for bathing
and irrigation. In recent years, however, it has become
grossly polluted due to various causes affecting human
health and biodiversity of the eco-system. Emphasis is
being laid on speedy execution of the Sewerage &
Drainage Plan proposed by Delhi Jal Board to ensure
water quality. The pollution potential in the catchment
area depends on various human activities and is
categorised into two groups: Point sources of pollution & Non
Point sources of pollution. 80 per cent of the pollution load
in the river comes from only 2 per cent of its catchment
that lies in Delhi between Wazirabad and Okhla Barrages.
One of the main causes of pollution of the river is
discharge of untreated domestic wastewater and other
wastes into the river from the towns located along its
banks. To arrest river pollution, certain measures of
cleaning river have been taken by the Ministry of
Environment and Forests (MoEF) of the Government of
India (GOI) in 12 towns of Haryana, 8 towns of Uttar
Pradesh, and Delhi under an action plan (Yamuna Action
Plan-YAP) which is being implemented since 1993 by the
National River Conservation Directorate (NRCD) of the
Ministry of Environment and Forest in two phases. Phase-
I costing Rs. 686 crore was completed during 2003 and
Phase-II costing Rs. 624 crores is likely to be completed
by 2009. Thus by 2009, Rs. 1310 crore would have been
spent over a stretch of 1376 km of the river flowing
through six states of Uttarakhand, Uttar Pradesh,
Himachal Pradesh, Haryana, Punjab, Rajasthan, and Delhi.
Recently, to save dying Yanuna, Prime Minister has
okayed the constitution of a high powered committee that
will suggest ways to conserve and develop the Capital’s
life line in a time bound fashion. The Committee will be
co-chaired by the Lt Governor and the Chief Minister of
Delhi. It will also redevelop the landscape on and around
the river front and decide the policy for commercial
utilisation of the area considering the sensitivety of the
river zone. Sewerage system of Delhi, is as given in Figure
3.3.
The Japan Bank for International Cooperation (JBIC) is
participating in the Yamuna Action Plan in 15 of the 21
towns in the above status (excluding 6 towns of Haryana
which included later on the direction of the Honourable
Supreme Court of India) with soft loan assistance of
17.773 billion Japanese Yen (equivalent to about Rs. 700
crore) while GoI is providing the funds for the remaining
6 towns added later.
3.3.3.1 Point Sources of Pollution
The point sources of pollution are contributed at a
single point in significant amount such as wastewater
drain joining a water body. The point source pollution
covers two major categories: domestic pollution and
industrial pollution
3.3.3.2 Domestic Pollution
Sewage is discharged into the river without any
treatment from the cities located along the banks of river
and its tributaries. The river water does not remain
suitable due to pollution, for uses like drinking, outdoor
bathing, propagation of aquatic life, irrigation, and
industrial purposes.
3.3.3.3 Industrial Pollution
Industrial pollution affects water quality in many ways
i.e., dissolved oxygen, temperature and pH etc. Some
industrial effluents cause toxicity. Large and medium
industrial units—22 in Haryana, 42 in Delhi, and 17 in
Uttar Pradesh—have been identified as directly
discharging and polluting the river Yamuna under the
Action Plan area. These industries include paper, sugar,
chemical, leather, distillery and pharmaceuticals etc.
3.3.3.4 Non-Point Sources of Pollution
The diffused pollution originates mainly from the
catchment area through movement of water. Pollutants
originated from the topsoil losses include soil organic
matter, plant residues, nutrient elements, organic
chemicals, toxic elements, and bacteria. The important
non point pollution sources contributing to river Yamuna
are: agricultural pollution sources and pollution due to in
stream uses of water.
Run off from Medical andAgricultural Field
Diffused Sources
Disposal of Dead Bodies andAnimal Carcasses
Open Defecation andCattle Wallowing
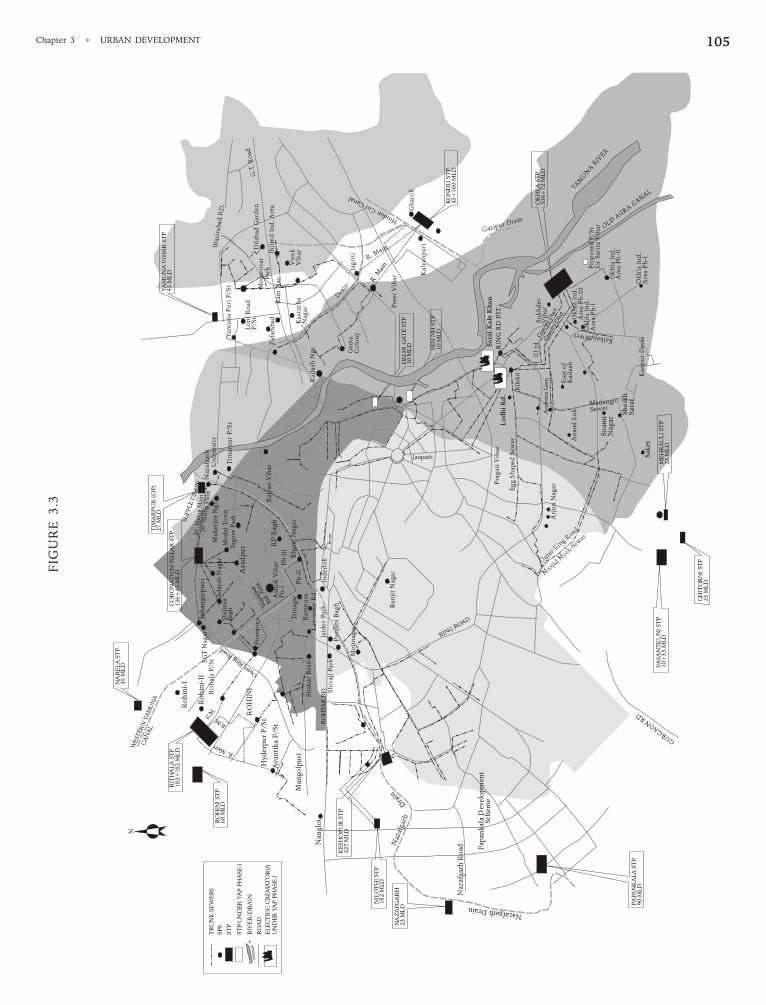
105Chapter 3 • URBAN DEVELOPMENT
FIG
UR
E 3
.3
Sak
etO
kh
la I
nd
.A
rea
Ph
-I
Ok
hla
In
d.
Are
a P
h-I
I
Pap
ankal
a D
evel
opm
ent
Sch
eme
Naz
afg
arh
Ro
ad
Nazafgarh Drain
Nazafgarh
Drain
Nan
glo
i
Man
go
lpu
ri
Hyd
erp
ur
P/S
t
Ava
nti
ka
P/S
t
RO
HIN
I
Ro
hin
i-I
Ro
hin
i-II
R.M.
R.M.
R. Main
Jah
ang
irp
uri
Shal
imar
B
agh
Aza
dpu
rTag
ore
Par
kM
od
el T
ow
n
Mu
ker
jee
Ng
r.A
dar
sh N
agar
SG
T N
agar
Rit
hal
a P
/St
Pit
amp
ura
RP
Bag
h
Ph
-III
Ph
-II
Ash
ok
Vih
arP
h-I
Waz
irpu
r
Ind.
Are
a
Tri
nag
ar
Ram
pu
raS
hak
ur
Bas
ti
Ind
erlo
kJa
ide
v P
ark
Law
ren
ce R
d.
Pu
nja
bi
Bag
hS
hiv
aji
Par
k
Mo
tin
agar
Ran
jit
Nag
ar
Janpath
Kal
yan
Vih
ar
Yam
un
a P
uri
P/S
t
Lo
ni
Ro
adP
/St
Zaf
arab
ad Kas
turb
a N
agar
Ram
Nar
Viv
ek
V
ihar
Dil
shad
Gar
den
Jhil
mil
In
d.
Are
a
G.T
. R
oad
Gee
ta
Co
lon
y
Kai
lash
Ngr
.
Pre
et V
ihar
Jag
riti
Kal
yan
pu
ri
Pra
gat
i V
ihar
Eg
g S
hap
ed S
ewer
Arj
un
Nag
ar
Eas
t o
f K
aila
sh
Kan
pu
r D
eoli
Wazir
ab
ad
RD
.
Gh
aro
li
Ok
hla
In
d.
Are
a P
h-I
IIO
kh
la I
nd
.A
rea
Ph
-I
An
and
Lo
k
Kalkaji Sewer
III
rdRIN
G R
D P
ST
Su
kh
dev
V
ihar
Hindon C
ut Canal
Sarai
Kale
Kh
an
Lo
dh
i R
d.
RIT
HA
LA
ST
P18
2+
182
ML
D
RO
HIN
I ST
P68
ML
D
NA
RE
LA
ST
P45
ML
D
TIM
AR
PU
R (
OP
)27
ML
D
CO
RO
NA
TIO
N P
ILLA
R S
TP
136+
45 M
LD
SU
PPLE
DR
AIN
36
" R
isi n
g M
ain
36"
Ris
ing
Mai
n
KE
SH
OP
UR
ST
P32
7 M
LD
NIL
OT
HI
ST
P
18
2 M
LD
NA
ZA
FGA
RH
23
ML
D
PA
PAN
KA
LA
ST
P
90
ML
D
VA
SA
NT
KU
NJ
ST
P
10
+3
3 M
LD
GH
ITO
RN
I ST
P
23 M
LD
ME
HR
AU
LI
ST
P
22
ML
D
OK
HL
A S
TP
53
6+
72 M
LD
KO
ND
LI
ST
P
45+
160 M
LD
DE
LH
I G
AT
E S
TP
10 M
LD SE
N N
H S
TP
10
ML
D
YA
MU
NA
VIH
AR
ST
P
45
ML
D
Mas
jid M
oth S
ewer
Oute
r Rin
g Roa
d
GU
RG
AO
N R
D
RIN
G RO
AD
Gazipur Drain
R. M
ain
R. M
ain
DrainM
nsa
rova
r P
ark
YA
MU
NA
RIV
ER
OLD
AG
RA
CA
NA
L
Gra
vity
Duc
t
Gra
vity
Duct
Kilo
kri
An
dre
ns
Gan
j
Sh
eik
h
Sar
ai
So
ami
Nag
ar
Madangir
Sewer
RO
HT
AK
RD
.
WE
ST
ER
N Y
AM
UN
A
CA
NA
L
N
TR
UN
K S
EW
ER
S
SPS
ST
P
ST
P-U
ND
ER
YA
P P
HA
SE
-I
RIV
ER
/DR
AIN
RO
AD
ELE
CT
RIC
CR
EM
AT
OR
IAU
ND
ER
YA
P P
HA
SE
-I
Outer R
ing Roa
d
Naz
afg
arh
Un
iver
sity
Bh
arat
Nag
ar
Tim
arp
ur
P/S
t
Pro
po
sed
P/S
tfo
r S
arit
a V
ihar
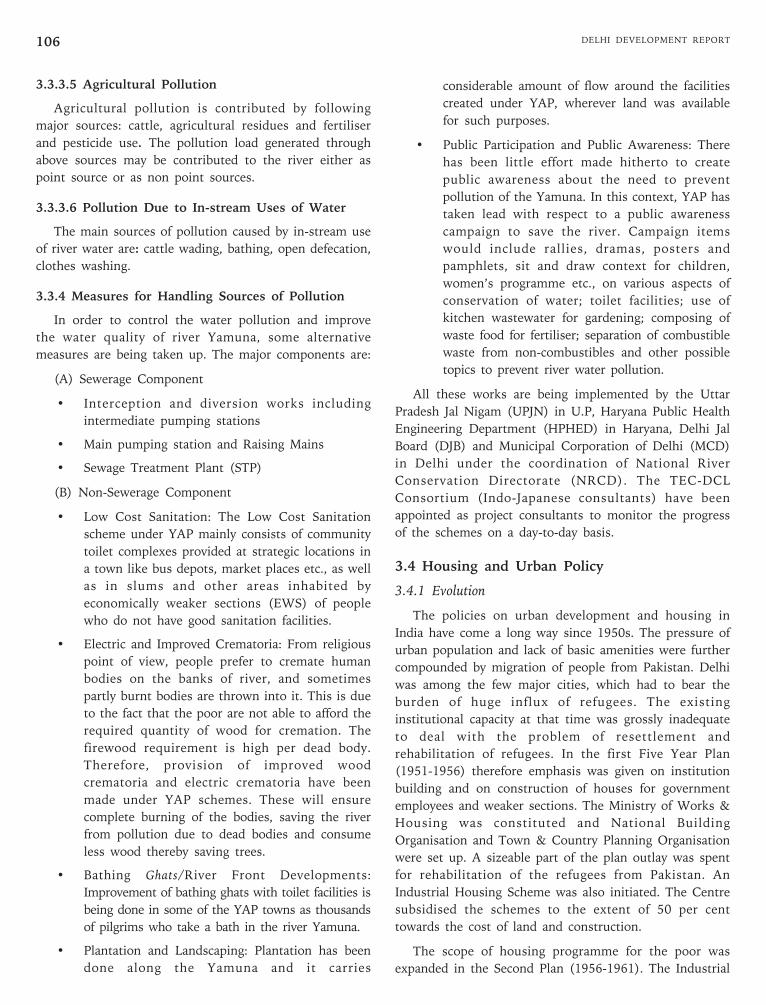
DELHI DEVELOPMENT REPORT106
3.3.3.5 Agricultural Pollution
Agricultural pollution is contributed by following
major sources: cattle, agricultural residues and fertiliser
and pesticide use. The pollution load generated through
above sources may be contributed to the river either as
point source or as non point sources.
3.3.3.6 Pollution Due to In-stream Uses of Water
The main sources of pollution caused by in-stream use
of river water are: cattle wading, bathing, open defecation,
clothes washing.
3.3.4 Measures for Handling Sources of Pollution
In order to control the water pollution and improve
the water quality of river Yamuna, some alternative
measures are being taken up. The major components are:
(A) Sewerage Component
• Interception and diversion works including
intermediate pumping stations
• Main pumping station and Raising Mains
• Sewage Treatment Plant (STP)
(B) Non-Sewerage Component
• Low Cost Sanitation: The Low Cost Sanitation
scheme under YAP mainly consists of community
toilet complexes provided at strategic locations in
a town like bus depots, market places etc., as well
as in slums and other areas inhabited by
economically weaker sections (EWS) of people
who do not have good sanitation facilities.
• Electric and Improved Crematoria: From religious
point of view, people prefer to cremate human
bodies on the banks of river, and sometimes
partly burnt bodies are thrown into it. This is due
to the fact that the poor are not able to afford the
required quantity of wood for cremation. The
firewood requirement is high per dead body.
Therefore, provision of improved wood
crematoria and electric crematoria have been
made under YAP schemes. These will ensure
complete burning of the bodies, saving the river
from pollution due to dead bodies and consume
less wood thereby saving trees.
• Bathing Ghats/River Front Developments:
Improvement of bathing ghats with toilet facilities is
being done in some of the YAP towns as thousands
of pilgrims who take a bath in the river Yamuna.
• Plantation and Landscaping: Plantation has been
done along the Yamuna and it carries
considerable amount of flow around the facilities
created under YAP, wherever land was available
for such purposes.
• Public Participation and Public Awareness: There
has been little effort made hitherto to create
public awareness about the need to prevent
pollution of the Yamuna. In this context, YAP has
taken lead with respect to a public awareness
campaign to save the river. Campaign items
would include rallies, dramas, posters and
pamphlets, sit and draw context for children,
women’s programme etc., on various aspects of
conservation of water; toilet facilities; use of
kitchen wastewater for gardening; composing of
waste food for fertiliser; separation of combustible
waste from non-combustibles and other possible
topics to prevent river water pollution.
All these works are being implemented by the Uttar
Pradesh Jal Nigam (UPJN) in U.P, Haryana Public Health
Engineering Department (HPHED) in Haryana, Delhi Jal
Board (DJB) and Municipal Corporation of Delhi (MCD)
in Delhi under the coordination of National River
Conservation Directorate (NRCD). The TEC-DCL
Consortium (Indo-Japanese consultants) have been
appointed as project consultants to monitor the progress
of the schemes on a day-to-day basis.
3.4 Housing and Urban Policy
3.4.1 Evolution
The policies on urban development and housing in
India have come a long way since 1950s. The pressure of
urban population and lack of basic amenities were further
compounded by migration of people from Pakistan. Delhi
was among the few major cities, which had to bear the
burden of huge influx of refugees. The existing
institutional capacity at that time was grossly inadequate
to deal with the problem of resettlement and
rehabilitation of refugees. In the first Five Year Plan
(1951-1956) therefore emphasis was given on institution
building and on construction of houses for government
employees and weaker sections. The Ministry of Works &
Housing was constituted and National Building
Organisation and Town & Country Planning Organisation
were set up. A sizeable part of the plan outlay was spent
for rehabilitation of the refugees from Pakistan. An
Industrial Housing Scheme was also initiated. The Centre
subsidised the schemes to the extent of 50 per cent
towards the cost of land and construction.
The scope of housing programme for the poor was
expanded in the Second Plan (1956-1961). The Industrial
107Chapter 3 • URBAN DEVELOPMENT
Housing Scheme was widened to cover all workers. Three
new schemes were introduced, namely, Rural Housing,
Slum Clearance and Sweepers Housing. Town & Country
Planning Legislations were enacted in many states and
necessary organisations were also set up for preparation of
Master Plans for important towns. The general directions
for housing programmes in the Third Plan (1961-1966)
were coordination of efforts of all agencies and orienting
the programmes to the needs of the Low Income Groups.
A scheme was introduced in 1959 to give loans to State
governments for a period of 10 years for acquisition and
development of land in order to make available building
sites in sufficient numbers. Master Plans for major cities
were prepared and the state capitals of Gandhi Nagar and
Bhubaneshwar were developed.
The balanced urban growth was accorded high priority
in the Fourth Plan (1969-1974). The Plan stressed the
need to prevent further growth of population in large
cities and need for decongestion or dispersal of
population. This was envisaged to be achieved by creation
of smaller towns and by planning the spatial location of
economic activity. Housing & Urban Development
Corporation (HUDCO) was established to fund the
remunerative housing and urban development
programmes, promising a quick turnover. A scheme for
Environmental Improvement of Urban Slums was
undertaken in the Central Sector from 1972-73 with a
view to provide a minimum level of services, like, water
supply, sewerage, drainage, street pavements in 11 cities
with a population of 8 lakh and above. The scheme was
later extended to 9 more cities.
The Fifth Plan (1974-1979) reiterated the policies of
the preceding Plans to promote smaller towns in new
urban centres, in order to ease the increasing pressure on
urbanisation. This was to be supplemented by efforts to
augment civic amenities in urban areas with particular
emphasis on a comprehensive and regional approach to
problems in metropolitan cities. A Task Force was set up
for development of small and medium towns. The Urban
Land (Ceiling & Regulation) Act was enacted to prevent
concentration of land holding in urban areas and to make
available urban land for construction of houses for the
middle and low income groups.
The thrust of the planning in the Sixth Plan (1980-
1985) was on integrated provision of services along with
shelter, particularly for the poor. The Integrated
Development of Small and Medium Towns (IDSMT) was
launched in towns with population below one lakh for
provision of roads, pavements, minor civic works, bus
stands, markets, shopping complex etc. Positive
inducements were proposed for setting up new industries
and commercial and professional establishments in small,
medium and intermediate towns.
The Seventh Plan (1985-1990) stressed on the need to
entrust major responsibility of housing construction in the
private sector. A three-fold role was assigned to the public
sector, namely, mobilisation of resources for housing,
provision for subsidised housing for the poor and acquisition
and development of land. The National Housing Bank was
set up to expand the base of housing finance. NBO was
reconstituted and a new organisation called Building Material
Technology Promotion Council (BMTPC) was set up for
promoting commercial production of innovative building
materials. A network of Building Centres was also set up
during this Plan period. The Seventh Plan explicitly
recognised the problems of the Urban poor and for the first
time an Urban Poverty Alleviation Scheme known as Urban
Basic Services for the Poor (UBSP) was launched.
As a follow-up of the Global Shelter Strategy (GSS),
National Housing Policy (NHP) was announced in 1988.
The long term goal of the NHP was to eradicate
houselessness, improve the housing conditions of the
inadequately housed and provide a minimum level of
basic services and amenities to all. The role of the
government was conceived as a provider for the poorest
and vulnerable sections and as a facilitator for other
income groups and private sector by the removal of
constraints and the increased supply of land and services.
The National Commission on Urbanisation eloquently
pointed out the reality of continuing rapid growth of the
urban population as well as the scale and intensity of
urbanisation, the critical deficiencies in the various items
of infrastructure, the concentration of vast number of
poor and deprived people, the acute disparities in the
access of shelter and basic services, deteriorating
environmental quality and the impact of poor governance
on the income and the productivity of enterprises.
In the backdrop of this report the Eighth Plan (1992-
1997) for the first time explicitly recognised the role and
importance of urban sector for the national economy.
While growth rate of employment in the urban areas
averaged around 3.8 per cent per annum, it dropped to
about 1.6 per cent in the rural areas. Therefore, the urban
areas had to be enabled to absorb larger increments to the
labour force. The plan identified the following key issues
in the emerging urban scenario:
• The widening gap between demand and supply of
infrastructural services badly hitting the poor,
whose access to the basic services like drinking
water, sanitation, education and basic health
services is shrinking.
DELHI DEVELOPMENT REPORT108
NATIONAL SLUM POLICY
Objectives
• To integrate slum settlements and the communities residing them into the urban area as a whole by creating awareness
amongst the public and in government of the underlying principles that guide the process of slum development and
improvement and the options that are available for bringing about the integration.
• To strengthen the legal and policy framework to facilitate the process of slum development and improvement on a
sustainable basis.
• To establish a framework for involving all stakeholders for the efficient and smooth implementation of policy objectives.
Salient features
The policy preliminary endorses and promotes an upgrading and improvement approach to deal with slums and informal
settlements as opposed to resettlement. It proposes that all existing planning instruments such as master plans, land use
plans etc. should be modified to ensure that slums and informal settlements can properly integrated into the wider urban
area.
The policy states that all physical upgrading and improvement in informal settlements should adopt a community-based
approach with the active involvement of members of the community at every stage of design, implementation, and
maintenance of services and assets. It sets forth specific norms and guiding principles for physical infrastructure
developments and the desirability of collection of user charges.
The policy also emphasises improving access to social services, health, education, child labour and child rights and public
distribution system as their effective delivery would also reduce social inequities and promote integration of people residing
in slums into the social and economic networks of the city as a whole.
The policy recognises the importance of economic empowerment of the slum dweller and lays guidelines for provision of
financial services for the poor and economic support/enterprise development designed to address the livelihood needs of
the urban poor.
the construction industry to participate in every
sphere of housing and habitat.
• Using technology for modernising the housing
sector to increase efficiency, productivity and quality
• Empowering Panchayati Raj Institutions and
village Cooperatives to mobilise credit for adding
to the housing stock.
3.4.3 Delhi’s Shelter Policy
Delhi’s policy on “Shelter” is based on the above
National Housing and Habitat Policy which has the
ultimate goal of ensuring “Shelter for all”. It recognises
that Housing has a spatial relationship with Employment,
Social Services and other urban activities. The Planning
Board of the National Capital Region (NCR) has
envisaged a Regional Plan Policy of “Induced Growth” of
some selected settlements in the NCR through large scale
housing activity to reduce population pressure on Delhi
and achieve balanced development of the entire region.
3.4.4 National Slum Policy
In view of the enormity of the problem of slums in
cities/towns at the National level, the Ministry of UD&PA
has framed draft ‘National Slum Policy’.
• Unabated growth of urban population aggravating
the accumulated backlog of housing shortages,
resulting in proliferation of slums and squatter
settlement and decay of city environment.
• High incidence of marginal employment and
urban poverty.
3.4.2 National Housing and Habitat Policy 1998
The National Housing and Habitat Policy of 1998
envisages that public agencies should perform the role of
facilitators by providing developed land and legal and
infrastructure support to enable the private sector to
make heavy investments in housing. The main objectives
of the policy are:
• Creation of surpluses in housing stock either on
rental or ownership basis.
• Providing quality and cost effective shelter options,
especially to vulnerable groups and the poor.
• Removing legal, financial and administrative
barriers for facilitating access to land, finance and
technology.
• Forging strong partnership among private, public
and cooperative sectors to enhance the capacity of
Contd...
109Chapter 3 • URBAN DEVELOPMENT
The policy proposes a sustainable financing mechanism for slum improvement through a Slum Development Fund at the
state level, while recognising the role of private sector funding and institutional finance.
The policy proposes a consolidated Service Tax on properties located in slums. It gives measures for strengthening municipal
governance and management in the context of slum areas. It also proposes establishment of a system of monitoring and
evaluation at different levels of government in order to find out the extent to which the programmes under the policy are
being implemented and whether the policy objectives are being achieved.
The policy is committed to a shelter upgradation approach that will enable, support and extend individual and community
initiatives for housing provision.
Incorporating some of the important features outlined in the policy, the Central government has announced the Valmiki
Ambedkar Malin Basti Awas Yojana (VAMBAY) for construction of dwelling units, upgrdation of slum tenements and
provision of basic amenities like water supply and sanitation in slums.
Source: National Slum Policy (Draft), Ministry of Urban Development and Poverty Alleviation, October 2001
3.4.5 Delhi’s Slum Policy
The broad policy adopted in Delhi is that no fresh
encroachments shall be permitted on Public land and past
encroachments, which had been in existence prior to 31
January 1990, will not be removed without providing
alternatives. A three-pronged strategy has been adopted
for dealing with the problems of Jhuggi-Jhopris as under:
i) Relocation of those jhuggi households where the
land owning agencies are in a position to
implement projects on the encroached land
pockets as per requirements in larger public
interest, and they submit requests to Slum & JJ
Department for clearance of the jhuggi cluster for
project implementation and also contribute due
share towards the resettlement cost.
ii) Insitu upgradation of JJ Clusters and informal
shelters in case of those encroached land pockets
where the land owning agencies issue NOC to
S&JJ Department for utilisation of land. However,
the utilisation of land under this strategy is linked
with the clearance of the project by the Technical
Committee of the DDA.
iii) Extension of minimum basic civic amenities for
community use under the scheme of
Environmental Improvement in JJ Clusters and its
component scheme of construction of Pay and
Use ‘Jansuvidha Complexes’ containing toilets and
baths and also introduction of mobile toilet vans
in the clusters irrespective of the status of the
encroached land till their coverage under one of
the aforesaid two strategies.
It can be categorically stated that the first part of this
policy has remained a pipe dream and no agency i.e., the
Land Owning Agencies or the Law Enforcement Agencies
has made any efforts to curb fresh encroachments. Even
the Government accepted this fact and therefore the
earlier cut off date of 31st January 1990 for determining
the eligibility for rehabilitation of squatters had to be
extended to 31st December 1998.
The NCR Planning Board has suggested a joint
approach with active cooperation between DDA, GNCT-
Delhi and the Development Authorities of towns in the
NCR (i.e. HUDA, GDA, MDA, NOIDA, etc.) wherein
NCT Delhi could consider entering into necessary
agreements/joint venture with them for:
i) Purchasing the existing vacant EWS plots and
flats available for immediate occupancy in these
towns; and/or
ii) Investing in fresh development of such facilities
in these towns for resettlement and taking full
advantage of the Government of India’s
(MOUD&PA) innovative schemes like VAMBAY
etc. in establishing housing colonies for the poor
and the needy.
The Board has suggested that these settlers would
have to be relocated preferably close to their work places,
on the rail, road transport corridors with the fast
commuting transportation system.
Some isolated efforts were made for rehabilitation of
slum dwellers in the NCR towns but the slum dwellers
were not inclined to move to these NCR towns because of
disruption of their economic means. Even within Delhi,
the squatter families do not want to move out to far away
locations, where they do not have any assured source of
earnings. They are reluctant to shift from their more
convenient central locations within the city to outlying
areas, away from their places of employement, due to the
distance involved and the extra transportation expenses
...contd...
DELHI DEVELOPMENT REPORT110
etc. Since these migrants have their roots somewhere else,
either at the place of last residence or place of work, they
are very often reluctant to move and resort to squatting.
Relocation/re-settlement efforts in the past had either
failed or had only limited success mainly because many
newly located sites deprived the residents of the much
needed job opportunities. In this context, it has also been
suggested time and again that the possibility of solving
the problem of slums in Delhi should be explored in the
regional context.
3.5 Data Base Development and Management
While a large amount of data on housing in Delhi is
generated by DDA, PWD, NDMC, MCD, Cantonment
Board etc., it remains uncoordinated and often redundant
to support decision making. Thus housing policy making
so far has been without proper linkages between various
sectors like physical Infrastructure, Business & Industry,
Education, Health, Environment etc.
The process of data collection is also not within any
regulatory framework. While the Indian conditions in
general and Delhi’s conditions in particular should govern
development of such a framework, it would be desirable
to consider the broad guidelines provided by the United
Nations Human Settlements Programme. The indicator
system for “shelter” developed by the U.N. Commission
on Human Settlements (UNCHS) lists the following
aspects/issues to be addressed:
i) Provision of security of tenure:
• Indicator 1- Tenure type
• Indicator 2- Evictions.
ii) Right to adequate housing:
• Qualitative data- Housing rights
• Indicator 3 – Housing price-to-income ratio
iii) Equal access to land:
• Indicator 4 – Land price-to-income ratio
iv) Equal access to credit:
• Indicator 5 – Mortgage and non-Mortgage
v) Access to basic services:
• Indicator 6 – Access to Water
• Indicator 7 – Household connections.
In case of Delhi, which attracts people from all parts of
the country many more aspects need to be considered for
urban planning in general and housing in particular viz.,
employment opportunities for skilled, semi-skilled and
unskilled people, public transport and over all carrying
capacity of the land and other resources of the city.
Carrying capacity of the city has to be assessed taking into
consideration a wide range of aspects such as:
• Availability of land and optimal land use pattern.
• Existing physical infrastructure and the optional
limits to which it can be expanded in future.
• Exhaustible and scarce natural resources
especially surface and ground water.
• Sustainability of healthy environment and
ecology.
• Internal support systems for healthy economic
interdependence and social harmony.
Collecting and compiling data according to an
appropriate Indicator System should be a collaborative
effort since no single agency can be expected to be
simultaneously conversant with all the issues involved.
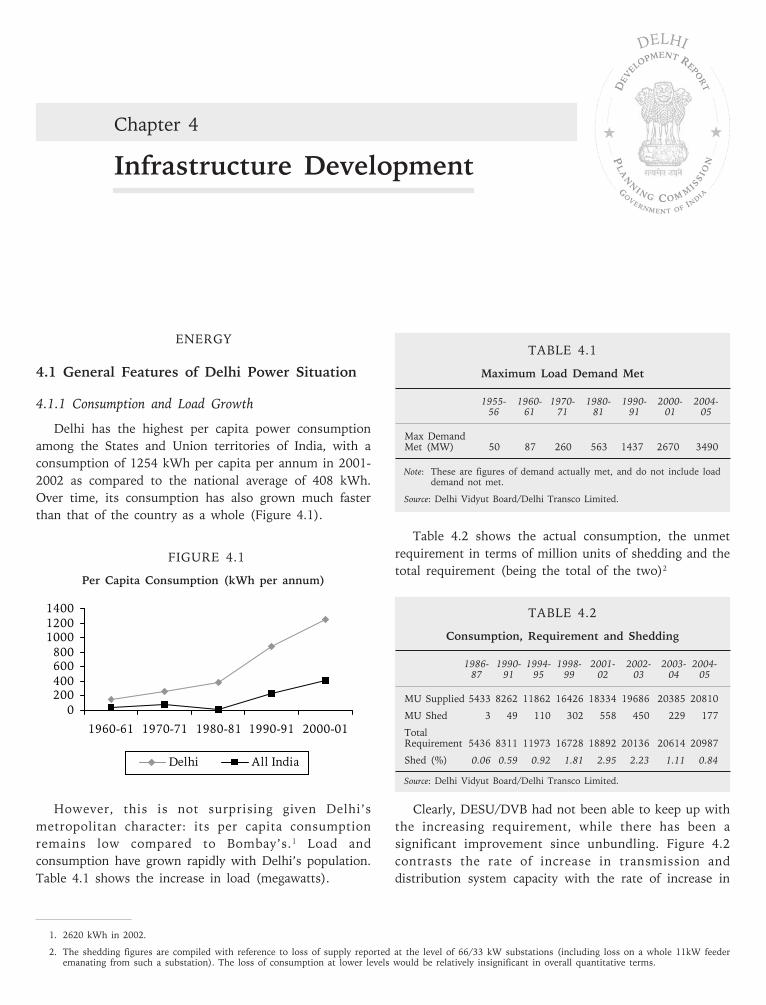
TABLE 4.1
Maximum Load Demand Met
1955- 1960- 1970- 1980- 1990- 2000- 2004-56 61 71 81 91 01 05
Max DemandMet (MW) 50 87 260 563 1437 2670 3490
Note: These are figures of demand actually met, and do not include loaddemand not met.
Source: Delhi Vidyut Board/Delhi Transco Limited.
Table 4.2 shows the actual consumption, the unmet
requirement in terms of million units of shedding and the
total requirement (being the total of the two)2
TABLE 4.2
Consumption, Requirement and Shedding
1986- 1990- 1994- 1998- 2001- 2002- 2003- 2004-87 91 95 99 02 03 04 05
MU Supplied 5433 8262 11862 16426 18334 19686 20385 20810
MU Shed 3 49 110 302 558 450 229 177
TotalRequirement 5436 8311 11973 16728 18892 20136 20614 20987
Shed (%) 0.06 0.59 0.92 1.81 2.95 2.23 1.11 0.84
Source: Delhi Vidyut Board/Delhi Transco Limited.
Clearly, DESU/DVB had not been able to keep up with
the increasing requirement, while there has been a
significant improvement since unbundling. Figure 4.2
contrasts the rate of increase in transmission and
distribution system capacity with the rate of increase in
ENERGY
4.1 General Features of Delhi Power Situation
4.1.1 Consumption and Load Growth
Delhi has the highest per capita power consumption
among the States and Union territories of India, with a
consumption of 1254 kWh per capita per annum in 2001-
2002 as compared to the national average of 408 kWh.
Over time, its consumption has also grown much faster
than that of the country as a whole (Figure 4.1).
FIGURE 4.1
Per Capita Consumption (kWh per annum)
However, this is not surprising given Delhi’s
metropolitan character: its per capita consumption
remains low compared to Bombay’s.1 Load and
consumption have grown rapidly with Delhi’s population.
Table 4.1 shows the increase in load (megawatts).
Chapter 4
Infrastructure Development
DELHI
0
200
400
600
800
1000
1200
1400
1960-61 1970-71 1980-81 1990-91 2000-01
Delhi All India
1. 2620 kWh in 2002.
2. The shedding figures are compiled with reference to loss of supply reported at the level of 66/33 kW substations (including loss on a whole 11kW feederemanating from such a substation). The loss of consumption at lower levels would be relatively insignificant in overall quantitative terms.
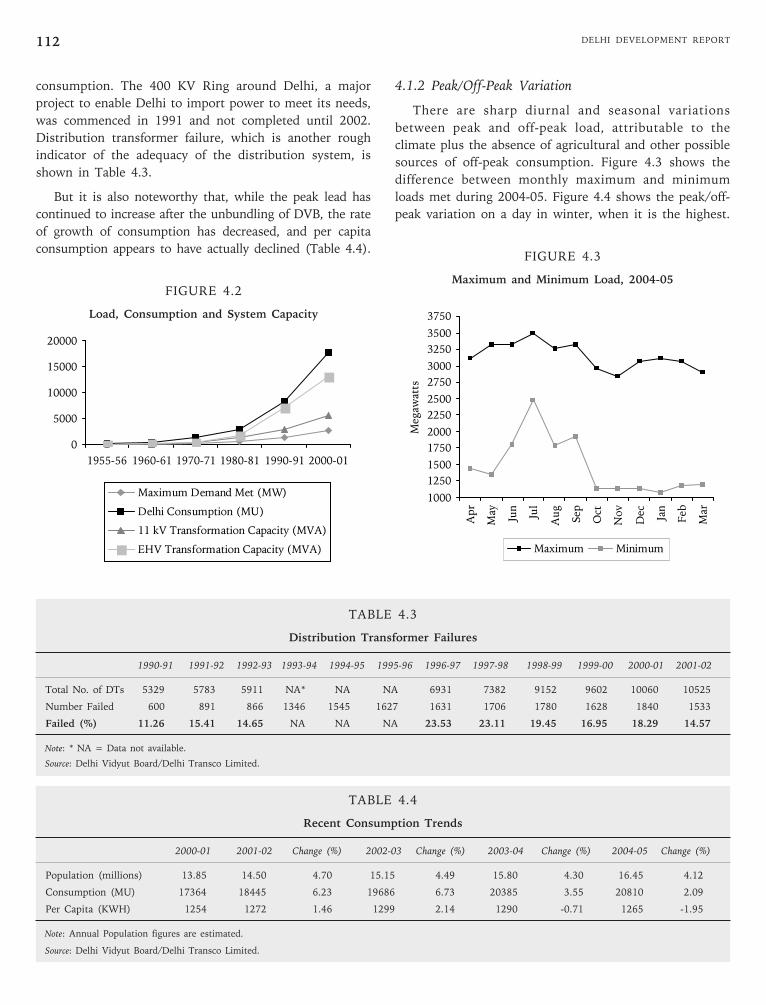
DELHI DEVELOPMENT REPORT112
consumption. The 400 KV Ring around Delhi, a major
project to enable Delhi to import power to meet its needs,
was commenced in 1991 and not completed until 2002.
Distribution transformer failure, which is another rough
indicator of the adequacy of the distribution system, is
shown in Table 4.3.
But it is also noteworthy that, while the peak lead has
continued to increase after the unbundling of DVB, the rate
of growth of consumption has decreased, and per capita
consumption appears to have actually declined (Table 4.4).
FIGURE 4.2
Load, Consumption and System Capacity
4.1.2 Peak/Off-Peak Variation
There are sharp diurnal and seasonal variations
between peak and off-peak load, attributable to the
climate plus the absence of agricultural and other possible
sources of off-peak consumption. Figure 4.3 shows the
difference between monthly maximum and minimum
loads met during 2004-05. Figure 4.4 shows the peak/off-
peak variation on a day in winter, when it is the highest.
FIGURE 4.3
Maximum and Minimum Load, 2004-05
0
5000
10000
15000
20000
1955-56 1960-61 1970-71 1980-81 1990-91 2000-01
Maximum Demand Met (MW)
Delhi Consumption (MU)
11 kV Transformation Capacity (MVA)
EHV Transformation Capacity (MVA)
TABLE 4.3
Distribution Transformer Failures
1990-91 1991-92 1992-93 1993-94 1994-95 1995-96 1996-97 1997-98 1998-99 1999-00 2000-01 2001-02
Total No. of DTs 5329 5783 5911 NA* NA NA 6931 7382 9152 9602 10060 10525
Number Failed 600 891 866 1346 1545 1627 1631 1706 1780 1628 1840 1533
Failed (%) 11.26 15.41 14.65 NA NA NA 23.53 23.11 19.45 16.95 18.29 14.57
Note: * NA = Data not available.
Source: Delhi Vidyut Board/Delhi Transco Limited.
TABLE 4.4
Recent Consumption Trends
2000-01 2001-02 Change (%) 2002-03 Change (%) 2003-04 Change (%) 2004-05 Change (%)
Population (millions) 13.85 14.50 4.70 15.15 4.49 15.80 4.30 16.45 4.12
Consumption (MU) 17364 18445 6.23 19686 6.73 20385 3.55 20810 2.09
Per Capita (KWH) 1254 1272 1.46 1299 2.14 1290 -0.71 1265 -1.95
Note: Annual Population figures are estimated.
Source: Delhi Vidyut Board/Delhi Transco Limited.
1000
1250
1500
1750
2000
2250
2500
2750
3000
3250
3500
3750
Apr
May
Jun
Jul
Aug
Sep
Oct
Nov
Dec Jan
Feb
Mar
Meg
awatts
Maximum Minimum
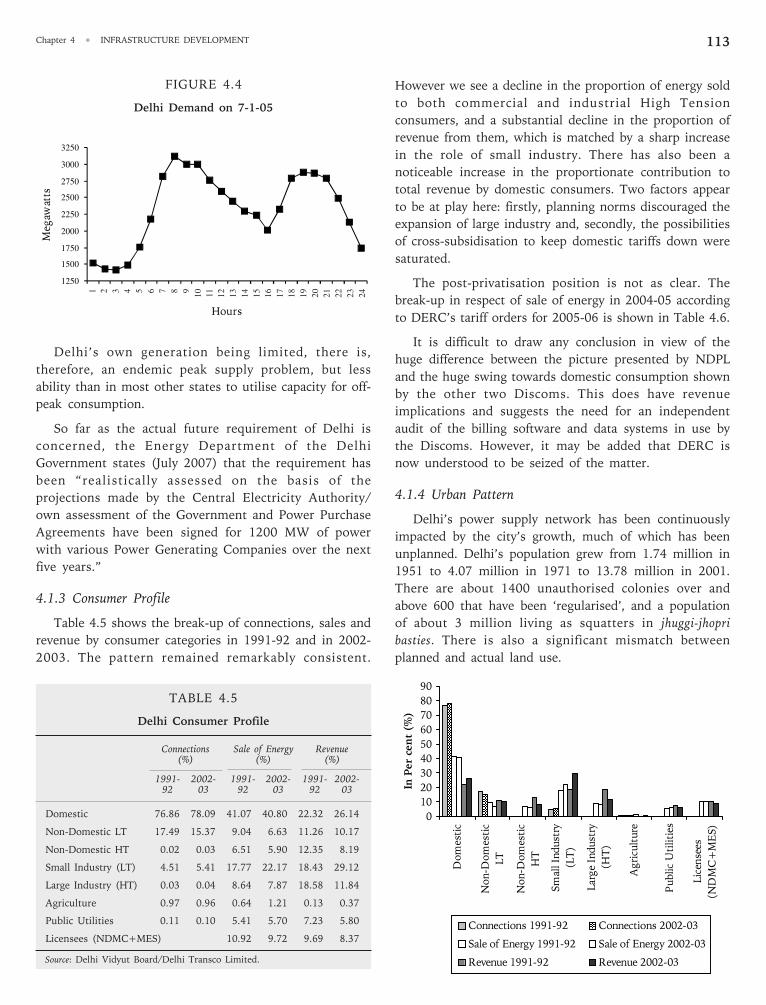
113Chapter 4 • INFRASTRUCTURE DEVELOPMENT
However we see a decline in the proportion of energy sold
to both commercial and industrial High Tension
consumers, and a substantial decline in the proportion of
revenue from them, which is matched by a sharp increase
in the role of small industry. There has also been a
noticeable increase in the proportionate contribution to
total revenue by domestic consumers. Two factors appear
to be at play here: firstly, planning norms discouraged the
expansion of large industry and, secondly, the possibilities
of cross-subsidisation to keep domestic tariffs down were
saturated.
The post-privatisation position is not as clear. The
break-up in respect of sale of energy in 2004-05 according
to DERC’s tariff orders for 2005-06 is shown in Table 4.6.
It is difficult to draw any conclusion in view of the
huge difference between the picture presented by NDPL
and the huge swing towards domestic consumption shown
by the other two Discoms. This does have revenue
implications and suggests the need for an independent
audit of the billing software and data systems in use by
the Discoms. However, it may be added that DERC is
now understood to be seized of the matter.
4.1.4 Urban Pattern
Delhi’s power supply network has been continuously
impacted by the city’s growth, much of which has been
unplanned. Delhi’s population grew from 1.74 million in
1951 to 4.07 million in 1971 to 13.78 million in 2001.
There are about 1400 unauthorised colonies over and
above 600 that have been ‘regularised’, and a population
of about 3 million living as squatters in jhuggi-jhopri
basties. There is also a significant mismatch between
planned and actual land use.
TABLE 4.5
Delhi Consumer Profile
Connections Sale of Energy Revenue(%) (%) (%)
1991- 2002- 1991- 2002- 1991- 2002-92 03 92 03 92 03
Domestic 76.86 78.09 41.07 40.80 22.32 26.14
Non-Domestic LT 17.49 15.37 9.04 6.63 11.26 10.17
Non-Domestic HT 0.02 0.03 6.51 5.90 12.35 8.19
Small Industry (LT) 4.51 5.41 17.77 22.17 18.43 29.12
Large Industry (HT) 0.03 0.04 8.64 7.87 18.58 11.84
Agriculture 0.97 0.96 0.64 1.21 0.13 0.37
Public Utilities 0.11 0.10 5.41 5.70 7.23 5.80
Licensees (NDMC+MES) 10.92 9.72 9.69 8.37
Source: Delhi Vidyut Board/Delhi Transco Limited.
FIGURE 4.4
Delhi Demand on 7-1-05
Delhi’s own generation being limited, there is,
therefore, an endemic peak supply problem, but less
ability than in most other states to utilise capacity for off-
peak consumption.
So far as the actual future requirement of Delhi is
concerned, the Energy Department of the Delhi
Government states (July 2007) that the requirement has
been “realistically assessed on the basis of the
projections made by the Central Electricity Authority/
own assessment of the Government and Power Purchase
Agreements have been signed for 1200 MW of power
with various Power Generating Companies over the next
five years.”
4.1.3 Consumer Profile
Table 4.5 shows the break-up of connections, sales and
revenue by consumer categories in 1991-92 and in 2002-
2003. The pattern remained remarkably consistent.
0
10
20
30
40
50
60
70
80
90
Dom
esti
c
Non-D
om
esti
c
LT
Non-D
om
esti
c
HT
Sm
all In
dust
ry
(LT
)
Lar
ge
Indust
ry
(HT
)
Agri
cult
ure
Public
Uti
liti
es
Lic
ense
es
(ND
MC
+M
ES)
In P
er
cen
t (%
)
Connections 1991-92 Connections 2002-03
Sale of Energy 1991-92 Sale of Energy 2002-03
Revenue 1991-92 Revenue 2002-03
1250
1500
1750
2000
2250
2500
2750
3000
3250
Hours
Meg
awatts
1 2 3 4 5 6 7 8 9 10 11 12 13 14 15 16 17 18 19 20 21 22 23 24
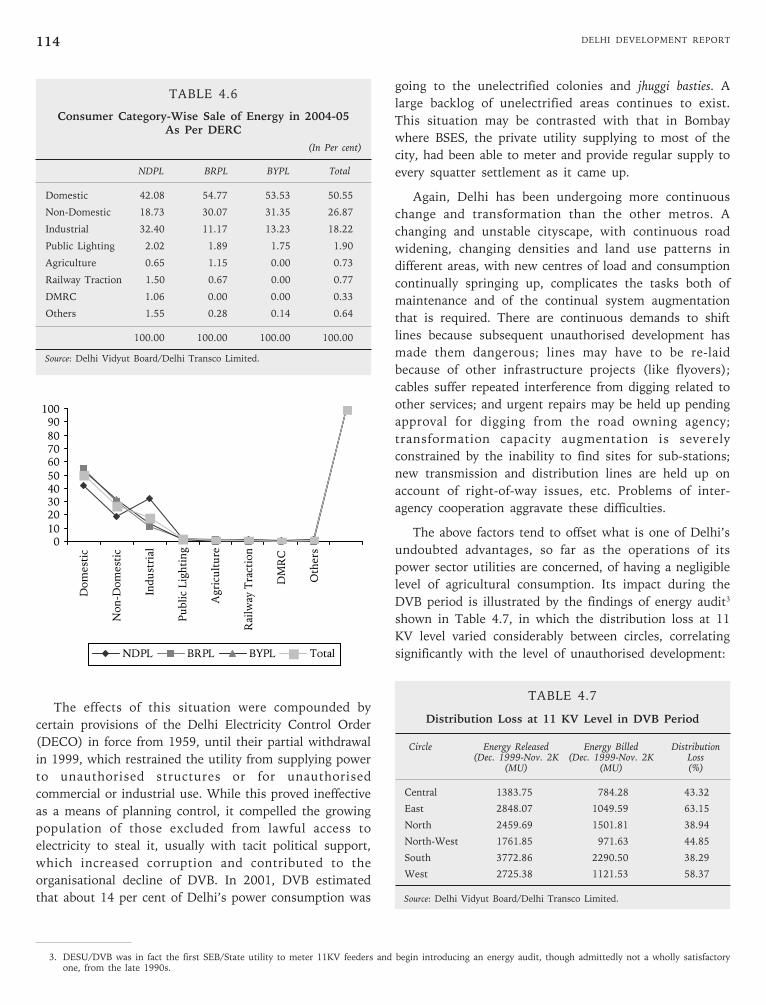
DELHI DEVELOPMENT REPORT114
going to the unelectrified colonies and jhuggi basties. A
large backlog of unelectrified areas continues to exist.
This situation may be contrasted with that in Bombay
where BSES, the private utility supplying to most of the
city, had been able to meter and provide regular supply to
every squatter settlement as it came up.
Again, Delhi has been undergoing more continuous
change and transformation than the other metros. A
changing and unstable cityscape, with continuous road
widening, changing densities and land use patterns in
different areas, with new centres of load and consumption
continually springing up, complicates the tasks both of
maintenance and of the continual system augmentation
that is required. There are continuous demands to shift
lines because subsequent unauthorised development has
made them dangerous; lines may have to be re-laid
because of other infrastructure projects (like flyovers);
cables suffer repeated interference from digging related to
other services; and urgent repairs may be held up pending
approval for digging from the road owning agency;
transformation capacity augmentation is severely
constrained by the inability to find sites for sub-stations;
new transmission and distribution lines are held up on
account of right-of-way issues, etc. Problems of inter-
agency cooperation aggravate these difficulties.
The above factors tend to offset what is one of Delhi’s
undoubted advantages, so far as the operations of its
power sector utilities are concerned, of having a negligible
level of agricultural consumption. Its impact during the
DVB period is illustrated by the findings of energy audit3
shown in Table 4.7, in which the distribution loss at 11
KV level varied considerably between circles, correlating
significantly with the level of unauthorised development:
TABLE 4.7
Distribution Loss at 11 KV Level in DVB Period
Circle Energy Released Energy Billed Distribution(Dec. 1999-Nov. 2K (Dec. 1999-Nov. 2K Loss
(MU) (MU) (%)
Central 1383.75 784.28 43.32
East 2848.07 1049.59 63.15
North 2459.69 1501.81 38.94
North-West 1761.85 971.63 44.85
South 3772.86 2290.50 38.29
West 2725.38 1121.53 58.37
Source: Delhi Vidyut Board/Delhi Transco Limited.
The effects of this situation were compounded by
certain provisions of the Delhi Electricity Control Order
(DECO) in force from 1959, until their partial withdrawal
in 1999, which restrained the utility from supplying power
to unauthorised structures or for unauthorised
commercial or industrial use. While this proved ineffective
as a means of planning control, it compelled the growing
population of those excluded from lawful access to
electricity to steal it, usually with tacit political support,
which increased corruption and contributed to the
organisational decline of DVB. In 2001, DVB estimated
that about 14 per cent of Delhi’s power consumption was
0
10
20
30
40
50
60
70
80
90
100
Do
mes
tic
No
n-D
om
esti
c
Ind
ust
rial
Pu
bli
c L
igh
tin
g
Agri
cult
ure
Rai
lway
Tra
ctio
n
DM
RC
Oth
ers
NDPL BRPL BYPL Total
3. DESU/DVB was in fact the first SEB/State utility to meter 11KV feeders and begin introducing an energy audit, though admittedly not a wholly satisfactoryone, from the late 1990s.
TABLE 4.6
Consumer Category-Wise Sale of Energy in 2004-05As Per DERC
(In Per cent)
NDPL BRPL BYPL Total
Domestic 42.08 54.77 53.53 50.55
Non-Domestic 18.73 30.07 31.35 26.87
Industrial 32.40 11.17 13.23 18.22
Public Lighting 2.02 1.89 1.75 1.90
Agriculture 0.65 1.15 0.00 0.73
Railway Traction 1.50 0.67 0.00 0.77
DMRC 1.06 0.00 0.00 0.33
Others 1.55 0.28 0.14 0.64
100.00 100.00 100.00 100.00
Source: Delhi Vidyut Board/Delhi Transco Limited.
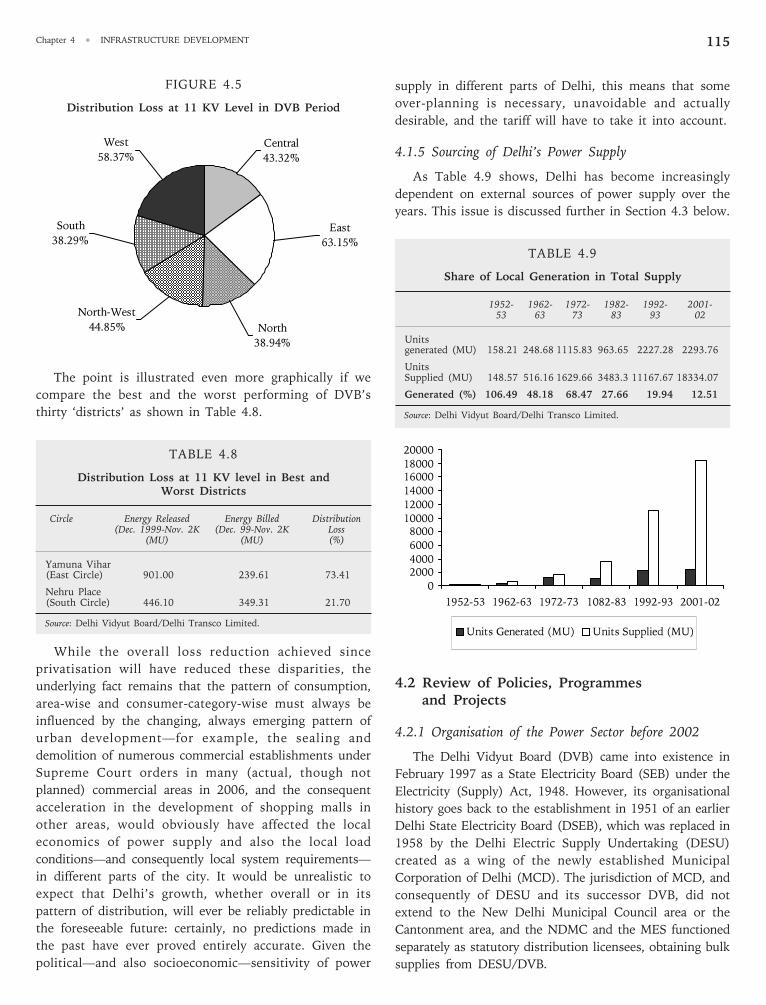
115Chapter 4 • INFRASTRUCTURE DEVELOPMENT
FIGURE 4.5
Distribution Loss at 11 KV Level in DVB Period
The point is illustrated even more graphically if we
compare the best and the worst performing of DVB’s
thirty ‘districts’ as shown in Table 4.8.
TABLE 4.8
Distribution Loss at 11 KV level in Best andWorst Districts
Circle Energy Released Energy Billed Distribution(Dec. 1999-Nov. 2K (Dec. 99-Nov. 2K Loss
(MU) (MU) (%)
Yamuna Vihar(East Circle) 901.00 239.61 73.41
Nehru Place(South Circle) 446.10 349.31 21.70
Source: Delhi Vidyut Board/Delhi Transco Limited.
While the overall loss reduction achieved since
privatisation will have reduced these disparities, the
underlying fact remains that the pattern of consumption,
area-wise and consumer-category-wise must always be
influenced by the changing, always emerging pattern of
urban development—for example, the sealing and
demolition of numerous commercial establishments under
Supreme Court orders in many (actual, though not
planned) commercial areas in 2006, and the consequent
acceleration in the development of shopping malls in
other areas, would obviously have affected the local
economics of power supply and also the local load
conditions—and consequently local system requirements—
in different parts of the city. It would be unrealistic to
expect that Delhi’s growth, whether overall or in its
pattern of distribution, will ever be reliably predictable in
the foreseeable future: certainly, no predictions made in
the past have ever proved entirely accurate. Given the
political—and also socioeconomic—sensitivity of power
supply in different parts of Delhi, this means that some
over-planning is necessary, unavoidable and actually
desirable, and the tariff will have to take it into account.
4.1.5 Sourcing of Delhi’s Power Supply
As Table 4.9 shows, Delhi has become increasingly
dependent on external sources of power supply over the
years. This issue is discussed further in Section 4.3 below.
TABLE 4.9
Share of Local Generation in Total Supply
1952- 1962- 1972- 1982- 1992- 2001-53 63 73 83 93 02
Unitsgenerated (MU) 158.21 248.68 1115.83 963.65 2227.28 2293.76
UnitsSupplied (MU) 148.57 516.16 1629.66 3483.3 11167.67 18334.07
Generated (%) 106.49 48.18 68.47 27.66 19.94 12.51
Source: Delhi Vidyut Board/Delhi Transco Limited.
4.2 Review of Policies, Programmesand Projects
4.2.1 Organisation of the Power Sector before 2002
The Delhi Vidyut Board (DVB) came into existence in
February 1997 as a State Electricity Board (SEB) under the
Electricity (Supply) Act, 1948. However, its organisational
history goes back to the establishment in 1951 of an earlier
Delhi State Electricity Board (DSEB), which was replaced in
1958 by the Delhi Electric Supply Undertaking (DESU)
created as a wing of the newly established Municipal
Corporation of Delhi (MCD). The jurisdiction of MCD, and
consequently of DESU and its successor DVB, did not
extend to the New Delhi Municipal Council area or the
Cantonment area, and the NDMC and the MES functioned
separately as statutory distribution licensees, obtaining bulk
supplies from DESU/DVB.
West
58.37%
South
38.29%
North-West
44.85% North
38.94%
East
63.15%
Central
43.32%
0
20004000
6000
800010000
12000
14000
1600018000
20000
1952-53 1962-63 1972-73 1082-83 1992-93 2001-02
Units Generated (MU) Units Supplied (MU)
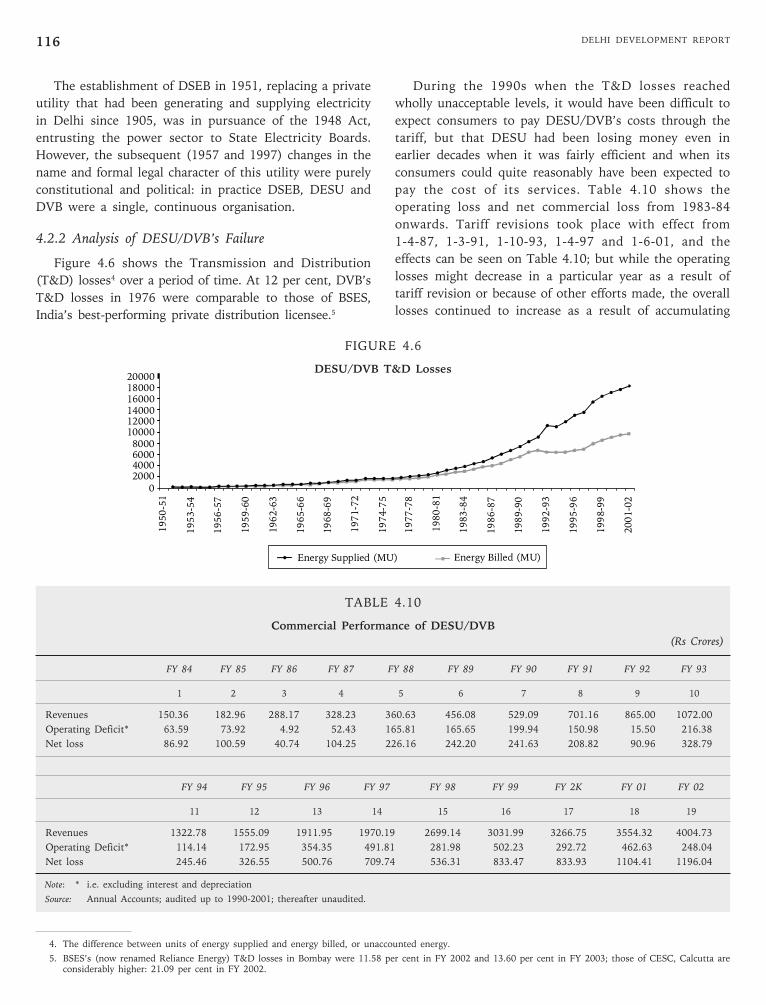
DELHI DEVELOPMENT REPORT116
FIGURE 4.6
DESU/DVB T&D Losses
TABLE 4.10
Commercial Performance of DESU/DVB
(Rs Crores)
FY 84 FY 85 FY 86 FY 87 FY 88 FY 89 FY 90 FY 91 FY 92 FY 93
1 2 3 4 5 6 7 8 9 10
Revenues 150.36 182.96 288.17 328.23 360.63 456.08 529.09 701.16 865.00 1072.00
Operating Deficit* 63.59 73.92 4.92 52.43 165.81 165.65 199.94 150.98 15.50 216.38
Net loss 86.92 100.59 40.74 104.25 226.16 242.20 241.63 208.82 90.96 328.79
FY 94 FY 95 FY 96 FY 97 FY 98 FY 99 FY 2K FY 01 FY 02
11 12 13 14 15 16 17 18 19
Revenues 1322.78 1555.09 1911.95 1970.19 2699.14 3031.99 3266.75 3554.32 4004.73
Operating Deficit* 114.14 172.95 354.35 491.81 281.98 502.23 292.72 462.63 248.04
Net loss 245.46 326.55 500.76 709.74 536.31 833.47 833.93 1104.41 1196.04
Note: * i.e. excluding interest and depreciation
Source: Annual Accounts; audited up to 1990-2001; thereafter unaudited.
The establishment of DSEB in 1951, replacing a private
utility that had been generating and supplying electricity
in Delhi since 1905, was in pursuance of the 1948 Act,
entrusting the power sector to State Electricity Boards.
However, the subsequent (1957 and 1997) changes in the
name and formal legal character of this utility were purely
constitutional and political: in practice DSEB, DESU and
DVB were a single, continuous organisation.
4.2.2 Analysis of DESU/DVB’s Failure
Figure 4.6 shows the Transmission and Distribution
(T&D) losses4 over a period of time. At 12 per cent, DVB’s
T&D losses in 1976 were comparable to those of BSES,
India’s best-performing private distribution licensee.5
During the 1990s when the T&D losses reached
wholly unacceptable levels, it would have been difficult to
expect consumers to pay DESU/DVB’s costs through the
tariff, but that DESU had been losing money even in
earlier decades when it was fairly efficient and when its
consumers could quite reasonably have been expected to
pay the cost of its services. Table 4.10 shows the
operating loss and net commercial loss from 1983-84
onwards. Tariff revisions took place with effect from
1-4-87, 1-3-91, 1-10-93, 1-4-97 and 1-6-01, and the
effects can be seen on Table 4.10; but while the operating
losses might decrease in a particular year as a result of
tariff revision or because of other efforts made, the overall
losses continued to increase as a result of accumulating
4. The difference between units of energy supplied and energy billed, or unaccounted energy.
5. BSES’s (now renamed Reliance Energy) T&D losses in Bombay were 11.58 per cent in FY 2002 and 13.60 per cent in FY 2003; those of CESC, Calcutta areconsiderably higher: 21.09 per cent in FY 2002.
02000400060008000
100001200014000
1950-51
1953-54
1956-57
1959-60
1962-63
1965-66
1968-69
1971-72
1974-75
1977-78
1980-81
1983-84
1986-87
1989-90
1992-93
1995-96
1998-99
2001-02
Energy Supplied (MU) Energy Billed (MU)
20000
1600018000
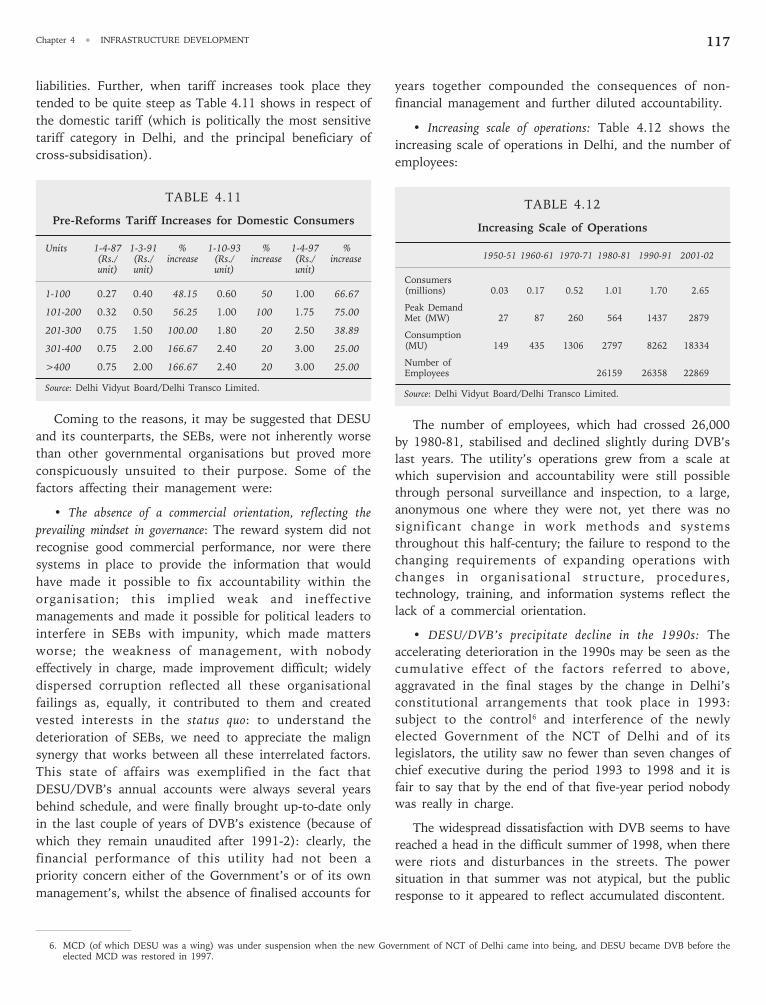
117Chapter 4 • INFRASTRUCTURE DEVELOPMENT
liabilities. Further, when tariff increases took place they
tended to be quite steep as Table 4.11 shows in respect of
the domestic tariff (which is politically the most sensitive
tariff category in Delhi, and the principal beneficiary of
cross-subsidisation).
TABLE 4.11
Pre-Reforms Tariff Increases for Domestic Consumers
Units 1-4-87 1-3-91 % 1-10-93 % 1-4-97 %(Rs./ (Rs./ increase (Rs./ increase (Rs./ increaseunit) unit) unit) unit)
1-100 0.27 0.40 48.15 0.60 50 1.00 66.67
101-200 0.32 0.50 56.25 1.00 100 1.75 75.00
201-300 0.75 1.50 100.00 1.80 20 2.50 38.89
301-400 0.75 2.00 166.67 2.40 20 3.00 25.00
>400 0.75 2.00 166.67 2.40 20 3.00 25.00
Source: Delhi Vidyut Board/Delhi Transco Limited.
Coming to the reasons, it may be suggested that DESU
and its counterparts, the SEBs, were not inherently worse
than other governmental organisations but proved more
conspicuously unsuited to their purpose. Some of the
factors affecting their management were:
• The absence of a commercial orientation, reflecting the
prevailing mindset in governance: The reward system did not
recognise good commercial performance, nor were there
systems in place to provide the information that would
have made it possible to fix accountability within the
organisation; this implied weak and ineffective
managements and made it possible for political leaders to
interfere in SEBs with impunity, which made matters
worse; the weakness of management, with nobody
effectively in charge, made improvement difficult; widely
dispersed corruption reflected all these organisational
failings as, equally, it contributed to them and created
vested interests in the status quo: to understand the
deterioration of SEBs, we need to appreciate the malign
synergy that works between all these interrelated factors.
This state of affairs was exemplified in the fact that
DESU/DVB’s annual accounts were always several years
behind schedule, and were finally brought up-to-date only
in the last couple of years of DVB’s existence (because of
which they remain unaudited after 1991-2): clearly, the
financial performance of this utility had not been a
priority concern either of the Government’s or of its own
management’s, whilst the absence of finalised accounts for
years together compounded the consequences of non-
financial management and further diluted accountability.
• Increasing scale of operations: Table 4.12 shows the
increasing scale of operations in Delhi, and the number of
employees:
TABLE 4.12
Increasing Scale of Operations
1950-51 1960-61 1970-71 1980-81 1990-91 2001-02
Consumers(millions) 0.03 0.17 0.52 1.01 1.70 2.65
Peak DemandMet (MW) 27 87 260 564 1437 2879
Consumption(MU) 149 435 1306 2797 8262 18334
Number ofEmployees 26159 26358 22869
Source: Delhi Vidyut Board/Delhi Transco Limited.
The number of employees, which had crossed 26,000
by 1980-81, stabilised and declined slightly during DVB’s
last years. The utility’s operations grew from a scale at
which supervision and accountability were still possible
through personal surveillance and inspection, to a large,
anonymous one where they were not, yet there was no
significant change in work methods and systems
throughout this half-century; the failure to respond to the
changing requirements of expanding operations with
changes in organisational structure, procedures,
technology, training, and information systems reflect the
lack of a commercial orientation.
• DESU/DVB’s precipitate decline in the 1990s: The
accelerating deterioration in the 1990s may be seen as the
cumulative effect of the factors referred to above,
aggravated in the final stages by the change in Delhi’s
constitutional arrangements that took place in 1993:
subject to the control6 and interference of the newly
elected Government of the NCT of Delhi and of its
legislators, the utility saw no fewer than seven changes of
chief executive during the period 1993 to 1998 and it is
fair to say that by the end of that five-year period nobody
was really in charge.
The widespread dissatisfaction with DVB seems to have
reached a head in the difficult summer of 1998, when there
were riots and disturbances in the streets. The power
situation in that summer was not atypical, but the public
response to it appeared to reflect accumulated discontent.
6. MCD (of which DESU was a wing) was under suspension when the new Government of NCT of Delhi came into being, and DESU became DVB before theelected MCD was restored in 1997.
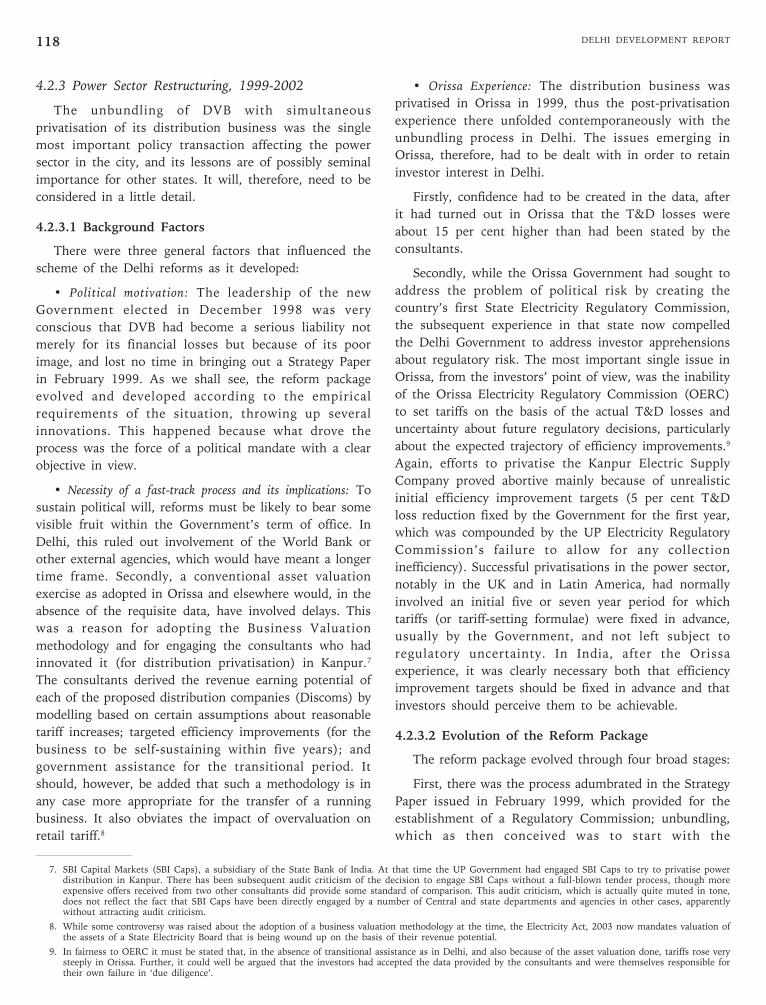
DELHI DEVELOPMENT REPORT118
4.2.3 Power Sector Restructuring, 1999-2002
The unbundling of DVB with simultaneous
privatisation of its distribution business was the single
most important policy transaction affecting the power
sector in the city, and its lessons are of possibly seminal
importance for other states. It will, therefore, need to be
considered in a little detail.
4.2.3.1 Background Factors
There were three general factors that influenced the
scheme of the Delhi reforms as it developed:
• Political motivation: The leadership of the new
Government elected in December 1998 was very
conscious that DVB had become a serious liability not
merely for its financial losses but because of its poor
image, and lost no time in bringing out a Strategy Paper
in February 1999. As we shall see, the reform package
evolved and developed according to the empirical
requirements of the situation, throwing up several
innovations. This happened because what drove the
process was the force of a political mandate with a clear
objective in view.
• Necessity of a fast-track process and its implications: To
sustain political will, reforms must be likely to bear some
visible fruit within the Government’s term of office. In
Delhi, this ruled out involvement of the World Bank or
other external agencies, which would have meant a longer
time frame. Secondly, a conventional asset valuation
exercise as adopted in Orissa and elsewhere would, in the
absence of the requisite data, have involved delays. This
was a reason for adopting the Business Valuation
methodology and for engaging the consultants who had
innovated it (for distribution privatisation) in Kanpur.7
The consultants derived the revenue earning potential of
each of the proposed distribution companies (Discoms) by
modelling based on certain assumptions about reasonable
tariff increases; targeted efficiency improvements (for the
business to be self-sustaining within five years); and
government assistance for the transitional period. It
should, however, be added that such a methodology is in
any case more appropriate for the transfer of a running
business. It also obviates the impact of overvaluation on
retail tariff.8
• Orissa Experience: The distribution business was
privatised in Orissa in 1999, thus the post-privatisation
experience there unfolded contemporaneously with the
unbundling process in Delhi. The issues emerging in
Orissa, therefore, had to be dealt with in order to retain
investor interest in Delhi.
Firstly, confidence had to be created in the data, after
it had turned out in Orissa that the T&D losses were
about 15 per cent higher than had been stated by the
consultants.
Secondly, while the Orissa Government had sought to
address the problem of political risk by creating the
country’s first State Electricity Regulatory Commission,
the subsequent experience in that state now compelled
the Delhi Government to address investor apprehensions
about regulatory risk. The most important single issue in
Orissa, from the investors’ point of view, was the inability
of the Orissa Electricity Regulatory Commission (OERC)
to set tariffs on the basis of the actual T&D losses and
uncertainty about future regulatory decisions, particularly
about the expected trajectory of efficiency improvements.9
Again, efforts to privatise the Kanpur Electric Supply
Company proved abortive mainly because of unrealistic
initial efficiency improvement targets (5 per cent T&D
loss reduction fixed by the Government for the first year,
which was compounded by the UP Electricity Regulatory
Commission’s failure to allow for any collection
inefficiency). Successful privatisations in the power sector,
notably in the UK and in Latin America, had normally
involved an initial five or seven year period for which
tariffs (or tariff-setting formulae) were fixed in advance,
usually by the Government, and not left subject to
regulatory uncertainty. In India, after the Orissa
experience, it was clearly necessary both that efficiency
improvement targets should be fixed in advance and that
investors should perceive them to be achievable.
4.2.3.2 Evolution of the Reform Package
The reform package evolved through four broad stages:
First, there was the process adumbrated in the Strategy
Paper issued in February 1999, which provided for the
establishment of a Regulatory Commission; unbundling,
which as then conceived was to start with the
7. SBI Capital Markets (SBI Caps), a subsidiary of the State Bank of India. At that time the UP Government had engaged SBI Caps to try to privatise powerdistribution in Kanpur. There has been subsequent audit criticism of the decision to engage SBI Caps without a full-blown tender process, though moreexpensive offers received from two other consultants did provide some standard of comparison. This audit criticism, which is actually quite muted in tone,does not reflect the fact that SBI Caps have been directly engaged by a number of Central and state departments and agencies in other cases, apparentlywithout attracting audit criticism.
8. While some controversy was raised about the adoption of a business valuation methodology at the time, the Electricity Act, 2003 now mandates valuation ofthe assets of a State Electricity Board that is being wound up on the basis of their revenue potential.
9. In fairness to OERC it must be stated that, in the absence of transitional assistance as in Delhi, and also because of the asset valuation done, tariffs rose verysteeply in Orissa. Further, it could well be argued that the investors had accepted the data provided by the consultants and were themselves responsible fortheir own failure in ‘due diligence’.
119Chapter 4 • INFRASTRUCTURE DEVELOPMENT
establishment of a generating company; disinvestment of
distribution; a commitment to protect the interests of
staff; and some interim measures to improve DVB’s
performance pending its restructuring.
Second, when the Consultants gave their initial report
in April 2000, it incorporated the following essential
features that were to remain in the final package:
(i) Unbundling into a generation, a transmission and
three distribution companies.
(ii) DVB’s unserviceable liabilities (which were almost
entirely payable to the Central Public Sector Undertakings,
Central government and NCT government) would not be
passed on to the successor entities. Correspondingly, the
Discoms would not take over DVB’s receivables; instead
they would retain a 20 per cent collection charge for the
receivables (other than those due from government-
owned consumers) that they collected. (However the idea
of a holding company had not yet been conceived; at this
stage the idea was that these dues would be taken over by
GNCTD and subsequently got written off by the Central
government and GNCTD for, respectively, the DESU and
DVB periods.10)
(iii) Business Valuation. The reasons for this have already
been discussed above.
(iv) Retirement benefits to be provided for: The successor
entities to DVB would not be saddled with the liability for
retirement benefits incurred up to the date of unbundling.
A separate fund would be created for the purpose, the
Government topping up the (inadequate) funds already
available with DVB for the purpose.
(v) Clubbing of T&D losses and collection inefficiency. The
intention was that the figure of units of electricity
supplied for which payment was recovered would be
accepted as a reliable figure, since the calculation of T&D
losses in Orissa had been discredited.
(vi) Return on equity for Discoms: A return on equity of
16 per cent was stipulated.
(vii) The Transfer Scheme was to be given the form of
delegated legislation, as statutory rules under the Delhi
Electricity Reform Act, 2000 (DERA) which was enacted
later in the year.
Third, there was the package that GNCTD adopted in
January 2001, which incorporated the following additional
features:
(i) Holding Company: It was now decided that a
Holding Company would be set up to retain the
unserviceable liabilities of DESU and DVB, partly because
write-off by the Central government of dues to Central
public sector utilities was now seen to be improbable. The
Holding Company would retain the proceeds from the sale
of a controlling interest in the Discoms (thus retaining
this as a resource available to discharge unavoidable
liabilities created by DVB, or for alternative use within the
sector).
(ii) Serviceable Liabilities: The business valuation of
DVB provided the basis for quantifying the serviceable
liabilities of DVB; 40 per cent of this amount was issued
to the Holding Company as equity by the other successor
entities and the balance remained as debt to be repaid
after an initial moratorium period of three (later increased
to four years).
(iii) Simultaneous Unbundling and Privatisation:
The new companies would be incorporated in advance, as
shell companies, so that unbundling and privatisation
could take place simultaneously. Besides saving time (a)
there was no risk of the new companies incurring
additional liabilities after unbundling but before an
attempt to privatise them and (b) the Government could
abort the process at any time, if satisfactory bids were not
forthcoming.
(iv) Tripartite Agreement: Government would top up
the available fund for terminal benefit liabilities of
employees in pursuance of the Tripartite Agreement
entered into between Government, DVB and the main
employee unions and associations.
(v) Transitional Assistance (of Rs.2600 crores) was
envisaged which the Government would release directly to
the Discoms.
(vi) Five-Year Tariff Package: An important
additional feature of the package at this stage was the
intention to get five-year tariff setting formulae
established in advance by DERC. DVB applied for five-
year tariff-setting formulae (or ‘principles’) along with its
Annual Revenue Requirement (ARR) for 2001-02. The
proposal was to target T&D loss reduction at 12 per cent
over the five-year period while simultaneously laying
down graded annual targets for improvement in collection
efficiency.11 In addition, the Commission was requested to
fix in advance the principles on which it would allow the
10. DESU, as a wing of the Municipal Corporation of Delhi, had been under the statutory control of the Central government: hence GNCTD did not own itsliabilities.
11. This was only a superficial departure from the intended clubbing of T&D loss and collection inefficiency, dictated by the necessity to adhere to DERC formatsfor filing before DERC.
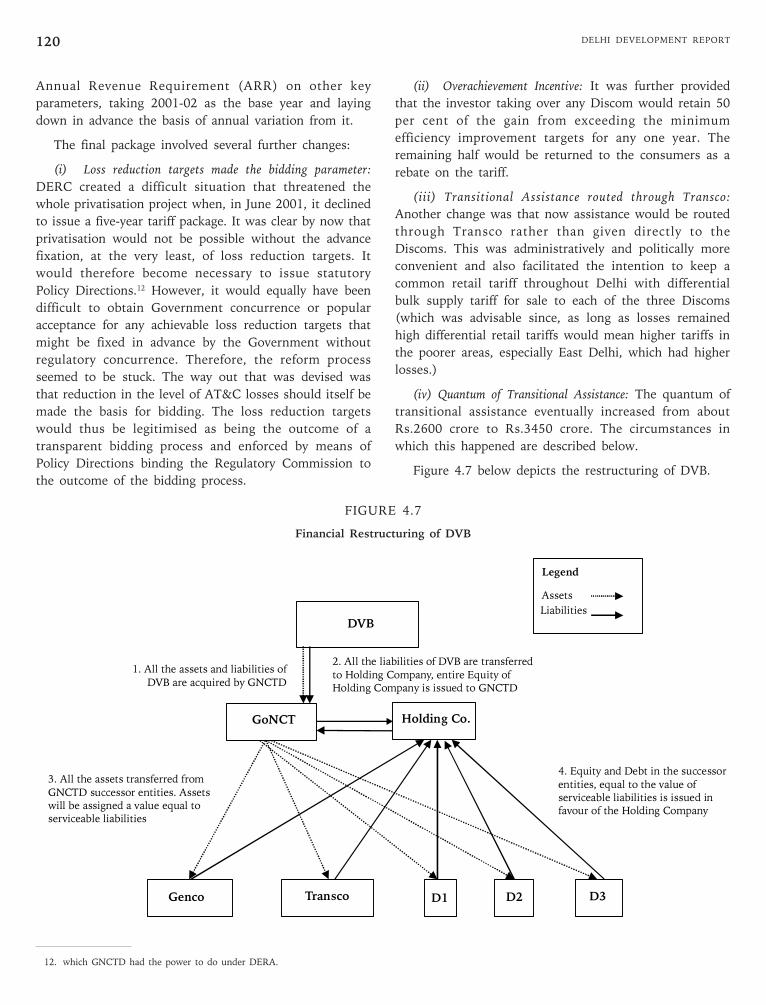
DELHI DEVELOPMENT REPORT120
Annual Revenue Requirement (ARR) on other key
parameters, taking 2001-02 as the base year and laying
down in advance the basis of annual variation from it.
The final package involved several further changes:
(i) Loss reduction targets made the bidding parameter:
DERC created a difficult situation that threatened the
whole privatisation project when, in June 2001, it declined
to issue a five-year tariff package. It was clear by now that
privatisation would not be possible without the advance
fixation, at the very least, of loss reduction targets. It
would therefore become necessary to issue statutory
Policy Directions.12 However, it would equally have been
difficult to obtain Government concurrence or popular
acceptance for any achievable loss reduction targets that
might be fixed in advance by the Government without
regulatory concurrence. Therefore, the reform process
seemed to be stuck. The way out that was devised was
that reduction in the level of AT&C losses should itself be
made the basis for bidding. The loss reduction targets
would thus be legitimised as being the outcome of a
transparent bidding process and enforced by means of
Policy Directions binding the Regulatory Commission to
the outcome of the bidding process.
(ii) Overachievement Incentive: It was further provided
that the investor taking over any Discom would retain 50
per cent of the gain from exceeding the minimum
efficiency improvement targets for any one year. The
remaining half would be returned to the consumers as a
rebate on the tariff.
(iii) Transitional Assistance routed through Transco:
Another change was that now assistance would be routed
through Transco rather than given directly to the
Discoms. This was administratively and politically more
convenient and also facilitated the intention to keep a
common retail tariff throughout Delhi with differential
bulk supply tariff for sale to each of the three Discoms
(which was advisable since, as long as losses remained
high differential retail tariffs would mean higher tariffs in
the poorer areas, especially East Delhi, which had higher
losses.)
(iv) Quantum of Transitional Assistance: The quantum of
transitional assistance eventually increased from about
Rs.2600 crore to Rs.3450 crore. The circumstances in
which this happened are described below.
Figure 4.7 below depicts the restructuring of DVB.
FIGURE 4.7
Financial Restructuring of DVB
12. which GNCTD had the power to do under DERA.
Legend
Assets
Liabilities
DVB
GoNCT Holding Co.
Genco Transco D1 D2
1. All the assets and liabilities of
DVB are acquired by GNCTD
3. All the assets transferred from
GNCTD successor entities. Assetswill be assigned a value equal to serviceable liabilities
2. All the liabilities of DVB are transferred
to Holding Company, entire Equity ofHolding Company is issued to GNCTD
4. Equity and Debt in the successor
entities, equal to the value ofserviceable liabilities is issued infavour of the Holding Company
D3
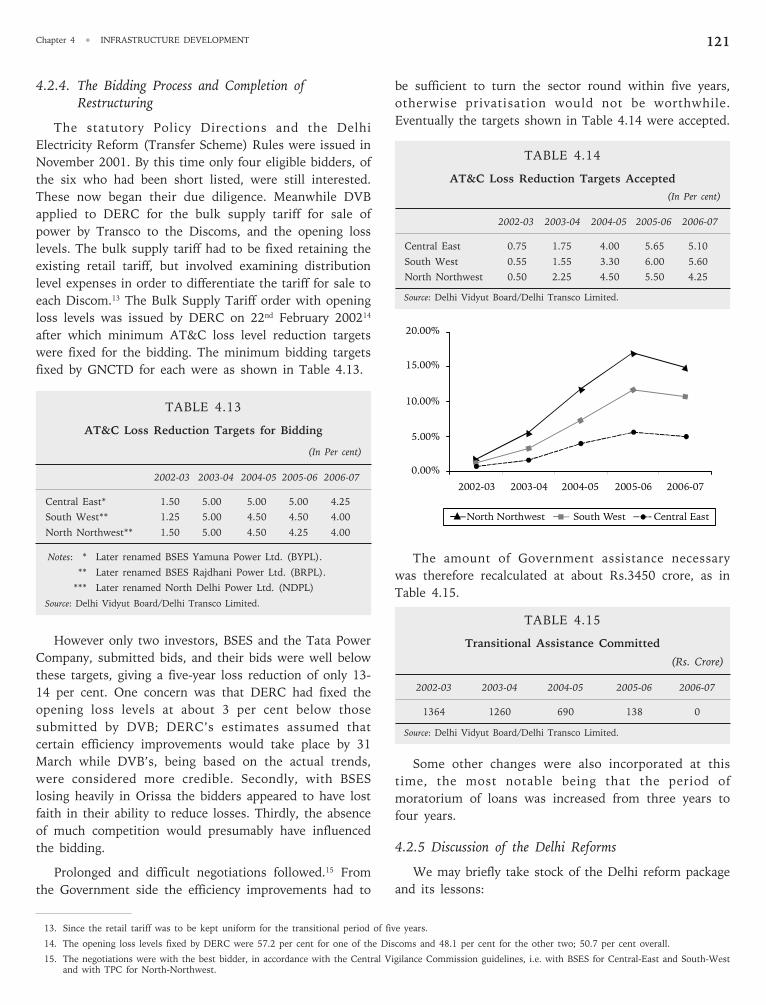
121Chapter 4 • INFRASTRUCTURE DEVELOPMENT
be sufficient to turn the sector round within five years,
otherwise privatisation would not be worthwhile.
Eventually the targets shown in Table 4.14 were accepted.
TABLE 4.14
AT&C Loss Reduction Targets Accepted
(In Per cent)
2002-03 2003-04 2004-05 2005-06 2006-07
Central East 0.75 1.75 4.00 5.65 5.10
South West 0.55 1.55 3.30 6.00 5.60
North Northwest 0.50 2.25 4.50 5.50 4.25
Source: Delhi Vidyut Board/Delhi Transco Limited.
The amount of Government assistance necessary
was therefore recalculated at about Rs.3450 crore, as in
Table 4.15.
TABLE 4.15
Transitional Assistance Committed
(Rs. Crore)
2002-03 2003-04 2004-05 2005-06 2006-07
1364 1260 690 138 0
Source: Delhi Vidyut Board/Delhi Transco Limited.
Some other changes were also incorporated at this
time, the most notable being that the period of
moratorium of loans was increased from three years to
four years.
4.2.5 Discussion of the Delhi Reforms
We may briefly take stock of the Delhi reform package
and its lessons:
4.2.4. The Bidding Process and Completion ofRestructuring
The statutory Policy Directions and the Delhi
Electricity Reform (Transfer Scheme) Rules were issued in
November 2001. By this time only four eligible bidders, of
the six who had been short listed, were still interested.
These now began their due diligence. Meanwhile DVB
applied to DERC for the bulk supply tariff for sale of
power by Transco to the Discoms, and the opening loss
levels. The bulk supply tariff had to be fixed retaining the
existing retail tariff, but involved examining distribution
level expenses in order to differentiate the tariff for sale to
each Discom.13 The Bulk Supply Tariff order with opening
loss levels was issued by DERC on 22nd February 200214
after which minimum AT&C loss level reduction targets
were fixed for the bidding. The minimum bidding targets
fixed by GNCTD for each were as shown in Table 4.13.
TABLE 4.13
AT&C Loss Reduction Targets for Bidding
(In Per cent)
2002-03 2003-04 2004-05 2005-06 2006-07
Central East* 1.50 5.00 5.00 5.00 4.25
South West** 1.25 5.00 4.50 4.50 4.00
North Northwest** 1.50 5.00 4.50 4.25 4.00
Notes: * Later renamed BSES Yamuna Power Ltd. (BYPL).
** Later renamed BSES Rajdhani Power Ltd. (BRPL).
*** Later renamed North Delhi Power Ltd. (NDPL)
Source: Delhi Vidyut Board/Delhi Transco Limited.
However only two investors, BSES and the Tata Power
Company, submitted bids, and their bids were well below
these targets, giving a five-year loss reduction of only 13-
14 per cent. One concern was that DERC had fixed the
opening loss levels at about 3 per cent below those
submitted by DVB; DERC’s estimates assumed that
certain efficiency improvements would take place by 31
March while DVB’s, being based on the actual trends,
were considered more credible. Secondly, with BSES
losing heavily in Orissa the bidders appeared to have lost
faith in their ability to reduce losses. Thirdly, the absence
of much competition would presumably have influenced
the bidding.
Prolonged and difficult negotiations followed.15 From
the Government side the efficiency improvements had to
13. Since the retail tariff was to be kept uniform for the transitional period of five years.
14. The opening loss levels fixed by DERC were 57.2 per cent for one of the Discoms and 48.1 per cent for the other two; 50.7 per cent overall.
15. The negotiations were with the best bidder, in accordance with the Central Vigilance Commission guidelines, i.e. with BSES for Central-East and South-Westand with TPC for North-Northwest.
20.00%
15.00%
10.00%
5.00%
0.00%
2002-03
North Northwest South West Central East
2003-04 2004-05 2005-06 2006-07
DELHI DEVELOPMENT REPORT122
Political motivation not necessarily replicable: Unlike those
in many states, the reforms were not driven by any
compelling necessity for the Government to obtain
external assistance to extricate itself from financial
difficulties, or under any external pressures from lending
agencies or the Central government. While DVB was
losing heavily with no prospect of a turnaround, the
operational problem in terms of actual cash outflow was
not unmanageable for the Delhi Government. What drove
the reforms was the political decision that privatisation
was the best route for improving the service on a
sustainable basis and would prove popular. This
combination of circumstances is not necessarily replicable.
Accurate measurement of commercial efficiency: The AT&C
loss concept as the measure of commercial efficiency was
a Delhi innovation. The Ministry of Power has now
adopted it for distribution reform generally. However,
even this calculation remains uncertain where there is
continuing uncertainty about the number of units actually
billed, since the figure must be derived either by dividing
the number of units input by the actual billing rate or by
correcting the T&D loss figure by the collection
inefficiency; therefore it is not foolproof in states with a
large proportion of unmetered billing. A tidier solution
might be simply to go by revenue per unit input, setting
utility-specific targets. The theoretical criticism of such a
criterion is that it would motivate the utility to
discriminate against less remunerative consumers, but it
is suggested that this is a manageable risk: firstly it
already happens—even SEBs discriminate by focused
shedding on loss-making areas when they can—and,
secondly, the political system (now supported, on this
point, by the regulatory system) will not let it happen
beyond a point. The real gain from the Delhi experience
has perhaps been not merely the AT&C loss concept but
the concern, lacking in the past, that commercial efficiency
should be depicted accurately.
Success in addressing personnel issues: Delhi, alone among
the states that had unbundled until then, saw no
disruption of supply on account of the reforms. This
shows the importance of political support: employee
leaders understood that the reforms were popular with
the public and, therefore, wisely focused on protecting the
interests of staff within the reform process.
But this was achieved at the cost of guaranteeing
existing staff against retrenchment, which is feasible in
this (electricity distribution) business but may not be
elsewhere. Personnel accounted for a little over 10 per
cent of DVB’s expenses; this was not an insignificant
figure, being Rs. 429.6 crore during FY 2002 whilst BSES,
serving about two million consumers in Bombay as an
integrated utility, had only about 3500 employees in
March 2002, who accounted for less than 5 per cent of its
expenses. However, reducing staff costs would not be a
crucial factor to turn the distribution business around.
Firstly the importance of reducing commercial losses puts
all other possible savings into the shade. Secondly, DVB
had an ageing work force and a high rate of
superannuation; to that extent, the problem would solve
itself with time. Finally, expenses on the existing
employees would normally be treated as a pass-through.
Financial savings: The Government is already a
beneficiary of the reforms, since with the phasing out of
transitional assistance its commitment of Plan funds to
the power sector has dropped significantly, freeing
resources for other purposes. The annual savings to
Government have been estimated by the Delhi
Government to be of the order of Rs. 1400 crores, which
is conservative if anything. The elements of saving to the
Government are as follows, based on the approximate
level of Government expenditure on each item below
during the last year of DVB (which would have continued
to increase annually in each case):
• Saving of Plan expenditure on the Distribution
sector (which was loan, but never actually repaid
and not expected to be repaid in practice):
Rs. 500 crores.
• Saving of non-Plan loan to DVB (which was
actually just a loan to repay the interest annually
on DVB’s mounting debt to the Delhi
Government, which was growing exponentially):
Rs. 400 crores.
• Saving of deduction by the Central government
(for payment to Central Utilities) of Delhi’s
Central Plan share—this was about Rs. 300
crores.
• Saving of non-plan temporary cash loans that had
to be given to DVB from time to time to keep it
afloat when it faced a serious payment crisis. This
varied considerably, but based on the experience
of DVB’s last couple of years, may safely be
estimated at Rs. 100 crores on the average.
The above gains do not take into account the savings
to consumers (through the AT&C loss reductions
achieved) of costs which would otherwise have been a
burden on the tariff. These were estimated for 2004-05,
by the Prayas Energy Group, Pune, a highly respected
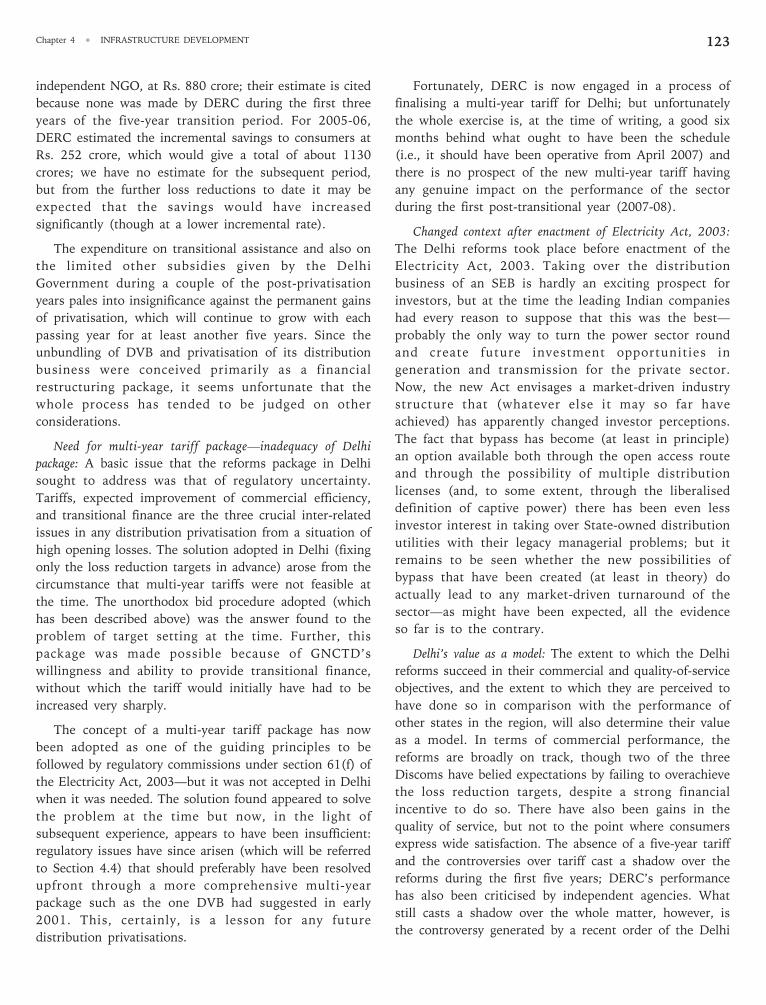
123Chapter 4 • INFRASTRUCTURE DEVELOPMENT
independent NGO, at Rs. 880 crore; their estimate is cited
because none was made by DERC during the first three
years of the five-year transition period. For 2005-06,
DERC estimated the incremental savings to consumers at
Rs. 252 crore, which would give a total of about 1130
crores; we have no estimate for the subsequent period,
but from the further loss reductions to date it may be
expected that the savings would have increased
significantly (though at a lower incremental rate).
The expenditure on transitional assistance and also on
the limited other subsidies given by the Delhi
Government during a couple of the post-privatisation
years pales into insignificance against the permanent gains
of privatisation, which will continue to grow with each
passing year for at least another five years. Since the
unbundling of DVB and privatisation of its distribution
business were conceived primarily as a financial
restructuring package, it seems unfortunate that the
whole process has tended to be judged on other
considerations.
Need for multi-year tariff package—inadequacy of Delhi
package: A basic issue that the reforms package in Delhi
sought to address was that of regulatory uncertainty.
Tariffs, expected improvement of commercial efficiency,
and transitional finance are the three crucial inter-related
issues in any distribution privatisation from a situation of
high opening losses. The solution adopted in Delhi (fixing
only the loss reduction targets in advance) arose from the
circumstance that multi-year tariffs were not feasible at
the time. The unorthodox bid procedure adopted (which
has been described above) was the answer found to the
problem of target setting at the time. Further, this
package was made possible because of GNCTD’s
willingness and ability to provide transitional finance,
without which the tariff would initially have had to be
increased very sharply.
The concept of a multi-year tariff package has now
been adopted as one of the guiding principles to be
followed by regulatory commissions under section 61(f) of
the Electricity Act, 2003—but it was not accepted in Delhi
when it was needed. The solution found appeared to solve
the problem at the time but now, in the light of
subsequent experience, appears to have been insufficient:
regulatory issues have since arisen (which will be referred
to Section 4.4) that should preferably have been resolved
upfront through a more comprehensive multi-year
package such as the one DVB had suggested in early
2001. This, certainly, is a lesson for any future
distribution privatisations.
Fortunately, DERC is now engaged in a process of
finalising a multi-year tariff for Delhi; but unfortunately
the whole exercise is, at the time of writing, a good six
months behind what ought to have been the schedule
(i.e., it should have been operative from April 2007) and
there is no prospect of the new multi-year tariff having
any genuine impact on the performance of the sector
during the first post-transitional year (2007-08).
Changed context after enactment of Electricity Act, 2003:
The Delhi reforms took place before enactment of the
Electricity Act, 2003. Taking over the distribution
business of an SEB is hardly an exciting prospect for
investors, but at the time the leading Indian companies
had every reason to suppose that this was the best—
probably the only way to turn the power sector round
and create future investment opportunities in
generation and transmission for the private sector.
Now, the new Act envisages a market-driven industry
structure that (whatever else it may so far have
achieved) has apparently changed investor perceptions.
The fact that bypass has become (at least in principle)
an option available both through the open access route
and through the possibility of multiple distribution
licenses (and, to some extent, through the liberalised
definition of captive power) there has been even less
investor interest in taking over State-owned distribution
utilities with their legacy managerial problems; but it
remains to be seen whether the new possibilities of
bypass that have been created (at least in theory) do
actually lead to any market-driven turnaround of the
sector—as might have been expected, all the evidence
so far is to the contrary.
Delhi’s value as a model: The extent to which the Delhi
reforms succeed in their commercial and quality-of-service
objectives, and the extent to which they are perceived to
have done so in comparison with the performance of
other states in the region, will also determine their value
as a model. In terms of commercial performance, the
reforms are broadly on track, though two of the three
Discoms have belied expectations by failing to overachieve
the loss reduction targets, despite a strong financial
incentive to do so. There have also been gains in the
quality of service, but not to the point where consumers
express wide satisfaction. The absence of a five-year tariff
and the controversies over tariff cast a shadow over the
reforms during the first five years; DERC’s performance
has also been criticised by independent agencies. What
still casts a shadow over the whole matter, however, is
the controversy generated by a recent order of the Delhi
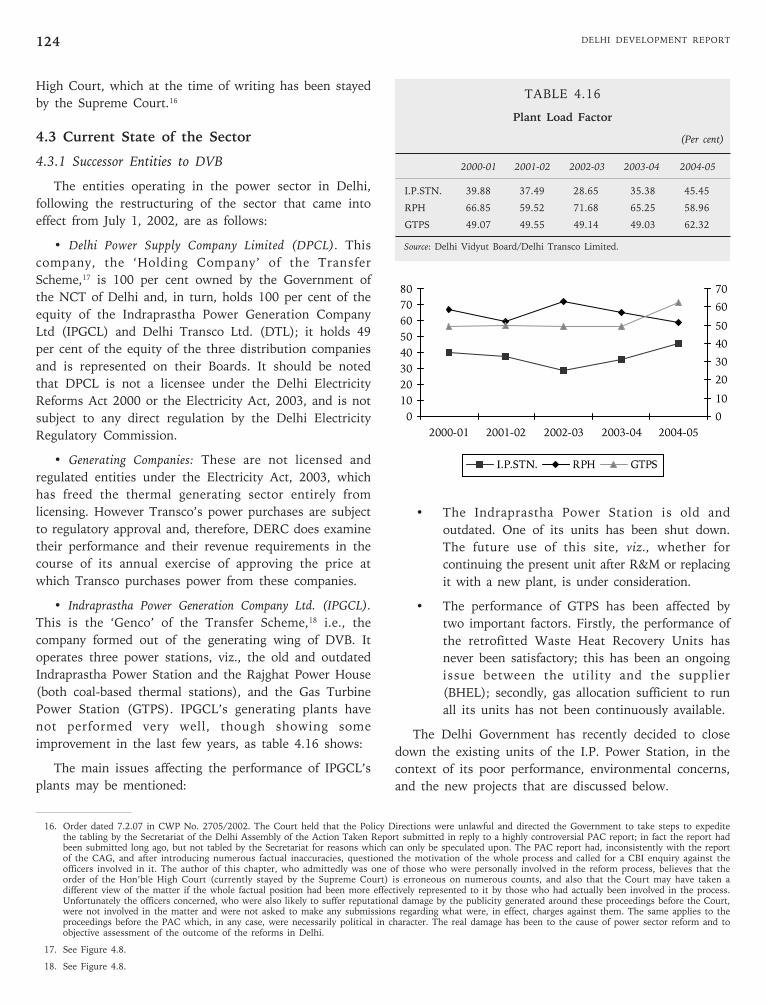
DELHI DEVELOPMENT REPORT124
• The Indraprastha Power Station is old and
outdated. One of its units has been shut down.
The future use of this site, viz., whether for
continuing the present unit after R&M or replacing
it with a new plant, is under consideration.
• The performance of GTPS has been affected by
two important factors. Firstly, the performance of
the retrofitted Waste Heat Recovery Units has
never been satisfactory; this has been an ongoing
issue between the utility and the supplier
(BHEL); secondly, gas allocation sufficient to run
all its units has not been continuously available.
The Delhi Government has recently decided to close
down the existing units of the I.P. Power Station, in the
context of its poor performance, environmental concerns,
and the new projects that are discussed below.
High Court, which at the time of writing has been stayed
by the Supreme Court.16
4.3 Current State of the Sector
4.3.1 Successor Entities to DVB
The entities operating in the power sector in Delhi,
following the restructuring of the sector that came into
effect from July 1, 2002, are as follows:
• Delhi Power Supply Company Limited (DPCL). This
company, the ‘Holding Company’ of the Transfer
Scheme,17 is 100 per cent owned by the Government of
the NCT of Delhi and, in turn, holds 100 per cent of the
equity of the Indraprastha Power Generation Company
Ltd (IPGCL) and Delhi Transco Ltd. (DTL); it holds 49
per cent of the equity of the three distribution companies
and is represented on their Boards. It should be noted
that DPCL is not a licensee under the Delhi Electricity
Reforms Act 2000 or the Electricity Act, 2003, and is not
subject to any direct regulation by the Delhi Electricity
Regulatory Commission.
• Generating Companies: These are not licensed and
regulated entities under the Electricity Act, 2003, which
has freed the thermal generating sector entirely from
licensing. However Transco’s power purchases are subject
to regulatory approval and, therefore, DERC does examine
their performance and their revenue requirements in the
course of its annual exercise of approving the price at
which Transco purchases power from these companies.
• Indraprastha Power Generation Company Ltd. (IPGCL).
This is the ‘Genco’ of the Transfer Scheme,18 i.e., the
company formed out of the generating wing of DVB. It
operates three power stations, viz., the old and outdated
Indraprastha Power Station and the Rajghat Power House
(both coal-based thermal stations), and the Gas Turbine
Power Station (GTPS). IPGCL’s generating plants have
not performed very well, though showing some
improvement in the last few years, as table 4.16 shows:
The main issues affecting the performance of IPGCL’s
plants may be mentioned:
16. Order dated 7.2.07 in CWP No. 2705/2002. The Court held that the Policy Directions were unlawful and directed the Government to take steps to expeditethe tabling by the Secretariat of the Delhi Assembly of the Action Taken Report submitted in reply to a highly controversial PAC report; in fact the report hadbeen submitted long ago, but not tabled by the Secretariat for reasons which can only be speculated upon. The PAC report had, inconsistently with the reportof the CAG, and after introducing numerous factual inaccuracies, questioned the motivation of the whole process and called for a CBI enquiry against theofficers involved in it. The author of this chapter, who admittedly was one of those who were personally involved in the reform process, believes that theorder of the Hon’ble High Court (currently stayed by the Supreme Court) is erroneous on numerous counts, and also that the Court may have taken adifferent view of the matter if the whole factual position had been more effectively represented to it by those who had actually been involved in the process.Unfortunately the officers concerned, who were also likely to suffer reputational damage by the publicity generated around these proceedings before the Court,were not involved in the matter and were not asked to make any submissions regarding what were, in effect, charges against them. The same applies to theproceedings before the PAC which, in any case, were necessarily political in character. The real damage has been to the cause of power sector reform and toobjective assessment of the outcome of the reforms in Delhi.
17. See Figure 4.8.
18. See Figure 4.8.
0
10
20
30
40
50
60
70
80
2000-01 2001-02 2002-03 2003-04 2004-05
0
10
20
30
40
50
60
70
I.P.STN. RPH GTPS
TABLE 4.16
Plant Load Factor
(Per cent)
2000-01 2001-02 2002-03 2003-04 2004-05
I.P.STN. 39.88 37.49 28.65 35.38 45.45
RPH 66.85 59.52 71.68 65.25 58.96
GTPS 49.07 49.55 49.14 49.03 62.32
Source: Delhi Vidyut Board/Delhi Transco Limited.
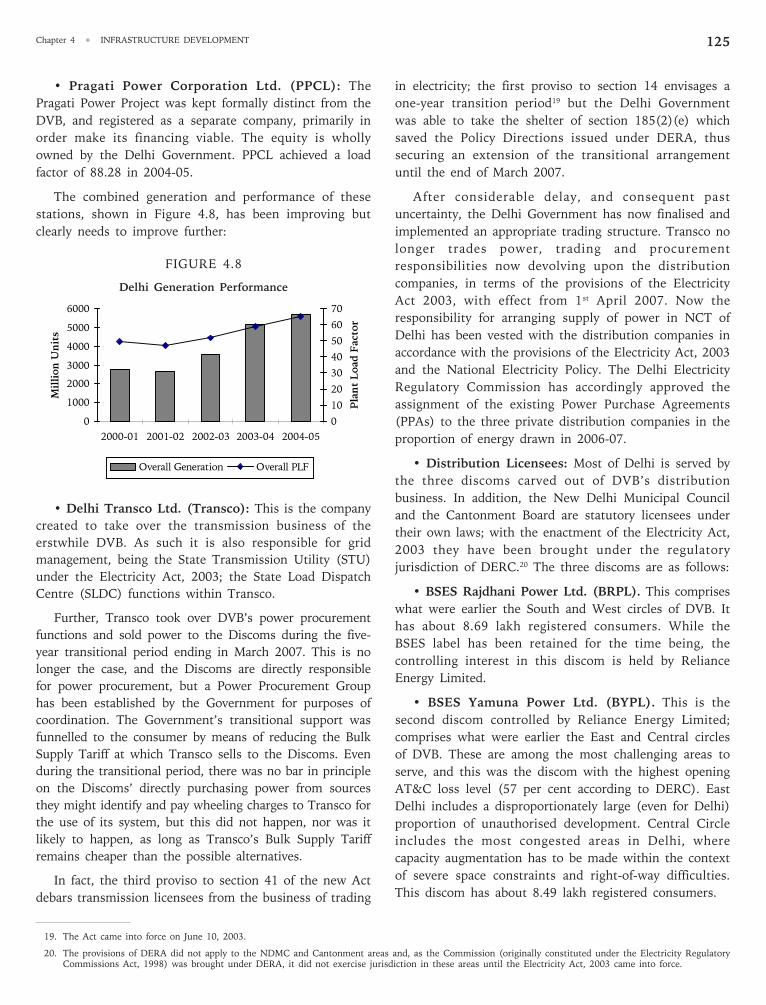
125Chapter 4 • INFRASTRUCTURE DEVELOPMENT
• Pragati Power Corporation Ltd. (PPCL): The
Pragati Power Project was kept formally distinct from the
DVB, and registered as a separate company, primarily in
order make its financing viable. The equity is wholly
owned by the Delhi Government. PPCL achieved a load
factor of 88.28 in 2004-05.
The combined generation and performance of these
stations, shown in Figure 4.8, has been improving but
clearly needs to improve further:
FIGURE 4.8
Delhi Generation Performance
• Delhi Transco Ltd. (Transco): This is the company
created to take over the transmission business of the
erstwhile DVB. As such it is also responsible for grid
management, being the State Transmission Utility (STU)
under the Electricity Act, 2003; the State Load Dispatch
Centre (SLDC) functions within Transco.
Further, Transco took over DVB’s power procurement
functions and sold power to the Discoms during the five-
year transitional period ending in March 2007. This is no
longer the case, and the Discoms are directly responsible
for power procurement, but a Power Procurement Group
has been established by the Government for purposes of
coordination. The Government’s transitional support was
funnelled to the consumer by means of reducing the Bulk
Supply Tariff at which Transco sells to the Discoms. Even
during the transitional period, there was no bar in principle
on the Discoms’ directly purchasing power from sources
they might identify and pay wheeling charges to Transco for
the use of its system, but this did not happen, nor was it
likely to happen, as long as Transco’s Bulk Supply Tariff
remains cheaper than the possible alternatives.
In fact, the third proviso to section 41 of the new Act
debars transmission licensees from the business of trading
in electricity; the first proviso to section 14 envisages a
one-year transition period19 but the Delhi Government
was able to take the shelter of section 185(2)(e) which
saved the Policy Directions issued under DERA, thus
securing an extension of the transitional arrangement
until the end of March 2007.
After considerable delay, and consequent past
uncertainty, the Delhi Government has now finalised and
implemented an appropriate trading structure. Transco no
longer trades power, trading and procurement
responsibilities now devolving upon the distribution
companies, in terms of the provisions of the Electricity
Act 2003, with effect from 1st April 2007. Now the
responsibility for arranging supply of power in NCT of
Delhi has been vested with the distribution companies in
accordance with the provisions of the Electricity Act, 2003
and the National Electricity Policy. The Delhi Electricity
Regulatory Commission has accordingly approved the
assignment of the existing Power Purchase Agreements
(PPAs) to the three private distribution companies in the
proportion of energy drawn in 2006-07.
• Distribution Licensees: Most of Delhi is served by
the three discoms carved out of DVB’s distribution
business. In addition, the New Delhi Municipal Council
and the Cantonment Board are statutory licensees under
their own laws; with the enactment of the Electricity Act,
2003 they have been brought under the regulatory
jurisdiction of DERC.20 The three discoms are as follows:
• BSES Rajdhani Power Ltd. (BRPL). This comprises
what were earlier the South and West circles of DVB. It
has about 8.69 lakh registered consumers. While the
BSES label has been retained for the time being, the
controlling interest in this discom is held by Reliance
Energy Limited.
• BSES Yamuna Power Ltd. (BYPL). This is the
second discom controlled by Reliance Energy Limited;
comprises what were earlier the East and Central circles
of DVB. These are among the most challenging areas to
serve, and this was the discom with the highest opening
AT&C loss level (57 per cent according to DERC). East
Delhi includes a disproportionately large (even for Delhi)
proportion of unauthorised development. Central Circle
includes the most congested areas in Delhi, where
capacity augmentation has to be made within the context
of severe space constraints and right-of-way difficulties.
This discom has about 8.49 lakh registered consumers.
0
1000
2000
3000
4000
5000
6000
2000-01 2001-02 2002-03 2003-04 2004-05
Mil
lio
n U
nit
s
0
10
20
30
40
50
60
70
Pla
nt L
oad
Factor
Overall Generation Overall PLF
19. The Act came into force on June 10, 2003.
20. The provisions of DERA did not apply to the NDMC and Cantonment areas and, as the Commission (originally constituted under the Electricity RegulatoryCommissions Act, 1998) was brought under DERA, it did not exercise jurisdiction in these areas until the Electricity Act, 2003 came into force.
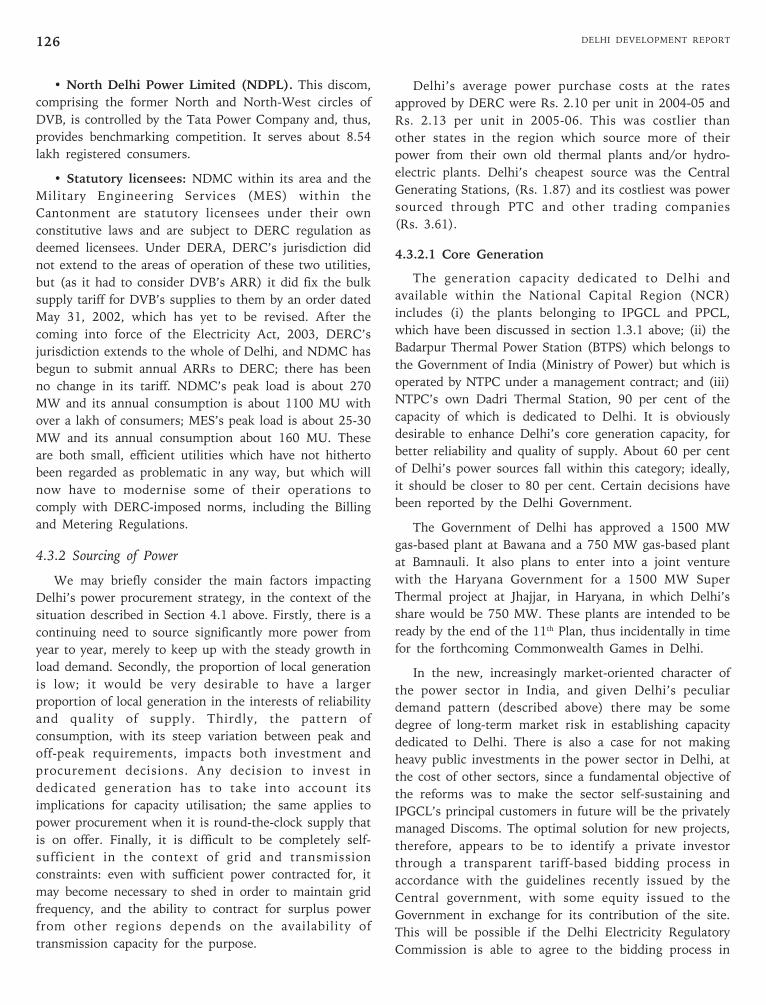
DELHI DEVELOPMENT REPORT126
• North Delhi Power Limited (NDPL). This discom,
comprising the former North and North-West circles of
DVB, is controlled by the Tata Power Company and, thus,
provides benchmarking competition. It serves about 8.54
lakh registered consumers.
• Statutory licensees: NDMC within its area and the
Military Engineering Services (MES) within the
Cantonment are statutory licensees under their own
constitutive laws and are subject to DERC regulation as
deemed licensees. Under DERA, DERC’s jurisdiction did
not extend to the areas of operation of these two utilities,
but (as it had to consider DVB’s ARR) it did fix the bulk
supply tariff for DVB’s supplies to them by an order dated
May 31, 2002, which has yet to be revised. After the
coming into force of the Electricity Act, 2003, DERC’s
jurisdiction extends to the whole of Delhi, and NDMC has
begun to submit annual ARRs to DERC; there has been
no change in its tariff. NDMC’s peak load is about 270
MW and its annual consumption is about 1100 MU with
over a lakh of consumers; MES’s peak load is about 25-30
MW and its annual consumption about 160 MU. These
are both small, efficient utilities which have not hitherto
been regarded as problematic in any way, but which will
now have to modernise some of their operations to
comply with DERC-imposed norms, including the Billing
and Metering Regulations.
4.3.2 Sourcing of Power
We may briefly consider the main factors impacting
Delhi’s power procurement strategy, in the context of the
situation described in Section 4.1 above. Firstly, there is a
continuing need to source significantly more power from
year to year, merely to keep up with the steady growth in
load demand. Secondly, the proportion of local generation
is low; it would be very desirable to have a larger
proportion of local generation in the interests of reliability
and quality of supply. Thirdly, the pattern of
consumption, with its steep variation between peak and
off-peak requirements, impacts both investment and
procurement decisions. Any decision to invest in
dedicated generation has to take into account its
implications for capacity utilisation; the same applies to
power procurement when it is round-the-clock supply that
is on offer. Finally, it is difficult to be completely self-
sufficient in the context of grid and transmission
constraints: even with sufficient power contracted for, it
may become necessary to shed in order to maintain grid
frequency, and the ability to contract for surplus power
from other regions depends on the availability of
transmission capacity for the purpose.
Delhi’s average power purchase costs at the rates
approved by DERC were Rs. 2.10 per unit in 2004-05 and
Rs. 2.13 per unit in 2005-06. This was costlier than
other states in the region which source more of their
power from their own old thermal plants and/or hydro-
electric plants. Delhi’s cheapest source was the Central
Generating Stations, (Rs. 1.87) and its costliest was power
sourced through PTC and other trading companies
(Rs. 3.61).
4.3.2.1 Core Generation
The generation capacity dedicated to Delhi and
available within the National Capital Region (NCR)
includes (i) the plants belonging to IPGCL and PPCL,
which have been discussed in section 1.3.1 above; (ii) the
Badarpur Thermal Power Station (BTPS) which belongs to
the Government of India (Ministry of Power) but which is
operated by NTPC under a management contract; and (iii)
NTPC’s own Dadri Thermal Station, 90 per cent of the
capacity of which is dedicated to Delhi. It is obviously
desirable to enhance Delhi’s core generation capacity, for
better reliability and quality of supply. About 60 per cent
of Delhi’s power sources fall within this category; ideally,
it should be closer to 80 per cent. Certain decisions have
been reported by the Delhi Government.
The Government of Delhi has approved a 1500 MW
gas-based plant at Bawana and a 750 MW gas-based plant
at Bamnauli. It also plans to enter into a joint venture
with the Haryana Government for a 1500 MW Super
Thermal project at Jhajjar, in Haryana, in which Delhi’s
share would be 750 MW. These plants are intended to be
ready by the end of the 11th Plan, thus incidentally in time
for the forthcoming Commonwealth Games in Delhi.
In the new, increasingly market-oriented character of
the power sector in India, and given Delhi’s peculiar
demand pattern (described above) there may be some
degree of long-term market risk in establishing capacity
dedicated to Delhi. There is also a case for not making
heavy public investments in the power sector in Delhi, at
the cost of other sectors, since a fundamental objective of
the reforms was to make the sector self-sustaining and
IPGCL’s principal customers in future will be the privately
managed Discoms. The optimal solution for new projects,
therefore, appears to be to identify a private investor
through a transparent tariff-based bidding process in
accordance with the guidelines recently issued by the
Central government, with some equity issued to the
Government in exchange for its contribution of the site.
This will be possible if the Delhi Electricity Regulatory
Commission is able to agree to the bidding process in
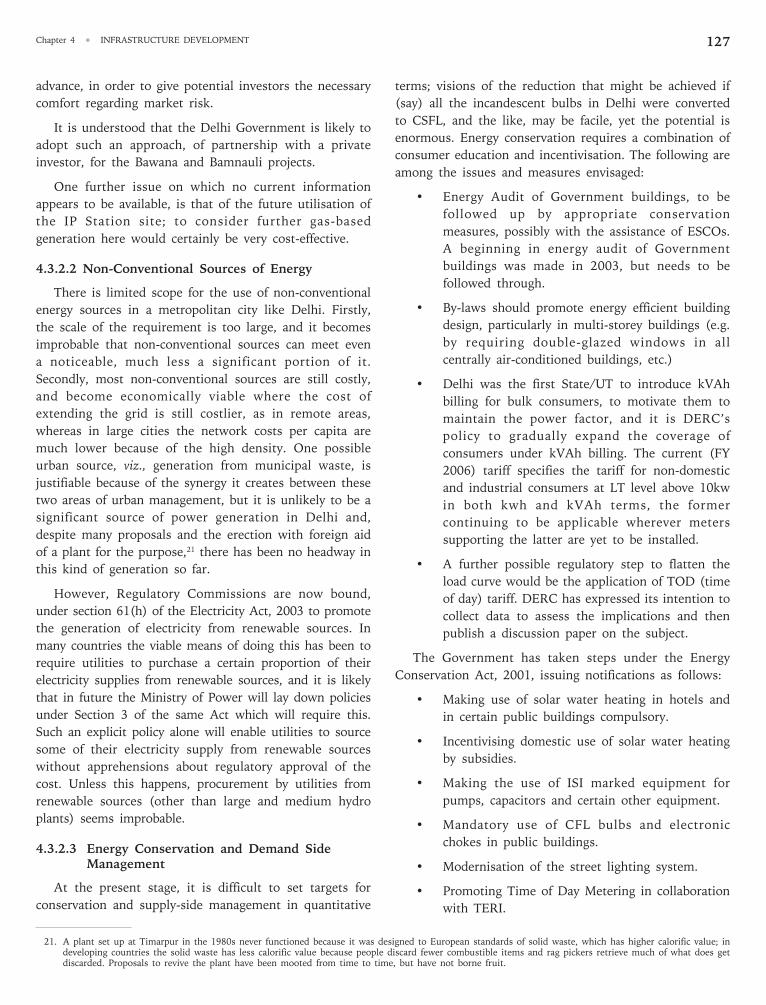
127Chapter 4 • INFRASTRUCTURE DEVELOPMENT
advance, in order to give potential investors the necessary
comfort regarding market risk.
It is understood that the Delhi Government is likely to
adopt such an approach, of partnership with a private
investor, for the Bawana and Bamnauli projects.
One further issue on which no current information
appears to be available, is that of the future utilisation of
the IP Station site; to consider further gas-based
generation here would certainly be very cost-effective.
4.3.2.2 Non-Conventional Sources of Energy
There is limited scope for the use of non-conventional
energy sources in a metropolitan city like Delhi. Firstly,
the scale of the requirement is too large, and it becomes
improbable that non-conventional sources can meet even
a noticeable, much less a significant portion of it.
Secondly, most non-conventional sources are still costly,
and become economically viable where the cost of
extending the grid is still costlier, as in remote areas,
whereas in large cities the network costs per capita are
much lower because of the high density. One possible
urban source, viz., generation from municipal waste, is
justifiable because of the synergy it creates between these
two areas of urban management, but it is unlikely to be a
significant source of power generation in Delhi and,
despite many proposals and the erection with foreign aid
of a plant for the purpose,21 there has been no headway in
this kind of generation so far.
However, Regulatory Commissions are now bound,
under section 61(h) of the Electricity Act, 2003 to promote
the generation of electricity from renewable sources. In
many countries the viable means of doing this has been to
require utilities to purchase a certain proportion of their
electricity supplies from renewable sources, and it is likely
that in future the Ministry of Power will lay down policies
under Section 3 of the same Act which will require this.
Such an explicit policy alone will enable utilities to source
some of their electricity supply from renewable sources
without apprehensions about regulatory approval of the
cost. Unless this happens, procurement by utilities from
renewable sources (other than large and medium hydro
plants) seems improbable.
4.3.2.3 Energy Conservation and Demand SideManagement
At the present stage, it is difficult to set targets for
conservation and supply-side management in quantitative
terms; visions of the reduction that might be achieved if
(say) all the incandescent bulbs in Delhi were converted
to CSFL, and the like, may be facile, yet the potential is
enormous. Energy conservation requires a combination of
consumer education and incentivisation. The following are
among the issues and measures envisaged:
• Energy Audit of Government buildings, to be
followed up by appropriate conservation
measures, possibly with the assistance of ESCOs.
A beginning in energy audit of Government
buildings was made in 2003, but needs to be
followed through.
• By-laws should promote energy efficient building
design, particularly in multi-storey buildings (e.g.
by requiring double-glazed windows in all
centrally air-conditioned buildings, etc.)
• Delhi was the first State/UT to introduce kVAh
billing for bulk consumers, to motivate them to
maintain the power factor, and it is DERC’s
policy to gradually expand the coverage of
consumers under kVAh billing. The current (FY
2006) tariff specifies the tariff for non-domestic
and industrial consumers at LT level above 10kw
in both kwh and kVAh terms, the former
continuing to be applicable wherever meters
supporting the latter are yet to be installed.
• A further possible regulatory step to flatten the
load curve would be the application of TOD (time
of day) tariff. DERC has expressed its intention to
collect data to assess the implications and then
publish a discussion paper on the subject.
The Government has taken steps under the Energy
Conservation Act, 2001, issuing notifications as follows:
• Making use of solar water heating in hotels and
in certain public buildings compulsory.
• Incentivising domestic use of solar water heating
by subsidies.
• Making the use of ISI marked equipment for
pumps, capacitors and certain other equipment.
• Mandatory use of CFL bulbs and electronic
chokes in public buildings.
• Modernisation of the street lighting system.
• Promoting Time of Day Metering in collaboration
with TERI.
21. A plant set up at Timarpur in the 1980s never functioned because it was designed to European standards of solid waste, which has higher calorific value; indeveloping countries the solid waste has less calorific value because people discard fewer combustible items and rag pickers retrieve much of what does getdiscarded. Proposals to revive the plant have been mooted from time to time, but have not borne fruit.
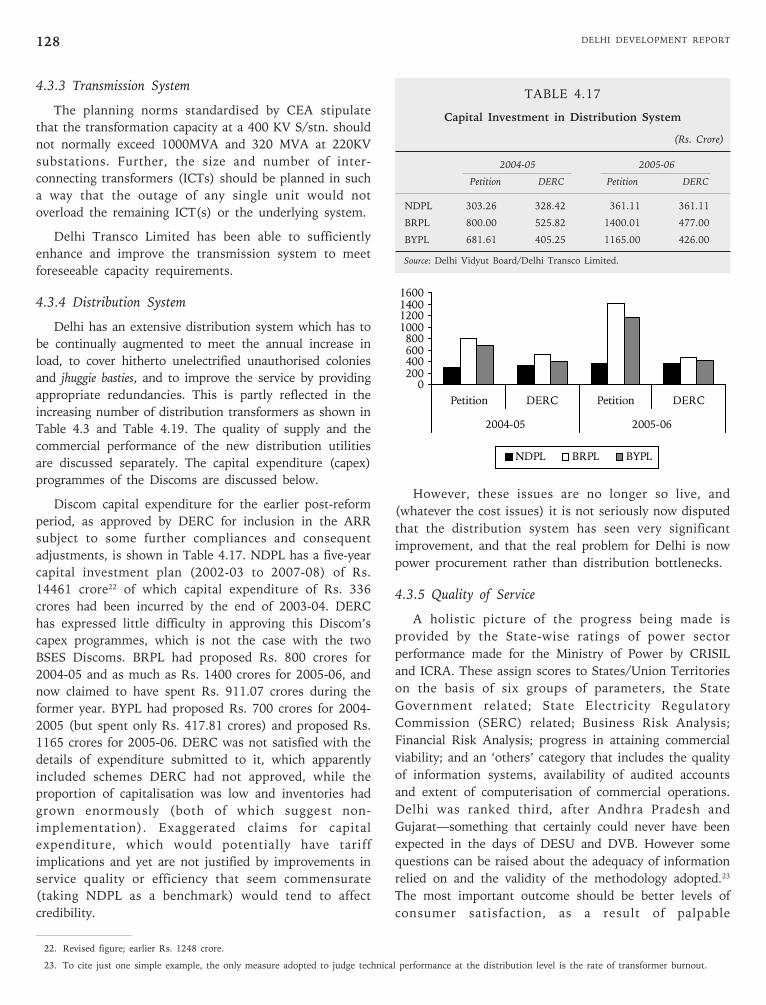
DELHI DEVELOPMENT REPORT128
TABLE 4.17
Capital Investment in Distribution System
(Rs. Crore)
2004-05 2005-06
Petition DERC Petition DERC
NDPL 303.26 328.42 361.11 361.11
BRPL 800.00 525.82 1400.01 477.00
BYPL 681.61 405.25 1165.00 426.00
Source: Delhi Vidyut Board/Delhi Transco Limited.
However, these issues are no longer so live, and
(whatever the cost issues) it is not seriously now disputed
that the distribution system has seen very significant
improvement, and that the real problem for Delhi is now
power procurement rather than distribution bottlenecks.
4.3.5 Quality of Service
A holistic picture of the progress being made is
provided by the State-wise ratings of power sector
performance made for the Ministry of Power by CRISIL
and ICRA. These assign scores to States/Union Territories
on the basis of six groups of parameters, the State
Government related; State Electricity Regulatory
Commission (SERC) related; Business Risk Analysis;
Financial Risk Analysis; progress in attaining commercial
viability; and an ‘others’ category that includes the quality
of information systems, availability of audited accounts
and extent of computerisation of commercial operations.
Delhi was ranked third, after Andhra Pradesh and
Gujarat—something that certainly could never have been
expected in the days of DESU and DVB. However some
questions can be raised about the adequacy of information
relied on and the validity of the methodology adopted.23
The most important outcome should be better levels of
consumer satisfaction, as a result of palpable
4.3.3 Transmission System
The planning norms standardised by CEA stipulate
that the transformation capacity at a 400 KV S/stn. should
not normally exceed 1000MVA and 320 MVA at 220KV
substations. Further, the size and number of inter-
connecting transformers (ICTs) should be planned in such
a way that the outage of any single unit would not
overload the remaining ICT(s) or the underlying system.
Delhi Transco Limited has been able to sufficiently
enhance and improve the transmission system to meet
foreseeable capacity requirements.
4.3.4 Distribution System
Delhi has an extensive distribution system which has to
be continually augmented to meet the annual increase in
load, to cover hitherto unelectrified unauthorised colonies
and jhuggie basties, and to improve the service by providing
appropriate redundancies. This is partly reflected in the
increasing number of distribution transformers as shown in
Table 4.3 and Table 4.19. The quality of supply and the
commercial performance of the new distribution utilities
are discussed separately. The capital expenditure (capex)
programmes of the Discoms are discussed below.
Discom capital expenditure for the earlier post-reform
period, as approved by DERC for inclusion in the ARR
subject to some further compliances and consequent
adjustments, is shown in Table 4.17. NDPL has a five-year
capital investment plan (2002-03 to 2007-08) of Rs.
14461 crore22 of which capital expenditure of Rs. 336
crores had been incurred by the end of 2003-04. DERC
has expressed little difficulty in approving this Discom’s
capex programmes, which is not the case with the two
BSES Discoms. BRPL had proposed Rs. 800 crores for
2004-05 and as much as Rs. 1400 crores for 2005-06, and
now claimed to have spent Rs. 911.07 crores during the
former year. BYPL had proposed Rs. 700 crores for 2004-
2005 (but spent only Rs. 417.81 crores) and proposed Rs.
1165 crores for 2005-06. DERC was not satisfied with the
details of expenditure submitted to it, which apparently
included schemes DERC had not approved, while the
proportion of capitalisation was low and inventories had
grown enormously (both of which suggest non-
implementation). Exaggerated claims for capital
expenditure, which would potentially have tariff
implications and yet are not justified by improvements in
service quality or efficiency that seem commensurate
(taking NDPL as a benchmark) would tend to affect
credibility.
0
200
400
600
800
1000
1200
1400
1600
Petition DERC Petition DERC
2004-05 2005-06
NDPL BRPL BYPL
22. Revised figure; earlier Rs. 1248 crore.
23. To cite just one simple example, the only measure adopted to judge technical performance at the distribution level is the rate of transformer burnout.
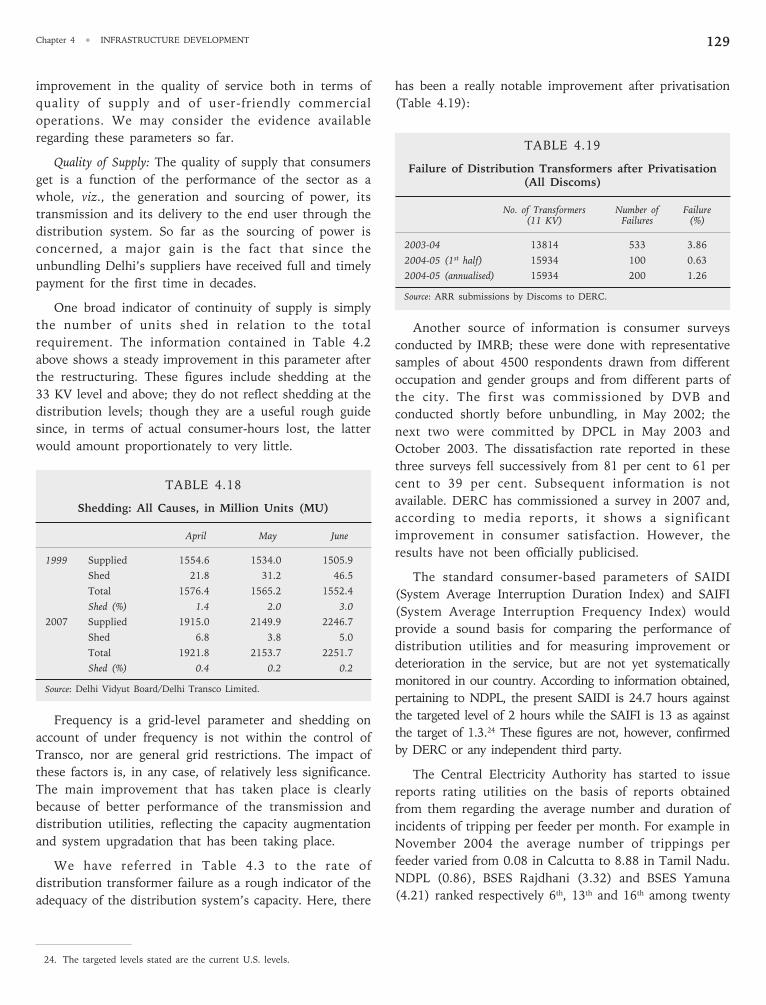
129Chapter 4 • INFRASTRUCTURE DEVELOPMENT
has been a really notable improvement after privatisation
(Table 4.19):
TABLE 4.19
Failure of Distribution Transformers after Privatisation(All Discoms)
No. of Transformers Number of Failure(11 KV) Failures (%)
2003-04 13814 533 3.86
2004-05 (1st half) 15934 100 0.63
2004-05 (annualised) 15934 200 1.26
Source: ARR submissions by Discoms to DERC.
Another source of information is consumer surveys
conducted by IMRB; these were done with representative
samples of about 4500 respondents drawn from different
occupation and gender groups and from different parts of
the city. The first was commissioned by DVB and
conducted shortly before unbundling, in May 2002; the
next two were committed by DPCL in May 2003 and
October 2003. The dissatisfaction rate reported in these
three surveys fell successively from 81 per cent to 61 per
cent to 39 per cent. Subsequent information is not
available. DERC has commissioned a survey in 2007 and,
according to media reports, it shows a significant
improvement in consumer satisfaction. However, the
results have not been officially publicised.
The standard consumer-based parameters of SAIDI
(System Average Interruption Duration Index) and SAIFI
(System Average Interruption Frequency Index) would
provide a sound basis for comparing the performance of
distribution utilities and for measuring improvement or
deterioration in the service, but are not yet systematically
monitored in our country. According to information obtained,
pertaining to NDPL, the present SAIDI is 24.7 hours against
the targeted level of 2 hours while the SAIFI is 13 as against
the target of 1.3.24 These figures are not, however, confirmed
by DERC or any independent third party.
The Central Electricity Authority has started to issue
reports rating utilities on the basis of reports obtained
from them regarding the average number and duration of
incidents of tripping per feeder per month. For example in
November 2004 the average number of trippings per
feeder varied from 0.08 in Calcutta to 8.88 in Tamil Nadu.
NDPL (0.86), BSES Rajdhani (3.32) and BSES Yamuna
(4.21) ranked respectively 6th, 13th and 16th among twenty
improvement in the quality of service both in terms of
quality of supply and of user-friendly commercial
operations. We may consider the evidence available
regarding these parameters so far.
Quality of Supply: The quality of supply that consumers
get is a function of the performance of the sector as a
whole, viz., the generation and sourcing of power, its
transmission and its delivery to the end user through the
distribution system. So far as the sourcing of power is
concerned, a major gain is the fact that since the
unbundling Delhi’s suppliers have received full and timely
payment for the first time in decades.
One broad indicator of continuity of supply is simply
the number of units shed in relation to the total
requirement. The information contained in Table 4.2
above shows a steady improvement in this parameter after
the restructuring. These figures include shedding at the
33 KV level and above; they do not reflect shedding at the
distribution levels; though they are a useful rough guide
since, in terms of actual consumer-hours lost, the latter
would amount proportionately to very little.
TABLE 4.18
Shedding: All Causes, in Million Units (MU)
April May June
1999 Supplied 1554.6 1534.0 1505.9
Shed 21.8 31.2 46.5
Total 1576.4 1565.2 1552.4
Shed (%) 1.4 2.0 3.0
2007 Supplied 1915.0 2149.9 2246.7
Shed 6.8 3.8 5.0
Total 1921.8 2153.7 2251.7
Shed (%) 0.4 0.2 0.2
Source: Delhi Vidyut Board/Delhi Transco Limited.
Frequency is a grid-level parameter and shedding on
account of under frequency is not within the control of
Transco, nor are general grid restrictions. The impact of
these factors is, in any case, of relatively less significance.
The main improvement that has taken place is clearly
because of better performance of the transmission and
distribution utilities, reflecting the capacity augmentation
and system upgradation that has been taking place.
We have referred in Table 4.3 to the rate of
distribution transformer failure as a rough indicator of the
adequacy of the distribution system’s capacity. Here, there
24. The targeted levels stated are the current U.S. levels.
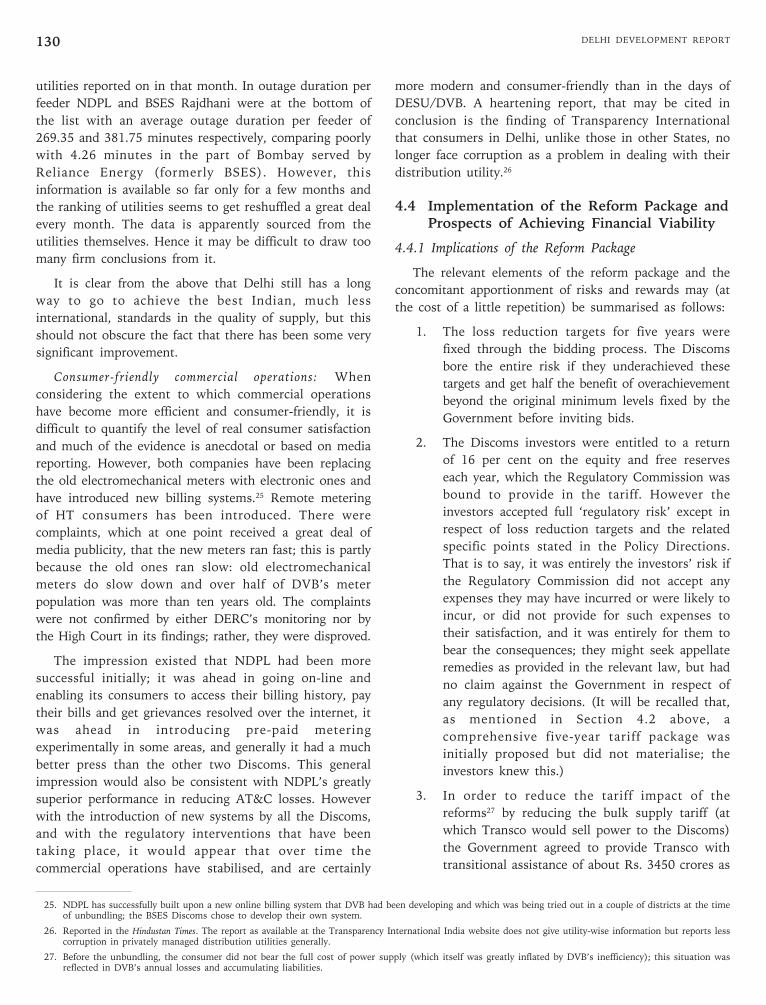
DELHI DEVELOPMENT REPORT130
utilities reported on in that month. In outage duration per
feeder NDPL and BSES Rajdhani were at the bottom of
the list with an average outage duration per feeder of
269.35 and 381.75 minutes respectively, comparing poorly
with 4.26 minutes in the part of Bombay served by
Reliance Energy (formerly BSES). However, this
information is available so far only for a few months and
the ranking of utilities seems to get reshuffled a great deal
every month. The data is apparently sourced from the
utilities themselves. Hence it may be difficult to draw too
many firm conclusions from it.
It is clear from the above that Delhi still has a long
way to go to achieve the best Indian, much less
international, standards in the quality of supply, but this
should not obscure the fact that there has been some very
significant improvement.
Consumer-friendly commercial operations: When
considering the extent to which commercial operations
have become more efficient and consumer-friendly, it is
difficult to quantify the level of real consumer satisfaction
and much of the evidence is anecdotal or based on media
reporting. However, both companies have been replacing
the old electromechanical meters with electronic ones and
have introduced new billing systems.25 Remote metering
of HT consumers has been introduced. There were
complaints, which at one point received a great deal of
media publicity, that the new meters ran fast; this is partly
because the old ones ran slow: old electromechanical
meters do slow down and over half of DVB’s meter
population was more than ten years old. The complaints
were not confirmed by either DERC’s monitoring nor by
the High Court in its findings; rather, they were disproved.
The impression existed that NDPL had been more
successful initially; it was ahead in going on-line and
enabling its consumers to access their billing history, pay
their bills and get grievances resolved over the internet, it
was ahead in introducing pre-paid metering
experimentally in some areas, and generally it had a much
better press than the other two Discoms. This general
impression would also be consistent with NDPL’s greatly
superior performance in reducing AT&C losses. However
with the introduction of new systems by all the Discoms,
and with the regulatory interventions that have been
taking place, it would appear that over time the
commercial operations have stabilised, and are certainly
more modern and consumer-friendly than in the days of
DESU/DVB. A heartening report, that may be cited in
conclusion is the finding of Transparency International
that consumers in Delhi, unlike those in other States, no
longer face corruption as a problem in dealing with their
distribution utility.26
4.4 Implementation of the Reform Package andProspects of Achieving Financial Viability
4.4.1 Implications of the Reform Package
The relevant elements of the reform package and the
concomitant apportionment of risks and rewards may (at
the cost of a little repetition) be summarised as follows:
1. The loss reduction targets for five years were
fixed through the bidding process. The Discoms
bore the entire risk if they underachieved these
targets and get half the benefit of overachievement
beyond the original minimum levels fixed by the
Government before inviting bids.
2. The Discoms investors were entitled to a return
of 16 per cent on the equity and free reserves
each year, which the Regulatory Commission was
bound to provide in the tariff. However the
investors accepted full ‘regulatory risk’ except in
respect of loss reduction targets and the related
specific points stated in the Policy Directions.
That is to say, it was entirely the investors’ risk if
the Regulatory Commission did not accept any
expenses they may have incurred or were likely to
incur, or did not provide for such expenses to
their satisfaction, and it was entirely for them to
bear the consequences; they might seek appellate
remedies as provided in the relevant law, but had
no claim against the Government in respect of
any regulatory decisions. (It will be recalled that,
as mentioned in Section 4.2 above, a
comprehensive five-year tariff package was
initially proposed but did not materialise; the
investors knew this.)
3. In order to reduce the tariff impact of the
reforms27 by reducing the bulk supply tariff (at
which Transco would sell power to the Discoms)
the Government agreed to provide Transco with
transitional assistance of about Rs. 3450 crores as
25. NDPL has successfully built upon a new online billing system that DVB had been developing and which was being tried out in a couple of districts at the timeof unbundling; the BSES Discoms chose to develop their own system.
26. Reported in the Hindustan Times. The report as available at the Transparency International India website does not give utility-wise information but reports lesscorruption in privately managed distribution utilities generally.
27. Before the unbundling, the consumer did not bear the full cost of power supply (which itself was greatly inflated by DVB’s inefficiency); this situation wasreflected in DVB’s annual losses and accumulating liabilities.
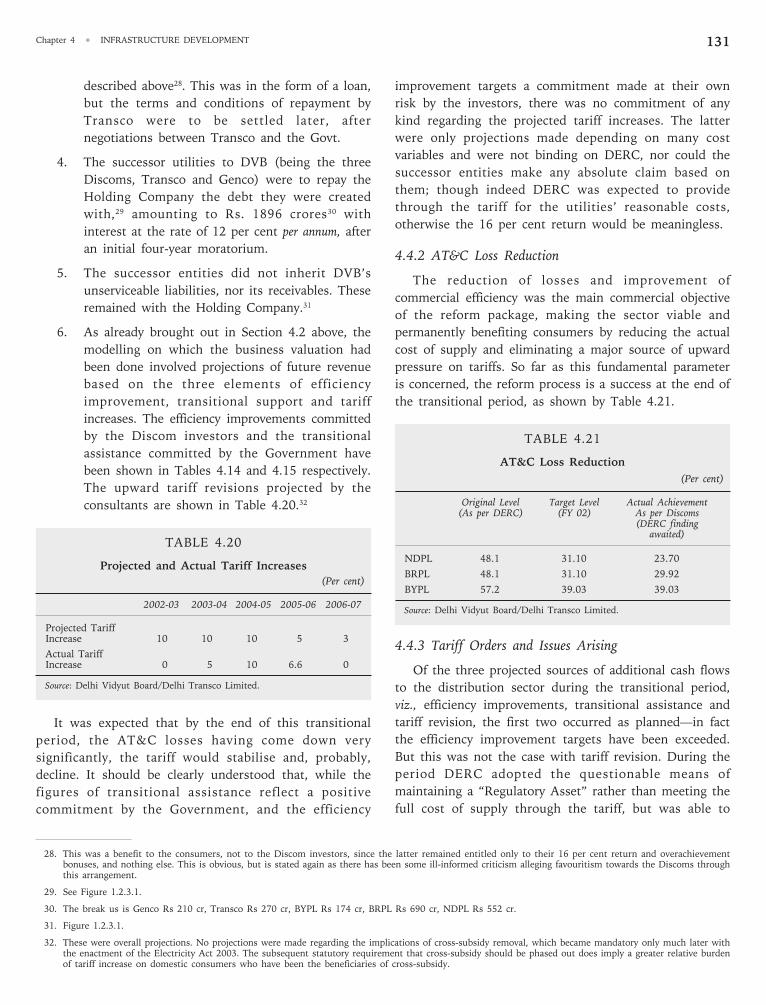
131Chapter 4 • INFRASTRUCTURE DEVELOPMENT
described above28. This was in the form of a loan,
but the terms and conditions of repayment by
Transco were to be settled later, after
negotiations between Transco and the Govt.
4. The successor utilities to DVB (being the three
Discoms, Transco and Genco) were to repay the
Holding Company the debt they were created
with,29 amounting to Rs. 1896 crores30 with
interest at the rate of 12 per cent per annum, after
an initial four-year moratorium.
5. The successor entities did not inherit DVB’s
unserviceable liabilities, nor its receivables. These
remained with the Holding Company.31
6. As already brought out in Section 4.2 above, the
modelling on which the business valuation had
been done involved projections of future revenue
based on the three elements of efficiency
improvement, transitional support and tariff
increases. The efficiency improvements committed
by the Discom investors and the transitional
assistance committed by the Government have
been shown in Tables 4.14 and 4.15 respectively.
The upward tariff revisions projected by the
consultants are shown in Table 4.20.32
TABLE 4.20
Projected and Actual Tariff Increases
(Per cent)
2002-03 2003-04 2004-05 2005-06 2006-07
Projected TariffIncrease 10 10 10 5 3
Actual TariffIncrease 0 5 10 6.6 0
Source: Delhi Vidyut Board/Delhi Transco Limited.
It was expected that by the end of this transitional
period, the AT&C losses having come down very
significantly, the tariff would stabilise and, probably,
decline. It should be clearly understood that, while the
figures of transitional assistance reflect a positive
commitment by the Government, and the efficiency
improvement targets a commitment made at their own
risk by the investors, there was no commitment of any
kind regarding the projected tariff increases. The latter
were only projections made depending on many cost
variables and were not binding on DERC, nor could the
successor entities make any absolute claim based on
them; though indeed DERC was expected to provide
through the tariff for the utilities’ reasonable costs,
otherwise the 16 per cent return would be meaningless.
4.4.2 AT&C Loss Reduction
The reduction of losses and improvement of
commercial efficiency was the main commercial objective
of the reform package, making the sector viable and
permanently benefiting consumers by reducing the actual
cost of supply and eliminating a major source of upward
pressure on tariffs. So far as this fundamental parameter
is concerned, the reform process is a success at the end of
the transitional period, as shown by Table 4.21.
TABLE 4.21
AT&C Loss Reduction
(Per cent)
Original Level Target Level Actual Achievement(As per DERC) (FY 02) As per Discoms
(DERC findingawaited)
NDPL 48.1 31.10 23.70
BRPL 48.1 31.10 29.92
BYPL 57.2 39.03 39.03
Source: Delhi Vidyut Board/Delhi Transco Limited.
4.4.3 Tariff Orders and Issues Arising
Of the three projected sources of additional cash flows
to the distribution sector during the transitional period,
viz., efficiency improvements, transitional assistance and
tariff revision, the first two occurred as planned—in fact
the efficiency improvement targets have been exceeded.
But this was not the case with tariff revision. During the
period DERC adopted the questionable means of
maintaining a “Regulatory Asset” rather than meeting the
full cost of supply through the tariff, but was able to
28. This was a benefit to the consumers, not to the Discom investors, since the latter remained entitled only to their 16 per cent return and overachievementbonuses, and nothing else. This is obvious, but is stated again as there has been some ill-informed criticism alleging favouritism towards the Discoms throughthis arrangement.
29. See Figure 1.2.3.1.
30. The break us is Genco Rs 210 cr, Transco Rs 270 cr, BYPL Rs 174 cr, BRPL Rs 690 cr, NDPL Rs 552 cr.
31. Figure 1.2.3.1.
32. These were overall projections. No projections were made regarding the implications of cross-subsidy removal, which became mandatory only much later withthe enactment of the Electricity Act 2003. The subsequent statutory requirement that cross-subsidy should be phased out does imply a greater relative burdenof tariff increase on domestic consumers who have been the beneficiaries of cross-subsidy.
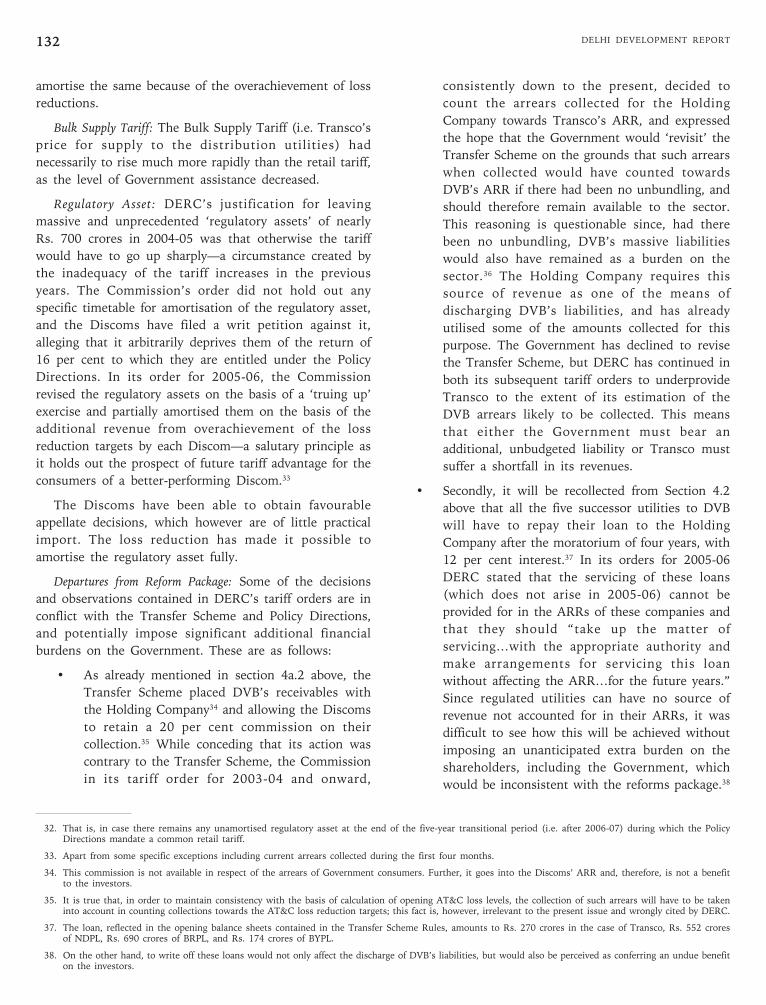
DELHI DEVELOPMENT REPORT132
amortise the same because of the overachievement of loss
reductions.
Bulk Supply Tariff: The Bulk Supply Tariff (i.e. Transco’s
price for supply to the distribution utilities) had
necessarily to rise much more rapidly than the retail tariff,
as the level of Government assistance decreased.
Regulatory Asset: DERC’s justification for leaving
massive and unprecedented ‘regulatory assets’ of nearly
Rs. 700 crores in 2004-05 was that otherwise the tariff
would have to go up sharply—a circumstance created by
the inadequacy of the tariff increases in the previous
years. The Commission’s order did not hold out any
specific timetable for amortisation of the regulatory asset,
and the Discoms have filed a writ petition against it,
alleging that it arbitrarily deprives them of the return of
16 per cent to which they are entitled under the Policy
Directions. In its order for 2005-06, the Commission
revised the regulatory assets on the basis of a ‘truing up’
exercise and partially amortised them on the basis of the
additional revenue from overachievement of the loss
reduction targets by each Discom—a salutary principle as
it holds out the prospect of future tariff advantage for the
consumers of a better-performing Discom.33
The Discoms have been able to obtain favourable
appellate decisions, which however are of little practical
import. The loss reduction has made it possible to
amortise the regulatory asset fully.
Departures from Reform Package: Some of the decisions
and observations contained in DERC’s tariff orders are in
conflict with the Transfer Scheme and Policy Directions,
and potentially impose significant additional financial
burdens on the Government. These are as follows:
• As already mentioned in section 4a.2 above, the
Transfer Scheme placed DVB’s receivables with
the Holding Company34 and allowing the Discoms
to retain a 20 per cent commission on their
collection.35 While conceding that its action was
contrary to the Transfer Scheme, the Commission
in its tariff order for 2003-04 and onward,
consistently down to the present, decided to
count the arrears collected for the Holding
Company towards Transco’s ARR, and expressed
the hope that the Government would ‘revisit’ the
Transfer Scheme on the grounds that such arrears
when collected would have counted towards
DVB’s ARR if there had been no unbundling, and
should therefore remain available to the sector.
This reasoning is questionable since, had there
been no unbundling, DVB’s massive liabilities
would also have remained as a burden on the
sector.36 The Holding Company requires this
source of revenue as one of the means of
discharging DVB’s liabilities, and has already
utilised some of the amounts collected for this
purpose. The Government has declined to revise
the Transfer Scheme, but DERC has continued in
both its subsequent tariff orders to underprovide
Transco to the extent of its estimation of the
DVB arrears likely to be collected. This means
that either the Government must bear an
additional, unbudgeted liability or Transco must
suffer a shortfall in its revenues.
• Secondly, it will be recollected from Section 4.2
above that all the five successor utilities to DVB
will have to repay their loan to the Holding
Company after the moratorium of four years, with
12 per cent interest.37 In its orders for 2005-06
DERC stated that the servicing of these loans
(which does not arise in 2005-06) cannot be
provided for in the ARRs of these companies and
that they should “take up the matter of
servicing…with the appropriate authority and
make arrangements for servicing this loan
without affecting the ARR…for the future years.”
Since regulated utilities can have no source of
revenue not accounted for in their ARRs, it was
difficult to see how this will be achieved without
imposing an unanticipated extra burden on the
shareholders, including the Government, which
would be inconsistent with the reforms package.38
32. That is, in case there remains any unamortised regulatory asset at the end of the five-year transitional period (i.e. after 2006-07) during which the PolicyDirections mandate a common retail tariff.
33. Apart from some specific exceptions including current arrears collected during the first four months.
34. This commission is not available in respect of the arrears of Government consumers. Further, it goes into the Discoms’ ARR and, therefore, is not a benefitto the investors.
35. It is true that, in order to maintain consistency with the basis of calculation of opening AT&C loss levels, the collection of such arrears will have to be takeninto account in counting collections towards the AT&C loss reduction targets; this fact is, however, irrelevant to the present issue and wrongly cited by DERC.
37. The loan, reflected in the opening balance sheets contained in the Transfer Scheme Rules, amounts to Rs. 270 crores in the case of Transco, Rs. 552 croresof NDPL, Rs. 690 crores of BRPL, and Rs. 174 crores of BYPL.
38. On the other hand, to write off these loans would not only affect the discharge of DVB’s liabilities, but would also be perceived as conferring an undue benefiton the investors.
133Chapter 4 • INFRASTRUCTURE DEVELOPMENT
However, fortunately, with the decline in interest
rates, the Discoms have been able to repay the
entire loan in advance on the basis of refinancing—
a win-win situation for all concerned.
• The same issue arises regarding the Government’s
transitional loan to Transco of Rs. 3450 crores.
Here the Government too failed to determine the
terms and conditions for repayment for far too
long. Fortunately, however, the Government was
eventually able to reach a very fair decision, to
convert the loan into equity, thus restoring a
gaping hole in Transco’s balance sheet.
Other issues: The Discom investors have at times
professed to be aggrieved by DERC’s disregard for their
stated requirements of compliance with the accounting
standards obligatory under Company law. Their
contention has been that if their obligations, as
companies, to provide for depreciation and deferred tax
liability are not considered in fixing their ARR, then they
are unable to actually realise their prescribed rate of
return. So far as depreciation is concerned, they have
eventually succeeded in obtaining favourable appellate
orders which have been upheld by the Supreme Court.
There remains an obvious force in the contention that
the prescribed return is meaningless for a company unless
reflected in the bottom line of its statutory profit and loss
account. This is a policy issue on a quite different footing
from the non-acceptance of any particular expenditure
projected by a utility, and it needs to be addressed. It is
certainly arguable that the Discoms have not obtained
their promised return (apart from the overachievement
bonuses earned by NDPL) despite overachieving their
efficiency improvement targets, in terms of their statutory
financial statements.
Conclusion: It should be sufficiently clear from the
foregoing discussion that the whole reform package has
been impacted by the tariff issue, which led DERC to
leave a large uncovered ‘regulatory asset’. The regulatory
asset has since been amortised, but such ‘back loading’
tends to increase, rather than reducing the burden on the
consumer in the long term. The implications are:
• Where the pain of reform should have been
behind us by now, and consumers should have
been able to look forward to the prospect of
steadily improving service without further tariff
increases, it now appears possible that the tariff
may have to rise again during the current year.
And as the pre-reform situation recedes in public
memory, and consumers feel the new entities
have had sufficient time to deliver, there is likely
to be more consumer resistance to such increases
in the future. This situation could have been
avoided, or at least minimised, by making fairer
increases in the early years, ending with the third
year of the five-year transitory lustrum, and
standing by them.
• DERC’s disregard of certain features of the
transfer scheme, referred to above, potentially
imposes a continuing burden on the Government
that was not envisaged.
• Investors, though they may wary of complaining
too much in public, have not benefited
sufficiently to motivate them, or other private
players in the power sector, to be interested in
taking over distribution in other States in India.
To that extent, the unique achievement in loss
reduction in Delhi has failed to create investor
interest in the distribution sector, which is a
tragedy for the power sector as a whole.
4.5 Areas of Strengths, Weaknesses andWhere Intervention is Needed
4.5.1 Strengths
The greatest strength of the power sector in Delhi is
the background of successful restructuring. This has freed
the successor companies of DVB from the burden of the
past. They are not burdened with DVB’s accumulated
financial losses and liabilities; the fact of restructuring and
change of management has provided an opportunity to
modernise and change the organisational culture,
especially in the distribution part of the business where it
was most needed. VRS schemes have been implemented
successfully by the Discoms and also, on a more modest
scale, by IPGCL. We already see a healthy competition
among utilities, and the superior performance of one of
the Discoms has posed a challenge for the others to meet.
Secondly, the restructuring with privatisation of
distribution has created scope for private sector investment
not only in the distribution sector itself but also in
generation. There is every prospect of the sector becoming
substantially self-sustaining and the need for public
expenditure on investment and current requirements of the
power sector has already come down a great deal.
As a result of these changes, as well as the enhanced
power procurement ability that has come with full
payments to power suppliers, the availability of power and
the quality of service to the public has improved
substantially and (if appropriate steps are taken regarding
the sourcing of more power) is likely to continue to
improve.
DELHI DEVELOPMENT REPORT134
4.5.2 Weaknesses
The two main weaknesses of the power sector in Delhi
are the failure to create a really strong feeling of
consumer satisfaction, especially during the transitional
period, and the continuing tariff issue described above.
These two issues are interrelated. There were very high
public expectations from the transfer of DVB’s
distribution business to the new Discoms controlled by
such reputed national companies. Despite the real
improvements that have taken place, the regularity and
quality of supply and the quality of service available to
consumers are still not up to the standards desired and
there was a lot of media criticism of two of the three
Discoms during the transitional period, though they too
have later been able to address the major public
grievances regarding their billing systems with some
degree of success. It is reasonable to suggest that if all
three of the Discoms had been able to perform to the
level that NDPL was able to achieve especially during the
second, third and fourth years after unbundling, then
there may have been more willingness to accept tariff
revisions as the cost of better service and, even more
important, the extent of tariff revision required would
have been smaller with better commercial efficiency.
Nevertheless, despite what has been said above, the
Discoms cannot be faulted for their commercial
performance so far since all three appear (subject to
DERC’s confirmation) met their committed loss reduction
targets.
A consequent third weakness of the sector is the fact
that the public-private partnership on which the reforms
were premised has come under strain. The regulatory
concerns that have been referred to have, in some cases,
put Transco and the Discoms in opposite camps. Discom
managements have been slow or remiss at times in
making payments to Transco and DPCL in terms of the
reform package (though payments for power purchase
have been timely). While Discom managements may have
felt at times that they were not getting sufficient
cooperation in various matters, they too may need to
appreciate that public and political support for them is
bound to weaken unless all three Discoms are able to
create a strong feeling of satisfaction among their
consumers.
The Government’s ability to deal with such issues as
those that have been referred to is also constrained by the
apprehension of audit or similar criticism. This is not the
place to comment on the C&AG’s report covering the
privatisation process, but media reporting on it has not
been consistently objective. The first draft of the C&AG’s
special review of the privatisation process was leaked to
the press and received wide publicity; when the final
report came out, dropping some of the original criticisms
(notably the observation that bids should have been
reinvited) the differences were not highlighted as they
should have been, and the coverage has presented the
report as being more critical than, on closer analysis, it
actually is. In fact, the C&AG dropped its initial
observation that bids should have been re-invited, and in
its final report merely said that, given the financial
implications of the decision taken (to accept negotiated
bids) the approval of the Lieutenant Governor should
have been obtained, and should now be obtained post
facto. This criticism did not at all go to the merits of the
decision, a distinction which the media failed to appreciate
and explain to the public. The possibility of a negative
atmosphere of opinion getting created by incomplete
reporting, sometimes to the point of misinformation, has
since materialised—greatly aided by the conflation in the
media, presumably in the public mind, of the C&AG
report with the PAC report, which went far beyond and
actually contradicted the C&AG’s report.
Further, Delhi’s energy security in regard to the power
sector remains a question mark since, three years after the
reforms, neither has any project to enhance local
generation been launched, nor has the opportunity of
benefiting from private sector participation in generation
in Delhi yet been availed of.
4.5.3. Interventions Required
Five-year tariff package: The ongoing multi-year tariff
exercise, and the tariff decision for the current year, need
to be expedited by DERC. They are already overdue.
Focus on consumer satisfaction: DERC needs to be
proactive in dealing not only with individual consumer
grievances but with overall utility performance. The
existing Metering & Billing Regulations establish norms
for processing individual matters and penalties for
individual failure. DERC has now taken steps to monitor
the performance of Discoms in the field. It should also
take steps to implement the well-known objective, overall
norms and standards for the quality of service provided by
Discoms (especially SAIDI39 and SAIFI40) with effective
penalties for failure to achieve them.
39. System Average Interruption Duration Index.
40. System Average Interruption Frequency Index.
135Chapter 4 • INFRASTRUCTURE DEVELOPMENT
Sourcing of power: Immediate steps should be taken to
expedite the allotment of the Bawana site for a generation
project and for expanding the capacity of Genco; the
issues have been discussed above.
4.5.4 Conclusion
Given the complexity of the whole restructuring
exercise, and its dependence for success on the decisions
and performance of different, independent participants—
the regulator, the investors, the managements of the
successor utilities and the Government itself—as well as
on various external factors, it is not surprising that things
have not gone exactly to plan in all respects and that the
overall picture is one of partial—though very substantial—
success. It is, further, to be hoped the difficulties
described above will be greatly mitigated if all the
Discoms are able, during the post-transitional period, to
step up the level of overachievement in loss reduction,
reducing pressure on the tariff (and also benefiting their
own shareholders). What is most necessary during the
current transitional period is to appreciate that the
reforms are still an ongoing process which needs to be
monitored and kept continuously on track rather than a
completed transaction to be merely commented upon.
RAILWAYS AND ROADS
4.6 Introduction
4.6.1 This Section covers the development of roads and
railways in the State of Delhi. Beginning with the present
status of Railway and Road network, the development
works planned, the works in progress, their present
status, resource requirement for completion with time
frame for the same have been covered. The deficiencies in
the existing network and proposals for removing them
and the resource requirement for the same have further
been analysed.
4.6.2 The effect of multiplicity of authority in the road
sector with different sectors and activities controlled by
Government of NCTD, MCD, NDMC, DDA, and NHAI
and the resulting mismatch in coordinated synergic
approach in this sector so far and the remedial measures
being taken have been detailed below.
4.6.3 The Maintenance of roads, lighting, sanitation
facilities on these roads, together with the aspects of road
furniture and signage has been examined.
4.6.4 The integration of rail and road transport is
essential for providing optimal services to the traveling
public. With the Metro Rail coming up rapidly, suitable
interfaces require to be developed with the Indian
Railways to meet the transportation needs of the people
of NCT Delhi and those travelling to and from Delhi to
neighbouring towns and to other parts of the country.
4.6.5 Delhi is the third largest city in India, surpassed
in population only by Calcutta and Bombay. Delhi’s
history dates back to the first millennium B.C., when it
was known as Indraprastha.
The long period, during which Delhi has served as the
capital of India, resulted in development of a network of
roads from all parts of the country to Delhi. After the
advent of Railways, similarly a network of Railways
developed leading to Delhi
Delhi was made a Union Territory on November 1,
1956. With the 69th Constitutional amendment, Delhi got
a Legislative Assembly when the National Capital
Territory Act was enacted in 1991.
Delhi is one of the fastest growing cities in the World.
Here, remnants of the past survive cheek-by-jowl with
skyscrapers, residential colonies and bustling commercial
complexes.
4.6.6 The population of Delhi, which was around 2
million in 1971, rose to13.78 million in 2001 and is
expected to reach 22 million by 2021. A large percentage
of this population is made up of immigrants from other
Indian states and their travel requirements are also
required to be serviced by the transport system.
4.6.7 This Section outlines the growth of the road and
rail network in and around Delhi, and the measures being
constantly planned and taken for providing a better and
more efficient road network to the people of Delhi. A
large number of flyovers have been recently commissioned
and several more are under construction, widening of
roads has been taken up, new bypasses and slip roads are
being added and other measures are being taken to
improve the system. This report goes on to identify the
further measures required and the action required to be
taken to make both the rail and road systems adequate for
the traffic they would be called upon to carry.
It also examines the main causes of environmental
degradation that has taken place due to traffic and
transport and reviews the earlier studies carried out by
various different authorities to provide relief to the ever
increasing traffic and transport problems of the city and
action taken on them, as well as by the Railways and the
NCR Planning Board in this connection.
4.6.8 The measures being taken to meet the objective
of having a world class road and rail network as per the
Master Plan Delhi 2021 have been detailed and steps to
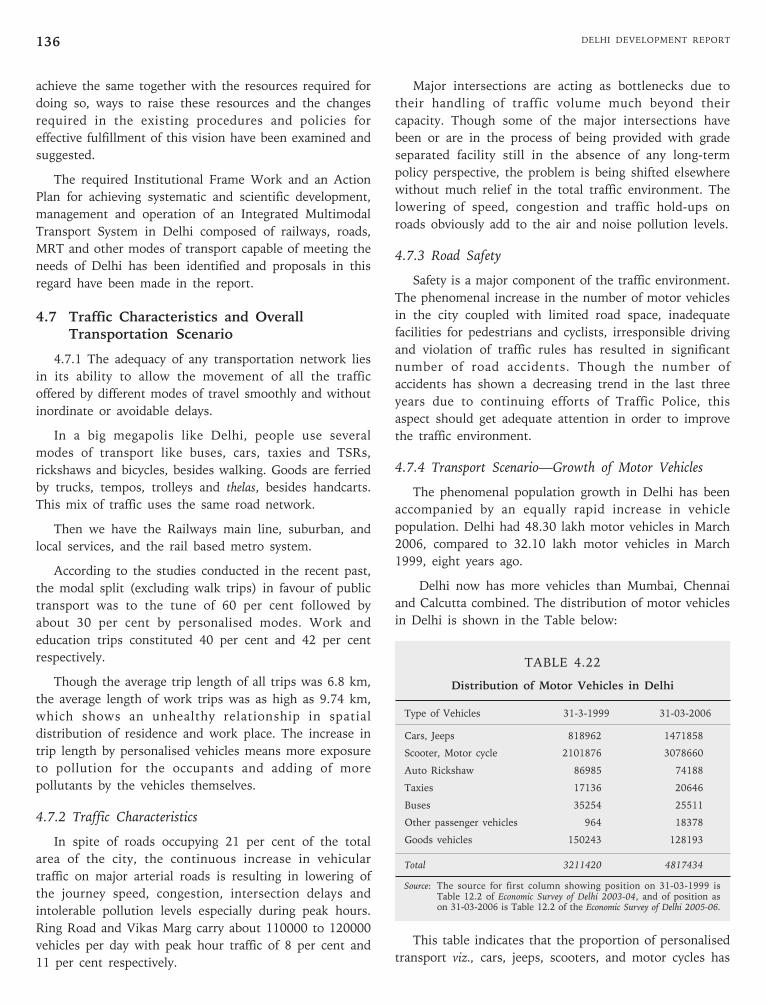
DELHI DEVELOPMENT REPORT136
Major intersections are acting as bottlenecks due to
their handling of traffic volume much beyond their
capacity. Though some of the major intersections have
been or are in the process of being provided with grade
separated facility still in the absence of any long-term
policy perspective, the problem is being shifted elsewhere
without much relief in the total traffic environment. The
lowering of speed, congestion and traffic hold-ups on
roads obviously add to the air and noise pollution levels.
4.7.3 Road Safety
Safety is a major component of the traffic environment.
The phenomenal increase in the number of motor vehicles
in the city coupled with limited road space, inadequate
facilities for pedestrians and cyclists, irresponsible driving
and violation of traffic rules has resulted in significant
number of road accidents. Though the number of
accidents has shown a decreasing trend in the last three
years due to continuing efforts of Traffic Police, this
aspect should get adequate attention in order to improve
the traffic environment.
4.7.4 Transport Scenario—Growth of Motor Vehicles
The phenomenal population growth in Delhi has been
accompanied by an equally rapid increase in vehicle
population. Delhi had 48.30 lakh motor vehicles in March
2006, compared to 32.10 lakh motor vehicles in March
1999, eight years ago.
Delhi now has more vehicles than Mumbai, Chennai
and Calcutta combined. The distribution of motor vehicles
in Delhi is shown in the Table below:
TABLE 4.22
Distribution of Motor Vehicles in Delhi
Type of Vehicles 31-3-1999 31-03-2006
Cars, Jeeps 818962 1471858
Scooter, Motor cycle 2101876 3078660
Auto Rickshaw 86985 74188
Taxies 17136 20646
Buses 35254 25511
Other passenger vehicles 964 18378
Goods vehicles 150243 128193
Total 3211420 4817434
Source: The source for first column showing position on 31-03-1999 isTable 12.2 of Economic Survey of Delhi 2003-04, and of position ason 31-03-2006 is Table 12.2 of the Economic Survey of Delhi 2005-06.
This table indicates that the proportion of personalised
transport viz., cars, jeeps, scooters, and motor cycles has
achieve the same together with the resources required for
doing so, ways to raise these resources and the changes
required in the existing procedures and policies for
effective fulfillment of this vision have been examined and
suggested.
The required Institutional Frame Work and an Action
Plan for achieving systematic and scientific development,
management and operation of an Integrated Multimodal
Transport System in Delhi composed of railways, roads,
MRT and other modes of transport capable of meeting the
needs of Delhi has been identified and proposals in this
regard have been made in the report.
4.7 Traffic Characteristics and OverallTransportation Scenario
4.7.1 The adequacy of any transportation network lies
in its ability to allow the movement of all the traffic
offered by different modes of travel smoothly and without
inordinate or avoidable delays.
In a big megapolis like Delhi, people use several
modes of transport like buses, cars, taxies and TSRs,
rickshaws and bicycles, besides walking. Goods are ferried
by trucks, tempos, trolleys and thelas, besides handcarts.
This mix of traffic uses the same road network.
Then we have the Railways main line, suburban, and
local services, and the rail based metro system.
According to the studies conducted in the recent past,
the modal split (excluding walk trips) in favour of public
transport was to the tune of 60 per cent followed by
about 30 per cent by personalised modes. Work and
education trips constituted 40 per cent and 42 per cent
respectively.
Though the average trip length of all trips was 6.8 km,
the average length of work trips was as high as 9.74 km,
which shows an unhealthy relationship in spatial
distribution of residence and work place. The increase in
trip length by personalised vehicles means more exposure
to pollution for the occupants and adding of more
pollutants by the vehicles themselves.
4.7.2 Traffic Characteristics
In spite of roads occupying 21 per cent of the total
area of the city, the continuous increase in vehicular
traffic on major arterial roads is resulting in lowering of
the journey speed, congestion, intersection delays and
intolerable pollution levels especially during peak hours.
Ring Road and Vikas Marg carry about 110000 to 120000
vehicles per day with peak hour traffic of 8 per cent and
11 per cent respectively.
137Chapter 4 • INFRASTRUCTURE DEVELOPMENT
increased from 90.9 per cent in 1998-99 to 94.25 per cent
in 2005-06, while the proportion of buses, taxies, auto
rickshaws and goods vehicles has declined.
4.7.5 Availability of Roads
The availability of roads in Delhi as per last available
statistics is 31183 kms in March 2006 of which 27139
kms belong to MCD, 1550 kms to NDMC, 144 kms to
DCB, 182 kms of National Highway and 2168 kms of
other roads. The average length of road per 100 sqm areas
is 2103 and the road length per 1000 population is about
1.94 kms.
4.7.6 National Highways
Five National Highways i.e., NH-1, NH-2, NH-10, NH-8
and NH-24 pass through the National Capital Territory of
Delhi, contributing significantly to the character of Delhi
as a major trading and distribution centre, and as the
melting pot of India. Delhi continues to stand at the cross
roads of modern India, with the Grand Trunk Road built
by Sher Shah Suri from Peshawar to Calcutta having been
the precursor of NH-1 and NH-24.
4.7.7 Rail Network
Delhi is a major junction on the rail map of India
linked with almost all Metropolitan cities directly. There
are four major railway stations at New Delhi, Old Delhi,
Hazrat Nizamuddin and Sarai Rohila besides a Container
Depot at Tuglakabad. There are eight rail corridors in the
National Capital Territory, which bring in more than 400
passenger trains and 40 goods trains each day.
4.7.8 Modes of Transport
As far as local traffic is concerned, Delhi is
predominantly dependent on road transport, with the
railways catering to only about 1 per cent of the
commuter traffic. The ring rail network in Delhi is grossly
underutilised. Buses cater to 62 per cent of the total
traffic while personal vehicles account for the balance 37
per cent. Although, buses are a small percentage of the
total number of vehicles, they cater to 62 per cent of the
total traffic load. Among personalised vehicles, motor
cycles and scooters comprise about two-third of the total
number of vehicles in Delhi, while cars and jeeps account
for one-fourth of the total vehicles.
Complete data about man and animal-driven vehicles
in Delhi is not available. However, there were 66195
rickshaws registered, 422 tongas, 62 rehras, 5239 handcarts
and 379 bullock carts as well as 135872 trollies/cycle
carts and rickshaws making a total of 208169 as on 31
March 2005. The unauthorised number of such vehicles is
estimated to be more than those registered with the local
bodies. Registered man and animal-driven vehicles
constitute about 3.5 per cent of the total vehicle
population in Delhi out of which about 51 per cent are
cycle rickshaws.
4.7.9 Ring Road
The Ring road, Outer Ring road and the radial roads
constitute a distinct feature of the road network in Delhi.
Ring road has a length of 48 km, out of which 16 km is
common with Outer Ring road and NH-1. The 6-lane
carriageway of the existing Ring Road had reached the
saturation capacity of 75,000 PCUs per day in 1994.
Traffic is projected to reach between 1.5-4 lakh PCUs by
2011, which will require creation of considerable
additional capacity on the both the Ring Roads.
4.7.10 Mass Rapid Transit System (MRTS)
MRTS is an ambitious project that aims at providing
an efficient rail based transport system properly integrated
with road transport. The first phase of the project is
currently under implementation. Considering the
escalation during the period of construction, the
completion cost of first phase is now estimated at
Rs.10571 crore. Of this 56 per cent of the cost is to be
funded by OECF of Japan, 30 per cent through equity
support by Government of Delhi and Central government,
8 per cent through interest free subordinate debt and 6
per cent through property development.
In the first phase three corridors were taken up
totaling 65 kms. These corridors have been completed and
already operational. Work on the next phase of Metro
lines development is progressing rapidly.
4.7.11 Integrated Freight Complexes
MPD-2001 envisaged the construction of four
integrated freight complexes in Delhi at Madanpur Khadar
(NH-2), Patparganj (NH-24), G.T. Road (NH-1), and
Bhartal (NH-8). These four integrated freight complexes
will consist of wholesale markets, warehousing, road
(truck), and rail transport terminals so as to curtail the
movement of heavy vehicles within the urban area. The
freight complexes are conceived to shift wholesale trade,
decongest the walled city and also cater to regional goods
traffic flowing through Delhi. The project design and
financing pattern is under consideration of DDA.
4.7.12 Interstate Bus Terminals (ISBTs)
MPD-2001 has suggested five ISBTs in Delhi by 2001.
DELHI DEVELOPMENT REPORT138
With the development of two new ISBTs at Sarai Kale
Khan and Anand Vihar and the existing ISBT at Kashmere
Gate, three ISBTs are functioning at present. These three
ISBTs cater to average 1.54 lakh passengers and 3300
buses/trips per day. Two more ISBTs are proposed to be
constructed during the 9th Five Year Plan at Dwarka and
in North Delhi.
4.7.13 Flyovers and Bridges
Work on the 14 flyovers has been recently completed
bringing the total number of existing flyovers to 72, while
27 more flyovers are to be built.
4.7.14 Delhi Transport Corporation
DTC was taken over by Government of N.C.T. of
Delhi from Government of India in August 1996. The
DTC fleet comprised 3131 buses in 1998-99. As on 1
January 2006, DTC had 3110 CNG driven buses. It also
has 364 diesel buses for plying on interstate routes.
Replacement of over aged buses, introduction of high
capacity twin buses and augmentation of the existing
carrying capacity is being planned. The DTC has
initiated action to procure 100 new modern low floor
buses.
4.7.15 Ring Railway
The ring rail was constructed in the 1930’s as the
goods avoiding line but its role in intra-urban service is
being emphasised for about last 40 years. The existing
system, which was built at a cost of 340 million rupees
and was expected to cater about 12 per cent of the total
commuter load, has proved a non-starter, carrying less
than 1 per cent of the load. The reasons for this are:
• Dependence on availability of goods avoiding
lines
• Absence of integration with feeder bus operation
• Absence of commuter facilities at stations
• Convenient access of platforms to commuters
• Lack of development along the railway corridor
• Unattractive fare structure
• Competitive and attractive parallel bus service
A committee has examined the deficiencies in the
system and subsequently it has been decided that
incurring an expenditure of about Rs.900 crore and
integrating it with radial lines and MRTS system could
significantly improve the ring railway services.
4.8 Status of Roads and TheirDevelopment So Far
4.8.1 While the NCT of Delhi is served by both rail
and road, Delhi is predominantly dependent on road
transport. The road network in Delhi is being developed
and maintained by many agencies, the main being the
State PWD, MCD, NDMC, Delhi Cantonment Board and
DDA. The road network in Delhi is 31183 kms as on 31
March 2006 (including 182 kms of National Highways).
The road network has increased from 8380 km in 1971-72
to 31183 km in 2005-06.
The phenomenal population growth in Delhi has been
accompanied by an equally rapid increase in vehicle
population. The number of vehicles has increased from 2.14
lakh in 1971-72 to 48.30 lakh motor vehicles in March 2006.
4.8.2 In view of the steep increase in growth of traffic,
and other factors, this road network is unable to meet the
requirements of Delhi and due to the very heavy traffic
and congestion; it is grossly inadequate and requires huge
inputs to make it effective. Congestion on Delhi roads is
worsening despite several local road improvement
programmes. Average speeds during peak periods range
from 10kmph-15kmph in central areas and 20km-40
kmph on arterial roads. Delhi does not lack road
infrastructure. However, problems arise as a result of the
wide variety of vehicle types including bicycles,
mechanical, man-powered and animal-drawn vehicles
sharing the same road space.
A much better picture can be expected only if all
vehicles present can use the road space available
efficiently. Reduced average speeds should result in fewer
fatalities. The number of total fatalities does show a
marginal decline; however, the share of pedestrian
fatalities continues to rise.The decline in the average
speed of motor vehicles and the increase in pollution
levels in the city seem to be the two most important
parameters. The transport system of NCR as of today
consists of a well-knit road network and radial rail
corridors catering to inter-city and intra-city commuter
and long-distance traffic.
The freight traffic is also substantial in the region and
this is mostly carried by road. Delhi acts as collection and
distribution center for the northern region.
4.8.3 Road Network
4.8.3.1 National Highways
Delhi is served by a network of National Highways.
Existing road network in the region shows convergence of
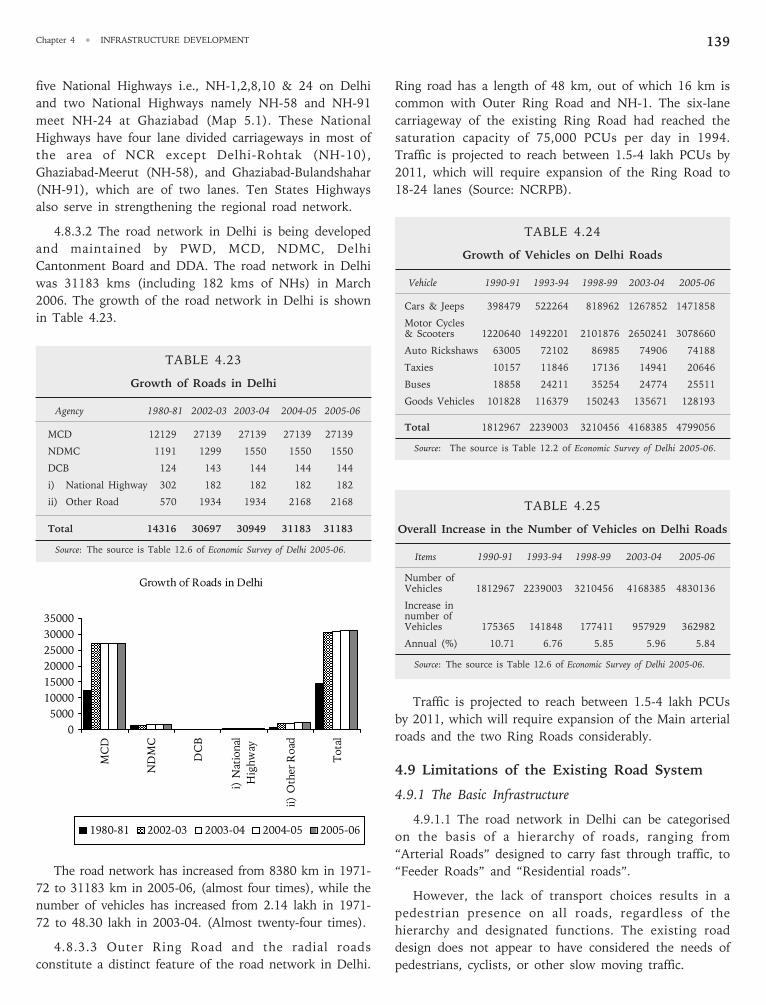
139Chapter 4 • INFRASTRUCTURE DEVELOPMENT
Ring road has a length of 48 km, out of which 16 km is
common with Outer Ring Road and NH-1. The six-lane
carriageway of the existing Ring Road had reached the
saturation capacity of 75,000 PCUs per day in 1994.
Traffic is projected to reach between 1.5-4 lakh PCUs by
2011, which will require expansion of the Ring Road to
18-24 lanes (Source: NCRPB).
TABLE 4.24
Growth of Vehicles on Delhi Roads
Vehicle 1990-91 1993-94 1998-99 2003-04 2005-06
Cars & Jeeps 398479 522264 818962 1267852 1471858
Motor Cycles& Scooters 1220640 1492201 2101876 2650241 3078660
Auto Rickshaws 63005 72102 86985 74906 74188
Taxies 10157 11846 17136 14941 20646
Buses 18858 24211 35254 24774 25511
Goods Vehicles 101828 116379 150243 135671 128193
Total 1812967 2239003 3210456 4168385 4799056
Source: The source is Table 12.2 of Economic Survey of Delhi 2005-06.
TABLE 4.25
Overall Increase in the Number of Vehicles on Delhi Roads
Items 1990-91 1993-94 1998-99 2003-04 2005-06
Number ofVehicles 1812967 2239003 3210456 4168385 4830136
Increase innumber ofVehicles 175365 141848 177411 957929 362982
Annual (%) 10.71 6.76 5.85 5.96 5.84
Source: The source is Table 12.6 of Economic Survey of Delhi 2005-06.
Traffic is projected to reach between 1.5-4 lakh PCUs
by 2011, which will require expansion of the Main arterial
roads and the two Ring Roads considerably.
4.9 Limitations of the Existing Road System
4.9.1 The Basic Infrastructure
4.9.1.1 The road network in Delhi can be categorised
on the basis of a hierarchy of roads, ranging from
“Arterial Roads” designed to carry fast through traffic, to
“Feeder Roads” and “Residential roads”.
However, the lack of transport choices results in a
pedestrian presence on all roads, regardless of the
hierarchy and designated functions. The existing road
design does not appear to have considered the needs of
pedestrians, cyclists, or other slow moving traffic.
five National Highways i.e., NH-1,2,8,10 & 24 on Delhi
and two National Highways namely NH-58 and NH-91
meet NH-24 at Ghaziabad (Map 5.1). These National
Highways have four lane divided carriageways in most of
the area of NCR except Delhi-Rohtak (NH-10),
Ghaziabad-Meerut (NH-58), and Ghaziabad-Bulandshahar
(NH-91), which are of two lanes. Ten States Highways
also serve in strengthening the regional road network.
4.8.3.2 The road network in Delhi is being developed
and maintained by PWD, MCD, NDMC, Delhi
Cantonment Board and DDA. The road network in Delhi
was 31183 kms (including 182 kms of NHs) in March
2006. The growth of the road network in Delhi is shown
in Table 4.23.
TABLE 4.23
Growth of Roads in Delhi
Agency 1980-81 2002-03 2003-04 2004-05 2005-06
MCD 12129 27139 27139 27139 27139
NDMC 1191 1299 1550 1550 1550
DCB 124 143 144 144 144
i) National Highway 302 182 182 182 182
ii) Other Road 570 1934 1934 2168 2168
Total 14316 30697 30949 31183 31183
Source: The source is Table 12.6 of Economic Survey of Delhi 2005-06.
The road network has increased from 8380 km in 1971-
72 to 31183 km in 2005-06, (almost four times), while the
number of vehicles has increased from 2.14 lakh in 1971-
72 to 48.30 lakh in 2003-04. (Almost twenty-four times).
4.8.3.3 Outer Ring Road and the radial roads
constitute a distinct feature of the road network in Delhi.
Growth of Roads in Delhi
0
5000
10000
15000
20000
25000
30000
35000
MC
D
ND
MC
DC
B
i) N
atio
nal
Hig
hw
ay
ii)
Oth
er R
oad
Tota
l
1980-81 2002-03 2003-04 2004-05 2005-06
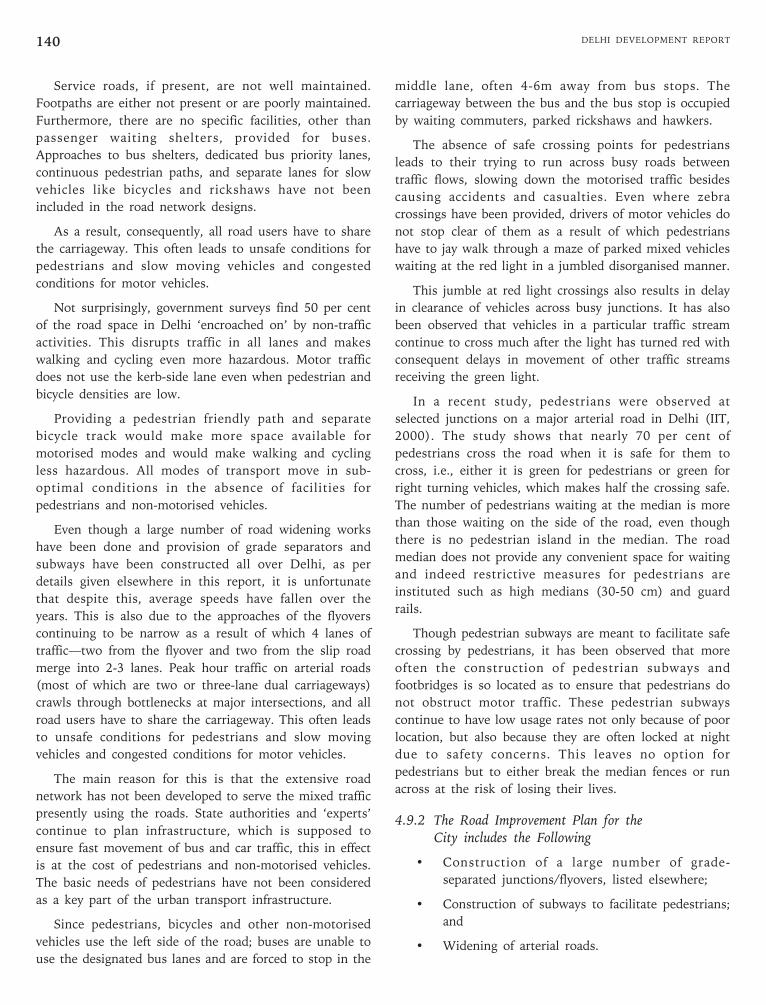
DELHI DEVELOPMENT REPORT140
Service roads, if present, are not well maintained.
Footpaths are either not present or are poorly maintained.
Furthermore, there are no specific facilities, other than
passenger waiting shelters, provided for buses.
Approaches to bus shelters, dedicated bus priority lanes,
continuous pedestrian paths, and separate lanes for slow
vehicles like bicycles and rickshaws have not been
included in the road network designs.
As a result, consequently, all road users have to share
the carriageway. This often leads to unsafe conditions for
pedestrians and slow moving vehicles and congested
conditions for motor vehicles.
Not surprisingly, government surveys find 50 per cent
of the road space in Delhi ‘encroached on’ by non-traffic
activities. This disrupts traffic in all lanes and makes
walking and cycling even more hazardous. Motor traffic
does not use the kerb-side lane even when pedestrian and
bicycle densities are low.
Providing a pedestrian friendly path and separate
bicycle track would make more space available for
motorised modes and would make walking and cycling
less hazardous. All modes of transport move in sub-
optimal conditions in the absence of facilities for
pedestrians and non-motorised vehicles.
Even though a large number of road widening works
have been done and provision of grade separators and
subways have been constructed all over Delhi, as per
details given elsewhere in this report, it is unfortunate
that despite this, average speeds have fallen over the
years. This is also due to the approaches of the flyovers
continuing to be narrow as a result of which 4 lanes of
traffic—two from the flyover and two from the slip road
merge into 2-3 lanes. Peak hour traffic on arterial roads
(most of which are two or three-lane dual carriageways)
crawls through bottlenecks at major intersections, and all
road users have to share the carriageway. This often leads
to unsafe conditions for pedestrians and slow moving
vehicles and congested conditions for motor vehicles.
The main reason for this is that the extensive road
network has not been developed to serve the mixed traffic
presently using the roads. State authorities and ‘experts’
continue to plan infrastructure, which is supposed to
ensure fast movement of bus and car traffic, this in effect
is at the cost of pedestrians and non-motorised vehicles.
The basic needs of pedestrians have not been considered
as a key part of the urban transport infrastructure.
Since pedestrians, bicycles and other non-motorised
vehicles use the left side of the road; buses are unable to
use the designated bus lanes and are forced to stop in the
middle lane, often 4-6m away from bus stops. The
carriageway between the bus and the bus stop is occupied
by waiting commuters, parked rickshaws and hawkers.
The absence of safe crossing points for pedestrians
leads to their trying to run across busy roads between
traffic flows, slowing down the motorised traffic besides
causing accidents and casualties. Even where zebra
crossings have been provided, drivers of motor vehicles do
not stop clear of them as a result of which pedestrians
have to jay walk through a maze of parked mixed vehicles
waiting at the red light in a jumbled disorganised manner.
This jumble at red light crossings also results in delay
in clearance of vehicles across busy junctions. It has also
been observed that vehicles in a particular traffic stream
continue to cross much after the light has turned red with
consequent delays in movement of other traffic streams
receiving the green light.
In a recent study, pedestrians were observed at
selected junctions on a major arterial road in Delhi (IIT,
2000). The study shows that nearly 70 per cent of
pedestrians cross the road when it is safe for them to
cross, i.e., either it is green for pedestrians or green for
right turning vehicles, which makes half the crossing safe.
The number of pedestrians waiting at the median is more
than those waiting on the side of the road, even though
there is no pedestrian island in the median. The road
median does not provide any convenient space for waiting
and indeed restrictive measures for pedestrians are
instituted such as high medians (30-50 cm) and guard
rails.
Though pedestrian subways are meant to facilitate safe
crossing by pedestrians, it has been observed that more
often the construction of pedestrian subways and
footbridges is so located as to ensure that pedestrians do
not obstruct motor traffic. These pedestrian subways
continue to have low usage rates not only because of poor
location, but also because they are often locked at night
due to safety concerns. This leaves no option for
pedestrians but to either break the median fences or run
across at the risk of losing their lives.
4.9.2 The Road Improvement Plan for theCity includes the Following
• Construction of a large number of grade-
separated junctions/flyovers, listed elsewhere;
• Construction of subways to facilitate pedestrians;
and
• Widening of arterial roads.
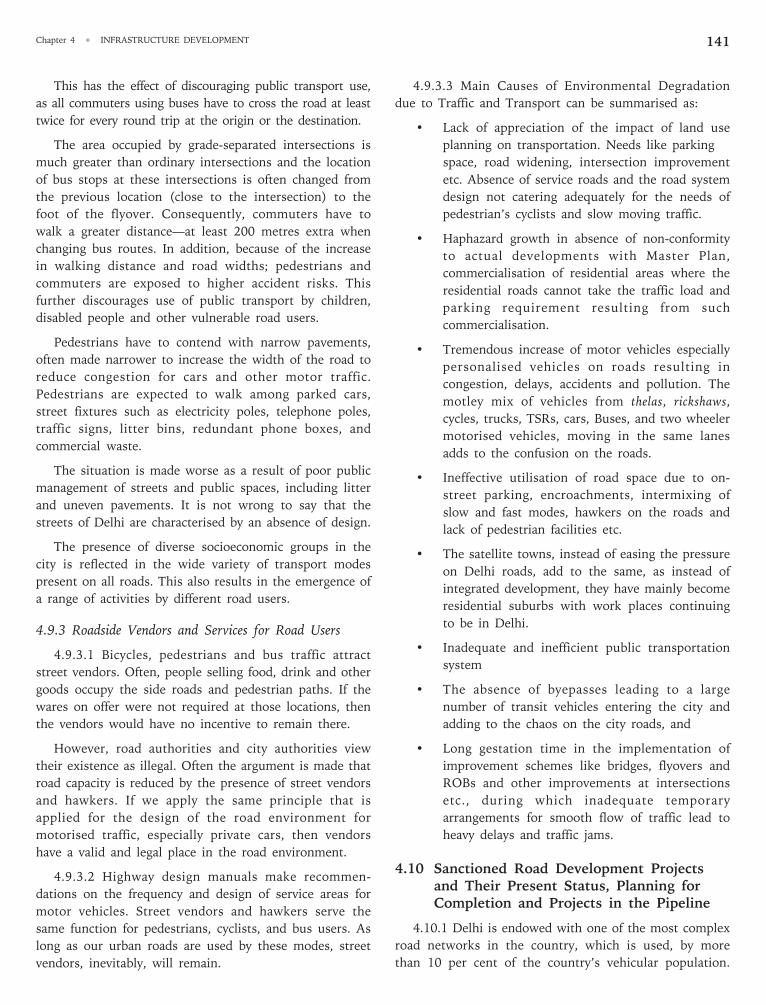
141Chapter 4 • INFRASTRUCTURE DEVELOPMENT
This has the effect of discouraging public transport use,
as all commuters using buses have to cross the road at least
twice for every round trip at the origin or the destination.
The area occupied by grade-separated intersections is
much greater than ordinary intersections and the location
of bus stops at these intersections is often changed from
the previous location (close to the intersection) to the
foot of the flyover. Consequently, commuters have to
walk a greater distance—at least 200 metres extra when
changing bus routes. In addition, because of the increase
in walking distance and road widths; pedestrians and
commuters are exposed to higher accident risks. This
further discourages use of public transport by children,
disabled people and other vulnerable road users.
Pedestrians have to contend with narrow pavements,
often made narrower to increase the width of the road to
reduce congestion for cars and other motor traffic.
Pedestrians are expected to walk among parked cars,
street fixtures such as electricity poles, telephone poles,
traffic signs, litter bins, redundant phone boxes, and
commercial waste.
The situation is made worse as a result of poor public
management of streets and public spaces, including litter
and uneven pavements. It is not wrong to say that the
streets of Delhi are characterised by an absence of design.
The presence of diverse socioeconomic groups in the
city is reflected in the wide variety of transport modes
present on all roads. This also results in the emergence of
a range of activities by different road users.
4.9.3 Roadside Vendors and Services for Road Users
4.9.3.1 Bicycles, pedestrians and bus traffic attract
street vendors. Often, people selling food, drink and other
goods occupy the side roads and pedestrian paths. If the
wares on offer were not required at those locations, then
the vendors would have no incentive to remain there.
However, road authorities and city authorities view
their existence as illegal. Often the argument is made that
road capacity is reduced by the presence of street vendors
and hawkers. If we apply the same principle that is
applied for the design of the road environment for
motorised traffic, especially private cars, then vendors
have a valid and legal place in the road environment.
4.9.3.2 Highway design manuals make recommen-
dations on the frequency and design of service areas for
motor vehicles. Street vendors and hawkers serve the
same function for pedestrians, cyclists, and bus users. As
long as our urban roads are used by these modes, street
vendors, inevitably, will remain.
4.9.3.3 Main Causes of Environmental Degradation
due to Traffic and Transport can be summarised as:
• Lack of appreciation of the impact of land use
planning on transportation. Needs like parking
space, road widening, intersection improvement
etc. Absence of service roads and the road system
design not catering adequately for the needs of
pedestrian’s cyclists and slow moving traffic.
• Haphazard growth in absence of non-conformity
to actual developments with Master Plan,
commercialisation of residential areas where the
residential roads cannot take the traffic load and
parking requirement resulting from such
commercialisation.
• Tremendous increase of motor vehicles especially
personalised vehicles on roads resulting in
congestion, delays, accidents and pollution. The
motley mix of vehicles from thelas, rickshaws,
cycles, trucks, TSRs, cars, Buses, and two wheeler
motorised vehicles, moving in the same lanes
adds to the confusion on the roads.
• Ineffective utilisation of road space due to on-
street parking, encroachments, intermixing of
slow and fast modes, hawkers on the roads and
lack of pedestrian facilities etc.
• The satellite towns, instead of easing the pressure
on Delhi roads, add to the same, as instead of
integrated development, they have mainly become
residential suburbs with work places continuing
to be in Delhi.
• Inadequate and inefficient public transportation
system
• The absence of byepasses leading to a large
number of transit vehicles entering the city and
adding to the chaos on the city roads, and
• Long gestation time in the implementation of
improvement schemes like bridges, flyovers and
ROBs and other improvements at intersections
etc., during which inadequate temporary
arrangements for smooth flow of traffic lead to
heavy delays and traffic jams.
4.10 Sanctioned Road Development Projectsand Their Present Status, Planning forCompletion and Projects in the Pipeline
4.10.1 Delhi is endowed with one of the most complex
road networks in the country, which is used, by more
than 10 per cent of the country’s vehicular population.
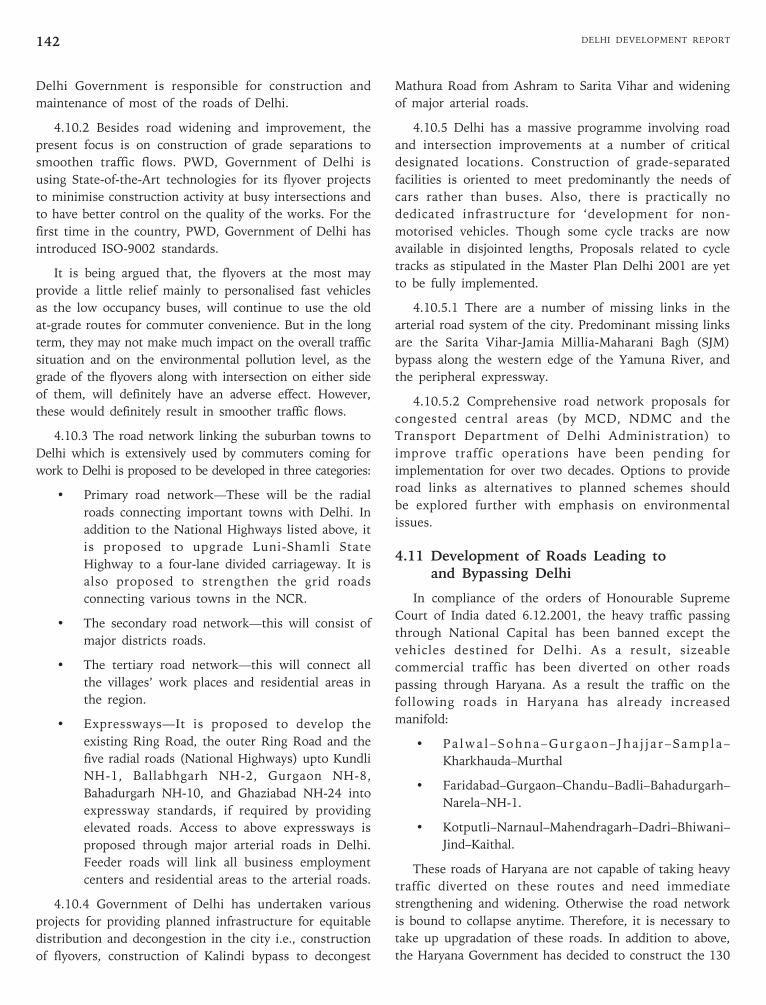
DELHI DEVELOPMENT REPORT142
Delhi Government is responsible for construction and
maintenance of most of the roads of Delhi.
4.10.2 Besides road widening and improvement, the
present focus is on construction of grade separations to
smoothen traffic flows. PWD, Government of Delhi is
using State-of-the-Art technologies for its flyover projects
to minimise construction activity at busy intersections and
to have better control on the quality of the works. For the
first time in the country, PWD, Government of Delhi has
introduced ISO-9002 standards.
It is being argued that, the flyovers at the most may
provide a little relief mainly to personalised fast vehicles
as the low occupancy buses, will continue to use the old
at-grade routes for commuter convenience. But in the long
term, they may not make much impact on the overall traffic
situation and on the environmental pollution level, as the
grade of the flyovers along with intersection on either side
of them, will definitely have an adverse effect. However,
these would definitely result in smoother traffic flows.
4.10.3 The road network linking the suburban towns to
Delhi which is extensively used by commuters coming for
work to Delhi is proposed to be developed in three categories:
• Primary road network—These will be the radial
roads connecting important towns with Delhi. In
addition to the National Highways listed above, it
is proposed to upgrade Luni-Shamli State
Highway to a four-lane divided carriageway. It is
also proposed to strengthen the grid roads
connecting various towns in the NCR.
• The secondary road network—this will consist of
major districts roads.
• The tertiary road network—this will connect all
the villages’ work places and residential areas in
the region.
• Expressways—It is proposed to develop the
existing Ring Road, the outer Ring Road and the
five radial roads (National Highways) upto Kundli
NH-1, Ballabhgarh NH-2, Gurgaon NH-8,
Bahadurgarh NH-10, and Ghaziabad NH-24 into
expressway standards, if required by providing
elevated roads. Access to above expressways is
proposed through major arterial roads in Delhi.
Feeder roads will link all business employment
centers and residential areas to the arterial roads.
4.10.4 Government of Delhi has undertaken various
projects for providing planned infrastructure for equitable
distribution and decongestion in the city i.e., construction
of flyovers, construction of Kalindi bypass to decongest
Mathura Road from Ashram to Sarita Vihar and widening
of major arterial roads.
4.10.5 Delhi has a massive programme involving road
and intersection improvements at a number of critical
designated locations. Construction of grade-separated
facilities is oriented to meet predominantly the needs of
cars rather than buses. Also, there is practically no
dedicated infrastructure for ‘development for non-
motorised vehicles. Though some cycle tracks are now
available in disjointed lengths, Proposals related to cycle
tracks as stipulated in the Master Plan Delhi 2001 are yet
to be fully implemented.
4.10.5.1 There are a number of missing links in the
arterial road system of the city. Predominant missing links
are the Sarita Vihar-Jamia Millia-Maharani Bagh (SJM)
bypass along the western edge of the Yamuna River, and
the peripheral expressway.
4.10.5.2 Comprehensive road network proposals for
congested central areas (by MCD, NDMC and the
Transport Department of Delhi Administration) to
improve traffic operations have been pending for
implementation for over two decades. Options to provide
road links as alternatives to planned schemes should
be explored further with emphasis on environmental
issues.
4.11 Development of Roads Leading toand Bypassing Delhi
In compliance of the orders of Honourable Supreme
Court of India dated 6.12.2001, the heavy traffic passing
through National Capital has been banned except the
vehicles destined for Delhi. As a result, sizeable
commercial traffic has been diverted on other roads
passing through Haryana. As a result the traffic on the
following roads in Haryana has already increased
manifold:
• Pa lwa l–Sohna–Gurgaon– Jha j j a r–Sampla–
Kharkhauda–Murthal
• Faridabad–Gurgaon–Chandu–Badli–Bahadurgarh–
Narela–NH-1.
• Kotputli–Narnaul–Mahendragarh–Dadri–Bhiwani–
Jind–Kaithal.
These roads of Haryana are not capable of taking heavy
traffic diverted on these routes and need immediate
strengthening and widening. Otherwise the road network
is bound to collapse anytime. Therefore, it is necessary to
take up upgradation of these roads. In addition to above,
the Haryana Government has decided to construct the 130
143Chapter 4 • INFRASTRUCTURE DEVELOPMENT
kms long Kundli–Manesar–Palwal Expressway which will
join the National Highway-1, National Highway-10,
National Highway-8, and National Highway-2, bypassing
all the major towns and industrial estates of Haryana sub-
region.
In addition to the above, Ministry of Road Transport &
Highway, has approved the construction of elevated
Highway at Badarpur on National Highway-2, to remove
the frequent traffic bottlenecks. Work on this project is
being taken up.
In addition to the Express Highway under construction
from Dhaula-Kuan to Gurgaon, Delhi Government is also
taking up widening and strengthening of Delhi-Mehrauli
road upto Gurgaon border in order to ease traffic on this
route. An additional road link to Gurgaon from Delhi
passing through village Dera Mandi to Vasant Kunj area is
also under consideration. Similarly the existing bypass
along Agra Canal in Faridabad is proposed to be
connected with the new road linking Sarita Vihar and
Kalindi Kunj in New Delhi.
4.12 New Expressways
Work on two new expressways is being taken up to
facilitate movement of traffic bypassing Delhi which now
has to pass through the city.
a) Eastern Peripheral Expressway, consisting of two
corridors:
1. Faridabad-NOIDA-Ghaziabad (FNG): 56
kms
2. Ghaziabad-Kundli (GK) Corridors: 49 km
b) Western Peripheral Expressway
The Western Peripheral Expressway having a length of
135 kms., will pass entirely through Haryana thereby linking
NH-1 at Kundli to NH-2 at Faridabad via NH-10 and NH-8.
4.13 Institutional Measures
The financial investments planned under the Tenth and
Eleventh Plans are proposed to be buttressed by
institutional measures to ensure effective and efficient
functioning of the transport system in an integrated
manner. For this, it is proposed to set up an Integrated
Metropolitan Transport Authority (IMTA) which will look
after regulatory issues like fares and tariffs as well as
provisioning and common functions/services for metro,
rail and bus systems. Until IMTA is formed, a Delhi
Transport Planning Group (DTPG) to be chaired by the
Chief Minister may be set up. To provide technical and
logistic support to the DTPG and then IMTA, a Traffic
Engineering and Transport Planning cell will be set up
which will function under the aegis of the Transport
Department but will draw expertise from PWD, MCD,
NDMC and the Traffic Police to ensure coordination and
the Traffic Police to ensure coordination and
implementation.
4.14 Phasing of Projects
The projects planned in the Master plan Delhi 2021 are
divided into two phases—first phase 2001-2011 and
second phase 2011-2021. In the first phase the following
projects on roads leading to Delhi and on construction of
the bypass which will result in easing the flows on Delhi
roads, are planned:
a) Western Peripheral Expressway
b) Eastern Peripheral Expressway
c) Four Laning of the following road sections:
• Bahadurgarh-Rohtak-NCR Border (NH-10)
• Rohtak–NCR Border (NH-71)
• Ghaziabad-Meerut-NCR Boundary (NH58)
• G h a z i a b a d - B u l a n d s h a h a r - K u r j a - N C R
Boundary (NH-91)
• Gurgaon-Alwar (Old NH-8)
In the second phase of the plan, following projects
would be taken up in the neighbouring states for easing
traffic flows to and from Delhi, for implementation:
a) Ghaziabad-Meerut Expressway
b) Bhiwadi-Rewari Road
c) Rewari-Jhajjar Road
d) Jhajjar-Rohtak Road
e) Rohtak-Sonipat Road
f) Sonipat-Baghpat Road
g) Baghpat-Meerut Road
h) Meerut-Hapur Road
i) Hapur-Bulandshahar Road
j) Bulandshahar-Khurja Road
k) Khurja-Palwal Road
l) Palwal-Bhiwadi Road
m) Rohtak-Panipat Road
Phasing of the transport projects will be modified on
the basis of suggestions received from the State
Governments.
DELHI DEVELOPMENT REPORT144
4.15 Multiplicity of Authority in the RoadSector and its effect on Development
4.15.1 Overview
At present the following agencies are responsible for
construction and maintenance of roads, bridges and
flyovers in Delhi:
• Public Works Department of Government of Delhi
• Municipal Corporation of Delhi
• New Delhi Municipal Council
• The Delhi Cantonment Board
• Delhi Development Authority
• Delhi Tourism and Travel Corporation
• Central Public Works Department
• National Highways Authority of India
Other authorities are also involved in different aspects
of road administration in Delhi.
All these agencies do their own planning and execution
with the result that there is little coordination. Moreover,
availability of resources with different agencies being
different, the completion of works by different agencies
proceeds at different speeds.
Further, there is no coordination between utility
providers digging up the roads for laying sewage, water
supply, cables both for power and communications etc
and the agencies controlling the road maintenance as a
result of which the roads are frequently dug up and left in
a state of disrepair, with excavated material heaped up on
the carriage way obstructing the smooth flow of traffic.
Garbage heaps, stray dogs and cattle moving on the
roads freely add to the problems of smooth flow of traffic.
Efforts are being made by the Government of Delhi to
overcome these problems but due to the multiplicity of
agencies, the problems persist.
During the last four decades a number of in-depth
traffic and transportation planning studies have been
undertaken for metropolitan Delhi and the National
Capital Region. The findings of these studies inter alia led
to the Delhi Metro Rail Project.
All the studies have stressed the need to strengthen
the institutional set up and to plan, implement, co-
ordinate, fund and monitor an integrated urban transport
system.
Fundamentally, the factors causing deterioration in the
transport system of metropolitan Delhi are, multi-agency
planning and implementation, inter-agency interests and
conflicts, lack of a strong will to improve the public
transport system, lack of land use-transport integration,
and, above all, a non-existent public transport culture.
In the context of MP, Delhi 21, the main objective and
long-term goal is to provide, promote and ensure safe,
economic and efficient movement of all categories of
passengers and goods, in an environment friendly manner,
through an integrated multi-modal transportation system.
4.16 Institutional Framework
In order to ensure systematic and scientific
development, management and operation of an integrated
multi-modal transport system in the NCT an institutional
framework is a basic prerequisite. The focus will be on:
• Institutional strengthening and capacity building
from within the available mechanism.
• Horizontal and vertical linkages at all levels of
government (Central, State and Local).
• Setting up an Urban Transport. Information
System.
Pending establishment of Delhi Unified Metropolitan
Transport Authority (DUMTA), an arrangement to
strengthen the institutional mechanism by drawing
expertise/resources from existing agencies is being set up.
This unifying metropolitan transport mechanism is
proposed to consist of five groups with clearly defined
roles.
4.17 Policy and Planning Group
A Policy and Planning Group (PPG) should be
established to function specifically at the level of NCT to
plan and coordinate with agencies at the level of DMA.
This group should also take into consideration, the
guidelines set out by overall spatial planning for the city
by the proposed Metropolitan Planning Committee
(MPC). This group should also ensure community
participation. To be effective the CM of Delhi should chair
this group. The main functions of this group will be:
• To set out goals and formulate policy guidelines
to facilitate preparation of a Strategic Transport
Plan (STP) for the NCT and a multi-modal plan
for linkages with the DMA/NCR.
• To coordinate activities of various groups/
agencies at the plan formulation stage.
• To regulate allocation of funds to different
agencies for coordinated development.
145Chapter 4 • INFRASTRUCTURE DEVELOPMENT
• To ensure provision of land with focus on
identification, reservation and protection for
development of transport related projects.
Information based innovative pricing strategies for
transport with adequate legal backing should be
formulated, and based on real costs.
As part of the policy planning function an independent
mechanism, on the pattern of Delhi Electricity Regulatory
Commission, should be installed to appropriately price all
the items of transport, parking and accessibility.
In this context there is a need to determine pricing of
all public and IPT modes on sound economic, system
operation and performance basis. The fares and tariffs,
determined by the proposed independent mechanism,
should be implemented in the entire DMA sub region.
Any subsidies, should be contained and minimised and
provided only to economically deserving,
4.17.1 Public Transport Group
Following the requirements of the STP, the Public
Transport Group (PTG) will be responsible to prepare an
action programme to achieve a sustainable and balanced
public transport system and optimum multi-modal
transport mix. The main agencies in this group will be
Indian Railways, DMRC, DTC and private operators and
Transport Department of GNCTD. Each agency will
ensure provision of services, operation and management
and maintenance of the system. The overall and
contextual responsibility of each agency in the PTG is
clearly defined ensuring functional independence.
4.17.2 Management Group
The Traffic Management Group (TMG) will prepare
traffic management strategic action plans with emphasis
on movement of people and goods. Area level traffic
management schemes with active participation from
peoples’ group should be prepared for implementation
according to time bound programmes.
4.17.3 Infrastructure Development Group
The Infrastructure Development Group (IDG) will
comprise of professional advisors and engineering experts
from agencies namely the PWD, MCD, NDMC, DDA, and
Cantonment Board etc. This group will streamline
construction and maintenance practices and formulate
project based schemes with latest technological and
management interventions. The activities of this group
will be based, among other localised schemes, on the
strategic transport plan.
4.17.4 Enforcement Group
The proposed Enforcement Group (EG) will have
professional advisors, concerned officers from local bodies
in addition to the traffic police and local residents and will
evolve strategic action plans to ensure smooth and safe
flow of all modes of traffic.
Once the unified authority is set up, things should
look up and the people of Delhi should get roads on
which traffic can move smoothly and without hinderance.
4.18 Maintenance of Roads, Signages,Street Lighting and Sanitation
4.18.1 Signages
One of the essential requirements for smooth flow of
traffic in a busy megapolis like Delhi is the provision of
proper signages to guide and direct the flow of traffic.
Though such signages have been provided in recent years
on the National Highways, Ring Road and Outer Ring
Road they are often misleading which lead to more
confusion. For instance on the Ring Road in Lajpat Nagar
you find a signage of the “Garden of Five Senses”. Though
rightfully an advertisement board, as it is made in the
same pattern and colours as a road signage, it misleads
people. Further on the Ring Road the main entrance to
Naraina Vihar is indicated as road leading to Patel Nagar.
On Mathura Road the indications are similarly misleading.
Not only is it important to have signages, but they
must direct the road users properly and not lead to
confusion in their minds.
The Delhi Government is doing a lot in this connection
and is providing luminous signages on all main roads.
With the Common Wealth games coming, the thrust
would be on making Delhi a beautiful and pleasant to the
eye. For this, it is proposed to change the entire road
fixtures including streetlights. Modern road signages and
markings, meant to educate road users about road safety
and rules, would be put up across the Capital.
4.18.2 Road Lighting
Though a lot of improvement has been carried out by
the local bodies viz., MCD and NDMC and by the
Government of Delhi to provide state of the art lighting
on the roads of Delhi and most flyovers have been
provided with cluster lights on high masts, there is still
vast scope for improvement.
In this connection, the Government of Delhi has
decided to bring about a sea change in the scenario before
the Commonwealth Games in 2010.
DELHI DEVELOPMENT REPORT146
Keeping the Commonwealth Games in mind, the
Central government is expected to spend nearly Rs.200
million (over $4 million) on lighting equipment alone.
A state of the art illumination technology can change
the way Delhi looks during the 2010 Commonwealth
Games.
The idea seems to be to make Delhi can look so much
better in the night by using effective lighting techniques.
This would showcase the array of heritage monuments
dotting the city. The city’s stadiums, the flyovers and
almost all other upcoming infrastructure can be made to
look much more attractive with effective lighting.
An electronic lighting control system for regulating the
street lights would help save energy and make
maintenance easy.
4.19 Pollution
Remote sensors are now identifying gross polluters on
the roads of Delhi by the Delhi Department of Transport
tests devices that detect vehicle emissions in real time and
driving situations.
The pilot study follows a test run of the equipment in
Pune and is being demonstrated under a partnership
between the city’s transportation department, the
Automotive Research Association of India and
Environmental Systems Products (a U.S. company). The
U.S. Agency for International Development’s U.S.-Asia
Environmental Partnership supports the public-private
effort to improve existing vehicle inspection and
certification methods that aim to curb air pollution from
city traffic.
The remote sensing device technology detects a
vehicle’s emissions when it drives through an invisible
light beam projected across a roadway, and can be placed
at different locations around the city. The devices identify
polluters and help evaluate control programmes such as
the Pollution under Control (PuC) Centers.
The technology is recognised by the U.S.
Environmental Protection Agency and is used by many
countries around the world together with fixed station
inspection and maintenance programmes to enhance
mobile source pollution control efforts.
4.20 Maintenance of Roads
There are of course state-of-the-art means of transport
and flyovers, but they exist along with uneven roads,
overflowing with dirty sewage water and pock-marked by
potholes and up to feet deep ditches.
For Delhi motorists, negotiating their way through
these hazardous stretches is a torture that takes all
pleasure out of the thought of the city that plans to be
among the best ones in the world. Despite the issue of
the wear and tear of roads taken up at the highest level
during the past monsoon season and claims made by the
government that quality and speed has been ensured in
the construction and repair of roads, their condition, even
in the VIP areas, is far from satisfactory.
There are multiple explanations for the poor state of
roads in the capital. In a report, the Central Public Works
Department, stated that Delhi roads were under great
strain because of the density of vehicular traffic, which
was the highest in the country.
Delhi Municipal Corporation has been citing lack of
funds among other things as coming in the way of
ensuring quality of construction and proper maintenance
of roads in as much as 90 per cent of the capital’s roads
are with the MCD and only four per cent with the PWD
and NDMC but when it comes to receiving grants, the
ratio is reversed. The PWD receives Rs. 400 cr. for
maintaining 4,000 km roads while the MCD receives
almost the same amount for maintaining 28,000 km
roads. Remedial action is required to rectify this
situation.
The roads of Delhi cannot be said to be well
maintained. After each monsoon there are pot holes and
ruts all over the place. Of late, the Delhi Government has
faced a huge problem with regard to repair and
construction of bitumen roads as the Supreme Court has
banned hot mix plants in the capital. Now the raw
material is being brought from the hot mix plants that
have come up on the periphery of the capital but these are
also slowly closing down in view of the tightening of
pollution norms in the National Capital Region (NCR).
In order to deal with this problem, the Delhi
Government has prepared a proposal for setting up a non-
polluting hot mix plants conforming to pollution
standards set by the Apex Court. This kind of hot mix
plants are already in operation in Gujarat and the PWD
has sought information on their functioning so that they
could be replicated in the capital.
The Government of Delhi proposes to establish such
plants in Delhi with one of the finest technologies in the
world. Approval of the Cabinet has already been given for
getting such non-polluting plant installed in Delhi. In any
case, the Government would first seek the permission of
the Supreme Court before setting up such non-polluting
hot mix plants.
147Chapter 4 • INFRASTRUCTURE DEVELOPMENT
Improvement of road surface by providing plastic/
rubberised wearing coats on Delhi Roads is also being
planned.
The Delhi Government is planning a separate Road
Maintenance Corporation, which will be entrusted with
the task of building and maintenance of roads in the city
of Delhi. Currently, the construction and maintenance of
roads, subways, bridges and flyovers in the city is looked
after by various agencies and departments like the State
Urban Development Department, Municipal Corporation
of Delhi, State PWD, New Delhi Municipal Council, Delhi
Tourism Development Corporation and DDA.
The proposed Corporation will have powers to
generate its own resources for its own projects like Metro
Rail and NHAI through advertising, constructing roads
and flyovers, and maintaining them.
Even though Delhi’s area under roads is comparable to
other major cities in the World, the condition of roads
leaves much to be desired. Poor drainage and heavy traffic
soon create pot holes and ruts, which compounded by
unplanned digging by various agencies, leads to many
bottlenecks to the smooth flow of traffic. Garbage heaps,
construction material, haphazard parking by buses and
stray cattle on the roads obstruct traffic.
4.21 Status of Railways and TheirDevelopment So Far
4.21.1 Delhi is also well connected to all important
cities and towns of India by rail. Delhi NCT currently has
156 route kms of BG lines. There are four major railway
stations at New Delhi, Delhi, Hazrat Nizamuddin, and
Sarai Rohilla besides container terminals at Tughlakabad.
There are in all 8 rail corridors in the NCT, which bring in
about 400 passenger trains and 40 goods trains every day.
Delhi has a double line ring railway but the same is
grossly under-utilised due to absence of proper road
linkages.
4.21.2 The Railways have a number of measures
planned for augmenting the services to and from Delhi.
Measures for improving the utilisation of the existing rail
infrastructure have also been examined together with
development of an integrated road-rail-metro based
transport system.
4.21.3 Delhi is now well connected to all important
cities and towns of India by rail. Delhi NCT currently has
156 route kms of BG railway lines. There are 4 major
railway stations at New Delhi, Delhi, Hazrat Nizamuddin,
and Sarai Rohilla besides container terminals at
Tughlakabad. There are in all 8 rail corridors in the NCT,
which bring in about 400 passenger trains and 40 goods
trains every day.
4.21.4 Delhi also has a double line ring railway but the
same is grossly under utilised due to absence of proper
road linkages.
4.21.5 Railways are planning to take several measures
for improving the utilisation of the existing rail
infrastructure together with development of an integrated
road-rail-metro based transport system.
4.21.6 To upgrade the services to the people of Delhi,
the Railways electrified Delhi-Howrah route in 1976 and
Delhi-Mumbai Route in 1987. The first Shatabadi Express
between New Delhi and Jhansi, which was the fastest
train in the country, was launched in 1988.
However, despite introduction of several fast Shatabdi
and Rajdhani services, which could compete with the best
in the World, the people of Delhi and other cities in the
country had to face lot of hardships to get reservations
due to touts and employees with vested interests. The
computerised passenger reservation system was
introduced in 1990 at New Delhi and other Metro Cities.
Simultaneously, the steam engines were phased out
which lead to considerable reduction in pollution and
improvement of ambient air quality in the NCT of Delhi.
The freight services were also upgraded and
containerisation of Cargo Traffic brought us close to the
state of the art systems in the field.
The rail network has two special features i.e., goods
avoiding line (GAL) and Delhi avoiding line (DAL).
The GAL provides a direct entry from Ghaziabad to
New Delhi bypassing the congested Delhi Railway Station
Complex.
The DAL provides a direct passage from the major
yards of Tughalakabad and Ghaziabad directly into the
Delhi-Ambala-Kalka section and through Lajpat Nagar-
Patel Nagar-Dayabasti and Azadpur link.
4.22 Railway Services in Delhi can becategorised as under
4.22.1 National Network Services
As far as the National network services are concerned,
Railways are constantly upgrading the same and adding
new trains, increasing capacity of existing trains and
speeding up trains to provide better services to the people
traveling to and from Delhi.
With a view to develop Indian Railways as a World
Class Railway an Integrated Railway Modernisation Plan
DELHI DEVELOPMENT REPORT148
spaning 5 years upto 2010 has been formulated. Under this
plan, running of 150 kms of per hour train on New Delhi-
Howrah and New Delhi-Chennai routes is envisaged. On
the freight side speeds on Delhi-Mumbai-Delhi-Kolkata and
Delhi-Chennai routes are being raised to 100 kmph.
These services are by and large adequate for the traffic
offered during most parts of the year except during the
summer rush period when the Railways have to run a
number of holidays specials to meet the demand. With
capacity augmentation works on all saturated sections
being taken up on priority and funded out of the Railway
Budget/through public private partnership via the RVNL
route, the Railways would be able to cope with the
projected increase in traffic on the National network link
to Delhi.
In order to reduce passenger concentration and
resultant discomfort at the existing 3 terminals of Delhi,
New Delhi and Nizamuddin, new directional terminals are
planned at Holambikalan, Bijwasan, Anand Vihar, and
Tughlakabad. A number of capacity enhancement works in
the region are under implementation.
The upgradation of New Delhi station to a World
Class terminal is in the planning and consultancy stage.
At this station arrivals and departures would be
segregated, proper parking and terminal facilities similar
to those provided in the state of the art modern stations
in other world capital cities and metros. The upgradation
of Delhi main station and Nizamuddin station is also
under implementation.
4.22.2 Commuter Services to Surrounding Towns like
Ghaziabad, Faridabad, Rohtak, Panipat and other NCR
Towns:
Though suburban trains are already in operation
between Delhi and its neighbouring towns, EMU/DMU
services are operating between Delhi-New Delhi and these
surrounding suburban towns but these carry only a small
percentage of the commuters, most of who continue to
travel by bus as the service is inadequate, unreliable and
inconvenient due to the lack of feeder services from trip
end points.
This is on account of limited path availability on the
railway lines since the Railways have to fit in these
services on available paths between Mail, Express and
passenger trains on the same busy routes. Moreover, since
these trains travel only upto Delhi, New Delhi and
Nizamuddin stations, commuters have to again travel by
bus to their destinations.
This service needs major augmentation by construction
of additional dedicated local lines with electrification from
Delhi to Ghaziabad, Faridabad, Gurgaon, Rohtak, Sonepat
and new electrified suburban lines to NOIDA/Greater
NOIDA. Thereafter EMU services can be introduced as in
Greater Mumbai and Kolkata.
However, to attract the commuters away from road,
which consume 6 times more energy for carrying the
same amount of traffic as a railway and occupy 4 times
more land, it would be essential to introduce an
Integrated Rail-cum-Bus Transportation System (IRBT).
The proposal for integrated Rail-cum-Bus
Transportation System has already been approved by the
NCR Planning Board in its meeting held on January 16,
2004. This proposal is under the consideration of the
Government of India. Integrated Rail-cum-Bus
Transportation System project is a part of Regional Rapid
Transit System (RRTS), which is proposed to be
implemented. The following two corridors have been
proposed in the first phase of the IRBT project:
• Pulbangash-Sabzimandi-Narela
• Badarpur–Tilak bridge
These corridors are proposed to be implemented by
forming two joint venture companies (Special Purpose
Vehicles) between Ministry of Urban Development/
National Capital Region Planning Board, Ministry of
Railways (MOR), GNCT-Delhi, Government of Haryana
and Government of Uttar Pradesh. RITES have completed
the technical and economic feasibility for this project. The
financing pattern will be on debt equity ratio of 1:1. The
equity will be shared such that a third each is borne by
the Ministry of Urban Development, Ministry of Railways
and by the respective State Governments.
4.22.3 Local Train Services for the Citizens of Delhi
These services are primarily on the ring railway. The
ring railway, which was expected to carry 12 per cent of
the commuter load, at present, carries less than 1 per
cent, with only 12 services.
The main hurdles are limited capacity especially in the
northern portion of the ring, inadequate feeder services,
commuter inconvenience and lack of integration with
radial lines.
A preliminary survey indicated that there was virtually
no scope for improving the capacity of northern portion of
the ring (between Tilak Bridge and New Delhi station)
but it would be possible to augment the capacity in, the
southern ring.
The strengthening project (98 kms out of 144 kms of
ring railway and radials within NCT) will facilitate
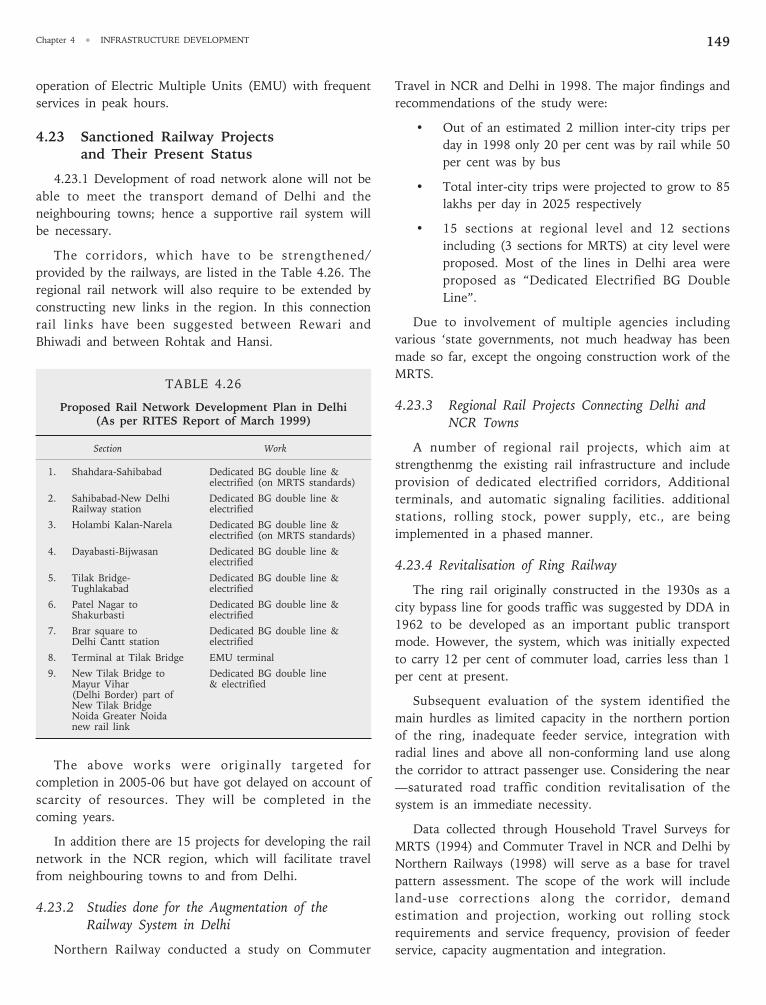
149Chapter 4 • INFRASTRUCTURE DEVELOPMENT
operation of Electric Multiple Units (EMU) with frequent
services in peak hours.
4.23 Sanctioned Railway Projectsand Their Present Status
4.23.1 Development of road network alone will not be
able to meet the transport demand of Delhi and the
neighbouring towns; hence a supportive rail system will
be necessary.
The corridors, which have to be strengthened/
provided by the railways, are listed in the Table 4.26. The
regional rail network will also require to be extended by
constructing new links in the region. In this connection
rail links have been suggested between Rewari and
Bhiwadi and between Rohtak and Hansi.
TABLE 4.26
Proposed Rail Network Development Plan in Delhi(As per RITES Report of March 1999)
Section Work
1. Shahdara-Sahibabad Dedicated BG double line &electrified (on MRTS standards)
2. Sahibabad-New Delhi Dedicated BG double line &Railway station electrified
3. Holambi Kalan-Narela Dedicated BG double line &electrified (on MRTS standards)
4. Dayabasti-Bijwasan Dedicated BG double line &electrified
5. Tilak Bridge- Dedicated BG double line &Tughlakabad electrified
6. Patel Nagar to Dedicated BG double line &Shakurbasti electrified
7. Brar square to Dedicated BG double line &Delhi Cantt station electrified
8. Terminal at Tilak Bridge EMU terminal
9. New Tilak Bridge to Dedicated BG double lineMayur Vihar & electrified(Delhi Border) part ofNew Tilak BridgeNoida Greater Noidanew rail link
The above works were originally targeted for
completion in 2005-06 but have got delayed on account of
scarcity of resources. They will be completed in the
coming years.
In addition there are 15 projects for developing the rail
network in the NCR region, which will facilitate travel
from neighbouring towns to and from Delhi.
4.23.2 Studies done for the Augmentation of theRailway System in Delhi
Northern Railway conducted a study on Commuter
Travel in NCR and Delhi in 1998. The major findings and
recommendations of the study were:
• Out of an estimated 2 million inter-city trips per
day in 1998 only 20 per cent was by rail while 50
per cent was by bus
• Total inter-city trips were projected to grow to 85
lakhs per day in 2025 respectively
• 15 sections at regional level and 12 sections
including (3 sections for MRTS) at city level were
proposed. Most of the lines in Delhi area were
proposed as “Dedicated Electrified BG Double
Line”.
Due to involvement of multiple agencies including
various ‘state governments, not much headway has been
made so far, except the ongoing construction work of the
MRTS.
4.23.3 Regional Rail Projects Connecting Delhi andNCR Towns
A number of regional rail projects, which aim at
strengthenmg the existing rail infrastructure and include
provision of dedicated electrified corridors, Additional
terminals, and automatic signaling facilities. additional
stations, rolling stock, power supply, etc., are being
implemented in a phased manner.
4.23.4 Revitalisation of Ring Railway
The ring rail originally constructed in the 1930s as a
city bypass line for goods traffic was suggested by DDA in
1962 to be developed as an important public transport
mode. However, the system, which was initially expected
to carry 12 per cent of commuter load, carries less than 1
per cent at present.
Subsequent evaluation of the system identified the
main hurdles as limited capacity in the northern portion
of the ring, inadequate feeder service, integration with
radial lines and above all non-conforming land use along
the corridor to attract passenger use. Considering the near
—saturated road traffic condition revitalisation of the
system is an immediate necessity.
Data collected through Household Travel Surveys for
MRTS (1994) and Commuter Travel in NCR and Delhi by
Northern Railways (1998) will serve as a base for travel
pattern assessment. The scope of the work will include
land-use corrections along the corridor, demand
estimation and projection, working out rolling stock
requirements and service frequency, provision of feeder
service, capacity augmentation and integration.
DELHI DEVELOPMENT REPORT150
4.23.5 Strengthening Rail Service to DMA andNCR Towns
The study on Commuter Travel in NCR and Delhi by
Northern Railways (1998) estimated about 2 million inter-
city trips per day of which only 20 per cent was carried by
rail. Considering the developments in DMA and other NCR
towns there is need to strengthen the available service
capacity along the tracks. Moreover land use correction
along the corridors and integration arrangements with Ring
Rail/MATS needs adequate attention.
Prioritisation of the corridors to be developed is to be
made in such a way so that the road traffic impact of this
rail based traffic within the city remains minimal.
4.24 Traffic Management
4.24.1 Traffic Engineering and Improvement Schemes
There is a need to strengthen the technical capability
of agencies to facilitate the preparation of traffic
engineering improvement schemes. The inherent
deficiencies in traffic management in metropolitan Delhi
are the absence of a clearly defined road hierarchy, lack of
access control, inadequate traffic design and road
equipment, and above all, the lack of road user discipline.
Some area-wide traffic management schemes have been
commissioned in places such as Connaught Circus and
India Gate. Based on the experience of SCOOT (Split
Cycle Off-Set Optimisation Technique), implemented by
Delhi Traffic Police for 50 intersections in New Delhi area
with Central Computer Center at Teen Murti. Similar
other areas with critical problems should also be covered
with such systems. At a number of locations pedestrian
subways are not being used optimally due to poor siting
and poor maintenance. Actions are necessary to improve
their utilisation.
4.24.2 Road Safety
Safety is a major component of the traffic environment.
The phenomenal increase in the number of motor vehicles
in the city coupled with limited road space, inadequate
facilities for pedestrians and cyclists, irresponsible driving
and violation of traffic rules has resulted in significant
number of road accidents. Though the number of
accidents has shown a decreasing trend in the last three
years due to continuing efforts of Traffic Police, this
aspect should get adequate attention in order to improve
the traffic environments. Public safety forms an integral
part of the sections that follow.
In addition, there is need for a GNCTD policy
regarding road safety education in schools so that children
can be made aware of the dangers of road traffic and learn
the proper rules of the road and Highway Code.
4.24.3 Parking
Increasing parking demand together with limited
parking supply and absence of a parking policy is an
impediment to the smooth flow of traffic, especially in
and around major commercial areas/activity centres. With
the basic objective of reducing the parking demand
(especially for personalised vehicles), parking pricing is a
major tool for environmental improvement Moreover,
provision of ‘Park and Ride’ facilities, additional parking
supply in critical areas with optimal private sector
participation, employers participation in transport demand
management, and stringent controls in zoned areas are
key policy issues.
The Government of Delhi is, at present, engaged in
finalising the parking policy. Through this policy, efforts
will be made to wean away the users of personalised
vehicles to “public transport” so that the demand for
parking is contained to an extent. It is also being
envisaged to raise the “parking fees” to enable such fees
reflects the economic cost of land.
Under the “Parking policy”, it is proposed to provide
“Park & Ride” services with access to important
commercial centers etc. so that the customers could park
their vehicles at convenient locations and commute to
their destination by using the “Park and ride” vehicles.
4.24.4 Enforcement
The traffic police have to bear the difficult
responsibility of managing and controlling traffic flow.
Difficulties are made worse due to lack of coordination
from local and road maintenance agencies. Local expertise
is required to facilitate formulation of low cost and viable
area-wide traffic management schemes. Vehicle pollution
control can be assisted through technological advances
and strict enforcement of regulations.
4.24.5 Transport System for Special Areas
Preparation of a strategic action plan is needed for
special areas and specialised markets to determine a
framework for functional optimisation and relocation. Car-
free zones with support from non-motorised vehicles and
environment friendly medium capacity transport modes,
like battery operated buses, should be established with
the provision of parking at the periphery. To conserve the
historic character of the walled city, pedestrian zones
should be reinstated. Entry of vehicles for the servicing of
151Chapter 4 • INFRASTRUCTURE DEVELOPMENT
shops and establishments would only be permitted
outside certain entry timings, at night, for example,
between 8 pm and 8 am.
4.24.6 Urban Transport Information System
Update and revision of available data, filling data gaps
and preparation of urban transport information system.
Traffic, travel, network and land use data are generally
collected by various agencies like PWD, DDA, DTC,
NDMC, MCD, GNCTD etc., with reference to some
specific project. For travel characteristics, the Household
Travel Surveys for MRTS (1994) and Commuter Travel in
NCR and Delhi by Northern Railways (1998) form base
line data. DCA is also in the process of preparing the
MPC-2021 from where existing and proposed land-use
maps will be available. Enough traffic and network related
data is available from PWD, NDMC and MCD, though
much of it needs updating. With all this availability of
data, no effort has been made so far to consolidate the
entire data base and make it available to decision makers,
researchers and transport specialists so that planning and
policy interventions are coordinated for an effective and
efficient transport system. The Urban Transport Information
System will be a giant step towards this direction. The scope
of the work inter-alia will cover consolidation of recent
available data, collection and updating of information,
bridging data gaps, computerisation and making them
available through the electronic media.
It is recommended that the agencies that collect data/
information about transport systems in Delhi and NCR
should make it available to all the other agencies so that
coordination in their activities could be established.
4.24.7 Recommendations in this regard are:
This report has attempted to present future directions
and actions that need to be initiated in the traffic and
transport sector in the context of the objective to provide,
promote and ensure, safe, economic and efficient
movement of all categories of passengers and goods, in an
integrated multi-modal transportation system.
The exclusive bus ways and Traffic Management
schemes can offer almost immediate relief at much lesser
cost and should therefore be given immediate attention.
A unifying mechanism has been proposed which needs
to be established as soon as possible. This mechanism can
be replaced by DUMTA in due course. The various groups
under this mechanism need to initiate actions in their
own spheres, which will get continuously reviewed, and
improvements will get introduced on the basis of the
experience gained.
The information base, the policy formulation and
review and monitoring will automatically keep this sector
active in its own sphere and also activate others
concerned, such as the land-use planners and those in
charge of development control, those responsible for
implementation of construction for traffic improvement
etc. The mechanism can review traffic flows on various
arteries and through various junctions. It can suggest local
and linked improvements in the interest of best flows and
initiate many such other actions especially in the
operation of the public sector transport systems of
different types of modes and their operation in a linked
manner.
Special attention also needs to be provided to the
green modes—for the cyclists and pedestrians. Such
proposals and progress on their implementation needs to
be reviewed periodically at the highest level. We are of
the view that the Master Plan should have provision for
these. Since the process is dynamic many more plans and
actions might get generated and implemented in the
future. Unlike the past, it is to be hoped that Delhi will
be a much more livable city in terms of traffic and
transportation achievements in a very short period - much
before the expectations as expressed in Delhi–21 i.e.
much before 2021.
The Ministry of Urban Development is preparing a
draft Bill for constituting the Delhi Metropolitan
Transport Authority (DMTA) and till that is finalised, a
Coordination Committee, known as Delhi Metropolitan
Transport Coordination Committee, will function to
secure compliance for inter agency requests and
coordinate the inter-agency activities.
4.25 Salient Features of the Report of theCommittee on Sustainable Transport
The main recommendations are to provide interse
priority in descending order to:
• Mass transport
• Non-Motorised Transport (NMT) namely bicycles,
cycle-rickshaws, pedestrians etc.
• Intermediate Public Transport (IPT) namely auto-
rickshaws, taxi etc., and
• Personalised motor transport
An integrated Metropolitan Transport Authority
(IMTA) should be set up not only for setting fares and
tariffs but also to provide provisioning and common
services for bus, metro and commuter rail as well as IPT
modes. There should be one authority for all modes of
transport.
DELHI DEVELOPMENT REPORT152
Pending the setting up of IMTA, a Delhi Transport
Planning Group (DTPG) should be constituted. A
technical cell of qualified and trained professionals from
all concerned departments may support the DTPG.
4.26 Further Recommendations
Work on the Phase I of the commuter rail system
called the Integrated Rail and Bus transit (IRBT) along
three existing railway lines needs to be speeded up.While
the Metro is coming up fast, even after a fully developed
rail based Mass Rapid Transit System has come into
existence, the bus system will continue to play the role of
the main mass transport system provider.
Development of bus terminals is very important for
efficient operation of any bus system. Three directional
Inter State Bus Terminals (ISBTs) have already been
provided and two more are to be taken up at Dwarka and
Narela. The services at the existing ISBTs at Kashmere
Gate, Anand Vihar, and Sarai Kale Khan need to be
further improved.
IPT modes will continue to play an important role even
in the future as feeder services to the main mass transport
system and providing accessible movement in pre-
designated areas. Therefore, steps have to be taken to
strengthen this system by proper regulation and
discipline.
Several low cost and quickly implementable transport
system management (TSM) measures are being given a lot
of importance in order to improve traffic flow. TSM plans
are being prepared for various corridors and will be taken
up for implementation.
4.27 Integration Issues
Integration of all modes of transport is necessary to
achieve the potential of each mode. Feeder systems to
metro and commuter rail will be provided. Facilities for
parking of personalised modes, autos and taxis are
proposed at all stations. Timetable and fare integration for
metro rail and buses are also contemplated.
4.28 Vision for the State and Policy ActionRequired for Achieving the Same
4.28.1 As per the Master Plan of Delhi, the vision of
the Government is that Delhi should be a well-managed,
clean and dynamic city serving its citizens as a model
capital city.
The mission is to provide safe, eco-friendly, cost-
effective and efficient modes of transportation through a
well-integrated multi-modal transport system.
4.28.1.1 In order to strike the appropriate modal
balance, an extensive mass transport system including a
metro, commuter rail and buses will be required.
Considering this, the Delhi Metro is being rapidly
progressed within the NCT as per details above and also
connecting to Gurgaon, Noida, and Faridabad and later to
Greater Noida which will help commuter traffic. In
addition, Phase I of the commuter rail system called the
Integrated Rail and Bus transit (IRBT) along three
existing railway lines is also being taken up in partnership
with neighbouring State Governments of Haryana and
Uttar Pradesh and the Government of India.
4.24.1.2 Even after a fully developed rail based Mass
Rapid Transit System has come into existence; the bus
system will continue to play the role of the main mass
transport system provider. The bus system is proposed to
be augmented to 10000 CNG buses within a year on
Stage Carriage to be supplemented with about 4000 CNG
buses on chartered and premium services. Premium bus
services will be introduced on selected routes. High
Capacity Bus Systems on selected corridors for 100 km is
planned. In addition, on 32 km of selected corridors,
Electric Trolley Buses will also be introduced in order to
reduce congestion and pollution. A Light Rail Transit for
the walled city is being considered. In order to improve
the bus system dedicated busways/lanes are being
planned on designated road corridors.
4.28.1.3 Development of bus terminals is very
important for efficient operation of any bus system. Three
directional Inter State Bus Terminals (ISBTs) have already
been provided and two more are to. IPT modes will
continue to play an important role even in the future as
feeder services to the main mass transport system and
providing accessible movement in pre-designated areas.
Therefore, steps are being taken to strengthen this system
by proper regulation and discipline.
4.28.2 Perspective for Future Needs:Travel Demand by 2021
Based on the existing situation and trends the
transport scenario for 2021 appears to be quite alarming.
The various indicators for assessment of travel demand
are shown in Table 4.27.
4.28.3 Traffic and Transport Management andEnvironment
The Goals laid down in the Master Plan for
Delhi 2021 are
Delhi should be free of environmental problems from
this sector. From this angle the following goals can be set
for traffic and transportation sector:
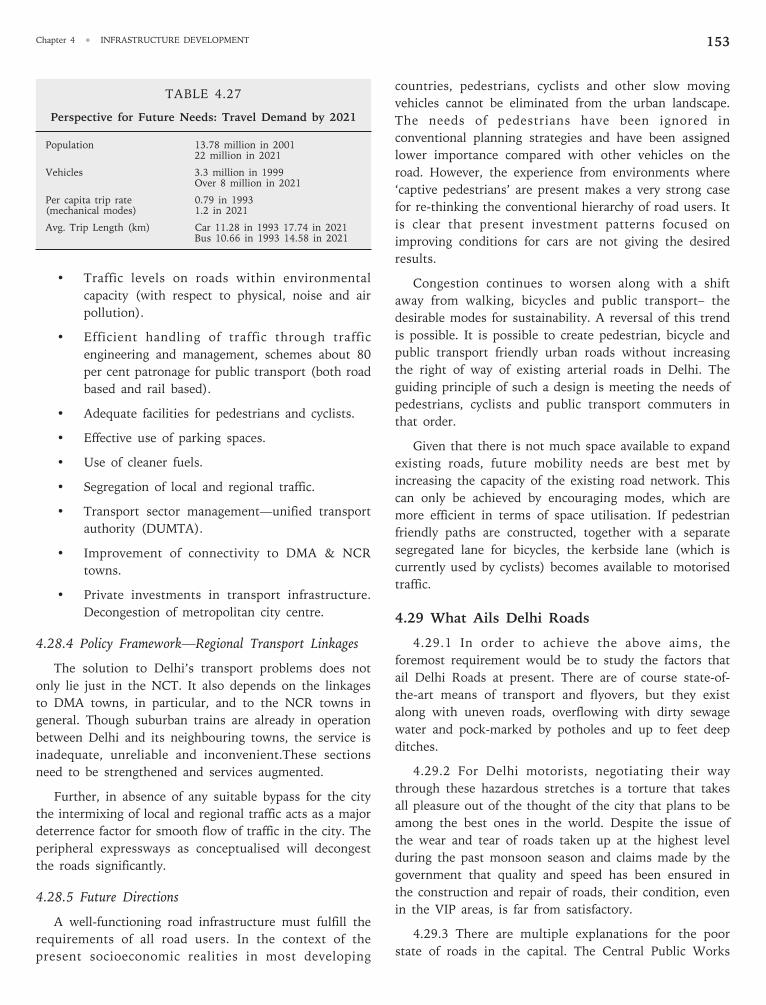
153Chapter 4 • INFRASTRUCTURE DEVELOPMENT
• Traffic levels on roads within environmental
capacity (with respect to physical, noise and air
pollution).
• Efficient handling of traffic through traffic
engineering and management, schemes about 80
per cent patronage for public transport (both road
based and rail based).
• Adequate facilities for pedestrians and cyclists.
• Effective use of parking spaces.
• Use of cleaner fuels.
• Segregation of local and regional traffic.
• Transport sector management—unified transport
authority (DUMTA).
• Improvement of connectivity to DMA & NCR
towns.
• Private investments in transport infrastructure.
Decongestion of metropolitan city centre.
4.28.4 Policy Framework—Regional Transport Linkages
The solution to Delhi’s transport problems does not
only lie just in the NCT. It also depends on the linkages
to DMA towns, in particular, and to the NCR towns in
general. Though suburban trains are already in operation
between Delhi and its neighbouring towns, the service is
inadequate, unreliable and inconvenient.These sections
need to be strengthened and services augmented.
Further, in absence of any suitable bypass for the city
the intermixing of local and regional traffic acts as a major
deterrence factor for smooth flow of traffic in the city. The
peripheral expressways as conceptualised will decongest
the roads significantly.
4.28.5 Future Directions
A well-functioning road infrastructure must fulfill the
requirements of all road users. In the context of the
present socioeconomic realities in most developing
countries, pedestrians, cyclists and other slow moving
vehicles cannot be eliminated from the urban landscape.
The needs of pedestrians have been ignored in
conventional planning strategies and have been assigned
lower importance compared with other vehicles on the
road. However, the experience from environments where
‘captive pedestrians’ are present makes a very strong case
for re-thinking the conventional hierarchy of road users. It
is clear that present investment patterns focused on
improving conditions for cars are not giving the desired
results.
Congestion continues to worsen along with a shift
away from walking, bicycles and public transport– the
desirable modes for sustainability. A reversal of this trend
is possible. It is possible to create pedestrian, bicycle and
public transport friendly urban roads without increasing
the right of way of existing arterial roads in Delhi. The
guiding principle of such a design is meeting the needs of
pedestrians, cyclists and public transport commuters in
that order.
Given that there is not much space available to expand
existing roads, future mobility needs are best met by
increasing the capacity of the existing road network. This
can only be achieved by encouraging modes, which are
more efficient in terms of space utilisation. If pedestrian
friendly paths are constructed, together with a separate
segregated lane for bicycles, the kerbside lane (which is
currently used by cyclists) becomes available to motorised
traffic.
4.29 What Ails Delhi Roads
4.29.1 In order to achieve the above aims, the
foremost requirement would be to study the factors that
ail Delhi Roads at present. There are of course state-of-
the-art means of transport and flyovers, but they exist
along with uneven roads, overflowing with dirty sewage
water and pock-marked by potholes and up to feet deep
ditches.
4.29.2 For Delhi motorists, negotiating their way
through these hazardous stretches is a torture that takes
all pleasure out of the thought of the city that plans to be
among the best ones in the world. Despite the issue of
the wear and tear of roads taken up at the highest level
during the past monsoon season and claims made by the
government that quality and speed has been ensured in
the construction and repair of roads, their condition, even
in the VIP areas, is far from satisfactory.
4.29.3 There are multiple explanations for the poor
state of roads in the capital. The Central Public Works
TABLE 4.27
Perspective for Future Needs: Travel Demand by 2021
Population 13.78 million in 200122 million in 2021
Vehicles 3.3 million in 1999Over 8 million in 2021
Per capita trip rate 0.79 in 1993(mechanical modes) 1.2 in 2021
Avg. Trip Length (km) Car 11.28 in 1993 17.74 in 2021Bus 10.66 in 1993 14.58 in 2021
DELHI DEVELOPMENT REPORT154
Department says that Delhi roads were under great strain
because of the density of vehicular traffic, which was the
highest in the country.
4.29.4 Various service providers like MTNL, private
Telecom operators and others for laying their cables was
one of the main reasons for the deteriorating condition of
roads as after doing their work, they do not do the repairs
properly. However, the system is going to end shortly.
The service providers will now leave the scene after
digging and it is MCD, which will do the repairs, and the
cost will be charged from the service providers.
4.29.5 Leakage and poor drainage was also an
important cause of early wear and tear of roads as per
Delhi PWD and the NDMC has expressed agreement on
this count.
4.29.6 It is felt that in order to improve maintenance
as well as to optimise construction costs, quality and
accountability, all roads in Delhi except National
Highways and those in Cantonment area, should be given
to one agency, the most suited is the PWD. This agency
should be responsible for construction, improvement and
maintainance. Legal issues will be there but these could
be sorted out.
4.29.7 Development of Directional Terminals andFreight Complexes
The MPD 2001 proposals for terminals and freight
complexes are yet to be implemented fully. The proposed
locations need to be reviewed in the light of present
movement patterns and road/rail development projects.
The scope of the proposed project will include assessment
of movement patterns for passengers and goods,
identification/validation of locations, layout clans and
designs, private sector participation options. Integration
with the total system. Implementation and operation.
DRINKING WATER SUPPLY
4.30 Current Status and Resource Assessment
4.30.1 Water Supply and Demand
4.30.1.1 Water—A Precious Resource
Water is a precious natural resource, next to air only,
vital for sustaining all forms of life on the earth. Three-
fourth of the earth’s surface area is under water and yet
only 3 per cent of it is usable, the balance 97 per cent
being in the oceans. Therefore, being an exhaustible
resource and with the associated problems of maintenance
of its quality due to environmental degradation,
management of this resource has been a matter of
concern for the civic authorities. Although, India receives
an average rainfall equivalent to about 4,000 billion cubic
meters (BCM) annually, it is unevenly distributed both
spatially and temporally. Nearly three-fourth of the annual
rainfall is concentrated in the four months of monsoon, most
of which flows down the sea as river runoff due to non-
availability of adequate storage in upstream river basins.
Surface water resources such as rivers and lakes are
the major sources of drinking water for majority of the
urban population. Due to problems of uneven distribution
of precipitation, abstraction of large quantities of water for
irrigation and growing anthropogenic pressures leading to
environmental degradation of the surface water resources,
availability of drinking water is becoming difficult day-by-
day. Every third person in the country does not have
access to safe drinking water. Despite the growing
problem of its scarcity and deteriorating quality, water in
India is still managed as a ‘cheap resource’ rather than a
‘productive asset’ with an economic value attached to it.
This goes against the very concept of conservation
amongst various consumptive and non-consumptive uses
of this precious resource.
4.30.1.2 Population of Delhi
According to the Census of India 2001, population of
Delhi is 13.85 million comprising 7.57 million (55 per
cent) males and 6.28 million (45 per cent) females. The
density of population is 9,294, which is the highest
amongst all States and Union Territories. The growth of
population during the decade 1991-2001 was 46.31 per
cent which portrays an annual rate of 4.63 per cent as
against the national average growth rate of 3.12 per cent
in the urban areas. According to the sources of the
Ministry of Urban Development, nearly 50 per cent of the
growth in population is on account of people migrating
into the city every year from other states for employment
opportunities. The current literacy level is 81.82 per cent
as compared to 75.29 per cent in 1991.
Nearly 31 per cent of the current population of Delhi
lives in Jhuggi-Jhopri (JJ) clusters, unauthorised colonies
and villages of various categories and does not have access
to the piped water supply and sewerage system. Of these,
about 3 million people live in about 600,000 shanties
comprising JJ clusters spread all over the city.
4.30.1.3 The Delhi Jal Board
The Delhi Jal Board (DJB) is entrusted with the
responsibility of production and supply of potable water in
Delhi. The DJB was constituted in April 1998 through an
Act of the Delhi Legislative Assembly incorporating the
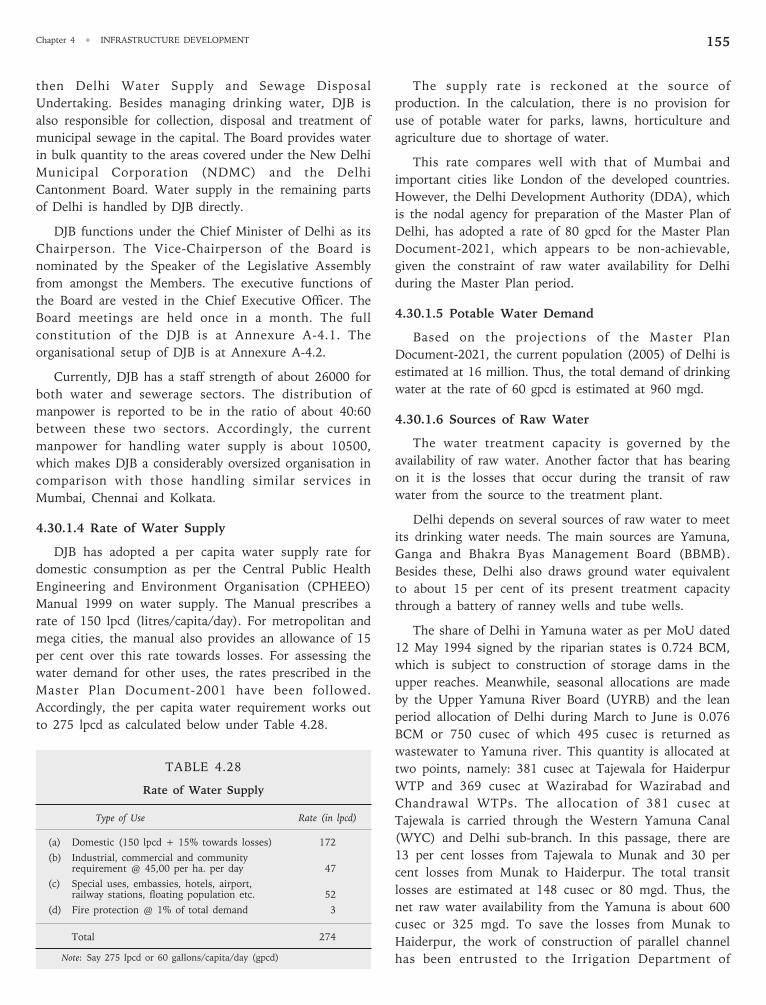
155Chapter 4 • INFRASTRUCTURE DEVELOPMENT
The supply rate is reckoned at the source of
production. In the calculation, there is no provision for
use of potable water for parks, lawns, horticulture and
agriculture due to shortage of water.
This rate compares well with that of Mumbai and
important cities like London of the developed countries.
However, the Delhi Development Authority (DDA), which
is the nodal agency for preparation of the Master Plan of
Delhi, has adopted a rate of 80 gpcd for the Master Plan
Document-2021, which appears to be non-achievable,
given the constraint of raw water availability for Delhi
during the Master Plan period.
4.30.1.5 Potable Water Demand
Based on the projections of the Master Plan
Document-2021, the current population (2005) of Delhi is
estimated at 16 million. Thus, the total demand of drinking
water at the rate of 60 gpcd is estimated at 960 mgd.
4.30.1.6 Sources of Raw Water
The water treatment capacity is governed by the
availability of raw water. Another factor that has bearing
on it is the losses that occur during the transit of raw
water from the source to the treatment plant.
Delhi depends on several sources of raw water to meet
its drinking water needs. The main sources are Yamuna,
Ganga and Bhakra Byas Management Board (BBMB).
Besides these, Delhi also draws ground water equivalent
to about 15 per cent of its present treatment capacity
through a battery of ranney wells and tube wells.
The share of Delhi in Yamuna water as per MoU dated
12 May 1994 signed by the riparian states is 0.724 BCM,
which is subject to construction of storage dams in the
upper reaches. Meanwhile, seasonal allocations are made
by the Upper Yamuna River Board (UYRB) and the lean
period allocation of Delhi during March to June is 0.076
BCM or 750 cusec of which 495 cusec is returned as
wastewater to Yamuna river. This quantity is allocated at
two points, namely: 381 cusec at Tajewala for Haiderpur
WTP and 369 cusec at Wazirabad for Wazirabad and
Chandrawal WTPs. The allocation of 381 cusec at
Tajewala is carried through the Western Yamuna Canal
(WYC) and Delhi sub-branch. In this passage, there are
13 per cent losses from Tajewala to Munak and 30 per
cent losses from Munak to Haiderpur. The total transit
losses are estimated at 148 cusec or 80 mgd. Thus, the
net raw water availability from the Yamuna is about 600
cusec or 325 mgd. To save the losses from Munak to
Haiderpur, the work of construction of parallel channel
has been entrusted to the Irrigation Department of
then Delhi Water Supply and Sewage Disposal
Undertaking. Besides managing drinking water, DJB is
also responsible for collection, disposal and treatment of
municipal sewage in the capital. The Board provides water
in bulk quantity to the areas covered under the New Delhi
Municipal Corporation (NDMC) and the Delhi
Cantonment Board. Water supply in the remaining parts
of Delhi is handled by DJB directly.
DJB functions under the Chief Minister of Delhi as its
Chairperson. The Vice-Chairperson of the Board is
nominated by the Speaker of the Legislative Assembly
from amongst the Members. The executive functions of
the Board are vested in the Chief Executive Officer. The
Board meetings are held once in a month. The full
constitution of the DJB is at Annexure A-4.1. The
organisational setup of DJB is at Annexure A-4.2.
Currently, DJB has a staff strength of about 26000 for
both water and sewerage sectors. The distribution of
manpower is reported to be in the ratio of about 40:60
between these two sectors. Accordingly, the current
manpower for handling water supply is about 10500,
which makes DJB a considerably oversized organisation in
comparison with those handling similar services in
Mumbai, Chennai and Kolkata.
4.30.1.4 Rate of Water Supply
DJB has adopted a per capita water supply rate for
domestic consumption as per the Central Public Health
Engineering and Environment Organisation (CPHEEO)
Manual 1999 on water supply. The Manual prescribes a
rate of 150 lpcd (litres/capita/day). For metropolitan and
mega cities, the manual also provides an allowance of 15
per cent over this rate towards losses. For assessing the
water demand for other uses, the rates prescribed in the
Master Plan Document-2001 have been followed.
Accordingly, the per capita water requirement works out
to 275 lpcd as calculated below under Table 4.28.
TABLE 4.28
Rate of Water Supply
Type of Use Rate (in lpcd)
(a) Domestic (150 lpcd + 15% towards losses) 172
(b) Industrial, commercial and communityrequirement @ 45,00 per ha. per day 47
(c) Special uses, embassies, hotels, airport,railway stations, floating population etc. 52
(d) Fire protection @ 1% of total demand 3
Total 274
Note: Say 275 lpcd or 60 gallons/capita/day (gpcd)
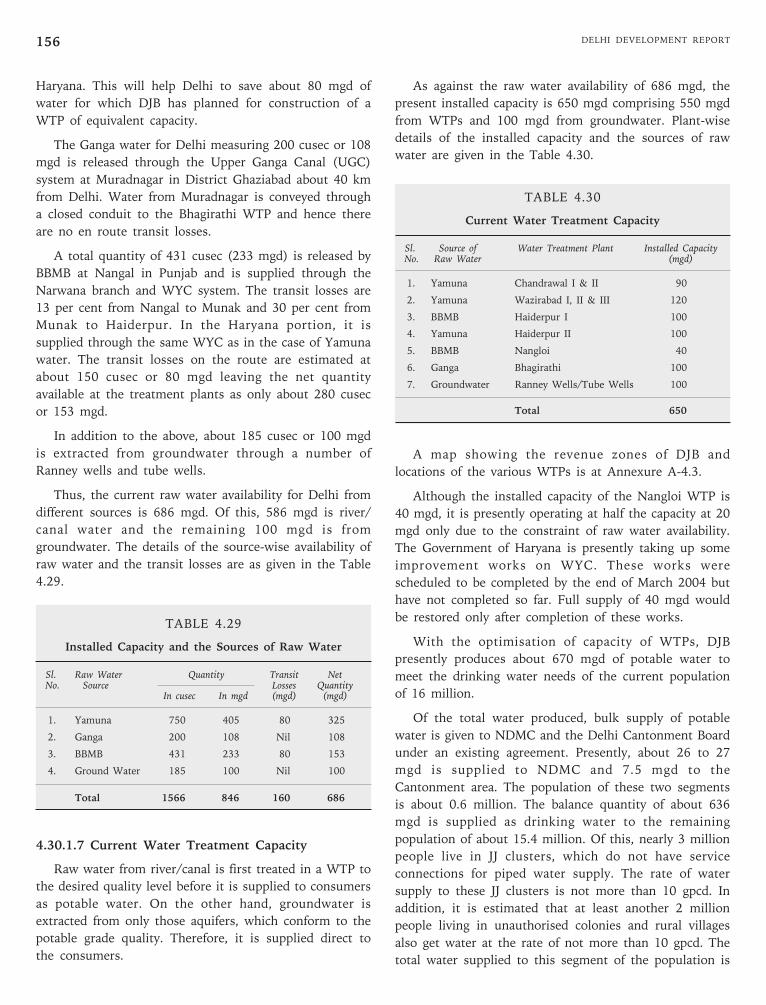
DELHI DEVELOPMENT REPORT156
As against the raw water availability of 686 mgd, the
present installed capacity is 650 mgd comprising 550 mgd
from WTPs and 100 mgd from groundwater. Plant-wise
details of the installed capacity and the sources of raw
water are given in the Table 4.30.
TABLE 4.30
Current Water Treatment Capacity
Sl. Source of Water Treatment Plant Installed CapacityNo. Raw Water (mgd)
1. Yamuna Chandrawal I & II 90
2. Yamuna Wazirabad I, II & III 120
3. BBMB Haiderpur I 100
4. Yamuna Haiderpur II 100
5. BBMB Nangloi 40
6. Ganga Bhagirathi 100
7. Groundwater Ranney Wells/Tube Wells 100
Total 650
A map showing the revenue zones of DJB and
locations of the various WTPs is at Annexure A-4.3.
Although the installed capacity of the Nangloi WTP is
40 mgd, it is presently operating at half the capacity at 20
mgd only due to the constraint of raw water availability.
The Government of Haryana is presently taking up some
improvement works on WYC. These works were
scheduled to be completed by the end of March 2004 but
have not completed so far. Full supply of 40 mgd would
be restored only after completion of these works.
With the optimisation of capacity of WTPs, DJB
presently produces about 670 mgd of potable water to
meet the drinking water needs of the current population
of 16 million.
Of the total water produced, bulk supply of potable
water is given to NDMC and the Delhi Cantonment Board
under an existing agreement. Presently, about 26 to 27
mgd is supplied to NDMC and 7.5 mgd to the
Cantonment area. The population of these two segments
is about 0.6 million. The balance quantity of about 636
mgd is supplied as drinking water to the remaining
population of about 15.4 million. Of this, nearly 3 million
people live in JJ clusters, which do not have service
connections for piped water supply. The rate of water
supply to these JJ clusters is not more than 10 gpcd. In
addition, it is estimated that at least another 2 million
people living in unauthorised colonies and rural villages
also get water at the rate of not more than 10 gpcd. The
total water supplied to this segment of the population is
Haryana. This will help Delhi to save about 80 mgd of
water for which DJB has planned for construction of a
WTP of equivalent capacity.
The Ganga water for Delhi measuring 200 cusec or 108
mgd is released through the Upper Ganga Canal (UGC)
system at Muradnagar in District Ghaziabad about 40 km
from Delhi. Water from Muradnagar is conveyed through
a closed conduit to the Bhagirathi WTP and hence there
are no en route transit losses.
A total quantity of 431 cusec (233 mgd) is released by
BBMB at Nangal in Punjab and is supplied through the
Narwana branch and WYC system. The transit losses are
13 per cent from Nangal to Munak and 30 per cent from
Munak to Haiderpur. In the Haryana portion, it is
supplied through the same WYC as in the case of Yamuna
water. The transit losses on the route are estimated at
about 150 cusec or 80 mgd leaving the net quantity
available at the treatment plants as only about 280 cusec
or 153 mgd.
In addition to the above, about 185 cusec or 100 mgd
is extracted from groundwater through a number of
Ranney wells and tube wells.
Thus, the current raw water availability for Delhi from
different sources is 686 mgd. Of this, 586 mgd is river/
canal water and the remaining 100 mgd is from
groundwater. The details of the source-wise availability of
raw water and the transit losses are as given in the Table
4.29.
TABLE 4.29
Installed Capacity and the Sources of Raw Water
Sl. Raw Water Quantity Transit NetNo. Source Losses Quantity
In cusec In mgd (mgd) (mgd)
1. Yamuna 750 405 80 325
2. Ganga 200 108 Nil 108
3. BBMB 431 233 80 153
4. Ground Water 185 100 Nil 100
Total 1566 846 160 686
4.30.1.7 Current Water Treatment Capacity
Raw water from river/canal is first treated in a WTP to
the desired quality level before it is supplied to consumers
as potable water. On the other hand, groundwater is
extracted from only those aquifers, which conform to the
potable grade quality. Therefore, it is supplied direct to
the consumers.
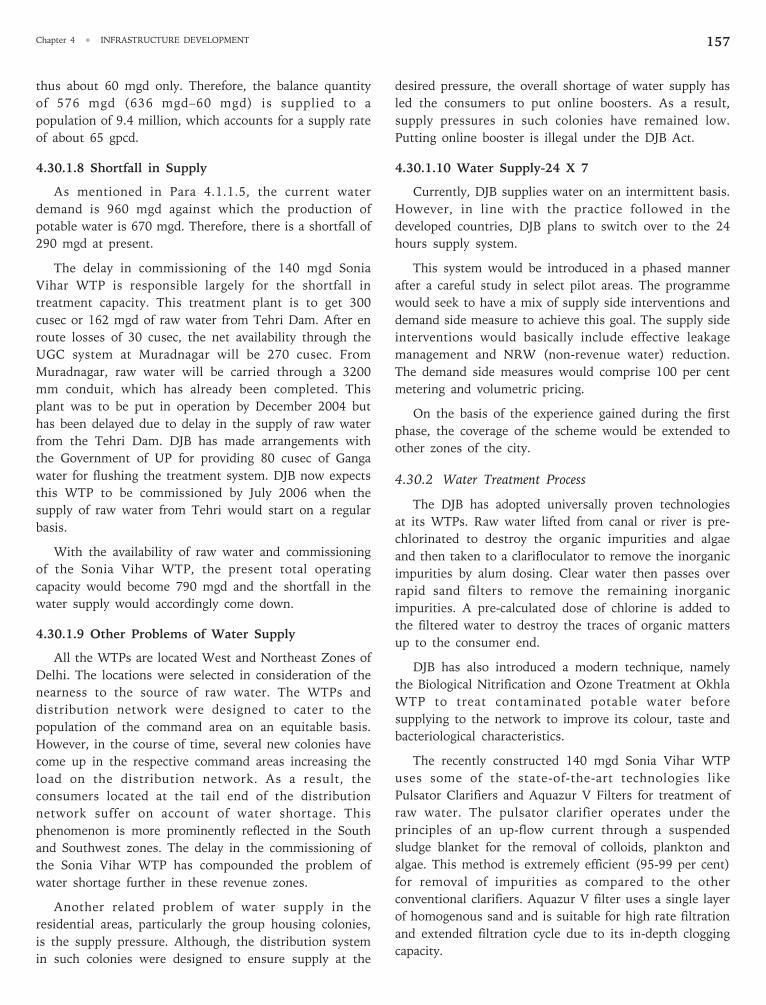
157Chapter 4 • INFRASTRUCTURE DEVELOPMENT
thus about 60 mgd only. Therefore, the balance quantity
of 576 mgd (636 mgd–60 mgd) is supplied to a
population of 9.4 million, which accounts for a supply rate
of about 65 gpcd.
4.30.1.8 Shortfall in Supply
As mentioned in Para 4.1.1.5, the current water
demand is 960 mgd against which the production of
potable water is 670 mgd. Therefore, there is a shortfall of
290 mgd at present.
The delay in commissioning of the 140 mgd Sonia
Vihar WTP is responsible largely for the shortfall in
treatment capacity. This treatment plant is to get 300
cusec or 162 mgd of raw water from Tehri Dam. After en
route losses of 30 cusec, the net availability through the
UGC system at Muradnagar will be 270 cusec. From
Muradnagar, raw water will be carried through a 3200
mm conduit, which has already been completed. This
plant was to be put in operation by December 2004 but
has been delayed due to delay in the supply of raw water
from the Tehri Dam. DJB has made arrangements with
the Government of UP for providing 80 cusec of Ganga
water for flushing the treatment system. DJB now expects
this WTP to be commissioned by July 2006 when the
supply of raw water from Tehri would start on a regular
basis.
With the availability of raw water and commissioning
of the Sonia Vihar WTP, the present total operating
capacity would become 790 mgd and the shortfall in the
water supply would accordingly come down.
4.30.1.9 Other Problems of Water Supply
All the WTPs are located West and Northeast Zones of
Delhi. The locations were selected in consideration of the
nearness to the source of raw water. The WTPs and
distribution network were designed to cater to the
population of the command area on an equitable basis.
However, in the course of time, several new colonies have
come up in the respective command areas increasing the
load on the distribution network. As a result, the
consumers located at the tail end of the distribution
network suffer on account of water shortage. This
phenomenon is more prominently reflected in the South
and Southwest zones. The delay in the commissioning of
the Sonia Vihar WTP has compounded the problem of
water shortage further in these revenue zones.
Another related problem of water supply in the
residential areas, particularly the group housing colonies,
is the supply pressure. Although, the distribution system
in such colonies were designed to ensure supply at the
desired pressure, the overall shortage of water supply has
led the consumers to put online boosters. As a result,
supply pressures in such colonies have remained low.
Putting online booster is illegal under the DJB Act.
4.30.1.10 Water Supply-24 X 7
Currently, DJB supplies water on an intermittent basis.
However, in line with the practice followed in the
developed countries, DJB plans to switch over to the 24
hours supply system.
This system would be introduced in a phased manner
after a careful study in select pilot areas. The programme
would seek to have a mix of supply side interventions and
demand side measure to achieve this goal. The supply side
interventions would basically include effective leakage
management and NRW (non-revenue water) reduction.
The demand side measures would comprise 100 per cent
metering and volumetric pricing.
On the basis of the experience gained during the first
phase, the coverage of the scheme would be extended to
other zones of the city.
4.30.2 Water Treatment Process
The DJB has adopted universally proven technologies
at its WTPs. Raw water lifted from canal or river is pre-
chlorinated to destroy the organic impurities and algae
and then taken to a clarifloculator to remove the inorganic
impurities by alum dosing. Clear water then passes over
rapid sand filters to remove the remaining inorganic
impurities. A pre-calculated dose of chlorine is added to
the filtered water to destroy the traces of organic matters
up to the consumer end.
DJB has also introduced a modern technique, namely
the Biological Nitrification and Ozone Treatment at Okhla
WTP to treat contaminated potable water before
supplying to the network to improve its colour, taste and
bacteriological characteristics.
The recently constructed 140 mgd Sonia Vihar WTP
uses some of the state-of-the-art technologies like
Pulsator Clarifiers and Aquazur V Filters for treatment of
raw water. The pulsator clarifier operates under the
principles of an up-flow current through a suspended
sludge blanket for the removal of colloids, plankton and
algae. This method is extremely efficient (95-99 per cent)
for removal of impurities as compared to the other
conventional clarifiers. Aquazur V filter uses a single layer
of homogenous sand and is suitable for high rate filtration
and extended filtration cycle due to its in-depth clogging
capacity.
DELHI DEVELOPMENT REPORT158
DJB is one of the few public utilities to undertake
extensive work on Geographical Information System
(GIS), mapping of its various utilities like the numerous
water and sewage treatment plants, water transmissions,
mains, underground reservoirs, overhead tanks, ranney
wells, tubewells and several other appurtenant works. The
attributes pertaining to the various objects are both
spatial as well as non-spatial to their maximum useful
aspects. The modeling and analysing tools are also
purposed to be put in place subsequently.
4.30.3 Quality Control
The drinking water supplied by DJB is potable,
wholesome and conforms to the BIS 10500 of the Bureau
of Indian Standards and the standards prescribed by the
CPHEEO of the Ministry of Urban Development. The
quality of water is checked at every stage of treatment right
from the raw water stage up to storage in service reservoirs
and also in the distribution system at the consumers’ end.
Water supplied from ranney wells and tubewells is also
tested on regular basis to ensure that it conforms to the
BIS 10500 and no contamination takes place during
transmission of water through water mains.
Besides nine laboratories at the WTPs, there are six
zonal laboratories manned by a staff of 200 persons
comprising, among others, qualified chemists.
Approximately 300 to 400 water samples are lifted daily
from the distribution system, individual taps, public
hydrants, etc. for ensuring the desired water quality in the
distribution system. Of these, only about 2-3 per cent
failures are reported, where remedial measures are
immediately taken to rectify the cause of failure. In order
to avoid contamination of water, all ground reservoirs,
overhead tanks and dead ends in the distribution system
are flushed and cleaned periodically.
Despite these quality checks, complaints of
contaminated water are often reported from users. Sewer
and water mains have been closely laid in the residential
areas. Leakage occurs in both these mains. Because of
intermittent water supply system, the water mains suck
sewage through leaking joints resulting in the
contamination of water. In order to curb this problem, a
more stringent inspection of the vulnerable areas and
sealing of leaking joints is necessary.
4.30.4 Water Conservation Measures andPublic Participation
4.30.4.1 Leakage Control
Leakage is one of the components of water losses and
comprises physical losses from old and damaged pipes,
joints and fittings and also overflows from service
reservoirs. These losses could be severe and may go
undetected for months or even years. The larger losses are
usually from burst pipes or from sudden rupture of a
joint. Leakage losses are sometimes referred to as
‘Unaccounted for Water’ or ‘Non-Revenue Water’.
Delhi has a network of about 9,000 Kms. of water
supply mains of which, a significant portion is as old as
40 to 50 years and prone to higher leakage losses.
Normally water losses are calculated by water billed or
consumed subtracted from the water produced. In the
case of Delhi, water billed or consumed and leakage losses
therefrom can not be calculated exactly as a majority of
houses do not have working meters. According to the
estimates of DJB, the total distribution losses are of the
order of 40 per cent of the total water supplied. These are
quite high as compared to 10-20 per cent in the
developing countries. The distribution losses include
losses due (a) leaking pipes and (b) theft of water
through unauthorised connections. The CPHEEO Manual
on water supply prescribes 15 per cent distribution losses.
DJB has taken several steps to minimise leakage losses.
To address this problem, a leak detection and
investigation (LDI) cell was set up in 1978 to provide
assistance in leak detection and to monitor leakage repairs
in transmission and distribution network. Initially, the
leak detection cell started functioning with the help of a
very few conventional equipments viz., sounding rods,
micro-correlates and pipe/cable locators. More sophisticated
sonic and electronic equipments were subsequently
acquired and are now being used regularly. During 2002-
03, a total of 12000 leaking points were repaired which
resulted in the saving of potable water at the rate of 2.5
million gallons/hr. In addition, the Board has replaced
about 1200 km length of the old, damaged and leaking
water mains during the last five years. DJB has also
started monitoring water thefts through unauthorised
connections. As a result of these initiatives, the Board
expects to bring down the distribution losses to 20 per
cent level in the near future.
4.30.4.2 Metering of Supply
Metering of water supply, be it domestic or for other
uses, is an important step towards conserving water
besides increasing the revenue of DJB.
The total number of water connections provided by
DJB at present is about 1.5 million in all categories. Of
these, nearly 1.32 million connections are in the domestic
category. Of these, there are about 322,000 connections
mostly in the rural areas where meters are not to be
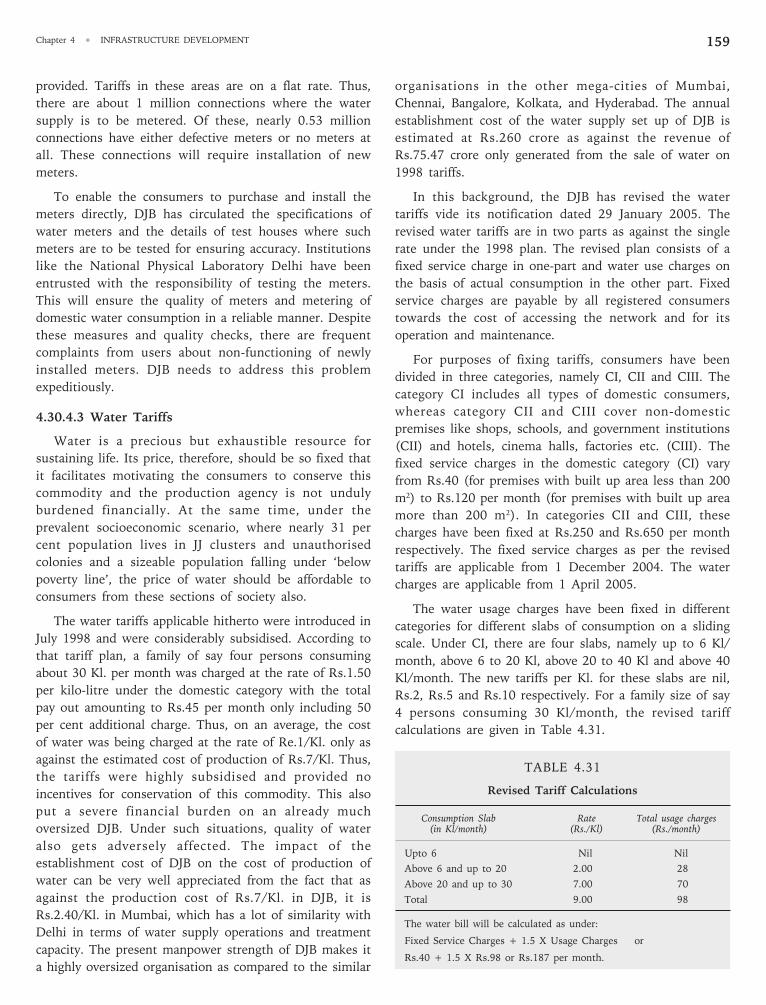
159Chapter 4 • INFRASTRUCTURE DEVELOPMENT
provided. Tariffs in these areas are on a flat rate. Thus,
there are about 1 million connections where the water
supply is to be metered. Of these, nearly 0.53 million
connections have either defective meters or no meters at
all. These connections will require installation of new
meters.
To enable the consumers to purchase and install the
meters directly, DJB has circulated the specifications of
water meters and the details of test houses where such
meters are to be tested for ensuring accuracy. Institutions
like the National Physical Laboratory Delhi have been
entrusted with the responsibility of testing the meters.
This will ensure the quality of meters and metering of
domestic water consumption in a reliable manner. Despite
these measures and quality checks, there are frequent
complaints from users about non-functioning of newly
installed meters. DJB needs to address this problem
expeditiously.
4.30.4.3 Water Tariffs
Water is a precious but exhaustible resource for
sustaining life. Its price, therefore, should be so fixed that
it facilitates motivating the consumers to conserve this
commodity and the production agency is not unduly
burdened financially. At the same time, under the
prevalent socioeconomic scenario, where nearly 31 per
cent population lives in JJ clusters and unauthorised
colonies and a sizeable population falling under ‘below
poverty line’, the price of water should be affordable to
consumers from these sections of society also.
The water tariffs applicable hitherto were introduced in
July 1998 and were considerably subsidised. According to
that tariff plan, a family of say four persons consuming
about 30 Kl. per month was charged at the rate of Rs.1.50
per kilo-litre under the domestic category with the total
pay out amounting to Rs.45 per month only including 50
per cent additional charge. Thus, on an average, the cost
of water was being charged at the rate of Re.1/Kl. only as
against the estimated cost of production of Rs.7/Kl. Thus,
the tariffs were highly subsidised and provided no
incentives for conservation of this commodity. This also
put a severe financial burden on an already much
oversized DJB. Under such situations, quality of water
also gets adversely affected. The impact of the
establishment cost of DJB on the cost of production of
water can be very well appreciated from the fact that as
against the production cost of Rs.7/Kl. in DJB, it is
Rs.2.40/Kl. in Mumbai, which has a lot of similarity with
Delhi in terms of water supply operations and treatment
capacity. The present manpower strength of DJB makes it
a highly oversized organisation as compared to the similar
organisations in the other mega-cities of Mumbai,
Chennai, Bangalore, Kolkata, and Hyderabad. The annual
establishment cost of the water supply set up of DJB is
estimated at Rs.260 crore as against the revenue of
Rs.75.47 crore only generated from the sale of water on
1998 tariffs.
In this background, the DJB has revised the water
tariffs vide its notification dated 29 January 2005. The
revised water tariffs are in two parts as against the single
rate under the 1998 plan. The revised plan consists of a
fixed service charge in one-part and water use charges on
the basis of actual consumption in the other part. Fixed
service charges are payable by all registered consumers
towards the cost of accessing the network and for its
operation and maintenance.
For purposes of fixing tariffs, consumers have been
divided in three categories, namely CI, CII and CIII. The
category CI includes all types of domestic consumers,
whereas category CII and CIII cover non-domestic
premises like shops, schools, and government institutions
(CII) and hotels, cinema halls, factories etc. (CIII). The
fixed service charges in the domestic category (CI) vary
from Rs.40 (for premises with built up area less than 200
m2) to Rs.120 per month (for premises with built up area
more than 200 m2). In categories CII and CIII, these
charges have been fixed at Rs.250 and Rs.650 per month
respectively. The fixed service charges as per the revised
tariffs are applicable from 1 December 2004. The water
charges are applicable from 1 April 2005.
The water usage charges have been fixed in different
categories for different slabs of consumption on a sliding
scale. Under CI, there are four slabs, namely up to 6 Kl/
month, above 6 to 20 Kl, above 20 to 40 Kl and above 40
Kl/month. The new tariffs per Kl. for these slabs are nil,
Rs.2, Rs.5 and Rs.10 respectively. For a family size of say
4 persons consuming 30 Kl/month, the revised tariff
calculations are given in Table 4.31.
TABLE 4.31
Revised Tariff Calculations
Consumption Slab Rate Total usage charges(in Kl/month) (Rs./Kl) (Rs./month)
Upto 6 Nil Nil
Above 6 and up to 20 2.00 28
Above 20 and up to 30 7.00 70
Total 9.00 98
The water bill will be calculated as under:
Fixed Service Charges + 1.5 X Usage Charges or
Rs.40 + 1.5 X Rs.98 or Rs.187 per month.
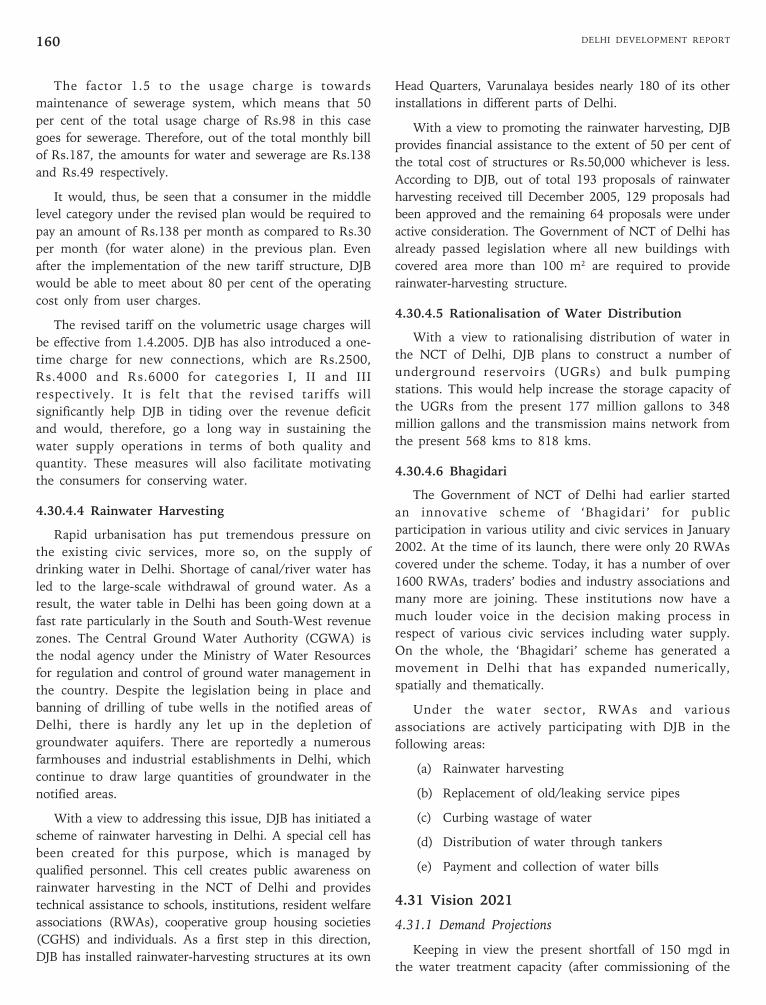
DELHI DEVELOPMENT REPORT160
The factor 1.5 to the usage charge is towards
maintenance of sewerage system, which means that 50
per cent of the total usage charge of Rs.98 in this case
goes for sewerage. Therefore, out of the total monthly bill
of Rs.187, the amounts for water and sewerage are Rs.138
and Rs.49 respectively.
It would, thus, be seen that a consumer in the middle
level category under the revised plan would be required to
pay an amount of Rs.138 per month as compared to Rs.30
per month (for water alone) in the previous plan. Even
after the implementation of the new tariff structure, DJB
would be able to meet about 80 per cent of the operating
cost only from user charges.
The revised tariff on the volumetric usage charges will
be effective from 1.4.2005. DJB has also introduced a one-
time charge for new connections, which are Rs.2500,
Rs.4000 and Rs.6000 for categories I, II and III
respectively. It is felt that the revised tariffs will
significantly help DJB in tiding over the revenue deficit
and would, therefore, go a long way in sustaining the
water supply operations in terms of both quality and
quantity. These measures will also facilitate motivating
the consumers for conserving water.
4.30.4.4 Rainwater Harvesting
Rapid urbanisation has put tremendous pressure on
the existing civic services, more so, on the supply of
drinking water in Delhi. Shortage of canal/river water has
led to the large-scale withdrawal of ground water. As a
result, the water table in Delhi has been going down at a
fast rate particularly in the South and South-West revenue
zones. The Central Ground Water Authority (CGWA) is
the nodal agency under the Ministry of Water Resources
for regulation and control of ground water management in
the country. Despite the legislation being in place and
banning of drilling of tube wells in the notified areas of
Delhi, there is hardly any let up in the depletion of
groundwater aquifers. There are reportedly a numerous
farmhouses and industrial establishments in Delhi, which
continue to draw large quantities of groundwater in the
notified areas.
With a view to addressing this issue, DJB has initiated a
scheme of rainwater harvesting in Delhi. A special cell has
been created for this purpose, which is managed by
qualified personnel. This cell creates public awareness on
rainwater harvesting in the NCT of Delhi and provides
technical assistance to schools, institutions, resident welfare
associations (RWAs), cooperative group housing societies
(CGHS) and individuals. As a first step in this direction,
DJB has installed rainwater-harvesting structures at its own
Head Quarters, Varunalaya besides nearly 180 of its other
installations in different parts of Delhi.
With a view to promoting the rainwater harvesting, DJB
provides financial assistance to the extent of 50 per cent of
the total cost of structures or Rs.50,000 whichever is less.
According to DJB, out of total 193 proposals of rainwater
harvesting received till December 2005, 129 proposals had
been approved and the remaining 64 proposals were under
active consideration. The Government of NCT of Delhi has
already passed legislation where all new buildings with
covered area more than 100 m2 are required to provide
rainwater-harvesting structure.
4.30.4.5 Rationalisation of Water Distribution
With a view to rationalising distribution of water in
the NCT of Delhi, DJB plans to construct a number of
underground reservoirs (UGRs) and bulk pumping
stations. This would help increase the storage capacity of
the UGRs from the present 177 million gallons to 348
million gallons and the transmission mains network from
the present 568 kms to 818 kms.
4.30.4.6 Bhagidari
The Government of NCT of Delhi had earlier started
an innovative scheme of ‘Bhagidari’ for public
participation in various utility and civic services in January
2002. At the time of its launch, there were only 20 RWAs
covered under the scheme. Today, it has a number of over
1600 RWAs, traders’ bodies and industry associations and
many more are joining. These institutions now have a
much louder voice in the decision making process in
respect of various civic services including water supply.
On the whole, the ‘Bhagidari’ scheme has generated a
movement in Delhi that has expanded numerically,
spatially and thematically.
Under the water sector, RWAs and various
associations are actively participating with DJB in the
following areas:
(a) Rainwater harvesting
(b) Replacement of old/leaking service pipes
(c) Curbing wastage of water
(d) Distribution of water through tankers
(e) Payment and collection of water bills
4.31 Vision 2021
4.31.1 Demand Projections
Keeping in view the present shortfall of 150 mgd in
the water treatment capacity (after commissioning of the
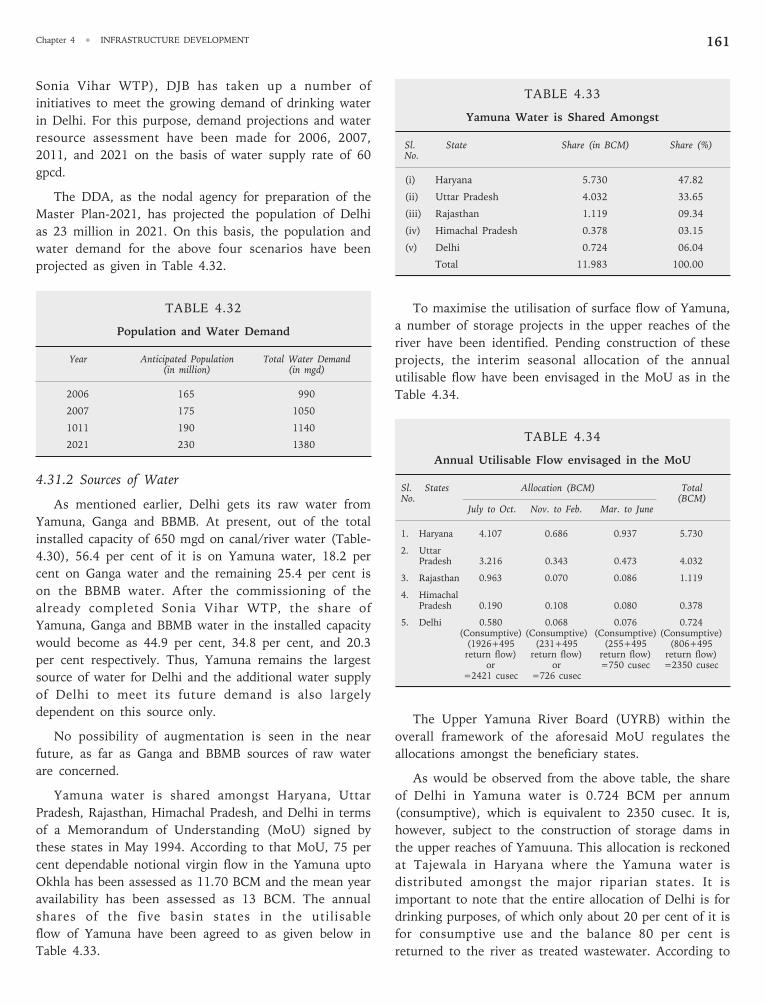
161Chapter 4 • INFRASTRUCTURE DEVELOPMENT
Sonia Vihar WTP), DJB has taken up a number of
initiatives to meet the growing demand of drinking water
in Delhi. For this purpose, demand projections and water
resource assessment have been made for 2006, 2007,
2011, and 2021 on the basis of water supply rate of 60
gpcd.
The DDA, as the nodal agency for preparation of the
Master Plan-2021, has projected the population of Delhi
as 23 million in 2021. On this basis, the population and
water demand for the above four scenarios have been
projected as given in Table 4.32.
TABLE 4.32
Population and Water Demand
Year Anticipated Population Total Water Demand(in million) (in mgd)
2006 165 990
2007 175 1050
1011 190 1140
2021 230 1380
4.31.2 Sources of Water
As mentioned earlier, Delhi gets its raw water from
Yamuna, Ganga and BBMB. At present, out of the total
installed capacity of 650 mgd on canal/river water (Table-
4.30), 56.4 per cent of it is on Yamuna water, 18.2 per
cent on Ganga water and the remaining 25.4 per cent is
on the BBMB water. After the commissioning of the
already completed Sonia Vihar WTP, the share of
Yamuna, Ganga and BBMB water in the installed capacity
would become as 44.9 per cent, 34.8 per cent, and 20.3
per cent respectively. Thus, Yamuna remains the largest
source of water for Delhi and the additional water supply
of Delhi to meet its future demand is also largely
dependent on this source only.
No possibility of augmentation is seen in the near
future, as far as Ganga and BBMB sources of raw water
are concerned.
Yamuna water is shared amongst Haryana, Uttar
Pradesh, Rajasthan, Himachal Pradesh, and Delhi in terms
of a Memorandum of Understanding (MoU) signed by
these states in May 1994. According to that MoU, 75 per
cent dependable notional virgin flow in the Yamuna upto
Okhla has been assessed as 11.70 BCM and the mean year
availability has been assessed as 13 BCM. The annual
shares of the five basin states in the utilisable
flow of Yamuna have been agreed to as given below in
Table 4.33.
TABLE 4.33
Yamuna Water is Shared Amongst
Sl. State Share (in BCM) Share (%)No.
(i) Haryana 5.730 47.82
(ii) Uttar Pradesh 4.032 33.65
(iii) Rajasthan 1.119 09.34
(iv) Himachal Pradesh 0.378 03.15
(v) Delhi 0.724 06.04
Total 11.983 100.00
To maximise the utilisation of surface flow of Yamuna,
a number of storage projects in the upper reaches of the
river have been identified. Pending construction of these
projects, the interim seasonal allocation of the annual
utilisable flow have been envisaged in the MoU as in the
Table 4.34.
TABLE 4.34
Annual Utilisable Flow envisaged in the MoU
Sl. States Allocation (BCM) TotalNo. (BCM)
July to Oct. Nov. to Feb. Mar. to June
1. Haryana 4.107 0.686 0.937 5.730
2. UttarPradesh 3.216 0.343 0.473 4.032
3. Rajasthan 0.963 0.070 0.086 1.119
4. HimachalPradesh 0.190 0.108 0.080 0.378
5. Delhi 0.580 0.068 0.076 0.724(Consumptive) (Consumptive) (Consumptive) (Consumptive)
(1926+495 (231+495 (255+495 (806+495return flow) return flow) return flow) return flow)
or or =750 cusec =2350 cusec=2421 cusec =726 cusec
The Upper Yamuna River Board (UYRB) within the
overall framework of the aforesaid MoU regulates the
allocations amongst the beneficiary states.
As would be observed from the above table, the share
of Delhi in Yamuna water is 0.724 BCM per annum
(consumptive), which is equivalent to 2350 cusec. It is,
however, subject to the construction of storage dams in
the upper reaches of Yamuuna. This allocation is reckoned
at Tajewala in Haryana where the Yamuna water is
distributed amongst the major riparian states. It is
important to note that the entire allocation of Delhi is for
drinking purposes, of which only about 20 per cent of it is
for consumptive use and the balance 80 per cent is
returned to the river as treated wastewater. According to
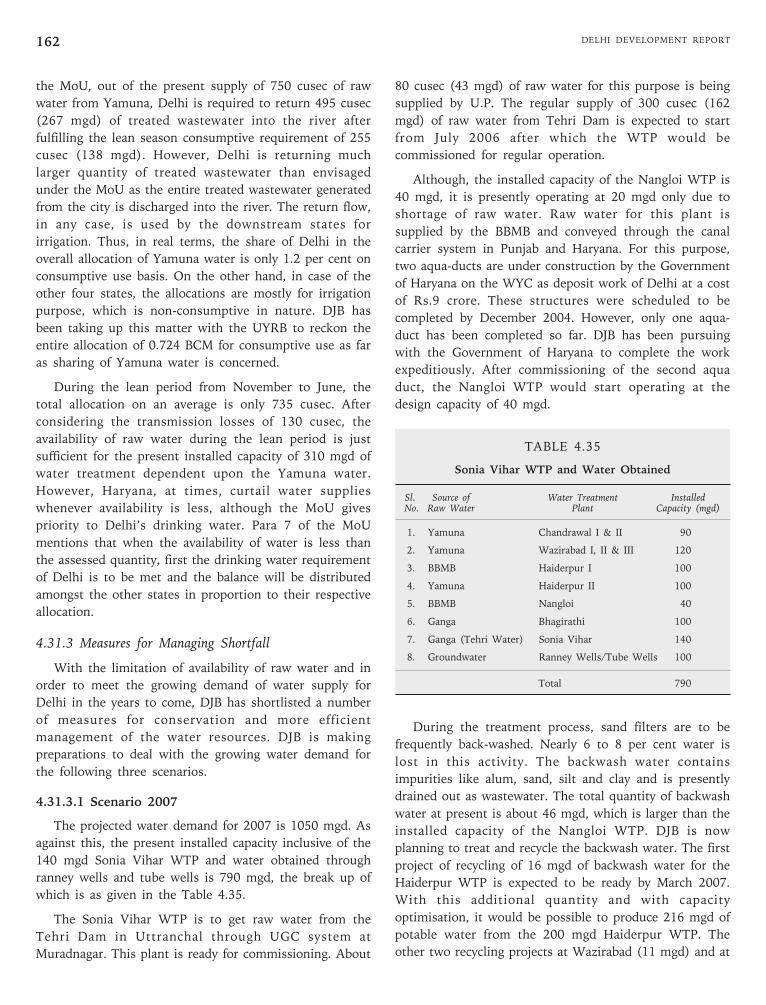
DELHI DEVELOPMENT REPORT162
the MoU, out of the present supply of 750 cusec of raw
water from Yamuna, Delhi is required to return 495 cusec
(267 mgd) of treated wastewater into the river after
fulfilling the lean season consumptive requirement of 255
cusec (138 mgd). However, Delhi is returning much
larger quantity of treated wastewater than envisaged
under the MoU as the entire treated wastewater generated
from the city is discharged into the river. The return flow,
in any case, is used by the downstream states for
irrigation. Thus, in real terms, the share of Delhi in the
overall allocation of Yamuna water is only 1.2 per cent on
consumptive use basis. On the other hand, in case of the
other four states, the allocations are mostly for irrigation
purpose, which is non-consumptive in nature. DJB has
been taking up this matter with the UYRB to reckon the
entire allocation of 0.724 BCM for consumptive use as far
as sharing of Yamuna water is concerned.
During the lean period from November to June, the
total allocation on an average is only 735 cusec. After
considering the transmission losses of 130 cusec, the
availability of raw water during the lean period is just
sufficient for the present installed capacity of 310 mgd of
water treatment dependent upon the Yamuna water.
However, Haryana, at times, curtail water supplies
whenever availability is less, although the MoU gives
priority to Delhi’s drinking water. Para 7 of the MoU
mentions that when the availability of water is less than
the assessed quantity, first the drinking water requirement
of Delhi is to be met and the balance will be distributed
amongst the other states in proportion to their respective
allocation.
4.31.3 Measures for Managing Shortfall
With the limitation of availability of raw water and in
order to meet the growing demand of water supply for
Delhi in the years to come, DJB has shortlisted a number
of measures for conservation and more efficient
management of the water resources. DJB is making
preparations to deal with the growing water demand for
the following three scenarios.
4.31.3.1 Scenario 2007
The projected water demand for 2007 is 1050 mgd. As
against this, the present installed capacity inclusive of the
140 mgd Sonia Vihar WTP and water obtained through
ranney wells and tube wells is 790 mgd, the break up of
which is as given in the Table 4.35.
The Sonia Vihar WTP is to get raw water from the
Tehri Dam in Uttranchal through UGC system at
Muradnagar. This plant is ready for commissioning. About
80 cusec (43 mgd) of raw water for this purpose is being
supplied by U.P. The regular supply of 300 cusec (162
mgd) of raw water from Tehri Dam is expected to start
from July 2006 after which the WTP would be
commissioned for regular operation.
Although, the installed capacity of the Nangloi WTP is
40 mgd, it is presently operating at 20 mgd only due to
shortage of raw water. Raw water for this plant is
supplied by the BBMB and conveyed through the canal
carrier system in Punjab and Haryana. For this purpose,
two aqua-ducts are under construction by the Government
of Haryana on the WYC as deposit work of Delhi at a cost
of Rs.9 crore. These structures were scheduled to be
completed by December 2004. However, only one aqua-
duct has been completed so far. DJB has been pursuing
with the Government of Haryana to complete the work
expeditiously. After commissioning of the second aqua
duct, the Nangloi WTP would start operating at the
design capacity of 40 mgd.
TABLE 4.35
Sonia Vihar WTP and Water Obtained
Sl. Source of Water Treatment InstalledNo. Raw Water Plant Capacity (mgd)
1. Yamuna Chandrawal I & II 90
2. Yamuna Wazirabad I, II & III 120
3. BBMB Haiderpur I 100
4. Yamuna Haiderpur II 100
5. BBMB Nangloi 40
6. Ganga Bhagirathi 100
7. Ganga (Tehri Water) Sonia Vihar 140
8. Groundwater Ranney Wells/Tube Wells 100
Total 790
During the treatment process, sand filters are to be
frequently back-washed. Nearly 6 to 8 per cent water is
lost in this activity. The backwash water contains
impurities like alum, sand, silt and clay and is presently
drained out as wastewater. The total quantity of backwash
water at present is about 46 mgd, which is larger than the
installed capacity of the Nangloi WTP. DJB is now
planning to treat and recycle the backwash water. The first
project of recycling of 16 mgd of backwash water for the
Haiderpur WTP is expected to be ready by March 2007.
With this additional quantity and with capacity
optimisation, it would be possible to produce 216 mgd of
potable water from the 200 mgd Haiderpur WTP. The
other two recycling projects at Wazirabad (11 mgd) and at
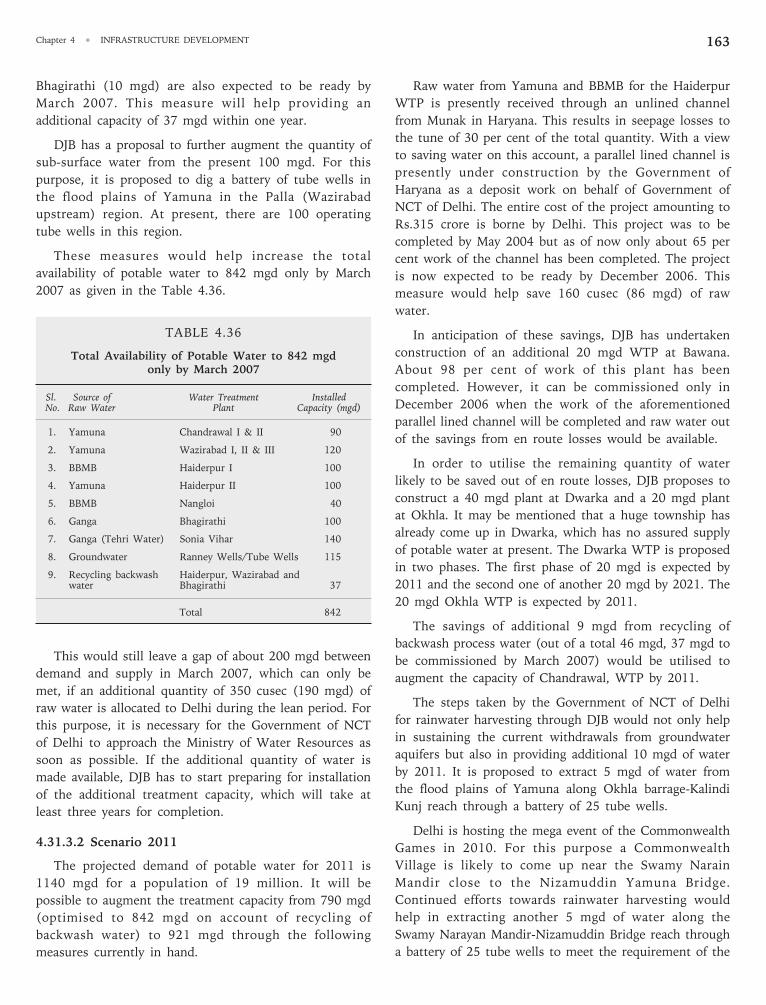
163Chapter 4 • INFRASTRUCTURE DEVELOPMENT
Bhagirathi (10 mgd) are also expected to be ready by
March 2007. This measure will help providing an
additional capacity of 37 mgd within one year.
DJB has a proposal to further augment the quantity of
sub-surface water from the present 100 mgd. For this
purpose, it is proposed to dig a battery of tube wells in
the flood plains of Yamuna in the Palla (Wazirabad
upstream) region. At present, there are 100 operating
tube wells in this region.
These measures would help increase the total
availability of potable water to 842 mgd only by March
2007 as given in the Table 4.36.
TABLE 4.36
Total Availability of Potable Water to 842 mgdonly by March 2007
Sl. Source of Water Treatment InstalledNo. Raw Water Plant Capacity (mgd)
1. Yamuna Chandrawal I & II 90
2. Yamuna Wazirabad I, II & III 120
3. BBMB Haiderpur I 100
4. Yamuna Haiderpur II 100
5. BBMB Nangloi 40
6. Ganga Bhagirathi 100
7. Ganga (Tehri Water) Sonia Vihar 140
8. Groundwater Ranney Wells/Tube Wells 115
9. Recycling backwash Haiderpur, Wazirabad andwater Bhagirathi 37
Total 842
This would still leave a gap of about 200 mgd between
demand and supply in March 2007, which can only be
met, if an additional quantity of 350 cusec (190 mgd) of
raw water is allocated to Delhi during the lean period. For
this purpose, it is necessary for the Government of NCT
of Delhi to approach the Ministry of Water Resources as
soon as possible. If the additional quantity of water is
made available, DJB has to start preparing for installation
of the additional treatment capacity, which will take at
least three years for completion.
4.31.3.2 Scenario 2011
The projected demand of potable water for 2011 is
1140 mgd for a population of 19 million. It will be
possible to augment the treatment capacity from 790 mgd
(optimised to 842 mgd on account of recycling of
backwash water) to 921 mgd through the following
measures currently in hand.
Raw water from Yamuna and BBMB for the Haiderpur
WTP is presently received through an unlined channel
from Munak in Haryana. This results in seepage losses to
the tune of 30 per cent of the total quantity. With a view
to saving water on this account, a parallel lined channel is
presently under construction by the Government of
Haryana as a deposit work on behalf of Government of
NCT of Delhi. The entire cost of the project amounting to
Rs.315 crore is borne by Delhi. This project was to be
completed by May 2004 but as of now only about 65 per
cent work of the channel has been completed. The project
is now expected to be ready by December 2006. This
measure would help save 160 cusec (86 mgd) of raw
water.
In anticipation of these savings, DJB has undertaken
construction of an additional 20 mgd WTP at Bawana.
About 98 per cent of work of this plant has been
completed. However, it can be commissioned only in
December 2006 when the work of the aforementioned
parallel lined channel will be completed and raw water out
of the savings from en route losses would be available.
In order to utilise the remaining quantity of water
likely to be saved out of en route losses, DJB proposes to
construct a 40 mgd plant at Dwarka and a 20 mgd plant
at Okhla. It may be mentioned that a huge township has
already come up in Dwarka, which has no assured supply
of potable water at present. The Dwarka WTP is proposed
in two phases. The first phase of 20 mgd is expected by
2011 and the second one of another 20 mgd by 2021. The
20 mgd Okhla WTP is expected by 2011.
The savings of additional 9 mgd from recycling of
backwash process water (out of a total 46 mgd, 37 mgd to
be commissioned by March 2007) would be utilised to
augment the capacity of Chandrawal, WTP by 2011.
The steps taken by the Government of NCT of Delhi
for rainwater harvesting through DJB would not only help
in sustaining the current withdrawals from groundwater
aquifers but also in providing additional 10 mgd of water
by 2011. It is proposed to extract 5 mgd of water from
the flood plains of Yamuna along Okhla barrage-Kalindi
Kunj reach through a battery of 25 tube wells.
Delhi is hosting the mega event of the Commonwealth
Games in 2010. For this purpose a Commonwealth
Village is likely to come up near the Swamy Narain
Mandir close to the Nizamuddin Yamuna Bridge.
Continued efforts towards rainwater harvesting would
help in extracting another 5 mgd of water along the
Swamy Narayan Mandir-Nizamuddin Bridge reach through
a battery of 25 tube wells to meet the requirement of the
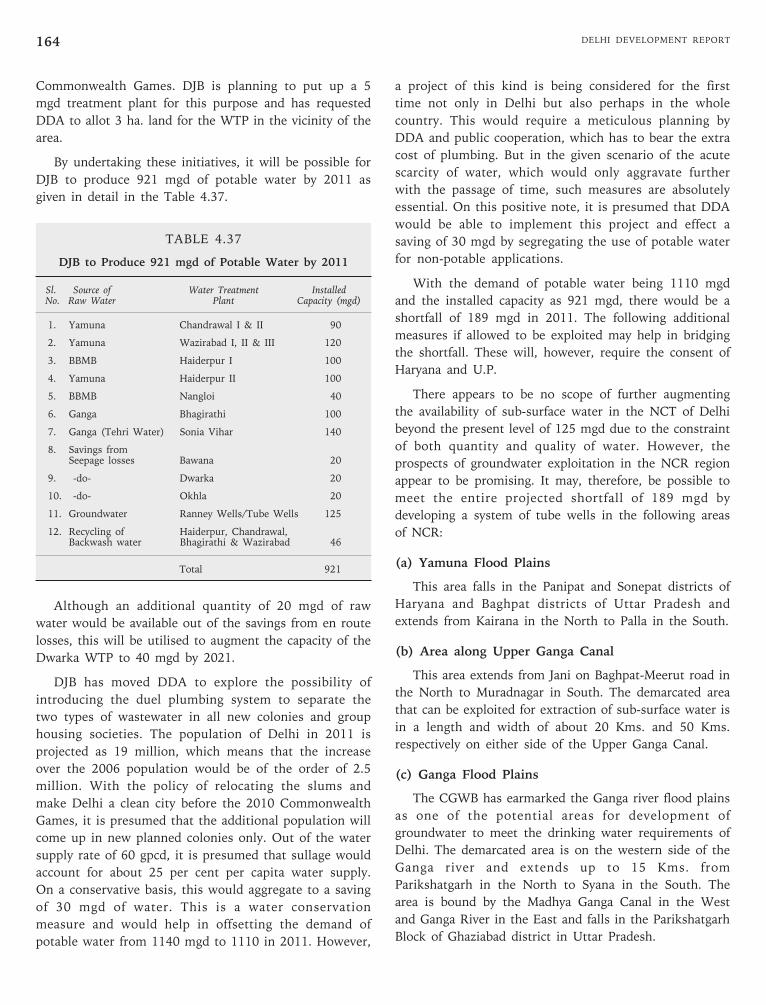
DELHI DEVELOPMENT REPORT164
Commonwealth Games. DJB is planning to put up a 5
mgd treatment plant for this purpose and has requested
DDA to allot 3 ha. land for the WTP in the vicinity of the
area.
By undertaking these initiatives, it will be possible for
DJB to produce 921 mgd of potable water by 2011 as
given in detail in the Table 4.37.
TABLE 4.37
DJB to Produce 921 mgd of Potable Water by 2011
Sl. Source of Water Treatment InstalledNo. Raw Water Plant Capacity (mgd)
1. Yamuna Chandrawal I & II 90
2. Yamuna Wazirabad I, II & III 120
3. BBMB Haiderpur I 100
4. Yamuna Haiderpur II 100
5. BBMB Nangloi 40
6. Ganga Bhagirathi 100
7. Ganga (Tehri Water) Sonia Vihar 140
8. Savings fromSeepage losses Bawana 20
9. -do- Dwarka 20
10. -do- Okhla 20
11. Groundwater Ranney Wells/Tube Wells 125
12. Recycling of Haiderpur, Chandrawal,Backwash water Bhagirathi & Wazirabad 46
Total 921
Although an additional quantity of 20 mgd of raw
water would be available out of the savings from en route
losses, this will be utilised to augment the capacity of the
Dwarka WTP to 40 mgd by 2021.
DJB has moved DDA to explore the possibility of
introducing the duel plumbing system to separate the
two types of wastewater in all new colonies and group
housing societies. The population of Delhi in 2011 is
projected as 19 million, which means that the increase
over the 2006 population would be of the order of 2.5
million. With the policy of relocating the slums and
make Delhi a clean city before the 2010 Commonwealth
Games, it is presumed that the additional population will
come up in new planned colonies only. Out of the water
supply rate of 60 gpcd, it is presumed that sullage would
account for about 25 per cent per capita water supply.
On a conservative basis, this would aggregate to a saving
of 30 mgd of water. This is a water conservation
measure and would help in offsetting the demand of
potable water from 1140 mgd to 1110 in 2011. However,
a project of this kind is being considered for the first
time not only in Delhi but also perhaps in the whole
country. This would require a meticulous planning by
DDA and public cooperation, which has to bear the extra
cost of plumbing. But in the given scenario of the acute
scarcity of water, which would only aggravate further
with the passage of time, such measures are absolutely
essential. On this positive note, it is presumed that DDA
would be able to implement this project and effect a
saving of 30 mgd by segregating the use of potable water
for non-potable applications.
With the demand of potable water being 1110 mgd
and the installed capacity as 921 mgd, there would be a
shortfall of 189 mgd in 2011. The following additional
measures if allowed to be exploited may help in bridging
the shortfall. These will, however, require the consent of
Haryana and U.P.
There appears to be no scope of further augmenting
the availability of sub-surface water in the NCT of Delhi
beyond the present level of 125 mgd due to the constraint
of both quantity and quality of water. However, the
prospects of groundwater exploitation in the NCR region
appear to be promising. It may, therefore, be possible to
meet the entire projected shortfall of 189 mgd by
developing a system of tube wells in the following areas
of NCR:
(a) Yamuna Flood Plains
This area falls in the Panipat and Sonepat districts of
Haryana and Baghpat districts of Uttar Pradesh and
extends from Kairana in the North to Palla in the South.
(b) Area along Upper Ganga Canal
This area extends from Jani on Baghpat-Meerut road in
the North to Muradnagar in South. The demarcated area
that can be exploited for extraction of sub-surface water is
in a length and width of about 20 Kms. and 50 Kms.
respectively on either side of the Upper Ganga Canal.
(c) Ganga Flood Plains
The CGWB has earmarked the Ganga river flood plains
as one of the potential areas for development of
groundwater to meet the drinking water requirements of
Delhi. The demarcated area is on the western side of the
Ganga river and extends up to 15 Kms. from
Parikshatgarh in the North to Syana in the South. The
area is bound by the Madhya Ganga Canal in the West
and Ganga River in the East and falls in the Parikshatgarh
Block of Ghaziabad district in Uttar Pradesh.
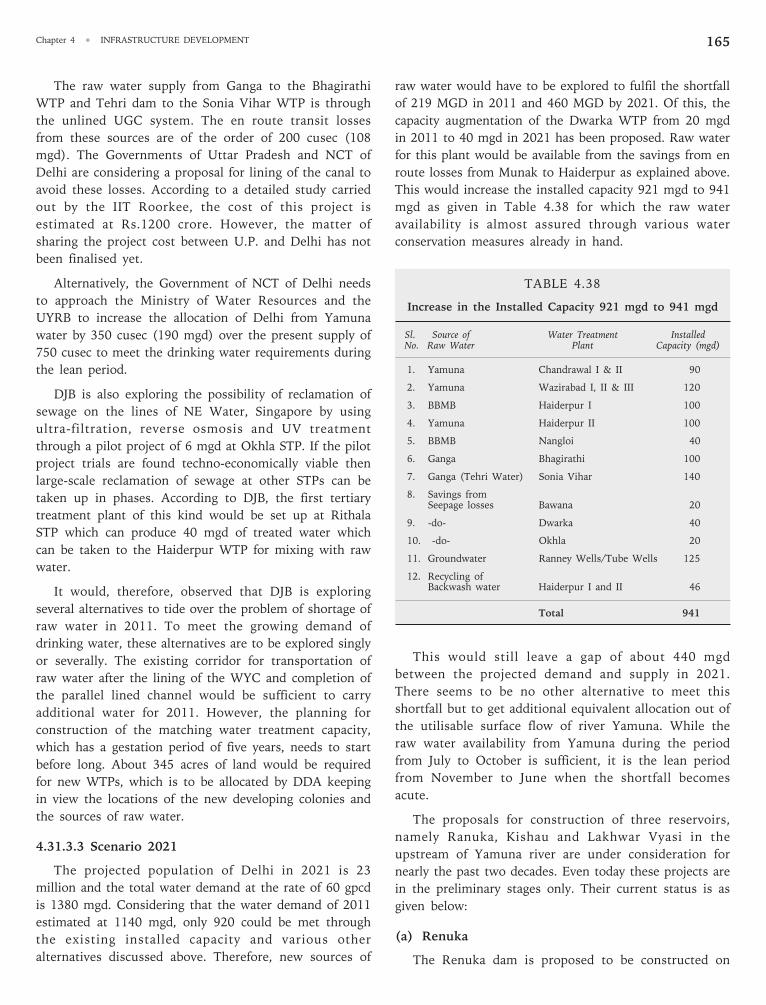
165Chapter 4 • INFRASTRUCTURE DEVELOPMENT
The raw water supply from Ganga to the Bhagirathi
WTP and Tehri dam to the Sonia Vihar WTP is through
the unlined UGC system. The en route transit losses
from these sources are of the order of 200 cusec (108
mgd). The Governments of Uttar Pradesh and NCT of
Delhi are considering a proposal for lining of the canal to
avoid these losses. According to a detailed study carried
out by the IIT Roorkee, the cost of this project is
estimated at Rs.1200 crore. However, the matter of
sharing the project cost between U.P. and Delhi has not
been finalised yet.
Alternatively, the Government of NCT of Delhi needs
to approach the Ministry of Water Resources and the
UYRB to increase the allocation of Delhi from Yamuna
water by 350 cusec (190 mgd) over the present supply of
750 cusec to meet the drinking water requirements during
the lean period.
DJB is also exploring the possibility of reclamation of
sewage on the lines of NE Water, Singapore by using
ultra-filtration, reverse osmosis and UV treatment
through a pilot project of 6 mgd at Okhla STP. If the pilot
project trials are found techno-economically viable then
large-scale reclamation of sewage at other STPs can be
taken up in phases. According to DJB, the first tertiary
treatment plant of this kind would be set up at Rithala
STP which can produce 40 mgd of treated water which
can be taken to the Haiderpur WTP for mixing with raw
water.
It would, therefore, observed that DJB is exploring
several alternatives to tide over the problem of shortage of
raw water in 2011. To meet the growing demand of
drinking water, these alternatives are to be explored singly
or severally. The existing corridor for transportation of
raw water after the lining of the WYC and completion of
the parallel lined channel would be sufficient to carry
additional water for 2011. However, the planning for
construction of the matching water treatment capacity,
which has a gestation period of five years, needs to start
before long. About 345 acres of land would be required
for new WTPs, which is to be allocated by DDA keeping
in view the locations of the new developing colonies and
the sources of raw water.
4.31.3.3 Scenario 2021
The projected population of Delhi in 2021 is 23
million and the total water demand at the rate of 60 gpcd
is 1380 mgd. Considering that the water demand of 2011
estimated at 1140 mgd, only 920 could be met through
the existing installed capacity and various other
alternatives discussed above. Therefore, new sources of
raw water would have to be explored to fulfil the shortfall
of 219 MGD in 2011 and 460 MGD by 2021. Of this, the
capacity augmentation of the Dwarka WTP from 20 mgd
in 2011 to 40 mgd in 2021 has been proposed. Raw water
for this plant would be available from the savings from en
route losses from Munak to Haiderpur as explained above.
This would increase the installed capacity 921 mgd to 941
mgd as given in Table 4.38 for which the raw water
availability is almost assured through various water
conservation measures already in hand.
TABLE 4.38
Increase in the Installed Capacity 921 mgd to 941 mgd
Sl. Source of Water Treatment InstalledNo. Raw Water Plant Capacity (mgd)
1. Yamuna Chandrawal I & II 90
2. Yamuna Wazirabad I, II & III 120
3. BBMB Haiderpur I 100
4. Yamuna Haiderpur II 100
5. BBMB Nangloi 40
6. Ganga Bhagirathi 100
7. Ganga (Tehri Water) Sonia Vihar 140
8. Savings fromSeepage losses Bawana 20
9. -do- Dwarka 40
10. -do- Okhla 20
11. Groundwater Ranney Wells/Tube Wells 125
12. Recycling ofBackwash water Haiderpur I and II 46
Total 941
This would still leave a gap of about 440 mgd
between the projected demand and supply in 2021.
There seems to be no other alternative to meet this
shortfall but to get additional equivalent allocation out of
the utilisable surface flow of river Yamuna. While the
raw water availability from Yamuna during the period
from July to October is sufficient, it is the lean period
from November to June when the shortfall becomes
acute.
The proposals for construction of three reservoirs,
namely Ranuka, Kishau and Lakhwar Vyasi in the
upstream of Yamuna river are under consideration for
nearly the past two decades. Even today these projects are
in the preliminary stages only. Their current status is as
given below:
(a) Renuka
The Renuka dam is proposed to be constructed on
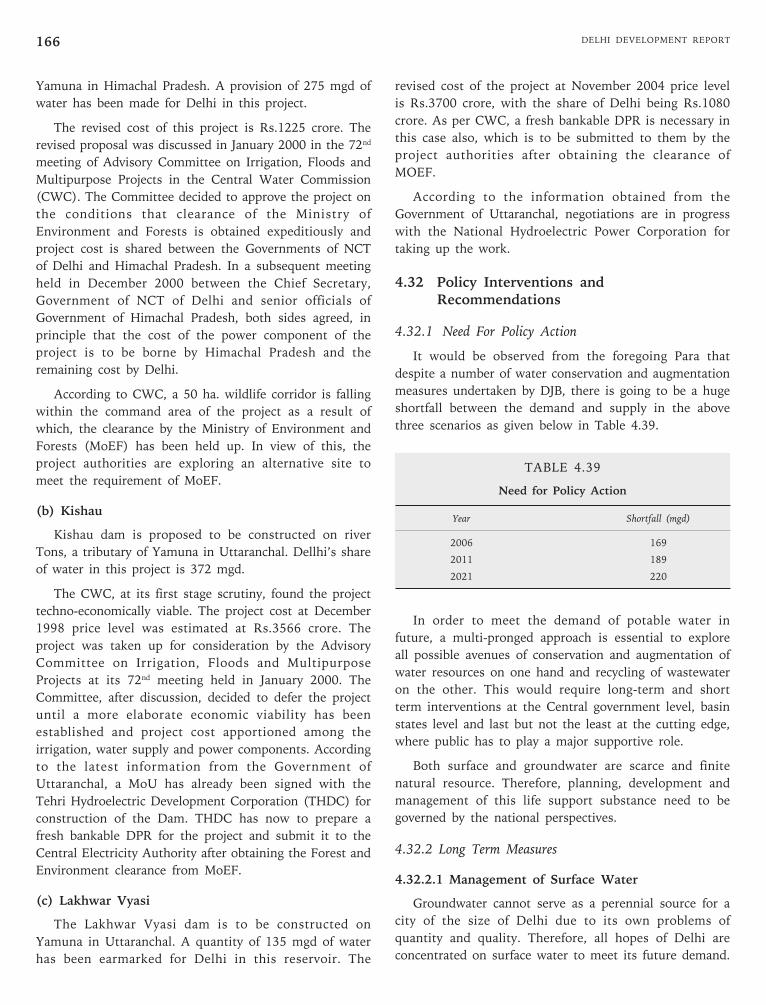
DELHI DEVELOPMENT REPORT166
Yamuna in Himachal Pradesh. A provision of 275 mgd of
water has been made for Delhi in this project.
The revised cost of this project is Rs.1225 crore. The
revised proposal was discussed in January 2000 in the 72nd
meeting of Advisory Committee on Irrigation, Floods and
Multipurpose Projects in the Central Water Commission
(CWC). The Committee decided to approve the project on
the conditions that clearance of the Ministry of
Environment and Forests is obtained expeditiously and
project cost is shared between the Governments of NCT
of Delhi and Himachal Pradesh. In a subsequent meeting
held in December 2000 between the Chief Secretary,
Government of NCT of Delhi and senior officials of
Government of Himachal Pradesh, both sides agreed, in
principle that the cost of the power component of the
project is to be borne by Himachal Pradesh and the
remaining cost by Delhi.
According to CWC, a 50 ha. wildlife corridor is falling
within the command area of the project as a result of
which, the clearance by the Ministry of Environment and
Forests (MoEF) has been held up. In view of this, the
project authorities are exploring an alternative site to
meet the requirement of MoEF.
(b) Kishau
Kishau dam is proposed to be constructed on river
Tons, a tributary of Yamuna in Uttaranchal. Dellhi’s share
of water in this project is 372 mgd.
The CWC, at its first stage scrutiny, found the project
techno-economically viable. The project cost at December
1998 price level was estimated at Rs.3566 crore. The
project was taken up for consideration by the Advisory
Committee on Irrigation, Floods and Multipurpose
Projects at its 72nd meeting held in January 2000. The
Committee, after discussion, decided to defer the project
until a more elaborate economic viability has been
established and project cost apportioned among the
irrigation, water supply and power components. According
to the latest information from the Government of
Uttaranchal, a MoU has already been signed with the
Tehri Hydroelectric Development Corporation (THDC) for
construction of the Dam. THDC has now to prepare a
fresh bankable DPR for the project and submit it to the
Central Electricity Authority after obtaining the Forest and
Environment clearance from MoEF.
(c) Lakhwar Vyasi
The Lakhwar Vyasi dam is to be constructed on
Yamuna in Uttaranchal. A quantity of 135 mgd of water
has been earmarked for Delhi in this reservoir. The
revised cost of the project at November 2004 price level
is Rs.3700 crore, with the share of Delhi being Rs.1080
crore. As per CWC, a fresh bankable DPR is necessary in
this case also, which is to be submitted to them by the
project authorities after obtaining the clearance of
MOEF.
According to the information obtained from the
Government of Uttaranchal, negotiations are in progress
with the National Hydroelectric Power Corporation for
taking up the work.
4.32 Policy Interventions andRecommendations
4.32.1 Need For Policy Action
It would be observed from the foregoing Para that
despite a number of water conservation and augmentation
measures undertaken by DJB, there is going to be a huge
shortfall between the demand and supply in the above
three scenarios as given below in Table 4.39.
TABLE 4.39
Need for Policy Action
Year Shortfall (mgd)
2006 169
2011 189
2021 220
In order to meet the demand of potable water in
future, a multi-pronged approach is essential to explore
all possible avenues of conservation and augmentation of
water resources on one hand and recycling of wastewater
on the other. This would require long-term and short
term interventions at the Central government level, basin
states level and last but not the least at the cutting edge,
where public has to play a major supportive role.
Both surface and groundwater are scarce and finite
natural resource. Therefore, planning, development and
management of this life support substance need to be
governed by the national perspectives.
4.32.2 Long Term Measures
4.32.2.1 Management of Surface Water
Groundwater cannot serve as a perennial source for a
city of the size of Delhi due to its own problems of
quantity and quality. Therefore, all hopes of Delhi are
concentrated on surface water to meet its future demand.
167Chapter 4 • INFRASTRUCTURE DEVELOPMENT
Amongst the three sources presently supplying raw water,
Delhi has riparian rites only on Yamuna water. Therefore,
it is this source only that needs to be developed and
managed effectively to meet the growing demand of water
in Delhi. It also needs to be appreciated that besides being
the capital of India, a sizeable population migrates to
Delhi from other states every year in search of
employment opportunities. Therefore, it is all the more
necessary to address the water supply issue of the city
from a national perspective.
In the absence of adequate storage in the upper
reaches, large quantities of water during monsoon months
flow down the river without serving any useful purpose as
far as Delhi is concerned. The first charge, therefore,
should be on expediting the construction of the three
reservoirs, which has been pending for some reason or the
other since the past two decades. For this purpose,
interventions at the levels of the Planning Commission
and the Ministry of Water Resources are necessary. The
project authorities are also required not only to prepare
the DPRs and addresses the inter-state issues
expeditiously, but also move the Ministry of Environment
and Forests to obtain the necessary clearances. These are
multipurpose projects involving power and irrigation
components besides water for Delhi. The delay in
construction is, therefore, adversely impacting on all the
beneficiary states including Delhi in one way or the other.
Considering a long gestation period in construction, it is
necessary that approval of these mega-projects is
processed on top priority.
Requirement of capital funds for these projects is the
next important issue that needs to be addressed at
appropriate level. Although, the cost estimates are not yet
firmed-up, if the available data are any indication, the
share of Delhi in the capital cost would be anywhere
around Rs.5000 crore. It is too large an outlay to be
managed by a small state like Delhi out of its own
resources. Therefore, once the projects are cleared,
support of the Planning Commission is necessary for
earmarking adequate funds for Delhi in their Annual/Five
Year Plans. Funding from multilateral/bilateral donors like
the World Bank, Japan Bank for International Cooperation
or Asian Development Bank also needs to be explored.
The National Water Policy 2002 has allocated first
priority to the drinking water amongst various
consumptive and non-consumptive uses of fresh water.
The MoU on sharing of Yamuna water amongst the basin
states also gives priority to drinking water for Delhi. It
needs to be appreciated that unlike the other four basin
States, the entire present allocation of 0.724 BCM or 806
cusec of water of Delhi is for consumptive use. Delhi has
no other option but to return about 80 per cent of it back
to the river as return wastewater, which is picked up at
Okhla by other basin states for irrigation purposes. As a
matter of fact, Delhi is returning the wastewater to the
river even from those water revenue zones also, where
WTPs are operating on Ganga and BBMB water. Delhi is,
therefore, at a great disadvantage vis-à-vis other four basin
States in so far as utilisation of Yamuna water is
concerned. Therefore, a more pragmatic approach needs to
be adopted on sharing the available surface flow of the
river amongst the basin States to ensure that Delhi gets
enough water to meet the growing demand.
4.32.3 Short Term Measure
4.32.3.1 Commissioning of Sonia Vihar WTP
There are several uncertainties associated with the
availability of raw water for the Sonia Vihar WTP. Being
an interstate matter, intervention of the Central
government at appropriate level is necessary so that this
plant gets full quantity of water from Tehri dam at least
by mid-July 2006.
4.32.3.2 Management of Groundwater
Keeping in view the fact that DJB draws over 100 mgd
of groundwater, it is necessary that its withdrawal is
regulated under a strict regime. Presently, there is no
control over extraction of groundwater except banning of
new bore wells in some selected pockets of South and
Southwest Delhi. In several parts of the city, unauthorised
extraction of large quantities of groundwater takes place
round the year. Due to meager rains and fewer rainwater
harvesting activities, groundwater recharge is minimal. As
a result, the water table is falling at an alarming rate. This
will eventually have adverse impact on the water supply of
Delhi. The nodal agency for regulation, development and
management of groundwater is CGWA under the Ministry
of Water Resource. DJB with its widespread network can
assist CGWA in checking unauthorised exploitation of
groundwater in Delhi. CGWA may, therefore, consider
delegating necessary powers to DJB in this regard on the
lines of Chandigarh.
4.32.3.3 Conservation Measures
(i) Leakage Control
Distribution losses in Delhi are very high at about 40
per cent as compared to other mega-cities. With a fairly
large gap between demand and supply of water, this area
assumes greater significance, as quick results can be
DELHI DEVELOPMENT REPORT168
possible with smaller interventions. DJB has already taken
several steps to minimise leakage losses. The target
should be to bring the losses within 15 per cent as set out
by CPHEEO as quickly as possible. It is, therefore,
necessary to prepare a comprehensive action plan to
complete the whole work in a given time frame.
(ii) Metering of Supply
With the recent increase in the water tariffs,
concurrent action on metering of supply can act as a good
deterrent against misuse or wastage of water. The work of
replacing the defective meters is already in hand. DJB
should ensure that it is completed expeditiously and
meters function on a sustainable basis.
(iii) Water for Horticulture
Water for parks, lawns and horticulture is extracted
from underground aquifers in significant quantities in
several parts of Delhi. Due to fast depletion of the water
table, most of the bore wells, particularly in South and
Southwest Delhi, have gone dry. As a result, parks in
Delhi are starving for water and loosing the greenery.
Most of these parks are in the neighbourhood of group
housing societies. These parks can be maintained
comfortably, if treated sewage from the neighbourhood is
used for watering them. Presently, the Sewerage wing of
DJB collects sewage from such areas and conveys it
through a long network of sewers to STPs at a significant
cost. The problem can be addressed in a more simplistic
and economic manner by providing small decentralised
STPs in such neighbourhoods from where sewage, treated
to the desired standards, can be used for horticulture and
other similar purposes in the same area. This approach
will render multiple benefits. Firstly, it will reduce the
load on the sewerage system and STPs and save in the
conveying cost. Secondly, it will provide a zero pollution
system in a local area. Thirdly, it will help in conserving
the fast depleting groundwater table. Lastly, it will help
save potable water where it is used for watering the parks
and lawns. To begin with, DJB should plan to put up such
decentralised systems on demonstration basis in some
parts of Delhi.
In many areas of New Delhi falling under NDMC,
potable water is used for watering the lawns and parks. In
several of these areas, pipe network for supply of treated
sewage for such purposes already exists. However,
according to the available reports, this system is seldom
used due to various reasons like foul smell, undependable
supply, leakage etc. All these bottlenecks can be easily
removed. DJB may consider reviewing this option on
priority, which can save a considerable quantity of potable
water.
(iv) Plugging of Transit Losses
Nearly 30-35 per cent water is lost in transit in the
WYC and UGC. The work of lining of the WYC from
Munak to Haiderpur is already in progress. This work
needs to be expedited so that it is completed by the
revised schedule of May 2006. This will result in the
saving of about 160 cusec (86 mgd) of raw water.
Similarly, seepage losses in UGC, which carries raw water
for Bhagirathi and the Sonia Vihar WTP, are of the order
of 200 cusec. This quantity can be made available to
Delhi, if, like the WYC, this canal is also lined. This
proposal is techno-economically viable and, therefore,
needs to be considered on priority. Interventions at the
Planning Commission/Central government level are
necessary to finalise the matter of sharing of the project
cost between U.P. and Delhi early.
To utilise the savings from en route transit losses in
the WYC, DJB is planning to construct a 40 mgd WTP at
Dwarka and a 20 mgd WTP at Okhla. Considering the
gestation period involved, these projects need to be taken
up on priority.
The Government of Haryana is constructing two aqua-
ducts on the WYC, which carries water for the 40 mgd
Nangloi WTP. The progress of this work is very slow.
The matter needs to be taken up with the Government
of Haryana so that this project is completed without
further delay and the Nangloi WTP is operated at its full
capacity.
DJB should also ensure that the project of recycling of
backwash water is completed as per schedule. This
measure would help conserve 46 mgd of water, which is
presently discharged as wastewater.
(v) Recycling of Sullage
Recycling the treated sullage in the new colonies
planned by DDA by providing duel-plumbing system is an
innovative project towards conserving water and needs to
be encouraged by all the concerned agencies. Similarly,
the proposal for reclamation and recycling of sewage
through tertiary treatment is also a novel idea and needs
to be taken up on priority.
DDA is the land use planning and development agency
for Delhi. There are instances like Dwarka, where a huge
colony has been developed without the matching
provision of water and sewerage utilities. Keeping in view
the constraint of raw water availability, all new colonies
169Chapter 4 • INFRASTRUCTURE DEVELOPMENT
need to be planned only when matching availability of
water is ensured.
About 17.5 per cent of the total water supplied is used
for industrial, commercial and community purposes.
Although firm data are not available, a sizeable quantity in
this category is used in the high-rise buildings and
complexes housing offices of government and public/
private sector companies. These offices generate a
significant quantity of wastewater in the form of mixed
sewage and sullage, which is discharged into the nearby
sewerage system. On the other hand many of these offices
have centralised cooling system, for which fresh water
either from DJB or from underground aquifers is used
adding to the problems of DJB during the lean months of
summer. Such requirements can also be met by recycling
the treated sewage from the complex. For instance, the
entire sewage of CGO complex can be collected and
treated to tertiary level and used for such purposes as
cooling or flushing of toilets or horticulture. These types
of plants are in operation in a number of high-rise
buildings in Mumbai. In order to motivate the agencies to
adopt this approach, the water tariffs may be fixed in such
a way that the recycling option is more economic than
using DJB water.
4.32.3.4 Public Participation
Although, the programmes of public participation
covering rainwater harvesting, curbing wastage of water,
identification and replacement of old/leaking service pipes,
payment and collection of water bills etc. have already been
started by DJB, it is necessary to step up public awareness
about these programmes. There is a tremendous scope of
public involvement in these areas, which can not only help
in water conservation activities but also help DJB to
improve its service and increase revenue generation. RWAs
and various other bodies under the Bhagidari scheme can
be more actively involved in these programmes. Some of
the areas where a focussed public awareness programme
can bring good results are as under:
(i) Nearly 20 litres of water is used in flushing of
toilets. About 10 per cent water can be saved in
this activity simply by putting a two-litre plastic
bottle in the flushing cistern. There are about 13
lakh domestic connections in Delhi. Considering
that a toilet is used at least five times a day, every
household can save an average 10 litres/day that
makes the total saving as 3 mgd from a single
measure without any investment. Secondly, in the
new construction, public needs to be educated
and motivated to use smaller cisterns in the
toilets. Water can be saved by not running the tap
continuously, as many people do, while brushing
the teeth or washing hands. A car can be washed
with a bucket of water, whereas many use a
hosepipe wasting a significant quantity of water.
People need to be sensitised about such facts.
These ideas are no new and are known to a
common man. But in practice, these norms are
not followed. Sensitising public in a focused
manner is the only way to achieve results in this
regard. RWAs can be of immense help in such
initiatives.
(ii) A significant quantity of water is wasted through
overflows in the desert coolers during summer,
when water demand is at its peak. Although, the
increase in tariffs now proposed by DJB is likely
to act as a deterrent in this regard, it is
necessary to sensitise the consumer to minimise
wastage in the national interest. Similarly, in
several areas, the service reservoirs provided in
the residential colonies overflow resulting in the
wastage of a significant quantity of potable
water. Such type of wastage can be controlled
through the involvement of RWAs. DJB may
devise a system wherein the pump operators
posted at such reservoirs are made accountable
to the RWAs operation of the water supply
system.
(iii) RWAs are a valuable resource in helping the civic
authorities in maintaining a better standard of
services. This resource must be utilised
intelligently and fruitfully. DJB, on its part,
should take steps to provide incentives for good
work done by the RWAs. This would inculcate a
spirit of competition amongst such bodies to
show better performance.
4.33 Conclusion
Controlling operation and maintenance costs, while
providing appropriate levels of service to customers, is an
important part of achieving an efficient water utility. To
that end, DJB is developing innovative measures to
address the complex problems associated with the water
supply of Delhi. However, the main problem of Delhi, as
far as water supply is concerned, is the uncontrolled
influx of migrating population from other states and non-
availability of matching quantity of raw water to meet the
growing demand. Although, to decongest Delhi, the
National Capital Region is being developed, its progress
so far has been slow. Therefore, this issue needs to be
DELHI DEVELOPMENT REPORT170
addressed at appropriate level early. Meanwhile,
implementation of the above measures in a planned and
time-bound manner can greatly help in managing the
water supply of Delhi in a more efficient manner and
bridging the gap between the supply and demand of
potable water.
Measures including water conservation, loss reduction,
dual plumbing, water recycling need to be strengthened
and implemented rigorously.
There is significant reduction in river-flows during the
lean periods. The proposals for construction of the
reservoirs on Yamuna river need to be considered
urgently and implemented.
The Ministry of Water Resources should intervene and
resolve the matter of availability of raw water for Sonia
Vihar Water Treatment Plant.
The withdrawal of ground water should be regulated.
Central Ground Water Authority may consider delegating
necessary powers to bring the management and
development of groundwater under DJB.
A decentralised approach for treating sewage may be
more economic. The treated water from such STPs may be
used for horticulture, parks and greening of Delhi.
All the works and other measures in hand to augment
and conserve water should be completed on priority.
On the lines of Mumbai, wastewater from the high rise
building should be treated insitu to the prescribed
standards and re-used for air conditioning and other
industrial applications.
Public awareness and education through the Bhagidari
Scheme should be encouraged for conserving and
managing potable water optimally.
Delhi may have to depend on Yamuna only to meet
the demand projected in the Master Plan Document-2021.
An additional quantity of 350 cusec needs to be made
available by the UYRB during the lean period.
There is need to construct dams to minimise the
shortfall during the lean periods. UYRB should be
persuaded to treat the allocation of Yamuna water for
consumptive use only.
The web site of DJB is available at
www.delhijalboard.com. However, the information on the
web is old. DJB needs to update the site regularly so that
people of Delhi know more about what is happening on
the waterfront.
TELECOMMUNICATIONS
4.34 Introduction
Telecommunication is an essential infrastructure of
modern day society. It acts as a catalyst to economic
development and leads to faster growth. It also leads to
improvement in education, health, environment,
governance, entertainment, social benefits etc. The legal
framework for the provision of telecommunication
services is provided by the following Acts.
a) The Indian Telegraph Act, 1885
b) The Indian Wireless Telegraphy Act, 1933
c) The Telegraph Wires (Unlawful Possession) Act,
1950
d) The Cable Television Networks (Regulation) Act,
1995
e) The Telecom Regulatory Authority of India Act,
1997
f) The Information Technology Act, 2000
4.35 Telecommunication Policy
Under the Indian Telegraph Act, 1885 the
telecommunication services can be provided by Central
government or an entity licensed by the government.
Telecommunication services in India were earlier
provided by Central government or Government PSUs.
In early 90s, a beginning was made and private service
providers started offering value-added services. About
ten years back licences were given to private service
operators for Mobile Telephone service. In 1994 the
government announced Telecommunication Policy,
which further liberalised the telecom sector and opened
Basic (Fixed) Telephone service for private service
operators. This was further followed by New Telecom
Policy 1999 which fully opened the telecom sector for
competition by allowing private service operators in all
telecom service. In the process private service providers
started offering Mobile telephone, Fixed telephone and
Internet services in late 1990s followed by National
Long Distance (STD) in year 2000 and International
Long Distance (ISD) in year 2002. There are limitations
on foreign direct investment (FDI) which varies from
49 per cent (recently announced by government to be
increased to 74 per cent) in basic, mobile and long
distance services to 100 per cent in Internet and value-
added services.
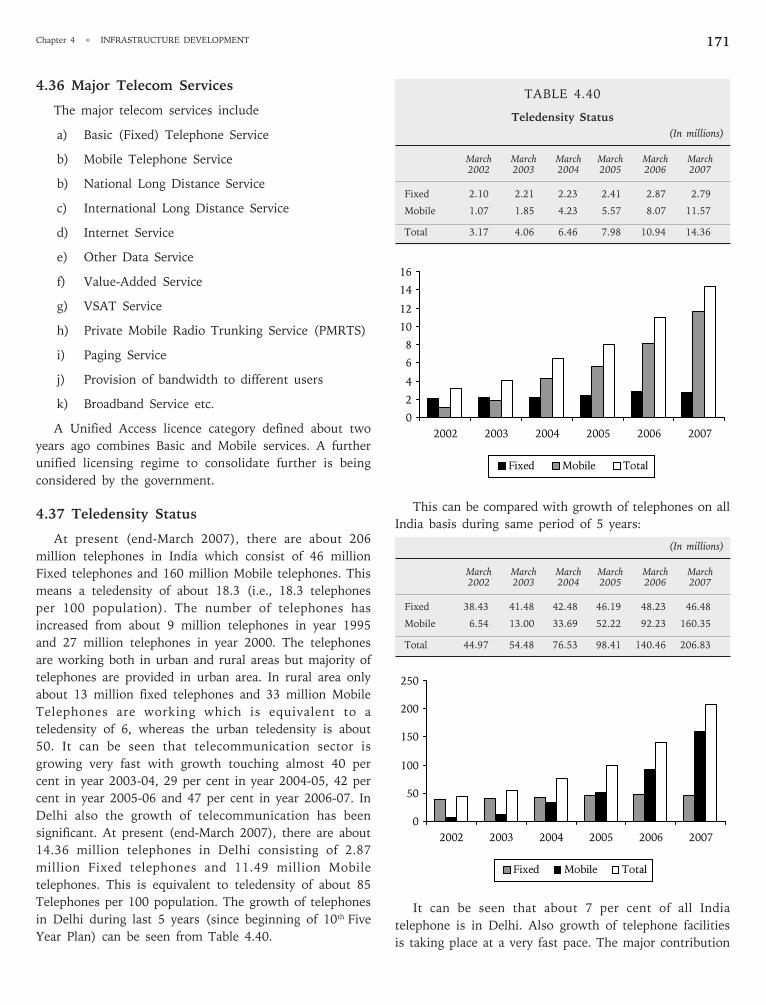
171Chapter 4 • INFRASTRUCTURE DEVELOPMENT
4.36 Major Telecom Services
The major telecom services include
a) Basic (Fixed) Telephone Service
b) Mobile Telephone Service
b) National Long Distance Service
c) International Long Distance Service
d) Internet Service
e) Other Data Service
f) Value-Added Service
g) VSAT Service
h) Private Mobile Radio Trunking Service (PMRTS)
i) Paging Service
j) Provision of bandwidth to different users
k) Broadband Service etc.
A Unified Access licence category defined about two
years ago combines Basic and Mobile services. A further
unified licensing regime to consolidate further is being
considered by the government.
4.37 Teledensity Status
At present (end-March 2007), there are about 206
million telephones in India which consist of 46 million
Fixed telephones and 160 million Mobile telephones. This
means a teledensity of about 18.3 (i.e., 18.3 telephones
per 100 population). The number of telephones has
increased from about 9 million telephones in year 1995
and 27 million telephones in year 2000. The telephones
are working both in urban and rural areas but majority of
telephones are provided in urban area. In rural area only
about 13 million fixed telephones and 33 million Mobile
Telephones are working which is equivalent to a
teledensity of 6, whereas the urban teledensity is about
50. It can be seen that telecommunication sector is
growing very fast with growth touching almost 40 per
cent in year 2003-04, 29 per cent in year 2004-05, 42 per
cent in year 2005-06 and 47 per cent in year 2006-07. In
Delhi also the growth of telecommunication has been
significant. At present (end-March 2007), there are about
14.36 million telephones in Delhi consisting of 2.87
million Fixed telephones and 11.49 million Mobile
telephones. This is equivalent to teledensity of about 85
Telephones per 100 population. The growth of telephones
in Delhi during last 5 years (since beginning of 10th Five
Year Plan) can be seen from Table 4.40.
TABLE 4.40
Teledensity Status
(In millions)
March March March March March March2002 2003 2004 2005 2006 2007
Fixed 2.10 2.21 2.23 2.41 2.87 2.79
Mobile 1.07 1.85 4.23 5.57 8.07 11.57
Total 3.17 4.06 6.46 7.98 10.94 14.36
This can be compared with growth of telephones on all
India basis during same period of 5 years:
(In millions)
March March March March March March2002 2003 2004 2005 2006 2007
Fixed 38.43 41.48 42.48 46.19 48.23 46.48
Mobile 6.54 13.00 33.69 52.22 92.23 160.35
Total 44.97 54.48 76.53 98.41 140.46 206.83
It can be seen that about 7 per cent of all India
telephone is in Delhi. Also growth of telephone facilities
is taking place at a very fast pace. The major contribution
0
2
4
6
8
10
12
14
16
2002 2003 2004 2005 2006 2007
Fixed Mobile Total
0
50
100
150
200
250
2002 2003 2004 2005 2006 2007
Fixed Mobile Total
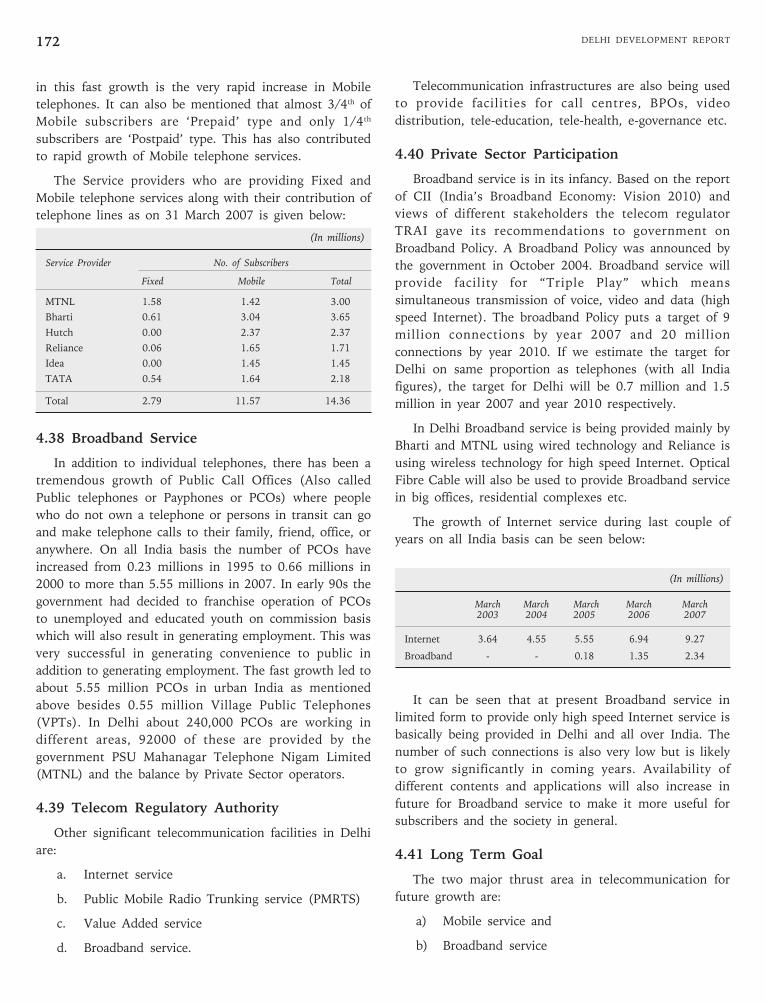
DELHI DEVELOPMENT REPORT172
in this fast growth is the very rapid increase in Mobile
telephones. It can also be mentioned that almost 3/4th of
Mobile subscribers are ‘Prepaid’ type and only 1/4th
subscribers are ‘Postpaid’ type. This has also contributed
to rapid growth of Mobile telephone services.
The Service providers who are providing Fixed and
Mobile telephone services along with their contribution of
telephone lines as on 31 March 2007 is given below:
(In millions)
Service Provider No. of Subscribers
Fixed Mobile Total
MTNL 1.58 1.42 3.00
Bharti 0.61 3.04 3.65
Hutch 0.00 2.37 2.37
Reliance 0.06 1.65 1.71
Idea 0.00 1.45 1.45
TATA 0.54 1.64 2.18
Total 2.79 11.57 14.36
4.38 Broadband Service
In addition to individual telephones, there has been a
tremendous growth of Public Call Offices (Also called
Public telephones or Payphones or PCOs) where people
who do not own a telephone or persons in transit can go
and make telephone calls to their family, friend, office, or
anywhere. On all India basis the number of PCOs have
increased from 0.23 millions in 1995 to 0.66 millions in
2000 to more than 5.55 millions in 2007. In early 90s the
government had decided to franchise operation of PCOs
to unemployed and educated youth on commission basis
which will also result in generating employment. This was
very successful in generating convenience to public in
addition to generating employment. The fast growth led to
about 5.55 million PCOs in urban India as mentioned
above besides 0.55 million Village Public Telephones
(VPTs). In Delhi about 240,000 PCOs are working in
different areas, 92000 of these are provided by the
government PSU Mahanagar Telephone Nigam Limited
(MTNL) and the balance by Private Sector operators.
4.39 Telecom Regulatory Authority
Other significant telecommunication facilities in Delhi
are:
a. Internet service
b. Public Mobile Radio Trunking service (PMRTS)
c. Value Added service
d. Broadband service.
Telecommunication infrastructures are also being used
to provide facilities for call centres, BPOs, video
distribution, tele-education, tele-health, e-governance etc.
4.40 Private Sector Participation
Broadband service is in its infancy. Based on the report
of CII (India’s Broadband Economy: Vision 2010) and
views of different stakeholders the telecom regulator
TRAI gave its recommendations to government on
Broadband Policy. A Broadband Policy was announced by
the government in October 2004. Broadband service will
provide facility for “Triple Play” which means
simultaneous transmission of voice, video and data (high
speed Internet). The broadband Policy puts a target of 9
million connections by year 2007 and 20 million
connections by year 2010. If we estimate the target for
Delhi on same proportion as telephones (with all India
figures), the target for Delhi will be 0.7 million and 1.5
million in year 2007 and year 2010 respectively.
In Delhi Broadband service is being provided mainly by
Bharti and MTNL using wired technology and Reliance is
using wireless technology for high speed Internet. Optical
Fibre Cable will also be used to provide Broadband service
in big offices, residential complexes etc.
The growth of Internet service during last couple of
years on all India basis can be seen below:
(In millions)
March March March March March2003 2004 2005 2006 2007
Internet 3.64 4.55 5.55 6.94 9.27
Broadband - - 0.18 1.35 2.34
It can be seen that at present Broadband service in
limited form to provide only high speed Internet service is
basically being provided in Delhi and all over India. The
number of such connections is also very low but is likely
to grow significantly in coming years. Availability of
different contents and applications will also increase in
future for Broadband service to make it more useful for
subscribers and the society in general.
4.41 Long Term Goal
The two major thrust area in telecommunication for
future growth are:
a) Mobile service and
b) Broadband service
173Chapter 4 • INFRASTRUCTURE DEVELOPMENT
In addition, value-added service, diverse applications,
IT enabled services eg. tele-education, tele-health, e-
governance etc., and entertainment using telecommunication
infrastructure and facilities will also grow significantly and
provide help to society and lead to economic
development. Broadband service can give facility to work
from home or nearby office in many cases such as
banking, insurance, software development, IT enabled
services etc. This can result in lesser strain on transport
sector and will thus be also eco-friendly. Growth of
Broadband services is also likely to lead to greater
employment, both direct and indirect.
4.42 E-governance Schemes
Growth of telecommunication services in Delhi have
been fuelled by provisioning of resources by many
telecommunication operators. The major
telecommunication operators in Delhi are
a) MTNL
b) Bharti
c) Hutch
d) Idea
e) Reliance
f) Tata Teleservices
They have been investing resources in the telecom
sector by utilising partly from their revenue generation
and partly from market in the form of equity or
borrowings. Fast changing technology affects the cost of
equipment and also leads to newer applications and
services. This makes it difficult to estimate the
requirement of resources for growth in telecommunication
sector accurately. However, as a rough estimate, about a
few thousand crores Rupees investments are required
every year for the next five years in Delhi for good growth
of telecommunication infrastructure and facilities. There
should not be any problem for telecommunication
operators to invest the required resources as the
telecommunication sector, if managed properly, provides
good return and profit even in a competitive environment.
4.43 Policy Formulation
With the coming of competition in telecommunication
sector in the last 10 years, the government set up an
independent regulator called TRAI (Telecom Regulatory
Authority of India) in 1997 under the TRAI Act, 1997
(which was significantly amended in 2000). The major
activities of TRAI include:
a) setting up tariff of different telecom services
b) ensuring compliance of terms and conditions of
licence
c) dealing with interconnection issues between
service providers
d) regulating sharing of revenue between service
providers
e) ensuring quality of service provided to consumers
f) giving recommendations to government on
different issues including spectrum etc.
Telecom Dispute Settlement and Appellate Tribunal
(TDSAT) was also set up as per TRAI Act 1997 to hear
and decide
a) dispute between government as licensor and
licensee (service provider)
b) dispute between two or more service providers
c) dispute between a service provider and a group of
consumers
d) appeal against any decision or order of TRAI
The appeal against judgment of TDSAT can be
challenged in Supreme Court only.
4.44 Private Sector Participation
Opening of the telecommunication sector to private
operators has helped the sector in many ways These can
be summarised
a) faster growth of telecom sector
b) new services and applications
c) reduced tariff
d) improved quality of service etc.
As mentioned above, is one of the major advantages to
consumers due to competition. For example, the Mobile
telephone tariff which was Rs. 8.40 per minute (Rs. 16.80
per minute at peak hours) in Delhi in 1997 has come
down to almost Re. 1 per minute. Similarly domestic call
long distance call say from Delhi to Mumbai has come
down from Rs. 42 per minute to less than Rs. 2 per
minute and an international call say from India to USA
has come down from Rs. 84 per minute to about Rs. 6
per minute. These sharp reductions of rates has led to
more demand of telecom facilities and also increased
traffic. The large spurt in demand for Mobile Telephones
in Delhi and whole of India is mainly due to reduced
tariffs. This has helped the consumers both for domestic
DELHI DEVELOPMENT REPORT174
as well as business purposes. One can see plumbers,
electricians, carpenters, taxi drivers, etc. all carrying
mobile telephones in Delhi.
4.45 Long Term Goal
The long term goal should be to provide Broadband
service connection (with triple play of voice data and
video) to all households in Delhi by year 2015. In
addition, Mobile telephone connection should be available
to everyone needing it. And tariff should be such that
these services are affordable to the general masses. The
services should include value-added services and
applications, IT enabled services and entertainment.
Growth of tele-education, tele-health, and e-governance
can be very useful to the society. Also growth of
Broadband services can lead to tele-working (i.e., working
from home or even other towns and villages) which can
lessen the load on transport sector and hopefully on other
infrastructures.
Another important goal is to make the whole of Delhi
a completely Wi-Fi enabled area using Wi-Max or other
relevant technologies which will allow the use of Laptop
and other devices in any part of the city and also while on
move.
The quality of service especially for Mobile Telephone
service needs lot of improvement. All the service
providers have to work on this area. The Central
government has to release additional spectrum for
telecommunication growth and improvement of quality of
service.
4.46 e-Governance
Delhi State Government is actively working for the last
few years to promote e-Governance schemes to make
efficiency in government functioning and also to make
citizen’s interaction easy and fruitful.
NIC has been actively supporting Delhi government in
e-Governance project including software development for
many applications. Some of the important software
developed by NIC includes:
a) Automation of District Administration for Land
Record Computerisation, Registration of
Documents, Certificate Issue Management System
b) Automation of District Courts
c) Land and Building
d) Industries
e) Pay and Accounts
f) Food Adulteration
g) Planning
h) Registrar of Cooperative Societies
i) Social Welfare
j) Transport
k) Common Applications for Citizens use etc.
A citizen centric web portal of Delhi government was
started in April 2003 to provide different services to
citizens. The aim of the portal was to make people
interact with the government electronically and to
gradually make most of the services available online. The
following online services are available.
a) Online filing of applications for 11 types of
certificates
b) Online birth, death, marriage certificate
c) Tender Notice Information System
d) Online registration of new vehicles etc.
Many other applications have been developed. These
include Computerisation of Driving Licences,
Computerisation of RC of Vehicles, Online Sales Tax,
Details of Old Age Pension, etc. Some more applications
are being developed.
The Delhi government should take further initiatives in
this area to make e-Governance project more useful and
friendly to citizens. Some of important areas are:
a) Give proper publicity of services to citizens by
newspaper and TV media.
b) Ensure opening of Cyber Facility Centre, where
citizens can avail these online services. Such cyber
centres can be opened by participation of private
sector on Revenue sharing model.
c) Assessment of existing services and requirement of
new needs of citizens by methods of survey etc.
d) Development of new applications and services e.g.
payment of bills of water, electricity, telephone,
house tax payment.
4.47 Suggestions
Delhi State government is not directly involved in
Policy formulation of Tele communication sector as it is
within the ambit of Central government. However, State
government can play a number of major roles to see that
175Chapter 4 • INFRASTRUCTURE DEVELOPMENT
growth in telecommunication sector takes place properly
and is instrumental in leading to benefit the people and
the society. Some of the important aspects are:
a) Mobile service requires large number of antennas
and towers. Possibility of sharing of towers at
some critical areas by different service providers;
provision of antennas and towers in high rise
buildings; aesthetic provisioning of these are
some of the issues.
b) Road digging by different service providers is
minimised by provisioning of ducts for cable
laying especially on major roads. Of course, road
digging for maintenance cannot be ruled out
completely.
c) Moral issues concerning undesirable use of some
telecommunication facilities in schools, hotels
and other places require attention.
d) State government along with Central government
can deal with some Policy issues especially
dealing with privacy aspects.
One example is unauthorised passing of
individual’s data by other agencies eg.,
telemarketing, insurance companies, banks etc.
e) State government can actively promote IT enabled
services like e-governance, tele-education etc. The
objective should be to make citizen’s interaction
with government as little as possible but the
interaction required is easy and friendly. In
addition to availability of applications and
services, this will require re-engineering of many
government processes.
f) State government along with Central government
can promote to make the whole of Delhi city a
Wi-Fi enabled city.
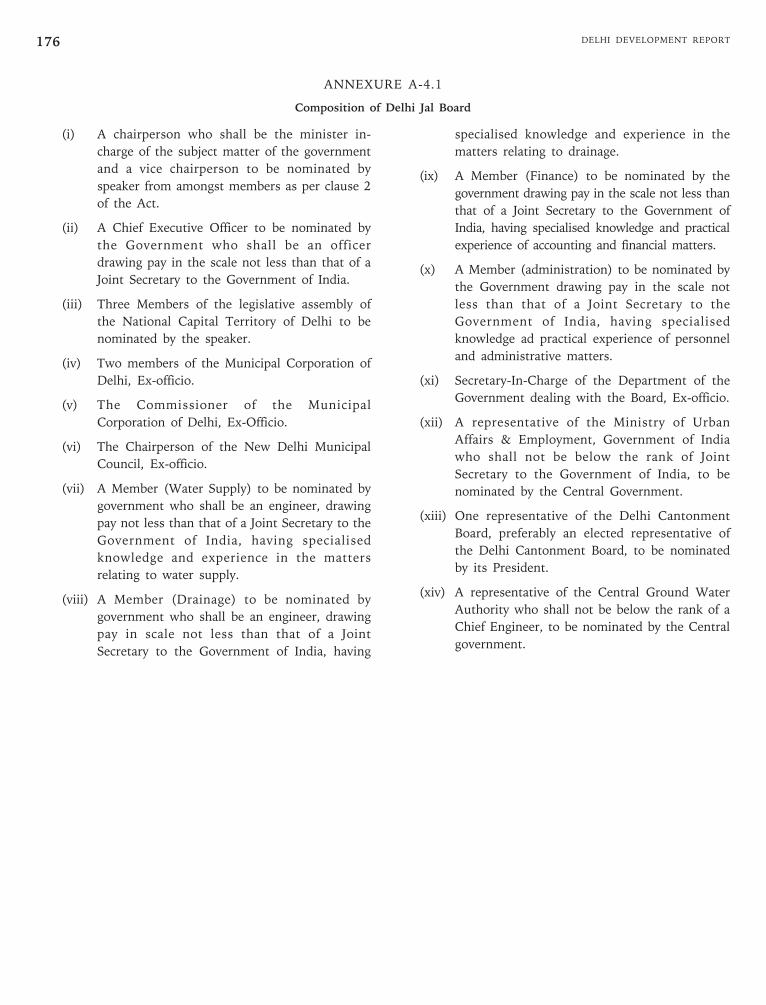
DELHI DEVELOPMENT REPORT176
ANNEXURE A-4.1
Composition of Delhi Jal Board
(i) A chairperson who shall be the minister in-
charge of the subject matter of the government
and a vice chairperson to be nominated by
speaker from amongst members as per clause 2
of the Act.
(ii) A Chief Executive Officer to be nominated by
the Government who shall be an officer
drawing pay in the scale not less than that of a
Joint Secretary to the Government of India.
(iii) Three Members of the legislative assembly of
the National Capital Territory of Delhi to be
nominated by the speaker.
(iv) Two members of the Municipal Corporation of
Delhi, Ex-officio.
(v) The Commissioner of the Municipal
Corporation of Delhi, Ex-Officio.
(vi) The Chairperson of the New Delhi Municipal
Council, Ex-officio.
(vii) A Member (Water Supply) to be nominated by
government who shall be an engineer, drawing
pay not less than that of a Joint Secretary to the
Government of India, having specialised
knowledge and experience in the matters
relating to water supply.
(viii) A Member (Drainage) to be nominated by
government who shall be an engineer, drawing
pay in scale not less than that of a Joint
Secretary to the Government of India, having
specialised knowledge and experience in the
matters relating to drainage.
(ix) A Member (Finance) to be nominated by the
government drawing pay in the scale not less than
that of a Joint Secretary to the Government of
India, having specialised knowledge and practical
experience of accounting and financial matters.
(x) A Member (administration) to be nominated by
the Government drawing pay in the scale not
less than that of a Joint Secretary to the
Government of India, having specialised
knowledge ad practical experience of personnel
and administrative matters.
(xi) Secretary-In-Charge of the Department of the
Government dealing with the Board, Ex-officio.
(xii) A representative of the Ministry of Urban
Affairs & Employment, Government of India
who shall not be below the rank of Joint
Secretary to the Government of India, to be
nominated by the Central Government.
(xiii) One representative of the Delhi Cantonment
Board, preferably an elected representative of
the Delhi Cantonment Board, to be nominated
by its President.
(xiv) A representative of the Central Ground Water
Authority who shall not be below the rank of a
Chief Engineer, to be nominated by the Central
government.
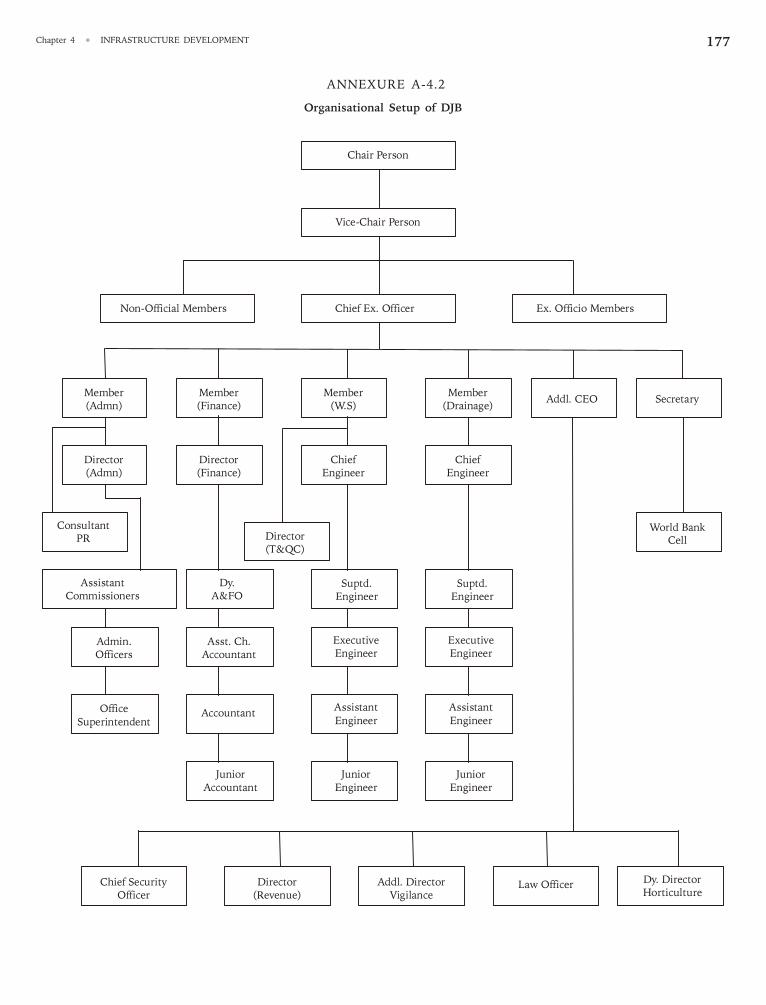
177Chapter 4 • INFRASTRUCTURE DEVELOPMENT
Chair Person
Vice-Chair Person
Non-Official Members Chief Ex. Officer Ex. Officio Members
Member(Admn)
Member(Finance)
Member(W.S)
Member(Drainage)
Addl. CEO Secretary
Director(Admn)
Director(Finance)
ChiefEngineer
ChiefEngineer
ConsultantPR Director
(T&QC)
World BankCell
AssistantCommissioners
Dy.A&FO
Suptd.Engineer
Suptd.Engineer
Admin.Officers
Asst. Ch.Accountant
ExecutiveEngineer
ExecutiveEngineer
OfficeSuperintendent
AccountantAssistantEngineer
AssistantEngineer
JuniorAccountant
JuniorEngineer
JuniorEngineer
Chief SecurityOfficer
Director(Revenue)
Addl. DirectorVigilance
Law Officer Dy. DirectorHorticulture
ANNEXURE A-4.2
Organisational Setup of DJB
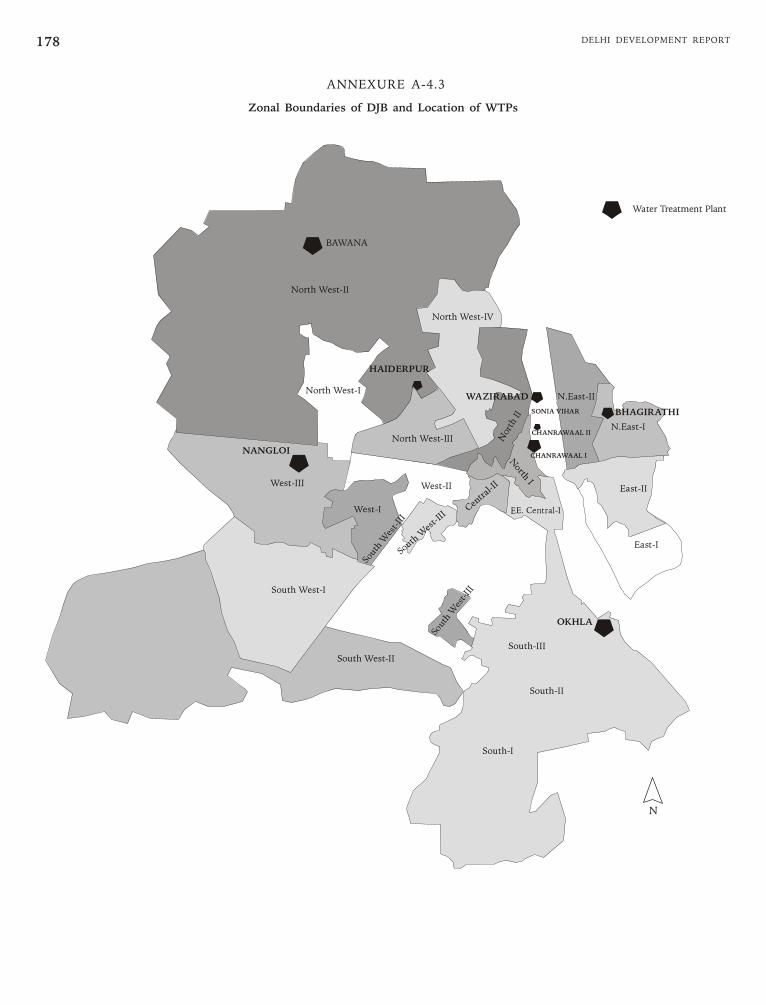
DELHI DEVELOPMENT REPORT178
ANNEXURE A-4.3
Zonal Boundaries of DJB and Location of WTPs
BAWANA
North West-II
North West-IV
North West-I
HAIDERPUR
WAZIRABAD
West-II
West-I
West-III
Nort
h II
NANGLOI
South West-I
East-I
East-II
N.East-I
N.East-II
SONIA VIHAR
CHANRAWAAL II
CHANRAWAAL I
BHAGIRATHI
South West-II
South
Wes
t-III
Sou
th W
est-III
South
Wes
t-III
North
I
Water Treatment Plant
OKHLA
South-II
South-I
North West-III
South-III
EE. Central-I
N
Cen
tral
-II
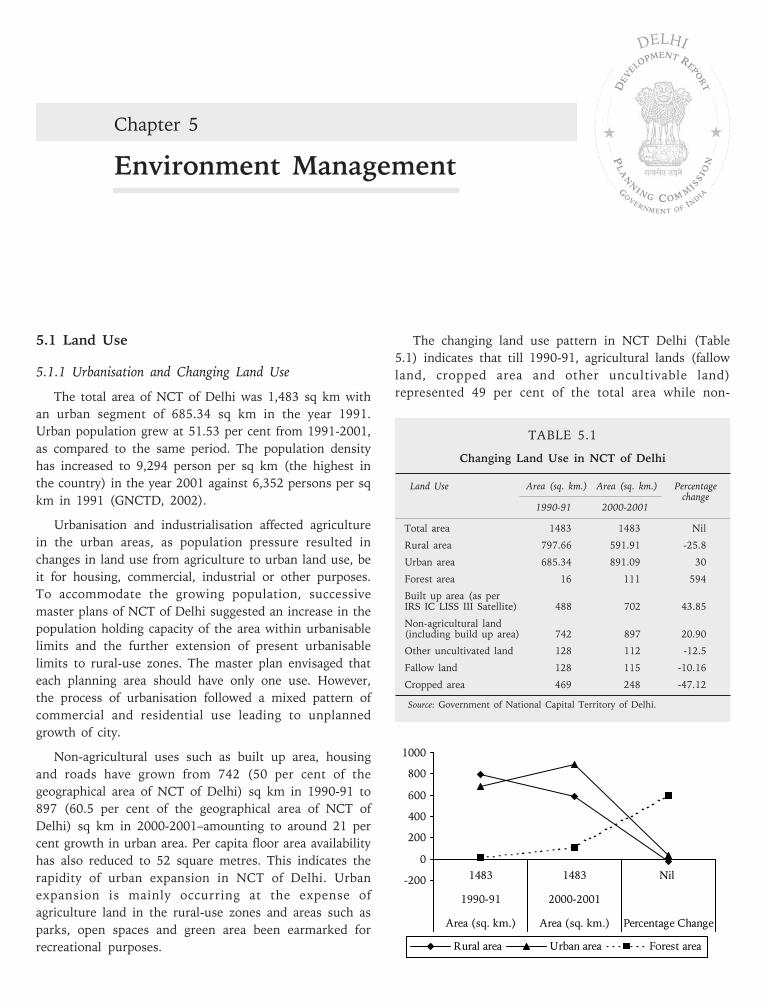
Chapter 5
Environment Management
DELHI
5.1 Land Use
5.1.1 Urbanisation and Changing Land Use
The total area of NCT of Delhi was 1,483 sq km with
an urban segment of 685.34 sq km in the year 1991.
Urban population grew at 51.53 per cent from 1991-2001,
as compared to the same period. The population density
has increased to 9,294 person per sq km (the highest in
the country) in the year 2001 against 6,352 persons per sq
km in 1991 (GNCTD, 2002).
Urbanisation and industrialisation affected agriculture
in the urban areas, as population pressure resulted in
changes in land use from agriculture to urban land use, be
it for housing, commercial, industrial or other purposes.
To accommodate the growing population, successive
master plans of NCT of Delhi suggested an increase in the
population holding capacity of the area within urbanisable
limits and the further extension of present urbanisable
limits to rural-use zones. The master plan envisaged that
each planning area should have only one use. However,
the process of urbanisation followed a mixed pattern of
commercial and residential use leading to unplanned
growth of city.
Non-agricultural uses such as built up area, housing
and roads have grown from 742 (50 per cent of the
geographical area of NCT of Delhi) sq km in 1990-91 to
897 (60.5 per cent of the geographical area of NCT of
Delhi) sq km in 2000-2001–amounting to around 21 per
cent growth in urban area. Per capita floor area availability
has also reduced to 52 square metres. This indicates the
rapidity of urban expansion in NCT of Delhi. Urban
expansion is mainly occurring at the expense of
agriculture land in the rural-use zones and areas such as
parks, open spaces and green area been earmarked for
recreational purposes.
The changing land use pattern in NCT Delhi (Table
5.1) indicates that till 1990-91, agricultural lands (fallow
land, cropped area and other uncultivable land)
represented 49 per cent of the total area while non-
TABLE 5.1
Changing Land Use in NCT of Delhi
Land Use Area (sq. km.) Area (sq. km.) Percentagechange
1990-91 2000-2001
Total area 1483 1483 Nil
Rural area 797.66 591.91 -25.8
Urban area 685.34 891.09 30
Forest area 16 111 594
Built up area (as perIRS IC LISS III Satellite) 488 702 43.85
Non-agricultural land(including build up area) 742 897 20.90
Other uncultivated land 128 112 -12.5
Fallow land 128 115 -10.16
Cropped area 469 248 -47.12
Source: Government of National Capital Territory of Delhi.
-200
0
200
400
600
800
1000
1483 1483 Nil
1990-91 2000-2001
Area (sq. km.) Area (sq. km.) Percentage Change
Rural area Urban area Forest area
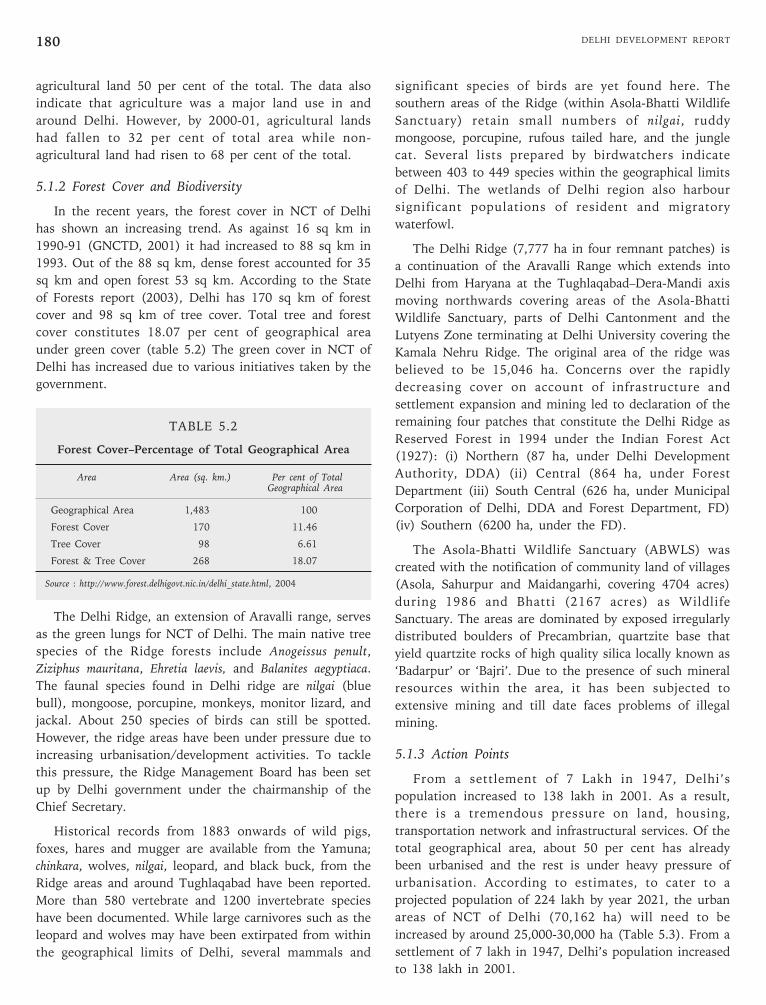
DELHI DEVELOPMENT REPORT180
agricultural land 50 per cent of the total. The data also
indicate that agriculture was a major land use in and
around Delhi. However, by 2000-01, agricultural lands
had fallen to 32 per cent of total area while non-
agricultural land had risen to 68 per cent of the total.
5.1.2 Forest Cover and Biodiversity
In the recent years, the forest cover in NCT of Delhi
has shown an increasing trend. As against 16 sq km in
1990-91 (GNCTD, 2001) it had increased to 88 sq km in
1993. Out of the 88 sq km, dense forest accounted for 35
sq km and open forest 53 sq km. According to the State
of Forests report (2003), Delhi has 170 sq km of forest
cover and 98 sq km of tree cover. Total tree and forest
cover constitutes 18.07 per cent of geographical area
under green cover (table 5.2) The green cover in NCT of
Delhi has increased due to various initiatives taken by the
government.
TABLE 5.2
Forest Cover–Percentage of Total Geographical Area
Area Area (sq. km.) Per cent of TotalGeographical Area
Geographical Area 1,483 100
Forest Cover 170 11.46
Tree Cover 98 6.61
Forest & Tree Cover 268 18.07
Source : http://www.forest.delhigovt.nic.in/delhi_state.html, 2004
The Delhi Ridge, an extension of Aravalli range, serves
as the green lungs for NCT of Delhi. The main native tree
species of the Ridge forests include Anogeissus penult,
Ziziphus mauritana, Ehretia laevis, and Balanites aegyptiaca.
The faunal species found in Delhi ridge are nilgai (blue
bull), mongoose, porcupine, monkeys, monitor lizard, and
jackal. About 250 species of birds can still be spotted.
However, the ridge areas have been under pressure due to
increasing urbanisation/development activities. To tackle
this pressure, the Ridge Management Board has been set
up by Delhi government under the chairmanship of the
Chief Secretary.
Historical records from 1883 onwards of wild pigs,
foxes, hares and mugger are available from the Yamuna;
chinkara, wolves, nilgai, leopard, and black buck, from the
Ridge areas and around Tughlaqabad have been reported.
More than 580 vertebrate and 1200 invertebrate species
have been documented. While large carnivores such as the
leopard and wolves may have been extirpated from within
the geographical limits of Delhi, several mammals and
significant species of birds are yet found here. The
southern areas of the Ridge (within Asola-Bhatti Wildlife
Sanctuary) retain small numbers of nilgai, ruddy
mongoose, porcupine, rufous tailed hare, and the jungle
cat. Several lists prepared by birdwatchers indicate
between 403 to 449 species within the geographical limits
of Delhi. The wetlands of Delhi region also harbour
significant populations of resident and migratory
waterfowl.
The Delhi Ridge (7,777 ha in four remnant patches) is
a continuation of the Aravalli Range which extends into
Delhi from Haryana at the Tughlaqabad–Dera-Mandi axis
moving northwards covering areas of the Asola-Bhatti
Wildlife Sanctuary, parts of Delhi Cantonment and the
Lutyens Zone terminating at Delhi University covering the
Kamala Nehru Ridge. The original area of the ridge was
believed to be 15,046 ha. Concerns over the rapidly
decreasing cover on account of infrastructure and
settlement expansion and mining led to declaration of the
remaining four patches that constitute the Delhi Ridge as
Reserved Forest in 1994 under the Indian Forest Act
(1927): (i) Northern (87 ha, under Delhi Development
Authority, DDA) (ii) Central (864 ha, under Forest
Department (iii) South Central (626 ha, under Municipal
Corporation of Delhi, DDA and Forest Department, FD)
(iv) Southern (6200 ha, under the FD).
The Asola-Bhatti Wildlife Sanctuary (ABWLS) was
created with the notification of community land of villages
(Asola, Sahurpur and Maidangarhi, covering 4704 acres)
during 1986 and Bhatti (2167 acres) as Wildlife
Sanctuary. The areas are dominated by exposed irregularly
distributed boulders of Precambrian, quartzite base that
yield quartzite rocks of high quality silica locally known as
‘Badarpur’ or ‘Bajri’. Due to the presence of such mineral
resources within the area, it has been subjected to
extensive mining and till date faces problems of illegal
mining.
5.1.3 Action Points
From a settlement of 7 Lakh in 1947, Delhi’s
population increased to 138 lakh in 2001. As a result,
there is a tremendous pressure on land, housing,
transportation network and infrastructural services. Of the
total geographical area, about 50 per cent has already
been urbanised and the rest is under heavy pressure of
urbanisation. According to estimates, to cater to a
projected population of 224 lakh by year 2021, the urban
areas of NCT of Delhi (70,162 ha) will need to be
increased by around 25,000-30,000 ha (Table 5.3). From a
settlement of 7 lakh in 1947, Delhi’s population increased
to 138 lakh in 2001.
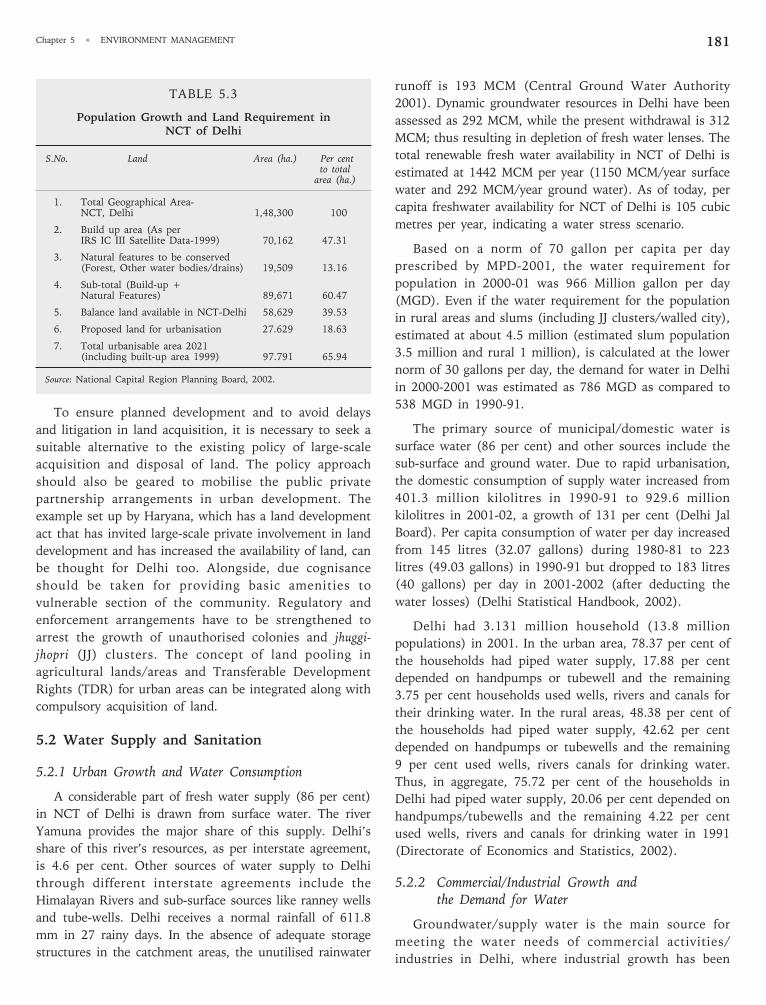
Chapter 5 • ENVIRONMENT MANAGEMENT 181
TABLE 5.3
Population Growth and Land Requirement inNCT of Delhi
S.No. Land Area (ha.) Per centto total
area (ha.)
1. Total Geographical Area-NCT, Delhi 1,48,300 100
2. Build up area (As perIRS IC III Satellite Data-1999) 70,162 47.31
3. Natural features to be conserved(Forest, Other water bodies/drains) 19,509 13.16
4. Sub-total (Build-up +Natural Features) 89,671 60.47
5. Balance land available in NCT-Delhi 58,629 39.53
6. Proposed land for urbanisation 27.629 18.63
7. Total urbanisable area 2021(including built-up area 1999) 97.791 65.94
Source: National Capital Region Planning Board, 2002.
To ensure planned development and to avoid delays
and litigation in land acquisition, it is necessary to seek a
suitable alternative to the existing policy of large-scale
acquisition and disposal of land. The policy approach
should also be geared to mobilise the public private
partnership arrangements in urban development. The
example set up by Haryana, which has a land development
act that has invited large-scale private involvement in land
development and has increased the availability of land, can
be thought for Delhi too. Alongside, due cognisance
should be taken for providing basic amenities to
vulnerable section of the community. Regulatory and
enforcement arrangements have to be strengthened to
arrest the growth of unauthorised colonies and jhuggi-
jhopri (JJ) clusters. The concept of land pooling in
agricultural lands/areas and Transferable Development
Rights (TDR) for urban areas can be integrated along with
compulsory acquisition of land.
5.2 Water Supply and Sanitation
5.2.1 Urban Growth and Water Consumption
A considerable part of fresh water supply (86 per cent)
in NCT of Delhi is drawn from surface water. The river
Yamuna provides the major share of this supply. Delhi’s
share of this river’s resources, as per interstate agreement,
is 4.6 per cent. Other sources of water supply to Delhi
through different interstate agreements include the
Himalayan Rivers and sub-surface sources like ranney wells
and tube-wells. Delhi receives a normal rainfall of 611.8
mm in 27 rainy days. In the absence of adequate storage
structures in the catchment areas, the unutilised rainwater
runoff is 193 MCM (Central Ground Water Authority
2001). Dynamic groundwater resources in Delhi have been
assessed as 292 MCM, while the present withdrawal is 312
MCM; thus resulting in depletion of fresh water lenses. The
total renewable fresh water availability in NCT of Delhi is
estimated at 1442 MCM per year (1150 MCM/year surface
water and 292 MCM/year ground water). As of today, per
capita freshwater availability for NCT of Delhi is 105 cubic
metres per year, indicating a water stress scenario.
Based on a norm of 70 gallon per capita per day
prescribed by MPD-2001, the water requirement for
population in 2000-01 was 966 Million gallon per day
(MGD). Even if the water requirement for the population
in rural areas and slums (including JJ clusters/walled city),
estimated at about 4.5 million (estimated slum population
3.5 million and rural 1 million), is calculated at the lower
norm of 30 gallons per day, the demand for water in Delhi
in 2000-2001 was estimated as 786 MGD as compared to
538 MGD in 1990-91.
The primary source of municipal/domestic water is
surface water (86 per cent) and other sources include the
sub-surface and ground water. Due to rapid urbanisation,
the domestic consumption of supply water increased from
401.3 million kilolitres in 1990-91 to 929.6 million
kilolitres in 2001-02, a growth of 131 per cent (Delhi Jal
Board). Per capita consumption of water per day increased
from 145 litres (32.07 gallons) during 1980-81 to 223
litres (49.03 gallons) in 1990-91 but dropped to 183 litres
(40 gallons) per day in 2001-2002 (after deducting the
water losses) (Delhi Statistical Handbook, 2002).
Delhi had 3.131 million household (13.8 million
populations) in 2001. In the urban area, 78.37 per cent of
the households had piped water supply, 17.88 per cent
depended on handpumps or tubewell and the remaining
3.75 per cent households used wells, rivers and canals for
their drinking water. In the rural areas, 48.38 per cent of
the households had piped water supply, 42.62 per cent
depended on handpumps or tubewells and the remaining
9 per cent used wells, rivers canals for drinking water.
Thus, in aggregate, 75.72 per cent of the households in
Delhi had piped water supply, 20.06 per cent depended on
handpumps/tubewells and the remaining 4.22 per cent
used wells, rivers and canals for drinking water in 1991
(Directorate of Economics and Statistics, 2002).
5.2.2 Commercial/Industrial Growth andthe Demand for Water
Groundwater/supply water is the main source for
meeting the water needs of commercial activities/
industries in Delhi, where industrial growth has been
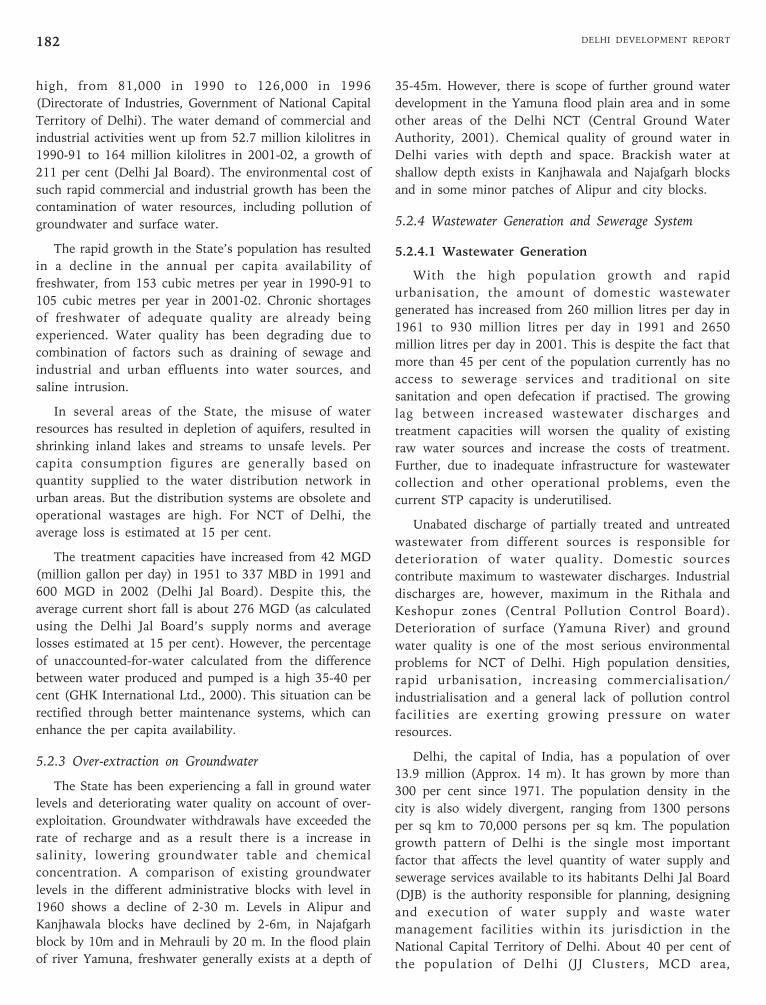
DELHI DEVELOPMENT REPORT182
high, from 81,000 in 1990 to 126,000 in 1996
(Directorate of Industries, Government of National Capital
Territory of Delhi). The water demand of commercial and
industrial activities went up from 52.7 million kilolitres in
1990-91 to 164 million kilolitres in 2001-02, a growth of
211 per cent (Delhi Jal Board). The environmental cost of
such rapid commercial and industrial growth has been the
contamination of water resources, including pollution of
groundwater and surface water.
The rapid growth in the State’s population has resulted
in a decline in the annual per capita availability of
freshwater, from 153 cubic metres per year in 1990-91 to
105 cubic metres per year in 2001-02. Chronic shortages
of freshwater of adequate quality are already being
experienced. Water quality has been degrading due to
combination of factors such as draining of sewage and
industrial and urban effluents into water sources, and
saline intrusion.
In several areas of the State, the misuse of water
resources has resulted in depletion of aquifers, resulted in
shrinking inland lakes and streams to unsafe levels. Per
capita consumption figures are generally based on
quantity supplied to the water distribution network in
urban areas. But the distribution systems are obsolete and
operational wastages are high. For NCT of Delhi, the
average loss is estimated at 15 per cent.
The treatment capacities have increased from 42 MGD
(million gallon per day) in 1951 to 337 MBD in 1991 and
600 MGD in 2002 (Delhi Jal Board). Despite this, the
average current short fall is about 276 MGD (as calculated
using the Delhi Jal Board’s supply norms and average
losses estimated at 15 per cent). However, the percentage
of unaccounted-for-water calculated from the difference
between water produced and pumped is a high 35-40 per
cent (GHK International Ltd., 2000). This situation can be
rectified through better maintenance systems, which can
enhance the per capita availability.
5.2.3 Over-extraction on Groundwater
The State has been experiencing a fall in ground water
levels and deteriorating water quality on account of over-
exploitation. Groundwater withdrawals have exceeded the
rate of recharge and as a result there is a increase in
salinity, lowering groundwater table and chemical
concentration. A comparison of existing groundwater
levels in the different administrative blocks with level in
1960 shows a decline of 2-30 m. Levels in Alipur and
Kanjhawala blocks have declined by 2-6m, in Najafgarh
block by 10m and in Mehrauli by 20 m. In the flood plain
of river Yamuna, freshwater generally exists at a depth of
35-45m. However, there is scope of further ground water
development in the Yamuna flood plain area and in some
other areas of the Delhi NCT (Central Ground Water
Authority, 2001). Chemical quality of ground water in
Delhi varies with depth and space. Brackish water at
shallow depth exists in Kanjhawala and Najafgarh blocks
and in some minor patches of Alipur and city blocks.
5.2.4 Wastewater Generation and Sewerage System
5.2.4.1 Wastewater Generation
With the high population growth and rapid
urbanisation, the amount of domestic wastewater
generated has increased from 260 million litres per day in
1961 to 930 million litres per day in 1991 and 2650
million litres per day in 2001. This is despite the fact that
more than 45 per cent of the population currently has no
access to sewerage services and traditional on site
sanitation and open defecation if practised. The growing
lag between increased wastewater discharges and
treatment capacities will worsen the quality of existing
raw water sources and increase the costs of treatment.
Further, due to inadequate infrastructure for wastewater
collection and other operational problems, even the
current STP capacity is underutilised.
Unabated discharge of partially treated and untreated
wastewater from different sources is responsible for
deterioration of water quality. Domestic sources
contribute maximum to wastewater discharges. Industrial
discharges are, however, maximum in the Rithala and
Keshopur zones (Central Pollution Control Board).
Deterioration of surface (Yamuna River) and ground
water quality is one of the most serious environmental
problems for NCT of Delhi. High population densities,
rapid urbanisation, increasing commercialisation/
industrialisation and a general lack of pollution control
facilities are exerting growing pressure on water
resources.
Delhi, the capital of India, has a population of over
13.9 million (Approx. 14 m). It has grown by more than
300 per cent since 1971. The population density in the
city is also widely divergent, ranging from 1300 persons
per sq km to 70,000 persons per sq km. The population
growth pattern of Delhi is the single most important
factor that affects the level quantity of water supply and
sewerage services available to its habitants Delhi Jal Board
(DJB) is the authority responsible for planning, designing
and execution of water supply and waste water
management facilities within its jurisdiction in the
National Capital Territory of Delhi. About 40 per cent of
the population of Delhi (JJ Clusters, MCD area,
Chapter 5 • ENVIRONMENT MANAGEMENT 183
unauthorised colonies and rural villages) lives in
unsewered areas. Presently, about 650 mgd (2955 mld)
water is distributed by the DJB in Delhi. Additional 90
mgd water supply is estimated from ground water. In
future the demand is projected by DJB as 845 mgd (3841
mld) by the year 2006 and 950 mgd (4319 mld) in 2011.
In absence of any additional source of water, no further
significant increase is expected up to 2021. The
population that has been projected by Delhi Development
Authority (DDA) by 2021 is 23 million.
5.2.4.2 Sewerage System
The development of sewerage system in Delhi started
soon after New Delhi was built in 1938. A Sewage
Treatment Plant (STP) of 82 nld capacity was constructed
at Okhla. By 1956, the capacity of this plant was
augmented to 164 mld. Additional STPs were later
constructed at coronation pillar (55 mld) in 1957 and
1960 respectilvely. The treatment capacity in creased from
273 mld in 1961 to 1273 mld in 1993. The present
sewage treatment capacity in Delhi stands at around 2330.
Presently, the urban area of Delhi is served by a gravity
collection sewers, sewerage system involving a large
network of branch sewers, intercepting sewers, peripheral
and trunk sewers, of about 6000 km length. As per DJB
there are 28 main trunk sewers with size ranging from
700 mm to over 2400 mm diameter with a total length of
round 140 km. The balance length comprises peripheral
sewers with smaller diameter with the smallest internal
sewers having diameter of 150 mm.
There are 36 major waste water pumping stations of
capacities ranging from 6 MLD to 455 mld. Even today,
only about 60 per cent of the population of Delhi is
served by the sewerage system. For the purposes of
sewerage and drainage, Delhi is served by the sewerage
system. For the purposes of sewerage and drainage, Delhi
can be divided into six zones: 1) Rithala; 2) Coronation
Pillar; 3) Keshopur; 4) Okhla; 5) Trans Yamuna; and
6) Outer Delhi. Besides this, there are newly developed
areas or urban extensions mostly contiguous with urban
limits such as Narela, Pappan Kalan, Nazafgarh, Ghitorni,
Vasant Kunj, Mehrauli, and Sarita Vihar. At present STPs
are located at 17 different places in Delhi with a
cumulative treatment capacity of 2330 mld (512.5 mgd).
5.2.5 Surface Water Contamination
The River Yamuna passing through Delhi receives
nearly 200 million litres of untreated sewage every day. As
per the data generated by Central Pollution Control Board
from monitoring stations in Delhi segment of Yamuna
from 1971-2001, the minimum and maximum coliform
values have demonstrated 150-fold and 10,00,000-fold
increases, thus indicating the severity of the pollution.
The longitudinal profile of the main water bodies
flowing through Delhi highlights a drastic deterioration in
water quality as observed at stations upstream, within and
downstream of Delhi (Central Pollution Control Board
2000). Depletion in Dissolved Oxygen (DO), increased
Biochemical Oxygen Demand (BOD) and increased faecal
coliform levels are characteristics of the stretch of Yamuna
passing through Delhi. During the non-monsoon period,
when the demand is high and adequate dilution water is
not available, the river stretch catering to Delhi’s needs
gets worse and becomes unfit for beneficial use.
5.2.6 Impact on Groundwater Quality
Groundwater, which has long been the primary
alternative to polluted surface water, is being increasingly
contaminated by human waste and leaching of chemicals,
as a result of over-extraction. According to a latest study,
conducted by Delhi Pollution Control Committee (DPCC)
in January 2004, presence of high TDS and hardness has
been reported near the industrial areas municipal solid
waste dump site, which indicates that the ground water is
receiving some contaminants from the industrial areas
either through leachate or the drains in the area. Iron
content in the groundwater has been found to be higher
in some samples through there is near absence of heavy
metal contamination.
5.2.7 Water Quality and Changes in Land Use
Changes in land use patterns brought about by
urbanisation affect the recharge of groundwater. Urban
run-off that collects toxic compounds from sewage,
vehicular exhaust and industrial pollution severely
degrades the water quality. Groundwater in most urban
areas of NCT of Delhi is contaminated due to polluted
run-off that percolates down.
5.2.8 Action Points
Rationalising water pricing: Demand management
initiatives in the water sector are important, considering
demand from various sectors. Demand management
policies are normally constrained due to the existing
pricing system from piped water supply in domestic and
commercial/industrial sector. The tariffs are very old and
do not even meet the operational costs. Moreover, the
unaccounted for water wastage needs to be reduced by
rehabilitating the existing infrastructure (leak detection,
replacement of meters, reduction in un-metered
connections, involvement of stakeholders in operation,
production and consumption, etc).
DELHI DEVELOPMENT REPORT184
There have been no incentives for water conservation
or for improving water use efficiency. Technology
development and transfer programmes can help in
reducing water usage and wastage. The augmentation of
water supply through rainwater harvesting and recycling
of wastewater also helps in meeting the water
requirement to some extent. Appropriate tariffs structure
for water services will have to be evolved to encourage
wise usage of the resource and generate additional
support for the fund starved service providers.
Additionally, there is a need to develop and implement
cost-effective water appliances such as low-flow cisterns
and faucets and formulate citizen groups to encourage and
raise awareness on water conservation.
Rainwater harvesting: The amount of runoff generated
from 910 MCM of precipitation in NCT of Delhi is 193
MCM. This can be tapped and stored in both surface and
sub-surface reservoirs. When clubbed with the 282 MCM
runoff in the Yamuna, the non-committed flow is 475
MCM. This can be stored in the regenerated quarries and
lakes for creating additional water storage for small
communities (GHK International Ltd., 2000).The
harvested rainwater can also be used to recharge the
groundwater through injection wells, recharge-pits, shafts
and trenches. The Yamuna Flood Plain also offers
excellent opportunities for future groundwater
development besides the ongoing process in different
hydro-geological locations (CGWA, 2001). PWD and DJB
have started rainwater-harvesting measures in government
office buildings. Cooperative Group Societies are also
being persuaded to adopt rainwater harvesting in their
complexes. Building byelaws have been amended to
ensure rainwater-harvesting measures in all new buildings
with 1000 sq metres and above size plot.
Participatory approach: A participatory approach is an
important prerequisite for sustainable water resources
management. There is an urgent need for an awareness
campaign to share experiences on the critical aspects of
availability of water resource in terms of quality and
quantity, conservation, etc. To achieve this, the services of
Civil Society Organisations (CSOs) can provide a very
important link between communities and government
institutions. The CSOs can offer their services in capacity
building of the relevant stakeholders, R&D for low-cost
and effective water supply and sanitation facilities, and
enforcement of policies.
Integrated water resource management: Integrated all
aspects of water management—namely, water allocation,
pollution control, protection of water resources and
mobilisation of financial resources—is important. An
analysis of the availability of utilisable water resources,
demand levels and consumption patterns is also needed.
Such an analysis would help in developing a Water
Zoning Atlas to guide decisions related to sitting of
commercial/industrial and other economic activities. The
treated wastewater can also be provided as a dual source
of supply for supply for bulk users such as institutions,
industries and for areas with greater water demands.
However, this requires identifying users for pilot
implementation and conducting studies to find the
potential cost of such provisions, cost/benefit ratio and
user acceptability.
The other methods of water management include
introducing water-saving technologies (such as sprinkler
and drip irrigation technologies) for commercial/
industrial and domestic use, reviving the traditional
wisdom of water harvesting system for storage and
utilisation, micro-catchments planning through
involvement of stakeholders at all levels.
Wastewater Management
There are two sources of pollution; domestic and
industrial. The domestic sources are mainly domestic
sewage and toilet wastewater; whereas industrial pollution
source is mainly from Industrial estates. Normally 80 per
cent of water supply is generated as sewage. However, the
flow of wastewater in various drains was observed as
3900 mld, which confirms the use of ground water for
drinking and other purposes. Presently, a large part of the
sewage flows through open sewer drains. Due to
ineffective conveyance system coupled with inadequate
sewage treatment capacity, untreated sewage from
sewered areas flows into 18 drains/nallahs which were
meant to carry only storm water and outfall directly into
the Yamuna.
There are 31 planned industrial estates in Delhi. The
industrial effluents from most of the industrial estates
flow through open surface drains ultimately finding access
into the River Yamuna. Some of the examples are
Wazirpur Industrial Area, G.T. Karnal Road Industrial
Area, Rajasthan Udyog, Jhilmil Industrial Area. The gross
population caused by effluents from these Industrial
Estates was taken note by Hon’ble Supreme Court of
India and the court ordered construction of 15 Common
Effluent Treatment Plans (CETP) in Delhi out of which 10
CETPs have been completed.
The DJB has 30 STPs at 17 locations in the NCT of
Delhi along with sewage pumping stations. The sewerage
network comprises 5600 kms of sewer lines including
trunk sewers and branch sewers (peripheral/internal
sewers). This includes 28 main trunk sewers of a total
Chapter 5 • ENVIRONMENT MANAGEMENT 185
length of 130 kms. For sewage management, Delhi is
divided into five drainage zones of Okhla, Keshopur,
Rithala-Rohinil, Coronation and Shahdara. In addition,
there are newly sewered areas of Pappan Kalan (Dwarka),
Vasant Kunj, Sarita Vihar, and Narela.
Serious efforts are needed to ensure effective operation
and maintenance of the CETPs and STPs. Future action
plans should also take into account the rise in wastewater
generation in proportion to the projected rise. Even if
piped water is supplied for the entire population of Delhi
as per the aim of the government, the amount of domestic
sewage generated will also rise proportionately. Various
forms of public-private partnerships for different levels of
services such as water supply metering should be
introduced. The feasibility of having cost effective package
treatment system for all communities located in outer
Delhi zone needs to be assessed.
5.3 Solid Wastes Management
5.3.1 Sources and Quantum of Solid Wastes
Municipal solid waste: With the exponential growth of
population in Delhi where half a million people are added
every year, the quantum of municipal solid waste
generation has considerably increased. It is estimated that
the present per capita waste generation, which is 450-500
grams, will go up to 900-1000 grams by 2021
(a projection based on an additional 8.6 million people
added to Delhi’s population). The present municipal solid
waste generation in Delhi is 7,000 to 7,500 metric tonne
per day, which is likely to increase in the range of 17,000
to 25,000 metric tonne by 2021 (NEERI). The waste
generation in MCD (Municipal Corporation of Delhi),
NDMC (New Delhi Municipal Corporation) and the
Cantonment Board are about 7,000 metric tonnes, 300-350
metric tonnes, and 60 metric tonnes per day, respectively.
Industrial waste: Industrial activities and treatment of
industrial effluents (sludge generation) are the major
sources of hazardous waste generation. As per the survey
conducted by NPC-NCAER in 2002-2003, about 23000
industrial units have been identified in the 31 approved
industrial areas. As per the above report, 1777 industrial
units are hazardous waste generating units. The
hazardous waste generation is around 50,000 kg/day (i.e.,
approximate 15,000 tonnes per year).
In addition, the generation of fly ash from three coal
based thermal power plants in Delhi is 2,893,179 tonnes
in the year 2005. There was a decrease in fly ash
generation during 1998-2000 due to the use of coal with
lower ash content (34 per cent as against 40 per cent used
earlier) and partly fuel substitution from coal to natural
gas. Further, siginificant reduction in the fly ash
accumulation has been observed at Rajghat Thermal
Power Plant and IP Thermal Power plant fly ash is being
used for various construction and landfill purposes.
Hospital waste: As per DHS report 2005, Delhi
Government has 31 hospitals; MCD has 59 hospitals;
NDMC has 4 hospitals; 23 hospitals belong to
Government of India/public sector unit or associated
institutions besides AIIMS. In addition, 562 private
nursing homes are also registered with DHS.
As per the report, the total bed strength is about
32,760. Out of this, 12,381 beds are with private sector
and the rest is with the government/autonomous bodies.
As per the annual report of DPCC 2005, about 8.5
tonnes per day of biomedical waste is collected and
treated per day.
5.3.2 Management Systems and Status
Municipal solid waste management: According to the
records available and as per the annual report submitted
by MCD, NDMC and the Cantonment Board, on average,
15-20 per cent of the municipal solid waste generated
remains uncollected. Out of the collected municipal solid
waste, only 10-15 per cent is used for composting and the
remaining is disposed at various landfills.
MCD generates around 7,000 metric tonnes of
municipal solid waste per day. Out of the generated waste,
6,000 to 6,500 metric tonnes per day gets collected.
Around 650 metric tonnes of waste per day is composted
in existing three composting plants and the remaining
goes for land filling. The estimated amount of waste that
remains uncollected is 500 to 1,000 metric tonnes per day.
NDMC generates around 300-350 metric tonnes of
municipal solid waste per day and the whole amount gets
collected. NDMC has its compost plant of 200 metric
tonnes of garbage handling capacity per day in Okhla,
which runs for 3 shifts. This plant was commissioned in
1985 and is functioning presently with garbage handling
capacity of 80-90 metric tonnes per day in two shifts. The
remaining waste goes for land filling at Okhla landfill site.
The Cantonment Board generates around 60 metric
tonnes of municipal solid waste per day and whole
amount is getting collected also. The Cantonment Board
does not have composting plants and the whole amount
goes for land filling at Okhla landfill site.
The disposal of solid waste is presently carried out at
four disposal sites—Okhla Phase–1, X-ing GT Karnal
DELHI DEVELOPMENT REPORT186
Road, Bhalswa, and Gazipur. The balance life of these
sites has reached a critical stage, and there is an urgent
need to identify and acquire more sites that would last for
the next 20-25 years. The total capacity of the proposed
disposal sites to manage MSW in Delhi is 22,55,000 sq/
mtr (228500 m2). The projected quantities of solid waste
to be disposed by 2021 are 100 MT, requiring a land area
of 600-800 ha.
The phenomenal increase in use of plastics in Delhi
started in the 80s. Although plastic waste contributes to
only 6 per cent of the total municipal solid waste
generated in NCT of Delhi, its management, especially of
discarded polythene bags, leaves much to be desired.
These bags are disposed in a haphazard manner, thus
choking sewage drains and destroying the landscape in
cities. Waste polythene bags are picked by rag pickers and
sent for recycling. Repeated recycling deteriorates the
quality of the bags produced, and pigments used to impart
colour to these bags poses health hazard to people
engaged in recycling because of the outdated technologies
used. Unsafe storage of waste plastics also poses a fire
hazard as was evident in the 1995 fire accident at
Jwalapuri in which resources worth crores were lost in
addition to emission of large amounts of toxic fumes. The
government has taken initiatives to introduce guidelines
on the use of food-grade plastics and use of recycled
plastic, and also minimising littering of waste.
Industrial waste management: Most of the industrial units
in Delhi are in the unorganised sector and much of the
hazardous waste is in the form of sludge from CETPs and
individual ETPs. The biggest problem is small scale
pickling units, electroplating and anodising, dyeing units
and vehicle service stations. As per the study conducted
by NPC/NCAER, the hazardous waste generation is
around 50,000 kg/day (i.e., a 15,000 tonnes/year). These
wastes are required to be disposed off in a safe manner as
specified in the Hazardous Waste (Management and
Handling) Rules, 1989.
In NCT of Delhi, the main industrial non-hazardous
waste is fly ash from coal based power plants that emitted
about 2.89 million tonnes in the year 2005. Out of the
total fly ash generated from the coal based thermal power
plants, huge quantity of fly ash is utilised mainly for
landfill, road embankments and brick making. Land is
now being allotted to three brick-manufacturing units
near Rajghat and Indraprastha thermal power stations so
that additional fly ash from these plants can be utilised.
At the same time, the use of beneficiated/washed coal
may reduce the amount of fly ash generated by thermal
power plants.
Hospital waste management: Most of the large hospitals
in Delhi have incineration facilities and in some cases
autoclaving facilities but these are close to residential
areas and are potential health and environmental hazards.
Private nursing homes and small hospitals do not have
arrangements to treat hospital waste. At present 54
incinerators, 18 autoclaves, and 2 microwaves are in
operation.
5.3.3 Action Points
Waste inventorisation: Detailed waste inventorisation is
one of the first steps in designing a proper and scientific
waste management plan for any site. Considering the
limited financial capability of the local bodies, it is
indispensable for them to utilise the resources fully to
have savings in overall cost. In order to distribute the
resources optimally to various sanitary wards of NCT of
Delhi and to regularise the operations to provide better
service consistently, a detailed survey would be required
which will have following objectives.
• Assessment of quantity and quality of solid waste
generated in each sanitary ward by different
sources;
• Assessment of community needs, perception and
willingness to pay for improved collection service;
• Selection of suitable waste disposal sites; and,
• Route optimisation for minimisation of collection
and transportation cost
Waste minimisation: Waste, which is costly to manage
must be reduced as much as is economical through waste
recycling and minimisation. Some of the waste minimisation
options are as follow:
• Incentives for use of cloth and paper bags;
• Segregating wastes in the house with the
municipality to prove separate containers for
recyclable waste;
• Large plot holders to have small compost pits in
their own landscaped areas; and
• Separate collection from large generators of
organic wastes, like mandis, sent for composting.
Combustible wastes from timber markets or
industries sent to ‘waste to energy’ generating
centres.
Private sector participation: Private Sector Participation
(PSP) may be used as an agent for change. The
privatisation process should initially be targeted towards
profit making centres, such as the following:
Chapter 5 • ENVIRONMENT MANAGEMENT 187
• Door-to-door collection and transportation of
wastes from restaurants and commercial centres,
hospitals and nursing homes;
• House to house collection of wastes in high
income areas;
• Operation of waste processing/utilisation systems
in selected areas.
The above-mentioned activities can be introduced on
full cost recovery basis with positives cash flow. The
procedure for handling and disposal of restaurants/hotel
was waste is entirely different from that of hospital
wastes. So also is the case with industrial wastes.
Therefore, municipal corporations should ensure
appropriate systems for collection, transportation,
processing and disposal of these wastes.
Public participation: Cooperation and participation of the
community is essential in implementing any waste
management strategy. Reduction, reuse and recycling of
waste cannot be performed without active public
participation. Community involvement in the decision-
making process in developing solid waste management
strategies should be encouraged at the inception and
during the implementation of waste management
programme. The State policies should be aimed at
reduction of waste by encouraging procedures and
consumers through education and awareness. Sorting of
waste at source plays an important role for getting private
sector partnership in solid waste management, especially
in the recycling industry. The growing volume of waste
spawned by the consumption inherent in city life is a
formidable challenge for low-income areas; the main solid
waste problem is how to extend the collection services to
the poor.
Technological interventions: For disposal of solid wastes,
the following technological options can be considered:
• Composting;
• Sanitary landfill;
• Anaerobic digestion; and,
• Incineration.
To meet the recurring expenditure towards salary of
the staff, operation and maintenance of vehicles and
workshop facilities, overheads and for purchase of tools
and equipment for improvement in collection and
transportation services and for development of new
sanitary landfill sites, the possibility of introducing a
separate solid waste management tax may be considered.
This tax initially be so levied that the recurring cost of
salary and operation and maintenance to be completely
recovered. The rates of tax could be based on property
value and frequency of service provided.
5.4 Air Quality
5.4.1 Causes of Air Pollution
The principal sources of air pollution in the city of
Delhi are the transport, power plants, industry and
domestic sectors. Besides the anthropogenic sources,
climate and natural sources too has played an important
role in the increasing pollution levels. Delhi has a semi-
arid climate, with an extremely hot summer, average
rainfall and very cold winters. Mean monthly temperatures
range from 14.3°C in January (Minimum 3°C) to 34.5°C in
June (Maximum 47°C).
The monsoon season witnesses the least pollution due
to washout of pollutants along with rains. Mixing height
is one of the important parameters that influence the
dilution of pollutants. It follows diurnal and seasonal
variations. During winter, ground-based temperature
inversions are a regular feature that restricts mixing
height to low levels. Lower temperatures, calm conditions,
lower mixing height, and temperature inversions during
winter restrict and confine pollutant dispersion and
dispersal. Winter evenings have higher pollution build-up
because of frequent calm conditions with temperature
inversions resulting in poor natural ventilation and high
emission loads due to evening traffic peaks. The situation
in Delhi during winter is therefore more critical as
compared to Mumbai, Chennai, and Kolkata as the effect
of natural sea breeze is absent resulting in virtually no
dilution of pollutant. In the summer season, there are
frequent pre-monsoon dust storms, when strong westerly
winds from Rajasthan desert deposit large concentration
of dust particles in Delhi’s atmosphere.
Vehicular pollution: Although Delhi has the longest road
length amongst the Indian cities (1284 km per 100 sq km
of area) the total number of registered vehicles in Delhi is
about 40 lakhs, which is more than the sum total of
vehicles registered in 3 other metropolitan cities viz.,
Calcutta, Mumbai, and Chennai. As many as 500 vehicles
exist for every kilometre of the road stretch in Delhi
whereas the figure for Mumbai and Kolkata is 350, and
for Chennai, this figure is less than 100 vehicles. About
two-thirds of the registered vehicles in Delhi are two-
wheelers. Cars and jeeps account for about 27 per cent o
the total vehicular population auto-rickshaws constitute
about 2.5 per cent. Buses constitute 1 per cent of the total
registered vehicles and goods carrying vehicles account for
4.5 per cent (Table 5.4).
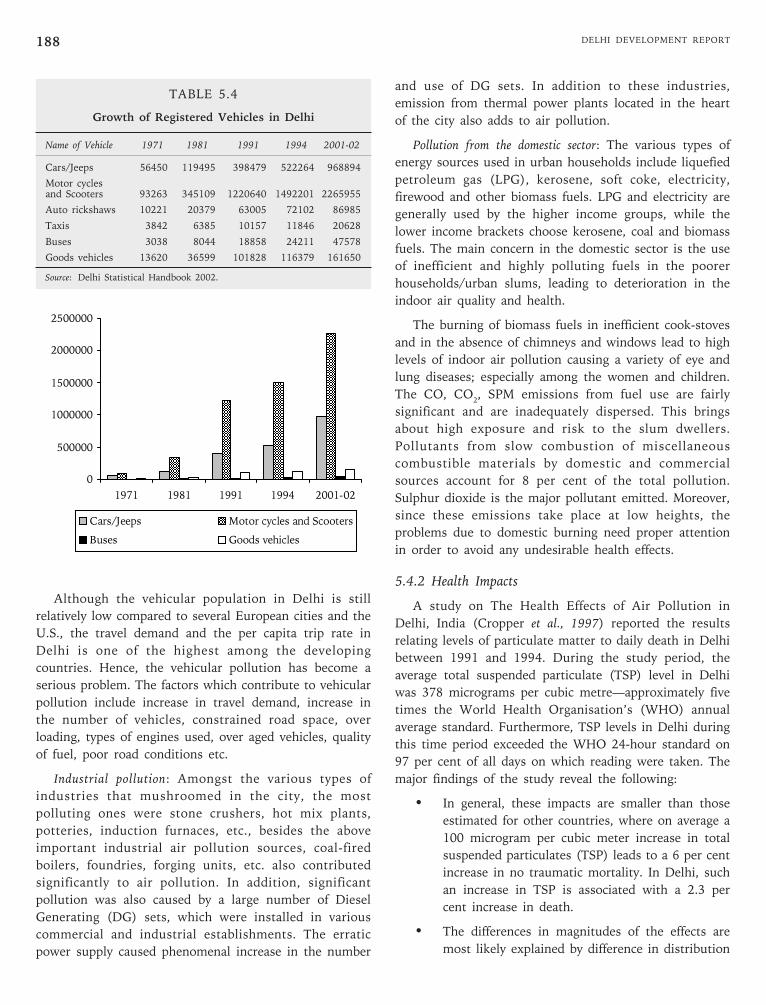
DELHI DEVELOPMENT REPORT188
and use of DG sets. In addition to these industries,
emission from thermal power plants located in the heart
of the city also adds to air pollution.
Pollution from the domestic sector: The various types of
energy sources used in urban households include liquefied
petroleum gas (LPG), kerosene, soft coke, electricity,
firewood and other biomass fuels. LPG and electricity are
generally used by the higher income groups, while the
lower income brackets choose kerosene, coal and biomass
fuels. The main concern in the domestic sector is the use
of inefficient and highly polluting fuels in the poorer
households/urban slums, leading to deterioration in the
indoor air quality and health.
The burning of biomass fuels in inefficient cook-stoves
and in the absence of chimneys and windows lead to high
levels of indoor air pollution causing a variety of eye and
lung diseases; especially among the women and children.
The CO, CO2, SPM emissions from fuel use are fairly
significant and are inadequately dispersed. This brings
about high exposure and risk to the slum dwellers.
Pollutants from slow combustion of miscellaneous
combustible materials by domestic and commercial
sources account for 8 per cent of the total pollution.
Sulphur dioxide is the major pollutant emitted. Moreover,
since these emissions take place at low heights, the
problems due to domestic burning need proper attention
in order to avoid any undesirable health effects.
5.4.2 Health Impacts
A study on The Health Effects of Air Pollution in
Delhi, India (Cropper et al., 1997) reported the results
relating levels of particulate matter to daily death in Delhi
between 1991 and 1994. During the study period, the
average total suspended particulate (TSP) level in Delhi
was 378 micrograms per cubic metre—approximately five
times the World Health Organisation’s (WHO) annual
average standard. Furthermore, TSP levels in Delhi during
this time period exceeded the WHO 24-hour standard on
97 per cent of all days on which reading were taken. The
major findings of the study reveal the following:
• In general, these impacts are smaller than those
estimated for other countries, where on average a
100 microgram per cubic meter increase in total
suspended particulates (TSP) leads to a 6 per cent
increase in no traumatic mortality. In Delhi, such
an increase in TSP is associated with a 2.3 per
cent increase in death.
• The differences in magnitudes of the effects are
most likely explained by difference in distribution
Although the vehicular population in Delhi is still
relatively low compared to several European cities and the
U.S., the travel demand and the per capita trip rate in
Delhi is one of the highest among the developing
countries. Hence, the vehicular pollution has become a
serious problem. The factors which contribute to vehicular
pollution include increase in travel demand, increase in
the number of vehicles, constrained road space, over
loading, types of engines used, over aged vehicles, quality
of fuel, poor road conditions etc.
Industrial pollution: Amongst the various types of
industries that mushroomed in the city, the most
polluting ones were stone crushers, hot mix plants,
potteries, induction furnaces, etc., besides the above
important industrial air pollution sources, coal-fired
boilers, foundries, forging units, etc. also contributed
significantly to air pollution. In addition, significant
pollution was also caused by a large number of Diesel
Generating (DG) sets, which were installed in various
commercial and industrial establishments. The erratic
power supply caused phenomenal increase in the number
0
500000
1000000
1500000
2000000
2500000
1971 1981 1991 1994 2001-02
Cars/Jeeps Motor cycles and Scooters
Buses Goods vehicles
TABLE 5.4
Growth of Registered Vehicles in Delhi
Name of Vehicle 1971 1981 1991 1994 2001-02
Cars/Jeeps 56450 119495 398479 522264 968894
Motor cyclesand Scooters 93263 345109 1220640 1492201 2265955
Auto rickshaws 10221 20379 63005 72102 86985
Taxis 3842 6385 10157 11846 20628
Buses 3038 8044 18858 24211 47578
Goods vehicles 13620 36599 101828 116379 161650
Source: Delhi Statistical Handbook 2002.
Chapter 5 • ENVIRONMENT MANAGEMENT 189
of age at death and cause of death, as most
deaths in Delhi occur before the age of 65 and are
not attributed to causes with a strong association
with air pollution.
• Although air pollution seems to have less impact
on mortality counts in Delhi, the number of life-
years saved per death avoided is greater in Delhi
that in the U.S. cities—because the age
distribution of impacts in these two places varies.
In the United States the particulates have the
greatest influence on daily deaths among persons
in the age of 65 and older. In Delhi, they have the
greatest impact in the 15 to 44 age group.
The traffic policemen posted at road intersections of
Delhi have also been victims of the increasing number of
vehicles in the city as evident from three studies
conducted in the 1990s. The first, in collaboration with
the Central Road Research Institute (CRRI) and the All
India Institute of Medical Sciences (AIIMS), studied the
effects of pollution on traffic policemen performing duties
at traffic intersections. The second study followed up in
association with the Patel Chest Institute of Delhi
University with a continual programme till 1997 for
diagnosis and treatment of traffic policemen’s lungs and
other respiratory diseases. In the third study, the local
Majidia Hospital in 1999 volunteered to provide free
treatment to traffic policemen affected with such ailments.
All the three studies revealed that traffic policemen
working in adverse environmental conditions are affected
both in the short and long-run, and their health and
efficiency are impacted. Eye irritation, throat infections,
respiratory discomfort, skin ailments, impaired hearing,
chest diseases, excessive carboxyl-haemoglobin, and
annoyance with noise are some of the ailments they suffer
from. A local survey has indicated that the incidence of
respiratory diseases in Delhi is 12 times the national
average, and 30 per cent of Delhi’s population suffers
from respiratory disorders due to air pollution.
5.4.3 Steps Taken to Improve Air Quality
Improvement in transport system: To provide a better
public transport service, a large number of private buses
(Blue line, White line, etc.) have been initiated since 1993
in a phased manner in addition to the DTC buses. Till the
late 90s, the DTC and other buses contributed heavily
towards the air pollution load of the city as most of buses
were old and poorly maintained. However, conversion of
the diesel driven public transport and the commercial
vehicles (buses, autos, taxis etc.) to CNG have resulted in
reduction of air pollution substantially. Also, to meet the
complex and ever growing transportation requirements of
the city, an integrated Mass Rapid Transit System (MRTS)
is being executed.
Thermal power plants: All the three thermal power plants
have installed electrostatic precipitators in all their units
to control particulate matter emissions. Consistent efforts
for environmental improvement have resulted in
installation of new high efficiency Electrostatic Precipitator
in unit no. 5 of I.P. Power Station. Besides this, the Power
Plants are using beneficiated coal (ash content less than
34 per cent) since 1999 as against the coal used earlier
(ash content above 40 per cent) to reduce pollution.
DPCC has further directed these power plants to achieve
stricter norms of 50 mg/Nm3 as against the standards of
150 mg/Nm3 notified by the Ministry of Environment and
Forests, Government of India.
Two gas based power plants namely I.P. Gas Turbine
Power Plant and Pragati Power Station have been
commissioned to augment the power generation capacity
from 1087 MW to 1700 MW. Since, these plants are
based on natural gas, there is no significant addition to
the existing air pollution levels as particulate emissions
are virtually absent in gas based plants. In addition, low
NOX burners have been installed at Pragati (gas-based)
power plant.
Small-scale industries: In 1996, Honourble Supreme
Court while hearing a Public Interest Litigation passed
various orders to close down the 1328 ‘H’ category units,
i.e., Hot mix plants, lead smelting units, stone crushers,
pesticides, heavy foundries, steel rolling mills etc.
Subsequently, DPCC also issued closer orders in respect
of 118 industrial units, which were engaged in ‘H’
category. In 2000, Hon’ble Supreme Court ordered the
closure of polluting industrial units in non-conforming/
industrial areas under the supervision of Ministry of
Urban Development, Government of India as a Nodal
Agency. Based on the criteria of polluting industries,
evolved by the Nodal Agency and Expert Committee
constituted by the Government of Delhi, 5046 units have
been closed down by Government of Delhi. Acting on
similar lines, Delhi Pollution Control Committee has also
identified 557 such industries and ordered their closure.
In addition, Delhi Pollution Control Committee directed
several industrial units to install pollution control devices,
which were found polluting during the course of action of
implementation of Air (Prevention and Control of
Pollution) Act, 1981.
In order to check the pollution from DG sets,
Government of Delhi, on December 10, 2001 authorised all
DELHI DEVELOPMENT REPORT190
Deputy Commissioners, SDMs and other Police officers
to implement the norms pertaining to DG sets. These
officers were asked to ensure that the DG Sets above 5
KVS capacity do not operate in residential areas,
between 10.00 p.m. to 6.00 a.m. (except Group Housing
Societies and Multi Storied Complexes) and ensure that
these DG sets meet the prescribed emission norms.
5.4.3.1 Steps Taken to Control Vehicular Pollution
To control vehicular pollution, the important steps
which have been taken in recent years include the
following:
• Stringent Emission Norms.
• Phasing out/Conversion of vehicles.
• Fuel Quality Improvement.
• Introduction of Clean Fuel.
• Delhi is the only city in the world with over 0.1
million fleet of CNG driven vehicles.The various
vehicular pollution control measures which have
been taken from time to time are given in the
following Table 5.5.
Other Measures
• Pollution under control (PuC) certificate
mandatory for all vehicles every 3 months.
• Improvement in traffic management through
flyover construction at major traffic intersections
and synchronisation of traffic signals.
• Introduction of Mass Rapid Transport System i.e.,
Metro Rail.
5.4.4 Air Quality Trends
The analysis of ambient air quality data of last five
years i.e., 2000 to 2005 (up to December 2005) of Delhi
has witnessed a significant reduction in pollution levels.
Sulphur Dioxide levels have fallen by 51 per cent in 2005
(up to December, 2005) as compared to 2000. The
concentration of other pollutants like Lead and Benzene
have also registered marked decline. The levels of
Suspended Particulate Matter (SPM) have fallen by 23 per
cent (2000-2005) and levels of Respirable Suspended
Particulate Matter (RSPM) have fallen by 6.7 per cent
during the same period. Despite the phenomenal growth
in vehicular population, Nitrogen Dioxide levels have
remained more or less constant.
TABLE 5.5
Vehicular Pollution Control Measures Taken in Delhi
Measures Taken 1996 1998 2000 2001 2002 & 2003 2004 & 2005
Emission Emission · Emission norms · Euro-1 equivalent norms · CNG/LPG · Euro-II in · Euro-III normsNorms of norms made for catalytic for all type of vehicles norms Goods Vehicles mandatory for allVehicles stringent as converter fitted except passenger vehicles finalised. from 1st Oct. four wheelers w.e.f.
compared vehicle made which are Euro-II 2002. 1st April 2005.to 1991. stringent. equivalent. · Euro-II norms
· Hot start replaced mandatory for allby Cold start Two and Threetest which gives wheelers w.e.f.less emission. 1st April 2005.
Fuel · Fuel quality · Diesel sulphur · Diesel sulphur reduced · Diesel with · 0.035 per centQuality specification reduced to 0.25 to 0.05 per cent in 0.05 per cent Sulphur in DieselImprove- notified under per cent. selected outlets. sulphur w.e.f. 1st April 2005.ment EPA for the · Gasoline · Gasoline benzene throughout · 0.015 per cent
first time. Benzene reduced to 1.0 retail Sulphur in PetrolLead content reduced to per cent. outlets w.e.f. 1st April 2005.(g/l)=0.15 3.0 per cent · Gasoline sulphur with in NCT.Diesel Sulphur Gasoline Lead 0.05 per cent maximum=0.5 per cent phased out. sulphur in all outlet.Gasoline · Low smoke 2-T oilBenzene= 5.0 introduce.per cent
Other Govt. vehicle · 15 years old · Buses more than · All taxis/ · Stringent EmissionMeasures to run CNG/ commercial 8 years phased out. Auto and Norms for in use
Catalytic vehicle banned. · Replacement of pre- buses to vehicles w.e.f.Converter. · Pre-mix 2-T oil 1990 auto/taxis with run on CNG. June 5, 2005.
in retail outlets. vehicle on clean fuels.· Conversion of post 1990
autos to CNG initiated.· Fuel testing laboratory
established.
Source: Transport Department (n.d.). Auto Fuel Policy, 2002. New Delhi: GNTCD.
Chapter 5 • ENVIRONMENT MANAGEMENT 191
5.4.5 Action Points
Transport Sector
• For facilitating the shift from personal to mass
transport, policy measures/programmes should
focus on providing a flexible and affordable mass
transport service system with decreased levels of
pollution, overcrowding and fuel consumption.
• Grade separation or additional lanes by road
widening for heavily polluting intersections and
high-density corridors needs to be provided.
• Alternative environment friendly modes of
transport such as, battery powered electric
vehicles need to be promoted to the maximum
extent.
• The road layout and traffic management need
modernisation because the inadequate road
network is unable to meet the increasing
transportation load in Delhi. Lack of adequate
control on proper land use and development has
added to the traffic congestion and increased
pollution. While planning the future extension
pockets of Delhi, adequate area would have to be
kept reserved under transportation use.
• The ring railway should be strengthened. The
land-use along the ring railway and existing/
proposed MRTS alignment may be studied in
details so that the location of traffic-generating
activities such as offices, business centres and
educational (higher) institutions are along their
routes. Delhi’s Master Plan may be modified to
locate District Centres along/near rail-lines.
Industrial Sector
• Identification of unregistered small-scale
industries located in various parts of the city.
• Steps to enforce compliance with pollution
standards for the polluting units. Dust control
measures such as cyclones, etc., especially in
small-scale industries to be enforced.
• Green belts to be promoted around industrial
estates.
• Environmental audit to be enforced with
immediate effect.
• Delineate adequate sites and shift nonconforming
industries (small as well as large) along with
enforcement of adequate pollution control
devices.
• Industries to adopt recycling and waste recovery
technologies. Incentives to be looked into in
order to promote recycle and re-use.
• Energy conservation techniques such as co-
generation and waste heat utilisation techniques
to be actively promoted.
Domestic Sector
• Demand side management through optimum
electricity consumption by replacement of
conventional bulbs (incandescent and fluorescent)
with compact fluorescent lamps (CFL). Even
though the use of CFLs involves much lower
electricity usage than conventional systems, the
higher upfront costs act as a deterrent to their
ready acceptability with consumers. It is therefore
required to formulate strategic plans, including
financing, for affecting such change.
5.5 Cleaning the River Yamuna
5.5.1 The Hon’ble Supreme Court, in its order dated 4
August 2004, expressed concern regarding deteriorating
water quality in the river Yamuna and inadequacy of
various measures so far taken to improve the situation.
Pursuant to the Court order, a High Powered Committee
was constituted to determine the quantum of water/waste
water generation, sources of pollution and to suggest the
mode and manner of improving the quality in the river.
The Committee has drawn up an Action Plan; the
components of which include the following:
• Maintenance of flows in the river;
• Water and waste water handling capacities;
• Refurbishment of trunk sewer age system;
• Treatment of the flows in Najafgarh and Shahdara
drains;
• Laying of sewer lines in the unsewered areas of
Delhi;
• Slum cluster on the river bed;
• Treatment of industrial effluents;
• Utilisation of treated effluents; and,
• Removal of coliform in the sewage treatment
plants.
5.5.2 Flows in River Yamuna: For improvement in water
quality, the water flow should be adequate and
continuous. To this end, the riparian States need to
contribute their share for maintaining a minimum flow in
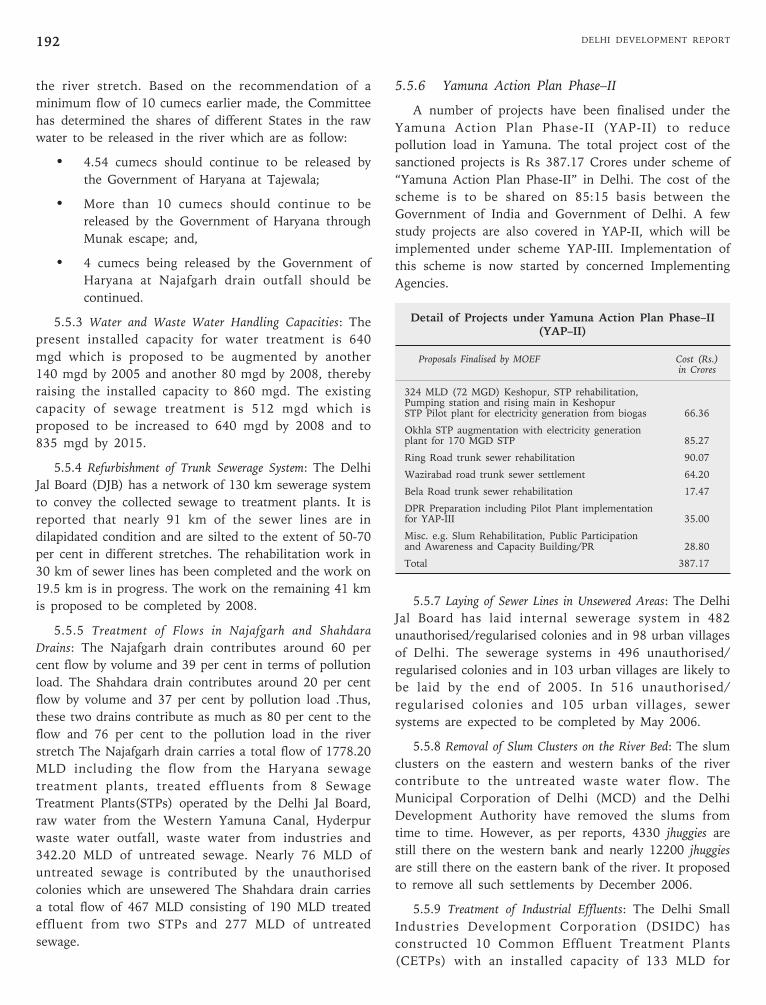
DELHI DEVELOPMENT REPORT192
the river stretch. Based on the recommendation of a
minimum flow of 10 cumecs earlier made, the Committee
has determined the shares of different States in the raw
water to be released in the river which are as follow:
• 4.54 cumecs should continue to be released by
the Government of Haryana at Tajewala;
• More than 10 cumecs should continue to be
released by the Government of Haryana through
Munak escape; and,
• 4 cumecs being released by the Government of
Haryana at Najafgarh drain outfall should be
continued.
5.5.3 Water and Waste Water Handling Capacities: The
present installed capacity for water treatment is 640
mgd which is proposed to be augmented by another
140 mgd by 2005 and another 80 mgd by 2008, thereby
raising the installed capacity to 860 mgd. The existing
capacity of sewage treatment is 512 mgd which is
proposed to be increased to 640 mgd by 2008 and to
835 mgd by 2015.
5.5.4 Refurbishment of Trunk Sewerage System: The Delhi
Jal Board (DJB) has a network of 130 km sewerage system
to convey the collected sewage to treatment plants. It is
reported that nearly 91 km of the sewer lines are in
dilapidated condition and are silted to the extent of 50-70
per cent in different stretches. The rehabilitation work in
30 km of sewer lines has been completed and the work on
19.5 km is in progress. The work on the remaining 41 km
is proposed to be completed by 2008.
5.5.5 Treatment of Flows in Najafgarh and Shahdara
Drains: The Najafgarh drain contributes around 60 per
cent flow by volume and 39 per cent in terms of pollution
load. The Shahdara drain contributes around 20 per cent
flow by volume and 37 per cent by pollution load .Thus,
these two drains contribute as much as 80 per cent to the
flow and 76 per cent to the pollution load in the river
stretch The Najafgarh drain carries a total flow of 1778.20
MLD including the flow from the Haryana sewage
treatment plants, treated effluents from 8 Sewage
Treatment Plants(STPs) operated by the Delhi Jal Board,
raw water from the Western Yamuna Canal, Hyderpur
waste water outfall, waste water from industries and
342.20 MLD of untreated sewage. Nearly 76 MLD of
untreated sewage is contributed by the unauthorised
colonies which are unsewered The Shahdara drain carries
a total flow of 467 MLD consisting of 190 MLD treated
effluent from two STPs and 277 MLD of untreated
sewage.
5.5.6 Yamuna Action Plan Phase–II
A number of projects have been finalised under the
Yamuna Action Plan Phase-II (YAP-II) to reduce
pollution load in Yamuna. The total project cost of the
sanctioned projects is Rs 387.17 Crores under scheme of
“Yamuna Action Plan Phase-II” in Delhi. The cost of the
scheme is to be shared on 85:15 basis between the
Government of India and Government of Delhi. A few
study projects are also covered in YAP-II, which will be
implemented under scheme YAP-III. Implementation of
this scheme is now started by concerned Implementing
Agencies.
Detail of Projects under Yamuna Action Plan Phase–II(YAP–II)
Proposals Finalised by MOEF Cost (Rs.)in Crores
324 MLD (72 MGD) Keshopur, STP rehabilitation,Pumping station and rising main in KeshopurSTP Pilot plant for electricity generation from biogas 66.36
Okhla STP augmentation with electricity generationplant for 170 MGD STP 85.27
Ring Road trunk sewer rehabilitation 90.07
Wazirabad road trunk sewer settlement 64.20
Bela Road trunk sewer rehabilitation 17.47
DPR Preparation including Pilot Plant implementationfor YAP-III 35.00
Misc. e.g. Slum Rehabilitation, Public Participationand Awareness and Capacity Building/PR 28.80
Total 387.17
5.5.7 Laying of Sewer Lines in Unsewered Areas: The Delhi
Jal Board has laid internal sewerage system in 482
unauthorised/regularised colonies and in 98 urban villages
of Delhi. The sewerage systems in 496 unauthorised/
regularised colonies and in 103 urban villages are likely to
be laid by the end of 2005. In 516 unauthorised/
regularised colonies and 105 urban villages, sewer
systems are expected to be completed by May 2006.
5.5.8 Removal of Slum Clusters on the River Bed: The slum
clusters on the eastern and western banks of the river
contribute to the untreated waste water flow. The
Municipal Corporation of Delhi (MCD) and the Delhi
Development Authority have removed the slums from
time to time. However, as per reports, 4330 jhuggies are
still there on the western bank and nearly 12200 jhuggies
are still there on the eastern bank of the river. It proposed
to remove all such settlements by December 2006.
5.5.9 Treatment of Industrial Effluents: The Delhi Small
Industries Development Corporation (DSIDC) has
constructed 10 Common Effluent Treatment Plants
(CETPs) with an installed capacity of 133 MLD for
Chapter 5 • ENVIRONMENT MANAGEMENT 193
treatment of industrial waste water before discharge into
the river. DSIDC is also constructing two treatment
plants—one at Naraina with a capacity of 21.6 MLD and
the other at Najafgarh having capacity of 9.6 MLD. As of
now, the CETPs are treating only 53 MLD of industrial
effluents. The low utilisation of the installed capacity is on
account of the provision made for handling the volume of
industrial effluents till 2021 besides the absence of
conveyance system at some places. It is proposed to lay
the conveyance system at Wazirpur, Friends Colony, and
Okhla Industrial Area, in addition to de-silting of
Mangalpuri sewerage system which expected to increase
the waste water flow in the CETPs.
5.5.10 Utilisation of Treated Effluent: Presently, 109.5
MGD of treated effluent is supplied to various agencies
and an additional amount of 241 MGD is available for
other user agencies. Occasional break down of conveyance
systems, irregular supply and offensive odour of the
treated effluent are among the reasons for limited use of
treated waste water.
5.5.11 Removal of Coliform at STPs: An Expert Group
headed by the Chairman, Central Pollution Control Board
(CPCB) has examined the issues relating permissible level
of coliform in the treated waste water and the process
required to achieve the desired levels. The Expert Group
has held that dilution available in the river is very little
and the fresh water available is less than the quantity of
sewage discharge. Hence, it is necessary to collect the
total effluent and treat it to achieve Biochemical Oxygen
Demand (BOD) of 20mg/l and Suspended Solids (SS) not
exceeding 30mg/l. Thereafter, in the second phase,
sewage treatment plants should be upgraded to reduce
BOD and SS to 10mg/l and 15mg/l respectively. The
process for achieving the limits may also remove coliform
to the extent of MPN 2500 per 100ml, which is the
maximum permissible limit for bathing as notified under
the Environment (Protection) Act, 1986.
5.5.12 Action Points
Besides the aforesaid targets and activities as proposed
in the Action Plan, it will be useful to address the
following issues:
• Assured availability of water in the river is vital
for improvement of water quality. Along with the
proposed measures for contribution of water from
Haryana, which are of interim nature, it will be
useful to explore the possibilities for sustainable
sources of water in the river. In this context, the
three water storage projects which were planned
in the upper reaches of Yamuna at Kishau,
Renuka and Lakhwar Vyasi should be revisited.
Such projects, if implemented, will help in
maintenance of a regular flow particularly during
the lean seasons:
• For ensuring adequate flow, the ground water
development potential in and around Delhi and
possibilities for ground water recharge need to
seriously looked into;
• Rain water harvesting activities, which are now
sporadically undertaken, need to be geared up;
and,
• Concerted efforts are needed for promoting the
use of water saving devices in house holds,
commercial establishments, industries and in
agriculture.
5.6 Storm Water and Flood Control
5.6.1 The territory of Delhi has been experiencing
floods mainly from Sahibi Nadi and Yamuna River. The
Sahibi River originates in Jaipur District of Rajasthan.
After passing through Alwar District in Rajasthan and
Gurgaon District in Haryana, it enters Delhi near Dhansa.
Sahibi River belongs to a special category of rivers in arid
and semi arid areas in Rajasthan. The Sahibi River
occasionally rises when its flood water travels down, up to
Yamuna through Rajasthan, Haryana, and Delhi. In Delhi,
flooding and consequent damage is caused mainly in the
rural area of Delhi in and around Najafgarh Jheel. It also
causes damage to the urban areas situated along the
banks of the Najafgarh Drain.
5.6.2 In order to cope up with the monsoons,
Irrigation and Flood Control Department of the
Government of NCT of Delhi undertakes pre-monsoon
anti water-logging and flood control measures. These
include desilting of all the trunk drains, restoration of anti
erosion works like spurs, installation of control rooms and
check post at various stations etc.
5.6.3 An Apex Committee has been constituted under
the Chairmanship of Chief Minister, Delhi to recommend,
supervise and co-ordinate the flood control measures.
NCT of Delhi has been divided into nine districts with a
sector committee for each district, which has come into
existence from 15 June 2005. A Central Flood Control
Room is established to assist the Apex Committee.
Following are the functions of the Central Flood Control
Room:
a) To receive flood warnings and other related
information.
DELHI DEVELOPMENT REPORT194
b) To submit flood situation reports to the Chief
Minister, Chief Secretary, Divisional Commissioner
and Secretary (I&F)
c) To convey flood situation reports and orders
relating to flood control measures to the sector
officers/sector control rooms and the concerned
organisations/departments of the administration
(through their liaison officers)
d) To issue necessary flood warnings and directions
for evacuation
e) To arrange necessary food articles and relief
supplies
f) To maintain liaison with Upper Yamuna Division
of the Central Water Commission (CWC), and
Army/Air Force, when required.
g) To maintain a fleet of vehicles needed for
mobility of staff and the relief measures
5.6.4 Dahisara bund upstream of R.M.E. near Palla is
under the control of Haryana Irrigation Department. A
proper watch needs to be kept on this embankment during
high floods for ensuring the safety of rural areas of Delhi
located on the North of Bawana Escape up to Diversion
drain No. 8 and East of G.T: Road up to R.M.E. Right
marginal embankment near Jhangola and Burari needs a
close watch, as the active course of the river is quite close
to the main marginal embankment at these locations.
5.6.5 The three ramps on Jagatpur bund acting as
spurs need constant watch during floods, requires a close
watch due to the eroding tendency of the river in this
reach. Left forward bund near R.D. 1350 mts. where
active course of the river is only 92 mts. away from the
main embankment. A constant watch has to be kept on
the right side connecting bund between Okhla Barrage
and Right Marginal Embankment downstream of Okhla
Barrage near villages Madanpur Khadar and Jaitpur, since
this portion of bund is lower than the left side bund and
is under control of UP. Irrigation Department Yamuna
Bazar wall near Nigam Bodh Ghat will have to be kept
under constant vigil during high floods.
5.6.6 Left marginal bund between Old Railway Bridge
and ITO Barrage shall also need to be kept under watch
during high floods, since active course of river is running
very close to this embankment. Special watch will have to
be kept on H.T: Pylon structure between Spur Nos. 17
and 18. The bund protecting Gas Turbine Power Station
shall have to be kept under watch during floods as river
course is flowing quite close to this bund.
5.6.7 Operation of Barrages: At present, the operation of
barrages across river Yamuna in Delhi Territory is under
the control of following authorities:
(i) Wazirabad Barrage Delhi Jal Board
(ii) I.T.O. Barrage Haryana Irrigation
Department
(iii) Okhla Barrage U.P. Irrigation
Department
5.6.8 Rural Drainage: Rural drains in Delhi territory
have been planned to drain out low lying rural areas
(agricultural). These areas are being served by
important drains like Mungeshpur drain, Nangloi Drain,
Drain No.6, Burari Creek, Karari Suleman Nagar Drain,
portion of supplementary drain below GT Road,
Bankner Drain, Sanoth Link Drain, Shahdara drainage
system and other small drains. Improvements in these
drains by clearance of silt where ever required, cleaning
of opening in pipe culvert/bridges etc. shall be ensured
before the flood season by I&F Department. However,
link drains from village ponds to these trunk drains are
under the control of MCD and the responsibility of
ensuring proper functioning of storm water drainage of
entire rural area of Delhi has been vested with the
M.C.D.
5.6.9 Drainage of Unauthorised Colonies: Proper drainage
system within the unauthorised colonies has not been
developed so far, resulting in stagnation of storm water in
pools and low lying plots. For drainage of these ponds, a
battery of pumps has to be installed to link the colony
water to nearby drains. These pumps shall be deployed by
MCD in all the unauthorised colonies outside the
development area of DDA. In the unauthorised colonies
falling within its jurisdiction, DDA has to make necessary
arrangements.
5.6.10 Urban Drainage: For monitoring the activities of
desilting of storm water drains, connecting drainage/
sewerage and for other related problems, an Operation
Mission has been constituted by Urban Development
Department, Government of Delhi. The Operation
Mission will have to monitor the following activities:
(i) Desilting of storm water drains.
(ii) Desilting of sewers.
iii) Tackling the problems of drainage congestion
wherever required.
iv) Delinking the sewer system from storm water
drains.
Chapter 5 • ENVIRONMENT MANAGEMENT 195
5.6.11 Responsibilities of Concerned Agencies
(a) Provision of Wireless Sets: Although adequate
Wireless sets are available in Irrigation and Flood
Control Department the Civil Defence
Volunteers/Home Guards will need to be
provided with supplemental support by setting up
wireless stations at the strategic places such as
Flood Control Room, L.M. Bund office of Deputy
Commissioner (East) and various sectors as per
requirements of the Divisional Commissioner
Delhi. All these wireless stations will be manned
by the Civil Defence Volunteers.
(b) Home Guards and Civil Defence Volunteers: Home
Guards will have to be deployed for patrolling
duties on bunds and regulators when required/
called for, to guard against sabotage and for
initiating rescue operations of marooned villages.
Civil Defence volunteers will be deployed for
camp management, distribution of rations, etc.
(c) Medical Arrangements: On receipt of requisition
from the Divisional Commissioner, Delhi,
Secretary (Medical), Government of Delhi would
make arrangements for setting up first-aid posts/
mobile dispensaries at relief camps and arrange
visits of medical team to the flood affected areas.
For such purposes, the Medical Department
would plan and make provisions for sufficient
stores of essential medicines in advance. In case
of need, Secretary (Medical) may seek the
assistance from the Chief Medical Officer,
NDMC/MCD.
(d) Sanitation etc.: M.C.D. would provide temporary
latrines, urinals and street lighting at camp site.
Supply of drinking water would be arranged by
D.J.B. in flood affected areas/relief camps.
(e) Support of Animal Husbandry Wing: On receipt of
the requisition from the Divisional Commissioner
Delhi, the animal husbandry wing of the
Development Department would send a medical
team of veterinary staff in the flood affected areas
and cattle camps.
(f) Transport: Commissioner (Transport), Government
of Delhi would arrange adequate number of
trucks or other category of vehicles as may be
needed by Divisional Commissioner, Delhi.
5.6.12 Action Points
An elaborate institutional mechanism has been put in
place for storm water and flood control. However, some
of the basic preventive measures which need to be given
priority attention include the following:
• Control on encroachment of the river banks for
unauthorised human settlements and commercial
activities;
• Restrictions on construction activities in the flood
plains;
• Collaboration with the neighbouring states for
creation of upstream water storage structures and
for flood water management systems; and,
• Preparation of a long term plan for storm water
and flood control.
References
Chhabra, Sunil K., Pragati Chhabra, Sanjay Rajpal, Rajiv K. Gupta (2001).“Ambient Air Pollution and Chronic Respiratory Morbidity in Delhi”,Achieves of Environmental Health, January.
Cropper, Maureen L., Nathalie B. Simon, Anna Alberini, andP.K. Sharma (1997). “The Health Effects of Air Pollution in Delhi,India”, Policy Research Working Paper. World Bank, December.
Delhi Pollution Control Committee (n.d.). Towards Cleaner Air, A Case Study ofDelhi. New Delhi: Dept. of Environment, GNCTD. http://www.dpcc.delhigovt.nic.in
Directorate of Economics and Statistics, 2002. Delhi Statistical Hand Book,2002. Delhi: Government of National Capital Territory of Delhi.
GNCTD (2001). Status Report for Delhi 21. New Delhi: Government of NationalCapital Territory of Delhi.
————. (2002). Economic Survey of Delhi, 2001-02. New Delhi: PlanningDepartment.
http://www.forest.delhigovt.nic.in/delhi_state.html
Ministry of Environment and Forests (MoEF) (n.d.). State of Forest Report, 1999.Chapter 3
Protecting traffic policemen from the hazards of pollutionwww.delhitrafficpolice.nic.in/art8.htm

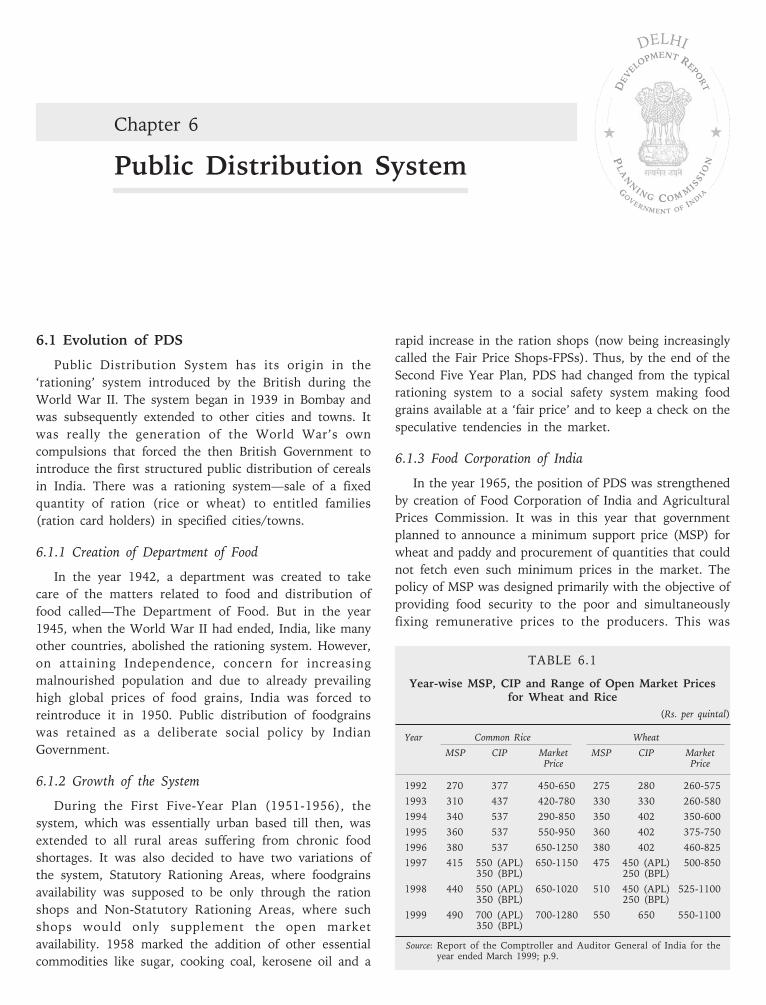
Chapter 6
Public Distribution System
DELHI
6.1 Evolution of PDS
Public Distribution System has its origin in the
‘rationing’ system introduced by the British during the
World War II. The system began in 1939 in Bombay and
was subsequently extended to other cities and towns. It
was really the generation of the World War’s own
compulsions that forced the then British Government to
introduce the first structured public distribution of cereals
in India. There was a rationing system—sale of a fixed
quantity of ration (rice or wheat) to entitled families
(ration card holders) in specified cities/towns.
6.1.1 Creation of Department of Food
In the year 1942, a department was created to take
care of the matters related to food and distribution of
food called—The Department of Food. But in the year
1945, when the World War II had ended, India, like many
other countries, abolished the rationing system. However,
on attaining Independence, concern for increasing
malnourished population and due to already prevailing
high global prices of food grains, India was forced to
reintroduce it in 1950. Public distribution of foodgrains
was retained as a deliberate social policy by Indian
Government.
6.1.2 Growth of the System
During the First Five-Year Plan (1951-1956), the
system, which was essentially urban based till then, was
extended to all rural areas suffering from chronic food
shortages. It was also decided to have two variations of
the system, Statutory Rationing Areas, where foodgrains
availability was supposed to be only through the ration
shops and Non-Statutory Rationing Areas, where such
shops would only supplement the open market
availability. 1958 marked the addition of other essential
commodities like sugar, cooking coal, kerosene oil and a
rapid increase in the ration shops (now being increasingly
called the Fair Price Shops-FPSs). Thus, by the end of the
Second Five Year Plan, PDS had changed from the typical
rationing system to a social safety system making food
grains available at a ‘fair price’ and to keep a check on the
speculative tendencies in the market.
6.1.3 Food Corporation of India
In the year 1965, the position of PDS was strengthened
by creation of Food Corporation of India and Agricultural
Prices Commission. It was in this year that government
planned to announce a minimum support price (MSP) for
wheat and paddy and procurement of quantities that could
not fetch even such minimum prices in the market. The
policy of MSP was designed primarily with the objective of
providing food security to the poor and simultaneously
fixing remunerative prices to the producers. This was
TABLE 6.1
Year-wise MSP, CIP and Range of Open Market Pricesfor Wheat and Rice
(Rs. per quintal)
Year Common Rice Wheat
MSP CIP Market MSP CIP MarketPrice Price
1992 270 377 450-650 275 280 260-575
1993 310 437 420-780 330 330 260-580
1994 340 537 290-850 350 402 350-600
1995 360 537 550-950 360 402 375-750
1996 380 537 650-1250 380 402 460-825
1997 415 550 (APL) 650-1150 475 450 (APL) 500-850350 (BPL) 250 (BPL)
1998 440 550 (APL) 650-1020 510 450 (APL) 525-1100350 (BPL) 250 (BPL)
1999 490 700 (APL) 700-1280 550 650 550-1100350 (BPL)
Source: Report of the Comptroller and Auditor General of India for theyear ended March 1999; p.9.
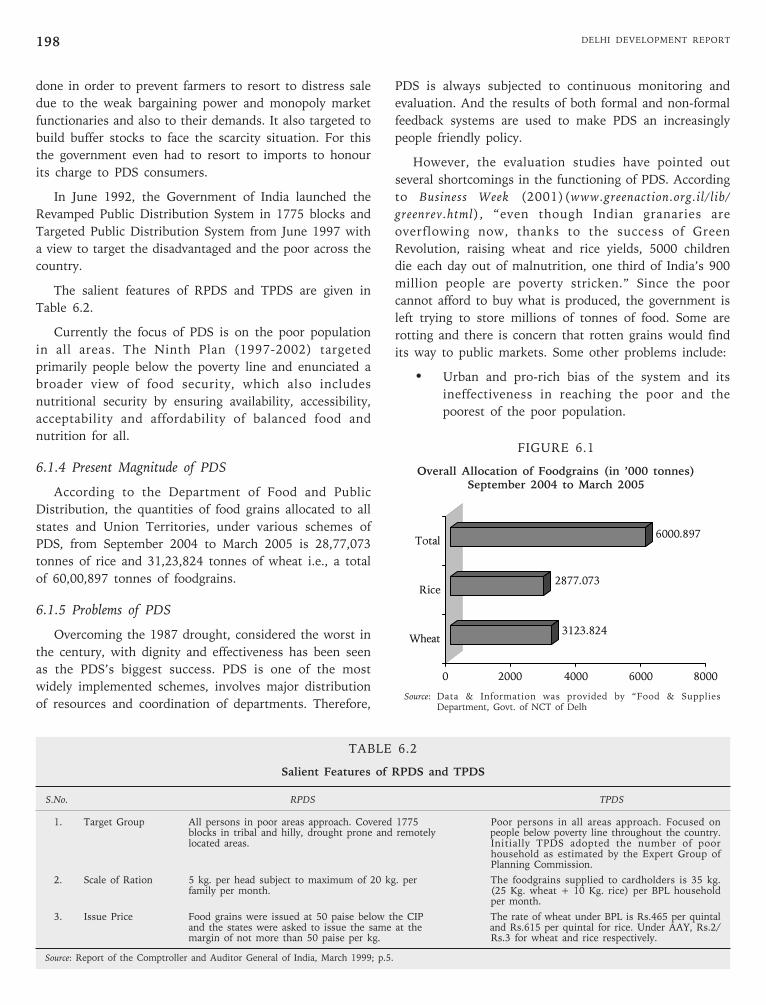
DELHI DEVELOPMENT REPORT198
done in order to prevent farmers to resort to distress sale
due to the weak bargaining power and monopoly market
functionaries and also to their demands. It also targeted to
build buffer stocks to face the scarcity situation. For this
the government even had to resort to imports to honour
its charge to PDS consumers.
In June 1992, the Government of India launched the
Revamped Public Distribution System in 1775 blocks and
Targeted Public Distribution System from June 1997 with
a view to target the disadvantaged and the poor across the
country.
The salient features of RPDS and TPDS are given in
Table 6.2.
Currently the focus of PDS is on the poor population
in all areas. The Ninth Plan (1997-2002) targeted
primarily people below the poverty line and enunciated a
broader view of food security, which also includes
nutritional security by ensuring availability, accessibility,
acceptability and affordability of balanced food and
nutrition for all.
6.1.4 Present Magnitude of PDS
According to the Department of Food and Public
Distribution, the quantities of food grains allocated to all
states and Union Territories, under various schemes of
PDS, from September 2004 to March 2005 is 28,77,073
tonnes of rice and 31,23,824 tonnes of wheat i.e., a total
of 60,00,897 tonnes of foodgrains.
6.1.5 Problems of PDS
Overcoming the 1987 drought, considered the worst in
the century, with dignity and effectiveness has been seen
as the PDS’s biggest success. PDS is one of the most
widely implemented schemes, involves major distribution
of resources and coordination of departments. Therefore,
PDS is always subjected to continuous monitoring and
evaluation. And the results of both formal and non-formal
feedback systems are used to make PDS an increasingly
people friendly policy.
However, the evaluation studies have pointed out
several shortcomings in the functioning of PDS. According
to Business Week (2001)(www.greenaction.org.il/lib/
greenrev.html), “even though Indian granaries are
overflowing now, thanks to the success of Green
Revolution, raising wheat and rice yields, 5000 children
die each day out of malnutrition, one third of India’s 900
million people are poverty stricken.” Since the poor
cannot afford to buy what is produced, the government is
left trying to store millions of tonnes of food. Some are
rotting and there is concern that rotten grains would find
its way to public markets. Some other problems include:
• Urban and pro-rich bias of the system and its
ineffectiveness in reaching the poor and the
poorest of the poor population.
TABLE 6.2
Salient Features of RPDS and TPDS
S.No. RPDS TPDS
1. Target Group All persons in poor areas approach. Covered 1775 Poor persons in all areas approach. Focused onblocks in tribal and hilly, drought prone and remotely people below poverty line throughout the country.located areas. Initially TPDS adopted the number of poor
household as estimated by the Expert Group ofPlanning Commission.
2. Scale of Ration 5 kg. per head subject to maximum of 20 kg. per The foodgrains supplied to cardholders is 35 kg.family per month. (25 Kg. wheat + 10 Kg. rice) per BPL household
per month.
3. Issue Price Food grains were issued at 50 paise below the CIP The rate of wheat under BPL is Rs.465 per quintaland the states were asked to issue the same at the and Rs.615 per quintal for rice. Under AAY, Rs.2/margin of not more than 50 paise per kg. Rs.3 for wheat and rice respectively.
Source: Report of the Comptroller and Auditor General of India, March 1999; p.5.
FIGURE 6.1
Overall Allocation of Foodgrains (in ’000 tonnes)September 2004 to March 2005
3123.824
2877.073
6000.897
0 2000 4000 6000 8000
Wheat
Rice
Total
Source: Data & Information was provided by “Food & SuppliesDepartment, Govt. of NCT of Delh
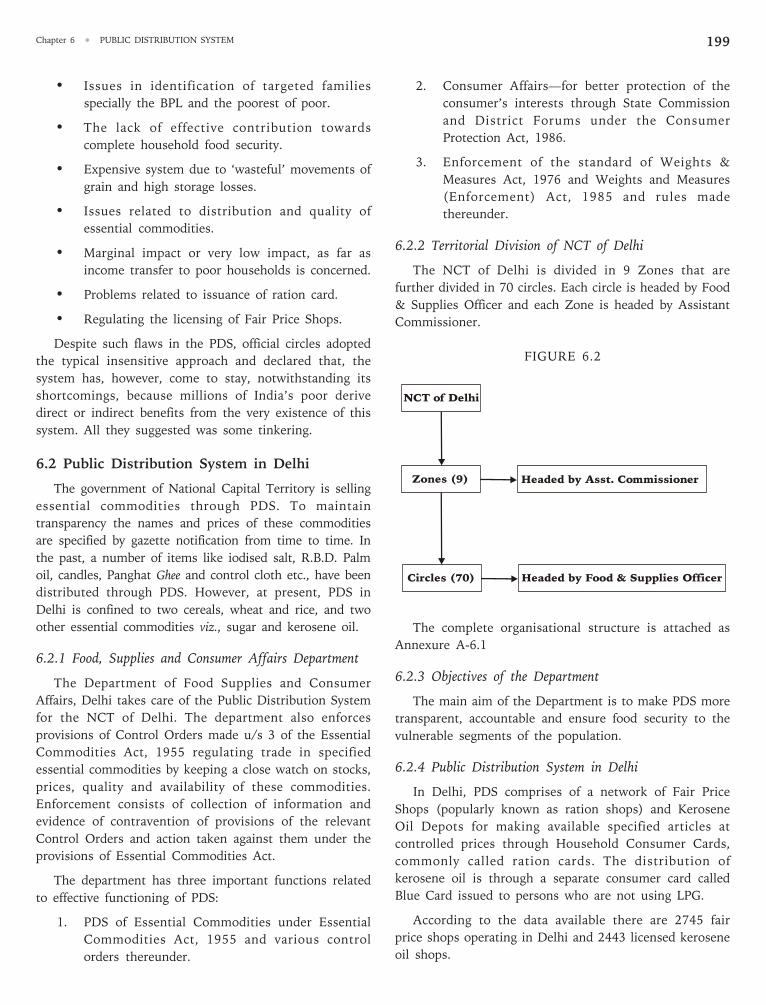
Chapter 6 • PUBLIC DISTRIBUTION SYSTEM 199
• Issues in identification of targeted families
specially the BPL and the poorest of poor.
• The lack of effective contribution towards
complete household food security.
• Expensive system due to ‘wasteful’ movements of
grain and high storage losses.
• Issues related to distribution and quality of
essential commodities.
• Marginal impact or very low impact, as far as
income transfer to poor households is concerned.
• Problems related to issuance of ration card.
• Regulating the licensing of Fair Price Shops.
Despite such flaws in the PDS, official circles adopted
the typical insensitive approach and declared that, the
system has, however, come to stay, notwithstanding its
shortcomings, because millions of India’s poor derive
direct or indirect benefits from the very existence of this
system. All they suggested was some tinkering.
6.2 Public Distribution System in Delhi
The government of National Capital Territory is selling
essential commodities through PDS. To maintain
transparency the names and prices of these commodities
are specified by gazette notification from time to time. In
the past, a number of items like iodised salt, R.B.D. Palm
oil, candles, Panghat Ghee and control cloth etc., have been
distributed through PDS. However, at present, PDS in
Delhi is confined to two cereals, wheat and rice, and two
other essential commodities viz., sugar and kerosene oil.
6.2.1 Food, Supplies and Consumer Affairs Department
The Department of Food Supplies and Consumer
Affairs, Delhi takes care of the Public Distribution System
for the NCT of Delhi. The department also enforces
provisions of Control Orders made u/s 3 of the Essential
Commodities Act, 1955 regulating trade in specified
essential commodities by keeping a close watch on stocks,
prices, quality and availability of these commodities.
Enforcement consists of collection of information and
evidence of contravention of provisions of the relevant
Control Orders and action taken against them under the
provisions of Essential Commodities Act.
The department has three important functions related
to effective functioning of PDS:
1. PDS of Essential Commodities under Essential
Commodities Act, 1955 and various control
orders thereunder.
2. Consumer Affairs—for better protection of the
consumer’s interests through State Commission
and District Forums under the Consumer
Protection Act, 1986.
3. Enforcement of the standard of Weights &
Measures Act, 1976 and Weights and Measures
(Enforcement) Act, 1985 and rules made
thereunder.
6.2.2 Territorial Division of NCT of Delhi
The NCT of Delhi is divided in 9 Zones that are
further divided in 70 circles. Each circle is headed by Food
& Supplies Officer and each Zone is headed by Assistant
Commissioner.
The complete organisational structure is attached as
Annexure A-6.1
6.2.3 Objectives of the Department
The main aim of the Department is to make PDS more
transparent, accountable and ensure food security to the
vulnerable segments of the population.
6.2.4 Public Distribution System in Delhi
In Delhi, PDS comprises of a network of Fair Price
Shops (popularly known as ration shops) and Kerosene
Oil Depots for making available specified articles at
controlled prices through Household Consumer Cards,
commonly called ration cards. The distribution of
kerosene oil is through a separate consumer card called
Blue Card issued to persons who are not using LPG.
According to the data available there are 2745 fair
price shops operating in Delhi and 2443 licensed kerosene
oil shops.
NCT of Delhi
Zones (9)
Circles (70)
Headed by Asst. Commissioner
Headed by Food & Supplies Officer
FIGURE 6.2
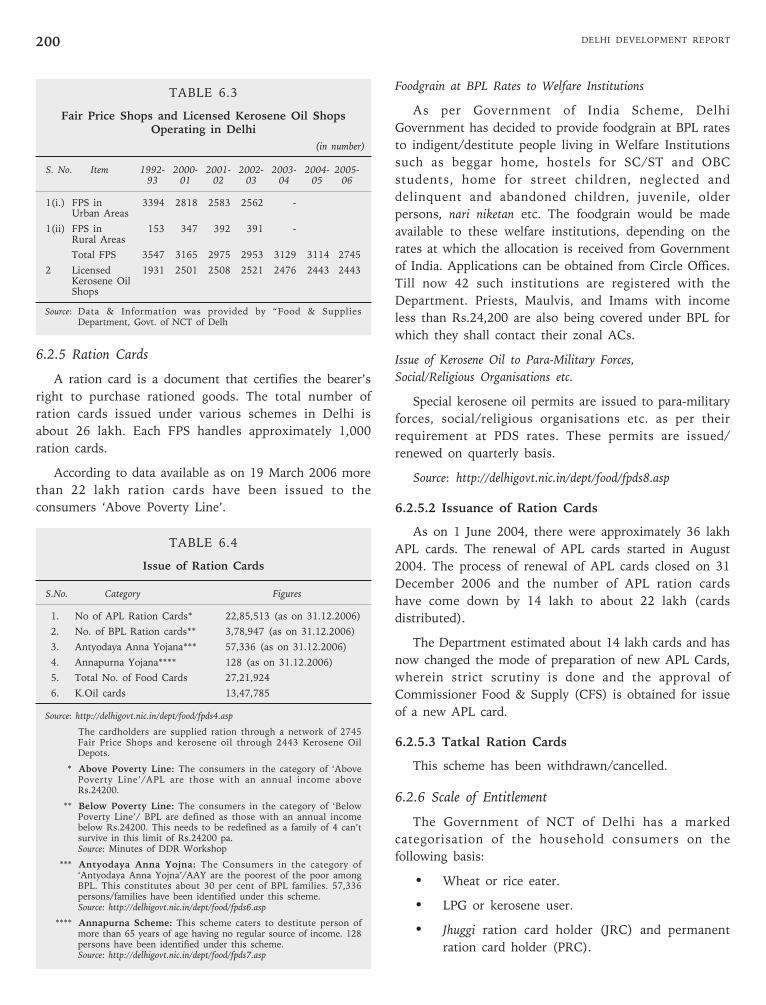
DELHI DEVELOPMENT REPORT200
TABLE 6.3
Fair Price Shops and Licensed Kerosene Oil ShopsOperating in Delhi
(in number)
S. No. Item 1992- 2000- 2001- 2002- 2003- 2004- 2005-93 01 02 03 04 05 06
1(i.) FPS in 3394 2818 2583 2562 -Urban Areas
1(ii) FPS in 153 347 392 391 -Rural Areas
Total FPS 3547 3165 2975 2953 3129 3114 2745
2 Licensed 1931 2501 2508 2521 2476 2443 2443Kerosene OilShops
Source: Data & Information was provided by “Food & SuppliesDepartment, Govt. of NCT of Delh
6.2.5 Ration Cards
A ration card is a document that certifies the bearer’s
right to purchase rationed goods. The total number of
ration cards issued under various schemes in Delhi is
about 26 lakh. Each FPS handles approximately 1,000
ration cards.
According to data available as on 19 March 2006 more
than 22 lakh ration cards have been issued to the
consumers ‘Above Poverty Line’.
TABLE 6.4
Issue of Ration Cards
S.No. Category Figures
1. No of APL Ration Cards* 22,85,513 (as on 31.12.2006)
2. No. of BPL Ration cards** 3,78,947 (as on 31.12.2006)
3. Antyodaya Anna Yojana*** 57,336 (as on 31.12.2006)
4. Annapurna Yojana**** 128 (as on 31.12.2006)
5. Total No. of Food Cards 27,21,924
6. K.Oil cards 13,47,785
Source: http://delhigovt.nic.in/dept/food/fpds4.asp
The cardholders are supplied ration through a network of 2745Fair Price Shops and kerosene oil through 2443 Kerosene OilDepots.
* Above Poverty Line: The consumers in the category of ‘AbovePoverty Line’/APL are those with an annual income aboveRs.24200.
** Below Poverty Line: The consumers in the category of ‘BelowPoverty Line’/ BPL are defined as those with an annual incomebelow Rs.24200. This needs to be redefined as a family of 4 can’tsurvive in this limit of Rs.24200 pa.Source: Minutes of DDR Workshop
*** Antyodaya Anna Yojna: The Consumers in the category of‘Antyodaya Anna Yojna’/AAY are the poorest of the poor amongBPL. This constitutes about 30 per cent of BPL families. 57,336persons/families have been identified under this scheme.Source: http://delhigovt.nic.in/dept/food/fpds6.asp
**** Annapurna Scheme: This scheme caters to destitute person ofmore than 65 years of age having no regular source of income. 128persons have been identified under this scheme.Source: http://delhigovt.nic.in/dept/food/fpds7.asp
Foodgrain at BPL Rates to Welfare Institutions
As per Government of India Scheme, Delhi
Government has decided to provide foodgrain at BPL rates
to indigent/destitute people living in Welfare Institutions
such as beggar home, hostels for SC/ST and OBC
students, home for street children, neglected and
delinquent and abandoned children, juvenile, older
persons, nari niketan etc. The foodgrain would be made
available to these welfare institutions, depending on the
rates at which the allocation is received from Government
of India. Applications can be obtained from Circle Offices.
Till now 42 such institutions are registered with the
Department. Priests, Maulvis, and Imams with income
less than Rs.24,200 are also being covered under BPL for
which they shall contact their zonal ACs.
Issue of Kerosene Oil to Para-Military Forces,
Social/Religious Organisations etc.
Special kerosene oil permits are issued to para-military
forces, social/religious organisations etc. as per their
requirement at PDS rates. These permits are issued/
renewed on quarterly basis.
Source: http://delhigovt.nic.in/dept/food/fpds8.asp
6.2.5.2 Issuance of Ration Cards
As on 1 June 2004, there were approximately 36 lakh
APL cards. The renewal of APL cards started in August
2004. The process of renewal of APL cards closed on 31
December 2006 and the number of APL ration cards
have come down by 14 lakh to about 22 lakh (cards
distributed).
The Department estimated about 14 lakh cards and has
now changed the mode of preparation of new APL Cards,
wherein strict scrutiny is done and the approval of
Commissioner Food & Supply (CFS) is obtained for issue
of a new APL card.
6.2.5.3 Tatkal Ration Cards
This scheme has been withdrawn/cancelled.
6.2.6 Scale of Entitlement
The Government of NCT of Delhi has a marked
categorisation of the household consumers on the
following basis:
• Wheat or rice eater.
• LPG or kerosene user.
• Jhuggi ration card holder (JRC) and permanent
ration card holder (PRC).
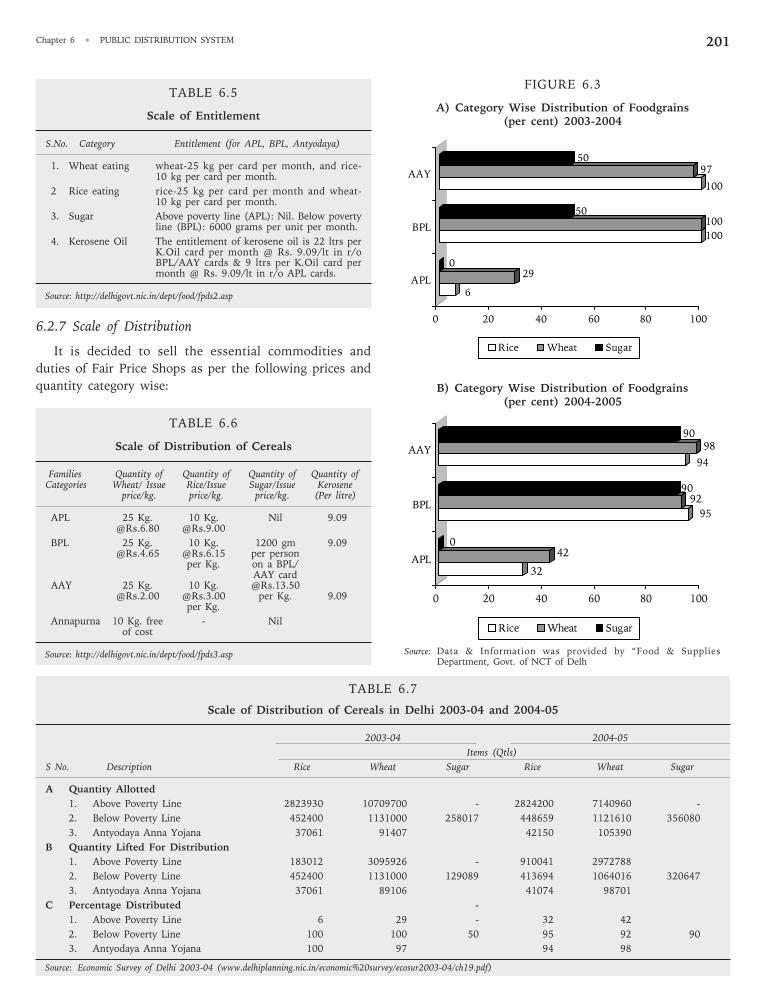
Chapter 6 • PUBLIC DISTRIBUTION SYSTEM 201
TABLE 6.5
Scale of Entitlement
S.No. Category Entitlement (for APL, BPL, Antyodaya)
1. Wheat eating wheat-25 kg per card per month, and rice-10 kg per card per month.
2 Rice eating rice-25 kg per card per month and wheat-10 kg per card per month.
3. Sugar Above poverty line (APL): Nil. Below povertyline (BPL): 6000 grams per unit per month.
4. Kerosene Oil The entitlement of kerosene oil is 22 ltrs perK.Oil card per month @ Rs. 9.09/lt in r/oBPL/AAY cards & 9 ltrs per K.Oil card permonth @ Rs. 9.09/lt in r/o APL cards.
Source: http://delhigovt.nic.in/dept/food/fpds2.asp
6.2.7 Scale of Distribution
It is decided to sell the essential commodities and
duties of Fair Price Shops as per the following prices and
quantity category wise:
TABLE 6.6
Scale of Distribution of Cereals
Families Quantity of Quantity of Quantity of Quantity ofCategories Wheat/ Issue Rice/Issue Sugar/Issue Kerosene
price/kg. price/kg. price/kg. (Per litre)
APL 25 Kg. 10 Kg. Nil [email protected] @Rs.9.00
BPL 25 Kg. 10 Kg. 1200 gm [email protected] @Rs.6.15 per person
per Kg. on a BPL/AAY card
AAY 25 Kg. 10 Kg. @[email protected] @Rs.3.00 per Kg. 9.09
per Kg.
Annapurna 10 Kg. free - Nilof cost
Source: http://delhigovt.nic.in/dept/food/fpds3.asp
FIGURE 6.3
A) Category Wise Distribution of Foodgrains(per cent) 2003-2004
B) Category Wise Distribution of Foodgrains(per cent) 2004-2005
6
290
100
10050
100
9750
0 20 40 60 80 100
APL
BPL
AAY
Rice Wheat Sugar
32
420
95
9290
94
9890
0 20 40 60 80 100
APL
BPL
AAY
Rice Wheat Sugar
TABLE 6.7
Scale of Distribution of Cereals in Delhi 2003-04 and 2004-05
2003-04 2004-05
Items (Qtls)
S No. Description Rice Wheat Sugar Rice Wheat Sugar
A Quantity Allotted
1. Above Poverty Line 2823930 10709700 - 2824200 7140960 -
2. Below Poverty Line 452400 1131000 258017 448659 1121610 356080
3. Antyodaya Anna Yojana 37061 91407 42150 105390
B Quantity Lifted For Distribution
1. Above Poverty Line 183012 3095926 - 910041 2972788
2. Below Poverty Line 452400 1131000 129089 413694 1064016 320647
3. Antyodaya Anna Yojana 37061 89106 41074 98701
C Percentage Distributed -
1. Above Poverty Line 6 29 - 32 42
2. Below Poverty Line 100 100 50 95 92 90
3. Antyodaya Anna Yojana 100 97 94 98
Source: Economic Survey of Delhi 2003-04 (www.delhiplanning.nic.in/economic%20survey/ecosur2003-04/ch19.pdf)
Source: Data & Information was provided by “Food & SuppliesDepartment, Govt. of NCT of Delh
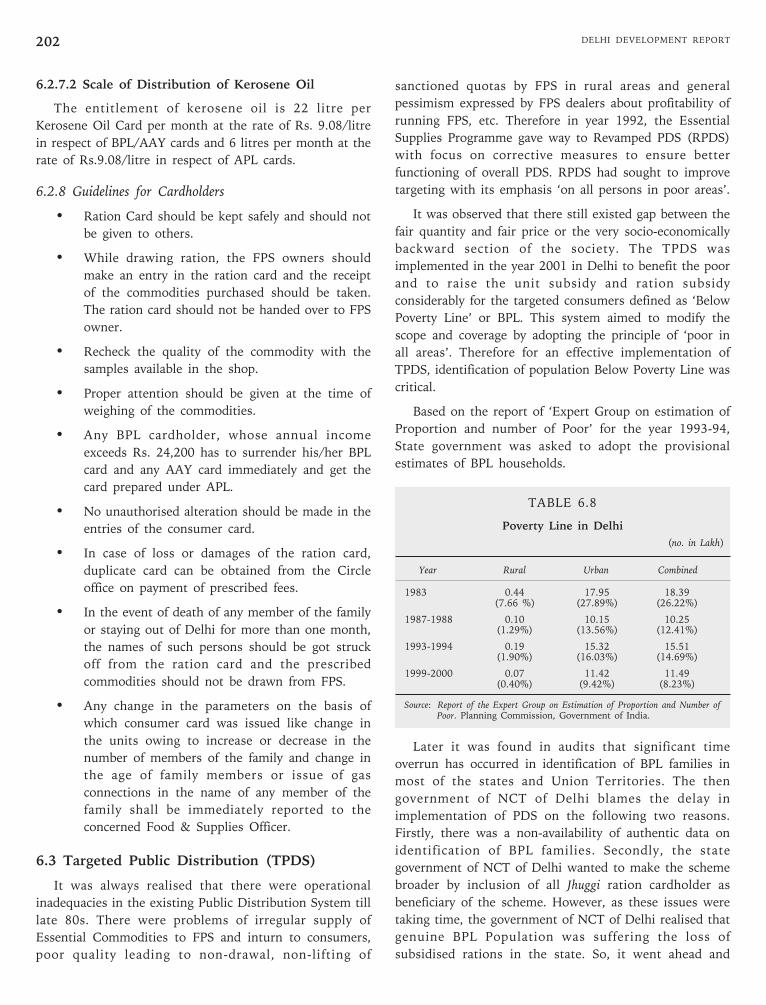
DELHI DEVELOPMENT REPORT202
6.2.7.2 Scale of Distribution of Kerosene Oil
The entitlement of kerosene oil is 22 litre per
Kerosene Oil Card per month at the rate of Rs. 9.08/litre
in respect of BPL/AAY cards and 6 litres per month at the
rate of Rs.9.08/litre in respect of APL cards.
6.2.8 Guidelines for Cardholders
• Ration Card should be kept safely and should not
be given to others.
• While drawing ration, the FPS owners should
make an entry in the ration card and the receipt
of the commodities purchased should be taken.
The ration card should not be handed over to FPS
owner.
• Recheck the quality of the commodity with the
samples available in the shop.
• Proper attention should be given at the time of
weighing of the commodities.
• Any BPL cardholder, whose annual income
exceeds Rs. 24,200 has to surrender his/her BPL
card and any AAY card immediately and get the
card prepared under APL.
• No unauthorised alteration should be made in the
entries of the consumer card.
• In case of loss or damages of the ration card,
duplicate card can be obtained from the Circle
office on payment of prescribed fees.
• In the event of death of any member of the family
or staying out of Delhi for more than one month,
the names of such persons should be got struck
off from the ration card and the prescribed
commodities should not be drawn from FPS.
• Any change in the parameters on the basis of
which consumer card was issued like change in
the units owing to increase or decrease in the
number of members of the family and change in
the age of family members or issue of gas
connections in the name of any member of the
family shall be immediately reported to the
concerned Food & Supplies Officer.
6.3 Targeted Public Distribution (TPDS)
It was always realised that there were operational
inadequacies in the existing Public Distribution System till
late 80s. There were problems of irregular supply of
Essential Commodities to FPS and inturn to consumers,
poor quality leading to non-drawal, non-lifting of
sanctioned quotas by FPS in rural areas and general
pessimism expressed by FPS dealers about profitability of
running FPS, etc. Therefore in year 1992, the Essential
Supplies Programme gave way to Revamped PDS (RPDS)
with focus on corrective measures to ensure better
functioning of overall PDS. RPDS had sought to improve
targeting with its emphasis ‘on all persons in poor areas’.
It was observed that there still existed gap between the
fair quantity and fair price or the very socio-economically
backward section of the society. The TPDS was
implemented in the year 2001 in Delhi to benefit the poor
and to raise the unit subsidy and ration subsidy
considerably for the targeted consumers defined as ‘Below
Poverty Line’ or BPL. This system aimed to modify the
scope and coverage by adopting the principle of ‘poor in
all areas’. Therefore for an effective implementation of
TPDS, identification of population Below Poverty Line was
critical.
Based on the report of ‘Expert Group on estimation of
Proportion and number of Poor’ for the year 1993-94,
State government was asked to adopt the provisional
estimates of BPL households.
TABLE 6.8
Poverty Line in Delhi
(no. in Lakh)
Year Rural Urban Combined
1983 0.44 17.95 18.39(7.66 %) (27.89%) (26.22%)
1987-1988 0.10 10.15 10.25(1.29%) (13.56%) (12.41%)
1993-1994 0.19 15.32 15.51(1.90%) (16.03%) (14.69%)
1999-2000 0.07 11.42 11.49(0.40%) (9.42%) (8.23%)
Source: Report of the Expert Group on Estimation of Proportion and Number ofPoor. Planning Commission, Government of India.
Later it was found in audits that significant time
overrun has occurred in identification of BPL families in
most of the states and Union Territories. The then
government of NCT of Delhi blames the delay in
implementation of PDS on the following two reasons.
Firstly, there was a non-availability of authentic data on
identification of BPL families. Secondly, the state
government of NCT of Delhi wanted to make the scheme
broader by inclusion of all Jhuggi ration cardholder as
beneficiary of the scheme. However, as these issues were
taking time, the government of NCT of Delhi realised that
genuine BPL Population was suffering the loss of
subsidised rations in the state. So, it went ahead and
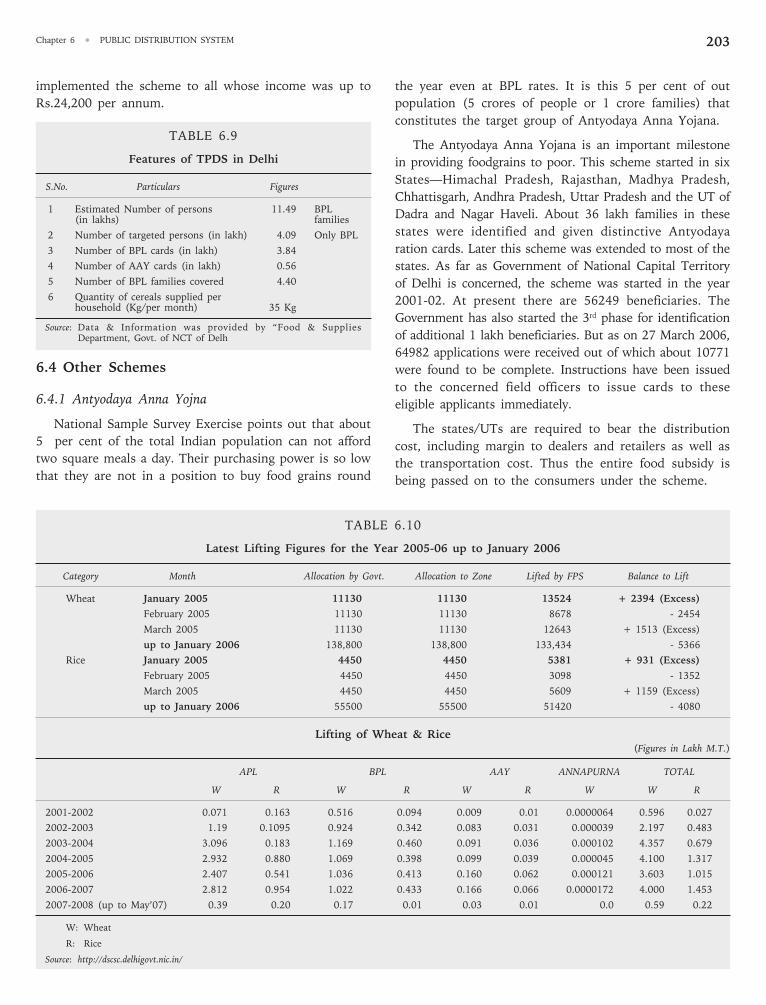
Chapter 6 • PUBLIC DISTRIBUTION SYSTEM 203
implemented the scheme to all whose income was up to
Rs.24,200 per annum.
TABLE 6.9
Features of TPDS in Delhi
S.No. Particulars Figures
1 Estimated Number of persons 11.49 BPL(in lakhs) families
2 Number of targeted persons (in lakh) 4.09 Only BPL
3 Number of BPL cards (in lakh) 3.84
4 Number of AAY cards (in lakh) 0.56
5 Number of BPL families covered 4.40
6 Quantity of cereals supplied perhousehold (Kg/per month) 35 Kg
Source: Data & Information was provided by “Food & SuppliesDepartment, Govt. of NCT of Delh
6.4 Other Schemes
6.4.1 Antyodaya Anna Yojna
National Sample Survey Exercise points out that about
5 per cent of the total Indian population can not afford
two square meals a day. Their purchasing power is so low
that they are not in a position to buy food grains round
the year even at BPL rates. It is this 5 per cent of out
population (5 crores of people or 1 crore families) that
constitutes the target group of Antyodaya Anna Yojana.
The Antyodaya Anna Yojana is an important milestone
in providing foodgrains to poor. This scheme started in six
States—Himachal Pradesh, Rajasthan, Madhya Pradesh,
Chhattisgarh, Andhra Pradesh, Uttar Pradesh and the UT of
Dadra and Nagar Haveli. About 36 lakh families in these
states were identified and given distinctive Antyodaya
ration cards. Later this scheme was extended to most of the
states. As far as Government of National Capital Territory
of Delhi is concerned, the scheme was started in the year
2001-02. At present there are 56249 beneficiaries. The
Government has also started the 3rd phase for identification
of additional 1 lakh beneficiaries. But as on 27 March 2006,
64982 applications were received out of which about 10771
were found to be complete. Instructions have been issued
to the concerned field officers to issue cards to these
eligible applicants immediately.
The states/UTs are required to bear the distribution
cost, including margin to dealers and retailers as well as
the transportation cost. Thus the entire food subsidy is
being passed on to the consumers under the scheme.
TABLE 6.10
Latest Lifting Figures for the Year 2005-06 up to January 2006
Category Month Allocation by Govt. Allocation to Zone Lifted by FPS Balance to Lift
Wheat January 2005 11130 11130 13524 + 2394 (Excess)
February 2005 11130 11130 8678 - 2454
March 2005 11130 11130 12643 + 1513 (Excess)
up to January 2006 138,800 138,800 133,434 - 5366
Rice January 2005 4450 4450 5381 + 931 (Excess)
February 2005 4450 4450 3098 - 1352
March 2005 4450 4450 5609 + 1159 (Excess)
up to January 2006 55500 55500 51420 - 4080
Lifting of Wheat & Rice (Figures in Lakh M.T.)
APL BPL AAY ANNAPURNA TOTAL
W R W R W R W W R
2001-2002 0.071 0.163 0.516 0.094 0.009 0.01 0.0000064 0.596 0.027
2002-2003 1.19 0.1095 0.924 0.342 0.083 0.031 0.000039 2.197 0.483
2003-2004 3.096 0.183 1.169 0.460 0.091 0.036 0.000102 4.357 0.679
2004-2005 2.932 0.880 1.069 0.398 0.099 0.039 0.000045 4.100 1.317
2005-2006 2.407 0.541 1.036 0.413 0.160 0.062 0.000121 3.603 1.015
2006-2007 2.812 0.954 1.022 0.433 0.166 0.066 0.0000172 4.000 1.453
2007-2008 (up to May’07) 0.39 0.20 0.17 0.01 0.03 0.01 0.0 0.59 0.22
W: Wheat
R: Rice
Source: http://dscsc.delhigovt.nic.in/
DELHI DEVELOPMENT REPORT204
6.4.1.2 Expansions of Antyodaya Anna Yojna
Ever since the scheme was announced there have been
continuous expansions. In line with the National
Common Minimum Programme (NCMP) of the UPA
Government and the announcement made by the Hon’ble
Finance Minister in the Union Budget 2004-05, the
Antyodaya Anna Yojana (AAY) was expanded with effect
from 1 August 2004 by adding 50 lakh BPL families by
including interalia all households at the risk of hunger.
In Delhi the expansion was started in September 2005,
but due to stringent scrutiny only 64982 applications were
received till 27 March 2006. Out of these only 10771 were
found to be complete. To ensure that only genuine and
needy poorest of the poor is selected, the department had
insisted on income certificate issued by the area SDM. Now
only eligible persons are submitting these applications.
The following are the other criteria adopted for
identification of additional Antyodaya families:
(a) Landless agriculture labourers, marginal farmers,
rural artisans/craftsmen such as potters, tanners,
weavers, blacksmiths, carpenters, slum dwellers,
and persons earning their livelihood on daily basis
in the informal sector like porters, coolies,
rickshaw pullers, hand cart pullers, fruit and
flower sellers, snake charmers, rag pickers,
cobblers, destitutes and other similar categories
in both rural and urban areas.
(b) Households headed by widows or terminally ill
persons/disabled persons/persons aged 60 years
or more with no assured means of subsistence or
societal support.
(c) Widows or terminally ill persons or disabled
persons or persons aged 60 years or more or
single women or single men with no family or
societal support or assured means of subsistence.
6.4.1.3 Objectives of the Scheme
Antyodaya Anna Yojana reflects the commitment of the
Government of India to ensure food security for all and
create a hunger free India. The objective of the scheme is
to reform and improve the Public Distribution System so
as to serve the poorest of the poor in rural and urban
areas. It is for the poorest of poor that the Antyodya Anna
Yojana has been conserved.
6.4.1.4 Scale and Issue Price
Antyodaya Anna Yojana contemplates identification of
one crore families out of the number of BPL families who
would be provided foodgrains at the rate of 35 kg. per
family per month. The approximate annual requirement of
food grains for Antyodaya families would be 30 lakh
tonnes. The food grains will be issued by the Government
of India at the rate of Rs.2 per kg. for wheat and Rs. 3 per
kg. for rice. The Government of India suggests that in view
of the abject poverty of this group of beneficiaries, the state
government may ensure that the end retail price is retained
at Rs.2 per kg. for wheat and Rs.3 per kg. for rice.
As far as Delhi is concerned, about 1,00,000 additional
beneficiaries are to be identified in addition to present
56249 beneficiaries. Therefore the total requirement of
food grains would be 5.46 lakh qtls. per month.
6.4.1.5 Issue of Ration Cards
After the identification of Antyodaya families,
distinctive ration cards known as “Antyodaya Ration
Card” are issued to the Antyodaya families by the
designated authority. The ration card has the necessary
details about the Antyodaya family, scale of ration etc.
There is no application form and no fees for applying for
Antyodaya Cards.
6.4.2 Annapurna Scheme
The Annapurna scheme aims at providing food security
to meet the requirement of those senior citizens who
though eligible have remained uncovered under the
National Old Age Pension Scheme (NOAPS). This scheme
addresses senior citizens of the country who are above 65
years of age and are not receiving any pension. The
objective of the scheme is to ensure food security for the
aged destitutes of the state. A “destitute person” is
defined, as the person who has no regular source of
income or financial support and therefore it is difficult for
him to support himself.
6.4.2.2 Eligibility Criteria
Central assistance under Annapurna Scheme are
provided to the beneficiaries fulfilling the following
criteria:
a) The age of the applicant (male or female) should
be 65 years or above.
b) The applicant must be “destitute” in the sense of
having little or no regular means of subsistence
from his/her own source of income or through
financial support from family members or other
sources. In order to determine destitution, the
criteria (if any) currently in force in the state/UTs
could also be followed.
c) The applicant should not be in receipt of pension
under the NOAPS or State Pension Scheme.
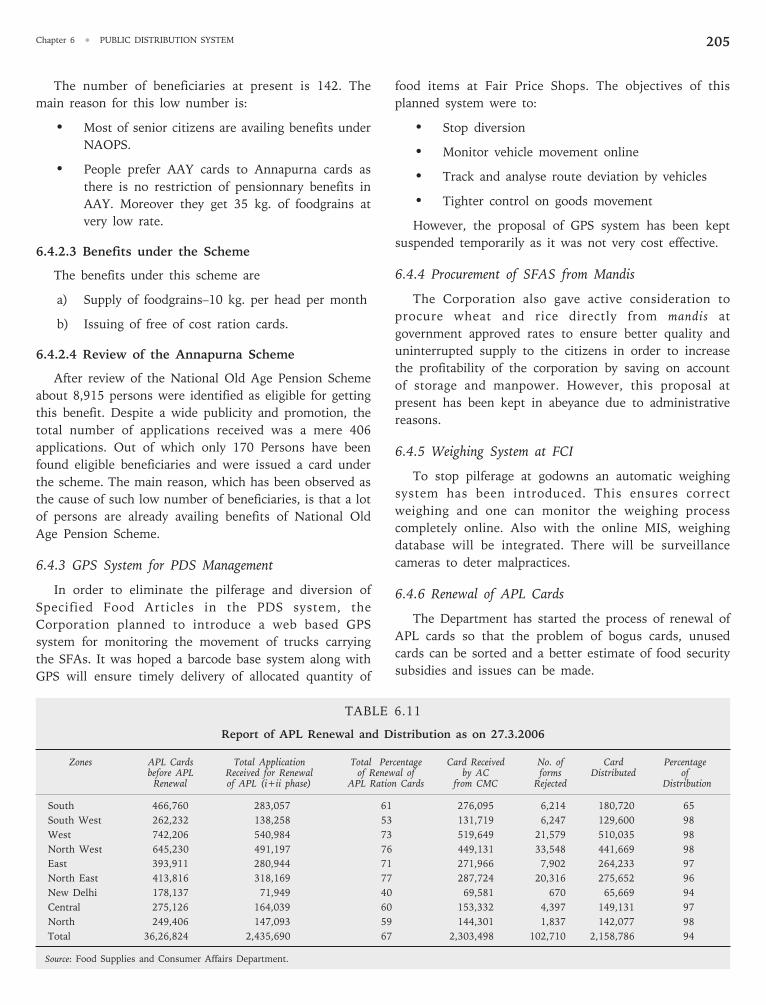
Chapter 6 • PUBLIC DISTRIBUTION SYSTEM 205
The number of beneficiaries at present is 142. The
main reason for this low number is:
• Most of senior citizens are availing benefits under
NAOPS.
• People prefer AAY cards to Annapurna cards as
there is no restriction of pensionnary benefits in
AAY. Moreover they get 35 kg. of foodgrains at
very low rate.
6.4.2.3 Benefits under the Scheme
The benefits under this scheme are
a) Supply of foodgrains–10 kg. per head per month
b) Issuing of free of cost ration cards.
6.4.2.4 Review of the Annapurna Scheme
After review of the National Old Age Pension Scheme
about 8,915 persons were identified as eligible for getting
this benefit. Despite a wide publicity and promotion, the
total number of applications received was a mere 406
applications. Out of which only 170 Persons have been
found eligible beneficiaries and were issued a card under
the scheme. The main reason, which has been observed as
the cause of such low number of beneficiaries, is that a lot
of persons are already availing benefits of National Old
Age Pension Scheme.
6.4.3 GPS System for PDS Management
In order to eliminate the pilferage and diversion of
Specified Food Articles in the PDS system, the
Corporation planned to introduce a web based GPS
system for monitoring the movement of trucks carrying
the SFAs. It was hoped a barcode base system along with
GPS will ensure timely delivery of allocated quantity of
food items at Fair Price Shops. The objectives of this
planned system were to:
• Stop diversion
• Monitor vehicle movement online
• Track and analyse route deviation by vehicles
• Tighter control on goods movement
However, the proposal of GPS system has been kept
suspended temporarily as it was not very cost effective.
6.4.4 Procurement of SFAS from Mandis
The Corporation also gave active consideration to
procure wheat and rice directly from mandis at
government approved rates to ensure better quality and
uninterrupted supply to the citizens in order to increase
the profitability of the corporation by saving on account
of storage and manpower. However, this proposal at
present has been kept in abeyance due to administrative
reasons.
6.4.5 Weighing System at FCI
To stop pilferage at godowns an automatic weighing
system has been introduced. This ensures correct
weighing and one can monitor the weighing process
completely online. Also with the online MIS, weighing
database will be integrated. There will be surveillance
cameras to deter malpractices.
6.4.6 Renewal of APL Cards
The Department has started the process of renewal of
APL cards so that the problem of bogus cards, unused
cards can be sorted and a better estimate of food security
subsidies and issues can be made.
TABLE 6.11
Report of APL Renewal and Distribution as on 27.3.2006
Zones APL Cards Total Application Total Percentage Card Received No. of Card Percentagebefore APL Received for Renewal of Renewal of by AC forms Distributed of
Renewal of APL (i+ii phase) APL Ration Cards from CMC Rejected Distribution
South 466,760 283,057 61 276,095 6,214 180,720 65
South West 262,232 138,258 53 131,719 6,247 129,600 98
West 742,206 540,984 73 519,649 21,579 510,035 98
North West 645,230 491,197 76 449,131 33,548 441,669 98
East 393,911 280,944 71 271,966 7,902 264,233 97
North East 413,816 318,169 77 287,724 20,316 275,652 96
New Delhi 178,137 71,949 40 69,581 670 65,669 94
Central 275,126 164,039 60 153,332 4,397 149,131 97
North 249,406 147,093 59 144,301 1,837 142,077 98
Total 36,26,824 2,435,690 67 2,303,498 102,710 2,158,786 94
Source: Food Supplies and Consumer Affairs Department.
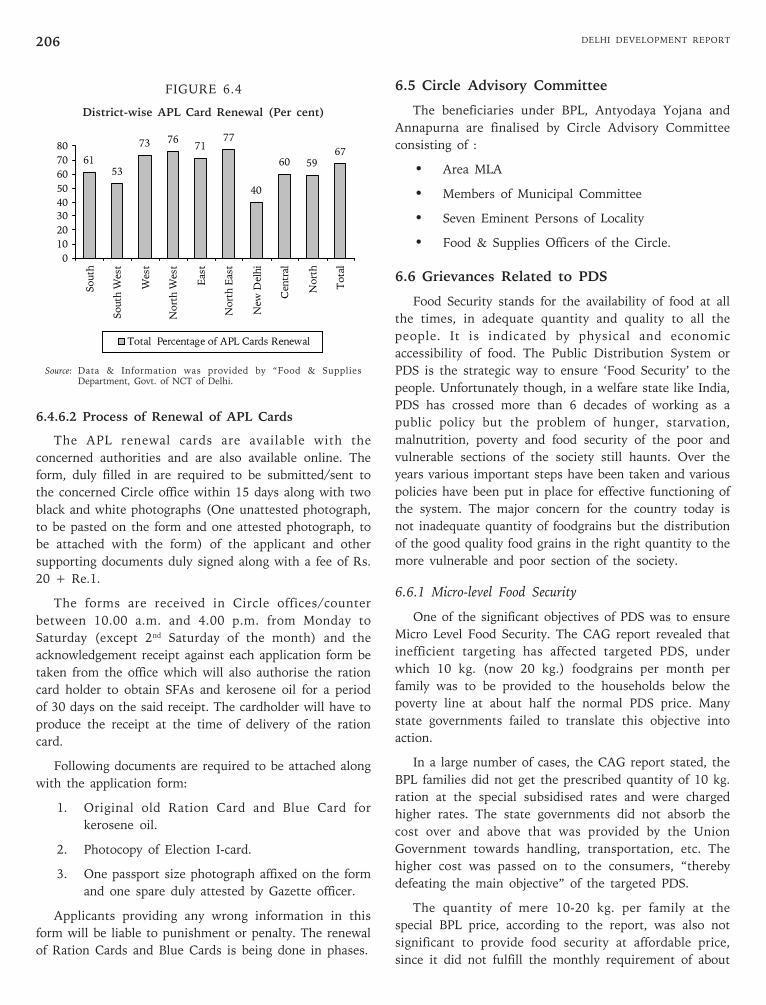
DELHI DEVELOPMENT REPORT206
FIGURE 6.4
District-wise APL Card Renewal (Per cent)
6.4.6.2 Process of Renewal of APL Cards
The APL renewal cards are available with the
concerned authorities and are also available online. The
form, duly filled in are required to be submitted/sent to
the concerned Circle office within 15 days along with two
black and white photographs (One unattested photograph,
to be pasted on the form and one attested photograph, to
be attached with the form) of the applicant and other
supporting documents duly signed along with a fee of Rs.
20 + Re.1.
The forms are received in Circle offices/counter
between 10.00 a.m. and 4.00 p.m. from Monday to
Saturday (except 2nd Saturday of the month) and the
acknowledgement receipt against each application form be
taken from the office which will also authorise the ration
card holder to obtain SFAs and kerosene oil for a period
of 30 days on the said receipt. The cardholder will have to
produce the receipt at the time of delivery of the ration
card.
Following documents are required to be attached along
with the application form:
1. Original old Ration Card and Blue Card for
kerosene oil.
2. Photocopy of Election I-card.
3. One passport size photograph affixed on the form
and one spare duly attested by Gazette officer.
Applicants providing any wrong information in this
form will be liable to punishment or penalty. The renewal
of Ration Cards and Blue Cards is being done in phases.
6.5 Circle Advisory Committee
The beneficiaries under BPL, Antyodaya Yojana and
Annapurna are finalised by Circle Advisory Committee
consisting of :
• Area MLA
• Members of Municipal Committee
• Seven Eminent Persons of Locality
• Food & Supplies Officers of the Circle.
6.6 Grievances Related to PDS
Food Security stands for the availability of food at all
the times, in adequate quantity and quality to all the
people. It is indicated by physical and economic
accessibility of food. The Public Distribution System or
PDS is the strategic way to ensure ‘Food Security’ to the
people. Unfortunately though, in a welfare state like India,
PDS has crossed more than 6 decades of working as a
public policy but the problem of hunger, starvation,
malnutrition, poverty and food security of the poor and
vulnerable sections of the society still haunts. Over the
years various important steps have been taken and various
policies have been put in place for effective functioning of
the system. The major concern for the country today is
not inadequate quantity of foodgrains but the distribution
of the good quality food grains in the right quantity to the
more vulnerable and poor section of the society.
6.6.1 Micro-level Food Security
One of the significant objectives of PDS was to ensure
Micro Level Food Security. The CAG report revealed that
inefficient targeting has affected targeted PDS, under
which 10 kg. (now 20 kg.) foodgrains per month per
family was to be provided to the households below the
poverty line at about half the normal PDS price. Many
state governments failed to translate this objective into
action.
In a large number of cases, the CAG report stated, the
BPL families did not get the prescribed quantity of 10 kg.
ration at the special subsidised rates and were charged
higher rates. The state governments did not absorb the
cost over and above that was provided by the Union
Government towards handling, transportation, etc. The
higher cost was passed on to the consumers, “thereby
defeating the main objective” of the targeted PDS.
The quantity of mere 10-20 kg. per family at the
special BPL price, according to the report, was also not
significant to provide food security at affordable price,
since it did not fulfill the monthly requirement of about
6153
73 7671
77
40
60 5967
0
10
20
30
40
50
60
70
80
South
South
West
West
Nort
h W
est
East
Nort
h E
ast
New
Delh
i
Centr
al
Nort
h
Tota
lTotal Percentage of APL Cards Renewal
Source: Data & Information was provided by “Food & SuppliesDepartment, Govt. of NCT of Delhi.
Chapter 6 • PUBLIC DISTRIBUTION SYSTEM 207
53 kg. of foodgrains for an average size family of five
members.
The average per household per month was as low as
mere 6.5 kg. “Thus, while the cost to the exchequer was
enormous, the gains to the consumer were marginal.”
During a good harvest time general public and also
BPL depends on PDS for a very small quantity of total
requirement, as the PDS prices are generally higher than
the market prices. And therefore a very meagre income
transfer.
6.6.2 Food and Nutritional Security
Low availability of food grains through PDS assumed
importance in the face of acute nutritional inadequacy in
diet and very low per capita calorie intake of BPL
population in the country. Several studies have indicated
that the per capita cereal consumption of the poor had
remained the same despite a significant improvement in
their real per capita expenditure and decline in the cereal
prices compared to non-cereal food, which is attributed to
the change in the preference of the people to non-cereal
food.
6.6.3 Identification of Target Group
One of the major problems with the functioning of
PDS is the problem of identification of the right target
group. There is no availability of authentic data for
classification of population in APL, BPL and other relevant
categories. There still exists a gap between the targeted
number of beneficiaries vis-à-vis actual beneficiaries.
Approximately only about 57 per cent of the BPL
households are covered by TPDS.
6.6.4 Distribution Network
The PDS chain starts with the Departments of Food
and Civil Supplies that monitor and look after various
policy matters, followed by Food Corporation of India
(FCI) taking care of the procurement of foodgrains from
producers, their storage and also the import of other
means food items. But the arm that directly reaches the
target group is the Fair Price Shop Owners (FPS). Their
number is directly proportional to the number of targeted
population living in that particular area. Due to callous
attitude or low profit associated with PDS, these FPS
owners resort to illegal and mis-appropriate means and
ways:
• Excess issuances of ration cards to increase
margins. Many FPSs have large number of ghost
cards in order to get more quantity of foodgrains
and earn huge profit by selling them in the open
market.
• As a result of low annual turnover some of FPS
owners indulge in leakage of commodities and
diversion of subsidised grains available with
them.
• Irregularities in opening and closing of FPS.
• Harassment to the card holders.
• Entries of the commodity sold to the beneficiary
is not made.
• Commodities sold are not weighed properly.
• Over charging from consumers.
• Good quality commodities replaced by poor
quality foodgrains/kerosene.
• Lacunae in the licensing and selection of FPS.
Marked irregularities have been found in
allotment of licence to FPS.
• Inaccessible location of FPS from the BPL or
Antyodaya beneficiaries.
6.6.5 Leakages
A significant portion of subsidised food grains and
other essential commodities do not reach the beneficiaries
due to their diversion. The review of the scheme by
Comptroller and Auditor General of India has also
disclosed significant number of cases of diversion of PDS
commodities, undue benefit to millers losses in transit
and storage, existence of large number of bogus ration
cards, excess charging from the consumers compared to
the maximum price prescribed by the Central government
and poor quality of foodgrains supplied which reduced the
efficacy of the PDS.
6.6.5.1 Ration Cards as Identity Proof
There are a number of ration cards issued by
government not been used for years together but exist for
the sake of personal identity. This leads to mis-planned
targets for food distribution and lot of subsidy and
resources get wasted due to such cards. The Supreme
Court has strictly issued the order that no ration card will
be treated as ‘Identity Proof’. The department has already
issued circular to this effect that ration cards shall not be
issued as proof of identification.
6.6.5.2 Bogus Ration Cards
To deal with the problem of bogus ration cards, which
cause large scale diversion to open market of foodgrains,
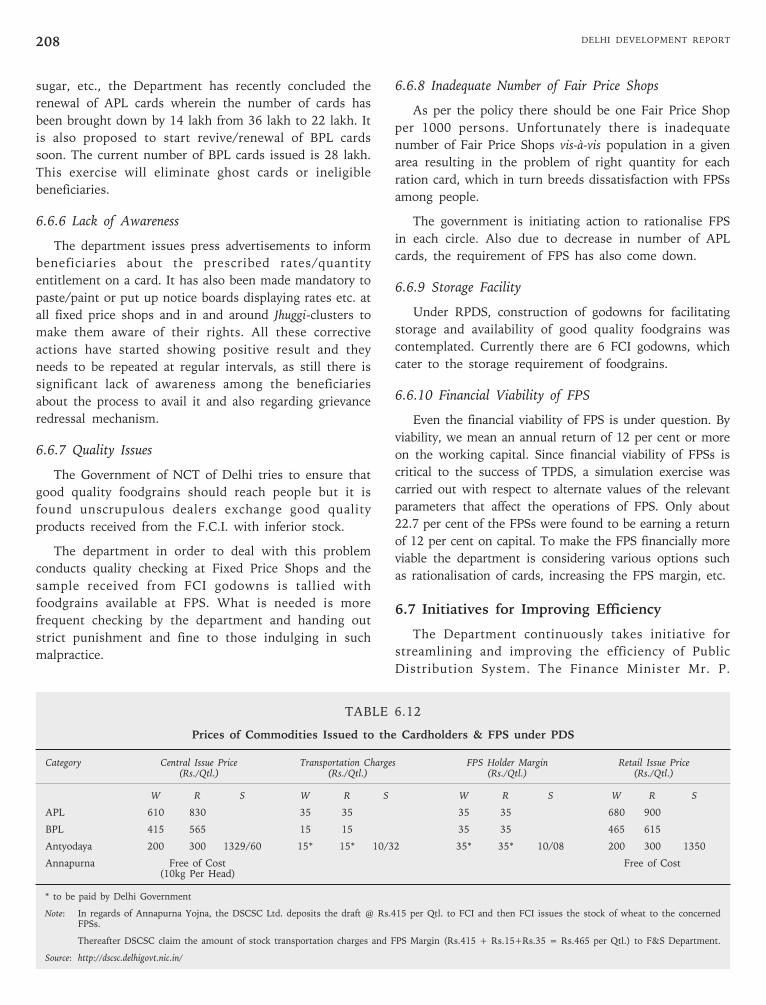
DELHI DEVELOPMENT REPORT208
sugar, etc., the Department has recently concluded the
renewal of APL cards wherein the number of cards has
been brought down by 14 lakh from 36 lakh to 22 lakh. It
is also proposed to start revive/renewal of BPL cards
soon. The current number of BPL cards issued is 28 lakh.
This exercise will eliminate ghost cards or ineligible
beneficiaries.
6.6.6 Lack of Awareness
The department issues press advertisements to inform
beneficiaries about the prescribed rates/quantity
entitlement on a card. It has also been made mandatory to
paste/paint or put up notice boards displaying rates etc. at
all fixed price shops and in and around Jhuggi-clusters to
make them aware of their rights. All these corrective
actions have started showing positive result and they
needs to be repeated at regular intervals, as still there is
significant lack of awareness among the beneficiaries
about the process to avail it and also regarding grievance
redressal mechanism.
6.6.7 Quality Issues
The Government of NCT of Delhi tries to ensure that
good quality foodgrains should reach people but it is
found unscrupulous dealers exchange good quality
products received from the F.C.I. with inferior stock.
The department in order to deal with this problem
conducts quality checking at Fixed Price Shops and the
sample received from FCI godowns is tallied with
foodgrains available at FPS. What is needed is more
frequent checking by the department and handing out
strict punishment and fine to those indulging in such
malpractice.
6.6.8 Inadequate Number of Fair Price Shops
As per the policy there should be one Fair Price Shop
per 1000 persons. Unfortunately there is inadequate
number of Fair Price Shops vis-à-vis population in a given
area resulting in the problem of right quantity for each
ration card, which in turn breeds dissatisfaction with FPSs
among people.
The government is initiating action to rationalise FPS
in each circle. Also due to decrease in number of APL
cards, the requirement of FPS has also come down.
6.6.9 Storage Facility
Under RPDS, construction of godowns for facilitating
storage and availability of good quality foodgrains was
contemplated. Currently there are 6 FCI godowns, which
cater to the storage requirement of foodgrains.
6.6.10 Financial Viability of FPS
Even the financial viability of FPS is under question. By
viability, we mean an annual return of 12 per cent or more
on the working capital. Since financial viability of FPSs is
critical to the success of TPDS, a simulation exercise was
carried out with respect to alternate values of the relevant
parameters that affect the operations of FPS. Only about
22.7 per cent of the FPSs were found to be earning a return
of 12 per cent on capital. To make the FPS financially more
viable the department is considering various options such
as rationalisation of cards, increasing the FPS margin, etc.
6.7 Initiatives for Improving Efficiency
The Department continuously takes initiative for
streamlining and improving the efficiency of Public
Distribution System. The Finance Minister Mr. P.
TABLE 6.12
Prices of Commodities Issued to the Cardholders & FPS under PDS
Category Central Issue Price Transportation Charges FPS Holder Margin Retail Issue Price(Rs./Qtl.) (Rs./Qtl.) (Rs./Qtl.) (Rs./Qtl.)
W R S W R S W R S W R S
APL 610 830 35 35 35 35 680 900
BPL 415 565 15 15 35 35 465 615
Antyodaya 200 300 1329/60 15* 15* 10/32 35* 35* 10/08 200 300 1350
Annapurna Free of Cost Free of Cost(10kg Per Head)
* to be paid by Delhi Government
Note: In regards of Annapurna Yojna, the DSCSC Ltd. deposits the draft @ Rs.415 per Qtl. to FCI and then FCI issues the stock of wheat to the concernedFPSs.
Thereafter DSCSC claim the amount of stock transportation charges and FPS Margin (Rs.415 + Rs.15+Rs.35 = Rs.465 per Qtl.) to F&S Department.
Source: http://dscsc.delhigovt.nic.in/
Chapter 6 • PUBLIC DISTRIBUTION SYSTEM 209
Chidambaram had announced in his budgetary speech that
a policy will be developed for “comprehensive medium-
term strategy for food and nutrition security for all”.
Government of Delhi has been working continuously
towards meeting the set objective and strengthening of
the PDS. The Chief Minister of Delhi has ensured the
following:
• There is a periodical checking of FPSs and
mechanism of issuance of ration cards to identify
and eliminate bogus rations cards.
• To take stern action against persons found guilty
of misusing the TPDS benefit.
• The cardholders should get their entitled
allotment on any day any time/on the dates
indicated in the card.
6.7.1 Fair Price Shops
According to an order by Hon’ble Supreme Court of
India of India ration card shops shall remain open
throughout the month during fixed hours and the details
of which shall be displayed on their notice board. Also,
they should display the following information on a notice
board at a prominent place in the shop:
• Display of information on the wall outside the
Fair Price Shops/Kerosene Oil Depots.
• Licence name and number of authority letter.
• Entitlement of essential commodities.
• Stock as on date.
- Stock of essential commodities received during
the month.
- Opening and closing stock of essential
commodities, and
• Rates of commodities.
• Sample of sugar, wheat, rice.
• Timings of opening and closing office of Fair
Price Shop/Kerosene Oil Depots.
• Weekly off.
• He should have a complete list of BPL and
Antyodaya beneficiaries.
• Procedure for making complaints indicating the
authorities for redressal of grievance of the
consumer.
• Maintaining a complaint register for recording
complaints with regard to quality/quantity of
stocks.
6.7.2 Area Vigilance Committee
To suggest objective methods for deletion of inflated
and ineligible units and to suggest ways and means for
preventing diversion of SFAs and kerosene oil, Area
Vigilance Committee has been constituted consisting of
the following members
• Area MLA – Chairman.
• Members of Municipal Committee of both the
wards of the area.
• Seven Eminent Persons of Locality (including
ladies, social workers, RWA and members of SC/
ST) nominated by area MLA.
• Food & Supplies Officers of the Circle—Secretary.
6.7.3 Monthly Inspection
Besides other measures taken to ensure proper
functioning of FPS, there is a team of Inspection staff who
keeps a close eye on FPS. The Food Commissioner of Delhi
is a vigilant officer himself and to keep everyone agile, he
leaves nothing to chance. He himself goes for sudden visits
to take an overall assessment of the area. He personally
visits all the FPS and in case of any irregularity or problem,
he gives warning to the FPS owner and still if the problem
persists he files an FIR and calls the police. It has been
ordered that the officers of the Department will conduct
monthly random inspection of FPSs/KODs as follows:
Area Inspector : 15
FSO : 10
Assistant Commissioner : 7
Addl. Commissioner : 5
6.7.4 Public Audit
The present Food Commissioner of Delhi Mr. K.S.
Mehra has introduced a system of ‘Public Audit’. This is a
very interesting mechanism to keep a check on the issues
of distribution. This programme began with North and
Northeast of Delhi as pilot districts. The reason for
selection of these areas was that there is a greater number
of slums and BPL population compared to other districts
in Delhi. This project was conceived by Mr. Mehra himself
in the month of February 2005 and it started immediately
in March 2005.
Initially it was made that Fair Price Shop (FPS) owners
will show the records to public as and when asked. But
later it was observed that FPS owners used to intimidate
the people and the purpose of the programme was getting
defeated. After much deliberation, the programme was
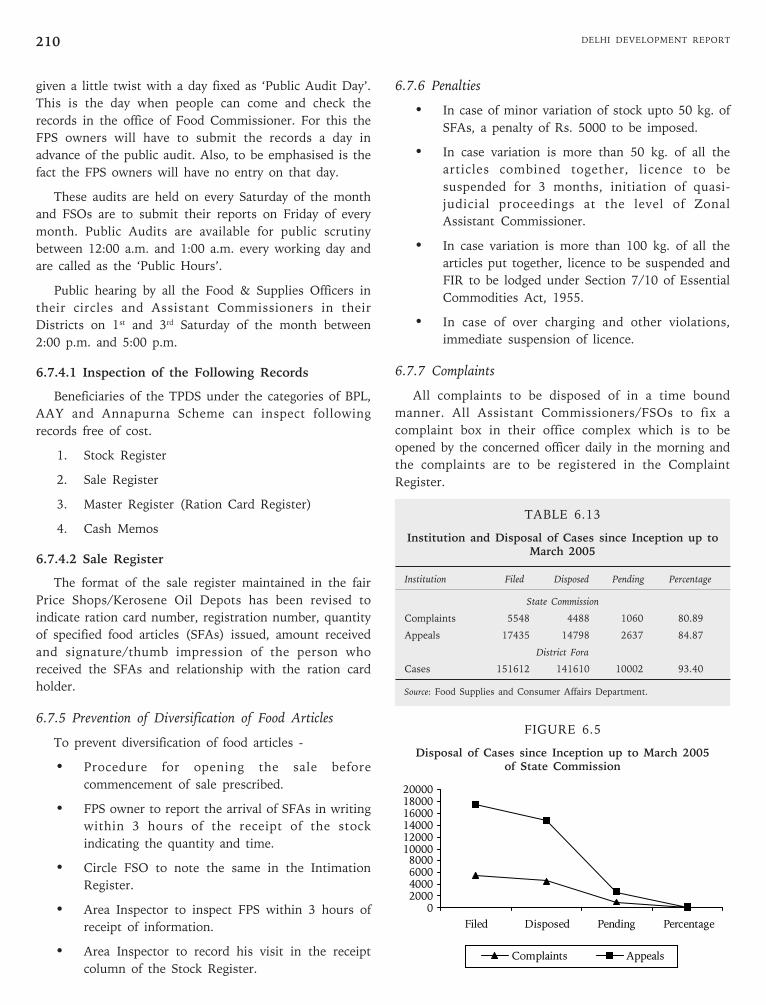
DELHI DEVELOPMENT REPORT210
given a little twist with a day fixed as ‘Public Audit Day’.
This is the day when people can come and check the
records in the office of Food Commissioner. For this the
FPS owners will have to submit the records a day in
advance of the public audit. Also, to be emphasised is the
fact the FPS owners will have no entry on that day.
These audits are held on every Saturday of the month
and FSOs are to submit their reports on Friday of every
month. Public Audits are available for public scrutiny
between 12:00 a.m. and 1:00 a.m. every working day and
are called as the ‘Public Hours’.
Public hearing by all the Food & Supplies Officers in
their circles and Assistant Commissioners in their
Districts on 1st and 3rd Saturday of the month between
2:00 p.m. and 5:00 p.m.
6.7.4.1 Inspection of the Following Records
Beneficiaries of the TPDS under the categories of BPL,
AAY and Annapurna Scheme can inspect following
records free of cost.
1. Stock Register
2. Sale Register
3. Master Register (Ration Card Register)
4. Cash Memos
6.7.4.2 Sale Register
The format of the sale register maintained in the fair
Price Shops/Kerosene Oil Depots has been revised to
indicate ration card number, registration number, quantity
of specified food articles (SFAs) issued, amount received
and signature/thumb impression of the person who
received the SFAs and relationship with the ration card
holder.
6.7.5 Prevention of Diversification of Food Articles
To prevent diversification of food articles -
• Procedure for opening the sale before
commencement of sale prescribed.
• FPS owner to report the arrival of SFAs in writing
within 3 hours of the receipt of the stock
indicating the quantity and time.
• Circle FSO to note the same in the Intimation
Register.
• Area Inspector to inspect FPS within 3 hours of
receipt of information.
• Area Inspector to record his visit in the receipt
column of the Stock Register.
6.7.6 Penalties
• In case of minor variation of stock upto 50 kg. of
SFAs, a penalty of Rs. 5000 to be imposed.
• In case variation is more than 50 kg. of all the
articles combined together, licence to be
suspended for 3 months, initiation of quasi-
judicial proceedings at the level of Zonal
Assistant Commissioner.
• In case variation is more than 100 kg. of all the
articles put together, licence to be suspended and
FIR to be lodged under Section 7/10 of Essential
Commodities Act, 1955.
• In case of over charging and other violations,
immediate suspension of licence.
6.7.7 Complaints
All complaints to be disposed of in a time bound
manner. All Assistant Commissioners/FSOs to fix a
complaint box in their office complex which is to be
opened by the concerned officer daily in the morning and
the complaints are to be registered in the Complaint
Register.
TABLE 6.13
Institution and Disposal of Cases since Inception up toMarch 2005
Institution Filed Disposed Pending Percentage
State Commission
Complaints 5548 4488 1060 80.89
Appeals 17435 14798 2637 84.87
District Fora
Cases 151612 141610 10002 93.40
Source: Food Supplies and Consumer Affairs Department.
FIGURE 6.5
Disposal of Cases since Inception up to March 2005of State Commission
02000400060008000
100001200014000160001800020000
Filed Disposed Pending Percentage
Complaints Appeals
Chapter 6 • PUBLIC DISTRIBUTION SYSTEM 211
6.7.8 Citizen Charter
Citizen Charter of the Department provides following:
Getting a new ration card : 30 days
Surrender of ration Card : Same day
Addition/Deletion of name : 10 days
Tatkal Ration Card : This scheme has been
withdrawn
6.7.9 Feedback Forms
Each Cardholder is asked to fill in a feed back form
provided by the Food and Civil Supplies Department,
Delhi. This form is kept very simple and all questions are
asked in a direct manner. This form deals with the
behaviour of FPS owner, quality and quantity of the food
items purchased and other related issues
6.7.10 Other Instructions
• All the FSOs to give certificate that FPSs/KODs
in their jurisdiction are being run by the
authorised person.
• All the PDS outlets to give undertaking relating
to the authorised salesman/representative.
• Only authorised representative to unload the
SFAs.
• Photo Identity Card of the Salesman/Authorised
representative to be displayed.
• Instructions have been issued to allow senior
citizens to get their work done on priority by
forming separate queues.
• It has been decided to keep the records of the
FPS/KOD such as stock register, sale register,
master register, cash memos, etc. open to allow
the bonafide card holders to see the records and
satisfy themselves whether they have received the
same quantity, etc.
6.8 Futuristic Approach
The Consumer Affairs Department, Delhi has set
priorities for today and action points for tomorrow. They
believe in an interactive and participatory mechanism that
leads to lesser grievances. Some of the futuristic steps by
them are:
• Setting up consumer clubs.
• Setting up of district consumer information
centres.
• Financial assistance for consumer welfare
activities.
• Meeting the expenses of district consumer
protection councils.
• Sponsoring NGOs for grants-in-aid.
• Setting up consumer clubs.
• Educating students in schools on consumer
related matters.
• Setting up consumer information centres for
spreading consumer awareness.
• Create awareness about consumer related matter,
rights, grievance-handling mechanism, etc.
through mass media like newspapers, posters,
brochures, etc. Also to be involved in this is the
civil society. They are expected to organise
seminars, street plays, nukkad nataks, puppet
shows, essay competitions, etc.
• One more district forum by bifurcation of District
South will start functioning shortly. And there is
a proposal to open three more district forums.
• There is a proposal to open one more bench of
the State Commission
6.9 Right to Information
To make sure that each cardholder knows his rights
and has his faith restored in the system, the working of
the department is made absolutely transparent. Each FPS
will display information such as beneficiaries’ entitlement
of various essential commodities, the issue prices,
periodicity at which ration can be drawn, name of Fair
Price Shopkeeper, timings of opening and closing of FPS
and weekly closing days, stock position, etc. at a
conspicuous place.
The process is designed keeping in mind that the
cardholder should not get scared to ask for any
information and the entire necessary information is always
on display. This is leading to number of grievance cases
coming down, as the information is readily available.
Since the inception of Delhi Right to Information Act,
2001, a total of 569 applications were received upto
February 2005 of which 565 applications have been
disposed of.
There used to be only one competent authority under
the Delhi Right to Information Act as the Headquarter,
Office of Commissioner (Food & Supplies). However,
w.e.f 1 June 2004, all the Zonal Assistant Commissioners
DELHI DEVELOPMENT REPORT212
have been notified as the competent authority under the
Delhi Right to Information Act.
To ensure that there is proper awareness regarding the
grievance redressal system it is compulsory for the FPS to
also display procedure for lodging the complaints with
reference to quality and quantity of ration, other problems
being faced by the beneficiaries during the course of
getting their ration. And to ensure success of this, the
departments has made all the officers equipped enough to
answer all queries. Even the officers of other departments
who are not aware of the rules and guidelines related to
PDS and its functioning are made aware.
The department has specially prepared a ready
reckoner, which is made available to all the officers for
ready reference. Even the directions by Supreme Court
and other important papers are included.
Besides the above, the consumer who is listed in the
list of the FPS is entitled to inspect the stock register,
sales register and ration card register at the shop.
6.10 Role of Civil Society
The role of civil society is indispensable in making any
public welfare policy work. It has been observed that
when civil society takes up the challenges to make a
programme success, it can ensure complete people
participation and put the desired pressure on the
government for the rights of the people.
It is well understood that the government has a limited
reach to people. It is physically impossible for the
government to be present at each and every place whereas
civil societies are grass root people and they interact with
common public day in and out. They can understand the
grievance of the people better and explain it to the
government as desired by the cardholders. Therefore, they
can play the role of a mediator and inform government of
the issues pending with people.
In a landscape where exists an inadequate
implementation of government regulations, long-standing,
un-addressed grievances, it is natural that people will go
on losing faith in the overall system of Public
Distribution. In Delhi various Non-Profit organisations
like ‘Parivartan’ are working towards restoring the lost
faith in the system. But civil society has to play a balanced
role. They can serve as a vehicle for informing the most
uninformed public and mobilising them to make the much
criticised ‘system’ accountable.
Government wants civil society to play a participatory
role in planning, executing, monitoring and evaluating
public policies relevant to Public Distribution System.
Only a participatory approach will give the government’s
policies on food and food security a more humane shape
and a much-needed impetus.
6.11 Some Suggestions
• Reward/Recognition
• Reward for the meritorious and honest officers
who are vigilant and care for people’s needs.
• Recognition or annual award for the FSPs so
that more and more shop owners would try to
follow the system.
• Legalised Ways to make Profit
• As there are low margins in the running of FPS,
there should be legalised and genuine ways to
earn profit for an honest business.
• There can be a provision for the supply of other
essential items like tea, soap, matchbox etc. be
made available through FPS.
• There can be various Tax exemption provisions
in procurement and distribution of other
essential commodities to encourage the concept
of providing complete service to people.
• Quantity/Quality/Timeliness of Foodgrains
• A timely arrival of foodgrains at FPS can ensure
timely distribution of essential commodities. It is
interesting to note that most of the people get
their wages/salaries in the first seven days of the
month so the system should be such that it
ensures the supply of food grains during that
period. Failing which people will buy from the
commercial outfits leading to non-lifting of the
quota and diversion of supply to black marketers.
• The supply should be in adequate quantity
keeping in mind the number of consumers
registered with the FPS owners. Inadequate
quantity of food grains leads to shaking of the
trust of the consumer in the FPS owner and
hence the whole Public Distribution System.
• Licence to FPS
• The mechanism of allotment of FPS licence
should be made more stringent. People from
economically weaker section should be given
opportunity.
Last but not the least, people’s participation should be
sought for successful functioning of PDS. Voluntary
organisations should also actively be involved for better
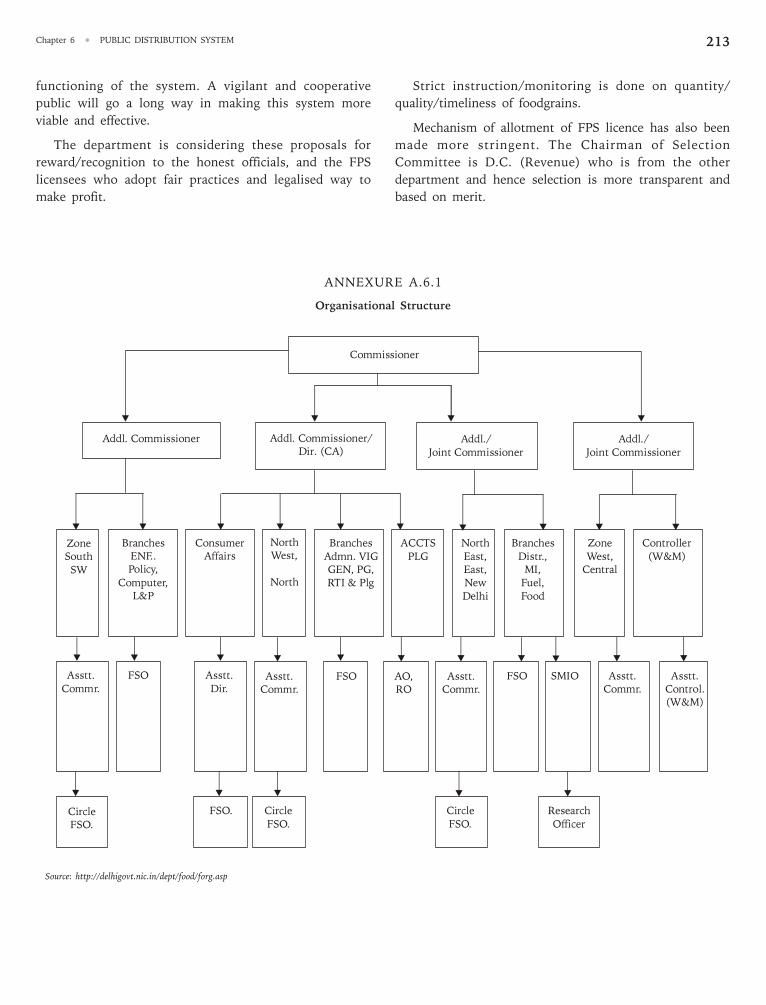
Chapter 6 • PUBLIC DISTRIBUTION SYSTEM 213
functioning of the system. A vigilant and cooperative
public will go a long way in making this system more
viable and effective.
The department is considering these proposals for
reward/recognition to the honest officials, and the FPS
licensees who adopt fair practices and legalised way to
make profit.
Strict instruction/monitoring is done on quantity/
quality/timeliness of foodgrains.
Mechanism of allotment of FPS licence has also been
made more stringent. The Chairman of Selection
Committee is D.C. (Revenue) who is from the other
department and hence selection is more transparent and
based on merit.
Source: http://delhigovt.nic.in/dept/food/forg.asp
ANNEXURE A.6.1
Organisational Structure
Commissioner
Addl. Commissioner Addl. Commissioner/Dir. (CA)
Addl./Joint Commissioner
Addl./Joint Commissioner
Controller(W&M)
ZoneWest,
Central
BranchesDistr.,
MI,Fuel,Food
NorthEast,East,NewDelhi
ACCTSPLG
BranchesAdmn. VIGGEN, PG,RTI & Plg
NorthWest,
North
ConsumerAffairs
BranchesENF..Policy,
Computer,L&P
ZoneSouthSW
Asstt.Commr.
FSO Asstt.Dir.
Asstt.Commr.
FSO AO,RO
Asstt.Commr.
FSO SMIO Asstt.Commr.
Asstt.Control.(W&M)
ResearchOfficer
CircleFSO.
CircleFSO.
FSO.CircleFSO.

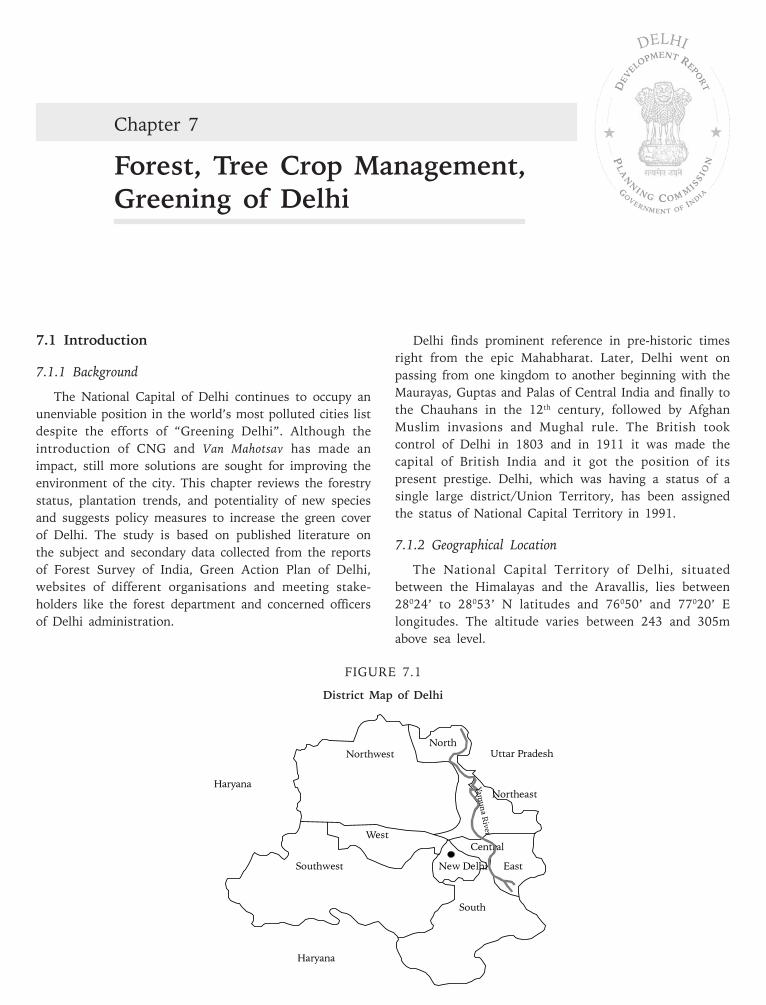
Chapter 7
Forest, Tree Crop Management,Greening of Delhi
DELHI
7.1 Introduction
7.1.1 Background
The National Capital of Delhi continues to occupy an
unenviable position in the world’s most polluted cities list
despite the efforts of “Greening Delhi”. Although the
introduction of CNG and Van Mahotsav has made an
impact, still more solutions are sought for improving the
environment of the city. This chapter reviews the forestry
status, plantation trends, and potentiality of new species
and suggests policy measures to increase the green cover
of Delhi. The study is based on published literature on
the subject and secondary data collected from the reports
of Forest Survey of India, Green Action Plan of Delhi,
websites of different organisations and meeting stake-
holders like the forest department and concerned officers
of Delhi administration.
Delhi finds prominent reference in pre-historic times
right from the epic Mahabharat. Later, Delhi went on
passing from one kingdom to another beginning with the
Maurayas, Guptas and Palas of Central India and finally to
the Chauhans in the 12th century, followed by Afghan
Muslim invasions and Mughal rule. The British took
control of Delhi in 1803 and in 1911 it was made the
capital of British India and it got the position of its
present prestige. Delhi, which was having a status of a
single large district/Union Territory, has been assigned
the status of National Capital Territory in 1991.
7.1.2 Geographical Location
The National Capital Territory of Delhi, situated
between the Himalayas and the Aravallis, lies between
28024’ to 28053’ N latitudes and 76050’ and 77020’ E
longitudes. The altitude varies between 243 and 305m
above sea level.
FIGURE 7.1
District Map of Delhi
Haryana
Uttar Pradesh
Haryana
Southwest
South
NorthNorthwest
Northeast
EastNew Delhi
CentralWest
Yam
un
a R
iver
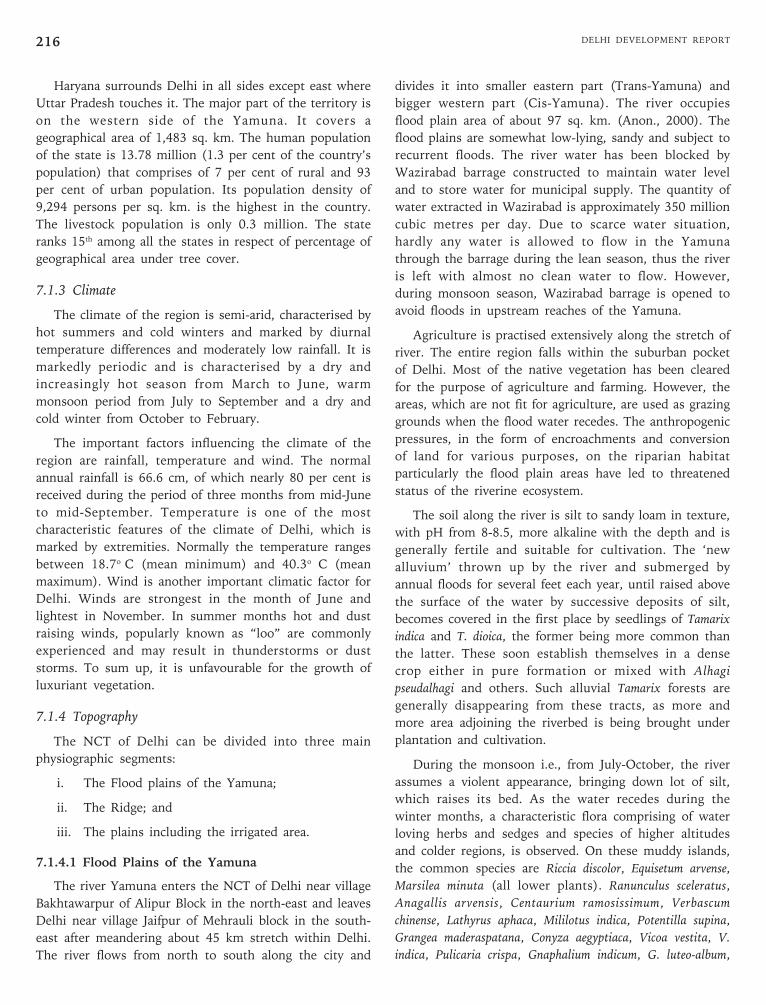
DELHI DEVELOPMENT REPORT216
Haryana surrounds Delhi in all sides except east where
Uttar Pradesh touches it. The major part of the territory is
on the western side of the Yamuna. It covers a
geographical area of 1,483 sq. km. The human population
of the state is 13.78 million (1.3 per cent of the country’s
population) that comprises of 7 per cent of rural and 93
per cent of urban population. Its population density of
9,294 persons per sq. km. is the highest in the country.
The livestock population is only 0.3 million. The state
ranks 15th among all the states in respect of percentage of
geographical area under tree cover.
7.1.3 Climate
The climate of the region is semi-arid, characterised by
hot summers and cold winters and marked by diurnal
temperature differences and moderately low rainfall. It is
markedly periodic and is characterised by a dry and
increasingly hot season from March to June, warm
monsoon period from July to September and a dry and
cold winter from October to February.
The important factors influencing the climate of the
region are rainfall, temperature and wind. The normal
annual rainfall is 66.6 cm, of which nearly 80 per cent is
received during the period of three months from mid-June
to mid-September. Temperature is one of the most
characteristic features of the climate of Delhi, which is
marked by extremities. Normally the temperature ranges
between 18.7o C (mean minimum) and 40.3o C (mean
maximum). Wind is another important climatic factor for
Delhi. Winds are strongest in the month of June and
lightest in November. In summer months hot and dust
raising winds, popularly known as “loo” are commonly
experienced and may result in thunderstorms or dust
storms. To sum up, it is unfavourable for the growth of
luxuriant vegetation.
7.1.4 Topography
The NCT of Delhi can be divided into three main
physiographic segments:
i. The Flood plains of the Yamuna;
ii. The Ridge; and
iii. The plains including the irrigated area.
7.1.4.1 Flood Plains of the Yamuna
The river Yamuna enters the NCT of Delhi near village
Bakhtawarpur of Alipur Block in the north-east and leaves
Delhi near village Jaifpur of Mehrauli block in the south-
east after meandering about 45 km stretch within Delhi.
The river flows from north to south along the city and
divides it into smaller eastern part (Trans-Yamuna) and
bigger western part (Cis-Yamuna). The river occupies
flood plain area of about 97 sq. km. (Anon., 2000). The
flood plains are somewhat low-lying, sandy and subject to
recurrent floods. The river water has been blocked by
Wazirabad barrage constructed to maintain water level
and to store water for municipal supply. The quantity of
water extracted in Wazirabad is approximately 350 million
cubic metres per day. Due to scarce water situation,
hardly any water is allowed to flow in the Yamuna
through the barrage during the lean season, thus the river
is left with almost no clean water to flow. However,
during monsoon season, Wazirabad barrage is opened to
avoid floods in upstream reaches of the Yamuna.
Agriculture is practised extensively along the stretch of
river. The entire region falls within the suburban pocket
of Delhi. Most of the native vegetation has been cleared
for the purpose of agriculture and farming. However, the
areas, which are not fit for agriculture, are used as grazing
grounds when the flood water recedes. The anthropogenic
pressures, in the form of encroachments and conversion
of land for various purposes, on the riparian habitat
particularly the flood plain areas have led to threatened
status of the riverine ecosystem.
The soil along the river is silt to sandy loam in texture,
with pH from 8-8.5, more alkaline with the depth and is
generally fertile and suitable for cultivation. The ‘new
alluvium’ thrown up by the river and submerged by
annual floods for several feet each year, until raised above
the surface of the water by successive deposits of silt,
becomes covered in the first place by seedlings of Tamarix
indica and T. dioica, the former being more common than
the latter. These soon establish themselves in a dense
crop either in pure formation or mixed with Alhagi
pseudalhagi and others. Such alluvial Tamarix forests are
generally disappearing from these tracts, as more and
more area adjoining the riverbed is being brought under
plantation and cultivation.
During the monsoon i.e., from July-October, the river
assumes a violent appearance, bringing down lot of silt,
which raises its bed. As the water recedes during the
winter months, a characteristic flora comprising of water
loving herbs and sedges and species of higher altitudes
and colder regions, is observed. On these muddy islands,
the common species are Riccia discolor, Equisetum arvense,
Marsilea minuta (all lower plants). Ranunculus sceleratus,
Anagallis arvensis, Centaurium ramosissimum, Verbascum
chinense, Lathyrus aphaca, Mililotus indica, Potentilla supina,
Grangea maderaspatana, Conyza aegyptiaca, Vicoa vestita, V.
indica, Pulicaria crispa, Gnaphalium indicum, G. luteo-album,
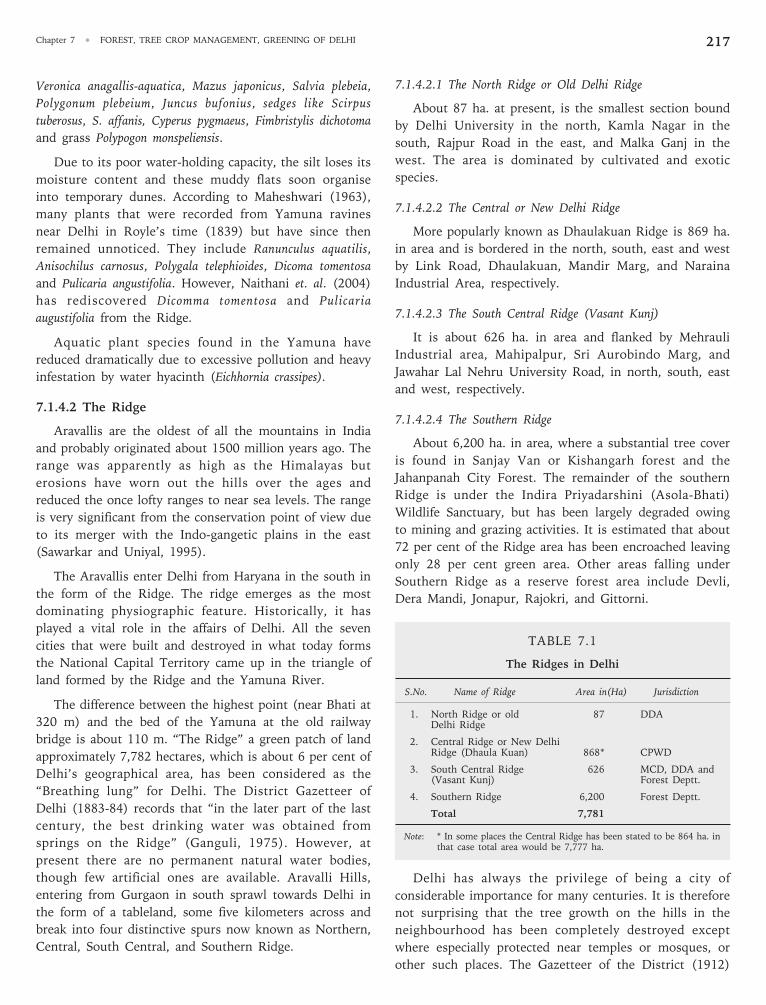
Chapter 7 • FOREST, TREE CROP MANAGEMENT, GREENING OF DELHI 217
Veronica anagallis-aquatica, Mazus japonicus, Salvia plebeia,
Polygonum plebeium, Juncus bufonius, sedges like Scirpus
tuberosus, S. affanis, Cyperus pygmaeus, Fimbristylis dichotoma
and grass Polypogon monspeliensis.
Due to its poor water-holding capacity, the silt loses its
moisture content and these muddy flats soon organise
into temporary dunes. According to Maheshwari (1963),
many plants that were recorded from Yamuna ravines
near Delhi in Royle’s time (1839) but have since then
remained unnoticed. They include Ranunculus aquatilis,
Anisochilus carnosus, Polygala telephioides, Dicoma tomentosa
and Pulicaria angustifolia. However, Naithani et. al. (2004)
has rediscovered Dicomma tomentosa and Pulicaria
augustifolia from the Ridge.
Aquatic plant species found in the Yamuna have
reduced dramatically due to excessive pollution and heavy
infestation by water hyacinth (Eichhornia crassipes).
7.1.4.2 The Ridge
Aravallis are the oldest of all the mountains in India
and probably originated about 1500 million years ago. The
range was apparently as high as the Himalayas but
erosions have worn out the hills over the ages and
reduced the once lofty ranges to near sea levels. The range
is very significant from the conservation point of view due
to its merger with the Indo-gangetic plains in the east
(Sawarkar and Uniyal, 1995).
The Aravallis enter Delhi from Haryana in the south in
the form of the Ridge. The ridge emerges as the most
dominating physiographic feature. Historically, it has
played a vital role in the affairs of Delhi. All the seven
cities that were built and destroyed in what today forms
the National Capital Territory came up in the triangle of
land formed by the Ridge and the Yamuna River.
The difference between the highest point (near Bhati at
320 m) and the bed of the Yamuna at the old railway
bridge is about 110 m. “The Ridge” a green patch of land
approximately 7,782 hectares, which is about 6 per cent of
Delhi’s geographical area, has been considered as the
“Breathing lung” for Delhi. The District Gazetteer of
Delhi (1883-84) records that “in the later part of the last
century, the best drinking water was obtained from
springs on the Ridge” (Ganguli, 1975). However, at
present there are no permanent natural water bodies,
though few artificial ones are available. Aravalli Hills,
entering from Gurgaon in south sprawl towards Delhi in
the form of a tableland, some five kilometers across and
break into four distinctive spurs now known as Northern,
Central, South Central, and Southern Ridge.
7.1.4.2.1 The North Ridge or Old Delhi Ridge
About 87 ha. at present, is the smallest section bound
by Delhi University in the north, Kamla Nagar in the
south, Rajpur Road in the east, and Malka Ganj in the
west. The area is dominated by cultivated and exotic
species.
7.1.4.2.2 The Central or New Delhi Ridge
More popularly known as Dhaulakuan Ridge is 869 ha.
in area and is bordered in the north, south, east and west
by Link Road, Dhaulakuan, Mandir Marg, and Naraina
Industrial Area, respectively.
7.1.4.2.3 The South Central Ridge (Vasant Kunj)
It is about 626 ha. in area and flanked by Mehrauli
Industrial area, Mahipalpur, Sri Aurobindo Marg, and
Jawahar Lal Nehru University Road, in north, south, east
and west, respectively.
7.1.4.2.4 The Southern Ridge
About 6,200 ha. in area, where a substantial tree cover
is found in Sanjay Van or Kishangarh forest and the
Jahanpanah City Forest. The remainder of the southern
Ridge is under the Indira Priyadarshini (Asola-Bhati)
Wildlife Sanctuary, but has been largely degraded owing
to mining and grazing activities. It is estimated that about
72 per cent of the Ridge area has been encroached leaving
only 28 per cent green area. Other areas falling under
Southern Ridge as a reserve forest area include Devli,
Dera Mandi, Jonapur, Rajokri, and Gittorni.
TABLE 7.1
The Ridges in Delhi
S.No. Name of Ridge Area in(Ha) Jurisdiction
1. North Ridge or old 87 DDADelhi Ridge
2. Central Ridge or New DelhiRidge (Dhaula Kuan) 868* CPWD
3. South Central Ridge 626 MCD, DDA and(Vasant Kunj) Forest Deptt.
4. Southern Ridge 6,200 Forest Deptt.
Total 7,781
Note: * In some places the Central Ridge has been stated to be 864 ha. inthat case total area would be 7,777 ha.
Delhi has always the privilege of being a city of
considerable importance for many centuries. It is therefore
not surprising that the tree growth on the hills in the
neighbourhood has been completely destroyed except
where especially protected near temples or mosques, or
other such places. The Gazetteer of the District (1912)
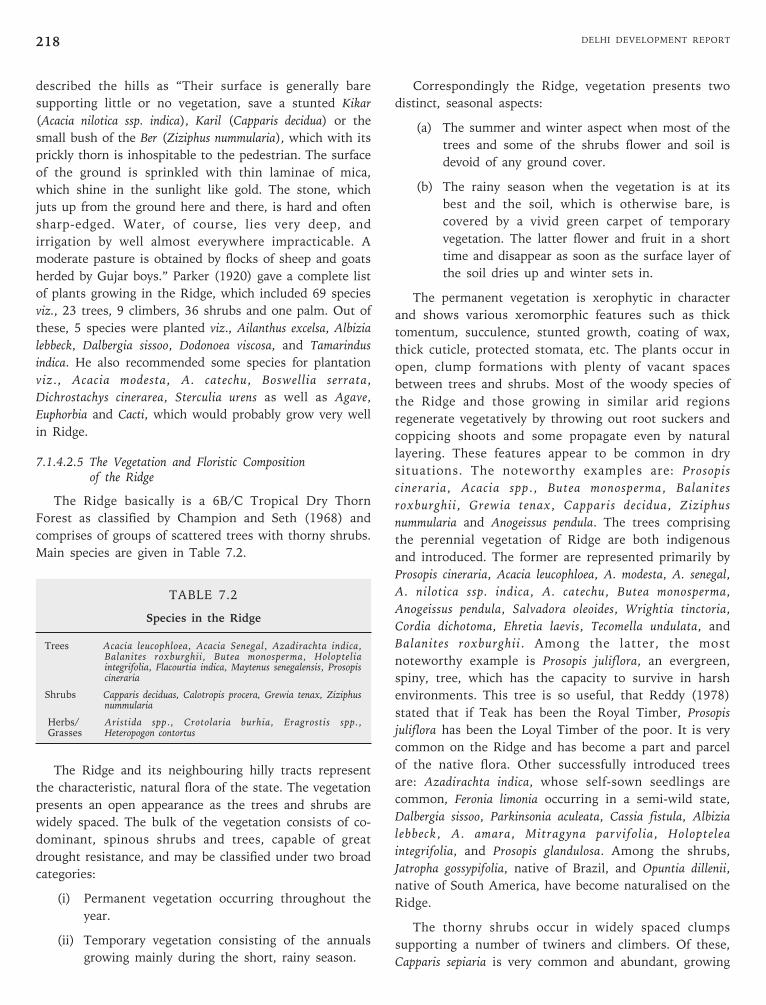
DELHI DEVELOPMENT REPORT218
described the hills as “Their surface is generally bare
supporting little or no vegetation, save a stunted Kikar
(Acacia nilotica ssp. indica), Karil (Capparis decidua) or the
small bush of the Ber (Ziziphus nummularia), which with its
prickly thorn is inhospitable to the pedestrian. The surface
of the ground is sprinkled with thin laminae of mica,
which shine in the sunlight like gold. The stone, which
juts up from the ground here and there, is hard and often
sharp-edged. Water, of course, lies very deep, and
irrigation by well almost everywhere impracticable. A
moderate pasture is obtained by flocks of sheep and goats
herded by Gujar boys.” Parker (1920) gave a complete list
of plants growing in the Ridge, which included 69 species
viz., 23 trees, 9 climbers, 36 shrubs and one palm. Out of
these, 5 species were planted viz., Ailanthus excelsa, Albizia
lebbeck, Dalbergia sissoo, Dodonoea viscosa, and Tamarindus
indica. He also recommended some species for plantation
viz., Acacia modesta, A. catechu, Boswellia serrata,
Dichrostachys cinerarea, Sterculia urens as well as Agave,
Euphorbia and Cacti, which would probably grow very well
in Ridge.
7.1.4.2.5 The Vegetation and Floristic Compositionof the Ridge
The Ridge basically is a 6B/C Tropical Dry Thorn
Forest as classified by Champion and Seth (1968) and
comprises of groups of scattered trees with thorny shrubs.
Main species are given in Table 7.2.
TABLE 7.2
Species in the Ridge
Trees Acacia leucophloea, Acacia Senegal, Azadirachta indica,Balanites roxburghii, Butea monosperma, Holopteliaintegrifolia, Flacourtia indica, Maytenus senegalensis, Prosopiscineraria
Shrubs Capparis deciduas, Calotropis procera, Grewia tenax, Ziziphusnummularia
Herbs/ Aristida spp., Crotolaria burhia, Eragrostis spp.,Grasses Heteropogon contortus
The Ridge and its neighbouring hilly tracts represent
the characteristic, natural flora of the state. The vegetation
presents an open appearance as the trees and shrubs are
widely spaced. The bulk of the vegetation consists of co-
dominant, spinous shrubs and trees, capable of great
drought resistance, and may be classified under two broad
categories:
(i) Permanent vegetation occurring throughout the
year.
(ii) Temporary vegetation consisting of the annuals
growing mainly during the short, rainy season.
Correspondingly the Ridge, vegetation presents two
distinct, seasonal aspects:
(a) The summer and winter aspect when most of the
trees and some of the shrubs flower and soil is
devoid of any ground cover.
(b) The rainy season when the vegetation is at its
best and the soil, which is otherwise bare, is
covered by a vivid green carpet of temporary
vegetation. The latter flower and fruit in a short
time and disappear as soon as the surface layer of
the soil dries up and winter sets in.
The permanent vegetation is xerophytic in character
and shows various xeromorphic features such as thick
tomentum, succulence, stunted growth, coating of wax,
thick cuticle, protected stomata, etc. The plants occur in
open, clump formations with plenty of vacant spaces
between trees and shrubs. Most of the woody species of
the Ridge and those growing in similar arid regions
regenerate vegetatively by throwing out root suckers and
coppicing shoots and some propagate even by natural
layering. These features appear to be common in dry
situations. The noteworthy examples are: Prosopis
cineraria, Acacia spp., Butea monosperma , Balanites
roxburghii, Grewia tenax, Capparis decidua, Ziziphus
nummularia and Anogeissus pendula. The trees comprising
the perennial vegetation of Ridge are both indigenous
and introduced. The former are represented primarily by
Prosopis cineraria, Acacia leucophloea, A. modesta, A. senegal,
A. nilotica ssp. indica, A. catechu, Butea monosperma,
Anogeissus pendula, Salvadora oleoides, Wrightia tinctoria,
Cordia dichotoma, Ehretia laevis, Tecomella undulata, and
Balanites roxburghii. Among the latter, the most
noteworthy example is Prosopis juliflora, an evergreen,
spiny, tree, which has the capacity to survive in harsh
environments. This tree is so useful, that Reddy (1978)
stated that if Teak has been the Royal Timber, Prosopis
juliflora has been the Loyal Timber of the poor. It is very
common on the Ridge and has become a part and parcel
of the native flora. Other successfully introduced trees
are: Azadirachta indica, whose self-sown seedlings are
common, Feronia limonia occurring in a semi-wild state,
Dalbergia sissoo, Parkinsonia aculeata, Cassia fistula, Albizia
lebbeck , A. amara, Mitragyna parvifolia, Holoptelea
integrifolia, and Prosopis glandulosa. Among the shrubs,
Jatropha gossypifolia, native of Brazil, and Opuntia dillenii,
native of South America, have become naturalised on the
Ridge.
The thorny shrubs occur in widely spaced clumps
supporting a number of twiners and climbers. Of these,
Capparis sepiaria is very common and abundant, growing
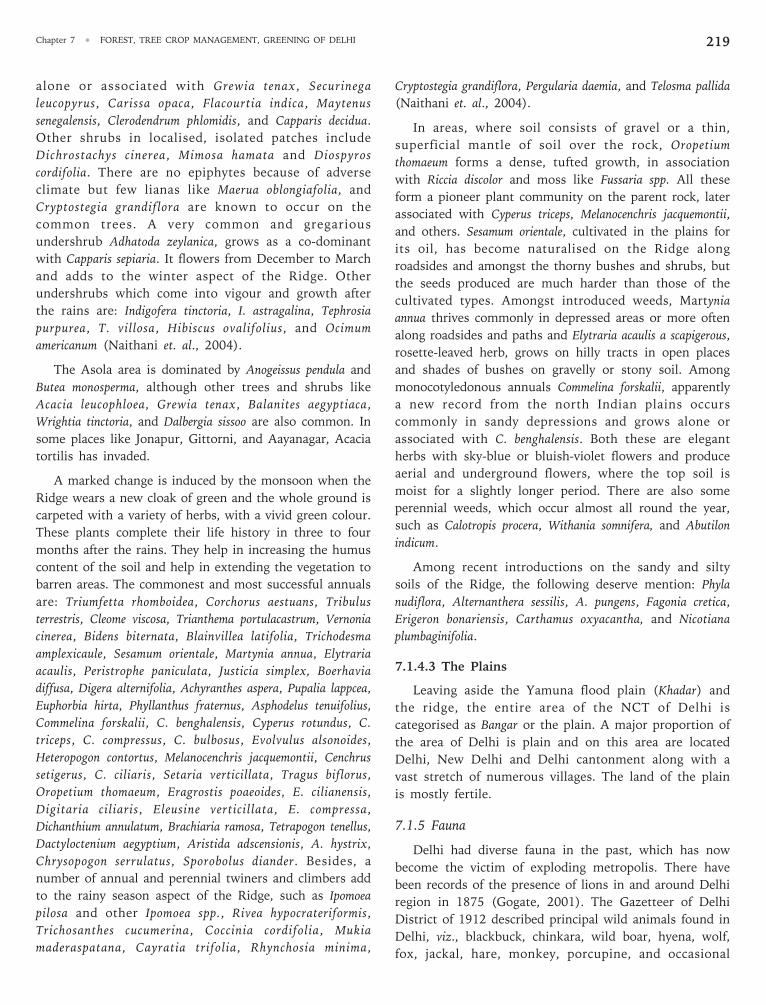
Chapter 7 • FOREST, TREE CROP MANAGEMENT, GREENING OF DELHI 219
alone or associated with Grewia tenax, Securinega
leucopyrus, Carissa opaca, Flacourtia indica, Maytenus
senegalensis, Clerodendrum phlomidis, and Capparis decidua.
Other shrubs in localised, isolated patches include
Dichrostachys cinerea, Mimosa hamata and Diospyros
cordifolia. There are no epiphytes because of adverse
climate but few lianas like Maerua oblongiafolia, and
Cryptostegia grandiflora are known to occur on the
common trees. A very common and gregarious
undershrub Adhatoda zeylanica, grows as a co-dominant
with Capparis sepiaria. It flowers from December to March
and adds to the winter aspect of the Ridge. Other
undershrubs which come into vigour and growth after
the rains are: Indigofera tinctoria, I. astragalina, Tephrosia
purpurea, T. villosa, Hibiscus ovalifolius, and Ocimum
americanum (Naithani et. al., 2004).
The Asola area is dominated by Anogeissus pendula and
Butea monosperma, although other trees and shrubs like
Acacia leucophloea, Grewia tenax, Balanites aegyptiaca,
Wrightia tinctoria, and Dalbergia sissoo are also common. In
some places like Jonapur, Gittorni, and Aayanagar, Acacia
tortilis has invaded.
A marked change is induced by the monsoon when the
Ridge wears a new cloak of green and the whole ground is
carpeted with a variety of herbs, with a vivid green colour.
These plants complete their life history in three to four
months after the rains. They help in increasing the humus
content of the soil and help in extending the vegetation to
barren areas. The commonest and most successful annuals
are: Triumfetta rhomboidea, Corchorus aestuans, Tribulus
terrestris, Cleome viscosa, Trianthema portulacastrum, Vernonia
cinerea, Bidens biternata, Blainvillea latifolia, Trichodesma
amplexicaule, Sesamum orientale, Martynia annua, Elytraria
acaulis, Peristrophe paniculata, Justicia simplex, Boerhavia
diffusa, Digera alternifolia, Achyranthes aspera, Pupalia lappcea,
Euphorbia hirta, Phyllanthus fraternus, Asphodelus tenuifolius,
Commelina forskalii, C. benghalensis, Cyperus rotundus, C.
triceps, C. compressus, C. bulbosus, Evolvulus alsonoides,
Heteropogon contortus, Melanocenchris jacquemontii, Cenchrus
setigerus, C. ciliaris, Setaria verticillata, Tragus biflorus,
Oropetium thomaeum, Eragrostis poaeoides, E. cilianensis,
Digitaria ciliaris, Eleusine verticillata, E. compressa,
Dichanthium annulatum, Brachiaria ramosa, Tetrapogon tenellus,
Dactyloctenium aegyptium, Aristida adscensionis, A. hystrix,
Chrysopogon serrulatus, Sporobolus diander. Besides, a
number of annual and perennial twiners and climbers add
to the rainy season aspect of the Ridge, such as Ipomoea
pilosa and other Ipomoea spp., Rivea hypocrateriformis,
Trichosanthes cucumerina, Coccinia cordifolia, Mukia
maderaspatana, Cayratia trifolia, Rhynchosia minima,
Cryptostegia grandiflora, Pergularia daemia, and Telosma pallida
(Naithani et. al., 2004).
In areas, where soil consists of gravel or a thin,
superficial mantle of soil over the rock, Oropetium
thomaeum forms a dense, tufted growth, in association
with Riccia discolor and moss like Fussaria spp. All these
form a pioneer plant community on the parent rock, later
associated with Cyperus triceps, Melanocenchris jacquemontii,
and others. Sesamum orientale, cultivated in the plains for
its oil, has become naturalised on the Ridge along
roadsides and amongst the thorny bushes and shrubs, but
the seeds produced are much harder than those of the
cultivated types. Amongst introduced weeds, Martynia
annua thrives commonly in depressed areas or more often
along roadsides and paths and Elytraria acaulis a scapigerous,
rosette-leaved herb, grows on hilly tracts in open places
and shades of bushes on gravelly or stony soil. Among
monocotyledonous annuals Commelina forskalii, apparently
a new record from the north Indian plains occurs
commonly in sandy depressions and grows alone or
associated with C. benghalensis. Both these are elegant
herbs with sky-blue or bluish-violet flowers and produce
aerial and underground flowers, where the top soil is
moist for a slightly longer period. There are also some
perennial weeds, which occur almost all round the year,
such as Calotropis procera, Withania somnifera, and Abutilon
indicum.
Among recent introductions on the sandy and silty
soils of the Ridge, the following deserve mention: Phyla
nudiflora, Alternanthera sessilis, A. pungens, Fagonia cretica,
Erigeron bonariensis, Carthamus oxyacantha, and Nicotiana
plumbaginifolia.
7.1.4.3 The Plains
Leaving aside the Yamuna flood plain (Khadar) and
the ridge, the entire area of the NCT of Delhi is
categorised as Bangar or the plain. A major proportion of
the area of Delhi is plain and on this area are located
Delhi, New Delhi and Delhi cantonment along with a
vast stretch of numerous villages. The land of the plain
is mostly fertile.
7.1.5 Fauna
Delhi had diverse fauna in the past, which has now
become the victim of exploding metropolis. There have
been records of the presence of lions in and around Delhi
region in 1875 (Gogate, 2001). The Gazetteer of Delhi
District of 1912 described principal wild animals found in
Delhi, viz., blackbuck, chinkara, wild boar, hyena, wolf,
fox, jackal, hare, monkey, porcupine, and occasional
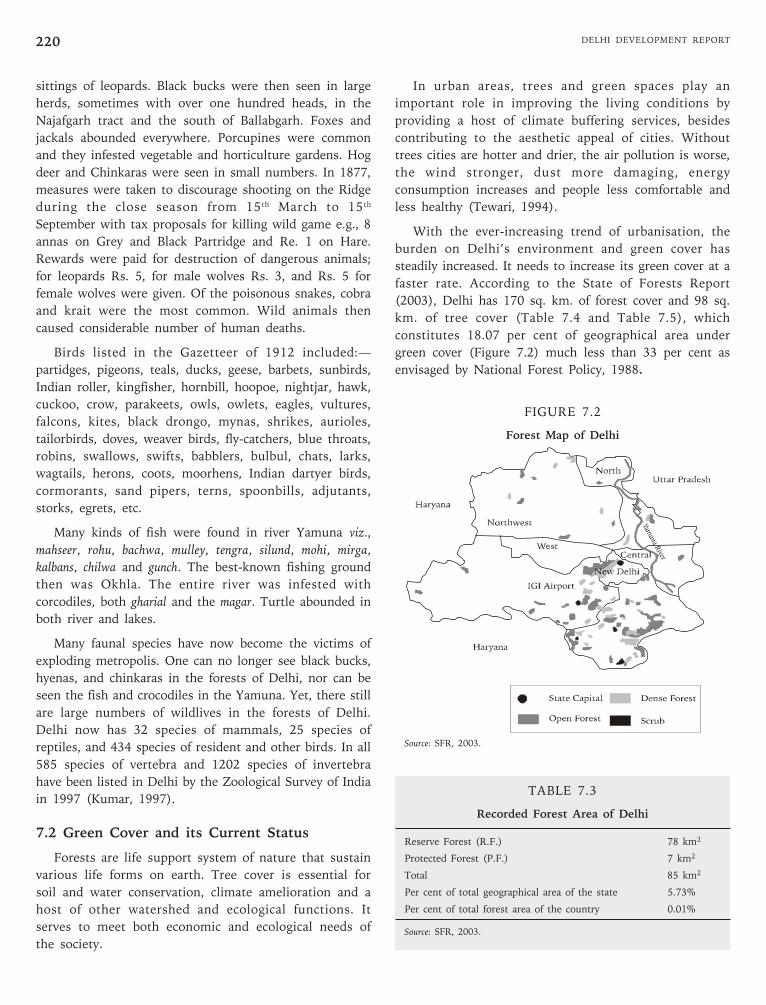
DELHI DEVELOPMENT REPORT220
sittings of leopards. Black bucks were then seen in large
herds, sometimes with over one hundred heads, in the
Najafgarh tract and the south of Ballabgarh. Foxes and
jackals abounded everywhere. Porcupines were common
and they infested vegetable and horticulture gardens. Hog
deer and Chinkaras were seen in small numbers. In 1877,
measures were taken to discourage shooting on the Ridge
during the close season from 15 th March to 15 th
September with tax proposals for killing wild game e.g., 8
annas on Grey and Black Partridge and Re. 1 on Hare.
Rewards were paid for destruction of dangerous animals;
for leopards Rs. 5, for male wolves Rs. 3, and Rs. 5 for
female wolves were given. Of the poisonous snakes, cobra
and krait were the most common. Wild animals then
caused considerable number of human deaths.
Birds listed in the Gazetteer of 1912 included:—
partidges, pigeons, teals, ducks, geese, barbets, sunbirds,
Indian roller, kingfisher, hornbill, hoopoe, nightjar, hawk,
cuckoo, crow, parakeets, owls, owlets, eagles, vultures,
falcons, kites, black drongo, mynas, shrikes, aurioles,
tailorbirds, doves, weaver birds, fly-catchers, blue throats,
robins, swallows, swifts, babblers, bulbul, chats, larks,
wagtails, herons, coots, moorhens, Indian dartyer birds,
cormorants, sand pipers, terns, spoonbills, adjutants,
storks, egrets, etc.
Many kinds of fish were found in river Yamuna viz.,
mahseer, rohu, bachwa, mulley, tengra, silund, mohi, mirga,
kalbans, chilwa and gunch. The best-known fishing ground
then was Okhla. The entire river was infested with
corcodiles, both gharial and the magar. Turtle abounded in
both river and lakes.
Many faunal species have now become the victims of
exploding metropolis. One can no longer see black bucks,
hyenas, and chinkaras in the forests of Delhi, nor can be
seen the fish and crocodiles in the Yamuna. Yet, there still
are large numbers of wildlives in the forests of Delhi.
Delhi now has 32 species of mammals, 25 species of
reptiles, and 434 species of resident and other birds. In all
585 species of vertebra and 1202 species of invertebra
have been listed in Delhi by the Zoological Survey of India
in 1997 (Kumar, 1997).
7.2 Green Cover and its Current Status
Forests are life support system of nature that sustain
various life forms on earth. Tree cover is essential for
soil and water conservation, climate amelioration and a
host of other watershed and ecological functions. It
serves to meet both economic and ecological needs of
the society.
In urban areas, trees and green spaces play an
important role in improving the living conditions by
providing a host of climate buffering services, besides
contributing to the aesthetic appeal of cities. Without
trees cities are hotter and drier, the air pollution is worse,
the wind stronger, dust more damaging, energy
consumption increases and people less comfortable and
less healthy (Tewari, 1994).
With the ever-increasing trend of urbanisation, the
burden on Delhi’s environment and green cover has
steadily increased. It needs to increase its green cover at a
faster rate. According to the State of Forests Report
(2003), Delhi has 170 sq. km. of forest cover and 98 sq.
km. of tree cover (Table 7.4 and Table 7.5), which
constitutes 18.07 per cent of geographical area under
green cover (Figure 7.2) much less than 33 per cent as
envisaged by National Forest Policy, 1988.
FIGURE 7.2
Forest Map of Delhi
Source: SFR, 2003.
TABLE 7.3
Recorded Forest Area of Delhi
Reserve Forest (R.F.) 78 km2
Protected Forest (P.F.) 7 km2
Total 85 km2
Per cent of total geographical area of the state 5.73%
Per cent of total forest area of the country 0.01%
Source: SFR, 2003.
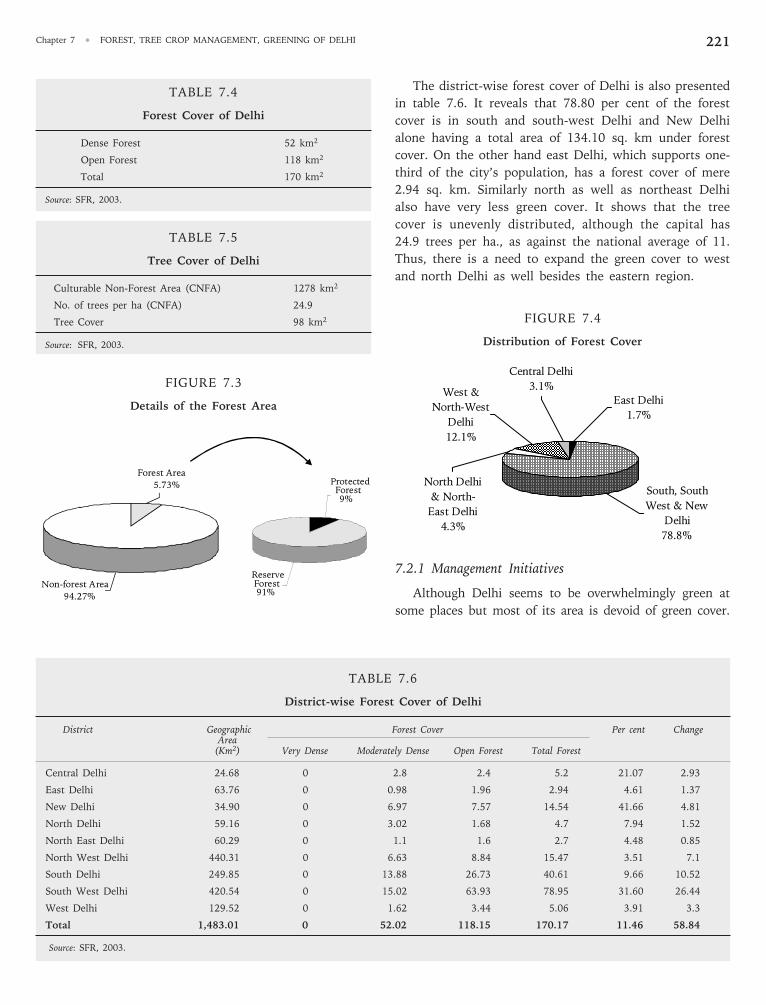
Chapter 7 • FOREST, TREE CROP MANAGEMENT, GREENING OF DELHI 221
TABLE 7.4
Forest Cover of Delhi
Dense Forest 52 km2
Open Forest 118 km2
Total 170 km2
Source: SFR, 2003.
TABLE 7.5
Tree Cover of Delhi
Culturable Non-Forest Area (CNFA) 1278 km2
No. of trees per ha (CNFA) 24.9
Tree Cover 98 km2
Source: SFR, 2003.
FIGURE 7.3
Details of the Forest Area
The district-wise forest cover of Delhi is also presented
in table 7.6. It reveals that 78.80 per cent of the forest
cover is in south and south-west Delhi and New Delhi
alone having a total area of 134.10 sq. km under forest
cover. On the other hand east Delhi, which supports one-
third of the city’s population, has a forest cover of mere
2.94 sq. km. Similarly north as well as northeast Delhi
also have very less green cover. It shows that the tree
cover is unevenly distributed, although the capital has
24.9 trees per ha., as against the national average of 11.
Thus, there is a need to expand the green cover to west
and north Delhi as well besides the eastern region.
FIGURE 7.4
Distribution of Forest Cover
7.2.1 Management Initiatives
Although Delhi seems to be overwhelmingly green at
some places but most of its area is devoid of green cover.
TABLE 7.6
District-wise Forest Cover of Delhi
District Geographic Forest Cover Per cent ChangeArea
(Km2) Very Dense Moderately Dense Open Forest Total Forest
Central Delhi 24.68 0 2.8 2.4 5.2 21.07 2.93
East Delhi 63.76 0 0.98 1.96 2.94 4.61 1.37
New Delhi 34.90 0 6.97 7.57 14.54 41.66 4.81
North Delhi 59.16 0 3.02 1.68 4.7 7.94 1.52
North East Delhi 60.29 0 1.1 1.6 2.7 4.48 0.85
North West Delhi 440.31 0 6.63 8.84 15.47 3.51 7.1
South Delhi 249.85 0 13.88 26.73 40.61 9.66 10.52
South West Delhi 420.54 0 15.02 63.93 78.95 31.60 26.44
West Delhi 129.52 0 1.62 3.44 5.06 3.91 3.3
Total 1,483.01 0 52.02 118.15 170.17 11.46 58.84
Source: SFR, 2003.
Central Delhi
3.1%West &
North-West
Delhi
12.1%
North Delhi
& North-
East Delhi
4.3%
East Delhi
1.7%
South, South
West & New
Delhi
78.8%
Non-forest Area
94.27%
Forest Area
5.73%
Reserve Forest91%
Protected Forest9%
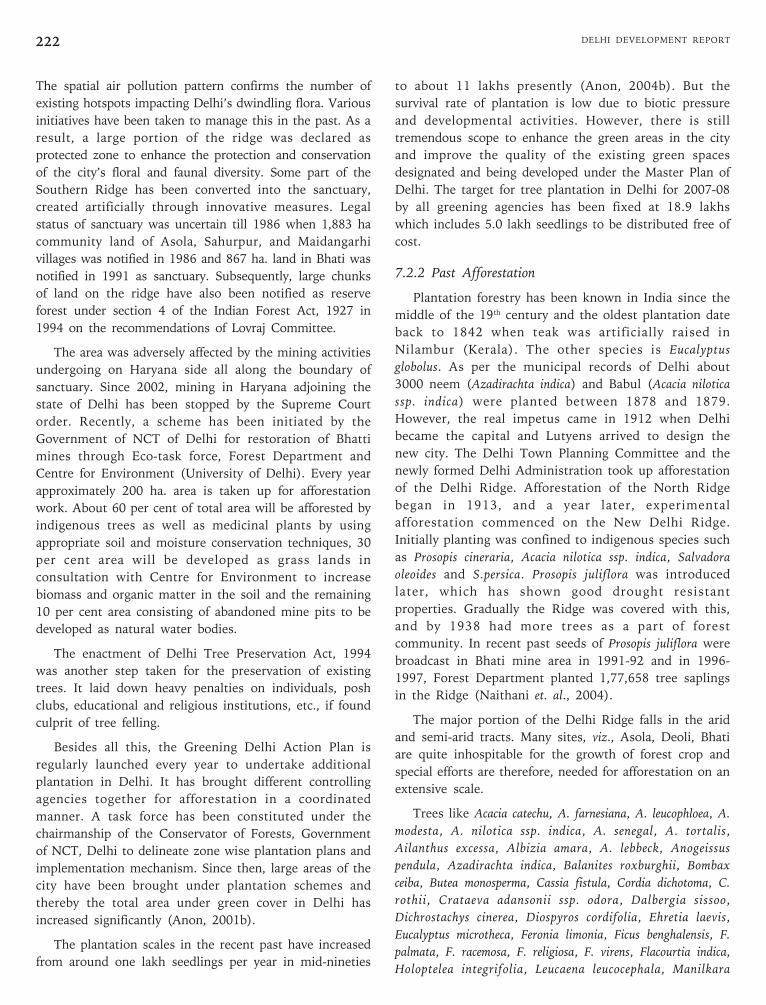
DELHI DEVELOPMENT REPORT222
The spatial air pollution pattern confirms the number of
existing hotspots impacting Delhi’s dwindling flora. Various
initiatives have been taken to manage this in the past. As a
result, a large portion of the ridge was declared as
protected zone to enhance the protection and conservation
of the city’s floral and faunal diversity. Some part of the
Southern Ridge has been converted into the sanctuary,
created artificially through innovative measures. Legal
status of sanctuary was uncertain till 1986 when 1,883 ha
community land of Asola, Sahurpur, and Maidangarhi
villages was notified in 1986 and 867 ha. land in Bhati was
notified in 1991 as sanctuary. Subsequently, large chunks
of land on the ridge have also been notified as reserve
forest under section 4 of the Indian Forest Act, 1927 in
1994 on the recommendations of Lovraj Committee.
The area was adversely affected by the mining activities
undergoing on Haryana side all along the boundary of
sanctuary. Since 2002, mining in Haryana adjoining the
state of Delhi has been stopped by the Supreme Court
order. Recently, a scheme has been initiated by the
Government of NCT of Delhi for restoration of Bhatti
mines through Eco-task force, Forest Department and
Centre for Environment (University of Delhi). Every year
approximately 200 ha. area is taken up for afforestation
work. About 60 per cent of total area will be afforested by
indigenous trees as well as medicinal plants by using
appropriate soil and moisture conservation techniques, 30
per cent area will be developed as grass lands in
consultation with Centre for Environment to increase
biomass and organic matter in the soil and the remaining
10 per cent area consisting of abandoned mine pits to be
developed as natural water bodies.
The enactment of Delhi Tree Preservation Act, 1994
was another step taken for the preservation of existing
trees. It laid down heavy penalties on individuals, posh
clubs, educational and religious institutions, etc., if found
culprit of tree felling.
Besides all this, the Greening Delhi Action Plan is
regularly launched every year to undertake additional
plantation in Delhi. It has brought different controlling
agencies together for afforestation in a coordinated
manner. A task force has been constituted under the
chairmanship of the Conservator of Forests, Government
of NCT, Delhi to delineate zone wise plantation plans and
implementation mechanism. Since then, large areas of the
city have been brought under plantation schemes and
thereby the total area under green cover in Delhi has
increased significantly (Anon, 2001b).
The plantation scales in the recent past have increased
from around one lakh seedlings per year in mid-nineties
to about 11 lakhs presently (Anon, 2004b). But the
survival rate of plantation is low due to biotic pressure
and developmental activities. However, there is still
tremendous scope to enhance the green areas in the city
and improve the quality of the existing green spaces
designated and being developed under the Master Plan of
Delhi. The target for tree plantation in Delhi for 2007-08
by all greening agencies has been fixed at 18.9 lakhs
which includes 5.0 lakh seedlings to be distributed free of
cost.
7.2.2 Past Afforestation
Plantation forestry has been known in India since the
middle of the 19th century and the oldest plantation date
back to 1842 when teak was artificially raised in
Nilambur (Kerala). The other species is Eucalyptus
globolus. As per the municipal records of Delhi about
3000 neem (Azadirachta indica) and Babul (Acacia nilotica
ssp. indica) were planted between 1878 and 1879.
However, the real impetus came in 1912 when Delhi
became the capital and Lutyens arrived to design the
new city. The Delhi Town Planning Committee and the
newly formed Delhi Administration took up afforestation
of the Delhi Ridge. Afforestation of the North Ridge
began in 1913, and a year later, experimental
afforestation commenced on the New Delhi Ridge.
Initially planting was confined to indigenous species such
as Prosopis cineraria, Acacia nilotica ssp. indica, Salvadora
oleoides and S.persica. Prosopis juliflora was introduced
later, which has shown good drought resistant
properties. Gradually the Ridge was covered with this,
and by 1938 had more trees as a part of forest
community. In recent past seeds of Prosopis juliflora were
broadcast in Bhati mine area in 1991-92 and in 1996-
1997, Forest Department planted 1,77,658 tree saplings
in the Ridge (Naithani et. al., 2004).
The major portion of the Delhi Ridge falls in the arid
and semi-arid tracts. Many sites, viz., Asola, Deoli, Bhati
are quite inhospitable for the growth of forest crop and
special efforts are therefore, needed for afforestation on an
extensive scale.
Trees like Acacia catechu, A. farnesiana, A. leucophloea, A.
modesta, A. nilotica ssp. indica, A. senegal, A. tortalis,
Ailanthus excessa, Albizia amara, A. lebbeck, Anogeissus
pendula, Azadirachta indica, Balanites roxburghii, Bombax
ceiba, Butea monosperma, Cassia fistula, Cordia dichotoma, C.
rothii, Crataeva adansonii ssp. odora, Dalbergia sissoo,
Dichrostachys cinerea, Diospyros cordifolia, Ehretia laevis,
Eucalyptus microtheca, Feronia limonia, Ficus benghalensis, F.
palmata, F. racemosa, F. religiosa, F. virens, Flacourtia indica,
Holoptelea integrifolia, Leucaena leucocephala, Manilkara
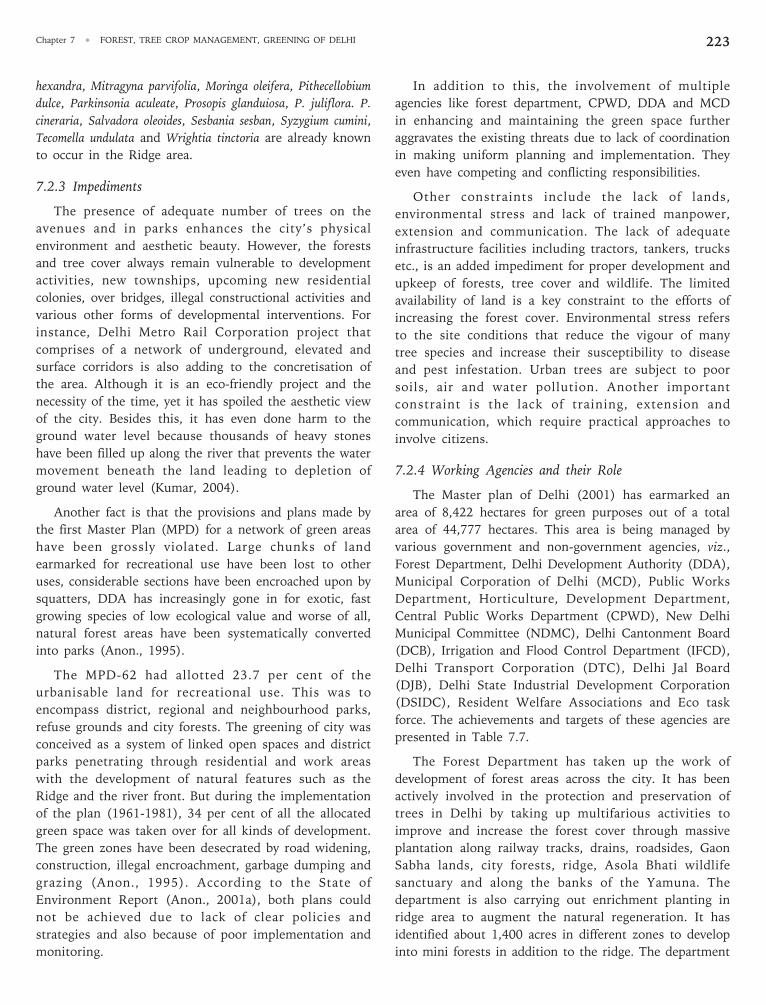
Chapter 7 • FOREST, TREE CROP MANAGEMENT, GREENING OF DELHI 223
hexandra, Mitragyna parvifolia, Moringa oleifera, Pithecellobium
dulce, Parkinsonia aculeate, Prosopis glanduiosa, P. juliflora. P.
cineraria, Salvadora oleoides, Sesbania sesban, Syzygium cumini,
Tecomella undulata and Wrightia tinctoria are already known
to occur in the Ridge area.
7.2.3 Impediments
The presence of adequate number of trees on the
avenues and in parks enhances the city’s physical
environment and aesthetic beauty. However, the forests
and tree cover always remain vulnerable to development
activities, new townships, upcoming new residential
colonies, over bridges, illegal constructional activities and
various other forms of developmental interventions. For
instance, Delhi Metro Rail Corporation project that
comprises of a network of underground, elevated and
surface corridors is also adding to the concretisation of
the area. Although it is an eco-friendly project and the
necessity of the time, yet it has spoiled the aesthetic view
of the city. Besides this, it has even done harm to the
ground water level because thousands of heavy stones
have been filled up along the river that prevents the water
movement beneath the land leading to depletion of
ground water level (Kumar, 2004).
Another fact is that the provisions and plans made by
the first Master Plan (MPD) for a network of green areas
have been grossly violated. Large chunks of land
earmarked for recreational use have been lost to other
uses, considerable sections have been encroached upon by
squatters, DDA has increasingly gone in for exotic, fast
growing species of low ecological value and worse of all,
natural forest areas have been systematically converted
into parks (Anon., 1995).
The MPD-62 had allotted 23.7 per cent of the
urbanisable land for recreational use. This was to
encompass district, regional and neighbourhood parks,
refuse grounds and city forests. The greening of city was
conceived as a system of linked open spaces and district
parks penetrating through residential and work areas
with the development of natural features such as the
Ridge and the river front. But during the implementation
of the plan (1961-1981), 34 per cent of all the allocated
green space was taken over for all kinds of development.
The green zones have been desecrated by road widening,
construction, illegal encroachment, garbage dumping and
grazing (Anon., 1995). According to the State of
Environment Report (Anon., 2001a), both plans could
not be achieved due to lack of clear policies and
strategies and also because of poor implementation and
monitoring.
In addition to this, the involvement of multiple
agencies like forest department, CPWD, DDA and MCD
in enhancing and maintaining the green space further
aggravates the existing threats due to lack of coordination
in making uniform planning and implementation. They
even have competing and conflicting responsibilities.
Other constraints include the lack of lands,
environmental stress and lack of trained manpower,
extension and communication. The lack of adequate
infrastructure facilities including tractors, tankers, trucks
etc., is an added impediment for proper development and
upkeep of forests, tree cover and wildlife. The limited
availability of land is a key constraint to the efforts of
increasing the forest cover. Environmental stress refers
to the site conditions that reduce the vigour of many
tree species and increase their susceptibility to disease
and pest infestation. Urban trees are subject to poor
soils, air and water pollution. Another important
constraint is the lack of training, extension and
communication, which require practical approaches to
involve citizens.
7.2.4 Working Agencies and their Role
The Master plan of Delhi (2001) has earmarked an
area of 8,422 hectares for green purposes out of a total
area of 44,777 hectares. This area is being managed by
various government and non-government agencies, viz.,
Forest Department, Delhi Development Authority (DDA),
Municipal Corporation of Delhi (MCD), Public Works
Department, Horticulture, Development Department,
Central Public Works Department (CPWD), New Delhi
Municipal Committee (NDMC), Delhi Cantonment Board
(DCB), Irrigation and Flood Control Department (IFCD),
Delhi Transport Corporation (DTC), Delhi Jal Board
(DJB), Delhi State Industrial Development Corporation
(DSIDC), Resident Welfare Associations and Eco task
force. The achievements and targets of these agencies are
presented in Table 7.7.
The Forest Department has taken up the work of
development of forest areas across the city. It has been
actively involved in the protection and preservation of
trees in Delhi by taking up multifarious activities to
improve and increase the forest cover through massive
plantation along railway tracks, drains, roadsides, Gaon
Sabha lands, city forests, ridge, Asola Bhati wildlife
sanctuary and along the banks of the Yamuna. The
department is also carrying out enrichment planting in
ridge area to augment the natural regeneration. It has
identified about 1,400 acres in different zones to develop
into mini forests in addition to the ridge. The department
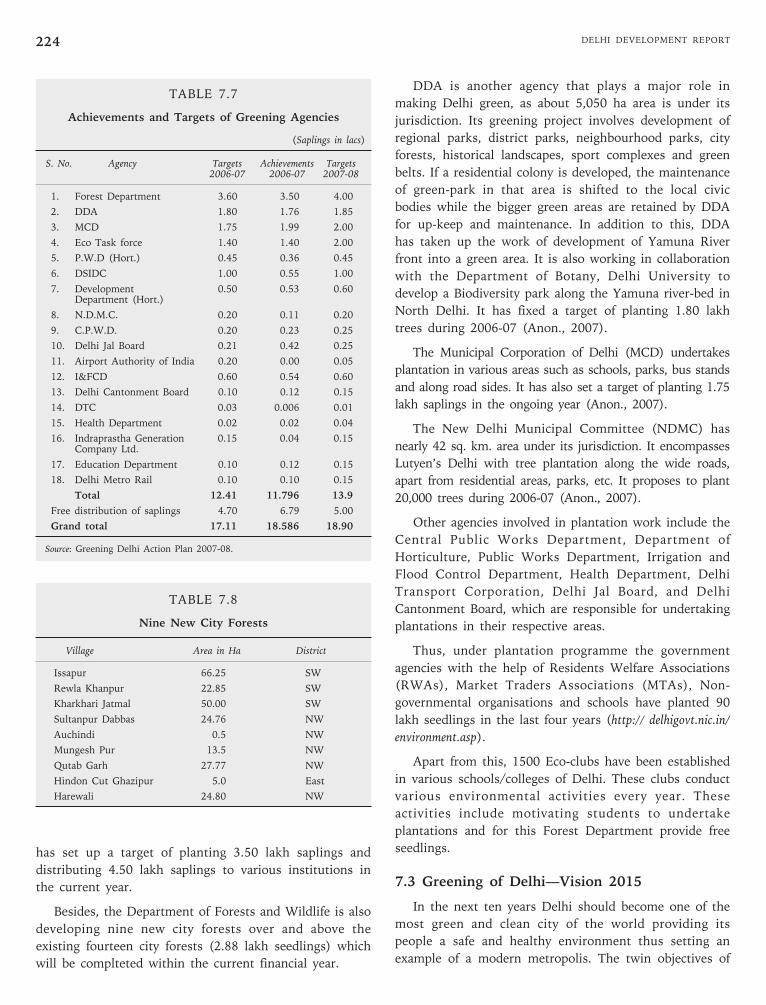
DELHI DEVELOPMENT REPORT224
DDA is another agency that plays a major role in
making Delhi green, as about 5,050 ha area is under its
jurisdiction. Its greening project involves development of
regional parks, district parks, neighbourhood parks, city
forests, historical landscapes, sport complexes and green
belts. If a residential colony is developed, the maintenance
of green-park in that area is shifted to the local civic
bodies while the bigger green areas are retained by DDA
for up-keep and maintenance. In addition to this, DDA
has taken up the work of development of Yamuna River
front into a green area. It is also working in collaboration
with the Department of Botany, Delhi University to
develop a Biodiversity park along the Yamuna river-bed in
North Delhi. It has fixed a target of planting 1.80 lakh
trees during 2006-07 (Anon., 2007).
The Municipal Corporation of Delhi (MCD) undertakes
plantation in various areas such as schools, parks, bus stands
and along road sides. It has also set a target of planting 1.75
lakh saplings in the ongoing year (Anon., 2007).
The New Delhi Municipal Committee (NDMC) has
nearly 42 sq. km. area under its jurisdiction. It encompasses
Lutyen’s Delhi with tree plantation along the wide roads,
apart from residential areas, parks, etc. It proposes to plant
20,000 trees during 2006-07 (Anon., 2007).
Other agencies involved in plantation work include the
Central Public Works Department, Department of
Horticulture, Public Works Department, Irrigation and
Flood Control Department, Health Department, Delhi
Transport Corporation, Delhi Jal Board, and Delhi
Cantonment Board, which are responsible for undertaking
plantations in their respective areas.
Thus, under plantation programme the government
agencies with the help of Residents Welfare Associations
(RWAs), Market Traders Associations (MTAs), Non-
governmental organisations and schools have planted 90
lakh seedlings in the last four years (http:// delhigovt.nic.in/
environment.asp).
Apart from this, 1500 Eco-clubs have been established
in various schools/colleges of Delhi. These clubs conduct
various environmental activities every year. These
activities include motivating students to undertake
plantations and for this Forest Department provide free
seedlings.
7.3 Greening of Delhi—Vision 2015
In the next ten years Delhi should become one of the
most green and clean city of the world providing its
people a safe and healthy environment thus setting an
example of a modern metropolis. The twin objectives of
TABLE 7.7
Achievements and Targets of Greening Agencies
(Saplings in lacs)
S. No. Agency Targets Achievements Targets2006-07 2006-07 2007-08
1. Forest Department 3.60 3.50 4.00
2. DDA 1.80 1.76 1.85
3. MCD 1.75 1.99 2.00
4. Eco Task force 1.40 1.40 2.00
5. P.W.D (Hort.) 0.45 0.36 0.45
6. DSIDC 1.00 0.55 1.00
7. Development 0.50 0.53 0.60Department (Hort.)
8. N.D.M.C. 0.20 0.11 0.20
9. C.P.W.D. 0.20 0.23 0.25
10. Delhi Jal Board 0.21 0.42 0.25
11. Airport Authority of India 0.20 0.00 0.05
12. I&FCD 0.60 0.54 0.60
13. Delhi Cantonment Board 0.10 0.12 0.15
14. DTC 0.03 0.006 0.01
15. Health Department 0.02 0.02 0.04
16. Indraprastha Generation 0.15 0.04 0.15Company Ltd.
17. Education Department 0.10 0.12 0.15
18. Delhi Metro Rail 0.10 0.10 0.15
Total 12.41 11.796 13.9
Free distribution of saplings 4.70 6.79 5.00
Grand total 17.11 18.586 18.90
Source: Greening Delhi Action Plan 2007-08.
TABLE 7.8
Nine New City Forests
Village Area in Ha District
Issapur 66.25 SW
Rewla Khanpur 22.85 SW
Kharkhari Jatmal 50.00 SW
Sultanpur Dabbas 24.76 NW
Auchindi 0.5 NW
Mungesh Pur 13.5 NW
Qutab Garh 27.77 NW
Hindon Cut Ghazipur 5.0 East
Harewali 24.80 NW
has set up a target of planting 3.50 lakh saplings and
distributing 4.50 lakh saplings to various institutions in
the current year.
Besides, the Department of Forests and Wildlife is also
developing nine new city forests over and above the
existing fourteen city forests (2.88 lakh seedlings) which
will be complteted within the current financial year.
Chapter 7 • FOREST, TREE CROP MANAGEMENT, GREENING OF DELHI 225
greening Delhi and combating pollution can be achieved
in a meaningful way only through combined efforts of
various Government and non-government agencies and
the active participation of the people. Following strategic
actions have been suggested in this regard.
7.3.1 Expanding Green Area
The geographical area of Delhi is 1,483 sq. km., out of
this 268 sq. km. or 18.07 of percent area is under the
forest and tree cover (SFR, 2003). In the existing scenario
there is no scope of expanding the green cover because of
non-availability of land for this purpose. Around eleven
lakh seedlings are being planted every year by the various
agencies in their respective areas to expand the green
cover (Anon., 2004b). Although these small blocks of
plantations, road side trees, gardens and parks are
providing good services to the people even than they
cannot be compared with the natural forests which have
altogether different composition and purpose to serve.
Another problem with such trees or plantations is that
sooner or later they become prey to some development
activity, viz., road widening, pavement repair, social
gathering, etc. The needs and the perception of the society
keep on changing with the passage of time and trees are
not a priority for most of the people. Thus there is no
possibility of expanding green area through such activities.
However, if there is a will there is a way to achieve this.
The two possible options are mentioned below:
i. Developing 1 km. wide green belt on both sides
of the Yamuna River; and
ii. Acquisition of atleast 2 km. wide strip of land
along Haryana border and developing it into forest.
In the present scenario both of these options may look
wild or absurd. Although land acquisition is an expensive
propostion but both the dreams can be made true if
government is really keen to make Delhi green.
The flood plain area of Yamuna River constitutes 97
sq. km. (Anon., 2000). Agriculture is practiced extensively
along the stretch of river and most of the native
vegetation has been cleared for agriculture and farming.
The areas not fit for agriculture are used as grazing
grounds when flood water recedes.
The advantage with Yamuna bank is that most of the
area is still under the possession of government.
However, the area is getting decreased day by day due to
encroachments and developmental activities and if the
same trend continues, the whole area might get converted
into the jungle of concrete after few years. The
government should take a bold decision of handing all
available area to the forest department to plant suitable
species on both sides of the river. It would be a great
service to the people of the whole country and shall be
remembered in the years to come.
The plantation of native trees, shrubs, reeds and
grasses along the natural levee would check erosion and
bank cutting and help in restoration of the floodplains. An
increase in habitat diversity and the vegetation is expected
to revive the natural fisheries as well as other biodiversity
(birds, amphibia, reptiles, molluscs and macro-
invertebrates) that once occurred in the area (Gopal,
2003). The loss of agricultural production will be more
than compensated by the potential for fisheries and the
production of forage and fuel. Additional benefits will
accrue in terms of improvement in water quality due to
the reduction in the application of agrochemicals and
through nutrient transformation in the restored floodplain
wetlands. A programme of rehabilitation by providing
alternate opportunities for livelihood to people who own
or cultivate the land in floodplain should be formulated.
Efforts can be made to involve these people in the
restoration and follow-up management activities, and
motivate them to take up fisheries and prawn culture that
are economically profitable.
Since river Yamuna is an ecological feature with high
conservation value for NCT of Delhi and its surrounding
area, its safeguard from encroachments and urbanisation
is of paramount importance. The rehabilitation of people
who cultivate there is but a small price the government has
to shell out for the survival of the Yamuna till posterity.
As suggested above, after taking over the complete
flood plain area of river Yamuna by Forest Department
and rehabilitating the oustees, the actual area available
needs to be worked out and annual targets for future
plantations should be fixed including the 1 km. wide
green belt on both sides of the river Yamuna.
The Delhi Ridge, an extension of Aravalli range, serves
as green lungs for NCT Delhi and is ecologically very
important with immense conservation value. The original
area of the ridge is believed to be 15,046 ha which is at
present 7,782 ha. (some refer it as 7777 ha. for the sake
of convenience). There are more than 580 species of
vertebrates and 1200 species of invertebrates that inhabit
the ridge area besides supporting a significant population
of resident and migratory waterfowl and more than 400
species of birds in the wetland areas. Due to rapid
urbanisation and encroachment the ridge area has not
only been severely ravaged but also reduced to 4 remnant
patches which have ultimately been declared reserved
forests in 1994.
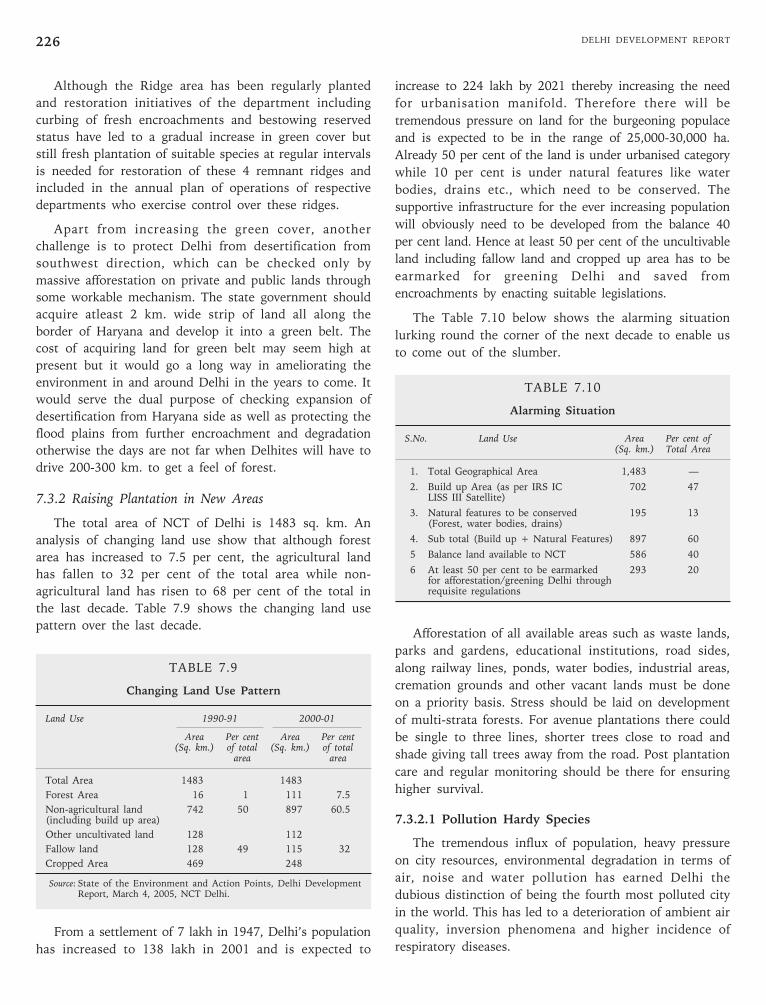
DELHI DEVELOPMENT REPORT226
increase to 224 lakh by 2021 thereby increasing the need
for urbanisation manifold. Therefore there will be
tremendous pressure on land for the burgeoning populace
and is expected to be in the range of 25,000-30,000 ha.
Already 50 per cent of the land is under urbanised category
while 10 per cent is under natural features like water
bodies, drains etc., which need to be conserved. The
supportive infrastructure for the ever increasing population
will obviously need to be developed from the balance 40
per cent land. Hence at least 50 per cent of the uncultivable
land including fallow land and cropped up area has to be
earmarked for greening Delhi and saved from
encroachments by enacting suitable legislations.
The Table 7.10 below shows the alarming situation
lurking round the corner of the next decade to enable us
to come out of the slumber.
TABLE 7.10
Alarming Situation
S.No. Land Use Area Per cent of(Sq. km.) Total Area
1. Total Geographical Area 1,483 —
2. Build up Area (as per IRS IC 702 47LISS III Satellite)
3. Natural features to be conserved 195 13(Forest, water bodies, drains)
4. Sub total (Build up + Natural Features) 897 60
5 Balance land available to NCT 586 40
6 At least 50 per cent to be earmarked 293 20for afforestation/greening Delhi throughrequisite regulations
Afforestation of all available areas such as waste lands,
parks and gardens, educational institutions, road sides,
along railway lines, ponds, water bodies, industrial areas,
cremation grounds and other vacant lands must be done
on a priority basis. Stress should be laid on development
of multi-strata forests. For avenue plantations there could
be single to three lines, shorter trees close to road and
shade giving tall trees away from the road. Post plantation
care and regular monitoring should be there for ensuring
higher survival.
7.3.2.1 Pollution Hardy Species
The tremendous influx of population, heavy pressure
on city resources, environmental degradation in terms of
air, noise and water pollution has earned Delhi the
dubious distinction of being the fourth most polluted city
in the world. This has led to a deterioration of ambient air
quality, inversion phenomena and higher incidence of
respiratory diseases.
Although the Ridge area has been regularly planted
and restoration initiatives of the department including
curbing of fresh encroachments and bestowing reserved
status have led to a gradual increase in green cover but
still fresh plantation of suitable species at regular intervals
is needed for restoration of these 4 remnant ridges and
included in the annual plan of operations of respective
departments who exercise control over these ridges.
Apart from increasing the green cover, another
challenge is to protect Delhi from desertification from
southwest direction, which can be checked only by
massive afforestation on private and public lands through
some workable mechanism. The state government should
acquire atleast 2 km. wide strip of land all along the
border of Haryana and develop it into a green belt. The
cost of acquiring land for green belt may seem high at
present but it would go a long way in ameliorating the
environment in and around Delhi in the years to come. It
would serve the dual purpose of checking expansion of
desertification from Haryana side as well as protecting the
flood plains from further encroachment and degradation
otherwise the days are not far when Delhites will have to
drive 200-300 km. to get a feel of forest.
7.3.2 Raising Plantation in New Areas
The total area of NCT of Delhi is 1483 sq. km. An
analysis of changing land use show that although forest
area has increased to 7.5 per cent, the agricultural land
has fallen to 32 per cent of the total area while non-
agricultural land has risen to 68 per cent of the total in
the last decade. Table 7.9 shows the changing land use
pattern over the last decade.
TABLE 7.9
Changing Land Use Pattern
Land Use 1990-91 2000-01
Area Per cent Area Per cent(Sq. km.) of total (Sq. km.) of total
area area
Total Area 1483 1483
Forest Area 16 1 111 7.5
Non-agricultural land 742 50 897 60.5(including build up area)
Other uncultivated land 128 112
Fallow land 128 49 115 32
Cropped Area 469 248
Source: State of the Environment and Action Points, Delhi DevelopmentReport, March 4, 2005, NCT Delhi.
From a settlement of 7 lakh in 1947, Delhi’s population
has increased to 138 lakh in 2001 and is expected to
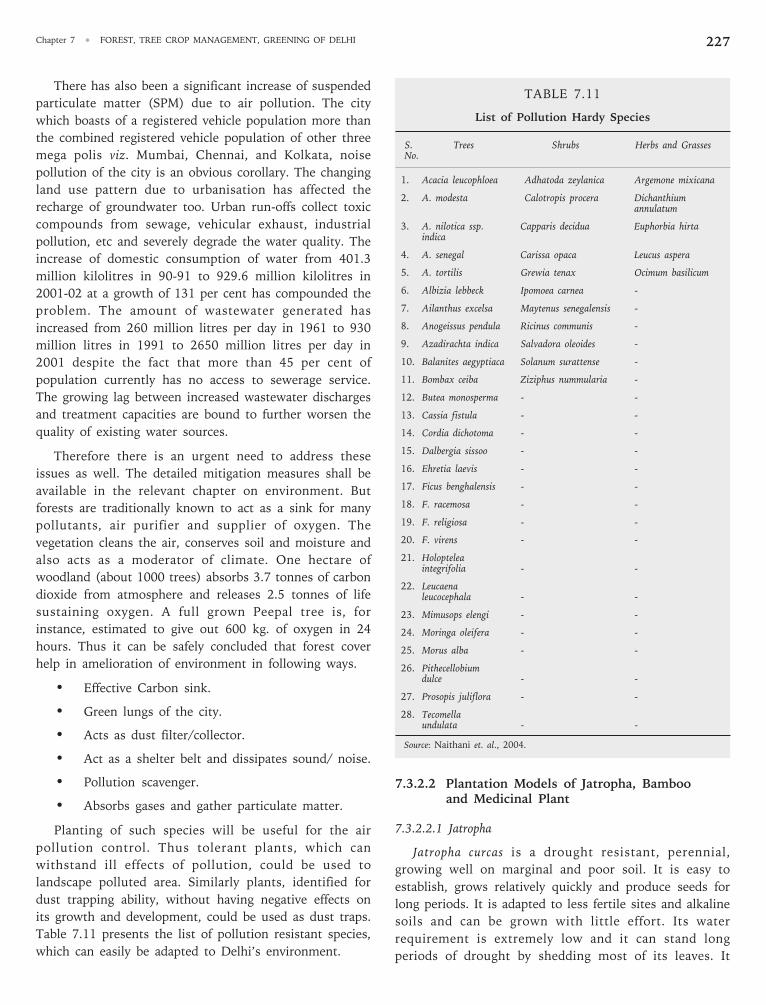
Chapter 7 • FOREST, TREE CROP MANAGEMENT, GREENING OF DELHI 227
There has also been a significant increase of suspended
particulate matter (SPM) due to air pollution. The city
which boasts of a registered vehicle population more than
the combined registered vehicle population of other three
mega polis viz. Mumbai, Chennai, and Kolkata, noise
pollution of the city is an obvious corollary. The changing
land use pattern due to urbanisation has affected the
recharge of groundwater too. Urban run-offs collect toxic
compounds from sewage, vehicular exhaust, industrial
pollution, etc and severely degrade the water quality. The
increase of domestic consumption of water from 401.3
million kilolitres in 90-91 to 929.6 million kilolitres in
2001-02 at a growth of 131 per cent has compounded the
problem. The amount of wastewater generated has
increased from 260 million litres per day in 1961 to 930
million litres in 1991 to 2650 million litres per day in
2001 despite the fact that more than 45 per cent of
population currently has no access to sewerage service.
The growing lag between increased wastewater discharges
and treatment capacities are bound to further worsen the
quality of existing water sources.
Therefore there is an urgent need to address these
issues as well. The detailed mitigation measures shall be
available in the relevant chapter on environment. But
forests are traditionally known to act as a sink for many
pollutants, air purifier and supplier of oxygen. The
vegetation cleans the air, conserves soil and moisture and
also acts as a moderator of climate. One hectare of
woodland (about 1000 trees) absorbs 3.7 tonnes of carbon
dioxide from atmosphere and releases 2.5 tonnes of life
sustaining oxygen. A full grown Peepal tree is, for
instance, estimated to give out 600 kg. of oxygen in 24
hours. Thus it can be safely concluded that forest cover
help in amelioration of environment in following ways.
• Effective Carbon sink.
• Green lungs of the city.
• Acts as dust filter/collector.
• Act as a shelter belt and dissipates sound/ noise.
• Pollution scavenger.
• Absorbs gases and gather particulate matter.
Planting of such species will be useful for the air
pollution control. Thus tolerant plants, which can
withstand ill effects of pollution, could be used to
landscape polluted area. Similarly plants, identified for
dust trapping ability, without having negative effects on
its growth and development, could be used as dust traps.
Table 7.11 presents the list of pollution resistant species,
which can easily be adapted to Delhi’s environment.
TABLE 7.11
List of Pollution Hardy Species
S. Trees Shrubs Herbs and GrassesNo.
1. Acacia leucophloea Adhatoda zeylanica Argemone mixicana
2. A. modesta Calotropis procera Dichanthiumannulatum
3. A. nilotica ssp. Capparis decidua Euphorbia hirtaindica
4. A. senegal Carissa opaca Leucus aspera
5. A. tortilis Grewia tenax Ocimum basilicum
6. Albizia lebbeck Ipomoea carnea -
7. Ailanthus excelsa Maytenus senegalensis -
8. Anogeissus pendula Ricinus communis -
9. Azadirachta indica Salvadora oleoides -
10. Balanites aegyptiaca Solanum surattense -
11. Bombax ceiba Ziziphus nummularia -
12. Butea monosperma - -
13. Cassia fistula - -
14. Cordia dichotoma - -
15. Dalbergia sissoo - -
16. Ehretia laevis - -
17. Ficus benghalensis - -
18. F. racemosa - -
19. F. religiosa - -
20. F. virens - -
21. Holopteleaintegrifolia - -
22. Leucaenaleucocephala - -
23. Mimusops elengi - -
24. Moringa oleifera - -
25. Morus alba - -
26. Pithecellobiumdulce - -
27. Prosopis juliflora - -
28. Tecomellaundulata - -
Source: Naithani et. al., 2004.
7.3.2.2 Plantation Models of Jatropha, Bambooand Medicinal Plant
7.3.2.2.1 Jatropha
Jatropha curcas is a drought resistant, perennial,
growing well on marginal and poor soil. It is easy to
establish, grows relatively quickly and produce seeds for
long periods. It is adapted to less fertile sites and alkaline
soils and can be grown with little effort. Its water
requirement is extremely low and it can stand long
periods of drought by shedding most of its leaves. It
DELHI DEVELOPMENT REPORT228
prevents soil erosion and shifting of sand dunes. Thus it
can play an important role in meeting the challenge of
afforestation in Delhi.
Jatropha is a small, deciduous tree or shrub with
smooth, grey bark, which exudes whitish coloured, watery
latex when cut. Normally, it grows between 3-5 m in
height but can attain a height of upto 8-10 m under
favourable conditions. Flowering occurs during the wet
season. The seeds mature about 3 months after flowering.
Nurseries can be set up by forest department to supply
seedlings for afforestation to ensure success of plantation.
Seedlings are generally planted at 2m X 2m spacing. Early
growth is fast and with good rainfall conditions nursery
plants may bear fruits after the first rainy season, direct
sown plants after the 2nd rainy season.
The seeds are rich in oil having properties of an
excellent fuel and are thus a good source of bio-diesel.
Besides this, various parts of the plant are of medicinal
value. In addition, the plantation removes carbon from the
atmosphere, stores it in the woody tissues and assists in
the build up of soil carbon. It is thus environment friendly
also.
7.3.2.2.2 Bamboo
Bamboo is a cultural feature of south-east Asia. No
country in the region is without an indigenous bamboo
flora. Its plethora of essential uses has led to the use of
term such as “bamboo culture”, “green gold”, “poor
man’s timber”, “bamboo friend of the people” and “the
cradle to coffin timber”. It is the fastest growing plant
amongst the woody species, attaining harvestable
maturity in less than five years. In India 120 species
belonging to 23 genera are distributed (Naithani, 1993).
Dendrocalamus strictus and Bambusa bambos (B.
arundinaecea) are the most commonly planted species in
the country. Figure 7.5 presents different plantation
techniques of Bamboo.
An experiment conducted at the Forestry Research
Centre (FRC) of The Energy and Resource Institute
(TERI), Gaul Pahari, Gurgaon, Haryana, showed that
Dendrocalamus strictus and Acacia nilotica ssp. indica as mixed
plantation (6mX5m) bring about significant improvements
in degraded lands and demonstrated the scope of
production of wood as well as bamboos in high degraded
lands. The site was an agriculture land with severly
eroded slopes, active soil erosion and devoid of vegetation
cover. The sandy loam soil was very poor in nitrogen,
phosphorous and organic carbon. Rehabilitation of mined
areas through bamboo afforestation has been tried in two
villages located in the upper stream of the confluence of
the Ganga and the Yamuna rivers at Allahabad. In this
area rampant mining of topsoil by the brick industries
over long period had ravaged the land. Bamboo helped in
reclaiming the degraded land and micro-watershed. It
prevented the loss of topsoil, rejuvenated the degraded
soil, conserved moisture, and increased the vegetal cover
(Tewari and Kumar, 2002).
Recently aerial seeding was done in the Palani Reserve
forest in Dindigul Forest Division, Tamilnadu. This area is
classified as a degraded, dry deciduous and thorny forest.
Out of the species selected for seeding, Acacia ferruginea,
A. leucophloea, A. palnifrons, and D. strictus emerged as the
successful species capable of withstanding the limiting
factors. The high success of D. strictus is attributed to its
ability of better withstand adverse conditions and to the
presence of rhizome that facilitates recovery and
reestablishment (Rao, 2002). As the conditions of Delhi
are similar to Palni, the introduction of D. strictus may be
quite useful in restoring the green cover in the degraded
area.
7.3.2.2.3 Medicinal Plants
NCT of Delhi has a good potential of Medicinal plants.
Out of 31 plant species, which are in high demand both in
domestic and international markets eleven species are
found in Delhi. These are: Emblica officinalis, Saraca asoka,
Withania sominifera, Aegle marmelos, Phyllanthus amarus,
Tinospora cordifolia, Andrographis paniculata, Solanum nigrum,
Rauvolfia serpentina, Asparagus racemosus and Ocimum
sanctum. The National Medicinal Plant Board, Government
of India has recommended these species to bring into
cultivation status, as these constitute a bulk of the
ingredients used in the preparation of ISM & H and
herbal products. The demand of raw material is increasing
day by day at national as well as in global markets.
Therefore, cultivation of selected species can be promoted
in a big way.
The National Medicinal Plant Board has developed a
medicinal Herbal Garden in the Rashtrapati Bhawan where
about 200 species have been planted. The garden is
elliplitical in shape, divided into eight sectors; each sector
dedicated to a specific therapeutic category. These sectors
represent eight organ systems, viz., Digestive system, Blood
and Circulatory system, Skeleto Muscular system, Skin
Care system, Urinogenital system, Respiratory system,
Inflammations and fevers and Nervous system. In addition,
four thematic corners are developed at the periphery of the
garden. These corners have plants specifically used under
Bal Ayurvedam (medicinal plants useful in the treatment of
diseases of the children, Nari Ayurvedam (medicinal plants
used for curing gynaecological disorders and specific
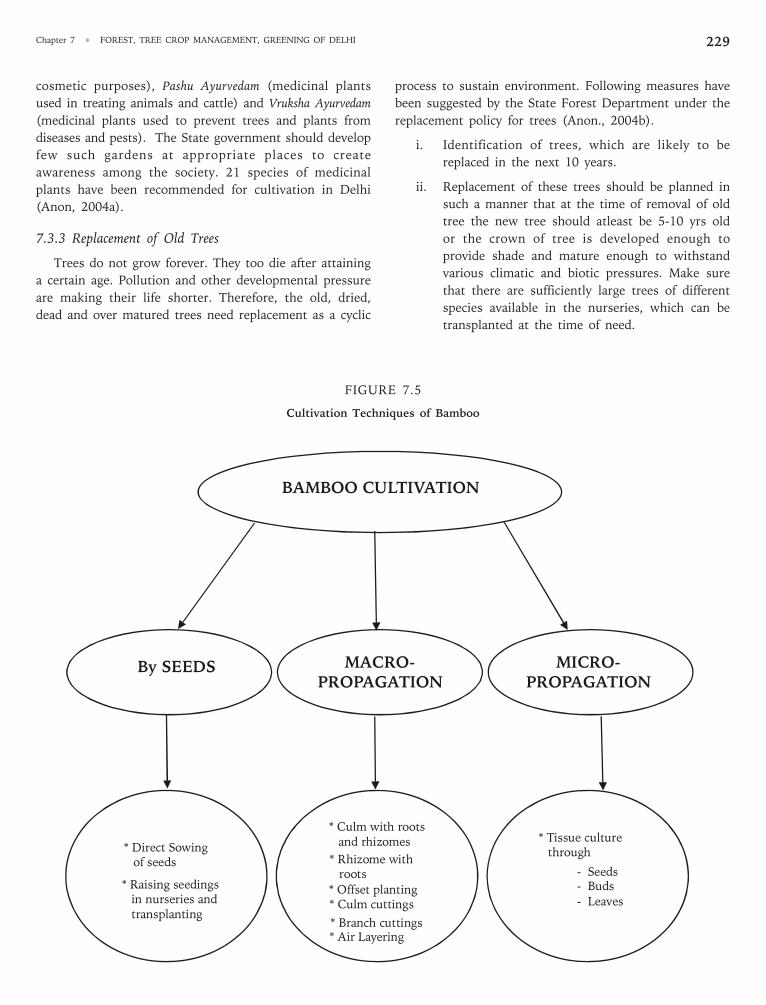
Chapter 7 • FOREST, TREE CROP MANAGEMENT, GREENING OF DELHI 229
cosmetic purposes), Pashu Ayurvedam (medicinal plants
used in treating animals and cattle) and Vruksha Ayurvedam
(medicinal plants used to prevent trees and plants from
diseases and pests). The State government should develop
few such gardens at appropriate places to create
awareness among the society. 21 species of medicinal
plants have been recommended for cultivation in Delhi
(Anon, 2004a).
7.3.3 Replacement of Old Trees
Trees do not grow forever. They too die after attaining
a certain age. Pollution and other developmental pressure
are making their life shorter. Therefore, the old, dried,
dead and over matured trees need replacement as a cyclic
process to sustain environment. Following measures have
been suggested by the State Forest Department under the
replacement policy for trees (Anon., 2004b).
i. Identification of trees, which are likely to be
replaced in the next 10 years.
ii. Replacement of these trees should be planned in
such a manner that at the time of removal of old
tree the new tree should atleast be 5-10 yrs old
or the crown of tree is developed enough to
provide shade and mature enough to withstand
various climatic and biotic pressures. Make sure
that there are sufficiently large trees of different
species available in the nurseries, which can be
transplanted at the time of need.
FIGURE 7.5
Cultivation Techniques of Bamboo
BAMBOO CULTIVATION
By SEEDS MACRO-
PROPAGATION
MICRO-
PROPAGATION
* Direct Sowing of seeds
* Raising seedings in nurseries and transplanting
* Culm with roots and rhizomes
* Rhizome with roots
* Offset planting* Culm cuttings
* Branch cuttings* Air Layering
* Tissue culture through
- Seeds- Buds
- Leaves
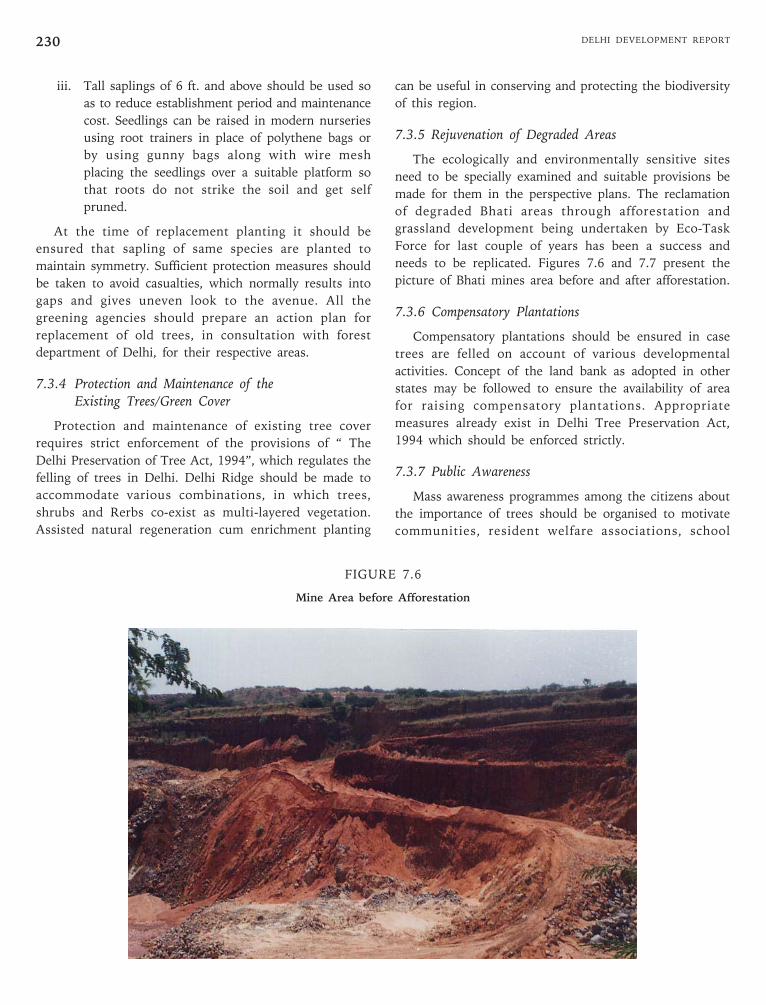
DELHI DEVELOPMENT REPORT230
iii. Tall saplings of 6 ft. and above should be used so
as to reduce establishment period and maintenance
cost. Seedlings can be raised in modern nurseries
using root trainers in place of polythene bags or
by using gunny bags along with wire mesh
placing the seedlings over a suitable platform so
that roots do not strike the soil and get self
pruned.
At the time of replacement planting it should be
ensured that sapling of same species are planted to
maintain symmetry. Sufficient protection measures should
be taken to avoid casualties, which normally results into
gaps and gives uneven look to the avenue. All the
greening agencies should prepare an action plan for
replacement of old trees, in consultation with forest
department of Delhi, for their respective areas.
7.3.4 Protection and Maintenance of theExisting Trees/Green Cover
Protection and maintenance of existing tree cover
requires strict enforcement of the provisions of “ The
Delhi Preservation of Tree Act, 1994”, which regulates the
felling of trees in Delhi. Delhi Ridge should be made to
accommodate various combinations, in which trees,
shrubs and Rerbs co-exist as multi-layered vegetation.
Assisted natural regeneration cum enrichment planting
can be useful in conserving and protecting the biodiversity
of this region.
7.3.5 Rejuvenation of Degraded Areas
The ecologically and environmentally sensitive sites
need to be specially examined and suitable provisions be
made for them in the perspective plans. The reclamation
of degraded Bhati areas through afforestation and
grassland development being undertaken by Eco-Task
Force for last couple of years has been a success and
needs to be replicated. Figures 7.6 and 7.7 present the
picture of Bhati mines area before and after afforestation.
7.3.6 Compensatory Plantations
Compensatory plantations should be ensured in case
trees are felled on account of various developmental
activities. Concept of the land bank as adopted in other
states may be followed to ensure the availability of area
for raising compensatory plantations. Appropriate
measures already exist in Delhi Tree Preservation Act,
1994 which should be enforced strictly.
7.3.7 Public Awareness
Mass awareness programmes among the citizens about
the importance of trees should be organised to motivate
communities, resident welfare associations, school
FIGURE 7.6
Mine Area before Afforestation
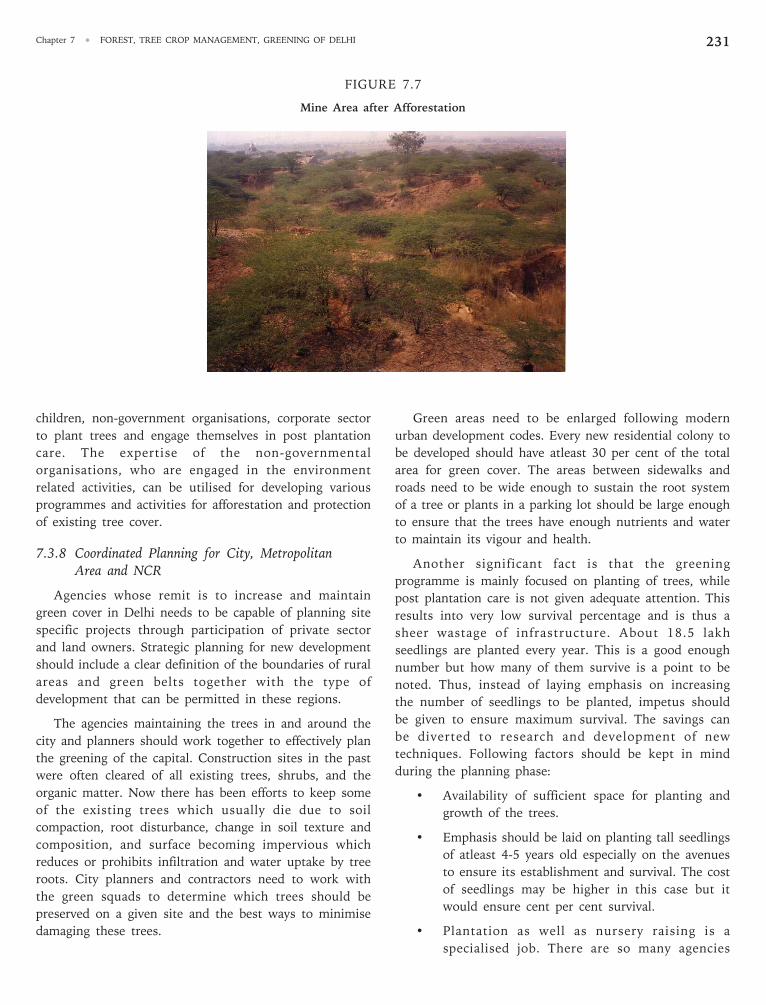
Chapter 7 • FOREST, TREE CROP MANAGEMENT, GREENING OF DELHI 231
children, non-government organisations, corporate sector
to plant trees and engage themselves in post plantation
care. The expertise of the non-governmental
organisations, who are engaged in the environment
related activities, can be utilised for developing various
programmes and activities for afforestation and protection
of existing tree cover.
7.3.8 Coordinated Planning for City, MetropolitanArea and NCR
Agencies whose remit is to increase and maintain
green cover in Delhi needs to be capable of planning site
specific projects through participation of private sector
and land owners. Strategic planning for new development
should include a clear definition of the boundaries of rural
areas and green belts together with the type of
development that can be permitted in these regions.
The agencies maintaining the trees in and around the
city and planners should work together to effectively plan
the greening of the capital. Construction sites in the past
were often cleared of all existing trees, shrubs, and the
organic matter. Now there has been efforts to keep some
of the existing trees which usually die due to soil
compaction, root disturbance, change in soil texture and
composition, and surface becoming impervious which
reduces or prohibits infiltration and water uptake by tree
roots. City planners and contractors need to work with
the green squads to determine which trees should be
preserved on a given site and the best ways to minimise
damaging these trees.
Green areas need to be enlarged following modern
urban development codes. Every new residential colony to
be developed should have atleast 30 per cent of the total
area for green cover. The areas between sidewalks and
roads need to be wide enough to sustain the root system
of a tree or plants in a parking lot should be large enough
to ensure that the trees have enough nutrients and water
to maintain its vigour and health.
Another significant fact is that the greening
programme is mainly focused on planting of trees, while
post plantation care is not given adequate attention. This
results into very low survival percentage and is thus a
sheer wastage of infrastructure. About 18.5 lakh
seedlings are planted every year. This is a good enough
number but how many of them survive is a point to be
noted. Thus, instead of laying emphasis on increasing
the number of seedlings to be planted, impetus should
be given to ensure maximum survival. The savings can
be diverted to research and development of new
techniques. Following factors should be kept in mind
during the planning phase:
• Availability of sufficient space for planting and
growth of the trees.
• Emphasis should be laid on planting tall seedlings
of atleast 4-5 years old especially on the avenues
to ensure its establishment and survival. The cost
of seedlings may be higher in this case but it
would ensure cent per cent survival.
• Plantation as well as nursery raising is a
specialised job. There are so many agencies
FIGURE 7.7
Mine Area after Afforestation
DELHI DEVELOPMENT REPORT232
involved in planting trees. Many of them do not
even have specialised manpower to carry out the
plantations and maintain them. Such agencies
should be removed and only specialised agencies
should be handed over the task.
• A considerable degree of forward planning is
required for effective use of available funds.
Funds should be allocated for long-term
maintenance of trees.
Thus a strategic overview is required so that the
planning and management of the green areas is closely
coordinated across the different agencies that have a role
to play.
7.3.9 Establishment of GIS Cell
The geographic information system (GIS) is a
computer based information system that is designed to
work with data referenced by spatial or geographic
coordinates. The use of GIS is rapidly increasing, as
city, regional and environmental planners, resource
managers and the scientific community become aware
of the capabilities these systems have to offer (Wood,
1990).
A GIS allows the user the ability to quickly
manipulate, analyse, display geographic or spatial data and
take advantage of existing spatial information (Miller,
1997). GIS has long been recognised as a useful tool in
the management of natural resource development, land
use planning, wildlife management, environmental
planning, and forestry planning. The use of tree
inventories is essential for the management of trees in an
urban community. The street tree inventories can be
greatly enhanced by using a geographic information
system. This would help the urban foresters and planners
to make more thorough and cost effective management
decisions to better manage and maintain healthy urban
forests.
A GIS cell should be established immediately to create
a database of all the area under forest and tree cover for
regular monitoring. The benefits of GIS would exceed the
initial costs of the software and digital data that is needed.
Updating data in a GIS is much more cost efficient and
less time consuming than having to manually redraw
maps. This would give up-to-date information, which can
be used by urban and environmental planners during
planning and policy formulation. Based on the database,
remedial measure, if any, can be suggested without any
loss of time.
7.4 Policy Framework
There are lots of issues regarding the causes and
consequences of degradation of green cover in Delhi.
However, a strategic, integrated and coordinated
institutional approach is not in place to address these
issues. There is clear lack of focus both in terms of policy,
priorities and intervention. The government and non-
government agencies and communities must integrate,
develop and achieve a shared vision for increasing the
green cover. Some of the issues, which may be useful in
deciding policy framework, are mentioned below:
• There are various agencies involved in the task of
afforestation and maintenance of green space,
which leads to administrative confusion in
planning and implementation. Handing over the
task to one body with the sole objective of
protecting and increasing the green cover would
reduce the complexity.
• Conversion of recreational areas to other uses
should not be permitted at all.
• In all the developmental processes, visual
characteristics should be given consideration. In
the planning of “ New Delhi” in 1961, the central
vista was conceived as a landscaped stretch to
form continuity between the ridge and the river
Yamuna. But the new developments are more on
the basis of division of land for different uses and
lack spatial qualities (Anon., 1990). Thus policies
should be framed to support urban design, giving
importance to the aesthetic view besides the
developmental activities.
• Recently the MoEF has issued guidelines making
it mandatory for development projects,
government or private (hotels, hospitals,
industrial estates, office and commercial
complexes, new townships etc.) to obtain
environmental clearance if it caters to the needs
of 1,000 persons or more, discharging sewage of
50,000 litres a day or more, with an investment
of Rs. 50 crores or more. These guidelines should
be followed strictly.
• Regular survey of user’s attitude and expectations
and of potential for increased community
involvement in creating and managing green
spaces should be conducted.
• Management of each area of green belt and
recreational land should be made fully transparent
and accountable, with appropriate rewards for
Chapter 7 • FOREST, TREE CROP MANAGEMENT, GREENING OF DELHI 233
effective management and penalties for
mismanagement.
• Ring road and rail corridors have the potential to
acquire an additional dimension of visual quality
and integration.
• The banners, hoarding, signboards, bill boards
etc., should not be allowed to be placed on trees.
These not only harm the trees but spoil the visual
quality also.
• On the basis of the study conducted by Central
Water Pollution Control and Prevention Board,
six areas, viz., Najafgarh road, Lawrence Road,
Wazirpur, Kirti Nagar, DLF Industries area, and
Moti Nagar have been declared as Pollution
Control Areas under the Air (Prevention and
Control of Pollution) act, 1981 (Anon., 1990).
Thus emphasis on pollution hardy species should
be laid especially in these areas for pollution
abatement.
• A green buffer should be developed along the
major roads, commercial areas like shopping
complexes and cultural centres for controlling
noise pollution.
• Trees in the periphery of airport should be short
statured to avoid birds, which are a menace to air
safety.
• Avenue trees should be strong enough to
withstand heavy wind, pleasing crown shape and
have attractive flowers. Trees bearing edible fruits
or fodder leaves are prone to be damaged heavily.
• In “Make Bangalore Green” campaign, to avoid
the cost of tree guards, industries were
approached to adopt avenues and use the space
for the advertisement of their logos (Sunder,
1986). Another step taken by the forest
Department was to involve individuals for
extension work and for protecting the seedlings
and tree guards. They in turn were appointed as
‘Honorary Tree Wardens’, which later became a
status symbol. This approach can be adopted in
Delhi as well.
• Local authorities should encourage formation of
neighbourhood watch organisations for green
areas in their purview.
• The achievements of local groups and people who
care for their local green spaces should be
acknowledged. For this community award can be
instituted to encourage and reward the efforts of
local communities.
• ‘Delhi Green Spaces Taskforce’ should be set up
for developing and maintaining green areas in the
city.
• Non-governmental organisations can work in
conjunction with the forest department to come
ahead and motivate people to plant trees in their
surroundings on special occasions such as
birthdays, anniversaries, wedding, and valentine’s
day etc. This would make their days memorable
besides adding to the aesthetic appeal of the
place.
• Students should also be involved in planting trees
and to look after them in and around school and
college campuses. In short the concept of “Tree
Police” as proposed by the Green Delhi Action
Plan should be realised.
• Local initiatives and partnerships should be
encouraged to promote greater involvement of
local people, optimise the capacity of
communities, foster a greater sense of individual
responsibility and citizenship and give
communities a sense of ownership of their green
spaces, all leading to more cohesive and
sustainable communities.
Policies in accordance with the National Forest Policy,
1988 need to be formulated with the aim to have a
minimum of one-third of total land area of the city under
forest or tree cover. Thus, protection, afforestation and
maintenance of existing tree cover should be strongly
supported by enabling policy decisions whether on
strengthening the existing rules and regulations, staff
strength, training, research, funding, etc.
7.5 Conclusion
The responsibility of making Delhi green is not a duty
of one department alone. It is an obligation on all.
Government departments, public authorities, non-
government organisations and communities each have a
fundamental role to play. Hence concerted efforts are
required by all to make Delhi one of the most attractive
and appealing cities of the world. The suggestions
contained in this report will provide a better focus and
building blocks for all those involved in planning,
managing and maintaining green spaces in Delhi to
identify the important issues and develop consensus and
priorities for further action.
DELHI DEVELOPMENT REPORT234
References
Anonymous (2001a). State of Environment Report for Delhi, Tata Energy andResearch Institute. Delhi.
————. (2001b). State of Forest Report, 2001. Forest Survey of India.Kaulagarh Road, Dehra Dun.
————. (2004a). Agrotechniques and Economics of Some Important MedicinalPlants of India. National Medicinal Plants Board, Department of Ayush.Ministry of Health and Family Welfare, Government of India.
————. (2004b). Greening Delhi Action Plan, 2004-05. Department of Forestand Wildlife, Government of NCT of Delhi.
————. (2007). Greening Delhi Action Plan, 2007-08. Department of Forestand Wildlife, Government of NCT of Delhi.
————. (1912). Delhi Gazetteer.
————. (1990). What will be Delhi in 2001. Delhi Master Plan August 1990,Delhi: Akalank Publications. pp. 37-40.
————. (1995). Delhi Environment Status Report. World wide fund for Nature-India. Department of Environment, Government of NCT, Delhi.
————. (2000). Environmental Management Plan for rejuvenation of river Yamunain NCT. National Environmental Engineering Research Institute.
Champion, H.G. & S.K. Seth (1968). A Revised Survey of the Forest Types ofIndia. Government of India Publ. Delhi. p.404.
Ganguli, U. (1975). A Guide to the Birds of the Delhi Area, I.C.A.R., New Delhi.
Gogate, V.G. (2001). Impact of Urbanisation on Delhi Fauna with special referenceto Avifauna. 13-15. CENDE & Dept of Environment, Delhi.
Gopal, B. (2003). State of Degradation and Approaches to Restoration of FloodplainRivers in India. Proceedings of the second international symposium onthe management of large rivers for fisheries: Sustaining livelihoods andbiodiversity in new millennium. Vol II. 11th–14th Feb. 2003, PhnomPhen, Cambodia.
Kumar, A. (1997). Fauna of Delhi: An overview 1-15. Zoological Survey ofIndia. Calcutta.
Kumar, P. (2004). Ecosystem Services of Floodplains: An Exploration of Water
Recharge Potential of the Yamuna Floodplain for Delhi. Draft Version. PaperPresented at the conference on Market Development of Water &Waste Technologies through Environmental Economics, 28th-29th May2004, Paris. p.6.
Maheshwari, J.K. (1963). The Flora of Delhi 1-947, C.S.I.R., New Delhi.
Miller, R.W. (1997). Urban Forestry: Planning and Managing Urban Greenspaces.2nd ed. Englewood cliffs, New Jersey: Prentice Hall. p. 105-130.
Naithani, H.B. (1993). Contributions to the Taxonomic studies of Indian Bamboos.Vol. I and II. Ph.D. Thesis submitted to the HNB Garhwal University,Srinagar, Garhwal.
Naithani, H.B., M. Pal, Sumer Chandra and V.P. Khanduri (2004).Vegetational Survey and Inventorisation of Species in the Ridge Forest ofDelhi. Report. Submitted to Department of Forest and Wildlife,Government of NCT of Delhi.
Parker, R.N. (1920). Afforestation of the Ridge at Delhi. Indian Forester. 46 (1):21-28.
Rao, M.J. (2002). Technology for Large Scale Propagation of Bamboo through AerialSeeding. pp 323-331. In Kumar A., Ramanuja Rao, I.V. and Sastry, Ch.(Eds.) Bamboo for Sustainable Development. INBAR Proc. No. 7,Netherlands.
Reddy, C.V.K. (1978). Prosopis Juliflora. The Precious Child of the PlantWorld. Indian Forester. 104: 14-18.
Sawarkar, V.B. and V.K. Uniyal (1995). Management Planning of Asola BhatiWildlife Sanctuary. Wildlife Institute of India, Dehra Dun.
Sunder, S.S. (1986). Urban Tree Planting-Foresters Efforts in Bangalore. IndianForester. 112: 296-304.
Tewari, D.N. (1994). Urban Forestry. Indian Forester. 120: 647- 657.
Tewari, D.N and K. Kumar (2002). Rehabilitation of Mined Areas throughBamboo Afforestation: A Case Study. pp. 777-782. ibid.
Wood, J.P. (1990). Tree Inventories and GIS in Urban Forestry. Project reportsubmitted to the Faculty of the Virginia Polytechnic Institute and StateUniversity in partial fulfillment of the requirements for the degree ofMaster in Forestry in Forest Biology, Blacksburg, Virginia.
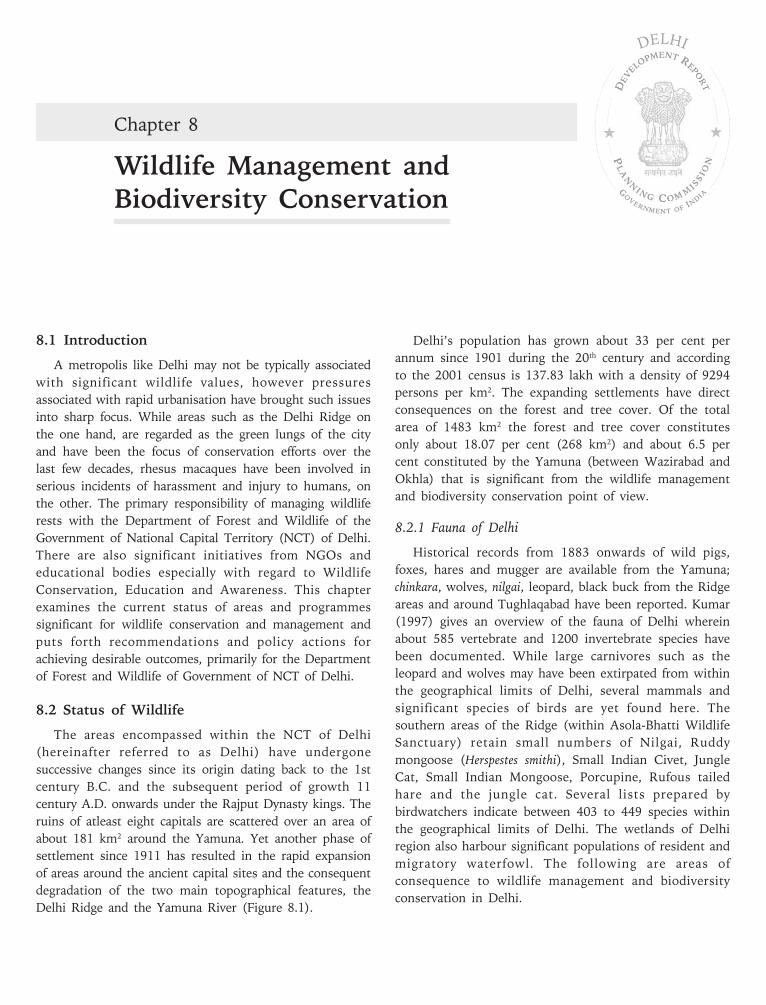
Chapter 8
Wildlife Management andBiodiversity Conservation
DELHI
8.1 Introduction
A metropolis like Delhi may not be typically associated
with significant wildlife values, however pressures
associated with rapid urbanisation have brought such issues
into sharp focus. While areas such as the Delhi Ridge on
the one hand, are regarded as the green lungs of the city
and have been the focus of conservation efforts over the
last few decades, rhesus macaques have been involved in
serious incidents of harassment and injury to humans, on
the other. The primary responsibility of managing wildlife
rests with the Department of Forest and Wildlife of the
Government of National Capital Territory (NCT) of Delhi.
There are also significant initiatives from NGOs and
educational bodies especially with regard to Wildlife
Conservation, Education and Awareness. This chapter
examines the current status of areas and programmes
significant for wildlife conservation and management and
puts forth recommendations and policy actions for
achieving desirable outcomes, primarily for the Department
of Forest and Wildlife of Government of NCT of Delhi.
8.2 Status of Wildlife
The areas encompassed within the NCT of Delhi
(hereinafter referred to as Delhi) have undergone
successive changes since its origin dating back to the 1st
century B.C. and the subsequent period of growth 11
century A.D. onwards under the Rajput Dynasty kings. The
ruins of atleast eight capitals are scattered over an area of
about 181 km2 around the Yamuna. Yet another phase of
settlement since 1911 has resulted in the rapid expansion
of areas around the ancient capital sites and the consequent
degradation of the two main topographical features, the
Delhi Ridge and the Yamuna River (Figure 8.1).
Delhi’s population has grown about 33 per cent per
annum since 1901 during the 20th century and according
to the 2001 census is 137.83 lakh with a density of 9294
persons per km2. The expanding settlements have direct
consequences on the forest and tree cover. Of the total
area of 1483 km2 the forest and tree cover constitutes
only about 18.07 per cent (268 km2) and about 6.5 per
cent constituted by the Yamuna (between Wazirabad and
Okhla) that is significant from the wildlife management
and biodiversity conservation point of view.
8.2.1 Fauna of Delhi
Historical records from 1883 onwards of wild pigs,
foxes, hares and mugger are available from the Yamuna;
chinkara, wolves, nilgai, leopard, black buck from the Ridge
areas and around Tughlaqabad have been reported. Kumar
(1997) gives an overview of the fauna of Delhi wherein
about 585 vertebrate and 1200 invertebrate species have
been documented. While large carnivores such as the
leopard and wolves may have been extirpated from within
the geographical limits of Delhi, several mammals and
significant species of birds are yet found here. The
southern areas of the Ridge (within Asola-Bhatti Wildlife
Sanctuary) retain small numbers of Nilgai, Ruddy
mongoose (Herspestes smithi), Small Indian Civet, Jungle
Cat, Small Indian Mongoose, Porcupine, Rufous tailed
hare and the jungle cat. Several lists prepared by
birdwatchers indicate between 403 to 449 species within
the geographical limits of Delhi. The wetlands of Delhi
region also harbour significant populations of resident and
migratory waterfowl. The following are areas of
consequence to wildlife management and biodiversity
conservation in Delhi.
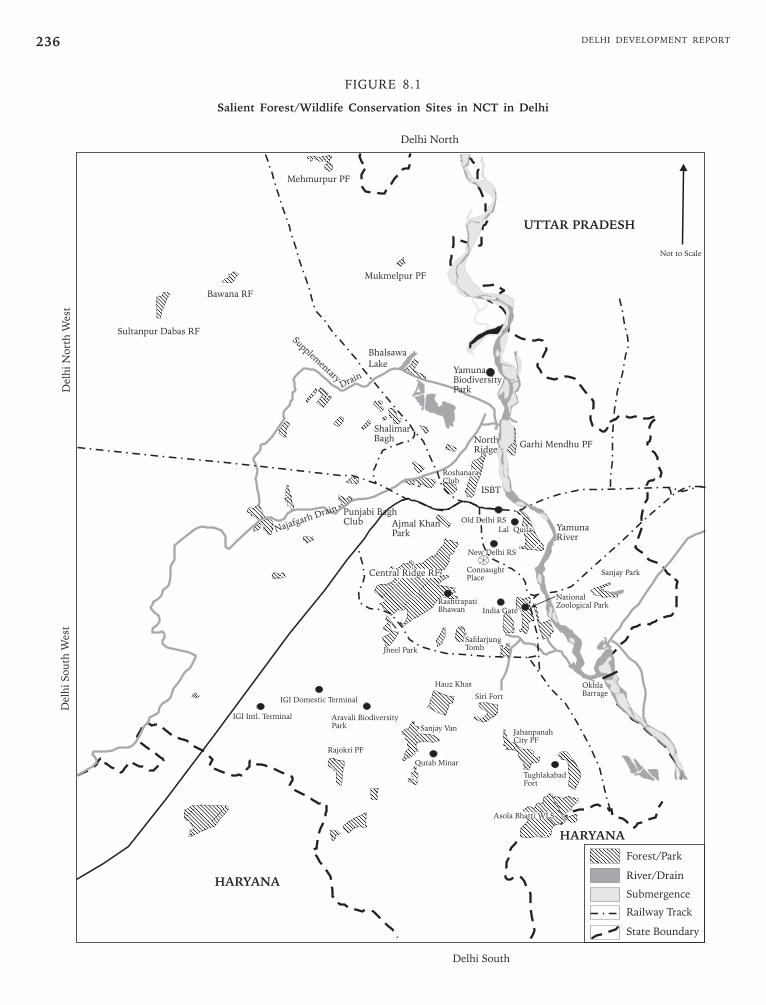
DELHI DEVELOPMENT REPORT236
FIGURE 8.1
Salient Forest/Wildlife Conservation Sites in NCT in Delhi
Chapter 8 • WILDLIFE MANAGEMENT AND BIODIVERSITY CONSERVATION 237
8.2.2 Delhi Ridge
The Delhi Ridge (7,777 ha. in four remnant patches) is
a continuation of the Aravalli Range which extends into
Delhi from Haryana at the Tughlaqabad — Dera-Mandi
axis moving northwards covering areas of the Asola-Bhatti
Wildlife Sanctuary, parts of Delhi Cantonment and the
Lutyens Zone terminating at Delhi University covering the
Kamla Nehru Ridge (Thapliyal, 1987). The original area of
the ridge was believed to be 15,046 ha (Madan, 2002).
Concerns over the rapidly decreasing cover on account of
infrastructure and settlement expansion and mining led to
declaration of the remaining four patches that constitute
the Delhi Ridge as Reserved Forest in 1994 under the
Indian Forest Act (1927): (i) Northern (87 ha, under
Delhi Development Authority, DDA); (ii) Central (864 ha,
under Central Public Works Department, CPWD); (iii)
South Central (626 ha, under Municipal Corporation of
Delhi, DDA and Forest Department, FD); and (iv)
Southern (6200 ha, under the FD).
The vegetation is typical Northern Tropical Thorn
Forest Type (Champion and Seth, 1968). Among trees
Acacias such as A. nilotica, A. leucophloea, A. catechu, A.
modesta, Butea monosperma (Dhak), Cassia fistula (Amaltas),
Salvadora persica are prominent. There are patches of
Anogeissus latifolia while Prosopis juliflora is abundant.
Shrubs include Capparis sepiaria, C.decidua, Zizyphus
aenoplia, Croton sparaiflorus. Herbaceous flora includes
Calotropis procera, Withania somnifera, Achyranthes aspera,
Alysicarpus vaginalis, and Peistrophe bicalyculata. The main
grasses are Cenchrus ciliaris, Aristida, Eragrostis poaeioides,
Saccharum spontaneum (Kumar and Khanna, 1997).
Among the notable avian species of the ridge areas are
Grey-breasted Prinias, Small Minivets, Common Wood-
shrike, Paradise Flycatcher, several barbets and
woodpeckers. In winter Olive-backed Pipits are regular in
several places and several buntings (notably White-
capped) have been recorded. Peafowl and Grey Francolin
are numerous and Eurasian Thick-knees are also noted to
breed in good numbers (www.Delhibird.org, retrieved on
27/12/2004). The only Protected Area (PA) Asola – Bhatti
Wildlife Sanctuary constituting the Southern Patch of
Delhi Ridge harbours significant wildlife species.
8.2.2 Asola-Bhatti Wildlife Sanctuary
The Asola–Bhatti Wildlife Sanctuary (ABWLS) was
created with the notification of community land of villages
(Asola, Sahurpur and Maidangarhi, 4704 acres) during
1986 and Bhatti (2167 acres) during 1991 as Wildlife
Sanctuary. The area is dominated by exposed irregularly
distributed boulders of Precambrian, quartzite base that
yield quartzite rocks of high quality silica locally known as
‘Badarpur’ or ‘Bajri’ (Sawarkar and Hussain, 1997). Due
to the presence of such mineral resources within the area
it had been subjected to extensive mining and till date
faces problems of illegal mining. As part of the extensive
habitat recovery activities of the Department of Forests
and Wildlife along with the Eco-Task Force of the
Territorial Army since 2001-2002 over 7 lakh indigenous
trees have been planted in the Bhatti area (2500 acres)
including over 1.4 lakh trees in the Dera Mandi area for
recovery of the tree cover.
Historical records indicate that before 1900 A.D. there
were abundant populations of Black Buck, Nilgai, and
Chinkara along with reported sightings of Wolf, Hyena
and Leopard as late as 1940. However, due to the extreme
anthropogenic pressures that the areas have been
subjected to, the species now found are Nilgai, Common
Mongoose, Small Indian Civet, Jungle Cat, Small Indian
Mongoose, Porcupine, Palm Squirrel, Spiny Tailed Lizard,
and the Rufous tailed Hare. Records indicate between 110
and 200 species of resident and migratory birds including
Little Grebe, Little Cormorant, Cattle Egret, Peregrine
Falcon, Grey Francolin, Brown-headed Barbet,
Coppersmith Barbet, Indian Grey Hornbill, Common
Hoopoe, Indian Roller, Sirkeer Malkoha, Alexandrine
Parakeet, Spotted Owlet, Spotted Dove, Common Kestrel,
Common Myna, and Jungle Prinia among others.
8.2.3 Yamuna Flood Plains
Floodplains are the most widespread of the wetland
ecosystems present in the Yamuna river corridor in the
Delhi stretch from Wazirabad to Okhla, comprising
approximately 95 per cent of the total area (Babu et. al.,
2001). The remainder area comprises marshy areas and
seasonal pools that are of critical importance in providing
nurseries for fish fries and nesting sites for the migrating
waterfowl respectively. Floodplains are the stretch of flat
land between the manmade embankments and the levee
of the river channel that is regularly inundated with
floodwater during the monsoons. Ecosystem goods and
services provided by wetlands include fish, water supply
for domestic, industrial and agricultural purposes, fodder
and other utilisable plant species, fuel wood, recreation
and tourism. Existence of the wetland ecosystems in the
Yamuna river corridor however is threatened due to the
immense anthropogenic pressures including civic
infrastructure development and construction, pollution
and discharge of raw sewage into the river, change in
nature of vegetation, over-exploitation of species and
agriculture. According to an estimate (Kumar, 2001), the
capitalised value of 3250 ha land of floodplain varies from
DELHI DEVELOPMENT REPORT238
Rs. 72620 lakh to Rs. 12103 lakh. In terms of per ha the
range of value comes to be Rs. 22.34 lakh to Rs. 3.72
lakh. The range depends upon the rate of discount
applied.
S. munja—a characteristic plant species of floodplains is
found in small pockets near Wazirabad barrage. Marshy
areas are predominantly present from Chilla regulator to
Okhla barrage and Typha angustata is the dominant plant
species here. Field surveys indicate that 115 plant species
belonging to 27 families were identified and categorised
(Babu et. al., 2001).
Marshy areas present in the Yamuna river corridor
provide nesting and feeding grounds for many migrating
waterfowl species. Thus these sites are of prime
importance with respect to their potential to act as
waterfowl habitat. Most of the birds remain in the
Yamuna corridors for about 4 winter months on an
average which makes the wetlands of the river to function
as wildlife habitats. Of the 97 species visiting the
wetlands, 47 species (about 46 per cent) of birds are
resident and breed in and around the areas of the
wetlands (Babu et. al., 2001). With the development of
the Yamuna Biodiversity Park, the biodiversity of the
region is expected to receive a considerable boost.
8.2.4 Okhla Barrage
The construction of a barrage on the Yamuna near
Okhla in 1986 created a large water body that is shared
between Delhi and the adjoining state of Uttar Pradesh.
The area is rich in avian diversity wherein 302 bird
species have been recorded (Urfi, 2003). During winter,
between 14,000 to 20,000 water birds are recorded
including two critically ‘Endangered Species’, nine
‘Vulnerable Species’ and one ‘Conservation Dependent’
species. Bird species that have shown a decline across the
country and in the Okhla area include the Sarus Crane
(Grus antigone), Indian Skimmer (Rynchops albicollis) and
the Black Neck Stork (Ephippiorhynchus asiaticus). Among
the winter migratory species are the Northern Shoveller
(Anas clypeata), Northern Pintail (Anas acuta) and Ruddy
Shelduck (Tadorna ferruginea) and Graylag Goose (Anser
anser). The Okhla barrage is an important feeding ground
for the hundreds of Painted Storks that breed in the
vicinity of the National Zoological Park (Islam and
Rahamani, 2004.).
8.2.5 National Zoological Park
The National Zoological Park or Delhi Zoo as it is
popularly known is yet another resource of consequence
to wildlife and biodiversity with obvious ex-situ
implications. The administrative control of the zoo is with
the Government of India, Ministry of Environment and
Forests. However, as the resource is located within the
NCT of Delhi it is taken up for consideration in this
chapter. A vital function served by the zoo is that of
promoting education and awareness among people
regarding wildlife and biodiversity conservation. Also the
zoo provides veterinary care and rehabilitation facilities to
rescued animals in and around Delhi. The zoo was visited
by 13.35 lakh persons in the year 2003-2004, thus
exposing them to several facets of wildlife conservation.
Several programmes for education and awareness were
carried out for students and teachers during the same
period such as painting competition, primate and bat
conservation programmes among the notable. The zoo is
also home to a number of free living birds such as
Peafowl, Cormorants, Comb Duck, Shoveller, Spotbill
Duck, Cattle and Little Egrets, White Ibis, Indian
Moorhen, and Painted Stork.
8.2.6 Other Urban Forest Patches
There exist several smaller forest patches around Delhi
that provide shelter to several bird species. Some of the
notable forest patches are Mitraon Protected Forest (PF,
105 acres), Sultanpur PF (120 acres), Mukhmelpur PF
(133 acres), Rajokri PF (600 acres) that are under the
administrative control of the Forest and Wildlife
Department. There are 21 other PF patches under the
control of Delhi Development Authority and Defence
lands that comprise a total area of 3186.9 acres. Another
notable patch of city forest is that near Nasirpur (28 ha)
along with 10 other patches occupying a total of 741
acres. Several gardens along with these urban forest
patches have the potential to harbour significant bird
populations that add to the biodiversity of the region.
An appraisal of the policies and programmes pertaining
to wildlife and biodiversity conservation is considered next.
8.3 Multi-Agency Programmes and Areas
In this section we consider areas and programmes that
are not under the direct administrative and executive
control of the Forest and Wildlife Department of
Government of NCT of Delhi but are managed by other
agencies or involve joint efforts. These areas and
programmes as listed earlier are significant from the
wildlife and biodiversity point of view for the NCT of
Delhi.
8.3.1 Okhla Barrage
The stretch of Yamuna River between Wazirabad (the
Chapter 8 • WILDLIFE MANAGEMENT AND BIODIVERSITY CONSERVATION 239
entry point into Delhi) and Okhla Barrage (the exit point)
has enormous volumes of raw sewage and other industrial
pollutants being emptied into it. This is the most critical
factor affecting the floral and faunal communities of the
wetland created by the barrage. It is pertinent to note here
that dabbling ducks such as the Shovlers and Pintails, the
diving ducks and grazing ducks (Graylag and Barheaded
Geese) have different feeding ecology within the same
area. Besides providing irrigation to the adjacent crop
fields the wetland provides flood and storm damage
protection, groundwater recharge, fish and shellfish
habitat, water source for fish and wildlife and recreation
in the form of boating and fishing.
The Forest Department could take the lead in
improving the water quality in this stretch of Yamuna
along with the ongoing efforts of the Yamuna River
Authority, the Central Pollution Control Board and
agencies like the Delhi Jal Board and Municipal
Corporation of Delhi. Apart from the pollution the
barrage is choking with Eichhorina crassipes covering more
than 35-45 per cent of the water during February and
March which affects the migrating ducks and geese
population (Wildlife Institute of India, 2002). Regular
discharge of the water from the main gate of the barrage
so as to get rid of the Eichhorina mats along with manual
removal of the weeds needs to be undertaken during the
months of May and June.
Fishing and grass cutting are two important benefits
being derived by the people along with use by the washer
men. These important sources of livelihood need to be
taken care of in the absence of any alternative areas while
according a Wildlife Sanctuary status to the parts of the
area within Delhi. It is desirable from the wildlife and
biodiversity conservation viewpoint that the Okhla islands
along with the stretch upto Yamuna Bridge/Noida Toll
Bridge is accorded the status of Wildlife Sanctuary on par
with the existing status on the Uttar Pradesh (Ghaziabad
district) side. Declaration of requisite areas upstream and
down stream of the barrage as buffer zones will not only
augment the pollution control efforts but also allow the
pollution load to be removed by the natural wetland
ecosystem process. While it will be extremely difficult to
completely stop the discharge of effluents and raw sewage
into the river stretch between Wazirabad and Okhla,
minimising such discharge will enable the wetland
ecosystem to remove this load provided adequate flow of
volume is available. Also enhancing the recreational use of
the area needs to be carefully planned in order to manage
the tourist potential of the area.
8.3.2 Yamuna and Aravalli Biodiversity Parks
The River Yamuna and the Aravalli Mountains or the
Delhi Ridge are the two life support systems. However,
they are severely degraded and face high biotic pressure
due to over exploitation, fragmentation and conversion of
habitat, pollution, biological invasions and rapid
population growth. These environmental resources have
almost lost their life supporting potential and ecosystems
have lost their resilience and natural self-sustaining
ameliorative capabilities. Recognising this, the Centre for
Environmental Management of Degraded Ecosystems,
University of Delhi and the Delhi Development Authority
initiated the project on establishing a network of
biodiversity parks in the form of Yamuna and Aravalli
Biodiversity Parks at a total project cost of about Rs. 19
crores over ten years. Natural ecosystems characteristic of
the Yamuna River Basin and Aravalli Mountain System are
being developed in these parks respectively with the help
of extensive landscaping and planting of native and
indigenous species. Some of the key functions of the
biodiversity parks are (Anon, 2005):
• Augmentation of freshwater availability by acting
as a catchment area, enhancing groundwater
recharge and increasing the groundwater table
• Positively impacting local weather patterns by
buffering ambient temperatures by reducing
albedo
• An ideal alternative habitat for migratory and
resident bird species
• An important venue for ecotourism for the people
of Delhi
• Provide a place for coexistence of nature and
culture
• An ideal medium for environmental education at
every level
• Research opportunities for closely understanding
and documenting birth of lost ecosystems
• Linkages with other parks and botanical gardens
for promoting conservation efforts at national and
international level
• Reducing pollution load of the city
• Sequestering atmospheric carbon dioxide
• Trapping dust coming with westerly desert winds
• Checking advancing of deserts
DELHI DEVELOPMENT REPORT240
Yamuna Biodiversity Park is adjacent to the river
stretch upstream of the Wazirabad Bridge across the river
(Figure 8.1). The project initiated in 2002 over an area of
157 acres is now slated to be extended to an adjacent area
of 300 acres which will be developed in the second phase
of the plan. An Information Centre has already been
opened on the site, displaying the plan of the park, the
aim and other related information. One of the major
challenges faced at the park site was to deal with excess
alkalinity of the soil coupled with saline water. To
overcome this problem, first year works focused on
improvement of the soil environment for paving the way
for introduction of indigenous species of the Yamuna river
basin that are characteristic of biotic communities of the
river basin. The Yamuna Biodiversity Park will eventually
be home to 10 ecosystems (Anon, 2005).
A total of about 30 biotic communities, that are most
prominent ones in the entire Yamuna River basin, are
planned for introduction and development in the park.
Some of these communities under development are:
Mixed deciduous with bamboo, Mixed deciduous without
bamboo, Sal dominated mixed evergreen, Teak dominated
mixed deciduous, Sal Dominated mixed deciduous,
Acacia Woodlands, Grasslands, Thorn-scrub forests,
Shallow Wetland communities, Deep Wetland
Communities, Semi-Evergreen low-lying forest, Broad-
leaved mixed communities, Marshy communities, Riparian
communities, Peripheral Plantations, and Island
communities (Acacia nilotica-grasses). Plants that were
collected and brought to the park from the wild have
added to the increase in the number of species. A total of
about 450 plant species are now existing in the park.
Further areas such as Sacred Grove, Herbal Garden, Fruit
Orchard are being developed along with a site for
camping. The major purpose of conservation awareness
will be served through visits of groups and individuals to
these areas within the park.
A narrow wetland designed like a river with a total
length of 1.8 km was created through artificial digging of
soil in 2002 with plantation being completed in 2003.
Another deeper wetland of about 2.5 hectares has been
created in July 2004 for providing habitat particularly for
the migratory birds. About 500 individuals of Rana sp. (3
sp.), 1000 fish fingerlings collected from local wetlands
and 1,50,000 fish fingerlings of various carp species have
been introduced in the wetlands resulting in a resident
population of Cormorants.
With improvement in the habitat quality, and the
development of the wetlands, a number of faunal species
have started appearing. The diversity is relatively higher in
the case with birds. During early 2002, when plantation
work was started, there were about 30 species of common
birds found in the area. After the development of the
wetlands, the number of bird species has gone to over
160 with over 40 species of birds nesting in the park. The
Red Crested Pochard, a migratory bird from Siberia is
being seen in Delhi in the Yamuna Biodiversity Park after
a gap of almost five years. This bird is an indicator of
good water quality. Besides increase in the avifauna, the
number of species recorded for mammals has also gone
up. The following animals have been sighted/indirect
evidence observed in the park site: Fruit Bats, Wild Pig,
Nilgai, Black Napped Hare, Porcupine, Gerbil, Cobra—
Brown and Black, Checkered Keel Back, Wolf Snake, Rat
Snake and Common Krait (Anon, 2005)
Aravalli Biodiversity Park located between Vasant Kunj
and Vasant Vihar is spread over 692 acres with plans for
water bodies, a rock garden, a butterfly park and a safari
park. This park is intended to highlight flora and fauna
that are characteristic of a desert. Communities under
development in the Aravalli Biodiversity Park are:
Anogeissus-Boswelia, Mixed deciduous forest, Sacred
Grove, Butea dominated deciduous, Mixed semi-evergreen
community, and Wetlands. A total number of 230 plant
species belonging to 53 families and 152 genera and 90
species of birds have been sighted in the park. Mammals
such as Nilgai, Jackal, Brown hare, Jackals and Hyena and
five snake species (Cobra, Banded krait, Russell’s viper,
Rat snake and Water snake) are the notable fauna of the
area. Water harvesting has already started in the Aravalli
Biodiversity Park and waste-water from the Mahipalpur
Dairy is being diverted to the park.
While the progress made in the case of Yamuna
Biodiversity Park has been considerable, the Aravalli
Biodiversity Park is embroiled in a controversy. Residents
and NGOs filed complaints with the Supreme Court
Central Empowered Committee (CEC) claiming that the
development of the park was in violation of the
designated green area. Although the Supreme Court
Central Empowered Committee consequently has cleared
the project, doubts have been raised on the environmental
feasibility of both the parks. In the interim, it would
suffice to view the development of the biodiversity parks
as a vital opportunity to demonstrate the regenerative
potential of sites which have otherwise been subject to
immense anthropogenic pressures. In this regard, the case
of Yamuna Biodiversity Park is of special interest as there
could be vital lessons to be learnt for the development of
the Yamuna Floodplains as a whole. This should be seen
in light of the earlier recommendation for Okhla Barrage
Chapter 8 • WILDLIFE MANAGEMENT AND BIODIVERSITY CONSERVATION 241
pertaining to the need to provide opportunities for the
wetland system to thrive along the entire stretch of the
Yamuna. The ability of wetlands to remove the pollution
load from the water and other associated benefits provide
tangible benefits to society at large. While it may be too
early to comment on the intensity and extent of
replication of the Yamuna Biodiversity Park experience
along the stretch of the Yamuna within Delhi and
elsewhere, the project is expected to yield vital insights
for the evolving of an integrated water management plan.
Also, the contribution of such parks towards increasing
awareness regarding wildlife and biodiversity conservation
cannot be overstated.
8.3.3 Wildlife Conservation Awareness
The initiatives by the Forest and Wildlife Department,
NGOs and members of civil society towards improvement
of their environs have been aided by the enormous growth
in media. The cable revolution within the last decade has
brought wildlife and environment related entertainment
right into the homes of the ordinary urban citizen. Cable
TV channels like the National Geographic and Discovery
have provided the opportunity to millions of viewers to
appreciate matters related to the environment in general
and wildlife specifically. Those households that have
access to the Internet have an additional source of
information and entertainment that is being made
available on the World Wide Web.
An environment and ecology related programme of
awareness was initiated during 1998-1999 by the
Environment Department of the Government of NCT of
Delhi and at present is operational in 1560 schools and
colleges of Delhi. An eco-club was established in each
institution with the objective of promoting an ethos of
conservation, creating awareness regarding waste
generation and recycling, sensitising students to minimise
use of polythene bags, organise tree plantation with the
Forest Department and awareness generation through
organising quizzes, painting competition, rally, street plays
on environmental issues. An evaluation conducted by the
Planning Department has put forth some encouraging
results for the continuation and augmentation of this
scheme (Anon, 2002). Some of the major highlights of the
findings of the evaluation include: 28 per cent of the
sampled eco-clubs were formed of the initiatives of the
students themselves; 63 per cent of the eco-clubs gave 1-
3 hours/week and 3 per cent more than 6 hours/week for
various activities; 99 per cent of the eco-clubs have
conducted plantation activities, 89 per cent drawing and
poster competitions, 63 per cent debates and 66 per cent
have organised rallies. It is encouraging to note that 92
per cent of the student members shared views regarding
eco-clubs with their friends and family and 65 per cent
members continued activities since the formation in 1999-
2000. With a total of Rs. 94.87 lakh having been spent on
the scheme the evaluation indicated some
recommendations for the continuation and improved
working of the scheme.
Several NGOs are active in the area of wildlife
conservation awareness and have on occasion joined
forces to highlight issues like the ban on Shatoosh, illegal
trade in wildlife, plight of captive animals etc. Some of the
NGOs taking leadership roles in awareness generation
within Delhi and outside are Wildlife Trust of India,
Wildlife Protection Society of India, World Wide Fund for
Nature-India, ATREE and CEE. While it is not possible to
comment on the investment of these organisations in
terms of resources both monetary and human, it is
desirable that partnerships for such awareness towards
wildlife conservation between the government agencies,
NGOs and industrial houses are strengthened.
The education section of the National Zoological Park
has been actively pursuing the task of awareness building
among its visitors. Among the major activities and budget
heads listed are: (a) printing of guide maps, brochures,
posters, stickers and pamphlets; (b) preparation and
installation of signage’s for interpretation; (c) celebration
of wildlife week, van mahotsav and other events; (d)
educational seminars; and (e) purchase of books,
periodicals and other equipment. A sum of
Rs. 11.6 lakh (4.64 per cent of total outlay) is proposed to
be spent on educational and awareness related activities
(for 2004-2005) by the zoo authorities. A permanent
kiosk for selling educational material is proposed to be
put up in the premises in the near future. The
effectiveness of the various educational and awareness
activities in the past however are not ascertainable and
hence any comments on the matter are not attempted at
this juncture.
The Forest Department itself is also involved in
wildlife conservation awareness raising activities. The
Forest Department funds for publicity are primarily
utilised for forestry activities wherein publicity activities
are being targeted at specific groups such as school and
colleges, parents of school children, market associations
and resident welfare associations. The publicity efforts are
carried via radio, newspapers, posters, kiosks and panels
on buses and bus shelters and animated display systems.
Also the active participation of NGOs, Voluntary bodies,
Resident Welfare Associations and the corporate sector is
sought for the distribution and planting of saplings
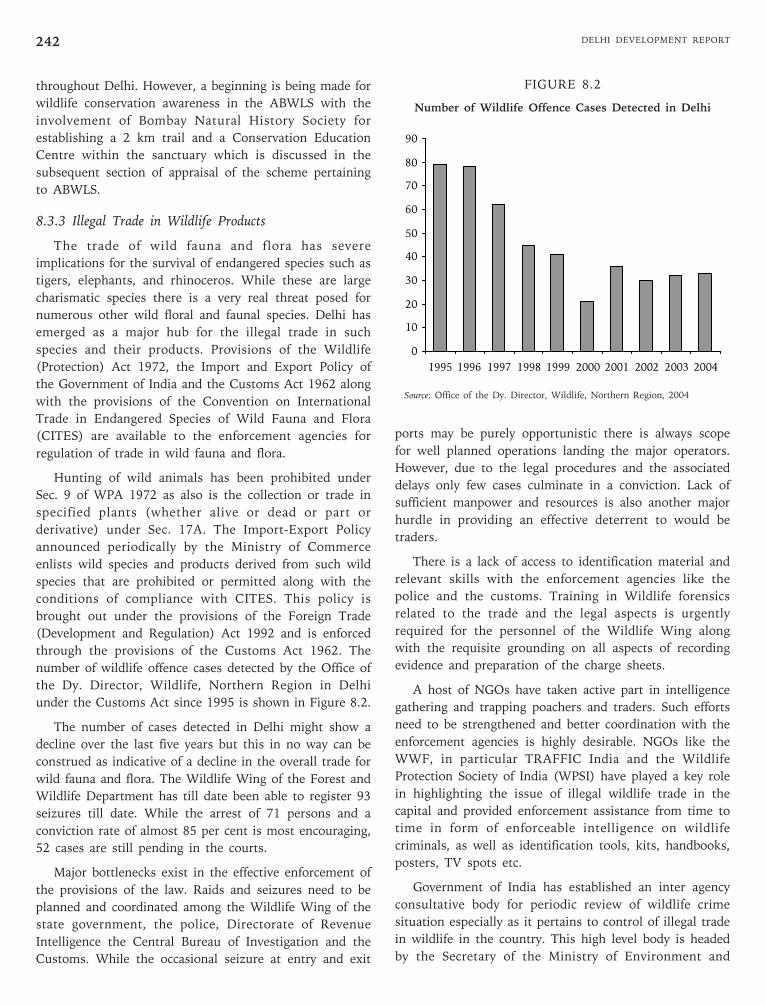
DELHI DEVELOPMENT REPORT242
throughout Delhi. However, a beginning is being made for
wildlife conservation awareness in the ABWLS with the
involvement of Bombay Natural History Society for
establishing a 2 km trail and a Conservation Education
Centre within the sanctuary which is discussed in the
subsequent section of appraisal of the scheme pertaining
to ABWLS.
8.3.3 Illegal Trade in Wildlife Products
The trade of wild fauna and flora has severe
implications for the survival of endangered species such as
tigers, elephants, and rhinoceros. While these are large
charismatic species there is a very real threat posed for
numerous other wild floral and faunal species. Delhi has
emerged as a major hub for the illegal trade in such
species and their products. Provisions of the Wildlife
(Protection) Act 1972, the Import and Export Policy of
the Government of India and the Customs Act 1962 along
with the provisions of the Convention on International
Trade in Endangered Species of Wild Fauna and Flora
(CITES) are available to the enforcement agencies for
regulation of trade in wild fauna and flora.
Hunting of wild animals has been prohibited under
Sec. 9 of WPA 1972 as also is the collection or trade in
specified plants (whether alive or dead or part or
derivative) under Sec. 17A. The Import-Export Policy
announced periodically by the Ministry of Commerce
enlists wild species and products derived from such wild
species that are prohibited or permitted along with the
conditions of compliance with CITES. This policy is
brought out under the provisions of the Foreign Trade
(Development and Regulation) Act 1992 and is enforced
through the provisions of the Customs Act 1962. The
number of wildlife offence cases detected by the Office of
the Dy. Director, Wildlife, Northern Region in Delhi
under the Customs Act since 1995 is shown in Figure 8.2.
The number of cases detected in Delhi might show a
decline over the last five years but this in no way can be
construed as indicative of a decline in the overall trade for
wild fauna and flora. The Wildlife Wing of the Forest and
Wildlife Department has till date been able to register 93
seizures till date. While the arrest of 71 persons and a
conviction rate of almost 85 per cent is most encouraging,
52 cases are still pending in the courts.
Major bottlenecks exist in the effective enforcement of
the provisions of the law. Raids and seizures need to be
planned and coordinated among the Wildlife Wing of the
state government, the police, Directorate of Revenue
Intelligence the Central Bureau of Investigation and the
Customs. While the occasional seizure at entry and exit
ports may be purely opportunistic there is always scope
for well planned operations landing the major operators.
However, due to the legal procedures and the associated
delays only few cases culminate in a conviction. Lack of
sufficient manpower and resources is also another major
hurdle in providing an effective deterrent to would be
traders.
There is a lack of access to identification material and
relevant skills with the enforcement agencies like the
police and the customs. Training in Wildlife forensics
related to the trade and the legal aspects is urgently
required for the personnel of the Wildlife Wing along
with the requisite grounding on all aspects of recording
evidence and preparation of the charge sheets.
A host of NGOs have taken active part in intelligence
gathering and trapping poachers and traders. Such efforts
need to be strengthened and better coordination with the
enforcement agencies is highly desirable. NGOs like the
WWF, in particular TRAFFIC India and the Wildlife
Protection Society of India (WPSI) have played a key role
in highlighting the issue of illegal wildlife trade in the
capital and provided enforcement assistance from time to
time in form of enforceable intelligence on wildlife
criminals, as well as identification tools, kits, handbooks,
posters, TV spots etc.
Government of India has established an inter agency
consultative body for periodic review of wildlife crime
situation especially as it pertains to control of illegal trade
in wildlife in the country. This high level body is headed
by the Secretary of the Ministry of Environment and
0
10
20
30
40
50
60
70
80
90
1995 1996 1997 1998 1999 2000 2001 2002 2003 2004
FIGURE 8.2
Number of Wildlife Offence Cases Detected in Delhi
Source: Office of the Dy. Director, Wildlife, Northern Region, 2004
Chapter 8 • WILDLIFE MANAGEMENT AND BIODIVERSITY CONSERVATION 243
Forests, MOEF and includes representatives of all relevant
agencies and Ministries at the union level. It is desirable
that such mechanisms are replicated at the state level
also, where at present information gathering and
coordination exist mostly at an informal level based on
the perceived urgency of specific cases. A coordination
committee with representatives of Police, Customs and
Central Excise, Railways, Forests and NGOs and
nominees of the Hon’ble Chief Justice of Delhi High
Court has been constituted during 2006-07 for effective
implementation of the Wildlife (Protection) Act. The
revival of the Central Sector Scheme relating to Control of
Poaching and Illegal Trade that had been transferred
during the 8th Plan to the State sector will augment the
resources at the disposal of the enforcement agencies.
8.3.4 Managing Monkey and Captive ElephantPopulations in Delhi
A major issue of concern relates to the management of
macaque populations within Delhi. At present the Animal
Welfare department is responsible for managing this issue
and the Department of Forest and Wildlife maintains
captive monkeys at a holding facility at Rajokri PF.
8.3.4.1 Background
According to an estimate, there are more than 4500
rhesus macaques (Macaca mulatta) (hereinafter called
‘monkeys’) in Delhi who share urban habitat with human
populations in residential colonies, markets and office
premises. This interface invariably results into conflicts,
and sometime quite fatal too.
The primary reason prompting monkeys to use urban
environ as their inseparable habitat is related basically
with their commensal behaviour (capacity to share human
inhabited habitations) being put into practice by them to
compensate for shortage of food (or as substitute of) and
cover following large scale destruction of their natural
habitat (the sylvan environ). This rather forced entry of
monkeys into the urban environ, over a period of time,
has got further fortified due to the presence of freely
available provisioned food (both as solid waste material
across the urban environ and as offerings by devotees of
Hanuman God). Apart from being easily available (the
monkeys do not need to range for longer distances to
procure stomach full of food as they have to do while in
forest habitat), the provisioned food is also very rich in its
nutritional values. The ensured supply of rich provisioned
food, absence of natural predators and availability of extra
time with the adult males to practice promiscuity, saw
their population booming (compared to the population
growth within the groups of their counterparts in forest
habitat) and occupying all available nook and corners of
the urban habitat before long. True to their innate
behaviour, any resistance faced subsequently by monkeys
in easy procurement of provisioned food and cover was
countered by them with depredation activities—be it
destruction of properties or inflicting injuries on the
person. For them, the only aim left is to meet their basic
requirements for food and cover.
8.3.4.2 Management Strategies
The management strategies for mitigation of monkey
menace involve adopting an integrated approach of both
short- and long-term measures. One major step in the
entire mitigation strategy is to first categorise monkey
populations based on their behavioural traits. Broadly the
monkeys fall into three categories; obligatory urban
monkeys, facultative urban monkeys and semi-wild
monkeys. It is believed that major populations of monkeys
in Delhi belong to obligatory urban category.
The monkeys in each of these categories would have to
be treated with separate set of strategies. The most hostile
groups of monkeys that are causing severe depredation in
and around the human habitations can be captured and
translocated at alternate sites (forested habitat) as a short-
term relief measure. However, this would have to be
preceded with a thorough assessment of possible impacts
of the released monkeys on native flora and fauna at the
release site. This would also require proper facilities for
appropriate health care and other quarantine measures
before release of monkeys in the wild. The long-term
measures would include facilitating resurrection of their
lost natural habitat, complete check on the availability of
provisioned food to the monkeys in the urban environ
(this will slowly allow them to switch over to natural
food), population control/management with the aim of
reduction in the population growth (through application
of anti-fertility measures and physical capture of males
using non-lethal methods), and education and awareness
among the public to attempt at shunning all such
activities that would help minimising the chances of
confrontation with monkeys.
Behaviourally, the obligatory urban monkeys are
virtually at a point of no return (to the wilderness areas)
and would have to be removed physically from the urban
environ. Realising the fact that their health (it is
suspected that they might have contracted many zoonotic
diseases) and behaviour would not allow their release in
the wild habitat straightaway, it may be worthwhile to
have specially created monkey sanctuaries in suburban
areas for those groups of monkeys for health check-up,
various quarantine regulations and for habituating them
DELHI DEVELOPMENT REPORT244
to live in a forest habitat. These sanctuaries would also
have facilities for religious feeding by the devotees after
clamping a total ban on religious feeding in and around
temples premises. The free availability of provisioned food
in these sanctuaries would also help lure the obligatory
and facultative groups of monkeys reducing their
populations from the urban areas. The monkeys in these
sanctuaries, after proper health treatments, can also be
supplied to various laboratories across the country as
experimental animals after observing relevant rules and
regulations to this effect. Simultaneously, the population
growth of these monkey groups inside the sanctuary will
have to be checked with the application of appropriate
sterilisation techniques.
The facultative group of monkeys mostly occupy
peripheral areas of the urban environ (mostly the temple
sites and the road-sides). These monkeys mostly act as a
transitory stage between the obligatory and semi-wild
groups of monkeys. If appropriate measures are not taken,
the void created following translocation of above
mentioned obligatory urban monkey populations will be
filled in no time by the facultative group of monkeys. The
strategy to deal with these monkey groups primarily rests
with the effective management of solid waste across their
habitation range to ensure non-availability of provisioned
food and resurrection of their lost wild habitat to allow
them to switch over to natural diet: being facultative these
monkeys are still left with wild instincts and can be forced
to home-coming in absence of provisioned food. Also, the
strategy of physical capture and translocation as in the
case of obligatory monkeys can also be adopted for those
stubborn individuals (mainly the alpha males) who would
resist return to the wild with all their might from these
facultative groups of monkeys.
The semi-wild monkey groups are mostly confronted as
road-side beggars with the difference that they are choosers
too. Though occupying the forested habitat (whatever little
is available in Delhi on ridge areas and other greens) for
cover, they would prefer provisioned food either through
begging (road-side) or snatching (in temple locations) to
supplement the natural food available close to their
roosting places. These groups are the easiest to control
compared to above two categories. Main strategy would be
to strengthen the forest habitat and convert them into a
kind of conservation reserves with major food species of
their choice. This has to be done in conjunction with
putting a complete ban on the availability of provisioned
food on the road/temple/residential colonies sites by
invoking relevant Acts/Rules and Regulations of Traffic
Department, Municipality/City Development Authority,
Forests and Wildlife Department, etc.
A common strategy to deal with all the three different
categories of monkey groups relate with creation of
awareness about the health hazards associated with
feeding and messing up with monkeys and learning
among the local residents, motorists, devotees, staff and
officers working in different office premises on how to co-
exist with these forced non-human city dwellers till they
are helped to vacate unnatural urban environ in favour of
their natural forested habitat.
In pursuance of the orders of the Hon’ble Delhi High
Court, monkeys are being trapped by MCD and NDMC
from Delhi and are being released in the ABWLS. As the
forest area is deficient in fruit bearing trees, arrangements
have been made for feeding as also tall saplings of fruit
bearing trees are being planted. About 800 monkeys have
been relocated to ABWLS. Public awareness about the ban
on feeding by members of the public is also being
attempted through advertisements.
8.3.4.3 Captive Elephants
There has been increasing concern with respect to the
captive elephants in Delhi. The captive elephants are
viewed as a traffic hazard, and movement of these animals
on the arterial roads is cause for concern to all. There are
a total of 37 captive elephants in Delhi on last count. The
elephants were primarily kept on the banks of the
Yamuna adjacent to the ITO bridge area but since their
eviction from here have scattered across the city. These
elephants are engaged in weddings and other special
occasions such as the Republic Day Parade.
Due to unavailability of the specific costs of
maintenance and the earnings from such employment by
the owners it is extremely difficult to comment on the
status of welfare of these captive elephants. Only 20
elephants have been implanted with an identifying
microchip and 19 ownership certificates have been issued.
The rest of the cases are under review with the Wildlife
Wing. In view of the scant information available it is only
recommended that the Chief Wildlife Wardens of the
adjacent states do not issue any transit permits without
verifying the ownership certificates. On the issue of a
requisite welfare and housing policy for the elephants, the
Kerala Captive Elephant (Management and Maintenance)
Rules 2003 could be referred to for necessary guidelines.
8.4 Appraisal of Policy and Programmes
The Wildlife (Protection) Act of 1972 and the Delhi
Wildlife Protection Rules 1973 are the overarching
statutes under which the wildlife management activities
are primarily defined. Additionally, provisions within the
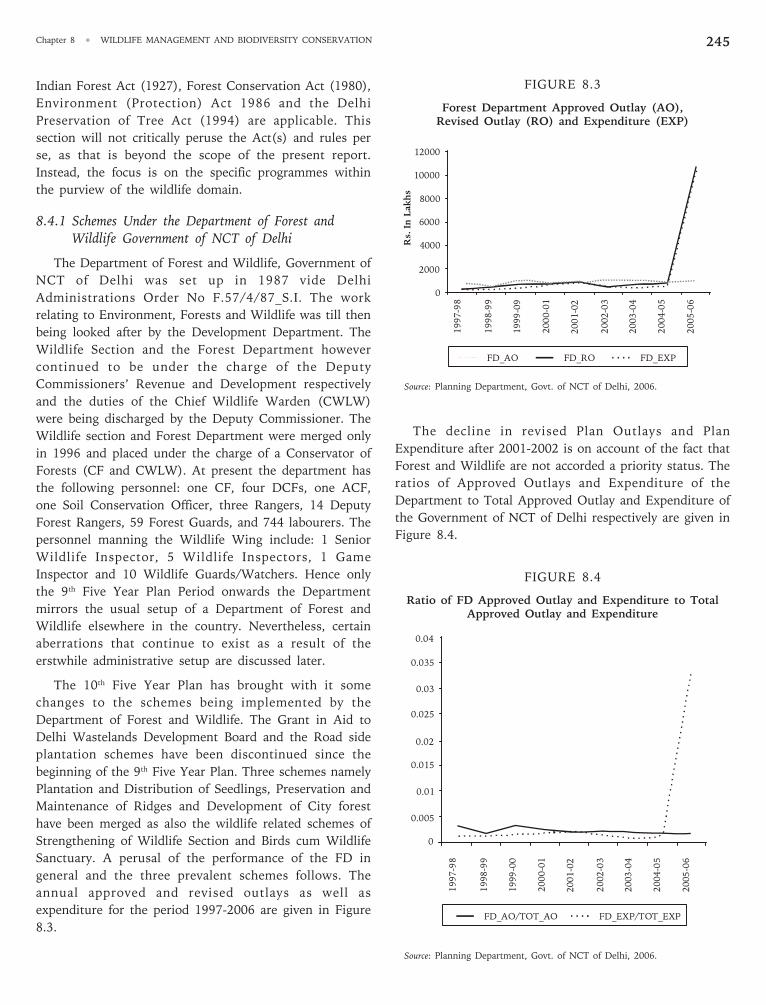
Chapter 8 • WILDLIFE MANAGEMENT AND BIODIVERSITY CONSERVATION 245
Indian Forest Act (1927), Forest Conservation Act (1980),
Environment (Protection) Act 1986 and the Delhi
Preservation of Tree Act (1994) are applicable. This
section will not critically peruse the Act(s) and rules per
se, as that is beyond the scope of the present report.
Instead, the focus is on the specific programmes within
the purview of the wildlife domain.
8.4.1 Schemes Under the Department of Forest andWildlife Government of NCT of Delhi
The Department of Forest and Wildlife, Government of
NCT of Delhi was set up in 1987 vide Delhi
Administrations Order No F.57/4/87_S.I. The work
relating to Environment, Forests and Wildlife was till then
being looked after by the Development Department. The
Wildlife Section and the Forest Department however
continued to be under the charge of the Deputy
Commissioners’ Revenue and Development respectively
and the duties of the Chief Wildlife Warden (CWLW)
were being discharged by the Deputy Commissioner. The
Wildlife section and Forest Department were merged only
in 1996 and placed under the charge of a Conservator of
Forests (CF and CWLW). At present the department has
the following personnel: one CF, four DCFs, one ACF,
one Soil Conservation Officer, three Rangers, 14 Deputy
Forest Rangers, 59 Forest Guards, and 744 labourers. The
personnel manning the Wildlife Wing include: 1 Senior
Wildlife Inspector, 5 Wildlife Inspectors, 1 Game
Inspector and 10 Wildlife Guards/Watchers. Hence only
the 9th Five Year Plan Period onwards the Department
mirrors the usual setup of a Department of Forest and
Wildlife elsewhere in the country. Nevertheless, certain
aberrations that continue to exist as a result of the
erstwhile administrative setup are discussed later.
The 10th Five Year Plan has brought with it some
changes to the schemes being implemented by the
Department of Forest and Wildlife. The Grant in Aid to
Delhi Wastelands Development Board and the Road side
plantation schemes have been discontinued since the
beginning of the 9th Five Year Plan. Three schemes namely
Plantation and Distribution of Seedlings, Preservation and
Maintenance of Ridges and Development of City forest
have been merged as also the wildlife related schemes of
Strengthening of Wildlife Section and Birds cum Wildlife
Sanctuary. A perusal of the performance of the FD in
general and the three prevalent schemes follows. The
annual approved and revised outlays as well as
expenditure for the period 1997-2006 are given in Figure
8.3.
FIGURE 8.3
Forest Department Approved Outlay (AO),Revised Outlay (RO) and Expenditure (EXP)
Source: Planning Department, Govt. of NCT of Delhi, 2006.
The decline in revised Plan Outlays and Plan
Expenditure after 2001-2002 is on account of the fact that
Forest and Wildlife are not accorded a priority status. The
ratios of Approved Outlays and Expenditure of the
Department to Total Approved Outlay and Expenditure of
the Government of NCT of Delhi respectively are given in
Figure 8.4.
FIGURE 8.4
Ratio of FD Approved Outlay and Expenditure to TotalApproved Outlay and Expenditure
Source: Planning Department, Govt. of NCT of Delhi, 2006.
12000
10000
8000
6000
4000
2000
0
1997-98
1998-99
1999-09
2000-01
2001-02
2002-03
2003-04
2004-05
2005-06
Rs.
In
Lak
hs
FD_AO FD_RO FD_EXP
0.04
0.035
0.03
0.025
0.02
0.015
0.01
0.005
0
1997-98
1998-99
1999-00
2000-01
2001-02
2002-03
2003-04
2004-05
2005-06
FD_AO/TOT_AO FD_EXP/TOT_EXP
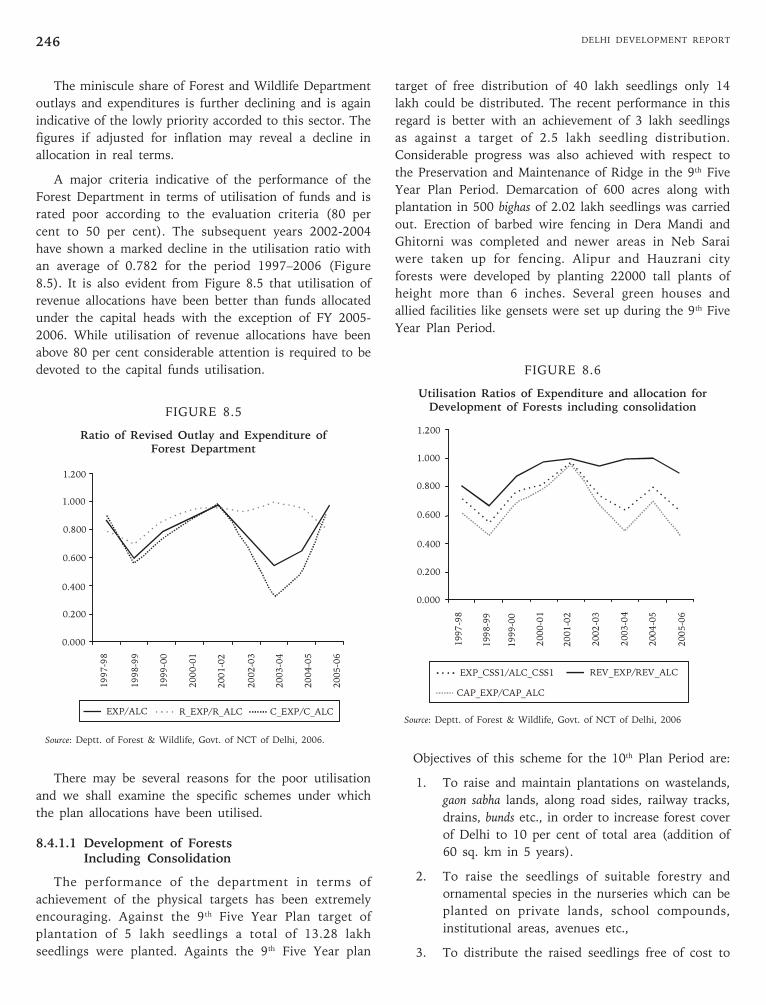
DELHI DEVELOPMENT REPORT246
The miniscule share of Forest and Wildlife Department
outlays and expenditures is further declining and is again
indicative of the lowly priority accorded to this sector. The
figures if adjusted for inflation may reveal a decline in
allocation in real terms.
A major criteria indicative of the performance of the
Forest Department in terms of utilisation of funds and is
rated poor according to the evaluation criteria (80 per
cent to 50 per cent). The subsequent years 2002-2004
have shown a marked decline in the utilisation ratio with
an average of 0.782 for the period 1997–2006 (Figure
8.5). It is also evident from Figure 8.5 that utilisation of
revenue allocations have been better than funds allocated
under the capital heads with the exception of FY 2005-
2006. While utilisation of revenue allocations have been
above 80 per cent considerable attention is required to be
devoted to the capital funds utilisation.
FIGURE 8.5
Ratio of Revised Outlay and Expenditure ofForest Department
Source: Deptt. of Forest & Wildlife, Govt. of NCT of Delhi, 2006.
There may be several reasons for the poor utilisation
and we shall examine the specific schemes under which
the plan allocations have been utilised.
8.4.1.1 Development of ForestsIncluding Consolidation
The performance of the department in terms of
achievement of the physical targets has been extremely
encouraging. Against the 9th Five Year Plan target of
plantation of 5 lakh seedlings a total of 13.28 lakh
seedlings were planted. Againts the 9th Five Year plan
target of free distribution of 40 lakh seedlings only 14
lakh could be distributed. The recent performance in this
regard is better with an achievement of 3 lakh seedlings
as against a target of 2.5 lakh seedling distribution.
Considerable progress was also achieved with respect to
the Preservation and Maintenance of Ridge in the 9th Five
Year Plan Period. Demarcation of 600 acres along with
plantation in 500 bighas of 2.02 lakh seedlings was carried
out. Erection of barbed wire fencing in Dera Mandi and
Ghitorni was completed and newer areas in Neb Sarai
were taken up for fencing. Alipur and Hauzrani city
forests were developed by planting 22000 tall plants of
height more than 6 inches. Several green houses and
allied facilities like gensets were set up during the 9th Five
Year Plan Period.
FIGURE 8.6
Utilisation Ratios of Expenditure and allocation forDevelopment of Forests including consolidation
Source: Deptt. of Forest & Wildlife, Govt. of NCT of Delhi, 2006
Objectives of this scheme for the 10th Plan Period are:
1. To raise and maintain plantations on wastelands,
gaon sabha lands, along road sides, railway tracks,
drains, bunds etc., in order to increase forest cover
of Delhi to 10 per cent of total area (addition of
60 sq. km in 5 years).
2. To raise the seedlings of suitable forestry and
ornamental species in the nurseries which can be
planted on private lands, school compounds,
institutional areas, avenues etc.,
3. To distribute the raised seedlings free of cost to
1997-98
1998-99
1999-00
2000-01
2001-02
2002-03
2003-04
2004-05
2005-06
EXP/ALC R_EXP/R_ALC C_EXP/C_ALC
0.000
0.200
0.400
0.600
0.800
1.000
1.200
1997-98
1998-99
1999-00
2000-01
2001-02
2002-03
2003-04
2004-05
2005-06
EXP_CSS1/ALC_CSS1 REV_EXP/REV_ALC
CAP_EXP/CAP_ALC
1.000
1.200
0.800
0.600
0.400
0.200
0.000
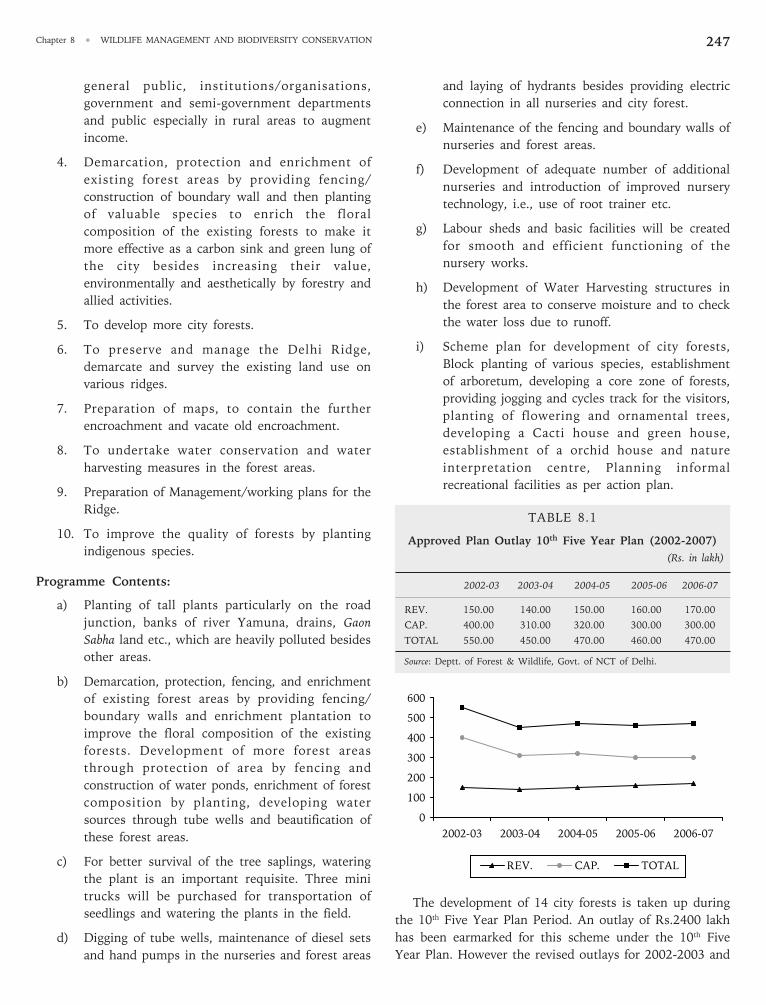
Chapter 8 • WILDLIFE MANAGEMENT AND BIODIVERSITY CONSERVATION 247
general public, institutions/organisations,
government and semi-government departments
and public especially in rural areas to augment
income.
4. Demarcation, protection and enrichment of
existing forest areas by providing fencing/
construction of boundary wall and then planting
of valuable species to enrich the floral
composition of the existing forests to make it
more effective as a carbon sink and green lung of
the city besides increasing their value,
environmentally and aesthetically by forestry and
allied activities.
5. To develop more city forests.
6. To preserve and manage the Delhi Ridge,
demarcate and survey the existing land use on
various ridges.
7. Preparation of maps, to contain the further
encroachment and vacate old encroachment.
8. To undertake water conservation and water
harvesting measures in the forest areas.
9. Preparation of Management/working plans for the
Ridge.
10. To improve the quality of forests by planting
indigenous species.
Programme Contents:
a) Planting of tall plants particularly on the road
junction, banks of river Yamuna, drains, Gaon
Sabha land etc., which are heavily polluted besides
other areas.
b) Demarcation, protection, fencing, and enrichment
of existing forest areas by providing fencing/
boundary walls and enrichment plantation to
improve the floral composition of the existing
forests. Development of more forest areas
through protection of area by fencing and
construction of water ponds, enrichment of forest
composition by planting, developing water
sources through tube wells and beautification of
these forest areas.
c) For better survival of the tree saplings, watering
the plant is an important requisite. Three mini
trucks will be purchased for transportation of
seedlings and watering the plants in the field.
d) Digging of tube wells, maintenance of diesel sets
and hand pumps in the nurseries and forest areas
and laying of hydrants besides providing electric
connection in all nurseries and city forest.
e) Maintenance of the fencing and boundary walls of
nurseries and forest areas.
f) Development of adequate number of additional
nurseries and introduction of improved nursery
technology, i.e., use of root trainer etc.
g) Labour sheds and basic facilities will be created
for smooth and efficient functioning of the
nursery works.
h) Development of Water Harvesting structures in
the forest area to conserve moisture and to check
the water loss due to runoff.
i) Scheme plan for development of city forests,
Block planting of various species, establishment
of arboretum, developing a core zone of forests,
providing jogging and cycles track for the visitors,
planting of flowering and ornamental trees,
developing a Cacti house and green house,
establishment of a orchid house and nature
interpretation centre, Planning informal
recreational facilities as per action plan.
TABLE 8.1
Approved Plan Outlay 10th Five Year Plan (2002-2007)
(Rs. in lakh)
2002-03 2003-04 2004-05 2005-06 2006-07
REV. 150.00 140.00 150.00 160.00 170.00
CAP. 400.00 310.00 320.00 300.00 300.00
TOTAL 550.00 450.00 470.00 460.00 470.00
Source: Deptt. of Forest & Wildlife, Govt. of NCT of Delhi.
The development of 14 city forests is taken up during
the 10th Five Year Plan Period. An outlay of Rs.2400 lakh
has been earmarked for this scheme under the 10th Five
Year Plan. However the revised outlays for 2002-2003 and
0
100
200
300
400
500
600
2002-03 2003-04 2004-05 2005-06 2006-07
REV. CAP. TOTAL
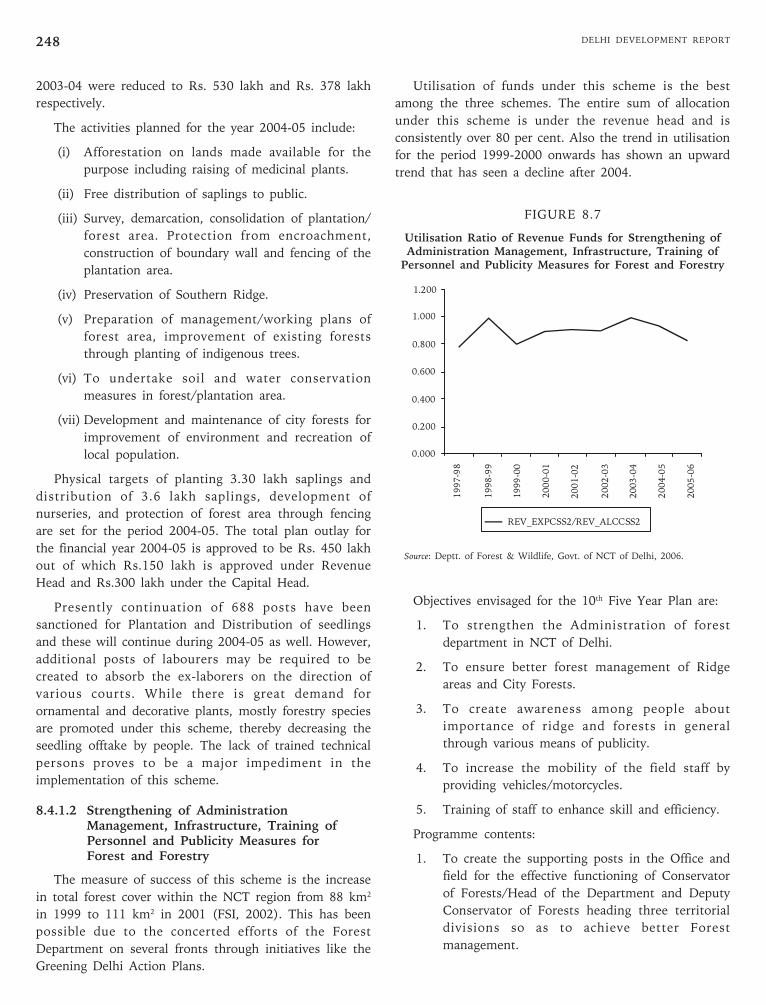
DELHI DEVELOPMENT REPORT248
2003-04 were reduced to Rs. 530 lakh and Rs. 378 lakh
respectively.
The activities planned for the year 2004-05 include:
(i) Afforestation on lands made available for the
purpose including raising of medicinal plants.
(ii) Free distribution of saplings to public.
(iii) Survey, demarcation, consolidation of plantation/
forest area. Protection from encroachment,
construction of boundary wall and fencing of the
plantation area.
(iv) Preservation of Southern Ridge.
(v) Preparation of management/working plans of
forest area, improvement of existing forests
through planting of indigenous trees.
(vi) To undertake soil and water conservation
measures in forest/plantation area.
(vii) Development and maintenance of city forests for
improvement of environment and recreation of
local population.
Physical targets of planting 3.30 lakh saplings and
distribution of 3.6 lakh saplings, development of
nurseries, and protection of forest area through fencing
are set for the period 2004-05. The total plan outlay for
the financial year 2004-05 is approved to be Rs. 450 lakh
out of which Rs.150 lakh is approved under Revenue
Head and Rs.300 lakh under the Capital Head.
Presently continuation of 688 posts have been
sanctioned for Plantation and Distribution of seedlings
and these will continue during 2004-05 as well. However,
additional posts of labourers may be required to be
created to absorb the ex-laborers on the direction of
various courts. While there is great demand for
ornamental and decorative plants, mostly forestry species
are promoted under this scheme, thereby decreasing the
seedling offtake by people. The lack of trained technical
persons proves to be a major impediment in the
implementation of this scheme.
8.4.1.2 Strengthening of AdministrationManagement, Infrastructure, Training ofPersonnel and Publicity Measures forForest and Forestry
The measure of success of this scheme is the increase
in total forest cover within the NCT region from 88 km2
in 1999 to 111 km2 in 2001 (FSI, 2002). This has been
possible due to the concerted efforts of the Forest
Department on several fronts through initiatives like the
Greening Delhi Action Plans.
Utilisation of funds under this scheme is the best
among the three schemes. The entire sum of allocation
under this scheme is under the revenue head and is
consistently over 80 per cent. Also the trend in utilisation
for the period 1999-2000 onwards has shown an upward
trend that has seen a decline after 2004.
FIGURE 8.7
Utilisation Ratio of Revenue Funds for Strengthening ofAdministration Management, Infrastructure, Training of
Personnel and Publicity Measures for Forest and Forestry
Source: Deptt. of Forest & Wildlife, Govt. of NCT of Delhi, 2006.
Objectives envisaged for the 10th Five Year Plan are:
1. To strengthen the Administration of forest
department in NCT of Delhi.
2. To ensure better forest management of Ridge
areas and City Forests.
3. To create awareness among people about
importance of ridge and forests in general
through various means of publicity.
4. To increase the mobility of the field staff by
providing vehicles/motorcycles.
5. Training of staff to enhance skill and efficiency.
Programme contents:
1. To create the supporting posts in the Office and
field for the effective functioning of Conservator
of Forests/Head of the Department and Deputy
Conservator of Forests heading three territorial
divisions so as to achieve better Forest
management.
1.200
1.000
0.800
0.600
0.400
0.200
0.0001997-98
1998-99
1999-00
2000-01
2001-02
2002-03
2003-04
2004-05
2005-06
REV_EXPCSS2/REV_ALCCSS2
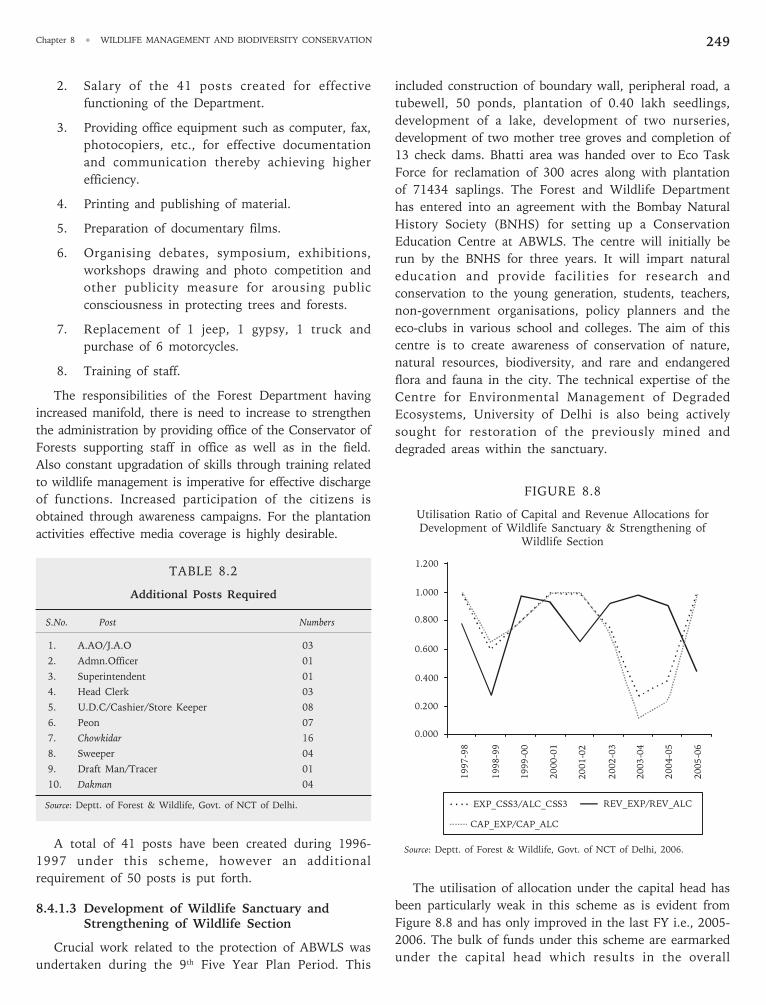
Chapter 8 • WILDLIFE MANAGEMENT AND BIODIVERSITY CONSERVATION 249
2. Salary of the 41 posts created for effective
functioning of the Department.
3. Providing office equipment such as computer, fax,
photocopiers, etc., for effective documentation
and communication thereby achieving higher
efficiency.
4. Printing and publishing of material.
5. Preparation of documentary films.
6. Organising debates, symposium, exhibitions,
workshops drawing and photo competition and
other publicity measure for arousing public
consciousness in protecting trees and forests.
7. Replacement of 1 jeep, 1 gypsy, 1 truck and
purchase of 6 motorcycles.
8. Training of staff.
The responsibilities of the Forest Department having
increased manifold, there is need to increase to strengthen
the administration by providing office of the Conservator of
Forests supporting staff in office as well as in the field.
Also constant upgradation of skills through training related
to wildlife management is imperative for effective discharge
of functions. Increased participation of the citizens is
obtained through awareness campaigns. For the plantation
activities effective media coverage is highly desirable.
TABLE 8.2
Additional Posts Required
S.No. Post Numbers
1. A.AO/J.A.O 03
2. Admn.Officer 01
3. Superintendent 01
4. Head Clerk 03
5. U.D.C/Cashier/Store Keeper 08
6. Peon 07
7. Chowkidar 16
8. Sweeper 04
9. Draft Man/Tracer 01
10. Dakman 04
Source: Deptt. of Forest & Wildlife, Govt. of NCT of Delhi.
A total of 41 posts have been created during 1996-
1997 under this scheme, however an additional
requirement of 50 posts is put forth.
8.4.1.3 Development of Wildlife Sanctuary andStrengthening of Wildlife Section
Crucial work related to the protection of ABWLS was
undertaken during the 9th Five Year Plan Period. This
included construction of boundary wall, peripheral road, a
tubewell, 50 ponds, plantation of 0.40 lakh seedlings,
development of a lake, development of two nurseries,
development of two mother tree groves and completion of
13 check dams. Bhatti area was handed over to Eco Task
Force for reclamation of 300 acres along with plantation
of 71434 saplings. The Forest and Wildlife Department
has entered into an agreement with the Bombay Natural
History Society (BNHS) for setting up a Conservation
Education Centre at ABWLS. The centre will initially be
run by the BNHS for three years. It will impart natural
education and provide facilities for research and
conservation to the young generation, students, teachers,
non-government organisations, policy planners and the
eco-clubs in various school and colleges. The aim of this
centre is to create awareness of conservation of nature,
natural resources, biodiversity, and rare and endangered
flora and fauna in the city. The technical expertise of the
Centre for Environmental Management of Degraded
Ecosystems, University of Delhi is also being actively
sought for restoration of the previously mined and
degraded areas within the sanctuary.
FIGURE 8.8
Utilisation Ratio of Capital and Revenue Allocations forDevelopment of Wildlife Sanctuary & Strengthening of
Wildlife Section
Source: Deptt. of Forest & Wildlife, Govt. of NCT of Delhi, 2006.
The utilisation of allocation under the capital head has
been particularly weak in this scheme as is evident from
Figure 8.8 and has only improved in the last FY i.e., 2005-
2006. The bulk of funds under this scheme are earmarked
under the capital head which results in the overall
1.200
1.000
0.800
0.600
0.400
0.200
0.000
EXP_CSS3/ALC_CSS3 REV_EXP/REV_ALC
CAP_EXP/CAP_ALC
1997-98
1998-99
1999-00
2000-01
2001-02
2002-03
2003-04
2004-05
2005-06
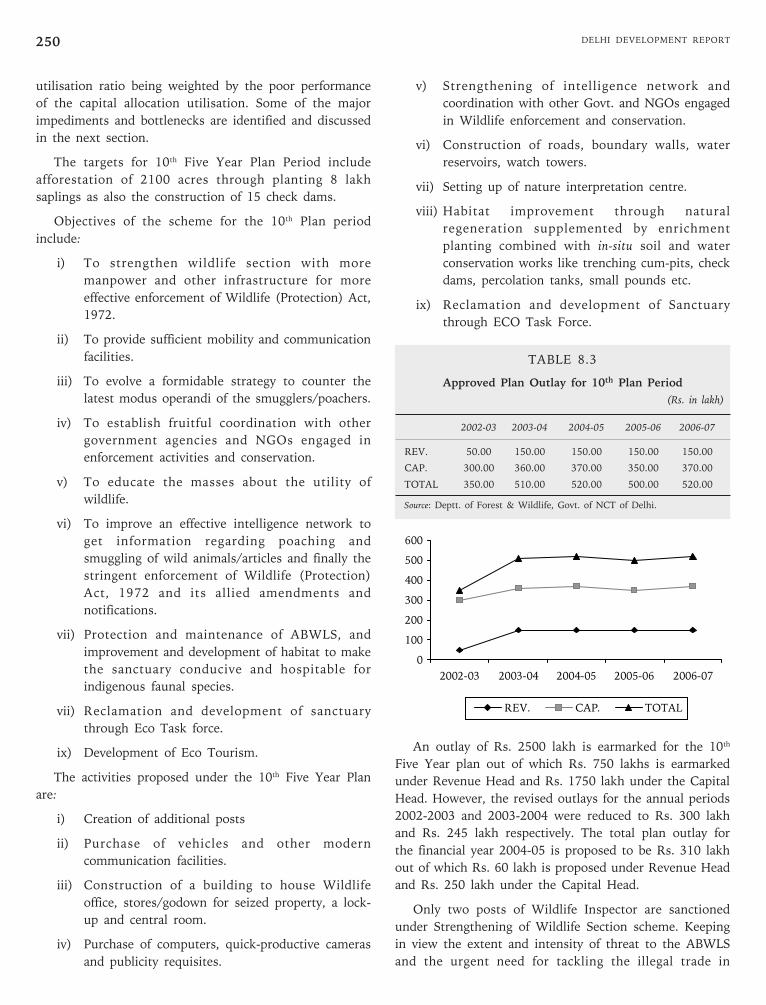
DELHI DEVELOPMENT REPORT250
utilisation ratio being weighted by the poor performance
of the capital allocation utilisation. Some of the major
impediments and bottlenecks are identified and discussed
in the next section.
The targets for 10th Five Year Plan Period include
afforestation of 2100 acres through planting 8 lakh
saplings as also the construction of 15 check dams.
Objectives of the scheme for the 10th Plan period
include:
i) To strengthen wildlife section with more
manpower and other infrastructure for more
effective enforcement of Wildlife (Protection) Act,
1972.
ii) To provide sufficient mobility and communication
facilities.
iii) To evolve a formidable strategy to counter the
latest modus operandi of the smugglers/poachers.
iv) To establish fruitful coordination with other
government agencies and NGOs engaged in
enforcement activities and conservation.
v) To educate the masses about the utility of
wildlife.
vi) To improve an effective intelligence network to
get information regarding poaching and
smuggling of wild animals/articles and finally the
stringent enforcement of Wildlife (Protection)
Act, 1972 and its allied amendments and
notifications.
vii) Protection and maintenance of ABWLS, and
improvement and development of habitat to make
the sanctuary conducive and hospitable for
indigenous faunal species.
vii) Reclamation and development of sanctuary
through Eco Task force.
ix) Development of Eco Tourism.
The activities proposed under the 10th Five Year Plan
are:
i) Creation of additional posts
ii) Purchase of vehicles and other modern
communication facilities.
iii) Construction of a building to house Wildlife
office, stores/godown for seized property, a lock-
up and central room.
iv) Purchase of computers, quick-productive cameras
and publicity requisites.
v) Strengthening of intelligence network and
coordination with other Govt. and NGOs engaged
in Wildlife enforcement and conservation.
vi) Construction of roads, boundary walls, water
reservoirs, watch towers.
vii) Setting up of nature interpretation centre.
viii) Habitat improvement through natural
regeneration supplemented by enrichment
planting combined with in-situ soil and water
conservation works like trenching cum-pits, check
dams, percolation tanks, small pounds etc.
ix) Reclamation and development of Sanctuary
through ECO Task Force.
TABLE 8.3
Approved Plan Outlay for 10th Plan Period
(Rs. in lakh)
2002-03 2003-04 2004-05 2005-06 2006-07
REV. 50.00 150.00 150.00 150.00 150.00
CAP. 300.00 360.00 370.00 350.00 370.00
TOTAL 350.00 510.00 520.00 500.00 520.00
Source: Deptt. of Forest & Wildlife, Govt. of NCT of Delhi.
An outlay of Rs. 2500 lakh is earmarked for the 10th
Five Year plan out of which Rs. 750 lakhs is earmarked
under Revenue Head and Rs. 1750 lakh under the Capital
Head. However, the revised outlays for the annual periods
2002-2003 and 2003-2004 were reduced to Rs. 300 lakh
and Rs. 245 lakh respectively. The total plan outlay for
the financial year 2004-05 is proposed to be Rs. 310 lakh
out of which Rs. 60 lakh is proposed under Revenue Head
and Rs. 250 lakh under the Capital Head.
Only two posts of Wildlife Inspector are sanctioned
under Strengthening of Wildlife Section scheme. Keeping
in view the extent and intensity of threat to the ABWLS
and the urgent need for tackling the illegal trade in
0
100
200
300
400
500
600
2002-03 2003-04 2004-05 2005-06 2006-07
REV. CAP. TOTAL
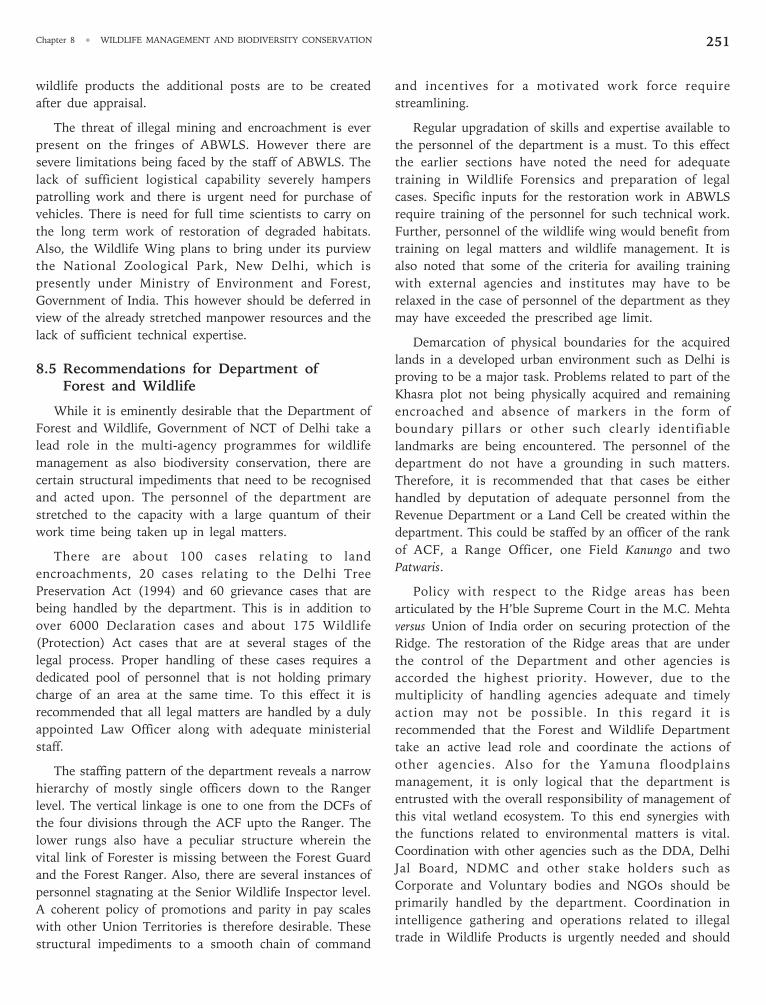
Chapter 8 • WILDLIFE MANAGEMENT AND BIODIVERSITY CONSERVATION 251
wildlife products the additional posts are to be created
after due appraisal.
The threat of illegal mining and encroachment is ever
present on the fringes of ABWLS. However there are
severe limitations being faced by the staff of ABWLS. The
lack of sufficient logistical capability severely hampers
patrolling work and there is urgent need for purchase of
vehicles. There is need for full time scientists to carry on
the long term work of restoration of degraded habitats.
Also, the Wildlife Wing plans to bring under its purview
the National Zoological Park, New Delhi, which is
presently under Ministry of Environment and Forest,
Government of India. This however should be deferred in
view of the already stretched manpower resources and the
lack of sufficient technical expertise.
8.5 Recommendations for Department ofForest and Wildlife
While it is eminently desirable that the Department of
Forest and Wildlife, Government of NCT of Delhi take a
lead role in the multi-agency programmes for wildlife
management as also biodiversity conservation, there are
certain structural impediments that need to be recognised
and acted upon. The personnel of the department are
stretched to the capacity with a large quantum of their
work time being taken up in legal matters.
There are about 100 cases relating to land
encroachments, 20 cases relating to the Delhi Tree
Preservation Act (1994) and 60 grievance cases that are
being handled by the department. This is in addition to
over 6000 Declaration cases and about 175 Wildlife
(Protection) Act cases that are at several stages of the
legal process. Proper handling of these cases requires a
dedicated pool of personnel that is not holding primary
charge of an area at the same time. To this effect it is
recommended that all legal matters are handled by a duly
appointed Law Officer along with adequate ministerial
staff.
The staffing pattern of the department reveals a narrow
hierarchy of mostly single officers down to the Ranger
level. The vertical linkage is one to one from the DCFs of
the four divisions through the ACF upto the Ranger. The
lower rungs also have a peculiar structure wherein the
vital link of Forester is missing between the Forest Guard
and the Forest Ranger. Also, there are several instances of
personnel stagnating at the Senior Wildlife Inspector level.
A coherent policy of promotions and parity in pay scales
with other Union Territories is therefore desirable. These
structural impediments to a smooth chain of command
and incentives for a motivated work force require
streamlining.
Regular upgradation of skills and expertise available to
the personnel of the department is a must. To this effect
the earlier sections have noted the need for adequate
training in Wildlife Forensics and preparation of legal
cases. Specific inputs for the restoration work in ABWLS
require training of the personnel for such technical work.
Further, personnel of the wildlife wing would benefit from
training on legal matters and wildlife management. It is
also noted that some of the criteria for availing training
with external agencies and institutes may have to be
relaxed in the case of personnel of the department as they
may have exceeded the prescribed age limit.
Demarcation of physical boundaries for the acquired
lands in a developed urban environment such as Delhi is
proving to be a major task. Problems related to part of the
Khasra plot not being physically acquired and remaining
encroached and absence of markers in the form of
boundary pillars or other such clearly identifiable
landmarks are being encountered. The personnel of the
department do not have a grounding in such matters.
Therefore, it is recommended that that cases be either
handled by deputation of adequate personnel from the
Revenue Department or a Land Cell be created within the
department. This could be staffed by an officer of the rank
of ACF, a Range Officer, one Field Kanungo and two
Patwaris.
Policy with respect to the Ridge areas has been
articulated by the H’ble Supreme Court in the M.C. Mehta
versus Union of India order on securing protection of the
Ridge. The restoration of the Ridge areas that are under
the control of the Department and other agencies is
accorded the highest priority. However, due to the
multiplicity of handling agencies adequate and timely
action may not be possible. In this regard it is
recommended that the Forest and Wildlife Department
take an active lead role and coordinate the actions of
other agencies. Also for the Yamuna floodplains
management, it is only logical that the department is
entrusted with the overall responsibility of management of
this vital wetland ecosystem. To this end synergies with
the functions related to environmental matters is vital.
Coordination with other agencies such as the DDA, Delhi
Jal Board, NDMC and other stake holders such as
Corporate and Voluntary bodies and NGOs should be
primarily handled by the department. Coordination in
intelligence gathering and operations related to illegal
trade in Wildlife Products is urgently needed and should
DELHI DEVELOPMENT REPORT252
be moved from the informal case to case basis to a regular
exercise.
Last but not the least there is enormous scope for
improvement in the funds utilisation especially the capital
funds allocated to the Department. The tremendous
pressures in terms of work load in the face of a lack of a
coherent activity plan have led to the poor utilisation of
funds. A target of minimum 85 per cent to 90 per cent
utilisation is highly desirable for the remainder of the 10th
Five Year Plan Period.
References
Anon (2002). Evaluation Study Report on Eco-clubs in Schools, Evaluation Unit,Planning Department, Government of NCT of Delhi. Delhi.
————. (2004). Greening Delhi Action Plan, Department of Forests and Wildlife,Government of NCT of Delhi. New Delhi.
————. (2005). Status Report, Yamuna and Aravalli Biodiversity Parks, Centre forManagement of Degraded Ecosystems. Delhi: Delhi University.
Babu, C.R., Pushpam Kumar, Lallan Prasad and Rashmi Agrawal (2001).“Valuation of Ecological Functions and Benefits: A Case Study ofWetland Ecosystems along the Yamuna River Corridors of DelhiRegion”, EERC Working Paper Series:WB-6, Indira Gandhi Institute ofDevelopment Research, Mumbai.
Champion, H.G. and S.K. Seth (1968). Revised Forest Types of India, Governmentof India Publication, New Delhi< http://www.delhibird.org/checklists/Delhi/checklists_delhi.htm>
Forest Survey of India (2002). State of Forest Report, 2001, Forest Survey ofIndia, Ministry of Environment and Forests, Dehradun.
Islam, M.Z. and A.R. Rahamani (2004). Important Bird Areas in India: Prioritysites for Conservation. Indian Bird Conservation Network: Bombay NaturalHistory Society and Birdlife International (U.K.) pp.357-359.
Kumar, Arun (1997). “Fauna of Delhi: An Overview”, in Fauna of Delhi, StateFauna Series 6, Calcutta: Zoological Survey of India, pp.1-15.
Kumar, A. and V. Khanna (1997). “Biogeography of Delhi”, in Fauna of Delhi,
State Fauna Series 6. Calcutta: Zoological Survey of India, pp. 17-44.
Kumar Pushpam (2001). Cost of Wetland Conversion: A case study ofFloodplain Wetland Ecosystems along the Yamuna River Corridors ofDelhi Region, Presented at the Open Meeting of the GlobalEnvironmental Change Research Community, October 6-8, 2001, Rio deJaneiro.
Madan, Mohan (2002). GIS-Based Spatial Information Integration, Modelingand Digital Mapping: A New Blend of Tool for Geospatial EnvironmentalHealth Analysis for Delhi Ridge, FIG XXII International Congress, April19-26 2002, Washington D.C. USA.
Sawarkar, V.B. and S.A. Hussain (1997). “Problems and Prospects inconserving Asola-Bhatti Wildlife Sanctuary: Some ManagementStrategies”, in Fauna of Delhi, State Fauna Series 6. Calcutta: ZoologicalSurvey of India, pp.1-15.
Thapliyal, U.P. (1987). Gazetteer of Rural Delhi, Gazetteer Unit, DelhiAdministration. Delhi.
Urfi, A.J. (2003). “The Birds of Okhla Barrage Bird Sanctuary”. Delhi, India.Forktail 19:39-50.
Wildlife Institute of India (2002). Report on the Ecological social andhydrological factors affecting the management of wetland systems inUttar Pradesh with special reference to Vijay Sagar and Associated waterbodies in Ghaziabad district, Bakhira Bird Sanctuary and Nawabganj BirdSanctuary, Dehradun.
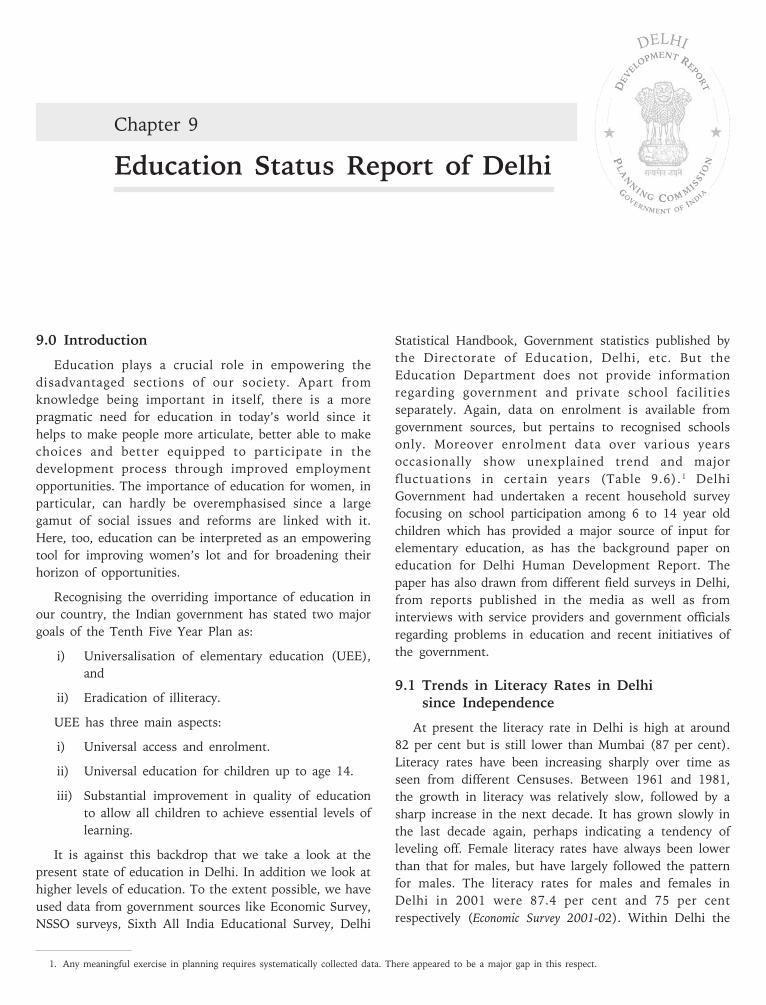
Chapter 9
Education Status Report of Delhi
DELHI
9.0 Introduction
Education plays a crucial role in empowering the
disadvantaged sections of our society. Apart from
knowledge being important in itself, there is a more
pragmatic need for education in today’s world since it
helps to make people more articulate, better able to make
choices and better equipped to participate in the
development process through improved employment
opportunities. The importance of education for women, in
particular, can hardly be overemphasised since a large
gamut of social issues and reforms are linked with it.
Here, too, education can be interpreted as an empowering
tool for improving women’s lot and for broadening their
horizon of opportunities.
Recognising the overriding importance of education in
our country, the Indian government has stated two major
goals of the Tenth Five Year Plan as:
i) Universalisation of elementary education (UEE),
and
ii) Eradication of illiteracy.
UEE has three main aspects:
i) Universal access and enrolment.
ii) Universal education for children up to age 14.
iii) Substantial improvement in quality of education
to allow all children to achieve essential levels of
learning.
It is against this backdrop that we take a look at the
present state of education in Delhi. In addition we look at
higher levels of education. To the extent possible, we have
used data from government sources like Economic Survey,
NSSO surveys, Sixth All India Educational Survey, Delhi
Statistical Handbook, Government statistics published by
the Directorate of Education, Delhi, etc. But the
Education Department does not provide information
regarding government and private school facilities
separately. Again, data on enrolment is available from
government sources, but pertains to recognised schools
only. Moreover enrolment data over various years
occasionally show unexplained trend and major
fluctuations in certain years (Table 9.6).1 Delhi
Government had undertaken a recent household survey
focusing on school participation among 6 to 14 year old
children which has provided a major source of input for
elementary education, as has the background paper on
education for Delhi Human Development Report. The
paper has also drawn from different field surveys in Delhi,
from reports published in the media as well as from
interviews with service providers and government officials
regarding problems in education and recent initiatives of
the government.
9.1 Trends in Literacy Rates in Delhisince Independence
At present the literacy rate in Delhi is high at around
82 per cent but is still lower than Mumbai (87 per cent).
Literacy rates have been increasing sharply over time as
seen from different Censuses. Between 1961 and 1981,
the growth in literacy was relatively slow, followed by a
sharp increase in the next decade. It has grown slowly in
the last decade again, perhaps indicating a tendency of
leveling off. Female literacy rates have always been lower
than that for males, but have largely followed the pattern
for males. The literacy rates for males and females in
Delhi in 2001 were 87.4 per cent and 75 per cent
respectively (Economic Survey 2001-02). Within Delhi the
1. Any meaningful exercise in planning requires systematically collected data. There appeared to be a major gap in this respect.
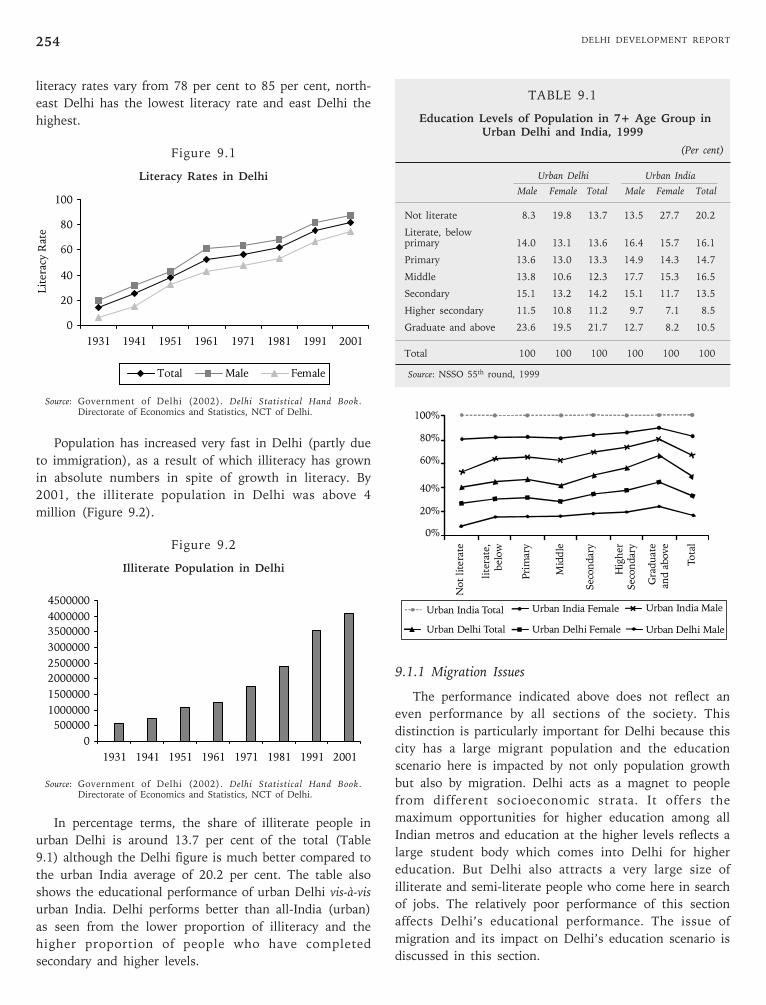
DELHI DEVELOPMENT REPORT254
literacy rates vary from 78 per cent to 85 per cent, north-
east Delhi has the lowest literacy rate and east Delhi the
highest.
Figure 9.1
Literacy Rates in Delhi
Source: Government of Delhi (2002). Delhi Statistical Hand Book.Directorate of Economics and Statistics, NCT of Delhi.
Population has increased very fast in Delhi (partly due
to immigration), as a result of which illiteracy has grown
in absolute numbers in spite of growth in literacy. By
2001, the illiterate population in Delhi was above 4
million (Figure 9.2).
Figure 9.2
Illiterate Population in Delhi
Source: Government of Delhi (2002). Delhi Statistical Hand Book.Directorate of Economics and Statistics, NCT of Delhi.
In percentage terms, the share of illiterate people in
urban Delhi is around 13.7 per cent of the total (Table
9.1) although the Delhi figure is much better compared to
the urban India average of 20.2 per cent. The table also
shows the educational performance of urban Delhi vis-à-vis
urban India. Delhi performs better than all-India (urban)
as seen from the lower proportion of illiteracy and the
higher proportion of people who have completed
secondary and higher levels.
TABLE 9.1
Education Levels of Population in 7+ Age Group inUrban Delhi and India, 1999
(Per cent)
Urban Delhi Urban India
Male Female Total Male Female Total
Not literate 8.3 19.8 13.7 13.5 27.7 20.2
Literate, belowprimary 14.0 13.1 13.6 16.4 15.7 16.1
Primary 13.6 13.0 13.3 14.9 14.3 14.7
Middle 13.8 10.6 12.3 17.7 15.3 16.5
Secondary 15.1 13.2 14.2 15.1 11.7 13.5
Higher secondary 11.5 10.8 11.2 9.7 7.1 8.5
Graduate and above 23.6 19.5 21.7 12.7 8.2 10.5
Total 100 100 100 100 100 100
Source: NSSO 55th round, 1999
9.1.1 Migration Issues
The performance indicated above does not reflect an
even performance by all sections of the society. This
distinction is particularly important for Delhi because this
city has a large migrant population and the education
scenario here is impacted by not only population growth
but also by migration. Delhi acts as a magnet to people
from different socioeconomic strata. It offers the
maximum opportunities for higher education among all
Indian metros and education at the higher levels reflects a
large student body which comes into Delhi for higher
education. But Delhi also attracts a very large size of
illiterate and semi-literate people who come here in search
of jobs. The relatively poor performance of this section
affects Delhi’s educational performance. The issue of
migration and its impact on Delhi’s education scenario is
discussed in this section.
0
20
40
60
80
100
1931 1941 1951 1961 1971 1981 1991 2001
Lit
era
cy R
ate
Total Male Female
0
500000
1000000
1500000
2000000
2500000
3000000
3500000
4000000
4500000
1931 1941 1951 1961 1971 1981 1991 2001
100%
80%
60%
40%
20%
0%
Not
lite
rate
lite
rate
, b
elow
Pri
mar
y
Mid
dle
Sec
on
dar
y
Hig
her
Sec
on
dar
y
Gra
du
ate
and a
bove
Tota
l
Urban India Total
Urban Delhi Total
Urban India Female
Urban FemaleDelhi
Urban India Male
Urban MaleDelhi
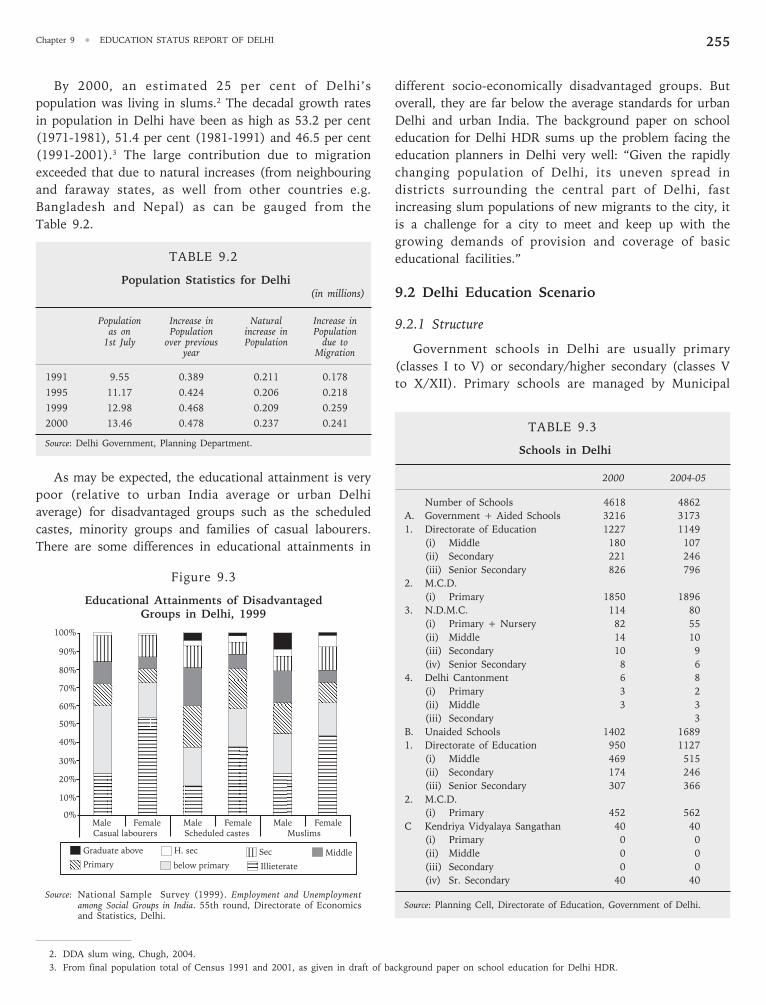
Chapter 9 • EDUCATION STATUS REPORT OF DELHI 255
By 2000, an estimated 25 per cent of Delhi’s
population was living in slums.2 The decadal growth rates
in population in Delhi have been as high as 53.2 per cent
(1971-1981), 51.4 per cent (1981-1991) and 46.5 per cent
(1991-2001).3 The large contribution due to migration
exceeded that due to natural increases (from neighbouring
and faraway states, as well from other countries e.g.
Bangladesh and Nepal) as can be gauged from the
Table 9.2.
TABLE 9.2
Population Statistics for Delhi(in millions)
Population Increase in Natural Increase inas on Population increase in Population
1st July over previous Population due toyear Migration
1991 9.55 0.389 0.211 0.178
1995 11.17 0.424 0.206 0.218
1999 12.98 0.468 0.209 0.259
2000 13.46 0.478 0.237 0.241
Source: Delhi Government, Planning Department.
As may be expected, the educational attainment is very
poor (relative to urban India average or urban Delhi
average) for disadvantaged groups such as the scheduled
castes, minority groups and families of casual labourers.
There are some differences in educational attainments in
different socio-economically disadvantaged groups. But
overall, they are far below the average standards for urban
Delhi and urban India. The background paper on school
education for Delhi HDR sums up the problem facing the
education planners in Delhi very well: “Given the rapidly
changing population of Delhi, its uneven spread in
districts surrounding the central part of Delhi, fast
increasing slum populations of new migrants to the city, it
is a challenge for a city to meet and keep up with the
growing demands of provision and coverage of basic
educational facilities.”
9.2 Delhi Education Scenario
9.2.1 Structure
Government schools in Delhi are usually primary
(classes I to V) or secondary/higher secondary (classes V
to X/XII). Primary schools are managed by Municipal
Figure 9.3
Educational Attainments of DisadvantagedGroups in Delhi, 1999
TABLE 9.3
Schools in Delhi
2000 2004-05
Number of Schools 4618 4862
A. Government + Aided Schools 3216 3173
1. Directorate of Education 1227 1149
(i) Middle 180 107
(ii) Secondary 221 246
(iii) Senior Secondary 826 796
2. M.C.D.
(i) Primary 1850 1896
3. N.D.M.C. 114 80
(i) Primary + Nursery 82 55
(ii) Middle 14 10
(iii) Secondary 10 9
(iv) Senior Secondary 8 6
4. Delhi Cantonment 6 8
(i) Primary 3 2
(ii) Middle 3 3
(iii) Secondary 3
B. Unaided Schools 1402 1689
1. Directorate of Education 950 1127
(i) Middle 469 515
(ii) Secondary 174 246
(iii) Senior Secondary 307 366
2. M.C.D.
(i) Primary 452 562
C Kendriya Vidyalaya Sangathan 40 40
(i) Primary 0 0
(ii) Middle 0 0
(iii) Secondary 0 0
(iv) Sr. Secondary 40 40
Source: Planning Cell, Directorate of Education, Government of Delhi.
2. DDA slum wing, Chugh, 2004.
3. From final population total of Census 1991 and 2001, as given in draft of background paper on school education for Delhi HDR.
Source: National Sample Survey (1999). Employment and Unemploymentamong Social Groups in India. 55th round, Directorate of Economicsand Statistics, Delhi.
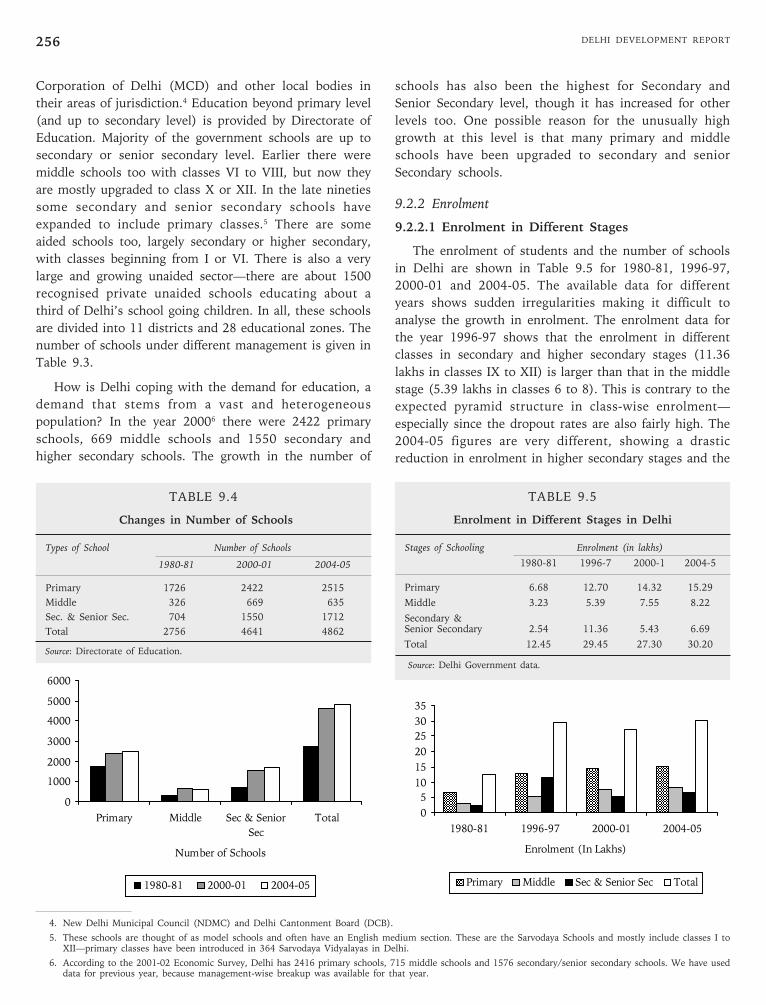
DELHI DEVELOPMENT REPORT256
Corporation of Delhi (MCD) and other local bodies in
their areas of jurisdiction.4 Education beyond primary level
(and up to secondary level) is provided by Directorate of
Education. Majority of the government schools are up to
secondary or senior secondary level. Earlier there were
middle schools too with classes VI to VIII, but now they
are mostly upgraded to class X or XII. In the late nineties
some secondary and senior secondary schools have
expanded to include primary classes.5 There are some
aided schools too, largely secondary or higher secondary,
with classes beginning from I or VI. There is also a very
large and growing unaided sector—there are about 1500
recognised private unaided schools educating about a
third of Delhi’s school going children. In all, these schools
are divided into 11 districts and 28 educational zones. The
number of schools under different management is given in
Table 9.3.
How is Delhi coping with the demand for education, a
demand that stems from a vast and heterogeneous
population? In the year 20006 there were 2422 primary
schools, 669 middle schools and 1550 secondary and
higher secondary schools. The growth in the number of
schools has also been the highest for Secondary and
Senior Secondary level, though it has increased for other
levels too. One possible reason for the unusually high
growth at this level is that many primary and middle
schools have been upgraded to secondary and senior
Secondary schools.
9.2.2 Enrolment
9.2.2.1 Enrolment in Different Stages
The enrolment of students and the number of schools
in Delhi are shown in Table 9.5 for 1980-81, 1996-97,
2000-01 and 2004-05. The available data for different
years shows sudden irregularities making it difficult to
analyse the growth in enrolment. The enrolment data for
the year 1996-97 shows that the enrolment in different
classes in secondary and higher secondary stages (11.36
lakhs in classes IX to XII) is larger than that in the middle
stage (5.39 lakhs in classes 6 to 8). This is contrary to the
expected pyramid structure in class-wise enrolment—
especially since the dropout rates are also fairly high. The
2004-05 figures are very different, showing a drastic
reduction in enrolment in higher secondary stages and the
TABLE 9.4
Changes in Number of Schools
Types of School Number of Schools
1980-81 2000-01 2004-05
Primary 1726 2422 2515
Middle 326 669 635
Sec. & Senior Sec. 704 1550 1712
Total 2756 4641 4862
Source: Directorate of Education.
0
1000
2000
3000
4000
5000
6000
Primary Middle Sec & Senior
Sec
Total
Number of Schools
1980-81 2000-01 2004-05
TABLE 9.5
Enrolment in Different Stages in Delhi
Stages of Schooling Enrolment (in lakhs)
1980-81 1996-7 2000-1 2004-5
Primary 6.68 12.70 14.32 15.29
Middle 3.23 5.39 7.55 8.22
Secondary &Senior Secondary 2.54 11.36 5.43 6.69
Total 12.45 29.45 27.30 30.20
Source: Delhi Government data.
4. New Delhi Municipal Council (NDMC) and Delhi Cantonment Board (DCB).
5. These schools are thought of as model schools and often have an English medium section. These are the Sarvodaya Schools and mostly include classes I toXII—primary classes have been introduced in 364 Sarvodaya Vidyalayas in Delhi.
6. According to the 2001-02 Economic Survey, Delhi has 2416 primary schools, 715 middle schools and 1576 secondary/senior secondary schools. We have useddata for previous year, because management-wise breakup was available for that year.
0
5
10
15
20
25
30
35
1980-81 1996-97 2000-01 2004-05
Enrolment (In Lakhs)
Primary Middle Sec & Senior Sec Total
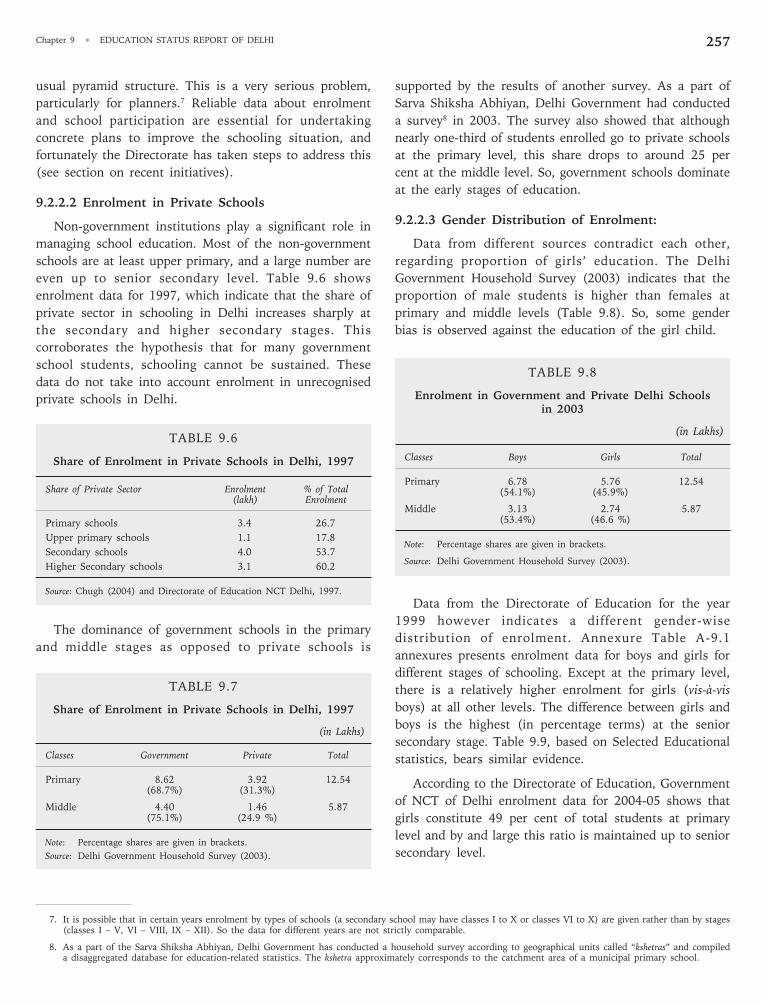
Chapter 9 • EDUCATION STATUS REPORT OF DELHI 257
usual pyramid structure. This is a very serious problem,
particularly for planners.7 Reliable data about enrolment
and school participation are essential for undertaking
concrete plans to improve the schooling situation, and
fortunately the Directorate has taken steps to address this
(see section on recent initiatives).
9.2.2.2 Enrolment in Private Schools
Non-government institutions play a significant role in
managing school education. Most of the non-government
schools are at least upper primary, and a large number are
even up to senior secondary level. Table 9.6 shows
enrolment data for 1997, which indicate that the share of
private sector in schooling in Delhi increases sharply at
the secondary and higher secondary stages. This
corroborates the hypothesis that for many government
school students, schooling cannot be sustained. These
data do not take into account enrolment in unrecognised
private schools in Delhi.
TABLE 9.6
Share of Enrolment in Private Schools in Delhi, 1997
Share of Private Sector Enrolment % of Total(lakh) Enrolment
Primary schools 3.4 26.7
Upper primary schools 1.1 17.8
Secondary schools 4.0 53.7
Higher Secondary schools 3.1 60.2
Source: Chugh (2004) and Directorate of Education NCT Delhi, 1997.
The dominance of government schools in the primary
and middle stages as opposed to private schools is
supported by the results of another survey. As a part of
Sarva Shiksha Abhiyan, Delhi Government had conducted
a survey8 in 2003. The survey also showed that although
nearly one-third of students enrolled go to private schools
at the primary level, this share drops to around 25 per
cent at the middle level. So, government schools dominate
at the early stages of education.
9.2.2.3 Gender Distribution of Enrolment:
Data from different sources contradict each other,
regarding proportion of girls’ education. The Delhi
Government Household Survey (2003) indicates that the
proportion of male students is higher than females at
primary and middle levels (Table 9.8). So, some gender
bias is observed against the education of the girl child.
TABLE 9.8
Enrolment in Government and Private Delhi Schoolsin 2003
(in Lakhs)
Classes Boys Girls Total
Primary 6.78 5.76 12.54(54.1%) (45.9%)
Middle 3.13 2.74 5.87(53.4%) (46.6 %)
Note: Percentage shares are given in brackets.
Source: Delhi Government Household Survey (2003).
Data from the Directorate of Education for the year
1999 however indicates a different gender-wise
distribution of enrolment. Annexure Table A-9.1
annexures presents enrolment data for boys and girls for
different stages of schooling. Except at the primary level,
there is a relatively higher enrolment for girls (vis-à-vis
boys) at all other levels. The difference between girls and
boys is the highest (in percentage terms) at the senior
secondary stage. Table 9.9, based on Selected Educational
statistics, bears similar evidence.
According to the Directorate of Education, Government
of NCT of Delhi enrolment data for 2004-05 shows that
girls constitute 49 per cent of total students at primary
level and by and large this ratio is maintained up to senior
secondary level.
7. It is possible that in certain years enrolment by types of schools (a secondary school may have classes I to X or classes VI to X) are given rather than by stages(classes I – V, VI – VIII, IX – XII). So the data for different years are not strictly comparable.
8. As a part of the Sarva Shiksha Abhiyan, Delhi Government has conducted a household survey according to geographical units called “kshetras” and compileda disaggregated database for education-related statistics. The kshetra approximately corresponds to the catchment area of a municipal primary school.
TABLE 9.7
Share of Enrolment in Private Schools in Delhi, 1997
(in Lakhs)
Classes Government Private Total
Primary 8.62 3.92 12.54(68.7%) (31.3%)
Middle 4.40 1.46 5.87(75.1%) (24.9 %)
Note: Percentage shares are given in brackets.
Source: Delhi Government Household Survey (2003).
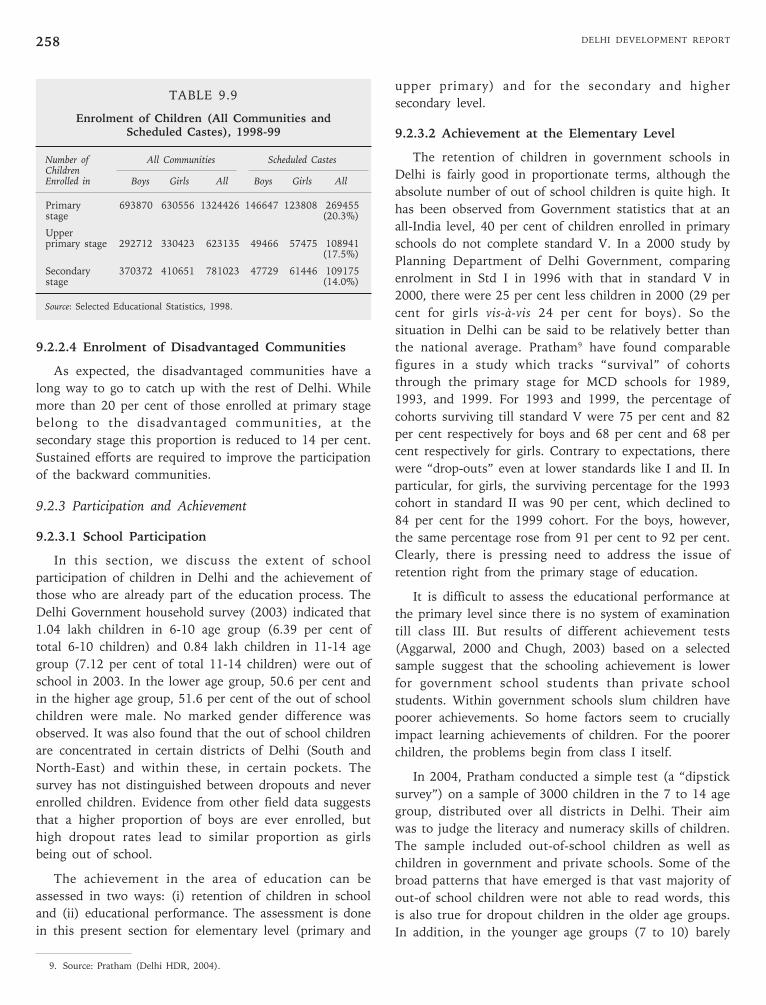
DELHI DEVELOPMENT REPORT258
TABLE 9.9
Enrolment of Children (All Communities andScheduled Castes), 1998-99
Number of All Communities Scheduled CastesChildrenEnrolled in Boys Girls All Boys Girls All
Primary 693870 630556 1324426 146647 123808 269455stage (20.3%)
Upperprimary stage 292712 330423 623135 49466 57475 108941
(17.5%)
Secondary 370372 410651 781023 47729 61446 109175stage (14.0%)
Source: Selected Educational Statistics, 1998.
9.2.2.4 Enrolment of Disadvantaged Communities
As expected, the disadvantaged communities have a
long way to go to catch up with the rest of Delhi. While
more than 20 per cent of those enrolled at primary stage
belong to the disadvantaged communities, at the
secondary stage this proportion is reduced to 14 per cent.
Sustained efforts are required to improve the participation
of the backward communities.
9.2.3 Participation and Achievement
9.2.3.1 School Participation
In this section, we discuss the extent of school
participation of children in Delhi and the achievement of
those who are already part of the education process. The
Delhi Government household survey (2003) indicated that
1.04 lakh children in 6-10 age group (6.39 per cent of
total 6-10 children) and 0.84 lakh children in 11-14 age
group (7.12 per cent of total 11-14 children) were out of
school in 2003. In the lower age group, 50.6 per cent and
in the higher age group, 51.6 per cent of the out of school
children were male. No marked gender difference was
observed. It was also found that the out of school children
are concentrated in certain districts of Delhi (South and
North-East) and within these, in certain pockets. The
survey has not distinguished between dropouts and never
enrolled children. Evidence from other field data suggests
that a higher proportion of boys are ever enrolled, but
high dropout rates lead to similar proportion as girls
being out of school.
The achievement in the area of education can be
assessed in two ways: (i) retention of children in school
and (ii) educational performance. The assessment is done
in this present section for elementary level (primary and
upper primary) and for the secondary and higher
secondary level.
9.2.3.2 Achievement at the Elementary Level
The retention of children in government schools in
Delhi is fairly good in proportionate terms, although the
absolute number of out of school children is quite high. It
has been observed from Government statistics that at an
all-India level, 40 per cent of children enrolled in primary
schools do not complete standard V. In a 2000 study by
Planning Department of Delhi Government, comparing
enrolment in Std I in 1996 with that in standard V in
2000, there were 25 per cent less children in 2000 (29 per
cent for girls vis-à-vis 24 per cent for boys). So the
situation in Delhi can be said to be relatively better than
the national average. Pratham9 have found comparable
figures in a study which tracks “survival” of cohorts
through the primary stage for MCD schools for 1989,
1993, and 1999. For 1993 and 1999, the percentage of
cohorts surviving till standard V were 75 per cent and 82
per cent respectively for boys and 68 per cent and 68 per
cent respectively for girls. Contrary to expectations, there
were “drop-outs” even at lower standards like I and II. In
particular, for girls, the surviving percentage for the 1993
cohort in standard II was 90 per cent, which declined to
84 per cent for the 1999 cohort. For the boys, however,
the same percentage rose from 91 per cent to 92 per cent.
Clearly, there is pressing need to address the issue of
retention right from the primary stage of education.
It is difficult to assess the educational performance at
the primary level since there is no system of examination
till class III. But results of different achievement tests
(Aggarwal, 2000 and Chugh, 2003) based on a selected
sample suggest that the schooling achievement is lower
for government school students than private school
students. Within government schools slum children have
poorer achievements. So home factors seem to crucially
impact learning achievements of children. For the poorer
children, the problems begin from class I itself.
In 2004, Pratham conducted a simple test (a “dipstick
survey”) on a sample of 3000 children in the 7 to 14 age
group, distributed over all districts in Delhi. Their aim
was to judge the literacy and numeracy skills of children.
The sample included out-of-school children as well as
children in government and private schools. Some of the
broad patterns that have emerged is that vast majority of
out-of school children were not able to read words, this
is also true for dropout children in the older age groups.
In addition, in the younger age groups (7 to 10) barely
9. Source: Pratham (Delhi HDR, 2004).
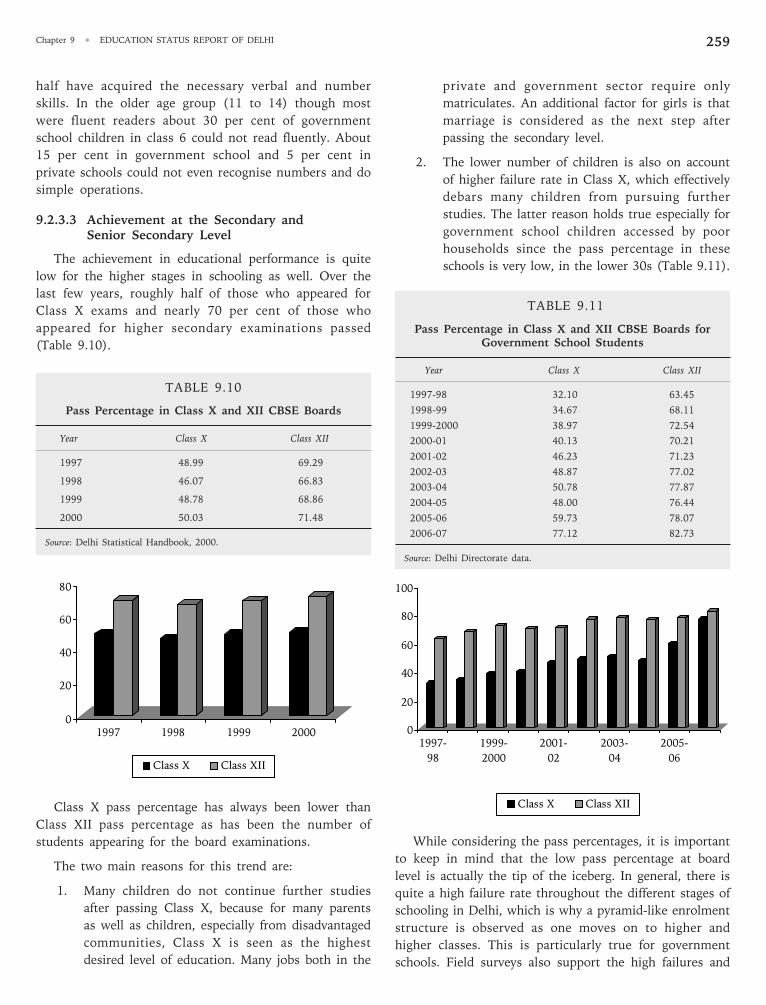
Chapter 9 • EDUCATION STATUS REPORT OF DELHI 259
half have acquired the necessary verbal and number
skills. In the older age group (11 to 14) though most
were fluent readers about 30 per cent of government
school children in class 6 could not read fluently. About
15 per cent in government school and 5 per cent in
private schools could not even recognise numbers and do
simple operations.
9.2.3.3 Achievement at the Secondary andSenior Secondary Level
The achievement in educational performance is quite
low for the higher stages in schooling as well. Over the
last few years, roughly half of those who appeared for
Class X exams and nearly 70 per cent of those who
appeared for higher secondary examinations passed
(Table 9.10).
TABLE 9.10
Pass Percentage in Class X and XII CBSE Boards
Year Class X Class XII
1997 48.99 69.29
1998 46.07 66.83
1999 48.78 68.86
2000 50.03 71.48
Source: Delhi Statistical Handbook, 2000.
Class X pass percentage has always been lower than
Class XII pass percentage as has been the number of
students appearing for the board examinations.
The two main reasons for this trend are:
1. Many children do not continue further studies
after passing Class X, because for many parents
as well as children, especially from disadvantaged
communities, Class X is seen as the highest
desired level of education. Many jobs both in the
private and government sector require only
matriculates. An additional factor for girls is that
marriage is considered as the next step after
passing the secondary level.
2. The lower number of children is also on account
of higher failure rate in Class X, which effectively
debars many children from pursuing further
studies. The latter reason holds true especially for
government school children accessed by poor
households since the pass percentage in these
schools is very low, in the lower 30s (Table 9.11).
TABLE 9.11
Pass Percentage in Class X and XII CBSE Boards forGovernment School Students
Year Class X Class XII
1997-98 32.10 63.45
1998-99 34.67 68.11
1999-2000 38.97 72.54
2000-01 40.13 70.21
2001-02 46.23 71.23
2002-03 48.87 77.02
2003-04 50.78 77.87
2004-05 48.00 76.44
2005-06 59.73 78.07
2006-07 77.12 82.73
Source: Delhi Directorate data.
While considering the pass percentages, it is important
to keep in mind that the low pass percentage at board
level is actually the tip of the iceberg. In general, there is
quite a high failure rate throughout the different stages of
schooling in Delhi, which is why a pyramid-like enrolment
structure is observed as one moves on to higher and
higher classes. This is particularly true for government
schools. Field surveys also support the high failures and
0
20
40
60
80
1997 1998 1999 2000
Class X Class XII
0
20
40
60
80
100
1997-
98
1999-
2000
2001-
02
2003-
04
2005-
06
Class X Class XII
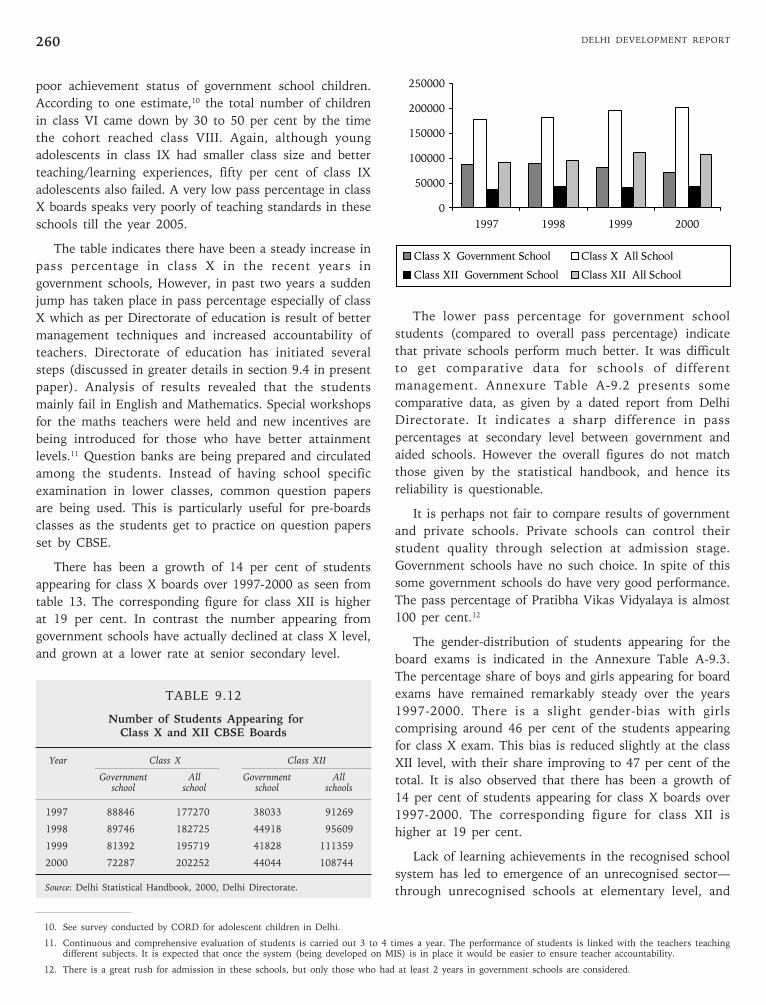
DELHI DEVELOPMENT REPORT260
poor achievement status of government school children.
According to one estimate,10 the total number of children
in class VI came down by 30 to 50 per cent by the time
the cohort reached class VIII. Again, although young
adolescents in class IX had smaller class size and better
teaching/learning experiences, fifty per cent of class IX
adolescents also failed. A very low pass percentage in class
X boards speaks very poorly of teaching standards in these
schools till the year 2005.
The table indicates there have been a steady increase in
pass percentage in class X in the recent years in
government schools, However, in past two years a sudden
jump has taken place in pass percentage especially of class
X which as per Directorate of education is result of better
management techniques and increased accountability of
teachers. Directorate of education has initiated several
steps (discussed in greater details in section 9.4 in present
paper). Analysis of results revealed that the students
mainly fail in English and Mathematics. Special workshops
for the maths teachers were held and new incentives are
being introduced for those who have better attainment
levels.11 Question banks are being prepared and circulated
among the students. Instead of having school specific
examination in lower classes, common question papers
are being used. This is particularly useful for pre-boards
classes as the students get to practice on question papers
set by CBSE.
There has been a growth of 14 per cent of students
appearing for class X boards over 1997-2000 as seen from
table 13. The corresponding figure for class XII is higher
at 19 per cent. In contrast the number appearing from
government schools have actually declined at class X level,
and grown at a lower rate at senior secondary level.
TABLE 9.12
Number of Students Appearing forClass X and XII CBSE Boards
Year Class X Class XII
Government All Government Allschool school school schools
1997 88846 177270 38033 91269
1998 89746 182725 44918 95609
1999 81392 195719 41828 111359
2000 72287 202252 44044 108744
Source: Delhi Statistical Handbook, 2000, Delhi Directorate.
The lower pass percentage for government school
students (compared to overall pass percentage) indicate
that private schools perform much better. It was difficult
to get comparative data for schools of different
management. Annexure Table A-9.2 presents some
comparative data, as given by a dated report from Delhi
Directorate. It indicates a sharp difference in pass
percentages at secondary level between government and
aided schools. However the overall figures do not match
those given by the statistical handbook, and hence its
reliability is questionable.
It is perhaps not fair to compare results of government
and private schools. Private schools can control their
student quality through selection at admission stage.
Government schools have no such choice. In spite of this
some government schools do have very good performance.
The pass percentage of Pratibha Vikas Vidyalaya is almost
100 per cent.12
The gender-distribution of students appearing for the
board exams is indicated in the Annexure Table A-9.3.
The percentage share of boys and girls appearing for board
exams have remained remarkably steady over the years
1997-2000. There is a slight gender-bias with girls
comprising around 46 per cent of the students appearing
for class X exam. This bias is reduced slightly at the class
XII level, with their share improving to 47 per cent of the
total. It is also observed that there has been a growth of
14 per cent of students appearing for class X boards over
1997-2000. The corresponding figure for class XII is
higher at 19 per cent.
Lack of learning achievements in the recognised school
system has led to emergence of an unrecognised sector—
through unrecognised schools at elementary level, and
0
50000
100000
150000
200000
250000
1997 1998 1999 2000
Class X Government School Class X All School
Class XII Government School Class XII All School
10. See survey conducted by CORD for adolescent children in Delhi.
11. Continuous and comprehensive evaluation of students is carried out 3 to 4 times a year. The performance of students is linked with the teachers teachingdifferent subjects. It is expected that once the system (being developed on MIS) is in place it would be easier to ensure teacher accountability.
12. There is a great rush for admission in these schools, but only those who had at least 2 years in government schools are considered.
Chapter 9 • EDUCATION STATUS REPORT OF DELHI 261
coaching classes at higher levels. In addition taking private
tuition, some from schoolteachers but largely from the
educated unemployed, has become a common
phenomenon among all income groups. These are the
available alternatives for the parents to support their
children’s education. Being unrecognised, there is no way
of estimating their overall impact, though there are ample
evidence as seen from hoardings, leaflets, and newspaper
advertisements. It is even more difficult to ensure any
degree of quality control. While this may have helped
some students to improve their performance in exams, it
has led to large increases in household expenditure, as
seen from different household surveys. This is a very
disturbing development, especially when it becomes a
necessary part of school education, and goes against the
government’s commitment towards 8 years of free and
compulsory education.
9.3 Possible Causes behind Poor Achievement
9.3.1 Shortage of Facilities
A major reason for so many children still being out of
school is shortage in schooling facilities. This includes
shortage of schools, of infrastructural facilities in existing
schools and of teachers. The problems for the elementary
stage are discussed first.
9.3.1.1 Elementary Education
(i) Schools: A very large portion of children in Delhi go
to government schools, and though the government has
attempted to create adequate number of schools and
classrooms, it has not been able to keep pace with increase
in enrolment (as seen from Tables 9.3 and 9.5). As a result
the schools have increased in size and are often very
crowded. Not only are primary schools not enough to enrol
all children, the facilities for upper primary education
(which are part of secondary schools) are insufficient. In
the background paper for Delhi HDR the researchers
demonstrated (through a sample study) how a large drop
in enrolment occurs in the transitional phase between
classes V and VI. The capacity to admit students in class VI
in the government schools is much lower than the
enrolment in class V in all its feeder schools.
Setting up new schools is not always easy. The Master
Plan for Delhi as developed by DDA specifies the norms
for the provision of primary education in the urban areas.
These provisions have generally been made in colonies
that are developed according to master plan. However, a
parallel growth of unauthorised colonies had resulted in a
situation where it is difficult to allocate land according to
prescribed norms for primary schools. Physical acquisition
of land and development of social infrastructure is a
difficult problem in a metropolitan city like Delhi. MCD
has to acquire land from DDA, Gram Sabhas and other
agencies for opening primary schools. Many schools were
sanctioned long back but could not be started because of
unavailability of land at suitable places. There are many
complicated issues involved in land acquisition, thus
creating problems regarding easy access to primary
schools. These problems are aggravated in unauthorised
colonies.
(ii) Infrastructure: On the positive side it should be
noted that infrastructure in secondary and senior
secondary schools is reasonably good as compared to
primary schools. Still many of the infrastructural problems
are applicable to primary as well as to secondary and
senior secondary schools. Several features of the Delhi
MCD and government schools have been observed in a
field survey (Prahtam—HDR, 2004). First, many
government schools work in two shifts: morning and
afternoon. Second, schooling for children and adolescents
in the sample areas was a gender-segregated experience.
Third, almost all children experienced a transition from
primary school (class I-V) to secondary school i.e., they
had to move to a different school, upper primary or
secondary. In some cases they had to move even three
times: primary-upper, primary-secondary and sometimes,
a fourth time – to senior secondary school. At present
efforts are on to open more schools of secondary and
senior secondary level (and to upgrade middle schools)
and to convert them to single shift as far as possible.
The morning shift functioned from 7.30 a.m. to 12.30
p.m. It was usually for girls, and mostly had female
teachers and headteachers. The second shift ran from 1
p.m. to 5 p.m. and was usually for boys with mostly male
teachers and male headteachers. The shift system was
found to lead to deterioration in school quality due to
reduced teaching time (often girls were grouped fifteen
minutes earlier for the final dismissal to avoid any
problems with the boys who come in for the second
shift). There was no time for extra classes or remedial
classes for the girls. There is also little time to clean the
school between the shifts. As a result these boys have to
study in filthy, paper strewn class rooms. With the second
shift finishing only at 6 p.m., again the time was not
conducive for extra classes or remedial classes for the
boys. The second factor relates to the lack of sense of
belonging to the schools for students as well as teachers
e.g., there was reduced accountability for maintenance of
the premises.
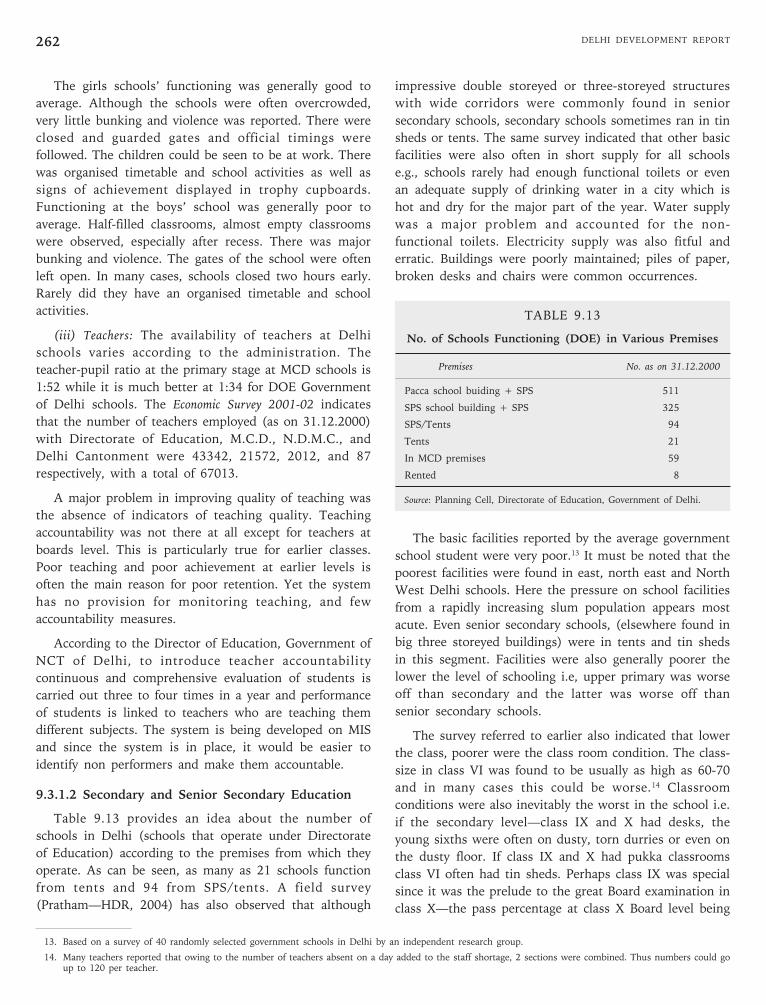
DELHI DEVELOPMENT REPORT262
The girls schools’ functioning was generally good to
average. Although the schools were often overcrowded,
very little bunking and violence was reported. There were
closed and guarded gates and official timings were
followed. The children could be seen to be at work. There
was organised timetable and school activities as well as
signs of achievement displayed in trophy cupboards.
Functioning at the boys’ school was generally poor to
average. Half-filled classrooms, almost empty classrooms
were observed, especially after recess. There was major
bunking and violence. The gates of the school were often
left open. In many cases, schools closed two hours early.
Rarely did they have an organised timetable and school
activities.
(iii) Teachers: The availability of teachers at Delhi
schools varies according to the administration. The
teacher-pupil ratio at the primary stage at MCD schools is
1:52 while it is much better at 1:34 for DOE Government
of Delhi schools. The Economic Survey 2001-02 indicates
that the number of teachers employed (as on 31.12.2000)
with Directorate of Education, M.C.D., N.D.M.C., and
Delhi Cantonment were 43342, 21572, 2012, and 87
respectively, with a total of 67013.
A major problem in improving quality of teaching was
the absence of indicators of teaching quality. Teaching
accountability was not there at all except for teachers at
boards level. This is particularly true for earlier classes.
Poor teaching and poor achievement at earlier levels is
often the main reason for poor retention. Yet the system
has no provision for monitoring teaching, and few
accountability measures.
According to the Director of Education, Government of
NCT of Delhi, to introduce teacher accountability
continuous and comprehensive evaluation of students is
carried out three to four times in a year and performance
of students is linked to teachers who are teaching them
different subjects. The system is being developed on MIS
and since the system is in place, it would be easier to
identify non performers and make them accountable.
9.3.1.2 Secondary and Senior Secondary Education
Table 9.13 provides an idea about the number of
schools in Delhi (schools that operate under Directorate
of Education) according to the premises from which they
operate. As can be seen, as many as 21 schools function
from tents and 94 from SPS/tents. A field survey
(Pratham—HDR, 2004) has also observed that although
impressive double storeyed or three-storeyed structures
with wide corridors were commonly found in senior
secondary schools, secondary schools sometimes ran in tin
sheds or tents. The same survey indicated that other basic
facilities were also often in short supply for all schools
e.g., schools rarely had enough functional toilets or even
an adequate supply of drinking water in a city which is
hot and dry for the major part of the year. Water supply
was a major problem and accounted for the non-
functional toilets. Electricity supply was also fitful and
erratic. Buildings were poorly maintained; piles of paper,
broken desks and chairs were common occurrences.
TABLE 9.13
No. of Schools Functioning (DOE) in Various Premises
Premises No. as on 31.12.2000
Pacca school buiding + SPS 511
SPS school building + SPS 325
SPS/Tents 94
Tents 21
In MCD premises 59
Rented 8
Source: Planning Cell, Directorate of Education, Government of Delhi.
The basic facilities reported by the average government
school student were very poor.13 It must be noted that the
poorest facilities were found in east, north east and North
West Delhi schools. Here the pressure on school facilities
from a rapidly increasing slum population appears most
acute. Even senior secondary schools, (elsewhere found in
big three storeyed buildings) were in tents and tin sheds
in this segment. Facilities were also generally poorer the
lower the level of schooling i.e, upper primary was worse
off than secondary and the latter was worse off than
senior secondary schools.
The survey referred to earlier also indicated that lower
the class, poorer were the class room condition. The class-
size in class VI was found to be usually as high as 60-70
and in many cases this could be worse.14 Classroom
conditions were also inevitably the worst in the school i.e.
if the secondary level—class IX and X had desks, the
young sixths were often on dusty, torn durries or even on
the dusty floor. If class IX and X had pukka classrooms
class VI often had tin sheds. Perhaps class IX was special
since it was the prelude to the great Board examination in
class X—the pass percentage at class X Board level being
13. Based on a survey of 40 randomly selected government schools in Delhi by an independent research group.
14. Many teachers reported that owing to the number of teachers absent on a day added to the staff shortage, 2 sections were combined. Thus numbers could goup to 120 per teacher.
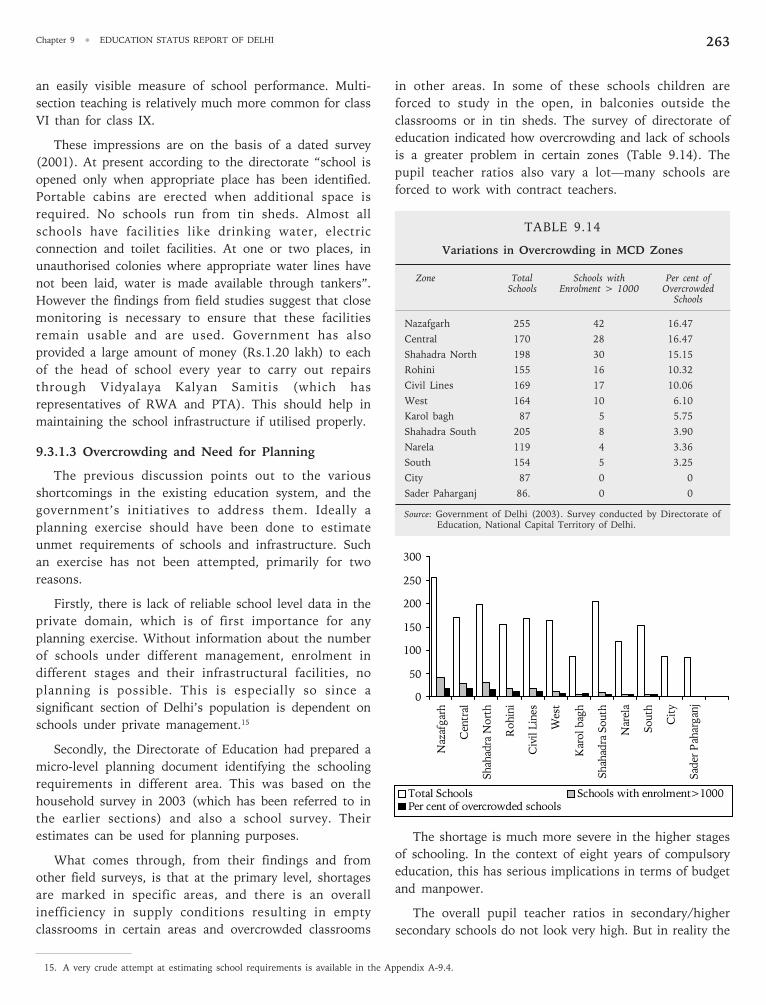
Chapter 9 • EDUCATION STATUS REPORT OF DELHI 263
an easily visible measure of school performance. Multi-
section teaching is relatively much more common for class
VI than for class IX.
These impressions are on the basis of a dated survey
(2001). At present according to the directorate “school is
opened only when appropriate place has been identified.
Portable cabins are erected when additional space is
required. No schools run from tin sheds. Almost all
schools have facilities like drinking water, electric
connection and toilet facilities. At one or two places, in
unauthorised colonies where appropriate water lines have
not been laid, water is made available through tankers”.
However the findings from field studies suggest that close
monitoring is necessary to ensure that these facilities
remain usable and are used. Government has also
provided a large amount of money (Rs.1.20 lakh) to each
of the head of school every year to carry out repairs
through Vidyalaya Kalyan Samitis (which has
representatives of RWA and PTA). This should help in
maintaining the school infrastructure if utilised properly.
9.3.1.3 Overcrowding and Need for Planning
The previous discussion points out to the various
shortcomings in the existing education system, and the
government’s initiatives to address them. Ideally a
planning exercise should have been done to estimate
unmet requirements of schools and infrastructure. Such
an exercise has not been attempted, primarily for two
reasons.
Firstly, there is lack of reliable school level data in the
private domain, which is of first importance for any
planning exercise. Without information about the number
of schools under different management, enrolment in
different stages and their infrastructural facilities, no
planning is possible. This is especially so since a
significant section of Delhi’s population is dependent on
schools under private management.15
Secondly, the Directorate of Education had prepared a
micro-level planning document identifying the schooling
requirements in different area. This was based on the
household survey in 2003 (which has been referred to in
the earlier sections) and also a school survey. Their
estimates can be used for planning purposes.
What comes through, from their findings and from
other field surveys, is that at the primary level, shortages
are marked in specific areas, and there is an overall
inefficiency in supply conditions resulting in empty
classrooms in certain areas and overcrowded classrooms
in other areas. In some of these schools children are
forced to study in the open, in balconies outside the
classrooms or in tin sheds. The survey of directorate of
education indicated how overcrowding and lack of schools
is a greater problem in certain zones (Table 9.14). The
pupil teacher ratios also vary a lot—many schools are
forced to work with contract teachers.
TABLE 9.14
Variations in Overcrowding in MCD Zones
Zone Total Schools with Per cent ofSchools Enrolment > 1000 Overcrowded
Schools
Nazafgarh 255 42 16.47
Central 170 28 16.47
Shahadra North 198 30 15.15
Rohini 155 16 10.32
Civil Lines 169 17 10.06
West 164 10 6.10
Karol bagh 87 5 5.75
Shahadra South 205 8 3.90
Narela 119 4 3.36
South 154 5 3.25
City 87 0 0
Sader Paharganj 86. 0 0
Source: Government of Delhi (2003). Survey conducted by Directorate ofEducation, National Capital Territory of Delhi.
The shortage is much more severe in the higher stages
of schooling. In the context of eight years of compulsory
education, this has serious implications in terms of budget
and manpower.
The overall pupil teacher ratios in secondary/higher
secondary schools do not look very high. But in reality the
15. A very crude attempt at estimating school requirements is available in the Appendix A-9.4.
0
50
100
150
200
250
300
Naz
afgar
h
Cen
tral
Shah
adra
No
rth
Ro
hin
i
Civ
il L
ines
Wes
t
Kar
ol
bag
h
Sh
ahad
ra S
outh
Nar
ela
South
Cit
y
Sad
er P
ahar
gan
j
Total Schools Schools with enrolment>1000
Per cent of overcrowded schools
DELHI DEVELOPMENT REPORT264
situation is much worse. In most government schools
enrolment is in a pyramid shape and classes VI and VII
have very large class sizes. So pupil teacher ratios in these
classes are very adverse.
What is of first importance for proper planning is
introduction of a reliable system of data collection from
all schools. This is essential for both planning and
monitoring. Fortunately this is being done. The
directorate of education had a planned approach. Attempts
are being made to get the out-of-school children back to
school. But what appears as the major problem is the
poor retention and poor learning achievements. For this,
higher budgetary allocations are necessary, but are not
enough. Solving these problems is much more
complicated. Also one of the causes for poor retention like
Dyslexia are totally overlooked in government schools
which with simple methods of identification can be
pinpointed. This identification can help a child in exams
where he/she can get extra time as it is identified by
CBSE.
The other issues like no provisions for free note books
to students of all levels, and no support for uniforms at
pre primary levels and fees at pre primary level are the
ones that discourages students to come to school as they
add extra costs.
Delhi has one of the largest per capita financial
allocations. But centralised control and bureaucratic
procedure (arisen partly to prevent corruption) leads to
unnecessary delay—shortages remain even when funds are
available. The main problem is setting up an
accountability mechanism as well as a support system for
principals and teachers. Many policies have been
introduced to improve accountability, but it is too early to
assess its impact.
There is one more issue that is of pre school education
which is not discussed in the report because it does not
come presently under the purview of DOE. However after
Ganguly Committee’s report now the scenario has changed
and gives a free hand to private players in the name of pre
school education in Delhi. The working women who are
granted only three months maternity leave, solely rely on
the crèches and pre schools for rearing of their children
who are the future of this country. This is an established
fact that education of a child starts with the time of their
entry in this world. The DOE should step in as a
regulating and monitoring authority deciding parameters
regarding the safety and education of these children as the
pre school environment forms the base for the
development of future human resources of the country.
9.4 Initiatives in Improving theEducation Scenario in Delhi
9.4.1 Government Initiative
Delhi Government has been very active in the last few
years. It has taken several initiatives to achieve the EFA
(Education for All) objectives. The household survey to
assess the school participation status of 6 to 14 year olds
formed the base of their intervention. The directorate of
education had done a planning exercise indicating the
number of primary and secondary schools required in
different areas. However, since there are a variety of
reasons why children remain out-of-school and “there is
great heterogeneity among these out of school children”
the directorate have decided on mainstreaming through
bridge courses. These courses are taught in learning
centres which are run by various NGOs already working
in education sector. The objective is to bring these out-of-
school children upto appropriate competency levels
through condensed courses and get them admitted into
appropriate grades in formal schools.
These learning centres are of at least 4 hours duration
and the teacher was required to put in an extra hour of
preparation time. The government has tried to
coordinate NGO activities in a manner to ensure EFA.
On the basis of the survey the required number of
centres and their location has been identified and
different NGOs have been allotted some centres in the
districts where they are active. There are provisions for
monitoring by the community (Kshetra Education
Committee were formed for that purpose). Government
supplied the teaching learning materials and paid a
certain amount per student to cover Centre’s cost (Rs.
845 annually per child at primary level and 1200 per
child at upper primary level. The teachers were required
to have formal training—1 for primary level students and
2 for upper primary level)
About 3000 learning centres are there in Delhi, run by
about 200 NGOs. Nearly a lakh of out-of-school children
are in these centres. In the first year of its functioning
about 8000 children were mainstreamed. A major
problem faced by these learning centres is that sufficient
schools or classrooms have not come up. So the problem
of mainstreaming remains. Without improvement in
school conditions these children will not remain in the
schools. The situation is visibly improving as in the year
2004, out of 187,000 out-of-school children identified,
134,000 have been brought under the ambit of the
learning centres. Till the year 2005-06, 32000 children
have been mainstreamed.

Chapter 9 • EDUCATION STATUS REPORT OF DELHI 265
In an attempt to reach the hitherto unreached groups
of children, particularly those at construction sites, the
government is experimenting with the concept of mobile
learning centres. At present two vans are put into action
which are fully equipped with teaching-learning materials,
teachers, mid-day meals, and CAL unit.
The Directorate is busy at present constructing
additional classrooms and toilets under SSA. This
enhanced space will be useful to start CRCs and ECCEs in
the school complex. ECCEs will specially target the 3 to 5
year olds and focus on their play, health, nutrition and
joyful learning. It will be very useful for young girls who
remain out-of-school in order to take care of younger
siblings.
Delhi government has sought cooperation from private
sector as well in its attempt to improve school availability.
The private unaided schools in Delhi are also non-profit
organisations. Delhi High Court had ordered that they are
to reserve 20 per cent of the seats for the economically
disadvantaged children—and grant them freeship. Initially
this reservation was applicable for the new admissions,
but over time this will allow many children from weaker
section access to quality schools. It will reduce pressure
on government schools too. Not all schools have complied
with this order in 2004—and so around 7000 students
were admitted through this reservation in the first year.
But better result is expected in the next year.
It is too early to assess the impact of these initiatives,
but they appear to be in the right direction. However
there is need for careful monitoring of activities of the
NGOs—without proper accountability mechanisms, these
NGOs may also fail to deliver. Also with high migration
rates and a shifting population, the household survey may
be required to be repeated.
Improving Learning Achievement and SchoolFunctioning of Government Schools
Continuous and Comprehensive Evaluation
The directorate has been concerned with providing
quality education in their schools. So far the Boards
results were the only accountability measure for teachers,
and gave a performance appraisal for teachers who taught
in class X or XII. Nothing much was known about
learning level and teaching quality in other classes. For
this purpose the directorate took a major step to reform
the examination system. In addition to the 3 terminal
tests, 4 additional tests were introduced for students of
class III to class XII. Each exam was to cover a quarter of
syllabus taught in the relevant quarter, and was in the
form of objective type tests. The answer sheets are
evaluated through optical readers so that feedback is
available immediately. This scheme of Continuous and
Comprehensive Evaluation helped keeping track of the
children’s progress. The school and the teachers were not
to receive results of individual child but an analysis of the
learning levels in the class. It also forms a basis of
evaluation of teachers, taking into account the
performance level of children as well as their
improvement.
Computerising Information System
The directorate has developed web based MIS where
data on schools, students and teachers are stored.
Information is easily accessible not only for the planners
but also the other stakeholders.
All postings and transfers are carried out electronically.
Budgetary allocations and sanctions are also issued
electronically. This has helped in better utilisation of
manpower and physical infrastructure and exercised
control on financial resources.
Admissions are done on-line. School leaving certificates
are also issued electronically. All students from class V in
MCD schools or other feeder schools are automatically
admitted to class VI of government school. This has
reduced dropout rates at transition.
It is planned that marksheets will be generated
through computers with in-built logos, from next year.
This is expected to eliminate the market for fake
marksheets.
A tracking system has been brought in place. Through
online monitoring of all children enrolled in bridge
courses and Learning centres is expected to improve
enrolment and attendance.
Improve Retention and Learning Achievements
Several projects are being implemented in the
government schools to make schools enjoyable and
meaningful. YUVA has been introduced in government
schools with twin objectives—to make sure that the
school is a safer and happier place for the students and
that they are taught to be responsible adults. So it would
give basic education on all subjects like HIV-AIDS, career
counseling etc. Project RAKSHA was launched to teach
self defense skills to the girl students. For this purpose
the female Physical Education teachers were trained by
Delhi Police, Computer aided learning (CAL) is also
introduced in class VI last year. The course content of
different subjects like English, Mathematics, Science, and
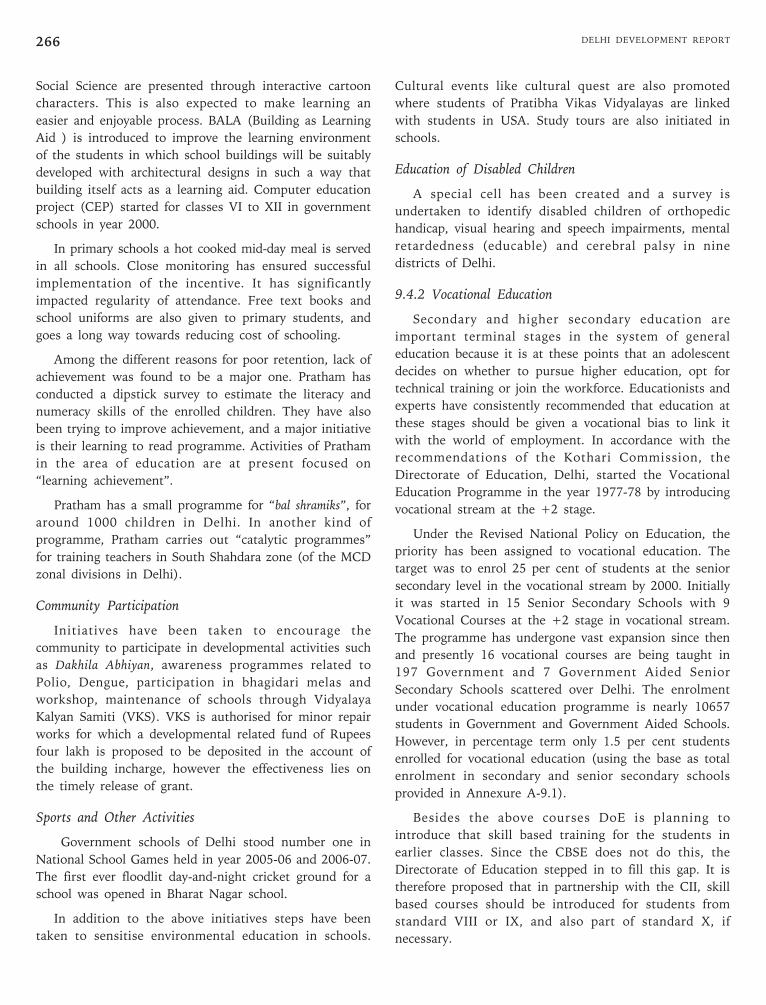
DELHI DEVELOPMENT REPORT266
Social Science are presented through interactive cartoon
characters. This is also expected to make learning an
easier and enjoyable process. BALA (Building as Learning
Aid ) is introduced to improve the learning environment
of the students in which school buildings will be suitably
developed with architectural designs in such a way that
building itself acts as a learning aid. Computer education
project (CEP) started for classes VI to XII in government
schools in year 2000.
In primary schools a hot cooked mid-day meal is served
in all schools. Close monitoring has ensured successful
implementation of the incentive. It has significantly
impacted regularity of attendance. Free text books and
school uniforms are also given to primary students, and
goes a long way towards reducing cost of schooling.
Among the different reasons for poor retention, lack of
achievement was found to be a major one. Pratham has
conducted a dipstick survey to estimate the literacy and
numeracy skills of the enrolled children. They have also
been trying to improve achievement, and a major initiative
is their learning to read programme. Activities of Pratham
in the area of education are at present focused on
“learning achievement”.
Pratham has a small programme for “bal shramiks”, for
around 1000 children in Delhi. In another kind of
programme, Pratham carries out “catalytic programmes”
for training teachers in South Shahdara zone (of the MCD
zonal divisions in Delhi).
Community Participation
Initiatives have been taken to encourage the
community to participate in developmental activities such
as Dakhila Abhiyan, awareness programmes related to
Polio, Dengue, participation in bhagidari melas and
workshop, maintenance of schools through Vidyalaya
Kalyan Samiti (VKS). VKS is authorised for minor repair
works for which a developmental related fund of Rupees
four lakh is proposed to be deposited in the account of
the building incharge, however the effectiveness lies on
the timely release of grant.
Sports and Other Activities
Government schools of Delhi stood number one in
National School Games held in year 2005-06 and 2006-07.
The first ever floodlit day-and-night cricket ground for a
school was opened in Bharat Nagar school.
In addition to the above initiatives steps have been
taken to sensitise environmental education in schools.
Cultural events like cultural quest are also promoted
where students of Pratibha Vikas Vidyalayas are linked
with students in USA. Study tours are also initiated in
schools.
Education of Disabled Children
A special cell has been created and a survey is
undertaken to identify disabled children of orthopedic
handicap, visual hearing and speech impairments, mental
retardedness (educable) and cerebral palsy in nine
districts of Delhi.
9.4.2 Vocational Education
Secondary and higher secondary education are
important terminal stages in the system of general
education because it is at these points that an adolescent
decides on whether to pursue higher education, opt for
technical training or join the workforce. Educationists and
experts have consistently recommended that education at
these stages should be given a vocational bias to link it
with the world of employment. In accordance with the
recommendations of the Kothari Commission, the
Directorate of Education, Delhi, started the Vocational
Education Programme in the year 1977-78 by introducing
vocational stream at the +2 stage.
Under the Revised National Policy on Education, the
priority has been assigned to vocational education. The
target was to enrol 25 per cent of students at the senior
secondary level in the vocational stream by 2000. Initially
it was started in 15 Senior Secondary Schools with 9
Vocational Courses at the +2 stage in vocational stream.
The programme has undergone vast expansion since then
and presently 16 vocational courses are being taught in
197 Government and 7 Government Aided Senior
Secondary Schools scattered over Delhi. The enrolment
under vocational education programme is nearly 10657
students in Government and Government Aided Schools.
However, in percentage term only 1.5 per cent students
enrolled for vocational education (using the base as total
enrolment in secondary and senior secondary schools
provided in Annexure A-9.1).
Besides the above courses DoE is planning to
introduce that skill based training for the students in
earlier classes. Since the CBSE does not do this, the
Directorate of Education stepped in to fill this gap. It is
therefore proposed that in partnership with the CII, skill
based courses should be introduced for students from
standard VIII or IX, and also part of standard X, if
necessary.
Chapter 9 • EDUCATION STATUS REPORT OF DELHI 267
TABLE 9.15
Courses Offered under Vocational Education andPre-Vocational levels
S.N Name of Course
1. Electrical Technology
2. Automobile
3. AC & Refrigeration Technology
4. Electronics
5. Stenography (English)
6. Stenography (Hindi)
7. Banking
8. Food Service &Management
9. Fashion Design & Clothing Construction
10. Textile Designing
11. Health Care & Beauty Culture
12. Medical Lab. Technology
13. Tourism & Travel Technique
14. Horticulture
15. Information Technology/Computer Application
16. Library Information Science
Pre-Vocational Courses offered to classes VIII to IX
1. Cutting & Tailoring
2. B. Office Practice
3. Skin & Beauty Care
4. Silk & Screen printing
Source: DoE
There is hardly any provision for vocational stream in
private schools of Delhi which limits the students option
of selection A course at plus two level.
Possible Causes behind Poor Performance ofVocational Education
The selection of course is the most important aspect
of vocationalisation. The relevance of course in world of
work and quality of training makes it marketable. The
poor enrolment in these courses indicates that either
the good courses are not offered to students or those
which are offered are not perceived as a marketable
vocation. There may be several other reasons for that,
such as selection and updating of courses, lack a
continuous and comprehensive market research for
skills in demand, non availability of proper trainers,
competency building of trainers, lack of higher
academic prospects of these courses etc., which DoE
has to find out in order to achieve the desired number
of enrolments.
Initiatives to Improve Vocationalisation byGovernment
Research to evaluate vocational education Programme : The
Directorate of Education, Government of Delhi had
commissioned Delhi School of Social Work, Delhi
University to conduct an evaluation study of the
Vocational Education Programme in schools to explore
new areas of the Vocational Occupation. The study report
has been submitted to the department and necessary
action on the report is yet to be taken.
Capacity Building of Vocational Teachers
In order to revamp vocational education in Delhi
schools training of teachers that was not organised for
the last 10 years is initiated. Following that key to
success of vocational programmes is the involvement of
organisations and agencies of excellence working in the
respective fields, the help of National Institute of
Fashion Technology (NIFT) for fashion designing
course and Institute of Secretarial Training and
Management (ISTM) for stenography and office
procedures course is being sought and two training
programmes for the teachers of fashion designing and
clothing construction and one training programme for
stenography and office procedure were organised by
SCERT. The main emphasis of the training was to
orient the trainees about the demands of the growing
industry and changing market and develop their skills
to fulfill those demands.
Introduction of pre-vocational Courses in Schools in
partnership with Confederation of Indian Industry (CII)
All CBSE courses on vocational education are for
students of standards XI and XII only and the subjects
taught till standard X do not really teach any skill, and so
it was felt that skill based training should be introduced
for the students in earlier classes. And for that purpose in
partnership with the CII, skill based courses for students
from standard VIII or IX and also part of standard X (if
necessary) will be initiated.
The final syllabus and curriculum for the skill based
(job oriented) courses at pre vocational level would be
jointly evolved by the CII and the Directorate of
Education, based largely in consultation of existing
material provided by National Open School, Department
of Technical Education, Delhi and CBSE. It is proposed
that trainers would be those persons who are already
running trades. The training will be held outside the
school and school hours preferable at the trainer’s work
place or at their training centers. The certification of
DELHI DEVELOPMENT REPORT268
training is proposed to be done jointly by the Government
of Delhi and the CII. However, to arrest drop-out all
certificates under this training would be given to the
students only after they appear for the standard X exams.
9.5 Strategies, Choices and Issues in the Fieldof Education for Delhi of Tomorrow
9.5.1 Vocational Education
The above discussion suggests that supply led as well
as demand fed restrictions slowed down the growth of
vocationalisation at school level. Schools either do not
have teachers to impart training or students to learn the
skill. Vocationalisation lacks planning for selection of
courses and training. One time study is not solution to
keep pace with the changing market scenario. It needs
proper, continuous and comprehensive research. For
selection of the vocation in which training be imparted the
approach should be at macro level means that planners
should take into account the different industry reports and
their skill requirements, as well as reports of different
commissions addressing the skill requirement of the
industry in the concerned area. This would avoid the
oversupplying of popular skills as well as the shortage of
relatively less popular but useful and remunerative skills
in the industry.
As far as training is concerned then the best option of
training is hands on experience on the job itself. However,
the past experience suggests that all the employers do not
take training in very good spirit as it has heavy
opportunity costs. The apprenticeship Act also has lost his
relevance in the modern type of industry set up where
number of manpower is reduced. In other words, largely,
present nature of industry has no obligation to have
apprentices. Therefore the need of hour is to sensitise this
issue among the users as the ultimate user of skills is
industry only. This could be achieved only through regular
interaction with the industry.
9.5.2 Higher Education
Amongst all cities of India, Delhi is considered to be
the most favourable destination for pursuing higher
education. The city is home to several renowned
universities, which attract students from all parts of the
globe.
Government Universities: There are five Government
Universities in Delhi which include the University of
Delhi (DU), Jawaharlal Nehru University (JNU), Guru
Gobind Singh Indraprastha University (GGSIPU), Jamia
Millia University (JMU), and Jamia Hamdard.
The latest and the Delhi Government initiative in this
list is of GGSIP university. The establishment of GGSIP
university which is purely a Delhi Government initiative
came into existence because of the fact that demand for
higher education in Delhi had increased tremendously and
the Delhi University was not enthusiastic of opening new
colleges or granting affiliation to private colleges. In order
to fill this gap GGSIPU is established as a teaching and
affiliating university. Through this the government of
Delhi has also promoted the private initiative in higher
education.
At present there are 68 self-financing institutions, and
nine Government managed engineering institutions are
affiliated with the University in the diverse areas of
engineering/technology, management, computer
applications, mass communications, bachelor of
education physiotherapy, homeopathy, heritage and
conservation management & LLD (Hons.).This includes
Mahila Institute of Technology, one of the first
institutions offering engineering, programme exclusively
for women and five privately managed engineering
colleges. Eighty-five per cent of seats in the institution
located in NCR of Delhi were reserved for Delhi
Students. A total intake capacity of about 9000 seats in
different disciplines was created. However this is a
matter of research that out of approximately 6.69 lakh of
enrolment at secondary and senior secondary level how
many can have a seat in higher education institutions in
their state.
Private Universities: Among private universities in the
capital are the Amity University and Rai University.
Open University: Delhi is also home to the largest open
university of the world i.e., The Indira Gandhi National
Open University, commonly known as IGNOU.
In total 7 universities and 131 degree colleges are
there in Delhi. Of these, 82 colleges are affiliated with
Delhi University and the remaining 49 colleges are
affiliated with GGSIPU. The Delhi Government sponsors
40 Delhi University Colleges, of which 20 are fully funded
by Delhi Government.
Deemed Universities: In addition to the above, there are
ten deemed universities in the capital namely the Indian
Agricultural Research Institute (IARI), Indian Institute of
Foreign Trade (IIFT), Indian Law Institute (ILI), National
Museum Institute of History of Art, Conversation and
Museology, National School of Drama (NSD), Rashtriya
Sanskrit Sansthana, School of Planning and Architecture
(SPA), Shri Lal Bahadur Shastri Rashtriya Sanskrit
Vidyapeeth, TERI School of Advanced Studies, and
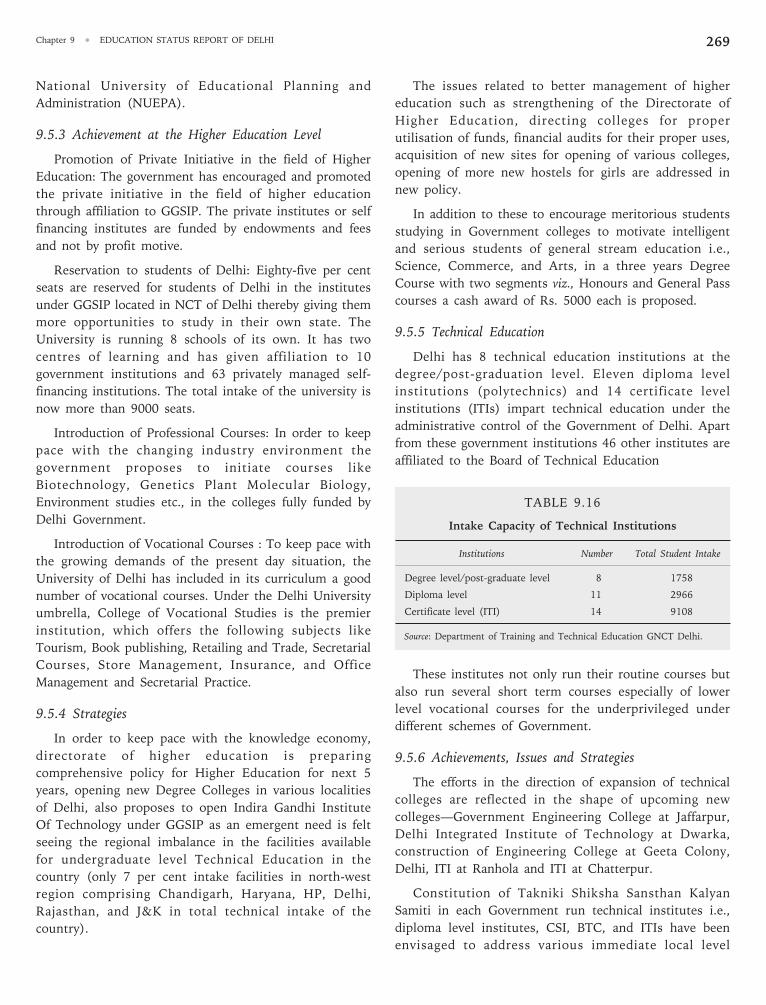
Chapter 9 • EDUCATION STATUS REPORT OF DELHI 269
National University of Educational Planning and
Administration (NUEPA).
9.5.3 Achievement at the Higher Education Level
Promotion of Private Initiative in the field of Higher
Education: The government has encouraged and promoted
the private initiative in the field of higher education
through affiliation to GGSIP. The private institutes or self
financing institutes are funded by endowments and fees
and not by profit motive.
Reservation to students of Delhi: Eighty-five per cent
seats are reserved for students of Delhi in the institutes
under GGSIP located in NCT of Delhi thereby giving them
more opportunities to study in their own state. The
University is running 8 schools of its own. It has two
centres of learning and has given affiliation to 10
government institutions and 63 privately managed self-
financing institutions. The total intake of the university is
now more than 9000 seats.
Introduction of Professional Courses: In order to keep
pace with the changing industry environment the
government proposes to initiate courses like
Biotechnology, Genetics Plant Molecular Biology,
Environment studies etc., in the colleges fully funded by
Delhi Government.
Introduction of Vocational Courses : To keep pace with
the growing demands of the present day situation, the
University of Delhi has included in its curriculum a good
number of vocational courses. Under the Delhi University
umbrella, College of Vocational Studies is the premier
institution, which offers the following subjects like
Tourism, Book publishing, Retailing and Trade, Secretarial
Courses, Store Management, Insurance, and Office
Management and Secretarial Practice.
9.5.4 Strategies
In order to keep pace with the knowledge economy,
directorate of higher education is preparing
comprehensive policy for Higher Education for next 5
years, opening new Degree Colleges in various localities
of Delhi, also proposes to open Indira Gandhi Institute
Of Technology under GGSIP as an emergent need is felt
seeing the regional imbalance in the facilities available
for undergraduate level Technical Education in the
country (only 7 per cent intake facilities in north-west
region comprising Chandigarh, Haryana, HP, Delhi,
Rajasthan, and J&K in total technical intake of the
country).
The issues related to better management of higher
education such as strengthening of the Directorate of
Higher Education, directing colleges for proper
utilisation of funds, financial audits for their proper uses,
acquisition of new sites for opening of various colleges,
opening of more new hostels for girls are addressed in
new policy.
In addition to these to encourage meritorious students
studying in Government colleges to motivate intelligent
and serious students of general stream education i.e.,
Science, Commerce, and Arts, in a three years Degree
Course with two segments viz., Honours and General Pass
courses a cash award of Rs. 5000 each is proposed.
9.5.5 Technical Education
Delhi has 8 technical education institutions at the
degree/post-graduation level. Eleven diploma level
institutions (polytechnics) and 14 certificate level
institutions (ITIs) impart technical education under the
administrative control of the Government of Delhi. Apart
from these government institutions 46 other institutes are
affiliated to the Board of Technical Education
TABLE 9.16
Intake Capacity of Technical Institutions
Institutions Number Total Student Intake
Degree level/post-graduate level 8 1758
Diploma level 11 2966
Certificate level (ITI) 14 9108
Source: Department of Training and Technical Education GNCT Delhi.
These institutes not only run their routine courses but
also run several short term courses especially of lower
level vocational courses for the underprivileged under
different schemes of Government.
9.5.6 Achievements, Issues and Strategies
The efforts in the direction of expansion of technical
colleges are reflected in the shape of upcoming new
colleges—Government Engineering College at Jaffarpur,
Delhi Integrated Institute of Technology at Dwarka,
construction of Engineering College at Geeta Colony,
Delhi, ITI at Ranhola and ITI at Chatterpur.
Constitution of Takniki Shiksha Sansthan Kalyan
Samiti in each Government run technical institutes i.e.,
diploma level institutes, CSI, BTC, and ITIs have been
envisaged to address various immediate local level
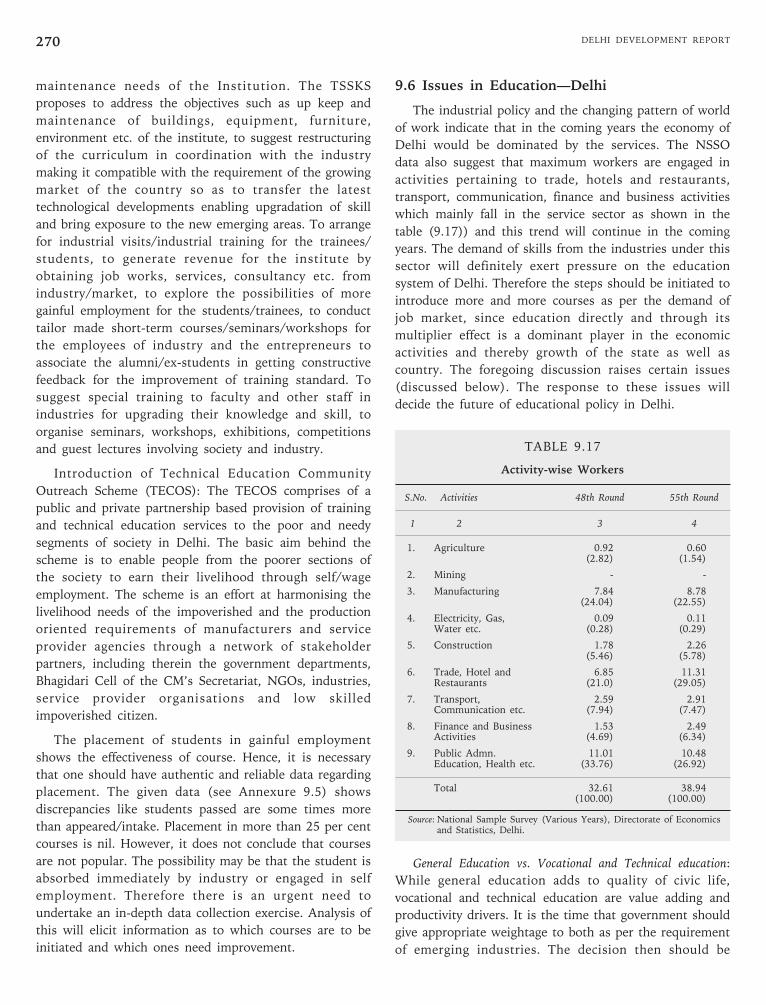
DELHI DEVELOPMENT REPORT270
maintenance needs of the Institution. The TSSKS
proposes to address the objectives such as up keep and
maintenance of buildings, equipment, furniture,
environment etc. of the institute, to suggest restructuring
of the curriculum in coordination with the industry
making it compatible with the requirement of the growing
market of the country so as to transfer the latest
technological developments enabling upgradation of skill
and bring exposure to the new emerging areas. To arrange
for industrial visits/industrial training for the trainees/
students, to generate revenue for the institute by
obtaining job works, services, consultancy etc. from
industry/market, to explore the possibilities of more
gainful employment for the students/trainees, to conduct
tailor made short-term courses/seminars/workshops for
the employees of industry and the entrepreneurs to
associate the alumni/ex-students in getting constructive
feedback for the improvement of training standard. To
suggest special training to faculty and other staff in
industries for upgrading their knowledge and skill, to
organise seminars, workshops, exhibitions, competitions
and guest lectures involving society and industry.
Introduction of Technical Education Community
Outreach Scheme (TECOS): The TECOS comprises of a
public and private partnership based provision of training
and technical education services to the poor and needy
segments of society in Delhi. The basic aim behind the
scheme is to enable people from the poorer sections of
the society to earn their livelihood through self/wage
employment. The scheme is an effort at harmonising the
livelihood needs of the impoverished and the production
oriented requirements of manufacturers and service
provider agencies through a network of stakeholder
partners, including therein the government departments,
Bhagidari Cell of the CM’s Secretariat, NGOs, industries,
service provider organisations and low skilled
impoverished citizen.
The placement of students in gainful employment
shows the effectiveness of course. Hence, it is necessary
that one should have authentic and reliable data regarding
placement. The given data (see Annexure 9.5) shows
discrepancies like students passed are some times more
than appeared/intake. Placement in more than 25 per cent
courses is nil. However, it does not conclude that courses
are not popular. The possibility may be that the student is
absorbed immediately by industry or engaged in self
employment. Therefore there is an urgent need to
undertake an in-depth data collection exercise. Analysis of
this will elicit information as to which courses are to be
initiated and which ones need improvement.
9.6 Issues in Education—Delhi
The industrial policy and the changing pattern of world
of work indicate that in the coming years the economy of
Delhi would be dominated by the services. The NSSO
data also suggest that maximum workers are engaged in
activities pertaining to trade, hotels and restaurants,
transport, communication, finance and business activities
which mainly fall in the service sector as shown in the
table (9.17)) and this trend will continue in the coming
years. The demand of skills from the industries under this
sector will definitely exert pressure on the education
system of Delhi. Therefore the steps should be initiated to
introduce more and more courses as per the demand of
job market, since education directly and through its
multiplier effect is a dominant player in the economic
activities and thereby growth of the state as well as
country. The foregoing discussion raises certain issues
(discussed below). The response to these issues will
decide the future of educational policy in Delhi.
TABLE 9.17
Activity-wise Workers
S.No. Activities 48th Round 55th Round
1 2 3 4
1. Agriculture 0.92 0.60(2.82) (1.54)
2. Mining - -
3. Manufacturing 7.84 8.78(24.04) (22.55)
4. Electricity, Gas, 0.09 0.11Water etc. (0.28) (0.29)
5. Construction 1.78 2.26(5.46) (5.78)
6. Trade, Hotel and 6.85 11.31Restaurants (21.0) (29.05)
7. Transport, 2.59 2.91Communication etc. (7.94) (7.47)
8. Finance and Business 1.53 2.49Activities (4.69) (6.34)
9. Public Admn. 11.01 10.48Education, Health etc. (33.76) (26.92)
Total 32.61 38.94(100.00) (100.00)
Source: National Sample Survey (Various Years), Directorate of Economicsand Statistics, Delhi.
General Education vs. Vocational and Technical education:
While general education adds to quality of civic life,
vocational and technical education are value adding and
productivity drivers. It is the time that government should
give appropriate weightage to both as per the requirement
of emerging industries. The decision then should be
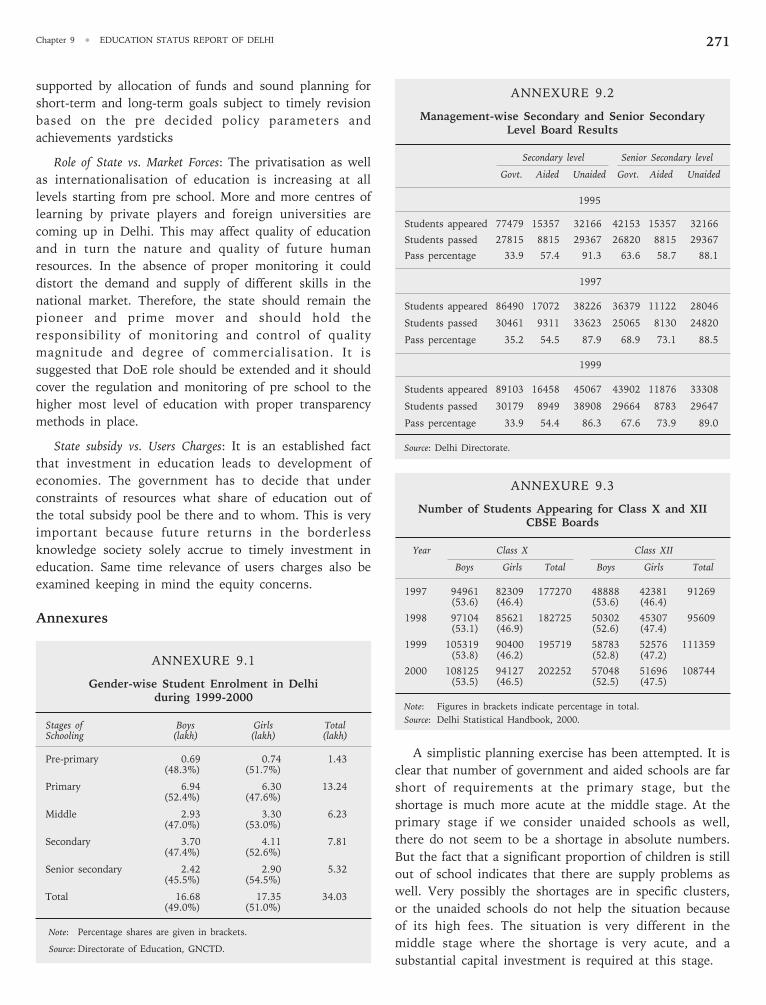
Chapter 9 • EDUCATION STATUS REPORT OF DELHI 271
ANNEXURE 9.2
Management-wise Secondary and Senior SecondaryLevel Board Results
Secondary level Senior Secondary level
Govt. Aided Unaided Govt. Aided Unaided
1995
Students appeared 77479 15357 32166 42153 15357 32166
Students passed 27815 8815 29367 26820 8815 29367
Pass percentage 33.9 57.4 91.3 63.6 58.7 88.1
1997
Students appeared 86490 17072 38226 36379 11122 28046
Students passed 30461 9311 33623 25065 8130 24820
Pass percentage 35.2 54.5 87.9 68.9 73.1 88.5
1999
Students appeared 89103 16458 45067 43902 11876 33308
Students passed 30179 8949 38908 29664 8783 29647
Pass percentage 33.9 54.4 86.3 67.6 73.9 89.0
Source: Delhi Directorate.
ANNEXURE 9.3
Number of Students Appearing for Class X and XIICBSE Boards
Year Class X Class XII
Boys Girls Total Boys Girls Total
1997 94961 82309 177270 48888 42381 91269(53.6) (46.4) (53.6) (46.4)
1998 97104 85621 182725 50302 45307 95609(53.1) (46.9) (52.6) (47.4)
1999 105319 90400 195719 58783 52576 111359(53.8) (46.2) (52.8) (47.2)
2000 108125 94127 202252 57048 51696 108744(53.5) (46.5) (52.5) (47.5)
Note: Figures in brackets indicate percentage in total.
Source: Delhi Statistical Handbook, 2000.
A simplistic planning exercise has been attempted. It is
clear that number of government and aided schools are far
short of requirements at the primary stage, but the
shortage is much more acute at the middle stage. At the
primary stage if we consider unaided schools as well,
there do not seem to be a shortage in absolute numbers.
But the fact that a significant proportion of children is still
out of school indicates that there are supply problems as
well. Very possibly the shortages are in specific clusters,
or the unaided schools do not help the situation because
of its high fees. The situation is very different in the
middle stage where the shortage is very acute, and a
substantial capital investment is required at this stage.
supported by allocation of funds and sound planning for
short-term and long-term goals subject to timely revision
based on the pre decided policy parameters and
achievements yardsticks
Role of State vs. Market Forces: The privatisation as well
as internationalisation of education is increasing at all
levels starting from pre school. More and more centres of
learning by private players and foreign universities are
coming up in Delhi. This may affect quality of education
and in turn the nature and quality of future human
resources. In the absence of proper monitoring it could
distort the demand and supply of different skills in the
national market. Therefore, the state should remain the
pioneer and prime mover and should hold the
responsibility of monitoring and control of quality
magnitude and degree of commercialisation. It is
suggested that DoE role should be extended and it should
cover the regulation and monitoring of pre school to the
higher most level of education with proper transparency
methods in place.
State subsidy vs. Users Charges: It is an established fact
that investment in education leads to development of
economies. The government has to decide that under
constraints of resources what share of education out of
the total subsidy pool be there and to whom. This is very
important because future returns in the borderless
knowledge society solely accrue to timely investment in
education. Same time relevance of users charges also be
examined keeping in mind the equity concerns.
Annexures
ANNEXURE 9.1
Gender-wise Student Enrolment in Delhiduring 1999-2000
Stages of Boys Girls TotalSchooling (lakh) (lakh) (lakh)
Pre-primary 0.69 0.74 1.43(48.3%) (51.7%)
Primary 6.94 6.30 13.24(52.4%) (47.6%)
Middle 2.93 3.30 6.23(47.0%) (53.0%)
Secondary 3.70 4.11 7.81(47.4%) (52.6%)
Senior secondary 2.42 2.90 5.32(45.5%) (54.5%)
Total 16.68 17.35 34.03(49.0%) (51.0%)
Note: Percentage shares are given in brackets.
Source: Directorate of Education, GNCTD.
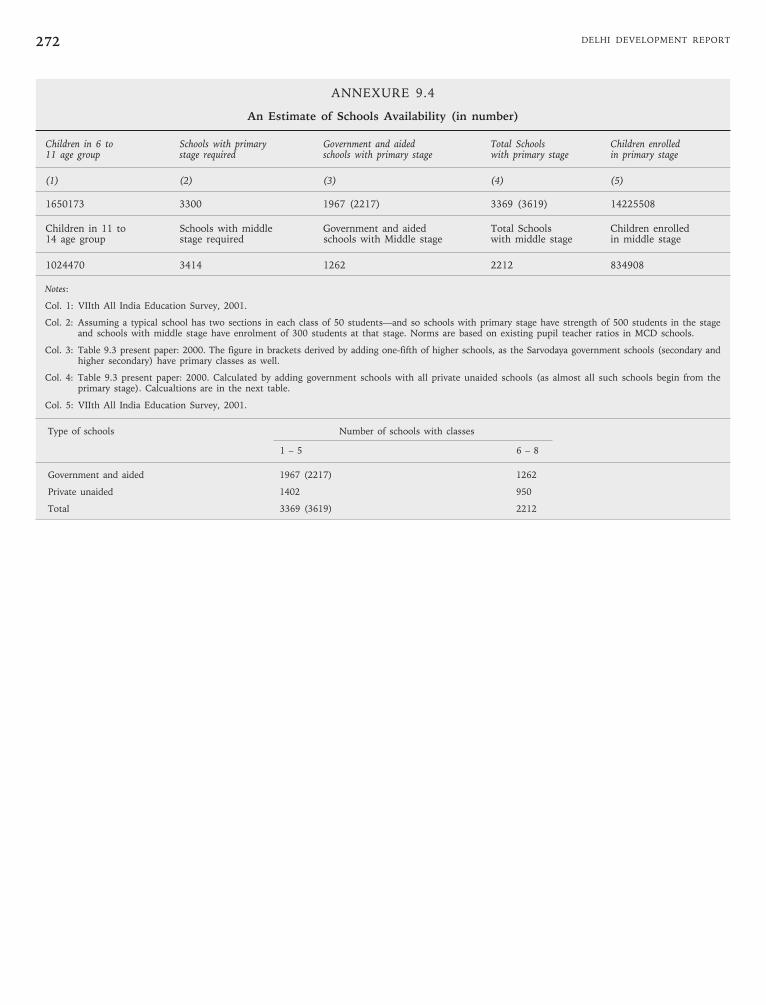
DELHI DEVELOPMENT REPORT272
ANNEXURE 9.4
An Estimate of Schools Availability (in number)
Children in 6 to Schools with primary Government and aided Total Schools Children enrolled11 age group stage required schools with primary stage with primary stage in primary stage
(1) (2) (3) (4) (5)
1650173 3300 1967 (2217) 3369 (3619) 14225508
Children in 11 to Schools with middle Government and aided Total Schools Children enrolled14 age group stage required schools with Middle stage with middle stage in middle stage
1024470 3414 1262 2212 834908
Notes:
Col. 1: VIIth All India Education Survey, 2001.
Col. 2: Assuming a typical school has two sections in each class of 50 students—and so schools with primary stage have strength of 500 students in the stageand schools with middle stage have enrolment of 300 students at that stage. Norms are based on existing pupil teacher ratios in MCD schools.
Col. 3: Table 9.3 present paper: 2000. The figure in brackets derived by adding one-fifth of higher schools, as the Sarvodaya government schools (secondary andhigher secondary) have primary classes as well.
Col. 4: Table 9.3 present paper: 2000. Calculated by adding government schools with all private unaided schools (as almost all such schools begin from theprimary stage). Calcualtions are in the next table.
Col. 5: VIIth All India Education Survey, 2001.
Type of schools Number of schools with classes
1 – 5 6 – 8
Government and aided 1967 (2217) 1262
Private unaided 1402 950
Total 3369 (3619) 2212
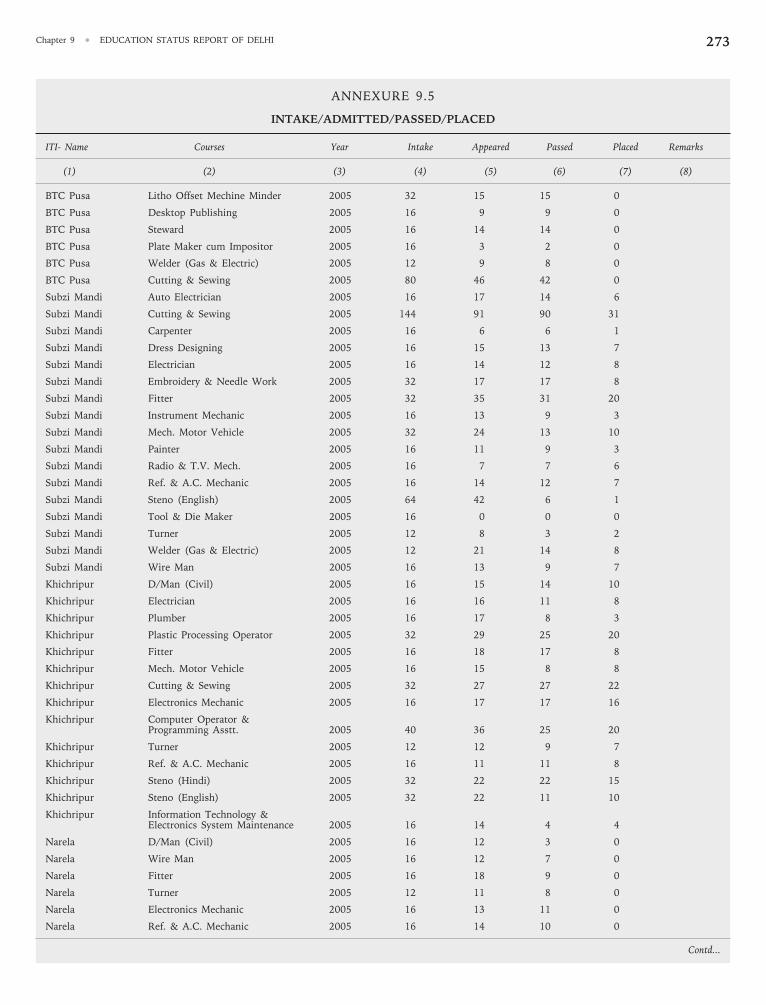
Chapter 9 • EDUCATION STATUS REPORT OF DELHI 273
ANNEXURE 9.5
INTAKE/ADMITTED/PASSED/PLACED
ITI- Name Courses Year Intake Appeared Passed Placed Remarks
(1) (2) (3) (4) (5) (6) (7) (8)
BTC Pusa Litho Offset Mechine Minder 2005 32 15 15 0
BTC Pusa Desktop Publishing 2005 16 9 9 0
BTC Pusa Steward 2005 16 14 14 0
BTC Pusa Plate Maker cum Impositor 2005 16 3 2 0
BTC Pusa Welder (Gas & Electric) 2005 12 9 8 0
BTC Pusa Cutting & Sewing 2005 80 46 42 0
Subzi Mandi Auto Electrician 2005 16 17 14 6
Subzi Mandi Cutting & Sewing 2005 144 91 90 31
Subzi Mandi Carpenter 2005 16 6 6 1
Subzi Mandi Dress Designing 2005 16 15 13 7
Subzi Mandi Electrician 2005 16 14 12 8
Subzi Mandi Embroidery & Needle Work 2005 32 17 17 8
Subzi Mandi Fitter 2005 32 35 31 20
Subzi Mandi Instrument Mechanic 2005 16 13 9 3
Subzi Mandi Mech. Motor Vehicle 2005 32 24 13 10
Subzi Mandi Painter 2005 16 11 9 3
Subzi Mandi Radio & T.V. Mech. 2005 16 7 7 6
Subzi Mandi Ref. & A.C. Mechanic 2005 16 14 12 7
Subzi Mandi Steno (English) 2005 64 42 6 1
Subzi Mandi Tool & Die Maker 2005 16 0 0 0
Subzi Mandi Turner 2005 12 8 3 2
Subzi Mandi Welder (Gas & Electric) 2005 12 21 14 8
Subzi Mandi Wire Man 2005 16 13 9 7
Khichripur D/Man (Civil) 2005 16 15 14 10
Khichripur Electrician 2005 16 16 11 8
Khichripur Plumber 2005 16 17 8 3
Khichripur Plastic Processing Operator 2005 32 29 25 20
Khichripur Fitter 2005 16 18 17 8
Khichripur Mech. Motor Vehicle 2005 16 15 8 8
Khichripur Cutting & Sewing 2005 32 27 27 22
Khichripur Electronics Mechanic 2005 16 17 17 16
Khichripur Computer Operator &Programming Asstt. 2005 40 36 25 20
Khichripur Turner 2005 12 12 9 7
Khichripur Ref. & A.C. Mechanic 2005 16 11 11 8
Khichripur Steno (Hindi) 2005 32 22 22 15
Khichripur Steno (English) 2005 32 22 11 10
Khichripur Information Technology &Electronics System Maintenance 2005 16 14 4 4
Narela D/Man (Civil) 2005 16 12 3 0
Narela Wire Man 2005 16 12 7 0
Narela Fitter 2005 16 18 9 0
Narela Turner 2005 12 11 8 0
Narela Electronics Mechanic 2005 16 13 11 0
Narela Ref. & A.C. Mechanic 2005 16 14 10 0
Contd...
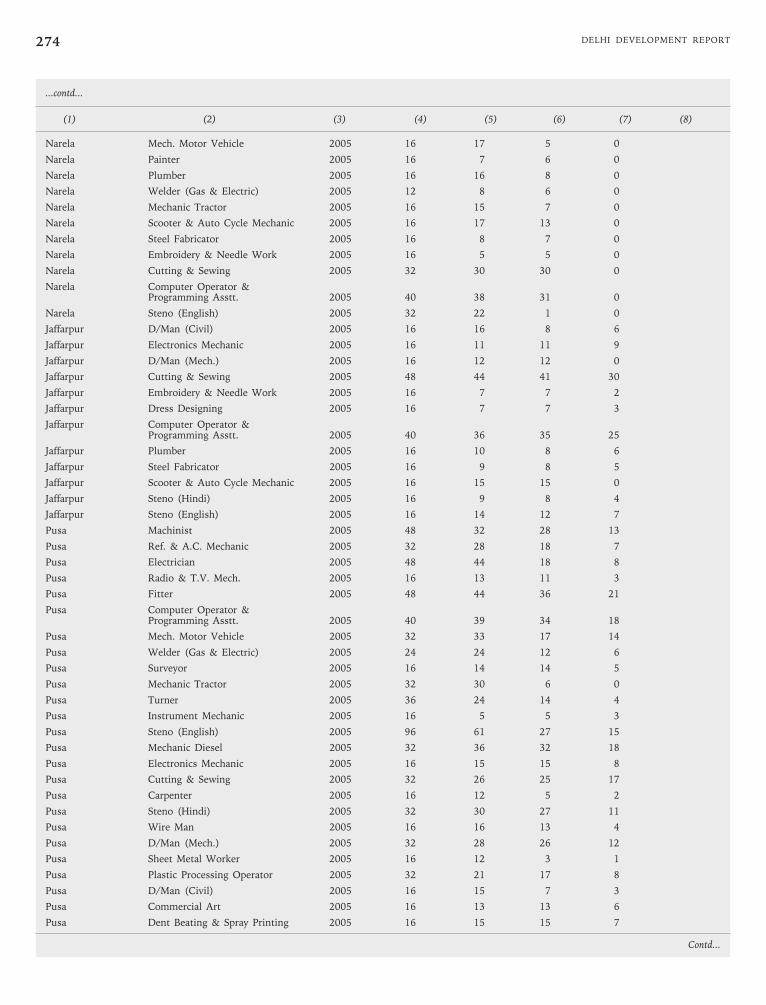
DELHI DEVELOPMENT REPORT274
(1) (2) (3) (4) (5) (6) (7) (8)
Narela Mech. Motor Vehicle 2005 16 17 5 0
Narela Painter 2005 16 7 6 0
Narela Plumber 2005 16 16 8 0
Narela Welder (Gas & Electric) 2005 12 8 6 0
Narela Mechanic Tractor 2005 16 15 7 0
Narela Scooter & Auto Cycle Mechanic 2005 16 17 13 0
Narela Steel Fabricator 2005 16 8 7 0
Narela Embroidery & Needle Work 2005 16 5 5 0
Narela Cutting & Sewing 2005 32 30 30 0
Narela Computer Operator &Programming Asstt. 2005 40 38 31 0
Narela Steno (English) 2005 32 22 1 0
Jaffarpur D/Man (Civil) 2005 16 16 8 6
Jaffarpur Electronics Mechanic 2005 16 11 11 9
Jaffarpur D/Man (Mech.) 2005 16 12 12 0
Jaffarpur Cutting & Sewing 2005 48 44 41 30
Jaffarpur Embroidery & Needle Work 2005 16 7 7 2
Jaffarpur Dress Designing 2005 16 7 7 3
Jaffarpur Computer Operator &Programming Asstt. 2005 40 36 35 25
Jaffarpur Plumber 2005 16 10 8 6
Jaffarpur Steel Fabricator 2005 16 9 8 5
Jaffarpur Scooter & Auto Cycle Mechanic 2005 16 15 15 0
Jaffarpur Steno (Hindi) 2005 16 9 8 4
Jaffarpur Steno (English) 2005 16 14 12 7
Pusa Machinist 2005 48 32 28 13
Pusa Ref. & A.C. Mechanic 2005 32 28 18 7
Pusa Electrician 2005 48 44 18 8
Pusa Radio & T.V. Mech. 2005 16 13 11 3
Pusa Fitter 2005 48 44 36 21
Pusa Computer Operator &Programming Asstt. 2005 40 39 34 18
Pusa Mech. Motor Vehicle 2005 32 33 17 14
Pusa Welder (Gas & Electric) 2005 24 24 12 6
Pusa Surveyor 2005 16 14 14 5
Pusa Mechanic Tractor 2005 32 30 6 0
Pusa Turner 2005 36 24 14 4
Pusa Instrument Mechanic 2005 16 5 5 3
Pusa Steno (English) 2005 96 61 27 15
Pusa Mechanic Diesel 2005 32 36 32 18
Pusa Electronics Mechanic 2005 16 15 15 8
Pusa Cutting & Sewing 2005 32 26 25 17
Pusa Carpenter 2005 16 12 5 2
Pusa Steno (Hindi) 2005 32 30 27 11
Pusa Wire Man 2005 16 16 13 4
Pusa D/Man (Mech.) 2005 32 28 26 12
Pusa Sheet Metal Worker 2005 16 12 3 1
Pusa Plastic Processing Operator 2005 32 21 17 8
Pusa D/Man (Civil) 2005 16 15 7 3
Pusa Commercial Art 2005 16 13 13 6
Pusa Dent Beating & Spray Printing 2005 16 15 15 7
...contd...
Contd...
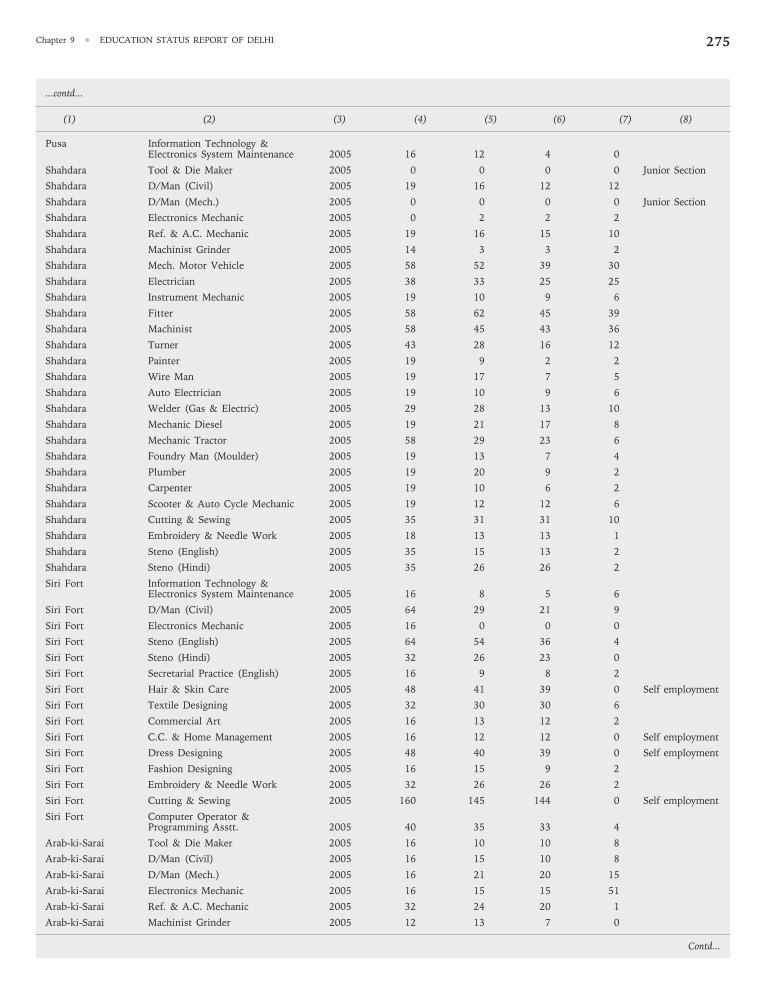
Chapter 9 • EDUCATION STATUS REPORT OF DELHI 275
(1) (2) (3) (4) (5) (6) (7) (8)
Pusa Information Technology &Electronics System Maintenance 2005 16 12 4 0
Shahdara Tool & Die Maker 2005 0 0 0 0 Junior Section
Shahdara D/Man (Civil) 2005 19 16 12 12
Shahdara D/Man (Mech.) 2005 0 0 0 0 Junior Section
Shahdara Electronics Mechanic 2005 0 2 2 2
Shahdara Ref. & A.C. Mechanic 2005 19 16 15 10
Shahdara Machinist Grinder 2005 14 3 3 2
Shahdara Mech. Motor Vehicle 2005 58 52 39 30
Shahdara Electrician 2005 38 33 25 25
Shahdara Instrument Mechanic 2005 19 10 9 6
Shahdara Fitter 2005 58 62 45 39
Shahdara Machinist 2005 58 45 43 36
Shahdara Turner 2005 43 28 16 12
Shahdara Painter 2005 19 9 2 2
Shahdara Wire Man 2005 19 17 7 5
Shahdara Auto Electrician 2005 19 10 9 6
Shahdara Welder (Gas & Electric) 2005 29 28 13 10
Shahdara Mechanic Diesel 2005 19 21 17 8
Shahdara Mechanic Tractor 2005 58 29 23 6
Shahdara Foundry Man (Moulder) 2005 19 13 7 4
Shahdara Plumber 2005 19 20 9 2
Shahdara Carpenter 2005 19 10 6 2
Shahdara Scooter & Auto Cycle Mechanic 2005 19 12 12 6
Shahdara Cutting & Sewing 2005 35 31 31 10
Shahdara Embroidery & Needle Work 2005 18 13 13 1
Shahdara Steno (English) 2005 35 15 13 2
Shahdara Steno (Hindi) 2005 35 26 26 2
Siri Fort Information Technology &Electronics System Maintenance 2005 16 8 5 6
Siri Fort D/Man (Civil) 2005 64 29 21 9
Siri Fort Electronics Mechanic 2005 16 0 0 0
Siri Fort Steno (English) 2005 64 54 36 4
Siri Fort Steno (Hindi) 2005 32 26 23 0
Siri Fort Secretarial Practice (English) 2005 16 9 8 2
Siri Fort Hair & Skin Care 2005 48 41 39 0 Self employment
Siri Fort Textile Designing 2005 32 30 30 6
Siri Fort Commercial Art 2005 16 13 12 2
Siri Fort C.C. & Home Management 2005 16 12 12 0 Self employment
Siri Fort Dress Designing 2005 48 40 39 0 Self employment
Siri Fort Fashion Designing 2005 16 15 9 2
Siri Fort Embroidery & Needle Work 2005 32 26 26 2
Siri Fort Cutting & Sewing 2005 160 145 144 0 Self employment
Siri Fort Computer Operator &Programming Asstt. 2005 40 35 33 4
Arab-ki-Sarai Tool & Die Maker 2005 16 10 10 8
Arab-ki-Sarai D/Man (Civil) 2005 16 15 10 8
Arab-ki-Sarai D/Man (Mech.) 2005 16 21 20 15
Arab-ki-Sarai Electronics Mechanic 2005 16 15 15 51
Arab-ki-Sarai Ref. & A.C. Mechanic 2005 32 24 20 1
Arab-ki-Sarai Machinist Grinder 2005 12 13 7 0
...contd...
Contd...
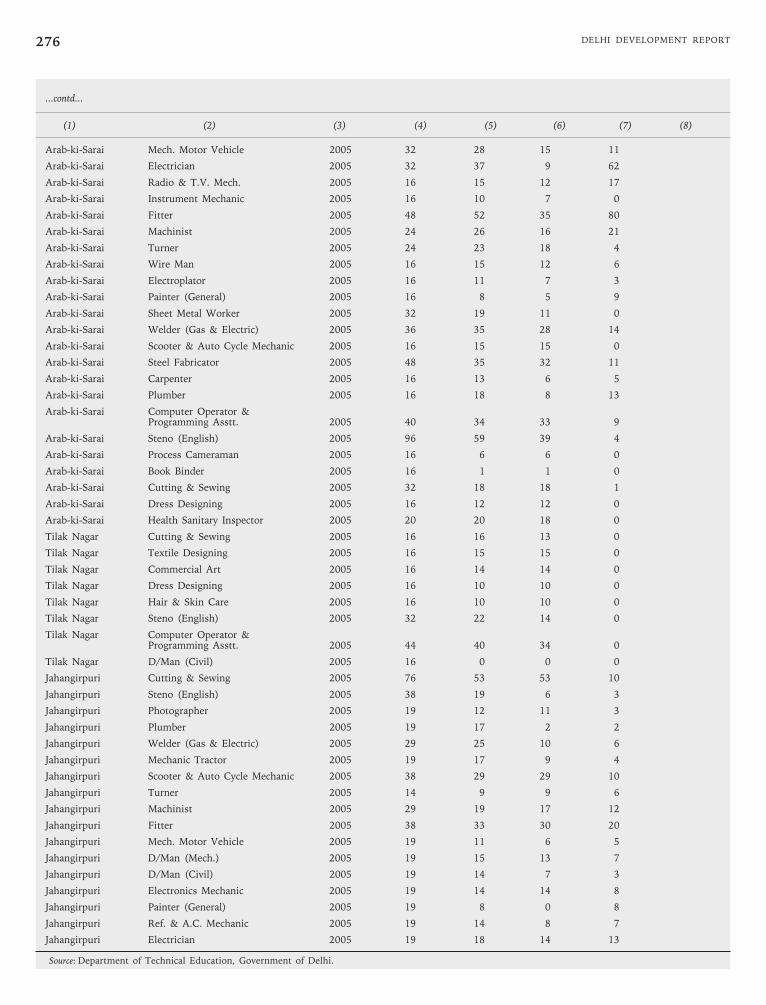
DELHI DEVELOPMENT REPORT276
(1) (2) (3) (4) (5) (6) (7) (8)
Arab-ki-Sarai Mech. Motor Vehicle 2005 32 28 15 11
Arab-ki-Sarai Electrician 2005 32 37 9 62
Arab-ki-Sarai Radio & T.V. Mech. 2005 16 15 12 17
Arab-ki-Sarai Instrument Mechanic 2005 16 10 7 0
Arab-ki-Sarai Fitter 2005 48 52 35 80
Arab-ki-Sarai Machinist 2005 24 26 16 21
Arab-ki-Sarai Turner 2005 24 23 18 4
Arab-ki-Sarai Wire Man 2005 16 15 12 6
Arab-ki-Sarai Electroplator 2005 16 11 7 3
Arab-ki-Sarai Painter (General) 2005 16 8 5 9
Arab-ki-Sarai Sheet Metal Worker 2005 32 19 11 0
Arab-ki-Sarai Welder (Gas & Electric) 2005 36 35 28 14
Arab-ki-Sarai Scooter & Auto Cycle Mechanic 2005 16 15 15 0
Arab-ki-Sarai Steel Fabricator 2005 48 35 32 11
Arab-ki-Sarai Carpenter 2005 16 13 6 5
Arab-ki-Sarai Plumber 2005 16 18 8 13
Arab-ki-Sarai Computer Operator &Programming Asstt. 2005 40 34 33 9
Arab-ki-Sarai Steno (English) 2005 96 59 39 4
Arab-ki-Sarai Process Cameraman 2005 16 6 6 0
Arab-ki-Sarai Book Binder 2005 16 1 1 0
Arab-ki-Sarai Cutting & Sewing 2005 32 18 18 1
Arab-ki-Sarai Dress Designing 2005 16 12 12 0
Arab-ki-Sarai Health Sanitary Inspector 2005 20 20 18 0
Tilak Nagar Cutting & Sewing 2005 16 16 13 0
Tilak Nagar Textile Designing 2005 16 15 15 0
Tilak Nagar Commercial Art 2005 16 14 14 0
Tilak Nagar Dress Designing 2005 16 10 10 0
Tilak Nagar Hair & Skin Care 2005 16 10 10 0
Tilak Nagar Steno (English) 2005 32 22 14 0
Tilak Nagar Computer Operator &Programming Asstt. 2005 44 40 34 0
Tilak Nagar D/Man (Civil) 2005 16 0 0 0
Jahangirpuri Cutting & Sewing 2005 76 53 53 10
Jahangirpuri Steno (English) 2005 38 19 6 3
Jahangirpuri Photographer 2005 19 12 11 3
Jahangirpuri Plumber 2005 19 17 2 2
Jahangirpuri Welder (Gas & Electric) 2005 29 25 10 6
Jahangirpuri Mechanic Tractor 2005 19 17 9 4
Jahangirpuri Scooter & Auto Cycle Mechanic 2005 38 29 29 10
Jahangirpuri Turner 2005 14 9 9 6
Jahangirpuri Machinist 2005 29 19 17 12
Jahangirpuri Fitter 2005 38 33 30 20
Jahangirpuri Mech. Motor Vehicle 2005 19 11 6 5
Jahangirpuri D/Man (Mech.) 2005 19 15 13 7
Jahangirpuri D/Man (Civil) 2005 19 14 7 3
Jahangirpuri Electronics Mechanic 2005 19 14 14 8
Jahangirpuri Painter (General) 2005 19 8 0 8
Jahangirpuri Ref. & A.C. Mechanic 2005 19 14 8 7
Jahangirpuri Electrician 2005 19 18 14 13
Source: Department of Technical Education, Government of Delhi.
...contd...
Chapter 10
Health and Family Welfare, RCH,Ayush and Nutrition
DELHI
10.1 Background
Physical, mental, social, financial and spiritual growth
of human beings is a continuous process that is essential
for ensuring development of full potential of human
capabilities in any given society, state or the country, as a
whole. Standards for these parameters denote the
development level of the human race in the defined
group. Human development is a continuous process and
the HDI is a relative indicator of the same. Parameters
that currently form the base for HDI include: i) Longevity,
ii) Knowledge, and iii) Income. At the given point of time,
the Index certainly helps in determining the relative levels
of growth and development in a defined group of
population—country wise, region wise or in any other
suitable defined group to determine the apparent
deprivation in a given group of population for initiating
appropriate measures accordingly. Ranking for India in the
latest HDR of 2004 is dismal 127th out of 175 countries and
it has remained at the same rank as that of the last year.
10.2 Peculiarities of Delhi—The Capital State
Delhi is the national capital of the largest and one of
the most vibrant democracies in the world, and also it is
one of the most rapidly expanding economies. A city of
hopes and promises for a common man—leading to a
common belief that whatever was not possible at their
local place could be achieved in Delhi—a trust that needs
to be upheld. The city has its own share of problems
too—partly inherent and partly due to a large number of
in-migrations of people from other states with hope and
expectations (on daily floating basis as well as on long-
term/permanent basis)—leading to unusually very high
population density of over 9000 persons/sq. km (93 per
cent urban) compared to the national average of about
350 persons/sq. km (25 per cent urban). This extra share
of population load puts additional pressure on all the
infrastructure facilities that are already overstretched to
their extreme. There is a lot of stress on the public
facilities in Delhi—especially on the Health sector.
Medical care and treatment cannot be denied to a fellow
countryman on any ground. No restriction can be made
on any basis.
Health care facilities in the adjoining regions,
unfortunately, remain very poor leading to extra load on
Delhi necessitating provision of adequate infrastructure to
shoulder this additional responsibility. The geographic
distribution of people in Delhi varies from those staying
in posh urban localities with well-developed infrastructure
to those who are homeless or live in slums with complete
absence of basic facilities. A large number of urbanised
villages (Lal Dora areas) also lack basic infrastructure and/
or proper planning of the residential areas leading to over
crowding with unhealthy surroundings. About 15 per cent
of Delhi’s population lives in slums. As per the Census of
2001, the population of Delhi is about 13.8 million with a
projection of 17.7 million by 2007, if the present trend of
migration of population from the adjoining states
continues. Though during the last decade, the birth rate
has fallen from 28.52 to 23.33 per 1,000, the growth rate
of Delhi has remained unaffected due to continued in-
migration.
The health of people anywhere is largely dependent
upon their living conditions and lifestyles. The factors in
our everyday life, which significantly influence our health
status, are called “health determinants”. Health
determinants include water supply, sanitation, nutrition,
food safety, health services, housing conditions, working
conditions, education, lifestyles, population changes, income,
and so on. They form the physical, social and economic
environments that surround us. The Hon’ble Chief Minister
has a long cherished dream to make Delhi as ‘the role
model’ city in the country for health care infrastructure.
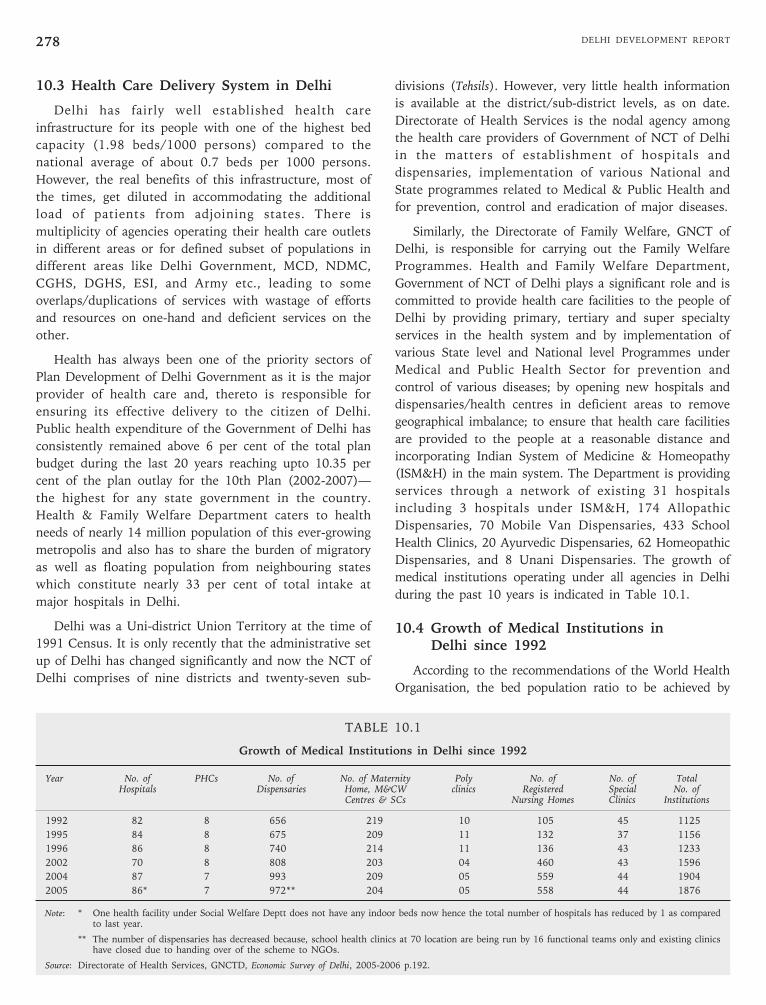
DELHI DEVELOPMENT REPORT278
TABLE 10.1
Growth of Medical Institutions in Delhi since 1992
Year No. of PHCs No. of No. of Maternity Poly No. of No. of TotalHospitals Dispensaries Home, M&CW clinics Registered Special No. of
Centres & SCs Nursing Homes Clinics Institutions
1992 82 8 656 219 10 105 45 1125
1995 84 8 675 209 11 132 37 1156
1996 86 8 740 214 11 136 43 1233
2002 70 8 808 203 04 460 43 1596
2004 87 7 993 209 05 559 44 1904
2005 86* 7 972** 204 05 558 44 1876
Note: * One health facility under Social Welfare Deptt does not have any indoor beds now hence the total number of hospitals has reduced by 1 as comparedto last year.
** The number of dispensaries has decreased because, school health clinics at 70 location are being run by 16 functional teams only and existing clinicshave closed due to handing over of the scheme to NGOs.
Source: Directorate of Health Services, GNCTD, Economic Survey of Delhi, 2005-2006 p.192.
10.3 Health Care Delivery System in Delhi
Delhi has fairly well established health care
infrastructure for its people with one of the highest bed
capacity (1.98 beds/1000 persons) compared to the
national average of about 0.7 beds per 1000 persons.
However, the real benefits of this infrastructure, most of
the times, get diluted in accommodating the additional
load of patients from adjoining states. There is
multiplicity of agencies operating their health care outlets
in different areas or for defined subset of populations in
different areas like Delhi Government, MCD, NDMC,
CGHS, DGHS, ESI, and Army etc., leading to some
overlaps/duplications of services with wastage of efforts
and resources on one-hand and deficient services on the
other.
Health has always been one of the priority sectors of
Plan Development of Delhi Government as it is the major
provider of health care and, thereto is responsible for
ensuring its effective delivery to the citizen of Delhi.
Public health expenditure of the Government of Delhi has
consistently remained above 6 per cent of the total plan
budget during the last 20 years reaching upto 10.35 per
cent of the plan outlay for the 10th Plan (2002-2007)—
the highest for any state government in the country.
Health & Family Welfare Department caters to health
needs of nearly 14 million population of this ever-growing
metropolis and also has to share the burden of migratory
as well as floating population from neighbouring states
which constitute nearly 33 per cent of total intake at
major hospitals in Delhi.
Delhi was a Uni-district Union Territory at the time of
1991 Census. It is only recently that the administrative set
up of Delhi has changed significantly and now the NCT of
Delhi comprises of nine districts and twenty-seven sub-
divisions (Tehsils). However, very little health information
is available at the district/sub-district levels, as on date.
Directorate of Health Services is the nodal agency among
the health care providers of Government of NCT of Delhi
in the matters of establishment of hospitals and
dispensaries, implementation of various National and
State programmes related to Medical & Public Health and
for prevention, control and eradication of major diseases.
Similarly, the Directorate of Family Welfare, GNCT of
Delhi, is responsible for carrying out the Family Welfare
Programmes. Health and Family Welfare Department,
Government of NCT of Delhi plays a significant role and is
committed to provide health care facilities to the people of
Delhi by providing primary, tertiary and super specialty
services in the health system and by implementation of
various State level and National level Programmes under
Medical and Public Health Sector for prevention and
control of various diseases; by opening new hospitals and
dispensaries/health centres in deficient areas to remove
geographical imbalance; to ensure that health care facilities
are provided to the people at a reasonable distance and
incorporating Indian System of Medicine & Homeopathy
(ISM&H) in the main system. The Department is providing
services through a network of existing 31 hospitals
including 3 hospitals under ISM&H, 174 Allopathic
Dispensaries, 70 Mobile Van Dispensaries, 433 School
Health Clinics, 20 Ayurvedic Dispensaries, 62 Homeopathic
Dispensaries, and 8 Unani Dispensaries. The growth of
medical institutions operating under all agencies in Delhi
during the past 10 years is indicated in Table 10.1.
10.4 Growth of Medical Institutions inDelhi since 1992
According to the recommendations of the World Health
Organisation, the bed population ratio to be achieved by
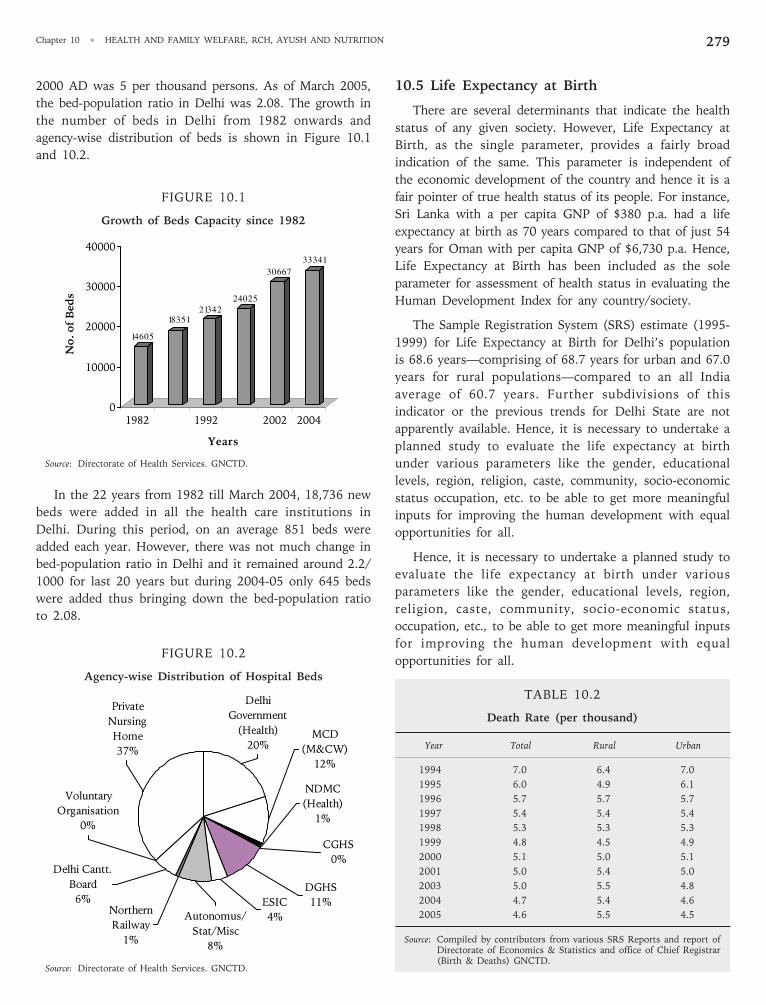
Chapter 10 • HEALTH AND FAMILY WELFARE, RCH, AYUSH AND NUTRITION 279
TABLE 10.2
Death Rate (per thousand)
Year Total Rural Urban
1994 7.0 6.4 7.0
1995 6.0 4.9 6.1
1996 5.7 5.7 5.7
1997 5.4 5.4 5.4
1998 5.3 5.3 5.3
1999 4.8 4.5 4.9
2000 5.1 5.0 5.1
2001 5.0 5.4 5.0
2003 5.0 5.5 4.8
2004 4.7 5.4 4.6
2005 4.6 5.5 4.5
Source: Compiled by contributors from various SRS Reports and report ofDirectorate of Economics & Statistics and office of Chief Registrar(Birth & Deaths) GNCTD.
2000 AD was 5 per thousand persons. As of March 2005,
the bed-population ratio in Delhi was 2.08. The growth in
the number of beds in Delhi from 1982 onwards and
agency-wise distribution of beds is shown in Figure 10.1
and 10.2.
FIGURE 10.1
Growth of Beds Capacity since 1982
Source: Directorate of Health Services. GNCTD.
In the 22 years from 1982 till March 2004, 18,736 new
beds were added in all the health care institutions in
Delhi. During this period, on an average 851 beds were
added each year. However, there was not much change in
bed-population ratio in Delhi and it remained around 2.2/
1000 for last 20 years but during 2004-05 only 645 beds
were added thus bringing down the bed-population ratio
to 2.08.
FIGURE 10.2
Agency-wise Distribution of Hospital Beds
Source: Directorate of Health Services. GNCTD.
10.5 Life Expectancy at Birth
There are several determinants that indicate the health
status of any given society. However, Life Expectancy at
Birth, as the single parameter, provides a fairly broad
indication of the same. This parameter is independent of
the economic development of the country and hence it is a
fair pointer of true health status of its people. For instance,
Sri Lanka with a per capita GNP of $380 p.a. had a life
expectancy at birth as 70 years compared to that of just 54
years for Oman with per capita GNP of $6,730 p.a. Hence,
Life Expectancy at Birth has been included as the sole
parameter for assessment of health status in evaluating the
Human Development Index for any country/society.
The Sample Registration System (SRS) estimate (1995-
1999) for Life Expectancy at Birth for Delhi’s population
is 68.6 years—comprising of 68.7 years for urban and 67.0
years for rural populations—compared to an all India
average of 60.7 years. Further subdivisions of this
indicator or the previous trends for Delhi State are not
apparently available. Hence, it is necessary to undertake a
planned study to evaluate the life expectancy at birth
under various parameters like the gender, educational
levels, region, religion, caste, community, socio-economic
status occupation, etc. to be able to get more meaningful
inputs for improving the human development with equal
opportunities for all.
Hence, it is necessary to undertake a planned study to
evaluate the life expectancy at birth under various
parameters like the gender, educational levels, region,
religion, caste, community, socio-economic status,
occupation, etc., to be able to get more meaningful inputs
for improving the human development with equal
opportunities for all.
14605
1835121342
24025
3066733341
0
10000
20000
30000
40000
No
. o
f B
ed
s
1982 1992 2002 2004
Years
Private
Nursing
Home
37%
Delhi
Government
(Health)
20%MCD
(M&CW)
12%
CGHS
0%
NDMC
(Health)
1%
DGHS
11%ESIC
4%Autonomus/
Stat/Misc
8%
Voluntary
Organisation
0%
Delhi Cantt.
Board
6%Northern
Railway
1%
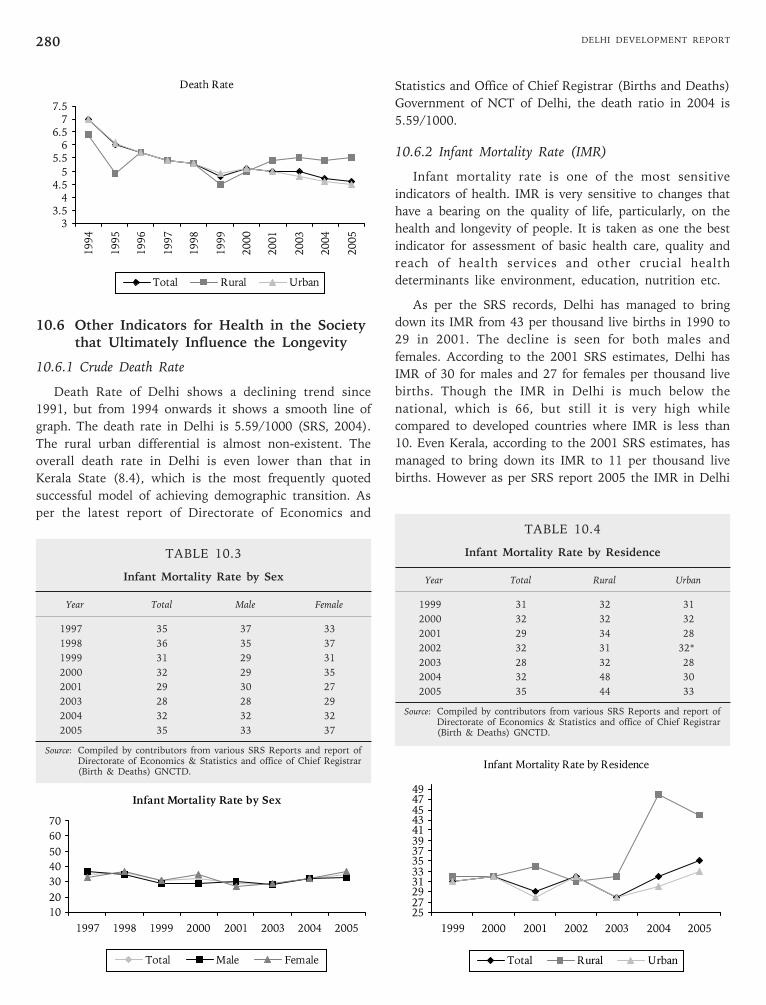
DELHI DEVELOPMENT REPORT280
Statistics and Office of Chief Registrar (Births and Deaths)
Government of NCT of Delhi, the death ratio in 2004 is
5.59/1000.
10.6.2 Infant Mortality Rate (IMR)
Infant mortality rate is one of the most sensitive
indicators of health. IMR is very sensitive to changes that
have a bearing on the quality of life, particularly, on the
health and longevity of people. It is taken as one the best
indicator for assessment of basic health care, quality and
reach of health services and other crucial health
determinants like environment, education, nutrition etc.
As per the SRS records, Delhi has managed to bring
down its IMR from 43 per thousand live births in 1990 to
29 in 2001. The decline is seen for both males and
females. According to the 2001 SRS estimates, Delhi has
IMR of 30 for males and 27 for females per thousand live
births. Though the IMR in Delhi is much below the
national, which is 66, but still it is very high while
compared to developed countries where IMR is less than
10. Even Kerala, according to the 2001 SRS estimates, has
managed to bring down its IMR to 11 per thousand live
births. However as per SRS report 2005 the IMR in Delhi
TABLE 10.3
Infant Mortality Rate by Sex
Year Total Male Female
1997 35 37 33
1998 36 35 37
1999 31 29 31
2000 32 29 35
2001 29 30 27
2003 28 28 29
2004 32 32 32
2005 35 33 37
Source: Compiled by contributors from various SRS Reports and report ofDirectorate of Economics & Statistics and office of Chief Registrar(Birth & Deaths) GNCTD.
10.6 Other Indicators for Health in the Societythat Ultimately Influence the Longevity
10.6.1 Crude Death Rate
Death Rate of Delhi shows a declining trend since
1991, but from 1994 onwards it shows a smooth line of
graph. The death rate in Delhi is 5.59/1000 (SRS, 2004).
The rural urban differential is almost non-existent. The
overall death rate in Delhi is even lower than that in
Kerala State (8.4), which is the most frequently quoted
successful model of achieving demographic transition. As
per the latest report of Directorate of Economics and
Death Rate
3
3.5
4
4.5
5
5.5
6
6.5
7
7.5
1994
1995
1996
1997
1998
1999
2000
2001
2003
2004
2005
Total Rural Urban
TABLE 10.4
Infant Mortality Rate by Residence
Year Total Rural Urban
1999 31 32 31
2000 32 32 32
2001 29 34 28
2002 32 31 32*
2003 28 32 28
2004 32 48 30
2005 35 44 33
Source: Compiled by contributors from various SRS Reports and report ofDirectorate of Economics & Statistics and office of Chief Registrar(Birth & Deaths) GNCTD.
Infant Mortality Rate by Sex
10
20
30
40
50
60
70
1997 1998 1999 2000 2001 2003 2004 2005
Total Male Female
Infant Mortality Rate by Residence
25272931333537394143454749
1999 2000 2001 2002 2003 2004 2005
Total Rural Urban
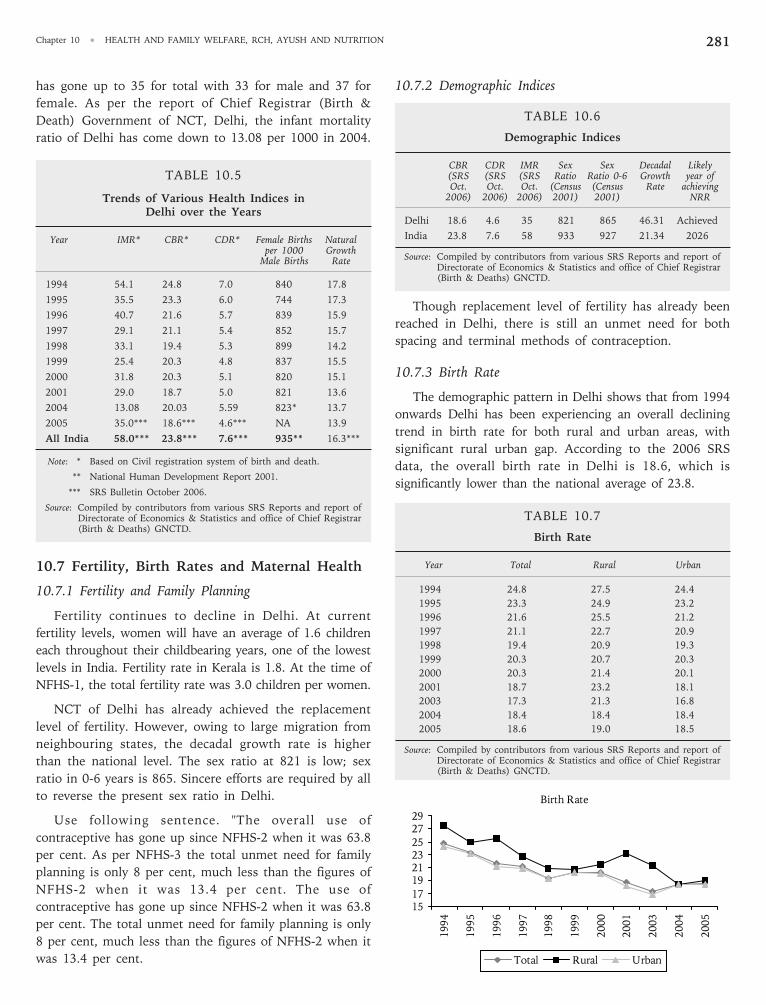
Chapter 10 • HEALTH AND FAMILY WELFARE, RCH, AYUSH AND NUTRITION 281
10.7.2 Demographic Indices
TABLE 10.6
Demographic Indices
CBR CDR IMR Sex Sex Decadal Likely(SRS (SRS (SRS Ratio Ratio 0-6 Growth year ofOct. Oct. Oct. (Census (Census Rate achieving
2006) 2006) 2006) 2001) 2001) NRR
Delhi 18.6 4.6 35 821 865 46.31 Achieved
India 23.8 7.6 58 933 927 21.34 2026
Source: Compiled by contributors from various SRS Reports and report ofDirectorate of Economics & Statistics and office of Chief Registrar(Birth & Deaths) GNCTD.
Though replacement level of fertility has already been
reached in Delhi, there is still an unmet need for both
spacing and terminal methods of contraception.
10.7.3 Birth Rate
The demographic pattern in Delhi shows that from 1994
onwards Delhi has been experiencing an overall declining
trend in birth rate for both rural and urban areas, with
significant rural urban gap. According to the 2006 SRS
data, the overall birth rate in Delhi is 18.6, which is
significantly lower than the national average of 23.8.
TABLE 10.7
Birth Rate
Year Total Rural Urban
1994 24.8 27.5 24.4
1995 23.3 24.9 23.2
1996 21.6 25.5 21.2
1997 21.1 22.7 20.9
1998 19.4 20.9 19.3
1999 20.3 20.7 20.3
2000 20.3 21.4 20.1
2001 18.7 23.2 18.1
2003 17.3 21.3 16.8
2004 18.4 18.4 18.4
2005 18.6 19.0 18.5
Source: Compiled by contributors from various SRS Reports and report ofDirectorate of Economics & Statistics and office of Chief Registrar(Birth & Deaths) GNCTD.
has gone up to 35 for total with 33 for male and 37 for
female. As per the report of Chief Registrar (Birth &
Death) Government of NCT, Delhi, the infant mortality
ratio of Delhi has come down to 13.08 per 1000 in 2004.
TABLE 10.5
Trends of Various Health Indices inDelhi over the Years
Year IMR* CBR* CDR* Female Births Naturalper 1000 Growth
Male Births Rate
1994 54.1 24.8 7.0 840 17.8
1995 35.5 23.3 6.0 744 17.3
1996 40.7 21.6 5.7 839 15.9
1997 29.1 21.1 5.4 852 15.7
1998 33.1 19.4 5.3 899 14.2
1999 25.4 20.3 4.8 837 15.5
2000 31.8 20.3 5.1 820 15.1
2001 29.0 18.7 5.0 821 13.6
2004 13.08 20.03 5.59 823* 13.7
2005 35.0*** 18.6*** 4.6*** NA 13.9
All India 58.0*** 23.8*** 7.6*** 935** 16.3***
Note: * Based on Civil registration system of birth and death.
** National Human Development Report 2001.
*** SRS Bulletin October 2006.
Source: Compiled by contributors from various SRS Reports and report ofDirectorate of Economics & Statistics and office of Chief Registrar(Birth & Deaths) GNCTD.
10.7 Fertility, Birth Rates and Maternal Health
10.7.1 Fertility and Family Planning
Fertility continues to decline in Delhi. At current
fertility levels, women will have an average of 1.6 children
each throughout their childbearing years, one of the lowest
levels in India. Fertility rate in Kerala is 1.8. At the time of
NFHS-1, the total fertility rate was 3.0 children per women.
NCT of Delhi has already achieved the replacement
level of fertility. However, owing to large migration from
neighbouring states, the decadal growth rate is higher
than the national level. The sex ratio at 821 is low; sex
ratio in 0-6 years is 865. Sincere efforts are required by all
to reverse the present sex ratio in Delhi.
Use following sentence. "The overall use of
contraceptive has gone up since NFHS-2 when it was 63.8
per cent. As per NFHS-3 the total unmet need for family
planning is only 8 per cent, much less than the figures of
NFHS-2 when it was 13.4 per cent. The use of
contraceptive has gone up since NFHS-2 when it was 63.8
per cent. The total unmet need for family planning is only
8 per cent, much less than the figures of NFHS-2 when it
was 13.4 per cent.
Birth Rate
15
17
19
21
23
25
27
29
1994
1995
1996
1997
1998
1999
2000
2001
2003
2004
2005
Total Rural Urban
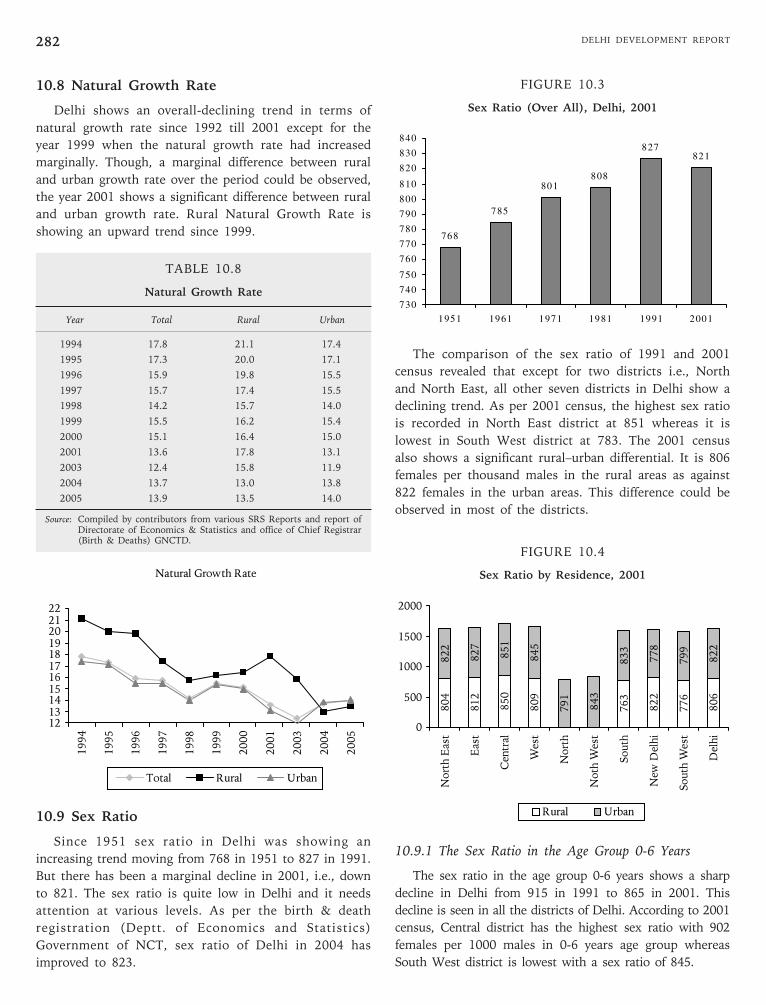
DELHI DEVELOPMENT REPORT282
10.8 Natural Growth Rate
Delhi shows an overall-declining trend in terms of
natural growth rate since 1992 till 2001 except for the
year 1999 when the natural growth rate had increased
marginally. Though, a marginal difference between rural
and urban growth rate over the period could be observed,
the year 2001 shows a significant difference between rural
and urban growth rate. Rural Natural Growth Rate is
showing an upward trend since 1999.
TABLE 10.8
Natural Growth Rate
Year Total Rural Urban
1994 17.8 21.1 17.4
1995 17.3 20.0 17.1
1996 15.9 19.8 15.5
1997 15.7 17.4 15.5
1998 14.2 15.7 14.0
1999 15.5 16.2 15.4
2000 15.1 16.4 15.0
2001 13.6 17.8 13.1
2003 12.4 15.8 11.9
2004 13.7 13.0 13.8
2005 13.9 13.5 14.0
Source: Compiled by contributors from various SRS Reports and report ofDirectorate of Economics & Statistics and office of Chief Registrar(Birth & Deaths) GNCTD.
10.9 Sex Ratio
Since 1951 sex ratio in Delhi was showing an
increasing trend moving from 768 in 1951 to 827 in 1991.
But there has been a marginal decline in 2001, i.e., down
to 821. The sex ratio is quite low in Delhi and it needs
attention at various levels. As per the birth & death
registration (Deptt. of Economics and Statistics)
Government of NCT, sex ratio of Delhi in 2004 has
improved to 823.
FIGURE 10.3
Sex Ratio (Over All), Delhi, 2001
The comparison of the sex ratio of 1991 and 2001
census revealed that except for two districts i.e., North
and North East, all other seven districts in Delhi show a
declining trend. As per 2001 census, the highest sex ratio
is recorded in North East district at 851 whereas it is
lowest in South West district at 783. The 2001 census
also shows a significant rural–urban differential. It is 806
females per thousand males in the rural areas as against
822 females in the urban areas. This difference could be
observed in most of the districts.
FIGURE 10.4
Sex Ratio by Residence, 2001
10.9.1 The Sex Ratio in the Age Group 0-6 Years
The sex ratio in the age group 0-6 years shows a sharp
decline in Delhi from 915 in 1991 to 865 in 2001. This
decline is seen in all the districts of Delhi. According to 2001
census, Central district has the highest sex ratio with 902
females per 1000 males in 0-6 years age group whereas
South West district is lowest with a sex ratio of 845.
Natural Growth Rate
12
13
14
15
16
17
18
19
20
21
22
1994
1995
1996
1997
1998
1999
2000
2001
2003
2004
2005
Total Rural Urban
768
785
801808
827821
730
740
750
760
770
780
790
800
810
820
830
840
1951 1961 1971 1981 1991 2001
80
4
81
2
850
80
9
76
3
82
2
77
6
80
6
822
827
851
845
79
1
843
83
3
778
79
9
822
0
500
1000
1500
2000
Nort
h E
ast
East
Centr
al
West
Nort
h
Noth
West
South
New
Delh
i
So
uth
West
Delh
i
Rural Urban
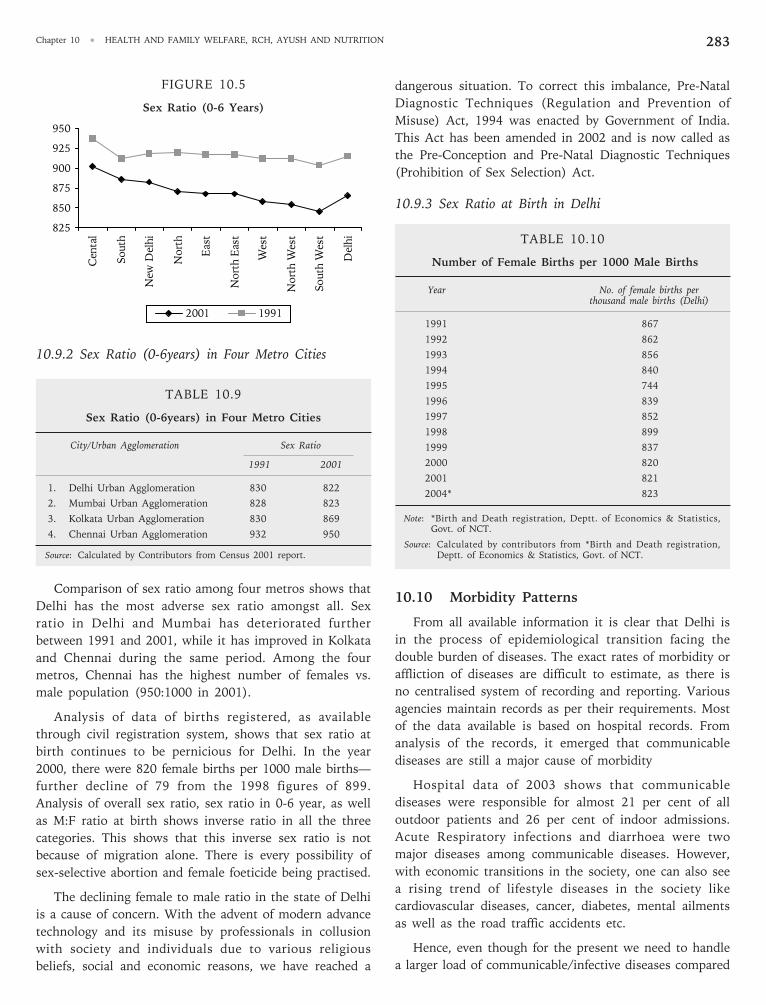
Chapter 10 • HEALTH AND FAMILY WELFARE, RCH, AYUSH AND NUTRITION 283
FIGURE 10.5
Sex Ratio (0-6 Years)
10.9.2 Sex Ratio (0-6years) in Four Metro Cities
TABLE 10.9
Sex Ratio (0-6years) in Four Metro Cities
City/Urban Agglomeration Sex Ratio
1991 2001
1. Delhi Urban Agglomeration 830 822
2. Mumbai Urban Agglomeration 828 823
3. Kolkata Urban Agglomeration 830 869
4. Chennai Urban Agglomeration 932 950
Source: Calculated by Contributors from Census 2001 report.
Comparison of sex ratio among four metros shows that
Delhi has the most adverse sex ratio amongst all. Sex
ratio in Delhi and Mumbai has deteriorated further
between 1991 and 2001, while it has improved in Kolkata
and Chennai during the same period. Among the four
metros, Chennai has the highest number of females vs.
male population (950:1000 in 2001).
Analysis of data of births registered, as available
through civil registration system, shows that sex ratio at
birth continues to be pernicious for Delhi. In the year
2000, there were 820 female births per 1000 male births—
further decline of 79 from the 1998 figures of 899.
Analysis of overall sex ratio, sex ratio in 0-6 year, as well
as M:F ratio at birth shows inverse ratio in all the three
categories. This shows that this inverse sex ratio is not
because of migration alone. There is every possibility of
sex-selective abortion and female foeticide being practised.
The declining female to male ratio in the state of Delhi
is a cause of concern. With the advent of modern advance
technology and its misuse by professionals in collusion
with society and individuals due to various religious
beliefs, social and economic reasons, we have reached a
dangerous situation. To correct this imbalance, Pre-Natal
Diagnostic Techniques (Regulation and Prevention of
Misuse) Act, 1994 was enacted by Government of India.
This Act has been amended in 2002 and is now called as
the Pre-Conception and Pre-Natal Diagnostic Techniques
(Prohibition of Sex Selection) Act.
10.9.3 Sex Ratio at Birth in Delhi
TABLE 10.10
Number of Female Births per 1000 Male Births
Year No. of female births perthousand male births (Delhi)
1991 867
1992 862
1993 856
1994 840
1995 744
1996 839
1997 852
1998 899
1999 837
2000 820
2001 821
2004* 823
Note: *Birth and Death registration, Deptt. of Economics & Statistics,Govt. of NCT.
Source: Calculated by contributors from *Birth and Death registration,Deptt. of Economics & Statistics, Govt. of NCT.
10.10 Morbidity Patterns
From all available information it is clear that Delhi is
in the process of epidemiological transition facing the
double burden of diseases. The exact rates of morbidity or
affliction of diseases are difficult to estimate, as there is
no centralised system of recording and reporting. Various
agencies maintain records as per their requirements. Most
of the data available is based on hospital records. From
analysis of the records, it emerged that communicable
diseases are still a major cause of morbidity
Hospital data of 2003 shows that communicable
diseases were responsible for almost 21 per cent of all
outdoor patients and 26 per cent of indoor admissions.
Acute Respiratory infections and diarrhoea were two
major diseases among communicable diseases. However,
with economic transitions in the society, one can also see
a rising trend of lifestyle diseases in the society like
cardiovascular diseases, cancer, diabetes, mental ailments
as well as the road traffic accidents etc.
Hence, even though for the present we need to handle
a larger load of communicable/infective diseases compared
825
850
875
900
925
950
Centa
l
South
New
Delh
i
Nort
h
East
Nort
h E
ast
West
Nort
h W
est
South
West
Delh
i
2001 1991
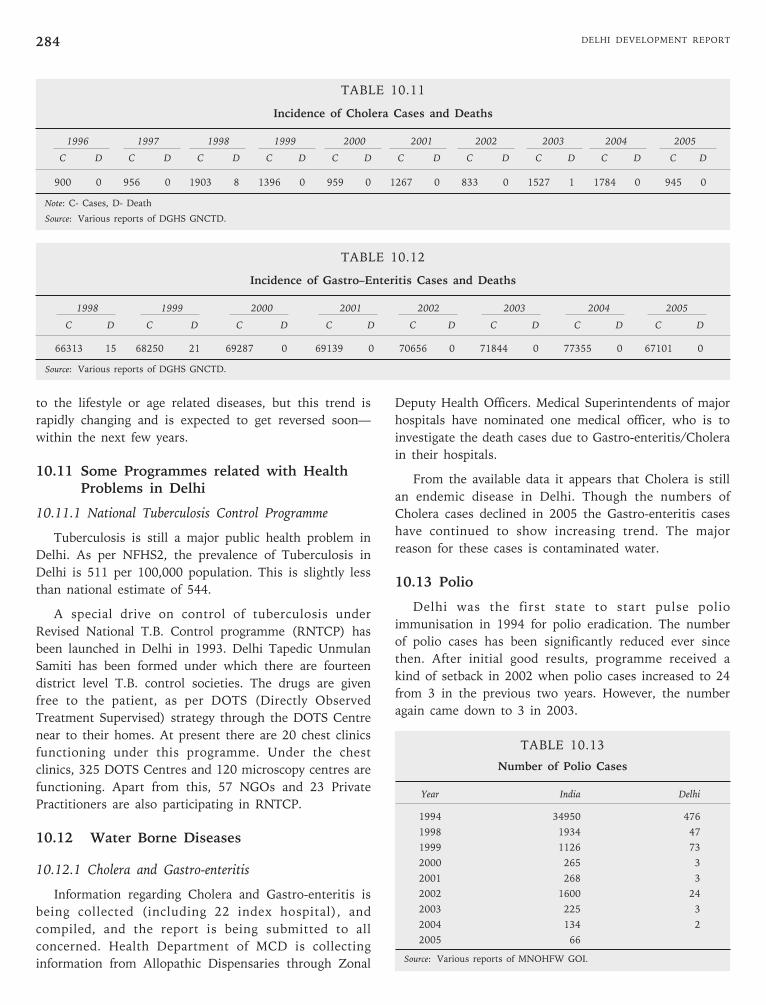
DELHI DEVELOPMENT REPORT284
to the lifestyle or age related diseases, but this trend is
rapidly changing and is expected to get reversed soon—
within the next few years.
10.11 Some Programmes related with HealthProblems in Delhi
10.11.1 National Tuberculosis Control Programme
Tuberculosis is still a major public health problem in
Delhi. As per NFHS2, the prevalence of Tuberculosis in
Delhi is 511 per 100,000 population. This is slightly less
than national estimate of 544.
A special drive on control of tuberculosis under
Revised National T.B. Control programme (RNTCP) has
been launched in Delhi in 1993. Delhi Tapedic Unmulan
Samiti has been formed under which there are fourteen
district level T.B. control societies. The drugs are given
free to the patient, as per DOTS (Directly Observed
Treatment Supervised) strategy through the DOTS Centre
near to their homes. At present there are 20 chest clinics
functioning under this programme. Under the chest
clinics, 325 DOTS Centres and 120 microscopy centres are
functioning. Apart from this, 57 NGOs and 23 Private
Practitioners are also participating in RNTCP.
10.12 Water Borne Diseases
10.12.1 Cholera and Gastro-enteritis
Information regarding Cholera and Gastro-enteritis is
being collected (including 22 index hospital), and
compiled, and the report is being submitted to all
concerned. Health Department of MCD is collecting
information from Allopathic Dispensaries through Zonal
Deputy Health Officers. Medical Superintendents of major
hospitals have nominated one medical officer, who is to
investigate the death cases due to Gastro-enteritis/Cholera
in their hospitals.
From the available data it appears that Cholera is still
an endemic disease in Delhi. Though the numbers of
Cholera cases declined in 2005 the Gastro-enteritis cases
have continued to show increasing trend. The major
reason for these cases is contaminated water.
10.13 Polio
Delhi was the first state to start pulse polio
immunisation in 1994 for polio eradication. The number
of polio cases has been significantly reduced ever since
then. After initial good results, programme received a
kind of setback in 2002 when polio cases increased to 24
from 3 in the previous two years. However, the number
again came down to 3 in 2003.
TABLE 10.13
Number of Polio Cases
Year India Delhi
1994 34950 476
1998 1934 47
1999 1126 73
2000 265 3
2001 268 3
2002 1600 24
2003 225 3
2004 134 2
2005 66
Source: Various reports of MNOHFW GOI.
TABLE 10.11
Incidence of Cholera Cases and Deaths
1996 1997 1998 1999 2000 2001 2002 2003 2004 2005
C D C D C D C D C D C D C D C D C D C D
900 0 956 0 1903 8 1396 0 959 0 1267 0 833 0 1527 1 1784 0 945 0
Note: C- Cases, D- Death
Source: Various reports of DGHS GNCTD.
TABLE 10.12
Incidence of Gastro–Enteritis Cases and Deaths
1998 1999 2000 2001 2002 2003 2004 2005
C D C D C D C D C D C D C D C D
66313 15 68250 21 69287 0 69139 0 70656 0 71844 0 77355 0 67101 0
Source: Various reports of DGHS GNCTD.
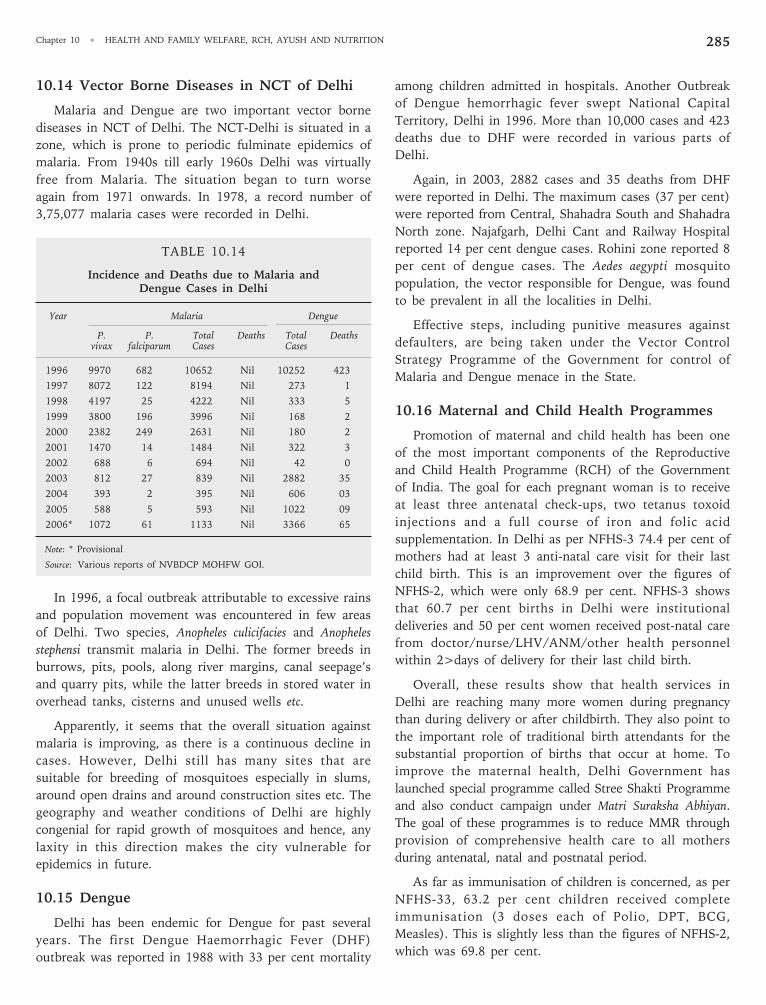
Chapter 10 • HEALTH AND FAMILY WELFARE, RCH, AYUSH AND NUTRITION 285
10.14 Vector Borne Diseases in NCT of Delhi
Malaria and Dengue are two important vector borne
diseases in NCT of Delhi. The NCT-Delhi is situated in a
zone, which is prone to periodic fulminate epidemics of
malaria. From 1940s till early 1960s Delhi was virtually
free from Malaria. The situation began to turn worse
again from 1971 onwards. In 1978, a record number of
3,75,077 malaria cases were recorded in Delhi.
TABLE 10.14
Incidence and Deaths due to Malaria andDengue Cases in Delhi
Year Malaria Dengue
P. P. Total Deaths Total Deathsvivax falciparum Cases Cases
1996 9970 682 10652 Nil 10252 423
1997 8072 122 8194 Nil 273 1
1998 4197 25 4222 Nil 333 5
1999 3800 196 3996 Nil 168 2
2000 2382 249 2631 Nil 180 2
2001 1470 14 1484 Nil 322 3
2002 688 6 694 Nil 42 0
2003 812 27 839 Nil 2882 35
2004 393 2 395 Nil 606 03
2005 588 5 593 Nil 1022 09
2006* 1072 61 1133 Nil 3366 65
Note: * Provisional
Source: Various reports of NVBDCP MOHFW GOI.
In 1996, a focal outbreak attributable to excessive rains
and population movement was encountered in few areas
of Delhi. Two species, Anopheles culicifacies and Anopheles
stephensi transmit malaria in Delhi. The former breeds in
burrows, pits, pools, along river margins, canal seepage’s
and quarry pits, while the latter breeds in stored water in
overhead tanks, cisterns and unused wells etc.
Apparently, it seems that the overall situation against
malaria is improving, as there is a continuous decline in
cases. However, Delhi still has many sites that are
suitable for breeding of mosquitoes especially in slums,
around open drains and around construction sites etc. The
geography and weather conditions of Delhi are highly
congenial for rapid growth of mosquitoes and hence, any
laxity in this direction makes the city vulnerable for
epidemics in future.
10.15 Dengue
Delhi has been endemic for Dengue for past several
years. The first Dengue Haemorrhagic Fever (DHF)
outbreak was reported in 1988 with 33 per cent mortality
among children admitted in hospitals. Another Outbreak
of Dengue hemorrhagic fever swept National Capital
Territory, Delhi in 1996. More than 10,000 cases and 423
deaths due to DHF were recorded in various parts of
Delhi.
Again, in 2003, 2882 cases and 35 deaths from DHF
were reported in Delhi. The maximum cases (37 per cent)
were reported from Central, Shahadra South and Shahadra
North zone. Najafgarh, Delhi Cant and Railway Hospital
reported 14 per cent dengue cases. Rohini zone reported 8
per cent of dengue cases. The Aedes aegypti mosquito
population, the vector responsible for Dengue, was found
to be prevalent in all the localities in Delhi.
Effective steps, including punitive measures against
defaulters, are being taken under the Vector Control
Strategy Programme of the Government for control of
Malaria and Dengue menace in the State.
10.16 Maternal and Child Health Programmes
Promotion of maternal and child health has been one
of the most important components of the Reproductive
and Child Health Programme (RCH) of the Government
of India. The goal for each pregnant woman is to receive
at least three antenatal check-ups, two tetanus toxoid
injections and a full course of iron and folic acid
supplementation. In Delhi as per NFHS-3 74.4 per cent of
mothers had at least 3 anti-natal care visit for their last
child birth. This is an improvement over the figures of
NFHS-2, which were only 68.9 per cent. NFHS-3 shows
that 60.7 per cent births in Delhi were institutional
deliveries and 50 per cent women received post-natal care
from doctor/nurse/LHV/ANM/other health personnel
within 2>days of delivery for their last child birth.
Overall, these results show that health services in
Delhi are reaching many more women during pregnancy
than during delivery or after childbirth. They also point to
the important role of traditional birth attendants for the
substantial proportion of births that occur at home. To
improve the maternal health, Delhi Government has
launched special programme called Stree Shakti Programme
and also conduct campaign under Matri Suraksha Abhiyan.
The goal of these programmes is to reduce MMR through
provision of comprehensive health care to all mothers
during antenatal, natal and postnatal period.
As far as immunisation of children is concerned, as per
NFHS-33, 63.2 per cent children received complete
immunisation (3 doses each of Polio, DPT, BCG,
Measles). This is slightly less than the figures of NFHS-2,
which was 69.8 per cent.
DELHI DEVELOPMENT REPORT286
10.17 HIV/AIDS
Delhi falls under low Prevalence State for HIV/AIDS.
However, 42,000 HIV positive cases are estimated till
January 2006, a total of 2759 cases were reported till
August 2006 while 322 deaths were reported till January
2006. The sentinel data from antenatal clinic shows that
the HIV infection is still within 1 per cent in Delhi. It is
feared that the HIV infection would percolate down from
various high-risk groups to general population in the
State, if effective awareness and control programmes were
not initiated.
Data from various STD Sentinel Sites shows that over
the year, the HIV infection has been progressing rapidly
among STD clinic attendees and is steadily spreading in
low risk population. The time lag for HIV infection to
spread from High Risk groups to low risk groups is
between 3 to 5 years, as the infection will spread from
High Risk groups to their clients, which act as bridge
population and then to wives of these clients during this
period. Among Intravenous Drug Users, the HIV infection
has shown increasing trend. It can be concluded from
above trends that there is an urgent need to start more
Targeted Intervention Project among High Risk groups in
Delhi.
Targeted Intervention is one of the core strategies for
the prevention of HIV in India under NACP-II. Targeted
Interventions in HIV/AIDS context are a set of activities
and approaches aimed at reducing the risk of HIV
infection amount people practising high-risk behaviour.
There are various sub-population groups such as
commercial sex workers, truckers, street children migrant
labourers, intravenous drug users etc., who are highly
vulnerable to the transmission of HIV by virtue of their
high risk behaviour and socio-economic conditions. As of
now 29 such programmes are being implemented. In
addition, School AIDS programme is also being
implemented in 450 schools.
In Delhi, 3 lakh delivery occurs per year. Considering
0.3 per cent HIV prevalence in ANC women and 30 per
cent transmission rate about 240 children are born every
year with HIV. Considering 0.3 per cent HIV prevalence
in ANC women and 30 per cent transmission rate about
240 children are born every year with HIV. Government
of Delhi has launched a special drive for prevention of
HIV transmission from an infected mother to the foetus.
• Fourteen Centres have been set up under the
Prevention of Parent to Child Transmission
Programme along with antenatal check-up clinics
in various hospitals. Four more will shortly be
opened. Another ten will be started at Maternal &
Child Welfare Centre (MCW centre) of MCD.
This way the programme can penetrate at the
grass root level.
• 28 Voluntary Counseling & Testing Centre
(VCTC) have been established out of which 3
(VCTC) is established in 3 Universities of Delhi
(DU, Jamia Millia Islamia, & JNU). In addition,
health care dispenser are also set up in the
Universities. But to reach more number of
population DSACS proposes to open Integrated
Counseling & Testing Centres at non-
conventional sites like ISBT, railway platforms.
• Mobile Integrated Testing & Wellness Access
(MITWA) is providing outreach services to slums
& JJ Cluster through 13 Mobile van and the
package include syndromic treatment of STD, free
condom distribution and counseling and test for
HIV.
• There are 52 Licensed Blood Bank out of which 8
are Regional Blood Transfusion Centre.
• 3 Community Care Centre
• 6 ART Centre.
• Tele-Counseling services.
• Workplace intervention is a new initiative of
DSACS in Collaboration with ILO.
10.18 Non-Communicable Diseases (NCDs)
Worldwide, the most serious non-communicable
diseases are cardiovascular diseases (CVD),
cerebrovascular diseases (including stroke and
hypertension), cancer, diabetes, and respiratory diseases.
Mental disorders, diseases of the bones and joints such as
osteoporosis and osteoarthritis and dental diseases are
also emerging as major non-communicable diseases.
As life expectancy increases and fertility rates
decline, the overall burden of NCDs is expected to
increase in our country, too. Given the present trends,
an explosion of non-communicable diseases in
developing countries is projected between now and the
year 2015. By then, for example, the ratio of deaths
from NCDs to deaths from infectious and parasitic
diseases would be 4:1 in Asia. According to these
projections, three times more people will die from
NCDs than from infectious and parasitic diseases in the
developing countries, and in absolute terms, twice as
many deaths due to NCDs will occur in developing
countries than in the industrialised world.
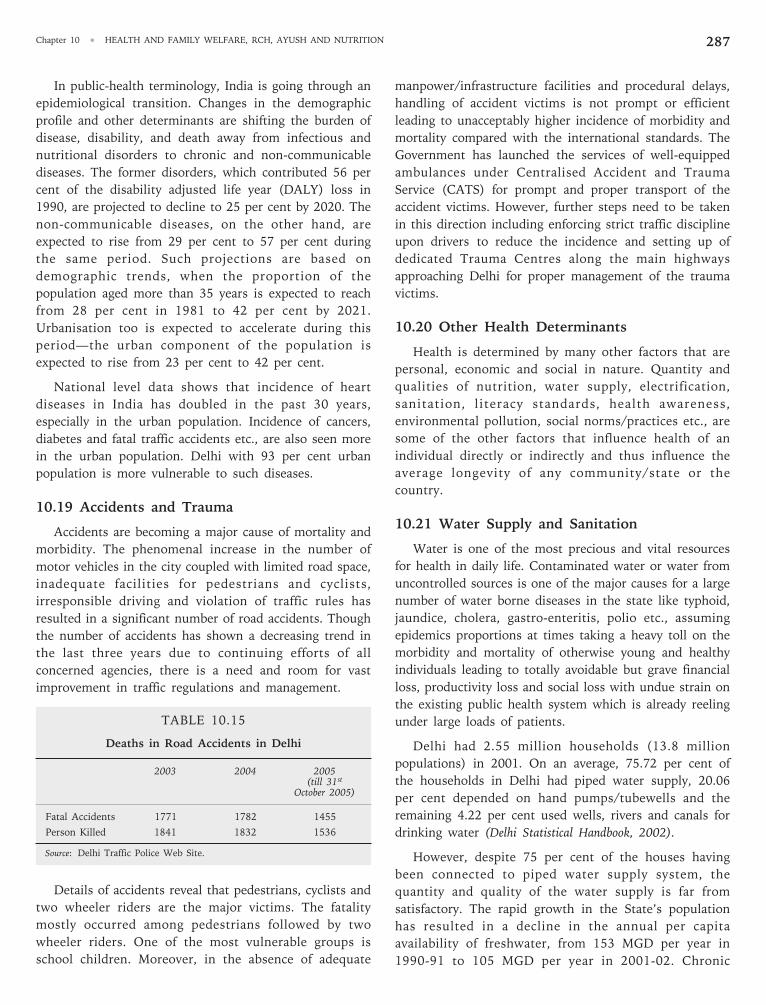
Chapter 10 • HEALTH AND FAMILY WELFARE, RCH, AYUSH AND NUTRITION 287
In public-health terminology, India is going through an
epidemiological transition. Changes in the demographic
profile and other determinants are shifting the burden of
disease, disability, and death away from infectious and
nutritional disorders to chronic and non-communicable
diseases. The former disorders, which contributed 56 per
cent of the disability adjusted life year (DALY) loss in
1990, are projected to decline to 25 per cent by 2020. The
non-communicable diseases, on the other hand, are
expected to rise from 29 per cent to 57 per cent during
the same period. Such projections are based on
demographic trends, when the proportion of the
population aged more than 35 years is expected to reach
from 28 per cent in 1981 to 42 per cent by 2021.
Urbanisation too is expected to accelerate during this
period—the urban component of the population is
expected to rise from 23 per cent to 42 per cent.
National level data shows that incidence of heart
diseases in India has doubled in the past 30 years,
especially in the urban population. Incidence of cancers,
diabetes and fatal traffic accidents etc., are also seen more
in the urban population. Delhi with 93 per cent urban
population is more vulnerable to such diseases.
10.19 Accidents and Trauma
Accidents are becoming a major cause of mortality and
morbidity. The phenomenal increase in the number of
motor vehicles in the city coupled with limited road space,
inadequate facilities for pedestrians and cyclists,
irresponsible driving and violation of traffic rules has
resulted in a significant number of road accidents. Though
the number of accidents has shown a decreasing trend in
the last three years due to continuing efforts of all
concerned agencies, there is a need and room for vast
improvement in traffic regulations and management.
TABLE 10.15
Deaths in Road Accidents in Delhi
2003 2004 2005(till 31st
October 2005)
Fatal Accidents 1771 1782 1455
Person Killed 1841 1832 1536
Source: Delhi Traffic Police Web Site.
Details of accidents reveal that pedestrians, cyclists and
two wheeler riders are the major victims. The fatality
mostly occurred among pedestrians followed by two
wheeler riders. One of the most vulnerable groups is
school children. Moreover, in the absence of adequate
manpower/infrastructure facilities and procedural delays,
handling of accident victims is not prompt or efficient
leading to unacceptably higher incidence of morbidity and
mortality compared with the international standards. The
Government has launched the services of well-equipped
ambulances under Centralised Accident and Trauma
Service (CATS) for prompt and proper transport of the
accident victims. However, further steps need to be taken
in this direction including enforcing strict traffic discipline
upon drivers to reduce the incidence and setting up of
dedicated Trauma Centres along the main highways
approaching Delhi for proper management of the trauma
victims.
10.20 Other Health Determinants
Health is determined by many other factors that are
personal, economic and social in nature. Quantity and
qualities of nutrition, water supply, electrification,
sanitation, literacy standards, health awareness,
environmental pollution, social norms/practices etc., are
some of the other factors that influence health of an
individual directly or indirectly and thus influence the
average longevity of any community/state or the
country.
10.21 Water Supply and Sanitation
Water is one of the most precious and vital resources
for health in daily life. Contaminated water or water from
uncontrolled sources is one of the major causes for a large
number of water borne diseases in the state like typhoid,
jaundice, cholera, gastro-enteritis, polio etc., assuming
epidemics proportions at times taking a heavy toll on the
morbidity and mortality of otherwise young and healthy
individuals leading to totally avoidable but grave financial
loss, productivity loss and social loss with undue strain on
the existing public health system which is already reeling
under large loads of patients.
Delhi had 2.55 million households (13.8 million
populations) in 2001. On an average, 75.72 per cent of
the households in Delhi had piped water supply, 20.06
per cent depended on hand pumps/tubewells and the
remaining 4.22 per cent used wells, rivers and canals for
drinking water (Delhi Statistical Handbook, 2002).
However, despite 75 per cent of the houses having
been connected to piped water supply system, the
quantity and quality of the water supply is far from
satisfactory. The rapid growth in the State’s population
has resulted in a decline in the annual per capita
availability of freshwater, from 153 MGD per year in
1990-91 to 105 MGD per year in 2001-02. Chronic
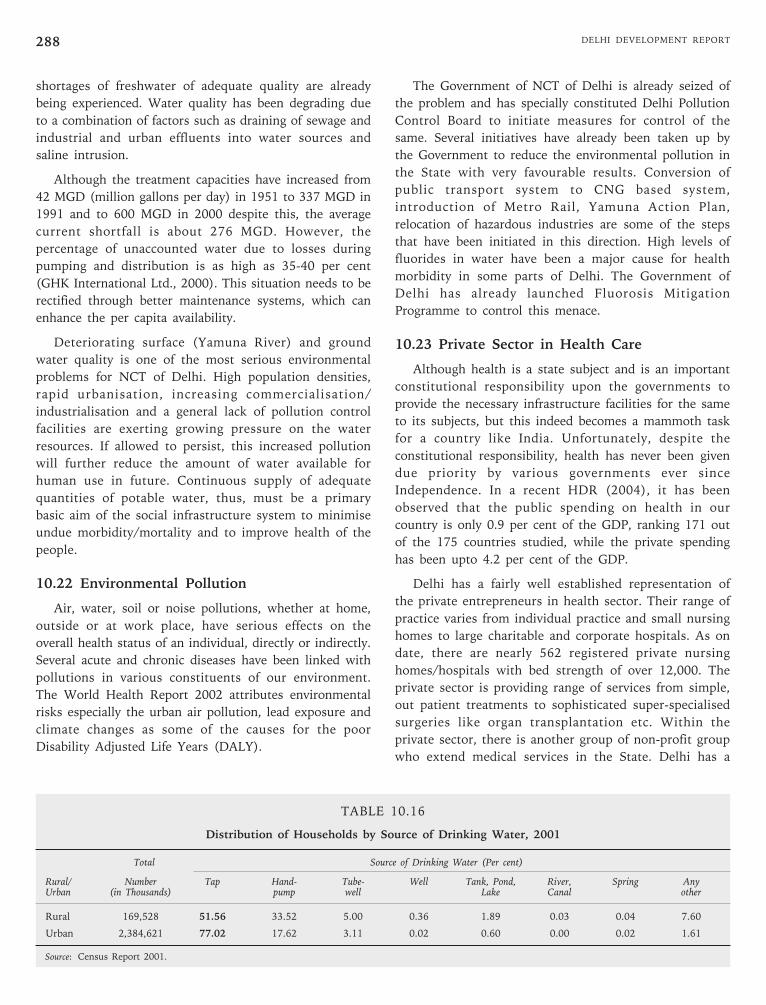
DELHI DEVELOPMENT REPORT288
shortages of freshwater of adequate quality are already
being experienced. Water quality has been degrading due
to a combination of factors such as draining of sewage and
industrial and urban effluents into water sources and
saline intrusion.
Although the treatment capacities have increased from
42 MGD (million gallons per day) in 1951 to 337 MGD in
1991 and to 600 MGD in 2000 despite this, the average
current shortfall is about 276 MGD. However, the
percentage of unaccounted water due to losses during
pumping and distribution is as high as 35-40 per cent
(GHK International Ltd., 2000). This situation needs to be
rectified through better maintenance systems, which can
enhance the per capita availability.
Deteriorating surface (Yamuna River) and ground
water quality is one of the most serious environmental
problems for NCT of Delhi. High population densities,
rapid urbanisation, increasing commercialisation/
industrialisation and a general lack of pollution control
facilities are exerting growing pressure on the water
resources. If allowed to persist, this increased pollution
will further reduce the amount of water available for
human use in future. Continuous supply of adequate
quantities of potable water, thus, must be a primary
basic aim of the social infrastructure system to minimise
undue morbidity/mortality and to improve health of the
people.
10.22 Environmental Pollution
Air, water, soil or noise pollutions, whether at home,
outside or at work place, have serious effects on the
overall health status of an individual, directly or indirectly.
Several acute and chronic diseases have been linked with
pollutions in various constituents of our environment.
The World Health Report 2002 attributes environmental
risks especially the urban air pollution, lead exposure and
climate changes as some of the causes for the poor
Disability Adjusted Life Years (DALY).
The Government of NCT of Delhi is already seized of
the problem and has specially constituted Delhi Pollution
Control Board to initiate measures for control of the
same. Several initiatives have already been taken up by
the Government to reduce the environmental pollution in
the State with very favourable results. Conversion of
public transport system to CNG based system,
introduction of Metro Rail, Yamuna Action Plan,
relocation of hazardous industries are some of the steps
that have been initiated in this direction. High levels of
fluorides in water have been a major cause for health
morbidity in some parts of Delhi. The Government of
Delhi has already launched Fluorosis Mitigation
Programme to control this menace.
10.23 Private Sector in Health Care
Although health is a state subject and is an important
constitutional responsibility upon the governments to
provide the necessary infrastructure facilities for the same
to its subjects, but this indeed becomes a mammoth task
for a country like India. Unfortunately, despite the
constitutional responsibility, health has never been given
due priority by various governments ever since
Independence. In a recent HDR (2004), it has been
observed that the public spending on health in our
country is only 0.9 per cent of the GDP, ranking 171 out
of the 175 countries studied, while the private spending
has been upto 4.2 per cent of the GDP.
Delhi has a fairly well established representation of
the private entrepreneurs in health sector. Their range of
practice varies from individual practice and small nursing
homes to large charitable and corporate hospitals. As on
date, there are nearly 562 registered private nursing
homes/hospitals with bed strength of over 12,000. The
private sector is providing range of services from simple,
out patient treatments to sophisticated super-specialised
surgeries like organ transplantation etc. Within the
private sector, there is another group of non-profit group
who extend medical services in the State. Delhi has a
TABLE 10.16
Distribution of Households by Source of Drinking Water, 2001
Total Source of Drinking Water (Per cent)
Rural/ Number Tap Hand- Tube- Well Tank, Pond, River, Spring AnyUrban (in Thousands) pump well Lake Canal other
Rural 169,528 51.56 33.52 5.00 0.36 1.89 0.03 0.04 7.60
Urban 2,384,621 77.02 17.62 3.11 0.02 0.60 0.00 0.02 1.61
Source: Census Report 2001.
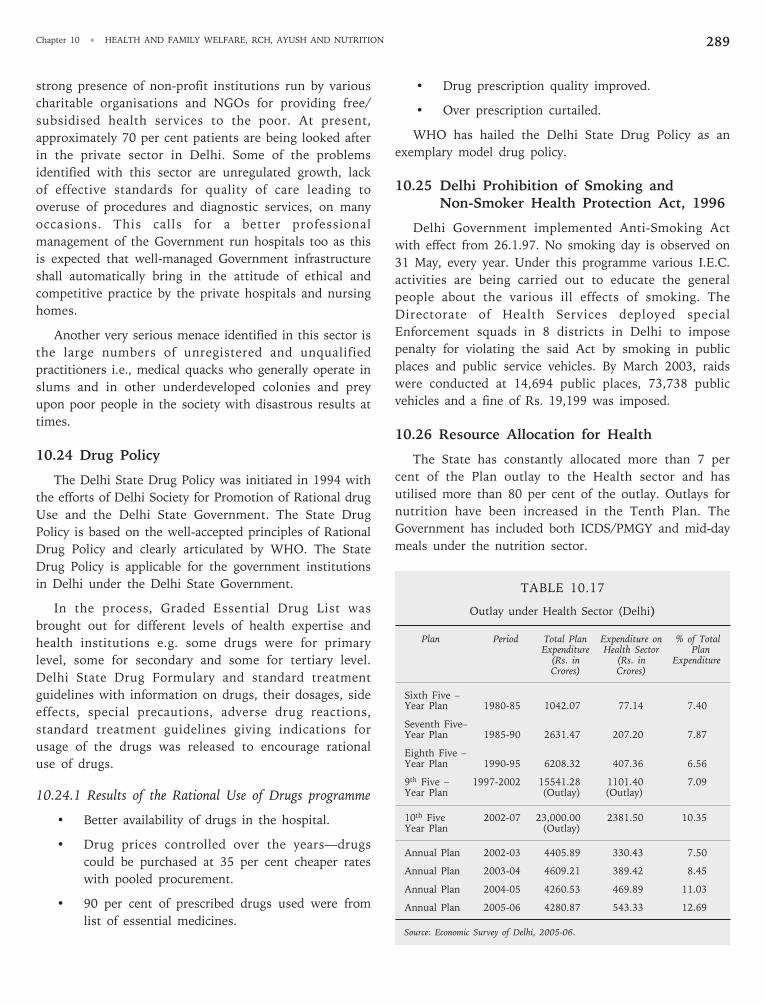
Chapter 10 • HEALTH AND FAMILY WELFARE, RCH, AYUSH AND NUTRITION 289
strong presence of non-profit institutions run by various
charitable organisations and NGOs for providing free/
subsidised health services to the poor. At present,
approximately 70 per cent patients are being looked after
in the private sector in Delhi. Some of the problems
identified with this sector are unregulated growth, lack
of effective standards for quality of care leading to
overuse of procedures and diagnostic services, on many
occasions. This calls for a better professional
management of the Government run hospitals too as this
is expected that well-managed Government infrastructure
shall automatically bring in the attitude of ethical and
competitive practice by the private hospitals and nursing
homes.
Another very serious menace identified in this sector is
the large numbers of unregistered and unqualified
practitioners i.e., medical quacks who generally operate in
slums and in other underdeveloped colonies and prey
upon poor people in the society with disastrous results at
times.
10.24 Drug Policy
The Delhi State Drug Policy was initiated in 1994 with
the efforts of Delhi Society for Promotion of Rational drug
Use and the Delhi State Government. The State Drug
Policy is based on the well-accepted principles of Rational
Drug Policy and clearly articulated by WHO. The State
Drug Policy is applicable for the government institutions
in Delhi under the Delhi State Government.
In the process, Graded Essential Drug List was
brought out for different levels of health expertise and
health institutions e.g. some drugs were for primary
level, some for secondary and some for tertiary level.
Delhi State Drug Formulary and standard treatment
guidelines with information on drugs, their dosages, side
effects, special precautions, adverse drug reactions,
standard treatment guidelines giving indications for
usage of the drugs was released to encourage rational
use of drugs.
10.24.1 Results of the Rational Use of Drugs programme
• Better availability of drugs in the hospital.
• Drug prices controlled over the years—drugs
could be purchased at 35 per cent cheaper rates
with pooled procurement.
• 90 per cent of prescribed drugs used were from
list of essential medicines.
• Drug prescription quality improved.
• Over prescription curtailed.
WHO has hailed the Delhi State Drug Policy as an
exemplary model drug policy.
10.25 Delhi Prohibition of Smoking andNon-Smoker Health Protection Act, 1996
Delhi Government implemented Anti-Smoking Act
with effect from 26.1.97. No smoking day is observed on
31 May, every year. Under this programme various I.E.C.
activities are being carried out to educate the general
people about the various ill effects of smoking. The
Directorate of Health Services deployed special
Enforcement squads in 8 districts in Delhi to impose
penalty for violating the said Act by smoking in public
places and public service vehicles. By March 2003, raids
were conducted at 14,694 public places, 73,738 public
vehicles and a fine of Rs. 19,199 was imposed.
10.26 Resource Allocation for Health
The State has constantly allocated more than 7 per
cent of the Plan outlay to the Health sector and has
utilised more than 80 per cent of the outlay. Outlays for
nutrition have been increased in the Tenth Plan. The
Government has included both ICDS/PMGY and mid-day
meals under the nutrition sector.
TABLE 10.17
Outlay under Health Sector (Delhi)
Plan Period Total Plan Expenditure on % of TotalExpenditure Health Sector Plan
(Rs. in (Rs. in ExpenditureCrores) Crores)
Sixth Five –Year Plan 1980-85 1042.07 77.14 7.40
Seventh Five–Year Plan 1985-90 2631.47 207.20 7.87
Eighth Five –Year Plan 1990-95 6208.32 407.36 6.56
9th Five – 1997-2002 15541.28 1101.40 7.09Year Plan (Outlay) (Outlay)
10th Five 2002-07 23,000.00 2381.50 10.35Year Plan (Outlay)
Annual Plan 2002-03 4405.89 330.43 7.50
Annual Plan 2003-04 4609.21 389.42 8.45
Annual Plan 2004-05 4260.53 469.89 11.03
Annual Plan 2005-06 4280.87 543.33 12.69
Source: Economic Survey of Delhi, 2005-06.
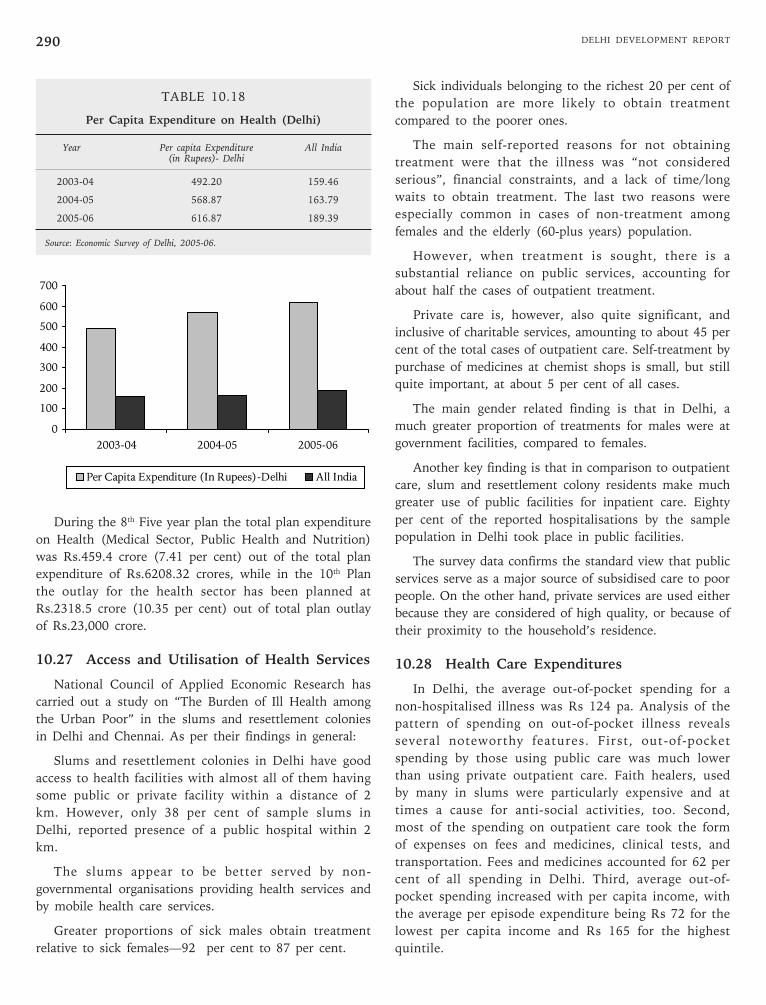
DELHI DEVELOPMENT REPORT290
TABLE 10.18
Per Capita Expenditure on Health (Delhi)
Year Per capita Expenditure All India(in Rupees)- Delhi
2003-04 492.20 159.46
2004-05 568.87 163.79
2005-06 616.87 189.39
Source: Economic Survey of Delhi, 2005-06.
During the 8th Five year plan the total plan expenditure
on Health (Medical Sector, Public Health and Nutrition)
was Rs.459.4 crore (7.41 per cent) out of the total plan
expenditure of Rs.6208.32 crores, while in the 10th Plan
the outlay for the health sector has been planned at
Rs.2318.5 crore (10.35 per cent) out of total plan outlay
of Rs.23,000 crore.
10.27 Access and Utilisation of Health Services
National Council of Applied Economic Research has
carried out a study on “The Burden of Ill Health among
the Urban Poor” in the slums and resettlement colonies
in Delhi and Chennai. As per their findings in general:
Slums and resettlement colonies in Delhi have good
access to health facilities with almost all of them having
some public or private facility within a distance of 2
km. However, only 38 per cent of sample slums in
Delhi, reported presence of a public hospital within 2
km.
The slums appear to be better served by non-
governmental organisations providing health services and
by mobile health care services.
Greater proportions of sick males obtain treatment
relative to sick females—92 per cent to 87 per cent.
Sick individuals belonging to the richest 20 per cent of
the population are more likely to obtain treatment
compared to the poorer ones.
The main self-reported reasons for not obtaining
treatment were that the illness was “not considered
serious”, financial constraints, and a lack of time/long
waits to obtain treatment. The last two reasons were
especially common in cases of non-treatment among
females and the elderly (60-plus years) population.
However, when treatment is sought, there is a
substantial reliance on public services, accounting for
about half the cases of outpatient treatment.
Private care is, however, also quite significant, and
inclusive of charitable services, amounting to about 45 per
cent of the total cases of outpatient care. Self-treatment by
purchase of medicines at chemist shops is small, but still
quite important, at about 5 per cent of all cases.
The main gender related finding is that in Delhi, a
much greater proportion of treatments for males were at
government facilities, compared to females.
Another key finding is that in comparison to outpatient
care, slum and resettlement colony residents make much
greater use of public facilities for inpatient care. Eighty
per cent of the reported hospitalisations by the sample
population in Delhi took place in public facilities.
The survey data confirms the standard view that public
services serve as a major source of subsidised care to poor
people. On the other hand, private services are used either
because they are considered of high quality, or because of
their proximity to the household’s residence.
10.28 Health Care Expenditures
In Delhi, the average out-of-pocket spending for a
non-hospitalised illness was Rs 124 pa. Analysis of the
pattern of spending on out-of-pocket illness reveals
several noteworthy features. First, out-of-pocket
spending by those using public care was much lower
than using private outpatient care. Faith healers, used
by many in slums were particularly expensive and at
times a cause for anti-social activities, too. Second,
most of the spending on outpatient care took the form
of expenses on fees and medicines, clinical tests, and
transportation. Fees and medicines accounted for 62 per
cent of all spending in Delhi. Third, average out-of-
pocket spending increased with per capita income, with
the average per episode expenditure being Rs 72 for the
lowest per capita income and Rs 165 for the highest
quintile.
0
100
200
300
400
500
600
700
2003-04 2004-05 2005-06
Per Capita Expenditure (In Rupees)-Delhi All India
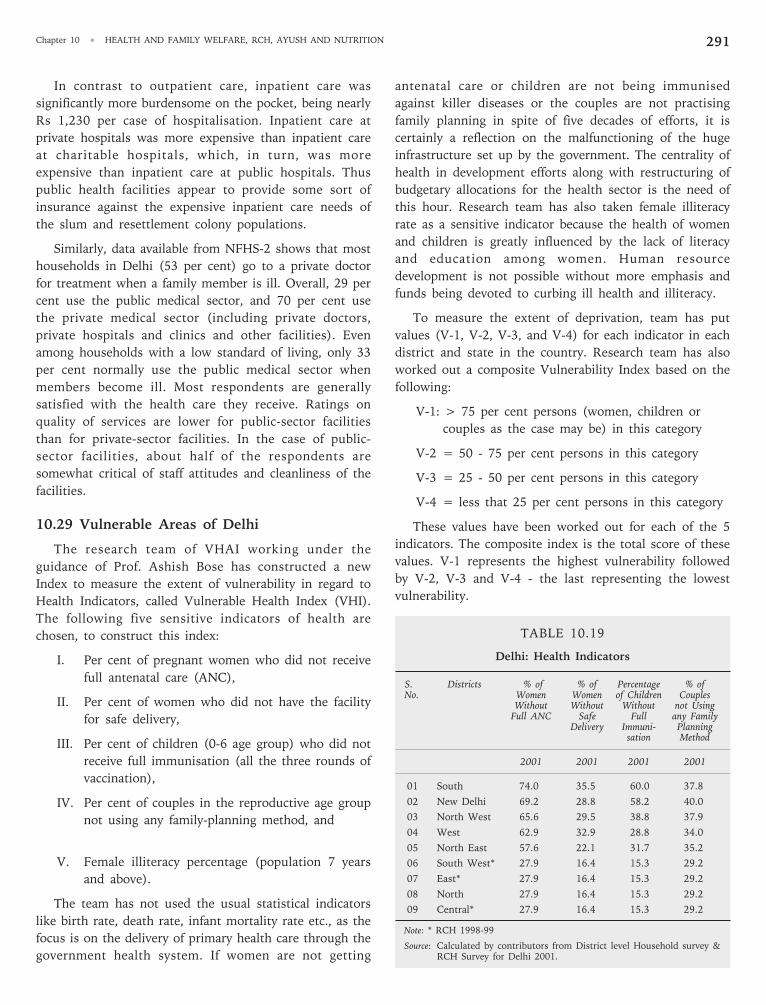
Chapter 10 • HEALTH AND FAMILY WELFARE, RCH, AYUSH AND NUTRITION 291
In contrast to outpatient care, inpatient care was
significantly more burdensome on the pocket, being nearly
Rs 1,230 per case of hospitalisation. Inpatient care at
private hospitals was more expensive than inpatient care
at charitable hospitals, which, in turn, was more
expensive than inpatient care at public hospitals. Thus
public health facilities appear to provide some sort of
insurance against the expensive inpatient care needs of
the slum and resettlement colony populations.
Similarly, data available from NFHS-2 shows that most
households in Delhi (53 per cent) go to a private doctor
for treatment when a family member is ill. Overall, 29 per
cent use the public medical sector, and 70 per cent use
the private medical sector (including private doctors,
private hospitals and clinics and other facilities). Even
among households with a low standard of living, only 33
per cent normally use the public medical sector when
members become ill. Most respondents are generally
satisfied with the health care they receive. Ratings on
quality of services are lower for public-sector facilities
than for private-sector facilities. In the case of public-
sector facilities, about half of the respondents are
somewhat critical of staff attitudes and cleanliness of the
facilities.
10.29 Vulnerable Areas of Delhi
The research team of VHAI working under the
guidance of Prof. Ashish Bose has constructed a new
Index to measure the extent of vulnerability in regard to
Health Indicators, called Vulnerable Health Index (VHI).
The following five sensitive indicators of health are
chosen, to construct this index:
I. Per cent of pregnant women who did not receive
full antenatal care (ANC),
II. Per cent of women who did not have the facility
for safe delivery,
III. Per cent of children (0-6 age group) who did not
receive full immunisation (all the three rounds of
vaccination),
IV. Per cent of couples in the reproductive age group
not using any family-planning method, and
V. Female illiteracy percentage (population 7 years
and above).
The team has not used the usual statistical indicators
like birth rate, death rate, infant mortality rate etc., as the
focus is on the delivery of primary health care through the
government health system. If women are not getting
antenatal care or children are not being immunised
against killer diseases or the couples are not practising
family planning in spite of five decades of efforts, it is
certainly a reflection on the malfunctioning of the huge
infrastructure set up by the government. The centrality of
health in development efforts along with restructuring of
budgetary allocations for the health sector is the need of
this hour. Research team has also taken female illiteracy
rate as a sensitive indicator because the health of women
and children is greatly influenced by the lack of literacy
and education among women. Human resource
development is not possible without more emphasis and
funds being devoted to curbing ill health and illiteracy.
To measure the extent of deprivation, team has put
values (V-1, V-2, V-3, and V-4) for each indicator in each
district and state in the country. Research team has also
worked out a composite Vulnerability Index based on the
following:
V-1: > 75 per cent persons (women, children or
couples as the case may be) in this category
V-2 = 50 - 75 per cent persons in this category
V-3 = 25 - 50 per cent persons in this category
V-4 = less that 25 per cent persons in this category
These values have been worked out for each of the 5
indicators. The composite index is the total score of these
values. V-1 represents the highest vulnerability followed
by V-2, V-3 and V-4 - the last representing the lowest
vulnerability.
TABLE 10.19
Delhi: Health Indicators
S. Districts % of % of Percentage % ofNo. Women Women of Children Couples
Without Without Without not UsingFull ANC Safe Full any Family
Delivery Immuni- Planningsation Method
2001 2001 2001 2001
01 South 74.0 35.5 60.0 37.8
02 New Delhi 69.2 28.8 58.2 40.0
03 North West 65.6 29.5 38.8 37.9
04 West 62.9 32.9 28.8 34.0
05 North East 57.6 22.1 31.7 35.2
06 South West* 27.9 16.4 15.3 29.2
07 East* 27.9 16.4 15.3 29.2
08 North 27.9 16.4 15.3 29.2
09 Central* 27.9 16.4 15.3 29.2
Note: * RCH 1998-99
Source: Calculated by contributors from District level Household survey &RCH Survey for Delhi 2001.
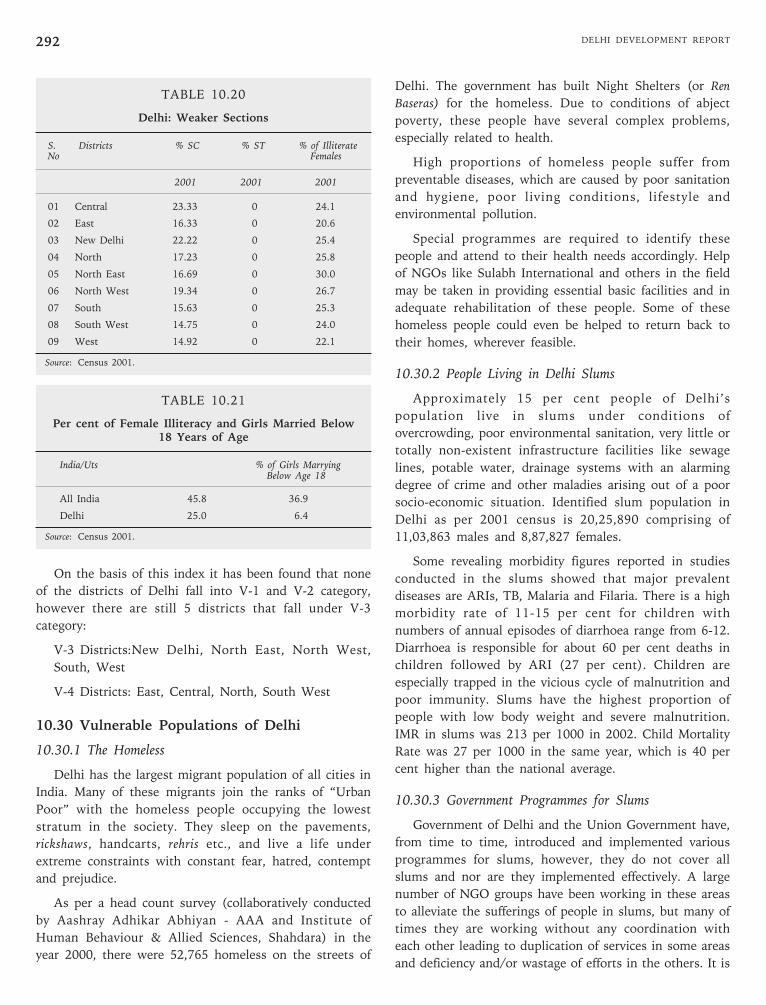
DELHI DEVELOPMENT REPORT292
TABLE 10.20
Delhi: Weaker Sections
S. Districts % SC % ST % of IlliterateNo Females
2001 2001 2001
01 Central 23.33 0 24.1
02 East 16.33 0 20.6
03 New Delhi 22.22 0 25.4
04 North 17.23 0 25.8
05 North East 16.69 0 30.0
06 North West 19.34 0 26.7
07 South 15.63 0 25.3
08 South West 14.75 0 24.0
09 West 14.92 0 22.1
Source: Census 2001.
TABLE 10.21
Per cent of Female Illiteracy and Girls Married Below18 Years of Age
India/Uts % of Girls MarryingBelow Age 18
All India 45.8 36.9
Delhi 25.0 6.4
Source: Census 2001.
On the basis of this index it has been found that none
of the districts of Delhi fall into V-1 and V-2 category,
however there are still 5 districts that fall under V-3
category:
V-3 Districts:New Delhi, North East, North West,
South, West
V-4 Districts: East, Central, North, South West
10.30 Vulnerable Populations of Delhi
10.30.1 The Homeless
Delhi has the largest migrant population of all cities in
India. Many of these migrants join the ranks of “Urban
Poor” with the homeless people occupying the lowest
stratum in the society. They sleep on the pavements,
rickshaws, handcarts, rehris etc., and live a life under
extreme constraints with constant fear, hatred, contempt
and prejudice.
As per a head count survey (collaboratively conducted
by Aashray Adhikar Abhiyan - AAA and Institute of
Human Behaviour & Allied Sciences, Shahdara) in the
year 2000, there were 52,765 homeless on the streets of
Delhi. The government has built Night Shelters (or Ren
Baseras) for the homeless. Due to conditions of abject
poverty, these people have several complex problems,
especially related to health.
High proportions of homeless people suffer from
preventable diseases, which are caused by poor sanitation
and hygiene, poor living conditions, lifestyle and
environmental pollution.
Special programmes are required to identify these
people and attend to their health needs accordingly. Help
of NGOs like Sulabh International and others in the field
may be taken in providing essential basic facilities and in
adequate rehabilitation of these people. Some of these
homeless people could even be helped to return back to
their homes, wherever feasible.
10.30.2 People Living in Delhi Slums
Approximately 15 per cent people of Delhi’s
population live in slums under conditions of
overcrowding, poor environmental sanitation, very little or
totally non-existent infrastructure facilities like sewage
lines, potable water, drainage systems with an alarming
degree of crime and other maladies arising out of a poor
socio-economic situation. Identified slum population in
Delhi as per 2001 census is 20,25,890 comprising of
11,03,863 males and 8,87,827 females.
Some revealing morbidity figures reported in studies
conducted in the slums showed that major prevalent
diseases are ARIs, TB, Malaria and Filaria. There is a high
morbidity rate of 11-15 per cent for children with
numbers of annual episodes of diarrhoea range from 6-12.
Diarrhoea is responsible for about 60 per cent deaths in
children followed by ARI (27 per cent). Children are
especially trapped in the vicious cycle of malnutrition and
poor immunity. Slums have the highest proportion of
people with low body weight and severe malnutrition.
IMR in slums was 213 per 1000 in 2002. Child Mortality
Rate was 27 per 1000 in the same year, which is 40 per
cent higher than the national average.
10.30.3 Government Programmes for Slums
Government of Delhi and the Union Government have,
from time to time, introduced and implemented various
programmes for slums, however, they do not cover all
slums and nor are they implemented effectively. A large
number of NGO groups have been working in these areas
to alleviate the sufferings of people in slums, but many of
times they are working without any coordination with
each other leading to duplication of services in some areas
and deficiency and/or wastage of efforts in the others. It is
Chapter 10 • HEALTH AND FAMILY WELFARE, RCH, AYUSH AND NUTRITION 293
essential to clearly identify the problems of these people
and take appropriate actions in a coordinated manner in
collaboration with various NGO groups working in these
areas to improve the status of slum dwellers as outlined
below:
• Coordination among various players.
• To organise themselves as a single front to
address the health needs in slums in holistic
manner.
• To evolve suitable plans for their own
coordinated activities.
• To avoid overlapping and conserve resources.
• To connect people together to help themselves.
Mapping the areas and developing database
Children as change agents
• Potential of children as change agents should be
fully tapped. Various suitable media forms should
be used as per the response or effectiveness like
skits, puppetry, and magic shows etc.
• Setting up and strengthening Bal Panchayats in
slums by partners can be very effective in local
campaigns on health issues. They can be used for
low cost state level campaigns.
• Children are also very effective in conducting
surveys. They should be fully involved in the
same.
Organising State level consultations for betterment of
living conditions in slums to look into:
• Health needs in slums.
• Identifying vulnerable and their special needs.
• Documenting people’s aspirations.
• Making suggestions for addressing these needs
and aspirations at Government, NGOs and
Corporate levels.
• Identifying advocacy issues.
10.30.4 Minimising Risk Factors
• The government must set up a mechanism for
early warning for impending hazards like floods.
• Legal electricity connections must be granted.
This will not only reduce fire hazards but also
increase revenue of the government by
discouraging theft through illegal tapping.
• Provision of safe drinking water and sanitation
facilities must be a priority.
• Recreation facilities should be provided for
children, and coverage of ‘Anganwadi’ should be
complete.
• Awareness of legal rights needs to be generated
and CBOs need to make efforts for establishing
good working relations with the government
departments (and officials). This should also
cover legal housing rights.
• CBOs like Federation of Slum Dwellers and Mahila
Mandal Societies must be strengthened. They may
also be very effectively used for lobbying for their
land titles and other rights as well as serve as
watchdogs for effective implementation of various
government programmes.
• Shifting of slum dwellers to new areas must not
be abrupt but in a phased manner.
• Efforts towards communal harmony in slums
must be encouraged. Inter-religion and inter
cultural dialogue must be encouraged.
10.30.5 Sustainability
• For long-term sustainability of health
programmes in slums, services should not be
given free. For this reason, a training of personnel
involved in social marketing and social
entrepreneurship is must.
• Services based on regular house visits are very
effective and need to be incorporated in the
programmes.
10.31 The Way Forward
From the information given in previous sections it is
clear that there is wide variation in the health status of
different population segments. On an average, Delhi
seems to enjoy better healthcare system as compared to
other parts of the country. But still there are areas of
marked imbalances. Delhi is still vulnerable to epidemics
like dengue, cholera, gastro-enteritis, and hepatitis etc.
There is also increasing threat from age-related and
lifestyle diseases like cardiovascular disorders, diabetes,
cancer, HIV/AIDS etc.
10.31.1 Health Promotion
Health promotion is an organised way of going about
improving the health of a population. It is based on the
DELHI DEVELOPMENT REPORT294
assumption that, through improving the health of the
population, the health of individuals within that
population will benefit. Looking at Delhi health scenario it
is clear that there is need for massive efforts for
promoting health.
10.31.2 Health Promotion in Hospitals
A combination of services and health education is the
most effective way in bringing about positive, health-
related behavioural changes. Hospitals and clinics, along
with medical personnel and students, play a major role in
health education. Health education in a hospital/clinic can
be tied up with the curative care provided by medical and
nursing personnel who should be concerned about total
well being of the patient. There needs to be a total change
in the work culture of the hospitals, especially the public
hospitals. Even an informal conversation between the
patient and clinical staff can promote positive health
practices. For the patient, health education should start
from the time he/she enters, to the time of departure. On
the patient’s discharge slip, a column for health education
acts as useful reminder of the necessary health
precautions to be observed by the discharged patient and
the drug regimen to be followed.
10.31.3 Health Promotion in Schools
Schools and colleges provide excellent platforms for
educating the children towards the healthy and hygienic
habits and towards proper lifestyle for them to enjoy
healthy life in future. Children can also be an important
force for educating their parents especially if the parents
are illiterate. It would, therefore, be extremely economical
and beneficial in long run to include proper health
education in school/college curricula.
10.31.4 Health Education and Awareness
Aggressive health education programmes should be
integrated with health and medical care programmes with
emphasis on:
• Environmental health
• Personal hygiene
• Nutrition education
• Healthy habits
Although the responsibility for comprehensive health
care lies with government agencies, a close partnership
between voluntary organisations, private practitioners and
local government infrastructure networks, is absolutely
essential for successful percolation of the health
programmes into the society. The Bhagidari Scheme
introduced by Government of Delhi is one such example
of collaborative approach.
10.31.5 Health Care Delivery System:
The state of Delhi has presently multiplicity of health
implementing agencies like MCD, NDMC, ESI, Delhi
Cantonment Board etc., with little coordination and
sharing of resources. Because of lack of desired
coordination, there is a tendency in not shouldering the
responsibility in the wake of epidemic outbreak and
other disaster requiring immediate concerted efforts.
Further there may be duplication of services, which leads
to wastage of resources. There is an immediate need for
a single unit of command for coordinating these multiple
health agencies and all these agencies should be
reporting to this common single health authority dealing
with:
a) Policy decisions on health issues
b) Creation/relocation of health facilities
c) Implementation of various health programmes/
campaigns, public health acts like Nursing Home
Act, MTP Act, Prenatal Diagnostic Test Act,
Antiquackery Act, Delhi Prohibition of Smoking
and Non-smokers Health Protection Act etc.
d) Imbalances into reporting of health information
e) Projection of health manpower requirements
10.31.6 Primary Health Care Approach
In spite of the better availability of health facilities in
the urban areas as compared to that of the rural areas,
and the relative proximity of hospitals and other medical
facilities, the standard of health care falls far below
reasonable minimum levels for slum residents. The actual
implementation of primary health care in the urban areas
poses special problems.
It is extremely essential to have intersectoral
coordination between relevant departments, including
those dealing with water and sanitation, education,
nutrition, housing, public works, transport, industry,
income generation control of pollution, crime and
delinquency, and mental and physical health.
Health facilities in the district need to be developed in
such a way so as make district a self-sustained unit having
its own referral system at district level. Patients attending
secondary and tertiary health facilities will need to be
referred by the primary health care unit or private
practitioners of any system of medicine duly registered
with the state councils except in emergency situations.
Chapter 10 • HEALTH AND FAMILY WELFARE, RCH, AYUSH AND NUTRITION 295
The proposed facilities should meet the preventive,
promotive, curative and referral requirements of the
population living in the defined area. This concept of
Urban Health Centre is based upon the recommendations
of Committee headed by Sh. SV Krishnan set up by
Government of India for improving the quality of health
care services and outreach services in urban area.
10.31.7 Hospital Care
WHO had suggested a need for 5 hospital beds per
1000 population. The establishment and maintenance of
this vast infrastructure involves a huge sum including
manpower, equipment etc., that may not be possible.
Therefore in draft master plan Delhi 2021 it is proposed
to achieve 3.5 beds per 1000 population by 2021 with
measures to reduce the stay of indoor patients through
promotion of day care facilities and back referral system.
Based upon this norm of 3.5 beds per thousand
populations the bed requirement for the year 2021 for 26
million population of Delhi shall be around 91,000.
Currently Delhi is having around 33,000 beds in various
governmental and non-governmental hospitals. Thus it is
needed to add around 58,000 beds over the next 17 years;
i.e., almost 3400 beds every year. This translates into
establishment of four new 500-bedded hospitals and seven
new 200-bedded hospitals every year. Thus at current
costs, the total investment would be around 640 crores
per year for establishment of hospitals alone.
To decongest the increasing load on facilities in Delhi,
one needs to encourage development of high-class health
care infrastructure in NCR towns as well as in the
neighbouring states of Delhi through incentives and/or
soft loans to entrepreneurs ensuring comparable quality at
competitive costs. Besides, professional management of
Government hospitals is essential for better efficiency of
services and duly qualified hospital administrators should
be placed as heads of institutions and selection should be
based on performance, efficiency, skill, dynamism, vision
and ideas and not merely on length of service or seniority
basis. Well-managed Government infrastructure shall also
automatically bring in the attitude of ethical and
competitive practice by the private hospitals and nursing
homes.
Proper planning of newer set ups is necessary that are
more efficient, practical, economical and friendly towards
the needs of the patients, as per the modern trends.
Similarly, networking of various hospitals shall help in
better coordination of patient care with efficiency and
economy. Integration of the local area family practitioners
with the Government hospitals and dispensaries in the
area for two-way referrals, closer coordination amongst
healthcare infrastructures of various civic bodies shall
ensure seamless cover without wastage or duplication.
10.31.8 Public Health
Though there has been considerable improvement in
certain areas, such as control of malaria and other vector
borne diseases, water borne diseases like diarrhoea,
cholera, typhoid, hepatitis etc., but the problems keep on
emerging from time to time with considerable morbidity
though the mortality has been contained to a significant
extent.
Adequate financial and manpower resources need to be
allocated to decentralise the activities for containment of
the diseases. The state needs to strengthen its disease
surveillance network to effectively detect any impending
outbreak and control it. Diseases surveillance network
needs to be strengthened at all levels with better
interagency coordination. Control of water borne and
vector borne diseases is possible only through
intersectoral collaborations, as most of the factors that
lead to increased risk of these diseases and preventive
measures, are not directly in the ambit of the health
department. Proper and adequate potable water supply
system, sewerage/sanitation system and electric supply
infrastructure is essential to permanently minimise the
incidence, morbidity and mortality of infective diseases
like typhoid, cholera, gastro-enteritis, jaundice, malaria,
polio, etc. in the community.
Stray animals like cattle and dogs etc. are a major
nuisance on the streets and roads of Delhi. Many a times,
they lead to serious traffic accidents and traffic
obstructions on the roads unnecessarily increasing the
trauma cases resulting in loss of man-hours due to the
associated morbidity and mortality besides the treatment
costs. A large number of dog bite cases on the streets of
Delhi also lead to a wasteful expenditure on anti-rabies
vaccine in large majority of cases in addition to the
associated morbidity. It is estimated that an amount of
Rs. 3-5 crores is spent annually by the State Government
only on the purchase of anti-rabies vaccine by its hospital.
Effective measures, to control the stray animals and dogs,
need to be initiated to save the vaccine cost, morbidity/
mortality arising out of the accidents, bites and other
diseases caused by these animals; besides averting the
international humiliation arising out of the situation.
Lifestyle diseases (hypertension, diabetes, ischaemic
heart disease, cancer, nutritional diseases etc.) are
emerging as, major health issues in the developing
countries too, due to changing epidemiological factors.
DELHI DEVELOPMENT REPORT296
The State needs to allocate adequate resource and
manpower to develop a system for addressing the
emerging problems of hypertension, diabetes, ischaemic
heart disease, cancer etc., in the urban population. All
secondary level government hospitals should be equipped
for prevention, early detection and comprehensive
management for these lifestyle diseases.
10.31.9 Health Information System
Currently the health information system in the state is
unorganised with poor coordination because of poor
conceptualisation and multiplicity of agencies involved in
health care delivery system of the state.
There is need to strengthen its existing Health
Information System to make it efficient and responsible to
state health needs and all health implementing agencies
should contribute to a common database system reporting
to a single agency to manage this comprehensive health
data base. This system may incorporate Geographical
Information System as well. The Health Information
System in the state needs to be developed in such a way
so as to aid referral process. The system should be
providing access to the health information at various
levels of patient care and hospital management according
to the needs.
10.31.10 Private Sector in Health Care
Partnerships with the private sector can greatly
enhance the efficacy of public health programmes of the
Government. However, to check unregulated growth and
ensure quality of services an accreditation council can be
set-up. Council may include different stakeholders like
representative of private hospitals owners, professional
bodies, consumer organisations, NGOs etc.
10.31.11 Participatory Approach
Meeting the basic health needs of people requires a
participative approach that involves not only various levels
of government and service providers, but also the active
involvement of the people. Improvement in basic health is
determined not only by the availability and usage of
medical services, but also, and possibly more, by the
practice of preventive measures, good hygiene and lifestyle
choices. Some of these measures involve delivery of
medical services, such as immunisation, but most involve
individual initiative and are intimately related to their
daily routine. As such, increasing awareness of good
health practice is a key ingredient. Awareness-building
programmes would therefore form an integral part of any
strategy for the enhancement of basic health. Family
physicians can play significant role in this direction by
delivering the necessary health information directly to the
public in their catchment areas. It is, hence, essential to
integrate the entire health system involving the public
health infrastructure with the private institutions, family
physicians, NGOs, Resident Welfare Associations
(RWAs), media, corporate world, local leaders and
religious heads etc to form a seamless cover of service,
knowledge and awareness about the health and disease in
the society.
10.31.12 Bhagidari Scheme of Government of Delhi
The Government of Delhi has outlined a philosophy
for governance, which is responsive and participative. This
has specifically emerged from the belief that Government
must work in partnership with the people and the citizens
also must feel that successful and meaningful governance
cannot be achieved without their involvement and without
their role. In view of this the concept of ‘Bhagidari’: the
citizen—government partnership was evolved and the ‘My
Delhi—I care’ drive initiated. This scheme is one of the
effective ways of ensuring community participation.
Through this scheme RWAs can be involved in awareness
generation as well as in taking certain preventive steps
like cleaning of water coolers, clearing of stagnant water,
sanitation, garbage segregation etc. Active RWA members
can even be made part of health centre/hospital welfare
committee.
10.31.13 Involvement of NGOs
NGOs in Delhi are playing a major role in supplementing
government services and raising general awareness. Their
work can be classified into following categories:
• Health services, health education and health
awareness.
• Health research and health advocacy.
• Allied services like blood banks, ambulance,
hearse, Dharamshalas for outstation patients and
their families etc.
Under the above broad categories, major contribution
of NGOs working in the field of health is in the following
areas:
• Catering to health needs of slum population. This
is especially significant in view of the fact that
many slums in Delhi are unauthorised and fall
beyond the service area of the government.
• Providing low cost health services through
charitable hospitals.
Chapter 10 • HEALTH AND FAMILY WELFARE, RCH, AYUSH AND NUTRITION 297
• Implementing RCH programme of the
government as Mother NGOs, service NGOs and
also taking up innovative programmes.
• A whole range of activities pertaining to
prevention, management and control of HIV/AIDS,
especially targeted interventions in collaboration
with Delhi State AIDS Control Society.
• Disability: working both for physically and
mentally challenged.
• Working for the health and well being of elderly
population.
• Providing health services to refugee population in
Delhi.
• Water and sanitation, as these have direct relation
with high morbidity seen due to contamination of
water and environmental pollution.
• Activities related to Children’s health, education
and rights.
• Women’s health and empowerment, gender
relations and equity in health.
• Health research and advocacy.
• Helping the government in operation of National
Health and Population Policy.
Apart from these, there are NGOs providing services
like ambulance, hearse van, Dharamshalas etc. Some
NGOs also take up consumer related issues in health
services. There is need for providing more support to
NGOs and treat them as partners in improving the health
of the community.
10.32 Suggestions for Improving Health Statusof People in Delhi
1. Professional management of Government
hospitals for better efficiency of services—
qualified hospital administrators to be placed as
heads of institutions. Well-managed Government
infrastructure shall also automatically bring in the
attitude of ethical values and competitiveness in
the practices followed by the private hospitals and
nursing homes as a result of improved and
quality health care in government’s hospitals.
2. Need for higher proportion of public spending on
health. As per the latest Human Development
Report (2004), public spending on health is
merely 0.9 per cent of the GDP in India, which
ranks at poor 171st position out of the 175
countries studied. Only 4 countries, namely
Nigeria, Indonesia, Sudan, and Myanmar rank
below India in the tally. This is in contrast to the
figures of 8.1 per cent of GDP for Germany, 7.3
per cent for France, 6.2 per cent for USA, 3.2 per
cent for Brazil, and 2.0 per cent for China for
public spending on health. On the other hand,
private spending on health in India is 4.2 per cent
of the GDP and ranks 18th in the world tally
compared to 7.7 per cent in USA and 4.4 per cent
in Brazil. In the country with a large number of
poor people as ours, the public health spending is
disproportionately very low that deprives the
masses from availing of proper and timely
medical aid in cases of need, thus affecting their
health, efficiency, compliance to treatment and
ultimately their chance of survival, in case of any
serious ailment. This also leads to their falling
prey to quacks and such other orthodox or
unapproved methods of treatments risking their
health and lives.
3. Proper planning of newer set-ups to make them
more considerate and friendly towards the needs
of the patients, as per the modern trends.
4. Networking of various hospitals for better
coordination of patient care.
5. Integration of the local area family practitioners
with the Government hospitals and dispensaries
in the area for two-way referrals.
6. Closer coordination amongst healthcare
infrastructures of all Government agencies and
various civic bodies to ensure seamless cover
without wastage or duplicacy.
7. Encourage development of high-class health care
infrastructure in NCR towns as well as in the
neighbouring states of Delhi through incentives
and/or soft loans to entrepreneurs ensuring
comparable quality at competitive costs.
8. Proper and adequate potable water supply system,
sewerage/sanitation system and electric supply
infrastructure to permanently minimise the
incidence, morbidity and mortality of infective
diseases like typhoid, cholera, gastro-enteritis,
jaundice, malaria, polio, etc., in the community.
9. Health education of public through various means
of media with emphasis on prevention aspects of
infective diseases, hygiene, dietary habits,
addictions etc.
DELHI DEVELOPMENT REPORT298
10. Inclusion of health related topics in school and
college curricula.
11. Improve general literacy status of the population
with proper definition of a literate persons having
ability to read newspaper, write letters and
perform simple calculations (instead of the
present criteria of just the ability to sign one’s
name). It is expected that a literate person would
understand the health needs and family planning
requirements better than the illiterates.
12. Strict control of food items and strict compliance
of laws for control of food/water borne infections
and adulterations.
13. Proper housing policy with adequate living space
per person with healthy surroundings and with
adequate infrastructure support system.
14. Policy about in-migration of people to control the
population growth of Delhi may require
strengthening of infrastructure facilities in NCR
towns, creation of well developed satellite towns
with rapid mass transport systems etc.
15. Well-equipped and dedicated trauma centers
along the main highways entering Delhi.
16. Widening of Health Insurance sector base and
Corporate support to their employees for medical
check ups and treatments.
17. Shifting of industries to outskirts to reduce health
hazards, accidents, pollution and traffic
congestion in the heart of the city.
18. Control of stray dogs and stray animals to
minimise traffic hazards/accidents and to reduce
the cost of superfluous use of Anti Rabies
vaccine, besides indirect saving on the man-hours.
(Annual expenditure on ARV in GNCTD Hospital
is approx. Rs. 3-5 crores).
Chapter 11
Tourism including Health Tourism
DELHI
11.0 Methodology
Broad picture of the tourism scenario in general and of
Delhi in particular is being given.The description will
identify selected areas of the tourism sector with inputs
from related organisation. Recent reports and data would
also be referred to in respect of the selected sectors.
An overview of the National Tourism scene during the
Ninth and Tenth Plan period will be provided and the
Delhi tourism scenario will be seen in the context of this
over view.
The selected Tourism sectors will be covered as
follows:
1. Heritage Culture Tourism
2. Business Tourism and Conference and
Conventional Tourism
3. Rural Tourism Handicraft etc.
4. Medical and Wellness related Tourism
5. Sports related Tourism
6. Shopping related Tourism
7. Adventure Tourism
8. Hub destination Tourism
9. Human Resource Development
Each of the above selected sectors of tourism would
be examined and evaluated and recommendation made
with a view to generate growth in the Tenth Five Year
Plan period as well as the special opportunity for
development linked to the Commonwealth Games
2010.
The conclusion of the Report will give the ‘way
forward’ and provide a ‘vision’ for Delhi tourism in the
coming years.
11.1 National Tourism Scene(Ninth Five Year Plan)
Over the years, tourism has emerged as a major
segment of Indian economy contributing substantially to
the foreign exchange earnings, which have increased from
Rs. 66110 crore in 1993 to Rs. 164290 crore in 2003. The
direct employment in the sector during 1995-96 was
about 8.5 million persons, accounting for about 2.4 per
cent of the total labour force. In 2003 the employment
figure is 25 million. There was a gradual increase in the
Central Plan outlay for tourism over the Plan periods
from Rs. 1.58 crore in the Second Plan to Rs. 272.00
crore in the Eighth Plan. The details of the expenditure
during the Eighth Plan period for the Department of
Tourism and ITDC are given in the Table 11.1.
As against the Eighth Plan outlay of Rs. 272 crore
(1991-92 prices), the expenditure during the period was
Rs. 490.42 (current prices). The entire Plan expenditure
of ITDC from the year 1994-95 onwards was met from
internal and extra budgetary resources. Bulk of the
expenditure of the Department of Tourism was incurred
on tourism publicity.
The major schemes of the Department of Tourism
relate to Promotion and Publicity, Central Assistance for
the Development of Tourism Infrastructure, Human
Resource Development and Incentives. The Central
government investment for the improvement and creation
of tourist facilities is channelised through State/UT
Government on a cost-sharing basis. Under this pattern of
funding, the Central Department of Tourism meets almost
the entire expenditure, except the cost of land and interior
decoration in the case of construction projects.
In order to finance major projects fro development of
tourist infrastructure, a new pattern of financing was
conceived during the Eighth plan. Apart from the State
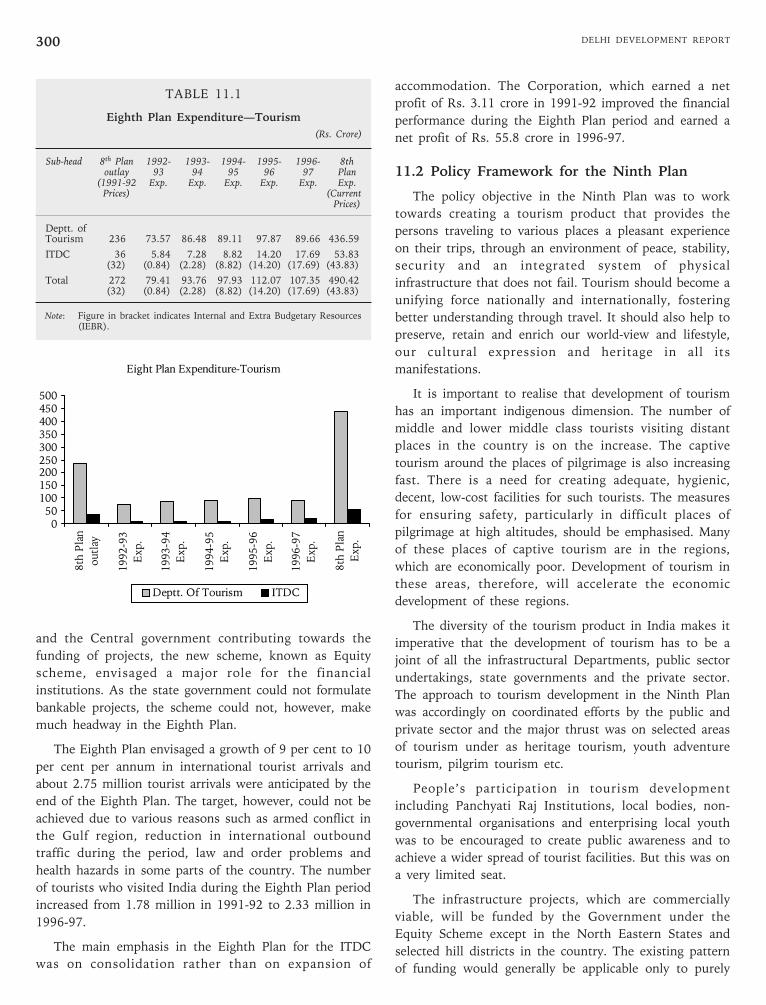
DELHI DEVELOPMENT REPORT300
and the Central government contributing towards the
funding of projects, the new scheme, known as Equity
scheme, envisaged a major role for the financial
institutions. As the state government could not formulate
bankable projects, the scheme could not, however, make
much headway in the Eighth Plan.
The Eighth Plan envisaged a growth of 9 per cent to 10
per cent per annum in international tourist arrivals and
about 2.75 million tourist arrivals were anticipated by the
end of the Eighth Plan. The target, however, could not be
achieved due to various reasons such as armed conflict in
the Gulf region, reduction in international outbound
traffic during the period, law and order problems and
health hazards in some parts of the country. The number
of tourists who visited India during the Eighth Plan period
increased from 1.78 million in 1991-92 to 2.33 million in
1996-97.
The main emphasis in the Eighth Plan for the ITDC
was on consolidation rather than on expansion of
accommodation. The Corporation, which earned a net
profit of Rs. 3.11 crore in 1991-92 improved the financial
performance during the Eighth Plan period and earned a
net profit of Rs. 55.8 crore in 1996-97.
11.2 Policy Framework for the Ninth Plan
The policy objective in the Ninth Plan was to work
towards creating a tourism product that provides the
persons traveling to various places a pleasant experience
on their trips, through an environment of peace, stability,
security and an integrated system of physical
infrastructure that does not fail. Tourism should become a
unifying force nationally and internationally, fostering
better understanding through travel. It should also help to
preserve, retain and enrich our world-view and lifestyle,
our cultural expression and heritage in all its
manifestations.
It is important to realise that development of tourism
has an important indigenous dimension. The number of
middle and lower middle class tourists visiting distant
places in the country is on the increase. The captive
tourism around the places of pilgrimage is also increasing
fast. There is a need for creating adequate, hygienic,
decent, low-cost facilities for such tourists. The measures
for ensuring safety, particularly in difficult places of
pilgrimage at high altitudes, should be emphasised. Many
of these places of captive tourism are in the regions,
which are economically poor. Development of tourism in
these areas, therefore, will accelerate the economic
development of these regions.
The diversity of the tourism product in India makes it
imperative that the development of tourism has to be a
joint of all the infrastructural Departments, public sector
undertakings, state governments and the private sector.
The approach to tourism development in the Ninth Plan
was accordingly on coordinated efforts by the public and
private sector and the major thrust was on selected areas
of tourism under as heritage tourism, youth adventure
tourism, pilgrim tourism etc.
People’s participation in tourism development
including Panchyati Raj Institutions, local bodies, non-
governmental organisations and enterprising local youth
was to be encouraged to create public awareness and to
achieve a wider spread of tourist facilities. But this was on
a very limited seat.
The infrastructure projects, which are commercially
viable, will be funded by the Government under the
Equity Scheme except in the North Eastern States and
selected hill districts in the country. The existing pattern
of funding would generally be applicable only to purely
TABLE 11.1
Eighth Plan Expenditure—Tourism
(Rs. Crore)
Sub-head 8th Plan 1992- 1993- 1994- 1995- 1996- 8thoutlay 93 94 95 96 97 Plan
(1991-92 Exp. Exp. Exp. Exp. Exp. Exp.Prices) (Current
Prices)
Deptt. ofTourism 236 73.57 86.48 89.11 97.87 89.66 436.59
ITDC 36 5.84 7.28 8.82 14.20 17.69 53.83(32) (0.84) (2.28) (8.82) (14.20) (17.69) (43.83)
Total 272 79.41 93.76 97.93 112.07 107.35 490.42(32) (0.84) (2.28) (8.82) (14.20) (17.69) (43.83)
Note: Figure in bracket indicates Internal and Extra Budgetary Resources(IEBR).
Eight Plan Expenditure-Tourism
050
100150200250300350400450500
8th
Pla
n
outl
ay
19
92-9
3
Exp.
19
93-9
4
Exp.
19
94-9
5
Exp.
19
95-9
6
Exp.
19
96-9
7
Exp.
8th
Pla
n
Exp
.
Deptt. Of Tourism ITDC
Chapter 11 • TOURISM INCLUDING HEALTH TOURISM 301
promotional and product development projects and in the
North East Region and selected hill districts where the
equity funding pattern is not insisted upon.
The main schemes of the Department of Tourism,
namely Central Assistance for Development of Tourism
Infrastructure and Promotion and Marketing would
continue in the Ninth Plan. Efforts would be made to
make them more effective.
In order to give boost to foreign exchange earnings,
employment and income generation through tourism
activities, export house status was granted to tourism
units.
ITDC continued its existing activities. The performance
of ITDC improved through restructuring of the existing
properties and improving the quality of service. No project
relating to construction of new hotels was taken up
during the Ninth Plan period.
The Ninth Plan period also saw initiatives being taken
in manpower development by strengthening the training
facilities. This was achieved by improving government run
institutes as well as by encouraging private institutes to
set up training facilities.
Effort was also made to improve coordination with
related sectors such as Civil Aviation, Railways, ASI, etc.
The Tenth Plan approach for Tourism signified a distinct
shift from that adopted in earlier Plans. The new Tourism
policy 2002 to be implemented during the Tenth Plan lays
emphasis on the benefit of the tourism for the host
population. It will motivate State Government to use
tourism for achieving socio-economic objectives. It will
encourage private sector investment and will provide
legislative and regulatory support for sustainable tourism
and also to protect the industry and the consumer. Special
encouragement will be given in promoting Rural, Heritage,
Adventure and Eco tourism. Emphasis would be on creating
“products” and “destinations”. The policy would endeavor to
remove barriers to growth and resolve contradictions so as
to achieve inter-sectoral convergence of activities that will go
to help the growth of the tourism sector.
11.3 Tourism Scene (Tenth Five Year Plan)
The Tenth Plan approach toward tourism signifies a
distinct shift from the approach adopted in earlier Plans.
Apart from acknowledging the well-accepted advantages of
developing tourism for the promotion of national
integration, international understanding and earning
foreign exchange, the Tenth Plan recognises the vast
employment generating potential of tourism and the role
it can play in furthering the socio-economic objectives of
the Plan. In order to create a supportive environment for
the promotion of tourism, the New Tourism Policy, 2002,
that is to be implemented during the Tenth Plan, will
generate awareness about the benefits of tourism for the
host population. It will mobilise state government to use
tourism as a means for achieving their socio-economic
objectives; encourage the private sector to enhance
investment in tourism and provide legislative and
regulatory support for sustainable tourism and to protect
the interests of the industry and the consumer. The policy
envisages involving the rural sector in the promotion of
rural, heritage, and adventure and eco-tourism and will
promote the development of competitive high quality
products and destinations. Most importantly, it will
remove the barriers to growth and resolve contradictions
in policy to achieve inter-sectoral convergence in activities
that help the growth of tourism.
The initiatives taken by the state so far have not
yielded the desired result and India’s tourism performance
has failed to match its potential even as countries its
natural and cultural endowments have taken the lead in
reaping the benefits of tourism development for their
people. The reasons for this poor performance need to be
speedily addressed to enable tourism to make an
appropriate contribution to national development.
As observed in the Planning Commission Report of the
National Committee on Tourism (1988), the public sector
made a significant contribution to the growth of tourism
in the initial stages of planned development by providing
a reasonable infrastructure base. During the Ninth Plan it
was recognised that a reappraisal of the role of the State
in tourism development and the extent of its participation
was needed as it is neither necessary nor feasible for the
State to make large investments in areas that are best left
to the initiative of the private sector. The state can
contribute through infrastructure development, the
planning of broad development strategies, the provision of
fiscal and monetary incentives to catalyse private sector
investment and devise an effective regulatory and
supervisory mechanism to protect the interests of the
industry and the consumer. The acceptance of this view
also led to the commencement of the process of
disinvestments in 18 hotels of the India Tourism
Development Corporation (ITDC) hotels.
The ITDC will have to redefine its role in the Tenth
Plan. The state can also play an effective role in ensuring
that tourism development does not harm the
environment. The interaction between tourism and
environmental pollution requires sensitive handling. There
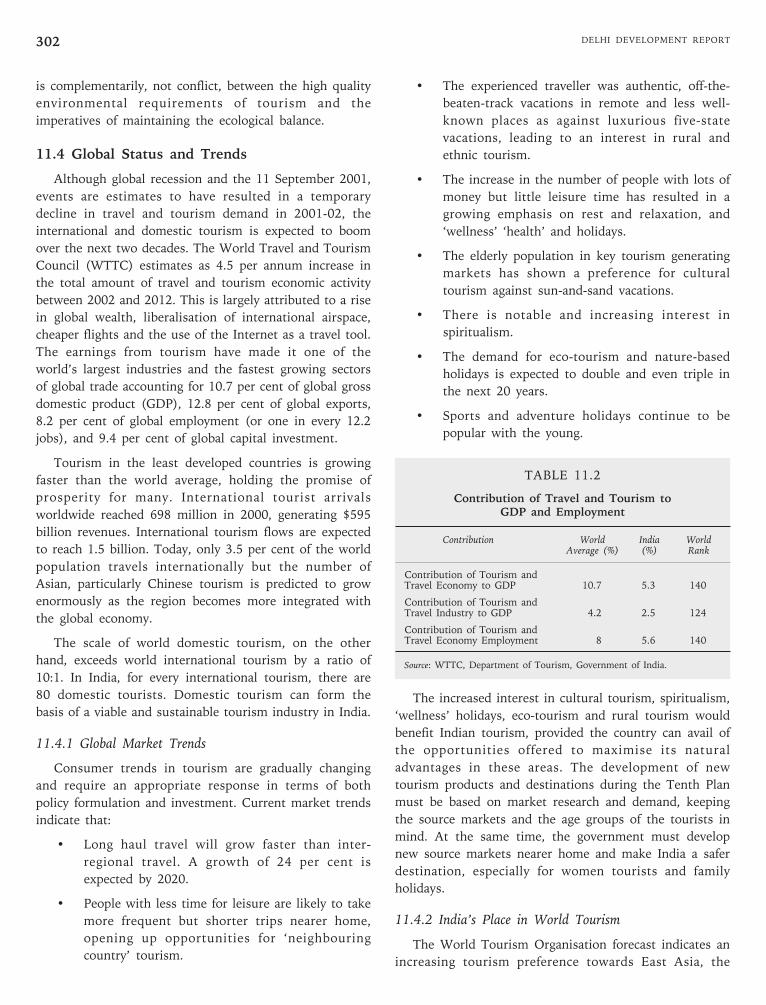
DELHI DEVELOPMENT REPORT302
is complementarily, not conflict, between the high quality
environmental requirements of tourism and the
imperatives of maintaining the ecological balance.
11.4 Global Status and Trends
Although global recession and the 11 September 2001,
events are estimates to have resulted in a temporary
decline in travel and tourism demand in 2001-02, the
international and domestic tourism is expected to boom
over the next two decades. The World Travel and Tourism
Council (WTTC) estimates as 4.5 per annum increase in
the total amount of travel and tourism economic activity
between 2002 and 2012. This is largely attributed to a rise
in global wealth, liberalisation of international airspace,
cheaper flights and the use of the Internet as a travel tool.
The earnings from tourism have made it one of the
world’s largest industries and the fastest growing sectors
of global trade accounting for 10.7 per cent of global gross
domestic product (GDP), 12.8 per cent of global exports,
8.2 per cent of global employment (or one in every 12.2
jobs), and 9.4 per cent of global capital investment.
Tourism in the least developed countries is growing
faster than the world average, holding the promise of
prosperity for many. International tourist arrivals
worldwide reached 698 million in 2000, generating $595
billion revenues. International tourism flows are expected
to reach 1.5 billion. Today, only 3.5 per cent of the world
population travels internationally but the number of
Asian, particularly Chinese tourism is predicted to grow
enormously as the region becomes more integrated with
the global economy.
The scale of world domestic tourism, on the other
hand, exceeds world international tourism by a ratio of
10:1. In India, for every international tourism, there are
80 domestic tourists. Domestic tourism can form the
basis of a viable and sustainable tourism industry in India.
11.4.1 Global Market Trends
Consumer trends in tourism are gradually changing
and require an appropriate response in terms of both
policy formulation and investment. Current market trends
indicate that:
• Long haul travel will grow faster than inter-
regional travel. A growth of 24 per cent is
expected by 2020.
• People with less time for leisure are likely to take
more frequent but shorter trips nearer home,
opening up opportunities for ‘neighbouring
country’ tourism.
• The experienced traveller was authentic, off-the-
beaten-track vacations in remote and less well-
known places as against luxurious five-state
vacations, leading to an interest in rural and
ethnic tourism.
• The increase in the number of people with lots of
money but little leisure time has resulted in a
growing emphasis on rest and relaxation, and
‘wellness’ ‘health’ and holidays.
• The elderly population in key tourism generating
markets has shown a preference for cultural
tourism against sun-and-sand vacations.
• There is notable and increasing interest in
spiritualism.
• The demand for eco-tourism and nature-based
holidays is expected to double and even triple in
the next 20 years.
• Sports and adventure holidays continue to be
popular with the young.
TABLE 11.2
Contribution of Travel and Tourism toGDP and Employment
Contribution World India WorldAverage (%) (%) Rank
Contribution of Tourism andTravel Economy to GDP 10.7 5.3 140
Contribution of Tourism andTravel Industry to GDP 4.2 2.5 124
Contribution of Tourism andTravel Economy Employment 8 5.6 140
Source: WTTC, Department of Tourism, Government of India.
The increased interest in cultural tourism, spiritualism,
‘wellness’ holidays, eco-tourism and rural tourism would
benefit Indian tourism, provided the country can avail of
the opportunities offered to maximise its natural
advantages in these areas. The development of new
tourism products and destinations during the Tenth Plan
must be based on market research and demand, keeping
the source markets and the age groups of the tourists in
mind. At the same time, the government must develop
new source markets nearer home and make India a safer
destination, especially for women tourists and family
holidays.
11.4.2 India’s Place in World Tourism
The World Tourism Organisation forecast indicates an
increasing tourism preference towards East Asia, the
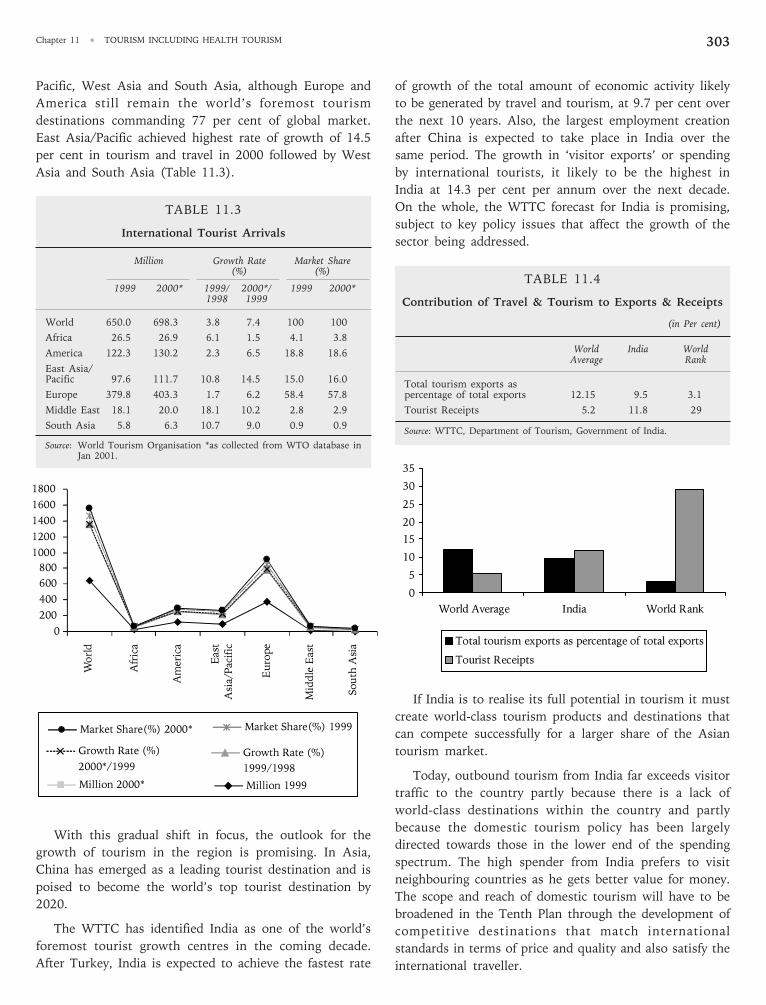
Chapter 11 • TOURISM INCLUDING HEALTH TOURISM 303
Pacific, West Asia and South Asia, although Europe and
America still remain the world’s foremost tourism
destinations commanding 77 per cent of global market.
East Asia/Pacific achieved highest rate of growth of 14.5
per cent in tourism and travel in 2000 followed by West
Asia and South Asia (Table 11.3).
TABLE 11.3
International Tourist Arrivals
Million Growth Rate Market Share(%) (%)
1999 2000* 1999/ 2000*/ 1999 2000*1998 1999
World 650.0 698.3 3.8 7.4 100 100
Africa 26.5 26.9 6.1 1.5 4.1 3.8
America 122.3 130.2 2.3 6.5 18.8 18.6
East Asia/Pacific 97.6 111.7 10.8 14.5 15.0 16.0
Europe 379.8 403.3 1.7 6.2 58.4 57.8
Middle East 18.1 20.0 18.1 10.2 2.8 2.9
South Asia 5.8 6.3 10.7 9.0 0.9 0.9
Source: World Tourism Organisation *as collected from WTO database inJan 2001.
With this gradual shift in focus, the outlook for the
growth of tourism in the region is promising. In Asia,
China has emerged as a leading tourist destination and is
poised to become the world’s top tourist destination by
2020.
The WTTC has identified India as one of the world’s
foremost tourist growth centres in the coming decade.
After Turkey, India is expected to achieve the fastest rate
of growth of the total amount of economic activity likely
to be generated by travel and tourism, at 9.7 per cent over
the next 10 years. Also, the largest employment creation
after China is expected to take place in India over the
same period. The growth in ‘visitor exports’ or spending
by international tourists, it likely to be the highest in
India at 14.3 per cent per annum over the next decade.
On the whole, the WTTC forecast for India is promising,
subject to key policy issues that affect the growth of the
sector being addressed.
TABLE 11.4
Contribution of Travel & Tourism to Exports & Receipts
(in Per cent)
World India WorldAverage Rank
Total tourism exports aspercentage of total exports 12.15 9.5 3.1
Tourist Receipts 5.2 11.8 29
Source: WTTC, Department of Tourism, Government of India.
If India is to realise its full potential in tourism it must
create world-class tourism products and destinations that
can compete successfully for a larger share of the Asian
tourism market.
Today, outbound tourism from India far exceeds visitor
traffic to the country partly because there is a lack of
world-class destinations within the country and partly
because the domestic tourism policy has been largely
directed towards those in the lower end of the spending
spectrum. The high spender from India prefers to visit
neighbouring countries as he gets better value for money.
The scope and reach of domestic tourism will have to be
broadened in the Tenth Plan through the development of
competitive destinations that match international
standards in terms of price and quality and also satisfy the
international traveller.
0
5
10
15
20
25
30
35
World Average India World Rank
Total tourism exports as percentage of total exports
Tourist Receipts
0
200
400
600
800
1000
1200
1400
1600
1800
Market Share(%) 2000* Market Share(%) 1999
Growth Rate (%)
2000*/1999
Growth Rate (%)
1999/1998
Million 2000* Million 1999
Worl
d
Afr
ica
Am
eric
a
Eas
t
Asi
a/P
acif
ic
Eu
rope
Mid
dle
Eas
t
Sou
th A
sia
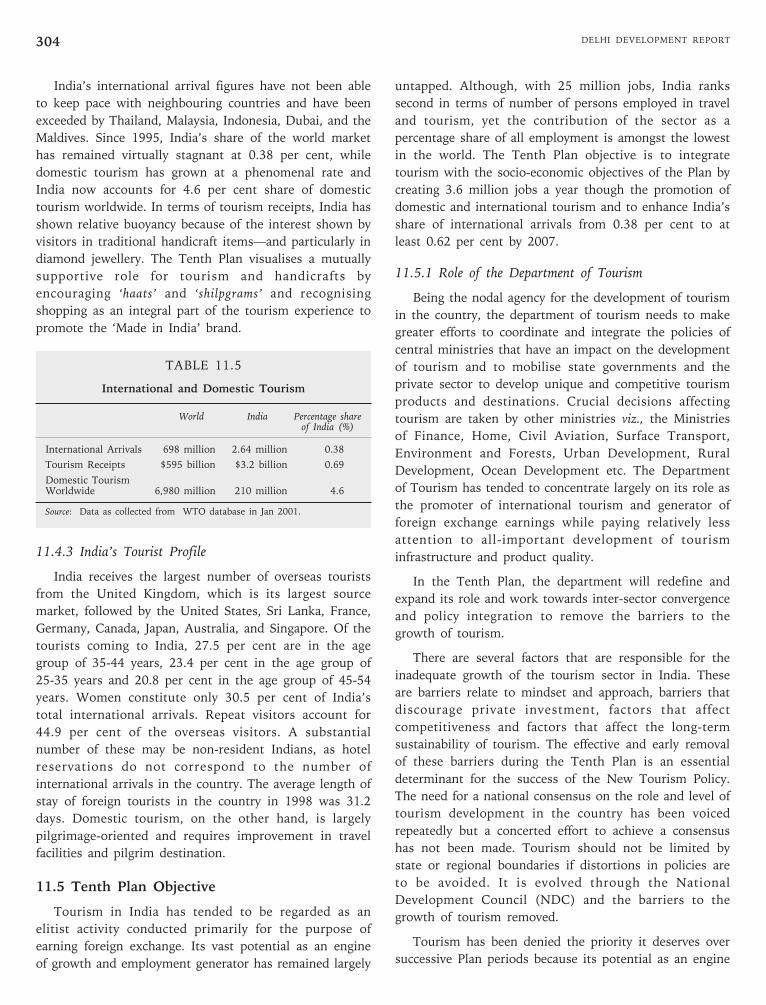
DELHI DEVELOPMENT REPORT304
India’s international arrival figures have not been able
to keep pace with neighbouring countries and have been
exceeded by Thailand, Malaysia, Indonesia, Dubai, and the
Maldives. Since 1995, India’s share of the world market
has remained virtually stagnant at 0.38 per cent, while
domestic tourism has grown at a phenomenal rate and
India now accounts for 4.6 per cent share of domestic
tourism worldwide. In terms of tourism receipts, India has
shown relative buoyancy because of the interest shown by
visitors in traditional handicraft items—and particularly in
diamond jewellery. The Tenth Plan visualises a mutually
supportive role for tourism and handicrafts by
encouraging ‘haats’ and ‘shilpgrams’ and recognising
shopping as an integral part of the tourism experience to
promote the ‘Made in India’ brand.
TABLE 11.5
International and Domestic Tourism
World India Percentage shareof India (%)
International Arrivals 698 million 2.64 million 0.38
Tourism Receipts $595 billion $3.2 billion 0.69
Domestic TourismWorldwide 6,980 million 210 million 4.6
Source: Data as collected from WTO database in Jan 2001.
11.4.3 India’s Tourist Profile
India receives the largest number of overseas tourists
from the United Kingdom, which is its largest source
market, followed by the United States, Sri Lanka, France,
Germany, Canada, Japan, Australia, and Singapore. Of the
tourists coming to India, 27.5 per cent are in the age
group of 35-44 years, 23.4 per cent in the age group of
25-35 years and 20.8 per cent in the age group of 45-54
years. Women constitute only 30.5 per cent of India’s
total international arrivals. Repeat visitors account for
44.9 per cent of the overseas visitors. A substantial
number of these may be non-resident Indians, as hotel
reservations do not correspond to the number of
international arrivals in the country. The average length of
stay of foreign tourists in the country in 1998 was 31.2
days. Domestic tourism, on the other hand, is largely
pilgrimage-oriented and requires improvement in travel
facilities and pilgrim destination.
11.5 Tenth Plan Objective
Tourism in India has tended to be regarded as an
elitist activity conducted primarily for the purpose of
earning foreign exchange. Its vast potential as an engine
of growth and employment generator has remained largely
untapped. Although, with 25 million jobs, India ranks
second in terms of number of persons employed in travel
and tourism, yet the contribution of the sector as a
percentage share of all employment is amongst the lowest
in the world. The Tenth Plan objective is to integrate
tourism with the socio-economic objectives of the Plan by
creating 3.6 million jobs a year though the promotion of
domestic and international tourism and to enhance India’s
share of international arrivals from 0.38 per cent to at
least 0.62 per cent by 2007.
11.5.1 Role of the Department of Tourism
Being the nodal agency for the development of tourism
in the country, the department of tourism needs to make
greater efforts to coordinate and integrate the policies of
central ministries that have an impact on the development
of tourism and to mobilise state governments and the
private sector to develop unique and competitive tourism
products and destinations. Crucial decisions affecting
tourism are taken by other ministries viz., the Ministries
of Finance, Home, Civil Aviation, Surface Transport,
Environment and Forests, Urban Development, Rural
Development, Ocean Development etc. The Department
of Tourism has tended to concentrate largely on its role as
the promoter of international tourism and generator of
foreign exchange earnings while paying relatively less
attention to all-important development of tourism
infrastructure and product quality.
In the Tenth Plan, the department will redefine and
expand its role and work towards inter-sector convergence
and policy integration to remove the barriers to the
growth of tourism.
There are several factors that are responsible for the
inadequate growth of the tourism sector in India. These
are barriers relate to mindset and approach, barriers that
discourage private investment, factors that affect
competitiveness and factors that affect the long-term
sustainability of tourism. The effective and early removal
of these barriers during the Tenth Plan is an essential
determinant for the success of the New Tourism Policy.
The need for a national consensus on the role and level of
tourism development in the country has been voiced
repeatedly but a concerted effort to achieve a consensus
has not been made. Tourism should not be limited by
state or regional boundaries if distortions in policies are
to be avoided. It is evolved through the National
Development Council (NDC) and the barriers to the
growth of tourism removed.
Tourism has been denied the priority it deserves over
successive Plan periods because its potential as an engine
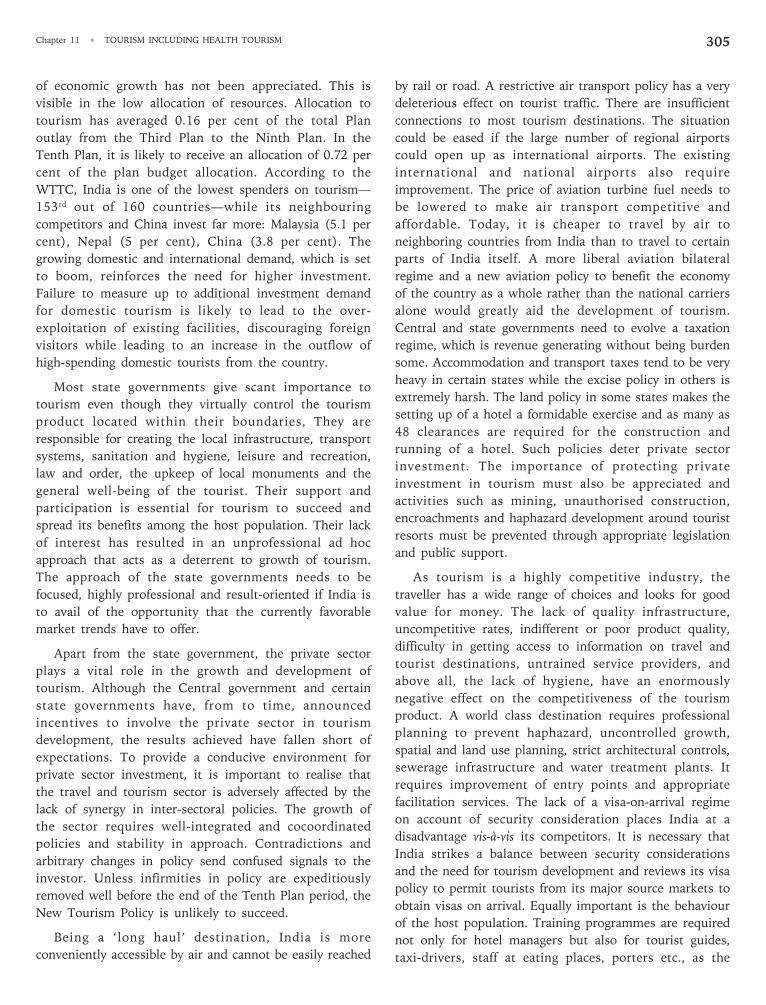
Chapter 11 • TOURISM INCLUDING HEALTH TOURISM 305
of economic growth has not been appreciated. This is
visible in the low allocation of resources. Allocation to
tourism has averaged 0.16 per cent of the total Plan
outlay from the Third Plan to the Ninth Plan. In the
Tenth Plan, it is likely to receive an allocation of 0.72 per
cent of the plan budget allocation. According to the
WTTC, India is one of the lowest spenders on tourism—
153rd out of 160 countries—while its neighbouring
competitors and China invest far more: Malaysia (5.1 per
cent), Nepal (5 per cent), China (3.8 per cent). The
growing domestic and international demand, which is set
to boom, reinforces the need for higher investment.
Failure to measure up to additional investment demand
for domestic tourism is likely to lead to the over-
exploitation of existing facilities, discouraging foreign
visitors while leading to an increase in the outflow of
high-spending domestic tourists from the country.
Most state governments give scant importance to
tourism even though they virtually control the tourism
product located within their boundaries, They are
responsible for creating the local infrastructure, transport
systems, sanitation and hygiene, leisure and recreation,
law and order, the upkeep of local monuments and the
general well-being of the tourist. Their support and
participation is essential for tourism to succeed and
spread its benefits among the host population. Their lack
of interest has resulted in an unprofessional ad hoc
approach that acts as a deterrent to growth of tourism.
The approach of the state governments needs to be
focused, highly professional and result-oriented if India is
to avail of the opportunity that the currently favorable
market trends have to offer.
Apart from the state government, the private sector
plays a vital role in the growth and development of
tourism. Although the Central government and certain
state governments have, from to time, announced
incentives to involve the private sector in tourism
development, the results achieved have fallen short of
expectations. To provide a conducive environment for
private sector investment, it is important to realise that
the travel and tourism sector is adversely affected by the
lack of synergy in inter-sectoral policies. The growth of
the sector requires well-integrated and cocoordinated
policies and stability in approach. Contradictions and
arbitrary changes in policy send confused signals to the
investor. Unless infirmities in policy are expeditiously
removed well before the end of the Tenth Plan period, the
New Tourism Policy is unlikely to succeed.
Being a ‘long haul’ destination, India is more
conveniently accessible by air and cannot be easily reached
by rail or road. A restrictive air transport policy has a very
deleterious effect on tourist traffic. There are insufficient
connections to most tourism destinations. The situation
could be eased if the large number of regional airports
could open up as international airports. The existing
international and national airports also require
improvement. The price of aviation turbine fuel needs to
be lowered to make air transport competitive and
affordable. Today, it is cheaper to travel by air to
neighboring countries from India than to travel to certain
parts of India itself. A more liberal aviation bilateral
regime and a new aviation policy to benefit the economy
of the country as a whole rather than the national carriers
alone would greatly aid the development of tourism.
Central and state governments need to evolve a taxation
regime, which is revenue generating without being burden
some. Accommodation and transport taxes tend to be very
heavy in certain states while the excise policy in others is
extremely harsh. The land policy in some states makes the
setting up of a hotel a formidable exercise and as many as
48 clearances are required for the construction and
running of a hotel. Such policies deter private sector
investment. The importance of protecting private
investment in tourism must also be appreciated and
activities such as mining, unauthorised construction,
encroachments and haphazard development around tourist
resorts must be prevented through appropriate legislation
and public support.
As tourism is a highly competitive industry, the
traveller has a wide range of choices and looks for good
value for money. The lack of quality infrastructure,
uncompetitive rates, indifferent or poor product quality,
difficulty in getting access to information on travel and
tourist destinations, untrained service providers, and
above all, the lack of hygiene, have an enormously
negative effect on the competitiveness of the tourism
product. A world class destination requires professional
planning to prevent haphazard, uncontrolled growth,
spatial and land use planning, strict architectural controls,
sewerage infrastructure and water treatment plants. It
requires improvement of entry points and appropriate
facilitation services. The lack of a visa-on-arrival regime
on account of security consideration places India at a
disadvantage vis-à-vis its competitors. It is necessary that
India strikes a balance between security considerations
and the need for tourism development and reviews its visa
policy to permit tourists from its major source markets to
obtain visas on arrival. Equally important is the behaviour
of the host population. Training programmes are required
not only for hotel managers but also for tourist guides,
taxi-drivers, staff at eating places, porters etc., as the
DELHI DEVELOPMENT REPORT306
manner in which they conduct themselves affects the
tourist’s experience of the country. Important ‘do’s’ and
‘don’ts’ in terms of a code of ethics need to be inculcated
among the service providers. During the Tenth Plan, the
Department of Tourism will organise capacity building
programmes for service providers through mobile training
units.
A major impediment to the growth of tourism in India
has been the lack of awareness about the benefits that it
can bestow upon the host population. Unless the host
population, both in the rural and urban areas, is
supportive of tourism, it cannot become a vibrant
economic force. The rural sector, in particular, has been
largely ignored in tourism development and had
consequently been deprived of the benefits of employment
and income generation accruing from tourism. The Tenth
Plan would create wide interest in rural tourism. While
awareness campaign that elicits local support for travel
and tourism is essential for the long-term growth of the
sector, it is also important to create awareness about the
environmental impact of tourism by generating respect for
the carrying as excessive exposure of ecologically fragile
areas to human interference can lead to irreparable
environmental degradation. As the demand for eco-
tourism is expected to grow enormously in the next
decade, it is important to have regulations in place to
prevent such damage. The local population must be
convinced of the need to support such regulations in the
interest of long-term sustainability. India’s hill resorts
have already suffered seriously from a lack of concern for
their carrying capacities and the unchecked influx of
tourists during the summer months. If India’s forest
sanctuaries and pristine beaches are not to suffer the
same fate, attention will have to be paid during the Tenth
Plan to obtaining regulatory and public support for
sustainability concerns.
11.5.2 The Tenth Plan Strategy
The Tenth Plan strategy is to work towards a national
consensus on the role of tourism in national development
and to focus on the removal of barriers that hamper its
growth. To make public sector investment more effective,
it is necessary to work towards the inter-sectoral
convergence of policies and programmes that could
benefit tourism. The New Tourism Policy envisages a
framework, which is government-led, private sector driven
and oriented towards community welfare, with the basic
infrastructure for tourism development, the private sector
providing the quality product and the community
providing active support. The overall vision of the
development of tourism in the new policy will be achieved
through five key strategic objectives. These are:
i. Positioning tourism as a national priority.
ii. Enhancing India’s competitiveness as a tourist
destination.
iii. Improving and expanding product development.
iv. Creation of world-class infrastructure.
v. Effective marketing plans and programmes.
Positioning Tourism as a National Priority
A concerted effort will be made, through the NDC, to
arrive at a consensus on the role of tourism in the
development agenda of the nation. Inclusion of tourism in
the Concurrent List of the Constitution will provide
constitutional recognition to the tourism sector and
enable the central government to legislate for tourism
development. A proposal to this effect has been circulated
by the Department of Tourism to the state governments
for comments and has also been discussed at a Chief
Ministers’ conference and a majority of the states have
agreed to the proposal. Other initiatives include the
setting up of Tourism Advisory Council with key
stakeholders functioning as a think tank and the
constitution of a Group of Ministers on Tourism to
improve policy integration and coordination. The adoption
of a tourism satellite accounting system is underway to
gauge more precisely the contribution of tourism to the
national economy. A national awareness campaign in
order to create a popular movement in favour of tourism
is being planned through a professionally managed
communication strategy. Most importantly, efficiency of
public investment in tourism supporting activities will be
improved through inter sector coordination and
prioritisation.
Enhancing India’s Competitiveness as aTourist Destination
As air capacity available to India is woefully short
during the peak travel months, ranging from October to
March, especially for the main tourism originating regions
such as North America, Western Europe and South Asia,
it is necessary to open India’s skies so as to increase
capacity and help enhance tourism. Additional air seat
capacity and help in enhancing tourism generating
destinations would significantly benefit the national
economy and provide a major impetus to tourism.
Improvement in the standard of facilities and services at
the international and national airports will need to be
Chapter 11 • TOURISM INCLUDING HEALTH TOURISM 307
speeded up by employing professional management
agencies and by privatising and leasing out airports.
To enhance India’s competitiveness as a tourist
destination, it is proposed to simplify the visa procedures
and consider strategies for the speedy issue of visas
including electronic visas and visas on arrival. An attempt
will be made, through a consensus, to reduce the heavy
and multiple taxes that reduce the competitiveness of the
Indian tourism product. Special tourism police will be
deployed at major tourist destinations during the Tenth
Plan to provide security to travellers and promote India as
a safe destination.
Improving and Expanding Product Development
Product development strategy during the Tenth Plan
will be related to the special interests of tourist target
markets.
• Cultural and heritage tourism will be expanded.
India has a vast array of protected monuments
with 22 world heritage sites, 16 of which are
monuments. The integrated development of areas
around these monuments provides an opportunity
for the development of cultural tourism in India.
• For the development of beach and coastal
tourism, a number of sites on the west coast of
India will be identified for the development as
beach resorts by the private sector. The sites will
be offered on long term lease at preferential
terms. These sites will primarily be on the beaches
of Goa, Kerala, and North Karnataka because of
easier access by air. During the Tenth Plan Kochi
in Kerala and the Andaman and Nicobar Islands
will be developed as international cruise
destinations because of their proximity to
international cruise routes and their exotic appeal.
• India’s unmatched variety of cuisine is becoming
increasingly popular in the world and will be
developed as a special attraction. It is proposed to
create a highly skilled workforce of culinary
professionals through an innovative incentive
scheme not only for India but also to promote
Indian cuisine internationally.
• Village tourism will be promoted as the primary
tourism product of India to spread tourism and
its socio-economic benefits to rural areas.
• India’s great wildlife variety has not been
developed as a tourist attraction. Wildlife
sanctuaries and national parks will become an
integral part of the Indian tourism product.
Priority will be given to the preparation of site
and visitor management plans for key parks. The
quality of tourist facilities available at the parks
will be enhanced after a prioritisation of parks.
Tentatively these will be: Corbett National Park,
Kaziranga, Mudhumalai, Bharatput, Periyar,
Ranthambore, Little Rann of Kutch, Chilka, and
the Sunderbans.
• India has the greatest adventure tourism assets in
the world in the Himalayas and its rivers.
Mountain-based adventure activities will be
developed and promoted. Regulations and
certification for adventure tourism operators will
be introduced so that the minimum standards of
safety and conservation are met.
• India receives only a minuscule proportion of the
global meetings, conventions and exhibition
market. It is important that India develops a
world-class international convention city not just
for the sake of tourism development but also for
international and domestic trade and commerce.
• India’s most unique tourism product during the
Tenth Plan will be holistic healing and
rejuvenation packages. In focusing on this, it will
capture the essence of Indian culture for
international and Indian visitors alike.
• India’s fairs and festivals, some of which are
already well established such as the Pushkar
mela, the Desert Festival at Jaisalmer, the Kumbh
Mela etc., will be promoted as unique products of
India. The Festivals of India programme will be
re-introduced in the top 12 future markets for
India initially with an annual event in the United
Kingdom and the United States, to be followed by
triennial events in the other markets.
• Shopping will be recognised as an integral part of
tourism. The development of dedicated shopping
centres for traditional crafts designed along the
lines of village haats such as Dilli Haat and
Shilpgram will be encouraged and information on
where to procure specific crafts made available
through shopping guides.
• Delhi will be positioned as the cultural capital of
India supported by an ongoing and vibrant
calendar of cultural events. The development of
such a niche-based special interest product mix
will position India as a unique and competitive
destination.
DELHI DEVELOPMENT REPORT308
Creation of World Class Infrastructure
The need for physical infrastructure for tourism ranges
from ports of entry to modes of transport to destinations
(airways, roadways, railways or waterways), to urban
infrastructure such as access roads, power, water supply,
sewage and telecommunication. This underscores the
need for inter-sectoral convergence of infrastructural
schemes and programmes that could support tourist
destinations.
The road network is vital for tourism as almost 70 per
cent of passengers in India travel by road. Many tourist
circuits are entirely dependent on roads. The current
government plan for the road system in the country
covering both interstate highways and improvements to
rural roads directly supports tourism development. There
is urgent need to construct and improve highways linking
the 22 world heritage sites and places of tourist
significance. The Ministry of Road Transport and National
Highways will collaborate with the Ministry of Tourism in
this effort.
The Indian railway system can also become an
enormous asset to the development of the tourism and
hospitality industry in the country. The railways hold a
special fascination for foreign tourists who wish to travel
the country. For the vast majority of domestic tourists
also, the railway is the most affordable means of travel
linking the length and breadth of the country.
Introduction of special tourist trains with pre-set
itineraries and private sector participation will be
encouraged.
The Indian Railways plan to establish 100 hotels at
railways stations to serve specific tourist centers. The
private sector will be given incentives to operate these
hotels on long-terms leases. These hotels will provide
clean and inexpensive accommodation for budget tourists.
The Indian Railways also owns a number of heritage
structures, which, if affectively maintained and marketed,
could serve, both as railway stations and places of tourist
interest. India has five hill railways, which compare with
the best hill railway systems in the world. The enormous
tourist potential of these products will be tapped during
the Tenth Plan. As steam-hauled trains like the Royal
Orient, Buddha Parikrama, Place-On-Wheels and Fairy
Queen are extremely popular with tourists, steam traction
for special tourist segments will be continued. Trains like
the Shatabdi and the Rajdhani with a special tourism and
hospitality focus will be planned both for foreign and
domestic tourists.
India’s 7,000km coastline and her mighty rivers will be
tapped for the promotion of cruises. Care will be taken to
develop world-class tourism products. As the Ministry of
Tourism’s financial assistance to the states has not been
able to have the desired impact in terms of creating of
world-class tourism infrastructure, the emphasis must
shift to the development of specific travel circuits as
internationally competitive destinations and the
convergence of resources and expertise for these circuits.
The availability of trained manpower is essential to
achieve excellence in the tourism sector. At present, there
are 21 institutes of Hotel and 13 Food Craft Institutes in
the country. In addition, a good number of accredited
institutes also cater to the growing demand in the service
sector. It is estimated that only 50 per cent of the
requirement of the market is met by these institutes. Five
new institutes of hotel management would be set up in
the Tenth Plan—three in the newly created state of
Uttarakhand, Jharkhand, and Chhattisgarh and two in the
northeast. In addition, 15 more Food Crafts Institutes will
be set up in the Tenth Plan, and efforts will be made to
take culinary crafts and training to the rural areas through
mobile training units. A new scheme on capacity building
to train service providers in the unorganised sector such
as small hotels, dhabas, restaurants and other eating joints
is also proposed.
Strategy for Effective Marketing
As there is fierce competition for tourists from India’s
source markets, India needs to change its traditional
marketing approach to one that is more competitive and
modern. It needs to develop a unique market position,
image and brand, which cannot be held by any other
competitor. India’s positioning statement will capture the
essence of its tourism product to convey an ‘image’ of the
product to a potential customer. This image will be
related not only to its ancient Vedic civilisation with a
cultural heritage that continues to thrive especially in its
rural areas but also to its essentially secular nature.
In the Tenth Plan, an extensive market research
programme will be launched in the target source markets
and tourism products developed to cater to the interests of
each source market. An effective and ongoing market
representation presence will be established with the travel
trade in each source market and an internet portal set up in
various languages to provide information, a description of
the product and the product requirements of the target
market segments. The Internet has a great impact on the
marketing of travel and tourism. It has already established
itself as a channel through which tourism organisations can
promote their destinations and products. Indian tourism
will utilise both the internet and other emerging interactive
technologies to avail of the benefits to be gained.
Chapter 11 • TOURISM INCLUDING HEALTH TOURISM 309
11.6 The Path Ahead
The tourism sector needs a national consensus on the
role and place of tourism in national development and the
early removal of impediments that have hitherto
handicapped its growth. The Tenth Plan target of the
creation of 18 million jobs through tourism requires a
substantial investment of Rs. 38,800 crore at the rate of
47 jobs per one million rupees of investment, both from
the public and the private sector. The central sector outlay
for tourism during the 10th Five Year Plan is Rs. 2,900
crore.
Public sector investment, though limited, can be made
more efficient through the inter-sectoral convergence of
policies and programmes supportive of tourism. An
integrated inter-sectoral investment plan that provides
effective infrastructural support to tourism through the
Ministries of Railways, Surface Transport, Shipping, Civil
Aviation, Urban Development, Rural Development and
Environment and Forests etc. can be achieved through the
preparation of a tourism component plan. Private Sector
investment can be enhanced by removing the barriers to
growth and expediting critical policies that are being
evolved. Public and legislative support will be essential for
the sustainable development of the sector.
The success of the New Tourism Policy 2002 will be
largely determined by the success achieved on all these
fronts.
11.6.1 A New Tourism Policy for Delhi
Delhi Tourism has recently outlined a new Tourism
Policy. The approach is based on the spirit of “Bhagidari”
and aims at “Tourism for All”. One of the principal
objectives is to make Delhi, which is also the national
capital, into a World Class Heritage City. In order to give
thrust to this objective, a multi pronged approach is to be
adopted, incorporating all the key players such as the
Department of Culture, MCD, NDMC, ASI, INTACH etc.
The selected sites are to be developed with view to
providing better visitor experience both to the heritage
sites and its surrounds. The second component of the
policy is that a Government led Private Sector driven
community welfare approach should be adopted. The ways
of effecting better private participation need to be better
spelt out in order to attract the private sector.
The third component of the policy is to offer incentives
so as to encourage heavy capital investment in the
development of tourism infrastructure and provide
increased employment opportunities.
The policy is to be supported by an aggressive
marketing campaign and training programme for tourism
personnel.
The areas identified for attention in development of
the “Delhi Tourism” experience are:
1. Cultural/heritage aspects.
2. Business tourism.
3. Convention and conferences.
4. Ethnic appeal—handicrafts, cuisine etc.
5. Leisure—shopping, golf, adventure etc.
6. Medical Tourism.
7. Hub destination for North India.
An action plan for fulfilling the objectives of the policy
has also been attempted which calls for the setting up of a
high level Tourism Advisory Board with the requisite
financial and regulatory capability to fulfill the task
assigned to it.
11.7 Status of Department of Tourism DelhiAdministration
The Department of Tourism, Delhi has been created
with the following objectives assigned to it as per the
allocation of business rules 1993:
1. Promotion of Domestic and International
Tourism.
2. Development of Tourism related infrastructure.
3. Coordination with agencies involved in Tourism
Industry.
4. Classification of Hotels.
5. Licensing the Tour Operators, Travel Agents etc.
6. To be the administrative department for
a. Delhi Tourism and Transportation
Corporation Ltd.
b. Delhi Institute of Hotel Management and
Catering Technology.
It also administers the Paying Guest Residential
Accommodation Schemes
11.7.1 Financial Outlay of the Tourism Department
The approved outlay of Ninth Five Year Plan 1997-
2002 and approved outlay of Tenth Five Plan to 2002-
2007 and Annual Plan 2002-2003 are as under:
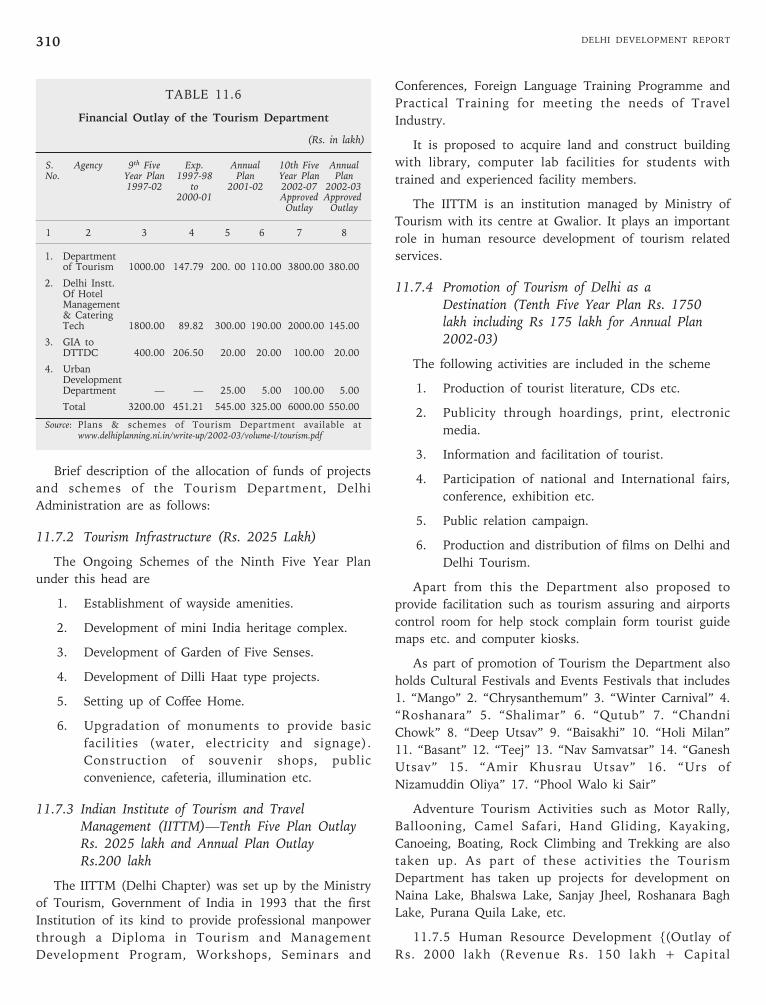
DELHI DEVELOPMENT REPORT310
TABLE 11.6
Financial Outlay of the Tourism Department
(Rs. in lakh)
S. Agency 9th Five Exp. Annual 10th Five AnnualNo. Year Plan 1997-98 Plan Year Plan Plan
1997-02 to 2001-02 2002-07 2002-032000-01 Approved Approved
Outlay Outlay
1 2 3 4 5 6 7 8
1. Departmentof Tourism 1000.00 147.79 200. 00 110.00 3800.00 380.00
2. Delhi Instt.Of HotelManagement& CateringTech 1800.00 89.82 300.00 190.00 2000.00 145.00
3. GIA toDTTDC 400.00 206.50 20.00 20.00 100.00 20.00
4. UrbanDevelopmentDepartment — — 25.00 5.00 100.00 5.00
Total 3200.00 451.21 545.00 325.00 6000.00 550.00
Source: Plans & schemes of Tourism Department available atwww.delhiplanning.ni.in/write-up/2002-03/volume-I/tourism.pdf
Brief description of the allocation of funds of projects
and schemes of the Tourism Department, Delhi
Administration are as follows:
11.7.2 Tourism Infrastructure (Rs. 2025 Lakh)
The Ongoing Schemes of the Ninth Five Year Plan
under this head are
1. Establishment of wayside amenities.
2. Development of mini India heritage complex.
3. Development of Garden of Five Senses.
4. Development of Dilli Haat type projects.
5. Setting up of Coffee Home.
6. Upgradation of monuments to provide basic
facilities (water, electricity and signage).
Construction of souvenir shops, public
convenience, cafeteria, illumination etc.
11.7.3 Indian Institute of Tourism and TravelManagement (IITTM)—Tenth Five Plan OutlayRs. 2025 lakh and Annual Plan OutlayRs.200 lakh
The IITTM (Delhi Chapter) was set up by the Ministry
of Tourism, Government of India in 1993 that the first
Institution of its kind to provide professional manpower
through a Diploma in Tourism and Management
Development Program, Workshops, Seminars and
Conferences, Foreign Language Training Programme and
Practical Training for meeting the needs of Travel
Industry.
It is proposed to acquire land and construct building
with library, computer lab facilities for students with
trained and experienced facility members.
The IITTM is an institution managed by Ministry of
Tourism with its centre at Gwalior. It plays an important
role in human resource development of tourism related
services.
11.7.4 Promotion of Tourism of Delhi as aDestination (Tenth Five Year Plan Rs. 1750lakh including Rs 175 lakh for Annual Plan2002-03)
The following activities are included in the scheme
1. Production of tourist literature, CDs etc.
2. Publicity through hoardings, print, electronic
media.
3. Information and facilitation of tourist.
4. Participation of national and International fairs,
conference, exhibition etc.
5. Public relation campaign.
6. Production and distribution of films on Delhi and
Delhi Tourism.
Apart from this the Department also proposed to
provide facilitation such as tourism assuring and airports
control room for help stock complain form tourist guide
maps etc. and computer kiosks.
As part of promotion of Tourism the Department also
holds Cultural Festivals and Events Festivals that includes
1. “Mango” 2. “Chrysanthemum” 3. “Winter Carnival” 4.
“Roshanara” 5. “Shalimar” 6. “Qutub” 7. “Chandni
Chowk” 8. “Deep Utsav” 9. “Baisakhi” 10. “Holi Milan”
11. “Basant” 12. “Teej” 13. “Nav Samvatsar” 14. “Ganesh
Utsav” 15. “Amir Khusrau Utsav” 16. “Urs of
Nizamuddin Oliya” 17. “Phool Walo ki Sair”
Adventure Tourism Activities such as Motor Rally,
Ballooning, Camel Safari, Hand Gliding, Kayaking,
Canoeing, Boating, Rock Climbing and Trekking are also
taken up. As part of these activities the Tourism
Department has taken up projects for development on
Naina Lake, Bhalswa Lake, Sanjay Jheel, Roshanara Bagh
Lake, Purana Quila Lake, etc.
11.7.5 Human Resource Development {(Outlay of
Rs. 2000 lakh (Revenue Rs. 150 lakh + Capital
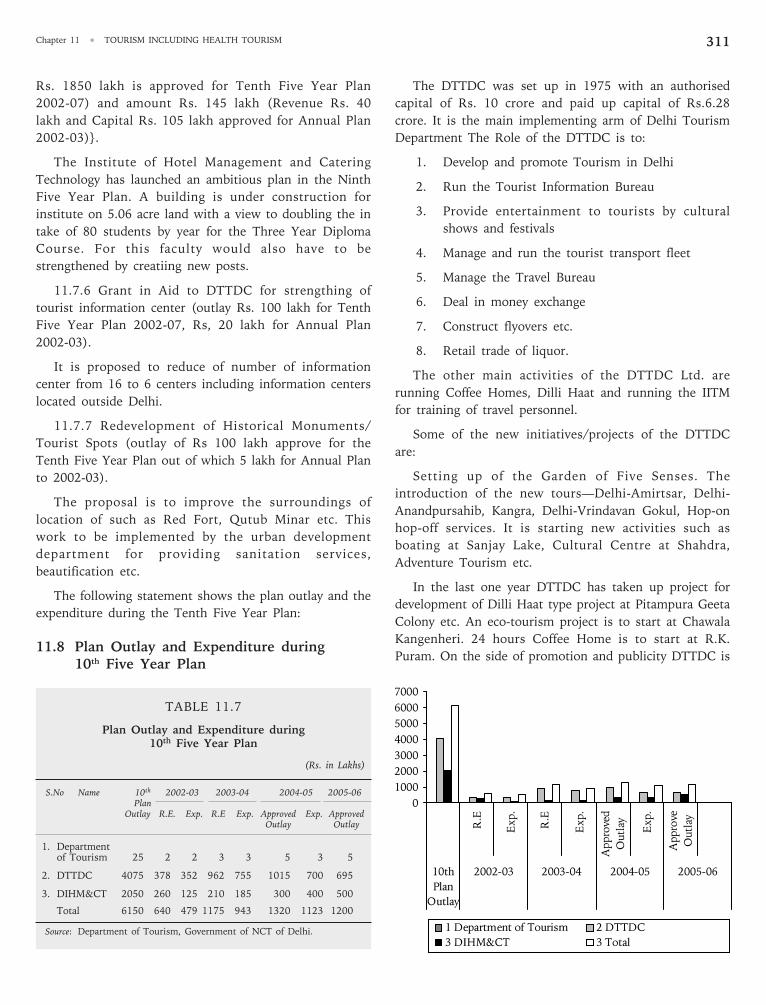
Chapter 11 • TOURISM INCLUDING HEALTH TOURISM 311
Rs. 1850 lakh is approved for Tenth Five Year Plan
2002-07) and amount Rs. 145 lakh (Revenue Rs. 40
lakh and Capital Rs. 105 lakh approved for Annual Plan
2002-03)}.
The Institute of Hotel Management and Catering
Technology has launched an ambitious plan in the Ninth
Five Year Plan. A building is under construction for
institute on 5.06 acre land with a view to doubling the in
take of 80 students by year for the Three Year Diploma
Course. For this faculty would also have to be
strengthened by creatiing new posts.
11.7.6 Grant in Aid to DTTDC for strengthing of
tourist information center (outlay Rs. 100 lakh for Tenth
Five Year Plan 2002-07, Rs, 20 lakh for Annual Plan
2002-03).
It is proposed to reduce of number of information
center from 16 to 6 centers including information centers
located outside Delhi.
11.7.7 Redevelopment of Historical Monuments/
Tourist Spots (outlay of Rs 100 lakh approve for the
Tenth Five Year Plan out of which 5 lakh for Annual Plan
to 2002-03).
The proposal is to improve the surroundings of
location of such as Red Fort, Qutub Minar etc. This
work to be implemented by the urban development
department for providing sanitation services,
beautification etc.
The following statement shows the plan outlay and the
expenditure during the Tenth Five Year Plan:
11.8 Plan Outlay and Expenditure during10th Five Year Plan
TABLE 11.7
Plan Outlay and Expenditure during10th Five Year Plan
(Rs. in Lakhs)
S.No Name 10th 2002-03 2003-04 2004-05 2005-06Plan
Outlay R.E. Exp. R.E Exp. Approved Exp. ApprovedOutlay Outlay
1. Departmentof Tourism 25 2 2 3 3 5 3 5
2. DTTDC 4075 378 352 962 755 1015 700 695
3. DIHM&CT 2050 260 125 210 185 300 400 500
Total 6150 640 479 1175 943 1320 1123 1200
Source: Department of Tourism, Government of NCT of Delhi.
The DTTDC was set up in 1975 with an authorised
capital of Rs. 10 crore and paid up capital of Rs.6.28
crore. It is the main implementing arm of Delhi Tourism
Department The Role of the DTTDC is to:
1. Develop and promote Tourism in Delhi
2. Run the Tourist Information Bureau
3. Provide entertainment to tourists by cultural
shows and festivals
4. Manage and run the tourist transport fleet
5. Manage the Travel Bureau
6. Deal in money exchange
7. Construct flyovers etc.
8. Retail trade of liquor.
The other main activities of the DTTDC Ltd. are
running Coffee Homes, Dilli Haat and running the IITM
for training of travel personnel.
Some of the new initiatives/projects of the DTTDC
are:
Setting up of the Garden of Five Senses. The
introduction of the new tours—Delhi-Amirtsar, Delhi-
Anandpursahib, Kangra, Delhi-Vrindavan Gokul, Hop-on
hop-off services. It is starting new activities such as
boating at Sanjay Lake, Cultural Centre at Shahdra,
Adventure Tourism etc.
In the last one year DTTDC has taken up project for
development of Dilli Haat type project at Pitampura Geeta
Colony etc. An eco-tourism project is to start at Chawala
Kangenheri. 24 hours Coffee Home is to start at R.K.
Puram. On the side of promotion and publicity DTTDC is
0
1000
2000
3000
4000
5000
6000
7000
R.E
Exp.
R.E
Exp.
Approved
Outlay Exp.
Approve
Outlay
10th
Plan
Outlay
2002-03 2003-04 2004-05 2005-06
1 Department of Tourism 2 DTTDC
3 DIHM&CT 3 Total
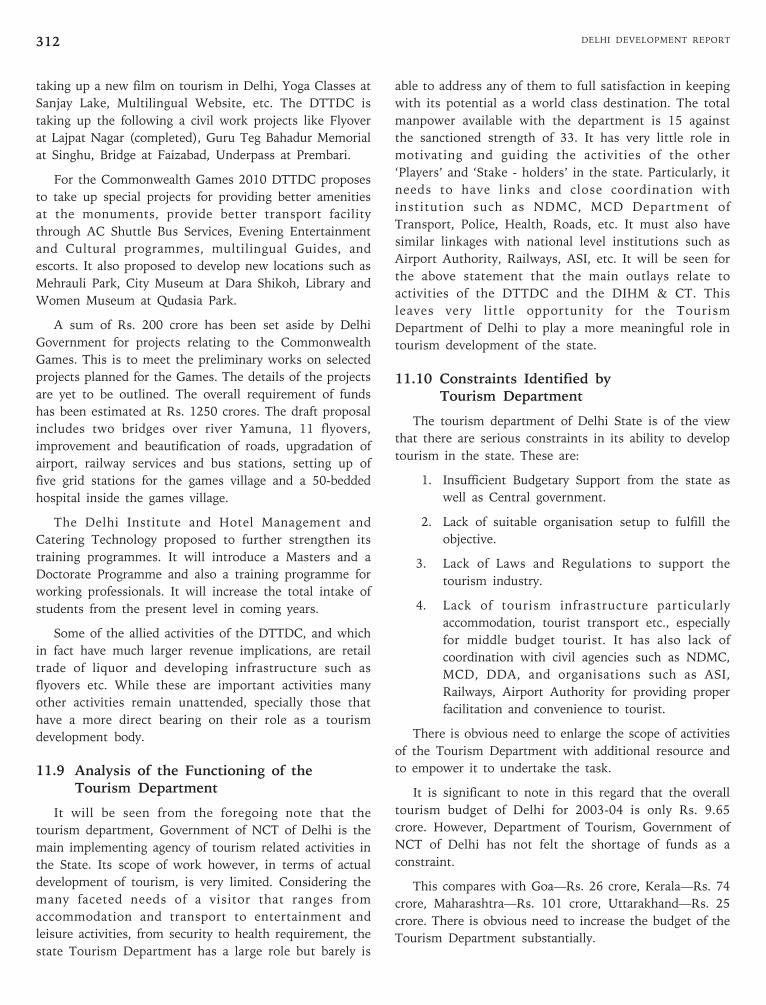
DELHI DEVELOPMENT REPORT312
taking up a new film on tourism in Delhi, Yoga Classes at
Sanjay Lake, Multilingual Website, etc. The DTTDC is
taking up the following a civil work projects like Flyover
at Lajpat Nagar (completed), Guru Teg Bahadur Memorial
at Singhu, Bridge at Faizabad, Underpass at Prembari.
For the Commonwealth Games 2010 DTTDC proposes
to take up special projects for providing better amenities
at the monuments, provide better transport facility
through AC Shuttle Bus Services, Evening Entertainment
and Cultural programmes, multilingual Guides, and
escorts. It also proposed to develop new locations such as
Mehrauli Park, City Museum at Dara Shikoh, Library and
Women Museum at Qudasia Park.
A sum of Rs. 200 crore has been set aside by Delhi
Government for projects relating to the Commonwealth
Games. This is to meet the preliminary works on selected
projects planned for the Games. The details of the projects
are yet to be outlined. The overall requirement of funds
has been estimated at Rs. 1250 crores. The draft proposal
includes two bridges over river Yamuna, 11 flyovers,
improvement and beautification of roads, upgradation of
airport, railway services and bus stations, setting up of
five grid stations for the games village and a 50-bedded
hospital inside the games village.
The Delhi Institute and Hotel Management and
Catering Technology proposed to further strengthen its
training programmes. It will introduce a Masters and a
Doctorate Programme and also a training programme for
working professionals. It will increase the total intake of
students from the present level in coming years.
Some of the allied activities of the DTTDC, and which
in fact have much larger revenue implications, are retail
trade of liquor and developing infrastructure such as
flyovers etc. While these are important activities many
other activities remain unattended, specially those that
have a more direct bearing on their role as a tourism
development body.
11.9 Analysis of the Functioning of theTourism Department
It will be seen from the foregoing note that the
tourism department, Government of NCT of Delhi is the
main implementing agency of tourism related activities in
the State. Its scope of work however, in terms of actual
development of tourism, is very limited. Considering the
many faceted needs of a visitor that ranges from
accommodation and transport to entertainment and
leisure activities, from security to health requirement, the
state Tourism Department has a large role but barely is
able to address any of them to full satisfaction in keeping
with its potential as a world class destination. The total
manpower available with the department is 15 against
the sanctioned strength of 33. It has very little role in
motivating and guiding the activities of the other
‘Players’ and ‘Stake - holders’ in the state. Particularly, it
needs to have links and close coordination with
institution such as NDMC, MCD Department of
Transport, Police, Health, Roads, etc. It must also have
similar linkages with national level institutions such as
Airport Authority, Railways, ASI, etc. It will be seen for
the above statement that the main outlays relate to
activities of the DTTDC and the DIHM & CT. This
leaves very little opportunity for the Tourism
Department of Delhi to play a more meaningful role in
tourism development of the state.
11.10 Constraints Identified byTourism Department
The tourism department of Delhi State is of the view
that there are serious constraints in its ability to develop
tourism in the state. These are:
1. Insufficient Budgetary Support from the state as
well as Central government.
2. Lack of suitable organisation setup to fulfill the
objective.
3. Lack of Laws and Regulations to support the
tourism industry.
4. Lack of tourism infrastructure particularly
accommodation, tourist transport etc., especially
for middle budget tourist. It has also lack of
coordination with civil agencies such as NDMC,
MCD, DDA, and organisations such as ASI,
Railways, Airport Authority for providing proper
facilitation and convenience to tourist.
There is obvious need to enlarge the scope of activities
of the Tourism Department with additional resource and
to empower it to undertake the task.
It is significant to note in this regard that the overall
tourism budget of Delhi for 2003-04 is only Rs. 9.65
crore. However, Department of Tourism, Government of
NCT of Delhi has not felt the shortage of funds as a
constraint.
This compares with Goa—Rs. 26 crore, Kerala—Rs. 74
crore, Maharashtra—Rs. 101 crore, Uttarakhand—Rs. 25
crore. There is obvious need to increase the budget of the
Tourism Department substantially.
Chapter 11 • TOURISM INCLUDING HEALTH TOURISM 313
11.11 A Broad Picture of Tourism in Delhi
Delhi is the major entry point of tourists for India by
air, that accounts for 30.8 per cent of the tourist, who
enter India as compared to Mumbai which account for
30.9 per cent. So far as comparison of foreign and
domestic is concerned the figures are as follows:
TABLE 11.8
A Broad Picture of Tourism in Delhi
State 2001 2002 2003
Domestic Foreign Domestic Foreign Domestic Foreign
Delhi 1324636 830092 1228059 543036 1430546 693827
Source: Delhi Tourism Department.
In comparison to the National figures the foreign
tourists comprise 10.3 per cent of the total and only 0.5
per cent domestic of the tourists. It will be seen therefore,
that Delhi is more significant for as a destination for
foreign tourists rather than domestic tourists in the
National scene.
As per the estimate of the Delhi Tourism Department
the total number of foreign tourists who visit Delhi is
1.35 million per annum at present. This includes those
who enter the country from Delhi or another spot.
However, it is showing a downward trend, going down
from 62 per cent to 51 per cent of the total arrivals in
India. The average length of stay of foreign tourists in
Delhi is two days. This is considered to be very short in
comparison with capital cities of other major international
destinations. There is scope for developing Delhi as a
major tourist hub with an increased share of the national
tourist arrivals and to reverse the downward trend.
11.12 Tourism Data Relating to TouristFacilities in Delhi
The most important tourist facility is tourist
accommodation. The total number of classified Hotel
Rooms is 9,841. The following statement shows the break
up:
Of these 14 are Five Star Deluxe (4,819 rooms), 13
Five Star (2,280 Rooms), 9 Four Star (925 Rooms), 14
Three Star (899 Room), 18 Two Star (524 Rooms), 12
One Star (284 Rooms), (One Hotel unclassified 110
Rooms), Total number of Hotels 81. In addition there are
82 Paying Guest accommodations of approved category
with 270 rooms. In addition it is estimated that there are
another 10,000 rooms in the unclassified category, many
of these in the well-known Pahargunj area of Delhi.
Therefore there is need to bring the unorganised sector in
to the organised category.
With the rapid increase in tourism activities it has
become clear that there is a serious shortage of hotel
rooms at present. It is imperative therefore, that the
number of hotel rooms be increased in every category.
Suitable land for hotels would have to be made available
by authorities to meet this shortage. It is estimated that
an additional 30,000 room should be added in the next
five years in Delhi and the contiguous areas of Gurgaon
and Noida to meet the demand.
DTDC has indicated that as of July 2006, 22 new hotel
sites have been identified in Delhi. Of these ‘options’ 8
sites have been accepted.
Tourism Transport is another very important area that
requires attention. The following is a broad picture of the
Road transport facility, which is available in Delhi at
present.
1. DTC etc. Buses-4,000
2. Black Yellow Bus Taxi-6,000
3. Three Wheelers-55,000
4. DLY Tourist Cars-20,000
5. Charter Buses-5,000
6. Inter State Buses-3,000
7. All India Permit Coaches-800
8. Radio Taxies-150
The association of Tourist Transport Operators is of
the view that Radio Taxies services need to be very
substantially increased in order to fulfil the need felt by
the tourists and in order to meet the international
standards for tourist transport. It is felt that it can be
Delhi
0
200000
400000
600000
800000
1000000
1200000
1400000
1600000
Domestic
Foreign
Domestic
Foreign
Domestic
Foreign
2001 2002 2003
Delhi
DELHI DEVELOPMENT REPORT314
achieved only by the early replacement of three-wheelers
by cheap and efficient Radio Taxies.
In addition, the recently introduced Metro Mass
Transit has started operating in Delhi and is being rapidly
expanded. This is expected to provide much better
transport facility to both the general public and the
tourists and will help to reduced the pressure very
substantially and make it both more comfortable and less
expensive.
11.13 Tourism Services Providers
Travel Agents Tour Operators and Tourist Transport
Operators are very important services provided to the
tourist. Delhi is particularly provided by such services in
comparison to the other states and destinations. The total
number of travel agents in Delhi is 85. The number of
tour operators is 238 and number of tourist transport
operators is 64. This is against the national total of 186
travel agents, 340-tour operators and 154 tourist transport
operators. In comparison, Maharashtra, which is the next
largest, has 40 travel agents, 30 tours operators and 11
tourist transport operators. It will be seen therefore, that
the tourism services sector is reasonably well developed
and the emphasis must be on upgrading and improving of
the quality of the services.
11.14 Opportunities in Delhi Tourism Sector
Delhi should be positioned as a global destination and
“bench marked” with other global capital cities. Delhi as
the National Capital has very high potential for tourism
development. Being the capital city of the country it has a
natural advantage in terms of infrastructure, in terms of
roads, rails, etc., and also tourism related services such as
hotels, transport services, travel and guide related services
etc. Delhi has a strong and historic culture and tradition
with as many as 1317 historically important monuments
including world heritage sites. It has also institutions such
as national museum, handicraft museum, cultural centers
and art galleries. There are year round events ranging
from the Republic Day Parade to international festivals of
dance, drama, music and crafts, and industry exhibition
and conferences. It is a hub for both business and
government related activities, which attract professionals
from India and abroad in large numbers. The growth of
Delhi as a tourist destination is to be seen in the
perspective of the development of the national capital
region. This includes Gurgaon, Noida, Greater Noida etc.,
all of which are also growing rapidly as important
commercial centres with international links and superior
infrastructure. The most recent development of
significance which will have an impact on the growth of
Delhi has a tourism destination is the forthcoming
Commonwealth Games 2010 to be held at Delhi.
While the tourism development of Delhi has broadly
been in line with the National policy it has admittedly
been on a small scale as is reflected in the very low
budgetary support. The Tenth Five Year Plan and more
significantly the Commonwealth Games preparation will
provide a substantial increase in funds in areas that will
directly impact on the Tourism Sector in and around
Delhi.
11.15 The Tourism Product that Need to beDeveloped for Achieving Growth in theTourism Industry in Delhi
11.15.1 Heritage Tourism/Culture/Museums
Visit to monuments and places of historic interest is
the most important tourism product in the state, along
with the visit to Museums, Art Galleries, Culture centre
etc. Delhi is dotted with historically important
monuments. There are 1317 listed monuments of which
many are would heritage sites. There are 477 heritage
buildings listed by INTACH. Although Delhi has a large
number of historical monuments it is desirable that a
selective approach is adopted for tourism development.
The selected location should be well integrated and
connected so that special attention can be paid from the
tourism point of view. It is suggested that the following
locations should be taken up for development as
‘integrated tourism zones’.
1. Red Fort, Chandni Chowk area.
2. Purana Quila – Paragati Maidan, Humayun’s Tomb.
3. Rajiv Gandhi Chowk, Parliament, Rashtrapati
Bhavan area.
4. Qutub Minar, Garden of Five Senses, Mehrauli
heritage area.
5. Airport, and
6. Railway Station areas to be developed as tourism
reception zones.
Each of these zones have a unique characteristic with
tourism potential. A Tourism product/experience must be
created at each of these locations. These must be made
easily accessible with transport and other support facilities
and amenities. These ‘products’ must then be marketed
by the private industry with the support of a publicity
campaign supported by government.
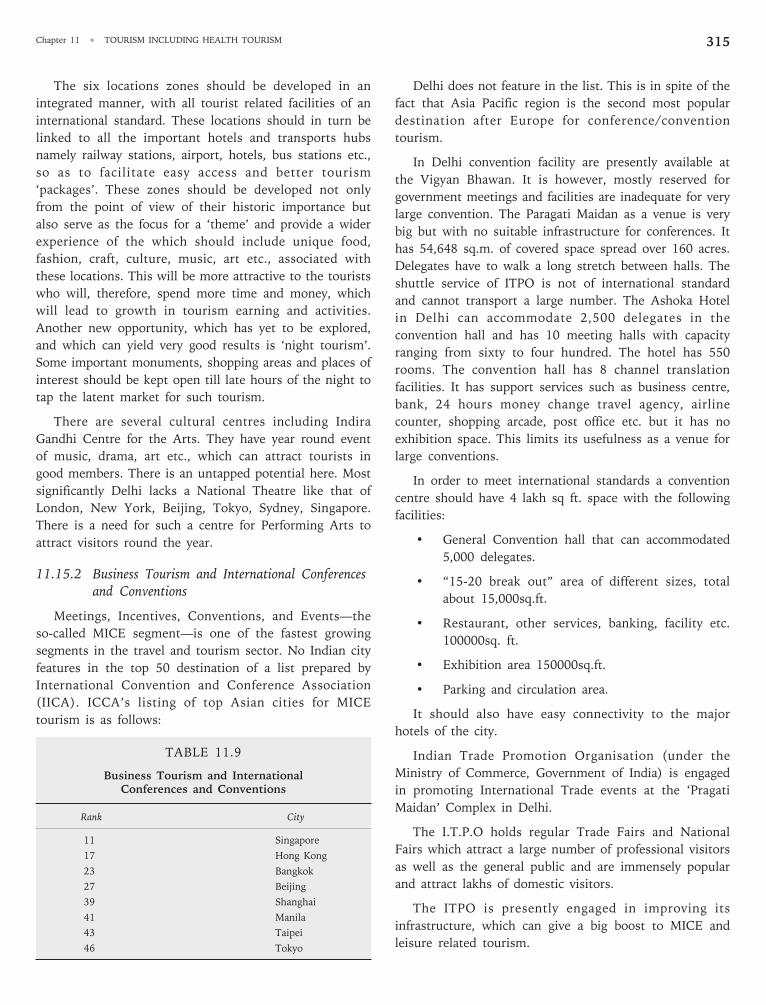
Chapter 11 • TOURISM INCLUDING HEALTH TOURISM 315
The six locations zones should be developed in an
integrated manner, with all tourist related facilities of an
international standard. These locations should in turn be
linked to all the important hotels and transports hubs
namely railway stations, airport, hotels, bus stations etc.,
so as to facilitate easy access and better tourism
‘packages’. These zones should be developed not only
from the point of view of their historic importance but
also serve as the focus for a ‘theme’ and provide a wider
experience of the which should include unique food,
fashion, craft, culture, music, art etc., associated with
these locations. This will be more attractive to the tourists
who will, therefore, spend more time and money, which
will lead to growth in tourism earning and activities.
Another new opportunity, which has yet to be explored,
and which can yield very good results is ‘night tourism’.
Some important monuments, shopping areas and places of
interest should be kept open till late hours of the night to
tap the latent market for such tourism.
There are several cultural centres including Indira
Gandhi Centre for the Arts. They have year round event
of music, drama, art etc., which can attract tourists in
good members. There is an untapped potential here. Most
significantly Delhi lacks a National Theatre like that of
London, New York, Beijing, Tokyo, Sydney, Singapore.
There is a need for such a centre for Performing Arts to
attract visitors round the year.
11.15.2 Business Tourism and International Conferencesand Conventions
Meetings, Incentives, Conventions, and Events—the
so-called MICE segment—is one of the fastest growing
segments in the travel and tourism sector. No Indian city
features in the top 50 destination of a list prepared by
International Convention and Conference Association
(IICA). ICCA’s listing of top Asian cities for MICE
tourism is as follows:
TABLE 11.9
Business Tourism and InternationalConferences and Conventions
Rank City
11 Singapore
17 Hong Kong
23 Bangkok
27 Beijing
39 Shanghai
41 Manila
43 Taipei
46 Tokyo
Delhi does not feature in the list. This is in spite of the
fact that Asia Pacific region is the second most popular
destination after Europe for conference/convention
tourism.
In Delhi convention facility are presently available at
the Vigyan Bhawan. It is however, mostly reserved for
government meetings and facilities are inadequate for very
large convention. The Paragati Maidan as a venue is very
big but with no suitable infrastructure for conferences. It
has 54,648 sq.m. of covered space spread over 160 acres.
Delegates have to walk a long stretch between halls. The
shuttle service of ITPO is not of international standard
and cannot transport a large number. The Ashoka Hotel
in Delhi can accommodate 2,500 delegates in the
convention hall and has 10 meeting halls with capacity
ranging from sixty to four hundred. The hotel has 550
rooms. The convention hall has 8 channel translation
facilities. It has support services such as business centre,
bank, 24 hours money change travel agency, airline
counter, shopping arcade, post office etc. but it has no
exhibition space. This limits its usefulness as a venue for
large conventions.
In order to meet international standards a convention
centre should have 4 lakh sq ft. space with the following
facilities:
• General Convention hall that can accommodated
5,000 delegates.
• “15-20 break out” area of different sizes, total
about 15,000sq.ft.
• Restaurant, other services, banking, facility etc.
100000sq. ft.
• Exhibition area 150000sq.ft.
• Parking and circulation area.
It should also have easy connectivity to the major
hotels of the city.
Indian Trade Promotion Organisation (under the
Ministry of Commerce, Government of India) is engaged
in promoting International Trade events at the ‘Pragati
Maidan’ Complex in Delhi.
The I.T.P.O holds regular Trade Fairs and National
Fairs which attract a large number of professional visitors
as well as the general public and are immensely popular
and attract lakhs of domestic visitors.
The ITPO is presently engaged in improving its
infrastructure, which can give a big boost to MICE and
leisure related tourism.
DELHI DEVELOPMENT REPORT316
As per the estimates of the Indian Convention
Promotion Bureau (ICPB) conference tourism in Delhi
accounts for almost 40 per cent of the total conference
tourism activity in the country. According to UIA there
were 101 international conferences held in India in 2003.
Of these it was estimated that 40 per cent were held in
Delhi with approximately 15,000 international
participants. Similarly ITPO estimates that about 10,000
international participants per annum attend international
exhibition at Delhi. In addition, a large number of
government sponsored conferences are held in Delhi. The
exact figure is not readily available. The full potential of
conference tourism in Delhi remains unrealised owing to
serious inadequacy of conference facilities. Central
Government has decided to earmark Rs. 1000 crore for
developing such facilities. Proposals are also under
consideration for developing consideration but are to be
finalised. There will be considerable expansion of
conference tourism related activity once these facilities
become available.
Countries such as Malaysia, Singapore, and Thailand
have benefited greatly by setting up purpose built
Convention Centres for International Conventions. Delhi
needs at least one such Convention centre.
11.15.3 Medical Tourism
This is a subject that has recently attracted the
attention of the tourism industry. It is estimated that 1.5
lakh foreigners come to India annually for medical
reasons. At present these are mainly NRIs, West Asians
and Africans. Recently India has been attracting patients
from UK and US also. This is in recognition of the quality
of medical services that India can provide which is also
both affordable and easily accessible. For instance heart
surgery in the US costs USD 30,000 and costs USD 6000
in India. Similarly a bone marrow transplant in US costs
USD 250,000 while in India it is USD 26,000 according to
Harpal Singh, President, Indian Health Care Federation.
A study done by Mckinsey Consultants has estimated
in a report for the CII that medical tourism can generate
Rs 10,000 crore additional revenue by 2012. It is
estimated that each medical tourist brings is a revenue of
USD 600 as compared to USD 230 from ordinary tourist.
Delhi is well served with world-class health facility to take
advantage of this opportunity. However, it needs to be
more organised and standardised in accordance with
international standards.
The Ministry of Health is now actively engaged in
developing medical tourism for which a committee has
been setup for promoting India as a health care
destination and is preparing a strategy document for
which a Task Force has been set up. The highlights of the
deliberation so far are as follows:
1. India can provide medical and health care of
international standard at a comparatively low
cost.
2. About one million people are awaiting treatment
under the National Health Scheme in UK alone.
There is waiting time, as adequate facilities and
specialist staff/doctors are not available to meet
the demand. This opportunity can be tapped.
3. Thailand has made significant progress in medical
and health tourism. It is necessary to establish
standards of medical services, price bands for
services, quality assurances, hospital accreditation
norms, and meet medico-legal requirements so as
to make the services internationally acceptable.
This is especially required as a pre requisite for
those covered by medical insurance.
4. It would be necessary to coordinate the medical
facilities with other related service in to
comprehensive packages to cover not only the
cost of treatment but also the cost of
accommodation, travel, post operative care etc.
Support services of the patient and the family
members’ companion would also need to be
addressed.
5. Ministry of Health has agreed to draw up a list of
“Centres of Excellence” along with details relating
to facilities available on a format devised by
Indian Health Care Foundation. Ministry of
Tourism would print the list of institution and
coordinate with the tourism industry to promote
health tourism packages. A strategy paper is
being prepared for developing India as a health
care destination.
6. The latest thinking in the Ministry of Health is
that the Government should not directly engage
itself in the approval process of internationally
recognised hospitals and that this may be better
left to the professional body of the medical
industry.
Apart from western medicine it is felt that traditional
medicine, particularly Ayurvedic system would also be
promoted in a similar manner. The department of
alternative medicine (Ayush) are also undertaking a
similar exercise and have drawn up a list of Ayurvedic
institutions of excellence.
Chapter 11 • TOURISM INCLUDING HEALTH TOURISM 317
A significant development is the setting up or a world
class Research cum Treatment Centre at Gurgaon. This
will be a 2000 bed institution of Integrated Medical
Sciences and Holistic Therapy. The Director of this
institution Dr. Naresh Trehan has been Director, Escorts
Hearts Institution in Delhi, which is already a recognised
centre attracting foreign patient for the last 20 years.
11.15.4 Leisure, Adventure and Sports Tourism
Delhi has a large variety of tourism attractions for
tourism. The tourism department, DTTDC have
developed a location such as Dilli Haat which provides
ethnic experience of food and handicraft. Several more
such locations are proposed to be developed in North,
East and West Delhi. The Garden of Five Senses has
provided an experience of nature. Events highlighting the
scene of unique cultural traditions are held regularly. The
Bhalswa Lake has been developed with facilities such as
public toilets, parking spaces, etc. The location has now
been handed over to DDA for developing a golf course.
The Sanjay Lake and the Purana Quila Lake have been
developed with facilities for boating etc. It is proposed to
develop Chawla-kanganhari Lake as a nature sport and
water sports activities.
The DDA has already developed a golf course at Saket
and is developing another one at Bhalswa Lake. The DDA
also has developed infrastructure facilities such as public
toilets, parking spaces, etc. which help to improve civic
amenities for the visitors. While these golf courses meet
local requirements they need upgradation to meet the
international standards. Another important development
is improvement in shopping facilities being developed at
Rajiv Gandhi Chowk, Vasant Kunj etc., where the large
shopping arcades and malls are coming up. These will
greatly increase facilities for shopping tourism. The
development of shopping malls in Gurgaon will also have
an impact on the shopping experience of visitors to the
national capital region.
Apart from the shopping experience the newly setup
malls etc. have all given rise to large number of restaurant
and food malls, eating places etc. The will also be
attractive to tourists who will the able to experience a
wide variety of national and international cuisine. More
liberal policy regarding licence for serving alcoholic drink
will also increase restaurant and pub activities.
The Commonwealth Games 2010 will be a major event
which will have impact on tourism development in Delhi.
The selected venue for the event will be the river area of
the Yamuna in East Delhi. However, many of the events
will be spread throughout Delhi such as the Nehru
Stadium, Indira Gandhi Stadium, and Talkatora Garden
etc. World class facilities are to be provided for the
participants and spectators who are expected to visit Delhi
in large number. In order to coordinate the development
of infra and the facilities for the event a Commonwealth
Games secretariat has been setup. The full details of the
infrastructure and services for the Commonwealth Games
are be prepared and will be ready shortly. Particulars and
details are been consented from the Commonwealth
games secretariat.
The MCD and the NDMC are the two statutory bodies
responsible for providing civic amenities in the state.
Many of the projects and the schemes of the MCD and
the NDMC have a direct bearing on the entire a tourism
sector. Details regarding these are to be collected and will
be included in the report.
11.16 The Way Forward
The rapid economic upturn in India has impacted the
tourism sector significantly. There has been 25 per cent
increase in tourism activities in 2004-05. The lack of
tourism related infrastructure in now being seriously felt.
In Delhi and National Capital Region rapid changes are
taking place and these will improve the infrastructure. The
Transport sector will be considerably strengthened by the
expansion of the Metro services. The roads and flyovers
have been upgraded and new improved bus and taxi
services have been introduced. The liberalisation of the
investment policy in Real Estate sector and in the hotel
sector will also impact the quality of the tourist
accommodation, shopping and other civic amenities. The
privatisation of the Airport and liberalised air services
policy will improve the quality of the connectivity of Delhi
for tourists. The forthcoming Commonwealth Games will
provide a new opportunity for the convergence of the
major stake holders for improving the quality of services.
The Commonwealth Games Committee set-up could play
a major role in achieving this.
In order to effectively achieve these objectives it is
necessary to make some basic changes in the organisation
and the structure of the Tourism Department and setup of
Delhi also. Some policy decisions affecting the tourism
sector will have to be taken at the State Government level.
11.16.1 The following is a brief outline of the issue
that needs to be addressed:
(i) Tourism is the “industry of industries”. It is
built on the base of a reasonable level of socio-
cultural and economic development of the host
community. It must also have an acceptable
level of tourism related infrastructure.
DELHI DEVELOPMENT REPORT318
(ii) Delhi is set to get huge ‘face lift’ and
upgradation of its infrastructure that will impact
tourism in terms of new facilities and better
visitor experience.
(iii) The Delhi Tourism must therefore, leverage the
emerging scenario of economic upturn of India
and the upgradation of urban infrastructure in
and around Delhi.
To affect a quantum jump in the tourism industry the
following course of action is recommended:
(a) Enhanced budgetary support for the tourism support
would be necessary as the existing funds are inadequate for
meeting the enhanced level of the services facilities which
needs to be provided to the Tourism sector.
(b) The administrative infrastructure would have to be
strengthened and enlarged.
It is necessary to consider the setting up of a statutory
Tourism Board on the lines of some other countries such
as UK and Singapore. The Tourism Board setup in some
states such as Uttaranchal has given more effective
powers to the Tourism administration of the State.
In the case of Delhi such a Board would require a
wider role as it would have to include bodies that are
strictly outside the purview of the State government such
as NDMC, MCD, DDA, ASI etc. It is therefore, suggested
that the tourist board with statutory power with setup
under the Chief Minister of the State with representation
of the principal stake holders organisation.
Officials from the Board could be placed on deputation
with the other stakeholder organisations so as to provide
better linkage and coordination in respect of tourism
related activities of each of these organisations. The
statutory board should have the power to effectively
regulate and guide all such tourism related activities in
these organisations.
(c) Rules, regulations and statutes relating to the
tourism sector would have to be revised and streamlined
so as to empower the authorities to effectively run the
tourism related services and achieve an international level
of quality in services.
(d) Tourist accommodation is one of the most
important areas that need attention. For this land for
setting up hotels of different category, according to
projected demand would have to be made available. At
present there is disproportionately low number of budget
hotels. This need will have to be arrested. Similarly the
paying guest accommodation sector needs to be enlarged
for which the bye-laws will require changes.
(e) Delhi’s growth as a tourist destination must go
hand in hand with the NCR region of the neigbouring
areas, particularly Noida and Gurgaon.
The tourism policy and plan of the entire NCR area
therefore, needs to be taken up in a comprehensive
manner along with that of Delhi.
In fact such an integrated approach could adopted for
nearby destinations such as Agra, Jaipur, etc. Delhi would
be the hub of this tourist region. Such a coordinated
approach will greatly benefit the tourism sector of the
region as a whole and will enlarge both the volume and
quality of tourist arrivals and substantially increase the
earnings from tourism activities.
(f) Private investment and private enterprise is to be a
major partner in the development of tourism in Delhi. At
present almost all the major hotel groups/chains have a
presence in Delhi. The Taj, Maurya ITC group, Oberoi-
Hiltons, Hayatt, Raddison all have a major presence in
Delhi. New international hotel-chains have also made an
entry in the hotel sector. The large international and
national Travel and Tour companies such as Kounis, Cox
and Kings, Travel House, Sita are active in Delhi. Even so
the new liberalised investment policy is expected attract
many new international players who are now making their
presence felt in India. Private investment in new tourism
sectors such as “convention “ tourism, incentive tourism
etc., which are yet to have a meaningful impact on the
tourism market can be expected grow rapidly with the
entry of the se international ‘players’. All this investment
can happen provided an investment friendly environment
is created by the state and Central government. Also, the
infrastructure and support facilities to support the growth
must be put in place in a time bound manner. The
challenge therefore in to harmonise and synergies the
initiatives taken by the main players and which will enable
the industry to move forward by making a cohesive,
creative and positive effort that will lead to growth in the
Tourism sector in keeping with the objectives of the
Tenth Five Year Plan.
11.17 The Vision for Delhi Tourism
11.17.1 Delhi must Position itself as a Major TourismDestination like Paris, London, Rome
As the capital city of a vast country like India with its
rich history and diverse culture, Delhi must position itself
as a tourist destination like other great capital cities of the
world. At present it is sadly lacking in tourism
infrastructure and quality and content of a world class
tourism experience. While the present approach and
Chapter 11 • TOURISM INCLUDING HEALTH TOURISM 319
initiatives have all yielded varying degrees of success,
what is needed is a quantum shift in approach and
programme of activities.
In order to achieve this it must have the following.
1. The Airport needs to be upgraded with world-
class facilities. This exercise is already underway
by the ‘privatisation’ route for which action has
already been initiated by Ministry of Civil
Aviation. The new liberal air service policy has
also increased the number of available ‘air seats’
in both domestic and international flights. This
will result in increased tourist arrivals and higher
level of tourist satisfaction.
2. Urban transport system in the city must be
modernised. The “metro” system in the city is
being rapidly extended and will greatly increase
the transport capacity and speed and comfort of
movement within the city. The bus services are
also due to be upgraded by induction of an
additional 1000 air-conditioned buses in time for
the Commonwealth Games.
3. The Road transport system in the city needs to be
upgraded by widening and improving the existing
roads and building additional flyovers and also
improving the traffic system in the city. Parking
spaces must be increased and improved to handle
the rapidly increasing number of cars and other
vehicles (present number of cars in Delhi - 44
lakhs.)
4. Delhi Municipal Corporation must upgrade the
general upkeep of civic amenities in the city. The
overall hygiene and civic amenities such as public
toilets, drainage and sewage, water supply etc.,
need to be addressed urgently. Public areas and
roads need to be well maintained. All this is
particularly important in places of tourist interest.
DMC is taking up special tourism related projects
such as the ‘heritage walk’ in Chandni Chowk
area.
5. The New Delhi Municipal Corporation must
upgrade the level of civic amenities in its control.
The Lutyens’ Delhi, Rajiv Chowk, Pragati Maidan
are all important tourism related assets that will
have to be developed to match the expectation of
the international and domestic tourists. Parking
facilities and public toilets are the two most
important facilities that need attention, as well as
the upkeep of the Roads and public areas, parks,
walkways etc.
6. Convention Tourism and Conference Tourism are
the areas that are seriously in need of attention.
This cannot be developed without the requisite
infrastructure. The best way to do this is to
develop the existing Pragati Maidan complex into
a purpose built International Convention Centre,
incorporating if possible the National Stadium
complex to provide an integrated convention
facility. Other suitable locations that my be
considered are Safdarjung Airport area and
Dwarka near the International Airport.
7. Heritage Tourism is already the mainstay of Delhi
Tourism experience with more than 1317
historical sites. This needs to be improved and
enriched by upgrading the monuments and
providing better tourist facilities and
conveniences. This heritage experience can be
enhanced by providing a more integrated
approach to the monuments by treating them as
Heritage Zones with the active participation
(bhagidari) of the stakeholders in the vicinity.
This is especially relevant for locations such as
Chandni Chowk, Mehrauli, Nizamuudin, Rajiv
Chowk etc. Facility for “night tourism” in these
areas will be especially attractive.
8. Culture Tourism, though a major attraction of
Delhi, is inadequate. Events such as 26 January
Parade and the many cultural events make Delhi
a great attraction. But it has nothing like the
Broadway of New York, The Theatre districts of
London, the Bolshoi of Moscow. At present the
Indira Gandhi National Centre for the Arts is
functioning at a very low key. With its 25 acre
prime location in the center of Delhi it could be
built up on the lines of, say the Barbican centre of
London to provide a cultural hub for the city
which will provide a year round and varied
cultural experience of international standard.
9. Eco-Tourism, river front, lakes, nature: With the
rapid urbanisation of Delhi there is grave danger
of losing the natural assets of the State. Efforts
being made to improve the Yamuna river front
for the Commonwealth Games and creating
nature parks at Kanganheri-Chhawla, Sanjay Lake
etc., will have to be given special attention to
provide relief to the city dweller and attract the
visitors from outside the State to experience the
natural beauty of the State, its flora and fauna.
Projects like the Garden of Five Senses would be
another way of creating this experience.
DELHI DEVELOPMENT REPORT320
10. Medical Tourism can allure an entirely new
segment of visitors attracted by the quality and
cost of medical treatment offered by the high
level medical facility that is now becoming
available in and around Delhi. Such tourism can
also be linked to other forms of tourism,
particularly ‘wellness’ tourism. This has already
been done very successfully by some countries
such as Thailand.
11. A New Organisation structure is necessary to
implement this vision. Delhi Administration and
Delhi Tourism are not equipped to deliver the
ambitious vision in its present state of
organisation and manpower. It needs an entirely
new setup and organisation possibly a ‘Tourism
Board’ headed by the Chief Minister, Delhi. Such
an organisation must be able to integrate the
many different ‘players’ under a single decision
making and implementing body with the requisite
statutory powers. This setup will have to play a
much greater role, which must certainly go far
beyond the marginal–player that the ‘Delhi
Tourism’ is today.
has a large network of employment exchanges spread over
the entire territory and therefore, more representative of
the situation of job seekers than in other parts of the
country where the rural population constitutes almost
three-fourth of the total but is hardly served by them. In
Delhi, the population of rural areas has fluctuated from
census to census and is currently estimated to be around
10 per cent, the rest being urban whether living in the
planned city or in the unplanned jhuggi jhopri (JJ) clusters,
slums, re-settlement colonies and unauthorised colonies
etc. Therefore, if a comparison of unemployment or
under-employment situation of Delhi has to be made, it
should rather be with the urban areas of the country or
the constituent states rather than the entire national
population. Further, it would be useful to look at the
gender dimensions of employment/unemployment since
the sex ratio for Delhi is rather low mainly because a very
large section of Delhi’s population migrated from different
parts of the country and as is natural, the initial migration
of a family is more by the males. In fact, the importance
of migrant population and their employment status cannot
be over-emphasised. In this respect, Delhi is almost
unique in the country.
It may be useful to point out here that detailed picture
of employment/unemployment for the entire country can
not be presented without taking note of the special cases
of states like Goa and Delhi. The picture of smaller states
including Delhi, cannot reliably obtained in sufficient
details from the national level picture, if based on the
central sample only, which is why the Delhi Government
in its Directorate of Economics and Statistics did a more
detailed analysis based on the larger state sample.
However, there are macro variables like employment
elasticities, sectoral break up of employment and broad
strategies of generating employment, which should be
examined not from the State level data alone but also
Chapter 12
Employment and Integrated RuralDevelopment
DELHI
12.1 Introduction
The generation of employment has been an explicit
objective of Indian Five Year Plans for a long time at the
National level. At the State level too, the Five Year Plans
have emphasised the creation of sufficient employment
opportunities to take care of not only the backlog of
unemployment and severe underemployment from the
past but also additions to labour force. However, it is also
accepted that measurement of employment/
unemployment is not easy in an agrarian economy with
seasonal operations. Therefore, at the National level the
measurements have been based on time utilisation (by
individuals) concept, as estimated by various Rounds of
the National Sample Survey Organisation (NSSO). This
organisation utilises three concepts for estimates of
unemployment, namely, usual status (US), current weekly
status (CWS) and current daily status (CDS), all based on
time utilisation only, ignoring the quality of work or
income generated through that work. While these
approaches have been accepted at the National level and
implemented by NSSO and Planning Commission for the
entire country, the underlying concepts are not necessarily
relevant for the almost non-agrarian National Capital
Territory of Delhi (NCT of Delhi or shortly, NCTD).
However, reliable estimates of employment and
unemployment even in the NCT of Delhi are obtained
from NSSO rounds through its nationally accepted
sampling procedures.
In the case of Delhi with an estimated population close
to 1.6 crores, the most recent estimates are those from
the 61st Round of the NSSO (2004-05) as also from the
last census of March 2001. However, Delhi Government
has taken care to analyse not only the data thrown up by
the Central Sample of NSSO of Delhi but also the State
Sample which is more than three times larger than the
Central Sample in terms of households canvassed. It also
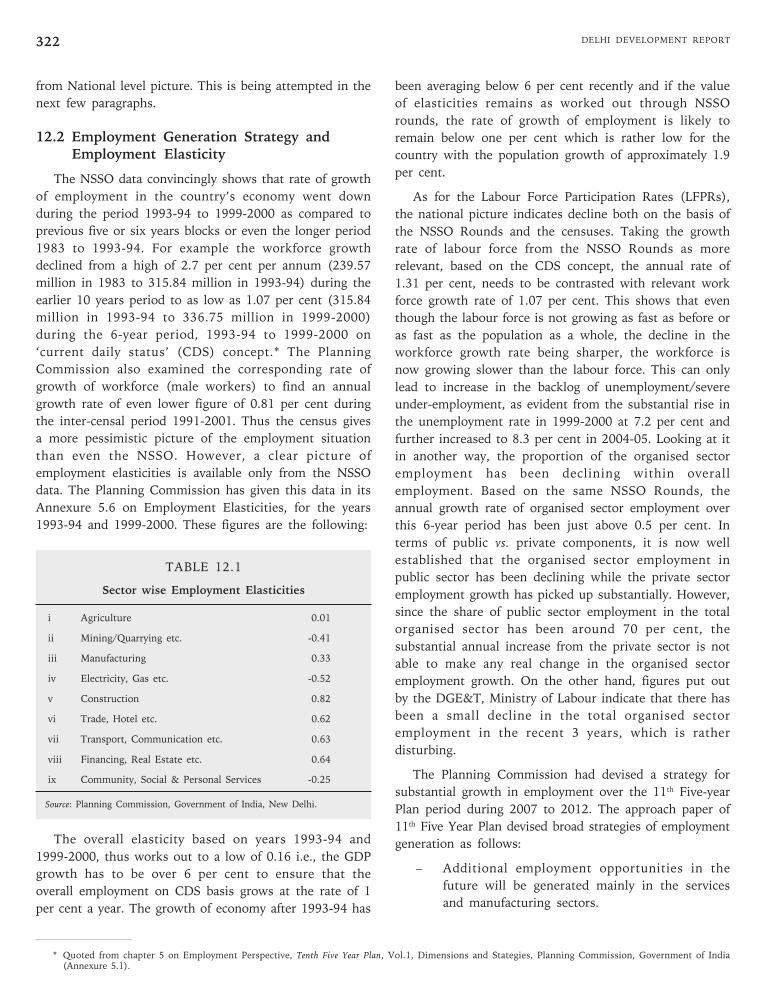
DELHI DEVELOPMENT REPORT322
from National level picture. This is being attempted in the
next few paragraphs.
12.2 Employment Generation Strategy andEmployment Elasticity
The NSSO data convincingly shows that rate of growth
of employment in the country’s economy went down
during the period 1993-94 to 1999-2000 as compared to
previous five or six years blocks or even the longer period
1983 to 1993-94. For example the workforce growth
declined from a high of 2.7 per cent per annum (239.57
million in 1983 to 315.84 million in 1993-94) during the
earlier 10 years period to as low as 1.07 per cent (315.84
million in 1993-94 to 336.75 million in 1999-2000)
during the 6-year period, 1993-94 to 1999-2000 on
‘current daily status’ (CDS) concept.* The Planning
Commission also examined the corresponding rate of
growth of workforce (male workers) to find an annual
growth rate of even lower figure of 0.81 per cent during
the inter-censal period 1991-2001. Thus the census gives
a more pessimistic picture of the employment situation
than even the NSSO. However, a clear picture of
employment elasticities is available only from the NSSO
data. The Planning Commission has given this data in its
Annexure 5.6 on Employment Elasticities, for the years
1993-94 and 1999-2000. These figures are the following:
TABLE 12.1
Sector wise Employment Elasticities
i Agriculture 0.01
ii Mining/Quarrying etc. -0.41
iii Manufacturing 0.33
iv Electricity, Gas etc. -0.52
v Construction 0.82
vi Trade, Hotel etc. 0.62
vii Transport, Communication etc. 0.63
viii Financing, Real Estate etc. 0.64
ix Community, Social & Personal Services -0.25
Source: Planning Commission, Government of India, New Delhi.
The overall elasticity based on years 1993-94 and
1999-2000, thus works out to a low of 0.16 i.e., the GDP
growth has to be over 6 per cent to ensure that the
overall employment on CDS basis grows at the rate of 1
per cent a year. The growth of economy after 1993-94 has
been averaging below 6 per cent recently and if the value
of elasticities remains as worked out through NSSO
rounds, the rate of growth of employment is likely to
remain below one per cent which is rather low for the
country with the population growth of approximately 1.9
per cent.
As for the Labour Force Participation Rates (LFPRs),
the national picture indicates decline both on the basis of
the NSSO Rounds and the censuses. Taking the growth
rate of labour force from the NSSO Rounds as more
relevant, based on the CDS concept, the annual rate of
1.31 per cent, needs to be contrasted with relevant work
force growth rate of 1.07 per cent. This shows that even
though the labour force is not growing as fast as before or
as fast as the population as a whole, the decline in the
workforce growth rate being sharper, the workforce is
now growing slower than the labour force. This can only
lead to increase in the backlog of unemployment/severe
under-employment, as evident from the substantial rise in
the unemployment rate in 1999-2000 at 7.2 per cent and
further increased to 8.3 per cent in 2004-05. Looking at it
in another way, the proportion of the organised sector
employment has been declining within overall
employment. Based on the same NSSO Rounds, the
annual growth rate of organised sector employment over
this 6-year period has been just above 0.5 per cent. In
terms of public vs. private components, it is now well
established that the organised sector employment in
public sector has been declining while the private sector
employment growth has picked up substantially. However,
since the share of public sector employment in the total
organised sector has been around 70 per cent, the
substantial annual increase from the private sector is not
able to make any real change in the organised sector
employment growth. On the other hand, figures put out
by the DGE&T, Ministry of Labour indicate that there has
been a small decline in the total organised sector
employment in the recent 3 years, which is rather
disturbing.
The Planning Commission had devised a strategy for
substantial growth in employment over the 11th Five-year
Plan period during 2007 to 2012. The approach paper of
11th Five Year Plan devised broad strategies of employment
generation as follows:
– Additional employment opportunities in the
future will be generated mainly in the services
and manufacturing sectors.
* Quoted from chapter 5 on Employment Perspective, Tenth Five Year Plan, Vol.1, Dimensions and Stategies, Planning Commission, Government of India(Annexure 5.1).
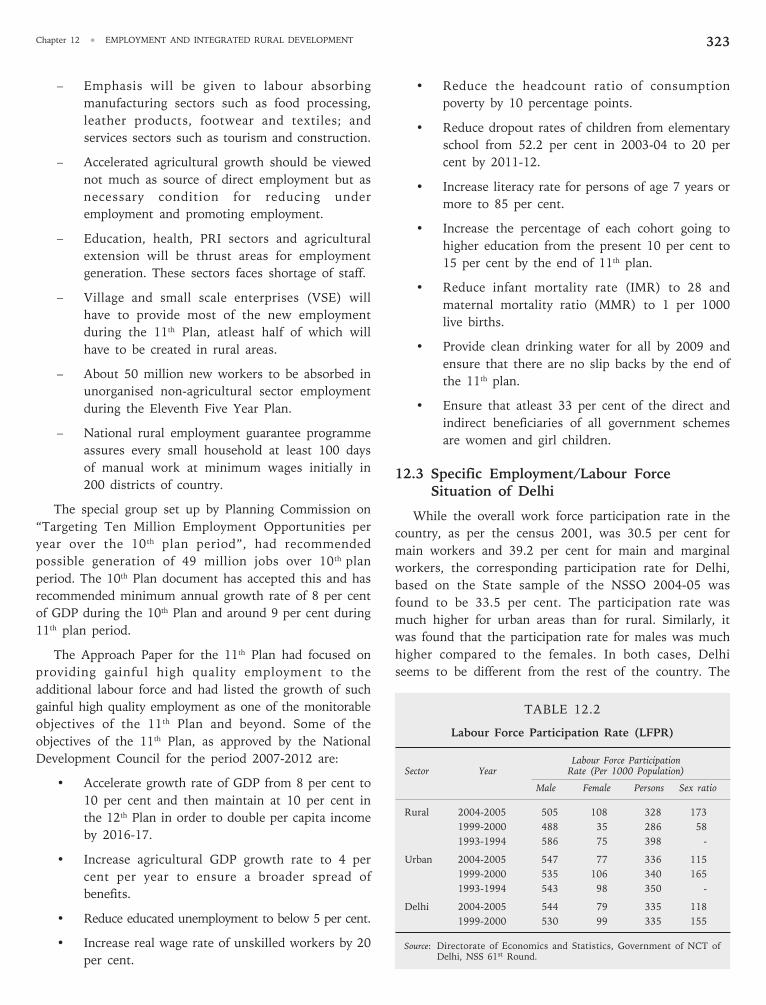
Chapter 12 • EMPLOYMENT AND INTEGRATED RURAL DEVELOPMENT 323
– Emphasis will be given to labour absorbing
manufacturing sectors such as food processing,
leather products, footwear and textiles; and
services sectors such as tourism and construction.
– Accelerated agricultural growth should be viewed
not much as source of direct employment but as
necessary condition for reducing under
employment and promoting employment.
– Education, health, PRI sectors and agricultural
extension will be thrust areas for employment
generation. These sectors faces shortage of staff.
– Village and small scale enterprises (VSE) will
have to provide most of the new employment
during the 11th Plan, atleast half of which will
have to be created in rural areas.
– About 50 million new workers to be absorbed in
unorganised non-agricultural sector employment
during the Eleventh Five Year Plan.
– National rural employment guarantee programme
assures every small household at least 100 days
of manual work at minimum wages initially in
200 districts of country.
The special group set up by Planning Commission on
“Targeting Ten Million Employment Opportunities per
year over the 10 th plan period”, had recommended
possible generation of 49 million jobs over 10th plan
period. The 10th Plan document has accepted this and has
recommended minimum annual growth rate of 8 per cent
of GDP during the 10th Plan and around 9 per cent during
11th plan period.
The Approach Paper for the 11th Plan had focused on
providing gainful high quality employment to the
additional labour force and had listed the growth of such
gainful high quality employment as one of the monitorable
objectives of the 11th Plan and beyond. Some of the
objectives of the 11th Plan, as approved by the National
Development Council for the period 2007-2012 are:
• Accelerate growth rate of GDP from 8 per cent to
10 per cent and then maintain at 10 per cent in
the 12th Plan in order to double per capita income
by 2016-17.
• Increase agricultural GDP growth rate to 4 per
cent per year to ensure a broader spread of
benefits.
• Reduce educated unemployment to below 5 per cent.
• Increase real wage rate of unskilled workers by 20
per cent.
• Reduce the headcount ratio of consumption
poverty by 10 percentage points.
• Reduce dropout rates of children from elementary
school from 52.2 per cent in 2003-04 to 20 per
cent by 2011-12.
• Increase literacy rate for persons of age 7 years or
more to 85 per cent.
• Increase the percentage of each cohort going to
higher education from the present 10 per cent to
15 per cent by the end of 11th plan.
• Reduce infant mortality rate (IMR) to 28 and
maternal mortality ratio (MMR) to 1 per 1000
live births.
• Provide clean drinking water for all by 2009 and
ensure that there are no slip backs by the end of
the 11th plan.
• Ensure that atleast 33 per cent of the direct and
indirect beneficiaries of all government schemes
are women and girl children.
12.3 Specific Employment/Labour ForceSituation of Delhi
While the overall work force participation rate in the
country, as per the census 2001, was 30.5 per cent for
main workers and 39.2 per cent for main and marginal
workers, the corresponding participation rate for Delhi,
based on the State sample of the NSSO 2004-05 was
found to be 33.5 per cent. The participation rate was
much higher for urban areas than for rural. Similarly, it
was found that the participation rate for males was much
higher compared to the females. In both cases, Delhi
seems to be different from the rest of the country. The
TABLE 12.2
Labour Force Participation Rate (LFPR)
Labour Force ParticipationSector Year Rate (Per 1000 Population)
Male Female Persons Sex ratio
Rural 2004-2005 505 108 328 173
1999-2000 488 35 286 58
1993-1994 586 75 398 -
Urban 2004-2005 547 77 336 115
1999-2000 535 106 340 165
1993-1994 543 98 350 -
Delhi 2004-2005 544 79 335 118
1999-2000 530 99 335 155
Source: Directorate of Economics and Statistics, Government of NCT ofDelhi, NSS 61st Round.
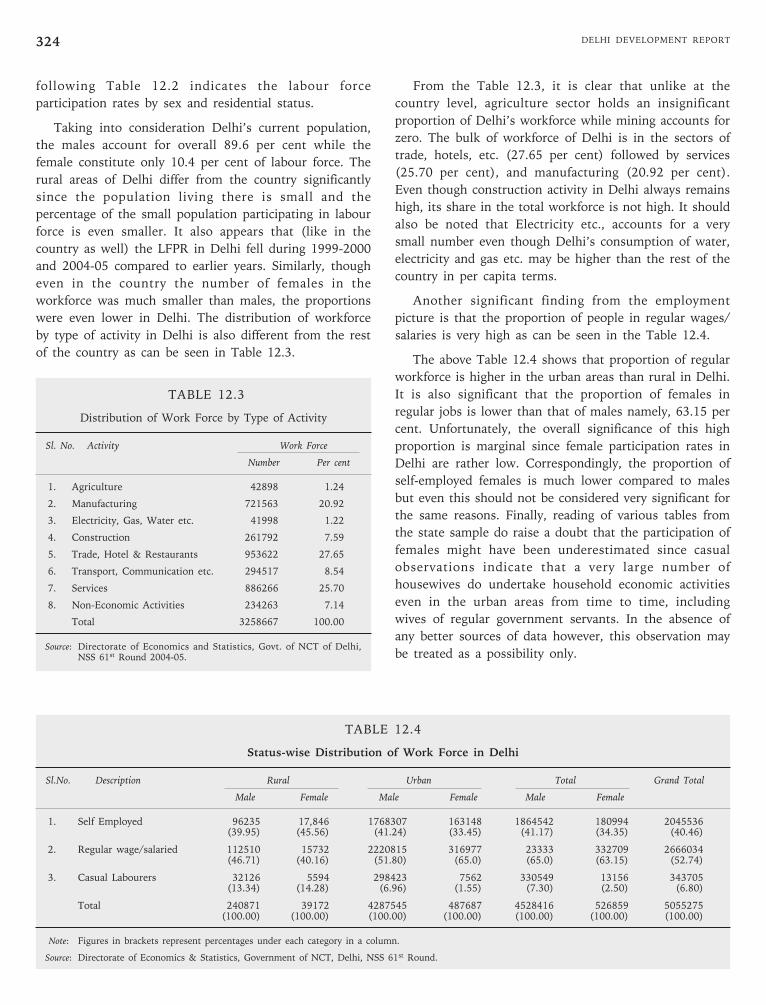
DELHI DEVELOPMENT REPORT324
following Table 12.2 indicates the labour force
participation rates by sex and residential status.
Taking into consideration Delhi’s current population,
the males account for overall 89.6 per cent while the
female constitute only 10.4 per cent of labour force. The
rural areas of Delhi differ from the country significantly
since the population living there is small and the
percentage of the small population participating in labour
force is even smaller. It also appears that (like in the
country as well) the LFPR in Delhi fell during 1999-2000
and 2004-05 compared to earlier years. Similarly, though
even in the country the number of females in the
workforce was much smaller than males, the proportions
were even lower in Delhi. The distribution of workforce
by type of activity in Delhi is also different from the rest
of the country as can be seen in Table 12.3.
TABLE 12.3
Distribution of Work Force by Type of Activity
Sl. No. Activity Work Force
Number Per cent
1. Agriculture 42898 1.24
2. Manufacturing 721563 20.92
3. Electricity, Gas, Water etc. 41998 1.22
4. Construction 261792 7.59
5. Trade, Hotel & Restaurants 953622 27.65
6. Transport, Communication etc. 294517 8.54
7. Services 886266 25.70
8. Non-Economic Activities 234263 7.14
Total 3258667 100.00
Source: Directorate of Economics and Statistics, Govt. of NCT of Delhi,NSS 61st Round 2004-05.
From the Table 12.3, it is clear that unlike at the
country level, agriculture sector holds an insignificant
proportion of Delhi’s workforce while mining accounts for
zero. The bulk of workforce of Delhi is in the sectors of
trade, hotels, etc. (27.65 per cent) followed by services
(25.70 per cent), and manufacturing (20.92 per cent).
Even though construction activity in Delhi always remains
high, its share in the total workforce is not high. It should
also be noted that Electricity etc., accounts for a very
small number even though Delhi’s consumption of water,
electricity and gas etc. may be higher than the rest of the
country in per capita terms.
Another significant finding from the employment
picture is that the proportion of people in regular wages/
salaries is very high as can be seen in the Table 12.4.
The above Table 12.4 shows that proportion of regular
workforce is higher in the urban areas than rural in Delhi.
It is also significant that the proportion of females in
regular jobs is lower than that of males namely, 63.15 per
cent. Unfortunately, the overall significance of this high
proportion is marginal since female participation rates in
Delhi are rather low. Correspondingly, the proportion of
self-employed females is much lower compared to males
but even this should not be considered very significant for
the same reasons. Finally, reading of various tables from
the state sample do raise a doubt that the participation of
females might have been underestimated since casual
observations indicate that a very large number of
housewives do undertake household economic activities
even in the urban areas from time to time, including
wives of regular government servants. In the absence of
any better sources of data however, this observation may
be treated as a possibility only.
TABLE 12.4
Status-wise Distribution of Work Force in Delhi
Sl.No. Description Rural Urban Total Grand Total
Male Female Male Female Male Female
1. Self Employed 96235 17,846 1768307 163148 1864542 180994 2045536(39.95) (45.56) (41.24) (33.45) (41.17) (34.35) (40.46)
2. Regular wage/salaried 112510 15732 2220815 316977 23333 332709 2666034(46.71) (40.16) (51.80) (65.0) (65.0) (63.15) (52.74)
3. Casual Labourers 32126 5594 298423 7562 330549 13156 343705(13.34) (14.28) (6.96) (1.55) (7.30) (2.50) (6.80)
Total 240871 39172 4287545 487687 4528416 526859 5055275(100.00) (100.00) (100.00) (100.00) (100.00) (100.00) (100.00)
Note: Figures in brackets represent percentages under each category in a column.
Source: Directorate of Economics & Statistics, Government of NCT, Delhi, NSS 61st Round.
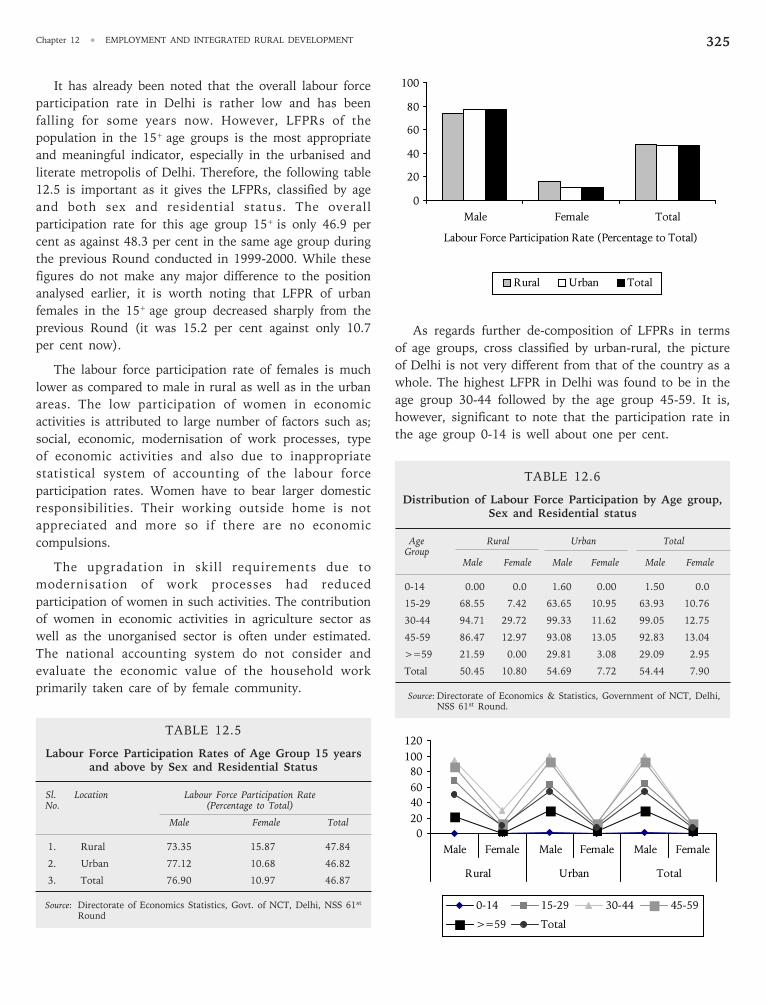
Chapter 12 • EMPLOYMENT AND INTEGRATED RURAL DEVELOPMENT 325
It has already been noted that the overall labour force
participation rate in Delhi is rather low and has been
falling for some years now. However, LFPRs of the
population in the 15+ age groups is the most appropriate
and meaningful indicator, especially in the urbanised and
literate metropolis of Delhi. Therefore, the following table
12.5 is important as it gives the LFPRs, classified by age
and both sex and residential status. The overall
participation rate for this age group 15+ is only 46.9 per
cent as against 48.3 per cent in the same age group during
the previous Round conducted in 1999-2000. While these
figures do not make any major difference to the position
analysed earlier, it is worth noting that LFPR of urban
females in the 15+ age group decreased sharply from the
previous Round (it was 15.2 per cent against only 10.7
per cent now).
The labour force participation rate of females is much
lower as compared to male in rural as well as in the urban
areas. The low participation of women in economic
activities is attributed to large number of factors such as;
social, economic, modernisation of work processes, type
of economic activities and also due to inappropriate
statistical system of accounting of the labour force
participation rates. Women have to bear larger domestic
responsibilities. Their working outside home is not
appreciated and more so if there are no economic
compulsions.
The upgradation in skill requirements due to
modernisation of work processes had reduced
participation of women in such activities. The contribution
of women in economic activities in agriculture sector as
well as the unorganised sector is often under estimated.
The national accounting system do not consider and
evaluate the economic value of the household work
primarily taken care of by female community.
TABLE 12.5
Labour Force Participation Rates of Age Group 15 yearsand above by Sex and Residential Status
Sl. Location Labour Force Participation RateNo. (Percentage to Total)
Male Female Total
1. Rural 73.35 15.87 47.84
2. Urban 77.12 10.68 46.82
3. Total 76.90 10.97 46.87
Source: Directorate of Economics Statistics, Govt. of NCT, Delhi, NSS 61st
Round
As regards further de-composition of LFPRs in terms
of age groups, cross classified by urban-rural, the picture
of Delhi is not very different from that of the country as a
whole. The highest LFPR in Delhi was found to be in the
age group 30-44 followed by the age group 45-59. It is,
however, significant to note that the participation rate in
the age group 0-14 is well about one per cent.
TABLE 12.6
Distribution of Labour Force Participation by Age group,Sex and Residential status
Age Rural Urban TotalGroup
Male Female Male Female Male Female
0-14 0.00 0.0 1.60 0.00 1.50 0.0
15-29 68.55 7.42 63.65 10.95 63.93 10.76
30-44 94.71 29.72 99.33 11.62 99.05 12.75
45-59 86.47 12.97 93.08 13.05 92.83 13.04
>=59 21.59 0.00 29.81 3.08 29.09 2.95
Total 50.45 10.80 54.69 7.72 54.44 7.90
Source: Directorate of Economics & Statistics, Government of NCT, Delhi,NSS 61st Round.
0
20
40
60
80
100
Male Female Total
Labour Force Participation Rate (Percentage to Total)
Rural Urban Total
0
20
40
60
80
100
120
Male Female Male Female Male Female
Rural Urban Total
0-14 15-29 30-44 45-59
>=59 Total
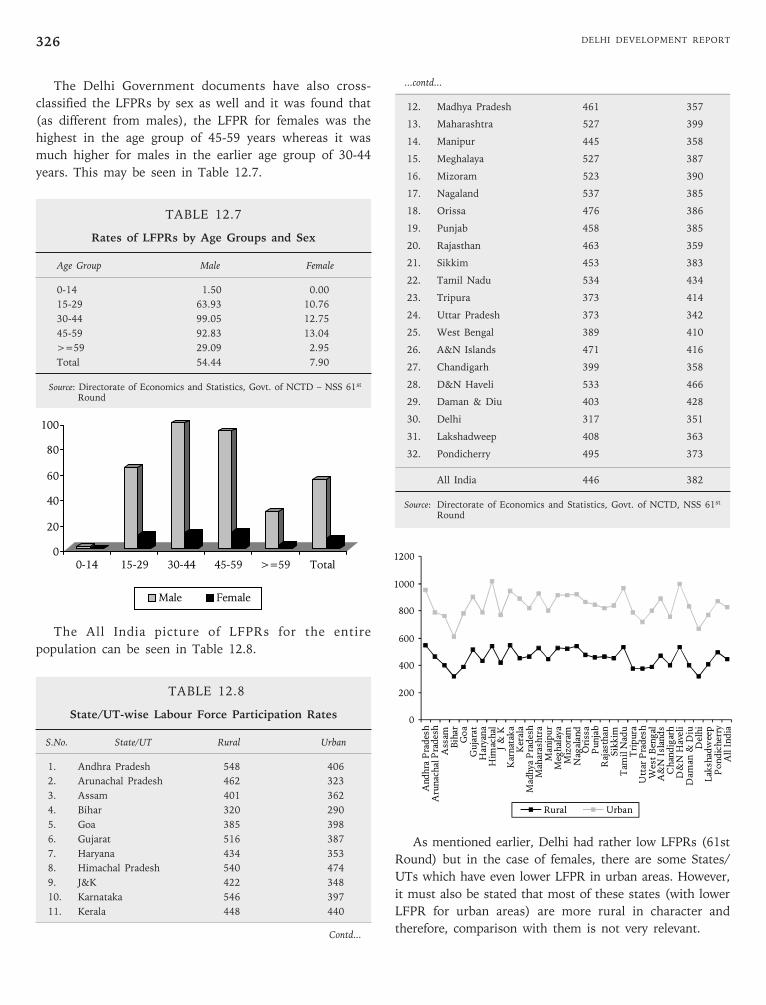
DELHI DEVELOPMENT REPORT326
12. Madhya Pradesh 461 357
13. Maharashtra 527 399
14. Manipur 445 358
15. Meghalaya 527 387
16. Mizoram 523 390
17. Nagaland 537 385
18. Orissa 476 386
19. Punjab 458 385
20. Rajasthan 463 359
21. Sikkim 453 383
22. Tamil Nadu 534 434
23. Tripura 373 414
24. Uttar Pradesh 373 342
25. West Bengal 389 410
26. A&N Islands 471 416
27. Chandigarh 399 358
28. D&N Haveli 533 466
29. Daman & Diu 403 428
30. Delhi 317 351
31. Lakshadweep 408 363
32. Pondicherry 495 373
All India 446 382
Source: Directorate of Economics and Statistics, Govt. of NCTD, NSS 61st
Round
As mentioned earlier, Delhi had rather low LFPRs (61st
Round) but in the case of females, there are some States/
UTs which have even lower LFPR in urban areas. However,
it must also be stated that most of these states (with lower
LFPR for urban areas) are more rural in character and
therefore, comparison with them is not very relevant.
The Delhi Government documents have also cross-
classified the LFPRs by sex as well and it was found that
(as different from males), the LFPR for females was the
highest in the age group of 45-59 years whereas it was
much higher for males in the earlier age group of 30-44
years. This may be seen in Table 12.7.
TABLE 12.7
Rates of LFPRs by Age Groups and Sex
Age Group Male Female
0-14 1.50 0.00
15-29 63.93 10.76
30-44 99.05 12.75
45-59 92.83 13.04
>=59 29.09 2.95
Total 54.44 7.90
Source: Directorate of Economics and Statistics, Govt. of NCTD – NSS 61st
Round
The All India picture of LFPRs for the entire
population can be seen in Table 12.8.
TABLE 12.8
State/UT-wise Labour Force Participation Rates
S.No. State/UT Rural Urban
1. Andhra Pradesh 548 406
2. Arunachal Pradesh 462 323
3. Assam 401 362
4. Bihar 320 290
5. Goa 385 398
6. Gujarat 516 387
7. Haryana 434 353
8. Himachal Pradesh 540 474
9. J&K 422 348
10. Karnataka 546 397
11. Kerala 448 440
0
20
40
60
80
100
0-14 15-29 30-44 45-59 >=59 Total
Male Female
Contd...
...contd...
0
200
400
600
800
1000
1200
Andhra
Pradesh
Arunachal
Assam
Bihar
Goa
Gujarat
Haryana
Him
achal
J&
KKarnatak
aKerala
Mad
hya
Mah
arashtra
Man
ipur
Meg
halaya
Mizoram
Nag
alan
dOrissa
Punjab
Rajasthan
Sikkim
Tam
ilNad
uTripura
Uttar
Pradesh
WestBen
gal
A&N
Islands
Chan
digarh
D&N
Haveli
Dam
an&
Diu
Delhi
Lak
shad
weep
Pondicherry
AllI ndia
Rural Urban
Pradesh
Pradesh
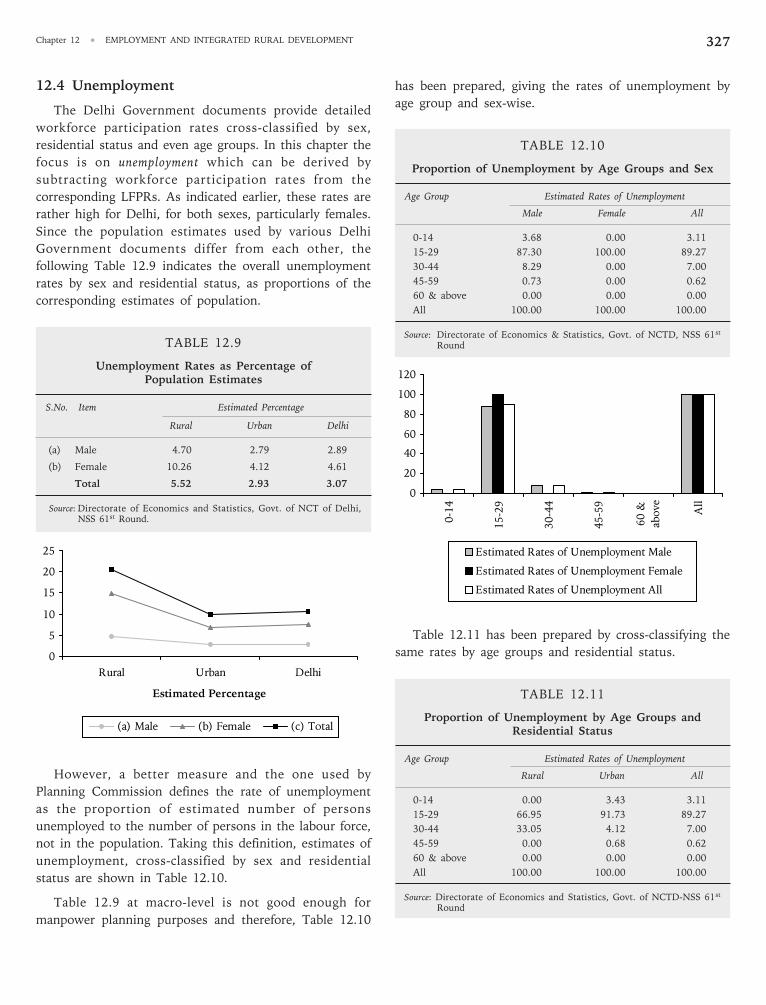
Chapter 12 • EMPLOYMENT AND INTEGRATED RURAL DEVELOPMENT 327
12.4 Unemployment
The Delhi Government documents provide detailed
workforce participation rates cross-classified by sex,
residential status and even age groups. In this chapter the
focus is on unemployment which can be derived by
subtracting workforce participation rates from the
corresponding LFPRs. As indicated earlier, these rates are
rather high for Delhi, for both sexes, particularly females.
Since the population estimates used by various Delhi
Government documents differ from each other, the
following Table 12.9 indicates the overall unemployment
rates by sex and residential status, as proportions of the
corresponding estimates of population.
TABLE 12.9
Unemployment Rates as Percentage ofPopulation Estimates
S.No. Item Estimated Percentage
Rural Urban Delhi
(a) Male 4.70 2.79 2.89
(b) Female 10.26 4.12 4.61
Total 5.52 2.93 3.07
Source: Directorate of Economics and Statistics, Govt. of NCT of Delhi,NSS 61st Round.
However, a better measure and the one used by
Planning Commission defines the rate of unemployment
as the proportion of estimated number of persons
unemployed to the number of persons in the labour force,
not in the population. Taking this definition, estimates of
unemployment, cross-classified by sex and residential
status are shown in Table 12.10.
Table 12.9 at macro-level is not good enough for
manpower planning purposes and therefore, Table 12.10
has been prepared, giving the rates of unemployment by
age group and sex-wise.
TABLE 12.10
Proportion of Unemployment by Age Groups and Sex
Age Group Estimated Rates of Unemployment
Male Female All
0-14 3.68 0.00 3.11
15-29 87.30 100.00 89.27
30-44 8.29 0.00 7.00
45-59 0.73 0.00 0.62
60 & above 0.00 0.00 0.00
All 100.00 100.00 100.00
Source: Directorate of Economics & Statistics, Govt. of NCTD, NSS 61st
Round
Table 12.11 has been prepared by cross-classifying the
same rates by age groups and residential status.
TABLE 12.11
Proportion of Unemployment by Age Groups andResidential Status
Age Group Estimated Rates of Unemployment
Rural Urban All
0-14 0.00 3.43 3.11
15-29 66.95 91.73 89.27
30-44 33.05 4.12 7.00
45-59 0.00 0.68 0.62
60 & above 0.00 0.00 0.00
All 100.00 100.00 100.00
Source: Directorate of Economics and Statistics, Govt. of NCTD-NSS 61st
Round
0
5
10
15
20
25
Rural Urban Delhi
Estimated Percentage
(a) Male (b) Female (c) Total
0
20
40
60
80
100
120
0-1
4
15
-29
30
-44
45
-59
60
&
ab
ove
All
Estimated Rates of Unemployment Male
Estimated Rates of Unemployment Female
Estimated Rates of Unemployment All
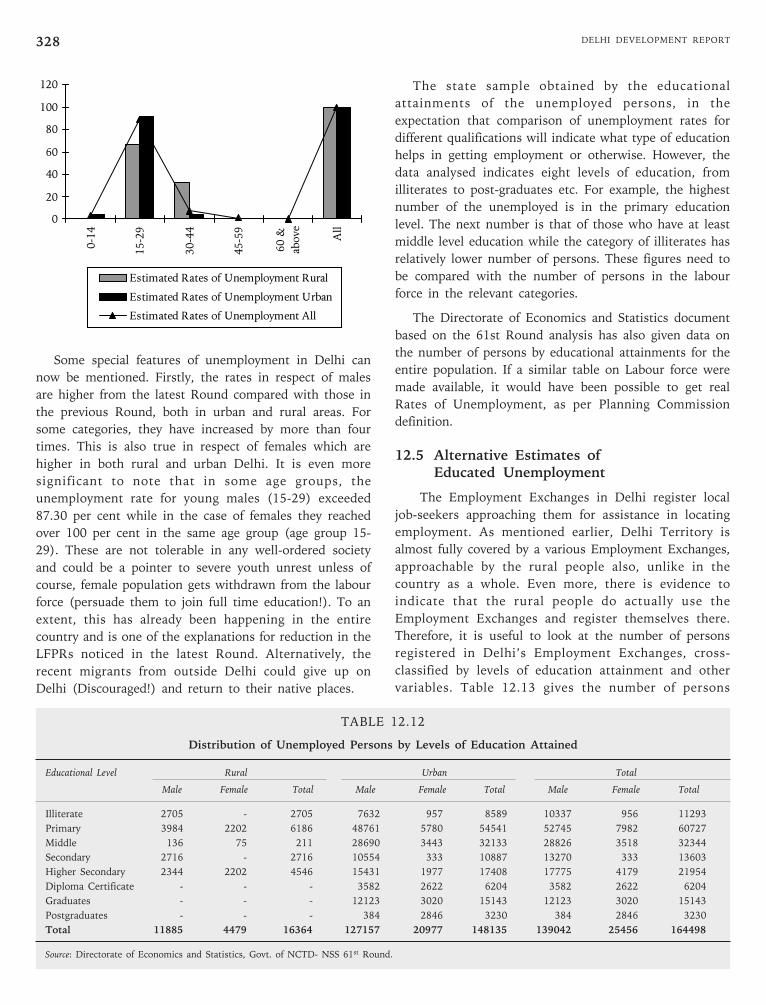
DELHI DEVELOPMENT REPORT328
Some special features of unemployment in Delhi can
now be mentioned. Firstly, the rates in respect of males
are higher from the latest Round compared with those in
the previous Round, both in urban and rural areas. For
some categories, they have increased by more than four
times. This is also true in respect of females which are
higher in both rural and urban Delhi. It is even more
significant to note that in some age groups, the
unemployment rate for young males (15-29) exceeded
87.30 per cent while in the case of females they reached
over 100 per cent in the same age group (age group 15-
29). These are not tolerable in any well-ordered society
and could be a pointer to severe youth unrest unless of
course, female population gets withdrawn from the labour
force (persuade them to join full time education!). To an
extent, this has already been happening in the entire
country and is one of the explanations for reduction in the
LFPRs noticed in the latest Round. Alternatively, the
recent migrants from outside Delhi could give up on
Delhi (Discouraged!) and return to their native places.
The state sample obtained by the educational
attainments of the unemployed persons, in the
expectation that comparison of unemployment rates for
different qualifications will indicate what type of education
helps in getting employment or otherwise. However, the
data analysed indicates eight levels of education, from
illiterates to post-graduates etc. For example, the highest
number of the unemployed is in the primary education
level. The next number is that of those who have at least
middle level education while the category of illiterates has
relatively lower number of persons. These figures need to
be compared with the number of persons in the labour
force in the relevant categories.
The Directorate of Economics and Statistics document
based on the 61st Round analysis has also given data on
the number of persons by educational attainments for the
entire population. If a similar table on Labour force were
made available, it would have been possible to get real
Rates of Unemployment, as per Planning Commission
definition.
12.5 Alternative Estimates ofEducated Unemployment
The Employment Exchanges in Delhi register local
job-seekers approaching them for assistance in locating
employment. As mentioned earlier, Delhi Territory is
almost fully covered by a various Employment Exchanges,
approachable by the rural people also, unlike in the
country as a whole. Even more, there is evidence to
indicate that the rural people do actually use the
Employment Exchanges and register themselves there.
Therefore, it is useful to look at the number of persons
registered in Delhi’s Employment Exchanges, cross-
classified by levels of education attainment and other
variables. Table 12.13 gives the number of persons
0
20
40
60
80
100
1200
-14
15
-29
30
-44
45
-59
60
&
ab
ove
All
Estimated Rates of Unemployment Rural
Estimated Rates of Unemployment Urban
Estimated Rates of Unemployment All
TABLE 12.12
Distribution of Unemployed Persons by Levels of Education Attained
Educational Level Rural Urban Total
Male Female Total Male Female Total Male Female Total
Illiterate 2705 - 2705 7632 957 8589 10337 956 11293
Primary 3984 2202 6186 48761 5780 54541 52745 7982 60727
Middle 136 75 211 28690 3443 32133 28826 3518 32344
Secondary 2716 - 2716 10554 333 10887 13270 333 13603
Higher Secondary 2344 2202 4546 15431 1977 17408 17775 4179 21954
Diploma Certificate - - - 3582 2622 6204 3582 2622 6204
Graduates - - - 12123 3020 15143 12123 3020 15143
Postgraduates - - - 384 2846 3230 384 2846 3230
Total 11885 4479 16364 127157 20977 148135 139042 25456 164498
Source: Directorate of Economics and Statistics, Govt. of NCTD- NSS 61st Round.
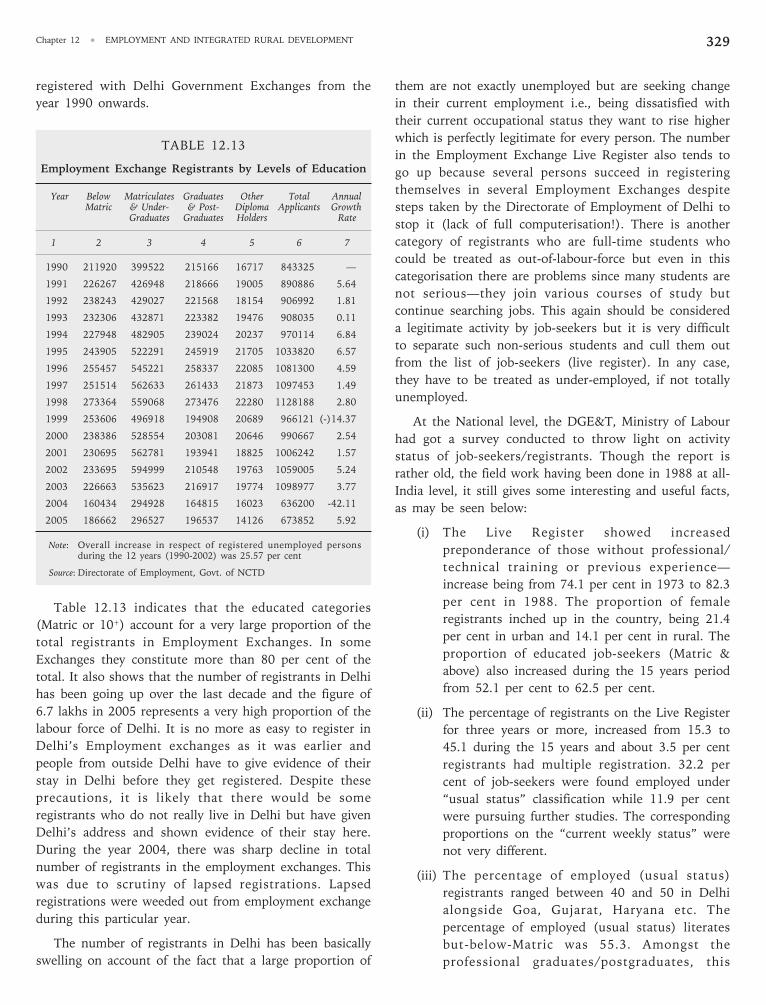
Chapter 12 • EMPLOYMENT AND INTEGRATED RURAL DEVELOPMENT 329
registered with Delhi Government Exchanges from the
year 1990 onwards.
TABLE 12.13
Employment Exchange Registrants by Levels of Education
Year Below Matriculates Graduates Other Total AnnualMatric & Under- & Post- Diploma Applicants Growth
Graduates Graduates Holders Rate
1 2 3 4 5 6 7
1990 211920 399522 215166 16717 843325 —
1991 226267 426948 218666 19005 890886 5.64
1992 238243 429027 221568 18154 906992 1.81
1993 232306 432871 223382 19476 908035 0.11
1994 227948 482905 239024 20237 970114 6.84
1995 243905 522291 245919 21705 1033820 6.57
1996 255457 545221 258337 22085 1081300 4.59
1997 251514 562633 261433 21873 1097453 1.49
1998 273364 559068 273476 22280 1128188 2.80
1999 253606 496918 194908 20689 966121 (-)14.37
2000 238386 528554 203081 20646 990667 2.54
2001 230695 562781 193941 18825 1006242 1.57
2002 233695 594999 210548 19763 1059005 5.24
2003 226663 535623 216917 19774 1098977 3.77
2004 160434 294928 164815 16023 636200 -42.11
2005 186662 296527 196537 14126 673852 5.92
Note: Overall increase in respect of registered unemployed personsduring the 12 years (1990-2002) was 25.57 per cent
Source: Directorate of Employment, Govt. of NCTD
Table 12.13 indicates that the educated categories
(Matric or 10+) account for a very large proportion of the
total registrants in Employment Exchanges. In some
Exchanges they constitute more than 80 per cent of the
total. It also shows that the number of registrants in Delhi
has been going up over the last decade and the figure of
6.7 lakhs in 2005 represents a very high proportion of the
labour force of Delhi. It is no more as easy to register in
Delhi’s Employment exchanges as it was earlier and
people from outside Delhi have to give evidence of their
stay in Delhi before they get registered. Despite these
precautions, it is likely that there would be some
registrants who do not really live in Delhi but have given
Delhi’s address and shown evidence of their stay here.
During the year 2004, there was sharp decline in total
number of registrants in the employment exchanges. This
was due to scrutiny of lapsed registrations. Lapsed
registrations were weeded out from employment exchange
during this particular year.
The number of registrants in Delhi has been basically
swelling on account of the fact that a large proportion of
them are not exactly unemployed but are seeking change
in their current employment i.e., being dissatisfied with
their current occupational status they want to rise higher
which is perfectly legitimate for every person. The number
in the Employment Exchange Live Register also tends to
go up because several persons succeed in registering
themselves in several Employment Exchanges despite
steps taken by the Directorate of Employment of Delhi to
stop it (lack of full computerisation!). There is another
category of registrants who are full-time students who
could be treated as out-of-labour-force but even in this
categorisation there are problems since many students are
not serious—they join various courses of study but
continue searching jobs. This again should be considered
a legitimate activity by job-seekers but it is very difficult
to separate such non-serious students and cull them out
from the list of job-seekers (live register). In any case,
they have to be treated as under-employed, if not totally
unemployed.
At the National level, the DGE&T, Ministry of Labour
had got a survey conducted to throw light on activity
status of job-seekers/registrants. Though the report is
rather old, the field work having been done in 1988 at all-
India level, it still gives some interesting and useful facts,
as may be seen below:
(i) The Live Register showed increased
preponderance of those without professional/
technical training or previous experience—
increase being from 74.1 per cent in 1973 to 82.3
per cent in 1988. The proportion of female
registrants inched up in the country, being 21.4
per cent in urban and 14.1 per cent in rural. The
proportion of educated job-seekers (Matric &
above) also increased during the 15 years period
from 52.1 per cent to 62.5 per cent.
(ii) The percentage of registrants on the Live Register
for three years or more, increased from 15.3 to
45.1 during the 15 years and about 3.5 per cent
registrants had multiple registration. 32.2 per
cent of job-seekers were found employed under
“usual status” classification while 11.9 per cent
were pursuing further studies. The corresponding
proportions on the “current weekly status” were
not very different.
(iii) The percentage of employed (usual status)
registrants ranged between 40 and 50 in Delhi
alongside Goa, Gujarat, Haryana etc. The
percentage of employed (usual status) literates
but-below-Matric was 55.3. Amongst the
professional graduates/postgraduates, this
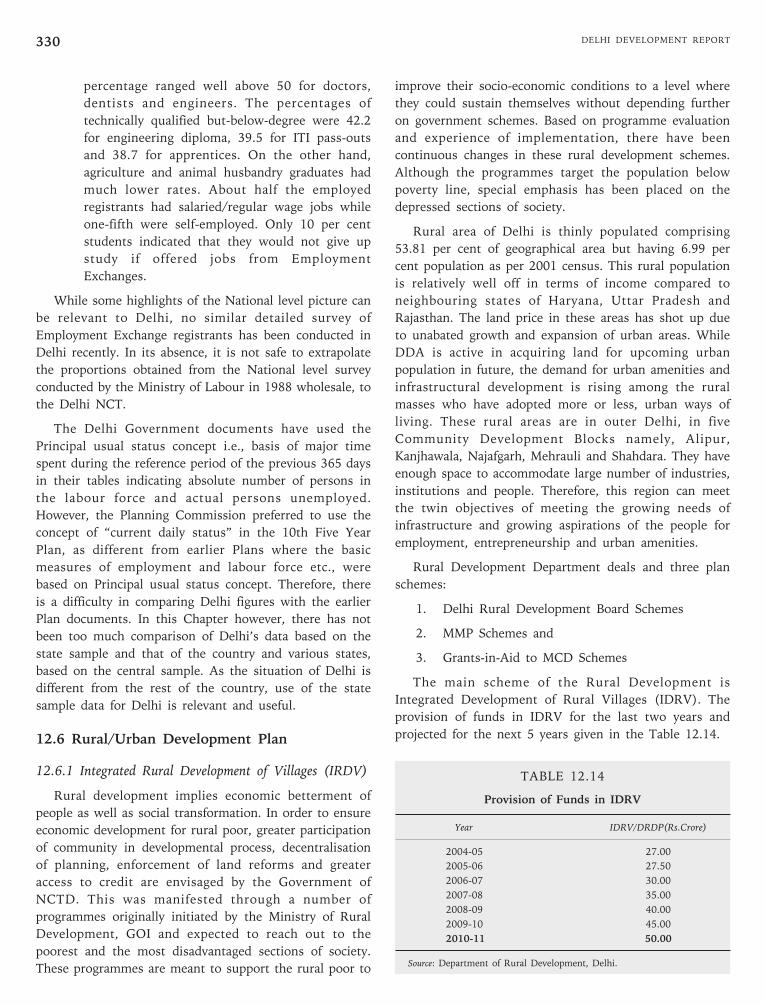
DELHI DEVELOPMENT REPORT330
improve their socio-economic conditions to a level where
they could sustain themselves without depending further
on government schemes. Based on programme evaluation
and experience of implementation, there have been
continuous changes in these rural development schemes.
Although the programmes target the population below
poverty line, special emphasis has been placed on the
depressed sections of society.
Rural area of Delhi is thinly populated comprising
53.81 per cent of geographical area but having 6.99 per
cent population as per 2001 census. This rural population
is relatively well off in terms of income compared to
neighbouring states of Haryana, Uttar Pradesh and
Rajasthan. The land price in these areas has shot up due
to unabated growth and expansion of urban areas. While
DDA is active in acquiring land for upcoming urban
population in future, the demand for urban amenities and
infrastructural development is rising among the rural
masses who have adopted more or less, urban ways of
living. These rural areas are in outer Delhi, in five
Community Development Blocks namely, Alipur,
Kanjhawala, Najafgarh, Mehrauli and Shahdara. They have
enough space to accommodate large number of industries,
institutions and people. Therefore, this region can meet
the twin objectives of meeting the growing needs of
infrastructure and growing aspirations of the people for
employment, entrepreneurship and urban amenities.
Rural Development Department deals and three plan
schemes:
1. Delhi Rural Development Board Schemes
2. MMP Schemes and
3. Grants-in-Aid to MCD Schemes
The main scheme of the Rural Development is
Integrated Development of Rural Villages (IDRV). The
provision of funds in IDRV for the last two years and
projected for the next 5 years given in the Table 12.14.
TABLE 12.14
Provision of Funds in IDRV
Year IDRV/DRDP(Rs.Crore)
2004-05 27.00
2005-06 27.50
2006-07 30.00
2007-08 35.00
2008-09 40.00
2009-10 45.00
2010-11 50.00
Source: Department of Rural Development, Delhi.
percentage ranged well above 50 for doctors,
dentists and engineers. The percentages of
technically qualified but-below-degree were 42.2
for engineering diploma, 39.5 for ITI pass-outs
and 38.7 for apprentices. On the other hand,
agriculture and animal husbandry graduates had
much lower rates. About half the employed
registrants had salaried/regular wage jobs while
one-fifth were self-employed. Only 10 per cent
students indicated that they would not give up
study if offered jobs from Employment
Exchanges.
While some highlights of the National level picture can
be relevant to Delhi, no similar detailed survey of
Employment Exchange registrants has been conducted in
Delhi recently. In its absence, it is not safe to extrapolate
the proportions obtained from the National level survey
conducted by the Ministry of Labour in 1988 wholesale, to
the Delhi NCT.
The Delhi Government documents have used the
Principal usual status concept i.e., basis of major time
spent during the reference period of the previous 365 days
in their tables indicating absolute number of persons in
the labour force and actual persons unemployed.
However, the Planning Commission preferred to use the
concept of “current daily status” in the 10th Five Year
Plan, as different from earlier Plans where the basic
measures of employment and labour force etc., were
based on Principal usual status concept. Therefore, there
is a difficulty in comparing Delhi figures with the earlier
Plan documents. In this Chapter however, there has not
been too much comparison of Delhi’s data based on the
state sample and that of the country and various states,
based on the central sample. As the situation of Delhi is
different from the rest of the country, use of the state
sample data for Delhi is relevant and useful.
12.6 Rural/Urban Development Plan
12.6.1 Integrated Rural Development of Villages (IRDV)
Rural development implies economic betterment of
people as well as social transformation. In order to ensure
economic development for rural poor, greater participation
of community in developmental process, decentralisation
of planning, enforcement of land reforms and greater
access to credit are envisaged by the Government of
NCTD. This was manifested through a number of
programmes originally initiated by the Ministry of Rural
Development, GOI and expected to reach out to the
poorest and the most disadvantaged sections of society.
These programmes are meant to support the rural poor to
Chapter 12 • EMPLOYMENT AND INTEGRATED RURAL DEVELOPMENT 331
The information given in the table reveals that there
has been net increase of about 85 per cent during 2004-05
to 2010-11 in IDRF Scheme in the State. Under the plan
schemes the following works are undertaken:
A. IDRV envisages:
1. Construction of approach roads
2. Construction of link roads
3. Development of ponds in rural villages
4. Development of parks, Vyagan Shalas in rural
villages
5. Development of cremation grounds
6. Development of play grounds
7. Fencing of Gram sabha land
8. Construction of drainage mainly to protect rural
areas from flooding.
B. Mini Master Plan (MMP) envisages:
Repair and maintenance of MPCCS
C. Grants in Aid to MCD
Grants in Aid to MCD is provided for Development of
Rural Villages and Construction of Rural roads:
1. Construction of approach roads
2. Construction of link roads
3. Construction of internal gullies (street in rural
villages)
12.6.2 Urban Development
The urban population dwells in a small geographical
area of 46.19 per cent but constitute 93.01 per cent of the
total population of Delhi. The growth rate and density of
this part is exceptionally high due to natural growth rate
plus inward migration, thus hampering the city
development. The problems so created include shortage of
dwelling units, mushrooming growth of jhuggis,
encroachment of public land, expansion of unauthorised
colonies and creation/expansion of slums etc. They have
put pressure on limited civic services and created major
bottlenecks in orderly development of Delhi, like in other
mega-cities. Another important dimension of such
unplanned human settlements is availability of cheap
labour, especially for informal industries, construction,
domestic services, transport, trade etc. Their productive
role in city development needs to be recognised. They are
the poor who are leading life, often below the poverty
line. The rapid in-migration and the consequent
development of unplanned human settlements in Delhi
have been accepted as a spontaneous process of
urbanisation and urban geographers, planners and
thinkers alike have accepted them as an inalienable part of
the city. Therefore, there is a need to adopt a balanced
approach to meet the growing needs and aspirations of all
the residents of Delhi.
Keeping in view the peculiar and gigantic problems of
Delhi, several measures had been initiated including
environmental improvement of urban slums, provision of
various facilities in urbanised villages, additional facilities
in resettlement colonies, development of regularised
unauthorised colonies etc. On the environment front, a
number of steps had been taken like mechanisation of
conservancy and sanitation services, environmental
improvement through horticulture works, construction of
public and community centers of mass scale in different
substandard localities of this territory etc.
In order to wipe out poverty from Delhi, a number of
centrally sponsored and state schemes have been launched
in Delhi. They can be grouped under two heads:
a) Self-Employment Programme; and
b) Wage Employment Programme.
a) Self-Employment Programmes
The Self-employment programmes were initiated by a
number of departments i.e., Industries, Urban
Development and Department for the Welfare of SC/ST/
OBC etc. Assistance was offered to all segments of people
including educated-unemployed youth, women, urban
poor living below the poverty line etc. Some of these
programmes are:
i) Society for Promotion of Self-Employment
This Society for self-employment was set up in 1986
by the Industries Department, Government of Delhi and
became functional with effect from 1 April 1987. The
main objective of the society was to provide short term
training in technical trades to the educated unemployed
youth of NCT of Delhi to enable them set up their own
ventures or get gainful employment after completing the
training. The Society has two training centres and the
following courses are offered:
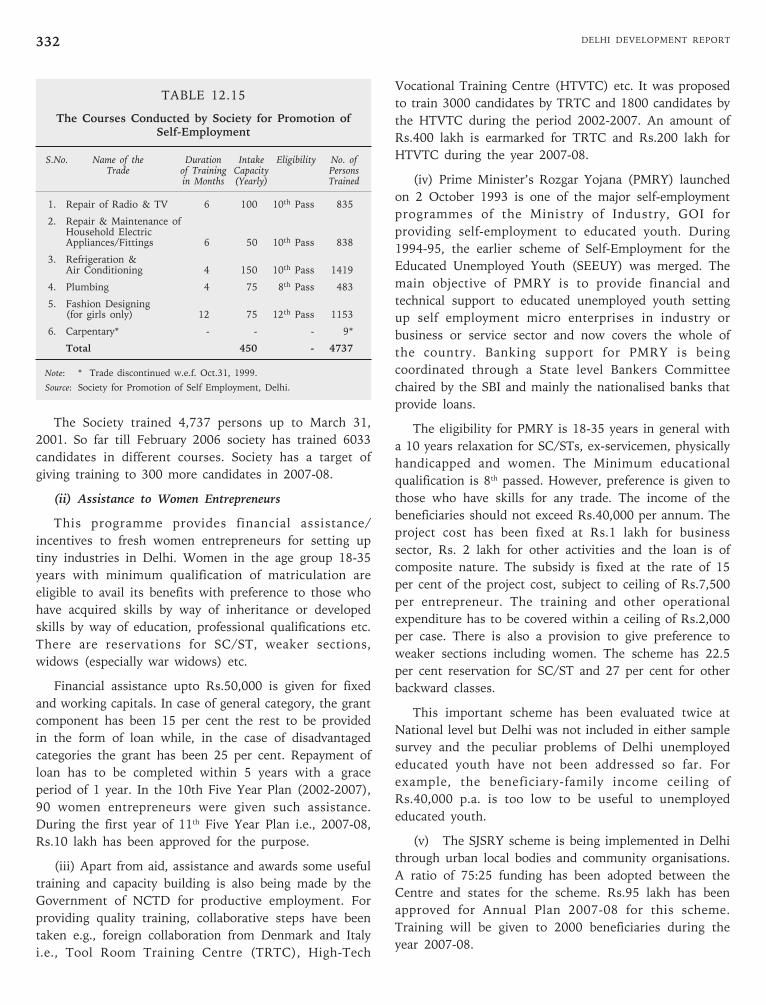
DELHI DEVELOPMENT REPORT332
TABLE 12.15
The Courses Conducted by Society for Promotion ofSelf-Employment
S.No. Name of the Duration Intake Eligibility No. ofTrade of Training Capacity Persons
in Months (Yearly) Trained
1. Repair of Radio & TV 6 100 10th Pass 835
2. Repair & Maintenance ofHousehold ElectricAppliances/Fittings 6 50 10th Pass 838
3. Refrigeration &Air Conditioning 4 150 10th Pass 1419
4. Plumbing 4 75 8th Pass 483
5. Fashion Designing(for girls only) 12 75 12th Pass 1153
6. Carpentary* - - - 9*
Total 450 - 4737
Note: * Trade discontinued w.e.f. Oct.31, 1999.
Source: Society for Promotion of Self Employment, Delhi.
The Society trained 4,737 persons up to March 31,
2001. So far till February 2006 society has trained 6033
candidates in different courses. Society has a target of
giving training to 300 more candidates in 2007-08.
(ii) Assistance to Women Entrepreneurs
This programme provides financial assistance/
incentives to fresh women entrepreneurs for setting up
tiny industries in Delhi. Women in the age group 18-35
years with minimum qualification of matriculation are
eligible to avail its benefits with preference to those who
have acquired skills by way of inheritance or developed
skills by way of education, professional qualifications etc.
There are reservations for SC/ST, weaker sections,
widows (especially war widows) etc.
Financial assistance upto Rs.50,000 is given for fixed
and working capitals. In case of general category, the grant
component has been 15 per cent the rest to be provided
in the form of loan while, in the case of disadvantaged
categories the grant has been 25 per cent. Repayment of
loan has to be completed within 5 years with a grace
period of 1 year. In the 10th Five Year Plan (2002-2007),
90 women entrepreneurs were given such assistance.
During the first year of 11th Five Year Plan i.e., 2007-08,
Rs.10 lakh has been approved for the purpose.
(iii) Apart from aid, assistance and awards some useful
training and capacity building is also being made by the
Government of NCTD for productive employment. For
providing quality training, collaborative steps have been
taken e.g., foreign collaboration from Denmark and Italy
i.e., Tool Room Training Centre (TRTC), High-Tech
Vocational Training Centre (HTVTC) etc. It was proposed
to train 3000 candidates by TRTC and 1800 candidates by
the HTVTC during the period 2002-2007. An amount of
Rs.400 lakh is earmarked for TRTC and Rs.200 lakh for
HTVTC during the year 2007-08.
(iv) Prime Minister’s Rozgar Yojana (PMRY) launched
on 2 October 1993 is one of the major self-employment
programmes of the Ministry of Industry, GOI for
providing self-employment to educated youth. During
1994-95, the earlier scheme of Self-Employment for the
Educated Unemployed Youth (SEEUY) was merged. The
main objective of PMRY is to provide financial and
technical support to educated unemployed youth setting
up self employment micro enterprises in industry or
business or service sector and now covers the whole of
the country. Banking support for PMRY is being
coordinated through a State level Bankers Committee
chaired by the SBI and mainly the nationalised banks that
provide loans.
The eligibility for PMRY is 18-35 years in general with
a 10 years relaxation for SC/STs, ex-servicemen, physically
handicapped and women. The Minimum educational
qualification is 8th passed. However, preference is given to
those who have skills for any trade. The income of the
beneficiaries should not exceed Rs.40,000 per annum. The
project cost has been fixed at Rs.1 lakh for business
sector, Rs. 2 lakh for other activities and the loan is of
composite nature. The subsidy is fixed at the rate of 15
per cent of the project cost, subject to ceiling of Rs.7,500
per entrepreneur. The training and other operational
expenditure has to be covered within a ceiling of Rs.2,000
per case. There is also a provision to give preference to
weaker sections including women. The scheme has 22.5
per cent reservation for SC/ST and 27 per cent for other
backward classes.
This important scheme has been evaluated twice at
National level but Delhi was not included in either sample
survey and the peculiar problems of Delhi unemployed
educated youth have not been addressed so far. For
example, the beneficiary-family income ceiling of
Rs.40,000 p.a. is too low to be useful to unemployed
educated youth.
(v) The SJSRY scheme is being implemented in Delhi
through urban local bodies and community organisations.
A ratio of 75:25 funding has been adopted between the
Centre and states for the scheme. Rs.95 lakh has been
approved for Annual Plan 2007-08 for this scheme.
Training will be given to 2000 beneficiaries during the
year 2007-08.
Chapter 12 • EMPLOYMENT AND INTEGRATED RURAL DEVELOPMENT 333
(vi) The Urban Self-Employment Programme is being
made on whole town basis with special emphasis on
urban poor clusters living below the poverty line in which
a provision of 30 per cent for poor women and 3 per cent
for disabled poor is made whereas the percentage
reservation for SCs and STs is as per their population in
local population.
USEP in Delhi has three parts viz.:
a) Assistance to the urban poor beneficiaries for
setting up gainful self-employment like auto
servicing, petty business and manufacturing;
b) Assistance to group of urban poor for setting up
gainful self employment ventures, also called the
Development of Women and Children in Urban
Areas (DWCUA) and,
c) Training of beneficiaries/potential beneficiaries
and other persons associated with the Urban
Employment Programme for updating/acquisition
of vocational and entrepreneurial skills. Persons
educated only upto class IX are considered under
this programme.
Under DWCUA, a group society consisting of at least
10 urban women, is entitled to a subsidy of Rs.1.25 lakh
or 50 per cent the cost of the project, whichever is less,
for thrift entrepreneurial activities. Appropriate training
for upgrading/acquiring vocational and entrepreneurial
skills of the beneficiaries is also part of this programme.
The unit cost allowed for training is Rs.2000 per trainee
and the training period varies from two to six months,
subject to a maximum of 300 hours. During 2006-07, 475
beneficiaries were given training under DWCUA Scheme.
Two DWCUA groups and three Thrift and Credit
Societies were formed during 2006-07.
(vii) Loans in Collaboration with Banks/NSFDC:
The main objective of this centrally sponsored scheme
is all-round economic uplift and development of SC/STs
population living below the poverty line by providing
them loan and subsidy. It has several components:
Training for self-employment of SC/STs includes
training in computers as well as other trades for all those
educated upto class XII. This scheme proved successful
and productive in creating employment opportunities to
SC/ST youths. A new dimension has been included in the
training to upgrade the skills and tradition of shoe
artisans i.e., computerised Footwear Designing.
Loans and subsidy are being provided to the better off
sections of SC & ST youths of Delhi to purchase light
commercial vehicles to help them become self-employed.
Similarly, provision has been made for purchasing CNG
three-wheelers/scooters.
Under the Centrally sponsored programme to liberate
and rehabilitate the scavengers and their dependents from
their existing hereditary obnoxious and inhumane
occupation and engage them in alternative dignified
occupations, the scheme is being implemented by
DSCFDC and the 10th Plan target proposed is to benefit
600 scavengers, mostly through financial assistance but
some also through training.
During first year of 11th Plan i.e., 2007-08, Rs.900 lakh
has been earmarked for financial assistance to SC/ST/
OBC/Minority/Safai Karamchari/Handicapped for self-
employment training through DSCFDC.
b) Wage Employment Programme
Urban Development Department of the GOI had
started an Urban Wage Employment Programme to
provide wage employment to beneficiaries living below
the poverty line by utilising their labour for construction
of socially and economically useful public assets. This
programme applies to such urban local bodies whose
population is less than 5 lakh and is not applicable to
Delhi.
The cosmopolitan character of Delhi has put it into a
unique situation where orthodox wage employment
programmes do not work. Moreover, ample scope for
regular or part-time employment is available in Delhi in
almost all sectors. It does not mean that the aspiration for
regular jobs is irrelevant—rather aspirations for white
collar jobs are rising continuously, which are very difficult
to meet by any Government.
12.6.3 Expenditure on Rural Development Programme
In the 10th Five Year Plan (2002-2007), the following
action plan was proposed by the NCTD and approved by
the Planning Commission:
1. Optimum utilisation of assets already created in
rural villages in the form of multi-purpose
community centre.
2. Construction of a network of approach road/link
road to facilitate better movement of people of
rural areas and transportation of goods and
services in rural areas.
3. Prioritisation of development work of growth
centres/points in already identified areas.
4. Expeditious acquisition of land for growth centers
at Alipur and Chhawala.
DELHI DEVELOPMENT REPORT334
5. Development of ponds in rural areas with a view
to provide better civic and hygienic conditions.
In the 9th Five Year Plan the acquisition of land for
several growth centers was completed and land handed
over to the implementing agency. Similarly, financial
provisions were made for the construction of Bawana
Sports Complex, many Multi purpose community centers
and development of Trunk infrastructure.
During first year of 11th Five Year Plan, i.e., the year
2007-2008, a provision of Rs.250 lakh was made for
implementing the Mini-master plan. Further, provision of
Rs.4750 lakh has been made for the integrated
development of rural villages. This scheme mainly covered
the construction of link roads, approach roads,
developments of cremation grounds and some other basic
amenities. Another provision of Rs.500 lakh has been
made for the protection of Gaon Sabha facilities and
infrastructure relating to Panchayati Raj institutions,
including construction and repair of chaupals, panchayat
ghars, wells, phirni/inner roads, drainage, street lights,
ponds and other essential public utilities. An outlay of
Rs.7500 lakh has been made for developmental work
within rural villages for making katcha roads pucca and
metalling them with pavements. The metalled and
premixed roads in certain cases require to be raised
further due to high berms and high plinth level of the
houses constructed later on. Many small drains are to be
made bigger. Some phirnies requires to be strengthened.
Since sewerage system is not available in villages, it is
proposed to construct Sulabh shouchalayas in about 50 per
cent of the villages in the first phase so as to make the
village environment healthier.
A noteworthy provision of Rs.7500 lakh has been
made for rural roads in the Annual Plan 2007-2008,
including improvement and widening of rural roads.
Another provision of Rs.10 lakh has been made for safe
energy (through DEDA) in rural areas—the main
objective of the Integrated Rural Energy Programme being
to meet cooking and lighting needs of the villages.
TABLE 12.16
Outlays in the 10th Five Year Plan andAnnual Plan 2007–2008 of Select Employment
Oriented Programmes
(in Rs. Lakh)
S.No Programmes on 10th Annual PlanRural Development Five Year Plan 2007–2008
1. The Mini Master Plan 5000.0 250.0
2. Integrated Development ofRural Villages (IDRV) 11000.0 4750.0
3. Strengthening and modernisationof the Panchayat Unit andits function. 4000.0 500.0
4. Rural Roads 26000.0 7500.0
5. Consolidation of land Holdings 25.0 5.0
6. Grant-in-Aid to DEDA 100.0 10.0
7. Others 200.0 120.0
Source: Annual Plan 2007-08 (Volume-I) Govt. of NCTD, 2007.
References
Directorate of Economics & Statistics, NCTD (2002). Employment andUnemployment Situation in Delhi.
———. (2007). Employment and Unemployment Situation in Delhi.
Institute of Applied Manpower Research, Delhi (2001). Impact Assessment ofRural Development Programmes in Baharaich District of Uttar Pradesh.
———. (2002). Manpower Profile.
———. (2005). Manpower Profile.
Govt. of India (2003). Annual Report 2002-2003, Ministry of Labour, New Delhi.
———. (1990). Survey on Activity Status of Jobseekers Registered with theEmployment Exchanges, Ministry of Labour, New Delhi.
———. National Sample Survey Organisation 61st Round (2004-05), “Employmentand Unemployment Situation in India”, New Delhi.
———. National Sample Survey Organisation 61 st Round (1999-2000),“Employment and Unemployment Situation in India”, New Delhi.
This chapter has been prepared by Institute of Applied Manpower Research, team associated with the preparation of the chapter includes Shri M.C. Verma,
Consultant, Smt. Madhu Srivastava, Head (E&U Studies Unit), Shri U.S. Bhandari, SRO, Shri S.K. Yadav, SRO, Shri J.S. Chauhan, RA and Shri Barun Kumar,RA. Study team members were highly benefited from the comments and suggestions of Professor Ajeet Narain Mathur, Director, IAMR in preparation of thechapter.
———. Tenth Five-year Plan (2002-07). New Delhi: Planning Commission.
———. Eleventh Five-year Plan Approach Paper (2007-2012). New Delhi: PlanningCommission.
Govt. of NCTD, Annual Plan 2003-04, Volumes I&II. Planning Department.
———. Annual Plan 2007-08, Volumes I&II. Planning Department.
———. Economic Survey of Delhi, 2005-06, Planning Department.
Craftsmen Training and Employment (2003). Resource Development Centre,New Delhi,
Aggarwal, Garima (2003). “Relocation of Industries in NCR” (Unpublished);Thesis presented for fulfilling Post Graduate Diploma in SPA, New Delhi.
Kumar, Barun (2003). “Political Dialectics of Slums in NCT Delhi”(unpublished), a paper presented in National Association of GeographersIndia in December 28, 2003.
Chapter 13
Science & Technology—IT andBiotechnology
DELHI
13.1 Framework
In the context of development policy, planning and
programmes, it is preferable to categorise Science and
Technology-IT& Biotechnology (S&T-IT & BT) activities
in the National Capital Territory of Delhi (indeed in any
region) under the following three categories, each
category of activity has a distinct purpose and related
policy, planning and implementation mechanism.
Category 1
S&T-IT&BT Education including technical training.
The purpose of this activity is to generate adequately
trained human resource. This is a legitimate S&T activity
but is usually subsumed under education.
Category 2
Research and Development in S&T-IT&BT; the
purpose of this activity is to generate new knowledge.
Knowledge that can potentially feed into a variety of
socio-economy sectors as well as into the education sector
(often this alone is narrowly taken to represent the
totality of S&T)
Category 3
Use of S&T-IT&BT in socio-economic sectors for
example in health and other services and industry. This is
essentially adaptive S&T-IT&BT; this is S&T-IT&BT
activity targeted to immediate applications to enhance the
efficacy and efficiency of services and products or leverage
commercial activity by utilising relevant results of S&T-
IT&BT.
Category 3 activities (adaptive S&T-IT&BT)
undertaken by socio-economic development agencies
contribute directly to development of a region but are
often ignored in accounting for S&T activities.
Each of the three categories of activities is important
for overall development of a region and although the
three are interlinked, the institutional and agency
channels for each are different.
For example, educational and technical agencies have
no mandate of providing products and services or engage
in industrial policy and planning or in R&D (for example
schools or poly-techniques) nor do they have the mandate
of providing health and social services, but they provide
S&T trained human resource that gets utilised by those
engaged in Category 2 and 3 activities.
Similarly agencies in Category 3 have the prime
responsibility for development of industry, trade and
commerce or for providing health, transportation and
other services or engage in governance; they use S&T
without necessarily engaging in teaching and education
and the research carried out by them is essentially for
adaptation of new knowledge. These agencies are quite
competent at understanding and applying S&T-IT&BT.
Such competences are of prime importance and can not be
overlooked in development plans.
The reason for treating R&D as a separate Category
under 2 is because many R&D institutions and agencies
do not engage directly in either education or in socio-
economic activity, but they feed into both.
From the perspective of policy, planning, and
implementation of S&T-IT&BT that can contribute to
socio-economic development, it is critical to strengthen
inter-linkages between the three categories of activities.
13.2 Organisation of S&T Activities
Organisationally and institutionally, activities in all the
three categories are channelled in Delhi through three
types of agencies:
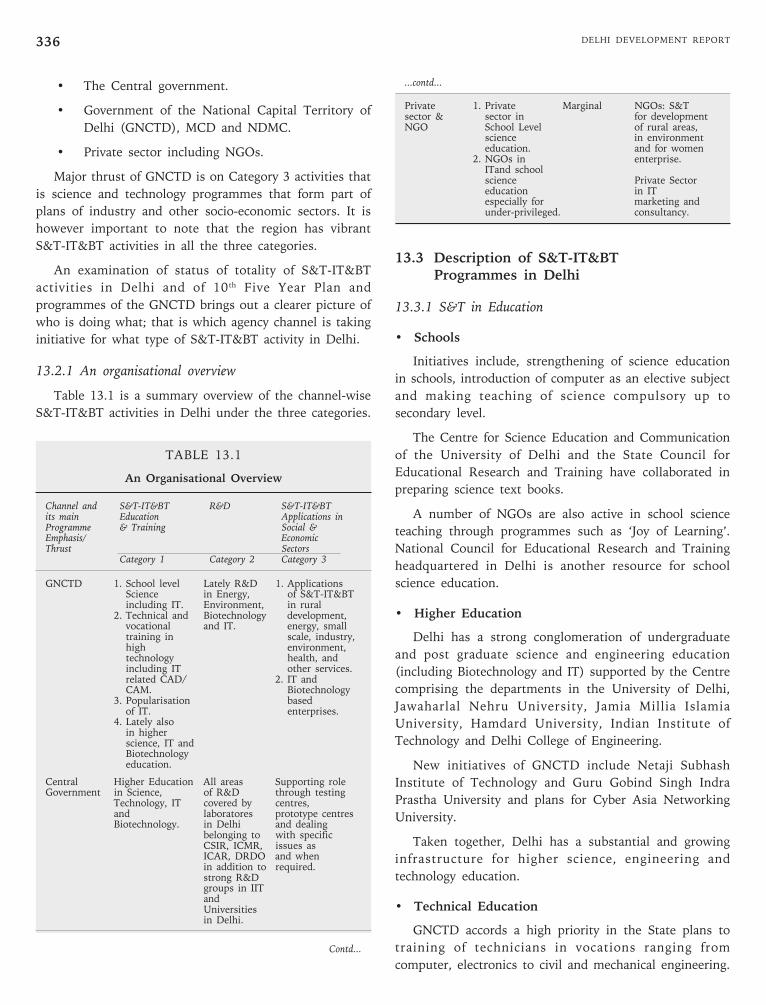
DELHI DEVELOPMENT REPORT336
• The Central government.
• Government of the National Capital Territory of
Delhi (GNCTD), MCD and NDMC.
• Private sector including NGOs.
Major thrust of GNCTD is on Category 3 activities that
is science and technology programmes that form part of
plans of industry and other socio-economic sectors. It is
however important to note that the region has vibrant
S&T-IT&BT activities in all the three categories.
An examination of status of totality of S&T-IT&BT
activities in Delhi and of 10 th Five Year Plan and
programmes of the GNCTD brings out a clearer picture of
who is doing what; that is which agency channel is taking
initiative for what type of S&T-IT&BT activity in Delhi.
13.2.1 An organisational overview
Table 13.1 is a summary overview of the channel-wise
S&T-IT&BT activities in Delhi under the three categories.
TABLE 13.1
An Organisational Overview
Channel and S&T-IT&BT R&D S&T-IT&BTits main Education Applications inProgramme & Training Social &Emphasis/ EconomicThrust Sectors
Category 1 Category 2 Category 3
GNCTD 1. School level Lately R&D 1. ApplicationsScience in Energy, of S&T-IT&BTincluding IT. Environment, in rural
2. Technical and Biotechnology development,vocational and IT. energy, smalltraining in scale, industry,high environment,technology health, andincluding IT other services.related CAD/ 2. IT andCAM. Biotechnology
3. Popularisation basedof IT. enterprises.
4. Lately alsoin higherscience, IT andBiotechnologyeducation.
Central Higher Education All areas Supporting roleGovernment in Science, of R&D through testing
Technology, IT covered by centres,and laboratores prototype centresBiotechnology. in Delhi and dealing
belonging to with specificCSIR, ICMR, issues asICAR, DRDO and whenin addition to required.strong R&Dgroups in IITandUniversitiesin Delhi.
...contd...
Private 1. Private Marginal NGOs: S&Tsector & sector in for developmentNGO School Level of rural areas,
science in environmenteducation. and for women
2. NGOs in enterprise.ITand schoolscience Private Sectoreducation in ITespecially for marketing andunder-privileged. consultancy.
13.3 Description of S&T-IT&BTProgrammes in Delhi
13.3.1 S&T in Education
• Schools
Initiatives include, strengthening of science education
in schools, introduction of computer as an elective subject
and making teaching of science compulsory up to
secondary level.
The Centre for Science Education and Communication
of the University of Delhi and the State Council for
Educational Research and Training have collaborated in
preparing science text books.
A number of NGOs are also active in school science
teaching through programmes such as ‘Joy of Learning’.
National Council for Educational Research and Training
headquartered in Delhi is another resource for school
science education.
• Higher Education
Delhi has a strong conglomeration of undergraduate
and post graduate science and engineering education
(including Biotechnology and IT) supported by the Centre
comprising the departments in the University of Delhi,
Jawaharlal Nehru University, Jamia Millia Islamia
University, Hamdard University, Indian Institute of
Technology and Delhi College of Engineering.
New initiatives of GNCTD include Netaji Subhash
Institute of Technology and Guru Gobind Singh Indra
Prastha University and plans for Cyber Asia Networking
University.
Taken together, Delhi has a substantial and growing
infrastructure for higher science, engineering and
technology education.
• Technical Education
GNCTD accords a high priority in the State plans to
training of technicians in vocations ranging from
computer, electronics to civil and mechanical engineering.
Contd...
Chapter 13 • SCIENCE & TECHNOLOGY—IT AND BIOTECHNOLOGY 337
In addition to Polytechnics, Industrial Training Institutes,
training in Footwear and Garment Technology mention
should be made of High Technology Vocational Training
Centre for reverse engineering and CAD/CAM and the
Centre of Art in Tool Engineering/Computer Aided Tool.
As parts of Delhi are classified as rural, training in
handloom technology, handicrafts, innovative agricultural
technologies, and in the use of non conventional energy
devices also come under the category of technical training
programmes.
13.3.2 Science Popularisation
Nehru Planetarium at Teen Murty and the National
Science Centre, Pragati Maidan are two excellent locations
for popularisation of science, especially amongst children
in addition to Railway Museum.
Periodic events by some NGOs also add to science
popularisation activities. Occasional lectures at the India
International Centre and lectures in halls and conference
venues by eminent scientists also add to this activity,
though catering to a limited audience.
Setting up of a science park is a new initiative of
GNCTD in addition to mass awareness campaigns for
popularising of IT.
13.3.3 Research & Development
The National Laboratories of CSIR (6), Indian
Agricultural Research Institute of Indian Council of
Agricultural Research, Solid State Physics Laboratory of
Defence Research and Development Organisation,
Institute of Immunology of Department of Biotechnology
carry out front line R&D.
Specifically in Information Technology, mention should
be made of IBM Research Centre at IIT and in
Biotechnology of the International Centre for Genetic
Engineering. Strong R&D laboratories in these areas also
exist in Universities and IIT located in Delhi.
R&D initiatives taken by GNCTD include setting up of
Biotechnology R&D Centre, promotion of research in IT,
research in rural energy systems by Mahatma Gandhi
Institute for Integrated Rural Energy Planning and
Development, R&D Centre in Pollution Monitoring and
Setting-up of Remote Sensing and GIS Centre.
13.3.4 S&T-IT&BT in Socio-Economic Sectors
One of the major initiatives by GNCTD is in the
applications and utilisation of IT; computerisation of the
functioning of Gaon Sabha, functioning of all the
departments, Agriculture Market Information Network, IT
in all branches of transport services, modernisation of
MCD, IT in Survey, Statistics and Planning functions.
In terms of IT based industry, High Technology City for
IT and Software Multimedia Park are the two major
initiatives. Strengthening of infrastructure for IT related
industry in the Industrial Estates and Flatted Factory
Complexes is also part of promotion of IT industry in Delhi.
(It is to be noted that in IT, the majority of private
sector in Delhi is essentially to promote the business of
their parent IT industries located outside Delhi).
Biotech Based industrial development is reflected in
the setting up of Biotechnology R&D Centre in
partnership with Industry and in the strengthening of
infrastructure for Biotech industry in the Industrial estates
and in Flatted Factory Complexes.
Other science and technology intensive socio-economic
programmes are:
• Agriculture Plant Protection, Integrated
horticulture and Vegetable development, Seed
Testing Laboratory and Floriculture development
• Programmes for Non-conventional sources of energy
• Development of manufacturing and small scale
industry (for example introduction of computer
aided design and manufacturing)
It is seen that programmes of almost all the sectors of
Delhi development have inbuilt component of S&T in
them, comprehensive understanding of S&T-IT&BT in
Delhi’s development can not emerge by treating Science
and Technology- IT& Biotechnology (S&T-IT & BT) as a
separate sector of development or group of activities.
Financial resources that go into this totality of S&T
have been collated from the different chapters of Plan
documents are given in the next section.
13.4 Financial Resources
13.4.1 S&T &Environment Sector
The Annual Plan 2003-04 of National Capital
Territory of Delhi has a separate chapter on S&T
including Environment with the following budgetary
allocations:
Main Budget 9th FY Plan 9th FY Plan 10th FY PlanHead outlay Expenditure outlay
(Lakh) (Lakh) (Lakh)% of Total % of Total % of TotalPlan Plan Plan
Science 11200.00 1906.74 5500.00Technology & (0.7%) (0.14%) (0.2%)Environment
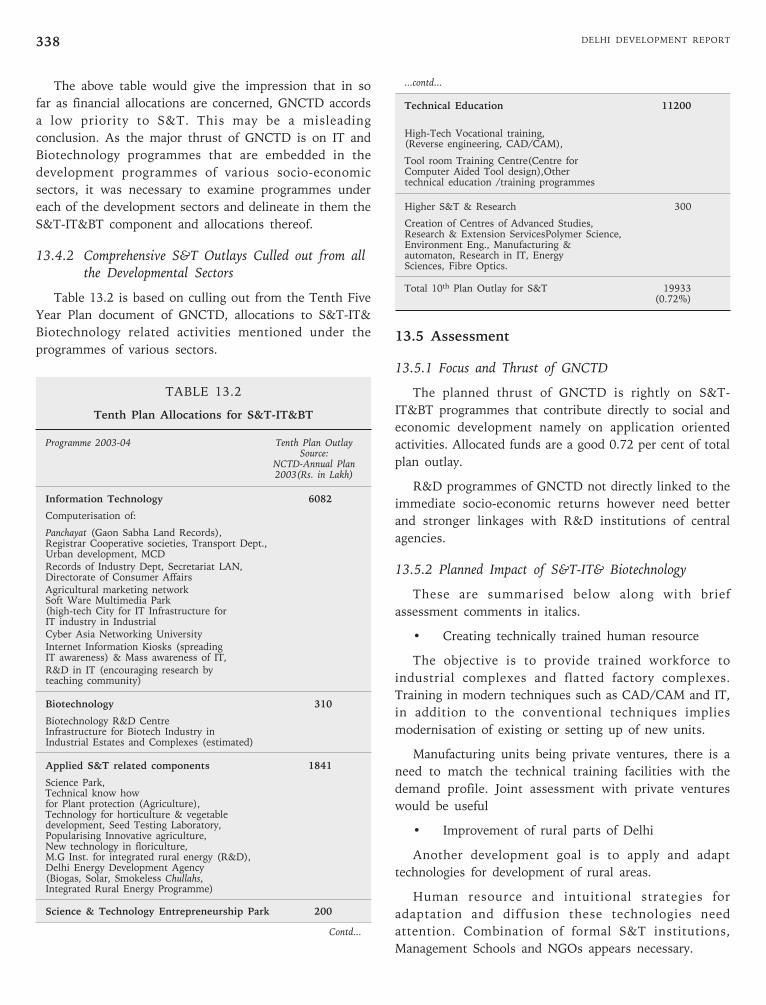
DELHI DEVELOPMENT REPORT338
The above table would give the impression that in so
far as financial allocations are concerned, GNCTD accords
a low priority to S&T. This may be a misleading
conclusion. As the major thrust of GNCTD is on IT and
Biotechnology programmes that are embedded in the
development programmes of various socio-economic
sectors, it was necessary to examine programmes under
each of the development sectors and delineate in them the
S&T-IT&BT component and allocations thereof.
13.4.2 Comprehensive S&T Outlays Culled out from allthe Developmental Sectors
Table 13.2 is based on culling out from the Tenth Five
Year Plan document of GNCTD, allocations to S&T-IT&
Biotechnology related activities mentioned under the
programmes of various sectors.
TABLE 13.2
Tenth Plan Allocations for S&T-IT&BT
Programme 2003-04 Tenth Plan OutlaySource:
NCTD-Annual Plan2003(Rs. in Lakh)
Information Technology 6082
Computerisation of:
Panchayat (Gaon Sabha Land Records),Registrar Cooperative societies, Transport Dept.,Urban development, MCDRecords of Industry Dept, Secretariat LAN,Directorate of Consumer AffairsAgricultural marketing networkSoft Ware Multimedia Park(high-tech City for IT Infrastructure forIT industry in IndustrialCyber Asia Networking UniversityInternet Information Kiosks (spreadingIT awareness) & Mass awareness of IT,R&D in IT (encouraging research byteaching community)
Biotechnology 310
Biotechnology R&D CentreInfrastructure for Biotech Industry inIndustrial Estates and Complexes (estimated)
Applied S&T related components 1841
Science Park,Technical know howfor Plant protection (Agriculture),Technology for horticulture & vegetabledevelopment, Seed Testing Laboratory,Popularising Innovative agriculture,New technology in floriculture,M.G Inst. for integrated rural energy (R&D),Delhi Energy Development Agency(Biogas, Solar, Smokeless Chullahs,Integrated Rural Energy Programme)
Science & Technology Entrepreneurship Park 200
...contd...
Technical Education 11200
High-Tech Vocational training,(Reverse engineering, CAD/CAM),
Tool room Training Centre(Centre forComputer Aided Tool design),Othertechnical education /training programmes
Higher S&T & Research 300
Creation of Centres of Advanced Studies,Research & Extension ServicesPolymer Science,Environment Eng., Manufacturing &automaton, Research in IT, EnergySciences, Fibre Optics.
Total 10th Plan Outlay for S&T 19933(0.72%)
13.5 Assessment
13.5.1 Focus and Thrust of GNCTD
The planned thrust of GNCTD is rightly on S&T-
IT&BT programmes that contribute directly to social and
economic development namely on application oriented
activities. Allocated funds are a good 0.72 per cent of total
plan outlay.
R&D programmes of GNCTD not directly linked to the
immediate socio-economic returns however need better
and stronger linkages with R&D institutions of central
agencies.
13.5.2 Planned Impact of S&T-IT& Biotechnology
These are summarised below along with brief
assessment comments in italics.
• Creating technically trained human resource
The objective is to provide trained workforce to
industrial complexes and flatted factory complexes.
Training in modern techniques such as CAD/CAM and IT,
in addition to the conventional techniques implies
modernisation of existing or setting up of new units.
Manufacturing units being private ventures, there is a
need to match the technical training facilities with the
demand profile. Joint assessment with private ventures
would be useful
• Improvement of rural parts of Delhi
Another development goal is to apply and adapt
technologies for development of rural areas.
Human resource and intuitional strategies for
adaptation and diffusion these technologies need
attention. Combination of formal S&T institutions,
Management Schools and NGOs appears necessary.
Contd...
Chapter 13 • SCIENCE & TECHNOLOGY—IT AND BIOTECHNOLOGY 339
• IT and Biotechnology industrial units
Being highly competitive sectors, market niche of these
units will have to be carefully examined. Government has
to play a proactive role to form consortia of different stake
holders.
• Introduction of IT in schools.
Extensive programme of providing hardware and soft
ware is being taken up.
Maintenance and upgradation of the systems need
attention. Often procurement of hard ware and software
programmes and setting-up of web sites receive attention
but in the absence of a well thought out plan and strategy
for the updating of content and for the utilisation of
network, returns on investments are not realised.
• E-Governance
Computerisation of government records and hosting
the information on websites is an extensive programme.
While outsourcing of jobs by line departments
facilitates creation of distributed data bases, their
coordination for single window delivery to citizens
requires a strong core unit within the government.
From the citizen’s point of view, convenient access to
Kiosks by public and the user-friendlyness of these sites
needs continued assessment for feed back and
improvement. In addition, model strategies need to be in
place for the continued financial sustainability of ‘kiosks’.
13.6 Suggested Vision and Initiatives
13.6.1 Delhi as IT Integrated Region :Technology Mission Approach
Technology Missions are planned and implemented as
end to end programmes from R&D to actual delivery to
achieve a desired development goal
A Technology Mission towards making Delhi an IT
Integrated Region could start by integrating several IT
supported services at present being planned and executed
as separate programmes by individual agencies into a
single major mission.
Difficulties in inter-departmental/agency coordination
are often cited as a major hurdle in planning and
execution of integrated programmes.
The experience of Technology Missions at National
Level however confirms that once a major target is
commonly shared between different agencies, coordination
and integration problems get resolved.
Following example illustrates the point:
Goal is to set up an integrated computerised transport
system for the region
This would mean integration of several components like
registration of vehicles, testing and issue of driving licence,
movement of vehicles, traffic control, ticketing and other
passenger services into one major programme. Experience
of using IT effectively in each and every component is
available in the country, budgetary allocations are also
available; these individual elements can be converted into a
single Technology Mission programme.
The region has the requisite capability from R&D to
actual delivery; the R&D strength of central institutions,
adaptive capabilities of GNCTD institutions and the
implementation strengths of line departments.
13.5.2 Missions for Rural Areas
Effective Technological interventions specific to the
rural region can be sourced from Central government
and GNCTD R&D and technical institutions. Targeted
and integrated region specific intervention Plans are
required.
Competent private and government aided management
and business schools as also NGOs in Delhi are assets that
can be utilised to implement these interventions. Business
and management schools located in and around rural areas
can become effective intuitional nodal points for integrated
planning and managing the execution of S&T interventions
in neighbourhood rural area jointly with concerned
departments/agencies of GNCTD. Sustained and
accountable NGO input can then be obtained by attaching
NGOs to a local established institution for the purpose of
specific Mission programmes.

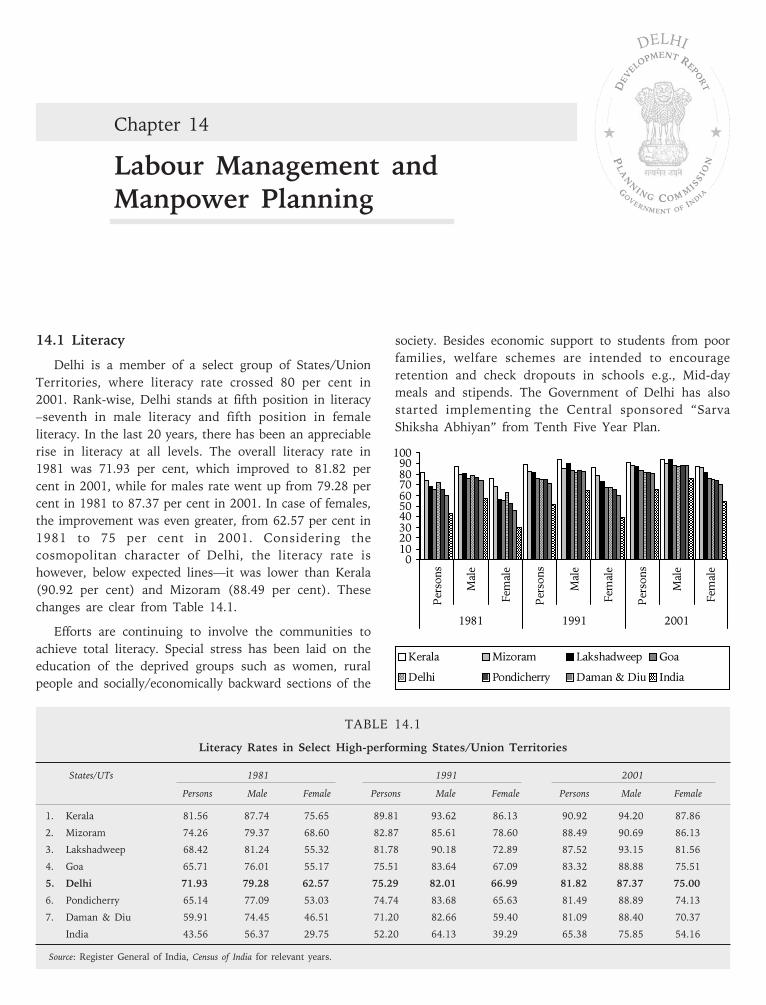
TABLE 14.1
Literacy Rates in Select High-performing States/Union Territories
States/UTs 1981 1991 2001
Persons Male Female Persons Male Female Persons Male Female
1. Kerala 81.56 87.74 75.65 89.81 93.62 86.13 90.92 94.20 87.86
2. Mizoram 74.26 79.37 68.60 82.87 85.61 78.60 88.49 90.69 86.13
3. Lakshadweep 68.42 81.24 55.32 81.78 90.18 72.89 87.52 93.15 81.56
4. Goa 65.71 76.01 55.17 75.51 83.64 67.09 83.32 88.88 75.51
5. Delhi 71.93 79.28 62.57 75.29 82.01 66.99 81.82 87.37 75.00
6. Pondicherry 65.14 77.09 53.03 74.74 83.68 65.63 81.49 88.89 74.13
7. Daman & Diu 59.91 74.45 46.51 71.20 82.66 59.40 81.09 88.40 70.37
India 43.56 56.37 29.75 52.20 64.13 39.29 65.38 75.85 54.16
Source: Register General of India, Census of India for relevant years.
Chapter 14
Labour Management andManpower Planning
DELHI
14.1 Literacy
Delhi is a member of a select group of States/Union
Territories, where literacy rate crossed 80 per cent in
2001. Rank-wise, Delhi stands at fifth position in literacy
–seventh in male literacy and fifth position in female
literacy. In the last 20 years, there has been an appreciable
rise in literacy at all levels. The overall literacy rate in
1981 was 71.93 per cent, which improved to 81.82 per
cent in 2001, while for males rate went up from 79.28 per
cent in 1981 to 87.37 per cent in 2001. In case of females,
the improvement was even greater, from 62.57 per cent in
1981 to 75 per cent in 2001. Considering the
cosmopolitan character of Delhi, the literacy rate is
however, below expected lines—it was lower than Kerala
(90.92 per cent) and Mizoram (88.49 per cent). These
changes are clear from Table 14.1.
Efforts are continuing to involve the communities to
achieve total literacy. Special stress has been laid on the
education of the deprived groups such as women, rural
people and socially/economically backward sections of the
society. Besides economic support to students from poor
families, welfare schemes are intended to encourage
retention and check dropouts in schools e.g., Mid-day
meals and stipends. The Government of Delhi has also
started implementing the Central sponsored “Sarva
Shiksha Abhiyan” from Tenth Five Year Plan.
0102030405060708090
100
Persons
Male
Female
Persons
Male
Female
Persons
Male
Female
1981 1991 2001
Kerala Mizoram Lakshadweep Goa
Delhi Pondicherry Daman & Diu India
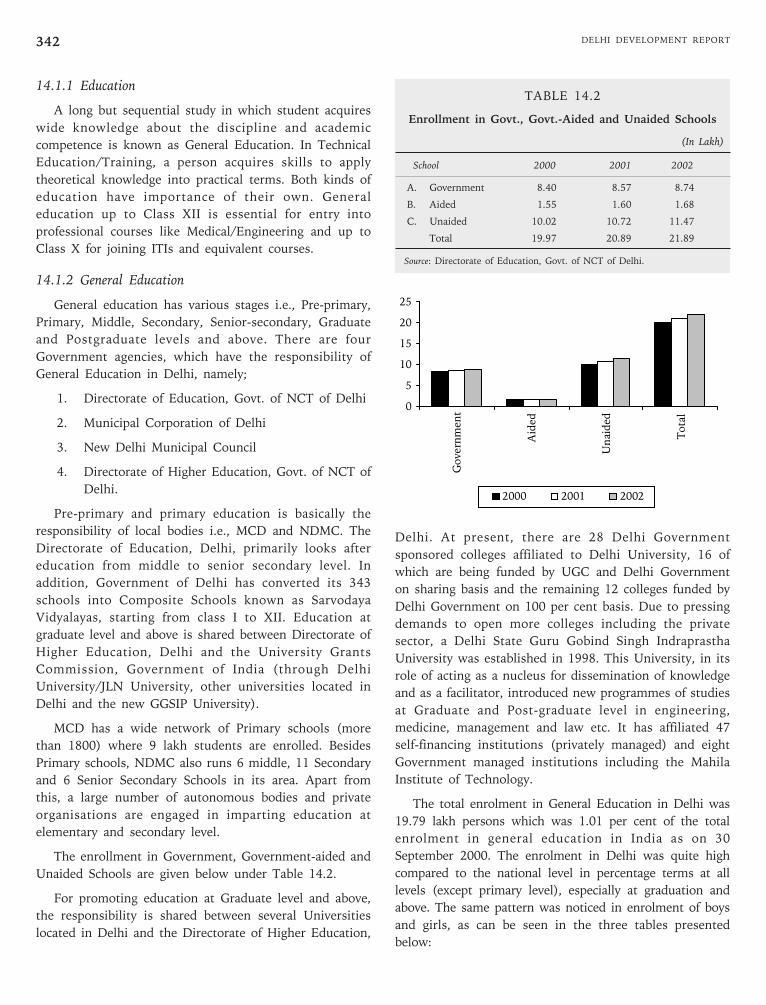
DELHI DEVELOPMENT REPORT342
14.1.1 Education
A long but sequential study in which student acquires
wide knowledge about the discipline and academic
competence is known as General Education. In Technical
Education/Training, a person acquires skills to apply
theoretical knowledge into practical terms. Both kinds of
education have importance of their own. General
education up to Class XII is essential for entry into
professional courses like Medical/Engineering and up to
Class X for joining ITIs and equivalent courses.
14.1.2 General Education
General education has various stages i.e., Pre-primary,
Primary, Middle, Secondary, Senior-secondary, Graduate
and Postgraduate levels and above. There are four
Government agencies, which have the responsibility of
General Education in Delhi, namely;
1. Directorate of Education, Govt. of NCT of Delhi
2. Municipal Corporation of Delhi
3. New Delhi Municipal Council
4. Directorate of Higher Education, Govt. of NCT of
Delhi.
Pre-primary and primary education is basically the
responsibility of local bodies i.e., MCD and NDMC. The
Directorate of Education, Delhi, primarily looks after
education from middle to senior secondary level. In
addition, Government of Delhi has converted its 343
schools into Composite Schools known as Sarvodaya
Vidyalayas, starting from class I to XII. Education at
graduate level and above is shared between Directorate of
Higher Education, Delhi and the University Grants
Commission, Government of India (through Delhi
University/JLN University, other universities located in
Delhi and the new GGSIP University).
MCD has a wide network of Primary schools (more
than 1800) where 9 lakh students are enrolled. Besides
Primary schools, NDMC also runs 6 middle, 11 Secondary
and 6 Senior Secondary Schools in its area. Apart from
this, a large number of autonomous bodies and private
organisations are engaged in imparting education at
elementary and secondary level.
The enrollment in Government, Government-aided and
Unaided Schools are given below under Table 14.2.
For promoting education at Graduate level and above,
the responsibility is shared between several Universities
located in Delhi and the Directorate of Higher Education,
Delhi. At present, there are 28 Delhi Government
sponsored colleges affiliated to Delhi University, 16 of
which are being funded by UGC and Delhi Government
on sharing basis and the remaining 12 colleges funded by
Delhi Government on 100 per cent basis. Due to pressing
demands to open more colleges including the private
sector, a Delhi State Guru Gobind Singh Indraprastha
University was established in 1998. This University, in its
role of acting as a nucleus for dissemination of knowledge
and as a facilitator, introduced new programmes of studies
at Graduate and Post-graduate level in engineering,
medicine, management and law etc. It has affiliated 47
self-financing institutions (privately managed) and eight
Government managed institutions including the Mahila
Institute of Technology.
The total enrolment in General Education in Delhi was
19.79 lakh persons which was 1.01 per cent of the total
enrolment in general education in India as on 30
September 2000. The enrolment in Delhi was quite high
compared to the national level in percentage terms at all
levels (except primary level), especially at graduation and
above. The same pattern was noticed in enrolment of boys
and girls, as can be seen in the three tables presented
below:
0
5
10
15
20
25
Government
Aided
Unaided
Total
2000 2001 2002
TABLE 14.2
Enrollment in Govt., Govt.-Aided and Unaided Schools
(In Lakh)
School 2000 2001 2002
A. Government 8.40 8.57 8.74
B. Aided 1.55 1.60 1.68
C. Unaided 10.02 10.72 11.47
Total 19.97 20.89 21.89
Source: Directorate of Education, Govt. of NCT of Delhi.
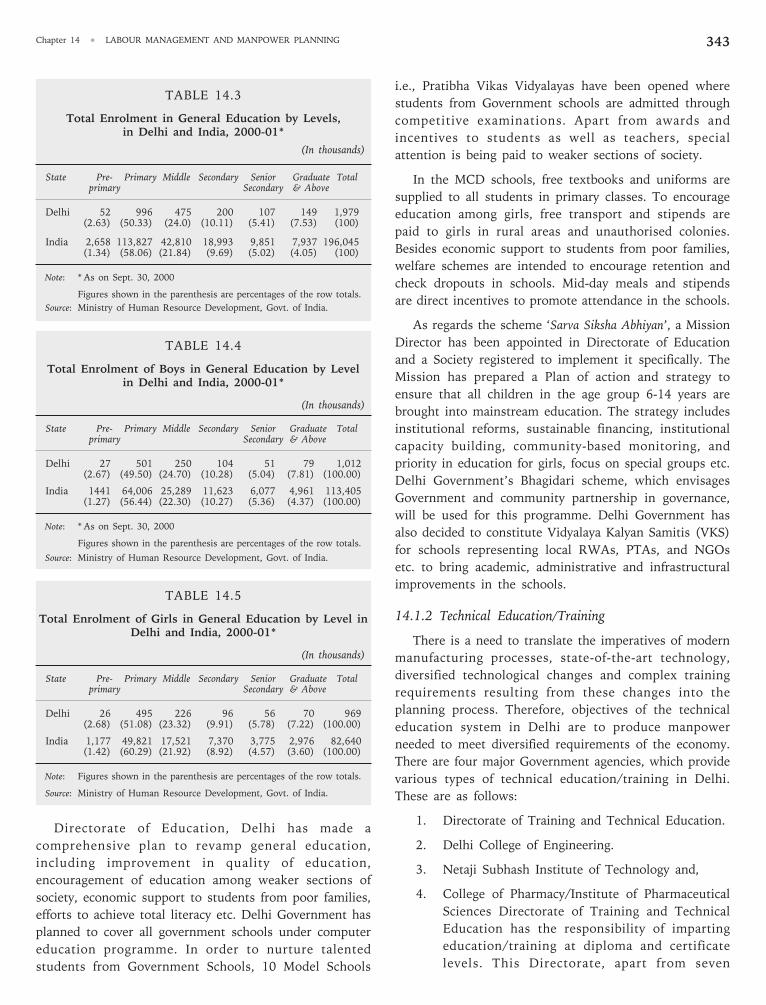
Chapter 14 • LABOUR MANAGEMENT AND MANPOWER PLANNING 343
TABLE 14.3
Total Enrolment in General Education by Levels,in Delhi and India, 2000-01*
(In thousands)
State Pre- Primary Middle Secondary Senior Graduate Totalprimary Secondary & Above
Delhi 52 996 475 200 107 149 1,979(2.63) (50.33) (24.0) (10.11) (5.41) (7.53) (100)
India 2,658 113,827 42,810 18,993 9,851 7,937 196,045(1.34) (58.06) (21.84) (9.69) (5.02) (4.05) (100)
Note: * As on Sept. 30, 2000
Figures shown in the parenthesis are percentages of the row totals.
Source: Ministry of Human Resource Development, Govt. of India.
TABLE 14.4
Total Enrolment of Boys in General Education by Levelin Delhi and India, 2000-01*
(In thousands)
State Pre- Primary Middle Secondary Senior Graduate Totalprimary Secondary & Above
Delhi 27 501 250 104 51 79 1,012(2.67) (49.50) (24.70) (10.28) (5.04) (7.81) (100.00)
India 1441 64,006 25,289 11,623 6,077 4,961 113,405(1.27) (56.44) (22.30) (10.27) (5.36) (4.37) (100.00)
Note: * As on Sept. 30, 2000
Figures shown in the parenthesis are percentages of the row totals.
Source: Ministry of Human Resource Development, Govt. of India.
TABLE 14.5
Total Enrolment of Girls in General Education by Level inDelhi and India, 2000-01*
(In thousands)
State Pre- Primary Middle Secondary Senior Graduate Totalprimary Secondary & Above
Delhi 26 495 226 96 56 70 969(2.68) (51.08) (23.32) (9.91) (5.78) (7.22) (100.00)
India 1,177 49,821 17,521 7,370 3,775 2,976 82,640(1.42) (60.29) (21.92) (8.92) (4.57) (3.60) (100.00)
Note: Figures shown in the parenthesis are percentages of the row totals.
Source: Ministry of Human Resource Development, Govt. of India.
Directorate of Education, Delhi has made a
comprehensive plan to revamp general education,
including improvement in quality of education,
encouragement of education among weaker sections of
society, economic support to students from poor families,
efforts to achieve total literacy etc. Delhi Government has
planned to cover all government schools under computer
education programme. In order to nurture talented
students from Government Schools, 10 Model Schools
i.e., Pratibha Vikas Vidyalayas have been opened where
students from Government schools are admitted through
competitive examinations. Apart from awards and
incentives to students as well as teachers, special
attention is being paid to weaker sections of society.
In the MCD schools, free textbooks and uniforms are
supplied to all students in primary classes. To encourage
education among girls, free transport and stipends are
paid to girls in rural areas and unauthorised colonies.
Besides economic support to students from poor families,
welfare schemes are intended to encourage retention and
check dropouts in schools. Mid-day meals and stipends
are direct incentives to promote attendance in the schools.
As regards the scheme ‘Sarva Siksha Abhiyan’, a Mission
Director has been appointed in Directorate of Education
and a Society registered to implement it specifically. The
Mission has prepared a Plan of action and strategy to
ensure that all children in the age group 6-14 years are
brought into mainstream education. The strategy includes
institutional reforms, sustainable financing, institutional
capacity building, community-based monitoring, and
priority in education for girls, focus on special groups etc.
Delhi Government’s Bhagidari scheme, which envisages
Government and community partnership in governance,
will be used for this programme. Delhi Government has
also decided to constitute Vidyalaya Kalyan Samitis (VKS)
for schools representing local RWAs, PTAs, and NGOs
etc. to bring academic, administrative and infrastructural
improvements in the schools.
14.1.2 Technical Education/Training
There is a need to translate the imperatives of modern
manufacturing processes, state-of-the-art technology,
diversified technological changes and complex training
requirements resulting from these changes into the
planning process. Therefore, objectives of the technical
education system in Delhi are to produce manpower
needed to meet diversified requirements of the economy.
There are four major Government agencies, which provide
various types of technical education/training in Delhi.
These are as follows:
1. Directorate of Training and Technical Education.
2. Delhi College of Engineering.
3. Netaji Subhash Institute of Technology and,
4. College of Pharmacy/Institute of Pharmaceutical
Sciences Directorate of Training and Technical
Education has the responsibility of imparting
education/training at diploma and certificate
levels. This Directorate, apart from seven
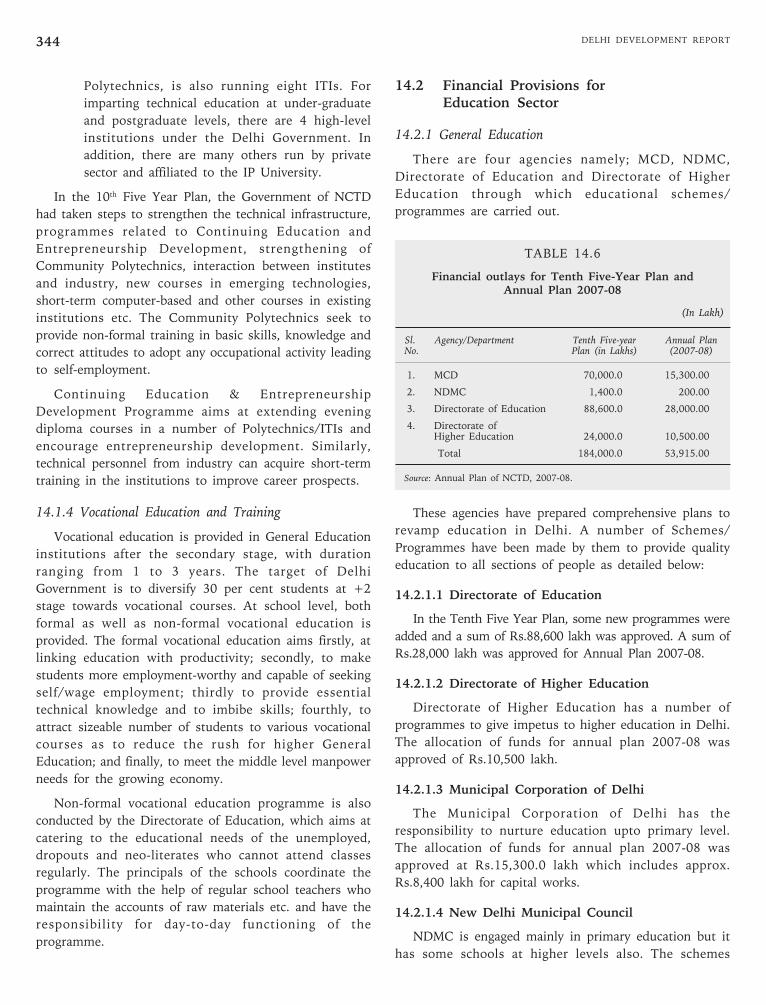
DELHI DEVELOPMENT REPORT344
Polytechnics, is also running eight ITIs. For
imparting technical education at under-graduate
and postgraduate levels, there are 4 high-level
institutions under the Delhi Government. In
addition, there are many others run by private
sector and affiliated to the IP University.
In the 10th Five Year Plan, the Government of NCTD
had taken steps to strengthen the technical infrastructure,
programmes related to Continuing Education and
Entrepreneurship Development, strengthening of
Community Polytechnics, interaction between institutes
and industry, new courses in emerging technologies,
short-term computer-based and other courses in existing
institutions etc. The Community Polytechnics seek to
provide non-formal training in basic skills, knowledge and
correct attitudes to adopt any occupational activity leading
to self-employment.
Continuing Education & Entrepreneurship
Development Programme aims at extending evening
diploma courses in a number of Polytechnics/ITIs and
encourage entrepreneurship development. Similarly,
technical personnel from industry can acquire short-term
training in the institutions to improve career prospects.
14.1.4 Vocational Education and Training
Vocational education is provided in General Education
institutions after the secondary stage, with duration
ranging from 1 to 3 years. The target of Delhi
Government is to diversify 30 per cent students at +2
stage towards vocational courses. At school level, both
formal as well as non-formal vocational education is
provided. The formal vocational education aims firstly, at
linking education with productivity; secondly, to make
students more employment-worthy and capable of seeking
self/wage employment; thirdly to provide essential
technical knowledge and to imbibe skills; fourthly, to
attract sizeable number of students to various vocational
courses as to reduce the rush for higher General
Education; and finally, to meet the middle level manpower
needs for the growing economy.
Non-formal vocational education programme is also
conducted by the Directorate of Education, which aims at
catering to the educational needs of the unemployed,
dropouts and neo-literates who cannot attend classes
regularly. The principals of the schools coordinate the
programme with the help of regular school teachers who
maintain the accounts of raw materials etc. and have the
responsibility for day-to-day functioning of the
programme.
14.2 Financial Provisions forEducation Sector
14.2.1 General Education
There are four agencies namely; MCD, NDMC,
Directorate of Education and Directorate of Higher
Education through which educational schemes/
programmes are carried out.
TABLE 14.6
Financial outlays for Tenth Five-Year Plan andAnnual Plan 2007-08
(In Lakh)
Sl. Agency/Department Tenth Five-year Annual PlanNo. Plan (in Lakhs) (2007-08)
1. MCD 70,000.0 15,300.00
2. NDMC 1,400.0 200.00
3. Directorate of Education 88,600.0 28,000.00
4. Directorate ofHigher Education 24,000.0 10,500.00
Total 184,000.0 53,915.00
Source: Annual Plan of NCTD, 2007-08.
These agencies have prepared comprehensive plans to
revamp education in Delhi. A number of Schemes/
Programmes have been made by them to provide quality
education to all sections of people as detailed below:
14.2.1.1 Directorate of Education
In the Tenth Five Year Plan, some new programmes were
added and a sum of Rs.88,600 lakh was approved. A sum of
Rs.28,000 lakh was approved for Annual Plan 2007-08.
14.2.1.2 Directorate of Higher Education
Directorate of Higher Education has a number of
programmes to give impetus to higher education in Delhi.
The allocation of funds for annual plan 2007-08 was
approved of Rs.10,500 lakh.
14.2.1.3 Municipal Corporation of Delhi
The Municipal Corporation of Delhi has the
responsibility to nurture education upto primary level.
The allocation of funds for annual plan 2007-08 was
approved at Rs.15,300.0 lakh which includes approx.
Rs.8,400 lakh for capital works.
14.2.1.4 New Delhi Municipal Council
NDMC is engaged mainly in primary education but it
has some schools at higher levels also. The schemes
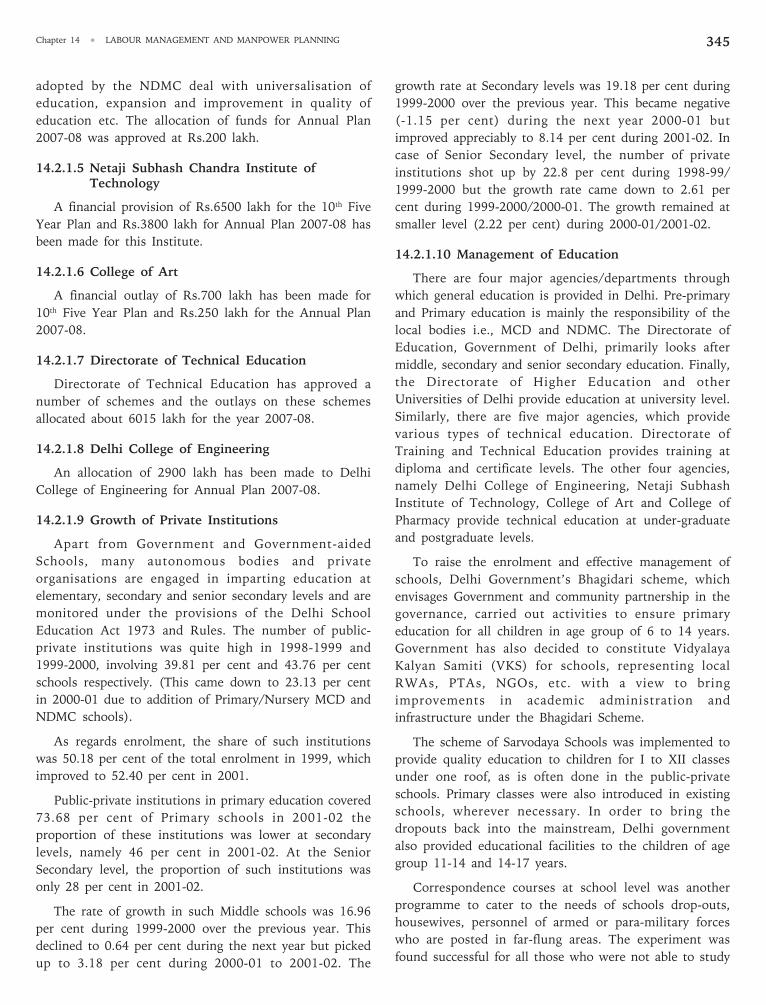
Chapter 14 • LABOUR MANAGEMENT AND MANPOWER PLANNING 345
adopted by the NDMC deal with universalisation of
education, expansion and improvement in quality of
education etc. The allocation of funds for Annual Plan
2007-08 was approved at Rs.200 lakh.
14.2.1.5 Netaji Subhash Chandra Institute ofTechnology
A financial provision of Rs.6500 lakh for the 10th Five
Year Plan and Rs.3800 lakh for Annual Plan 2007-08 has
been made for this Institute.
14.2.1.6 College of Art
A financial outlay of Rs.700 lakh has been made for
10th Five Year Plan and Rs.250 lakh for the Annual Plan
2007-08.
14.2.1.7 Directorate of Technical Education
Directorate of Technical Education has approved a
number of schemes and the outlays on these schemes
allocated about 6015 lakh for the year 2007-08.
14.2.1.8 Delhi College of Engineering
An allocation of 2900 lakh has been made to Delhi
College of Engineering for Annual Plan 2007-08.
14.2.1.9 Growth of Private Institutions
Apart from Government and Government-aided
Schools, many autonomous bodies and private
organisations are engaged in imparting education at
elementary, secondary and senior secondary levels and are
monitored under the provisions of the Delhi School
Education Act 1973 and Rules. The number of public-
private institutions was quite high in 1998-1999 and
1999-2000, involving 39.81 per cent and 43.76 per cent
schools respectively. (This came down to 23.13 per cent
in 2000-01 due to addition of Primary/Nursery MCD and
NDMC schools).
As regards enrolment, the share of such institutions
was 50.18 per cent of the total enrolment in 1999, which
improved to 52.40 per cent in 2001.
Public-private institutions in primary education covered
73.68 per cent of Primary schools in 2001-02 the
proportion of these institutions was lower at secondary
levels, namely 46 per cent in 2001-02. At the Senior
Secondary level, the proportion of such institutions was
only 28 per cent in 2001-02.
The rate of growth in such Middle schools was 16.96
per cent during 1999-2000 over the previous year. This
declined to 0.64 per cent during the next year but picked
up to 3.18 per cent during 2000-01 to 2001-02. The
growth rate at Secondary levels was 19.18 per cent during
1999-2000 over the previous year. This became negative
(-1.15 per cent) during the next year 2000-01 but
improved appreciably to 8.14 per cent during 2001-02. In
case of Senior Secondary level, the number of private
institutions shot up by 22.8 per cent during 1998-99/
1999-2000 but the growth rate came down to 2.61 per
cent during 1999-2000/2000-01. The growth remained at
smaller level (2.22 per cent) during 2000-01/2001-02.
14.2.1.10 Management of Education
There are four major agencies/departments through
which general education is provided in Delhi. Pre-primary
and Primary education is mainly the responsibility of the
local bodies i.e., MCD and NDMC. The Directorate of
Education, Government of Delhi, primarily looks after
middle, secondary and senior secondary education. Finally,
the Directorate of Higher Education and other
Universities of Delhi provide education at university level.
Similarly, there are five major agencies, which provide
various types of technical education. Directorate of
Training and Technical Education provides training at
diploma and certificate levels. The other four agencies,
namely Delhi College of Engineering, Netaji Subhash
Institute of Technology, College of Art and College of
Pharmacy provide technical education at under-graduate
and postgraduate levels.
To raise the enrolment and effective management of
schools, Delhi Government’s Bhagidari scheme, which
envisages Government and community partnership in the
governance, carried out activities to ensure primary
education for all children in age group of 6 to 14 years.
Government has also decided to constitute Vidyalaya
Kalyan Samiti (VKS) for schools, representing local
RWAs, PTAs, NGOs, etc. with a view to bring
improvements in academic administration and
infrastructure under the Bhagidari Scheme.
The scheme of Sarvodaya Schools was implemented to
provide quality education to children for I to XII classes
under one roof, as is often done in the public-private
schools. Primary classes were also introduced in existing
schools, wherever necessary. In order to bring the
dropouts back into the mainstream, Delhi government
also provided educational facilities to the children of age
group 11-14 and 14-17 years.
Correspondence courses at school level was another
programme to cater to the needs of schools drop-outs,
housewives, personnel of armed or para-military forces
who are posted in far-flung areas. The experiment was
found successful for all those who were not able to study
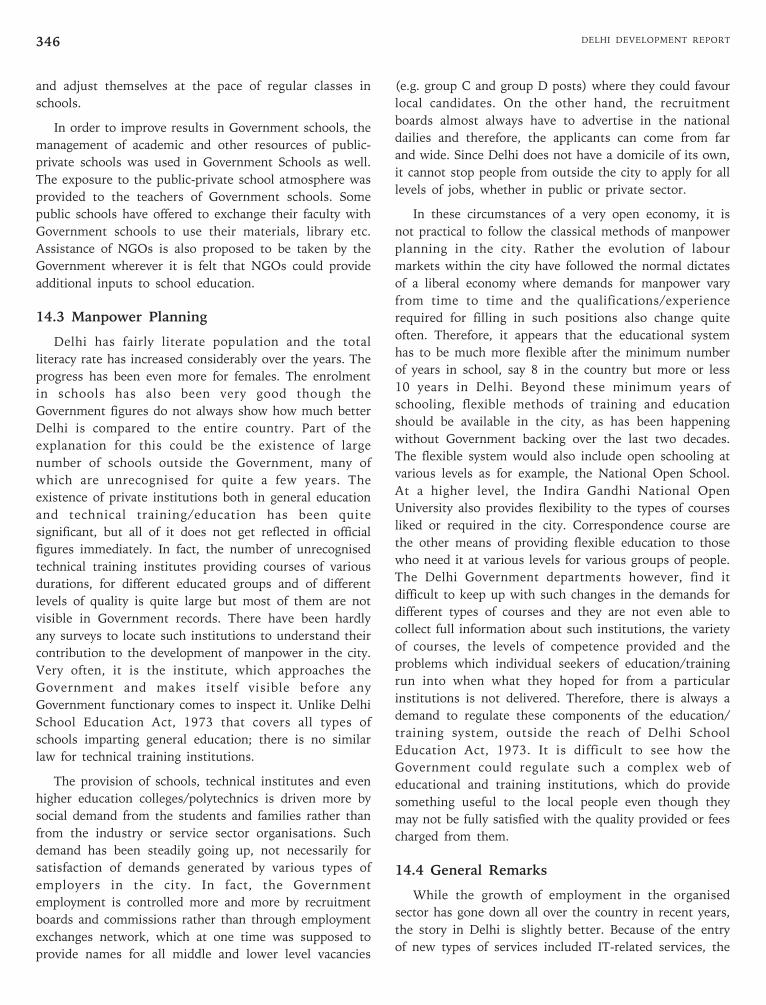
DELHI DEVELOPMENT REPORT346
and adjust themselves at the pace of regular classes in
schools.
In order to improve results in Government schools, the
management of academic and other resources of public-
private schools was used in Government Schools as well.
The exposure to the public-private school atmosphere was
provided to the teachers of Government schools. Some
public schools have offered to exchange their faculty with
Government schools to use their materials, library etc.
Assistance of NGOs is also proposed to be taken by the
Government wherever it is felt that NGOs could provide
additional inputs to school education.
14.3 Manpower Planning
Delhi has fairly literate population and the total
literacy rate has increased considerably over the years. The
progress has been even more for females. The enrolment
in schools has also been very good though the
Government figures do not always show how much better
Delhi is compared to the entire country. Part of the
explanation for this could be the existence of large
number of schools outside the Government, many of
which are unrecognised for quite a few years. The
existence of private institutions both in general education
and technical training/education has been quite
significant, but all of it does not get reflected in official
figures immediately. In fact, the number of unrecognised
technical training institutes providing courses of various
durations, for different educated groups and of different
levels of quality is quite large but most of them are not
visible in Government records. There have been hardly
any surveys to locate such institutions to understand their
contribution to the development of manpower in the city.
Very often, it is the institute, which approaches the
Government and makes itself visible before any
Government functionary comes to inspect it. Unlike Delhi
School Education Act, 1973 that covers all types of
schools imparting general education; there is no similar
law for technical training institutions.
The provision of schools, technical institutes and even
higher education colleges/polytechnics is driven more by
social demand from the students and families rather than
from the industry or service sector organisations. Such
demand has been steadily going up, not necessarily for
satisfaction of demands generated by various types of
employers in the city. In fact, the Government
employment is controlled more and more by recruitment
boards and commissions rather than through employment
exchanges network, which at one time was supposed to
provide names for all middle and lower level vacancies
(e.g. group C and group D posts) where they could favour
local candidates. On the other hand, the recruitment
boards almost always have to advertise in the national
dailies and therefore, the applicants can come from far
and wide. Since Delhi does not have a domicile of its own,
it cannot stop people from outside the city to apply for all
levels of jobs, whether in public or private sector.
In these circumstances of a very open economy, it is
not practical to follow the classical methods of manpower
planning in the city. Rather the evolution of labour
markets within the city have followed the normal dictates
of a liberal economy where demands for manpower vary
from time to time and the qualifications/experience
required for filling in such positions also change quite
often. Therefore, it appears that the educational system
has to be much more flexible after the minimum number
of years in school, say 8 in the country but more or less
10 years in Delhi. Beyond these minimum years of
schooling, flexible methods of training and education
should be available in the city, as has been happening
without Government backing over the last two decades.
The flexible system would also include open schooling at
various levels as for example, the National Open School.
At a higher level, the Indira Gandhi National Open
University also provides flexibility to the types of courses
liked or required in the city. Correspondence course are
the other means of providing flexible education to those
who need it at various levels for various groups of people.
The Delhi Government departments however, find it
difficult to keep up with such changes in the demands for
different types of courses and they are not even able to
collect full information about such institutions, the variety
of courses, the levels of competence provided and the
problems which individual seekers of education/training
run into when what they hoped for from a particular
institutions is not delivered. Therefore, there is always a
demand to regulate these components of the education/
training system, outside the reach of Delhi School
Education Act, 1973. It is difficult to see how the
Government could regulate such a complex web of
educational and training institutions, which do provide
something useful to the local people even though they
may not be fully satisfied with the quality provided or fees
charged from them.
14.4 General Remarks
While the growth of employment in the organised
sector has gone down all over the country in recent years,
the story in Delhi is slightly better. Because of the entry
of new types of services included IT-related services, the
Chapter 14 • LABOUR MANAGEMENT AND MANPOWER PLANNING 347
job opportunities have continued to grow in Delhi side by
side with rise in the rates of unemployment of several
age-sex-educational categories. The explanation for this
discrepancy lies in the fact of continued in-migration into
Delhi with migrants having practically all levels of
education. In fact, it can be stated without any
contradiction that more and more educated persons from
relatively less developed states of Uttar Pradesh, Bihar,
Jharkhand, Madhya Pradesh, Rajhasthan, Chhattisgarh,
and Uttaranchal look forward to getting a job in Delhi. It
is also true that due to changes in the employee
complexion due to influx of people of neighbouring
States, it has also changed the character of various
occupations in Delhi and perhaps increased their skill or
technology contents. Unfortunately, no hard data on these
matters is readily available but it is likely that individual
researchers have done research on related issues in
limited areas. A lot of changes are visible even to the
naked eye and the same have been confirmed in
discussions with senior officers of various departments,
especially those of labour and employment.
Since Delhi’s economy is becoming more and more
service oriented and since unionisation is traditionally low
in the services sub-sectors, especially the high-end
modern services, it has also been noticed that there are
not many demonstrations of discontent among
employees in Delhi. The latest one-day strike of
employees of public sector banking and insurance
companies had little to do with the conditions in Delhi
and practically everything to do with points of ideology
or policy at the national level. In any case, there has
been a shift out of large number of older industries;
especially textiles and many of them have been closed
for good. A recent study by Ms. Garima Aggarwal on the
impact of the Industrial Relocation in NCR on the
workers so displaced gives a range of figures about
closure of major industries and makes an assessment of
about one lakh workers displaced in the period 1996
onwards. It also gives a figure of about 7,000 units/
industries closed during the same period due to relocation
of industries as a result of intervention of higher Courts.
The study in fact, goes on to paint a grim picture for the
future by indicating that workers likely to be displaced by
relocation of industries could amount to as much as 10
lakh. However, not much supporting data is available
from discussions or observations to validate this large
figure of 10 lakh workers. It is also to be noted that
despite the loss of jobs by about one lakh workers over
the last 7 years or so, there has not been much of
discontent, strikes and violent demonstrations in Delhi.
Perhaps, the main reason for this lies in the fact that most
of such workers belong to other states in the country and
their incompetence to formally plant their roots in Delhi.
It is well known that most of the casual workers in
Delhi Small Scale Industries are still “outsiders” and
therefore, they are under pressure to return to their places
of origin in the neighbouring states in case a downturn
occurs in industry. Even otherwise, there has been a
general decline in labour militancy and workers are more
worried about losing employment rather than to fight for
increase in remuneration or better working conditions
through the trade unions. Since the new jobs in the ‘sun-
rise’ industries are hardly unionised and since area level
concentrations of workers are not required in the new
industries or services, trade unions are not able to
organise workers in the same way as in the past. The low
level of discontent among Delhi labour, including regular
employees is, therefore, not much of surprise.
One of the significant features of Delhi’s economy is
rather high rate of unemployment of the educated (10+),
most of whom are now residents of the city even though
no domicile policy can be prepared for the National
Capital. It is difficult to say, however, what percentage of
the educated unemployed are from areas outside Delhi. In
the absence of a formal domicile policy, it is perhaps,
possible to use the location of the schools from which a
person passed out as proxy variable. A study of this kind
(unpublished) was conducted for the Government of
NCTD in the year 2000-01 to find out the proportion of
people in the Employment exchange registers who had
passed out from non-Delhi schools. This study was made
in the context of preparation of a new scheme for
promoting self-employment to the educated unemployed
youth. It was to be an improvement over the PMRY but
has not yet seen the light of the day.
According to the study, the proportion of educated job-
seekers from outside Delhi’s school in the year 1999-2000
was as high as 50 per cent. Therefore, taking a parochial
view of Delhi’s problem, it is possible to reduce the rates
of unemployment of the educated youth in Delhi by
somewhere around 50 per cent. Even so, the fact remains
that Delhi being a highly educated city, the unemployed
persons of Delhi are most likely to have been educated
upto Class X and therefore, would still have to suffer
relatively high rate of unemployment.
The Delhi Government has a department devoted to
the problems of employment and manpower planning but
even in the 10th Five Year Plan no exercise was done to
work out balances of manpower in different categories,
especially high and middle level manpower categories. It
is unlikely that any outsider agency can do this kind of
DELHI DEVELOPMENT REPORT348
exercise of developing balances say, for engineers, doctors,
veterinary and other professionals with different levels of
competence and skills. What the private sector in Delhi
knows is clear—if there are no local candidates available
to fill up such vacancies, they can always draw upon the
manpower surpluses elsewhere in the country since Delhi
is such a good place to work and has never pushed out
migrants from outside. However, there could be problems
of getting sufficient number of candidates for some
middle level technical categories, including stenographers,
various kinds of mechanics etc. Even these vacancies in
the private sector get filled up by less educated but skilled
persons i.e., those who may not have undergone formal
courses in ITIs or any other technical institution but who
have learned on-the-job or have acquired competencies
from their extended families.
Again, there are differences in approach with the
public sector where there could be vacancies for such
categories, which remain unfilled for sometime. As
already stated, no firm figures on any of these categories
are available but it can be said without any hesitation that
manpower demand does not create any serious problems
for public or private or the NGO sector in Delhi. On the
other hand, there are surpluses of various categories as
evident from the employment exchanges data, which
could be either in nature of “waiting period” or inability
to get some kind of employment opportunity. It is this
type of persons who need to be targeted by any new
scheme as an improvement over the PMRY because of its
low income ceiling (Rs.40,000 per annum for the family),
it has been noticed that not much benefit is being derived
by unemployed educated persons of Delhi from this
scheme so far.
The growth of private sector enterprises in Delhi is
sizeable and character of such enterprises goes on
changing all the time in tune with the changes in the
economy and technology in use. This is all good for an
economy without any borders like Delhi. However, not
enough information is available or even collected on the
changing nature of enterprises or employment since the
employment exchanges network, especially its EMI set-up
has failed to collect information on such new areas. There
is very little information of direct relevance available from
the EMI for various reasons, including lack of
computerisation, lack of transportation facilities
dependence on postal type questionnaires, late
information (sometimes 3-4 years) and non-availbility of
motivated personnel for the employment exchanges as a
whole. Even though the organised sector employment in
the country has shrunk to as little as 7-8 per cent of total
employment, the situation in Delhi is different and with a
little effort the coverage of employment of the organised
sector can be increased manifold. The policymakers
outside labour and employment departments have more
or less given up on the employment exchanges but this
should not be so. On the other hand, there is an evidence
of proliferation of small and sometimes irresponsible job
placement agencies in the city.
There is a need to regularise the entry of private sector
in collection of information and placement activities since
private sector is now the dominant driver of manpower
growth. The Government needs to regulate them but
allow them to function for the benefit of employment
seekers, better than what has been happening so far.
Gujarat has already regularised the entry of private sector
into this area and allowed such agencies to charge
reasonable fees etc. Even the private sector would like to
use the analyses based on revamped EMI data. For the
employment/manpower planners such data are constantly
needed to track the changes in the manpower profile, the
enterprises and the education-skill vs. occupational mix,
which is constantly evolving in Delhi.
Management of labour, especially skilled labour, is not
a real problem in the city mainly because of the flexibility
of enterprises in Delhi and the influx of educated/skilled
migrants and new technologies in the city e.g. various
types of IT-enabled services like call centers or BPO
outfits. Side by side, it is also a fact that trade unions are
neither as powerful nor disruptive and in any case, the
highly skilled personnel tend not to join trade unions.
These characteristics do have a negative fall out as a
whole since unscrupulous enterprises or seekers for quick
profits can more easily exploit unorganised labour. The
ready availability of workers at practically all the levels of
education or skills from outside the city also makes it
difficult to organise the unorganised sector workers to
ensure that they are not exploited and do get the benefits
of social security laws.
The Government of India has just started a scheme for
providing basic social security benefits to the workers of
the unorganised sector in the nature of a pilot scheme,
but Delhi is getting covered under it with a target of
approximately 1 lakh workers to be enrolled under the
scheme. Hopefully, the pilot scheme would lead to large
scale provision of minimal social security benefits to many
others scattered all over the city and the rural areas in the
next few years. Practically, all these workers are in the
private sector though some of them also exist with the
education and training servie providers, regulated or
otherwise in Delhi. In fact, an undocumented number of
Chapter 14 • LABOUR MANAGEMENT AND MANPOWER PLANNING 349
persons, both below adulthood and above, are roped in by
a variety of such service providers though all of them may
not really get the right level of education/training from
them. Therefore, Government of India has been thinking
of a Training Fund for the benefit of such consumers of
education/training as well as providers of the same. Like
the proposed new scheme of promoting self-employment
for the unemployed educated youth, this idea has also not
This chapter has been prepared by Institute of Applied Manpower Research, team associated with the preparation of the chapter includes Shri M.C. Verma,Consultant, Smt. Madhu Srivastava, Head (E&U Studies Unit), Shri U.S. Bhandari, SRO, Shri S.K. Yadav, SRO, Shri J.S. Chauhan, RA and Shri Barun Kumar,RA. Study team members were highly benefited from the comments and suggestions of Professor Ajeet Narain Mathur, Director, IAMR in preparation of thechapter.
gone very far and the set up for the Training Fund has not
yet materialised despite the existence of “Bharat Shiksha
Kosh” under the auspices of Ministry of HRD,
Government of India. It is very clear, therefore, that a lot
of work remains to be done to bring together the
potential employers, the service providers and jobseekers
to encourage productive employment in Delhi’s economy
and accelerate its growth.
References
Directorate of Economics & Statistics, NCTD (2002). Employment andUnemployment Situation in Delhi.
———. (2007). Employment and Unemployment Situation in Delhi.
Institute of Applied Manpower Research, Delhi (2001). Impact Assessment ofRural Development Programmes in Baharaich District of Uttar Pradesh
———. (2002). Manpower Profile.
———. (2005). Manpower Profile
Govt of India, Annual Report 2002-2003, Ministry of Labour, New Delhi.
———. (1990). Survey on Activity Status of Jobseekers Registered with theEmployment Exchanges, Ministry of Labour, New Delhi.
———. National Sample Survey Organisation 61st Round (2004-05), “Employmentand Unemployment Situation in India”, New Delhi.
———. National Sample Survey Organisation 61 st Round (1999-2000),“Employment and Unemployment Situation in India”, New Delhi.
———. Tenth Five-year Plan (2002-07), Planning Commission, New Delhi.
———. Eleventh Five-year Plan Approach Paper (2007-2012), PlanningCommission, New Delhi.
———. Annual Plan 2003-04, Planning Department, Volumes I&II
———. Annual Plan 2007-08, Planning Department, Volumes I&II
———. Economic Survey of Delhi, 2005-06, Planning Department.
Craftsmen Training and Employment (2003). Resource Development Centre,New Delhi.
Aggarwal, Garima (2003). “Relocation of Industries in NCR” (Unpublished);Thesis presented for fulfilling Post Graduate Diploma in SPA, NewDelhi.
Kumar, Barun (2003). “Political Dialectics of Slums in NCT Delhi”(unpublished), a paper presented in National Association of GeographersIndia in December 28, 2003.

Chapter 15
Women and Vulnerable Groups
DELHI
15.0 Introduction
The development of the metropolitan-city, capital-state
of Delhi brings into focus a host of social concerns, which
are partly structural, partly institutional, and in some ways
associated with the very process of development. The
concept of vulnerable groups derives from a certain notion
of well-being, human rights and role of the state towards
its citizens, following principles of equality and justice. The
word ‘vulnerable’ connotes weakness, susceptibility,
defenselessness, helplessness, exclusion and refers to
persons exposed to danger or at risk due to their location
in a weak, subordinate position. It refers to a state of being
that calls for recognition, protection and security measures.
Structural and institutional factors leading to deficiencies,
vulnerabilities and insecurities, as opposed to certain kinds
of personal choice or individual characteristic, legitimise
positive discrimination practices and invite state
interventions as corrective or supportive measures.
Vulnerable groups as relevant in the current context
refers to all such persons who are weak and helpless due
to social, physical, economic, educational, financial,
infrastructural, health, legal, political or institutional
dimensions that intensify across caste, religion, class,
gender and community connotations. Powerlessness,
income and structural poverty, and social exclusion are
the characteristics that are associated with vulnerabilities.
The conventional meaning flowing from the
Constitutional provisions refers to linguistic and religious
minorities, and right to equality in various spheres.
Alternatively, it extends to the socially deprived and
disadvantaged groups of scheduled castes and tribes; the
physically disabled and mentally challenged, the
destitutes; and survival livelihood seeking unorganised
workers and migrants from the economically vulnerable
sections who are also education wise poor and low in
marketable skills; the social caste-class dimensions
accentuate the vulnerability of the politically
disempowered by rendering them voiceless and without
citizenship based human rights; even the lack of
infrastructural availability or access to facilities; the risk
arising of natural or human calamities; health related
vulnerabilities; inadequate legal protection and persons
who do not fit the accepted dominant social behaviour
such as single women, divorcées, children who run away
from home and so on.
Consider any aspect such as growing urbanisation for
instance and a wide range of issues concerning the
livelihoods, shelter and basic human rights of the poor
and vulnerable groups stand to be addressed. The capital,
metropolitan state of Delhi attracts a variety of persons
for the better opportunities it offers, but the situation for
certain sections, whether recognised or not as vulnerable
groups, remains wanting in various ways. This chapter
focuses on some of the prominently vulnerable groups
and addresses aspects that generate or perpetuate their
vulnerabilities with a view to improve their situation. The
question often posed is whether the status of vulnerable
sections of the populations improve or worsen due to
their location in the relatively privileged state of Delhi?
Such a comparison in the context of measuring or
assessing social development levels in the state is of poor
significance if not insignificant, since the very fact that
there are hungry, destitute, shelterless persons in any
state calls for improving their situation and intervening so
as to eliminate these dimensions that generate
vulnerability. In other words, it is immaterial whether
Delhi has more or less disabled, destitutes or migrants
than any other place, however, what is important is the
attention and addressal of the issues of concern pertinent
to persons vulnerable due to any of these factors.
DELHI DEVELOPMENT REPORT352
The employment potential of the state attracts
migrants. These migrant workers are contributing
significantly to the economy of the city by offering their
labour services. Yet, they are viewed as a burden, with the
State trying to shun its responsibility towards them. The
growth of slums and squatters are a source of grave
distress to the administrators who strategise and plan for
their resettlement and displacement in an effort to
beautify and clean up the metropolitan city. Social
discrimination in its worst form manifests itself in the
manner State approaches the concerns of the vulnerable
groups. While the professional and upper strata of society
among the migrants are warmly assimilated into the social
and political fabric; the poor, working masses are viewed
with disdain, not to be trusted and all efforts are being
made to dissuade migration for these segments.
The utter lack of social security for segments of the
population in the context of a modern, developed or
developing state worsens the plight of historically, socio-
economically poor and backward sections of the
population. The SC/STs, the OBCs are the sections
excluded from development and in spite of the positive
intervention policies adopted by the state to move
towards a more egalitarian society, the institutional
structures delimit benefits accruing to them.
Women are another category by themselves who are
viewed as vulnerable, albeit for slightly different reasons.
The fundamental element that weakens or disempowers
women is the power and authority equations stemming
from patriarchal structures which locate them at the lower
rungs of the hierarchies prevalent in society, economy and
polity. In the context of Delhi, the simultaneous presence
of progressive and retrogressive forces seems to be in
operation.
Women in Delhi (as in rest of the country and in fact
even the globe) also face discrimination and gender biases
that affect them adversely in their daily conduct of life and
living. This is in spite of the few other dimensions where
positive, progressive opportunities are noted for the
female gender as in the case of better employment
avenues in the organised sector for the educated women
for instance. The chance to undertake jobs in the non-
traditional, unconventional spheres is another noteworthy
aspect, with women in the technical spheres, in the police
force, as detectives, as drivers and so on. Many of these
alterations are a reflection of changing mindsets and social
support from parents and other agents who assist women
in breaking gender stereotypes and help them to be in
better control of their lives. Apart from these spheres
changes were occurring; in most others women remain
marginalised and vulnerable. What is most distressing is
the resilience in social perceptions of gender roles and
inflexibilities noted in the stereotypical norms prevalent
that serve as hurdles to overcome the inequalities and
discriminations against women.
The need for addressing or focusing on vulnerable
groups arises also due to the predominant approach of
state provision and intervention that is not always
individual based. In case of a bulk of these provisions, the
male head of the household is considered to be the
beneficiary representing the household. This perpetuates
the dependent status of women and children. It is as if
they have no citizenship based rights of their own as
individuals. This is of tremendous significance in the
context of changing kinship structures, increasing
nuclearisation, declining support institutions, rising
urbanisation, its association with development that is
based on individual oriented growth, as all these factors
work towards diminishing the protection offered by the
traditional social fabric and exposing persons to
heightened vulnerabilities.
Apart from the structural and institutional
vulnerabilities as in the case of socially disadvantaged SC/
STs and OBCs, and women and children; the other
segments which may be affected by one or more
dimensions of exclusion and deprivation are the
differently abled—physically and mentally challenged;
those who work in spheres not protected by legal
provisions or not recognised—such as unorganised
workers, child labourer, street-vendors, domestic workers,
rag/waste pickers, sex workers and so on; those who
suffer from health related disability – malaria, TB, cancer,
HIV/AIDs, other chronic ailments, aged; also individuals
who do not fit the accepted dominant normative
behaviour and therefore face difficulties in social
assimilation or due to treatment meted out to them, such
as single women (including divorced women) children
who run away from their homes, and so on.
Among the vulnerable groups there are also persons
affected due to natural or human calamity such as death
of main earners leading to dependents vulnerability, as
widows, orphans and other dependents; development
related displacement caused by land acquisition for
construction of say dams, roads, hospitals, factories and
so on. In Delhi, the agenda of cleaning up the city for
beautification and demolition of illegal settlements has
occurred, that is slightly distinct from the development
project led displacement. The illegal settlements and
habitations that involve the rich and powerful remain
unaffected while the slum dwellers and poor migrants are
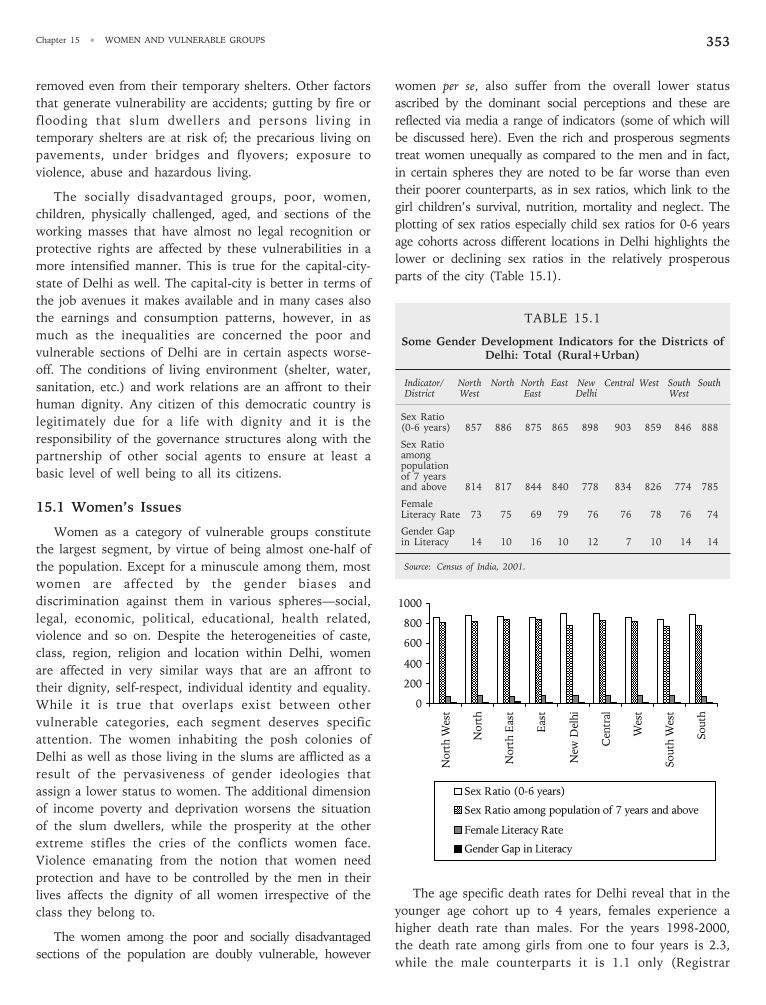
Chapter 15 •
WOMEN AND VULNERABLE GROUPS 353
removed even from their temporary shelters. Other factors
that generate vulnerability are accidents; gutting by fire or
flooding that slum dwellers and persons living in
temporary shelters are at risk of; the precarious living on
pavements, under bridges and flyovers; exposure to
violence, abuse and hazardous living.
The socially disadvantaged groups, poor, women,
children, physically challenged, aged, and sections of the
working masses that have almost no legal recognition or
protective rights are affected by these vulnerabilities in a
more intensified manner. This is true for the capital-city-
state of Delhi as well. The capital-city is better in terms of
the job avenues it makes available and in many cases also
the earnings and consumption patterns, however, in as
much as the inequalities are concerned the poor and
vulnerable sections of Delhi are in certain aspects worse-
off. The conditions of living environment (shelter, water,
sanitation, etc.) and work relations are an affront to their
human dignity. Any citizen of this democratic country is
legitimately due for a life with dignity and it is the
responsibility of the governance structures along with the
partnership of other social agents to ensure at least a
basic level of well being to all its citizens.
15.1 Women’s Issues
Women as a category of vulnerable groups constitute
the largest segment, by virtue of being almost one-half of
the population. Except for a minuscule among them, most
women are affected by the gender biases and
discrimination against them in various spheres—social,
legal, economic, political, educational, health related,
violence and so on. Despite the heterogeneities of caste,
class, region, religion and location within Delhi, women
are affected in very similar ways that are an affront to
their dignity, self-respect, individual identity and equality.
While it is true that overlaps exist between other
vulnerable categories, each segment deserves specific
attention. The women inhabiting the posh colonies of
Delhi as well as those living in the slums are afflicted as a
result of the pervasiveness of gender ideologies that
assign a lower status to women. The additional dimension
of income poverty and deprivation worsens the situation
of the slum dwellers, while the prosperity at the other
extreme stifles the cries of the conflicts women face.
Violence emanating from the notion that women need
protection and have to be controlled by the men in their
lives affects the dignity of all women irrespective of the
class they belong to.
The women among the poor and socially disadvantaged
sections of the population are doubly vulnerable, however
women per se, also suffer from the overall lower status
ascribed by the dominant social perceptions and these are
reflected via media a range of indicators (some of which will
be discussed here). Even the rich and prosperous segments
treat women unequally as compared to the men and in fact,
in certain spheres they are noted to be far worse than even
their poorer counterparts, as in sex ratios, which link to the
girl children’s survival, nutrition, mortality and neglect. The
plotting of sex ratios especially child sex ratios for 0-6 years
age cohorts across different locations in Delhi highlights the
lower or declining sex ratios in the relatively prosperous
parts of the city (Table 15.1).
TABLE 15.1
Some Gender Development Indicators for the Districts ofDelhi: Total (Rural+Urban)
Indicator/ North North North East New Central West South SouthDistrict West East Delhi West
Sex Ratio(0-6 years) 857 886 875 865 898 903 859 846 888
Sex Ratioamongpopulationof 7 yearsand above 814 817 844 840 778 834 826 774 785
FemaleLiteracy Rate 73 75 69 79 76 76 78 76 74
Gender Gapin Literacy 14 10 16 10 12 7 10 14 14
Source: Census of India, 2001.
The age specific death rates for Delhi reveal that in the
younger age cohort up to 4 years, females experience a
higher death rate than males. For the years 1998-2000,
the death rate among girls from one to four years is 2.3,
while the male counterparts it is 1.1 only (Registrar
0
200
400
600
800
1000
Nort
h W
est
No
rth
Nort
h E
ast
East
New
Delh
i
Centr
al
West
So
uth
West
South
Sex Ratio (0-6 years)
Sex Ratio among population of 7 years and above
Female Literacy Rate
Gender Gap in Literacy
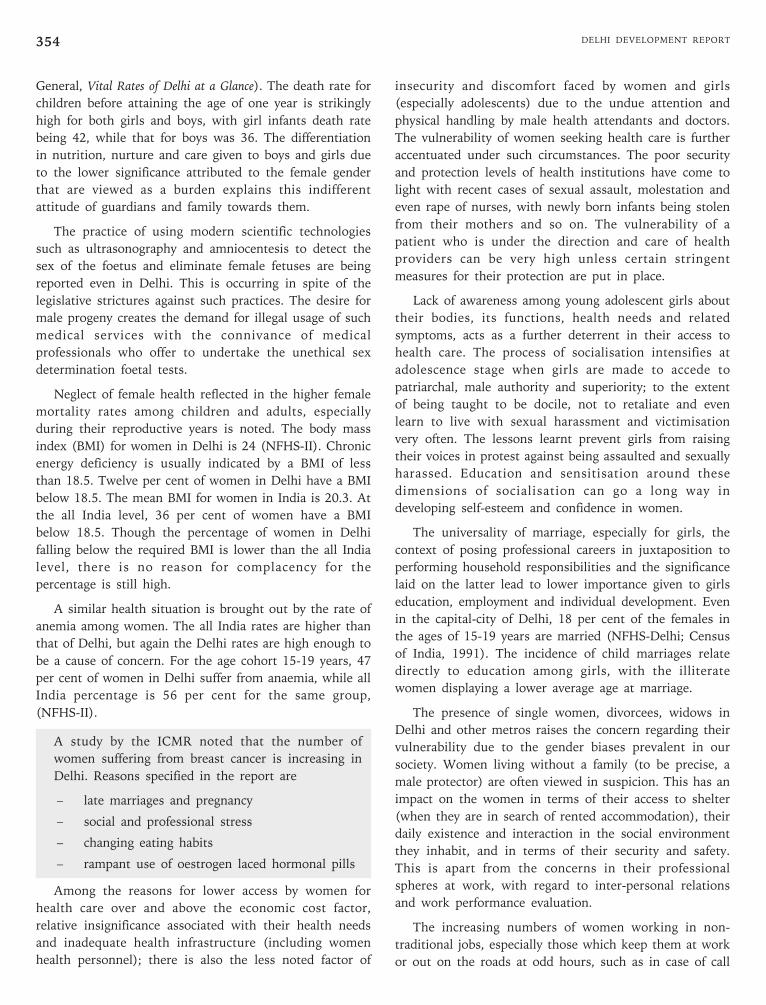
DELHI DEVELOPMENT REPORT354
General, Vital Rates of Delhi at a Glance). The death rate for
children before attaining the age of one year is strikingly
high for both girls and boys, with girl infants death rate
being 42, while that for boys was 36. The differentiation
in nutrition, nurture and care given to boys and girls due
to the lower significance attributed to the female gender
that are viewed as a burden explains this indifferent
attitude of guardians and family towards them.
The practice of using modern scientific technologies
such as ultrasonography and amniocentesis to detect the
sex of the foetus and eliminate female fetuses are being
reported even in Delhi. This is occurring in spite of the
legislative strictures against such practices. The desire for
male progeny creates the demand for illegal usage of such
medical services with the connivance of medical
professionals who offer to undertake the unethical sex
determination foetal tests.
Neglect of female health reflected in the higher female
mortality rates among children and adults, especially
during their reproductive years is noted. The body mass
index (BMI) for women in Delhi is 24 (NFHS-II). Chronic
energy deficiency is usually indicated by a BMI of less
than 18.5. Twelve per cent of women in Delhi have a BMI
below 18.5. The mean BMI for women in India is 20.3. At
the all India level, 36 per cent of women have a BMI
below 18.5. Though the percentage of women in Delhi
falling below the required BMI is lower than the all India
level, there is no reason for complacency for the
percentage is still high.
A similar health situation is brought out by the rate of
anemia among women. The all India rates are higher than
that of Delhi, but again the Delhi rates are high enough to
be a cause of concern. For the age cohort 15-19 years, 47
per cent of women in Delhi suffer from anaemia, while all
India percentage is 56 per cent for the same group,
(NFHS-II).
A study by the ICMR noted that the number of
women suffering from breast cancer is increasing in
Delhi. Reasons specified in the report are
– late marriages and pregnancy
– social and professional stress
– changing eating habits
– rampant use of oestrogen laced hormonal pills
Among the reasons for lower access by women for
health care over and above the economic cost factor,
relative insignificance associated with their health needs
and inadequate health infrastructure (including women
health personnel); there is also the less noted factor of
insecurity and discomfort faced by women and girls
(especially adolescents) due to the undue attention and
physical handling by male health attendants and doctors.
The vulnerability of women seeking health care is further
accentuated under such circumstances. The poor security
and protection levels of health institutions have come to
light with recent cases of sexual assault, molestation and
even rape of nurses, with newly born infants being stolen
from their mothers and so on. The vulnerability of a
patient who is under the direction and care of health
providers can be very high unless certain stringent
measures for their protection are put in place.
Lack of awareness among young adolescent girls about
their bodies, its functions, health needs and related
symptoms, acts as a further deterrent in their access to
health care. The process of socialisation intensifies at
adolescence stage when girls are made to accede to
patriarchal, male authority and superiority; to the extent
of being taught to be docile, not to retaliate and even
learn to live with sexual harassment and victimisation
very often. The lessons learnt prevent girls from raising
their voices in protest against being assaulted and sexually
harassed. Education and sensitisation around these
dimensions of socialisation can go a long way in
developing self-esteem and confidence in women.
The universality of marriage, especially for girls, the
context of posing professional careers in juxtaposition to
performing household responsibilities and the significance
laid on the latter lead to lower importance given to girls
education, employment and individual development. Even
in the capital-city of Delhi, 18 per cent of the females in
the ages of 15-19 years are married (NFHS-Delhi; Census
of India, 1991). The incidence of child marriages relate
directly to education among girls, with the illiterate
women displaying a lower average age at marriage.
The presence of single women, divorcees, widows in
Delhi and other metros raises the concern regarding their
vulnerability due to the gender biases prevalent in our
society. Women living without a family (to be precise, a
male protector) are often viewed in suspicion. This has an
impact on the women in terms of their access to shelter
(when they are in search of rented accommodation), their
daily existence and interaction in the social environment
they inhabit, and in terms of their security and safety.
This is apart from the concerns in their professional
spheres at work, with regard to inter-personal relations
and work performance evaluation.
The increasing numbers of women working in non-
traditional jobs, especially those which keep them at work
or out on the roads at odd hours, such as in case of call
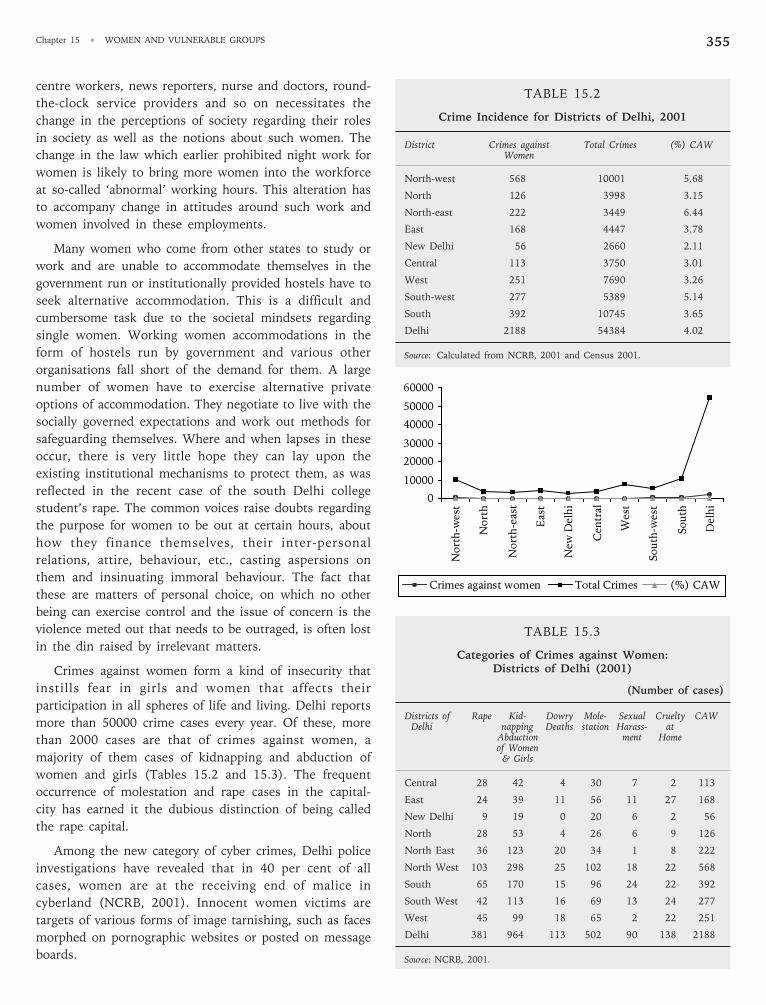
Chapter 15 •
WOMEN AND VULNERABLE GROUPS 355
centre workers, news reporters, nurse and doctors, round-
the-clock service providers and so on necessitates the
change in the perceptions of society regarding their roles
in society as well as the notions about such women. The
change in the law which earlier prohibited night work for
women is likely to bring more women into the workforce
at so-called ‘abnormal’ working hours. This alteration has
to accompany change in attitudes around such work and
women involved in these employments.
Many women who come from other states to study or
work and are unable to accommodate themselves in the
government run or institutionally provided hostels have to
seek alternative accommodation. This is a difficult and
cumbersome task due to the societal mindsets regarding
single women. Working women accommodations in the
form of hostels run by government and various other
organisations fall short of the demand for them. A large
number of women have to exercise alternative private
options of accommodation. They negotiate to live with the
socially governed expectations and work out methods for
safeguarding themselves. Where and when lapses in these
occur, there is very little hope they can lay upon the
existing institutional mechanisms to protect them, as was
reflected in the recent case of the south Delhi college
student’s rape. The common voices raise doubts regarding
the purpose for women to be out at certain hours, about
how they finance themselves, their inter-personal
relations, attire, behaviour, etc., casting aspersions on
them and insinuating immoral behaviour. The fact that
these are matters of personal choice, on which no other
being can exercise control and the issue of concern is the
violence meted out that needs to be outraged, is often lost
in the din raised by irrelevant matters.
Crimes against women form a kind of insecurity that
instills fear in girls and women that affects their
participation in all spheres of life and living. Delhi reports
more than 50000 crime cases every year. Of these, more
than 2000 cases are that of crimes against women, a
majority of them cases of kidnapping and abduction of
women and girls (Tables 15.2 and 15.3). The frequent
occurrence of molestation and rape cases in the capital-
city has earned it the dubious distinction of being called
the rape capital.
Among the new category of cyber crimes, Delhi police
investigations have revealed that in 40 per cent of all
cases, women are at the receiving end of malice in
cyberland (NCRB, 2001). Innocent women victims are
targets of various forms of image tarnishing, such as faces
morphed on pornographic websites or posted on message
boards.
TABLE 15.2
Crime Incidence for Districts of Delhi, 2001
District Crimes against Total Crimes (%) CAWWomen
North-west 568 10001 5.68
North 126 3998 3.15
North-east 222 3449 6.44
East 168 4447 3.78
New Delhi 56 2660 2.11
Central 113 3750 3.01
West 251 7690 3.26
South-west 277 5389 5.14
South 392 10745 3.65
Delhi 2188 54384 4.02
Source: Calculated from NCRB, 2001 and Census 2001.
TABLE 15.3
Categories of Crimes against Women:Districts of Delhi (2001)
(Number of cases)
Districts of Rape Kid- Dowry Mole- Sexual Cruelty CAWDelhi napping Deaths station Harass- at
Abduction ment Homeof Women
& Girls
Central 28 42 4 30 7 2 113
East 24 39 11 56 11 27 168
New Delhi 9 19 0 20 6 2 56
North 28 53 4 26 6 9 126
North East 36 123 20 34 1 8 222
North West 103 298 25 102 18 22 568
South 65 170 15 96 24 22 392
South West 42 113 16 69 13 24 277
West 45 99 18 65 2 22 251
Delhi 381 964 113 502 90 138 2188
Source: NCRB, 2001.
0
10000
20000
30000
40000
50000
60000
No
rth
-west
No
rth
No
rth
-east
East
New
Delh
i
Cen
tral
West
So
uth
-west
So
uth
Delh
i
Crimes against women Total Crimes (%) CAW
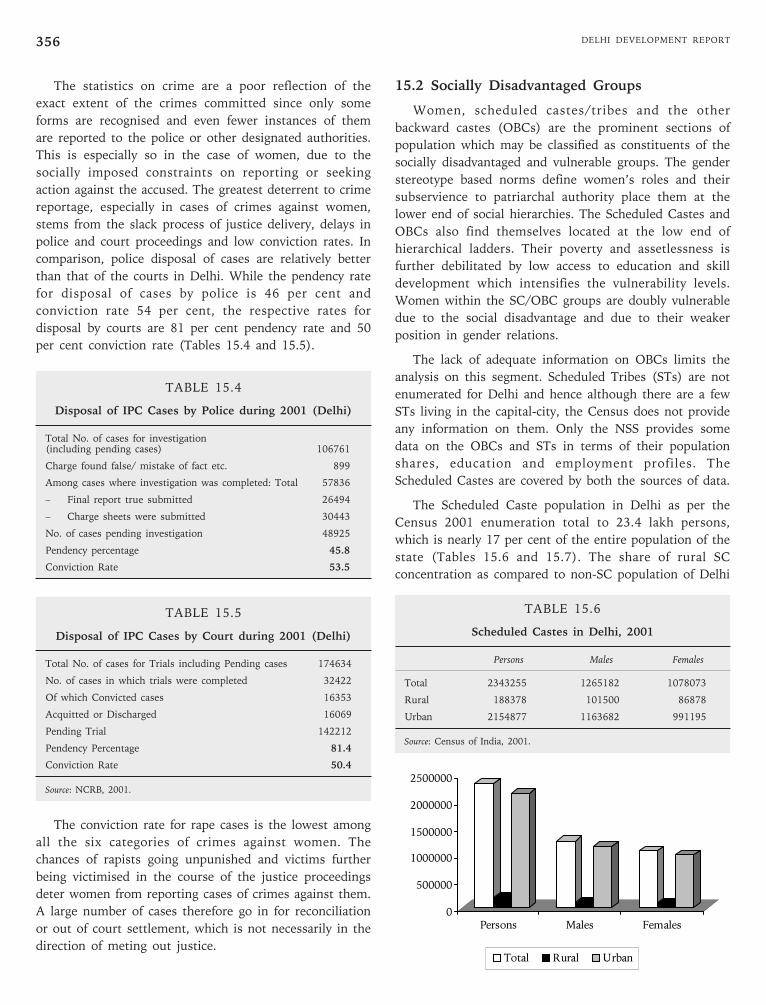
DELHI DEVELOPMENT REPORT356
The statistics on crime are a poor reflection of the
exact extent of the crimes committed since only some
forms are recognised and even fewer instances of them
are reported to the police or other designated authorities.
This is especially so in the case of women, due to the
socially imposed constraints on reporting or seeking
action against the accused. The greatest deterrent to crime
reportage, especially in cases of crimes against women,
stems from the slack process of justice delivery, delays in
police and court proceedings and low conviction rates. In
comparison, police disposal of cases are relatively better
than that of the courts in Delhi. While the pendency rate
for disposal of cases by police is 46 per cent and
conviction rate 54 per cent, the respective rates for
disposal by courts are 81 per cent pendency rate and 50
per cent conviction rate (Tables 15.4 and 15.5).
TABLE 15.4
Disposal of IPC Cases by Police during 2001 (Delhi)
Total No. of cases for investigation(including pending cases) 106761
Charge found false/ mistake of fact etc. 899
Among cases where investigation was completed: Total 57836
– Final report true submitted 26494
– Charge sheets were submitted 30443
No. of cases pending investigation 48925
Pendency percentage 45.8
Conviction Rate 53.5
TABLE 15.5
Disposal of IPC Cases by Court during 2001 (Delhi)
Total No. of cases for Trials including Pending cases 174634
No. of cases in which trials were completed 32422
Of which Convicted cases 16353
Acquitted or Discharged 16069
Pending Trial 142212
Pendency Percentage 81.4
Conviction Rate 50.4
Source: NCRB, 2001.
The conviction rate for rape cases is the lowest among
all the six categories of crimes against women. The
chances of rapists going unpunished and victims further
being victimised in the course of the justice proceedings
deter women from reporting cases of crimes against them.
A large number of cases therefore go in for reconciliation
or out of court settlement, which is not necessarily in the
direction of meting out justice.
15.2 Socially Disadvantaged Groups
Women, scheduled castes/tribes and the other
backward castes (OBCs) are the prominent sections of
population which may be classified as constituents of the
socially disadvantaged and vulnerable groups. The gender
stereotype based norms define women’s roles and their
subservience to patriarchal authority place them at the
lower end of social hierarchies. The Scheduled Castes and
OBCs also find themselves located at the low end of
hierarchical ladders. Their poverty and assetlessness is
further debilitated by low access to education and skill
development which intensifies the vulnerability levels.
Women within the SC/OBC groups are doubly vulnerable
due to the social disadvantage and due to their weaker
position in gender relations.
The lack of adequate information on OBCs limits the
analysis on this segment. Scheduled Tribes (STs) are not
enumerated for Delhi and hence although there are a few
STs living in the capital-city, the Census does not provide
any information on them. Only the NSS provides some
data on the OBCs and STs in terms of their population
shares, education and employment profiles. The
Scheduled Castes are covered by both the sources of data.
The Scheduled Caste population in Delhi as per the
Census 2001 enumeration total to 23.4 lakh persons,
which is nearly 17 per cent of the entire population of the
state (Tables 15.6 and 15.7). The share of rural SC
concentration as compared to non-SC population of Delhi
0
500000
1000000
1500000
2000000
2500000
Persons Males Females
Total Rural Urban
TABLE 15.6
Scheduled Castes in Delhi, 2001
Persons Males Females
Total 2343255 1265182 1078073
Rural 188378 101500 86878
Urban 2154877 1163682 991195
Source: Census of India, 2001.
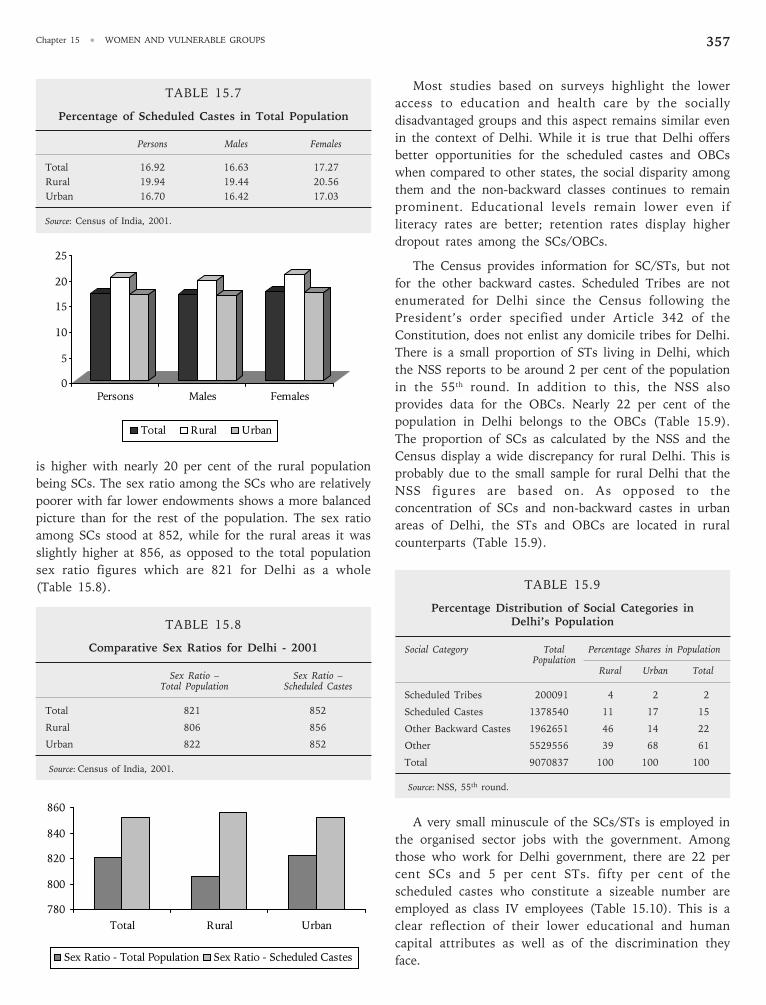
Chapter 15 •
WOMEN AND VULNERABLE GROUPS 357
is higher with nearly 20 per cent of the rural population
being SCs. The sex ratio among the SCs who are relatively
poorer with far lower endowments shows a more balanced
picture than for the rest of the population. The sex ratio
among SCs stood at 852, while for the rural areas it was
slightly higher at 856, as opposed to the total population
sex ratio figures which are 821 for Delhi as a whole
(Table 15.8).
TABLE 15.8
Comparative Sex Ratios for Delhi - 2001
Sex Ratio – Sex Ratio –Total Population Scheduled Castes
Total 821 852
Rural 806 856
Urban 822 852
Source: Census of India, 2001.
Most studies based on surveys highlight the lower
access to education and health care by the socially
disadvantaged groups and this aspect remains similar even
in the context of Delhi. While it is true that Delhi offers
better opportunities for the scheduled castes and OBCs
when compared to other states, the social disparity among
them and the non-backward classes continues to remain
prominent. Educational levels remain lower even if
literacy rates are better; retention rates display higher
dropout rates among the SCs/OBCs.
The Census provides information for SC/STs, but not
for the other backward castes. Scheduled Tribes are not
enumerated for Delhi since the Census following the
President’s order specified under Article 342 of the
Constitution, does not enlist any domicile tribes for Delhi.
There is a small proportion of STs living in Delhi, which
the NSS reports to be around 2 per cent of the population
in the 55th round. In addition to this, the NSS also
provides data for the OBCs. Nearly 22 per cent of the
population in Delhi belongs to the OBCs (Table 15.9).
The proportion of SCs as calculated by the NSS and the
Census display a wide discrepancy for rural Delhi. This is
probably due to the small sample for rural Delhi that the
NSS figures are based on. As opposed to the
concentration of SCs and non-backward castes in urban
areas of Delhi, the STs and OBCs are located in rural
counterparts (Table 15.9).
TABLE 15.9
Percentage Distribution of Social Categories inDelhi’s Population
Social Category Total Percentage Shares in PopulationPopulation
Rural Urban Total
Scheduled Tribes 200091 4 2 2
Scheduled Castes 1378540 11 17 15
Other Backward Castes 1962651 46 14 22
Other 5529556 39 68 61
Total 9070837 100 100 100
Source: NSS, 55th round.
A very small minuscule of the SCs/STs is employed in
the organised sector jobs with the government. Among
those who work for Delhi government, there are 22 per
cent SCs and 5 per cent STs. fifty per cent of the
scheduled castes who constitute a sizeable number are
employed as class IV employees (Table 15.10). This is a
clear reflection of their lower educational and human
capital attributes as well as of the discrimination they
face.
TABLE 15.7
Percentage of Scheduled Castes in Total Population
Persons Males Females
Total 16.92 16.63 17.27
Rural 19.94 19.44 20.56
Urban 16.70 16.42 17.03
Source: Census of India, 2001.
780
800
820
840
860
Total Rural Urban
Sex Ratio - Total Population Sex Ratio - Scheduled Castes
0
5
10
15
20
25
Persons Males Females
Total Rural Urban
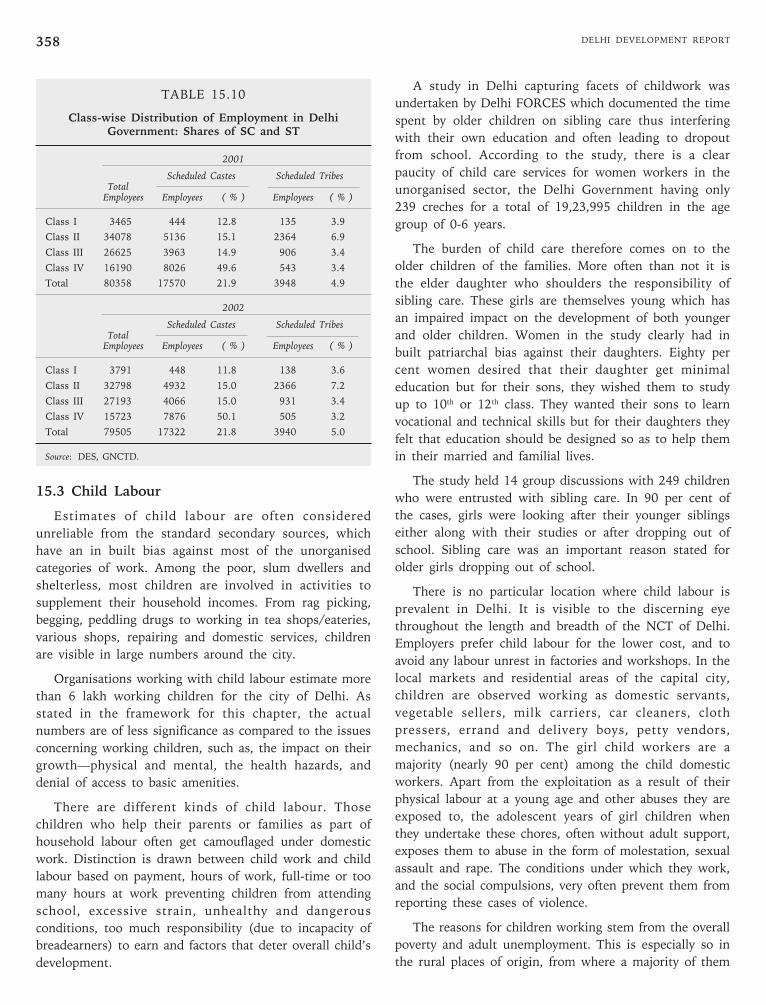
DELHI DEVELOPMENT REPORT358
TABLE 15.10
Class-wise Distribution of Employment in DelhiGovernment: Shares of SC and ST
2001
Scheduled Castes Scheduled TribesTotal
Employees Employees ( % ) Employees ( % )
Class I 3465 444 12.8 135 3.9
Class II 34078 5136 15.1 2364 6.9
Class III 26625 3963 14.9 906 3.4
Class IV 16190 8026 49.6 543 3.4
Total 80358 17570 21.9 3948 4.9
2002
Scheduled Castes Scheduled TribesTotal
Employees Employees ( % ) Employees ( % )
Class I 3791 448 11.8 138 3.6
Class II 32798 4932 15.0 2366 7.2
Class III 27193 4066 15.0 931 3.4
Class IV 15723 7876 50.1 505 3.2
Total 79505 17322 21.8 3940 5.0
Source: DES, GNCTD.
15.3 Child Labour
Estimates of child labour are often considered
unreliable from the standard secondary sources, which
have an in built bias against most of the unorganised
categories of work. Among the poor, slum dwellers and
shelterless, most children are involved in activities to
supplement their household incomes. From rag picking,
begging, peddling drugs to working in tea shops/eateries,
various shops, repairing and domestic services, children
are visible in large numbers around the city.
Organisations working with child labour estimate more
than 6 lakh working children for the city of Delhi. As
stated in the framework for this chapter, the actual
numbers are of less significance as compared to the issues
concerning working children, such as, the impact on their
growth—physical and mental, the health hazards, and
denial of access to basic amenities.
There are different kinds of child labour. Those
children who help their parents or families as part of
household labour often get camouflaged under domestic
work. Distinction is drawn between child work and child
labour based on payment, hours of work, full-time or too
many hours at work preventing children from attending
school, excessive strain, unhealthy and dangerous
conditions, too much responsibility (due to incapacity of
breadearners) to earn and factors that deter overall child’s
development.
A study in Delhi capturing facets of childwork was
undertaken by Delhi FORCES which documented the time
spent by older children on sibling care thus interfering
with their own education and often leading to dropout
from school. According to the study, there is a clear
paucity of child care services for women workers in the
unorganised sector, the Delhi Government having only
239 creches for a total of 19,23,995 children in the age
group of 0-6 years.
The burden of child care therefore comes on to the
older children of the families. More often than not it is
the elder daughter who shoulders the responsibility of
sibling care. These girls are themselves young which has
an impaired impact on the development of both younger
and older children. Women in the study clearly had in
built patriarchal bias against their daughters. Eighty per
cent women desired that their daughter get minimal
education but for their sons, they wished them to study
up to 10th or 12th class. They wanted their sons to learn
vocational and technical skills but for their daughters they
felt that education should be designed so as to help them
in their married and familial lives.
The study held 14 group discussions with 249 children
who were entrusted with sibling care. In 90 per cent of
the cases, girls were looking after their younger siblings
either along with their studies or after dropping out of
school. Sibling care was an important reason stated for
older girls dropping out of school.
There is no particular location where child labour is
prevalent in Delhi. It is visible to the discerning eye
throughout the length and breadth of the NCT of Delhi.
Employers prefer child labour for the lower cost, and to
avoid any labour unrest in factories and workshops. In the
local markets and residential areas of the capital city,
children are observed working as domestic servants,
vegetable sellers, milk carriers, car cleaners, cloth
pressers, errand and delivery boys, petty vendors,
mechanics, and so on. The girl child workers are a
majority (nearly 90 per cent) among the child domestic
workers. Apart from the exploitation as a result of their
physical labour at a young age and other abuses they are
exposed to, the adolescent years of girl children when
they undertake these chores, often without adult support,
exposes them to abuse in the form of molestation, sexual
assault and rape. The conditions under which they work,
and the social compulsions, very often prevent them from
reporting these cases of violence.
The reasons for children working stem from the overall
poverty and adult unemployment. This is especially so in
the rural places of origin, from where a majority of them
Chapter 15 •
WOMEN AND VULNERABLE GROUPS 359
have migrated. The increasingly contractual nature of jobs
that are highly insecure, indebtedness, ill-health of
breadearner or sheer compulsion for additional earnings
pushes children into employment. The desire to be
independent and escape ill treatment of guardians can also
result in children running away from home and having to
fend for themselves.
15.3.1 Street Children
A subset of these vulnerable sections of child labour
constitutes street children. They are identified on the
basis of the shelter available to them and levels of family
contact. While some of the street children are a part of
their families who are shelterless and live on the
pavement themselves, others may be living on the street
with or without contact of their families. The latter group
of street children who are on their own may be that of
orphans or run-away children. Almost all of these street
children who are on their own have to work for survival
or resort to beggary, stealing and so on.
It is estimated that there are nearly 100,000 street
children in Delhi (Panicker and Nangia, 1988). Children
engaged in rag picking, vending, coolie work and a range
of street trades who work and live on the streets are
included among street children. They are often harassed
and live in near-distress circumstances. These children are
helpless without a home, as they often have deserted their
guardians due to mistreatment, abuse, cruelty or
indifference.
The search for freedom and a chance to survive brings
them to cities, where very often they are subject to abuse
of all kinds—verbal, mental, physical, psychological and
sexual. The plight of girl child is even more susceptible to
maltreatment, violence and misguidance. Estimates of sex
workers reveal that a large proportion of the girls in
brothels are minors below the age of 18 years. The routes
through which these girls land up in the red light areas of
the city are complex and involve layers of deception,
fraud, false information and temptation luring them on
various pretexts such as marriage, employment and other
similar promises.
There are various organisations that work with street
children and some of them run shelter homes, while
others provide non-formal education, vocational training,
recreation avenues and assist them to benefit from saving
schemes. Some of the prominent ones are Salaam Balak
Trust, Butterflies, Prayas, Deepalaya and so on.
The government has enacted laws regarding child
labour (abolition of child labour in hazardous
occupations), juvenile justice and has ratified the UN
Convention on the Rights of the Child in order to prevent
exploitation of children and for the protection of their
rights. However, experience on the ground highlights that
these are inadequate to tackle the root of this problem.
Introduction of further restrictions and prohibitions make it
harder for children to earn a living, rendering their pursuits
illegal and easily prone to harassment. In this respect the
working child merges with the vast mass of unorganised
labourforce that faces similar challenges in pursuing their
livelihood in a dignified and respectful manner.
15.4 Vulnerabilities Stemming from Disability
The challenges posed by disability, both physical and
mental, manifest in rendering vulnerable the persons
affected by it, not only in the absolute sense but also in
terms of the neglect, exclusion and non-recognition
associated with it. The common perception of disability is
limited to the physically challenged persons who are
affected due to locomotor, visual, hearing or speech
disability. The understanding of what constitutes mental
disability is very poor. Until recently, there were almost
no reliable secondary data based estimates for mental
disability. The NSS included mental disability (both
mental retardation and mental illness) for the first time in
their 2002 survey. Most mental disability is congenital,
although there can be number of other reasons, some
known, while many are still undiscovered/unknown due
to medical limitations (Addlakha, 2005). Malnutrition and
micronutrient deficiencies may also result in disabling
conditions for children by stunting their physical and
mental growth. The loss of limb due to an accident may
debilitate a person that can be categorised as a static form
of disability. Alternatively, injuries from a mishap may
over time assume some form of episodic outburst of
symptoms resulting in degeneration in the condition of
the affected person. There are difficulties in recognising
certain forms of disability, such as diabetes, epilepsy,
schizophrenia, and so on which may be considered
relatively invisible due to the medical limitation, social
prejudices and levels of awareness among the public.
In addition to the vulnerability stemming from the
form of disability, the approach of the society at large and
the State deprive and disempower the disabled from their
due rights as citizens of the country. Women among the
disabled remain further marginalised and neglected and
have to face worse conditions than the non-disabled
women and even the disabled men due to the prevalent
notions of her inability to perform the normative roles
expected of women and of the associated social dishonour
and shame that propels families to keep them hidden
(Addlakha, 2005).
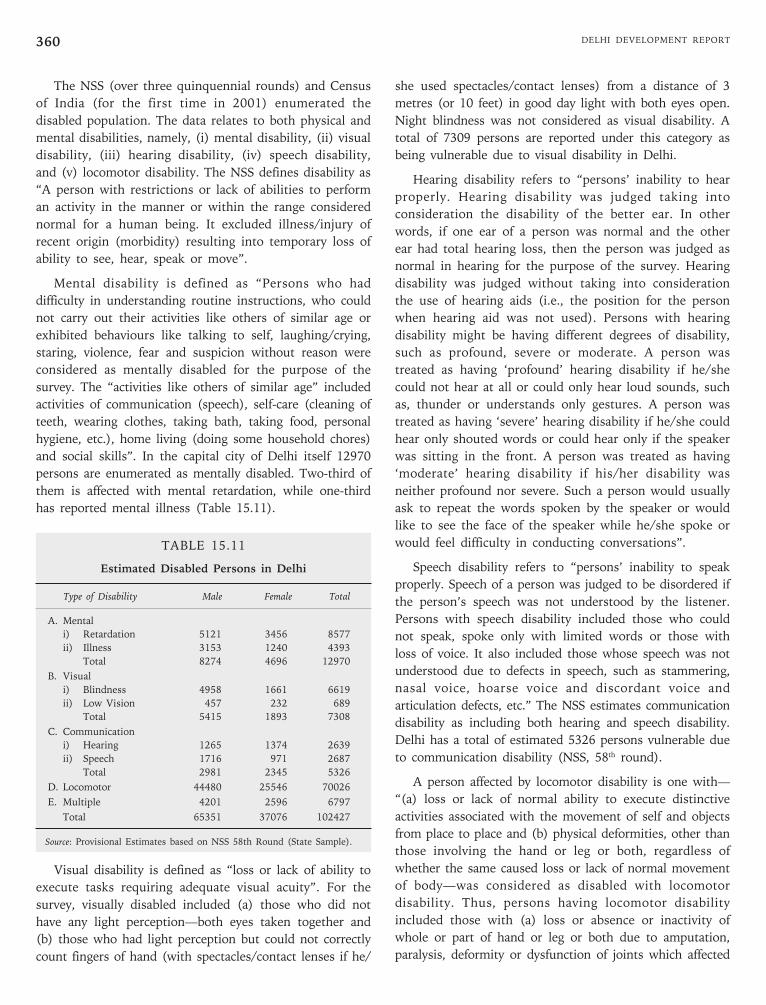
DELHI DEVELOPMENT REPORT360
The NSS (over three quinquennial rounds) and Census
of India (for the first time in 2001) enumerated the
disabled population. The data relates to both physical and
mental disabilities, namely, (i) mental disability, (ii) visual
disability, (iii) hearing disability, (iv) speech disability,
and (v) locomotor disability. The NSS defines disability as
“A person with restrictions or lack of abilities to perform
an activity in the manner or within the range considered
normal for a human being. It excluded illness/injury of
recent origin (morbidity) resulting into temporary loss of
ability to see, hear, speak or move”.
Mental disability is defined as “Persons who had
difficulty in understanding routine instructions, who could
not carry out their activities like others of similar age or
exhibited behaviours like talking to self, laughing/crying,
staring, violence, fear and suspicion without reason were
considered as mentally disabled for the purpose of the
survey. The “activities like others of similar age” included
activities of communication (speech), self-care (cleaning of
teeth, wearing clothes, taking bath, taking food, personal
hygiene, etc.), home living (doing some household chores)
and social skills”. In the capital city of Delhi itself 12970
persons are enumerated as mentally disabled. Two-third of
them is affected with mental retardation, while one-third
has reported mental illness (Table 15.11).
TABLE 15.11
Estimated Disabled Persons in Delhi
Type of Disability Male Female Total
A. Mental
i) Retardation 5121 3456 8577
ii) Illness 3153 1240 4393
Total 8274 4696 12970
B. Visual
i) Blindness 4958 1661 6619
ii) Low Vision 457 232 689
Total 5415 1893 7308
C. Communication
i) Hearing 1265 1374 2639
ii) Speech 1716 971 2687
Total 2981 2345 5326
D. Locomotor 44480 25546 70026
E. Multiple 4201 2596 6797
Total 65351 37076 102427
Source: Provisional Estimates based on NSS 58th Round (State Sample).
Visual disability is defined as “loss or lack of ability to
execute tasks requiring adequate visual acuity”. For the
survey, visually disabled included (a) those who did not
have any light perception—both eyes taken together and
(b) those who had light perception but could not correctly
count fingers of hand (with spectacles/contact lenses if he/
she used spectacles/contact lenses) from a distance of 3
metres (or 10 feet) in good day light with both eyes open.
Night blindness was not considered as visual disability. A
total of 7309 persons are reported under this category as
being vulnerable due to visual disability in Delhi.
Hearing disability refers to “persons’ inability to hear
properly. Hearing disability was judged taking into
consideration the disability of the better ear. In other
words, if one ear of a person was normal and the other
ear had total hearing loss, then the person was judged as
normal in hearing for the purpose of the survey. Hearing
disability was judged without taking into consideration
the use of hearing aids (i.e., the position for the person
when hearing aid was not used). Persons with hearing
disability might be having different degrees of disability,
such as profound, severe or moderate. A person was
treated as having ‘profound’ hearing disability if he/she
could not hear at all or could only hear loud sounds, such
as, thunder or understands only gestures. A person was
treated as having ‘severe’ hearing disability if he/she could
hear only shouted words or could hear only if the speaker
was sitting in the front. A person was treated as having
‘moderate’ hearing disability if his/her disability was
neither profound nor severe. Such a person would usually
ask to repeat the words spoken by the speaker or would
like to see the face of the speaker while he/she spoke or
would feel difficulty in conducting conversations”.
Speech disability refers to “persons’ inability to speak
properly. Speech of a person was judged to be disordered if
the person’s speech was not understood by the listener.
Persons with speech disability included those who could
not speak, spoke only with limited words or those with
loss of voice. It also included those whose speech was not
understood due to defects in speech, such as stammering,
nasal voice, hoarse voice and discordant voice and
articulation defects, etc.” The NSS estimates communication
disability as including both hearing and speech disability.
Delhi has a total of estimated 5326 persons vulnerable due
to communication disability (NSS, 58th round).
A person affected by locomotor disability is one with—
“(a) loss or lack of normal ability to execute distinctive
activities associated with the movement of self and objects
from place to place and (b) physical deformities, other than
those involving the hand or leg or both, regardless of
whether the same caused loss or lack of normal movement
of body—was considered as disabled with locomotor
disability. Thus, persons having locomotor disability
included those with (a) loss or absence or inactivity of
whole or part of hand or leg or both due to amputation,
paralysis, deformity or dysfunction of joints which affected
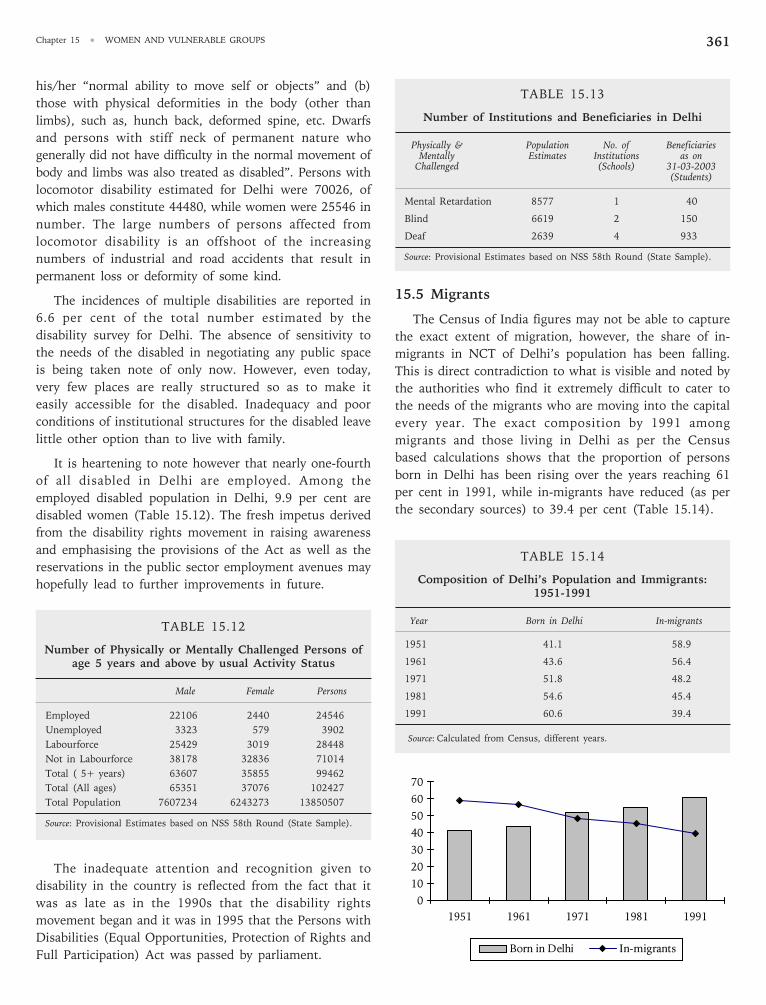
Chapter 15 •
WOMEN AND VULNERABLE GROUPS 361
his/her “normal ability to move self or objects” and (b)
those with physical deformities in the body (other than
limbs), such as, hunch back, deformed spine, etc. Dwarfs
and persons with stiff neck of permanent nature who
generally did not have difficulty in the normal movement of
body and limbs was also treated as disabled”. Persons with
locomotor disability estimated for Delhi were 70026, of
which males constitute 44480, while women were 25546 in
number. The large numbers of persons affected from
locomotor disability is an offshoot of the increasing
numbers of industrial and road accidents that result in
permanent loss or deformity of some kind.
The incidences of multiple disabilities are reported in
6.6 per cent of the total number estimated by the
disability survey for Delhi. The absence of sensitivity to
the needs of the disabled in negotiating any public space
is being taken note of only now. However, even today,
very few places are really structured so as to make it
easily accessible for the disabled. Inadequacy and poor
conditions of institutional structures for the disabled leave
little other option than to live with family.
It is heartening to note however that nearly one-fourth
of all disabled in Delhi are employed. Among the
employed disabled population in Delhi, 9.9 per cent are
disabled women (Table 15.12). The fresh impetus derived
from the disability rights movement in raising awareness
and emphasising the provisions of the Act as well as the
reservations in the public sector employment avenues may
hopefully lead to further improvements in future.
TABLE 15.12
Number of Physically or Mentally Challenged Persons ofage 5 years and above by usual Activity Status
Male Female Persons
Employed 22106 2440 24546
Unemployed 3323 579 3902
Labourforce 25429 3019 28448
Not in Labourforce 38178 32836 71014
Total ( 5+ years) 63607 35855 99462
Total (All ages) 65351 37076 102427
Total Population 7607234 6243273 13850507
Source: Provisional Estimates based on NSS 58th Round (State Sample).
The inadequate attention and recognition given to
disability in the country is reflected from the fact that it
was as late as in the 1990s that the disability rights
movement began and it was in 1995 that the Persons with
Disabilities (Equal Opportunities, Protection of Rights and
Full Participation) Act was passed by parliament.
TABLE 15.13
Number of Institutions and Beneficiaries in Delhi
Physically & Population No. of BeneficiariesMentally Estimates Institutions as on
Challenged (Schools) 31-03-2003(Students)
Mental Retardation 8577 1 40
Blind 6619 2 150
Deaf 2639 4 933
Source: Provisional Estimates based on NSS 58th Round (State Sample).
15.5 Migrants
The Census of India figures may not be able to capture
the exact extent of migration, however, the share of in-
migrants in NCT of Delhi’s population has been falling.
This is direct contradiction to what is visible and noted by
the authorities who find it extremely difficult to cater to
the needs of the migrants who are moving into the capital
every year. The exact composition by 1991 among
migrants and those living in Delhi as per the Census
based calculations shows that the proportion of persons
born in Delhi has been rising over the years reaching 61
per cent in 1991, while in-migrants have reduced (as per
the secondary sources) to 39.4 per cent (Table 15.14).
TABLE 15.14
Composition of Delhi’s Population and Immigrants:1951-1991
Year Born in Delhi In-migrants
1951 41.1 58.9
1961 43.6 56.4
1971 51.8 48.2
1981 54.6 45.4
1991 60.6 39.4
Source: Calculated from Census, different years.
0
10
20
30
40
50
60
70
1951 1961 1971 1981 1991
Born in Delhi In-migrants
DELHI DEVELOPMENT REPORT362
As per Singh’s calculation based on census data, nearly
80 per cent of in-migrants to Delhi come from the north
Indian neighbouring states. Uttar Pradesh contributes a
large share of 46 per cent while Haryana and Bihar record
12 and 7 per cent respectively (Table 15.15).
TABLE 15.15
Distribution of In-migrants from differentRegions/States to Delhi, 1991
Region/State In-migrants Population Percentage
North 29,69,315 80.0
Bihar 2,67,567 7.2
U.P. 17,04,197 45.9
Punjab 2,35,142 6.3
Haryana 4,40,275 11.9
Rajasthan 2,31,856 6.3
West 1,31,636 3.5
East and North-east 1,06,491 2.9
South 1,25,719 3.4
Source: Same as Table 15.14.
The assimilation of certain class categories of migrants
who are entering Delhi to work in organised sector jobs is
a characteristic that gives the capital-state its socio-
cultural heterogeneous profile. On the other hand, the
labouring masses who migrate into Delhi in search of a
livelihood seen to never belong to the city. Even if they
are second and third generation migrants, having
established steady, relatively stable entrepreneurial
ventures, the caste-class and social status seems to classify
them into the divisions of acceptable and unacceptable
groups. The poor and vulnerable migrants who live in
slums, JJ clusters, and similar conditions akin to
substandard housing remain the unacceptable populations
in public image as well as in state policymakers
perceptions. The pavement dwellers and shelterless,
destitute persons are worse off in the hierarchy of
vulnerabilities. Women among these groups are affected
the most due to exposure to insecurities stemming from a
range of factors like water to violence. The inflow of
migrants, even the temporary ones who try to save on
cost of financing for an accommodation by living on
pavements and so on add to the numbers of shelterless
persons. The shortage of housing for these segments
becomes more acute as a result of such migrants.
15.6 Housing Vulnerability/Shelterless
Large numbers of persons living in the capital city
(especially the socially and economically backward
population groups) live in substandard housing, in slums
and jhuggi jhopri clusters. The Planning Commission
calculated nearly 12 lakh people in the capital as living
below the poverty line—this accounts for 8 per cent of
Delhi’s population. Most of it is urban poverty. The
Census of India 2001 estimates Delhi’s slum population
to be above 20 lakhs, of which nearly 9 lakhs are women.
Only 4.3 lakhs of women inhabiting the slums in Delhi
are literate. The JJ clusters numbering 1160, houses 32
lakhs of people, which is nearly 24 per cent (Table 15.16).
Ali (2004) mentions that nearly 50-55 per cent of Delhi’s
population lives in substandard housing akin to slum like
conditions (Women’s Link, Jan.-March, 2004).
TABLE 15.16
Urban Settlement Pattern in 1999-2000
Category No. of Population Percentage PopulationSettlements (in Lakhs) to Total as per
Population DUEIIP
Jhuggi Jhopri Clusters 1160 32.0 23.84 20.72
Resettlement Colonies 52 20.0 14.90 17.76
Unauthorised Colonies 1500 35.0 26.08 25.16
Urban Villages 216 6.0 4.47 8.88
Notified Slum Areas - 9.5 7.08 26.64
Shelterless - 0.6 0.44 -
Planned Colonies - 29.2 23.18 33.08
Total - 132.3 100.00 132.34
Source: Hazards Centre, 2003;
i) Reports on Slums in Delhi, Slum & JJ Deptt, MCD, 1994.
ii) Evaluation of Slum upgradation strategies in Delhi, (2001),Parvesh Siroha, Unpublished Thesis, SPA, New Delhi
iii) Economic Survey of Delhi 2001-2002
iv) DUEIP, Status Report for Delhi 21, GOI & MoE&F, January2001, page 1, chapter 7.
The reasons for people to migrate to Delhi relate to
the higher per capita investment by the Central and state
government, the higher income earning levels and better
employment avenues it offers. A comparison of the State
Government Plan and non-plan expenditure between
Delhi and the neighbouring States (Table 15.17) show
that Delhi invests about 3 times more per capita
excluding the Union Government spending under Central
projects in Delhi. As expected this is going to provide
much greater opportunities for employment than what is
available in Uttar Pradesh, Rajasthan, Madhya Pradesh,
Bihar and even Haryana.
The increasing population in Delhi puts undue
pressure on the city’s administration for provision of
infrastructure and urban utilities such as water, roads,
electricity, shelter, sanitation, health, education and so on.
Chapter 15 •
WOMEN AND VULNERABLE GROUPS 363
Non-availability of safe water for drinking purposes causes
health problems which can be of very severe nature.
Inadequate provision of basic facilities such as water,
sanitation, health and so on, impact women more
adversely, adding on to their vulnerabilities. Women have
to often resort to open defecation for lack of any other
alternative options. The social shame associated with it
compels them to opt for darker hours of the day during
dawn or dusk that exposes them to violence and abuse.
TABLE 15.17
Per Capita Investment in Delhi and Neighbouring States
Year State Government Population Rupees per2001-2002 Expenditure Capita
(Rs. in crores)
Central Government 4,10,309 1,027,015,247 3995
Bihar 15,599 82,878,796 1879
Haryana 10,832 21,082,989 5158
Madhya Pradesh 16,794 60,385,118 2799
Rajasthan 19,561 56,443,122 3493
Uttar Pradesh 43,247 166,052,859 2605
Delhi 7,575 13,782,976 5410
Source: Hazards Centre, 2003; Public Finance, Centre for Monitoring,Indian Economy Pvt. Ltd., Mumbai, March 2002.
The pursuit to beautify the city has been undertaken at
the cost of some sections of the city’s population—the
poor and labouring masses. Extensive demolitions and
relocation of slums to the outskirts are underway by way
of resettling these slums and JJ clusters. In 1999-2001,
nearly 23,000 families were relocated while another
80,000 families were targeted for 2002.
According to MCD, the migrant population of Delhi is
about 5 to 6 lakhs per annum. Census decadal figures
reveal an overall growth of 4.4 lakhs per year. During
1991-2001, the Jhuggi Jhopri cluster population grew from
1.3 million to 3.2 million—approximately 2 lakh per year.
In 2001, of the 13.8 million populations in Delhi:
about 8 million live in subhuman conditions. There are
3.5 million people in the estimated 1500 unauthorised
colonies, which are not entitled to any civic services.
Another 3 million live in 1200 jhuggi clusters (slums)
where the municipality is supposed to provide communal
facilities. And more than 1.5 million live in resettlement
colonies that are entitled to household sites and services
(Sagar, to be published; Roy, 2000).
Many concerned groups have lamented the absence of
infrastructural facilities and basic amenities in the place
where these households have been relocated. Alpana
Sagar (based on her work in the Gautam Nagar slums
where the families have been relocated to Badarpur
border) reveals how this resettlement ruptures the fabric
of people’s existence. Apart from the physical disruption,
many people face economic disruption, especially the
women, as they lose out on the livelihood opportunities
offered by the surrounding areas. Even for the children,
the existing links for schooling established in the original
place are disturbed and often the place of relocation may
not be adequately equipped to replace their needs. The
added burden due to shifts in the livelihood profile of the
households also affects the children who are no longer in
a position to pursue education due to financial
constraints. Thus, while women find it difficult to manage
the domestic duties with the paid work as servants,
helpers that they earlier undertook, children have been
deprived of the social support structures in the new
location due to the nature of the resettling undertaken by
lottery. The need for transportation from the relocated
areas to their workplaces adds to the costs incurred by the
displaced persons.
A study by the Hazards Centre (2003) stated that
under the environmental improvement strategy, basic
amenities such as water, toilets, bathrooms, drainage,
pavements, dhalaos, Basti Vikas Kendras, community spaces,
etc. are extended to the JJ clusters within a norm of
Rs.800 per capita. Delhi Government provides necessary
funds to the tune of Rs.20 crores for this purpose. The
facilities provided since 1990 and up to March 2000 are as
follows:
• 19,049 toilets at 657 locations
• 18,00,340 sq. m. of pavements and 8,49,000 m.
of drains in most locations.
• 2692 water hydrants, 892 deep hand pumps, 4
tubewells up to 1991-92. DJB has been providing
water supply after that.
• 284 Shishu Vatikas.
Based on these figures it may be surmised that less
than half the JJ clusters have been provided with even the
basic urban amenities of water and sanitation. The
facilities that are lacking reflect the deprivations and
vulnerabilities faced by all those inhabiting these locations
and they are primary schools; dispensaries; street lights;
peripheral infrastructural services like roads, transport,
parks, workplaces, and hospitals (Hazards Centre, 2003).
As per government policy the relocation is necessitated
on the basis of certain priorities as follows:
1. where the lands is required for specific projects;
DELHI DEVELOPMENT REPORT364
2. because the existing JJ clusters are a cause of
social tension in the area;
3. from areas where they are continuously exposed
to the vagaries of nature such as ‘Yamuna Bandh’.
4. from along the railway tracks for both
environmental and human safety.
The people’s housing policy document drafted by the
Hazards Centre pointed out that the relocation scheme of
the government is based on two assumptions: (1) all the
squatters occupying public land would be given alternative
sites (on the basis of cut-off dates, beyond which jhuggies
would not be eligible for relocation); and (2) no new
jhuggies would be allowed to come up on public land in
Delhi after the cut-off date. The National Alliance of
People’s Movements has pointed out that the government
has failed on both these grounds.
15.7 Public Transportation
The availability of adequate means for public
transportation is an essential element to reduce
vulnerability of the commuting public in Delhi. The major
source of public commutation is traveling by buses, DTC,
Blue line or chartered services. In spite of possessing the
largest fleet of buses, Delhi still falls short of the demand
for transportation services. This may be due to the
outreach and routes followed, timing of services, capacity
of vehicle and so on. The public perception survey
conducted by DRS for Delhi found that public dependence
on bus transport services is quite significant. The cost of
traveling is also fairly reasonable, although the absence of
bus pass facility for poor, unorganised workers who earn
small sums and have to travel long distances within the
capital-city is a matter of grave concern and worthy of
attention. There is also a need to re-examine the demand
pattern for bus routes after resettlement and relocation of
large numbers of slums and squatters, as well as
industrial complexes subsequent to the order for closure
of polluting industries located within Delhi.
The increasing numbers of private vehicles in the city,
especially cars and other four wheelers have resulted in
clogging the roads of Delhi. Even the operation of flyovers
and widening of roads have not been able to ebb the
pressure put by these ever-growing numbers of vehicles.
The effort of Delhi Government to check for the in flow
from other states by putting some restrictions on timings
of goods carrying vehicles can only address a minor part
of the problem.
The operation of DMRC and its widening scope will
have some impact on easing the burden. At the moment,
1.5 lakh persons use the Delhi metro every day. Reliable
and comfortable public transportation can assist in
reducing the usage of privately owned vehicles. This may
help in preventing the accidents on roads, curb the rising
rage levels of drivers and the fear of common persons
being killed/hurt as a result of the high number of
accidents. More than 10,000 traffic accidents are reported
by the NCRB during 2001 in Delhi. Nearly 115 cases of
accidents involve private cars.
The other modes of private transport such as cycles,
two wheelers are also at risk of accidents. A substantial
number of pedestrians (557) are killed due to road
accidents, which accounts for nearly one-third of all
pedestrian deaths in the country (NCRB, 2001).
The new flyovers and high speed roads built with a
view to bring Delhi at par with international standards of
metropolitan cities, have limited concern for the walking
pedestrian. The manually driven handcarts, cycle
rickshaws, bicycles and so on also have to exert more
physical strain to negotiate these roads.
The control exercised on the number of cycle-rickshaws
by the Municipal Authorities of Delhi and the area
designated for their plying puts the operators through
tremendous insecurity and exposes them to harassment.
The city administration declared that it would not allow
more than 90,000 licenses for the entire city (Kishwar,
2003). There is no such ceiling imposed on the plying of
any other motorised vehicles. The imposition of such a
restrictive policy gives space for a flourishing extortion
racket for issuing and renewing licences as well as
periodical bribes for plying cycle-rickshaws. The vehicles
are arbitrarily seized in the name of decongestion of the
city with the city authorities proudly claiming destruction
of 50,000 rickshaws every year (Kishwar, 2003). The
harried rickshaw puller, often not even the owner but a
mere tenant operating the vehicle, is already under
tremendous pressure and has to face economic assault,
humiliation, physical beating for the service that is being
rendered to the population of Delhi.
The authorities expend quite a lot of energy trying to
restrict the movement of such slow/manually operated
modes of transportation, such as bullock-cart, tonga, thela,
rickshaw and so on especially in certain parts of the city
which they desire to make into the main travel corridors.
The need to plan for these sections of the population who
depend on these modes of transport for commuting or
livelihood is completely lost on them. It is highly desirable
that the authorities exert some of their energies towards
legitimately legalising these operations and providing the
space to work and live with dignity. These concerns are
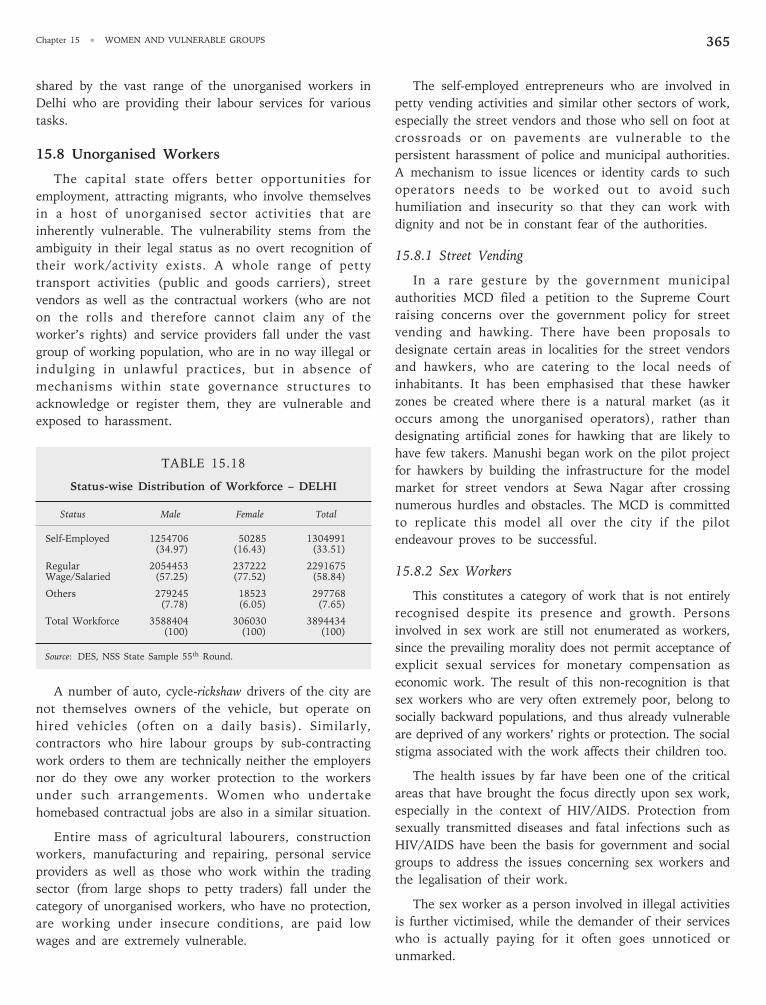
Chapter 15 •
WOMEN AND VULNERABLE GROUPS 365
shared by the vast range of the unorganised workers in
Delhi who are providing their labour services for various
tasks.
15.8 Unorganised Workers
The capital state offers better opportunities for
employment, attracting migrants, who involve themselves
in a host of unorganised sector activities that are
inherently vulnerable. The vulnerability stems from the
ambiguity in their legal status as no overt recognition of
their work/activity exists. A whole range of petty
transport activities (public and goods carriers), street
vendors as well as the contractual workers (who are not
on the rolls and therefore cannot claim any of the
worker’s rights) and service providers fall under the vast
group of working population, who are in no way illegal or
indulging in unlawful practices, but in absence of
mechanisms within state governance structures to
acknowledge or register them, they are vulnerable and
exposed to harassment.
TABLE 15.18
Status-wise Distribution of Workforce – DELHI
Status Male Female Total
Self-Employed 1254706 50285 1304991(34.97) (16.43) (33.51)
Regular 2054453 237222 2291675Wage/Salaried (57.25) (77.52) (58.84)
Others 279245 18523 297768(7.78) (6.05) (7.65)
Total Workforce 3588404 306030 3894434(100) (100) (100)
Source: DES, NSS State Sample 55th Round.
A number of auto, cycle-rickshaw drivers of the city are
not themselves owners of the vehicle, but operate on
hired vehicles (often on a daily basis). Similarly,
contractors who hire labour groups by sub-contracting
work orders to them are technically neither the employers
nor do they owe any worker protection to the workers
under such arrangements. Women who undertake
homebased contractual jobs are also in a similar situation.
Entire mass of agricultural labourers, construction
workers, manufacturing and repairing, personal service
providers as well as those who work within the trading
sector (from large shops to petty traders) fall under the
category of unorganised workers, who have no protection,
are working under insecure conditions, are paid low
wages and are extremely vulnerable.
The self-employed entrepreneurs who are involved in
petty vending activities and similar other sectors of work,
especially the street vendors and those who sell on foot at
crossroads or on pavements are vulnerable to the
persistent harassment of police and municipal authorities.
A mechanism to issue licences or identity cards to such
operators needs to be worked out to avoid such
humiliation and insecurity so that they can work with
dignity and not be in constant fear of the authorities.
15.8.1 Street Vending
In a rare gesture by the government municipal
authorities MCD filed a petition to the Supreme Court
raising concerns over the government policy for street
vending and hawking. There have been proposals to
designate certain areas in localities for the street vendors
and hawkers, who are catering to the local needs of
inhabitants. It has been emphasised that these hawker
zones be created where there is a natural market (as it
occurs among the unorganised operators), rather than
designating artificial zones for hawking that are likely to
have few takers. Manushi began work on the pilot project
for hawkers by building the infrastructure for the model
market for street vendors at Sewa Nagar after crossing
numerous hurdles and obstacles. The MCD is committed
to replicate this model all over the city if the pilot
endeavour proves to be successful.
15.8.2 Sex Workers
This constitutes a category of work that is not entirely
recognised despite its presence and growth. Persons
involved in sex work are still not enumerated as workers,
since the prevailing morality does not permit acceptance of
explicit sexual services for monetary compensation as
economic work. The result of this non-recognition is that
sex workers who are very often extremely poor, belong to
socially backward populations, and thus already vulnerable
are deprived of any workers’ rights or protection. The social
stigma associated with the work affects their children too.
The health issues by far have been one of the critical
areas that have brought the focus directly upon sex work,
especially in the context of HIV/AIDS. Protection from
sexually transmitted diseases and fatal infections such as
HIV/AIDS have been the basis for government and social
groups to address the issues concerning sex workers and
the legalisation of their work.
The sex worker as a person involved in illegal activities
is further victimised, while the demander of their services
who is actually paying for it often goes unnoticed or
unmarked.
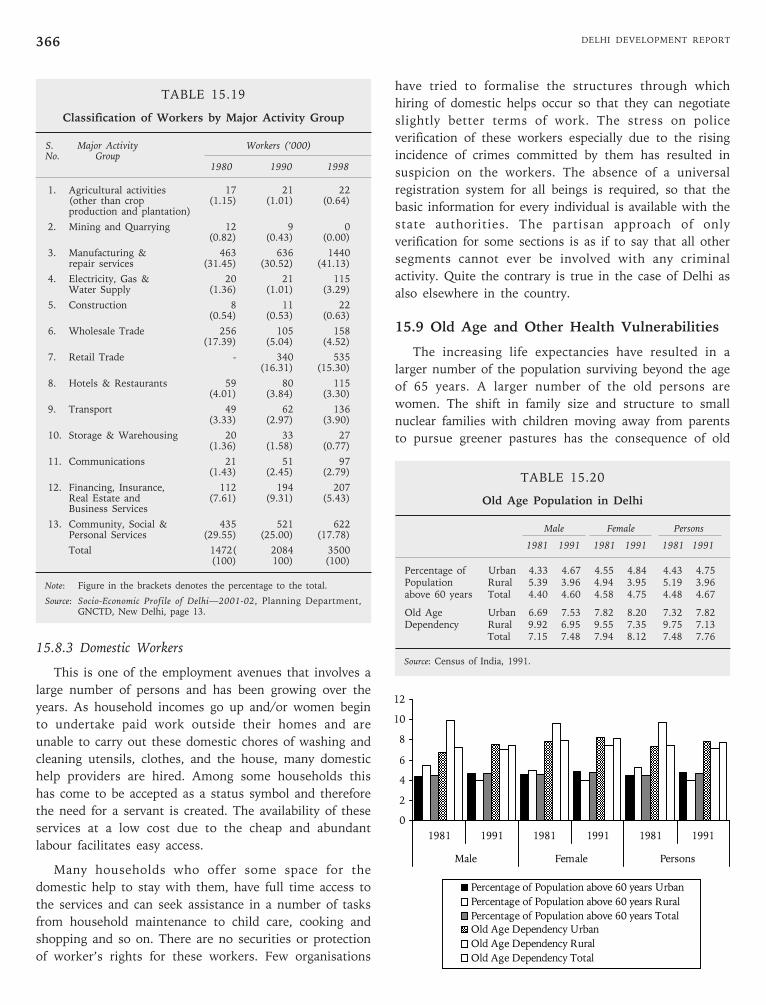
DELHI DEVELOPMENT REPORT366
TABLE 15.19
Classification of Workers by Major Activity Group
S. Major Activity Workers (’000)No. Group
1980 1990 1998
1. Agricultural activities 17 21 22(other than crop (1.15) (1.01) (0.64)production and plantation)
2. Mining and Quarrying 12 9 0(0.82) (0.43) (0.00)
3. Manufacturing & 463 636 1440repair services (31.45) (30.52) (41.13)
4. Electricity, Gas & 20 21 115Water Supply (1.36) (1.01) (3.29)
5. Construction 8 11 22(0.54) (0.53) (0.63)
6. Wholesale Trade 256 105 158(17.39) (5.04) (4.52)
7. Retail Trade - 340 535(16.31) (15.30)
8. Hotels & Restaurants 59 80 115(4.01) (3.84) (3.30)
9. Transport 49 62 136(3.33) (2.97) (3.90)
10. Storage & Warehousing 20 33 27(1.36) (1.58) (0.77)
11. Communications 21 51 97(1.43) (2.45) (2.79)
12. Financing, Insurance, 112 194 207Real Estate and (7.61) (9.31) (5.43)Business Services
13. Community, Social & 435 521 622Personal Services (29.55) (25.00) (17.78)
Total 1472( 2084 3500(100) 100) (100)
Note: Figure in the brackets denotes the percentage to the total.
Source: Socio-Economic Profile of Delhi—2001-02, Planning Department,GNCTD, New Delhi, page 13.
15.8.3 Domestic Workers
This is one of the employment avenues that involves a
large number of persons and has been growing over the
years. As household incomes go up and/or women begin
to undertake paid work outside their homes and are
unable to carry out these domestic chores of washing and
cleaning utensils, clothes, and the house, many domestic
help providers are hired. Among some households this
has come to be accepted as a status symbol and therefore
the need for a servant is created. The availability of these
services at a low cost due to the cheap and abundant
labour facilitates easy access.
Many households who offer some space for the
domestic help to stay with them, have full time access to
the services and can seek assistance in a number of tasks
from household maintenance to child care, cooking and
shopping and so on. There are no securities or protection
of worker’s rights for these workers. Few organisations
have tried to formalise the structures through which
hiring of domestic helps occur so that they can negotiate
slightly better terms of work. The stress on police
verification of these workers especially due to the rising
incidence of crimes committed by them has resulted in
suspicion on the workers. The absence of a universal
registration system for all beings is required, so that the
basic information for every individual is available with the
state authorities. The partisan approach of only
verification for some sections is as if to say that all other
segments cannot ever be involved with any criminal
activity. Quite the contrary is true in the case of Delhi as
also elsewhere in the country.
15.9 Old Age and Other Health Vulnerabilities
The increasing life expectancies have resulted in a
larger number of the population surviving beyond the age
of 65 years. A larger number of the old persons are
women. The shift in family size and structure to small
nuclear families with children moving away from parents
to pursue greener pastures has the consequence of old
TABLE 15.20
Old Age Population in Delhi
Male Female Persons
1981 1991 1981 1991 1981 1991
Percentage of Urban 4.33 4.67 4.55 4.84 4.43 4.75Population Rural 5.39 3.96 4.94 3.95 5.19 3.96above 60 years Total 4.40 4.60 4.58 4.75 4.48 4.67
Old Age Urban 6.69 7.53 7.82 8.20 7.32 7.82Dependency Rural 9.92 6.95 9.55 7.35 9.75 7.13
Total 7.15 7.48 7.94 8.12 7.48 7.76
Source: Census of India, 1991.
0
2
4
6
8
10
12
1981 1991 1981 1991 1981 1991
Male Female Persons
Percentage of Population above 60 years Urban
Percentage of Population above 60 years Rural
Percentage of Population above 60 years Total
Old Age Dependency Urban
Old Age Dependency Rural
Old Age Dependency Total
Chapter 15 •
WOMEN AND VULNERABLE GROUPS 367
where even institutions of education are unsafe from
violence and the educators themselves are perpetrators of
crimes. This acts as a severe deterrent in achieving the
goal of universal elementary education and improving
school enrollments, especially of girls. It is horrific that
this should be occurring in the capital city of Delhi.
• O.P. Sharma, Principal of Government Middle School
in Raghubir Nagar and Ved Prakash Sharma, Vice
Principal of Sarvodaya Bal Vidyalaya, West Patel
Nagar and their two friends were arrested for
allegedly raping a 16 year old girl – a correspondence
student. They threatened to kill her if she disclosed
the matter.
• A government school teacher, Naeem Ahmed Siddiqui
of Sarvodaya Bal Vidyalaya, Rouse Avenue, was sent
to judicial custody for allegedly sodomising a 10-year
old student.
• November, 2004 – Teacher of a Mehrauli Government
School, held on charges of raping an 8-year old
student in the school’s toilet. He had threatened to
kill the girl if she talked about it.
• Summer 2004 – A Jehangiri Government School
teacher raped a 10-year old student, the daughter of
a daily wage labour. Later arrested by police.
• September 2003 – A class VII student was raped
inside a Government School at Saket no arrests yet.
• June 2003 – Samaipur Badli School teacher raped a
10-year old student inside school; later arrested;
• February 2004 – a 14 year old girl was allegedly
molested by an unidentified man in a government
school at R.K. Puram. No trace of the accused.
Within Delhi, in terms of districts, Northwest stands
out to be the worst with 263 of the 697 cases being
registered are from this district (Table 15.21). In cases of
crimes against children, the guardians have a critical role
in generating awareness, identification and assisting in the
process of justice delivery along with the police and
judiciary. In 2002, the total number of cases pending with
the police for investigation was 949. Only in 28 cases,
investigation was refused, whereas in 203 cases the charge
was found false or a mistake of fact or law. Chargesheets
were submitted in 342 cases, with another 115 cases
remaining pending during the year. As compared to the all
India scenario, the chargesheeting rate for Delhi is lower
and the pendancy rate slightly higher in cases of crimes
committed against children.
In comparison, the performance of courts with respect
to disposal of persons arrested for committing crimes
against children has been very poor. Of the 967 cases
under trial at the beginning of the year 2002, in only 111
cases the trial could be completed. A large number of the
parents being left behind alone to fend for themselves.
This is the age of failing health and physical strength.
Among those who are relatively resourceful, the risk of
being robbed, killed and cheated is stronger. The
increasing pressure on the unemployed in the city for
survival often pushes them to resort to such crimes.
15.10 Child Abuse and Violenceagainst Children
The compulsion to work itself may be seen as child
abuse in the form of economic exploitation of children by
different agents involved—the employers, the parents and
the government—for their inability to provide for and
safeguard them against such a need. Children within
society as part of it and as a result of their vulnerability
are exposed to various crimes. The Indian Penal Code
(IPC) lists the crimes against children and for the
prominent categories data is collated annually from the
cases registered with the police.
Crimes Against Children (CAC) under the IPC sections
are: Murder (302 IPC); Foeticides (Crime against being
born) (Section 315 & 316 IPC); Infanticides (Crime against
Unborn Child) (Section 315 IPC); Abetment of Suicide
(Section 305 IPC); Exposure and Abandonment (Crime
against Children by Parents or Others to Expose or to Leave
them with the Intention of Abandonment) (Section 317
IPC); Kidnapping and Abduction for Several Reasons: for
exporting (Section 360 IPC); from lawful guardianship
(Section 361 IPC); for ransom (Section 363 to be read along
with 384 IPC); for camel racing (Section 363); for begging
(Section 363 A; to compel for marriage (Section 366); for
slavery (Section 367); for stealing from its person (under 10
years of age only) (Section 369 IPC); Procuration of Minor
Girls for Inducement to force or seduce to illicit intercourse
(Section 366 A); Selling of Girls for Prostitution (Section
372 IPC); Buying of Girls for Prostitution (Section 373 IPC);
Rape and Unnatural Offences.
The Special and Local Laws (SLL) sections are:
Immoral Trafficking (Prevention) Act (ITPA) (minors
abused in prostitution); Child Marriage Restraint Act; and
Child Labour (Prevention) Act.
As per the NCRB, a total of 697 cases of crimes
against children were registered in the UT of Delhi during
the year 2002. Nearly two-thirds of these involve cases of
kidnapping and abduction (426) for various reasons.
Other crimes against children involve rape (38 cases),
murder (29 cases), exposure and abandonment (29 cases)
and foeticide (20 cases).
Even a quick look at the newspaper reports
highlighting the growing malaise in our society show that
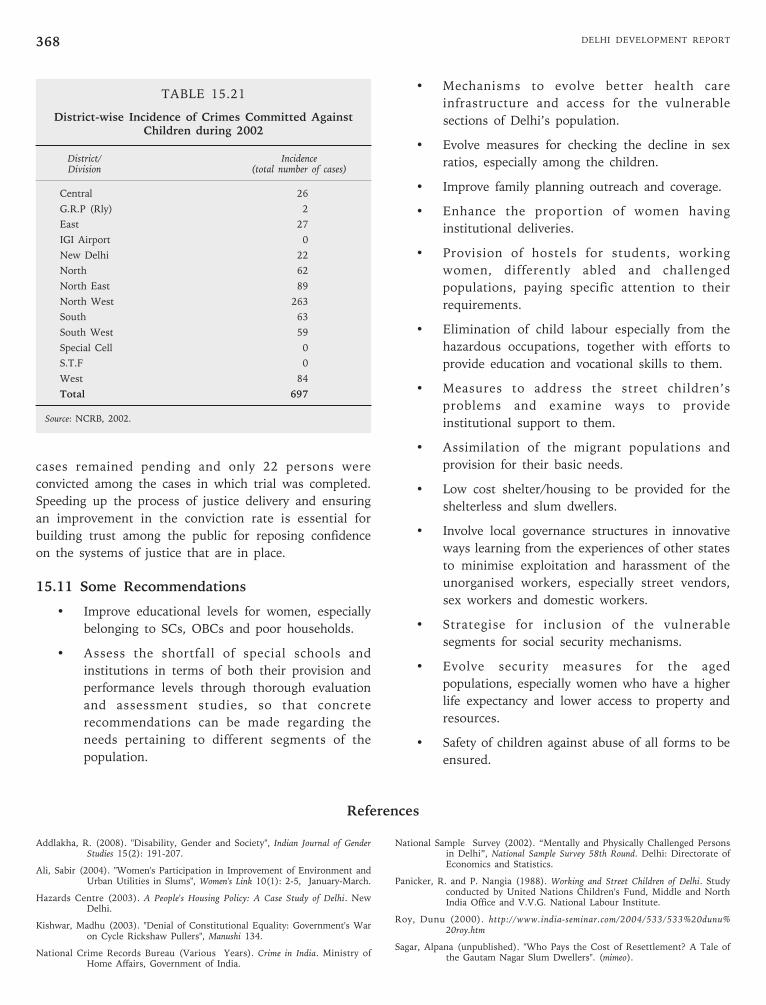
DELHI DEVELOPMENT REPORT368
• Mechanisms to evolve better health care
infrastructure and access for the vulnerable
sections of Delhi’s population.
• Evolve measures for checking the decline in sex
ratios, especially among the children.
• Improve family planning outreach and coverage.
• Enhance the proportion of women having
institutional deliveries.
• Provision of hostels for students, working
women, differently abled and challenged
populations, paying specific attention to their
requirements.
• Elimination of child labour especially from the
hazardous occupations, together with efforts to
provide education and vocational skills to them.
• Measures to address the street children’s
problems and examine ways to provide
institutional support to them.
• Assimilation of the migrant populations and
provision for their basic needs.
• Low cost shelter/housing to be provided for the
shelterless and slum dwellers.
• Involve local governance structures in innovative
ways learning from the experiences of other states
to minimise exploitation and harassment of the
unorganised workers, especially street vendors,
sex workers and domestic workers.
• Strategise for inclusion of the vulnerable
segments for social security mechanisms.
• Evolve security measures for the aged
populations, especially women who have a higher
life expectancy and lower access to property and
resources.
• Safety of children against abuse of all forms to be
ensured.
Addlakha, R. (2008). "Disability, Gender and Society", Indian Journal of GenderStudies 15(2): 191-207.
Ali, Sabir (2004). "Women's Participation in Improvement of Environment andUrban Utilities in Slums", Women's Link 10(1): 2-5, January-March.
Hazards Centre (2003). A People's Housing Policy: A Case Study of Delhi. NewDelhi.
Kishwar, Madhu (2003). "Denial of Constitutional Equality: Government's Waron Cycle Rickshaw Pullers", Manushi 134.
National Crime Records Bureau (Various Years). Crime in India. Ministry ofHome Affairs, Government of India.
National Sample Survey (2002). “Mentally and Physically Challenged Personsin Delhi”, National Sample Survey 58th Round. Delhi: Directorate ofEconomics and Statistics.
Panicker, R. and P. Nangia (1988). Working and Street Children of Delhi. Studyconducted by United Nations Children's Fund, Middle and NorthIndia Office and V.V.G. National Labour Institute.
Roy, Dunu (2000). http://www.india-seminar.com/2004/533/533%20dunu%20roy.htm
Sagar, Alpana (unpublished). "Who Pays the Cost of Resettlement? A Tale ofthe Gautam Nagar Slum Dwellers". (mimeo).
TABLE 15.21
District-wise Incidence of Crimes Committed AgainstChildren during 2002
District/ IncidenceDivision (total number of cases)
Central 26
G.R.P (Rly) 2
East 27
IGI Airport 0
New Delhi 22
North 62
North East 89
North West 263
South 63
South West 59
Special Cell 0
S.T.F 0
West 84
Total 697
Source: NCRB, 2002.
cases remained pending and only 22 persons were
convicted among the cases in which trial was completed.
Speeding up the process of justice delivery and ensuring
an improvement in the conviction rate is essential for
building trust among the public for reposing confidence
on the systems of justice that are in place.
15.11 Some Recommendations
• Improve educational levels for women, especially
belonging to SCs, OBCs and poor households.
• Assess the shortfall of special schools and
institutions in terms of both their provision and
performance levels through thorough evaluation
and assessment studies, so that concrete
recommendations can be made regarding the
needs pertaining to different segments of the
population.
References
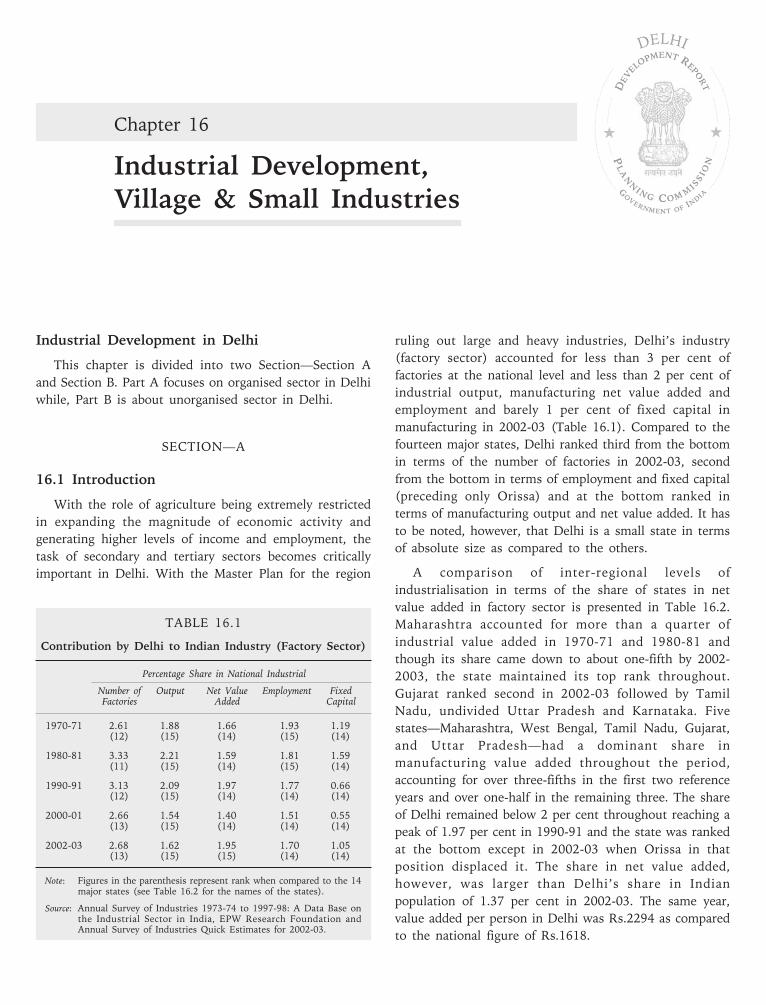
TABLE 16.1
Contribution by Delhi to Indian Industry (Factory Sector)
Percentage Share in National Industrial
Number of Output Net Value Employment FixedFactories Added Capital
1970-71 2.61 1.88 1.66 1.93 1.19(12) (15) (14) (15) (14)
1980-81 3.33 2.21 1.59 1.81 1.59(11) (15) (14) (15) (14)
1990-91 3.13 2.09 1.97 1.77 0.66(12) (15) (14) (14) (14)
2000-01 2.66 1.54 1.40 1.51 0.55(13) (15) (14) (14) (14)
2002-03 2.68 1.62 1.95 1.70 1.05(13) (15) (15) (14) (14)
Note: Figures in the parenthesis represent rank when compared to the 14major states (see Table 16.2 for the names of the states).
Source: Annual Survey of Industries 1973-74 to 1997-98: A Data Base onthe Industrial Sector in India, EPW Research Foundation andAnnual Survey of Industries Quick Estimates for 2002-03.
Chapter 16
Industrial Development,Village & Small Industries
DELHI
Industrial Development in Delhi
This chapter is divided into two Section—Section A
and Section B. Part A focuses on organised sector in Delhi
while, Part B is about unorganised sector in Delhi.
SECTION—A
16.1 Introduction
With the role of agriculture being extremely restricted
in expanding the magnitude of economic activity and
generating higher levels of income and employment, the
task of secondary and tertiary sectors becomes critically
important in Delhi. With the Master Plan for the region
ruling out large and heavy industries, Delhi’s industry
(factory sector) accounted for less than 3 per cent of
factories at the national level and less than 2 per cent of
industrial output, manufacturing net value added and
employment and barely 1 per cent of fixed capital in
manufacturing in 2002-03 (Table 16.1). Compared to the
fourteen major states, Delhi ranked third from the bottom
in terms of the number of factories in 2002-03, second
from the bottom in terms of employment and fixed capital
(preceding only Orissa) and at the bottom ranked in
terms of manufacturing output and net value added. It has
to be noted, however, that Delhi is a small state in terms
of absolute size as compared to the others.
A comparison of inter-regional levels of
industrialisation in terms of the share of states in net
value added in factory sector is presented in Table 16.2.
Maharashtra accounted for more than a quarter of
industrial value added in 1970-71 and 1980-81 and
though its share came down to about one-fifth by 2002-
2003, the state maintained its top rank throughout.
Gujarat ranked second in 2002-03 followed by Tamil
Nadu, undivided Uttar Pradesh and Karnataka. Five
states—Maharashtra, West Bengal, Tamil Nadu, Gujarat,
and Uttar Pradesh—had a dominant share in
manufacturing value added throughout the period,
accounting for over three-fifths in the first two reference
years and over one-half in the remaining three. The share
of Delhi remained below 2 per cent throughout reaching a
peak of 1.97 per cent in 1990-91 and the state was ranked
at the bottom except in 2002-03 when Orissa in that
position displaced it. The share in net value added,
however, was larger than Delhi’s share in Indian
population of 1.37 per cent in 2002-03. The same year,
value added per person in Delhi was Rs.2294 as compared
to the national figure of Rs.1618.
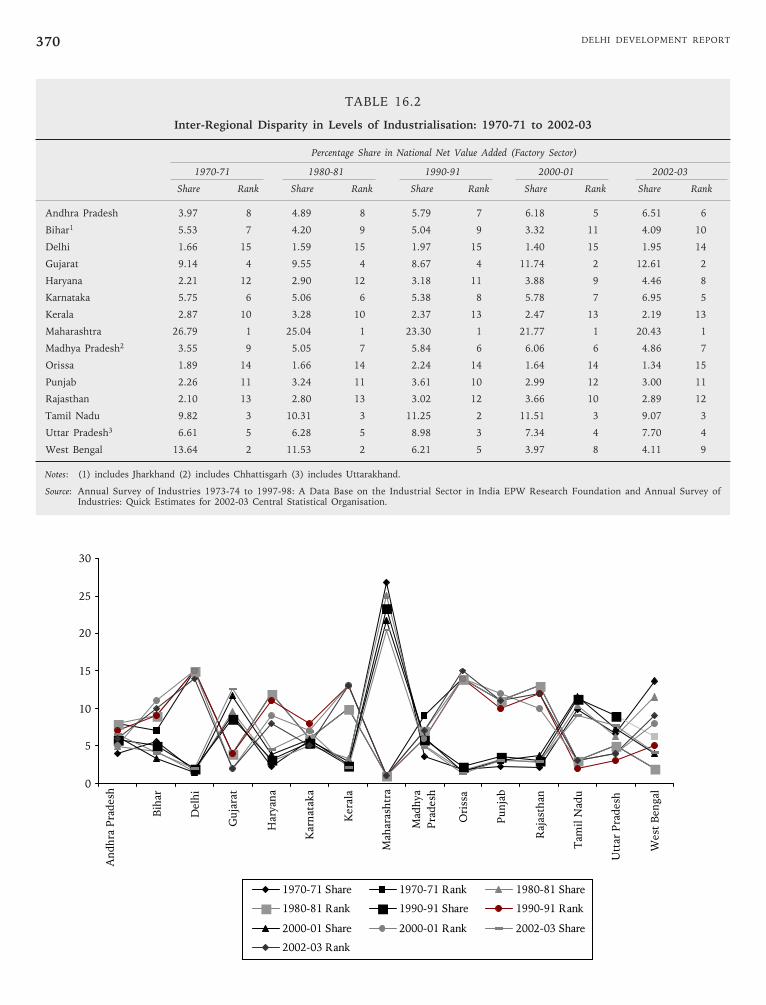
DELHI DEVELOPMENT REPORT370
TABLE 16.2
Inter-Regional Disparity in Levels of Industrialisation: 1970-71 to 2002-03
Percentage Share in National Net Value Added (Factory Sector)
1970-71 1980-81 1990-91 2000-01 2002-03
Share Rank Share Rank Share Rank Share Rank Share Rank
Andhra Pradesh 3.97 8 4.89 8 5.79 7 6.18 5 6.51 6
Bihar1 5.53 7 4.20 9 5.04 9 3.32 11 4.09 10
Delhi 1.66 15 1.59 15 1.97 15 1.40 15 1.95 14
Gujarat 9.14 4 9.55 4 8.67 4 11.74 2 12.61 2
Haryana 2.21 12 2.90 12 3.18 11 3.88 9 4.46 8
Karnataka 5.75 6 5.06 6 5.38 8 5.78 7 6.95 5
Kerala 2.87 10 3.28 10 2.37 13 2.47 13 2.19 13
Maharashtra 26.79 1 25.04 1 23.30 1 21.77 1 20.43 1
Madhya Pradesh2 3.55 9 5.05 7 5.84 6 6.06 6 4.86 7
Orissa 1.89 14 1.66 14 2.24 14 1.64 14 1.34 15
Punjab 2.26 11 3.24 11 3.61 10 2.99 12 3.00 11
Rajasthan 2.10 13 2.80 13 3.02 12 3.66 10 2.89 12
Tamil Nadu 9.82 3 10.31 3 11.25 2 11.51 3 9.07 3
Uttar Pradesh3 6.61 5 6.28 5 8.98 3 7.34 4 7.70 4
West Bengal 13.64 2 11.53 2 6.21 5 3.97 8 4.11 9
Notes: (1) includes Jharkhand (2) includes Chhattisgarh (3) includes Uttarakhand.
Source: Annual Survey of Industries 1973-74 to 1997-98: A Data Base on the Industrial Sector in India EPW Research Foundation and Annual Survey ofIndustries: Quick Estimates for 2002-03 Central Statistical Organisation.
0
5
10
15
20
25
30
An
dh
ra P
rad
esh
Bih
ar
Del
hi
Gu
jara
t
Har
yan
a
Kar
nat
aka
Ker
ala
Mah
aras
htr
a
Mad
hya
Pra
des
h
Ori
ssa
Pu
nja
b
Raj
asth
an
Tam
il N
adu
Utt
ar P
rad
esh
Wes
t B
engal
1970-71 Share 1970-71 Rank 1980-81 Share
1980-81 Rank 1990-91 Share 1990-91 Rank
2000-01 Share 2000-01 Rank 2002-03 Share
2002-03 Rank
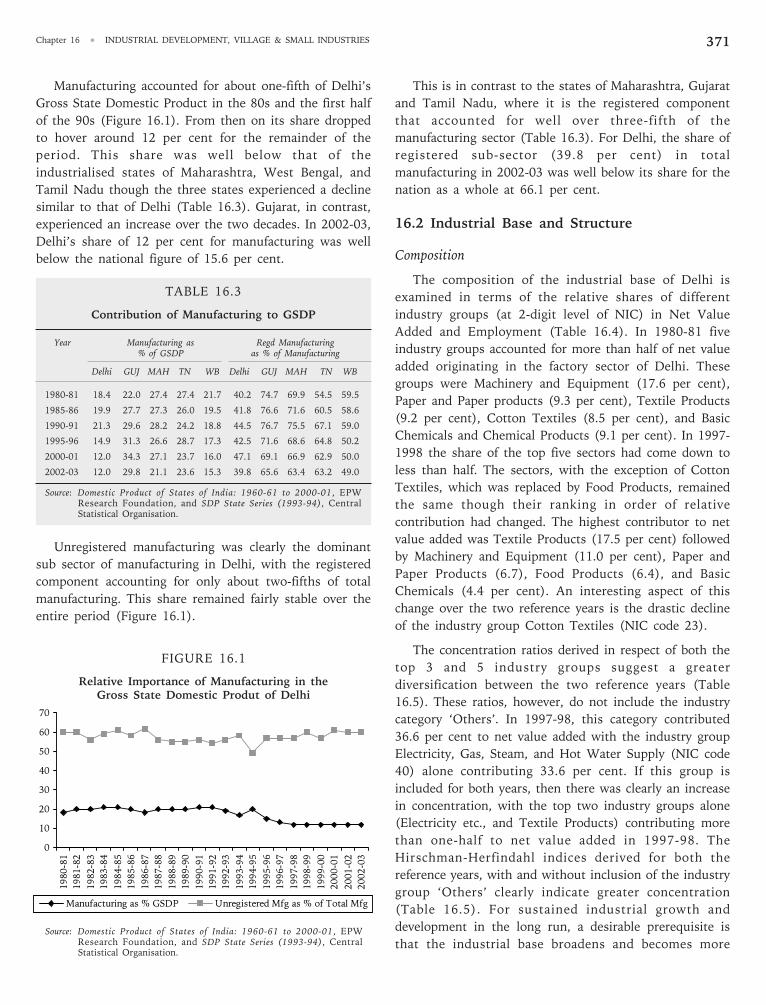
Chapter 16 • INDUSTRIAL DEVELOPMENT, VILLAGE & SMALL INDUSTRIES 371
Manufacturing accounted for about one-fifth of Delhi’s
Gross State Domestic Product in the 80s and the first half
of the 90s (Figure 16.1). From then on its share dropped
to hover around 12 per cent for the remainder of the
period. This share was well below that of the
industrialised states of Maharashtra, West Bengal, and
Tamil Nadu though the three states experienced a decline
similar to that of Delhi (Table 16.3). Gujarat, in contrast,
experienced an increase over the two decades. In 2002-03,
Delhi’s share of 12 per cent for manufacturing was well
below the national figure of 15.6 per cent.
TABLE 16.3
Contribution of Manufacturing to GSDP
Year Manufacturing as Regd Manufacturing% of GSDP as % of Manufacturing
Delhi GUJ MAH TN WB Delhi GUJ MAH TN WB
1980-81 18.4 22.0 27.4 27.4 21.7 40.2 74.7 69.9 54.5 59.5
1985-86 19.9 27.7 27.3 26.0 19.5 41.8 76.6 71.6 60.5 58.6
1990-91 21.3 29.6 28.2 24.2 18.8 44.5 76.7 75.5 67.1 59.0
1995-96 14.9 31.3 26.6 28.7 17.3 42.5 71.6 68.6 64.8 50.2
2000-01 12.0 34.3 27.1 23.7 16.0 47.1 69.1 66.9 62.9 50.0
2002-03 12.0 29.8 21.1 23.6 15.3 39.8 65.6 63.4 63.2 49.0
Source: Domestic Product of States of India: 1960-61 to 2000-01, EPWResearch Foundation, and SDP State Series (1993-94), CentralStatistical Organisation.
Unregistered manufacturing was clearly the dominant
sub sector of manufacturing in Delhi, with the registered
component accounting for only about two-fifths of total
manufacturing. This share remained fairly stable over the
entire period (Figure 16.1).
FIGURE 16.1
Relative Importance of Manufacturing in theGross State Domestic Produt of Delhi
This is in contrast to the states of Maharashtra, Gujarat
and Tamil Nadu, where it is the registered component
that accounted for well over three-fifth of the
manufacturing sector (Table 16.3). For Delhi, the share of
registered sub-sector (39.8 per cent) in total
manufacturing in 2002-03 was well below its share for the
nation as a whole at 66.1 per cent.
16.2 Industrial Base and Structure
Composition
The composition of the industrial base of Delhi is
examined in terms of the relative shares of different
industry groups (at 2-digit level of NIC) in Net Value
Added and Employment (Table 16.4). In 1980-81 five
industry groups accounted for more than half of net value
added originating in the factory sector of Delhi. These
groups were Machinery and Equipment (17.6 per cent),
Paper and Paper products (9.3 per cent), Textile Products
(9.2 per cent), Cotton Textiles (8.5 per cent), and Basic
Chemicals and Chemical Products (9.1 per cent). In 1997-
1998 the share of the top five sectors had come down to
less than half. The sectors, with the exception of Cotton
Textiles, which was replaced by Food Products, remained
the same though their ranking in order of relative
contribution had changed. The highest contributor to net
value added was Textile Products (17.5 per cent) followed
by Machinery and Equipment (11.0 per cent), Paper and
Paper Products (6.7), Food Products (6.4), and Basic
Chemicals (4.4 per cent). An interesting aspect of this
change over the two reference years is the drastic decline
of the industry group Cotton Textiles (NIC code 23).
The concentration ratios derived in respect of both the
top 3 and 5 industry groups suggest a greater
diversification between the two reference years (Table
16.5). These ratios, however, do not include the industry
category ‘Others’. In 1997-98, this category contributed
36.6 per cent to net value added with the industry group
Electricity, Gas, Steam, and Hot Water Supply (NIC code
40) alone contributing 33.6 per cent. If this group is
included for both years, then there was clearly an increase
in concentration, with the top two industry groups alone
(Electricity etc., and Textile Products) contributing more
than one-half to net value added in 1997-98. The
Hirschman-Herfindahl indices derived for both the
reference years, with and without inclusion of the industry
group ‘Others’ clearly indicate greater concentration
(Table 16.5). For sustained industrial growth and
development in the long run, a desirable prerequisite is
that the industrial base broadens and becomes more
0
10
20
30
40
50
60
70
1980-81
1981-82
1982-83
1983-84
1984-85
1985-86
1986-87
1987-88
1988-89
1989-90
1990-91
1991-92
1992-93
1993-94
1994-95
1995-96
1996-97
1997-98
1998-99
1999-00
2000-01
2001-02
2002-03
Manufacturing as % GSDP Unregistered Mfg as % of Total Mfg
Source: Domestic Product of States of India: 1960-61 to 2000-01, EPWResearch Foundation, and SDP State Series (1993-94), CentralStatistical Organisation.
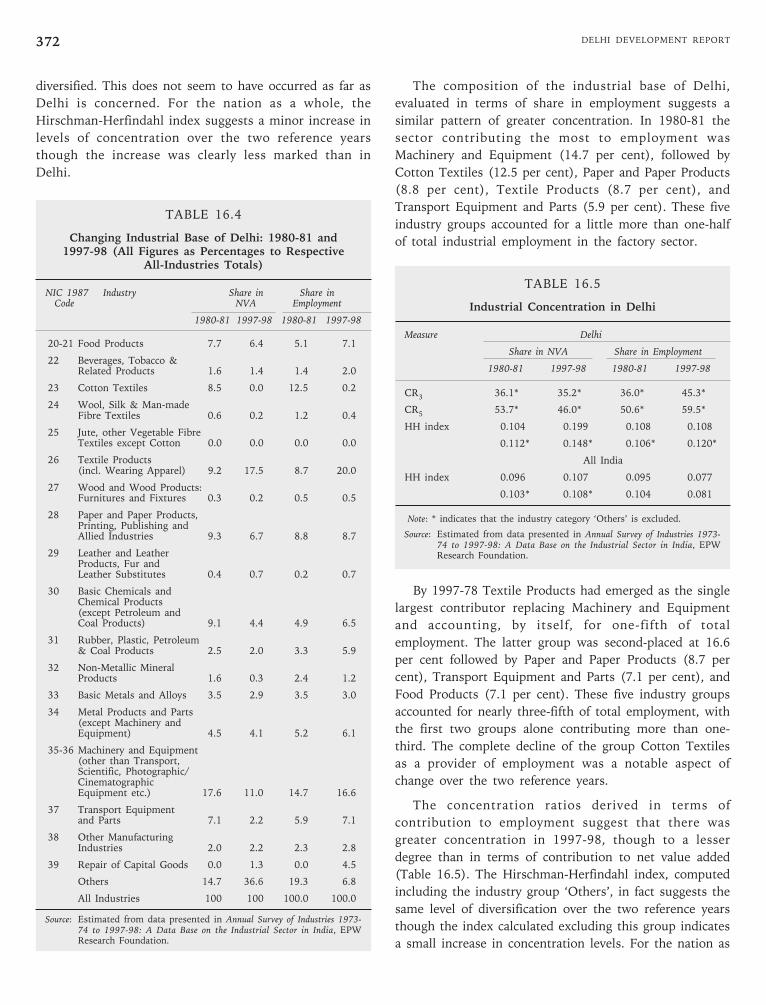
DELHI DEVELOPMENT REPORT372
The composition of the industrial base of Delhi,
evaluated in terms of share in employment suggests a
similar pattern of greater concentration. In 1980-81 the
sector contributing the most to employment was
Machinery and Equipment (14.7 per cent), followed by
Cotton Textiles (12.5 per cent), Paper and Paper Products
(8.8 per cent), Textile Products (8.7 per cent), and
Transport Equipment and Parts (5.9 per cent). These five
industry groups accounted for a little more than one-half
of total industrial employment in the factory sector.
TABLE 16.5
Industrial Concentration in Delhi
Measure Delhi
Share in NVA Share in Employment
1980-81 1997-98 1980-81 1997-98
CR3
36.1* 35.2* 36.0* 45.3*
CR5
53.7* 46.0* 50.6* 59.5*
HH index 0.104 0.199 0.108 0.108
0.112* 0.148* 0.106* 0.120*
All India
HH index 0.096 0.107 0.095 0.077
0.103* 0.108* 0.104 0.081
Note: * indicates that the industry category ‘Others’ is excluded.
Source: Estimated from data presented in Annual Survey of Industries 1973-74 to 1997-98: A Data Base on the Industrial Sector in India, EPWResearch Foundation.
By 1997-78 Textile Products had emerged as the single
largest contributor replacing Machinery and Equipment
and accounting, by itself, for one-fifth of total
employment. The latter group was second-placed at 16.6
per cent followed by Paper and Paper Products (8.7 per
cent), Transport Equipment and Parts (7.1 per cent), and
Food Products (7.1 per cent). These five industry groups
accounted for nearly three-fifth of total employment, with
the first two groups alone contributing more than one-
third. The complete decline of the group Cotton Textiles
as a provider of employment was a notable aspect of
change over the two reference years.
The concentration ratios derived in terms of
contribution to employment suggest that there was
greater concentration in 1997-98, though to a lesser
degree than in terms of contribution to net value added
(Table 16.5). The Hirschman-Herfindahl index, computed
including the industry group ‘Others’, in fact suggests the
same level of diversification over the two reference years
though the index calculated excluding this group indicates
a small increase in concentration levels. For the nation as
diversified. This does not seem to have occurred as far as
Delhi is concerned. For the nation as a whole, the
Hirschman-Herfindahl index suggests a minor increase in
levels of concentration over the two reference years
though the increase was clearly less marked than in
Delhi.
TABLE 16.4
Changing Industrial Base of Delhi: 1980-81 and1997-98 (All Figures as Percentages to Respective
All-Industries Totals)
NIC 1987 Industry Share in Share inCode NVA Employment
1980-81 1997-98 1980-81 1997-98
20-21 Food Products 7.7 6.4 5.1 7.1
22 Beverages, Tobacco &Related Products 1.6 1.4 1.4 2.0
23 Cotton Textiles 8.5 0.0 12.5 0.2
24 Wool, Silk & Man-madeFibre Textiles 0.6 0.2 1.2 0.4
25 Jute, other Vegetable FibreTextiles except Cotton 0.0 0.0 0.0 0.0
26 Textile Products(incl. Wearing Apparel) 9.2 17.5 8.7 20.0
27 Wood and Wood Products:Furnitures and Fixtures 0.3 0.2 0.5 0.5
28 Paper and Paper Products,Printing, Publishing andAllied Industries 9.3 6.7 8.8 8.7
29 Leather and LeatherProducts, Fur andLeather Substitutes 0.4 0.7 0.2 0.7
30 Basic Chemicals andChemical Products(except Petroleum andCoal Products) 9.1 4.4 4.9 6.5
31 Rubber, Plastic, Petroleum& Coal Products 2.5 2.0 3.3 5.9
32 Non-Metallic MineralProducts 1.6 0.3 2.4 1.2
33 Basic Metals and Alloys 3.5 2.9 3.5 3.0
34 Metal Products and Parts(except Machinery andEquipment) 4.5 4.1 5.2 6.1
35-36 Machinery and Equipment(other than Transport,Scientific, Photographic/CinematographicEquipment etc.) 17.6 11.0 14.7 16.6
37 Transport Equipmentand Parts 7.1 2.2 5.9 7.1
38 Other ManufacturingIndustries 2.0 2.2 2.3 2.8
39 Repair of Capital Goods 0.0 1.3 0.0 4.5
Others 14.7 36.6 19.3 6.8
All Industries 100 100 100.0 100.0
Source: Estimated from data presented in Annual Survey of Industries 1973-74 to 1997-98: A Data Base on the Industrial Sector in India, EPWResearch Foundation.
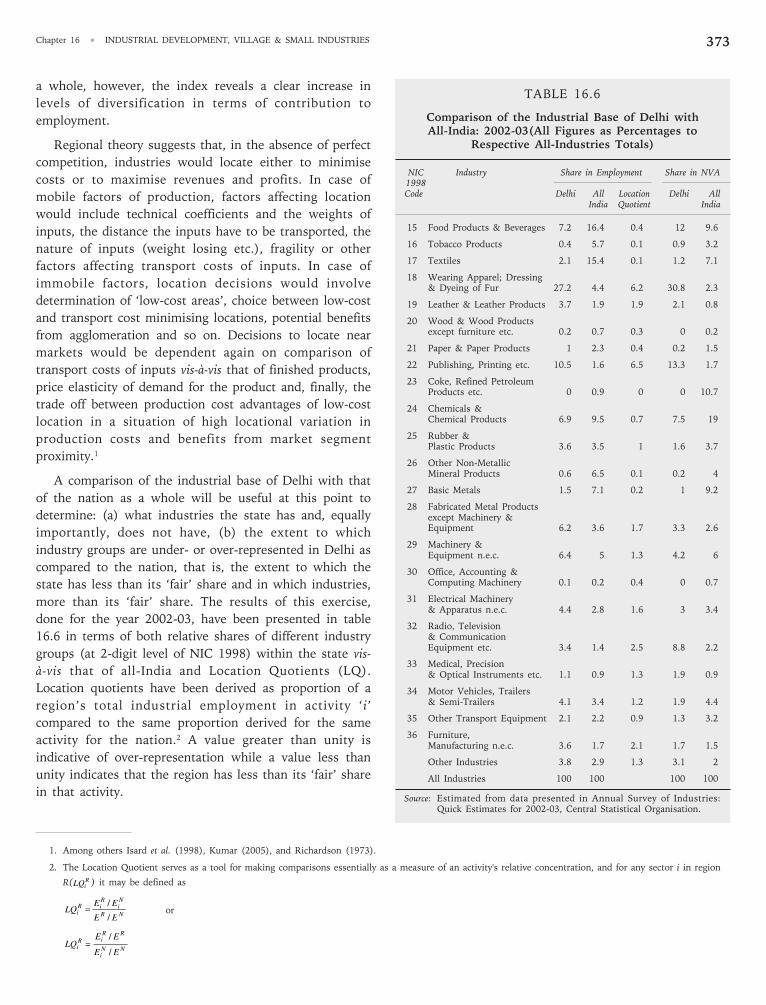
Chapter 16 • INDUSTRIAL DEVELOPMENT, VILLAGE & SMALL INDUSTRIES 373
a whole, however, the index reveals a clear increase in
levels of diversification in terms of contribution to
employment.
Regional theory suggests that, in the absence of perfect
competition, industries would locate either to minimise
costs or to maximise revenues and profits. In case of
mobile factors of production, factors affecting location
would include technical coefficients and the weights of
inputs, the distance the inputs have to be transported, the
nature of inputs (weight losing etc.), fragility or other
factors affecting transport costs of inputs. In case of
immobile factors, location decisions would involve
determination of ‘low-cost areas’, choice between low-cost
and transport cost minimising locations, potential benefits
from agglomeration and so on. Decisions to locate near
markets would be dependent again on comparison of
transport costs of inputs vis-à-vis that of finished products,
price elasticity of demand for the product and, finally, the
trade off between production cost advantages of low-cost
location in a situation of high locational variation in
production costs and benefits from market segment
proximity.1
A comparison of the industrial base of Delhi with that
of the nation as a whole will be useful at this point to
determine: (a) what industries the state has and, equally
importantly, does not have, (b) the extent to which
industry groups are under- or over-represented in Delhi as
compared to the nation, that is, the extent to which the
state has less than its ‘fair’ share and in which industries,
more than its ‘fair’ share. The results of this exercise,
done for the year 2002-03, have been presented in table
16.6 in terms of both relative shares of different industry
groups (at 2-digit level of NIC 1998) within the state vis-
à-vis that of all-India and Location Quotients (LQ).
Location quotients have been derived as proportion of a
region’s total industrial employment in activity ‘i’
compared to the same proportion derived for the same
activity for the nation.2 A value greater than unity is
indicative of over-representation while a value less than
unity indicates that the region has less than its ‘fair’ share
in that activity.
TABLE 16.6
Comparison of the Industrial Base of Delhi withAll-India: 2002-03(All Figures as Percentages to
Respective All-Industries Totals)
NIC Industry Share in Employment Share in NVA1998Code Delhi All Location Delhi All
India Quotient India
15 Food Products & Beverages 7.2 16.4 0.4 12 9.6
16 Tobacco Products 0.4 5.7 0.1 0.9 3.2
17 Textiles 2.1 15.4 0.1 1.2 7.1
18 Wearing Apparel; Dressing& Dyeing of Fur 27.2 4.4 6.2 30.8 2.3
19 Leather & Leather Products 3.7 1.9 1.9 2.1 0.8
20 Wood & Wood Productsexcept furniture etc. 0.2 0.7 0.3 0 0.2
21 Paper & Paper Products 1 2.3 0.4 0.2 1.5
22 Publishing, Printing etc. 10.5 1.6 6.5 13.3 1.7
23 Coke, Refined PetroleumProducts etc. 0 0.9 0 0 10.7
24 Chemicals &Chemical Products 6.9 9.5 0.7 7.5 19
25 Rubber &Plastic Products 3.6 3.5 1 1.6 3.7
26 Other Non-MetallicMineral Products 0.6 6.5 0.1 0.2 4
27 Basic Metals 1.5 7.1 0.2 1 9.2
28 Fabricated Metal Productsexcept Machinery &Equipment 6.2 3.6 1.7 3.3 2.6
29 Machinery &Equipment n.e.c. 6.4 5 1.3 4.2 6
30 Office, Accounting &Computing Machinery 0.1 0.2 0.4 0 0.7
31 Electrical Machinery& Apparatus n.e.c. 4.4 2.8 1.6 3 3.4
32 Radio, Television& CommunicationEquipment etc. 3.4 1.4 2.5 8.8 2.2
33 Medical, Precision& Optical Instruments etc. 1.1 0.9 1.3 1.9 0.9
34 Motor Vehicles, Trailers& Semi-Trailers 4.1 3.4 1.2 1.9 4.4
35 Other Transport Equipment 2.1 2.2 0.9 1.3 3.2
36 Furniture,Manufacturing n.e.c. 3.6 1.7 2.1 1.7 1.5
Other Industries 3.8 2.9 1.3 3.1 2
All Industries 100 100 100 100
Source: Estimated from data presented in Annual Survey of Industries:Quick Estimates for 2002-03, Central Statistical Organisation.
1. Among others Isard et al. (1998), Kumar (2005), and Richardson (1973).
2. The Location Quotient serves as a tool for making comparisons essentially as a measure of an activity's relative concentration, and for any sector i in region
R( RiLQ ) it may be defined as
NR
Ni
RiR
iEE
EELQ
/
/= or
NNi
RRiR
iEE
EELQ
/
/=
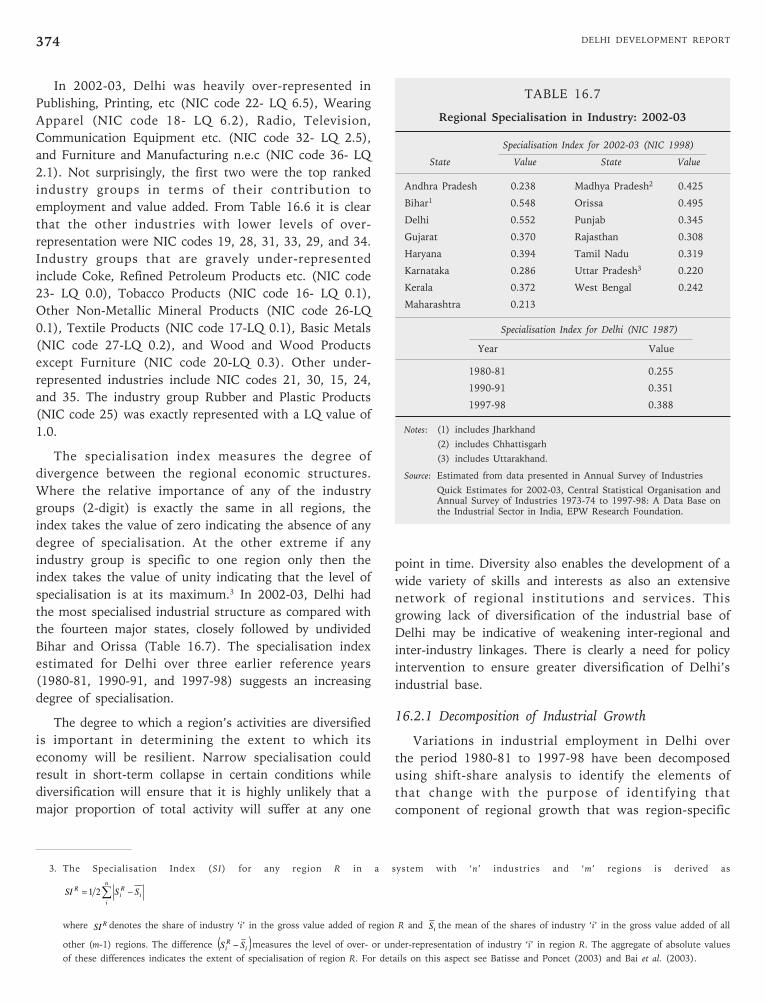
DELHI DEVELOPMENT REPORT374
In 2002-03, Delhi was heavily over-represented in
Publishing, Printing, etc (NIC code 22- LQ 6.5), Wearing
Apparel (NIC code 18- LQ 6.2), Radio, Television,
Communication Equipment etc. (NIC code 32- LQ 2.5),
and Furniture and Manufacturing n.e.c (NIC code 36- LQ
2.1). Not surprisingly, the first two were the top ranked
industry groups in terms of their contribution to
employment and value added. From Table 16.6 it is clear
that the other industries with lower levels of over-
representation were NIC codes 19, 28, 31, 33, 29, and 34.
Industry groups that are gravely under-represented
include Coke, Refined Petroleum Products etc. (NIC code
23- LQ 0.0), Tobacco Products (NIC code 16- LQ 0.1),
Other Non-Metallic Mineral Products (NIC code 26-LQ
0.1), Textile Products (NIC code 17-LQ 0.1), Basic Metals
(NIC code 27-LQ 0.2), and Wood and Wood Products
except Furniture (NIC code 20-LQ 0.3). Other under-
represented industries include NIC codes 21, 30, 15, 24,
and 35. The industry group Rubber and Plastic Products
(NIC code 25) was exactly represented with a LQ value of
1.0.
The specialisation index measures the degree of
divergence between the regional economic structures.
Where the relative importance of any of the industry
groups (2-digit) is exactly the same in all regions, the
index takes the value of zero indicating the absence of any
degree of specialisation. At the other extreme if any
industry group is specific to one region only then the
index takes the value of unity indicating that the level of
specialisation is at its maximum.3 In 2002-03, Delhi had
the most specialised industrial structure as compared with
the fourteen major states, closely followed by undivided
Bihar and Orissa (Table 16.7). The specialisation index
estimated for Delhi over three earlier reference years
(1980-81, 1990-91, and 1997-98) suggests an increasing
degree of specialisation.
The degree to which a region’s activities are diversified
is important in determining the extent to which its
economy will be resilient. Narrow specialisation could
result in short-term collapse in certain conditions while
diversification will ensure that it is highly unlikely that a
major proportion of total activity will suffer at any one
point in time. Diversity also enables the development of a
wide variety of skills and interests as also an extensive
network of regional institutions and services. This
growing lack of diversification of the industrial base of
Delhi may be indicative of weakening inter-regional and
inter-industry linkages. There is clearly a need for policy
intervention to ensure greater diversification of Delhi’s
industrial base.
16.2.1 Decomposition of Industrial Growth
Variations in industrial employment in Delhi over
the period 1980-81 to 1997-98 have been decomposed
using shift-share analysis to identify the elements of
that change with the purpose of identifying that
component of regional growth that was region-specific
3. The Specialisation Index (SI) for any region R in a system with ‘n’ industries and ‘m’ regions is derived as
∑ −=n
ii
Ri
R SSSI 21
where RSI denotes the share of industry ‘i’ in the gross value added of region R and iS the mean of the shares of industry ‘i’ in the gross value added of all
other (m-1) regions. The difference ( )iRi SS − measures the level of over- or under-representation of industry ‘i’ in region R. The aggregate of absolute values
of these differences indicates the extent of specialisation of region R. For details on this aspect see Batisse and Poncet (2003) and Bai et al. (2003).
TABLE 16.7
Regional Specialisation in Industry: 2002-03
Specialisation Index for 2002-03 (NIC 1998)
State Value State Value
Andhra Pradesh 0.238 Madhya Pradesh2 0.425
Bihar1 0.548 Orissa 0.495
Delhi 0.552 Punjab 0.345
Gujarat 0.370 Rajasthan 0.308
Haryana 0.394 Tamil Nadu 0.319
Karnataka 0.286 Uttar Pradesh3 0.220
Kerala 0.372 West Bengal 0.242
Maharashtra 0.213
Specialisation Index for Delhi (NIC 1987)
Year Value
1980-81 0.255
1990-91 0.351
1997-98 0.388
Notes: (1) includes Jharkhand
(2) includes Chhattisgarh
(3) includes Uttarakhand.
Source: Estimated from data presented in Annual Survey of Industries
Quick Estimates for 2002-03, Central Statistical Organisation andAnnual Survey of Industries 1973-74 to 1997-98: A Data Base onthe Industrial Sector in India, EPW Research Foundation.
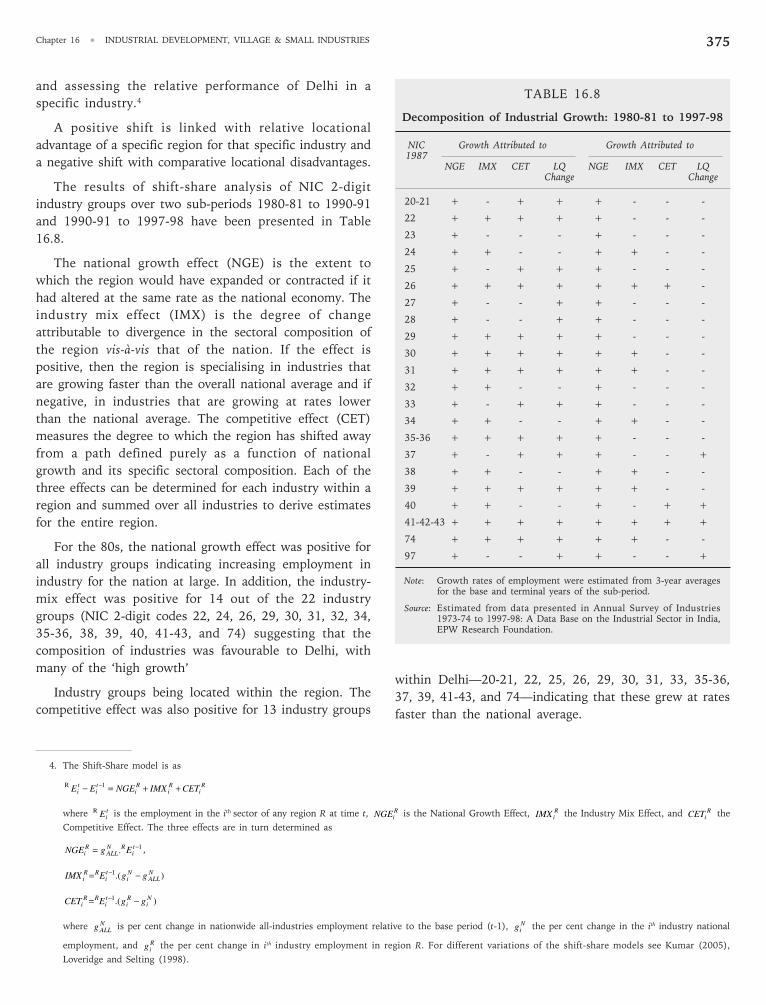
Chapter 16 • INDUSTRIAL DEVELOPMENT, VILLAGE & SMALL INDUSTRIES 375
and assessing the relative performance of Delhi in a
specific industry.4
A positive shift is linked with relative locational
advantage of a specific region for that specific industry and
a negative shift with comparative locational disadvantages.
The results of shift-share analysis of NIC 2-digit
industry groups over two sub-periods 1980-81 to 1990-91
and 1990-91 to 1997-98 have been presented in Table
16.8.
The national growth effect (NGE) is the extent to
which the region would have expanded or contracted if it
had altered at the same rate as the national economy. The
industry mix effect (IMX) is the degree of change
attributable to divergence in the sectoral composition of
the region vis-à-vis that of the nation. If the effect is
positive, then the region is specialising in industries that
are growing faster than the overall national average and if
negative, in industries that are growing at rates lower
than the national average. The competitive effect (CET)
measures the degree to which the region has shifted away
from a path defined purely as a function of national
growth and its specific sectoral composition. Each of the
three effects can be determined for each industry within a
region and summed over all industries to derive estimates
for the entire region.
For the 80s, the national growth effect was positive for
all industry groups indicating increasing employment in
industry for the nation at large. In addition, the industry-
mix effect was positive for 14 out of the 22 industry
groups (NIC 2-digit codes 22, 24, 26, 29, 30, 31, 32, 34,
35-36, 38, 39, 40, 41-43, and 74) suggesting that the
composition of industries was favourable to Delhi, with
many of the ‘high growth’
Industry groups being located within the region. The
competitive effect was also positive for 13 industry groups
4. The Shift-Share model is as
Ri
Ri
Ri
ti
ti CETIMXNGEEE ++=− −1R
where tiER is the employment in the ith sector of any region R at time t, R
iNGE is the National Growth Effect, RiIMX the Industry Mix Effect, and R
iCET the
Competitive Effect. The three effects are in turn determined as
1. −= ti
RNALL
Ri EgNGE ,
).(1 NALL
Ni
ti
RRi ggEIMX −= −
).(1 Ni
Ri
ti
RRi ggECET −= −
where NALLg is per cent change in nationwide all-industries employment relative to the base period (t-1), N
ig the per cent change in the ith industry national
employment, and Rig the per cent change in ith industry employment in region R. For different variations of the shift-share models see Kumar (2005),
Loveridge and Selting (1998).
TABLE 16.8
Decomposition of Industrial Growth: 1980-81 to 1997-98
NIC Growth Attributed to Growth Attributed to1987
NGE IMX CET LQ NGE IMX CET LQChange Change
20-21 + - + + + - - -
22 + + + + + - - -
23 + - - - + - - -
24 + + - - + + - -
25 + - + + + - - -
26 + + + + + + + -
27 + - - + + - - -
28 + - - + + - - -
29 + + + + + - - -
30 + + + + + + - -
31 + + + + + + - -
32 + + - - + - - -
33 + - + + + - - -
34 + + - - + + - -
35-36 + + + + + - - -
37 + - + + + - - +
38 + + - - + + - -
39 + + + + + + - -
40 + + - - + - + +
41-42-43 + + + + + + + +
74 + + + + + + - -
97 + - - + + - - +
Note: Growth rates of employment were estimated from 3-year averagesfor the base and terminal years of the sub-period.
Source: Estimated from data presented in Annual Survey of Industries1973-74 to 1997-98: A Data Base on the Industrial Sector in India,EPW Research Foundation.
within Delhi—20-21, 22, 25, 26, 29, 30, 31, 33, 35-36,
37, 39, 41-43, and 74—indicating that these grew at rates
faster than the national average.
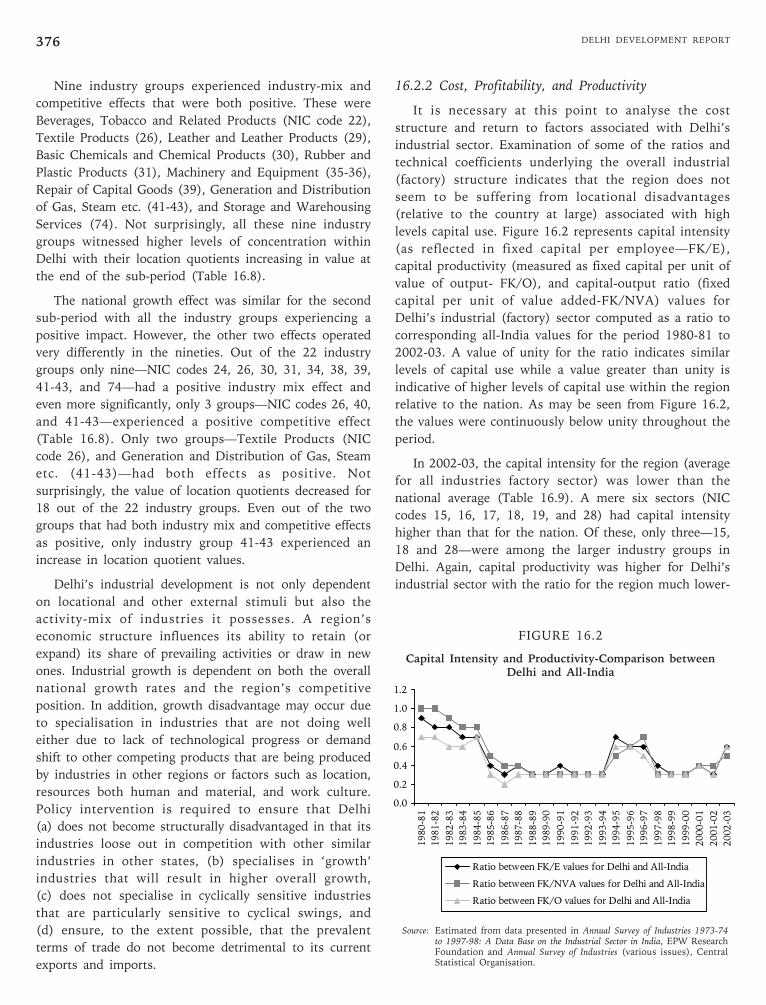
DELHI DEVELOPMENT REPORT376
Nine industry groups experienced industry-mix and
competitive effects that were both positive. These were
Beverages, Tobacco and Related Products (NIC code 22),
Textile Products (26), Leather and Leather Products (29),
Basic Chemicals and Chemical Products (30), Rubber and
Plastic Products (31), Machinery and Equipment (35-36),
Repair of Capital Goods (39), Generation and Distribution
of Gas, Steam etc. (41-43), and Storage and Warehousing
Services (74). Not surprisingly, all these nine industry
groups witnessed higher levels of concentration within
Delhi with their location quotients increasing in value at
the end of the sub-period (Table 16.8).
The national growth effect was similar for the second
sub-period with all the industry groups experiencing a
positive impact. However, the other two effects operated
very differently in the nineties. Out of the 22 industry
groups only nine—NIC codes 24, 26, 30, 31, 34, 38, 39,
41-43, and 74—had a positive industry mix effect and
even more significantly, only 3 groups—NIC codes 26, 40,
and 41-43—experienced a positive competitive effect
(Table 16.8). Only two groups—Textile Products (NIC
code 26), and Generation and Distribution of Gas, Steam
etc. (41-43)—had both effects as positive. Not
surprisingly, the value of location quotients decreased for
18 out of the 22 industry groups. Even out of the two
groups that had both industry mix and competitive effects
as positive, only industry group 41-43 experienced an
increase in location quotient values.
Delhi’s industrial development is not only dependent
on locational and other external stimuli but also the
activity-mix of industries it possesses. A region’s
economic structure influences its ability to retain (or
expand) its share of prevailing activities or draw in new
ones. Industrial growth is dependent on both the overall
national growth rates and the region’s competitive
position. In addition, growth disadvantage may occur due
to specialisation in industries that are not doing well
either due to lack of technological progress or demand
shift to other competing products that are being produced
by industries in other regions or factors such as location,
resources both human and material, and work culture.
Policy intervention is required to ensure that Delhi
(a) does not become structurally disadvantaged in that its
industries loose out in competition with other similar
industries in other states, (b) specialises in ‘growth’
industries that will result in higher overall growth,
(c) does not specialise in cyclically sensitive industries
that are particularly sensitive to cyclical swings, and
(d) ensure, to the extent possible, that the prevalent
terms of trade do not become detrimental to its current
exports and imports.
16.2.2 Cost, Profitability, and Productivity
It is necessary at this point to analyse the cost
structure and return to factors associated with Delhi’s
industrial sector. Examination of some of the ratios and
technical coefficients underlying the overall industrial
(factory) structure indicates that the region does not
seem to be suffering from locational disadvantages
(relative to the country at large) associated with high
levels capital use. Figure 16.2 represents capital intensity
(as reflected in fixed capital per employee—FK/E),
capital productivity (measured as fixed capital per unit of
value of output- FK/O), and capital-output ratio (fixed
capital per unit of value added-FK/NVA) values for
Delhi’s industrial (factory) sector computed as a ratio to
corresponding all-India values for the period 1980-81 to
2002-03. A value of unity for the ratio indicates similar
levels of capital use while a value greater than unity is
indicative of higher levels of capital use within the region
relative to the nation. As may be seen from Figure 16.2,
the values were continuously below unity throughout the
period.
In 2002-03, the capital intensity for the region (average
for all industries factory sector) was lower than the
national average (Table 16.9). A mere six sectors (NIC
codes 15, 16, 17, 18, 19, and 28) had capital intensity
higher than that for the nation. Of these, only three—15,
18 and 28—were among the larger industry groups in
Delhi. Again, capital productivity was higher for Delhi’s
industrial sector with the ratio for the region much lower-
FIGURE 16.2
Capital Intensity and Productivity-Comparison betweenDelhi and All-India
0.0
0.2
0.4
0.6
0.8
1.0
1.2
1980-81
1981-82
1982-83
1983-84
1984-85
1985-86
1986-87
1987-88
1988-89
1989-90
1990-91
1991-92
1992-93
1993-94
1994-95
1995-96
1996-97
1997-98
1998-99
1999-00
2000-01
2001-02
2002-03
Ratio between FK/E values for Delhi and All-India
Ratio between FK/NVA values for Delhi and All-India
Ratio between FK/O values for Delhi and All-India
Source: Estimated from data presented in Annual Survey of Industries 1973-74to 1997-98: A Data Base on the Industrial Sector in India, EPW ResearchFoundation and Annual Survey of Industries (various issues), CentralStatistical Organisation.
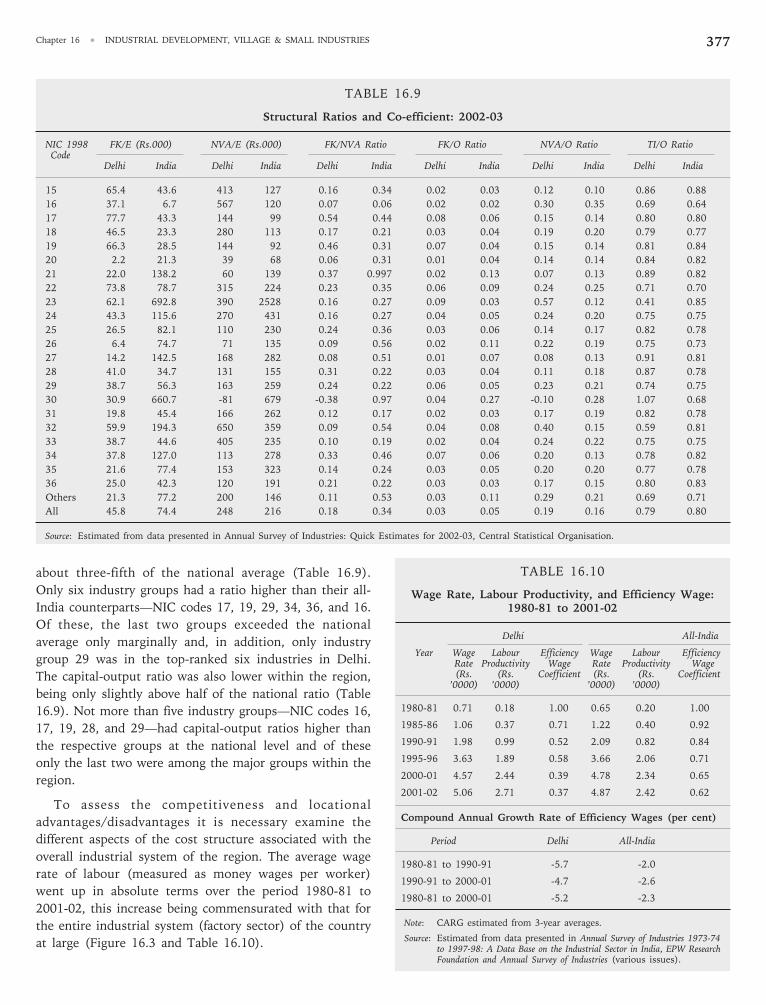
Chapter 16 • INDUSTRIAL DEVELOPMENT, VILLAGE & SMALL INDUSTRIES 377
TABLE 16.9
Structural Ratios and Co-efficient: 2002-03
NIC 1998 FK/E (Rs.000) NVA/E (Rs.000) FK/NVA Ratio FK/O Ratio NVA/O Ratio TI/O RatioCode
Delhi India Delhi India Delhi India Delhi India Delhi India Delhi India
15 65.4 43.6 413 127 0.16 0.34 0.02 0.03 0.12 0.10 0.86 0.88
16 37.1 6.7 567 120 0.07 0.06 0.02 0.02 0.30 0.35 0.69 0.64
17 77.7 43.3 144 99 0.54 0.44 0.08 0.06 0.15 0.14 0.80 0.80
18 46.5 23.3 280 113 0.17 0.21 0.03 0.04 0.19 0.20 0.79 0.77
19 66.3 28.5 144 92 0.46 0.31 0.07 0.04 0.15 0.14 0.81 0.84
20 2.2 21.3 39 68 0.06 0.31 0.01 0.04 0.14 0.14 0.84 0.82
21 22.0 138.2 60 139 0.37 0.997 0.02 0.13 0.07 0.13 0.89 0.82
22 73.8 78.7 315 224 0.23 0.35 0.06 0.09 0.24 0.25 0.71 0.70
23 62.1 692.8 390 2528 0.16 0.27 0.09 0.03 0.57 0.12 0.41 0.85
24 43.3 115.6 270 431 0.16 0.27 0.04 0.05 0.24 0.20 0.75 0.75
25 26.5 82.1 110 230 0.24 0.36 0.03 0.06 0.14 0.17 0.82 0.78
26 6.4 74.7 71 135 0.09 0.56 0.02 0.11 0.22 0.19 0.75 0.73
27 14.2 142.5 168 282 0.08 0.51 0.01 0.07 0.08 0.13 0.91 0.81
28 41.0 34.7 131 155 0.31 0.22 0.03 0.04 0.11 0.18 0.87 0.78
29 38.7 56.3 163 259 0.24 0.22 0.06 0.05 0.23 0.21 0.74 0.75
30 30.9 660.7 -81 679 -0.38 0.97 0.04 0.27 -0.10 0.28 1.07 0.68
31 19.8 45.4 166 262 0.12 0.17 0.02 0.03 0.17 0.19 0.82 0.78
32 59.9 194.3 650 359 0.09 0.54 0.04 0.08 0.40 0.15 0.59 0.81
33 38.7 44.6 405 235 0.10 0.19 0.02 0.04 0.24 0.22 0.75 0.75
34 37.8 127.0 113 278 0.33 0.46 0.07 0.06 0.20 0.13 0.78 0.82
35 21.6 77.4 153 323 0.14 0.24 0.03 0.05 0.20 0.20 0.77 0.78
36 25.0 42.3 120 191 0.21 0.22 0.03 0.03 0.17 0.15 0.80 0.83
Others 21.3 77.2 200 146 0.11 0.53 0.03 0.11 0.29 0.21 0.69 0.71
All 45.8 74.4 248 216 0.18 0.34 0.03 0.05 0.19 0.16 0.79 0.80
Source: Estimated from data presented in Annual Survey of Industries: Quick Estimates for 2002-03, Central Statistical Organisation.
about three-fifth of the national average (Table 16.9).
Only six industry groups had a ratio higher than their all-
India counterparts—NIC codes 17, 19, 29, 34, 36, and 16.
Of these, the last two groups exceeded the national
average only marginally and, in addition, only industry
group 29 was in the top-ranked six industries in Delhi.
The capital-output ratio was also lower within the region,
being only slightly above half of the national ratio (Table
16.9). Not more than five industry groups—NIC codes 16,
17, 19, 28, and 29—had capital-output ratios higher than
the respective groups at the national level and of these
only the last two were among the major groups within the
region.
To assess the competitiveness and locational
advantages/disadvantages it is necessary examine the
different aspects of the cost structure associated with the
overall industrial system of the region. The average wage
rate of labour (measured as money wages per worker)
went up in absolute terms over the period 1980-81 to
2001-02, this increase being commensurated with that for
the entire industrial system (factory sector) of the country
at large (Figure 16.3 and Table 16.10).
TABLE 16.10
Wage Rate, Labour Productivity, and Efficiency Wage:1980-81 to 2001-02
Delhi All-India
Year Wage Labour Efficiency Wage Labour EfficiencyRate Productivity Wage Rate Productivity Wage(Rs. (Rs. Coefficient (Rs. (Rs. Coefficient
’0000) ’0000) ’0000) ’0000)
1980-81 0.71 0.18 1.00 0.65 0.20 1.00
1985-86 1.06 0.37 0.71 1.22 0.40 0.92
1990-91 1.98 0.99 0.52 2.09 0.82 0.84
1995-96 3.63 1.89 0.58 3.66 2.06 0.71
2000-01 4.57 2.44 0.39 4.78 2.34 0.65
2001-02 5.06 2.71 0.37 4.87 2.42 0.62
Compound Annual Growth Rate of Efficiency Wages (per cent)
Period Delhi All-India
1980-81 to 1990-91 -5.7 -2.0
1990-91 to 2000-01 -4.7 -2.6
1980-81 to 2000-01 -5.2 -2.3
Note: CARG estimated from 3-year averages.
Source: Estimated from data presented in Annual Survey of Industries 1973-74to 1997-98: A Data Base on the Industrial Sector in India, EPW ResearchFoundation and Annual Survey of Industries (various issues).
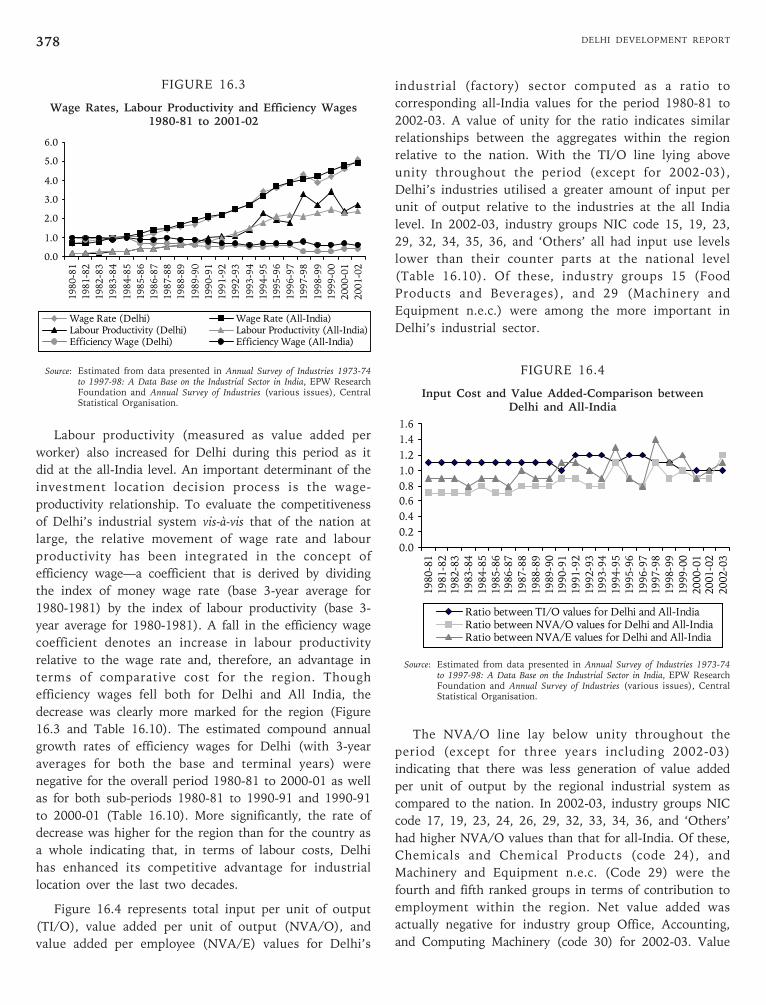
DELHI DEVELOPMENT REPORT378
industrial (factory) sector computed as a ratio to
corresponding all-India values for the period 1980-81 to
2002-03. A value of unity for the ratio indicates similar
relationships between the aggregates within the region
relative to the nation. With the TI/O line lying above
unity throughout the period (except for 2002-03),
Delhi’s industries utilised a greater amount of input per
unit of output relative to the industries at the all India
level. In 2002-03, industry groups NIC code 15, 19, 23,
29, 32, 34, 35, 36, and ‘Others’ all had input use levels
lower than their counter parts at the national level
(Table 16.10). Of these, industry groups 15 (Food
Products and Beverages), and 29 (Machinery and
Equipment n.e.c.) were among the more important in
Delhi’s industrial sector.
FIGURE 16.4
Input Cost and Value Added-Comparison betweenDelhi and All-India
Source: Estimated from data presented in Annual Survey of Industries 1973-74to 1997-98: A Data Base on the Industrial Sector in India, EPW ResearchFoundation and Annual Survey of Industries (various issues), CentralStatistical Organisation.
The NVA/O line lay below unity throughout the
period (except for three years including 2002-03)
indicating that there was less generation of value added
per unit of output by the regional industrial system as
compared to the nation. In 2002-03, industry groups NIC
code 17, 19, 23, 24, 26, 29, 32, 33, 34, 36, and ‘Others’
had higher NVA/O values than that for all-India. Of these,
Chemicals and Chemical Products (code 24), and
Machinery and Equipment n.e.c. (Code 29) were the
fourth and fifth ranked groups in terms of contribution to
employment within the region. Net value added was
actually negative for industry group Office, Accounting,
and Computing Machinery (code 30) for 2002-03. Value
Labour productivity (measured as value added per
worker) also increased for Delhi during this period as it
did at the all-India level. An important determinant of the
investment location decision process is the wage-
productivity relationship. To evaluate the competitiveness
of Delhi’s industrial system vis-à-vis that of the nation at
large, the relative movement of wage rate and labour
productivity has been integrated in the concept of
efficiency wage—a coefficient that is derived by dividing
the index of money wage rate (base 3-year average for
1980-1981) by the index of labour productivity (base 3-
year average for 1980-1981). A fall in the efficiency wage
coefficient denotes an increase in labour productivity
relative to the wage rate and, therefore, an advantage in
terms of comparative cost for the region. Though
efficiency wages fell both for Delhi and All India, the
decrease was clearly more marked for the region (Figure
16.3 and Table 16.10). The estimated compound annual
growth rates of efficiency wages for Delhi (with 3-year
averages for both the base and terminal years) were
negative for the overall period 1980-81 to 2000-01 as well
as for both sub-periods 1980-81 to 1990-91 and 1990-91
to 2000-01 (Table 16.10). More significantly, the rate of
decrease was higher for the region than for the country as
a whole indicating that, in terms of labour costs, Delhi
has enhanced its competitive advantage for industrial
location over the last two decades.
Figure 16.4 represents total input per unit of output
(TI/O), value added per unit of output (NVA/O), and
value added per employee (NVA/E) values for Delhi’s
FIGURE 16.3
Wage Rates, Labour Productivity and Efficiency Wages1980-81 to 2001-02
0.0
1.0
2.0
3.0
4.0
5.0
6.0
1980-81
1981-82
1982-83
1983-84
1984-85
1985-86
1986-87
1987-88
1988-89
1989-90
1990-91
1991-92
1992-93
1993-94
1994-95
1995-96
1996-97
1997-98
1998-99
1999-00
2000-01
2001-02
Wage Rate (Delhi) Wage Rate (All-India)Labour Productivity (Delhi) Labour Productivity (All-India)Efficiency Wage (Delhi) Efficiency Wage (All-India)
Source: Estimated from data presented in Annual Survey of Industries 1973-74to 1997-98: A Data Base on the Industrial Sector in India, EPW ResearchFoundation and Annual Survey of Industries (various issues), CentralStatistical Organisation.
0.0
0.2
0.4
0.6
0.8
1.0
1.2
1.4
1.61980-81
1981-82
1982-83
1983-84
1984-85
1985-86
1986-87
1987-88
1988-89
1989-90
1990-91
1991-92
1992-93
1993-94
1994-95
1995-96
1996-97
1997-98
1998-99
1999-00
2000-01
2001-02
2002-03
Ratio between TI/O values for Delhi and All-India
Ratio between NVA/O values for Delhi and All-India
Ratio between NVA/E values for Delhi and All-India
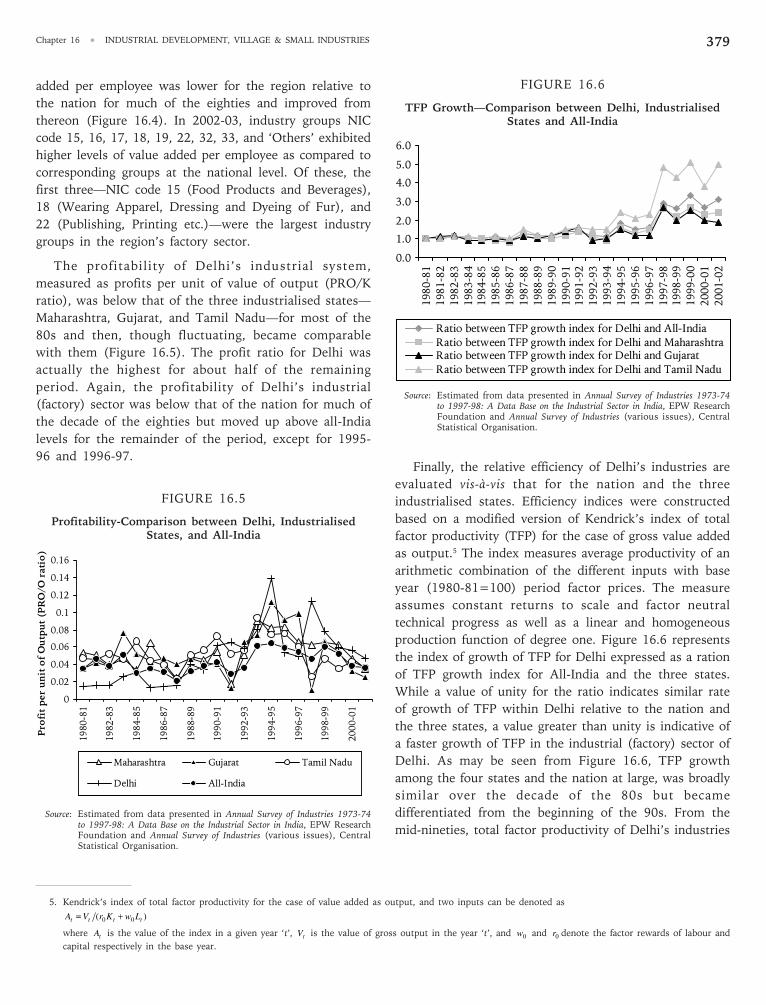
Chapter 16 • INDUSTRIAL DEVELOPMENT, VILLAGE & SMALL INDUSTRIES 379
added per employee was lower for the region relative to
the nation for much of the eighties and improved from
thereon (Figure 16.4). In 2002-03, industry groups NIC
code 15, 16, 17, 18, 19, 22, 32, 33, and ‘Others’ exhibited
higher levels of value added per employee as compared to
corresponding groups at the national level. Of these, the
first three—NIC code 15 (Food Products and Beverages),
18 (Wearing Apparel, Dressing and Dyeing of Fur), and
22 (Publishing, Printing etc.)—were the largest industry
groups in the region’s factory sector.
The profitability of Delhi’s industrial system,
measured as profits per unit of value of output (PRO/K
ratio), was below that of the three industrialised states—
Maharashtra, Gujarat, and Tamil Nadu—for most of the
80s and then, though fluctuating, became comparable
with them (Figure 16.5). The profit ratio for Delhi was
actually the highest for about half of the remaining
period. Again, the profitability of Delhi’s industrial
(factory) sector was below that of the nation for much of
the decade of the eighties but moved up above all-India
levels for the remainder of the period, except for 1995-
96 and 1996-97.
FIGURE 16.5
Profitability-Comparison between Delhi, IndustrialisedStates, and All-India
Source: Estimated from data presented in Annual Survey of Industries 1973-74to 1997-98: A Data Base on the Industrial Sector in India, EPW ResearchFoundation and Annual Survey of Industries (various issues), CentralStatistical Organisation.
Finally, the relative efficiency of Delhi’s industries are
evaluated vis-à-vis that for the nation and the three
industrialised states. Efficiency indices were constructed
based on a modified version of Kendrick’s index of total
factor productivity (TFP) for the case of gross value added
as output.5 The index measures average productivity of an
arithmetic combination of the different inputs with base
year (1980-81=100) period factor prices. The measure
assumes constant returns to scale and factor neutral
technical progress as well as a linear and homogeneous
production function of degree one. Figure 16.6 represents
the index of growth of TFP for Delhi expressed as a ration
of TFP growth index for All-India and the three states.
While a value of unity for the ratio indicates similar rate
of growth of TFP within Delhi relative to the nation and
the three states, a value greater than unity is indicative of
a faster growth of TFP in the industrial (factory) sector of
Delhi. As may be seen from Figure 16.6, TFP growth
among the four states and the nation at large, was broadly
similar over the decade of the 80s but became
differentiated from the beginning of the 90s. From the
mid-nineties, total factor productivity of Delhi’s industries
0
0.02
0.04
0.06
0.08
0.1
0.12
0.14
0.16
1980-81
1982-83
1984-85
1986-87
1988-89
1990-91
1992-93
1994-95
1996-97
1998-99
2000-01
Pro
fit
per
un
it o
f O
utp
ut
(PR
O/O
rati
o)
Maharashtra Gujarat Tamil Nadu
Delhi All-India
0.0
1.0
2.0
3.0
4.0
5.0
6.0
1980-81
1981-82
1982-83
1983-84
1984-85
1985-86
1986-87
1987-88
1988-89
1989-90
1990-91
1991-92
1992-93
1993-94
1994-95
1995-96
1996-97
1997-98
1998-99
1999-00
2000-01
2001-02
Ratio between TFP growth index for Delhi and All-India
Ratio between TFP growth index for Delhi and MaharashtraRatio between TFP growth index for Delhi and Gujarat
Ratio between TFP growth index for Delhi and Tamil Nadu
FIGURE 16.6
TFP Growth—Comparison between Delhi, IndustrialisedStates and All-India
Source: Estimated from data presented in Annual Survey of Industries 1973-74to 1997-98: A Data Base on the Industrial Sector in India, EPW ResearchFoundation and Annual Survey of Industries (various issues), CentralStatistical Organisation.
5. Kendrick’s index of total factor productivity for the case of value added as output, and two inputs can be denoted as
)( 00 tttt LwKrVA +=
where tA is the value of the index in a given year ‘t’, tV is the value of gross output in the year ‘t’, and 0w and 0r denote the factor rewards of labour and
capital respectively in the base year.
DELHI DEVELOPMENT REPORT380
grew at rates faster than that of the nation and even that
experienced by the three developed industrial states.
Delhi’s industrial system seems to be becoming relatively
more efficient than the rest of the country in terms of
factor use.
16.3 Industrial Support System
16.3.1 Delhi Finance Corporation
The Delhi Finance Corporation (DFC) was set-up
under State Financial Corporation’s Act, 1951 and has
been in existence since 1967 with the objective of
promoting, developing and financing industries in the
small and medium scale sectors in Union Territories of
Delhi & Chandigarh. DFC has an authorised capital of
Rs.50 crore and share capital of Rs.25.64 crore and as on
31 March 2003, DFC had Rs.27.93 crore as reserves and
surplus. Financial assistance in the form of long-term
credit is provided to new industrial units as well as
existing ones for expansion, modernisation,
diversification, as well as for up gradation of technology to
increase productivity and promote pollution control.
Assistance can be availed for projects having fixed assets
such as land, building, plant and machinery for working
capital. Concessional loans are also provided for relocation
and rehabilitation of industrial units.
DFC provides maximum financial assistance up to
Rs.500 lakh in case of companies/cooperative societies
where paid up capital and free reserves do not exceed
Rs.10 crore, and up to Rs.200 lakh in case of
partnership/proprietorship concerns. The industrial loans
are released in phases in proportion to the investment
brought in by the promoter in the project while in case
of transport loans, the loan is released after the entire
equity has been arranged/invested by the promoter.
Loans are given to the industrial as well as service
sectors units like medical & health care centres, hotels,
as well as to small road transport operators for
commercial vehicles and tourism related facilities,
software/hardware services, and hi-tech agro industries.
DFC also offers different loan schemes to virtually all
categories of entrepreneurs who may be from weaker
sections of society or a borrower under special category
or a general category. Its special schemes for different
sections of the society include: (a) Scheme for women
entrepreneurs under MUN, (b) Special scheme for
household industries, (c) Scheme for scheduled castes/
scheduled tribes, (d) Scheme for physically challenged,
(e) Scheme for acquisition of ISO 9000 series
certification by SSI units, and (f) Scheme for marketing
support to SSI/Cottage & Village Industries. The
corporation sanctioned loans worth Rs. 77.47 crore
during 2002-03.
16.3.2 The Delhi State Industrial DevelopmentCorporation
The Delhi State Industrial Development Corporation
(DSIDC) was established in February 1971 with the
objective of assisting, financing, and promoting the
interests of small-scale industries (SSIs) in the NCT of
Delhi. Its primary purpose is to create an industrial
environment where a wide variety of high-value and high
technology products are produced by the region’s SSIs.
The Corporation has an authorised capital of Rs. 30 crore
and paid-up capital of Rs.21.86 crore.
The Corporation has developed some major industrial
complexes in the past. Recently, it has acquired 1903
acres of land in Bawana (West Delhi) where world-class
infrastructure has been created in a record time of 18
months to facilitate the shifting of units from the city.
The specifications used to lay the services are very
stringent and match the best in the world including for
road construction, water supply etc. In Bawana, more
than 16,400 plots have been developed and allotted to
the eligible units. Other allied facilities like wholesale
market, commercial complex etc. are being added in the
near future. Another 450 acres of land has been recently
acquired in Bhorgarh village, Delhi, where about 5000
plots have been allotted under the Relocation Scheme.
The development work in this industrial estate is
expected to be completed soon. Industrial units have
also been allotted plots under the Relocation Scheme at
other sites in Narela, Jhilmil, Badli, Patparganj industrial
estates.
One of the major constraints in shifting of industrial
units from the city to the far-flung industrial estates was
the lack of affordable housing for the workers in the
vicinity. To meet this challenge, DSIDC has constructed
3164 flats in which new technology and material has been
used to keep prices low. The price here is said to be about
70 per cent of what DDA charges for similar housing
units.
DSIDC was mandated by the Honourable Supreme
Court of India to construct 15 CETPs to treat the
industrial effluents in order to reduce pollution in the city.
Twelve CETPs have already been constructed, eight of
which have been handed over to the respective societies
for operation and maintenance, two are in the process of
being handed over and the remaining two are nearing
completion.
Chapter 16 • INDUSTRIAL DEVELOPMENT, VILLAGE & SMALL INDUSTRIES 381
DSIDC has also provided quick, effective, and cheaper
technology solutions to provide accommodation to
government schools by constructing pre-fabricated porta
cabins in 43 such schools at very competitive prices and
handed over in record time, enabling the Corporation to
get further orders from the Department of Education
under the Sarva Shiksha Abhiyan.
The Corporation provides marketing assistance to the
small scale cottage handicrafts, and handlooms industries,
especially for sales to the government and its various
agencies. It also facilitates their participation in Trade
Fairs and Exhibitions both at national and international
level.
Recently, DSIDC took the initiative to boost Gem and
Jewellery trade infrastructure in Delhi which is hitherto,
confined in Surat, Mumbai, Jaipur and Coimbatore, by
starting The National Institute of Jewellery Design and
Technology at Okhla, to impart training in different
aspects of Gem and Jewellery trade.
16.3.3 The Delhi Khadi and Village Industries Board
The Delhi Khadi and Village Industries Board (DKVIB)
was established on 1 May 1983 by extending the
Himachal Pradesh Khadi and Village Industries Act 1966
to the NCT of Delhi in order to plan, programme and
promote Khadi and Village Industries and to generate
employment especially in the rural areas. Though earlier
there were only about 26 Village Industries, apart from
Khadi, Government of India has enhanced them to more
than 100 village industries depending upon the local
conditions, rules and regulations of the respective states.
In order to achieve its various objective and functions, the
Board has been receiving financial assistance from two
sources (a) the Government of Delhi provides 100 per
cent Grant-in-aid (under plan scheme) to meet its
administrative and establishment expenditure, through the
Industries Department and (b) the Khadi and Village
Industries Commission (KVIC). The Ministry of Industry,
Government of India has provided a State Guarantee to
KVIC on behalf of the Board.
There are six developmental schemes on the panel of
the Board; (a) KVIC pattern based, (b) Block Loan,
(c) Consortium Bank Credit Scheme, (d) Rural
Employment Generation Programme (REGP), (e) Rajiv
Gandhi Swavlamban Rozgar Yojna, and (f) Self
Employment for Educated Unemployed Youth. Funds
disbursement under the first three schemes has been
discontinued and only recoveries are being made from
the beneficiaries, who have already availed financial
assistance under these schemes. The fourth scheme i.e.,
Rural Employment Generation Programme (REGP) is
being implemented in the rural areas of Delhi with the
help of the nationalised banks. Under this scheme the
funds for margin money component is to be received
through KVIC, Government of India. The schemes of
Rajiv Gandhi Swavlamban Rozgar Yojna, and Self
Employment for Educated Unemployed Youth are being
implemented in the entire vicinity of Delhi with the
view to generate employment opportunities in Delhi.
These two schemes are implemented from 2004-05.
The funds for implementation of these schemes are
received from GNCT of Delhi. The goals of the present
schemes are (a) to generate employment opportunities
in the rural as well as urban areas of Delhi, (b) to
develop entrepreneur skills among the unemployed
youth, and (to achieve the goal of rural industrialisation
only through REGP.
The financial assistance under the above mentioned
schemes are made subject to the local conditions indicated
in the Delhi Master Plan 2001 and other notifications
issued by the civic bodies from time to time regarding
what type of industries are to be set up and the places
where the industries are to be set up. By the end of 2004-
05, the Board had disbursed 6815 units involving an
amount of Rs.968.71 lakhs in the various schemes of
KVIC, Government of India, and 588 units involving an
amount of Rs.112.71 lakhs in the schemes financed and
supported by the GNCT of Delhi. The GNCT of Delhi
reconstituted the Board on 8 February 2002 with a full
time Chairman and a Managing Director-cum-Member
Secretary.
16.3.4 Haryana Delhi Industrial Consultants Limited
Haryana Delhi Industrial Consultants Limited
(HARDICON) is a consultancy body set up by All India
Financial Institutions such as IFCI, IDBI, ICICI in
association with the DFC and Nationalised Banks and
with the objective of providing Technical and Financial
Consultancy Services to the medium, small and tiny
industrial units of Delhi.
16.3.5 Hi-Tech Vocational Training Centre
This Centre has been set up in the Okhla Industrial
area by the Government of Delhi in 1993, in collaboration
with the Government of Italy with the basic objectives of
(a) providing training in various fields of industrial
automation in the hi-tech areas by the way of conducting
various training programmes for the industrial workers
and fresh pass outs from engineering colleges and
polytechnics and (b) providing consultancy for the benefit
DELHI DEVELOPMENT REPORT382
of small and medium industries. The Italian government
has provided some of the most advanced industrial
machinery and equipment for this purpose. The centre has
been conducting nine different courses on widely diverse
areas ranging from Programmable Logic Controllers,
Digital Electronics to CNC programming and Operation,
CAD/CAM and Reverse Engineering techniques. The
centre has been undertaking major steps towards facility
upgradation in its various training labs in order to remain
in the forefront of technology for providing competitive
edge to the industrial workers, students and small and
medium industrial units.
16.3.6 Tool Room Training Centre
This Centre has been functioning from 1978 in the
Wazirpur Industrial Area with Danish collaboration for
training young persons as toolmakers and designers and
also for providing technical consultancy in tool making.
The Centre is equipped with modern high-tech
computerised numerically controlled machines so as to
manufacture high-tech high-precision tools, jigs, fixtures
and moulds for small scale and other industries. A new
Centre for Information Technology in Tool Engineering
and Computer Applications providing technical know-how
in the field of CAD/CAM has also been set up in the
campus.
16.3.7 Society for Self-Employment
The Society for Self-Employment established by
Government of NCT of Delhi, became functional from 1
April 1987 with the objective of providing short-term
training to economically deprived persons in the age
group of 18-25 in different technical trades to enable
them to establish their own ventures or to obtain
employment in private sector. Professional training is
being provided in trades like Repair of Radio & T.V.,
Household Electrical Appliances, Refrigeration and Air-
conditioning and Plumbing. A course in Fashion
Designing is also being conducted exclusively for female
candidates. There are two such training centres at present
functioning from Jhandewalan and Nand Nagri.
16.3.8 Other Facilities
In addition to these, other facilities for industries
include a Carpet Weaving and Training Centre as well as
a Paper Craft and Paper Mache Centre at Bharat Nagar,
the Indian Institute of Packaging operating from
Patparganj Industrial Area, Common Facilities Centre for
leather goods at the Flatted Factories Complex at
Wazirpur and Jhandewalan. Financial assistance is
provided to Scheduled Caste families to set up their own
enterprises by the Delhi Scheduled Caste Financial &
Development Corporation.
16.4 Industrial Policy
The Draft Industrial Policy for Delhi has already been
finalised. A Draft Cabinet note for seeking approval of the
Council of Ministers in respect of industrial policy was
circulated to all the concerned departments. The Finance
Minister, GNCT of Delhi has observed that industrial
policy should be finalised only after the ‘White Paper’ on
industries in Delhi is ready. The committee constituted
for the preparation of the ‘White Paper’ on industries in
Delhi has already finalised its report. The Draft Cabinet
note, after interdepartmental consultations, has also been
finalised and the same is likely to be placed before the
Cabinet. However, the industrial policy of Delhi could not
be earlier finalised because of the matter relating to
closure/shifting of industries from residential/
nonconforming areas being subjudice.
Since the draft Master Plan 2021 is likely to be notified
soon, the industrial policy for Delhi can only be suitably
modified and declared after the said Master Plan is
notified.
The salient features of the Draft Industrial Policy
include; (a) Promotion of sophisticated industries which
could achieve optimum level of production with less
space, power, water etc., (b) generation of employment
avenues through non-polluting industries, (c) emphasis
on encouraging non-polluting industries, (d) emphasis
on promotion of computer software, I.T. and I.T.
enabled services, electronics and high-tech industries
irrespective of investment limits, (e) no new industrial
unit shall be permitted in residential areas except
household industries, (f) a single unified agency for
development and maintenance of industrial areas in
Delhi. The involvement of industrial association of the
area in the maintenance of industrial areas shall be
encouraged, (g) Low-tech industries to be encouraged
to recycle into high-tech industries in industrial areas,
(h) hazardous/obnoxious industries as well as large/
heavy industries shall not be permitted in Delhi, and (i)
small-scale industries graduating to the medium sector
as a result of modernisation, technical upgradation shall
be permitted provided there is no substantial expansion
and where growth is in the same line or allied line, and
where industry is operating in an approved industrial
area.
A different policy exercise with a 20 year perspective
relates to formulating policies and projects for creating
a more environmental friendly and better governed
Chapter 16 • INDUSTRIAL DEVELOPMENT, VILLAGE & SMALL INDUSTRIES 383
region is the ‘Delhi Urban Environment and
Infrastructure Improvement Project (DUEIIP)- 2021’.
This study was sponsored by the Government of Delhi
and the Ministry of Environment, Government of India
and funded by Japan through the World Bank. A
specific report prepared under the DUEIIP-21 was a
policy framework and guidelines for Industrial Area
Upgradation.
The strategic plan for twenty years for the NCT of
Delhi incorporated in DUEIIP-21 suggests that industrial
location policies should include: (a) compulsory
registration of all industrial units, (b) permitting new
units or expansion of existing ones only after
environmental clearance, (c) promotion of high tech, high
skill industrial units, (d) no hazardous units be allowed,
(e) one window approach for cases relating to industrial
development, and (f) special efforts for promoting
industrial units. In preparing the Tenth Five-Year Plan for
Delhi, all departments/agencies were directed to take into
account the recommendations of DUEIIP-21.
16.4.1 Industrial Pollution and Relocation
An important development in the last decade has been
environmental concerns arising out of industrial
operations within Delhi. The major sources of industrial
pollution in Delhi were identified as thermal power
plants, brick kilns, hot mix plants and industrial units. In
1996, the Supreme Court ordered the closure of 168
hazardous units, 46 hot-mix plants, 243 brick kilns, and
21 arc/induction furnaces in addition to 513 other
industries. A high powered Committee headed by
Principal Secretary-cum-Commissioner of Industries had
been constituted in accordance with directives of the
Supreme Court for ensuring that the provisions of the
Master Plan are complied with and to examine the
permissibility of functioning of units in the residential/
non-conforming areas in terms of provisions contained in
MPD-2001.
According to a survey by the Government of Delhi,
there are 98,000 industries, out of a total of 1,25,000
industries, in non-conforming areas as per the Master
Plan of Delhi. The Supreme Court has agreed to the
Delhi Government’s proposal to rehabilitate such
industries and relocate them in the conforming use
zones and the latter has identified 102 acres of
developed land in the existing industrial estates and
seven other locations with an area of approximately
4,800 acres for relocation of the industries. A mega
industrial estate on about 1865 acres of land in North-
West Delhi (Bawana and surrounding areas) is being
developed through DSIDC for relocation of industries
operating in residential and non-conforming areas of
Delhi along with a flatted factory complex with 370
factories in the Jhilmil Industrial Area. The DDA and the
Union Ministry of Urban Development as well as the
Delhi Urban Arts Commission have approved the change
from agricultural to industrial land use as also the lay
out plans in respect of the land in Bawana.
Approximately 27,055 applicants out of a total of over
51,000 applicants have been found eligible to be
relocated from residential/non-conforming areas under
the Relocation Scheme for industries operating on a self-
financing basis and costing approximately Rs.100,000
lakh.
Another intervention by the Supreme Court in the
industrial operations in Delhi relate to the setting up of
15 Common Effluent Treatment Plants (CETPs) for the
28 industrial areas of Delhi in order to control pollution.
The funding pattern is based on a World Bank scheme
and the Delhi Government and the Ministry of
Environment and Forests have each deposited 25 per cent
of the total cost of Rs.90 crores of the CETPs. The DSIDC
is the executing agency in collaboration with the National
Environmental Research Institute (NEERI) and the Delhi
Pollution Control Committee (DPCC).
The construction of the following ten CETPs have
been completed and after their successful trial runs
handed over to the respective CETPs for their operation
and maintenance. Of the remaining five, two CETPs at
Naraina and Najafgarh are under construction at a very
slow pace because of paucity of funds as reported by the
DSIDC. The construction of three other CETPs at Anand
Parbat, Mohan cooperative societies, and Okhla
Industrial Estate have been kept in abeyance as per the
direction of EPCA. An issue that had come up in the
costing aspect of the CETPs was the non-inclusion of
three components viz., land, conveyance system and HT
lines and also the cost of other essential items required
as per detailed engineering. This has increased the total
financial liability of the Delhi Government to Rs.116.15
crores which is finally to be approved by EPCA. The
Delhi Government has already paid an amount of Rs.
87.77 crores to DSIDC and balance amount to the tune
of Rs. 28.38 crores is pending till its final decision by
EPCA. The costing adpect of the 15 CETPs and the
pending amount not paid by the society towards their
cost apportionment and the amount to be paid by the
Government of India of their share contribution etc., has
now been entrusted to EPCA vide the Supreme Court
order dated 2 February 2006. The concerned department
DELHI DEVELOPMENT REPORT384
has, however, kept a provision in the Plan scheme during
the current financial year 2006-07 of a token amount of
Rs. 1 lakh.
16.5 Prospects and Potentialfor Industry
Though manufacturing accounts for about 12 per cent
of Delhi’s GSDP and about 40 per cent of the total work
force, the priority given to the industrial sector in the Five
Year Plans is extremely low. During the Ninth Plan
(1997-2002), expenditure on industry accounted for
Rs.134 crore (0.98 per cent) out of total Plan expenditure
of Rs.13660 crore. The industrial sector ranked twelfth
out of a total of 31 sectors in terms of share in total
outlays. Industry has been given even lower priority
during the Tenth Plan (2002-2007) with budgeted
absolute expenditure on the industrial sector dropping to
Rs.100 crore out of the total proposed expenditure of
Rs.23,000 crore. The share of industry decreased by nearly
half to a mere 0.43 per cent of total outlays as compared
to its expenditure share in the Ninth Plan. Five sectors—
Transport (23.7 per cent), Water Supply (16.4 per cent),
Energy (15.0 per cent), Urban Development (12.8 per
cent), and Medical (9.7 per cent)—accounted for more
than three-fourth of total outlays. In terms of expenditure
priorities, industry dropped to rank nineteenth out a total
of thirty-one sectors.
The industrial sector of Delhi has to play an important
role in generating higher levels of income and
employment since the role of the primary sector can only
be extremely limited in the region. With manufacturing
accounting for the employment of about two-fifths of total
workers and there is clearly a need to assign a greater role
for this sector in terms of a higher priority in the State’s
Plan. Many of the fastest growing and highly
industrialised states have assigned a larger proportion of
Tenth Plan (2002-2007) outlays to industry—Andhra
Pradesh (3.2 per cent), Gujarat (3.5 per cent), Karnataka
(3.3 per cent), Maharashtra (2.5 per cent), and Tamil
Nadu (4.1 per cent). The all-states average outlay on
industry for the Tenth Plan is 3.2 per cent—nearly eight
times that for Delhi.
The closure of many polluting and hazardous
industrial units and the Relocation Scheme for non-
conforming units, though reducing environmental
pollution levels, may be expected to have had an adverse
impact on industrial growth and employment within
Delhi. The contribution of industrial sources of pollution
(including Thermal Power Plants) to ambient air has
come down from 56 per cent in 1970-71 to 20 per cent
in 2000-01, and with the coming into operation of all the
15 CETPs the contribution of this sector to both air and
water pollution levels would be heavily reduced. Under
these circumstances there is some justification for the
ongoing effort for regularisation of other industries
situated in residential/non-conforming areas. The
DUEIIP-21 has suggested the regularisation of about
54,000 industrial units if they are non-polluting and
satisfy revised norms and broader parameters of
environmental management and industrial/economic
planning. The Government of NCT of Delhi has
identified 24 industrial concentration areas where more
than 70 per cent residential premises have already been
converted to industrial use and has requested for
relevant amendments to the Master Plan to agencies like
DDA, DUAC and the Ministry of Urban Development,
Government of India for in situ regularisation, as well as
for broadening parameters governing household and
service industries which cater to the day to day needs of
the residents. As long as they are non-polluting and non-
hazardous, regularisation would avoid loss of output,
employment, underutilisation of capacity, entrepreneurial
confidence and productivity. Corrective measures
incorporating a system of suitable incentives and
disincentives are required in relation to such industries
in order to ensure shifting and relocation of industries
failing to meet the broadened parameters in terms of
environmental and other norms.
As mentioned before, a desirable prerequisite for
sustained industrial growth and development in the long
run is that the industrial base broadens and becomes
more diversified thus ensuring a higher level of resilience
of the regional economy. Analysis indicates an increasing
degree of specialisation in Delhi over time, which may be
suggestive of weakening inter-regional and inter-industry
linkages. In 2002-03, Delhi had the most specialised
industrial structure as compared with the fourteen major
states. There is clearly a need for policy intervention to
ensure greater diversification of Delhi’s industrial base in
terms of development of new industries that are hi-tech
and high value added in nature. Ad hoc licensing of
industrial units should be avoided and policy measures
introduced to ensure dispersal of existing industries as
well as their modernisation and technological up
gradation.
The project of setting of Hi-Tech city, Science Park and
Bio-Tech Park has been taken up together and they have
been renamed now as Knowledge Park. The requirement
of land for setting up the Knowledge Park is assessed
around 90-100 acres. The matter of identification of land
Chapter 16 • INDUSTRIAL DEVELOPMENT, VILLAGE & SMALL INDUSTRIES 385
which may be ideally suitable for this project is being
pursued with Land and Building Department and
Divisional Commissioner of GNCT of Delhi as well the
DDA. This project will be a joint venture of the Delhi
Government with the private sector for facilitating growth
of software driven IT/ITES units and in establishing
linkages between academics and the business sector/
industry in HRD sector. The Delhi Government’s
contribution will be limited to providing land as its share
of equity capital. A budget provision of Rs. 55 lakhs for
acquisition of land under capital head has been provided
in 2006-07 for this project.
Another joint venture being planned by the GNCT of
Delhi is the setting up of a World Trade Center (WTC)
in order to facilitate the nation’s (and the region’s) trade
and commerce by becoming a nodal point for
international flows of information, funds and
technologies. This will complement the other seven
Centres (Mumbai, Bangalore, Kolkata, Kochi,
Coimbatore, Hyderabad, and Chennai) as it will be in
capital city and the first in the North Indian region. The
WTC will provide space for the offices of international
institutions, trade promotion services, international trade
community, trade missions, as well as conference and
seminar facilities, business and corporate meetings,
information services, arrange for international
exhibitions and expositions and so on. The Delhi
Government’s contribution will be limited to providing
land as its share of equity capital. An amount of Rs. 5.5
lakh is earmarked in the financial year 2006-07 for the
WTC. The matter of land allotment is being pursued
with the DDA for this project.
SECTION—B
16.6 Unorganised Sector and Khadi andVillage Industries in Delhi
The Industrial Policy statement issued in 1982 put
special emphasis on promoting sophisticated industries,
which could achieve optimum levels of production with
less space, power and generate employment avenues for
skilled persons. The statement also postulated that
industrial growth should be in the small scale sector.
The small scale sector or village and small scale
industries comprises two sectors (i) Modern small
sector (ii) Traditional Sector. Modern small scale
Industries includes small scale industries (both factory
and non-factory sector) and power loom units. The
traditional sector comprises Khadi and Village
Industries, handlooms, sericulture, handicrafts, coir
sector, etc. The first part of this chapter was mainly
focused on the organised sector comprising mainly
factory sector (inclusive of modern small scale sector)
and the second part i.e., the following section addresses
the nature and extent of unorganised sector and the
village industries. The Khadi and Village industry is
part of unorganised sector also because of their nature
of activity and employment size since they also fall out
of purview of the factory sector definition which is
defined on the basis of number of workers and use of
power. In the following section first part will discuss
the unorganised sector in Delhi and subsequent section
will discuss the Khadi and village industries sector
including handicrafts in Delhi.
16.6.1 Unorganised Sector in Delhi
There are 2.30 lakh (NSSO 56 round) enterprises
engaged in activities pertaining to unorganised
manufacturing and 2.2 lakh enterprises in unorganised
service sector together making 4.5 lakh enterprises in
unorganised manufacturing and service sector in Delhi.
1.34 per cent of total population of all India lives in
Delhi. The share of Delhi in terms of unorganised sector
enterprises is 1.52 per cent, 4.51 per cent of fixed capital
is invested here, production share is 5.41 per cent,
employment share is 2.51 per cent and share in GVA is
6.37 per cent. Table 16.11 above gives the percentage of
employment, number of enterprises and gross value
added by the manufacturing and service sectors of all
states to the all-India value of these variables. It may be
seen that in terms of employment and the number of
MSE, Delhi’s position is at the 13 and 16 respectively. In
terms of gross value added, it has jumped to position
no. 7.
However, the absolute value of any state variable does
not convey a correct idea about the relative significance of
any variable for the state’s economy since the absolute
magnitude of any variable is dependent upon the relative
size of the state concerned. Delhi’s relative size may be
judged in terms of its population size. In order to
neutralise the effect of size on any of the three variables
which we are considering, one may estimate location
quotient of Delhi in terms of the three variables, namely,
employment, number of enterprises and gross value
added, with regard to population by using the location
quotient formula given below:
100/
/X
PP
iViViLq
jj
jjj =
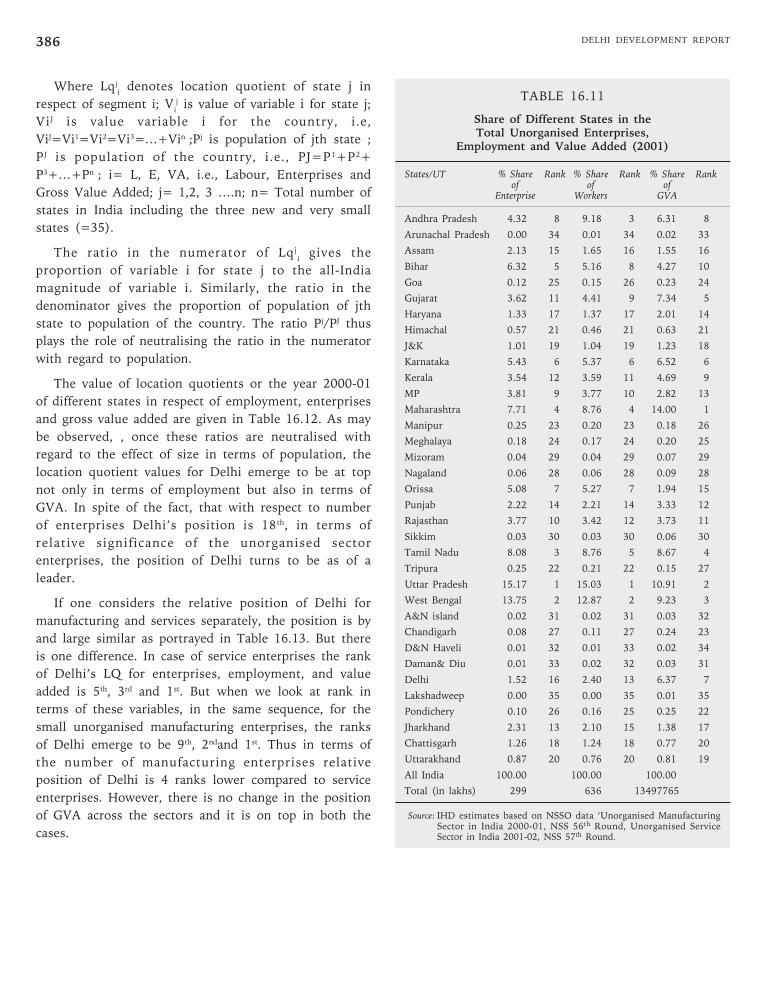
DELHI DEVELOPMENT REPORT386
Where Lqji denotes location quotient of state j in
respect of segment i; Vij is value of variable i for state j;
Vi J is value variable i for the country, i.e,
ViJ=Vi1=Vi2=Vi3=…+Vin ;Pj is population of jth state ;
P J is population of the country, i.e., PJ=P1+P2+
P3+…+Pn ; i= L, E, VA, i.e., Labour, Enterprises and
Gross Value Added; j= 1,2, 3 ….n; n= Total number of
states in India including the three new and very small
states (=35).
The ratio in the numerator of Lq ji gives the
proportion of variable i for state j to the all-India
magnitude of variable i. Similarly, the ratio in the
denominator gives the proportion of population of jth
state to population of the country. The ratio Pj/PJ thus
plays the role of neutralising the ratio in the numerator
with regard to population.
The value of location quotients or the year 2000-01
of different states in respect of employment, enterprises
and gross value added are given in Table 16.12. As may
be observed, , once these ratios are neutralised with
regard to the effect of size in terms of population, the
location quotient values for Delhi emerge to be at top
not only in terms of employment but also in terms of
GVA. In spite of the fact, that with respect to number
of enterprises Delhi’s position is 18th, in terms of
relative significance of the unorganised sector
enterprises, the position of Delhi turns to be as of a
leader.
If one considers the relative position of Delhi for
manufacturing and services separately, the position is by
and large similar as portrayed in Table 16.13. But there
is one difference. In case of service enterprises the rank
of Delhi’s LQ for enterprises, employment, and value
added is 5th, 3rd and 1st. But when we look at rank in
terms of these variables, in the same sequence, for the
small unorganised manufacturing enterprises, the ranks
of Delhi emerge to be 9th, 2ndand 1st. Thus in terms of
the number of manufacturing enterprises relative
position of Delhi is 4 ranks lower compared to service
enterprises. However, there is no change in the position
of GVA across the sectors and it is on top in both the
cases.
TABLE 16.11
Share of Different States in theTotal Unorganised Enterprises,
Employment and Value Added (2001)
States/UT % Share Rank % Share Rank % Share Rankof of of
Enterprise Workers GVA
Andhra Pradesh 4.32 8 9.18 3 6.31 8
Arunachal Pradesh 0.00 34 0.01 34 0.02 33
Assam 2.13 15 1.65 16 1.55 16
Bihar 6.32 5 5.16 8 4.27 10
Goa 0.12 25 0.15 26 0.23 24
Gujarat 3.62 11 4.41 9 7.34 5
Haryana 1.33 17 1.37 17 2.01 14
Himachal 0.57 21 0.46 21 0.63 21
J&K 1.01 19 1.04 19 1.23 18
Karnataka 5.43 6 5.37 6 6.52 6
Kerala 3.54 12 3.59 11 4.69 9
MP 3.81 9 3.77 10 2.82 13
Maharashtra 7.71 4 8.76 4 14.00 1
Manipur 0.25 23 0.20 23 0.18 26
Meghalaya 0.18 24 0.17 24 0.20 25
Mizoram 0.04 29 0.04 29 0.07 29
Nagaland 0.06 28 0.06 28 0.09 28
Orissa 5.08 7 5.27 7 1.94 15
Punjab 2.22 14 2.21 14 3.33 12
Rajasthan 3.77 10 3.42 12 3.73 11
Sikkim 0.03 30 0.03 30 0.06 30
Tamil Nadu 8.08 3 8.76 5 8.67 4
Tripura 0.25 22 0.21 22 0.15 27
Uttar Pradesh 15.17 1 15.03 1 10.91 2
West Bengal 13.75 2 12.87 2 9.23 3
A&N island 0.02 31 0.02 31 0.03 32
Chandigarh 0.08 27 0.11 27 0.24 23
D&N Haveli 0.01 32 0.01 33 0.02 34
Daman& Diu 0.01 33 0.02 32 0.03 31
Delhi 1.52 16 2.40 13 6.37 7
Lakshadweep 0.00 35 0.00 35 0.01 35
Pondichery 0.10 26 0.16 25 0.25 22
Jharkhand 2.31 13 2.10 15 1.38 17
Chattisgarh 1.26 18 1.24 18 0.77 20
Uttarakhand 0.87 20 0.76 20 0.81 19
All India 100.00 100.00 100.00
Total (in lakhs) 299 636 13497765
Source: IHD estimates based on NSSO data ‘Unorganised ManufacturingSector in India 2000-01, NSS 56th Round, Unorganised ServiceSector in India 2001-02, NSS 57th Round.
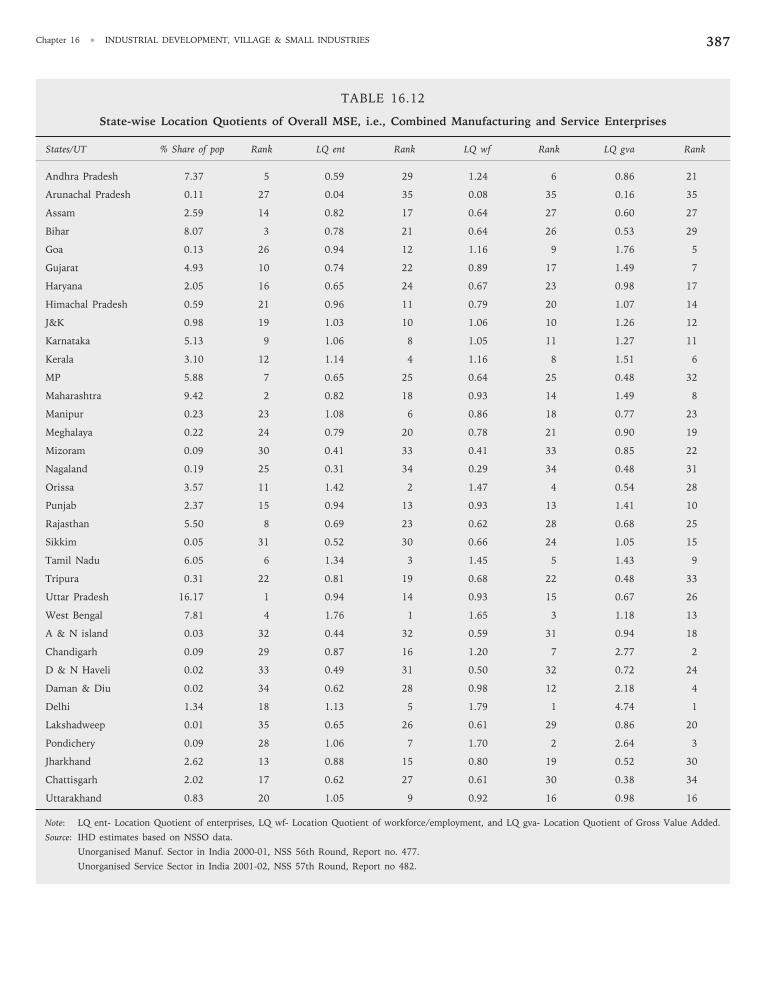
Chapter 16 • INDUSTRIAL DEVELOPMENT, VILLAGE & SMALL INDUSTRIES 387
TABLE 16.12
State-wise Location Quotients of Overall MSE, i.e., Combined Manufacturing and Service Enterprises
States/UT % Share of pop Rank LQ ent Rank LQ wf Rank LQ gva Rank
Andhra Pradesh 7.37 5 0.59 29 1.24 6 0.86 21
Arunachal Pradesh 0.11 27 0.04 35 0.08 35 0.16 35
Assam 2.59 14 0.82 17 0.64 27 0.60 27
Bihar 8.07 3 0.78 21 0.64 26 0.53 29
Goa 0.13 26 0.94 12 1.16 9 1.76 5
Gujarat 4.93 10 0.74 22 0.89 17 1.49 7
Haryana 2.05 16 0.65 24 0.67 23 0.98 17
Himachal Pradesh 0.59 21 0.96 11 0.79 20 1.07 14
J&K 0.98 19 1.03 10 1.06 10 1.26 12
Karnataka 5.13 9 1.06 8 1.05 11 1.27 11
Kerala 3.10 12 1.14 4 1.16 8 1.51 6
MP 5.88 7 0.65 25 0.64 25 0.48 32
Maharashtra 9.42 2 0.82 18 0.93 14 1.49 8
Manipur 0.23 23 1.08 6 0.86 18 0.77 23
Meghalaya 0.22 24 0.79 20 0.78 21 0.90 19
Mizoram 0.09 30 0.41 33 0.41 33 0.85 22
Nagaland 0.19 25 0.31 34 0.29 34 0.48 31
Orissa 3.57 11 1.42 2 1.47 4 0.54 28
Punjab 2.37 15 0.94 13 0.93 13 1.41 10
Rajasthan 5.50 8 0.69 23 0.62 28 0.68 25
Sikkim 0.05 31 0.52 30 0.66 24 1.05 15
Tamil Nadu 6.05 6 1.34 3 1.45 5 1.43 9
Tripura 0.31 22 0.81 19 0.68 22 0.48 33
Uttar Pradesh 16.17 1 0.94 14 0.93 15 0.67 26
West Bengal 7.81 4 1.76 1 1.65 3 1.18 13
A & N island 0.03 32 0.44 32 0.59 31 0.94 18
Chandigarh 0.09 29 0.87 16 1.20 7 2.77 2
D & N Haveli 0.02 33 0.49 31 0.50 32 0.72 24
Daman & Diu 0.02 34 0.62 28 0.98 12 2.18 4
Delhi 1.34 18 1.13 5 1.79 1 4.74 1
Lakshadweep 0.01 35 0.65 26 0.61 29 0.86 20
Pondichery 0.09 28 1.06 7 1.70 2 2.64 3
Jharkhand 2.62 13 0.88 15 0.80 19 0.52 30
Chattisgarh 2.02 17 0.62 27 0.61 30 0.38 34
Uttarakhand 0.83 20 1.05 9 0.92 16 0.98 16
Note: LQ ent- Location Quotient of enterprises, LQ wf- Location Quotient of workforce/employment, and LQ gva- Location Quotient of Gross Value Added.
Source: IHD estimates based on NSSO data.
Unorganised Manuf. Sector in India 2000-01, NSS 56th Round, Report no. 477.
Unorganised Service Sector in India 2001-02, NSS 57th Round, Report no 482.
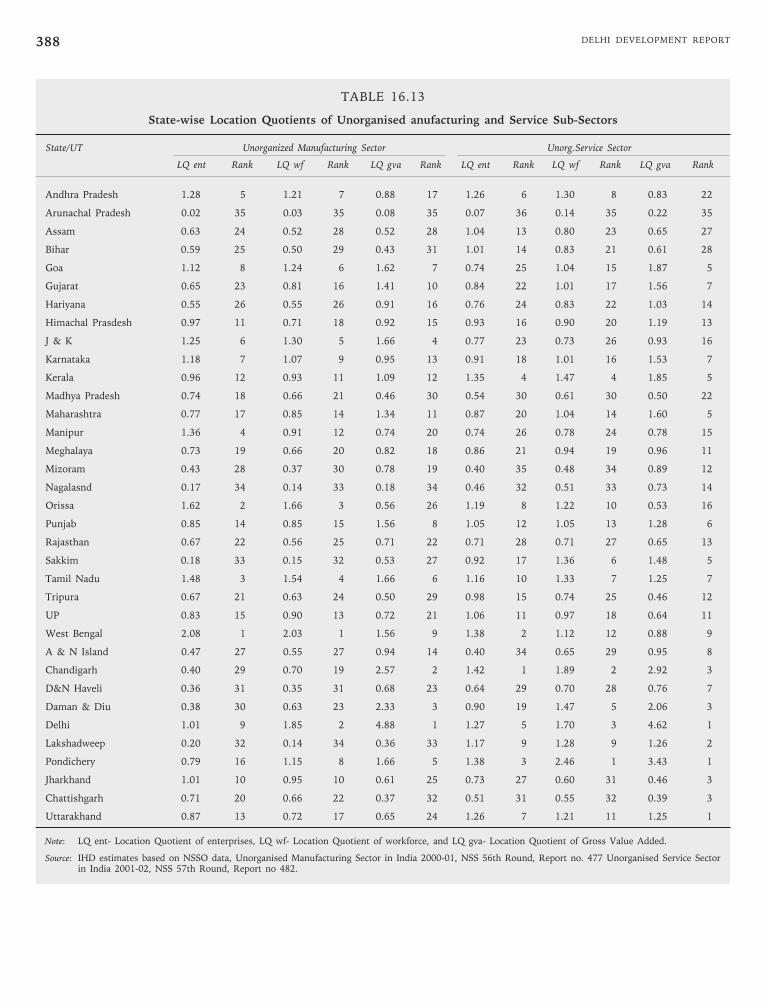
DELHI DEVELOPMENT REPORT388
TABLE 16.13
State-wise Location Quotients of Unorganised anufacturing and Service Sub-Sectors
State/UT Unorganized Manufacturing Sector Unorg.Service Sector
LQ ent Rank LQ wf Rank LQ gva Rank LQ ent Rank LQ wf Rank LQ gva Rank
Andhra Pradesh 1.28 5 1.21 7 0.88 17 1.26 6 1.30 8 0.83 22
Arunachal Pradesh 0.02 35 0.03 35 0.08 35 0.07 36 0.14 35 0.22 35
Assam 0.63 24 0.52 28 0.52 28 1.04 13 0.80 23 0.65 27
Bihar 0.59 25 0.50 29 0.43 31 1.01 14 0.83 21 0.61 28
Goa 1.12 8 1.24 6 1.62 7 0.74 25 1.04 15 1.87 5
Gujarat 0.65 23 0.81 16 1.41 10 0.84 22 1.01 17 1.56 7
Hariyana 0.55 26 0.55 26 0.91 16 0.76 24 0.83 22 1.03 14
Himachal Prasdesh 0.97 11 0.71 18 0.92 15 0.93 16 0.90 20 1.19 13
J & K 1.25 6 1.30 5 1.66 4 0.77 23 0.73 26 0.93 16
Karnataka 1.18 7 1.07 9 0.95 13 0.91 18 1.01 16 1.53 7
Kerala 0.96 12 0.93 11 1.09 12 1.35 4 1.47 4 1.85 5
Madhya Pradesh 0.74 18 0.66 21 0.46 30 0.54 30 0.61 30 0.50 22
Maharashtra 0.77 17 0.85 14 1.34 11 0.87 20 1.04 14 1.60 5
Manipur 1.36 4 0.91 12 0.74 20 0.74 26 0.78 24 0.78 15
Meghalaya 0.73 19 0.66 20 0.82 18 0.86 21 0.94 19 0.96 11
Mizoram 0.43 28 0.37 30 0.78 19 0.40 35 0.48 34 0.89 12
Nagalasnd 0.17 34 0.14 33 0.18 34 0.46 32 0.51 33 0.73 14
Orissa 1.62 2 1.66 3 0.56 26 1.19 8 1.22 10 0.53 16
Punjab 0.85 14 0.85 15 1.56 8 1.05 12 1.05 13 1.28 6
Rajasthan 0.67 22 0.56 25 0.71 22 0.71 28 0.71 27 0.65 13
Sakkim 0.18 33 0.15 32 0.53 27 0.92 17 1.36 6 1.48 5
Tamil Nadu 1.48 3 1.54 4 1.66 6 1.16 10 1.33 7 1.25 7
Tripura 0.67 21 0.63 24 0.50 29 0.98 15 0.74 25 0.46 12
UP 0.83 15 0.90 13 0.72 21 1.06 11 0.97 18 0.64 11
West Bengal 2.08 1 2.03 1 1.56 9 1.38 2 1.12 12 0.88 9
A & N Island 0.47 27 0.55 27 0.94 14 0.40 34 0.65 29 0.95 8
Chandigarh 0.40 29 0.70 19 2.57 2 1.42 1 1.89 2 2.92 3
D&N Haveli 0.36 31 0.35 31 0.68 23 0.64 29 0.70 28 0.76 7
Daman & Diu 0.38 30 0.63 23 2.33 3 0.90 19 1.47 5 2.06 3
Delhi 1.01 9 1.85 2 4.88 1 1.27 5 1.70 3 4.62 1
Lakshadweep 0.20 32 0.14 34 0.36 33 1.17 9 1.28 9 1.26 2
Pondichery 0.79 16 1.15 8 1.66 5 1.38 3 2.46 1 3.43 1
Jharkhand 1.01 10 0.95 10 0.61 25 0.73 27 0.60 31 0.46 3
Chattishgarh 0.71 20 0.66 22 0.37 32 0.51 31 0.55 32 0.39 3
Uttarakhand 0.87 13 0.72 17 0.65 24 1.26 7 1.21 11 1.25 1
Note: LQ ent- Location Quotient of enterprises, LQ wf- Location Quotient of workforce, and LQ gva- Location Quotient of Gross Value Added.
Source: IHD estimates based on NSSO data, Unorganised Manufacturing Sector in India 2000-01, NSS 56th Round, Report no. 477 Unorganised Service Sectorin India 2001-02, NSS 57th Round, Report no 482.
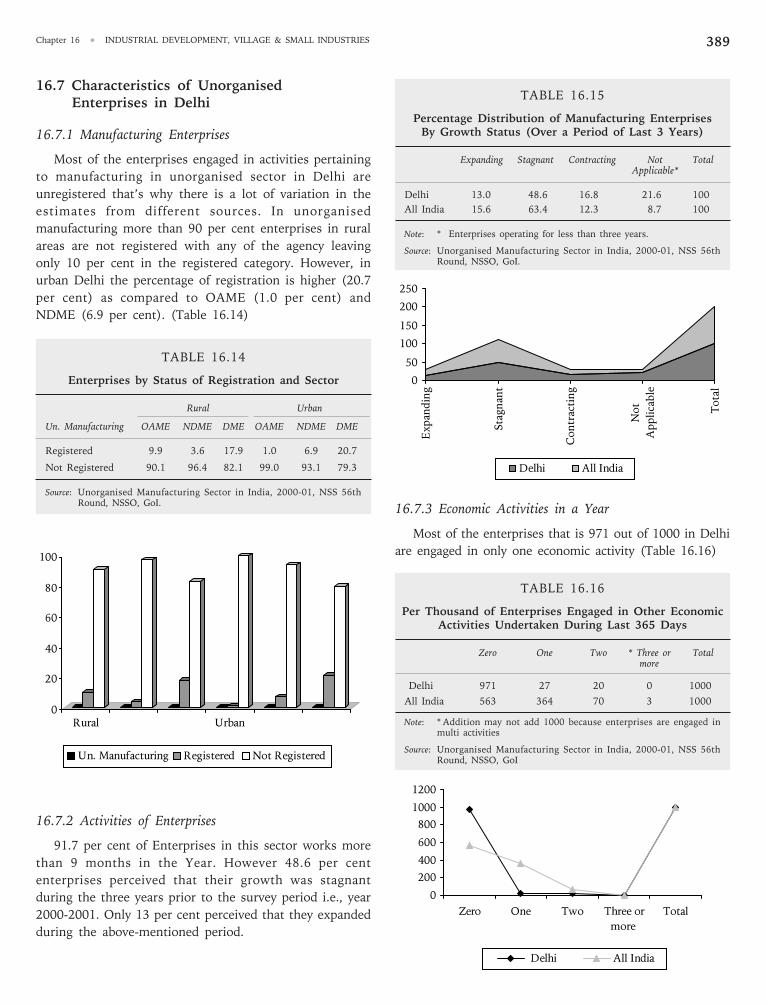
Chapter 16 • INDUSTRIAL DEVELOPMENT, VILLAGE & SMALL INDUSTRIES 389
16.7 Characteristics of UnorganisedEnterprises in Delhi
16.7.1 Manufacturing Enterprises
Most of the enterprises engaged in activities pertaining
to manufacturing in unorganised sector in Delhi are
unregistered that’s why there is a lot of variation in the
estimates from different sources. In unorganised
manufacturing more than 90 per cent enterprises in rural
areas are not registered with any of the agency leaving
only 10 per cent in the registered category. However, in
urban Delhi the percentage of registration is higher (20.7
per cent) as compared to OAME (1.0 per cent) and
NDME (6.9 per cent). (Table 16.14)
TABLE 16.14
Enterprises by Status of Registration and Sector
Rural Urban
Un. Manufacturing OAME NDME DME OAME NDME DME
Registered 9.9 3.6 17.9 1.0 6.9 20.7
Not Registered 90.1 96.4 82.1 99.0 93.1 79.3
Source: Unorganised Manufacturing Sector in India, 2000-01, NSS 56thRound, NSSO, GoI.
16.7.2 Activities of Enterprises
91.7 per cent of Enterprises in this sector works more
than 9 months in the Year. However 48.6 per cent
enterprises perceived that their growth was stagnant
during the three years prior to the survey period i.e., year
2000-2001. Only 13 per cent perceived that they expanded
during the above-mentioned period.
TABLE 16.15
Percentage Distribution of Manufacturing EnterprisesBy Growth Status (Over a Period of Last 3 Years)
Expanding Stagnant Contracting Not TotalApplicable*
Delhi 13.0 48.6 16.8 21.6 100
All India 15.6 63.4 12.3 8.7 100
Note: * Enterprises operating for less than three years.
Source: Unorganised Manufacturing Sector in India, 2000-01, NSS 56thRound, NSSO, GoI.
16.7.3 Economic Activities in a Year
Most of the enterprises that is 971 out of 1000 in Delhi
are engaged in only one economic activity (Table 16.16)
TABLE 16.16
Per Thousand of Enterprises Engaged in Other EconomicActivities Undertaken During Last 365 Days
Zero One Two * Three or Totalmore
Delhi 971 27 20 0 1000
All India 563 364 70 3 1000
Note: * Addition may not add 1000 because enterprises are engaged inmulti activities
Source: Unorganised Manufacturing Sector in India, 2000-01, NSS 56thRound, NSSO, GoI
0
20
40
60
80
100
Rural Urban
Un. Manufacturing Registered Not Registered
0
200
400
600
800
1000
1200
Zero One Two Three or
more
Total
Delhi All India
0
50
100
150
200
250
Expan
ding
Stagnan
t
Contracting
Not
Applicable
Total
Delhi All India
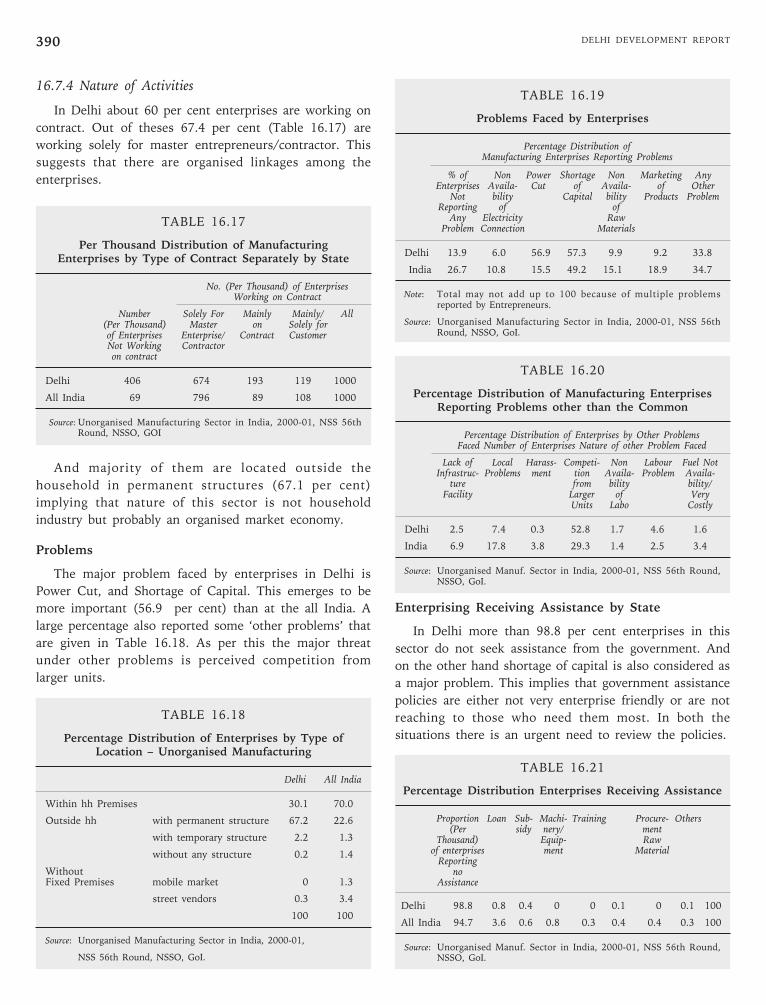
DELHI DEVELOPMENT REPORT390
TABLE 16.19
Problems Faced by Enterprises
Percentage Distribution ofManufacturing Enterprises Reporting Problems
% of Non Power Shortage Non Marketing AnyEnterprises Availa- Cut of Availa- of Other
Not bility Capital bility Products ProblemReporting of of
Any Electricity RawProblem Connection Materials
Delhi 13.9 6.0 56.9 57.3 9.9 9.2 33.8
India 26.7 10.8 15.5 49.2 15.1 18.9 34.7
Note: Total may not add up to 100 because of multiple problemsreported by Entrepreneurs.
Source: Unorganised Manufacturing Sector in India, 2000-01, NSS 56thRound, NSSO, GoI.
TABLE 16.20
Percentage Distribution of Manufacturing EnterprisesReporting Problems other than the Common
Percentage Distribution of Enterprises by Other ProblemsFaced Number of Enterprises Nature of other Problem Faced
Lack of Local Harass- Competi- Non Labour Fuel NotInfrastruc- Problems ment tion Availa- Problem Availa-
ture from bility bility/Facility Larger of Very
Units Labo Costly
Delhi 2.5 7.4 0.3 52.8 1.7 4.6 1.6
India 6.9 17.8 3.8 29.3 1.4 2.5 3.4
Source: Unorganised Manuf. Sector in India, 2000-01, NSS 56th Round,NSSO, GoI.
Enterprising Receiving Assistance by State
In Delhi more than 98.8 per cent enterprises in this
sector do not seek assistance from the government. And
on the other hand shortage of capital is also considered as
a major problem. This implies that government assistance
policies are either not very enterprise friendly or are not
reaching to those who need them most. In both the
situations there is an urgent need to review the policies.
TABLE 16.21
Percentage Distribution Enterprises Receiving Assistance
Proportion Loan Sub- Machi- Training Procure- Others(Per sidy nery/ ment
Thousand) Equip- Rawof enterprises ment Material
Reportingno
Assistance
Delhi 98.8 0.8 0.4 0 0 0.1 0 0.1 100
All India 94.7 3.6 0.6 0.8 0.3 0.4 0.4 0.3 100
Source: Unorganised Manuf. Sector in India, 2000-01, NSS 56th Round,NSSO, GoI.
16.7.4 Nature of Activities
In Delhi about 60 per cent enterprises are working on
contract. Out of theses 67.4 per cent (Table 16.17) are
working solely for master entrepreneurs/contractor. This
suggests that there are organised linkages among the
enterprises.
TABLE 16.17
Per Thousand Distribution of ManufacturingEnterprises by Type of Contract Separately by State
No. (Per Thousand) of EnterprisesWorking on Contract
Number Solely For Mainly Mainly/ All(Per Thousand) Master on Solely forof Enterprises Enterprise/ Contract CustomerNot Working Contractoron contract
Delhi 406 674 193 119 1000
All India 69 796 89 108 1000
Source: Unorganised Manufacturing Sector in India, 2000-01, NSS 56thRound, NSSO, GOI
And majority of them are located outside the
household in permanent structures (67.1 per cent)
implying that nature of this sector is not household
industry but probably an organised market economy.
Problems
The major problem faced by enterprises in Delhi is
Power Cut, and Shortage of Capital. This emerges to be
more important (56.9 per cent) than at the all India. A
large percentage also reported some ‘other problems’ that
are given in Table 16.18. As per this the major threat
under other problems is perceived competition from
larger units.
TABLE 16.18
Percentage Distribution of Enterprises by Type ofLocation – Unorganised Manufacturing
Delhi All India
Within hh Premises 30.1 70.0
Outside hh with permanent structure 67.2 22.6
with temporary structure 2.2 1.3
without any structure 0.2 1.4
WithoutFixed Premises mobile market 0 1.3
street vendors 0.3 3.4
100 100
Source: Unorganised Manufacturing Sector in India, 2000-01,
NSS 56th Round, NSSO, GoI.
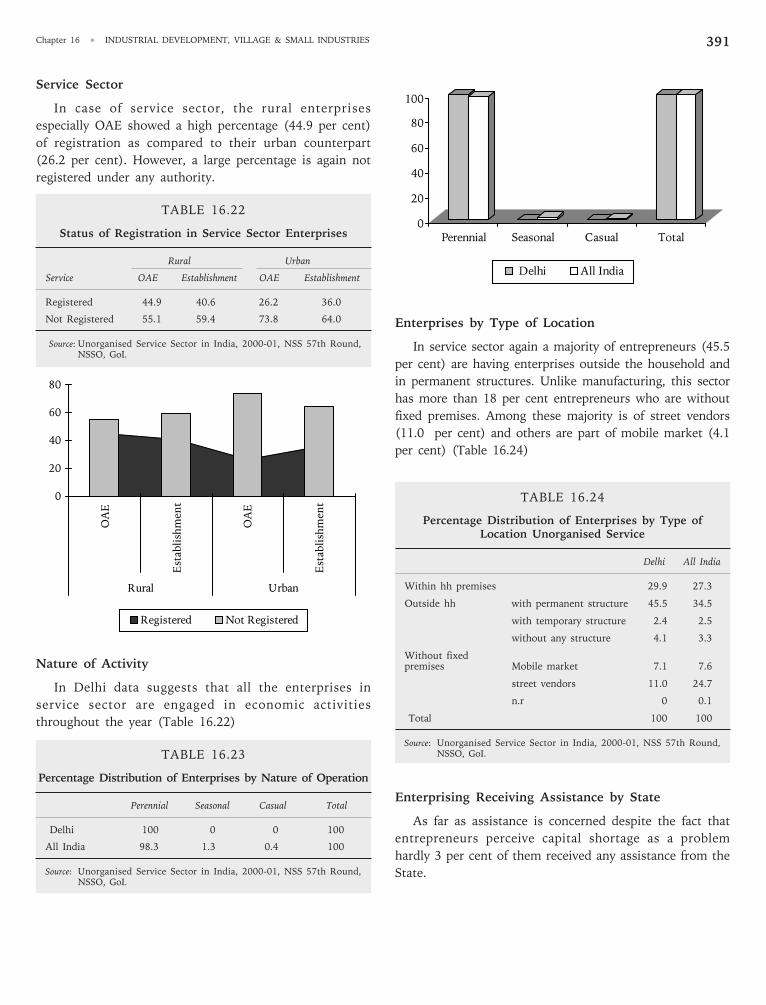
Chapter 16 • INDUSTRIAL DEVELOPMENT, VILLAGE & SMALL INDUSTRIES 391
Enterprises by Type of Location
In service sector again a majority of entrepreneurs (45.5
per cent) are having enterprises outside the household and
in permanent structures. Unlike manufacturing, this sector
has more than 18 per cent entrepreneurs who are without
fixed premises. Among these majority is of street vendors
(11.0 per cent) and others are part of mobile market (4.1
per cent) (Table 16.24)
TABLE 16.24
Percentage Distribution of Enterprises by Type ofLocation Unorganised Service
Delhi All India
Within hh premises 29.9 27.3
Outside hh with permanent structure 45.5 34.5
with temporary structure 2.4 2.5
without any structure 4.1 3.3
Without fixedpremises Mobile market 7.1 7.6
street vendors 11.0 24.7
n.r 0 0.1
Total 100 100
Source: Unorganised Service Sector in India, 2000-01, NSS 57th Round,NSSO, GoI.
Enterprising Receiving Assistance by State
As far as assistance is concerned despite the fact that
entrepreneurs perceive capital shortage as a problem
hardly 3 per cent of them received any assistance from the
State.
Service Sector
In case of service sector, the rural enterprises
especially OAE showed a high percentage (44.9 per cent)
of registration as compared to their urban counterpart
(26.2 per cent). However, a large percentage is again not
registered under any authority.
TABLE 16.22
Status of Registration in Service Sector Enterprises
Rural Urban
Service OAE Establishment OAE Establishment
Registered 44.9 40.6 26.2 36.0
Not Registered 55.1 59.4 73.8 64.0
Source: Unorganised Service Sector in India, 2000-01, NSS 57th Round,NSSO, GoI.
Nature of Activity
In Delhi data suggests that all the enterprises in
service sector are engaged in economic activities
throughout the year (Table 16.22)
TABLE 16.23
Percentage Distribution of Enterprises by Nature of Operation
Perennial Seasonal Casual Total
Delhi 100 0 0 100
All India 98.3 1.3 0.4 100
Source: Unorganised Service Sector in India, 2000-01, NSS 57th Round,NSSO, GoI.
0
20
40
60
80
OAE
Establishment
OAE
Establishment
Rural Urban
Registered Not Registered
0
20
40
60
80
100
Perennial Seasonal Casual Total
Delhi All India
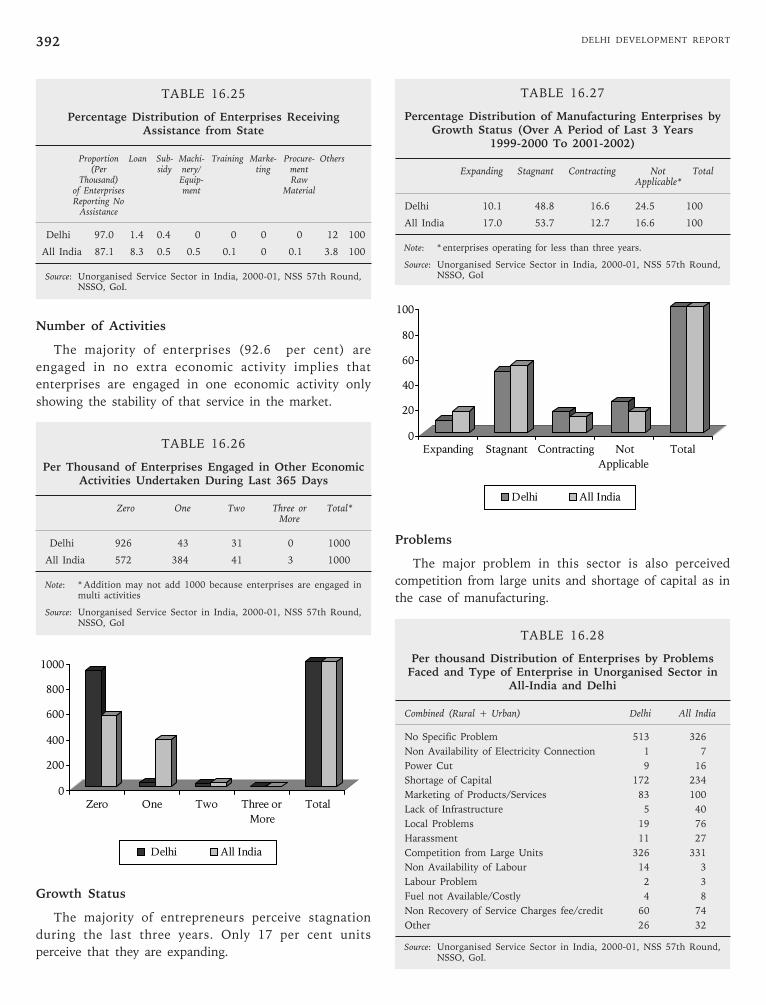
DELHI DEVELOPMENT REPORT392
TABLE 16.25
Percentage Distribution of Enterprises ReceivingAssistance from State
Proportion Loan Sub- Machi- Training Marke- Procure- Others(Per sidy nery/ ting ment
Thousand) Equip- Rawof Enterprises ment MaterialReporting No
Assistance
Delhi 97.0 1.4 0.4 0 0 0 0 12 100
All India 87.1 8.3 0.5 0.5 0.1 0 0.1 3.8 100
Source: Unorganised Service Sector in India, 2000-01, NSS 57th Round,NSSO, GoI.
Number of Activities
The majority of enterprises (92.6 per cent) are
engaged in no extra economic activity implies that
enterprises are engaged in one economic activity only
showing the stability of that service in the market.
TABLE 16.26
Per Thousand of Enterprises Engaged in Other EconomicActivities Undertaken During Last 365 Days
Zero One Two Three or Total*More
Delhi 926 43 31 0 1000
All India 572 384 41 3 1000
Note: * Addition may not add 1000 because enterprises are engaged inmulti activities
Source: Unorganised Service Sector in India, 2000-01, NSS 57th Round,NSSO, GoI
Growth Status
The majority of entrepreneurs perceive stagnation
during the last three years. Only 17 per cent units
perceive that they are expanding.
TABLE 16.27
Percentage Distribution of Manufacturing Enterprises byGrowth Status (Over A Period of Last 3 Years
1999-2000 To 2001-2002)
Expanding Stagnant Contracting Not TotalApplicable*
Delhi 10.1 48.8 16.6 24.5 100
All India 17.0 53.7 12.7 16.6 100
Note: * enterprises operating for less than three years.
Source: Unorganised Service Sector in India, 2000-01, NSS 57th Round,NSSO, GoI
Problems
The major problem in this sector is also perceived
competition from large units and shortage of capital as in
the case of manufacturing.
TABLE 16.28
Per thousand Distribution of Enterprises by ProblemsFaced and Type of Enterprise in Unorganised Sector in
All-India and Delhi
Combined (Rural + Urban) Delhi All India
No Specific Problem 513 326
Non Availability of Electricity Connection 1 7
Power Cut 9 16
Shortage of Capital 172 234
Marketing of Products/Services 83 100
Lack of Infrastructure 5 40
Local Problems 19 76
Harassment 11 27
Competition from Large Units 326 331
Non Availability of Labour 14 3
Labour Problem 2 3
Fuel not Available/Costly 4 8
Non Recovery of Service Charges fee/credit 60 74
Other 26 32
Source: Unorganised Service Sector in India, 2000-01, NSS 57th Round,NSSO, GoI.
0
200
400
600
800
1000
Zero One Two Three or
More
Total
Delhi All India
0
20
40
60
80
100
Expanding Stagnant Contracting Not
Applicable
Total
Delhi All India
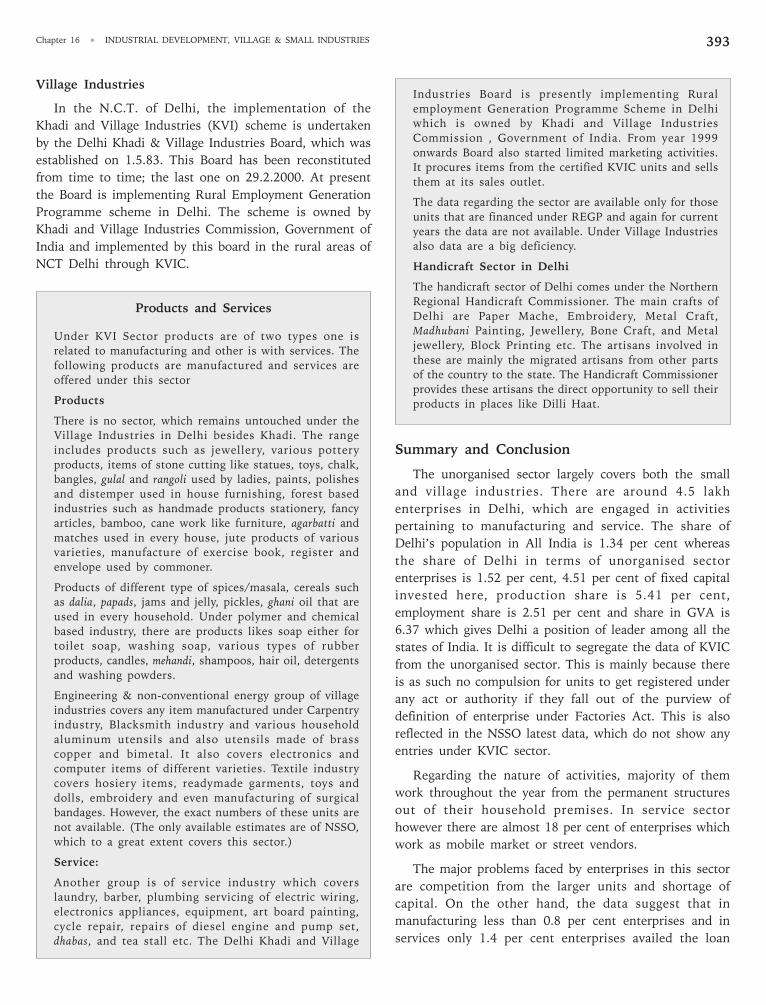
Chapter 16 • INDUSTRIAL DEVELOPMENT, VILLAGE & SMALL INDUSTRIES 393
Industries Board is presently implementing Rural
employment Generation Programme Scheme in Delhi
which is owned by Khadi and Village Industries
Commission , Government of India. From year 1999
onwards Board also started limited marketing activities.
It procures items from the certified KVIC units and sells
them at its sales outlet.
The data regarding the sector are available only for those
units that are financed under REGP and again for current
years the data are not available. Under Village Industries
also data are a big deficiency.
Handicraft Sector in Delhi
The handicraft sector of Delhi comes under the Northern
Regional Handicraft Commissioner. The main crafts of
Delhi are Paper Mache, Embroidery, Metal Craft,
Madhubani Painting, Jewellery, Bone Craft, and Metal
jewellery, Block Printing etc. The artisans involved in
these are mainly the migrated artisans from other parts
of the country to the state. The Handicraft Commissioner
provides these artisans the direct opportunity to sell their
products in places like Dilli Haat.
Summary and Conclusion
The unorganised sector largely covers both the small
and village industries. There are around 4.5 lakh
enterprises in Delhi, which are engaged in activities
pertaining to manufacturing and service. The share of
Delhi’s population in All India is 1.34 per cent whereas
the share of Delhi in terms of unorganised sector
enterprises is 1.52 per cent, 4.51 per cent of fixed capital
invested here, production share is 5.41 per cent,
employment share is 2.51 per cent and share in GVA is
6.37 which gives Delhi a position of leader among all the
states of India. It is difficult to segregate the data of KVIC
from the unorganised sector. This is mainly because there
is as such no compulsion for units to get registered under
any act or authority if they fall out of the purview of
definition of enterprise under Factories Act. This is also
reflected in the NSSO latest data, which do not show any
entries under KVIC sector.
Regarding the nature of activities, majority of them
work throughout the year from the permanent structures
out of their household premises. In service sector
however there are almost 18 per cent of enterprises which
work as mobile market or street vendors.
The major problems faced by enterprises in this sector
are competition from the larger units and shortage of
capital. On the other hand, the data suggest that in
manufacturing less than 0.8 per cent enterprises and in
services only 1.4 per cent enterprises availed the loan
Village Industries
In the N.C.T. of Delhi, the implementation of the
Khadi and Village Industries (KVI) scheme is undertaken
by the Delhi Khadi & Village Industries Board, which was
established on 1.5.83. This Board has been reconstituted
from time to time; the last one on 29.2.2000. At present
the Board is implementing Rural Employment Generation
Programme scheme in Delhi. The scheme is owned by
Khadi and Village Industries Commission, Government of
India and implemented by this board in the rural areas of
NCT Delhi through KVIC.
Products and Services
Under KVI Sector products are of two types one is
related to manufacturing and other is with services. The
following products are manufactured and services are
offered under this sector
Products
There is no sector, which remains untouched under the
Village Industries in Delhi besides Khadi. The range
includes products such as jewellery, various pottery
products, items of stone cutting like statues, toys, chalk,
bangles, gulal and rangoli used by ladies, paints, polishes
and distemper used in house furnishing, forest based
industries such as handmade products stationery, fancy
articles, bamboo, cane work like furniture, agarbatti and
matches used in every house, jute products of various
varieties, manufacture of exercise book, register and
envelope used by commoner.
Products of different type of spices/masala, cereals such
as dalia, papads, jams and jelly, pickles, ghani oil that are
used in every household. Under polymer and chemical
based industry, there are products likes soap either for
toilet soap, washing soap, various types of rubber
products, candles, mehandi, shampoos, hair oil, detergents
and washing powders.
Engineering & non-conventional energy group of village
industries covers any item manufactured under Carpentry
industry, Blacksmith industry and various household
aluminum utensils and also utensils made of brass
copper and bimetal. It also covers electronics and
computer items of different varieties. Textile industry
covers hosiery items, readymade garments, toys and
dolls, embroidery and even manufacturing of surgical
bandages. However, the exact numbers of these units are
not available. (The only available estimates are of NSSO,
which to a great extent covers this sector.)
Service:
Another group is of service industry which covers
laundry, barber, plumbing servicing of electric wiring,
electronics appliances, equipment, art board painting,
cycle repair, repairs of diesel engine and pump set,
dhabas, and tea stall etc. The Delhi Khadi and Village
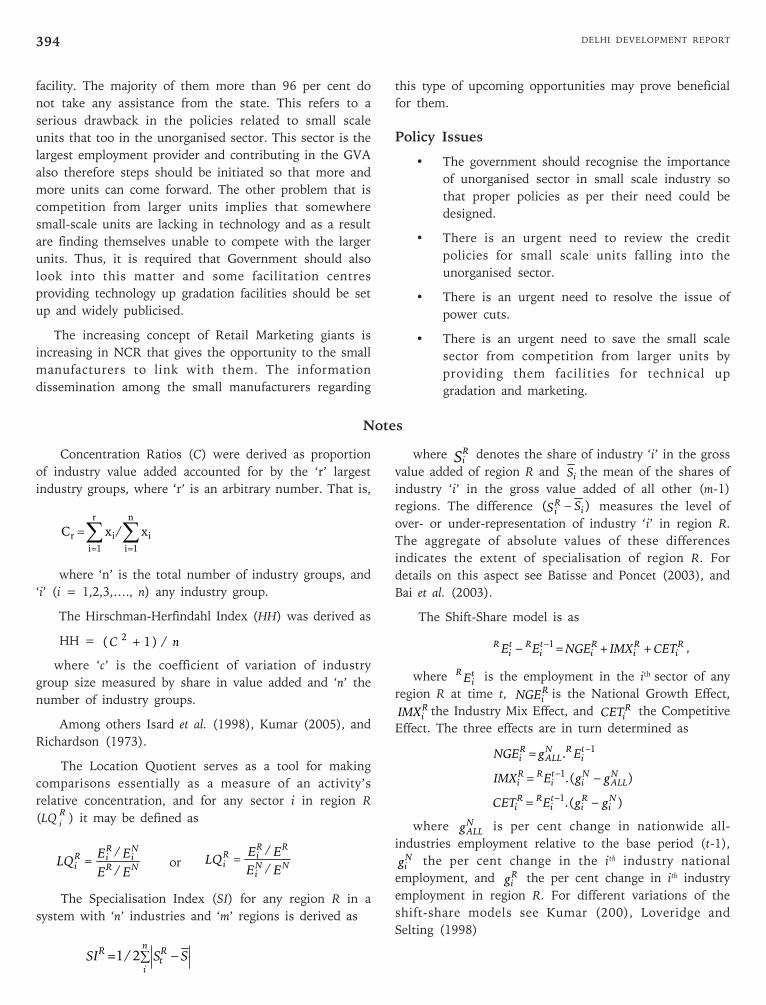
DELHI DEVELOPMENT REPORT394
facility. The majority of them more than 96 per cent do
not take any assistance from the state. This refers to a
serious drawback in the policies related to small scale
units that too in the unorganised sector. This sector is the
largest employment provider and contributing in the GVA
also therefore steps should be initiated so that more and
more units can come forward. The other problem that is
competition from larger units implies that somewhere
small-scale units are lacking in technology and as a result
are finding themselves unable to compete with the larger
units. Thus, it is required that Government should also
look into this matter and some facilitation centres
providing technology up gradation facilities should be set
up and widely publicised.
The increasing concept of Retail Marketing giants is
increasing in NCR that gives the opportunity to the small
manufacturers to link with them. The information
dissemination among the small manufacturers regarding
this type of upcoming opportunities may prove beneficial
for them.
Policy Issues
• The government should recognise the importance
of unorganised sector in small scale industry so
that proper policies as per their need could be
designed.
• There is an urgent need to review the credit
policies for small scale units falling into the
unorganised sector.
• There is an urgent need to resolve the issue of
power cuts.
• There is an urgent need to save the small scale
sector from competition from larger units by
providing them facilities for technical up
gradation and marketing.
Notes
Concentration Ratios (C) were derived as proportion
of industry value added accounted for by the ‘r’ largest
industry groups, where ‘r’ is an arbitrary number. That is,
∑∑==
=n
1i
i
r
1i
ir x/xC
where ‘n’ is the total number of industry groups, and
‘i’ (i = 1,2,3,…., n) any industry group.
The Hirschman-Herfindahl Index (HH) was derived as
HH = nC /)1( 2 +
where ‘c’ is the coefficient of variation of industry
group size measured by share in value added and ‘n’ the
number of industry groups.
Among others Isard et al. (1998), Kumar (2005), and
Richardson (1973).
The Location Quotient serves as a tool for making
comparisons essentially as a measure of an activity’s
relative concentration, and for any sector i in region R
(LQRi ) it may be defined as
EE
EELQ
NR
N
i
R
iR
i/
/= or
EE
EELQ
NN
i
RR
iR
i/
/=
The Specialisation Index (SI) for any region R in a
system with ‘n’ industries and ‘m’ regions is derived as
∑ −=n
i
R
t
RSSSI 2/1
where SR
i denotes the share of industry ‘i’ in the gross
value added of region R and iS the mean of the shares of
industry ‘i’ in the gross value added of all other (m-1)
regions. The difference )( iRi
SS − measures the level of
over- or under-representation of industry ‘i’ in region R.
The aggregate of absolute values of these differences
indicates the extent of specialisation of region R. For
details on this aspect see Batisse and Poncet (2003), and
Bai et al. (2003).
The Shift-Share model is as
R
i
R
i
R
i
t
i
Rt
i
RCETIMXNGEEE ++=− −1 ,
where Eti
R is the employment in the ith sector of any
region R at time t, R
iNGE is the National Growth Effect,R
iIMX the Industry Mix Effect, and R
iCET the Competitive
Effect. The three effects are in turn determined as
1.
−= t
i
RN
ALL
R
i EgNGE
).(1 N
ALL
N
i
t
i
RR
i ggEIMX −= −
).(1 N
i
R
i
t
i
RR
i ggECET −= −
where N
ALLg is per cent change in nationwide all-
industries employment relative to the base period (t-1),N
ig the per cent change in the ith industry national
employment, and R
ig the per cent change in ith industry
employment in region R. For different variations of the
shift-share models see Kumar (200), Loveridge and
Selting (1998)
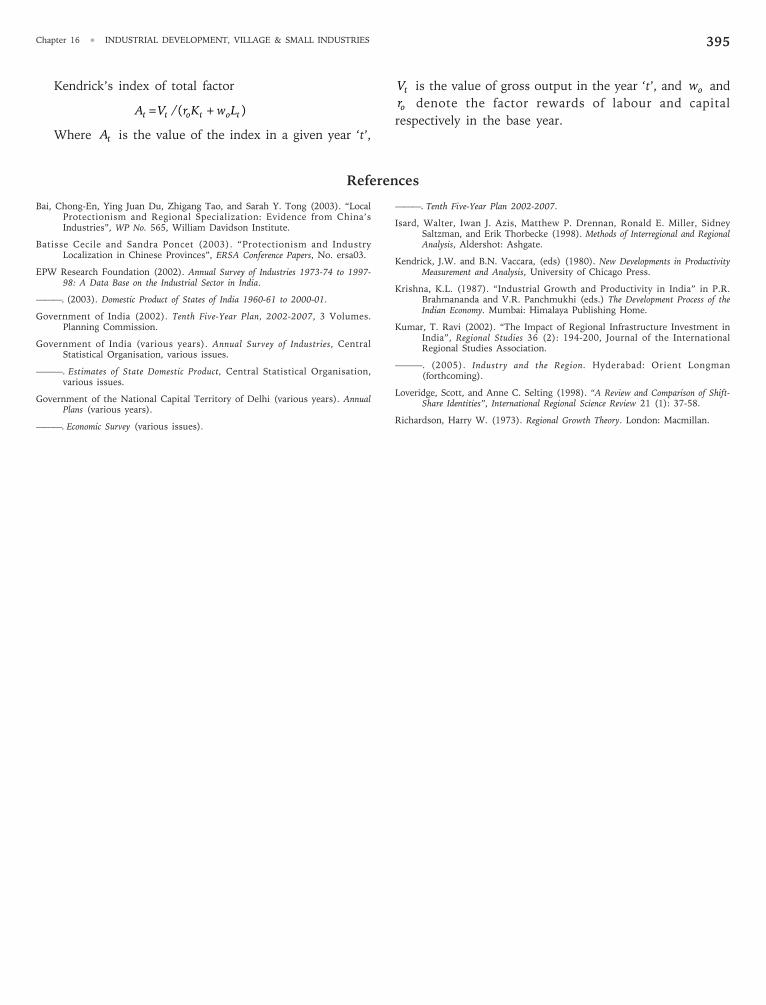
Chapter 16 • INDUSTRIAL DEVELOPMENT, VILLAGE & SMALL INDUSTRIES 395
Kendrick’s index of total factor
)/(totottLwKrVA +=
Where tA is the value of the index in a given year ‘t’,
tV is the value of gross output in the year ‘t’, and
ow and
or denote the factor rewards of labour and capital
respectively in the base year.
References
Bai, Chong-En, Ying Juan Du, Zhigang Tao, and Sarah Y. Tong (2003). “LocalProtectionism and Regional Specialization: Evidence from China’sIndustries”, WP No. 565, William Davidson Institute.
Batisse Cecile and Sandra Poncet (2003). “Protectionism and IndustryLocalization in Chinese Provinces”, ERSA Conference Papers, No. ersa03.
EPW Research Foundation (2002). Annual Survey of Industries 1973-74 to 1997-98: A Data Base on the Industrial Sector in India.
———. (2003). Domestic Product of States of India 1960-61 to 2000-01.
Government of India (2002). Tenth Five-Year Plan, 2002-2007, 3 Volumes.Planning Commission.
Government of India (various years). Annual Survey of Industries, CentralStatistical Organisation, various issues.
———. Estimates of State Domestic Product, Central Statistical Organisation,various issues.
Government of the National Capital Territory of Delhi (various years). AnnualPlans (various years).
———. Economic Survey (various issues).
———. Tenth Five-Year Plan 2002-2007.
Isard, Walter, Iwan J. Azis, Matthew P. Drennan, Ronald E. Miller, SidneySaltzman, and Erik Thorbecke (1998). Methods of Interregional and RegionalAnalysis, Aldershot: Ashgate.
Kendrick, J.W. and B.N. Vaccara, (eds) (1980). New Developments in ProductivityMeasurement and Analysis, University of Chicago Press.
Krishna, K.L. (1987). “Industrial Growth and Productivity in India” in P.R.Brahmananda and V.R. Panchmukhi (eds.) The Development Process of theIndian Economy. Mumbai: Himalaya Publishing Home.
Kumar, T. Ravi (2002). “The Impact of Regional Infrastructure Investment inIndia”, Regional Studies 36 (2): 194-200, Journal of the InternationalRegional Studies Association.
———. (2005). Industry and the Region. Hyderabad: Orient Longman(forthcoming).
Loveridge, Scott, and Anne C. Selting (1998). “A Review and Comparison of Shift-Share Identities”, International Regional Science Review 21 (1): 37-58.
Richardson, Harry W. (1973). Regional Growth Theory. London: Macmillan.

Chapter 17
Institutional Reforms andGovernance
DELHI
17.1 Concept
“The goal of governance initiatives should be to develop
capacities that are needed to realise development that
gives priority to the poor, advances women, sustains the
environment and creates needed opportunities for
employment and other livelihoods.”
UNDP 1994 Initiatives for Change
“Democracy and transparent and accountable governance
and administration in all sectors of society are
indispensable foundations for the realisation of social
and people-centred sustainable development.”
Declaration of the World Summit
for Social Development, 1995
The concept of “governance” is as old as human
civilisation. It is used in several contexts including those
of national or local governance. Governance is inextricably
linked to development but it is understood to have many
meanings; the implication being that for ‘sustainable
development’ good governance is a necessary condition.
Two of the definitions are given here.
Governance may be defined as the process of decision-
making and the process by which decisions are
implemented.
According to the 10th Plan Document of the Planning
Commission, “Governance relates to the management of
all such processes that, in any society, define the
environment which permits and enables individuals to
raise their capability levels, on the one hand, and provide
opportunities to realise their potential and enlarge the set
of available choices, on the other.”
17.2 Link between Governanceand Development
Even though the notions of good governance and the
link between governance and sustainable human
development vary, good governance and sustainable
human development are indivisible. According to UNDP
1994 Initiatives for Change, the goal of governance
initiatives should be to develop capacities that are needed
to realise development that gives priority to the
disadvantaged, advances women, sustains the environment
and creates needed opportunities for employment and
other livelihoods. Good governance can be—and should
be—the primary way to eliminate poverty. The view is
widely held that good governance assures that corruption
is minimised, the views of minorities are taken into
account, that the voices of the most vulnerable in society
are heard in decision-making and that it is responsive to
the present and future needs of society. Experience shows
that while good governance can help secure human well
being and sustained development, it is equally important
to recognise that poor governance could well erode the
individual capabilities, as well as institutional and
community capacities to meet the needs of sustenance.
Experience also shows that good governance is an ideal
which is difficult to achieve in its totality and very few
countries and societies have come close to achieving good
governance in its totality. However, to ensure sustainable
human development, actions must be taken to work
towards this ideal with the aim of making it a reality.
These processes, covering the political, social and
economic aspects of life impact every level of human
enterprise, be it the individual, the household, the village,
the region or the national level. It covers the State, civil
society and the market, each of which is critical for
sustaining human development. The State is responsible
for creating a conducive political, legal and economic
environment for building individual capabilities and
encouraging private initiative. The market is expected to
create opportunities for people. Civil society facilitates the
mobilisation of public opinion and peoples’ participation
in economic, social and political activities.
DELHI DEVELOPMENT REPORT398
17.3 Actors in Governance
Since governance is the process of decision-making and
the process by which decisions are implemented, an
analysis of governance focuses on the formal and informal
actors involved in decision-making and implementing the
decisions made and the formal and informal structures
that have been set in place to arrive at and implement the
decision.
Government including Union, State and Local, is one
of the main actors in governance. Governance includes the
state, but transcends it by taking in the private sector and
civil society. All three are critical for sustaining human
development. The state creates a conducive political and
legal environment. The private sector generates jobs and
income. And civil society facilitates political and social
interaction—mobilising groups to participate in economic,
social and political activities. Because each has weaknesses
and strengths, a major objective of our support for good
governance is to promote constructive interaction among
all three.
Actors involved in governance are included in the term
“Civil Society”. All actors other than government and the
military are grouped together as part of the “civil society.”
In urban areas, for example, other actors may include
those belonging to and representing industry and
commerce, professions including medicine, law, accounts
and finance, academic, cooperatives, NGOs, research
institutes, religious leaders, groups based on social
stratification, political parties etc. The situation in urban
areas is very complex.
Analysis of governance focuses on the formal and
informal actors involved in decision-making and
implementing the decisions made and the formal and
informal structures that have been set in place to arrive at
and implement the decision. In urban areas an example of
informal actors is organised crime syndicates such as the
“land Mafia” that may try to influence decision-making.
Such, influence is often the result of corrupt practices or
leads to corrupt practices.
17.4 Characteristics of Good Governance
Good governance has 8 major characteristics. It
a) is participatory
b) follows rule of law
c) is consensus oriented
d) is accountable
e) is transparent
f) is responsive
g) is effective and efficient
h) is equitable and inclusive.
17.5 Improving Governance
The social and political stability associated with good
governance are fundamental to sustainable human
development. Good governance is by nature preventive. By
valuing development assets and building social cohesion
and consensus, it can help reduce vulnerability to—and
even the likelihood of—disasters and conflicts. During
crises, systems and institutions that protect the vulnerable
are the first things to be destroyed and must be restored.
Good governance includes both procedural and
substantive elements; so too does the management of
economic and financial matters. There is need to establish
relationships between the state, the private sector and
civil society and develop frameworks that provide
incentives for broadly based and sustainable growth.
17.6 Governance in NCTD
Having discussed the theoretical aspects of the concept
of governance and its relationship with development, we
can move on to governance in the context of NCTD.
17.7 Evolution of Governance in NCTD
Till 1956, Delhi was a ‘state’. On the recommendation
of State Reorganisation Commission, Delhi was declared a
Union Territory in 1956. Delhi Municipal Corporation Act
1957 created a Municipal Corporation with jurisdiction
covering the entire Union Territory of Delhi but excluding
New Delhi Municipal Committee and Delhi Cantonment.
In this the MCD took over the functions previously
entrusted to 10 local bodies—municipalities, notified area
committees, Delhi District Board and three statutory
bodies, viz. Delhi State Electricity Board, Delhi Road
Transport Authority and Delhi Joint Water and Sewerage
Board. The Municipal Corporation became the premier
body for provision and maintenance of urban services,
sanitation and certain community facilities in Delhi. It
lacked power in regard to the planning, development and
disposal of urban land.
The Government of India, in November 1955, set up
“Delhi Development (Provisional) Authority”, which
became Delhi Development Authority with the passing of
its Act by the Parliament in December 1957.
The Delhi Development Authority is the apex agency
for planning and development of the city, is empowered to
Chapter 17 • INSTITUTIONAL REFORMS AND GOVERNANCE 399
prepare a master plan, zonal plans, to implement and
enforce the plans and to develop, manage and dispose of
lands in Delhi. It also discharges the functions of
developing housing, commercial centres, parks,
playgrounds, etc. Master Plan for Delhi provides a basic
policy frame for guiding Delhi’s development.
In 1966, the Delhi Administration Act was passed by
the Parliament, as a result of which the Metropolitan
Council, a representative body consisting of 56 elected
and 5 nominated members was created. Simultaneously
an Executive Council consisting of 4 members of whom
one as Chief Executive Councilor was created. But this
body had very limited powers, since the Administrator
(Lt. Governor) continued to enjoy vast decision making
and discretionary powers.
In January 1992, the Government of NCT of Delhi Act,
1991 was enacted by Parliament,. A Legislative Assembly
with a Council of Ministers under Articles 239 AA and
239 AB was created.
As Union Territory with an Assembly and a Council of
Ministers, NTDC has very many features of a State such
as Government, Assembly and Municipal bodies. Yet
Delhi is different from a State. As will be seen from the
constitutional provisions relating to NCTD, its powers are
seriously curtailed as mentioned below:
a) Although Legislative Assembly has the power to
make laws with respect to any of the matters
enumerated in the State List or in the Concurrent
List, it has no such power relating to public
order, police and offences relating to the subjects.
b) Even in respect of other subjects the Parliament
has overriding powers to make laws.
c) The advice of the Council of Ministers to the
Lieutenant Governor is not binding for in the case
of difference of opinion between the Lieutenant
Governor and his Council of Ministers on any
matter, the Lieutenant Governor can refer it to
the President for decision and act according to the
decision given thereon. Pending such decision the
Lieutenant Governor may take such action or give
such direction in the matter as he deems
necessary.
d) Law and order and land are within the
jurisdiction of the Government of India.
e) A Bill of Amendment relating to financial matters
shall not be introduced in the Assembly except
on the recommendations of the Lt. Governor in
relation to State taxes, financial expenditure
charged on consolidated fund of the Capital etc.
f) The annual budget is to be laid before the
Legislative Assembly by the Lt. Governor with the
previous sanction of the President as this is
mandatory under Article 239 (1) of the
Constitution according to which the President is
responsible for the Administration of every Union
Territory. Additional demand for expenditure
upon the consolidated fund of the Capital shall be
made on the recommendation of the Lt.
Governor.
g) Delhi is a city state in that most of its
geographical area is included within the Municipal
Corporation of Delhi (MCD), a very powerful
elected body. The remaining area is covered by
New Delhi Municipal Committee (NDMC), a
body under the Government of India and a small
portion under the Cantonment Board. Delhi is
divided into nine districts. The Municipal
Corporation of Delhi has created eleven divisions
of its jurisdiction to provide decentralised services
to the people. The civic services, elementary
education, health services, engineering services
many others are provided by these bodies.
h) Independent of Delhi Government and MCD,
NDMC performs municipal functions and
supplies electricity and water to the core area in
New Delhi, where the Government of India’s
main functionaries work and reside. NDMC
functions more as an administrative set-up under
the Ministry of Home Affairs through the Lt.
Governor, Delhi. Delhi Government has hardly
any role in its functioning.
i) The present relationship between the MCD and
the Delhi government is rather nebulous. The
DMC Act, 1957 was enacted without provision
for a Legislative Assembly in Delhi, which was
constituted only in 1992-93. Delhi Government’s
functions vis-à-vis MCD are limited to those of
paramount nature, which are reserved for the
Central government for exercise through the Lt.
Governor. The MCD, as a potent third force is
itself a centre of power in the affairs of Delhi.
The following table gives the evolution of governance
since Independence in 1947.
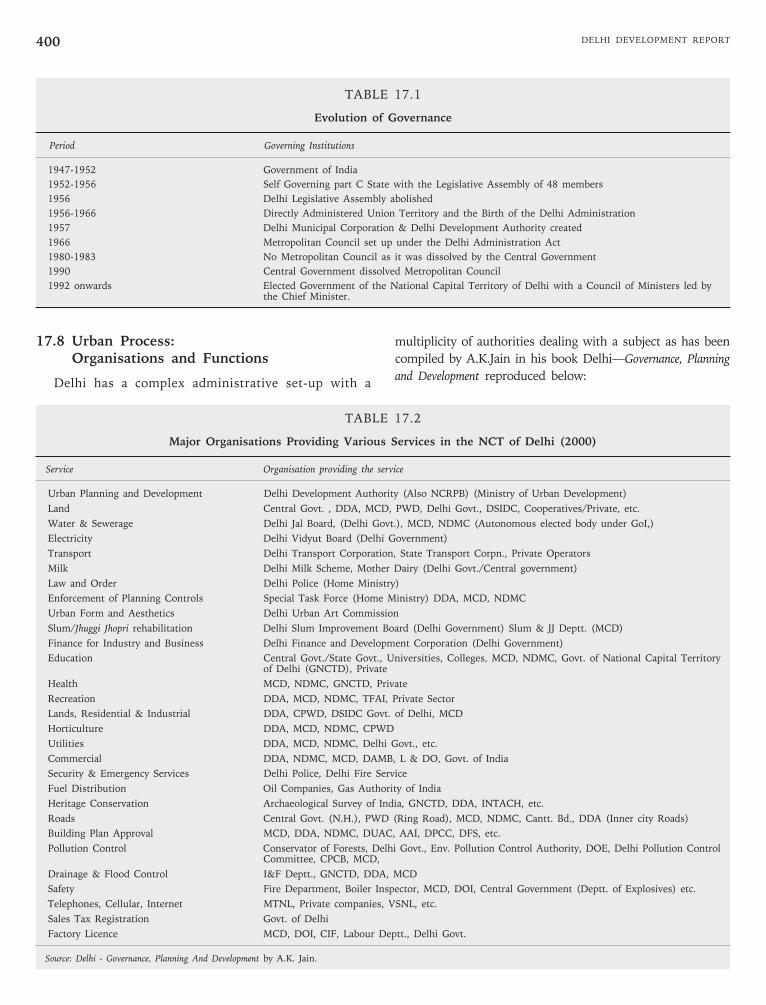
DELHI DEVELOPMENT REPORT400
TABLE 17.1
Evolution of Governance
Period Governing Institutions
1947-1952 Government of India
1952-1956 Self Governing part C State with the Legislative Assembly of 48 members
1956 Delhi Legislative Assembly abolished
1956-1966 Directly Administered Union Territory and the Birth of the Delhi Administration
1957 Delhi Municipal Corporation & Delhi Development Authority created
1966 Metropolitan Council set up under the Delhi Administration Act
1980-1983 No Metropolitan Council as it was dissolved by the Central Government
1990 Central Government dissolved Metropolitan Council
1992 onwards Elected Government of the National Capital Territory of Delhi with a Council of Ministers led bythe Chief Minister.
17.8 Urban Process:Organisations and Functions
Delhi has a complex administrative set-up with a
multiplicity of authorities dealing with a subject as has been
compiled by A.K.Jain in his book Delhi—Governance, Planning
and Development reproduced below:
TABLE 17.2
Major Organisations Providing Various Services in the NCT of Delhi (2000)
Service Organisation providing the service
Urban Planning and Development Delhi Development Authority (Also NCRPB) (Ministry of Urban Development)
Land Central Govt. , DDA, MCD, PWD, Delhi Govt., DSIDC, Cooperatives/Private, etc.
Water & Sewerage Delhi Jal Board, (Delhi Govt.), MCD, NDMC (Autonomous elected body under GoI,)
Electricity Delhi Vidyut Board (Delhi Government)
Transport Delhi Transport Corporation, State Transport Corpn., Private Operators
Milk Delhi Milk Scheme, Mother Dairy (Delhi Govt./Central government)
Law and Order Delhi Police (Home Ministry)
Enforcement of Planning Controls Special Task Force (Home Ministry) DDA, MCD, NDMC
Urban Form and Aesthetics Delhi Urban Art Commission
Slum/Jhuggi Jhopri rehabilitation Delhi Slum Improvement Board (Delhi Government) Slum & JJ Deptt. (MCD)
Finance for Industry and Business Delhi Finance and Development Corporation (Delhi Government)
Education Central Govt./State Govt., Universities, Colleges, MCD, NDMC, Govt. of National Capital Territoryof Delhi (GNCTD), Private
Health MCD, NDMC, GNCTD, Private
Recreation DDA, MCD, NDMC, TFAI, Private Sector
Lands, Residential & Industrial DDA, CPWD, DSIDC Govt. of Delhi, MCD
Horticulture DDA, MCD, NDMC, CPWD
Utilities DDA, MCD, NDMC, Delhi Govt., etc.
Commercial DDA, NDMC, MCD, DAMB, L & DO, Govt. of India
Security & Emergency Services Delhi Police, Delhi Fire Service
Fuel Distribution Oil Companies, Gas Authority of India
Heritage Conservation Archaeological Survey of India, GNCTD, DDA, INTACH, etc.
Roads Central Govt. (N.H.), PWD (Ring Road), MCD, NDMC, Cantt. Bd., DDA (Inner city Roads)
Building Plan Approval MCD, DDA, NDMC, DUAC, AAI, DPCC, DFS, etc.
Pollution Control Conservator of Forests, Delhi Govt., Env. Pollution Control Authority, DOE, Delhi Pollution ControlCommittee, CPCB, MCD,
Drainage & Flood Control I&F Deptt., GNCTD, DDA, MCD
Safety Fire Department, Boiler Inspector, MCD, DOI, Central Government (Deptt. of Explosives) etc.
Telephones, Cellular, Internet MTNL, Private companies, VSNL, etc.
Sales Tax Registration Govt. of Delhi
Factory Licence MCD, DOI, CIF, Labour Deptt., Delhi Govt.
Source: Delhi - Governance, Planning And Development by A.K. Jain.
Chapter 17 • INSTITUTIONAL REFORMS AND GOVERNANCE 401
17.9 Unique Features of NCT Delhi
The governance in Delhi is very complex. The
constitutional provisions have maintained the status of
NCTD as a Union Territory with a legislature and Council
of Ministers and given it more powers than other Union
Territories but considerably less than those enjoyed by a
State. The allocation of work is among a plethora of
agencies. The result is that there is a multiplicity of public
bodies dealing with the same subject. Unlike other states
law & order, police and land are under the areas of
responsibility of the Government of India and even in
other matters, the Government of India and the
parliament have overriding powers.
17.9.1 Relevance of Characteristics ofGood Governance in NCTD
The relevance of any specific characteristic or area
needing attention is a function of the stage of political,
economic and social development of the country. Some of
the characteristics/areas may seem not to have relevance
in the context of our country which is governed in the
framework of our constitution and a comprehensive set of
laws.
In theory and law, the governance is participatory as
elected bodies are in position. They are accountable to
people and have the authority to make laws, rules and
procedures, as the case may be, and to take decisions and
have them implemented. Moreover, every organ of the
State must follow law and principles of natural justice and
if it does not do so, it faces the risk of being called to
account in the High Court and the Supreme Court. The
consensus has to be achieved because minorities too have
a decisive voice and the majority cannot bulldoze its
decisions. There is accountability—financial and
administrative.
The accounts of government and bodies receiving
public funds are subject to audit by statutory authorities
and administrative actions have to be explained in the
appropriate elected body. The actions are again required
to be equitable and inclusive because there cannot be
discrimination against any body as guaranteed by the
constitution which enshrines the Fundamental Rights, the
principle of equality before the law and rights of
minorities. Thus it may appear on superficial examination
that there is no need for action relating to these
characteristics.
However, it is well known that theoretical provisions
do not conform to the ground reality and there is a big
gap between ‘precept and practice’. The governance is
weak institutions, though consisting of very bright people,
are subject to various kinds of pressure/influences, and
the procedures are cumbersome and time consuming and
so on. The result is that the public image of governance is
not very complimentary. It is perceived to have a tendency
to be inefficient, ineffective, corrupt and dilatory. The
unscrupulous among the citizens, in turn, tend to dodge
the law and appropriate public resources at the cost of
other fellow citizens. Thus there is need to take action to
strengthen all the eight characteristics identified in
paragraph 1.4.
17.9.2 Relevance of Areas Needing Attention
In the case of our country and NCTD, there is written
constitution and legislative and judicial institutions enjoy
autonomy. Any initiative for reforms, if any, will have to
come from these institutions. Any discussion of these
institutions and the processes followed by them are
irrelevant for the purposes of this report. However, other
areas mentioned in paragraph 17.5 are relevant.
The characteristics of Good Governance and areas
needing attention are equally applicable to all sectors—
education, health, transport or any other sector. Hence
these need to be discussed not sector wise but in a
general way cutting across all sectors and pertaining to
each of the principal organisations in the NCTD viz., the
Government of NCTD, Municipal Corporation of Delhi,
NDMC and the DDA.
17.10 Measures Initiated to ImproveGovernance in NCTD
The Government of NCT of Delhi through its
Department of Administrative Reforms has been taking
measures that cut across other departments of the
Government of NCTD, agencies and institutions and
monitoring the progress made by them.
17.10.1 Vision
The Government of Delhi in its Administrative
Reforms Department has adopted a vision to facilitate the
pursuit of excellence in governance through
improvements in Government structures and processes to
achieve:
• economy in Government expenditure;
• citizen-friendly initiatives including redressal of
public grievances;
• dissemination of best practices;
• simplification of procedures; and
DELHI DEVELOPMENT REPORT402
• implementation of Delhi Right to Information Act.
17.10.2 Organisations Selected
The organisations where these improvements are
sought to be achieved are:-
• Delhi Government Departments.
• Autonomous Bodies/Public Sector Undertakings
of Delhi Government.
• MCD/NDMC/Delhi Cantonment Board.
17.10.3 Means Used
The means used to achieve the improvements consist of
• Promote Role of civil society, People’s
participation and decentralisation. This has been
sought to be achieved through the introduction of
Bhagidari Scheme.
• e-Governance for the citizens of Delhi.
• To set up a dynamic website leading to e-
governance for departments/agencies.
• Mechanism to redress public grievances of which
establishment of Public Grievances Commission
is the main element.
• Civil Service Reforms.
• Procedural Reform.
• Synergy and Coordination.
• Empowerment of the weak.
• Social Audit.
• Implementation of the Right to Information Act.
• Introducing the Tender Information System under
which all notices for tenders are placed on the
Website of the Government of NCTD.
• Introducing a Unified Call Centre to register
grievances as a Listening Post of Lt. Governor.
To promote the role of civil society, people’s
participation and decentralisation in governance, the
scheme of Bhagidari has been introduced within the
government departments and its agencies including those
under the Union government.
17.11 Bhagidari
a) Concept
In line with the ideological heritage of involving the
common man in governance, initially propounded by
Mahatma Gandhi, and given expression to by Rajiv
Gandhi by giving constitutional status to Panchayats and
Municipal Bodies through 73rd and 74th amendments of
the Constitution, in December 1998 the Government of
NCTD outlined a philosophy for governance—
responsive to and participative with the citizen—known
as Bhagidari. This has specifically stemmed from the
belief that Government must work in partnership with
the people and that the citizens must feel that
successful and meaningful governance cannot be
achieved without their involvement and without their
role.
To evolve a mechanism for putting the concept of
Bhagidari into practice, wide consultations were initiated
with various citizen groups—the Resident Welfare
Associations (RWAs), the Market and Traders
Associations (MTAs) and other NGOs. Discussions were
also held with Municipal Corporation of Delhi, Delhi
Development Authority, New Delhi Municipal Committee,
Delhi Vidyut Board, Delhi Jal Board and Delhi Police and
the Department of Environment and Forest. These
departments subsequently became the participating
Departments in the Bhagidari Programme.
Launched in January 2000, Bhagidari, the Citizen’s
Partnership in Governance is conceived to:
• be a means for facilitating citywide changes in
Delhi;
• utilise processes and principles of multi-
stakeholders (citizen groups, NGOs, the
Government…) collaboration;
• apply the method of Large Group Interactive
Events;
• aim to develop ‘joint ownership’ by the citizens
and government of the change process; and
• to facilitate people’s participation in governance.
b) Issues Taken up under Bhagidari Scheme
The issues that have been taken up are simple and
common and have impact on a citizen’s everyday life and
are amenable to simple solutions. The idea is to build up
on these first successes and to take the movement forward
to addressing more complex matters. The participating
organisations and the number of activities under the
Bhagidari Scheme are given in the table below. The details
of the Scheme, organisation-wise, are given in the annexure
17.1.
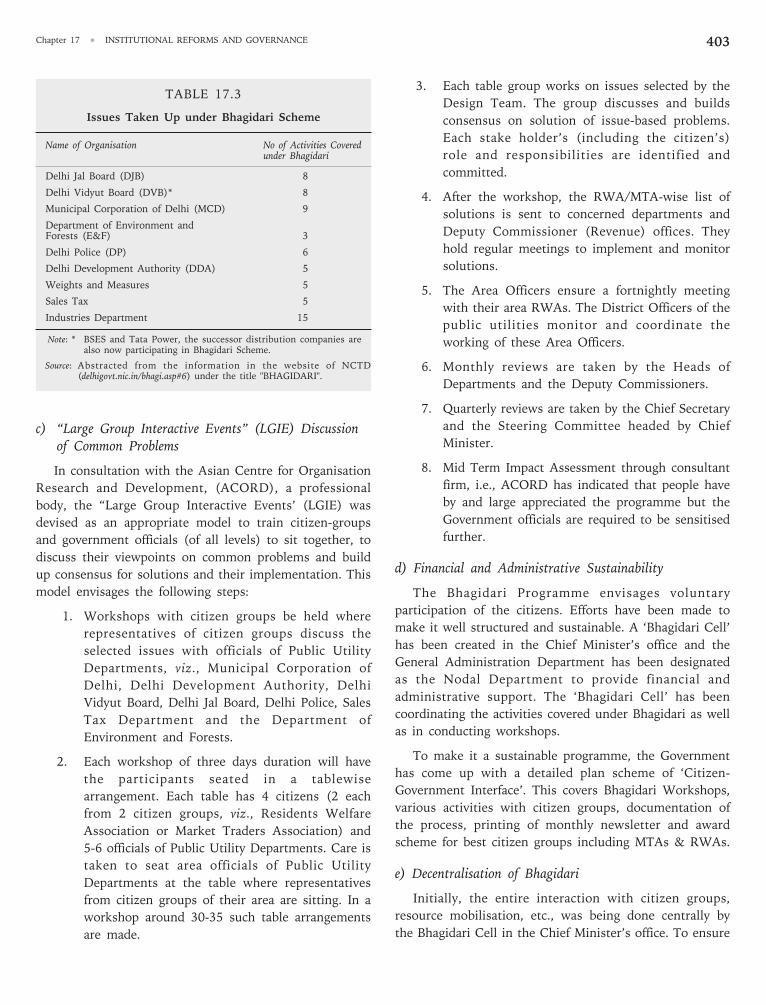
Chapter 17 • INSTITUTIONAL REFORMS AND GOVERNANCE 403
TABLE 17.3
Issues Taken Up under Bhagidari Scheme
Name of Organisation No of Activities Coveredunder Bhagidari
Delhi Jal Board (DJB) 8
Delhi Vidyut Board (DVB)* 8
Municipal Corporation of Delhi (MCD) 9
Department of Environment andForests (E&F) 3
Delhi Police (DP) 6
Delhi Development Authority (DDA) 5
Weights and Measures 5
Sales Tax 5
Industries Department 15
Note: * BSES and Tata Power, the successor distribution companies arealso now participating in Bhagidari Scheme.
Source: Abstracted from the information in the website of NCTD(delhigovt.nic.in/bhagi.asp#6) under the title "BHAGIDARI".
c) “Large Group Interactive Events” (LGIE) Discussionof Common Problems
In consultation with the Asian Centre for Organisation
Research and Development, (ACORD), a professional
body, the “Large Group Interactive Events’ (LGIE) was
devised as an appropriate model to train citizen-groups
and government officials (of all levels) to sit together, to
discuss their viewpoints on common problems and build
up consensus for solutions and their implementation. This
model envisages the following steps:
1. Workshops with citizen groups be held where
representatives of citizen groups discuss the
selected issues with officials of Public Utility
Departments, viz., Municipal Corporation of
Delhi, Delhi Development Authority, Delhi
Vidyut Board, Delhi Jal Board, Delhi Police, Sales
Tax Department and the Department of
Environment and Forests.
2. Each workshop of three days duration will have
the participants seated in a tablewise
arrangement. Each table has 4 citizens (2 each
from 2 citizen groups, viz., Residents Welfare
Association or Market Traders Association) and
5-6 officials of Public Utility Departments. Care is
taken to seat area officials of Public Utility
Departments at the table where representatives
from citizen groups of their area are sitting. In a
workshop around 30-35 such table arrangements
are made.
3. Each table group works on issues selected by the
Design Team. The group discusses and builds
consensus on solution of issue-based problems.
Each stake holder’s (including the citizen’s)
role and responsibilities are identified and
committed.
4. After the workshop, the RWA/MTA-wise list of
solutions is sent to concerned departments and
Deputy Commissioner (Revenue) offices. They
hold regular meetings to implement and monitor
solutions.
5. The Area Officers ensure a fortnightly meeting
with their area RWAs. The District Officers of the
public utilities monitor and coordinate the
working of these Area Officers.
6. Monthly reviews are taken by the Heads of
Departments and the Deputy Commissioners.
7. Quarterly reviews are taken by the Chief Secretary
and the Steering Committee headed by Chief
Minister.
8. Mid Term Impact Assessment through consultant
firm, i.e., ACORD has indicated that people have
by and large appreciated the programme but the
Government officials are required to be sensitised
further.
d) Financial and Administrative Sustainability
The Bhagidari Programme envisages voluntary
participation of the citizens. Efforts have been made to
make it well structured and sustainable. A ‘Bhagidari Cell’
has been created in the Chief Minister’s office and the
General Administration Department has been designated
as the Nodal Department to provide financial and
administrative support. The ‘Bhagidari Cell’ has been
coordinating the activities covered under Bhagidari as well
as in conducting workshops.
To make it a sustainable programme, the Government
has come up with a detailed plan scheme of ‘Citizen-
Government Interface’. This covers Bhagidari Workshops,
various activities with citizen groups, documentation of
the process, printing of monthly newsletter and award
scheme for best citizen groups including MTAs & RWAs.
e) Decentralisation of Bhagidari
Initially, the entire interaction with citizen groups,
resource mobilisation, etc., was being done centrally by
the Bhagidari Cell in the Chief Minister’s office. To ensure
DELHI DEVELOPMENT REPORT404
a spatial spread the programme was decentralised at the
Revenue District level with the Deputy Commissioner
(Revenue) as the district coordinator. This has helped to
involve more than 1100 citizen groups in the
programme. According to the Government, requests keep
coming in from new associations and NGOs to join the
movement.
After decentralisation Bhagidari has been spread to
Social Welfare Department where Stree-Shakti Programme
and Stree-Kosh have been launched. In Education
Department, the School Welfare Committees have been
appointed in more than 600 schools. Industrial
Associations have also been made Bhagidars after
conducting special Bhagidari workshop with them through
the Industries department.
f) Major Initiatives
The programme has become popular, leading to Major
initiatives under ‘Bhagidari’ by the Government since
January, 2002:
• Water Conservation and Water Harvesting by
Delhi Jal Board & Urban Development
Department.
• Anti Plastic and Anti-littering campaign by
Environment and Forest Department.
• Programmes for the welfare of Senior Citizens.
• Reforms in Hospital Management & Quality
Control by Health & Family Welfare Department.
‘Janhit Society’ in each major hospital has been
set up ith representation from RWAs of the area
and other citizen groups.
• Students Welfare Committee for Government.
• In addition to the above programmes, Bhagidari
has taken in its span the Industrial Associations.
In Conforming Industrial Areas of Delhi have
been made Bhagidars through their Industrial
Associations. A high power apex level committee
of senior officers and representatives of industries
is to prepare the policy frame work for growth
and development of Industries in Delhi.
g) Results of Bhagidari
More than 1100 citizen groups have become Bhagidars
after having participated in various Bhagidari workshops.
The Bhagidars have not only been successful in solving
their day-to-day problems, but have also been providing
help to public utility departments in maintenance and up
gradation of services. Some examples are:
1. Successful implementation of “Clean Yamuna”,
“Say no to plastic bags” & “No crackers on
Diwali” campaigns.
2. Switching on/off of streetlights by RWAs.
3. Meter reading by RWAs in their residential
colony.
4. Traffic regulation in the colonies.
5. Clean Delhi: “Green Delhi” campaign.
6. Tenant verification in the colonies.
7. Rain-water Harvesting.
8. Conservation of water by checking misuse of
water.
9. Water Bill collection and payment by RWAs.
10. Desilting of sewers.
11. Coordinating with DVB for handling load
shedding and power breakdown.
12. Prevention of power-theft.
13. Door to door collection of garbage.
14. Maintenance of community parks and halls.
15. Crime prevention and successful implementation
of neighbourhood watch scheme.
16. Prevention of encroachment.
h) Challenges
First, bringing together a large number of citizen
groups and government officials on a common platform
was not an easy task. It required detailed planning and
coordinated action holding preliminary meetings,
interactions and a whole gamut of logistical arrangements.
It required managing a change process—a change in
perceptions of both the citizens and government officials.
There was initially resistance from the field-level
government officers who were not willing to step out of
their bureaucratic shell and embrace the direct interaction
with citizen groups. They felt it was erosion of their
authority and in many instances it also stemmed
corruption at the field-level. So far the citizen-groups have
been registered associations, the challenge is now step out
with the programme into the slum clusters, resettlement
colonies and the unauthorised regularised areas.
Reaching out to rural areas, women groups and non-
governmental organisations work out changes in policies
and legislation, which would enable the citizen groups to
statutorily interact with Government.
Chapter 17 • INSTITUTIONAL REFORMS AND GOVERNANCE 405
17.12 Vigilance
The Central Vigilance Commissioner has jurisdiction
over personnel of the NCTD. The Delhi Lokayukta &
Upalokayukta Act, 1995 provides a forum for attending to
complaints against public functionaries to eradicate the
vice of corruption, favouritism, abuse of position and
power and present cleaner image. The Act takes within its
ambit the Ministers including the Chief Minister,
Members of Legislative Assembly, Members of Municipal
Corporation, etc.
17.13 Improve Governance, Bring Opennessand Transparency
In pursuance of the objective to improve governance,
bring openness and transparency in providing citizen-
friendly services the Government of NCT of Delhi has
initiated the following actions with emphasis on
“preventive vigilance”. It is expected that adoption of such
measures would, in the long run, help Governments in
curbing the menace of corruption and minimise it to a
large extent.
17.13.1 e-Governance for the Citizens of Delhi
To reduce citizens’ visit to offices and provide
information electronically rather than over the counter
and making Delhi a cyber city the government has set up
a dynamic website leading to e-governance for
departments/agencies to provide on line services including
services on e-applications. The Government has instituted
a system of making on line complaint. The citizen can also
check the status of the complaint, send a reminder and
send suggestions.
17.13.2 Right to Information
The Delhi Government has enacted the Delhi Right to
Information Act, 2001. It makes provision for securing
information as a matter of right, barring some
exemptions. The citizens can file an application with the
competent authority of the concerned Department along
with fee and get information within 30 days. In case the
information cannot be given, then a rejection letter with
reasons has to be issued. It provides for right to appeal in
Public Grievances Commission. The Act provides for a
unique provision for punitive action against the officials in
the form of fine at the rate of Rs.50 per day for delay and
Rs.1000 for tendering wrong information.
The Government has appointed State Public
Information Officers/Assistant State Public Information
Officers/First appellate Authority in all the departments of
the Government of NCTD, PSUs and Local Bodies.
Training programmes have been organised to sensitise the
officials of the officials of these bodies.
This measure is being widely used by the citizens and
as on 12 July 2007, 36390 applications were received out
of which 34090 were disposed of.
17.13.3 Tender Information System
In order to bring openness and transparency in the
tender inviting system the publication of all tenders on a
newly developed powerful website capable of handling
tenders of 356 tender issuing authorities has been made
obligatory.
17.13.4 Listening Post of Lt. Governor
A number of call centres have been providing
information to the citizens for different departments. To
do away with multiplicity of these call centres, the
Government of NCTD has decided to set up a unified Call
Centre which will also be used for registering complaints/
grievances. The Call Centre is equipped with a Grievance
Redressal Mechanism that has a computer network loaded
with software with time bound escalation matrix for
prompt redressal of the complaint.
17.13.5 Public Grievances Commission
The Government of Delhi has set up a Public
Grievance Commission through a Resolution for effective
redressal of grievances. It is an autonomous body which
attends to complaints received against the departments of
Government of Delhi, its local bodies, undertakings,
autonomous institutions/undertakings, etc. The
commission is an independent body responsible for
speedy redressal of complaints relating to acts of omission
or of commission. It can also take up suomoto action,
where required.
17.13.6 Citizen’s Charter
The innovation of citizen’s charter was made by the
British Government. Its objective is to address some of
the problems of interface between the Government and
citizens and to continuously improve the quality of public
services and to make them responsive to their needs and
wishes by empowering the citizens in relation to public
service delivery. It is expected to lead to accountability of
organisations and their staff with total transparency about
the rules, regulations and the processes and procedures. It
also aims to provide a mechanism for redressal of citizens’
grievances.
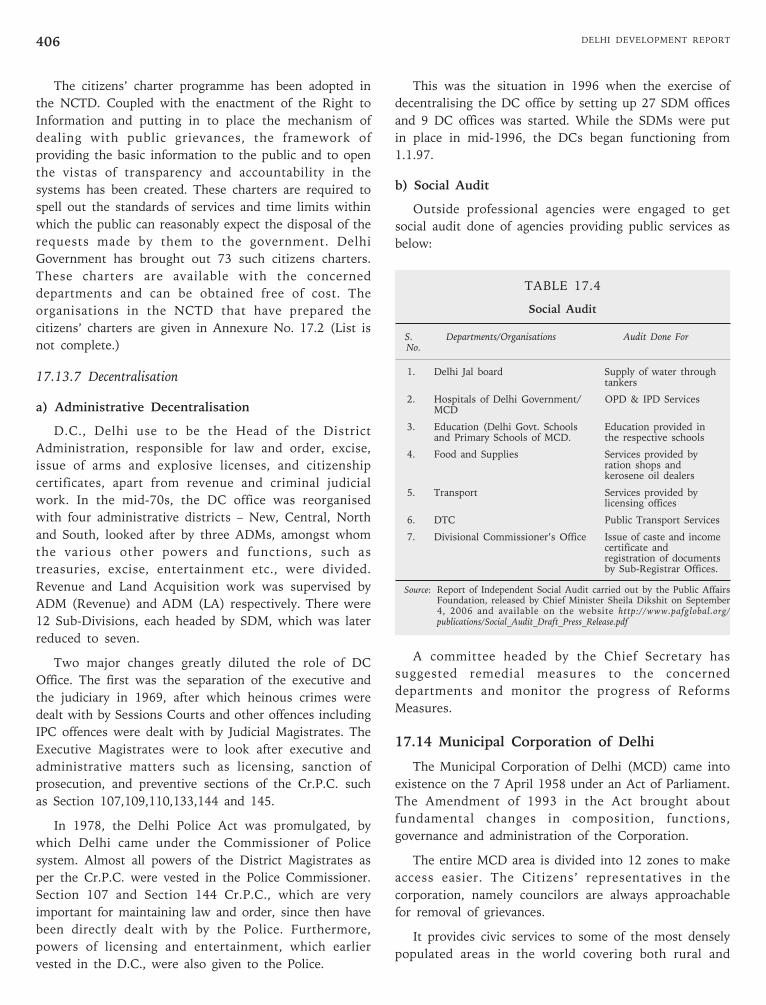
DELHI DEVELOPMENT REPORT406
The citizens’ charter programme has been adopted in
the NCTD. Coupled with the enactment of the Right to
Information and putting in to place the mechanism of
dealing with public grievances, the framework of
providing the basic information to the public and to open
the vistas of transparency and accountability in the
systems has been created. These charters are required to
spell out the standards of services and time limits within
which the public can reasonably expect the disposal of the
requests made by them to the government. Delhi
Government has brought out 73 such citizens charters.
These charters are available with the concerned
departments and can be obtained free of cost. The
organisations in the NCTD that have prepared the
citizens’ charters are given in Annexure No. 17.2 (List is
not complete.)
17.13.7 Decentralisation
a) Administrative Decentralisation
D.C., Delhi use to be the Head of the District
Administration, responsible for law and order, excise,
issue of arms and explosive licenses, and citizenship
certificates, apart from revenue and criminal judicial
work. In the mid-70s, the DC office was reorganised
with four administrative districts – New, Central, North
and South, looked after by three ADMs, amongst whom
the various other powers and functions, such as
treasuries, excise, entertainment etc., were divided.
Revenue and Land Acquisition work was supervised by
ADM (Revenue) and ADM (LA) respectively. There were
12 Sub-Divisions, each headed by SDM, which was later
reduced to seven.
Two major changes greatly diluted the role of DC
Office. The first was the separation of the executive and
the judiciary in 1969, after which heinous crimes were
dealt with by Sessions Courts and other offences including
IPC offences were dealt with by Judicial Magistrates. The
Executive Magistrates were to look after executive and
administrative matters such as licensing, sanction of
prosecution, and preventive sections of the Cr.P.C. such
as Section 107,109,110,133,144 and 145.
In 1978, the Delhi Police Act was promulgated, by
which Delhi came under the Commissioner of Police
system. Almost all powers of the District Magistrates as
per the Cr.P.C. were vested in the Police Commissioner.
Section 107 and Section 144 Cr.P.C., which are very
important for maintaining law and order, since then have
been directly dealt with by the Police. Furthermore,
powers of licensing and entertainment, which earlier
vested in the D.C., were also given to the Police.
This was the situation in 1996 when the exercise of
decentralising the DC office by setting up 27 SDM offices
and 9 DC offices was started. While the SDMs were put
in place in mid-1996, the DCs began functioning from
1.1.97.
b) Social Audit
Outside professional agencies were engaged to get
social audit done of agencies providing public services as
below:
TABLE 17.4
Social Audit
S. Departments/Organisations Audit Done ForNo.
1. Delhi Jal board Supply of water throughtankers
2. Hospitals of Delhi Government/ OPD & IPD ServicesMCD
3. Education (Delhi Govt. Schools Education provided inand Primary Schools of MCD. the respective schools
4. Food and Supplies Services provided byration shops andkerosene oil dealers
5. Transport Services provided bylicensing offices
6. DTC Public Transport Services
7. Divisional Commissioner’s Office Issue of caste and incomecertificate andregistration of documentsby Sub-Registrar Offices.
Source: Report of Independent Social Audit carried out by the Public AffairsFoundation, released by Chief Minister Sheila Dikshit on September4, 2006 and available on the website http://www.pafglobal.org/publications/Social_Audit_Draft_Press_Release.pdf
A committee headed by the Chief Secretary has
suggested remedial measures to the concerned
departments and monitor the progress of Reforms
Measures.
17.14 Municipal Corporation of Delhi
The Municipal Corporation of Delhi (MCD) came into
existence on the 7 April 1958 under an Act of Parliament.
The Amendment of 1993 in the Act brought about
fundamental changes in composition, functions,
governance and administration of the Corporation.
The entire MCD area is divided into 12 zones to make
access easier. The Citizens’ representatives in the
corporation, namely councilors are always approachable
for removal of grievances.
It provides civic services to some of the most densely
populated areas in the world covering both rural and
Chapter 17 • INSTITUTIONAL REFORMS AND GOVERNANCE 407
urban areas, Resettlement Colonies, regularised
unauthorised colonies, Jhuggi Jhopri squatter settlements,
slum basties, private katras, etc.
17.14.1 Citizen Service Bureau
MCD has started a unique and path breaking IT
initiative with the objective to deliver electronically its
services to citizens of Delhi through a Citizen Service
Bureau set-up, one in each Zone and one at Town Hall.
These Bureaus are run by a consortium of IT companies
namely ECIL & Sark Systems Ltd. Further MCD plans to
open 134 ICSBs(one in each ward).
The concept behind establishing Citizen Service Bureau
is to provide all municipal services under one roof in air-
conditioned comfort on payment of a very small
transaction fee. The transaction fee that is charged for all
municipal services, other than payment of property tax,
depends on the value of transaction.
17.15 New Delhi Municipal Council (NDMC)
17.15.1 Establishment
In 1911 the seat of the Government of India was
transferred from Calcutta to Delhi. Raisina Hill was
selected as the site for the Viceregal Palace and the area
East, North and South of it was chosen for the new
capital. Edwin Lutyens and his compatriot Herbert Baker
built the new capital of India to be known as New Delhi.
The ‘Raisina Municipal Committee’ was established in
1916 to cater to the municipal needs of the labour
engaged in the construction of new capital. In 1925, it was
upgraded and around this time, it was designated as
‘Imperial Delhi Municipal Committee”. It was named
‘New Delhi Municipal Committee” and in 1932, it became
a “First Class” municipality.
In May 1994, the NDMC Act replaced the Punjab
Municipal Act, 1911 under which the ‘Raisina Municipal
Committee’ was established, and the committee was
renamed as “New Delhi Municipal Council”. The act has
been passed by the Parliament. An eleven member
Council headed by a Chairperson governs the NDMC.
Five of them are officials, three are elected members of
the legislature representing the constituencies in the
NDMC area, two are drawn from among eminent
personalities. The MP of New Delhi parliamentary
constituency is an invitee to council’s meetings.
The area of NDMC includes the seat of Central
Government, Rashtrapati Bhawan, the Prime Minister’s
office and residence, Central Government office, Foreign
Missions, residences of Ministers, Members of Parliament,
Diplomats and Central Government employees.
17.15.2 Main Functions
In addition to providing basic civic amenities to its
residents, the Municipal Council also ensures various
social, cultural, educational and medical facilities,
especially to the government/municipal employees and
other weaker sections of society. Actually, the NDMC is a
municipality with a difference. The Act enjoins upon it a
role of a mini-government, with all facets of city
management except that of policing and transportation.
It is perhaps the only municipality in the country that
supplies electricity and water and its discretionary
functions encompass promotion of sports, art, music and
culture, maintenance of libraries, and care for the old,
mentally and hearing impaired. It takes care of working
women, housing problems and social facilities like barat
ghars and community centres. It always aims to achieve it
by eliciting peoples’ cooperation and public participation.
17.15.3 Citizens’ Charter
The NDMC had issued the first charter in 1997 and
has issued the new one in February 2005. It is a
simplified and yet a very comprehensive Charter giving all
the details of citizens’ entitlement to municipal services,
quality of services, access to information, stages in
decision-making, time bound schedule of services,
sanctions and approvals. It is a measure towards
transparency and efficient and timely provision of services.
Its Vision and Mission are reproduced below:
Vision: “NDMC resolves to intensify its efforts in
providing better civic services to the citizens and a
multitude of visiting patrons from all over the country and
overseas. Other objectives before the NDMC are to
improve quality of life providing social and community
welfare amenities with public, private participation—with
special emphasis on promotion of art and culture,
environmental improvement, cleaning and greening
campaigns to serve as a show window of “A Model Well
Planned Metropolitan City”.
17.15.4 Mission
“NDMC is committed to providing efficient,
qualitative, responsive and accountable services to all the
citizens and visitors of its area with instant access to
information to bring transparency.”
DELHI DEVELOPMENT REPORT408
17.15.5 Grievance Redressal System
NDMC has set up an Information and Facilitation
Centre and opened two Palika Suvidha Kendras where
citizens can pay their taxes, fees, etc., obtain birth/death
certificates, book Barat Ghars and register their complaints
relating to civic services. Very detailed information has
been provided in the Citizens’ Charter about the main
sectors of activity of the NDMC separately such as
electricity, water, felling of trees, sewers, unauthorised
construction, education, health, etc., as to who is
responsible, contact points, telephone numbers and the
complaint centres.
17.15.6 Annual Administrative Report
The NDMC publishes an Annual Administrative
Report enabling those interested in getting to know the
work done in the year gone by and the programme for the
coming year.
17.15.7 Delhi Development Authority
17.15.7.1 Establishment and Functions
India’s Independence in 1947 and resultant migration
increased Delhi’s population from 7 lakhs to 17 lakhs by
1951. Delhi Improvement Trust and Municipal Body, the
two local bodies at that time, were not adequately
equipped to cope up with the changing scenario.
The Central government appointed a Committee under
the chairmanship of Sh. G D. Birla in 1950. This
Committee recommended a Single Planning and
Controlling Authority for all the urban areas of Delhi.
Consequently, the Delhi Development (Provisional)
Authority - DDPA - was constituted by promulgating the
Delhi (Control of Building Operations) Ordinance, 1955
followed by the Delhi Development Act, 1957 with the
primary objective of ensuring the development of Delhi in
accordance with a plan. On 30th December, 1957, Delhi
Development Authority acquired its present name and its
role as the 9th builder of the grand city of Delhi.
• Planned development of Delhi is the main
function of DDA under Sections 7-11A of the DD
Act of 1957.
• DDA prepares plans, policies and proposals for
guiding Delhi’s planned development through the
process of Master Plan, Zonal Plans, Action Area
Plans and Urban Extension Projects etc.
• Some of the major achievements of Planning
Department towards planned development of
Delhi are as follows:
• Master Plan for Delhi-2021 (under preparation)
• Preparation of
• Master Plan for Delhi-2001
• Master Plan for Delhi-1962
• Zonal Plans
• Urban Extension Projects
• Special Projects
• Other Projects
• Policy Modifications: Mixed Land Use,
Housing, Transport, and Infrastructure
in respect of Urban Development,
Development Areas, Buildings by-laws
Development etc.
• DDA commenced its housing activities in 1967
and has played a crucial role in providing more
than a million houses to the people of Delhi,
housing about half the population of the national
capital.
• DDA has been constructing houses in Delhi
according to the requirements and purchasing
capacity of different strata of society.
• DDA, from time to time, has been announcing
schemes through newspapers and advertisements
for various categories of flats.
• Till March 2003, DDA has allotted a total of
333306 flats (including the re-allotment of
surrendered and cancelled flats). About half the
allotments are to weaker sections of society and
to those belonging to low income groups.
• Flats allotted by the DDA are provided with
essential services like electricity, water and
sewage disposal, besides other infrastructural
facilities required to make them habitable.
• Till March 2003, DDA has announced 35 housing
registration schemes for the benefit of the people
and allotment of houses has been made to
registrants of all 33 schemes.
Delhi Development Authority acquires land for the
planned development of Delhi. It develops these lands
and properties in implementation of the Master Plan
and Zonal Plans. DDA also disposes land and properties
for residential, commercial, industrial and institutional
uses.
Despite very impressive achievements of DDA, it has
an image of being an organisation that needs to improve
Chapter 17 • INSTITUTIONAL REFORMS AND GOVERNANCE 409
its sensitivity to the needs of its clients, efficiency and
public perception about incidence of corruption in the
organisation. The ‘Systems and Training Department’ has
adopted the following measures in this behalf.
17.15.7.2 Transparency and Automaticity in DDA
To minimise downtime, it has introduced systemic
automation in the following departments:
• Land Disposal
• Housing
Launching of a Website which is dynamic and provides
information on various aspects like housing, land, master
plan, environment etc. The results of housing and land
and tender notices are displayed. Senior officers are
reachable through e-mail. Different forms are available on
the website which can be down loaded.
• Land Record
This department has normal administrative functions
such as payroll, receipt and dispatch, legal cases
monitoring system etc. A training programme for
computer literacy seeks to train the staff in the use of
computers.
Apart from increasing transparency and automaticity in
the functions of its various departments concerned with
public dealings, through computerisation and automation
as above, there is a vigilance department to take action to
see that there are no unwarranted irregularities and also
handle complaints that could tarnish the image of the
DDA. The vigilance department is active as can be seen
from the record of complaints received, processed and
action taken on them.
17.16 Conclusion
17.16.1 Multiplicity of Institutions andDivided Responsibility and Authority
National Capital Territory of Delhi, being the capital of
fast developing India, is a Global City and has to serve a
large variety of purposes. As such it has been retained as
a Union Territory. Yet in order to satisfy the aspirations of
the people, it has been given a legislature and a Council
of Ministers headed by the Chief Minister. The areas of
responsibility of the Government of NCTD are restricted
and so also its powers. While land, police and law and
order are specifically outside its jurisdiction, in other
matters too, the powers are not absolute with the Lt.
Governor having the power to intervene in any matter and
refer the matter to the Government of India. The MCD is
an elected body. It is a very powerful body and performs
all civic functions. Then the area where the Government
of India is housed is covered by the NDMC. Delhi
Development Authority is responsible for the planned
development of Delhi and exercises influential voice in
land use and development of housing. Then there are a
number of other bodies whose concurrence is needed in
specified matters. There is duplication in the performance
of functions and the same function is performed by a
number of bodies. The plethora of bodies results in
confusion and the citizen is totally confused about the
agency that should be approached for a particular service
or grievance. It also enables the agencies to pass the buck
to other agencies. All agencies operating in the NCTD
find themselves seriously constrained in implementing
their decisions as consultation with and concurrence of a
large number of bodies becomes unavoidable.
17.16.2 Migration Resulting in Rapid Increase ofPopulation Causing Intense Pressure onPhysical and Administrative Infrastructure
In view of very good infrastructure of Delhi, excellent
educational facilities and the very fast growth of Delhi’s
economy, there is huge migration of population from
other states. Although this migration meets the growing
manpower needs for workers, there is tremendous
pressure on Delhi’s physical infrastructure and there is a
growing gap between demand and supply. Ambitious
schemes have been drawn and are being implemented
such as better and new roads, housing, air and surface
transport, communication. But the increased demand as a
result of economic development and immigration, soon
out-paces the expanded facilities. The administrative
system also is under severe pressure and there could be a
growing gap between expectation and delivery of services.
Delhi, has a very sound body of laws and regulations,
but suffers from ineffective implementation for a variety
of reasons, although, as described in this chapter, every
effort is being made to improve governance.
The changes taking place in Delhi are tending to place
it in the category of capitals of developed countries and so
its requirements of human, physical and financial capitals
are changing in a fundamental manner. The educational
system, does not place enough emphasis on vocational
and training component and so is not designed to produce
a work force in the required numbers, which is equipped
with the required skills, in the organised, formal and
informal sectors. It is much easier to raise finances for
projects and investment; but much more difficult and
time-consuming to produce manpower equipped with the
right attitude and skills to perform numerous kinds of
tasks in services, industry and agriculture. This requires a
DELHI DEVELOPMENT REPORT410
coordinated approach by the executive, legislature,
judiciary, the political parties, the bureaucracy and above
all the citizen.
Despite the unique character of Delhi and limitations
as mentioned above in this chapter, Delhi has been
developing into one of the finest cities in the country.
However, problems arise between state government and
Government of India and its agencies. State government
and MCD. The Lt. Governor is a powerful institution and
ensures that the governance runs smoothly.
17.16.3 Issues Needing Urgent Consideration
The following issues are complex involving the
Government of India and the Government of NCTD and
need to be considered at the highest level of the
Government and resolved:
a) Divided responsibility and authority between the
Government of India and the Government of
NCTD.
b) Multiplicity of organisations resulting in
overlapping functions, time consuming
consultations among them before a decision can
be taken and the absence of an effective over-
arching institutional authority.
c) Migration into Delhi.
d) Measures to provide marketable skills and
opportunities for employment to sections of
population prone to migration in the areas which
are known to be sources of migrants need to be
considered by the Government of India.
e) The manpower required to satisfy increasing
demand for the various socio-economic activities
requires a very well thought out plan for
imparting vocational education and training to the
entrants to the job market and to the workers
who are already employed but are ill equipped in
terms of skills to do their job well.
f) Enforcement of laws and regulations needs to be
effective to deter people from violating them.
Adequate numbers of well trained enforcement
staff and magistrates to punish the violators need
to be provided.
g) Outsourcing of the maintenance functions of
those infrastructure facilities as may be amenable
to being outsourced with efficient supervisory and
regulatory machinery may be considered.
h) Necessary resources may be provided to expand
and upgrade the physical and administrative
infrastructure to meet the growing needs.
i) The principle of payment of compensation for
damage or loss suffered by the citizens because of
substandard public service provided should be
accepted and suitable provision in law be made.
j) Good quality public infrastructure is dependent on
the involvement of the people implying that the
population needs to be aware of their duties and
rights and willing to respectively discharge and
demand them. A suitably designed programme of
public awareness and participation needs to be
developed and implemented for a length of time.
k) Use of Information Technology is proving to be
helpful in NCTD. A crash programme to re-
engineer processes related to the public services
and make them computer and network enabled
needs to be introduced.
l) The areas included in the National Capital Region
need to be integrated in the matters of transport,
state-taxation, standards of infrastructure and law
and order.
The vision of a World Class City for Delhi is
achievable provided a concerted effort is made to deal
with deficiencies and improve efficiencies and
effectiveness of systems is made.
Chapter 17 • INSTITUTIONAL REFORMS AND GOVERNANCE 411
ANNEXURE 17.1
Organisations Participating in Bhagidari Scheme
a) For Delhi Jal Board (DJB):
• RWAs to be made aware of water saving/waste conservation
• Payment and collection of water bills to be done by RWAs
• Distribution of water through water-tankers
• Replacing old/leaking pipelines
• Water Harvesting—involving RWAs
• RWAs role in internal colony sewage system
• Desilting of sewers
• Awareness against using water from handpumps for drinkingpurposes.
b) For Delhi Vidyut Board (DVB):
• Load shedding information will be given to RWAs/MTAs
• DVB will establish Complaint Cell specially for Bhagidars.
• Information will be provided to RWAs by DVB staff posted intheir respective areas
• Electricity meter reading will be done by RWAs and officials ofDVB
• Load enhancement to be made easy
• Meter name change in cooperation with RWAs
• Revenue enhancement and its re-investment involving the RWAs
• Replacement of ‘low tension wires” and “faulty meters”.
• Delhi Vidyut Board has now been unbundled into five companiesas a part of power sector reforms. The Generation Company andthe Transmission Company are Government owned whereas thethree Distribution Companies are in private hands (two ownedby BSES and one by Tata Power). The private distributioncompanies are also now participating in Bhagidari.
c) For Municipal Corporation of Delhi (MCD):
• House tax collection by interested RWAs
• Maintenance of community parks through RWAs
• Management of community hall through RWAs
• Sanitation services to be supervised by RWAs
• Information on Sanitary staff to be given to RWAs
• Imposition of fine on littering in co-operation with RWAs
• Desilting of nallahs
• Removal of stray and dead animals from colony
• Maintenance of Roads and Back Lanes on regular basis
d) Sanitation:
• Solutions on community bins
• RWAs role in internal colony sewage system
• Overseeing the work of sanitary staff by RWAs
• Door to Door collection of Waste/Garbage
• Generation of public awareness on sanitation
e) For Department of Environment and Forests (E&F):
• Plantation and maintenance of saplings
• Greening of the colony
• To discourage use of plastic bags
f) For Delhi Police (DP):
• Crime prevention through involvement of RWAs
• Neighbourhood watch scheme
• Verification of antecedents of domestic help
• Prevention of encroachments
• Regulation of traffic through colonies
• Prevention of illegal sale of liquor
g) For Delhi Development Authority (DDA)
• Solutions to prevent encroachment
• Maintenance of community parks
• Prevention of encroachment
• Maintenance of common areas
• Parking inside the colony
h) Issues exclusively for MTAs
A) Weights and Measures
• Weights and measurements used for commercial purposes
• Indigenous and imported package commodities
• Sale of beverages, ice creams, mineral water bottles at MRP
• Registration of packers and importers
• Inspections and challans
B) Sales Tax
• Strengthening communication channels for disseminating SalesTax information.
• Better communication channels for reviewing feedback on SalesTax from dealers.
• Joint detection of bogus and unregistered dealers.
• Interface between sales tax field officers.
• Grievance handling.
C) Industries Department
• Handing over of the estate/maintenance services to MCD in atime-bound manner—procedural aspects only.
• Uninterrupted Power supply metering, billing and changes inrules/regulations.
• Adequate and potable water supply “No Supply, No Billing”principle.
• CETP – a) Costing of Plants, b) escalation and govt. to bearescalation, c) Responsibility of maintenance, d) Cost ofmaintenance.
• Clearance of encroachments in parks, and on roadsides andpavements within industrial area/estates.
• Provision of streetlights in the Industrial Estates.
• Removal of Slums/JJ clusters, encroachments on approach roadsand pavements, etc.
• Rain Water Harvesting.
• MCD factory license—one time fee—no renewal-permission forindustries on floors (as flatted factories).
• One-window service concept.
• Inspection methods and procedures.
• Conversion to freehold plots and shed—procedures/modalities.
• Allotment of land to associations for administration of estate andprovision of P.O., Bank, Fire Station (on TOP priority where landalready allocated), R&D centre, tool room, etc.
• Categorisation of units by DPCC (Green Orange, Issue of consentin time-bound manner).
• Industrial waste/solid-waste disposal.
DELHI DEVELOPMENT REPORT412
ANNEXURE 17.2
Details of the Bhagidari Scheme
Delhi Jal Board
• Water is an essential civic commodity. Delhi has limited waterresources. We are mainly dependent on neighbouring states forsupply of raw water to quench the thirst of our vast population(1.25 crore) and also the migratory population, i.e., peoplevisiting Delhi everyday for business/job.
• As against present demand of 800 MGD ONLY 650 MGDpotable water is available. So we sought intensive involvement ofpeople/citizen groups in water conservation and water harvestingprogramme.
• Delhi Jal Board (DJB), an autonomous body under UrbanDevelopment Department has been identified as Nodal Agencyfor this purpose. It has taken following steps :-
i. Nominating 500 Water Wardens and 1500 Assistant WaterWardens from amongst citizen groups. They will beimparted specialised training to check and rectify waterleakage through supply lines.
ii. Intensive advertisement campaign to create awareness aboutneed and means of water conservation.
iii. To provide technical and financial assistance to GroupHousing Societies and individuals taking up rain waterharvesting projects in their buildings. This would help torecharge ground water table. 150 such work have beencompleted and 35 are in progress at present.
Anti Plastic and Anti-littering campaign by Environment andForest Department
Use of plastic bags has become a big menace largely due to its non-biodegradable nature. These bags choke our sewerage system, damagethe soil and kill our cows. The problem is further aggravated byunchecked habit of people who litter at any spot convenient to them.We felt that involvement of citizen groups is a must to desist peoplefrom using plastic bags and littering at public places. Our approach tothis has been persuasion and not coercion. Environm1ent & ForestDepartment has taken up ‘Anti-Plastic’ & ‘Anti-Littering’ campaignswith the active cooperation of Bhagidar RWAs, MTAs and Eco-Clubsconstituted in schools. Important steps taken :-
i. The ‘Delhi Plastic Bag (Manufacture, Sale & Usage) and Non-Biodegradable Garbage (Control) Act 2000’ has been madeeffective from 02.10.2001 in the NCT of Delhi. The act bans themanufacture and sale of plastic bags of thickness less than 20microns. The offence is punishable. The first offence iscompounded at the rate of Rs.10,000/-.
ii. A plastic bag collection drive-cum-competition was launchedunder which 5000 kgs. Of used plastic bags of less than 20micron thickness were collected. For public awareness, the hugepile of collected plastic bags was given the shape of a Dinosaurand kept at Nehru Park.
iii. In 125 colonies programme on waste management has beeninitiated as a pilot project for segregation of waste at source levelitself into biodegradable & non-biodegradable and its furtherrecycling.
Senior Citizens
Our Government recognises its responsibility towards our seniorcitizens. We have launched certain programmes as a token of respectto them :-
i. Opening of special clinics in 9 hospitals of Delhi Govt. wherethey can get all types of required medical services on Sundaysfrom 10.00 a.m. to 12.00 noon.
ii. Separate queues in OPD on working days for the senior citizensand giving them preferential treatment.
iii. Concessional travel passes in DTC buses.
iv. Special protection scheme for senior citizens has been launchedby Delhi Police. SHO of the area conducts survey of elderlypeople living alone.
v. At present 2 old age homes are functioning and we are consideringmore such homes where not only recreational facilities but alsothe health care facilities be provided to the senior citizens.
vi. Old age pension scheme has been started. Eligible senior citizensare given Rs.200 per month on the recommendation of area MLAwhich is paid to them on quarterly basis through banks and postoffices.
vii. Smart Card Scheme—the ‘Ayush Patra’—for senior citizens ofDelhi will be issued a Smart Card free of cost. The card willdigitally contain the vital profiles of the holder including hisblood group and preferential access to various civic services.
Reforms in Hospital Management & Quality Control byHealth & Family Welfare Department:
• To improve the management of Hospitals of Delhi Governmentand to make it responsible towards patients, we have decided toconstitute ‘Janhit Society’ in each major hospital. The society willhave representation from RWAs of the area and other citizengroups. The expert studies are being conducted for improving thequality of services offered by Hospitals and reducing delays inimparting medical help.
• Students Welfare Committee for Government Schools
• Although improvements have been made in the standards ofGovt. schools of Delhi since my Govt. came to power but still alot needs to be done and at a faster pace. With the existingadministrative structure the progress has been slow. Therefore,my Government decided to take help of local RWAs and NGOsin school administration. As a pilot project School WelfareCommittees – ‘Vidhyalaya Kalyan Samitis’ – have been appointedin nearly 600 Govt. schools. These committees will advise inmatters of school administration, cleanliness, petty repairs, etc.for which they have been given required administrative andfinancial powers. These Committees have been given powers torecommend expenditure up to Rs.10,000 per month for properupkeep of school infrastructure.
Development of Industries
In addition to the above programmes, Bhagidari has taken in its spanthe Industrial Associations. In association with the IndustriesDepartment confirming Industrial Areas of Delhi have been madeBhagidars through their Industrial Associations. A High power Apexlevel Committee of Senior officers and representatives of Industries toprepare the policy frame work for growth and development ofIndustries in Delhi in the right earnest.
Results Achieved
The initiative launched in January 2000 has firmed up and become amovement in two years. More than 1100 citizen groups have becomeour Bhagidars after having participated in various Bhagidariworkshops. The “Bhagidars” have not only been successful in solvingtheir day-to-day problems, but have also been providing help topublic utility departments in maintenance and up gradation ofservices. Some examples are:-
1. Successful implementation of ‘Clean Yamuna”, ‘Say no to plasticbags’ & ‘No crackers on Diwali’ campaigns.
2. Switching on/off of streetlights by RWAs.
3. Meter reading by RWAs in their residential colony.
4. Traffic regulation in the colonies.
5. Clean Delhi: “Green Delhi” campaign.
6. Tenant verification in the colonies.
7. Rain-water Harvesting.
8. Conservation of water by checking misuse of water.
9. Water Bill collection and payment by RWAs.
10. Desilting of sewers
11. Coordinating with DVB for handling load shedding and powerbreakdown.
12. Prevention of power-theft.
13. Door to door collection of garbage.
14. Maintenance of community parks and halls
Chapter 17 • INSTITUTIONAL REFORMS AND GOVERNANCE 413
15. Crime prevention and successful implementation ofneighbourhood watch scheme.
16. Prevention of encroachment.
Some Success Stories
• RWAs and MTAs have started taking up the collective paymentof water bills by cheque on fixed date and time.
• 267 RWAs and 5 MTAs are actively participating in observingwater leakage and noting them down in a special register kept byDJB.
• RWAs and MTAs in most of the colonies are participating in thedistribution of water through tankers.
• 140 RWAs have taken up Rain-water harvesting measures.
• 143 RWAs and 5 MTAs have voluntarily taken up participationin the replacement of old/leaking service pipes in their area.
• Delhi Vidyut Board had organised 16 camps under the Bhagidarischeme for load enhancement. The department received andprocessed 5279 applications generating revenue of Rs.2.64 crore.
• Federation of I.P. Extension II Housing Societies (Regd.) KiranVihar, Delhi having 35 housing and Group Housing Societies asits members covering a population of more than 50,000 people,in association with the Delhi Police conducts verification oftenants, security guards and domestic servants in the Societyitself and residents are regularly educated about use of safetydevices for vehicles and internal security has been tightenedthrough issue of identity cards to hawkers, kabaries.
i. Active cooperation with Delhi Jal Board resulted in desiltingof sewer lines in scheduled manner and the complaints areattended to without delay or harassment.
ii. Water bills are distributed through member societies. Billcollections are being done through collection boxes and theJal Board has agreed to accept any amount from theconsumer and arrears, if any, being carried forward.
• The Federation of Group Housing Societies, I.P. Extensionstarted the meter reading scheme in the member RWAs withactive co-operation of the concerned Zonal Officers of the DelhiVidyut Board. This federation is one such Bhagidar which haveimplemented the meter reading scheme by the RWAsthemselves. Under this programme, presently meter reading ofaround 23000 electric meters belonging to 22 RWAs is beingdone. The Delhi Vidyut Board paid the federation at the rate of2.00 per meter for the electric meter reading. The federationgives this money to the participating RWAs.
• Mayur Vihar Phase-I, Pocket-III Apartment Owners Associationhas been successful in solving the following problems under‘Bhagidari’:-
i. The old and obsolete panels of two sub-stations, which werecausing frequent break downs of power supply, were gotreplaced by the Chairman, DVB, within two days. Now,there is no disruption of power supply from these substations.
ii. Transformer of one of the sub-stations, which got burnt,was replaced by DVB within a matter of 4 to 5 hours.
iii. One electric pole, which was uprooted by a heavy vehiclewas replaced the same day.
iv. The street lighting of the area has greatly improved with thehelp of the member RWAs.
v. The water and power supply in the area has improvedtremendously.
vi. The cash counter centre in Mayur Vihar Phase-I has beenincluded in the list of authorised cash counter centres ofDVB for accepting electricity bills in bulk from RWAs.Similarly, DJB cash counter centre also accepts payment ofwater bills by cheques in bulk. A new cash counter is beingopened by DJB in the area shortly.
vii. Camps for collection of property tax bills are being organisedby MCD.
viii. The standard of sanitation and hygiene is very satisfactory.The Sanitary Supervisor meets them regularly in this regard.
• The Vasant Vihar Welfare Association is one of our founderBhagidars. With the active efforts of its President, Ms. DeepaKapoor, the association has successfully undertaken Rainwater
harvesting project and recycling of used water. The associationcreates awareness among its residents through printing ofposters, organising cultural programmes and seminars. Theirsuccessful implementation of the Rainwater harvesting projectespecially in the A-Block Nursery has become a model for theother RWAs to follow.
• After participating in the workshop for Market & TradersAssociation in July 2001, Prithviraj Market & Traders Associationcame forward to voluntarily take up the Anti-Plastic bagscampaign in their market. The association printed the posters tocreate awareness among its member shops and offices and hasbeen successful. The market no longer does give carry bags madeof plastic to their customers.
• The Gaffar Market and Traders Association, Karol Bagh hasundertaken the replacements of the generators in the shops intheir markets as a step towards making the environment clean.
• The Govt. colonies of Timarpur & Gulabi Bagh with activecooperation of the Delhi Police officials have successfully carriedout the tenant verification in their respective colonies.
• Kalkaji Bhagidari Coordination Committee is successfullycoordinating the Bhagidari activities of its 25 Residents WelfareAssociations.
• Harijan Basti Sudhar Samiti, East Loni Road, Ashok Nagar hascreated awareness against use of plastic bags, AIDS and waste ofdrinking water by organising camps. The association has issuedidentity cards to the hawkers in their colony.
• Rainwater harvesting projects are increasingly being taken up byour RWAs. Some notable initiatives in this direction have beenby our Bhagidars of Maharani Bagh Cooperative Housing Society,S-Block, Greater Kailash-II, RWA, Som Vihar RWA, Punch ShilaCo-operative House Building Society Ltd. and Sector-3, Rohini,RWA
• Tree plantation projects have been very popular with ourBhagidars. Extensive plantation measures within the colonies havebeen taken up by the RWAs of Greater Kailash-II, Niti Bagh,Chand Nagar, Tilak Nagar, Federation of Group Housing Society,Patparganj, Delhi, Chetra Vikas Sangthan, Palam and DilshadGarden Pocket-E.
• The Bhagidari programme was sent by Govt. of India as one ofthe official entries to the Commonwealth Association for PublicAdministration and Management (CAPAM) International Awards.The programme has been selected as one of the 30 semi-finalistout of a total of 150 international entries from all over the world.The CAPAM has recognised the programme as being trulyInnovative and worthy of the recognition that accompaniesachievements such as this in the Public Sector.
• Our government has also issued instructions that in the AnnualConfidential Reports (ACR) of officers who have a role inimplementing the Bhagidari scheme, a special mention will bemade by the Reporting and Reviewing officers about theinvolvement and ability of the officer in implementing theBhagidari in improving the provision of services to the public. Inparticular, mention will be made of significant innovationsintroduced, which have made a difference to people’s life.
Challenges
1. First, bringing together a large number of citizen groups andgovernment officials on a common platform was not an easy task.It required detailed planning and coordinated action holdingpreliminary meetings, interactions and a whole gamut oflogistical arrangements. As the concept emphasised the voluntarynature of all activities, we wanted to reply on the existingresources and manpower.
2. It required managing a change process—a change in perceptionsof both the citizens and government officials. The first reactionof citizens was to view this programme as another avenue forredressal of public grievances. It took some time to convincethem that what we were talking of was a partnership—a two wayprocess—in which the citizens had to contribute as much as thegovernment officials. Not only this, they had to acknowledge the‘ownership’ of the programme—acknowledge that they were thestakeholders in the development of this city.
3. We faced resistance from the field-level government officers whowere not willing to step out of their bureaucratic shell andembrace the direct interaction with citizen groups. They felt itwas erosion of their authority and in many instances it alsostemmed corruption at the field-level.
DELHI DEVELOPMENT REPORT414
4. So far the citizen-groups interacting with us have been registeredassociations. The challenge is now step out with the programmeinto the slum clusters, resettlement colonies and theunauthorised regularised areas.
5. We have also broad based the movement by including industrialassociations. Shortly we will reach out to rural areas, womengroups and non-governmental organisations.
6. Our intent would be to gradually work out changes in policiesand legislation, which would enable the citizen groups tostatutorily interact with Government.
Conclusion
• With pride one can say that the Bhagidari initiative hasattracted the attention of the government of India, which isdocumenting the entire process for replication in the country.The documentation of Phase-I of Bhagidari (January 2000–June2001) has been completed with the cooperation of theDepartment of Administrative Reforms, Ministry of Personnel,Pension & Public Grievances, Government of India. Thedocumentation of Phase-II (July 2001–October 2002) is ongoingand is scheduled to be published by end of November, 2002.
• In order to build up a regular interaction with the Bhagidars andto keep them apprised of the new activities under Bhagidari amonthly newsletter under the title ‘Bhagidari Masik Patrika’ isbeing published since December 2001.
• From a movement beginning with 20 Residents WelfareAssociations we are now in active partnership with more than1100 citizen groups.
• Our efforts have been recognised by the government of India,and they recommended our initiative for CAPAM InternationalInnovations Award, 2002. The scheme has been chosen as one ofthe 30 semi-finalists out of the total 150 international entriesfrom all over the world. Our initiative was also recommended byHuman Settlement Management Institute (HSMI), New Delhi forDubai International Award for Best Practices, 2002. [The HSMIhas been designated by Govt. of India as the National LevelNodal Agency for identification and documentation of Bestpractices as well as for submission of these Best Practice Entriesfor the awards of excellence instituted by Dubai Municipality, inassociations with the United Nations Conference of HumanSettlements (UNCHS).]
• The success of Bhagidari process is real. The reason of itssuccess lies in the application of democratic processes of problemsolving by dialogue and consensus, where every stake-holdershares both responsibility and authority, and takes ‘ownership’for finding and implementing solutions together. This non-partisan and democratic method of problem solving has beenable to touch the right chord in the citizens’ hearts and theybelieve that ‘Bhagidari’ can really give them a more meaningfulrole in governance.
List of Departments that have prepared the Citizens’Charter:
Administrative Reforms, Archaeology, Central Jail, Chit Fund, D.F.C.,DDU Hospital, Delhi Commission for Women, Delhi Institute ofHotel, Management, Delhi Jal Board(DJB), Delhi Khadi VillageIndustries, Board(DKVIB), Delhi Minority Commission, Delhi SC/ST/OBC Minorities Fin. & Dev. Corp. Ltd. Development, Directorate ofHealth Services(DHS), Drug Control, DSIDC, DTC, Dte Agrl. Mktg.,Dte. of Eco. And Stat. & O/o Chief Reg. Births & Deaths, DTT &DC, Election (Chief Electoral Office), Environment, Excise, Food andSupplies, G. B. Pant Hospital, GTB Hospital, Guru Nanak Eye Center,IBHAS, Industries, Information and Publicity, Irrigation and FloodControl(I&FC), Labour, Land and Building, Law and Justice andLegislative Affairs, LN Hospital, NCC, NDMC, Nehru HomeopathyMedical College, Netaji Subhash Institute of Tech., OBC Commission,Prevention of Food Adultration (PFA), Prosecution, Public GrievancesCommission, PWD, Registrar Cooperative, Society, Sales Tax, SanjayGandhi Memorial Hospital, Social Welfare, Rehabilitation Services,Training & Technical Education, Urban Development, Vigilance,Weights & Measures.
DELHI LOKAYUKTA AND UPLOKAYUKTA ACT, 1995(Delhi Act No.1 of 1996)
AN ACT To make provision for the establishment and functioning ofthe Institution of Lokayukta to inquire into the allegations againstpublic functionaries in the National Capital Territory of Delhi and formatters connected therewith.
“public functionary” means a person who is or has been at any time-
(i) the Chief Minister or a Minister;
(ii) a Member of Legislative Assembly;
(iii) a person having the rank of a Minister but shall not includeSpeaker and Deputy Speaker of the Legislative Assembly;
(iv) a Chairman, Vice-Chairman or Managing Director or a Memberof a Board of Directors (by Whatever name they be called) inrespect of –
(1). an Apex Cooperative Society or any Cooperative Societyconstituted or registered under the Delhi CooperativeSocieties Act, 1972, which is subject to the control of theGovernment;
(2) a Government Company within the meaning of section 617of the Companies Act, 1956, engaged in connection with theaffairs, and is under the control of the Government;
(3) a Local Authority established under any law in relation toDelhi; provided that the provisions of this Act shall not beapplicable to any authority of a Local Authority constitutedunder an enactment relatable to Entry No.18 of the StateList of the Seventh Schedule of the Constitution;
(4) a Corporation engaged in connection with the affairs, andunder the control, of the Government;
(5) any Commission or body set up by the Government which isowned and controlled by it;
(v) a Member of the Municipal Corporation of Delhi as defined inclause 2(27) of the Municipal Corporation Act, 1957 (asamended in 1993);
AR Departments activities:
• Policy support to all Departments of Delhi Government andcoordination relating to issues of :
• Simplification of procedures and improvement of organisationalstructure;
• Matters relating to organisation and method.
• Conducting work measurement study of various departments ofDelhi government;
• Re-organisation of departments.
• Office inspections.
• Enforcement of Delhi right to information act & rules, 2001.
• Lokayukta.
• Formulation and implementation of Citizen’s Charters.
Civil Service Reform/Procedural Reform
The officers and staff members of Government of Delhi and itsAutonomous Bodies are encouraged to contribute to decision makingthrough the suggestion scheme and can get even cash awards up toRs.5,000. The citizen’s and Non-Government Organisations arewelcome to extend their cooperation in bringing reforms in differentfields.
a) Contextual Characteristics:
• Socio-economic indicators including education, access to basicneeds and the role of women.
• The economy: its base, growth and type; financial dependence onexternal resources, including aid and debt; and degree ofintegration with the global economy.
• Human capacities and sustainability.
• Natural resource base and trends in the environment.
• Cultural, religious and ethnic diversity and structures, conflict orpolarisation and internal means of resolving conflict.
• Indigenous values, networks and knowledge.
The efforts made by them as well as the measures taken by the MCD;NDMC and the DDA are reviewed. The main organs of governance inNCTD are the Government, MCD, NDMC and the DDA.
Chapter 18
Conclusions and Recommendations
DELHI
On the basis of the discussions in the previous chapters it
is easy to draw conclusions about the subjects discussed
and make recommendations. This is done in two parts.
First some general conclusions are drawn and then the
conclusions and recommendations are made sector-wise.
18.0 General
a) Delhi, located in an area, which is agriculturally
very fertile, has developed, in the northern part of the
country, as the biggest market for agricultural as well as
other goods. It is a historical city and has numerous
architectural monuments of ages down its history. Its
service sector has grown very fast. It is the capital of the
largest democracy of the world. People from all parts of
the country reside here and it has an international
community in the foreign missions. It is thus a very
cosmopolitan place where people may feel comfortable
irrespective of their background—religious, social, cultural
and economic. Therefore, Delhi attracts people for work,
trade and commerce, tourism etc., from all over the
country, especially from the neighbouring states. Delhi
has become the most densely populated city with a
population density of 9224 per sq.km. Compared to an
average all-India density of 324.
b) Because of its unique position and the
requirement of the various roles that it has to perform,
Delhi has been given the status of a Union Territory. In
order to satisfy the democratic aspiration of self-
governance, striking a balance, it has been provided with
an elected legislature and a government headed by a Chief
Minister. However, the powers with the NCTD are
considerably less than that of a normal State of the Indian
Union but they are much wider than those of a Union
Territory.
c) The MCD covers a very large proportion of the
area of Delhi. It is an elected and a very powerful body
and performs all civic functions. The area where the
Government of India is housed is covered by the NDMC.
Cantonment Board is responsible for the remainder. Delhi
Development Authority is responsible for the planned
development of Delhi and exercises influential voice in
land use and development of housing. Apart from DDA,
Central government departments too perform a number of
functions.
d) Thus there are many bodies for performing a
function and this creates confusion and results in waste of
resources and the need for coordinating their activities.
The citizen is confused about the agency that should be
approached for a particular service or grievance. It also
enables the agencies to pass the buck to other agencies.
All agencies operating in the NCTD find themselves
seriously constrained in implementing their decisions as
consultation with and concurrence of a large number of
bodies becomes unavoidable.
e) Despite the unique character of Delhi and
limitations as mentioned above in this chapter, Delhi has
been developing into one of the finest cities in the
country. The parameters briefly discussed below
corroborate this view.
• It is a cosmopolitan city and provides equality of
opportunity to people irrespective of social,
regional and religious differences.
• It attracts people from all over the country
because of the opportunities that this city offers
in the field of education, health, employment and
enterprise etc. The growth of population is so
rapid that despite availability of land, which
appeared plentiful soon after Independence when
the expansion phase began looks too inadequate
now and the city’s infrastructure is unable to
keep pace with its expanding population.
DELHI DEVELOPMENT REPORT416
• Delhi has a developed economy with services
sector being dominant, the secondary sector way
behind and agricultural being negligible. It had the
second highest per capita NSDP at Rs. 48974 in
2001-02 and a very low poverty ratio. However,
wide disparities are reflected in the social and
economic status of the population with many
layers having differential access to various facilities.
• In the sphere of education it has a high literacy
rate and the standards of higher education are
believed by many to be the best in the country. It
ranks not higher than fourth among the states in
the matter of literacy mainly because of
continuous migration of the poor in search of
employment from all parts of the country.
• Of the metropolitan towns, Delhi has the least
percentage of its population living in slums.
• Delhi has initiated measures to deal with the
problem of transport and the Metro Rail project
has started making its impact felt.
• The over all birth rate in Delhi is substantially
lower than the national average and the Life
Expectancy at birth is 68.6 years against the
national average of 60.7 years.
• It is a green city having 12.5 trees per ha, as
against the national average of 12.
• Being a service industry centric city, the labour
relations in Delhi are harmonious.
f) Despite the rosy picture which emerges from the
impressive statistics mentioned above in relation to some
sectors in the NTDC, it is found that wide disparities are
reflected in the social and economic status of the
population with many layers having differential access to
facilities in the areas of health, education, housing,
transport etc. There is scope for improvement in almost
every sector.
18.1 SECTOR-WISE CONCLUSIONS ANDRECOMMENDATIONS
18.2 Fiscal and Financial Management
a) Delhi gives the picture of a developed economy,
with a dwindling primary sector, and a declining
secondary sector. Future development has to
concentrate on creation of more and more of
employment opportunities for the growing local
and migrant population.
b) Areas of concern are the rising debt burden and
the consequent fiscal deficit. Tax-GSDP ratio has
to be improved. For this, mounting tax arrears
have to be reduced, and it has to be ensured that
there is no further addition to these arrears in
future.
c) Despite the Union Government and local bodies
taking the responsibilities of activities on which
other states are required to spend their resources,
the revenue expenditure of NCT has been steadily
increasing in recent years.
d) The NCT of Delhi has been consistently having
surplus on revenue account. But, its fiscal deficit
has also been consistently going up, being 2.91
per cent of GSDP in 2003-04 against a low of
1.39 per cent in 1997-98.
e) Public debt of the NCT has been growing—from
2.42 per cent at the end of March 1995 to 17.08
per cent of the GSDP at the end of March 2004.
The NCT borrows from the Central government
and gives loans to its own public sector
undertakings and other bodies. It is a net
creditor, unlike many states.
f) The various bodies getting funds are defaulting
on repayment. Since some of these are providing
essential social and economic services, these
cannot be closed down but have to be supported
until some viable alternative is found. This is a
matter of concern.
18.3 Urban Development Housing andUtilisation of URIF, Slums etc.
a) A number of features of the National Capital
Territory of Delhi are unique in that it is almost entirely
urbanised, substantial population lives in the unplanned
clusters, and unauthorised colonies, majority of Delhi
population is immigrant and employment in the primary
sector including agriculture and mining has dwindled to
negligible levels.
b) In 2004 only 23.6 per cent of the population was
living in planned colonies, 64.5 per cent in Jhuggi Jhopri
(JJ) clusters, slum designated areas and unauthorised
colonies and the remaining 11.9 per cent in rural and
urban villages indicating the need of massive effort in the
housing sector.
c) The contribution to housing stock through
institutional agencies was only 53 per cent (this excludes
squatter housing) in 1991. DDA, the nodal agency for
Chapter 18 • CONCLUSION AND RECOMMENDATIONS 417
providing housing units, till March 2003, had allotted a
total of 0.33 million flats. The component of housing
through non institutional sources viz., unauthorised
colonies, squatter/JJ clusters, etc. is significant.
d) Slums/Informal Sector Housing
• The slum population in Delhi was about 26.0 per
cent in 2001, least of the metropolitan cities.
Greater Mumbai (34.3 per cent) was followed by
Kolkata (32.90 per cent) and Chennai (28.1 per
cent). In JJ clusters/squatter settlements about 6
lakh house holds with a population of 30 lakh
was living (1997).
• Relocation of Slum Population
The Municipal Corporation of Delhi (MCD)
initiated the process of relocating the slum
dwellers in early 1991. The relocation sites are
generally located at the peripheries of Delhi.
These sites have been selected with a vision of
having a density of 200 dwelling units per acre
with a plot size of 18 sq.m for each eligible family
and 12.5 sq.m for each ineligible family.
e) Type of Houses: The National Sample Survey (NSS)
50th Round (1993-94) data for Delhi indicates that 35.40
per cent of dwellings were independent houses, 24.90 per
cent are flats and 15.4 per cent are chawl/Basti. About
24.3 per cent of the dwellings fall under “others”
category.
f) Ownership of Houses: An analysis of housing data for
1991 indicates that in Delhi 68.1 per cent of houses are
owned by the residents and 28.61 are rented. Status of
3.29 per cent of the houses was not known
g) Size of Houses: About 44 per cent of the dwelling
units have only one room, 27 per cent two rooms and
15.5 per cent three rooms each. Larger accommodation
accounts for only 12.4 per cent of the total dwelling units.
h) Shortage of Housing: In 2001 Delhi’s backlog of
dwelling units stood at 4 lakh comprising of one lakh net
shortage and the rest by way of dilapidated and kutcha
structures requiring replacement.
i) Living Conditions: An analysis of data on housing
indicates that 58 per cent of the houses are in good
condition, 36.65 per cent are livable and 5.35 per cent are
in dilapidated condition.
j) Land Availability: According to the draft NCR Plan
2021 the land that can be urbanised in the NCT Delhi is
97190.90 ha. or 65.54 per cent of its total geographical
area of 148,300 ha. The population holding capacity of the
existing urban areas of Delhi is 122 lakh, which is
adequate to accommodate the existing (2001) population
of 109 lakh. However, further urban extension in about
27,000 ha. will be required to accommodate the
population in the future.
k) Water Supply And Waste Water Treatment and Disposal:
The total water supply capacity of Delhi Jal Board (DJB) as
on 31 March 2002, was 675 MGD. There are large areas
where the position of water supply is unsatisfactory.
Yamuna river being the only source of water, the matter
has to be pursued with the concerned states and the
Government of India so that the water supply needs can
be satisfied. There is need for conservation of water and
prevention of waste and recycling.
The actual quantity of wastewater treated is much
below the installed capacity of the 16 sewage treatment
plants (STP) of about 497.4 MGD. The low level of
capacity utilisation at the STPs is due to missing links in
sewer connectivity and choking/silting of sewer lines.
These must be remedied on priority.
l) Garbage Management: Generation of garbage was
estimated to be 9384 tons/day at the rate of 0.68 kg/
capita/day. The total handling capacity of MCD, NDMC
and cantonment Board is about 5543 tons.
m) Housing Policy: The long term goal of the NHP is
to eradicate houselessness, improve the housing
conditions of the inadequately housed and provide a
minimum level of basic services and amenities to all; for
this purpose provide land and legal and infrastructure
support to enable the private sector to make heavy
investments. No fresh encroachments are to be permitted
on public land and past encroachments which had been in
existence prior to 31 January 1990 will not be removed
without providing alternatives.
n) Data Base Development and Management: Data on
housing in Delhi by agencies involved remains
uncoordinated. The process of data collection is not
within any regulatory framework. Such a framework needs
to be developed for India and, until it is developed, the
broad guidelines provided by the United Nations Human
Settlements Programme may be adopted.
o) National Capital Region: The concept of a national
capital region covering an area of 30,242 sq. kms spread
over the states of Haryana, Rajasthan and the U.P. has
taken some shape. Action has been taken for preparation
of regional, and functional plans for transport, power,
telecommunication and industrial sector. However, the
population in Delhi continues to grow at a very rapid rate
much faster than the rate at which its infrastructure has
DELHI DEVELOPMENT REPORT418
grown. Already a large proportion of its population lives
in slums. Essential institutions such as schools cannot be
provided for want of land in areas where the poor live for
want of land. Water and electricity are in short supply and
drainage is inadequate for even small quantity of rain
leading to flooding of roads. Let alone parking of vehicles,
pedestrians and cyclists have a very tough time;
congestion and shrinking road space will continue to pose
huge traffic problems. Unless migration is checked, very
soon a stage is likely to be reached when there would be
no land for its further expansion. There is no single
administrative structure contemplated for this area. This
would have problems of governance in the area of
maintenance of public order, policing and judicial
administration.
p) Suggestion for Future Plans: The Draft Delhi Master
Plan 2021 suggests general strategy for future
development to meet the housing needs and for
improvements in other physical infrastructure. After it has
been finalised, the recommendations may be implemented
with sincerity.
18.4 Infrastructure
A) Transport
Roads
The main limitations relating to roads include
inadequate design, absence of clearly defined road
hierarchy and lack of access control, inadequate provision
of land to take care of, haphazard growth, poor
maintenance, encroachments and hawking on carriage
way, poor traffic management, inadequate integration of
rail and road services and the environmental degradation
resulting from the same, lack of road user discipline, huge
amount of traffic using Delhi road system for passing
through and absence of bypasses, satellite towns have
instead of easing pressure added to it and poor project
implementation.
The main features of road improvement plan include:
• Providing an institutional framework for
development, management and operation of an
integrated multi-modal transport system,
• Measures to deal with identified deficiencies.
• Using improvements in technology for road
surfaces such as improved wearing coats and
plastic roads, fibre reinforced concrete surface and
concrete roads depending on the circumstances.
• A separate Road Maintenance Corporation is to
be set-up generating its own resources.
• Road safety education should be provided in
schools.
• Preparation and implementation of strategic
action plans for special areas.
• Implementation of urban transport information
system which will proivde updated inputs of
actual traffic flows to enable proper planning.
• Providing special attention to slow green modes
of transport namely, cycles and pedestrians.
Railways
The Railway services to Delhi primarily consist of
national network services to all major cities of India,
commuter services to surrounding towns and local services
for the citizens of Delhi. All these services are unable to
cope with the traffic offered and extensive capacity
generation and inputs are essential. The upgradation and
expansion plans of the railways include additional
passenger terminals, Upgradation of stations at New Delhi
Delhi main and Hazarat Nizamuddin, construction of
separate freight corridors from Delhi to Kolkata/Mumbai,
strengthening of rail corridors to neighbouring towns,
revitalisation of Ring Railway is an essential component of
Delhi’s transport scenario by augmenting capacity,
increasing EMU services to suit commuter timings and
coordinating feeder bus linkages at ring railway stations
Vision of Transport Facilities
The vision for the State recommended in its Master
Plan is that Delhi should be a well-managed, clean and
dynamic model capital city. The mission is to provide safe,
eco-friendly, cost-effective and efficient modes of
transportation through a well-integrated multi-modal
transport system. The policy action required would
include, among other measures, up gradation and
strengthening of road system, provision of metro system
to cater for demand up to 2021, an integrated rail bus
transit to neighbouring towns, augmentation of bus
system, high capacity bus system on selected corridors
(100 kms), introduction of electric trolley bus, provision
of LRT in walled city.
B) Power
DERC should complete its exercise of finalising a
multi-year tariff expeditiously. The consumer mix data
provided by Discoms after unbundling seems to require
further regulatory scrutiny. It should also focus effectively
on consumer satisfaction, and impose and monitor
objective performance criteria like SAIDI and SAIFI. Steps
to promote local generation should be expedited.
Chapter 18 • CONCLUSION AND RECOMMENDATIONS 419
• The Discoms have accepted the risk that DERC
may not take decisions favourable to them in
matters not covered by the Policy Directions; they
may pursue the appellate and judicial remedies
available, but should not seek remedies against
the Government for grievances against DERC’s
decisions.
• As long as the Discoms make investments in the
system which DERC deems appropriate and
achieve the loss reduction targets agreed upon, it
should be ensured that they actually earn the
prescribed return.
• To achieve the above, the switchover from
concealed subsidies (including the ‘regulatory
asset’ idea) to transparent subsidies as envisaged
in the Electricity Act, 2003 (and, indeed, earlier in
DERA) should be made complete as soon as
possible.
• The Government should address the necessary
further unbundling of Transco. The issue of
creating local generating capacity, preferably
without further large-scale public investment,
should be addressed. DERC should complete its
exercise of finalising a multi-year tariff
expeditiously. The consumer mix data provided
by Discoms after unbundling seems to require
further regulatory scrutiny. It should also focus
effectively on consumer satisfaction, and impose
and monitor objective performance criteria like
SAIDI and SAIFI. Steps to promote local
generation should be expedited.
a) Strengths, Weaknesses and Areas forIntervention
Strengths
The greatest strength of Delhi’s power sector is the
background of successful restructuring, freeing the
successor companies from DVB’s financial burden and
providing an opportunity to modernise and change the
organisational culture.
Secondly, the restructuring has created scope for
private sector investment not only in the distribution
sector itself but also in generation. There is every prospect
of the sector becoming substantially self-sustaining.
Weaknesses
The two main weaknesses are the high degree of
dissatisfaction with the power situation in Delhi and with
the management of the distribution system by the
distribution companies. The distribution loss continues to
be disconcertingly high that makes the honest consumers
bear the burden of theft. There is an impression that the
meters run fast by design and coupled with the raise in
tariff, the situation is aggravated further. If the situation is
not corrected soon it may become very difficult to provide
consumer satisfaction, which is so important for the
sustainability of the new distribution arrangement evolved
after strenuous effort. The tariff issue is another area
major area that needs to be addressed.
Suggestions
For the remaining duration of the transitional period,
i.e., until the end of FY, 07, the apportionment of
regulatory, investment, management and commercial risks
as envisaged in the reform package should be strictly
adhered to. It is also time to begin reflecting on the issues
that will arise after the transitional period is over. The
Government should address the necessary further
unbundling of Transco. The issue of creating local
generating capacity, preferably without further large-scale
public investment, should be addressed.
Drinking Water
The main features in this sector are given below:
• Nearly 31 per cent of the population living in JJ
clusters, unauthorised colonies and villages of
various categories and does not have access to the
piped water supply and sewerage system.
• The Delhi Jal Board (DJB) has adopted the norm
of water supply as 275 lpcd at the source of
production.
• South and Southwest zones suffer on account of
water shortage.
• A significant portion of the water supply network
of 9000 kms 40-50 years old and the total
distribution losses are about 40 per cent of the
total water supplied. DJB has the target to bring
down the leakage losses to 20 per cent.
• There are about 1 million connections where the
supply is to be metered. DJB proposes to involve
consumers as well as private players to ensure
that the work of installation of all the 0.53
million meters is completed by May 2006.
• The water tariff, which was heavily subsidised, has
been revised, still it continues to be subsidised.
• Rapid urbanisation of Delhi has put tremendous
pressure on the groundwater table. DJB has
DELHI DEVELOPMENT REPORT420
initiated a scheme of rainwater harvesting in
Delhi under which DJB provides financial
assistance up to 50 per cent of the total cost of
structures.
• Under Bhagidari Scheme in the water sector,
RWAs and various associations are actively
participating with DJB in a number of activities.
• DJB is planning to switchover to 24 hours supply
system in phases through private firms and utility
operators.
• DJB has adopted universally proven state-of-art
technologies at its WTPs. It is one of the few
public utilities to undertake extensive work of
GIS mapping of its various utilities. DJB has also
initiated action to obtain ISO-9002 certification.
Policy Interventions and Recommendations(Drinking Water)
• Measures including water conservation, loss
reduction, dual plumbing, water recycling need to
be taken.
• There is significant variation in river flows during
the lean periods. The proposals for construction
of the reservoirs on Yamuna river need to be
implemented.
• The Ministry of Water Resources should
intervene and resolve the matter of availability of
raw water for Sonia Vihar Water Treatment Plant.
• The withdrawal of ground water should be
regulated. Central Ground Water Authority may
consider delegating necessary powers to bring the
management and development of groundwater
under DJB.
• A decentralised approach for treating sewage may
be more economic. The treated water from such
STPs may be used for horticulture, parks and
greening of Delhi.
• All the works and other measures in hand to
augment and conserve water should be completed
on priority.
• On the lines of Mumbai, wastewater from the
high rise building should be treated in-situ to
desirable standards and re-used for air
conditioning and other industrial applications.
• Public awareness and education through the
Bhagidari Scheme should be encouraged for
conserving and managing potable water optimally.
• Delhi may have to depend on Yamuna only to
meet the demand projected in the Master Plan
Document-2021. An additional quantity of 350
cusec needs to be made available by the UYRB
during the lean period.
• There is need to construct dams to minimise the
shortfall during the lean periods. UYRB should be
persuaded to treat the allocation of Yamuna water
for consumptive use only.
Telecommunication
• Telecommunication has made commendable
progress in all services. The number of Telephone
subscribers (Fixed + Mobile) has increased from
3.17 million in March 2002 to 7.98 million in
March 2005 in Delhi representing a growth rate
of more than 35 per cent. This leads to a
Telephone Density of more than 50 per 100
populations. The major growth has come from
mobile telephones. There is a good competition
with 6 service providers for mobile telephones in
Delhi. There are about 100,000 PCOs (Public Call
Office or Payphone) in Delhi. Internet service is
also quite popular with a number of service
providers giving this service.
• Broadband service is a recent phenomenon in
India and Delhi. Government has recently
announced a Broadband Policy. Broadband service
provides “Triple Play” i.e., voice (telephony), data,
and video which may include TV and video-on-
demand. Broadband service will lead to great
opportunity in tele-education, e-health, e-
governance, entertainment, tele-working (home
working) etc. A tele-working lead to less strain on
transport system and is eco-friendly.
• Telecom technology is fast changing and it is
difficult to assess resource requirement on long
term basis. There is likely to be no problem on
this score since the capital required (a few
thousand crore Rupees per year) are arranged by
service providers out of their revenue earnings
and market borrowings.
• Introduction of private sector has led to good
competition in telecom sector. This has led to a)
faster growth b) lower tariff c) improved quality
of service and d) new types of applications and
service. TRAI (Telecom Regulatory Authority of
India) and TDSAT (Telecom Dispute Settlement
and Appellate Tribunal ) have been set up under
the TRAI Act 1997 to fix tariff, regulate the
Chapter 18 • CONCLUSION AND RECOMMENDATIONS 421
telecom sector and provide for dispute settlement
mechanism.
• Vision should include broadband to all
households and mobile phone to all who need it.
• Central government is the main policy making
authority for telecom but state government must
make policies to facilitate proper and fast growth
of telecom infrastructure.
18.5 Environment
a) The unprecedented growth of Delhi has an adverse
impact on the environment. Motor vehicles are the biggest
source of air pollution. The number of registered working
factories has doubled between 1981 and 2000; so has the
industrial production. The industrial census of 1988 gives
a figure of 76559 industrial units in Delhi—many in
residential or non-conforming areas. The problem of toxic
gases and discharge of liquid wastes has been a problem
leading to air and water pollution. The standards
prescribed by the regulatory agencies have not always
been enforced. Recent interventions by the Supreme
Court have led to some improvement but these would
continue to be problem areas.
b) The flora and fauna of Delhi have depleted to a very
great extent. The ridge, which used to be the habitat of
many species of plant and animal life, has had
unprecedented human intrusions in the last century. The
technological changes as also the exposure to foreign
countries have brought tremendous changes in the life
styles of people, working to the degradation of the
environment.
18.6 Public Distribution System
PDS emerged as a social safety system making food
grains available at a fair-price and to keep a check on the
speculative tendencies in the market. Department of Food
Supplies and Consumer Affairs, Delhi is responsible for
the Public Distribution System. The Government of NCT
of Delhi has a marked categorisation of the household
consumers on the following basis:
• Wheat or rice eater
• LPG or kerosene user
• Jhuggi Ration card holder (JRC) & Permanent
Ration Card holder (PRC)
In spite of various steps taken from time to time to
streamline PDS it still has its weaknesses. Some of the
measures taken by Department of Food Supplies and
Consumer Affairs, Delhi for improving the efficiency of
the system are as under:
• Area vigilance committees have been set up.
• There is a periodical checking of FPSs and
mechanism of issuance of ration cards to identify
and eliminate bogus rations cards.
• A system of ‘Public Audit’ has been introduced.
• Stern action against persons found guilty of
misusing the TPDS benefit.
• Audio-Video cameras have been set up at the
FPSs.
• Penalties are imposed for violation.
• Citizen Charter has been formulated.
It is recommended to implement the following in order
to further improve the system:
• Reward for the meritorious and honest officers
who are vigilant and care for people’s needs.
• Recognition or annual award for the FSPs.
• There can be a provision for the supply of other
essential items like tea, soap, matchbox etc. be
made available through FPS.
• A timely arrival of food grains at FPS can ensure
timely distribution of essential commodities. It is
interesting to note that most of the people get
their wages/salaries in first seven days of the
month so the system should be such that it
ensures the supply of food grains during that
period. Failing which people will buy from the
commercial outfits leading to non-lifting of the
quota and diversion of supply to blank marketers.
18.7 Forest, Tree Crop Management,Greening, etc.
a) Current Status
NCT of Delhi has three main physiographical
segments, viz., Flood Plains of Yamuna, about the Ridge
and the Plains. Agriculture is practiced extensively along
the stretch of river. Most of the native vegetation has
been cleared for the purpose of farming and the areas,
which are not fit for agriculture, are used as grazing
grounds when the floodwater recedes. The riverine
ecosystem is under major threat.
On Delhi Ridge, planting was confined initially to
indigenous species and Prosopis juliflora was introduced
DELHI DEVELOPMENT REPORT422
later, which showed good drought resistance and
gradually the ridge has been covered with this species.
Although the capital has 12.5 trees per ha. as against
the national average of 12, tree cover is unevenly
distributed and is progressively declining. Delhi has 121
sq. km of forest cover and 40 sq. km of tree cover, which
constitutes only 10.2 per cent of geographical area under
green cover much less than 33 per cent as envisaged by
National Forest Policy, 1988. More than 70 per cent of
the forest cover is in south and southwest Delhi alone.
The rest of Delhi has very little green cover and enormous
biodiversity has been lost.
b) Management Initiatives and Past Afforestation
Various initiatives have been taken in the past to
manage hotspots impacting Delhi’s dwindling flora.
• A large portion of the ridge was declared a
protected zone. Subsequently, large chunks of
land on the ridge have also been notified Reserve
Forest. Another development was the establishment
of Asola Wildlife Sanctury in 1991 to enhance the
protection and conservation of the city’s floral and
faunal diversity.
• Delhi Tree Preservation Act 1994 laid down heavy
penalties on individuals, institutions and
organisations for tree felling.
• Greening Delhi Action Plan is launched every year
to undertake additional plantation. A task force
under the chairmanship of the Conservator
of Forests, Government of NCT, Delhi was
constituted. The plantation scales in the recent
past have increased from around one-lakh
seedlings per year in mid-90s to about eleven
lakhs presently.
c) Impediments
• Forests and tree cover in Delhi have always
remained vulnerable to developmental activities.
• Inadequate coordination among agencies like
forest department, CPWD, DDA and MCD
further aggravates the existing threats.
d) Agencies their Role in Plantation
• An area of 8,422 hectares, marked as green, is
managed by a large number of government and
non-government agencies.
• The Forest Department is carrying out a number
of activities for the development of forests
including enrichment planting in ridge area to
augment the natural regeneration. It has
identified about 1,400 acres in different zones to
develop into mini forests in addition to the
ridge.
• DDA has a greening project. It is working in
collaboration with the Department of Botany,
Delhi University to develop a Bio-Diversity park
along the Yamuna river-bed in North Delhi. It has
fixed a target of planting 1.68 lakh trees during
2004-05
• The Municipal Corporation of Delhi (MCD)
undertakes plantation in various areas such as
schools, parks, bus stands and along roadsides. It
has also set a target of planting 1.6 lakhs saplings
in the current year.
• The New Delhi Municipal Committee (NDMC)
undertakes tree plantation along the wide roads,
residential areas, parks etc. It has proposed to
plant 10,000 trees during 2004-05.
• Other agencies also are involved in plantation
work. Residents Welfare Associations (RWAs),
Market traders Associations (MTAs), non-
governmental organisations and schools have
planted 90 lakh seedlings in the last four years.
Apart from this, 1500 Eco-clubs have been
established in various schools/ colleges of Delhi.
e) Greening of Delhi—Vision 2015
In the next ten years Delhi should be one of the green
and clean capitals of the world with high aesthetic value,
providing its people a safe and healthy environment and
setting up an example of a modern metropolis. The
following strategic actions should be taken up in this
regard:
• To expand green area the afforestation of all
available areas should be undertaken. The
feasibility of acquiring a 2 km wide area on both
sides of Yamuna and a 2 km wide strip of
available land along the border of the state of
Haryana for developing it into a green belt should
be examined. It would serve the dual purpose of
protecting the flood plains from further
encroachment and degradation as well as help in
recharge of ground water.
• To protect Delhi from desertification from
southwest direction, massive afforestation on
private and public lands needs to be undertaken.
Chapter 18 • CONCLUSION AND RECOMMENDATIONS 423
• The existing tree cover should be protected and
maintained by strictly enforcing the provisions of
The Delhi Preservation of Tree Act, 1994.
• Delhi Ridge should be preserved by adopting
suitable combinations in which trees, shrubs and
herbs co-exist as multi-layered vegetation.
Assisted natural regeneration cum enrichment
planting can be useful in conserving and
protecting the biodiversity of this region.
• Information of green cover and forests should be
maintained in Geographical Information System
format for a which a suitably equipped Cell may
be set up.
18.8 Wildlife Management
The fast pace of urbanisation leaves very little scope for
wild life to thrive and it has been dwindling rapidly.
However, efforts must be made to conserve whatever is
possible under the circumstances. Efforts at increasing
awareness about the importance of wild life conservation
need to be made. Delhi is being used as a transit point for
the illegal trade in wildlife products. There is need for
increased vigil and action on part of the concerned
authorities. A multi-pronged approach is required to manage
the problematic species Macaca mulatta and captive elephants.
18.9 Education
Delhi is one of the few states in the county where
literacy rate is above 80 per cent, but there are four other
states/UTs with a higher literacy rates, and this is mainly
attributable to continuous inward migration from
relatively poor and underdeveloped states. The problem of
out-of-school and school drop out children is prevalent in
Delhi as in other states.
The MCD (Municipal Corporation) and NDMC (New
Delhi Municipal Council) have responsibility for
elementary education in their respective areas. The State
Directorate of Education also looks after middle education
and has converted 350 schools into composite, Sarvodaya
Vidyalayas, covering classes from I to XII. The MCD has a
network of 1,800 primary schools with 900,000 students.
In addition, large numbers of private unaided or aided
schools have come up in Delhi. About 20 lakh students
study at any point of time in the government, aided or
unaided schools in Delhi. However, there are uncovered
areas and irregular settlements, especially of migrants,
without a neighborhood school.
Delhi government in its 10th Plan has provided for
economic support for students from the poor families and
the weaker section to encourage the retention and check
dropouts in schools at the elementary stage. It has also
started taking measures under the new scheme of ‘Sarva
Shiksha Abhiyan’ (SSA).
Other programmes include covering all government
schools with computer education, setting up special
schools for the talented children. In the MCD schools,
free text books and uniforms are available to all children
but girls also get free transport and stipends if they come
from rural areas, JJ colonies or unauthorised colonies.
Mid-day meals and stipends are the other direct
incentives to encourage school attendance. The SSA has
already prepared a plan of action and strategy to ensure
that every child in 6-14 years age group gets main
stream education. There is a special focus on weaker
sections of the society and ‘Bhagidari schemes’ envisage
government and community participation for the
purpose. It is interesting to note that though the labour
force participation rates of females is rather low in Delhi,
the difference in enrolments between boys and girls is
rather small.
The private (non-government) schools play a major
role in providing school education; their share had already
crossed 50 per cent in 1999, which may be closer to 53
per cent now.
There are also correspondence courses at school level
and special programmes for the benefit of the school
drop-outs, house wives, etc. Many government schools
have also got assistance from private schools in
management of academic and other programmes. Some
private schools have offered to exchange their faculty with
the government schools.
The 10th Five Year Plan of Delhi provides for Rs. 1,840
crore for general education. In addition, there are
comparable allocations of funds for higher education
institutions run under the Directorate of Higher
Education of the Delhi government. The MCD and the
NDMC also have a large allocation of funds under the 10th
plan amounting.
At the post senior-secondary level, there are several
technical institutions providing degree or diploma or even
shorter courses with a certificate. Three more polytechnics
are coming up during the 10th Plan while a number of
community polytechnics are being strengthened with new
courses in emerging technologies, computer education,
etc. The community polytechnics, in particular, assist
weaker sections of the society through non-formal training
in basic skills, knowledge and correct attitudes leading to
worthwhile self-employment.
DELHI DEVELOPMENT REPORT424
The private sector contribution in various forms of
training and skill development is not fully documented.
Many private institutions are run by fly-by-night
operators, which give a bad name to all others. In any
case, there is no law like the Delhi School Education Act
for full reporting of new technical training institutions,
either for short or medium term courses. Long-term
courses (Degree/Diploma) are regulated by the AICTE
but not others.
There is need for a comprehensive survey of training
providers. The training providers need some regulatory
framework which has legal backing so as to ensure high
standards of training and protect the trainees from
exploitation.
18.10 Health
A) Current Status
• Delhi has done well in family welfare with birth rate
being 18.1 against the national average of 25.4.
• Sex ratio at birth i.e., 820 females birth/1000
male births suggests the prevalence of sex
selective abortion. This needs to be probed.
• Communicable diseases are still a major cause of
morbidity. However, this trend is rapidly changing
and is expected to reverse within the new next
few years.
• Delhi represents a widely varying populace and
correspondingly a widely varying disease pattern
ranging from life style diseases on the one hand
to the infective and malnutrition related diseases.
• Many urbanised villages lack basic infrastructure
and proper planning of the residential areas
leading to unhealthy overcrowding with unhealthy
surroundings.
• The Life Expectancy at birth for Delhi’s
population is 68.6 years compared to an all India
average of 60.7 years.
• Delhi has the best medical facilities available in
the country, but most of them are beyond the
reach of the common man. The per capita public
expenditure at Rs. 436 in 2001-02 is more than
double of the all-India average of 180. But this is
inadequate since most people depend on the
government hospitals and dispensaries.
B) Recommendations
• There are multiple agencies operating the health
care outlets leading to/duplication of services,
wastage of efforts and resources and deficient
services. Exercise to optimise the use of available
resources needs to be taken.
• Qualified hospital administrators need to be posted
in government hospitals to improve their services.
• Integration of the local area family practitioners
with the government hospitals and dispensaries in
the area for two-way referrals needs to be
promoted.
• Development of high-class healthcare infrastructure
in NCR towns should be encouraged.
• In the localities deficient in potable water supply
system, sewerage/sanitation system and electric
supply infrastructure their improvement will
minimise incidence of morbidity and mortality.
• Greater attention needs to be given to health
education of public with emphasis on preventive
aspects.
• Health related topics should be included in school
and college curricula.
• Strict enforcement of laws for control of food/
water borne infections and adulterations is
necessary.
• Health Insurance sector base and corporate
support to their employees for medical check ups
and treatments need to be widened.
• Well-equipped and dedicated trauma centres
along the main highways entering Delhi need to
be set up.
• Industries need to be shifted to outskirts to
reduce health hazards, accidents, pollution and
traffic congestion.
• The hazard caused by stray dogs and animals
needs to be addressed to minimise traffic
hazards/accidents and need for Anti Rabies
vaccine.
• The values for various parameters like the gender,
educational levels, residence type, region, religion,
caste, community, socio-economic status,
occupation, etc are not available and studies need
to be undertaken accordingly.
• Policies and programmes should be oriented to
the realisation of the ‘Vision’ of the Chief
Minister to make Delhi as a ‘role model’ for
healthcare infrastructure.
Chapter 18 • CONCLUSION AND RECOMMENDATIONS 425
18.11 Tourism
18.11.1 National and State Policy
(a) The National priority for Tourism is low as
reflected in the Five year Plans.
(b) This low priority is also reflected in state
government policy.
(c) The Tenth Five year Plan provides a significant
shift in policy:
(i) An increased importance has been given to
Tourism and Tourism related infrastructure eg.
Airports, Roads etc.
(ii) Provides increased opportunity for private
investiment and participation in tourism
development.
(iii) Furthering socio-economic objectives such as
Employment generation, people’s participation
(‘Bhagidari’).
(d) The Policy and growth of tourism in the State of
Delhi reflects the National trend.
18.11.2 Market Trends and Prospects
(a) Global trends indicate an annual growth of 4.5
per cent for international tourism in the 2002-
2012 periods.
(b) In India the growth trend is higher at 9.7 per cent
in the next ten years.
(c) Growth in domestic tourism is likely to be at a
higher rate and will impact future growth.
(d) In Delhi the Commonwealth Games 2010
provides a special opportunity to development as
a destination.
18.11.3 The New Tourism Policy of Delhi
(a) The Policy is based on “Tourism for All” and is
covered under ‘Bhagidari’.
(b) It is a Government led, private sector driven
community welfare approach.
(c) Delhi should become a World Class Heritage
City.
(d) Special imitiative will be taken in developing
Tourism in the following areas:
(i) Cultural/Heritage tourism.
(ii) Business Tourism
(iii) Convention and Conference Tourism
(MICE)
(iv) Increase ethnic appeal—handicrafts, fashion,
cuisine.
(v) Leisure Tourism—shopping, golf, adventure
(vi) Medical/Health Tourism
(vii) Develop Delhi as a hub for Tourism in
North India.
(e) Increased funds for projects and promotion
activity
(f) Enlarged Training facility and Human Resource
Development and create job opportunities.
18.11.4 An Evaluation of the Present Role and Statusof Department of Tourism, DTTDC etc
(a) Delhi Tourism Department has a very limited role
in creating an impact in Tourism in the State.
(b) Funds and resources disproportionately low for
the objectives identified.
(c) DTTDC role as an implementing agency is diluted
by other activities e.g. liquor trade, flyover
construction.
18.11.5 A Broad Picture of the Delhi Tourism Scene
(a) Tourist traffic trends:
(i) Delhi accounts for 30.8 per cent of
international arrivals.
(ii) It accounts for 51 per cent (1.35 million) of
total arrivals of international tourists. This
has been showing a downward trend (it was
62 per cent earlier).
(iii) It accounts for only 0.5 per cent of domestic
tourists (most of them are pilgrim tourists).
(b) Hotel Room:
(i) Delhi has 9841 classified rooms—nearly half
in the five star category.
(ii) Almost an equal number are in the
unclassified category.
(iii) There is an obvious imbalance in the
categories and classification spread in the
tourist accommodation.
(iv) Growth in demand has led to recent scarcity
of hotel rooms to the tune of 3,000 rooms.
DELHI DEVELOPMENT REPORT426
(c) Tourist transport:
(i) Tourist transport needs to be strengthened
by improving tourist transport facilities.
(ii) Existing infrastructure can be improved by
better traffic movement, flyover, etc.
(iii) Improved services—Radio taxis, Volvo
buses, easier inter state movement.
(iv) Metro will improve overall connectivity but
have limited impact on tourist movement.
(d) Tourist traffic providers—Travel agents, tour
operators, guides, need to improve this quality of
service and reliability.
18.11.6 Suggestions—Way Forward for Delhi Tourism
(a) A new mindset for Tourism Development is
needed. It means that—
(i) Tourism must be seen as “the industry of
industries” to fully realise the socio-
economic benefits.
(ii) A statutory Tourism Board will make for
more effective implementation and
management of Tourism in the state.
(iii) An empowered body such as a Tourism
Board can effect better “Convergence” with
important state agencies such as NDMC,
DMC, DDA, Police, Transport etc.
(iv) It can also coordinate more effectively with
Airport Authority, Railway, ASI etc.
(b) Delhi can become a world class Heritage City by
developing “integrated tourism zones”—keeping
tourism needs in mind and creating a unique
tourism experience at each location as identified:
(i) Red Fort/Chandni Chowk
(ii) Purana Quila/Pragati Maidan/Humayun’s
Tomb
(iii) Rajiv Chowk, India Gate, Rashtrapati Bhawan.
(iv) Qutub Minar, Mehrauli heritage area,
Garden of Five Senses.
(v) Create tourism friendly transport and other
services linking them to Airport, Hotels,
Railway station, and Road transport.
(c) Create a world class Convention facility with all
related infrastructure and systems including
administrative and manpower support.
(d) Develop Delhi as a destination for Medical
Tourism—Task force recommendations or
“Chemical Establishment Act”, medical visa,
health insurance and linkages with tourism
marketing need to be acted on.
(e) Develop leisure and entertainment facilities at
selected locations:
(i) Shopping—handicrafts, fashion goods,
jewellery
(ii) Parks, gardens, water bodies, golf courses
(iii) Food and ethnic cuisine
(iv) Festivals and special events
(f) Create effective linkages with NCR and nearby
destinations particularly Agra so as to prolong
stay by tourists.
18.12 Employment, Rural Development andPoverty Alleviation:
(a) The main features of the employment situation and
points on which action is required are
• The employment base in Delhi is almost entirely
composed of services of various kinds and
manufacturing
• It has a low workforce participation rate of 33.5 per
cent as against 39.2 per cent at the national level.
• Males account for 86 per cent of labour force as a
whole with urban areas indicating as high as 91
per cent share of the males. Majority workforce is
in the regular/wage-employed category for
females the figure is over 77 per cent.
• The largest sector of activity on the basis of
workforce numbers is the service group trade and
hotels etc., followed by public administration.
Services are followed by manufacturing.
• The construction sector accounts for less than 6
per cent of total workforce.
• Delhi has an overall unemployment rate of 12.5
per cent, higher than the national level with very
high unemployment rates for females in the age
group 20-24 and 25-29 years.
• The male unemployment rates are very high for
the age groups 15-19 and 20-24 years. These are
much higher than the countrywide picture.
• In Delhi, the phenomenon of ‘discouraged
workers’ could possibly reduce the workforce
Chapter 18 • CONCLUSION AND RECOMMENDATIONS 427
participation rate and ultimately the rate of
migration into Delhi itself.
• Educated unemployed form a large proportion of
the unemployed.
• The simple rate of growth of the registered
unemployed persons has been 2.5 per cent a year
—majority of them is increasingly from the
educated category.
(b) Suggestions
The above deficiencies in the employment situation
need to be carefully examined and a plan prepared to take
effective remedial measures. The employment situation
reflects the state of health of the economy of the area and
if the aspiration is to have Delhi as a capital which may be
counted among the best capitals in the world, the
situation will have to be addressed on priority.
18.13 Science & Technology
18.13.1 Categories of Activities
The activities in this sector can be divided into three
categories:
(a) Category 1: S&T-IT&BT Education including
technical training.
It includes school level science (including IT),
vocational training in high technology (including
IT related CAD/ CAM), popularisation of IT and
lately also higher education in Science, IT and
Biotechnology.
(b) Category 2: Research and Development in S&T-
IT&BT.
(c) Category 3: Use of S&T-IT&BT in socio-economic
sectors
It includes use of Information Technology (IT) in
governance and health delivery, software industry
and promotion of IT and Biotechnology related
enterprise. S&T component is also reflected in
programmes for development of rural areas, in
energy supply, small-scale industry development
and environmental protection.
18.13.2 Channels of Activities
Activities are channeled through three main agencies;
the departments and institutions under the GNCTD
(Government of Delhi), Laboratories of Central
government agencies including Universities and IIT and
Private sector including NGO.
• Government of the National Capital Territory of
Delhi (GNCTD), MCD and NDMC are active in
Category 1 and Category 3 programmes. Category
2, namely R&D is mainly performed by the
laboratories of the Central Government and
Universities and IIT located in the NCTD. The
thrust of S&T activities supported by the State
Government is on IT and science education in
schools, IT in governance, IT and BT embedded in
its industrial and rural development programmes.
• Private sector is active in IT and Biotechnology
marketing and consultancy as also lately in.
software industry through the IT Park being set
up by the Delhi Metro Rail Corporation and in
Biotechnology R&D Centre at South Campus of
the University of Delhi.
• NGO participation is in science education,
environment awareness, and water conservation
and in rural development through Bhagidari is
also note worthy.
18.13.3 Recommendations
(a) The vision from the point of Science and
Technology should be to make the economy of
National Capital Region of Delhi a knowledge
intensive economy.
(b) One of the areas of thrust is to upgrade the
technical competence of human resource in the
use of modern techniques such as CAD/CAM and
IT enabling them to work in industrial complexes.
(c) Manufacturing units being private sector
ventures, the technical training and facilities need
to be matched with the demand profiles of the
manufacturing units. It would be appropriate to
associate the companies with the training
programmes.
(d) Improvement of rural parts of Delhi by applying
so called rural technologies developed in
laboratories is another development goal receiving
attention in the development plans of Delhi.
(e) The maximum concentration of villages is in the
Mehrauli sub-division of Delhi (28 villages).
Linking technology suppliers/sources and the
rural populations is critical for such programmes.
Some business and management schools are
located in and around rural areas and can become
effective link institutions. Business and
management schools need to be utilised for
DELHI DEVELOPMENT REPORT428
coordinated implementation including the
activities of NGOs.
(f) It is recognised that knowledge industries are
highly competitive and market niche of these
units will have to be carefully developed. Exercise
in this direction through industry involvement is
necessary.
(g) Substantive investment is envisaged for
introduction of IT in government departments.
There is a desire in the plan to strengthen
government-citizen interface. The Delhi
Government has made progress towards
computerisation of its administration.
(h) The next critical issue is the easy accessibility of
information to the citizens. It is necessary to
establish effective and sustainable network of
access centres. These can be set up as micro
enterprises. The example of the entrepreneurial
model of AISECT (All India Society for
Electronics and Computer Technology) that has
already spread all over the country with
maximum concentration in semi urban and rural
areas of Madhya Pradesh and Chhattisgarh is
worth emulating. AISECT model has been
recognised by the Indian Innovation Award as the
largest network with potential of wider
applicability. This model can be effectively used in
the National Capital Region.
(i) Setting up of IT and Biotechnology industrial
units in Delhi are important new initiatives
towards knowledge based industries. These are
best established through industry-academic
linkages making full use of Delhi’s strong
conglomeration of post graduate science and
engineering education (including Biotechnology
and IT) and of R&D laboratories supported by
the State and the Centre.
18.14 Labour
18.14.1 Labour Situation
The main features of the labour situation in Delhi are:
(a) The proportion of employment in the organised
sector is much higher than the national average.
(b) Most activities are still in the unorganised sector
without proper reporting.
(c) The employment exchanges have failed to satisfy
both the employers and potential employees. The
organised sector has its own recruitment
mechanisms.
(d) Both the employees and the training providers are
more and more in the private sector.
(e) The job opportunities in Delhi have not only
continued to grow, they have also changed and
become more complex.
(f) Requirement of any skill or education level is met
by outsiders coming to Delhi in search of
employment.
(g) The casual workers in Delhi’s small industries/
enterprises came from outside without much of
skills and learned the crafts on-the-job.
18.14.2 Skill Development and Training
(a) In an open economy like Delhi, the classical
methods of manpower balancing as part of
manpower planning are not practical. It is also
not practical to decide the length of the course,
subject matter, the skill sets and the teachers at
the government level in a centralised fashion.
(b) Delhi’s economy lies mainly in the service sector
whose needs are not known in advance. The
government institutes have found it difficult to
change courses/curricula to meet such short-term
needs of potential employers.
(c) In the case of Information Technology enabled
services private training providers did the job
under some kind of supervision of the Ministry of
IT and the government accepted a variety of
courses with different lengths, different quality/
levels and different subject matters in the private
unorganised sector. Likewise, there is enormous
scope for innovation and participation by private
sector to develop and organise a variety of
courses.
(d) The providers of the training in the private sector
are in a position to develop some skills of use to
the employers; they need to be encouraged.
(e) In this regard ideas like Skill Development Fund
have been mooted but none has come into
existence so far.
(f) However, government must ensure proper
supervision over such training providers so that
fresh migrants or weaker sections of society are
protected against potential exploitation.
Chapter 18 • CONCLUSION AND RECOMMENDATIONS 429
18.14.3 Labour management
(a) Labour management especially that of skilled/
educated labour force or those engaged in
services outside the Government has not been a
problem in the city.
(b) The behaviour of trade unions in large
manufacturing enterprises, i.e. blue-collar workers
has been always different from that in the service
sector and educated people. Formal trade unions
have not had much impact on workers in Delhi
after a large number of manufacturing enterprises,
especially the bigger ones shifted out of Delhi.
(c) The unorganised sector manufacturing, by
definition, is not unionised; but such workers face
potential exploitation such as low wages and long
hours of work.
(d) The scheme of the NDA government for
providing social security to unorganised sector
workers became a non-starter.
(e) The government needs to provide some form of
social security to such workers.
18.15 Social Development andVulnerable Groups
18.15.1 Categories of Vulnerable Groups
Ten different segments are categorised as vulnerable
groups that include women, socially disadvantaged
groups, child labour and street children, the disabled and
challenged, migrants, shelterless, those affected by the
inadequacy of public transportation, unorganised workers
(such as street vendors, sex and domestic workers), the
elderly, and children facing violence and abuse.
18.15.2 Sources of Vulnerability
Vulnerabilities are derived from a host of parameters
including social, physical, gender related, economic,
financial, infrastructural, health-related, legal, political or
institutional. Powerlessness, income and structural
poverty, and social exclusion are the characteristics
associated with vulnerabilities.
18.15.3 Women’s Issues
The issues pertaining to women in Delhi in the context
of vulnerability go beyond the poor and the needy and
cover even the prosperous and better-off populations.
There are various indicators to establish women’s
vulnerability. Declining sex ratio highlights the lower
significance given to the girl child.
18.15.4 Socially Deprived Sections
The socially deprived sections belonging to Scheduled
Castes and Other Backward Castes face social
discrimination and educational differentiation in terms of
access and retention. There are a number of socio-
economic reasons. The initial unequal resource position
perpetuates imbalance and disparity in their access to
other infrastructure. In the labour market, they tend to
find place in the lower echelons of the job hierarchies.
18.15.5 Children
(a) Substantial numbers of children in the capital
work as service providers, helpers, assistants,
vendors and so on.
(b) The poor, slum dwellers, pavement dwellers,
shelterless, orphans, and street children are all
vulnerable, easily exploitable and voiceless.
(c) The concerns of many of these workers are akin
to the plight of the unorganised workers who are
unprotected by legal provisions and have no
security as workers.
(d) These children are deprived of childhood and
avenues to develop themselves.
(e) The girl child is often left in charge of the
younger siblings in order to relieve her mother
for labour market participation at the cost of her
own all round growth.
(f) The street children are exposed to and
unprotected from abuse of various kinds, with the
girls susceptible to finding themselves as part of
trafficking and sex worker chains.
18.15.6 The Disabled
(a) The challenges posed by disability, both physical
and mental render persons vulnerable.
(b) The lack of understanding regarding these adds to
the difficulties of the challenged in negotiating
the institutional and infrastructural constraints
present.
(c) The incorporation of the disabled in the 2001
Census was a landmark that provided one crucial
tool to make their presence and needs visible.
18.15.7 Migrants
(a) Migration into the capital-state from various parts
has assumed a problem of tremendous
magnitude.
DELHI DEVELOPMENT REPORT430
(b) The migrants are able to find some paid
employment, howsoever low paying and insecure.
(c) There are however, no provisions for them by the
state administrative authorities in terms of
housing, water, toilets, electricity and so on, leave
alone the needs of their families.
(d) Commonly housed in some slum squatter
settlement, these families have to face many
difficulties.
(e) The attempt to clean the city and remove the
slums by relocation and rehabilitation without
adequate transportation facilities curtails the
workers from negotiating between their
residences and workplaces.
(f) There is need to re-examine the demand pattern
for bus routes after resettlement of large slums as
well as industrial complexes subsequent to
closure of polluting industries.
18.15.8 Unorganised Sector Workers
(a) The vulnerability of the unorganised sector
workers arises out of the ambiguity in their legal
status as no overt recognition of their work/
activity exists.
(b) These workers go through undue suffering.
(c) The lack of recognition as sex workers and the
taboo attached to the service provider while the
demander is often unaffected, makes the women
sex worker vulnerable. The recognition of the sex
worker to some extent has occurred in the
context of the drive for protection against HIV/
AIDS.
18.15.9 Vulnerable Groups Not Covered Above
(a) The elderly and the aged who are left alone in the
city after children have gone for greener pastures
or due to the death of the other family members,
are vulnerable on account of the insecurity
stemming from their loneliness and their health
needs.
(b) Abuse and violence forms another deplorable
dimension of vulnerability faced by children in the
capital. From heinous crimes like rape and murder
to kidnapping and abduction, there seems to be a
growing incidence of crimes against children.
(c) The pedestrian in the wake of the flyovers and
high speed roads that have come up faces great
difficulty and feels unsafe while wanting to cross
the road.
(d) In the context of transportation, the shrinking
spaces for the manually driven handcarts, cycle
rickshaws and bicycles make things difficult for
the class.
18.16 Industrial Development
18.16.1 Contribution of Primary, Secondary andTertiary Sectors in Economy of NCTD
(a) The contribution of the primary sector has rapidly
declined and has become negligible. The share of
manufacturing in the 80s and the first half of the
90s has declined from about 20 per cent to about
12 per cent. However, the contribution of the
Tertiary Sector has been rapidly rising and
dominant in the economy of the NCTD.
(b) The share of registered sub-sector (39.8 per cent)
in total manufacturing in 2002-03 was well below
its share for the nation as a whole at 66.1 per
cent.
18.16.2 Contribution of Industry Groups
(a) The highest contributor to net value added was
Textile Products (17.5 per cent) followed by
Machinery and Equipment (12.0), Paper and
Paper Products (6.7), Food Products (6.4), and
Basic Chemicals (4.4).
(b) The concentration ratios derived in respect of
both the top 3 and 5 industry groups suggest that
there was clearly an increase in concentration,
with the top two industry groups alone
(Electricity etc., and Textile Products)
contributing more than one-half to net value
added.
(c) The Hirschman-Herfindahl indices derived for
both the reference years also clearly indicate
greater concentration in terms of share in NVA.
(d) In 2002-03, Delhi was heavily over-represented in
Publishing, Printing, etc., Wearing Apparel,
Radio, Television, Communication Equipment
etc., and Furniture and Manufacturing.
(e) Industry groups that are gravely under-represented
include Coke, Refined Petroleum Products etc.,
Tobacco Products, Other Non-Metallic Mineral
Products, Textile Products, Basic Metals, and
Wood and Wood Products except Furniture.
Chapter 18 • CONCLUSION AND RECOMMENDATIONS 431
18.16.3 Industrial Structure
(a) In 2002-03, Delhi had the most specialised
industrial structure as compared with the 14
major states.
(b) Decomposing employment growth indicates that
in the 1980s nine industry groups experienced
industry-mix and competitive effects that were
both positive. These were Beverages, Tobacco and
Related Products, Textile Products, Leather and
Leather Products, Basic Chemicals and Chemical
Products, Rubber and Plastic Products, Machinery
and Equipment, Repair of Capital Goods,
Generation and Distribution of Gas, Steam etc.,
and Storage and Warehousing Services.
(c) The industry-mix and competitive effects operated
very differently in the 90s. Out of the 22 industry
groups only nine had a positive industry mix
effect and even more significantly, only 3 groups
experienced a positive competitive effect.
(d) Examination of some of the ratios and technical
coefficients underlying the overall industrial
(factory) structure indicates that the region does
not seem to be suffering from locational
disadvantages (relative to the country at large)
associated with high levels capital use.
(e) In 2002-03, the capital intensity for the region
(average for all industries factory sector) was
lower than the national average.
18.16.4 Productivity and Other Indicators
(a) The capital-output ratio was also lower within the
region, being only slightly above half of the
national ratio. Not more than five industry groups
had capital-output ratios higher than the
respective groups at the national level and of
these only the last two were among the major
groups within the region.
(b) The average wage rate of labour went up in
absolute terms over the period 1980-81 to 2001-
2002, this increase being commensurate with that
for the entire industrial system (factory sector) of
the country at large.
(c) Labour productivity also increased for Delhi
during this period as it did at the all-India level.
(d) Delhi’s industries utilised a greater amount of
input per unit of output relative to the industries
at the all India level. In 2002-03, only 8 industry
groups had input use levels lower than their
counter parts at the national level. Of these,
industry groups Food Products and Beverages, and
Machinery and Equipment were among the more
important groups in Delhi’s industrial sector.
(e) There was less generation of value added per unit
of output by the regional industrial system as
compared to the nation. In 2002-03, 10 industry
groups had higher value added per unit of output
values than that for all-India.
(f) The profitability of Delhi’s industrial system,
measured as profits per unit of value of output,
was below that of the three industrialised states-
Maharashtra, Gujarat, and Tamil Nadu for most
of the 80s and then, though fluctuating, became
comparable with them. The profit ratio for Delhi
was actually the highest for about half of the
remaining period.
(g) The profitability of Delhi’s industrial (factory)
sector was below that of the nation for much of
the decade of the 80s but moved up above all-
India levels for the remainder of the period,
except for 1995-96 and 1996-97.
(h) From the mid-90s, total factor productivity of
Delhi’s industries grew at rates faster than that of
the nation and even that experienced by the three
developed industrial states. Delhi’s industrial
system seems to be becoming relatively more
efficient than the rest of the country in terms of
factor use.
18.16.5 Priorities
(a) Though manufacturing accounts for about 12 per
cent of Delhi’s GSDP and about 40 per cent of
the total work force, the priority given to the
industrial sector in the Five Year Plans is
extremely low. In the Tenth Plan, the share of
industry in the outlay decreased by nearly half to
a mere 0.43 per cent of total outlays as compared
to its expenditure share in the Ninth Plan.
(b) In terms of expenditure priorities, industry
dropped to rank nineteenth out of a total of 31
sectors. The all-States average outlay on industry
for the Tenth Plan is 3.2 per cent—nearly eight
times that for Delhi.
18.16.6 Environmental Factors Impact on Industry
(a) The closure of many polluting and hazardous
industrial units and the Relocation Scheme for
non-conforming units, though reducing
DELHI DEVELOPMENT REPORT432
environmental pollution levels, may be expected
to have had an adverse impact on industrial
growth and employment within Delhi.
(b) The contribution of industrial sources of pollution
(including Thermal Power Plants) to ambient air
has come down from 56 per cent in 1970-71 to
20 percent in 2000-01, and with the coming into
operation of all the 15 CETPs the contribution of
this sector to both air and water pollution levels
would be heavily reduced.
(c) Under these circumstances there is some
justification for the ongoing effort for
regularisation of other industries situated in
residential/non-conforming areas.
(d) Corrective measures incorporating a system of
suitable incentives and disincentives are required
in relation to such industries in order to ensure
shifting and relocation of industries failing to
meet the broadened parameters in terms of
environmental and other norms.
18.16.7 Need of Diversification, Dispersal andTechnological Upgradation
There is clearly a need for policy intervention to ensure
greater diversification of Delhi’s industrial base in terms
of development of new industries that are hi-tech and
high value added in nature. Ad hoc licensing of industrial
units should be avoided and policy measures introduced
to ensure dispersal of existing industries as well as their
modernisation and technological upgradation.
18.17 Agriculture and Allied Activities
The National Capital Region is witnessing a surge of
physical and economic growth of Delhi and under
development of the area outside. The process of
globalisation relies primarily on private sector initiative,
aided by the evolution of the global information network.
There is constant influx of population into Delhi.
Central government has a very important supportive or
facilitating role in this connection to check this influx of
population from villages to the cities and Metros.
Strategies should focus upon retaining the farming
population to villages through creating better
opportunities at farm.
Initiatives as mentioned in NCR Plan (2001) need to
be translated into following concrete action at grass root
level:
• Training programmes in micro-entrepreneurship,
processing of local produce, vocational skill up
gradation etc. Allied agro-economic activities such
as poultry, dairy, pottery, handlooms, handicrafts
and rural tourism may be encouraged.
• Financial incentives and loan schemes for starting
micro-enterprises.
• Rural settlements may be planned to have the
very best technological input in various aspects of
its development including rural sanitation, water
supply, communications and information system.
• Cultivating non-conventional crops such as
mushrooms, broccoli, babycorn, bamboo shoot,
poultry, fish etc. as well as floriculture. The state
government should provide necessary
infrastructure in terms of technical know-how,
finance and marketing support facilities, etc. to
the farmers to promote the non-conventional high
value commercial farming in the NCR.
• Promotion of strategic partnership between
government agencies, private sector, NGOs and
cooperatives in the area of marketing, research &
development and development of rural
infrastructure.
• Dissemination of relevant information on regular
basis to apprise rural people about the new
opportunities on-going programmes, sources of
micro-credit, market potentials, etc.
Resource Constraints like improper information
network, transport system, packing houses and
modernised market places result in farmers fetching low
price for their produce. But Delhi has a number of
premier institutions of agricultural research, and like IARI
and these can be looked for all sorts of technical guidance.
It is recommended to implement the following schemes:
• Unemployed but educated rural youth and
women are available to be trained in vegetable
cultivation for gainful employment and increased
production. This potential needs to be tapped.
• A fresh vegetable export zone (VEZ) can be
established comprising of a group of villages
involved in custom production conforming to
norms of export in certain low volume-high value
vegetables.
• Protected cultivation of off-season vegetables of
high quality.
• Organic farms can be established and recycled
wastes from city and APMC Mandis (fresh
vegetables sale points) consumed as organic
Chapter 18 • CONCLUSION AND RECOMMENDATIONS 433
manure. This will also reduce environmental
pollution and health hazards.
• Arrangement/production of sufficient planting
material/seed including F1 seed. And
establishment of commercial nursery seed
production units.
• Establishment of protected crop cultivation
demonstration units.
• Establishment of model production farms for
fresh vegetable export.
• Promotion of IPM, IPNM and micro–irrigation
(drip, sprinkler) systems.
• Development/improvement of infrastructural
facilities for post harvest management of the
produce, including cool chain, cold storage, etc.
• Reclamation and conversion of un-utilised
cultivable land, wasteland, fallow land, and
riverbed and Diara land area into scientific
vegetable cultivation.
• Promotion of organic farming, mushroom
cultivation and bee keeping.
• Promotion of cultivation and marketing of
medicinal and aromatic plants. Development of
market information system to regulate supply,
price, and efficient sale of the produce.
18.18 Institutional Reforms and Governance
18.18.1 Evolution of Institutions of Governance:
(a) Having gone through various phases, the present
status of Delhi has evolved with the enactment in
January 1992, of the Government of National
Capital Territory of Delhi. As Union Territory
with an Assembly and a Council of Ministers,
NCTD has very many features of a State. Yet
Delhi is not a State as its powers are seriously
curtailed as mentioned below:
(i) It has no power to make laws relating to
public order, police and offences relating to
the subjects and law and order and land are
within the jurisdiction of the Government of
India.
(ii) Even in respect of other subjects the
Parliament has overriding powers to make
laws.
(iii) The Lt. Governor is a powerful institution and
ensures that the governance runs smoothly.
(iv) The advice of the Council of Ministers to
the Lieutenant Governor is not binding.
(v) A Bill of Amendment relating to financial
matters shall not be introduced in the
Assembly except on the recommendations
of the Lt. Governor.
(vi) The annual budget is to be laid before the
Legislative Assembly by the Lt. Governor
with the previous sanction of the President.
(vii) Delhi is a city state in that most of its
geographical area is included within the
Municipal Corporation of Delhi (MCD),
New Delhi Municipal Committee (NDMC),
and the Cantonment Board, bodies which
are very powerful providing civic and other
services. These are legal bodies and are very
powerful, specially the MCD.
(b) The Delhi Development Authority, set up in
December 1957 is the apex agency for planning
and development of the city, is empowered to
prepare plans, to implement and enforce them
and to develop, manage and dispose of lands in
Delhi. It also discharges the functions of
developing housing, commercial centres, parks,
playgrounds, etc.
(c) The multifarious factors have led to the evolution
of institutions that are required to satisfy, in
some matters, seemingly irreconcilable interests
and objectives. This has resulted in a complex
system of governance with a multiplicity of
organisations and institutions and, quite often,
duplication of functions.
(d) Problems arise between state government and
Government of India and its agencies; state
government and MCD. The Lt. Governor is a
powerful institution and ensures that the
governance runs smoothly.
18.18.2 Measures Initiated to Improve Governance in theGovernment of NCTD
Although the issues of governance needing attention
are large and many are under multiple authorities, all
organisations are conscious of the fact that there is
considerable scope for improvement of governance. The
media is playing an important role in raising awareness
among all sections of population and though rather
slowly, one finds improvements taking place in systems
that result in improving efficiency and movement to a
more citizen friendly and law enforcing governance.
DELHI DEVELOPMENT REPORT434
(a) Vision
The Government of Delhi has adopted a vision to
facilitate the pursuit of excellence in governance through
improvements in Government structures and processes.
(b) Means Used
The means used to achieve the improvements consist of:
• Promote role of civil society, People’s
participation and decentralisation through the
introduction of Bhagidari Scheme within the
government departments and its agencies
including those under the Union Government.
• Institute Preventive Vigilance.
• Introduction of:
• e-Governance for the citizens of Delhi and
creation of a dynamic websites of
Departments/Agencies.
• Right of the citizen to information.
• Mechanism to redress public grievances of
which establishment of Public Grievances
Commission are the main elements.
• Civil Service Reforms.
• Procedural Reform.
• Synergy and Coordination.
• Empowerment of the weak.
(c) Bhagidari Scheme
The Bhagidari Programme envisages voluntary
participation of the citizens. Efforts have been made to
make it well structured and sustainable. Nine
organisations and 64 of their activities have been covered.
A ‘Bhagidari Cell’ has been created in the Chief Minister’s
office. A detailed plan of ‘Citizen-Government Interface’
has been prepared. It has been decentralised at the
Revenue District level.
In consultation with the Asian Centre for Organisation
Research and Development, (ACORD), the “Large Group
Interactive Events’ (LGIE) a model was developed to train
citizen-groups and government officials to agree on
solutions and their implementation.
The programme has shown encouraging results leading
to the formation of more than 1200 citizen groups that
have not only been successful in addressing their day-to-
day problems, but have also been providing help to public
utility departments in maintenance and upgradation of
services.
(d) Decentralisation
Administrative Decentralisation:
With a view to making the access of the citizen to the
government easier, in 1996 the exercise of decentralising
the DC office was done by setting up 27 SDM offices and
9 DC offices.
(e) Vigilance
• The Central Vigilance Commissioner has
jurisdiction over personnel of the NCTD.
• The Delhi Lokayukta & Upalokayukta Act, 1995
provides a forum for attending to complaints
against public functionaries to eradicate the vice
of corruption, favouritism, abuse of position and
power and present cleaner image. The Act takes
within its ambit the Ministers including the Chief
Minister, Members of Legislative Assembly,
Members of Municipal Corporation etc.
(f) Preventive Vigilance–Openness andTransparency
The Government of NCT of Delhi has initiated
the following actions with emphasis on
“preventive vigilance”.
• e-Governance for the Citizens of Delhi: The
government has set up a dynamic website of
Departments/Agencies to provide online services
including services on e-applications and making
online complaint. The citizen can also check the
status of the complaint, send a reminder and send
suggestions.
• Right to Information: The Delhi Right to
Information Act, 2001 makes provision for
securing information as a matter of right. It
provides for right to appeal in Public Grievances
Commission.
• Public Grievances Commission: The Government has
set up a Public Grievance Commission, which
attends to complaints received against the
departments of Government of Delhi, its local
bodies, undertakings, autonomous institutions/
undertakings etc.
• Citizens’ Charter: The citizens’ charter programme
has been adopted in the NCTD. These charters
are required to spell out the standards of services
and time limits within which the public can
reasonably expect the disposal of the requests
made by them to the government. Delhi
Government has brought out 73 such citizens
Chapter 18 • CONCLUSION AND RECOMMENDATIONS 435
charters. Coupled with the enactment of the
Right to Information and putting in to place the
mechanism of dealing with public grievances, the
framework of providing the basic information to
the public and to open the vistas of transparency
and accountability in the systems has been
created.
18.18.3 Measures to Improve Governance inMunicipal Corporation of Delhi
(a) The Municipal Corporation of Delhi provides civic
services to some of the most densely populated
areas in the world covering both rural and urban
areas. The measures initiated are briefly
mentioned below:
(b) The entire MCD area is divided into 12 zones to
make access easier.
(c) Citizen Service Bureau:
The concept behind establishing Citizen Service Bureau
is to provide all municipal services under one roof. MCD
has started a unique and path breaking IT initiative with
the objective to deliver electronically its services to
citizens of Delhi through a Citizen Service Bureau set-up,
one in each Zone and one at Town Hall.
18.18.4 Measures to Improve Governance in New DelhiMunicipal Council (NDMC)
(a) NDMC is a municipality with a difference and
also performs the role of a mini-government. It is
perhaps the only municipality in the country that
supplies electricity and water and its discretionary
functions encompass promotion of sports, art,
music and culture, maintenance of libraries, and
care for the old, mentally and hearing impaired.
The area of NDMC includes the seat of Central
Government, Rashtrapati Bhawan, the Prime Minister’s
office and residence, Central government office, Foreign
Missions, residences of Ministers, Members of Parliament,
Diplomats and Central government employees.
(b) Measures taken to improve governance include:
• Citizens’ Charter
The NDMC had issued the first charter in 1997 and
has issued the new one in February 2005. It is a measure
towards transparency and efficient and timely provision of
services. Grievance Redressal System:
• Information and Facilitation Centre
NDMC has set up an Information and Facilitation
Centre and opened two Palika Suvidha Kendras where
citizens can pay their taxes, fees etc., obtain birth/death
certificates, book Barat Ghars and register their complaints
relating to civic services.
• Annual Administrative Report
The NDMC publishes an Annual Administrative
Report enabling those interested in getting to know the
work done in the year gone by and the programme for
the coming year.
18.18.5 Delhi Development Authority
(a) Delhi Development Authority was constituted by
promulgating the Delhi Development Act, 1957
with the primary objective of ensuring the
development of Delhi in accordance with a plan.
Planned development of Delhi is the main
function of DDA. Presently the Master Plan for
Delhi-2021 is under preparation.
(b) Despite very impressive achievements of DDA, it
has an image of being an organisation that needs
to improve its sensitivity to the needs of its
clients, efficiency and public perception about
integrity of the organisation. The organisation is
actively engaged in taking a host of measures
among which transparency and automation are
basic which if successful can make a qualitative
impact.
Transparency and Automation in DDA
To minimise downtime, it has introduced systemic
automation in the following departments:
• Land Disposal.
• Housing.
• Launching of a Website, which is dynamic and
provides information on various aspects like
housing, land, master plan, environment etc. The
results of housing and land and tender notices are
displayed. Senior officers are reachable through e-
mail. Different forms are available on the website
which can be down loaded.
• Land Record.
• Normal administrative functions such as payroll,
receipt and dispatch, legal cases monitoring system
etc. A training programme for computer literacy
seeks to train the staffing in the use of computers.
• Vigilance department takes action to see that
there are no unwarranted irregularities and also
handle complaints that could tarnish the image of
the DDA.
