definition of homogenous groundnut production domains – a tool to
TRANSCRIPT
K Mausch and MCS Bantilan
1
Definition of homogenous groundnut production domains – a tool to assess transferability and spillover effects from ICRISAT groundnut
technologies
K. Mausch1 and MCS Bantilan23
ABSTRACT Sustained, well-targeted, and effectively used investments in agricultural R&D
improved productivity worldwide and thereby contributed to food security. In this context, research spillover effects refer to situations in which a technology that is developed for a specific target region or product is also applicable to other locations or products that are not targeted during the research process. (Deb/Bantilan 2001) The focus of this paper is the definition of homogenous zones (domains) as the basis to distinguish target from non target regions of dissemination and therefore enable delineating spillover effects from technology transfers that occur within the initial target region. Efforts to quantify these effects have shown that the contribution of spillover effects to the overall impact can be substantial at times (see e.g. Davis et al. 1987, Brennan et al 1997). To maximize their impact, the thorough understanding, separation and quantification of transfers and spillover effects emerging from past research is one important tool in the priority setting process of international research institutions like the CGIAR centers.
Based on methodologies developed by Davis et al 1987 and others, this paper enhances the measurement of transferability along agroclimatic homogenous domains for groundnut research. After illustrating the basis for the transferability measurement, the application of the concept is outlined along the example of ICRISAT groundnut variety ICGV 87123. Results show that the transferability between African and Asian locations is higher than the former domains depicted based on agroclimatic similarities across the locations. Nevertheless, actual transfers are lower possibly due to differences in market structure, governance factors and other socioeconomic factors. To overcome these bottlenecks through new innovations along the research continuum as well as along the commodity value chain is crucial in order to achieve higher impact from the funds invested and therefore increase the poverty reduction impact from ICRISAT research.
Keywords: Homogenous Zones, Technology transfer, Spillover effects, Africa and Asia, Agricultural research, priority setting
1 ICRISAT, Chitedze Agricultural Research Station, PO Box 1096, Lilongwe, Malawi. Mail:
[email protected]. 2 ICRISAT, Headquarter, Patancheru, India. 3 Acknowledgments: The authors greatly appreciate the data and information provided by SN Nigam
and I Mohamed as well as further ICRISAT scientists.

K Mausch and MCS Bantilan
2
INTRODUCTION
Agricultural research is an investment aimed at improving the well‐being of farmers and consumers by reducing costs, increasing output, improving product quality, or introducing new products (Arndt, Dalrymple, and Ruttan 1977). Recognizing the importance of this investment, funding agencies have made a sizable investment in agricultural research. This research generates new knowledge which may be disseminated far beyond where the research is conducted. This transfer of knowledge can occur in the form of transfers into regions having similar characteristics or in the form of spillover effects if the receiving region has different characteristics as compared to the target region. Based on ICRISAT’s global mandate to produce international public goods the applicability and dissemination and thus the transfer of technologies developed is of crucial importance to fulfill its mission.
The spillover effects from agricultural research among states or regions have received little attention by economists evaluating the economic impacts of agricultural research although they are of crucial importance for research fund allocation decisions. Spillover effects refer to a situation in which a technology that is generated for a specific target region or product is also applicable to other locations or products that are not targeted during the research process. They are generally categorized in three groups. First, across-location spillovers occur when a technology designed for a specific target region is also applied in other regions. Second, across-commodity spillovers refer to a situation in which a technology designed for a specific crop is also applied to other crops. Third, price spillovers occur when the technology change for a specific crop does change the supply of that product and therefore influences the price. If that product is internationally traded this price change will affect the world price and therefore other regions in which no research was undertaken. (Deb and Bantilan 2001) Furthermore, an increase in the price, based on e.g. higher quality, might also lead to demand changes or substitution effects that may affect the prices of other (substitute) products.
The International Crops Research Institute for the Semi-Arid Tropics (ICRISAT) as part of the Consultative Group of International Agricultural Research (CGIAR) has a mission that includes the international dissemination of agricultural technologies. It is important to note here the important role of international transfer and spillovers to the world’s poorest countries of technologies from industrialized countries both individually and through their collective action via the CGIAR. Until recently, much of the successful innovative effort in most of the world’s poorer countries applied at the very last stage of the process selecting and adapting crop varieties and livestock breeds for local conditions using materials developed elsewhere. Only a few developing countries in Asia and Africa were able to achieve much by themselves at the more upstream stages of the research and innovation process, even for improved crop technologies for which conventional breeding strategies are widely applied. It is widely understood that, international agricultural research aimed at improving productivity in developing countries also has spillover effects on developed countries (Brennan and Bantilan 2002). But until recently, that strategy was reasonable, given an abundant and freely accessible supply of suitable materials, at least for the main temperate‐zone food crops. But now changes taking place in the emphasis of ‘rich’‐country research, combined with new intellectual property rules and practices and an increased use of modern biotechnology methods, have already

K Mausch and MCS Bantilan
3
begun to spell a drying up of the public pool of new varieties. The reduction in spillovers from these traditional sources means that less developed countries will have to find new ways of meeting their demands for new varieties. Against this background, the achievement of spillover effects especially from agricultural research becomes even more desirable.
This paper is organized in five sections. The first one gave a short introduction of the topic and its relevance. The second briefly outlines the theoretical background and defines key terms used before the technical aspects of creating homogenous zones that constitute the basis for the measurement of technology transferability, transfer and spillover effects from ICRISAT research are given in section three. Section four introduces the application of the concept along the example of an ICRISAT groundnut variety before summarizing, drawing conclusions and outlining further research to be conducted in section five.
THEORETICAL BACKGROUND FOR MEASURING TRANSFERABILITY, TRANSFER AND SPILLOVER BENEFITS FROM ICRISAT RESEARCH
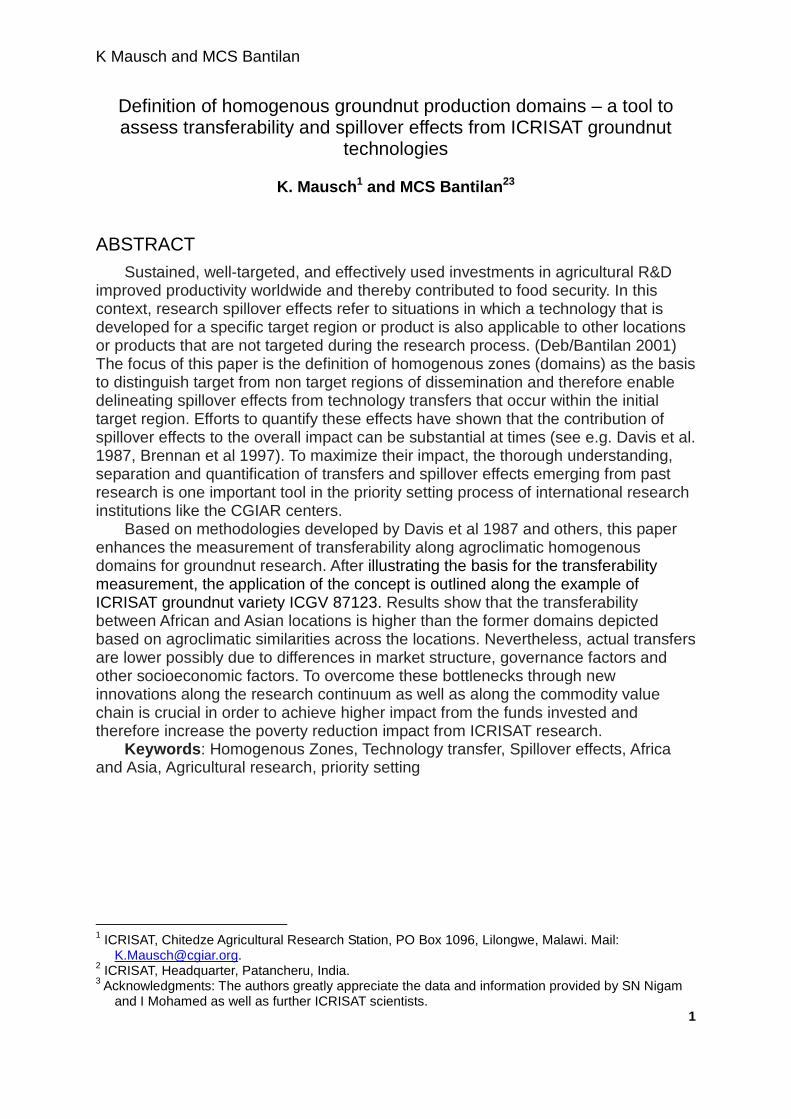
To utilize the concept of spillover effects for ICRISAT priority setting and funds allocation two further definitions are necessary that outline the movement of technologies across ecoregions and administrative boundaries. First, transferability refers to the potential that a technology developed in a certain ecoregion will have in the same ecoregion in other parts of the world and in other regions all over the globe. And second, transfer which will denote the movement of a technology from one country or region to another country or region with similar ecology. Therefore, transfer will capture the target impact of the technology, spillover effects will measure the non-targeted but desired impact of a technology and the sum will therefore be the total impact as outlined in Figure 1
Thus, the two concepts of benefits from technology transfer and spillover effects are the two components of the international flow of innovations. While transfer refers to a movement of an innovation from the region where a technology is developed to another region which has similar characteristics, spillover effects refer to a move to a region which has different characteristics. The transferability is close to 100% in the case of a transfer while it is significantly different from one for spillover effects.
In contrast to most technology spillover effects from industrial research and development, agricultural innovations are not applicable in all environments and therefore the transferability is different for these two types of innovations. While, in the context of technology spillovers, trade and FDI are the main determinants of spillover potential, environmental similarities are much more important in the investigation of agricultural research spillover benefits. Therefore, these conditions have to be incorporated in the assessment of the transferability and spillover effects that might then be much lower as compared to other technologies.
K Mausch and MCS Bantilan
4
Figure 1: Spillover effects and impact. Source: Own presentation based on Davis et al (1987) and Mareida et al (1996).
To measure spillover effects, Davis et al (1987) bases his analysis on these seven main steps: 1: Selecting commodities; 2: Definition of Agro climatically Homogenous Regions; 3:Identifying the Probability of Success of Research for Each ‘Homogenous Region’; 4:Expected Ceiling Level of Adoption and Adoption Time Lag; 5:Determine Spillover Effects; 6: Derive Prices, Transportation Costs, and Elasticities. As here only the groundnut technologies are analyzed, step 1 is already completed and the second and one of the most important steps is made, the definition of the homogenous regions/zones. This step is of crucial importance as on the basis of this classification the transferability will be assessed and distinction of transfers and spillover effects will be made. This paper will provide a methodology for the definition of these homogenous zones and will therefore contribute to the improvement of the results from existing measures of research spillover effects.
Besides the methodology of Davis et al. (1987), the concept of Maredia et al (1996) allows assessing spillover effects from agricultural research and thereby also addresses the issue of priority setting in this line of research. It is based on an econometric approach utilizing international trial data along the example of wheat improvement. Similar to the approach of Davis et al., it builds on the notion that agricultural technology adoption and success depends on the similarity of environmental factors. A matrix of m*m agro-ecological zones with cij spillover coefficients is utilized. The coefficients cij “measure the performance of a technology developed for environment i, in environment j, in relation to the technology developed for environment j” (Maredia et al. 1996, p. 160).
Both of these concepts crucially rely on an accurate classification on homogenous regions across the world. This zoning is the basic precondition for the definition of variety dissemination in target and non-target zones. Additionally, the homogenous zones represent a useful tool to assess the transferability and thereby allow to measure spillover effects. In a situation in which two regions in two different locations across the globe are characterized by identical agro-ecology and climatology, a variety developed and released in one of these two locations is highly likely to perform similar in the other location and the transferability is high. Accordingly, if two regions are characterized as being similar but not fully equal a variety might still be transferable to the other region but might not lead to the same

K Mausch and MCS Bantilan
5
performance. Then the degree of transferability is different from 1 but still there is chance of the variety performing better than any other local variety. This scenario would then be defined as a spillover effect.
DEFINING HOMOGENOUS ZONES
Background
Besides being of crucial importance for the quantification of transfers and spillover effects, an improved definition of the target-region will also significantly improve ‘traditional’ impact assessment as the size and location of the target area might vary tremendously depending on the level of accuracy of its definition. Even a reduction from a 18x18 km pixel based assessment to an 9x9km pixel based comparison has proved to lead to significant changes in the size of predefined zones in South America. (Wood and Pardey, 1997) Wood and Pardey (1997) argue for a more flexible definition of homogenous zones that is adjustable to the level of details available and necessary for different purposes. While some Center wide decisions would require a more generalized zoning, some specific research tasks need a higher level of differentiation and therefore, the final zone maps should still inherit the original attributes used. Though having a rather specific task at hand, the measurement of spillover effects, the global level of this research requires a more generalized definition that will lead to rather few zones that might not always accurately account for the diversity within these zones. Nevertheless, it will be assured that they represent regions in which the most important features are similar with respect to groundnut production.
The ICRISAT Groundnut domains
As ICRISAT technologies are always designed to target certain problems or regions on a global basis and in the semi arid tropics in particular, the applicability of a technology is generally supposed to be in the regions in which these problems are endemic or that have similar characteristics. A technology transfer from one region to another is therefore only considered as a spillover effects if it moves beyond the “boundaries” of these homogenous target zones. In an attempt to define and formalize these homogenous zones ICRISAT developed domain maps of its mandate crops in the Medium Term Plan 1994-98 (ICRISAT, 1992). These domains were designed to reflect the main characteristics and group regions in Africa and Asia according to these common characteristics.
Several indicators like Length of growing period, pest and disease pressure and several others are included in the ICRISAT crop domains (ICRISAT, 1992). These domains combine these indicators define homogenous zones (domains) for each of ICRISAT’s mandate crops. These zones however can be refined and improved using modern GIS facilities in order to adjust them to the current conditions and to make their definition more transparent and coherent over the globe. Though being very useful even today, their accuracy was limited by the technology available during the early 1990s. Utilizing the progress in the area of GIS, they can be revised and improved in order to even better guide the definition of homogenous zones and to reflect the climatic changes that took place in the last decades. Furthermore, the zones were defined separately for India and Africa. This was based on the

K Mausch and MCS Bantilan
6
assessment that these regions are rather different. From recent experience and the number of varieties adopted in both regions this might not hold nowadays and might need to be reconsidered.
Figure 2: The ICRISAT groundnut domains as of 1994-984. Source: Own
presentation based on ICRISAT (1992).
In the 1990s the first step was the consideration of the length of growing period
across all locations. Groups were built along this most important indicator. After these basic delineations have been established the zones were further subdivided according to the cropping system and some of the major constraints that are endemic across regions. This resulted in the zones mapped in Figure 2.
From this, one can clearly see that only little overlap exists between the Asian, West African and East African domains. This would indicate that almost all dissemination from one of those ICRISAT regions to another would have to be considered spillover effect as the breeding was mainly targeting those domains.
In the effort to improve these zones, initial consultations with leading ICRISAT groundnut scientists were held. Their assessment of the 1992 domains indicated that they do not cover the real situations and are rather rough drawings mainly based on the LGP which has changed by today in many locations.
Suitability
As groundnut is a very specific crop and not by any means suitable for all environments unlike e.g. wheat that is planted in almost all environments all over the
4 Data digitalized and provided by I. Mohamed, ICRISAT GIS unit.

K Mausch and MCS Bantilan
7
globe (although different varieties are planted in different ecoregions) the definition of homogenous zones will be based on regions that are at least marginally suitable for rainfed groundnut production (the dominant smallholder cropping system) and therefore potential target areas for breeding efforts. For this assessment the FAO (2000) suitability maps are utilized. This assessment combines several environmental features relevant for rainfed groundnut production. The suitability analysis is performed in three steps for each crop:
1. Agro climatic characterization, including thermal climates, temperature profiles, temperature and moisture growing period characteristics
2. Calculate temperature and radiation limited potential crop yields, quantify moisture stress related restrictions, determine optimal crop calendar
3. Provide average attainable yield ranges from maximum attainable yield. (FAO 2000)
Figure 3: The suitability for groundnut. Source: Own presentation based on FAO 2000.
Therefore, this already includes most of the basic requirements for groundnut
production and allows reducing the area that has to be considered.
The SPAM groundnut production estimates
As it might happen that groundnuts are produced even outside regions that are actually suitable for rainfed groundnut production based on its natural conditions. This might occur in areas where irrigation is available or where more advanced technologies area able to overcome the adverse natural conditions. The regions
K Mausch and MCS Bantilan
8
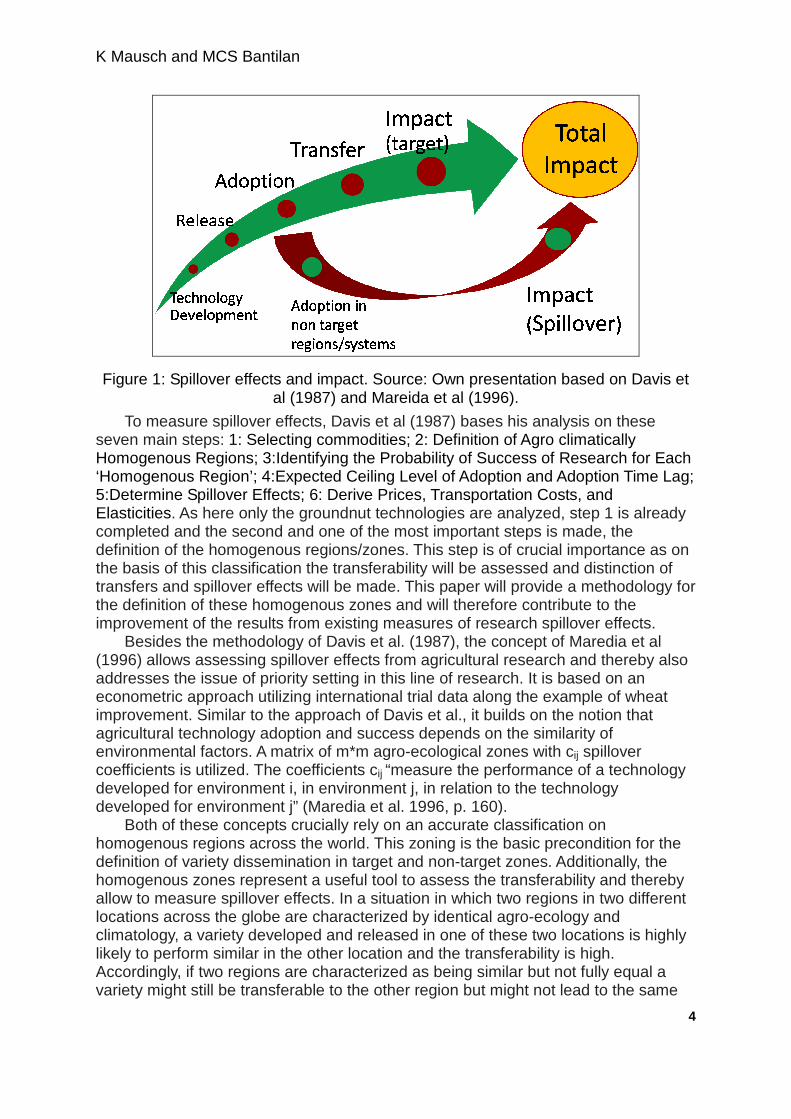
where groundnuts are currently produced are incorporated as an additional layer in the formation of the base area for the definition of the homogenous zones.
The spatial allocation model by Harvest Choice (2009) provides spatial estimates for the groundnut production (circa 2000) and is based on:
1. Crop production statistics on sub-national or national level for the years 1999-2001 with the reference year 2000;
2. Production systems based on several data sources available (e.g. commercial production, mechanized production, fertilized use);
3. Landcover images to only attribute production to actual crop land; 4. Agroclimatic suitability based on the agroecological zones by FAO; 5. Population density as a proxy for market access; and 6. Irrigation maps to account for the mentioned extended possibilities of crop
production and higher attainable yields. The resulting map of groundnut production (here: harvested area) is given in
Figure 4.
Figure 4: Harvest Choice Groundnut physical area estimates (circa 2000)5. Source:
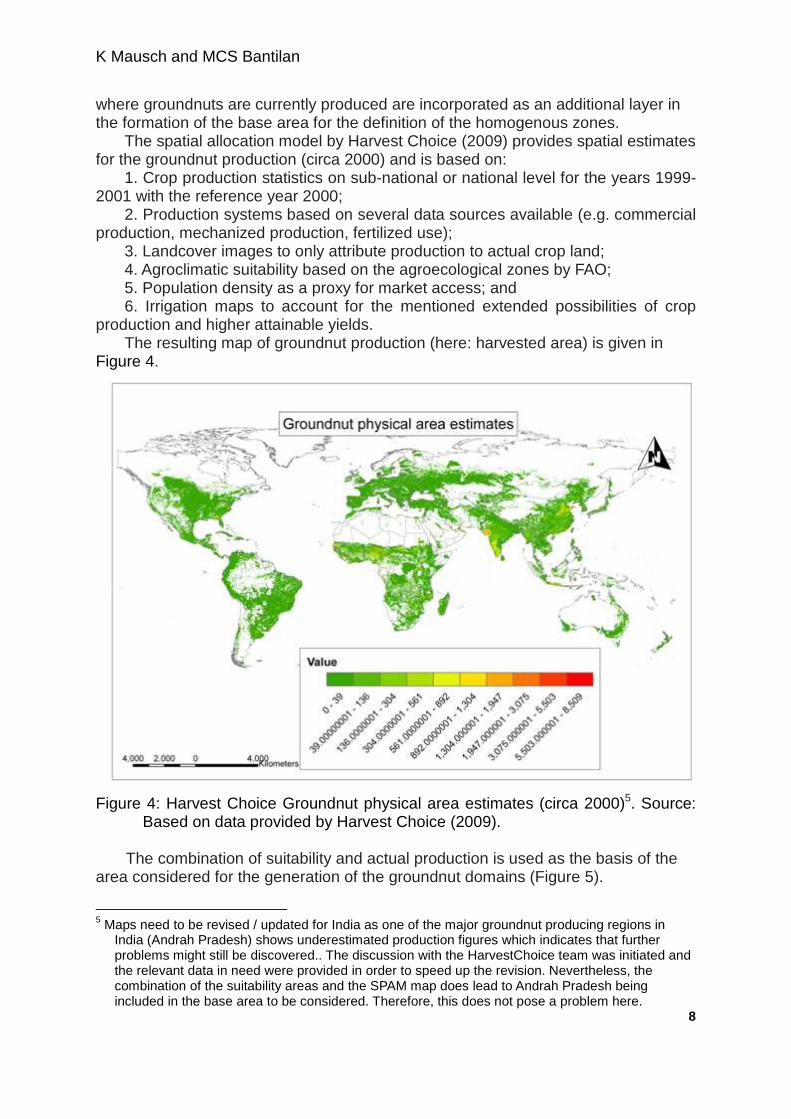
Based on data provided by Harvest Choice (2009). The combination of suitability and actual production is used as the basis of the
area considered for the generation of the groundnut domains (Figure 5).
5 Maps need to be revised / updated for India as one of the major groundnut producing regions in
India (Andrah Pradesh) shows underestimated production figures which indicates that further problems might still be discovered.. The discussion with the HarvestChoice team was initiated and the relevant data in need were provided in order to speed up the revision. Nevertheless, the combination of the suitability areas and the SPAM map does lead to Andrah Pradesh being included in the base area to be considered. Therefore, this does not pose a problem here.
K Mausch and MCS Bantilan
9
Figure 5: Intersected world suitable and producing areas. Source: Own presentation base on FAO 2000 and HarvestChoice 2009.
Although the suitability maps indicate that these areas are the only one suitable
for groundnut production, the SPAM estimates indicate that also outside these suitable areas groundnuts are produced. This is mainly in North America and Northern Europe, but also in Northern Asia and Eastern Europe. The relevance of these areas will be assessed later on when the distribution of the ICRISAT varieties is investigated.
This combination does not only cover the current distribution of groundnut production but also includes potential areas in which groundnuts may be produced in the future due to environmental changes or changes in the preferences of consumers/producers. Therefore, this base area for the classification gives a very broad assessment and might overstate the transfers and spillover effects that are achievable in the short run. Therefore, the divergence between the actual spillovers and transfers realized in the past and the potential transfers and spillovers should be investigated carefully.
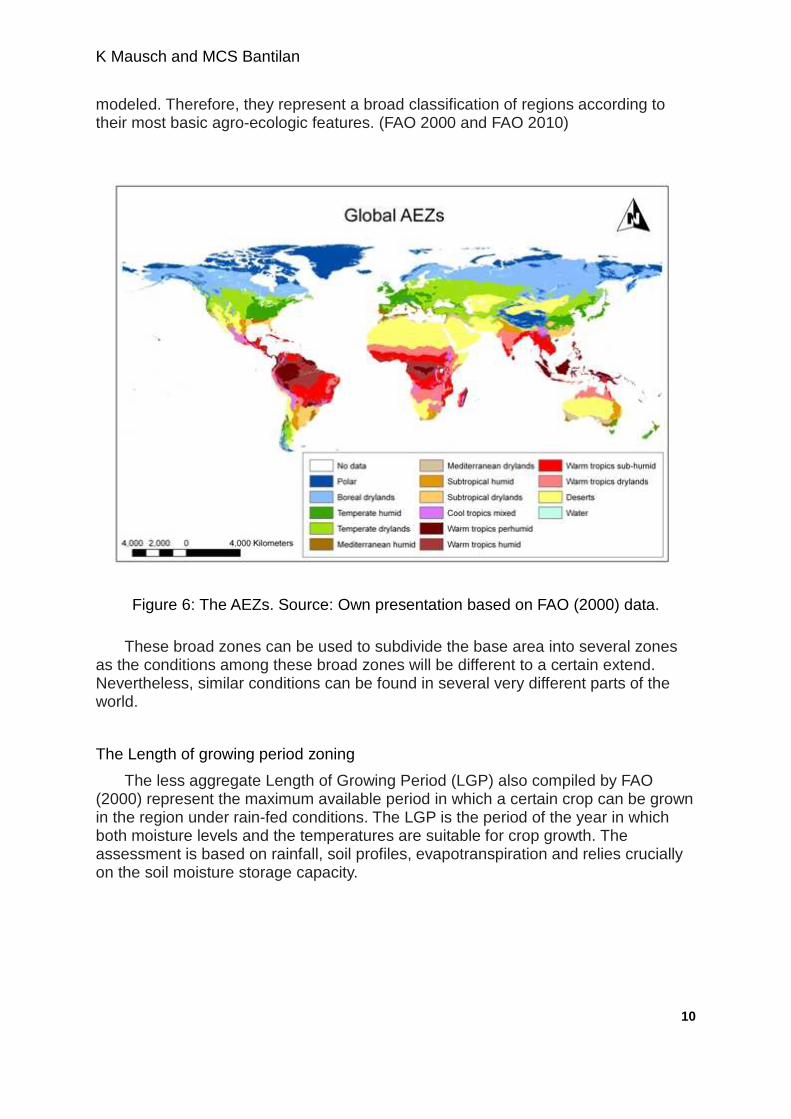
The Agroecological Zones
Based on the combination of the SPAM estimates and the suitability maps, several indicators are available that can be used and/or combined for the definition of homogenous zones. One of the broader features are the Agro-ecological Zones (AEZ) by FAO (2000). These zones are based on climate soil and terrain conditions that are most relevant to agricultural production. Using crop modeling and environmental matching, the crop specific limitations of these factors have been
K Mausch and MCS Bantilan
10
modeled. Therefore, they represent a broad classification of regions according to their most basic agro-ecologic features. (FAO 2000 and FAO 2010)
Figure 6: The AEZs. Source: Own presentation based on FAO (2000) data.
These broad zones can be used to subdivide the base area into several zones
as the conditions among these broad zones will be different to a certain extend. Nevertheless, similar conditions can be found in several very different parts of the world.
The Length of growing period zoning
The less aggregate Length of Growing Period (LGP) also compiled by FAO (2000) represent the maximum available period in which a certain crop can be grown in the region under rain-fed conditions. The LGP is the period of the year in which both moisture levels and the temperatures are suitable for crop growth. The assessment is based on rainfall, soil profiles, evapotranspiration and relies crucially on the soil moisture storage capacity.

K Mausch and MCS Bantilan
11
Figure 7: the LGP. Source: Own presentation based on FAO 2000a data.
The length of growing period has direct implications for the possibilities of
farmers and for the crops from which they can choose. Also the available LGP is important for groundnut production as different varieties have different durations. In regions with rather short LGPs ICRISATs efforts do focus on short or medium duration varieties as long duration varieties with more than 120 days till maturity are not suitable for certain regions. Therefore, this is a crucial factor to differentiate regions.
Other environmental characteristics
Further important factors to be considered here are elevation as well as rainfall pattern that have a big impact on crop production. First, the rainfall pattern, i.e. the differentiation between unimodal and bimodal rainfall determines to a huge extend how much of the days are actually useable for cropping as well as which types of crops are suitable. On the one hand, if a region with unimodal rainfall has a LGP of 120 days it is no problem to grow crop that take up to 120 days till maturity. But if, on the other hand, a region with bimodal rainfall (e.g. summer and winter rains) has 120 days total LGP, it is highly unlikely that the same crop can grow there as the continuous LGP is not long enough for the crop to mature. Therefore, this factor is included to further subdivide the homogenous regions.
Second, the elevation mainly affects the temperature as high elevation usually goes along with cooler climate. Taking the case of coffee the importance is very obvious as coffee is only grown in areas of higher elevation. Furthermore, the
K Mausch and MCS Bantilan
12
temperature and therefore the elevation influences the spread of pests and diseases6 which will influence the transferability of varieties.
The spread of pest and diseases is another very important factor that influences the transferability of technologies and especially varieties. Accurate maps are however not available on a global level and this factor was therefore not possible to incorporate. Nevertheless, we believe that the factors included are already covering the differences to a great extend as many pest and diseases rely on specific environmental conditions which are covered.
The updated groundnut domains
First of all, the union of the suitable areas with the areas where groundnuts are produced is used as a basis for the domain mapping. Then, the most important factor is the LGP as this determines which crops/varieties can be grown here and which other alternatives a farmer generally has. Furthermore, when looking at the ‘old’ ICRISAT domains, a close linkage between the domains and the LGP is already visible. Based on the LGP the areas are subdivided in LGP > 120 days and < 120 days based on the mean days to maturity for the medium and short duration varieties in the ICRISAT international trials.7 According to the data the mean days till harvest among the medium duration groundnut varieties is 120 days which was therefore chosen as the threshold. A further subdivision between short- and medium duration was not implemented as the required LGP is overlapping to a great extend depending on the region in which they were planted. The close relationship between the domains and the LGP and the huge importance of this factor that was already visible in the ICRISAT domains was confirmed by Dr. Nigam who was involved in the domain mapping during the early 1990s. As elaborated earlier, the further subdivision was done based on the LGP pattern (rainfall regime) as well as the AEZ definition. As more detailed AEZ definition used here already includes the distinction between warm and cold tropics/subtropics, this one was taken which makes the inclusion of the elevation unnecessary in this case.
This approach leads to 62 possible domains. After excluding deserts, “no data” regions, Water and domains that consist of less than 1% of the data fields, 15 domains and the category ‘others’ that contains the domains of less than 1% of the data fields are remaining. The details are shown in Table 1 and Figure 8.
6 According to personnel discussions with groundnut breeders and pathologists, this distinction is
extremely relevant for the distribution of groundnut diseases like Rosette in Africa as the temperature influences the distribution of Aphids, the vector that transmits the Virus.
7 The international trials conducted by ICRISAT are a set of trials that are regularly conducted since shortly after ICRISAT was founded. Here the 6321 trial datasets for more than 800 varieties conducted in 95 cities of 43 countries .between 1985 and 2008 are utilized.

K Mausch and MCS Bantilan
13
Table 1: Classification system for the narrow homogenous regions.
GN relevance
LGP LGP pattern AEZ
At least marginally suitable and/or producing areas
Above 120 days
Bimodal rains Subtropical drylands Warm tropics sub-humid Warm tropics drylands
Unimodal rains
Boreal drylands Temperate humid Temperate drylands Subtropical humid Subtropical drylands Cool tropics mixed Warm tropics perhumid Warm tropics humid Warm tropics sub-humid Tropics dryland
Below 120 days
Temperate drylands Warm tropics drylands
Other combinations The highest share is about 26% of all data fields and lies in the warm sub-humid
region with unimodal rains and more than 120 days LGP. The tropical drylands with more than 120 days LGP and unimodal rainfall are also fairly wide with about 16% of all data fields. Almost 13% of the fields were attributed to regions that are too small to constitute an own domain. Though this leads to the third biggest category being not an actual domain, the limit was set rather low and the possible number of domains of 62 would not be very meaningful for further analysis.

K Mausch and MCS Bantilan
14
Figure 8: Groundnut domains. Source: Own presentation.

K Mausch and MCS Bantilan
15
The final step in the process of establishing homogenous zones / groundnut domains was the verification from experts within ICRISAT. During earlier discussions of the efforts to measure transferability, transfer and spillover effects Dr. Nigam mentioned that varieties are more likely to disseminate horizontal (along similar latitudes) or vertical (mirrored at the equator with similar latitudes north and south of the equator). This assessment is confirmed by the new domain maps as the main domains stretch just along those regions. Taking domain #9 as an example, one can see that it spreads around the 8th degree North and South in Africa and South/Middle America and a bit further North/South in Asia/Australia. After finalizing the update of the domains, the newly established zones were briefly presented after the general background was introduced. Based on time limitations and based on practical reasons this was done via email and a telephone conference. This led to a general agreement that the new domains should serve the task at hand.8
Finally, based on the SPAM estimates of area and production as well as the GIS calculations of the total area covered it is now possible to compare the relevance of the resulting domains (Table 2).
Table 2: Domain characteristics
Zone Total area Estimated GN area1 Estimated production1 ‘000km2 % of total ‘000ha % of total ‘000tons % of total 1 913 1.7% 0.4 0.0% 0.4 0.0% 2 5,487 10.0% 2,550 9.1% 8,271 20.4% 3 4,083 7.4% 792 2.8% 2,440 6.0% 4 487 0.9% 183 0.7% 209 0.5% 5 2,502 4.5% 1,738 6.2% 3,683 9.1% 6 2,216 4.0% 467 1.7% 450 1.1% 7 1,740 3.2% 217 0.8% 267 0.7% 8 4,908 8.9% 1,396 5.0% 1,550 3.8% 9 11,484 20.8% 5,771 20.6% 5,888 14.5% 10 5,140 9.3% 6,019 21.5% 6,039 14.9% 11 1,057 1.9% 510 1.8% 1,096 2.7% 12 722 1.3% 649 2.3% 640 1.6% 13 505 0.9% 626 2.2% 629 1.6% 14 2,570 4.7% 435 1.6% 1,172 2.9% 15 2,364 4.3% 4,606 16.4% 4,112 10.2% 000 8,957 16.2% 2,095 7.5% 4,045 10.0% Note: 1: Based on overlay of the domains and the HarvestChoice SPAM estimates. These estimates are not yet final as the SPAM model is currently under review and especially in western India the figures included are vastly underestimated due to some initial data problems. Therefore the area as well as the production in domain #9 and #10 will be even higher but for now these are the best estimates available..
Based on the area estimates, the differences in the size of the data fileds is also
obvious. The largest domains in terms of size are now #9, #000 and #2 in that order. When it comes to production and actual groundnut area the ranking changes and e.g. domain 10 with only 10% of the total area produces almost 15% of world’s groundnuts.
8 In depth discussions will follow as soon as possible to assure the accuracy of the domains.
K Mausch and MCS Bantilan
16
When comparing the new domains to the former ICRISAT domains, some changes occur. Besides the minor movements of some domains that otherwise align very closely with the former ones, the most obvious difference is the coverage. The new domains go far beyond the ‘old’ domains and will therefore cover a much higher share of the actual groundnut production. These production areas are not necessarily within ICRISAT’s mandate region (the Semi-Arid Tropics), but as the review of the variety distribution showed, are important for the measurement of international transfer and spillover effects and therefore the impact of ICRISAT research.
The updated domains will assist ICRISAT breeders in targeting their efforts to a wider region and therefore contribute to further dissemination of developed varieties and collaborate with NARS and Scientists working in the region. Furthermore, the Learning Systems Unit of ICRISAT could improve the targeting of their exchanges by linking visiting scientists and students to the breeding program that is most likely to benefit their country of origin best. Thus, resource allocation will be more efficient and benefits could spread wider and faster.
THE EXAMPLE OF ICGV 87123 (ICGS 11)9
Origin, development and transferability
ICGV 87123 also known as ICGS 11 originates from a single plant selection in a natural hybrid of Robut 33-1 conducted in ICRISAT India during 1977/78 planting season. ICGS 11 was collected in India from an unknown source in 1976. The research process that led to the release of ICGV 87123 was started in 1980 aiming at high yields. ICGV 87123 is a spanish type, medium height high yielding variety that matures in 109-120 days (India). The oil content is 49-51% and the shelling percentage is 70. It was first released for several provinces of India in 1986 after broad testing during the postrainy seasons between 1980 and 1983. During these trials it outyielded the local cultivar SB XI by 25.5% and 33.3% depending on the region. (ICRISAT, 1989)
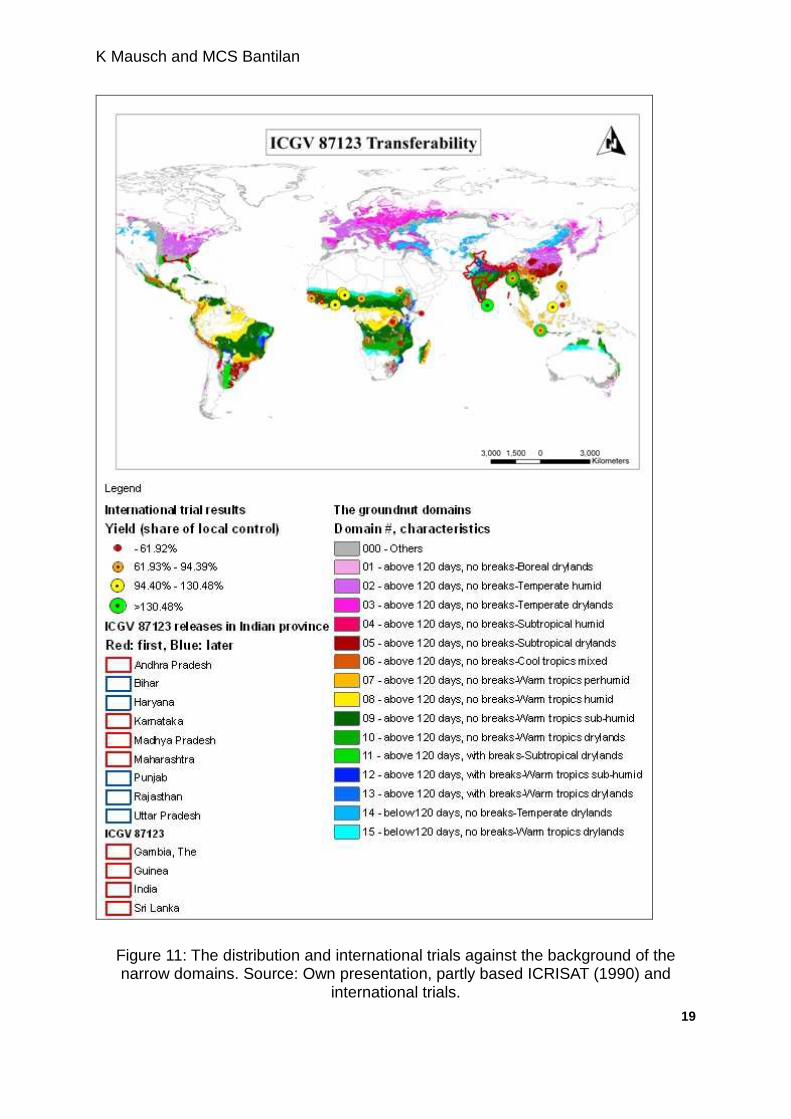
ICGV 87123 was expected to be suitable for release in Benin, Sri Lanka and the Indian provinces Andrah Pradesh, Karnataka and Maharashtra. These countries/provinces are mainly located in domain 9 and 10 (see Figure 11).
9 For a complete list of international ICRISAT varieties see Appendix.

K Mausch and MCS Bantilan
17
Figure 9: ICGV 87123 transferability. Source: Own presentation.
Therefore, this variety should be applicable to many more countries/regions in
these domains. Thus, the potential area for ICGV 87123 covers more than 40% of the global groundnut area as well as more than 30% of the world groundnut production. These figures however depend on the local cultivars available and on their characteristics as compared to ICGV 87123 due to a release being only beneficial if ICGV 87123 performs superior to the best local alternative.
International trials, releases/transfers and potentially spillover effects
ICGV 87123 was expected to be suitable for some Indian provinces as well as Sri Lanka and Benin. Officially it was then released in nine Indian provinces (1986 as ICGS 11) and Sri Lanka (1994 as Indi). Furthermore, it is planted by farmers in Gambia and was sent for pre-release testing in Guinea-Conakry (see Figure 10 and Figure 11).

K Mausch and MCS Bantilan
18
Figure 10: The dissemination of ICGV 87123. Source Own presentation based on
ICRISAT (1989) and international trial data.
While it is found in Sri Lanka already, Benin has neither tested nor yet released ICGV 87123 although the similarities in the environmental characteristics suggest very good transferability to Benin. As even during the breeding and after finalizing the variety Benin was one of the potential target countries further factors besides the pure applicability might have prevented ICGV 87123 from being released in Benin. These could be political or socioeconomic factors like political focus and cooperation or consumer/producer preferences that might have been unfavorable for the introduction.10
10 These factors will be investigated in later steps of the research process where the factors
influencing successful transfers will be focused on. Here setting the basis for the assessment of transferability is the main focus which does not allow going into details of these further factors
K Mausch and MCS Bantilan
19
Figure 11: The distribution and international trials against the background of the narrow domains. Source: Own presentation, partly based ICRISAT (1990) and
international trials.

K Mausch and MCS Bantilan
20
Since its development, the results of 22 trials in 15 countries have been reported and documented. These trials were conducted in Burundi, Ghana, Guinea, Indonesia, Malawi, Malaysia, Myanmar, Nepal, Niger, Philippines, Rwanda, Somalia, Sri Lanka, Sudan and Vietnam. These trials cover the domains 5-10, 15 and 0. The results range from 42% to 162% yield as compared to the local control and the mean advantageous over the local controls range from 9% 130% of the local control over the domains.
Table 3: ICGV 87123 international trial results
# yield (kg) % of local variety
Outyielding local control N
mean median mean median %
1-4 - - - - - 0 5 2430 2430 0.72 0.72 0 2 6 260 260 0.09 0.09 0 1 7 2960 3010 1.03 1.16 - 3 8 1953 1600 1.21 1.13 67 3 9 1538 1844 1.15 0.90 67 6
10 1656 1160 0.83 0.89 25 4 11-14 - - - - - 0
15 1370 1370 1.30 1.30 100 1 0 2069 2069 1.19 1.19 50 2
Total 1873 1787 1.01 0.89 41 2
2 Note: Own calculations based on reported results of ICRISAT international trials. Bold highlighted rows are the domains of the first releases in India.
These figures however have to be taken with caution as the number of cases is
rather low and therefore many other factors may have influenced the results. This outlines that further data on the performance of the variety is essential for the further analysis. One way is aggregating the varieties from each location as further trials are not available. This will come at the costs of combining very different varieties with very different characteristics and will therefore require careful assessment and discussions with the breeders concerned. However, the data available so far outlines the purpose of each trial and therefore the data can at least be separated by medium and short duration and long duration trials. This leads to more meaningful number of cases across the domains (see Table 4).
K Mausch and MCS Bantilan
21
Table 4: Medium and short duration trial results.
Domain Yield advantage over local
control (% of local) Outyielding local
control Mean Median % N
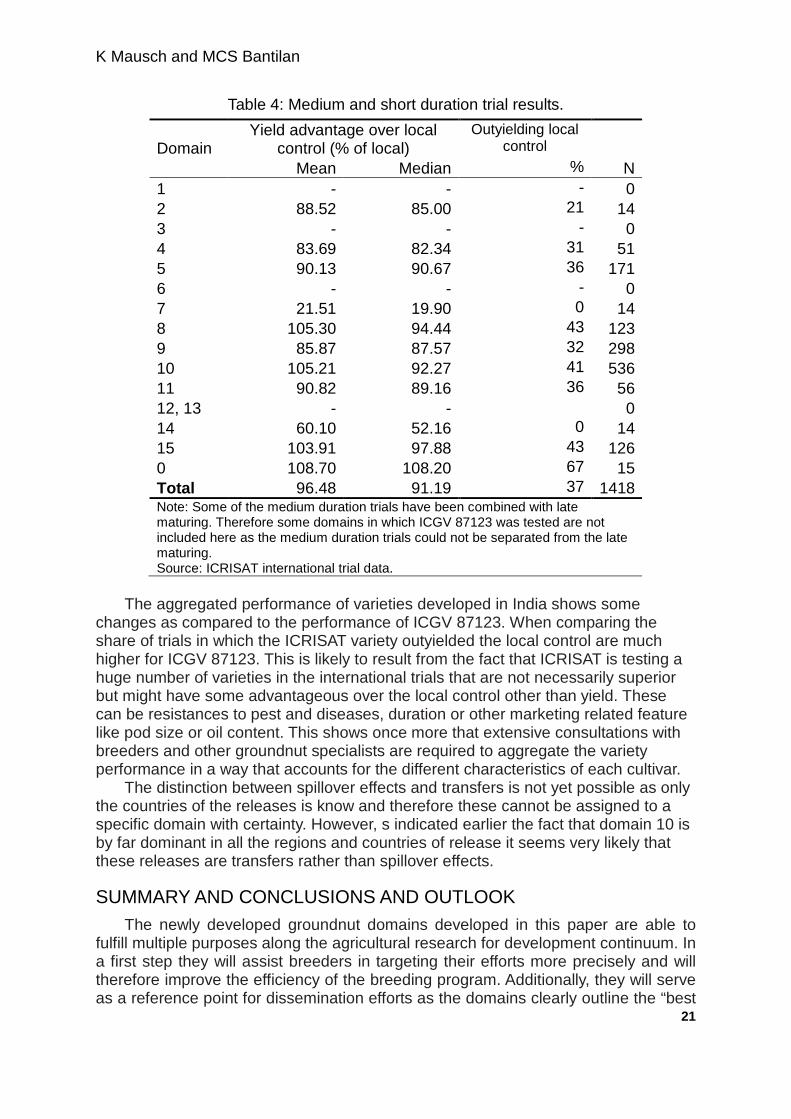
1 - - - 0 2 88.52 85.00 21 14 3 - - - 0 4 83.69 82.34 31 51 5 90.13 90.67 36 171 6 - - - 0 7 21.51 19.90 0 14 8 105.30 94.44 43 123 9 85.87 87.57 32 298 10 105.21 92.27 41 536 11 90.82 89.16 36 56 12, 13 - - 0 14 60.10 52.16 0 14 15 103.91 97.88 43 126 0 108.70 108.20 67 15 Total 96.48 91.19 37 1418 Note: Some of the medium duration trials have been combined with late maturing. Therefore some domains in which ICGV 87123 was tested are not included here as the medium duration trials could not be separated from the late maturing. Source: ICRISAT international trial data.
The aggregated performance of varieties developed in India shows some
changes as compared to the performance of ICGV 87123. When comparing the share of trials in which the ICRISAT variety outyielded the local control are much higher for ICGV 87123. This is likely to result from the fact that ICRISAT is testing a huge number of varieties in the international trials that are not necessarily superior but might have some advantageous over the local control other than yield. These can be resistances to pest and diseases, duration or other marketing related feature like pod size or oil content. This shows once more that extensive consultations with breeders and other groundnut specialists are required to aggregate the variety performance in a way that accounts for the different characteristics of each cultivar.
The distinction between spillover effects and transfers is not yet possible as only the countries of the releases is know and therefore these cannot be assigned to a specific domain with certainty. However, s indicated earlier the fact that domain 10 is by far dominant in all the regions and countries of release it seems very likely that these releases are transfers rather than spillover effects.
SUMMARY AND CONCLUSIONS AND OUTLOOK The newly developed groundnut domains developed in this paper are able to
fulfill multiple purposes along the agricultural research for development continuum. In a first step they will assist breeders in targeting their efforts more precisely and will therefore improve the efficiency of the breeding program. Additionally, they will serve as a reference point for dissemination efforts as the domains clearly outline the “best
K Mausch and MCS Bantilan
22
bet” regions for successful adoption. Finally, the domains will improve the impact assessment as they allow for clear distinction between target and non target regions and thus lay the basis for the more accurate measurement of impacts of agricultural research.
The concept of transferability based on the distinction between transfers and spillover effects is very useful for every organization working on international level and especially working on global public goods as ICRISAT. The domain mapping and therefore the assessment of transferability allows better targeting and resource allocation aiming at the dissemination of technologies and its benefits. Utilizing modern GIS facilities and the huge amount of open source data available it is possible to create domains have the potential to improve breeding efforts. Especially when the original data is still included these domains can even be adjusted to specific task and problems in order to assist breeding institutions and other stakeholders in partnering even after the initial breeding is finalized.
Nevertheless, as useful as the domains are, the example of the short application to and actual ICRISAT variety and its dissemination showed the need for a more aggregated assessment as the available data combined with the number of domains leads to extremely low numbers of trials of each variety across the domains. Thus intense discussions with breeders and other scientists involved are crucial in order to group varieties correctly and then aggregate the available data as far as necessary to gain meaningful results for as many domains as possible. Furthermore, the need of more disaggregated data on dissemination has been shown as the domains do not stick to administrative boundaries which are the usual delineations for available adoption data. Further research will require a detailed analysis of the dissemination of varieties in countries of release in order to attribute those to the domains and then measure the impact of transfers and spillovers
All in all, the usefulness of the domains for the thorough analysis of transfers and spillovers has been shown. Here only a brief outline of the application could be given and the main focus was the development of the domains that will serve as the basis for the further assessment of ICRISAT research. Nevertheless, some bottlenecks and problems of the further analysis did emerge and will be addressed.

K Mausch and MCS Bantilan
23
REFERENCES Arndt, T.M., D.G. Dalrymple and V.W. Ruttan (eds.) (1977): Resource allocation and
productivity in national and international agricultural research, Minneapolis : University of Minnesota Press, 1977.
Brennan, J.P. and Bantilan, M.C.S. (2003): Price and yield effects of spillovers in international agricultural research: Evidence from ICRISAT and Australia. Agricultural Economics 28(2): 87‐97.
Brennan, J.; Singh, I. and Lewin, L. (1997): Identifying international rice research spillovers in New South Wales Agricultural Economics, 1997, 17, 35-44.
Davis, J.S., Oram, P.A. and Ryan, J.G. (1987): Assessment of Agricultural Research Priorities: An International Perspective. Australian Centre for International Agricultural Research (ACIAR), Canberra, Australia.
Deb, U.K. and Bantilan, M.C.S. (2001): Spillover Impacts of Agricultural Research: A Review of Studies. ICRISAT Working Paper Series – Socioeconomics and Policy Program, No.8.
Deom, C.M., Kapewa, T., Busolo-Bulafu, C.M., Naidu, R.A., Chyembekeza, A.J., Kimmins, F.M., Subrahmanyam, P. and van der Merwe, P. (2006): Registration of ICG 12991 Peanut Germplasm Line, Crop Science 46:481.
FAO (2000): Global Agro-Ecological Zones – 2000, Food and Agriculture Organization of the United Nations Rome, Italy and International Institute for Applied Systems Analysis, Laxenburg, Austria. CD-ROM
FAO (2010): Data available from FAO Geonetwork. http://www.fao.org/geonetwork/srv/en/main.home
Harvest Choice (2009): Maps and data generated according to: You, L., Z. Guo, J. Koo, W. Ojo, K. Sebastian, M.T. Tenorio, S. Wood, U. Wood-Sichra. Spatial Produciton Allocation Model (SPAM) 2000 Version 3 Release 1. http://MapSPAM.info. (Your accessing date - e.g. March. 01, 2010); maps and data provided on Harvest choice website (http://mapspam.info/maps and http://mapspam.info/download-data). Last access: 15.03.2010.
ICRISAT (1992). ICRISAT Medium-term plan 1994-1998. Patancheru 502 324, Andhra Pradesh, India: International Crops Research Institute for the Semi-Arid Tropics.
ICRISAT (1989): ICRISAT Plant Material Description no. 20. http://dspace.icrisat.res.in/handle/10731/2788
Maredia, M.K., Ward, R. and Byerlee, R. (1996): Econometric estimation of a global spillover matrix for wheat varietal technology. Agricultural Economics 14 (1996) 159-173.
Wood, S. and P.G. Pardey (1997): Agroecological Aspects of Evaluating Agricultural R&D, IFPRI EPTD Discussion Paper No. 23.

24
APPENDICES Description of the ICRISAT domains as in Figure 2.
Domain Production system characteristics `Major constraint Locations GN I Rainy season Drought Mid tier of Sahel (Senegal, Mali, Burkina Faso, Niger) 90 – 100 days duration Late leaf spot Rainfed Rust Oil and confectionary use Rosette Aflatoxin India (Gujerat) GN II Rainy season Late leaf spot East Africa (Sudan) 100-120 days duration Rust India (N Maharashtra, Madyha Pradesh) Rainfed Drought Mostly oil use Aflatoxin rosette GN III Rainy season Late leaf spot Southern tier of Sahel (Nigeria, Gambia, Cameroon, Ghana) 90-130 days duration Rust India (N coastal Andrah Pradesh, Orissa, West Bengal) Rainfed Rosette Bangladesh Oil and confectionary use Millepedes North Vietnam Pod rots Indonesia GN IV Rainy season Late leaf spot India (S Maharashtra, Andrah Pradesh, Tamil Nadu, Karnataka) 100-120 days duration Rust Rainfed Drought Myanmar Mostly oil use Leaf minor Thailand Spodopetera Southern Vietnam GN V Summer season No major constraint India (Gujerat, N Maharashtra, Madhya Pradesh) 110-120 days duration Full irrigation Mostly oil use GN VI Postrainy season Late leaf spot India ( W & S Maharashtra, Andrah Pradesh, Tamil Nadu, Orissa, Karnataka,
Kerala) 100-120 days duration Bud necrosis Full irrigation Leaf miner N India Mostly oil use Spodoptera Pakistan White grubs Nepal

25
GN VIIa Rainy season Early leaf spot Southern Africa (N Mozambique, N Zimbabwe, C Malawi, E Zambia, S Tanzania, DR Congo) 120-140 days duration Rust
Mostly monocropping Rosette Confectionary use Aphids Large seeded varieties preferred Jassids GN VIIb Rainy season Late leaf spot Souther Africa (S Mozambique, S Zimbabwe 90-110 days duration Rust Mono- and intercropping Rosette Rainfed Drought Mostly oil use alflatoxin GN VIII Rainy season Early leaf spot Central Africa (N Tanzania, N Zaire, Uganda, Rwanda, Burundi, W Kenya) Rainfed (bi-modal) Late leaf spot Mono- and intercropping Rust 90-120 days Rosette Oil and confectionary use Pod rots Three seeded varieties preferred Source: ICRISAT (1992).

26
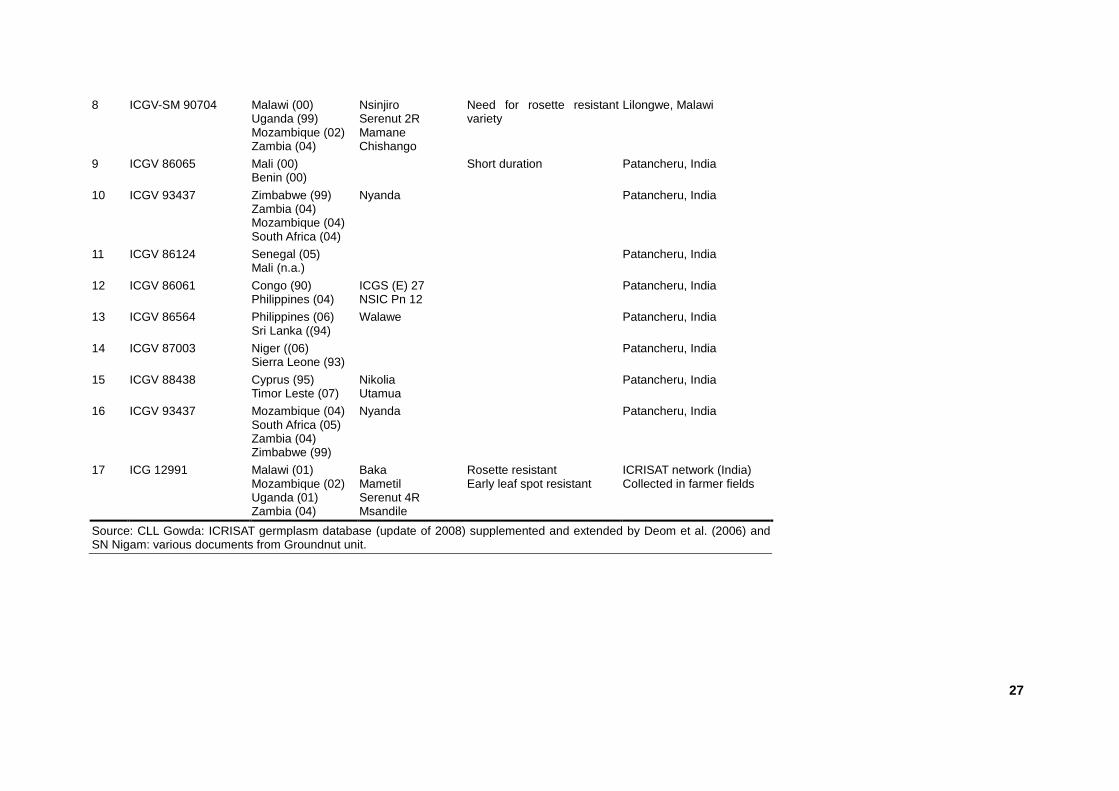
ICRISAT international Groundnut varieties.
ICRISAT name Where found (released/testing/grown)
Also known as Special feature Where developed
1 ICGV-SM 83708 (ICGMS 42; ICGV 89322)
Malawi (90) Uganda (99) Zambia (90) testing: Swaziland (94)
CG 7, MGV 4 Serenut 1R ICGMS 42
High yielding, large seeds, confectionary trait;
Parental line from Patancheru, India; further developed in Lilongwe, Malawi
2 Robut 33-1 Myanmar (84) Tanzania (85) testing: Gambia
Sinpadeths-3 Johari
ICRISAT network
3 JL-24 (ICG 7827)
Malawi (00) Mali (00) Myanmar (84) Philippines (92) Congo (90) Zambia (99) South Africa (02) Testing Sierra Leone (92)
Kakoma Sameke Sinapadetha-2 UPL Pn 10 Luena
Early, high yield ICRISAT network (India) Collected in farmer fields
4 CGS 11 (ICGV 87123)
India (86) Sri Lanka (94) testing: Guinea Grown in: Gambia
India High yielding, tolerant to bud necrosis and end season drought
Patancheru, India
5 ICGV 87160 ICG(FDRS)
India (90) Myanmar (93)
Sinpadetha - 5 Foliar disease resistant Patancheru, India
6 ICGV 86015 (ICGS(E)56)
Nepal (96) Pakistan (94) Vietnam (92) Sri Lanka (04)
Jayanti BARD 92 HL 25 Tikiri
Short duration Patancheru, India
7 ICGV 86143 India (94) Vietnam (00) Zambia (99)
BSR-1 LO 5 MGS 2
High yielding, tolerant to bud necrosis & PMV
Patancheru, India
27
8 ICGV-SM 90704 Malawi (00) Uganda (99) Mozambique (02) Zambia (04)
Nsinjiro Serenut 2R Mamane Chishango
Need for rosette resistant variety
Lilongwe, Malawi
9 ICGV 86065 Mali (00) Benin (00)
Short duration Patancheru, India
10 ICGV 93437 Zimbabwe (99) Zambia (04) Mozambique (04) South Africa (04)
Nyanda Patancheru, India
11 ICGV 86124 Senegal (05) Mali (n.a.)
Patancheru, India
12 ICGV 86061 Congo (90) Philippines (04)
ICGS (E) 27 NSIC Pn 12
Patancheru, India
13 ICGV 86564 Philippines (06) Sri Lanka ((94)
Walawe Patancheru, India
14 ICGV 87003 Niger ((06) Sierra Leone (93)
Patancheru, India
15 ICGV 88438 Cyprus (95) Timor Leste (07)
Nikolia Utamua
Patancheru, India
16 ICGV 93437 Mozambique (04) South Africa (05) Zambia (04) Zimbabwe (99)
Nyanda Patancheru, India
17 ICG 12991 Malawi (01) Mozambique (02) Uganda (01) Zambia (04)
Baka Mametil Serenut 4R Msandile
Rosette resistant Early leaf spot resistant
ICRISAT network (India) Collected in farmer fields
Source: CLL Gowda: ICRISAT germplasm database (update of 2008) supplemented and extended by Deom et al. (2006) and SN Nigam: various documents from Groundnut unit.