defining chlorophyll-a reference conditions in european lakes
TRANSCRIPT

This article was published in the above mentioned Springer issue.The material, including all portions thereof, is protected by copyright;all rights are held exclusively by Springer Science + Business Media.
The material is for personal use only;commercial use is not permitted.
Unauthorized reproduction, transfer and/or usemay be a violation of criminal as well as civil law.
ISSN 0364-152X, Volume 45, Number 6

Defining Chlorophyll-a Reference Conditions in European Lakes
Sandra Poikane • Maria Helena Alves • Christine Argillier • Marcel van den Berg •
Fabio Buzzi • Eberhard Hoehn • Caridad de Hoyos • Ivan Karottki •
Christophe Laplace-Treyture • Anne Lyche Solheim • Jose Ortiz-Casas •
Ingmar Ott • Geoff Phillips • Ansa Pilke • Joao Padua • Spela Remec-Rekar •
Ursula Riedmuller • Jochen Schaumburg • Maria Luisa Serrano •
Hanna Soszka • Deirdre Tierney • Gorazd Urbanic • Georg Wolfram
Received: 8 July 2009 / Accepted: 17 March 2010 / Published online: 18 April 2010
� The Author(s) 2010. This article is published with open access at Springerlink.com
Abstract The concept of ‘‘reference conditions’’ describes
the benchmark against which current conditions are com-
pared when assessing the status of water bodies. In this paper
we focus on the establishment of reference conditions for
European lakes according to a phytoplankton biomass indi-
cator—the concentration of chlorophyll-a. A mostly spatial
approach (selection of existing lakes with no or minor
human impact) was used to set the reference conditions for
chlorophyll-a values, supplemented by historical data,
paleolimnological investigations and modelling. The work
resulted in definition of reference conditions and the
boundary between ‘‘high’’ and ‘‘good’’ status for 15 main
lake types and five ecoregions of Europe: Alpine, Atlantic,
Central/Baltic, Mediterranean, and Northern. Additionally,
empirical models were developed for estimating site-specific
reference chlorophyll-a concentrations from a set of potential
S. Poikane (&)
Institute for Environment and Sustainability, European
Commission Joint Research Centre, 21027 Ispra (VA), Italy
e-mail: [email protected]
M. H. Alves � J. Padua
Water National Institute, Av. Gago Coutinho 30,
1049-066 Lisbon, Portugal
C. Argillier
Research Institute for Agricultural and Environmental
Engineering, CEMAGREF, 3275 Route de Cezanne,
CS 40061 Aix-en-Provence, France
M. van den Berg
Centre for Water Management, Zuiderwagenplein 2,
8200 AA Lelystad, The Netherlands
F. Buzzi
Environmental Protection Agency of Lombardy,
via I Maggio 21/B, 23848 Oggiono (LC), Italy
E. Hoehn
LBH, Glumerstr. 2a, 79102 Freiburg, Germany
C. de Hoyos
Centre for Hydrographic Studies, CEDEX, C/Paseo Bajo
de la Virgen del Puerto 3, 28005 Madrid, Spain
I. Karottki
Ministry of Environment, Haraldsgade 53, 2100
Copenhagen, Denmark
C. Laplace-Treyture
Research Institute for Agricultural and Environmental
Engineering, CEMAGREF, av de Verdun 50,
33612 Cestas-Gazinet, France
A. L. Solheim
Norwegian Institute for Water Research, Brekkeveien 19,
0411 Oslo, Norway
J. Ortiz-Casas � M. L. Serrano
Ministry of Environment, Pza San Juan de la Cruz,
28071 Madrid, Spain
I. Ott
Estonian University of Life Sciences, Kreutzwaldi 1,
51014 Tartu, Estonia
G. Phillips
Environment Agency, Kings Meadow Road,
RG1 8DQ Reading, United Kingdom
A. Pilke
Finnish Environment Institute, P.O. Box 140,
00251 Helsinki, Finland
S. Remec-Rekar
Environmental Agency, Kidriceva 10,
4260 Bled, Slovenia
U. Riedmuller
BNO, Erlenweg 13, 79822 Titisee-Neustadt, Germany
123
Environmental Management (2010) 45:1286–1298
DOI 10.1007/s00267-010-9484-4 Author's personal copy

predictor variables. The results were recently formulated into
the EU legislation, marking the first attempt in international
water policy to move from chemical quality standards to
ecological quality targets.
Keywords Reference condition � Chlorophyll �Phytoplankton � Eutrophication �Water Framework Directive � Water assessment �Lakes
Introduction
This work focuses on the defining of reference conditions,
which is one of the major keystones of ecological assess-
ment of water body status required by the European
Commission Water Framework Directive (WFD; EC
2000). Most biological assessment systems are based on
the concept of comparing the current biological community
to the ‘‘reference conditions’’—a status of community
observed in the absence of human disturbance or alteration
(Bailey and others 2004). Therefore, reference conditions
can serve as an important guide to set management aims,
but it is important to emphasize that reference conditions
are not the same as restoration goals (Egan and Howell
2001). However, the term ‘‘reference condition’’ has been
used to refer to multiple, and often confusing and contra-
dictory, concepts. For example, it can be used to refer to
the condition of ecosystems at some point in the past; the
best remaining conditions in a region heavily modified by
human activity and so on (Stoddard and others 2006). In
this article, the term ‘‘reference conditions’’ is used in the
WFD sense which defined type-specific reference condi-
tions as the biological conditions associated with no or very
low human pressure (EC 2000).
Reference conditions can be defined in a number of
different ways (Reynoldson and others 1997; Stoddard and
others 2006). By far, the most common approach for esti-
mating reference conditions is to quantify them at a set of
sites relatively unexposed by human activity. This
approach is widely known as the ‘‘reference site approach’’
(Hughes 1995; Bailey and others 2004) and presents a
scientifically sound method for setting expectations, pro-
vided that the method of selecting reference sites is clearly
defined. However, the spatial approach faces a practical
obstacle because it is often difficult to find undisturbed
sites. Establishment of reference sites is especially chal-
lenging in Europe (Moss and others 2003) for all but polar
and mountain areas, and even there, climate warming and
airborne pollutants make it unlikely that true reference sites
exist. It may be especially difficult to find minimally
impacted waters for some particular types, e.g., shallow
lowland lakes (Bennion and others 2004).
The derivation of reference conditions from paleolim-
nological studies offers an alternative method in such cases.
Paleolimnological research has a long tradition in Europe
using various elements e.g., diatoms (Bennion and others
1995) and pigments (Kamenik and others 2000). Never-
theless, the reconstructions are often subject to variabilities
of more than one order of magnitude (Sayer 2001), and this
can obscure precise reconstruction of reference conditions.
Historical data probably give the best insight into how
reference lakes looked. They often suffer, however, from
poor quality, be it due to different sampling methods or
different taxonomic resolution. The basic problems are the
paucity of data available and the definition of the ‘‘refer-
ence period’’ which is usually considered the period before
1850 (Battarbee 1999) or before the Second World War if
impacts from anthropogenic land use and urbanisation can
be considered as negligible (Reichmann and Schulz 2004).
In situations without minimally disturbed sites and his-
torical data, empirical models derived from associations
between biological indicators and human-disturbance gra-
dients can be extrapolated to infer conditions in the absence
of human disturbance (Stoddard and others 2006). A
promising approach to estimate the natural trophic state for
lakes is the use of models that predict the trophic state of a
lake from nutrient loading (e.g., Vollenweider 1976; OECD
1982), however, it must be borne in mind that any empirical
model involving nutrient export coefficients bears various
methodological errors (Ryding and Rust 1989).
It is acknowledged (Moss and others 2003) that, cur-
rently, the best approach is a combination of reference
sites, modelling, paleolimnology and expert judgment.
Integrating several approaches may lead to firmer, more
defensible reference conditions, particularly if the conclu-
sions derived from the different approaches are consistent
(Stoddard and others 2006). The process depends on the
accumulation of experience and integration from all of
these lines of evidence rather than statistically rigorous
J. Schaumburg
Bavarian Environment Agency, Demollstraße 31,
82407 Wielenbach, Germany
H. Soszka
Institute of Environmental Protection, Kolektorska 4,
01692 Warsaw, Poland
D. Tierney
Environmental Protection Agency, Clonskeagh Road,
14 Dublin, Ireland
G. Urbanic
Institute for Water, Hajdrihova 28c, 1000 Ljubljana,
Slovenia
Environmental Management (2010) 45:1286–1298 1287
123
Author's personal copy

procedures (Moss and others 2003). Such an approach was
used for setting chlorophyll-a reference conditions in
European water legislation and is presented in this article.
According to the Water Framework Directive, Member
States are required to develop lake ecological status
assessment systems based on various characteristics of
phytoplankton, macrophytes, benthic invertebrates and fish
fauna. An intercalibration exercise is foreseen to harmonise
assessment systems of all EU and to ensure that the obli-
gation to reach good status has the same meaning
throughout Europe. The first stage of the intercalibration
(2003–2008) aimed at setting of reference conditions and
class boundaries for chlorophyll-a values for all lake types
and all geographical regions of the EU. The work was
carried out under the Common Implementation strategy of
the Water Framework Directive (EC 2001) by joint effort
of all European countries and greatly supported by several
scientific studies of the European Framework 6 project
REBECCA, e.g. setting of total phosphorus (TP) reference
conditions (Cardoso and others 2007), preliminary analyses
of chlorophyll-a values in reference lakes of Northern and
Central regions (Carvalho and others 2008), development
of chlorophyll-nutrient relationships (Phillips and others
2008) and phytoplankton responses to eutrophication
(Ptacnik and others 2008).
The initial steps in development of reference conditions
were (1) identification of anthropogenic pressures and
selecting appropriate biological components and indicators
to address their impact; (2) defining geographically
homogenous regions and common types of lakes within
them. This study has focused on the major pressure for
lakes of Europe—eutrophication and the most relevant
community detecting this pressure—phytoplankton. Chlo-
rophyll-a was selected as a simple indicator for phyto-
plankton abundance with sufficient data availability across
Europe. Five lake regions including all of the EU Member
States and Norway were established based on Illies lim-
nofaunistic division of Europe (1978)—Alpine, Atlantic,
Central/Baltic, Mediterranean and Northern regions (EC
2005). Common lake typology with fifteen international
lake types were selected for intercalibration (Table 1)
based on natural abiotic characteristics—altitude, alkalinity
Table 1 Description of common international lake types included in analysis
Type code Lake type characterisation Altitude
(m a.s.l.)
Mean
depth (m)
Alkalinity
(meq/l)
Additional characteristics
Alpine region
AL3 Lowland or mid-altitude, deep, moderate
to high alkalinity, large
50–800 [15 [1 Surface area [50 ha
AL4 Mid-altitude, shallow, moderate to
high alkalinity, large
200–800 3–15 [1 Surface area [50 ha
Atlantic region
A1/2 Lowland, shallow, calcareous \200 3–15 [1 Non-humic
Central Baltic region
CB1 Lowland, shallow, calcareous \200 3–15 [1 Residence time 1–10 years
CB2 Lowland, very shallow, calcareous \200 \3 [1 Residence time 0.1–1 years
CB3 Lowland, shallow, siliceous \200 3–15 0.2–1 Residence time 1–10 years
Mediterranean region
Msw Reservoirs, deep, large siliceous,
lowland, ‘‘wet areas’’
0–800 [15 \1 Surface area [50 ha, annual mean
precipitation 800 mm or
annual mean T \ 15�C,
catchment area \ 20 000km2
Mc Reservoirs, deep, large, calcareous 0–800 [15 [1 Surface area [ 50 ha,
catchment area \ 20 000km2
Northern region
N1 Lowland, shallow, moderate alkalinity, non-humic \200 m 3–15 0.2–1 Colour \30 mg Pt/l
N2a Lowland, shallow, low alkalinity, non-humic \200 m 3–15 \0.2 Colour \30 mg Pt/l
N2b Lowland, deep, low alkalinity, non-humic \200 m [15 \0.2 Colour \30 mg Pt/l
N3a Lowland, shallow, low alkalinity, humic \200 m 3–15 \0.2 Colour 30–90 mg Pt/l
N5a Mid-altitude, shallow, low alkalinity, non-humic 200–800 m 3–15 \0.2 Colour \30 mg Pt/l
N6a Mid-altitude, shallow, low alkalinity, humic 200–800 m 3–15 \0.2 Colour 30–90 mg Pt/l
N8a Lowland, shallow, moderate alkalinity, humic \200 m 3–15 0.2–1 Colour 30–90 mg Pt/l
Lake type codes: AL Alpine; A Atlantic; CB Central Baltic; M Mediterranean; N Northern GIG
1288 Environmental Management (2010) 45:1286–1298
123
Author's personal copy

and mean depth—which are important factors in deter-
mining the composition and abundance of biological
communities (e.g., Kolada and others 2005). Additional
factors were used in several regions, e.g., lake area (Alpine
region), humic substances (Nordic region), climate factors
(Mediterranean region), water retention time (Central
region) the importance of which has been demonstrated in
several studies (e.g., Miettinen and others 2005).
In short, this paper summarizes the evolution of type-
specific chlorophyll-a reference conditions and describes
the data and research used in their development. More
specifically, we set the following objectives: (1) to describe
and compare different approaches of selection of reference
lakes and setting reference conditions and to evaluate
consistency of the results; (2) to determine whether selec-
ted reference lakes may be considered representative of the
whole lake population; (3) to explore relationships between
chlorophyll-a values and environment variables and define
the most important drivers of chlorophyll-a concentration
in unimpacted lakes; (4) to develop empirical models for
estimating site-specific reference chlorophyll-a values from
a set of potential predictor variables.
Material and Methods
Data Sets
Altogether, data for approximately 1200 lakes and 2700
lake years were pooled from national datasets into inter-
calibration databases (see Table 2). These databases con-
tained both basic data (altitude, surface area, mean depth,
alkalinity), quality data (chlorophyll-a, nutrients, Secchi
depth) and pressure data (land use, population density,
other impacts).
Data were collected from environment agencies and
scientific institutes including data both from national
monitoring programs and several research projects. Inevi-
tably, with such a large dataset of lakes from many coun-
tries, there were questions regarding data quality which
were solved before the data analyses:
– Checking and correction of data were required before
the data could be used: a common problem was
erroneous units, values below detection limits coded in
different ways, as well as numerous other irregularities;
Table 2 Description of lake data sets by region, type and country
Region Lake
type
Number of
all lakes
Number of
ref lakes
Number of reference lakes per country
Alpine AL3 78 22 AT (14), DE (5), IT (2), SI (1)
AL4 69 13 AT (10), DE (3)
Atlantic A1/2 46 9 IE (8), UK (1)
Central Baltic CB1 209 21 DE (3), DK (1), EE (1), LT (3), LV (6), NL (2), PL (5)
CB2 138 5 LV (2), NL (2), UK (1)
CB3 37 8 DK (1), EE (2), LV (3), PL (2)
CB4 50 4 LV (3), NL (1)
Mediterranean Mc 21 5 CY (1), ES (2), FR (1), RO (1)
Msw 20 5 ES (2), GR (1), PT (2)
Northern N1 69 19 FI (8), NO (10), UK (1)
N2a 86 60 FI (26), NO (28), SE (1) UK (5)
N2b 96 71 FI (2), NO (62), UK (7)
N3a 98 46 FI (35), IE (2), NO (9)
N3ba 42 16 FI (14), UK (2)
N5a 49 37 FI (1), NO (22), SE (14)
N6a 21 7 FI (3), NO (3), UK (1)
N6ba 1 1 IE (1)
N7a 3 2 SE (2)
N8a 65 8 FI (6), NO (2)
All 1197 359 AT (24), CY (1), DE (11), DK (2), EE (3), ES (4), FI (95),
FR (1), GR (1), IE (11), IT (2), LT (5), LV (14), NL (3),
NO (136), PL (7), PT (2), RO (1), SE (17), SI (1), UK (18)
AT austria; BE Belgium; CY Cyprus; DE Germany; DK Denmark; EE Estonia; ES Spain; FI Finland; FR France; GR Greece; HU Hungary; IEIreland; IT Italy; LT Lithuania; LV Latvia; NL The Netherlands; NO Norway; PL Poland; PT Portugal; RO Romania; SE Sweden; SI Slovenia; UKUnited Kingdoma Lake types not included in the final analyses due to low number of lakes
Environmental Management (2010) 45:1286–1298 1289
123
Author's personal copy

– Data quality was further checked by revealing outliers
and testing well established relationships (e.g., between
conductivity and alkalinity, chlorophyll-a and TP).
One problem was the heterogeneity of the data: due to
different data origins, different sampling and analysis
methods were used (except Mediterranean region, where
sampling was carried out using an unified strategy).
Despite the large heterogeneity of the data, some common
patterns can be defined:
– Samples were mostly from the vegetation season; also
winter/spring season samples included in the Alpine
region;
– Approximately 4 sampling dates per season were used
(ranging from 1–2 to 10);
– Most samples were taken from the epilimnion/surface
layer; Mediterranean region—samples from the eupho-
tic zone, defined as 2.5 Secchi depth;
– Spectrophotometry with ethanol/acetone extraction was
used for chlorophyll-a measurements.
For our analyses, we used chlorophyll-a annual average
values (Alpine region) or average values of vegetation
season (all other regions).
Selection of Reference Lakes
A preferred approach to locate reference sites is to establish
a set of criteria that, in total, describe the characteristics of
sites in a region that are not or only minimally exposed to
stressors (Stoddard and others 2006). It is advisable to use a
set of reference criteria based on pressure data, not
chemical and biological parameters which must be used
only for confirmation of, not for selection of, reference
sites because of the possibility of circularity and precon-
ceived notions about the chemistry and biology at a ‘‘typ-
ical reference site’’ (Bailey and others 2004).
A list of criteria for the selection of reference sites was
developed in every region (Table 3) based on criteria
assessing the pressure from the catchment. Land use, point
sources and population density were the main factors, but
additional elements were included by several regions, such
as the change of the natural regime, artificial modifications
of the shoreline, introduction of fish and fish-farming
activities, mass recreation, and invasive species. Some
Member States (UK, Ireland, and Austria) additionally
used paleolimnological data for confirmation of reference
sites. For instance, Taylor and others (2006) found that
diatom assemblages in the sediment core top samples from
11 of 34 candidate reference lakes in Ireland showed rel-
atively little deviation from those in sediment core bottom
samples. The core bottom samples appeared to pre-date ca.
1850, or the onset of agricultural intensification and major
aforestation in the catchment, so those sites were selected
as reference sites in the Atlantic region.
Historical quantitative data on phytoplankton were used
only in the Alpine region, available from the 1930s for
Carinthian lakes (Findenegg 1935; 1954) and for several
lakes in the Northern Calcareous Alps (Ruttner 1937).
Since these lakes were not affected by major anthropogenic
pressure from industrialisation, intensive urbanisation or
agriculture, the 1930s reflect reference conditions with
insignificant anthropogenic impact.
A distinctive approach was taken in the Alpine region in
which sites were accepted as reference sites if their actual
trophic state did not deviate from the reference trophic
state prior to industrialisation, intensive urbanisation or
agriculture. From paleoreconstruction (e.g., Loffler 1972;
Klee and others 1993) and theoretical considerations using
the Vollenweider phosphorus loading model (Vollenweider
1976; OECD 1982), it was concluded that oligotrophy is
the natural reference trophic state of deep Alpine lakes
(AL3, mean depth [15 m). Lakes belonging to the lake
type AL4 (mean depth 3–15 m), however, tend to have a
higher reference trophic state at oligomesotrophic level.
This is proved again by loading model calculations and
paleoreconstruction (e.g., Lotter 2001; Schmidt and others
2002).
In summary, the reference lakes have been selected
using the following approaches or a combination of these
approaches:
– Criteria assessing the pressure from the catchment, e.g.,
predominantly (90%) natural land cover, absence of
major point sources, population density (e.g. \10
inhabitants/km2), were used in all regions for initial
selection of candidate reference lakes;
– TP concentration corresponding to the defined natural
trophic state was used in the Alpine region;
– Paleoreconstruction for selection or confirmation of
reference sites was used in the Alpine, Atlantic and
Northern regions;
– Historical data reflecting the reference state were used
in Alpine region;
– Phosphorus loading model (Alpine and Nordic regions)
was used for TP concentrations in the reference lakes;
– Additional screening by quality criteria (nutrient,
chlorophyll-a) and expert judgment was broadly used
in the final review of reference lake lists.
According to the reference criteria, 359 reference lakes
were selected across the EU. Most of the reference lakes
(267 lakes) belong to the Northern region (Table 2),
dominated by lakes in Norway (136 lakes) and Finland (95
lakes), while the lowest numbers occur in the Central
Baltic (38 lakes) and Mediterranean region (10 reservoirs),
1290 Environmental Management (2010) 45:1286–1298
123
Author's personal copy

Table 3 Pressure criteria used for reference lake selection
Region Pressure criteria
ALP Insignificant contribution of anthropogenic to total nutrient loading, validated by nutrient loading calculations
No deviation from the natural trophic state:
– natural trophic state of LAL3: oligotrophic (threshold value for the preselection of reference sites TP B8 lg/l)
– natural trophic state of LAL4: oligomesotrophic (threshold value for the preselection of reference sites TP B12 lg/l)
[80–90% natural forest, wasteland, moors, meadows, pasture
No (or insignificant) urbanization or peri-urban areas
No deterioration of associated wetland areas
No (or insignificant) changes in the hydrological and sediment regime of the tributaries
No direct inflow of (treated or untreated) waste water, no (or insignificant) diffuse discharges
No (or insignificant) change of the natural regime (regulation, artificial rise or fall, withdrawal)
No (or insignificant) artificial modifications of the shore line
No introduction of fish where they were absent naturally (last decades) and fish-farming activities
No mass recreation (camping, swimming, rowing)
No exotic or proliferating species (any plant or animal group)
ATL Absence of major modification to catchment e.g. intensive afforestation
No discharges present that would impair ecological quality
Water abstraction at level that would not interfere with ecological quality
Water level fluctuation: within natural range
Absence of shoreline alteration e.g. roads and harbours
Groundwater connectivity within natural range
No impairment by invasive plant or animal species
Stocking of non-indigenous fish not significantly affecting the structure and functioning of the ecosystem
No impact from fish farming, no intensive use for recreation purposes
Dissolved oxygen: within range 80–120% saturation
Oxygen depletion (66% of lake deoxygenated for a period [2 months) absent
pH within range 6–9, salinity: \100 mg Cl/l
TP \15 lg/l
CB 90% of catchment land use natural (or semi-natural)
Population density \10 km-2
No point sources in the catchment:
Criteria can be overruled if
– clear and sound evidence from paleolimnological data, which is published or otherwise publicly available;
– the direct related catchment of the lake is surrounded is for more than 90% of the area by natural land use and there are no signs of anydisturbance;
– the use of agricultural land is very extensive meaning, no artificial fertilizers are used;
– the whole population in the catchment is connected to waste water treatment plants while the discharge is not connected to the candidatereference lake
MED 70% of the catchment area classified as ‘‘natural areas’’ (80% in Portugal, 90% in Cyprus and Greece)
Very low occurrence of anthropogenic pressure in the catchment area
Spain: Upstream accumulated demand of water for domestic use must be \3% of annual loading; \1.5% for industrial use; and \10% foragricultural irrigation
Portugal: Low/moderate fishing and navigation pressures, low/moderate water level fluctuations
NOR Agriculture: \10% in catchment (\5 Norway), mainly judged from visual observations of GIS land use data
Population density \5 p.e./km (Norway), \10 p.e/km (Sweden) or absence of major settlements in catchment
Absence of large industries in catchment
Absence of major point sources in catchment
Sweden and Norway: TP \ 10 lg/l or higher if high colour
Norway: chl-a \4 lg/l (low alkalinity clear types) or \6 lg/l (other types)
UK and Ireland: confirmation with paleodata of diatoms
Alp Alpine; ATL Atlantic; CB Central Baltic; MED Mediterranean; NOR Northern
Environmental Management (2010) 45:1286–1298 1291
123
Author's personal copy

which can be explained both by data availability and the
level of anthropogenic pressure in those regions.
Setting of Reference Conditions and High/Good Status
Boundary
In different regions chlorophyll-a reference values and the
values corresponding to the boundary between the High
and Good quality classes (H/G boundary) were established
by following common principles (median of chlorophyll-a
values in reference lake type specific populations was used
for setting reference value, 75th–95th percentile—for set-
ting H/G boundary), but slightly different methods.
In the Alpine region, class boundaries were set in two
steps: (1) the reference conditions and boundaries were set
for the annual mean total phytoplankton biovolume; (2) the
reference value and boundaries for chlorophyll-a were
derived from regression with total biovolume. The use of
total biovolume is justified by the fact that historical data
from the 1930s, which represent the best reference data, are
available for total biovolume only, not for chlorophyll-a
values. The reference value was calculated as the median
of the values measured in the set of selected reference
lakes, while H/G boundary—as 95th percentile of values in
the reference lake population. The use of 95th percentile
was justified by the strict criteria used for selection of
reference sites and use of the arithmetic means of the lakes
(1–19 years each) in the analyses, instead of single lake-
years, in order to prevent a bias toward lakes with more
data available.
In the Central-Baltic region, the median value of mean
chlorophyll-a concentrations in reference lakes was used as
the reference value for chlorophyll-a and the 75th per-
centile—as the H/G boundary. The 75th percentile was
considered more appropriate for setting the H/G boundary
than the 90th percentile which would result in a relatively
high proportion of lakes that would be assessed to have
high status but not assigned as reference lakes. To avoid
the problem of insufficient data, the analysis was based on
lake-years, not single lake averages. The results were
compared with similar lake types from the Northern region
and results of project REBECCA (Carvalho 2008) and
found to be similar.
In the Mediterranean region, the median chlorophyll-a
value in reference sites was taken for reference conditions
(in fact, for Maximum Ecological Potential, as both Med-
iterranean types represented only reservoirs). The High/
Good potential boundary is not required to be reported for
heavily modified or artificial water bodies so it was not
calculated. The reference lake number was small in this
region, and future research is planned to revise the current
results.
In the Northern region, the reference value was calcu-
lated as the median value of type-specific chlorophyll a of
reference lakes, supplemented with expert judgments for
types with insufficient data. H/G boundaries were set pri-
marily at the 90th percentile of the distribution of the
metric in reference lakes, thereafter, the values were
compared with the response curves of phytoplankton tax-
onomic indicators (Ptacnik and others 2008) in conjunction
with statistical analysis of Member State reference lake
populations.
It is well known that no single value can represent ref-
erence conditions over all types of water bodies: ecosys-
tems are complex and their characteristics mutually vary
within large ranges, determined by external and internal
factors (Moss and others 2003). Therefore, the final results
of reference conditions and the H/G boundary were
expressed as ranges, not fixed values for the following
reasons: (1) a broad range of natural conditions within
every common lake type (2) different monitoring practices
in use, e.g., sampling depth, time and frequency, which
have influences on chlorophyll-a data; (3) in the Mediter-
ranean region, the main concern was interannual variability
since the results were derived from one single sampling
year dataset.
Statistical Analysis
Statistical analyses were carried out using the following
methods:
• To derive type-specific reference conditions, descrip-
tive statistics were used for chlorophyll-a for each lake
type (medians, quartiles and percentiles);
• Cumulative frequency analyses were used for defining
reference conditions (the cumulative distributions of
the reference lake population were compared to the
non-reference lake population);
• Analysis of Variance (ANOVA) was used to compare
the mean chlorophyll-a concentrations among regions,
types and Member states;
• Mann–Whitney U test was used to examine how
representative the selected reference sites are of all
lake populations. To address this issue, selected
descriptors (altitude, depth, area, alkalinity, conductiv-
ity, TP, chlorophyll-a, Secchi depth) of type-specific
reference lake populations were compared with
impacted lake populations;
• General Linear Model (GLM) was used to estimate the
best model to predict mean chlorophyll-a from several
predictor variables. 2 types of predictors were used to
estimate chlorophyll-a values: (1) altitude, alkalinity,
mean depth, surface area (log transformed in order to
obtain all normally distributed variables); (2) humic
1292 Environmental Management (2010) 45:1286–1298
123
Author's personal copy

type and region used as dummy variables—3 humic
types (low, medium and high colour) and 5 regions
(Alpine, Atlantic, Central/Baltic, Mediterranean and
Northern).
Results and Discussion
Chlorophyll-a Concentrations in European Reference
Lakes
The median type-specific chlorophyll-a concentrations in
reference lake populations ranged from 1.4 to 7.8 lg/l (see
basic statistics in Table 4) and in general followed the
natural trophic gradient, influenced by depth, alkalinity and
humic level (Fig. 1).
Depth was an important factor impacting chlorophyll-a
reference values: the lowest values were found in deep
Mediterranean reservoirs (1.4 and 1.8 lg/l), deep Alpine
lake type AL3 (2.0 lg/l) and deep Northern lake type N2b
(2.0 lg/l); there was no significant difference between the
deep lake reference populations (ANOVA, P [ 0.1).
Conversely, the highest values were recorded for only one
very shallow lake type, LCB2 (depth \3 m, median chlo-
rophyll-a value 7.5 lg/l, which clearly differs from deep
lakes (ANOVA, P \ 0.001).
Surprisingly, the most important factor was water col-
our—all three humic lake types (colour 30–90 mg Pt/l) had
significantly higher chlorophyll-a values compared to non-
humic lake types, Mediterranean and Alpine lakes (Fig. 1,
humic types N3a, N6a, N8a). The highest concentrations
were found in shallow humic moderate alkalinity lake type
(median value 7.8 lg/l) which was significantly higher
compared with all other lake types (ANOVA, P \ 0.01).
Still, there were relatively few lakes in humic lake types
N6a and N8a, so additional research is needed to draw
clear conclusions.
Multiple Regression Model for Site-Specific Reference
Chlorophyll-a
The results of the GLM model using independent predic-
tors are presented in Table 5, revealing a significant effect
of region, humic type, altitude, depth, and alkalinity, but
not lake area. Overall, the variance explained by the model
was 48.0% which is clearly acceptable and comparable
with variability explained by TP model (51.4%, Cardoso
and others 2007) or by diatom-inferred TP (47%, Bradshaw
and Anderson 2001).
Our analyses has highlighted that a geographical region,
humic type, altitude, depth and alkalinity all have a sig-
nificant relationship with chlorophyll-a (Table 5) and
several different regression models for predicting chloro-
phyll-a concentrations are required across Europe to take
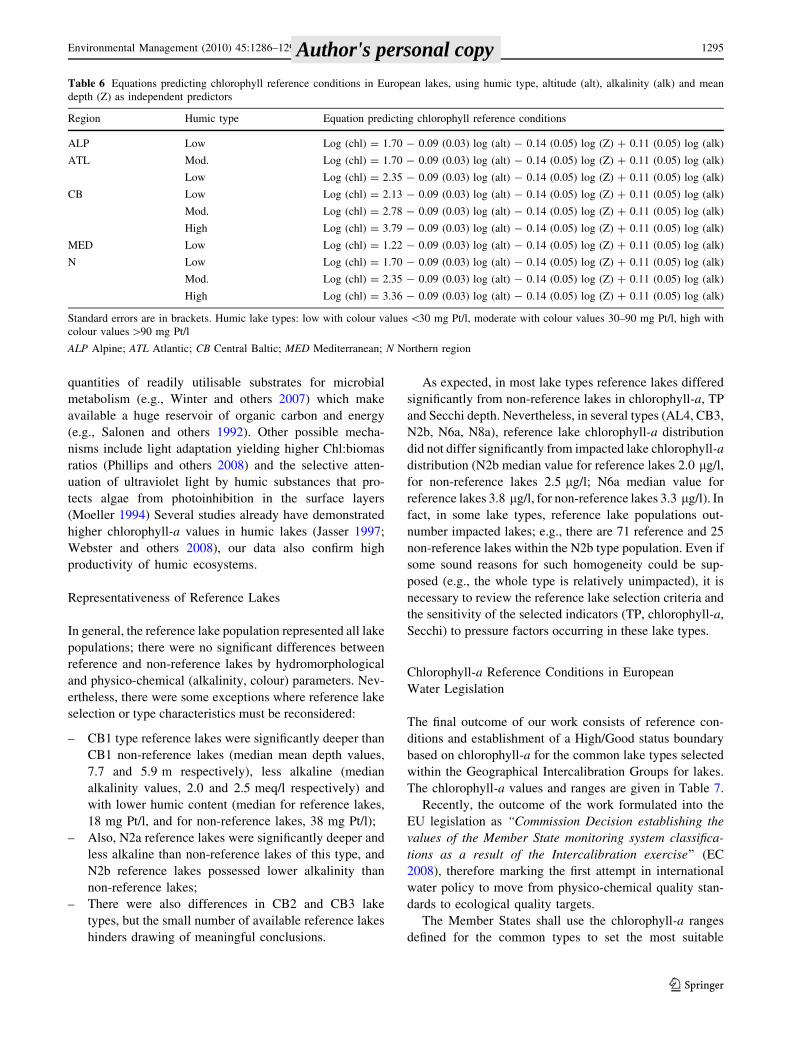
account these predictors (Table 6):
– The strongest gradients were observed for humic type:
chlorophyll-a concentrations generally increased with
increasing humic content (P \ 0.00001);
– Depth (r = -0.14, P = 0.0073) and altitude (r = -0.09,
P = 0.0038) had a negative correlation, while alkalin-
ity was in positive correlation with chlorophyll-a
values (0.11, P = 0.043);
Table 4 Chlorophyll-a concentration in European reference lakes: mean, median, minimum and maximum values, lower (25%) and upper
(75%) quartile, standard deviation and number of lakes (n)
GIG IC type Mean Median Min Max 25% 75% St dev n Type description
Alpine AL3 2.0 2.0 0.7 3.9 1.5 2.6 0.8 20 Lowland or mid-altitude, deep, high alkalinity, large
AL4 3.1 3.3 1.6 4.5 2.2 3.8 1.0 13 Mid-altitude, shallow, high alkalinity, large
Atlantic A1/2 4.7 2.7 1.4 12.7 2.3 5.1 4.3 9 Lowland, shallow, calcareous
Central Baltic CB1 3.7 2.7 1.6 10.8 2.1 4.2 2.4 21 Lowland, shallow, calcareous
CB2 6.2 7.5 1.4 11.3 1.7 9.0 4.4 5 Lowland, very shallow, calcareous,
CB3 4.6 3.4 0.9 12.4 2.2 6.0 3.7 8 Lowland, shallow, small, moderate alkalinity
Mediterranean LMc 1.4 1.8 0.4 1.8 0.5 1.6 0.6 5 Reservoirs, deep, large siliceous, lowland, ‘‘wet areas’’
LMsw 1.9 1.4 0.7 3.7 1.1 2.6 1.2 5 Reservoirs, deep, large, calcareous
Northern N1 3.4 2.9 1.1 8.6 2.2 5.1 1.9 19 Lowland, shallow, moderate alkalinity, clear
N2a 2.5 2.2 0.7 7.5 1.7 3.0 1.2 60 Lowland, shallow, low alkalinity, clear
N2b 2.2 2.0 0.5 6.5 1.4 2.5 1.2 71 Lowland, deep, low alkalinity, clear
N3a 5.0 4.2 1.1 21.5 3.0 6.3 3.6 46 Lowland, shallow, low alkalinity, humic
N5a 1.9 1.7 0.8 7.3 1.1 2.2 1.1 37 Mid-altitude, shallow, low alkalinity, clear
N6a 6.3 3.8 2.4 24.9 2.6 4.0 8.2 7 Mid-altitude, shallow, low alkalinity, humic
N8a 10.8 7.8 3.7 25.5 4.8 16.0 8.3 8 Lowland, shallow, moderate alkalinity, humic
Environmental Management (2010) 45:1286–1298 1293
123
Author's personal copy

– As for the region effect, we found only two statistically
significant classes: lakes in the Central Baltic region
had on average more chlorophyll-a, but Mediterranean
lakes less chlorophyll-a than lakes on the Alpine,
Atlantic and Northern regions.
These findings are in accordance with well-established
relationships between TP concentration and alkalinity (e.g.,
Vighi and Chiaudani 1985; Cardoso and others 2007), alti-
tude (Muller and others 1998; Cardoso and others 2007) and
depth (e.g., Ryder and others 1974). Our results only partly
agree with Cardoso and others (2007) which found higher
TP concentrations both in Central Baltic and Mediterranean
region. The difference can be explained by the low number
of Mediterranean lakes included in both studies and Medi-
terranean lake types which comprise reservoirs which
biological characteristics differ from natural lakes. Higher
chlorophyll-a values in the Central Baltic region can be
explained by a type effect (lakes are shallower with higher
alkalinity and lower altitude) and latitudinal effect related
to temperature and its effects on mineralization in the
catchment.
More controversial is the relationship between humic
substances and chlorophyll-a values—for a long time,
humic lakes were considered unproductive systems, as
humic substances form complexes with phosphate ions
and organophosphorus compounds, thereby reducing
phosphorus availability to phytoplankton (Jones and oth-
ers 1993). From the other side, it is now known from
extensive recent experimental work that both natural
ultraviolet as well as visible light induce major photolytic
changes in complex organic molecules and generate large
LAL3LAL4
LA1/2LCB1
LCB2LCB3
LMcLMSW
LN1L-N2a
L-N2bLN3a
LN5LN6a
LN8a0
2
4
6
8
10
12
14
16
18
20
22
24
26
Chl
orop
hyll-
a (µ
g/l)
Fig. 1 Boxplots comparing
chlorophyll reference conditions
by different lake IC common
types. The middle square
indicates the median value, the
top and bottom of the box are
the upper (75%) and lower
(25%) percentiles, the upper and
lower line extend to the limits of
non-outlier range, and the
values beyond the lines
represent outliers and extreme
values
Table 5 General linear model
result for chlorophyll-avariation in European reference
lakes
Sum of squares Degree of freedom Mean square F Significance
Intercept 34.61 1 34.61 113.86 0.000
GIG region 4.33 4 1.08 3.56 0.007
Humic class 38.51 2 19.25 63.34 0.000
Altitude 2.59 1 2.59 8.51 0.004
Depth 2.22 1 2.22 7.31 0.007
Area 1.07 1 1.07 3.52 0.061
Alkalinity 1.27 1 1.26 4.15 0.042
Error 84.19 277 0.30
1294 Environmental Management (2010) 45:1286–1298
123
Author's personal copy
quantities of readily utilisable substrates for microbial
metabolism (e.g., Winter and others 2007) which make
available a huge reservoir of organic carbon and energy
(e.g., Salonen and others 1992). Other possible mecha-
nisms include light adaptation yielding higher Chl:biomas
ratios (Phillips and others 2008) and the selective atten-
uation of ultraviolet light by humic substances that pro-
tects algae from photoinhibition in the surface layers
(Moeller 1994) Several studies already have demonstrated
higher chlorophyll-a values in humic lakes (Jasser 1997;
Webster and others 2008), our data also confirm high
productivity of humic ecosystems.
Representativeness of Reference Lakes
In general, the reference lake population represented all lake
populations; there were no significant differences between
reference and non-reference lakes by hydromorphological
and physico-chemical (alkalinity, colour) parameters. Nev-
ertheless, there were some exceptions where reference lake
selection or type characteristics must be reconsidered:
– CB1 type reference lakes were significantly deeper than
CB1 non-reference lakes (median mean depth values,
7.7 and 5.9 m respectively), less alkaline (median
alkalinity values, 2.0 and 2.5 meq/l respectively) and
with lower humic content (median for reference lakes,
18 mg Pt/l, and for non-reference lakes, 38 mg Pt/l);
– Also, N2a reference lakes were significantly deeper and
less alkaline than non-reference lakes of this type, and
N2b reference lakes possessed lower alkalinity than
non-reference lakes;
– There were also differences in CB2 and CB3 lake
types, but the small number of available reference lakes
hinders drawing of meaningful conclusions.
As expected, in most lake types reference lakes differed
significantly from non-reference lakes in chlorophyll-a, TP
and Secchi depth. Nevertheless, in several types (AL4, CB3,
N2b, N6a, N8a), reference lake chlorophyll-a distribution
did not differ significantly from impacted lake chlorophyll-a
distribution (N2b median value for reference lakes 2.0 lg/l,
for non-reference lakes 2.5 lg/l; N6a median value for
reference lakes 3.8 lg/l, for non-reference lakes 3.3 lg/l). In
fact, in some lake types, reference lake populations out-
number impacted lakes; e.g., there are 71 reference and 25
non-reference lakes within the N2b type population. Even if
some sound reasons for such homogeneity could be sup-
posed (e.g., the whole type is relatively unimpacted), it is
necessary to review the reference lake selection criteria and
the sensitivity of the selected indicators (TP, chlorophyll-a,
Secchi) to pressure factors occurring in these lake types.
Chlorophyll-a Reference Conditions in European
Water Legislation
The final outcome of our work consists of reference con-
ditions and establishment of a High/Good status boundary
based on chlorophyll-a for the common lake types selected
within the Geographical Intercalibration Groups for lakes.
The chlorophyll-a values and ranges are given in Table 7.
Recently, the outcome of the work formulated into the
EU legislation as ‘‘Commission Decision establishing the
values of the Member State monitoring system classifica-
tions as a result of the Intercalibration exercise’’ (EC
2008), therefore marking the first attempt in international
water policy to move from physico-chemical quality stan-
dards to ecological quality targets.
The Member States shall use the chlorophyll-a ranges
defined for the common types to set the most suitable
Table 6 Equations predicting chlorophyll reference conditions in European lakes, using humic type, altitude (alt), alkalinity (alk) and mean
depth (Z) as independent predictors
Region Humic type Equation predicting chlorophyll reference conditions
ALP Low Log (chl) = 1.70 - 0.09 (0.03) log (alt) - 0.14 (0.05) log (Z) ? 0.11 (0.05) log (alk)
ATL Mod. Log (chl) = 1.70 - 0.09 (0.03) log (alt) - 0.14 (0.05) log (Z) ? 0.11 (0.05) log (alk)
Low Log (chl) = 2.35 - 0.09 (0.03) log (alt) - 0.14 (0.05) log (Z) ? 0.11 (0.05) log (alk)
CB Low Log (chl) = 2.13 - 0.09 (0.03) log (alt) - 0.14 (0.05) log (Z) ? 0.11 (0.05) log (alk)
Mod. Log (chl) = 2.78 - 0.09 (0.03) log (alt) - 0.14 (0.05) log (Z) ? 0.11 (0.05) log (alk)
High Log (chl) = 3.79 - 0.09 (0.03) log (alt) - 0.14 (0.05) log (Z) ? 0.11 (0.05) log (alk)
MED Low Log (chl) = 1.22 - 0.09 (0.03) log (alt) - 0.14 (0.05) log (Z) ? 0.11 (0.05) log (alk)
N Low Log (chl) = 1.70 - 0.09 (0.03) log (alt) - 0.14 (0.05) log (Z) ? 0.11 (0.05) log (alk)
Mod. Log (chl) = 2.35 - 0.09 (0.03) log (alt) - 0.14 (0.05) log (Z) ? 0.11 (0.05) log (alk)
High Log (chl) = 3.36 - 0.09 (0.03) log (alt) - 0.14 (0.05) log (Z) ? 0.11 (0.05) log (alk)
Standard errors are in brackets. Humic lake types: low with colour values \30 mg Pt/l, moderate with colour values 30–90 mg Pt/l, high with
colour values [90 mg Pt/l
ALP Alpine; ATL Atlantic; CB Central Baltic; MED Mediterranean; N Northern region
Environmental Management (2010) 45:1286–1298 1295
123
Author's personal copy

boundaries for their national types according to the type
characteristics, e.g., lakes types with low alkalinity, low
humic matter, high altitude, high depth, and/or short
retention time correspond with reference values close to the
minimum of the range and vice versa.
Comparison with Chlorophyll-a Reference
Values USA and Australia
Also, other nations have codified the concept of reference
conditions in their legislation. For instance, in United
States ecoregional reference conditions were established
representing conditions minimally impacted by human
activities (US EPA 2000). In general, the chlorophyll-a
reference values are of the same magnitude as those for
comparable lakes in Europe (1.9–4.9 lg/l). Although sev-
eral approaches for setting reference conditions were pro-
posed (historical data, predictive models, data of minimally
impacted sites), in practice the 25th percentile of a sample
distribution from the entire population of lakes was used to
derive reference values. As a consequence, reference con-
ditions are significantly higher for ecoregions with higher
overall human impact (e.g., ecoregion VI, Western Corn
Belt plains and ecoregion XIII, Southern Florida Coastal
Plain).
Chlorophyll-a reference values for Australian freshwater
lakes were derived using the statistical distribution of ref-
erence lake data collected within five geographical regions
across Australia and New Zealand (ANZECC 2000).
Although the term ‘‘reference condition’’ was used in a much
less stringent way, allowing use of altered sites when it is not
possible to find unimpacted sites, chlorophyll-a reference
values for Australian lakes range from 3 to 5 lg/l and lie in
the same magnitude as those found for lakes in Europe.
It can be concluded that lake chlorophyll-a reference
conditions set in the European, USA and Australian leg-
islation frameworks are broadly comparable, even if there
are substantial differences both in theoretical background
and practical application of the reference condition concept
and setting environmental quality targets.
Methodological Concerns and Future Directions
There are several aspects which strongly influence the
confidence of the chlorophyll-a reference values e.g.,
insufficient number of reference lakes, inherently large
heterogeneity of data (different sampling and analyses
methods); insufficient geographical coverage of the data;
high natural variability within common lake types.
The main problem is that the present work has only
focused on eutrophication pressure and only on quantita-
tive part of phytoplankton while considering other pres-
sures and taxonomic composition of phytoplankton are still
the tasks for the nearest future.
We therefore believe that the work to be continued for
the period of the next River Basin Management Plan, and
that a longer period is needed to validate the present
results and develop reference conditions both for phyto-
plankton biomass and taxonomic composition with higher
confidence.
Table 7 Chlorophyll-a reference conditions, High/Good boundary values and ranges by IC lake type defined and agreed in the WFD Inter-
calibration process
Lake type Lake type characterisation Reference conditions High/Good boundary
Value Range Value Range
AL3 Lowland or mid-altitude, deep, moderate to high alkalinity, large 1.9 1.5–1.9 2.7 2.1–2.7
AL4 Mid-altitude, shallow, moderate to high alkalinity, large 3.3 2.7–3.3 4.4 3.6–4.4
A1/2 Lowland, shallow, calcareous 3.2 2.6–3.8 5.8 4.6–7.0
CB1 Lowland, shallow, calcareous 3.2 2.6–3.8 5.8 4.6–7.0
CB2 Lowland, very shallow, calcareous 6.8 6.2–7.4 10.8 9.9–11.7
CB3 Lowland, shallow, siliceous 3.1 2.5–3.7 5.4 4.3–6.5
Msw Reservoirs, deep, large, siliceous, lowland, ‘‘wet areas’’ 1.4 1.4–2.0 n.e. n.e.
Mc Reservoirs, deep, large, calcareous 1.8 1.8–2.6 n.e. n.e.
N1 Lowland, shallow, moderate alkalinity, non-humic, large 3.0 2.5–3.5 6.0 5.0–7.0
N2a Lowland, shallow, low alkalinity, non-humic, large 2.0 1.5–2.5 4.0 3.0–5.0
N2b Lowland, deep, low alkalinity, non-humic, large 2.0 1.5–2.5 4.0 3.0–5.0
N3a Lowland, shallow, low alkalinity, humic, large 3.0 2.5–3.5 6.0 5.0–7.0
N5a Mid-altitude, shallow, low alkalinity, non-humic, large 1.5 1.0–2.0 3.0 2.0–4.0
N6a Mid-altitude, shallow, low alkalinity, humic, large 2.5 2.0–3.0 5.0 4.0–6.0
N8a Lowland, shallow, moderate alkalinity, humic, large 4.0 3.5–5.0 8.0 7.0–10.0
n.e. not established
1296 Environmental Management (2010) 45:1286–1298
123
Author's personal copy

Conclusions
1. Mainly a ‘‘reference site’’ approach—selection of
lakes with no or very minor human impact—was used
for setting chlorophyll-a reference conditions in Eur-
ope. The selection of reference lakes based on criteria
assessing the pressure from the catchment. (land-use,
population density and absence of point sources). In
some regions paleolimnological data, historical data
and modelling of nutrient load were used to validate
their choice of reference sites.
2. According to the reference criteria, 359 reference lakes
were selected across the EU, representing fifteen
common intercalibration types. In the majority of types,
reference lakes may be considered type representative;
nevertheless, in several cases reference lake selection or
type characteristics must be reconsidered, for example,
the Central-Baltic types and several Northern types. The
dataset ideally needs further inclusion of lakes from the
Central-Baltic (especially lake types LCB2 and LCB3)
and Mediterranean region. Also, several Northern lake
types have a low number of lakes and high variability of
the data (LN6a and LN8a).
3. Reference conditions for 15 international lake types were
calculated using a common principle: the median value of
the measured metric at reference sites was used for
reference conditions, while for the High/Good boundary,
a percentile between the 75th and 95th was used.
4. Additionally, empirical models were developed for
estimating site-specific reference chlorophyll-a concen-
trations from a set of potential predictor variables.
Chlorophyll-a concentrations increased with humic level
and alkalinity, decreased with lake depth and altitude,
and varied with geographical region, while there was no
clear relationship between chlorophyll-a and lake area.
5. A cross-region comparison of reference values and
target value for chlorophyll-a shows a very good
consistency between regions and types: high chloro-
phyll-a values are associated with low depth, high
alkalinity, low altitude, and high water colour; con-
versely, the lowest values were defined for deep lakes
with low content of humic matter.
6. The setting of ecological classification is included in
the EU legislation (EC Decision), marking the first
attempt in international water policy to move from
physico-chemical quality standards to ecological qual-
ity targets.
Acknowledgments The work was carried out under the Common
Implementation Strategy of Water Framework Directive, lead by
Working Group ECOSTAT and coordinated by European Commis-
sion Joint Research Centre. The authors thank all Lake Intercalibra-
tion experts who contributed to the realization of the database and the
formulation of ideas and concepts during intercalibration meetings:
Luc Denys and Jeroen van Wichelen (Belgium), Andre - Sylvia
Nicolaou and Gerald Dorflinger (Cyprus), Martin Søndergaard (Den-
mark), Helle Maemets (Estonia), Liisa Lepisto (Finland), Julien de
Bartoli and Vincent Bertrin (France), Jorg Schonfelder and Ute Mis-
chke (Germany), Vasiliki Tsiaoussi (Greece), Wayne Trodd (Ireland),
Antonio Dalmiglio and Aldo Marchetto (Italy), Mindaugas Gudas
(Lithuania), Rob Portielje (the Netherlands), Dag Rosland and Tone
Joeran Oredalen (Norway), Agnieszka Kolada (Poland), Ruxandra
Maxim (Romania), Mikaela.Gonczi (Sweden), and Sian Davies (UK).
Open Access This article is distributed under the terms of the
Creative Commons Attribution Noncommercial License which per-
mits any noncommercial use, distribution, and reproduction in any
medium, provided the original author(s) and source are credited.
References
Australian and New Zealand Environment and Conservation Council
(ANZECC) (2000) Australian and New Zealand guidelines for
fresh and marine water quality. Auckland, New Zealand
Bailey RC, Norris RH, Reynoldson TB (2004) Bioassessment of
freshwater ecosystems using the reference condition approach.
Kluwer Academic Publishers, New York
Battarbee RW (1999) The importance of palaeolimnology to lake
restoration. Hydrobiologia 395(396):149–159
Bennion H, Fluin J, Simpson GL (2004) Assessing eutrophication and
reference conditions for Scottish freshwater lochs using subfossil
diatoms. The Journal of Applied Ecology 41:124–138
Bennion H, Wunsam S, Schmidt R (1995) The validation of diatom-
phosphorus transfer functions: an example from Mondsee,
Austria. Freshwater Biology 34:271–283
Bradshaw EG, Anderson NJ (2001) Validation of a diatom-phospho-
rus calibration set for Sweden. Freshwater Biology 46:1035–
1048
Cardoso AC, Solimini A, Premazzi G, Carvalho L, Lyche Solheim A,
Rekolainen S (2007) Phosphorus reference concentrations in
European lakes. Hydrobiologia 584:3–12
Carvalho L, Solimini A, Phillips G, van den Berg M, Pietilainen OP,
Lyche Solheim A, Poikane S, Mischke U (2008) Chlorophyll
reference conditions for European lake types used for intercal-
ibration of ecological status. Aquatic Ecology 42:203–211
EC (2000) Directive 2000/60/EC of the European Parliament and of
the Council of 23rd October 2000 establishing a framework for
Community action in the field of water policy. Official Journal of
the European Communities, 22 December, L 327/1. European
Commission, Brussels
EC (2001) Common implementation strategy for the water framework
directive (2000/60/EC). Strategic document as agreed by the
Water Directors, May 2, 2001. http://circa.europa.eu/Public/irc/
env/wfd/library
EC (2005) Common implementation strategy for the water framework
directive (2000/60/EC). Guidance on the Intercalibration process
2004–2006. Luxembourg, Office for Official publications of the
European Communities. http://circa.europa.eu/Public/irc/env/wfd/
library
EC (2008) Commission Decision of 30 October 2008 establishing,
pursuant to Directive 2000/60/EC of the European Parliament
and the Council, the values of the Member State monitoring
system classifications as a result of the intercalibration exercise
2008/915/EC. Official Journal of the European Communities,
L332/20. European Commission, Brussels
Egan D, Howell EA (2001) The historical ecology handbook: a
restorationist’s guide to reference ecosystems. Island Press,
Washington, USA
Environmental Management (2010) 45:1286–1298 1297
123
Author's personal copy

Findenegg I (1935) Limnologische Untersuchungen im Karntner
Seengebiet. Internationale Revue der gesamten. Hydrobiologie
Hydrographie 32:408–415
Findenegg I (1954) Versuch einer soziologischen Gliederung der
Karntner Seen nach ihrem Phytoplankton. Angewandte
Pflanzensoziologie, Festschrift Aichinger 1:299–309
Hughes RM (1995) Defining acceptable biological status by compar-
ing with reference conditions. In: Davis WS, Simon T (eds)
Biological assessment and criteria: tools for water resource
planning and decision making. Lewis Publishers, Boca Raton,
Florida, USA, pp 145–152
Illies J (1978) Limnofauna Europaea. A checklist of the animals
inhabiting European inland waters, with account of their
distribution and ecology. G. Fischer, Stuttgart and Swets &
Zeitlinger, Amsterdam
Jasser I (1997) The dynamics and importance of picoplankton in a
shallow, dystrophic lake in comparison with surface waters of
two deep lakes with contrasting trophic status. Hydrobiologia
342(343):87–93
Jones RI, Salonen K, Haan H (1993) Phosphorus transformation in the
epilinnion of humic lakes: abiotic interactions between dissolved
humic materials and phosphate. Freshwater Biology 19:357–369
Kamenik C, Koinig KA, Schmidt R, Appleby PG, Dearing JA, Lami
A, Thompson R, Psenner R (2000) Eight hundred years of
environmental changes in a high Alpine lake inferred from
sediment records. Journal of Limnology 59:43–52
Klee R, Schmidt R, Muller J (1993) Allerod diatom assemblages in
prealpine hardwater lakes of Bavaria and Austria as preserved by
the Laacher See eruption event. Limnologica 23:131–143
Kolada A, Soszka H, Cydzik D, Golub M (2005) Abiotic typology of
Polish lakes. Limnologica 35:145–150
Loffler H (1972) The distribution of subfossil ostracods and diatoms
in pre-alpine lakes. Verhandlungen Internationale Vereinigung
fur Theoretische und Angewandte Limnologie 18:1039–1050
Lotter AF (2001) The palaeolimnology of Soppensee (Central
Switzerland), as evidenced by diatom, pollen and fossil-pigment
analysis. Journal of Palaeolimnology 25:65–79
Miettinen JO, Kukkonen M, Simola H (2005) Hindcasting baseline
values for water colour and total phosphorus concentration in
lakes using sedimentary diatoms: implications for lake typology
in Finland. Boreal Environment Research 10:31–43
Moeller RE (1994) Contribution of ultraviolet radiation (UV-A, UV-B)
to photoinhibition of epilimnetic phytoplankton in lakes of differing
UV transparency. Ergebnisse der Limnologie 43:157–170
Moss B, Stephen D, Alvarez C, Becares E, Bund van de W, Collings
SE, Van Donk E, Eyto de E, Feldmann T, Fernandez-alaez C,
Fernandez-alaez M, Franken RJM, Garcıa-Criado F, Gross EM,
Gyllstrom M, Hansson LA, Irvine K, Jarvalt A, Jensen JP,
Jeppesen E, Kairesalo T, Kornijow R, Krause T, Kunnap H, Laas
A, Lill E, Lorens B, Luup H, Miracle MR, Noges P, Noges T,
Nykanen M, Ott I, Peczula W, Peeters ETHM, Phillips G, Romo
S, Russell V, Salujoe J, Scheffer M, Siewertsen K, Smal H,
Tesch C, Timm H, Tuvikene L, Tonno I, Virro T, Vicente E,
Wilson D (2003) The determination of ecological status in
shallow lakes—a tested system (ECOFRAME) for implementa-
tion of the European Water Framework Directive. Aquatic
Conservation: Marine and Freshwater Ecosystems 13:507–549
Muller B, Lotter AF, Sturm M, Ammann A (1998) Influence of
catchment quality and altitude on the water and sediment
composition of 68 small lakes in Central Europe. Aquatic
Sciences 60:316–337
OECD (1982) Eutrophication of waters—monitoring, assessment and
control. Organization for Economic Cooperation and Develop-
ment, Paris
Phillips G, OPietilainen OP, Carvalho L, Solimini A, Lyche Solheim
A, Cardoso AC (2008) Chlorophyll–nutrient relationships of
different lake types using a large European dataset. Aquatic
Ecology 42:213–226
Ptacnik R, Lepisto L, Willen E, Brettum P, Andersen T, Rekolainen
S, Lyche Solheim A (2008) Quantitative responses of lake
phytoplankton to eutrophication in Northern Europe. Aquatic
Ecology 42:227–236
Reichmann M, Schulz L (2004) Typenspezifische Referenzbedingun-
gen fur die integrierende Bewertung des okologischen
Zustandes stehender Gewasser Osterreichs gemaß der
EU-Wasserrahmenrichtlinie. Projektstudie, Phase 3, Abschlußbe-
richt Modul 2: Bewertung des Phytoplanktons anhand der
Gruppen- bzw. Artverteilung. Bericht, Bundesministerium fur
Land- und Forstwirtschaft, Umwelt und Wasserwirtschaft, Wien
Reynoldson TB, Rosenberg DR, Day KE, Norris RH, Resh VH (1997)
The reference condition: a comparison of multimetric and
multivariate approaches to assess water quality impairment using
benthic macroinvertebrates. Journal of the North American
Benthological Society 16:833–852
Ruttner F (1937) Okotypen mit verschiedener Vertikalverteilung im
Plankton der Alpenseen. International Review of Hydrobiology
35:7–34
Ryder RA, Kerr SR, Loftus KH, Regier HA (1974) The morphoe-
daphic index, a fish yield estimator—review and evaluation.
Journal of the Fisheries Research Board of Canada 31:663–688
Ryding SO, Rast W (1989) The control of eutrophication of lakes and
reservoirs. Man and biosphere series. UNESCO, Paris and
Parthenon Publishing, Carnforth
Salonen K, Kankaala P, Tulonen T, Hammar T, James M, Metsala
TR, Arvola L (1992) Planktonic food chains in a highly humic
lakes. Hydrobiologia 229:143–157
Sayer C (2001) Problems with diatom-total phosphorus transfer
functions: examples from a shallow English lake. Freshwater
Biology 46:743–757
Schmidt R, Psenner R, Muller J, Indinger P, Kamenik C (2002)
Impact of late glacial climate variations on stratification and
trophic state of the meromictic lake Langsee (Austria): valida-
tion of a conceptual model by multi proxy studies. Journal of
Limnology 61:49–60
Stoddard JL, Larsen DP, Hawkins CP, Johnson RK, Norris RH (2006)
Setting expectations for the ecological condition of streams: the
concept of reference condition. Ecological Applications
16(4):1267–1276
Taylor D, Dalton C, Leira M, Jordan P, Irvine K, Bennion H, McGee
E, Leon-Vintro L (2006) Identification of reference status for
Irish lake typologies using palaeolimnological methods and
techniques. IN-SIGHT EPA/ERTDI Project # 2002-W-LS/7
Final Report. School of Natural Sciences. Trinity College,
University of Dublin, Dublin
United States Environment Protection Agency (US EPA) (2000)
Nutrient criteria technical guidance manual. Lakes and Reser-
voirs. EPAA 822-B-00–007 U.S. EPA, Washington, DC
Vighi M, Chiaudani G (1985) A simple method to estimate lake
phosphorus concentrations resulting from natural background
loading. Water Resources 10:987–991
Vollenweider RA (1976) Advances in defining critical loading levels
for phosphorus in lake eutrophication. Memorie dell’Istituto
Italiano di Idrobiologia 33:53–69
Webster KE, Soranno PA, Cheruvelil KS, Bremigan M, Downing A,
Vaux P, Asplund T, Bacon LC, Connor J (2008) An empirical
evaluation of the nutrient color paradigm for lakes. Limnology
and Oceanography 53(3):1137–1148
Winter A, Fish T, Playle R, Smith DS, Curtis P (2007) Photodeg-
radation of natural organic matter from diverse freshwater
sources. Aquatic Toxicology 84:215–222
1298 Environmental Management (2010) 45:1286–1298
123
Author's personal copy