deep chandra observations of tev binaries ? i. ls?i?+61°303
TRANSCRIPT
Mon. Not. R. Astron. Soc. 405, 2206–2214 (2010) doi:10.1111/j.1365-2966.2010.16642.x
Deep Chandra observations of TeV binaries – I. LS I +61◦303
N. Rea,1�† D. F. Torres,1,2 M. van der Klis,3 P. G. Jonker,4,5 M. Mendez6
and A. Sierpowska-Bartosik7
1Institut de Ciencies de l’Espai (ICE, IEEC–CSIC), Campus UAB, Fac. de Ciencies, Torre C5-parell, 2a planta, 08193 Barcelona, Spain2Institucio Catalana de Recerca i Estudis Avancats (ICREA), Barcelona, Spain3University of Amsterdam, Astronomical Institute “Anton Pannekoek”, Postbus 94249, 1090 GE Amsterdam, the Netherlands4SRON-Netherlands Institute for Space Research, Sorbonnelaan 2, 3584 CA Utrecht, the Netherlands5Harvard-Smithsonian Center for Astrophysics, 60 Garden Street, Cambridge, MA 02138, USA6Kapteyn Astronomical Institute, University of Groningen, PO Box 800, 9700 AV Groningen, the Netherlands7University of Lodz, Department of Astrophysics, Pormorska Street 149/153, PL-90236 Lodz, Poland
Accepted 2010 March 6. Received 2010 March 6; in original form 2009 December 6
ABSTRACTWe report on a 95 ks Chandra observation of the TeV emitting high-mass X-ray binaryLS I +61◦303, using the ACIS-S camera in continuous clocking mode to search for a possibleX-ray pulsar in this system. The observation was performed while the compact object waspassing from phase 0.94 to 0.98 in its orbit around the Be companion star (hence close tothe apastron passage). We did not find any periodic or quasi-periodic signal (at this orbitalphase) in a frequency range of 0.005–175 Hz. We derived an average pulsed fraction (PF)3σ upper limit for the presence of a periodic signal of �10 per cent (although this limit isstrongly dependent on the frequency and the energy band), the deepest limit ever reached forthis object. Furthermore, the source appears highly variable in flux and spectrum even in thisvery small orbital phase range, in particular we detect two flares, lasting thousands of seconds,with a very hard X-ray spectrum with respect to the average source spectral distribution.The X-ray PF limits we derived are lower than the PF of any isolated rotational-poweredpulsar, in particular having a TeV counterpart. In this scenario, most of the X-ray emissionof LS I +61◦303 should necessarily come from the interwind or innerpulsar wind zone shockrather than from the magnetosphere of the putative pulsar. On the other hand, very low X-rayPFs are not unseen in accreting neutron star systems, although we cannot at all exclude theblack hole nature of the hosted compact object, a pulsar with a beam pointing away fromour line of sight or spinning faster than ∼5.6 ms, nor that pulsations might have a transientappearance in only a small fraction of the orbit. Furthermore, we did not find evidence for thepreviously suggested extended X-ray emission.
Key words: stars: individual: LS I +61◦303 – X-rays: binaries.
1 IN T RO D U C T I O N
High-mass X-ray binaries (HMXBs) are relatively young (<107 yr)systems composed of a massive OB-type star and a compact object,either a neutron star or a black hole. These systems are generallybright X-ray emitters, due to matter from the OB star accreting on tothe compact object. The majority of the HMXBs are Be/X-ray bina-ries, and some tens of them are O main-sequence or supergiant X-raybinary systems. Accretion takes place through either the strong stel-
�Ramon y Cajal Research Fellow.†E-mail: [email protected]
lar wind of the optical companion or Roche lobe overflow, wherematter flows via the inner Lagrangian point and an accretion discto the compact object (see Frank, King & Raine 1992). A pow-erful X-ray source (LX ∼ 1035–1038 erg s−1) is produced, whichionizes almost the whole stellar wind. The X-ray continuum spectraof HMXBs are often described by a power law with photon indexα ∼ 1–2 (modified at higher energies by an exponential cut-off). Aspectrum of this form can be produced by inverse Compton scat-tering of soft X-rays by hot electrons in the accretion column nearthe compact object, and a part of this emission is scattered by thestellar wind of the massive companion. This might sometimes resultin a further non-thermal spectral component, but with a differentabsorption column depending on the orbital phase of the system.
C© 2010 The Authors. Journal compilation C© 2010 RAS
Dow
nloaded from https://academ
ic.oup.com/m
nras/article/405/4/2206/1044302 by guest on 11 March 2022
Deep Chandra observations of LS I +61◦303 2207
Furthermore, in some HMXBs a soft excess at ∼0.1–2 keV is de-tected, very common in systems hosting pulsars (Hickox, Narayan& Kallman 2004).
On top of the continuum model, spectral lines are often presentin these systems, neutral and ionized, such as Fe, Si, Mg, Ar, N, Ca,mainly produced in the stellar wind or in the accretion disc (if any)illuminated by the strong X-ray emission of the compact object (seee.g. Cottam et al. 2001; van der Meer et al. 2005).
To date, there are only four or five binary systems known tobe emitting up to TeV energies, all of them of the HMXB class:PSR B1259–63 (Aharonian et al. 2005a), LS I +61◦303 (Albertet al. 2006), LS 5039 (Aharonian et al. 2005b, 2006), Cyg X-1(Albert et al. 2007) and possibly the newly suggested candidateHESS J0632+057 (Aharonian et al. 2007, Hinton et al. 2009).These sources are rather peculiar with respect to the HMXBclass. The first identified TeV binary system was PSR B1259–63, a3.4-yr period binary hosting a 48 ms radio pulsar in an eccentricorbit around a Be star (Johnston et al. 1992). The TeV emissionfrom this object is thought to be associated with the radio pulsarwind and its interaction with the radiation field and material aroundthe Be-star, and shows variable unpulsed X-ray (Chernyakova et al.2006b, 2009) and radio emission (Johnston et al. 1999, 2005), inparticular close to the periastron passage due to the interaction be-tween the pulsar and the Be disc. PSR B1259–63’s X-ray emissionis well described by an absorbed power law (NH = 5 × 1021 cm−2;� ∼ 1.2–1.8), with an unabsorbed 1–10 keV flux varying between0.1–3 × 10⁻¹¹ erg s−1 cm−2 (Chernyakova et al. 2006b, 2009).
LS I +61◦303 and LS 5039 are both much closer binaries, withorbital periods of 26.5 and 3.9 d, respectively, hosting a very mas-sive star (B and O types) and a compact object, the nature of whichis still unknown for both sources (see Fig. 1 for a schematic viewof LS I +61◦303’s orbit). Furthermore, LS I +61◦303 and LS 5039share the quality of (i) being the only two known γ -ray binaries
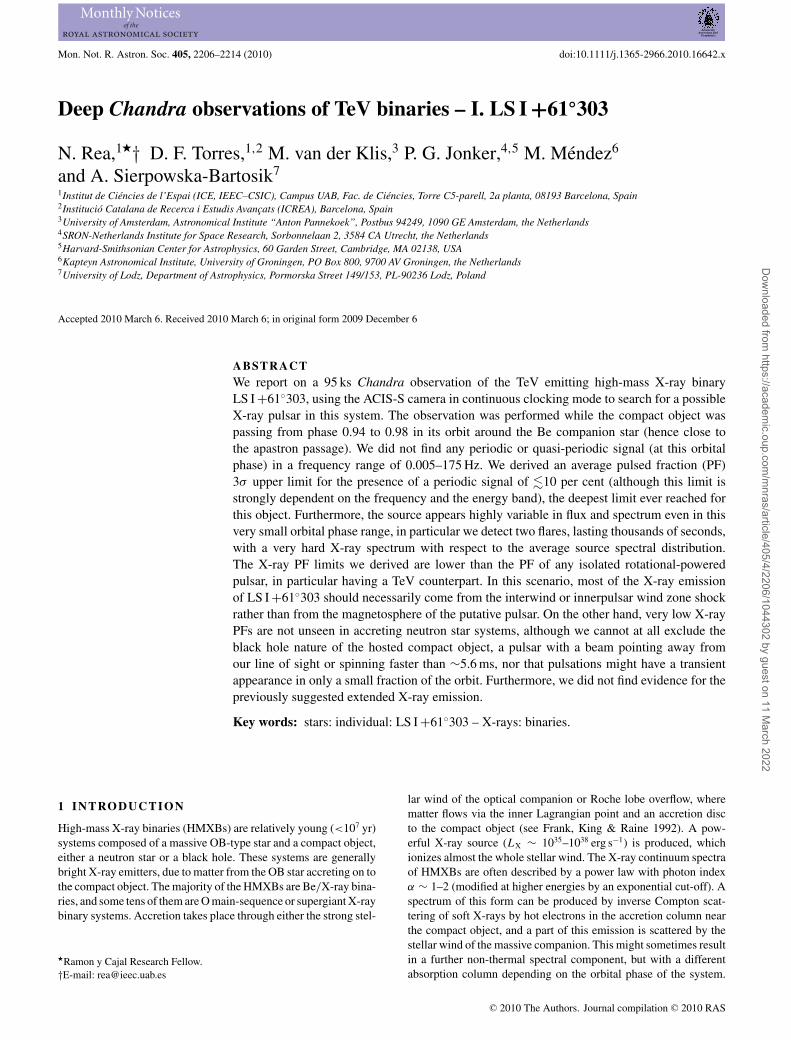
Figure 1. LS I +61◦303’s geometry considering the orbital solution ofCasares et al. (2005). The phases for inferior conjunction (INFC), supe-rior conjunction (SUPC), periastron (P), and apastron (A) are marked, andthe inclination is not taken into account in the plot. The orbit (black solidline), the massive star (MS; in orange) and the equatorial Be disc (in yellow)are roughly to scale, assuming a disc radius seven times larger than thestellar radius. The blue thick line indicates the orbital phases spanned by ourChandra observation (adapted from Sierpowska-Bartosik & Torres 2009).
detected in the GeV band (Abdo et al. 2009a,b), (ii) they bothshow periodic TeV emission modulated by their orbital motion(Aharonian et al. 2006; Albert et al. 2008, 2009), (iii) variable X-ray emission (Bosch-Ramon et al. 2005, 2007; Sidoli et al. 2006;Paredes et al. 2007) correlated with the orbital motion, and (iv)they have a variable radio counterpart (see also below). TheirX-ray emission is highly variable on a ks time-scale, and is forboth objects characterized by an absorbed power-law spectrum(LS I +61◦303: NH = 6 × 1021 cm−2 and � ∼ 1.4–1.9; LS 5039 :NH = 7×1021 cm−2 and � ∼ 1.4–1.6), with a 1–10 keV unabsorbedflux varying between 0.4–1.5 and 0.5–1.2 × 10⁻¹¹ erg s−1 cm−2,for LS I +61◦303 and LS 5039, respectively (Sidoli et al. 2006;Esposito et al. 2007; Kishishita et al. 2009).
As the nature of the compact object is unknown in these two sys-tems, it is not clear if their emission (especially in the TeV band) isdue to a relativistic outflow from a rotational powered pulsar (as thecase of PSR B1259–63) or accretion on to a black hole or a neutronstar which might e.g. accelerate particles through a relativistic jet.Recently, a soft gamma repeater (SGR)-like burst detected fromthe direction of LS I +61◦303 raised the possibility of this systemhosting a magnetar, although this is so far a very controversial hy-pothesis (see Barthelmy et al. 2008; de Pasquale et al. 2008; Dubus& Giebels 2008; Munoz-Arjonilla et al. 2008; Ray & Hartman 2008;Rea & Torres 2008). In the accretion scenario context, the recentevidence for TeV emission from the black hole binary Cyg X-1 isvery exciting (Albert et al. 2007). However, the very high-energyphenomenology of Cyg X-1 appears different from that of theseother sources: it has been in fact detected in TeV just once, andduring a flaring state. The three other sources, instead, present per-sistent TeV emission modulated by the orbital motion, and whichdominates their radiative outputs. For the new candidate TeV binaryHESS J0632+057, it is still only very little known (e.g. no orbitalperiod detected yet) to make any solid comparison (Aharonian et al.2007, Hinton et al. 2009; Maier et al. 2009).
For LS I +61◦303, extended radio emitting structures at angu-lar extensions of 0.01–0.05 arcsec have been reported (Massi et al.2001, 2004). This discovery has earlier supported its microquasarinterpretation, as a claim for a jet-like feature. However, a subse-quent large Very Long Baseline Interferometry (VLBI) campaign(Dhawan et al. 2006) discovered rapid changes during the orbit, inthe orientation of what seems to be a cometary tail consistent withbeing the result of a pulsar wind more than a jet-like structure. Infact, if due to a jet, the changing morphology of the radio emissionalong the orbit would require a highly unstable jet, and the shapeof this structure is not expected to be reproduced orbit after orbitas current results indicate (Albert et al. 2008). Similarly, the dis-covery of a jet-like radio structure in LS 5039, initially prompted amicroquasar interpretation (Paredes et al. 2001). However, Dubus(2006) showed that this extended radio emission could also be inter-preted as the result of a pulsar wind, with no need to invoke a radiojet. Furthermore, recent Very Large Baseline Array (VLBA) obser-vations showed that a microquasar scenario cannot easily explainthe observed morphology changes of this radio extended feature(Ribo et al. 2008).
At this point, one of the long-standing open questions of high-energy astrophysics is: are these two peculiar binary systems ac-celerating charged particles until TeV energies, e.g. through thepowerful jets of an accreting neutron star or black hole, as it mightbe the case of the TeV flares from Cyg X-1? Or is the TeV emissionof these binaries instead related to a young and energetic rotationalpowered-pulsar as the case of PSR B1259–63? To try to address thisquestion we performed deep Chandra observations of LS I +61◦303
C© 2010 The Authors. Journal compilation C© 2010 RAS, MNRAS 405, 2206–2214
Dow
nloaded from https://academ
ic.oup.com/m
nras/article/405/4/2206/1044302 by guest on 11 March 2022
2208 N. Rea et al.
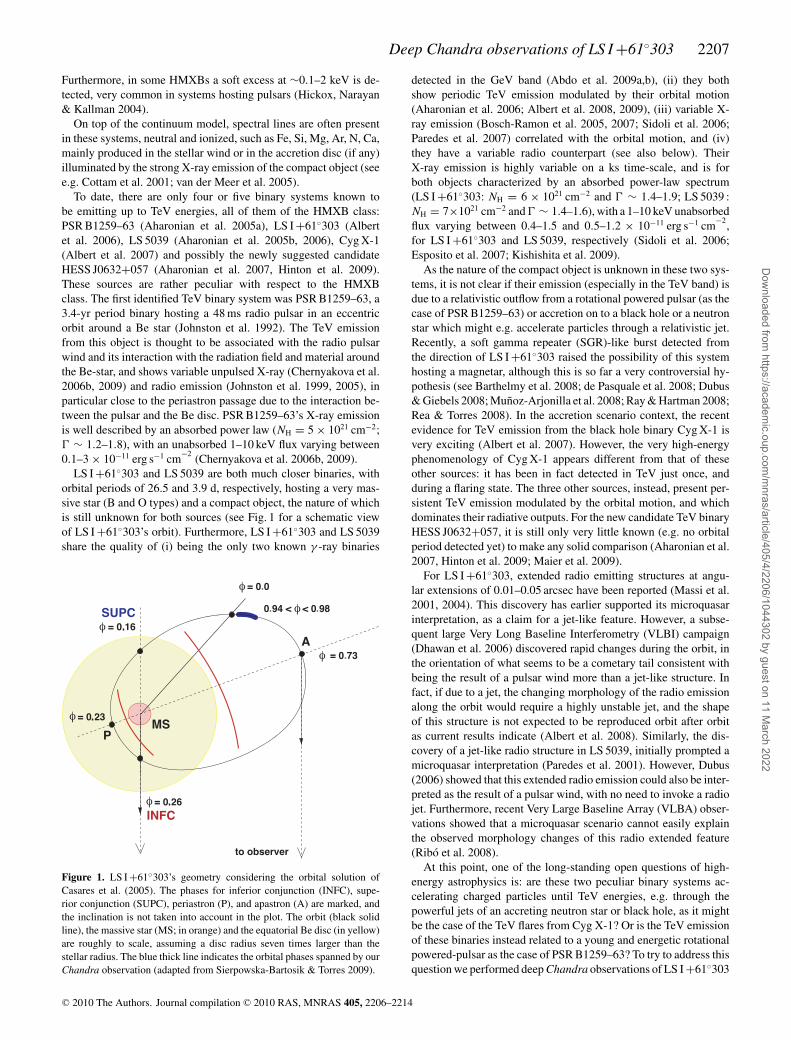
Figure 2. Chandra background-subtracted light curve of LS I +61◦303 binned at 100 s, and in the 0.3–10 keV energy range. The orbital phase φ is alsoreported.
(this paper) and LS 5039 (Rea et al., in preparation) in search forpulsed X-ray emission with very low pulsed fraction (PF) (e.g. be-cause contaminated by the wind-shock emission), which due to thehigher background of previous X-ray observations might have beenmissed. In Section 2, we report on the LS I +61◦303 observationand analysis, and we present our results in Section 3, followed by adiscussion (Section 4).
2 O BSERVATION AND DATA ANALYSIS
The Advanced CCD Imaging Spectrometer (ACIS) camera on boardof Chandra observed LS I +61◦303 on 2008 November 14 (starttime 11:09:58 UT; Obs-ID 10052) for an exposure time of 95.668 ksin continuous clocking (CC) mode (FAINT). The CC observingmode provides a time resolution of 2.85 ms and imaging along asingle direction. The source was positioned in the back-illuminatedACIS-S3 CCD at the nominal target position. Standard processingof the data was performed by the Chandra X-ray Center to level 1and level 2 (processing software DS ver. 7.6.11.9). The data werereprocessed using the CIAO software (ver. 4.1) and the Chandracalibration files (CALDB ver. 4.2.0).
Since in the CC mode the events are tagged with the times of theframe store, we corrected the times for the variable delay due to thespacecraft dithering and telescope flexure, starting from level 1 dataand assuming that all photons were originally detected at the targetposition. Furthermore, data were filtered to exclude hot pixels, badcolumns and possible afterglow events (residual charge from theinteraction of a cosmic ray in the CCD). Photon arrival times are inTDB and were referred to the barycentre of the Solar system usingthe JPL-DE405 ephemeris.
In order to carry out a timing analysis, we extracted the eventsin the 0.3–10 keV energy range from a region of 5 × 5 pixelsaround the source position (RA 02:40:31.670, Dec. +61:13:45.11)to reduce the background contamination, while the source spectrumwas extracted from a rectangular region of 5 × 25 pixels around thesource position, and the background was taken independently froma source-free region in the same chip. We extracted the responsematrix files (RMFs) and ancillary response files (ARFs), first cre-ating a weighted image, rebinning by a factor of 8, then using it tobuild the RMF file using the MKACISRMF tool, with an energy grid
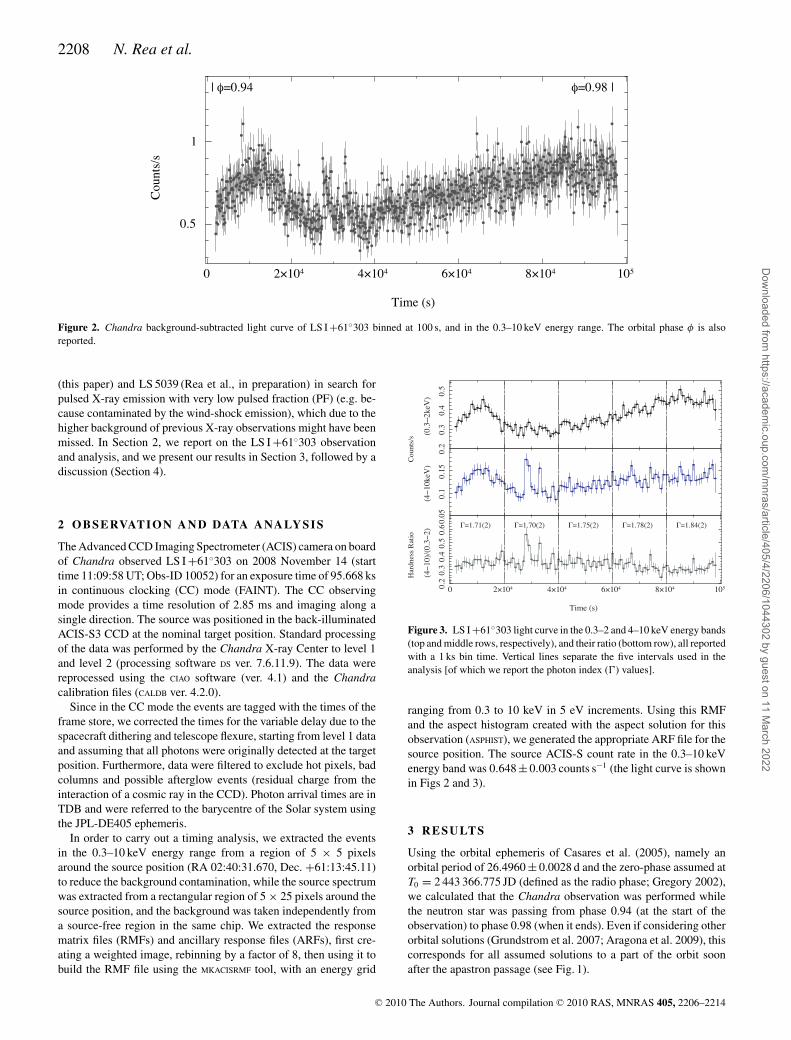
Figure 3. LS I +61◦303 light curve in the 0.3–2 and 4–10 keV energy bands(top and middle rows, respectively), and their ratio (bottom row), all reportedwith a 1 ks bin time. Vertical lines separate the five intervals used in theanalysis [of which we report the photon index (�) values].
ranging from 0.3 to 10 keV in 5 eV increments. Using this RMFand the aspect histogram created with the aspect solution for thisobservation (ASPHIST), we generated the appropriate ARF file for thesource position. The source ACIS-S count rate in the 0.3–10 keVenergy band was 0.648 ± 0.003 counts s−1 (the light curve is shownin Figs 2 and 3).
3 R ESULTS
Using the orbital ephemeris of Casares et al. (2005), namely anorbital period of 26.4960 ± 0.0028 d and the zero-phase assumed atT0 = 2 443 366.775 JD (defined as the radio phase; Gregory 2002),we calculated that the Chandra observation was performed whilethe neutron star was passing from phase 0.94 (at the start of theobservation) to phase 0.98 (when it ends). Even if considering otherorbital solutions (Grundstrom et al. 2007; Aragona et al. 2009), thiscorresponds for all assumed solutions to a part of the orbit soonafter the apastron passage (see Fig. 1).
C© 2010 The Authors. Journal compilation C© 2010 RAS, MNRAS 405, 2206–2214
Dow
nloaded from https://academ
ic.oup.com/m
nras/article/405/4/2206/1044302 by guest on 11 March 2022
Deep Chandra observations of LS I +61◦303 2209
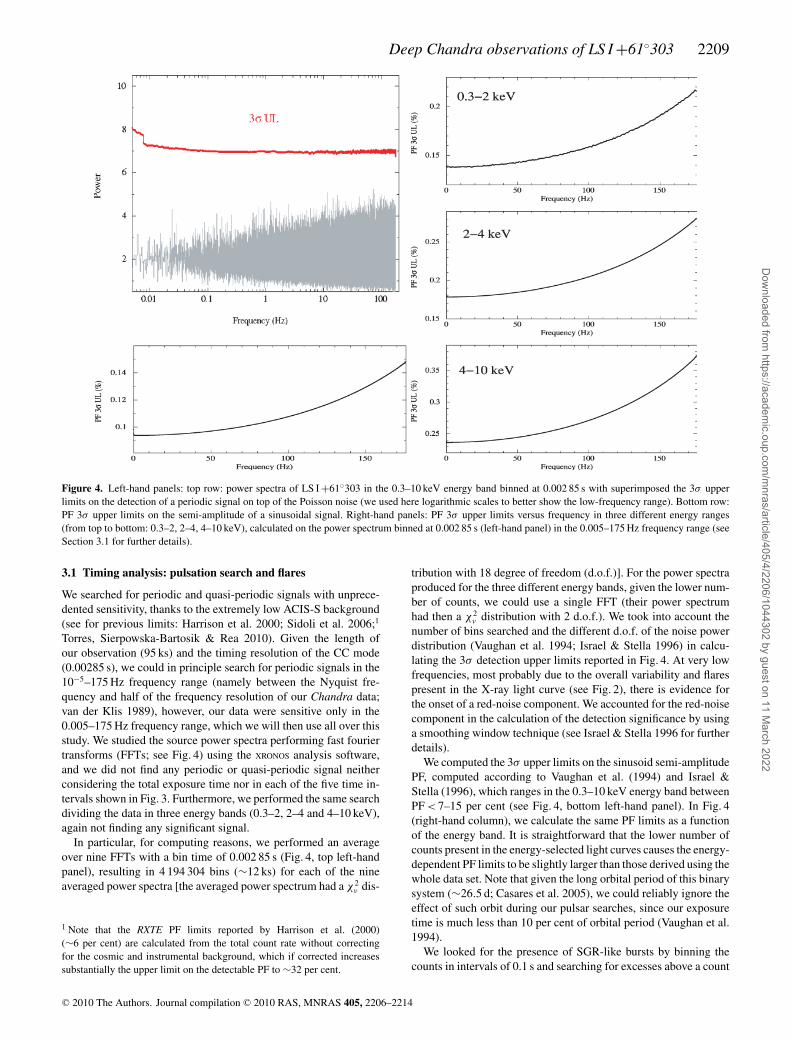
Figure 4. Left-hand panels: top row: power spectra of LS I +61◦303 in the 0.3–10 keV energy band binned at 0.002 85 s with superimposed the 3σ upperlimits on the detection of a periodic signal on top of the Poisson noise (we used here logarithmic scales to better show the low-frequency range). Bottom row:PF 3σ upper limits on the semi-amplitude of a sinusoidal signal. Right-hand panels: PF 3σ upper limits versus frequency in three different energy ranges(from top to bottom: 0.3–2, 2–4, 4–10 keV), calculated on the power spectrum binned at 0.002 85 s (left-hand panel) in the 0.005–175 Hz frequency range (seeSection 3.1 for further details).
3.1 Timing analysis: pulsation search and flares
We searched for periodic and quasi-periodic signals with unprece-dented sensitivity, thanks to the extremely low ACIS-S background(see for previous limits: Harrison et al. 2000; Sidoli et al. 2006;1
Torres, Sierpowska-Bartosik & Rea 2010). Given the length ofour observation (95 ks) and the timing resolution of the CC mode(0.00285 s), we could in principle search for periodic signals in the10−5–175 Hz frequency range (namely between the Nyquist fre-quency and half of the frequency resolution of our Chandra data;van der Klis 1989), however, our data were sensitive only in the0.005–175 Hz frequency range, which we will then use all over thisstudy. We studied the source power spectra performing fast fouriertransforms (FFTs; see Fig. 4) using the XRONOS analysis software,and we did not find any periodic or quasi-periodic signal neitherconsidering the total exposure time nor in each of the five time in-tervals shown in Fig. 3. Furthermore, we performed the same searchdividing the data in three energy bands (0.3–2, 2–4 and 4–10 keV),again not finding any significant signal.
In particular, for computing reasons, we performed an averageover nine FFTs with a bin time of 0.002 85 s (Fig. 4, top left-handpanel), resulting in 4 194 304 bins (∼12 ks) for each of the nineaveraged power spectra [the averaged power spectrum had a χ 2
ν dis-
1 Note that the RXTE PF limits reported by Harrison et al. (2000)(∼6 per cent) are calculated from the total count rate without correctingfor the cosmic and instrumental background, which if corrected increasessubstantially the upper limit on the detectable PF to ∼32 per cent.
tribution with 18 degree of freedom (d.o.f.)]. For the power spectraproduced for the three different energy bands, given the lower num-ber of counts, we could use a single FFT (their power spectrumhad then a χ 2
ν distribution with 2 d.o.f.). We took into account thenumber of bins searched and the different d.o.f. of the noise powerdistribution (Vaughan et al. 1994; Israel & Stella 1996) in calcu-lating the 3σ detection upper limits reported in Fig. 4. At very lowfrequencies, most probably due to the overall variability and flarespresent in the X-ray light curve (see Fig. 2), there is evidence forthe onset of a red-noise component. We accounted for the red-noisecomponent in the calculation of the detection significance by usinga smoothing window technique (see Israel & Stella 1996 for furtherdetails).
We computed the 3σ upper limits on the sinusoid semi-amplitudePF, computed according to Vaughan et al. (1994) and Israel &Stella (1996), which ranges in the 0.3–10 keV energy band betweenPF < 7–15 per cent (see Fig. 4, bottom left-hand panel). In Fig. 4(right-hand column), we calculate the same PF limits as a functionof the energy band. It is straightforward that the lower number ofcounts present in the energy-selected light curves causes the energy-dependent PF limits to be slightly larger than those derived using thewhole data set. Note that given the long orbital period of this binarysystem (∼26.5 d; Casares et al. 2005), we could reliably ignore theeffect of such orbit during our pulsar searches, since our exposuretime is much less than 10 per cent of orbital period (Vaughan et al.1994).
We looked for the presence of SGR-like bursts by binning thecounts in intervals of 0.1 s and searching for excesses above a count
C© 2010 The Authors. Journal compilation C© 2010 RAS, MNRAS 405, 2206–2214
Dow
nloaded from https://academ
ic.oup.com/m
nras/article/405/4/2206/1044302 by guest on 11 March 2022
2210 N. Rea et al.
threshold corresponding to a chance occurrence of 0.1 per cent(taking into account the total number of bins), but we did not findany significant short burst. On the other hand, on top of a slowvariability of a factor of ∼2, we significantly detect two flareslasting ∼3 and 1.5 ks (not unseen in this source: Sidoli et al. 2006;Paredes et al. 2007; Esposito et al. 2007; Smith et al. 2009) duringthe minimum of the light curve, with a rise-time of ∼100 s, andpeaking after about 28 and 33 ks from the observation start (seeFigs 2 and 3).
3.2 Spatial analysis: search for extended emission
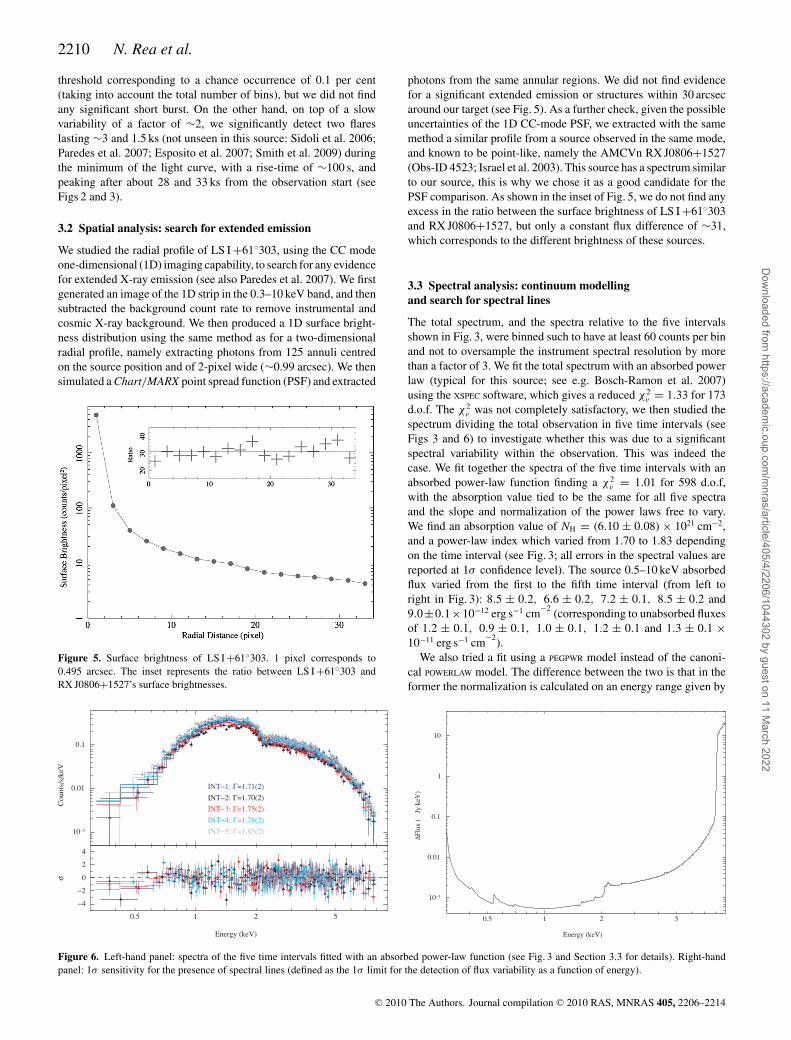
We studied the radial profile of LS I +61◦303, using the CC modeone-dimensional (1D) imaging capability, to search for any evidencefor extended X-ray emission (see also Paredes et al. 2007). We firstgenerated an image of the 1D strip in the 0.3–10 keV band, and thensubtracted the background count rate to remove instrumental andcosmic X-ray background. We then produced a 1D surface bright-ness distribution using the same method as for a two-dimensionalradial profile, namely extracting photons from 125 annuli centredon the source position and of 2-pixel wide (∼0.99 arcsec). We thensimulated a Chart/MARX point spread function (PSF) and extracted
Figure 5. Surface brightness of LS I +61◦303. 1 pixel corresponds to0.495 arcsec. The inset represents the ratio between LS I +61◦303 andRX J0806+1527’s surface brightnesses.
photons from the same annular regions. We did not find evidencefor a significant extended emission or structures within 30 arcsecaround our target (see Fig. 5). As a further check, given the possibleuncertainties of the 1D CC-mode PSF, we extracted with the samemethod a similar profile from a source observed in the same mode,and known to be point-like, namely the AMCVn RX J0806+1527(Obs-ID 4523; Israel et al. 2003). This source has a spectrum similarto our source, this is why we chose it as a good candidate for thePSF comparison. As shown in the inset of Fig. 5, we do not find anyexcess in the ratio between the surface brightness of LS I +61◦303and RX J0806+1527, but only a constant flux difference of ∼31,which corresponds to the different brightness of these sources.
3.3 Spectral analysis: continuum modellingand search for spectral lines
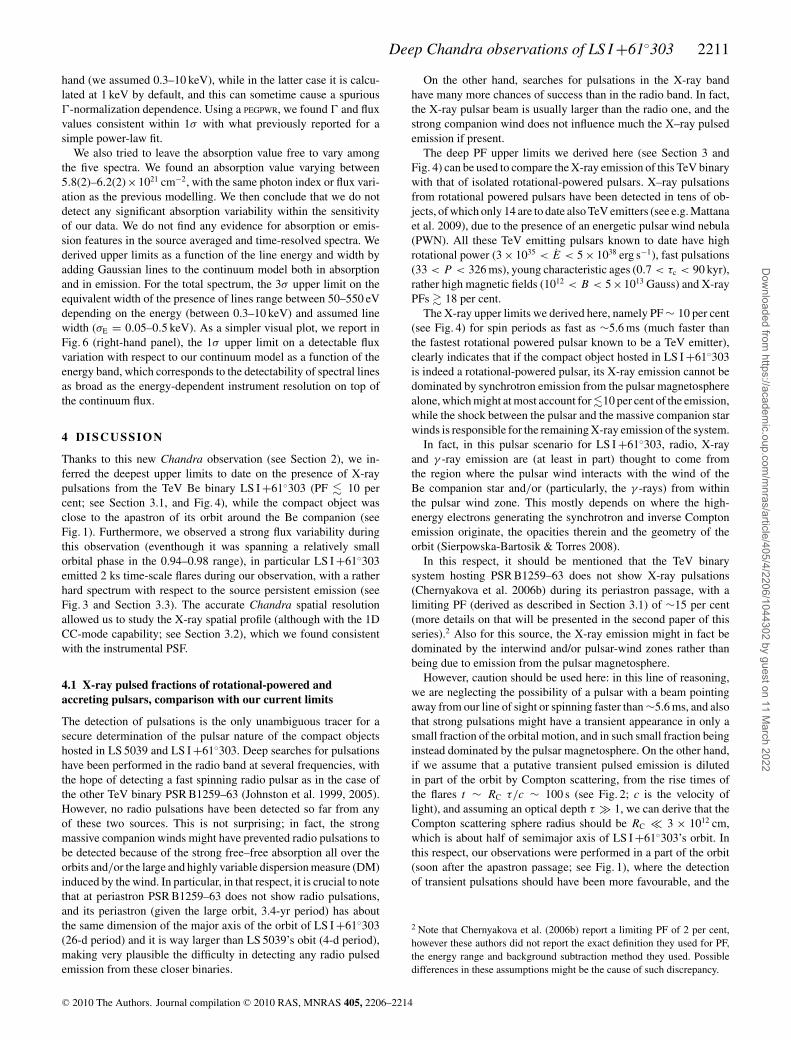
The total spectrum, and the spectra relative to the five intervalsshown in Fig. 3, were binned such to have at least 60 counts per binand not to oversample the instrument spectral resolution by morethan a factor of 3. We fit the total spectrum with an absorbed powerlaw (typical for this source; see e.g. Bosch-Ramon et al. 2007)using the XSPEC software, which gives a reduced χ 2
ν = 1.33 for 173d.o.f. The χ 2
ν was not completely satisfactory, we then studied thespectrum dividing the total observation in five time intervals (seeFigs 3 and 6) to investigate whether this was due to a significantspectral variability within the observation. This was indeed thecase. We fit together the spectra of the five time intervals with anabsorbed power-law function finding a χ 2
ν = 1.01 for 598 d.o.f,with the absorption value tied to be the same for all five spectraand the slope and normalization of the power laws free to vary.We find an absorption value of NH = (6.10 ± 0.08) × 1021 cm−2,and a power-law index which varied from 1.70 to 1.83 dependingon the time interval (see Fig. 3; all errors in the spectral values arereported at 1σ confidence level). The source 0.5–10 keV absorbedflux varied from the first to the fifth time interval (from left toright in Fig. 3): 8.5 ± 0.2, 6.6 ± 0.2, 7.2 ± 0.1, 8.5 ± 0.2 and9.0±0.1×10⁻¹² erg s−1 cm−2 (corresponding to unabsorbed fluxesof 1.2 ± 0.1, 0.9 ± 0.1, 1.0 ± 0.1, 1.2 ± 0.1 and 1.3 ± 0.1 ×10⁻¹¹ erg s−1 cm−2).
We also tried a fit using a PEGPWR model instead of the canoni-cal POWERLAW model. The difference between the two is that in theformer the normalization is calculated on an energy range given by
Figure 6. Left-hand panel: spectra of the five time intervals fitted with an absorbed power-law function (see Fig. 3 and Section 3.3 for details). Right-handpanel: 1σ sensitivity for the presence of spectral lines (defined as the 1σ limit for the detection of flux variability as a function of energy).
C© 2010 The Authors. Journal compilation C© 2010 RAS, MNRAS 405, 2206–2214
Dow
nloaded from https://academ
ic.oup.com/m
nras/article/405/4/2206/1044302 by guest on 11 March 2022
Deep Chandra observations of LS I +61◦303 2211
hand (we assumed 0.3–10 keV), while in the latter case it is calcu-lated at 1 keV by default, and this can sometime cause a spurious�-normalization dependence. Using a PEGPWR, we found � and fluxvalues consistent within 1σ with what previously reported for asimple power-law fit.
We also tried to leave the absorption value free to vary amongthe five spectra. We found an absorption value varying between5.8(2)–6.2(2)×1021 cm−2, with the same photon index or flux vari-ation as the previous modelling. We then conclude that we do notdetect any significant absorption variability within the sensitivityof our data. We do not find any evidence for absorption or emis-sion features in the source averaged and time-resolved spectra. Wederived upper limits as a function of the line energy and width byadding Gaussian lines to the continuum model both in absorptionand in emission. For the total spectrum, the 3σ upper limit on theequivalent width of the presence of lines range between 50–550 eVdepending on the energy (between 0.3–10 keV) and assumed linewidth (σE = 0.05–0.5 keV). As a simpler visual plot, we report inFig. 6 (right-hand panel), the 1σ upper limit on a detectable fluxvariation with respect to our continuum model as a function of theenergy band, which corresponds to the detectability of spectral linesas broad as the energy-dependent instrument resolution on top ofthe continuum flux.
4 D ISCUSSION
Thanks to this new Chandra observation (see Section 2), we in-ferred the deepest upper limits to date on the presence of X-raypulsations from the TeV Be binary LS I +61◦303 (PF � 10 percent; see Section 3.1, and Fig. 4), while the compact object wasclose to the apastron of its orbit around the Be companion (seeFig. 1). Furthermore, we observed a strong flux variability duringthis observation (eventhough it was spanning a relatively smallorbital phase in the 0.94–0.98 range), in particular LS I +61◦303emitted 2 ks time-scale flares during our observation, with a ratherhard spectrum with respect to the source persistent emission (seeFig. 3 and Section 3.3). The accurate Chandra spatial resolutionallowed us to study the X-ray spatial profile (although with the 1DCC-mode capability; see Section 3.2), which we found consistentwith the instrumental PSF.
4.1 X-ray pulsed fractions of rotational-powered andaccreting pulsars, comparison with our current limits
The detection of pulsations is the only unambiguous tracer for asecure determination of the pulsar nature of the compact objectshosted in LS 5039 and LS I +61◦303. Deep searches for pulsationshave been performed in the radio band at several frequencies, withthe hope of detecting a fast spinning radio pulsar as in the case ofthe other TeV binary PSR B1259–63 (Johnston et al. 1999, 2005).However, no radio pulsations have been detected so far from anyof these two sources. This is not surprising; in fact, the strongmassive companion winds might have prevented radio pulsations tobe detected because of the strong free–free absorption all over theorbits and/or the large and highly variable dispersion measure (DM)induced by the wind. In particular, in that respect, it is crucial to notethat at periastron PSR B1259–63 does not show radio pulsations,and its periastron (given the large orbit, 3.4-yr period) has aboutthe same dimension of the major axis of the orbit of LS I +61◦303(26-d period) and it is way larger than LS 5039’s obit (4-d period),making very plausible the difficulty in detecting any radio pulsedemission from these closer binaries.
On the other hand, searches for pulsations in the X-ray bandhave many more chances of success than in the radio band. In fact,the X-ray pulsar beam is usually larger than the radio one, and thestrong companion wind does not influence much the X–ray pulsedemission if present.
The deep PF upper limits we derived here (see Section 3 andFig. 4) can be used to compare the X-ray emission of this TeV binarywith that of isolated rotational-powered pulsars. X–ray pulsationsfrom rotational powered pulsars have been detected in tens of ob-jects, of which only 14 are to date also TeV emitters (see e.g. Mattanaet al. 2009), due to the presence of an energetic pulsar wind nebula(PWN). All these TeV emitting pulsars known to date have highrotational power (3 × 1035 < E < 5 × 1038 erg s−1), fast pulsations(33 < P < 326 ms), young characteristic ages (0.7 < τc < 90 kyr),rather high magnetic fields (1012 < B < 5×10¹³ Gauss) and X-rayPFs � 18 per cent.
The X-ray upper limits we derived here, namely PF ∼ 10 per cent(see Fig. 4) for spin periods as fast as ∼5.6 ms (much faster thanthe fastest rotational powered pulsar known to be a TeV emitter),clearly indicates that if the compact object hosted in LS I +61◦303is indeed a rotational-powered pulsar, its X-ray emission cannot bedominated by synchrotron emission from the pulsar magnetospherealone, which might at most account for �10 per cent of the emission,while the shock between the pulsar and the massive companion starwinds is responsible for the remaining X-ray emission of the system.
In fact, in this pulsar scenario for LS I +61◦303, radio, X-rayand γ -ray emission are (at least in part) thought to come fromthe region where the pulsar wind interacts with the wind of theBe companion star and/or (particularly, the γ -rays) from withinthe pulsar wind zone. This mostly depends on where the high-energy electrons generating the synchrotron and inverse Comptonemission originate, the opacities therein and the geometry of theorbit (Sierpowska-Bartosik & Torres 2008).
In this respect, it should be mentioned that the TeV binarysystem hosting PSR B1259–63 does not show X-ray pulsations(Chernyakova et al. 2006b) during its periastron passage, with alimiting PF (derived as described in Section 3.1) of ∼15 per cent(more details on that will be presented in the second paper of thisseries).2 Also for this source, the X-ray emission might in fact bedominated by the interwind and/or pulsar-wind zones rather thanbeing due to emission from the pulsar magnetosphere.
However, caution should be used here: in this line of reasoning,we are neglecting the possibility of a pulsar with a beam pointingaway from our line of sight or spinning faster than ∼5.6 ms, and alsothat strong pulsations might have a transient appearance in only asmall fraction of the orbital motion, and in such small fraction beinginstead dominated by the pulsar magnetosphere. On the other hand,if we assume that a putative transient pulsed emission is dilutedin part of the orbit by Compton scattering, from the rise times ofthe flares t ∼ RC τ/c ∼ 100 s (see Fig. 2; c is the velocity oflight), and assuming an optical depth τ � 1, we can derive that theCompton scattering sphere radius should be RC � 3 × 1012 cm,which is about half of semimajor axis of LS I +61◦303’s orbit. Inthis respect, our observations were performed in a part of the orbit(soon after the apastron passage; see Fig. 1), where the detectionof transient pulsations should have been more favourable, and the
2 Note that Chernyakova et al. (2006b) report a limiting PF of 2 per cent,however these authors did not report the exact definition they used for PF,the energy range and background subtraction method they used. Possibledifferences in these assumptions might be the cause of such discrepancy.
C© 2010 The Authors. Journal compilation C© 2010 RAS, MNRAS 405, 2206–2214
Dow
nloaded from https://academ
ic.oup.com/m
nras/article/405/4/2206/1044302 by guest on 11 March 2022
2212 N. Rea et al.
Compton scattering highly reduced with respect to other parts ofthe orbit closer to the massive companion.
Considering instead the accreting neutron star scenario (in theblack hole case we obviously do not expect pulsations at all hencewe will not discuss this possibility which is of course open), lowPFs are not unexpected. In particular, in many cases, the pulsedX-ray emission coming from the accretion column might representonly a small fraction of the total X-ray emission which can alsohave a dominant unpulsed component coming from the accretiondisc and/or the neutron star surface.
4.2 Flares and flux/spectral variability on ks time-scales
A large variety of flares on several time-scales (from seconds todays) have been observed to date from both neutron star and blackhole binary systems. While in the accretion scenario flares are easilyexplainable as changes in the accretion rate from the companion star,or accretion disc, towards the compact object, this kind of X-rayvariability has never been observed in isolated rotation powered-pulsars.3
In the rotational-powered pulsar scenario, the ks variability weobserve here indicates that the interaction of the putative pulsar andthe stellar wind change at distance scales which are smaller thanthe size of the binary orbit; put otherwise, that the mechanism bywhich the variability is generated has a shorter-than-orbital time-scale. To interpret the short time-scale variability (of the order ofks, and in the form of hard flares) seen in our Chandra data [alsoseen earlier in XMM–Newton observations by Sidoli et al. (2006)and Chernyakova, Neronov & Walter (2006a)], it seems reasonableto invoke clumpiness of the stellar wind (see ideas by Neronov &Chernyakova 2007; Zdziarski, Neronov & Chernyakova 2008).
If one assumes that the power output in the pulsar wind is con-stant in ks time-scales (which may not be necessarily true, due toinhomogeneities in the pulsar wind zone, and if so, ks variabilitycould be related to it), the distance scale related to the fast variabilityhas to be associated with the pulsar wind interactions with clumpsof the Be stellar wind. In the latter case, the size, mass and numberdensity of the clumps imprint their signal on the X-ray emission.The distance scale relevant for this fast variability can be estimatedas
Rw ∼ v�t ∼ 1011( v
107 cm s−1
) (�t
10 ks
)cm,
where v is typical velocity scale (e.g. the orbital velocity of thepulsar or the speed of the stellar wind).
The stellar wind of Be stars, like the one present in LS I +61◦303,is typically assumed to have two components, one related with apolar contribution, and the other, with an equatorial disc (e.g. Waterset al. 1988). The polar wind is radiatively driven (e.g. Castor &Lamers 1979). The equatorial wind is instead assumed to havean homogeneous velocity law Veq(r) = V eq
o (r/Rs)m where m ∼
1.25, Rs is the stellar radius and Veq
0 = 5 km s−1. These authorsfurther assume that the terminal velocity of the equatorial wind isV eq
∞ ∼ few 100 km s−1, so that it is about a factor of at least 10 timessmaller than the terminal velocity of the polar component, V polar
∞ .Clumpiness in this wind can make the region of collision betweenthe pulsar and stellar outflows to loose coherence, leading to the
3 Note that magnetars do show X-ray flaring activity on several time-scales,but in fact they are not rotational-powered while their emission (flaring andpersistent) is due to the presence and instability of their ultrastrong magneticfields (see Mereghetti 2008 for a recent review).
disappearance of a regular bow-shaped surface. If so happens, theescape time-scale of the pulsar wind mixed with the stellar windcan be written as
tesc ∼ D/vwind ∼ 100
(1012 cm
D
) (107 cm s−1
vwind
)ks
(slowed down from the case in which electrons move along theshock with the plasma velocity c/3, the drift velocity in the directionparallel to the shock surface), and where vwind can take typical V eq
∞or V polar
∞ values.Even with this time-scale, clumps can cool electrons via inverse
Compton. This statement can be entertained after comparing thecooling time-scale of electrons of about 10 MeV, which wouldbe responsible via inverse Compton emission of X-ray photonsbetween 1 and 10 keV. Assuming that electrons diffuse in disorderedmagnetic field in the clump, one can estimate the Bohm-diffusion-regime escape time as
tdiff � 3 × 10⁶
(Rw
1011 cm
)2 (B
1 G
) (10 MeV
E
)s,
thus, clumps with such magnetic fields can retain electrons oversignificant time-scales. The losses by synchrotron and inverseCompton are
tsynch � 3 × 10⁵
(1 G
B
)2 (10 MeV
E
)s,
tIC � 104
(L∗
1038 erg s−1
) (D
1012 cm
)2 (10 MeV
E
)s
with L∗ being the luminosity of the star. For nominal values of theparameters, then, an inverse Compton cooling is possible.
Using the expression for the inverse Compton and synchrotrontime-scales one finds that if the magnetic field does not signifi-cantly rise from its PWN value of ∼1 G towards the centre of thesystem, inverse Compton losses dominate at the inner region. How-ever, synchrotron emission quickly dominate the farther out of thesystem electrons are, and can contribute to the overall X-ray emis-sion detected, given the nebula an onion-like structure where lossesdominance change. Depending on the location of the inhomogene-ity and value of magnetic field, relative contributions of inverseCompton and synchrotron X-rays can vary.
Finally, if clumps can be described by variations in density, andif the typical density of a clump in the wind is nclump ∼ 1010 cm−3
and its size is Rclump ∼ 1011 cm, then δNH ∼ nclump × Rclump ∼1021 cm−2. We did not find significant NH variability within our data,however the strong dependence between NH, � and the power-lawnormalization, intrinsinc to the power-law modelling, might havehidden this variability in an increase of the hardness of the emission,as seen in our Figs 3 and 6 (see also Smith et al. 2009).
4.3 Limits on the presence of diffuse emission
Studying the 1D Chandra PSF, we did not find evidence for X-ray diffuse emission (see Fig. 5 and Section 3.2). For a quantitativecomparison of our limits with the hint for diffuse emission observedby Paredes et al. (2007; see their Section 2.3), we followed theiranalysis extracting the counts in an annular region of 5–12.5 arcsecradii. Assuming an absorbed power-law spectrum with NH = 6.1×1021 cm−2 and � = 2, we inferred a 3σ limiting unabsorbed flux forthe presence of X-ray diffuse emission of ∼1 × 10⁻¹⁴ erg s−1 cm−2
C© 2010 The Authors. Journal compilation C© 2010 RAS, MNRAS 405, 2206–2214
Dow
nloaded from https://academ
ic.oup.com/m
nras/article/405/4/2206/1044302 by guest on 11 March 2022
Deep Chandra observations of LS I +61◦303 2213
in the 0.3–10 keV energy range.4 Using the same assumptions wemade, the flux of the diffuse emission proposed by Paredes et al.(2007) would be ∼2×10⁻¹⁴ erg s−1 cm−2, well above our detectionlimit.
We caveat that if a putative extended emission (Paredes et al.2007) shows a long-term variability, our non-detection can bedue to a different observing epoch with respect to the origi-nal Chandra observation which hinted at the presence of diffuseemission.
5 SU M M A RY
With the Chandra observation we report here, we inferred the deep-est upper limits to date on the presence of X-ray pulsations fromthe TeV Be binary LS I +61◦303 (PF � 10 per cent; with a strongenergy and frequency dependence, see Fig. 4), while the compactobject was close to the apastron of its orbit around the Be compan-ion (see Fig. 1). These PF limits are deeper than the PF measuredfrom any isolated rotational-powered pulsar, in particular from thoseemitting in the TeV range, while they are well in line with what isobserved from accreting neutron star binaries (although we do notsee clear signs of accretion, as e.g. spectral lines). Hence, if hostinga rotational-powered pulsar, LS I +61◦303’s X-ray emission cannotbe driven by the same processes as for a similar isolated case (withthe caveats discussed in Section 4.1 though), while indeed a majorcontribution to its X-ray emission should come from the shock be-tween the pulsar and Be star winds. This is probably also the casefor PSR B1259–63. The ks time-scale flares we saw in this Chandraobservation of LS I +61◦303 show a harder spectrum with respect tothe source emission, and can be explained in an accretion scenarioby variability in the accretion rate, while in the rotational-poweredpulsar one, as the interaction between the pulsar wind and clumpsin the Be wind.
AC K N OW L E D G M E N T S
This research has made use of data from the Chandra X-ray Obser-vatory and software provided by the Chandra X-ray Center. NR issupported by a Ramon y Cajal Research Fellowship to CSIC, andthanks G. L. Israel for useful discussion, advices concerning thetiming analysis and for allowing the use of his DPS software. Wethank the anonymous referee for his/her very useful suggestionsand V. Bosch-Ramon and M. Ribo for comments. This work hasbeen supported by grants AYA2009-07391 and SGR2009-811.
RE FER ENCES
Abdo A. et al., 2009a, ApJ, 701, L123Abdo A. et al., 2009b, ApJ, 706, L56Aharonian F. et al., 2005a, A&A, 442, 1Aharonian F. et al., 2005b, Sci, 309, 746Aharonian F. et al., 2006, A&A, 460, 743Aharonian F. et al., 2007, A&A, 469, L1Albert J. et al., 2006, Sci, 312, 177Albert J. et al., 2007, ApJ, 665, L51Albert J. et al., 2008, ApJ, 684, 1351
4 Note that to infer the diffuse flux, Paredes et al. (2007) assumed thespectrum of their Chandra observation, � = 1.25, which was highly affectedby pile-up. We then prefer to assume � = 2, the typical value for a PWNe.
Albert J. et al., 2009, ApJ, 693, 303Aragona C., McSwain M. V., Grundstrom E. D., Marsh A. N., Roetten-
bacher R. M., Hessler K. M., Boyajian T. S., Ray P. S., 2009, ApJ, 698,514
Barthelmy S. et al., 2008, GCN, 8215Bosch-Ramon V., Paredes J. M., Ribo M., Miller J. M., Reig P., Martı J.,
2005, ApJ, 628, 388Bosch-Ramon V., Motch C., Ribo M., Lopes de Oliveira R., Janot-Pacheco
E., Negueruela I., Paredes J. M., Martocchia A., 2007, A&A, 473,545
Casares J., Ribo M., Ribas I., Paredes J. M., Martı J., Herrero A., 2005,MNRAS, 364, 899
Castor J. I., Lamers H. J. G. L. M., 1979, ApJ, 39, 481Chernyakova M., Neronov A., Walter R., 2006a, MNRAS, 367, 1201Chernyakova M., Neronov A., Lutovinov A., Rodriguez J., Johnston S.,
2006b, MNRAS, 372, 1585Chernyakova M., Neronov A., Aharonian F., Uchiyama Y., Takahashi T.,
2009, MNRAS, 397, 2123Cottam J., Sako M., Kahn S. M., Paerels F., Liedahl D. A., 2001, ApJ, 557,
L104de Pasquale M. et al., 2008, GCN, 8209Dhawan V., Mioduszewski A., Rupen M., 2006, Micro. Work. p. 52Dubus G., 2006, A&A, 451, 9Dubus G., Giebels B., 2008, Astron. Tel., 1715Esposito P., Caraveo P. A., Pellizzoni A., de Luca A., Gehrels N., Marelli
M. A., 2007, A&A, 474, 575Frank J., King A., Raine D., 1992, Sci, 258, 1015Gregory P. C., 2002, ApJ, 525, 427Grundstrom E. D. et al., 2007, ApJ, 656, 437Harrison F. A., Ray P. S., Leahy D. A., Waltman E. B., Pooley G. G., 2000,
ApJ, 528, 454Hickox R. C., Narayan R., Kallman T. R., 2004, ApJ, 614, 881Hinton J. et al., 2009, ApJ, 690, L101Israel G. L., Stella L., 1996, ApJ, 468, 369Israel G. L. et al., 2003, ApJ, 598, 492Johnston S., Manchester R. N., Lyne A., Bailes M., Kaspi V. M., Qiao G.,
D’Amico N., 1992, ApJ, 387, L37Johnston S., Manchester R. N., McConnell D., Campbell-Wilson D., 1999,
MNRAS, 302, 277Johnston S., Ball L., Wang N., Manchester R. N., 2005, MNRAS, 358,
1069Kishishita T., Tanaka T., Uchiyama Y., Takahashi T., 2009, ApJ, 697,
L1Maier G. et al., 2009, Proc. 31st ICRC, Lodz 2009, 0512, preprint
(arXiv:0907.3958)Massi M., Ribo M., Paredes J. M., Peracaula M., Estalella R., 2001, A&A,
376, 217Massi M., Ribo M., Paredes J. M., Garrington S. T., Peracaula M., Martı J.,
2004, A&A, 414, L1Mattana F. et al., 2009, ApJ, 694, 12Mereghetti S., 2008, A&AR, 15, 225Munoz-Arjonilla A. J., Zabalza V., Martı J., Combi J. A., Luque-Escamilla
P. L., Sanchez-Sutil J. R., Paredes J. M., 2008, Astron. Tel., 1740Neronov A., Chernyakova M., 2007, preprint (astro-ph/0701144)Paredes J. M., Ribo M., Martı J., Massi M., 2001, Ap&SS, 276, 79Paredes J. M., Ribo M., Bosch-Ramon V., West J. R., Butt Y. M., Torres
D. F., Martı J., 2007, ApJ, 664, L39Ray P. S., Hartman, J. M., 2008, Astron. Tel., 1730Rea N., Torres D. F., 2008, Astron. Tel., 1731Ribo M., Paredes J. M., Moldon J. Martı J., Massi M., 2008, A&A,
481, 17Sidoli L., Pellizzoni A., Vercellone S., Moroni M., Mereghetti S., Tavani
M., 2006, A&A, 459, 901Sierpowska-Bartosik A., Torres D. F., 2008, Astropart. Phys., 30, 239Sierpowska-Bartosik A., Torres D. F., 2009, ApJ, 693, 1462Smith A. W., Kaaret P., Holder J., Falcone A., Maier G., Pandel D., Stroh
M., 2009, ApJ, 693, 1621
C© 2010 The Authors. Journal compilation C© 2010 RAS, MNRAS 405, 2206–2214
Dow
nloaded from https://academ
ic.oup.com/m
nras/article/405/4/2206/1044302 by guest on 11 March 2022
2214 N. Rea et al.
Torres D. F., Sierpowska-Bartosik A., Rea N., 2010, Rep. Prog. Phys.,submitted
van der Klis M., 1989, in Ogelman H., van den Heuvel E. P. J., eds, TimingNeutron Stars. Dordrecht, Kluwer, p. 27
van der Meer A., Kaper L., di Salvo T., Mendez M., van der Klis M., BarrP., Trams N. R., 2005, A&A, 432, 999
Vaughan B. A. et al., 1994, ApJ, 435, 362
Waters L. B. F. M., van den Heuvel E. P. J., Taylor A. R., Habets G. M. H.J., Persi P., 1988, A&A, 198, 200
Zdziarski A. A., Neronov A., Chernyakova M., 2008, preprint(arXiv:0802.1174)
This paper has been typeset from a TEX/LATEX file prepared by the author.
C© 2010 The Authors. Journal compilation C© 2010 RAS, MNRAS 405, 2206–2214
Dow
nloaded from https://academ
ic.oup.com/m
nras/article/405/4/2206/1044302 by guest on 11 March 2022