customers' satisfaction of drugstore' service
TRANSCRIPT
CUSTOMERS’ SATISFACTION OF DRUGSTORE’ SERVICE
IN MUANG DISTRICT OF RAYONG PROVINCE
PANID KEERATIBUMRUNGPHONG
AN INDEPENDENT STUDY SUBMITTED IN PARTIAL FULFFILLMENT OF
THE REQUIREMENTS FOR THE MASTER DEGREE OF
BUSINESS ADMINISTERATION
GRADUATE SCHOOL OF COMMERCE
BURAPA UNIVERSITY
JULY 2016 COPYRIGHT OF BURAPHA UNIVERSITY
ACKNOWLEDGEMENT
Without the encouragement and support from many people and institutes,
this thesis cannot be accomplished. I hereby would like to take this opportunity to
express my deepest gratitude to all who have contributed to this study.
My profound gratitude is expressed to my beloved family for their love,
care, understanding, great sacrifice, and encouragement throughout my life.
I wish to express my profound gratitude to Dr. Supasit Lertbuasin,
my advisor and the chairman of my independent study committee, for his invariable
guidance, kindness and time devotion throughout the period of study. I am especially
grateful to Dr. Sawitree Bintasan Dr. Nont Sahayaand, Dr. Malai Kornkeawsomnuek
members of the independent study committee, for their constructive comments and
invaluable suggestions.
Finally, special acknowledge goes to my friend for providing me the
understanding of spss analysis. Sincere recognition also goes to the close friends
for their kindness and helpfulness.
Nevertheless, I am the only person who takes full responsibility for all
mistakes and ambiguities, which may remain in this study.
Panid Keeratibumrungphong

iv
56740017: MAJOR: BUSINESS ADMINISTRATION; M.B.A.
(BUSINESS ADMINISTRATION)
KEYWORDS: CUSTOMER SATISFACTION/ SERVICE QUALITY/
CUSTOMER RELATIONSHIP MANAGEMENT
PANID KEERATIBUMRUNGPHONG: CUSTOMERS’ SATISFACTION
OF DRUGSTORE’ SERVICE IN MUEANG DISTRICT OF RAYONG PROVINCE.
ADVISOR: SUPASIT LERTBUSIN, Ph.D. 74 P. 2015.
This research aims to study the customer relationship management, service
quality and customers’ satisfaction of drugstore in Muang district of Rayong province,
studied the customer relationship management affected to customers’ satisfaction of
drugstore in Muang district of Rayong province, and studied service quality affected
to customers’ satisfaction of drugstore in Muang district of Rayong province.
The population is the customer who purchased medicine or something from drugstore
in Muang district of Rayong province by convenience sampling, that sample size is
400 samples. Statistical analysis divided to 2 parts, first was descriptive statistics that
consist percentage, average, mean, standard deviation (SD). Next is inferential
statistics used multiple regression analysis.
However, the result founded that the most of respondent was a female who
was age between 25-34 years old, works a company employee, graduated Bachelor’s
degree and salary is 10,001-20,000 baht. They satisfied to service quality and
customer relationship management were high level.
Finally, the correlation between service quality and customer relationship
management have a positive influence to the customer satisfaction statistically
significant at the 0.01 level by regression coefficients are 0.391 and 0.122
respectively. That mean both factors were correlated with customer satisfaction.
For the other researcher interest to study about the customer satisfaction of Drugstore,
you should study the influence of choosing a drugstore on customer behavior to find
why a customer usually go to the same drugstore or study marketing strategy of
drugstore.
1
CHAPTER 1
INTRODUCTION
Background of the problem
Medicine is one of the factors that play an important role in the daily life
of human beings. When a man’s illness, they will find a way to alleviate or cured
with methods. Some people may go to see the doctor, some people might buy some
medicines. With the faith of the individual, which ways of medicines use have two big
is the first patient to the doctor by a hospital or clinic and medical diagnosis. And treat
by the prescribing to get or buy some medicine. Sometimes to maintain themselves by
going out to buy them from pharmacy such as illness, insomnia, dizziness,
constipation, diarrhea, influenza, headache, abdominal pain, allergies.
Nowadays in Thailand, there are not enough for demand. According to the
use of such services, most patients are solving problems that mean many people who
like a self-treatment, especially when you are sick. So a practice about drug use on a
daily basis correctly, it is a necessary to help our lives go a blessing.
From medicines consumption data of the Ministry of public health, there are
Thai medicines expenses increased from a million in year 2000 from 36,506 million
to 98,375 million in average annual 2008, 15% per year which done the country’s
Thai drug spending accounted for 46.7% of the country’s health care expense.
That is higher than the developed economics over 2 times and tends to be more
exotic drugs from 46% to 65% in the same time, and also say that from a survey of
the Medical Department. I found that in the year 2010, Thai people eat all pills or
drugs approximately 47,000 million per year or 128 million per day.
From the statistics, the number of drug stores in the country since 2007-2013
found that the number of increase continuous. I found that during the year the number
of drug store 2012-2013 in the region does not increase the number of up at all
(7680 drug stores) maybe there is an increase in the number of lost and equally.
But in Bangkok, the most of increasing is mostly franchise, which in the year 2010
has a growth rate of Modern Trade Mart and 7-11 are due to increasing.
2
In Rayong, researcher found that in year 2008 there are many drugstore,
it is called “ขย.1” and “ขย.2” where have 95 and 64 stores respectively
In 2013 there has 114 drugstore, after 3 years it is increasing to 162
drugstores (The Pharmacy Council).
From this data, it can be seen that some drugstore businesses are a highly
competitive and continuous development in order to survive. So it is the use of
various strategies for customers, both in terms of price from the decoration shop.
System services efficiently, cause to respond to the needs of the customers are
important when the customers get the goods or services meet the needs will be
satisfied, Muller said. (Muller, 1991, p. 23 cited in Phongvaranon, 2010, p. 23)
That is a quality goods only. Can’t help business, while care, counseling clients to
recover from the illness to help the business have the competition ability that how to
superior competitors due to. Thus the attention, the importance to study the needs of
customer the drugstore in Rayong.
Purpose of the research
1. To study customer relationship, service quality and customers’ satisfaction
for drugstore in Muang district of Rayong province.
2. To study customer relationship factor affect to customers’ satisfaction
for drugstore in Muang district of Rayong province
3. To study service quality factor affect to customers’ satisfaction for
drugstore in Muang district of Rayong province
Importance of study
1. To utilize the essential information for drugstore business to anyone who
interests investment.
2. To develop strategy for drugstore business in Muang district of Rayong
province.
3
Limitation of the study
1. The study focused on people who has bought some medicine in Muang
district of Rayong province pharmacy only.
2. The customers’ satisfaction of drugstore’service in Muang district of
Rayong province, which is about servicing satisfaction. In the other hand this study
can’t be represent for all of drugstores in Thailand.
Definition of term
1. Customer Satisfaction: refer to the positive attitude of the people towards
something. A feeling or attitude of individuals towards work done in a positive way.
Happy party arising from the operation and the results are satisfactory. It makes a
happy, enthusiastic commitment to work. A demoralized and discouraged with
agencies that take pride in the success of the work done. And these things will affect
the efficiency and effectiveness of the work affects the progress and success of the
organization.
2. Customer: refer to people who entrance to purchase products or use
service in Muang district of the Rayong province pharmacy.
3. Drugstore: refer to establishments with medications and other items too,
such cosmetics. Miscellaneous goods, the seller may drink as who can pick up the
goods according to the needs of the user.
4. Service: refer to an activity or a process in one of the actions of a person
or organization to meet the needs of other people, happiness and comfort or
satisfaction from the result of the action by having its own specific characteristics.
Can’t touch and not be occupied as owner in the concrete and do not need to be
included with the product or any other product.
5. Service Quality: refer to an ability to meet the needs of the business.
Quality of service is the most important thing that will differentiate your business
beyond the competition. To offer a quality service that meets the expectations of
consumers as to what should be done. The patients will be satisfied if I get something
like. That included 5 dimensions
4
Reliability is defined as the ability to provide services to match the contract
given to recipients of services. Services, whenever it needs to be properly and get the
same result in every point of service. This consistency will make people feel that the
service is reliable and can trust.
Assurance is defined as the ability to build the confidence to come up with
the client. Service providers will need to demonstrate skills, knowledge. The ability to
serve and meet the needs of the client, with the gentle mannered good. Use effective
communication and to ensure that clients get the best service.
Tangibles are defined as the physical characteristics and the facilities
in place including location, personnel, equipment, tools, and materials used in
communication and symbols. As well as the environment that makes the client feel
cared for and caring attention from service providers. The service is offered to clients
to make a concrete recognition of the service.
Empathy is defined as “take care”, the ability to take care of patients,
according to the different needs of each person.
Responsiveness is the availability and willingness to serve which can meet
the needs of clients in a timely manner. The clients can access the service easy and
convenient service will distribute evenly to fast.
6. Customer relationship management: refer to how we manage, the
customer feels attached to the product, service, or our organization. When customers
layout are good with us, then that customer is not thought to be gone from our goods
or services. We have a client base constant eruptions. And bring stability to the
company.
Research Hypothesis
1. The customer relationship management factor affect to customers’
satisfaction for drugstore in Muang district of Rayong province.
2. The service quality factor affect to customers’satisfaction for drugstore
in Muang district of Rayong province.
5
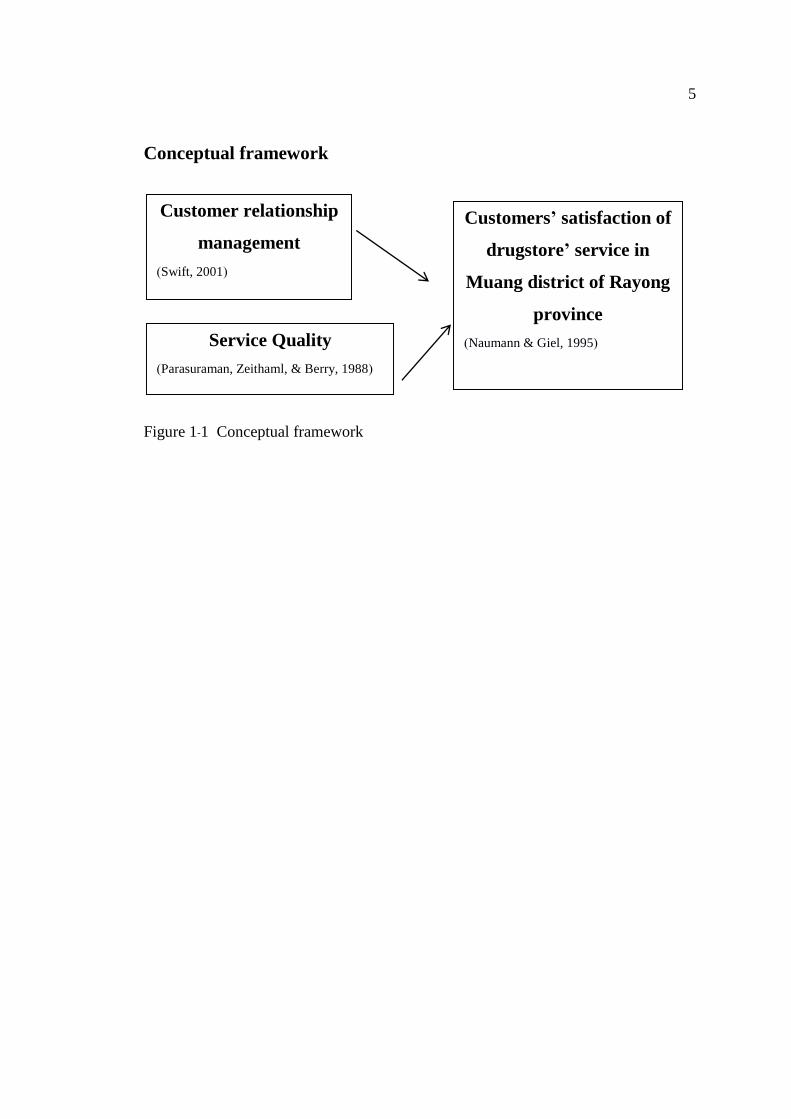
Conceptual framework
Figure 1-1 Conceptual framework
Customer relationship
management
(Swift, 2001)
Customers’ satisfaction of
drugstore’ service in
Muang district of Rayong
province
(Naumann & Giel, 1995)
Service Quality
(Parasuraman, Zeithaml, & Berry, 1988)
CHEAPTER 2
LITERATURE REVIEWS
In this research of the customers’ satisfaction of drugstore’ service in
Mueangdistrict of Rayong province. The researcher of this research will study
documents and related research to guide the study. Divided into parts, as follows:
1. Concept and theories of customer relationship management
2. Concept and theories of service quality
3.Concept and theories of satisfaction
4.Concept and theories of customer satisfaction
5.Concept of customer satisfaction and quality
6. Drugstore business
7. Related researches
Concept and theories of customer relationship management
Management process to build relationships with customers and provide
useful applied to your next sales.The organization is led by using CRM may be
within one or more departments, which may be to keep a history of customer care
department customer service by saving the customer reviews or information that
customers want more, which is what has changed recently.Is the impact of new
technologies, customer administration process.Is the use of technology in order
to collect a customer database in electronic format (computer storage) or telephone
information center (Call center) to support the work. Modern systems often have the
ability to store a lot of data about your customers and will be a tool in gathering all the
information Central for ease of.Use of the organization.The stored data can be useful
in various occasions, such as when a customer contacts with the Organization in the
last, what, is in contact with it, and how to resolve the issue of who is responsible for
the care of that customer.
Swift (2001)CRM can be defined as "Organizational methods for
understanding and influencing customer behavior through effective communication
that is meant to improve customer acquisition, customer retention and customer
7
profitability,"the word "organization" is very important, since the CRM is the way
to be integrated into everything the company does, and must involve the entire
company.
Kalakota and Robinson (2001 cited in Al-Alawi, 2004) Clients or customers
do not care howcompanies collect data or how the data from different sources to be
combined to givethem what they want. They did not care that he would call the
wrong place. All clients are aware that they need great service and want it now.
Timely delivery of excellent service is the customer relationship management.
Bruce and Langdon (2002 cited in Al-Alawi, 2004) Managing relationships
with customers and make them happy as major issues to the organization. Focused on
our customers and give them what they want to, those organizations have to find a
way to get a better understanding of customer needs and requirements.This has led
many companies and business organizations to shift the focus from managing
customer management products.
Kotler (2003)Making all of valuable customer relationships, through the
Using of effective customer accounts information
Feinbery (2003 cited in Jafari, Zarrin, & Yazdanpanah, 2015) Customer
Relationship Management is a comprehensive strategy, and marketing technology
provider that processes and business activities integrated across the entire client base.
Ahmasebi (2012 cited in Jafari et al., 2015) Customer Relationship
Management is a comprehensive strategy. And processes that enable organizations
to attract, retain and train clients identify profitable by building and maintaining
long-term relationships with them.
The CRM Life cycle
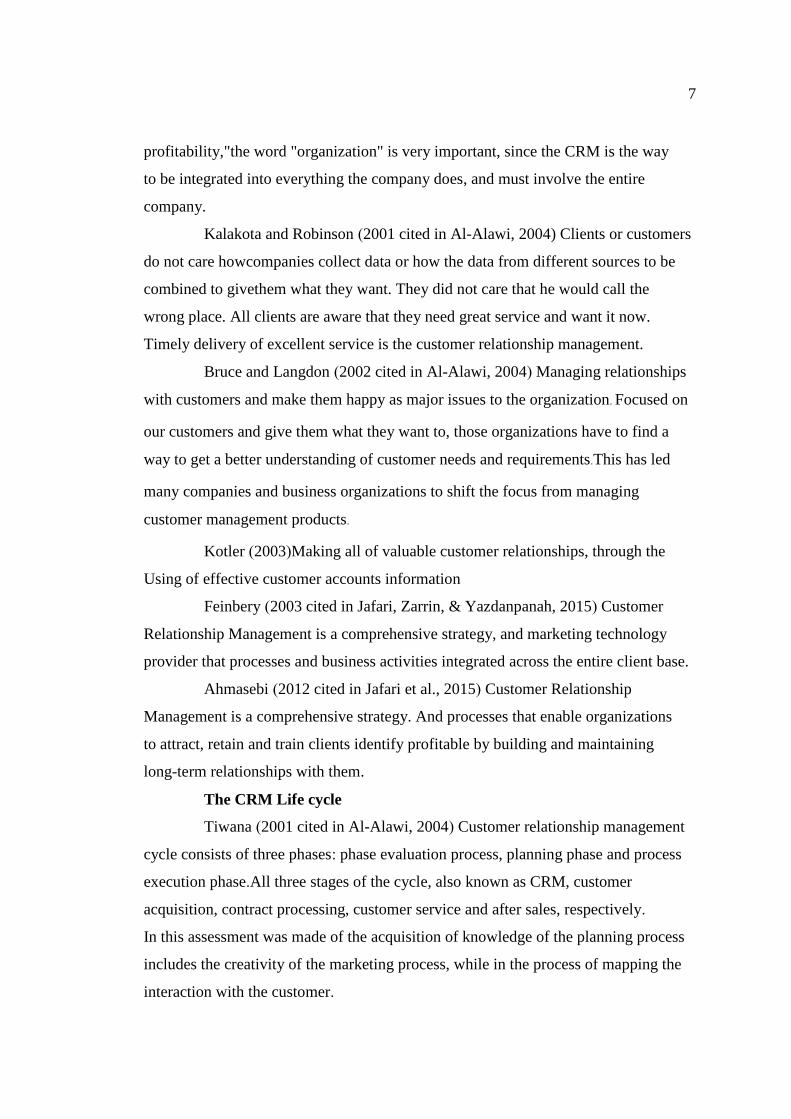
Tiwana (2001 cited in Al-Alawi, 2004) Customer relationship management
cycle consists of three phases: phase evaluation process, planning phase and process
execution phase.All three stages of the cycle, also known as CRM, customer
acquisition, contract processing, customer service and after sales, respectively.
In this assessment was made of the acquisition of knowledge of the planning process
includes the creativity of the marketing process, while in the process of mapping the
interaction with the customer.
8
CRM implementation process
The process of customer relationship management, in order to achieve this
goal which is a different view. One of all theories is the life cycle of CRM version
Kalakota (2001cited in Al-Alawi, 2004) which includes of three stages of
attractions and promotingmaintenance and support in all phases of the knowledge
and understandingof the relationship between the company and the customer.
This theory, in the United States where every step has different effects to customers.
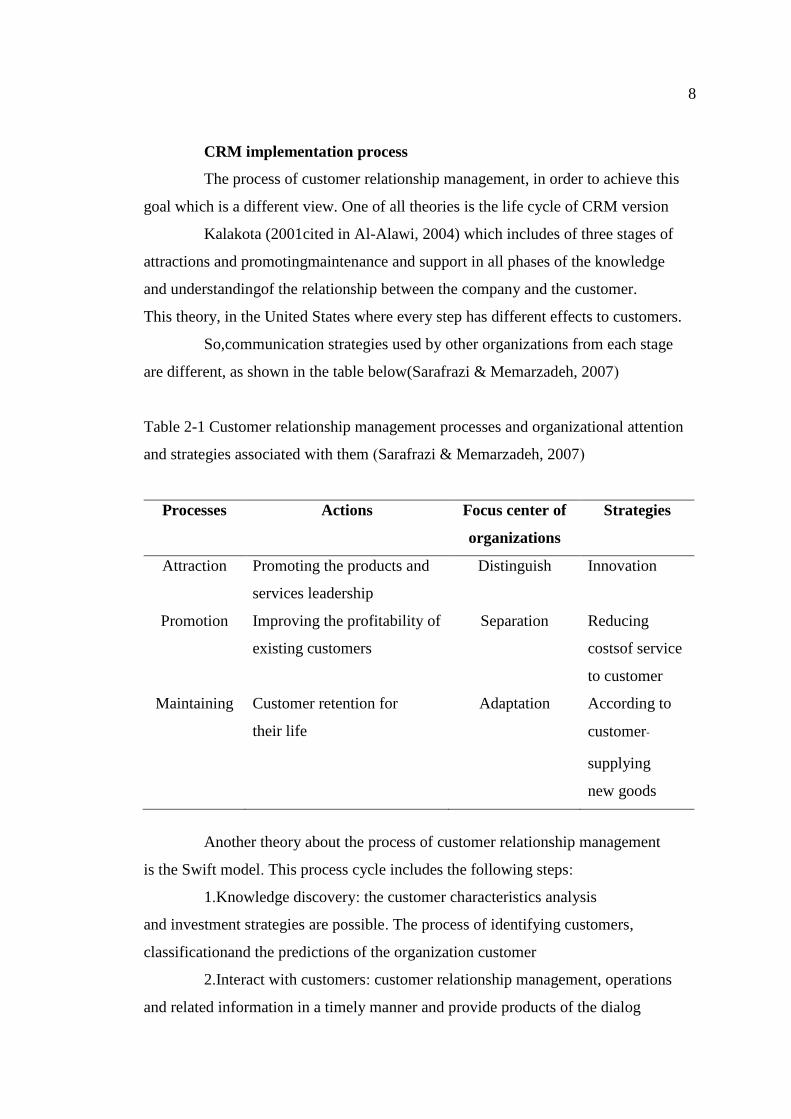
So,communication strategies used by other organizations from each stage
are different, as shown in the table below(Sarafrazi & Memarzadeh, 2007)
Table 2-1 Customer relationship management processes and organizational attention
and strategies associated with them (Sarafrazi & Memarzadeh, 2007)
Processes Actions Focus center of
organizations
Strategies
Attraction Promoting the products and
services leadership
Distinguish Innovation
Promotion Improving the profitability of
existing customers
Separation Reducing
costsof service
to customer
Maintaining Customer retention for
their life
Adaptation According to
customer-
supplying
new goods
Another theory about the process of customer relationship management
is the Swift model. This process cycle includes the following steps:
1.Knowledge discovery: the customer characteristics analysis
and investment strategies are possible. The process of identifying customers,
classificationand the predictions of the organization customer
2.Interact with customers: customer relationship management, operations
and related information in a timely manner and provide products of the dialog
9
3.Marketing Planning: the definition of product and distribution it offers
to customers and develop a strategic plan of communications programs and exquisite.
4. Analysis: The objective is to attract customers through data analysis
and communication organization received.The interactive routed (Swift, 2001).
Swift defines the customer relationship management as a continuous process
of learning in the information about each customer to build a relationship with them.
Customer information is not enough, but the individual requirement, they should be
collected and analyzed the data, and a proper response.
5.The process of providing customer service on customer relationship
management in the first phase of the database provider will provide information
and customer information. An analysis of the information collected in the database,
according to tricks that have different customers, based on the profit for the company
in the next step. The marketing mix is designed for a target audience, then start using
information from the previous customer communication, and after the operation
of relation marketing. The result is that monitoring and evaluation.
Khedkar(2015)He has studied the effect of customer relationship
management in customer satisfaction and loyalty. His research aims to clarify the
relationship between the variables of customer satisfaction and customer loyalty.
Customer relationship management. (CRM), integrated management is the process
of customer groups. Head of the organization and management of the business in an
efficient way is a tool. To support the business of our customers and to improve the
relationship with constituents.
KOÇOĞLU (2012) he studied the customer relationship managementand
customer loyalty; a survey in the sector of banking. This study aimed to demonstrate
the relationship between the bank and customer relationshipmanagement, customer
loyalty. One of the basic elements of understanding ofmodern marketing is customer
satisfaction. A business can survive as long as they can meet the needs of customers
and enable customer satisfaction. Determining the needs and desires of consumers
and meeting them is one way to enable the satisfaction ofconsumers.
10
Concept and theories of service quality
In order for the company to reach customers with a need for service.
These services are based on the type of product and it's different in different
organizations. Services can be defined in several ways, depending on the area,
which is a term that was used. The author defines service as. "The absence of any act
or performance that one party to another has no effect on the ownership of anything”
Zeithaml et al. (1990 cited in Agbor, 2011) The Relationship between
Customer Satisfaction and Service Quality: a study of three Service sectors in Umea.)
The quality of service can be provided to customers in the enterprise, which may be
good or bad Parasuraman defined quality of service, "the difference between customer
expectations and perceptions of service.
Parasuramanet al. (1988)They claim that the service quality of the
Measurementis the difference between the perceived and the service at which is the
correct way to make the management and identify the gap with what they serve.
One of the mostuseful of the service quality dimensions from the SERVQUAL model
in creating this before.Parasuraman et al. (1985) identify 97 attributes of which have
been condensed into ten dimensions. They have found that affected the quality of
service and has been hailed as the criteria that are critical to our client’ expectation
and perception of service delivery.
SERVQUAL modal, which is the size of the gap by Parasuraman, he has
proven to be one of the ways to measure the quality of this approach to evaluate
customer service was consistent, proven and reliable. By some authors when treated
with less experience. Or perceived quality service means expectedto be less than
satisfactory. No services are perceived and expected service.The reference is clear
Quality of service is more than enough and the presentation of this theory. It seems
that the idea of SERVQUAL most appropriate quality services to the customer's
perspective. This is because when the service expected "and" recognize "it is clear
that much. This is to the personor service to consumers. The course is a consumer/
client education guide by Parasuraman proposed ten dimensions of service quality.
Tangibles are defined as the physical characteristics and the facilities
in place including location, personnel, equipment, tools, and materials used in
communication and symbols. As well as the environment that makes the client feel
11
cared for and caring attention from service providers. The service is offered to clients
to make a concrete recognition of the service.
Reliability: the ability to provide services to match the contract given to
recipients of services. Services, whenever it needs to be properly and get the same
result in every point of service. This consistency will make people feel that the service
is reliable and can trust.
Responsiveness: the availability and willingness to serve which can meet
the needs of clients in a timely manner. The clients can access the service easy and
convenient service will distribute evenly to fast.Competence: the capability of staff
members in executing the service.
Courtesy: the respect, thoughtfulness, and politeness exhibited by staff
members who are in contact with the customer.
Credibility: the integrity and reliability of the service provider (honesty
and trust provider)
Security: unscathed risk and doubt(without danger of risk,economic and
physical risk)
Access: accessible and easy to communicate
Communication: to listen from the customer and provide the necessary
information to customers. Using language that can be understood.Understanding
customers: an attempt by the provider to know and understand the customer.
First, SERVQUAL modelcame had 22 pairs of Likert type item of which measure
perceived levels of service provided by the organization in particular and other parts.
The expected level of quality of services provided by the respondents, further
investigation led to the discovery that among these 10 measures, some are associated.
After customizing these ten dimensions above down to the following fivedimensions
Tangibility: the physical characteristics and the facilities in place including
location, personnel, equipment, tools, and materials used in communication and
symbols.
Reliability: the ability to provide services to match the contract given to
recipients of services. Services, whenever it needs to be properly and get the same
result in every point of service. This consistency will make people feel that the service
is reliable and can trust.Responsiveness: the availability and willingness to serve
12
which can meet the needs ofclients in a timely manner. The clients can access the
service easy and convenient service will distribute evenly to fast. Competence:
the capability of staff members in executing the service.Assurance: the ability
to build the confidence to come up with the client.Service providers will need to
demonstrate skills, knowledge. The ability to serve and meet the needs of the client,
with the gentle mannered good. Use effective communication and to ensure that
clients get the best service.
Empathy: as “take care”, the ability to take care of patients, according to
the different needs of each person.
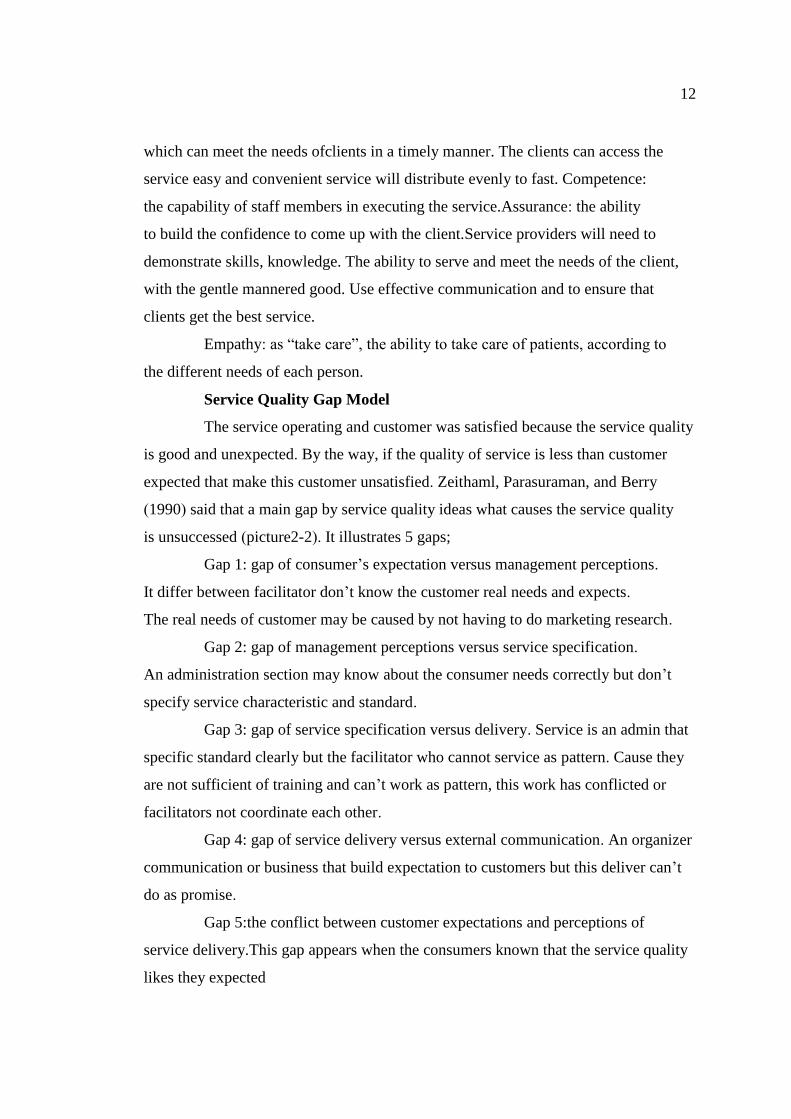
Service Quality Gap Model
The service operating and customer was satisfied because the service quality
is good and unexpected. By the way, if the quality of service is less than customer
expected that make this customer unsatisfied. Zeithaml, Parasuraman, and Berry
(1990) said that a main gap by service quality ideas what causes the service quality
is unsuccessed (picture2-2). It illustrates 5 gaps;
Gap 1: gap of consumer’s expectation versus management perceptions.
It differ between facilitator don’t know the customer real needs and expects.
The real needs of customer may be caused by not having to do marketing research.
Gap 2: gap of management perceptions versus service specification.
An administration section may know about the consumer needs correctly but don’t
specify service characteristic and standard.
Gap 3: gap of service specification versus delivery. Service is an admin that
specific standard clearly but the facilitator who cannot service as pattern. Cause they
are not sufficient of training and can’t work as pattern, this work has conflicted or
facilitators not coordinate each other.
Gap 4: gap of service delivery versus external communication. An organizer
communication or business that build expectation to customers but this deliver can’t
do as promise.
Gap 5:the conflict between customer expectations and perceptions of
service delivery.This gap appears when the consumers known that the service quality
likes they expected

13
By the way, Shahin (2005) offered another gaps which might born while
the service quality deliver to customer. So it has 2 new gaps;
Gap 6: the conflict between customer expectations and staffs’ perceptions.
This gap appear when employee or facilitator understand customer’s expectation
dislike the customers though.
Gap 7: the conflict between staffs’ perceptions and management perceptions.
This gap appears when the customer expectation differ from management segment
and staff who serviced
Additionally, Rahim Mosahab studied about qualityof service, customer
satisfaction & loyalty: A test of medition. The researcher was conducted with a bank
in Tehran, Iran, in 2009 and 2010 that aimed to verify the quality of services offered
by Sepah Bank, and studying the relationship between the service quality, satisfaction
and loyalty. This study shows that in all five dimensions of service quality
(Reliability, Responsiveness, Assurance, Empathy, Tangibles). In fact, findings
of this result of this research shows that even though in all five dimensions of service
quality in higher performance than the Sepah Bank limit average.
Concept and theories of satisfaction
Baijarean (1997 cited in Paovimarn, 2010) Good feelings or attitude of the
person on that. When people devote energy and intelligence to do that.
Daychakup (2000 cited in Paovimarn, 2010) Expression evaluation situation
arising from experience and purchase goods and services. That means the satisfaction
of your condition that have positive emotions that arise due to the evaluation of
one’sex perience, something that is missing upon offer to what was to become the
foundation of satisfied and dissatisfied.
Sudjai (2002 cited in Kasempipatkul, 2014) describe the meaning of
satisfaction. Personal feelings or attitude towards something may be possible to
evaluate both the visual sense and comment on anything that is going to be both
positive and negative.
Dulayapakorncha (2013 cited in Kasempipatkul, 2014) Feeling or attitude
of a person towards something, including a happy feeling, or willing to get responses
on something that is missing by the positive valuation that feeling or attitude toward
14
something it has highlighted as positive or negative.
Vesapen (2012 cited in Kasempipatkul, 2014) The feeling of people towards
something pleasurable feeling occurs when a person has. To achieve the aim, that will
be reduced or not occur if the destination or have not received a response, or could
mean. Such a great feeling of people have been responding achieve what they want
and expect satisfaction as individual preferences. The satisfaction level of the
individual may be different due to the individual characteristics of each.
Concept and theories of customer satisfaction
Solomon (2009 cited in Agbor, 2011) People who buy goods or services by
the company as a customer, in other words, the customers are the key stakeholders of
the organizations that give money in Exchange for an offer to him. By an organization
with the aim of responding to needs and satisfaction. Sometimes the word customer
and consumer confusion, the customer can be consumers, but consumers may not
need to be a customer. Another writer described these differences, such as a customer
to buy a product and consumers are the ones that are most. Use of the product.
Wolman (1973 cited in Agbor, 2011) give the meaning of the customer’s
satisfaction is a feeling of happiness. When you success as a aims according to your
need or get motivated by the customer’s satisfaction is a person’s feeling that arise
from getting. Demand response in individual, where the requirements of a motivation
or an on the basis.
Oliver (1981) give the meaning that refers to the satisfaction to express
positive feeling arising from comparative assessment of experience to receive services
that meet all of customer expectations and exceed customer expectations.
Good (1973 cited in Paovimarn, 2010) give the meaning of customer
satisfaction, the level of satisfaction which come from various interests and attitudes
that people have towards the thing done.
Tiffin and Mc. Comic (n.d. cited in Buriphraserd, 2007) said that the
customer’s satisfaction is the motivation of human being based on basic needs are
related closely with achievement and motivation and try to avoid unwanted things.
15
Pitipattanaphong (2014 cited in Kasempipatkul, 2014) they said that the
customer’s satisfaction as the sum of a person’s feeling about the level of like or
dislike for various condition and as a result of attitudes related to the various
elements.
Seareratch and Other (2003, pp. 90-93 cited in Phongvaranon, 2010)
estimated from the results of the recognition, in the operation of goods or service to
the customer’s expectations. If the customer’s perception of a product or service is
equal to or higher than expectation, the customers are satisfied. Conversely, if the
customer’s perception of a product or service is less than expectation, the customers
will not feel satisfied.
From the above, even if the meaning of satisfaction. But different enough to
conduct that satisfaction is a feeling of a person towards in-depth evaluations,
which will see how ideas about the satisfaction associated with attitudes, not separate.
Naumann and Giel (1995) they offer that means “satisfaction, it depended
Onthe past of experience. It included 3 parts; follow as
1. Quality Product and Service; it influenced the perception or customer
when the customer acknowledge that product or service that have come with good
quality. Pleased in the products or service. In general, the customer will see the
quality of the detail or samples of goods or service.
2. Price; it is a component2 of it, that makes the customer satisfaction
when they compare the price for judging. The characteristic of the products, there
were a reasonable price to the customer satisfaction. If the customers satisfaction
feels that when it doesn’t suitable this price they might be unsatisfied.
3. Corporate Image; there should be an image join is known as both a
general business operations that is an integrity and social responsibility.
Kano (1996 cited in Qiting, Uno, & Kubota, 2015) Kano model is a theory
that was developed in the 80s by Professor Noriaki Kano and his colleagues of Tokyo
Rika University. The Kano model of customer satisfaction is a feature based on how
they are. The research will get to know our customers and the impact. 1) basic or
expected attributes, 2) the performance or speech attributes, and 3) surprise and
delight attributes.
16
The performance or speaking of features shows the expectations of
customers. The basic feature or that it means that represents the basic feature is not
a priority at the core of the worth mentioning. The third one, the surprising feature
is the delight that are beyond the customer's expectations. Kano model measuring
customer satisfaction Recognition of competency attributes; grade according to the
needs of the customer and determine their level of satisfaction. The assumption is
that the roof no as a customer satisfaction is not always according to work fully
the product or service, or in other words that have high quality must not lead to
satisfaction needs all the features of a product or service.
In his model, Kano conflicts between three types of basic requirements,
which influence customer satisfaction. They are:
1. Threshold/basic feature is the expected features, or "must" item and does
not provide opportunities for different types of goods. The optimization of these
attributes is reduced. The payoff in terms of customer satisfaction, by the way,
or the lack of good performance, these features result in customer dissatisfaction
very seriously.
2. Performance attributes or operational features, as more is usually better.
And to improve customer satisfaction, on the other hand, lack of or weak performance
feature reduces customer satisfaction. Customer demand can largely be in the nature
of work. These features are weighted to form the concept of the product will be
evaluated. The price customers are willing to pay for a product that is linked closely
to the feature, for example, customers are willing to pay more for a vehicle that
provides them with better fuel economy.
3. The exciting and unexpected by the customers. But can result in high
levels of customer satisfaction. In addition, the lack of them does not lead to
dissatisfaction. The exciting feature often meet potential. And the real needs of
customers who are unaware. In competitive markets, manufacturers provide similar
performance. The excitement Feature is the "demand" that can provide a competitive
advantage. Although they have generally followed the evolution of the show and
features. Cup holders begin the exciting features, products often have features that
can’t be classified according to the Kano model. These attributes are often of little
or no consequence to our customers. And it's not a factor in the decision. Examples
17
of this type of sheet attributes of the part number can be found on many vehicles
from cars to use repairpersons.
Kotler (1997, p. 40) said that the customer’s satisfaction means that
ultimately resulted from the comparison between the results obtained from the goods
or services to the customer’s expectations that customers can feel a satisfaction level
in 3 levels, as follows:
Level 1; if the work has been recognized from the goods or services under
the customer’s expectations. They will bed is satisfied.
Level 2; if the work has received recognition from the products or services
of equivalent the customer’s expectation. They will be satisfied.
Level 3; if the work has received recognition from the goods and services
is better than the customer’s expectations
Overall, the customer’s satisfaction means be feeling that from the
measurements between the expectation with experience gained from another goods
or service, or parallel to be satisfied and dissatisfied, it depended on whether the
goods or service they provided. If the response is based on where the client expects,
it will have a reason of feeling satisfied. Therefore, it is important for one thing to
make different. The customer’s satisfaction occurs when a customer perception in a
goods or service that is received is better than the expectations of the customer before
purchasing products or services.
Concluded that customer satisfaction means good feeling or attitude of a
person that is often caused by a response as they want to take a good feeling towards
the opposite thing if their demand is not responding.It is not satisfied it will occur.
Customer satisfaction refers to the level of feelings resulting from the comparison
between the benefits from the properties of the product, or from the operation of
the product with the customer's expectations
Supyaprapa (2005, pp. 231-232 cited in Yaibauthead, 2015) surely he will
surely have satisfied if value or cover the benefits that they get from the products and
services of equal or higher than the level of his expectations. But if it results from the
use of goods or services is lower than his expectation. He will inevitably feel not
satisfaction.
18
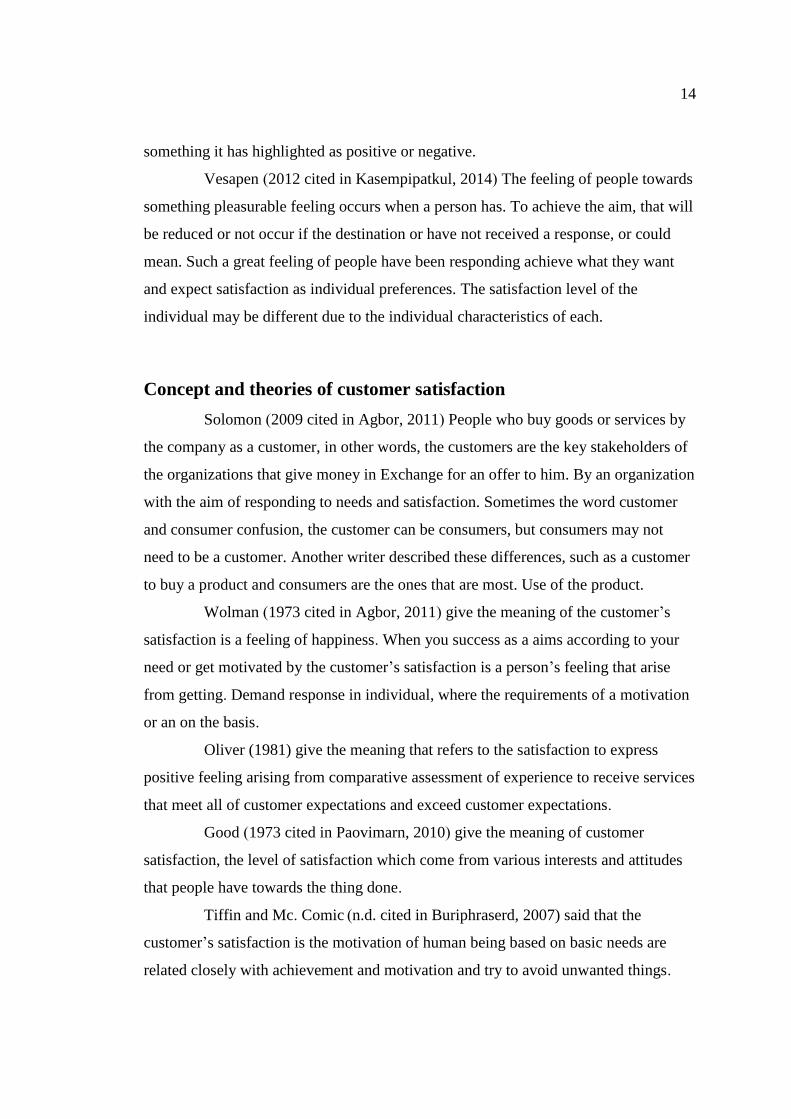
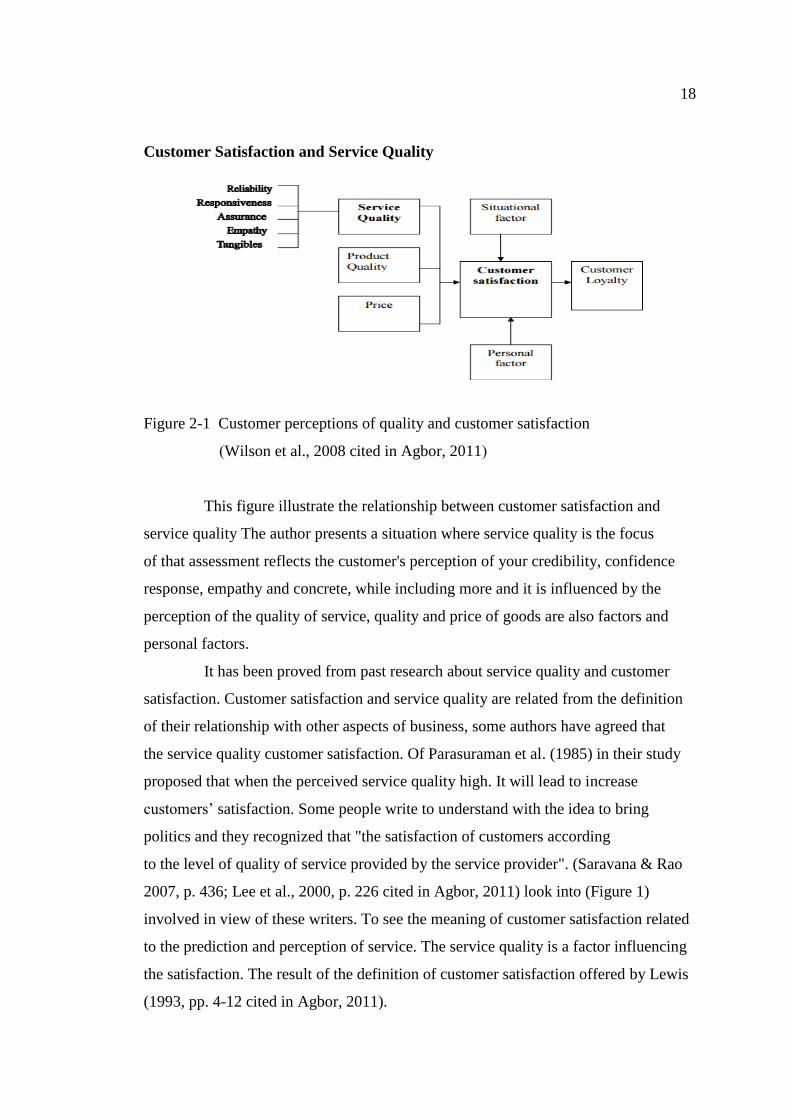
Customer Satisfaction and Service Quality
Figure 2-1 Customer perceptions of quality and customer satisfaction
(Wilson et al., 2008 cited in Agbor, 2011)
This figure illustrate the relationship between customer satisfaction and
service quality The author presents a situation where service quality is the focus
of that assessment reflects the customer's perception of your credibility, confidence
response, empathy and concrete, while including more and it is influenced by the
perception of the quality of service, quality and price of goods are also factors and
personal factors.
It has been proved from past research about service quality and customer
satisfaction. Customer satisfaction and service quality are related from the definition
of their relationship with other aspects of business, some authors have agreed that
the service quality customer satisfaction. Of Parasuraman et al. (1985) in their study
proposed that when the perceived service quality high. It will lead to increase
customers’ satisfaction. Some people write to understand with the idea to bring
politics and they recognized that "the satisfaction of customers according
to the level of quality of service provided by the service provider". (Saravana & Rao
2007, p. 436; Lee et al., 2000, p. 226 cited in Agbor, 2011) look into (Figure 1)
involved in view of these writers. To see the meaning of customer satisfaction related
to the prediction and perception of service. The service quality is a factor influencing
the satisfaction. The result of the definition of customer satisfaction offered by Lewis
(1993, pp. 4-12 cited in Agbor, 2011).
19
Baker and the Cascades (2000, pp. 73-82 cited in Agbor, 2011) used a
random national telephone their shoppers. To study the relationship between service
quality, customer satisfaction and loyalty, retail stores within the context of the results
to influence the attitudes and preferences related to service quality department stores.
They found a strong relationship between customer satisfaction and service quality.
In addition to what the researchers. It is found from the customer satisfaction
and service quality. Some other authors Wang and Hing Po (2002 cited in Agbor,
2011) into the details. The value of the study of the relationship between customer
satisfaction and customer service quality. Study of using a quality assessment to
measure service quality in Chinese mobile phone market But with the changes on the
basis of discussion groups and the opinions of experts. To reflect the characteristics
of the special industry and culture of China. Emphasis is paid to the study of dynamic
relationship between quality, value of customer services. Customer satisfaction and
impact on behavior in the future after the drivers of the important value of customers
and customer satisfaction were identified. All of them were used in the development
of the structural equation model by using Pls-graph package (Wang & Hing Po, 2002,
pp. 50-60 cited in Agbor, 2011). This study, mix the customer satisfaction and service
quality and customer value. Add more weight in the link between customer
satisfaction and service quality. Because the value is what the customer is looking
for the proposal.
Drugstore business
1. Pharmaceutical business systems.
Jumrerndararadsameii (2003, pp.12-42 cited in Phongvaranon, 2010)
pharmaceutical industry group, said the business group is composed of 3 drug
manufacturers, who ordered imported from pharmaceutical suppliers and international
business groups, each consisting of a number of other subgroups, but the same
business goal is to sell your own product, as much as possible, which will result in
greater profits as a proportion of each group must be used as part of the strategy.
The more competitive new strategies have been used more as a sequence.
When combined with the weak regulatory system was that lack of
performance. It causes the system to business expansion to affect drug distribution

20
patterns even in town.In many rural areas are different.For the drug store as
operators of small and medium enterprises.Drug store operators in Thailand is
divided into 4 categories according to the nature of the business management.
As follows:
1.1 The distributors (Distributors) sells various types of drugs, most of
which are imported from foreign countries is medicines and medical material, as it
contains medicinal plants acting as drugs anymore. Medicinal herbal tea produced
there from what is not yet over, and the need to encourage the pharmaceutical
industry's arm.
1.2 Vendor sends (Wholesalers) are all types of medicines from different
companies, many companies come stored in a warehouse and then sold to another
sub-per-drug store.
1.3 Retailers (Retailers) are direct sales to customers, which are divided
into 4 subcategories 1967 (Drug Act section 39 amendments the medicines Act
1.3.1 Current medicine shop; the current plan, the drug store pharmacy
specific.
1.3.2 Packaging is non-hazardous drugs or medications, special
control, and traditional medicine shop
1.3.3 Current medicine shop pharmacy-specific packaging is for
animals.
1.3.4 The retail tobacco store and send it together, which is most
common in the provinces, and is located in the town by prescription to sell each drug
store sales was smaller, and then send it, or store it away little pills from the province.
2. Growth of pharmacy business.
Vibunsunti and Others (2005, p. 60 cited in Phongvaranon, 2010) in the
past, said the drugstore model, there is only one category:Independent pharmacy
(Independent drugstore) refers to the current plan, pharmacy is operated by a single
owner, or a partner who has a pharmacy located in one place.There is no other branch
is currently a pharmacy store (Chain drugstores) is a current plan pharmacy operations
by an individual or legal entity that has more than one pharmacy and branch of the
same store, can be considered as the more popular drug store in each format are
handled. Actions and different management systems. Cause the advantages and
21
disadvantage that vary in each style and affect the response to the maximum
satisfaction of the customer's service.On the basis of the Office promoting small
and medium enterprises have to demonstrate the growth of pharmacy business during
the past year.In addition to these forms of drug ever.Also includes the expansion of
the pharmacy chain(Chain drugstores) new items coming from abroad are numerous:
1. A traditional pharmacy is divided into 3 categories:
1.1 The Pharmacy and pharmacist who is often served throughout the
operating time (the time specified on the labels with time)
1.2 The drugstore pharmacist is a pharmacist, but do not have a regular
annual operating time, or not at all, but is sold by the owner or other person shall have
a label that says "Pharmacy plan"
1.3 Non-store pharmacist or store ขย. 2 will have a label stating that
"the current plan pharmacy packaging"
2. FDA's pharmacy-pharmacy, at present, there are only 6 only branch was
the headquarters the old Southern, the wet, Rangsit, yotse, and the Ministry of public
health.
3. A retail store items, health and beauty retail store format only, or also
known as Specialty Store with market leaders include Watson.Shop boots etc.
At present, retail stores, health and beauty items, fast growing consumer demand for a
new era.This is caused by a lifestyle of consumers it wants modernity and comfort in
buying goods that they want to include a variety of items for a cheaper one at a time.
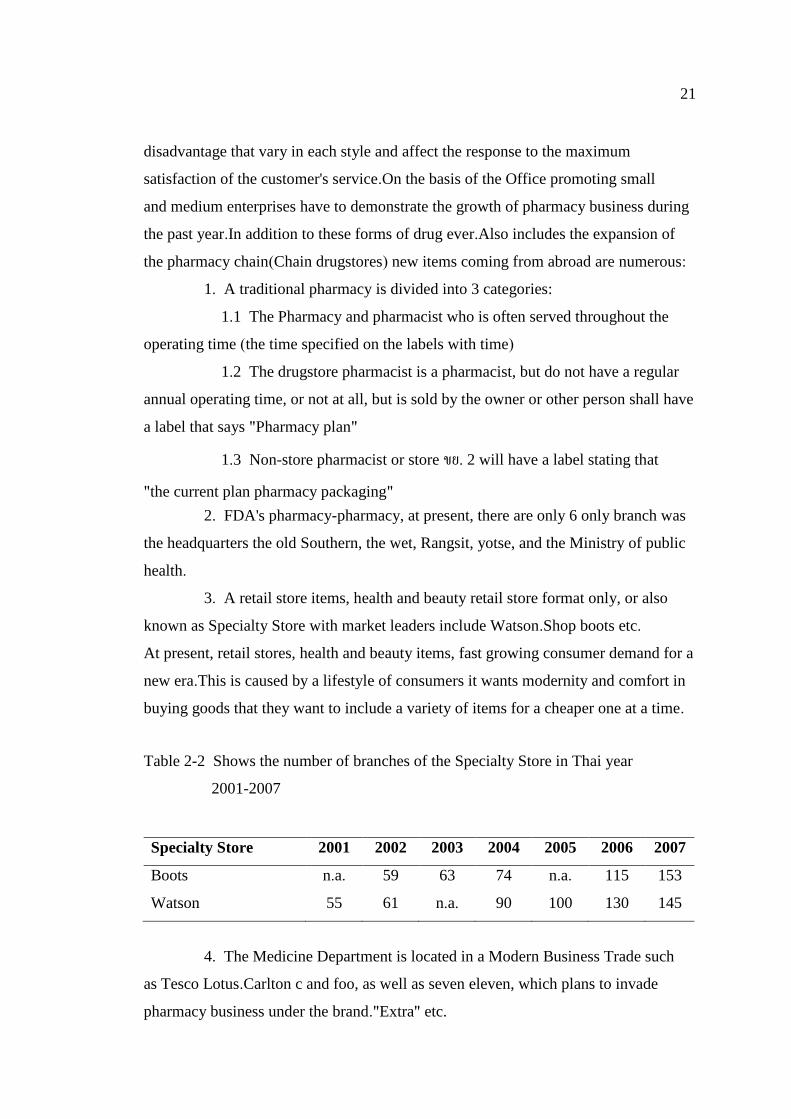
Table 2-2 Shows the number of branches of the Specialty Store in Thai year
2001-2007
Specialty Store 2001 2002 2003 2004 2005 2006 2007
Boots n.a. 59 63 74 n.a. 115 153
Watson 55 61 n.a. 90 100 130 145
4. The Medicine Department is located in a Modern Business Trade such
as Tesco Lotus.Carlton c and foo, as well as seven eleven, which plans to invade
pharmacy business under the brand."Extra" etc.
22
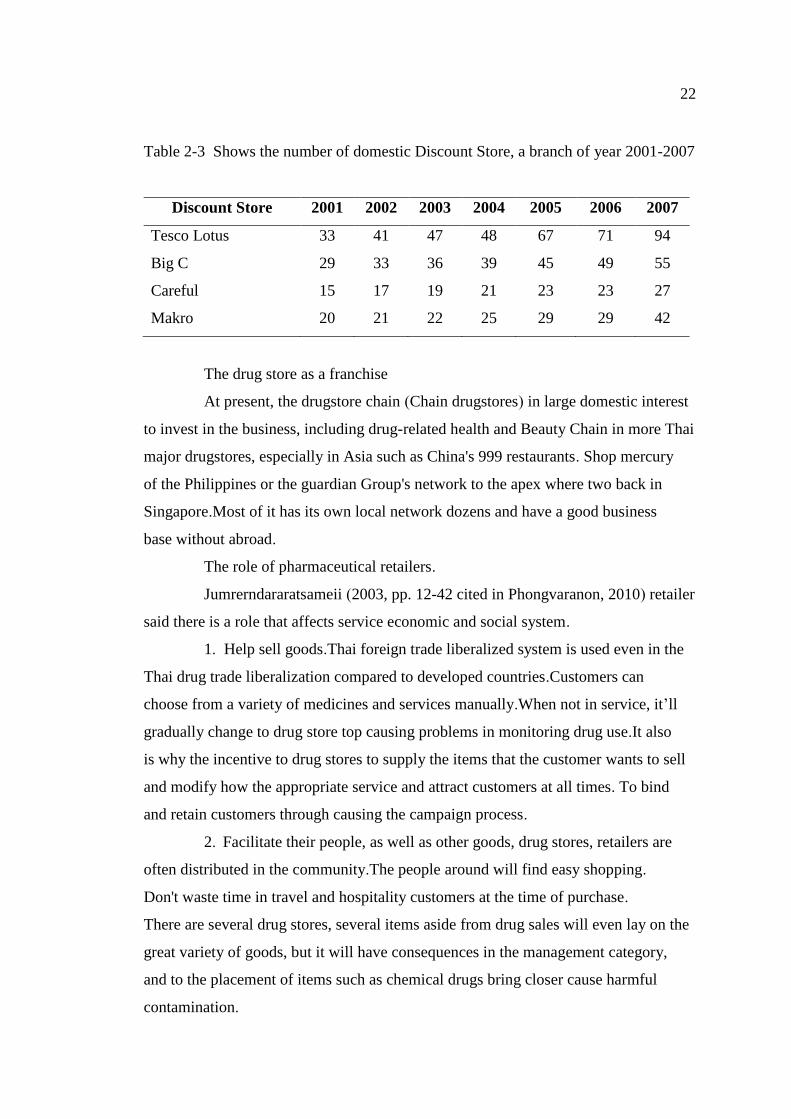
Table 2-3 Shows the number of domestic Discount Store, a branch of year 2001-2007
The drug store as a franchise
At present, the drugstore chain (Chain drugstores) in large domestic interest
to invest in the business, including drug-related health and Beauty Chain in more Thai
major drugstores, especially in Asia such as China's 999 restaurants. Shop mercury
of the Philippines or the guardian Group's network to the apex where two back in
Singapore.Most of it has its own local network dozens and have a good business
base without abroad.
The role of pharmaceutical retailers.
Jumrerndararatsameii (2003, pp. 12-42 cited in Phongvaranon, 2010) retailer
said there is a role that affects service economic and social system.
1. Help sell goods.Thai foreign trade liberalized system is used even in the
Thai drug trade liberalization compared to developed countries.Customers can
choose from a variety of medicines and services manually.When not in service, it’ll
gradually change to drug store top causing problems in monitoring drug use.It also
is why the incentive to drug stores to supply the items that the customer wants to sell
and modify how the appropriate service and attract customers at all times. To bind
and retain customers through causing the campaign process.
2. Facilitate their people, as well as other goods, drug stores, retailers are
often distributed in the community.The people around will find easy shopping.
Don't waste time in travel and hospitality customers at the time of purchase.
There are several drug stores, several items aside from drug sales will even lay on the
great variety of goods, but it will have consequences in the management category,
and to the placement of items such as chemical drugs bring closer cause harmful
contamination.
Discount Store 2001 2002 2003 2004 2005 2006 2007
Tesco Lotus 33 41 47 48 67 71 94
Big C 29 33 36 39 45 49 55
Careful 15 17 19 21 23 23 27
Makro 20 21 22 25 29 29 42
23
3. Help raise the standard of living. Shop retail store distribution as well,
there are many items that can be manufactured in bulk to make the unit prices were
down.People buy it for the lowest price. At the same time, it is inviting, with many
manufacturers deregulation occurred. Who will benefit from the high quality category
and type of goods must increasingly develop according to the market mechanism.
In the drug store, I found that a combination between a drug store to buy the drug in
quantities that are very combative.In order to make the cost price is down as well.
4. As a service to community pharmacies are generally good items can
provide a clean and beautiful shops bring pride to the local. Modern drug store could
be a place where customers come shopping for goods coming from other customers,
meet with the question.Consultation on the issues is to create a human connection,
and the needs of society in a In many provinces, there are drug trader also had strong
acting community leaders.The project manager as well.Many drug store operator is
trusted. Acting as purchasing agent for the people.In the case of a community that has
a lot of effects, or retailers may be gathered from a large number of procurement and
retail.
Related research
The related literature with this research the study of customers’ satisfaction
of drugstore’ service in the city of Rayong province are as following:
Buriphraserd (2007) study one of private hospital's service qualities:
Women’s Health of out-patients case study This research studied 6 topics as;
equipment, staff service, reliability of medicians, treatment, aware of feeling and
needs of customers and cost of treatment.The research result founded that most of
out- patients are women who ages 21-30 years old, graduated bachelor's degree,
be employee in company, 15,000-25,000 baht salary and twice times for seeing a
doctor. Their point of view are each service of there, which is high criterion as staffs,
health care, cost of treatment, medical instruments and reliability of health stuff such
as nurses, doctors and pharmacists. Especially most of them focus on the medicians
reliability than another points. In addition, the different gender though dislike for
service quality at 0.05 statically significant. Example gender had difference opinions,
women who is sensitive and worry than men. On the other hand, age, education,
24
occupation, salary, cost of treatment and frequency of coming isn’t different.In
conclusion, this result reflected on women’s health service quality of some hospital
that is high level, but some part is medium level which was developed to high quality.
Because it make the customers feel good at servicing and suitable for curing.
Jidtiwat (2009) studied the level of satisfaction of pharmacy services and
the factors affect customer satisfaction of pharmacy services in Don Mueang district
This study founded that consumers of community pharmacies in Don Mueang district,
most of female, aged 41-50 years old with marriage status and be staff of
professionals. Level of education degree, revenue increased to 5,000 baht per month.
Additionally, this research studied the level of satisfaction of customers,
the cost of services, information received from the service, co-operated with other
services, disposition of interesting to service providers and service quality which were
easier to get from the service and promotion of market.It compared each other, follow
as;
Compared between these factors influenced satisfaction with the level of
satisfaction of consumer in community pharmacies, including Don Mueang district
founded that product factor related a convenience from service, the level is medium.
But price and promotion of market factors, these levels are high.Co-operated with
other services founded that the promotion of market factor is high level and another
factors are medium level.Disposition of interesting to service providers and service
quality found that these factors of product and channels are medium. In opposite,
price and promotion of market factors are high levels.Information received from the
service founded that only promotion of market factor is high level and another factors
are medium levels. Service quality and cost of service founded that all of factors are
medium levels.
Keawkes (2010) Studied satisfaction and opinion of Mahasarakham
University population toward the University Pharmacies.In addition, this report also
found that the highest score of satisfaction of University pharmacy in health
promotion. Service sales both alcohol and cigarettes. The lowest score in the health
information service and labeling of the illness to the customer community pharmacies
in the other had the highest score in terms of quality and price. And health promotion
25
services, while the lowest score is, as found in the labeling of illness service. The
price tag rooms and comfortable service to choose manually. The owner wants to
complete service of health counseling, service minded, mark of the provider who
provides care and clean the place.
Phongvaranon (2010) Studied the customer’s satisfaction of chain
drugstores’ service.This research studied customers’ satisfaction of franchise
drugstores’ service that consists product, price, place, promotion, people, physical
evidence, process and productivity which classified by gender, age, education level,
career, salary, duration of being customers and frequency of service usage, who have
purchased goods from franchise drugstores in Bangkok. By the way, this result
showed that most of customers are female, aged between 35-44 years old, holding
graduate degree. Most of customers are self-employ with monthly income level of
30,001-40,000 baht, and have been customers at Boots for 5-6 years. They have
bought products from Boots twice a month. The most purchased product is healthcare
product and customers with different gender have different satisfaction in product.
Customers with different age have different satisfaction in productivity. Customers
with different education have different satisfaction in product, price, place, promotion
and process. Customers with different occupation have different satisfaction in place
and process. Customers with different monthly income have different satisfaction in
place and promotion. Customers with different duration of being customers and
service usage frequency have no different satisfaction in overall aspects.
Mosahab (2010) studied service quality, customer satisfaction & loyalty: A
test of Mediation. His research was conducted with a bank in Tehran, Iran, in 2009
and 2010 that aimed to determine the quality of services offered by Sepah Bank,
and studied of the relationship between service quality, customer satisfaction and
loyalty. The research illustrates that in every five dimensions of service quality
(reliability, responsiveness, assurance, empathy tranquility.) in fact, research has
shown that, although all five dimensions of performance in all of the Sepah Bank
has received higher-than-average credit limit, but since it did not meet the
expectations of the customer. Additionally, the research shows that the
relationship positive and significant in all five dimensions of service quality with
customer satisfaction and loyalty, which in the case of insurance and have the most
26
physical and Aqua. Relations with less satisfaction and loyalty on the other hand,
it can be considered as a factor that physical health and insurance factors inspiring.
However, the five dimensions of service quality can be observed from a different
perspective. In fact, these can be divided into two General dimensions of performance
and processing. The resulting dimensions are dimensions that are more reliable, and
dimension processing, including other dimension (physical response, confidence and
compassion). The findings of this section it is shown that both the results and the
processing size correlated positively and with customer satisfaction and loyalty.
But the key point is that there is a significant relationship between the dimension
processing and customer satisfaction and loyalty. This point is important, because
even though the final result may not satisfy our customers, but it does not mean
that no customer satisfaction. In fact, I found the service plays an important role
in customer satisfaction and loyalty. Based on the above findings, the Manager of
the Bank should try to gradually reduce the gap in the first step.
Jareansriviriyakul (2011) study service quality of general public hospital
in Pathum Thani province. The results found that the differences of demographic
factors including age, educational level and occupation had different effects on overall
service quality. In detailed consideration, the results found that gender, age, marital
status, educational level and occupation affected service quality in tangibility.
Age, educational level and occupation affected service quality in empathy and
responsiveness. Occupation affected service quality in reliability. Age and education
affected service quality in assurance. The analysis factors of service usage behavior,
including nature of service usage and the payment method for the medical bills,
affected overall service quality.
By the way, the result found that nature of service usage affected service
quality in tangibility, empathy, reliability, responsiveness and assurance. The payment
method for the medical bills affected service quality in tangibility, empathy, reliability
and responsiveness.
KOÇOĞLU (2012) studied customer relationship management and customer
loyalty; a survey in the sector of banking This research aims to demonstrate the
relationship between customer relationship management and customer loyalty.
One of the basic elements of an understanding of modern marketing is customer
27
satisfaction. A business can survive as long as they can meet the needs of the
customer and enable customer satisfaction. Determining of consumer wishes
and needs and meeting them is one way to enable consumer satisfaction.
As a result, there are two objectives of customer relationship management
in banking. One of them is to get customers to your potential customers, so the
number of existing customers to the end customer data should occur, and frequent
updates. For a successful communication with clients, personnel information system,
is the requirement of customer insights by forming and sustainable customer
relationships that are healthy and have become long term that refers to the importance
of competition in the banking sector. The attempt to maintain the customer impact
of the Bank's success due to the fact that one on one communication to be successful
with customers, particularly in the areas of trade finance and margin will come from
credit customers.
Srathonghon (2012) studied factors influencing consumer behavior and
satisfaction toward service usage of Watson shop in Bankok metroprolis.In
conclusion, the factors of this research include demographic characteristics,
attitude toward the marketing mix, brand identity, customer relationship management,
consumer behavior and satisfaction. However, the research result were as follow:
In term of demographic characteristics, these factors include gender, age, occupation,
education background and monthly income. It found that the majority of the
respondents are female, with average age between 26-30 years old, holding bachelor’s
degree, working as employee in private company, and with the average income of
Baht 10,001-15,00 per month.By the way, customer with difference gender, age and
monthly income affected different the average buying frequency within month at 0.05
statically significant levels and customer with difference gender and monthly income
affected a different average expenditure a time at 0.01 statically significant levels.
In addition customer with difference age affected different satisfaction toward service
usage of this shop at 0.05 statically significant levels. Customers with difference
educational background, occupation and monthly income affected different
satisfaction on this shop’s promotion overall at 0.05, 0.01 and 0.01 statically
significant levels.
28
Attitude toward the marketing mix, brand identity, customer relationship
management and satisfaction toward service usage of this shop overall were good and
high level in each aspect.Consumer behavior; most of them purchased about skin care
product especially in 50% mid-year sale. The satisfaction on product and service,
this shop’s promotion compared with expectation at 0.05, 0.01 and 0.05 statically
significant levels which were at the low levels in the same direction.
Sukridee (2014) studied factors affected the drug retailer’s satisfaction
toward pharmaceutical manufacturer and distributor: Case Study of T. Man pharma
incorporation.This survey research aimed to investigate the satisfaction of the
relevant factors and affected drug retailer’s of T. Man Pharma Incorporation,
pharmaceutical manufacturer and distributor. Especially, the independent factors
were studied: market-oriented, service quality, product quality, promotion strategy,
manufacturer trust and representative trust.The findings revealed that the market-
oriented, quality, service quality, product strategy, promotions, manufacturer's
representative, trust, trust was positively correlated with the satisfaction of retailers
of drugs. In addition, Quality of Service (ß = 0.265) promotional strategy (ß = 0.239)
and a trust agent (ß = 0.161) with the power to predict customer satisfaction with the
retail of drugs on. Pharmaceutical Manufacturer and Distributor
Finally, all of the factors have positive relationship with the satisfaction
of the retailer of medicine towards the pharmaceutical production and distribution.
Niti (2014) studiedthe marketing composition causing customer’s loyalty
toward drugstores in Bangkok. The sample group used in this study is 400 customers
who visit modern drug store in Bangkok. Questionnaire is used for collecting data.
Data is analyzed in percentage, average number, standard deviation, and one-way
variation. The result shows that most people answering the questionnaire are female,
age between 21-30 years old, and working as public officer, public enterprise, and
self-employed. Their income is between 15,000-30,000 Baht. Their educational
level is undergraduate. In customer’s view, level for service value in marketing
composition toward modern drugstore in Bangkok is high in general. When consider
each aspect, the researcher found that every aspect is high. Considering each point,
the researcher found that every point is high. Total loyalty level of drugstore’s
customer is high in general. When consider each aspect, the researcher found that
29
every aspect is high. Considering each point, the researcher found that every point
is high.
Khrdkar (2015) studied the effect of customer relationship management on
customer satisfaction and loyalty.His study aims to elucidate the relationship between
the variables of customer satisfaction and customer loyalty. Customer Relationship
Management (CRM) is the process that integrates the management of customers,
the management of enterprises and managed in an efficient CRM serves as a tool to
facilitate business and improve customer relations with the organization.
Finally after conducting this research and validating various data and
quantitative analysis that can be effectively stated that CRM is needed in any
organization will result in optimizing profitability, income and meeting the needs
of customers. The most things that CRM provides is customer satisfaction. An
effective CRM will lead to customer satisfaction and if the customer is satisfied it
drives towards positive word of mouth and loyalty. In fact helps in leveraging the
business as well as generating more revenues and profits. This research is an attempt
by the researcher to acknowledge two important variables that effect CRM i.e.
customer satisfaction and customer loyalty.
30
CHAPTER 3
RESEARCH METHODOLOGY
This research aims to study customers’ satisfaction of drugstore’service in
Muang district of Rayong province
Research design
The study is obtaining data by observe the study of customers’satisfaction
of drugstore’service in Muang district of Rayong provincefrom people who has
bought some medicine or another cosmceutical from drugstore in there. This research
is descriptive research by questionnaire that has corrected data for 2 months (May to
June 2016)
Data was collect by using questionnaires.
1. Data collection
1.1 Primary data - It’s gathered from observation by questionnaires.
The researcher created the questionnaire for survey of consumer opinion that buy
some medicine or entrance to drugstore in the city of Rayong province. Researcher
will distribute this questionnaire by convenience sampling and got the data at two
places where are Central plaza and Leamthong Rayong
1.2 Secondary Data-In this research is from related documents such as
literature review, web-site, thesis, internet, newspaper and other information from
libraries.
Research variables
1. Independent variables of general data consist of:
1.1 Customer relationship management
1.1.1 Customer Retention
1.1.2 Customer Acquisition
1.1.3 Customer Profitability
1.2 Service quality
1.2.1 Reliability
31
1.2.2 Assurance
1.2.3 Tangibles
1.2.4 Empathy
1.2.5 Responsiveness
2. Dependent variables are consisted of:
2.1 Customers’satisfaction of drugstore’service in Muang district of
Rayong province.
2.1.1 Quality Product and Service
2.1.2 Price
2.1.3 Corporate Image
Population
Population of this study is people who has bought products from drugstores
where are located in Muang district of Rayong province.
Sample size
The study focused on the personal characteristics and factors that effect to
customers’ satisfaction of pharmacy’ service in Muang district of Rayong province.
Sample sizes in this study samples used in research, including customer
service, drugstores in Muang District, Rayong is aged 15 years or above because it is
non-parametric inference due to the exact number of the population. Sample size to
store information used to calculate the size of the samples by 95% confidence is
expected to move up to 5% sample size is equal to 385 samples.
Formula n = Z2pq/ E2
As n = Sampling
E = Tolerance
Z = Z Score, depended on confidence
P = Probability of sample
Q = 1-p
32
As in the formula
n = (1.96)2 (0.5) (1 - 0.5)/ (0.05)2
n = 385 example
Also the calculated sample size equals 385 examples. However the
researcher is going to distribute this questionnaire 400 sets due to protect error.
Instruments
For this study, the researcher studies from other researches, concept, thesis
and document in order to create the questionnaire as the instrument to gather the data.
There are four parts as following:
Part 1: Demographic factors
This part of demographic factor of customers included gender, age,
education, income per month and occupation.
Part 2: Customer relationship management
This part the consumer in this research will get the ranking analyze a
document. In the document have 3 topics of customer relationship management and
each of point has different option that is following:
Customer Retention
Customer Acquisition
Customer Profitability
This part affect to customers’ satisfaction of drugstore’ service in Muang
district of Rayong province.
Part 3: Service quality
This part includes the tools of service quality that is tangibles, reliability,
responsiveness, assurance, and empathy when the customers purchased product from
drugstore in Muang district of Rayong province.
Part 4: Customer satisfaction
This part includes the elements of customer satisfaction that relates with
price, quality product & service and corporate image when the customers purchased
product from drugstore in Muang district of Rayong province.
33
Method of analysis
The researcher distribute these questionnaires at 2 places in Rayong where is
Leamthong Rayong and Central Rayong because the both have a lot of people and
easier to distribute questionnaire. When the researcher collects data complete, the
researcher will put all the data to calculate and analyzed the data by computer.
This study used Statistical Package for the social science for analyzed the data.
The statistic will use for analysis by Descriptive Statistics and Inferential Statistics
1. Descriptive Statistics; researcher will use descriptive statistic for part 1
that is demographic factors. There includes gender, age, education, income per month
and occupation. Also descriptive statistics will be used percentage, mean, mode,
standard deviation and average.
2. Inferential Statistics; researcher will use inferential statistics for part 2-4
which are customer relationship management, service quality and customer
satisfaction, Additionally inferential statistics will be used multiple regression
analysis.
34
CHAPTER 4
DATA ANALYSIS AND RESULTS
In order to analyze data for the research topic the study of customers’
satisfaction of drugstore’ service in Muang district of Rayong province.
The researcher has taken the sample data were 400 set to analyze using statistic
methods the results divided into part respectively as below:
Part 1: Statistic of demographics factor
Part 2: Statistic of descriptive customer relationship factors
Part 3: Statistic of descriptive service quality factors
Part 4: Statistic of descriptive customer satisfaction factors
Part 5: Multiple regressions
Part 1 Statistic of demographics factor
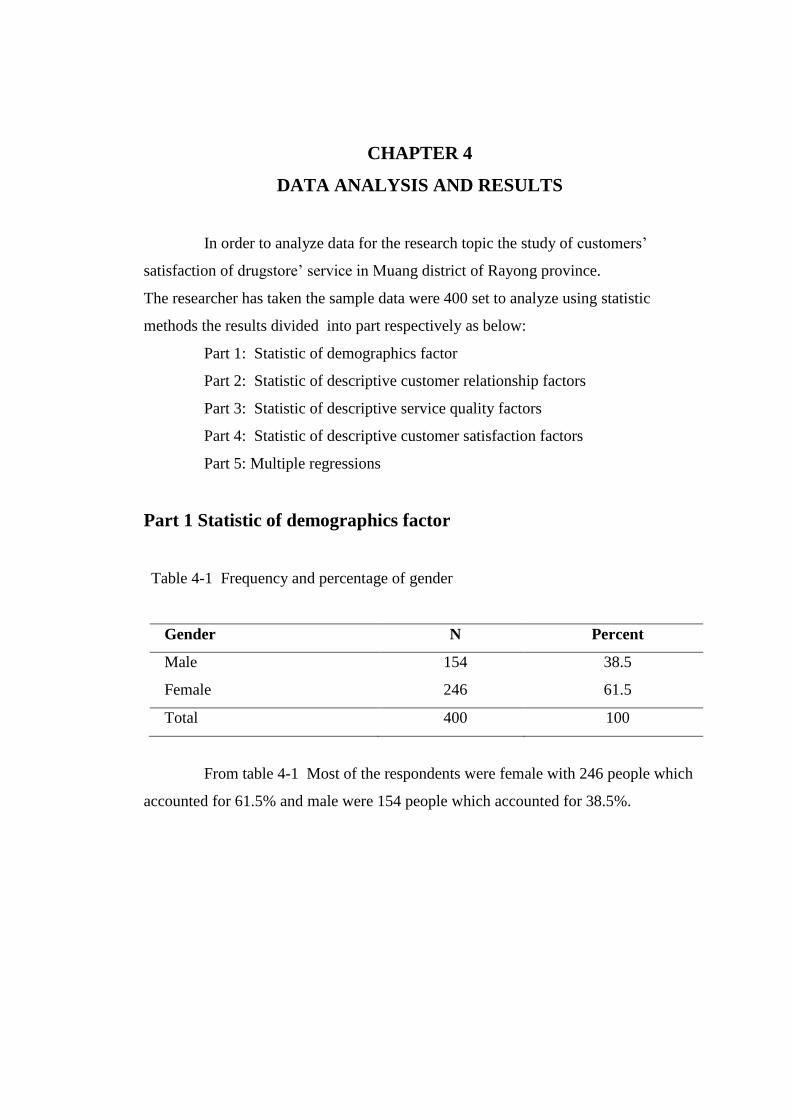
Table 4-1 Frequency and percentage of gender
Gender N Percent
Male 154 38.5
Female 246 61.5
Total 400 100
From table 4-1 Most of the respondents were female with 246 people which
accounted for 61.5% and male were 154 people which accounted for 38.5%.
35
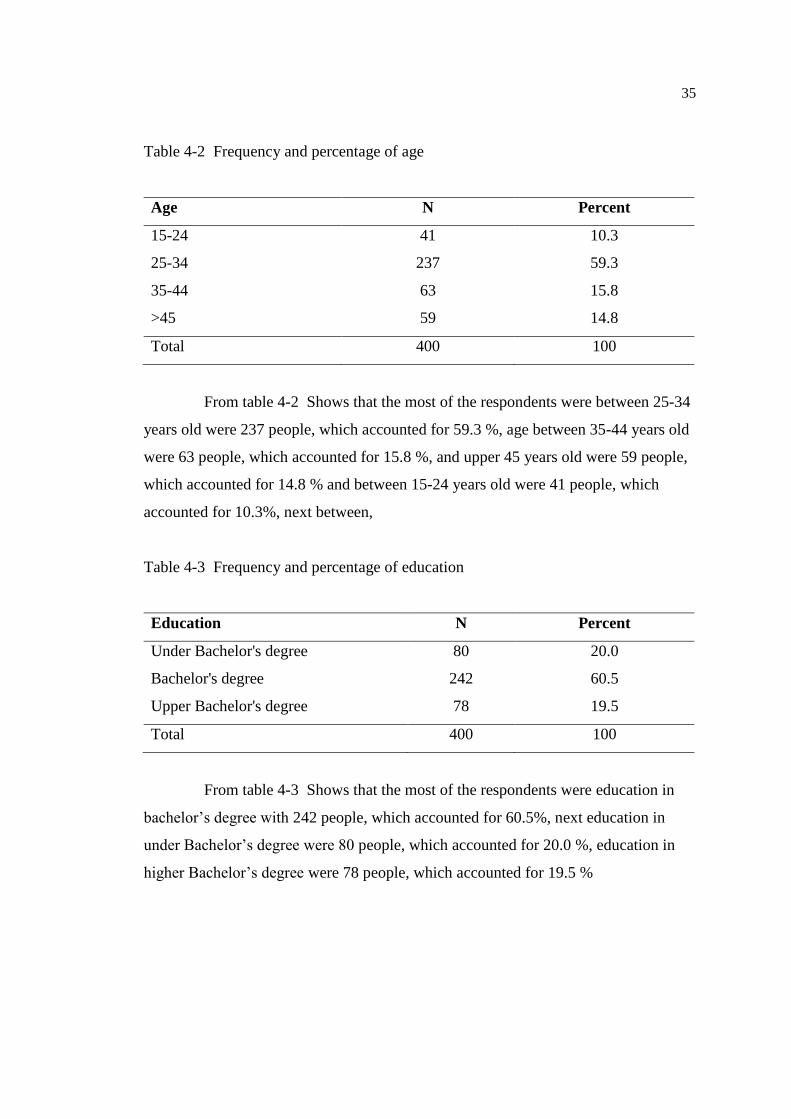
Table 4-2 Frequency and percentage of age
Age N Percent
15-24 41 10.3
25-34 237 59.3
35-44 63 15.8
>45 59 14.8
Total 400 100
From table 4-2 Shows that the most of the respondents were between 25-34
years old were 237 people, which accounted for 59.3 %, age between 35-44 years old
were 63 people, which accounted for 15.8 %, and upper 45 years old were 59 people,
which accounted for 14.8 % and between 15-24 years old were 41 people, which
accounted for 10.3%, next between,
Table 4-3 Frequency and percentage of education
Education N Percent
Under Bachelor's degree 80 20.0
Bachelor's degree 242 60.5
Upper Bachelor's degree 78 19.5
Total 400 100
From table 4-3 Shows that the most of the respondents were education in
bachelor’s degree with 242 people, which accounted for 60.5%, next education in
under Bachelor’s degree were 80 people, which accounted for 20.0 %, education in
higher Bachelor’s degree were 78 people, which accounted for 19.5 %
36
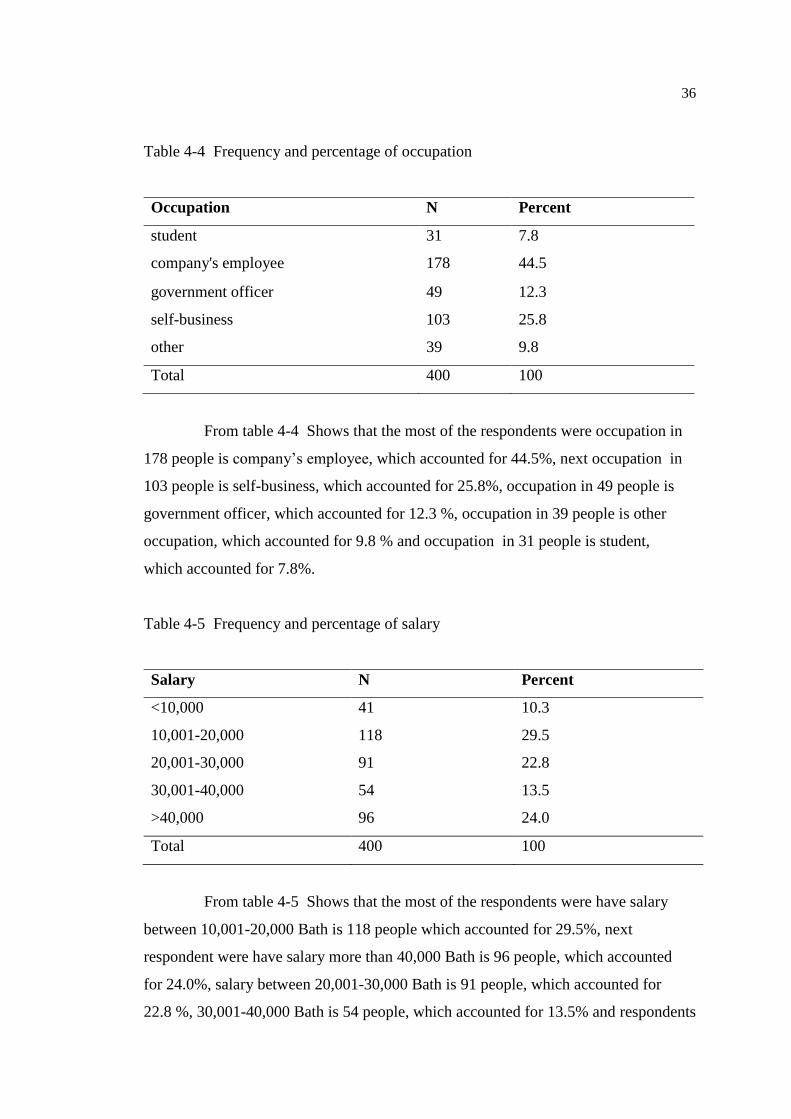
Table 4-4 Frequency and percentage of occupation
Occupation N Percent
student 31 7.8
company's employee 178 44.5
government officer 49 12.3
self-business 103 25.8
other 39 9.8
Total 400 100
From table 4-4 Shows that the most of the respondents were occupation in
178 people is company’s employee, which accounted for 44.5%, next occupation in
103 people is self-business, which accounted for 25.8%, occupation in 49 people is
government officer, which accounted for 12.3 %, occupation in 39 people is other
occupation, which accounted for 9.8 % and occupation in 31 people is student,
which accounted for 7.8%.
Table 4-5 Frequency and percentage of salary
Salary N Percent
<10,000 41 10.3
10,001-20,000 118 29.5
20,001-30,000 91 22.8
30,001-40,000 54 13.5
>40,000 96 24.0
Total 400 100
From table 4-5 Shows that the most of the respondents were have salary
between 10,001-20,000 Bath is 118 people which accounted for 29.5%, next
respondent were have salary more than 40,000 Bath is 96 people, which accounted
for 24.0%, salary between 20,001-30,000 Bath is 91 people, which accounted for
22.8 %, 30,001-40,000 Bath is 54 people, which accounted for 13.5% and respondents
37
were have salary less than 10,000 Bath is 41 people, which accounted for 10.3.
Part 2 Statistic of descriptive customer relationship Factors
The result of customer relationship management factors consist customer
retention, customer acquisition and customer profitability. These results are illustrated
by mean and standard deviation as follow:
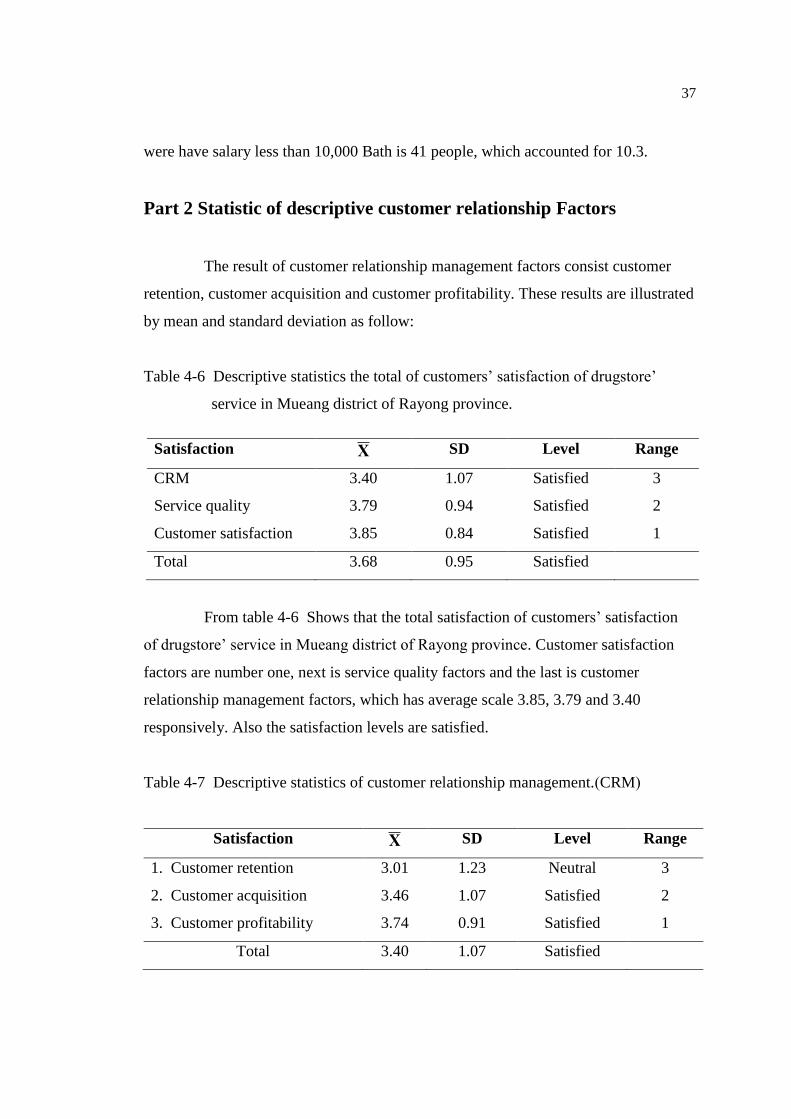
Table 4-6 Descriptive statistics the total of customers’ satisfaction of drugstore’
service in Mueang district of Rayong province.
From table 4-6 Shows that the total satisfaction of customers’ satisfaction
of drugstore’ service in Mueang district of Rayong province. Customer satisfaction
factors are number one, next is service quality factors and the last is customer
relationship management factors, which has average scale 3.85, 3.79 and 3.40
responsively. Also the satisfaction levels are satisfied.
Table 4-7 Descriptive statistics of customer relationship management.(CRM)
Satisfaction Χ SD Level Range
1. Customer retention 3.01 1.23 Neutral 3
2. Customer acquisition 3.46 1.07 Satisfied 2
3. Customer profitability 3.74 0.91 Satisfied 1
Total 3.40 1.07 Satisfied
Satisfaction Χ SD Level Range
CRM 3.40 1.07 Satisfied 3
Service quality 3.79 0.94 Satisfied 2
Customer satisfaction 3.85 0.84 Satisfied 1
Total 3.68 0.95 Satisfied
38
From table 4-7 Shows that the satisfaction of customer relationship
management is satisfied level, the average is 3.40. First is the customer profitability,
average is 3.74, second is the customer acquisition, average is 3.46 and the last is
customer retention, average is 3.01. Also all of them are satisfied except the customer
retention is neutral and next table will be telling more detail.
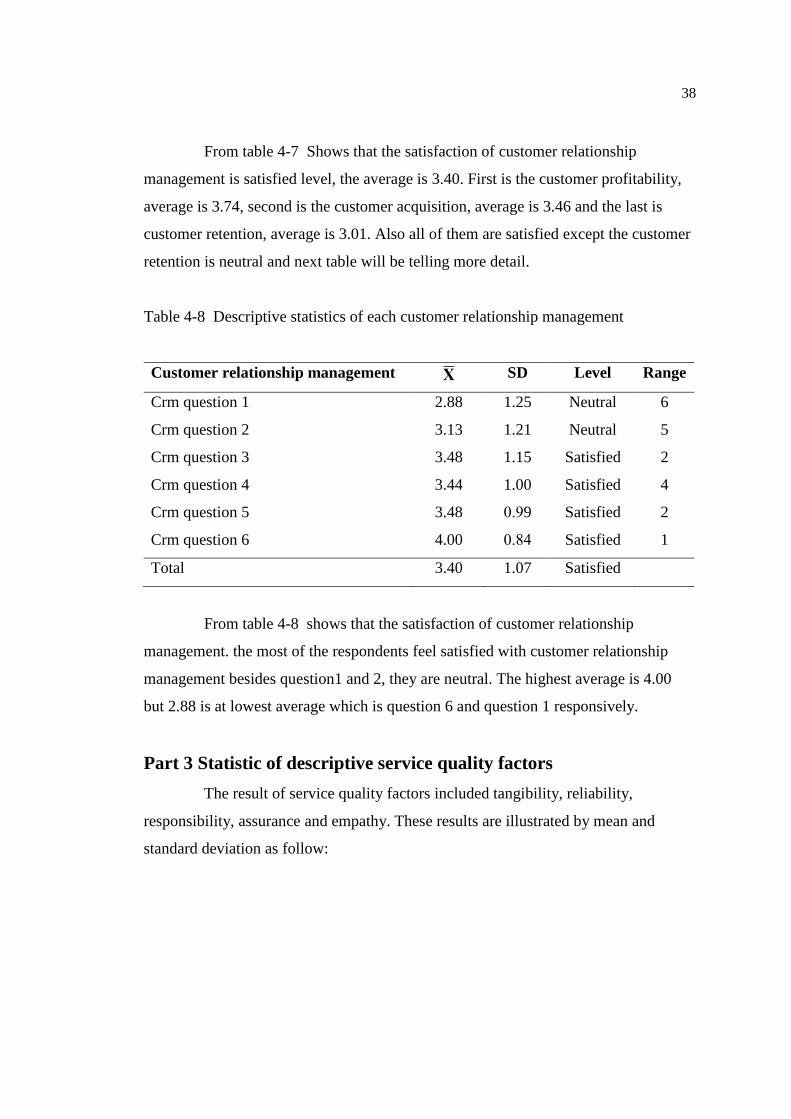
Table 4-8 Descriptive statistics of each customer relationship management
Customer relationship management Χ SD Level Range
Crm question 1 2.88 1.25 Neutral 6
Crm question 2 3.13 1.21 Neutral 5
Crm question 3 3.48 1.15 Satisfied 2
Crm question 4 3.44 1.00 Satisfied 4
Crm question 5 3.48 0.99 Satisfied 2
Crm question 6 4.00 0.84 Satisfied 1
Total 3.40 1.07 Satisfied
From table 4-8 shows that the satisfaction of customer relationship
management. the most of the respondents feel satisfied with customer relationship
management besides question1 and 2, they are neutral. The highest average is 4.00
but 2.88 is at lowest average which is question 6 and question 1 responsively.
Part 3 Statistic of descriptive service quality factors
The result of service quality factors included tangibility, reliability,
responsibility, assurance and empathy. These results are illustrated by mean and
standard deviation as follow:
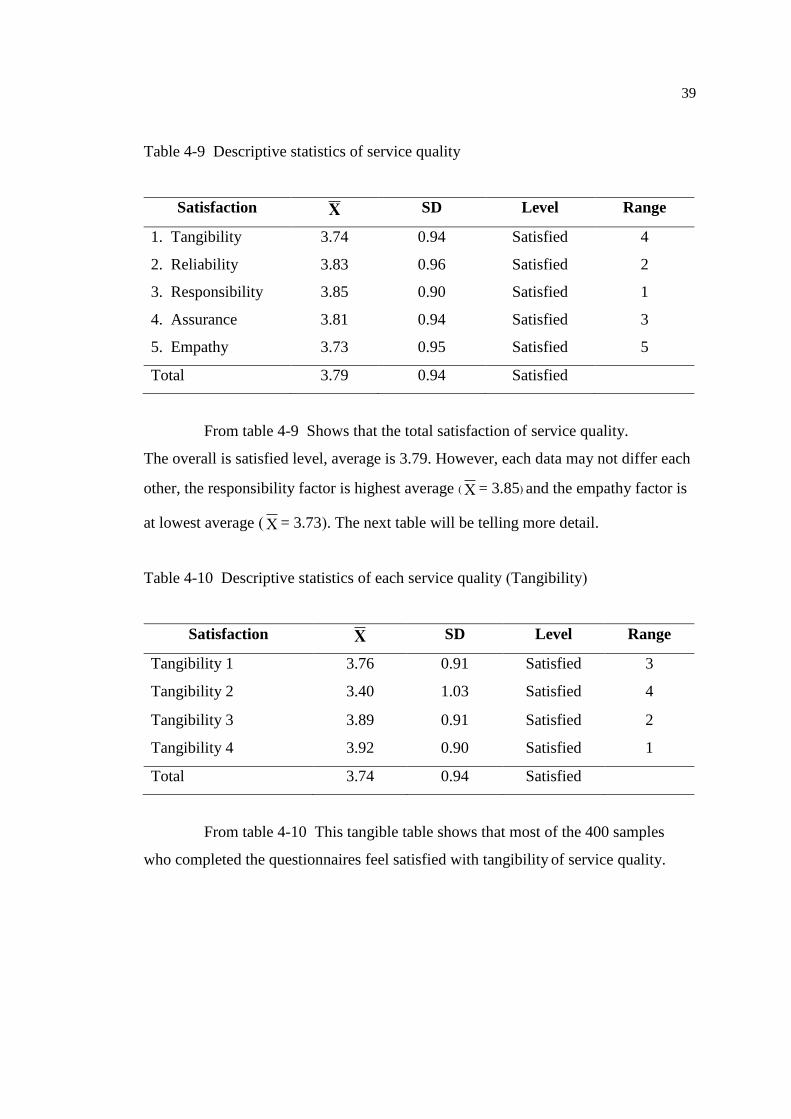
39
Table 4-9 Descriptive statistics of service quality
Satisfaction Χ SD Level Range
1. Tangibility 3.74 0.94 Satisfied 4
2. Reliability 3.83 0.96 Satisfied 2
3. Responsibility 3.85 0.90 Satisfied 1
4. Assurance 3.81 0.94 Satisfied 3
5. Empathy 3.73 0.95 Satisfied 5
Total 3.79 0.94 Satisfied
From table 4-9 Shows that the total satisfaction of service quality.
The overall is satisfied level, average is 3.79. However, each data may not differ each
other, the responsibility factor is highest average ( = 3.85) and the empathy factor is
at lowest average ( = 3.73). The next table will be telling more detail.
Table 4-10 Descriptive statistics of each service quality (Tangibility)
Satisfaction Χ SD Level Range
Tangibility 1 3.76 0.91 Satisfied 3
Tangibility 2 3.40 1.03 Satisfied 4
Tangibility 3 3.89 0.91 Satisfied 2
Tangibility 4 3.92 0.90 Satisfied 1
Total 3.74 0.94 Satisfied
From table 4-10 This tangible table shows that most of the 400 samples
who completed the questionnaires feel satisfied with tangibility of service quality.
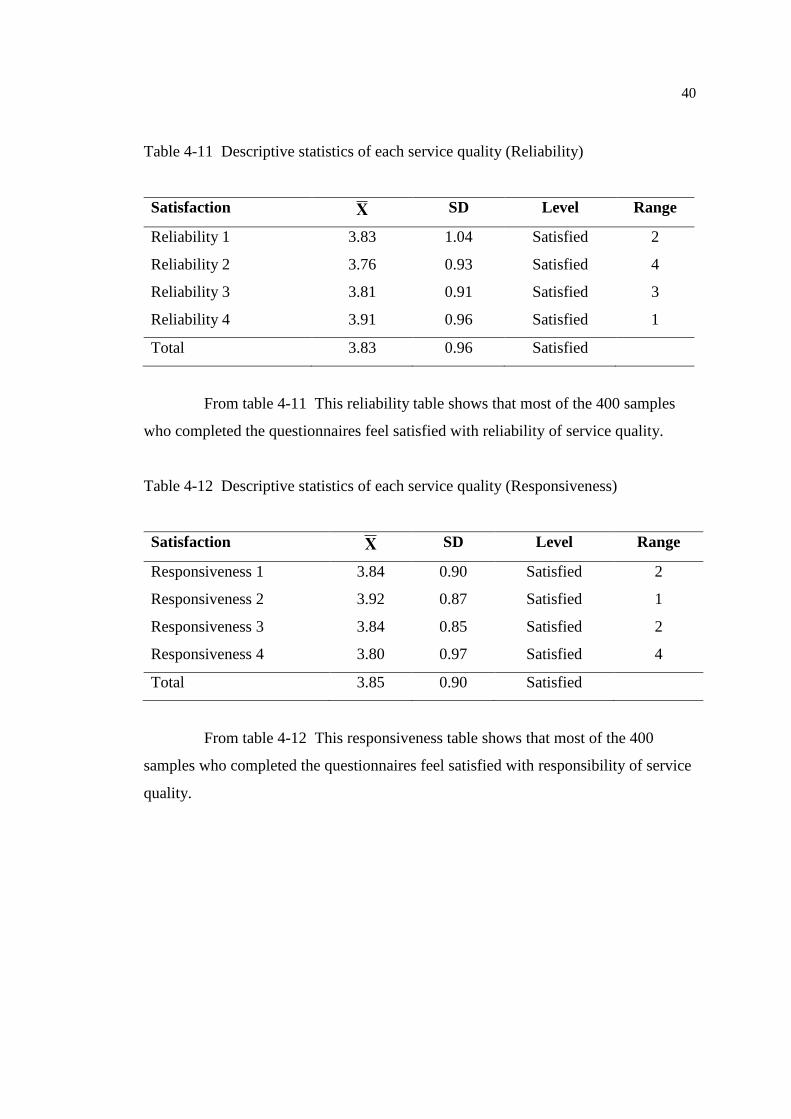
40
Table 4-11 Descriptive statistics of each service quality (Reliability)
Satisfaction Χ SD Level Range
Reliability 1 3.83 1.04 Satisfied 2
Reliability 2 3.76 0.93 Satisfied 4
Reliability 3 3.81 0.91 Satisfied 3
Reliability 4 3.91 0.96 Satisfied 1
Total 3.83 0.96 Satisfied
From table 4-11 This reliability table shows that most of the 400 samples
who completed the questionnaires feel satisfied with reliability of service quality.
Table 4-12 Descriptive statistics of each service quality (Responsiveness)
Satisfaction Χ SD Level Range
Responsiveness 1 3.84 0.90 Satisfied 2
Responsiveness 2 3.92 0.87 Satisfied 1
Responsiveness 3 3.84 0.85 Satisfied 2
Responsiveness 4 3.80 0.97 Satisfied 4
Total 3.85 0.90 Satisfied
From table 4-12 This responsiveness table shows that most of the 400
samples who completed the questionnaires feel satisfied with responsibility of service
quality.
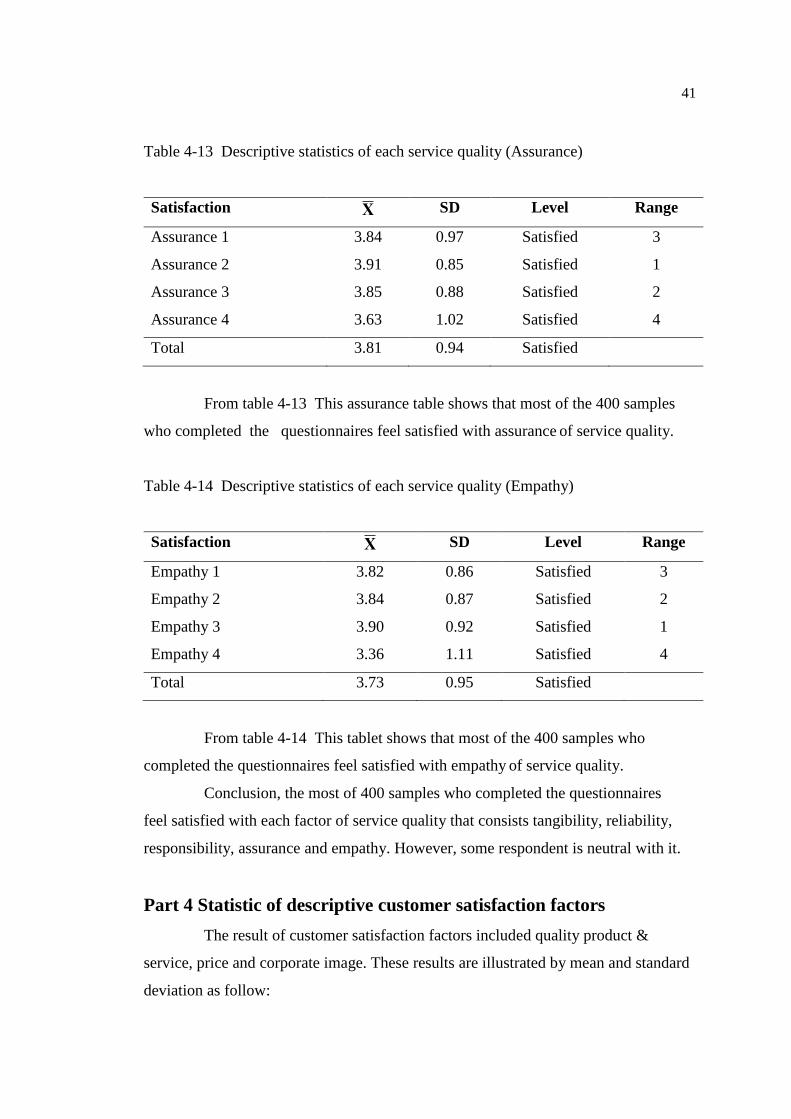
41
Table 4-13 Descriptive statistics of each service quality (Assurance)
Satisfaction Χ SD Level Range
Assurance 1 3.84 0.97 Satisfied 3
Assurance 2 3.91 0.85 Satisfied 1
Assurance 3 3.85 0.88 Satisfied 2
Assurance 4 3.63 1.02 Satisfied 4
Total 3.81 0.94 Satisfied
From table 4-13 This assurance table shows that most of the 400 samples
who completed the questionnaires feel satisfied with assurance of service quality.
Table 4-14 Descriptive statistics of each service quality (Empathy)
Satisfaction Χ SD Level Range
Empathy 1 3.82 0.86 Satisfied 3
Empathy 2 3.84 0.87 Satisfied 2
Empathy 3 3.90 0.92 Satisfied 1
Empathy 4 3.36 1.11 Satisfied 4
Total 3.73 0.95 Satisfied
From table 4-14 This tablet shows that most of the 400 samples who
completed the questionnaires feel satisfied with empathy of service quality.
Conclusion, the most of 400 samples who completed the questionnaires
feel satisfied with each factor of service quality that consists tangibility, reliability,
responsibility, assurance and empathy. However, some respondent is neutral with it.
Part 4 Statistic of descriptive customer satisfaction factors
The result of customer satisfaction factors included quality product &
service, price and corporate image. These results are illustrated by mean and standard
deviation as follow:
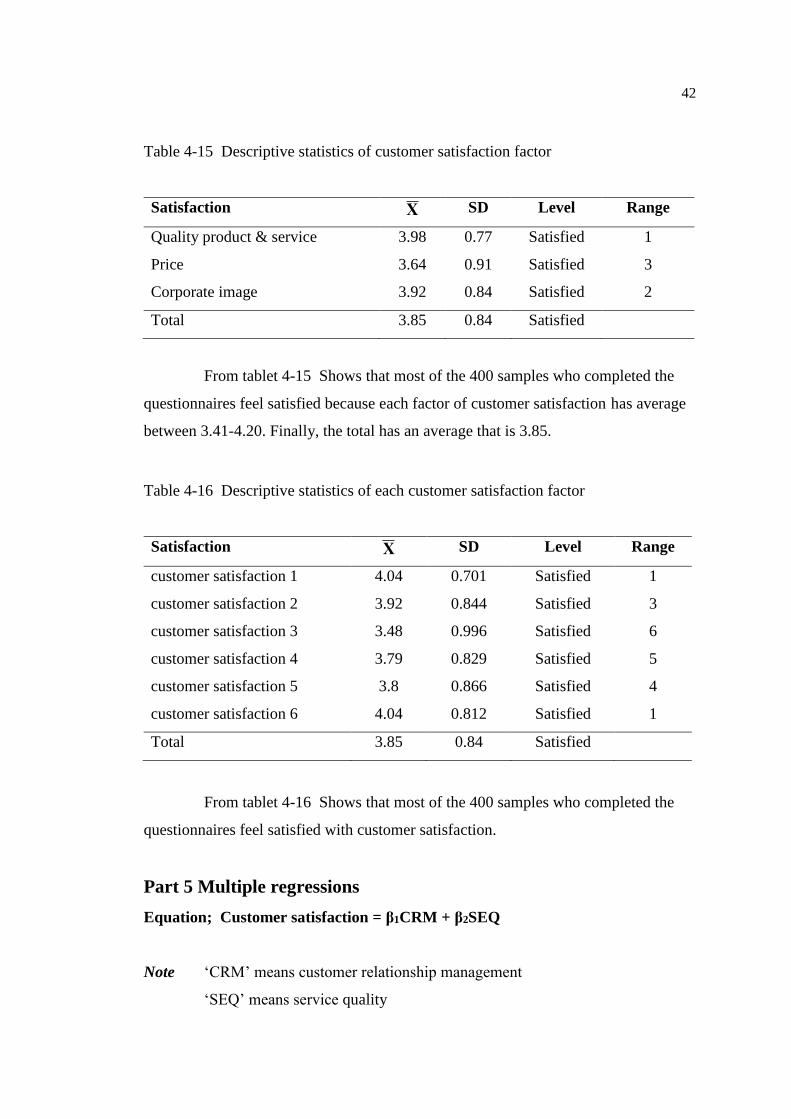
42
Table 4-15 Descriptive statistics of customer satisfaction factor
Satisfaction Χ SD Level Range
Quality product & service 3.98 0.77 Satisfied 1
Price 3.64 0.91 Satisfied 3
Corporate image 3.92 0.84 Satisfied 2
Total 3.85 0.84 Satisfied
From tablet 4-15 Shows that most of the 400 samples who completed the
questionnaires feel satisfied because each factor of customer satisfaction has average
between 3.41-4.20. Finally, the total has an average that is 3.85.
Table 4-16 Descriptive statistics of each customer satisfaction factor
Satisfaction Χ SD Level Range
customer satisfaction 1 4.04 0.701 Satisfied 1
customer satisfaction 2 3.92 0.844 Satisfied 3
customer satisfaction 3 3.48 0.996 Satisfied 6
customer satisfaction 4 3.79 0.829 Satisfied 5
customer satisfaction 5 3.8 0.866 Satisfied 4
customer satisfaction 6 4.04 0.812 Satisfied 1
Total 3.85 0.84 Satisfied
From tablet 4-16 Shows that most of the 400 samples who completed the
questionnaires feel satisfied with customer satisfaction.
Part 5 Multiple regressions
Equation; Customer satisfaction = β1CRM + β2SEQ
Note ‘CRM’ means customer relationship management
‘SEQ’ means service quality
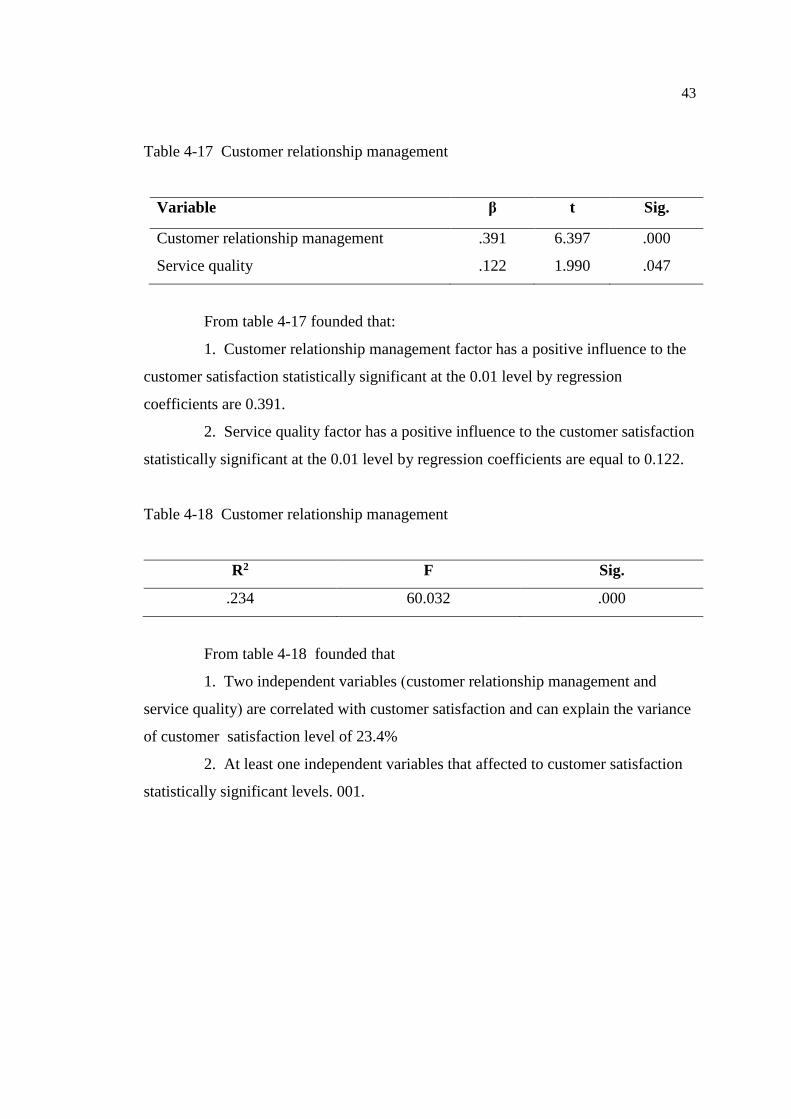
43
Table 4-17 Customer relationship management
Variable β t Sig.
Customer relationship management .391 6.397 .000
Service quality .122 1.990 .047
From table 4-17 founded that:
1. Customer relationship management factor has a positive influence to the
customer satisfaction statistically significant at the 0.01 level by regression
coefficients are 0.391.
2. Service quality factor has a positive influence to the customer satisfaction
statistically significant at the 0.01 level by regression coefficients are equal to 0.122.
Table 4-18 Customer relationship management
R2 F Sig.
.234 60.032 .000
From table 4-18 founded that
1. Two independent variables (customer relationship management and
service quality) are correlated with customer satisfaction and can explain the variance
of customer satisfaction level of 23.4%
2. At least one independent variables that affected to customer satisfaction
statistically significant levels. 001.
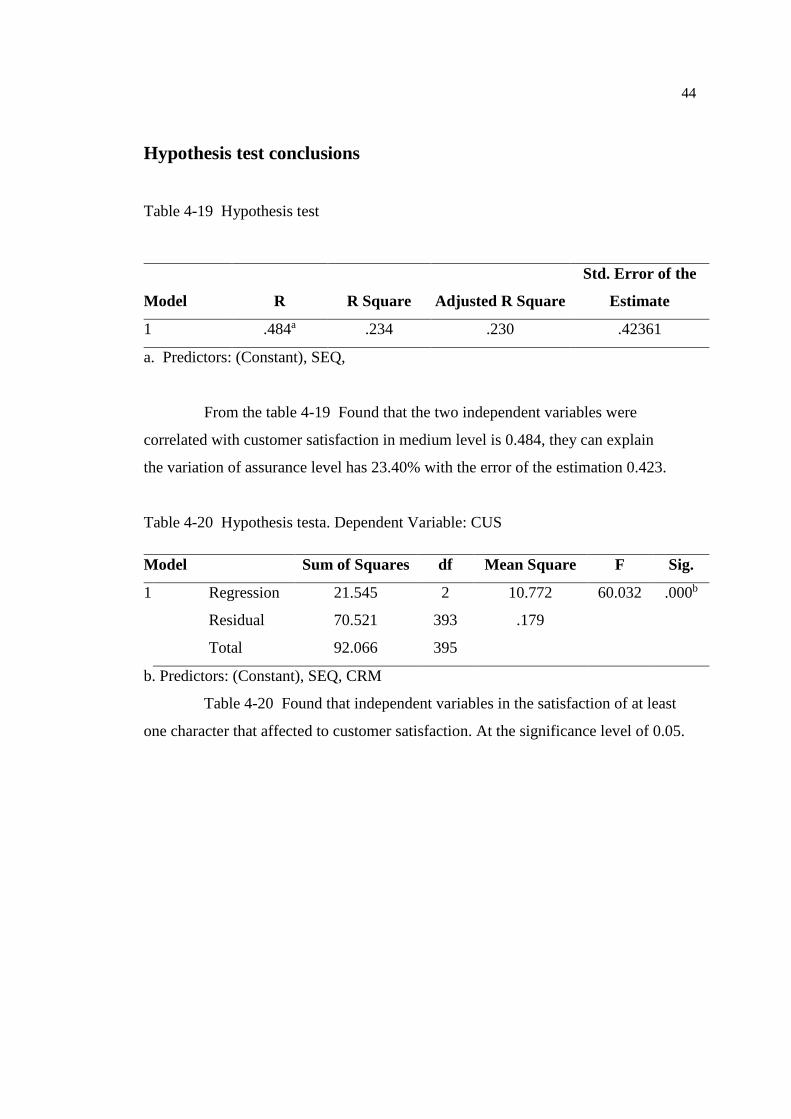
44
Hypothesis test conclusions
Table 4-19 Hypothesis test
From the table 4-19 Found that the two independent variables were
correlated with customer satisfaction in medium level is 0.484, they can explain
the variation of assurance level has 23.40% with the error of the estimation 0.423.
Table 4-20 Hypothesis testa. Dependent Variable: CUS
b. Predictors: (Constant), SEQ, CRM
Table 4-20 Found that independent variables in the satisfaction of at least
one character that affected to customer satisfaction. At the significance level of 0.05.
Model R R Square Adjusted R Square
Std. Error of the
Estimate
1 .484a .234 .230 .42361
a. Predictors: (Constant), SEQ,
Model Sum of Squares df Mean Square F Sig.
1 Regression 21.545 2 10.772 60.032 .000b
Residual 70.521 393 .179
Total 92.066 395
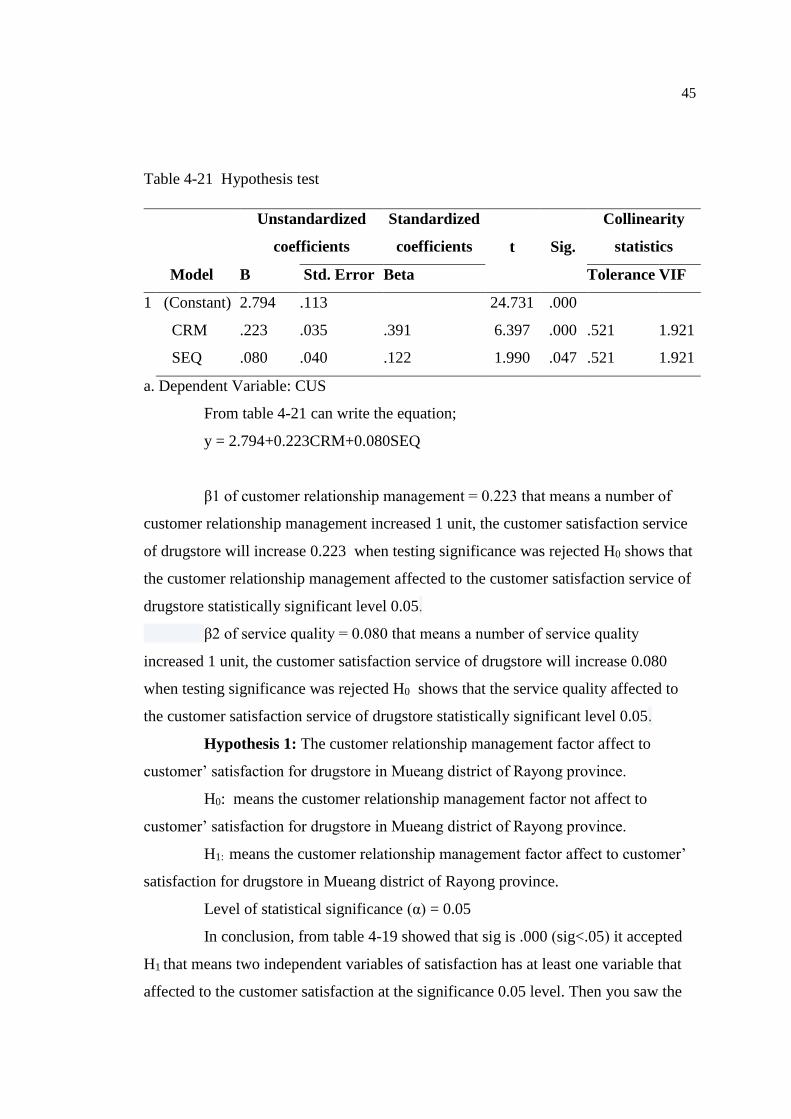
45
Table 4-21 Hypothesis test
a. Dependent Variable: CUS
From table 4-21 can write the equation;
y = 2.794+0.223CRM+0.080SEQ
β1 of customer relationship management = 0.223 that means a number of
customer relationship management increased 1 unit, the customer satisfaction service
of drugstore will increase 0.223 when testing significance was rejected H0 shows that
the customer relationship management affected to the customer satisfaction service of
drugstore statistically significant level 0.05.
β2 of service quality = 0.080 that means a number of service quality
increased 1 unit, the customer satisfaction service of drugstore will increase 0.080
when testing significance was rejected H0 shows that the service quality affected to
the customer satisfaction service of drugstore statistically significant level 0.05.
Hypothesis 1: The customer relationship management factor affect to
customer’ satisfaction for drugstore in Mueang district of Rayong province.
H0: means the customer relationship management factor not affect to
customer’ satisfaction for drugstore in Mueang district of Rayong province.
H1: means the customer relationship management factor affect to customer’
satisfaction for drugstore in Mueang district of Rayong province.
Level of statistical significance (α) = 0.05
In conclusion, from table 4-19 showed that sig is .000 (sig<.05) it accepted
H1 that means two independent variables of satisfaction has at least one variable that
affected to the customer satisfaction at the significance 0.05 level. Then you saw the
Model
Unstandardized
coefficients
Standardized
coefficients t Sig.
Collinearity
statistics
B Std. Error Beta Tolerance VIF
1 (Constant) 2.794 .113 24.731 .000
CRM .223 .035 .391 6.397 .000 .521 1.921
SEQ .080 .040 .122 1.990 .047 .521 1.921
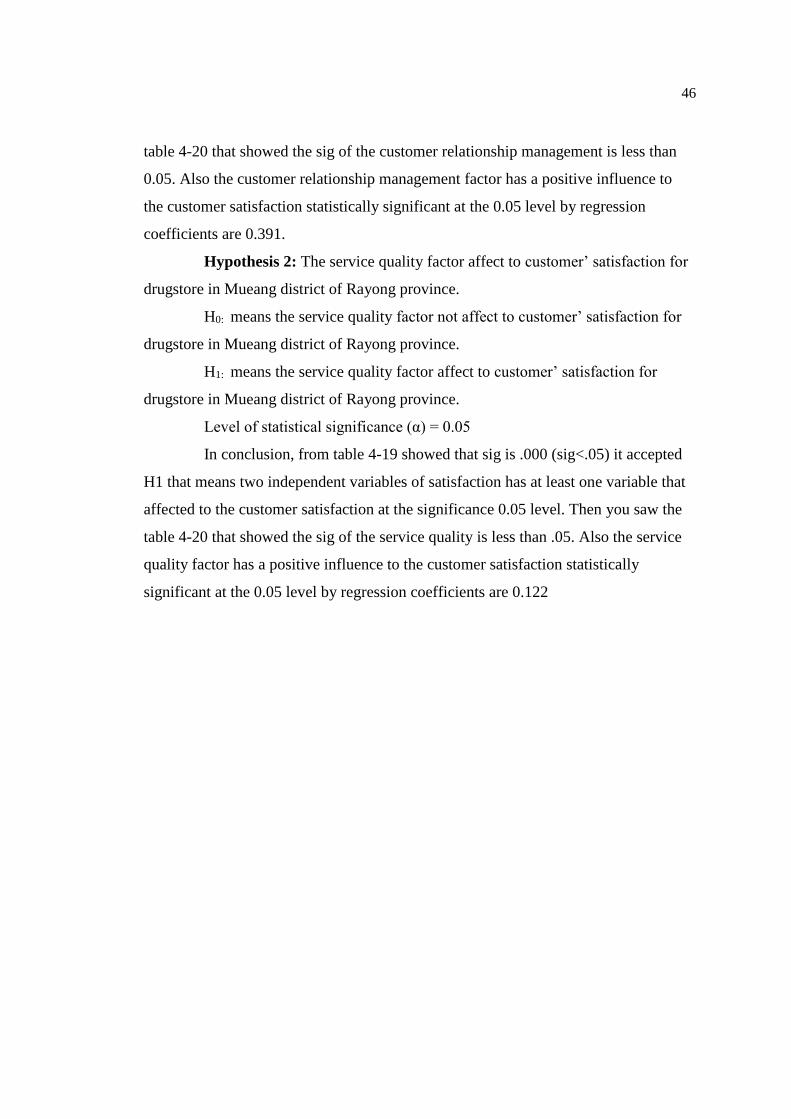
46
table 4-20 that showed the sig of the customer relationship management is less than
0.05. Also the customer relationship management factor has a positive influence to
the customer satisfaction statistically significant at the 0.05 level by regression
coefficients are 0.391.
Hypothesis 2: The service quality factor affect to customer’ satisfaction for
drugstore in Mueang district of Rayong province.
H0: means the service quality factor not affect to customer’ satisfaction for
drugstore in Mueang district of Rayong province.
H1: means the service quality factor affect to customer’ satisfaction for
drugstore in Mueang district of Rayong province.
Level of statistical significance (α) = 0.05
In conclusion, from table 4-19 showed that sig is .000 (sig<.05) it accepted
H1 that means two independent variables of satisfaction has at least one variable that
affected to the customer satisfaction at the significance 0.05 level. Then you saw the
table 4-20 that showed the sig of the service quality is less than .05. Also the service
quality factor has a positive influence to the customer satisfaction statistically
significant at the 0.05 level by regression coefficients are 0.122
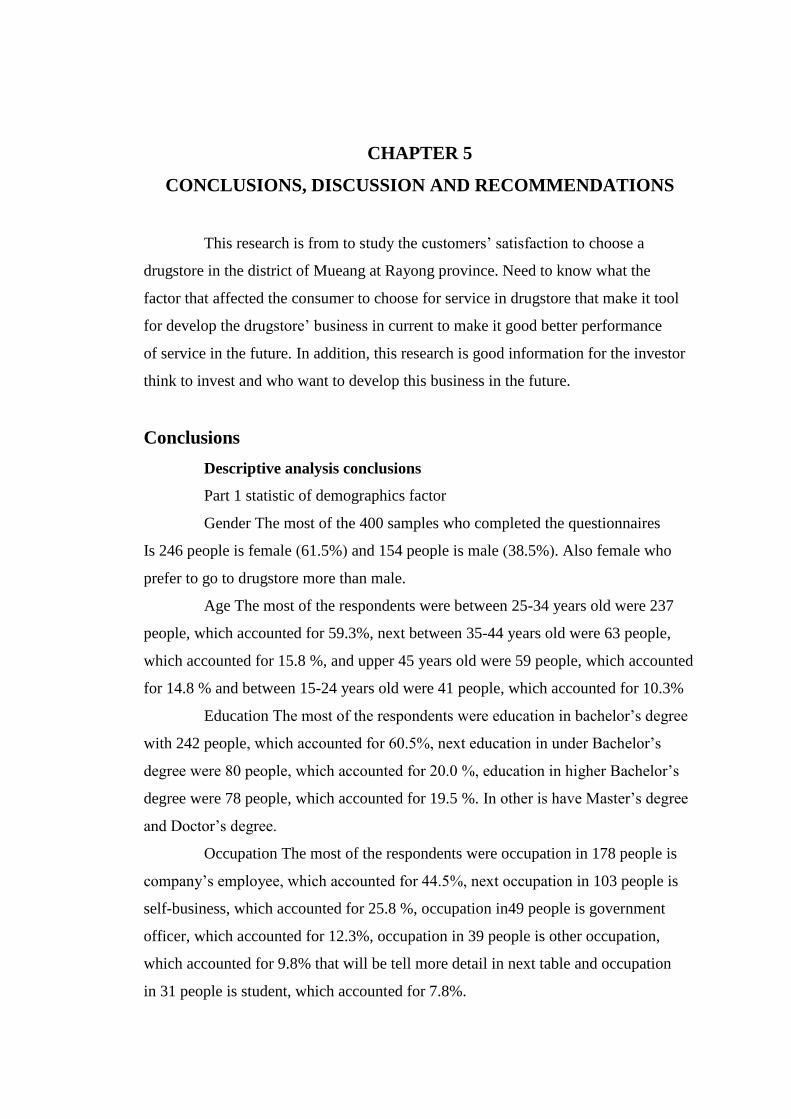
CHAPTER 5
CONCLUSIONS, DISCUSSION AND RECOMMENDATIONS
This research is from to study the customers’ satisfaction to choose a
drugstore in the district of Mueang at Rayong province. Need to know what the
factor that affected the consumer to choose for service in drugstore that make it tool
for develop the drugstore’ business in current to make it good better performance
of service in the future. In addition, this research is good information for the investor
think to invest and who want to develop this business in the future.
Conclusions
Descriptive analysis conclusions
Part 1 statistic of demographics factor
Gender The most of the 400 samples who completed the questionnaires
Is 246 people is female (61.5%) and 154 people is male (38.5%). Also female who
prefer to go to drugstore more than male.
Age The most of the respondents were between 25-34 years old were 237
people, which accounted for 59.3%, next between 35-44 years old were 63 people,
which accounted for 15.8 %, and upper 45 years old were 59 people, which accounted
for 14.8 % and between 15-24 years old were 41 people, which accounted for 10.3%
Education The most of the respondents were education in bachelor’s degree
with 242 people, which accounted for 60.5%, next education in under Bachelor’s
degree were 80 people, which accounted for 20.0 %, education in higher Bachelor’s
degree were 78 people, which accounted for 19.5 %. In other is have Master’s degree
and Doctor’s degree.
Occupation The most of the respondents were occupation in 178 people is
company’s employee, which accounted for 44.5%, next occupation in 103 people is
self-business, which accounted for 25.8 %, occupation in49 people is government
officer, which accounted for 12.3%, occupation in 39 people is other occupation,
which accounted for 9.8% that will be tell more detail in next table and occupation
in 31 people is student, which accounted for 7.8%.
48
Salary The most of the respondents were have salary between 10,001-
20,000 baht is 118 people which accounted for 29.5%, next respondent were have
salary more than 40,000 baht is 96 people, which accounted for 24.0%, salary
between 20,001-30,000 baht is 91 people, which accounted for 22.8 %, 30,001-40,000
baht is 54 people, which accounted for 13.5% and respondents were have salary less
than 10,000 baht is 41 people, which accounted for 10.3%
Part 2 Statistic of descriptive customer relationship management factors
The result of customer relationship management factors consisted customer
retention, customer acquisition and customer profitability. These results are illustrated
by mean and standard deviation as follow:
Customer relationship management factors are satisfied level, the average is
3.40. First is the customer profitability, average is 3.74, second is the customer
acquisition, average is 3.46 and the last is customer retention, average is 3.01.
Also all of them are satisfied except the customer retention is neutral.
Part 3 Statistic of descriptive service quality factors
The result of service quality factors included tangibility, reliability,
responsibility, assurance and empathy. These results are illustrated by mean and
standard deviation.
Service quality the total satisfaction of service quality. The overall is
satisfied level, average is 3.79. However, each data may not differ each other, the
responsibility factor is highest average ( = 3.85) and the empathy factor is at lowest
average ( = 3.73).
Tangibility, Reliability, Responsibility, Assurance and Empathy
The most of the 400 samples who completed the questionnaires feel satisfied with
All of service quality factors.
Part 4 Statistic of descriptive customer satisfaction factors
The result of customer satisfaction factors included quality product &
service, price and corporate image. These results are illustrated by mean and standard
deviation.
Customer satisfaction factors that most of the 400 samples that completed
the questionnaires feel satisfied because each factor of customer satisfaction has
average between 3.41-4.20. Finally, the total has an average that is 3.85. Also,
49
the most of the 400 samples who completed the questionnaires feel satisfied with
overall customer satisfaction factors.
Part 5 Multiple regressions
Regression analysis is a study the relationship between two variables or
attributes of data and brings this result to predict. Also this result studied the
relationship between two independent variables and one dependent variable.
The independent variables consisted customer relationship management factors
and service quality factors. And the dependent variable is customer satisfaction.
Equation; Customer satisfaction = β1CRM + β2SEQ
Note ‘CRM’ means customer relationship management
‘SEQ’ means service quality
From the result founded that
The two independent variables are correlated with customers’ satisfaction of
drugstore service in medium level is 0.484. Both variables could explain the variation
was 23.40%, with the error of approximately 0.424. And two independent variables of
satisfaction have at least one variable that affected to the customer satisfaction at the
significance 0.05 level.
Additionally, the customer relationship management factor has a positive
influence to the customer satisfaction statistically significant at the 0.05 level by
regression coefficients are 0.391. By the way, service quality factor has a positive
influence to the customer satisfaction statistically significant at the 0.05 level by
regression coefficients are equal to 0.122.
Discussion
1. The most of respondents are female, age 25-34 years old, Bachelor’s
degree and company as Buriphraserd (2007) and Phongvaranon (2010), study one of
private hospital's service qualities: Women’s Health of out-patients case study and
studied the customer’s satisfaction of chain drugstores’ service respectively.
Therefore, the explicit correction in this study, their result founded that most of
out- patients are women who ages 21-30 years old, graduated bachelor's degree,
be employee in company, 15,000-25,000 baht salary. Their point of view are each
service of there, which is high criterion as staffs, health care, cost of treatment,
50
medical instruments and reliability of health stuff.
2. The result of service quality factors included tangibility, reliability,
responsibility, assurance and empathy. The most of the 400 samples who completed
the questionnaires feel satisfied with all of service quality factors. As Mosahab (2010)
studied on customer satisfaction, quality of service and loyalty; testing mediation
He studied the relationship between customer satisfaction, quality of service and
loyalty. The findings show that in all five dimensions of service quality. He claimed
that research shows that the relationship positive and significant in all five dimensions
of service quality, satisfaction and loyalty. By the way, this can be divided into two
dimensions of performance and processing, results in a dimension that is more
reliable and processing as well as other dimensions (concrete response, confidence
and compassion), The findings of this section is to show that. both the size and the
processing and positively correlated with customer satisfaction and loyalty.
3. The result of customer relationship management factors consisted
customer retention, customer acquisition and customer profitability, all of them are
satisfied level. KOÇOĞLU (2012) studied on CRM and loyalty, collect this data in
the sector of banking. This research aims to llustrate the relationship between CRM
and loyalty of customer. He argued that an understanding of the basic elements of
marketing a new era of customer satisfaction. A business can survive for as long as
they can meet the needs of customers. And ensure customer satisfaction Determining
the needs and demands of consumers. The meeting is one way to enable the
satisfaction of consumers.
4. Two independent variables (customer relationship management and
service quality) have a positive influence to the customer satisfaction statistically
significant at the 0.01 level by regression coefficients are 0.391 and 0.122
respectively. That mean both factors were correlated with customer satisfaction.
However, this result related with the study of Mosahab (2010) he studied customer
satisfaction, quality of service and loyalty; a test of mediation. He studied a quality of
service, customer loyalty & satisfaction: a test of mediation. This research was
conducted with a bank in two countries for two years that aimed to show the quality
of services by Bank, and studied of the relationship between quality of service, loyalty
and customer satisfaction. The research illustrates that in all dimensions of service
51
quality. Additionally, research has shown that, although all five dimensions of
performance in all of the Sepah Bank has received higher-than-average credit limit,
which in both of tangibles and assurance those have the highest and the least correlate
with the customer satisfaction and loyalty. But it did not meet the expectations of the
customer.
Recommendationin implication for business
1. The reliability of customer satisfaction factor is weak but another factor
is high. Because the theory does not strength and cover this factor as Parasuraman,
Zeithaml theory. The researcher thinks that you should find another factor to cover the
customer satisfaction such as trust, etc. it makes the reliability of customer satisfaction
factor is high.
2. The most of this result, respondents are satisfied with drugstore’ service
that consists service quality and customer relationship management. However,
satisfaction of some point is low level such as price and promotion. An owner should
compare a price with another shop and create a new promotion to attract customer.
Recommendationfor the further
1. For the other researcher interest to study about the customer satisfaction
of Drugstore, you should study the influence of choosing a drugstore on customer
behavior to find why a customer usually go to the same drugstore.
2. Nowadays, a pharmacy business has grown quickly as 7-11 shop.
You can see everywhere has a lot of people or village where has more than one
pharmacy. Also the study marketing strategy of drugstore is interested because who
interest to invest this business can get this result to study before doing it. And owner
pharmacy business can bring this result to develop or solve some problem.
3. Studied the comparing of customer’s satisfaction service between chain
drugstores and owner is not chain drugstore or franchise because to days franchise
businesses are population, people would rather to go there. Also this topic is
interesting to find a result then a researcher can get the result to develop a business.
REFERENCES
Agbor, J. M. (2011). The relationship between customer satisfaction and service
quality: A study of three Service sectors in Umeå. Masters Thesis,
Department of Business, Umeå School of Business.
Al-Alawi, I. A. (2004). Customer relationship management in Kingdom of Ahrain,
University of Bahrain, n.p.
Buriphraserd, R. (2007). The study one of private hospital's service qualities:
Women’s Health of out-patients case study. Chonburi: Burapha University.
Good, C.V. (1973). Dictionary of education. New York: McGraw-hill.
Jafari, J. M., Zarrin, E, & Yazdanpanah, R. (2015). Models, theories and challenges
of customer relationship management (CRM). Master’s thesis.. Management
Department, Yasouj Branch. Iran. Islamic Azad University, Yasouj,
Jareansriviriyakul, S. (2011). The study service quality of general public hospital in
Pathum Thani Province. Master’s thesis, Department of Business,
Graduate School, Rajamangala University of Technology Thanyaburi.
Jidtiwat, S. (2009). The study the level of satisfaction of pharmacy services and the
factors affect customer satisfaction of pharmacy services in Don Mueang
district. Retrieved from http://www.research.rmutt.ac.th/wp-content
/uploads/2011/08/%CA%D8%C7%D4%B5%D2-%A8%D4%B5%B5%
D4%C7%D1%B8%B9%EC.pdf
Kasempipatkul, S. (2014). The study factors affected the drug retailer’s satisfaction
toward pharmaceutical manufacturer and distributor: Case study of T.Man
pharma incorporation. Retrieved from http://dspace.bu.ac.th/bitstream/
123456789/984/1/sukrudee_kase.pdf
Keawkes, A. (2010). The studied satisfaction and opinion of Mahasarakham
University population toward the University Pharmacies. Mahasarakham
University. file:///C:/Users/ACER/Downloads/4803-5384-1-PB.pdf
Khrdkar, E. B. (2015). The study of the effect of customer relationship management
on customer satisfaction and loyalty: Formerly University of Pune.
Retrieved from http://citeseerx.ist.psu.edu/viewdoc/download?doi
=10.1.1.695.8310&rep=rep1&type=pdf
53
KOÇOĞLU, D. (2012). The study customer relationship management and customer
loyalty; a survey in the sector of banking. Retrieved from
http://ijbssnet.com/journals/Vol_3_No_3_February_2012/30.pdf
Kotler, P. (1997). Marketing management: analysis, planning implementation and
control. (9th ed). New Jersey: Free Press.
Kotler, P. (2003). Marketing management (11th ed.). Upper Sanddle River,
New Jersey: Prentice Hall.
Mosahab, R. (2010). The study service quality, customer satisfaction & loyalty: A test
of Mediation. Master’s thesis, Graduate School of Business, Universiti Sains
Malaysia.
Naumann, E., & Giel, K. (1995). Customer satisfaction measurement and
management. Chmcimmati, OH: Thomson Executive Press.
Niti. (2014). The study of the marketing composition causing customer’s loyalty
toward drugstores in Bangkok. Nonthaburi: Faculty of Technical Education,
King Mongkut’s University of Technology North Bangkok.
Oliver, R. L. (1981). Measurement and evaluation of satisfaction process in retail
setting. Journal of Retailing, 57(3), 25-48.
Paovimarn, P. (2010). Customer satisfaction of Toyota in Chiang Mai, Chiang Mai:
Faculty of Economics, Chiang Mai University,
Parasuraman, A., Zeithaml, V. A., & Berry, L. L. (1985). A conceptual model of
service quality and implications for future research. Journal of Marketing,
49, Fall, 41-50.
Parasuraman, A., Zeithaml, V. A., & Berry, L. L. (1988). SERVQUAL: A multiple-
item scale for measuring customer perceptions of service quality.
Journal of Retailing, Spring, 12- 40.
Parasuraman, A., Zeithaml, V. A., & Berry, L. L. (1990). Delivering quality service.
New York: The Free Press.
Phongvaranon, S. (2010). The study the customer’s satisfaction of chain drugstores’
service. Retrieved from http://thesis.swu.ac.th/swuthesis/Pha_En_Man/
Shidapa_P.pdf
54
Qiting,P., Uno,N.,&Kubota,Y. (2015). Kano model analysis of customer needs
and satisfaction at the Shanghai Disneyland. Master’s thesis,
Graduate School of Management, Kyoto University.
Sarafrazi, M., & Memarzadeh, G. R. (2007). Customer orientation a basic
requirement in establishing the TQM. Mazandaran: Azad University of
Firoozkooh.
Shahin, A. (2005). SERVQUAL and model of service quality gaps: A framework for
determining and prioritizing critical factors in delivering quality services.
University of Isfahan, Iran. Retrieved from www.proserv.nu/ b/Docs/
Servqual.pdf
Srathonghon, S. (2012). The study factors influencing consumer behavior and
satisfaction toward service usage of Watson shop in Bankok metroprolis.
Retrieved from http://thesis.swu.ac.th/swuthesis/Mark/Sirinapha_S.pdf
Sukridee. (2014). The study factors affected the drug retailer’s satisfaction toward
pharmaceutical manufacturer and distributor: Case study of T. Man
pharma incorporation. Retrieved from http://dspace.bu.ac.th/bitstream/
123456789/984/1/sukrudee_kase.pdf
Swift, R. S. (2001). Accelerating customer relationships. NJ: Prentice- Hall.
Wolman, B. B. (1973). Dictionary of behavioral science. New York: Van Nostrand
Reinhold.
Yaibauthead, T. (2015).The effect of satisfaction in service quality toward finance
and securities company’s brand loyalty in Bangkok. Master’s thesis,
Cluster of Business & Management, School of Business Administration,
Bangkok University.

55
Appendix

56
Appendix 1
Questionnaire (Thai version)
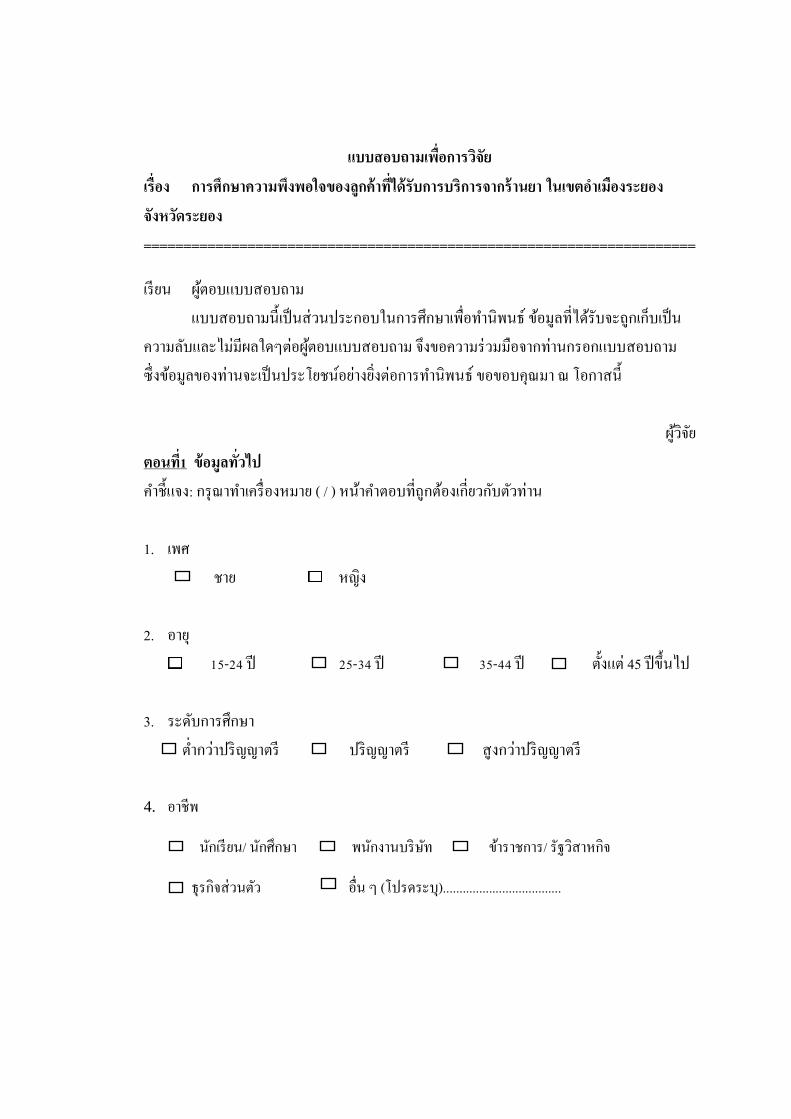
57
แบบสอบถามเพอการวจย เรอง การศกษาความพงพอใจของลกคาทไดรบการบรการจากรานยา ในเขตอ าเมองระยอง จงหวดระยอง =====================================================================
เรยน ผตอบแบบสอบถาม แบบสอบถามนเปนสวนประกอบในการศกษาเพอท านพนธ ขอมลทไดรบจะถกเกบเปนความลบและไมมผลใดๆตอผตอบแบบสอบถาม จงขอความรวมมอจากทานกรอกแบบสอบถาม ซงขอมลของทานจะเปนประโยชนอยางยงตอการท านพนธ ขอขอบคณมา ณ โอกาสน
ผวจย
ตอนท1 ขอมลทวไป ค าชแจง: กรณาท าเครองหมาย ( / ) หนาค าตอบทถกตองเกยวกบตวทาน 1. เพศ ชาย หญง 2. อาย 15-24 ป 25-34 ป 35-44 ป ตงแต 45 ปขนไป 3. ระดบการศกษา ต ากวาปรญญาตร ปรญญาตร สงกวาปรญญาตร 4. อาชพ
นกเรยน/ นกศกษา พนกงานบรษท ขาราชการ/ รฐวสาหกจ
ธรกจสวนตว อน ๆ (โปรดระบ)....................................
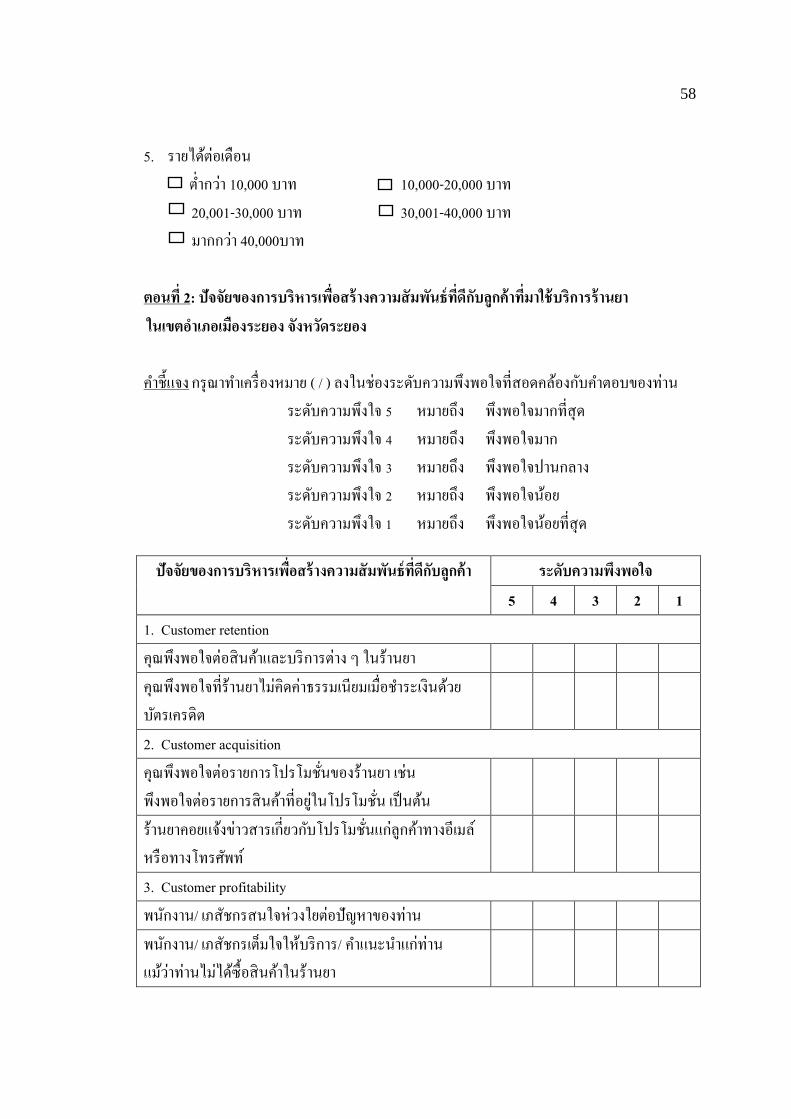
58
5. รายไดตอเดอน ต ากวา 10,000 บาท 10,000-20,000 บาท
20,001-30,000 บาท 30,001-40,000 บาท มากกวา 40,000บาท
ตอนท 2: ปจจยของการบรหารเพอสรางความสมพนธทดกบลกคาทมาใชบรการรานยา ในเขตอ าเภอเมองระยอง จงหวดระยอง ค าชแจง กรณาท าเครองหมาย ( / ) ลงในชองระดบความพงพอใจทสอดคลองกบค าตอบของทาน
ระดบความพงใจ 5 หมายถง พงพอใจมากทสด
ระดบความพงใจ 4 หมายถง พงพอใจมาก ระดบความพงใจ 3 หมายถง พงพอใจปานกลาง ระดบความพงใจ 2 หมายถง พงพอใจนอย
ระดบความพงใจ 1 หมายถง พงพอใจนอยทสด
ปจจยของการบรหารเพอสรางความสมพนธทดกบลกคา ระดบความพงพอใจ 5 4 3 2 1
1. Customer retention คณพงพอใจตอสนคาและบรการตาง ๆ ในรานยา คณพงพอใจทรานยาไมคดคาธรรมเนยมเมอช าระเงนดวยบตรเครดต
2. Customer acquisition คณพงพอใจตอรายการโปรโมชนของรานยา เชน พงพอใจตอรายการสนคาทอยในโปรโมชน เปนตน
รานยาคอยแจงขาวสารเกยวกบโปรโมชนแกลกคาทางอเมล หรอทางโทรศพท
3. Customer profitability พนกงาน/ เภสชกรสนใจหวงใยตอปญหาของทาน พนกงาน/ เภสชกรเตมใจใหบรการ/ ค าแนะน าแกทาน แมวาทานไมไดซอสนคาในรานยา
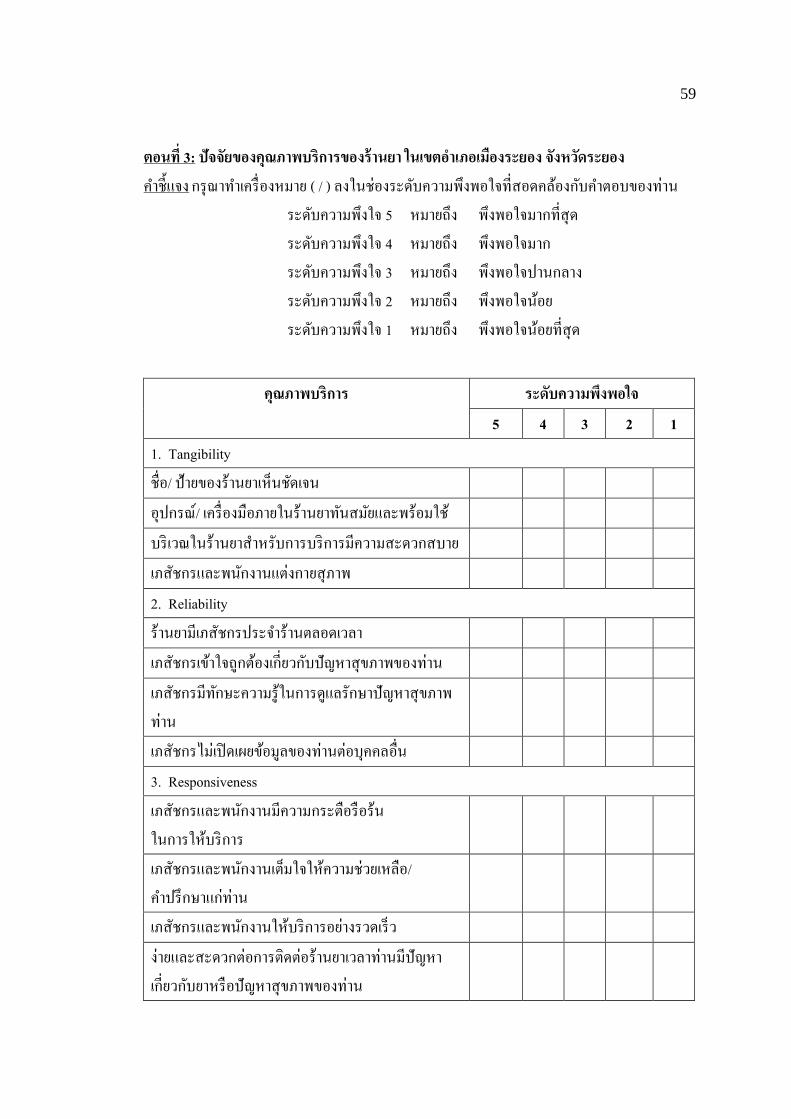
59
ตอนท 3: ปจจยของคณภาพบรการของรานยา ในเขตอ าเภอเมองระยอง จงหวดระยอง ค าชแจง กรณาท าเครองหมาย ( / ) ลงในชองระดบความพงพอใจทสอดคลองกบค าตอบของทาน
ระดบความพงใจ 5 หมายถง พงพอใจมากทสด ระดบความพงใจ 4 หมายถง พงพอใจมาก ระดบความพงใจ 3 หมายถง พงพอใจปานกลาง ระดบความพงใจ 2 หมายถง พงพอใจนอย
ระดบความพงใจ 1 หมายถง พงพอใจนอยทสด
คณภาพบรการ ระดบความพงพอใจ
5 4 3 2 1 1. Tangibility ชอ/ ปายของรานยาเหนชดเจน อปกรณ/ เครองมอภายในรานยาทนสมยและพรอมใช บรเวณในรานยาส าหรบการบรการมความสะดวกสบาย เภสชกรและพนกงานแตงกายสภาพ 2. Reliability รานยามเภสชกรประจ ารานตลอดเวลา เภสชกรเขาใจถกตองเกยวกบปญหาสขภาพของทาน เภสชกรมทกษะความรในการดแลรกษาปญหาสขภาพทาน
เภสชกรไมเปดเผยขอมลของทานตอบคคลอน 3. Responsiveness เภสชกรและพนกงานมความกระตอรอรน ในการใหบรการ
เภสชกรและพนกงานเตมใจใหความชวยเหลอ/ค าปรกษาแกทาน
เภสชกรและพนกงานใหบรการอยางรวดเรว งายและสะดวกตอการตดตอรานยาเวลาทานมปญหาเกยวกบยาหรอปญหาสขภาพของทาน
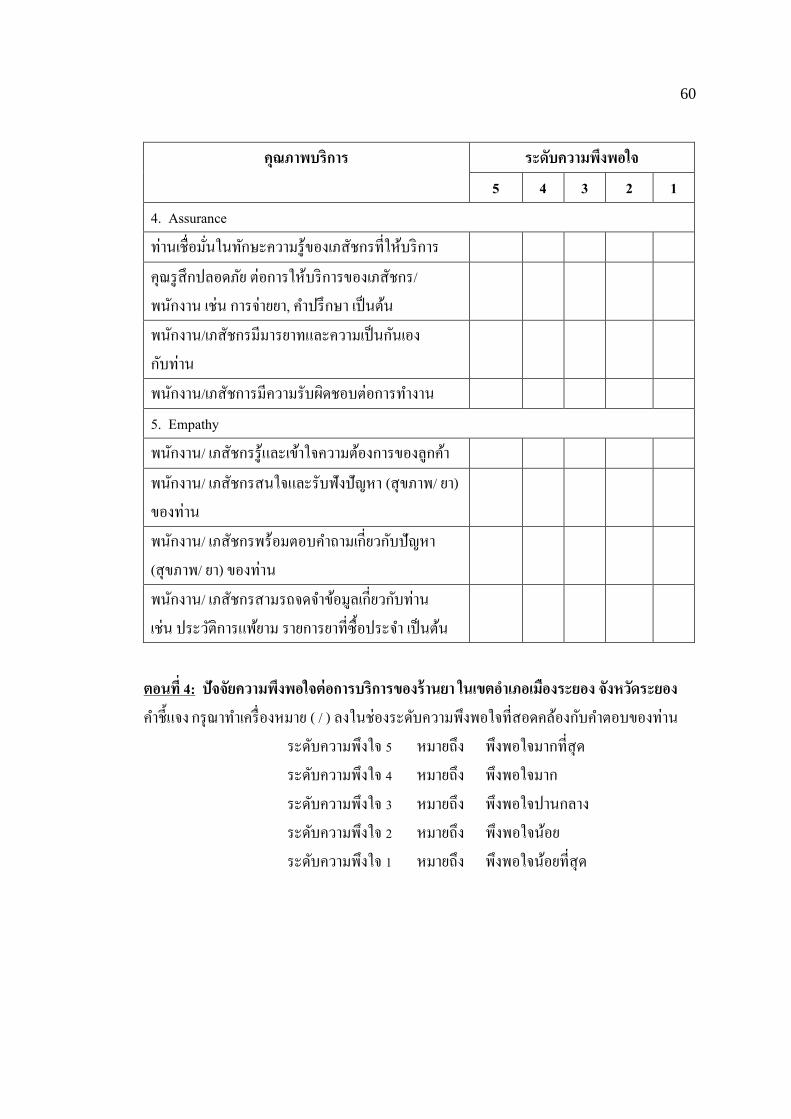
60
คณภาพบรการ ระดบความพงพอใจ
5 4 3 2 1 4. Assurance ทานเชอมนในทกษะความรของเภสชกรทใหบรการ คณรสกปลอดภย ตอการใหบรการของเภสชกร/พนกงาน เชน การจายยา, ค าปรกษา เปนตน
พนกงาน/เภสชกรมมารยาทและความเปนกนเอง กบทาน
พนกงาน/เภสชการมความรบผดชอบตอการท างาน 5. Empathy พนกงาน/ เภสชกรรและเขาใจความตองการของลกคา พนกงาน/ เภสชกรสนใจและรบฟงปญหา (สขภาพ/ ยา)ของทาน
พนกงาน/ เภสชกรพรอมตอบค าถามเกยวกบปญหา(สขภาพ/ ยา) ของทาน
พนกงาน/ เภสชกรสามรถจดจ าขอมลเกยวกบทาน เชน ประวตการแพยาม รายการยาทซอประจ า เปนตน
ตอนท 4: ปจจยความพงพอใจตอการบรการของรานยา ในเขตอ าเภอเมองระยอง จงหวดระยอง ค าชแจง กรณาท าเครองหมาย ( / ) ลงในชองระดบความพงพอใจทสอดคลองกบค าตอบของทาน
ระดบความพงใจ 5 หมายถง พงพอใจมากทสด ระดบความพงใจ 4 หมายถง พงพอใจมาก ระดบความพงใจ 3 หมายถง พงพอใจปานกลาง ระดบความพงใจ 2 หมายถง พงพอใจนอย
ระดบความพงใจ 1 หมายถง พงพอใจนอยทสด
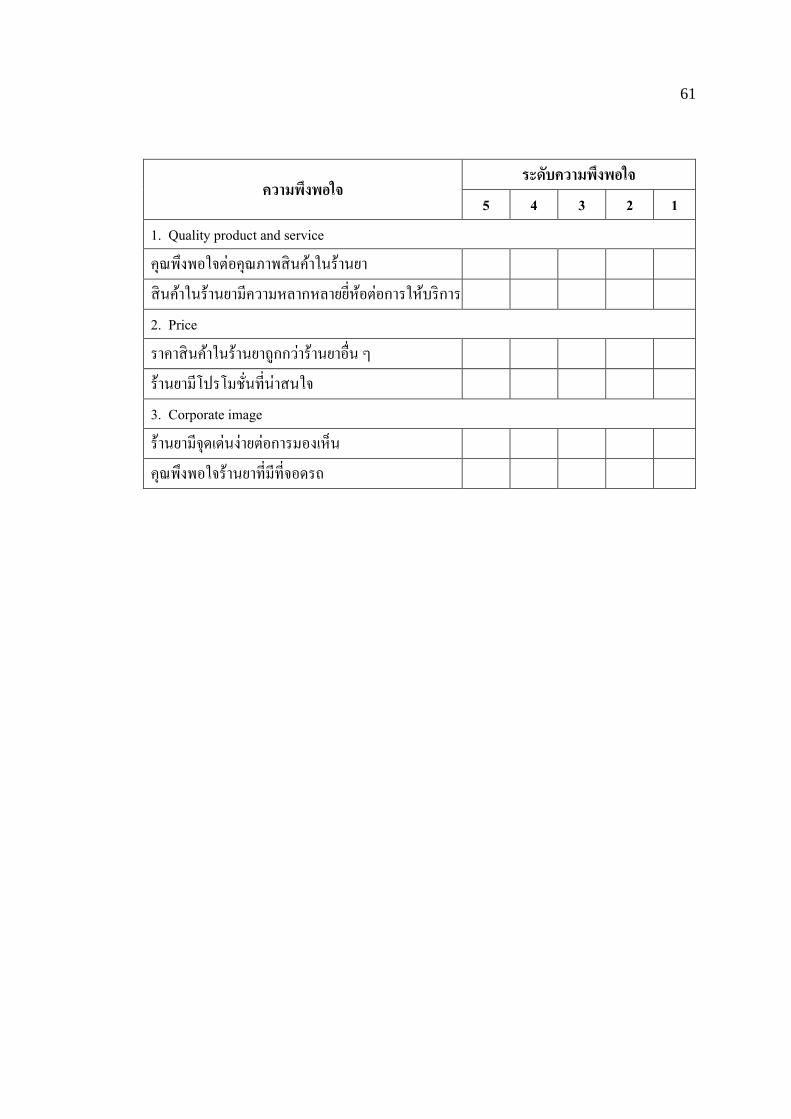
61
ความพงพอใจ ระดบความพงพอใจ
5 4 3 2 1 1. Quality product and service คณพงพอใจตอคณภาพสนคาในรานยา สนคาในรานยามความหลากหลายยหอตอการใหบรการ 2. Price ราคาสนคาในรานยาถกกวารานยาอน ๆ รานยามโปรโมชนทนาสนใจ 3. Corporate image รานยามจดเดนงายตอการมองเหน คณพงพอใจรานยาทมทจอดรถ

62
Appendix 2
Questionnaire (English version)
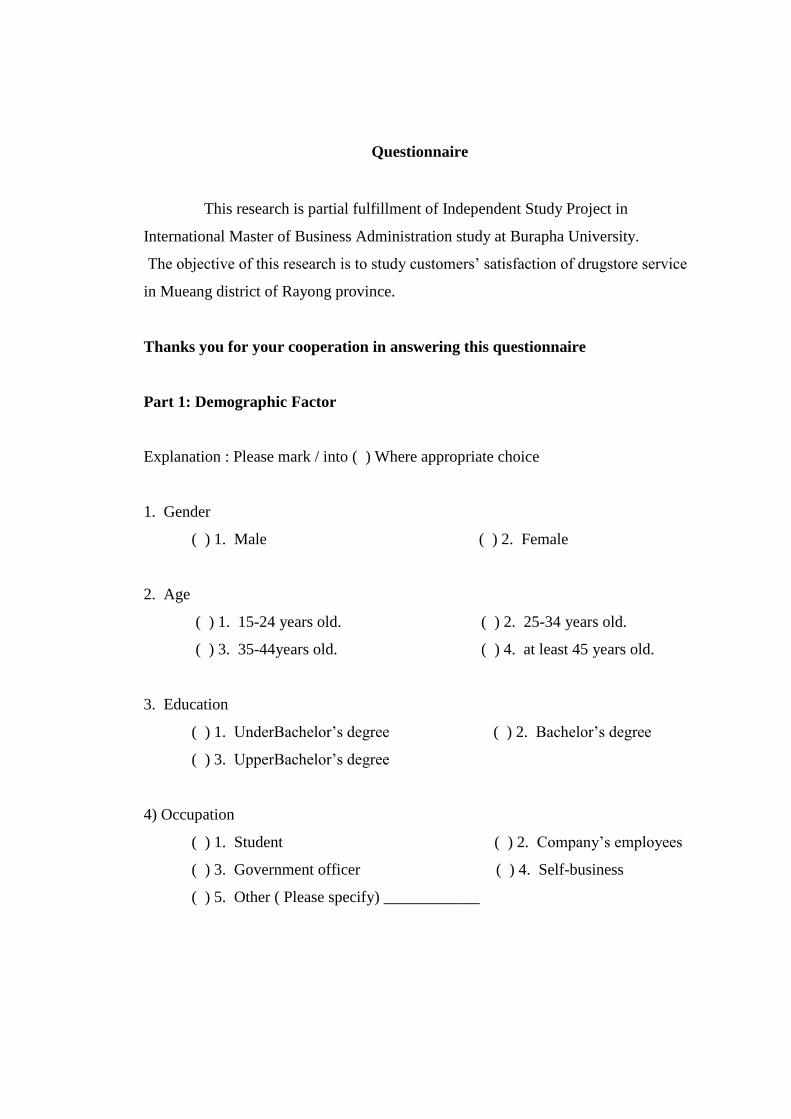
63
Questionnaire
This research is partial fulfillment of Independent Study Project in
International Master of Business Administration study at Burapha University.
The objective of this research is to study customers’ satisfaction of drugstore service
in Mueang district of Rayong province.
Thanks you for your cooperation in answering this questionnaire
Part 1: Demographic Factor
Explanation : Please mark / into ( ) Where appropriate choice
1. Gender
( ) 1. Male ( ) 2. Female
2. Age
( ) 1. 15-24 years old. ( ) 2. 25-34 years old.
( ) 3. 35-44years old. ( ) 4. at least 45 years old.
3. Education
( ) 1. UnderBachelor’s degree ( ) 2. Bachelor’s degree
( ) 3. UpperBachelor’s degree
4) Occupation
( ) 1. Student ( ) 2. Company’s employees
( ) 3. Government officer ( ) 4. Self-business
( ) 5. Other ( Please specify) ____________
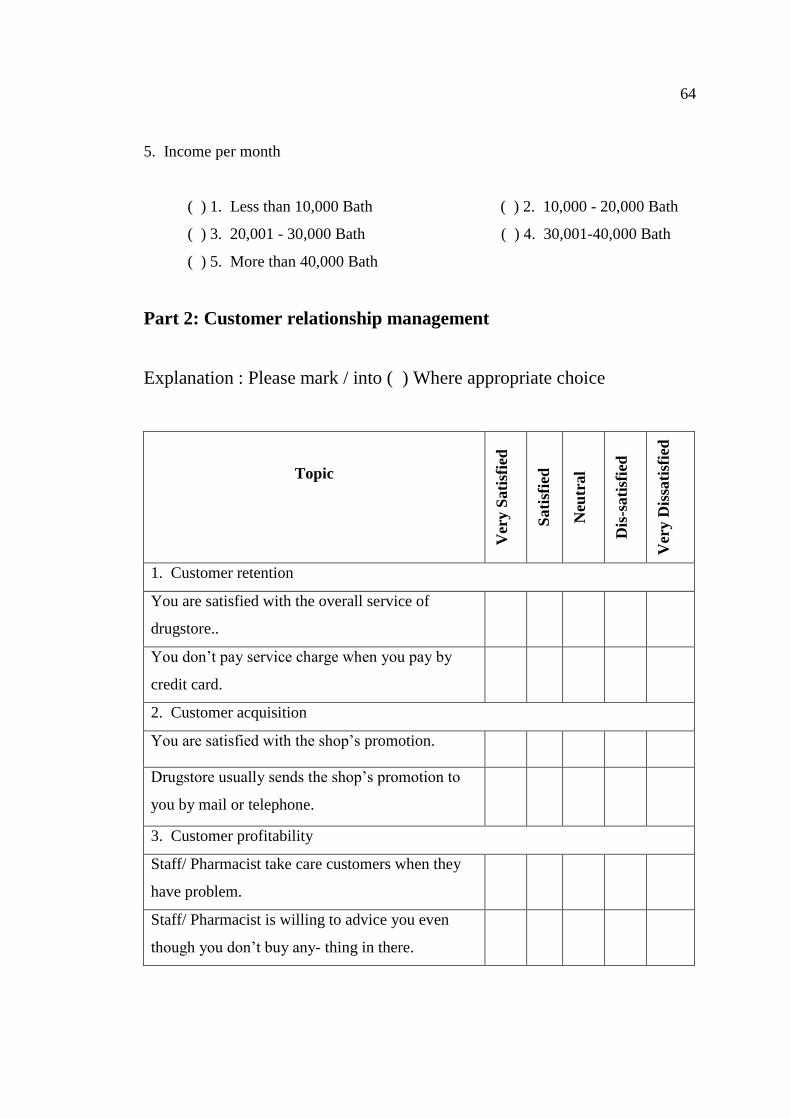
64
5. Income per month
( ) 1. Less than 10,000 Bath ( ) 2. 10,000 - 20,000 Bath
( ) 3. 20,001 - 30,000 Bath ( ) 4. 30,001-40,000 Bath
( ) 5. More than 40,000 Bath
Part 2: Customer relationship management
Explanation : Please mark / into ( ) Where appropriate choice
Topic
Ver
y S
ati
sfie
d
Sati
sfie
d
Neu
tral
Dis
-sati
sfie
d
Ver
y D
issa
tisf
ied
1. Customer retention
You are satisfied with the overall service of
drugstore..
You don’t pay service charge when you pay by
credit card.
2. Customer acquisition
You are satisfied with the shop’s promotion.
Drugstore usually sends the shop’s promotion to
you by mail or telephone.
3. Customer profitability
Staff/ Pharmacist take care customers when they
have problem.
Staff/ Pharmacist is willing to advice you even
though you don’t buy any- thing in there.
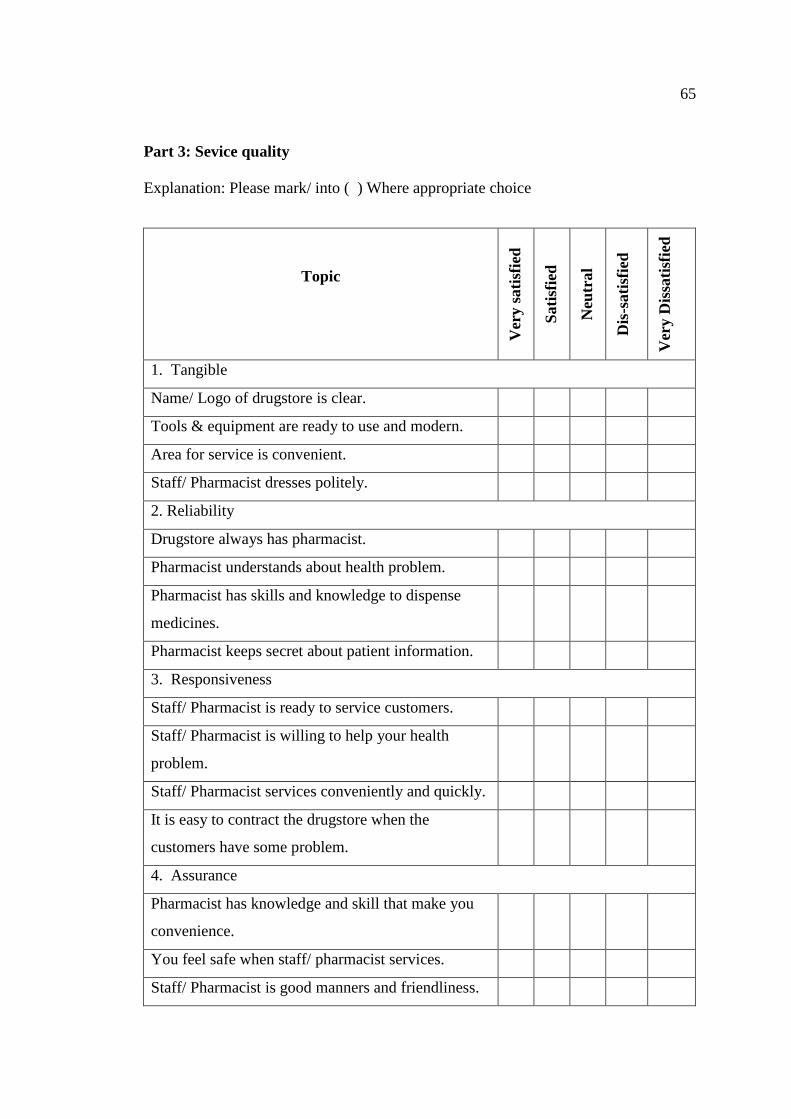
65
Part 3: Sevice quality
Explanation: Please mark/ into ( ) Where appropriate choice
Topic
Ver
y s
ati
sfie
d
Sati
sfie
d
Neu
tral
Dis
-sati
sfie
d
Ver
y D
issa
tisf
ied
1. Tangible
Name/ Logo of drugstore is clear.
Tools & equipment are ready to use and modern.
Area for service is convenient.
Staff/ Pharmacist dresses politely.
2. Reliability
Drugstore always has pharmacist.
Pharmacist understands about health problem.
Pharmacist has skills and knowledge to dispense
medicines.
Pharmacist keeps secret about patient information.
3. Responsiveness
Staff/ Pharmacist is ready to service customers.
Staff/ Pharmacist is willing to help your health
problem.
Staff/ Pharmacist services conveniently and quickly.
It is easy to contract the drugstore when the
customers have some problem.
4. Assurance
Pharmacist has knowledge and skill that make you
convenience.
You feel safe when staff/ pharmacist services.
Staff/ Pharmacist is good manners and friendliness.
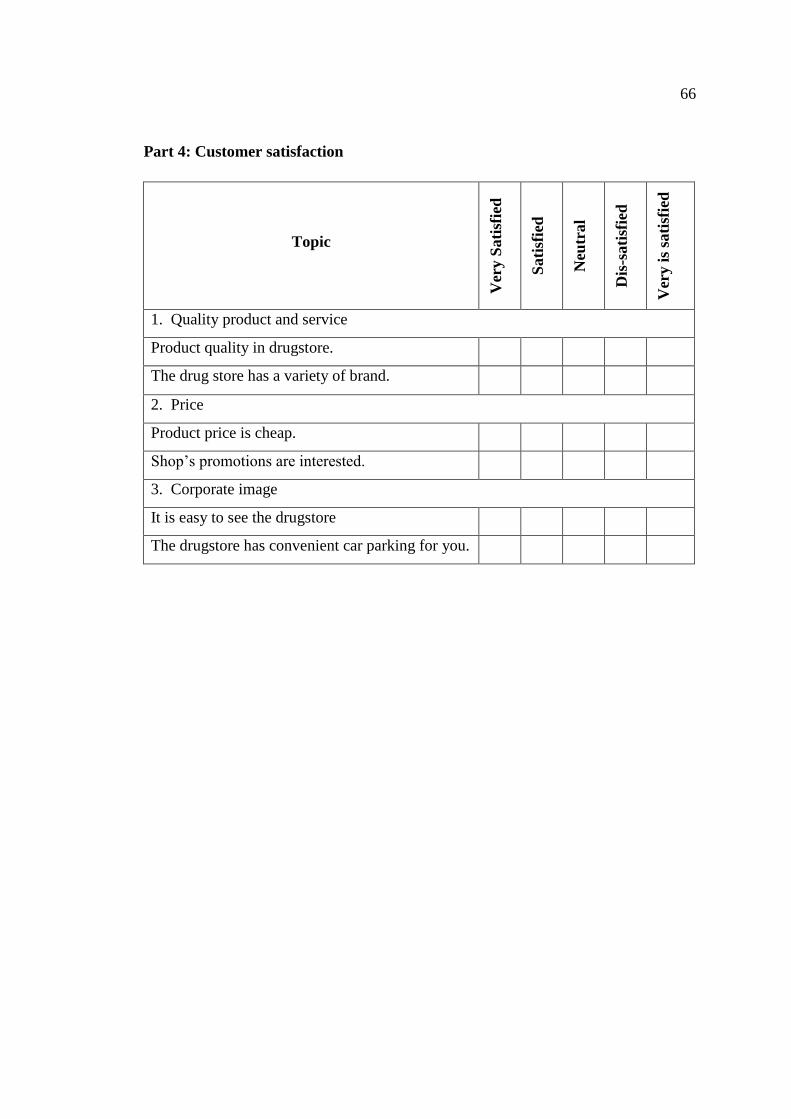
66
Part 4: Customer satisfaction
Topic
Ver
y S
ati
sfie
d
Sati
sfie
d
Neu
tral
Dis
-sati
sfie
d
Ver
y i
s sa
tisf
ied
1. Quality product and service
Product quality in drugstore.
The drug store has a variety of brand.
2. Price
Product price is cheap.
Shop’s promotions are interested.
3. Corporate image
It is easy to see the drugstore
The drugstore has convenient car parking for you.
67
APPENDIX 3
SPSS
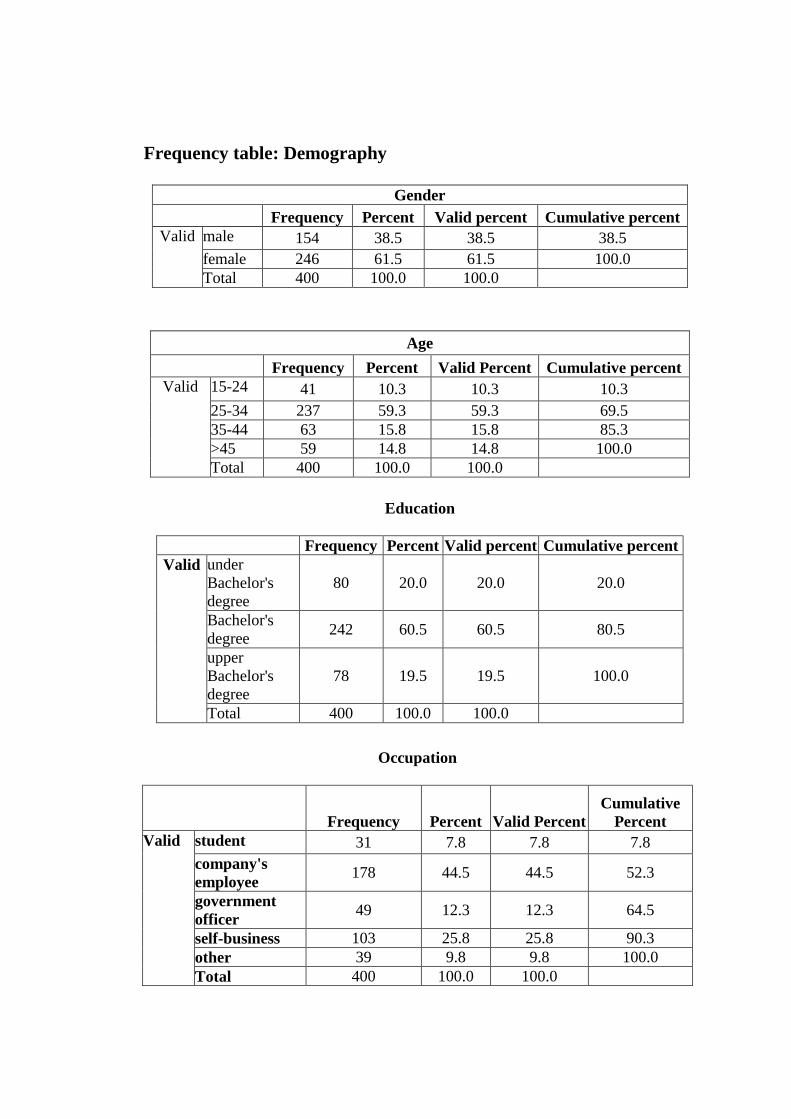
68
Frequency table: Demography
Gender
Frequency Percent Valid percent Cumulative percent
Valid male 154 38.5 38.5 38.5
female 246 61.5 61.5 100.0
Total 400 100.0 100.0
Age
Frequency Percent Valid Percent Cumulative percent
Valid 15-24 41 10.3 10.3 10.3
25-34 237 59.3 59.3 69.5
35-44 63 15.8 15.8 85.3
>45 59 14.8 14.8 100.0
Total 400 100.0 100.0
Education
Frequency Percent Valid percent Cumulative percent
Valid under
Bachelor's
degree
80 20.0 20.0 20.0
Bachelor's
degree 242 60.5 60.5 80.5
upper
Bachelor's
degree
78 19.5 19.5 100.0
Total 400 100.0 100.0
Occupation
Frequency Percent Valid Percent
Cumulative
Percent
Valid student 31 7.8 7.8 7.8
company's
employee 178 44.5 44.5 52.3
government
officer 49 12.3 12.3 64.5
self-business 103 25.8 25.8 90.3
other 39 9.8 9.8 100.0
Total 400 100.0 100.0
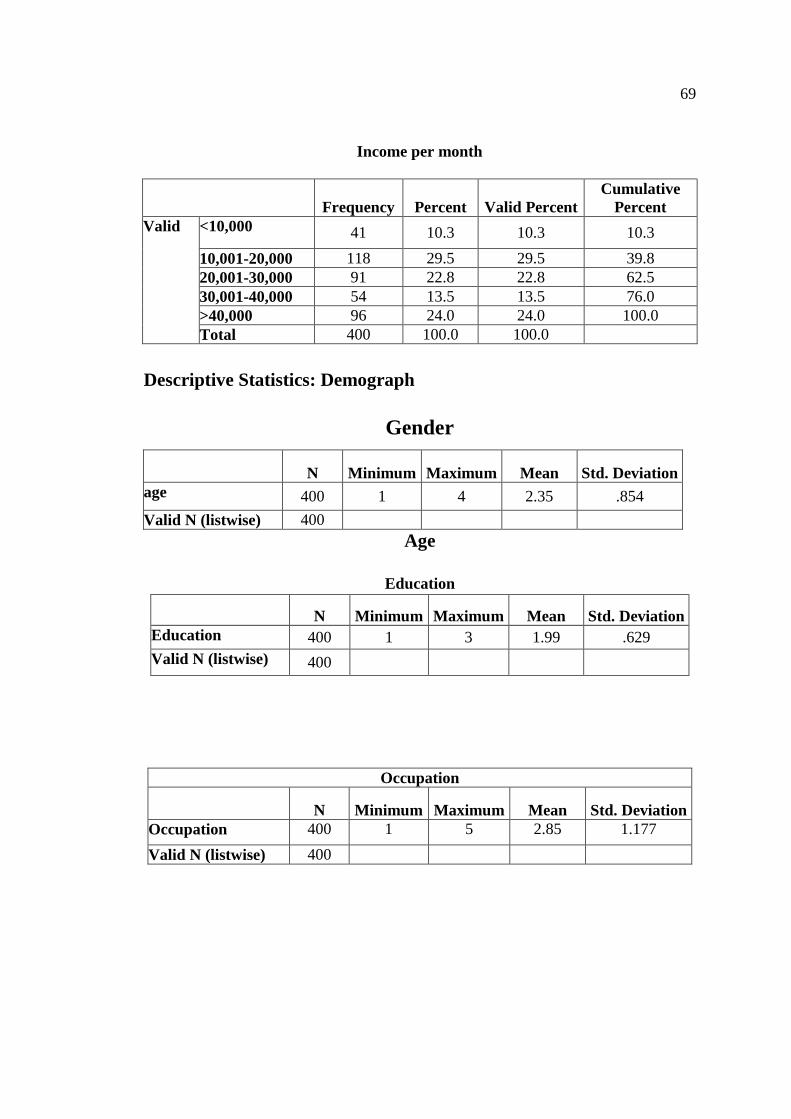
69
Income per month
Frequency Percent Valid Percent
Cumulative
Percent
Valid <10,000 41 10.3 10.3 10.3
10,001-20,000 118 29.5 29.5 39.8
20,001-30,000 91 22.8 22.8 62.5
30,001-40,000 54 13.5 13.5 76.0
>40,000 96 24.0 24.0 100.0
Total 400 100.0 100.0
Descriptive Statistics: Demograph
Gender
Age
Education
N Minimum Maximum Mean Std. Deviation
Education 400 1 3 1.99 .629
Valid N (listwise) 400
N Minimum Maximum Mean Std. Deviation
age 400 1 4 2.35 .854
Valid N (listwise) 400
Occupation
N Minimum Maximum Mean Std. Deviation
Occupation 400 1 5 2.85 1.177
Valid N (listwise) 400
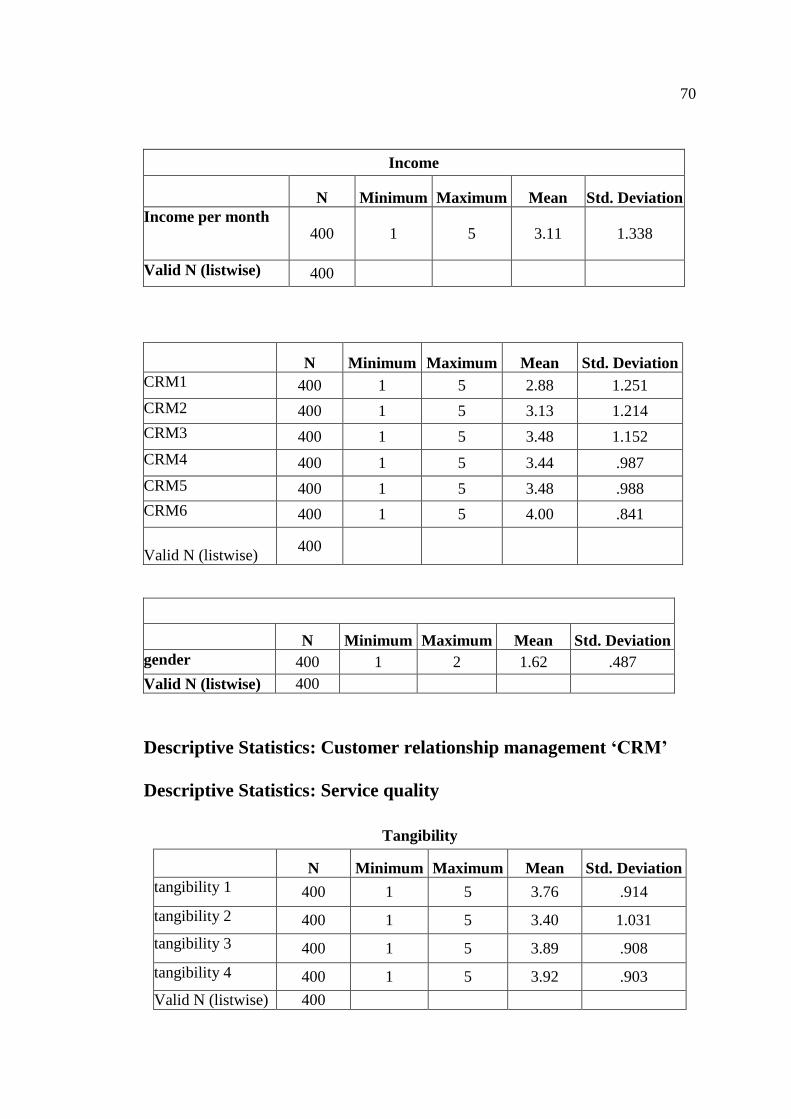
70
Descriptive Statistics: Customer relationship management ‘CRM’
Descriptive Statistics: Service quality
Tangibility
N Minimum Maximum Mean Std. Deviation
tangibility 1 400 1 5 3.76 .914
tangibility 2 400 1 5 3.40 1.031
tangibility 3 400 1 5 3.89 .908
tangibility 4 400 1 5 3.92 .903
Valid N (listwise) 400
Income
N Minimum Maximum Mean Std. Deviation
Income per month 400 1 5 3.11 1.338
Valid N (listwise) 400
N Minimum Maximum Mean Std. Deviation
CRM1 400 1 5 2.88 1.251
CRM2 400 1 5 3.13 1.214
CRM3 400 1 5 3.48 1.152
CRM4 400 1 5 3.44 .987
CRM5 400 1 5 3.48 .988
CRM6 400 1 5 4.00 .841
Valid N (listwise) 400
N Minimum Maximum Mean Std. Deviation
gender 400 1 2 1.62 .487
Valid N (listwise) 400

71
Reliability
N Minimum Maximum Mean Std. Deviation
Reliability 1 400 1 5 3.83 1.035
Reliability 2 400 1 5 3.76 .934
Reliability 3 400 1 5 3.81 .905
Reliability 4
400 1 5 3.91 .959
Valid N (listwise) 400
Responsiveness
N Minimum Maximum Mean Std. Deviation
Responsiveness 1 400 1 5 3.84 .904
Responsiveness2 400 1 5 3.92 .872
Responsiveness 3 400 2 5 3.84 .851
Responsiveness 4 400 1 5 3.80 .968
Valid N (listwise) 400
Assurance
N Minimum Maximum Mean Std. Deviation
Assurance 1 400 1 5 3.84 .973
Assurance 2 400 1 5 3.91 .847
Assurance 3 400 1 5 3.85 .878
Assurance 4 400 1 5 3.63 1.018
Valid N (listwise) 400
Empathy
N Minimum Maximum Mean Std. Deviation
Empathy 1 400 1 5 3.82 .885
Empathy 2 400 1 5 3.84 .871
Empathy 3 400 1 5 3.90 .924
Empathy 4 400 1 5 3.36 1.117
Valid N (listwise) 400
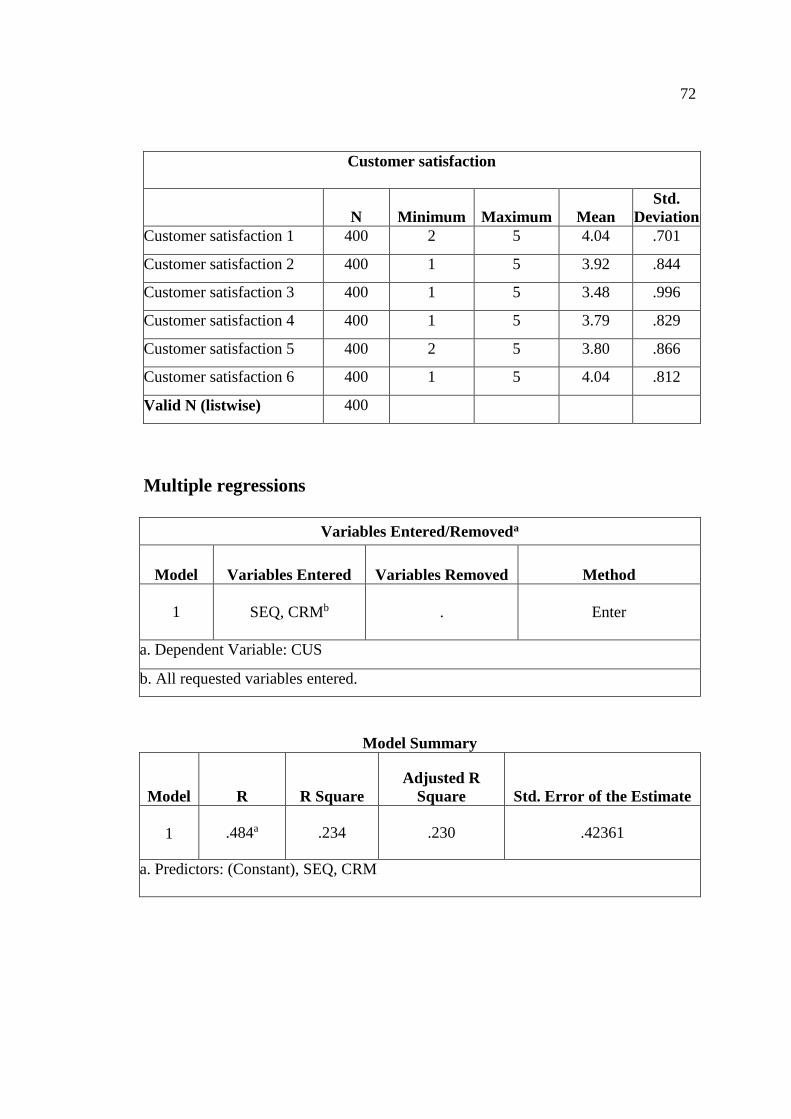
72
Multiple regressions
Variables Entered/Removeda
Model Variables Entered Variables Removed Method
1 SEQ, CRMb . Enter
a. Dependent Variable: CUS
b. All requested variables entered.
Model Summary
Model R R Square
Adjusted R
Square Std. Error of the Estimate
1 .484a .234 .230 .42361
a. Predictors: (Constant), SEQ, CRM
Customer satisfaction
N Minimum Maximum Mean
Std.
Deviation
Customer satisfaction 1 400 2 5 4.04 .701
Customer satisfaction 2 400 1 5 3.92 .844
Customer satisfaction 3 400 1 5 3.48 .996
Customer satisfaction 4 400 1 5 3.79 .829
Customer satisfaction 5 400 2 5 3.80 .866
Customer satisfaction 6 400 1 5 4.04 .812
Valid N (listwise) 400

73
Coefficientsa
Model
Unstandardized
Coefficients
Standardized
Coefficients
t Sig.
Collinearity
Statistics
B Std. Error Beta Tolerance VIF
1
(Constant) 2.794 .113 24.731 .000
CRM .223 .035 .391 6.397 .000 .521 1.921
SEQ .080 .040 .122 1.990 .047 .521 1.921
a. Dependent Variable: CUS
Collinearity Diagnosticsa
Model Dimension Eigenvalue
Condition
Index
Variance Proportions
(Constant) CRM SEQ
1 1 2.958 1.000 .00 .00 .00
2 .030 9.976 .66 .46 .00
3 .012 15.435 .34 .54 .99
a. Dependent Variable: CUS
ANOVAa
Model Sum of
Squares df Mean Square F Sig.
1
Regression 21.545 2 10.772 60.032 .000b
Residual 70.521 393 .179
Total 92.066 395 a. Dependent Variable: CUS
b. Predictors: (Constant), SEQ, CRM
74
BIOGRAPHY
Name Miss Panid Keeratibumrungphong
Date of birth July 26,1989
Place of birth Chonburi
Present address 88/6 M.2Noen-Phra, MueangDitrict
Rayong 21000
Education
2008 -2013 Bachelor’s degree Pharmacy (Pharmacy)
SilpakornUnivesity
2015 Master of Businss Administration (M.B.A.)
(International Program)
Graduate School of Commerce
Burapha University