job satisfaction, life satisfaction, and turnover intent among food-service managers
TRANSCRIPT
28 CORNELL HOTEL AND RESTAURANT ADMINISTRATION QUARTERLY28 CORNELL HOTEL AND RESTAURANT ADMINISTRATION QUARTERLY
T
Job Satisfaction, Life Satisfaction,and Turnover IntentAmong Food-service
Managers
by Richard F. Ghiselli,Joseph M. La Lopa, andBilly Bai
Richard Ghiselli, Ph.D, CCE, is anassociate professor and director of theAvery Foodservice Research Centerin the department of hospitality andtourism management at Purdue Univer-sity ( [email protected]), whereJoseph M. La Lopa, Ph.D., is anassociate professor and Billy Bai, M.S.,is a doctoral candidate.
© 2001, Cornell University
The rewards are considerable. The people are great. The customers
are appreciative. So, why do so many people want to leave the food-
service business?
urnover remains one of the most troubling issues for hos-
pitality businesses. While the turn-over rates of hourly workers arelegendary, even more challengingare the turnover rates among man-agers—especially because of thedisruption caused by managers’ de-partures. In a limited study of hotelmanagers, annual turnover wasfound to be as high as 80 percent.1
1 R.H. Woods and J.F. McCauley, “Rx forTurnover: Retention Programs that Work,”Cornell Hotel and Restaurant AdministrationQuarterly, Vol. 30, No. 1 (May 1989), pp. 79–90.
at UNIV OF NEVADA LAS VEGAS LIB on January 7, 2015cqx.sagepub.comDownloaded from
April 2001 • 29
H U M A N R E S O U R C E S
In another study, 35 percent ofmid-level hotel managers indicatedan intent to leave their currentposition—with fewer than half indi-cating they would remain in thehospitality industry.2 Similarly, theNational Restaurant Association hasreported acute turnover of salariedemployees in the restaurant industry.In 1998, for example, the annualturnover rate for salaried employeesin full-service restaurants with acheck average over $10 was 50 per-cent; for restaurants under $10,33 percent; and for limited-service,fast-food restaurants, 100 percent.3
Likewise, Horton and Ghiselli foundthe annual turnover rate for food-service managers and supervisorsto be approximately 67 percent.4
Researchers have consistentlylinked a number of variables toturnover. Those with the strongestempirical correlations are age, ten-ure, job content, and job satisfac-tion.5 Other factors have shownvarying correlations, including skilllevel, type of occupation, and edu-cation.6 A number of studies havefound age to be one of the strongestcorrelates of employee turnover.7
The consensus is that young em-ployees have higher turnover ratesthan do their elders. Similarly, ten-ure has been found to be inversely
related to turnover, in that employ-ees who have been with an em-ployer longer are less likely toleave.8
Working conditions. Thecomposition and working condi-tions in the hospitality industry—the food-service segment in par-ticular—lend themselves toturnover. The food-service industryemploys many young workers whotend not to stay with a companylong. Almost 60 percent of eating-and drinking-place workers are 29years old or younger.9 Wages in theindustry are relatively low.10 Forrestaurant and food-service manag-ers the median earnings in 1996were $460 per week—or approxi-mately $23,920 annually.11 Accord-ing to the National RestaurantAssociation, the median salary forrestaurant unit managers in 1998was $32,495, and for assistant unitmanagers, $25,000.12
Job satisfaction. One key toturnover seems to be a job’s charac-teristics. A number of dimensionshave been used to define the con-tent or characteristics of jobs, in-cluding autonomy, variety, taskidentity, feedback, dealing withothers, and friendship opportuni-ties.13 We argue that many of theseoverlap or are subsumed within thenotion of job satisfaction. In some
instances, we believe that managersand operators may be able to im-prove or enrich jobs and heightensatisfaction by reviewing and ma-nipulating those dimensions. Whilethere is evidence that some of thejob-content factors are significantlyrelated to turnover,14 their relation-ship to satisfaction, which is alsoassociated with turnover, has notbeen established for food-serviceemployment.15 Instead, the resultshave been contradictory. One studydetected no significant relationshipbetween job characteristics andsatisfaction, while another founda strong connection between jobcharacteristics and satisfaction in afood-service setting.16
Job satisfaction is, we believe, themost important construct in at-tempting to understand turnover.Locke defined it as “a positiveemotional state produced from aperson’s experience associated withhis or her job.”17 It has long beenestablished that employees who aredissatisfied on the job are morelikely to leave than those who aresatisfied.18 Some of the elementsthat have been used to characterizeor measure job satisfaction are abil-ity utilization, the need for achieve-ment, the chance for advancement,company policies and practices,compensation, creativity, security,and working conditions.19 Eventhough the (inverse) relationshipbetween satisfaction and turnoverhas been established, the statistics
2 C.S. Tzeng, “Factors Influencing MiddleManagement’s Intention to Leave in the HotelIndustry,” West Lafayette, IN: unpublishedmaster’s thesis, Purdue University, 1997.
3 National Restaurant Association andDeloitte & Touche, Restaurant Industry OperationsReport 1999 (Washington, DC: National Restau-rant Association, 1999).
4 B.W. Horton and R. Ghiselli, “Identificationof Variables Influencing Food and BeverageTurnover,” in The Practice of Graduate Research inHospitality and Tourism, ed. K. S. Chon(Binghamton, NY: Haworth Hospitality Press,1999).
5 See: W.H. Mobley, R.W. Griffeth, H.H. Hand,and B.M. Meglino, “Review of ConceptualAnalysis of the Employee Turnover Process,”Psychological Bulletin, Vol. 86, No. 3 (1979), pp.493–522; and J.L. Price, The Study of Turnover(Ames, IA: Iowa State University Press, 1977).
6 Price, 1977.7 Mobley et al., 1979; and Price, 1977.
8 Mobley et al., 1979; and Price, 1977.9 Bureau of Labor Statistics, Career Guide to
Industries, L2.3/4-3:992 (Washington, DC:U.S. Department of Labor, 1992).
10 U.S. Bureau of the Census, Statistical Abstractof the United States: 1998, 118th edition (Wash-ington, DC: Bureau of the Census, 1998).
11 Bureau of Labor Statistics, OccupationalOutlook Handbook, Bulletin 2500 (Washington,DC: U.S. Department of Labor, 1998).
12 National Restaurant Association, “Food-service Trends,” Restaurants USA, Vol. 19,February 1999, pp. 41–45.
13 Mobley et al., 1979; H.P. Sims, A.D. Szilagyi,and R.T. Keller, “The Measurement of JobCharacteristics,” Academy of Management Journal,Vol. 19 ( June 1976), pp. 195–212; and J. Sneed,“Job Characteristics and Job Satisfaction ofSchool Food-service Employees,” School FoodService Research Review, Vol. 12, No. 2 (1988),pp. 65–68.
14 Mobley et al., 1979.15 Sneed, 1988.16 Ibid.17 E.A. Locke, “What Is Job Satisfaction?,”
Organizational Behavior and Human Performance,Vol. 4, No. 4 (1969), pp. 309–336.
18 For example, see: Mobley et al., 1979; andPrice, 1977.
19 See: R.P. Quinn and G.L. Staines, 1977Quality of Employment Survey (Ann Arbor, MI:Institute for Social Research, 1979); D.J. Weiss,R.V. Dawis, G.W. England, and L.H. Lofquist,Manual for the Minnesota Satisfaction Questionnaire,Vol. xxii (Minneapolis, MN: Industrial RelationsCenter, University of Minnesota, 1967).
at UNIV OF NEVADA LAS VEGAS LIB on January 7, 2015cqx.sagepub.comDownloaded from
30 CORNELL HOTEL AND RESTAURANT ADMINISTRATION QUARTERLY
relating to that relationship are stillnot as strong as one might expect.20
Perhaps because the link betweensatisfaction and turnover has notbeen explained sufficiently, a num-ber of factors have been incorpo-rated and models developed in ef-forts to explain turnover moresatisfactorily. At first glance some ofthese factors may appear to be dis-tinct influences on turnover. Forexample, the availability of otheropportunities is sometimes treatedas a separate influential or interven-ing variable.21 Yet this factor couldreasonably be considered not as adistinct indicator, but rather as acomponent or element of job satis-faction. The reason that the avail-ability of another job does not workas a sole explanation for turnover isthat it seems unlikely that an indi-vidual would leave a job she or heliked unless there were somethingabout the new job—say, greaterpay or increased autonomy—that offered greater job or lifesatisfaction.
One factor that is indispensable tounderstanding both turnover andjob satisfaction is “quality of life,” orlife satisfaction. While it may be tooelusive to define precisely, the notionof life satisfaction suggests or con-notes a (minimum) level or feelingof contentment. In this sense itwould be an overarching goal thatwould certainly include job satisfac-tion as a major component. In thecontext of leaving a job or intendingto do so, however, job satisfactionand life satisfaction may be ultimatefactors that together influence ormoderate the turnover decision.
To date, evidence of a connectionbetween job satisfaction and qualityof life has not been strong.22 This is
perplexing, especially given theamount of time that hospitalitymanagers spend at their jobs. In-deed, the primary reasons given bymany young hospitality managersfor leaving the industry were thelong hours and the inconvenientschedules.23 Moreover, among res-taurant managers, intent to leave hasbeen found to be related to thenumber of hours worked.24 Oneexplanation for this puzzling rela-tionship might be that those whoare employed in challenging andstressful occupations are more satis-fied with both their jobs and theirlives.25 Notwithstanding that possi-bility, if significant amounts of timewere spent at work—to the detri-ment of away-from-work life—aseparate measure of life satisfactionwould be devalued or corrupted.
Interrole conflict. One way togauge the effect of a job on otherlife activities might be to measurethe discord in an individual’s efforts,or interrole conflict. Interrole con-flict has been defined as “the extentto which a person experiences pres-sures within one role that are in-compatible with the pressures thatarise within another.”26 Researchershave adduced some evidence of anegative relationship betweeninterrole conflict and job satisfac-tion, most likely driven by excessivework hours.27 A similar relationshipto life satisfaction seems likely.
20 Mobley et al., 1979.21 Ibid.; and Price, 1977.22 J.P. Near, R.W. Rice, and R.G. Hunt, “Job
Satisfaction and Life Satisfaction: A ProfileAnalysis, Social Indicators Research, Vol. 19 (1987),pp. 383–401.
23 D.V. Pavesic and R.A. Brymer, “Job Satisfac-tion: What’s Happening to the Young Manag-ers?,” Cornell Hotel and Restaurant AdministrationQuarterly, Vol. 30, No. 4 (February 1990), pp. 90–96.
24 W. Crandall, D.A. Emenheiser, and C.A.Jones, “Are We Working Our Managers TooHard? Examining the Link Between Work Hoursand Restaurant Manager Intentions to Leave,”Journal of Foodservice Systems, Vol. 8 (1995),pp. 103–113.
25 Near et al.26 R.E. Kopelman, J.H. Greenhaus, and T.F.
Connolly, “A Model of Work, Family, andInterrole Conflict: A Construct Validation Study,”Organizational Behavior and Human Performance,Vol. 32 (1983), pp. 198–215.
27 See: W. Crandall et al., 1995; and Kopelmanet al., 1983.
One factor that is indispensable
to understanding turnover and
job satisfaction is employees’
sense of “quality of life.”
at UNIV OF NEVADA LAS VEGAS LIB on January 7, 2015cqx.sagepub.comDownloaded from
April 2001 • 31
H U M A N R E S O U R C E S
Even though employee turnoverin hospitality businesses has beenstudied extensively, little of thatresearch has examined managerial-level relationships among job satis-faction, intent to leave, and qualityof life. The purpose of our studywas to investigate those relation-ships as they relate to food-servicemanagers—specifically, to examineturnover in the context of both jobsatisfaction and life satisfaction mea-sures, as well as certain demographicvariables. Of particular concernwere the satisfaction levels andturnover of operational managers—that is, general managers, assistantmanagers, and functional-area su-pervisors at the unit level.
Three-fold QuestionnairesWe conducted a mail survey using acombination of three questionnairesto carry out the study. We devel-oped a questionnaire that includedthe short form of the MinnesotaSatisfaction Questionnaire (MSQ),the life-satisfaction scale used in theQuality of Employment Survey, andan interrole-conflict scale.28
MSQ. The Minnesota Satisfac-tion Questionnaire measures jobsatisfaction on a five-point Likert-type scale. In this approach, threeconstructs are typically derived: ameasure of general satisfaction, onefor intrinsic satisfaction, and anotherfor external satisfaction. The intrin-sic factor is thought to measuresatisfaction with intrinsic reinforce-ment factors—that is, a person’ssatisfaction with aspects of a jobthat are intrinsically reinforcing toemployee–respondents. The extrin-sic factor, on the other hand, is heldto measure satisfaction with rein-forcers that are external to the job,but which are important in defining
overall satisfaction in that they helpdefine the context of the job.
Satisfaction. Using two dimen-sions, the life-satisfaction scale mea-sures general life satisfaction andasks respondents to assess their psy-chic mood or feelings about theircurrent situation. One score comesfrom a semantic-differential scalecontaining eight paired items; theother score is from respondents’feelings about life in general. Theinternal-consistency reliability ofthese measures has been reportedto be .87.29
Role conflict. The interrole-conflict scale attempts to measurethe strain that results when workconflicts with home or family re-sponsibilities. Respondents areasked to indicate the extent towhich they agree or disagree witheight statements on a five-pointLikert-type scale. The Cronbach-alpha coefficient for the interrole-conflict scale was reported to begreater than .80.30
Outta here. The respondentswere also asked about their intentto leave. As it relates to turnover, anumber of studies have found thatintent to leave is a significant indica-tor of future turnover action.31
Also, intent to leave or to remainhas been found to be indicative ofboth near-term and distant turnoveraction.32 While intent is sometimesconsidered a variable or factor inand of itself, it is perhaps betterunderstood as the result of a per-sonal review or evaluation of a joband may be indicative of a worker’sjob satisfaction.
Finally, the respondents wereasked to provide a limited amount
of information about themselves,their current job and employer, andtheir industry segment.
Working with the IndustryTo collect the data we selected 24food-service companies with whichwe had previously collaborated orwhich appeared on the Nation’sRestaurant News “second one hun-dred.”33 After we discussed theproposed study with the human-resources vice president or directorat each company, eight of themagreed to participate.
With the cooperation of thesecompanies, we solicited participa-tion from more than 1,200 manag-ers. In some instances, the HRdepartment distributed the ques-tionnaires internally, while othersprovided to us the managers’ namesand addresses and we contactedthem directly. The questionnairesincluded a letter explaining thestudy and a postage-paid returnenvelope. If we had the addresses,we sent a follow-up reminder post-card a week after we sent out thesurvey. Companies that used internaldistribution sent second-requestletters on our behalf. All partici-pants were provided with infor-mation to contact the researchersdirectly and were guaranteed com-plete anonymity.
Returns. We received 459 ques-tionnaires, 21 of which were notcomplete. Assuming all of the ques-tionnaires that were provided to thecompanies for distribution weredelivered, the overall response ratebased on usable questionnaires wasjust over 36 percent (438 out of1,209). By company, the responserate ranged from a low of nearly 26percent (49/191) to a high of 50percent (51/101). The response ratewas greater when the companies
28 Minnesota Satisfaction Questionnaire, asused by Weiss et al., 1967; The Quality of Employ-ment Survey, as used by Quinn & Staines, 1979;and interrole-conflict scale as used by Kopelmanet al., 1983.
29 Quinn and Staines, 1979.30 Kopelman et al., 1983.31 See: A.I. Kraut, “Predicting Turnover of
Employees from Measured Job Attitudes,” Orga-nizational Behavior and Human Performance, Vol. 13(1975), pp. 233–243; Locke, 1969; and Mobleyet al., 1979.
32 Kraut, 1975.
33 “Second 100 Companies Ranked by U.S.Foodservice Revenues,” Nation’s Restaurant News,1998.
at UNIV OF NEVADA LAS VEGAS LIB on January 7, 2015cqx.sagepub.comDownloaded from
32 CORNELL HOTEL AND RESTAURANT ADMINISTRATION QUARTERLY
distributed the questionnaires (42percent) than when we contactedthe managers directly (32 percent).
Respondent ProfileThe respondents were generally ayoung group. The respondents’mean age was 32.6 years and themedian was 31. More than onequarter of the respondents werebetween 25 and 29 years old, andapproximately two-thirds of thegroup was 40 years old or under.About one-third of the respondentswere women (146). Nine out of tenindicated that they were Caucasian,and about half were married. Morethan one-third had a bachelor’s de-gree (35.7 percent), but only onein eight indicated that they had abachelor’s degree in a hospitality-related area.
The sample consisted primarilyof general managers (29 percent),first assistant managers (24 percent),and assistant managers (33 percent).About half of the respondents oper-ated full-service restaurants wherethe average check was over $10.00
(47 percent) and many of the rest(29 percent) operated full-servicerestaurants, with an average checkunder $10.00. A small percentage(7 percent) operated no-tableservicerestaurants or commercial cafeterias(18 percent).
On average, the managers hadbeen working for their current em-ployer 5.5 years, had been in theircurrent managerial position 2.9years, and had 7.7 years of manage-ment experience in various food-service positions. This compareswell with the industry average of4.3 years for food-service managersand supervisors.34 By and large, themen in this study had more experi-ence than did the women. The menhad worked in their current posi-tion longer than had the women,had worked for their current em-ployer longer, and had more mana-gerial food-service experience.35
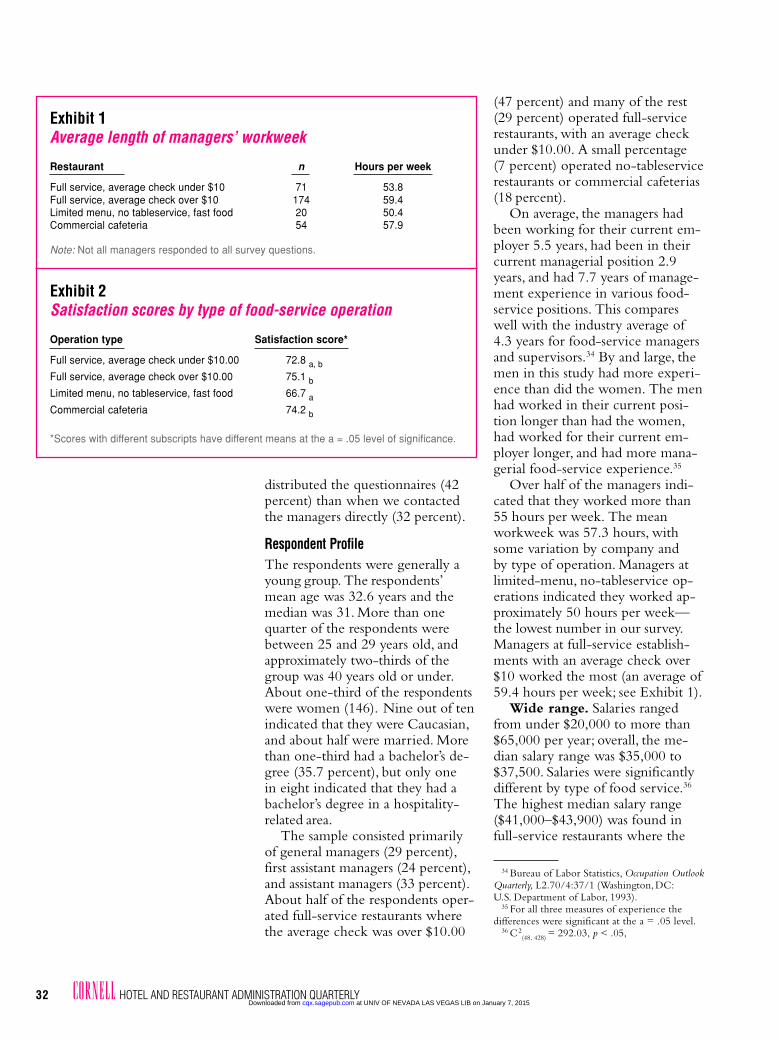
Over half of the managers indi-cated that they worked more than55 hours per week. The meanworkweek was 57.3 hours, withsome variation by company andby type of operation. Managers atlimited-menu, no-tableservice op-erations indicated they worked ap-proximately 50 hours per week—the lowest number in our survey.Managers at full-service establish-ments with an average check over$10 worked the most (an average of59.4 hours per week; see Exhibit 1).
Wide range. Salaries rangedfrom under $20,000 to more than$65,000 per year; overall, the me-dian salary range was $35,000 to$37,500. Salaries were significantlydifferent by type of food service.36
The highest median salary range($41,000–$43,900) was found infull-service restaurants where the
34 Bureau of Labor Statistics, Occupation OutlookQuarterly, L2.70/4:37/1 (Washington, DC:U.S. Department of Labor, 1993).
35 For all three measures of experience thedifferences were significant at the a = .05 level.
36 C 2(48, 428) = 292.03, p < .05,
Exhibit 1Average length of managers’ workweek
Restaurant n Hours per week
Full service, average check under $10 71 53.8Full service, average check over $10 174 59.4Limited menu, no tableservice, fast food 20 50.4Commercial cafeteria 54 57.9
Note: Not all managers responded to all survey questions.
Exhibit 2Satisfaction scores by type of food-service operation
Operation type Satisfaction score*
Full service, average check under $10.00 72.8 a, b
Full service, average check over $10.00 75.1 bLimited menu, no tableservice, fast food 66.7 aCommercial cafeteria 74.2 b
*Scores with different subscripts have different means at the a = .05 level of significance.
at UNIV OF NEVADA LAS VEGAS LIB on January 7, 2015cqx.sagepub.comDownloaded from
April 2001 • 33
H U M A N R E S O U R C E S
average check was over $10,while the lowest ($20,000–$22,900) was in limited-menu, no-tableservicerestaurants.
When analyzed by posi-tion, kitchen managers hadthe highest annual salaries,at $53,000–$55,900. Thenext highest group wasgeneral managers, at$47,000–$49,900, and assis-tant managers had the low-est salaries with a range of$29,000–$31,900.
Job SatisfactionThe total scores on Minne-sota Satisfaction Question-naire ranged from a lowof 33 (very unsatisfied) to100 (very satisfied); theaverage was 73.8 (n = 409,σ = 12.4). The individualitems or components withthe highest mean scoreswere activity (being ableto keep busy all the time),social service (the chance todo things for other people),security, and moral values.On the other hand, compensation,recognition, company policies andpractices, and social status wererated the lowest.
Not only were there variationsin satisfaction by company, but wefound significant differences by typeof operation, as shown in Exhibit 2.The significant differences in satis-faction levels by operation were asfollows: full service with averagecheck over $10 compared to fullservice with average check under$10 and to commercial cafeteria;and full service with average checkunder $10 compared to limitedmenu.
Salary was found to affect jobsatisfaction.37 We divided the re-spondents into the following
37 F(3, 405) = 2.63, p < .05.
Exhibit 3Semantic-differential outcome
Scale of responses on feelings
One 1 2 3 4 5 6 7 Other extreme
extreme n, % n, % n, % n, % n, % n, % n, % Mean
Boring 11 19 59 82 111 99 49 Interesting 4.762.6% 4.4% 13.7% 19.1% 25.8% 23.0% 11.4%
Miserable 9 22 45 96 102 101 54 Enjoyable 4.822.1% 5.1% 10.5% 22.4% 23.8% 23.5% 12.6%
Useless 4 9 17 73 108 126 91 Worthwhile 5.37.9% 2.1% 4.0% 17.1% 25.2% 29.4% 21.3%
Lonely 16 27 40 61 58 121 106 Friendly 5.113.7% 6.3% 9.3% 14.2% 13.5% 28.2% 24.7%
Empty 7 18 45 87 83 103 85 Full 5.031.6% 4.2% 10.5% 20.3% 19.4% 24.1% 19.9%
Discouraging 12 22 41 57 91 115 93 Hopeful 5.112.8% 5.1% 9.5% 13.2% 21.1% 26.7% 21.6%
Disappointing 16 15 49 86 110 95 60 Rewarding 4.823.7% 3.5% 11.4% 20.0% 25.5% 22.0% 13.9%
Doesn’t give me 11 24 46 97 88 102 60 Brings out the 4.81much chance 2.6% 5.6% 10.7% 22.7% 20.6% 23.8% 14.0% best in me
Not good at 2 4 4 9 45 171 194 Good at 6.21my job .5% .9% .9% 2.1% 10.5% 39.9% 45.2% my job
(approximate) quartiles: those whoearned less than $28,900 per year;those with incomes between$29,000 and $37,900; respondentswho earned $38,000 to $46,900;and those whose earnings exceeded$47,000 per year. As such, satisfac-tion tended to increase as salaryincreased, and the respondents whohad the highest salaries had thehighest satisfaction scores; post hoctests, however, were inconclusive.On the other hand, job satisfactiondid not vary significantly amongthe various managerial categories orby gender, marital status, ethnicity,education, or length of industryexperience.
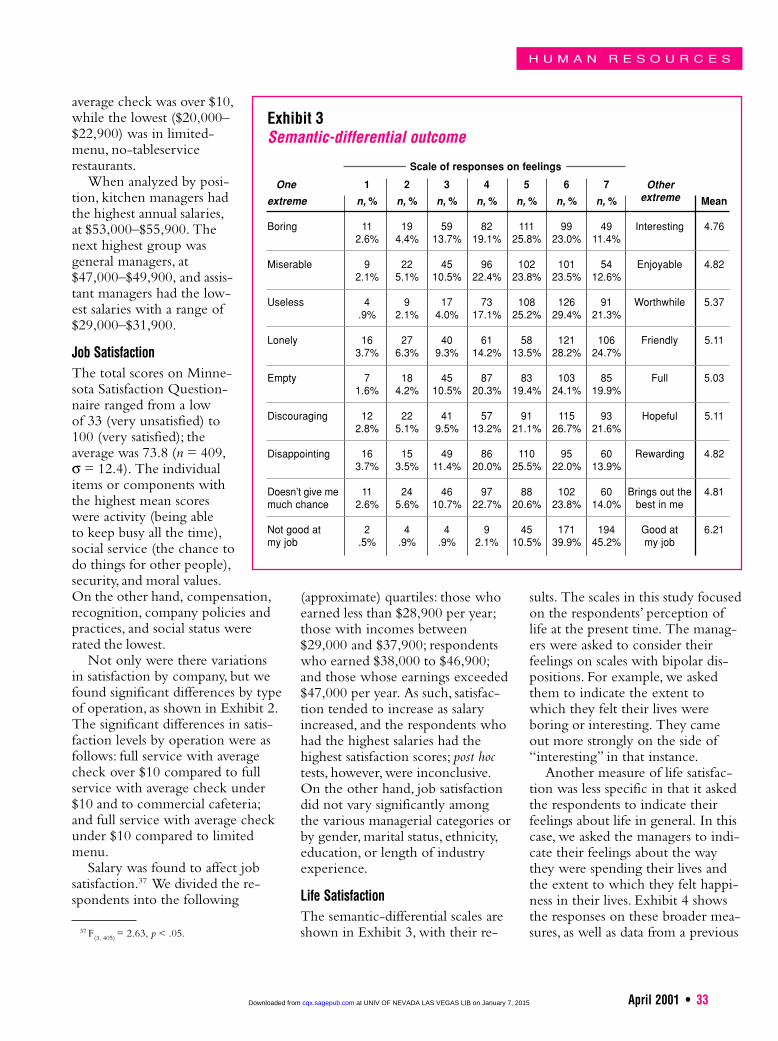
Life SatisfactionThe semantic-differential scales areshown in Exhibit 3, with their re-
sults. The scales in this study focusedon the respondents’ perception oflife at the present time. The manag-ers were asked to consider theirfeelings on scales with bipolar dis-positions. For example, we askedthem to indicate the extent towhich they felt their lives wereboring or interesting. They cameout more strongly on the side of“interesting” in that instance.
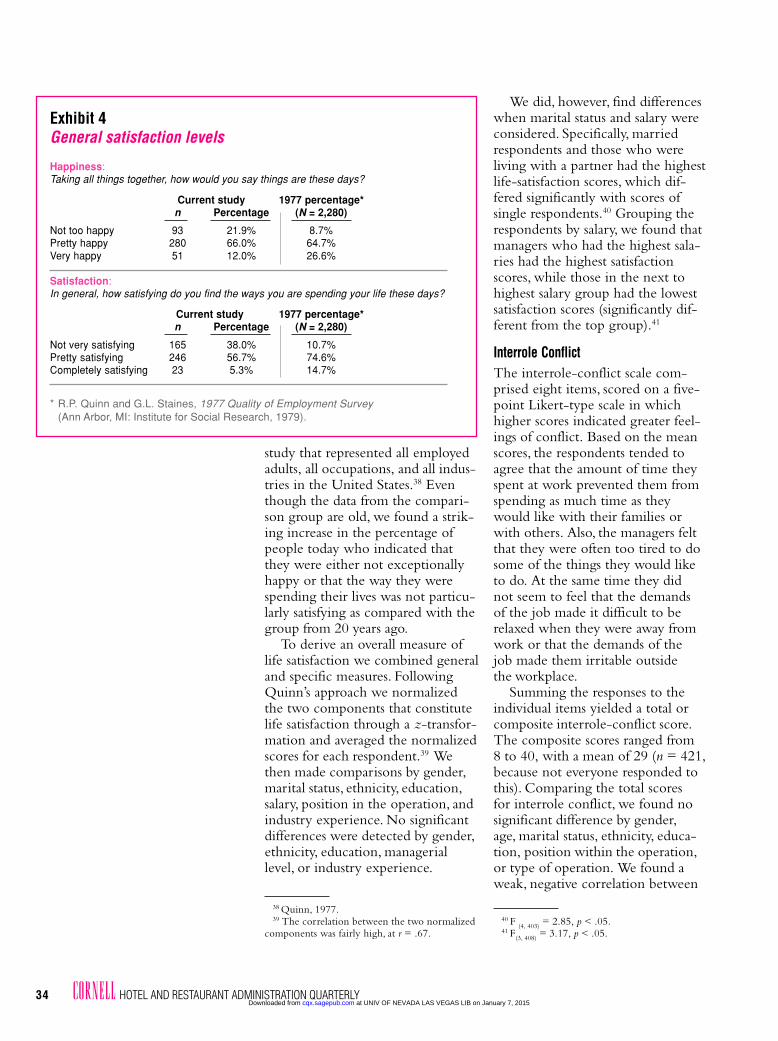
Another measure of life satisfac-tion was less specific in that it askedthe respondents to indicate theirfeelings about life in general. In thiscase, we asked the managers to indi-cate their feelings about the waythey were spending their lives andthe extent to which they felt happi-ness in their lives. Exhibit 4 showsthe responses on these broader mea-sures, as well as data from a previous
Otherextreme
at UNIV OF NEVADA LAS VEGAS LIB on January 7, 2015cqx.sagepub.comDownloaded from
34 CORNELL HOTEL AND RESTAURANT ADMINISTRATION QUARTERLY
study that represented all employedadults, all occupations, and all indus-tries in the United States.38 Eventhough the data from the compari-son group are old, we found a strik-ing increase in the percentage ofpeople today who indicated thatthey were either not exceptionallyhappy or that the way they werespending their lives was not particu-larly satisfying as compared with thegroup from 20 years ago.
To derive an overall measure oflife satisfaction we combined generaland specific measures. FollowingQuinn’s approach we normalizedthe two components that constitutelife satisfaction through a z-transfor-mation and averaged the normalizedscores for each respondent.39 Wethen made comparisons by gender,marital status, ethnicity, education,salary, position in the operation, andindustry experience. No significantdifferences were detected by gender,ethnicity, education, manageriallevel, or industry experience.
We did, however, find differenceswhen marital status and salary wereconsidered. Specifically, marriedrespondents and those who wereliving with a partner had the highestlife-satisfaction scores, which dif-fered significantly with scores ofsingle respondents.40 Grouping therespondents by salary, we found thatmanagers who had the highest sala-ries had the highest satisfactionscores, while those in the next tohighest salary group had the lowestsatisfaction scores (significantly dif-ferent from the top group).41
Interrole ConflictThe interrole-conflict scale com-prised eight items, scored on a five-point Likert-type scale in whichhigher scores indicated greater feel-ings of conflict. Based on the meanscores, the respondents tended toagree that the amount of time theyspent at work prevented them fromspending as much time as theywould like with their families orwith others. Also, the managers feltthat they were often too tired to dosome of the things they would liketo do. At the same time they didnot seem to feel that the demandsof the job made it difficult to berelaxed when they were away fromwork or that the demands of thejob made them irritable outsidethe workplace.
Summing the responses to theindividual items yielded a total orcomposite interrole-conflict score.The composite scores ranged from8 to 40, with a mean of 29 (n = 421,because not everyone responded tothis). Comparing the total scoresfor interrole conflict, we found nosignificant difference by gender,age, marital status, ethnicity, educa-tion, position within the operation,or type of operation. We found aweak, negative correlation between
Exhibit 4General satisfaction levels
Happiness:Taking all things together, how would you say things are these days?
Current study 1977 percentage*n Percentage (N = 2,280)
Not too happy 93 21.9% 8.7%Pretty happy 280 66.0% 64.7%Very happy 51 12.0% 26.6%
Satisfaction:In general, how satisfying do you find the ways you are spending your life these days?
Current study 1977 percentage*n Percentage (N = 2,280)
Not very satisfying 165 38.0% 10.7%Pretty satisfying 246 56.7% 74.6%Completely satisfying 23 5.3% 14.7%
* R.P. Quinn and G.L. Staines, 1977 Quality of Employment Survey(Ann Arbor, MI: Institute for Social Research, 1979).
38 Quinn, 1977.39 The correlation between the two normalized
components was fairly high, at r = .67.
40 F (4, 403) = 2.85, p < .05.41 F(3, 408) = 3.17, p < .05.
at UNIV OF NEVADA LAS VEGAS LIB on January 7, 2015cqx.sagepub.comDownloaded from
April 2001 • 35
H U M A N R E S O U R C E S
interrole conflict and salary, lengthof time in current position, andlength of employment with (cur-rent) company.
The high correlation betweenjob satisfaction and life satisfactionmay have diminished the value ofthe interrole-conflict scale. In par-ticular, since job satisfaction and lifesatisfaction were (highly) correlated,the relationships between interroleconflict and the two satisfactionmeasures were comparable with astrong, negative correlation. To anextent this supports the notion thatthose in challenging and stressfuloccupations are more satisfied withboth their jobs and their lives.42
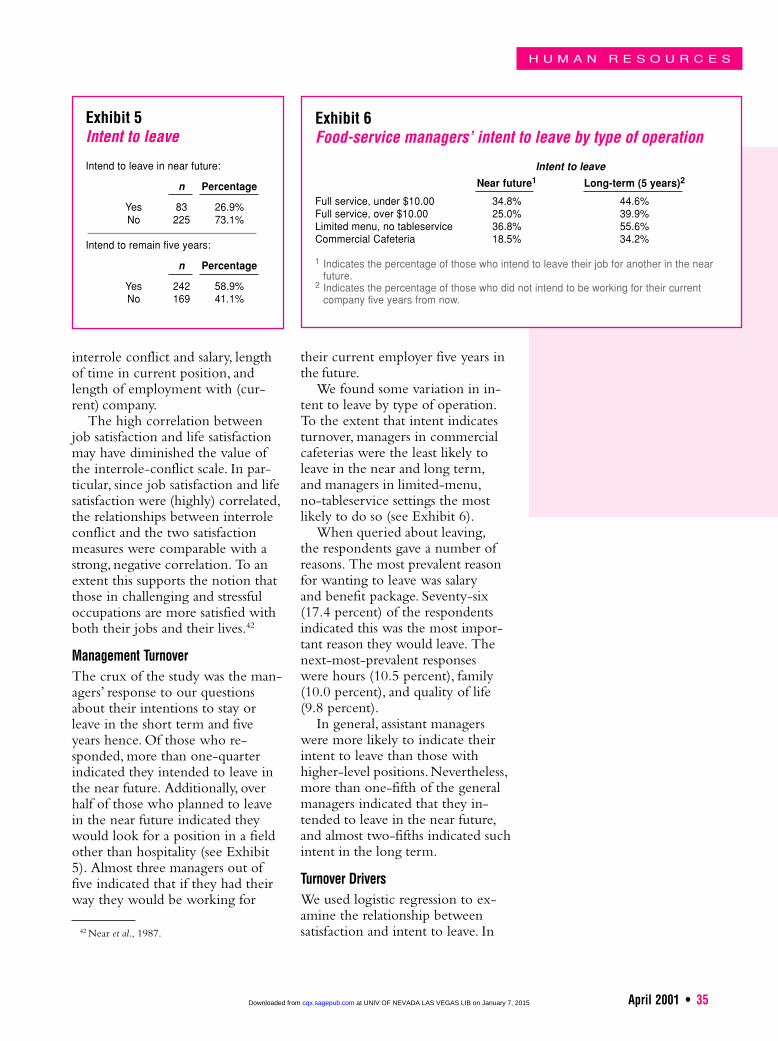
Management TurnoverThe crux of the study was the man-agers’ response to our questionsabout their intentions to stay orleave in the short term and fiveyears hence. Of those who re-sponded, more than one-quarterindicated they intended to leave inthe near future. Additionally, overhalf of those who planned to leavein the near future indicated theywould look for a position in a fieldother than hospitality (see Exhibit5). Almost three managers out offive indicated that if they had theirway they would be working for
their current employer five years inthe future.
We found some variation in in-tent to leave by type of operation.To the extent that intent indicatesturnover, managers in commercialcafeterias were the least likely toleave in the near and long term,and managers in limited-menu,no-tableservice settings the mostlikely to do so (see Exhibit 6).
When queried about leaving,the respondents gave a number ofreasons. The most prevalent reasonfor wanting to leave was salaryand benefit package. Seventy-six(17.4 percent) of the respondentsindicated this was the most impor-tant reason they would leave. Thenext-most-prevalent responseswere hours (10.5 percent), family(10.0 percent), and quality of life(9.8 percent).
In general, assistant managerswere more likely to indicate theirintent to leave than those withhigher-level positions. Nevertheless,more than one-fifth of the generalmanagers indicated that they in-tended to leave in the near future,and almost two-fifths indicated suchintent in the long term.
Turnover DriversWe used logistic regression to ex-amine the relationship betweensatisfaction and intent to leave. In
Exhibit 6Food-service managers’ intent to leave by type of operation
Intent to leave
Near future1 Long-term (5 years)2
Full service, under $10.00 34.8% 44.6%Full service, over $10.00 25.0% 39.9%Limited menu, no tableservice 36.8% 55.6%Commercial Cafeteria 18.5% 34.2%
1 Indicates the percentage of those who intend to leave their job for another in the nearfuture.
2 Indicates the percentage of those who did not intend to be working for their currentcompany five years from now.
Exhibit 5Intent to leave
Intend to leave in near future:
n Percentage
Yes 83 26.9%No 225 73.1%
Intend to remain five years:
n Percentage
Yes 242 58.9%No 169 41.1%
42 Near et al., 1987.
at UNIV OF NEVADA LAS VEGAS LIB on January 7, 2015cqx.sagepub.comDownloaded from
36 CORNELL HOTEL AND RESTAURANT ADMINISTRATION QUARTERLY
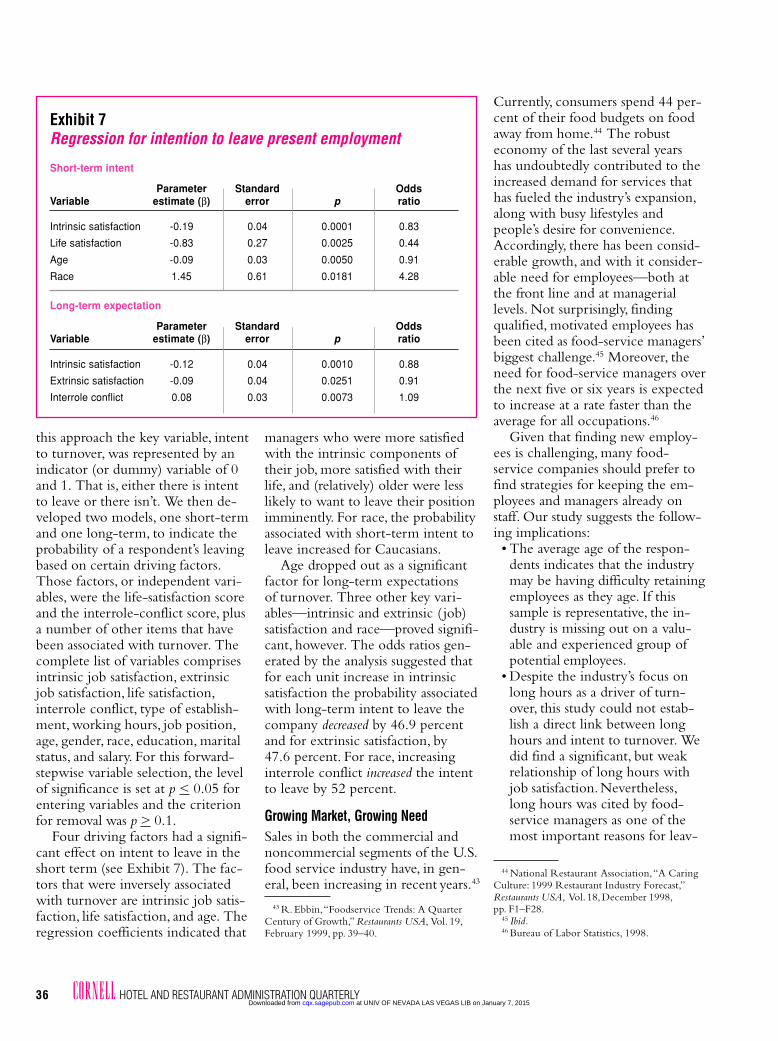
this approach the key variable, intentto turnover, was represented by anindicator (or dummy) variable of 0and 1. That is, either there is intentto leave or there isn’t. We then de-veloped two models, one short-termand one long-term, to indicate theprobability of a respondent’s leavingbased on certain driving factors.Those factors, or independent vari-ables, were the life-satisfaction scoreand the interrole-conflict score, plusa number of other items that havebeen associated with turnover. Thecomplete list of variables comprisesintrinsic job satisfaction, extrinsicjob satisfaction, life satisfaction,interrole conflict, type of establish-ment, working hours, job position,age, gender, race, education, maritalstatus, and salary. For this forward-stepwise variable selection, the levelof significance is set at p < 0.05 forentering variables and the criterionfor removal was p > 0.1.
Four driving factors had a signifi-cant effect on intent to leave in theshort term (see Exhibit 7). The fac-tors that were inversely associatedwith turnover are intrinsic job satis-faction, life satisfaction, and age. Theregression coefficients indicated that
Currently, consumers spend 44 per-cent of their food budgets on foodaway from home.44 The robusteconomy of the last several yearshas undoubtedly contributed to theincreased demand for services thathas fueled the industry’s expansion,along with busy lifestyles andpeople’s desire for convenience.Accordingly, there has been consid-erable growth, and with it consider-able need for employees—both atthe front line and at manageriallevels. Not surprisingly, findingqualified, motivated employees hasbeen cited as food-service managers’biggest challenge.45 Moreover, theneed for food-service managers overthe next five or six years is expectedto increase at a rate faster than theaverage for all occupations.46
Given that finding new employ-ees is challenging, many food-service companies should prefer tofind strategies for keeping the em-ployees and managers already onstaff. Our study suggests the follow-ing implications:• The average age of the respon-dents indicates that the industrymay be having difficulty retainingemployees as they age. If thissample is representative, the in-dustry is missing out on a valu-able and experienced group ofpotential employees.
• Despite the industry’s focus onlong hours as a driver of turn-over, this study could not estab-lish a direct link between longhours and intent to turnover. Wedid find a significant, but weakrelationship of long hours withjob satisfaction. Nevertheless,long hours was cited by food-service managers as one of themost important reasons for leav-
managers who were more satisfiedwith the intrinsic components oftheir job, more satisfied with theirlife, and (relatively) older were lesslikely to want to leave their positionimminently. For race, the probabilityassociated with short-term intent toleave increased for Caucasians.
Age dropped out as a significantfactor for long-term expectationsof turnover. Three other key vari-ables—intrinsic and extrinsic ( job)satisfaction and race—proved signifi-cant, however. The odds ratios gen-erated by the analysis suggested thatfor each unit increase in intrinsicsatisfaction the probability associatedwith long-term intent to leave thecompany decreased by 46.9 percentand for extrinsic satisfaction, by47.6 percent. For race, increasinginterrole conflict increased the intentto leave by 52 percent.
Growing Market, Growing NeedSales in both the commercial andnoncommercial segments of the U.S.food service industry have, in gen-eral, been increasing in recent
44 National Restaurant Association, “A CaringCulture: 1999 Restaurant Industry Forecast,”Restaurants USA, Vol. 18, December 1998,pp. F1–F28.
45 Ibid.46 Bureau of Labor Statistics, 1998.
43 R. Ebbin, “Foodservice Trends: A QuarterCentury of Growth,” Restaurants USA, Vol. 19,February 1999, pp. 39–40.
Exhibit 7Regression for intention to leave present employment
Short-term intent
Parameter Standard OddsVariable estimate (β) error p ratio
Intrinsic satisfaction -0.19 0.04 0.0001 0.83
Life satisfaction -0.83 0.27 0.0025 0.44
Age -0.09 0.03 0.0050 0.91
Race 1.45 0.61 0.0181 4.28
Long-term expectation
Parameter Standard OddsVariable estimate (β) error p ratio
Intrinsic satisfaction -0.12 0.04 0.0010 0.88
Extrinsic satisfaction -0.09 0.04 0.0251 0.91
Interrole conflict 0.08 0.03 0.0073 1.09
years.43
at UNIV OF NEVADA LAS VEGAS LIB on January 7, 2015cqx.sagepub.comDownloaded from
April 2001 • 37
H U M A N R E S O U R C E S
ing. Indeed, the number of hoursworked by restaurant managersplaces them in the upper quintileof all persons at work in theUnited States. In 1996 the aver-age work week for persons work-ing full time was 43.3 hours,while the managers in our sampleaveraged 60 hours per week. Justover 8 percent of people worked60 hours or more, according tothe Bureau of the Census.47 Thismay be one of the reasons theage distribution is skewed towardyounger managers; the numberof hours worked may have elimi-nated many (older) managers.
• While compensation may not bea factor that significantly affectsintent to leave, it is a componentof job satisfaction. Our respon-dents gave compensation theirlowest rating. Moreover, it was themost frequent response whenmanagers were asked why theymight leave. While our survey didnot directly address this matter,one perception is that the finan-cial rewards and the number ofhours worked are not in balance.
• The managers in our sampleidentified a number of potentialsatisfiers that are not being ful-filled to the extent that they in-crease satisfaction and reduceturnover. Specifically, achieve-ment, creativity, independence,advancement, social status, andrecognition were not highlyrated. Considering the cost andeffects of turnover, as well as theintense competition for employ-ees, enhancing job satisfactionmay reduce turnover, and thedeleterious effects that entail,such as reduced organizationaleffectiveness and lower sales andproductivity.
• Intrinsic satisfaction seems tobe more important in the shortterm, and extrinsic satisfaction
more important in the long run.This indicates that initially man-agers find their jobs intrinsicallyrewarding, but over time theyhave stronger extrinsic needs. Asa result, food-service companieswill have to manage or reinforcethose elements that constitutesatisfaction as the length of serviceincreases, and as managers mature.In essence corporations mustmanage the elements that defineeach of the measures of satisfac-tion as they relate to length ofservice and maturity. What thissuggests is that keeping opera-tional managers over the longterm means giving them increas-ing authority and responsibility, aswell as job security and variety intheir jobs. The managers also needrecognition—from both the em-ployer and in the community—for their efforts.
• Almost all of the managers con-sidered themselves good at theirjobs, but a surprising numberindicated that they were neitherhappy nor satisfied with theirlives. Close to one-fifth of themanagers considered their lives tobe more boring than interesting,and expressed feelings of loneli-ness and disappointment. Whileone might expect to have somerespondents report such feelings,the frequency with which theyoccurred troubles us. In manyinstances the percentage of re-spondents was two to three timesgreater than that found in thegeneral population. Moreover,even though the data from thecomparison group are old,48 wenote again the rise in the percent-age of individuals who indicatedthey were either not happy ornot satisfied.
• Over half of those who indicatedan intent to leave were consider-ing leaving the industry alto-
gether—a particularly dishearten-ing finding. Given that our re-spondents were mostly young andgiven that many of them plannedto leave, we see what seems to bea short-term mentality among alarge number of food-serviceemployees and managers.
• While interrole conflict did notprove to be significantly relatedto turnover intent, the time de-mands of food-service manage-ment is an issue that runsthroughout many of the itemson the scale. Based on the meanresponses, the managers felt thatthe amount of time spent atwork or the work schedulecreated discord in their lives.
• If this sample is indicative of theindustry, there is little culturaldiversity in unit management.Such a strong bias toward whitemen is striking considering thecomposition of the workforce.In 1999 the National RestaurantAssociation reported that 16 per-cent of all eating-and-drinking-place employees are Hispanic, 12percent are Afro-American, and56 percent are women—a far cryfrom the statistics in this study.Limitations. The study took in
only eight companies, and all seg-ments of the industry were not rep-resented equally. Thus, the resultsshould be generalized with caution.Undoubtedly, there is some samplebias because of the manner in whichthe food-service companies werechosen. Also, even though the man-agers were guaranteed completeanonymity, the response rate waslower than preferred, and non-response bias is a concern. Finally,we are concerned about the agedistribution of the managers in oursurvey. We are intrigued by thequestion of whether individualswho are older than the median inour survey have left the industry,or whether they simple chose notto respond to this survey. CQ47 U.S. Bureau of the Census, 1998. 48 Quinn, 1977.
at UNIV OF NEVADA LAS VEGAS LIB on January 7, 2015cqx.sagepub.comDownloaded from