curbing adult student attrition: evidence from a field experiment
TRANSCRIPT
Curbing adult student attrition: Evidence from a field experiment*
February 1, 2015
Raj Chande†, Michael Luca‡, Michael Sanders§, Zhi Soon**, Oana Borcan††, Netta Barak-Corren‡‡, Elizabeth Linos§§, and Elspeth Kirkman***
Abstract
Roughly 20% of adults in the OECD lack basic numeracy and literacy skills. In the UK, many colleges offer fully government subsidized adult education programs to improve these skills. Constructing a unique dataset consisting of weekly attendance records for 1179 students, we find that approximately 25% of learners stop attending these programs in the first ten weeks and that average attendance rates deteriorate by 20% in that time. We implement a large-scale field experiment in which we send encouraging text messages to students. Our initial results show that these simple text messages reduce the proportion of students that stop attending by 36% and lead to a 7% increase in average attendance relative to the control group. The effects on attendance rates persist through the three weeks of available data following the initial intervention. Keywords: Behavioral Economics, Field Experiment, Education, Adult Education
* This research is funded by the UK government department for Business, Innovation and Skills, through a grant to the Behavioural Insights Research Centre for Adult Skills and Knowledge. We are grateful to Angela Rooney-Tchetchnev, Sharon Starkey, Lucy Pates, Sanda Riding, Kully Sundhu, Steve Middleton and Verity Hancock at Leicester College and Claire King, Damien Steel, Angela Foulkes, Rhys Crombie and Lisa O’Loughlin at Manchester college for their assistance in conducting this experiment. Thanks to Patrick Rooney and Sean Robinson for excellent research assistance, and to Owain Service for comments on an earlier draft. † Behavioural Insights Team, ASK, and University of Bristol ‡ Harvard Business School § Behavioural Insights Team and Harvard Kennedy School of Government ** ASK, Behavioural Insights Team †† ASK, Behavioural Insights Team, and University of Gothenburg ‡‡ Harvard Law School §§ ASK, Behavioural Insights Team, and Harvard Kennedy School of Government *** ASK, Behavioural Insights Team
2
“80% of success in life is showing up.” – Woody Allen
1. Introduction
According to a recent assessment, roughly 16% and 19% of OECD adults
have low proficiency in literacy10 and numeracy,11 with low proficiency being
defined as failing to achieve the level expected of a 16 year-old. These groups
suffer inferior health and labor market outcomes and demonstrate lower levels
of civic engagement and trust in society (OECD, 2013 and BIS, 2014). Many
community colleges offer subsidized literacy and numeracy programs aimed at
this population; similarly, the UK government spends around one billion pounds
per year on such courses, undertaken by approximately one million adults each
year at no charge to the learner (BIS Skills Funding Statement, 2014).
While many adults enroll in these skills programs, there are significant
barriers to attendance and completion. Many adult learners have never entered
higher education, and have been out of the educational system altogether for
years before enrolling. Moreover, enrollees in adult skills courses have often
performed poorly during their compulsory education and therefore have fragile
confidence and motivation to improve their skills (Gorard et al, 2006; Barton et
al., 2006). These factors can create psychological barriers to attending.
Adult learners can also face high opportunity costs to attending. Relative
to younger students, adult learners are more likely to be working and have
children. While at home or work, the benefits of numeracy and literacy may seem
less top of mind than the immediate challenge of attendance.
This paper presents evidence from a large-scale field experiment
designed to improve attendance rates by texting motivational messages and
organizational reminders to students, with messages drawing on insights from
behavioral economics. We find that the intervention has a large effect on
attendance rates, and that this effect persists for the remainder of our sample
period (three consecutive weeks of messaging).
To implement this experiment, we partnered with two further education
colleges in England, consisting of 1179 adult learners. Both schools offer fully
subsidized numeracy and literacy courses for adult learners. We begin by
analyzing attendance patterns of the control group to gain insight into the
dynamics of attendance.
We find that for the first three weeks, attendance is relatively low but
steady at roughly 70%. Attendance then begins to decline for several consecutive
weeks and drops down to roughly 57% by the ninth week. Within an adult
10 Literacy is defined as “the ability to understand and use information from written texts in a variety of contexts to achieve goals and develop knowledge and potential.” 11Numeracy is defined as “the ability to use, apply, interpret, and communicate mathematical information and ideas.”
3
learner, there is significant persistence in changes in attendance behavior –
suggesting scope for changing the habits of learners.
Working with the colleges, we then implement a field experiment in
which we send text messages to students each week beginning in the mid-term
break (the sixth week). We chose this as a starting date for two reasons. First,
this allowed us to observe baseline attendance rates for each student. Second, a
growing body of literature within behavioral economics suggests the importance
of temporal breaks in habit formation. Looking at the likelihood of completing a
weekly task, Taubinsky (2013) investigates the economics of habit formation,
and shows that forcing participants to skip a week reduces the likelihood that
they will return to the task the following week (even though the break was
planned). Dai et al (2014) document the idea of a fresh start effect, showing that
temporal landmarks are a good opportunity to create new habits as well. Hence,
a weeklong break is a natural point at which attendance might drop and where
simple nudges may be effective.
Our intervention messages leverage and test insights based in behavioral
economics. First, they make class more salient when students are home, hence
shifting their attention. Second, they encourage students to engage with their
classmates on Facebook, which can increase a sense of belonging. Third, they
provide encouraging messages – such as “keep up the hard work” – that can
serve as nonpecuniary incentives.
Should we expect this intervention to influence attendance behavior? On
the one hand, this is a very mild intervention, merely shifting the attention of
students while providing no financial incentives and no new information. If adult
students are not attending because they are constrained by other
responsibilities, then we would not expect to see an effect. On the other hand,
there is growing evidence of the role of psychology and behavioral economics in
decisions such as whether to matriculate in college (Bettinger et al. 2012; Pallais
2013; Castleman and Page, forthcoming). Carrell and Sacerdote (2013) and
Bettinger and Baker (2011) show that once students are in school, coaching and
mentoring can help to reduce drop-out rates. This suggests scope for leveraging
behavioral economics in this context.
Empirically, we find that the proportion of students that stop attending is
reduced by a third, with only 16% of the treatment group ceasing to attend
classes compared to 25% of the control group. Average attendance is 7% higher
in the treatment group (a difference of approximately 4% points) and this effect
shows no signs of decaying for three weeks after the intervention.
This paper contributes to the literature on the behavioral foundations of
educational decisions – and more generally, on the implementation of behavioral
field experiments. Our contribution to this literature is threefold. First, we shed
light on the behavioral foundations of adult learning and the dynamics of student
attendance. Second, our results provide evidence on the role of simple
behaviorally informed interventions within a classroom context. At roughly $5
4
per learner per year, this is a very cost-effective way of improving attendance
rates. Third, one potential criticism of these types of behavioral interventions is
that they may dull over time with repeated exposure (Allcott and Rogers 2014).
The persistence of the effects in the 3 weeks after the start of the intervention
provides initial evidence that repeated exposure to messages does not dull the
effect in our context – at least in the short term.
The remainder of the paper is organized as follows: Section 2 reviews the
empirical context. Section 3 details the experimental design and the intervention.
Section 4 presents the results. Section 5 concludes.
2. Empirical Setting
Despite growing high school graduation and college attendance rates,
improving basic literacy and numeracy skills remains an important policy issue
at the lower part of the educational distribution. In the UK, a 1999 report found
that approximately 20% of the British adult population “lacked the basic skills
required to function in work and society,” driven by low literacy and numeracy
rates (DfEE, 1999). The government responded in 2001 with Skills for Life (SFL),
a course of study for adult learners aimed at increasing the educational levels of
the lowest-skilled and preparing them for better employment opportunities.
These courses led to an increase in self-esteem and self-perceived ability
to learn among program participants (Metcalf et al. 2009). While initial research
was inconclusive about the impact of skills-training on employment and
earnings, subsequent studies have shown that students who complete basic
courses are more likely to take higher-level classes, which in turn leads to
improved labor market outcomes (Boe 1997; Bonjour and Smeaton 2003;
Bynner et al. 2001).
The UK government has now set a goal for 95% of the British population
to achieve basic levels of skills by 2020 (HM Treasury, 2006). Further education
colleges are the main providers of these courses in the UK, educating more than
950,000 learners in the academic year 2013/14 (BIS, 2014).12
While enrollment has been steady for the past five years, the proportion
that goes on to ”achieve” (pass the qualification) is low and declining. During this
period, achievement has dropped from 67% to below 60% (Skills Funding
Agency, 2015). A major reason for non-achievement is that learners drop out of
their programs (Newman-Ford et al 2008). Informal discussions with
prospective trial partner colleges suggested that learners drop out steadily
throughout the year, with increased attrition observed after breaks such as those
for Christmas, Easter, or mid-term breaks (conversations with program
administrators at Leicester College, 7/18/2014; and Stoke on Trent,
7/22/2014).
12 Some of these learners will be the same people taking multiple courses; no data are available on how many people form this group of 950,000 enrollments per year.
5
There are several possible factors contributing to low attendance. In a
2000 Basic Skills Agency survey, 51% of adults felt that being too busy and not
having enough time was the main barrier to improving their basic skills. Other
main reasons given were the inability to get time off work for learning (17%)
and financial constraints (13%) (see also Tomoana & Heinrich, 2004; Kambouri
& Francis, 1994; Barton et al., 2006; Comings et al. 2009). Within the education
literature, Davies (2001) notes that learners’ attitudes towards their educational
experience are more predictive of success than their background. Moreover,
motivation to learn is a strong predictor of enrollment, persistence, and success
in basic skills courses (e.g., Gorard et al., 2004; Webb, 2006; MacLeod & Straw,
2010).
3. Experiment Design
3.1 Partner Colleges and Sample
Our experiment took place in 2 further education colleges in England;
Leicester College and Manchester College.13 Both colleges provide courses for
younger learners in compulsory and vocational education as well as voluntary
adult learners. Annually, Leicester College has approximately 2500 adult
learners taking literacy and numeracy courses and Manchester College has
approximately 1500 of these learners. In both colleges, adults are approximately
25% of the learner population. Both colleges are arranged across multiple
campuses (purposely built to accommodate large numbers of learners) and
smaller community venues (often local community centers that host part-time
courses and facilitate the reach out to adult learners). Courses are either taught
on an “Evening” (structured curriculum with examinations usually taken at the
end of the year) or “Part-Time” (less structured curriculum, examinations taken
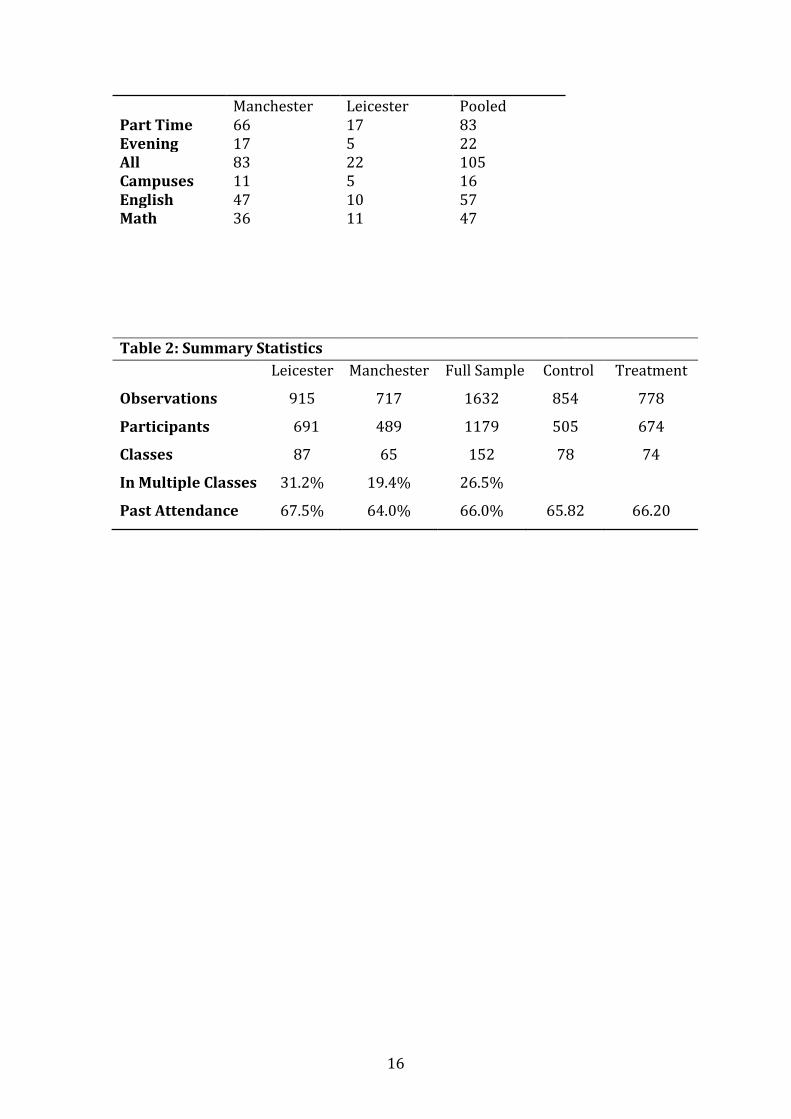
more irregularly) basis. Table 1 documents the number of courses taught across
the two schools.
In our field experiment, learners were 19 or older and enrolled in basic
math and/or English programs, which run on approximately the same academic
calendar as schools and universities – September through June. There are 3
semesters: Autumn, Spring, and Summer. Each semester has a one-week break in
the middle. Learners complete no assessments apart from an examination at the
end of the course, so there are no attainment data available. Learners continue to
enroll throughout the year, but anyone who enrolled after the date of the first
text (in October, the mid-term break) was excluded from the study.
13 A third college participated in the trial and delivered the intervention. However, at the time of writing, it has not been possible to match records of the classes who were treated with subsequent attendance data (due to the way this third college stores their data means).
6
The courses in our sample vary in difficulty and in topic, although we
generally do not have enough power to detect heterogeneous treatment effects
across courses. Learners might be enrolled in math, English, or math and English
courses. Variances in difficulty in these courses are referred to as “levels.” Most
learners in either subject will be aspiring to obtain “Level 2,” the equivalent of a
grade C or above in GCSE (the high-stakes standardized examination taken by 16
year-olds in England; similar to SATs). Learners will often take Entry Level or
Level 1 qualifications before entering Level 2 qualifications, though teaching for
adjacent levels are often delivered together.14
Most courses will be taught on campus in groups of approximately 10 at
the same time each week. A substantial minority of learners who cannot attend a
class at the same time each week will instead enroll in “independent learning,”
where they can “drop in” at one of the community venues to learn when they
have spare time, receiving help from on-site tutors. Such classes are often much
larger, as learners are unlikely to all be there at the same time.
Informal discussions with partner colleges indicated that observable and
unobservable characteristics of new enrollers are likely to systematically vary
across different types of courses, as would subsequent attendance rates and
achievement. College administrators reported lower enrollment for math classes
in general, possibly because math is more abstract, more challenging, and
induces greater anxiety of failure than English among learners. Administrators
also speculated that attrition rates might vary depending on method of
instruction (evening vs part-time). Hence, randomization was stratified along
these class characteristics where possible.
3.2 Randomization
The trial had two conditions (see “Interventions,” below). Half of the
classes were randomized to receive the treatment and half of the classes were
randomized to the control arm. To reduce the extent of within-class spillover
(which would downward bias any possible results), randomization was
conducted at the class-level, such that either everyone in a class was treated, or
nobody was. As explained above, randomization was stratified by college, class
content (Math/English), campus, and method of instruction (evening or part-
time). Only learners that had enrolled before the first texts had been sent were
included.
The structure of our sample posed challenges for randomization.
Specifically, because participants could enroll in multiple courses, participants
could be part of two classes, one of which was assigned to the treatment group,
and one to the control group. If text messages are effective at encouraging
participants to attend the class they refer to, they may also be effective at
14 A table and explanation of qualifications in the UK can be found in Appendix A.
7
encouraging participants to attend others, and so there is a risk of within-subject
spillovers. This is particularly likely, as the language of the text messages is not
tailored to specific classes. In our analysis, we consider these effects by analyzing
an individual as treated first if their class is treated, and second if any of their
classes are treated.
Because there were class-level Facebook groups, contamination effects
were reduced, as were potential feelings of exclusion from a relevant learning
resource by class-level randomization. Informal conversations with college
informants revealed that inter-class communication is highly unlikely in the
adult learning setting, and thus was less of a concern than initially thought.
3.3 Outcome Measures
Our primary outcome measures are weekly class attendance by students
and the proportion of students that stop attending, where a participant is said to
have dropped out if they are absent for three weeks, the entire period after our
intervention that we have data.15 Our partner colleges (and more generally,
further education colleges) do not conduct exams or grade assignments
submitted by adult learners, and so no grades are available at the end of the first
semester.
3.4 Interventions
The experiment consists of sending multiple messages and prompts via
text. Each treated learner received several text messages throughout the
duration of the course (which goes beyond the first semester, which is the data
that is currently available and analyzed in this paper), sent on behalf of the
college. Relative to earlier interventions, these messages require very little
investment on the part of the college as they seek to influence behavior without
changing the level of assistance, incentive, or information that students have.
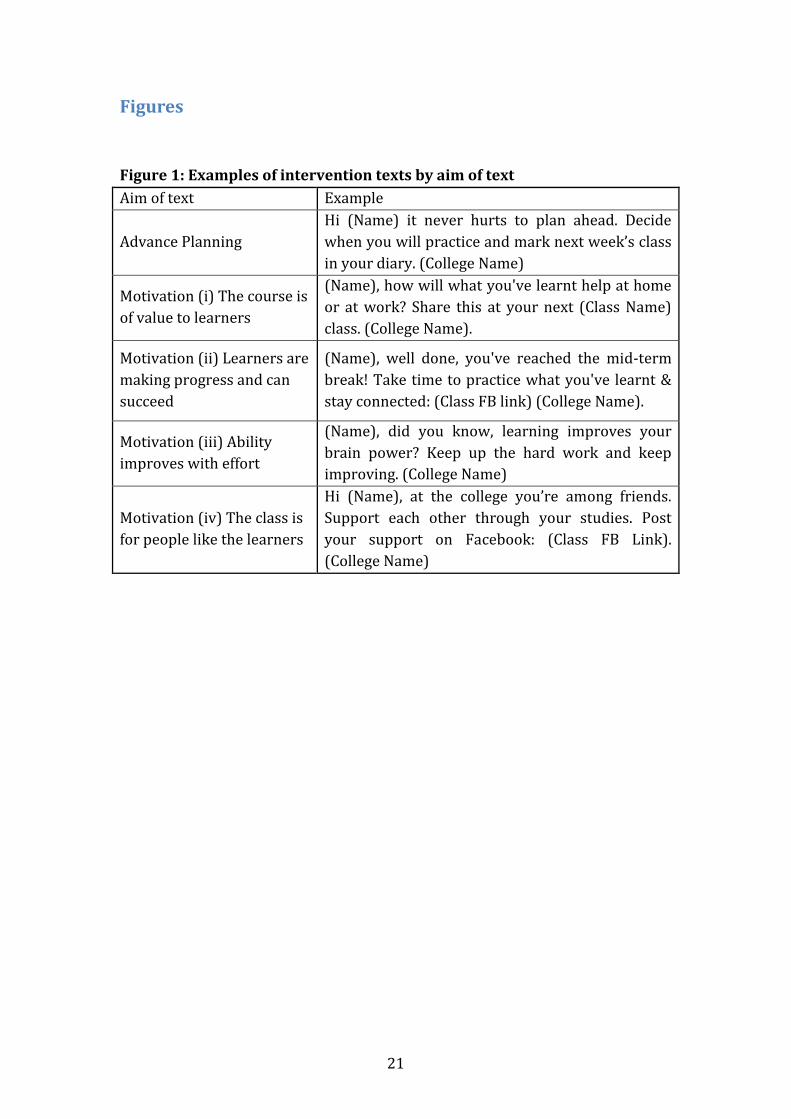
The messages target three types of barriers that were hypothesized to
prevent learners from completing their courses: lack of social support networks,
lack of positive feedback and encouragement, and planning problems. The
program of messages aimed to increase persistence by prompting learners to
organize themselves for their classes in the week ahead, and by nurturing their
motivation for learning. Examples of texts that attempted to foster these beliefs
and that prompted advanced planning of attending classes are detailed below. A
full catalogue of all messages sent can be found in the Appendix.
15 Attendance records are not habitually stored digitally at either of our partner colleges. To obtain the data for this study, a temp was sent to digitize paper attendance records.
8
Before the experiment, all students were notified they may or may not
receive text messages designed to support their learning.16 Control learners did
not receive any further message during the duration of the trial. Treatment
learners were texted motivational messages and planning prompts with a link to
a Facebook page specifically created for their class (which they already knew
about). Mobile phone numbers were acquired from college administrative
records and messages were sent using a bulk SMS system. The first text
messages were sent during the midterm break. Three messages were sent during
this one-week period, after which point messages were sent every Sunday
evening at 7pm.17 The software used enabled texts to be customized to include
the learner’s first name and the class in which they were enrolled (with a
corresponding Facebook link), but other than those details, all learners received
the same messages. Therefore, minimal administrative time was required to
deliver the intervention. Were the texts to be delivered for an entire year, the
intervention would cost less than $5 per learner, including administrator time.
3.5 Data Description
At the end of the semester, our partner colleges provided us with weekly
attendance records for each (deidentified) student, which were merged with
treatment assignments. Each dataset contains participants who were randomly
assigned but never attended any classes prior to the intervention, and
participants who joined the school after random assignment. These participants
are excluded from analysis without substantially impacting our findings. Each
observation is an enrollment in a class, so an individual may appear in the
dataset multiple times if they are enrolled in multiple courses. A substantial
number of new learners will continue to enroll throughout the year, but anyone
who did so after the first texts were sent in the half-term break were excluded
from the study.
This produces two datasets – one for each of the colleges in our study,
which are then pooled. The dependent variables are a learner’s weekly
attendance, measured in percentages as the number of times they attended out
of the number of weekly meetings they had in their course, and a measure of
whether they drop out, based on having zero attendances in the three weeks
after our intervention commenced (the period for which we have data).
These data contain participants’ weekly attendance before and after the
introduction of the treatment, as well as an identifier that allows us to observe
whether a participant/class observation is subject to treatment, and to track
16 In accordance with standard IRB procedures, learners in both Treatment and Control groups were notified a research project was being conducted at the college and that they had the right to either opt-out of the intervention or their data being used in subsequent analyses. 17 Learners were able to opt out from further texts at any time. If they replied to a text, they would have received an automated response telling them to text “STOP” if they wanted to receive no further messages.
9
participants across multiple classes. For participants in multiple classes, we
derive a variable set to 1 if they are treated in any of their classes, and 0 if they
are treated in none of the classes that they take.
A summary of these data, as well as balance checks for past attendance,
can be found in Table 2. There is no statistically significant difference between
attendance prior to the experiment between the treatment and control groups in
the pooled sample (p=0.79). This finding is common to data from Leicester and
Manchester colleges (p=0.84 and p=0.74, respectively). This suggests that
randomization was successful.
4. Results
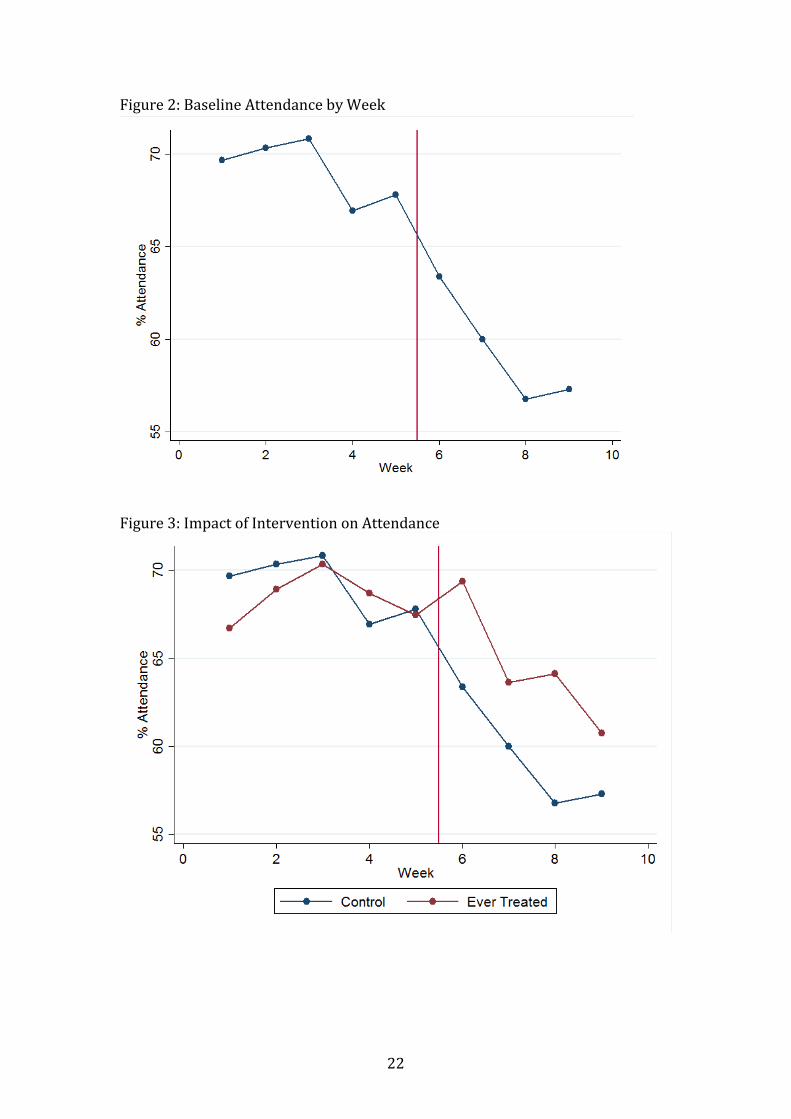
4.1 Dynamics of Class Attendance
Figure 1 shows the pattern of attendance in the control group for the
period covered by our data, with the vertical red line denoting the beginning of
our experiment and the half term break. Average attendance starts at 70%;
informal discussions with colleges indicated this is not uncommon as learners
will either be “course shopping” or may have already been discouraged. During
the 10-week span of the experiment, there is a 20% fall in attendance among the
control group that becomes steeper after the half term point.
4.2 The Impact of Messages on Attendance
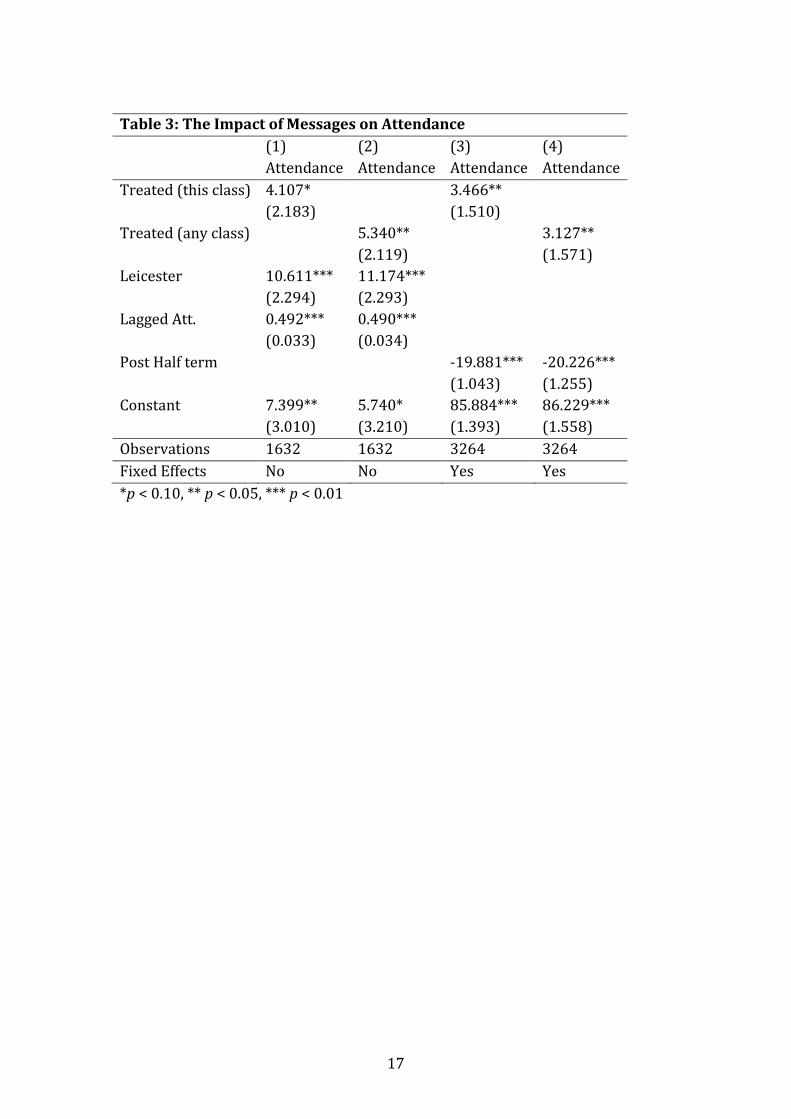
Table 3 presents the main results. Because treatment was assigned at the
class level, some students received messages for one class but not the other.
Clearly, these messages might also influence their behavior in both classes. The
variable “Treated (this class)” defines treatment as whether the student received
a message for that particular class whereas “Treated (any class)” defines
treatment as whether the student received a message for any class.
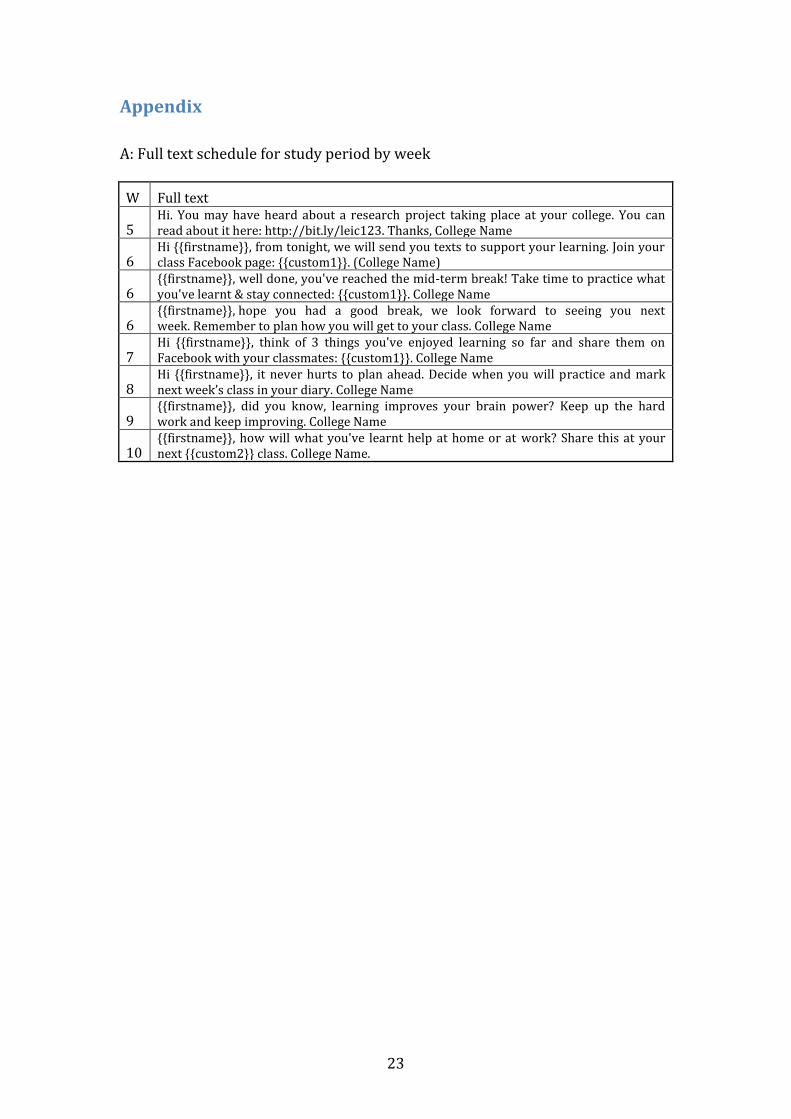
Across the specifications, the treatment messages have a positive and
significant effect on attendance levels, ranging form three to five percentage
points (roughly a 7% increase). This is robust to controlling for lagged
attendance, student fixed effects, and time controls.
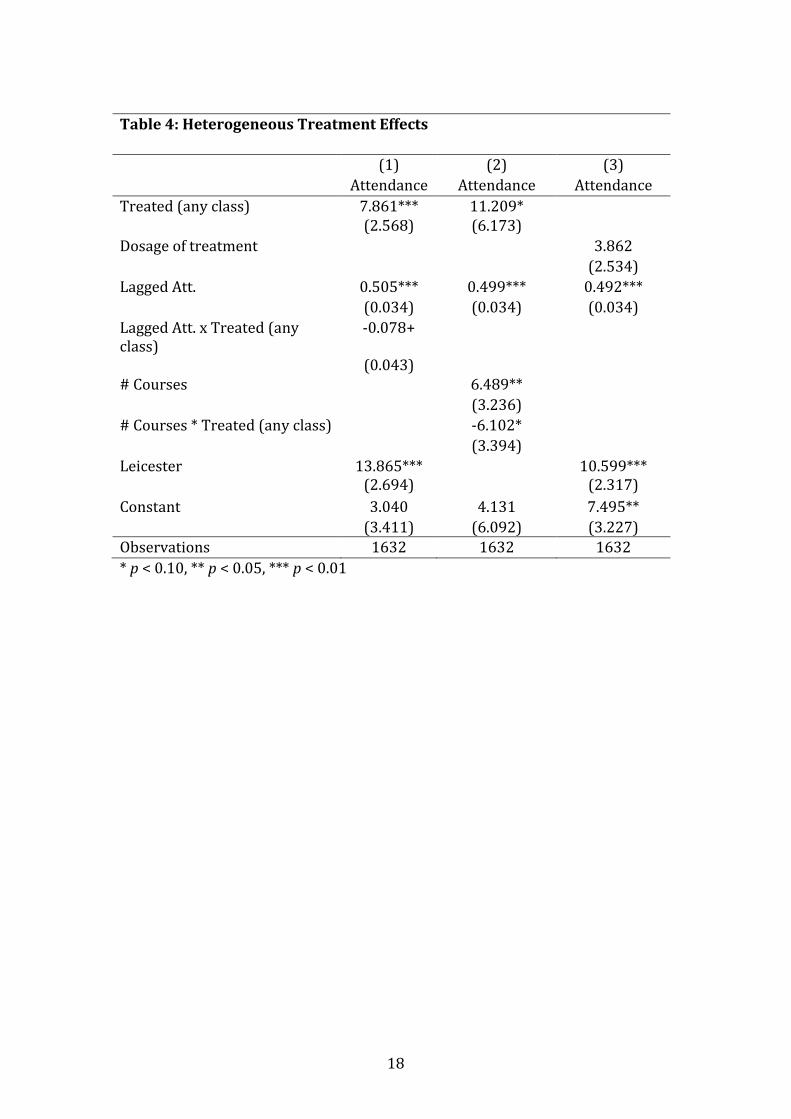
4.3 Heterogeneous Treatment Effects
Table 4 documents heterogeneous treatment effects. Column 1 shows
that the treatment effect is smaller for individuals with higher pre-treatment
attendance rate, which is the group that is most likely to drop out. Column 2
shows that the treatment effect is smaller for students who are taking multiple
classes, perhaps because they are already more motivated. Column 3 includes a
“dosage” variable indicating the proportion of a student’s classes in which they
10
are treated, to determine whether receiving more messages makes a participant
more (or less) likely to attend class, and shows a positive but insignificant impact
of being treated multiple times.
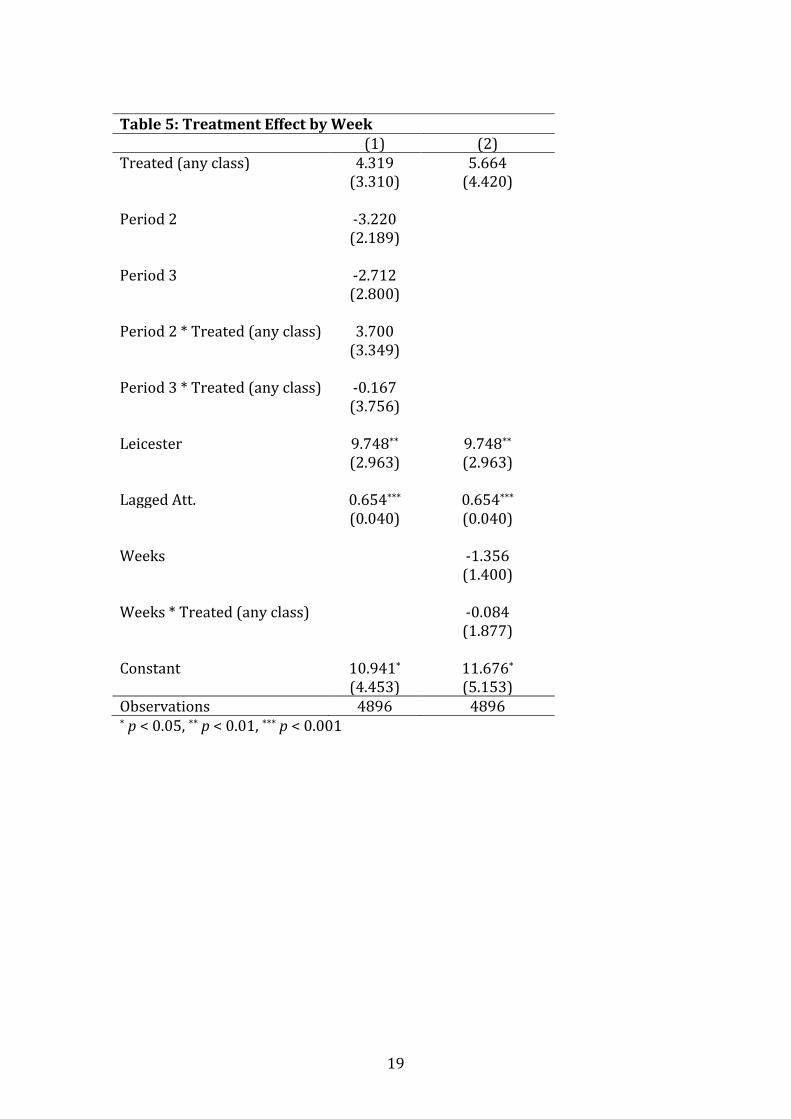
Table 5 shows the effect broken out by week. Although our data do not
contain truly “long term” effects, it is possible to determine for the period
covered by our data whether or not participants continue responding to
treatment, or whether the effects are short lived. Looking at Figure 3 and at
Table 5, the effects directionally persist but are noisy and inconclusive.
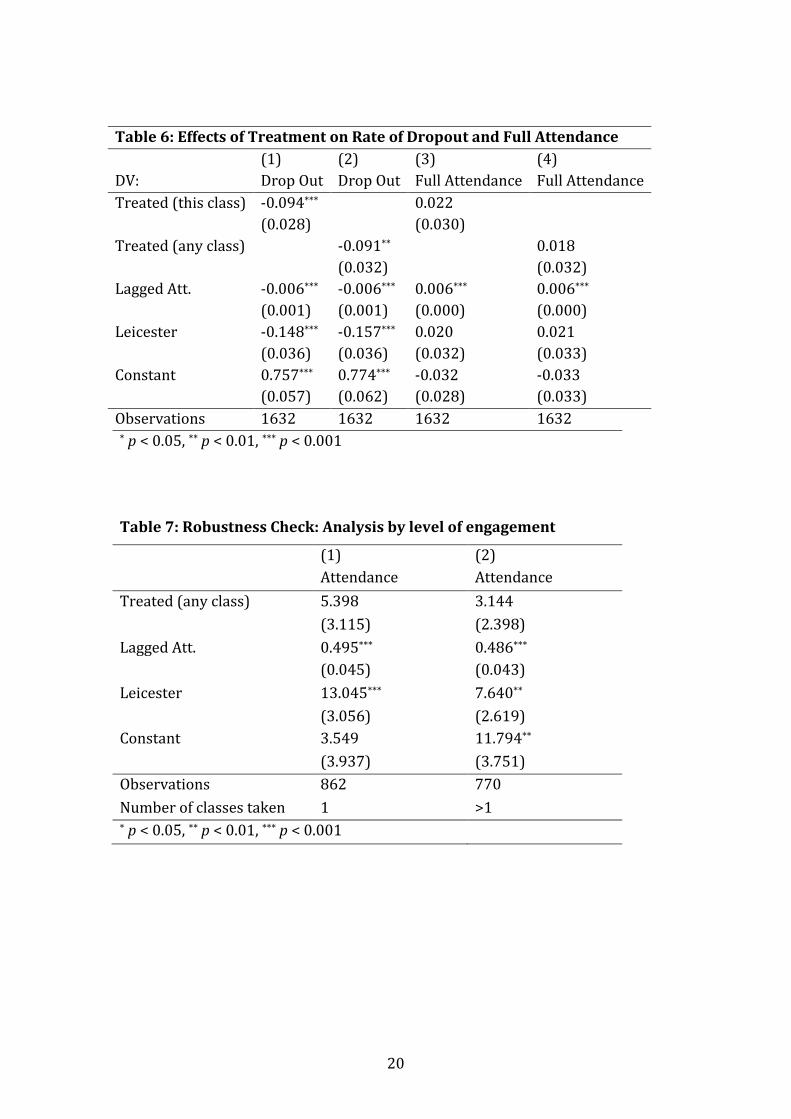
4.4 The Impact of Messages on Dropout Decisions
Thus far, we have focused primarily on overall attendance rates. In this
section, we investigate drop out decisions as well as decisions to always attend.
Results are presented in Table 6.
Columns 1 and 2 regress a binary dropout variable on treatment as well
as control variables. Dropout is defined as one for any student who attended
none of the last three classes of the semester. There is a significant and
substantial drop in dropout rates among treated participants, among whom
dropout rates fall from 25% to 16%.
Columns 3 and 4 regress an indicator for whether the participant attends
all classes after the intervention (three classes remain after the break). Odd-
numbered columns consider treatment-in-class and even-numbered columns
consider treatment-in-any-class. There is a small, insignificant of treatment on
full attendance rate.
Overall, these findings are consistent with the subgroup analyses
conducted above, which shows that people with the lowest attendance (those
most at risk of dropping out), are most beneficially affected by our treatment.
This also suggests that results are being driven by decisions of whether or not to
drop out, as opposed to decisions about whether to skip a single class.
4.5 Robustness
As has been noted, the presence of participants in multiple clusters offers
a potential source of bias to our experiment. As a robustness check, we therefore
conduct the same analysis as in Table 3, Column 2 for a reduced sample of only
those participants who take only one class (X Control participants and Y treated
participants), or for those who take more than one class. The results of this
analysis may be found in table 7. As noted previously, our study is not powered
to detect effects in these subsamples individually. However, the point estimates
are in the same range as those reported previously.
11
5. Discussion
This paper has reported the results of a field experiment carried out on
adult learners in two UK colleges. In contrast with earlier behaviorally informed
interventions, which typically required extra guidance counselors or assistance
in filling out forms, our intervention influenced behavior without providing any
new information, assistance, or financial incentives. In this sense, we were
purely leveraging insights about student attention and decision-making,
imposing virtually no additional cost on the organization that might implement
this type of intervention.
We find that these text messages have a positive and significant effect on
attendance of individual classes and, perhaps more importantly, that these
effects are particularly concentrated on participants who are at high risk of non-
attendance, reducing the proportion of learners who stop attending by
approximately one third. We are unable to detect an effect on the probability of
attending every class after our intervention. The returns on investment for this
low-cost intervention are high enough to justify its use.
12
References
Allcott, Hunt, and Todd Rogers (2014). “The short-run and long-run effects of behavioral interventions: Experimental evidence from energy conservation,” The American Economic Review, 104 (10). Barton, D., Appleby, Y., Hodge, R., Tusting, K., & Ivanic, R. (2006). “Relating adults’ lives and learning: Participation and engagement in different settings,” London: National Research and Development Centre for Adult Literacy and Numeracy. Bettinger, Eric, and Rachel Baker (2011). “The effects of student coaching in college: An evaluation of a randomized experiment in student mentoring,” NBER Working Paper No. w16881. Bettinger, Eric P., et al. (2012) "The Role of Application Assistance and Information in College Decisions: Results from the H&R Block Fafsa Experiment*." The Quarterly Journal of Economics 127.3: 1205-1242. BIS (2014). FE Trends. London: Department for Business, Innovation & Skills. BIS (2015). Skills Funding Statement 2013-16. London: Department for Business, Innovation & Skills. BIS (2013) The International Survey of Adult Skills 2012: Adult literacy, numeracy and problem solving skills in England. London: Department for Business, Innovation & Skills. Boe R. (1997). “A Two-Year Follow-Up of Federal Offenders who Participated in the Adult Basic Education (ABE) Program.” Ottawa: Correctional Service of Canada Research Report R-60. Bonjour D., and Smeaton D. (2003). “The Impact of Adult Basic Skills Pathfinder Extension Activities: stage 2 of the evaluation.” London: Department for Education and Skills Research Report 238. Bynner J, McIntosh S, Vignoles A, Dearden L, Reed H and Van Reenen J. (2001). “Improving Adult Basic Skills: Benefits to the Individual and to Society.” DfEE Research Centre Wider Benefits of Learning, Report 251. Carrell, Scott E., and Bruce Sacerdote (2013). “Late Interventions Matter Too: The Case of College Coaching New Hampshire,” NBER Working Paper No. w19031. Castleman, Benjamin, and Lindsay Page (2015). "Summer Nudging: Can Personalized Text Messages and Peer Mentor Outreach Increase College Going Among Low-Income High School Graduates?" Journal of Economic Behavior and Organization, forthcoming.
13
Comings, J., Parrella, A., & Soricone, L. (1999). “Persistence among adult basic education students in pre-GED classes (NCSALL Reports No.12)”. Cambridge, MA: National Center for the Study of Adult Learning and Literacy. Dai, Hengchen, Katherine Milkman, and Jason Riis (2014). “The Fresh Start Effect: Temporal Landmarks Motivate Aspirational Behavior,” Management Science, forthcoming. Davies P. (2001). “Closing the achievement gap – colleges making a difference.” Learning and Skills Development Agency. Department for Education and Employment (1999). A Fresh Start – improving literacy and numeracy. London: Department for Education and Skills. (Also known as The Moser Report), 1999. Farrington, Camille A., et al. (2012). Teaching Adolescents to Become Learners: The Role of Noncognitive Factors in Shaping School Performance--A Critical Literature Review. Consortium on Chicago School Research. 1313 East 60th Street, Chicago, IL 60637. Fisher, Mercedes and Derek Baird. "Online learning design that fosters student support, self-regulation, and retention." Campus-Wide Information Systems 22 (2), 2005. Gollwitzer, Peter (1999). “Implementation Intentions: Strong Effects of Simple Plans.” American Psychologist 54 (7). Gorard, S., Selwyn, N., & Furlong, J. (2004). “How do adults learn at home?” Paper presented at the British Educational Research Association Annual Conference, University of Manchester, 16-18 September. Gorard, S., Smith, E., May, H., Thomas, L., Adnett, N., & Slack, K. (2006). “Review of widening participation research: addressing the barriers to participation in higher education.” Bristol: Higher Education Funding Council. Horner, R., G. Sugai, and C. Anderson (2010). “Examining the Evidence Base for School-Wide Positive Behavior Support.” Focus on Exceptional Children 42 (8). Junco, Reynol (2011). “The relationship between frequency of Facebook use, participation in Facebook activities, and student engagement.” Computers and Education 58. Kambouri, M., & Francis, H. (1994). “Time to leave? Progression and drop out in basic skills programmes.” London: Adult Literacy and Basic Skills Unit. Keller, J. M. (1984). “The use of the ARCS model of motivation in teacher training. In K. Shaw and A. J. Trott (Eds.), Aspects of educational technology volume XVII: Staff development and career updating.” London: Kogan Page.
14
Keller, J. M. Motivational design of instruction (1983). In C. M. Reigeluth (Ed.), Instructional-design theories and models: An overview of their current status. Hillsdale, NJ: Lawrence Erlbaum Associates. Leitch, Lord Sandy (2006). “Prosperity for all in the global economy – world class skills.” London: HM Treasury and Leitch Review of Skills. (Also known as The Leitch Report). Litster, J. (2007). “Motivating Skills for Life learners to persist, progress and achieve.” Literature Review. Final report to the Quality Improvement Agency. Coventry: QIA. Martin, Andrew (2008). “Enhancing student motivation and engagement: The effects of a multi-dimensional intervention.” Contemporary Educational Psychology 33 (2). Martin, Andrew (2005). “Exploring the effects of a youth enrichment program on academic motivation and engagement.” Social Psychology of Education 8. Martinez, Paul (2001). “Improving student retention and achievement: What do we know and what do we need to find out?” Learning and Skills Development Agency. Macleod, S., & Straw, S. (2010). Adult Basic Skills. Reading: CfBT Education Trust. Melrose, Karen (2014). “Encouraging Participation and Persistence in Adult Literacy and Numeracy Education: A Review.” Behavioural Insights Research Centre for English and Maths (BIRCEM). Metcalf, Hilary, Pamela Meadows, Heather Rolfe, Amar Dhudwar, Nick Coleman, Jo Wapshott, and Hannah Carpenter (2009). “Evaluation of the Impact of Skills for Life Learning: Longitudinal Survey of Adult Learners on College-based Literacy and Numeracy Courses, final Report.” National Institute of Economic and Social Research with BMRB Social Research. Milkman, K., J. Beshears, J. Choi, D. Laibson, and B. Madrian (2011). “Using implementation intentions prompts to enhance influenza vaccination rates.” Proceedings of the National Academy of Sciences. Nagaoka, J., C. Farrington, S. Ehrlich, D. Johnson, S. Dickson, R. Heath, and A. Mayo (2014). “A Framework for Developing Young Adult Success in the 21st Century.” University of Chicago Consortium on Chicago School Research, Working Paper. Nickerson, D., and T. Rodgers (2014). “Do You Have a Voting Plan?: Implementation Intentions, Voter Turnout, and Organic Plan Making.” Psychological Science 21 (194). Newman‐Ford, L., Fitzgibbon, K., Lloyd, S., & Thomas, S. (2008). “A large‐scale investigation into the relationship between attendance and attainment: a study
15
using an innovative, electronic attendance monitoring system.” Studies in Higher Education, 33(6), 699-717. OECD (2013), OECD Skills Outlook 2013: First Results from the Survey of Adult Skills, OECD Publishing. http://dx.doi.org/10.1787/9789264204256-en Pallais, Amanda. “Small differences that matter: Mistakes in applying to college.” Journal of Labor Economics, forthcoming. Skills Funding Agency (2015). Further education & skills: Learner participation, outcomes and level of highest qualification held, Available at: https://www.gov.uk/government/statistics/learner-participation-outcomes-and-level-of-highest-qualification-held. Taubinsky, Dmitry (2013). “From Intentions to Actions: A Model and Experimental Evidence of Inattentive Choice.” Working paper. Tomoana, J., & Heinrich, J. (2004). “Demand-side factors in adult foundation learning programmes: A review of the international literature completed for the Department of Labour.” Wellington, New Zealand: Department of Labour. Vorhaus, J., Litster, J., Frearson, M., Johnson, S. (2011). “Review of research and evaluation on improving adult literacy and numeracy skills.” Research paper no. 61. London: Department for Business and Skills. Ward, J., & Edwards, J. (2002). “Learning journeys: learners’ voices; learners’ views on progress and achievement in literacy and numeracy.” London: Learning and Skills Development Agency. Webb, S. (2006). “Can ICT reduce social exclusion? The case of an adults’ English language learning programme.” British Educational Research Journal 32(3): 481-507. Wlodkowski, R. J. (2008). “Enhancing adult motivation to learn, 3rd Edition.” San Francisco, CA: Jossey-Bass. Wlodkowski, R. J., & Ginsberg, M. B. “Diversity and motivation: Culturally responsive teaching.” San Francisco, CA: Jossey-Bass, 1995. Yu, Angela, Stella Tian, Douglas Vogel, Ron Chi-Wai Kwok (2010). “Can learning be virtually boosted? An investigation of online social networking impacts.” Computers and Education 55.
Tables
Table 1: Number of Courses by College
16
Manchester Leicester Pooled
Part Time 66 17 83
Evening 17 5 22
All 83 22 105
Campuses 11 5 16
English 47 10 57
Math 36 11 47
Table 2: Summary Statistics
Leicester Manchester Full Sample Control Treatment
Observations 915 717 1632 854 778
Participants 691 489 1179 505 674
Classes 87 65 152 78 74
In Multiple Classes 31.2% 19.4% 26.5%
Past Attendance 67.5% 64.0% 66.0% 65.82 66.20
17
Table 3: The Impact of Messages on Attendance
(1) (2) (3) (4)
Attendance Attendance Attendance Attendance
Treated (this class) 4.107* 3.466**
(2.183) (1.510)
Treated (any class)
5.340**
(2.119)
3.127**
(1.571)
Leicester 10.611*** 11.174***
(2.294) (2.293)
Lagged Att. 0.492*** 0.490***
(0.033) (0.034)
Post Half term -19.881*** -20.226***
(1.043) (1.255)
Constant 7.399** 5.740* 85.884*** 86.229***
(3.010) (3.210) (1.393) (1.558)
Observations 1632 1632 3264 3264
Fixed Effects No No Yes Yes
*p < 0.10, ** p < 0.05, *** p < 0.01
18
Table 4: Heterogeneous Treatment Effects
(1) (2) (3)
Attendance Attendance Attendance
Treated (any class) 7.861*** 11.209* (2.568) (6.173)
Dosage of treatment 3.862
(2.534)
Lagged Att. 0.505*** 0.499*** 0.492***
(0.034) (0.034) (0.034)
Lagged Att. x Treated (any class)
-0.078+
(0.043) # Courses 6.489**
(3.236)
# Courses * Treated (any class) -6.102*
(3.394)
Leicester
13.865*** (2.694)
10.599*** (2.317)
Constant 3.040 4.131 7.495**
(3.411) (6.092) (3.227) Observations 1632 1632 1632
* p < 0.10, ** p < 0.05, *** p < 0.01
19
Table 5: Treatment Effect by Week (1) (2) Treated (any class) 4.319 5.664 (3.310) (4.420) Period 2 -3.220 (2.189) Period 3 -2.712 (2.800) Period 2 * Treated (any class) 3.700 (3.349) Period 3 * Treated (any class) -0.167 (3.756) Leicester 9.748** 9.748** (2.963) (2.963) Lagged Att. 0.654*** 0.654*** (0.040) (0.040) Weeks -1.356 (1.400) Weeks * Treated (any class) -0.084 (1.877) Constant 10.941* 11.676* (4.453) (5.153) Observations 4896 4896 * p < 0.05, ** p < 0.01, *** p < 0.001
20
* p < 0.05, ** p < 0.01, *** p < 0.001
Table 7: Robustness Check: Analysis by level of engagement
(1) (2)
Attendance Attendance
Treated (any class) 5.398 3.144
(3.115) (2.398)
Lagged Att. 0.495*** 0.486***
(0.045) (0.043)
Leicester 13.045*** 7.640**
(3.056) (2.619)
Constant 3.549 11.794**
(3.937) (3.751)
Observations 862 770
Number of classes taken 1 >1 * p < 0.05, ** p < 0.01, *** p < 0.001
Table 6: Effects of Treatment on Rate of Dropout and Full Attendance
(1) (2) (3) (4)
DV: Drop Out Drop Out Full Attendance Full Attendance
Treated (this class) -0.094*** 0.022
(0.028) (0.030)
Treated (any class) -0.091** 0.018
(0.032) (0.032)
Lagged Att. -0.006*** -0.006*** 0.006*** 0.006***
(0.001) (0.001) (0.000) (0.000)
Leicester -0.148*** -0.157*** 0.020 0.021
(0.036) (0.036) (0.032) (0.033)
Constant 0.757*** 0.774*** -0.032 -0.033
(0.057) (0.062) (0.028) (0.033)
Observations 1632 1632 1632 1632
21
Figures
Figure 1: Examples of intervention texts by aim of text
Aim of text Example
Advance Planning
Hi (Name) it never hurts to plan ahead. Decide
when you will practice and mark next week’s class
in your diary. (College Name)
Motivation (i) The course is
of value to learners
(Name), how will what you've learnt help at home
or at work? Share this at your next (Class Name)
class. (College Name).
Motivation (ii) Learners are
making progress and can
succeed
(Name), well done, you've reached the mid-term
break! Take time to practice what you've learnt &
stay connected: (Class FB link) (College Name).
Motivation (iii) Ability
improves with effort
(Name), did you know, learning improves your
brain power? Keep up the hard work and keep
improving. (College Name)
Motivation (iv) The class is
for people like the learners
Hi (Name), at the college you’re among friends.
Support each other through your studies. Post
your support on Facebook: (Class FB Link).
(College Name)
22
Figure 2: Baseline Attendance by Week
Figure 3: Impact of Intervention on Attendance
23
Appendix
A: Full text schedule for study period by week
W Full text
5 Hi. You may have heard about a research project taking place at your college. You can read about it here: http://bit.ly/leic123. Thanks, College Name
6 Hi {{firstname}}, from tonight, we will send you texts to support your learning. Join your class Facebook page: {{custom1}}. (College Name)
6 {{firstname}}, well done, you've reached the mid-term break! Take time to practice what you've learnt & stay connected: {{custom1}}. College Name
6 {{firstname}}, hope you had a good break, we look forward to seeing you next week. Remember to plan how you will get to your class. College Name
7 Hi {{firstname}}, think of 3 things you've enjoyed learning so far and share them on Facebook with your classmates: {{custom1}}. College Name
8 Hi {{firstname}}, it never hurts to plan ahead. Decide when you will practice and mark next week’s class in your diary. College Name
9 {{firstname}}, did you know, learning improves your brain power? Keep up the hard work and keep improving. College Name
10 {{firstname}}, how will what you've learnt help at home or at work? Share this at your next {{custom2}} class. College Name.