crystal templating through liquid–liquid phase separation
TRANSCRIPT

This journal is©The Royal Society of Chemistry 2014 Chem. Commun.
Cite this:DOI: 10.1039/c4cc07880b
Crystal templating through liquid–liquid phaseseparation†
Joanna Mosses,a David A. Turton,a Leo Lue,b Jan Sefcikb and Klaas Wynne*ab
Controlled induction of crystal nucleation is a highly desirable but
elusive goal. Attempts to speed up crystallization, such as high
super saturation or working near a liquid–liquid critical point,
always led to irregular and uncontrollable crystal growth. Here,
we show that under highly nonequilibrium conditions of spinodal
decomposition, water crystals grow as thin wires in a template-less
formation of ‘‘Haareis’’. This suggests that such nonequilibrium
conditions may be employed more widely as mechanisms for
crystal growth control.
The physical chemistry of crystal nucleation is of great fundamentaland practical importance but is yet poorly understood. It is there-fore one of the grand challenges on the border between physics,chemistry, and chemical engineering. Crystal nucleation in melt orsolution is typically described by Gibbs’s classical nucleation theorybased on the competition between the free energy of solidificationand the free energy due to the presence of the interface.1,2 Thelatter results in a barrier to crystallization and hence super-saturation and a metastable nonequilibrium state. Thermodynamicfluctuations then lead to pre-nucleation sites, the majority of whichwill redissolve.3 Occasionally, a nucleus will grow big enough toovercome the barrier (a critical nucleus) and continue to grow. Onlyat considerable super-saturation will the energy barrier disappear,at which point homogeneous nucleation will occur.
As a result, crystal nucleation is generally a rare process that isdifficult to study either experimentally or even through computersimulation. In addition, Ostwald’s rule of stages suggests that thereare intermediate metastable states critical to the understanding ofthe path and thermodynamics of nucleation. Such metastablestates are typically too rare or short-lived to be observed.
However, recent work by Gebauer and others has shown that insome cases (such as the nucleation of carbonates from aqueoussolution4–7) solute clusters may form that aggregate into amorphousclusters, which then transform into crystal nuclei.4,7–9 Such non-classical nucleation theories do not require a ‘‘critical nucleus’’.These theories appear to, but may not necessarily,10 be counter tothermodynamic theory. Interestingly, a number of light scatteringstudies of solutions have shown anomalous clustering in solutionsuggesting that the effect might be more general.11,12
In the 1990s, Frenkel introduced the concept of the enhance-ment of crystal nucleation due to the presence of liquid–liquidcritical points.13 Such a critical point would induce concentrationfluctuations that would give rise to droplets of so-called ‘‘densefluid’’ in which the nucleation probability would be greatlyenhanced.7,14–16 Thus, in this scheme the nucleation mechanismis not changed (it could be classical or non-classical) other than toprovide an environment with an increased concentration. AlthoughFrenkel’s theory was developed for protein crystallization, it is nowwidely used in chemical-engineering descriptions of crystal nuclea-tion of small molecules where the dense-fluid effect is referred to as‘‘oiling out’’.17,18 However, the direct application of a theory forsuspensions of mesoscopic objects to small molecules in solutionis unlikely to be straightforward as the interaction strengths arevery different.19,20
Here we will study the nucleation of crystals in highly none-quilibrium conditions experimentally. There have been manyprevious experiments in which crystallization in deeply super-saturated solutions was studied. It is considered well known thathigh driving force for nucleation results in ill defined amorphousor polycrystalline objects.17,21,22 Here we will take a systematicapproach and study crystal nucleation in the presence of (a criticalpoint for) liquid–liquid phase separation using liquids of smallmolecules and will demonstrate that high driving force does notnecessarily lead to ill defined crystalline forms.
In the classical approach to crystallization, a solution of asubstance in a solvent is prepared and cooled down. At acertain concentration-dependent temperature, the solutionbecomes supersaturated, metastable, and can in principle
a School of Chemistry, WestCHEM, University of Glasgow, Glasgow G12 8QQ, UK.E-mail: [email protected]
b Department of Chemical and Process Engineering, University of Strathclyde,Glasgow G1 1XJ, UK
† Electronic supplementary information (ESI) available: Information ontemperature-composition phase diagrams of nitrobenzene–hexane and water–trans-DCE. Additional data on fluff in other nonpolar liquids. A video of thegrowth of fluff. See DOI: 10.1039/c4cc07880b
Received 6th October 2014,Accepted 28th November 2014
DOI: 10.1039/c4cc07880b
www.rsc.org/chemcomm
ChemComm
COMMUNICATION
Publ
ished
on
28 N
ovem
ber 2
014.
Dow
nloa
ded
by U
nive
rsity
of G
lasg
ow L
ibra
ry o
n 05
/12/
2014
14:
11:3
1.
View Article OnlineView Journal
Chem. Commun. This journal is©The Royal Society of Chemistry 2014
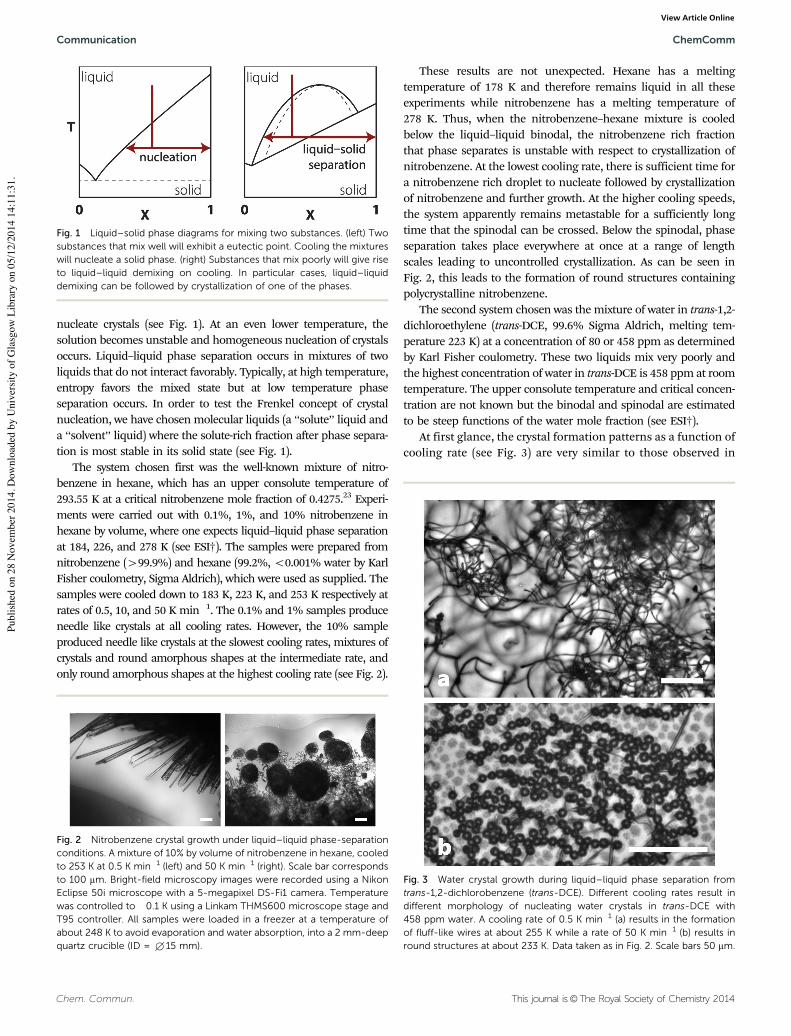
nucleate crystals (see Fig. 1). At an even lower temperature, thesolution becomes unstable and homogeneous nucleation of crystalsoccurs. Liquid–liquid phase separation occurs in mixtures of twoliquids that do not interact favorably. Typically, at high temperature,entropy favors the mixed state but at low temperature phaseseparation occurs. In order to test the Frenkel concept of crystalnucleation, we have chosen molecular liquids (a ‘‘solute’’ liquid anda ‘‘solvent’’ liquid) where the solute-rich fraction after phase separa-tion is most stable in its solid state (see Fig. 1).
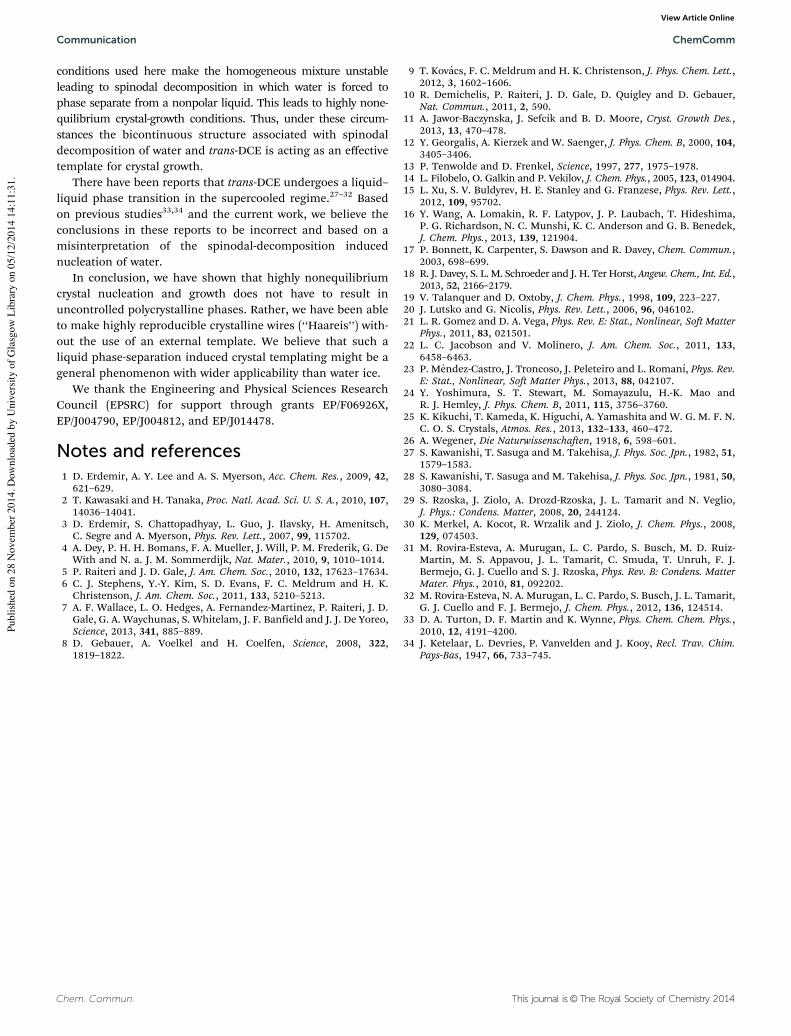
The system chosen first was the well-known mixture of nitro-benzene in hexane, which has an upper consolute temperature of293.55 K at a critical nitrobenzene mole fraction of 0.4275.23 Experi-ments were carried out with 0.1%, 1%, and 10% nitrobenzene inhexane by volume, where one expects liquid–liquid phase separationat 184, 226, and 278 K (see ESI†). The samples were prepared fromnitrobenzene (499.9%) and hexane (99.2%, o0.001% water by KarlFisher coulometry, Sigma Aldrich), which were used as supplied. Thesamples were cooled down to 183 K, 223 K, and 253 K respectively atrates of 0.5, 10, and 50 K min!1. The 0.1% and 1% samples produceneedle like crystals at all cooling rates. However, the 10% sampleproduced needle like crystals at the slowest cooling rates, mixtures ofcrystals and round amorphous shapes at the intermediate rate, andonly round amorphous shapes at the highest cooling rate (see Fig. 2).
These results are not unexpected. Hexane has a meltingtemperature of 178 K and therefore remains liquid in all theseexperiments while nitrobenzene has a melting temperature of278 K. Thus, when the nitrobenzene–hexane mixture is cooledbelow the liquid–liquid binodal, the nitrobenzene rich fractionthat phase separates is unstable with respect to crystallization ofnitrobenzene. At the lowest cooling rate, there is sufficient time fora nitrobenzene rich droplet to nucleate followed by crystallizationof nitrobenzene and further growth. At the higher cooling speeds,the system apparently remains metastable for a sufficiently longtime that the spinodal can be crossed. Below the spinodal, phaseseparation takes place everywhere at once at a range of lengthscales leading to uncontrolled crystallization. As can be seen inFig. 2, this leads to the formation of round structures containingpolycrystalline nitrobenzene.
The second system chosen was the mixture of water in trans-1,2-dichloroethylene (trans-DCE, 99.6% Sigma Aldrich, melting tem-perature 223 K) at a concentration of 80 or 458 ppm as determinedby Karl Fisher coulometry. These two liquids mix very poorly andthe highest concentration of water in trans-DCE is 458 ppm at roomtemperature. The upper consolute temperature and critical concen-tration are not known but the binodal and spinodal are estimatedto be steep functions of the water mole fraction (see ESI†).
At first glance, the crystal formation patterns as a function ofcooling rate (see Fig. 3) are very similar to those observed in
Fig. 1 Liquid–solid phase diagrams for mixing two substances. (left) Twosubstances that mix well will exhibit a eutectic point. Cooling the mixtureswill nucleate a solid phase. (right) Substances that mix poorly will give riseto liquid–liquid demixing on cooling. In particular cases, liquid–liquiddemixing can be followed by crystallization of one of the phases.
Fig. 2 Nitrobenzene crystal growth under liquid–liquid phase-separationconditions. A mixture of 10% by volume of nitrobenzene in hexane, cooledto 253 K at 0.5 K min!1 (left) and 50 K min!1 (right). Scale bar correspondsto 100 mm. Bright-field microscopy images were recorded using a NikonEclipse 50i microscope with a 5-megapixel DS-Fi1 camera. Temperaturewas controlled to "0.1 K using a Linkam THMS600 microscope stage andT95 controller. All samples were loaded in a freezer at a temperature ofabout 248 K to avoid evaporation and water absorption, into a 2 mm-deepquartz crucible (ID = +15 mm).
Fig. 3 Water crystal growth during liquid–liquid phase separation fromtrans-1,2-dichlorobenzene (trans-DCE). Different cooling rates result indifferent morphology of nucleating water crystals in trans-DCE with458 ppm water. A cooling rate of 0.5 K min!1 (a) results in the formationof fluff-like wires at about 255 K while a rate of 50 K min!1 (b) results inround structures at about 233 K. Data taken as in Fig. 2. Scale bars 50 mm.
Communication ChemComm
Publ
ished
on
28 N
ovem
ber 2
014.
Dow
nloa
ded
by U
nive
rsity
of G
lasg
ow L
ibra
ry o
n 05
/12/
2014
14:
11:3
1.
View Article Online

This journal is©The Royal Society of Chemistry 2014 Chem. Commun.
nitrobenzene in hexane: at low cooling rates crystals appear toform whereas at higher cooling rates, polycrystalline roundstructures form. However, the crystalline structures are highlyunusual: they are thin curved wires that grow for about 50 mm,then branch off a handful of additional wires, which then growlinearly again, etc. Fig. 4 and the movie in the ESI† show this brush-like growth pattern more clearly. This figure also demonstrates theasymmetry of the crystalline structures. When this growth con-tinues for a while it forms what looks like balls of ‘‘fluff’’.
Fig. 5 shows the effect occurring in a bulk sample. Here,water fluff is seen to float in the bulk but in particular nearinterfaces. In the microscopy experiments, the location ofgreatest growth is also near an interface such as the meniscusof the liquid drop. Although the water fluff can be formed at atemperature where trans-DCE is supercooled, it does not act as
a nucleation site for its crystallization. In the experiments, super-cooled trans-DCE crystallizes spontaneously on a timescale of anhour in bulk experiments (see ESI†). Experiments were carried outin other nonpolar liquids and similar results were found in cis-1,2-dichloroethylene and CS2 (see the ESI† for details).
Raman spectra of the wires could be taken only after the removalof liquid trans-DCE through vacuum evaporation at 228 K. Thespectra in the region of the ice phonon band (150–350 cm!1) andthe OH-stretch region are shown in Fig. 6. The Raman spectrumfrom 100 to 3600 cm!1 is indistinguishable from that of hexagonalice24 and does not show any activity in the CH-stretch region rulingout clathrate formation. Slight shifts (B5 cm!1) in the phononband are observed, which are attributable to size effects.
Highly nonequilibrium crystal growth is typically associatedwith polycrystallinity and uncontrollable shapes. In our experi-ments on nitrobenzene–hexane mixtures that are pushedtowards the spinodal of the liquid–liquid phase separation,this is most certainly the case. It is almost certain that reportsof ‘‘oiling out’’17,18 are all related to the crossing of such spinodalsalthough the spinodal can be below the liquid–solid separationline in some cases. However, in mixtures of poorly mixing sub-stances (by necessity at low concentration), we have found thatcrossing the spinodal results in highly organized asymmetric wire-like structures without the use of external templates.
The asymmetric structure seen, for example, in Fig. 4 is highlyunexpected. When a water ice crystal grows in an environment lowin free water molecules (such as in the cold air of the atmosphere),the growth habit is the standard hexagonal form and symmetricsnowflake patterns develop caused by the limitation in the rate ofdiffusion of the free water molecules. In fact, there are currently121 known categories of aqueous solid precipitation particles,none of which is shaped like a wire or fluff.25 Here, we haveobserved novel asymmetric growth and asymmetric branchinginconsistent with transport-limited growth.
There is only one little-known wire-like form of water ice,known as Haareis, Kammeis, or needle ice. Haareis is formedwhen a template (such as the bark of a dead tree or porous soil)is just above 0 1C while the air above is just below.26 However,in the results described here there is no external physicaltemplate. Although the binodal is very steep making it difficultto predict the location of the spinodal, it is likely that the
Fig. 4 Bright-field microscopic images of fluff-like water crystals in trans-DCE. Typical appearance of nucleating water crystals showing an asym-metric brush-like crystal growth in trans-DCE with 80 ppm water cooledto 213 K. Scale bar 50 mm.
Fig. 5 Dark field images of fluff-like water crystals in trans-DCE. Thesamples shown here are contained in a 2 mm deep by 10 mm wide quartzcuvette inside a cryostat cooled to 218 K. Scale bars are 1 mm. (a) In afreshly cooled sample, water fluff floating in supercooled liquid carried by aconvection current. (b) Similar sample but after several minutes of equili-bration. The arrow points to a large agglomeration of water fluff nucleatedon the curved gas–liquid interface. Suspended fluff below the meniscuscontinues to give rise to light scattering.
Fig. 6 Raman spectra of fluff-like water crystals. Confocal Raman micro-scopy experiments were performed using a Horiba LabRAM HR system.The excitation source was a 532 nm DPSS laser with a laser power at thesample stage of 28 mW. A 50 mm diameter aperture and 50# long-workingdistance objective were used to record the Raman spectra.
ChemComm Communication
Publ
ished
on
28 N
ovem
ber 2
014.
Dow
nloa
ded
by U
nive
rsity
of G
lasg
ow L
ibra
ry o
n 05
/12/
2014
14:
11:3
1.
View Article Online
Chem. Commun. This journal is©The Royal Society of Chemistry 2014
conditions used here make the homogeneous mixture unstableleading to spinodal decomposition in which water is forced tophase separate from a nonpolar liquid. This leads to highly none-quilibrium crystal-growth conditions. Thus, under these circum-stances the bicontinuous structure associated with spinodaldecomposition of water and trans-DCE is acting as an effectivetemplate for crystal growth.
There have been reports that trans-DCE undergoes a liquid–liquid phase transition in the supercooled regime.27–32 Basedon previous studies33,34 and the current work, we believe theconclusions in these reports to be incorrect and based on amisinterpretation of the spinodal-decomposition inducednucleation of water.
In conclusion, we have shown that highly nonequilibriumcrystal nucleation and growth does not have to result inuncontrolled polycrystalline phases. Rather, we have been ableto make highly reproducible crystalline wires (‘‘Haareis’’) with-out the use of an external template. We believe that such aliquid phase-separation induced crystal templating might be ageneral phenomenon with wider applicability than water ice.
We thank the Engineering and Physical Sciences ResearchCouncil (EPSRC) for support through grants EP/F06926X,EP/J004790, EP/J004812, and EP/J014478.
Notes and references1 D. Erdemir, A. Y. Lee and A. S. Myerson, Acc. Chem. Res., 2009, 42,
621–629.2 T. Kawasaki and H. Tanaka, Proc. Natl. Acad. Sci. U. S. A., 2010, 107,
14036–14041.3 D. Erdemir, S. Chattopadhyay, L. Guo, J. Ilavsky, H. Amenitsch,
C. Segre and A. Myerson, Phys. Rev. Lett., 2007, 99, 115702.4 A. Dey, P. H. H. Bomans, F. A. Mueller, J. Will, P. M. Frederik, G. De
With and N. a. J. M. Sommerdijk, Nat. Mater., 2010, 9, 1010–1014.5 P. Raiteri and J. D. Gale, J. Am. Chem. Soc., 2010, 132, 17623–17634.6 C. J. Stephens, Y.-Y. Kim, S. D. Evans, F. C. Meldrum and H. K.
Christenson, J. Am. Chem. Soc., 2011, 133, 5210–5213.7 A. F. Wallace, L. O. Hedges, A. Fernandez-Martinez, P. Raiteri, J. D.
Gale, G. A. Waychunas, S. Whitelam, J. F. Banfield and J. J. De Yoreo,Science, 2013, 341, 885–889.
8 D. Gebauer, A. Voelkel and H. Coelfen, Science, 2008, 322,1819–1822.
9 T. Kovacs, F. C. Meldrum and H. K. Christenson, J. Phys. Chem. Lett.,2012, 3, 1602–1606.
10 R. Demichelis, P. Raiteri, J. D. Gale, D. Quigley and D. Gebauer,Nat. Commun., 2011, 2, 590.
11 A. Jawor-Baczynska, J. Sefcik and B. D. Moore, Cryst. Growth Des.,2013, 13, 470–478.
12 Y. Georgalis, A. Kierzek and W. Saenger, J. Phys. Chem. B, 2000, 104,3405–3406.
13 P. Tenwolde and D. Frenkel, Science, 1997, 277, 1975–1978.14 L. Filobelo, O. Galkin and P. Vekilov, J. Chem. Phys., 2005, 123, 014904.15 L. Xu, S. V. Buldyrev, H. E. Stanley and G. Franzese, Phys. Rev. Lett.,
2012, 109, 95702.16 Y. Wang, A. Lomakin, R. F. Latypov, J. P. Laubach, T. Hideshima,
P. G. Richardson, N. C. Munshi, K. C. Anderson and G. B. Benedek,J. Chem. Phys., 2013, 139, 121904.
17 P. Bonnett, K. Carpenter, S. Dawson and R. Davey, Chem. Commun.,2003, 698–699.
18 R. J. Davey, S. L. M. Schroeder and J. H. Ter Horst, Angew. Chem., Int. Ed.,2013, 52, 2166–2179.
19 V. Talanquer and D. Oxtoby, J. Chem. Phys., 1998, 109, 223–227.20 J. Lutsko and G. Nicolis, Phys. Rev. Lett., 2006, 96, 046102.21 L. R. Gomez and D. A. Vega, Phys. Rev. E: Stat., Nonlinear, Soft Matter
Phys., 2011, 83, 021501.22 L. C. Jacobson and V. Molinero, J. Am. Chem. Soc., 2011, 133,
6458–6463.23 P. Mendez-Castro, J. Troncoso, J. Peleteiro and L. Romanı, Phys. Rev.
E: Stat., Nonlinear, Soft Matter Phys., 2013, 88, 042107.24 Y. Yoshimura, S. T. Stewart, M. Somayazulu, H.-K. Mao and
R. J. Hemley, J. Phys. Chem. B, 2011, 115, 3756–3760.25 K. Kikuchi, T. Kameda, K. Higuchi, A. Yamashita and W. G. M. F. N.
C. O. S. Crystals, Atmos. Res., 2013, 132–133, 460–472.26 A. Wegener, Die Naturwissenschaften, 1918, 6, 598–601.27 S. Kawanishi, T. Sasuga and M. Takehisa, J. Phys. Soc. Jpn., 1982, 51,
1579–1583.28 S. Kawanishi, T. Sasuga and M. Takehisa, J. Phys. Soc. Jpn., 1981, 50,
3080–3084.29 S. Rzoska, J. Ziolo, A. Drozd-Rzoska, J. L. Tamarit and N. Veglio,
J. Phys.: Condens. Matter, 2008, 20, 244124.30 K. Merkel, A. Kocot, R. Wrzalik and J. Ziolo, J. Chem. Phys., 2008,
129, 074503.31 M. Rovira-Esteva, A. Murugan, L. C. Pardo, S. Busch, M. D. Ruiz-
Martin, M. S. Appavou, J. L. Tamarit, C. Smuda, T. Unruh, F. J.Bermejo, G. J. Cuello and S. J. Rzoska, Phys. Rev. B: Condens. MatterMater. Phys., 2010, 81, 092202.
32 M. Rovira-Esteva, N. A. Murugan, L. C. Pardo, S. Busch, J. L. Tamarit,G. J. Cuello and F. J. Bermejo, J. Chem. Phys., 2012, 136, 124514.
33 D. A. Turton, D. F. Martin and K. Wynne, Phys. Chem. Chem. Phys.,2010, 12, 4191–4200.
34 J. Ketelaar, L. Devries, P. Vanvelden and J. Kooy, Recl. Trav. Chim.Pays-Bas, 1947, 66, 733–745.
Communication ChemComm
Publ
ished
on
28 N
ovem
ber 2
014.
Dow
nloa
ded
by U
nive
rsity
of G
lasg
ow L
ibra
ry o
n 05
/12/
2014
14:
11:3
1.
View Article Online
1
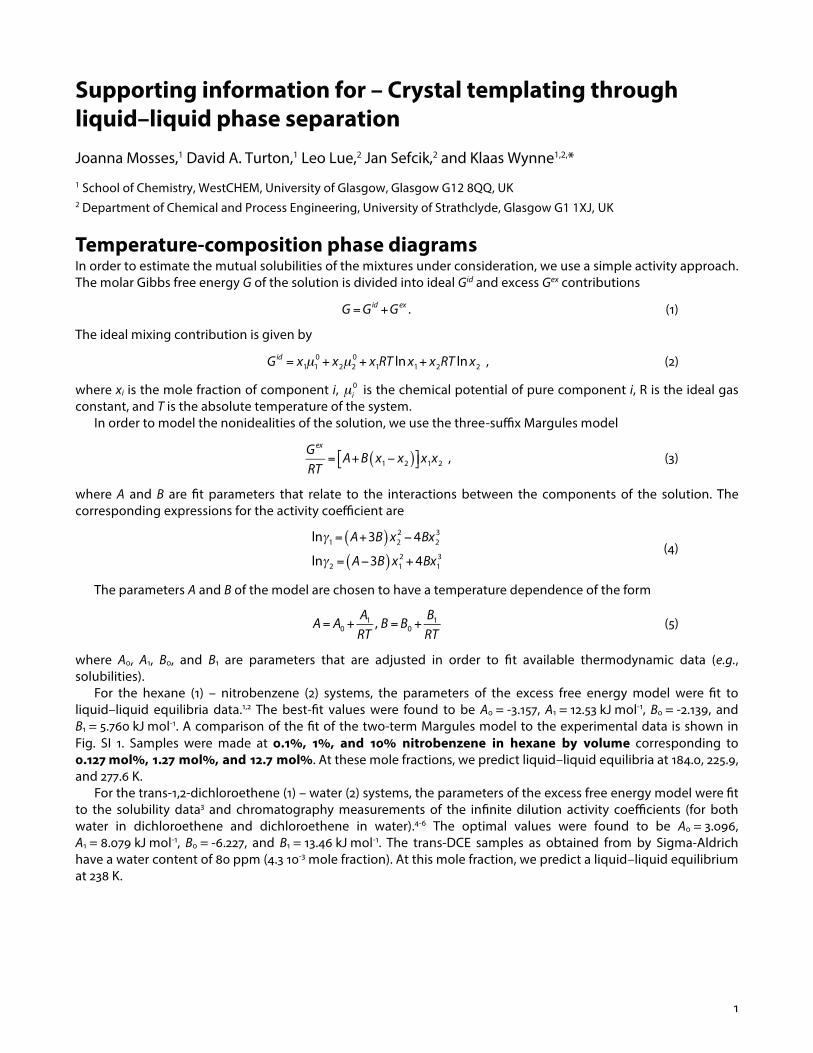
Supporting information for – Crystal templating through liquid–liquid phase separation Joanna Mosses,1 David A. Turton,1 Leo Lue,2 Jan Sefcik,2 and Klaas Wynne1,2,* 1 School of Chemistry, WestCHEM, University of Glasgow, Glasgow G12 8QQ, UK 2 Department of Chemical and Process Engineering, University of Strathclyde, Glasgow G1 1XJ, UK
Temperature-composition phase diagrams In order to estimate the mutual solubilities of the mixtures under consideration, we use a simple activity approach. The molar Gibbs free energy G of the solution is divided into ideal Gid and excess Gex contributions
G =Gid +Gex . (1)
The ideal mixing contribution is given by
Gid = x1µ1
0 + x2µ20 + x1RT ln x1+ x2RT ln x2 , (2)
where xi is the mole fraction of component i, µi0 is the chemical potential of pure component i, R is the ideal gas
constant, and T is the absolute temperature of the system. In order to model the nonidealities of the solution, we use the three-suffix Margules model
Gex
RT= A+B x1− x2( )"# $%x1x2 , (3)
where A and B are fit parameters that relate to the interactions between the components of the solution. The corresponding expressions for the activity coefficient are
lnγ1= A+3B( )x22 −4Bx2
3
lnγ2 = A−3B( )x12 +4Bx1
3 (4)
The parameters A and B of the model are chosen to have a temperature dependence of the form
A = A0 +
A1
RT, B = B0 +
B1
RT (5)
where A0, A1, B0, and B1 are parameters that are adjusted in order to fit available thermodynamic data (e.g., solubilities).
For the hexane (1) – nitrobenzene (2) systems, the parameters of the excess free energy model were fit to liquid–liquid equilibria data.1,2 The best-fit values were found to be A0 = -3.157, A1 = 12.53 kJ mol-1, B0 = -2.139, and B1 = 5.760 kJ mol-1. A comparison of the fit of the two-term Margules model to the experimental data is shown in Fig. SI 1. Samples were made at 0.1%, 1%, and 10% nitrobenzene in hexane by volume corresponding to 0.127 mol%, 1.27 mol%, and 12.7 mol%. At these mole fractions, we predict liquid–liquid equilibria at 184.0, 225.9, and 277.6 K.
For the trans-1,2-dichloroethene (1) – water (2) systems, the parameters of the excess free energy model were fit to the solubility data3 and chromatography measurements of the infinite dilution activity coefficients (for both water in dichloroethene and dichloroethene in water).4-6 The optimal values were found to be A0 = 3.096, A1 = 8.079 kJ mol-1, B0 = -6.227, and B1 = 13.46 kJ mol-1. The trans-DCE samples as obtained from by Sigma-Aldrich have a water content of 80 ppm (4.3 10-3 mole fraction). At this mole fraction, we predict a liquid–liquid equilibrium at 238 K.

2
Fig. SI 1. Temperature-composition phase diagram for mixtures of nitrobenzene and hexane. Symbols are the measurements in Refs. 1,2. Dashed line is the estimated spinodal.
Fig. SI 2. Partial temperature-composition phase diagram for mixtures of water in trans-1,2-dichloroethylene. Symbols are the measurements in Refs. 3-6 Dashed line is the estimated spinodal based on limited solubility data.
3
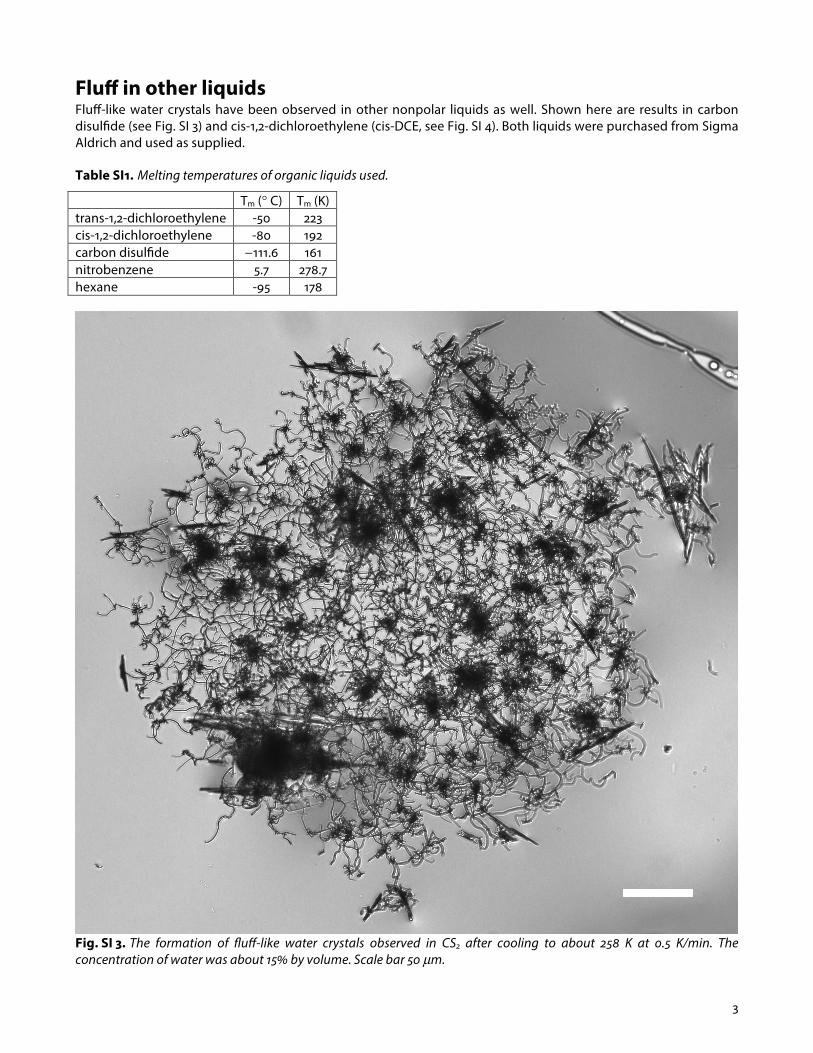
Fluff in other liquids Fluff-like water crystals have been observed in other nonpolar liquids as well. Shown here are results in carbon disulfide (see Fig. SI 3) and cis-1,2-dichloroethylene (cis-DCE, see Fig. SI 4). Both liquids were purchased from Sigma Aldrich and used as supplied.
Table SI1. Melting temperatures of organic liquids used.
Tm (° C) Tm (K) trans-1,2-dichloroethylene -50 223 cis-1,2-dichloroethylene -80 192 carbon disulfide −111.6 161 nitrobenzene 5.7 278.7 hexane -95 178
Fig. SI 3. The formation of fluff-like water crystals observed in CS2 after cooling to about 258 K at 0.5 K/min. The concentration of water was about 15% by volume. Scale bar 50 µm.
4
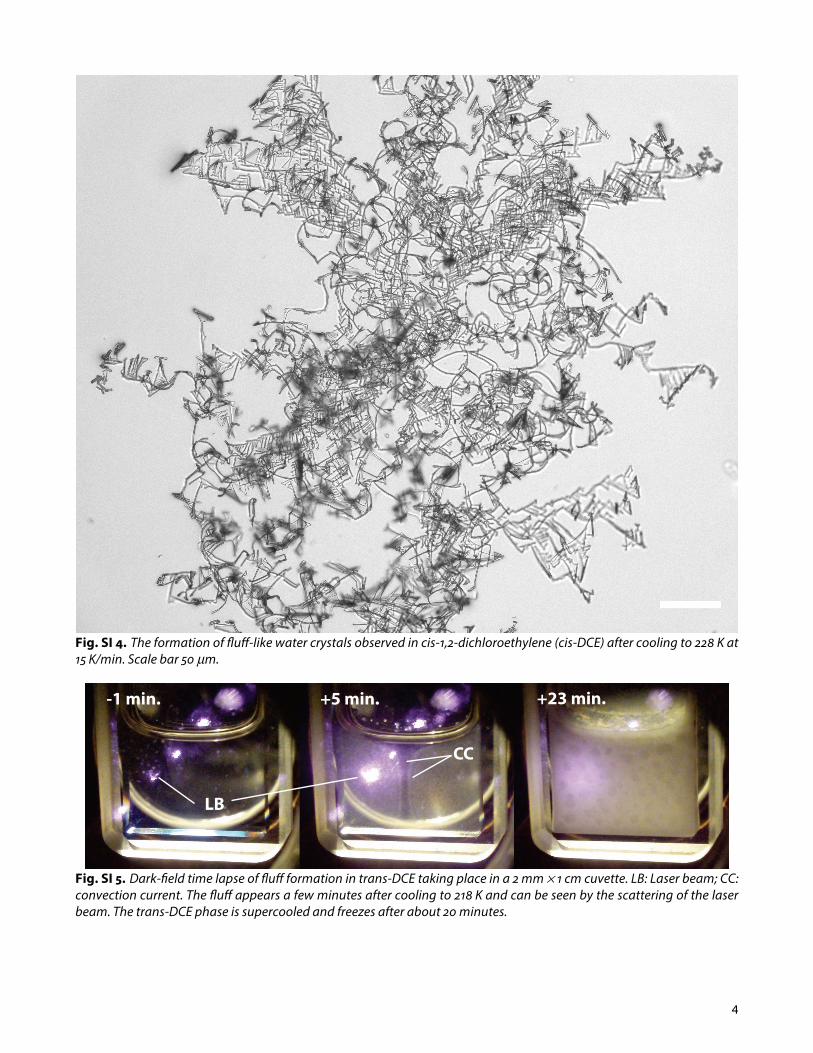
Fig. SI 4. The formation of fluff-like water crystals observed in cis-1,2-dichloroethylene (cis-DCE) after cooling to 228 K at 15 K/min. Scale bar 50 µm.
Fig. SI 5. Dark-field time lapse of fluff formation in trans-DCE taking place in a 2 mm × 1 cm cuvette. LB: Laser beam; CC: convection current. The fluff appears a few minutes after cooling to 218 K and can be seen by the scattering of the laser beam. The trans-DCE phase is supercooled and freezes after about 20 minutes.
LB
CC
+23 min.+5 min.-1 min.

5
Viscosity trans-DCE The viscosity of trans-DCE was measured over the accessible range of -10 to 30° C using a Cambridge Viscosity Viscolab 3000 viscometer (see Fig. SI 6 and Table SI2) and over this very limited range was found to be Arrhenius with an activation energy of EA = 0.13 kJ mol-1.7
Fig. SI 6. Measured temperature-dependent viscosity of trans-DCE.
T/K ηη/cP 263.15 0.5895 265.15 0.5697 267.15 0.55535 269.15 0.5412 271.15 0.52615 273.15 0.5132 275.15 0.4976 277.15 0.48165 279.15 0.46985 281.15 0.4572 283.15 0.44295 285.15 0.4333 287.15 0.4215 289.15 0.4088 291.15 0.4082 293.15 0.3934 295.15 0.3995 297.15 0.3874
Table SI2. Temperature-dependent viscosity of trans-DCE
References (1) Snyder, R. B.; Eckert, C. A. J Chem Eng Data 1973, 18, 282. (2) Tang, K.; Zhou, C.; An, X.; Shen, W. Journal of Chemical Thermodynamics 1999, 31, 943. (3) Mcgovern, E. W. Ind. Eng. Chem. 1943, 35, 1230. (4) Tse, G.; Orbey, H.; Sandler, S. I. Environ. Sci. Technol. 1992, 26, 2017. (5) Cooling, M. R.; Khalfaoui, B.; Newsham, D. M. T. Fluid Phase Equilibria 1992, 81, 217. (6) Khalfaoui, B.; Newsham, D. M. T. J. Chromatogr. A 1994, 673, 85. (7) Turton, D. A.; Martin, D. F.; Wynne, K. Phys Chem Chem Phys 2010, 12, 4191.
0.55
0.50
0.45
0.40
visc
osity
/Cp
295290285280275270265T/K