crypto-rhombomeres of the mouse medulla oblongata, defined by molecular and morphological features
TRANSCRIPT
ORIGINAL ARTICLE
Crypto-rhombomeres of the mouse medulla oblongata, definedby molecular and morphological features
Laura Tomas-Roca • Ruben Corral-San-Miguel •
Pilar Aroca • Luis Puelles • Faustino Marın
Received: 17 September 2014 / Accepted: 31 October 2014
� Springer-Verlag Berlin Heidelberg 2014
Abstract The medulla oblongata is the caudal portion of
the vertebrate hindbrain. It contains major ascending and
descending fiber tracts as well as several motor and inter-
neuron populations, including neural centers that regulate
the visceral functions and the maintenance of bodily
homeostasis. In the avian embryo, it has been proposed that
the primordium of this region is subdivided into five seg-
ments or crypto-rhombomeres (r7–r11), which were
defined according to either their parameric position relative
to intersomitic boundaries (Cambronero and Puelles, in J
Comp Neurol 427:522–545, 2000) or a stepped expression
of Hox genes (Marın et al., in Dev Biol 323:230–247,
2008). In the present work, we examine the implied similar
segmental organization of the mouse medulla oblongata.
To this end, we analyze the expression pattern of Hox
genes from groups 3 to 8, comparing them to the expres-
sion of given cytoarchitectonic and molecular markers,
from mid-gestational to perinatal stages. As a result of this
approach, we conclude that the mouse medulla oblongata is
segmentally organized, similarly as in avian embryos.
Longitudinal structures such as the nucleus of the solitary
tract, the dorsal vagal motor nucleus, the hypoglossal
motor nucleus, the descending trigeminal and vestibular
columns, or the reticular formation appear subdivided into
discrete segmental units. Additionally, our analysis iden-
tified an internal molecular organization of the migrated
pontine nuclei that reflects a differential segmental origin
of their neurons as assessed by Hox gene expression.
Keywords Rhombomeres � Medulla oblongata � Hox �Brain segmentation � Neuromeres � Sensory columns
Abbreviations
5 Trigeminal motor nucleus
6 Abducens motor nucleus
6n Abducens nerve fibers
7 Facial motor nucleus
7asc Ascending facial nerve fibers
7g Facial nerve genus
7n Descending facial nerve fibers
10 Dorsal vagal motor nucleus
10n Vagal nerve fibers
12 Hypoglossal motor nucleus
12n Hypoglossal nerve fibers
Amb Ambiguus motor nucleus
AP Area postrema
DC Dorsal cochlear nucleus
dcn Dorsal column nuclei
ECn External cuneate nucleus
Gi Gigantocellular reticular nucleus
IO Inferior olive
IRt Intermediate reticular nucleus
LRt Lateral reticular nucleus
MdV Ventral medullary reticular nucleus
MdD Dorsal medullary reticular nucleus
MVe Medial vestibular nucleus
mlf Medial longitudinal fascicle
PCRt Parvicellular reticular nucleus
pd Pyramidal decussation
L. Tomas-Roca � R. Corral-San-Miguel � P. Aroca �L. Puelles � F. Marın (&)
Department of Human Anatomy and Psychobiology, School of
Medicine, University of Murcia, and IMIB (Instituto Murciano
de Investigacion Biosanitaria), 30100 Murcia, Spain
e-mail: [email protected]
L. Tomas-Roca
Department of Human Genetics, Nijmegen Center for Molecular
Life Sciences, Radboud University Medical Center, Nijmegen,
The Netherlands
123
Brain Struct Funct
DOI 10.1007/s00429-014-0938-y

Pn Basilar pontine nuclei
PnC Caudal pontine reticular nucleus
PnR Pontine raphe nucleus
Po Periolivary region
PPnR Prepontine raphe nucleus
Pr Prepositus nucleus
r Rhombomere
RAmb Retroambiguus nucleus
RMgV Raphe magnus nucleus, ventral part
RMgD Raphe magnus nucleus, dorsal part
Ro Roller nucleus
ROb Raphe obscurus nucleus
RPa Raphe pallidus nucleus
RtTg Reticular tegmental nucleus
RVL Rostroventrolateral reticular nucleus
sc Spinal cord
Sol Nucleus of the solitary tract
Sp5I Interpolar trigeminal nucleus
Sp5C Caudal trigeminal nucleus
SpVe Spinal vestibular nucleus
tz Trapezoid body
vh Ventral horn
Introduction
The developing brain of vertebrates is subdivided into
transverse segments or neuromeres disposed serially along
the longitudinal axis. Though they show regional diversity,
all neuromeric units share the same primary dorsoventral
zones (roof, alar, basal and floor plates), as a consequence
of a common mechanism of dorsoventral patterning. This
shared fundamental morphological organization represents
what is metamerically repeated. These segments express
specific combinations of developmental genes that control
more detailed differential specification of their primary
dorsoventral zones, and behave during development as
relatively self-contained proliferative and histogenetic
units. Interactions between neighboring neuromeres may
include interchange of specific cell populations by tan-
gential migration. Neuromeres have been putatively iden-
tified within the forebrain, midbrain and hindbrain (Vaage
1969; Puelles and Rubenstein 1993, 2003; Rubenstein et al.
1994; Kiecker and Lumsden 2005; Puelles et al. 2007;
Puelles 2013).
In the hindbrain, some of these neuromeric segments—
known as rhombomeres—appear at early stages as obser-
vable bulges of the neural tube wall, separated by external
transverse constrictions and ventricular interrhombomeric
ridges; they are each correlated with different hindbrain
motor nuclei and nerve roots (Vaage 1969; Lumsden
1990), and display an heterochronic pattern of neurogen-
esis, with the even-numbered rhombomeres ahead of the
odd-numbered ones. The interrhombomeric boundaries
display specific cellular and molecular characteristics, such
as particular (longer) cell cycle kinetics, reduced gap
junctional permeability, differential cell–cell adhesive
properties and restriction of clonal neuroepithelial cell
dispersion (Jimenez-Guri et al. 2010, and references
therein). Various transcription factors belonging to the Hox
family (among other genes) were demonstrated with
respect to these boundaries in a characteristic sequence
(Wilkinson and Krumlauf 1990; Krumlauf et al. 1993;
Capecchi 1997).
All these characteristics appear only in rhombomeres
r2–r6. Rostrally, the isthmus (r0) and r1 units develop
under the influence of gradiental signals from the isthmic
organizer, forming a morphogenetic field together with the
caudal midbrain (Martınez 2001). Caudally to r6 (facial
motor nucleus level), the hindbrain includes a large med-
ullary territory lacking observable outer transverse con-
strictions. The neurogenetic pattern of this caudal region is
rather homogeneous along the rostrocaudal axis, without
apparent discontinuity with the spinal cord (Amat 1986;
Lumsden and Keynes 1989). This caudal territory has been
classically identified as an enlarged r7 segment (Vaage
1969), or subdivided into r7 plus an enlarged r8 that con-
tains the hypoglossal nerve roots. However, the hypothet-
ical boundary between r7 and r8 does not share the
forementioned molecular and cellular characteristics of
typical interrhombomeric boundaries, and the hypothetical
r8 is about four times larger than the rest of rhombomeres
(Vaage 1969; Lumsden 1990).
A possible hidden segmentation of the forementioned r7
plus r8 medullary region was first contemplated by Cam-
bronero and Puelles (2000). These authors took into
account that this neural region lies adjacent to the first 4–5
pairs of (postotic) somites, while in the nearby presumptive
spinal cord the apparent segmental units (myelomeres) are
separated by clonal boundaries aligned with the middle of
adjacent somites (Vaage 1969; Lim et al. 1991; Stern et al.
1991). Consequently, Cambronero and Puelles (2000)
performed quail-to-chick grafts of medullary neuroepithe-
lial portions delimited by planes crossing through the
middle of adjacent somites, aiming to fate map potential
hidden rhombomeres beyond r6 in the adjacent neuroepi-
thelium. Each graft down to the middle of the fifth somite
indeed gave rise to a segment-like portion of the mature
hindbrain, with surprising coincidence of the arbitrary
limits with cytoarchitectonic internuclear boundaries. This
led to the proposal of a segmental map of five pseudo- or
crypto-rhombomeres (r7–r11) in the medulla oblongata
(Cambronero and Puelles 2000). Ulteriorly, an analysis of
late embryonic Hox gene expression patterns within the
Brain Struct Funct
123

medullary region in the chick hindbrain demonstrated that
the rostral expression limits of the paralogue Hox groups
4–7 sequentially coincide with the proposed limits of r7–
r11, similarly as the paralogue Hox groups 1–3 identify the
r1–r6 limits (Marın et al. 2008). These findings were
clearly consistent with the concept of pseudo- or crypto-
rhombomeres postulated by Cambronero and Puelles
(2000), emphasizing the higher relevance of molecular
differentiation of rhombomeres over their delimitation via
characteristics of the interrhombomeric limits.
The region mapped in this way corresponds to the por-
tion of the adult brain classically called medulla oblongata
that contains structures such as the motor hypoglossal
nucleus, the nucleus of the solitary tract and the dorsal
motor vagal nucleus, as well as portions of the trigeminal
descending column, the reticular formation, and the ves-
tibular column. All these structures display five segmental
subdivisions lying caudal to the overt r6 neuromere
(Cambronero and Puelles 2000; Puelles et al. 2007). The
resulting segmental hindbrain map including 11 rhombo-
meres (or 12 of them, if we consider the isthmus as r0) can
be extrapolated into the topological map of the anamniote
brainstem, as proposed from studies in diverse fish and
amphibian species (Nieuwenhuys 2011). Concerning
mammals, a corresponding segmental organization of the
medulla oblongata has been postulated in the mouse brain,
according to the regionalized expression of some molecular
markers within serotonergic and glutamatergic neuronal
populations (Alonso et al. 2013; Gray 2013; see also
Watson 2012).
In the present study, we aimed to corroborate the pre-
dicted hidden segmentation within the mouse medulla
oblongata by correlating morphological landmarks such as
the motor nuclei and the pyramidal decussation at the
hindbrain/spinal cord boundary, as well as the disposition
of blood vessels, nerve roots and fiber tracts, with the
forementioned stepped Hox-gene expression pattern. The
resulting segmental map of the medulla oblongata was used
to interpret the expression pattern of Calb2, Th, Trh, Gal
and Cart genes within this brain region. Additionally, our
study provided information in relation to the crypto-
rhombomeric ascription of the pontine progenitor domains,
deducible from a molecular regionalization of the basilar
pons.
Materials and methods
In situ hybridization (ISH) and immunohistochemistry
All animals were treated according to the stipulations and
laws of the European Union (2010/63/UE) and the Spanish
Government (Royal Decree 53/2013) and the ethical
guidelines on animal experiments of the University of
Murcia. Swiss albino mice bred in the Service of Labora-
tory Animals of the University of Murcia were used.
Embryos at 14.5 and 16.5 days post coitum (dpc)—
staged according to Theiler (1989)—as well as postnatal
day 0 (P0) pups, were decapitated and their brains dissected
out. These specimens were fixed by immersion in para-
formaldehyde 4 % in PBS pH 7.5 at 4 �C for 24–48 h.
After fixation, the brains were embedded in agarose and cut
in a vibratome at 80–100 um thickness in the sagittal plane.
The sections were first processed for in situ hybridization
(ISH) with digoxigenin riboprobes for the different Hox
genes, and subsequently counterstained with 3A10 immu-
nohistochemistry, as commented below.
EST cDNA clones of respective Hox genes were obtained
either from RZPD, ImaGenes GmbH or Geneservice Ltd
(services currently integrated in Source BioScience, Not-
tingham, UK). These clones consisted of IMAGp998
L154446Q (Hoxa3), IMAGp998O0113791Q (Hoxb3),
IMAGE:30145107 (Hoxd3), RZPDp981c0713D (Hoxb4),
IRAPp965E0881D (Hoxc4), RZPDp981C03284D5
(Hoxa5) IRAMp995L079Q (Hoxb5,), IMAGp998N1912
668Q (Hoxc5), RZPDp981E04288D (Hoxa6), IRAVp
968D1230D (Hoxb6), IRAKp961O1666Q (Hoxc6),
IMAGE:4986801 (Hoxa7), IMAGp998B153740Q (Hoxb7),
IMAGp998F23989Q (Hoxb8) and IMAGp998I121402Q
(Hoxd8). The Hoxd4 cDNA was cloned from genomic DNA
in the lab by PCR, using primers that flanked a region
including the second exon and the 30UTR of this gene.
Respective digoxigenin-labeled riboprobes were syn-
thesized from all the cited cDNAs, and used for ISH on
vibratome–floating sections according to Nieto et al.
(1996), with minor modifications. To detect the hybridized
product, the sections were incubated with alkaline phos-
phatase-conjugated antidigoxigenin Fab fragments and
nitroblue tetrazolium/bromochloroindolyl phosphate
(NBT/BCIP) were used as chromogenic substrates for the
final phosphatase reaction. After the ISH, the sections were
processed for immunohistochemistry with the 3A10 anti-
body (Hybridoma Bank, Iowa Univ., Iowa), following
standard peroxidase-diaminobenzidine methods.
Finally, the sections were mounted with Eukitt and
photographed with an Axiophot camera with a Zeiss Axi-
ocam camera (Carl Zeiss, Oberkochen, Germany) or with a
ScanScope digital slide scanner (Aperio, Vista, CA, USA).
Collection of ISH images from web sources
We retrieved from online high-throughput ISH databases
image series corresponding to serial sections of mid-ges-
tational mouse embryos or perinatal brains processed for
detection of Hox, Calb2, Th, Cart, Gal, Adam19 and Trh
gene expression (Tables 1, 2).
Brain Struct Funct
123

The Genepaint (http://genepaint.org/) online database
provided ISH series from C57BL/6 14.5 dpc mouse
embryos. The Allen Developing Mouse Brain Atlas
(ADMBA) (http://developingmouse.brain-map.org) pro-
vided ISH series from 15.5 dpc to P4 C57BL/6 mouse
embryos and postnatal brains. In the latter database the
embryonic ISH sections were counterstained with Feul-
gen-HP yellow.
Results
In the present work, we used morphological and molecular
criteria to delimit predicted interrhombomeric boundaries
in the mouse hindbrain. We obtained in this way a seg-
mental map of the medulla oblongata, which was used to
locate more precisely the position of several neurochemi-
cally specific neuron populations.
Table 1 Embryonic brains
analyzed for Hox expression
‘‘H’’-labeled cases correspond
to brains processed for Hox ISH
and 3A10
immunohistochemistry as
commented in ‘‘Methods’’, and
the other items refer to image
series retrieved from the
indicated databases (Gp
Genepaint, AB Allen
Developing Mouse Brain Atlas)
14.5 dpc 15.5 dpc 16.5 dpc 18.5 dpc P0 P4
Hoxa3 H80 H45 H81
Hoxb3 H57,
Gp#EN1287
AB#100056326 H62 H79 AB#100092319
Hoxd3 H51,
Gp#EN1290
AB#100093060 H64,
H108
H83
Hoxa4 H9 Gp#EB664 H1 H4
Hoxb4 H21,
Gp#MH3073
H18 H14, H29
Hoxc4 H22 H19 AB#100077728 H15 AB#100081843
Hoxd4 AB#100085315 H85 H86 AB#100101317
Hoxa5 H10, H127,
Gp#EN692
H2 H5, H93,
H133
Hoxb5 H12 AB#100056327 H20,
H89
AB#100072330 H7 AB#100075759
Hoxc5 H35 H25,
H28
H31
Hoxa6 H11,
Gp#EH1322
H36 H6
Hoxb6 H13,
Gp#EH1240
AB#100072762 H23 AB#100077738 H8 AB#100081822
Hoxc6 H26,
Gp#MH3074
AB#100073054 H27
Hoxa7 H30, H90,
Gp#EN165
AB#100057606 H24 AB#100085496
Hoxb7 H38 AB#113390109 H76 AB#100094304 AB#100094296
Hoxb8 H75,
Gp#EN2488
AB#100094038 H43,
H77
AB#
100098210
H39 AB#100094295
Hoxc8 Gp#MH3051 AB#100072481
Hoxd8 Gp#MH3002 AB#100059027
Table 2 Embryonic brains analyzed for Adam19, Calb2, Cart, Gal, Th or Trh expression, as retrieved from the indicated databases
14.5 dpc 15.5 dpc 18.5 dpc P4
Adam19 AB#100076349 AB#100081475
Calb2 AB#100051842
Cart Gp#EB1557 AB#100042591 AB#100054822 AB#100092234
Gal Gp#EG539 AB#100055854 AB#100056067
Th Gp #MH130 AB#100053204 AB#100071454 AB#100073400
Trh Gp#MH3188 AB#100083525 AB#100051790 AB#100054752 AB#100054942
Additionally, the GENSAT database (www.gensat.org) provided image sections from transgenic E15.5, P7 or adult brains with GFP-reporter
constructions for Chat, Layn and Fev genes, in which the detection of expression was done by immunohistochemistry for GFP (Fig. 1)
Brain Struct Funct
123

Delimitation of segmental boundaries
by cytoarchitectonic landmarks
We first traced the intersegmental boundaries according to
morphological landmarks such as the motor nuclei and
some fiber formations, including nerve roots, known to
have a specific topographic correlation with them. Trans-
versally coursing (radial) blood vessels visible in medial
sagittal sections often help to determine the deformed
spatial framework of neuromeres. The relationship between
these landmarks and given rhombomeres is already known
according to the previous studies performed at early stages
of neural tube development, as commented below. In
general, the coincidence of the rostral and caudal bound-
aries of diverse nuclei at a particular transversal plane
bespeaks of a potential interrhombomeric boundary
(Cambronero and Puelles 2000).
The motor nuclei have a clearcut correlation with spe-
cific rhombomeres because they can be identified when the
interrhombomeric boundaries are still visible, as reported
in different vertebrate species (Neal 1918; Vaage 1969;
Lumsden and Krumlauf 1996). Therefore, in the
9.5–10.5 dpc mouse embryo, the trochlear nucleus appears
in the isthmus (r0), the trigeminal motor nucleus develops
within r2 and r3; the facial branchiomotor and viscero-
motor nuclei form, respectively, in r4 and r5; the abducens
motor nucleus lies in r6, and the ambiguus, dorsal vagal
and hypoglossal motor nuclei are found within the caudal
territory classically considered as r7 plus r8 (Cordes 2001).
However, the facial branchiomotor nucleus follows a
characteristic caudalwards migration leading it to be
positioned finally within r6 (Garel et al. 2000; Studer 2001;
Vivancos et al. 2009).
We identified the forementioned motor nuclei by means
of the Chat gene, which labels all cholinergic cells,
including motoneurons (Kimura et al. 1984). To this end,
we mapped the motor nuclei in transgenic mice expressing
EGFP under control of the Chat promoter region (Fig. 1a–
d). Since this material offered by Gensat does not include a
complete image series, we additionally consulted the Chat
ISH series from the Allen Developing Mouse Brain Atlas
(data not shown).
Regarding the mature facial branchiomotor nucleus,
expected to be located within r6 as its final postmigratory
position (Garel et al. 2000; Studer 2001), we found that it
bulges out considerably, deforming locally the hypothetical
boundaries of r6 (Fig. 1a–c). The apparent overgrowth of
this nucleus is apparent also in relation to interrhombo-
meric boundaries traced according to Hox gene expression
(see below). Other Chat-positive landmark features related
to the facial nerve are its ascending fibers within r6 (7asc),
the genu facialis passing through r5 around the abducens
nucleus (7 g) and the efferent root fibers within r4 (7n)
(Fig. 1a–d).
The ambiguus, dorsal vagal and hypoglossal nuclei
supposedly extend through several crypto-rhombomeres
inside the medulla oblongata. The ambiguus nucleus (Amb)
is formed by several cell aggregates with decreasing size
and extends from r7, just caudal to the facial branchiomotor
nucleus, to approximately r10 (Fig. 1a, b and data not
shown; see Watson et al. 2010; their Fig. 11.10). The
ambiguus nucleus is continuous caudally with the retro-
ambiguus nucleus (Franklin and Paxinos 2008) which
would probably fit into r11 (data not shown). In their turn,
the vagal (10) and hypoglossal (12) nuclei putatively extend
over r9, r10 and r11. That is, their anterior ends lie within a
distance of 2-rhombomeres-wide from the facial branchio-
motor nucleus and its ascending fibers in r6, while their
posterior ends abut the pyramidal decussation (see below).
The proposed location in r9–r11 of the hypoglossal and
vagal nuclei, as deduced from the Chat expression images,
coincides with the results obtained in the Hox-related
segmental map of the medulla oblongata in the chick
(Marın et al. 2008) and in the mouse (present work).
Nevertheless, the rostralmost hypoglossal nerve fibers
show a rostrally concave curve into r8, which suggests that
there may exist a minor origin within r8, whose moto-
neurons are undetectable, or have secondarily migrated into
r9 (arrows in Fig. 1d, g). Therefore, we can observe Chat-
positive rootlets from r8 to r11 (Fig. 1d, g), while the
nucleus itself occupies only r9, r10 and r11 (Fig. 1d, f, g).
Another interesting landmark in relation to the caudal
hindbrain is the pyramidal decussation, classically con-
sidered as the boundary between the mammalian hindbrain
and spinal cord. Therefore, in the mouse brain it might be
used to define the limit between the last hindbrain segment
(r11) and the first myelomere or spinal cord segment
(my1). However, in sagittal sections this structure does not
correspond to a single limiting plane, but appears as a thick
fiber bundle occupying roughly the space of a rhombomere.
We identified the pyramidal decussation by the expression
of transgenic GFP under the control of the Layn promoter
region, in the corresponding GENSAT series. The Layn
gene is expressed in cortical pyramidal neurons from
perinatal stages onwards (Allen Mouse Brain Atlas; data
not shown). Since the GFP protein is present in the axons,
the pyramidal decussation appears strongly immunoposi-
tive for GFP (pd in Fig. 1e, f). Alonso et al. (2013) con-
sidered its posterior end as the r11/my1 boundary,
including therefore the crossing fibers within r11. How-
ever, we found that the pyramidal decussation lies behind
the topologically transverse plane limiting the caudal end
of the hypoglossal and vagal nuclei, and we interpret this
plane as the r11/my1 limit, according to both Cambronero
Brain Struct Funct
123
Brain Struct Funct
123

and Puelles (2000) and our own Hox mapping results (see
below). Therefore, we traced the r11/my1 limit at the upper
end of the pyramidal decussation (Fig. 1e, f), so that in our
interpretation the crossing fibers lie within my1 (see
‘‘Discussion’’).
To trace the segmental map of the hindbrain, we con-
sidered that the interrhombomeric boundaries are planes
topologically transverse to the longitudinal (anteroposte-
rior) axis, irrespective that these may become deformed by
brainstem curvatures. In the pontine region (r2–r6), the
rhombomeres appear skewed and wedge-shaped, narrow-
ing from ventral to dorsal (the corresponding choroidal
roof areas are found caudal to the cerebellum), adapting to
the convex pontine curvature (Marın and Puelles 1995;
Wingate and Lumsden 1996). This deformation disappears
in the medullary region, while at the brain/spinal angle r10
and r11 become skewed in the opposite sense, widening
from ventral to dorsal, due to the cervical flexure (Cam-
bronero and Puelles 2000).
There are additional structures that define topologically
transverse (dorsoventral) limiting planes at given antero-
posterior positions, so that any neighboring interrhombo-
meric boundaries must be traced parallel to them. Several
axonal tracts follow this transverse direction, namely the
ascending and efferent facial nerve fibers (7asc, 7n; occu-
pying, respectively, r6 and r4) (Fig. 1a–c, h), the abducens
nerve fibers in r5 (6n in Fig. 1c) and the hypoglossal and
vagal nerve fibers from r8 to r11 (12n and 10n in Fig. 1b,
g). Median sagittal sections also show the decussation of
the trapezoid body, which is restricted to r5 (tz in Fig. 1e)
(similarly as the corresponding interstitial nuclei and the
superior olivary nuclei, more laterally—Di Bonito et al.
2013; L. Puelles, personal observations). The decussation
of the olivocerebellar superficial arcuate fibers occurs
between r8 and r11, in agreement with the extent of the
migrated inferior olive cells (data not shown). In the pro-
cess of angiogenesis, the major median and paramedian
blood vessels of the hindbrain have a tendency to distribute
segmentally and follow a radial course from the meningeal
entry points towards the ventricular surface, keeping this
original orientation till adult stages (Minamikawa et al.
1987; Gerhardt et al. 2004; Fantin et al. 2013) (Fig. 1h).
The radial glia cells within each rhombomere also follow
the transverse axis (radiality), since they extend perpen-
dicularly from the ventricular to the meningeal surfaces;
these fibers sometimes show higher density at interseg-
mental boundaries (Gubert et al. 2009). However, due to
the curvature of the neural wall both vessels and radial glia
processes can be detected clearly only in midsagittal sec-
tions (Fig. 1h and data not shown).
On the other hand, there are axonal tracts that follow the
curved anteroposterior axis, such as the medial longitudinal
fasciculus (Fig. 1g), whose fibers are perpendicular to the
forementioned transverse structures; they also are of help
as spatial guides for the segmental map.
All these landmarks were used as a framework for the
putative delimitation of rhombomeres, which was corre-
lated with the following results of Hox gene expression.
Delimitation of segmental boundaries by Hox
expression
We analyzed Hox gene expression domains aiming to
assess whether intersegmental boundaries can be delimited
in the mature differentiated mouse hindbrain, as at early
neural tube stages. At these early stages, the domains of
these genes extend stepwise from the spinal cord up to
different hindbrain domains following a rule of 30–50 spa-
tial Hox colinearity (Krumlauf et al. 1993). The conser-
vation of this pattern across ontogeny into late embryonic
stages was already reported in chick embryos (Marın et al.
2008). Concerning the mouse prepontine-pontine-retro-
pontine region, which forms part of the overtly segmented
hindbrain region (r2–r6; note the basilar pons lies in r3 and
r4), most of the boundaries within this region have been
corroborated in the adult thanks to transgenic Cre/Flp mice
labeling either r2-, r4-, or r3-plus-r5-derived territories
(Farago et al. 2006; Pasqualetti et al. 2007; Di Bonito et al.
2013).
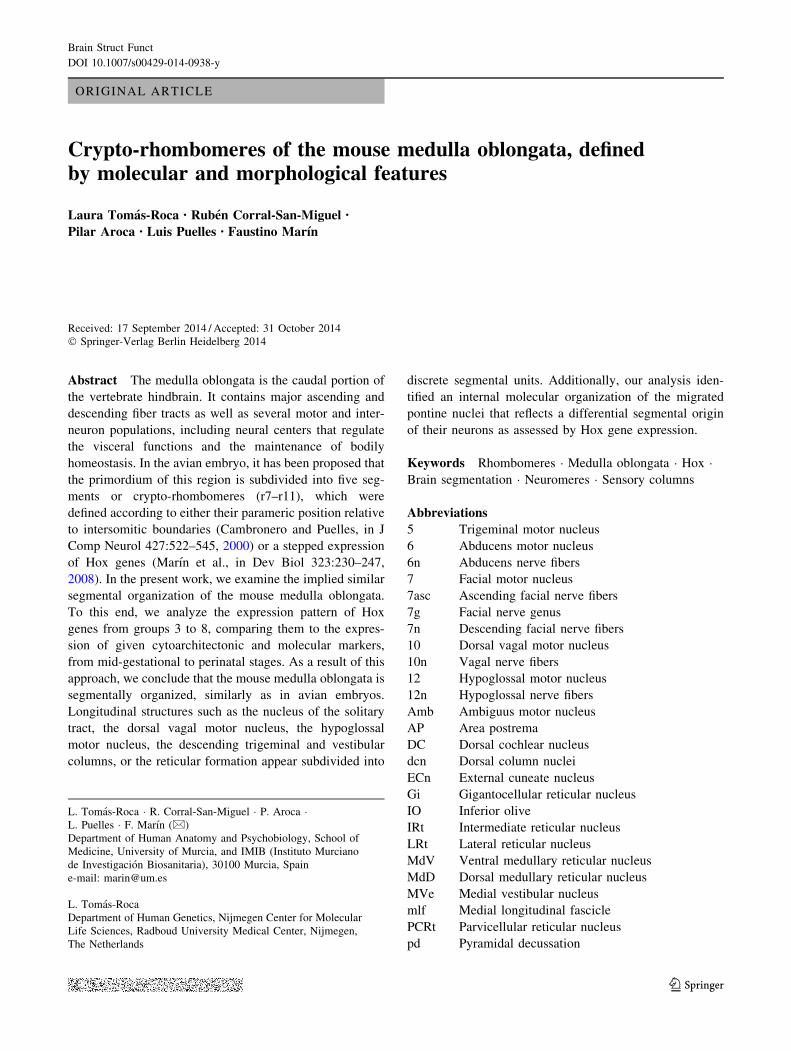
b Fig. 1 Delimitation of rhombomeres according to motor nuclei and
fiber tracts. a–d Sagittal sections of a P7 transgenic brain with GFP
under the Chat promoter, processed for immunohistochemistry for the
former protein. Ambiguus (Amb), trigeminal (5), abducens (6), facial
branchiomotor (7), vagal (10) and hypoglossal (12) motor nuclei and
their nerve fibers are labeled. The intersegmentary boundaries are
represented by dotted lines. The arrow in d points to hypoglossal
nerve fibers in r8 while this nucleus remains in r9–r11. e, f Sagittal
sections of a P7 transgenic brain with GFP under the Layn promoter,
processed for immunohistochemistry for the former protein. Segment-
related fibers are visible like the fibers of the pyramidal decussation
(pd) behind r11, and the trapezoid body (tz) (unlabeled) in r5.
g Sagital section of an 16.5 dpc brain processed for 3A10 immuno-
histochemistry, showing the medial longitudinal fascicle (mlf), the
facial ascending nerve fibers (7asc) and the vagal (10) and
hypoglossal (12) nuclei and nerve fibers of the latter (12n). The
hypoglossal nucleus covers from r9 to r11 but its anteriormost fibers
extend into r8 (arrow). h Sagittal section at the midline of a P7
transgenic brain with GFP under the Fev promoter, processed for
immunohistochemistry for the former molecule. The labelling
corresponds to the raphe serotonergic groups, including the prepon-
tine raphe (PPnR), pontine raphe (PnR), dorsal and ventral raphe
magnus (RMgD, RMgV), raphe obscurus and raphe pallidus (ROb,
RPa) nuclei, located, respectively, in r2, r3–r4, r5–r6 and r7–r11
(Alonso et al. 2013). It can be observed also the location of the
(unlabeled) basilar pontine nuclei (Pn) in r3–r4, the trapezoid body
(tz) in r5, and the inferior olive (IO) in r8–r11. Since this is a midline
section, the major blood vessels are visible following the dorsoventral
axis. Images a–f and h are retrieved from the Gensat database. These
and all the following images in this paper correspond to brain sagittal
sections with the rostral end to the left
Brain Struct Funct
123

Brain Struct Funct
123

In the present work, we focused on the medullary region
formed by crypto-rhombomeres r7–r11 as described in the
chick, examining as well their rostral r5–r6 and caudal my1
neighbors. Within this study, we identified the rostral limit
of the Hoxb8 expression domain as an apparent molecular
marker for the hindbrain/spinal cord boundary, delimited
morphologically by the pyramidal decussation, as com-
mented above. Additionally, we found that specific mem-
bers of the Hox gene groups are differentially expressed
within the basilar pontine nuclei, implying a specific, ori-
gin-derived molecular regionalization of this structure. We
next report the expression patterns observed for the third to
eighth Hox gene paralogue groups, described within the
framework of segmental landmarks mentioned above.
Hoxa3, -b3 and -d3 delimit, respectively, the r4/r5, r6/r7
and r5/r6 boundaries
At 10.5–11 dpc Hoxa3 is expressed in the neuroepithelium
extending from the spinal cord up to the r4/r5 boundary
(Manzanares et al. 1999; Gaufo et al. 2003). We analyzed
serial sections at 14.5 dpc and P0, corroborating Hoxa3
expression in the hindbrain caudal to the r4/r5 boundary.
That is, at P0 the positive zone abuts rostrally r4 as iden-
tified by the efferent facial nerve fibers (7n in Fig. 2a, c)
(Garel et al. 2000) and the caudal part of the basilar pons.
The domain of this gene includes r5, a rhombomere char-
acterized by the presence of the facial nerve genus (7g), the
abducens motor nucleus together with its fibers (6n)
(Fig. 2b, d) (Cordes 2001), and the superior olivary com-
plex (plus the periolivary region—Po in Fig. 2c) and the
trapezoid nuclei (plus the trapezoid decussation—tz in
Fig. 2d).
Concerning sensory columns, the Hoxa3 domain
includes the whole viscerosensory column, i.e., the nucleus
of the solitary tract (Sol), and portions of the vestibular
nuclei (medial ‘MVe’ and spinal ‘SpVe’ vestibular nuclei)
up to the r4/r5 boundary (Fig. 2a–d). Laterally, the caudal
portion of the dorsal cochlear nucleus appears derived from
r5, in agreement with Farago et al. (2006), being labeled as
a rostral part of the Hoxa3 expression domain (data not
shown; see DC in Fig. 2e for Hoxb3). In lateral sections,
the interpolar portion of the spinal trigeminal nucleus
appears labeled (data not shown; see Sp5I for Hoxb3 in
Fig. 2e).
The Hoxa3 expression domain includes also the corre-
sponding portions of the hindbrain reticular formation, i.e.,
the caudal portion of the caudal pontine reticular nucleus
(PnC), the parvicellular reticular nucleus (PCRt), the
medullary dorsal reticular nucleus (MdD), the intermediate
reticular nucleus (IRt), and, laterally, the lateral reticular
nucleus (LRt) (Fig. 2a, c); medially, there is lower
expression of the marker in the gigantocellular reticular
nucleus (Gi) and medullary ventral reticular nucleus
(MdV) (Fig. 2b, d). The ambiguus, vagal and hypoglossal
motor nuclei are included within this domain, in agreement
with their reported rhombomeric positions, as commented
above (Fig. 1).
There appeared as well Hoxa3 expression throughout
the basilar pontine nuclei (Pn) and the suprajacent reticular
tegmental nucleus (RtTg) (Fig. 2a, c, d). These structures
reportedly form by tangential migration from r6 to r7
rhombic lip (Farago et al. 2006; Geisen et al. 2008), so that
their progenitors are fully included within the Hoxa3
domain. These neurons clearly keep the expression of this
marker gene throughout their migration, as observed pre-
viously in the chick (Marın et al. 2008).
In contrast, Hoxb3 has an early domain of expression of
high intensity up to the r6/r7 boundary, while there is
additional weaker expression covering r4, r5 and r6, as
described in 11 dpc embryos (Gaufo et al. 2003). We found
that this pattern is largely maintained at 14.5 dpc and P0,
so that the principal expression domain reaches up to the
r6/r7 boundary, including the corresponding portions of the
sensory, motor and reticular entities (Fig. 2e, f). There is
additional weak expression of Hoxb3 in the dorsal part of
r6 (asterisks in Fig. 2e, f), including portions of the spinal
trigeminal (Sp5I) and vestibular (SpVe) columns, as well
as the dorsal cochlear nucleus (DC in Fig. 2e), whose
caudalmost part derives from r5 according to Farago et al.
(2006). The expression observed in these structures would,
thus, be a remnant from earlier stages (Gaufo et al. 2003).
Hoxb3 is also expressed throughout the basilar pontine
nuclei and the reticular tegmental nucleus (Fig. 2f).
At early neural tube stages, Hoxd3 is expressed from the
spinal cord up to r6, with additional weak expression in r5
(Gaufo et al. 2003). We found that this gene is consistently
expressed up to the r5/r6 boundary at 14.5 dpc and P0,
including r6 as its rostralmost rhombomeric domain, in
both alar and basal plates (Fig. 2g, h, and data not shown).
The facial branchiomotor nucleus is not labeled, though
lying within r6, due to its origin within r4 (Fig. 2g); the
b Fig. 2 Hoxa3, -b3 and -d3. Sections of embryonic and postnatal
brains processed for 3A10 immunohistochemistry (reddish precipi-
tate) and ISH (blue precipitate) respectively for Hoxa3 (a–d), Hoxb3
(e, f) and Hoxd3 (g, h). Hoxa3 expression domain reaches from the
spinal cord up to the r4/r5 limit (arrows in a, b). Hoxb3 expression
shows a domain with high expression reaching from the spinal cord
up to the r6/r7 limit, plus a small region with weaker expression in the
dorsal portion of r6 (asterisks in e, f). Hoxd3 expression abutts the r5/
r6 limit (g, h). In these and ulterior figures, the sections in each
vertical column are ordered from lateral to medial levels; inter-
rhombomeric boundaries are indicated by dotted lines, while bound-
aries of cytoarchitectural regions (e.g., Sol nucleus of the solitary
tract, MVe medial vestibular nucleus, SpVe spinal vestibular nucleus)
are indicated by dashed lines
Brain Struct Funct
123

labelling around the facial motor nucleus suggests that the
r5/r6 and r6/r7 boundaries are topologically deformed by
the ectopic development of this large nucleus (Figs. 1a–c,
2e, g). Additionally to its expression domain reaching up to
r6, Hoxd3 is also strongly expressed in the periolivary
region (Po) in r5, suggesting a possible tangential translo-
cation of these cells from r6 (Fig. 2g); Hoxd3 is also
expressed in the migrated basilar pontine nuclei, whose
expression shows strong signal intensity in 14.5 and
15.5 dpc brains, but decreases in perinatal brains (Fig. 2h
and data not shown).
In conclusion, Hoxa3 and -d3 genes distinctly delimit
the caudal or retropontine interhombomeric boundaries
within the overtly segmented hindbrain (respectively, r4/r5
and r5/r6), while the domain showing high expression for
Hoxb3 marks the r6/r7 boundary, that is, the rostral limit of
the crypto-rhombomeric medulla oblongata. As com-
mented above, if we compare these patterns with those
observed at early stages, there are some downregulation
phenomena (Manzanares et al. 1999; Gaufo et al. 2003),
but the respective late expression patterns of these genes
conserve without significant variations the topography
observed at mid-gestational to perinatal stages.
Hoxa4, -b4, -c4 and -d4 delimit the r7/r8 boundary
Hoxa4 is expressed in the neural tube at 9.5–10.5 dpc with
an anterior boundary within the medullary region (Gaunt
et al. 1989; Packer et al. 1998; Behringer et al. 1993;
Krumlauf 1993). Krumlauf (1993) proposed that this gene
had a principal expression domain up to the r7/r8 boundary,
plus a domain of weak expression in r7, thus reaching the
Fig. 3 Hoxa4. Sections of embryonic and postnatal brains processed
for 3A10 immunohistochemistry and Hoxa4 ISH. The expression
domain of Hoxa4 lies just behind r7 (which is defined by comparison
to r6) delimiting thus the r7/r8 boundary. In b, the white square in the
right upper corner is an artifact derived from the merging of
photographic fields of this brain section
Brain Struct Funct
123

Fig. 4 Hoxb4, -c4 and -d4.
Sections of embryonic and
postnatal brains processed for
3A10 immunohistochemistry
and ISH, respectively, for
Hoxb4 (a–d), Hoxc4 (e, f) and
Hoxd4 genes (g–j). The
expression domain reachs up to
the r7/r8 limit principally in
lateral sections corresponding to
the hindbrain alar plate (a–d, g–
i), while in medial/basal
sections the expression appears
partially downregulated (e, f, h,
j)
Brain Struct Funct
123

Brain Struct Funct
123

r6/r7 boundary. In our material, the domain of this gene
abuts rostrally a transverse plane that leaves approximately
the space of a rhombomere behind r6, as defined by the
position of the facial motor nucleus (Fig. 3a, d). Therefore,
we have interpreted this anterior boundary of expression as
the r7/r8 boundary. As happened with the studied Hox3
genes, this pattern is maintained from 14.5 dpc at least up
to P0 (Fig. 3a–f). However, the perinatal staining shows
low intensity in sagittal sections close to the midline,
pointing to a downregulation of this gene in the medullary
basal plate (Fig. 3c, f).
The other Hox4 paralogues (Hoxb4, -c4 and d-4) were
described to display at early stages (9.5–11 dpc) anterior
boundaries within the medulla oblongata with rostral limits
roughly coinciding with the r6/r7 boundary (Gaunt et al.
1989; Krumlauf 1993; Boulet and Capecchi 1996). We
found that this shared limit fits instead r7/r8, with minor
variations. We describe next the common pattern for these
four Hox4 genes.
Besides the Hox4 domain extending longitudinally from
r8 down to the spinal cord, there appears additional
expression of these genes more rostrally in the basilar
pontine nuclei (Pn) and the reticular tegmental nucleus
(RtTg), mainly in their respective caudal halves (Figs. 3e,
4b–j). This result suggests that the caudal portions of these
tangentially migrated nuclei originate from the rhombic lip
caudal to r7/r8.
In the alar plate, the labeled r7/r8 boundary crosses
through the vestibular column, specifically the medial and
spinal vestibular nuclei (MVe, SpVe), the somatosensory
trigeminal descending column, namely its interpolar
nucleus (Sp5I), and the viscerosensory column, represented
by the nucleus of the solitary tract (Sol) (Figs. 3a–d, 4a–i,
j). Therefore, the Hoxa4 domain includes a restricted
caudal portion of these nuclei, while lacking evident cor-
relation with any overt cyto- or chemoarchitectural
boundaries within them (Franklin and Paxinos 2008;
Watson and Paxinos 2009).
Concerning motor nuclei, the Hoxa4 domain includes
the full extent of the dorsal vagal (10) and hypoglossal (12)
nuclei, although the labelling of their cell populations
appears heterogeneous (Figs. 3c, f, 4e, f, h, j). The caudal
portions of the ambiguus motor nucleus (Amb) are also
labeled, leaving its rostralmost r7 portion unlabeled
(Figs. 3a, d, 4a, d). Structures lying just rostral to the
hypoglossal nucleus, such as the nucleus prepositus hypo-
glossi (Pr), or ventral to it such as the nucleus of Roller
(Ro) are weakly Hoxa4-positive and are thus included in
this domain (Figs. 3c, f, 4e, f, h, j). As mentioned above,
Hox4 genes show downregulation in the basal derivatives
(Figs. 3c, f, 4e, f, h, j).
After extrapolating the classical reticular subdivisions
(Franklin and Paxinos 2008) into our schema, the r7/r8
boundary defined by Hox4 genes apparently divides the
parvicellular reticular (PCRt), intermediate reticular (IRt)
and gigantocellular (Gi) nuclei into rostral and caudal parts
(Figs. 3a–d, 4a–f). Ventrally, the inferior olive showed
labelling in some of its cell populations, suggesting a Hox-
related internal regionalization of this structure (IO in
Figs. 3b–f, 4b– j); this is a structure derived by dorso-
ventral tangential migration from the medullary rhombic
lip, which extends from r8 to r11 (Cambronero and Puelles
2000; Hidalgo-Sanchez et al. 2012; Fig. 1h).
Hoxa5, -b5 and -c5 delimit the r8/r9 boundary
In 12.5 dpc embryos, Hoxa5, -b5 and -c5 share a domain of
expression extending from the spinal cord up to a sharp
transverse plane within the caudal portion of the medulla
oblongata (Gaunt et al. 1990), although this limit was not
correlated so far with any interrhombomeric boundary (due
to the assumption that none were present in this area, as
commented in the ‘‘Introduction’’).
We found that the rostral expression limit of these genes
lies caudal to r6 as defined by the facial motor nucleus,
approximately at a range twice as large as the width of a
rhombomere when compared with the r7/r8 boundary, thus
apparently corresponding to the r8/r9 limit (Fig. 5a, c, e, g).
The expression appears downregulated in paramedian
sections through the r9–r11 domain (Fig. 5b, d, f, h). A
salient morphological feature associated with this limit is
its coincidence with the rostral end of the dorsal vagal and
hypoglossal nuclei (Fig. 5b, d, f, h). The dorsal medullary
reticular nucleus (MdD) was also largely included within
this basal domain, although in our material we could not
identify its possible rostral limit with the gigantocellular
reticular nucleus (Gi) across the r8/r9 border (Franklin and
Paxinos 2008).
The Hox5-positive alar domain of the hindbrain includes
from r9 to r11 the corresponding caudal segmental portions
of the nucleus of the solitary tract (Sol), the spinal and
medial vestibular nuclei (SpVe, MVe), and the interpolar
and caudal trigeminal nuclei (Sp5I, Sp5C) (Fig. 5a–h).
Moreover, other hindbrain alar structures such as the area
postrema (AP), and the dorsal column nuclei (dcn) are
completely included within this domain (Fig. 5a–h). The
external cuneate nucleus (ECn) apparently falls entirely
within r9, lying dorsal to the caudalmost (r9) portion of the
b Fig. 5 Hoxa5, -b5 and -c5. Sections of embryonic and postnatal
brains processed for 3A10 immunohistochemistry and ISH, respec-
tively, for Hoxa5 (a, b), Hoxb5 (c–f) and Hoxc5 genes (g, h). The
expression domain of these genes reachs from the spinal cord up to
the r8/r9 boundary. The arrow in H points to the caudal portion of the
basilar pontine nuclei (Pn) expressing Hoxc5. In g, the white square
beneath r6–r8 is an artifact derived from the merging of photographic
fields of this brain section
Brain Struct Funct
123

interpolar nucleus (Figs. 5a, c, e, g, 6f–h). In some sections
at lateral levels, the expression of these genes shows a
caudorostral gradient of decreasing expression towards the
r8/r9 boundary, with weaker expression within r9 (e.g. r9 in
Fig. 5e, h). In the lateralmost sections, there is an apparent
rostralward dispersion of Hoxb5 positive cells within the
trigeminal column, a feature observed in all the analyzed
stages (Sp5I in Fig. 6f, and data not shown)
The basilar pontine (Pn) and reticular tegmental (RtTg)
nuclei display Hoxa5, -b5 and -c5 labeling, but only in
some neurons at their caudal ends, thus suggesting a sparse
contribution of the r9-r11 rhombic lip to the formation of
these nuclei, perhaps limited to r9 (arrow in Fig. 5h and
data not shown). The corresponding segmental portion of
the inferior olive lying in these rhombomeres expressed
weakly these genes (Fig. 5d, f, h and data not shown).
Hoxa6 and -b6 delimit the r9/r10 boundary
In 10.5–12.5 dpc mouse embryos, the expression domains
of Hoxa6 and -b6 have a similarly unspecified rostral
boundary within the caudal medulla oblongata (Toth et al.
Fig. 6 Hoxa6, -b6 and -c6. a–e Sections of embryonic and postnatal
brains processed for 3A10 immunohistochemistry and ISH, respec-
tively, for Hoxa6 (a, b), Hoxb6 (c, d) and Hoxc6 genes (e). The
expression domain of these genes reaches from the spinal cord up to
the r9/r10 boundary, but they are mostly restricted to structures of he
alar plate such as the dorsal column nuclei (dcn) and the caudal
trigeminal nucleus (Sp5C). f–h Lateral sections showing expression,
respectively, of Hoxb5 (f), Hoxb6 (g) and Calb2 (h) genes in the
descending trigeminal column. The caudalis portion of this column
can be recognized by a laminar organization, with its outer layer
positive for Calb2, while the interpolaris portion show a more
homogenous and dispersed labelling for this gene (Sp5C and Sp5I in
h). The identification of interrhombomeric boundaries according to
Hoxb5 and Hoxb6 expression (f, g) shows that the boundary between
Sp5I and Sp5C coincides with the r9/r10 limit, that is, the anterior
limit of the Hox6 domain
Brain Struct Funct
123

1987; Schughart et al. 1988), while Hoxc6 is expressed only
up to a rostral boundary within the cervical spinal cord,
being thus absent from the hindbrain (Shimeld et al. 1993).
We corroborated these results for mid-gestational and
perinatal mice. At 14.5 dpc and P0, Hoxa6 (Fig. 6a, b) and
-b6 (Fig. 6c, d) are expressed up to a rostral boundary that
intersects the caudal portions of the nucleus of the solitary
tract (Sol), the spinal trigeminal nucleus (Sp5), the dorsal
column nuclei (dcn), the dorsal vagal (10) and hypoglossal
(12) motor nuclei, and the intermediate reticular nucleus
(IRt); this limit passes behind the external cuneate nucleus
(ECn) in r9 (Fig. 6f, g). This transverse boundary can be
extrapolated into other components of the reticular for-
mation and the inferior olive, although these structures do
not display significant expression. Similarly to the former
Hox paralogues, the expression appears principally in alar
structures, while there is a downregulation of the signal in
the hindbrain basal plate, as noted in medial sagittal sec-
tions (Fig. 6b, d). The rostral limit of these genes coincides
with the cytoarchitectonically distinct boundary between
the interpolar and caudal nuclei of the descending tri-
geminal column, which are identifiable principally in lat-
eral sections according to their differential pattern of Calb2
expression (Ashwell et al. 2006) (Sp5I and Sp5C in
Fig. 6g, h). Coherently with the segmental pattern of the
preceding Hox paralogues, the anterior limit of the domain
of these Hox6 genes would correspond to the r9/r10 limit,
so that they would be expressed in the r10 and r11 crypto-
rhombomeres plus the spinal cord.
In its turn, Hoxc6 appears expressed more caudally, in
the alar and basal plates of the cervical spinal cord; its
signal decreases gradually from caudal to rostral, so that
there is no sharp rostrocaudal boundary (Fig. 6e).
Hoxb7 delimits the r10/r11 boundary
Among the Hox7 paralogue genes, Hoxa7 is expressed in
12.5 dpc embryos in the spinal cord, up to a rostral
boundary within the cervical region (Mahon et al. 1988).
We also found the expression of Hoxa7 restricted to the
spinal cord, with a topography similar to Hoxc6 (data not
shown).
On the other hand, Hoxb7 expression reaches further up
into the caudal end of the medullary region, ending slightly
rostral to the obex (Vogels et al. 1990). In our material
from 14.5 dpc and P0, Hoxb7 expression extends into the
caudal end of the hindbrain, involving parts of the dorsal
column nuclei (dcn) and the caudal nucleus of the
descending trigeminal column (Sp5C), plus the local
reticular formation (Fig. 7a, b). According to the stepwise
Hox expression pattern, we interpreted that this boundary
corresponds to the postulated r10/r11 limit, so that Hoxb7
would be expressed in r11 and the spinal cord.
Hoxb8 delimits the r11/spinal cord boundary
Hoxb8 is apparently expressed up to the boundary between
hindbrain and spinal cord in 12.5 dpc embryos (Holstege
et al. 2008). In our material at 14.5 dpc and P0, the
expression of this gene appeared in the alar plate of the
cervical spinal cord (Fig. 7c–f), ending at a transverse limit
disposed behind the hypoglossal motor nucleus (Fig. 7d, f)
and just rostral to the pyramidal decussation (Fig. 1e, f).
We argue that this transverse plane marks the limit between
r11 and my1 (first myelomere), that is, the limit between
the hindbrain and the spinal cord. Remarkably, the domain
of expression of this gene includes a sizeable part of the
conventional caudal trigeminal nucleus (Sp5C), with strong
expression up to the r11/my1 boundary (Fig. 7c, e).
However, there appeared additionally weaker gradiental
expression within the dorsal part of r11 (Figs. 7c, e, f, 10d).
Additionally, Hoxb8 was also expressed in part of the
intermediate reticular nucleus, which may include the ret-
roambiguus nucleus (RAmb) (Fig. 7c, d).
On the other hand, the Hoxc8 and -d8 expression
domains are restricted to the spinal cord, lacking expres-
sion in the medulla oblongata (Breier et al. 1988; Izpisua-
Belmonte et al. 1990. The image series available in the
Allen Brain web confirmed this pattern (data not shown).
Segmental map of some medullary neurochemically
identified populations
We analyzed the topological location of some neuro-
chemically identified populations of the medulla oblongata,
following the segmental (pseudorhombomeric) map
derived here from cytoarchitectural landmarks and Hox
expression patterns. We focused on marker molecules with
regionalized expression in the nucleus of the tractus soli-
tarius (Th, Cart and Gal) and the hypoglossal motor
nucleus (Trh). These two nuclei extend across several of
the crypto-rhombomeres, so that any rostrocaudal molec-
ular subdivisions may correlate with a differential seg-
mental origins. Our approach does not allow co-labeling at
single cell level of Hox genes and these molecular markers,
but offers the possibility to place particular neuronal pop-
ulations within the coordinates of the segmental map.
Th
In the hindbrain, the neuronal populations expressing
tyrosine hydroxylase develop a noradrenergic or adrenergic
phenotype. The noradrenergic/adrenergic A2/C2 cell group
occupies the commissural nucleus and the medial nucleus
of the tractus solitarius (Kalia et al. 1985). This cell group
is visible immunohistochemically in mid-gestational brains
as a relatively compact population under the caudal end of
Brain Struct Funct
123

Fig. 7 Hoxb7 and Hoxb8. Sections of embryonic and postnatal brains
processed for 3A10 immunohistochemistry and ISH, respectively, for
Hoxb7 (a, b) and Hoxb8 (c–f). Hoxb7 expression reaches up to the
r10/r11 limit, while Hoxb8 has a domain of strong expression
reaching up to the r11/spinal cord boundary, plus additional weaker
staining in the r11 portion of the caudal trigeminal nucleus (asterisks
in c, e) and in the retroambiguus nucleus (RAmb)
Fig. 8 Th and Hoxa6. Sections
of embryonic brains processed
for ISH, respectively, for Th (a,
b) and Hoxa6 (c, d). The images
inside each horizontal row a–
c and b–d correspond to
approximately the same
mediolateral level. The Th-
positive portion of the nucleus
of the solitary tract (A2), is
located across the r9/r10
boundary. These images have
been retrieved from the
Genepaint database (see
Tables 1, 2)
Brain Struct Funct
123

the fourth ventricle (Specht et al. 1981a, b). We compared
Th ISH labelling of this population with the expression
pattern of Hoxa6 (Fig. 8) which delimits the boundary
between r9 and r10. The A2/C2 population sits across this
interrhombomeric boundary in 14.5 dpc brains (A2 in
Fig. 8a, b). At ulterior stages this population becomes more
widely distributed, including dispersed neurons across the
whole length of the nucleus of the solitary tract, up to r7
(data not shown). On the other hand, the A1 Th population
in the ventrolateral medulla extends from r7 to r11 (A1 in
Fig. 8a; Kalia et al. 1985).
Cart
Cocaine- and amphetamine-regulated transcript (CART)
peptide is expressed in hindbrain areas involved in
homeostatic regulation, including the nucleus of the soli-
tary tract, the dorsal vagal complex and the area postrema,
as detected by immunohistochemistry in the postnatal and
adult rat brain (Koylu et al. 1998; Dun et al. 2001. In the
embryonic mouse medulla oblongata, Cart mRNA
expression appears in scattered cells of the reticular for-
mation as well as in a discrete population within the
nucleus of the solitary tract (Sol), as we have observed in
mid- and late gestational brains pertaining to the Genepaint
and Allen Brain databases (Fig. 9a, e). The comparison
with Hoxa5 and -b5 gene expression (Fig. 9b, g, h) shows
that it is located at the anterior end of the Hox5 domain,
that is, within r9, at both 14.5 dpc and P4.
Gal
In the medulla oblongata of the rat at perinatal stages,
Galanine (Gal) protein is expressed in neurons of the
nucleus of the solitary tract, dorsal vagal nucleus and
reticular populations (Wickstrom et al. 2000) while in the
adult there appear additionally other medullary positive
regions (Cheung et al. 2001).
Fig. 9 Cart, Gal, Hox5 and Hox6. Sections of embryonic brains
processed for ISH, respectively, for Cart (a, e), Hoxa5 (b), Hoxb5 (g,
h), Gal (i, j), Hoxa6 (d) and Hoxb6 (k, l), respectively, from stages
14.5 dpc (a–d; retrieved from the Genepaint database) and 18.5 dpc
(e–l; retrieved from the Allen Brain database). The Cart-positive
region of the nucleus of the solitary tract (Sol) is located within r9 (a,
e) while the Gal-positive region of that nucleus is located within r10
(c, j) as deduced from the comparison with similar sections processed
for ISH detection of Hoxb5 and -b6 genes
Brain Struct Funct
123

We analyzed the material from the forementioned
databases (Table 2) showing Gal mRNA expression
finding that at 14.5 dpc and P4 stages, the expression of
this gene appears particularly strong in a discrete neuronal
population located within the commissural/medial por-
tions of the nucleus of the solitary tract (Sol in Fig. 9c, j).
This Gal-positive subdivision lies posterior and medial to
the Cart population commented above. After comparison
with the domain of Hox6 paralogues that reach up to the
r9/r10 boundary (Fig. 9d, k, l), we concluded that this
Gal-positive population would be located within r10
(Fig. 9c, j).
Trh
Trh (thyrotropin-releasing hormone) is expressed princi-
pally in the hypothalamus, as described either by immu-
nohistochemistry or ISH in the perinatal and adult rodent
brain (Tsuruo et al. 1987; Hokfelt et al. 1989). Addition-
ally, in the medulla oblongata, Trh expression appears in
the raphe nuclei, external cuneate nucleus, dorsal vagal
complex and area postrema, according to the foremen-
tioned works.
Analyzing the material of the Allen Brain Institute,
we observed that at perinatal stages the medullary
expression of Trh mRNA appears principally in the
raphe nuclei and the hypoglossal motor nucleus. The
positive raphe nuclei are the ventral raphe magnus
(RMgV) in r5–r6 and the raphe pallidus (RPa) extending
from r7 to r11 (Alonso et al. 2013). The expression in
the hypoglossal nucleus is transient, since it disappears at
later stages (data not shown). The hypoglossal Trh
expression appears principally in two discrete neuronal
subpopulations (arrows in Fig. 10b, and data not shown).
We compared the position of these patches with the full
extent of the hypoglossal nucleus, identified by the
expression of Adam19 (Yan et al. 2011), detected by ISH
in sections from the Allen Brain (Fig. 10a). We used this
marker for motor nuclei instead of Chat because good
quality images were not available for the latter in the
Allen Brain public database. According to our segmental
map, the two hypoglossal Trh populations would be,
respectively, placed within r9 (or near the r9/r10 limit),
and in r11, as observed at 18.5 dpc and P4 (arrows in
Fig. 10b, and data not shown). These rhombomeres were
identified by comparison with similar sections processed
for Hoxb7 and Hoxb8 ISH (Fig. 10c, d). This molecular
regionalization of the hypoglossal motor nucleus may be
related to a temporal differentiation pattern (if this is
regulated heterochronically according to a segmental
pattern) or to differential specification of the motoneuron
pools that innervate different tongue muscles (Aldes
1995).
Discussion
We have found that in the embryonic and perinatal mouse
medulla oblongata Hox genes from the paralogue groups
3–8 display correlative differential anterior limits of
expression which follow the principle of 30–50 colinearity;
these limits are disposed transversally and subdivide this
hindbrain region into successive segment-like units. These
units can be easily correlated with equivalent territories of
the avian medulla oblongata, described according to their
antimeric delimitation relative to intersomitic boundaries
(Cambronero and Puelles 2000), as well as by a compa-
rable Hox paralogue expression pattern (Marın et al. 2008).
Therefore, the mouse medulla oblongata can also be sub-
divided into rhombomere-like hidden segments—crypto-
rhombomeres—which share with typical rhombomeres at
least their stepped Hox expression pattern, apart of a
standard dorsoventral structural organization (summarized
in Fig. 11). The cryptic molecular boundaries correlate
topographically with some nuclear or intranuclear trans-
verse boundaries visible cytoarchitectonically or chemo-
architectonically, and also mark some unexpected
intranuclear subdivisions.
The concept of medulla oblongata
Classical neuroembryology subdivided the embryonic
hindbrain into two territories called metencephalon and
myelencephalon (His 1904), conceived as rostral and
caudal hindbrain vesicles of the neural tube. These terri-
tories were assumed to give, respectively, rise to the pons
and medulla oblongata regions in the adult brain, conven-
tionally identified according to their external gross mor-
phology. Major morphological features attributed to the
pons included the cerebellum in its dorsal part and the
prominent basilar pontine nuclei together with the fibers of
the middle cerebellar peduncle ventrally, while in its turn
the medulla oblongata includes the pyramids and the
bilateral bulge of the inferior olive ventrally and the res-
tiform body (inferior cerebellar peduncle) and the dorsal
column nuclei dorsally; the pyramidal decussation appears
at its caudal end (Nieuwenhuys et al. 2008).
In contrast, modern developmental biology focused on the
analysis of early hindbrain regionalization into rhombo-
meres (started by Orr 1887), that is, into smaller segmental
units identified and characterized by cellular and molecular
criteria (Kallen 1953; Vaage 1969; Lumsden 1990; Krum-
lauf et al. 1993). Eventually, fate mapping experimental
analyses showed that the seemingly fading early segmental
boundaries were merely hidden, persisting throughout
ontogeny and correlating with distinct boundaries between
cytoarchitectonic subdivisions of the adult hindbrain (Marın
and Puelles 1995; Wingate and Lumsden 1996).
Brain Struct Funct
123
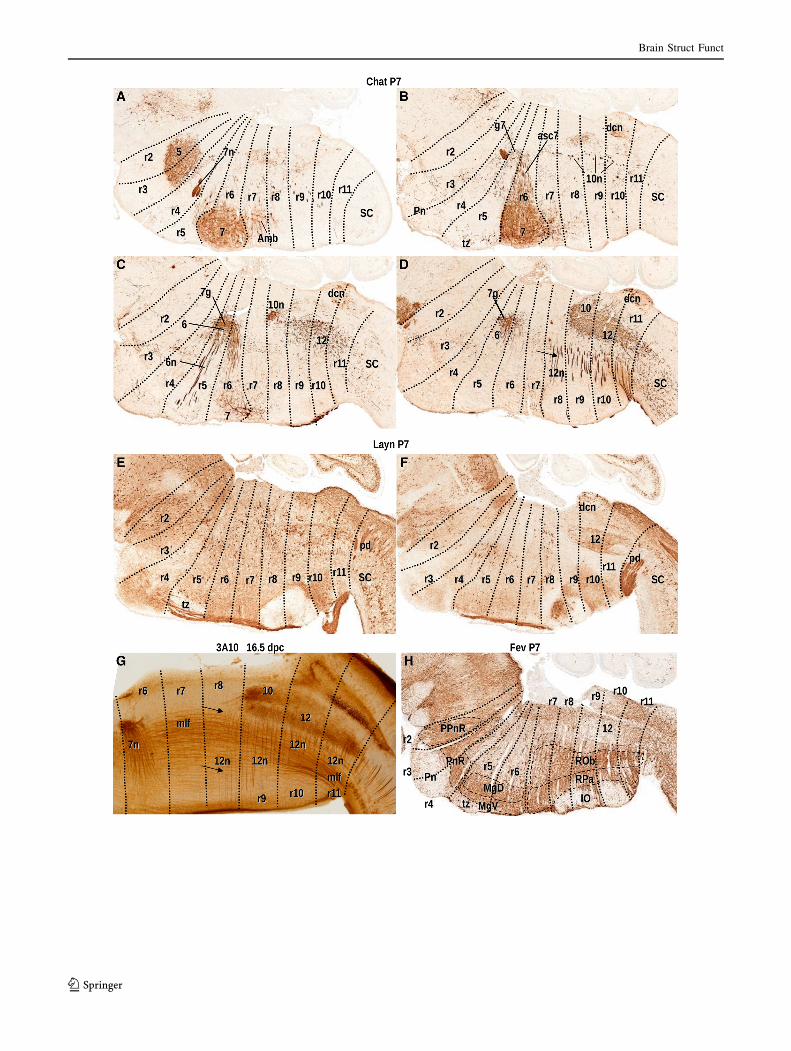
The forementioned fate maps, however, included only
the region of the pons, which appears overtly segmented at
early stages of development, while the medulla oblongata
essentially derives from a large, apparently unsegmented
territory found caudal to rhombomere r6. This caveat was
solved by Cambronero and Puelles (2000) who tested the
assumption that, similarly as in the spinal cord, hidden
caudal hindbrain segments might have boundaries anti-
meric to the intersomitic limits. The cryptic segmental map
of the chicken medulla that they obtained experimentally
(formed by segments of regular size, from r7 to r11) was
ulteriorly corroborated by the discovery of a corresponding
co-linear Hox expression pattern (Marın et al. 2008),
leading to the present-say concept of crypto-rhombomeres
(Puelles 2013). The set of five overt rhombomeres (r2–r6)
plus the cryptic isthmus and r1 units (r0–r1) and the crypto-
rhombomeres r7–r11 build up a division of the embryonic
and adult hindbrain into 12 transverse units, which cannot
be conciliated causally with the classic simpler schema of
metencephalon and myelencephalon (the latter are now
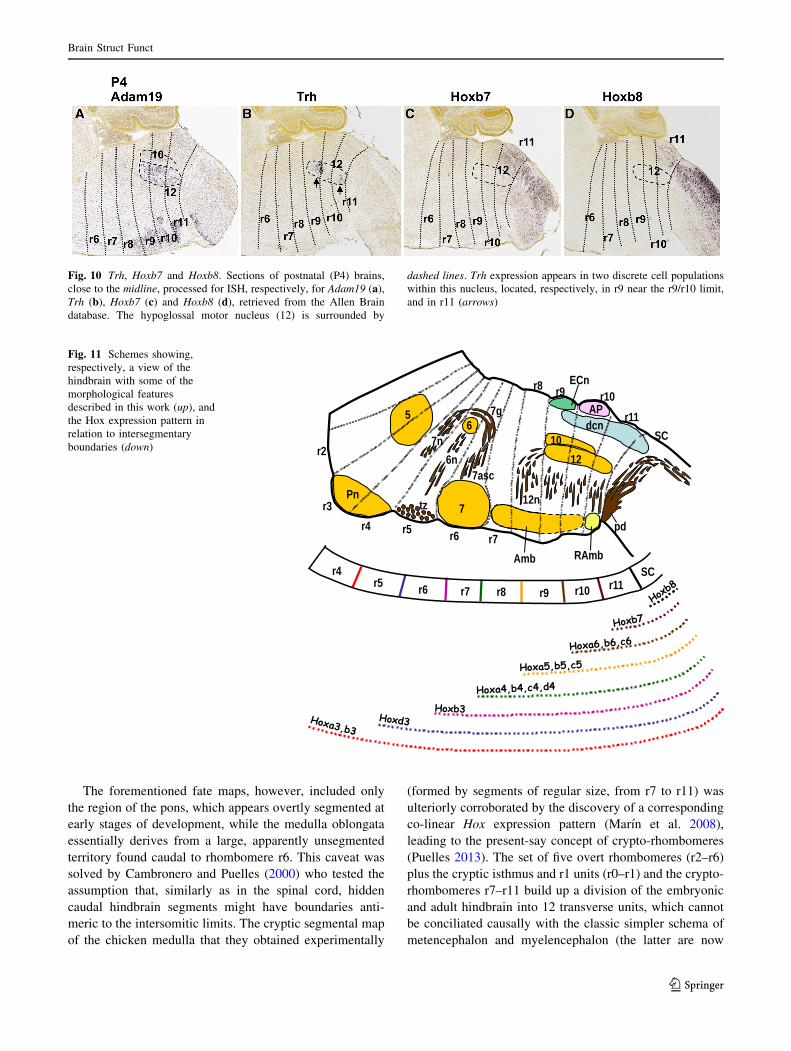
Fig. 10 Trh, Hoxb7 and Hoxb8. Sections of postnatal (P4) brains,
close to the midline, processed for ISH, respectively, for Adam19 (a),
Trh (b), Hoxb7 (c) and Hoxb8 (d), retrieved from the Allen Brain
database. The hypoglossal motor nucleus (12) is surrounded by
dashed lines. Trh expression appears in two discrete cell populations
within this nucleus, located, respectively, in r9 near the r9/r10 limit,
and in r11 (arrows)
Fig. 11 Schemes showing,
respectively, a view of the
hindbrain with some of the
morphological features
described in this work (up), and
the Hox expression pattern in
relation to intersegmentary
boundaries (down)
Brain Struct Funct
123

regarded as obsolete concepts, due to the experimental
falsation derived from the fate mapping and molecular
studies; they should no longer be used in neuroanatomy, to
avoid confusion); Puelles (2013) proposed that the classic
metencephalon can be conveniently reclassified into isth-
mus (r0), prepontine (r1–r2), pontine (r3–r4) and retro-
pontine (r5–r6) regions, whereas the r7–r11 crypto-
rhombomeres build the medulla oblongata proper (see also
the reference atlases of the Allen Developing Mouse Brain
Atlas; developing mouse.brain-atlas.org).
The experimentally corroborated developmental orga-
nization of the medulla oblongata into five transversal units
derived from respective crypto-rhombomeres, which was
reported first for chicken embryos (Cambronero and Pu-
elles 2000; Marın et al. 2008) can be extrapolated to the
mammalian hindbrain according to the highly conserved
Hox gene expression pattern, as we demonstrated in this
work. Similar studies would be predicted to validate the
same pattern in other vertebrate phyla, as is suggested
already by a number of comparative anatomic results (Neal
1918; Bergquist 1952; Vaage 1969; Nieuwenhuys 1998,
2011; Murakami et al. 2004; Rodrıguez-Moldes et al.
2011).
The role of Hox genes in the regionalization of the pons
and medulla oblongata
Hox genes are involved in multiple developmental pro-
cesses requiring different positional identities along a given
spatial axis, considering in vertebrates either the body plan
of the whole organism, or particular structures such as the
neural tube, the embryonic gut or the digits (Zakany and
Duboule 1999; Mallo et al. 2010).
In the case of the neural tube, in particular the portion of
the hindbrain with typical overt rhombomeres r2–r6
(vaguely referred to as the’pons’), the graded expression of
Hox paralogues according to their genomic colinearity is
known to participate in the acquisition of differential
identity by each of these rhombomeres, due to the activa-
tion of unique combinations of transcription factors within
each unit (Tumpel et al. 2009). However, this is not the
only mechanism responsible for rostrocaudal regionaliza-
tion, since, additionally, the neuroepithelium of neighbor-
ing rhombomeres may become isolated by boundaries that
restrict the intermingling of proliferating neuroepithelial
cell clones, and apparently also the transmission of mor-
phogenetic signals via neuroepithelial gap junctions,
between adjacent rhombomeres (Fraser et al. 1990;
Martınez et al. 1992; Jimenez-Guri et al. 2010). These
secondary phenomena contribute to the morphologic defi-
nition and differential structural differentiation of the overt
rhombomeric territories as a result of the relative autonomy
of their respective histogenetic processes, which affects as
well differential axonal navigation (Lumsden and Keynes
1989; Clarke and Lumsden 1993). These distinct features
of overt interrhombomeric boundaries apparently are not
shared by the crypto-rhombomeric limits, leading to the
tendency to produce more homogeneous (apparently con-
tinuous) plurineuromeric columns of derivatives in the case
of both motor and sensory nuclei. Nevertheless, funda-
mental molecular segmentation characterizes the whole
hindbrain and largely resides in the observed co-linear
pattern of Hox gene expression (r2–r11), amplified by the
rostral distinction between isthmus and r1. This molecular
pattern is able to establish iterated causally relevant
transverse molecular boundaries and corresponding dif-
ferential segmental molecular identity codes throughout
this brain territory. There is evidence for patterns corrob-
orating the whole hindbrain as an unitary primary devel-
opmental field or brain tagma, as indicated, e.g., by the
development of serotonergic neurons (Alonso et al. 2013).
The delimiting patterns that appear restricted to overt
rhombomeres can be assumed to obey particular secondary
patterning or interactive effects occurring within a specific
subset of rhombomeres (r2–r6).
In conclusion, the medulla oblongata, formed by the
crypto-rhombomeres r7–r11, develops under the influence
of a graded Hox pattern that strictly continues the pattern
observed across the overt rhombomeres (Marın et al. 2008;
present work), but apparently lacks intersegmental
boundaries identifiable according to the criteria valid for
overt segments. That is, the cellular and molecular char-
acteristics of interrhombomeric boundaries, such as clonal
lineage restriction (Fraser et al. 1990; Jimenez-Guri et al.
2010), reduced gap junction permeability (Martınez et al.
1992), specific cell cycle kinetics (Guthrie et al. 1991) and
expression of some specific molecular markers (Heyman
et al. 1995) appear only at the boundaries r1/r2–r6/r7.
Therefore, we postulate that in the medullary hindbrain, the
Hox code works as a source of periodically distributed
positional information for the migration, aggregation and
differentiation of neuronal derivatives of the crypto-
rhombomeres, whose development does not require the
level of segregation found at the overt rhombomeres. Note
that, irrespective of these differences, some quite sharp
cytoarchitectonic boundaries develop within the medullary
region, as exemplified by the limit between the interpolar
and caudal divisions of the spinal trigeminal column.
Recently, gain- and loss-of-function experiments in
mouse and chick embryos have shown that Hox proteins
from the paralogue groups 1–4 drive the neuroepithelial
cellular segregation at interrhombomeric boundaries,
inducing as well the typical morphology of the cells at
these limits (Prin et al. 2014). Unfortunately, these authors
did not examine the medullary hindbrain; it would be of
interest to study with this approach the cryptic medullary
Brain Struct Funct
123

segmental units defined by a comparable Hox expression
pattern (Marın et al. 2008; present results) but lacking as
far as we presently know lineage-restricted and cyto-
chemically defined boundaries, as commented above.
Possible significance of the expression of Hox genes
in the hindbrain at late developmental stages
Historically, the hindbrain was assumed to lose its original
segmental structure by late developmental stages. The
rhombomeres were thus held to be transient structures of
the early neural tube, since they could not be recognized
morphologically in the more differentiated brain (Vaage
1969; Lumsden 1990). The correlation of distinct neuronal
populations with particular rhombomeric territories was
accepted only for the motor nuclei, since these coexist
temporarily with the visible rhombomeres (Neal 1918;
Vaage 1969; Lumsden 1990). This view changed when it
was shown by quail-chick fate mapping experiments that
the rhombomeres keep their morphological limits as hidden
segmental units at least until late gestational stages (Marın
and Puelles 1995; Wingate and Lumsden 1996). Ulteriorly,
Cambronero and Puelles (2000) found the same result for
the avian medullary crypto-rhombomeres, which are never
visible morphologically. Additionally, labeling of the
rhombomeres by transgenesis in the mouse also has shown
the persistence of the delimited neuromere-derived fields
until adult stages (Farago et al. 2006; Pasqualetti et al.
2007; Di Bonito et al. 2013).
According to these fate maps, a segmental map of the
adult hindbrain can be elaborated (reviewed in Puelles
et al. 2007; Nieuwenhuys 2011; Puelles 2013) including
the position of all the neuronal populations in relation to
the segmental scaffold. However, many classic hindbrain
anatomic entities (cell populations or nuclei) do not display
a one-to-one relationship with particular rhombomeres,
revealing a multi- or plurisegmental origin (note such
columns may be structurally homogeneous or not). This
raises the possibility that the original multiple Hox gene
code of each complex columnar entity conditions the
ulterior development of specific identities of subpopula-
tions or subnuclei inside those structures (Puelles et al.
2007; Puelles 2013).
In this regard, we have shown that both overt and cryptic
rhombomeres develop their differential segmental structure
maintaining their endogenous primary Hox expression
pattern (with minor variations), at least until late gesta-
tional stages in the chick (Marın et al. 2008) and perinatal
stages in the mouse (present work). This suggests that the
Hox genes have a role in the differential development of
these segments beyond their early role in the molecular
segmentation of the neuroepithelium. These transcription
factors, acting interactively with dorsoventral fate
determinants, may govern the production of specific neu-
ronal phenotypes, e.g., cells using specific neurotransmit-
ters and transmitter-related molecules, as well as the
establishment of detailed patterns of connections which
display a segmental pattern (e.g., Dıaz et al. 1998).
The segmental-like maintenance of the Hox pattern is
particularly striking in the case of the basilar pontine
nuclei, which develop within r3 and r4 (Pasqualetti et al.
2007; Geisen et al. 2008; Di Bonito et al. 2013; see
Fig. 1h) after a complex route of tangential migration; they
supposedly come as a whole from the r6–r9 rhombic lip
progenitor area (Geisen et al. 2008; present data). Our ISH
results suggest that these cell populations keep memory of
their original Hox expression profile within the co-linear
rostrocaudal segmental sequence. Notably, the anterior
portion of these nuclei located within r3 possibly derives
from r6 to r7, according to its expression of Hox3 para-
logue genes (Fig. 2c, d, f), while the posterior portion
formed within r4 would derive from r8, according to its
expression of Hox4 genes (Figs. 3e, 4b–f). An additional
caudal sliver derived from r9 (at the back of r4) may be
distinguished according to its Hox5 expression (Fig. 5h
and data not shown).
Concerning the typical motor and sensory columnar
anatomic structures of the medulla oblongata (the ambig-
uus, hypoglossal and vagal nuclei, the nucleus of the sol-
itary tract, the trigeminal and vestibular columns, and the
dorsal column nuclei) as well as the inferior olive and the
reticular formation, we also showed that they display an AP
molecular regionalization according to the co-linear
expression of Hox genes. The Hox pattern thus apparently
provides a scaffold that potentially organizes the detailed
heterogeneity of neuronal populations along the AP axis up
to intracolumnar levels of subdivision that were not con-
sidered by the classic neuroanatomists. Medullary systems
such as the inferior olive with an internal AP pattern of
olivocerebellar projections (Sotelo et al. 1984), the tri-
geminal descending column subdivided into architectonic
and hodologic subregions along its AP axis (Ashwell et al.
2006), or the respiratory rhythm generator in the rostral
ventrolateral medulla (Borday et al. 2006; Duchcherer et al.
2013), would likely be organized according to this seg-
mental pattern. Further developmental, anatomic and
physiological experiments examining these implicit
(cryptically delimited) neuronal subpopulations keeping in
mind the Hox positional scaffold and/or mouse lines
characterized by conditional Hox loss-of-function are
needed to examine this possibility.
Acknowledgments We thank C. Reyes Mendoza, M. Carmen
Fernandez, M. Carmen Morga and Isabel Piqueras for technical
assistance. This study has been supported by a contract
04548-GERM-06 from the Fundacion Seneca of the Government of
the Murcia Region and grant MICINN-BFU2008-04156 from the
Brain Struct Funct
123

Spanish Ministry of Science and Innovation to L.P. L.T-R. and R.C–
S-M were recipient of respective predoctoral fellowships from the
above-mentioned Fundacion Seneca contract. We also thank RZPD,
imaGenes GmbH and Geneservice Ltd for providing cDNA clones;
and GenePaint.org, Allen Institute for Brain Science, and The Gene
Expression Nervous System Atlas (GENSAT) database projects for
providing part of the images analyzed in this work. The 3A10 anti-
body developed by T.M. Jessell and J. Dodd was obtained from the
Developmental Studies Hybridoma Bank developed under the aus-
pices of the NICHD and maintained by The University of Iowa,
Department of Biology, Iowa City, IA, USA. cDNA clones were
sequenced by the Molecular Biology Lab of the SAI (Servicio de
Apoyo a la Investigacion) at the University of Murcia.
Conflict of interest The authors state that no conflict of interest is
involved in the present publication.
References
Aldes LD (1995) Subcompartmental organization of the ventral
(protrusor) compartment in the hypoglossal nucleus of the rat.
J Comp Neurol 353:89–108
Alonso A, Merchan P, Sandoval JE, Sanchez-Arrones L, Garcia-
Cazorla A, Artuch R, Ferran JL, Martınez-de-la-Torre M, Puelles
L (2013) Development of the serotonergic cells in murine raphe
nuclei and their relations with rhombomeric domains. Brain
Struct Funct 218:1229–1277
Amat JA (1986) Compartimentacion y dinamica neurogenetica del
tubo neuronal del embrion de pollo. Manifestacion heterocronica
del plan estructural del neuroeje. Dissertation, University of
Murcia, Spain
Ashwell KW, Hardman CD, Paxinos G (2006) Cyto- and chemoar-
chitecture of the sensory trigeminal nuclei of the echidna,
platypus and rat. J Chem Neuroanat 31:81–107
Behringer RR, Crotty DA, Tennyson VM, Brinster RL, Palmiter RD,
Wolgemuth DJ (1993) Sequences 50 of the homeobox of the
Hox-1.4 gene direct tissue-specific expression of lacZ during
mouse development. Development 117:823–833
Bergquist H (1952) Studies on the cerebral tube in vertebrates. The
neuromeres. Acta Zool 33:117–187
Borday C, Vias C, Autran S, Thoby-Brisson M, Champagnat J, Fortin
G (2006) The pre-Botzinger oscillator in the mouse embryo.
J Physiol Paris 100:284–289
Boulet AM, Capecchi MR (1996) Targeted disruption of hoxc-4
causes esophageal defects and vertebral transformations. Dev
Biol 177:232–249
Breier G, Dressler GR, Gruss P (1988) Primary structure and
developmental expression pattern of Hox 3.1, a member of the
murine Hox 3 homeobox gene cluster. EMBO J 7:1329–1336
Cambronero F, Puelles L (2000) Rostrocaudal nuclear relationships in
the avian medulla oblongata: a fate map with quail chick
chimeras. J Comp Neurol 427:522–545
Capecchi MR (1997) Hox genes and mammalian development. Cold
Spring Harb Symp Quant Biol 62:273–281
Cheung CC, Hohmann JG, Clifton DK, Steiner RA (2001) Distribu-
tion of galanin messenger RNA-expressing cells in murine brain
and their regulation by leptin in regions of the hypothalamus.
Neuroscience 103:423–432
Clarke JD, Lumsden A (1993) Segmental repetition of neuronal
phenotype sets in the chick embryo hindbrain. Development
118:151–162
Cordes SP (2001) Molecular genetics of cranial nerve development in
mouse. Nat Rev Neurosci 2:611–623
Di Bonito M, Narita Y, Avallone B, Sequino L, Mancuso M, Andolfi
G, Franze AM, Puelles L, Rijli FM, Studer M (2013) Assembly
of the auditory circuitry by a Hox genetic network in the mouse
brainstem. PLoS Genet 9:e1003249. doi:10.1371/journal.pgen.
1003249
Dıaz C, Puelles L, Marın F, Glover JC (1998) The relationship
between rhombomeres and vestibular neuron populations as
assessed in quail-chicken chimeras. Dev Biol 202:14–28
Duchcherer M, Baghdadwala MI, Paramonov J, Wilson RJA (2013)
Localization of essential rhombomeres for respiratory rhythm
generation in bullfrog tadpoles using a binary search algo-
rithm: rhombomere 7 is essential for the gill rhythm and
suppresses lung bursts before metamorphosis. Dev Neurobiol
73:888–898
Dun SL, Castellino SJ, Yang J, Chang JK, Dun NJ (2001) Cocaine-
and amphetamine-regulated transcript peptide-immunoreactivity
in dorsal motor nucleus of the vagus neurons of immature rats.
Brain Res Dev Brain Res 131:93–102
Fantin A, Vieira JM, Plein A, Maden CH, Ruhrberg C (2013) The
embryonic mouse hindbrain as a qualitative and quantitative
model for studying the molecular and cellular mechanisms of
angiogenesis. Nat Protoc 8:418–429
Farago AF, Awatramani RB, Dymecki SM (2006) Assembly of the
brainstem cochlear nuclear complex is revealed by intersectional
and subtractive genetic fate maps. Neuron 50:205–218
Franklin KBJ, Paxinos G (2008) The mouse brain in stereotaxic
coordinates, 3rd edn. Elsevier, Amsterdam
Fraser S, Keynes R, Lumsden A (1990) Segmentation in the chick
embryo hindbrain is defined by cell lineage restrictions. Nature
344:431–435
Garel S, Garcia-Dominguez M, Charnay P (2000) Control of the
migratory pathway of facial branchiomotor neurones. Develop-
ment 127:5297–5307
Gaufo GO, Thomas KR, Capecchi MR (2003) Hox3 genes coordinate
mechanisms of genetic suppression and activation in the
generation of branchial and somatic motoneurons. Development
130:5191–5201
Gaunt SJ, Krumlauf R, Duboule D (1989) Mouse homeo-genes within
a subfamily, Hox-1.4, -2.6 and -5.1, display similar anteropos-
terior domains of expression in the embryo, but show stage- and
tissue-dependent differences in their regulation. Development
107:131–141
Gaunt SJ, Coletta PL, Pravtcheva D, Sharpe PT (1990) Mouse Hox-
3.4: homeobox sequence and embryonic expression patterns
compared with other members of the Hox gene network.
Development 109:329–339
Geisen MJ, Di Meglio T, Pasqualetti M, Ducret S, Brunet J-F,
Chedotal A, Rijli F (2008) Hox paralog group 2 genes control the
migration of mouse pontine neurons through Slit-Robo signaling.
PLoS Biol 6(6):e142
Gerhardt H, Ruhrberg C, Abramsson A, Fujisawa H, Shima D,
Betsholtz C (2004) Neuropilin-1 is required for endothelial tip
cell guidance in the developing central nervous system. Dev Dyn
231:503–509
Gray PA (2013) Transcription factors define the neuroanatomical
organization of the medullary reticular formation. Front Neuro-
anat 7:7. doi:10.3389/fnana.2013.00007
Gubert F, Zaverucha-do-Valle C, Pimentel-Coelho PM, Mendez-
Otero R, Santiago MF (2009) Radial glia-like cells persist in the
adult rat brain. Brain Res 1258:43–52
Guthrie S, Butcher M, Lumsden A (1991) Patterns of cell division and
interkinetic nuclear migration in the chick embryo hindbrain.
J Neurobiol 22:742–754
Heyman I, Faissner A, Lumsden A (1995) Cell and matrix speciali-
sations of rhombomere boundaries. Dev Dyn 204:301–315
Brain Struct Funct
123

Hidalgo-Sanchez M, Backer S, Puelles L, Bloch-Gallego E (2012)
Origin and plasticity of the subdivisions of the inferior olivary
complex. Dev Biol 371:215–226
His W (1904) Die Entwickelung des menschlichen Gehirns: wahrend
der ersten Monate. S. Hirzel, Leipzig
Hokfelt T, Tsuruo Y, Ulfhake B, Cullheim S, Arvidsson U, Foster
GA, Schultzberg M, Schalling M, Arborelius L, Freedman J
(1989) Distribution of TRH-like immunoreactivity with special
reference to coexistence with other neuroactive compounds. Ann
N Y Acad Sci 553:76–105
Holstege JC, de Graaff W, Hossaini M, Cardona Cano S, Jaarsma D,
van den Akker E, Deschamps J (2008) Loss of Hoxb8 alters
spinal dorsal laminae and sensory responses in mice. Proc Natl
Acad Sci USA 105:6338–6343
Izpisua-Belmonte JC, Dolle P, Renucci A, Zappavigna V, Falkenstein
H, Duboule D (1990) Primary structure and embryonic expres-
sion pattern of the mouse Hox-4.3 homeobox gene. Development
110:733–745
Jimenez-Guri E, Udina F, Colas J-F, Sharpe J, Padron-Barthe L,
Torres M, Pujades C (2010) Clonal analysis in mice underlines
the importance of rhombomeric boundaries in cell movement
restriction during hindbrain segmentation. PLoS One 5:e10112.
doi:10.1371/journal.pone.0010112
Kalia M, Fuxe K, Goldstein M (1985) Rat medulla oblongata. II.
Dopaminergic, noradrenergic (A1 and A2) and adrenergic
neurons, nerve fibers, and presumptive terminal processes.
J Comp Neurol 233:308–332
Kallen B (1953) On the Significance of the Neuromeres and Similar
Structures in Vertebrate Embryos. J Embryol Exp Morphol
1:387–392
Kiecker C, Lumsden A (2005) Compartments and their boundaries in
vertebrate brain development. Nat Rev Neurosci 6:553–564
Kimura H, McGeer PL, Peng J-H, McGeer EG (1984) Choline
acetyltransferase-containing neurons in the rat brain. In: Bjorkl-
und A, Hokfelt T, Kuhar MJ (eds) Handbook of chemical
neuroanatomy, vol 3: classical transmitters and transmitter
receptors in the CNS. Elsevier, Amsterdam, pp 51–67
Koylu EO, Couceyro PR, Lambert PD, Kuhar MJ (1998) Cocaine- and
amphetamine-regulated transcript peptide immunohistochemical
localization in the rat brain. J Comp Neurol 391:115–132
Krumlauf R (1993) Hox genes and pattern formation in the branchial
region of the vertebrate head. Trends Genet 9:106–112
Krumlauf R, Marshall H, Studer M, Nonchev S, Sham MH, Lumsden
A (1993) Hox homeobox genes and regionalisation of the
nervous system. J Neurobiol 24:1328–1340
Lim TM, Jaques KF, Stern CD, Keynes RJ (1991) An evaluation of
myelomeres and segmentation of the chick embryo spinal cord.
Development 113:227–238
Lumsden A (1990) The cellular basis of segmentation in the
developing hindbrain. Trends Neurosci 13:329–335
Lumsden A, Keynes R (1989) Segmental patterns of neuronal
development in the chick hindbrain. Nature 337:424–428
Lumsden A, Krumlauf R (1996) Patterning the vertebrate neuraxis.
Science 274:1109–1115
Mahon KA, Westphal H, Gruss P (1988) Expression of homeobox
gene Hox 1.1 during mouse embryogenesis. Development
104(Suppl):187–195
Mallo M, Wellik DM, Deschamps J (2010) Hox genes and regional
patterning of the vertebrate body plan. Dev Biol 344:7–15
Manzanares M, Cordes S, Ariza-McNaughton L, Sadl V, Maruthainar
K, Barsh G, Krumlauf R (1999) Conserved and distinct roles of
kreisler in regulation of the paralogous Hoxa3 and Hoxb3 genes.
Development 126:759–769
Marın F, Puelles L (1995) Morphological fate of rhombomeres in
quail/chick chimeras: a segmental analysis of hindbrain nuclei.
Eur J Neurosci 7:1714–1738
Marın F, Aroca P, Puelles L (2008) Hox gene colinear expression in
the avian medulla oblongata is correlated with pseudorhombo-
meric domains. Dev Biol 323:230–247
Martınez S (2001) The isthmic organizer and brain regionalization.
Int J Dev Biol 45:367–371
Martınez S, Geijo E, Sanchez-Vives MV, Puelles L, Gallego R (1992)
Reduced junctional permeability at interrhombomeric bound-
aries. Development 116:1069–1076
Minamikawa T, Miyake T, Takamatsu T, Fujita S (1987) A new
method of lectin histochemistry for the study of brain angio-
genesis. Lectin angiography. Histochemistry 87:317–320
Murakami Y, Pasqualetti M, Takio Y, Hirano S, Rijli FM, Kuratani S
(2004) Segmental development of reticulospinal and branchio-
motor neurons in lamprey: insights into the evolution of the
vertebrate hindbrain. Development 131:983–995
Neal HV (1918) Neuromeres and metameres. J Morphol 31:293–315
Nieto MA, Patel K, Wilkinson DG (1996) In situ hybridization
analysis of chick embryos in whole mount and tissue sections.
Methods Cell Biol 51:219–235
Nieuwenhuys R (1998) Morphogenesis and general structure. In:
Nieuwenhuys R, ten Donkelaar HJ, Nicholson C (eds) The
central nervous system of vertebrates. Springer-Verlag, Berlin,
pp 159–228
Nieuwenhuys R (2011) The structural, functional, and molecular
organization of the brainstem. Front Neuroanat 5:33. doi:10.
3389/fnana.2011.00033
Nieuwenhuys R, Voogd J, van Huijzen C (2008) The human central
nervous system. Springer, New York
Orr H (1887) Contribution to the embryology of the lizard; With
especial reference to the central nervous system and some organs
of the head; together with observations on the origin of the
vertebrates. J Morphol 1:311–372
Packer AI, Crotty DA, Elwell VA, Wolgemuth DJ (1998) Expression
of the murine Hoxa4 gene requires both autoregulation and a
conserved retinoic acid response element. Development
125:1991–1998
Pasqualetti M, Dıaz C, Renaud J-S, Rijli FM, Glover JC (2007) Fate-
mapping the mammalian hindbrain: segmental origins of
vestibular projection neurons assessed using rhombomere-spe-
cific Hoxa2 enhancer elements in the mouse embryo. J Neurosci
27:9670–9681
Prin F, Serpente P, Itasaki N, Gould AP (2014) Hox proteins drive
cell segregation and non-autonomous apical remodelling during
hindbrain segmentation. Development 141:1492–1502
Puelles L (2013) Plan of the developing vertebrate nervous system:
relating embryology to the adult nervous system (prosomere
model, overview of brain organization). In: Rakic P, Rubenstein
J (eds) Patterning and Cell Type Specification in the Developing
Cns and Pns. Elsevier, Amsterdam, pp 187–209
Puelles L, Rubenstein JL (1993) Expression patterns of homeobox
and other putative regulatory genes in the embryonic mouse
forebrain suggest a neuromeric organization. Trends Neurosci
16:472–479
Puelles L, Rubenstein JLR (2003) Forebrain gene expression domains
and the evolving prosomeric model. Trends Neurosci 26:469–476
Puelles L, Martinez-de-la-Torre M, Paxinos G, Watson C, Martınez S
(2007) The chick brain in stereotaxic coordinates: an atlas
featuring neuromeric subdivisions and mammalian homologies.
Academic Press, Amsterdam
Rodrıguez-Moldes I, Carrera I, Pose-Mendez S, Quintana-Urzainqui I,
Candal E, Anadon R, Mazan S, Ferreiro-Galve S (2011) Region-
alization of the shark hindbrain: a survey of an ancestral organi-
zation. Front Neuroanat 5:16. doi:10.3389/fnana.2011.00016
Rubenstein JL, Martinez S, Shimamura K, Puelles L (1994) The
embryonic vertebrate forebrain: the prosomeric model. Science
266:578–580
Brain Struct Funct
123

Schughart K, Utset MF, Awgulewitsch A, Ruddle FH (1988)
Structure and expression of Hox-2.2, a murine homeobox-
containing gene. Proc Natl Acad Sci USA 85:5582–5586
Shimeld SM, Gaunt SJ, Coletta PL, Geada AM, Sharpe PT (1993)
Spatial localisation of transcripts of the Hox-C6 gene. J Anat
183:515–523
Sotelo C, Bourrat F, Triller A (1984) Postnatal development of the
inferior olivary complex in the rat. II. Topographic organization
of the immature olivocerebellar projection. J Comp Neurol
222:177–199
Specht LA, Pickel VM, Joh TH, Reis DJ (1981a) Light-microscopic
immunocytochemical localization of tyrosine hydroxylase in
prenatal rat brain. I. Early ontogeny. J Comp Neurol
199:233–253
Specht LA, Pickel VM, Joh TH, Reis DJ (1981b) Light-microscopic
immunocytochemical localization of tyrosine hydroxylase in
prenatal rat brain. II. Late ontogeny. J Comp Neurol
199:255–276
Stern CD, Jaques KF, Lim TM, Fraser SE, Keynes RJ (1991)
Segmental lineage restrictions in the chick embryo spinal cord
depend on the adjacent somites. Development 113:239–244
Studer M (2001) Initiation of facial motoneurone migration is
dependent on rhombomeres 5 and 6. Development
128:3707–3716
Theiler K (1989) The house mouse: atlas of embryonic development.
Springer, New York
Toth LE, Slawin KL, Pintar JE, Nguyen-Huu MC (1987) Region-
specific expression of mouse homeobox genes in the embryonic
mesoderm and central nervous system. Proc Natl Acad Sci USA
84:6790–6794
Tsuruo Y, Hokfelt T, Visser T (1987) Thyrotropin releasing hormone
(TRH)-immunoreactive cell groups in the rat central nervous
system. Exp Brain Res 68:213–217
Tumpel S, Wiedemann LM, Krumlauf R (2009) Hox genes and
segmentation of the vertebrate hindbrain. Curr Top Dev Biol
88:103–137
Vaage S (1969) The segmentation of the primitive neural tube in
chick embryos (Gallus domesticus). A morphological, histo-
chemical and autoradiographical investigation. Ergeb Anat
Entwicklungsgesch 41:3–87
Vivancos V, Chen P, Spassky N, Qian D, Dabdoub A, Kelley M,
Studer M, Guthrie S (2009) Wnt activity guides facial branchi-
omotor neuron migration, and involves the PCP pathway and
JNK and ROCK kinases. Neural Dev 4:7
Vogels R, de Graaff W, Deschamps J (1990) Expression of the murine
homeobox-containing gene Hox-2.3 suggests multiple time-
dependent and tissue-specific roles during development. Devel-
opment 110:1159–1168
Watson C (2012) Hindbrain. In: Watson C, Paxinos G, Puelles L (eds)
The Mouse Nervous System. Elsevier Academic Press, Amster-
dan, pp 398–423
Watson C, Paxinos G (2009) Chemoarchitectonic atlas of the mouse
brain. Academic Press, London
Watson C, Kirkcaldie M, Paxinos G (2010) The Brain. An Introduc-
tion to Functional Neuroanatomy. Academic Press, London
Wickstrom R, Holgert H, Lagercrantz H, Hokfelt T (2000) Perinatal
distribution of galanin and galanin receptor-1 mRNA in the rat
hindbrain. Brain Res Dev Brain Res 123:53–65
Wilkinson DG, Krumlauf R (1990) Molecular approaches to the
segmentation of the hindbrain. Trends Neurosci 13:335–339
Wingate RJ, Lumsden A (1996) Persistence of rhombomeric orga-
nisation in the postsegmental hindbrain. Development
122:2143–2152
Yan X, Lin J, Markus A, Rolfs A, Luo J (2011) Regional expression
of ADAM19 during chicken embryonic development. Dev
Growth Differ 53:333–346
Zakany J, Duboule D (1999) Hox genes in digit development and
evolution. Cell Tissue Res 296:19–25
Brain Struct Funct
123