cross-regulation among disparate antibiotic biosynthetic pathways of streptomyces coelicolor
TRANSCRIPT

Molecular Microbiology (2005)
58
(5) 1276ndash1287 doi101111j1365-2958200504879xFirst published online 3 November 2005
copy 2005 The AuthorsJournal compilation copy 2005 Blackwell Publishing Ltd
Blackwell Science LtdOxford UKMMIMolecular Microbiology0950-382Xcopy 2005 The Authors Journal compilation copy 2005 Blackwell Publishing Ltd
2005
58
512761287
Original Article
Cross-regulation between antibiotic pathwaysJ Huang
et al
Accepted 22 August 2005 For correspondence E-mail snco-henstanfordedu Tel (
+
1) 650 723 5315 Fax (
+
1) 650 725 1536Present addresses
dagger
Institut de Biologie et Chimie des ProteacuteinesUMR5086 Centre National de la Recherche Scientifique LyonFrance
Dagger
National Center for Genetic Engineering and Biotechnology(BIOTEC) 113 Thailand Science Park Phaholyothin Road Klong 1Klong Luang Pathumthani Thailand 12120
Cross-regulation among disparate antibiotic biosynthetic pathways of
Streptomyces coelicolor
Jianqiang Huang
1
Jing Shi
1
Virginie Molle
2dagger
Bjoumlrn Sohlberg
1
David Weaver
3
Maureen J Bibb
2
Nitsara Karoonuthaisiri
3Dagger
Chih-Jian Lih
1
Camilla M Kao
3
Mark J Buttner
2
and Stanley N Cohen
1
1
Department of Genetics MC 5120 Stanford University Stanford CA 94305 USA
2
Department of Molecular Microbiology John Innes Centre Colney Norwich NR4 7UH UK
3
Department of Chemical Engineering MC 5025 Stanford University Stanford CA 94305 USA
Summary
A complex programme of regulation governs geneexpression during development of the morphologi-cally and biochemically complex eubacterial genus
Streptomyces
Earlier work has suggested a model inwhich lsquohigher levelrsquo pleiotropic regulators activatelsquopathway-specificrsquo regulators located within chromo-somal gene clusters encoding biosynthesis of indi-vidual antibiotics We used mutational analysis andadventitious overexpression of key
Streptomycescoelicolor
regulators to investigate functionalinteractions among them We report here that cluster-situated regulators (CSRs) thought to be pathway-specific can also control other antibiotic biosyntheticgene clusters and thus have pleiotropic actionsSurprisingly we also find that CSRs exhibit growth-phase-dependent control over
afsR2afsS
a lsquohigherlevelrsquo pleiotropic regulatory locus not located withinany of the chromosomal gene clusters it targets andfurther demonstrate that cross-regulation by CSRs ismodulated globally and differentially during the
Scoelicolor
growth cycle by the RNaseIII homologueAbsB Our results which reveal a network of func-tional interactions among regulators that governproduction of antibiotics and other secondary metab-olites in
S coelicolor
suggest that revision of thecurrently prevalent view of higher-level versus path-
way-specific regulation of secondary metabolism in
Streptomyces
species is warranted
Introduction
Members of the Gram-positive eubacterial genus
Strepto-myces
are notable for their ability to produce a wide vari-ety of pharmaceutically useful compounds as secondarymetabolites these include antitumour agents immuno-suppressants and nearly two-thirds of currently availablenatural antibiotics (Chater and Bibb 1997 Challis andHopwood 2003) When cultured on solid media membersof the
Streptomyces
genus undergo a series of geneticallyprogrammed morphological and biochemical changesGermination of spores initiates vegetative growth of
Strep-tomyces
as a tangle of multinucleate hyphae that extendsinto the medium Later aerial hyphae that reach awayfrom the substrate appear develop cross-walls and gen-erate spores concurrent with this process is a biochemi-cal transition from primary to secondary metabolism(Hopwood 1988 Chater 1993)
Like most other streptomycetes
Streptomyces coeli-color
is known to synthesize a variety of chemicallydiverse secondary metabolites (Hopwood
et al
1995)Completion of the genome sequence led to the predictionof about two dozen pathways for secondary metabolitesin this organism antibiotics pigments siderophores sig-nalling molecules and complex lipids including hopanoids(Bentley
et al
2002) Earlier investigations indicate thatgenes encoding the products of individual pathways ofsecondary metabolism commonly grouped together onthe chromosome in physically distinct clusters are subjectto multiple levels of regulation (Arias
et al
1999) Someregulators are located within the group of chromosomallyclustered genes that they control and the actions of theselsquolow levelrsquo regulatory genes commonly are referred to aslsquopathway-specificrsquo (Bibb 1996) such
S coelicolor
genesinclude
actII-ORF4
of the actinorhodin (Act) biosyntheticgene cluster (Fernandez-Moreno
et al
1991) the
redD
and
redZ
genes of the undecylprodigiosin (Red) cluster(Takano
et al
1992 White and Bibb 1997) and
cdaR
of the calcium-dependent antibiotic (CDA) cluster(Chouayekh and Virolle 2002 Ryding
et al
2002)lsquoHigher levelrsquo regulatory genes largely situated outside ofbiosynthetic gene clusters exert pleiotropic effects on theproduction of multiple secondary metabolites or on both
Cross-regulation between antibiotic pathways
1277
copy 2005 The AuthorsJournal compilation copy 2005 Blackwell Publishing Ltd
Molecular Microbiology
58
1276ndash1287
secondary metabolism and morphological development(eg
afs
abs
and
bld
genes) An important question in
Streptomyces
biology is how these multiple levels of con-trol of antibiotic biosynthetic pathways are co-ordinated(Bibb 1996) The task of co-ordination is made even morecomplex by the production of multiple antibiotics in a sin-gle organism (Hopwood
et al
1995) and the occurrenceof multiple regulatory genes in some antibiotic gene clus-ters (White and Bibb 1997 Bate
et al
1999 Ryding
et al
2002)The availability of the
sim
87 Mb chromosomal DNAsequence of
S coelicolor
has enabled global investiga-tions of gene expression in this organism using DNAmicroarrays (Huang
et al
2001 Bentley
et al
2002Karoonuthaisiri
et al
2005) Earlier microarray-basedexperiments have shown that genes located within thesame biosynthetic gene cluster can be regulated differen-tially as well as co-ordinately during growth and develop-ment of
S coelicolor
(Huang
et al
2001) these studiesalso have identified chromosomally distant genes whoseexpression is co-ordinated with genes in antibiotic biosyn-thetic gene clusters and whose promoter regions resem-ble those of the biosynthetic genes While theseobservations argue that the actions of regulators locatedwithin biosynthetic gene clusters can extend beyond theirown cluster cluster-situated regulators (CSRs) continueto be viewed largely as lsquopathway-specificrsquo We report herethe results of microarray experiments aimed at gaining abetter understanding of functional interactions among thegenes that regulate expression of antibiotics during
Scoelicolor
development Our findings indicate that con-trary to current notions there is extensive lsquocross-talkrsquobetween CSRs of streptomycetes that these lsquolow levelrsquoregulators can control expression of genes designatedpreviously as lsquohigher levelrsquo regulators and that the extentof cross-talk between different biosynthetic pathways ismodulated by the pleiotropic regulator AbsB during thecell growth cycle Our results indicate that a complexnetwork of functional interactions exists among disparatebiosynthetic pathways of
S coelicolor
and suggest thatrevision of the currently prevalent paradigm for higher-level versus pathway-specific regulation of secondarymetabolism in
Streptomyces
species is warranted
Results
Effects of
absB
on expression of genes in antibiotic biosynthetic pathways
The
absB
gene of
S coelicolor
is a pleiotropic regulatorof antibiotic synthesis (Adamidis and Champness 1992)Earlier work has shown that mutations in
absB
whichencodes an RNase III homologue result in decreasedabundance of transcripts encoded by the
actII-ORF4
and
redD
genes which affect the expression of genes in the
Act and Red pathways respectively (Aceti and Champ-ness 1998) We sought to investigate the effects of CSRson antibiotic biosynthetic pathways in bacteria devoid ofAbsB-mediated lsquohigher-levelrsquo regulation to this end thechromosomally integrating
P
tipA
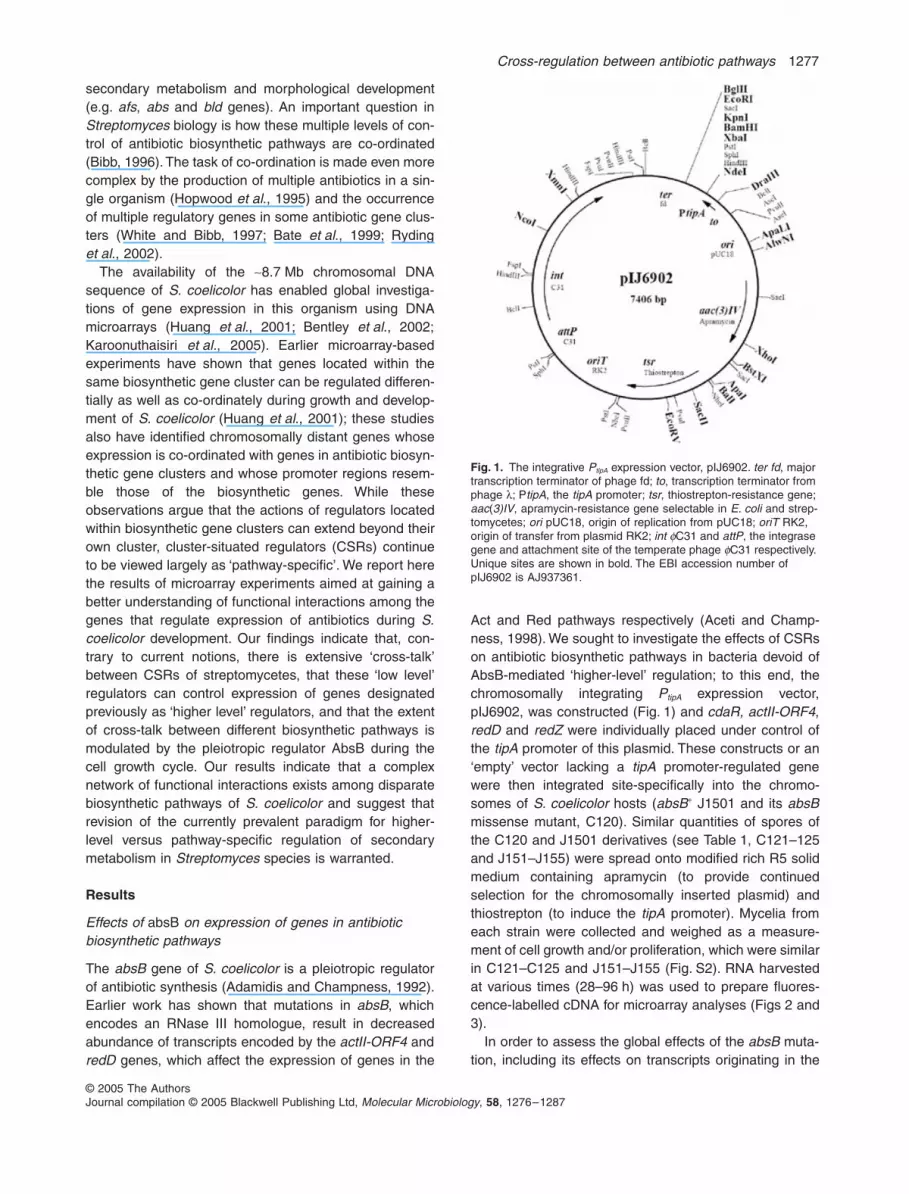
expression vectorpIJ6902 was constructed (Fig 1) and
cdaR actII-ORF4
redD
and
redZ
were individually placed under control ofthe
tipA
promoter of this plasmid These constructs or anlsquoemptyrsquo vector lacking a
tipA
promoter-regulated genewere then integrated site-specifically into the chromo-somes of
S coelicolor
hosts (
absB
+
J1501 and its
absB
missense mutant C120) Similar quantities of spores ofthe C120 and J1501 derivatives (see Table 1 C121ndash125and J151ndashJ155) were spread onto modified rich R5 solidmedium containing apramycin (to provide continuedselection for the chromosomally inserted plasmid) andthiostrepton (to induce the
tipA
promoter) Mycelia fromeach strain were collected and weighed as a measure-ment of cell growth andor proliferation which were similarin C121ndashC125 and J151ndashJ155 (Fig S2) RNA harvestedat various times (28ndash96 h) was used to prepare fluores-cence-labelled cDNA for microarray analyses (Figs 2 and3)
In order to assess the global effects of the
absB
muta-tion including its effects on transcripts originating in the
Fig 1
The integrative
P
tipA
expression vector pIJ6902
ter fd
major transcription terminator of phage fd
to
transcription terminator from phage
λ
P
tipA
the
tipA
promoter
tsr
thiostrepton-resistance gene
aac
(
3)IV
apramycin-resistance gene selectable in
E coli
and strep-tomycetes
ori
pUC18 origin of replication from pUC18
oriT
RK2 origin of transfer from plasmid RK2
int
φ
C31 and
attP
the integrase gene and attachment site of the temperate phage
φ
C31 respectively Unique sites are shown in bold The EBI accession number of pIJ6902 is AJ937361
1278
J Huang
et al
copy 2005 The AuthorsJournal compilation copy 2005 Blackwell Publishing Ltd
Molecular Microbiology
58
1276ndash1287
three known chromosomal clusters of antibiotic biosyn-thetic genes of
S coelicolor
at single gene resolution theCy5-dCTP red fluorescence-labelled cDNA from the
absB
ndash
and
absB
+
control strains [C121 (C120
tipA
p) andJ151 (J1501
tipA
p) respectively] was separately hybrid-ized on DNA microarrays with Cy3-dCTP green fluores-cence-labelled genomic J1501 DNA (Fig 2 and Fig S1also see web site httpsncohenlabstanfordedustreptomyces2 or httpwww-genomestanfordedumicroarray for raw data) From these experiments weobtained gene expression signatures for mycelium at dif-ferent stages of the bacterial growth cycle in the presence
or absence of
absB
function We observed that there areabout 200 genes having at least a sixfold difference inRNA abundance between
absB
ndash
and
absB
+
strains(Table S5) including genes involved in secondary metab-olism differentiation (eg
ramR
) and response to stress(eg the superoxide dismutase genes
sodF
12) Whilethe abundance of transcripts involved in secondarymetabolism was largely decreased by the
absB
mutationupregulation of transcript abundance in
absB
ndash
relative to
absB
+
bacteria was also observed (eg a gene cluster ofunknown function SCO4358ndash4363) (Fig 2 and Fig S1)
The abundance of mRNA encoded by
actII-ORF4
or
redD
and by previously demonstrated targets of thesegenes within the
act
and
red
clusters was increased
DNA-Cy3 J1501 genomic DNA
RNA-Cy5 C121 J151 vs
ActRed
3 red
2 act
4 typeI PKS
1 cda
5 Pig-ments
absB- absB+
(tipAp) (tipAp)
redD-independent genes
redD-dependent genes
SCO3211SCO3212SCO3213SCO3214SCO3215SCO3216SCO3217 cdaRSCO3218SCO3219SCO3220SCO3221SCO3222SCO3223SCO3224SCO3225SCO3226SCO3227SCO3228SCO3229SCO3230SCO3231SCO3232SCO3233SCO3234SCO3235SCO3236SCO3237SCO3238SCO3239SCO3240SCO3241SCO3242SCO3243SCO3244SCO3245SCO3246SCO3247SCO3248SCO3249
SCO5070SCO5071SCO5072SCO5073SCO5074SCO5075SCO5076SCO5077SCO5078SCO5079SCO5080SCO5081SCO5082SCO5083SCO5084SCO5085 actII-ORF4SCO5086SCO5087SCO5088SCO5089SCO5090SCO5091SCO5092
SCO5877 redDSCO5878SCO5879SCO5880SCO5881 redZSCO5882SCO5883SCO5884SCO5885SCO5887SCO5888 SCO5889 SCO5890 SCO5891 SCO5892 SCO5893 SCO5894SCO5895 SCO5896 SCO5897SCO5898 SCO5899
SCO6273SCO6274SCO6275SCO6276SCO6277SCO6278SCO6279SCO6280SCO6281SCO6282SCO6283SCO6284SCO6285SCO6286SCO6287SCO6288
28 36 41 48 72 96 28 36 48 60 72 96
ND
I IIgt8 foldlt18 fold
Fig 2 Transcriptional effects of absB on secondary metabolite path-ways RNA samples from the control strains C121(absBndash tipAp) and J151(absB+ tipAp) were isolated at the indicated time points For microarray experiments Cy3-dCTP (green)-labelled J1501 genomic DNA was hybridized with Cy5-dCTP (red)-labelled cDNA correspond-ing to total RNA of C121 (Panel I) and J151 (Panel II) (indicated in figure as lsquoDNA vs RNArsquo) Each individual secondary metabolite locus is shown in order of its position on the chromosome (panels 1ndash4) Rows correspond to individual genes and columns to different time points in hours after inoculation as indicated The change in tran-script abundance for each gene is displayed by means of a colour scale Brighter red shades represent higher transcript abundance and brighter green shades represent lower transcript abundance Black indicates an equal amount of cDNA and genomic DNA and grey represents the absence of data Red and blue arrows in panel 5 indicate the onset of Act or Red production respectively and ND indicates no detectable Act or Red production All original data can be downloaded from the Stanford Microarray Database (httpwww-genomestanfordedumicroarray)
Table 1 Strains used in this study
Strain Relevant characteristic(s) Reference
S coelicolor A3(2)J1501 hisA1 uraA1 strA1
SCP1ndash SCP2ndash PglndashKieser et al
(2000)C120 J1501 absB120 Price et al
(1999)C121 C120 tipAp This studyC122 C120 tipApcdaR This studyC123 C120 tipApactII-ORF4 This studyC124 C120 tipApredD This studyC125 C120 tipApredZ This studyJ151 J1501 tipAp This studyJ152 J1501 tipApcdaR This studyJ153 J1501 tipApactII-ORF4 This studyJ154 J1501 tipApredD This studyJ155 J1501 tipApredZ This studyM145 Prototroph SCP1ndash SCP2ndash Kieser et al
(2000)M512 M145 ∆redD ∆actII-ORF4 Floriano and
Bibb (1996)M550 M145 ∆redZ White and Bibb
(1997)E coli
DH5α InvitrogenET12567pUZ8002 dam dcm Kieser et al
(2000)
Cross-regulation between antibiotic pathways 1279
copy 2005 The AuthorsJournal compilation copy 2005 Blackwell Publishing Ltd Molecular Microbiology 58 1276ndash1287
sharply in absB+ bacteria (Fig 2) Similar effects wereobserved for actII-ORF4-regulated and redD-regulatedgenes located external to these clusters [eg the eca(expression co-ordinated with act) and ecr (expression co-ordinated with red) genes (Huang et al 2001) seeFig S3] These observations are consistent with earlierevidence that the actII-ORF4 and redD regulatory genesare subject to absB control (Aceti and Champness 1998)The cdaR gene and others in the cda cluster also wereupregulated in absB+ mycelium (Fig 2 panel II) howeverwhereas cda genes were activated by absB throughoutthe S coelicolor growth cycle absB expression resultedin upregulation of act and red cluster genes and in pro-duction of the antibiotics actinorhodin and undecylprodi-giosin (Fig 2 panel 5-II) only at later time pointssuggesting that additional factors whose actions aregrowth-phase-dependent can differentially modulate theeffects of absB on different biosynthetic pathways Addi-tionally the extent of absB-dependent upregulation oftranscript abundance was greater for certain genes withinindividual biosynthetic clusters [for example the red path-way transcriptional regulator RedZ (SCO5881) (White andBibb 1997) and a gene encoding a putative small hypo-thetical protein (SCO3218) in the cda cluster (Fig 2 pan-els 3 and 1)] although lower transcript abundancethroughout the cluster was observed in the absB mutantversus absB+ bacteria Quantitative real-time reverse tran-scription polymerase chain reaction (RT-PCR) analysis ofredZ SCO3218 and seven and eight other randomlyselected genes from each of the red and cda clustersconfirmed the quantitative difference in absB effectsamong genes of these clusters (see Table S2) Notwith-standing the production in absB mutant bacteria of tran-scripts of redZ which is believed to be a transcriptionalactivator of redD (White and Bibb 1997) the expressionof redD and redD-dependent genes (Huang et al 2001)and the biosynthesis of undecylprodigiosin were notobserved in the absB mutant C121 (Fig 2 panels 3 and5) This finding suggests that either AbsB itself or a sep-arate absB-regulated function is required along with redZfor redD activation and undecylprodigiosin productionTranscripts of the type I polyketide gene cluster showedincreased abundance at certain time points in both strains(Fig 2 panel 4) Exempted from regulation by absB weresome genes in the hopanoid and coelichelin biosyntheticpathways (Fig S1)
Effects of CSRs on expression of antibiotic pathways in the absence or presence of higher-level regulation
Our identification of genes in all three known S coelicolorantibiotic biosynthetic pathways that produce little or nomRNA in absBndash bacteria enabled us to compare theeffects of the cluster-situated regulatory genes cdaR
actII-ORF4 redD and redZ in the absence or presence ofextra-cluster control by absB In these experiments(Fig 3) gene expression in an absBndash strain that constitu-tively expressed cdaR actII-ORF4 redD or redZ from thetipA promoter [C122ndashC125 (tipApcdaRactII-ORF4redDredZ)] was compared through the growth-cycle withexpression in the control strain C121(tipAp) (Fig 3 pan-els AndashD) and in absB+ bacteria [J152ndashJ155 (tipApcdaRactII-ORF4redDredZ) versus J151 (tipAp)] (Fig 3 pan-els EndashH) Transcripts whose abundance showed a statis-tically significant change relative to either C121 or J151control strain (gt 75 genes in each cluster with P-valuelt005 see Table S4) are highlighted with red or greentriangles in Fig 3 The relative increase (red triangles) ordecrease (green triangles) in transcript abundance in thehighlighted groupings was confirmed by repeats of arrayexperiments and by quantitative real-time RT-PCR analy-sis of randomly selected transcripts (see Table S3)
As seen in Fig 3 in the absence of absB functionconstitutive expression of the cdaR actII-ORF4 and redDregulatory genes under control of the tipA promoterincreased the abundance of transcripts encoded by genesin their own biosynthetic clusters but decreased the abun-dance of transcripts from the type I polyketide gene clus-ter (Fig 3 panels 1A 2B 3C and 4AndashC) The genes mostprominently affected by redD include the previously iden-tified redD-dependent genes (Huang et al 2001) (Fig 3panel 3C) and ecr genes (Fig S3) In contrast while con-stitutive expression of redZ in the absence of absBresulted in increased expression of redD-independentgenes it failed to increase the transcripts regulated byredD despite elevation of the redD transcript itself argu-ing that absB acts directly or indirectly in concert with redZfor the production of functional RedD protein to activatethe redD-dependent genes (Fig 3 panel 3D) Theabsence of detectable undecylprodigiosin in extracts ofmycelium obtained from redZ overproducing bacteria(Fig 3 panel 5D) is consistent with these findings Impor-tantly redZ overexpression additionally increased theabundance of transcripts from the cda gene cluster(Fig 3 panel 1D) indicating that the actions of this CSRextend beyond the red pathway
In the presence of absB function transcripts of the cdaact and red clusters and of the type I polyketide genecluster were increased in abundance during certain peri-ods of the S coelicolor growth cycle (see Fig 2 panel II)Constitutive expression of cdaR actII-ORF4 and redDwhich activated expression of genes in their respectivepathways surprisingly also affected the abundance oftranscripts from genes that function in disparate biosyn-thetic pathways For example constitutive expression ofcdaR increased the relative abundance (compared withthe control strain J151) of transcripts from genes in thecda and act pathways at times when these pathway genes
1280 J Huang et al
copy 2005 The AuthorsJournal compilation copy 2005 Blackwell Publishing Ltd Molecular Microbiology 58 1276ndash1287
Fig 3 Transcriptional effects on secondary metabolite pathways during induction of cluster-situated regulatory genes in the absence or presence of absB RNA samples from absBndash (C121ndashC125) and absB+ (J151ndashJ155) strains were isolated at the indicated time points during parallel growth on modified R5 media containing thiostrepton For microarray experiments (indicated in figure as lsquoRNA vs RNArsquo) Cy5-dCTP (red)-labelled cDNA samples from absBndash strains (C122ndashC125 tipAp each of four regulatory genes) were hybridized with the same time point Cy3-dCTP (green)-labelled cDNA samples of the absBndash control strain (C121 tipAp) Cy5-dCTP labelled cDNA samples from absB+ strains (J152ndashJ155 tipAp each of four regulatory genes) were hybridized with the same time point Cy3-dCTP labelled cDNA sample of the absB+ control strain (J151 tipAp) The change in transcript abundance for each gene is displayed by means of a colour scale in which colour saturation represents the magnitude of the difference of RNA abundance between the detected strains (C122ndashC125 or J152ndashJ155) and control strains (C121 or J151) at the same indicated time point The brighter red shades represent higher transcript abundance and brighter green shades represent lower transcript abundance in detected stain comparing with the control strain Black indicates an equal amount of RNA abundance between the two strains and grey represents the absence of data Ratios of genes with multiple spots on the array were averaged Red and blue arrows in panel 5 indicate the onset of Act or Red production respectively and ND indicates no detectable Act or Red production Triangles highlight instances of the increased (red) or decreased (green) expression relative to the control strain in clusters containing gt75 genes having statistically significant changes (P-value lt005) in expression The relative increase or decrease in RNA abundance in the highlighted groupings was confirmed by repeat array experiments and quantitative real-time RT-PCR analysis
SCO3210SCO3211SCO3212SCO3213SCO3214SCO3215SCO3216SCO3217 cdaRSCO3218SCO3219SCO3220SCO3221SCO3222SCO3223SCO3224SCO3225SCO3226SCO3227SCO3228SCO3229SCO3230SCO3231SCO3232SCO3233SCO3234SCO3235SCO3236SCO3237SCO3238SCO3239SCO3240SCO3241SCO3242SCO3243SCO3244SCO3245SCO3246SCO3247SCO3248SCO3249
SCO5070SCO5071SCO5072SCO5073SCO5074SCO5075SCO5076SCO5077SCO5078SCO5079SCO5080SCO5081SCO5082SCO5083SCO5084SCO5085 actII-ORF4SCO5086SCO5087SCO5088SCO5089SCO5090SCO5091SCO5092
SCO5877 redDSCO5878SCO5879SCO5880SCO5881 redZSCO5882SCO5883SCO5884SCO5885SCO5887SCO5888SCO5889SCO5890SCO5891SCO5892SCO5893SCO5894SCO5895SCO5896SCO5897SCO5898SCO5899
SCO6273SCO6274SCO6275SCO6276SCO6277SCO6278SCO6279SCO6280SCO6281SCO6282SCO6283SCO6284SCO6285SCO6286SCO6287SCO6288
28 36 41 48 72 96 28 36 48 60 72 96
ActRed
3 red
2 act
4 typeI PKS
1 cda
A B C D E F G H
28 36 41 48 72 96 28 36 48 60 72 96 28 36 48 60 72 96 28 36 48 60 72 9628 36 41 48 72 96 28 36 41 48 72 96
vs (tipApcdaR) (tipApactII-O4) (tipApredD) (tipApredZ) (tipApcdaR) (tipApactII-O4) (tipApredD) (tipApredZ)
absB- absB+
RNA-Cy5 C122 C123 C124 C125 J152 J153 J154 J155
RNA-Cy3 C121(tipA) J151(tipA)
redD-independent genes
redD-dependent genes
5 Pig-ments
ND ND
gt8 foldlt18 fold
Cross-regulation between antibiotic pathways 1281
copy 2005 The AuthorsJournal compilation copy 2005 Blackwell Publishing Ltd Molecular Microbiology 58 1276ndash1287
were not normally expressed (ie at 28 h and 72 h respec-tively) (Fig 3 panels 1E and 2E) Conversely constitutiveexpression of actII-ORF4 first decreased and thenincreased the abundance of cda transcripts relative tocontrol strain (J151 tipAp) at 28 and 48 h respectively(Fig 3 panel 1F) it also resulted in a relative decreasein expression of redD-independent genes of the red clus-ter at 72 h when these genes normally show elevatedexpression in the control strain J151 (Fig 3 panel 3FFig 2 panel 3-II) A parallel effect on the abundance ofecr transcripts was observed (Fig S3)
Constitutive expression of redZ in absB+ bacteriaresulted not only in the expected constitutive increase inredD and redD-independent transcripts relative to thecontrol strain (J151 tipAp) containing the empty vector(Fig 3 panel 3H) but also in a transient increase in therelative abundance of redD-dependent and act transcriptsat times prior to the normal appearance of these tran-scripts in the control strain (Fig 3 panels 3H and 2H)Accompanying these latter increases was the synthesisof undecylprodigiosin and actinorhodin at earlier than nor-mal times (60 h and 72 h respectively versus 72 h and96 h Fig 3 panel 5H and Fig 2 panel 5-II) Parallelinga relative decrease in expression of redD-dependentgenes of the red cluster at 72 h in absB+ bacteria thatconstitutively express actII-ORF4 (J153 tipApactII-ORF4 Fig 3 panel 3F) were a relative decrease inexpression of redD-dependent genes in mycelia that con-stitutively express redZ (J155 tipApredZ Fig 3 panel3H) and a concurrent relative elevation of act geneexpression in these cells (Fig 3 panel 2H) Effects ofredZ expression on other gene clusters outside of the Redand Act biosynthetic gene clusters were also observedsuggesting that this cluster-situated regulatory gene mayhave more general regulatory functions Among the genesaffected were a previously undefined 15-gene cluster(SCO6566ndashSCO6580) and genes of the whiE locuswhich encodes a grey pigment present in S coelicolorspores (Davis and Chater 1990 Kelemen et al 1998)(Fig S4) Interestingly constitutive expression of any ofthese CSRs affected the abundance of mRNAs of the typeI polyketide in both absB mutant and absB+ bacteria(Fig 3 panel 4)
Effects of mutations in cluster-situated regulatory genes on disparate antibiotic biosynthetic pathways
Consistent with our finding that constitutive expression ofredZ activates genes in other biosynthetic clusters as wellas genes in the red cluster (Fig 3 panels D and H) weobserved that deletion of redZ in absB+ bacteria (M550∆redZ) resulted in delayed expression of genes of the actcda and type I polyketide gene clusters for 6ndash12 h andimpaired expression of redD and other genes in the red
cluster (Fig 4 panel C) Detection of Act was delayed for16 h in M550 (∆redZ) versus the wild-type strain M145(Fig 4 panel 5) These findings provide further evidencefor functional interaction between redZ and multiple bio-synthetic gene pathways Additionally we observed thatred pathway mRNAs were more abundant in cells blocked
Fig 4 Expression profiles of secondary metabolite loci genes in S coelicolor M145 mutant M512 (∆redD ∆actII-ORF4) and M550 (∆redZ) RNA samples isolated from M145 (wild type) M512 (∆redD ∆actII-ORF4) and M550 (∆redZ) were isolated at the indicated time points on modified R5 medium For microarray experiments Cy5-dCTP labelled cDNA corresponding to total RNA of M145 (panel A) M512 (panel B) and M550 (panel C) was hybridized with Cy3-dCTP labelled M145 genomic DNA Data were displayed as described in the Fig 2 legend
26 32 45 56 72 96
3 red
2 act
4 typeI PKS
1 cda
5 Pig-ments
26 32 45 56 72 96 26 32 45 56 72 96
A B C
ActRed
SCO3211SCO3212SCO3213SCO3214SCO3215SCO3216SCO3217SCO3218SCO3219SCO3220SCO3221SCO3222SCO3223SCO3224SCO3225SCO3226SCO3227SCO3228SCO3229SCO3230SCO3231SCO3232SCO3233SCO3234SCO3235SCO3236SCO3237SCO3238SCO3239SCO3240SCO3241SCO3243SCO3244SCO3245SCO3246SCO3247SCO3248SCO3249
SCO5070SCO5071SCO5072SCO5073SCO5074SCO5075SCO5076SCO5077SCO5078SCO5079SCO5080SCO5081SCO5082SCO5083SCO5084SCO5085SCO5086 actII-ORF4SCO5087SCO5088SCO5089SCO5090SCO5091SCO5092
SCO5877 redDSCO5878SCO5879SCO5880SCO5881 redZSCO5882SCO5883SCO5884SCO5885SCO5886SCO5887SCO5888SCO5889SCO5890SCO5891SCO5892SCO5893SCO5894SCO5895SCO5896SCO5897SCO5898SCO5899
SCO6273SCO6274SCO6275SCO6276SCO6277SCO6278SCO6279SCO6280SCO6281SCO6282SCO6283SCO6284SCO6285SCO6286SCO6287SCO6288
(wt) ( redD actII-O4) ( redZ)
DNA-Cy3 M145 genomic DNA
RNA-Cy5 M145 M512 M550 vs
ND
gt8 foldlt18 fold
1282 J Huang et al
copy 2005 The AuthorsJournal compilation copy 2005 Blackwell Publishing Ltd Molecular Microbiology 58 1276ndash1287
in the Act pathway (Huang et al 2001) In our currentexperiments we observed that cda pathway transcriptswere also more abundant in bacteria deleted in actII-ORF4 and redD (Fig 4 panel 1B) providing an additionaldemonstration of the effects of CSRs on disparatepathways
Cross-regulation between redZ and higher level regulator afsR2afsS
Overexpression of the higher level regulator AfsR2(known also as AfsS) has long been known to stimulatethe production of multiple antibiotics in Streptomyceslividans (Vogtli et al 1994) and S coelicolor A3(2)(Floriano and Bibb 1996) In our microarray experimentswe observed that afsR2 was highly and constitutivelyexpressed during the growth cycle of both of the Scoelicolor stains we examined (Fig 5 panels 1-I and 2-II) In S coelicolor mycelium expressing redZ constitu-tively under control of the tipA promoter (J155tipApredZ) we surprisingly found that transcription ofafsR2 was increased dramatically over the control strainlevel specifically at 60 h (Fig 5 panel 2-H) when Redpigment precociously appeared (Fig 3 panel 5H) Twelvehours later (at 72 h) actinorhodin production by this strainwas observed whereas this antibiotic normally was notdetectable until 96 h in control strain J151 (Fig 3 panel5H and Fig 2 panel 5-II) RT-PCR analysis confirmed therelative increase in afsR2 mRNA abundance in bacteria
expressing redZ under the control of tipA (Fig 5 panels3ndash4)
Discussion
Experiments carried out over the past four decades indi-cate that a complex regulatory programme has evolved inS coelicolor to control the biosynthesis and flux of sec-ondary metabolites It has long been recognized that theproduction of multiple secondary metabolites by thisorganism is co-ordinated during the growth cycle perhapsto facilitate its ability to compete against other biologicalspecies (Challis and Hopwood 2003) Such co-ordinationhas been believed to be mediated by global regulators thatactivate expression of chromosomal clusters of disparatebiosynthetic genes by turning on lower level regulatorsthat highly specifically control transcription of other genesin their own cluster Additionally the supply of metabolitesutilized in common by different pathways has been postu-lated to alter the actions of pathways whose protein prod-ucts compete for the same precursor (Chater 1990 Sunet al 2002) The investigations reported here indicate theexistence of functional interactions among participants inthe S coelicolor regulatory programme the ability of reg-ulators situated within biosynthetic gene clusters to alterexpression of other clusters as well as their own and alsoto modulate the effects of regulators that act more globallyThey further show that cross-pathway regulation is con-trolled temporally in S coelicolor by absB Functionalinteractions among transcriptional regulators have beenobserved also for Escherichia coli (Oshima et al 2002)and yeast (Kaniak et al 2004)
Our results indicate that CSRs that act pleiotropicallycan function pleiotropically and that their effects on dis-parate biosynthetic pathways can occur at the RNA levelWhether competition between pathways for pools of pre-cursor metabolites used in common or actions of biosyn-thetic pathway products on other pathways have a role inthese effects has not been determined
Foremost perhaps among CSRs is the Red cluster generedZ which we show can upregulate the production of allthree known antibiotics of S coelicolor Induction of redZtransiently increased expression of cda red and act ineither the absence or presence of expression of absBDeletion of redZ abolished red expression and delayedexpression of two other antibiotics and the type Ipolyketide Interestingly the sequence of the RedZ proteinshows a helixndashturnndashhelix motif plus 26 end-to-end iden-tity to AbsA2 the response regulator component of a two-component system encoded by a locus in the cda cluster(Guthrie et al 1998 Anderson et al 2001 Ryding et al2002) AbsA2 together with the sensor kinase encodedby the neighbouring gene AbsA1 can negatively affectthe flux through other antibiotic production pathways in
Fig 5 Expression profiles for afsR2 gene during the S coelicolor growth cycle and during induction of CSRs Panels 1-I and 2-II are from the same data set as Fig 2 (panels I and II) panels AndashH are from the same data set as Fig 3 (panels AndashH) panel 3 RT-PCR analysis of afsR2 60 h mRNA samples from strains J151ndashJ155 panel 4 RT-PCR analysis of 60 h 16s rRNA samples from strains J151ndashJ155 Red triangles highlight the higher expression observed in strain J155 (tipApredZ) compared with the control strain J151 (tipAp) at 60 h
28 36 41 48 72 96 28 36 41 48 72 9628 36 41 48 72 96 28 36 41 48 72 9628 36 41 48 72 96
28 36 48 60 72 9628 36 48 60 72 96 28 36 48 60 72 96 28 36 48 60 72 9628 36 48 60 72 96
afsR2
afsR2
I A B C D
II E F G H
RNA-Cy5 C121 C122 C123 C124 C125
DNARNA-Cy3 J1501 gDNA C121 RNA
RNA-Cy5 J151 J152 J153 J154 J155
DNARNA-Cy3 J1501 gDNA J151 RNA
vs (tipAp) (tipApcdaR) (tipApactII-O4) (tipApredD) (tipApredZ)
vs (tipAp) (tipApcdaR) (tipApactII-O4) (tipApredD) (tipApredZ)
SCO4425 afsR2
16S rRNA
J151 J152 J153 J154 J155 60 h
1
2
3
4
gt8 foldlt18 fold
Cross-regulation between antibiotic pathways 1283
copy 2005 The AuthorsJournal compilation copy 2005 Blackwell Publishing Ltd Molecular Microbiology 58 1276ndash1287
addition to more prominently repressing its own pathwayparalleling the positive regulatory effects of RedZ on dis-parate pathways
Our microarray analysis indicated that the abundanceof mRNAs encoded by afsR2 and several other genes thathave been annotated in the Streptomyces database(ScoDB httpstreptomycesorguk) as putative regula-tors (SCO5147 SCO4908 and SCO1699) were increaseddramatically in J155 (tipApredZ) over the control strainlevel (J151 tipAp) (Fig 5 and Fig S4) thus demonstrat-ing unanticipated redZ control over the afsR2 higher levelregulator and providing a possible basis for RedZ activa-tion of the Red and Act biosynthetic pathways Howeverdespite constitutive expression of redZ throughout the Scoelicolor growth cycle the effects of afsR2 were notprominently observed until the 60 h time point implyingthat other cellular factors regulated along with afsR2 areneeded for activation of these pathways
Our results suggest that absB regulation of productionof undecylprodigiosin in S coelicolor results from absBactivation of redD possibly through stimulation of theproduction of afsR2 gene product which we found canrestore antibiotic production in the absence of absB Sim-ilarly redZ upregulation restored expression of CDA bio-synthetic genes in the absence of absB but required absBto activate act genes (Fig 3 panels 1D and 2H) Whereasearlier work (Kim et al 2001 Lee et al 2002) and ourunpublished studies indicate that afsR2 overexpression issufficient to activate all of these pathways it seemsunlikely that afsR2 expression is required for this effect asantibiotic biosynthesis occurred in cultures that failed toproduce afsR2
Analysis of the S coelicolor genomic DNA sequencesuggests that there are more than 20 distinct pathwaysfor the production of secondary metabolites in thismicroorganism (Bentley et al 2002) Effects of the CSRswe studied on other pathways were observed the originaldata are available at httpsncohenlabstanfordedustreptomyces2 or httpwww-genomestanfordedumicroarray Among the genes altered by RedZ and ActII-ORF4 were the whiE cluster (SCO5314ndash5321) (Fig S4)and the coelichelin non-ribosomal peptide synthetase(NRPS) gene locus (SCO489ndash499) A large gene locus ofunknown function (SCO6566ndash6580) was also regulatedby redZ resulting in increased expression in both C125(tipApredZ) and J155 (tipApredZ) and decreasedexpression in M550 (∆redZ) as compared with M145 Forother gene groups affected by induction of redZ seeFig S4
Overexpression of actII-ORF4 was found to increasetranscripts of the catalase (catA SCO0379) and super-oxide dismutase genes (sodF12 SCO2633SCO0999)(Fig S5) which have been implicated in cellular resis-tance to the toxic effects of exposure to oxidants (Cho and
Roe 1997 Chung et al 1999) This observation sug-gests that S coelicolor may increase its anti-oxidativedefence mechanisms during production of actinorhodin
The extent and boundaries of the type I polyketide locus(from SCO6273 to SCO6288) were inferred fromsequence analysis of S coelicolor genomic DNA (Bentleyet al 2002) During our studies we observed that a geneSCO6272 (SC2C402 a putative secreted FAD-bindingprotein) adjacent to the inferred type I polyketide locusshowed an expression correlation coefficient of gt09 withgenes designated by Bentley et al as components of thetype I polyketide locus (Fig S6) Moreover expression ofthree other genes separated from SCO6272 by only 5 kbalso showed a high correlation coefficient (gt 08) withexpression of genes in the type I polyketide locus two ofthese scbR (SCO6265) and scbA (SCO6266) mediatethe synthesis of gamma-butyrolactone SCB1 of S coeli-color (Takano et al 2001) The third is a putative histidinekinase gene (SCO6268 SCAH1033c) These findingsraise the possibility that these genes collectively may havea role in regulating the type I polyketide locus (Fig S6)Supporting this postulated connection between SCB1 andthe type I polyketide is a recent report by Takano et al(2005) which has identified a regulatory gene kasO inthe type I polyketide cluster that is regulated directly byscbR
absB mutant bacteria previously have been found to bedeficient in antibiotic production in S coelicolor and theDNA sequence of this gene indicates that it encodes a Scoelicolor homologue of the E coli endoribonucleaseRNase III (rnc) (Price et al 1999) RNase III proteins ofbacteria are known to have a diverse role in the process-ing of double-stranded mRNA and rRNA substrates(Court 1993) and RNase III homologues in eukaryotescan process double-stranded RNAs into small regulatoryRNAs (Lee et al 2003 Carmell and Hannon 2004 Tijs-terman and Plasterk 2004) Our finding that absB whichis widely conserved in streptomycetes (Price et al 1999)has extensive effects on the abundance of about 200different S coelicolor transcripts having a multitude offunctions suggests that ribonucleolytic processing ofduplex RNA regions may modulate key aspects of geneexpression in this organism (Fig S1)
The cross-regulation wersquove observed occurs in both thepresence (Figs 2 and 3) or absence (Fig 4) of antibioticsHowever our microarray analyses also indicated that theextent of dependence of biosynthetic pathway geneexpression on absB was influenced by the addition ofthiostrepton and apramycin in the medium (data notshown) the abundance of red and act transcripts wasdecreased and of type I polyketide gene transcripts wasincreased in the presence of these antibiotics suggestingthat control of secondary metabolism by regulatory genesof S coelicolor can be affected by alterations in the cellu-
1284 J Huang et al
copy 2005 The AuthorsJournal compilation copy 2005 Blackwell Publishing Ltd Molecular Microbiology 58 1276ndash1287
lar environment The ability of extracellular agents to alterthe actions of individual regulatory genes may account inpart for the well-known dependence of antibiotic produc-tion on medium composition Notwithstanding such obser-vations the differential expression that provides a basisfor our conclusions cannot result from effects of antibioticsper se as experimental cultures were compared with con-trol cultures that included the same antibiotics (Fig 3)
Experimental procedures
Construction of the integrative PtipA expression vector pIJ6902 and its derivatives
A 0625 kb fragment carrying a polylinker downstream of thethiostrepton-inducible PtipA promoter both ends flanked bytranscriptional terminators was amplified from the multicopyexpression vector pIJ6021 (Takano et al 1995) by PCRusing Pfu DNA polymerase (Promega) and the primers (5prime-GCCTCGTGATCACCAATAAAAAACGCCCGGCGG-3prime and5prime-CGCGTGATCAGCCCCGCAAAAGCGGCCTTTGAC-3prime)The PCR product was cloned into EcoRI-XbaI-cut pSET152(Takano et al 1995) for which both cleavage sites had beenfilled in to generate blunt ends (thereby destroying both sites)The sequence of the inserted fragment in the resulting con-struct pIJ6901 was confirmed The tsr gene was amplifiedby PCR from pIJ6021 using Pfu DNA polymerase and theprimers THIONHE (5prime-GAAATGTAGCTAGCAGGCGAATACTT-3prime) and THIONHEREV (5prime-GACGAATCGGCTAGCAGGAACCGAGCGTCC-3prime) both of which carry NheI sites Theresulting 106 kb PCR product was cut with NheI and clonedinto the unique NheI of pIJ6901 to create pIJ6902 and thetsr sequence in the final construct was confirmed
Open reading frames (ORFs) of cdaR actII-ORF4 redDand redZ were amplified by PCR and cloned into the pCR21-TOPO vector (Invitrogen) with an NdeI site overlapping anATG start codon NdeI and EcoRIBamHI were used toremove the inserted ORFs which were cloned into the inte-grative vector pIJ6902 under control of the tipA promoter Allcloned products were confirmed by DNA sequencing Theprimers used for PCR amplification are as follows cdaR-LGAGCAT-ATGGATCTTCGGCTGATAGAACCG cdaR-RCAGCACTCGCTGTGGCCGTC redZ-L CAACAT-ATGACGACCCGTGTCCTGGTGTG redZ-R CCGCACGGAACGCGAAGC redD-L CGGCAT-ATGACGGGTGGGGGAGTGCTTG redD-R GTTTCCGTGACGGTGGGTGTGTC actII-ORF4-L GCGCAT-ATGAGATTCAACTTATTGGGACGTGTCCAT actII-ORF4-R CGGTGCTACACGAGCACCTTCTCAC
Strains growth conditions RNA isolation and assay of antibiotics
Streptomyces coelicolor strains used in this study are listedin Table 1 pIJ6902 and its derivatives containing insertionsof the cdaR actII-ORF4 redD and redZ genes were intro-duced by conjugation from E coli ET12567pUZ8002 intoJ1501 and C120 strains where they integrated site-specifi-cally into the chromosome at the φC31 attB site The ex-
conjugants (J151ndashJ155 and C121ndashC125 Table 1) werechecked by PCR
We used cellophane membranes placed on plates for alltotal RNA sample isolation from surface-grown cells RNAfrom M145 and its mutants grown on solid medium wasobtained as described earlier (Huang et al 2001) Spores(105 per plate) of strains C121ndashC125 and J151ndashJ155 wereplated onto R5-medium containing 10 mM CaCl2 50 microg mlminus1
apramycin and 50 microg mlminus1 thiostrepton as the final concentra-tion We detected growth of each strain by measuring dry cellweight (Miguelez et al 1999) and we combined the surface-grown cells harvested from 4 to 10 plates at each time pointand used the modified Kirby-mix method (Kieser et al 2000)to extract total RNA RNA samples were purified using theRNeasy Kit (Qiagen) Later experimental repeats of microar-ray and quantitative real-time RT-PCR experiments at certaintime points (highlighted with the green or red triangles inFig 3) were performed with RNA samples isolated and puri-fied using the RNeasyreg Plant Kit
Assays for Act and Red were as described previously(Huang et al 2001) However CDA production on solidmedium containing thiostrepton was impractical by bioassayof the indicator Staphylococcus aureus strain because thisCDA-sensitive bacterium is also sensitive to thiostrepton
Streptomyces coelicolor microarray experiments and quantitative real time RT-PCR
The whole-genome DNA sequences with 7846 S coelicolorM145 ORFs (ftpftpsangeracukpubS_coelicolorsequences) were used for design of primer pairs that ampli-fied 50ndash2400 bp internal fragments of putative ORFs (httpsncohenlabStanfordedustreptomyces) The arrays contain97 of 7846 ORFs and about 10 of the ORFs printed onarrays were duplicates or overlapping sequences Primerdesign PCR amplification RNA labelling and hybridizationwere as described earlier (Huang et al 2001 Elliot et al2003)
Genomic DNA was labelled with Cy3-dCTP as follows Twomicrograms of M145 or J1501 genomic DNA was fragmentedby sonication to an average size of 500ndash1000 bp mixed with8 microg of high-GC (72) hexamers (total 20 microl) and after incu-bation at 98degC for 5 min transferred to ice water 30 microl oflabelling mix [5 microl 10times Klenow buffer 6 microl 10times dNTP (4 mMdATP 4 mM dTTP 10 mM dGTP and 05mM dCTP) 3 microlCy3-dCTP (Amersham Pharmacia Biotech) 1 microl KlenowDNA polymerase (NEB 50 U microlminus1) and 15 microl ddH2O] wasadded and the mixture was incubated for 5ndash6 h at 37degC inthe dark The Cy3-dCTP labelled genomic DNA probe waspurified using Microcon-10 filters (Amicon) and hybridizedwith Cy5-dCTP labelled cDNA
Quantitative real-time RT-PCR was applied for validation ofgene expression changes observed in microarrays First-strand cDNA synthesis was carried out using 2 microg total RNAand SuperScript II (Invitrogen) following the manufacturerrsquosinstructions (Cat No 18064-014) Quantitative real-timePCR of randomly selected genes from the antibiotic or typeI polyketide cluster was performed using the Bio-Rad iCyc-lerTM Real-Time PCR Detection System and iQTM SYBRGreen Supermix Kit (170-8880) Five per cent of the first-strand reaction was used as DNA template real-time PCR
Cross-regulation between antibiotic pathways 1285
copy 2005 The AuthorsJournal compilation copy 2005 Blackwell Publishing Ltd Molecular Microbiology 58 1276ndash1287
conditions were as follows 94degC for 10 min 40 cycles of94degC for 30 s 62degC for 30 s and 72degC for 30 s The targetcDNA was normalized internally to 16S rDNA levels (seeTable S1 for all RT-PCR primers)
Microarray data normalization and analysis
Built-in functions of the Stanford Microarray Database (httpwww-genomestanfordedumicroarray) were used to nor-malize and analyse RNA-versus-genomic DNA data Thenormalization assumes equal log average signal intensity ineach fluorescence channel and that RNAgDNA ratios wereequivalent to relative transcript abundances after nor-malization (Bernstein et al 2002) Data analysis of RNA-versus-RNA hybridization was performed as describedearlier (Huang et al 2001 Elliot et al 2003) and a k-near-est neighbours (KNN) algorithm was applied for missing data(Troyanskaya et al 2001)
We determined the statistical significance of the changesin gene expression as follows Using replicate microarrays fora subset of the conditions we calculated the standard errorof the expression values for each gene across the replicatesand took the median standard error of all the genes as thefudge factor We then estimated the standard error for eachgene as the sum of the standard error of that gene in thereplicates plus the fudge factor (Efron et al 2001) For thoseconditions for which we did not have replicates we calculatedan approximate t-statistic for each gene as the expressionvalue of that gene divided by its estimated standard errorBecause redD-dependent genes and redD-independentgenes have different expression patterns we separated theminto two subclusters for t-score calculation We estimated theP-value (two-tailed) for each gene using the t-statistic Geneexpression was considered to be significantly changed if itsP-value was lt005 Expression in an entire cluster was con-sidered to be significantly changed if expression of at least75 of the genes within it were significantly changed Quan-titative real-time PCR analysis and additional microarrayexperiments were carried out to further evaluate the alter-ations in gene expression (see Supplementary materials athttpsncohenlabstanfordedustreptomyces2)
Acknowledgements
We thank David Hopwood for helpful comments and sugges-tions on the manuscript and Mervyn Bibb Wendy Champ-ness Robert Tibshirani Christine Miller Weijing Xu Li Li KaiBao and Yontao Lu for strains andor advice We also thankRichard Lin for web site development These investigationswere supported by a John Innes Foundation studentship toVirginie Molle by a grant-in-aid to the John Innes Centre fromthe BBSRC in part by NSF Grant BES-0093900-001 and NIHGrant GM65470-02 to CMK and by Grant AI08619 fromthe NIAID and by DARPA Grant MDA972-00-1-0032 toSNC
References
Aceti DJ and Champness WC (1998) Transcriptional reg-ulation of Streptomyces coelicolor pathway-specific antibi-
otic regulators by the absA and absB loci J Bacteriol 1803100ndash3106
Adamidis T and Champness W (1992) Genetic analysisof absB a Streptomyces coelicolor locus involved in globalantibiotic regulation J Bacteriol 174 4622ndash4628
Anderson T Brian P and Champness W (2001) Geneticand transcriptional analysis of absA an antibiotic genecluster-linked two-component system that regulates multi-ple antibiotics in Streptomyces coelicolor Mol Microbiol 39553ndash566
Arias P Fernandez-Moreno MA and Malpartida F(1999) Characterization of the pathway-specific positivetranscriptional regulator for actinorhodin biosynthesis inStreptomyces coelicolor A3(2) as a DNA-binding proteinJ Bacteriol 181 6958ndash6968
Bate N Butler AR Gandecha AR and Cundliffe E(1999) Multiple regulatory genes in the tylosin biosyntheticcluster of Streptomyces fradiae Chem Biol 6 617ndash624
Bentley SD Chater KF Cerdeno-Tarraga AM ChallisGL Thomson NR James KD et al (2002) Completegenome sequence of the model actinomycete Streptomy-ces coelicolor A3(2) Nature 417 141ndash147
Bernstein JA Khodursky AB Lin PH Lin-Chao S andCohen SN (2002) Global analysis of mRNA decay andabundance in Escherichia coli at single-gene resolutionusing two-color fluorescent DNA microarrays Proc NatlAcad Sci USA 99 9697ndash9702
Bibb M (1996) 1995 Colworth Prize Lecture The regulationof antibiotic production in Streptomyces coelicolor A3(2)Microbiology 142 1335ndash1344
Carmell MA and Hannon GJ (2004) RNase III enzymesand the initiation of gene silencing Nat Struct Mol Biol 11214ndash218
Challis GL and Hopwood DA (2003) Synergy andcontingency as driving forces for the evolution of multiplesecondary metabolite production by Streptomyces spe-cies Proc Natl Acad Sci USA 100 (Suppl 2) 14555ndash14561
Chater KF (1990) The improving prospects for yieldincrease by genetic engineering in antibiotic-producingStreptomycetes Biotechnology (N Y) 8 115ndash121
Chater KF (1993) Genetics of differentiation in Streptomy-ces Annu Rev Microbiol 47 685ndash713
Chater KF and Bibb MJ (1997) Regulation of bacterialantibiotic production In Products of Secondary Metabo-lism Biotechnology 7 Kleinkauf H and Von Dohren H(eds) Weinheim Germany VCH pp 59ndash105
Cho YH and Roe JH (1997) Isolation and expression ofthe catA gene encoding the major vegetative catalase inStreptomyces coelicolor Muller J Bacteriol 179 4049ndash4052
Chouayekh H and Virolle MJ (2002) The polyphosphatekinase plays a negative role in the control of antibioticproduction in Streptomyces lividans Mol Microbiol 43919ndash930
Chung HJ Kim EJ Suh B Choi JH and Roe JH(1999) Duplicate genes for Fe-containing superoxide dis-mutase in Streptomyces coelicolor A3(2) Gene 231 87ndash93
Court D (1993) RNA processing and degradation by RNaseIII In Control of messenger RNA Stability Belasco JG
1286 J Huang et al
copy 2005 The AuthorsJournal compilation copy 2005 Blackwell Publishing Ltd Molecular Microbiology 58 1276ndash1287
and Brawerman G (eds) San Diego Academic Press pp71ndash116
Davis NK and Chater KF (1990) Spore colour in Strep-tomyces coelicolor A3(2) involves the developmentally reg-ulated synthesis of a compound biosynthetically related topolyketide antibiotics Mol Microbiol 4 1679ndash1691
Efron B Tibshirani R Storey J and Tusher V (2001)Empirical Bayes analysis of a microarray experiment J AmStat Assoc 96 1151ndash1160
Elliot MA Karoonuthaisiri N Huang J Bibb MJ CohenSN Kao CM and Buttner MJ (2003) The chaplins afamily of hydrophobic cell-surface proteins involved inaerial mycelium formation in Streptomyces coelicolorGenes Dev 17 1727ndash1740
Fernandez-Moreno MA Caballero JL Hopwood DAand Malpartida F (1991) The act cluster contains regula-tory and antibiotic export genes direct targets for transla-tional control by the bldA tRNA gene of Streptomyces Cell66 769ndash780
Floriano B and Bibb M (1996) afsR is a pleiotropic butconditionally required regulatory gene for antibiotic produc-tion in Streptomyces coelicolor A3(2) Mol Microbiol 21385ndash396
Guthrie EP Flaxman CS White J Hodgson DA BibbMJ and Chater KF (1998) A response-regulator-likeactivator of antibiotic synthesis from Streptomyces coeli-color A3(2) with an amino-terminal domain that lacks aphosphorylation pocket Microbiology 144 727ndash738
Hopwood DA (1988) The Leeuwenhoek lecture 1987Towards an understanding of gene switching in Streptomy-ces the basis of sporulation and antibiotic production ProcR Soc Lond B Biol Sci 235 121ndash138
Hopwood DA Chater KF and Bibb MJ (1995) Geneticsof antibiotic production in Streptomyces coelicolor A3(2) amodel streptomycete Biotechnology 28 65ndash102
Huang J Lih CJ Pan KH and Cohen SN (2001)Global analysis of growth phase responsive gene expres-sion and regulation of antibiotic biosynthetic pathways inStreptomyces coelicolor using DNA microarrays GenesDev 15 3183ndash3192
Kaniak A Xue Z Macool D Kim JH and Johnston M(2004) Regulatory network connecting two glucose signaltransduction pathways in Saccharomyces cerevisiaeEukaryot Cell 3 221ndash231
Karoonuthaisiri N Weaver D Huang J Cohen SN andKao CM (2005) Regional organization of gene expres-sion in Streptomyces coelicolor Gene 353 53ndash66
Kelemen GH Brian P Flardh K Chamberlin L ChaterKF and Buttner MJ (1998) Developmental regulation oftranscription of whiE a locus specifying the polyketidespore pigment in Streptomyces coelicolor A3(2) J Bacte-riol 180 2515ndash2521
Kieser T Bibb MJ Chater KF and Hopwood DA(2000) Practical Streptomyces Genetics Norwich UKJohn Innes Foundation
Kim ES Hong HJ Choi CY and Cohen SN (2001)Modulation of actinorhodin biosynthesis in Streptomyceslividans by glucose repression of afsR2 gene transcriptionJ Bacteriol 183 2198ndash2203
Lee PC Umeyama T and Horinouchi S (2002) afsS isa target of AfsR a transcriptional factor with ATPase activ-
ity that globally controls secondary metabolism in Strepto-myces coelicolor A3(2) Mol Microbiol 43 1413ndash1430
Lee Y Ahn C Han J Choi H Kim J Yim J et al(2003) The nuclear RNase III Drosha initiates microRNAprocessing Nature 425 415ndash419
Miguelez EM Hardisson C and Manzanal MB (1999)Hyphal death during colony development in Streptomycesantibioticus morphological evidence for the existence of aprocess of cell deletion in a multicellular prokaryote J CellBiol 145 515ndash525
Oshima T Aiba H Masuda Y Kanaya S Sugiura MWanner BL et al (2002) Transcriptome analysis of alltwo-component regulatory system mutants of Escherichiacoli K-12 Mol Microbiol 46 281ndash291
Price B Adamidis T Kong R and Champness W (1999)A Streptomyces coelicolor antibiotic regulatory geneabsB encodes an RNase III homolog J Bacteriol 1816142ndash6151
Ryding NJ Anderson TB and Champness WC (2002)Regulation of the Streptomyces coelicolor calcium-depen-dent antibiotic by absA encoding a cluster-linked two-com-ponent system J Bacteriol 184 794ndash805
Sun Y Zhou X Liu J Bao K Zhang G Tu G et al(2002) lsquoStreptomyces nanchangensisrsquo a producer of theinsecticidal polyether antibiotic nanchangmycin and theantiparasitic macrolide meilingmycin contains multiplepolyketide gene clusters Microbiology 148 361ndash371
Takano E Gramajo HC Strauch E Andres N WhiteJ and Bibb MJ (1992) Transcriptional regulation of theredD transcriptional activator gene accounts for growth-phase-dependent production of the antibiotic undecylpro-digiosin in Streptomyces coelicolor A3(2) Mol Microbiol 62797ndash2804
Takano E White J Thompson CJ and Bibb MJ (1995)Construction of thiostrepton-inducible high-copy-numberexpression vectors for use in Streptomyces spp Gene 166133ndash137
Takano E Chakraburtty R Nihira T Yamada Y andBibb MJ (2001) A complex role for the gamma-butyrolac-tone SCB1 in regulating antibiotic production in Streptomy-ces coelicolor A3(2) Mol Microbiol 41 1015ndash1028
Takano E Kinoshita H Mersinias V Bucca G Hotch-kiss G Nihira T et al (2005) A bacterial hormone (theSCB1) directly controls the expression of a pathway-spe-cific regulatory gene in the cryptic type I polyketide biosyn-thetic gene cluster of Streptomyces coelicolor MolMicrobiol 56 465ndash479
Tijsterman M and Plasterk RH (2004) Dicers at RISC themechanism of RNAi Cell 117 1ndash3
Troyanskaya O Cantor M Sherlock G Brown PHastie T Tibshirani R et al (2001) Missing value esti-mation methods for DNA microarrays Bioinformatics 17520ndash525
Vogtli M Chang PC and Cohen SN (1994) afsR2 apreviously undetected gene encoding a 63-amino-acid pro-tein that stimulates antibiotic production in Streptomyceslividans Mol Microbiol 14 643ndash653
White J and Bibb M (1997) bldA dependence of undecyl-prodigiosin production in Streptomyces coelicolor A3(2)involves a pathway-specific regulatory cascade J Bacteriol179 627ndash633
Cross-regulation between antibiotic pathways 1287
copy 2005 The AuthorsJournal compilation copy 2005 Blackwell Publishing Ltd Molecular Microbiology 58 1276ndash1287
Supplementary material
The following supplementary material is available for thisarticle onlineFig S1 Global effects of absB gene In total sim1500 genesthat were highly expressed during the growth cycle wereselected and hierarchically clustered according to transcriptabundance Panels I and II are from the same data set asFig 2 (panel I and II) Rows correspond to individual genesand columns to different time points as indicated Thechange in transcript abundance for each gene is displayedby means of a colour scale Brighter red shades representhigher transcript abundance and brighter green shades rep-resent lower transcript abundance Black indicates an equalamount of cDNA relative to genomic DNA and grey repre-sents the absence of data Arrows indicate examples of sev-eral known genesgene clusters and a previously unidentifiedgene cluster In order to compare the different gene expres-sion between the absBndash and absB+ strain directly transcriptabundance for the absB mutant (panel I) was subtractedfrom transcript abundance of absB+ the strain (panel II) toobtain the net fold difference between them In total sim200genes were observed to have at least a sixfold differentabundance in at least one time point between the absBmutant and absB+ the strain (Table S5) All original datacan be downloaded from httpsncohenlabstanfordedustreptomyces2 or the Stanford Microarray Database (httpwww-genomezstanfordedumicroarray)Fig S2 Growth curves of strains in Figs 2 and 3 Growth of
mycelia was monitored as mg dry cell weight per plate afterinoculation of sim105 per plate spores on modified R5-solidmediumFig S3 Expression of ecaecr genes is similar to expressionof the act and red biosynthetic genes respectively Panels Iand II are from the same data set as Fig 2 (panel I and II)panels AndashH are from the same data set as Fig 3 (panels AndashH) See Figs 2 and 3 legends in the main text for detailsFig S4 Additional targets regulated by redZ Panels arefrom the same data sets shown in Figs 2ndash4 as indicated SeeFigs 2ndash4 legends in the main text for detailsFig S5 Additional targets regulated by actII-ORF4 PanelsI and II are from the same data sets as Fig 2 (panel I andII) Panels AndashH are from the same data set as Fig 3 (panelsAndashH) See Figs 2 and 3 legends in the main text for detailsFig S6 Extent of the type I polyketide locus and similarexpression patterns observed for scbRA Panel I is from thesame data set as Fig 2 (panel I) panels AndashD are from thesame data set as Fig 3 (panels AndashD) See Figs 2 and 3legends in the main text for detailsTable S1 Primers used for quantitative real-time RT-PCRTable S2 Results of quantitative real-time RT-PCR in Fig 2Table S3 Results of quantitative real-time RT-PCR in Fig 3Table S4 P-values of the genes in Fig 3Table S5 Ratio of sim1500 genes in Fig S1
This material is available as part of the online article fromhttpwwwblackwell-synergycom
Cross-regulation between antibiotic pathways
1277
copy 2005 The AuthorsJournal compilation copy 2005 Blackwell Publishing Ltd
Molecular Microbiology
58
1276ndash1287
secondary metabolism and morphological development(eg
afs
abs
and
bld
genes) An important question in
Streptomyces
biology is how these multiple levels of con-trol of antibiotic biosynthetic pathways are co-ordinated(Bibb 1996) The task of co-ordination is made even morecomplex by the production of multiple antibiotics in a sin-gle organism (Hopwood
et al
1995) and the occurrenceof multiple regulatory genes in some antibiotic gene clus-ters (White and Bibb 1997 Bate
et al
1999 Ryding
et al
2002)The availability of the
sim
87 Mb chromosomal DNAsequence of
S coelicolor
has enabled global investiga-tions of gene expression in this organism using DNAmicroarrays (Huang
et al
2001 Bentley
et al
2002Karoonuthaisiri
et al
2005) Earlier microarray-basedexperiments have shown that genes located within thesame biosynthetic gene cluster can be regulated differen-tially as well as co-ordinately during growth and develop-ment of
S coelicolor
(Huang
et al
2001) these studiesalso have identified chromosomally distant genes whoseexpression is co-ordinated with genes in antibiotic biosyn-thetic gene clusters and whose promoter regions resem-ble those of the biosynthetic genes While theseobservations argue that the actions of regulators locatedwithin biosynthetic gene clusters can extend beyond theirown cluster cluster-situated regulators (CSRs) continueto be viewed largely as lsquopathway-specificrsquo We report herethe results of microarray experiments aimed at gaining abetter understanding of functional interactions among thegenes that regulate expression of antibiotics during
Scoelicolor
development Our findings indicate that con-trary to current notions there is extensive lsquocross-talkrsquobetween CSRs of streptomycetes that these lsquolow levelrsquoregulators can control expression of genes designatedpreviously as lsquohigher levelrsquo regulators and that the extentof cross-talk between different biosynthetic pathways ismodulated by the pleiotropic regulator AbsB during thecell growth cycle Our results indicate that a complexnetwork of functional interactions exists among disparatebiosynthetic pathways of
S coelicolor
and suggest thatrevision of the currently prevalent paradigm for higher-level versus pathway-specific regulation of secondarymetabolism in
Streptomyces
species is warranted
Results
Effects of
absB
on expression of genes in antibiotic biosynthetic pathways
The
absB
gene of
S coelicolor
is a pleiotropic regulatorof antibiotic synthesis (Adamidis and Champness 1992)Earlier work has shown that mutations in
absB
whichencodes an RNase III homologue result in decreasedabundance of transcripts encoded by the
actII-ORF4
and
redD
genes which affect the expression of genes in the
Act and Red pathways respectively (Aceti and Champ-ness 1998) We sought to investigate the effects of CSRson antibiotic biosynthetic pathways in bacteria devoid ofAbsB-mediated lsquohigher-levelrsquo regulation to this end thechromosomally integrating
P
tipA
expression vectorpIJ6902 was constructed (Fig 1) and
cdaR actII-ORF4
redD
and
redZ
were individually placed under control ofthe
tipA
promoter of this plasmid These constructs or anlsquoemptyrsquo vector lacking a
tipA
promoter-regulated genewere then integrated site-specifically into the chromo-somes of
S coelicolor
hosts (
absB
+
J1501 and its
absB
missense mutant C120) Similar quantities of spores ofthe C120 and J1501 derivatives (see Table 1 C121ndash125and J151ndashJ155) were spread onto modified rich R5 solidmedium containing apramycin (to provide continuedselection for the chromosomally inserted plasmid) andthiostrepton (to induce the
tipA
promoter) Mycelia fromeach strain were collected and weighed as a measure-ment of cell growth andor proliferation which were similarin C121ndashC125 and J151ndashJ155 (Fig S2) RNA harvestedat various times (28ndash96 h) was used to prepare fluores-cence-labelled cDNA for microarray analyses (Figs 2 and3)
In order to assess the global effects of the
absB
muta-tion including its effects on transcripts originating in the
Fig 1
The integrative
P
tipA
expression vector pIJ6902
ter fd
major transcription terminator of phage fd
to
transcription terminator from phage
λ
P
tipA
the
tipA
promoter
tsr
thiostrepton-resistance gene
aac
(
3)IV
apramycin-resistance gene selectable in
E coli
and strep-tomycetes
ori
pUC18 origin of replication from pUC18
oriT
RK2 origin of transfer from plasmid RK2
int
φ
C31 and
attP
the integrase gene and attachment site of the temperate phage
φ
C31 respectively Unique sites are shown in bold The EBI accession number of pIJ6902 is AJ937361
1278
J Huang
et al
copy 2005 The AuthorsJournal compilation copy 2005 Blackwell Publishing Ltd
Molecular Microbiology
58
1276ndash1287
three known chromosomal clusters of antibiotic biosyn-thetic genes of
S coelicolor
at single gene resolution theCy5-dCTP red fluorescence-labelled cDNA from the
absB
ndash
and
absB
+
control strains [C121 (C120
tipA
p) andJ151 (J1501
tipA
p) respectively] was separately hybrid-ized on DNA microarrays with Cy3-dCTP green fluores-cence-labelled genomic J1501 DNA (Fig 2 and Fig S1also see web site httpsncohenlabstanfordedustreptomyces2 or httpwww-genomestanfordedumicroarray for raw data) From these experiments weobtained gene expression signatures for mycelium at dif-ferent stages of the bacterial growth cycle in the presence
or absence of
absB
function We observed that there areabout 200 genes having at least a sixfold difference inRNA abundance between
absB
ndash
and
absB
+
strains(Table S5) including genes involved in secondary metab-olism differentiation (eg
ramR
) and response to stress(eg the superoxide dismutase genes
sodF
12) Whilethe abundance of transcripts involved in secondarymetabolism was largely decreased by the
absB
mutationupregulation of transcript abundance in
absB
ndash
relative to
absB
+
bacteria was also observed (eg a gene cluster ofunknown function SCO4358ndash4363) (Fig 2 and Fig S1)
The abundance of mRNA encoded by
actII-ORF4
or
redD
and by previously demonstrated targets of thesegenes within the
act
and
red
clusters was increased
DNA-Cy3 J1501 genomic DNA
RNA-Cy5 C121 J151 vs
ActRed
3 red
2 act
4 typeI PKS
1 cda
5 Pig-ments
absB- absB+
(tipAp) (tipAp)
redD-independent genes
redD-dependent genes
SCO3211SCO3212SCO3213SCO3214SCO3215SCO3216SCO3217 cdaRSCO3218SCO3219SCO3220SCO3221SCO3222SCO3223SCO3224SCO3225SCO3226SCO3227SCO3228SCO3229SCO3230SCO3231SCO3232SCO3233SCO3234SCO3235SCO3236SCO3237SCO3238SCO3239SCO3240SCO3241SCO3242SCO3243SCO3244SCO3245SCO3246SCO3247SCO3248SCO3249
SCO5070SCO5071SCO5072SCO5073SCO5074SCO5075SCO5076SCO5077SCO5078SCO5079SCO5080SCO5081SCO5082SCO5083SCO5084SCO5085 actII-ORF4SCO5086SCO5087SCO5088SCO5089SCO5090SCO5091SCO5092
SCO5877 redDSCO5878SCO5879SCO5880SCO5881 redZSCO5882SCO5883SCO5884SCO5885SCO5887SCO5888 SCO5889 SCO5890 SCO5891 SCO5892 SCO5893 SCO5894SCO5895 SCO5896 SCO5897SCO5898 SCO5899
SCO6273SCO6274SCO6275SCO6276SCO6277SCO6278SCO6279SCO6280SCO6281SCO6282SCO6283SCO6284SCO6285SCO6286SCO6287SCO6288
28 36 41 48 72 96 28 36 48 60 72 96
ND
I IIgt8 foldlt18 fold
Fig 2 Transcriptional effects of absB on secondary metabolite path-ways RNA samples from the control strains C121(absBndash tipAp) and J151(absB+ tipAp) were isolated at the indicated time points For microarray experiments Cy3-dCTP (green)-labelled J1501 genomic DNA was hybridized with Cy5-dCTP (red)-labelled cDNA correspond-ing to total RNA of C121 (Panel I) and J151 (Panel II) (indicated in figure as lsquoDNA vs RNArsquo) Each individual secondary metabolite locus is shown in order of its position on the chromosome (panels 1ndash4) Rows correspond to individual genes and columns to different time points in hours after inoculation as indicated The change in tran-script abundance for each gene is displayed by means of a colour scale Brighter red shades represent higher transcript abundance and brighter green shades represent lower transcript abundance Black indicates an equal amount of cDNA and genomic DNA and grey represents the absence of data Red and blue arrows in panel 5 indicate the onset of Act or Red production respectively and ND indicates no detectable Act or Red production All original data can be downloaded from the Stanford Microarray Database (httpwww-genomestanfordedumicroarray)
Table 1 Strains used in this study
Strain Relevant characteristic(s) Reference
S coelicolor A3(2)J1501 hisA1 uraA1 strA1
SCP1ndash SCP2ndash PglndashKieser et al
(2000)C120 J1501 absB120 Price et al
(1999)C121 C120 tipAp This studyC122 C120 tipApcdaR This studyC123 C120 tipApactII-ORF4 This studyC124 C120 tipApredD This studyC125 C120 tipApredZ This studyJ151 J1501 tipAp This studyJ152 J1501 tipApcdaR This studyJ153 J1501 tipApactII-ORF4 This studyJ154 J1501 tipApredD This studyJ155 J1501 tipApredZ This studyM145 Prototroph SCP1ndash SCP2ndash Kieser et al
(2000)M512 M145 ∆redD ∆actII-ORF4 Floriano and
Bibb (1996)M550 M145 ∆redZ White and Bibb
(1997)E coli
DH5α InvitrogenET12567pUZ8002 dam dcm Kieser et al
(2000)
Cross-regulation between antibiotic pathways 1279
copy 2005 The AuthorsJournal compilation copy 2005 Blackwell Publishing Ltd Molecular Microbiology 58 1276ndash1287
sharply in absB+ bacteria (Fig 2) Similar effects wereobserved for actII-ORF4-regulated and redD-regulatedgenes located external to these clusters [eg the eca(expression co-ordinated with act) and ecr (expression co-ordinated with red) genes (Huang et al 2001) seeFig S3] These observations are consistent with earlierevidence that the actII-ORF4 and redD regulatory genesare subject to absB control (Aceti and Champness 1998)The cdaR gene and others in the cda cluster also wereupregulated in absB+ mycelium (Fig 2 panel II) howeverwhereas cda genes were activated by absB throughoutthe S coelicolor growth cycle absB expression resultedin upregulation of act and red cluster genes and in pro-duction of the antibiotics actinorhodin and undecylprodi-giosin (Fig 2 panel 5-II) only at later time pointssuggesting that additional factors whose actions aregrowth-phase-dependent can differentially modulate theeffects of absB on different biosynthetic pathways Addi-tionally the extent of absB-dependent upregulation oftranscript abundance was greater for certain genes withinindividual biosynthetic clusters [for example the red path-way transcriptional regulator RedZ (SCO5881) (White andBibb 1997) and a gene encoding a putative small hypo-thetical protein (SCO3218) in the cda cluster (Fig 2 pan-els 3 and 1)] although lower transcript abundancethroughout the cluster was observed in the absB mutantversus absB+ bacteria Quantitative real-time reverse tran-scription polymerase chain reaction (RT-PCR) analysis ofredZ SCO3218 and seven and eight other randomlyselected genes from each of the red and cda clustersconfirmed the quantitative difference in absB effectsamong genes of these clusters (see Table S2) Notwith-standing the production in absB mutant bacteria of tran-scripts of redZ which is believed to be a transcriptionalactivator of redD (White and Bibb 1997) the expressionof redD and redD-dependent genes (Huang et al 2001)and the biosynthesis of undecylprodigiosin were notobserved in the absB mutant C121 (Fig 2 panels 3 and5) This finding suggests that either AbsB itself or a sep-arate absB-regulated function is required along with redZfor redD activation and undecylprodigiosin productionTranscripts of the type I polyketide gene cluster showedincreased abundance at certain time points in both strains(Fig 2 panel 4) Exempted from regulation by absB weresome genes in the hopanoid and coelichelin biosyntheticpathways (Fig S1)
Effects of CSRs on expression of antibiotic pathways in the absence or presence of higher-level regulation
Our identification of genes in all three known S coelicolorantibiotic biosynthetic pathways that produce little or nomRNA in absBndash bacteria enabled us to compare theeffects of the cluster-situated regulatory genes cdaR
actII-ORF4 redD and redZ in the absence or presence ofextra-cluster control by absB In these experiments(Fig 3) gene expression in an absBndash strain that constitu-tively expressed cdaR actII-ORF4 redD or redZ from thetipA promoter [C122ndashC125 (tipApcdaRactII-ORF4redDredZ)] was compared through the growth-cycle withexpression in the control strain C121(tipAp) (Fig 3 pan-els AndashD) and in absB+ bacteria [J152ndashJ155 (tipApcdaRactII-ORF4redDredZ) versus J151 (tipAp)] (Fig 3 pan-els EndashH) Transcripts whose abundance showed a statis-tically significant change relative to either C121 or J151control strain (gt 75 genes in each cluster with P-valuelt005 see Table S4) are highlighted with red or greentriangles in Fig 3 The relative increase (red triangles) ordecrease (green triangles) in transcript abundance in thehighlighted groupings was confirmed by repeats of arrayexperiments and by quantitative real-time RT-PCR analy-sis of randomly selected transcripts (see Table S3)
As seen in Fig 3 in the absence of absB functionconstitutive expression of the cdaR actII-ORF4 and redDregulatory genes under control of the tipA promoterincreased the abundance of transcripts encoded by genesin their own biosynthetic clusters but decreased the abun-dance of transcripts from the type I polyketide gene clus-ter (Fig 3 panels 1A 2B 3C and 4AndashC) The genes mostprominently affected by redD include the previously iden-tified redD-dependent genes (Huang et al 2001) (Fig 3panel 3C) and ecr genes (Fig S3) In contrast while con-stitutive expression of redZ in the absence of absBresulted in increased expression of redD-independentgenes it failed to increase the transcripts regulated byredD despite elevation of the redD transcript itself argu-ing that absB acts directly or indirectly in concert with redZfor the production of functional RedD protein to activatethe redD-dependent genes (Fig 3 panel 3D) Theabsence of detectable undecylprodigiosin in extracts ofmycelium obtained from redZ overproducing bacteria(Fig 3 panel 5D) is consistent with these findings Impor-tantly redZ overexpression additionally increased theabundance of transcripts from the cda gene cluster(Fig 3 panel 1D) indicating that the actions of this CSRextend beyond the red pathway
In the presence of absB function transcripts of the cdaact and red clusters and of the type I polyketide genecluster were increased in abundance during certain peri-ods of the S coelicolor growth cycle (see Fig 2 panel II)Constitutive expression of cdaR actII-ORF4 and redDwhich activated expression of genes in their respectivepathways surprisingly also affected the abundance oftranscripts from genes that function in disparate biosyn-thetic pathways For example constitutive expression ofcdaR increased the relative abundance (compared withthe control strain J151) of transcripts from genes in thecda and act pathways at times when these pathway genes
1280 J Huang et al
copy 2005 The AuthorsJournal compilation copy 2005 Blackwell Publishing Ltd Molecular Microbiology 58 1276ndash1287
Fig 3 Transcriptional effects on secondary metabolite pathways during induction of cluster-situated regulatory genes in the absence or presence of absB RNA samples from absBndash (C121ndashC125) and absB+ (J151ndashJ155) strains were isolated at the indicated time points during parallel growth on modified R5 media containing thiostrepton For microarray experiments (indicated in figure as lsquoRNA vs RNArsquo) Cy5-dCTP (red)-labelled cDNA samples from absBndash strains (C122ndashC125 tipAp each of four regulatory genes) were hybridized with the same time point Cy3-dCTP (green)-labelled cDNA samples of the absBndash control strain (C121 tipAp) Cy5-dCTP labelled cDNA samples from absB+ strains (J152ndashJ155 tipAp each of four regulatory genes) were hybridized with the same time point Cy3-dCTP labelled cDNA sample of the absB+ control strain (J151 tipAp) The change in transcript abundance for each gene is displayed by means of a colour scale in which colour saturation represents the magnitude of the difference of RNA abundance between the detected strains (C122ndashC125 or J152ndashJ155) and control strains (C121 or J151) at the same indicated time point The brighter red shades represent higher transcript abundance and brighter green shades represent lower transcript abundance in detected stain comparing with the control strain Black indicates an equal amount of RNA abundance between the two strains and grey represents the absence of data Ratios of genes with multiple spots on the array were averaged Red and blue arrows in panel 5 indicate the onset of Act or Red production respectively and ND indicates no detectable Act or Red production Triangles highlight instances of the increased (red) or decreased (green) expression relative to the control strain in clusters containing gt75 genes having statistically significant changes (P-value lt005) in expression The relative increase or decrease in RNA abundance in the highlighted groupings was confirmed by repeat array experiments and quantitative real-time RT-PCR analysis
SCO3210SCO3211SCO3212SCO3213SCO3214SCO3215SCO3216SCO3217 cdaRSCO3218SCO3219SCO3220SCO3221SCO3222SCO3223SCO3224SCO3225SCO3226SCO3227SCO3228SCO3229SCO3230SCO3231SCO3232SCO3233SCO3234SCO3235SCO3236SCO3237SCO3238SCO3239SCO3240SCO3241SCO3242SCO3243SCO3244SCO3245SCO3246SCO3247SCO3248SCO3249
SCO5070SCO5071SCO5072SCO5073SCO5074SCO5075SCO5076SCO5077SCO5078SCO5079SCO5080SCO5081SCO5082SCO5083SCO5084SCO5085 actII-ORF4SCO5086SCO5087SCO5088SCO5089SCO5090SCO5091SCO5092
SCO5877 redDSCO5878SCO5879SCO5880SCO5881 redZSCO5882SCO5883SCO5884SCO5885SCO5887SCO5888SCO5889SCO5890SCO5891SCO5892SCO5893SCO5894SCO5895SCO5896SCO5897SCO5898SCO5899
SCO6273SCO6274SCO6275SCO6276SCO6277SCO6278SCO6279SCO6280SCO6281SCO6282SCO6283SCO6284SCO6285SCO6286SCO6287SCO6288
28 36 41 48 72 96 28 36 48 60 72 96
ActRed
3 red
2 act
4 typeI PKS
1 cda
A B C D E F G H
28 36 41 48 72 96 28 36 48 60 72 96 28 36 48 60 72 96 28 36 48 60 72 9628 36 41 48 72 96 28 36 41 48 72 96
vs (tipApcdaR) (tipApactII-O4) (tipApredD) (tipApredZ) (tipApcdaR) (tipApactII-O4) (tipApredD) (tipApredZ)
absB- absB+
RNA-Cy5 C122 C123 C124 C125 J152 J153 J154 J155
RNA-Cy3 C121(tipA) J151(tipA)
redD-independent genes
redD-dependent genes
5 Pig-ments
ND ND
gt8 foldlt18 fold
Cross-regulation between antibiotic pathways 1281
copy 2005 The AuthorsJournal compilation copy 2005 Blackwell Publishing Ltd Molecular Microbiology 58 1276ndash1287
were not normally expressed (ie at 28 h and 72 h respec-tively) (Fig 3 panels 1E and 2E) Conversely constitutiveexpression of actII-ORF4 first decreased and thenincreased the abundance of cda transcripts relative tocontrol strain (J151 tipAp) at 28 and 48 h respectively(Fig 3 panel 1F) it also resulted in a relative decreasein expression of redD-independent genes of the red clus-ter at 72 h when these genes normally show elevatedexpression in the control strain J151 (Fig 3 panel 3FFig 2 panel 3-II) A parallel effect on the abundance ofecr transcripts was observed (Fig S3)
Constitutive expression of redZ in absB+ bacteriaresulted not only in the expected constitutive increase inredD and redD-independent transcripts relative to thecontrol strain (J151 tipAp) containing the empty vector(Fig 3 panel 3H) but also in a transient increase in therelative abundance of redD-dependent and act transcriptsat times prior to the normal appearance of these tran-scripts in the control strain (Fig 3 panels 3H and 2H)Accompanying these latter increases was the synthesisof undecylprodigiosin and actinorhodin at earlier than nor-mal times (60 h and 72 h respectively versus 72 h and96 h Fig 3 panel 5H and Fig 2 panel 5-II) Parallelinga relative decrease in expression of redD-dependentgenes of the red cluster at 72 h in absB+ bacteria thatconstitutively express actII-ORF4 (J153 tipApactII-ORF4 Fig 3 panel 3F) were a relative decrease inexpression of redD-dependent genes in mycelia that con-stitutively express redZ (J155 tipApredZ Fig 3 panel3H) and a concurrent relative elevation of act geneexpression in these cells (Fig 3 panel 2H) Effects ofredZ expression on other gene clusters outside of the Redand Act biosynthetic gene clusters were also observedsuggesting that this cluster-situated regulatory gene mayhave more general regulatory functions Among the genesaffected were a previously undefined 15-gene cluster(SCO6566ndashSCO6580) and genes of the whiE locuswhich encodes a grey pigment present in S coelicolorspores (Davis and Chater 1990 Kelemen et al 1998)(Fig S4) Interestingly constitutive expression of any ofthese CSRs affected the abundance of mRNAs of the typeI polyketide in both absB mutant and absB+ bacteria(Fig 3 panel 4)
Effects of mutations in cluster-situated regulatory genes on disparate antibiotic biosynthetic pathways
Consistent with our finding that constitutive expression ofredZ activates genes in other biosynthetic clusters as wellas genes in the red cluster (Fig 3 panels D and H) weobserved that deletion of redZ in absB+ bacteria (M550∆redZ) resulted in delayed expression of genes of the actcda and type I polyketide gene clusters for 6ndash12 h andimpaired expression of redD and other genes in the red
cluster (Fig 4 panel C) Detection of Act was delayed for16 h in M550 (∆redZ) versus the wild-type strain M145(Fig 4 panel 5) These findings provide further evidencefor functional interaction between redZ and multiple bio-synthetic gene pathways Additionally we observed thatred pathway mRNAs were more abundant in cells blocked
Fig 4 Expression profiles of secondary metabolite loci genes in S coelicolor M145 mutant M512 (∆redD ∆actII-ORF4) and M550 (∆redZ) RNA samples isolated from M145 (wild type) M512 (∆redD ∆actII-ORF4) and M550 (∆redZ) were isolated at the indicated time points on modified R5 medium For microarray experiments Cy5-dCTP labelled cDNA corresponding to total RNA of M145 (panel A) M512 (panel B) and M550 (panel C) was hybridized with Cy3-dCTP labelled M145 genomic DNA Data were displayed as described in the Fig 2 legend
26 32 45 56 72 96
3 red
2 act
4 typeI PKS
1 cda
5 Pig-ments
26 32 45 56 72 96 26 32 45 56 72 96
A B C
ActRed
SCO3211SCO3212SCO3213SCO3214SCO3215SCO3216SCO3217SCO3218SCO3219SCO3220SCO3221SCO3222SCO3223SCO3224SCO3225SCO3226SCO3227SCO3228SCO3229SCO3230SCO3231SCO3232SCO3233SCO3234SCO3235SCO3236SCO3237SCO3238SCO3239SCO3240SCO3241SCO3243SCO3244SCO3245SCO3246SCO3247SCO3248SCO3249
SCO5070SCO5071SCO5072SCO5073SCO5074SCO5075SCO5076SCO5077SCO5078SCO5079SCO5080SCO5081SCO5082SCO5083SCO5084SCO5085SCO5086 actII-ORF4SCO5087SCO5088SCO5089SCO5090SCO5091SCO5092
SCO5877 redDSCO5878SCO5879SCO5880SCO5881 redZSCO5882SCO5883SCO5884SCO5885SCO5886SCO5887SCO5888SCO5889SCO5890SCO5891SCO5892SCO5893SCO5894SCO5895SCO5896SCO5897SCO5898SCO5899
SCO6273SCO6274SCO6275SCO6276SCO6277SCO6278SCO6279SCO6280SCO6281SCO6282SCO6283SCO6284SCO6285SCO6286SCO6287SCO6288
(wt) ( redD actII-O4) ( redZ)
DNA-Cy3 M145 genomic DNA
RNA-Cy5 M145 M512 M550 vs
ND
gt8 foldlt18 fold
1282 J Huang et al
copy 2005 The AuthorsJournal compilation copy 2005 Blackwell Publishing Ltd Molecular Microbiology 58 1276ndash1287
in the Act pathway (Huang et al 2001) In our currentexperiments we observed that cda pathway transcriptswere also more abundant in bacteria deleted in actII-ORF4 and redD (Fig 4 panel 1B) providing an additionaldemonstration of the effects of CSRs on disparatepathways
Cross-regulation between redZ and higher level regulator afsR2afsS
Overexpression of the higher level regulator AfsR2(known also as AfsS) has long been known to stimulatethe production of multiple antibiotics in Streptomyceslividans (Vogtli et al 1994) and S coelicolor A3(2)(Floriano and Bibb 1996) In our microarray experimentswe observed that afsR2 was highly and constitutivelyexpressed during the growth cycle of both of the Scoelicolor stains we examined (Fig 5 panels 1-I and 2-II) In S coelicolor mycelium expressing redZ constitu-tively under control of the tipA promoter (J155tipApredZ) we surprisingly found that transcription ofafsR2 was increased dramatically over the control strainlevel specifically at 60 h (Fig 5 panel 2-H) when Redpigment precociously appeared (Fig 3 panel 5H) Twelvehours later (at 72 h) actinorhodin production by this strainwas observed whereas this antibiotic normally was notdetectable until 96 h in control strain J151 (Fig 3 panel5H and Fig 2 panel 5-II) RT-PCR analysis confirmed therelative increase in afsR2 mRNA abundance in bacteria
expressing redZ under the control of tipA (Fig 5 panels3ndash4)
Discussion
Experiments carried out over the past four decades indi-cate that a complex regulatory programme has evolved inS coelicolor to control the biosynthesis and flux of sec-ondary metabolites It has long been recognized that theproduction of multiple secondary metabolites by thisorganism is co-ordinated during the growth cycle perhapsto facilitate its ability to compete against other biologicalspecies (Challis and Hopwood 2003) Such co-ordinationhas been believed to be mediated by global regulators thatactivate expression of chromosomal clusters of disparatebiosynthetic genes by turning on lower level regulatorsthat highly specifically control transcription of other genesin their own cluster Additionally the supply of metabolitesutilized in common by different pathways has been postu-lated to alter the actions of pathways whose protein prod-ucts compete for the same precursor (Chater 1990 Sunet al 2002) The investigations reported here indicate theexistence of functional interactions among participants inthe S coelicolor regulatory programme the ability of reg-ulators situated within biosynthetic gene clusters to alterexpression of other clusters as well as their own and alsoto modulate the effects of regulators that act more globallyThey further show that cross-pathway regulation is con-trolled temporally in S coelicolor by absB Functionalinteractions among transcriptional regulators have beenobserved also for Escherichia coli (Oshima et al 2002)and yeast (Kaniak et al 2004)
Our results indicate that CSRs that act pleiotropicallycan function pleiotropically and that their effects on dis-parate biosynthetic pathways can occur at the RNA levelWhether competition between pathways for pools of pre-cursor metabolites used in common or actions of biosyn-thetic pathway products on other pathways have a role inthese effects has not been determined
Foremost perhaps among CSRs is the Red cluster generedZ which we show can upregulate the production of allthree known antibiotics of S coelicolor Induction of redZtransiently increased expression of cda red and act ineither the absence or presence of expression of absBDeletion of redZ abolished red expression and delayedexpression of two other antibiotics and the type Ipolyketide Interestingly the sequence of the RedZ proteinshows a helixndashturnndashhelix motif plus 26 end-to-end iden-tity to AbsA2 the response regulator component of a two-component system encoded by a locus in the cda cluster(Guthrie et al 1998 Anderson et al 2001 Ryding et al2002) AbsA2 together with the sensor kinase encodedby the neighbouring gene AbsA1 can negatively affectthe flux through other antibiotic production pathways in
Fig 5 Expression profiles for afsR2 gene during the S coelicolor growth cycle and during induction of CSRs Panels 1-I and 2-II are from the same data set as Fig 2 (panels I and II) panels AndashH are from the same data set as Fig 3 (panels AndashH) panel 3 RT-PCR analysis of afsR2 60 h mRNA samples from strains J151ndashJ155 panel 4 RT-PCR analysis of 60 h 16s rRNA samples from strains J151ndashJ155 Red triangles highlight the higher expression observed in strain J155 (tipApredZ) compared with the control strain J151 (tipAp) at 60 h
28 36 41 48 72 96 28 36 41 48 72 9628 36 41 48 72 96 28 36 41 48 72 9628 36 41 48 72 96
28 36 48 60 72 9628 36 48 60 72 96 28 36 48 60 72 96 28 36 48 60 72 9628 36 48 60 72 96
afsR2
afsR2
I A B C D
II E F G H
RNA-Cy5 C121 C122 C123 C124 C125
DNARNA-Cy3 J1501 gDNA C121 RNA
RNA-Cy5 J151 J152 J153 J154 J155
DNARNA-Cy3 J1501 gDNA J151 RNA
vs (tipAp) (tipApcdaR) (tipApactII-O4) (tipApredD) (tipApredZ)
vs (tipAp) (tipApcdaR) (tipApactII-O4) (tipApredD) (tipApredZ)
SCO4425 afsR2
16S rRNA
J151 J152 J153 J154 J155 60 h
1
2
3
4
gt8 foldlt18 fold
Cross-regulation between antibiotic pathways 1283
copy 2005 The AuthorsJournal compilation copy 2005 Blackwell Publishing Ltd Molecular Microbiology 58 1276ndash1287
addition to more prominently repressing its own pathwayparalleling the positive regulatory effects of RedZ on dis-parate pathways
Our microarray analysis indicated that the abundanceof mRNAs encoded by afsR2 and several other genes thathave been annotated in the Streptomyces database(ScoDB httpstreptomycesorguk) as putative regula-tors (SCO5147 SCO4908 and SCO1699) were increaseddramatically in J155 (tipApredZ) over the control strainlevel (J151 tipAp) (Fig 5 and Fig S4) thus demonstrat-ing unanticipated redZ control over the afsR2 higher levelregulator and providing a possible basis for RedZ activa-tion of the Red and Act biosynthetic pathways Howeverdespite constitutive expression of redZ throughout the Scoelicolor growth cycle the effects of afsR2 were notprominently observed until the 60 h time point implyingthat other cellular factors regulated along with afsR2 areneeded for activation of these pathways
Our results suggest that absB regulation of productionof undecylprodigiosin in S coelicolor results from absBactivation of redD possibly through stimulation of theproduction of afsR2 gene product which we found canrestore antibiotic production in the absence of absB Sim-ilarly redZ upregulation restored expression of CDA bio-synthetic genes in the absence of absB but required absBto activate act genes (Fig 3 panels 1D and 2H) Whereasearlier work (Kim et al 2001 Lee et al 2002) and ourunpublished studies indicate that afsR2 overexpression issufficient to activate all of these pathways it seemsunlikely that afsR2 expression is required for this effect asantibiotic biosynthesis occurred in cultures that failed toproduce afsR2
Analysis of the S coelicolor genomic DNA sequencesuggests that there are more than 20 distinct pathwaysfor the production of secondary metabolites in thismicroorganism (Bentley et al 2002) Effects of the CSRswe studied on other pathways were observed the originaldata are available at httpsncohenlabstanfordedustreptomyces2 or httpwww-genomestanfordedumicroarray Among the genes altered by RedZ and ActII-ORF4 were the whiE cluster (SCO5314ndash5321) (Fig S4)and the coelichelin non-ribosomal peptide synthetase(NRPS) gene locus (SCO489ndash499) A large gene locus ofunknown function (SCO6566ndash6580) was also regulatedby redZ resulting in increased expression in both C125(tipApredZ) and J155 (tipApredZ) and decreasedexpression in M550 (∆redZ) as compared with M145 Forother gene groups affected by induction of redZ seeFig S4
Overexpression of actII-ORF4 was found to increasetranscripts of the catalase (catA SCO0379) and super-oxide dismutase genes (sodF12 SCO2633SCO0999)(Fig S5) which have been implicated in cellular resis-tance to the toxic effects of exposure to oxidants (Cho and
Roe 1997 Chung et al 1999) This observation sug-gests that S coelicolor may increase its anti-oxidativedefence mechanisms during production of actinorhodin
The extent and boundaries of the type I polyketide locus(from SCO6273 to SCO6288) were inferred fromsequence analysis of S coelicolor genomic DNA (Bentleyet al 2002) During our studies we observed that a geneSCO6272 (SC2C402 a putative secreted FAD-bindingprotein) adjacent to the inferred type I polyketide locusshowed an expression correlation coefficient of gt09 withgenes designated by Bentley et al as components of thetype I polyketide locus (Fig S6) Moreover expression ofthree other genes separated from SCO6272 by only 5 kbalso showed a high correlation coefficient (gt 08) withexpression of genes in the type I polyketide locus two ofthese scbR (SCO6265) and scbA (SCO6266) mediatethe synthesis of gamma-butyrolactone SCB1 of S coeli-color (Takano et al 2001) The third is a putative histidinekinase gene (SCO6268 SCAH1033c) These findingsraise the possibility that these genes collectively may havea role in regulating the type I polyketide locus (Fig S6)Supporting this postulated connection between SCB1 andthe type I polyketide is a recent report by Takano et al(2005) which has identified a regulatory gene kasO inthe type I polyketide cluster that is regulated directly byscbR
absB mutant bacteria previously have been found to bedeficient in antibiotic production in S coelicolor and theDNA sequence of this gene indicates that it encodes a Scoelicolor homologue of the E coli endoribonucleaseRNase III (rnc) (Price et al 1999) RNase III proteins ofbacteria are known to have a diverse role in the process-ing of double-stranded mRNA and rRNA substrates(Court 1993) and RNase III homologues in eukaryotescan process double-stranded RNAs into small regulatoryRNAs (Lee et al 2003 Carmell and Hannon 2004 Tijs-terman and Plasterk 2004) Our finding that absB whichis widely conserved in streptomycetes (Price et al 1999)has extensive effects on the abundance of about 200different S coelicolor transcripts having a multitude offunctions suggests that ribonucleolytic processing ofduplex RNA regions may modulate key aspects of geneexpression in this organism (Fig S1)
The cross-regulation wersquove observed occurs in both thepresence (Figs 2 and 3) or absence (Fig 4) of antibioticsHowever our microarray analyses also indicated that theextent of dependence of biosynthetic pathway geneexpression on absB was influenced by the addition ofthiostrepton and apramycin in the medium (data notshown) the abundance of red and act transcripts wasdecreased and of type I polyketide gene transcripts wasincreased in the presence of these antibiotics suggestingthat control of secondary metabolism by regulatory genesof S coelicolor can be affected by alterations in the cellu-
1284 J Huang et al
copy 2005 The AuthorsJournal compilation copy 2005 Blackwell Publishing Ltd Molecular Microbiology 58 1276ndash1287
lar environment The ability of extracellular agents to alterthe actions of individual regulatory genes may account inpart for the well-known dependence of antibiotic produc-tion on medium composition Notwithstanding such obser-vations the differential expression that provides a basisfor our conclusions cannot result from effects of antibioticsper se as experimental cultures were compared with con-trol cultures that included the same antibiotics (Fig 3)
Experimental procedures
Construction of the integrative PtipA expression vector pIJ6902 and its derivatives
A 0625 kb fragment carrying a polylinker downstream of thethiostrepton-inducible PtipA promoter both ends flanked bytranscriptional terminators was amplified from the multicopyexpression vector pIJ6021 (Takano et al 1995) by PCRusing Pfu DNA polymerase (Promega) and the primers (5prime-GCCTCGTGATCACCAATAAAAAACGCCCGGCGG-3prime and5prime-CGCGTGATCAGCCCCGCAAAAGCGGCCTTTGAC-3prime)The PCR product was cloned into EcoRI-XbaI-cut pSET152(Takano et al 1995) for which both cleavage sites had beenfilled in to generate blunt ends (thereby destroying both sites)The sequence of the inserted fragment in the resulting con-struct pIJ6901 was confirmed The tsr gene was amplifiedby PCR from pIJ6021 using Pfu DNA polymerase and theprimers THIONHE (5prime-GAAATGTAGCTAGCAGGCGAATACTT-3prime) and THIONHEREV (5prime-GACGAATCGGCTAGCAGGAACCGAGCGTCC-3prime) both of which carry NheI sites Theresulting 106 kb PCR product was cut with NheI and clonedinto the unique NheI of pIJ6901 to create pIJ6902 and thetsr sequence in the final construct was confirmed
Open reading frames (ORFs) of cdaR actII-ORF4 redDand redZ were amplified by PCR and cloned into the pCR21-TOPO vector (Invitrogen) with an NdeI site overlapping anATG start codon NdeI and EcoRIBamHI were used toremove the inserted ORFs which were cloned into the inte-grative vector pIJ6902 under control of the tipA promoter Allcloned products were confirmed by DNA sequencing Theprimers used for PCR amplification are as follows cdaR-LGAGCAT-ATGGATCTTCGGCTGATAGAACCG cdaR-RCAGCACTCGCTGTGGCCGTC redZ-L CAACAT-ATGACGACCCGTGTCCTGGTGTG redZ-R CCGCACGGAACGCGAAGC redD-L CGGCAT-ATGACGGGTGGGGGAGTGCTTG redD-R GTTTCCGTGACGGTGGGTGTGTC actII-ORF4-L GCGCAT-ATGAGATTCAACTTATTGGGACGTGTCCAT actII-ORF4-R CGGTGCTACACGAGCACCTTCTCAC
Strains growth conditions RNA isolation and assay of antibiotics
Streptomyces coelicolor strains used in this study are listedin Table 1 pIJ6902 and its derivatives containing insertionsof the cdaR actII-ORF4 redD and redZ genes were intro-duced by conjugation from E coli ET12567pUZ8002 intoJ1501 and C120 strains where they integrated site-specifi-cally into the chromosome at the φC31 attB site The ex-
conjugants (J151ndashJ155 and C121ndashC125 Table 1) werechecked by PCR
We used cellophane membranes placed on plates for alltotal RNA sample isolation from surface-grown cells RNAfrom M145 and its mutants grown on solid medium wasobtained as described earlier (Huang et al 2001) Spores(105 per plate) of strains C121ndashC125 and J151ndashJ155 wereplated onto R5-medium containing 10 mM CaCl2 50 microg mlminus1
apramycin and 50 microg mlminus1 thiostrepton as the final concentra-tion We detected growth of each strain by measuring dry cellweight (Miguelez et al 1999) and we combined the surface-grown cells harvested from 4 to 10 plates at each time pointand used the modified Kirby-mix method (Kieser et al 2000)to extract total RNA RNA samples were purified using theRNeasy Kit (Qiagen) Later experimental repeats of microar-ray and quantitative real-time RT-PCR experiments at certaintime points (highlighted with the green or red triangles inFig 3) were performed with RNA samples isolated and puri-fied using the RNeasyreg Plant Kit
Assays for Act and Red were as described previously(Huang et al 2001) However CDA production on solidmedium containing thiostrepton was impractical by bioassayof the indicator Staphylococcus aureus strain because thisCDA-sensitive bacterium is also sensitive to thiostrepton
Streptomyces coelicolor microarray experiments and quantitative real time RT-PCR
The whole-genome DNA sequences with 7846 S coelicolorM145 ORFs (ftpftpsangeracukpubS_coelicolorsequences) were used for design of primer pairs that ampli-fied 50ndash2400 bp internal fragments of putative ORFs (httpsncohenlabStanfordedustreptomyces) The arrays contain97 of 7846 ORFs and about 10 of the ORFs printed onarrays were duplicates or overlapping sequences Primerdesign PCR amplification RNA labelling and hybridizationwere as described earlier (Huang et al 2001 Elliot et al2003)
Genomic DNA was labelled with Cy3-dCTP as follows Twomicrograms of M145 or J1501 genomic DNA was fragmentedby sonication to an average size of 500ndash1000 bp mixed with8 microg of high-GC (72) hexamers (total 20 microl) and after incu-bation at 98degC for 5 min transferred to ice water 30 microl oflabelling mix [5 microl 10times Klenow buffer 6 microl 10times dNTP (4 mMdATP 4 mM dTTP 10 mM dGTP and 05mM dCTP) 3 microlCy3-dCTP (Amersham Pharmacia Biotech) 1 microl KlenowDNA polymerase (NEB 50 U microlminus1) and 15 microl ddH2O] wasadded and the mixture was incubated for 5ndash6 h at 37degC inthe dark The Cy3-dCTP labelled genomic DNA probe waspurified using Microcon-10 filters (Amicon) and hybridizedwith Cy5-dCTP labelled cDNA
Quantitative real-time RT-PCR was applied for validation ofgene expression changes observed in microarrays First-strand cDNA synthesis was carried out using 2 microg total RNAand SuperScript II (Invitrogen) following the manufacturerrsquosinstructions (Cat No 18064-014) Quantitative real-timePCR of randomly selected genes from the antibiotic or typeI polyketide cluster was performed using the Bio-Rad iCyc-lerTM Real-Time PCR Detection System and iQTM SYBRGreen Supermix Kit (170-8880) Five per cent of the first-strand reaction was used as DNA template real-time PCR
Cross-regulation between antibiotic pathways 1285
copy 2005 The AuthorsJournal compilation copy 2005 Blackwell Publishing Ltd Molecular Microbiology 58 1276ndash1287
conditions were as follows 94degC for 10 min 40 cycles of94degC for 30 s 62degC for 30 s and 72degC for 30 s The targetcDNA was normalized internally to 16S rDNA levels (seeTable S1 for all RT-PCR primers)
Microarray data normalization and analysis
Built-in functions of the Stanford Microarray Database (httpwww-genomestanfordedumicroarray) were used to nor-malize and analyse RNA-versus-genomic DNA data Thenormalization assumes equal log average signal intensity ineach fluorescence channel and that RNAgDNA ratios wereequivalent to relative transcript abundances after nor-malization (Bernstein et al 2002) Data analysis of RNA-versus-RNA hybridization was performed as describedearlier (Huang et al 2001 Elliot et al 2003) and a k-near-est neighbours (KNN) algorithm was applied for missing data(Troyanskaya et al 2001)
We determined the statistical significance of the changesin gene expression as follows Using replicate microarrays fora subset of the conditions we calculated the standard errorof the expression values for each gene across the replicatesand took the median standard error of all the genes as thefudge factor We then estimated the standard error for eachgene as the sum of the standard error of that gene in thereplicates plus the fudge factor (Efron et al 2001) For thoseconditions for which we did not have replicates we calculatedan approximate t-statistic for each gene as the expressionvalue of that gene divided by its estimated standard errorBecause redD-dependent genes and redD-independentgenes have different expression patterns we separated theminto two subclusters for t-score calculation We estimated theP-value (two-tailed) for each gene using the t-statistic Geneexpression was considered to be significantly changed if itsP-value was lt005 Expression in an entire cluster was con-sidered to be significantly changed if expression of at least75 of the genes within it were significantly changed Quan-titative real-time PCR analysis and additional microarrayexperiments were carried out to further evaluate the alter-ations in gene expression (see Supplementary materials athttpsncohenlabstanfordedustreptomyces2)
Acknowledgements
We thank David Hopwood for helpful comments and sugges-tions on the manuscript and Mervyn Bibb Wendy Champ-ness Robert Tibshirani Christine Miller Weijing Xu Li Li KaiBao and Yontao Lu for strains andor advice We also thankRichard Lin for web site development These investigationswere supported by a John Innes Foundation studentship toVirginie Molle by a grant-in-aid to the John Innes Centre fromthe BBSRC in part by NSF Grant BES-0093900-001 and NIHGrant GM65470-02 to CMK and by Grant AI08619 fromthe NIAID and by DARPA Grant MDA972-00-1-0032 toSNC
References
Aceti DJ and Champness WC (1998) Transcriptional reg-ulation of Streptomyces coelicolor pathway-specific antibi-
otic regulators by the absA and absB loci J Bacteriol 1803100ndash3106
Adamidis T and Champness W (1992) Genetic analysisof absB a Streptomyces coelicolor locus involved in globalantibiotic regulation J Bacteriol 174 4622ndash4628
Anderson T Brian P and Champness W (2001) Geneticand transcriptional analysis of absA an antibiotic genecluster-linked two-component system that regulates multi-ple antibiotics in Streptomyces coelicolor Mol Microbiol 39553ndash566
Arias P Fernandez-Moreno MA and Malpartida F(1999) Characterization of the pathway-specific positivetranscriptional regulator for actinorhodin biosynthesis inStreptomyces coelicolor A3(2) as a DNA-binding proteinJ Bacteriol 181 6958ndash6968
Bate N Butler AR Gandecha AR and Cundliffe E(1999) Multiple regulatory genes in the tylosin biosyntheticcluster of Streptomyces fradiae Chem Biol 6 617ndash624
Bentley SD Chater KF Cerdeno-Tarraga AM ChallisGL Thomson NR James KD et al (2002) Completegenome sequence of the model actinomycete Streptomy-ces coelicolor A3(2) Nature 417 141ndash147
Bernstein JA Khodursky AB Lin PH Lin-Chao S andCohen SN (2002) Global analysis of mRNA decay andabundance in Escherichia coli at single-gene resolutionusing two-color fluorescent DNA microarrays Proc NatlAcad Sci USA 99 9697ndash9702
Bibb M (1996) 1995 Colworth Prize Lecture The regulationof antibiotic production in Streptomyces coelicolor A3(2)Microbiology 142 1335ndash1344
Carmell MA and Hannon GJ (2004) RNase III enzymesand the initiation of gene silencing Nat Struct Mol Biol 11214ndash218
Challis GL and Hopwood DA (2003) Synergy andcontingency as driving forces for the evolution of multiplesecondary metabolite production by Streptomyces spe-cies Proc Natl Acad Sci USA 100 (Suppl 2) 14555ndash14561
Chater KF (1990) The improving prospects for yieldincrease by genetic engineering in antibiotic-producingStreptomycetes Biotechnology (N Y) 8 115ndash121
Chater KF (1993) Genetics of differentiation in Streptomy-ces Annu Rev Microbiol 47 685ndash713
Chater KF and Bibb MJ (1997) Regulation of bacterialantibiotic production In Products of Secondary Metabo-lism Biotechnology 7 Kleinkauf H and Von Dohren H(eds) Weinheim Germany VCH pp 59ndash105
Cho YH and Roe JH (1997) Isolation and expression ofthe catA gene encoding the major vegetative catalase inStreptomyces coelicolor Muller J Bacteriol 179 4049ndash4052
Chouayekh H and Virolle MJ (2002) The polyphosphatekinase plays a negative role in the control of antibioticproduction in Streptomyces lividans Mol Microbiol 43919ndash930
Chung HJ Kim EJ Suh B Choi JH and Roe JH(1999) Duplicate genes for Fe-containing superoxide dis-mutase in Streptomyces coelicolor A3(2) Gene 231 87ndash93
Court D (1993) RNA processing and degradation by RNaseIII In Control of messenger RNA Stability Belasco JG
1286 J Huang et al
copy 2005 The AuthorsJournal compilation copy 2005 Blackwell Publishing Ltd Molecular Microbiology 58 1276ndash1287
and Brawerman G (eds) San Diego Academic Press pp71ndash116
Davis NK and Chater KF (1990) Spore colour in Strep-tomyces coelicolor A3(2) involves the developmentally reg-ulated synthesis of a compound biosynthetically related topolyketide antibiotics Mol Microbiol 4 1679ndash1691
Efron B Tibshirani R Storey J and Tusher V (2001)Empirical Bayes analysis of a microarray experiment J AmStat Assoc 96 1151ndash1160
Elliot MA Karoonuthaisiri N Huang J Bibb MJ CohenSN Kao CM and Buttner MJ (2003) The chaplins afamily of hydrophobic cell-surface proteins involved inaerial mycelium formation in Streptomyces coelicolorGenes Dev 17 1727ndash1740
Fernandez-Moreno MA Caballero JL Hopwood DAand Malpartida F (1991) The act cluster contains regula-tory and antibiotic export genes direct targets for transla-tional control by the bldA tRNA gene of Streptomyces Cell66 769ndash780
Floriano B and Bibb M (1996) afsR is a pleiotropic butconditionally required regulatory gene for antibiotic produc-tion in Streptomyces coelicolor A3(2) Mol Microbiol 21385ndash396
Guthrie EP Flaxman CS White J Hodgson DA BibbMJ and Chater KF (1998) A response-regulator-likeactivator of antibiotic synthesis from Streptomyces coeli-color A3(2) with an amino-terminal domain that lacks aphosphorylation pocket Microbiology 144 727ndash738
Hopwood DA (1988) The Leeuwenhoek lecture 1987Towards an understanding of gene switching in Streptomy-ces the basis of sporulation and antibiotic production ProcR Soc Lond B Biol Sci 235 121ndash138
Hopwood DA Chater KF and Bibb MJ (1995) Geneticsof antibiotic production in Streptomyces coelicolor A3(2) amodel streptomycete Biotechnology 28 65ndash102
Huang J Lih CJ Pan KH and Cohen SN (2001)Global analysis of growth phase responsive gene expres-sion and regulation of antibiotic biosynthetic pathways inStreptomyces coelicolor using DNA microarrays GenesDev 15 3183ndash3192
Kaniak A Xue Z Macool D Kim JH and Johnston M(2004) Regulatory network connecting two glucose signaltransduction pathways in Saccharomyces cerevisiaeEukaryot Cell 3 221ndash231
Karoonuthaisiri N Weaver D Huang J Cohen SN andKao CM (2005) Regional organization of gene expres-sion in Streptomyces coelicolor Gene 353 53ndash66
Kelemen GH Brian P Flardh K Chamberlin L ChaterKF and Buttner MJ (1998) Developmental regulation oftranscription of whiE a locus specifying the polyketidespore pigment in Streptomyces coelicolor A3(2) J Bacte-riol 180 2515ndash2521
Kieser T Bibb MJ Chater KF and Hopwood DA(2000) Practical Streptomyces Genetics Norwich UKJohn Innes Foundation
Kim ES Hong HJ Choi CY and Cohen SN (2001)Modulation of actinorhodin biosynthesis in Streptomyceslividans by glucose repression of afsR2 gene transcriptionJ Bacteriol 183 2198ndash2203
Lee PC Umeyama T and Horinouchi S (2002) afsS isa target of AfsR a transcriptional factor with ATPase activ-
ity that globally controls secondary metabolism in Strepto-myces coelicolor A3(2) Mol Microbiol 43 1413ndash1430
Lee Y Ahn C Han J Choi H Kim J Yim J et al(2003) The nuclear RNase III Drosha initiates microRNAprocessing Nature 425 415ndash419
Miguelez EM Hardisson C and Manzanal MB (1999)Hyphal death during colony development in Streptomycesantibioticus morphological evidence for the existence of aprocess of cell deletion in a multicellular prokaryote J CellBiol 145 515ndash525
Oshima T Aiba H Masuda Y Kanaya S Sugiura MWanner BL et al (2002) Transcriptome analysis of alltwo-component regulatory system mutants of Escherichiacoli K-12 Mol Microbiol 46 281ndash291
Price B Adamidis T Kong R and Champness W (1999)A Streptomyces coelicolor antibiotic regulatory geneabsB encodes an RNase III homolog J Bacteriol 1816142ndash6151
Ryding NJ Anderson TB and Champness WC (2002)Regulation of the Streptomyces coelicolor calcium-depen-dent antibiotic by absA encoding a cluster-linked two-com-ponent system J Bacteriol 184 794ndash805
Sun Y Zhou X Liu J Bao K Zhang G Tu G et al(2002) lsquoStreptomyces nanchangensisrsquo a producer of theinsecticidal polyether antibiotic nanchangmycin and theantiparasitic macrolide meilingmycin contains multiplepolyketide gene clusters Microbiology 148 361ndash371
Takano E Gramajo HC Strauch E Andres N WhiteJ and Bibb MJ (1992) Transcriptional regulation of theredD transcriptional activator gene accounts for growth-phase-dependent production of the antibiotic undecylpro-digiosin in Streptomyces coelicolor A3(2) Mol Microbiol 62797ndash2804
Takano E White J Thompson CJ and Bibb MJ (1995)Construction of thiostrepton-inducible high-copy-numberexpression vectors for use in Streptomyces spp Gene 166133ndash137
Takano E Chakraburtty R Nihira T Yamada Y andBibb MJ (2001) A complex role for the gamma-butyrolac-tone SCB1 in regulating antibiotic production in Streptomy-ces coelicolor A3(2) Mol Microbiol 41 1015ndash1028
Takano E Kinoshita H Mersinias V Bucca G Hotch-kiss G Nihira T et al (2005) A bacterial hormone (theSCB1) directly controls the expression of a pathway-spe-cific regulatory gene in the cryptic type I polyketide biosyn-thetic gene cluster of Streptomyces coelicolor MolMicrobiol 56 465ndash479
Tijsterman M and Plasterk RH (2004) Dicers at RISC themechanism of RNAi Cell 117 1ndash3
Troyanskaya O Cantor M Sherlock G Brown PHastie T Tibshirani R et al (2001) Missing value esti-mation methods for DNA microarrays Bioinformatics 17520ndash525
Vogtli M Chang PC and Cohen SN (1994) afsR2 apreviously undetected gene encoding a 63-amino-acid pro-tein that stimulates antibiotic production in Streptomyceslividans Mol Microbiol 14 643ndash653
White J and Bibb M (1997) bldA dependence of undecyl-prodigiosin production in Streptomyces coelicolor A3(2)involves a pathway-specific regulatory cascade J Bacteriol179 627ndash633
Cross-regulation between antibiotic pathways 1287
copy 2005 The AuthorsJournal compilation copy 2005 Blackwell Publishing Ltd Molecular Microbiology 58 1276ndash1287
Supplementary material
The following supplementary material is available for thisarticle onlineFig S1 Global effects of absB gene In total sim1500 genesthat were highly expressed during the growth cycle wereselected and hierarchically clustered according to transcriptabundance Panels I and II are from the same data set asFig 2 (panel I and II) Rows correspond to individual genesand columns to different time points as indicated Thechange in transcript abundance for each gene is displayedby means of a colour scale Brighter red shades representhigher transcript abundance and brighter green shades rep-resent lower transcript abundance Black indicates an equalamount of cDNA relative to genomic DNA and grey repre-sents the absence of data Arrows indicate examples of sev-eral known genesgene clusters and a previously unidentifiedgene cluster In order to compare the different gene expres-sion between the absBndash and absB+ strain directly transcriptabundance for the absB mutant (panel I) was subtractedfrom transcript abundance of absB+ the strain (panel II) toobtain the net fold difference between them In total sim200genes were observed to have at least a sixfold differentabundance in at least one time point between the absBmutant and absB+ the strain (Table S5) All original datacan be downloaded from httpsncohenlabstanfordedustreptomyces2 or the Stanford Microarray Database (httpwww-genomezstanfordedumicroarray)Fig S2 Growth curves of strains in Figs 2 and 3 Growth of
mycelia was monitored as mg dry cell weight per plate afterinoculation of sim105 per plate spores on modified R5-solidmediumFig S3 Expression of ecaecr genes is similar to expressionof the act and red biosynthetic genes respectively Panels Iand II are from the same data set as Fig 2 (panel I and II)panels AndashH are from the same data set as Fig 3 (panels AndashH) See Figs 2 and 3 legends in the main text for detailsFig S4 Additional targets regulated by redZ Panels arefrom the same data sets shown in Figs 2ndash4 as indicated SeeFigs 2ndash4 legends in the main text for detailsFig S5 Additional targets regulated by actII-ORF4 PanelsI and II are from the same data sets as Fig 2 (panel I andII) Panels AndashH are from the same data set as Fig 3 (panelsAndashH) See Figs 2 and 3 legends in the main text for detailsFig S6 Extent of the type I polyketide locus and similarexpression patterns observed for scbRA Panel I is from thesame data set as Fig 2 (panel I) panels AndashD are from thesame data set as Fig 3 (panels AndashD) See Figs 2 and 3legends in the main text for detailsTable S1 Primers used for quantitative real-time RT-PCRTable S2 Results of quantitative real-time RT-PCR in Fig 2Table S3 Results of quantitative real-time RT-PCR in Fig 3Table S4 P-values of the genes in Fig 3Table S5 Ratio of sim1500 genes in Fig S1
This material is available as part of the online article fromhttpwwwblackwell-synergycom
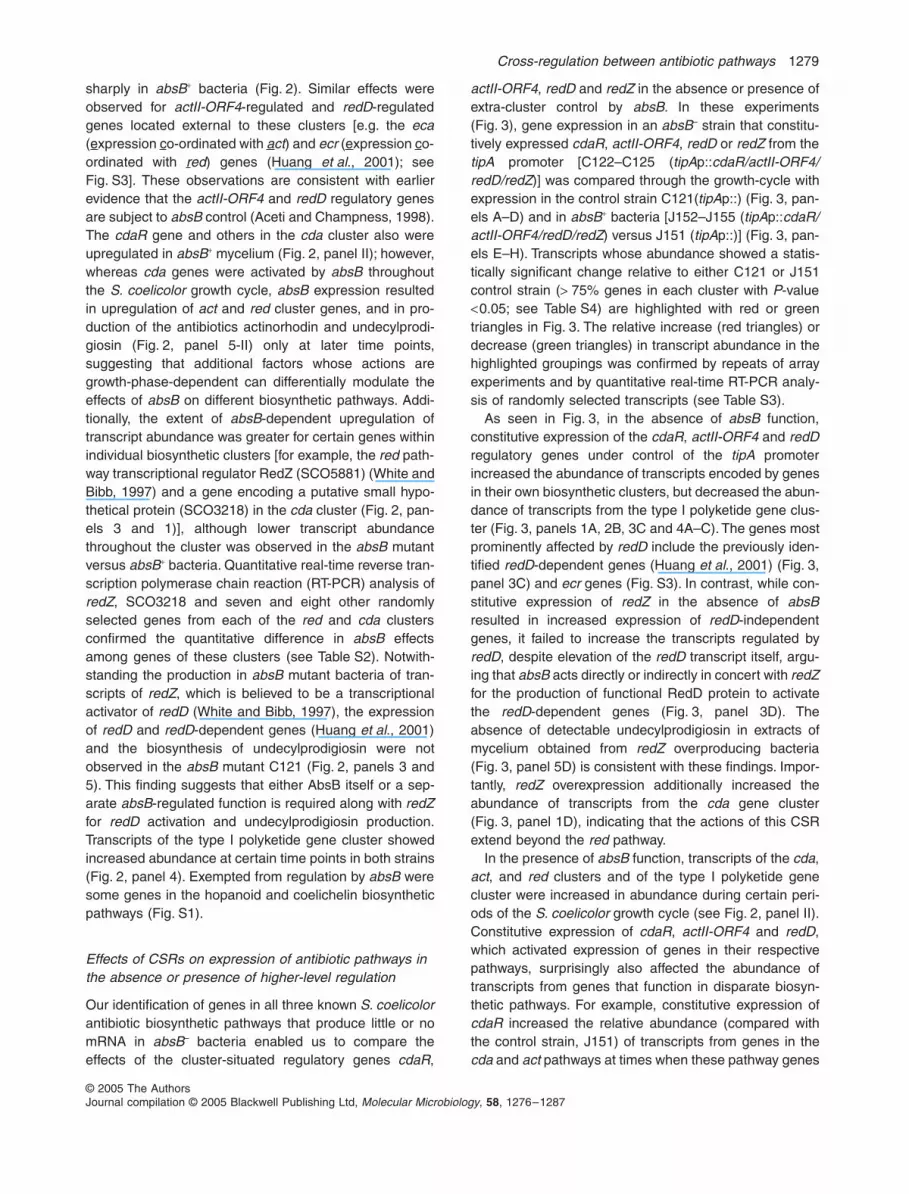
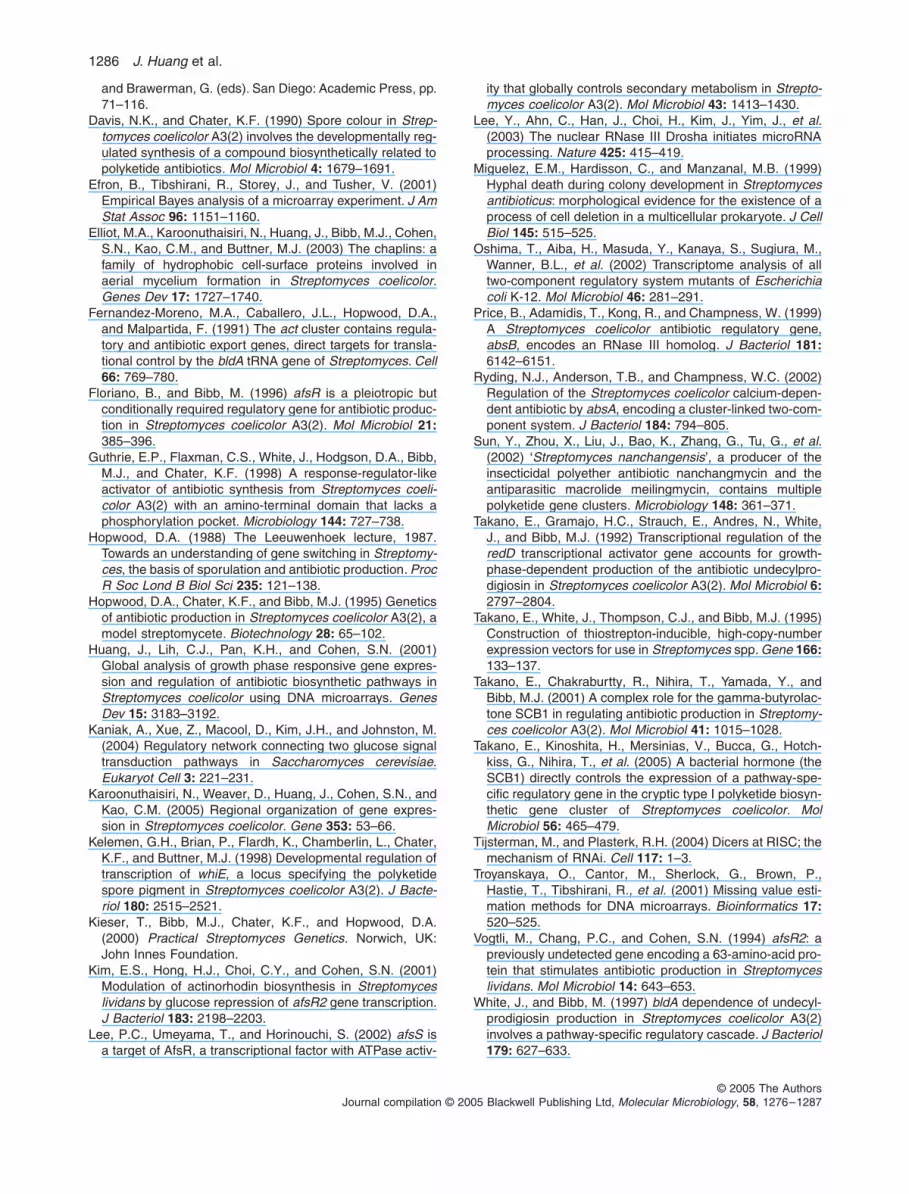