cross-country variations in national economic growth rates
TRANSCRIPT
CROSS-COUNTRY VARIATIONS INNATIONAL ECONOMIC GROWTH RATES:THE ROLE OF aTECHNOLOGY"
J. Bradford De Long*
I want to praise "technology" as the important factor in the relativegrowth performance of the nation-states’ economies. I want to argue thatthe conventional wisdom substantially understates the role of differencesin total factor productivity in explaining differentials across nation-stateeconomies in GDP per capita. "Technology" in this sense is moreimportant, because of the strong endogeneity of population growth andinvestment rates. Rich economies are economies in which children aremuch more "consumption" than "investment" goods; these economieshave completed their demographic transitions to a r~gime of low fertilityand low population growth. Thus, an economy that initially finds itselfwith a small advantage in total factor productivity will see that advantagemagnified into a larger advantage in output per capita, as it converges toa steady-state growth path with lower population growth and a highercapital-output ratio.
Similarly, a rich economy is one in which the price of capital goodsis relatively low: In a rich economy, a given share of national productsaved translates into a greater real investment effort than if the economyhad the world’s average relative price structure. This channel magnifiesdifferences in total factor productivity into larger differences in output percapita, working through the steady-state capital-output ratio.
Researchers in economic growth have been puzzled by the apparentcombination of "conditional convergence" with absolute divergence.Economies appear to be moving toward their individual steady-state
*Associate Professor of Economics, University of California at Berkeley. The authorwould like to thank Chad Jones, Lant Pritchett, and Robert Waldmann for helpful con-versations.
128 J. Bradford De Long
growth paths by about 2 percent per year, yet the spread of relativeoutput per capita levels across the world continues to increase.
A naive interpretation Of this pattern would suggest that, at sometime in the past, nation-states’ savings and population growth rates--andthus their levels of output per capita--were closer together than they arenow; that some shock drove savings and population growth rates apart;and that since then the world’s distribution of relative incomes hasdiverged as economies have traversed toward their steady-state growthpaths. But what was this shock that drove savings and population growthrates apart? The evolution of the world’s cross-country distribution ofincome and productivity is much more understandable once one recog-nizes the endogeneity of factor accumulation, and the fact that relativelypoor countries have low investment rates and high rates of populationgrowth in large part because they are relatively poor.
But I also have a caveat: In another sense, I want to bury "technol-ogy." Robert Solow’s (1957) seminal article is entitled "Technical Changeand the Aggregate Production Function." Certainly since 1957, andperhaps before, economists have used "technical change" and "technol-ogy" as shorthand ways of referring to shifts in the aggregate produc-tion function. Yet much of the difference seen across nations in aggregatetotal factor productivity has little to do with technology--in the sense ofknowledge of the internal combustion engine, continuous-casting, thefreeze-drying process, or anything that would be recognizable in a modellike that of Caballero and Jaffe (1993). Technology properly so-called is theultimate source of our enormous material wealth today relative to ourcounterparts of a century or so ago: Economic growth over the pastcentury in the United States is built on our knowledge of the internalcombustion engine, continuous-casting, freeze-drying, and all of ourother technologies. Yet differences across nation-states in total factorproductivity seem to be related tenuously, or not at all, to technology.
Robert Solow may not have done us a big favor when he convincedus to call shifts in the aggregate production function "technical change";his doing so may not have helped economists to think clear thoughts overthe past 40 years.
DIVERGENCE
As best we can determine from badly flawed data, the economichistory of the past century and a quarter is a history not of "convergence"but of "divergence": The different countries and peoples of the worldhave not drawn closer together in relative living standards, but havedrifted further apart.
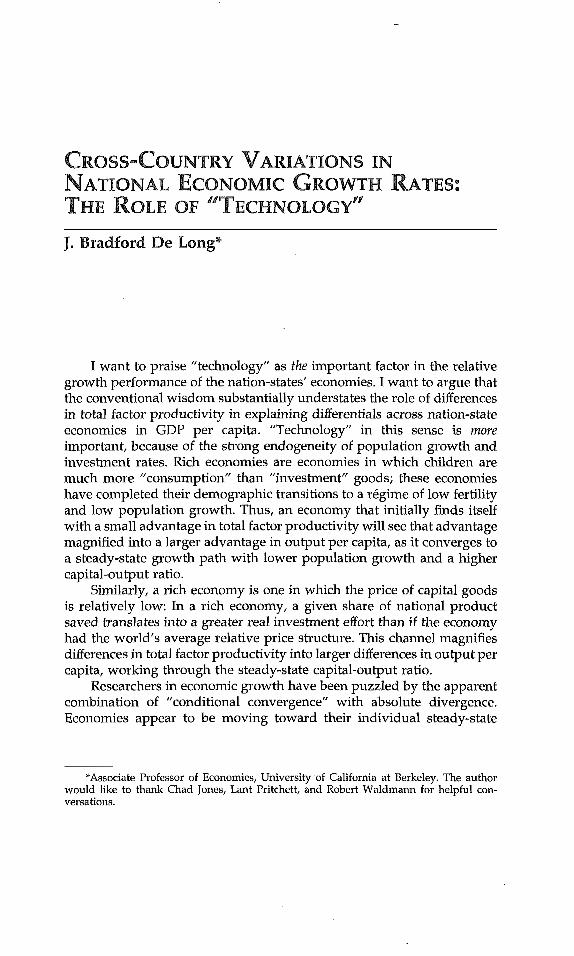
Figure 1 shows the distribution of world real GDP per capita--bypercentage of world population, not by nation-state--in 1993 and in 1870,as best as it can be estimated. The 1993 estimates of real GDP per capita
CROSS-COUNTRY VARIATIONS IN NATIONAL ECONOMIC GROWTH RATES 129
Figure 1
World Distributions of per Capita GDP, 1870 and 1993(Purchasing Power Parity Concept}
GDPper Capita (1993 Dollars)(Log Scale)
$22,000
$8,000
$3,000
$1,100
1993
1870
$40099 89 79 69 59 49 39 29 19 9
Percentile of World Population
are purchasing-power-parity estimates, measured in the "internationaldollar" concept that pegs U.S. GDP per capita to its current-dollar value,but attempts to use the relative price structure not of the advancedindustrial economies but of the "world average" economy. They aretaken from the 1995 World Development Report. The 1870 estimates of realGDP per capita are my own extensions and modifications of those foundin Maddison’s (1995) Monitoring the World Economy; by and large theyare constructed by "backcasting" individual, nation-specific estimates ofgrowth rates of real GDP per capita.
Thus, a very large number of caveats must be attached to Figure 1:
Because estimates of 1870 GDP per capita are "backcast," errors inestimating 1993 GDP per capita are necessarily included in esti-mates of 1870 GDP per capita as well.The individual, nation-specific estimates of growth rates underly-ing the backcasting are of widely variable quality; they do not usethe same methodology.Most of the nation-states of today’s world did not exist in 1870.Estimates for 1870 cover roughly the same area that the nation-state occupies now.Figure 1 suppresses all variability in productivity and real GDP

130 1. Bradford De Long
per capita inside nation-states: Everyone in China in 1993 isassumed to have the 1993 real GDP per capita of $2,330 estimatedusing the purchasing-power-parity concept.Estimates even for 1993 are very uncertain for developing coun-tries. This applies especially to China which, as the World Bankteam politely puts it in a footnote, has a GDP per capita estimatethat is "subject to more than the usual margin of error."The entire enterprise of computing levels of real GDP per capitausing the purchasing-power-parity concept may be seriously bi-ased; it may fail to incorporate appropriate allowances for qualitydifferences between products produced in industrialized and indeveloping economies. Certainly, purchasing-power-parity esti-mates made in the 1980s of relative living standards east and westof the Iron Curtain appear, in retrospect, to have wildly exagger-ated the levels of productivity and material wealth in the formerSoviet Union’s sphere of influence.1
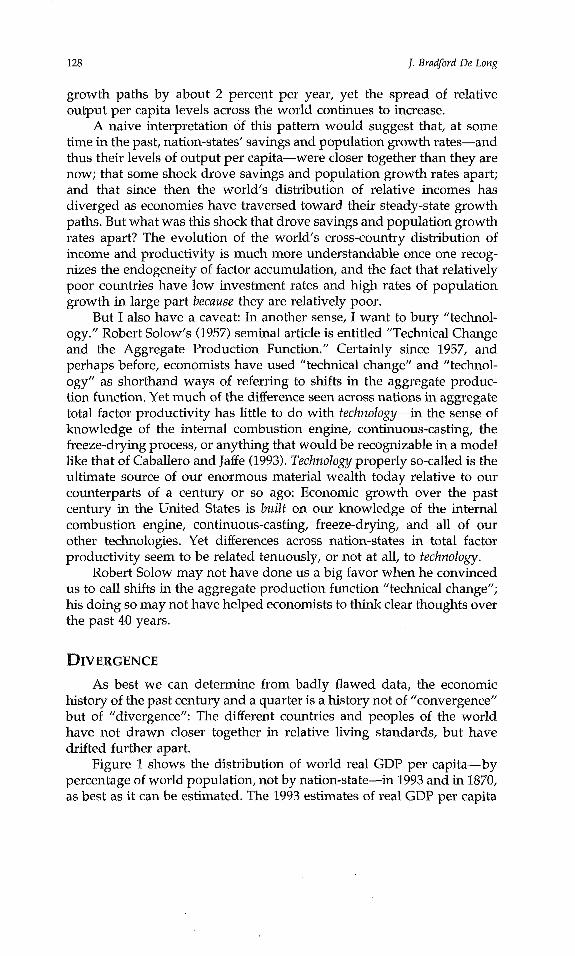
Estimates of growth in real GDP per capita between 1870 and 1993are unlikely to incorporate adequately changes in quality and inthe scope of products that are produced. The thought experimentthat underlies constant-dollar, cross-time comparisons implicitlyinvolves taking the output produced at a particular date, movingit across time to the base year, and selling it in the base year at thebase year’s market prices. But suppose you gave me $2,763--theestimate of U.S. GDP per capita in 1870--and told me "By theway, you can only spend this sum on products that existed in 1870and at the quality levels that were produced then." Under thesestringent restrictions on what I could purchase, I might well valuethat sum as worth much less than $2,763 in today’s dollars.Figure 1--plotting approximate GDP per capita by percentile ofthe world’s population--looks significantly different in some re-spects from Figure 2, which plots GDP per capita in 1870 and 1993by percentile of the world’s number of nation-states. Nation-state-based calculations show a nearly uniforrrl distribution of log GDPper capita levels over the observed range, especially for 1993.Population-based calculations show a non-uniform distributionwith a pronounced upper tail: The difference, of course, springsfrom the two very large populations of the nation-states China andIndia, which are now and were in 1870 relatively poor.
~ Current exchange rate-based calculations of relative productivity levels and livingstandards show differences an order of magnitude greater than do purchasing powerparity-based calculations; it may be that in some senses the exchange rate-based calculationsare more informative.
CROSS-COUNTRY VARIATIONS IN NATIONAL ECONOMIC GROWTH RATES 131
Figure 2
1870 and 1993 Distributions of GDP per Capita, by Nation-State(Purchasing Power Parity Concept)
GDP per Capita (1993 Dollars)(Log Scale)
$22,00O
$8,000
$3,000
$1,100
$400100 90 81 71 62 52 43 33 24 14
Percentile ofNation States
Nevertheless, Figure I is the best we can do at present. What are theprincipal lessons of Figure 1? I believe that there are three. The first is theextraordinary pace of real economic growth over the past century. Thehighest level of GDP per capita attained in 1993 (for the United States)was some $24,470 in 1993-level international dollars; the highest attainedin 1870 (for Australia) was some $4,108 in 1993-level international dollars.Using this particular metric, the United States today is some six times aswealthy in a material-product, real-income sense as was Australia in 1870(and some nine times as well off as was the United States in 1870).2
I stress that this pace of growth is not only very fast but alsoextraordinarily faster than in any previous century that we know of. If1870-1993 growth were simply a continuation of pre-1870 growth trends,
2 This pace of real economic growth would be further magnified if the argument turnedout to be correct that measured growth in the GDP accounts fails to capture much of thegrowth in real income that takes form of improvements in the quality and variety ofcommodities. Such factors might lead standard estimates to understate "true" economicgrowth over the past century by a factor of two or three. See, for example, Nordhaus (1994).On the other hand, Simon Kuznets (1963) argued that the constant-dollar, current-base-yearcalculations of real GDP that he designed were the most appropriate ones: that we shoulduse the yardstick of the present to assess the past.
132 J. Bradfor~t De Long
then in 1600 the richest economy in the world would have had a real GDPper capita level of some $110 a year--far too low to support human life.~
The twentieth century (extended back to 1870) has seen at least asixfold multiplication of real GDP per capita at the leading edge of theworld’s economies; the previous century and a quarter had seen per-haps a doubling during the period of the classical Industrial Revolution(Crafts 1985; Mokyr 1985). But before that? Perhaps the most prosperouseconomy of the mid eighteenth century (probably the Netherlands) helda 50-percent edge over the most prosperous economy of the mid fifteenthcentury (probably the city-states of northern Italy). But perhaps not.
And looking more than 500 years into the past, it is hard to see anysignificant advance in living standards or average productivity levels.Human populations appear to have been in a near-Malthusian equilib-rium, in which population growth quickly removes the margin for anysignificant increase in living standards (Kremer 1993; Livi-Bacci 1992;Malthus 1798). It is not clear that a French peasant of the seventeenthcentury was any better off than an Athenian peasant of the fourth centuryB.C.
The second important lesson of Figure 1 is the extremely unevenpace of economic growth over the past century. Because the relativelypoor economies of the world have not yet completed their demographictransitions to a r~gime of relatively low fertility, the.poorest economieshave had the fastest-growing populations over the past century. Inter-national migration has not proceeded at a particularly fast pace. Thus,the distribution of economic growth appears more uneven and lesswidely distributed in Figure 1, which plots GDP per capita by percentileof the world’s population, than in Figure 2, which plots GDP per capitaby nation-state.
But in both figures, the line plotting the world’s economic growthhas rotated clockwise about the bottom right corner. The richest econo-mies today have some six to nine times the GDP per capita of theircounterparts in 1870; the median economy today has perhaps four timesthe GDP per capita of its counterpart in 1870; the poorest economies arelittle advanced over their counterparts of 1870, ’
To put this another way, the strong economic growth of the pastcentury--the rise in the geometric average of output per capita in theworld from some $760 to some $3,150 in 1993 international dollars peryear--has been accompanied by a substantial increase in variance aswell. In 1870, the standard deviation of log GDP per capita across theworld’s population was some 0.53; today it is 1.00. The range from onestandard deviation below to one standard deviation above the mean in
a A point made by Kuznets (1963), and expanded on in considerable depth by Pritchett(1994).
CROSS-COUNTRY VARIATIONS IN NATIONAL ECONOMIC GROWTH RATES 133
log GDP per capita took up the interval from $450 to $1,310 internationaldollars in 1870; the same interval runs from $1,160 to $8,510 internationaldollars today.
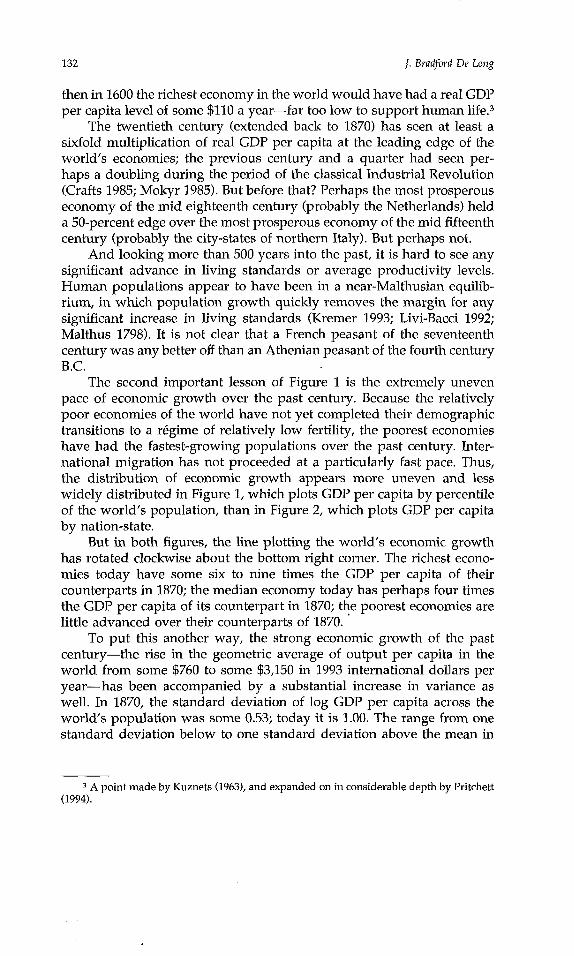
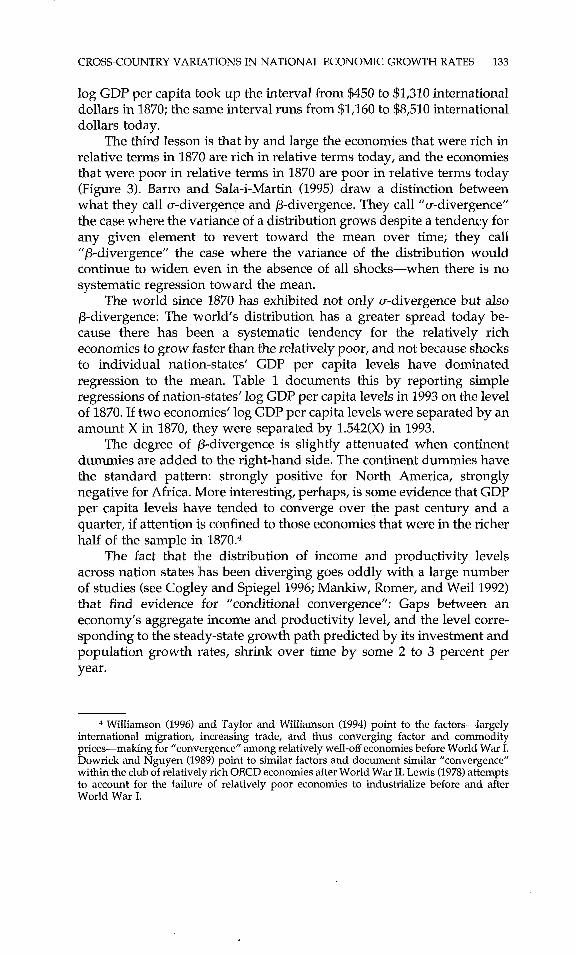
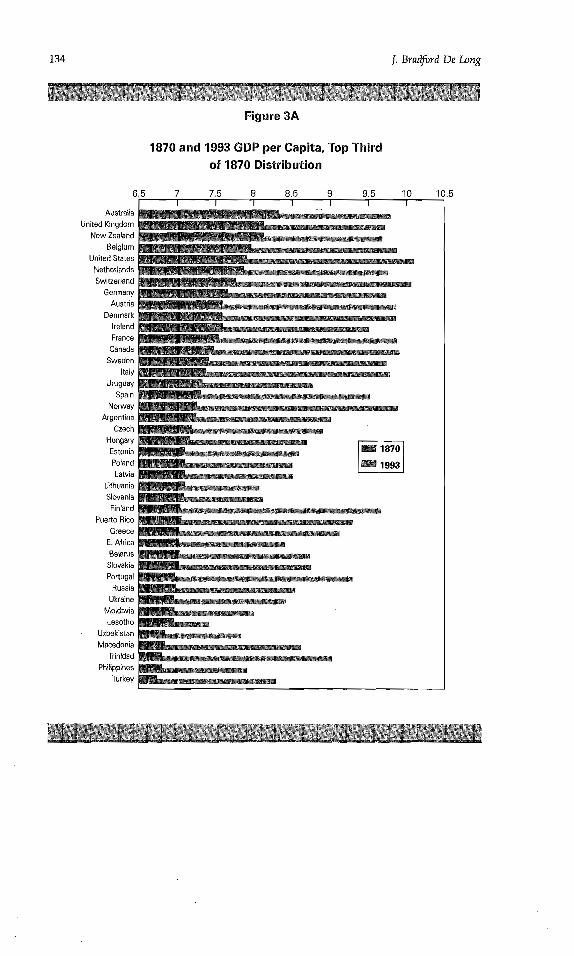
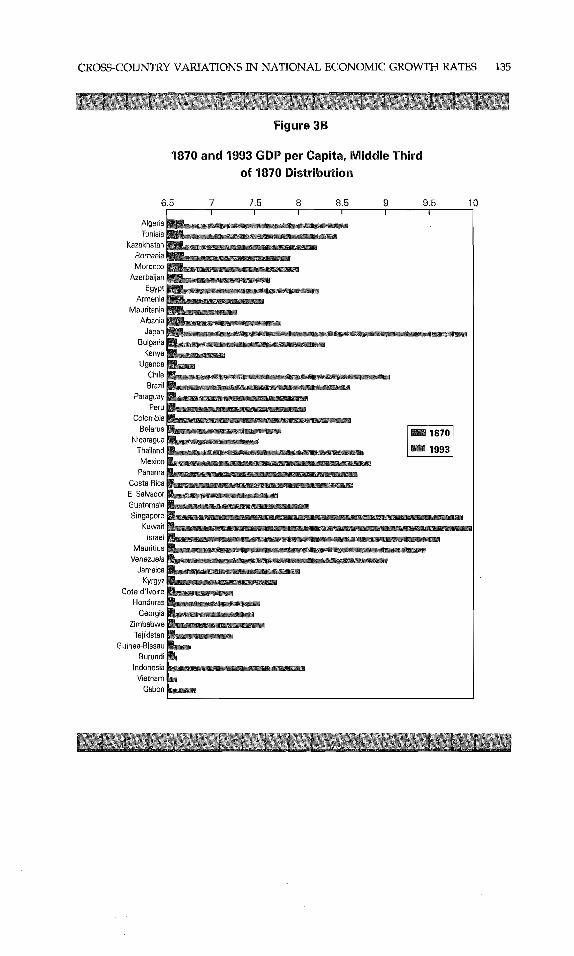
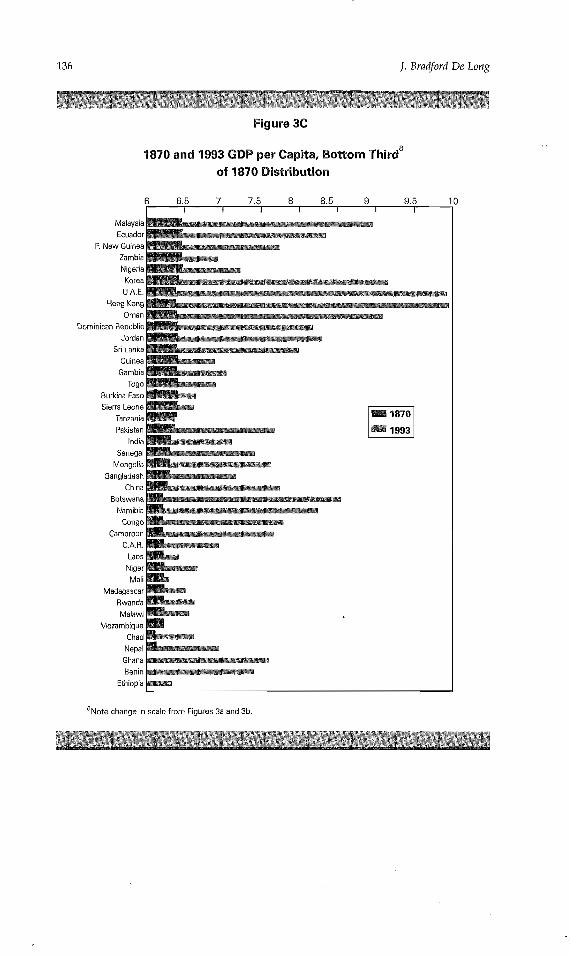
The third lesson is that by and large the economies that were rich inrelative terms in 1870 are rich in relative terms today, and the economiesthat were poor in relative terms in 1870 are poor in relative terms today(Figure 3). Barro and Sala-i-Martin (1995) draw a distinction betweenwhat they call ~r-divergenc.e and/3-divergence. They call "~r-divergence"the case where the variance of a distribution grows despite a tendency forany given element to revert toward the mean over time; they call"/3-divergence" the case where the variance of the distribution wouldcontinue to widen even in the absence of all shocks--when there is nosystematic regression toward the mean.
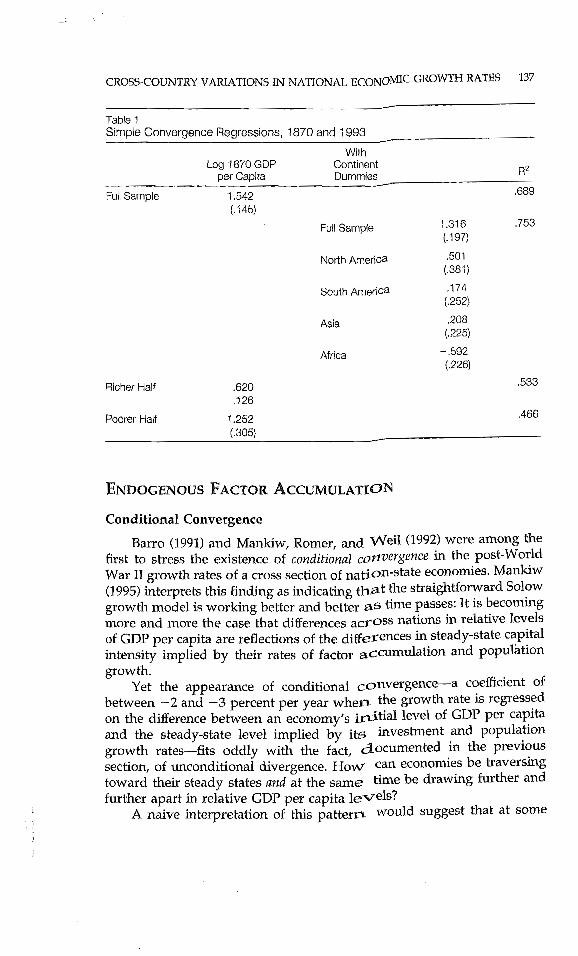
The world since 1870 has exhibited not only o-divergence but also/3-divergence: The world’s distribution has a greater spread today be-cause there has been a systematic tendency for the relatively richeconomics to grow faster than the relatively poor, and not because shocksto individual nation-states’ GDP per capita levels have dominatedregression to the mean. Table 1 documents this by reporting simpleregressions of nation-states’ log GDP per capita levels in 1993 on the levelof 1870. If two economies’ log GDP per capita levels were separated by anamount X in 1870, they were separated by 1.542(X) in 1993.
The degree of /3-divergence is slightly attenuated when continentdummies are added to the right-hand side. The continent dummies havethe standard pattern: strongly positive for North America, stronglynegative for Africa. More interesting, perhaps, is some evidence that GDPper capita levels have tended to converge over the. past century and aquarter, if attention is confined to those economies that were in the richerhalf of the sample in 1870.4
The fact that the distribution of income and productivity levelsacross nation states has been diverging goes oddly with a large numberof studies (see Cogley and Spiegel 1996; Mankiw, Romer, and Weil 1992)that find evidence for "conditional convergence": Gaps between aneconomy’s aggregate income and productivity level, and the level corre-sponding to the steady-state growth path predicted by its investment andpopulation growth rates, shrink over time by some 2 to 3 percent peryear.
4 Williamson (1996) and Taylor and Williamson (1994) point to the factors--largelyinternational migration, increasing trade, and thus converging factor and commodityprices--making for "convergence" among relatively well-off economies before World War LDowrick and Nguyen (1989) point to similar factors and document similar "convergence"within the club of relatively rich OECD economies after World War II. Lewis (1978) attemptsto account for the failure of relatively poor economies to industrialize before and afterWorld War I.
134 J. Bradford De Long
AustraliaUnited Kingdom
New ZealandBelgium
United StatesNetherlandsSwitzerland
GermanyAuatda
Denmark~relandFrance
CanadaSweden
ItalyUruguay
Spain INorway
ArgentinaCzech
HungaryEstoniaPolandLatvia
LithuaniaS~ovenia
FinlandPuerto Rico
GreeceE. A|ricaBeIB[usSlovakiaPortugal
RussiaUkraine
MoldaviaLesotho
UzbekistanMacedonia
TrinidadPhilippines
Turkey
Figure 3A
1870 and 1993 GDP per Capita, Top Thirdof 1870 Distribution
6.5 7 7.5 8 8.5 9 9.5 10 10.5
CROSS-COUNTRY VARIATIONS IN NATIONAL ECONOMIC GROWTH RATES 135
Figure 3B
1870 and 1993 GDP per Capita, Middle Thirdof 1870 Distribution
6.5
AlgeriaTunisia
KazakhstanRomaniaMorocco
Azerbaijan ~Egypt’
ArmeniaMauritania
AlbaniaJapan
BulgariaKenya
UgandaChileBrazil
Paraguay/Peru
ColombiaBelarus
NicaraguaThailandMexico
PanamaCosta RicaEl SalvadorGuatemalaSingapore
KuwaitIsrael
MauritiusVenezuela
JamaicaKyrDyz
Cote d’lvoireHonduras
GeorgiaZimbabwe
TajikistanGuinea-Bissau
BurundiindonesiaVietnam
Gabon
7 7.5 8 8.5 9 9.5 10
136 ]. Bradford De Long
Figure 3C
1870 and 1993 GDP per Capita, Bottom Third a
of 1870 Distribution
6
MalaysiaEcuador
P. New GuineaZambiaNigeria
KoreaU.A.E.
Hong KongOman
Dominican RepublicJordan
Sri LankaGuinea
GambiaTogo
Burkina FasoSierra Leone
TanzaniaPakistan
IndiaSenegal
MongoliaBangladesh
ChinaBotswana
NamibiaCongo
CameroonC.A.B.
LaosNigerMall
MadagascarRwandaMalawi
MozambiqueChadNepal
GhanaBenin
Ethiopia
6.5 7 7.5 8 8.5 9 9.5 10
aNote change in scale from Figures 3a and 3b.
CROSS-COUNTRY VARIATIONS IN NATIONAL ECONOMIC GROWTH RATES 137
Table 1Simple Convergence Regressions, 1870 and 1993
WithLog 1870 GDP Continent
per Capita Dummies R2Full Sample 1.542 ,689
(.145)
Full Sample 1.316(.197)
North America .501(.381)
South America .174(.252)
Asia .208(.225)
Africa - ,592(.226)
,753
Richer Half .620 .533.126
Poorer Half 1.252 .466(.3o5)
ENDOGENOUS FACTOR ACCUMULATION
Conditional Convergence
Barro (1991) and Mankiw, Romer, and Well (1992) were among thefirst to stress the existence of conditional cor~vergence in the post-WorldWar II growth rates of a cross section of nation-state economies. Mankiw(1995) interprets this finding as indicating that the straightforward Solowgrowth model is working better and better as time passes: It is becomingmore and more the case that differences across nations in relative levelsof GDP per capita are reflections of the differences in steady-state capitalintensity implied by their rates of factor accumulation and populhtiongrowth.
Yet the appearance of conditional convergence--a coefficient ofbetween -2 and -3 percent per year when the growth rate is regressedon the difference between an economy’s i~-titial level of GDP per capitaand the steady-state level implied by its investment and populationgrowth rates--fits oddly with the fact, clocumented in the previoussection, of unconditional divergence. Ho~r can economies be traversingtoward their steady states and at the same time be drawing further andfurther apart in relative GDP per capita levels?
A naive interpretation of this patterr~ would suggest that at some
138 J. Bradford De Long
time in the past, nation-states" savings and population growth rates musthave been much more closely bunched together than they are today. Thiswould mean that at that time, economies’ steady-state and actual levelsof output per capita also were bunched together more closely than theyare today, and that some economic shock or series of shocks has sincedriven their respective savings and population growth rates apart. Thus,the world’s relative distribution of incomes has diverged since, as theworld’s relative economies have traversed toward their now distantlyseparated paths of steady-state growth.
But this naive interpretation has a central problem: What was thisshock that drove savings and population growth rates apart? Theprincipal candidate would be the Industrial Revolution. But the Indus-trial Revolution saw not a fall but a sharp rise in population growth ratesin the most heavily affected economies (Livi-Bacci 1992). And today verylittle is left of Rostow’s (1957) bold hypothesis that the key to theIndustrial Revolution was a sharp rise in investment as a share of nationalproduct (Crafts 1985; Mokyr 1985). The shifts in investment and inpopulation growth rates brought about by the Industrial Revolution didnot occur in the directions that would support such an interpretation.
Other candidates for a shock sharp enough to drive economies’investment and population growth rates away from one another simplyare absent. The overwhelming bulk of the divergence in GDP per capitaover the past century and a quarter has been due to the uneven spreadof the Industrial Revolution, and to differences in relative national ratesof growth in total factor productivity. But why, then, the finding ofconditional convergence, and the strong positive association of per capitalevels of GDP with investment rates and the negative association withpopulation growth rates?
Population Growth and the Demographic Transition
One reason is the endogeneity of population growth. Sometimebetween the fifteenth and the eighteenth centuries, the human racepassed through what we all hope was its last "Malthusian" episode, inwhich rising population and limited agricultural resources led to nutri-tional deficits, higher than average mortality, and population stagnation.Since then, the pace of productivity improvement in agriculture haskept ahead of agricultural resource scarcity and the population growththat has carried the world’s population from one to six billion, so far.Nutrition has been relatively high by historical standards, natural fertilityhigh as well, and natural mortality low.
In the past, the richest human populations appear to have also seenthe fastest population growth. But, starting perhaps in eighteenth centuryFrance, a new pattern began to emerge, in which increases in GDP percapita led not to greater fertility and faster population growth but to
CROSS-COUNTRY VARIATIONS IN NATIONAL ECONOMIC GROWTH RATES 139
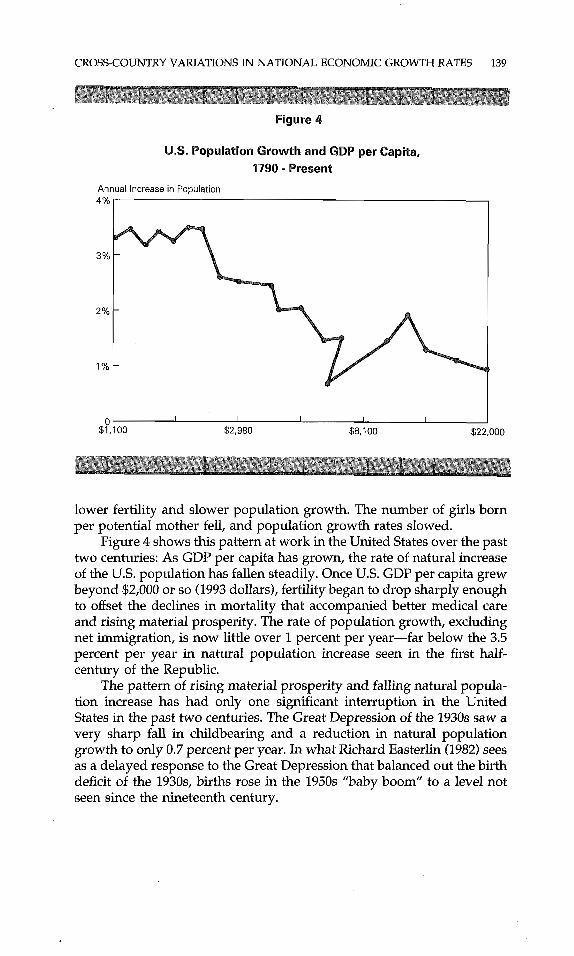
Figure 4
U.S. Population Growth and GDP per Capita,1790 - Present
Annual Increase in Population4%
3%
2%
1%
$1,100 $2,980 $8,100 $22,000
lower fertility and slower population growth.-The number of girls bornper potential mother fell, and population growth rates slowed.
Figure 4 shows this pattern at work in the United States over the pasttwo centuries: As GDP per capita has grown, the rate of natural increaseof the U.S. population has fallen steadily. Once U.S. GDP per capita grewbeyond $2,000 or so (1993 dollars), fertility began to drop sharply enoughto offset the declines in mortality that accompanied better medical careand rising material prosperity. The rate of population growth, excludingnet immigration, is now little over 1 percent per year--far below the 3.5percent per year in natural population increase seen in the first half-century of the Republic.
The pattern of rising material prosperity and falling natural popula-tion increase has had only one significant interruption in the UnitedStates in the past two centuries. The Great Depression of the 1930s saw avery sharp fall in childbearing and a reduction in natural populationgrowth to only 0.7 percent per year. In what Richard Easterlin (1982) seesas a delayed response to the Great Depression that balanced out the birthdeficit of the 1930s, births rose in the 1950s "baby boom" to a level notseen since the nineteenth century.
140 ]. Bradford De Long
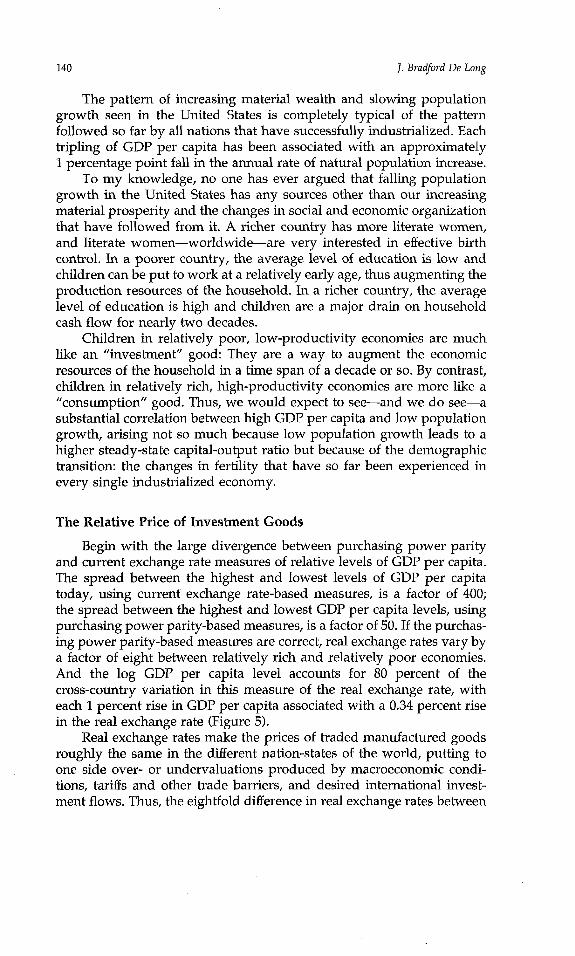
The pattern of increasing material wealth and slowing populationgrowth seen in the United States is completely typical of the patternfollowed so far by all nations that have successfully industrialized. Eachtripling of GDP per capita has been associated with an approximatelyI percentage point fall in the annual rate of natural population increase.
To my knowledge, no one has ever argued that falling populationgrowth in the United States has any sources other than our increasingmaterial prosperity and the changes in social and economic organizationthat have followed from it. A richer country has more literate women,and literate women--worldwide--are very interested in effective birthcontrol. In a poorer country, the average level of education is low andchildren can be put to work at a relatively early age, thus augmenting theproduction resources of the household. In a richer country, the averagelevel of education is high and children are a major drain on householdcash flow for nearly two decades.
Children in relatively poor, low-productivity economies are muchlike an "investment" good: They are a way to augment the economicresources of the household in a time span of a decade or so. By contrast,children in relatively rich, high-productivity economies are more like a"consumption" good. Thus, we would expect to see--and we do see--asubstantial correlation between high GDP per capita and low populationgrowth, arising not so much because low population growth leads to ahigher steady-state capital-output ratio but because of the demographictransition: the changes in fertility that have so far been experienced inevery single industrialized economy.
The Relative Price of Investment Goods
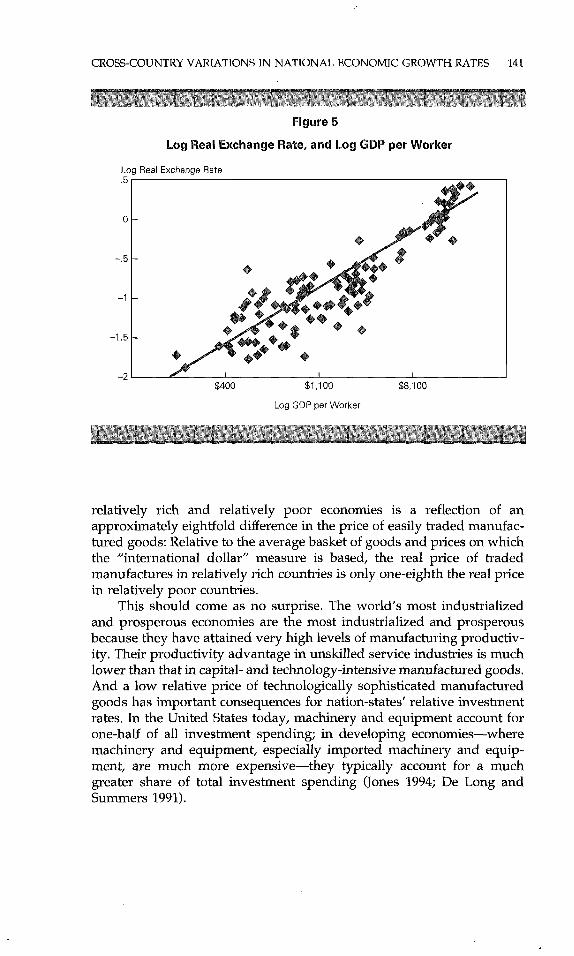
Begin with the large divergence between purchasing power parityand current exchange rate measures of relative levels of GDP per capita.The spread between the highest and lowest levels of GDP per capitatoday, using curren~ exchange rate-based measures, is a factor of 400;the spread between the highest and lowest GDP per capita levels, usingpurchasing power parity-based measures, is a factor of 50. If the purchas-ing power parity-based measures are correct, real exchange rates vary bya factor of eight between relatively rich and relatively poor economies.And the log GDP per capita level accounts for 80 percent of thecross-country variation in this measure of the real exchange rate, witheach 1 percent rise in GDP per capita associated with a 0.34 percent risein the real exchange rate (Figure 5).
Real exchange rates make the prices of traded manufactured goodsroughly the same in the different nation-states of the world, putting toone side over- or undervaluations produced by macroeconomic condi-tions, tariffs and other trade barriers, and desired international invest-ment flows. Thus, the eightfold difference in real exchange rates between
CROSS-COUNTRY VARIATIONS IN NATIONAL ECONOMIC GROWTH RATES 141
Figure 5
Log Real Exchange Rate, and Log GDP per Worker
Log Real Exchange Rate.5
-.5
-1
-1.5
-2$400 $1,100 $8,100
Log GDP per Worker
relatively rich and relatively poor economies is a reflection of anapproximately eightfold difference in the price of easily traded manufac-tured goods: Relative to the average basket of goods and prices on whichthe "international dollar" measure is based, the real price of tradedmanufactures in relatively rich countries is only one-eighth the real pricein relatively poor countries.
This should come as no surprise. The world’s most industrializedand prosperous economies are the most industrialized and prosperousbecause they have attained very high levels of manufacturing productiv-ity. Their productivity advantage in unskilled service industries is muchlower than that in capital- and technology-intensive manufactured goods.And a low relative price of technologically sophisticated manufacturedgoods has important consequences for nation-states’ relative investmentrates. In the United States today, machinery and equipment account forone-half of all investment spending; in developing economies--wheremachinery and equipment, especially imported machinery and equip-ment, are much more expensive--they typically account for a muchgreater share of total investment spending (Jones 1994; De Long andSummers 1991).
142 J. Bradford De Long
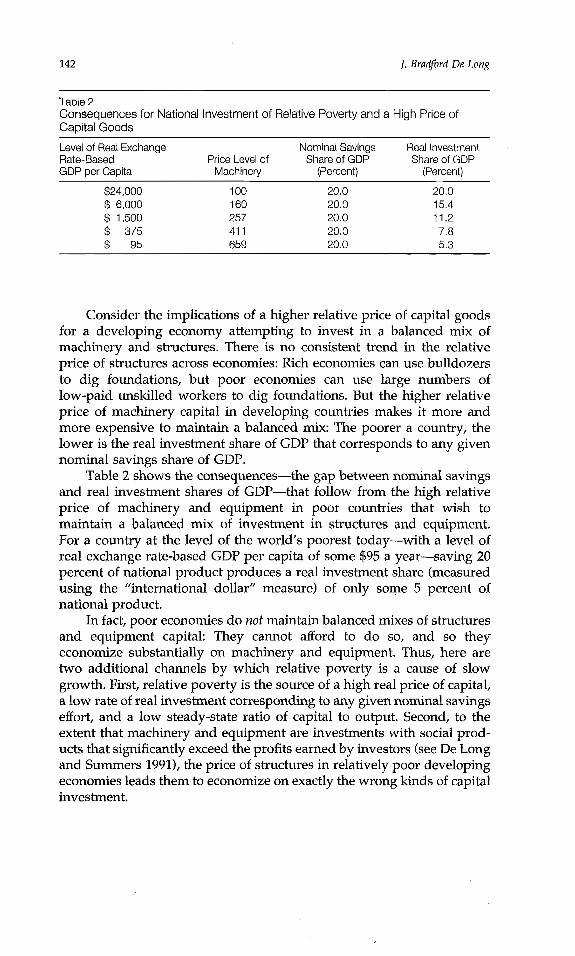
Table 2Consequences for National Investment of Relative Poverty and a High Price ofCapital Goods
Level of Real Exchange Nominal Savings Real InvestmentRate-Based Price Level of Share of GDP Share of GDPGDP per Capita Machinery (Percent) (Percent)
$24,000 100 20,0 20,0$ 6,000 160 20.0 15.4$ 1,500 257 20,0 11.2$ 375 411 20.0 7,8$ 95 659 20,0 5,3
Consider the implications of a higher relative price of capital goodsfor a developing economy attempting to invest in a balanced mix ofmachinery and structures. There is no consistent trend in the relativeprice of structures across economies: Rich economies can use bulldozersto dig foundations, but poor economies can use large numbers oflow-paid unskilled workers to dig foundations. But the higher relativeprice of machinery capital in developing countries makes it more andmore expensive to maintain a balanced mix: The poorer a country, thelower is the real investment share of GDP that corresponds to any givennominal savings share of GDP.
Table 2 shows the consequences--the gap between nominal savingsand real investment shares of GDP--that follow from the high relativeprice of machinery and equipment in poor countries that wish tomaintain a balanced mix of investment in structures and equipment.For a country at the level of the world’s poorest today--with a level ofreal exchange rate-based GDP per capita of some $95 a year--saving 20percent of national product produces a real investment share (measuredusing the "international dollar" measure) of only some 5 percent ofnational product.
In fact, poor economies do not maintain balanced mixes of structuresand equipment capital: They cannot afford to do so, and so theyeconomize substantially on machinery and equipment. Thus, here aretwo additional channels by which relative poverty is a cause of slowgrowth. First, relative poverty is the source of a high real price of capital,a low rate of real investment corresponding to any given nominal savingseffort, and a low steady-state ratio of capital to output. Second, to theextent that machinery and equipment are investments with social prod-ucts that significantly exceed the profits earned by investors (see De Longand Summers 1991), the price of structures in relatively poor developingeconomies leads them to economize on exactly the wrong kinds of capitalinvestment.
CROSS-COUNTRY VARIATIONS IN NATIONAL ECONOMIC GROWTH RATES 143
The Implications
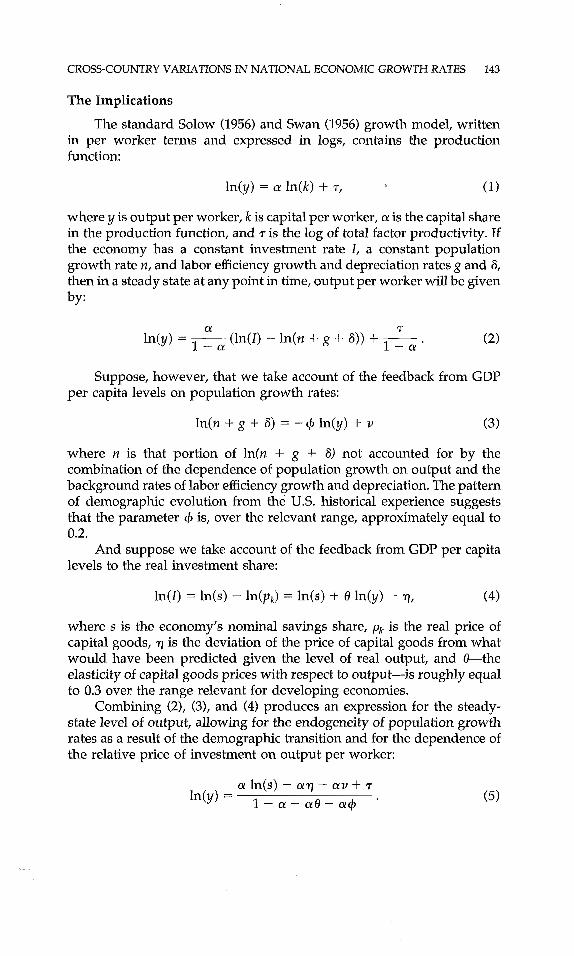
The standard Solow (1956) and Swan (1956) growth model, writtenin per worker terms and expressed in logs, contains the productionfunction:
In(y) = o~ In(k) (1)
where y is output per worker, k is capital per worker, o~ is the capital sharein the production function, and ~- is the log of total factor productivity. Ifthe economy has a constant investment rate /, a constant populationgrowth rate n, and labor efficiency growth and depreciation rates g and 8,then in a steady state at any point in time, output per worker will be givenby:
In(y) = 1 - a (In(l) - ln(n + g + 8)) + 1-~a (2)
Suppose, however, that we take account of the feedback from GDPper capita levels on population growth rates:
In(n + g + 8) = -q~ In(y) + v (3)
where n is that portion of ln(n + g + 8) not accounted for by thecombination of the dependence of population growth on output and thebackground rates of labor efficiency growth and depreciation. The patternof demographic evolution from the U.S. historical experience suggeststhat the parameter q~ is, over the relevant range, approximately equal to0.2.
And suppose we take account of the feedback from GDP per capitalevels to the real investment share:
In(l) = In(s) - ln(pk) = In(s) + (4)
where s is the economy’s nominal savings share, Pk is the real price ofcapital goods, ~/is the deviation of the price of capital goods from whatwould have been predicted given the level of real output, and 0--theelasticity of capital goods prices with respect to output--is roughly equalto 0.3 over the range relevant for developing economies.
Combining (2), (3), and (4) produces an expression for the steady-state level of output, allowing for the endogeneity of population growthrates as a result of the demographic transition and for the dependence ofthe relative price of investment on output per worker:
a ln(s) - c~ - av + ~"In(y) = 1 - o~ - ~0 - o~q~ (5)

144 I. Bradford De Long
Table 3Consequences for Steady State of Endogenous Population Growth andCapital Goods Prices
Capital Denominator of Effect of TotalShare ~ Equation (5) Effect of s, g, ~ Factor Productivity
,20 ,70 ,29 1,43.40 .40 1,00 2.50.60 ,10 6,00 10.00.67 .00 ~o oo
Equation (5) allows us to calculate, for various possible values for theshare a of produced capital goods in the production function and for thechosen values of ~ and 0, the impact on the level of the steady-stategrowth path of a shift in the exogenous component of savings, capitalgoods prices, population growth, or total factor productivity. Becausethey enter symmetrically into equation (5), the effects of the first three arethe same.
Table 3 reports that--with a share of produced factor inputs in theproduction function of 0.4--a I percent increase in the savings rate (or aI percent fall in the exogenous component of capital goods prices) carrieswith it a 1 percent increase in the steady-state level of output. But a 1percent increase in total factor productivity raises the steady-state level ofoutput by fully 2.5 percent. Growth-accounting decompositions would, ifapplied to such an economy, attribute only 1 percent of the higher levelof output to higher total factor productivity--less than two-fifths of thetotal effect. The growth accounting decomposition is not wrong, butincomplete: To the extent that the higher capital stock is a result of highertotal factor productivity reducing the relative price of capital, and to theextent that higher total factor productivity pushes an economy furtheralong its demographic transition to low population growth, exogenousshifts in total factor productivity have effects that are orders of magnitudegreater than growth accounting procedures suggest, even without anypowerful externalities in the production function.
Equally interesting, perhaps, is the case in which there are external-ities to investment--whether in infrastructure, in research and develop-ment, in human capital, or in machinery and equipment--and in whichthe true capital share a in the production function is substantially greaterthan the 0.4 found in the usual specifications of the Solow model. The truecapital share cannot get as high as 0.67 without triggering explosive pathsfor output per capita, in which very small boosts to total factor produc-tivity set in motion patterns of population growth reduction and invest-ment increase that converge to no steady state at all, but simply growuntil the log-linear approximations in equations (3) and (4) break down.
CROSS-COUNTRY VARIATIONS IN NATIONAL ECONOMIC GROWTH RATES 145
It is difficult to look at th~ cross-country pattern of growth over thepast century without thinking that the determinants of the steady-stategrowth paths toward which countries converge must be nearly singular.What differences between Canada and Argentina in 1870 would have ledanyone to forecast their now more than two and one-half-fold differencein GDP per capita? Or the twentyfold gap between Taiwan and India?Recognizing the endogeneity of the demographic transition and ofinvestment has the potential to help us understand why the economichistory of the past century and a quarter has proceeded as it did, withoutrequiring assumptions of external effects that seem perhaps implausiblylarge.
The endogeneity of the demographic transition, and of investment,also helps make sense of the odd combination of global divergencetogether with "conditional convergence." To the extent that relatively lowproductivity today is a cause of an economy’s attraction to a lowsteady-state growth path, it is less necessary to look for shocks in the pastthat both pushed economies away from their long-run growth paths andpushed economies’ GDP per capita levels together, if we want to accountfor the evolution of the world’s distribution of income.
Caveat
But I still have one important caveat: Do we really want to refer toshifts in the aggregate production function as "technical change" and"technology"? Much of the difference seen across nations in aggregatetotal factor productivity seems to have little to do with technology per se.
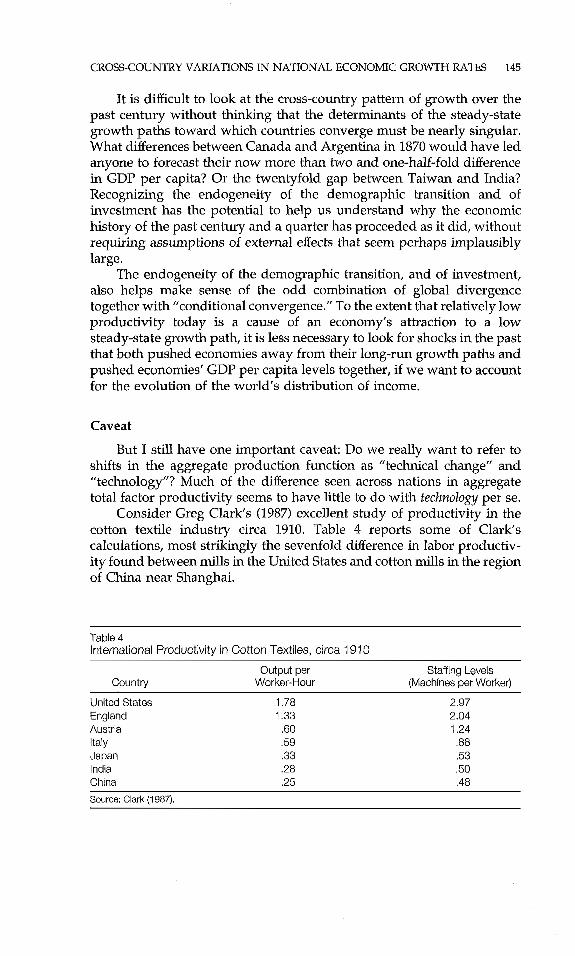
Consider Greg Clark’s (1987) excellent study of productivity in thecotton textile industry circa 1910. Table 4 reports some of Clark’scalculations, most strikingly the sevenfold difference in labor productiv-ity found between mills in the United States and cotton mills in the regionof China near Shanghai.
Table 4International Productivity in Cotton Textiles, circa 1910
Output per Staffing LevelsCountry Worker-Hour (Machines per Worker)
United States 1,78 2.97England 1.33 2,04Austria .60 1.24Italy .59 .88Japan .33 .53India .28 ,50China .25 .48Source: Clark (1987).

146 ]. Bradford De Long
The most striking thing about this sevenfold differential--the pointof Clark’s article--is that all of these mills used the same technology, if thatword has any meaning. Japanese, Chinese, and Indian cotton mills had nolocal source of capital goods, so they bought and imported textilemachinery made in the same machine shops near Liverpool that Britishmanufacturers used. The United States produced its own textile machin-ery; Belgium, France, Germany, and Austria produced textile machineryas well. But everyone else imported capital goods--and in many cases,according to Clark, paid British mechanics to assemble and install it aswell.
Yet with the same technology--the same machinery, the same pro-duction process, the same automated transformation of raw materials bymetal and chemistry into final product--Clark found differences in laborproductivity that reached three-to-one even when comparing the UnitedStates to Italy, a country with a very long history of textile production.
The key to the differences in labor productivity is found in the lastcolumn of Table 4: staffing levels. In the United States, one operative tookcare of three machines. In China, two operatives took care of onemachine. Add this sixfold differences in staffing levels to the perhaps 15percent lower output per machine-hour near Shanghai to obtain anarithmetic explanation of the sevenfold difference in output per worker.
Since Clark wrote his article, a cottage industry has sprung up to tryto explain how all of these textile mills could still be operating on thesame production function. Perhaps the extra workers in the Asian millswere substituting for a poorer quality of raw materials? After all,poorer-quality raw materials would lead to more breaks, snarls, andmachine stoppages that would have to be corrected. Perhaps the extraworkers in the Asian mills allowed machines to run faster? Perhaps theextra workers allowed the machines to run with less downtime? Not oneof the attempts to establish that these textile mills were working on thesame production function, with Asian mills getting increased output (ordiminished other inputs) in return for their higher staffing levels, hasbeen convincing. The turn-of-the-last-century cotton textile industry didexhibit very large differences in productivity across countries, yes. But thedifferences are not readily attributable to differences in anything I wouldcall technology.
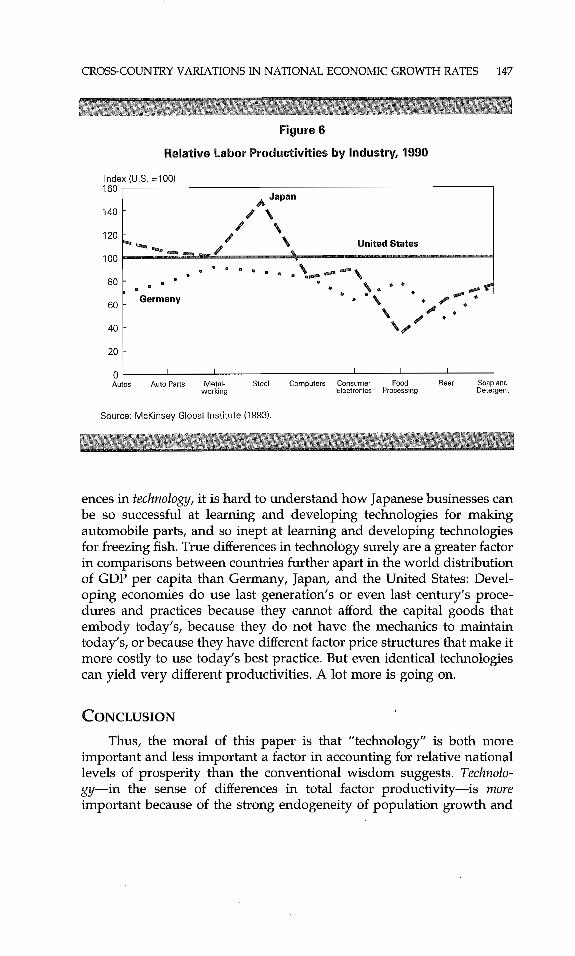
Or consider the McKinsey Global Institute’s (1993) study of manu-facturing productivity in the United States, Germany, and Japan--a studycarried out with the assistance of Martin Baily and Robert Solow. Asbest they could estimate, Japanese manufacturing productivity in 1990varied from 33 percent of the U.S. level in food processing to 147 percentof the U.S. level in steel. German manufacturing productivity varied from43 percent of the U.S. level in beer to 91 percent of the U.S. level inmetalworking (Figure 6).
If we are going to attribute these productivity differences to differ-
CROSS-COUNTRY VARIATIONS IN NATIONAL ECONOMIC GROWTH RATES 147
Figure 6
Relative Labor Productivities by Industry, 1990
Index (U,S. =100)160
Japan
~ ~ ~ ~ United States
Germany
Auto Parts Metal- Steel Computers Consumer Soap andworking Electronics Detergent
140
120
100
80
60
40
20
0Autos
IFood Beer
Processing
Source: McKinsey Global Institute (1993).
ences in technology, it is hard to understand how Japanese businesses canbe so successful at learning and developing technologies for makingautomobile parts, and so inept at learning and developing technologiesfor freezing fish. True differences in technology surely are a greater factorin comparisons between countries further apart in the world distributionof GDP per capita than Germany, Japan, and the United States: Devel-oping economies do use last generation’s or even last century’s proce-dures and practices because they cannot afford the capital goods thatembody today’s, because they do not have the mechanics to maintaintoday’s, or because they have different factor price structures that make itmore costly to use today’s best practice. But even identical technologiescan yield very different productivities. A lot more is going on.
CONCLUSION
Thus, the moral of this paper is that "technology" is both moreimportant and less important a factor in accounting for relative nationallevels of prosperity than the conventional wisdom suggests. Technolo-gy-in the sense of differences in total factor productivity--is moreimportant because of the strong endogeneity of population growth and
148 J. Bradford De Long
capital investment rates. Countries that are rich have low rates ofpopulation growth: They have completed their demographic transitionsto a r~gime in which fertility is relatively low and their children havebecome more "consumption" than "investment" goods. Countries thatare rich also have relatively low prices of capital goods--a given shareof national product saved implies a higher ratio of investment to GDP.Hence, being rich tends to make a nation-state’s capital-output ratio high.
Thus, small differences in total factor productivity can translateinto large differences in productivity levels and living standards, once thefeedback from a richer economy to higher investment and lower popu-lation growth rates is taken into account. Studies examining the impactof total factor productivity differences on output per capita that holdsavings and population growth rates constant understate the true long-run impact of raising total factor productivity.
On the other hand, technology--in the sense of knowledge of theinternal combustion engine, continuous-casting, or freeze-drying--ismuch less important in accounting for differences across nations. Manydifferences in total factor productivity are related tenuously, or not at all,to differences in technology. All of the textile factories at the turn of thelast century were equipped with the same or similar machines, manyof them from the same machine shops in Lowell, Massachusetts orManchester, Lancashire.
This should not be taken to imply that technology per se is unimpor-tant in long-run economic growth. It is very important in those particularindustries that are near the active edge of technological expansion andintensive in research and development. Indeed, better technology todayis the sole important reason why we today have six to 20 times thestandard of living of our predecessors in 1870. But it has much less to dowith the sources of aggregate productivity differences across nations.
The last wave of research on aggregate growth theory called forthan effort, by Abramovitz (1956, 1986) and Denison (1967) among others,to try to decompose aggregate total factor productivity differences intomore interesting and meaningful components. It is too bad that thecurrent wave of research on aggregate growth has failed to generate acorre.sponding effort.
References
Abramovitz, Moses. 1956. "Resource and Output Trends in the United States since 1870."The American Economic Review, vol. 46, no. 2 (May), pp. 5-23.
--. 1986. "Catching Up, Forging Ahead, and Falling Behind." Jqurnal of EconomicHistory, vol. 46, no. 2 (June), pp. 385-406.
Barro, Robert. 1991. "Economic Growth in a Cross Section of Nations." Quarterly Journal ofEconomics, vol. 106, no. 2 (May), pp. 407-43.
Barro, Robert and Xavier Sala-i-Martin. 1995. Economic Growth. New York: McGraw Hill.Caballero, Ricardo and Adam Jaffe. 1993. "How High Are the Giants’ Shoulders?: An
CROSS-COUNTRY VARIATIONS IN NATIONAL ECONOMIC GROWTH RATES 149
Empirical Assessment of Knowledge Spillovers and Creative Destruction in a Model ofEconomic Growth." NBER Macroeconomics Annual, pp. 15-74.
Clark, Gregory. 1987. "Why Isn’t the Whole World Developed? Lessons from the CottonMills." Journal of Economic History, vol. 47, no. 1 (March), pp. 141-73.
Cogley, Timothy and Mark M. Spiegel. 1996. " ’Slow Convergence’ Results from Time-SeriesMethods: Confidence Intervals for Convergence Rates." Federal Reserve Bank of SanFransisco, March, mimeo.
Crafts, N.F.R. 1985. British Economic Growth during the Industrial Revolution. Oxford: OxfordUniversity Press.
De Long, J. Bradford. 1988. "Productivity Growth, Convergence, and Welfare: Comment."The American Economic Review, vol. 78, no. 5 (December), pp. 1138-54.
De Long, J. Bradford and Lawrence H. Summers. 1991. "Equipment Investment andEconomic Growth." Quarterly Journal of Economics, vol. 106, no. 2 (May), pp. 445-502.
Denison, Edward. 1967. Why Growth Rates D~er. Washington, DC: The Brookings Institu-tion.
Dowrick, Steven and Duc-Tho Nguyen. 1989. "OECD Comparative Economic Growth1950-85: Catch-Up and Convergence." The American Economic Review, vol. 79, no. 5(December), pp. 1010-30.
Easterlin, Richard. 1982. Birth and Fortune: The Impact of Numbers on Personal Welfare. NewYork: Basic Books.
Jones, Charles. 1994. "Economic Growth and the Relative Price of Capital." Journal ofMonetary Economies, vol. 54 (December), pp. 359-82.
--. 1995a. "Time Series Tests of Endogenous Growth Models." Quarterly Journal ofEconomics, vol. 110 (May), pp. 495-525.
--. 1995b. "R&D-Based Models of Economic Growth." Journal of Political Economy, vol.103, no. 4 (August), pp. 759-84.
Kremer, Michael, 1993. "Population Growth and Technological Change: One Million B.C. to1990." Quarterly Journal of Economics, vol. 108 (August), pp. 681-716.
Kuznets, Simon. 1963. "The Meaning and Measurement of Economic Growth." In BarrySupple, ed., The Experience of Economic Growth. New York: Random House.
--. 1973. "Modem Economic Growth: Findings and Reflections." The American Eco-nomic Review, vol. 63, no. 3 (June), pp. 247-58.
Levine, Ross and David Renelt. 1992. "A Sensitivity Analysis of Cross-Country GrowthRegressions." The American Economic Review, vol. 82, no. 4 (September), pp. 942-63.
Lewis, W. Arthur. 1978. The Evolution of the International Economic Order. Princeton, NJ:Princeton University Press.
Livi-Bacci, Massimo. 1992. A Concise History of World Population. Oxford: Blackwell.Maddison, Angus. 1995. Monitoring the World Economy, 1820-1992. Paris: OECD.Malthus, Thomas R. 1798. An Essay on the Principle of Population. London.Mankiw, N. Gregory. 1995. "The Growth of Nations." Brookings Papers on Economic Activity,
no. 1, pp. 275-310.Mankiw, N. Gregory, David Romer, and David Weil. 1992. "A Contribution to the Empirics
of Economics Growth." Quarterly Journal of Economics, vol. 107, no. 2 (May), pp. 407-37.Mansfield, Edwin. 1985. "How Rapidly Does New Industrial Technology Leak Out?" Journal
of Industrial Economics, vol. 34, no. 2 (December), pp. 217-23.McKinsey Global Institute. 1993. Manufacturing Productivity. Washington, DC: McKinsey
Global Institute.Mokyr, Joel. 1985. "Introduction" to Mokyr, ed., The British Industrial Revolution. Totowa, NJ:
Rowman and Allanheld.Nordhaus, William. 1994. "Do Real Output and Real Wage Measures Capture Reality? The
History of Lighting Suggests Not." New Haven, CT: Cowles Discussion Paper 1078.Pritchett, Lant. 1994. "Divergence, Bigtime." Washington, DC: World Bank Discussion
Paper.Quah, Danny. 1993. "Galton’s Fallacy and Tests of the Convergence Hypothesis." Scandi-
navian Journal of Economics, vol. 95, no. 4 (Fall), pp. 427-43.Romer, Paul. 1986. "Increasing Returns and Long Run Growth." Journal of Political Economy,
vol. 94, no. 5 (October), pp. 1002-1037.Rostow, Walt Whitman. 1957. The Stages of Economic Growth. New York: Harper and Row.

150 ]. Bradford De Long
Solow, Robert. 1956. "A Contribution to the Theory of Economic Growth." Quarterly Journalof Economies, vol. 70, no. 1 (February), pp. 65-94.
--. 1957. "Technical Change and the Aggregate Production Function." The Review ofEconomics and Statistics, vol. 39, no. 3 (August), pp. 312-20.
Summers, Robert and Alan Heston. 1991. "The Penn World Table (Mark 5): An ExpandedSet of International Comparisons." Quarterly Journal of Economics, vol. 106, no. 2 (May),pp. 327-68.
Swan, Trevor. 1956. "Economic Growth and Capital Accumulation." Economic Record, vol. 32(November), pp. 334-61.
Taylor, Alan and Jeffrey Williamson. 1994. "Convergence in the Age of Mass Migration."NBER Working Paper No. 4711.
Williamson, Jeffrey. 1996. "Globalization, Convergence, and History." Journal of EconomicHistory, vol. 56, no. 2 (June), pp. 1-23.
World Bank Staff. World Development Report 1995: Workers in an Integrating World. New York:Oxford University Press.
DISCUSSION
Jeffrey A. Frankel*
Upon my first reading of J. Bradford De Long’s paper, my reactionwas to be impressed with its clarity and convinced by its basic arguments.He takes on some big ideas regarding the statistical record of cross-country growth rates, and he provokes the reader into new and usefulthoughts. I expected, at most, to be pointing out some missing referencesthat are relevant to the central point, the endogeneity of investment andother standard determinants of growth. Upon further thought, I remainimpressed by his clarity and stimulated by his ideas, but no longer soconvinced of all his conclusions.
The basic starting point is an apparent paradox. On the one hand,countries’ income levels have failed to converge over time. In fact, theinequality among nations has actually increased by most standardmeasures. On the other hand, when we condition on the standarddeterminants of growth such as investment and population growth, wefind a tendency for inequality to diminish--the finding now known asconditional convergence (Barro and Sala-i-Martin 1992; Mankiw, Romer,and Weil 1992). There is no contradiction here, but an interesting pair ofmajor trends remain to be explained. It would be nice to be able to foldthem into a single explanation. How tan this be done?
De Long’s explanation is elegant in its simplicity. Initial differences intechnology, for example, Britain’s Industrial Revolution, have becomeincreasingly magnified with the passage of time because of two channels.First, higher income levels lead to less rapid population growth. Popu-
*Professor of Economics and Director of the Center for International and DevelopmentEconomics Research, University of California at Berkeley. The author would like to thankTeresa Cyrus for very efficient research assistance, and Jeffrey Hammer for useful dis-cussion.
152 Jeffrey A. Frankel
lation growth is, in turn, a standard negative determinant of GNP percapita in the neoclassical growth model of Solow (not to mention inearlier contributions going back to Malthus). The reason is that higherpopulation growth means that more of investment is used up equippingworkers with the already existing level of capital, and less is left over toraise the capital/labor ratio. Second, higher income levels lead to lowerrelative prices of capital goods, so that a given saving rate buys more realinvestment. Through both cham~els, the initial divergence in incomesbecomes self-reinforcing.
My response falls into several parts. First, I will recall previousauthors who have made similar points, together with some additionalways that the standard determinants of growth could in theory beendogenous. Then, I will discuss some empirical evidence: on conver-gence itself, on the timing of increases in investment, and on what causessome countries to converge and others not.
DOCTRINAL ~’~ISTORY
Both the endogeneity of investment and the endogeneity of popula-tion growth are points that are long-known and well-known. Perhapsthey are better known in the development literature than in the growthliterature. In the case of investment, the specific channel mentioned byDeLong, via the relative price of capital goods, is new, so far as I know.But many have noted that saving (and therefore investment) mightchange as income rises.
One possible channel comes out of the same demographic transitiondescribed by De Long: A lower ratio of children to working-age popula-tion implies a higher saving rate, according to the life-cycle hypothesis(Mason 1987; Leff 1969). Other possible effects have been suggested aswell. The development process is often accompanied by the growth ofmore sophisticated financial systems, as well as pension plans and socialsecurity systems. This evolution can lead not only to more saving andinvestment, but also to lower population growth, since a prime motive inpoor countries for having many children is that they provide the onlyform of insurance against destitution in old age.I Investment in humancapit~l is often greater in rich countries than in poor countries, perhapsbecause education is a superior good.
I would like to add another effect to the list. The growth literatureoften falls into the habit of speaking of national saving and investmentinterchangeably. But the two differ; the difference is net foreign borrow-ing. Countries undergoing rapid growth often find foreign capital in-creasingly available, perhaps even to a greater extent than they would
1 For citations on all these points, see Hammer (1985) or Kelley (1988, pp. 1706-07).
DISCUSSION 153
like, as some emerging market countries found in the 1990s. Theincreased ease of international financing of investment is another waythat this key determinant of growth can be endogenous.
Some effects can also go the other way. Not everyone agrees thatpopulation growth has a clear negative effect on income per capita. Alonger life span leads to an increased ratio of elderly to working-agepopulation, which in turn results in a fall in saving, according to thelife-cycle hypothesis. Another effect is symmetric to De Long’s effect onthe price of capital goods. As he points out, countries as they grow tendto undergo a real appreciation of their currency, and thus an increase intheir relative price of nontraded goods and services, versus traded goods.But just as this means cheaper capital goods, it also means moreexpensive education. Thus, a given saving rate buys less real investmentin human capital (as parents of today’s students are well aware). I wouldnot argue that either of these two effects dominates the ones that work toreinforce growth, though someone else might.
Perhaps the most important precedent for De Long’s argument isresearch by Richard Nelson.2 He argued precisely that, because popula-tion growth and saving could be endogenous, a takeoff in growth couldbecome self-sustaining. The alternative was what he called a "low-levelequilibrium trap," in which a country is unable to achieve growth until itgets its population growth down and its saving rate up, but is unable toget its population growth down and its saving rate up until it achievesgrowth. This sort of model leads directly to De Long’s worldwidedivergence.
Before I leave the subject of doctrinal history, I want to make acomment on De Long’s characterization of technology. He says, on theone hand, that shifts in total factor productivity are more important thansometimes thought, in that they, rather than added inputs per capita,form the origin of the self-sustaining takeoff. But, on the other hand, hesays that Solow’s labeling such shifts as technology "may not have helpedeconomists think clear thoughts over the past 40 years." I do not believeBob Solow needs me to defend him, and in any case I am sure that nolack of respect for his contributions in this area was meant. Nevertheless,I thought I would recall the relevant two sentences from Solow (1957):"I am using the phrase ’technical change’ as a shorthand expression forany kind of shift in the production function. Thus slowdowns, speedups,improvements in the education of the labor force, and all sorts of thingswill appear as ’technical change.’" From the start, there has been plentyof awareness that the Solow residual was only "a measure of ourignorance," and that it could be influenced by managerial practices,government-induced distortions, cultural factors, and a hundred other
Nelson (1956 and 1960, p. 378); see also Jones (1976, p. 88).

154 Jed~rey A. Frankel
aspects of how countries organize their economies, as easily as by themastery of the internal combustion engine or the freeze-drying process.
EMPIRICAL EVIDENCE
Now I will turn to empirical observation. The divergence in percapita incomes that De Long identifies is striking, but this generalizationis a bit too sweeping and unqualified. Some of the most important trendsover the postwar period are obscured.
In 1870, the self-evident generalization would have been that Europeand European-settled regions had achieved remarkable growth and otherregions had not. In the middle of this century, the picture did not lookvery different, with a few exceptions: Japan had industrialized, whileLatin America had fallen behind (most dramatically Argentina andUruguay, which in 1870 had been as rich as Norway, as one can see fromDe Long’s interesting Figure 3a). But when numerous colonies gainedtheir independence in the 1950s and 1960s, the great hopes that many hadfor their rapid economic development were based on theory, on politics,on hope--on anything but historical experience. By 1980, those hopeshad been dashed. It seemed that countries developed if and only if theywere European (with Japan the only major exception).
Now, at last, this situation has suddenly changed. A group of EastAsian nations, led by the four tigers, have joined the class of industrial-ized countries. On a per capita basis, Hong Kong and Singapore are nowricher than Canada, France, the United Kingdom, and many otherindustrial countries. At the same time, a group of European nations, ledby the former Soviet Union, have joined the class of less-developedcountries.
On an aggregate basis, the U.S. share of Gross World Product hasdeclined from almost one-half after World War II to less than one-fourth.China has surpassed Japan and Germany, in terms of total GDP. Indiahas surpassed France, Italy, and Britain. Brazil and Mexico have sur-passed Canada. Indonesia has surpassed Spain. Korea and Thailand havesurpassed Australia. If the criterion were economic size, three of thesecountries would have a greater claim to be in the G-7 than does Canada,as would others within the foreseeable future.3
Why, then, does De Long find divergence rather than convergence?Romer (1986, 1989), Sala-i-Martin (1995), and others find the same. (Thisresult has been an important stimulus to the recent surge in growththeory.) But still others conclude the opposite. For instance, Baumol
3 Frankel (1996). These comparisons are on a Purchasing Power Parity basis. If one doesthe comparison on the basis of current exchange rates, then the Third World countries donot rank as high.
DISCUSSION 155
(1986), Dowrick and Nguyen (1989), and others see convergence amongdeveloped countries.4 De Long (1988), in a earlier paper, attributed thisfinding to sample selection bias. That critique was convincing. Neverthe-less, a number of authors have found convergence within groups ofcountries, such as Europe, or within groups of regions within countries,such as states of the United States, prefectures of Japan, or provinceswithin other countries. These findings are not due to sample selectionbias. Sala-i-Martin describes them as another kind of "conditional con-vergence," conditioning now on a class of countries or regions, ratherthan on factor accumulation or other determinants of growth.
I think we have to go at least one cut deeper than simply looking atthe variance across all countries. We have to consider which kinds ofcountries have converged and which kinds have not. Clearly, most EastAsian countries have done well, while most African countries havenot. Indeed, this last is an understatement. Some Asian countries havevirtually completed convergence with European levels of development,while most African countries have made no progress in this regard at all.Why is this?
The large empirical literature on cross-country growth comparisonshas found many explanations. The most robust are definitely the rates ofinvestment in physical and human capital, which are high in East Asia.(Population growth shows up much less consistently.) Indeed, Young(1995) and his popularizer Krugman (1994) have started many peoplewith their claims that factor accumulation explains most or all of thesuperior performance of the Newly Industrialized Economies of EastAsia. Little is left to be attributed to technical change or total factor pro-ductivity growth, whether interpreted as technology or Confucianism.
For present purposes, the key question is whether the high rates ofinvestment in East Asia were a cause of the takeoffs of the high-performing economies, as is most often assumed traditionally, or whetherthey merely resulted from and amplified the high growth rates once theywere already under way, as De Long argues (and the same for lower ratesof population growth). Both channels that De Long mentions shouldrequire time to occur--certainly the demographic transition takes time,and so I think does the process of bidding up the price of nontraded
4 Helpman (1987), in a different context (the connection between income and trade,discussed below) and with a different measure, found that the dispersion of incomeshas fallen over the postwar period. That calculation, like Baumol’s, was on a sample ofdeveloped countries, but Hummels and Levinsohn (1995) reproduced the result on a sampleof developing countries. While difference in sample may play a role, the major explanationfor this finding is probably that these authors are looking at countries’ total GDPs, while thegrowth literature works with countries’ per capita GDPs. The demographic transition saysthat rich countries have lower population growth than middle-income countries, so thedistribution across countries could become more equal over time for total incomes, even asit becomes less equal for per capita incomes.
156 JeJfrey A. Frankel
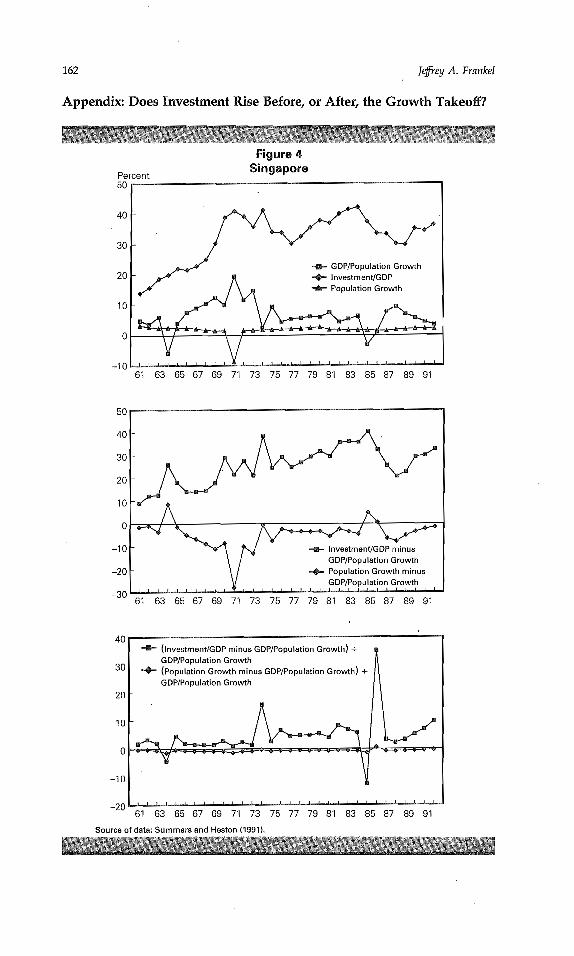
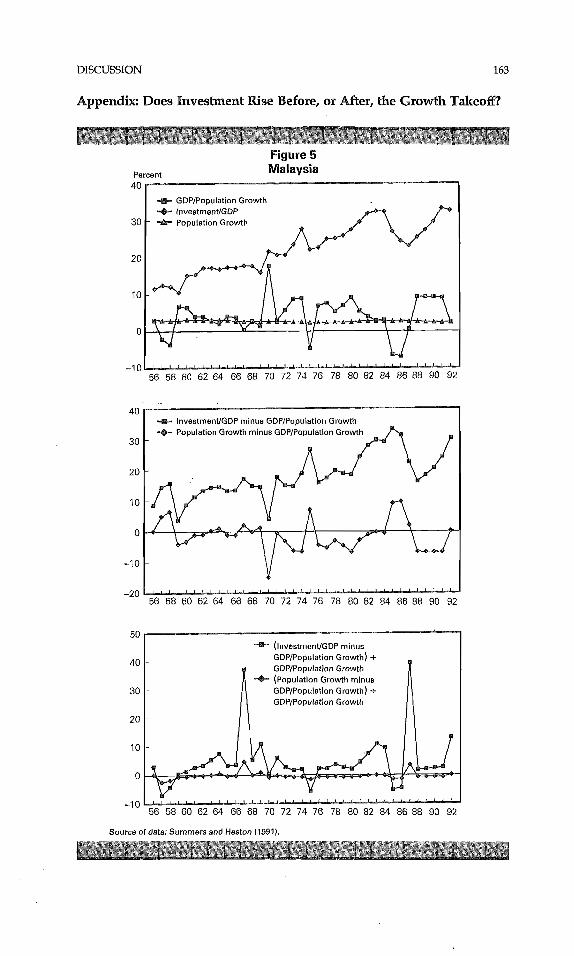
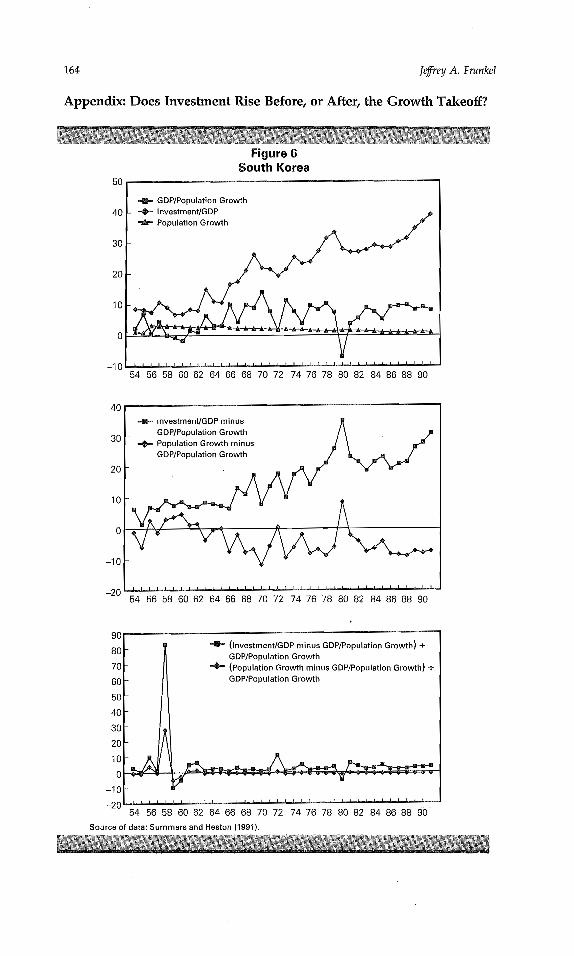
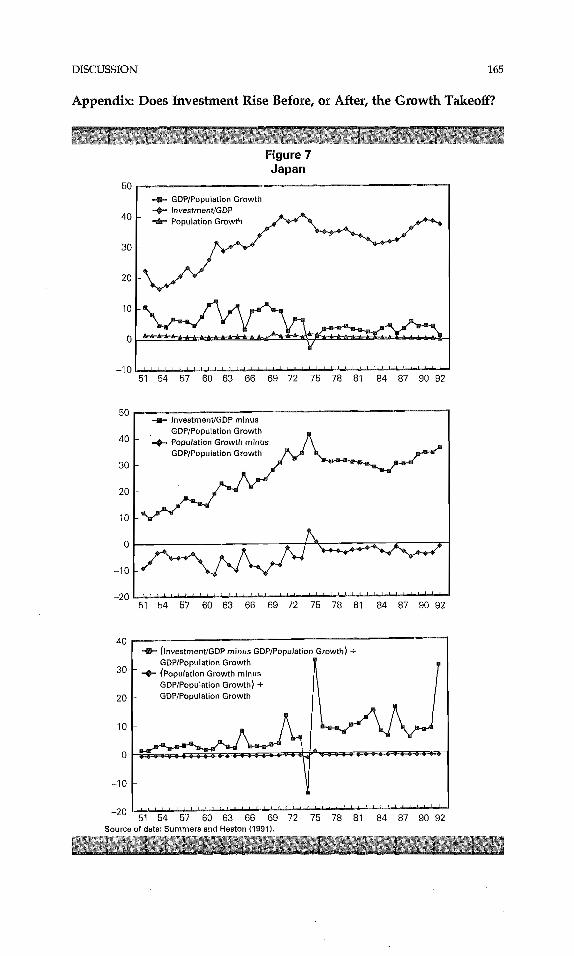
goods and services relative to internationally traded capital goods. Thus,one can look to see whether the changes occurred early in the takeoffprocess, supporting the traditional interpretation, or followed it, support-ing De Long’s interpretation. The one thing that seems to me missingfrom this paper is such an attempt to test the timing from the data.
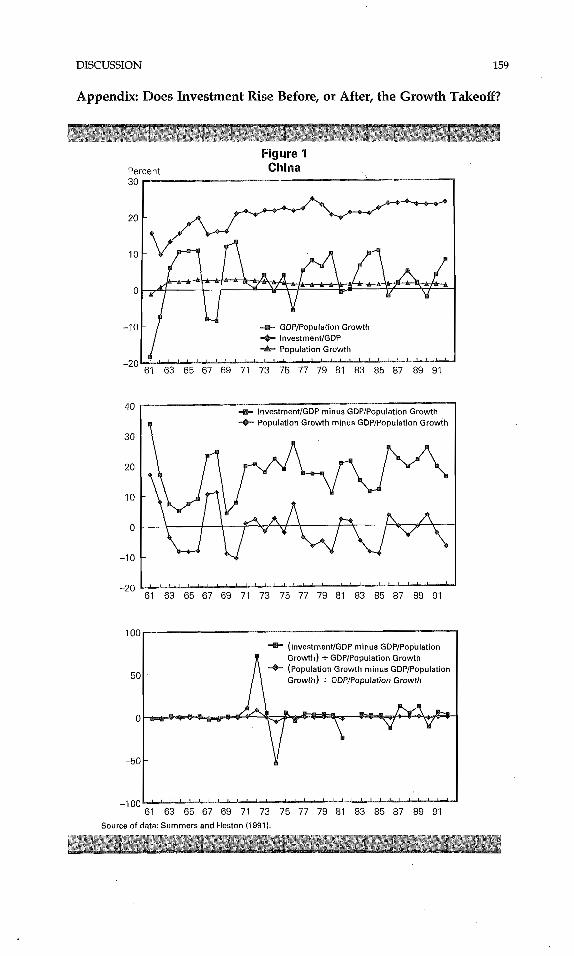
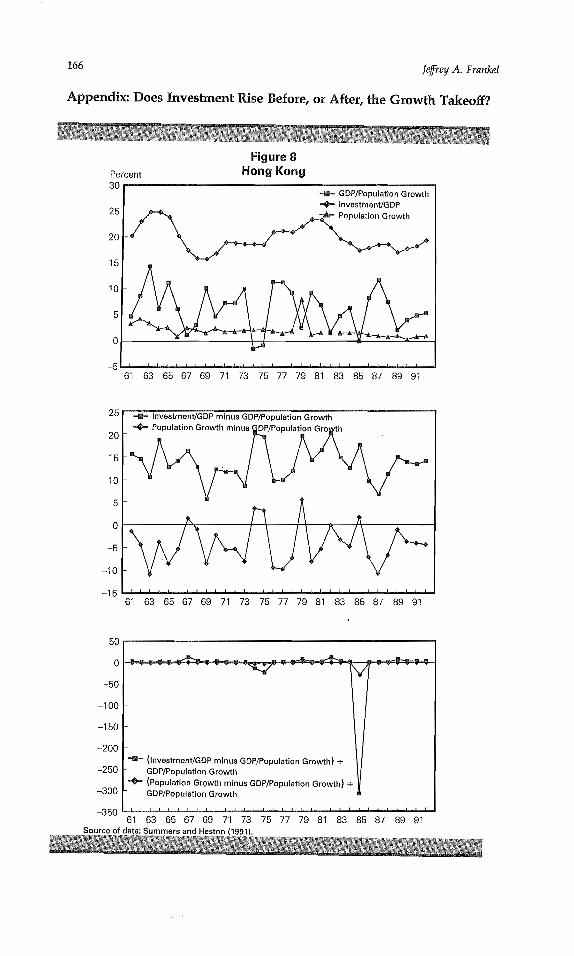
I have plotted the investment rates and population growth rates ofthe East Asian countries over the past 30 to 40 years, the time span of theirtakeoffs.5 (See the Figures, in the Appendix.) Most cases show very littleevidence of population growth declining more in the aftermath of thepeak in growth rates than it did before. Perhaps most of these countrieswill complete their demographic transitions in the future, but they havenot yet done so. Investment rates show much more evidence of favorablechanges after the peak in growth rates. However, they also show largeincreases in investment that pre-date the peak in growth rates, and theseappear to be likely candidates for the cause of the takeoff, contrary to theDe Long hypothesis. Perhaps the point about endogeneity of investmentrates and self-reinforcing growth is correct, and yet the point about theinitial takeoff being due more to exogenous technology than to exogenousinvestment differences is incorrect. More systematic analysis is needed.
CONCLUDING REMARKS
This discussion leaves out many other determinants of growth. Icannot end my comment without calling attention to one of them:openness to trade and investment. Many studies have found that open-ness, in addition to factor accumulation, is an important determinant ofgrowth. Furthermore, this relationship survives accusations of simulta-neity that have been frequently leveled against it, analogously to thepoint about the endogeneity of investment (Frankel and Romer 1996;Frankel, Romer, and Cyrus 1995). The countries that have converged arethose that are open. This observation can explain convergence withinthe OECD, within Europe, within the United States, and within othercountries. It is also part of the success of the East Asian countries.Openness is how countries absorb the best technology from the leaders,whether it is technology in the technological sense, or in more generalorganizational, managerial, and cultural senses. (See, for example, Gross-man and Helpman 1991.)
Openness, by the way, is another self-reinforcing mechanism. Whiletrade promotes growth, without question growth also promotes trade.
s This is a more compressed time span than that in which the transition of theindustrialized countries occurred. But the time taken by the East Asian tigers to double theirincomes has been only about 10 years, whereas it originally took the United States 47 yearsto do so (from 1839), and the United Kingdom 58 years (from 1780).
DISCUSSION 157
Countries tend to lower tariffs, for example, as they become richer. Tradehas made East Asia today a powerful, self-sustaining growth area. Thetrade is the result (as is well-known) of pro-trade policies and also (Iwould argue) of the proximity of the East Asian countries to each other.At their takeoff stages, they were dependent on the North Americanmarket for trade. In the 1990s, however, they have continued to chugalong on their own, even when the United States and Japan were inrecession--another example of self-reinforcing growth.
References
Barro, Robert and Xavier Sala-i-Martin. 1992. "Convergence." Journal of Political Economy,vol. 100, no. 2 (April), pp. 223-51.
Baumol, William. 1986. "Productivity Growth, Convergence, and Welfare: What theLong-Run Data Show." The American Economic Review, vol. 76, no. 5 (December), pp.1072-85.
De Long, J. Bradford, 1988. "Productivity Growth, Convergence, and Welfare: Comment."The American Economic Review, vol. 78, no. 5 (December), pp. 1138-54.
Dowrick, Steve and Duc-Tho Nguyen. 1989. "OECD Comparative Economic Growth1950-1985: Catch-up and Convergence." The American Economic Review, vol. 79, no. 5(December), pp. 1010-30.
Frankel, Jeffrey. 1996. "The World Over the Next Twenty-five Years: Global TradeLiberalization, and the Relative Growth of Different Regions." In The World in 2020: Aninternational panel on economic prospects a quarter of a century ahead. Prometeia, Bologna,Italy, 1995. CIDER Working Paper No. C96-061, January.
Frankel, Jeffrey and David Romer. 1996. "Trade and Growth: An Empirical Investigation."NBER Working Paper No. 5476, March.
Frankel, Jeffrey, David Romer, and Teresa Cyrus. 1995. "Trade and Growth in East AsianCountries: Cause and Effect?" Pacific Basin Working Paper Series No. 95-03, FederalReserve Bank of San Francisco, July.
Grossman, Gene and Elhanan Helpman. 1991. Innovation and Growth in the Global Economy.Cambridge, MA: The MIT Press.
Hammer, Jeffrey. 1985. "Population Growth and Savings in Developing Countries: ASurvey." World Bank Staff Working Paper No. 687. Washington, DC: The World Bank.
Helpman, Elhanan. 1987. "Imperfect Competition and International Trade: Evidence fromFourteen Industrial Countries." Journal of the Japanese and International Economies, vol. 1,pp. 62-81.
Hummels, David and James Levinsohn. 1995. "Monopolistic Competition and InternationalTrade: Reconsidering the Evidence." NBER Working Paper No. 4389 and QuarterlyJournal of Economics, vol. CX, no. 3, August, pp. 799-836.
Jones, Hywel. 1976. Introduction to Modern Theory of Economic Growth. New York: McGrawHill.
Kelley, Allen C. 1988. "Economic Consequences of Population Change." Journal of EconomicLiterature, vol. 26, no. 4 (December), pp. 1685-1728.
Krugman, Paul. 1994. "The Myth of Asia’s Miracle." Foreign Affairs, vol. 73, no. 6(November/December), pp. 62-78.
Left, Nathaniel. 1969. "Dependency Rates and Savings Rates." The American EconomicReview, vol. 59, no. 5 (December), pp. 886-96.
Mankiw, N. Gregory, David Romer, and David Weft. 1992. "A Contribution to the Empiricsof Economic Growth." Quarterly Journal of Economics, vol. 107, pp. 407-37.
Mason, Andrew. 1987. "National Saving Rates and Population Growth: A New Model andNew Evidence." In D. Gale Johnson and Ronald Lee, eds., Population Growth andEconomic Development: Issues and Evidence, pp. 523-60. Madison, WI: University ofWisconsin Press.
Nelson, Richard. 1956. "A Theory of the Low-Level Equilibrium Trap in UnderdevelopedEconomies." The American Economic Review, vol. 46, no. 5 (December), pp. 894-908.

158 Jeffrey A. Frankel
--. 1960. "Growth Models m~d the Escape from the Low Level Equilibrium Trap: TheCase of Japan." Economic Development and Cultural Change, vol. 8, July, pp. 378-88.
Romer, Paul. 1986. "Increasing Returns and Long-Run Growth." Journal of Political Economy,vol. 94, no. 5 (October), pp. 1002-37.
--. 1989. "Capital Accumulation in the Theory of Long-Run Growth," In Robert Barro,ed., Modern Business Cycle Theory. Cambridge, MA: Harvard University Press.
Sala-i-Martin, Xavier. 1995. "The Classical Approach to Convergence Analysis." CEPRDiscussion Paper No. 1254, October.
Solow, Robert. 1957. J’Technical Change and the Aggregate Production Function." TheReview of Economics and Statistics, vol. 39, no. 3 (August), pp. 312-20.
Summers, Robert and Alan Heston. 1991. "The Penn World Table (Mark 5): An ExpandedSet of International Comparisons, 1950-1988." Quarterly Journal of Economics, vol. 106,no. 2 (May), pp. 327-68.
Young, Alwyn. 1995. "The Tyranny of Numbers: Confronting the Statistical Reality of theEast Asian Growth Experience." Quarterly Journal of Economics, vol. 110, no. 3 (August),pp. 641-80.
DISCUSSION 159
Appendix: Does Investment Rise Before, or After, the Growth Takeoff?
Figure 1Percent China ,,,3O
10
0
-10
-2061 63 65 67 69 71 73 75 77 79 81 83 85 87 89 91
40
30
20
10
0
-10
Investment/GDP minus GDP/Population GrowthPopulation Growth minus GDP/Population Grow~h
-2061 63 65 67 69 71 73 75 77 79 81 83 85 87 89 91
100
5O
0
-5O
(Investment/GDP minus GDP/PopulationGrowth) + GDP/Population Growth(Population Growth minus GDP/Population
-10061 63 65 67 69 71 73 75 77 79 81 83 85 87 89 91Source of data: Summers and Heston (1991).
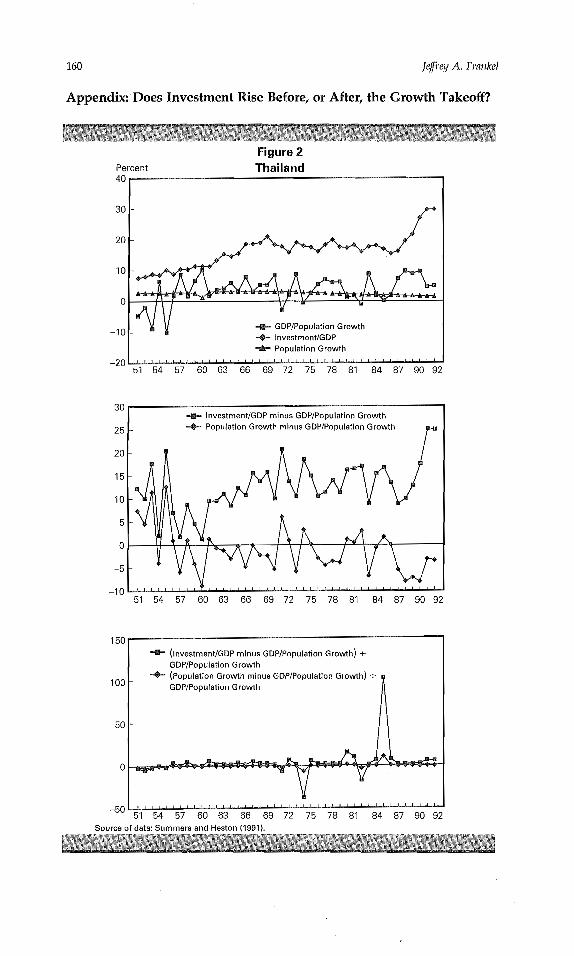
160 Je.l~rey A. Frankel
Appendix:Does Investment Rise Before, or After, the Growth Takeoff?
Percent40
3ol
Figure 2Thailand
2O
10
-2051 54 57 60 63 66 69 72 75 78 81 84 87 90 92
30
25
20
15
10
5
0
-5
-10
~ Investment/GDP minus GDP/Population Growth~ Population Growth minus GDP/Population Growth
5~ 54 57 60 63 66 69 72 75 78 81 84 87 90 92
150+ (Investment/GDP minus GDP/Population Growth) +
GDP/Population Growth100 "~= (Population Growth. minus GDP/Population Growth) + ~
5O
0
-50 ~ ’ ’ ’ ’ ’ ’ ’ ’ ’ ~~51 54 57 60 63 66 69 72 75 78 81 84 87 90 92
Source of data: Summers and Heston (1991).

DISCUSSION 161
Appendix: Does Investment Rise l~efore, or After, the Growth Takeoff?
Percent35
30
25
GDPJPopulation GrowthInvestment/GDPPopulation Growth
20
15
Figure 3Taiwan
o52 56 60 64 68 72 76 80 84 88
30
2O
lO
-lO
-2052
~ Investment/GDP minusGDP/Population Growth
-~=- Population Growth minusGDP/Population Growth
56 60 64 68 72 76 80 84 88
25 ~ (Investment/GDP minus GDP/Population Growth) +GDP/Population Growth
20 -=~= (Population Growth minus GDP/Population GrowthGDP/Population Growth
15
10
5
0
-5 52 56 60 64 68 72 76Source of data: Summers and Heston (1991).
80 84 88
162 Je~rey A. Frankel
Appendix: Does Investment Rise Before, or After, the Growth Takeoff?
Percent
40
aO
20
~0
0
-]0
Figure 4Singapore
GDP/Population GrowthInvestment/GDPPopulation Growth
61 63 65 67 69 71 73 75 77 79 81 83 85 87 89 91
50
40
30
20
10
0
-10
-20
-3061 63 65 67 69 71 73 75 77 79 81 83 85 87 89 91
40~ ~ (Investment/GDP minus GDP/Population Growth) +
GDP/Population GrowthI30 + (Population Growth minus GDP/Population Growth)GDP/Population Growth
20
10
0
-lO
-2061 63 65 67 69 71 73 75 77 79 81 83 85 87 89 91
Source of data: Summers and Heston (1991).
DISCUSSION 163
Appendix: Does Investment Rise Before, or After, the Growth Takeoff?
Percent4O
3O
2O
10
-10
Figure 5Malaysia
GDP/Population GrowthInvestment/GDPPopulation Growth
56 58 60 62 64 66 68 70 72 74 76 78 80 82 84 86 88 90 92
~ Investment/GDP minus GDP/Population Growth+ Population Growth minus GDP/Population Growth
3O
20
10
-10
-2056 58 60 62 64 66 68 70 72 74 76 78 80 82 84 86 88 90 92
50
40
30
20
10
0
-10
==~=" (InvestmentiGDP minusGDP/Population Growth) +GDP/Population Growth
+ (Population Growth minusGDP/Population Growth) +GDP/Population Growth
56 58 60 62 64 66 68 70 72 74 76 78 80 82 84 86 88 90 92
Source of data: Summera and Heston (1991).
164 Je~rey A. Frankel
Appendix: Does Investment Rise Before, or After, the Growth Takeoff?
50
40
30
20
10
0
-10
Figure 6South Korea
~ GDP/Population Growth~ Investment/GDP
g4 g6 58 60 62 64 66 68 70 72 74 76 78 80 82 84 86 88 90
40~ Investment/GDP minus
30GDP/Population Growth
+ Population Growth minusGDP/Population Growth
2O
10
-10
-2054 56 58 60 62 64 66 68 70 72 74 76 78 80 82 84 86 88 90
9080
70
6050
4030
20
100
-10-20
(Investment/GDP minus GDP/Population Growth) +GDP/Population Growth(Population Growth minus GDP/Population Growth) +GDP/Population Growth
54 56 58 60 62 64 66 68 70 72 74 76 78 80 82 84 86 88 90""Source of data: Summers and Heston (1991).
DISCUSSION 165
Appendix: Does Investment Rise Before, or After, the Growth Takeoff?
50
40
30
20
10
0
-10
Figure 7Japan
~ GDP/Population Growth~ Investment?GDP
51 54 57 60 63 66 69 72 75 78 81 84 87 90 92
50
40
30
20
10
0
-10
-20
Investment]GDP minusGDP/Population GrowthPopulation Growth minus
54 57 63 66 72 75 78 81 84 87 90 92
40
30
20
10
0
-10
-20
GDP/Population Growth(Population Growth minusGDP/Poputation Growth) +GDP/Population Growth
~ (Investment?GDP minus GDP/Population Growth) +
51 54 57 60 63 66 69 72 75 78 81 84 87 90 92Source of data: Summers and Heston (1991),
166 ]e~rey A. Frankel
Appendix: Does Investment Rise Before, or After, the Growth Takeoff?
Percent3O
25
2O
15
10
5
0
-5
Figure 8Hong Kong
~’ GDP/Population Growth"4TM Investment/GDP
61 63 65 67 69 71 73 75 77 79 81 83 85 87 89 91
25 ~ Investment/GDP minus GDP/Population Growth~ Population Growth minus GDP/Population
2O
15
10
5
0
-5
-10
-1561 63 65 67 69 71 73 75 77 79 81 83 85 87 89 91
5O
0
-50
-100
-150
-200
-250
-300
=~= (Investment]GDP minus GDP/Population Growth) +- GDP/Population Growth+ (Population Growth minus GDP/Population Growth) +
- GDP/Population Growth
-350 61 63 65 67 69 71 7375 77 79 81 83 85 87 89 91
Source of data: Summers and Heston (1991).
Adam g. Jaffe*
This paper by J. Bradford De Long provides a clear and provocativeoverview of a number of issues related to long-run trends in economicgrowth. The paper makes five important points. First, the historicalrecord provides us with the task of reconciling the fact that incomeper capita has been diverging across nations (unconditional divergence)at the same time that countries individually appear to be convergingtowards the steady-state income levels implied by their savings andpopulation growth rates (conditional convergence). Second, populationgrowth rates are endogenous, tending to decline as per capita incomerises. Third, the real price of investment goods is also endogenous, andtending to decline as income rises. Fourth, both of these "positivefeedback" effects amplify the impact of differences in productivity acrosscountries. And fifth, such productivity differences are not determinedsolely, or perhaps even primarily, by "technology" as that term isnormally defined.
There is much that I agree with in this presentation, at leastqualitatively. In my comment, I wish to make three points that bearprimarily on the interpretation and implications of these findings. First, Ibelieve that the evidence for the qualitative endogeneity of populationgrowth and the real price of investment goods is compelling. Thesephenomena undoubtedly are important in understanding the historicalrecord, particularly the dramatic failure of some of the world’s underde-veloped countries to grow. Second, it is less clear that modeling thesephenomena as continuous functions, and analyzing their effects in thesteady state, is the most useful approach. The change in population
*Associate Professor of Economics, Brandeis University.
168 Adam B. Jaff:e
growth, particularly, is more likely to behave as a one-time transition,its occurrence facilitated by high income. Finally, I would put aside thesemantic question of which shifters of the aggregate production ftmctionought to be labeled "technology" and which "not technology." But Iwould endorse the charge to disaggregate the different sources of suchshifts and to understand how economic incentives and effects differ fordifferent sources of productivity improvements.
THE CASE FOR QUALITATIVEENDOGENEITY IS COMPELLING
De Long’s paper makes the case for the effect of income on popula-tion growth primarily by reference to the historical record in the UnitedStates. This case can be augmented by the cross-sectional evidencepresented in my Figure 1. This plot shows a strong negative relationshipbetween the log of purchasing power parity (PPP) per capita incomeand the rate of population growth. The simple correlation coefficientbetween the two series is about -0.6, and a regression line implies that anincrease in income from $1,000 to $10,000 per capita is associated with adecline in population growth from about 2.5 percent per year to about1.5 percent per year. Of course, causality rtms in both directions here. Butthe magnitude of the relationship makes it implausible that it is dueentirely to high population.growth leading to low income per head. If twocountries started out at the same income level, but one had populationgrowth of 1.5 percent and one had population growth of 2.5 percent, itwould take 156 years for the per capita income of the less fertile countryto reach 10 times that of the other, all else equal. Hence, the cross-sectionevidence supports the proposition that the countries in the lower right-hand corner of the scatter have high rates of population growth becausethey have low income, to a significant extent.
My acceptance of the effect of income on the price of investmentgoods has a theoretical rather than an empirical basis. By definition,improvements in productivity make goods and .services cheaper (in realterms) than they used to be. It is clear that productivity improvementsover the last century have been disproportionately concentrated inmanufactured goods, for which the application of non-animal energy andtechniques of mass production have dramatically increased output.1 Thismeans that the real price of manufactured goods has fallen faster than thereal price of services. If investment draws on manufactured goods more
~ The true extent of the concentration of productivity improvements in manufacturingis difficult to determine, because output of the service sector is so hard to measure. But thedirection of the bias is not in doubt.
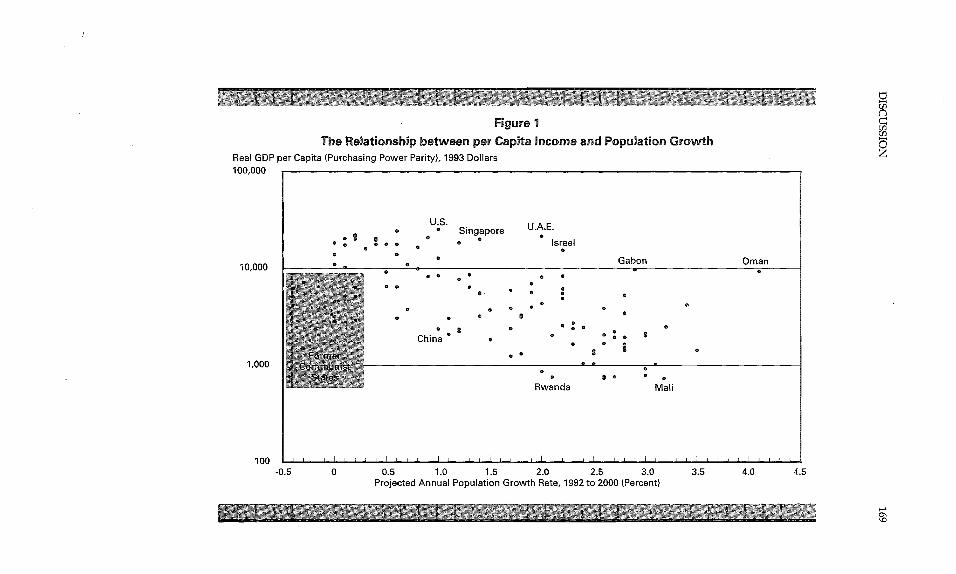
Figure 1The Relationship between per Capita income and Population Growth
Real GDP )er Capita (Purchasing Power Parity), 1993 Dollars100,000
10,000
Singapore U.A.E.~ Israel
Gabon
o
China
e
1,000
100
Rwanda Mali
Oman
-0.5 0 0.5 1.0 1.5 2.0 2.5 3.0 3.5 4.0 4,5Projected Annual Population Growth Rate, 1992 to 2000 (Percent)
170 Adam B, la~e
than it draws on services, then it has to be the case that the relative priceof investment goods falls as productivity rises.
Note that this positive feedback mechanism, and its resulting impli-cations for unconditional divergence, do not depend on internationaltrade. Completely autarkic economies would enjoy the same positivefeedback as productivity rose, and this positive feedback would amplifyincome differences resulting from productivity differences. The realexchange rate figures provided in De Long’s paper are the manifestationof the underlying disproportionate rates of productivity improvement,not the cause.
FEEDBACK EFFECTS ARE NOT SMOOTH OR CONTINUOUS
Referring back to Figure 1, .the correlation between log income andpopulation growth falls to -0.3 if only countries above the medianincome (about $3,000) are considered. For countries above $10,000 (theincome level where the regression line crosses the U.S. population growthrate of 1 percent), the correlation is actually +0.15, though this positivecorrelation is not significantly different from zero. Thus, among theapproximately 30 countries with income at least as high as Slovenia orKorea, there appears to be no further depressing effect of incomeincreases on population growth. Hence, rather than a function q~ln(y) asmodeled by De Long, it would seem more appropriate to think of ademographic transition that countries must traverse, reducing theirpopulation growth rate from something like 2.5 percent per year tosomething like 1 percent or less. With the exception of small, naturalresource-rich countries and countries with high immigration rates, allwealthy countries have made this transition. Rising income helps inmaking this transition, but it is clearly not a necessary condition, asdemonstrated by the important examples of China and the other formerlyCommunist states.2
This one-time demographic transition has different steady-stateimplications than the model analyzed by De Long. Essentially, twoclasses of steady states exist, one class in which the demographictransition has been made, and one class in which it has not. The twoclasses will have very different levels of per capita income, but withinclasses the amplification effect described by De Long for differences ininitial productivity levels will not operate. One way to think of it may bethat higher productivity increases the probability of making the demo-graphic transition, rather than increasing steady-state income per se.
This suggests that the endogeneity of population growth was more
2 Interestingly, very few countries that have achieved population growth of I percentor less are not either high-income or once-Communist.

DISCUSSION 171
important historically than it will be prospectively. While it clearly helpsus in understanding what happened in the United States over the pastcentury and what will happen to the countries of sub-Saharan Africa overthe next several decades, it is apparently irrelevant to understandingwhat will happen in China or the former Soviet Union.
Finally, understanding that income affects population growth, andprobably does so in a highly nonlinear way, has implications for theeconometric specification of the conditional convergence regressions thatDe Long discusses. Accepting the population growth rate as a nonlinearfunction of income suggests that the conditional convergence regres-sions have to be estimated as part of some kind of nonlinear system ofequations.
SOURCES OF DIFFERENCES IN TOTAL FACTORPRODUCTIVITY ACROSS TIME AND SPACE
I do not think that it is productive to engage in extended debateregarding which factors that shift production functions ought to belabeled technology and which ought to be labeled something else. WhatI do think is productive is to recognize that production functions differfor several distinct reasons, and with different implications for economicanalysis. My personal list would look something like this:
~ Hardware:. technology embodied in equipment;o Software: technology embodied in digital programs, training man-
uals, textbooks, and other places where knowledge is encoded in. ways that can be read by others;
¯ Human capital: skills that can be taught, or acquired throughlearning by doing;
¯ Ideas: knowledge carried by humans in their minds that cannot beor is not encoded in software;
¯ Institutional and market factors: political, legal, and social forces thataffect efficiency;
, Idiosyncrasies: everything else.
These shifters of the production function differ in the nature ofincentives that surround their creation and in the economic forces thatgovern their spread. For example, ideas are nonrival in use, meaning thattheir use in one context does not deplete them. Software also is largelynonrival, equipment is less so, and human capital is largely rival. Thismeans that their contribution to output is likely to be characterized byincreasing returns to scale, with implications for growth as captured inthe new growth theory models.
Another important characteristic is the extent to which factors areexcludable, meaning that it is possible to prevent people who do not payfor them from using them. Human capital is mostly excludable, but

172 Adam B. Ja~e
hardware and software are only partially so. This means that theircreation produces spillovers, implying that their contribution to outputand hence growth exceeds their returns to their creators. Finally, hard-ware and software are largely portable and tradable, facilitating theirdiffusion around the world; human capital and ideas are much less so. Byidentifying and analyzing these distinct categories, we can begin tounderstand the economic forces driving productivity improvement andhence growth.